Table of Contents
UNITED STATES
SECURITIES AND EXCHANGE COMMISSION
Washington, D.C. 20549
FORM N-CSR
CERTIFIED SHAREHOLDER REPORT OF REGISTERED
MANAGEMENT INVESTMENT COMPANIES
Investment Company Act file number 811-22975
AllianzGI Institutional Multi-
Series Trust
(Exact name of registrant as specified in charter)
1633 Broadway, New York, New York 10019
(Address of principal executive offices) (Zip code)
Scott Whisten
1633 Broadway
New York, New York 10019
(Name and address of agent for service)
Registrant’s telephone number, including area code: 212-739-3367
Date of fiscal year end: September 30
Date of reporting period: September 30, 2020
Table of Contents
Item 1. Report to Shareholders
AllianzGI Institutional Multi-Series Trust
Annual Report
September 30, 2020
Beginning on January 1, 2021, as permitted by regulations adopted by the U.S. Securities and Exchange Commission, paper copies of shareholder reports will no longer be sent by mail, unless you specifically request paper copies of the reports. Instead, the reports will be made available on the Portfolios’ website (us.allianzgi.com), and you will be notified by mail each time a report is posted and provided with a website link to access the report.
If you already elected to receive shareholder reports electronically, you will not be affected by this change and you need not take any action. You may elect to receive shareholder reports and other communications from a Portfolio electronically anytime by contacting your financial intermediary (such as a broker-dealer or bank) or, if you are a direct investor, by enrolling at us.allianzgi.com/edelivery.
If you prefer to receive paper copies of your shareholder reports after January 1, 2021, direct investors may inform a Portfolio at any time. Paper copies are provided free of charge and your election to receive reports in paper will apply to all funds held with the fund complex.
Table of Contents
| 2-7 | ||||
| 8-9 | ||||
| 10-27 | ||||
| 28 | ||||
| 29 | ||||
| 30-31 | ||||
| 32-33 | ||||
| 34-47 | ||||
| 48 | ||||
| 49 | ||||
Matters Relating to the Trustees’ Consideration of the Investment | ||||
| 50-54 | ||||
Changes to the Board of Trustees/Liquidity Risk Management Program | 55 | |||
| 56-58 | ||||
| 59-61 | ||||
Table of Contents
AllianzGI Best Styles Global Managed Volatility Portfolio*
(unaudited)
For the period of October 1, 2019 through September 30, 2020, as provided by Christian McCormick, Senior Product Specialist.
Portfolio Insights
|
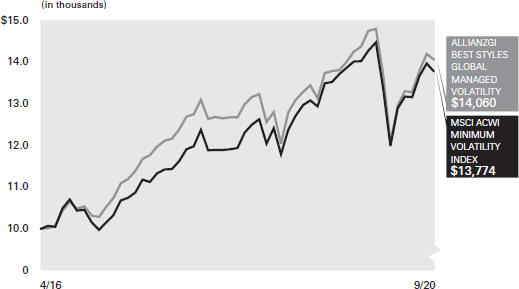
For the twelve-month period ended September 30, 2020, the AllianzGI Best Styles Global Managed Volatility Portfolio (the “Portfolio”) returned 0.41%, outperforming the MSCI ACWI Minimum Volatility Index (the “benchmark”), which returned -0.64%.
Market Overview
Global equities rallied over the third quarter of 2020, buoyed by positive trial results for potential COVID-19 vaccines, further stimulus measures and hopes that the global economy may be over the worst of its pandemic-induced recession. However, after recording their strongest August returns since 1986, stock markets weakened throughout September 2020, undermined by political wrangling in the US over the size of further fiscal stimulus and concerns over a potentially destabilising US presidential election. A surge in new coronavirus infections in Europe further weighed on sentiment. In general, emerging markets outperformed developed markets, helped by a weaker tone to the US dollar.
Portfolio Review
The Best Styles strategies implement a well-diversified blend of the five long-term successful investment styles value, momentum, earnings revisions, growth and quality. Over the trailing twelve months, the style Value
underperformed globally, driven primarily by significant underperformance in the US market. The trend following styles of Momentum and Revisions did outperform, along with Growth, which had the strongest performance of the trend following styles. Quality also performed well. From a capitalization perspective, small cap stocks underperformed mega cap and large cap stocks, which was an overall head wind to the strategy.
The Portfolio has only moderate leeway for sector and regional allocation with a maximum deviation of 3% vs. the benchmark for active weightings. There was a significant negative contribution from our underweight to materials, despite is small size, mainly due to not holding gold mining related stocks, which performed very well during the period. Outside of the materials sector, attribution from a country and sector perspective was benign.
Best Styles holds a broad number of stocks to implement a well-diversified mix of investment styles and assigns a maximum active weighting of 1% to individual stocks. Therefore, we expect stock selection to be the biggest driver of relative returns and this was the case over the past twelve months. Stock selection in the information technology was the largest contributor and materials was the largest detractor. In fact, despite an aggregate
underweight of only 3.3%, four gold mining stocks alone detracted -163 basis points from relative performance.
Outlook
The coronavirus has caused a global demand and supply shock. The recession started in the first quarter of 2020 and gross domestic product collapsed in the second quarter of 2020. In response to this crisis, governments and central banks all over the world have enacted fiscal and monetary stimulus measures to counteract the disruption caused by the coronavirus. We believe that the third quarter of 2020 will probably see a V-shaped recovery. Due to the continued spread of the coronavirus, however, the outlook for the fought quarter of 2020 and 2021 is getting cloudier. The back-to-normal process will take some time.
* Effective on November 20, 2020, the AllianzGI Best Styles Global Managed Volatility Portfolio was liquidated.
Average Annual Total Return for the period ended September 30, 2020
|
| 1 Year | Since Inception† | |||
AllianzGI Best Styles Global Managed Volatility Portfolio | 0.41% | 7.92% | ||
MSCI ACWI Minimum Volatility Index†† | -0.64% | 7.42% | ||
† The Portfolio began operations on April 11, 2016. Benchmark return comparisons began on the portfolio inception date.
†† The MSCI ACWI Minimum Volatility Index aims to reflect the performance characteristics of a minimum variance strategy applied to large and mid-cap equities across developed markets and emerging markets countries. The index is calculated by optimizing the MSCI ACWI Index, its parent index, for the lowest absolute risk (within a given set of constraints). Historically, the index has shown lower beta and volatility characteristics relative to the MSCI ACWI Index. Index returns reflect the reinvestment of income dividends and capital gains, if any, but do not reflect fees, brokerage commissions or other expenses of investing. It is not possible to invest directly in an index.
Performance quoted represents past performance and is no guarantee of future results. Current performance may be lower or higher than performance shown. Investment return and the principal value will fluctuate. Shares may be worth more or less than original cost when redeemed. Returns do not reflect deduction of taxes that a shareholder would pay on portfolio distributions or redemption of portfolio shares. Total return performance assumes that all dividends and capital gain distributions were reinvested on the payable date. The Portfolio’s gross expense ratio is 0.70%. This ratio does not include an expense reduction, contractually agreed to through January 31, 2021. The Portfolio’s expense ratio net of this reduction is 0.45%. Expense ratio information is as of the Portfolio’s current PPM dated February 1, 2020, as further revised or supplemented from time to time.
| 2 | Annual Report September 30, 2020 |
Table of Contents
AllianzGI Best Styles Global Managed Volatility Portfolio
(unaudited) (continued)
Country Allocation (as of September 30, 2020) | Cumulative Returns through September 30, 2020 | |||||
| United States | 49.0% |
| ||||
| Japan | 15.0% | |||||
| Switzerland | 6.7% | |||||
| Taiwan | 4.8% | |||||
| Canada | 3.0% | |||||
| Germany | 2.1% | |||||
| China | 1.8% | |||||
| France | 1.4% | |||||
| Other | 15.3% | |||||
Cash & Equivalents — Net | 0.9% | |||||
| Shareholder Expense Example | Actual Performance | ||||
| Institutional Class | |||||
Beginning Account Value (4/1/20) | $ | 1,000.00 | |||
Ending Account Value (9/30/20) | $ | 1,165.10 | |||
Expenses Paid During Period | $ | 2.44 | |||
| Hypothetical Performance | |||||
| (5% return before expenses) | |||||
| Institutional Class | |||||
Beginning Account Value (4/1/20) | $ | 1,000.00 | |||
Ending Account Value (9/30/20) | $ | 1,022.75 | |||
Expenses Paid During Period | $ | 2.28 | |||
Expenses (net of reimbursement, if any) are equal to the annualized expense ratio (0.45%), multiplied by the average account value over the period, multiplied by 183/366
| 3 | Annual Report September 30, 2020 |
Table of Contents
AllianzGI Global Small-Cap Opportunities Portfolio*
(unaudited)
For the period of October 1, 2019 through September 30, 2020, as provided by Kunal Ghosh, Portfolio Manager.
Portfolio Insights
|
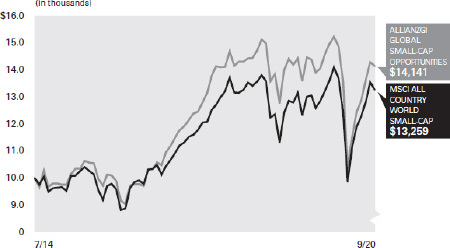
For the twelve-month period ended September 30, 2020, the AllianzGI Global Small-Cap Opportunities Portfolio (the “Portfolio”) returned 0.66%, underperforming the MSCI All Country World Small-Cap Index (the “benchmark”), which returned 3.22%.
Market Overview
Global small cap equities were influenced by rapidly shifting macroeconomic conditions during the annual reporting period in light of moderating global growth expectations and impact from the coronavirus (COVID-19).
Global small cap equities initially advanced in October to December 2019 period due to interest rate cuts from central banks in both developed and developing economies as well as improving trade relations, including agreement of a “phase one” trade deal between the US and China. The economic outlook then shifted suddenly as global small cap equities declined meaningfully in the January to March 2020 period, crippled by the spread COVID-19 and global economic growth ground to a standstill. The market decline reversed in April 2020 as the prior measures which were employed to curtail the virus were gradually lifted. The resilient performance continued with positive gains in each month from the May to August 2020 period as equities were lifted amid optimism that the COVID-19 concerns which plagued the asset class were subsiding thanks to unprecedented government and central bank support buoyed stocks, helping investors overcome fears of a second wave of infections. The asset class declined modestly in September as COVID-19 cases spiked, particularly in Europe, and uncertainty over the US Presidential election began to weigh on sentiment.
During the reporting period, emerging markets small cap equities generally outpaced their developed market small cap counterparts. Country results were mixed with 25 of 48 countries posting gains. Results were led to the
upside by a 42.9% rally in Sweden, followed by a 36.2% advance in South Korea and a 34.1% gain in Denmark. Small cap shares in the United States, which represent more than half of the benchmark index, posted a mere 0.3% advance. Meanwhile, Indonesia, Chile and Colombia, which are trivial benchmark weights, each declined more than 34% during the reporting period.
Sector performance for the benchmark index was divergent, with 7 out of 11 sectors advancing. Health care gained 36.8% thanks to increased attention related to the search for tests, treatments and vaccines to tackle COVID-19, while information technology was higher by 24.3% due to resilient demand. Materials posted a 10.5% gain for the period. Alternatively, cyclically-oriented sectors were the hardest hit, including energy which was down 45.4%, followed by a 17.9% decline in financials and a 15.2% loss in real estate during the annual reporting period.
Portfolio Review
Our goal is to provide clients with a portfolio capitalizing on conviction at the stock level, while limiting other risks including country, industry and market capitalization. The Portfolio trailed on a relative basis due to selection and an underweight to higher growth and higher risk stocks in the benchmark which were among the top performers.
During the reporting period, stock selection in China contributed to results as did modest overweight allocations to Japan and South Korea. Conversely, an underweight position in Sweden, the benchmark’s top performer, offset results as did stockpicking in Switzerland and India. From a sector perspective, an underweight position and bottom-up stock section in real estate aided results. A sizeable overweight allocation and positive selections in information technology outpaced the benchmark as did a relative underweight
allocation and bottom-up stockpicking in energy. Meanwhile, a slight underweight allocation and more conservative stock selection in health care was the primary detractor to performance. Selections in consumer discretionary and materials lagged the benchmark index more modestly during the annual reporting period.
Outlook
Global small cap equities may continue to benefit from encouraging investor sentiment coupled against the backdrop of favorable fiscal and monetary policies. COVID-19 impacts remain a key determinant for market direction. While the number of COVID-19 cases continue to rise globally, investors appear to look past these near-term uncertainties and instead focus on earnings growth potential over the coming years. Market volatility may persist and be data-driven based on COVID-19 and US presidential election news. Our proactive focus on building a portfolio with a favorable growth vs. valuation mix alongside a reduction in volatility may help navigate the prevailing market conditions. In addition, the broad investment opportunities in the asset class and historical alpha demonstrated by active management, give us confidence in the ability to outperform the benchmark over time.
We continue to construct the Portfolio on a bottom-up basis with conviction at the stock level. In addition, we apply a dual risk-budget, targeting a tracking error of 4-6% and lower forecast risk than the benchmark, which may help protect capital during inevitable down market periods and provide our clients with a greater level of return consistency. We believe investment results will be supported by earnings growth and our behavioral finance-focused investment process and focus on higher quality securities with attractive company fundamentals will be a driver of returns for the coming quarters.
* Effective on November 18, 2020, the AllianzGI Global Small-Cap Opportunities Portfolio was liquidated.
Average Annual Total Return for the period ended September 30, 2020
|
| 1 Year | 5 Year | Since Inception† | ||||
AllianzGI Global Small-Cap Opportunities Portfolio | 0.66% | 7.80% | 5.76% | |||
MSCI All Country World Small-Cap Index†† | 3.22% | 7.63% | 4.66% | |||
† The Portfolio began operations on July 23, 2014. Benchmark return comparisons began on the portfolio inception date.
†† The MSCI All Country World Small-Cap Index captures small-cap representation across developed markets and emerging markets countries. The Index covers about 14% of the free float-adjusted market capitalization in each country. Index returns reflect the reinvestment of income dividends and capital gains, if any, but do not reflect fees, brokerage commissions or other expenses of investing. It is not possible to invest directly in an index.
Performance quoted represents past performance and is no guarantee of future results. Current performance may be lower or higher than performance shown. Investment return and the principal value will fluctuate. Shares may be worth more or less than original cost when redeemed. Returns do not reflect deduction of taxes that a shareholder would pay on portfolio distributions or redemption of portfolio shares. Total return performance assumes that all dividends and capital gain distributions were reinvested on the payable date. The Portfolio’s gross expense ratio is 3.44%. This ratio does not include an expense reduction, contractually agreed to through January 31, 2021. The Portfolio’s expense ratio net of this reduction is 1.20%. Expense ratio information is as of the Portfolio’s current PPM dated February 1, 2020, as further revised or supplemented from time to time.
| 4 | Annual Report September 30, 2020 |
Table of Contents
AllianzGI Global Small-Cap Opportunities Portfolio
(unaudited) (continued)
Country Allocation (as of September 30, 2020)
|
| |||
United States | 49.6% | |||
Japan | 12.7% | |||
Taiwan | 4.2% | |||
Canada | 3.6% | |||
United Kingdom | 3.6% | |||
Korea (Republic of) | 3.0% | |||
Netherlands | 2.9% | |||
Australia | 2.7% | |||
Other | 18.3% | |||
Cash & Equivalents — Net | -0.6% | |||
Cumulative Returns through September 30, 2020
|
| Shareholder Expense Example | Actual Performance | |||
| Institutional Class | ||||
Beginning Account Value (4/1/20)
|
| $1,000.00
|
| |
Ending Account Value (9/30/20)
|
| $1,366.80
|
| |
Expenses Paid During Period
|
| $ 7.16
|
| |
| ||||
| Hypothetical Performance | ||||
| (5% return before expenses) | ||||
| Institutional Class | ||||
Beginning Account Value (4/1/20)
|
| $1,000.00
|
| |
Ending Account Value (9/30/20)
|
| $1,018.95
|
| |
Expenses Paid During Period
|
| $ 6.11
|
| |
Expenses (net of reimbursement, if any) are equal to the annualized expense ratio (1.21%), multiplied by the average account value over the period, multiplied by 183/366.
| 5 | Annual Report September 30, 2020 |
Table of Contents
AllianzGI International Growth Portfolio*
(unaudited)
From inception on October 1, 2019 through September 30, 2020, as provided by Laura Villani, Product Specialist, Equities.
Portfolio Insights
|
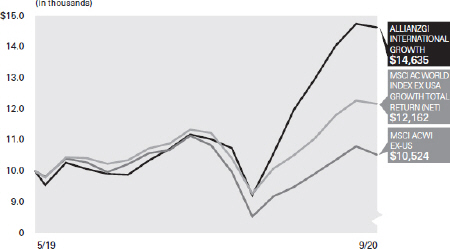
For the twelve-month period ended September 30, 2020, the AllianzGI International Growth Portfolio (the “Portfolio”) returned 48.13%, outperforming the MSCI ACWI ex USA Index (the “benchmark”), which returned 3.00%.
Market Overview
International equities had a strong finish to the end of 2019, leading many equity markets to record their strongest annual gains in several years. That set the stage for the worst quarterly fall since the Global Financial Crisis in the first quarter of 2020, as the COVID-19 outbreak established itself as a global pandemic, leading to household and business lockdowns and an unprecedented global demand shock environment. In turn, this triggered fears of a severe global recession, leading markets to sell-off broadly in mid-March 2020. Investors quickly moved to establish the winners of the new pandemic environment however, with the information technology and health care sectors coming into favor, and the travel sector remaining challenged. Quality as a style was also well rewarded, with strong balance sheets and market leadership positions becoming especially valuable.
International equities then rebounded in the second quarter of 2020, helped by growing optimism over an economic recovery as well as unprecedented government and central bank support. This has shrunk the size of year-to-date losses, and we see strong recoveries from many stocks where valuations have even become stretched in some well supported areas of the market. By the third quarter of 2020, more market volatility set in with numerous geopolitical events on the agenda such as the US elections and Brexit, as well as rising COVID-19 risks that are competing with positive vaccine and medication news flow, Visibility remains fairly low.
Portfolio Review
The Portfolio maintains its strategy that takes a bottom-up approach to identifying structural growth, rather than chasing growth momentum. We believe that our focus on high quality businesses, that display long term structural growth independently of the wider market, should shelter us to some extent from uncertainty in the
markets. The pandemic environment has been a very tough test of this philosophy, and so we are pleased to see the strong outperformance of the Portfolio, which has displayed its natural strength (minimal repositioning required) in one of the most challenging environments for companies imaginable.
The Portfolio enjoyed a positive contribution from the both stock selection and sector allocation, with stock selection demonstrating by far the strongest effect. With regards to sector allocation, the overweight of information technology was especially supportive, while the overweight of financials was the main but still only slight detractor from active performance. From a country perspective, stock selection in Israel contributed to active performance most positively, which China detracted most. With the Portfolio being both sector and country agnostic, these results are simply an effect of the stock selection.
Many companies had their structural growth investment cases accelerated by the pandemic environment. Israel information technology name Wix, top contributor to active performance over the period (+538 basis points), provides simple and effective website design software and was a clear winner. We see rather a longer-term step-change in its growth profile, like many other COVID-19 beneficiaries in the Portfolio. Ambu, Netcompany, Shopify, and Mercado Libre also contributed strongly (between 294 and 159 basis points each).
Meanwhile HDFC Bank was the lead detractor of -130 basis points, with the market targeting the financials name as susceptible to COVID-19 impact, with India also going into strict lockdown. However, it is a high-quality company with very low non-performing loans ratio and meaningful long-term drivers still intact.
Outlook
The Portfolio has enjoyed a strong performance run year-to-date, and over the past year. However, it is important to highlight that from our perspective, the Portfolio is not just benefiting from a temporary boost to stay-at-home stocks in this
short-term pandemic environment. We have rather seen an acceleration of our structural growth investment cases, where for many holdings, 2-3 years of growth has been compressed into the past 12 months. Said another way, many of our companies have seen a step change in their growth profiles, achieved through new customer wins, cost reductions, increased market share, and emphasis on digitalisation improvements, which is sustainable growth that will be further compounded over time.
As we stated early in the crisis, we believe the winners will only get stronger. Europe’s €750bn stimulus, and its focus on climate protection and digitalisation to strengthen its companies on a global stage, also sees many of our local holdings positioned well. Abroad, many of the platform business models (and now multi-platform business models) we own still look very early in their growth journey, with plenty of runway ahead from huge markets where they still hold low share, or from opportunities in combining additional businesses or digital components to open up entirely new growth avenues. In that respect, we may well be at the gates of a technological revolution.
On account of the sentiment fueled, short-term oriented market, we may look for an opportunity to rotate out of the year-to-date winners in the quarters ahead. Valuations begin to look rich in places, and the gap to Value as a style has only widened further in the past quarters. But here we should also acknowledge the significant and continually rising role of intangible assets like data, custom software and vast user bases that are not accurately captured as assets in a balance sheet, despite being responsible for much of the value creation in a companies like Alibaba, Wix, Shopify, and Sea. These intangibles are difficult to value and in their new combinations (Alipay’s 1.2bn users + fintech platform offering credit + AI for example) can have exponential growth results if executed well.
Longer term, we continue to believe the Portfolio will be rewarded for its focus on real earnings growth, from high quality companies that are leading their markets and really driving the future.
* Effective on or about December 14, 2020, the AllianzGI International Growth Portfolio will liquidate.
Average Annual Total Return for the period ended September 30, 2020
|
| 1 Year | Since Inception† | |||||||
AllianzGI International Growth Portfolio | 48.13% | 31.83% | ||||||
MSCI ACWI ex USA Index†† | 3.00% | 3.77% | ||||||
MSCI AC World Index ex USA Growth Index | 17.54% | 15.24% | ||||||
† The Portfolio began operations on May 15, 2019. Benchmark return comparisons began on the portfolio inception date.
†† The MSCI ACWI ex USA Index captures large- and mid-cap representation across Developed Markets countries (excluding the U.S.) and Emerging Markets countries. The index covers approximately 85% of the global equity opportunity set outside the US.
Performance quoted represents past performance and is no guarantee of future results. Current performance may be lower or higher than performance shown. Investment return and the principal value will fluctuate. Shares may be worth more or less than original cost when redeemed. Returns do not reflect deduction of taxes that a shareholder would pay on portfolio distributions or redemption of portfolio shares. Total return performance assumes that all dividends and capital gain distributions were reinvested on the payable date. The Portfolio’s gross expense ratio is 1.71%. This ratio does not include an expense reduction, contractually agreed to through January 31, 2021. The Portfolio’s expense ratio net of this reduction is 0.80%. Expense ratio information is as of the Portfolio’s current Private Placement Memorandum (“PPM”) dated February 1, 2020, as further revised or supplemented from time to time.
| 6 | Annual Report September 30, 2020 |
Table of Contents
AllianzGI International Growth Portfolio
(unaudited) (continued)
Country Allocation (as of September 30, 2020)
|
| |||
China | 17.6% | |||
Denmark | 15.1% | |||
Germany | 10.4% | |||
Israel | 6.7% | |||
Canada | 5.9% | |||
Netherlands | 5.4% | |||
Sweden | 5.3% | |||
Brazil | 5.2% | |||
Other | 22.2% | |||
Cash & Equivalents — Net | 6.2% | |||
Cumulative Returns through September 30, 2020
|
Shareholder Expense Example
| Actual Performance
| |||
Institutional Class
| ||||
Beginning Account Value (4/1/20)
|
| $1,000.00
|
| |
Ending Account Value (9/30/20)
|
| $1,586.80
|
| |
Expenses Paid During Period
|
| $ 5.17
|
| |
| ||||
Hypothetical Performance
| ||||
| Institutional Class (5% return before expenses) | ||||
Beginning Account Value (4/1/20)
|
| $1,000.00
|
| |
Ending Account Value (9/30/20)
|
| $1,021.00
|
| |
Expenses Paid During Period
|
| $ 4.04
|
| |
Expenses (net of reimbursement, if any) are equal to the annualized expense ratio (0.80%), multiplied by the average account value over the period, multiplied by 183/366.
| 7 | Annual Report September 30, 2020 |
Table of Contents
AllianzGI Institutional Multi-Series Trust
Important Information (unaudited)
As of September 30, 2020, AllianzGI Institutional Multi-Series Trust (the “Trust”) consisted of three investment series, AllianzGI Best Styles Global Managed Volatility Portfolio, AllianzGI Global Small-Cap Opportunities Portfolio and AllianzGI International Growth (each a “Portfolio” and collectively the “Portfolios”). The Portfolios each currently offer one share class.
The Cumulative Returns charts for each Portfolio assume the initial investment was made on the first day of each Portfolio’s initial fiscal year. Results assume that all dividends and capital gain distributions, if any, were reinvested. They do not take into account the effect of taxes. The benchmark cumulative return began on the last day of the month of each Portfolio’s inception date.
The following disclosure provides important information regarding each Portfolio’s Shareholder Expense Example, which appears on each Portfolio Summary page in this Annual report. “Cash & Equivalents-Net” in the Allocation Summaries may be comprised of cash, repurchase agreements, U.S. Treasury Bills, and other assets net of other liabilities including net unrealized appreciation (depreciation) on futures contracts, and forward foreign currency contracts, as applicable. Please refer to this information when reviewing the Shareholder Expense Example for each Portfolio.
Proxy Voting
The Portfolios’ Investment Manager, Allianz Global Investors U.S. LLC (“AllianzGI U.S.” or the “Investment Manager”), has adopted written proxy voting policies and procedures (“Proxy Policy”) as required by Rule 206(4)-6 under the Investment Advisers Act of 1940. The Proxy Policy has been adopted by the Trust as the policies and procedures that the Investment Manager will use when voting proxies on behalf of each Portfolio. Copies of the written Proxy Policy and the factors that the Investment Manager may consider in determining how to vote proxies for each Portfolio, and information about how each Portfolio voted proxies relating to portfolio securities held during the most recent twelve-month period ended June 30, are available without charge, upon request, by calling 1-800-498-5413, on the Allianz Global Investors website at us.allianzgi.com and on the Securities and Exchange Commission’s (the “SEC”) website at http://www.sec.gov.
Form N-PORT
The Trust files complete schedules of each Portfolio’s holdings with the SEC on Form N-PORT for the first and third quarters of the fiscal year; such filings are available on the SEC’s website at http://www.sec.gov.
A copy of the Trust’s Form N-PORT, when available, will be provided without charge, upon request, by calling 1-800-498-5413. In addition, the Trust’s Form N-PORT may be reviewed and copied at the SEC’s Public Reference Room in Washington, D.C. Information on the operation of the Public Reference Room may be obtained by calling 1-800-SEC-0330. A description of the Trust’s policies and procedures with respect to the disclosure of each Portfolio’s portfolio holdings is available in the Trust’s Statement of Additional Information. The Investment Manager will post each Portfolio’s holdings information on the Portfolio’s website at us.allianzgi.com. Each Portfolio’s website will contain a complete schedule of portfolio holdings as of the relevant month end. The information will be posted on the website approximately thirty (30) calendar days after the relevant month’s end. Portfolio holdings information for each Portfolio will remain accessible on its website until the Trust files its Form N-CSR, or Form N-PORT for the last month of the Portfolio’s first or third fiscal quarters, with the SEC for the period that includes the date as of which the website information is current. The Trust’s policies with respect to the disclosure of the portfolio holdings are subject to change without notice.
Shareholder Expense Example
Shareholders incur two types of costs: (1) transaction costs; and (2) ongoing costs, including investment management fees and other Portfolio expenses. The Shareholder Expense Example is intended to help shareholders understand ongoing costs (in dollars) of investing in a Portfolio and to compare these costs with the ongoing costs of investing in other mutual funds. The Shareholder Expense Example is based on $1,000.00 invested at the beginning of the period, as indicated, and held for the entire period April 1, 2020 through September 30, 2020.
Actual Expenses
The information in the table under the heading “Actual Performance” provides information about actual account values and actual expenses. You may use the information in this column, together with the amount you invested, to estimate the expenses that you paid over the period. Simply divide your account value by $1,000.00 (for example, an $8,600.00 account value divided by $1,000.00 = 8.6), then multiply the result by the number in the row titled “Expenses Paid During Period” to estimate the expenses you paid on your account during this period.
| 8 | Annual Report September 30, 2020 |
Table of Contents
Hypothetical Example for Comparison Purposes
The information in the tables for “Hypothetical Performance (5% return before expenses)” provides information about hypothetical account values and hypothetical expenses based on a Portfolio’s actual expense ratio and an assumed rate of return of 5% per year before expenses, which is not each Portfolio’s actual return. The hypothetical account values and expenses may not be used to estimate the actual ending account balance or expenses you paid for the period. You may use this information to compare the ongoing costs of investing in a Portfolio and other funds. To do so, compare this 5% hypothetical example with the 5% hypothetical examples that appear in the shareholder reports of other funds.
Please note that the expenses shown in the table are meant to highlight your ongoing costs only and do not reflect any transactional costs. Therefore, the information for “Hypothetical Performance (5% return before expenses)” is useful in comparing ongoing costs only, and will not help you determine the relative total costs of owning different funds. In addition, if these transactional costs were included, your costs may have been higher.
Allianz Global Investors Distributors LLC, 1633 Broadway, New York, NY, 10019, us.allianzgi.com, 1-800-498-5413.
| 9 | Annual Report September 30, 2020 |
Table of Contents
September 30, 2020
AllianzGI Best Styles Global Managed Volatility Portfolio
| Shares | Value | |||||||
COMMON STOCK - 98.9% | ||||||||
Australia - 0.5% | ||||||||
Brickworks Ltd. | 2,903 | $ | 40,593 | |||||
Telstra Corp. Ltd. | 37,854 | 75,793 | ||||||
|
|
| ||||||
| 116,386 | ||||||||
|
|
| ||||||
Austria - 0.1% | ||||||||
Telekom Austria AG (e) | 2,708 | 19,145 | ||||||
|
|
| ||||||
Belgium - 0.4% | ||||||||
Elia Group S.A. | 639 | 63,880 | ||||||
Proximus SADP | 2,691 | 49,092 | ||||||
|
|
| ||||||
| 112,972 | ||||||||
|
|
| ||||||
Canada - 3.0% | ||||||||
Canadian Utilities Ltd., Class A | 2,046 | 48,801 | ||||||
Cascades, Inc. | 673 | 8,511 | ||||||
Cogeco Communications, Inc. | 804 | 65,930 | ||||||
Emera, Inc. | 1,688 | 69,343 | ||||||
Empire Co., Ltd., Class A | 1,850 | 53,699 | ||||||
Franco-Nevada Corp. | 786 | 109,835 | ||||||
Intact Financial Corp. | 1,224 | 131,064 | ||||||
Killam Apartment Real Estate Investment Trust REIT | 1,828 | 23,833 | ||||||
Metro, Inc. | 1,762 | 84,544 | ||||||
Morneau Shepell, Inc. | 1,365 | 28,498 | ||||||
Restaurant Brands International, Inc. | 1,294 | 74,323 | ||||||
Shaw Communications, Inc., Class B | 4,307 | 78,600 | ||||||
|
|
| ||||||
| 776,981 | ||||||||
|
|
| ||||||
Chile - 0.3% | ||||||||
Falabella S.A. | 21,693 | 63,540 | ||||||
|
|
| ||||||
China - 1.8% | ||||||||
BOC Aviation Ltd. (a) | 8,500 | 58,243 | ||||||
China Dongxiang Group Co., Ltd. | 68,883 | 8,580 | ||||||
China Everbright Greentech Ltd. (a) | 55,000 | 22,119 | ||||||
China Mobile Ltd. | 6,000 | 38,516 | ||||||
China Railway Signal & Communication Corp., Ltd., Class H (a) | 35,000 | 11,558 | ||||||
ENN Energy Holdings Ltd. | 6,500 | 71,326 | ||||||
Golden Eagle Retail Group Ltd. | 20,000 | 18,168 | ||||||
Legend Holdings Corp., Class H (a) | 12,400 | 15,110 | ||||||
Lenovo Group Ltd. | 112,000 | 74,050 | ||||||
Postal Savings Bank of China Co., Ltd., Class H (a) | 125,000 | 52,658 | ||||||
Tencent Holdings Ltd. | 1,300 | 87,806 | ||||||
Yuzhou Group Holdings Co., Ltd. | 52,204 | 20,789 | ||||||
|
|
| ||||||
| 478,923 | ||||||||
|
|
| ||||||
Czech Republic - 0.4% | ||||||||
CEZ AS | 3,409 | 64,459 | ||||||
O2 Czech Republic AS | 3,534 | 33,589 | ||||||
|
|
| ||||||
| 98,048 | ||||||||
|
|
| ||||||
Denmark - 0.5% | ||||||||
Solar A/S, Class B | 333 | 15,759 | ||||||
Spar Nord Bank A/S (e) | 733 | 5,475 | ||||||
Topdanmark A/S | 662 | 32,044 | ||||||
Tryg A/S | 2,448 | 77,069 | ||||||
|
|
| ||||||
| 130,347 | ||||||||
|
|
| ||||||
Finland - 0.7% | ||||||||
Elisa Oyj | 1,393 | 81,896 | ||||||
Neste Oyj | 1,942 | 102,265 | ||||||
|
|
| ||||||
| 184,161 | ||||||||
|
|
| ||||||
France - 1.4% | ||||||||
Eiffage S.A. (e) | 480 | 39,175 | ||||||
Hermes International | 231 | 198,949 | ||||||
SEB S.A. | 36 | 5,856 | ||||||
Sodexo S.A. | 699 | 49,828 | ||||||
Vinci S.A. | 852 | 71,190 | ||||||
|
|
| ||||||
| 364,998 | ||||||||
|
|
| ||||||
| See accompanying notes to financial statements | 10 | Annual Report September 30, 2020 |
Table of Contents
Schedule of Investments
September 30, 2020
AllianzGI Best Styles Global Managed Volatility Portfolio (continued)
| Shares | Value | |||||||
Germany - 2.1% | ||||||||
Deutsche Boerse AG | 522 | 91,517 | ||||||
Deutsche Telekom AG | 8,275 | 137,779 | ||||||
Muenchener Rueckversicherungs-Gesellschaft AG in Muenchen | 495 | 125,838 | ||||||
TAG Immobilien AG (e) | 2,490 | 75,083 | ||||||
Talanx AG (e) | 1,782 | 57,538 | ||||||
TLG Immobilien AG (e) | 1,493 | 30,715 | ||||||
WCM Beteiligungs & Grundbesitz AG (e) | 4,510 | 16,604 | ||||||
|
|
| ||||||
| 535,074 | ||||||||
|
|
| ||||||
Hong Kong - 1.1% | ||||||||
CLP Holdings Ltd. | 13,719 | 128,098 | ||||||
Hang Seng Bank Ltd. | 2,200 | 32,593 | ||||||
Power Assets Holdings Ltd. | 16,500 | 86,967 | ||||||
Swire Pacific Ltd., Class A | 9,344 | 45,239 | ||||||
Yue Yuen Industrial Holdings Ltd. | 2,802 | 4,541 | ||||||
|
|
| ||||||
| 297,438 | ||||||||
|
|
| ||||||
Hungary - 0.4% | ||||||||
Magyar Telekom Telecommunications PLC | 32,624 | 38,144 | ||||||
MOL Hungarian Oil & Gas PLC (e) | 4,902 | 26,682 | ||||||
OTP Bank Nyrt (e) | 836 | 25,162 | ||||||
|
|
| ||||||
| 89,988 | ||||||||
|
|
| ||||||
Ireland - 0.0% | ||||||||
Irish Residential Properties REIT PLC | 3,629 | 5,999 | ||||||
|
|
| ||||||
Israel - 1.1% | ||||||||
Azrieli Group Ltd. | 1,557 | 69,513 | ||||||
Mizrahi Tefahot Bank Ltd. | 3,016 | 53,497 | ||||||
Nice Ltd. (e) | 468 | 106,107 | ||||||
Strauss Group Ltd. | 2,171 | 62,321 | ||||||
|
|
| ||||||
| 291,438 | ||||||||
|
|
| ||||||
Italy - 1.0% | ||||||||
Enav SpA (a) | 5,868 | 22,278 | ||||||
Enel SpA | 10,393 | 90,169 | ||||||
Hera SpA | 2,579 | 9,509 | ||||||
Snam SpA | 29,073 | 149,516 | ||||||
|
|
| ||||||
| 271,472 | ||||||||
|
|
| ||||||
Japan - 15.0% | ||||||||
Aoyama Trading Co., Ltd. | 189 | 996 | ||||||
Asahi Group Holdings Ltd. | 2,300 | 80,161 | ||||||
Astellas Pharma, Inc. | 8,108 | 120,863 | ||||||
Canon Marketing Japan, Inc. | 1,500 | 30,107 | ||||||
Canon, Inc. | 4,190 | 69,498 | ||||||
Central Japan Railway Co. | 600 | 86,004 | ||||||
FP Corp. | 1,000 | 42,120 | ||||||
FUJIFILM Holdings Corp. | 1,979 | 97,549 | ||||||
Fukuyama Transporting Co., Ltd. | 454 | 22,123 | ||||||
Ichibanya Co., Ltd. | 400 | 21,417 | ||||||
ITOCHU Corp. | 3,900 | 99,863 | ||||||
Japan Post Holdings Co., Ltd. | 10,400 | 70,918 | ||||||
Kajima Corp. | 6,500 | 78,313 | ||||||
Kamigumi Co., Ltd. | 2,200 | 43,352 | ||||||
KDDI Corp. | 4,100 | 103,121 | ||||||
Kintetsu Group Holdings Co., Ltd. | 1,700 | 72,550 | ||||||
McDonald’s Holdings Co. Japan Ltd. | 1,400 | 68,093 | ||||||
Medipal Holdings Corp. | 3,100 | 62,162 | ||||||
MEIJI Holdings Co., Ltd. | 1,600 | 122,217 | ||||||
NEC Corp. | 2,100 | 122,837 | ||||||
NET One Systems Co., Ltd. | 2,100 | 95,413 | ||||||
Nichias Corp. | 1,302 | 30,817 | ||||||
Nihon Unisys Ltd. | 1,779 | 56,128 | ||||||
Nippon Prologis REIT, Inc. REIT | 33 | 111,285 | ||||||
Nippon Telegraph & Telephone Corp. | 9,888 | 201,880 | ||||||
Nissin Foods Holdings Co., Ltd. | 1,000 | 93,948 | ||||||
| See accompanying notes to financial statements | 11 | Annual Report September 30, 2020 |
Table of Contents
Schedule of Investments
September 30, 2020
AllianzGI Best Styles Global Managed Volatility Portfolio (continued)
| Shares | Value | |||||||
Nitori Holdings Co., Ltd. | 300 | 62,236 | ||||||
NTT DOCOMO, Inc. | 12,757 | 468,770 | ||||||
Obayashi Corp. | 6,973 | 63,658 | ||||||
Okumura Corp. | 1,800 | 45,192 | ||||||
Rengo Co., Ltd. | 3,100 | 23,432 | ||||||
Rinnai Corp. | 800 | 78,033 | ||||||
Sankyo Co., Ltd. | 2,300 | 60,227 | ||||||
Sawai Pharmaceutical Co., Ltd. | 1,100 | 55,502 | ||||||
Secom Co., Ltd. | 2,000 | 183,031 | ||||||
Sekisui House Ltd. | 4,100 | 72,655 | ||||||
Senko Group Holdings Co., Ltd. | 4,704 | 43,858 | ||||||
Shibaura Electronics Co., Ltd. | 200 | 4,112 | ||||||
Shimizu Corp. | 4,700 | 35,382 | ||||||
Shizuoka Bank Ltd. | 9,200 | 63,536 | ||||||
Softbank Corp. | 6,400 | 71,516 | ||||||
Sugi Holdings Co., Ltd. | 1,100 | 77,774 | ||||||
Sumitomo Corp. | 6,100 | 73,532 | ||||||
Sumitomo Dainippon Pharma Co., Ltd. | 532 | 7,010 | ||||||
Sumitomo Densetsu Co., Ltd. | 1,000 | 23,508 | ||||||
Suzuken Co., Ltd. | 1,400 | 53,402 | ||||||
Takasago Thermal Engineering Co., Ltd. | 2,903 | 41,694 | ||||||
TOKAI Holdings Corp. | 1,800 | 17,777 | ||||||
Tokio Marine Holdings, Inc. | 2,000 | 87,509 | ||||||
Tokyo Gas Co., Ltd. | 3,100 | 70,743 | ||||||
Toyo Seikan Group Holdings Ltd. | 5,500 | 54,409 | ||||||
Toyo Suisan Kaisha Ltd. | 1,100 | 58,087 | ||||||
|
|
| ||||||
| 3,900,320 | ||||||||
|
|
| ||||||
Korea (Republic of) - 0.8% | ||||||||
Easy Bio, Inc. (e) | 43 | 2,269 | ||||||
Easy Holdings Co., Ltd. | 1,063 | 3,800 | ||||||
KC Co., Ltd. | 210 | 4,267 | ||||||
Samsung Electronics Co., Ltd. | 1,958 | 97,203 | ||||||
Samsung Fire & Marine Insurance Co., Ltd. | 444 | 69,168 | ||||||
Shinhan Financial Group Co., Ltd. | 631 | 14,804 | ||||||
SK Telecom Co., Ltd. | 129 | 26,223 | ||||||
|
|
| ||||||
| 217,734 | ||||||||
|
|
| ||||||
Malaysia - 1.1% | ||||||||
CIMB Group Holdings Bhd. | 54,900 | 40,770 | ||||||
Hong Leong Financial Group Bhd. | 2,400 | 8,283 | ||||||
Malayan Banking Bhd. | 49,500 | 86,111 | ||||||
MISC Bhd. | 29,600 | 53,557 | ||||||
Petronas Dagangan Bhd. | 3,300 | 15,691 | ||||||
Telekom Malaysia Bhd. | 25,100 | 25,003 | ||||||
Tenaga Nasional Bhd. | 16,300 | 41,246 | ||||||
VS Industry Bhd. | 31,600 | 17,369 | ||||||
|
|
| ||||||
| 288,030 | ||||||||
|
|
| ||||||
Morocco - 0.2% | ||||||||
Maroc Telecom | 3,182 | 46,757 | ||||||
|
|
| ||||||
Netherlands - 0.9% | ||||||||
ASR Nederland NV | 2,138 | 71,908 | ||||||
Coca-Cola European Partners PLC | 865 | 33,571 | ||||||
Koninklijke Ahold Delhaize NV | 4,159 | 122,931 | ||||||
|
|
| ||||||
| 228,410 | ||||||||
|
|
| ||||||
New Zealand - 0.3% | ||||||||
Air New Zealand Ltd. | 27,175 | 24,789 | ||||||
Summerset Group Holdings Ltd. | 8,231 | 49,227 | ||||||
Tourism Holdings Ltd. | 3,878 | 5,728 | ||||||
|
|
| ||||||
| 79,744 | ||||||||
|
|
| ||||||
Norway - 0.4% | ||||||||
B2Holding ASA (e) | 5,084 | 3,431 | ||||||
Mowi ASA | 1,895 | 33,716 | ||||||
Orkla ASA | 7,757 | 78,287 | ||||||
|
|
| ||||||
| 115,434 | ||||||||
|
|
| ||||||
Peru - 0.1% | ||||||||
Ferreycorp SAA | 32,712 | 15,886 | ||||||
|
|
| ||||||
| See accompanying notes to financial statements | 12 | Annual Report September 30, 2020 |
Table of Contents
Schedule of Investments
September 30, 2020
AllianzGI Best Styles Global Managed Volatility Portfolio (continued)
| Shares | Value | |||||||
Philippines - 0.2% | ||||||||
Altus San Nicolas Corp. (e) | 398 | 76 | ||||||
Globe Telecom, Inc. | 505 | 21,661 | ||||||
PLDT, Inc. | 935 | 25,695 | ||||||
Robinsons Land Corp. | 29,500 | 8,693 | ||||||
|
|
| ||||||
| 56,125 | ||||||||
|
|
| ||||||
Poland - 0.1% | ||||||||
Asseco Poland S.A. | 2,017 | 36,262 | ||||||
|
|
| ||||||
Portugal - 0.1% | ||||||||
NOS SGPS S.A. | 6,083 | 21,567 | ||||||
REN - Redes Energeticas Nacionais SGPS S.A. | 5,617 | 15,619 | ||||||
|
|
| ||||||
| 37,186 | ||||||||
|
|
| ||||||
Singapore - 1.1% | ||||||||
ARA LOGOS Logistics Trust REIT | 21,200 | 9,676 | ||||||
CapitaLand Mall Trust REIT | 54,900 | 78,137 | ||||||
China Aviation Oil Singapore Corp. Ltd. | 6,900 | 4,731 | ||||||
Mapletree Commercial Trust REIT | 40,273 | 57,855 | ||||||
Oversea-Chinese Banking Corp., Ltd. | 8,600 | 53,481 | ||||||
Singapore Airlines Ltd. | 16,100 | 41,201 | ||||||
Singapore Telecommunications Ltd. | 29,500 | 46,170 | ||||||
Sino Grandness Food Industry Group Ltd. (e) | 77,400 | 1,207 | ||||||
|
|
| ||||||
| 292,458 | ||||||||
|
|
| ||||||
South Africa - 0.0% | ||||||||
Astral Foods Ltd. | 1,214 | 9,522 | ||||||
|
|
| ||||||
Spain - 0.4% | ||||||||
Iberdrola S.A. | 8,593 | 105,767 | ||||||
Lar Espana Real Estate Socimi S.A. REIT | 1,947 | 8,980 | ||||||
|
|
| ||||||
| 114,747 | ||||||||
|
|
| ||||||
Sweden - 0.6% | ||||||||
Castellum AB | 2,487 | 56,490 | ||||||
Investor AB, Class B | 1,362 | 88,966 | ||||||
|
|
| ||||||
| 145,456 | ||||||||
|
|
| ||||||
Switzerland - 6.7% | ||||||||
Allreal Holding AG | 302 | 65,067 | ||||||
Baloise Holding AG | 483 | 71,109 | ||||||
Banque Cantonale Vaudoise | 590 | 59,874 | ||||||
Barry Callebaut AG | 38 | 84,640 | ||||||
BKW AG | 111 | 11,821 | ||||||
Cembra Money Bank AG | 604 | 71,688 | ||||||
Chocoladefabriken Lindt & Spruengli AG | 8 | 67,528 | ||||||
Galenica AG (a) | 748 | 52,014 | ||||||
Geberit AG | 149 | 88,152 | ||||||
Givaudan S.A. | 20 | 86,356 | ||||||
Intershop Holding AG | 26 | 16,796 | ||||||
Mobimo Holding AG (e) | 128 | 37,521 | ||||||
Nestle S.A. | 2,060 | 245,165 | ||||||
PSP Swiss Property AG | 573 | 69,219 | ||||||
Roche Holding AG | 620 | 212,375 | ||||||
Swiss Life Holding AG | 190 | 71,894 | ||||||
Swiss Prime Site AG | 1,098 | 99,720 | ||||||
Swiss Re AG | 1,002 | 74,327 | ||||||
Swisscom AG | 132 | 69,928 | ||||||
Zurich Insurance Group AG | 539 | 187,957 | ||||||
|
|
| ||||||
| 1,743,151 | ||||||||
|
|
| ||||||
Taiwan - 4.8% | ||||||||
Asia Cement Corp. | 19,000 | 27,376 | ||||||
Cheng Loong Corp. | 31,000 | 33,913 | ||||||
China Petrochemical Development Corp. | 54,500 | 15,842 | ||||||
Chunghwa Telecom Co., Ltd. | 23,000 | 85,001 | ||||||
Compal Electronics, Inc. | 110,000 | 72,749 | ||||||
CTBC Financial Holding Co., Ltd. | 115,000 | 73,474 | ||||||
E.Sun Financial Holding Co., Ltd. | 142,019 | 126,480 | ||||||
Inventec Corp. | 74,000 | 57,645 | ||||||
| See accompanying notes to financial statements | 13 | Annual Report September 30, 2020 |
Table of Contents
Schedule of Investments
September 30, 2020
AllianzGI Best Styles Global Managed Volatility Portfolio (continued)
| Shares | Value | |||||||
Mega Financial Holding Co., Ltd. | 144,000 | 138,983 | ||||||
Oriental Union Chemical Corp. | 7,000 | 3,926 | ||||||
Powertech Technology, Inc. | 16,000 | 48,116 | ||||||
President Chain Store Corp. | 8,000 | 72,817 | ||||||
SinoPac Financial Holdings Co., Ltd. | 90,000 | 33,935 | ||||||
Taiwan Business Bank | 197,200 | 65,353 | ||||||
Taiwan Fertilizer Co., Ltd. | 10,000 | 17,590 | ||||||
Taiwan Semiconductor Manufacturing Co., Ltd. | 11,000 | 165,485 | ||||||
United Microelectronics Corp. | 116,000 | 114,420 | ||||||
Yuanta Financial Holding Co., Ltd. | 137,280 | 84,995 | ||||||
|
|
| ||||||
| 1,238,100 | ||||||||
|
|
| ||||||
Thailand - 0.9% | ||||||||
Bangchak Corp. PCL (c)(d) | 42,300 | 20,085 | ||||||
Bangkok Bank PCL (c)(d) | 13,100 | 39,916 | ||||||
PTT PCL (c)(d) | 11,800 | 11,976 | ||||||
Siam Cement PCL (c)(d) | 6,200 | 63,148 | ||||||
Siamgas & Petrochemicals PCL (c)(d) | 127,700 | 34,927 | ||||||
Star Petroleum Refining PCL (c)(d) | 179,100 | 31,491 | ||||||
Tisco Financial Group PCL (c)(d) | 11,100 | 22,388 | ||||||
|
|
| ||||||
| 223,931 | ||||||||
|
|
| ||||||
United Kingdom - 1.4% | ||||||||
Aon PLC, Class A | 489 | 100,881 | ||||||
Berkeley Group Holdings PLC | 955 | 52,060 | ||||||
Compass Group PLC | 4,443 | 66,742 | ||||||
Diageo PLC | 1,971 | 67,701 | ||||||
Unilever PLC | 1,337 | 82,430 | ||||||
|
|
| ||||||
| 369,814 | ||||||||
|
|
| ||||||
United States - 49.0% | ||||||||
Accenture PLC, Class A | 305 | 68,927 | ||||||
Adobe, Inc. (e) | 173 | 84,844 | ||||||
Aflac, Inc. | 1,717 | 62,413 | ||||||
AG Mortgage Investment Trust, Inc. REIT | 3,004 | 8,291 | ||||||
Allstate Corp. | 1,626 | 153,072 | ||||||
Ameren Corp. | 1,286 | 101,697 | ||||||
American Electric Power Co., Inc. | 886 | 72,413 | ||||||
American Financial Group, Inc. | 740 | 49,565 | ||||||
American Tower Corp. REIT | 318 | 76,870 | ||||||
Amgen, Inc. | 483 | 122,759 | ||||||
Annaly Capital Management, Inc. REIT | 10,656 | 75,871 | ||||||
Anthem, Inc. | 287 | 77,085 | ||||||
Apple, Inc. | 1,401 | 162,250 | ||||||
AT&T, Inc. | 6,321 | 180,212 | ||||||
Automatic Data Processing, Inc. | 648 | 90,390 | ||||||
AvalonBay Communities, Inc. REIT | 392 | 58,541 | ||||||
Berkshire Hathaway, Inc., Class B (e) | 385 | 81,982 | ||||||
Booz Allen Hamilton Holding Corp. | 1,070 | 88,789 | ||||||
Bright Horizons Family Solutions, Inc. (e) | 462 | 70,242 | ||||||
Bristol-Myers Squibb Co. | 2,683 | 161,758 | ||||||
Brown & Brown, Inc. | 1,671 | 75,646 | ||||||
Cadence Design Systems, Inc. (e) | 160 | 17,061 | ||||||
Campbell Soup Co. | 1,043 | 50,450 | ||||||
Casey’s General Stores, Inc. | 228 | 40,504 | ||||||
Cboe Global Markets, Inc. | 592 | 51,942 | ||||||
Centene Corp. (e) | 909 | 53,022 | ||||||
Cherry Hill Mortgage Investment Corp. REIT | 16 | 144 | ||||||
Church & Dwight Co., Inc. | 544 | 50,978 | ||||||
Cisco Systems, Inc. | 1,397 | 55,028 | ||||||
Citrix Systems, Inc. | 387 | 53,294 | ||||||
CMS Energy Corp. | 1,195 | 73,385 | ||||||
Coca-Cola Co. | 2,802 | 138,335 | ||||||
Columbia Sportswear Co. | 759 | 66,018 | ||||||
Consolidated Edison, Inc. | 3,397 | 264,287 | ||||||
Costco Wholesale Corp. | 410 | 145,550 | ||||||
Crown Castle International Corp. REIT | 227 | 37,795 | ||||||
Dollar General Corp. | 336 | 70,432 | ||||||
DTE Energy Co. | 951 | 109,403 | ||||||
Duke Energy Corp. | 850 | 75,276 | ||||||
Easterly Government Properties, Inc. REIT | 2,284 | 51,184 | ||||||
Eli Lilly and Co. | 1,562 | 231,207 | ||||||
Encompass Health Corp. | 1,079 | 70,113 | ||||||
Entergy Corp. | 1,122 | 110,551 | ||||||
Equity Residential REIT | 1,762 | 90,443 | ||||||
| See accompanying notes to financial statements | 14 | Annual Report September 30, 2020 |
Table of Contents
Schedule of Investments
September 30, 2020
AllianzGI Best Styles Global Managed Volatility Portfolio (continued)
| Shares | Value | |||||||
Exelon Corp. | 1,730 | 61,865 | ||||||
Exponent, Inc. | 774 | 55,751 | ||||||
Facebook, Inc., Class A (e) | 298 | 78,046 | ||||||
Fidelity National Information Services, Inc. | 569 | 83,762 | ||||||
Fiserv, Inc. (e) | 720 | 74,196 | ||||||
frontdoor, Inc. (e) | 1,390 | 54,085 | ||||||
FTI Consulting, Inc. (e) | 457 | 48,428 | ||||||
General Mills, Inc. | 2,024 | 124,840 | ||||||
Gentex Corp. | 2,915 | 75,061 | ||||||
Graham Holdings Co., Class B | 87 | 35,158 | ||||||
Hanover Insurance Group, Inc. | 572 | 53,299 | ||||||
Hershey Co. | 1,200 | 172,008 | ||||||
Hormel Foods Corp. | 1,623 | 79,348 | ||||||
Humana, Inc. | 170 | 70,361 | ||||||
Intel Corp. | 2,479 | 128,363 | ||||||
Intuit, Inc. | 247 | 80,574 | ||||||
Johnson & Johnson | 2,287 | 340,489 | ||||||
Kearny Financial Corp. | 2,236 | 16,122 | ||||||
Kellogg Co. | 861 | 55,612 | ||||||
Kimberly-Clark Corp. | 1,227 | 181,179 | ||||||
L3Harris Technologies, Inc. | 1,080 | 183,427 | ||||||
Laboratory Corp. of America Holdings (e) | 399 | 75,120 | ||||||
Lockheed Martin Corp. | 624 | 239,167 | ||||||
ManTech International Corp., Class A | 725 | 49,938 | ||||||
Marsh & McLennan Cos., Inc. | 560 | 64,232 | ||||||
Mastercard, Inc., Class A | 646 | 218,458 | ||||||
McDonald’s Corp. | 793 | 174,056 | ||||||
McGrath RentCorp | 616 | 36,707 | ||||||
Merck & Co., Inc. | 3,598 | 298,454 | ||||||
Microsoft Corp. | 1,105 | 232,415 | ||||||
Motorola Solutions, Inc. | 688 | 107,885 | ||||||
Nasdaq, Inc. | 567 | 69,577 | ||||||
National CineMedia, Inc. | 706 | 1,917 | ||||||
NextEra Energy, Inc. | 1,044 | 289,773 | ||||||
Northfield Bancorp, Inc. | 396 | 3,612 | ||||||
Northrop Grumman Corp. | 261 | 82,343 | ||||||
NVR, Inc. (e) | 8 | 32,665 | ||||||
O’Reilly Automotive, Inc. (e) | 385 | 177,516 | ||||||
Omnicom Group, Inc. | 1,264 | 62,568 | ||||||
Paychex, Inc. | 1,033 | 82,402 | ||||||
PepsiCo, Inc. | 1,065 | 147,609 | ||||||
Pfizer, Inc. | 4,866 | 178,582 | ||||||
Pinnacle West Capital Corp. | 1,038 | 77,383 | ||||||
Portland General Electric Co. | 1,241 | 44,055 | ||||||
Procter & Gamble Co. | 2,974 | 413,356 | ||||||
Progressive Corp. | 1,780 | 168,513 | ||||||
Public Storage REIT | 134 | 29,844 | ||||||
QCR Holdings, Inc. | 286 | 7,839 | ||||||
Quest Diagnostics, Inc. | 702 | 80,372 | ||||||
Raytheon Technologies Corp. | 836 | 48,103 | ||||||
Realty Income Corp. REIT | 1,172 | 71,199 | ||||||
Republic Services, Inc. | 1,989 | 185,673 | ||||||
Ross Stores, Inc. | 872 | 81,375 | ||||||
S&P Global, Inc. | 236 | 85,102 | ||||||
Shockwave Medical, Inc. (e) | 1,041 | 78,908 | ||||||
Southern Co. | 1,178 | 63,871 | ||||||
SP Plus Corp. (e) | 1,202 | 21,576 | ||||||
Starbucks Corp. | 2,341 | 201,139 | ||||||
T-Mobile U.S., Inc. (e) | 1,023 | 116,990 | ||||||
Target Corp. | 863 | 135,853 | ||||||
TFS Financial Corp. | 2,337 | 34,331 | ||||||
TJX Cos., Inc. | 2,295 | 127,717 | ||||||
Tyler Technologies, Inc. (e) | 251 | 87,489 | ||||||
Tyson Foods, Inc., Class A | 485 | 28,848 | ||||||
UniFirst Corp. | 269 | 50,941 | ||||||
UnitedHealth Group, Inc. | 515 | 160,562 | ||||||
Verizon Communications, Inc. | 5,458 | 324,696 | ||||||
Visa, Inc., Class A | 588 | 117,582 | ||||||
Walmart, Inc. | 1,470 | 205,668 | ||||||
Walt Disney Co. | 337 | 41,815 | ||||||
Waste Management, Inc. | 3,443 | 389,644 | ||||||
Waterstone Financial, Inc. | 1,038 | 16,079 | ||||||
Watsco, Inc. | 359 | 83,607 | ||||||
WEC Energy Group, Inc. | 2,891 | 280,138 | ||||||
Xcel Energy, Inc. | 4,031 | 278,179 | ||||||
| See accompanying notes to financial statements | 15 | Annual Report September 30, 2020 |
Table of Contents
Schedule of Investments
September 30, 2020
AllianzGI Best Styles Global Managed Volatility Portfolio (continued)
| Shares | Value | |||||||
Zoetis, Inc. | 701 | 115,924 | ||||||
|
|
| ||||||
| 12,761,360 | ||||||||
|
|
| ||||||
Total Common Stock (cost-$22,234,461) | 25,757,337 | |||||||
|
|
| ||||||
PREFERRED STOCK - 0.2% | ||||||||
Brazil - 0.2% | ||||||||
Telefonica Brasil S.A. (cost-$85,150) | 6,800 | 52,575 | ||||||
|
|
| ||||||
RIGHTS - 0.0% | ||||||||
Thailand - 0.0% | ||||||||
Siam Cement PCL, exercise price THB 35.00, expires 10/2/20 (c)(d)(e) (cost-$0) | 972 | —† | ||||||
|
|
| ||||||
Total Investments (cost-$22,319,611) (b)-99.1% | 25,809,912 | |||||||
|
|
| ||||||
Other assets less liabilities-0.9% | 229,276 | |||||||
|
|
| ||||||
Net Assets-100.0% | $ | 26,039,188 | ||||||
|
|
| ||||||
| See accompanying notes to financial statements | 16 | Annual Report September 30, 2020 |
Table of Contents
Schedule of Investments
September 30, 2020
AllianzGI Best Styles Global Managed Volatility Portfolio (continued)
Notes to Schedule of Investments:
| † | Actual amount rounds to less than $1. |
| (a) | 144A—Exempt from registration under Rule 144A of the Securities Act of 1933. These securities may be resold in transactions exempt from registration, typically only to qualified institutional buyers. Securities with an aggregate value of $233,980, representing 0.9% of net assets. |
| (b) | Securities with an aggregate value of $11,749,987, representing 45.1% of net assets, were valued utilizing modeling tools provided by a third-party vendor. See Note 1(a) and Note 1(b) in the Notes to Financial Statements. |
| (c) | Fair-Valued—Securities with an aggregate value of $223,931, representing 0.9% of net assets. See Note 1(a) and Note 1(b) in the Notes to Financial Statements. |
| (d) | Level 3 security. See Note 1(a) and Note 1(b) in the Notes to Financial Statements. |
| (e) | Non-income producing. |
Glossary:
REIT - Real Estate Investment Trust
THB - Thai Baht
| See accompanying notes to financial statements | 17 | Annual Report September 30, 2020 |
Table of Contents
Schedule of Investments
September 30, 2020
AllianzGI Best Styles Global Managed Volatility Portfolio
The industry classification of portfolio holdings and other assets less liabilities shown as a percentage of net assets were as follows:
Insurance | 7.1 | % | ||
Electric Utilities | 6.7 | % | ||
Pharmaceuticals | 6.6 | % | ||
Diversified Telecommunication Services | 5.7 | % | ||
Food Products | 5.3 | % | ||
IT Services | 4.4 | % | ||
Banks | 3.9 | % | ||
Multi-Utilities | 3.5 | % | ||
Wireless Telecommunication Services | 3.3 | % | ||
Commercial Services & Supplies | 3.3 | % | ||
Food & Staples Retailing | 3.1 | % | ||
Healthcare Providers & Services | 3.1 | % | ||
Equity Real Estate Investment Trusts (REITs) | 2.7 | % | ||
Software | 2.7 | % | ||
Hotels, Restaurants & Leisure | 2.5 | % | ||
Technology Hardware, Storage & Peripherals | 2.5 | % | ||
Household Products | 2.5 | % | ||
Real Estate Management & Development | 2.2 | % | ||
Aerospace & Defense | 2.1 | % | ||
Beverages | 1.8 | % | ||
Semiconductors & Semiconductor Equipment | 1.8 | % | ||
Specialty Retail | 1.7 | % | ||
Construction & Engineering | 1.4 | % | ||
Trading Companies & Distributors | 1.3 | % | ||
Capital Markets | 1.1 | % | ||
Gas Utilities | 1.1 | % | ||
Multi-Line Retail | 1.1 | % | ||
Textiles, Apparel & Luxury Goods | 1.1 | % | ||
Diversified Financial Services | 1.0 | % | ||
Oil, Gas & Consumable Fuels | 1.0 | % | ||
Household Durables | 0.9 | % | ||
Road & Rail | 0.9 | % | ||
Media | 0.8 | % | ||
Interactive Media & Services | 0.6 | % | ||
Communications Equipment | 0.6 | % | ||
Containers & Packaging | 0.6 | % | ||
Building Products | 0.6 | % | ||
Diversified Consumer Services | 0.6 | % | ||
Professional Services | 0.5 | % | ||
Construction Materials | 0.5 | % | ||
Chemicals | 0.5 | % | ||
Biotechnology | 0.5 | % | ||
Metals & Mining | 0.4 | % | ||
Mortgage Real Estate Investment Trusts (REITs) | 0.3 | % | ||
Personal Products | 0.3 | % | ||
Healthcare Equipment & Supplies | 0.3 | % | ||
Consumer Finance | 0.3 | % | ||
Auto Components | 0.3 | % | ||
Thrifts & Mortgage Finance | 0.3 | % | ||
Airlines | 0.3 | % | ||
Transportation Infrastructure | 0.3 | % | ||
Electronic Equipment, Instruments & Components | 0.2 | % | ||
Leisure Equipment & Products | 0.2 | % | ||
Marine | 0.2 | % | ||
Entertainment | 0.2 | % | ||
Real Estate | 0.1 | % | ||
Independent Power Producers & Energy Traders | 0.1 | % | ||
Industrial Conglomerates | 0.1 | % | ||
Other assets less liabilities | 0.9 | % | ||
|
|
| ||
| 100.0 | % | |||
|
|
|
| See accompanying notes to financial statements | 18 | Annual Report September 30, 2020 |
Table of Contents
Schedule of Investments
September 30, 2020
AllianzGI Global Small-Cap Opportunities Portfolio
| Shares | Value | |||||||
| ||||||||
COMMON STOCK - 100.2% | ||||||||
Australia - 2.7% | ||||||||
BWP Trust REIT | 7,387 | $ | 21,493 | |||||
JB Hi-Fi Ltd. | 1,657 | 56,338 | ||||||
|
| |||||||
| 77,831 | ||||||||
|
| |||||||
Belgium - 0.6% | ||||||||
bpost S.A. | 1,784 | 15,622 | ||||||
|
| |||||||
Canada - 3.6% | ||||||||
Alamos Gold, Inc., Class A | 1,090 | 9,602 | ||||||
B2Gold Corp. | 1,840 | 11,981 | ||||||
Centerra Gold, Inc. | 1,313 | 15,274 | ||||||
Cogeco Communications, Inc. | 325 | 26,651 | ||||||
Eldorado Gold Corp. (e) | 1,493 | 15,753 | ||||||
IAMGOLD Corp. (e) | 3,768 | 14,460 | ||||||
Real Matters, Inc. (e) | 560 | 10,914 | ||||||
|
| |||||||
| 104,635 | ||||||||
|
| |||||||
China - 2.5% | ||||||||
China National Building Material Co., Ltd., Class H | 12,000 | 15,293 | ||||||
Huaxin Cement Co., Ltd., Class B (e) | 6,399 | 14,578 | ||||||
Weichai Power Co., Ltd., Class H | 21,000 | 42,493 | ||||||
|
| |||||||
| 72,364 | ||||||||
|
| |||||||
Denmark - 1.0% | ||||||||
Pandora A/S | 215 | 15,510 | ||||||
Scandinavian Tobacco Group A/S, Class A (a) | 904 | 13,388 | ||||||
|
| |||||||
| 28,898 | ||||||||
|
| |||||||
Germany - 0.7% | ||||||||
HelloFresh SE (e) | 203 | 11,282 | ||||||
MorphoSys AG ADR (e) | 249 | 7,816 | ||||||
|
| |||||||
| 19,098 | ||||||||
|
| |||||||
Hong Kong - 0.4% | ||||||||
Hysan Development Co., Ltd. | 4,000 | 12,030 | ||||||
|
| |||||||
India - 0.4% | ||||||||
Bajaj Auto Ltd. | 280 | 10,946 | ||||||
|
| |||||||
Ireland - 2.4% | ||||||||
Horizon Therapeutics PLC (e) | 890 | 69,135 | ||||||
|
| |||||||
Israel - 0.4% | ||||||||
Teva Pharmaceutical Industries Ltd. ADR (e) | 1,105 | 9,956 | ||||||
|
| |||||||
Italy - 1.7% | ||||||||
Unipol Gruppo SpA | 11,332 | 49,521 | ||||||
|
| |||||||
Japan - 12.7% | ||||||||
Advance Residence Investment Corp. REIT | 6 | 17,675 | ||||||
Change, Inc. (e) | 400 | 32,059 | ||||||
EDION Corp. | 2,600 | 27,239 | ||||||
Fuji Soft, Inc. | 400 | 20,626 | ||||||
GungHo Online Entertainment, Inc. | 790 | 17,017 | ||||||
Hulic Co., Ltd. | 1,600 | 15,013 | ||||||
IDOM, Inc. | 2,400 | 14,479 | ||||||
IR Japan Holdings Ltd. | 300 | 38,021 | ||||||
Japan Logistics Fund, Inc. REIT | 6 | 17,204 | ||||||
MonotaRO Co., Ltd. | 600 | 29,802 | ||||||
Nippon Accommodations Fund, Inc. REIT | 3 | 17,315 | ||||||
Nippon Gas Co., Ltd. | 600 | 30,324 | ||||||
Sankyu, Inc. | 800 | 31,593 | ||||||
Sumitomo Forestry Co., Ltd. | 1,900 | 30,323 | ||||||
T-Gaia Corp. | 800 | 15,056 | ||||||
Usen-Next Holdings Co, Ltd. | 1,100 | 13,210 | ||||||
|
| |||||||
| 366,956 | ||||||||
|
| |||||||
Korea (Republic of) - 3.0% | ||||||||
DB HiTek Co., Ltd. | 1,279 | 40,977 | ||||||
| See accompanying notes to financial statements | 19 | Annual Report September 30, 2020 |
Table of Contents
Schedule of Investments
September 30, 2020
AllianzGI Global Small-Cap Opportunities Portfolio (continued)
| Shares | Value | |||||||
| ||||||||
LG Innotek Co., Ltd. | 341 | 45,001 | ||||||
|
| |||||||
| 85,978 | ||||||||
|
| |||||||
Netherlands - 2.9% | ||||||||
ASR Nederland NV | 879 | 29,564 | ||||||
Signify NV (a)(e) | 1,472 | 54,445 | ||||||
|
| |||||||
| 84,009 | ||||||||
|
| |||||||
Portugal - 0.3% | ||||||||
NOS SGPS S.A. (e) | 2,431 | 8,619 | ||||||
|
| |||||||
Russian Federation - 0.7% | ||||||||
Federal Grid Co. Unified Energy System PJSC (c)(d)(e) | 7,800,000 | 19,890 | ||||||
|
| |||||||
Singapore - 0.7% | ||||||||
Mapletree Industrial Trust REIT | 8,100 | 19,191 | ||||||
|
| |||||||
South Africa - 1.5% | ||||||||
Gold Fields Ltd. ADR | 1,898 | 23,327 | ||||||
Harmony Gold Mining Co., Ltd. ADR (e) | 3,586 | 18,898 | ||||||
|
| |||||||
| 42,225 | ||||||||
|
| |||||||
Spain - 0.5% | ||||||||
Viscofan S.A. | 229 | 15,277 | ||||||
|
| |||||||
Sweden - 2.2% | ||||||||
Swedish Match AB | 779 | 63,696 | ||||||
|
| |||||||
Switzerland - 0.5% | ||||||||
Galenica AG (a) | 219 | 15,228 | ||||||
|
| |||||||
Taiwan - 4.2% | ||||||||
Powertech Technology, Inc. | 8,000 | 24,058 | ||||||
Silicon Motion Technology Corp. ADR | 1,062 | 40,122 | ||||||
Wistron Corp. | 54,000 | 56,002 | ||||||
|
| |||||||
| 120,182 | ||||||||
|
| |||||||
Thailand - 0.7% | ||||||||
Thanachart Capital PCL (c)(d) | 22,900 | 21,077 | ||||||
|
| |||||||
Turkey - 0.7% | ||||||||
Enerjisa Enerji AS (a) | 9,591 | 11,078 | ||||||
Turkiye Sinai Kalkinma Bankasi AS (e) | 68,356 | 9,822 | ||||||
|
| |||||||
| 20,900 | ||||||||
|
| |||||||
United Kingdom - 3.6% | ||||||||
Centamin PLC | 10,459 | 27,305 | ||||||
Computacenter PLC | 919 | 28,062 | ||||||
Ferrexpo PLC | 3,968 | 9,036 | ||||||
Plus500 Ltd. | 1,279 | 25,854 | ||||||
Polymetal International PLC | 572 | 12,464 | ||||||
|
| |||||||
| 102,721 | ||||||||
|
| |||||||
United States - 49.6% | ||||||||
AdaptHealth Corp. (e) | 743 | 16,205 | ||||||
America’s Car-Mart, Inc. (e) | 182 | 15,448 | ||||||
Arcosa, Inc. | 465 | 20,502 | ||||||
Asbury Automotive Group, Inc. | 380 | 37,031 | ||||||
Aspen Technology, Inc. (e) | 206 | 26,078 | ||||||
At Home Group, Inc. (e) | 1,014 | 15,068 | ||||||
Balchem Corp. | 220 | 21,479 | ||||||
Bruker Corp. | 263 | 10,454 | ||||||
Cavco Industries, Inc. (e) | 103 | 18,572 | ||||||
Century Communities, Inc. (e) | 1,255 | 53,124 | ||||||
Charles River Laboratories International, Inc. (e) | 150 | 33,967 | ||||||
Chemed Corp. | 105 | 50,437 | ||||||
Cirrus Logic, Inc. (e) | 120 | 8,094 | ||||||
Clearway Energy, Inc., Class A | 1,592 | 39,322 | ||||||
Cloudera, Inc. (e) | 1,059 | 11,533 | ||||||
Comfort Systems USA, Inc. | 597 | 30,751 | ||||||
Digital Turbine, Inc. (e) | 1,641 | 53,726 | ||||||
Donnelley Financial Solutions, Inc. (e) | 871 | 11,637 | ||||||
| See accompanying notes to financial statements | 20 | Annual Report September 30, 2020 |
Table of Contents
Schedule of Investments
September 30, 2020
AllianzGI Global Small-Cap Opportunities Portfolio (continued)
| Shares | Value | |||||||
EMCOR Group, Inc. | 586 | 39,678 | ||||||
Emergent Biosolutions, Inc. (e) | 280 | 28,932 | ||||||
ePlus, Inc. (e) | 209 | 15,299 | ||||||
Generac Holdings, Inc. (e) | 308 | 59,641 | ||||||
Gladstone Commercial Corp. REIT | 536 | 9,032 | ||||||
GMS, Inc. (e) | 615 | 14,821 | ||||||
Grocery Outlet Holding Corp. (e) | 253 | 9,948 | ||||||
HarborOne Bancorp, Inc. (e) | 1,089 | 8,788 | ||||||
Hecla Mining Co. | 3,348 | 17,008 | ||||||
Hibbett Sports, Inc. (e) | 531 | 20,826 | ||||||
Hilltop Holdings, Inc. | 1,613 | 33,196 | ||||||
Hubbell, Inc. | 202 | 27,642 | ||||||
Inphi Corp. (e) | 435 | 48,829 | ||||||
Integer Holdings Corp. (e) | 559 | 32,987 | ||||||
M/I Homes, Inc. (e) | 461 | 21,229 | ||||||
ManTech International Corp., Class A | 669 | 46,081 | ||||||
Methode Electronics, Inc. | 1,444 | 41,154 | ||||||
MSA Safety, Inc. | 143 | 19,186 | ||||||
NewMarket Corp. | 138 | 47,240 | ||||||
Owens & Minor, Inc. | 504 | 12,655 | ||||||
PRA Health Sciences, Inc. (e) | 400 | 40,576 | ||||||
Prestige Consumer Healthcare, Inc. (e) | 653 | 23,782 | ||||||
Progress Software Corp. | 827 | 30,334 | ||||||
Rent-A-Center, Inc. | 1,906 | 56,970 | ||||||
Rush Enterprises, Inc., Class A | 555 | 28,050 | ||||||
Sangamo Therapeutics, Inc. (e) | 1,217 | 11,501 | ||||||
Silgan Holdings, Inc. | 1,413 | 51,956 | ||||||
Sportsman’s Warehouse Holdings, Inc. (e) | 516 | 7,384 | ||||||
Tetra Tech, Inc. | 427 | 40,778 | ||||||
TopBuild Corp. (e) | 329 | 56,157 | ||||||
U.S. Silica Holdings, Inc. | 4,129 | 12,387 | ||||||
United Therapeutics Corp. (e) | 244 | 24,644 | ||||||
Vectrus, Inc. (e) | 468 | 17,784 | ||||||
|
| |||||||
| 1,429,903 | ||||||||
|
| |||||||
Total Common Stock (cost-$2,299,096) | 2,885,888 | |||||||
|
| |||||||
PREFERRED STOCK - 0.4% | ||||||||
Brazil - 0.4% | ||||||||
Cia Paranaense de Energia (cost-$10,748) | 1,200 | 13,250 | ||||||
|
| |||||||
Total Investments (cost-$2,309,844) (b)-100.6% | 2,899,138 | |||||||
|
| |||||||
Liabilities in excess of other assets-(0.6)% | (18,491) | |||||||
|
| |||||||
Net Assets-100.0% | $ | 2,880,647 | ||||||
|
| |||||||
| See accompanying notes to financial statements | 21 | Annual Report September 30, 2020 |
Table of Contents
Schedule of Investments
September 30, 2020
AllianzGI Global Small-Cap Opportunities Portfolio (continued)
Notes to Schedule of Investments:
| (a) | 144A—Exempt from registration under Rule 144A of the Securities Act of 1933. These securities may be resold in transactions exempt from registration, typically only to qualified institutional buyers. Securities with an aggregate value of $94,139, representing 3.3% of net assets. |
| (b) | Securities with an aggregate value of $1,114,774, representing 38.7% of net assets, were valued utilizing modeling tools provided by a third-party vendor. See Note 1(a) and Note 1(b) in the Notes to Financial Statements. |
| (c) | Fair-Valued—Securities with an aggregate value of $40,967, representing 1.4% of net assets. See Note 1(a) and Note 1(b) in the Notes to Financial Statements. |
| (d) | Level 3 security. See Note 1(a) and Note 1(b) in the Notes to Financial Statements. |
| (e) | Non-income producing. |
Glossary:
ADR - American Depositary Receipt
REIT - Real Estate Investment Trust
| See accompanying notes to financial statements | 22 | Annual Report September 30, 2020 |
Table of Contents
Schedule of Investments
September 30, 2020
AllianzGI Global Small-Cap Opportunities Portfolio
The industry classification of portfolio holdings and liabilities in excess of other assets shown as a percentage of net assets were as follows:
Specialty Retail | 9.2% | |
Household Durables | 6.2% | |
Metals & Mining | 6.1% | |
Semiconductors & Semiconductor Equipment | 5.6% | |
Software | 4.9% | |
Electrical Equipment | 4.9% | |
IT Services | 3.7% | |
Pharmaceuticals | 3.6% | |
Equity Real Estate Investment Trusts (REITs) | 3.5% | |
Electronic Equipment, Instruments & Components | 3.5% | |
Healthcare Providers & Services | 3.3% | |
Construction & Engineering | 3.2% | |
Life Sciences Tools & Services | 3.0% | |
Insurance | 2.8% | |
Tobacco | 2.7% | |
Biotechnology | 2.5% | |
Trading Companies & Distributors | 2.5% | |
Chemicals | 2.4% | |
Banks | 2.2% | |
Commercial Services & Supplies | 2.1% | |
Technology Hardware, Storage & Peripherals | 1.9% | |
Containers & Packaging | 1.8% | |
Electric Utilities | 1.5% | |
Machinery | 1.5% | |
Independent Power Producers & Energy Traders | 1.4% | |
Professional Services | 1.3% | |
Diversified Financial Services | 1.2% | |
Healthcare Equipment & Supplies | 1.2% | |
Road & Rail | 1.1% | |
Gas Utilities | 1.1% | |
Construction Materials | 1.0% | |
Real Estate Management & Development | 0.9% | |
Media | 0.9% | |
Diversified Telecommunication Services | 0.8% | |
Aerospace & Defense | 0.6% | |
Entertainment | 0.6% | |
Air Freight & Logistics | 0.5% | |
Textiles, Apparel & Luxury Goods | 0.5% | |
Food Products | 0.5% | |
Energy Equipment & Services | 0.4% | |
Capital Markets | 0.4% | |
Internet & Direct Marketing Retail | 0.4% | |
Automobiles | 0.4% | |
Real Estate | 0.4% | |
Food & Staples Retailing | 0.4% | |
Liabilities in excess of other assets | (0.6)% | |
| ||
| 100.0% | ||
|
| See accompanying notes to financial statements | 23 | Annual Report September 30, 2020 |
Table of Contents
Schedule of Investments
September 30, 2020
AllianzGI International Growth Portfolio
| Shares | Value | |||||||
COMMON STOCK - 93.8% | ||||||||
Argentina - 4.0% | ||||||||
MercadoLibre, Inc. (d) | 243 | $ | 263,043 | |||||
Brazil - 5.2% | ||||||||
StoneCo Ltd., Class A (d) | 6,444 | 340,823 | ||||||
Canada - 5.9% | ||||||||
Alimentation Couche-Tard, Inc., Class B | 3,298 | 114,850 | ||||||
Canadian National Railway Co. | 395 | 42,067 | ||||||
Constellation Software, Inc. (a) | 69 | 76,673 | ||||||
Shopify, Inc., Class A (d) | 148 | 151,400 | ||||||
| 384,990 | ||||||||
China - 17.6% | ||||||||
Alibaba Group Holding Ltd. ADR (d) | 1,682 | 494,474 | ||||||
TAL Education Group ADR (d) | 877 | 66,687 | ||||||
Tencent Holdings Ltd. | 5,758 | 388,915 | ||||||
Tencent Music Entertainment Group ADR (d) | 13,662 | 201,788 | ||||||
| 1,151,864 | ||||||||
Denmark - 15.1% | ||||||||
Ambu A/S, Class B | 17,219 | 484,876 | ||||||
DSV PANALPINA A/S | 1,594 | 258,552 | ||||||
Netcompany Group A/S (b)(d) | 1,901 | 157,661 | ||||||
Novo Nordisk A/S, Class B | 1,310 | 90,763 | ||||||
| 991,852 | ||||||||
Germany - 10.4% | ||||||||
Adidas AG (d) | 254 | 82,027 | ||||||
Infineon Technologies AG | 9,795 | 276,080 | ||||||
SAP SE | 1,308 | 203,679 | ||||||
Zalando SE (b)(d) | 1,248 | 116,601 | ||||||
| 678,387 | ||||||||
Hong Kong - 3.0% | ||||||||
AIA Group Ltd. | 19,712 | 195,939 | ||||||
India - 4.1% | ||||||||
HDFC Bank Ltd. ADR | 5,396 | 269,584 | ||||||
Israel - 6.7% | ||||||||
Wix.com Ltd. (d) | 1,724 | 439,362 | ||||||
Japan - 3.8% | ||||||||
Keyence Corp. | 341 | 159,410 | ||||||
MonotaRO Co., Ltd. | 1,854 | 92,090 | ||||||
| 251,500 | ||||||||
Netherlands - 5.4% | ||||||||
ASML Holding NV | 958 | 353,859 | ||||||
Singapore - 4.5% | ||||||||
Sea Ltd. ADR (d) | 1,922 | 296,065 | ||||||
Sweden - 5.3% | ||||||||
Assa Abloy AB, Class B | 2,007 | 46,924 | ||||||
Atlas Copco AB, Class A | 2,195 | 104,655 | ||||||
Epiroc AB, Class A | 4,020 | 58,234 | ||||||
Hexagon AB, Class B (d) | 1,302 | 98,344 | ||||||
Hexpol AB (d) | 4,538 | 40,593 | ||||||
| 348,750 | ||||||||
Switzerland - 2.8% | ||||||||
Partners Group Holding AG | 93 | 85,542 | ||||||
Sika AG | 164 | 40,271 | ||||||
Temenos AG | 404 | 54,299 | ||||||
| 180,112 | ||||||||
Total Common Stock (cost-$3,570,429) | 6,146,130 | |||||||
| See accompanying notes to financial statements | 24 | Annual Report September 30, 2020 |
Table of Contents
Schedule of Investments
September 30, 2020
AllianzGI International Growth Portfolio (continued)
Principal Amount (000s) | ||||||||||||
Repurchase Agreements - 5.4% | ||||||||||||
State Street Bank and Trust Co., | $ | 352 | 352,000 | |||||||||
Total Investments (cost-$3,922,429) (c)-99.2% | 6,498,130 | |||||||||||
Other assets less liabilities-0.8% | 51,592 | |||||||||||
Net Assets-100.0% | $ | 6,549,722 | ||||||||||
| See accompanying notes to financial statements | 25 | Annual Report September 30, 2020 |
Table of Contents
Schedule of Investments
September 30, 2020
AllianzGI International Growth Portfolio (continued)
Notes to Schedule of Investments:
| (a) | Private Placement—Restricted as to resale and may not have a readily available market. Private placement securities include Rule 144A securities. Security with a value of $76,673, representing 1.2% of net assets. |
| (b) | 144A—Exempt from registration under Rule 144A of the Securities Act of 1933. These securities may be resold in transactions exempt from registration, typically only to qualified institutional buyers. Securities with an aggregate value of $274,262, representing 4.2% of net assets. |
| (c) | Securities with an aggregate value of $3,389,314, representing 51.7% of net assets, were valued utilizing modeling tools provided by a third-party vendor. See Note 1(a) and Note 1(b) in the Notes to Financial Statements. |
| (d) | Non-income producing. |
Glossary:
ADR - American Depositary Receipt
| See accompanying notes to financial statements | 26 | Annual Report September 30, 2020 |
Table of Contents
Schedule of Investments
September 30, 2020
AllianzGI International Growth Portfolio
The industry classification of portfolio holdings and other assets less liabilities shown as a percentage of net assets were as follows:
IT Services | 14.2% | |||
Internet & Direct Marketing Retail | 13.4% | |||
Semiconductors & Semiconductor Equipment | 9.6% | |||
Entertainment | 7.6% | |||
Software | 7.5% | |||
Healthcare Equipment & Supplies | 7.4% | |||
Interactive Media & Services | 5.9% | |||
Banks | 4.1% | |||
Air Freight & Logistics | 4.0% | |||
Electronic Equipment, Instruments & Components | 3.9% | |||
Insurance | 3.0% | |||
Machinery | 2.5% | |||
Food & Staples Retailing | 1.8% | |||
Trading Companies & Distributors | 1.4% | |||
Pharmaceuticals | 1.4% | |||
Capital Markets | 1.3% | |||
Textiles, Apparel & Luxury Goods | 1.3% | |||
Chemicals | 1.2% | |||
Diversified Consumer Services | 1.0% | |||
Building Products | 0.7% | |||
Road & Rail | 0.6% | |||
Repurchase Agreements | 5.4% | |||
Other assets less liabilities | 0.8% | |||
| 100.0% |
| See accompanying notes to financial statements | 27 | Annual Report September 30, 2020 |
Table of Contents
Statements of Assets and Liabilities
September 30, 2020
| AllianzGI Best | ||||||||||||||||||
| Styles Global | AllianzGI Global | AllianzGI | ||||||||||||||||
| Managed | Small-Cap | International | ||||||||||||||||
| Volatility | Opportunities | Growth | ||||||||||||||||
Assets: | ||||||||||||||||||
Investments, at value | $25,809,912 | $2,899,138 | $6,146,130 | |||||||||||||||
|
|
|
|
|
|
| ||||||||||||
Repurchase agreements, at value | – | – | 352,000 | |||||||||||||||
|
|
|
|
|
|
| ||||||||||||
Cash | 16,411 | – | 219 | |||||||||||||||
|
|
|
|
|
|
| ||||||||||||
Foreign currency, at value | 28,726 | 18,152 | 215 | |||||||||||||||
|
|
|
|
|
|
| ||||||||||||
Receivable for investments sold | 123,264 | 305,492 | 65,407 | |||||||||||||||
|
|
|
|
|
|
| ||||||||||||
Dividends and interest receivable (net of foreign withholding taxes) | 73,571 | 8,797 | 986 | |||||||||||||||
|
|
|
|
|
|
| ||||||||||||
Tax reclaims receivable | 34,220 | 1,179 | 18,173 | |||||||||||||||
|
|
|
|
|
|
| ||||||||||||
Receivable from Investment Manager | 20,550 | 8,253 | 20,480 | |||||||||||||||
|
|
|
|
|
|
| ||||||||||||
Investments in Affiliated Funds - Trustees Deferred Compensation Plan (see Note 4) | 9,468 | 905 | – | |||||||||||||||
|
|
|
|
|
|
| ||||||||||||
Prepaid expenses and other assets | 5,049 | 4,136 | 1,828 | |||||||||||||||
|
|
|
|
|
|
| ||||||||||||
Total Assets | 26,121,171 | 3,246,052 | 6,605,438 | |||||||||||||||
|
|
|
|
|
|
| ||||||||||||
Liabilities: | ||||||||||||||||||
Trustees Deferred Compensation Plan payable (see Note 4) | 9,468 | 905 | – | |||||||||||||||
|
|
|
|
|
|
| ||||||||||||
Payable to custodian for cash overdraft | – | 14,511 | – | |||||||||||||||
|
|
|
|
|
|
| ||||||||||||
Payable for investments purchased | – | 288,454 | – | |||||||||||||||
|
|
|
|
|
|
| ||||||||||||
Accrued expenses and other liabilities | 72,515 | 61,535 | 55,716 | |||||||||||||||
|
|
|
|
|
|
| ||||||||||||
Total Liabilities | 81,983 | 365,405 | 55,716 | |||||||||||||||
|
|
|
|
|
|
| ||||||||||||
Net Assets | $26,039,188 | $2,880,647 | $6,549,722 | |||||||||||||||
|
|
|
|
|
|
| ||||||||||||
Net Assets Consist of: | ||||||||||||||||||
Paid-in-capital | $20,621,519 | $2,455,452 | $456,855 | |||||||||||||||
|
|
|
|
|
|
| ||||||||||||
Total distributable earnings (loss) | 5,417,669 | 425,195 | 6,092,867 | |||||||||||||||
|
|
|
|
|
|
| ||||||||||||
Net Assets | $26,039,188 | $2,880,647 | $6,549,722 | |||||||||||||||
|
|
|
|
|
|
| ||||||||||||
Common Shares Issued and Outstanding | 1,669,564 | 180,616 | 298,654 | |||||||||||||||
|
|
|
|
|
|
| ||||||||||||
Cost of Investments | $22,319,611 | $2,309,844 | $3,570,429 | |||||||||||||||
|
|
|
|
|
|
| ||||||||||||
Cost of Repurchase Agreements | – | – | 352,000 | |||||||||||||||
|
|
|
|
|
|
| ||||||||||||
Cost of Foreign Currency | $28,561 | $17,945 | $214 | |||||||||||||||
|
|
|
|
|
|
| ||||||||||||
Shares Issued and Outstanding | 1,669,564 | 180,616 | 298,654 | |||||||||||||||
|
|
|
|
|
|
| ||||||||||||
Net Asset Value Per Share* | $15.60 | $15.95 | $21.93 | |||||||||||||||
|
|
|
|
|
|
| ||||||||||||
| * | Net asset value and redemption price per share may not recalculate exactly due to rounding. |
| See accompanying notes to financial statements | 28 | Annual Report September 30, 2020 |
Table of Contents
Year ended September 30, 2020
| AllianzGI Best | ||||||||||||||||||
| Styles Global | AllianzGI Global | AllianzGI | ||||||||||||||||
| Managed | Small-Cap | International | ||||||||||||||||
| Volatility | Opportunities | Growth | ||||||||||||||||
Investment Income: | ||||||||||||||||||
Dividends, net of foreign withholding taxes* | $1,110,834 | $148,442 | $192,812 | |||||||||||||||
|
|
|
|
|
|
| ||||||||||||
Interest | 698 | 138 | 1,015 | |||||||||||||||
|
|
|
|
|
|
| ||||||||||||
Miscellaneous | 4 | 6 | – | |||||||||||||||
|
|
|
|
|
|
| ||||||||||||
Non-cash income | – | – | 246,758 | |||||||||||||||
|
|
|
|
|
|
| ||||||||||||
Total Investment Income | 1,111,536 | 148,586 | 440,585 | |||||||||||||||
|
|
|
|
|
|
| ||||||||||||
Expenses: | ||||||||||||||||||
Investment management | 172,680 | 68,963 | 232,581 | |||||||||||||||
|
|
|
|
|
|
| ||||||||||||
Custodian and accounting agent | 122,667 | 49,433 | 81,627 | |||||||||||||||
|
|
|
|
|
|
| ||||||||||||
Legal | 69,825 | 33,775 | 47,159 | |||||||||||||||
|
|
|
|
|
|
| ||||||||||||
Audit and tax services | 51,776 | 46,333 | 35,966 | |||||||||||||||
|
|
|
|
|
|
| ||||||||||||
Shareholder communications | 5,834 | 9,125 | 3,216 | |||||||||||||||
|
|
|
|
|
|
| ||||||||||||
Insurance | 5,797 | 4,567 | 8,363 | |||||||||||||||
|
|
|
|
|
|
| ||||||||||||
Transfer agent | 5,256 | 4,517 | 2,731 | |||||||||||||||
|
|
|
|
|
|
| ||||||||||||
Trustees | 5,240 | 899 | 2,966 | |||||||||||||||
|
|
|
|
|
|
| ||||||||||||
Line of credit commitment | 988 | 203 | 562 | |||||||||||||||
|
|
|
|
|
|
| ||||||||||||
Excise tax | – | 476 | – | |||||||||||||||
|
|
|
|
|
|
| ||||||||||||
Offering | – | – | 16,946 | |||||||||||||||
|
|
|
|
|
|
| ||||||||||||
Miscellaneous | 6,131 | 6,444 | 2,207 | |||||||||||||||
|
|
|
|
|
|
| ||||||||||||
Total Expenses | 446,194 | 224,735 | 434,324 | |||||||||||||||
|
|
|
|
|
|
| ||||||||||||
Less: Fee Waiver/Reimbursement from | ||||||||||||||||||
Investment Manager | (250,905 | ) | (132,105 | ) | (167,669 | ) | ||||||||||||
|
|
|
|
|
|
| ||||||||||||
Net Expenses | 195,289 | 92,630 | 266,655 | |||||||||||||||
|
|
|
|
|
|
| ||||||||||||
Net Investment Income | 916,247 | 55,956 | 173,930 | |||||||||||||||
|
|
|
|
|
|
| ||||||||||||
Realized and Change in Unrealized Gain (Loss): |
| |||||||||||||||||
Net realized gain (loss) on: | ||||||||||||||||||
Investments | 1,693,296 | (67,944 | ) | 11,065,352 | ||||||||||||||
|
|
|
|
|
|
| ||||||||||||
Forward foreign currency contracts | (2,781 | ) | (2 | ) | (4,834 | ) | ||||||||||||
|
|
|
|
|
|
| ||||||||||||
Foreign currency transactions | 4,060 | (2,038 | ) | (13,738 | ) | |||||||||||||
|
|
|
|
|
|
| ||||||||||||
Net change in unrealized appreciation/depreciation of: | ||||||||||||||||||
Investments | (2,985,616 | ) | 149,635 | 2,883,497 | ||||||||||||||
|
|
|
|
|
|
| ||||||||||||
Forward foreign currency contracts | 1 | 1 | – | |||||||||||||||
|
|
|
|
|
|
| ||||||||||||
Foreign currency transactions | 909 | 367 | 648 | |||||||||||||||
|
|
|
|
|
|
| ||||||||||||
Net realized and change in unrealized gain (loss) | (1,290,131 | ) | 80,019 | 13,930,925 | ||||||||||||||
|
|
|
|
|
|
| ||||||||||||
Net Increase (Decrease) in Net Assets Resulting from Investment Operations | $(373,884 | ) | $135,975 | $14,104,855 | ||||||||||||||
|
|
|
|
|
|
| ||||||||||||
*Foreign withholding taxes | $76,615 | $13,982 | $26,240 | |||||||||||||||
|
|
|
|
|
|
| ||||||||||||
| See accompanying notes to financial statements | 29 | Annual Report September 30, 2020 |
Table of Contents
Statements of Changes in Net Assets
| AllianzGI Best Styles Global Managed Volatility | AllianzGI Global Small-Cap Opportunities | |||||||||||||||
|
|
| ||||||||||||||
| Year ended | Year ended | Year ended | Year ended | |||||||||||||
| September 30, 2020 | September 30, 2019 | September 30, 2020 | September 30, 2019 | |||||||||||||
|
|
| ||||||||||||||
Increase (Decrease) in Net Assets from: | ||||||||||||||||
Investment Operations: | ||||||||||||||||
Net investment income | $916,247 | $1,196,116 | $55,956 | $66,187 | ||||||||||||
|
|
|
|
|
|
|
|
|
|
|
|
| ||||
Net realized gain (loss) | 1,694,575 | 1,645,571 | (69,984 | ) | (64,571 | ) | ||||||||||
|
|
|
|
|
|
|
|
|
|
|
|
| ||||
Net change in unrealized appreciation/depreciation | (2,984,706 | ) | (376,626 | ) | 150,003 | (384,287 | ) | |||||||||
|
|
|
|
|
|
|
|
|
|
|
|
| ||||
Net increase (decrease) in net assets resulting from investment operations | (373,884 | ) | 2,465,061 | 135,975 | (382,671 | ) | ||||||||||
|
|
|
|
|
|
|
|
|
|
|
|
| ||||
Distributions to Shareholders from: | ||||||||||||||||
Distributable earnings | (2,602,380 | ) | (7,046,627 | ) | (172,672 | ) | (441,282 | ) | ||||||||
|
|
|
|
|
|
|
|
|
|
|
|
| ||||
Common Stock Transactions: | ||||||||||||||||
Net proceeds from the sale of common stock | 9,781,524 | 5,548,753 | 3,142,783 | 2,867,171 | ||||||||||||
|
|
|
|
|
|
|
|
|
|
|
|
| ||||
Issued in reinvestment of distributions | 2,602,380 | 7,046,627 | 172,672 | 441,282 | ||||||||||||
|
|
|
|
|
|
|
|
|
|
|
|
| ||||
Cost of shares redeemed | (34,307,656 | ) | (8,896,535 | ) | (8,390,289 | ) | – | |||||||||
|
|
|
|
|
|
|
|
|
|
|
|
| ||||
Net increase (decrease) from Portfolio share transactions | (21,923,752 | ) | 3,698,845 | (5,074,834 | ) | 3,308,453 | ||||||||||
|
|
|
|
|
|
|
|
|
|
|
|
| ||||
Total increase (decrease) in net assets | (24,900,016 | ) | (882,721 | ) | (5,111,531 | ) | 2,484,500 | |||||||||
|
|
|
|
|
|
|
|
|
|
|
|
| ||||
Net Assets: | ||||||||||||||||
Beginning of year | 50,939,204 | 51,821,925 | 7,992,178 | 5,507,678 | ||||||||||||
|
|
|
|
|
|
|
|
|
|
|
|
| ||||
End of year | $26,039,188 | $50,939,204 | $2,880,647 | $7,992,178 | ||||||||||||
|
|
|
|
|
|
|
|
|
|
|
|
| ||||
Shares Activity: | ||||||||||||||||
Issued | 592,213 | 338,152 | 186,898 | 175,792 | ||||||||||||
|
|
|
|
|
|
|
|
|
|
|
|
| ||||
Issued in reinvestment of distributions | 160,048 | 506,587 | 10,080 | 30,433 | ||||||||||||
|
|
|
|
|
|
|
|
|
|
|
|
| ||||
Redeemed | (2,206,348 | ) | (582,274 | ) | (513,160 | ) | – | |||||||||
|
|
|
|
|
|
|
|
|
|
|
|
| ||||
Net increase (decrease) | (1,454,087 | ) | 262,465 | (316,182 | ) | 206,225 | ||||||||||
|
|
|
|
|
|
|
|
|
|
|
|
| ||||
– May reflect actual amounts rounding to less than $1.
| See accompanying notes to financial statements | 30 | Annual Report September 30, 2020 |
Table of Contents
Statements of Changes in Net Assets
| AllianzGI International Growth | ||||||||||||||||
| Period from | ||||||||||||||||
| Year ended | May 15, 2019* through | |||||||||||||||
| September 30, 2020 | September 30, 2019 | |||||||||||||||
Increase (Decrease) in Net Assets from: | ||||||||||||||||
Investment Operations: | ||||||||||||||||
Net investment income | $173,930 | $4,291 | ||||||||||||||
|
|
|
|
| ||||||||||||
Net realized gain | 11,046,780 | 9,142 | ||||||||||||||
|
|
|
|
| ||||||||||||
Net change in unrealized appreciation/depreciation | 2,884,145 | (307,634 | ) | |||||||||||||
|
|
|
|
| ||||||||||||
Net increase (decrease) in net assets resulting from investment operations | 14,104,855 | (294,201 | ) | |||||||||||||
|
|
|
|
| ||||||||||||
Distributions to Shareholders from: | ||||||||||||||||
Distributable earnings | (42,407 | ) | – | |||||||||||||
|
|
|
|
| ||||||||||||
Common Stock Transactions: | ||||||||||||||||
Net proceeds from the sale of common stock | 12,700,707 | 47,320,433 | ||||||||||||||
|
|
|
|
| ||||||||||||
Issued in reinvestment of distributions | 42,407 | – | ||||||||||||||
|
|
|
|
| ||||||||||||
Cost of shares redeemed | (70,009,197 | ) | (272,875 | ) | ||||||||||||
|
|
|
|
| ||||||||||||
Net increase (decrease) from Portfolio share transactions | (57,266,083 | ) | 47,047,558 | |||||||||||||
|
|
|
|
| ||||||||||||
Total increase (decrease) in net assets | (43,203,635 | ) | 46,753,357 | |||||||||||||
|
|
|
|
| ||||||||||||
Net Assets: | ||||||||||||||||
Beginning of period | 49,753,357 | 3,000,000 | ||||||||||||||
|
|
|
|
| ||||||||||||
End of period | $6,549,722 | $49,753,357 | ||||||||||||||
|
|
|
|
| ||||||||||||
Shares Activity: | ||||||||||||||||
Issued | 834,080 | 3,174,908 | ||||||||||||||
|
|
|
|
| ||||||||||||
Issued in reinvestment of distributions | 2,558 | – | ||||||||||||||
|
|
|
|
| ||||||||||||
Redeemed | (3,894,615 | ) | (18,277 | ) | ||||||||||||
|
|
|
|
| ||||||||||||
Net increase (decrease) | (3,057,977 | ) | 3,156,631 | |||||||||||||
|
|
|
|
| ||||||||||||
| – | May reflect actual amounts rounding to less than $1. |
| * | Commencement of operations. |
| See accompanying notes to financial statements | 31 | Annual Report September 30, 2020 |
Table of Contents
For a share of common stock outstanding throughout each period: ^
| AllianzGI Best Styles Global Managed Volatility | |||||||||||||||||||||||||
| Period from | |||||||||||||||||||||||||
| April 11, 2016* | |||||||||||||||||||||||||
| Year ended | Year ended | Year ended | Year ended | through | |||||||||||||||||||||
| September 30, | September 30, | September 30, | September 30, | September 30, | |||||||||||||||||||||
| 2020 | 2019 | 2018 | 2017 | 2016 | |||||||||||||||||||||
Net asset value, beginning of period | $16.31 | $18.11 | $17.85 | $15.81 | $15.00 | ||||||||||||||||||||
Investment Operations: | |||||||||||||||||||||||||
Net investment income(a) | 0.33 | 0.39 | 0.42 | 0.40 | 0.22 | ||||||||||||||||||||
Net realized and change in unrealized gain (loss) | (0.23) | 0.25 | 1.09 | 1.99 | 0.59 | ||||||||||||||||||||
Total from investment operations | 0.10 | 0.64 | 1.51 | 2.39 | 0.81 | ||||||||||||||||||||
Dividends and Distributions to Shareholders from: | |||||||||||||||||||||||||
Net investment income | (0.38) | (0.50) | (0.60) | (0.31) | — | ||||||||||||||||||||
Net realized gains | (0.43) | (1.94) | (0.65) | (0.04) | — | ||||||||||||||||||||
Total dividends and distributions to shareholders | (0.81) | (2.44) | (1.25) | (0.35) | — | ||||||||||||||||||||
Net asset value, end of period | $15.60 | $16.31 | $18.11 | $17.85 | $15.81 | ||||||||||||||||||||
Total Return(b) | 0.41% | 5.84% | 8.77% | 15.41% | 5.40% | ||||||||||||||||||||
RATIOS/SUPPLEMENTAL DATA: | |||||||||||||||||||||||||
Net assets, end of period (000s) | $26,039 | $50,939 | $51,822 | $59,116 | $77,339 | ||||||||||||||||||||
Ratio of expenses to average net assets with fee reimbursement | 0.45%(c) | 0.45%(c) | 0.45%(c) | 0.45%(c) | 0.45%(d)(e) | ||||||||||||||||||||
Ratio of expenses to average net assets without fee reimbursement | 1.03%(c) | 0.70%(c)(f) | 0.84%(c) | 0.83%(c) | 0.99%(d)(e) | ||||||||||||||||||||
Ratio of net investment income to average net assets | 2.12%(c) | 2.45%(c) | 2.37%(c) | 2.42%(c) | 2.96%(d)(e) | ||||||||||||||||||||
Portfolio turnover rate | 35% | 45% | 59% | 31%(g) | 1% | ||||||||||||||||||||
| ^ | A “—” may reflect actual amounts rounding to less than $0.01 or 0.01%. |
| * | Commencement of operations. |
| (a) | Calculated on average shares outstanding during the period. |
| (b) | Total return is calculated assuming a purchase of a share on the first day of the period and a sale of a share on the last day of each period reported. Dividends and distributions, if any, are assumed, for purposes of this calculation, to be reinvested. Total return does not reflect sales charges and includes the effect of expense reimbursements. Total return may reflect adjustments to conform to U.S. GAAP. Total return for a period of less than one year is not annualized. |
| (c) | Does not include expenses of the investment in which the Portfolio invests. |
| (d) | Annualized, unless otherwise noted. |
| (e) | Certain expenses incurred by the Portfolio were not annualized. |
| (f) | Due to a change in accounting estimate resulting from a revised agreement with the Portfolio’s custodian and accounting agent, in order to lower costs and seek economies of scale for all Portfolios in the Trust, the custodian and accounting agent expense was reduced for the period. The effect of the Ratio of Expenses to Average Net Assets without Fee Waiver/Reimbursement was a decrease in the ratio of 0.19%. |
| (g) | Portfolio turnover rate excludes securities received or delivered from in-kind fund share transactions. |
| See accompanying notes to financial statements | 32 | Annual Report September 30, 2020 |
Table of Contents
Financial Highlights
For a share of common stock outstanding throughout each period:^
| AllianzGI Global Small-Cap Opportunities | AllianzGI International Growth | |||||||||||||
| Period from | ||||||||||||||
| May 15, | ||||||||||||||
| Year ended | Year ended | Year ended | Year ended | Year ended | Year ended | 2019* through | ||||||||
| September 30, | September 30, | September 30, | September 30, | September 30, | September | September | ||||||||
| 2020 | 2019 | 2018 | 2017 | 2016 | 30, 2020 | 30, 2019 | ||||||||
Net asset value, beginning of period | $16.09 | $18.95 | $20.19 | $15.72 | $14.53 | $14.82 | $15.00 | |||||||
Investment Operations: | ||||||||||||||
Net investment income(a) | 0.11 | 0.21 | 0.22 | 0.19 | 0.15 | 0.09 | — | |||||||
Net realized and change in unrealized gain (loss) | 0.01 | (1.55) | 1.40 | 4.49 | 1.13 | 7.04 | (0.18) | |||||||
Total from investment operations | 0.12 | (1.34) | 1.62 | 4.68 | 1.28 | 7.13 | (0.18) | |||||||
Dividends and Distributions to Shareholders from: | ||||||||||||||
Net investment income | (0.26) | (0.31) | (0.43) | (0.21) | (0.09) | (0.01) | — | |||||||
Net realized gains | — | (1.21) | (2.43) | — | — | (0.01) | — | |||||||
Total dividends and distributions to shareholders | (0.26) | (1.52) | (2.86) | (0.21) | (0.09) | (0.02) | — | |||||||
Net asset value, end of period | $15.95 | $16.09 | $18.95 | $20.19 | $15.72 | $21.93 | $14.82 | |||||||
Total Return(b) | 0.66% | (6.20)% | 8.91% | 30.06% | 8.85% | 48.13% | (1.20)% | |||||||
RATIOS/SUPPLEMENTAL DATA: | ||||||||||||||
Net assets, end of period (000s) | $2,881 | $7,992 | $5,508 | $5,055 | $5,287 | $6,550 | $49,753 | |||||||
Ratio of expenses to average net assets with fee reimbursement | 1.21% | 1.20% | 1.20% | 1.20% | 1.20% | 0.80% | 0.80%(c)(d) | |||||||
Ratio of expenses to average net assets without fee reimbursement | 2.93% | 3.44%(e) | 3.70% | 4.24% | 5.48% | 1.31% | 1.83%(c)(d) | |||||||
Ratio of net investment income to average net assets | 0.73% | 1.27% | 1.16% | 1.10% | 1.04% | 0.52% | 0.03%(c)(d) | |||||||
Portfolio turnover rate | 121% | 53% | 98% | 143% | 177% | 38% | 22%(f) | |||||||
| ^ | A “—” may reflect actual amounts rounding to less than $0.01 or 0.01%. |
| * | Commencement of operations. |
| (a) | Calculated on average shares outstanding during the period. |
| (b) | Total return is calculated assuming a purchase of a share on the first day of the period and a sale of a share on the last day of each period reported. Dividends and distributions, if any, are assumed, for purposes of this calculation, to be reinvested. Total return does not reflect sales charges and includes the effect of expense reimbursements. Total return may reflect adjustments to conform to U.S. GAAP. Total return for a period of less than one year is not annualized. |
| (c) | Annualized, unless otherwise noted. |
| (d) | Certain expenses incurred were not annualized. |
| (e) | Due to a change in accounting estimate resulting from a revised agreement with the Portfolio’s custodian and accounting agent, in order to lower costs and seek economies of scale for all Portfolios in the Trust, the custodian and accounting agent expense was reduced for the period. The effect of the Ratio of Expenses to Average Net Assets without Fee Waiver/Reimbursement was a decrease in the ratio of 1.08%. |
| (f) | Portfolio turnover rate excludes securities received or delivered from in-kind fund share transactions. |
| See accompanying notes to financial statements | 33 | Annual Report September 30, 2020 |
Table of Contents
AllianzGI Institutional Multi-Series Trust
Notes to Financial Statements
September 30, 2020
1. ORGANIZATION AND SIGNIFICANT ACCOUNTING POLICIES
AllianzGI Institutional Multi-Series Trust (the “Trust”) was organized on June 3, 2014 and is registered under the Investment Company Act of 1940, as amended (the “1940-Act”), as an open-end registered investment company. The Trust follows the investment company accounting and reporting guidance of the Financial Accounting Standards Board (“FASB”) Accounting Standard Codification Topic 946 Financial Services-Investment Companies. As of September 30, 2020, the Trust consisted of three separate investment series, (each a “Portfolio” and collectively the “Portfolios”). Allianz Global Investors U.S. LLC (“AllianzGI U.S.” or the “Investment Manager”) serves as the Portfolios’ investment manager. AlllianzGI U.S. is an indirect wholly-owned subsidiary of PFP Holdings, Inc. and is a member of Munich-based Allianz Group. Shares of the Portfolios have not been registered for public sale and are currently offered and sold on a private placement basis in accordance with Rule 506(c) of Regulation D under the Securities Act of 1933, as amended. Currently, the Trust has authorized one class of shares.
The investment objective of AllianzGI Best Styles Global Managed Volatility, AllianzGI Global Small-Cap Opportunities and AllianzGI International Growth is to seek long-term capital appreciation. There can be no assurance that the Portfolios will meet their stated objective.
The preparation of the Portfolios’ financial statements in accordance with accounting principles generally accepted in the United States of America (“U.S. GAAP”) requires the Portfolios’ management to make estimates and assumptions that affect the reported amounts and disclosures in each Portfolio’s financial statements. Actual results could differ from those estimates.
Like many other companies, the Portfolios’ organizational documents provide that its officers (“Officers”) and the Board of Trustees of the Trust (the “Board” or the “Trustees”) are indemnified against certain liabilities arising out of the performance of their duties to the Portfolios. In addition, both in some of their principal service contracts and in the normal course of its business, the Portfolios enter into contracts that provide indemnifications to other parties for certain types of losses or liabilities. The Portfolios maximum exposure under these arrangements is unknown as this could involve future claims against the Portfolios.
The following is a summary of significant accounting policies consistently followed by the Portfolios:
(a) Valuation of Investments. Portfolio securities and other financial instruments for which market quotations are readily available are valued at market value. Market values for various types of securities and other instruments are determined on the basis of closing prices or last sales prices on an exchange or other market, based on quotes or other market information obtained from quotation reporting systems, established market makers or independent pricing services. Investments in mutual funds are valued at the net asset value (“NAV”) as reported on each business day, and under normal circumstances. Exchange-traded funds (“ETFs”) are valued at their current market trading price. The Portfolios’ investments are valued daily using prices supplied by an independent pricing service or broker/dealer quotations, or by using the last sale or settlement price on the exchange that is the primary market for such securities, or the mean between the last bid and ask quotations. The market value for NASDAQ Global Market and NASDAQ Capital Market securities may also be calculated using the NASDAQ Official Closing Price instead of the last reported sales price. Independent pricing services use information provided by market makers or estimates of market values obtained from yield data relating to investments or securities with similar characteristics.
The Board has adopted procedures for valuing portfolio securities and other financial derivative instruments in circumstances where market quotes are not readily available (including in cases where available market quotes are deemed to be unreliable), and has delegated primary responsibility for applying the valuation methods to the Investment Manager. The Trust’s Valuation Committee was established by the Board to oversee the implementation of the Portfolios’ valuation methods and to make fair value determinations on behalf of the Board, as instructed. The Investment Manager monitors the continued appropriateness of methods applied and identifies circumstances and events that may require fair valuation. The Investment Manager determines if adjustments should be made in light of market changes, events affecting the issuer or other factors. If the Investment Manager determines that a valuation method may no longer be appropriate, another valuation method previously approved by the Trust’s Valuation Committee may be selected or the Trust’s Valuation Committee will be convened to consider the matter and take any appropriate action in accordance with procedures set forth by the Board. The Board shall review and ratify the appropriateness of the valuation methods and these methods may be amended or supplemented from time to time by the Trust’s Valuation Committee.
| 34 | Annual Report September 30, 2020 |
Table of Contents
AllianzGI Institutional Multi-Series Trust
Notes to Financial Statements
September 30, 2020 (continued)
Short-term debt investments having a remaining maturity of 60 days or less are valued at amortized cost unless the Board or its Valuation Committee determines that particular circumstances dictate otherwise.
Investments initially valued in currencies other than the U.S. dollar are converted to the U.S. dollar using exchange rates obtained from pricing services. As a result, the NAV of the Portfolios may be affected by changes in the value of currencies in relation to the U.S. dollar. The value of securities traded in markets outside the U.S. or denominated in currencies other than the U.S. dollar may be affected significantly on a day that the New York Stock Exchange (“NYSE”) is closed and the NAV of a Portfolio’s shares may change on days when an investor is not able to purchase or redeem or exchange shares.
The prices used by the Portfolios to value investments may differ from the value that would be realized if the investments were sold, and these differences could be material to the Portfolios’ financial statements. Each Portfolio’s NAV is normally determined as of the close of regular trading (normally, 4:00 p.m., Eastern Time) on the NYSE on each day the NYSE is open for business. In unusual circumstances, the Board or the Valuation Committee may in good faith determine the NAV as of 4:00 p.m., Eastern Time, notwithstanding an earlier, unscheduled close or halt of trading on the NYSE.
The prices of certain portfolio securities or financial instruments may be determined at a time prior to the close of regular trading on the NYSE. In considering whether fair value pricing is required and in determining fair values, the Portfolios may, among other things, consider significant events (which may be considered to include changes in the value of U.S. securities or securities indices) that occur after the close of the relevant market and before the time the NAV of a Portfolio is calculated. With respect to certain foreign securities, the Portfolios may fair-value securities using modeling tools provided by third-party vendors, where appropriate. The Portfolios have retained a statistical research service to assist in determining the fair value of foreign securities. This service utilizes statistics and programs based on historical performance of markets and other economic data to assist in making fair value estimates. Fair value estimates used by the Portfolios for foreign securities may differ from the value realized from the sale of those securities and the difference could be material to the financial statements. Fair value pricing may require subjective determinations about the value of a security or other assets, and fair values used to determine the NAV of a Portfolio may differ from quoted or published prices, or from prices that are used by others, for the same investments. In addition, the use of fair value pricing may not always result in adjustments to the prices of securities or other assets held by a Portfolio.
(b) Fair Value Measurements. Fair value is defined as the price that would be received to sell an asset or paid to transfer a liability (i.e., the “exit price”) in an orderly transaction between market participants. The three levels of the fair value hierarchy are described below:
| • | Level 1 – quoted prices in active markets for identical investments that the Portfolios have the ability to access |
| • | Level 2 – valuations based on other significant observable inputs, which may include, but are not limited to, quoted prices for similar assets or liabilities, interest rates, yield curves, volatilities, prepayment speeds, loss severities, credit risks and default rates or other market corroborated inputs |
| • | Level 3 – valuations based on significant unobservable inputs (including the Investment Manager’s or the Trust’s Valuation Committee’s own assumptions and securities whose price was determined by using a single broker’s quote) |
The valuation techniques used by the Portfolios to measure fair value during the year ended September 30, 2020 were intended to maximize the use of observable inputs and to minimize the use of unobservable inputs.
An investment asset’s or liability’s level within the fair value hierarchy is based on the lowest level input, individually or in aggregate, that is significant to the fair value measurement. The objective of fair value measurement remains the same even when there is a significant decrease in the volume and level of activity for an asset or liability and regardless of the valuation techniques used.
The inputs or methodology used for valuing securities are not necessarily an indication of the risk associated with investing in those securities. The following are certain inputs and techniques that the Portfolios generally use to evaluate how to classify each major category of assets and liabilities within Level 2 and Level 3, in accordance with U.S. GAAP.
| 35 | Annual Report September 30, 2020 |
Table of Contents
AllianzGI Institutional Multi-Series Trust
Notes to Financial Statements
September 30, 2020 (continued)
An asset or liability for which market values cannot be measured using the methodologies described above is valued by methods deemed reasonable in good faith by the Valuation Committee, following the procedures established by the Board, to represent fair value. Under these procedures, the Portfolios generally use a market-based approach which may use related or comparable assets or liabilities, recent transactions, market multiples, book values and other relevant information. Fair value determinations involve the consideration of a number of subjective factors, an analysis of applicable facts and circumstances and the exercise of judgment. As a result, it is possible that the fair value for a security determined in good faith in accordance with the Portfolios’ valuation procedures may differ from valuations for the same security determined by other funds using their own valuation procedures. Although the Portfolios’ valuation procedures are designed to value a security at the price the Portfolios may reasonably expect to receive upon the security’s sale in an orderly transaction, there can be no assurance that any fair value determination thereunder would, in fact, approximate the amount that the Portfolios would actually realize upon the sale of the security or the price at which the security would trade if a reliable market price were readily available.
Equity Securities (Common and Preferred Stock and Warrants) — Equity securities traded in inactive markets and certain foreign equity securities are valued using inputs which include broker-dealer quotes, recently executed transactions adjusted for changes in the benchmark index, or evaluated price quotes received from independent pricing services that take into account the integrity of the market sector and issuer, the individual characteristics of the security, and information received from broker-dealers and other market sources pertaining to the issuer or security. To the extent that these inputs are observable, the values of equity securities are categorized as Level 2. To the extent that these inputs are unobservable, the values are categorized as Level 3.
A summary of the inputs used at September 30, 2020 in valuing each Portfolio’s assets and liabilities is listed below (refer to the Schedules of Investments and Notes to the Schedules of Investments for more detailed information on Investments in Securities and Other Financial Instruments):
AllianzGI Best Styles Global Managed Volatility:
| Level 2 - | Level 3 - | |||||||||||||||
| Other Significant | Significant | |||||||||||||||
| Level 1 - | Observable | Unobservable | Value at | |||||||||||||
| Quoted Prices | Inputs | Inputs | 9/30/20 | |||||||||||||
Investments in Securities - Assets | ||||||||||||||||
Common Stock: | ||||||||||||||||
Australia | — | $ | 116,386 | — | $ | 116,386 | ||||||||||
Belgium | — | 112,972 | — | 112,972 | ||||||||||||
Chile | — | 63,540 | — | 63,540 | ||||||||||||
China | $ | 18,168 | 460,755 | — | 478,923 | |||||||||||
Czech Republic | — | 98,048 | — | 98,048 | ||||||||||||
Denmark | 15,759 | 114,588 | — | 130,347 | ||||||||||||
Finland | — | 184,161 | — | 184,161 | ||||||||||||
France | — | 364,998 | — | 364,998 | ||||||||||||
Germany | 16,604 | 518,470 | — | 535,074 | ||||||||||||
Hong Kong | — | 297,438 | — | 297,438 | ||||||||||||
Hungary | — | 89,988 | — | 89,988 | ||||||||||||
Israel | — | 291,438 | — | 291,438 | ||||||||||||
Italy | — | 271,472 | — | 271,472 | ||||||||||||
Japan | — | 3,900,320 | — | 3,900,320 | ||||||||||||
Korea (Republic of) | 2,269 | 215,465 | — | 217,734 | ||||||||||||
Malaysia | — | 288,030 | — | 288,030 | ||||||||||||
Morocco | — | 46,757 | — | 46,757 | ||||||||||||
Netherlands | 33,571 | 194,839 | — | 228,410 | ||||||||||||
New Zealand | — | 79,744 | — | 79,744 | ||||||||||||
Norway | — | 115,434 | — | 115,434 | ||||||||||||
Philippines | — | 56,125 | — | 56,125 | ||||||||||||
Poland | — | 36,262 | — | 36,262 | ||||||||||||
Portugal | — | 37,186 | — | 37,186 | ||||||||||||
Singapore | — | 292,458 | — | 292,458 | ||||||||||||
South Africa | — | 9,522 | — | 9,522 | ||||||||||||
Spain | — | 114,747 | — | 114,747 | ||||||||||||
Sweden | — | 145,456 | — | 145,456 | ||||||||||||
Switzerland | 16,796 | 1,726,355 | — | 1,743,151 | ||||||||||||
Taiwan | — | 1,238,100 | — | 1,238,100 | ||||||||||||
Thailand | — | — | $ | 223,931 | 223,931 | |||||||||||
United Kingdom | 100,881 | 268,933 | — | 369,814 | ||||||||||||
All Other | 13,579,371 | — | — | 13,579,371 | ||||||||||||
Preferred Stock | 52,575 | — | — | 52,575 | ||||||||||||
Rights | — | — | — | † | — | † | ||||||||||
Totals | $ | 13,835,994 | $ | 11,749,987 | $ | 223,931 | $ | 25,809,912 | ||||||||
| 36 | Annual Report September 30, 2020 |
Table of Contents
AllianzGI Institutional Multi-Series Trust
Notes to Financial Statements
September 30, 2020 (continued)
AllianzGI Global Small-Cap Opportunities:
| Level 2 - | Level 3 - | |||||||||||||||
| Other Significant | Significant | |||||||||||||||
| Level 1 - | Observable | Unobservable | Value at | |||||||||||||
| Quoted Prices | Inputs | Inputs | 9/30/20 | |||||||||||||
Investments in Securities - Assets | ||||||||||||||||
Common Stock: | ||||||||||||||||
Australia | — | $ | 77,831 | — | $ | 77,831 | ||||||||||
Belgium | — | 15,622 | — | 15,622 | ||||||||||||
China | — | 72,364 | — | 72,364 | ||||||||||||
Denmark | — | 28,898 | — | 28,898 | ||||||||||||
Germany | $ | 7,816 | 11,282 | — | 19,098 | |||||||||||
Hong Kong | — | 12,030 | — | 12,030 | ||||||||||||
India | — | 10,946 | — | 10,946 | ||||||||||||
Italy | — | 49,521 | — | 49,521 | ||||||||||||
Japan | — | 366,956 | — | 366,956 | ||||||||||||
Korea (Republic of) | — | 85,978 | — | 85,978 | ||||||||||||
Netherlands | — | 84,009 | — | 84,009 | ||||||||||||
Portugal | — | 8,619 | — | 8,619 | ||||||||||||
Russian Federation | — | — | $ | 19,890 | 19,890 | |||||||||||
Singapore | — | 19,191 | — | 19,191 | ||||||||||||
Sweden | — | 63,696 | — | 63,696 | ||||||||||||
Switzerland | — | 15,228 | — | 15,228 | ||||||||||||
Taiwan | 40,122 | 80,060 | — | 120,182 | ||||||||||||
Thailand | — | — | 21,077 | 21,077 | ||||||||||||
Turkey | 11,078 | 9,822 | — | 20,900 | ||||||||||||
United Kingdom | — | 102,721 | — | 102,721 | ||||||||||||
All Other | 1,671,131 | — | — | 1,671,131 | ||||||||||||
Preferred Stock | 13,250 | — | — | 13,250 | ||||||||||||
Totals | $ | 1,743,397 | $ | 1,114,774 | $ | 40,967 | $ | 2,899,138 | ||||||||
AllianzGI International Growth:
| Level 2 - | Level 3 - | |||||||||||||||
| Other Significant | Significant | |||||||||||||||
| Level 1 - | Observable | Unobservable | Value at | |||||||||||||
| Quoted Prices | Inputs | Inputs | 9/30/20 | |||||||||||||
Investments in Securities - Assets | ||||||||||||||||
Common Stock: | ||||||||||||||||
Argentina | $ | 263,043 | — | — | $ | 263,043 | ||||||||||
Brazil | 340,823 | — | — | 340,823 | ||||||||||||
Canada | 384,990 | — | — | 384,990 | ||||||||||||
China | 762,949 | $ | 388,915 | — | 1,151,864 | |||||||||||
India | 269,584 | — | — | 269,584 | ||||||||||||
Israel | 439,362 | — | — | 439,362 | ||||||||||||
Singapore | 296,065 | — | — | 296,065 | ||||||||||||
All Other | — | 3,000,399 | — | 3,000,399 | ||||||||||||
Repurchase Agreements | — | 352,000 | — | 352,000 | ||||||||||||
Totals | $ | 2,756,816 | $ | 3,741,314 | — | $ | 6,498,130 | |||||||||
| 37 | Annual Report September 30, 2020 |
Table of Contents
AllianzGI Institutional Multi-Series Trust
Notes to Financial Statements
September 30, 2020 (continued)
A roll forward of fair value measurements using significant unobservable inputs (Level 3) for the year ended September 30, 2020, was as follows:
AllianzGI Best Styles Global Managed Volatility:
| Net Change | ||||||||||||||||||||||||||||||||||||
| Beginning | Accrued | Net | in Unrealized | Transfers | Transfers | Ending | ||||||||||||||||||||||||||||||
| Balance | Discount | Realized | Appreciation/ | into | out of | Balance | ||||||||||||||||||||||||||||||
| 9/30/19 | Purchases | Sales | (Premiums) | Gain (Loss) | Depreciation | Level 3* | Level 3** | 9/30/20 | ||||||||||||||||||||||||||||
Investments in Securities - Assets | ||||||||||||||||||||||||||||||||||||
Common Stock: | ||||||||||||||||||||||||||||||||||||
Philippines | $ | 57 | $ | — | $ | — | $ | — | $ | — | $ | 19 | $ | — | $ | (76 | ) | $ | — | |||||||||||||||||
Taiwan | 35,017 | — | (18,070 | ) | — | (16,890 | ) | (57 | ) | — | — | — | ||||||||||||||||||||||||
Thailand | 571,570 | — | (225,220 | ) | — | (53,102 | ) | (109,233 | ) | 39,916 | — | 223,931 | ||||||||||||||||||||||||
Rights: | ||||||||||||||||||||||||||||||||||||
Singapore | 569 | — | — | †† | — | — | (569 | ) | — | — | — | |||||||||||||||||||||||||
Totals | $ | 607,213 | $ | — | $ | (243,290 | ) | $ | — | $ | (69,992 | ) | $ | (109,840 | ) | $ | 39,916 | $ | (76 | ) | $ | 223,931 | ||||||||||||||
AllianzGI Global Small-Cap Opportunities:
| Net Change | ||||||||||||||||||||||||||||||||||||
| Beginning | Accrued | Net | in Unrealized | Transfers | Transfers | Ending | ||||||||||||||||||||||||||||||
| Balance | Discount | Realized | Appreciation/ | into | out of | Balance | ||||||||||||||||||||||||||||||
| 9/30/19 | Purchases | Sales | (Premiums) | Gain (Loss) | Depreciation | Level 3 | Level 3 | 9/30/20 | ||||||||||||||||||||||||||||
Investments in Securities - Assets | ||||||||||||||||||||||||||||||||||||
Common Stock: | ||||||||||||||||||||||||||||||||||||
Russian Federation | $ | 44,314 | $ | 91,254 | $ | (108,793 | ) | $ | — | $ | (11,984 | ) | $ | 5,099 | $ | — | $ | — | $ | 19,890 | ||||||||||||||||
Thailand | 95,457 | 43,598 | (69,072 | ) | — | (31,566 | ) | (17,340 | ) | — | — | 21,077 | ||||||||||||||||||||||||
Totals | $ | 139,771 | $ | 134,852 | $ | (177,865 | ) | $ | — | $ | (43,550 | ) | $ | (12,241 | ) | $ | — | $ | — | $ | 40,967 | |||||||||||||||
The tables above do not include Level 3 investments that are valued by brokers or independent pricing services. The inputs for these investments are not readily available or cannot be reasonably estimated.
* Transferred out of Level 2 and into Level 3 as a result of securities trading outside of the U.S. whose values were adjusted by the application of a modeling tool.
** Transferred out of Level 3 and into Level 2 because an exchange traded price was available at September 30, 2020.
† Actual amount rounds to less than $1.
†† Issued or removed via corporate action.
The net change in unrealized appreciation/depreciation of Level 3 investments which the following Portfolios held at September 30, 2020 was:
AllianzGI Best Styles Global Managed Volatility | $ | (119,084 | ) | |
AllianzGI Global Small-Cap Opportunities | (26,344 | ) |
(c) Investment Transactions and Investment Income. Investment transactions are accounted for on the trade date. Realized gains and losses on investments are determined on an identified cost basis. Interest income adjusted for the accretion of discounts and amortization of premiums is recorded on an accrual basis. Discounts or premiums on debt securities purchased are accreted or amortized, respectively, to interest income. Dividend income is recorded on the ex-dividend date, except for certain dividends from foreign securities where the ex-dividend date may have passed, and then are recorded as soon after the ex-dividend date as the Portfolios, using reasonable diligence, become aware of such dividends. Dividend and interest income on the Statements of Operations are shown net of any foreign taxes withheld on income from foreign securities. Payments received from real estate investment trust securities may be comprised of dividends, realized gains and return of capital. The payment may initially be recorded as dividend income and may subsequently be reclassified as realized gains and/or return of capital upon receipt of information from the issuer. Payments considered return of capital reduce the cost basis of the respective security. Distributions, if any, in excess of the cost basis of a security are recognized as capital gains.
(d) Federal Income Taxes. The Portfolios intend to distribute all of their taxable income and to comply with the other requirements of Subchapter M of the U.S. Internal Revenue Code of 1986, as amended, applicable to regulated investment companies. Accordingly, no provision for U.S. federal income taxes is required. The Portfolios may be subject to excise tax based on distributions to shareholders.
| 38 | Annual Report September 30, 2020 |
Table of Contents
AllianzGI Institutional Multi-Series Trust
Notes to Financial Statements
September 30, 2020 (continued)
Accounting for uncertainty in income taxes establishes for all entities, including pass-through entities such as the Portfolios, a minimum threshold for financial statement recognition of the benefit of positions taken in filing tax returns (including whether an entity is taxable in a particular jurisdiction), and requires certain expanded tax disclosures. In accordance with provisions set forth under U.S. GAAP, the Investment Manager has reviewed the Portfolios’ tax positions for all open tax years. As of September 30, 2020, the Portfolios have recorded no liability for net unrecognized tax benefits relating to uncertain income tax positions they have taken. The Portfolios’ U.S. federal income tax returns since inception remain subject to examination by the Internal Revenue Service. The Portfolios’ federal income tax returns for the prior three years, as applicable, remain subject to examination by the Internal Revenue Service.
(e) Dividends and Distributions to Shareholders. The Portfolios declare dividends and distributions from net investment income and net realized capital gains, if any, annually. The Portfolios record dividends and distributions to their respective shareholders on the ex-dividend date. The amount of dividends from net investment income and distributions from net realized capital gains is determined in accordance with federal income tax regulations, which may differ from U.S. GAAP. These “book-tax” differences are considered either temporary or permanent in nature. To the extent these differences are permanent in nature, such amounts are reclassified within the capital accounts based on their federal income tax treatment. Temporary differences do not require reclassification. To the extent dividends and/or distributions exceed current and accumulated earnings and profits for federal income tax purposes, they are reported as dividends and/or distributions to shareholders from return of capital.
(f) Foreign Currency Translation. The Portfolios’ accounting records are maintained in U.S. dollars as follows: (1) the foreign currency market values of investments and other assets and liabilities denominated in foreign currencies are translated at the prevailing exchange rate at the end of the period; and (2) purchases and sales, income and expenses are translated at the prevailing exchange rate on the respective dates of such transactions. The resulting net foreign currency gain (loss) is included in the Portfolios’ Statements of Operations.
The Portfolios do not generally isolate that portion of the results of operations arising as a result of changes in foreign currency exchange rates from the fluctuations arising from changes in the market prices of securities. Accordingly, such foreign currency gain (loss) is included in net realized and unrealized gain (loss) on investments. However, the Portfolios do isolate the effect of fluctuations in foreign currency exchange rates when determining the gain (loss) upon the sale or maturity of foreign currency denominated debt obligations pursuant to U.S. federal income tax regulations; such amount is categorized as foreign currency gain (loss) for both financial reporting and income tax reporting purposes.
(g) Repurchase Agreements. The Portfolios are parties to Master Repurchase Agreements (“Master Repo Agreements”) with select counterparties. The Master Repo Agreements include provisions for the initiation of repurchase transactions, income payments, events of default, and maintenance of collateral.
The Portfolios enter into transactions, under the Master Repo Agreements, with their custodian bank or securities brokerage firms whereby they purchase securities under agreements (i.e., repurchase agreements) to resell such securities at an agreed upon price and date. The Portfolios, through their custodian, take possession of securities collateralizing the repurchase agreement. Such agreements are carried at the contract amount in the financial statements, which is considered to represent fair value. The collateral that is pledged (i.e. the securities received by the Portfolios), which consists primarily of U.S. government obligations and asset-backed securities, is held by the custodian bank for the benefit of the Portfolios until the maturity of the repurchase agreement. Provisions of the repurchase agreements and the procedures adopted by the Portfolios require that the market value of the collateral, including accrued interest thereon, be sufficient in the event of default by the counterparty. If the counterparty defaults under the Master Repo Agreements and the value of the collateral declines or if the counterparty enters an insolvency proceeding, realization of the collateral by the Portfolios may be delayed or limited. The gross values are included in the Portfolios’ Schedules of Investments. As of September 30, 2020, the value of the related collateral exceeded the value of the repurchase agreements for each Portfolio.
(h) Rights. The Portfolios may receive rights. A right is a privilege granted to existing shareholders of a corporation to subscribe for shares of a new issue of common stock before it is issued. Rights normally have a short life, usually two to four weeks, are
| 39 | Annual Report September 30, 2020 |
Table of Contents
AllianzGI Institutional Multi-Series Trust
Notes to Financial Statements
September 30, 2020 (continued)
freely transferable and entitle the holder to buy the new common stock at a lower price than the public offering price. Rights may entail greater risks than certain other types of investments. Generally, rights do not carry the right to receive dividends or exercise voting rights with respect to the underlying securities, and they do not represent any rights in the assets of the issuer. In addition, their value does not necessarily change with the value of the underlying securities, and they cease to have value if they are not exercised on or before their expiration date. If the market price of the underlying stock does not exceed the exercise price during the life of the right, the right will expire worthless. Rights may increase the potential profit or loss to be realized from the investment as compared with investing the same amount in the underlying securities.
(i) Organizational and Offering Costs. Organizational costs are expensed at the inception of the Portfolio. Offering costs are amortized over a twelve-month period from the inception of the Portfolio.
2. PRINCIPAL RISKS
In the normal course of business, the Portfolios trade financial instruments and enter into financial transactions where risk of potential loss exists due to, among other things, changes in the market (market risk) or failure of the other party to a transaction to perform (counterparty risk). The Portfolios are also exposed to other risks such as, but not limited to, interest rate, foreign currency, credit and leverage risks.
To the extent the Portfolios directly invest in foreign currencies or in securities that trade in, and receive revenues in, foreign currencies, or in derivatives that provide exposure to foreign currencies, they will be subject to the risk that those currencies will decline in value relative to the U.S. dollar, or, in the case of hedging positions, that the U.S. dollar will decline in value relative to the currency being hedged. Currency rates in foreign countries may fluctuate significantly over short periods of time for a number of reasons, including economic growth, inflation, changes in interest rates, intervention (or the failure to intervene) by U.S. or foreign governments, central banks or supranational entities such as the International Monetary Fund, or the imposition of currency controls or other political developments in the United States or abroad. As a result, the Portfolios’ investments in foreign currency-denominated securities may reduce the returns of the Portfolios.
The Portfolios are subject to elements of risk not typically associated with investments in the U.S., due to concentrated investments in foreign issuers located in a specific country or region. Such concentrations will subject the Portfolios to additional risks resulting from future political or economic conditions in such country or region and the possible imposition of adverse governmental laws or currency exchange restrictions affecting such country or region, which could cause the securities and their markets to be less liquid and prices more volatile than those of comparable U.S. companies.
The market values of securities may decline due to general market conditions (market risk) which are not specifically related to a particular company, such as real or perceived adverse economic conditions, changes in the general outlook for corporate earnings, changes in interest or currency rates, adverse changes to credit markets or adverse investor sentiment. They may also decline due to factors that affect a particular industry or industries, such as labor shortages or increased production costs and competitive conditions within an industry. Equity securities and equity-related investments generally have greater market price volatility than fixed income securities, although under certain market conditions fixed income securities may have comparable or greater price volatility. Credit ratings downgrades may also negatively affect securities held by the Portfolios. Even when markets perform well, there is no assurance that the investments held by the Portfolios will increase in value along with the broader market. In addition, market risk includes the risk that local, regional or global events, including geopolitical and other events will, may disrupt the economy on a national or global level. For example, events such as war, acts of terrorism, the spread of infectious illness or other public health issues, recessions, or other events could have a significant impact on the economy or the markets for financial instruments and, as a result, could have a significant impact on a Portfolio and its investments. As a further example, an outbreak of respiratory disease caused by a novel coronavirus designated as COVID-19 was first detected in China in December 2019 and subsequently spread globally, being designated as a pandemic in early 2020. The transmission of COVID-19 and efforts to contain its spread have resulted in, among other things, border closings and other significant travel restrictions and disruptions; mandatory stay-at-home and work-from-home orders in numerous countries, including the United States; significant disruptions to business operations, supply chains and customer activity, as well as mandatory business closures; lower consumer demand for goods and services; event cancellations and restrictions; cancellations, reductions and other changes in services; significant challenges in healthcare service preparation and delivery; public gathering limitations and prolonged quarantines; and general concern and uncertainty. These effects have exacerbated the significant risks inherent in market investments, and the COVID-19 pandemic has already meaningfully disrupted the global economy and markets, causing market losses across a range of asset classes, as well as both heightened market volatility and
| 40 | Annual Report September 30, 2020 |
Table of Contents
AllianzGI Institutional Multi-Series Trust
Notes to Financial Statements
September 30, 2020 (continued)
increased illiquidity for trading. Although the long-term economic fallout of COVID-19 is difficult to predict, it has the potential to continue to have ongoing material adverse effects on the global economy, the economies of individual countries, and the financial performance of individual issuers, sectors, industries, asset classes, and markets in significant and unforeseen ways. Health crises caused by the outbreak of COVID-19 may also exacerbate other pre-existing political, social, economic, market and financial risks. The effects of the outbreak in developing or emerging market countries may be greater due to less established health care systems. The COVID-19 pandemic and its effects may be short term or may last for an extended period of time, and in either case could result in significant market volatility, exchange trading suspensions and closures, declines in global financial markets, higher default rates, and a substantial economic downturn or recession. Furthermore, the ability of the Investment Manager or its affiliates to operate effectively, including the ability of personnel to function, communicate and travel to the extent necessary to carry out each Portfolio’s investment strategies and objectives, may be materially impaired. All of the foregoing could impair a Fund’s ability to maintain operational standards (such as with respect to satisfying redemption requests), providers, adversely affect the value and liquidity of each Portfolio’s investments, and negatively impact each Portfolio’s performance and your investment in the respective Portfolio.
The Portfolios are exposed to counterparty risk, or the risk that an institution or other entity with which the Portfolios have unsettled or open transactions will default. The potential loss to the Portfolios could exceed the value of the financial assets recorded in the Portfolios’ financial statements. Financial assets, which potentially expose the Portfolios to counterparty risk, consist principally of cash due from counterparties and investments. The Investment Manager seeks to minimize the Portfolios’ counterparty risk by performing reviews of each counterparty and by minimizing concentration of counterparty risk by undertaking transactions with multiple customers and counterparties on recognized and reputable exchanges. Delivery of securities sold is only made once the Portfolios’ have received payment. Payment is made on a purchase once the securities have been delivered by the counterparty. The trade will fail if either party fails to meet its obligation.
3. FINANCIAL DERIVATIVE INSTRUMENTS
Disclosure about derivatives and hedging activities requires qualitative disclosure regarding objectives and strategies for using derivatives, quantitative disclosure about fair value amounts of gains and losses on derivatives, and disclosure about credit-risk-related contingent features in derivative agreements. The disclosure requirements distinguish between derivatives which are accounted for as “hedges”, and those that do not qualify for such accounting. Although the Portfolios at times use derivatives for hedging purposes, the Portfolios reflect derivatives at fair value and recognize changes in fair value through the Portfolios’ Statements of Operations, and such derivatives do not qualify for hedge accounting treatment.
Forward Foreign Currency Contracts. A forward foreign currency contract is an agreement between two parties to buy and sell a currency at a set exchange rate on a future date. The Portfolios enter into forward foreign currency contracts for the purpose of hedging against foreign currency risk arising from the investment or anticipated investment in securities denominated in foreign currencies. The Portfolios also enter into these contracts for purposes of increasing exposure to a foreign currency or shifting exposure to foreign currency fluctuations from one country to another. The market value of a forward foreign currency contract fluctuates with changes in foreign currency exchange rates. All commitments are marked to market daily at the applicable exchange rates and any resulting unrealized appreciation or depreciation is recorded. Realized gains or losses are recorded at the time the forward contract matures or by delivery of the currency. Risks may arise upon entering into these contracts from the potential inability of counterparties to meet the terms of their contracts and from unanticipated movements in the value of a foreign currency relative to the U.S. dollar. In addition, these contracts may involve market risk in excess of the unrealized appreciation (depreciation) reflected in the Portfolios’ Statements of Assets and Liabilities. The Portfolios did not have any open forward foreign currency contracts as of September 30, 2020.
The following is a summary of the Portfolios’ derivatives categorized by risk exposure.
The effect of derivatives on the Statements of Operations for the year ended September 30, 2020:
AllianzGI Best Styles Global Managed Volatility: | ||||
| Foreign Exchange | ||||
| Location | Contracts | |||
Net realized loss on: | ||||
Forward foreign currency contracts | $ | (2,781 | ) | |
| 41 | Annual Report September 30, 2020 |
Table of Contents
AllianzGI Institutional Multi-Series Trust
Notes to Financial Statements
September 30, 2020 (continued)
Net change in unrealized appreciation/depreciation of: | ||||||
Forward foreign currency contracts | $ | 1 | ||||
AllianzGI Global Small-Cap Opportunities: | ||||||
Location | | Foreign Exchange Contracts | | |||
Net realized loss on: | ||||||
Forward foreign currency contracts | $ | (2) | ||||
Net change in unrealized appreciation/depreciation of: | ||||||
Forward foreign currency contracts | $ | 1 | ||||
AllianzGI International Growth: | ||||||
Location | | Foreign Exchange Contracts | | |||
Net realized loss on: | ||||||
Forward foreign currency contracts | $ | (4,834) | ||||
The average volume (based on open positions at each fiscal month-end) of derivative activity during the year ended September 30, 2020:
| Forward Foreign | ||||||
| Currency Contracts (1) | ||||||
| Purchased | Sold | |||||
AllianzGI Best Styles Global Managed Volatility | — | $234 | ||||
AllianzGI Global Small-Cap Opportunities | — | 45 | ||||
AllianzGI International Growth | $1,226 | 18,645 | ||||
(1) U.S. $ value on origination date
4. INVESTMENT MANAGER/DISTRIBUTOR FEES/DEFERRED COMPENSATION
Investment Management Fee. Each Portfolio has an Investment Management Agreement (for the purpose of this section, the “Agreement”) with the Investment Manager. Subject to the supervision of the Trust’s Board, the Investment Manager was responsible for managing, either directly or through others selected by it, each Portfolio’s investment activities, business affairs and administrative matters. Pursuant to the Agreement, the Investment Manager receives an annual fee, payable monthly, at an annual rate of each Portfolio’s average daily net assets (the “Investment Management Fee”).
The Investment Management fee was charged at an annual rate as indicated in the following table:
Management Fee | ||||
AllianzGI Best Styles Global Managed Volatility | 0.40% | |||
AllianzGI Global Small-Cap Opportunities | 0.90 | |||
AllianzGI International Growth | 0.70 |
Distribution Fees. Allianz Global Investors Distributors LLC (the “Distributor”), an affiliate of the Investment Manager, serves as the distributor of the Portfolios’ shares pursuant to a Distribution Contract. The Distributor, for each of the Portfolios, currently receives no compensation in connection with the services it provides under the Distribution Contract.
Deferred Compensation. The Trustees do not currently receive any pension or retirement benefits from the Trust. In calendar year 2018 and certain prior periods, the Trust maintained a deferred compensation plan pursuant to which each Independent Trustee had the opportunity to elect not to receive all or a portion of his or her fees from the Trust on a current basis, but instead to receive in a subsequent period chosen by the Trustee an amount equal to the value of such compensation if such compensation had been invested in one or more series of Allianz Funds or Allianz Funds Multi-Strategy Trust selected by the Trustees from
| 42 | Annual Report September 30, 2020 |
Table of Contents
AllianzGI Institutional Multi-Series Trust
Notes to Financial Statements
September 30, 2020 (continued)
and after the normal payment dates for such compensation. The deferred compensation program was closed to new deferrals effective January 1, 2019, and all Trustee fees earned with respect to service in calendar year 2019 and beyond have been or will be paid in cash, on a current basis, unless the Board of Trustees of the Allianz-Sponsored Funds reopens the program to new deferrals. Allianz Funds and Allianz Funds Multi-Strategy Trust still have obligations with respect to Trustee fees deferred in 2018 and in prior periods, and will continue to have such obligations until all deferred Trustee fees are paid out pursuant to the terms of the deferred compensation plan.
5. EXPENSE LIMITATION/MANAGEMENT FEE WAIVER AND RECOUPMENT
The Trust and the Investment Manager have entered into Expense Limitation and Management Fee Waiver Agreements as indicated below:
| Expense Limitation | ||||
AllianzGI Best Styles Global Managed Volatility (1) | 0.45% | |||
AllianzGI Global Small-Cap Opportunities (2) | 1.20 | |||
AllianzGI International Growth (3) | 0.80 |
(1) The Investment Manager has contractually agreed to irrevocably waive its management fee and/or reimburse the Portfolio through January 31, 2021, to the extent that Total Annual Portfolio Operating Expenses, including payment of organizational expenses but excluding interest, tax and extraordinary expenses, and certain credits and other expenses, exceed 0.45%. Under the Expense Limitation Agreement, the Investment Manager may recoup waived or reimbursed amounts for three years, provided total expenses, including such recoupment, do not exceed the annual expense limit in effect at the time of such waiver/reimbursement or recoupment. The Expense Limitation Agreement is terminable by the Trust (based on approval by the Board) upon 90 days’ prior written notice to the Investment Manager or at any time by mutual agreement of the parties. (2) The Investment Manager has contractually agreed to irrevocably waive its management fee or reimburse the Portfolio through January 31, 2021, to the extent that Total Annual Portfolio Operating Expenses, including payment of organizational expenses but excluding interest, tax and extraordinary expenses, and certain credits and other expenses, exceed 1.20%. Under the Expense Limitation Agreement, the Investment Manager may recoup waived or reimbursed amounts for three years, provided total expenses, including such recoupment, do not exceed the annual expense limit in effect at the time of such waiver/reimbursement or recoupment. The Expense Limitation Agreement is terminable by the Trust (based on approval by the Board) upon 90 days’ prior written notice to the Investment Manager or at any time by mutual agreement of the parties. (3) The Investment Manager has contractually agreed to irrevocably waive its management fee or reimburse the Portfolio through January 31, 2021, to the extent that Total Annual Portfolio Operating Expenses, including payment of organizational expenses but excluding interest, tax and extraordinary expenses, and certain credits and other expenses, exceed 0.80%. Under the Expense Limitation Agreement, the Investment Manager may recoup waived or reimbursed amounts for three years, provided total expenses, including such recoupment, do not exceed the annual expense limit in effect at the time of such waiver/reimbursement or recoupment. The Expense Limitation Agreement is terminable by the Trust (based on approval by the Board) upon 90 days’ prior written notice to the Investment Manager or at any time by mutual agreement of the parties.
During the year ended September 30, 2020, the Investment Manager did not recoup any expenses from the Portfolios. The following represents the amounts that still can be recouped by the Investment Manager:
| Unrecouped Expenses Waived/Reimbursed through | ||||||||||
| Fiscal Period or Year ended | ||||||||||
| 9/30/2018 | 9/30/2019 | 9/30/2020 | Totals | |||||||
AllianzGI Best Styles Global Managed Volatility | $241,955 | $122,823 | $250,905 | $615,683 | ||||||
AllianGI Global Small-Cap Opportunities | 132,581 | 116,337 | 132,105 | 381,023 | ||||||
AllianzGI International Growth | — | 180,491 | 167,669 | 348,160 | ||||||
| 43 | Annual Report September 30, 2020 |
Table of Contents
AllianzGI Institutional Multi-Series Trust
Notes to Financial Statements
September 30, 2020 (continued)
6. INVESTMENTS IN SECURITIES
For the year ended September 30, 2020, purchases and sales of investments, other than short-term were:
| Purchases | Sales | |||
AllianzGI Best Styles Global Managed Volatility | $14,969,285 | $37,996,899 | ||
AllianzGI Global Small-Cap Opportunities | 8,973,754 | 14,137,759 | ||
AllianzGI International Growth | 7,782,669 | 64,861,797 |
7. INCOME TAX INFORMATION
The tax character of dividends and distributions paid was:
| Period ended September 30, 2020 | Period ended September 30, 2019 | |||||||||
|
| |||||||||
| Ordinary Income(1) | 20% Long- Term Capital Gain | 25% Long- Term Capital Gain | Ordinary Income (1) | 15% Long-Term Capital Gain | ||||||
|
|
| ||||||||
AllianzGI Best Styles Global Managed Volatility | $1,221,526 | $1,380,147 | $707 | $2,330,943 | $4,715,684 | |||||
AllianzGI Global Small-Cap Opportunities | 172,672 | - | - | 164,409 | 276,873 | |||||
AllianzGI International Growth | 42,407 | - | - | - | - | |||||
(1) Includes short-term capital gains, if any.
At September 30, 2020, the components of distributable earnings were:
| Long- Term | Capital Loss | Late Year | Post-October Capital Loss (Gain) (4) | |||||||||
| ||||||||||||
| Ordinary | Capital | Carryforwards | Ordinary | |||||||||
| Income | Gains | (2) | Loss (3) | Short-Term | Long-Term | |||||||
|
| |||||||||||
AllianzGI Best Styles Global Managed Volatility | $951,904 | $1,437,398 | - | $72,527 | $205,801 | - | ||||||
AllianzGI Global Small-Cap Opportunities | 54,073 | - | $9,675 | 42,338 | 243,596 | $(112,907) | ||||||
AllianzGI International Growth | 3,718,530 | - | - | 54,523 | - | - | ||||||
(2) Capital loss carryforwards available as a reduction, to the extent provided in the regulations, of any future net realized gains. To the extent that these losses are used to offset future realized capital gains, such gains will not be disbursed.
(3) Certain ordinary losses realized during the period November 1, 2019 through September 30, 2020, and/or other ordinary losses realized during the period January 1, 2020 through September 30, 2020, which the Funds elected to defer to the following taxable year pursuant to income tax regulations.
(4) Capital losses realized during the period November 1, 2019 through September 30, 2020 which the Funds elected to defer to the following taxable year pursuant to income tax regulations.
At September 30, 2020, capital loss carryforward amounts were:
No Expiration | ||||
| ||||
| Short-Term | Long-Term | |||
|
| |||
AllianzGI Global Small-Cap Opportunities | $9,633 | $42 | ||
Under the Regulated Investment Company Modernization Act of 2010, the Portfolios will be permitted to carry forward capital losses incurred in taxable years beginning after December 22, 2010, for an unlimited period. Post-enactment capital losses that are carried forward will retain their character as either short-term or long-term capital losses rather than being considered all short-term capital losses.
| 44 | Annual Report September 30, 2020 |
Table of Contents
AllianzGI Institutional Multi-Series Trust
Notes to Financial Statements
September 30, 2020 (continued)
For the year ended September 30, 2020, permanent “book-tax” adjustments were:
| Undistributed (Dividends in Excess of) Net Investment Income | Accumulated Net Realized Gain(Loss) | Paid-in Capital | Net unrealized appreciation (depreciation) | |||||
| ||||||||
AllianzGI Best Styles Global Managed | $143,554 | $(202,528) | - | $58,974 | ||||
AllianzGI Global Small-Cap | 64,171 | 43,436 | $(108,343) | 736 | ||||
AllianzGI International Growth (b)(c)(g) | (38,521) | (7,636,859) | 7,675,380 | - | ||||
These permanent “book-tax” differences were primarily attributable to:
(a) Reclassifications related to investments in Real Estate Investment Trusts (REITs)
(b) Reclassification of gains and losses from foreign currency transactions
(c) Reclassification of gains from securities classified as Passive Foreign Investment Companies (“PFICs”) for tax purposes
(d) Reclassification from sales of securities with return of capital
(e) Non-deductible excise tax
(f) Reclassification of income from investments in partnerships
(g) Redemptions treated as distributions
(h) Capital Loss Carryforward disallowed
Net investment income, net realized gains or losses and net assets were not affected by these adjustments.
At September 30, 2020, the aggregate cost basis and the net unrealized appreciation (depreciation) of investments in securities and other financial instruments for federal income tax purposes were:
| Federal Tax Cost Basis(5) | Unrealized Appreciation | Unrealized Depreciation | Net Unrealized Appreciation | |||||
AllianzGI Best Styles Global Managed Volatility | $22,497,594 | $4,876,460 | $1,564,142 | $3,312,318 | ||||
AllianzGI Global Small-Cap Opportunities | 2,344,488 | 634,136 | 79,486 | 554,650 | ||||
AllianzGI International Growth | 4,070,080 | 2,428,050 | - | 2,428,050 |
(5) Differences, if any, between book and tax cost basis are primarily attributable to wash sale loss deferrals, differing treatment of premium amortization, PFIC mark-to-market, basis adjustments from investments in partnerships, and 1256 futures contracts mark-to-market.
8. SIGNIFICANT ACCOUNT HOLDERS
From time to time, a Portfolio may have a concentration of shareholders, which may include the Investment Manager or affiliates of the Investment Manager, holding a significant percentage of shares outstanding. Investment activities of these shareholders could have a material impact to a Portfolio.
At September 30, 2020, the significant account-holders, owners of 5% or greater of each respective Portfolio’s outstanding shares, were as follows:
| Affiliated* | ||||||||||||||||
| Number of Account Holders | Approximate Ownership | AFI | ||||||||||||||
AllianzGI Best Styles Global Managed Volatility | 1 | 100 | % | — | ||||||||||||
AllianzGI Global Small-Cap Opportunities | — | — | 100 | % | ||||||||||||
AllianzGI International Growth | 1 | 64 | % | 36 | % | |||||||||||
* This represents the aggregate percentage of affiliated entities that own 5% or more of the Portfolio’s outstanding shares. These affiliated entities include portfolios of the Trust and Allianz Multi-Series Collective Investment Trust.
| 45 | Annual Report September 30, 2020 |
Table of Contents
AllianzGI Institutional Multi-Series Trust
Notes to Financial Statements
September 30, 2020 (continued)
9. BORROWINGS
The Trust entered into a credit agreement (the “State Street Agreement”), among the Trust, AllianzGI Multi-Strategy Trust and Allianz Funds, as borrowers (collectively, the “AllianzGI Borrowers” and each series thereof, an “AllianzGI Borrower Fund”), and State Street Bank and Trust Company, as agent and lender, for a committed line of credit. The State Street Agreement permits the AllianzGI Borrowers to borrow up to $200 million in aggregate, subject to (i) a requirement that each AllianzGI Borrower Fund’s asset coverage with respect to senior securities representing indebtedness be 300% or higher, and (ii) certain other limitations and conditions. For the period from October 24, 2019 through October 1, 2020, pursuant to the terms of the State Street Agreement then in effect, each AllianzGI Borrower Fund paid interest on any amounts borrowed under the facility at a rate per annum equal to 1.25% plus the higher of the then-current federal funds overnight rate or the one-month LIBOR rate, subject to upward adjustment for outstanding past due payments. The State Street Agreement was extended by an additional 364-day period by an amendment effective October 2, 2020 with an expiration date of October 1, 2021 (the “Amendment”). In addition, effective October 2, 2020, each AllianzGI Borrower Fund must pay interest on any amounts borrowed under the facility at a rate per annum equal to the sum of (a) 0.10% plus (b) the “applicable margin” of 1.25% plus (c) the higher of the then-current federal funds overnight rate or an overnight bank lending rate. Amounts borrowed may be repaid and reborrowed on a revolving basis during the term of the facility. The Portfolios did not utilize the line of credit during the year ended September 30, 2020. Prior to October 2, 2020, in connection with their use of leverage as well as their investment activities, the Portfolios may have had exposure to the London Interbank Offered Rate (“LIBOR”). LIBOR is an average interest rate, determined by the ICE Benchmark Administration, that banks charge one another for the use of short-term money. The United Kingdom’s Financial Conduct Authority, which regulates LIBOR, has announced plans to phase out the use of LIBOR by the end of 2021.
Pursuant to an exemptive order issued by the SEC (the “Order”), the Portfolios are authorized to enter into a master interfund lending agreement (the “Interfund Program”) with each other and certain funds advised by the Investment Manager (each a “Participating Fund”). The Interfund Program allows each Participating Fund, whose policies permit it to do so, to lend money directly to and borrow money directly from other Funds for temporary purposes. During the period or year ended September 30, 2020, the Portfolios did not participate as a borrower or lender in the Interfund Program.
10. PORTFOLIO EVENTS
Portfolio Liquidations
On February 27, 2020, AllianzGI Advanced Core Bond Portfolio liquidated as a series of the Trust.
11. SUBSEQUENT EVENTS
In preparing these financial statements, the Portfolios’ management has evaluated events and transactions for potential recognition or disclosure through the date the financial statements were issued.
During the period, the Board approved a plan of liquidation, termination and dissolution (the “Plan”) to liquidate and terminate the Portfolios and, thereafter, terminate the Trust. Pursuant to the Plan, it is anticipated that the Portfolios will cease operations, except for the purposes of winding up its affairs and taking other actions related to liquidation and dissolution, on November 18, 2020 for AllianzGI Global Small-Cap Opportunities Portfolio, on November 20, 2020 for AllianzGI Best Style Global Managed Volatility Portfolio and on or about December 14, 2020 for AllianzGI International Growth Portfolio, or such other date as may be determined by the President of the Trust (each, a “Termination Date”).
| 46 | Annual Report September 30, 2020 |
Table of Contents
AllianzGI Institutional Multi-Series Trust
Notes to Financial Statements
September 30, 2020 (continued)
On November 12, 2020, the following Portfolios declared per-share net investment income dividends and capital gains distributions to shareholders, payable November 12, 2020 to shareholders of record on November 11, 2020.
| Dividend Rate | Short- Term Capital Gains | Long- Term Capital Gains | ||||||||||||||
AllianzGI Global Small-Cap Opportunities Portfolio | $ | 0.29938 | $ | 0.50217 | $ | 1.75476 | ||||||||||
AllianzGI Best Styles Global Managed Volatility Portfolio | $ | 0.57015 | $ | 0.01241 | $ | 0.97220 | ||||||||||
There were no other subsequent events identified that require recognition or disclosure.
| 47 | Annual Report September 30, 2020 |
Table of Contents
Report of Independent Registered Public Accounting Firm
To the Board of Trustees of AllianzGI Institutional Multi-Series Trust and Shareholders of each of the three funds listed in the table below
Opinions on the Financial Statements
We have audited the accompanying statements of assets and liabilities, including the schedules of investments, of each of the funds listed in the table below (constituting AllianzGI Institutional Multi-Series Trust, hereafter collectively referred to as the “Funds”) as of September 30, 2020, the related statements of operations and the statements of changes in net assets for each of the periods indicated in the table below, including the related notes, and the financial highlights for each of the periods indicated therein (collectively referred to as the “financial statements”). In our opinion, the financial statements present fairly, in all material respects, the financial position of each of the Funds as of September 30, 2020, the results of each of their operations and the changes in each of their net assets for each of the periods indicated in the table below and each of the financial highlights for each of the periods indicated therein in conformity with accounting principles generally accepted in the United States of America.
AllianzGI Best Styles Global Managed Volatility Portfolio (1)
|
AllianzGI Global Small-Cap Opportunities Portfolio (1)
|
AllianzGI International Growth Portfolio (2)
|
| (1) | Statement of operations for the year ended September 30, 2020 and statements of changes in net assets for each of the two years in the period ended September 30, 2020 |
| (2) | Statement of operations for the year ended September 30, 2020 and statements of changes in net assets for the year ended September 30, 2020 and for the period May 15, 2019 (commencement of operations) through September 30, 2019 |
Basis for Opinions
These financial statements are the responsibility of the Funds’ management. Our responsibility is to express an opinion on the Funds’ financial statements based on our audits. We are a public accounting firm registered with the Public Company Accounting Oversight Board (United States) (PCAOB) and are required to be independent with respect to the Funds in accordance with the U.S. federal securities laws and the applicable rules and regulations of the Securities and Exchange Commission and the PCAOB.
We conducted our audits of these financial statements in accordance with the standards of the PCAOB. Those standards require that we plan and perform the audit to obtain reasonable assurance about whether the financial statements are free of material misstatement, whether due to error or fraud.
Our audits included performing procedures to assess the risks of material misstatement of the financial statements, whether due to error or fraud, and performing procedures that respond to those risks. Such procedures included examining, on a test basis, evidence regarding the amounts and disclosures in the financial statements. Our audits also included evaluating the accounting principles used and significant estimates made by management, as well as evaluating the overall presentation of the financial statements. Our procedures included confirmation of securities owned as of September 30, 2020 by correspondence with the custodian and brokers; when replies were not received from brokers, we performed other auditing procedures. We believe that our audits provide a reasonable basis for our opinions.
PricewaterhouseCoopers LLP
New York, New York
November 25, 2020
We have served as the auditor of one or more of the investment companies in the Allianz Global Investors U.S. group of investment companies since at least 1995. We have not been able to determine the specific year we began serving as auditor.
| 48 | Annual Report September 30, 2020 |
Table of Contents
AllianzGI Institutional Multi-Series Trust
Federal Tax Information (unaudited)
As required by the Internal Revenue Code, shareholders must be notified regarding certain tax attributes of distributions made by each Portfolio.
During the year ended September 30, 2020, the following Portfolios distributed long-term capital gains in the amounts indicated (or the maximum amount allowable):
| 20% Long-Term Capital Gain | 25% Long-Term Capital Gain | |||
AllianzGI Best Styles Global Managed Volatility | $1,380,147 | $707 | ||
AllianzGI International Growth | 7,305,015 | - | ||
Under the Jobs and Growth Tax Relief Reconciliation Act of 2003, the following approximate percentages of ordinary dividends paid during the fiscal year ended September 30, 2020, are designated as “qualified dividend income” (or the maximum amount allowable):
AllianzGI Best Styles Global Managed Volatility | 77 | % | ||
AllianzGI Global Small-Cap Opportunities | 65 | % | ||
AllianzGI International Growth | 66 | % | ||
Corporate shareholders are generally entitled to take the dividend received deduction on the portion of a Portfolio’s dividend distribution that qualifies under tax law. The following approximate percentages of the Portfolios’ ordinary income dividends paid during the fiscal year ended September 30, 2020, that qualify for the corporate dividend received deduction is set forth below (or the maximum amount allowable):
AllianzGI Best Styles Global Managed Volatility | 44 | % | ||
AllianzGI Global Small-Cap Opportunities | 18 | % | ||
AllianzGI International Growth | 0 | % | ||
The following Portfolios have elected to pass through the credit for tax paid in foreign countries. The foreign income and foreign tax per share outstanding on September 30, 2020 are as follows (or the maximum amount allowable):
| Gross Foreign Dividends | Gross Foreign Dividends Per Share | Foreign Tax | Foreign Tax Per Share | |||||
AllianzGI International Growth | $465,809 | 1.559698 | $26,240 | $0.087861 |
Since the Portfolios’ tax year is not the calendar year, another notification will be sent with respect to calendar year 2020. In January 2021, shareholders will be advised on IRS Form 1099-DIV as to the federal tax status of the dividends and distributions received during calendar year 2020. The amount that will be reported will be the amount to use on the shareholder’s 2020 federal income tax return and may differ from the amount which must be reported in connection with the Portfolios’ tax year ended September 30, 2020. Shareholders are advised to consult their tax advisers as to the federal, state and local tax status of the dividend income received from the Portfolios.
| 49 | Annual Report September 30, 2020 |
Table of Contents
AllianzGI Institutional Multi-Series Trust
Matters Relating to the Trustees’ Consideration of the Investment Management
Agreements (unaudited)
The Investment Company Act of 1940, as amended (the “1940 Act”), requires that both the full Board of Trustees (the “Board” or “Trustees”), including a majority of the Trustees who are not “interested persons” of the Trust, as that term is defined in the 1940 Act (the “Independent Trustees”), voting separately, annually approve the continuation of the Trust’s Investment Management Agreement (the “Agreement”) on behalf of AllianzGI Best Styles Global Managed Volatility Portfolio (“Best Styles Global Managed Volatility Portfolio”), AllianzGI Global Small-Cap Opportunities Portfolio (“Global Small-Cap Opportunities Portfolio”) and AllianzGI International Growth Portfolio (“International Growth Portfolio”) (each a “Portfolio” together the “Portfolios”) with Allianz Global Investors U.S. LLC (“AllianzGI U.S.” or the “Investment Manager”). Throughout the process, the Independent Trustees received separate legal advice from independent legal counsel that is experienced in 1940 Act matters and that is independent of the Investment Manager (“Independent Counsel”), and with whom they met separately from the Investment Manager during the contract review meetings.
At their meeting held on June 25, 2020, the Board, including the Independent Trustees, unanimously approved the continuation of the Agreement through June 30, 2021 with respect to the Portfolios.1
The contract review process consisted of multiple meetings and discussions that included meetings of the Contracts Committee and meetings of the Independent Trustees and Independent Trustee Counsel leading up to the full Board’s consideration of the Agreement. Representatives from fund management participated in portions of those meetings to, among other topics, review the comparative fee and expense information and comparative performance information prepared and provided by Broadridge Financial Solutions, Inc. (“Broadridge”), an independent third party, for each Portfolio using its respective Broadridge peer groups for performance and expense comparisons.
In connection with their deliberations regarding the approval of the Agreement, the Independent Trustees considered such information and factors as they believed, in light of the legal advice furnished to them and their own business judgment, to be relevant. As described below, the Trustees considered the nature, quality and extent of the various investment management, administrative, and other services to be performed by the Investment Manager under the Agreement.
In evaluating the Agreement with respect to each Portfolio, the Board, including the Independent Trustees, reviewed extensive materials provided by the Investment Manager in response to questions submitted by the Independent Trustees and Independent Counsel, and met with senior representatives of the Investment Manager regarding its personnel, operations, and financial condition as they relate to the Portfolios. The Board also considered the broad range of information relevant to the annual contract review that is provided to the Board (including its various standing committees) at meetings throughout the year, including reports on investment performance, portfolio risk, and other portfolio information for each Portfolio, including the use of derivatives if used as part of the Portfolio’s principal investment strategy, as well as periodic reports on, among other matters, pricing and valuation; quality and cost of portfolio trade execution; compliance; and shareholder and other services provided by the Investment Manager and its affiliates. To assist with their review, the Independent Trustees reviewed a summary for each Portfolio prepared by the Investment Manager that included, among other information, performance comparisons between the Portfolios and their Broadridge Performance Universe (as defined below), investment objective, total net assets, annual fund operating expenses, portfolio managers, total expense ratio and management fee comparisons between each Portfolio and its Broadridge Expense Group (as defined below), and trends in the Investment Manager’s profitability from its advisory relationship with each Portfolio. They also considered summaries assigning a quadrant placement to each Portfolio based on an average of certain measures of performance (including in relation to risk) and fees/expenses versus peer group medians. The Independent Trustees also considered the risk profiles of the Portfolios.
The Independent Trustees’ conclusions as to the approval of the Agreement were based on a comprehensive consideration of all information provided to the Independent Trustees and were not the result of any single factor. Individual Independent Trustees may have evaluated the information presented differently from one another, attributing different weights to various
1 The Board, including a majority of the Independent Trustees, determined to rely on the relief granted by an exemptive order issued by the U.S. Securities and Exchange Commission (the “SEC”) that permits mutual fund boards of directors to remotely approve advisory contracts rather than in-person in response to the impact of COVID-19 on investment advisers and funds. The Board determined that reliance on the exemptive order was necessary and appropriate due to circumstances related to current or potential effects of COVID-19, and prior to commencing the approval meeting, the Board confirmed that all Board members could hear each other simultaneously during the meeting. The Board noted that it would ratify any actions taken at this meeting pursuant to the SEC relief at its next in-person meeting.
| 50 | Annual Report September 30, 2020 |
Table of Contents
AllianzGI Institutional Multi-Series Trust
Matters Relating to the Trustees’ Consideration of the Investment Management
Agreements (unaudited) (continued)
factors. The Independent Trustees recognized that the fee arrangements for the Portfolios are the result of review and discussion in the prior years between the Independent Trustees and the Investment Manager, that certain aspects of such arrangements may receive greater scrutiny in some years than in others, and that the Independent Trustees’ conclusions may be based, in part, on their consideration of these same arrangements during the course of the year and in prior years. The Independent Trustees evaluated information available to them on a Portfolio-by-Portfolio basis, and their determinations were made separately in respect of each Portfolio.
Performance Information
With respect to investment performance, the Independent Trustees considered information regarding each Portfolio’s short-, intermediate- and long-term performance, as applicable, net of the Portfolio’s fees and expenses, both on an absolute basis and relative to an appropriate benchmark index that does not deduct the fees or expenses of investing. The Independent Trustees also considered information provided by Broadridge for each Portfolio relative to the investment performance of a group of funds with investment classifications and/or objectives comparable to the Portfolio as identified by Broadridge (the “Broadridge Performance Universe”). The Independent Trustees recognized that the performance information, including the Broadridge performance information, was as of March 31, 2020, and, as such, included the period of extreme market volatility resulting from COVID-19. The Independent Trustees also reviewed performance in relation to certain measures of the degree of investment risk undertaken by the portfolio managers.
For Portfolios that underperformed, the Board considered the magnitude and duration of that underperformance relative to the Broadridge Performance Universe and/or the benchmark (e.g., the amount by which a Portfolio underperformed, including, for example, whether the Portfolio slightly underperformed or significantly underperformed). To the extent that the Independent Trustees identified a Portfolio as having underperformed its benchmark indices and/or Broadridge Performance Universes to an extent, or over a period of time, that the Independent Trustees felt warranted additional inquiry, the Independent Trustees discussed with the Investment Manager the Portfolio’s performance, potential reasons for the underperformance, and, if necessary, steps that the Investment Manager had taken, or intended to take, to improve performance. The Independent Trustees also met with the portfolio managers of certain Portfolios during the 12 months prior to voting on the contract renewal and had the opportunity to discuss the Portfolios’ performance with the portfolio managers. The Independent Trustees considered the Investment Manager’s responsiveness with respect to the Portfolios that experienced lagging performance. The Independent Trustees noted that performance is only one of the factors that they deem relevant to their consideration of the Agreement and that, after considering all relevant factors, it may be appropriate to approve the continuation of the Agreement notwithstanding a Portfolio’s relative performance.
Nature, Extent, and Quality of Services
As part of their review, the Trustees received and considered descriptions of various functions performed by the Investment Manager for the Portfolios, such as portfolio management, compliance monitoring, portfolio trading practices and oversight of third party service providers. They also considered information regarding the overall organization and business functions of the Investment Manager, including, without limitation, information regarding senior management, portfolio managers and other personnel providing or proposed to provide investment management, administrative and other services, and corporate ownership and business operations unrelated to the Portfolios. They considered certain changes to the executive leadership and the organization of the governance structure, as well as the availability of research and other capabilities within the global organization. The Trustees examined the ability of the Investment Manager to provide high-quality investment management and other services to the Portfolios. Among other information, the Trustees considered the investment philosophy and research and decision-making processes of the Investment Manager, as well as the Investment Manager’s broker selection process and trading operations; the experience of key advisory personnel of the Investment Manager and its affiliates, as applicable, responsible for portfolio management of the Portfolios; the ability of the Investment Manager to attract and retain capable personnel; the philosophy of employee compensation; and the operational infrastructure, including technology and systems, of the Investment Manager. The Independent Trustees also considered actions taken by the Investment Manager to manage the impact on the Portfolios and their portfolio holdings of the market volatility resulting from COVID-19.
In addition, the Independent Trustees noted the extensive range of services that the Investment Manager provides to the Portfolios beyond the investment management services. In this regard, the Independent Trustees reviewed the extent and quality of the Investment Manager’s services with respect to regulatory compliance and ability to comply with the investment
| 51 | Annual Report September 30, 2020 |
Table of Contents
AllianzGI Institutional Multi-Series Trust
Matters Relating to the Trustees’ Consideration of the Investment Management
Agreements (unaudited) (continued)
policies of the Portfolios; the compliance programs and risk controls of the Investment Manager; the specific contractual obligations of the Investment Manager pursuant to the Agreements; the nature, extent and quality of certain administrative services the Investment Manager is responsible for providing to the Portfolios; the Investment Manager’s risk management function; and conditions that might affect the ability of the Investment Manager to provide high quality services to the Portfolios in the future under the Agreements, including, but not limited to, the organization’s financial condition and operational stability. The Independent Trustees also considered that the Investment Manager assumes significant ongoing risks with respect to all Portfolios, including entrepreneurial and business risks the Investment Manager has undertaken in serving as Investment Manager and sponsor of the Portfolios, for which it is entitled to reasonable compensation. Specifically, its responsibilities include continual management of investment, operational, enterprise, legal, regulatory and compliance risks as they relate to the Portfolios. The Independent Trustees also noted the Investment Manager’s activities under its contractual obligation to oversee the Portfolios’ various outside service providers, including its ongoing evaluation of the quality of the services provided, negotiation of certain service providers’ fees and its evaluation of service providers’ infrastructure, cybersecurity programs, compliance programs, and business continuity programs, among other matters. It also considered the Investment Manager’s ongoing development of its own infrastructure and information technology to support the Portfolios through, among other things, cybersecurity, business continuity planning, and risk management. The Independent Trustees also noted the Investment Manager’s effective operation and implementation of its business continuity plan in response to COVID-19 and its oversight of the service providers’ business continuity plans during this period.
The Independent Trustees considered that the Investment Manager provides the Portfolios with office space, administrative services and personnel to serve as Portfolio officers, and that the Investment Manager and its affiliates pay all of the compensation of the Portfolios’ interested Trustees and officers (in their capacities as employees of the Investment Manager or such affiliates). Based on the foregoing, the Trustees concluded that the Investment Manager’s investment processes, research capabilities and philosophy were well-suited to each Portfolio given its investment objective and policies, that the Investment Manager would be able to continue to meet any reasonably foreseeable obligations under the Agreement, and that the Investment Manager would otherwise be able to provide services to the Portfolios of sufficient extent and quality.
Fee and Expense Information and Comparisons
In assessing the reasonableness of the Portfolios’ fees and expenses under the Agreement, the Independent Trustees considered, among other information, each Portfolio’s management fee, each Portfolio’s total expense ratio and information regarding the management fees and other expenses of comparable funds identified by Broadridge (the “Broadridge Expense Group”). Where a Portfolio’s management fee or total expense ratio was higher than the Broadridge Expense Group median, the Independent Trustees considered whether specific portfolio management, administration, or oversight needs contributed to the Portfolio’s contractual management fees or total expense ratio. The Independent Trustees also noted any expense limitations and/or waivers applicable to the Portfolios. The Independent Trustees also considered, among other items: (i) current asset levels of each Portfolio as compared to prior years, and (ii) certain of the Portfolios’ “active share,” i.e., the percentage of stock holdings in a Portfolio that differ from its benchmark index and discussed with the Investment Manager the reasons some Portfolios may have lower active share than others.
To the extent applicable, the Independent Trustees considered information regarding the investment performance and fees for other funds and/or separately managed accounts, including institutional accounts, managed by the Investment Manager or its affiliates with similar investment objective(s) and policies to those of the Portfolios, if any (“similar accounts”). Specifically, the Independent Trustees reviewed information showing the contractual advisory fees charged by the Investment Manager to the similar accounts. In comparing these fees, the Independent Trustees considered information provided by the Investment Manager as to the generally broader and more extensive services provided or to be provided to the Portfolios in comparison to institutional or separate accounts; the higher demands placed on the Investment Manager’s investment personnel and trading infrastructure as a result of the daily cash in-flows and out-flows of the Portfolios; the greater entrepreneurial, enterprise and reputational risk in managing mutual funds; and the impact on the Investment Manager and expenses associated with the more extensive regulatory and compliance requirements to which the Portfolios are subject in comparison to institutional or separate accounts.
| 52 | Annual Report September 30, 2020 |
Table of Contents
AllianzGI Institutional Multi-Series Trust
Matters Relating to the Trustees’ Consideration of the Investment Management
Agreements (unaudited) (continued)
Economies of Scale and “Fall-Out” Benefits
The Independent Trustees considered the extent to which the Investment Manager may realize economies of scale or other efficiencies in managing and supporting the Portfolios. The Independent Trustees took into account that, as open-end investment companies, the Portfolios intend to raise additional assets, so as the assets of the Portfolios grow over time, certain economies of scale and other efficiencies may be realized through spreading certain fixed costs across a larger asset base or across a variety of products and services, while also taking into account the fee waiver and expense limitation arrangements observed by the Investment Manager for applicable Portfolios. Additionally, the Independent Trustees considered so-called “fall-out benefits” to the Investment Manager, as a result of its advisory arrangements with the Portfolios, including research, statistical and quotation services from broker-dealers executing the Portfolios’ portfolio transactions on an agency basis, and enhanced visibility for marketing and distribution of other products managed by the Investment Manager. The Independent Trustees also took into account the entrepreneurial, legal, regulatory and business risks the Investment Manager has undertaken and will undertake as investment manager and sponsor of the Portfolios as well as the reputational value derived from serving as investment manager to the Portfolios.
Profitability
The Independent Trustees considered the overall estimated profitability to the Investment Manager on a Portfolio-by-Portfolio basis for the twelve months ended December 31, 2019. They also reviewed the Investment Manager’s aggregate profitability with respect to the fund complex and the Investment Manager’s overall profitability with respect to all products globally. As part of its considerations, the Board considered the cost allocation methodology that the Investment Manager used in developing its estimated profitability figures. In this connection, the Independent Trustees considered that for certain Portfolios profitability had increased as a result of expense reduction efforts, although the Portfolios’ assets had declined over the last year. The Independent Trustees recognized that it is difficult to make comparisons of profitability from mutual Portfolios’ advisory and administration contracts because comparative information is not generally available and is affected by numerous factors, including the structure of the particular adviser, the types of funds it manages, its business mix, numerous assumptions about allocations and the adviser’s capital structure and cost of capital. The Independent Trustees concluded that the Investment Manager’s estimated pre-tax profitability for advisory services was not excessive or unreasonable, although it was sizeable for certain of the Portfolios, and that estimated pre-tax profitability for advisory and administrative services combined, including when calculated on a net revenue basis regarding the administrative fee, was sizeable for certain of the Portfolios, but generally not unreasonable under the circumstances. The Independent Trustees recognized that the Investment Manager and its affiliates should be entitled to earn a reasonable level of profits for services they provide to the Portfolios and, based on their review, determined that the estimated profitability to the Investment Manager with respect to its relationship with each of the Portfolios did not, in any case, appear to be excessive.
Portfolio-by-Portfolio Analysis
With regard to the investment performance of each Portfolio and the fees charged to each Portfolio, the Independent Trustees considered the following information. The comparative performance, fee, and expense information was prepared and provided by Broadridge and was not independently verified by the Independent Trustees.
With respect to all Portfolios, the Independent Trustees reviewed, among other information, comparative information showing performance for each Portfolio against its respective Broadridge Performance Universe for the one-year and three-year periods (to the extent each such Portfolio had been in existence), each ended March 31, 2020. The inception dates for AllianzGI Global Small-Cap Opportunities Portfolio, AllianzGI Best Styles Global Managed Volatility Portfolio and AllianzGI International Growth Portfolio were July 23, 2014, April 11, 2016 and May 15, 2019, respectively, so performance data for longer time periods was not available. The Portfolio’s performance relative to the median for each Portfolio’s Broadridge Performance Universe is described below, and for those Portfolios with performance that ranked below median for their respective Broadridge Performance Universes, the specific quintile rankings are also noted below with respect to the relevant periods of underperformance. With respect to performance quintile rankings for a Portfolio compared to its Broadridge Performance Universe, the first quintile represents the highest (best) performance and the fifth quintile represents the lowest performance.
The Independent Trustees reviewed, among other information, information provided by Broadridge comparing each Portfolio’s net advisory fee and ratio of total expenses to net assets (“Total Expense Ratio”) to each Portfolio’s respective Broadridge
| 53 | Annual Report September 30, 2020 |
Table of Contents
AllianzGI Institutional Multi-Series Trust
Matters Relating to the Trustees’ Consideration of the Investment Management
Agreements (unaudited) (continued)
Expense Group for the most recently reported fiscal year. The Independent Trustees noted that the Broadridge data takes into account any fee reductions or expense limitations that were in effect during a Portfolio’s last fiscal year.
Best Styles Global Managed Volatility Portfolio: As compared to its Broadridge Performance Universe, the Portfolio’s performance was above median for the one- and three-year periods. The Portfolio’s inception date was April 11, 2016, and accordingly does not have all performance periods reflected. As compared to its Broadridge Expense Group, both the Portfolio’s advisory fees and total expense ratios were each below the median (on a net basis).
Global Small-Cap Opportunities Portfolio: As compared to its Broadridge Performance Universe, the Portfolio’s performance was below median for the one-, three- and five-year periods (in the fifth quintile for the one-year period and in the fourth quintile for the three- and five-year periods). The Portfolio’s inception date was July 23, 2014, and accordingly does not have all performance periods reflected. As compared to its Broadridge Expense Group, both the Portfolio’s advisory fees and total expense ratios were each below the median (on a net basis).
International Growth Portfolio: As compared to its Broadridge Performance Universe, the Portfolio’s performance was above median since inception. The Portfolio’s inception date was May 15, 2019, and accordingly does not have all performance periods reflected. As compared to its Broadridge Expense Group, both the Portfolio’s advisory fees and total expense ratios were each below the median (on a net basis).
The Independent Trustees also considered, with respect to each Portfolio, the management fees charged by the Investment Manager to other funds and accounts, if any, with similar investment strategies to each Portfolio.
Conclusion
After reviewing these and other factors described herein, the Independent Trustees concluded, with respect to each Portfolio, within the context of their overall conclusions regarding the Agreement and in their business judgement, that they were satisfied with the Investment Manager’s responses and on-going efforts relating to the investment performance of the Portfolios. The Independent Trustees also concluded that the fees payable under each Agreement represent reasonable compensation in light of the nature, extent and quality of services provided by the Investment Manager and should be continued. Based on their evaluation of factors that they deemed to be material, including, but not limited to, those factors described above, the Independent Trustees unanimously concluded that the continuation of the Agreements with respect to the Portfolios were in the interests of the applicable Portfolios and their shareholders, and determined to recommend that the continuance of the Agreements be approved by the full Board.
| 54 | Annual Report September 30, 2020 |
Table of Contents
AllianzGI Institutional Multi-Series Trust
Changes to the Board of Trustees/Liquidity Risk Management Program (unaudited)
Changes to the Board of Trustees:
Effective December 31, 2019, Bradford K. Gallagher retired as an Independent Trustee of the Trust.
Liquidity Risk Management Program:
Consistent with Rule 22e-4 under the 1940 Act (the “Liquidity Rule”), the Portfolios have adopted a liquidity risk management program (the “Program”) on April 23, 2019. The Board appointed the Investment Manager, acting principally through its US Risk Committee, to administer the Program (the “Program Administrator”). The Program governs the Portfolios’ approach to managing liquidity risk, and its principal objectives include assessing, managing and periodically reviewing each Portfolio’s liquidity risk, based on factors specific to the circumstances of the Portfolio. Liquidity risk is defined as the risk that a Portfolio could not meet redemption requests without significant dilution of remaining investors’ interests in the Portfolio.
During the period, the Board reviewed a report prepared by the Program Administrator regarding the operation and effectiveness of the Program for the period from June 1, 2019 through April 30, 2020 (the “Program Period”), the key conclusions of which are summarize as follows. During the Program Period, there were no liquidity events that materially affected the performance of any Portfolio or its ability to timely meet redemptions without dilution to remaining investors. The Portfolios maintained a high level of liquidity during the Program Period and primarily held assets that are defined under the Liquidity Rule as “Highly Liquid Investments,” which are defined to include securities a Portfolio expects to be convertible into cash in current market conditions in three business days without significantly changing their market value. The Portfolios that had previously established “Highly Liquid Investment Minimum” (HLIM) thresholds, as defined under the Liquidity Rule, operated significantly above their respective HLIM thresholds during the reporting period. The Program Administrator determined that, during the Program reporting period, the Program operated adequately and effectively to manage each Portfolio’s liquidity risk.
There can be no assurance that the Program will achieve its objectives under all circumstances in the future. Please refer to your Portfolio’s prospectus for more information regarding exposure to liquidity and other risks.
| 55 | Annual Report September 30, 2020 |
Table of Contents
AllianzGI Institutional Multi-Series Trust
Please read this Policy carefully. It gives you important information about how Allianz Global Investors U.S. and its U.S. affiliates (“AllianzGI US,” “we” or “us”) handle non-public personal information (“Personal Information”) that we may receive about you. It applies to all of the past, present and future clients and shareholders of AllianzGI US and the funds and accounts it manages, advises, administers or distributes, and will continue to apply when you are no longer a client or shareholder. As used throughout this Policy, “AllianzGI US” means Allianz Global Investors U.S. LLC, Allianz Global Investors Distributors LLC, and the family of registered and unregistered funds managed by one or more of these firms. AllianzGI US is part of a global investment management group, and the privacy policies of other Allianz Global Investors entities outside of the United States may have provisions in their policies that differ from this Privacy Policy. Please refer to the website of the specific non-US Allianz Global Investors entity for its policy on privacy.
We Care about Your Privacy
We consider your privacy to be a fundamental aspect of our relationship with you, and we strive to maintain the confidentiality, integrity and security of your Personal Information. To ensure your privacy, we have developed policies that are designed to protect your Personal Information while allowing your needs to be served.
Information We May Collect
In the course of providing you with products and services, we may obtain Personal Information about you, which may come from sources such as account application and other forms, from other written, electronic, or verbal communications, from account transactions, from a brokerage or financial advisory firm, financial advisor or consultant, and/or from information you provide on our website.
You are not required to supply any of the Personal Information that we may request. However, failure to do so may result in us being unable to open and maintain your account, or to provide services to you.
How Your Information Is Shared
We do not disclose your Personal Information to anyone for marketing purposes. We disclose your Personal Information only to those service providers, affiliated and non-affiliated, who need the information for everyday business purposes, such as to respond to your inquiries, to perform services, and/or to service and maintain your account. This applies to all of the categories of Personal Information we collect about you. The affiliated and non-affiliated service providers who receive your Personal Information also may use it to process your transactions, provide you with materials (including preparing and mailing prospectuses and shareholder reports and gathering shareholder proxies), and provide you with account statements and other materials relating to your account. These service providers provide services at our direction, and under their agreements with us, are required to keep your Personal Information confidential and to use it only for providing the contractually required services. Our service providers may not use your Personal Information to market products and services to you except in conformance with applicable laws and regulations. We also may provide your Personal Information to your respective brokerage or financial advisory firm, custodian, and/or to your financial advisor or consultant.
In addition, we reserve the right to disclose or report Personal Information to non-affiliated third parties, in limited circumstances, where we believe in good faith that disclosure is required under law, to cooperate with regulators or law enforcement authorities or pursuant to other legal process, or to protect our rights or property, including to enforce our Privacy Policy or other agreements with you. Personal Information collected by us may also be transferred as part of a corporate sale, restructuring, bankruptcy, or other transfer of assets.
Security of Your Information
We maintain your Personal Information for as long as necessary for legitimate business purposes or otherwise as required by law. In maintaining this information, we have implemented appropriate procedures that are designed to restrict access to your Personal Information only to those who need to know that information in order to provide products and/or services to you. In addition, we have implemented physical, electronic and procedural safeguards to help protect your Personal Information.
| 56 | Annual Report September 30, 2020 |
Table of Contents
AllianzGI Institutional Multi-Series Trust
Privacy Policy (unaudited) (continued)
Privacy and the Internet
The Personal Information that you provide through our website, as applicable, is handled in the same way as the Personal Information that you provide by any other means, as described above. This section of the Policy gives you additional information about the way in which Personal Information that is obtained online is handled.
• Online Enrollment, Account Access and Transactions: When you visit our website, you can visit pages that are open to the general public, or, where available, log into protected pages to enroll online, access information about your account, or conduct certain transactions. Access to these secure pages is permitted only after you have created a User ID and Password. The User ID and Password must be supplied each time you want to access your account information online. This information serves to verify your identity. When you enter Personal Information into our website to enroll or access your account online, you will log into secure pages. By using our website, you consent to this Privacy Policy and to the use of your Personal Information in accordance with the practices described in this Policy. If you provide Personal Information to effect transactions, a record of the transactions you have performed while on the site is retained by us. For additional terms and conditions governing your use of our website, please refer to the Investor Mutual Fund Access – Disclaimer which is incorporated herein by reference and is available on our website.
• Cookies and Similar Technologies: Cookies are small text files stored in your computer’s hard drive when you visit certain web pages. Clear GIFs (also known as Web Beacons) are typically transparent very small graphic images (usually 1 pixel x 1 pixel) that are placed on a website that may be included on our services provided via our website and typically work in conjunction with cookies to identify our users and user behavior. We may use cookies and automatically collected information to: (i) personalize our website and the services provided via our website, such as remembering your information so that you will not have to re-enter it during your use of, or the next time you use, our website and the services provided via our website; (ii) provide customized advertisements, content, and information; (iii) monitor and analyze the effectiveness of our website and the services provided via our website and third-party marketing activities; (iv) monitor aggregate site usage metrics such as total number of visitors and pages viewed; and (v) track your entries, submissions, and status in any promotions or other activities offered through our website and the services provided via our website. Tracking technology also helps us manage and improve the usability of our website, (i) detecting whether there has been any contact between your computer and us in the past and (ii) to identify the most popular sections of our website. Because an industry-standard Do-Not-Track protocol is not yet established, our website will continue to operate as described in this Privacy Policy and will not be affected by any Do-Not-Track signals from any browser.
• Use of Social Media Plugins Our website uses the following Social Media Plugins (“Plugins”):
• Facebook Share Button operated by Facebook Inc., 1601 S. California Ave, Palo Alto, CA 94304, USA
• Tweet Button operated by Twitter Inc., 795 Folsom St., Suite 600, San Francisco, CA 94107, USA
• LinkedIn Share Button operated by LinkedIn Corporation, 2029 Stierlin Court, Mountain View, CA 94043, USA
All Plugins are marked with the brand of the respective operators Facebook, Twitter and LinkedIn (“Operators”). When you visit our website that contains a social plugin, your browser establishes a direct connection to the servers of the Operator. The Operator directly transfers the plugin content to your browser which embeds the latter into our website, enabling the Operator to receive information about you having accessed the respective page of our website. Thus, AllianzGI US has no influence on the data gathered by the plugin and we inform you according to our state of knowledge: The embedded plugins provide the Operator with the information that you have accessed the corresponding page of our website. If you do not wish to have such data transferred to the Operators, you need to log out of your respective account before visiting our website. Please see the Operators’ data privacy statements in order to get further information about purpose and scope of the data collection and the processing and use:
• Facebook: https://de-de.facebook.com/about/privacy
• Twitter: https://twitter.com/privacy
• LinkedIn: https://www.linkedin.com/legal/privacy-policy
| 57 | Annual Report September 30, 2020 |
Table of Contents
AllianzGI Institutional Multi-Series Trust
Privacy Policy (unaudited) (continued)
Changes to Our Privacy Policy
We may modify this Privacy Policy from time-to-time to reflect changes in related practices and procedures, or applicable laws and regulations. If we make changes, we will notify you on our website and the revised Policy will become effective immediately upon posting to our website. We also will provide account owners with a copy of our Privacy Policy, annually if required. We encourage you to visit our website periodically to remain up to date on our Privacy Policy. You acknowledge that by using our website after we have posted changes to this Privacy Policy, you are agreeing to the terms of the Privacy Policy as modified.
Obtaining Additional Information
If you have any questions about this Privacy Policy or our privacy related practices in the United States, you may contact us via our dedicated email at PrivacyUS@allianzgi.com.
| 58 | Annual Report September 30, 2020 |
Table of Contents
AllianzGI Institutional Multi-Series Trust – Board of Trustees (unaudited)
Name, Year of Birth, Position(s) Held with Trust, Length of
| Principal Occupation(s) During Past 5 Years:
| |
The address of each trustee is 1633 Broadway, New York, NY 10019
| ||
Alan Rappaport Year of Birth: 1953 Trustee since: 2014 Trustee/Director of 72* funds in Fund Complex Trustee/Director of no funds outside of Fund Complex
| Adjunct Professor, New York University Stern School of Business (since 2011); Lecturer, Stanford University Graduate School of Business (since 2013); and Director, Victory Capital Holdings, Inc., an asset management firm (since 2013). Formerly, Trustee, American Museum of Natural History (2005-2015); Trustee and Member of Board of Overseers, NYU Langone Medical Center (2007-2015); and Advisory Director (formerly, Vice Chairman), Roundtable Investment Partners (2009-2018).
| |
Sarah E. Cogan Year of Birth: 1956 Trustee since: 2019 Trustee/Director of 72* funds in Fund Complex Trustee/Director of no funds outside of Fund Complex
| Retired partner of Simpson Thacher & Bartlett LLP (law firm) (“STB”); Formerly, Partner, STB (1989-2018); Director, Girl Scouts of Greater New York (since 2016); and Trustee, Natural Resources Defense Council, Inc. (since 2013).
| |
Deborah A. DeCotis Year of Birth: 1952 Trustee since: 2014 Trustee/Director of 72* funds in Fund Complex Trustee/Director of no funds outside of Fund Complex
| Advisory Director, Morgan Stanley & Co., Inc. (since 1996); Co-Chair Special Projects Committee, Memorial Sloan Kettering (since 2005); Member, Circle Financial Group (since 2009); Trustee, Stanford University (since 2010); and Member, Council on Foreign Relations (since 2013). Formerly, Director, Helena Rubenstein Foundation (1997-2010); Principal, LaLoop LLC, a retail accessories company (1999-2014).
| |
Thomas J. Fuccillo † Year of Birth: 1968 Trustee since: 2019 Trustee/Director of 43* funds in Fund Complex Trustee/Director of no funds outside of Fund Complex
| Managing Director and Head of US Funds of Allianz Global Investors U.S. Holdings LLC; Managing Director of Allianz Global Investors Distributors LLC; Trustee, President and Chief Executive Officer of 43 funds in the Fund Complex; and President and Chief Executive Officer of The Korea Fund, Inc. and The Taiwan Fund, Inc. Formerly, Associate General Counsel, Head of US Funds and Retail Legal; Chief Legal Officer and Secretary of Allianz Global Investors Distributors LLC; Vice President, Secretary and Chief Legal Officer of numerous funds in the Fund Complex; and Secretary and Chief Legal Officer of The Korea Fund, Inc.
| |
F. Ford Drummond Year of Birth: 1962 Trustee since: 2014 Trustee/Director of 43 funds in Fund Complex Trustee/Director of no funds outside of Fund Complex Director, BancFirst Corporation. | Owner/Operator, Drummond Ranch; and Director, Oklahoma Water Resources Board. Formerly, Director, The Cleveland Bank; and General Counsel, BMI-Health Plans (benefits administration). and Chairman, Oklahoma Water Resources Board. | |
James A. Jacobson Year of Birth: 1945 Trustee since: 2014 Trustee/Director of 72* funds in Fund Complex Formerly, Trustee, Alpine Mutual Funds Complex (consisting of 18 funds) (2009-2016)
| Retired. Trustee (since 2002) and Chairman of Investment Committee (since 2007), Ronald McDonald House of New York; and Trustee, New Jersey City University (since 2014). | |
Hans W. Kertess Year of Birth: 1939 Trustee since: 2014 Trustee/Director of 72* funds in Fund Complex Trustee/Director of no funds outside the Fund Complex
| President, H. Kertess & Co., a financial advisory company; and Senior Adviser (formerly Managing Director), Royal Bank of Canada Capital Markets (since 2004). | |
James S. MacLeod Year of Birth: 1947 Trustee since: 2014 Trustee/Director of 43 funds in Fund Complex Non-Executive Chairman & Director, Sykes Enterprises, Inc. | Non-Executive Chairman, CoastalSouth Bancshares, Inc. (since 2018); Director, Coastal States Bank; Director, Coastal States Mortgage, Inc.; Vice Chairman, MUSC Foundation; Chairman of the Board of Trustees, University of Tampa. Formerly, Chief Executive Officer of CoastalSouth Bancshares (2010-2018); President and Chief Operating Officer, Coastal States Bank (2007-2018); Managing Director and President, Homeowners Mortgage, a subsidiary of Coastal States Bank (2007-2018), Executive Vice President, Mortgage Guaranty Insurance Corporation (1984-2004). | |
William B. Ogden, IV Year of Birth: 1945 Trustee since: 2014 Trustee/Director of 72* funds in Fund Complex Trustee/Director of no funds outside of Fund Complex
| Retired. Formerly, Asset Management Industry Consultant; and Managing Director, Investment Banking Division of Citigroup Global Markets Inc. | |
| 59 | Annual Report September 30, 2020 |
Table of Contents
AllianzGI Institutional Multi-Series Trust – Board of Trustees (unaudited) (continued)
| Davey S. Scoon | Formerly Adjunct Professor, University of Wisconsin-Madison (2011-2019). | |
| Year of Birth: 1946 | ||
| Trustee since: 2014 | ||
| Trustee/Director of 43 funds in Fund Complex | ||
| Trustee/Director of no funds outside the Fund Complex | ||
| Director, Albireo Pharma, Inc. (since 2016); and Director, | ||
| AMG Pharmaceuticals, Inc. (since 2006). Formerly, | ||
| Director, Biodel Inc. (2013-2016); Director, Orthofix | ||
International N.V. (2011-2015).
| ||
| Erick R. Holt† | Board Member, Global Chief Risk Officer, General Counsel and Chief Compliance Officer of Allianz Asset Management GmbH (2006-2018). | |
| Year of Birth: 1952 | ||
| Trustee since: 2017 | ||
| Trustee/Director of 43 funds in Fund Complex | ||
| Trustee/Director of no funds outside the Fund | ||
| Complex |
The Portfolios’ Statement of Additional Information contains additional information about the Trustees. The Statement of Additional Information is available without charge, upon request, by calling 1-800-498-5413.
* Inclusive of 29 funds managed by Pacific Investment Management Company, LLC (“PIMCO”).
† Each of Mr. Holt and Mr. Fuccillo is an “Interested Person” of the Trust, as defined in Section 2(a)(19) of the 1940 Act, due to her or his affiliation with the Investment Manager and its affiliates.
| 60 | Annual Report September 30, 2020 |
Table of Contents
AllianzGI Institutional Multi-Series Trust - Officers (unaudited)
Name, Year of Birth, Position(s) Held with Trust
| Principal Occupation(s) During Past 5 Years
| |
Thomas J. Fuccillo 1968 President and Chief Executive Officer | Managing Director, and Head of US Funds of Allianz Global Investors U.S. Holdings LLC; Managing Director of Allianz Global Investors Distributors LLC; Trustee, President and Chief Executive Officer of 43 funds in the Fund Complex and President and Chief Executive Officer of The Korea Fund, Inc. and The Taiwan Fund, Inc. Formerly, Associate General Counsel, Head of US Funds and Retail Legal; Chief Legal Officer and Secretary of Allianz Global Investors Distributors LLC; Vice President, Secretary and Chief Legal Officer of numerous funds in the Fund Complex (2004-2016); and Secretary and Chief Legal Officer of The Korea Fund, Inc. | |
Scott Whisten 1971 Treasurer, Principal Financial | Director of Allianz Global Investors U.S. LLC; and Treasurer, Principal Financial and Accounting Officer of 43 funds in the Fund Complex. Formerly, Assistant Treasurer of numerous funds in the Fund Complex (2007-2018). | |
Angela Borreggine 1964 Chief Legal Officer and | Director and Senior Counsel of Allianz Global Investors U.S. Holdings LLC; Chief Legal Officer and Secretary of 43 funds in the Fund Complex and Secretary and Chief Legal Officer of The Korea Fund, Inc. Formerly, Assistant Secretary of numerous funds in the Fund Complex (2007-2018). | |
Thomas L. Harter, CFA 1975 Chief Compliance Officer | Director of Allianz Global Investors U.S. Holdings LLC; Director, Deputy Chief Compliance Officer of Allianz Global Investors U.S. LLC and Chief Compliance Officer of 43 funds in the Fund Complex and of the Korea Fund, Inc. | |
Richard J. Cochran 1961 Assistant Treasurer | Vice President of Allianz Global Investors U.S. LLC; Assistant Treasurer of 43 funds in the Fund Complex and of The Korea Fund, Inc. | |
Orhan Dzemaili 1974 Assistant Treasurer | Director of Allianz Global Investors U.S. LLC; Treasurer, Principal Financial and Accounting Officer of The Korea Fund, Inc. and Assistant Treasurer of 43 Funds in the Fund Complex. Formerly, Assistant Treasurer of The Korea Fund. Inc (2016- 2018). | |
Craig A. Ruckman 1977 Assistant Secretary | Director and Senior Counsel of Allianz Global Investors U.S. Holdings LLC; Chief Legal Officer of Allianz Global Investors Distributors LLC; and Assistant Secretary of 43 funds in the Fund Complex. Formerly, Associate of K& L Gates LLP (2012-2016). | |
| * | The officers of the Trust are elected annually by the Board of Trustees. |
| 61 | Annual Report September 30, 2020 |
Table of Contents
| Trustees | Investment Manager | |
| Alan Rappaport | Allianz Global Investors U.S. LLC | |
| Chairman of the Board of Trustees | 1633 Broadway | |
| Sarah E. Cogan | New York, NY 10019 | |
| Deborah A. Decotis | ||
| F. Ford Drummond | Distributor | |
| Thomas J. Fuccillo | Allianz Global Investors Distributors LLC | |
| Erick R. Holt | 1633 Broadway | |
| James A. Jacobson | New York, NY 10019 | |
| Hans W. Kertess | ||
| James S. MacLeod | Custodian & Accounting Agent | |
| William B. Ogden, IV | State Street Bank and Trust Co. | |
| Davey S. Scoon | 801 Pennsylvania Avenue | |
Kansas City, MO 64105 | ||
| Officers | ||
| Thomas J. Fuccillo | ||
President and Chief Executive Officer | Transfer Agent | |
| Scott Whisten | State Street Bank and Trust Company, which has delegated its | |
Treasurer, Principal Financial and Accounting Officer | obligations as transfer agent to: | |
| Angela Borreggine | DST Asset Management Solutions, Inc. | |
Chief Legal Officer and Secretary | P.O. Box 219723 | |
| Thomas L. Harter | Kansas City, MO 64121-9723 | |
Chief Compliance Officer, CFA | ||
| Richard J. Cochran | Independent Registered Public Accounting Firm | |
Assistant Treasurer | PricewaterhouseCoopers LLP | |
| Orhan Dzemaili | 300 Madison Avenue | |
Assistant Treasurer | New York, NY 10017 | |
| Craig A. Ruckman | ||
Assistant Secretary | Legal Counsel | |
Ropes & Gray LLC | ||
Prudential Tower | ||
800 Boylston Street | ||
Boston, MA 02199 |
This report, including the financial information herein, is transmitted to the shareholders of the Trust for their information. It is not a prospectus, circular or representation intended for use in the purchase of shares of each Portfolio or any securities mentioned in this report.
Table of Contents
| ITEM 2. | CODE OF ETHICS |
| (a) | As of the end of the period covered by this report, the registrant has adopted a code of ethics (the “Section 406 Standards for Investment Companies – Ethical Standards for Principal Executive and Financial Officers”) that applies to the registrant’s President and Chief Executive Officer and Principal Financial Officer; the registrant’s Principal Financial Officer also serves as the Principal Accounting Officer. The registrant undertakes to provide a copy of such code of ethics to any person upon request, without charge, by calling 1-800-926-4456. The code of ethics are included as an Exhibit 99.CODE ETH hereto. |
| (b) | During the period covered by this report, there were not any amendments to a provision of the code of ethics adopted in 2(a) above. |
| (c) | During the period covered by this report, there were not any waivers or implicit waivers to a provision of the code of ethics adopted in 2(a) above. |
| ITEM 3. | AUDIT COMMITTEE FINANCIAL EXPERT |
The registrant’s Board has determined that Messrs. James A. Jacobson and Davey S. Scoon, both of whom serve on the Trust’s Audit Oversight Committee, qualify as “audit committee financial experts,” and that they are “independent,” for purposes of this Item.
| ITEM 4. | PRINCIPAL ACCOUNTANT FEES AND SERVICES |
| a) | Audit fees. The aggregate fees billed for each of the last two fiscal years (the “Reporting Periods”) for professional services rendered by the Registrant’s principal accountant (the “Auditor”) for the audit of the Registrant’s annual financial statements, or services that are normally provided by the Auditor in connection with the statutory and regulatory filings or engagements for the Reporting Periods, were $100,441 in 2019 and $79,778 in 2020. |
| b) | Audit-Related Fees. The aggregate fees billed in the Reporting Periods for assurance and related services by the principal accountants that are reasonably related to the performance of the audit registrant’s financial statements and are not reported under paragraph (e) of this Item were $0 in 2019 and $0 in 2020. |
| c) | Tax Fees. The aggregate fees billed in the Reporting Periods for professional services rendered by the Auditor for tax compliance, tax service and tax planning (“Tax Services”) were $39,327 in 2019 and $43,000 in 2020. These services consisted of review or preparation of U.S. federal, state, local and excise tax returns and calculations of excise tax distributions. |
| d) | All Other Fees. There were no other Fees billed in the Reporting Periods for products and services provided by the Auditor to the Registrant. |
| e)1. | Audit Committee Pre-Approval Policies and Procedures. The Registrant’s Audit Oversight Committee has established policies and procedures for pre-approval of all audit and permissible non-audit services by the Auditor for the Registrant, as well as the Auditor’s engagements related directly to the operations and financial reporting of the Registrant. The Registrant’s policy is stated below. |
Page 1 of 1
AllianzGI Institutional Multi-Series Trust
AUDIT OVERSIGHT COMMITTEE POLICY
FOR
PRE-APPROVAL OF SERVICES PROVIDED BY THE INDEPENDENT ACCOUNTANTS
The Trust’s Audit Oversight Committee (“Committee”) is charged with the oversight of the Trust’s financial reporting policies and practices and their internal controls. As part of this responsibility, the Committee must pre-approve any independent accounting firm’s engagement to render audit and/or permissible non-audit services to the Trust as well as to the Trust’s investment adviser(1) or any entity controlling, controlled by or under common control with the investment adviser that provides ongoing services to the Trust (“Applicable Service Providers”), if the engagement relates directly to operations and financial reporting of the Trust. In evaluating a proposed engagement by the independent accountants, the Committee will assess the effect that the engagement might reasonably be expected to have on the accountant’s independence. The Committee’s evaluation will be based on:
a review of the nature of the professional services expected to be provided, the fees to be charged in connection with the services expected to be provided a review of the safeguards put into place by the accounting firm to safeguard independence, and periodic meetings with the accounting firm.
The Committee need not evaluate all four factors each time it pre-approves a service; it may rely on previous evaluations to the extent it considers appropriate.
POLICY FOR PRE-APPROVAL OF AUDIT AND NON-AUDIT SERVICES TO BE PROVIDED TO THE TRUST
On an annual basis, the Committee of the Trust will review and if the Committee so determines, pre-approve the scope of the audits of the Trust and proposed audit fees, and permitted non-audit (including audit-related) services that are proposed to be performed by the Trust’s independent accountants for the Trust and its Applicable Service Providers (to the extent the services to be provided to the Applicable Service Providers relate directly to the operations and financial reporting of the Trust). The Committee may also pre-approve services at any other in-person or telephonic Committee meeting. At least annually, the Committee will receive a report of all audit and non-audit services that were rendered in the previous calendar year by the independent accountants for the Trust and its Applicable Service Providers pursuant to this Policy.
Table of Contents
In addition to the Committee’s pre-approval of services pursuant to this Policy, the engagement of the independent accounting firm for any permitted non-audit service provided to the fund with also require the separate pre-approval of the President, Treasurer or Assistant Treasurer of the Trust, who may only grant such approval if he or she believes that the accounting firm’s engagement will not adversely affect the firm’s independence. All non-audit services performed by the independent accounting firm will be disclosed, as required, in filings with the Securities and Exchange Commission.
AUDIT SERVICES
The categories of audit services and related fees to be reviewed and pre-approved annually by the Committee are:
Annual Trust financial statement audits
Seed audits (related to new product filings, as required)
SEC and regulatory filings and consents
Semiannual financial statement reviews
Individual audit services that fall within one of these categories and are not presented to the Committee as part of the annual pre-approval process described above, may be pre-approved, if deemed consistent with the accounting firm’s independence, by the Committee Chair (or any other Committee member who is a disinterested trustee under the Investment Company to whom this responsibility has been delegated) so long as the estimated fee for those services does not exceed $500,000. Any pre-approval by a Committee member shall be reported to the full Committee at its next regularly scheduled meeting.
(1) For purposes of this requirement, the term “adviser” does not include sub-advisers that are not affiliated with a Trust’s investment adviser, are overseen by that investment adviser, and whose role is primarily portfolio management.
AUDIT-RELATED SERVICES
The following categories of audit-related services are considered to be consistent with the role of the Trust’s independent accountants and services falling under one of these categories will be pre-approved by the Committee on an annual basis if the Committee deems those services to be consistent with the accounting firm’s independence:
Accounting consultations Trust
merger support services
Agreed upon procedure reports
Other Attestation reports
Comfort letters
Other internal control reports
Individual audit-related services that fall within one of these categories and are not presented to the Committee as part of the annual pre-approval process described above, may be pre-approved, if deemed consistent with the accounting firm’s independence, by the Committee Chair (or any other Committee member who is a disinterested trustee under the Investment Company to whom this responsibility has been delegated) so long as the estimated fee for those services does not exceed $500,000. Any pre-approval by a Committee member shall be reported to the full Committee at its next regularly scheduled meeting.
TAX SERVICES
The following categories of tax services are considered to be consistent with the role of the Trust’s independent accountants and services falling under one of these categories will be pre-approved by the Committee on an annual basis if the Committee deems those services to be consistent with the accounting firm’s independence:
Federal, state and local income tax compliance; and, sales and use tax compliance, including required filings and amendments
Timely RIC qualification reviews
Tax distribution analysis and planning
Tax authority examination services
Tax appeals support services
Accounting methods studies
Trust merger support services
Other tax consulting services and related projects
Individual tax services that fall within one of these categories and are not presented to the Committee as part of the annual pre-approval process described above, may be pre-approved, if deemed consistent with the accounting firm’s independence, by the Committee at any regular or special meeting. Such services may also be pre-approved by the Committee Chair (or any other Committee member who is a disinterested trustee under the Investment Company Act to whom this responsibility has been delegated) so long as the estimated fee for the particular service for which pre-approval is sought does not exceed $500,000. Any pre-approval by a Committee Member shall be reported to the full Committee at its next regularly scheduled meeting.
OTHER SERVICES
Services that are proposed to be provided to the Trust which are not audit, audit-related or tax services may be pre-approved, if deemed consistent with the accounting firm’s independence, by the Committee at any regular or special meeting. Such services may also be pre-approved by the Committee Chair (or any other Committee member who is a disinterested trustee under the Investment Company Act to whom this responsibility has been delegated) so long as the estimated fee for the particular service for which pre-approval is sought does not exceed $500,000. Any pre-approval by a Committee member shall be reported to the full Committee at its next regularly scheduled meeting.
Table of Contents
PROHIBITED SERVICES
The Trust’s independent accountants will not render services in the following categories of non-audit services:
Bookkeeping or other services related to the accounting records or financial statements of the Trust
Financial information systems design and implementation
Appraisal or valuation services, fairness opinions, or contribution-in-kind reports
Actuarial services
Internal audit outsourcing services
Management functions or human resources
Broker or dealer, investment adviser or investment banking services
Legal services and expert services unrelated to the audit
Any other service that the Public Company Accounting Oversight Board determines, by regulation, is impermissible.
PRE-APPROVAL OF NON-AUDIT SERVICES PROVIDED TO OTHER ENTITIES WITHIN THE FUND COMPLEX
Rule 2-01(c)(7) of Regulation S-X provides that an accountant is not independent of the Trust unless the Trust’s Committee approves any permitted non-audit services to be provided to the Trust’s Applicable Service Providers, provided, in each case, that the engagement relates directly to the operations and financial reporting of the Trust.
Services to be provided to Applicable Service Providers that are required to be pre-approved, may be pre-approved, if deemed consistent with the accounting firm’s independence, by the Committee at a regular or special meeting or by the Committee Chair (or any other Committee member who is a disinterested trustee under the Investment Company Act to whom this responsibility has been delegated) so long as the estimated fee for those services does not exceed $500,000. If a service is approved by a Committee member, the full Committee is notified of such pre-approval at its next regularly scheduled meeting.
Although the Committee will not be required to pre-approve all services provided to Applicable Service Providers and their affiliates, the Committee will receive an annual report from the Trust’s independent accounting firm showing the aggregate fees for all services provided to Applicable Service Providers and their affiliates.
DE MINIMUS EXCEPTION TO REQUIREMENT OF PRE-APPROVAL OF NON-AUDIT SERVICES
With respect to the provision of permitted non-audit services to the Trust or Accounting Affiliates, the pre-approval requirement is waived if:
(1) The aggregate fees and costs of all non-audit services that, but for the limited exception provided by this section, would require pre-approval by the Committee constitutes no more than five percent of the total fees and costs paid by the Trust and Applicable Service Providers to the independent accountant during the fiscal year during which such non-audit services are provided;
(2) At the time of the engagement for such services, the Trust did not recognize that the services were “non-audit services” that required preapproval; and
(3) Each such service is brought promptly to the attention of the Committee and approved prior to the completion of the audit by the Committee, Committee Chair or any other Committee member who is a disinterested trustee under the Investment Company Act to whom this responsibility has been delegated.
e)2. No services were approved pursuant to the procedures contained in paragraph (C) (7) (i) (C) of Rule 2-01 of Registration S-X.
f) Not applicable.
g) Non-audit fees. The aggregate non-audit fees billed by the Auditor for services rendered to the Registrant, and rendered to the Adviser, for the 2019 Reporting Period was $1,119,039 and the 2020 Reporting Period was $1,261,815.
h) Auditor Independence. The Registrant’s Audit Oversight Committee has considered whether the provision of non-audit services that were rendered to the Adviser which were not pre-approved is compatible with maintaining the Auditor’s independence.
| ITEM 5. | AUDIT COMMITTEE OF LISTED REGISTRANT |
Disclosure not required for open-end management investment companies.
| ITEM 6. | INVESTMENTS |
| (a) | Schedule of Investments is included as part of the report to shareholders filed under Item 1 of this form. |
| (b) | Not applicable. |
| ITEM 7. | DISCLOSURE OF PROXY VOTING POLICIES AND PROCEDURES FOR CLOSED-END MANAGEMENT INVESTMENT COMPANIES |
Disclosure not required for open-end management investment companies.
| ITEM 8. | PORTFOLIO MANAGERS OF CLOSED-END MANAGEMENT INVESTMENT COMPANIES |
Disclosure not required for open-end management investment companies.
Table of Contents
| ITEM 9. | PURCHASES OF EQUITY SECURITIES BY CLOSED-END MANAGEMENT INVESTMENT COMPANY AND AFFILIATED PURCHASERS |
Disclosure not required for open-end management investment companies.
| ITEM 10. | SUBMISSION OF MATTERS TO A VOTE OF SECURITY HOLDERS |
There have been no material changes to the procedures by which shareholders may recommend nominees to the Trust’s Board of Trustees since the Trust last provided disclosure in response to this item.
| ITEM 11. | CONTROLS AND PROCEDURES |
| (a) | The registrant’s President & Chief Executive Officer and Treasurer, Principal Financial & Accounting Officer have concluded that the registrant’s disclosure controls and procedures (as defined in Rule 30a-3(c) under the Investment Company Act of 1940 (the “1940 Act”) (17 CFR 270.30a-3(c)), as amended) are effective based on their evaluation of these controls and procedures as of a date within 90 days of the filing date of this document. |
| (b) | There were no changes in the registrant’s internal control over financial reporting (as defined in Rule 30a-3(d) under the 1940 Act (17 CFR 270.30a-3(d))) that occurred during the most recent fiscal half-year covered by this report that has materially affected, or is reasonably likely to materially affect, the registrant’s internal control over financial reporting. |
| ITEM 12. | DISCLOSURE OF SECURITIES LENDING ACTIVITIES FOR CLOSED-END MANAGEMENT INVESTMENT COMPANIES. |
Disclosure not required for open-end management investment companies.
| ITEM 13. | EXHIBITS |
(a)(1) Exhibit 99.CODE ETH – Code of Ethics
(a)(4) Not applicable
(b) Exhibit 99.906 CERT. – Certification pursuant to Section 906 of the Sarbanes-Oxley Act of 2002
Table of Contents
Signatures
Pursuant to the requirements of the Securities Exchange Act of 1934 and the Investment Company Act of 1940, the registrant has duly caused this report to be signed on its behalf by the undersigned, thereunto duly authorized.
AllianzGI Institutional Multi-Series Trust
| By: | /s/ Thomas J. Fuccillo | |
| Thomas J. Fuccillo | ||
| President & Chief Executive Officer |
Date: December 7, 2020
| By: | /s/ Scott Whisten | |
| Scott Whisten | ||
| Treasurer, Principal Financial & | ||
| Accounting Officer |
Date: December 7, 2020
Pursuant to the requirements of the Securities Exchange Act of 1934 and the Investment Company Act of 1940, this report has been signed below by the following persons on behalf of the registrant and in the capacities and on the dates indicated.
| By: | /s/ Thomas J. Fuccillo | |
| Thomas J. Fuccillo | ||
| President & Chief Executive Officer |
Date: December 7, 2020
| By: | /s/ Scott Whisten | |
| Scott Whisten | ||
| Treasurer, Principal Financial & | ||
| Accounting Officer |
Date: December 7, 2020