UNITED STATES
SECURITIES AND EXCHANGE COMMISSION
Washington, D.C. 20549
_________________
FORM 6-K
REPORT OF FOREIGN PRIVATE ISSUER
PURSUANT TO RULE 13a-16 OR 15d-16 UNDER
THE SECURITIES EXCHANGE ACT OF 1934
Date: July 23, 2019
UBS Group AG
Commission File Number: 1-36764
UBS AG
Commission File Number: 1-15060
(Registrants' Names)
Bahnhofstrasse 45, Zurich, Switzerland and
Aeschenvorstadt 1, Basel, Switzerland
(Address of principal executive offices)
Indicate by check mark whether the registrants file or will file annual reports under cover of Form 20‑F or Form 40-F.
Form 20-F x Form 40-F o
This Form 6-K consists of the presentation materials related to the Second Quarter 2019 Results of UBS Group AG and UBS AG, and the related speaker notes, which appear immediately following this page.

1
2
3
4
5
6
7
8
![]()
9
![]()
10
![]()
11
![]()
12
![]()
13
![]()
14
![]()
15
![]()
16
![]()
17
![]()
18
19

20

21

22
23
24

25

26
27
28

29
30
31
32

33

34

35
Second quarter 2019 results
23 July 2019
Speeches by Sergio P. Ermotti, Group Chief Executive Officer, and Kirt Gardner, Group Chief Financial Officer
Including analyst Q&A session
Check against delivery.
Numbers for slides refer to the second quarter 2019 results presentation. Materials and a webcast replay are available at www.ubs.com/investors
Martin Osinga (Investor Relations)
Slide 1 – Important information
Good morning and welcome to our second quarter 2019 results presentation.
I would like to draw your attention to our slide regarding forward-looking statements at the end of this presentation. It refers to cautionary statements including in our discussion of risk factors in our latest annual report. Some of these factors may affect our future results and financial condition.
Now over to Sergio.
36
Sergio P. Ermotti
Thank you Martin and good morning everyone.
Before I comment on our financial performance, allow me to draw your attention to the cover of our presentation, which highlights our #TOGETHERBAND initiative.
The goal of this initiative, launched on World Earth Day in April this year, is to raise public awareness and inspire action for the 17 United Nations Sustainable Development Goals, or UN SDGs in short. They are critical for the long-term economic growth and the future of communities around the world.
One fundamental problem is how little the public is aware of these goals. Various surveys show less than 2% of the wider population actually knows what the UN SDGs are. And that's something that #TOGETHERBAND is trying to address.
UBS is proud to be the founding partner of #TOGETHERBAND. At the heart of the #TOGETHERBAND campaign are friendship bands in the 17 colors of the UN SDGs that come in packets of two: one to wear, one to share. The UBS Optimus Foundation provides guidance on how all net profits of the campaign will be used for projects aligned with the SDGs. It is supported by a group of high-profile ambassadors and experts with a strong commitment to sustainability.
The response from our employees and many clients has been amazing.
For UBS, as a leader in sustainable and impact investing and smart philanthropy, this is an important initiative... but also for me personally. The bands I am wearing represent “life below water,” “quality education” and “no poverty.”
All of you on this call are opinion makers and I encourage you to take part and spread the word. Together, we can achieve more than as individuals. You can find [edit: out] more at togetherband.org.
So now on to our financials.
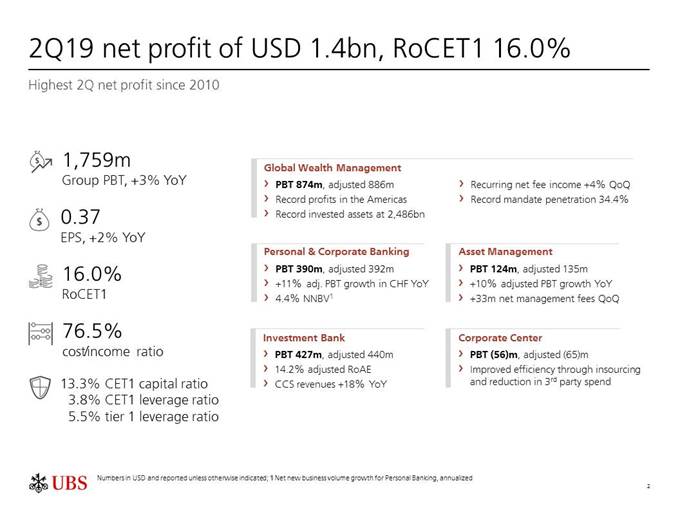
Slide 2 – 2Q19 net profit of USD 1.4bn, RoCET1 16.0%
In the second quarter we delivered the highest Q2 net profit since 2010 – an improvement on an already strong 2Q18.
Our earnings reached 1.4 billion dollars. Return on CET1 capital increased to 16% and our cost/income ratio is also in line with our full-year targets.
Once again we showed the strength of our business model and its ability to generate competitive returns even in market conditions far poorer than last year’s.
The impact of the challenging environment is particularly evident in our Global Wealth Management business. Here, we had record profits in the Americas and global invested assets reached an all-time high of 2.5 trillion dollars. But NII come [edit: came] under pressure just like for our US peers. Kirt will cover this later on in more detail.
37
Our P&C business again delivered very strong performance with double-digit profit growth, increases across all revenue lines and excellent new business volume.
Asset Management revenues recovered nicely in the quarter, leading to strong earnings growth.
The Investment Bank nearly doubled its profit from a difficult first quarter. Our CCS revenues increased 18%, driven by outperformance from our Advisory and ECM franchises. We completed a number of significant transactions, including the 27 billion Novartis spin-off of Alcon, the Amcor acquisition of Bemis and the Brambles unit spin-off. This was our best quarter for M&A revenues since 2012, with the number one spot in APAC.
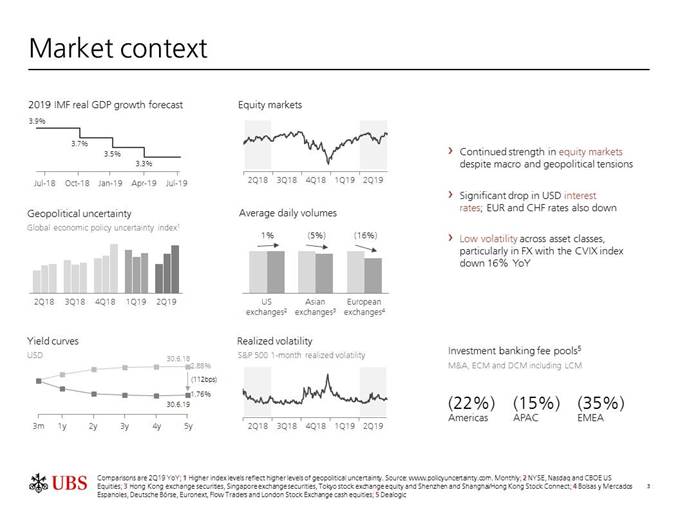
Slide 3 – Market context
The second quarter brought some normalization to business conditions following the very difficult start of the year. Equity markets recovered further, volatility in credit spreads and rates was more constructive, and deal volume increased quarter on quarter.
However, we are still operating in an environment with low volatility and trade volumes in Equities and FX.
Also, global geopolitical and macroeconomic uncertainty remained, and in some cases got worse weighing on both sentiment and economic prospects.
The outlook for US and European interest rates surprisingly quickly turned for the worse in the quarter with yields on US 5Y Treasuries down 40 basis points in just two weeks between May and June.
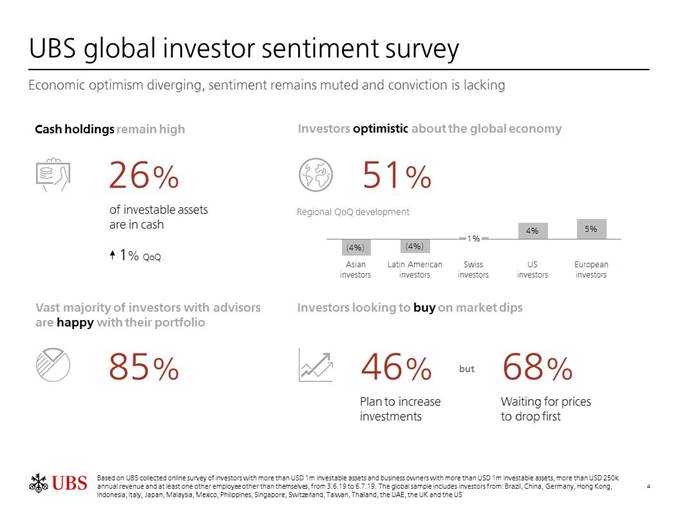
Slide 4 – UBS global investor sentiment survey
It is no surprise our quarterly survey shows that investor sentiment remains muted, with persisting concerns over national politics, geopolitical uncertainty and global trade.
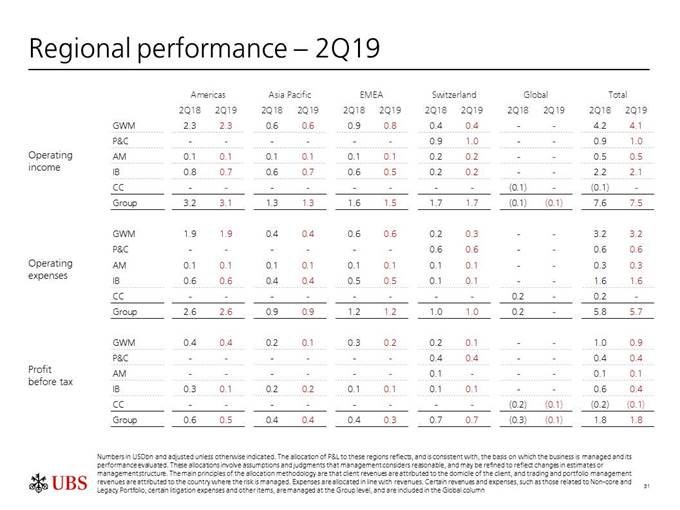
We see diverging regional dynamics. Asian investors are more worried about effects of trade tensions resulting in declines in optimism, in contrast to improving moods in Europe and the US. We saw signs of these trends in our regional performance.
Overall, investors lack the conviction to step into the market right now, waiting for prices to be more attractive before increasing their exposure.
Having said that, clients remain generally satisfied with their current asset allocations, but it is noteworthy to see the share of cash in their portfolios increased further even with a general increase in asset prices.
While understandable from a client stand point of view, it is not a supportive backdrop for transactions or lending. Our approach here is to intensify even further our dialogue with clients to help them navigate the current environment.
38
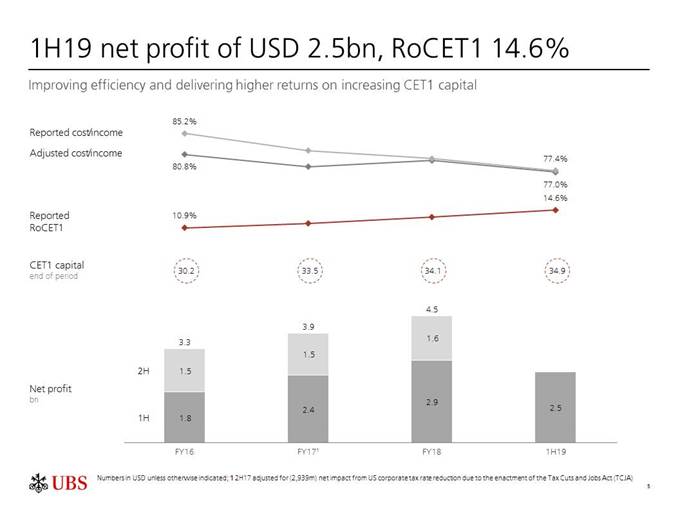
Slide 5 – 1H19 net profit of USD 2.5bn, RoCET1 14.6%
The difficult start of the year weighed on our half-year results, but we have made significant progress over the last three months.
Return on CET1 capital for the first half was 14.6%, higher than for the full-year of 2018. And this return was on a capital base that is nearly 1 billion higher than just six months ago, and over 15% higher than in 2016.
It is difficult to predict how external factors will develop in the second half of the year, and of course we face the usual seasonality affecting both revenues and costs.
But, the results so far reinforce our conviction that we can achieve a return on CET1 capital in line with last year’s.
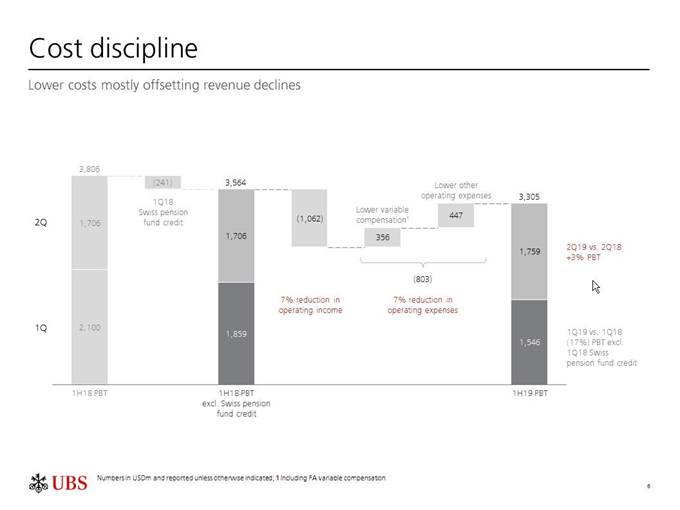
Slide 6 – Cost discipline
We remain committed to our strategic and tactical cost reductions. Against a 7% reduction in operating income, our operating expenses were also down 7% driven by natural hedges built into our model, some of our structural and tactical cost actions, as well as lower litigation.
As I said, we are aware that the second half of the year will present further cost challenges, including seasonality, but we remain committed to actively minimizing the effects by continuing to implement our strategic and tactical plans.
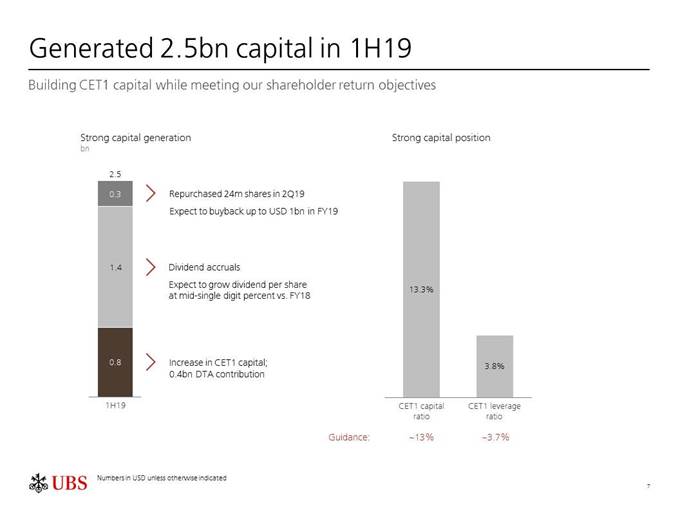
Slide 7 – Generated 2.5bn capital in 1H19
Year to date we already generated 2.5 billion of capital. As you can see, we accrued for future dividends, bought back 300 million dollars of shares, and built up 800 million of CET1 capital, improving our high capital ratios.
For the rest of the year, we intend to continue to execute on our capital return plans as previously communicated.
Slide 8 – Growing book value while distributing capital
Growth in tangible book value is of natural interest to shareholders and often comes up in discussions. Here is my take.
In order to assess absolute and relative developments in tangible book value per share, we need to take cash dividends into consideration.
Since 2011 we paid around 15 billion in dividends, or a third of the tangible book value, ranking us among the top cash dividend payers across large global peers.
With a 6% CAGR on cumulative book value and dividends per share over the last eight years, we compare very favourably to European peers and, most importantly, are in line with our US competitors. On this basis our tangible book value per share increased 9% year on year.
39
Slide 9 – Continued strong momentum in the Americas
As I mentioned in the past, there is no such thing as being a leading global wealth manager without a significant presence in the US, which remains by far the world's largest wealth pool. It is also a very attractive market for our Investment Bank and Asset Management businesses.
We already have strong position in the region. GWM quarterly profits reached a record-high, our advisor productivity remains market-leading, and invested assets increased to a record 1.3 trillion dollars. That's more than half of GWM’s total.
In addition to being a big growth driver for our business, the US will continue to provide unique value to UBS shareholders due to 6 billion in tax loss DTAs. These can only be used by us and should benefit our CET1 capital over the next decade.
Our strategy and growth ambitions here are very clear. We want to increase wealth management’s profit margins to 25% in the US and become the market leader in LatAm.
We also aim to strengthen the IB’s position in our key capital-light businesses, our Asset Management, and generate additional value by increasing revenues through collaboration.
Slide 10 – Strong growth prospects in APAC
We have been in Asia for over 50 years, in good and bad times. This unwavering commitment to the long-term prospects growth of the region, has helped us earn the leadership position in key business areas.
In wealth management we are the clear market leader in the region with over 400 billion invested assets, 70% more than the next competitor. We are also the top-ranked foreign asset manager in China, and have leading equities, research and M&A businesses through our Investment Bank.
Our goal is to grow further, both organically and through strategic partnerships.
A few weeks ago we signed an agreement with Japan’s leading private trust bank, Sumitomo Mitsui Trust Bank, to offer services to one of the largest pools of High Net Worth and Ultra High Net Worth clients in the country. No other wealth management firm in Japan can offer a comparable range of services at the moment, and we are confident this joint venture will be beneficial for both UBS and SuMi Trust.
We believe such partnerships are an effective model allowing us to efficiently scale our business. We are currently exploring other such opportunities globally.
Slide 11 – The #1 bank in Switzerland
Our global growth prospects are underpinned by the stability, efficiency and effectiveness of our home market.
Despite severe interest rate headwinds, the four business divisions operating in Switzerland have collaborated to generate a third of our Group profits and consistently deliver around 20% return on attributed equity.
40
We stayed disciplined on pricing and made significant investments into technology over the past few years, which are now paying off. We are seeing higher client satisfaction levels leading to increased client and business inflows and improved efficiency.
Slide 12 – 1H19 highlights and 2H19 priorities
To summarize, we have made good progress in the second quarter, but we have more work ahead of us to deliver on our plans.
We are very focused on efficiency, including our strategic initiatives and incremental tactical savings to mitigate regulatory cost pressures and NII headwinds in the second half.
We will continue to execute on our alpha initiatives and pursue other strategic optimization opportunities.
For example, while the Q2 performance of our IB demonstrated the strength of the franchise, we recognize the revenue pressures across the industry are likely to persist. Therefore we are looking at ways to further evolve its business model, leveraging our tech capabilities, building on our strengths and focusing resources on the highest growth opportunities.
We are also exploring new ways to enhance collaboration in the GFO and Ultra space between Global Wealth Management and the IB.
Across the Group, we will continue to drive our front-to-back technology initiatives, to innovate our platforms. Some of these changes will also bring us tax and regulatory benefits.
Overall, our goal remains unchanged: to deliver sustainable and profitable long-term growth while investing in our businesses and providing attractive shareholder returns.
With this I'll hand over to Kirt.
41
Kirt Gardner
Thank you, Sergio. Good morning everyone.
Slide 13 – UBS Group AG results (consolidated)
As usual, my comments will compare year-on-year quarters and reference adjusted results in US dollars unless otherwise stated.
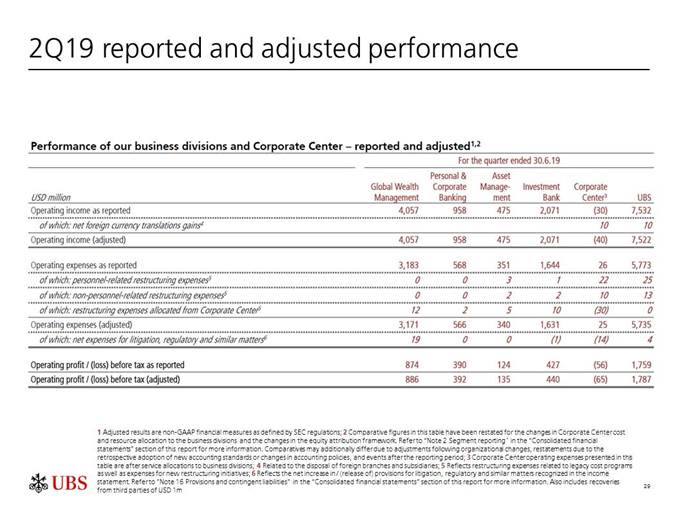
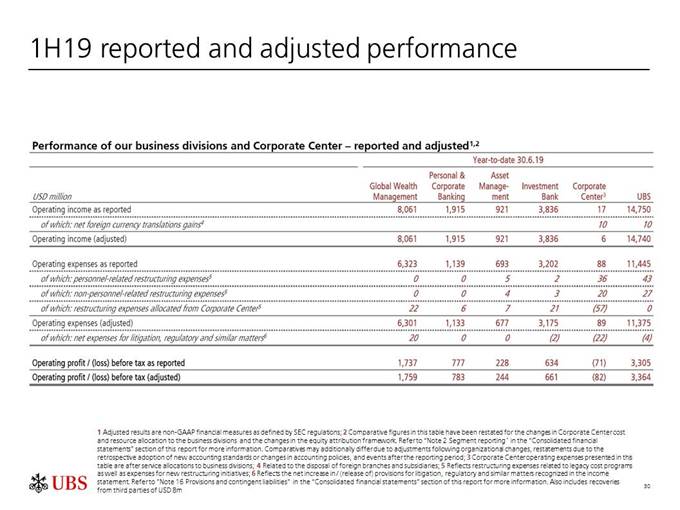
We adjusted for foreign currency translation gains on sales of 10 million and restructuring expenses of 39 million, as our reported and adjusted results have largely converged. Year-to-date, restructuring expenses were 70 million, and we still expect to incur around 200 million for legacy programs for the full year 2019.
Our Group effective tax rate was 21% in 2Q, reflecting 65 million of net DTA benefits primarily resulting from certain real estate asset transfers from UBS AG to UBS Americas Inc. In addition, we shifted parts of the business, which achieved further tax efficiency. The cash tax relevant portion was just 12%, with the rest related to DTAs, leading to a sizeable direct benefit to CET1 capital.
We expect our tax rate for the second half of 2019 to be lower than the 23.4% in the first half of the year, reflecting the benefit of real estate asset transfers I mentioned, subject to any potential DTA-related adjustments made as part of our annual business planning process. From 2020 onwards, we expect a tax rate of around 25%, including a roughly 1.5 percentage point benefit from the business shifts I previously mentioned and excluding the effects from any remeasurement of DTAs.
Our tangible book value per share is up 6% to 12.72, with a third of the increase coming from share count reduction.
Slide 14 – Global Wealth Management
Moving to our businesses. This has been a challenging first half for Global Wealth Management, and interest rate headwinds intensified in 2Q.
For the quarter, operating income was down 3% on lower net interest income and recurring fees, partly offset by higher transaction income. I’ll cover revenues in more detail in a moment.
Costs increased by 1%, driven by strategic investments in the business, partly offset by our savings initiatives, which we highlighted at our Investor Update, and lower litigation. During the quarter, we continued investing in APAC, including our SuMi Trust partnership, building out our ultra-high net worth business in the Americas, US branch expansion, and investing in our strategic platforms, while contributing to the Group's tactical cost savings.
We reached a record 34.4% mandate penetration. Net new lending was slightly positive, despite muted client appetite for leverage.
42
Slide 15 – Global Wealth Management
Back to revenues, transaction-based income increased by 3%, despite continuing client concerns as evidenced in both the heightened geopolitical uncertainty index and investor feedback from our survey that Sergio referenced.
Recurring fees were up 4% sequentially and down 2% year-on-year. The QoQ increase is partly driven by sales and some margin uptick, but also due to the pick-up in invested assets from the first quarter, per the usual time lag effect that’s most pronounced in the US. Year-over-year, there were some headwinds from client preferences for cheaper mandates, which we already noted last quarter, along with a mix shift towards ultra-high net worth, although our recurring fee margin has stabilized sequentially.
Net interest income was down 7% overall versus a decade high in 2Q18, driven by lower revenues from both deposits and loans, along with accelerated mortgage-backed security amortization.
Slide 16 – Global Wealth Management
As you saw from the US banks, NII pressure accelerated during 2Q from accumulated shifts in client deposits, lower rates, and heightened price competition.
We saw similar trends in our NII – and faced added headwinds from euro and Swiss franc rates going further negative. NII declined 4% sequentially.
On the deposit side, we continued to see a mix shift towards clients moving into money market funds and term deposits. We also saw a 5 billion increase in Swiss franc deposits from net inflows along with clients increasing their cash holdings.
And on lending, margins were under pressure, mainly in the US, as competitors sought to protect market share with very aggressive pricing as clients refinanced.
If the Fed were to cut rates by 25 basis points, we would expect to see NII to be slightly down sequentially in the third quarter.
Slide 17 – Global Wealth Management
Moving to the regional view. In the Americas, we posted record PBT of 367 million. Recurring fees and transaction-based income increased, with some offset from lower NII. We delivered top-line growth with fewer advisors, consistent with our strategy, and average annualized revenues per advisor increased to a record 1.3 million, ahead of US peers. And we improved our efficiency to the lowest cost/income ratio we’ve ever had.
Outside the Americas, income decreased largely due to lower NII and recurring fees, particularly in Asia. Seven billion lower average loan balances in Asia following deleveraging in 2018, and a decrease in loan margins from heightened pricing competition weighed on revenues. Costs were also up due to our ongoing investments in the region to drive long-term growth, such as expenses related to our China onshore build-out, as well as lower litigation, as well as higher litigation, excuse me. Furthermore, clients shifted 4 percentage points of invested assets out of equities into cash and fixed income. This more conservative asset allocation by clients also weighed on revenues and profits.
43
Net mandate sales globally were positive and mandate penetration increased across all regions.
In terms of net new money, we had 1.7 billion outflows globally. This was driven by the Americas, where we had the typical seasonal outflows for US tax payments, which were around 5 billion. All other regions had net inflows. Overall, year-to-date net new money has been solid at a growth rate of around 2%.
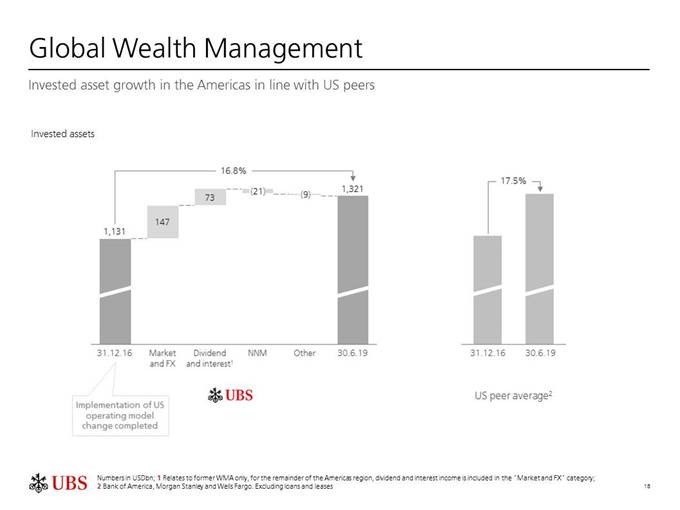
Slide 18 – Global Wealth Management
We'd like to provide a peer comparison of invested asset developments in the US, which is the only way for us to benchmark our net new money performance, as US peers do not disclose this metric.
While we've seen outflows, our invested assets have grown in line with the peer average since 2016. That's when we completed the implementation of our operating model change in the US, focusing on retention and away from recruitment, which has had an adverse impact on net new money. This change in the model has contributed to the 1 percentage point reduction in our cost/income ratio over the same period.
We recognize that quality net new money is an important driver of sustainable growth in the business over the cycle, and we are focused on improving this metric.
Slide 19 – Personal & Corporate Banking (CHF)
Personal and Corporate had a very strong quarter, with PBT up 11% to 391 million Swiss francs.
Operating income was up 4%, driven in part by transaction revenues, which were the highest on record with increased credit card and foreign exchange transactions. Credit loss expenses were also substantially lower.
In net interest income, we further improved our product result in both deposits and loans, offsetting pressure from higher funding costs and negative interest rates. This is evidenced by the resilient net interest margin, which at 152 basis points was in the upper half of our target range.
Recurring net fee income also rose slightly on higher account fees.
Business momentum remains very strong, with 4.4% net new business volume growth in Personal Banking. We saw loan growth and strong net new client acquisition in both Personal Banking and Corporate & Institutional Clients.
Costs were down marginally and the cost/income ratio improved to 59%, in line with our target for the year.
Slide 20 – Asset Management
Asset Management had a strong quarter, with PBT up 10% to 135 million dollars.
Net management fees increased by 2%, reflecting higher average invested assets.
Costs were flat as higher personnel expenses were offset by lower G&A expenses. The cost/income ratio improved to 72%, in line with our target for the year.
44
Excluding money markets, net new money outflows of 14 billion in the quarter mainly reflected client de-risking, asset allocation changes, and delayed investment decisions in reaction to continued market uncertainties. Outflows were largely in lower margin indexed funds, with minimal impact on operating income.
Invested assets were up 1% or 7 billion sequentially, driven primarily by market performance.
Slide 21 – Investment Bank
The IB generated 14.2% RoAE in a very challenging market environment. PBT excluding around 1 [Edit: 100] million day-1 P&L in 2Q18 and Tradeweb-related gains in FRC, was down 10% and revenues were virtually flat versus a very strong 2Q.
CCS revenues were very strong, up 18% against a 21% decline in the global fee pool. Advisory stood out, with M&A revenues up 67% against a 26% fee pool decline, partly aided by closing deals that slipped from 1Q19. We gained share in all regions and were ranked #1 in M&A in APAC. ECM also performed well, with revenues up 23% versus a 5% decline in fee pools.
Our Equities revenues were down 9%, in line with US peers, reflecting persistently low volatility that weighed on client activity, along with deleveraging by hedge fund clients at the end of last year. We were, however, pleased with our performance in electronic Cash trading, where we believe we've once again gained market share.
FRC held up well, considering extremely low volatility and volumes in FX. Revenues were down 7% excluding previously deferred day-1 profits and Tradeweb, as Credit and Rates performed well, partly offset by declines in FX.
IB costs were up 3%, reflecting higher tech spend.
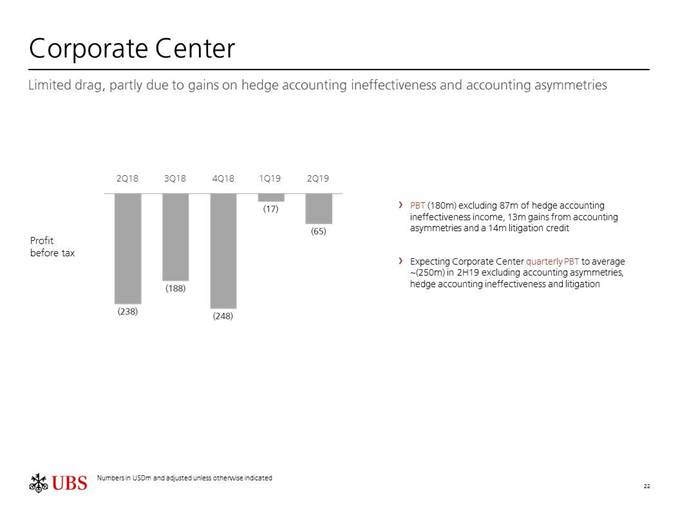
Slide 22 – Corporate Center
In Corporate Center, accounting asymmetries and hedge accounting ineffectiveness, and litigation jointly contributed a 114 million gain compared with negative 127 million in 2Q18.
Absent any effects from accounting asymmetries, hedge accounting ineffectiveness, and litigation, we still expect Corporate Center to average around a 250 million loss per quarter in the second half of this year.
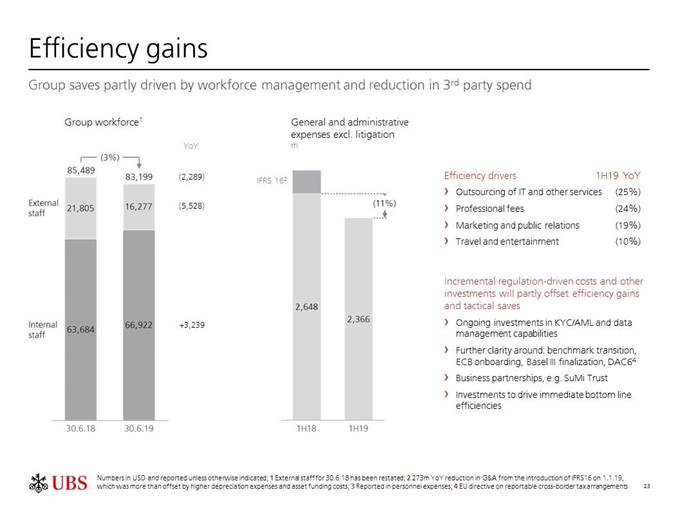
Slide 23 – Efficiency gains
Driving continued improvements in our efficiency remains a core focus, as evidenced by the 7% reduction in 1H19 reported operating expenses that you saw earlier.
Our cost performance is underpinned by structural improvements, as well as disciplined management of third-party costs that contributed to an 11% reduction in our reported G&A costs, excluding litigation and IFRS 16 impacts.
Insourcing technology headcount is a key initiative driving improvements in efficiency and contributing to the Group's overall 3% reduction in workforce. IT and other services outsourcing costs are down nearly 200 million, or 25%, partly offset by higher personnel expenses. And we are reducing risk and improving effectiveness.
45
As you can see from the slide, we constantly drive efficiency gains, while funding new requirements and investments in the business, along with mitigating market headwinds.
So while we will remain diligently focused on expenses, we are seeing incremental costs as we gain further clarity on regulatory requirements. This includes, for example, investments in our KYC/AML and data capabilities, transitioning to new benchmark rates, and implementing ECB requirements.
We have also identified new attractive investment opportunities, including the announced SuMi Trust partnership, consolidation of our capital markets business in the US, and various actions to drive immediate bottom line efficiencies.
Given all of these factors and typical seasonality, we currently expect our second half adjusted operating expenses excluding litigation to be up slightly versus the first half of the year.
Slide 24 – Capital and leverage ratios
Our CET1, going concern and gone concern capital ratios are all above the 2020 requirements.
LRD has increased year-to-date mostly due to higher equity markets, but somewhat offsetting this, we’ve achieved9 billion reduction in LRD as a result of our optimization efforts. For example, merging our UK entity UBS Limited into UBS Europe SE reduced our liquidity requirements. We have also realized initial benefits from improved intra-day liquidity modeling. For the full year, we still expect to deliver about 20 billion LRD reduction versus our plan, as we said in March.
To sum up the quarter, we delivered a strong 1.4 billion in net profit, our best since 2010, and a 16% return on CET1 capital, while making progress towards our capital return objectives. But we know we have work to do and we are very focused on executing our strategy and delivering our alpha plans to drive long-term growth.
With that, we'll take questions.
46
Analyst Q&A (CEO and CFO)
Amit Goel, Barclays
Hi, thank you, thank you for the presentation. So, two questions from me. Firstly, just on the net interest income guidance for GWM. I heard you mentioned the sequential impact if we get a 25-bp cut, but just thinking more into 2020, if we were to see the current forward curves – is there a bit more color you can give us on the potential impact?
And the second question, just relates to the kind of the strategy and the plan and obviously versus what the environment was like as of October last year – we’ve seen quite a lot of change – so just curious how you think about that, how you go into kind of Q3 when you’re thinking about the strategy etc. and how you evaluate the changes in the environment. Thank you.
Kirt Gardner
So I’ll take the first and Sergio will address your second question on it. In terms of net interest income, the reduction and longer term rates had an impact immediately on the amortization of our MBS portfolio – just with model assumptions that payment levels increase, and year on year that was about a 14 million impact. Naturally if rates stay low or further reduce, we’ll continue to see a further accelerated amortization as we go forward into the following quarters. Beyond that, the lower longer term rates as you suggest have an impact on the structural position that we use to hedge both our deposits as well as our equity, and that impact will materialize over time, given the duration that we have on our investment of equity as well as on our deposit portfolio. So we would expect to see that reduction to accrete in over the next couple of years, depending of course on further movements and interest rates. That’s something naturally that we’ll update as we go through our three-year planning process.
Sergio Ermotti
Yes, on the second point of course, as you mention, during the summer, at the end of the third quarter, we always go through our three-year rolling plan. And we take in consideration the so-called beta factors, based on consensus, so basically no subjective input by management or anybody in respect of how we see rates development, on how we see economic developments in the various regions that are usually the drivers of our business from a beta standpoint of view, And together with our growth and alpha initiatives, we will assess the impact on our forward-looking target.
You know, I think as we demonstrated so far this year, we are not, you know, giving up on trying to always maximize and get to our absolute returns, but of course we always need to see exactly how those factors play to each other. We will also have to consider the new environment and decide if and how we need to take strategic measures to offset or mitigate some of those developments. But I guess considering the volatility and the lack of visibility we see in the current macro- and geopolitical environment, it’s quite difficult to answer right now what it means for 2020. You saw last year that within a few months, we had a total turnaround in expectations on rates, so we will need to see how things develop in the last part of the year.
47
Amit Goel
Good. Thank you.
Jon Peace, Credit Suisse
Yes, thank you. So my first question follows on a little bit from the previous one. Beyond the sort of beta factors of the market, when you think of the sort of competitive pressures you highlighted on slide 15, on loan margins and also shifting client preferences within the mandates and on deposit mix, how persistent do you think this sort of decline in gross margins, excluding transaction revenues, is likely to be?
And then, my second question is just on the buy-back of up to 1 billion. Now we’re half way through the year. How close to that figure do you think you might get? Thank you.
Kirt Gardner
Yeah, thank you Jon. And in terms of the beta factors that we’ve highlighted, first, if I look at our recurring margin, as I mentioned, our recurring margin has largely stabilized quarter to quarter. At this point, we don’t believe that we’re going to see any further pronounced shifts into lower risk. We expect the mix overall of client preference around mandates going forward to relatively stabilize. So we don’t see any factors apart from the continued segment mixed change with a bias towards ultra-high net worth that would have a significant further downward pressure on recurring margins.
Now, on net interest income, the competitive intensity remains, and it gets a little exacerbated, because with the lower rates you see higher levels of refinancing. So what we’re seeing is very, very high volumes of clients actually paying down loans and then building back up their positions, and when they’re in play, it opens you up to some competitive vulnerability. So there we do expect to continue to see some competitive intensity and pricing. However, apart from the potential rate move from the Fed, we don’t see any other factors that would naturally result in a significant quarter-on-quarter decline in our net interest income or margin.
Sergio Ermotti
Yes, in respect of the share buyback. Of course we have been on a black-out period during the last few weeks. So our aim is to restart the buyback program in the next couple of days, as soon as we are out of the black-out, and you know, continue to execute on our targets to buy back up to a billion in between now and year-end.
Jon Peace
Ok, thank you.
Magdalena Stoklosa, Morgan Stanley
Thank you very much. I’ve got two questions and both are quite structural ones. When we look at the Asian business and we’ve gone through quite a lot of details on the kind of changes in the investment allocation and the changes in risk appetite impacting part of revenues. When you look at Asia overall, and that’s across your business, how should we think about the cost trajectory? Because you’ve got kind of two key buckets there. One, of course your business as usual. But two, also your kind of your big strategic projects, like the China onshore build-out that you have called out. How shall we think about that cost trajectory, and how potentially elevated is it because of those more strategic projects there?
And two, US – because we’ve talked about the margin levels of 25% but we’ve also talked about at least kind of near-term pressure on revenues. How do you see the flexibility of costs, or maybe even mitigants on the other parts of the revenues rather than NII to effectively end up around that targeted margin rate? Thank you.
48
Kirt Gardner
In terms of, Magdalena – and first of all thank you for your questions. Looking at Asia overall, you’re right, what we saw is actually quite a pronounced impact on our revenue line overall, with clients shifting, and the magnitude of shifting, just to put that into perspective, is we saw clients shift 4% out of equities into cash, 2%, over 2% into cash and into fixed income. And that of course impacts overall our recurring revenue, as well as putting a little bit of pressure on our net interest income. In addition to that, we saw the deleveraging with about a 7 billion reduction overall in loans on a year on year basis.
Now what we do know about Asia is, Asia can turn very, very quickly, and we can see wild swings quarter on quarter if clients get more confident in the environment. Now while we don’t see a catalyst in the near term, we are very confident that over the medium term, we are going to continue to see very, very good growth in the Asia Pacific; therefore, it’s important for us to maintain our investment overall in that region. Naturally though, we’ll pace those investments. So with these current headwinds you would expect us to be able to delay some of our investments, to delay our hiring plants, and then to pick up that momentum as we see the market improve overall. But it’s really been our 50-year commitment to that region that has allowed us to have the position that we have.
Now if you look at the US margins overall, what we articulated in terms of the 25 basis point improvement overall in our margin, actually moving our margin at 25 basis points, but down to 75 points is an increase in mandate penetration. We continue to see that. That’s actually performing as we would expect. An increase in banking product, penetration, now there we haven’t seen the level of growth in banking products, and that’s really because of the environment and plus the headwinds in net interest income, along with the continued increase in productivity, which we do see just given our overall strategy. But clearly if we don’t have, along with the actions we are taking, the beta environment that we planned for, that is going to have an impact and it’s going to delay the pace at which we can actually achieve the target 75% efficiency ratio in the US business.
Magdalena Stoklosa
Thank you.
Andrew Stimpson, Bank of America
Morning everyone. First question from me is on the client appetite, which you’ve been talking about a bit. You are saying there, Kirt, that you don’t expect much more client rotation into the lower risk mandates, but I wanted to get maybe some more numbers around that. I know you said there is that 4 percentage point shift from APAC clients from equities into fixed income and cash. I just wondered how far off that is say, from the lowest levels we’ve had over the past five years or so, and maybe more broadly for GWM, not just for APAC?
And then secondly, we spent a lot of time at the Investor Day, as we often do, talking about the connection between the Investment Bank and Wealth Management, and in particular one of the things we often talk about is how better ECM can drive better flows within Wealth Management. But this quarter we’ve seen actually really strong ECM. But the inflows weren’t as strong. So is that, should I be reading anything into that there? Is it just a regional thing? Is it just didn’t work out this quarter? Or any reason to doubt that those two things shouldn’t eventually go together please? Thank you.
49
Kirt Gardner
Yes, Andrew, thank you for your question. If you look at our current, the trend that we’ve seen over the last year, there are a couple of dynamics on the mandate side. It’s one, clients have shown a preference for lower margin mandates in terms of the sales that we’ve seen, versus managed product. In addition to that, we’ve seen the mix shift and also the segment shift. Now the indication is quarter to quarter that that trend has stabilized. Also if you look at the client sentiment survey, well you see that there is a high percentage of clients who have indicated that they’re happy with their current asset allocation. So that would suggest to us that we’re unlikely to see further derisking going forward, but on the other hand at the same time, since we also have a high percentage of clients that are really waiting for markets to drop before they’re likely to move further, there could be a muted impact overall of client activity. So I think those are the two client impacts that our client survey is suggesting going forward.
Now in terms of your question overall on ECM, if you look at our, the ECM business, and what drove the good performance within the IB, it was really much more focused in our institutional client business, and not necessarily focused as much in our overall GWM business. So therefore you didn’t see the linkage and the correlation between outperformance versus the market on the ECM side in our IB, and necessarily flows on the GWM side.
Andrew Stimpson
Ok, thank you, and then just to follow up on the first question, you don’t have any, is there any, I don’t know if you’re comfortable giving a time series on how that client asset allocation has changed? I know you’ve given us the cash allocation number a few times. I just wondered if you think we’re near the lows, or if your comment is just purely, if you’re more talking about what the survey has said, or whether it’s based on what you have seen previously.
Kirt Gardner
Yeah, I think Andrew we’ve got two points. One is in terms of the survey, cash levels were already at highs. And with the 1% increase quarter on quarter, we actually have cash levels that are even well above what has been historic highs. And I think if you look across the regions, and I’ll speak to the survey, in Asia we’re seeing 32% of overall holdings in cash, and that’s the highest amongst the regions, up 1%. Switzerland at 30% is next. The US at 22%, and you saw 3% cash increase in the US. The US typically has been the lowest amongst the regions. Now we’ve seen the same pattern in our own business. Our cash levels are pretty much at highs versus where we’ve been historically. As I said, at this point it doesn’t seem there is any indication that we’re going to see further moves into cash, but of course that’s going to be dependent on the environment going forward.
Andrew Stimpson
Ok, thank you very much.
50
Kian Abouhoussein, JP Morgan
Thank you for taking my question. Maybe to be a little bit more focused on some of the numbers you gave at the Investor Day. On slide 4, Kirt, you gave some of the beta factors to drive your assumptions in terms of investment and growth. Out of the four assumptions, two of them don’t hold anymore: The forward curve has clearly shifted from up to down, the real GDP growth number is lower than originally expected. So I am just wondering at what point, Sergio and Kirt, do you make a decision that, what would be the trigger that we actually need to slightly change our plan and outlook so to say?
That’s the first question. The second question is related to ultra-high net worth business US. You mentioned the 70 billion in the past, and I just want to see where you are at this point, and when should we expect some statistics on that – and what are going to be the key drivers for us to see the 70 billion to come in?
Sergio Ermotti
As I answered before, you know, the moment in which we create additional transparency and clarity about how we look at our forward-looking targets – it’s going to be year-end, as we plan for the 3-year cycle based on these assumptions, which I’d like to reiterate are consensus-based and not subjective to our own assumptions, so that we can isolate the impact of alpha versus beta, when we analyze our performance. So I guess the right moment to assess is towards year-end. So we’re going to do it as every year.
Guide long-term, the trajectory has to be the one mentioned before, because the underlying trends sustaining our business model – wealth creation, Asia – and the fact that we believe that the US, we have the opportunity to gain share of wallet, are still intact. Of course the pace and the contribution of the beta factor may not be the one that we were planning for based on those assumptions. But the timing is going to be that one. In the meantime, we will think about any strategic or tactical measures that we need to do to adapt to any changing environment, I am sure, like many of our competitors will do.
Kirt Gardner
Kian, to your second question, as we highlighted, the overall Americas program, focused on ultra-high net worth and GFO, is more of a medium term of course objective in terms of the 70 billion – we indicated that that was over a 3-year period.
So where we are is that we’ve laid all the groundwork, we built out our ultra-teams and we’ve ring-fenced them. We’ve built out our GFO teams, we’ve identified the target client set, and as we highlighted, the majority of those clients already have relationships with us, so we have an ongoing dialogue. And we put in place some of the other ultra-high net worth offering capabilities, and we are now starting to build a pipeline. So the process is starting. We would expect some actual momentum, some real inflow momentum in the second half of the year. That should grow as we go through the year, and then of course as we get into 2020, that momentum will continue to grow.
Kian Abouhoussein
Thank you.
51
Jeremy Sigee, Exane BNP Paribas
Good morning, thank you. Two questions. The first one is on the Investment Bank costs, which are, I was a little surprised, you know. As you point out they are up 3% year-on-year, while revenues are down 4%. And I suggest wondered to what extent that new cost level, the 1631 adjusted costs that you printed to Q2, is that a run-rate going into 3Q and 4Q? Or is there scope to get it back down below 1600 as it was in previous quarters? So that’s my first question.
My second question, which I hope you won’t find too annoying. But it’s going back a little to the strategic review that you were talking about, which is underway, and you’re going to tell us about it at 3Q. Obviously that will then be very late in the year and probably too late to do very much about this year’s numbers, which don’t seem to be on track for the targets. What range of options do you think you might consider as you look at the 2020 numbers? Is it again going to be about delaying investment spend? Or could it be more structural efficiencies? What’s the range of options that you might look at?
Kirt Gardner
Yes, Jeremy, so if you look at what drove the year-on-year increase in the IB cost overall, it was really tech-related, and it’s reflective of the fact that we do continue to build out our digital platforms and we also have an increased cost year-on-year overall, just related to our tech infrastructure for the IB. And we would expect to continue to maintain that level of investment. Away from that though, we would also expect that the IB will manage their costs prudently as they have in the past. And of course variable compensation will be directly linked to revenue and mix.
Sergio Ermotti
On the second part, I think, first of all I looked at our performance in the second quarter, and by the way I don’t find the question annoying at all, and we’re more than happy to continue to explain how we look at our business and how we adapt to the changing environment. The second quarter was a demonstration that we were able to compete at similar performance across our equity businesses, our [inaudible], even when you neutralize for year-on-year effects. And when I look at our CCS performance it indicates again that we have a very strong franchise, particularly when you look to the performance of our APAC numbers, then the M&A numbers.
Now, from this position of strength we will continue to look at ways to evolve and adapt our business model. We are not thinking about making a revolution. It’s a constant evolution of the business, trying to look at ways to redeploy resources in areas where we see more growth, and also creating opportunities not necessarily just on optimizing financial resource utilization, balance sheet utilization, but also cost – but also most importantly to drive growth, and drive collaboration between our units, particularly with wealth management, but also with our corporate business in Switzerland. So what you have to expect is a series of steps that we take. Some of them will be more public by its nature, some of them may be not be public at all, because again this is the way we manage the business, and therefore expect an evolution and not a revolution.
Jeremy Sigee
Thank you.
52
Jernej Omahen, Goldman Sachs
Yes, good morning from my side as well. I have three questions please. The first one, just a clarification question for Kirt, because I didn’t understand it well when you talked about it prior. So you were talking about clients taking advantage of lower rates by trying to refinance the existing positions, I think you mentioned that they would be winding down their current positions and then putting them on at a lower funding cost, and I didn’t understand what you mean but I’d like to understand it, please.
Then the second question is on the Swiss bank. Just looking at page 19 and the net interest income trajectory. In the eventuality that the Swiss Central Bank cuts again, even further into negative territory, what is the ability that you have to pass this further cut on to your clients? And would you consider increasing the perimeter of clients to which you charge negative rates, too?
And then my final question, and I am going to try to ask this in a way that would allow you to say something, is: You talk about geopolitical situation a lot. And I guess we’ve been following some of the media reporting about UBS’s operations in China and some of the backlash that you’ve received in the media there. And I wanted to ask you two things. One, in your assessment, has the ease of doing business in Asia and in China changed significantly over the recent period? So call it the last three months.
And the second question I wanted to ask you is: UBS is still working on integrating the global wealth management capabilities into a more singular unit? And I was just wondering given the new geopolitical realities, whether that changes the pace of that project or the way you think about that project? Thank you very much.
Kirt Gardner
Thank you, Jernej, and I think I counted four questions there, but to first address the first one. So what’s the dynamic? We’ll take the US first and if you think about mortgages, as rates go down, naturally the inclination is for mortgage holders to look to refinance, to lock into lower rates, and once that happens and refinancing picks up, then those clients shop, they shop their mortgage, particularly in the US, where you have the highest degree of fundability, just across different distributors and mortgages.
And we’ve seen US players price very aggressively, and price well below their cost of capital, and that’s put pressure overall on our mortgage rates. We’ve seen the same dynamic in Asia Pacific – there’s been deleveraging – but also there’s been just an increased volume. I’ll just give you an example overall: If you look at the total amount of pay-downs that we saw in Asia Pacific during the first half of the year, we saw 15.2 billion of overall pay-downs. Now we offset that with about 14.7 billion of rebooking of loans for a slight reduction in our lending. And that’s the same volume we saw for the full year last year, and that also is the impact of lower rates – and again, once those clients are in play, they’ll look to finance at lower rates and you introduce competitive pressures.
Jernej Omahen
And Kirt, these pay-downs that you refer to in Asia, what kinds of loans are these?
Kirt Gardner
These are all Lombard loans, so they’re all security loans.
Jernej Omahen
So the logic is: I have a client, he sells the underlying asset, he repays the loan for no prepayment penalty and then he could literally take out a new loan with you at a lower rate?
53
Kirt Gardner
Or generally he doesn’t sell down the collateral, what he does is he pays down the loan and he looks to refinance at a lower rate because he is uncomfortable with the current margin that he is receiving, given the fact that interest rates have come down and expectations on equity values have come down.
Jernej Omahen
Yup, clear. Thank you very much.
Sergio Ermotti
So on the question of the potential SNB or any other central bank further moving into a negative territory. I think that of course we are contemplating like we did in the past before such potential outcomes would materialize, a series of actions we will take across the board. I think of course that I am sure you understand that it would be totally premature and not appropriate to outline what they are before things move, we also need to see if this is happening, what is going to be, if any, the other actions or points that a central bank would put in place in order to mitigate the effects of going deeper into negative rates with a low inflation environment. I think that you know, we will see a need to understand how effective that policy would be. But nothing is ruled out, we think about every possible option at this stage. Of course the only thing we know is that we are not going to get just our shareholders to pay for negative rates and of course as things get wider, like we did in the last couple of years we’ll implement measures to offset and protect our margins.
In respect of China and the geopolitical, which has nothing to do with the geopolitical what happened. I think that we took a little, you know you saw some reactions, I have to say that other than the first few days in which we had you know both internally and externally because it was not just an external event, some issues to be addressed. The situation I can say has normalized, and there is no impact whatsoever on our commitment to the region.
We have been in Asia for 50 years and more, we have been in China for many, many years. I think that this was an unfortunate situation, but I think we took all the actions necessary to remediate and as we go forward, we are confident about our position now. Of course you saw in the quarter that we reached a number one M&A position in league tables in Asia, so I think that there is little evidence that there is an impact on that.
In respect to the geopolitical tensions, it has nothing to do with the way we manage our global business lines. If anything, this is something that is more related to the legal entity activities. And one of the strongest offerings we give to our wealth management clients is an opportunity to book assets globally. So our wealth management clients – the wealthy, the ultras, the GFO – can book in the US, can have relationships with us in Asia, in Switzerland, in London and so on, and getting the same level of service. And this is one of the unique features that we can offer that makes us the only truly global wealth management franchise.
Jernej Omahen
Thank you very much
54
Andrew Coombs, Citigroup
Good morning. Two questions please. One on clarification of costs, and one on equity. On the op ex guidance you provided the second half to be slightly up versus the first half ex-litigation. Would that still hold true if you stripped out the UK bank levy in the fourth quarter? I think that was 85 million last year.
And then my second question on the Equities business. The year on year revenue performance down 9% looks to be consistent with the US banks that have reported, but looking at the detail you provide, the mix seems a bit different. I think your Cash and Derivative revenues have held up relatively well and actually the bigger decline is coming in the Financing Services revenues. If I look at those Financing revenues, you talk about lower prime brokerage balances. Could you just explain what is driving that, is that a share loss issue? Thank you.
Kirt Gardner
Thank you Andrew. In terms of your first question regarding total costs, as we highlighted that we expect to be slightly up year on year in the second half. Now that includes the combined impact of all the actions that we have taken, including the tactical initiatives where we expect to see the majority of those in the second half of the year, along with some of the headwinds that we highlighted around the further clarification regarding regulatory matters, in addition to some of the investments that we’re making in the business. That also reflects the fact that we do see seasonality in the 4th quarter and that includes the UK banking levy. So the UK banking levy will contribute to that slightly up year on year. I won’t comment as to whether or not if we exclude that does that mean we are going to be flat or down, I would just mention that it is all aggregate and that is kind of the aggregate picture that I commented on.
Now looking at our Equities business, as you indicated, our Cash, Derivatives held up fairly well, and that is actually in the course of a very low vol environment, which does impact our business. I would mention as well, we do believe we increased our share of electronic trading in Equities, particularly in Asia, as well as the Americas. Now in terms, on the prime brokerage and the financing side, I can’t comment on a relative basis, I haven’t seen any indication at all that we’ve lost share. It is just a level of activity that we are seeing with our own clients and our activity levels are down quite a bit, which isn’t surprising just given the environment.
Andrew Coombs
Thank you.
Benjamin Goy, Deutsche Bank
Yes, hi, good morning. Two questions please. The first one in loan growth in GWM, so the 10 to 15% you highlighted last year, do you think that is still feasible in an environment where you highlight more competitive pressure in loan pricing?
And then secondly in the Investment Bank, the RWAs fell quite significantly and we’re now below the, or you basically more than compensated the increase we have seen in Q4 last year. Is that now the new run-rate or you expect a bit of recovery after maybe a subdued Q2 in terms of volatility going forward? Thank you.
55
Kirt Gardner
Ah yes, in terms of loan growth naturally, the environment is of course going to impact overall our loan growth performances versus our plan, just given the changes and assumptions around the beta factors. And specifically as an example, we saw accelerated deleveraging in Asia Pacific that was completely due to our clients’ outlook that resulted in a seven billion overall reduction in loans in Asia Pacific.
On top of that, with the increased level of refinancing the very aggressive pricing in the US even though our US mortgage book is actually up QonQ it is still going to impact the pace of growth versus what we had anticipated. So certainly as we reformulate our plans and Sergio commented on that several times, we will come back and give an indication of what we feel that trajectory is.
In terms of RWA and I think you know, very clearly when we received quite a significant reaction to the increase in market risk in the 4th quarter, and we highlighted that that was really due to the volatility, and we would expect it to come back down, that is exactly what you have seen. In fact, market risk continued to come down in the second quarter, we also saw a reduction overall in credit risk, right now our RWAs are at around a third of the total group, and maintain our guidance that we expect RWA and LWD usage to be around a third of the group with some volatility from quarter to quarter.
Benjamin Goy
Ok thank you.
Stefan Stalmann, Autonomous Research
Hi yes, good morning gentlemen. Two questions from my side please. For the first time, I think you have now disclosed your interest rate risk in the banking book, and you spell out a stressed loss in the 200 basis point upside scenario of 4.5 billion dollars. Could you give a rough guidance of how much of this 4.5 billion stress test loss would be CET1 capital relevant? I assume some of that would be filtered out through cash flow hedges etc.
And the second question: last year when you switched to the US dollar reporting, you mentioned a roughly 300 million revenue benefit as a result of this. Could you provide some color as to whether this is already in the current run-rate of revenue in the first half? Or is there still some of that to come because the positions have not been put on yet? Thank you very much.
Kirt Gardner
Yes Stefan, according to the updated Pillar III requirements we are now reporting on the interest rate in our banking book. The stress loss, that we quote, the 4.5 billion, which is an economic measure loss, would not have material effect, would have an insignificant effect on our CET1.
In terms of the US dollar, our reporting, we have actually seen a little bit more than the 300 million and it is already in our current results. And I would mention that the run-rate of that benefit from the change in currency will be impacted by the lower rates going forward. So you will see as we roll over our hedges on our investment in equity there will be some erosion of that over time. But that 300 million holds for the full year and it is already in our run-rate.
Stefan Stalmann
Great, thank you.
56
Andrew Lim, Société Générale
Hi, thanks for taking my questions. So the first one is on the competitive intensity for deposits that you referred to on page 16. I was wondering if, going forward, with interest rates set to go lower, you would except that competitive intensity to alleviate going forward, based on your historical experience? And then following on from that just another question on NII in general about factoring in forward rates. Can you give an equivalent impact on your gross margin over the next 12 months or so, everything else being equal?
And then my second question is on the outflows, the net new money outflows in the Americas. Obviously you have attributed that mainly to seasonal tax effects, but I also note that you have got advisors dropping by about a hundred or so over the quarter. Is that a contributory factor to the outflows or is it the case that you retain [inaudible] from when those advisors leaving the franchise goes to your more experienced advisors that you would retain? Many thanks.
Kirt Gardner
Yes, the competitive intensity on deposits, so really that has been building up over the last year and there are a couple of drivers. Firstly, it was actually more a response to interest rates as they were going up. As interest rates were increasing we saw our US clients in particular but also other clients in US dollars move into money markets. We saw about 11 billion increases in money market – a large portion of that coming out of demand deposits. And the second is actually clients moving into term deposits. Now we, in addition to clients shifting on their own re preference we also have been active in putting clients into term deposits and that is really just to continue to help with the funding structure of our US business. And all of that contributed to the reduction in deposit margins. Now that interest rates have reversed and they are coming down, we don’t really expect to see much more shifts into money markets and into time deposits going forward so we think that effect is largely stabilized.
On the NII guidance what we’ll really just stick to the fact that sequentially, we would expect to be down slightly if we see the 25 basis point drop. Now clearly the longer term rates will have an impact over time as we roll over our hedges on our US dollar book but as well on our Swiss franc book – you have seen in our Swiss business we have been able to offset that through some pricing actions.
In our US business in terms of the net new money outflows, you are correct. The largest portion of the US outflows were driven by tax payments but in addition to that we had some net recruiting outflows. Now I would say that we have a really strong pipeline of high quality new recruits. A number of those recruits actually come from the private banks, which means that they have a cooling down period, so there is a little bit of delay between when we recruit the FAs and when we actually onboard them and that is causing a little bit of delay of the inflows. So we would expect with our current pipeline and the confirmed recruits to see some improvement in our net recruiting numbers in the second half of the year.
Andrew Lim
That was great, many thanks.
57
Adam Terelak, Mediobanca
Good morning. Sorry to return to NII again, but you have given an indication on NII pressure coming both from the short end and the long end of the curve, but which would you actually say is the greater threat to GWM NII? Should we be focusing on multiple cuts from the Fed, or the inverted yield curve and lower mid-term rates? And how confident are you in protecting NII at the 9.50 to a billion sort of run-rate a quarter level we are at today?
And then the other side of that is how much flex do you have in your cost base? So year over year, revenues in GWM are down, but FA compensation in the US is up. Is this driven by the revenue mix and does it imply that much of the NII pressures will actually end up dropping straight to the bottom line?
Kirt Gardner
Yes Adam, thank you for another question on NII. In terms of the dynamics, the interplay between long-term and short-term, it is somewhat complex. I would just highlight, short-term rates we immediately see the flow through to our NII, because it depends of course on the beta factors. When we gave our guidance on the 25 basis point impact having a sequential reduction overall in our NII that was purely from an assumed 25 basis points, along with an assumed level of beta and how much of that we would pass on to our clients. And away from that, we don’t see much outside of that in terms of headwinds on a quarter on quarter basis. Now the longer term rates, they actually drive clients preferences, and so you see a lot of the shifts that have taken place. It is a combination of short and long term rates.
It also drives a pre-payment impact that you saw on mortgages which was very pronounced in US banks but also it was evident in our results on a year on year basis and so there are a number of complexities in terms of short versus long rates impacts overall the business.
Now on the overall, you talked about the US business and the fact that our FA comp is up. I would just highlight that actually, as we mentioned, our pre-tax profit was up record levels in the US. And so year on year, our PBT was up 4% year on year and 10% quarter on quarter, so really our FA comp move is directly in line with that. Having said that, as we have indicated before of course banking product revenue has very little payout on the grids and so you are right, banking product revenues including deposits and loans is much more accretive or dilutive to our pre-tax profit on the way up and down, particularly in the US.
Adam Terelak
Perfect, thank you.
Patrick Lee, Santander
Hiya, good morning, it’s Patrick from Santander. Thanks for taking my questions. I have two questions from the global wealth management division. One more general on the inflow dynamics, and the second one on the revenue mechanics. And firstly on the inflow question, outside the US seasonality, you recorded very good inflows in Q2 in Switzerland and EMEA but APAC was particularly weak after a record first quarter and I know you have talked about general economic and politic environments but I just wanted to ask you how much of that weak Q2 in APAC was due to all these conditions, problems and how much of that was your decision to stay out of competition for example?
58
And secondly, on the revenue dynamics, and I think in the past you have alluded to some sort of a lag or timing difference between getting the assets through the door and getting clients to deploy their assets so as to generate revenues. But if I look at for example your APAC example, you had a record inflow since the first quarter but that has not translated to better revenues sequentially. So I just wanted to know how much of that is because of all the issues you mentioned like client deleveraging and lower margin products or can we be more positive and expect some sort of a pickup in second half of the year as people put money to work so to speak. Thanks.
Kirt Gardner
Yes so in terms of your first question I guess that if you look at the net new money, you are right, APAC was down to 1.1 billion after a very strong first quarter. And as we indicated during the first quarter where we also had a challenging overall market and geopolitical environment. That is often driven to effects outside of market factors and often it is driven by larger idiosyncratic inflows, it could be driven by an entrepreneur either having gone through an IPO or actually wanting to look to monetize positions that they have. So it is, you don’t always have direct correlation so I wouldn’t read much into the fact that we are lower in this quarter than we were first quarter. We would expect to continue to see volatility, but overall we are pretty confident that we will see good flows in Asia during the second half of the year. You mentioned EMEA. Actually EMEA had a very strong quarter with 4.5 billion and that is off of a good first quarter, so they’re at 7.4 billion year to date. So EMEA in many ways today is probably our better performance certainly outside of Asia Pacific in terms of net new money.
Now on the revenue side, in a typical environment when we get invested assets in, it takes up to a full year before we fully put those new assets to work. Now if the inflows are in the form of cash, it is usually going to take longer, and in this environment where clients are inclined to hold a higher proportion of their assets in cash, in an Asia that is even more pronounced as we highlighted we saw an allocation out of equities into cash, and cash holdings increased by over 2%, you would expect that is going to take even longer for us to see that money be put into investments. And a lot of it is going to depend on our clients and their convictions. As you saw from the survey right now, there is not high conviction and clients are more or less in a wait and see mode.
Patrick Lee
Great thanks.
59
Cautionary statement regarding forward-looking statements: This document contains statements that constitute “forward-looking statements,” including but not limited to management’s outlook for UBS’s financial performance and statements relating to the anticipated effect of transactions and strategic initiatives on UBS’s business and future development. While these forward-looking statements represent UBS’s judgments and expectations concerning the matters described, a number of risks, uncertainties and other important factors could cause actual developments and results to differ materially from UBS’s expectations. These factors include, but are not limited to: (i) the degree to which UBS is successful in the ongoing execution of its strategic plans, including its cost reduction and efficiency initiatives and its ability to manage its levels of risk-weighted assets (RWA) and leverage ratio denominator (LRD), including to counteract regulatory-driven increases, liquidity coverage ratio and other financial resources, and the degree to which UBS is successful in implementing changes to its businesses to meet changing market, regulatory and other conditions; (ii) the continuing low or negative interest rate environment in Switzerland and other jurisdictions, developments in the macroeconomic climate and in the markets in which UBS operates or to which it is exposed, including movements in securities prices or liquidity, credit spreads, and currency exchange rates, and the effects of economic conditions, market developments, and geopolitical tensions on the financial position or creditworthiness of UBS’s clients and counterparties as well as on client sentiment and levels of activity; (iii) changes in the availability of capital and funding, including any changes in UBS’s credit spreads and ratings, as well as availability and cost of funding to meet requirements for debt eligible for total loss-absorbing capacity (TLAC); (iv) changes in or the implementation of financial legislation and regulation in Switzerland, the US, the UK, the European Union and other financial centers that have imposed, or resulted in, or may do so in the future, more stringent or entity-specific capital, TLAC, leverage ratio, liquidity and funding requirements, incremental tax requirements, additional levies, limitations on permitted activities, constraints on remuneration, constraints on transfers of capital and liquidity and sharing of operational costs across the Group or other measures, and the effect these will or would have on UBS’s business activities; (v) the degree to which UBS is successful in implementing further changes to its legal structure to improve its resolvability and meet related regulatory requirements and the potential need to make further changes to the legal structure or booking model of UBS Group in response to legal and regulatory requirements, proposals in Switzerland and other jurisdictions for mandatory structural reform of banks or systemically important institutions or to other external developments, and the extent to which such changes will have the intended effects; (vi) UBS’s ability to maintain and improve its systems and controls for the detection and prevention of money laundering and compliance with sanctions to meet evolving regulatory requirements and expectations, in particular in the US; (vii) the uncertainty arising from the timing and nature of the UK exit from the EU; (viii) changes in UBS’s competitive position, including whether differences in regulatory capital and other requirements among the major financial centers will adversely affect UBS’s ability to compete in certain lines of business; (ix) changes in the standards of conduct applicable to our businesses that may result from new regulation or new enforcement of existing standards, including recently enacted and proposed measures to impose new and enhanced duties when interacting with customers and in the execution and handling of customer transactions; (x) the liability to which UBS may be exposed, or possible constraints or sanctions that regulatory authorities might impose on UBS, due to litigation, contractual claims and regulatory investigations, including the potential for disqualification from certain businesses, potentially large fines or monetary penalties, or the loss of licenses or privileges as a result of regulatory or other governmental sanctions, as well as the effect that litigation, regulatory and similar matters have on the operational risk component of our RWA as well as the amount of capital available for return to shareholders; (xi) the effects on UBS’s cross-border banking business of tax or regulatory developments and of possible changes in UBS’s policies and practices relating to this business; (xii) UBS’s ability to retain and attract the employees necessary to generate revenues and to manage, support and control its businesses, which may be affected by competitive factors; (xiii) changes in accounting or tax standards or policies, and determinations or interpretations affecting the recognition of gain or loss, the valuation of goodwill, the recognition of deferred tax assets and other matters; (xiv) UBS’s ability to implement new technologies and business methods, including digital services and technologies and ability to successfully compete with both existing and new financial service providers, some of which may not be regulated to the same extent; (xv) limitations on the effectiveness of UBS’s internal processes for risk management, risk control, measurement and modeling, and of financial models generally; (xvi) the occurrence of operational failures, such as fraud, misconduct, unauthorized trading, financial crime, cyberattacks, and systems failures; (xvii) restrictions on the ability of UBS Group AG to make payments or distributions, including due to restrictions on the ability of its subsidiaries to make loans or distributions, directly or indirectly, or, in the case of financial difficulties, due to the exercise by FINMA or the regulators of UBS’s operations in other countries of their broad statutory powers in relation to protective measures, restructuring and liquidation proceedings; (xviii) the degree to which changes in regulation, capital or legal structure, financial results or other factors may affect UBS’s ability to maintain its stated capital return objective; and (xix) the effect that these or other factors or unanticipated events may have on our reputation and the additional consequences that this may have on our business and performance. The sequence in which the factors above are presented is not indicative of their likelihood of occurrence or the potential magnitude of their consequences. Our business and financial performance could be affected by other factors identified in our past and future filings and reports, including those filed with the SEC. More detailed information about those factors is set forth in documents furnished by UBS and filings made by UBS with the SEC, including UBS’s Annual Report on Form 20-F for the year ended 31 December 2018. UBS is not under any obligation to (and expressly disclaims any obligation to) update or alter its forward-looking statements, whether as a result of new information, future events, or otherwise..
60
Disclaimer: This document and the information contained herein are provided solely for information purposes, and are not to be construed as a solicitation of an offer to buy or sell any securities or other financial instruments in Switzerland, the United States or any other jurisdiction. No investment decision relating to securities of or relating to UBS Group AG, UBS AG or their affiliates should be made on the basis of this document. No representation or warranty is made or implied concerning, and UBS assumes no responsibility for, the accuracy, completeness, reliability or comparability of the information contained herein relating to third parties, which is based solely on publicly available information. UBS undertakes no obligation to update the information contained herein.
Non-GAAP Financial Measures: In addition to reporting results in accordance with International Financial Reporting Standards (IFRS), UBS reports adjusted results that exclude items that management believes are not representative of the underlying performance of its businesses. Such adjusted results are non-GAAP financial measures as defined by US Securities and Exchange Commission (SEC) regulations and may be Alternative Performance Measures as defined under the guidelines published the European Securities Market Authority (ESMA). Please refer to pages 7-10 of UBS's Quarterly Report for the second quarter of 2019 and to its most recent Annual Report for a reconciliation of adjusted performance measures to reported results under IFRS and for definitions of adjusted performance measures and other alternative performance measures.
© UBS 2019. The key symbol and UBS are among the registered and unregistered trademarks of UBS. All rights reserved.
61
SIGNATURES
Pursuant to the requirements of the Securities Exchange Act of 1934, the registrants have duly caused this report to be signed on their behalf by the undersigned, thereunto duly authorized.
UBS Group AG
By: _/s/ David Kelly________________
Name: David Kelly
Title: Managing Director
By: _/s/ Ella Campi ________________
Name: Ella Campi
Title: Executive Director
UBS AG
By: _/s/ David Kelly________________
Name: David Kelly
Title: Managing Director
By: _/s/ Ella Campi ________________
Name: Ella Campi
Title: Executive Director
Date: July 23, 2019