SECURITIES AND EXCHANGE COMMISSION
Washington, D.C. 20549
_________________
FORM 6-K
REPORT OF FOREIGN PRIVATE ISSUER
PURSUANT TO RULE 13a-16 OR 15d-16 UNDER
THE SECURITIES EXCHANGE ACT OF 1934
Date: August 27, 2019
UBS Group AG
Commission File Number: 1-36764
UBS AG
Commission File Number: 1-15060
(Registrants' Name)
Bahnhofstrasse 45, Zurich, Switzerland and
Aeschenvorstadt 1, Basel, Switzerland
(Address of principal executive offices)
Indicate by check mark whether the registrants file or will file annual reports under cover of Form 20‑F or Form 40-F.
Form 20-F x Form 40-F o
This Form 6-K consists of the Basel III Pillar 3 disclosure for UBS Group AG and significant regulated subsidiaries report as of 30 June 2019, which appears immediately following this page.

30 June 2019 Pillar 3 report
UBS Group and significant regulated subsidiaries and sub-groups
Table of contents | |||
| |||
UBS Group AG | |||
6 | Section 1 | ||
8 | Section 2 | ||
12 | Section 3 | ||
24 | Section 4 | ||
31 | Section 5 | ||
36 | Section 6 | ||
40 | Section 7 | ||
43 | Section 8 | ||
50 | Section 9 | ||
52 | Section 10 | ||
55 | Section 11 | ||
57 | Section 12 | Requirements for global systemically important banks and related indicators | |
|
|
| |
|
| ||
Significant regulated subsidiaries and sub-groups | |||
60 | Section 1 | ||
60 | Section 2 | ||
64 | Section 3 | ||
70 | Section 4 | ||
71 | Section 5 | ||
|
|
| |
|
Switchboards
For all general inquiries
www.ubs.com/contact
Zurich +41-44-234 1111
London +44- 207-567 8000
New York +1-212-821 3000
Hong Kong +852-2971 8888 Singapore +65-6495 8000
Investor Relations
UBS’s Investor Relations team supports institutional, professional and retail investors from
our offices in Zurich,
New York and Krakow.
UBS Group AG, Investor Relations
P.O. Box, CH-8098 Zurich, Switzerland
www.ubs.com/investors
Zurich +41-44-234 4100
New York +1-212-882 5734
Media Relations
UBS’s Media Relations team supports
global media and journalists
from our offices in Zurich, London, New York and Hong Kong.
www.ubs.com/media
Zurich +41-44-234 8500
mediarelations@ubs.com
London +44-20-7567 4714
ubs-media-relations@ubs.com
New York +1-212-882 5858
mediarelations-ny@ubs.com
Hong Kong +852-2971 8200
sh-mediarelations-ap@ubs.com
Office of the Group Company Secretary
The Group Company Secretary receives inquiries regarding compensation and related issues addressed to members of the Board of Directors.
UBS Group AG, Office of the
Group Company Secretary
P.O. Box, CH-8098 Zurich, Switzerland
sh-company-secretary@ubs.com
+41-44-235 6652
Shareholder Services
UBS’s Shareholder Services team,
a unit of the Group Company Secretary Office, is responsible
for the registration of UBS Group AG registered shares.
UBS Group AG, Shareholder Services
P.O. Box, CH-8098 Zurich, Switzerland
sh-shareholder-services@ubs.com
+41-44-235 6652
US Transfer Agent
For global registered share-related
inquiries in the US.
Computershare Trust Company NA
P.O. Box 505000
Louisville, KY 40233-5000, USA
Shareholder online inquiries:
https://www-us.computershare.com/
investor/Contact
Shareholder website:
www.computershare.com/investor
Calls from the US
+1-866-305-9566
Calls from outside the US
+1-781-575-2623
TDD for hearing impaired
+1-800-231-5469
TDD for foreign shareholders
+1-201-680-6610
Imprint
Publisher: UBS Group AG, Zurich, Switzerland | www.ubs.com
Language: English
© UBS 2019. The key symbol and UBS are among the registered and unregistered trademarks of UBS. All rights reserved.
Introduction and basis for preparation
Scope and location of Basel III Pillar 3 disclosures
The Basel Committee on Banking Supervision (BCBS) Basel III capital adequacy framework consists of three complementary pillars. Pillar 1 provides a framework for measuring minimum capital requirements for the credit, market, operational and non-counterparty-related risks faced by banks. Pillar 2 addresses the principles of the supervisory review process, emphasizing the need for a qualitative approach to supervising banks. Pillar 3 requires banks to publish a range of disclosures, mainly covering risk, capital, leverage, liquidity and remuneration.
This report provides Pillar 3 disclosures for UBS Group AG and prudential key figures and regulatory information for UBS AG standalone, UBS Switzerland AG standalone, UBS Europe SE consolidated and UBS Americas Holding LLC consolidated in the respective sections under “Significant regulated subsidiaries and sub-groups.”
As UBS is considered a systemically relevant bank (SRB) under Swiss banking law, UBS Group AG and UBS AG are required to comply with regulations based on the Basel III framework as applicable to Swiss SRBs on a consolidated basis. Capital and other regulatory information as of 30 June 2019 for UBS Group AG consolidated is provided in the “Capital management” section of our second quarter 2019 report and for UBS AG consolidated in the “Capital management” section of the UBS AG second quarter 2019 report, which are available under “Quarterly reporting” at www.ubs.com/investors.
Local regulators may also require the publication of Pillar 3 information at a subsidiary or sub-group level. Where applicable, these local disclosures are provided under “Holding company and significant regulated subsidiaries and sub-groups” at www.ubs.com/investors.
Significant BCBS and FINMA capital adequacy, liquidity and funding, and related disclosure requirements
This Pillar 3 report has been prepared in accordance with FINMA Pillar 3 disclosure requirements (FINMA Circular 2016/1, “Disclosure – banks”) issued on 16 July 2018, the underlying BCBS guidance “Revised Pillar 3 disclosure requirements” issued in January 2015, the “Frequently asked questions on the revised Pillar 3 disclosure requirements” issued in August 2016, the “Pillar 3 disclosure requirements – consolidated and enhanced framework” issued in March 2017 and the subsequent “Technical Amendment – Pillar 3 disclosure requirements – regulatory treatment of accounting provisions” issued in August 2018.
Changes to Pillar 3 disclosure requirements
In line with BCBS and FINMA requirements, the following disclosures are published for the first time, effective as of 30 June 2019:
– “TLAC1 – TLAC composition for G-SIBs (at resolution group level)” applicable to UBS Group AG consolidated;
– “TLAC3 – Resolution entity – creditor ranking at legal entity level” applicable to UBS Group AG at a legal entity level;
– “IRRBBA – IRRBB risk management objective and policies – qualitative requirements” applicable to UBS Group AG consolidated;
– “IRRBB1 – Quantitative information on IRRBB” applicable to UBS Group AG consolidated; and
– “IRRBBA1 – Quantitative disclosures relating to the position structure and interest rate reset of IRRBB risk” applicable to UBS Group AG consolidated.
We currently expect to provide the "TLAC2 – Material subgroup entity – creditor ranking at legal entity level” disclosure in our 31 December 2019 Pillar 3 report. The “CR1 – Credit quality of assets” table in this report has been revised to address additional disclosure requirements with regard to the allocation of the accounting provisions for credit losses between the standardized approach and the internal ratings-based approach, as required by the aforementioned BCBS Technical Amendment issued in August 2018.
2
Significant BCBS requirements to be adopted in the second half of 2019 or later
BCBS initial margin offset in the leverage ratio and new disclosure requirements
The BCBS agreed to align the leverage ratio measurement of client-cleared derivatives with the standardized approach to measuring counterparty credit risk exposures (SA-CCR). We expect these provisions will become effective as of 1 January 2022. This treatment permits both cash and non-cash forms of segregated initial margin, as well as cash and non-cash variation margin, received from a client to offset the replacement cost and potential future exposure for client-cleared derivatives only. This will help to mitigate any potential effect on the leverage ratio denominator from the finalization of the Basel III capital framework, which takes effect from 1 January 2022.
The BCBS also introduced a new disclosure standard, effective as of 1 January 2022, which sets out additional requirements for banks to disclose their leverage ratios based on quarter-end and daily average values of securities financing transactions.
Frequency and comparability of Pillar 3 disclosures
FINMA has specified the reporting frequency for each disclosure, as outlined in the table on pages 5 and 6 of our 31 December 2018 Pillar 3 report, which is available under “Pillar 3 disclosures” at www.ubs.com/investors.
In line with the FINMA-specified disclosure frequency and requirements for disclosure with regard to comparative periods, we provide quantitative comparative information as of 31 March 2019 for disclosures required on a quarterly basis, and as of 31 December 2018 for disclosures required on a semiannual basis. Where specifically required by FINMA and/or BCBS, we disclose comparative information for additional reporting dates. The new TLAC1, TLAC3 and IRRBB disclosures are provided for the first time as of 30 June 2019 in this report without comparative information. The IRRBB disclosure will be provided on an annual basis from 31 December 2019 onward.
Where required, movement commentary is aligned with the corresponding disclosure frequency required by FINMA and always refers to the latest comparative period. Throughout this report, signposts are displayed at the beginning of a section, table or chart – Annual | Semiannual | Quarterly | – indicating whether the disclosure is provided annually, semiannually or quarterly. A triangle symbol – p p p – indicates the end of the signpost.
® Refer to our 31 March 2019 Pillar 3 report, which is available under “Pillar 3 disclosures” at www.ubs.com/investors, for more information about previously published quarterly movement commentary
3
UBS Group AG
Key metrics of the second quarter of 2019
Quarterly | The KM1 and KM2 tables below are based on Basel Committee on Banking Supervision (BCBS) Basel III phase-in rules. The KM2 table includes a reference to the total loss-absorbing capacity (TLAC) term sheet, published by the Financial Stability Board (FSB). The website of the FSB provides this term sheet, at www.fsb.org/2015/11/total-loss-absorbing-capacity-tlac-principles-and-term-sheet.
During the second quarter of 2019, our common equity tier 1 (CET1) capital increased by USD 0.3 billion to USD 34.9 billion, mainly as a result of operating profit before tax and foreign currency translation effects, partly offset by accruals for capital returns to shareholders, compensation-related regulatory capital accruals, share repurchases under our share repurchase program and current tax expense.
® Refer to “UBS shares” in the “Capital management” section of our second quarter 2019 report for more information about the share repurchase program
The TLAC available as of 30 June 2019 included CET1 capital, additional tier 1 and tier 2 capital instruments eligible under the TLAC framework, and non-regulatory capital elements of TLAC. Under the Swiss systemically relevant bank (SRB) framework, including transitional arrangements, TLAC excludes 45% of the gross unrealized gains on debt instruments measured at fair value through other comprehensive income for accounting purposes, which for regulatory capital purposes is measured at the lower of cost or market value. This amount was negligible as of 30 June 2019 but is included as available TLAC in the KM2 table below and in the TLAC1 table on page 50 of this report.
Risk-weighted assets (RWA) decreased by USD 5.4 billion to USD 262.1 billion, mainly as a result of decreases in credit risk RWA and market risk RWA. Leverage ratio exposure remained stable during the quarter. High-quality liquid assets decreased by USD 9.9 billion, primarily driven by lower average cash balances, reflecting increased funding consumption by the business divisions. p
Quarterly |
KM1: Key metrics |
|
|
|
|
|
|
|
|
| |
USD million, except where indicated |
| |||||||||
|
|
| 30.6.19 |
| 31.3.19 |
| 31.12.18 |
| 30.9.183 | 30.6.183 |
Available capital (amounts)1 |
|
|
|
|
|
|
|
|
| |
1 | Common equity tier 1 (CET1) |
| 34,948 |
| 34,658 |
| 34,119 |
| 34,816 | 34,116 |
1a | Fully loaded ECL accounting model |
| 34,904 |
| 34,613 |
| 34,071 |
| 34,816 | 34,116 |
2 | Tier 1 |
| 49,993 |
| 49,436 |
| 46,279 |
| 45,972 | 45,353 |
2a | Fully loaded ECL accounting model Tier 1 |
| 49,949 |
| 49,391 |
| 46,231 |
| 45,972 | 45,353 |
3 | Total capital |
| 56,345 |
| 56,148 |
| 52,981 |
| 52,637 | 52,450 |
3a | Fully loaded ECL accounting model total capital |
| 56,302 |
| 56,103 |
| 52,933 |
| 52,637 | 52,450 |
Risk-weighted assets (amounts) |
|
|
|
|
|
|
|
|
| |
4 | Total risk-weighted assets (RWA) |
| 262,135 |
| 267,556 |
| 263,747 |
| 257,041 | 254,603 |
4a | Minimum capital requirement2 |
| 20,971 |
| 21,404 |
| 21,100 |
| 20,563 | 20,368 |
4b | Total risk-weighted assets (pre-floor) |
| 262,135 |
| 267,556 |
| 263,747 |
| 257,041 | 254,603 |
Risk-based capital ratios as a percentage of RWA1 |
|
|
|
|
|
|
|
|
| |
5 | Common equity tier 1 ratio (%) |
| 13.33 |
| 12.95 |
| 12.94 |
| 13.55 | 13.40 |
5a | Fully loaded ECL accounting model Common equity tier 1 (%) |
| 13.32 |
| 12.94 |
| 12.92 |
| 13.55 | 13.40 |
6 | Tier 1 ratio (%) |
| 19.07 |
| 18.48 |
| 17.55 |
| 17.89 | 17.81 |
6a | Fully loaded ECL accounting model Tier 1 ratio (%) |
| 19.05 |
| 18.46 |
| 17.53 |
| 17.89 | 17.81 |
7 | Total capital ratio (%) |
| 21.49 |
| 20.99 |
| 20.09 |
| 20.48 | 20.60 |
7a | Fully loaded ECL accounting model total capital ratio (%) |
| 21.48 |
| 20.97 |
| 20.07 |
| 20.48 | 20.60 |
Additional CET1 buffer requirements as a percentage of RWA |
|
|
|
|
|
|
|
|
| |
8 | Capital conservation buffer requirement (2.5% from 2019) (%) |
| 2.50 |
| 2.50 |
| 1.88 |
| 1.88 | 1.88 |
9 | Countercyclical buffer requirement (%) |
| 0.09 |
| 0.10 |
| 0.08 |
| 0.05 | 0.06 |
9a | Additional countercyclical buffer for Swiss mortgage loans (%) |
| 0.22 |
| 0.21 |
| 0.21 |
| 0.21 | 0.20 |
10 | Bank G-SIB and/or D-SIB additional requirements (%) |
| 1.00 |
| 1.00 |
| 0.75 |
| 0.75 | 0.75 |
11 | Total of bank CET1 specific buffer requirements (%)1 |
| 3.59 |
| 3.60 |
| 2.71 |
| 2.68 | 2.68 |
12 | CET1 available after meeting the bank’s minimum capital requirements (%)1 |
| 8.83 |
| 8.45 |
| 8.44 |
| 9.05 | 8.90 |
Basel III leverage ratio |
|
|
|
|
|
|
|
|
| |
13 | Total Basel III leverage ratio exposure measure |
| 911,379 |
| 910,993 |
| 904,598 |
| 915,066 | 910,383 |
14 | Basel III leverage ratio (%)1 |
| 5.49 |
| 5.43 |
| 5.12 |
| 5.02 | 4.98 |
14a | Fully loaded ECL accounting model Basel III leverage ratio (%)1 |
| 5.48 |
| 5.42 |
| 5.11 |
| 5.02 | 4.98 |
Liquidity coverage ratio |
|
|
|
|
|
|
|
|
| |
15 | Total HQLA |
| 176,173 |
| 186,038 |
| 173,389 |
| 176,594 | 183,202 |
16 | Total net cash outflow |
| 121,314 |
| 121,521 |
| 127,352 |
| 130,750 | 127,324 |
17 | LCR ratio (%) |
| 145 |
| 153 |
| 136 |
| 135 | 144 |
1 Based on BCBS Basel III phase-in rules. 2 Calculated as 8% of total RWA, based on total capital minimum requirements, excluding CET1 buffer requirements. 3 In line with the change of the presentation currency of UBS Group AG’s and UBS AG’s consolidated and standalone financial statements from Swiss francs to US dollars in October 2018, prior periods were translated to US dollars at the respective spot rates prevailing on the relevant reporting dates. | ||||||||||
p
6
Quarterly |
KM2: Key metrics – TLAC requirements (at resolution group level)1 | |||||||||||
USD million, except where indicated |
|
|
|
|
|
|
|
|
|
| |
|
| 30.6.19 |
| 31.3.19 |
| 31.12.18 |
| 30.9.182 |
| 30.6.182 | |
1 | Total loss-absorbing capacity (TLAC) available |
| 87,388 |
| 87,477 |
| 83,740 |
| 81,711 |
| 82,211 |
1a | Fully loaded ECL accounting model TLAC available |
| 87,344 |
| 87,433 |
| 83,692 |
| 81,711 |
| 82,211 |
2 | Total RWA at the level of the resolution group |
| 262,135 |
| 267,556 |
| 263,747 |
| 257,041 |
| 254,603 |
3 | TLAC as a percentage of RWA (%) |
| 33.34 |
| 32.69 |
| 31.75 |
| 31.79 |
| 32.29 |
3a | Fully loaded ECL accounting model TLAC as a percentage of fully loaded ECL accounting model RWA (%) |
| 33.32 |
| 32.68 |
| 31.73 |
| 31.79 |
| 32.29 |
4 | Leverage ratio exposure measure at the level of the resolution group |
| 911,379 |
| 910,993 |
| 904,598 |
| 915,066 |
| 910,383 |
5 | TLAC as a percentage of leverage ratio exposure measure (%) |
| 9.59 |
| 9.60 |
| 9.26 |
| 8.93 |
| 9.03 |
5a | Fully loaded ECL accounting model TLAC as a percentage of fully loaded ECL accounting model Leverage exposure measure (%) |
| 9.58 |
| 9.60 |
| 9.25 |
| 8.93 |
| 9.03 |
6a | Does the subordination exemption in the antepenultimate paragraph of Section 11 of the FSB TLAC Term Sheet apply? |
| No | ||||||||
6b | Does the subordination exemption in the penultimate paragraph of Section 11 of the FSB TLAC Term Sheet apply? |
| No | ||||||||
6c | If the capped subordination exemption applies, the amount of funding issued that ranks pari passu with excluded liabilities and that is recognized as external TLAC, divided by funding issued that ranks pari passu with excluded liabilities and that would be recognized as external TLAC if no cap was applied (%) |
| N/A – Refer to our response to 6b. | ||||||||
1 Resolution group level is defined as the UBS Group AG consolidated level. 2 In line with the change of the presentation currency of UBS Group AG’s and UBS AG’s consolidated and standalone financial statements from Swiss francs to US dollars in October 2018, prior-period disclosures were translated to US dollars at the respective spot rates prevailing on the relevant reporting dates. | |||||||||||
p
7
UBS Group AG
Our approach to measuring risk exposure and risk-weighted assets
Depending on the purpose, the measurement of risk exposure that we apply may differ. Exposures may be measured for financial accounting purposes under International Financial Reporting Standards (IFRS), for deriving our regulatory capital requirements or for internal risk management and control purposes. Our Pillar 3 disclosures are generally based on measures of risk exposure used to derive the regulatory capital required under Pillar 1. Our risk-weighted assets (RWA) are calculated according to the Basel Committee on Banking Supervision (BCBS) Basel III framework, as implemented by the Swiss Capital Adequacy Ordinance issued by the Swiss Federal Council and by the associated circulars issued by the Swiss Financial Market Supervisory Authority (FINMA).
For information about the measurement of risk exposures and RWA, refer to pages 9–12 of our 31 December 2018 Pillar 3 report, which is available under “Pillar 3 disclosures” at www.ubs.com/investors.
RWA development in the second quarter of 2019
Quarterly | The OV1 table below provides an overview of our risk-weighted assets (RWA) and the related minimum capital requirements by risk type. The FINMA template includes rows that are currently not applicable to UBS and therefore have been left empty.
During the second quarter of 2019, RWA decreased by USD 5.4 billion to USD 262.1 billion, mainly as a result of decreases of USD 3.4 billion in credit risk RWA and USD 2.0 billion in market risk RWA.
Counterparty credit risk RWA measured under the standardized approach as disclosed in line 7 of the OV1 table below increased by USD 0.6 billion, mainly driven by increases in derivatives exposures in the Investment Bank.
Equity positions under the simple risk weight approach decreased by USD 0.7 billion, primarily driven by the sale of a limited number of positions in the Investment Bank’s Foreign Exchange, Rates and Credit business.
The flow tables for credit risk, counterparty credit risk and market risk RWA in the respective sections of this report provide further details regarding the movements in RWA in the second quarter of 2019. More information about capital management and RWA, including details of movements in RWA during the second and first quarters of 2019, is provided on pages 53–54 of our second quarter 2019 report and on pages 52–53 of our first quarter 2019 report, both available under “Quarterly reporting” at www.ubs.com/investors.p
8
Quarterly |
OV1: Overview of RWA | |||||||
USD million |
| RWA |
| Minimum capital requirements1 | |||
|
| 30.6.19 | 31.3.19 | 31.12.18 |
| 30.6.19 | |
1 | Credit risk (excluding counterparty credit risk) |
| 114,991 | 118,419 | 112,991 |
| 9,199 |
2 | of which: standardized approach (SA)2 |
| 28,287 | 28,971 | 25,972 |
| 2,263 |
3 | of which: foundation internal ratings-based (F-IRB) approach |
|
|
|
|
|
|
4 | of which: supervisory slotting approach |
|
|
|
|
|
|
5 | of which: advanced internal ratings-based (A-IRB) approach |
| 86,703 | 89,448 | 87,019 |
| 6,936 |
6 | Counterparty credit risk3 |
| 37,487 | 36,793 | 34,282 |
| 2,999 |
7 | of which: SA for counterparty credit risk (SA-CCR)4 |
| 5,793 | 5,183 | 5,415 |
| 463 |
8 | of which: internal model method (IMM) |
| 20,133 | 19,371 | 17,624 |
| 1,611 |
8a | of which: value-at-risk (VaR) |
| 5,453 | 5,889 | 5,036 |
| 436 |
9 | of which: other CCR |
| 6,107 | 6,351 | 6,207 |
| 489 |
10 | Credit valuation adjustment (CVA) |
| 2,553 | 2,631 | 2,816 |
| 204 |
11 | Equity positions under the simple risk weight approach5 |
| 3,302 | 3,960 | 3,658 |
| 264 |
12 | Equity investments in funds – look-through approach6 |
|
|
|
|
|
|
13 | Equity investments in funds – mandate-based approach6 |
|
|
|
|
|
|
14 | Equity investments in funds – fall-back approach6 |
|
|
|
|
|
|
15 | Settlement risk |
| 415 | 384 | 375 |
| 33 |
16 | Securitization exposures in banking book |
| 664 | 703 | 709 |
| 53 |
17 | of which securitization internal ratings-based approach (SEC-IRBA) |
|
|
|
|
|
|
18 | of which securitization external ratings-based approach (SEC-ERBA) including internal assessment approach (IAA) |
| 657 | 696 | 701 |
| 53 |
19 | of which securitization standardized approach (SEC-SA) |
| 7 | 7 | 8 |
| 1 |
20 | Market Risk |
| 10,977 | 12,985 | 19,992 |
| 878 |
21 | of which: standardized approach (SA) |
| 452 | 643 | 452 |
| 36 |
22 | of which: internal model approaches (IMA) |
| 10,526 | 12,343 | 19,541 |
| 842 |
23 | Capital charge for switch between trading book and banking book |
|
|
|
|
|
|
24 | Operational risk |
| 80,345 | 80,345 | 77,558 |
| 6,428 |
25 | Amounts below thresholds for deduction (250% risk weight)7 |
| 11,402 | 11,335 | 11,365 |
| 912 |
26 | Floor adjustment8 |
| 0 | 0 | 0 |
| 0 |
27 | Total |
| 262,135 | 267,556 | 263,747 |
| 20,971 |
1 Calculated based on 8% of RWA. 2 Includes non-counterparty-related risk not subject to the threshold deduction treatment (30 June 2019: RWA USD 12,912 million; 31 March 2019: RWA USD 12,779 million; 31 December 2018: RWA USD 9,514 million). Non-counterparty-related risk (30 June 2019: RWA USD 8,853 million; 31 March 2019: RWA USD 8,747 million; 31 December 2018: RWA USD 8,782 million), which is subject to the threshold treatment, is reported in line 25 “Amounts below thresholds for deduction (250% risk weight).” 3 Excludes settlement risk, which is separately reported in line 15 “Settlement risk.” Includes RWA with central counterparties. A new regulation for the calculation of RWA for exposure to central counterparties will be implemented by 1 January 2020. The split between the subcomponents of counterparty credit risk refers to the calculation of the exposure measure. 4 Calculated in accordance with the current exposure method (CEM), until SA-CCR is implemented by 1 January 2020. 5 Includes investments in funds. Items subject to threshold deduction treatments that do not exceed their respective threshold are risk weighted at 250% (30 June 2019: RWA USD 2,548 million; 31 March 2019: RWA USD 2,588 million; 31 December 2018: RWA USD 2,583 million) and are separately included in line 25 “Amounts below thresholds for deduction (250% risk weight).” 6 A new regulation for the calculation of RWA for investments in funds will be implemented by 1 January 2020. 7 Includes items subject to threshold deduction treatments that do not exceed their respective threshold and risk weighted at 250%. Items subject to threshold deduction treatments are significant investments in common shares of non-consolidated financial institutions (banks, insurance and other financial entities) and deferred tax assets arising from temporary differences, both of which are measured against their respective threshold. 8 No floor effect, as 80% of our Basel I RWA including the RWA equivalent of the Basel I capital deductions do not exceed our Basel III RWA including the RWA equivalent of the Basel III capital deductions. For the status of the finalization of the Basel III capital framework, refer to the “Regulatory and legal developments” section of our Annual Report 2018, available under “Annual reporting” at www.ubs.com/investors, which outlines how the proposed floor calculation would differ in significant aspects from the current approach. | |||||||
p
9
UBS Group AG
The table below is provided on a voluntary basis to complement other disclosures provided, is aligned with the principles applied in the OV1 table shown above and presents the net exposure at default (EAD) and RWA by risk type and FINMA-defined asset class, which forms the basis for the calculation of RWA. These exposures are further subdivided into standardized approaches and advanced internal ratings-based (A-IRB) or model-based approaches. For credit risk, the classification defines the method used to derive the risk weight factors, through either internal ratings (A-IRB) or external ratings (standardized approach). The split between standardized approaches and A-IRB or model-based approaches for counterparty credit risk refers to the exposure measure, whereas the split in templates CCR3 and CCR4 refers to the risk-weighting approach. Market and operational risk RWA, excluding securitization and re-securitization in the trading book, are derived using model calculations and are therefore included in the model-based approach columns.
The table below provides references to sections in this report containing more information about the specific topics.
Regulatory exposures and risk-weighted assets | |||||||||||
30.6.19 | |||||||||||
|
| A-IRB / model-based approaches |
| Standardized approaches2 |
| Total | |||||
USD million |
| Net EAD | RWA | Section or table reference |
| Net EAD | RWA | Section or table reference |
| Net EAD | RWA |
Credit risk (excluding counterparty credit risk) |
| 529,925 | 86,703 | 3 |
| 49,922 | 28,287 | 3 |
| 579,847 | 114,991 |
Central governments and central banks |
| 140,098 | 3,064 | CR6, CR7 |
| 11,017 | 885 | CR4, CR5 |
| 151,115 | 3,949 |
Banks and securities dealers |
| 15,953 | 4,762 | CR6, CR7 |
| 5,132 | 1,172 | CR4, CR5 |
| 21,086 | 5,934 |
Public-sector entities, multilateral development banks |
| 6,822 | 817 | CR6, CR7 |
| 949 | 278 | CR4, CR5 |
| 7,771 | 1,095 |
Corporates: specialized lending |
| 23,511 | 11,798 | CR6, CR7 |
|
|
| CR4, CR5 |
| 23,511 | 11,798 |
Corporates: other lending |
| 52,992 | 29,669 | CR6, CR7 |
| 6,080 | 4,864 | CR4, CR5 |
| 59,073 | 34,533 |
Central counterparties |
|
|
|
|
| 376 | 14 |
|
| 376 | 14 |
Retail |
| 290,548 | 36,593 | CR6, CR7 |
| 12,367 | 8,162 | CR4, CR5 |
| 302,914 | 44,755 |
Residential mortgages |
| 145,852 | 27,678 |
|
| 6,662 | 2,860 |
|
| 152,514 | 30,538 |
Qualifying revolving retail exposures (QRRE) |
| 1,836 | 647 |
|
|
|
|
|
| 1,836 | 647 |
Other retail1 |
| 142,860 | 8,269 |
|
| 5,705 | 5,302 |
|
| 148,565 | 13,571 |
Non-counterparty-related risk |
|
|
|
|
| 14,001 | 12,912 | CR4, CR5 |
| 14,001 | 12,912 |
Property, equipment and software |
|
|
|
|
| 12,645 | 12,645 |
|
| 12,645 | 12,645 |
Other |
|
|
|
|
| 1,356 | 267 |
|
| 1,356 | 267 |
Counterparty credit risk2 |
| 84,322 | 25,587 | 4 |
| 82,687 | 11,900 | 4 |
| 167,009 | 37,487 |
Central governments and central banks |
| 7,144 | 747 | CCR3, CCR4 |
| 3,460 | 106 | CCR3, CCR4 |
| 10,604 | 853 |
Banks and securities dealers |
| 17,067 | 5,077 | CCR3, CCR4 |
| 3,014 | 835 | CCR3, CCR4 |
| 20,081 | 5,911 |
Public-sector entities, multilateral development banks |
| 1,839 | 345 | CCR3, CCR4 |
| 504 | 23 | CCR3, CCR4 |
| 2,344 | 368 |
Corporates incl. specialized lending |
| 42,391 | 19,023 | CCR3, CCR4 |
| 20,343 | 8,761 | CCR3, CCR4 |
| 62,734 | 27,784 |
Central counterparties |
| 15,881 | 396 |
|
| 49,149 | 1,621 |
|
| 65,031 | 2,017 |
Retail |
|
|
|
|
| 6,216 | 554 | CCR3, CCR4 |
| 6,216 | 554 |
Credit valuation adjustment (CVA) |
|
| 1,106 | 4, CCR2 |
|
| 1,447 | 4, CCR2 |
|
| 2,553 |
Equity positions in the banking book (CR) |
| 788 | 3,302 | 3, CR10 |
|
|
|
|
| 788 | 3,302 |
Settlement risk |
| 30 | 74 |
|
| 167 | 340 |
|
| 197 | 415 |
Securitization exposure in the banking book |
|
|
|
|
| 203 | 664 | 5 |
| 203 | 664 |
Market risk |
|
| 10,526 | 6 |
| 720 | 452 | 5, 6 |
| 720 | 10,977 |
Value-at-risk (VaR) |
|
| 1,439 | MR2 |
|
|
|
|
|
| 1,439 |
Stressed value-at risk (SVaR) |
|
| 3,448 | MR2 |
|
|
|
|
|
| 3,448 |
Add-on for risks-not-in-VaR (RniV) |
|
| 4,114 | MR2 |
|
|
|
|
|
| 4,114 |
Incremental risk charge (IRC) |
|
| 1,524 | MR2 |
|
|
|
|
|
| 1,524 |
Comprehensive risk measure (CRM)3 |
|
|
|
|
|
|
|
|
|
| 0 |
Securitization / re-securitization in the trading book |
|
|
|
|
| 720 | 452 | MR1 |
| 720 | 452 |
Operational risk |
|
| 80,345 |
|
|
|
|
|
|
| 80,345 |
Amounts below thresholds for deduction (250% risk weight) |
| 1,019 | 2,548 |
|
| 3,541 | 8,853 |
|
| 4,560 | 11,402 |
Deferred tax assets |
|
|
|
|
| 3,541 | 8,853 |
|
| 3,541 | 8,853 |
Significant investments in non-consolidated financial institutions |
| 1,019 | 2,548 |
|
|
|
|
|
| 1,019 | 2,548 |
Total |
| 616,084 | 210,191 |
|
| 137,240 | 51,944 |
|
| 753,324 | 262,135 |
10
Regulatory exposures and risk-weighted assets (continued) | |||||||||||
31.12.18 | |||||||||||
|
| A-IRB / model-based approaches |
| Standardized approaches2 |
| Total | |||||
USD million |
| Net EAD | RWA | Section or table reference |
| Net EAD | RWA | Section or table reference |
| Net EAD | RWA |
Credit risk (excluding counterparty credit risk) |
| 533,587 | 87,019 | 3 |
| 56,467 | 25,972 | 3 |
| 590,054 | 112,990 |
Central governments and central banks |
| 139,632 | 2,537 | CR6, CR7 |
| 17,854 | 748 | CR4, CR5 |
| 157,485 | 3,285 |
Banks and securities dealers |
| 15,454 | 5,272 | CR6, CR7 |
| 7,456 | 1,842 | CR4, CR5 |
| 22,910 | 7,114 |
Public-sector entities, multilateral development banks |
| 8,093 | 769 | CR6, CR7 |
| 1,232 | 349 | CR4, CR5 |
| 9,324 | 1,118 |
Corporates: specialized lending |
| 22,858 | 12,156 | CR6, CR7 |
|
|
| CR4, CR5 |
| 22,858 | 12,156 |
Corporates: other lending |
| 60,639 | 30,588 | CR6, CR7 |
| 6,467 | 5,010 | CR4, CR5 |
| 67,106 | 35,599 |
Central counterparties |
|
|
|
|
| 284 | 27 |
|
| 284 | 27 |
Retail |
| 286,912 | 35,697 | CR6, CR7 |
| 12,650 | 8,481 | CR4, CR5 |
| 299,562 | 44,178 |
Residential mortgages |
| 142,413 | 26,696 |
|
| 6,685 | 2,884 |
|
| 149,098 | 29,580 |
Qualifying revolving retail exposures (QRRE) |
| 1,772 | 624 |
|
|
|
|
|
| 1,772 | 624 |
Other retail1 |
| 142,726 | 8,377 |
|
| 5,966 | 5,597 |
|
| 148,692 | 13,974 |
Non-counterparty-related risk |
|
|
|
|
| 10,524 | 9,514 | CR4, CR5 |
| 10,524 | 9,514 |
Property, equipment and software |
|
|
|
|
| 9,305 | 9,305 |
|
| 9,305 | 9,305 |
Other |
|
|
|
|
| 1,219 | 209 |
|
| 1,219 | 209 |
Counterparty credit risk2 |
| 83,202 | 22,660 | 4 |
| 85,179 | 11,622 | 4 |
| 168,381 | 34,282 |
Central governments and central banks |
| 6,068 | 693 | CCR3, CCR4 |
| 2,997 | 353 | CCR3, CCR4 |
| 9,065 | 1,046 |
Banks and securities dealers |
| 16,843 | 5,118 | CCR3, CCR4 |
| 3,166 | 955 | CCR3, CCR4 |
| 20,009 | 6,073 |
Public-sector entities, multilateral development banks |
| 1,988 | 249 | CCR3, CCR4 |
| 670 | 39 | CCR3, CCR4 |
| 2,658 | 288 |
Corporates incl. specialized lending |
| 41,673 | 16,253 | CCR3, CCR4 |
| 16,850 | 7,849 | CCR3, CCR4 |
| 58,522 | 24,102 |
Central counterparties |
| 16,630 | 346 |
|
| 51,139 | 1,795 |
|
| 67,769 | 2,142 |
Retail |
|
|
|
|
| 10,358 | 631 | CCR3, CCR4 |
| 10,358 | 631 |
Credit valuation adjustment (CVA) |
|
| 1,479 | 4, CCR2 |
|
| 1,338 | 4, CCR2 |
|
| 2,816 |
Equity positions in the banking book (CR) |
| 879 | 3,658 | 3, CR10 |
|
|
|
|
| 879 | 3,658 |
Settlement risk |
| 58 | 89 |
|
| 222 | 285 |
|
| 280 | 375 |
Securitization exposure in the banking book |
|
|
|
|
| 213 | 709 | 5 |
| 213 | 709 |
Market risk |
|
| 19,541 | 6 |
| 500 | 452 | 5, 6 |
| 500 | 19,992 |
Value-at-risk (VaR) |
|
| 2,454 | MR2 |
|
|
|
|
|
| 2,454 |
Stressed value-at risk (SVaR) |
|
| 5,866 | MR2 |
|
|
|
|
|
| 5,866 |
Add-on for risks-not-in-VaR (RniV) |
|
| 8,915 | MR2 |
|
|
|
|
|
| 8,915 |
Incremental risk charge (IRC) |
|
| 2,299 | MR2 |
|
|
|
|
|
| 2,299 |
Comprehensive risk measure (CRM) |
|
| 7 |
|
|
|
|
|
|
| 7 |
Securitization / re-securitization in the trading book |
|
|
|
|
| 500 | 452 | MR1 |
| 500 | 452 |
Operational risk |
|
| 77,558 |
|
|
|
|
|
|
| 77,558 |
Amounts below thresholds for deduction (250% risk weight) |
| 975 | 2,583 |
|
| 3,513 | 8,782 |
|
| 4,487 | 11,365 |
Deferred tax assets |
|
|
|
|
| 3,513 | 8,782 |
|
| 3,513 | 8,782 |
Significant investments in non-consolidated financial institutions |
| 975 | 2,583 |
|
|
|
|
|
| 975 | 2,583 |
Total |
| 618,701 | 214,587 |
|
| 146,094 | 49,159 |
|
| 764,795 | 263,747 |
1 Consists primarily of Lombard lending, which represents loans made against the pledge of eligible marketable securities or cash, as well as exposures to small businesses, private clients and other retail customers without mortgage financing. 2 The split between A-IRB / model-based approaches and standardized approaches for counterparty credit risk refers to the exposure measure, whereas the split in CCR3 and CCR4 refers to the risk weight approach. As of 30 June 2019, USD 95,241 million of EAD (31 December 2018: USD 93,933 million) was subject to the A-IRB approach, and USD 6,737 million of EAD (31 December 2018: USD 6,679 million) was subject to the standardized approach. 3 As of 30 June 2019, the CRM-based capital requirement is not applicable to us, as we no longer held eligible correlation trading positions. | |||||||||||
11
UBS Group AG
Section 3 Credit risk
This section provides information about the exposures subject to the Basel III credit risk framework, as presented in the “Regulatory exposures and risk-weighted assets” table on pages 10–11 of this report. Information about counterparty credit risk is reflected in the “Counterparty credit risk” section on pages 24–30 of this report. Securitization positions are reported in the “Securitizations” section on pages 31–35 of this report.
The tables in this section provide details regarding the exposures used to determine the firm’s credit risk-related regulatory capital requirements. The parameters applied under the advanced internal ratings-based (A-IRB) approach are generally based on the same methodologies, data and systems we use for internal credit risk quantification, except where certain treatments are specified by
regulatory requirements. These include, for example, the application of regulatory prescribed floors and multipliers, and differences with respect to eligibility criteria and exposure definitions. The exposure information presented in this section may therefore differ from our internal management view disclosed in the “Risk management and control” sections of our quarterly and annual reports. Similarly, the measure of credit risk exposure for regulatory capital also differs from how it is defined under International Financial Reporting Standards (IFRS).
For information about credit risk exposure categories, credit risk management and credit risk mitigation, refer to pages 23–24, 27, 30 and 31–33 of our 31 December 2018 Pillar 3 report, which is available under “Pillar 3 disclosures” at www.ubs.com/investors.
12
Credit quality of assets
Semiannual | The CR1 table below provides a breakdown of loans, debt securities and off-balance sheet exposures into defaulted and non-defaulted exposures. It was revised to additionally include the split of ECL accounting provisions based on the standardized approach and internal ratings-based approach. The CR2 table illustrates changes in stock of defaulted loans, debt securities and off-balance sheet exposures for the first half year of 2019.
For information about the definitions of default and credit-impaired, refer to page 152 of our Annual Report 2018, which is available under “Annual reporting” at www.ubs.com/investors.
More information about the credit risk mitigation techniques related to the defaulted loans and debt securities is provided in the CR3 table on the following page.p
Semiannual |
CR1: Credit quality of assets |
|
|
|
|
| ||||||||
|
|
| Gross carrying values of: |
| Allowances / impairments |
| Of which: ECL accounting provisions for credit losses on SA exposures |
| Of which: ECL accounting provisions for credit losses on IRB exposures (Stage 1, 2, 3) |
| Net values | ||
USD million |
| Defaulted exposures1 | Non-defaulted exposures |
|
| Allocated in regulatory category of Specific (Stage 3 credit-impaired) | Allocated in regulatory category of General (Stage 1 & 2) |
|
| ||||
30.6.19 |
|
|
|
|
|
|
|
|
|
|
|
| |
1 | Loans2 |
| 2,703 | 446,046 |
| (902)3 |
| (148) | (56) |
| (698) |
| 447,847 |
2 | Debt securities |
|
| 67,788 |
|
|
|
|
|
|
|
| 67,788 |
3 | Off-balance sheet exposures |
| 285 | 332,449 |
| (122) |
| (1) | (3) |
| (118) |
| 332,612 |
4 | Total |
| 2,988 | 846,283 |
| (1,024)3 |
| (149) | (60) |
| (815) |
| 848,247 |
|
|
|
|
|
|
|
|
|
|
|
|
|
|
31.12.18 |
|
|
|
|
|
|
|
|
|
|
|
| |
1 | Loans2 |
| 2,886 | 460,119 |
| (931)3 |
| (124) | (58) |
| (750) |
| 462,073 |
2 | Debt securities |
|
| 69,902 |
|
|
|
|
|
|
|
| 69,902 |
3 | Off-balance sheet exposures |
| 383 | 304,595 |
| (116) |
| (1) | (1) |
| (114) |
| 304,863 |
4 | Total |
| 3,269 | 834,616 |
| (1,047)3 |
| (125) | (59) |
| (864) |
| 836,838 |
1 Defaulted exposures are in line with credit-impaired exposures (stage 3) under IFRS 9. Refer to Note 10 “Expected credit loss measurement“ of our second quarter 2019 report under “Quarterly reporting” at www.ubs.com/investors for more information about IFRS 9. 2 Loan exposure is reported in line with the Pillar 3 definition. Refer to “Credit risk exposure categories” on page 23 of our 31 December 2018 Pillar 3 report, which is available under “Pillar 3 disclosures” at www.ubs.com/investors for more information about the classification of Loans and Debt securities. 3 Excludes ECL on exposures subject to counterparty credit risk (30 June 2019: USD 5 million; 31 December 2018: USD 4 million). | |||||||||||||
p
Semiannual |
CR2: Changes in stock of defaulted loans, debt securities and off-balance sheet exposures |
| ||
USD million | For the half year ended 30.6.19 | For the half year ended 31.12.18 | |
1 | Defaulted loans, debt securities and off-balance sheet exposures as of the beginning of the half year | 3,269 | 3,215 |
2 | Loans and debt securities that have defaulted since the last reporting period | 336 | 381 |
3 | Returned to non-defaulted status | (205) | (56) |
4 | Amounts written off | (72) | (172) |
5 | Other changes | (341) | (99) |
6 | Defaulted loans, debt securities and off-balance sheet exposures as of the end of the half year | 2,988 | 3,269 |
| |||
p
13
UBS Group AG
Credit risk mitigation
Semiannual | The table below provides a breakdown of loans and debt securities into unsecured and partially or fully secured exposures, with additional information about security type.
Total carrying amount of loans decreased by USD 14 billion to USD 448 billion in the first half of 2019. This was primarily driven by a decrease in cash and balances at central banks that are unsecured, mainly resulting from client-driven activity that affected funding consumption by the business divisions. In addition, certain collar financing transactions in the Investment Bank were excluded from the carrying amount of loans due to their non-credit bearing nature. The total carrying value of debt securities decreased by USD 2 billion to USD 68 billion, mainly in government bills and bonds in the Investment Bank. p
Semiannual |
CR3: Credit risk mitigation techniques – overview | |||||||||
|
|
|
|
|
| Secured portion of exposures partially or fully secured: | |||
USD million |
| Exposures fully unsecured: carrying amount | Exposures partially or fully secured: carrying amount | Total: carrying amount |
| Exposures secured by collateral | Exposures secured by financial guarantees | Exposures secured by credit derivatives | |
|
|
|
|
|
|
|
|
|
|
30.6.19 |
|
|
|
|
|
|
|
| |
1 | Loans2 |
| 134,317 | 313,530 | 447,847 |
| 302,665 | 1,174 | 36 |
2 | Debt securities |
| 67,788 |
| 67,788 |
|
|
|
|
3 | Total |
| 202,104 | 313,530 | 515,635 |
| 302,665 | 1,174 | 36 |
4 | of which: defaulted |
| 342 | 1,709 | 2,051 |
| 1,137 | 316 |
|
|
|
|
|
|
|
|
|
|
|
31.12.18 |
|
|
|
|
|
|
|
| |
1 | Loans2 |
| 145,458 | 316,615 | 462,073 |
| 304,900 | 1,204 | 38 |
2 | Debt securities |
| 69,902 |
| 69,902 |
|
|
|
|
3 | Total |
| 215,360 | 316,615 | 531,975 |
| 304,900 | 1,204 | 38 |
4 | of which: defaulted |
| 412 | 1,815 | 2,227 |
| 1,215 | 320 |
|
1 Exposures in this table represent carrying values in accordance with the regulatory scope of consolidation. 2 Loan exposure is reported in line with the Pillar 3 definition. Refer to “Credit risk exposure categories” on page 23 of our 31 December 2018 Pillar 3 report, which is available under “Pillar 3 disclosures” at www.ubs.com/investors for more information about the classification of Loans and Debt securities. | |||||||||
p
14
Standardized approach – credit risk mitigation
Semiannual | The table below illustrates the effect of credit risk mitigation (CRM) on the calculation of capital requirements under the standardized approach. p
Semiannual |
CR4: Standardized approach – credit risk exposure and credit risk mitigation (CRM) effects | ||||||||||||
|
|
| Exposures before CCF and CRM1 |
| Exposures post CCF and CRM |
| RWA and RWA density | |||||
USD million, except where indicated |
| On-balance sheet amount | Off-balance sheet amount | Total |
| On-balance sheet amount | Off-balance sheet amount | Total |
| RWA | RWA density in % | |
|
|
|
|
|
|
|
|
|
|
|
|
|
30.6.19 |
|
|
|
|
|
|
|
|
|
|
| |
Asset classes2 |
|
|
|
|
|
|
|
|
|
|
| |
1 | Central governments and central banks |
| 11,015 |
| 11,015 |
| 11,011 |
| 11,011 |
| 882 | 8.0 |
2 | Banks and securities dealers |
| 4,415 | 1,203 | 5,618 |
| 4,412 | 720 | 5,132 |
| 1,169 | 22.8 |
3 | Public-sector entities and multilateral development banks |
| 907 | 323 | 1,231 |
| 890 | 64 | 954 |
| 281 | 29.5 |
4 | Corporates |
| 5,975 | 4,177 | 10,151 |
| 5,892 | 565 | 6,457 |
| 4,880 | 75.6 |
5 | Retail |
| 12,428 | 4,364 | 16,792 |
| 12,235 | 131 | 12,367 |
| 8,162 | 66.0 |
6 | Equity |
|
|
|
|
|
|
|
|
|
|
|
7 | Other assets |
| 14,001 |
| 14,001 |
| 14,001 |
| 14,001 |
| 12,912 | 92.2 |
8 | Total |
| 48,741 | 10,067 | 58,808 |
| 48,442 | 1,481 | 49,922 |
| 28,287 | 56.7 |
|
|
|
|
|
|
| �� |
|
|
|
|
|
31.12.18 |
|
|
|
|
|
|
|
|
|
|
| |
Asset classes2 |
|
|
|
|
|
|
|
|
|
|
| |
1 | Central governments and central banks |
| 17,859 |
| 17,859 |
| 17,851 |
| 17,851 |
| 746 | 4.2 |
2 | Banks and securities dealers |
| 6,749 | 1,179 | 7,928 |
| 6,733 | 722 | 7,456 |
| 1,842 | 24.7 |
3 | Public-sector entities and multilateral development banks |
| 1,180 | 277 | 1,457 |
| 1,179 | 55 | 1,235 |
| 351 | 28.4 |
4 | Corporates |
| 6,146 | 4,523 | 10,669 |
| 6,087 | 722 | 6,810 |
| 5,058 | 74.3 |
5 | Retail |
| 12,786 | 4,230 | 17,016 |
| 12,437 | 155 | 12,592 |
| 8,461 | 67.2 |
6 | Equity |
|
|
|
|
|
|
|
|
|
|
|
7 | Other assets |
| 10,524 |
| 10,524 |
| 10,524 |
| 10,524 |
| 9,513 | 90.4 |
8 | Total |
| 55,244 | 10,208 | 65,452 |
| 54,812 | 1,655 | 56,467 |
| 25,972 | 46.0 |
1 Exposures in this table represent carrying values in accordance with the regulatory scope of consolidation. 2 The CRM effect is reflected on the original asset class. | ||||||||||||
p
15
UBS Group AG
IRB approach – credit derivatives used as credit risk mitigation
Semiannual | The probability of default (PD) substitution is only applied in the RWA calculation when the PD of the hedge provider is lower than the PD of the obligor. In addition, default correlation between the obligor and hedge provider is taken into account through the double default approach. Credit derivatives with tranched cover or first-loss protection are recognized through the securitization framework. Refer to the “CCR6: Credit derivatives exposures” table in the “Counterparty credit risk” section on page 30 of this report for notional and fair value information about credit derivatives used as credit risk mitigation. p
Semiannual |
CR7: IRB – effect on RWA of credit derivatives used as CRM techniques1 | |||||||
|
| 30.6.19 |
| 31.12.18 | |||
USD million |
| Pre-credit derivatives RWA | Actual RWA |
| Pre-credit derivatives RWA | Actual RWA | |
1 | Central governments and central banks – FIRB |
|
|
|
|
|
|
2 | Central governments and central banks – AIRB |
| 3,034 | 3,033 |
| 2,502 | 2,500 |
3 | Banks and securities dealers – FIRB |
|
|
|
|
|
|
4 | Banks and securities dealers – AIRB |
| 4,755 | 4,755 |
| 5,240 | 5,240 |
5 | Public-sector entities, multilateral development banks – FIRB |
|
|
|
|
|
|
6 | Public-sector entities, multilateral development banks – AIRB |
| 823 | 823 |
| 798 | 798 |
7 | Corporates: Specialized lending – FIRB |
|
|
|
|
|
|
8 | Corporates: Specialized lending – AIRB |
| 11,835 | 11,835 |
| 12,172 | 12,172 |
9 | Corporates: Other lending – FIRB |
|
|
|
|
|
|
10 | Corporates: Other lending – AIRB |
| 30,039 | 29,794 |
| 31,083 | 30,612 |
11 | Retail: mortgage loans |
| 27,666 | 27,666 |
| 26,696 | 26,696 |
12 | Retail exposures: qualifying revolving retail (QRRE) |
| 647 | 647 |
| 624 | 624 |
13 | Retail: other |
| 8,151 | 8,151 |
| 8,377 | 8,377 |
14 | Equity positions (PD/LGD approach) |
|
|
|
|
|
|
15 | Total |
| 86,950 | 86,703 |
| 87,493 | 87,019 |
1 The CRM effect is reflected on the original asset class. | |||||||
p
16
Credit risk under the standardized approach
Semiannual | The standardized approach is generally applied where it is not possible to use the A-IRB approach. The table below illustrates the exposures by asset classes and the risk weights applied. p
Semiannual |
CR5: Standardized approach – exposures by asset classes and risk weights | ||||||||||||
USD million |
|
|
|
|
|
|
|
|
|
|
| |
Risk weight |
| 0% | 10% | 20% | 35% | 50% | 75% | 100% | 150% | Others | Total credit exposures amount (post CCF and CRM) | |
|
|
|
|
|
|
|
|
|
|
|
|
|
30.6.19 |
|
|
|
|
|
|
|
|
|
|
| |
Asset classes |
|
|
|
|
|
|
|
|
|
|
| |
1 | Central governments and central banks |
| 9,924 |
| 226 |
| 53 |
| 813 |
|
| 11,017 |
2 | Banks and securities dealers |
|
|
| 4,655 |
| 471 |
| 6 |
|
| 5,132 |
3 | Public-sector entities and multilateral development banks |
| 161 |
| 528 |
| 174 |
| 85 |
|
| 949 |
4 | Corporates |
|
|
| 1,826 |
| 147 | 185 | 4,297 | 2 |
| 6,457 |
5 | Retail |
|
|
|
| 5,805 | 36 | 1,763 | 4,707 | 55 |
| 12,367 |
6 | Equity |
|
|
|
|
|
|
|
|
|
|
|
7 | Other assets |
| 1,089 |
|
|
|
|
| 12,912 |
|
| 14,001 |
8 | Total |
| 11,174 |
| 7,235 | 5,805 | 881 | 1,948 | 22,821 | 58 |
| 49,922 |
9 | of which: mortgage loans |
|
|
|
| 5,805 |
| 115 | 742 |
|
| 6,662 |
10 | of which: past due1 |
|
|
|
|
|
|
| 86 |
|
| 86 |
|
|
|
|
|
|
|
|
|
|
|
|
|
31.12.18 |
|
|
|
|
|
|
|
|
|
|
| |
Asset classes |
|
|
|
|
|
|
|
|
|
|
| |
1 | Central governments and central banks |
| 17,061 |
| 42 |
| 24 |
| 727 |
|
| 17,854 |
2 | Banks and securities dealers |
|
|
| 6,259 |
| 1,192 |
| 4 | 0 |
| 7,456 |
3 | Public-sector entities and multilateral development banks |
| 101 |
| 771 |
| 330 |
| 30 | 0 |
| 1,232 |
4 | Corporates |
|
|
| 1,961 |
| 138 | 266 | 4,385 | 2 |
| 6,751 |
5 | Retail |
|
|
|
| 5,809 |
| 1,811 | 4,910 | 120 |
| 12,650 |
6 | Equity |
|
|
|
|
|
|
|
|
|
|
|
7 | Other assets |
| 1,010 |
|
|
|
|
| 9,513 |
|
| 10,524 |
8 | Total |
| 18,172 |
| 9,033 | 5,809 | 1,684 | 2,077 | 19,570 | 122 |
| 56,467 |
9 | of which: mortgage loans |
|
|
|
| 5,809 |
| 97 | 778 |
|
| 6,685 |
10 | of which: past due1 |
|
|
|
|
|
|
| 112 |
|
| 112 |
1 Includes mortgage loans. | ||||||||||||
p
Credit risk under internal ratings-based approaches
Semiannual | The tables in this sub-section provide information about credit risk exposures under the A-IRB approach, including the main parameters used in A-IRB models for the calculation of capital requirements, presented by portfolio and PD range.
Under the A-IRB approach, the required capital for credit risk is quantified through empirical models that we have developed to estimate the PD, loss given default (LGD), exposure at default (EAD) and other parameters, subject to FINMA approval. The proportion of EAD covered by either the standardized or the
A-IRB approach is provided in the “Regulatory exposures and risk-weighted assets” table on pages 10–11 of this report.
The CR6 table on the following pages provides a breakdown of the key parameters used for the calculation of capital requirements under the A-IRB approach, shown by PD range across FINMA-defined asset classes.
As of 30 June 2019, exposures before the application of the credit conversion factors (CCFs) increased by USD 6 billion to
USD 780 billion. Off-balance sheet exposures increased on a net basis by USD 10 billion, almost entirely in Global Wealth Management, due to a business-driven increase in unutilized credit lines in the asset class "Retail: other retail". On-balance sheet exposures decreased on a net basis by USD 4 billion, mainly relating to the Investment Bank in the asset class "Corporates: other lending", predominantly driven by the exclusion of certain collar financing transactions in the amount of USD 8 billion due to their non-credit bearing nature. This decrease was partly offset by increases in the asset class "Residential mortgages' in Global Wealth Management and Personal & Corporate Banking.
Information about credit risk risk-weighted assets (RWA) for the first quarter of 2019, including details of movements in RWA, is provided on pages 9–10 of our 31 March 2019 Pillar 3 report, which is available under “Pillar 3 disclosures” at www.ubs.com/investors and for the second quarter of 2019 on page 23 of this report. p
17
UBS Group AG
Semiannual |
CR6: IRB – Credit risk exposures by portfolio and PD range |
|
|
|
|
|
|
|
| ||||||
USD million, except where indicated |
| Original on-balance sheet gross exposure | Off-balance sheet exposures pre-CCF | Total exposures pre-CCF | Average CCF in % | EAD post-CCF and post-CRM | Average PD in % | Number of obligors (in thousands) | Average LGD in % | Average maturity in years | RWA | RWA density in % | EL | Provisions1 |
|
|
|
|
|
|
|
|
|
|
|
|
|
|
|
Central governments and central banks as of 30.6.19 |
|
| ||||||||||||
0.00 to <0.15 |
| 139,976 | 187 | 140,163 | 50.6 | 140,066 | 0.0 | 0.1 | 41.1 | 1.0 | 3,030 | 2.2 | 4 |
|
0.15 to <0.25 |
| 0 | 0 | 0 | 0.0 | 0 | 0.2 | <0.1 | 64.1 | 1.0 | 0 | 40.6 | 0 |
|
0.25 to <0.50 |
| 1 | 0 | 1 | 0.0 | 1 | 0.3 | <0.1 | 54.5 | 1.0 | 1 | 53.7 | 0 |
|
0.50 to <0.75 |
| 5 | 0 | 5 | 0.0 | 5 | 0.7 | <0.1 | 52.9 | 1.1 | 4 | 77.5 | 0 |
|
0.75 to <2.50 |
| 1 | 0 | 1 | 55.0 | 1 | 1.1 | <0.1 | 37.3 | 2.7 | 1 | 101.6 | 0 |
|
2.50 to <10.00 |
| 0 | 4 | 4 | 56.3 | 2 | 3.6 | <0.1 | 56.4 | 2.4 | 4 | 166.2 | 0 |
|
10.00 to <100.00 |
| 0 | 0 | 0 | 9.8 | 0 | 13.9 | <0.1 | 44.9 | 1.0 | 0 | 211.4 | 0 |
|
100.00 (default) |
| 13 | 37 | 51 | 55.0 | 23 | 100.0 | <0.1 |
|
| 25 | 106.0 | 10 |
|
Subtotal |
| 139,996 | 228 | 140,224 | 51.4 | 140,098 | 0.0 | 0.1 | 41.1 | 1.0 | 3,064 | 2.2 | 14 | 12 |
|
|
|
|
|
|
|
|
|
|
|
|
|
|
|
Central governments and central banks as of 31.12.18 |
|
| ||||||||||||
0.00 to <0.15 |
| 139,551 | 19 | 139,570 | 46.7 | 139,558 | 0.0 | 0.1 | 29.1 | 1.0 | 2,474 | 1.8 | 3 |
|
0.15 to <0.25 |
| 0 | 0 | 0 | 0.0 | 0 | 0.2 | <0.1 | 55.2 | 1.0 | 0 | 34.7 | 0 |
|
0.25 to <0.50 |
| 3 | 0 | 3 | 9.8 | 3 | 0.3 | <0.1 | 54.9 | 1.0 | 1 | 54.2 | 0 |
|
0.50 to <0.75 |
| 9 | 0 | 9 | 0.0 | 9 | 0.7 | <0.1 | 97.9 | 1.1 | 13 | 143.1 | 0 |
|
0.75 to <2.50 |
| 2 | 0 | 2 | 55.0 | 1 | 1.0 | <0.1 | 38.3 | 2.6 | 1 | 101.5 | 0 |
|
2.50 to <10.00 |
| 4 | 12 | 15 | 52.1 | 10 | 3.6 | <0.1 | 54.3 | 2.7 | 16 | 162.2 | 0 |
|
10.00 to <100.00 |
| 28 | 0 | 28 | 9.8 | 28 | 13.9 | <0.1 | 5.0 | 1.0 | 8 | 27.1 | 0 |
|
100.00 (default) |
| 13 | 37 | 50 | 55.0 | 23 | 100.0 | <0.1 |
|
| 25 | 106.0 | 10 |
|
Subtotal |
| 139,609 | 68 | 139,676 | 52.2 | 139,632 | 0.0 | 0.2 | 29.1 | 1.0 | 2,537 | 1.8 | 14 | 11 |
|
|
|
|
|
|
|
|
|
|
|
|
|
|
|
Banks and securities dealers as of 30.6.19 |
|
| ||||||||||||
0.00 to <0.15 |
| 12,528 | 1,769 | 14,296 | 53.9 | 13,516 | 0.0 | 0.5 | 41.7 | 1.1 | 2,355 | 17.4 | 6 |
|
0.15 to <0.25 |
| 836 | 545 | 1,381 | 39.1 | 670 | 0.2 | 0.3 | 54.9 | 1.3 | 345 | 51.5 | 1 |
|
0.25 to <0.50 |
| 559 | 452 | 1,011 | 49.4 | 663 | 0.4 | 0.2 | 62.1 | 1.0 | 541 | 81.6 | 2 |
|
0.50 to <0.75 |
| 316 | 206 | 522 | 40.7 | 354 | 0.6 | 0.1 | 51.3 | 1.1 | 307 | 86.7 | 1 |
|
0.75 to <2.50 |
| 539 | 268 | 807 | 27.7 | 484 | 1.4 | 0.2 | 61.5 | 0.9 | 724 | 149.5 | 4 |
|
2.50 to <10.00 |
| 244 | 269 | 513 | 43.4 | 264 | 5.1 | 0.2 | 51.4 | 1.0 | 488 | 184.7 | 6 |
|
10.00 to <100.00 |
| 0 | 4 | 4 | 29.5 | 1 | 17.0 | <0.1 | 12.2 | 1.2 | 1 | 67.9 | 0 |
|
100.00 (default) |
|
|
|
|
|
|
|
|
|
|
|
|
|
|
Subtotal |
| 15,022 | 3,513 | 18,535 | 47.4 | 15,953 | 0.2 | 1.5 | 44.1 | 1.1 | 4,762 | 29.8 | 20 | 8 |
|
|
|
|
|
|
|
|
|
|
|
|
|
|
|
Banks and securities dealers as of 31.12.18 |
|
| ||||||||||||
0.00 to <0.15 |
| 11,855 | 1,805 | 13,659 | 54.1 | 12,639 | 0.1 | 0.5 | 43.0 | 1.1 | 2,433 | 19.2 | 4 |
|
0.15 to <0.25 |
| 1,011 | 458 | 1,469 | 45.8 | 793 | 0.2 | 0.3 | 49.3 | 1.3 | 364 | 45.9 | 1 |
|
0.25 to <0.50 |
| 454 | 391 | 845 | 51.9 | 570 | 0.4 | 0.2 | 61.8 | 1.1 | 455 | 79.8 | 1 |
|
0.50 to <0.75 |
| 167 | 263 | 430 | 42.4 | 221 | 0.6 | 0.1 | 62.9 | 1.1 | 243 | 110.0 | 1 |
|
0.75 to <2.50 |
| 974 | 304 | 1,278 | 45.9 | 866 | 1.7 | 0.2 | 48.3 | 1.4 | 1,098 | 126.8 | 7 |
|
2.50 to <10.00 |
| 320 | 388 | 708 | 44.6 | 363 | 4.7 | 0.2 | 52.5 | 1.0 | 674 | 185.5 | 9 |
|
10.00 to <100.00 |
| 0 | 12 | 12 | 28.0 | 3 | 15.9 | <0.1 | 32.5 | 1.0 | 5 | 165.1 | 0 |
|
100.00 (default) |
|
|
|
|
|
|
|
|
|
|
|
|
|
|
Subtotal |
| 14,780 | 3,621 | 18,401 | 50.0 | 15,454 | 0.3 | 1.5 | 44.8 | 1.1 | 5,272 | 34.1 | 22 | 7 |
18
CR6: IRB – Credit risk exposures by portfolio and PD range (continued) |
|
|
|
|
|
|
|
| ||||||
USD million, except where indicated |
| Original on-balance sheet gross exposure | Off-balance sheet exposures pre-CCF | Total exposures pre-CCF | Average CCF in % | EAD post-CCF and post-CRM | Average PD in % | Number of obligors (in thousands) | Average LGD in % | Average maturity in years | RWA | RWA density in % | EL | Provisions1 |
|
|
|
|
|
|
|
|
|
|
|
|
|
|
|
Public-sector entities, multilateral development banks as of 30.6.19 |
|
| ||||||||||||
0.00 to <0.15 |
| 5,615 | 918 | 6,533 | 19.1 | 5,808 | 0.0 | 0.4 | 35.6 | 1.2 | 514 | 8.9 | 1 |
|
0.15 to <0.25 |
| 308 | 165 | 473 | 12.5 | 328 | 0.2 | 0.2 | 31.1 | 2.6 | 87 | 26.4 | 0 |
|
0.25 to <0.50 |
| 559 | 336 | 896 | 22.0 | 633 | 0.3 | 0.2 | 26.6 | 2.6 | 192 | 30.4 | 1 |
|
0.50 to <0.75 |
| 36 | 3 | 39 | 14.0 | 37 | 0.6 | <0.1 | 28.8 | 3.1 | 18 | 48.5 | 0 |
|
0.75 to <2.50 |
| 1 | 3 | 3 | 96.9 | 3 | 1.0 | <0.1 | 11.3 | 1.1 | 1 | 18.7 | 0 |
|
2.50 to <10.00 |
| 26 | 14 | 40 | 54.9 | 9 | 2.9 | <0.1 | 5.5 | 5.0 | 1 | 16.1 | 0 |
|
10.00 to <100.00 |
|
|
|
|
|
|
|
|
|
|
|
|
|
|
100.00 (default) |
| 4 | 0 | 4 | 0.0 | 4 | 100.0 | <0.1 |
|
| 4 | 106.0 | 0 |
|
Subtotal |
| 6,549 | 1,439 | 7,988 | 19.5 | 6,822 | 0.1 | 0.8 | 34.4 | 1.4 | 817 | 12.0 | 1 | 1 |
|
|
|
|
|
|
|
|
|
|
|
|
|
|
|
Public-sector entities, multilateral development banks as of 31.12.18 |
|
| ||||||||||||
0.00 to <0.15 |
| 6,816 | 909 | 7,725 | 19.2 | 6,990 | 0.0 | 0.4 | 37.2 | 1.1 | 433 | 6.2 | 1 |
|
0.15 to <0.25 |
| 350 | 221 | 571 | 12.0 | 377 | 0.2 | 0.2 | 29.9 | 2.6 | 99 | 26.4 | 0 |
|
0.25 to <0.50 |
| 581 | 332 | 913 | 24.3 | 662 | 0.3 | 0.2 | 27.4 | 2.7 | 210 | 31.7 | 1 |
|
0.50 to <0.75 |
| 44 | 1 | 44 | 27.6 | 44 | 0.6 | <0.1 | 31.7 | 3.0 | 23 | 51.9 | 0 |
|
0.75 to <2.50 |
| 1 | 3 | 5 | 90.4 | 4 | 1.1 | <0.1 | 17.8 | 1.1 | 1 | 28.1 | 0 |
|
2.50 to <10.00 |
| 5 | 20 | 25 | 53.3 | 16 | 2.8 | <0.1 | 5.5 | 4.9 | 3 | 17.0 | 0 |
|
10.00 to <100.00 |
|
|
|
|
|
|
|
|
|
|
|
|
|
|
100.00 (default) |
|
|
|
|
|
|
|
|
|
|
|
|
|
|
Subtotal |
| 7,797 | 1,487 | 9,284 | 19.9 | 8,093 | 0.1 | 0.8 | 36.0 | 1.3 | 769 | 9.5 | 2 | 1 |
|
|
|
|
|
|
|
|
|
|
|
|
|
|
|
Corporates: specialized lending as of 30.6.19 |
|
| ||||||||||||
0.00 to <0.15 |
| 2,122 | 540 | 2,662 | 68.2 | 2,490 | 0.1 | 0.5 | 12.9 | 2.1 | 168 | 6.8 | 0 |
|
0.15 to <0.25 |
| 1,027 | 180 | 1,207 | 79.9 | 1,171 | 0.2 | 0.3 | 17.7 | 2.0 | 197 | 16.8 | 0 |
|
0.25 to <0.50 |
| 3,709 | 2,145 | 5,854 | 32.3 | 4,365 | 0.4 | 0.6 | 27.8 | 1.9 | 1,435 | 32.9 | 4 |
|
0.50 to <0.75 |
| 4,605 | 3,061 | 7,667 | 28.8 | 5,427 | 0.6 | 0.6 | 30.8 | 1.6 | 2,568 | 47.3 | 11 |
|
0.75 to <2.50 |
| 7,814 | 2,534 | 10,348 | 36.9 | 8,749 | 1.4 | 1.5 | 32.6 | 1.6 | 5,972 | 68.3 | 39 |
|
2.50 to <10.00 |
| 1,089 | 246 | 1,336 | 56.0 | 1,226 | 3.4 | 0.3 | 39.5 | 1.5 | 1,371 | 111.8 | 16 |
|
10.00 to <100.00 |
|
|
|
|
|
|
|
|
|
|
|
|
|
|
100.00 (default) |
| 177 | 13 | 190 | 18.9 | 82 | 100.0 | 0.1 |
|
| 87 | 106.0 | 97 |
|
Subtotal |
| 20,544 | 8,720 | 29,264 | 36.3 | 23,511 | 1.3 | 3.8 | 28.9 | 1.7 | 11,798 | 50.2 | 169 | 113 |
|
|
|
|
|
|
|
|
|
|
|
|
|
|
|
Corporates: specialized lending as of 31.12.18 |
|
| ||||||||||||
0.00 to <0.15 |
| 1,853 | 327 | 2,180 | 71.4 | 2,087 | 0.1 | 0.4 | 13.5 | 1.9 | 137 | 6.6 | 0 |
|
0.15 to <0.25 |
| 994 | 161 | 1,155 | 77.4 | 1,118 | 0.2 | 0.3 | 18.3 | 1.9 | 190 | 17.0 | 0 |
|
0.25 to <0.50 |
| 3,712 | 2,006 | 5,718 | 40.3 | 4,496 | 0.4 | 0.6 | 30.9 | 1.8 | 1,627 | 36.2 | 5 |
|
0.50 to <0.75 |
| 4,446 | 2,875 | 7,321 | 34.0 | 5,360 | 0.6 | 0.6 | 32.1 | 1.6 | 2,643 | 49.3 | 11 |
|
0.75 to <2.50 |
| 7,379 | 2,467 | 9,846 | 36.0 | 8,266 | 1.3 | 1.5 | 33.7 | 1.6 | 5,819 | 70.4 | 38 |
|
2.50 to <10.00 |
| 1,195 | 289 | 1,483 | 64.4 | 1,381 | 3.3 | 0.4 | 40.5 | 1.7 | 1,581 | 114.5 | 18 |
|
10.00 to <100.00 |
|
|
|
|
|
|
|
|
|
|
|
|
|
|
100.00 (default) |
| 232 | 46 | 278 | 53.5 | 150 | 100.0 | 0.1 |
|
| 159 | 106.0 | 107 |
|
Subtotal |
| 19,810 | 8,171 | 27,981 | 39.7 | 22,858 | 1.6 | 3.8 | 30.6 | 1.7 | 12,156 | 53.2 | 180 | 121 |
19
UBS Group AG
CR6: IRB – Credit risk exposures by portfolio and PD range (continued) |
|
|
|
|
|
|
|
| ||||||
USD million, except where indicated |
| Original on-balance sheet gross exposure | Off-balance sheet exposures pre-CCF | Total exposures pre-CCF | Average CCF in % | EAD post-CCF and post-CRM | Average PD in % | Number of obligors (in thousands) | Average LGD in % | Average maturity in years | RWA | RWA density in % | EL | Provisions1 |
|
|
|
|
|
|
|
|
|
|
|
|
|
|
|
Corporates: other lending as of 30.6.19 |
|
| ||||||||||||
0.00 to <0.15 |
| 15,564 | 20,154 | 35,718 | 37.6 | 18,265 | 0.0 | 3.9 | 37.9 | 1.7 | 3,777 | 20.7 | 25 |
|
0.15 to <0.25 |
| 4,176 | 5,345 | 9,521 | 39.3 | 5,573 | 0.2 | 1.7 | 34.0 | 2.4 | 2,173 | 39.0 | 3 |
|
0.25 to <0.50 |
| 3,207 | 4,024 | 7,231 | 39.8 | 4,776 | 0.4 | 2.5 | 34.4 | 2.3 | 2,626 | 55.0 | 6 |
|
0.50 to <0.75 |
| 3,733 | 2,418 | 6,151 | 40.4 | 4,814 | 0.6 | 2.6 | 33.6 | 1.9 | 2,959 | 61.5 | 10 |
|
0.75 to <2.50 |
| 8,838 | 5,029 | 13,867 | 44.4 | 11,167 | 1.4 | 11.2 | 29.3 | 2.1 | 7,502 | 67.2 | 44 |
|
2.50 to <10.00 |
| 4,015 | 7,707 | 11,722 | 40.0 | 7,107 | 4.0 | 4.8 | 31.3 | 2.3 | 9,301 | 130.9 | 87 |
|
10.00 to <100.00 |
| 259 | 326 | 584 | 55.5 | 439 | 15.5 | 0.1 | 14.7 | 1.8 | 434 | 98.8 | 8 |
|
100.00 (default) |
| 1,074 | 186 | 1,260 | 42.5 | 851 | 100.0 | 0.7 |
|
| 898 | 106.0 | 376 |
|
Subtotal |
| 40,865 | 45,188 | 86,054 | 39.5 | 52,992 | 2.7 | 27.4 | 33.9 | 2.0 | 29,669 | 56.0 | 560 | 521 |
|
|
|
|
|
|
|
|
|
|
|
|
|
|
|
Corporates: other lending as of 31.12.18 |
|
| ||||||||||||
0.00 to <0.15 |
| 18,566 | 21,196 | 39,763 | 37.4 | 20,917 | 0.0 | 3.9 | 36.7 | 1.8 | 5,157 | 24.7 | 8 |
|
0.15 to <0.25 |
| 4,347 | 6,500 | 10,847 | 37.4 | 6,099 | 0.2 | 1.6 | 33.4 | 2.4 | 2,417 | 39.6 | 4 |
|
0.25 to <0.50 |
| 3,604 | 4,593 | 8,197 | 40.3 | 5,328 | 0.4 | 2.5 | 30.2 | 2.2 | 2,612 | 49.0 | 6 |
|
0.50 to <0.75 |
| 3,111 | 2,516 | 5,627 | 43.6 | 4,204 | 0.6 | 2.6 | 37.8 | 1.8 | 2,906 | 69.1 | 10 |
|
0.75 to <2.50 |
| 7,481 | 6,155 | 13,637 | 41.2 | 10,142 | 1.4 | 11.4 | 26.4 | 2.3 | 5,980 | 59.0 | 38 |
|
2.50 to <10.00 |
| 9,116 | 7,861 | 16,977 | 39.3 | 12,321 | 3.4 | 4.8 | 18.1 | 2.2 | 9,783 | 79.4 | 85 |
|
10.00 to <100.00 |
| 297 | 285 | 582 | 52.8 | 449 | 15.3 | 0.1 | 16.7 | 2.0 | 484 | 107.8 | 9 |
|
100.00 (default) |
| 1,385 | 409 | 1,794 | 41.5 | 1,178 | 100.0 | 0.7 |
|
| 1,249 | 106.0 | 385 |
|
Subtotal |
| 47,908 | 49,516 | 97,424 | 38.9 | 60,639 | 3.1 | 27.5 | 30.1 | 2.1 | 30,588 | 50.4 | 546 | 533 |
|
|
|
|
|
|
|
|
|
|
|
|
|
|
|
Retail: residential mortgages as of 30.6.19 |
|
| ||||||||||||
0.00 to <0.15 |
| 63,360 | 1,448 | 64,808 | 58.1 | 64,200 | 0.1 | 129.9 | 19.0 |
| 2,602 | 4.1 | 11 |
|
0.15 to <0.25 |
| 13,740 | 307 | 14,047 | 71.8 | 13,961 | 0.2 | 21.0 | 22.9 |
| 1,260 | 9.0 | 6 |
|
0.25 to <0.50 |
| 21,020 | 549 | 21,569 | 76.4 | 21,439 | 0.4 | 28.2 | 23.8 |
| 3,150 | 14.7 | 18 |
|
0.50 to <0.75 |
| 13,774 | 396 | 14,170 | 82.2 | 14,100 | 0.6 | 15.7 | 24.3 |
| 3,236 | 22.9 | 22 |
|
0.75 to <2.50 |
| 21,465 | 1,350 | 22,815 | 74.3 | 22,468 | 1.3 | 28.1 | 27.6 |
| 9,574 | 42.6 | 84 |
|
2.50 to <10.00 |
| 7,816 | 312 | 8,128 | 80.2 | 8,066 | 4.4 | 9.8 | 24.4 |
| 5,947 | 73.7 | 85 |
|
10.00 to <100.00 |
| 882 | 22 | 904 | 84.2 | 901 | 15.6 | 1.2 | 24.4 |
| 1,148 | 127.4 | 34 |
|
100.00 (default) |
| 739 | 7 | 746 | 38.9 | 717 | 100.0 | 1.1 |
|
| 760 | 106.0 | 24 |
|
Subtotal |
| 142,796 | 4,392 | 147,188 | 70.1 | 145,852 | 1.2 | 235.0 | 22.3 |
| 27,678 | 19.0 | 283 | 123 |
|
|
|
|
|
|
|
|
|
|
|
|
|
|
|
Retail: residential mortgages as of 31.12.18 |
|
| ||||||||||||
0.00 to <0.15 |
| 62,193 | 1,272 | 63,465 | 56.8 | 62,916 | 0.1 | 129.5 | 19.4 |
| 2,460 | 3.9 | 10 |
|
0.15 to <0.25 |
| 13,409 | 229 | 13,638 | 69.0 | 13,567 | 0.2 | 20.7 | 23.3 |
| 1,186 | 8.7 | 6 |
|
0.25 to <0.50 |
| 20,155 | 479 | 20,634 | 81.1 | 20,544 | 0.4 | 27.8 | 24.2 |
| 2,955 | 14.4 | 18 |
|
0.50 to <0.75 |
| 13,276 | 425 | 13,701 | 87.8 | 13,649 | 0.6 | 15.4 | 24.5 |
| 3,063 | 22.4 | 21 |
|
0.75 to <2.50 |
| 21,252 | 1,318 | 22,570 | 77.9 | 22,278 | 1.3 | 27.1 | 28.3 |
| 9,433 | 42.3 | 85 |
|
2.50 to <10.00 |
| 7,608 | 260 | 7,868 | 83.5 | 7,825 | 4.3 | 10.2 | 25.1 |
| 5,715 | 73.0 | 85 |
|
10.00 to <100.00 |
| 912 | 25 | 937 | 84.2 | 933 | 15.3 | 1.2 | 24.4 |
| 1,140 | 122.2 | 35 |
|
100.00 (default) |
| 723 | 5 | 729 | 68.8 | 702 | 100.0 | 1.1 |
|
| 744 | 106.0 | 25 |
|
Subtotal |
| 139,529 | 4,013 | 143,542 | 72.5 | 142,413 | 1.2 | 232.8 | 22.7 |
| 26,696 | 18.7 | 286 | 151 |
20
CR6: IRB – Credit risk exposures by portfolio and PD range (continued) |
|
|
|
|
|
|
|
| ||||||
USD million, except where indicated |
| Original on-balance sheet gross exposure | Off-balance sheet exposures pre-CCF | Total exposures pre-CCF | Average CCF in % | EAD post-CCF and post-CRM | Average PD in % | Number of obligors (in thousands) | Average LGD in % | Average maturity in years | RWA | RWA density in % | EL | Provisions1 |
|
|
|
|
|
|
|
|
|
|
|
|
|
|
|
Retail: qualifying revolving retail exposures (QRRE) as of 30.6.192 |
|
| ||||||||||||
0.00 to <0.15 |
|
|
|
|
|
|
|
|
|
|
|
|
|
|
0.15 to <0.25 |
|
|
|
|
|
|
|
|
|
|
|
|
|
|
0.25 to <0.50 |
|
|
|
|
|
|
|
|
|
|
|
|
|
|
0.50 to <0.75 |
|
|
|
|
|
|
|
|
|
|
|
|
|
|
0.75 to <2.50 |
| 108 | 364 | 472 |
| 150 | 1.7 | 36.5 | 47.0 |
| 42 | 28.0 | 1 |
|
2.50 to <10.00 |
| 1,205 | 5,534 | 6,740 |
| 1,669 | 2.7 | 913.1 | 42.0 |
| 587 | 35.2 | 18 |
|
10.00 to <100.00 |
|
|
|
|
|
|
|
|
|
|
|
|
|
|
100.00 (default) |
| 28 | 0 | 28 |
| 17 | 100.0 | 23.0 |
|
| 18 | 106.0 | 12 |
|
Subtotal |
| 1,342 | 5,898 | 7,240 |
| 1,836 | 3.5 | 972.6 | 42.0 |
| 647 | 35.2 | 31 | 26 |
|
|
|
|
|
|
|
|
|
|
|
|
|
|
|
Retail: qualifying revolving retail exposures (QRRE) as of 31.12.182 |
|
| ||||||||||||
0.00 to <0.15 |
|
|
|
|
|
|
|
|
|
|
| �� |
|
|
0.15 to <0.25 |
|
|
|
|
|
|
|
|
|
|
|
|
|
|
0.25 to <0.50 |
|
|
|
|
|
|
|
|
|
|
|
|
|
|
0.50 to <0.75 |
|
|
|
|
|
|
|
|
|
|
|
|
|
|
0.75 to <2.50 |
| 103 | 348 | 450 |
| 142 | 1.7 | 34.6 | 47.0 |
| 40 | 28.0 | 1 |
|
2.50 to <10.00 |
| 1,166 | 5,213 | 6,378 |
| 1,614 | 2.7 | 860.5 | 42.0 |
| 568 | 35.2 | 18 |
|
10.00 to <100.00 |
|
|
|
|
|
|
|
|
|
|
|
|
|
|
100.00 (default) |
| 26 | 0 | 26 |
| 16 | 100.0 | 21.4 |
|
| 17 | 106.0 | 11 |
|
Subtotal |
| 1,294 | 5,560 | 6,855 |
| 1,772 | 3.5 | 916.5 | 42.0 |
| 624 | 35.2 | 29 | 24 |
21
UBS Group AG
CR6: IRB – Credit risk exposures by portfolio and PD range (continued) |
|
|
|
|
|
|
|
| ||||||
USD million, except where indicated |
| Original on-balance sheet gross exposure | Off-balance sheet exposures pre-CCF | Total exposures pre-CCF | Average CCF in % | EAD post-CCF and post-CRM | Average PD in % | Number of obligors (in thousands) | Average LGD in % | Average maturity in years | RWA | RWA density in % | EL | Provisions1 |
|
|
|
|
|
|
|
|
|
|
|
|
|
|
|
Retail: other retail as of 30.6.19 |
|
| ||||||||||||
0.00 to <0.15 |
| 105,756 | 214,575 | 320,331 | 12.7 | 132,852 | 0.0 | 194.1 | 30.6 |
| 5,467 | 4.1 | 17 |
|
0.15 to <0.25 |
| 2,106 | 3,678 | 5,784 | 16.4 | 2,709 | 0.2 | 5.8 | 29.1 |
| 302 | 11.2 | 1 |
|
0.25 to <0.50 |
| 1,373 | 2,070 | 3,443 | 16.3 | 1,709 | 0.4 | 2.6 | 29.7 |
| 314 | 18.4 | 2 |
|
0.50 to <0.75 |
| 1,294 | 2,312 | 3,606 | 11.6 | 1,563 | 0.6 | 1.8 | 29.6 |
| 545 | 34.9 | 3 |
|
0.75 to <2.50 |
| 2,128 | 7,275 | 9,403 | 14.2 | 3,160 | 1.1 | 44.9 | 31.0 |
| 1,131 | 35.8 | 11 |
|
2.50 to <10.00 |
| 551 | 645 | 1,196 | 20.9 | 685 | 4.0 | 1.8 | 33.9 |
| 401 | 58.6 | 9 |
|
10.00 to <100.00 |
| 158 | 46 | 204 | 19.6 | 167 | 15.5 | 0.5 | 26.6 |
| 93 | 55.8 | 7 |
|
100.00 (default) |
| 19 | 1 | 19 | 38.0 | 14 | 100.0 | <0.1 |
|
| 15 | 106.0 | 5 |
|
Subtotal |
| 113,385 | 230,601 | 343,986 | 12.8 | 142,860 | 0.1 | 251.4 | 30.6 |
| 8,269 | 5.8 | 54 | 11 |
|
|
|
|
|
|
|
|
|
|
|
|
|
|
|
Retail: other retail as of 31.12.18 |
|
| ||||||||||||
0.00 to <0.15 |
| 104,165 | 202,715 | 306,881 | 13.4 | 131,207 | 0.0 | 195.3 | 30.7 |
| 5,404 | 4.1 | 17 |
|
0.15 to <0.25 |
| 2,718 | 4,373 | 7,091 | 14.7 | 3,361 | 0.2 | 6.2 | 26.3 |
| 340 | 10.1 | 2 |
|
0.25 to <0.50 |
| 2,256 | 2,434 | 4,690 | 12.8 | 2,567 | 0.4 | 2.6 | 32.1 |
| 508 | 19.8 | 3 |
|
0.50 to <0.75 |
| 1,283 | 1,519 | 2,803 | 12.6 | 1,474 | 0.6 | 1.8 | 28.7 |
| 527 | 35.8 | 3 |
|
0.75 to <2.50 |
| 2,193 | 6,013 | 8,207 | 14.4 | 3,140 | 1.1 | 48.1 | 29.4 |
| 1,080 | 34.4 | 10 |
|
2.50 to <10.00 |
| 680 | 850 | 1,530 | 12.1 | 782 | 4.2 | 1.5 | 31.9 |
| 390 | 49.8 | 10 |
|
10.00 to <100.00 |
| 156 | 89 | 245 | 18.9 | 173 | 16.4 | 0.7 | 28.1 |
| 104 | 60.2 | 8 |
|
100.00 (default) |
| 27 | 8 | 34 | 2.1 | 22 | 100.0 | <0.1 |
|
| 23 | 106.0 | 5 |
|
Subtotal |
| 113,478 | 218,002 | 331,480 | 13.4 | 142,726 | 0.1 | 256.2 | 30.6 |
| 8,377 | 5.9 | 57 | 16 |
|
|
|
|
|
|
|
|
|
|
|
|
|
|
|
Total 30.6.19 |
| 480,500 | 299,979 | 780,479 | 18.6 | 529,925 | 0.7 | 1,492.5 | 31.8 | 1.33 | 86,703 | 16.4 | 1,133 | 815 |
Total 31.12.18 |
| 484,205 | 290,438 | 774,644 | 19.6 | 533,587 | 0.8 | 1,439.3 | 28.6 | 1.43 | 87,019 | 16.3 | 1,135 | 864 |
1 In line with the Pillar 3 guidance, provisions are only provided for the subtotals by asset class. 2 For the calculation of column “EAD post-CCF and post-CRM,” a balance factor approach is used instead of a CCF approach. The EAD is calculated by multiplying the on-balance sheet exposure with a fixed factor of 1.4. 3 Retail asset classes are excluded from the average maturity as they are not subject to maturity treatment. | ||||||||||||||
p
22
Credit risk RWA development in the second quarter of 2019
Quarterly | The CR8 table below provides a breakdown of the credit risk RWA movements in the second quarter of 2019 across movement categories defined by the Basel Committee on Banking Supervision (BCBS). These categories are described on page 45 of our 31 December 2018 Pillar 3 report, which is available under “Pillar 3 disclosures” at www.ubs.com/investors.
Credit risk RWA under the advanced internal ratings-based
(A-IRB) approach decreased by USD 2.7 billion to USD 86.7 billion as of 30 June 2019.
The RWA decrease from asset size movements of USD 1.5 billion was mainly driven by decreases in loan exposures, margin loans and unutilized credit facilities in the Investment Bank’s Corporate Client Solutions business.
The RWA decrease of USD 1 billion from asset quality was primarily driven by improved probability of default (PD) and loss given default (LGD) distribution across Swiss residential mortgages and income-producing real estate exposures in Personal & Corporate Banking and Global Wealth Management.
Methodology and policy changes reduced RWA by USD 2.1 billion, predominantly driven by the exclusion of certain collar financing transactions in the Investment Bank from credit risk RWA due to their non-credit bearing nature.
The aforementioned decreases were partly offset by a USD 0.5 billion increase in RWA from model updates, driven by the continued phasing-in of RWA increases related to probability of default (PD) and loss given default (LGD) changes from the implementation of revised models for Swiss residential mortgages, affecting Personal & Corporate Banking and Global Wealth Management. p
Quarterly |
CR8: RWA flow statements of credit risk exposures under IRB | |||
USD million | For the quarter ended 30.6.19 | For the quarter ended 31.3.19 | |
1 | RWA as of the beginning of the quarter | 89,448 | 87,019 |
2 | Asset size | (1,454) | 3,212 |
3 | Asset quality | (989) | (70) |
4 | Model updates | 520 | 430 |
5 | Methodology and policy | (2,119) | (102) |
6 | Acquisitions and disposals | (53) | 0 |
7 | Foreign exchange movements | 976 | (667) |
8 | Other | 375 | (374) |
9 | RWA as of the end of the quarter | 86,703 | 89,448 |
p
Equity exposures
Semiannual | The table below provides information about our equity exposures under the simple risk weight method. p
Semiannual |
CR10: IRB (equities under the simple risk-weight method)1 | ||||||
USD million, except where indicated |
| On-balance sheet amount | Off-balance sheet amount | Risk weight in %2 | Exposure amount3 | RWA2 |
|
|
|
|
|
|
|
30.6.19 |
|
|
|
|
|
|
Exchange-traded equity exposures |
| 50 |
| 300 | 37 | 119 |
Other equity exposures |
| 999 |
| 400 | 751 | 3,182 |
Total |
| 1,049 |
|
| 788 | 3,302 |
|
|
|
|
|
|
|
31.12.18 |
|
|
|
|
|
|
Exchange-traded equity exposures |
| 66 |
| 300 | 65 | 208 |
Other equity exposures |
| 1,122 |
| 400 | 814 | 3,450 |
Total |
| 1,188 |
|
| 879 | 3,658 |
1 This table excludes significant investments in the common shares of non-consolidated financial institutions (banks, insurance and other financial entities) that are subject to the threshold treatment and risk weighted at 250%. 2 RWA are calculated post-application of the A-IRB multiplier of 6%, therefore the respective risk weight is higher than 300% and 400%. 3 The exposure amount for equities in the banking book is based on the net position. | ||||||
p
23
UBS Group AG
Section 4 Counterparty credit risk
Counterparty credit risk (CCR) arises from over-the-counter and exchange-traded derivatives, securities financing transactions (SFTs) and long settlement transactions. Within traded products we determine the regulatory credit exposure on the majority of our derivatives portfolio by applying the effective expected positive exposure (EEPE) and stressed expected positive exposure methods as defined in the Basel III framework. For the rest of the portfolio we apply the current exposure method (CEM) based on the replacement value of derivatives in combination with a regulatory prescribed add-on. For the majority of SFTs we determine the regulatory credit exposure using the close-out period approach.
Counterparty credit risk RWA
Quarterly | This sub-section consists of disclosures regarding the quarterly credit risk risk-weighted assets (RWA) development. p
Counterparty credit risk RWA development in the second quarter of 2019
Quarterly | The CCR7 table below provides a breakdown of the CCR RWA movements in the second quarter of 2019 across the movement categories defined by the Basel Committee on Banking Supervision (BCBS). These categories are described on page 45 of our 31 December 2018 Pillar 3 report, which is available under “Pillar 3 disclosures” at www.ubs.com/investors.
CCR RWA under the internal model method (IMM) increased by USD 0.8 billion during the second quarter of 2019, primarily due to mark-to-market effects on derivatives held and higher embedded spreads on new trades compared with those rolling off in our Foreign Exchange, Rates and Credit business in the Investment Bank.
CCR RWA under the VaR decreased by USD 0.4 billion to USD 5.5 billion, primarily reflecting lower sourcing requirements for non-cash collateral within Group Treasury. p
Quarterly |
CCR7: RWA flow statements of CCR exposures under internal model method (IMM) and value-at-risk (VaR) | |||||||||||
|
| For the quarter ended 30.6.19 |
| For the quarter ended 31.3.19 | |||||||
|
| Derivatives |
| SFTs |
| Total |
| Derivatives | SFTs | Total | |
USD million |
| Subject to IMM |
| Subject to VaR |
|
|
| Subject to IMM | Subject to VaR |
| |
1 | RWA as of the beginning of the quarter |
| 19,371 |
| 5,889 |
| 25,260 |
| 17,624 | 5,036 | 22,660 |
2 | Asset size |
| 727 |
| (603) |
| 124 |
| 1,147 | 900 | 2,047 |
3 | Credit quality of counterparties |
| 9 |
| (85) |
| (76) |
| 15 | (189) | (174) |
4 | Model updates |
| 0 |
| 0 |
| 0 |
| 0 | 0 | 0 |
5 | Methodology and policy |
| 0 |
| 244 |
| 244 |
| 621 | 150 | 771 |
5a | of which: regulatory add-ons |
| 0 |
| 0 |
| 0 |
| 450 | 150 | 600 |
6 | Acquisitions and disposals |
| 0 |
| 0 |
| 0 |
| 0 | 0 | 0 |
7 | Foreign exchange movements |
| 26 |
| 9 |
| 35 |
| (36) | (8) | (44) |
8 | Other |
| 0 |
| 0 |
| 0 |
| 0 | 0 | 0 |
9 | RWA as of the end of the quarter |
| 20,133 |
| 5,453 |
| 25,587 |
| 19,371 | 5,889 | 25,260 |
p
24
Counterparty credit risk exposure
Semiannual | This sub-section provides information about our CCR exposures, credit valuation adjustment (CVA) capital charge and credit derivatives exposures. This sub-section excludes CCR exposures to central counterparties; CVA is separately covered in the CCR2 table.
Exposure at default (EAD) post credit risk mitigation (CRM) related to CCR increased by USD 1.4 billion to USD 102.0 billion and RWA increased by USD 3.3 billion to USD 35.5 billion as of 30 June 2019. EAD post CRM on derivative exposures decreased
by USD 3.4 billion, primarily reflecting lower levels of client activity in Global Wealth Management, partly offset by higher levels of client activity in the Investment Bank. As the decrease in derivative exposures in Global Wealth Management was driven by obligors with favorable credit ratings, the effect on RWA was limited. RWA for derivatives increased by USD 3.1 billion in the first half of 2019 as a result of an increase in expected positive exposure (EEPE) from the Investment Bank and a regulatory add-on of USD 0.6 billion for certain portfolios in Corporate Center awaiting the development of a formalized rating tool. p
Semiannual |
CCR1: Analysis of counterparty credit risk (CCR) exposure by approach | ||||||||
USD million, except where indicated |
| Replacement cost | Potential future exposure | EEPE | Alpha used for computing regulatory EAD | EAD post-CRM | RWA | |
|
|
|
|
|
|
|
|
|
30.6.19 |
|
|
|
|
|
|
| |
1 | SA-CCR (for derivatives)1 |
| 5,7672 | 6,723 |
| 1.01 | 12,490 | 4,297 |
2 | Internal model method (for derivatives) |
|
|
| 26,468 | 1.6 | 42,349 | 19,874 |
3 | Simple approach for credit risk mitigation (for SFTs) |
|
|
|
|
|
|
|
4 | Comprehensive approach for credit risk mitigation (for SFTs) |
|
|
|
|
| 21,048 | 5,982 |
5 | VaR (for SFTs) |
|
|
|
|
| 26,091 | 5,317 |
6 | Total |
|
|
|
|
| 101,978 | 35,470 |
|
|
|
|
|
|
|
|
|
31.12.18 |
|
| ||||||
1 | SA-CCR (for derivatives)1 |
| 8,6702 | 8,168 |
| 1.01 | 16,838 | 3,664 |
2 | Internal model method (for derivatives) |
|
|
| 25,889 | 1.6 | 41,423 | 17,375 |
3 | Simple approach for credit risk mitigation (for SFTs) |
|
|
|
|
|
|
|
4 | Comprehensive approach for credit risk mitigation (for SFTs) |
|
|
|
|
| 17,202 | 6,163 |
5 | VaR (for SFTs) |
|
|
|
|
| 25,149 | 4,939 |
6 | Total |
|
|
|
|
| 100,612 | 32,140 |
1 Standardized approach for CCR. Calculated in accordance with the current exposure method (CEM) until the implementation of SA-CCR with expected effective date 1 January 2020, when an alpha factor of 1.4 will be used for calculating regulatory EAD. 2 Replacement costs include collateral mitigation for on- and off-balance sheet exposures related to CCR for derivative transactions. | ||||||||
p
Semiannual | In addition to the default risk capital requirements for CCR based on the advanced internal ratings-based or standardized approach, we are required to add a capital charge to derivatives to cover the risk of mark-to-market losses associated with the deterioration of counterparty credit quality, referred to as CVA. The advanced CVA VaR approach has been used to calculate the CVA capital charge where we apply the IMM. Where this is not the case, the standardized CVA approach has been applied. More information about our portfolios subject to the CVA capital charge as of 30 June 2019 is provided in the table below. p
Semiannual |
CCR2: Credit valuation adjustment (CVA) capital charge | |||||||
|
|
| 30.6.19 |
| 31.12.18 | ||
USD million |
| EAD post-CRM1 | RWA |
| EAD post-CRM1 | RWA | |
| Total portfolios subject to the advanced CVA capital charge |
| 22,052 | 1,106 |
| 26,680 | 1,479 |
1 | (i) VaR component (including the 3× multiplier) |
|
| 205 |
|
| 271 |
2 | (ii) Stressed VaR component (including the 3× multiplier) |
|
| 900 |
|
| 1,208 |
3 | All portfolios subject to the standardized CVA capital charge |
| 4,842 | 1,447 |
| 4,946 | 1,338 |
4 | Total subject to the CVA capital charge |
| 26,894 | 2,553 |
| 31,626 | 2,816 |
1 Includes EAD of the underlying portfolio subject to the respective CVA charge. | |||||||
p
25
UBS Group AG
Semiannual | The table below provides information about our CCR under the standardized approach. Total CCR exposures in the 75% risk weight bucket decreased by USD 0.8 billion to USD 4.2 billion, primarily driven by exposure decreases in the Investment Bank’s Corporate Client Solutions business. p
Semiannual |
CCR3: Standardized approach – CCR exposures by regulatory portfolio and risk weights | |||||||||||
USD million |
|
|
|
|
|
|
|
|
|
| |
Risk weight |
| 0% | 10% | 20% | 50% | 75% | 100% | 150% | Others | Total credit exposure | |
|
|
|
|
|
|
|
|
|
|
|
|
| Regulatory portfolio as of 30.6.19 |
|
| ||||||||
1 | Central governments and central banks |
| 169 |
|
|
|
| 3 |
|
| 172 |
2 | Banks and securities dealers |
|
|
| 112 | 117 |
| 3 |
|
| 232 |
3 | Public-sector entities and multilateral development banks |
|
|
| 99 | 228 |
| 71 |
|
| 398 |
4 | Corporates |
|
|
| 22 | 105 | 4,213 | 1,472 | 2 |
| 5,813 |
5 | Retail |
|
|
|
|
| 5 | 117 |
|
| 123 |
6 | Equity |
|
|
|
|
|
|
|
|
|
|
7 | Other assets |
|
|
|
|
|
|
|
|
|
|
8 | Total |
| 169 |
| 232 | 450 | 4,218 | 1,666 | 2 |
| 6,737 |
|
|
|
|
|
|
|
|
|
|
|
|
| Regulatory portfolio as of 31.12.18 |
|
| ||||||||
1 | Central governments and central banks |
| 202 |
|
|
|
| 0 |
|
| 202 |
2 | Banks and securities dealers |
|
|
| 31 | 176 | 0 | 4 | 0 |
| 210 |
3 | Public-sector entities and multilateral development banks |
|
|
| 0 |
|
|
|
|
| 1 |
4 | Corporates |
|
|
|
| 99 | 4,974 | 1,045 | 0 |
| 6,119 |
5 | Retail |
|
|
|
|
| 18 | 128 |
|
| 147 |
6 | Equity |
|
|
|
|
|
|
|
|
|
|
7 | Other assets |
|
|
|
|
|
|
|
|
|
|
8 | Total |
| 202 |
| 32 | 275 | 4,993 | 1,177 | 0 |
| 6,679 |
p
26
Semiannual | Information about RWA, including details of movements in counterparty credit risk RWA, is provided on pages 9–10 of our 31 March 2019 Pillar 3 report, which is available under “Pillar 3 disclosures” at www.ubs.com/investors, and on page 24 of this report.
The CCR4 table below and on the following pages provides a breakdown of the key parameters used for the calculation of capital requirements under the advanced internal ratings-based (A-IRB) approach, by PD range across FINMA-defined asset classes. As of 30 June 2019, EAD post CRM increased slightly by USD 1 billion to USD 95 billion, while RWA increased by USD 3 billion, resulting in an increase in RWA density. The increase in RWA was mainly due to a business-driven exposure increase of USD 4 billion in the “Corporates: including specialized lending” asset class, primarily from the Investment Bank. The business-driven movements of EAD post CRM in the “Central governments and central banks” and “Retail: other retail” asset classes were related to obligors with favorable credit ratings, resulting in a limited effect on RWA.p
Semiannual |
CCR4: IRB – CCR exposures by portfolio and PD scale | ||||||||
USD million, except where indicated |
| EAD post-CRM | Average PD in % | Number of obligors (in thousands) | Average LGD in % | Average maturity in years | RWA | RWA density in % |
|
|
|
|
|
|
|
|
|
Central governments and central banks as of 30.6.19 |
|
| ||||||
0.00 to <0.15 |
| 9,795 | 0.0 | 0.1 | 33.4 | 0.3 | 489 | 5.0 |
0.15 to <0.25 |
| 200 | 0.2 | <0.1 | 44.8 | 1.0 | 64 | 32.3 |
0.25 to <0.50 |
| 213 | 0.3 | <0.1 | 55.0 | 1.0 | 116 | 54.5 |
0.50 to <0.75 |
| 195 | 0.7 | <0.1 | 54.2 | 1.0 | 151 | 77.4 |
0.75 to <2.50 |
| 23 | 0.9 | <0.1 | 53.3 | 0.5 | 20 | 85.2 |
2.50 to <10.00 |
| 5 | 2.6 | <0.1 | 80.0 | 1.0 | 11 | 198.1 |
10.00 to <100.00 |
|
|
|
|
|
|
|
|
100.00 (default) |
|
|
|
|
|
|
|
|
Subtotal |
| 10,432 | 0.1 | 0.2 | 34.5 | 0.3 | 851 | 8.2 |
|
|
|
|
|
|
|
|
|
Central governments and central banks as of 31.12.18 |
|
| ||||||
0.00 to <0.15 |
| 8,415 | 0.0 | 0.1 | 44.0 | 0.3 | 740 | 8.8 |
0.15 to <0.25 |
| 197 | 0.2 | <0.1 | 65.3 | 0.9 | 93 | 47.0 |
0.25 to <0.50 |
| 128 | 0.3 | <0.1 | 84.3 | 1.0 | 106 | 83.4 |
0.50 to <0.75 |
| 100 | 0.7 | <0.1 | 45.0 | 1.0 | 85 | 85.1 |
0.75 to <2.50 |
| 23 | 1.0 | <0.1 | 53.8 | 0.8 | 21 | 90.2 |
2.50 to <10.00 |
| 0 | 2.6 | <0.1 | 88.8 | 1.0 | 0 | 229.2 |
10.00 to <100.00 |
|
|
|
|
|
|
|
|
100.00 (default) |
|
|
|
|
|
|
|
|
Subtotal |
| 8,864 | 0.1 | 0.2 | 45.1 | 0.5 | 1,046 | 11.8 |
|
|
|
|
|
|
|
|
|
Banks and securities dealers as of 30.6.19 |
|
| ||||||
0.00 to <0.15 |
| 13,548 | 0.1 | 0.4 | 49.3 | 0.8 | 2,706 | 20.0 |
0.15 to <0.25 |
| 3,892 | 0.2 | 0.2 | 48.9 | 0.9 | 1,422 | 36.5 |
0.25 to <0.50 |
| 1,490 | 0.4 | 0.2 | 43.4 | 0.7 | 651 | 43.7 |
0.50 to <0.75 |
| 559 | 0.7 | 0.1 | 60.3 | 1.1 | 545 | 97.5 |
0.75 to <2.50 |
| 303 | 1.3 | 0.2 | 63.4 | 0.7 | 370 | 122.2 |
2.50 to <10.00 |
| 57 | 3.7 | 0.1 | 74.0 | 1.0 | 132 | 233.9 |
10.00 to <100.00 |
|
|
|
|
|
|
|
|
100.00 (default) |
|
|
|
|
|
|
|
|
Subtotal |
| 19,849 | 0.2 | 1.1 | 49.4 | 0.8 | 5,827 | 29.4 |
|
|
|
|
|
|
|
|
|
Banks and securities dealers as of 31.12.18 |
|
| ||||||
0.00 to <0.15 |
| 13,103 | 0.1 | 0.4 | 50.5 | 0.8 | 2,672 | 20.4 |
0.15 to <0.25 |
| 3,927 | 0.2 | 0.2 | 48.3 | 0.8 | 1,415 | 36.0 |
0.25 to <0.50 |
| 1,458 | 0.4 | 0.2 | 49.9 | 0.8 | 764 | 52.4 |
0.50 to <0.75 |
| 636 | 0.7 | 0.1 | 58.8 | 0.8 | 551 | 86.7 |
0.75 to <2.50 |
| 352 | 1.2 | 0.2 | 63.7 | 0.8 | 432 | 122.8 |
2.50 to <10.00 |
| 320 | 7.5 | 0.1 | 12.0 | 0.2 | 132 | 41.2 |
10.00 to <100.00 |
| 0 | 13.0 | <0.1 | 66.0 | 1.0 | 10 | 0.0 |
100.00 (default) |
|
|
|
|
|
|
|
|
Subtotal |
| 19,799 | 0.3 | 1.1 | 49.9 | 0.8 | 5,976 | 30.2 |
27
UBS Group AG
CCR4: IRB – CCR exposures by portfolio and PD scale (continued) | ||||||||
USD million, except where indicated |
| EAD post-CRM | Average PD in % | Number of obligors (in thousands) | Average LGD in % | Average maturity in years | RWA | RWA density in % |
|
|
|
|
|
|
|
|
|
Public-sector entities, multilateral development banks as of 30.6.19 |
|
| ||||||
0.00 to <0.15 |
| 1,886 | 0.0 | 0.1 | 37.0 | 1.1 | 122 | 6.5 |
0.15 to <0.25 |
| 31 | 0.2 | <0.1 | 58.4 | 1.1 | 10 | 33.4 |
0.25 to <0.50 |
| 7 | 0.3 | <0.1 | 73.8 | 1.0 | 6 | 90.9 |
0.50 to <0.75 |
|
|
|
|
|
|
|
|
0.75 to <2.50 |
| 1 | 1.0 | <0.1 | 75.5 | 1.0 | 1 | 168.4 |
2.50 to <10.00 |
|
|
|
|
|
|
|
|
10.00 to <100.00 |
|
|
|
|
|
|
|
|
100.00 (default) |
| 22 | 100.0 | <0.1 |
|
| 23 | 106.0 |
Subtotal |
| 1,946 | 1.2 | 0.1 | 37.2 | 1.1 | 163 | 8.4 |
|
|
|
|
|
|
|
|
|
Public-sector entities, multilateral development banks as of 31.12.18 |
|
| ||||||
0.00 to <0.15 |
| 2,519 | 0.0 | 0.1 | 43.7 | 1.1 | 223 | 8.8 |
0.15 to <0.25 |
| 86 | 0.2 | <0.1 | 53.2 | 1.1 | 28 | 32.3 |
0.25 to <0.50 |
| 39 | 0.4 | <0.1 | 61.3 | 1.0 | 24 | 62.6 |
0.50 to <0.75 |
| 0 | 0.0 | <0.1 | 0.0 | 0.0 | 0 | 0.0 |
0.75 to <2.50 |
| 0 | 1.0 | <0.1 | 35.0 | 1.0 | 0 | 60.4 |
2.50 to <10.00 |
| 0 | 2.7 | <0.1 | 35.0 | 1.0 | 0 | 87.4 |
10.00 to <100.00 |
|
|
|
|
|
|
|
|
100.00 (default) |
| 12 | 100.0 | <0.1 |
|
| 13 | 106.0 |
Subtotal |
| 2,657 | 0.5 | 0.1 | 44.1 | 1.1 | 288 | 10.8 |
|
|
|
|
|
|
|
|
|
Corporates: including specialized lending as of 30.6.191 |
|
| ||||||
0.00 to <0.15 |
| 36,389 | 0.0 | 12.7 | 35.2 | 0.6 | 5,205 | 14.3 |
0.15 to <0.25 |
| 7,062 | 0.2 | 1.7 | 53.2 | 0.7 | 4,116 | 58.3 |
0.25 to <0.50 |
| 2,222 | 0.4 | 0.9 | 82.1 | 0.9 | 3,312 | 149.1 |
0.50 to <0.75 |
| 3,661 | 0.6 | 1.0 | 57.1 | 0.6 | 4,879 | 133.3 |
0.75 to <2.50 |
| 5,367 | 1.2 | 1.7 | 28.0 | 0.5 | 4,388 | 81.8 |
2.50 to <10.00 |
| 2,219 | 3.2 | 0.4 | 12.2 | 0.2 | 1,190 | 53.6 |
10.00 to <100.00 |
|
|
|
|
|
|
|
|
100.00 (default) |
| 1 | 100.0 | <0.1 |
|
| 1 | 106.0 |
Subtotal |
| 56,921 | 0.3 | 18.5 | 39.1 | 0.6 | 23,092 | 40.6 |
|
|
|
|
|
|
|
|
|
Corporates: including specialized lending as of 31.12.181 |
|
| ||||||
0.00 to <0.15 |
| 35,475 | 0.0 | 12.0 | 35.0 | 0.6 | 4,717 | 13.3 |
0.15 to <0.25 |
| 6,761 | 0.2 | 1.6 | 51.0 | 0.6 | 3,688 | 54.6 |
0.25 to <0.50 |
| 2,194 | 0.4 | 0.9 | 78.3 | 1.0 | 2,815 | 128.3 |
0.50 to <0.75 |
| 2,351 | 0.6 | 1.0 | 68.2 | 0.6 | 3,668 | 156.0 |
0.75 to <2.50 |
| 4,311 | 1.2 | 1.6 | 28.2 | 0.7 | 3,569 | 82.8 |
2.50 to <10.00 |
| 1,311 | 3.2 | 0.3 | 13.8 | 0.4 | 819 | 62.4 |
10.00 to <100.00 |
| 0 | 13.0 | <0.1 | 5.0 | 1.0 | 0 | 36.7 |
100.00 (default) |
| 1 | 100.0 | <0.1 |
|
| 1 | 106.0 |
Subtotal |
| 52,403 | 0.3 | 17.3 | 39.3 | 0.6 | 19,276 | 36.8 |
28
CCR4: IRB – CCR exposures by portfolio and PD scale (continued) | ||||||||
USD million, except where indicated |
| EAD post-CRM | Average PD in % | Number of obligors (in thousands) | Average LGD in % | Average maturity in years | RWA | RWA density in % |
|
|
|
|
|
|
|
|
|
Retail: other retail as of 30.6.19 |
|
| ||||||
0.00 to <0.15 |
| 5,299 | 0.0 | 16.9 | 28.9 |
| 205 | 3.9 |
0.15 to <0.25 |
| 83 | 0.2 | 0.3 | 27.3 |
| 9 | 10.5 |
0.25 to <0.50 |
| 38 | 0.4 | 0.2 | 29.8 |
| 7 | 18.4 |
0.50 to <0.75 |
| 57 | 0.6 | 0.1 | 42.4 |
| 21 | 36.7 |
0.75 to <2.50 |
| 603 | 1.0 | 11.6 | 29.6 |
| 186 | 30.8 |
2.50 to <10.00 |
| 12 | 2.9 | 0.4 | 28.7 |
| 5 | 42.3 |
10.00 to <100.00 |
| 2 | 21.8 | <0.1 | 37.0 |
| 2 | 90.4 |
100.00 (default) |
|
|
|
|
|
|
|
|
Subtotal |
| 6,093 | 0.2 | 29.5 | 29.1 |
| 433 | 7.1 |
|
|
|
|
|
|
|
|
|
Retail: other retail as of 31.12.18 |
|
| ||||||
0.00 to <0.15 |
| 9,749 | 0.0 | 15.1 | 28.0 |
| 362 | 3.7 |
0.15 to <0.25 |
| 19 | 0.2 | 0.3 | 28.2 |
| 2 | 10.8 |
0.25 to <0.50 |
| 126 | 0.4 | 0.1 | 29.5 |
| 23 | 18.2 |
0.50 to <0.75 |
| 30 | 0.6 | 0.1 | 28.0 |
| 7 | 24.2 |
0.75 to <2.50 |
| 271 | 1.1 | 9.0 | 29.6 |
| 87 | 32.1 |
2.50 to <10.00 |
| 11 | 2.9 | 0.1 | 27.9 |
| 5 | 42.0 |
10.00 to <100.00 |
| 4 | 21.3 | <0.1 | 30.1 |
| 3 | 70.4 |
100.00 (default) |
|
|
|
|
|
|
|
|
Subtotal |
| 10,211 | 0.1 | 24.6 | 28.1 |
| 489 | 4.8 |
|
|
|
|
|
|
|
|
|
Total 30.6.19 |
| 95,241 | 0.3 | 49.4 | 40.1 | 0.72 | 30,366 | 31.9 |
Total 31.12.18 |
| 93,933 | 0.2 | 43.4 | 41.0 | 0.72 | 27,075 | 28.8 |
1 Includes exposures to managed funds. 2 Retail asset classes are excluded from the average maturity as they are not subject to maturity treatment. | ||||||||
p
29
UBS Group AG
Semiannual | The fair value of collateral received for securities financing transactions increased by USD 15.0 billion to USD 635.7 billion, resulting from client activities in the Investment Bank and Corporate Center. p
Semiannual |
CCR5: Composition of collateral for CCR exposure1 | ||||||||||||
|
| Collateral used in derivative transactions |
| Collateral used in SFTs | ||||||||
|
| Fair value of collateral received |
| Fair value of posted collateral |
| Fair value of collateral received |
| Fair value of posted collateral | ||||
USD million |
| Segregated2 | Unsegregated | Total |
| Segregated3 | Unsegregated | Total |
|
|
|
|
|
|
|
|
|
|
|
|
|
|
|
|
|
30.6.19 |
|
|
|
|
|
|
|
|
|
|
|
|
Cash – domestic currency |
| 2,492 | 17,321 | 19,813 |
| 1,584 | 6,508 | 8,093 |
| 30,459 |
| 78,118 |
Cash – other currencies |
|
| 20,106 | 20,106 |
| 1,658 | 13,742 | 15,400 |
| 10,467 |
| 41,381 |
Sovereign debt |
| 6,569 | 6,780 | 13,349 |
| 8,301 | 6,009 | 14,310 |
| 229,076 |
| 169,360 |
Other debt securities |
|
| 3,177 | 3,177 |
| 1,441 | 1,026 | 2,467 |
| 99,247 |
| 40,954 |
Equity securities |
| 3,776 | 28 | 3,804 |
| 999 | 566 | 1,565 |
| 266,468 |
| 149,513 |
Total |
| 12,837 | 47,412 | 60,249 |
| 13,983 | 27,852 | 41,835 |
| 635,717 |
| 479,327 |
|
|
|
|
|
|
|
|
|
|
|
|
|
31.12.18 |
|
|
|
|
|
|
|
|
|
|
|
|
Cash – domestic currency |
| 2,042 | 16,958 | 19,000 |
| 1,221 | 6,980 | 8,200 |
| 33,134 |
| 72,932 |
Cash – other currencies |
|
| 19,784 | 19,285 |
| 1,591 | 13,808 | 15,399 |
| 12,987 |
| 49,636 |
Sovereign debt |
| 5,552 | 8,656 | 14,208 |
| 7,995 | 5,444 | 13,439 |
| 252,257 |
| 176,260 |
Other debt securities |
|
| 2,277 | 2,277 |
| 812 | 135 | 946 |
| 79,359 |
| 32,851 |
Equity securities |
| 4,778 | 23 | 4,801 |
| 1,570 | 1,465 | 3,035 |
| 243,027 |
| 145,939 |
Total |
| 12,372 | 47,698 | 59,571 |
| 13,190 | 27,831 | 41,020 |
| 620,764 |
| 477,617 |
1 This table includes collateral received and posted with and without the right of rehypothecation, but excludes securities placed with central banks related to undrawn credit lines and for payment, clearing and settlement purposes for which there were no associated liabilities or contingent liabilities. 2 Includes collateral received in derivative transactions, primarily initial margins, that is placed with a third-party custodian and to which UBS has access only in the case of counterparty default. 3 Includes collateral posted to central counterparties, where we apply a 0% risk weight for trades that we have entered into on behalf of a client and where the client has signed a legally enforceable agreement stipulating that the default risk of that central counterparty is carried by the client. | ||||||||||||
p
Semiannual | Notionals of credit derivatives decreased by USD 5.4 billion for protection bought and by USD 5.8 billion for protection sold, primarily due to trade roll-offs and compression activities in the Investment Bank’s Foreign Exchange, Rates and Credit business and Equities business. The decrease was partly offset by an increase in credit options in the Investment Bank’s Corporate Client Solutions business due to hedging of new loan commitments. p
Semiannual |
CCR6: Credit derivatives exposures | ||||||
|
| 30.6.19 |
| 31.12.18 | ||
USD million |
| Protection bought | Protection sold |
| Protection bought | Protection sold |
Notionals1 |
|
|
|
|
|
|
Single-name credit default swaps |
| 37,191 | 42,151 |
| 43,265 | 44,875 |
Index credit default swaps |
| 36,410 | 29,482 |
| 37,006 | 32,309 |
Total return swaps |
| 4,236 | 1,697 |
| 4,726 | 1,976 |
Credit options |
| 5,861 | 57 |
| 4,065 | 57 |
Other credit derivatives |
|
|
|
|
|
|
Total notionals |
| 83,698 | 73,388 |
| 89,063 | 79,218 |
Fair values |
|
|
|
|
|
|
Positive fair value (asset) |
| 947 | 1,314 |
| 1,117 | 815 |
Negative fair value (liability) |
| 2,059 | 1,260 |
| 1,612 | 1,232 |
1 Includes notional amounts for client-cleared transactions. | ||||||
p
30
Section 5 Securitizations
This section provides details of traditional and synthetic securitization exposures in the banking and trading book based on the Basel III securitization framework.
In a traditional securitization, a pool of loans (or other debt obligations) is typically transferred to structured entities that have been established to own the loan pool and to issue tranched securities to third-party investors referencing this pool of loans. In a synthetic securitization, legal ownership of securitized pools of assets is typically retained, but associated credit risk is transferred to structured entities typically through guarantees, credit derivatives or credit-linked notes. Hybrid structures with a mix of traditional and synthetic features are disclosed as synthetic securitizations.
As of 30 June 2019, we did not use internal ratings for purposes of calculating RWA for securitization positions in the banking book. More information about regulatory capital treatment of securitization exposures is provided on page 73 of our 31 December 2018 Pillar 3 report, which is available under “Pillar 3 disclosures” at www.ubs.com/investors.
Securitization exposures in the banking and trading book
Semiannual | The tables SEC1 and SEC2 outline the carrying values on the balance sheet in the banking and trading books as of 30 June 2019 and 31 December 2018. The securitization activity is further broken down by our role (originator, sponsor or investor) and by securitization type (traditional or synthetic). Amounts disclosed in the “Traditional” column of these tables reflect the total outstanding notes at par value issued by the securitization vehicle at issuance. For synthetic securitization transactions, the amounts disclosed generally reflect the balance sheet carrying values of the securitized exposures at issuance.
The tables SEC3 and SEC4 provide the regulatory capital requirements associated with the securitization exposure differentiated by our role in the securitization process.
Development in RWA related to securitization exposures in the first half of 2019
In the first half of 2019, securitization exposures in the banking book and the related RWA were stable, however securitization exposures in the trading book increased from USD 280 million to USD 390 million, mainly arising from secondary trading in commercial mortgage-backed securities in the Investment Bank.p
31
UBS Group AG
Semiannual |
SEC1: Securitization exposures in the banking book | |||||||||||||||||||
|
| Bank acts as originator |
| Bank acts as sponsor |
| Bank acts as originator & sponsor |
| Bank acts as investor |
| Total | |||||||||
USD million |
| Traditional | Synthetic | Subtotal |
| Traditional | Synthetic | Subtotal |
| Traditional | Synthetic | Subtotal |
| Traditional | Synthetic | Subtotal |
|
| |
|
|
|
|
|
|
|
|
|
|
|
|
|
|
|
|
|
|
|
|
30.6.19 |
|
|
|
|
|
|
|
|
|
|
|
|
|
|
|
|
|
| |
Asset classes |
|
|
|
|
|
|
|
|
|
|
|
|
|
|
|
|
|
| |
1 | Retail (total) |
| 84 |
| 84 |
|
|
|
|
|
|
|
|
| 1 |
| 1 |
| 85 |
2 | of which: residential mortgage |
| 84 |
| 84 |
|
|
|
|
|
|
|
|
| 1 |
| 1 |
| 85 |
3 | of which: credit card receivables |
|
|
|
|
|
|
|
|
|
|
|
|
|
|
|
|
|
|
4 | of which: student loans |
|
|
|
|
|
|
|
|
|
|
|
|
|
|
|
|
|
|
5 | of which: consumer loans |
|
|
|
|
|
|
|
|
|
|
|
|
|
|
|
|
|
|
6 | of which: other retail exposures |
|
|
|
|
|
|
|
|
|
|
|
|
|
|
|
|
|
|
7 | Wholesale (total) |
|
|
|
|
| 0 |
| 0 |
|
|
|
|
| 118 |
| 118 |
| 118 |
8 | of which: loans to corporates or SME |
|
|
|
|
|
|
|
|
|
|
|
|
|
|
|
|
|
|
9 | of which: commercial mortgage |
|
|
|
|
| 0 |
| 0 |
|
|
|
|
|
|
|
|
| 0 |
10 | of which: lease and receivables |
|
|
|
|
|
|
|
|
|
|
|
|
|
|
|
|
|
|
11 | of which: trade receivables |
|
|
|
|
|
|
|
|
|
|
|
|
|
|
|
|
|
|
12 | of which: other wholesale |
|
|
|
|
|
|
|
|
|
|
|
|
| 118 |
| 118 |
| 118 |
13 | Re-securitization |
|
|
|
|
|
|
|
|
|
|
|
|
|
|
|
|
|
|
14 | Total securitization / re-securitization (including retail and wholesale) |
| 84 |
| 84 |
| 0 |
| 0 |
|
|
|
|
| 119 |
| 119 |
| 203 |
|
|
|
|
|
|
|
|
|
|
|
|
|
|
|
|
|
|
|
|
31.12.18 |
|
|
|
|
|
|
|
|
|
|
|
|
|
|
|
|
|
| |
Asset classes |
|
|
|
|
|
|
|
|
|
|
|
|
|
|
|
|
|
| |
1 | Retail (total) |
| 87 |
| 87 |
|
|
|
|
|
|
|
|
| 1 |
| 1 |
| 88 |
2 | of which: residential mortgage |
| 87 |
| 87 |
|
|
|
|
|
|
|
|
| 1 |
| 1 |
| 88 |
3 | of which: credit card receivables |
|
|
|
|
|
|
|
|
|
|
|
|
|
|
|
|
|
|
4 | of which: student loans |
|
|
|
|
|
|
|
|
|
|
|
|
|
|
|
|
|
|
5 | of which: consumer loans |
|
|
|
|
|
|
|
|
|
|
|
|
|
|
|
|
|
|
6 | of which: other retail exposures |
|
|
|
|
|
|
|
|
|
|
|
|
|
|
|
|
|
|
7 | Wholesale (total) |
|
|
|
|
| 0 |
| 0 |
|
|
|
|
| 125 |
| 125 |
| 126 |
8 | of which: loans to corporates or SME |
|
|
|
|
|
|
|
|
|
|
|
|
|
|
|
|
|
|
9 | of which: commercial mortgage |
|
|
|
|
| 0 |
| 0 |
|
|
|
|
|
|
|
|
| 0 |
10 | of which: lease and receivables |
|
|
|
|
|
|
|
|
|
|
|
|
|
|
|
|
|
|
11 | of which: trade receivables |
|
|
|
|
|
|
|
|
|
|
|
|
|
|
|
|
|
|
12 | of which: other wholesale |
|
|
|
|
|
|
|
|
|
|
|
|
| 126 |
| 126 |
| 126 |
13 | Re-securitization |
|
|
|
|
|
|
|
|
|
|
|
|
|
|
|
|
|
|
14 | Total securitization / re-securitization (including retail and wholesale) |
| 87 |
| 87 |
| 0 |
| 0 |
|
|
|
|
| 126 |
| 126 |
| 213 |
p
32
Semiannual |
SEC2: Securitization exposures in the trading book | |||||||||||||||||||
|
| Bank acts as originator |
| Bank acts as sponsor |
| Bank acts as originator & sponsor |
| Bank acts as investor |
| Total | |||||||||
USD million |
| Traditional | Synthetic | Subtotal |
| Traditional | Synthetic | Subtotal |
| Traditional | Synthetic | Subtotal |
| Traditional | Synthetic | Subtotal |
|
| |
|
|
|
|
|
|
|
|
|
|
|
|
|
|
|
|
|
|
|
|
30.6.19 |
|
|
|
|
|
|
|
|
|
|
|
|
|
|
|
|
|
| |
Asset classes |
|
|
|
|
|
|
|
|
|
|
|
|
|
|
|
|
|
| |
1 | Retail (total) |
| 2 |
| 2 |
| 6 |
| 6 |
|
|
|
|
| 14 |
| 14 |
| 23 |
2 | of which: residential mortgage |
| 2 |
| 2 |
| 6 |
| 6 |
|
|
|
|
| 14 |
| 14 |
| 23 |
3 | of which: credit card receivables |
|
|
|
|
|
|
|
|
|
|
|
|
|
|
|
|
|
|
4 | of which: student loans |
|
|
|
|
|
|
|
|
|
|
|
|
|
|
|
|
|
|
5 | of which: consumer loans |
|
|
|
|
|
|
|
|
|
|
|
|
|
|
|
|
|
|
6 | of which: other retail exposures |
|
|
|
|
|
|
|
|
|
|
|
|
|
|
|
|
|
|
7 | Wholesale (total) |
| 21 |
| 21 |
| 1 |
| 1 |
| 299 |
| 299 |
| 29 |
| 29 |
| 351 |
8 | of which: loans to corporates or SME |
|
|
|
|
|
|
|
|
|
|
|
|
|
|
|
|
|
|
9 | of which: commercial mortgage |
| 21 |
| 21 |
| 1 |
| 1 |
| 299 |
| 299 |
| 28 |
| 28 |
| 350 |
10 | of which: lease and receivables |
|
|
|
|
|
|
|
|
|
|
|
|
|
|
|
|
|
|
11 | of which: trade receivables |
|
|
|
|
|
|
|
|
|
|
|
|
|
|
|
|
|
|
12 | of which: other wholesale |
|
|
|
|
|
|
|
|
|
|
|
|
| 1 |
| 1 |
| 1 |
13 | Re-securitization |
|
| 6 | 6 |
|
|
|
|
|
|
|
|
| 10 |
| 10 |
| 16 |
14 | Total securitization / re-securitization (including retail and wholesale) |
| 24 | 6 | 30 |
| 7 |
| 7 |
| 299 |
| 299 |
| 53 |
| 53 |
| 390 |
|
|
|
|
|
|
|
|
|
|
|
|
|
|
|
|
|
|
|
|
31.12.18 |
|
|
|
|
|
|
|
|
|
|
|
|
|
|
|
|
|
| |
Asset classes |
|
|
|
|
|
|
|
|
|
|
|
|
|
|
|
|
|
| |
1 | Retail (total) |
| 3 |
| 3 |
| 7 |
| 7 |
|
|
|
|
| 13 |
| 13 |
| 22 |
2 | of which: residential mortgage |
| 3 |
| 3 |
| 7 |
| 7 |
|
|
|
|
| 13 |
| 13 |
| 22 |
3 | of which: credit card receivables |
|
|
|
|
|
|
|
|
|
|
|
|
|
|
|
|
|
|
4 | of which: student loans |
|
|
|
|
|
|
|
|
|
|
|
|
|
|
|
|
|
|
5 | of which: consumer loans |
|
|
|
|
|
|
|
|
|
|
|
|
|
|
|
|
|
|
6 | of which: other retail exposures |
|
|
|
|
|
|
|
|
|
|
|
|
|
|
|
|
|
|
7 | Wholesale (total) |
| 1 | 4 | 5 |
| 1 |
| 1 |
| 222 |
| 222 |
| 16 |
| 16 |
| 244 |
8 | of which: loans to corporates or SME |
|
|
|
|
|
|
|
|
|
|
|
|
|
|
|
|
|
|
9 | of which: commercial mortgage |
| 1 |
| 1 |
| 1 |
| 1 |
| 222 |
| 222 |
| 14 |
| 14 |
| 238 |
10 | of which: lease and receivables |
|
|
|
|
|
|
|
|
|
|
|
|
|
|
|
|
|
|
11 | of which: trade receivables |
|
|
|
|
|
|
|
|
|
|
|
|
|
|
|
|
|
|
12 | of which: other wholesale |
|
| 4 | 4 |
|
|
|
|
|
|
|
|
| 3 |
| 3 |
| 6 |
13 | Re-securitization |
|
| 3 | 3 |
|
|
|
|
| 1 |
| 1 |
| 10 |
| 10 |
| 13 |
14 | Total securitization / re-securitization (including retail and wholesale) |
| 4 | 6 | 10 |
| 8 |
| 8 |
| 223 |
| 223 |
| 39 |
| 39 |
| 280 |
| |||||||||||||||||||
p
33
UBS Group AG
Semiannual |
SEC3: Securitization exposures in the banking book and associated regulatory capital requirements – bank acting as originator or as sponsor | ||||||||||||||||||||||||||||
USD million |
| Total exposure values |
| Exposure values (by RW bands) |
| Exposure values (by regulatory approach) |
| Total RWA |
| RWA (by regulatory approach) |
| Total capital charge after cap |
| Capital charge after cap | ||||||||||||||
30.6.19 |
|
|
| ≤20% RW | >20% to 50% RW | >50% to 100% RW | >100% to <1250% RW | 1250% RW |
| SEC-IRBA | SEC-ERBA | SEC-SA | 1250% |
|
|
| SEC-IRBA | SEC-ERBA | SEC-SA | 1250% |
|
|
| SEC-IRBA | SEC-ERBA | SEC-SA | 1250% | |
Asset classes |
|
|
|
|
|
|
|
|
|
|
|
|
|
|
|
|
|
|
|
|
|
|
|
|
|
|
| |
1 | Total exposures |
| 84 |
|
|
|
| 64 | 21 |
|
| 84 | 0 |
|
| 580 |
|
| 580 | 0 |
|
| 46 |
|
| 46 | 0 |
|
2 | Traditional securitization |
| 84 |
|
|
|
| 64 | 21 |
|
| 84 | 0 |
|
| 580 |
|
| 580 | 0 |
|
| 46 |
|
| 46 | 0 |
|
3 | of which: securitization |
| 84 |
|
|
|
| 64 | 21 |
|
| 84 | 0 |
|
| 580 |
|
| 580 | 0 |
|
| 46 |
|
| 46 | 0 |
|
4 | of which: retail underlying |
| 84 |
|
|
|
| 64 | 21 |
|
| 84 |
|
|
| 580 |
|
| 580 | 0 |
|
| 46 |
|
| 46 | 0 |
|
5 | of which: wholesale |
| 0 |
|
|
|
| 0 | 0 |
|
|
| 0 |
|
| 0 |
|
|
| 0 |
|
| 0 |
|
|
| 0 |
|
6 | of which: re-securitization |
| 0 |
|
|
|
|
| 0 |
|
|
|
|
|
| 0 |
|
|
|
|
|
| 0 |
|
|
|
|
|
7 | of which: senior |
|
|
|
|
|
|
|
|
|
|
|
|
|
|
|
|
|
|
|
|
|
|
|
|
|
|
|
8 | of which: non-senior |
|
|
|
|
|
|
|
|
|
|
|
|
|
|
|
|
|
|
|
|
|
|
|
|
|
|
|
9 | Synthetic securitization |
|
|
|
|
|
|
|
|
|
|
|
|
|
|
|
|
|
|
|
|
|
|
|
|
|
|
|
10 | of which: securitization |
|
|
|
|
|
|
|
|
|
|
|
|
|
|
|
|
|
|
|
|
|
|
|
|
|
|
|
11 | of which: retail underlying |
|
|
|
|
|
|
|
|
|
|
|
|
|
|
|
|
|
|
|
|
|
|
|
|
|
|
|
12 | of which: wholesale |
|
|
|
|
|
|
|
|
|
|
|
|
|
|
|
|
|
|
|
|
|
|
|
|
|
|
|
13 | of which: re-securitization |
|
|
|
|
|
|
|
|
|
|
|
|
|
|
|
|
|
|
|
|
|
|
|
|
|
|
|
14 | of which: senior |
|
|
|
|
|
|
|
|
|
|
|
|
|
|
|
|
|
|
|
|
|
|
|
|
|
|
|
15 | of which: non-senior |
|
|
|
|
|
|
|
|
|
|
|
|
|
|
|
|
|
|
|
|
|
|
|
|
|
|
|
|
|
|
|
|
|
|
|
|
|
|
|
|
|
|
|
|
|
|
|
|
|
|
|
|
|
|
|
|
31.12.18 |
|
|
|
|
|
|
|
|
|
|
|
|
|
|
|
|
|
|
|
|
|
|
|
|
|
|
| |
Asset classes |
|
|
|
|
|
|
|
|
|
|
|
|
|
|
|
|
|
|
|
|
|
|
|
|
|
|
| |
1 | Total exposures |
| 87 |
|
|
| 0 | 67 | 20 |
|
| 87 |
|
|
| 589 |
|
| 589 |
|
|
| 47 |
|
| 47 |
|
|
2 | Traditional securitization |
| 87 |
|
|
| 0 | 67 | 20 |
|
| 87 |
|
|
| 589 |
|
| 589 |
|
|
| 47 |
|
| 47 |
|
|
3 | of which: securitization |
| 87 |
|
|
| 0 | 67 | 20 |
|
| 87 |
|
|
| 589 |
|
| 589 |
|
|
| 47 |
|
| 47 |
|
|
4 | of which: retail underlying |
| 87 |
|
|
|
| 67 | 20 |
|
| 87 |
|
|
| 589 |
|
| 589 |
|
|
| 47 |
|
| 47 |
|
|
5 | of which: wholesale |
| 0 |
|
|
| 0 |
|
|
|
| 0 |
|
|
| 0 |
|
| 0 |
|
|
| 0 |
|
| 0 |
|
|
6 | of which: re-securitization |
|
|
|
|
|
|
|
|
|
|
|
|
|
|
|
|
|
|
|
|
|
|
|
|
|
|
|
7 | of which: senior |
|
|
|
|
|
|
|
|
|
|
|
|
|
|
|
|
|
|
|
|
|
|
|
|
|
|
|
8 | of which: non-senior |
|
|
|
|
|
|
|
|
|
|
|
|
|
|
|
|
|
|
|
|
|
|
|
|
|
|
|
9 | Synthetic securitization |
|
|
|
|
|
|
|
|
|
|
|
|
|
|
|
|
|
|
|
|
|
|
|
|
|
|
|
10 | of which: securitization |
|
|
|
|
|
|
|
|
|
|
|
|
|
|
|
|
|
|
|
|
|
|
|
|
|
|
|
11 | of which: retail underlying |
|
|
|
|
|
|
|
|
|
|
|
|
|
|
|
|
|
|
|
|
|
|
|
|
|
|
|
12 | of which: wholesale |
|
|
|
|
|
|
|
|
|
|
|
|
|
|
|
|
|
|
|
|
|
|
|
|
|
|
|
13 | of which: re-securitization |
|
|
|
|
|
|
|
|
|
|
|
|
|
|
|
|
|
|
|
|
|
|
|
|
|
|
|
14 | of which: senior |
|
|
|
|
|
|
|
|
|
|
|
|
|
|
|
|
|
|
|
|
|
|
|
|
|
|
|
15 | of which: non-senior |
|
|
|
|
|
|
|
|
|
|
|
|
|
|
|
|
|
|
|
|
|
|
|
|
|
|
|
p
34
Semiannual |
SEC4: Securitization exposures in the banking book and associated regulatory capital requirements – bank acting as investor | ||||||||||||||||||||||||||||
USD million |
| Total exposure values |
| Exposure values (by RW bands) |
| Exposure values (by regulatory approach) |
| Total RWA |
| RWA (by regulatory approach) |
| Total capital charge after cap |
| Capital charge after cap | ||||||||||||||
30.6.19 |
|
|
| ≤20% RW | >20% to 50% RW | >50% to 100% RW | >100% to <1250% RW | 1250% RW |
| SEC-IRBA | SEC-ERBA | SEC-SA | 1250% |
|
|
| SEC-IRBA | SEC-ERBA | SEC-SA | 1250% |
|
|
| SEC-IRBA | SEC-ERBA | SEC-SA | 1250% | |
Asset classes |
|
|
|
|
|
|
|
|
|
|
|
|
|
|
|
|
|
|
|
|
|
|
|
|
|
|
| |
1 | Total exposures |
| 119 |
|
|
| 118 |
| 1 |
|
| 118 |
| 1 |
| 84 |
|
| 77 |
| 7 |
| 7 |
|
| 6 |
| 1 |
2 | Traditional securitization |
| 119 |
|
|
| 118 |
| 1 |
|
| 118 |
| 1 |
| 84 |
|
| 77 |
| 7 |
| 7 |
|
| 6 |
| 1 |
3 | of which: securitization |
| 119 |
|
|
| 118 |
| 1 |
|
| 118 |
| 1 |
| 84 |
|
| 77 |
| 7 |
| 7 |
|
| 6 |
| 1 |
4 | of which: retail underlying |
| 1 |
|
|
|
|
| 1 |
|
|
|
| 1 |
| 7 |
|
|
|
| 7 |
| 1 |
|
| 0 |
| 1 |
5 | of which: wholesale |
| 118 |
|
|
| 118 |
|
|
|
| 118 |
|
|
| 77 |
|
| 77 |
|
|
| 6 |
|
| 6 |
|
|
6 | of which: re-securitization |
|
|
|
|
|
|
|
|
|
|
|
|
|
|
|
|
|
|
|
|
|
|
|
|
|
|
|
7 | of which: senior |
|
|
|
|
|
|
|
|
|
|
|
|
|
|
|
|
|
|
|
|
|
|
|
|
|
|
|
8 | of which: non-senior |
|
|
|
|
|
|
|
|
|
|
|
|
|
|
|
|
|
|
|
|
|
|
|
|
|
|
|
9 | Synthetic securitization |
|
|
|
|
|
|
|
|
|
|
|
|
|
|
|
|
|
|
|
|
|
|
|
|
|
|
|
10 | of which: securitization |
|
|
|
|
|
|
|
|
|
|
|
|
|
|
|
|
|
|
|
|
|
|
|
|
|
|
|
11 | of which: retail underlying |
|
|
|
|
|
|
|
|
|
|
|
|
|
|
|
|
|
|
|
|
|
|
|
|
|
|
|
12 | of which: wholesale |
|
|
|
|
|
|
|
|
|
|
|
|
|
|
|
|
|
|
|
|
|
|
|
|
|
|
|
13 | of which: re-securitization |
|
|
|
|
|
|
|
|
|
|
|
|
|
|
|
|
|
|
|
|
|
|
|
|
|
|
|
14 | of which: senior |
|
|
|
|
|
|
|
|
|
|
|
|
|
|
|
|
|
|
|
|
|
|
|
|
|
|
|
15 | of which: non-senior |
|
|
|
|
|
|
|
|
|
|
|
|
|
|
|
|
|
|
|
|
|
|
|
|
|
|
|
|
|
|
|
|
|
|
|
|
|
|
|
|
|
|
|
|
|
|
|
|
|
|
|
|
|
|
|
|
31.12.18 |
|
|
|
|
|
|
|
|
|
|
|
|
|
|
|
|
|
|
|
|
|
|
|
|
|
|
| |
Asset classes |
|
|
|
|
|
|
|
|
|
|
|
|
|
|
|
|
|
|
|
|
|
|
|
|
|
|
| |
1 | Total exposures |
| 126 |
|
|
| 49 | 77 | 1 |
|
| 126 |
| 1 |
| 121 |
|
| 112 |
| 8 |
| 10 |
|
| 9 |
| 1 |
2 | Traditional securitization |
| 126 |
|
|
| 49 | 77 | 1 |
|
| 126 |
| 1 |
| 121 |
|
| 112 |
| 8 |
| 10 |
|
| 9 |
| 1 |
3 | of which: securitization |
| 126 |
|
|
| 49 | 77 | 1 |
|
| 126 |
| 1 |
| 121 |
|
| 112 |
| 8 |
| 10 |
|
| 9 |
| 1 |
4 | of which: retail underlying |
| 1 |
|
|
|
|
| 1 |
|
|
|
| 1 |
| 8 |
|
|
|
| 8 |
| 1 |
|
|
|
| 1 |
5 | of which: wholesale |
| 126 |
|
|
| 49 | 77 |
|
|
| 126 |
|
|
| 112 |
|
| 112 |
|
|
| 9 |
|
| 9 |
|
|
6 | of which: re-securitization |
|
|
|
|
|
|
|
|
|
|
|
|
|
|
|
|
|
|
|
|
|
|
|
|
|
|
|
7 | of which: senior |
|
|
|
|
|
|
|
|
|
|
|
|
|
|
|
|
|
|
|
|
|
|
|
|
|
|
|
8 | of which: non-senior |
|
|
|
|
|
|
|
|
|
|
|
|
|
|
|
|
|
|
|
|
|
|
|
|
|
|
|
9 | Synthetic securitization |
|
|
|
|
|
|
|
|
|
|
|
|
|
|
|
|
|
|
|
|
|
|
|
|
|
|
|
10 | of which: securitization |
|
|
|
|
|
|
|
|
|
|
|
|
|
|
|
|
|
|
|
|
|
|
|
|
|
|
|
11 | of which: retail underlying |
|
|
|
|
|
|
|
|
|
|
|
|
|
|
|
|
|
|
|
|
|
|
|
|
|
|
|
12 | of which: wholesale |
|
|
|
|
|
|
|
|
|
|
|
|
|
|
|
|
|
|
|
|
|
|
|
|
|
|
|
13 | of which: re-securitization |
|
|
|
|
|
|
|
|
|
|
|
|
|
|
|
|
|
|
|
|
|
|
|
|
|
|
|
14 | of which: senior |
|
|
|
|
|
|
|
|
|
|
|
|
|
|
|
|
|
|
|
|
|
|
|
|
|
|
|
15 | of which: non-senior |
|
|
|
|
|
|
|
|
|
|
|
|
|
|
|
|
|
|
|
|
|
|
|
|
|
|
|
p
35
UBS Group AG
Section 6 Market risk
The amount of capital required to underpin market risk in the regulatory trading book is calculated using a variety of methods approved by FINMA. The components of market risk risk-weighted assets (RWA) are value-at-risk (VaR), stressed VaR (SVaR), an add-on for risks that are potentially not fully modeled in VaR, the incremental risk charge (IRC), the comprehensive risk measure (CRM) for the correlation portfolio and the securitization framework for securitization positions in the trading book. Refer to pages 72–73, 85 and 87–89 of our 31 December 2018 Pillar 3 report, which is available under “Pillar 3 disclosures” at www.ubs.com/investors, for more information about each of these components.
Market risk risk-weighted assets
Market risk RWA development in the second quarter of 2019
Quarterly | The MR2 table below provides a breakdown of the market risk RWA movement in the second quarter of 2019 across the main components, according to the movement categories defined by the Basel Committee on Banking Supervision. VaR and SVaR components include the RWA charge for risks-not-in-VaR. These categories are described on page 81 of our 31 December 2018 Pillar 3 report, which is available under “Pillar 3 disclosures” at www.ubs.com/investors.
Market risk RWA decreased by USD 1.8 billion in the second quarter of 2019, primarily driven by a reduction from regulatory add-ons reflecting updates from the monthly risks-not-in-VaR assessment.
As of 30 June 2019, the CRM-based capital requirement was not applicable to us, as we no longer held eligible correlation trading positions.
The VaR multiplier remained unchanged, at 3.0, compared with the first quarter of 2019. p
Quarterly |
MR2: RWA flow statements of market risk exposures under an internal models approach1 | |||||||
USD million | VaR | Stressed VaR | IRC | CRM | Other | Total RWA | |
1 | RWA as of 31.12.18 | 5,085 | 12,149 | 2,299 | 7 |
| 19,541 |
1a | Regulatory adjustment | (2,167) | (8,470) | (1,059) | (7) |
| (11,702) |
1b | RWA at previous quarter-end (end of day) | 2,918 | 3,680 | 1,240 | 0 |
| 7,838 |
2 | Movement in risk levels | (1,771) | (831) | (26) | 0 |
| (2,628) |
3 | Model updates / changes | (12) | 41 | 0 | 0 |
| 29 |
4 | Methodology and policy | 0 | 0 | 0 | 0 |
| 0 |
5 | Acquisitions and disposals | 0 | 0 | 0 | 0 |
| 0 |
6 | Foreign exchange movements | 0 | 0 | 0 | 0 |
| 0 |
7 | Other | (205) | (495) | 0 | 0 |
| (700) |
8a | RWA at the end of the reporting period (end of day) | 929 | 2,395 | 1,214 | 0 |
| 4,539 |
8b | Regulatory adjustment | 2,298 | 5,506 | 0 | 0 |
| 7,804 |
8c | RWA as of 31.3.19 | 3,227 | 7,901 | 1,214 | 0 |
| 12,343 |
1 | RWA as of 31.3.19 | 3,227 | 7,901 | 1,214 |
|
| 12,343 |
1a | Regulatory adjustment | (2,298) | (5,506) | 0 |
|
| (7,804) |
1b | RWA at previous quarter-end (end of day) | 929 | 2,395 | 1,214 |
|
| 4,539 |
2 | Movement in risk levels | (163) | (442) | 168 |
|
| (438) |
3 | Model updates / changes | (27) | (32) | (70) |
|
| (128) |
4 | Methodology and policy | 0 | 0 | 0 |
|
| 0 |
5 | Acquisitions and disposals | 0 | 0 | 0 |
|
| 0 |
6 | Foreign exchange movements | 0 | 0 | 0 |
|
| 0 |
7 | Other | (53) | (71) | 0 |
|
| (124) |
8a | RWA at the end of the reporting period (end of day) | 687 | 1,850 | 1,312 |
|
| 3,849 |
8b | Regulatory adjustment | 1,874 | 4,591 | 212 |
|
| 6,677 |
8c | RWA as of 30.6.19 | 2,561 | 6,441 | 1,524 |
|
| 10,526 |
1 Components that describe movements in RWA are presented in italic. | |||||||
p
36
Securitization positions in the trading book
Semiannual | Our exposure to securitization positions in the trading book includes exposures arising from secondary trading in commercial mortgage-backed securities in the Investment Bank, and limited positions in Corporate Center – Non-core and Legacy Portfolio that we continue to wind down. Refer to the “Securitizations” section on pages 31–35 of this report for more information.
The table below provides information about market risk RWA from securitization exposures in the trading book. p
Semiannual |
MR1: Market risk under standardized approach | |||
|
| RWA | |
USD million | 30.6.19 | 31.12.18 | |
| Outright products |
|
|
1 | Interest rate risk (general and specific) |
|
|
2 | Equity risk (general and specific) |
|
|
3 | Foreign exchange risk |
|
|
4 | Commodity risk |
|
|
| Options |
|
|
5 | Simplified approach |
|
|
6 | Delta-plus method |
|
|
7 | Scenario approach |
|
|
8 | Securitization | 452 | 452 |
9 | Total | 452 | 452 |
| |||
p
37
UBS Group AG
Regulatory calculation of market risk
Semiannual | The table below shows minimum, maximum, average and period-end regulatory VaR, SVaR, the IRC and the comprehensive risk capital charge. As of 30 June 2019 we no longer held eligible correlation trading positions.
During the first half of 2019, average 10-day 99% regulatory VaR and SVaR decreased, driven by the Equities business, reflecting a reduction in market volatility as well as a decrease in client activity along with an overall reduction in credit exposure in the Investment Bank’s Foreign Exchange, Rates and Credit business, compared with the higher levels observed in the second half of 2018. p
Semiannual |
MR3: IMA values for trading portfolios |
| |||
USD million | For the six-month period ended 30.6.19 | For the six-month period ended 31.12.18 | For the six-month period ended 30.6.18 | |
| VaR (10-day 99%) |
|
|
|
1 | Maximum value | 88 | 107 | 181 |
2 | Average value | 31 | 38 | 52 |
3 | Minimum value | 17 | 6 | 2 |
4 | Period end | 24 | 79 | 65 |
| Stressed VaR (10-day 99%) |
|
|
|
5 | Maximum value | 143 | 202 | 334 |
6 | Average value | 74 | 93 | 107 |
7 | Minimum value | 45 | 35 | 23 |
8 | Period end | 61 | 98 | 122 |
| Incremental risk charge (99.9%) |
|
|
|
9 | Maximum value | 141 | 247 | 342 |
10 | Average value | 107 | 193 | 222 |
11 | Minimum value | 87 | 99 | 153 |
12 | Period end | 105 | 99 | 192 |
| Comprehensive risk capital charge (99.9%) |
|
|
|
13 | Maximum value |
| 5 | 5 |
14 | Average value |
| 1 | 4 |
15 | Minimum value |
| 0 | 3 |
16 | Period end |
| 0 | 5 |
17 | Floor (standardized measurement method) |
| 0 | 1 |
| ||||
p
38
MR4: Comparison of VaR estimates with gains/losses
Semiannual | The “Group: development of backtesting revenues and actual trading revenues against backtesting VaR (1-day, 99% confidence)” chart below shows the six-month development of backtesting VaR against the Group’s backtesting revenues and actual trading revenues for the first half of 2019. The chart shows both, the 99% and the 1% backtesting VaR. The asymmetry between the negative and positive tails is a result of the long gamma risk profile that has been run historically in the Investment Bank.
The actual trading revenues include, in addition to backtesting revenues, intraday revenues.
There were no Group VaR negative backtesting exceptions in the first half of 2019, and the total number of negative backtesting exceptions within the most recent 250-business-day window decreased from 2 to 1. The FINMA VaR multiplier for market risk RWA remained unchanged at 3.0 as of 30 June 2019.
More information about the backtesting exceptions that occurred during 2018 is provided on pages 157–158 of our Annual Report 2018, which is available under “Annual reporting” at www.ubs.com/investors, and on page 86 of our 31 December 2018 Pillar 3 report, which is available under “Pillar 3 disclosures” at www.ubs.com/investors. p
Semiannual |
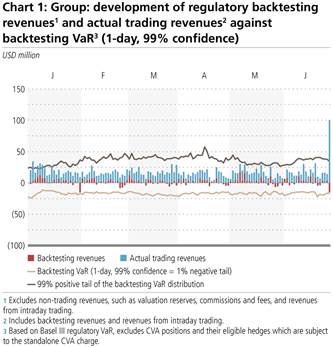 p
p
39
UBS Group AG
Annual | Interest rate risk in the banking book (IRRBB) arises from balance sheet positions such as Loans and advances to banks, Loans and advances to customers, Financial assets at fair value not held for trading, Financial assets measured at amortized cost, Customer deposits, Debt issued measured at amortized cost and derivatives, including those used for cash flow hedge accounting purposes. These positions may affect Other comprehensive income (OCI) or the income statement, depending on their accounting treatment.
IRRBB is measured using a number of metrics, the most relevant of which are the following:
– Interest rate sensitivity to a +1 basis point parallel shift in yield curves. This metric is also the key risk factor for statistical and stress-based measures, such as value-at-risk and stress scenarios (including economic value of equity (EVE)) and is measured and reported with a daily frequency.
– Net interest income (NII) sensitivity assesses the change in NII over a set time horizon compared with the baseline NII, which is calculated assuming that interest rates in all currencies develop according to their market-implied forward rates and under the assumption of constant business volumes and no specific management actions. NII sensitivity is measured and reported on a monthly basis.
The disclosures below take into account the revised FINMA Circular 2019/2, which sets out minimum standards for the measurement, management, monitoring and control of interest rate risks in the banking book.
Our largest banking book interest rate exposures arise from client deposits and lending products in Global Wealth Management and Personal & Corporate Banking. The inherent interest rate risks are generally transferred from Global Wealth Management and Personal & Corporate Banking to Group Treasury, to manage them centrally within Corporate Center. This allows for the netting of interest rate risks across different sources, while leaving the originating businesses with commercial margin and volume management. The residual interest rate risk is mainly hedged with interest rate swaps, to the vast majority of which we apply hedge accounting. Short-term exposures and high-quality liquid assets classified as Financial assets at fair value not held for trading are hedged with derivatives accounted for on a mark-to-market basis. Long-term fixed-rate debt issued is hedged with interest rate swaps designated in fair value hedge accounting relationships.
We actively manage IRRBB, with the objective of reducing the volatility of NII, while keeping the EVE sensitivity within set internal risk limits.
EVE and NII sensitivity are monitored against limits and triggers, both at consolidated and at significant legal entity levels. We also assess the sensitivity of EVE and NII under stressed market conditions by applying a suite of parallel and non-parallel interest rate scenarios, as well as specific economic scenarios.
The Interest Rate Risk in the Banking Book Strategy Committee, a subcommittee of the Group Asset and Liability Management Committee (ALCO), and, where relevant, ALCOs at a legal entity level perform independent oversight over the management of IRRBB. IRRBB is also subject to Group Internal Audit and model governance. Refer to “Group Internal Audit” in the “Corporate governance” section and to “Risk measurement” in the “Risk management and control” section of our Annual Report 2018 for more information.
The cash flows from client deposits and lending products used in the calculation of EVE sensitivity exclude commercial margins and other spread components, are aggregated for each business day and are discounted using risk-free rates. Our external issuances are discounted using UBS’s fund transfer curve, and capital instruments are modelled to the first call date. NII sensitivity is calculated over a one-year time horizon assuming constant balance sheet structure and volumes and considers the flooring impact of embedded interest rate options.
The average repricing maturity of non-maturing deposits and loans is determined via a replication portfolio strategy that protects product margin. The optimal replicating portfolio is determined at a granular currency- and product-specific level by simulating and applying a real-world market rate model to historically calibrated client rate and volume models.
We use an econometric prepayment model to forecast prepayment rates on US mortgage whole loans in UBS Bank USA, as well as agency mortgage-backed securities (MBS) held in various liquidity portfolios of UBS Americas Holding LLC consolidated. These prepayment rates are used to forecast both mortgage whole loan and MBS balances under various macroeconomic scenarios. The prepayment model is used for a variety of purposes, including risk management and regulatory stress testing. Mortgages in Switzerland generally do not carry similar optionality, due to prepayment penalties.
The interest rate risk sensitivity figures presented in the IRRBB1 table below represent the effect of six interest rate scenarios defined by FINMA on the theoretical present value of the banking book as well as the impact of the two parallel shock scenarios on the net interest income of the banking book. EVE sensitivity excludes equity, goodwill, real estate and additional tier 1 (AT1) capital instruments.
40
As of 30 June 2019, the most adverse of the six FINMA interest rate scenarios with regard to EVE was the “Parallel up” scenario (+200 basis points for US dollars and +150 basis points for Swiss francs), resulting in a change of the economic value of equity of negative USD 4.5 billion, representing a pro-forma effect equal to 9.0% of tier 1 capital, which is well below the threshold of 15% of tier 1 capital of the regulatory outlier test in the IRRBB regulation. The immediate effect of the “Parallel up” scenario on tier 1 capital as of 30 June 2019 would be a reduction of 0.5%, or USD 0.2 billion, relating to the part of our banking book that is measured at fair value through profit or loss with recognition in eligible capital and a positive effect from pension funds.
The more adverse of the two parallel interest rate scenarios with regard to NII over the next 12 months was the “Parallel up” scenario, resulting in a potential change of negative USD 0.4 billion. This excludes the contribution from cash held at central banks as per FINMA Pillar 3 disclosure requirements. With the inclusion of the cash held at central banks, the NII would increase by USD 0.9 billion under the “Parallel up” scenario. p
® Refer to our second quarter 2019 report for more information about IRRBB
USD Scenarios1 | Description |
Parallel up | rates for all tenors move by +200 bps |
Parallel down | rates for all tenors move by –200 bps |
Steepener | front-end moves by –195 bps, long-end by +134 bps |
Flattener | front-end moves by +240 bps, long-end by –89 bps |
Short-term up | front-end moves by +300 bps, long-end by +1 bp |
Short-term down | front-end moves by –300 bps, long-end by –1 bp |
1 The six scenarios for other currencies have a similar shape, but different magnitude: the parallel shocks are 150 basis points for CHF, 200 basis points for EUR, and 250 basis points for GBP. The term “front-end” stands for overnight tenor and “long-end” for a 20-year tenor of the yield curve. Refer to FINMA Circular 2019/2 for more information.
41
UBS Group AG
Annual |
IRRBB1: Quantitative information on IRRBB | ||||
As of 30.6.19 |
|
|
|
|
USD million |
| Delta EVE – Change of economic value of equity |
| Delta NII – Change of Net interest income2 |
Parallel up |
| (4,504) |
| (355) |
Parallel down |
| 3,807 |
| 204 |
Steepener |
| (749) |
|
|
Flattener |
| (298) |
|
|
Short rate up |
| (1,908) |
|
|
Short rate down |
| 2,048 |
|
|
Maximum1 |
| (4,504) |
| (355) |
|
|
|
|
|
Period |
|
|
| 30.6.19 |
Tier 1 capital |
| 49,993 | ||
1 “Maximum” indicates the most adverse interest rate scenario as shown in the table. 2 Disclosure of the NII sensitivity is only required for the two parallel shock scenarios. The NII estimates are based on hypothetical scenarios of immediate changes in interest rates and assume no change to balance sheet size and structure, constant foreign exchange rates and no specific management action. Furthermore, the change in NII does not include the contribution from cash held at central banks. | ||||
p
Annual |
IRRBBA1: Quantitative disclosures relating to the position structure and interest rate reset of IRRBB risk | ||||||||||||
As of 30.6.19 |
|
| Volume1 |
| Average interest rate repricing period (in years) |
| Maximum interest rate repricing period (in years) for exposures with modelled interest rate repricing dates | |||||
USD million, except where indicated |
| Total | of which: CHF | of which: EUR | of which: USD |
| Total | of which: CHF |
| Total | of which: CHF | |
Determined repricing period | Loans and advances to banks |
| 12,193 | 4,459 | 3,628 | 4,086 |
| 0.69 | 0.91 |
|
|
|
Loans and advances to customers |
| 144,803 | 35,569 | 12,117 | 73,908 |
| 0.64 | 1.38 |
|
|
| |
Money market mortgages |
| 39,551 | 39,551 |
|
|
| 0.15 | 0.15 |
|
|
| |
Fixed-rate mortgages |
| 83,709 | 83,709 | 0 | 0 |
| 4.13 | 4.13 |
|
|
| |
Financial investments |
| 50,450 | 1,231 | 4,974 | 31,685 |
| 1.80 | 3.72 |
|
|
| |
Other receivables |
| 172,358 |
| 26,125 | 95,684 |
| 0.13 | 0.10 |
|
|
| |
Receivables from interest rate derivatives |
| 687,361 | 104,235 | 145,253 | 353,448 |
| 1.29 | 0.98 |
|
|
| |
Amounts due to banks |
| (12,816) | (3,360) | (11) | (9,269) |
| 1.37 | 1.46 |
|
|
| |
Customer deposits |
| (52,696) | (195) | (1,284) | (39,129) |
| 0.40 | 0.49 |
|
|
| |
Medium-term notes |
| (75) | (73) | (1) |
|
| 2.73 | 2.72 |
|
|
| |
Bonds and covered bonds |
| (97,060) | (9,984) | (32,653) | (46,605) |
| 1.81 | 5.05 |
|
|
| |
Other liabilities |
| (117,535) | 0 | (22,200) | (64,966) |
| 0.11 | 0.01 |
|
|
| |
Liabilities from interest rate derivatives |
| (687,321) | (127,566) | (93,615) | (341,800) |
| 0.68 | 0.86 |
|
|
| |
Undetermined repricing period | Loans and advances to banks |
|
|
|
|
|
|
|
|
|
|
|
Loans and advances to customers |
| 15,739 | 2,030 | 3,114 | 9,186 |
| 1.17 | 0.91 |
|
|
| |
Variable-rate mortgages |
| 17,921 |
|
| 14,482 |
| 3.92 |
|
|
|
| |
Other receivables on sight |
| 2,173 | 2,173 |
|
|
| 1.31 | 1.31 |
|
|
| |
Liabilities on sight in personal and current accounts |
| (261,637) | (83,101) | (55,465) | (101,572) |
| 1.30 | 1.32 |
|
|
| |
Other liabilities on sight |
|
|
|
|
|
|
|
|
|
|
| |
Liabilities from client deposits, callable but not transferable |
| (112,048) | (112,048) |
|
|
| 2.16 | 2.16 |
|
|
| |
Total |
| 409,519 | 199,352 | 58,579 | 125,241 |
| 1.20 | 1.74 |
| 10 | 10 | |
1 The volume figures cover only banking book positions excluding subordinated liabilities and are risk-based measures which differ from the accounting values on the IFRS balance sheet. | ||||||||||||
p
42
Section 8 Going and gone concern requirements and eligible capital
The table below provides details of the Swiss systemically relevant bank (SRB) going and gone concern capital requirements as required by FINMA. More information about capital management is provided on pages 47–56 of our second quarter 2019 report, which is available under “Quarterly reporting” at www.ubs.com/investors.
Quarterly |
Swiss SRB going and gone concern requirements and information | ||||||||||
|
| Swiss SRB, including transitional arrangements |
| Swiss SRB as of 1.1.20 | ||||||
As of 30.6.19 |
| RWA | LRD |
| RWA | LRD | ||||
USD million, except where indicated |
| in % |
| in % |
|
| in % |
| in % |
|
Required going concern capital |
|
|
|
|
|
|
|
|
|
|
Total going concern capital |
| 13.89 | 36,401 | 4.50 | 41,012 |
| 14.611 | 38,289 | 5.001 | 45,569 |
Common equity tier 1 capital |
| 9.99 | 26,178 | 3.20 | 29,164 |
| 10.31 | 27,017 | 3.50 | 31,898 |
of which: minimum capital |
| 4.90 | 12,845 | 1.70 | 15,493 |
| 4.50 | 11,796 | 1.50 | 13,671 |
of which: buffer capital |
| 4.78 | 12,530 | 1.50 | 13,671 |
| 5.50 | 14,417 | 2.00 | 18,228 |
of which: countercyclical buffer |
| 0.31 | 803 |
|
|
| 0.31 | 803 |
|
|
Maximum additional tier 1 capital |
| 3.90 | 10,223 | 1.30 | 11,848 |
| 4.30 | 11,272 | 1.50 | 13,671 |
of which: additional tier 1 capital |
| 3.10 | 8,126 | 1.30 | 11,848 |
| 3.50 | 9,175 | 1.50 | 13,671 |
of which: additional tier 1 buffer capital |
| 0.80 | 2,097 |
|
|
| 0.80 | 2,097 |
|
|
|
|
|
|
|
|
|
|
|
|
|
Eligible going concern capital |
|
|
|
|
|
|
|
|
|
|
Total going concern capital |
| 21.22 | 55,618 | 6.10 | 55,618 |
| 19.07 | 49,993 | 5.49 | 49,993 |
Common equity tier 1 capital |
| 13.33 | 34,948 | 3.83 | 34,948 |
| 13.33 | 34,948 | 3.83 | 34,948 |
Total loss-absorbing additional tier 1 capital |
| 7.89 | 20,670 | 2.27 | 20,670 |
| 5.74 | 15,045 | 1.65 | 15,045 |
of which: high-trigger loss-absorbing additional tier 1 capital |
| 4.81 | 12,609 | 1.38 | 12,609 |
| 4.81 | 12,609 | 1.38 | 12,609 |
of which: low-trigger loss-absorbing additional tier 1 capital2 |
| 0.93 | 2,436 | 0.27 | 2,436 |
| 0.93 | 2,436 | 0.27 | 2,436 |
of which: low-trigger loss-absorbing tier 2 capital3 |
| 2.15 | 5,625 | 0.62 | 5,625 |
|
|
|
|
|
|
|
|
|
|
|
|
|
|
|
|
Required gone concern capital |
|
|
|
|
|
|
|
|
|
|
Total gone concern loss-absorbing capacity |
| 9.74 | 25,542 | 3.36 | 30,622 |
| 10.69 | 28,014 | 3.82 | 34,804 |
of which: base requirement |
| 10.52 | 27,577 | 3.63 | 33,038 |
| 12.86 | 33,711 | 4.50 | 41,012 |
of which: additional requirement for market share and LRD |
| 1.08 | 2,831 | 0.38 | 3,418 |
| 1.44 | 3,775 | 0.50 | 4,557 |
of which: applicable reduction on requirements |
| (1.86) | (4,865) | (0.64) | (5,833) |
| (3.61) | (9,471) | (1.18) | (10,765) |
of which: rebate granted (equivalent to 40% of maximum rebate) |
| (1.86) | (4,865) | (0.64) | (5,833) |
| (2.29) | (5,998) | (0.80) | (7,291) |
of which: reduction for usage of low-trigger tier 2 capital instruments |
|
|
|
|
|
| (1.33) | (3,474) | (0.38) | (3,474) |
|
|
|
|
|
|
|
|
|
|
|
Eligible gone concern capital |
|
|
|
|
|
|
|
|
|
|
Total gone concern loss-absorbing capacity |
| 12.11 | 31,744 | 3.48 | 31,744 |
| 14.26 | 37,370 | 4.10 | 37,370 |
Total tier 2 capital |
| 0.77 | 2,024 | 0.22 | 2,024 |
| 2.92 | 7,649 | 0.84 | 7,649 |
of which: low-trigger loss-absorbing tier 2 capital |
| 0.50 | 1,322 | 0.15 | 1,322 |
| 2.65 | 6,947 | 0.76 | 6,947 |
of which: non-Basel III-compliant tier 2 capital |
| 0.27 | 702 | 0.08 | 702 |
| 0.27 | 702 | 0.08 | 702 |
TLAC-eligible senior unsecured debt |
| 11.34 | 29,721 | 3.26 | 29,721 |
| 11.34 | 29,721 | 3.26 | 29,721 |
|
|
|
|
|
|
|
|
|
|
|
Total loss-absorbing capacity |
|
|
|
|
|
|
|
|
|
|
Required total loss-absorbing capacity |
| 23.63 | 61,944 | 7.86 | 71,634 |
| 25.29 | 66,303 | 8.82 | 80,373 |
Eligible total loss-absorbing capacity |
| 33.33 | 87,363 | 9.59 | 87,363 |
| 33.33 | 87,363 | 9.59 | 87,363 |
|
|
|
|
|
|
|
|
|
|
|
Risk-weighted assets / leverage ratio denominator | ||||||||||
Risk-weighted assets |
| 262,135 |
|
|
| 262,135 |
|
| ||
Leverage ratio denominator |
|
|
| 911,379 |
|
|
| 911,379 | ||
1 Includes applicable add-ons of 1.44% for RWA and 0.5% for LRD. 2 Includes outstanding low-trigger loss-absorbing additional tier 1 (AT1) capital instruments, which are available under the transitional rules of the Swiss SRB framework to meet the going concern requirements until their first call date, even if the first call date is after 31 December 2019. As of their first call date, these instruments are eligible to meet the gone concern requirements. 3 Includes outstanding low-trigger loss-absorbing tier 2 capital instruments, which are available under the transitional rules of the Swiss SRB framework to meet the going concern requirements until the earlier of (i) their maturity or first call date or (ii) 31 December 2019, and to meet gone concern requirements thereafter. Outstanding low-trigger loss-absorbing tier 2 capital instruments are subject to amortization starting five years prior to their maturity, with the amortized portion qualifying as gone concern loss-absorbing capacity. Instruments available to meet gone concern requirements are eligible until one year before maturity, with a haircut of 50% applied in the last year of eligibility. | ||||||||||
p
43
UBS Group AG
Explanation of the differences between the IFRS and regulatory scopes of consolidation
Quarterly | The scope of consolidation for the purpose of calculating Group regulatory capital is generally the same as the consolidation scope under International Financial Reporting Standards (IFRS) and includes subsidiaries that are directly or indirectly controlled by UBS Group AG and are active in banking and finance. However, subsidiaries consolidated under IFRS the business of which is outside the banking and finance sector are excluded from the regulatory scope of consolidation.
The key differences between the IFRS and regulatory capital scopes of consolidation as of 30 June 2019 related to investments in insurance, real estate and commercial companies as well as investment vehicles that are consolidated under IFRS, but not for regulatory capital purposes, where they are subject to risk-weighting.
The table below provides a list of the most significant entities that were included in the IFRS scope of consolidation, but not in the regulatory capital scope of consolidation. These entities account for most of the difference between the “Balance sheet
in accordance with IFRS scope of consolidation” and the “Balance sheet in accordance with regulatory scope of consolidation” columns in the CC2 table and such difference is mainly related to financial assets at fair value not held for trading and other financial liabilities designated at fair value. As of 30 June 2019, entities consolidated under either the IFRS or the regulatory scope of consolidation did not report any significant capital deficiencies.
In the banking book, certain equity investments are not consolidated under either the IFRS or the regulatory scope of consolidation. As of 30 June 2019, these investments mainly consisted of infrastructure holdings and joint operations (e.g., settlement and clearing institutions, and stock and financial futures exchanges) and included our participation in the SIX Group. These investments were risk-weighted based on applicable threshold rules.
More information about the legal structure of the UBS Group and about the IFRS scope of consolidation is provided on pages 12–13 and 328–329, respectively, of our Annual Report 2018, which is available under “Annual reporting” at www.ubs.com/investors. p
Quarterly |
Main legal entities consolidated under IFRS but not included in the regulatory scope of consolidation | ||||||
|
| 30.6.19 |
|
| ||
USD million |
| Total assets1 | Total equity1 |
|
| Purpose |
UBS Asset Management Life Ltd |
| 25,132 | 41 |
|
| Life Insurance |
A&Q Alpha Select Hedge Fund Limited |
| 297 | 2972 |
|
| Investment vehicle for multiple investors |
A&Q Alternative Solution Limited |
| 244 | 2402 |
|
| Investment vehicle for multiple investors |
A&Q Alternative Solution Master Limited |
| 238 | 2382 |
|
| Investment vehicle for multiple investors |
UBS Life Insurance Company USA |
| 157 | 43 |
|
| Life insurance |
1 Total assets and total equity on a standalone basis. 2 Represents the net asset value of issued fund units. These fund units are subject to liability treatment in the consolidated financial statements in accordance with IFRS. | ||||||
p
44
Semiannual | The table below and on the next page provides a reconciliation of the IFRS balance sheet to the balance sheet according to the regulatory scope of consolidation as defined by the Basel Committee on Banking Supervision (BCBS) and FINMA. Lines in the balance sheet under the regulatory scope of consolidation are expanded and referenced where relevant to display all components that are used in the CC1 table. p
Semiannual |
CC2: Reconciliation of accounting balance sheet to balance sheet under the regulatory scope of consolidation | |||||
As of 30.6.19 | Balance sheet in accordance with IFRS scope of consolidation | Effect of deconsolidated entities for regulatory consolidation | Effect of additional consolidated entities for regulatory consolidation | Balance sheet in accordance with regulatory scope of consolidation | Ref1 |
USD million |
|
|
|
|
|
Assets |
|
|
|
|
|
Cash and balances at central banks | 101,457 | 0 |
| 101,457 |
|
Loans and advances to banks | 12,916 | (235) |
| 12,680 |
|
Receivables from securities financing transactions | 92,919 |
|
| 92,919 |
|
Cash collateral receivables on derivative instruments | 23,774 |
|
| 23,774 |
|
Loans and advances to customers | 322,655 | 56 |
| 322,711 |
|
Other financial assets measured at amortized cost | 22,158 | (345) |
| 21,813 |
|
Total financial assets measured at amortized cost | 575,878 | (524) | 0 | 575,354 |
|
Financial assets at fair value held for trading | 120,173 | (438) |
| 119,736 |
|
of which: assets pledged as collateral that may be sold or repledged by counterparties | 36,010 |
|
| 36,010 |
|
Derivative financial instruments | 121,686 | 10 |
| 121,696 |
|
Brokerage receivables | 16,915 |
|
| 16,915 |
|
Financial assets at fair value not held for trading | 89,569 | (24,710) |
| 64,860 |
|
Total financial assets measured at fair value through profit or loss | 348,343 | (25,137) | 0 | 323,206 |
|
Financial assets measured at fair value through other comprehensive income | 7,422 | 0 | 0 | 7,422 |
|
Consolidated participations | 0 | 95 |
| 95 |
|
Investments in associates | 1,049 |
|
| 1,049 |
|
of which: goodwill | 177 |
|
| 177 | 4 |
Property, equipment and software | 12,694 | (48) |
| 12,645 |
|
Goodwill and intangible assets | 6,624 | 0 |
| 6,624 |
|
of which: goodwill | 6,392 | 0 |
| 6,393 | 4 |
of which: intangible assets | 232 |
|
| 232 | 5 |
Deferred tax assets | 9,571 | 0 |
| 9,571 |
|
of which: deferred tax assets recognized for tax loss carry-forwards | 5,988 | 0 |
| 5,988 | 6 |
of which: deferred tax assets on temporary differences | 3,583 | 0 |
| 3,583 | 10 |
Other non-financial assets | 7,146 | (10) |
| 7,137 |
|
of which: net defined benefit pension and other post-employment assets | 3 |
|
| 3 | 8 |
Total assets | 968,728 | (25,625) | 0 | 943,103 |
|
|
|
|
|
|
|
45
UBS Group AG
CC2: Reconciliation of accounting balance sheet to balance sheet under the regulatory scope of consolidation (continued)
As of 30.6.19 | Balance sheet in accordance with IFRS scope of consolidation | Effect of deconsolidated entities for regulatory consolidation | Effect of additional consolidated entities for regulatory consolidation | Balance sheet in accordance with regulatory scope of consolidation | Ref1 |
USD million |
|
|
|
|
|
Liabilities |
|
|
|
|
|
Amounts due to banks | 9,494 |
|
| 9,494 |
|
Payables from securities financing transactions | 6,798 |
|
| 6,798 |
|
Cash collateral payables on derivative instruments | 31,448 | 0 |
| 31,448 |
|
Customer deposits | 433,017 | (38) |
| 432,979 |
|
Debt issued measured at amortized cost | 120,805 | (5) |
| 120,799 |
|
of which: amount eligible for high-trigger loss-absorbing additional tier 1 capital | 10,595 |
|
| 10,595 | 9 |
of which: amount eligible for low-trigger loss-absorbing additional tier 1 capital | 2,436 |
|
| 2,436 | 9 |
of which: amount eligible for low-trigger loss-absorbing tier 2 capital | 6,947 |
|
| 6,947 | 11 |
of which: amount eligible for capital instruments subject to phase-out from tier 2 capital | 702 |
|
| 702 | 12 |
Other financial liabilities measured at amortized cost | 10,520 | (488) |
| 10,032 |
|
Total financial liabilities measured at amortized cost | 612,082 | (532) | 0 | 611,550 |
|
Financial liabilities at fair value held for trading | 32,261 | 0 |
| 32,261 |
|
Derivative financial instruments | 121,087 | 4 |
| 121,091 |
|
Brokerage payables designated at fair value | 36,929 |
|
| 36,929 |
|
Debt issued designated at fair value | 67,984 | 2 |
| 67,987 |
|
Other financial liabilities designated at fair value | 34,407 | (25,087) |
| 9,321 |
|
Total financial liabilities measured at fair value through profit or loss | 292,668 | (25,081) | 0 | 267,587 |
|
Provisions | 3,011 | 0 |
| 3,010 |
|
Other non-financial liabilities | 7,617 | (2) |
| 7,615 |
|
of which: amount eligible for high-trigger loss-absorbing capital (Deferred Contingent Capital Plan (DCCP))2 | 1,504 |
|
| 1,504 | 9 |
of which: deferred tax liabilities related to goodwill | 265 |
|
| 265 | 4 |
of which: deferred tax liabilities related to other intangible assets | 0 |
|
| 0 | 5 |
Total liabilities | 915,378 | (25,615) | 0 | 889,763 |
|
Equity |
|
|
|
|
|
Share capital | 338 |
|
| 338 | 1 |
Share premium | 17,802 |
|
| 17,802 | 1 |
Treasury shares | (2,843) |
|
| (2,843) | 3 |
Retained earnings | 32,548 | (18) |
| 32,530 | 2 |
Other comprehensive income recognized directly in equity, net of tax | 5,335 | 8 |
| 5,343 | 3 |
of which: unrealized gains / (losses) from cash flow hedges | 1,346 |
|
| 1,346 | 7 |
Equity attributable to shareholders | 53,180 | (10) | 0 | 53,170 |
|
Equity attributable to non-controlling interests | 170 |
|
| 170 |
|
Total equity | 53,350 | (10) | 0 | 53,340 |
|
Total liabilities and equity | 968,728 | (25,625) | 0 | 943,103 |
|
1 References link the lines of this table to the respective reference numbers provided in the “References” column in the “CC1: Composition of regulatory capital” table. 2 IFRS carrying value is USD 1,671 million. Refer to the “Compensation” section of our Annual Report 2018 for more information about the DCCP. | |||||
p
46
Composition of capital
Semiannual | The CC1 table below and on the following pages provides the composition of capital as defined by the BCBS and FINMA. Reference is made to items reconciling to the balance sheet under the regulatory scope of consolidation as disclosed in the CC2 table.
Refer to the documents titled “Capital and total loss-absorbing capacity instruments of UBS Group AG consolidated and UBS AG consolidated and standalone – key features” and “UBS Group AG consolidated capital instruments and TLAC-eligible senior unsecured debt” under “Bondholder information” at www.ubs.com/investors for an overview of the main features of our regulatory capital instruments, as well as the full terms and conditions. p
Semiannual |
CC1: Composition of regulatory capital | |||
As of 30.6.19 | Amounts | References1 | |
USD million except where indicated |
|
| |
| Common Equity Tier 1 capital: instruments and reserves |
|
|
1 | Directly issued qualifying common share (and equivalent for non-joint stock companies) capital plus related stock surplus | 18,140 | 1 |
2 | Retained earnings | 32,530 | 2 |
3 | Accumulated other comprehensive income (and other reserves) | 2,501 | 3 |
4 | Directly issued capital subject to phase-out from CET1 (only applicable to non-joint stock companies) |
|
|
5 | Common share capital issued by subsidiaries and held by third parties (amount allowed in group CET1) |
|
|
6 | Common Equity Tier 1 capital before regulatory adjustments | 53,170 |
|
| Common Equity Tier 1 capital: regulatory adjustments |
|
|
7 | Prudent valuation adjustments | (104) |
|
8 | Goodwill (net of related tax liability) | (6,305) | 4 |
9 | Other intangibles other than mortgage servicing rights (net of related tax liability) | (232) | 5 |
10 | Deferred tax assets that rely on future profitability, excluding those arising from temporary differences (net of related tax liability)2 | (6,208) | 6 |
11 | Cash flow hedge reserve | (1,346) | 7 |
12 | Shortfall of provisions to expected losses | (412) |
|
13 | Securitization gain on sale |
|
|
14 | Gains and losses due to changes in own credit risk on fair valued liabilities | (109) |
|
15 | Defined benefit pension fund net assets | (3) | 8 |
16 | Investments in own shares (if not already subtracted from paid-in capital on reported balance sheet)3 | (1,760) | 9 |
17 | Reciprocal cross-holdings in common equity |
|
|
17a | Qualified holdings where a significant influence is exercised with other owners (CET1 instruments) |
|
|
17b | Immaterial investments (CET1 items) |
|
|
18 | Investments in the capital of banking, financial and insurance entities that are outside the scope of regulatory consolidation, where the bank does not own more than 10% of the issued share capital (amount above 10% threshold) |
|
|
19 | Significant investments in the common stock of banking, financial and insurance entities that are outside the scope of regulatory consolidation (amount above 10% threshold) |
|
|
20 | Mortgage servicing rights (amount above 10% threshold) |
|
|
21 | Deferred tax assets arising from temporary differences (amount above 10% threshold, net of related tax liability) | (266) | 10 |
22 | Amount exceeding the 15% threshold |
|
|
23 | of which: significant investments in the common stock of financials |
|
|
24 | of which: mortgage servicing rights |
|
|
25 | of which: deferred tax assets arising from temporary differences |
|
|
26 | Expected losses on equity investment under the PD / LGD approach |
|
|
26a | Further adjustments to financial statements in accordance with a recognized international accounting standard | (56) |
|
26b | Other adjustments | (1,421) |
|
27 | Regulatory adjustments applied to Common Equity Tier 1 due to insufficient Additional Tier 1 and Tier 2 to cover deductions |
|
|
28 | Total regulatory adjustments to Common Equity Tier 1 | (18,222) |
|
29 | Common Equity Tier 1 capital (CET1) | 34,948 |
|
47
UBS Group AG
CC1: Composition of regulatory capital (Continued) | |||
As of 30.6.19 | Amounts | References1 | |
USD million except where indicated |
|
| |
| Additional Tier 1 capital: instruments |
|
|
30 | Directly issued qualifying additional Tier 1 instruments plus related stock surplus | 15,052 |
|
31 | of which: classified as equity under applicable accounting standards |
|
|
32 | of which: classified as liabilities under applicable accounting standards | 15,052 |
|
33 | Directly issued capital instruments subject to phase-out from additional Tier 1 |
|
|
34 | Additional Tier 1 instruments (and CET1 instruments not included in row 5) issued by subsidiaries and held by third parties (amount allowed in group AT1) |
|
|
35 | of which: instruments issued by subsidiaries subject to phase-out |
|
|
36 | Additional Tier 1 capital before regulatory adjustments | 15,052 |
|
| Additional Tier 1 capital: regulatory adjustments |
|
|
37 | Investments in own additional Tier 1 instruments | (7) |
|
38 | Reciprocal cross-holdings in additional Tier 1 instruments |
|
|
38a | Qualified holdings where a significant influence is exercised with other owners (AT1 instruments) |
|
|
38b | Immaterial investments (AT1 instruments) |
|
|
39 | Investments in the capital of banking, financial and insurance entities that are outside the scope of regulatory consolidation, where the bank does not own more than 10% of the issued common share capital of the entity (amount above 10% threshold) |
|
|
40 | Significant investments in the capital of banking, financial and insurance entities that are outside the scope of regulatory consolidation |
|
|
41 | Other adjustments |
|
|
42 | Regulatory adjustments applied to additional Tier 1 due to insufficient Tier 2 to cover deductions |
|
|
42a | Regulatory adjustments applied to CET1 capital due to insufficient additional Tier 1 to cover deductions |
|
|
43 | Total regulatory adjustments to additional Tier 1 capital |
|
|
44 | Additional Tier 1 capital (AT1) | 15,045 | 9 |
45 | Tier 1 capital (T1 = CET1 + AT1) | 49,993 |
|
| Tier 2 capital: instruments and provisions |
|
|
46 | Directly issued qualifying Tier 2 instruments plus related stock surplus | 5,6514 | 11 |
47 | Directly issued capital instruments subject to phase-out from Tier 2 | 720 | 12 |
48 | Tier 2 instruments (and CET1 and AT1 instruments not included in rows 5 or 34) issued by subsidiaries and held by third parties (amount allowed in group Tier 2) |
|
|
49 | of which: instruments issued by subsidiaries subject to phase-out |
|
|
50 | Provisions |
|
|
51 | Tier 2 capital before regulatory adjustments | 6,370 |
|
| Tier 2 capital: regulatory adjustments |
|
|
52 | Investments in own Tier 2 instruments5 | (18) | 12 |
53 | Reciprocal cross-holdings in Tier 2 instruments and other TLAC liabilities |
|
|
53a | Qualified holdings where a significant influence is exercised with other owners (T2 instruments and other TLAC instruments) |
|
|
53b | Immaterial investments (T2 instruments and other TLAC instruments) |
|
|
54 | Investments in the capital and other TLAC liabilities of banking, financial and insurance entities that are outside the scope of regulatory consolidation, where the bank does not own more than 10% of the issued common share capital of the entity (amount above 10% threshold) |
|
|
55 | Significant investments in the capital and other TLAC liabilities of banking, financial and insurance entities that are outside the scope of regulatory consolidation (net of eligible short positions) |
|
|
56 | Other adjustments |
|
|
56a | Excess of the adjustments, which are allocated to the AT1 capital |
|
|
57 | Total regulatory adjustments to Tier 2 capital | (18) |
|
58 | Tier 2 capital (T2) | 6,353 |
|
59 | Total regulatory capital (TC = T1 + T2) | 56,345 |
|
60 | Total risk-weighted assets | 262,135 |
|
48
CC1: Composition of regulatory capital (Continued) | |||
As of 30.6.19 | Amounts | References1 | |
USD million except where indicated |
|
| |
| Capital ratios and buffers |
|
|
61 | Common Equity Tier 1 (as a percentage of risk-weighted assets) | 13.33 |
|
62 | Tier 1 (as a percentage of risk-weighted assets) | 19.07 |
|
63 | Total capital (as a percentage of risk-weighted assets) | 21.49 |
|
64 | Institution-specific buffer requirement (capital conservation buffer plus countercyclical buffer requirements plus higher loss absorbency requirement, expressed as a percentage of risk-weighted assets)6 | 3.59 |
|
65 | of which: capital conservation buffer requirement | 2.50 |
|
66 | of which: bank-specific countercyclical buffer requirement | 0.09 |
|
67 | of which: higher loss absorbency requirement | 1.00 |
|
68 | Common Equity Tier 1 (as a percentage of risk-weighted assets) available after meeting the bank’s minimum capital requirements | 8.83 |
|
| Amounts below the thresholds for deduction (before risk weighting) |
|
|
72 | Non-significant investments in the capital and other TLAC liabilities of other financial entities | 1,482 |
|
73 | Significant investments in the common stock of financial entities | 911 |
|
74 | Mortgage servicing rights (net of related tax liability) |
|
|
75 | Deferred tax assets arising from temporary differences (net of related tax liability) | 3,787 |
|
| Applicable caps on the inclusion of provisions in Tier 2 |
|
|
76 | Provisions eligible for inclusion in Tier 2 in respect of exposures subject to standardized approach (prior to application of cap) |
|
|
77 | Cap on inclusion of provisions in Tier 2 under standardized approach |
|
|
78 | Provisions eligible for inclusion in Tier 2 in respect of exposures subject to internal ratings-based approach (prior to application of cap) |
|
|
79 | Cap for inclusion of provisions in Tier 2 under internal ratings-based approach |
|
|
| Capital instruments subject to phase-out arrangements (only applicable between 1 Jan 2018 and 1 Jan 2022) according to ERV Art. 141 |
|
|
80 | Current cap on CET1 instruments subject to phase-out arrangements |
|
|
81 | Amount excluded from CET1 due to cap (excess over cap after redemptions and maturities) |
|
|
82 | Current cap on AT1 instruments subject to phase-out arrangements |
|
|
83 | Amount excluded from AT1 due to cap (excess over cap after redemptions and maturities) |
|
|
84 | Current cap on T2 instruments subject to phase-out arrangements | 1,715 |
|
85 | Amount excluded from T2 due to cap (excess over cap after redemptions and maturities) |
|
|
1 References link the lines of this table to the respective reference numbers provided in the “References” column in the “CC2: Reconciliation of accounting balance sheet to balance sheet under the regulatory scope of consolidation” table. 2 IFRS netting for deferred tax assets and liabilities is reversed for items deducted from CET1 capital. 3 Includes USD 510 million in DCCP-related charge for regulatory capital purposes. 4 Consists of instruments with a IFRS carrying value of USD 6.9 million less amortization of instruments where remaining maturity is more than one year, and 45% of the gross unrealized gains on debt instruments measured at fair value through other comprehensive income, which are measured at the lower of cost or market value for regulatory capital purposes. 5 Consists of own instruments for phase-out tier 2 capital of USD 17.8 million. 6 BCBS requirements are exceeded by our Swiss SRB requirements. Refer to the “Capital management“ section of our Annual Report 2018 for more information about the Swiss SRB requirements. | |||
p
Semiannual | The table below provides details of the underlying exposures and RWA used in the computation of the countercyclical buffer of UBS Group AG. Further information about the methodology of geographical allocation used is provided on page 166 of our Annual Report 2018, in the “Country risk exposure allocation” section. Effective from 1 January 2019, the countercyclical capital buffer rate for Hong Kong increased to 2.5%, whereas the 2% rate for Sweden was no longer subject to phase-in arrangements as compared with 2018.p
Semiannual |
CCyB1: Geographical distribution of credit exposures used in the countercyclical capital buffer | ||||||
USD million, except where indicated |
|
|
|
|
|
|
Geographical breakdown | Countercyclical capital buffer rate, % | Exposure values and / or risk-weighted assets used in the computation of the countercyclical capital buffer | Bank-specific countercyclical capital buffer rate, % | Countercyclical amount | ||
Exposure values1 |
| Risk-weighted assets | ||||
Hong Kong | 2.500 | 6,029 |
| 2,020 |
|
|
Sweden | 2.000 | 1,273 |
| 390 |
|
|
United Kingdom | 1.000 | 38,716 |
| 8,427 |
|
|
Sum |
| 46,018 |
| 10,837 |
|
|
Total |
| 518,333 |
| 157,781 | 0.09 | 237 |
1 Includes private sector exposures in the countries that are Basel Committee on Banking Supervision member jurisdictions under categories “Credit risk,” “counterparty credit risk,” “equity positions in the banking book,” “settlement risk,” “securitization exposures in the banking book” and “amounts below thresholds for deduction” as shown in the “Regulatory exposures and risk-weighted assets” table in section 2 of this report. | ||||||
p
49
UBS Group AG
Resolution Group – composition of total loss absorbing capacity (TLAC)
Semiannual |
The TLAC1 table below is based on Basel Committee on Banking Supervision (BCBS) phase-in rules, and only applicable for UBS Group AG as the ultimate parent entity of the defined UBS resolution group, to which, in case of resolution, resolution tools (e.g. a bail-in) are expected to be applied. p
Semiannual |
TLAC1: TLAC Composition for G-SIBs (at resolution group level) | |||
As of 30.6.19 |
|
| |
USD million, except where indicated |
|
| |
| Regulatory capital elements of TLAC and adjustments |
|
|
1 | Common Equity Tier 1 capital (CET1) |
| 34,948 |
2 | Additional Tier 1 capital (AT1) before TLAC adjustments |
| 15,045 |
3 | AT1 ineligible as TLAC as issued out of subsidiaries to third parties |
|
|
4 | Other adjustments |
|
|
5 | Total AT1 instruments eligible under the TLAC framework |
| 15,045 |
6 | Tier 2 capital (T2) before TLAC adjustments |
| 6,353 |
7 | Amortized portion of T2 instruments where remaining maturity > 1 year |
| 1,322 |
8 | T2 capital ineligible as TLAC as issued out of subsidiaries to third parties |
|
|
9 | Other adjustments |
|
|
10 | Total T2 instruments eligible under the TLAC framework |
| 7,675 |
11 | TLAC arising from regulatory capital |
| 57,668 |
| Non-regulatory capital elements of TLAC |
|
|
12 | External TLAC instruments issued directly by the bank and subordinated to excluded liabilities |
|
|
13 | External TLAC instruments issued directly by the bank which are not subordinated to excluded liabilities but meet all other TLAC term sheet requirements |
|
|
14 | of which: amount eligible as TLAC after application of the caps |
| n/a |
15 | External TLAC instruments issued by funding vehicles prior to 1 January 2022 |
| 29,721 |
16 | Eligible ex ante commitments to recapitalize a G-SIB in resolution |
|
|
17 | TLAC arising from non-regulatory capital instruments before adjustments |
| 29,721 |
| Non-regulatory capital elements of TLAC: adjustments |
|
|
18 | TLAC before deductions |
| 87,388 |
19 | Deductions of exposures between multiple-point-of-entry (MPE) resolution groups that correspond to items eligible for TLAC (not applicable to SPE G-SIBs) |
| n/a |
20 | Deduction of investments in own other TLAC liabilities |
|
|
21 | Other adjustments to TLAC |
|
|
22 | TLAC after deductions |
| 87,388 |
| Risk-weighted assets and leverage exposure measure for TLAC purposes |
|
|
23 | Total risk-weighted assets adjusted as permitted under the TLAC regime |
| 262,135 |
24 | Leverage exposure measure |
| 911,379 |
| TLAC ratios and buffers |
|
|
25 | TLAC (as a percentage of risk-weighted assets adjusted as permitted under the TLAC regime) |
| 33.34 |
26 | TLAC (as a percentage of leverage exposure) |
| 9.59 |
27 | CET1 (as a percentage of risk-weighted assets) available after meeting the resolution group’s minimum capital and TLAC requirements |
| 8.83 |
28 | Institution-specific buffer requirement (capital conservation buffer plus countercyclical buffer requirements plus higher loss absorbency requirement, expressed as a percentage of risk-weighted assets) |
| 3.59 |
29 | of which: capital conservation buffer requirement |
| 2.50 |
30 | of which: bank specific countercyclical buffer requirement |
| 0.09 |
31 | of which: higher loss absorbency requirement |
| 1.00 |
| |||
p
50
Resolution Entity – creditor ranking at legal entity level
Semiannual | The TLAC3 table below provides an overview of the creditor ranking structure of the resolution entity UBS Group AG on a standalone basis.
As of 30 June 2019, UBS had issued loss-absorbing additional tier 1 (AT1) capital instruments and bail-in debt through UBS Group Funding (Switzerland) AG, a direct subsidiary of UBS Group AG, for a nominal amount of USD 44,645 million. These liabilities are not reflected in the TLAC3 table below. Upon occurrence of a restructuring event, UBS Group AG would automatically be substituted as the issuer of these instruments. It is expected that during the fourth quarter of 2019 UBS Group AG will assume the outstanding capital and debt instruments that were previously issued by UBS Group Funding (Switzerland) AG. New loss absorbing AT1 capital instruments and total loss absorbing-capacity (TLAC)-eligible senior unsecured debt are issued out of UBS Group AG.
UBS Group AG grants Deferred Contingent Capital Plan (DCCP) awards to UBS Group employees. Awards granted since February 2015 qualify as Basel III AT1 capital on a UBS Group consolidated basis and amounted to USD 2,014 million as of 30 June 2019. The related liabilities of UBS Group AG on a standalone basis of USD 1,493 million are not included in the table below, as these do not give rise to a current claim until the awards are legally vested.
As of 30 June 2019, the TLAC available on a UBS Group consolidated basis amounted to USD 87,388 million.
® Refer to “Bondholder information” at www.ubs.com/investors for more information
® Refer to the “TLAC1: composition for G-SIBs (at resolution group level)” table in section 8 of this report for more information about TLAC for UBS Group AG consolidated
Financial information for UBS Group AG standalone for the six months ended 30 June 2019 is provided under “Holding company and significant regulated subsidiaries and sub-groups” at www.ubs.com/investors. p
Semiannual |
TLAC3: creditor ranking at legal entity level for the resolution entity UBS Group AG
| |||||||
As of 30.6.19 |
| Creditor ranking |
| Total | |||
USD million |
| 1 | 2 | 3 |
|
| |
1 | Description of creditor ranking |
| Common shares (most junior)2 | Additional Tier 1 | Bail-in debt and pari-passu liabilities (most senior)3 |
|
|
2 | Total capital and liabilities net of credit risk mitigation1 |
| 39,892 |
| 1,030 |
| 40,921 |
3 | Subset of row 2 that are excluded liabilities |
|
|
|
|
|
|
4 | Total capital and liabilities less excluded liabilities (row 2 minus row 3) |
| 39,892 |
| 1,030 |
| 40,921 |
5 | Subset of row 4 that are potentially eligible as TLAC |
| 39,892 |
|
|
| 39,892 |
6 | Subset of row 5 with 1 year ≤ residual maturity < 2 years |
|
|
|
|
|
|
7 | Subset of row 5 with 2 years ≤ residual maturity < 5 years |
|
|
|
|
|
|
8 | Subset of row 5 with 5 years ≤ residual maturity < 10 years |
|
|
|
|
|
|
9 | Subset of row 5 with residual maturity ≥ 10 years, but excluding perpetual securities |
|
|
|
|
|
|
10 | Subset of row 5 that is perpetual securities |
| 39,892 |
|
|
| 39,892 |
1 No credit risk mitigation is applied to capital and liabilities for UBS Group AG standalone. 2 Common shares including the associated reserves are equal to equity attributable to shareholders as disclosed in the UBS Group AG standalone financial information for the six months ended 30 June 2019, which was prepared in accordance with the principles of the Swiss Law on Accounting and Financial Reporting (32nd title of the Swiss Code of Obligations). 3 Represents interest-bearing liabilities which comprise loans from UBS AG and UBS Switzerland AG as well tax liabilities which are not excluded liabilities under Swiss law that rank pari-passu to bail-in debt. | |||||||
p
51
UBS Group AG
Section 10 Leverage ratio
Quarterly | The Basel Committee on Banking Supervision (BCBS) leverage ratio is calculated by dividing the period-end tier 1 capital by the period-end leverage ratio denominator (LRD). The LRD consists of IFRS on-balance sheet assets and off-balance sheet items. Derivative exposures are adjusted for a number of items, including replacement value and eligible cash variation margin netting, the current exposure method add-on and net notional amounts for written credit derivatives. The LRD also includes an additional charge for counterparty credit risk related to securities financing transactions (SFTs).
The table on this page shows the difference between total IFRS assets per IFRS consolidation scope and the BCBS total on-balance sheet exposures. Those exposures are the starting point for calculating the BCBS LRD, as shown in the LR2 table on the following page. The difference is due to the application of the regulatory scope of consolidation for the purpose of the BCBS
calculation. In addition, carrying values for derivative financial instruments and SFTs are deducted from IFRS total assets. They are measured differently under BCBS leverage ratio rules and are therefore added back in separate exposure line items in the LR2 table.
As of 30 June 2019, our BCBS Basel III leverage ratio was 5.5% and the BCBS Basel III LRD was USD 911 billion. p
Difference between the Swiss SRB and BCBS leverage ratio
Quarterly | The LRD is the same under Swiss SRB and BCBS rules. However, there is a difference in the capital numerator between the two frameworks. Under BCBS rules, only common equity tier 1 and additional tier 1 capital are included in the numerator. Under Swiss SRB rules we are required to meet going as well as gone concern leverage ratio requirements. Therefore, depending on the requirement, the numerator includes tier 1 capital instruments, tier 2 capital instruments and / or total loss-absorbing capacity (TLAC)-eligible senior unsecured debt. p
Quarterly |
Reconciliation of IFRS total assets to BCBS Basel III total on-balance sheet exposures excluding derivatives and securities financing transactions | ||
USD million | 30.6.19 | 31.3.19 |
On-balance sheet exposures |
|
|
IFRS total assets | 968,727 | 956,580 |
Adjustment for investments in banking, financial, insurance or commercial entities that are consolidated for accounting purposes but outside the scope of regulatory consolidation | (25,625) | (25,074) |
Adjustment for investments in banking, financial, insurance or commercial entities that are outside the scope of consolidation for accounting purposes but consolidated for regulatory purposes | 0 | 0 |
Adjustment for fiduciary assets recognized on the balance sheet pursuant to the operative accounting framework but excluded from the leverage ratio exposure measure | 0 | 0 |
Less carrying value of derivative financial instruments in IFRS total assets1 | (145,470) | (136,335) |
Less carrying value of securities financing transactions in IFRS total assets2 | (120,008) | (124,070) |
Adjustments to accounting values | 0 | 0 |
On-balance sheet items excluding derivatives and securities financing transactions, but including collateral | 677,624 | 671,101 |
Asset amounts deducted in determining BCBS Basel III tier 1 capital | (13,461) | (13,588) |
Total on-balance sheet exposures (excluding derivatives and securities financing transactions) | 664,164 | 657,514 |
1 Consists of derivative financial instruments and cash collateral receivables on derivative instruments in accordance with the regulatory scope of consolidation. 2 Consists of receivables from securities financing transactions, margin loans, prime brokerage receivables and financial assets at fair value not held for trading related to securities financing transactions in accordance with the regulatory scope of consolidation. | ||
p
52
Quarterly |
LR2: BCBS Basel III leverage ratio common disclosure |
|
| |
USD million, except where indicated | 30.6.19 | 31.3.19 | |
|
|
|
|
| On-balance sheet exposures |
|
|
1 | On-balance sheet items excluding derivatives and SFTs, but including collateral | 677,624 | 671,101 |
2 | (Asset amounts deducted in determining Basel III tier 1 capital) | (13,461) | (13,588) |
3 | Total on-balance sheet exposures (excluding derivatives and SFTs) | 664,164 | 657,514 |
|
|
|
|
| Derivative exposures |
|
|
4 | Replacement cost associated with all derivatives transactions (i.e., net of eligible cash variation margin) | 39,849 | 40,032 |
5 | Add-on amounts for PFE associated with all derivatives transactions | 84,806 | 86,524 |
6 | Gross-up for derivatives collateral provided where deducted from the balance sheet assets pursuant to the operative accounting framework | 0 | 0 |
7 | (Deductions of receivables assets for cash variation margin provided in derivatives transactions) | (14,218) | (13,012) |
8 | (Exempted CCP leg of client-cleared trade exposures) | (19,289) | (20,126) |
9 | Adjusted effective notional amount of all written credit derivatives1 | 71,554 | 74,842 |
10 | (Adjusted effective notional offsets and add-on deductions for written credit derivatives)2 | (69,663) | (73,213) |
11 | Total derivative exposures | 93,039 | 95,046 |
|
|
|
|
| Securities financing transaction exposures |
|
|
12 | Gross SFT assets (with no recognition of netting), after adjusting for sale accounting transactions | 221,683 | 213,202 |
13 | (Netted amounts of cash payables and cash receivables of gross SFT assets) | (101,676) | (89,132) |
14 | CCR exposure for SFT assets | 8,672 | 8,075 |
15 | Agent transaction exposures | 0 | 0 |
16 | Total securities financing transaction exposures | 128,680 | 132,145 |
|
|
|
|
| Other off-balance sheet exposures |
|
|
17 | Off-balance sheet exposure at gross notional amount | 73,852 | 78,673 |
18 | (Adjustments for conversion to credit equivalent amounts) | (48,354) | (52,385) |
19 | Total off-balance sheet items | 25,497 | 26,287 |
| Total exposures (leverage ratio denominator) | 911,379 | 910,993 |
|
|
|
|
| Capital and total exposures (leverage ratio denominator) |
|
|
20 | Tier 1 capital | 49,993 | 49,436 |
21 | Total exposures (leverage ratio denominator) | 911,379 | 910,993 |
|
|
|
|
| Leverage ratio |
|
|
22 | Basel III leverage ratio (%) | 5.5 | 5.4 |
1 Includes protection sold, including agency transactions. 2 Protection sold can be offset with protection bought on the same underlying reference entity, provided that the conditions according to the Basel III leverage ratio framework and disclosure requirements are met. | |||
p
53
UBS Group AG
Quarterly | LRD remained stable at USD 911 billion in the second quarter of 2019, as the increase from currency effects was substantially offset by the decrease in asset size and other movements. p
Quarterly |
LR1: BCBS Basel III leverage ratio summary comparison |
|
| |
USD million | 30.6.19 | 31.3.19 | |
1 | Total consolidated assets as per published financial statements | 968,727 | 956,580 |
2 | Adjustment for investments in banking, financial, insurance or commercial entities that are consolidated for accounting purposes but outside the scope of regulatory consolidation1 | (39,085) | (38,661) |
3 | Adjustment for fiduciary assets recognized on the balance sheet pursuant to the operative accounting framework but excluded from the leverage ratio exposure measure | 0 | 0 |
4 | Adjustments for derivative financial instruments | (52,432) | (41,289) |
5 | Adjustment for securities financing transactions (i.e., repos and similar secured lending) | 8,672 | 8,075 |
6 | Adjustment for off-balance sheet items (i.e., conversion to credit equivalent amounts of off-balance sheet exposures) | 25,497 | 26,287 |
7 | Other adjustments | 0 | 0 |
8 | Leverage ratio exposure (leverage ratio denominator) | 911,379 | 910,993 |
1 This item includes assets that are deducted from tier 1 capital. | |||
p
Quarterly |
BCBS Basel III leverage ratio |
|
|
|
|
USD million, except where indicated | 30.6.19 | 31.3.19 | 31.12.18 | 30.9.18 |
Total tier 1 capital | 49,993 | 49,436 | 46,279 | 45,972 |
BCBS total exposures (leverage ratio denominator) | 911,379 | 910,993 | 904,598 | 915,066 |
BCBS Basel III leverage ratio (%) | 5.5 | 5.4 | 5.1 | 5.0 |
p
54
Section 11 Liquidity coverage ratio
LIQ1: Liquidity risk management
Quarterly | We monitor the Liquidity coverage ratio (LCR) in all significant currencies in order to manage any currency mismatch between high-quality liquid assets (HQLA) and the net expected cash outflows in times of stress. p
Quarterly |
LIQ1: Liquidity risk management | |||||||
Pillar 3 disclosure requirement |
| Quarterly Rerport |
| Disclosure |
| Second quarter 2019 report | |
|
|
|
|
|
|
|
|
Concentration of funding sources |
| Treasury management |
| – | Funding by product and currency |
| 46 |
p
High-quality liquid assets
Quarterly | HQLA must be easily and immediately convertible into cash at little or no loss of value, especially during a period of stress. HQLA are assets that are of low risk and are unencumbered. Other characteristics of HQLA are ease and certainty of valuation, low correlation with risky assets, listing on
a developed and recognized exchange, existence of an active and sizeable market, and low volatility. Based on these characteristics, HQLA are categorized as Level 1 (primarily central bank reserves and government bonds) or Level 2 (primarily US and European agency bonds as well as non-financial corporate covered bonds). Level 2 assets are subject to regulatory haircuts and caps. p
Quarterly |
High-quality liquid assets |
|
|
|
| ||||
|
| Average 2Q191 |
| Average 1Q191 | ||||
USD billion |
| Level 1 weighted liquidity value2 | Level 2 weighted liquidity value2 | Total weighted liquidity value2 |
| Level 1 weighted liquidity value2 | Level 2 weighted liquidity value2 | Total weighted liquidity value2 |
Cash balances3 |
| 108 | 0 | 108 |
| 115 | 0 | 115 |
Securities (on- and off-balance sheet) |
| 53 | 15 | 68 |
| 58 | 13 | 71 |
Total high-quality liquid assets4 |
| 161 | 15 | 176 |
| 173 | 13 | 186 |
1 Calculated based on an average of 65 data points in the second quarter of 2019 and 63 data points in the first quarter of 2019. 2 Calculated after the application of haircuts. 3 Includes cash and balances with central banks and other eligible balances as prescribed by FINMA. 4 Calculated in accordance with FINMA requirements. | ||||||||
p
55
UBS Group AG
Liquidity coverage ratio
Quarterly | In the second quarter of 2019, the UBS Group AG liquidity coverage ratio (LCR) decreased by 8 percentage points to 145%, remaining above the 110% Group LCR minimum communicated by the Swiss Financial Market Supervisory Authority (FINMA). The LCR decrease was mainly driven by a reduction in eligible HQLA relating to lower average cash balances, reflecting increased funding consumption by the business divisions. p
Quarterly |
LIQ1: Liquidity coverage ratio |
|
|
|
|
|
| |
|
|
| Average 2Q191 |
| Average 1Q191 | ||
USD billion, except where indicated |
| Unweighted value | Weighted value2 |
| Unweighted value | Weighted value2 | |
| |||||||
High-quality liquid assets |
|
|
|
|
|
| |
1 | High-quality liquid assets |
| 179 | 176 |
| 188 | 186 |
|
|
|
|
|
|
|
|
Cash outflows |
|
|
|
|
|
| |
2 | Retail deposits and deposits from small business customers |
| 239 | 27 |
| 238 | 27 |
3 | of which: stable deposits |
| 31 | 1 |
| 34 | 1 |
4 | of which: less stable deposits |
| 207 | 26 |
| 204 | 26 |
5 | Unsecured wholesale funding |
| 186 | 106 |
| 183 | 103 |
6 | of which: operational deposits (all counterparties) |
| 41 | 10 |
| 42 | 10 |
7 | of which: non-operational deposits (all counterparties) |
| 132 | 82 |
| 130 | 82 |
8 | of which: unsecured debt |
| 13 | 13 |
| 11 | 11 |
9 | Secured wholesale funding |
|
| 74 |
|
| 73 |
10 | Additional requirements: |
| 75 | 22 |
| 72 | 24 |
11 | of which: outflows related to derivatives and other transactions |
| 41 | 15 |
| 38 | 16 |
12 | of which: outflows related to loss of funding on debt products3 |
| 0 | 0 |
| 0 | 0 |
13 | of which: committed credit and liquidity facilities |
| 34 | 7 |
| 33 | 7 |
14 | Other contractual funding obligations |
| 14 | 12 |
| 14 | 13 |
15 | Other contingent funding obligations |
| 241 | 6 |
| 251 | 6 |
16 | Total cash outflows |
|
| 247 |
|
| 246 |
|
|
|
|
|
|
|
|
Cash inflows |
|
|
|
|
|
| |
17 | Secured lending |
| 297 | 85 |
| 296 | 84 |
18 | Inflows from fully performing exposures |
| 65 | 29 |
| 66 | 29 |
19 | Other cash inflows |
| 11 | 11 |
| 11 | 11 |
20 | Total cash inflows |
| 373 | 126 |
| 374 | 124 |
|
|
|
|
|
|
|
|
| Average 2Q191 |
|
| Average 1Q191 | |||
USD billion, except where indicated |
|
| Total adjusted value4 |
|
| Total adjusted value4 | |
|
|
|
|
|
|
|
|
Liquidity coverage ratio |
|
|
|
|
|
| |
21 | High-quality liquid assets |
|
| 176 |
|
| 186 |
22 | Net cash outflows |
|
| 121 |
|
| 122 |
23 | Liquidity coverage ratio (%) |
|
| 145 |
|
| 153 |
1 Calculated based on an average of 65 data points in the second quarter of 2019 and 63 data points in the first quarter of 2019. 2 Calculated after the application of haircuts and inflow and outflow rates. 3 Includes outflows related to loss of funding on asset-backed securities, covered bonds, other structured financing instruments, asset-backed commercial papers, structured entities (conduits), securities investment vehicles and other such financing facilities. 4 Calculated after the application of haircuts and inflow and outflow rates as well as, where applicable, caps on Level 2 assets and cash inflows. | |||||||
p
56
Section 12 Requirements for global systemically important banks and related indicators
The Financial Stability Board (the FSB) has determined that UBS is a global systemically important bank (G-SIB), using an indicator-based methodology adopted by the Basel Committee on Banking Supervision (the BCBS). Banks that qualify as G-SIBs are required to disclose the 12 indicators for assessing the systemic importance of G-SIBs as defined by the BCBS. These indicators are used for the G-SIB score calculation and cover five categories: size, cross-jurisdictional activity, interconnectedness, substitutability / financial institution infrastructure and complexity.
Based on the published indicators, G-SIBs are subject to additional CET1 capital buffer requirements in a range from 1.0% to 3.5%. In November 2018, the FSB determined that the requirement for UBS is 1.0%. As our Swiss SRB Basel III capital requirements exceed the BCBS requirements including the G-SIB buffer, we are not affected by these additional G-SIB requirements.
In July 2018, the BCBS published a revised assessment methodology and higher loss absorbency requirements. These will take effect in 2021 and the higher loss absorbency surcharge would be applied from 1 January 2023 onward. We do not expect these changes to result in an increase of our additional CET1 capital buffer requirement.
Annual | Our G-SIB indicators as of 31 December 2018 were published in July 2019 under “Pillar 3 disclosures” at www.ubs.com/investors. p
57
Significant regulated subsidiaries and sub-groups
Section 1 Introduction
The sections below include capital and other regulatory information for UBS AG standalone, UBS Switzerland AG standalone, UBS Europe SE consolidated and UBS Americas Holding LLC consolidated.
Capital information in this section is based on Pillar 1 requirements. Entities may be subject to significant additional Pillar 2 requirements, which represent additional amounts of capital considered necessary and agreed with regulators based on the risk profile of the entities.
Key metrics of the second quarter of 2019
Quarterly | The table below is based on Basel Committee on Banking Supervision (BCBS) Basel III phase-in rules. During the second quarter of 2019, common equity tier 1 (CET1) capital increased by USD 2.2 billion to USD 51.3 billion, mainly as a result of operating profit. Risk-weighted assets (RWA) decreased by USD 6.4 billion to USD 294.3 billion, driven by decreases in
credit and counterparty credit risk RWA and market risk RWA. Leverage ratio exposure remained stable during the quarter. High-quality liquid assets decreased by USD 4.5 billion as a result of lower average cash balances, reflecting increased funding consumption by the business divisions. Net cash outflows increased by USD 5.2 billion, reflecting higher outflows from intercompany transactions, partly offset by higher third-party cash inflows. p
Quarterly |
KM1: Key metrics |
|
|
|
|
|
|
|
|
| |
USD million, except where indicated | ||||||||||
|
|
| 30.6.19 | 31.3.19 |
| 31.12.18 |
| 30.9.184 |
| 30.6.184 |
Available capital (amounts)1 |
|
|
|
|
|
|
|
|
| |
1 | Common equity tier 1 (CET1) |
| 51,261 | 49,024 |
| 49,411 |
| 49,810 |
| 49,583 |
1a | Fully loaded ECL accounting model |
| 51,258 | 49,021 |
| 49,411 |
| 49,810 |
| 49,583 |
2 | Tier 1 |
| 64,315 | 61,839 |
| 59,595 |
| 59,341 |
| 59,161 |
2a | Fully loaded ECL accounting model tier 1 |
| 64,312 | 61,836 |
| 59,595 |
| 59,341 |
| 59,161 |
3 | Total capital |
| 70,612 | 68,542 |
| 66,295 |
| 66,005 |
| 66,258 |
3a | Fully loaded ECL accounting model total capital |
| 70,609 | 68,539 |
| 66,295 |
| 66,005 |
| 66,258 |
Risk-weighted assets (amounts) |
|
|
|
|
|
|
|
|
| |
4 | Total risk-weighted assets (RWA) |
| 294,348 | 300,734 |
| 292,888 |
| 288,045 |
| 286,457 |
4a | Minimum capital requirement2 |
| 23,548 | 24,059 |
| 23,431 |
| 23,044 |
| 22,917 |
4b | Total risk-weighted assets (pre-floor) |
| 294,348 | 300,734 |
| 292,888 |
| 288,045 |
| 286,457 |
Risk-based capital ratios as a percentage of RWA1 |
|
|
|
|
|
|
|
|
| |
5 | Common equity tier 1 ratio (%) |
| 17.41 | 16.30 |
| 16.87 |
| 17.29 |
| 17.31 |
5a | Fully loaded ECL accounting model CET1 (%) |
| 17.41 | 16.30 |
| 16.87 |
| 17.29 |
| 17.31 |
6 | Tier 1 ratio (%) |
| 21.85 | 20.56 |
| 20.35 |
| 20.60 |
| 20.65 |
6a | Fully loaded ECL accounting model tier 1 ratio (%) |
| 21.85 | 20.56 |
| 20.35 |
| 20.60 |
| 20.65 |
7 | Total capital ratio (%) |
| 23.99 | 22.79 |
| 22.63 |
| 22.91 |
| 23.13 |
7a | Fully loaded ECL accounting model total capital ratio (%) |
| 23.99 | 22.79 |
| 22.63 |
| 22.91 |
| 23.13 |
Additional CET1 buffer requirements as a percentage of RWA |
|
|
|
|
|
|
|
|
| |
8 | Capital conservation buffer requirement (2.5% from 2019) (%) |
| 2.50 | 2.50 |
| 1.88 |
| 1.88 |
| 1.88 |
9 | Countercyclical buffer requirement (%) |
| 0.08 | 0.09 |
| 0.07 |
| 0.05 |
| 0.08 |
9a | Additional countercyclical buffer for Swiss mortgage loans (%) |
| 0.00 | 0.00 |
| 0.00 |
| 0.00 |
| 0.00 |
10 | Bank G-SIB and / or D-SIB additional requirements (%)3 |
|
|
|
|
|
|
|
|
|
11 | Total of bank CET1 specific buffer requirements (%)1 |
| 2.58 | 2.59 |
| 1.95 |
| 1.92 |
| 1.96 |
12 | CET1 available after meeting the bank’s minimum capital requirements (%)1 |
| 12.91 | 11.80 |
| 12.37 |
| 12.79 |
| 12.81 |
Basel III leverage ratio |
|
|
|
|
|
|
|
|
| |
13 | Total Basel III leverage ratio exposure measure |
| 618,704 | 617,329 |
| 601,013 |
| 619,741 |
| 620,074 |
14 | Basel III leverage ratio (%)1 |
| 10.40 | 10.02 |
| 9.92 |
| 9.58 |
| 9.54 |
14a | Fully loaded ECL accounting model Basel III leverage ratio (%)1 |
| 10.39 | 10.02 |
| 9.92 |
| 9.58 |
| 9.54 |
Liquidity coverage ratio |
|
|
|
|
|
|
|
|
| |
15 | Total HQLA |
| 82,201 | 86,690 |
| 76,456 |
| 81,214 |
| 83,473 |
16 | Total net cash outflow |
| 56,626 | 51,434 |
| 55,032 |
| 59,450 |
| 60,786 |
17 | LCR ratio (%) |
| 145 | 169 |
| 139 |
| 137 |
| 137 |
1 Based on BCBS Basel III phase-in rules. 2 Calculated as 8% of total RWA, based on total capital minimum requirements, excluding CET1 buffer requirements. 3 Swiss SRB going concern requirements and information for UBS AG standalone is provided in the following pages in this section. 4 In line with the change of the presentation currency of UBS Group AG’s and UBS AG’s consolidated and standalone financial statements from Swiss francs to US dollars in October 2018, prior periods were translated to US dollars at the respective spot rates prevailing on the relevant reporting dates. | ||||||||||
p
60
Swiss SRB going concern requirements and information
Quarterly | Under Swiss systemically relevant bank (SRB) regulations, Art. 125 “Reliefs for financial groups and individual institutions” of the Capital Adequacy Ordinance stipulates that the Swiss Financial Market Supervisory Authority (FINMA) may grant, under certain conditions, capital relief to individual institutions to ensure that an individual institution’s compliance with the capital requirements does not lead to a de facto overcapitalization of the group of which it is a part.
FINMA granted relief concerning the regulatory capital requirements of UBS AG on a standalone basis by means of decrees issued on 20 December 2013 and 20 October 2017, the latter effective as of 1 July 2017 and partly replacing the former.
More information is provided in “Section 2 UBS AG standalone” of our 31 December 2018 Pillar 3 report, which is available under “Pillar 3 disclosures” at www.ubs.com/investors. p
Quarterly |
Swiss SRB going and gone concern requirements and information | ||||||||||
|
| Swiss SRB, including transitional arrangements |
| Swiss SRB as of 1.1.20 | ||||||
As of 30.6.19 |
| RWA | LRD |
| RWA | LRD | ||||
USD million, except where indicated |
| in %1 |
| in %1 |
|
| in % |
| in % |
|
Required going concern capital |
|
|
|
|
|
|
|
|
|
|
Total going concern capital |
| 14.382 | 42,315 | 5.002 | 30,935 |
| 14.382 | 54,657 | 5.002 | 30,935 |
Common equity tier 1 capital |
| 10.08 | 29,658 | 3.50 | 21,655 |
| 10.08 | 38,309 | 3.50 | 21,655 |
of which: minimum capital |
| 4.50 | 13,246 | 1.50 | 9,281 |
| 4.50 | 17,109 | 1.50 | 9,281 |
of which: buffer capital |
| 5.50 | 16,189 | 2.00 | 12,374 |
| 5.50 | 20,911 | 2.00 | 12,374 |
of which: countercyclical buffer |
| 0.08 | 223 |
|
|
| 0.08 | 289 |
|
|
Maximum additional tier 1 capital |
| 4.30 | 12,657 | 1.50 | 9,281 |
| 4.30 | 16,349 | 1.50 | 9,281 |
of which: additional tier 1 capital |
| 3.50 | 10,302 | 1.50 | 9,281 |
| 3.50 | 13,307 | 1.50 | 9,281 |
of which: additional tier 1 buffer capital |
| 0.80 | 2,355 |
|
|
| 0.80 | 3,042 |
|
|
|
|
|
|
|
|
|
|
|
|
|
Eligible going concern capital |
|
|
|
|
|
|
|
|
|
|
Total going concern capital |
| 22.93 | 67,485 | 10.91 | 67,485 |
| 16.28 | 61,880 | 10.00 | 61,880 |
Common equity tier 1 capital |
| 17.41 | 51,261 | 8.29 | 51,261 |
| 13.48 | 51,261 | 8.29 | 51,261 |
Total loss-absorbing additional tier 1 capital3 |
| 5.51 | 16,225 | 2.62 | 16,225 |
| 2.79 | 10,619 | 1.72 | 10,619 |
of which: high-trigger loss-absorbing additional tier 1 capital |
| 3.61 | 10,619 | 1.72 | 10,619 |
| 2.79 | 10,619 | 1.72 | 10,619 |
of which: low-trigger loss-absorbing tier 2 capital |
| 1.90 | 5,606 | 0.91 | 5,606 |
|
|
|
|
|
|
|
|
|
|
|
|
|
|
|
|
Risk-weighted assets / leverage ratio denominator | ||||||||||
Risk-weighted assets |
| 294,348 |
|
|
| 380,200 |
|
| ||
Leverage ratio denominator |
|
|
| 618,704 |
|
|
| 618,704 | ||
1 By FINMA decree, requirements exceed those based on the transitional arrangements of the Swiss Capital Adequacy Ordinance, i.e., a total going concern capital ratio requirement of 13.58% plus the effect of countercyclical buffer (CCB) requirements of 0.08%, of which 9.68% plus the effect of CCB requirements of 0.08% must be satisfied with CET1 capital, and a total going concern leverage ratio requirement of 4.5%, of which 3.2% must be satisfied with CET1 capital. 2 Includes applicable add-ons of 1.44% for RWA and 0.5% for leverage ratio denominator (LRD). 3 Includes outstanding low-trigger loss-absorbing tier 2 capital instruments, which are available under the transitional rules of the Swiss SRB framework to meet the going concern requirements until the earlier of (i) their maturity or first call date or (ii) 31 December 2019. Outstanding low-trigger loss-absorbing tier 2 capital instruments are subject to amortization starting five years prior to their maturity. | ||||||||||
p
61
Significant regulated subsidiaries and sub-groups
Quarterly |
Swiss SRB going and gone concern information |
| |||||||||
|
| Swiss SRB, including transitional arrangements |
| Swiss SRB as of 1.1.20 | ||||||
USD million, except where indicated |
| 30.6.19 |
| 31.3.19 | 31.12.18 |
| 30.6.19 |
| 31.3.19 | 31.12.18 |
|
|
|
|
|
|
|
|
|
|
|
Eligible going concern capital |
|
|
|
|
|
|
|
|
|
|
Total going concern capital |
| 67,485 |
| 65,472 | 63,225 |
| 61,880 |
| 59,460 | 57,217 |
Total tier 1 capital |
| 61,880 |
| 59,460 | 57,217 |
| 61,880 |
| 59,460 | 57,217 |
Common equity tier 1 capital |
| 51,261 |
| 49,024 | 49,411 |
| 51,261 |
| 49,024 | 49,411 |
Total loss-absorbing additional tier 1 capital |
| 10,619 |
| 10,435 | 7,805 |
| 10,619 |
| 10,435 | 7,805 |
of which: high-trigger loss-absorbing additional tier 1 capital |
| 10,619 |
| 10,435 | 7,805 |
| 10,619 |
| 10,435 | 7,805 |
Total tier 2 capital |
| 5,606 |
| 6,012 | 6,008 |
|
|
|
|
|
of which: low-trigger loss-absorbing tier 2 capital1 |
| 5,606 |
| 6,012 | 6,008 |
|
|
|
|
|
|
|
|
|
|
|
|
|
|
|
|
Risk-weighted assets / leverage ratio denominator |
|
|
|
|
|
|
|
|
|
|
Risk-weighted assets |
| 294,348 |
| 300,734 | 292,888 |
| 380,200 |
| 382,634 | 383,578 |
of which: direct and indirect investments in Swiss-domiciled subsidiaries2 |
| 33,034 |
| 32,558 | 31,711 |
| 40,285 |
| 39,705 | 39,639 |
of which: direct and indirect investments in foreign-domiciled subsidiaries2 |
| 96,068 |
| 91,366 | 82,762 |
| 174,668 |
| 166,119 | 165,525 |
Leverage ratio denominator |
| 618,704 |
| 617,329 | 601,013 |
| 618,704 |
| 617,329 | 601,013 |
|
|
|
|
|
|
|
|
|
|
|
Capital and loss-absorbing capacity ratios (%) |
|
|
|
|
|
|
|
|
|
|
Going concern capital ratio |
| 22.9 |
| 21.8 | 21.6 |
| 16.3 |
| 15.5 | 14.9 |
of which: common equity tier 1 capital ratio |
| 17.4 |
| 16.3 | 16.9 |
| 13.5 |
| 12.8 | 12.9 |
|
|
|
|
|
|
|
|
|
|
|
Leverage ratios (%) |
|
|
|
|
|
|
|
|
|
|
Going concern leverage ratio |
| 10.9 |
| 10.6 | 10.5 |
| 10.0 |
| 9.6 | 9.5 |
of which: common equity tier 1 leverage ratio |
| 8.3 |
| 7.9 | 8.2 |
| 8.3 |
| 7.9 | 8.2 |
1 Outstanding low-trigger loss-absorbing tier 2 capital instruments qualify as going concern capital until the earlier of (i) their maturity or first call date or (ii) 31 December 2019, and are subject to amortization starting five years prior to their maturity. 2 Carrying value for direct and indirect investments including holding of regulatory capital instruments in Swiss-domiciled subsidiaries (30 June 2019: USD 16,114 million; 31 March 2019: USD 15,882 million), and for direct and indirect investments including holding of regulatory capital instruments in foreign-domiciled subsidiaries (30 June 2019: USD 43,667 million; 31 March 2019: USD 41,530 million), is risk weighted at 205% and 220%, respectively, for the current year. Risk weights will gradually increase by 5% per year for Swiss-domiciled investments and 20% per year for foreign-domiciled investments until the fully applied risk weights of 250% and 400%, respectively, are applied. | ||||||||||
p
62
Leverage ratio information
Quarterly |
Swiss SRB leverage ratio denominator | |||||
USD billion |
| 30.6.19 |
| 31.3.19 | 31.12.18 |
|
|
|
|
|
|
Leverage ratio denominator |
|
|
|
|
|
Swiss GAAP total assets |
| 501.0 |
| 498.4 | 480.0 |
Difference between Swiss GAAP and IFRS total assets |
| 121.6 |
| 110.8 | 118.6 |
Less: derivative exposures and SFTs1 |
| (238.9) |
| (225.4) | (236.7) |
On-balance sheet exposures (excluding derivative exposures and SFTs) |
| 383.7 |
| 383.8 | 361.9 |
Derivative exposures |
| 100.5 |
| 98.8 | 99.3 |
Securities financing transactions |
| 111.8 |
| 111.1 | 114.2 |
Off-balance sheet items |
| 23.4 |
| 24.2 | 26.1 |
Items deducted from Swiss SRB tier 1 capital |
| (0.6) |
| (0.5) | (0.5) |
Total exposures (leverage ratio denominator) |
| 618.7 |
| 617.3 | 601.0 |
1 Consists of derivative financial instruments, cash collateral receivables on derivative instruments, receivables from securities financing transactions, and margin loans, as well as prime brokerage receivables and financial assets at fair value not held for trading, both related to securities financing transactions, in accordance with the regulatory scope of consolidation, which are presented separately under Derivative exposures and Securities financing transactions in this table.
| |||||
p
Quarterly |
BCBS Basel III leverage ratio | |||||
USD million, except where indicated |
| 30.6.19 | 31.3.19 | 31.12.18 | 30.9.18 |
Total tier 1 capital |
| 64,315 | 61,839 | 59,595 | 59,341 |
Total exposures (leverage ratio denominator) |
| 618,704 | 617,329 | 601,013 | 619,741 |
BCBS Basel III leverage ratio (%) |
| 10.4 | 10.0 | 9.9 | 9.6 |
| |||||
p
Liquidity coverage ratio
UBS AG is required to maintain a minimum liquidity coverage ratio of 105% as communicated by FINMA. p
Quarterly |
Liquidity coverage ratio |
|
|
|
|
| Weighted value1 | |
USD billion, except where indicated |
| Average 2Q192 | Average 1Q192 |
High-quality liquid assets |
| 82 | 87 |
Total net cash outflows |
| 57 | 51 |
of which: cash outflows |
| 175 | 171 |
of which: cash inflows |
| 118 | 119 |
Liquidity coverage ratio (%) |
| 145 | 169 |
1 Calculated after the application of haircuts and inflow and outflow rates. 2 Calculated based on an average of 65 data points in the second quarter of 2019 and 63 data points in the first quarter of 2019. | |||
p
63
Significant regulated subsidiaries and sub-groups
Key metrics of the second quarter of 2019
Quarterly | The table below is based on Basel Committee on Banking Supervision (BCBS) Basel III phase-in rules. During the second quarter of 2019, common equity tier 1 (CET1) capital increased by CHF 0.2 billion to CHF 10.7 billion, mainly as a result of operating profit. Risk-weighted assets (RWA) and leverage ratio exposure remained stable during the quarter. High-quality liquid assets decreased by CHF 4.2 billion as a result of lower average cash balances, reflecting increased funding consumption by the business divisions. Net cash outflows decreased by CHF 3.2 billion, reflecting higher inflows from intercompany transactions. p
Quarterly |
KM1: Key metrics |
|
|
|
|
|
| |
CHF million, except where indicated | |||||||
|
|
| 30.6.19 | 31.3.19 | 31.12.18 | 30.9.18 | 30.6.18 |
Available capital (amounts)1 |
|
|
|
|
|
| |
1 | Common equity tier 1 (CET1) |
| 10,654 | 10,463 | 10,225 | 10,165 | 10,072 |
1a | Fully loaded ECL accounting model |
| 10,649 | 10,457 | 10,225 | 10,165 | 10,072 |
2 | Tier 1 |
| 14,894 | 14,712 | 14,468 | 13,165 | 13,072 |
2a | Fully loaded ECL accounting model tier 1 |
| 14,889 | 14,706 | 14,468 | 13,165 | 13,072 |
3 | Total capital |
| 14,894 | 14,712 | 14,468 | 13,165 | 13,072 |
3a | Fully loaded ECL accounting model total capital |
| 14,889 | 14,706 | 14,468 | 13,165 | 13,072 |
Risk-weighted assets (amounts) |
|
|
|
|
|
| |
4 | Total risk-weighted assets (RWA) |
| 96,640 | 96,067 | 95,646 | 95,541 | 94,887 |
4a | Minimum capital requirement2 |
| 7,731 | 7,685 | 7,652 | 7,643 | 7,591 |
4b | Total risk-weighted assets (pre-floor) |
| 91,013 | 90,068 | 91,457 | 88,299 | 88,357 |
Risk-based capital ratios as a percentage of RWA1 |
|
|
|
|
|
| |
5 | Common equity tier 1 ratio (%) |
| 11.02 | 10.89 | 10.69 | 10.64 | 10.61 |
5a | Fully loaded ECL accounting model CET1 (%) |
| 11.02 | 10.89 | 10.69 | 10.64 | 10.61 |
6 | Tier 1 ratio (%) |
| 15.41 | 15.31 | 15.13 | 13.78 | 13.78 |
6a | Fully loaded ECL accounting model tier 1 ratio (%) |
| 15.41 | 15.31 | 15.13 | 13.78 | 13.78 |
7 | Total capital ratio (%) |
| 15.41 | 15.31 | 15.13 | 13.78 | 13.78 |
7a | Fully loaded ECL accounting model total capital ratio (%) |
| 15.41 | 15.31 | 15.13 | 13.78 | 13.78 |
Additional CET1 buffer requirements as a percentage of RWA3 |
|
|
|
|
|
| |
8 | Capital conservation buffer requirement (2.5% from 2019) (%) |
| 2.50 | 2.50 | 1.88 | 1.88 | 1.88 |
9 | Countercyclical buffer requirement (%) |
| 0.01 | 0.01 | 0.01 | 0.00 | 0.00 |
9a | Additional countercyclical buffer for Swiss mortgage loans (%) |
| 0.57 | 0.58 | 0.56 | 0.56 | 0.54 |
10 | Bank G-SIB and / or D-SIB additional requirements (%)4 |
|
|
|
|
|
|
11 | Total of bank CET1 specific buffer requirements (%)1 |
| 2.51 | 2.51 | 1.88 | 1.88 | 1.88 |
12 | CET1 available after meeting the bank’s minimum capital requirements (%)1 |
| 6.52 | 6.39 | 6.19 | 6.14 | 6.11 |
Basel III leverage ratio |
|
|
|
|
|
| |
13 | Total Basel III leverage ratio exposure measure |
| 311,212 | 310,545 | 306,487 | 303,257 | 304,046 |
14 | Basel III leverage ratio (%)1 |
| 4.79 | 4.74 | 4.72 | 4.34 | 4.30 |
14a | Fully loaded ECL accounting model Basel III leverage ratio (%)1 |
| 4.78 | 4.74 | 4.72 | 4.34 | 4.30 |
Liquidity coverage ratio |
|
|
|
|
|
| |
15 | Total HQLA |
| 67,160 | 71,392 | 67,427 | 66,174 | 68,620 |
16 | Total net cash outflow |
| 48,761 | 51,945 | 52,846 | 53,130 | 53,731 |
17 | LCR ratio (%) |
| 138 | 137 | 128 | 125 | 128 |
1 Based on BCBS Basel III phase-in rules. 2 Calculated as 8% of total RWA, based on total capital minimum requirements, excluding CET1 buffer requirements. 3 As Annex 8 of Swiss Capital Adequacy Ordinance (CAO) does not apply to the systemically relevant banks, UBS can abstain from disclosing the information required in lines 12a–12e. In the event of a waiver, UBS nevertheless provides information about the Swiss sector-specific countercyclical buffer in row 9a pursuant to Art. 44 CAO. 4 Swiss SRB going concern requirements and information for UBS Switzerland AG are provided on the next page. | |||||||
p
64
Swiss SRB going and gone concern requirements and information
Quarterly | UBS Switzerland AG is considered a systemically relevant bank (SRB) under Swiss banking law and is subject to capital regulations on a standalone basis. As of 30 June 2019, the transitional going concern capital and leverage ratio requirements for UBS Switzerland AG standalone were 14.16% and 4.5%, respectively. The gone concern requirements under transitional arrangements were 9.74% for the RWA-based requirement and 3.36% for the LRD-based requirement. p
Quarterly |
Swiss SRB going and gone concern requirements and information | ||||||||||
|
| Swiss SRB, including transitional arrangements |
| Swiss SRB as of 1.1.20 | ||||||
As of 30.6.19 |
| RWA | LRD |
| RWA | LRD | ||||
CHF million, except where indicated |
| in %1 |
| in % |
|
| in % |
| in % |
|
Required going concern capital |
|
|
|
|
|
|
|
|
|
|
Total going concern capital |
| 14.16 | 13,684 | 4.50 | 14,005 |
| 14.882 | 14,380 | 5.002 | 15,561 |
Common equity tier 1 capital |
| 10.26 | 9,915 | 3.20 | 9,959 |
| 10.58 | 10,224 | 3.50 | 10,892 |
of which: minimum capital |
| 4.90 | 4,735 | 1.70 | 5,291 |
| 4.50 | 4,349 | 1.50 | 4,668 |
of which: buffer capital |
| 4.78 | 4,619 | 1.50 | 4,668 |
| 5.50 | 5,315 | 2.00 | 6,224 |
of which: countercyclical buffer |
| 0.58 | 560 |
|
|
| 0.58 | 560 |
|
|
Maximum additional tier 1 capital |
| 3.90 | 3,769 | 1.30 | 4,046 |
| 4.30 | 4,156 | 1.50 | 4,668 |
of which: additional tier 1 capital |
| 3.10 | 2,996 | 1.30 | 4,046 |
| 3.50 | 3,382 | 1.50 | 4,668 |
of which: additional tier 1 buffer capital |
| 0.80 | 773 |
|
|
| 0.80 | 773 |
|
|
|
|
|
|
|
|
|
|
|
|
|
Eligible going concern capital |
|
|
|
|
|
|
|
|
|
|
Total going concern capital |
| 15.41 | 14,894 | 4.79 | 14,894 |
| 15.41 | 14,894 | 4.79 | 14,894 |
Common equity tier 1 capital |
| 11.02 | 10,654 | 3.42 | 10,654 |
| 11.02 | 10,654 | 3.42 | 10,654 |
Total loss-absorbing additional tier 1 capital |
| 4.39 | 4,240 | 1.36 | 4,240 |
| 4.39 | 4,240 | 1.36 | 4,240 |
of which: high-trigger loss-absorbing additional tier 1 capital |
| 4.39 | 4,240 | 1.36 | 4,240 |
| 4.39 | 4,240 | 1.36 | 4,240 |
|
|
|
|
|
|
|
|
|
|
|
Required gone concern capital |
|
|
|
|
|
|
|
|
|
|
Total gone concern loss-absorbing capacity |
| 9.74 | 9,417 | 3.36 | 10,457 |
| 12.01 | 11,608 | 4.20 | 13,071 |
of which: base requirement |
| 10.52 | 10,167 | 3.63 | 11,281 |
| 12.86 | 12,428 | 4.50 | 14,005 |
of which: additional requirement for market share and LRD |
| 1.08 | 1,044 | 0.38 | 1,167 |
| 1.44 | 1,392 | 0.50 | 1,556 |
of which: applicable reduction on requirements |
| (1.86) | (1,794) | (0.64) | (1,992) |
| (2.29) | (2,211) | (0.80) | (2,490) |
of which: rebate granted (equivalent to 40% of maximum rebate) |
| (1.86) | (1,794) | (0.64) | (1,992) |
| (2.29) | (2,211) | (0.80) | (2,490) |
|
|
|
|
|
|
|
|
|
|
|
Eligible gone concern capital |
|
|
|
|
|
|
|
|
|
|
Total gone concern loss-absorbing capacity |
| 11.30 | 10,924 | 3.51 | 10,924 |
| 11.30 | 10,924 | 3.51 | 10,924 |
TLAC-eligible debt |
| 11.30 | 10,924 | 3.51 | 10,924 |
| 11.30 | 10,924 | 3.51 | 10,924 |
|
|
|
|
|
|
|
|
|
|
|
Total loss-absorbing capacity |
|
|
|
|
|
|
|
|
|
|
Required total loss-absorbing capacity |
| 23.90 | 23,100 | 7.86 | 24,461 |
| 26.89 | 25,988 | 9.20 | 28,631 |
Eligible total loss-absorbing capacity |
| 26.72 | 25,818 | 8.30 | 25,818 |
| 26.72 | 25,818 | 8.30 | 25,818 |
|
|
|
|
|
|
|
|
|
|
|
Risk-weighted assets / leverage ratio denominator | ||||||||||
Risk-weighted assets |
| 96,640 |
|
|
| 96,640 |
|
| ||
Leverage ratio denominator |
|
|
| 311,212 |
|
|
| 311,212 | ||
1 The total loss-absorbing capacity ratio requirement of 23.90% is the current requirement based on the transitional rules of the Swiss Capital Adequacy Ordinance including the aforementioned rebate on the gone concern requirements. In addition, FINMA has defined a total capital ratio requirement, which is the sum of 14.4% and the effect of countercyclical buffer (CCB) requirements of 0.58%, of which 10% plus the effect of CCB requirements must be satisfied with CET1 capital. These FINMA requirements will be effective until they are exceeded by the Swiss SRB requirements based on the transitional rules. 2 Includes applicable add-ons of 1.44% for RWA and 0.5% for leverage ratio denominator (LRD). | ||||||||||
65
Significant regulated subsidiaries and sub-groups
Swiss SRB loss-absorbing capacity
Quarterly |
Swiss SRB going and gone concern information1 | |||||
CHF million, except where indicated |
| 30.6.19 |
| 31.3.19 | 31.12.18 |
|
|
|
|
|
|
Eligible going concern capital |
|
|
|
|
|
Total going concern capital |
| 14,894 |
| 14,712 | 14,468 |
Total tier 1 capital |
| 14,894 |
| 14,712 | 14,468 |
Common equity tier 1 capital |
| 10,654 |
| 10,463 | 10,225 |
of which: high-trigger loss-absorbing additional tier 1 capital |
| 4,240 |
| 4,248 | 4,243 |
|
|
|
|
|
|
Eligible gone concern capital |
|
|
|
|
|
Total gone concern loss-absorbing capacity |
| 10,924 |
| 10,945 | 10,932 |
TLAC-eligible debt |
| 10,924 |
| 10,945 | 10,932 |
|
|
|
|
|
|
Total loss-absorbing capacity |
|
|
|
|
|
Total loss-absorbing capacity |
| 25,818 |
| 25,657 | 25,400 |
|
|
|
|
|
|
Risk-weighted assets / leverage ratio denominator |
|
|
|
|
|
Risk-weighted assets |
| 96,640 |
| 96,067 | 95,646 |
Leverage ratio denominator |
| 311,212 |
| 310,545 | 306,487 |
|
|
|
|
|
|
Capital and loss-absorbing capacity ratios (%) |
|
|
|
|
|
Going concern capital ratio |
| 15.4 |
| 15.3 | 15.1 |
of which: common equity tier 1 capital ratio |
| 11.0 |
| 10.9 | 10.7 |
Gone concern loss-absorbing capacity ratio |
| 11.3 |
| 11.4 | 11.4 |
Total loss-absorbing capacity ratio |
| 26.7 |
| 26.7 | 26.6 |
|
|
|
|
|
|
Leverage ratios (%) |
|
|
|
|
|
Going concern leverage ratio |
| 4.8 |
| 4.7 | 4.7 |
of which: common equity tier 1 leverage ratio |
| 3.4 |
| 3.4 | 3.3 |
Gone concern leverage ratio |
| 3.5 |
| 3.5 | 3.6 |
Total loss-absorbing capacity leverage ratio |
| 8.3 |
| 8.3 | 8.3 |
1 The numbers disclosed in the table are identical for Swiss SRB (including transitional arrangement) requirements and Swiss SRB requirements applicable as of 1 January 2020. | |||||
p
66
Leverage ratio information
Swiss SRB leverage ratio denominator |
|
|
|
|
CHF billion |
| 30.6.19 | 31.3.19 | 31.12.18 |
|
|
|
|
|
Leverage ratio denominator |
|
|
|
|
Swiss GAAP total assets |
| 295.7 | 295.8 | 293.0 |
Difference between Swiss GAAP and IFRS total assets |
| 3.6 | 2.8 | 1.8 |
Less: derivative exposures and SFTs1 |
| (39.2) | (36.6) | (32.5) |
On-balance sheet exposures (excluding derivative exposures and SFTs) |
| 260.1 | 262.1 | 262.3 |
Derivative exposures |
| 5.0 | 4.1 | 3.7 |
Securities financing transactions |
| 34.3 | 32.4 | 28.5 |
Off-balance sheet items |
| 12.0 | 12.2 | 12.4 |
Items deducted from Swiss SRB tier 1 capital |
| (0.2) | (0.2) | (0.5) |
Total exposures (leverage ratio denominator) |
| 311.2 | 310.5 | 306.5 |
1 Consists of derivative financial instruments, cash collateral receivables on derivative instruments, receivables from securities financing transactions, and margin loans as well as prime brokerage receivables and financial assets at fair value not held for trading, both related to securities financing transactions, in accordance with the regulatory scope of consolidation, which are presented separately under Derivative exposures and Securities financing transactions in this table. | ||||
p
Quarterly |
BCBS Basel III leverage ratio | |||||
CHF million, except where indicated |
| 30.6.19 | 31.3.19 | 31.12.18 | 30.9.18 |
Total tier 1 capital |
| 14,894 | 14,712 | 14,468 | 13,165 |
Total exposures (leverage ratio denominator) |
| 311,212 | 310,545 | 306,487 | 303,257 |
BCBS Basel III leverage ratio (%) |
| 4.8 | 4.7 | 4.7 | 4.3 |
| |||||
p
Liquidity coverage ratio
Quarterly | UBS Switzerland AG, as a Swiss SRB, is required to maintain a minimum liquidity coverage ratio of 100%.p
Quarterly |
Liquidity coverage ratio | |||
|
| Weighted value1 | |
CHF billion, except where indicated |
| Average 2Q192 | Average 1Q192 |
High-quality liquid assets |
| 67 | 71 |
Total net cash outflows |
| 49 | 52 |
of which: cash outflows |
| 85 | 86 |
of which: cash inflows |
| 36 | 34 |
Liquidity coverage ratio (%) |
| 138 | 137 |
1 Calculated after the application of haircuts and inflow and outflow rates. 2 Calculated based on an average of 65 data points in the second quarter of 2019 and 63 data points in the first quarter of 2019. | |||
p
67
Significant regulated subsidiaries and sub-groups
Capital instruments
Quarterly |
Capital instruments of UBS Switzerland AG – key features |
|
|
|
| |||||||||
Presented according to issuance date. |
|
|
|
| |||||||||
|
|
| Share capital |
| Additional tier 1 capital | ||||||||
1 | Issuer |
| UBS Switzerland AG, Switzerland |
| UBS Switzerland AG, Switzerland | ||||||||
1a | Instrument number |
| 1 |
| 2 |
| 3 |
| 4 |
| 5 |
| 6 |
2 | Unique identifier (e.g., CUSIP, ISIN or Bloomberg identifier for private placement) |
| n/a |
| n/a | ||||||||
3 | Governing law(s) of the instrument |
| Swiss |
| Swiss | ||||||||
3a | Means by which enforceability requirement of Section 13 of the TLAC Term Sheet is achieved (for other TLAC-eligible instruments governed by foreign law) |
| n/a |
| n/a | ||||||||
| Regulatory treatment |
|
|
|
|
|
|
|
| ||||
4 | Transitional Basel III rules1 |
| CET1 – Going concern capital |
| Additional tier 1 capital | ||||||||
5 | Post-transitional Basel III rules2 |
| CET1 – Going concern capital |
| Additional tier 1 capital | ||||||||
6 | Eligible at solo / group / group and solo |
| UBS Switzerland AG consolidated and standalone |
| UBS Switzerland AG consolidated and standalone | ||||||||
7 | Instrument type (types to be specified by each jurisdiction) |
| Ordinary shares |
| Loan4 |
| Loan4 |
| Loan4 |
| Loan |
| Loan |
8 | Amount recognized in regulatory capital (currency in millions, as of most recent reporting date)1 |
| CHF 10.0 |
| CHF 1,500 |
| CHF 500 |
| CHF 1,000 |
| CHF 825 |
| USD 425 |
9 | Par value of instrument |
| CHF 10.0 |
| CHF 1,500 |
| CHF 500 |
| CHF 1,000 |
| CHF 825 |
| USD 425 |
10 | Accounting classification3 |
| Equity attributable to UBS Switzerland AG shareholders |
| Due to banks held at amortized cost | ||||||||
11 | Original date of issuance |
| – |
| 1 April 2015 |
| 11 March 2016 |
| 18 December 2017 |
| 12 December 2018 |
| 12 December 2018 |
12 | Perpetual or dated |
| – |
| Perpetual | ||||||||
13 | Original maturity date |
| – |
| – | ||||||||
14 | Issuer call subject to prior supervisory approval |
| – |
| Yes | ||||||||
15 | Optional call date, contingent call dates and redemption amount |
| – |
| First optional repayment date: 1 April 2020 |
| First optional repayment date: 11 March 2021 |
| First optional repayment date: 18 December 2022 |
| First optional repayment date: 12 December 2023
|
| First optional repayment date: 12 December 2023
|
|
| Repayable at any time after the first optional repayment date. Repayment subject to FINMA approval. Optional repayment amount: principal amount, together with any accrued and unpaid interest thereon | |||||||||||
16 | Subsequent call dates, if applicable |
| – |
| Early repayment possible due to a tax or regulatory event. Repayment due to tax event subject to FINMA approval. Repayment amount: principal amount, together with accrued and unpaid interest | ||||||||
p
68
Quarterly |
Capital instruments of UBS Switzerland AG – key features (continued) | |||||||||||||
| Coupons |
|
|
|
|
|
|
|
|
|
|
|
|
17 | Fixed or floating dividend / coupon |
| – |
| Floating | ||||||||
18 | Coupon rate and any related index |
| – |
| 6-month CHF Libor + 370 bps per annum semiannually |
| 3-month CHF Libor + 459 bps per annum quarterly |
| 3-month CHF Libor + 250 bps per annum quarterly |
| 3-month CHF Libor + 489 bps per annum quarterly |
| 3-month USD Libor + 547 bps per annum quarterly |
19 | Existence of a dividend stopper |
| – |
| No | ||||||||
20 | Fully discretionary, partially discretionary or mandatory |
| Fully discretionary |
| Fully discretionary | ||||||||
21 | Existence of step-up or other incentive to redeem |
| – |
| No | ||||||||
22 | Non-cumulative or cumulative |
| Non-cumulative |
| Non-cumulative | ||||||||
23 | Convertible or non-convertible |
| – |
| Non-convertible | ||||||||
24 | If convertible, conversion trigger(s) |
| – |
| – | ||||||||
25 | If convertible, fully or partially |
| – |
| – | ||||||||
26 | If convertible, conversion rate |
| – |
| – | ||||||||
27 | If convertible, mandatory or optional conversion |
| – |
| – | ||||||||
28 | If convertible, specify instrument type convertible into |
| – |
| – | ||||||||
29 | If convertible, specify issuer of instrument it converts into |
| – |
| – | ||||||||
30 | Write-down feature |
| – |
| Yes | ||||||||
31 | If write-down, write-down trigger(s) |
| – |
| Trigger: CET1 ratio is less than 7% | ||||||||
|
| FINMA determines a write-down necessary to ensure UBS Switzerland AG’s viability; or UBS Switzerland AG receives a commitment of governmental support that FINMA determines necessary to ensure UBS Switzerland AG‘s viability. Subject to applicable conditions | |||||||||||
32 | If write-down, fully or partially |
| – |
| Fully | ||||||||
33 | If write-down, permanent or temporary |
| – |
| Permanent | ||||||||
34 | If temporary write-down, description of write-up mechanism |
| – |
| – | ||||||||
34a | Type of subordination |
| Statutory |
| Contractual | ||||||||
35 | Position in subordination hierarchy in liquidation (specify instrument type immediately senior to instrument in the insolvency creditor hierarchy of the legal entity concerned). |
| Unless otherwise stated in the Articles of Association, once debts are paid back, the assets of the liquidated company are divided between the shareholders pro rata based on their contributions and considering the preferences attached to certain categories of shares (Art. 745, Swiss Code of Obligations) |
| Subject to any obligations that are mandatorily preferred by law, all obligations of UBS Switzerland AG that are unsubordinated or that are subordinated and do not rank junior, such as all classes of share capital, or at par, such as tier 1 instruments | ||||||||
36 | Non-compliant transitioned features |
| – |
| – | ||||||||
37 | If yes, specify non-compliant features |
| – |
| – | ||||||||
1 Based on Swiss SRB (including transitional arrangement) requirements. 2 Based on Swiss SRB requirements applicable as of 1 January 2020. 3 As applied in UBS Switzerland AG‘s financial statements under Swiss GAAP. 4 Loans granted by UBS AG, Switzerland. | |||||||||||||
p
69
Significant regulated subsidiaries and sub-groups
Quarterly | The table below discloses information about the regulatory capital components, capital ratios, leverage ratio and liquidity of UBS Europe SE consolidated based on the Pillar 1 requirements.
During the second quarter of 2019, common equity tier 1 (CET1) capital remained stable. Risk-weighted assets (RWA) decreased by EUR 0.7 billion, mainly as a result of a decrease in credit risk RWA. Leverage ratio exposure increased by EUR 1.2 billion, reflecting an increase in securities financing transactions and higher trading assets, partly offset by a decrease in derivative add-ons. Net cash outflows increased by EUR 1.3 billion, largely due to Treasury activities.
Entities may also be subject to significant Pillar 2 requirements, which represent additional amounts of capital considered necessary and agreed with regulators based on the risk profile of the entities. p
Quarterly |
KM1: Key metrics1,2,3 |
| |||
EUR million, except where indicated |
| |||
|
|
| 30.6.19 | 31.3.19 |
Available capital (amounts) |
|
|
| |
1 | Common equity tier 1 (CET1) |
| 3,543 | 3,568 |
2 | Tier 1 |
| 3,833 | 3,858 |
3 | Total capital |
| 3,833 | 3,858 |
Risk-weighted assets (amounts) |
|
|
| |
4 | Total risk-weighted assets (RWA) |
| 13,725 | 14,432 |
4a | Minimum capital requirement4 |
| 1,098 | 1,155 |
Risk-based capital ratios as a percentage of RWA |
|
|
| |
5 | Common equity tier 1 ratio (%) |
| 25.8 | 24.7 |
6 | Tier 1 ratio (%) |
| 27.9 | 26.7 |
7 | Total capital ratio (%) |
| 27.9 | 26.7 |
Additional CET1 buffer requirements as a percentage of RWA |
|
|
| |
8 | Capital conservation buffer requirement (2.5% from 2019) (%) |
| 2.5 | 2.5 |
9 | Countercyclical buffer requirement (%) |
| 0.2 | 0.2 |
10 | Bank G-SIB and / or D-SIB additional requirements (%) |
|
|
|
11 | Total of bank CET1 specific buffer requirements (%) |
| 2.7 | 2.7 |
12 | CET1 available after meeting the bank’s minimum capital requirements (%) |
| 18.6 | 17.5 |
Basel III leverage ratio |
|
|
| |
13 | Total Basel III leverage ratio exposure measure |
| 52,291 | 51,060 |
14 | Basel III leverage ratio (%)5 |
| 7.3 | 7.6 |
Liquidity coverage ratio6 |
|
|
| |
15 | Total HQLA |
| 14,367 | 14,770 |
16 | Total net cash outflow |
| 8,200 | 6,895 |
17 | LCR ratio (%) |
| 177 | 214 |
1 Based on applicable EU Basel III rules. 2 As a result of the cross-border merger of UBS Limited into UBS Europe SE effective 1 March 2019, UBS Europe SE has become a significant regulated subsidiary of UBS Group AG. The size, scope and business model of the merged entity is now materially different. Comparatives for December 2018 have not been provided in the table because data produced on the same basis is not available. For more information about the cross-border merger of UBS Limited into UBS Europe SE, refer to the “Recent developments” section in our first quarter 2019 report. 3 There is no local disclosure requirement for the net stable funding ratio as at 30 June 2019. 4 Calculated as 8% of total RWA, based on total capital minimum requirements, excluding CET1 buffer requirements. 5 On the basis of tier 1 capital. 6 Figures as of 30 June 2019 are based on a four-month average rather than a twelve-month average, as data produced on the same basis is only available for the period since the cross-border merger. For 31 March 2019, month-end reporting date values are disclosed. | ||||
p
70
The table below discloses information about the regulatory capital components and capital ratios, as well as leverage ratio, of UBS Americas Holding LLC consolidated based on the Pillar 1 requirements (i.e., US Basel III standardized rules).
Quarterly | During the second quarter of 2019, common equity tier 1 (CET1) increased by USD 0.9 billion to USD 12.9 billion, as a result of increases in the share premium related to a fixed asset transfer, operating profit and other comprehensive income. Risk-weighted assets (RWA) decreased by USD 1.4 billion to USD 53.9 billion, mainly driven by a decrease in credit risk RWA. Leverage ratio exposure remained stable during the quarter.
Entities may also be subject to significant Pillar 2 requirements, which represent additional amounts of capital considered necessary and agreed with regulators based on the risk profile of the entities. p
Quarterly |
KM1: Key metrics1,2 |
|
|
|
|
|
|
|
| |||
USD million, except where indicated | |||||||||||
|
|
| 30.6.19 |
| 31.3.19 |
| 31.12.183 |
| 30.9.184 |
| 30.6.184 |
Available capital (amounts) |
|
|
|
|
|
|
|
|
|
| |
1 | Common equity tier 1 (CET1) |
| 12,900 |
| 12,028 |
| 11,746 |
| 11,068 |
| 10,693 |
2 | Tier 1 |
| 15,055 |
| 14,170 |
| 13,887 |
| 13,209 |
| 12,834 |
3 | Total capital |
| 15,772 |
| 14,882 |
| 14,601 |
| 13,925 |
| 13,555 |
Risk-weighted assets (amounts) |
|
|
|
|
|
|
|
|
|
| |
4 | Total risk-weighted assets (RWA) |
| 53,892 |
| 55,313 |
| 54,063 |
| 54,488 |
| 52,991 |
4a | Minimum capital requirement5 |
| 4,311 |
| 4,425 |
| 4,325 |
| 4,359 |
| 4,239 |
Risk-based capital ratios as a percentage of RWA |
|
|
|
|
|
|
|
|
|
| |
5 | Common equity tier 1 ratio (%) |
| 23.9 |
| 21.7 |
| 21.7 |
| 20.3 |
| 20.2 |
6 | Tier 1 ratio (%) |
| 27.9 |
| 25.6 |
| 25.7 |
| 24.2 |
| 24.2 |
7 | Total capital ratio (%) |
| 29.3 |
| 26.9 |
| 27.0 |
| 25.6 |
| 25.6 |
Additional CET1 buffer requirements as a percentage of RWA |
|
|
|
|
|
|
|
|
|
| |
8 | Capital conservation buffer requirement (2.5% from 2019) (%) |
| 2.5 |
| 2.5 |
| 1.9 |
| 1.9 |
| 1.9 |
9 | Countercyclical buffer requirement (%)6 |
|
|
|
|
|
|
|
|
|
|
10 | Bank G-SIB and / or D-SIB additional requirements (%)7 |
|
|
|
|
|
|
|
|
|
|
11 | Total of bank CET1 specific buffer requirements (%) |
| 2.5 |
| 2.5 |
| 1.9 |
| 1.9 |
| 1.9 |
12 | CET1 available after meeting the bank’s minimum capital requirements (%)8 |
| 16.9 |
| 14.7 |
| 15.3 |
| 13.9 |
| 13.8 |
Basel III leverage ratio |
|
|
|
|
|
|
|
|
|
| |
13 | Total Basel III leverage ratio exposure measure |
| 123,008 |
| 124,981 |
| 122,829 |
| 124,982 |
| 129,375 |
14 | Basel III leverage ratio (%)9 |
| 12.2 |
| 11.3 |
| 11.3 |
| 10.6 |
| 9.9 |
1 For UBS Americas Holding LLC based on applicable US Basel III rules. 2 There is no local disclosure requirement for liquidity coverage ratio or net stable funding ratio for UBS Americas Holding LLC as of 30 June 2019. 3 Figures as of or for the quarter ended 31 December 2018 have been adjusted for consistency with the full-year audited financial statements and / or local regulatory reporting, which were finalized after the publication of our Annual Report 2018 and our 31 December 2018 Pillar 3 report on 15 March 2019. 4 Figures as of 30 September 2018 and 30 June 2018 have been adjusted for consistency with the local regulatory reporting of the entity. 5 Calculated as 8% of total RWA, based on total capital minimum requirements, excluding CET1 buffer requirements. 6 Not applicable as the countercyclical buffer requirement applies only to banking organizations subject to the advanced approaches capital rules. 7 Not applicable as requirements have not been proposed. 8 Capital surplus measures excess to minimum regulatory requirements. As such, it overstates actual excess capital capacity as it is not measured against additional capital that local regulators expect is positioned within UBS Americas Holding LLC in order to resource stressed risk loss exposures arising from the activities that UBS conducts in UBS Americas Holding LLC. 9 On the basis of tier 1 capital. | |||||||||||
p
|
71
|
A
ABS asset-backed security
AEI automatic exchange of information
AGM annual general meeting of shareholders
A-IRB advanced internal
ratings-based
AI artificial intelligence
AIV alternative investment vehicle
ALCO Asset and Liability Management Committee
AMA advanced measurement approach
AML anti-money laundering
AoA Articles of Association of UBS Group AG
ASF available stable funding
ASFA advanced supervisory formula approach
AT1 additional tier 1
AuM assets under management
B
BCBS Basel Committee on
Banking Supervision
BD business division
BEAT base erosion and anti-abuse tax
BIS Bank for International Settlements
BoD Board of Directors
BSC Business Solutions Center
BVG Swiss occupational
pension plan
C
CAO Capital Adequacy Ordinance
CC Corporate Center
CCAR Comprehensive Capital Analysis and Review
CCB countercyclical buffer
CCF credit conversion factor
CCP central counterparty
CCR counterparty credit risk
CCRC Corporate Culture and Responsibility Committee
CDO collateralized debt
obligation
CDR constant default rate
CDS credit default swap
CEA Commodity Exchange Act
CECL current expected credit loss
CEM current exposure method
CEO Chief Executive Officer
CET1 common equity tier 1
CFO Chief Financial Officer
CFTC US Commodity Futures Trading Commission
CHF Swiss franc
CIC Corporate Institutional Clients
CIO Chief Investment Office
CLN credit-linked note
CLO collateralized loan obligation
CLS continuous linked settlement
CMBS commercial mortgage-backed security
C&ORC Compliance & Operational Risk Control
CRD IV EU Capital Requirements Directive of 2013
CSO Client Strategy Office
CVA credit valuation adjustment
D
DBO defined benefit obligation
DCCP Deferred Contingent Capital Plan
DJSI Dow Jones Sustainability Indices
DOJ US Department of Justice
DOL US Department of Labor
D-SIB domestic systemically important bank
DTA deferred tax asset
DVA debit valuation adjustment
E
EAD exposure at default
EBA European Banking Authority
EC European Commission
ECB European Central Bank
ECL expected credit loss(es)
EIR effective interest rate
EL expected loss
EMEA Europe, Middle East and Africa
EOP Equity Ownership Plan
EPE expected positive exposure
EPS earnings per share
ERISA Employee Retirement Income Security Act of 1974
ESG environmental, social and governance
ESMA European Securities and Markets Authority
ESR environmental and social risk
ETD exchange-traded derivative
ETF exchange-traded fund
EU European Union
EUR euro
EURIBOR Euro Interbank Offered Rate
F
FCA UK Financial Conduct
Authority
FCT foreign currency translation
FINMA Swiss Financial Market Supervisory Authority
FINRA US Financial Industry Regulatory Authority
FMIA Swiss Financial Market Infrastructure Act
|
|
|
Abbreviations frequently used in our financial reports (continued)
FRA forward rate agreement
FSB Financial Stability Board
FTA Swiss Federal Tax Administration
FTD first to default
FTP funds transfer pricing
FVA funding valuation adjustment
FVOCI fair value through other comprehensive income
FVTPL fair value through profit or loss
FX foreign exchange
G
GAAP generally accepted
accounting principles
GBP pound sterling
GEB Group Executive Board
GFA Group Franchise Awards
GHG greenhouse gas
GIA Group Internal Audit
GIIPS Greece, Italy, Ireland,
Portugal and Spain
GMD Group Managing Director
GRI Global Reporting Initiative
Group ALM Group Asset and Liability Management
G-SIB global systemically important bank
H
HQLA high-quality liquid assets
HR human resources
I
IAA internal assessment approach
IAS International Accounting Standards
IASB International Accounting Standards Board
IBOR interbank offered rate
IFRIC International Financial Reporting Interpretations Committee
IFRS International Financial Reporting Standards
IHC intermediate holding companies
IMA internal models approach
IMM internal model method
IPS Investment Platforms and Solutions
IRB internal ratings-based
IRC incremental risk charge
ISDA International Swaps and Derivatives Association
K
KRT Key Risk Taker
L
LAC loss-absorbing capacity
LAS liquidity-adjusted stress
LCR liquidity coverage ratio
LGD loss given default
LIBOR London Interbank Offered Rate
LLC limited liability company
LRD leverage ratio denominator
LTV loan-to-value
M
MiFID II Markets in Financial Instruments Directive II
MiFIR Markets in Financial Instruments Regulation
MRT Material Risk Taker
MTN medium-term note
N
NAV net asset value
NII net interest income
NRV negative replacement value
NSFR net stable funding ratio
NYSE New York Stock Exchange
O
OCA own credit adjustment
OCI other comprehensive income
OECD Organisation for Economic Co-operation and Development
OIS overnight index swap
OTC over-the-counter
P
PD probability of default
PFE potential future exposure
PIT point in time
P&L profit or loss
POCI purchased or originated credit-impaired
PRA UK Prudential Regulation Authority
PRV positive replacement value
Q
QRRE qualifying revolving retail exposures
R
RBA role-based allowances
RBC risk-based capital
RLN reference-linked note
RMBS residential mortgage-backed securities
RniV risks not in VaR
RoAE return on attributed equity
RoCET1 return on CET1
RoE return on equity
RoTE return on tangible equity
RV replacement value
RW risk weight
RWA risk-weighted assets
|
</BCLPAGE>73
|
Abbreviations frequently used in our financial reports (continued)
S
SA standardized approach
SA-CCR standardized approach for counterparty credit risk
SAR stock appreciation right
SBC Swiss Bank Corporation
SCCL single-counterparty credit limit
SDGs Sustainable Development Goals
SE structured entity
SEC US Securities and Exchange Commission
SEEOP Senior Executive Equity Ownership Plan
SFTs securities financing transactions
SI sustainable investing
SICR significant increase in credit risk
SIX SIX Swiss Exchange
SMA standardized measurement approach
SME small and medium-sized enterprises
SMF Senior Management Function
SNB Swiss National Bank
SPPI solely payments of principal and interest
SRB systemically relevant bank
SRM specific risk measure
SVaR stressed value-at-risk
T
TBTF too big to fail
TCJA US Tax Cuts and Jobs Act
TLAC total loss-absorbing capacity
TRS total return swap
TTC through the cycle
U
UoM units of measure
USD US dollar
US IHC US intermediate holding company
V
VaR value-at-risk
This is a general list of the abbreviations frequently used in our financial reporting. Not all of the listed abbreviations may appear in this particular report.
|
|
|
Cautionary Statement | This report and the information contained herein are provided solely for information purposes, and are not to be construed as solicitation of an offer to buy or sell any securities or other financial instruments in Switzerland, the United States or any other jurisdiction. No investment decision relating to securities of or relating to UBS Group AG, UBS AG or their affiliates should be made on the basis of this report. Refer to UBS’s second quarter 2019 report and its Annual Report 2018, available at www.ubs.com/investors, for additional information.
Rounding | Numbers presented throughout this report may not add up precisely to the totals provided in the tables and text. Percentages, percent changes, and adjusted results are calculated on the basis of unrounded figures. Information on absolute changes between reporting periods, which is provided in text and that can be derived from figures displayed in the tables, is calculated on a rounded basis.
Tables | Within tables, blank fields generally indicate that the field is not applicable or not meaningful, or that information is not available as of the relevant date or for the relevant period. Zero values generally indicate that the respective figure is zero on an actual or rounded basis. Percentage changes are presented as a mathematical calculation of the change between periods.
|
</BCLPAGE>75
UBS Group AG
P.O. Box
CH-8098 Zurich
ubs.com
![]()
SIGNATURES
Pursuant to the requirements of the Securities Exchange Act of 1934, the registrants have duly caused this report to be signed on their behalf by the undersigned, thereunto duly authorized.
UBS Group AG
By: _/s/ David Kelly_____________
Name: David Kelly
Title: Managing Director
By: _/s/ Ella Campi _____
Name: Ella Campi
Title: Executive Director
UBS AG
By: _/s/ David Kelly_____________
Name: David Kelly
Title: Managing Director
By: _/s/ Ella Campi _____
Name: Ella Campi
Title: Executive Director
Date: August 27, 2019