Exhibit 99.3
INC Research + inVentiv Health Merger Creating a Leading Global Biopharmaceutical Solutions Organization May 10, 2017
Important Information 1 Forward-Looking Statements This communication includes forward-looking statements within the meaning of Section 27A of the Securities Act of 1933, as amended, or the Securities Act, and Section 21E of the Securities Exchange Act of 1934, as amended, or the Exchange Act. Such forward-looking statements reflect, among other things, our current expectations and anticipated results of operations, all of which are subject to known and unknown risks, uncertainties and other factors that may cause our actual results, performance or achievements, market trends, or industry results to differ materially from those expressed or implied by such forward-looking statements. Therefore, any statements contained herein that are not statements of historical fact may be forward-looking statements and should be evaluated as such. Without limiting the foregoing, the words “anticipates,” “believes,” “can,” “continue,” “could,” “estimates,” “expects,” “intends,” “may,” “might,” “plans,” “projects,” “should,” “would,” “targets,” “will” and the negative thereof and similar words and expressions are intended to identify forward-looking statements. Forward-looking statements by their nature address matters that are, to different degrees, uncertain, such as statements about the potential timing or consummation of the proposed transaction or the anticipated benefits thereof, including, without limitation, future financial and operating results. INC Research and inVentiv Health caution readers that these and other forward-looking statements are not guarantees of future results and are subject to risks, uncertainties and assumptions that could cause actual results to differ materially from those expressed in any forward-looking statements. Important risk factors that may cause such a difference include, but are not limited to risks and uncertainties related to (i) the ability to obtain shareholder and regulatory approvals, or the possibility that they may delay the transaction or that such regulatory approval may result in the imposition of conditions that could cause the parties to abandon the transaction, (ii) the risk that a condition to closing of the merger may not be satisfied; (iii) the ability of INC Research and inVentiv Health to integrate their businesses successfully and to achieve anticipated synergies, (iv) the possibility that other anticipated benefits of the proposed transaction will not be realized, including without limitation, anticipated revenues, expenses, earnings and other financial results, and growth and expansion of the new combined company’s operations, and the anticipated tax treatment, (v) potential litigation relating to the proposed transaction that could be instituted against INC Research, inVentiv Health or their respective directors, (vi) possible disruptions from the proposed transaction that could harm INC Research’s and/or inVentiv Health’s business, including current plans and operations, (vii) the ability of INC Research or inVentiv Health to retain, attract and hire key personnel, (viii) potential adverse reactions or changes to relationships with clients, employees, suppliers or other parties resulting from the announcement or completion of the merger, (ix) potential business uncertainty, including changes to existing business relationships, during the pendency of the merger that could affect INC Research’s or inVentiv Health’s financial performance, (x) certain restrictions during the pendency of the merger that may impact INC Research’s or inVentiv Health’s ability to pursue certain business opportunities or strategic transactions, (xi) continued availability of capital and financing and rating agency actions, (xii) legislative, regulatory and economic developments and (xiii) unpredictability and severity of catastrophic events, including, but not limited to, acts of terrorism or outbreak of war or hostilities, as well as management’s response to any of the aforementioned factors. These risks, as well as other risks associated with the proposed transaction, will be more fully discussed in the proxy statement that will be filed with the Securities and Exchange Commission in connection with the proposed transaction. While the list of factors presented here is, and the list of factors to be presented in the proxy statement are, considered representative, no such list should be considered to be a complete statement of all potential risks and uncertainties. Unlisted factors may present significant additional obstacles to the realization of forward looking statements. Consequences of material differences in results as compared with those anticipated in the forward-looking statements could include, among other things, business disruption, operational problems, financial loss, legal liability to third parties and similar risks, any of which could have a material adverse effect on INC Research’s or inVentiv Health’s consolidated financial condition, results of operations, credit rating or liquidity. Unless legally required, neither INC Research nor inVentiv Health assumes any obligation to update any such forward-looking information to reflect actual results or changes in the factors affecting such forward-looking information. Additional Information and Where to Find It This communication is being made in respect of the proposed merger transaction involving the INC Research and inVentiv Health. In connection with the proposed transaction, INC Research will file with the Securities and Exchange Commission a proxy statement and will mail the proxy statement to its shareholders. Shareholders are encouraged to read the proxy statement regarding the proposed transaction in its entirety when it becomes available and before making any voting decision as it will contain important information about the transaction. Shareholders will be able to obtain a free copy of the proxy statement (when available), as well as other filings made by INC Research regarding INC Research, inVentiv Health, and the proposed transaction, without charge, at the Securities and Exchange Commission’s website (http://www.sec.gov) or at INC Research’s website (investor.incresearch.com). Participants in the Solicitation INC Research and its respective executive officers, directors and other persons may be deemed to be participants in the solicitation of proxies from INC Research’s shareholders with respect to the special meeting of shareholders that will be held to consider and vote upon the approval of the share issuance and the proposed transaction. Information regarding the officers and directors of INC Research is included in its Annual Report on Form10-K for the year ended Dec. 31, 2016, and INC Research’s notice of Annual Meeting of Shareholders and Proxy Statement, which were filed with the Securities and Exchange Commission on April 13, 2017. Other information regarding the participants in the solicitation and a description of their direct and indirect interests, by security holdings or otherwise, which may be different than those of INC Research’s shareholders generally, will be contained in the proxy statement (when filed) and other relevant materials to be filed with the Securities and Exchange Commission in connection with the proposed transaction. This communication is not intended to and shall not constitute an offer to sell or the solicitation of an offer to sell or the solicitation of an offer to buy any securities or a solicitation of any vote of approval, nor shall there be any sale of securities in any jurisdiction in which such offer, solicitation or sale would be unlawful prior to registration or qualification under the securities laws of any such jurisdiction. No offering of securities shall be made except by means of a prospectus meeting the requirements of Section 10 of the Securities Act of 1933, as amended
Important Information (Cont’d)
Non-GAAP Financial Measures
In addition to the financial measures prepared in accordance with GAAP, this presentation contains certainnon-GAAP financial measures, including Adjusted Income from Operations, Adjusted Operating Margin, Adjusted Net Income (including Adjusted Diluted Earnings per Share), EBITDA and Adjusted EBITDA. Both INC Research’s and inVentiv Health’s financial statements and the associatednon-GAAP measures have been prepared in accordance with their historical accounting and reporting policies. The combined company has not yet determined the conforming policy or adjustments that it will make upon consummation of this merger.
A“non-GAAP financial measure” is generally defined as a numerical measure of a company’s financial performance that excludes or includes amounts so as to be different than the most directly comparable measure calculated and presented in accordance with GAAP in the statements of operations, balance sheets or statements of cash flows of the Company.
The Company defines Adjusted Income from Operations as income from operations excluding expenses and transactions that the Company believes are not representative of its core operations, namely, acquisition-related amortization; restructuring, CEO transition, and other costs; transaction expenses; share-based compensation expense; and contingent consideration related to acquisitions and other expense. The Company defines Adjusted Operating Margin as adjusted income from operations as a percentage of net service revenue.
The Company defines Adjusted Net Income (including Adjusted Diluted Earnings per Share) as net income (including diluted earnings per share) excluding the items excluded from adjusted income from operations mentioned previously and other expense. After giving effect to these items and other unusual tax impacts during the period, the Company has also included an adjustment to its income tax rate to reflect the expected long-term income tax rate.
EBITDA represents earnings before interest, taxes, depreciation and amortization. The Company defines Adjusted EBITDA as EBITDA, further adjusted to exclude certain expenses and transactions that the Company believes are not representative of its core operations, namely, restructuring, CEO transition, and other costs; transaction expenses; share-based compensation expense; contingent consideration related to acquisitions and other expense; and other expense. The Company presents EBITDA and Adjusted EBITDA because it believes they are useful metrics for investors as they are commonly used by investors, analysts and debt holders to measure the Company’s ability to fund capital expenditures and meet working capital requirements.
Each of thenon-GAAP measures noted above are used by management and the Board to evaluate the Company’s core operating results as they exclude certain items whose fluctuations fromperiod-to-period do not necessarily correspond to changes in the core operations of the business. Adjusted Income from Operations, Adjusted Operating Margin and Adjusted Net Income (including Adjusted Diluted Earnings per Share) are used by management and the Board to assess the Company’s business.
Non-GAAP measures have limitations in that they do not reflect all of the amounts associated with the Company’s results of operations as determined in accordance with GAAP. Also, other companies might calculate these measures differently. Investors are encouraged to review the reconciliations of thenon-GAAP financial measures to their most directly comparable GAAP measures included on slides18-20 in the appendix of this presentation.
Preliminary InVentiv Health Financial Results
The financial data relating to inVentiv Health’s quarter ended March 31, 2017 is preliminary and has been prepared by, and is the responsibility of inVentiv Health’s management. Neither inVentiv Health’s independent registered public accounting firm nor any other independent registered public accounting firm has audited, reviewed or compiled, examined or performed any procedures with respect to the estimated results, nor have they expressed any opinion or any other form of assurance on the preliminary estimated financial results.
This preliminary information reflects management’s estimates based solely upon information available as of the date of this presentation and is not a comprehensive statement of inVentiv Health’s financial results for the three months ended March 31, 2017. The information presented herein should not be considered a substitute for the full unaudited first quarter financial statements. There is a possibility that actual results will vary from these preliminary estimates.
2
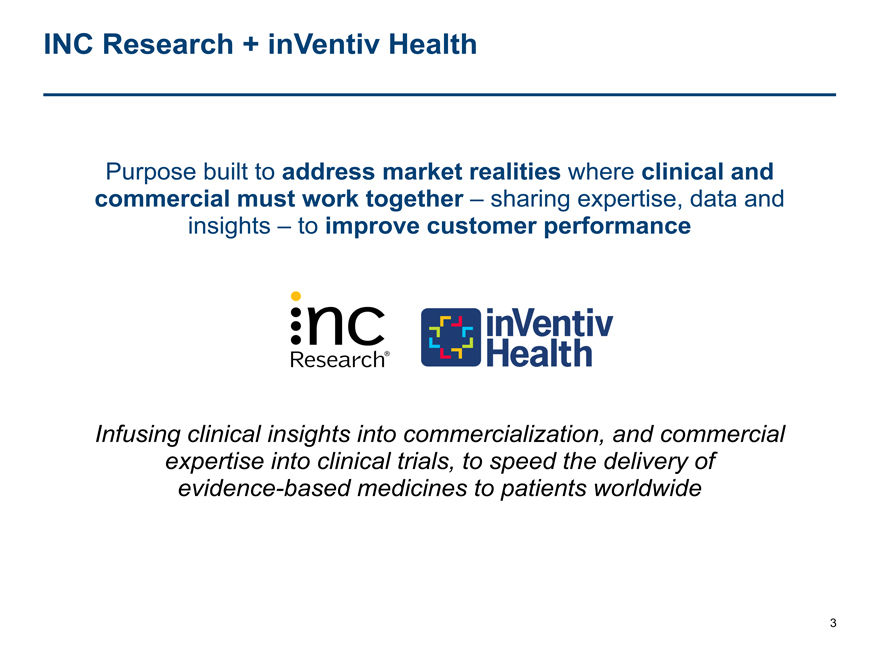
INC Research + inVentiv Health
Purpose built to address market realities where clinical and commercial must work together – sharing expertise, data and insights – to improve customer performance
Infusing clinical insights into commercialization, and commercial expertise into clinical trials, to speed the delivery of evidence-based medicines to patients worldwide
3
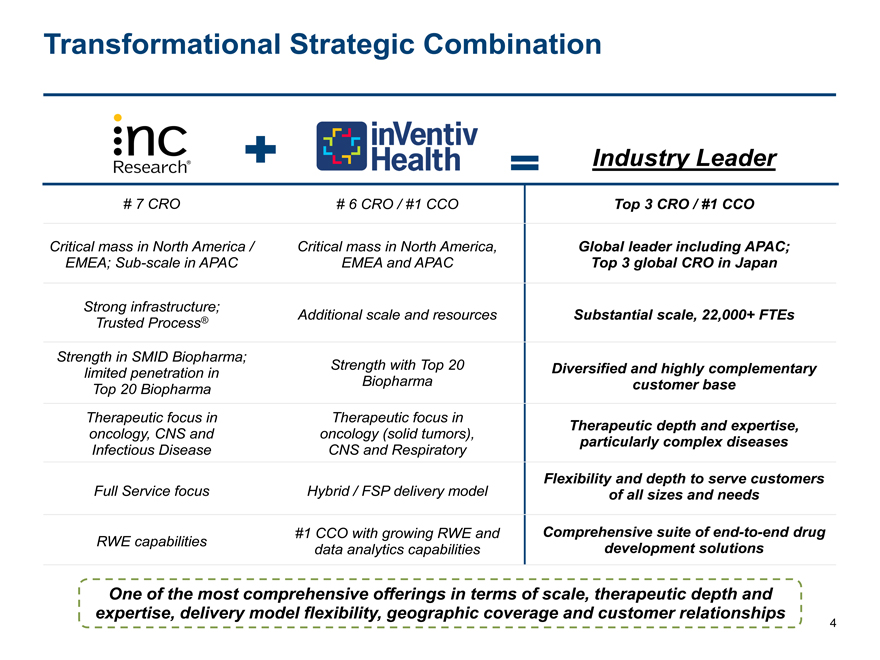
Transformational Strategic Combination
Industry Leader
# 7 CRO # 6 CRO / #1 CCO Top 3 CRO / #1 CCO
Critical mass in North America / Critical mass in North America, Global leader including APAC;
EMEA;Sub-scale in APAC EMEA and APAC Top 3 global CRO in Japan
Strong infrastructure; Additional scale and resources Substantial scale, 22,000+ FTEs
Trusted Process®
Strength in SMID Biopharma;
limited penetration in Strength with Top 20 Diversified and highly complementary
Top 20 Biopharma Biopharma customer base
Therapeutic focus in Therapeutic focus in Therapeutic depth and expertise,
oncology, CNS and oncology (solid tumors), particularly complex diseases
Infectious Disease CNS and Respiratory
Flexibility and depth to serve customers
Full Service focus Hybrid / FSP delivery model of all sizes and needs
#1 CCO with growing RWE and Comprehensive suite ofend-to-end drug
RWE capabilities data analytics capabilities development solutions
One of the most comprehensive offerings in terms of scale, therapeutic depth and
expertise, delivery model flexibility, geographic coverage and customer relationships
4
.
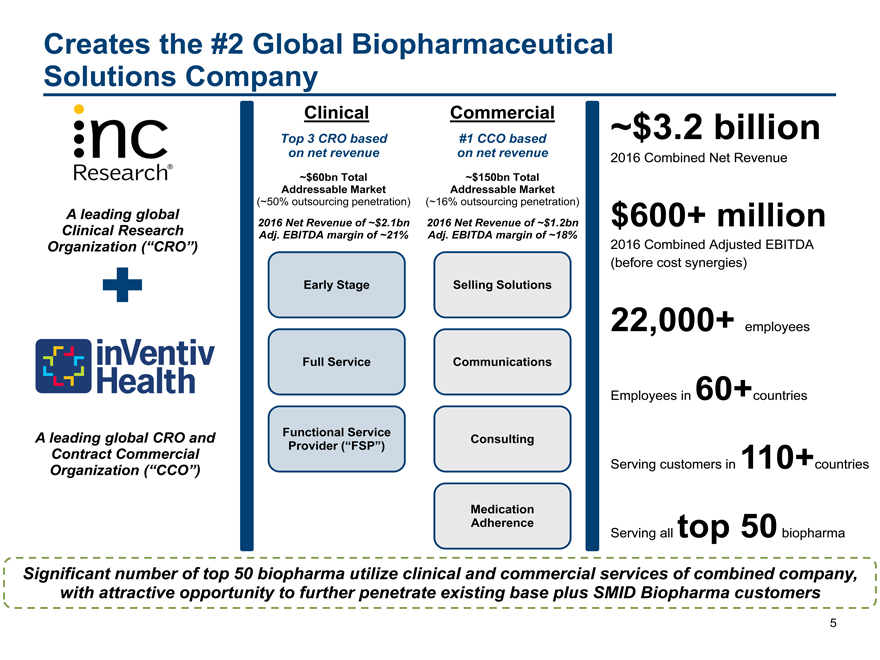
Creates the #2 Global Biopharmaceutical
Solutions Company
Clinical Commercial~$3.2 billion
Top 3 CRO based #1 CCO based
on net revenue on net revenue2016 Combined Net Revenue
~$60bn Total ~$150bn Total
Addressable Market Addressable Market
(~50% outsourcing penetration) (~16% outsourcing penetration)
A leading global 2016 Net Revenue of ~$2.1bn 2016 Net Revenue of ~$1.2bn$600+ million
Clinical Research Adj. EBITDA margin of ~21% Adj. EBITDA margin of ~18%
Organization (“CRO”) 2016 Combined Adjusted EBITDA
(before cost synergies)
Early Stage Selling Solutions
22,000+ employees
Full Service Communications
Employees in 60+countries
A leading global CRO and Functional Service Consulting
Provider (“FSP”)
Organization Contract Commercial (“CCO”) Serving customers in 110+countries
Medication
Adherencetop 50
Serving allbiopharma
Significant number of top 50 biopharma utilize clinical and commercial services of combined company,
with attractive opportunity to further penetrate existing base plus SMID Biopharma customers
5
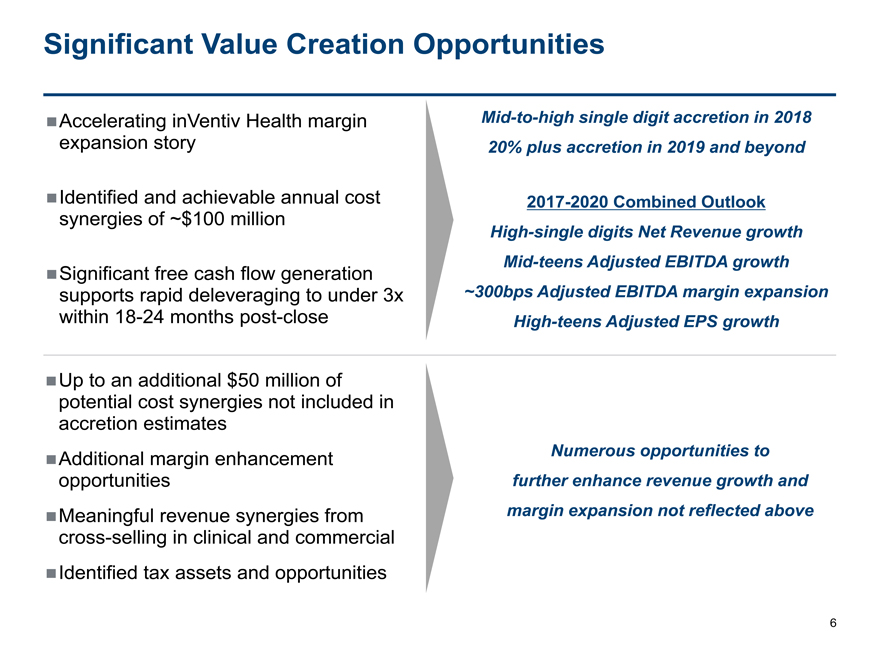
Significant Value Creation Opportunities
Accelerating inVentiv Healthmargin Mid-to-high single digit accretion in 2018
expansion story 20% plus accretion in 2019 and beyond
Identified and achievable annual cost 2017-2020 Combined Outlook
synergies of ~$100 million
High-single digits Net Revenue growth
Significant free cash flowgeneration Mid-teens Adjusted EBITDA growth
supports rapid deleveraging to under 3x ~300bps Adjusted EBITDA margin expansion
within18-24 months post-close High-teens Adjusted EPS growth
Up to an additional $50 million of
potential cost synergies not included in
accretion estimates
Additional margin enhancement Numerous opportunities to
opportunities further enhance revenue growth and
Meaningful revenue synergies from margin expansion not reflected above
cross-selling in clinical and commercial
Identified tax assets and opportunities
6
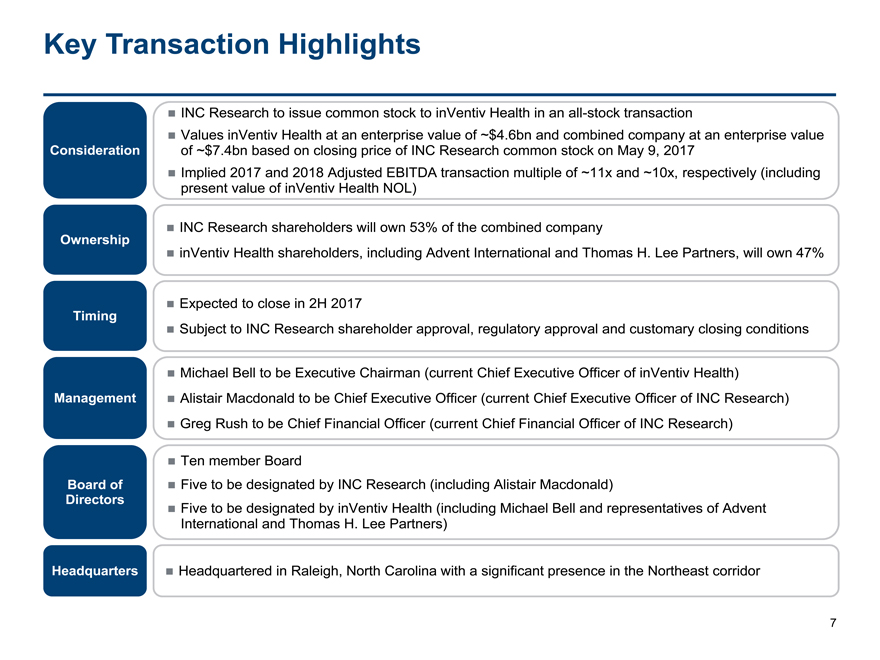
Key Transaction Highlights
INC Research to issue common stock to inVentiv Health in anall-stock transaction
Values inVentiv Health at an enterprise value of ~$4.6bn and combined company at an enterprise value
Consideration of ~$7.4bn based on closing price of INC Research common stock on May 9, 2017
Implied 2017 and 2018 Adjusted EBITDA transaction multiple of ~11x and ~10x, respectively (including
present value of inVentiv Health NOL)
INC Research shareholders will own 53% of the combined company
Ownership
inVentiv Health shareholders, including Advent International and Thomas H. Lee Partners, will own 47%
Expected to close in 2H 2017
Timing
Subject to INC Research shareholder approval, regulatory approval and customary closing conditions
Michael Bell to be Executive Chairman (current Chief Executive Officer of inVentiv Health)
Management Alistair Macdonald to be Chief Executive Officer (current Chief Executive Officer of INC Research)
Greg Rush to be Chief Financial Officer (current Chief Financial Officer of INC Research)
Ten member Board
Board of Five to be designated by INC Research (including Alistair Macdonald)
Directors Five to be designated by inVentiv Health (including Michael Bell and representatives of Advent
International and Thomas H. Lee Partners)
Headquarters Headquartered in Raleigh, North Carolina with a significant presence in the Northeast corridor
7
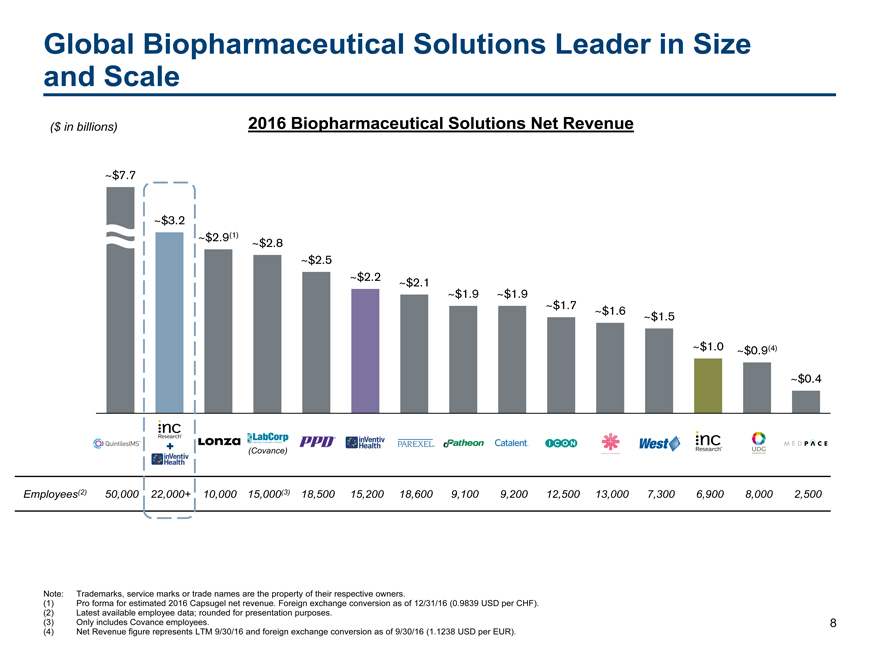
Global Biopharmaceutical Solutions Leader in Size
and Scale
($ in billions) 2016 Biopharmaceutical Solutions Net Revenue
~$7.7
~$3.2
~$2.9(1)~$2.8
~~$2.5
~$2.2~$2.1
~$1.9~$1.9
~$1.7~$1.6
~$1.5
~$1.0~$0.9(4)
~$0.4
(Covance)
Employees(2) 50,000 22,000+ 10,000 15,000(3) 18,500 15,20018,6009,1009,20012,50013,0007,3006,9008,0002,500
Note: Trademarks, service marks or trade names are the property of their respective owners.
(1) Pro forma for estimated 2016 Capsugel net revenue. Foreign exchange conversion as of 12/31/16 (0.9839 USD per CHF).
(2) Latest available employee data; rounded for presentation purposes.
(3) Only includes Covance employees. 8
(4) Net Revenue figure represents LTM 9/30/16 and foreign exchange conversion as of 9/30/16 (1.1238 USD per EUR).
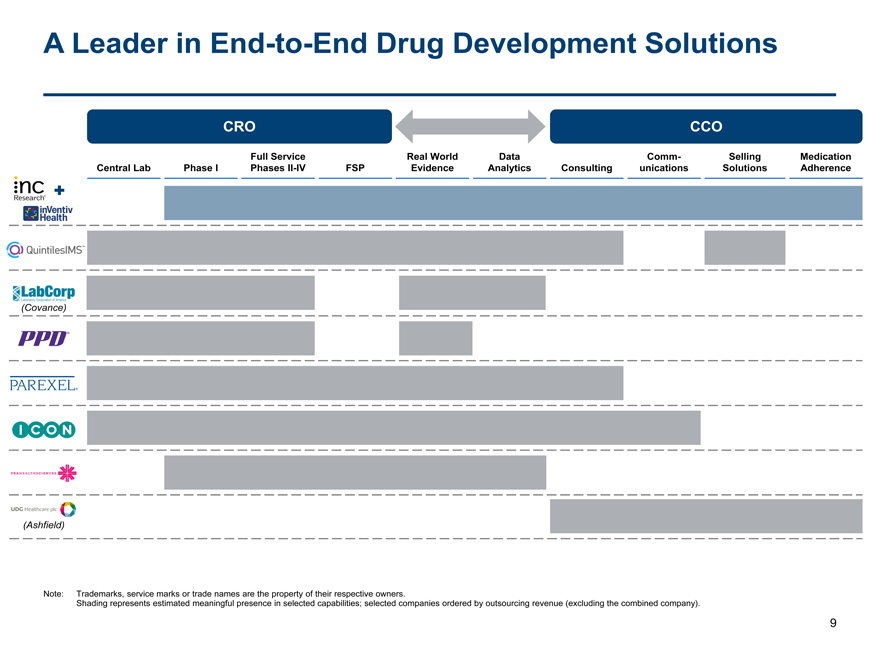
A Leader inEnd-to-End Drug Development Solutions
CRO CCO
Full Service Real World Data Comm- Selling Medication Central Lab Phase I PhasesII-IV FSP Evidence Analytics Consulting unications Solutions Adherence
(Covance)
(Ashfield)
Note: Trademarks, service marks or trade names are the property of their respective owners.
Shading represents estimated meaningful presence in selected capabilities; selected companies ordered by outsourcing revenue (excluding the combined company).
9
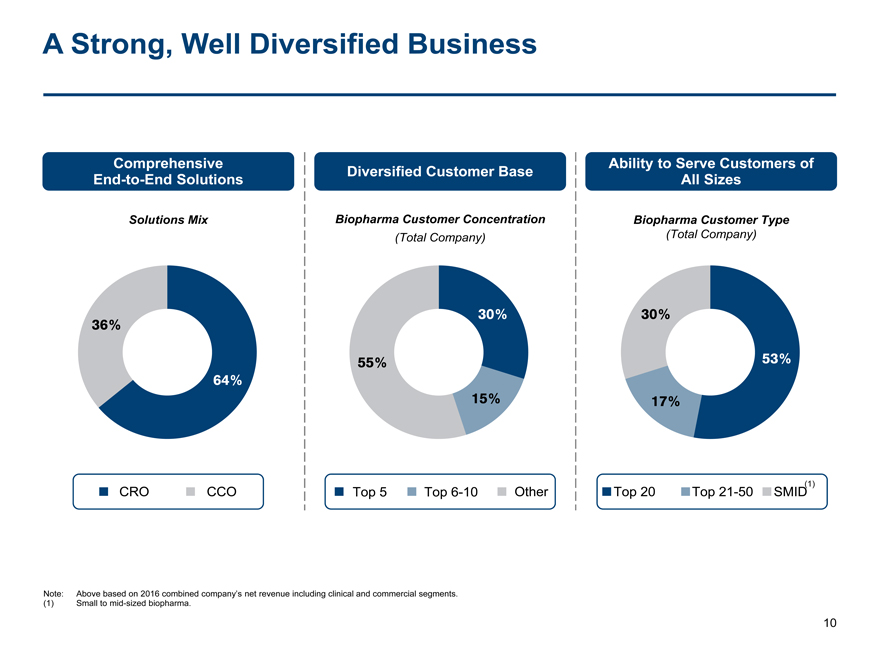
A Strong, Well Diversified Business
Comprehensive Ability to Serve Customers of
Diversified Customer Base
End-to-End Solutions All Sizes
Solutions Mix Biopharma Customer ConcentrationBiopharma Customer Type
(Total Company)(Total Company)
30%30%
36%
55%53%
64%
15%17%
CRO CCOTop 5Top6-10OtherTop 20Top21-50SMID(1)
Note: Above based on 2016 combined company’s net revenue including clinical and commercial segments.
(1) Small tomid-sized biopharma.
10
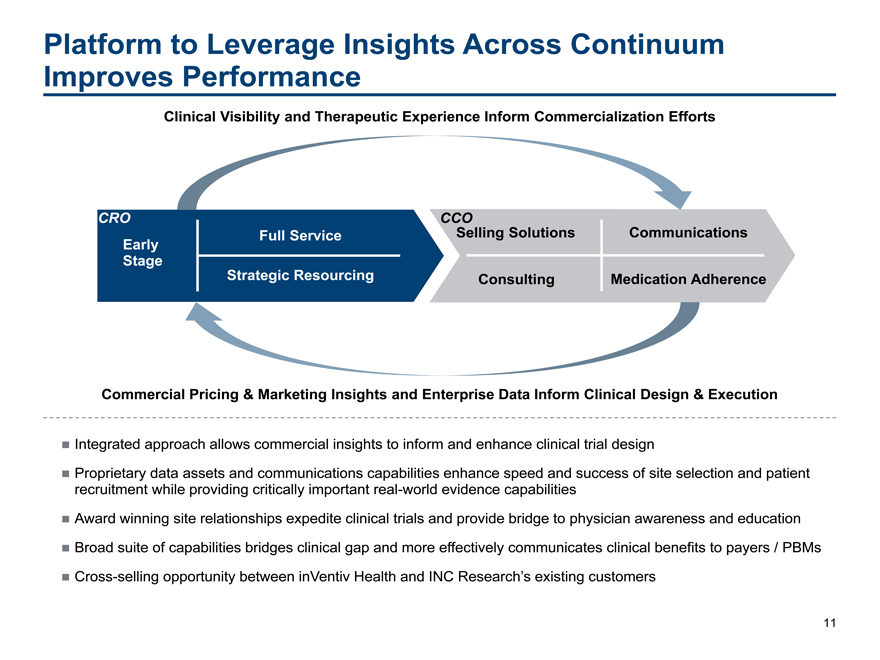
Platform to Leverage Insights Across Continuum Improves Performance
Clinical Visibility and Therapeutic Experience Inform Commercialization Efforts
CRO CCO
Full Service Selling Solutions Communications Early Stage Strategic Resourcing Consulting Medication Adherence
Commercial Pricing & Marketing Insights and Enterprise Data Inform Clinical Design & Execution
Integrated approach allows commercial insights to inform and enhance clinical trial design
Proprietary data assets and communications capabilities enhance speed and success of site selection and patient recruitment while providing critically important real-world evidence capabilities
Award winning site relationships expedite clinical trials and provide bridge to physician awareness and education Broad suite of capabilities bridges clinical gap and more effectively communicates clinical benefits to payers / PBMs Cross-selling opportunity between inVentiv Health and INC Research’s existing customers
11
Clinical Research Organization Segment
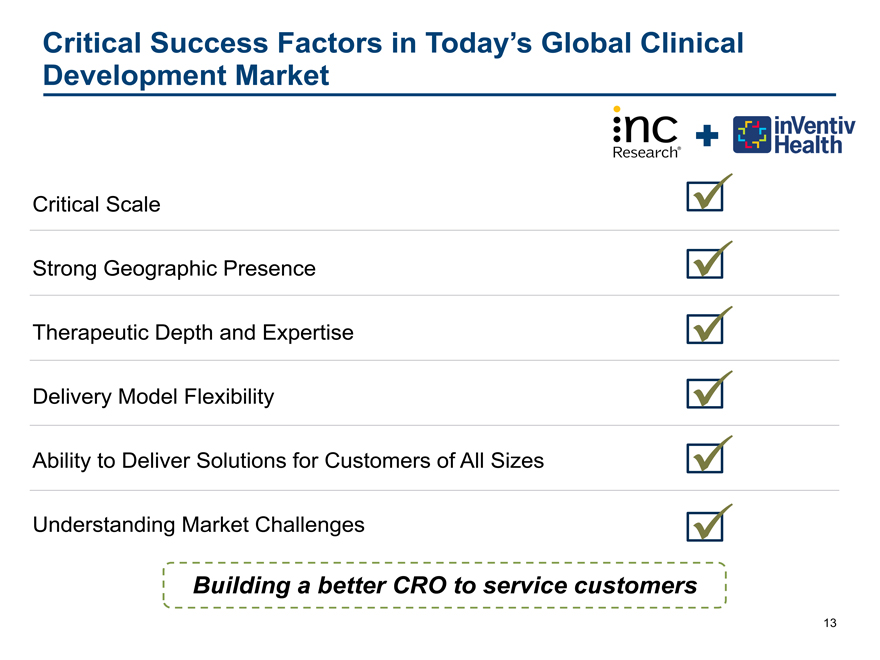
Critical Success Factors in Today’s Global Clinical
Development Market
Critical Scale
Strong Geographic Presence
Therapeutic Depth and Expertise
Delivery Model Flexibility
Ability to Deliver Solutions for Customers of All Sizes
Understanding Market Challenges
Building a better CRO to service customers
13
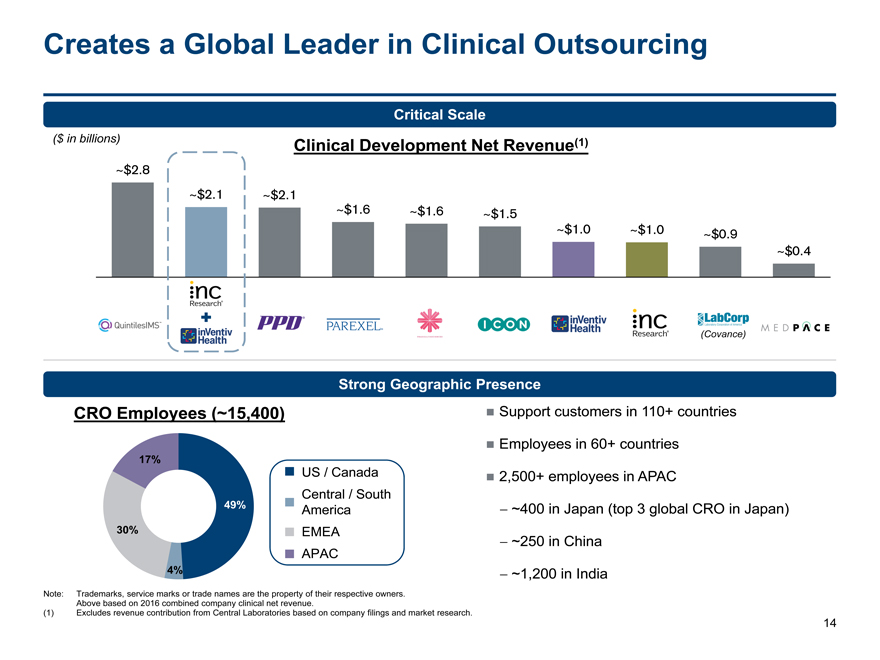
Creates a Global Leader in Clinical Outsourcing
Critical Scale
($ in billions) Clinical Development Net Revenue(1)
~$2.8
~$2.1 ~$2.1
~$1.6~$1.6~$1.5
~$1.0~$1.0~$0.9
~$0.4
(Covance)
Strong Geographic Presence
CRO Employees (~15,400) Support customers in 110+ countries
Employees in 60+ countries
17%
US / Canada 2,500+ employees in APAC
Central / South
49% America- ~400 in Japan (top 3 global CRO in Japan)
30% EMEA- ~250 in China
APAC
4% - ~1,200 in India
Note: Trademarks, service marks or trade names are the property of their respective owners.
Above based on 2016 combined company clinical net revenue.
(1) Excludes revenue contribution from Central Laboratories based on company filings and market research.
14
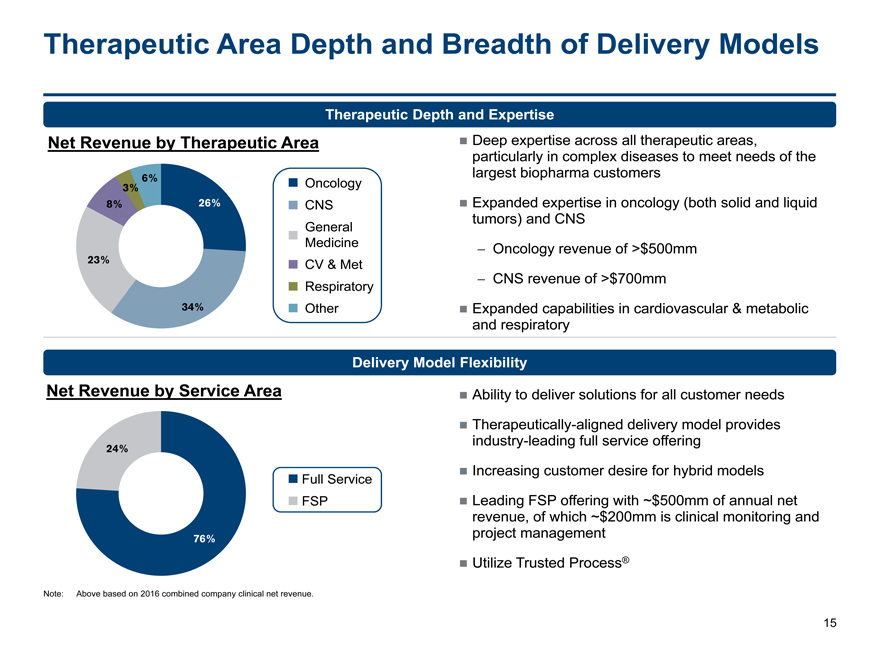
Therapeutic Area Depth and Breadth of Delivery Models
Therapeutic Depth and Expertise
Net Revenue by Therapeutic Area Deep expertise across all therapeutic areas,
particularly in complex diseases to meet needs of the
largest biopharma customers
3% 6% Oncology
8% 26% CNS Expanded expertise in oncology (both solid and liquid
Generaltumors) and CNS
Medicine-Oncology revenue of >$500mm
23% CV & Met
Respiratory-CNS revenue of >$700mm
34% Other Expanded capabilities in cardiovascular & metabolic
and respiratory
Delivery Model Flexibility
Net Revenue by Service Area Ability to deliver solutions for all customer needs
Therapeutically-aligned delivery model provides
industry-leading full service offering
24%
Full Service Increasing customer desire for hybrid models
FSP Leading FSP offering with ~$500mm of annual net
revenue, of which ~$200mm is clinical monitoring and
76% project management
Utilize Trusted Process®
Note: Above based on 2016 combined company clinical net revenue.
15
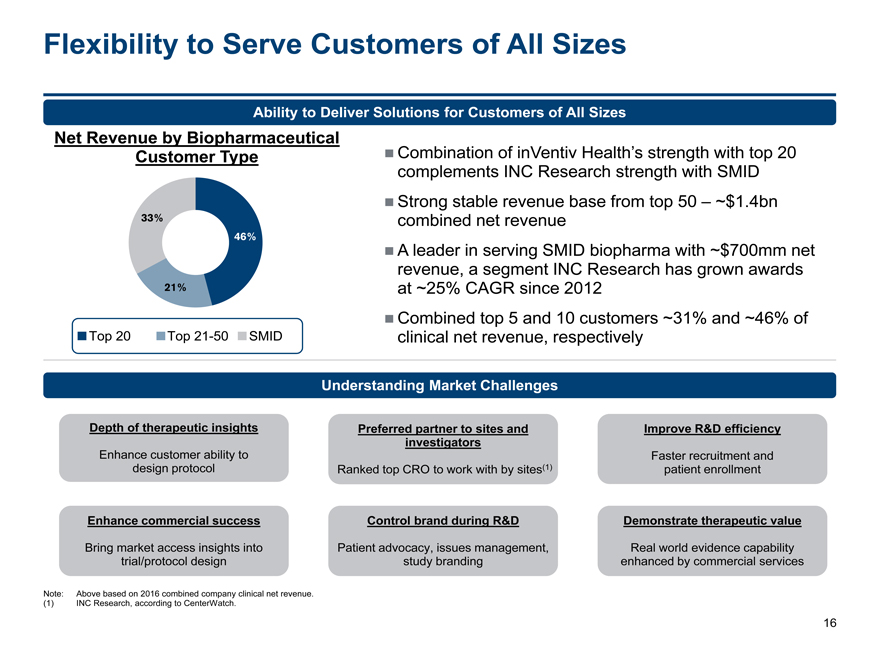
Flexibility to Serve Customers of All Sizes
Ability to Deliver Solutions for Customers of All Sizes
Net Revenue by Biopharmaceutical
Customer Type Combination of inVentiv Health’s strength with top 20
complements INC Research strength with SMID
Strong stable revenue base from top 50 – ~$1.4bn
33%combined net revenue
46%
A leader in serving SMID biopharma with ~$700mm net
revenue, a segment INC Research has grown awards
21%at ~25% CAGR since 2012
Combined top 5 and 10 customers ~31% and ~46% of
Top 20 Top21-50SMIDclinical net revenue, respectively
Understanding Market Challenges
Depth of therapeutic insights Preferred partner to sites andImprove R&D efficiency
investigators
Enhance customer ability to Faster recruitment and
design protocolRanked top CRO to work with by sites(1)patient enrollment
Enhance commercial success Control brand during R&DDemonstrate therapeutic value
Bring market access insights into Patient advocacy, issues management,Real world evidence capability
trial/protocol design study brandingenhanced by commercial services
Note: Above based on 2016 combined company clinical net revenue.
(1) INC Research, according to CenterWatch.
16
Contract Commercial Organization Segment
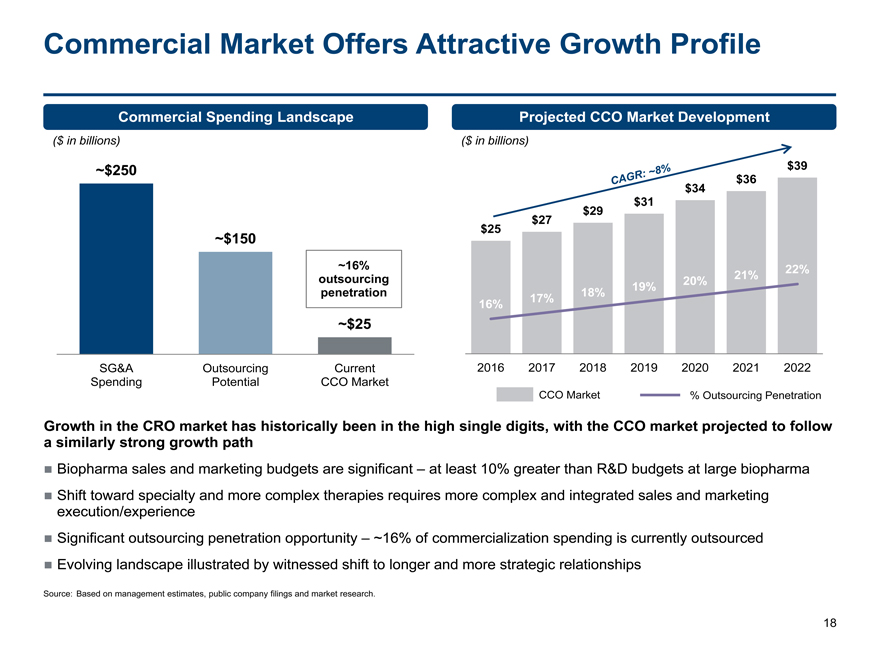
Commercial Market Offers Attractive Growth Profile
Commercial Spending Landscape Projected CCO Market Development
($ in billions) ($ in billions)
~$250 $39
$36
$34
$31
$29
$27
$25
~$150
~16%22%
outsourcing20%21%
penetration18%19%
16%17%
~$25
SG&A OutsourcingCurrent2016201720182019202020212022
Spending PotentialCCO Market
CCO Market% Outsourcing Penetration
Growth in the CRO market has historically been in the high single digits, with the CCO market projected to follow
a similarly strong growth path
Biopharma sales and marketing budgets are significant – at least 10% greater than R&D budgets at large biopharma
Shift toward specialty and more complex therapies requires more complex and integrated sales and marketing
execution/experience
Significant outsourcing penetration opportunity – ~16% of commercialization spending is currently outsourced
Evolving landscape illustrated by witnessed shift to longer and more strategic relationships
Source: Based on management estimates, public company filings and market research.
18
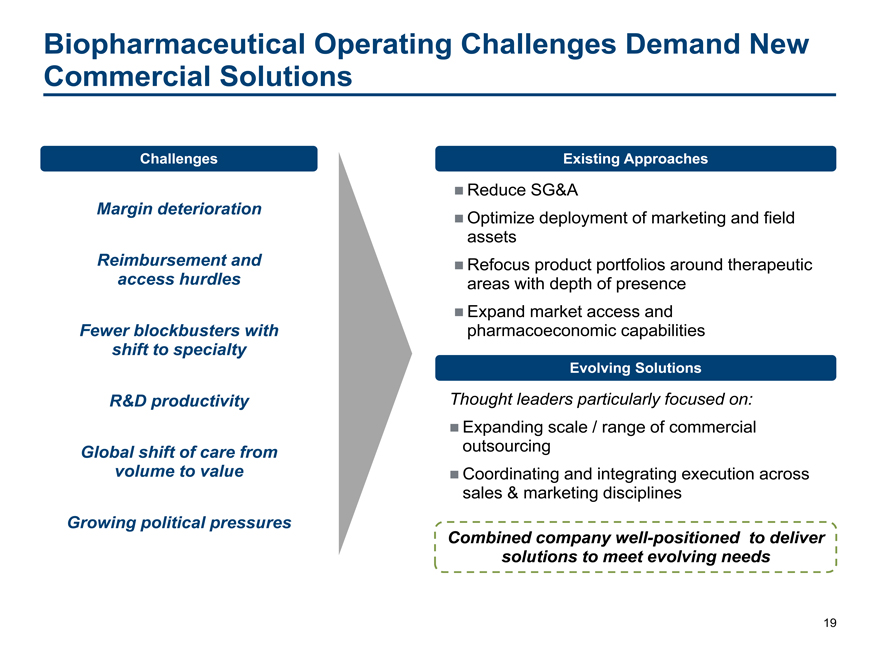
Biopharmaceutical Operating Challenges Demand New
Commercial Solutions
Challenges Existing Approaches
Reduce SG&A
Margin deterioration Optimize deployment of marketing and field
assets
Reimbursement and Refocus product portfolios around therapeutic
access hurdles areas with depth of presence
Expand market access and
Fewer blockbusters with pharmacoeconomic capabilities
shift to specialty
Evolving Solutions
R&D productivity Thought leaders particularly focused on:
Expanding scale / range of commercial
Global shift of care from outsourcing
volume to value Coordinating and integrating execution across
sales & marketing disciplines
Growing political pressures
Combined company well-positioned to deliver
solutions to meet evolving needs
19
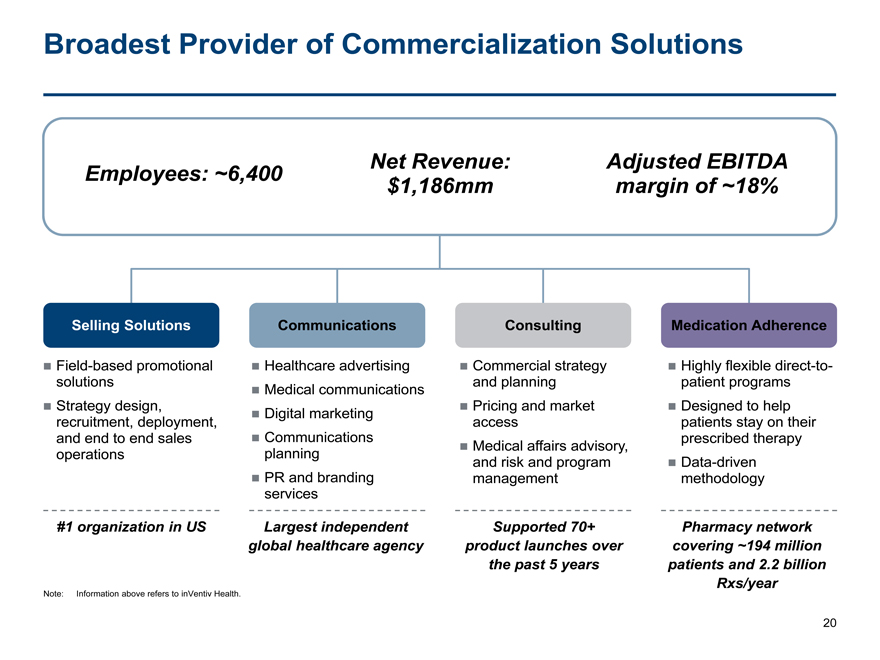
Broadest Provider of Commercialization Solutions
Employees: ~6,400 Net Revenue:Adjusted EBITDA
$1,186mmmargin of ~18%
Selling Solutions CommunicationsConsultingMedication Adherence
Field-based promotional Healthcare advertising Commercial strategy Highly flexibledirect-to-
solutions and planningpatient programs
Medical communications
Strategy design, Pricing and market Designed to help
Digital marketing
recruitment, deployment, accesspatients stay on their
and end to end sales Communicationsprescribed therapy
Medical affairs advisory,
operations planningand risk and program Data-driven
PR and brandingmanagementmethodology
services
#1 organization in US Largest independentSupported 70+Pharmacy network
global healthcare agencyproduct launches overcovering ~194 million
the past 5 yearspatients and 2.2 billion
Rxs/year
Note: Information above refers to inVentiv Health.
20
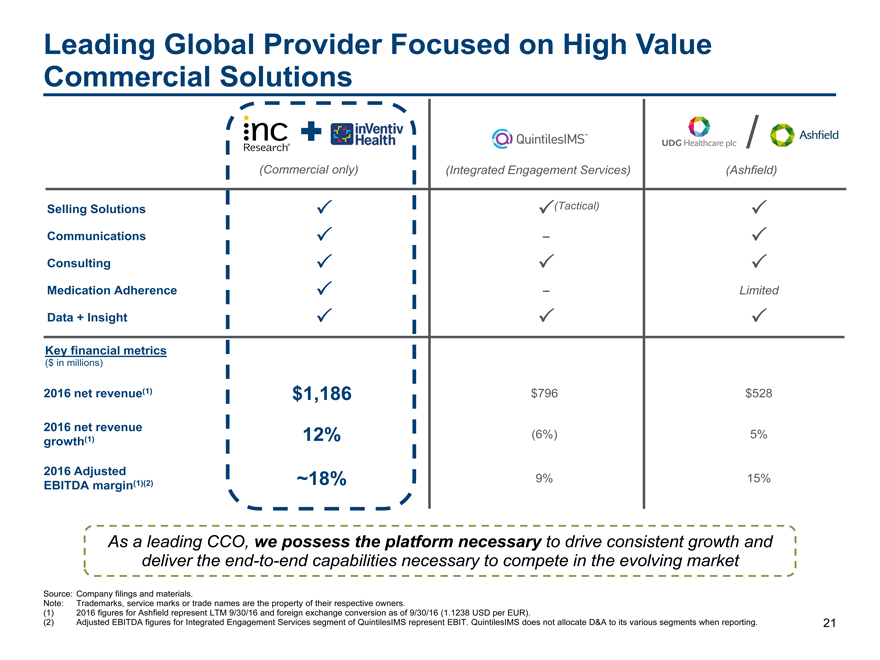
Leading Global Provider Focused on High Value
Commercial Solutions
/
(Commercial only)(Integrated Engagement Services)(Ashfield)
Selling Solutions (Tactical)
Communications –
Consulting
Medication Adherence –Limited
Data + Insight
Key financial metrics
($ in millions)
2016 net revenue(1) $1,186 $796$528
2016 net revenue 12% (6%)5%
growth(1)
2016 Adjusted ~18% 9%15%
EBITDA margin(1)(2)
As a leading CCO, we possess the platform necessary to drive consistent growth and
deliver theend-to-end capabilities necessary to compete in the evolving market
Source: Company filings and materials.
Note: Trademarks, service marks or trade names are the property of their respective owners.
(1) 2016 figures for Ashfield represent LTM 9/30/16 and foreign exchange conversion as of 9/30/16 (1.1238 USD per EUR).
(2) Adjusted EBITDA figures for Integrated Engagement Services segment of QuintilesIMS represent EBIT. QuintilesIMS does not allocate D&A to its various segments when reporting. 21
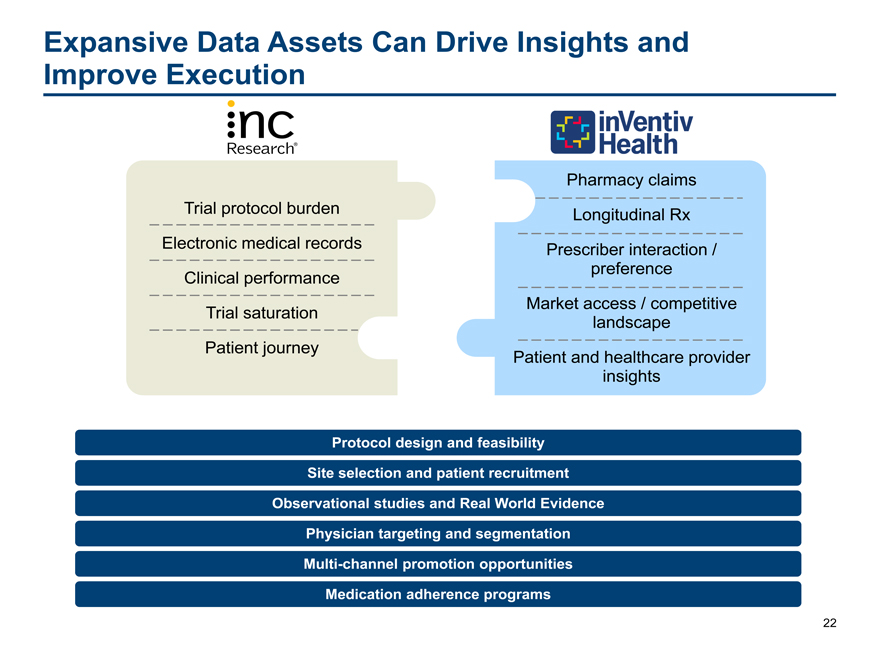
Expansive Data Assets Can Drive Insights and
Improve Execution
Pharmacy claims
Trial protocol burden Longitudinal Rx
Electronic medical records Prescriber interaction /
Clinical performance preference
Trial saturation Market access / competitive
landscape
Patient journey Patient and healthcare provider
insights
Protocol design and feasibility
Site selection and patient recruitment
Observational studies and Real World Evidence
Physician targeting and segmentation
Multi-channel promotion opportunities
Medication adherence programs
22

Financial Highlights
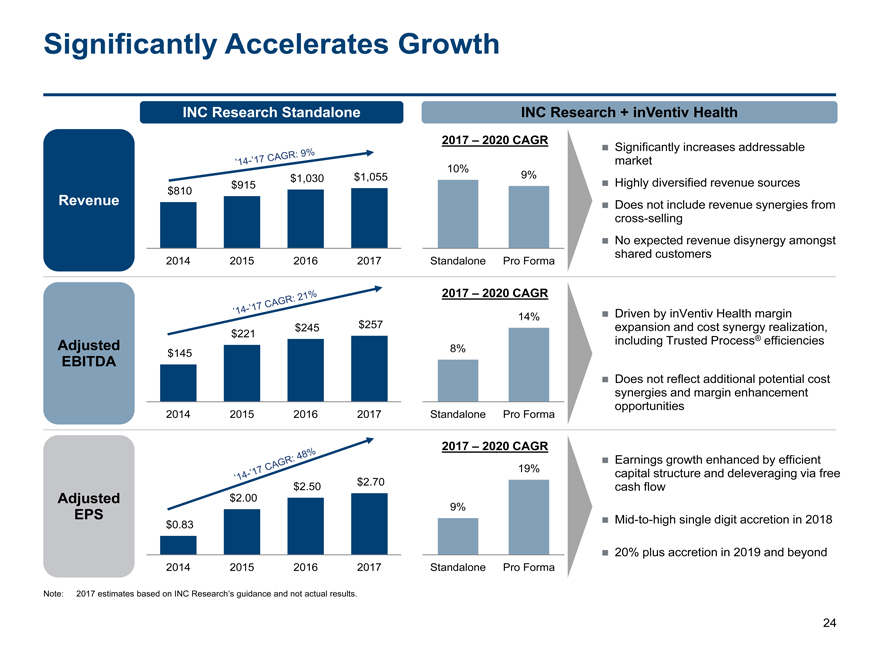
Significantly Accelerates Growth
INC Research Standalone INC Research + inVentiv Health
2017 – 2020 CAGR Significantly increases addressable
market
10%
$1,030$1,0559%
$810 $915 Highly diversified revenue sources
Revenue Does not include revenue synergies from
cross-selling
No expected revenue disynergy amongst
2014 201520162017Standalone Pro Formashared customers
2017 – 2020 CAGR
14% Driven by inVentiv Health margin
$221$245$257expansion and cost synergy realization,
Adjusted 8%including Trusted Process® efficiencies
EBITDA $145
Does not reflect additional potential cost
synergies and margin enhancement
opportunities
2014 201520162017Standalone Pro Forma
2017 – 2020 CAGR
Earnings growth enhanced by efficient
19%capital structure and deleveraging via free
$2.50$2.70cash flow
Adjusted $2.00
9%
EPS $0.83Mid-to-high single digit accretion in 2018
20% plus accretion in 2019 and beyond
2014 201520162017Standalone Pro Forma
Note: 2017 estimates based on INC Research’s guidance and not actual results.
24
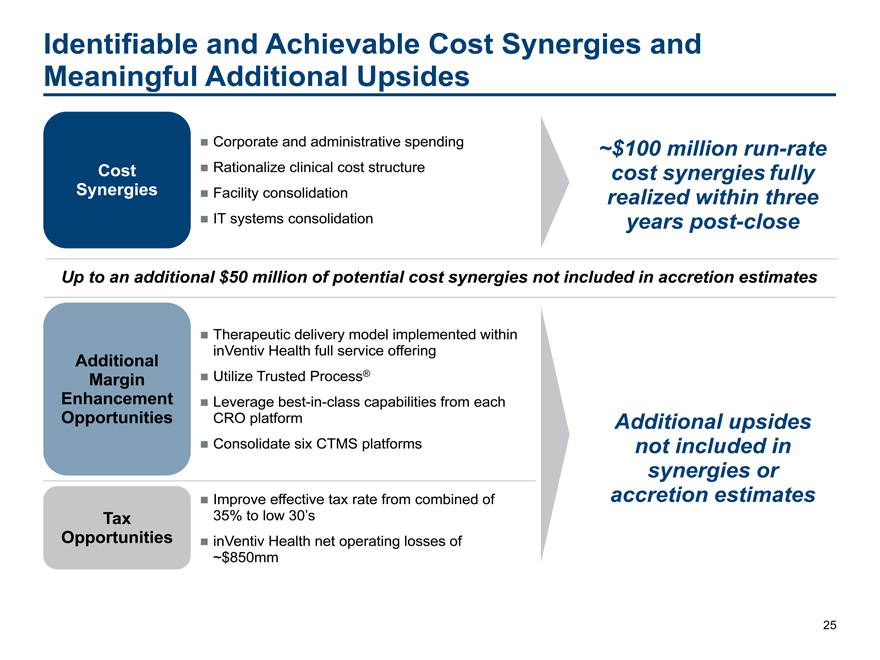
Identifiable and Achievable Cost Synergies and
Meaningful Additional Upsides
Corporate and administrative spending~$100 millionrun-rate
Cost Rationalize clinical cost structurecost synergies fully
Synergies Facility consolidationrealized within three
IT systems consolidationyears post-close
Up to an additional $50 million of potential cost synergies not included in accretion estimates
Therapeutic delivery model implemented within
Additional inVentiv Health full service offering
Margin Utilize Trusted Process®
Enhancement Leveragebest-in-class capabilities from each
Opportunities CRO platformAdditional upsides
Consolidate six CTMS platformsnot included in
synergies or
Improve effective tax rate from combined ofaccretion estimates
Tax 35% to low 30’s
Opportunities inVentiv Health net operating losses of
~$850mm
25
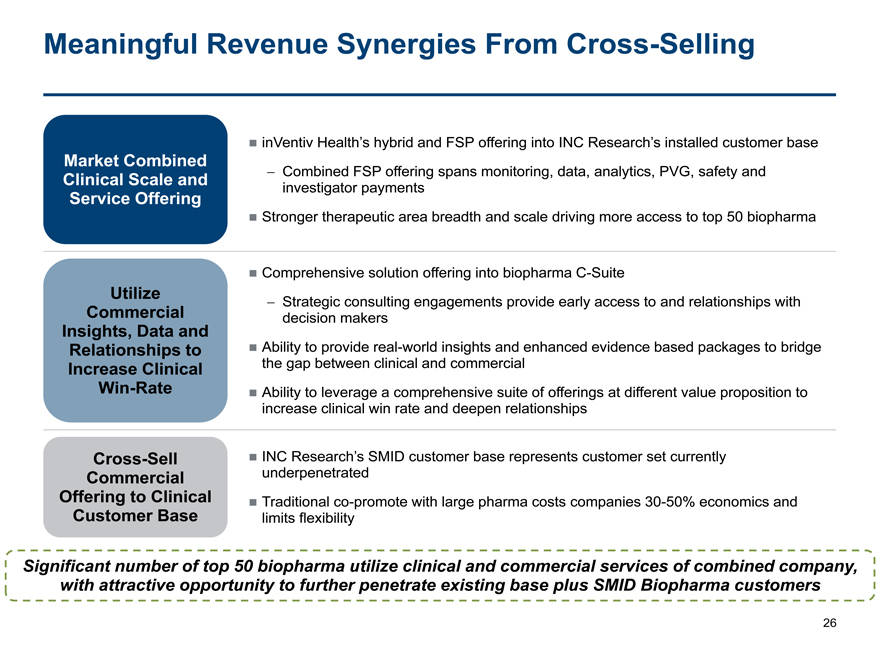
Meaningful Revenue Synergies From Cross-Selling
inVentiv Health’s hybrid and FSP offering into INC Research’s installed customer base
Market Combined
Clinical Scale and
- Combined FSP offering spans monitoring, data, analytics, PVG, safety and
investigator payments
Service Offering
Stronger therapeutic area breadth and scale driving more access to top 50 biopharma
Comprehensive solution offering into biopharmaC-Suite
Utilize
- Strategic consulting engagements provide early access to and relationships with
Commercial
decision makers
Insights, Data and
Relationships to
Ability to provide real-world insights and enhanced evidence based packages to bridge
Increase Clinical
the gap between clinical and commercial
Win-Rate
Ability to leverage a comprehensive suite of offerings at different value proposition to
increase clinical win rate and deepen relationships
Cross-Sell
INC Research’s SMID customer base represents customer set currently
Commercial
underpenetrated
Offering to Clinical
Traditionalco-promote with large pharma costs companies30-50% economics and
Customer Base
limits flexibility
Significant number of top 50 biopharma utilize clinical and commercial services of combined company,
with attractive opportunity to further penetrate existing base plus SMID Biopharma customers
26
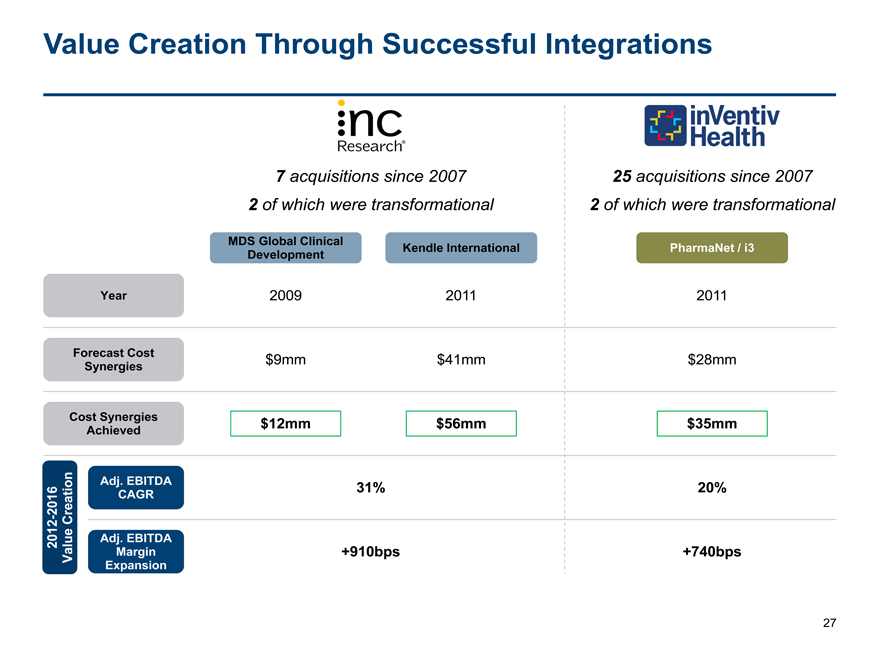
Value Creation Through Successful Integrations
7 acquisitions since 200725 acquisitions since 2007
2 of which were transformational2 of which were transformational
MDS Global ClinicalKendle InternationalPharmaNet / i3
Development
Year 200920112011
Forecast Cost $9mm$41mm$28mm
Synergies
Cost Synergies $12mm $56mm$35mm
Achieved
Adj. EBITDA 31%20%
CAGR
- 2016 Creation
2012 Adj. EBITDA
Value Margin +910bps+740bps
Expansion
27
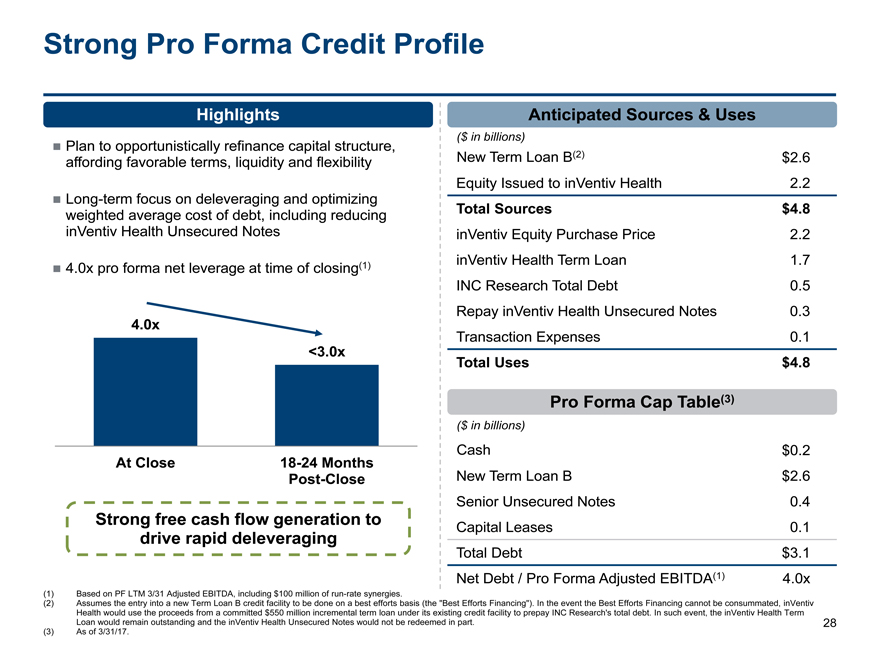
Strong Pro Forma Credit Profile
HighlightsAnticipated Sources & Uses
($ in billions)
Plan to opportunistically refinance capital structure,
affording favorable terms, liquidity and flexibility New Term Loan B(2)$2.6
Equity Issued to inVentiv Health2.2
Long-term focus on deleveraging and optimizing
weighted average cost of debt, including reducing Total Sources$4.8
inVentiv Health Unsecured Notes inVentiv Equity Purchase Price2.2
4.0x pro forma net leverage at time of closing(1) inVentiv Health Term Loan1.7
INC Research Total Debt0.5
Repay inVentiv Health Unsecured Notes0.3
4.0x
Transaction Expenses0.1
<3.0x
Total Uses$4.8
Pro Forma Cap Table(3)
($ in billions)
Cash$0.2
AtClose 18-24 Months
Post-CloseNew Term Loan B$2.6
Senior Unsecured Notes0.4
Strong free cash flow generation to Capital Leases0.1
drive rapid deleveraging
Total Debt$3.1
Net Debt / Pro Forma Adjusted EBITDA(1)4.0x
(1) Based on PF LTM 3/31 Adjusted EBITDA, including $100 million ofrun-rate synergies.
(2) Assumes the entry into a new Term Loan B credit facility to be done on a best efforts basis (the “Best Efforts Financing”). In the event the Best Efforts Financing cannot be consummated, inVentiv
Health would use the proceeds from a committed $550 million incremental term loan under its existing credit facility to prepay INC Research’s total debt. In such event, the inVentiv Health Term
Loan would remain outstanding and the inVentiv Health Unsecured Notes would not be redeemed in part. 28
(3) As of 3/31/17.
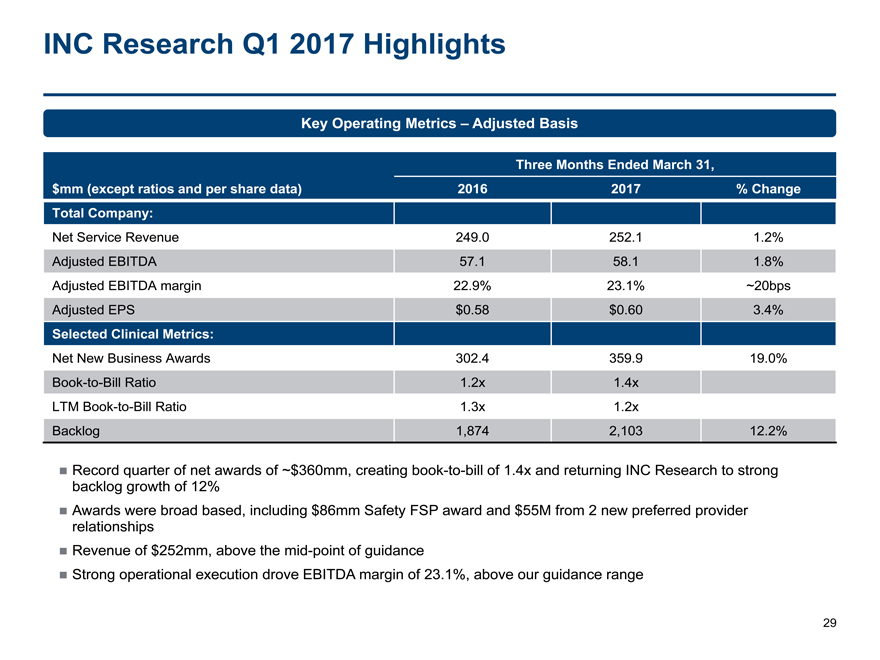
INC Research Q1 2017 Highlights
Key Operating Metrics – Adjusted Basis
Three Months Ended March 31,
$mm (except ratios and per share data) 2016 2017% Change
Total Company:
Net Service Revenue 249.0 252.11.2%
Adjusted EBITDA 57.1 58.11.8%
Adjusted EBITDA margin 22.9% 23.1%~20bps
Adjusted EPS $0.58 $0.603.4%
Selected Clinical Metrics:
Net New Business Awards 302.4 359.919.0%
Book-to-Bill Ratio 1.2x 1.4x
LTMBook-to-Bill Ratio 1.3x 1.2x
Backlog 1,874 2,10312.2%
Record quarter of net awards of ~$360mm, creatingbook-to-bill of 1.4x and returning INC Research to strong
backlog growth of 12%
Awards were broad based, including $86mm Safety FSP award and $55M from 2 new preferred provider
relationships
Revenue of $252mm, above themid-point of guidance
Strong operational execution drove EBITDA margin of 23.1%, above our guidance range
29
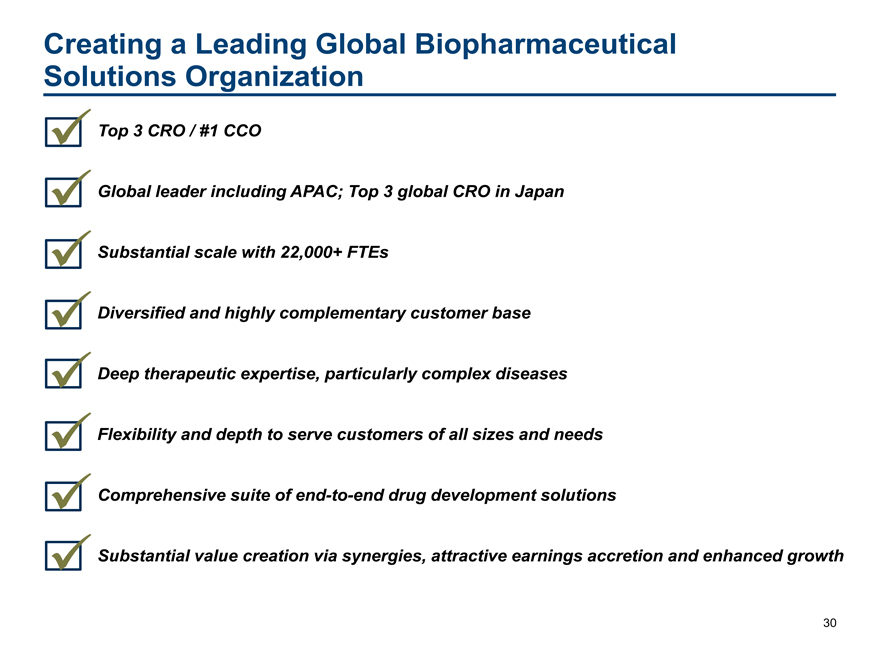
Creating a Leading Global Biopharmaceutical Solutions Organization
Top 3 CRO / #1 CCO
Global leader including APAC; Top 3 global CRO in Japan Substantial scale with 22,000+ FTEs Diversified and highly complementary customer base Deep therapeutic expertise, particularly complex diseases Flexibility and depth to serve customers of all sizes and needs Comprehensive suite ofend-to-end drug development solutions
Substantial value creation via synergies, attractive earnings accretion and enhanced growth
30

Appendix
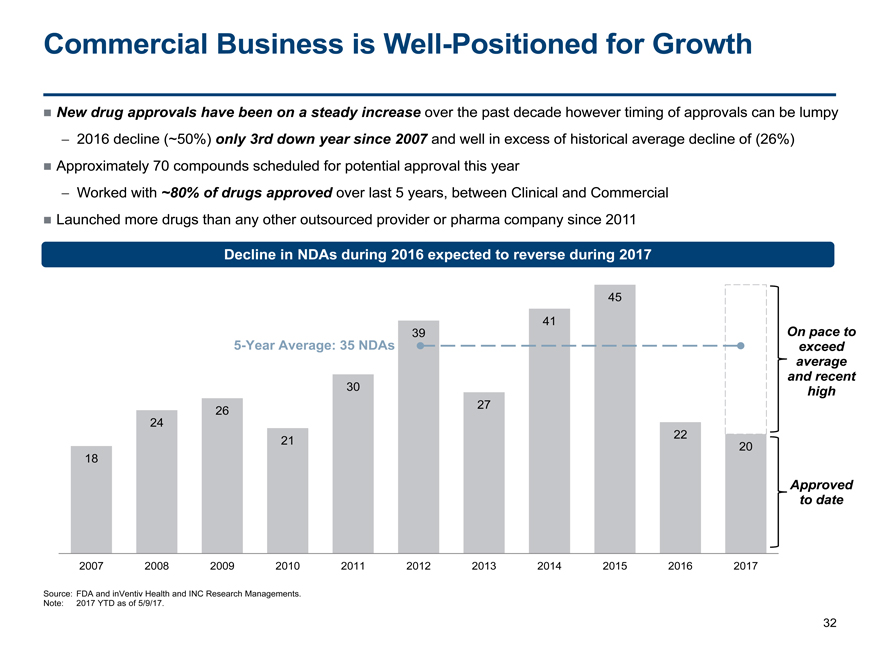
18 24 26 21 30 39 27 41 45 22 20 2007 2008 2009 2010 2011 2012 2013 2014 2015 2016 2017 Commercial Business is Well-Positioned for Growth 32 New drug approvals have been on a steady increase over the past decade however timing of approvals can be lumpy — 2016 decline (~50%) only 3rd down year since 2007 and well in excess of historical average decline of (26%) Approximately 70 compounds scheduled for potential approval this year — Worked with ~80% of drugs approved over last 5 years, between Clinical and Commercial Launched more drugs than any other outsourced provider or pharma company since 20115-Year Average: 35 NDAs Decline in NDAs during 2016 expected to reverse during 2017 Approved to date On pace to exceed average and recent high Source: FDA and inVentiv Health and INC Research Managements. Note: 2017 YTD as of 5/9/17.
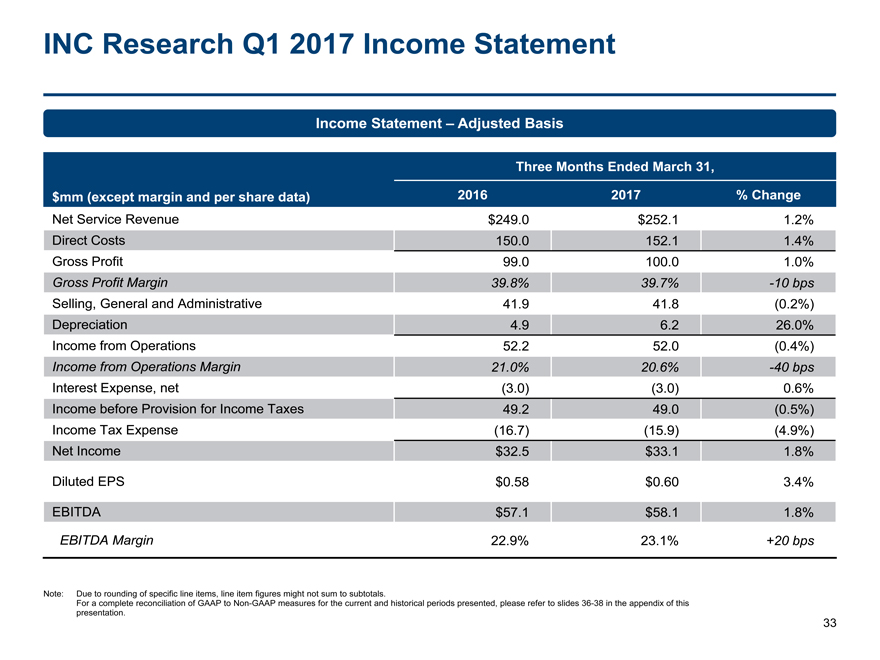
INC Research Q1 2017 Income Statement 33 Income Statement – Adjusted Basis Note: Due to rounding of specific line items, line item figures might not sum to subtotals. For a complete reconciliation of GAAP toNon-GAAP measures for the current and historical periods presented, please refer to slides36-38 in the appendix of this presentation. $mm (except margin and per share data) Three Months Ended March 31, 2016 2017 % Change Net Service Revenue $249.0 $252.1 1.2% Direct Costs 150.0 152.1 1.4% Gross Profit 99.0 100.0 1.0% Gross Profit Margin 39.8% 39.7%-10 bps Selling, General and Administrative 41.9 41.8 (0.2%) Depreciation 4.9 6.2 26.0% Income from Operations 52.2 52.0 (0.4%) Income from Operations Margin 21.0% 20.6%-40 bps Interest Expense, net (3.0) (3.0) 0.6% Income before Provision for Income Taxes 49.2 49.0 (0.5%) Income Tax Expense (16.7) (15.9) (4.9%) Net Income $32.5 $33.1 1.8% Diluted EPS $0.58 $0.60 3.4% EBITDA $57.1 $58.1 1.8% EBITDA Margin 22.9% 23.1% +20 bps
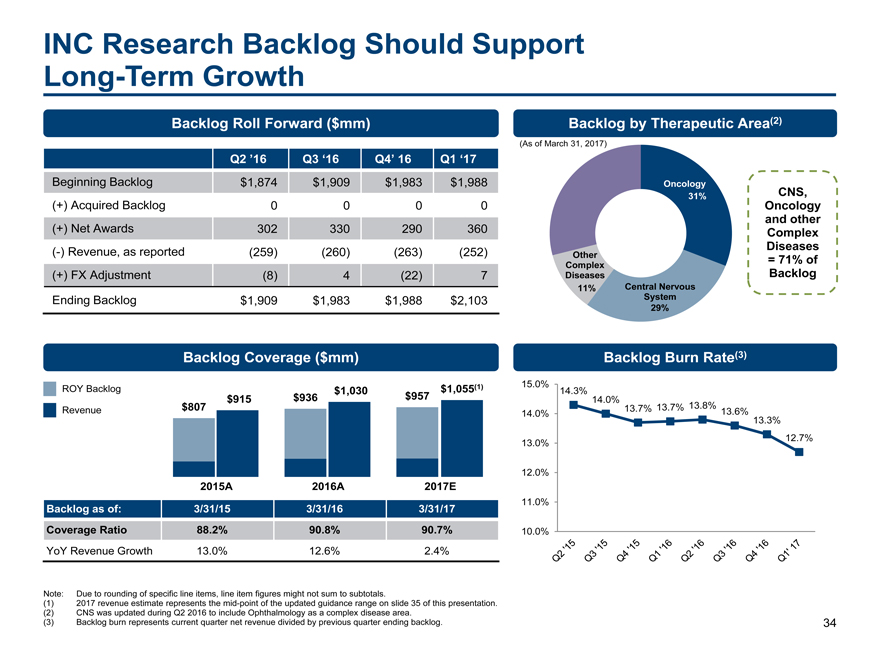
$1,030 $957 $1,055(1) INC Research Backlog Should Support Long-Term Growth 34 Note: Due to rounding of specific line items, line item figures might not sum to subtotals. (1) 2017 revenue estimate represents themid-point of the updated guidance range on slide 35 of this presentation. (2) CNS was updated during Q2 2016 to include Ophthalmology as a complex disease area. (3) Backlog burn represents current quarter net revenue divided by previous quarter ending backlog. Backlog Roll Forward ($mm) Q2 ’16 Q3 ‘16 Q4’ 16 Q1 ‘17 Beginning Backlog $1,874 $1,909 $1,983 $1,988 (+) Acquired Backlog 0 0 0 0 (+) Net Awards 302 330 290 360 (-) Revenue, as reported (259) (260) (263) (252) (+) FX Adjustment (8) 4 (22) 7 Ending Backlog $1,909 $1,983 $1,988 $2,103 Backlog by Therapeutic Area(2) Backlog Coverage ($mm) Backlog Burn Rate(3) (As of March 31, 2017) 31% 29% 11% CNS, Oncology and other Complex Diseases = 71% of Backlog Oncology Other Complex Diseases Central Nervous System Backlog as of: 3/31/15 3/31/16 3/31/17 Coverage Ratio 88.2% 90.8% 90.7% YoY Revenue Growth 13.0% 12.6% 2.4% $915 2015A $936 2016A $807 2017E 14.3% 14.0% 13.7% 13.7% 13.8% 13.6% 13.3% 12.7% 10.0% 11.0% 12.0% 13.0% 14.0% 15.0% Revenue ROY Backlog
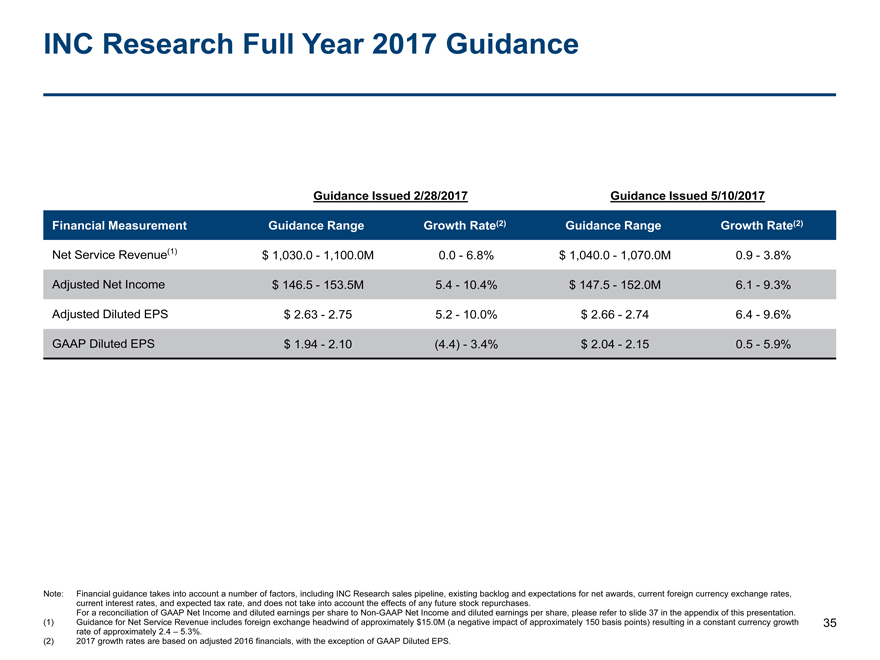
INC Research Full Year 2017 Guidance 35 Note: Financial guidance takes into account a number of factors, including INC Research sales pipeline, existing backlog and expectations for net awards, current foreign currency exchange rates, current interest rates, and expected tax rate, and does not take into account the effects of any future stock repurchases. For a reconciliation of GAAP Net Income and diluted earnings per share toNon-GAAP Net Income and diluted earnings per share, please refer to slide 37 in the appendix of this presentation. (1) Guidance for Net Service Revenue includes foreign exchange headwind of approximately $15.0M (a negative impact of approximately 150 basis points) resulting in a constant currency growth rate of approximately 2.4 – 5.3%. (2) 2017 growth rates are based on adjusted 2016 financials, with the exception of GAAP Diluted EPS. Guidance Issued 2/28/2017 Guidance Issued 5/10/2017 Financial Measurement Guidance Range Growth Rate(2) Guidance Range Growth Rate(2) Net Service Revenue(1) $ 1,030.0 - 1,100.0M 0.0 - 6.8% $ 1,040.0 - 1,070.0M 0.9 - 3.8% Adjusted Net Income $ 146.5 - 153.5M 5.4 - 10.4% $ 147.5 - 152.0M 6.1 - 9.3% Adjusted Diluted EPS $ 2.63 - 2.75 5.2 - 10.0% $ 2.66 - 2.74 6.4 - 9.6% GAAP Diluted EPS $ 1.94 - 2.10 (4.4) - 3.4% $ 2.04 - 2.15 0.5 - 5.9%
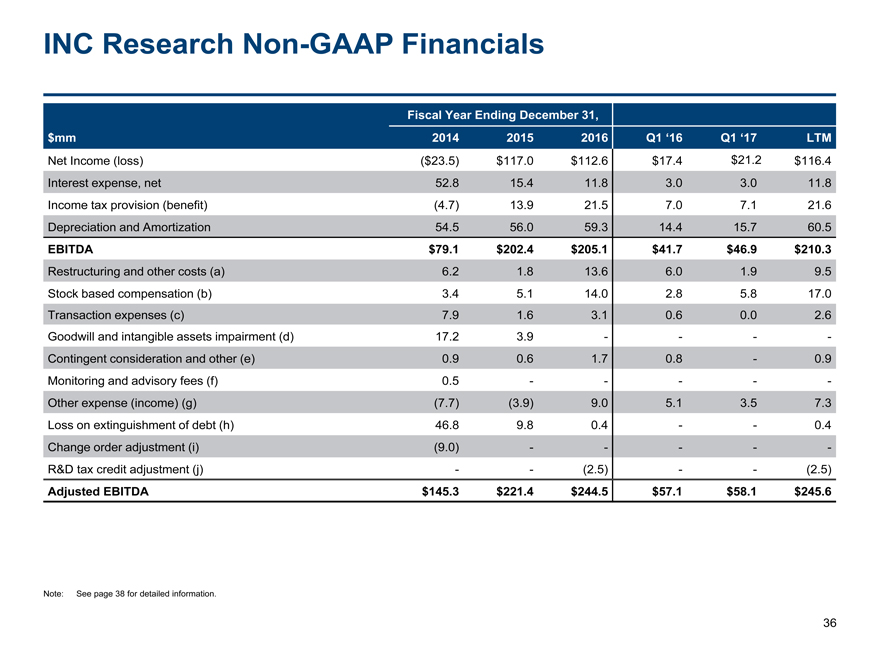
INC ResearchNon-GAAP Financials 36 $mm Fiscal Year Ending December 31, 2014 2015 2016 Q1 ‘16 Q1 ‘17 LTM Net Income (loss) ($23.5) $117.0 $112.6 $17.4 $21.2 $116.4 Interest expense, net 52.8 15.4 11.8 3.0 3.0 11.8 Income tax provision (benefit) (4.7) 13.9 21.5 7.0 7.1 21.6 Depreciation and Amortization 54.5 56.0 59.3 14.4 15.7 60.5 EBITDA $79.1 $202.4 $205.1 $41.7 $46.9 $210.3 Restructuring and other costs (a) 6.2 1.8 13.6 6.0 1.9 9.5 Stock based compensation (b) 3.4 5.1 14.0 2.8 5.8 17.0 Transaction expenses (c) 7.9 1.6 3.1 0.6 0.0 2.6 Goodwill and intangible assets impairment (d) 17.2 3.9 - - - - Contingent consideration and other (e) 0.9 0.6 1.7 0.8 - 0.9 Monitoring and advisory fees (f) 0.5 - - - - - Other expense (income) (g) (7.7) (3.9) 9.0 5.1 3.5 7.3 Loss on extinguishment of debt (h) 46.8 9.8 0.4 - - 0.4 Change order adjustment (i) (9.0) - - - - - R&D tax credit adjustment (j) - - (2.5) - - (2.5) Adjusted EBITDA $145.3 $221.4 $244.5 $57.1 $58.1 $245.6 Note: See page 38 for detailed information.
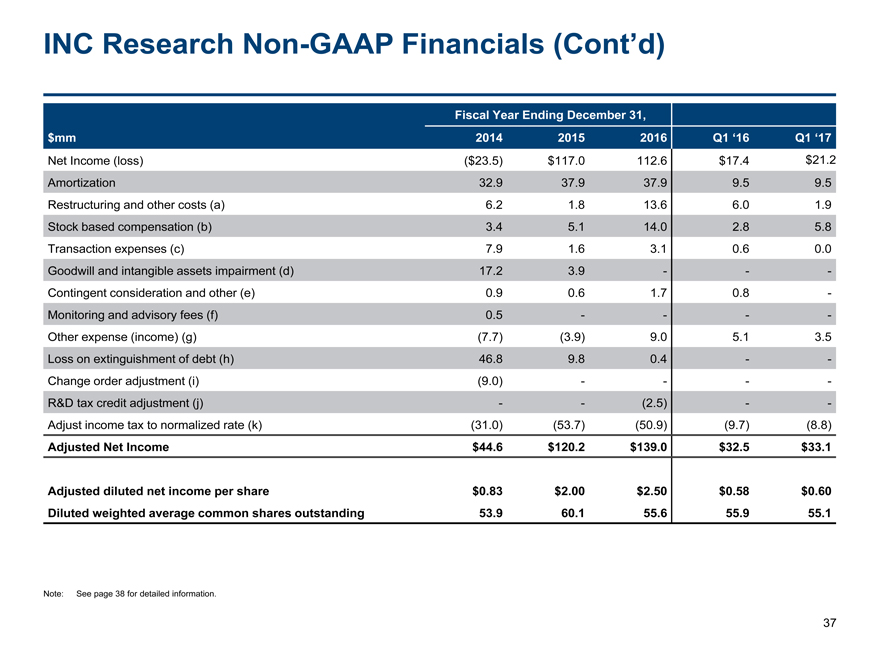
INC ResearchNon-GAAP Financials (Cont’d) 37 $mm Fiscal Year Ending December 31, 2014 2015 2016 Q1 ‘16 Q1 ‘17 Net Income (loss) ($23.5) $117.0 112.6 $17.4 $21.2 Amortization 32.9 37.9 37.9 9.5 9.5 Restructuring and other costs (a) 6.2 1.8 13.6 6.0 1.9 Stock based compensation (b) 3.4 5.1 14.0 2.8 5.8 Transaction expenses (c) 7.9 1.6 3.1 0.6 0.0 Goodwill and intangible assets impairment (d) 17.2 3.9 - - - Contingent consideration and other (e) 0.9 0.6 1.7 0.8 - Monitoring and advisory fees (f) 0.5 - - - - Other expense (income) (g) (7.7) (3.9) 9.0 5.1 3.5 Loss on extinguishment of debt (h) 46.8 9.8 0.4 - - Change order adjustment (i) (9.0) - - - - R&D tax credit adjustment (j) - - (2.5) - - Adjust income tax to normalized rate (k) (31.0) (53.7) (50.9) (9.7) (8.8) Adjusted Net Income $44.6 $120.2 $139.0 $32.5 $33.1 Adjusted diluted net income per share $0.83 $2.00 $2.50 $0.58 $0.60 Diluted weighted average common shares outstanding 53.9 60.1 55.6 55.9 55.1 Note: See page 38 for detailed information.
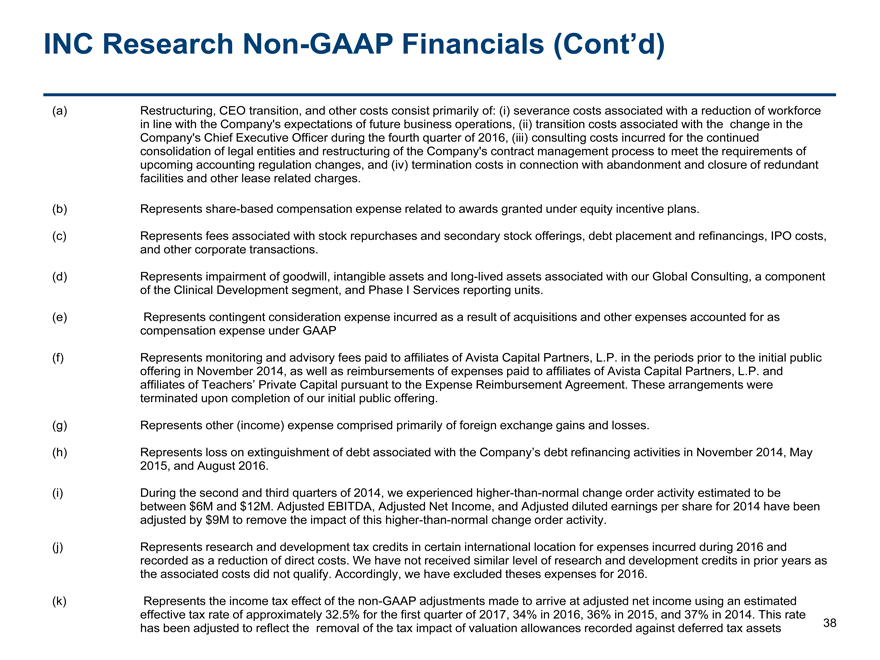
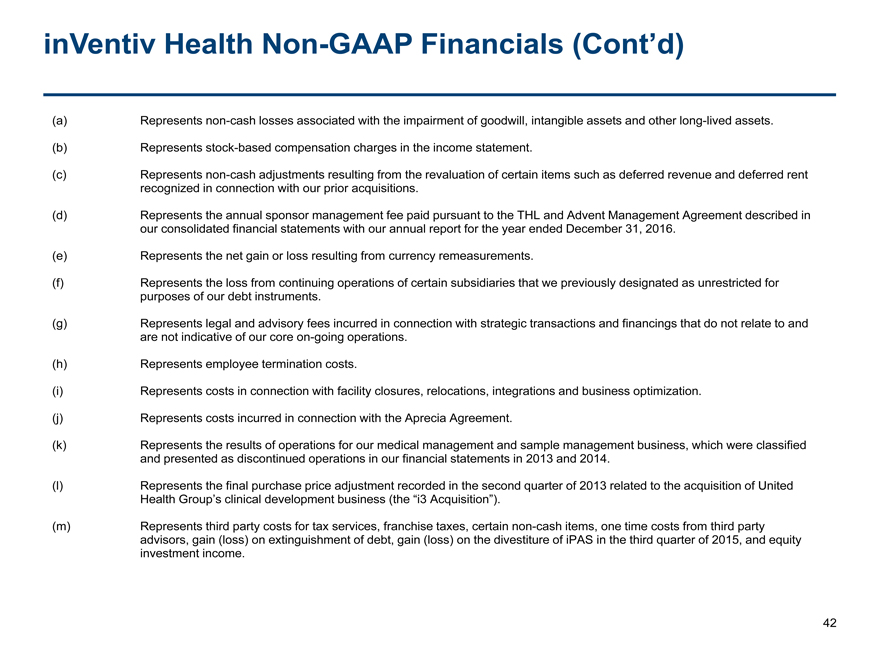
INC ResearchNon-GAAP Financials (Cont’d) 38 (a) Restructuring, CEO transition, and other costs consist primarily of: (i) severance costs associated with a reduction of workforce in line with the Company’s expectations of future business operations, (ii) transition costs associated with the change in the Company’s Chief Executive Officer during the fourth quarter of 2016, (iii) consulting costs incurred for the continued consolidation of legal entities and restructuring of the Company’s contract management process to meet the requirements of upcoming accounting regulation changes, and (iv) termination costs in connection with abandonment and closure of redundant facilities and other lease related charges. (b) Represents share-based compensation expense related to awards granted under equity incentive plans. (c) Represents fees associated with stock repurchases and secondary stock offerings, debt placement and refinancings, IPO costs, and other corporate transactions. (d) Represents impairment of goodwill, intangible assets and long-lived assets associated with our Global Consulting, a component of the Clinical Development segment, and Phase I Services reporting units. (e) Represents contingent consideration expense incurred as a result of acquisitions and other expenses accounted for as compensation expense under GAAP (f) Represents monitoring and advisory fees paid to affiliates of Avista Capital Partners, L.P. in the periods prior to the initial public offering in November 2014, as well as reimbursements of expenses paid to affiliates of Avista Capital Partners, L.P. and affiliates of Teachers’ Private Capital pursuant to the Expense Reimbursement Agreement. These arrangements were terminated upon completion of our initial public offering. (g) Represents other (income) expense comprised primarily of foreign exchange gains and losses. (h) Represents loss on extinguishment of debt associated with the Company’s debt refinancing activities in November 2014, May 2015, and August 2016. (i) During the second and third quarters of 2014, we experienced higher-than-normal change order activity estimated to be between $6M and $12M. Adjusted EBITDA, Adjusted Net Income, and Adjusted diluted earnings per share for 2014 have been adjusted by $9M to remove the impact of this higher-than-normal change order activity. (j) Represents research and development tax credits in certain international location for expenses incurred during 2016 and recorded as a reduction of direct costs. We have not received similar level of research and development credits in prior years as the associated costs did not qualify. Accordingly, we have excluded theses expenses for 2016. (k) Represents the income tax effect of thenon-GAAP adjustments made to arrive at adjusted net income using an estimated effective tax rate of approximately 32.5% for the first quarter of 2017, 34% in 2016, 36% in 2015, and 37% in 2014. This rate has been adjusted to reflect the removal of the tax impact of valuation allowances recorded against deferred tax assets
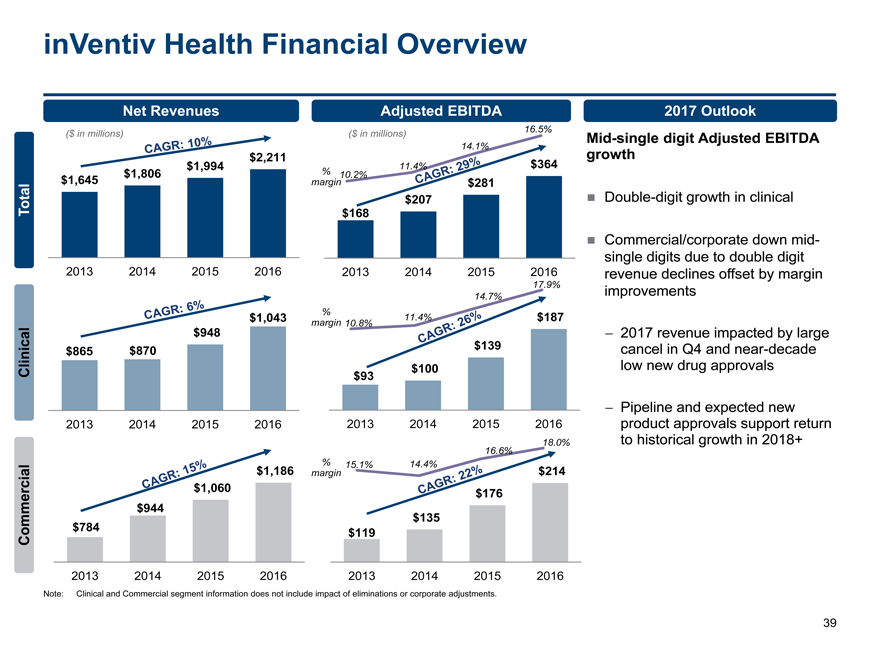
inVentiv Health Financial Overview 39 15.1% 14.4% 16.6% 18.0% 10.2% 11.4% 14.1% 16.5% 10.8% 11.4% 14.7% 17.9% $168 $207 $281 $364 2013 2014 2015 2016 $1,645 $1,806 $1,994 $2,211 2013 2014 2015 2016 ($ in millions) ($ in millions) % margin $865 $870 $948 $1,043 2013 2014 2015 2016 $93 $100 $139 $187 2013 2014 2015 2016 % margin $784 $944 $1,060 $1,186 2013 2014 2015 2016 % marginMid-single digit Adjusted EBITDA growth Double-digit growth in clinical Commercial/corporate down midsingle digits due to double digit revenue declines offset by margin improvements — 2017 revenue impacted by large cancel in Q4 and near-decade low new drug approvals — Pipeline and expected new product approvals support return to historical growth in 2018+ Net Revenues Adjusted EBITDA 2017 Outlook Commercial Clinical Total $119 $135 $176 $214 2013 2014 2015 2016 Note: Clinical and Commercial segment information does not include impact of eliminations or corporate adjustments.
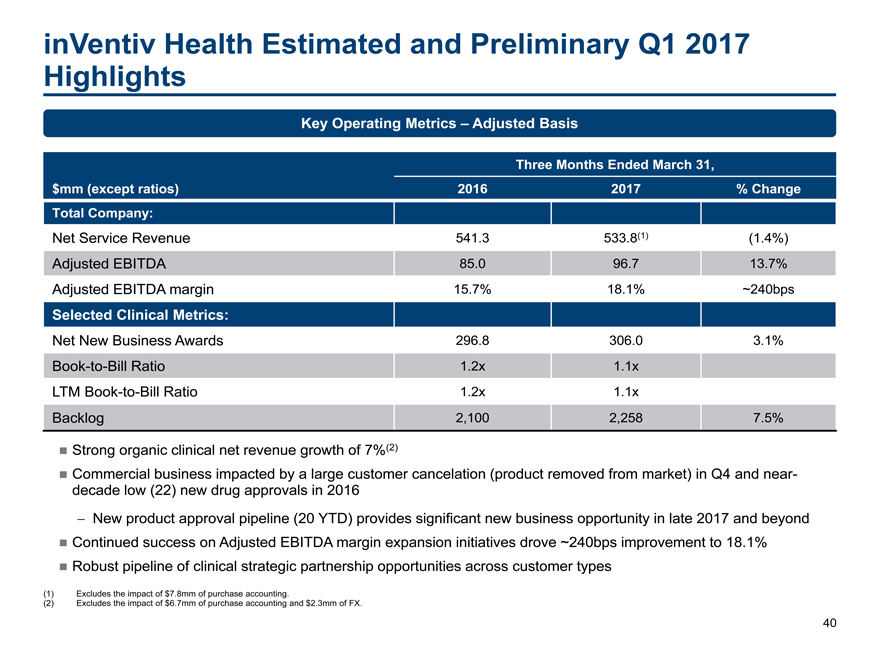
inVentiv Health Estimated and Preliminary Q1 2017 Highlights 40 $mm (except ratios) Three Months Ended March 31, 2016 2017 % Change Total Company: Net Service Revenue 541.3 533.8(1) (1.4%) Adjusted EBITDA 85.0 96.7 13.7% Adjusted EBITDA margin 15.7% 18.1% ~240bps Selected Clinical Metrics: Net New Business Awards 296.8 306.0 3.1%Book-to-Bill Ratio 1.2x 1.1x LTMBook-to-Bill Ratio 1.2x 1.1x Backlog 2,100 2,258 7.5% Strong organic clinical net revenue growth of 7%(2) Commercial business impacted by a large customer cancelation (product removed from market) in Q4 and neardecade low (22) new drug approvals in 2016 — New product approval pipeline (20 YTD) provides significant new business opportunity in late 2017 and beyond Continued success on Adjusted EBITDA margin expansion initiatives drove ~240bps improvement to 18.1% Robust pipeline of clinical strategic partnership opportunities across customer types Key Operating Metrics – Adjusted Basis (1) Excludes the impact of $7.8mm of purchase accounting. (2) Excludes the impact of $6.7mm of purchase accounting and $2.3mm of FX.
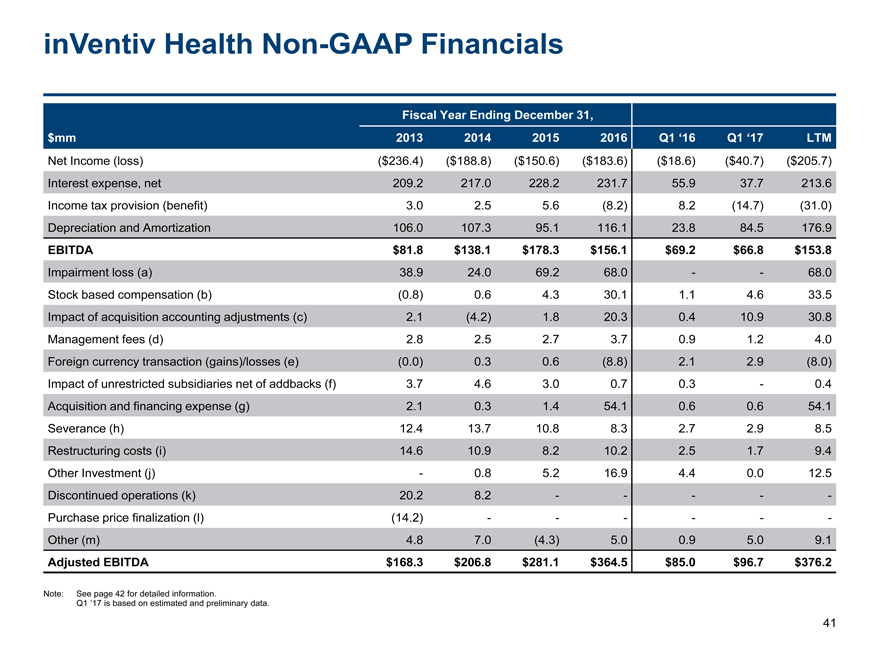
inVentiv HealthNon-GAAP Financials 41 $mm Fiscal Year Ending December 31, 2013 2014 2015 2016 Q1 ‘16 Q1 ‘17 LTM Net Income (loss) ($236.4) ($188.8) ($150.6) ($183.6) ($18.6) ($40.7) ($205.7) Interest expense, net 209.2 217.0 228.2 231.7 55.9 37.7 213.6 Income tax provision (benefit) 3.0 2.5 5.6 (8.2) 8.2 (14.7) (31.0) Depreciation and Amortization 106.0 107.3 95.1 116.1 23.8 84.5 176.9 EBITDA $81.8 $138.1 $178.3 $156.1 $69.2 $66.8 $153.8 Impairment loss (a) 38.9 24.0 69.2 68.0 - - 68.0 Stock based compensation (b) (0.8) 0.6 4.3 30.1 1.1 4.6 33.5 Impact of acquisition accounting adjustments (c) 2.1 (4.2) 1.8 20.3 0.4 10.9 30.8 Management fees (d) 2.8 2.5 2.7 3.7 0.9 1.2 4.0 Foreign currency transaction (gains)/losses (e) (0.0) 0.3 0.6 (8.8) 2.1 2.9 (8.0) Impact of unrestricted subsidiaries net of addbacks (f) 3.7 4.6 3.0 0.7 0.3 - 0.4 Acquisition and financing expense (g) 2.1 0.3 1.4 54.1 0.6 0.6 54.1 Severance (h) 12.4 13.7 10.8 8.3 2.7 2.9 8.5 Restructuring costs (i) 14.6 10.9 8.2 10.2 2.5 1.7 9.4 Other Investment (j) - 0.8 5.2 16.9 4.4 0.0 12.5 Discontinued operations (k) 20.2 8.2 - - - - - Purchase price finalization (l) (14.2) - - - - - - Other (m) 4.8 7.0 (4.3) 5.0 0.9 5.0 9.1 Adjusted EBITDA $168.3 $206.8 $281.1 $364.5 $85.0 $96.7 $376.2 Note: See page 42 for detailed information. Q1 ’17 is based on estimated and preliminary data.
inVentiv HealthNon-GAAP Financials (Cont’d) 42 (a) Representsnon-cash losses associated with the impairment of goodwill, intangible assets and other long-lived assets. (b) Represents stock-based compensation charges in the income statement. (c) Representsnon-cash adjustments resulting from the revaluation of certain items such as deferred revenue and deferred rent recognized in connection with our prior acquisitions. (d) Represents the annual sponsor management fee paid pursuant to the THL and Advent Management Agreement described in our consolidated financial statements with our annual report for the year ended December 31, 2016. (e) Represents the net gain or loss resulting from currency remeasurements. (f) Represents the loss from continuing operations of certain subsidiaries that we previously designated as unrestricted for purposes of our debt instruments. (g) Represents legal and advisory fees incurred in connection with strategic transactions and financings that do not relate to and are not indicative of our coreon-going operations. (h) Represents employee termination costs. (i) Represents costs in connection with facility closures, relocations, integrations and business optimization. (j) Represents costs incurred in connection with the Aprecia Agreement. (k) Represents the results of operations for our medical management and sample management business, which were classified and presented as discontinued operations in our financial statements in 2013 and 2014. (l) Represents the final purchase price adjustment recorded in the second quarter of 2013 related to the acquisition of United Health Group’s clinical development business (the “i3 Acquisition”). (m) Represents third party costs for tax services, franchise taxes, certainnon-cash items, one time costs from third party advisors, gain (loss) on extinguishment of debt, gain (loss) on the divestiture of iPAS in the third quarter of 2015, and equity investment income.