As filed with the Securities and Exchange Commission on 03/30/17
UNITED STATES
SECURITIES AND EXCHANGE COMMISSION
Washington, D.C. 20549
FORM N-CSR
CERTIFIED SHAREHOLDER REPORT OF REGISTERED
MANAGEMENT INVESTMENT COMPANIES
Investment Company Act file number 811-22980
Angel Oak Funds Trust
(Exact name of registrant as specified in charter)
One Buckhead Plaza
3060 Peachtree Rd. NW, Suite 500
Atlanta, Georgia 30305
(Address of principal executive offices) (Zip code)
Dory S. Black, Esq., President
One Buckhead Plaza
3060 Peachtree Rd. NW, Suite 500
Atlanta, Georgia 30305
(Name and address of agent for service)
Copy to:
Douglas P. Dick
Stephen T. Cohen
Dechert LLP
1900 K Street NW
Washington, DC 20006
404-953-4900
Registrant’s telephone number, including area code
Date of fiscal year end: January 31
Date of reporting period: February 1, 2016 to January 31, 2017
Item 1. Reports to Stockholders.
ANNUAL REPORT
January 31, 2017

Angel Oak Multi-Strategy Income Fund
Angel Oak Flexible Income Fund
Angel Oak High Yield Opportunities Fund
Angel Oak Capital Advisors, LLC
One Buckhead Plaza
3060 Peachtree Road NW
Suite 500
Atlanta, GA 30305
(404) 953-4900
Table of Contents
Dear Shareholder,
2016 was a tale of two halves and two completely unexpected election results. The first half was driven by worries about a corporate credit default cycle led by commodity-related credits, fears of a U.S. recession, and a Chinese currency devaluation, all of which led to a major risk-off environment. Equities and other risk assets were off to a tumultuous start in 2016. The S&P 500 Total Return Index was down as much as 10.27% as of February 11, marking the worst start of all time. Risk assets began to recover by the summer, but the Brexit vote surprised all market participants, and some feared the worst.
The bid for risk-free assets surged on the heels of Brexit, with the 10-year note yield closing at a 1.37% yield on July 8, the lowest in its history. “Lower for longer” seemed here to stay, although ironically Brexit was actually the catalyst for risk-on trades in the second half of 2016. The economic data began to improve in the U.S., recession worries began to subside, equities began to rise, commodities recovered, credit spreads began to tighten, and risk-free rates began to rise off post-Brexit lows.
“Lower for longer” was still the widely held expectation in the U.S. prior to the November election, but the Trump victory changed everything heading into year-end. Inflation and growth expectations completely changed, and the risk-free term structure repriced accordingly. We believe reflationary macro trends will continue in earnest in 2017, buoyed by the rekindling of animal spirits thanks to the surprise Trump victory. We expect the election outcome to pour gas on the Federal Open Market Committee (FOMC) inflation fire smoldering throughout the post-crisis period, through greater fiscal expansion, tax cuts, and deregulation-driven credit expansion. It is still too early to predict what effect a Trump administration will have on the economy, but expectations are high.
We believe all the above will be beneficial for our strategies, as they should all drive higher-than-expected inflation and growth in 2017. We feel our short effective duration profile should continue to benefit performance as U.S. risk-free rates rise, driven by increased inflation and growth expectations in 2017. Tax cuts and fiscal expansion should keep credit spreads stable to tighter throughout the year as corporate earnings and ever-improving consumer balance sheets outweigh the effects of higher interest rates.
We also expect the U.S. economic outlook to be favorable if the Trump administration delivers on market expectations of corporate tax reform, infrastructure spending, large-scale fiscal stimulus, and significant deregulation (“Trumponomics”). We believe Trumponomics will be the final potent cocktail to rid the U.S. of the bitter taste of deflation and anemic growth for this business cycle. The post-crisis expansion, now in its 77th month, may still have a long way to go as the consumer credit box expands. Seventy percent of the U.S. economy is related to consumer spending, and wages have finally begun to outpace inflation seven years into the recovery. Additionally, household leverage is at its lowest level since 2002. Consumer credit expansion through single-family mortgage credit has been hindered due to tightening credit standards, but residential mortgage guidelines have finally begun to relax.
The coming consumer credit expansion, coupled with the potential of Trumponomics, will create some clear winners and losers. We believe the winners could include risk assets that perform well in inflationary environments, such as equities, real estate, real estate-backed assets, floating rate securities, short duration assets, and high current carry credit spread assets. We believe the losers could be duration-sensitive assets, particularly negatively convex fixed income products such as agency mortgages and long duration investment grade corporate bonds.
Thank you for your continued support.
Respectfully yours,
Sreeniwas V. Prabhu
Chief Executive Officer and Chief Investment Officer
The opinions expressed are subject to change at any time, are not guaranteed and should not be considered investment advice.
Must be accompanied or preceded by a prospectus.
Mutual fund investing involves risk. Principal loss is possible.
The Angel Oak Funds are distributed by Quasar Distributors, LLC.
1
Angel Oak Multi-Strategy Income Fund
| 1. | How did the Fund perform during the period? |
For the 12-month period ended January 31, 2017, the Fund’s Institutional Shares (ANGIX) returned 6.96%, while the A Shares (ANGLX) and C Shares (ANGCX) returned 6.64% and 5.87%, respectively. During the same period, the Fund’s benchmark, the Bloomberg Barclays U.S. Aggregate Bond Index, returned 1.45%.
| 2. | What were the main contributors to and detractors from the Fund’s performance during the period? |
Duration and credit strategies benefited the Fund relative to the benchmark. Duration positioning short of the index was a positive contributor to relative performance for the period as the 5 and 10-year U.S. Treasury yields rose 59 and 53 basis points (bps), respectively. The floating rate bond allocation based primarily on front-end LIBOR floaters was beneficial to relative Fund performance as 3-month LIBOR rose 45 bps over the period. Credit strategies benefited the Fund relative to the benchmark for the 12-month period, as the total returns of non-agency residential mortgage-backed securities (NA RMBS), collateralized loan obligations (CLOs) and commercial mortgage-backed securities (CMBS) were all positive contributors to the Fund.
NA RMBS were the primary contributor to Fund performance for the 12-month period. Current income benefited from a rise in LIBOR, increasing bond interest and the boost to yield from rising voluntary prepayment speeds.
CLOs were another sector that exhibited strong performance for the period as prices sharply recovered following steep widening in early 2016. The decision to maintain a significant allocation to CLOs following early 2016 price volatility was a benefit to Fund performance.
Last, the CMBS allocation was a positive contributor for the 12-month period but lagged other structured product asset classes amid headwinds, including negative implications of e-commerce for the bricks-and-mortar retail sector and the upcoming maturity of approximately $228 billion of 2007 CMBS originations. Despite the positive performance in the period, CMBS did underperform relative to the NA RMBS and CLO exposure in the Fund, yet may foreshadow excess opportunities for the period ahead.
| 3. | What is your outlook heading into 2017, and how is the Fund positioned? |
We believe the Federal Open Market Committee (FOMC) may prove to be more hawkish than expected in 2017, marking the first time in the post-crisis period the FOMC will have been less dovish than market participants. Higher headline inflation data should begin to pressure longer duration assets as the reset of higher year-over-year crude prices flow through. Market participants could begin to price in more than the two FOMC hikes currently anticipated in 2017 if the growth and inflation data begin to surprise to the upside. We expect this will lead to a higher, yet slightly flatter, risk-free curve in the U.S.
With this rate view in mind, three overarching themes will drive portfolio positioning for the Fund in early 2017:
| | 1. | Minimize interest rate sensitivity with a bias toward floating rate credit assets |
| | 2. | Overweight structured credit relative to traditional U.S. fixed income |
| | 3. | Target less-levered sectors with positive credit fundamentals |
Therefore, the Fund remains overweight non-agency mortgage credit through both legacy floating rate NA RMBS and investment grade CMBS. Legacy NA RMBS remain attractive due to their floating rate coupons, deeply discounted dollar prices and appreciating collateral. Targeted opportunities also currently exist in non-agency commercial mortgage-backed securities and CLOs due to their recent underperformance relative to corporate credit.
Past performance is not a guarantee of future results.
Investments in debt securities typically decreases when interest rates rise. This risk is usually greater for longer-term debt securities. Investments in lower rated and non-rated securities present a greater risk of loss to principal and interest than higher rated securities. Investments in asset-backed and mortgage-backed securities include additional risks that investors should be aware of including credit risk, prepayment risk, possible illiquidity and default, as well as increased susceptibility to adverse economic developments. Derivatives involve risks different from, and in certain cases, greater than the risks presented by more traditional investments. Derivatives may involve certain costs and risks such as illiquidity, interest rate, market, credit, management and the risk that a position could not be closed when most advantageous. Investing in derivatives could lose more than the amount invested. The Fund may make short sales of securities, which involves the risk that losses may exceed the original amount invested.
2
Angel Oak Flexible Income Fund
| 1. | How did the Fund perform during the period? |
For the 12-month period ended January 31, 2017, the Fund’s Institutional Shares (ANFIX) returned 3.69%, while the A Shares (ANFLX) and C Shares (AFLCX) returned 3.47% and 2.73%, respectively. During the same period, the Fund’s benchmark, the Bloomberg Barclays U.S. Aggregate Bond Index, returned 1.45%.
| 2. | What were the main contributors to and detractors from the Fund’s performance during the period? |
Credit strategies, senior and subordinated debt of depository institutions, and collateralized loan obligations (CLOs) benefited Fund performance relative to the benchmark during the 12-month reporting period. Duration positioning short of the index was also a positive contributor to relative performance for the period.
Within corporates, bank credit spreads continued to tighten over the 12-month reporting period, more than offsetting the increase in Treasury rates. The corporate allocation was the best contributor for the period. Based on Q4 earnings releases, bank fundamentals continue to improve. Loan growth continues at a moderate pace, and earnings have improved, driven by expense control, low credit charges, and improving net interest margins.
CLOs were a significant positive contributor to performance for the period as prices sharply recovered following steep widening in early 2016. The decision to maintain a significant allocation to CLOs following early 2016 price volatility was a benefit to Fund performance.
| 3. | What is your outlook heading into 2017, and how is the Fund positioned? |
We believe the Federal Open Market Committee (FOMC) may prove to be more hawkish than expected in 2017, marking the first time in the post-crisis period the FOMC will have been less dovish than market participants. Higher headline inflation data should begin to pressure longer duration assets as the reset of higher year-over-year crude prices flow through. Market participants could begin to price in more than the two FOMC hikes currently anticipated in 2017 if the growth and inflation data begin to surprise to the upside. We expect this will lead to a higher, yet slightly flatter, risk-free curve in the U.S.
The Fund’s target allocation to corporate credit has increased to approximately 60% as the regional and community bank debt spreads have lagged generic high-yield and investment-grade corporate spread tightening in 2017. The increase in interest rates and overall steepening of the U.S. yield curve should improve banks’ investment portfolio book yields and net interest margins. The potential for deregulation should also increase efficiencies for the banking industry and improve expected profitability in the future, thus raising expected debt service coverage ratios and leading to lower credit risk premiums. The Fund continues to favor this sector for the attractive spreads of high-quality names amid improving bank fundamentals and mergers and acquisitions activity.
The Fund also continues to favor earlier vintage BBB-rated 2.0 CLOs with short reinvestment periods, as we believe deal deleveraging should lead to stable performance. On a relative basis, CLO spreads look attractive as there is room for further improvement given post-crisis tights that were set in the early part of 2015. Spread duration has decreased in the Fund given the recent outperformance of CLOs versus community bank corporate credit. Furthermore, 3-month LIBOR currently sits at approximately 1%, and the potential for further Fed hikes in 2017 could continue to generate demand for floating rate assets. As a result, we seek for positive relative outperformance compared with investment grade U.S. corporate industrial bonds, as corporate credit has experienced significant spread tightening and has limited ability to absorb further rate increases via the FOMC.
Past performance is not a guarantee of future results.
The Fund can make short sales of securities, which involves the risk that losses in securities may exceed the original amount invested. The Fund may use leverage, which may exaggerate the effect of any increase or decrease in the value of securities in the Fund’s portfolio on the Fund’s Net Asset Value and therefore may increase the volatility of the Fund. Investments in foreign securities involve greater volatility and political, economic and currency risks and differences in accounting methods. These risks are increased for emerging markets. Investments in fixed income instruments typically decrease in value when interest rates rise. Derivatives involve risks different from and, in certain cases, greater than the risks presented by more traditional investments. Investments in asset-backed and mortgage-backed securities include additional risks that investors should be aware of, such as credit risk, prepayment risk, possible illiquidity and default, as well as increased susceptibility to adverse economic developments. Investment by the Fund in lower-rated and non-rated securities presents a greater risk of loss to principal and interest than higher-rated securities. The Fund is non-diversified, so it may be more susceptible to being adversely affected by a single corporate, economic, political or regulatory occurrence than a diversified fund. The Fund will incur higher and duplicative costs when it invests in mutual funds, ETFs and other investment companies. There is also the risk that the Fund may suffer losses due to the investment practices of the underlying funds. For more information on these risks and other risks of the Fund, please see the Prospectus.
3
Angel Oak High Yield Opportunities Fund
| 1. | How did the Fund perform during the period? |
For the 12-month period ended January 31, 2017, the Fund’s Institutional Shares (ANHIX) returned 20.77% while the A Shares (ANHAX) returned 20.53%. During the same period, the Fund’s benchmark, the BofA Merrill Lynch High Yield Index, returned 20.98%.
| 2. | What were the main contributors to and detractors from the Fund’s performance during the period? |
The Fund’s (ANHIX) 20.77% return for the 12-month period ended January 31, 2017 was strong despite being 45 basis points (bps) less than the benchmark. The Fund’s strong performance was driven by a combination of both sector selection and issuer selection. As the year progressed, our view strengthened with regard to the domestic economy relative to the global economy and, therefore, we began to position the portfolio toward sectors and issuers that would benefit from a pickup in growth in the U.S., as well as avoiding companies dependent on exports. With that in mind, we found investment opportunities in the basic industry sector, the capital goods sector, and the financial services sector, which are actually now among our largest overweights in the portfolio.
During the period, the portfolio benefited from a significant underweight to the healthcare sector, which was among the top-performing sectors from an attribution perspective relative to the benchmark. Valuations appeared rich from a risk/reward standpoint, especially as some companies had an increased propensity to buy back stock rather than strengthen their balance sheets. Additionally, following the presidential election, the healthcare sector in general sold off, reflecting increased uncertainty due to the likely repeal of the Affordable Care Act.
Automotive was another sector that was a significant positive contributor to performance for the year. The positive attribution reflects the ongoing strength of automotive demand as well as investment selection. Portfolio investments in specific companies benefited as they were able to capitalize on the strong demand for cars and implement operational improvements that resulted in improved margins and cash flow and a stronger credit profile. Additionally, the portfolio benefited from the consolidation activity taking place among automotive parts suppliers.
Energy and basic materials were among the largest detractors from performance during the period on an attribution basis. These two sectors were among the best-performing sectors in the index, with energy and metals and mining company valuations rebounding following the exceptionally weak performance the prior year, when China’s economic strength was being challenged, fears of a recession were rising in the U.S. and commodity prices were hitting recent lows. Portfolio performance benefited on the way down as we avoided the weakest companies and did not speculate on their potential recovery during the period, resulting in negative attribution as valuations recovered from distressed levels.
| 3. | What is your outlook heading into 2017, and how is the Fund positioned? |
Our positive outlook for the high-yield market in 2017 is supported by the technicals as well as the fundamentals. From a technical perspective, high-yield attracted over $11 billion of inflows in 2016. This follows three years of outflows cumulatively totaling more than $45 billion. We expect the demand for yield and income to remain strong, and high-yield corporates with the potential to improve their credit profiles and valuations as the economy accelerates, potentially mitigating the negative impact of rising interest rates, should continue to be an attractive option in this environment.
The fundamental indicators we follow suggest that the economy will continue to expand, which should be beneficial to high-yield issuers in terms of revenue growth, margins, cash flow and credit profile improvement, which should translate into improving credit spread valuations. One of the fundamental indicators we look at is industrial production, which has turned positive on a year-over-year basis. Early in 2016, it was negative, and this was one of the rare instances when negative industrial production didn’t translate into a recession. Bank lending continues to be strong, increasing at a high-single-digits rate year-over-year. Bank lending standards, which are measured quarterly by the Federal Reserve for commercial and industrial loans, after tightening somewhat, have eased recently.
We think the high-yield market looks attractive when you put it in the context of other risk assets as of January 31, 2017. High-yield, as represented by the BofA Merrill Lynch US High Yield Index, at 400 bps, is still trading wide of its post-crisis tights of 335 bps, and it still yields approximately 6%. At the same time, investment grade corporate, as represented by the BofA Merrill Lynch US Corporate Index, is at 128 bps, only 42 bps off their post-crisis tights, and yield only 3.38%. Relative to investment grade, high-yield still offers significant credit spread tightening potential and yields almost twice as much. This credit spread and
4
yield advantage provides the basis for high-yield to provide an opportunity for outperformance of investment grade if the economy continues to improve, leading to rising interest rates. Additionally, equity valuations are at some of their highest levels since the early 2000s, using price-to-earnings as a proxy, and are looking very stretched. Within that context, high-yield not only looks attractive from an absolute return basis, but also from a risk/reward perspective compared to U.S. stocks and more interest rate sensitive fixed income.
In the context of an expected acceleration of economic growth and considering current valuations, we are focused on the balance of risk and reward and our goal of long-term, superior risk-adjusted returns. As such, we will opportunistically reduce the risk profile at the margin while also focusing on sectors that we believe should directly benefit from the new administration’s policies, such as housing, basic materials, and financial services.
Past performance is not a guarantee of future results.
Investments in debt securities typically decreases when interest rates rise. This risk is usually greater for longer-term debt securities. Investments in lower rated and non-rated securities present a greater risk of loss to principal and interest than higher rated securities. Investments in asset-backed and mortgage-backed securities include additional risks that investors should be aware of including credit risk, prepayment risk, possible illiquidity and default, as well as increased susceptibility to adverse economic developments. Derivatives involve risks different from, and in certain cases, greater than the risks presented by more traditional investments. Derivatives may involve certain costs and risks such as illiquidity, interest rate, market, credit, management and the risk that a position could not be closed when most advantageous. Investing in derivatives could lose more than the amount invested. The Fund may make short sales of securities, which involves the risk that losses may exceed the original amount invested.
5
Bank of America Merrill Lynch U.S. High Yield Index: Tracks the performance of below investment grade, but not in default, U.S. dollar denominated corporate bonds publicly issued in the U.S. domestic market, and includes issues with a credit rating of BBB or below, as rated by Moody’s and S&P.
Bank of America Merrill Lynch U.S. Corporate Index: Tracks the performance of the U.S. dollar denominated investment grade corporate debt publicly issued I the U.S. domestic market. Qualifying securities must have an investment grade rating (based on an average of Moody’s, S&P and Fitch), at least 18 months to final maturity at the time of issuance, at least one year remaining term to final maturity as of the rebalancing date, a fixed coupon schedule and a minimum amount outstanding of $250 million.
Basis Points (bps): A basis point refers to a common unit of measure for interest rates and other percentages in finance. One basis point is equal to 1/100th of 1%, or 0.01% (0.0001), and is used to denote the percentage change in a financial instrument. The relationship between percentage changes and basis points can be summarized as follows: 1% change = 100 basis points, and 0.01% = 1 basis point.
Bloomberg Barclays U.S. Aggregate Bond Index: The Bloomberg Barclays U.S. Aggregate Bond Index is a broad-based flagship benchmark that measures the investment grade, U.S. dollar-denominated, fixed-rate taxable bond market. The index includes Treasuries, government-related and corporate securities, MBS (agency fixed-rate and hybrid ARM pass-throughs), ABS and CMBS (agency and non-agency).
Duration: Duration is a measure of the sensitivity of the price – the value of principal – of a fixed-income investment to a change in interest rates. Duration is expressed as a number of years. Bond prices are said to have an inverse relationship with interest rates. Therefore, rising interest rates indicate bond prices are likely to fall, while declining interest rates indicate bond prices are likely to rise.
LIBOR: LIBOR or ICE LIBOR (previously BBA LIBOR) is a benchmark rate that some of the world’s leading banks charge each other for short-term loans. It stands for IntercontinentalExchange London Interbank Offered Rate and serves as the first step to calculating interest rates on various loans throughout the world. LIBOR is administered by the ICE Benchmark Administration (IBA), and is based on five currencies: U.S. dollar (USD), Euro (EUR), pound sterling (GBP), Japanese yen (JPY) and Swiss franc (CHF), and serves seven different maturities: overnight, one week, and 1, 2, 3, 6 and 12 months. There are a total of 35 different LIBOR rates each business day. The most commonly quoted rate is the three-month U.S. dollar rate.
Price Earnings Ratio: The price-earnings ratio is the ratio for valuing a company that measures its current share price relative to its per-share earnings.
S&P 500 Total Return Index: S&P 500 Total Return Index is a capitalization-weighted index of 500 stocks. The index is designed to measure performance of the broad domestic economy through changes in the aggregate market value of 500 stocks representing all major industries. The index was developed with a base level of 10 for the 1941-43 base period.
Spread: The difference in yield between a U.S. Treasury bond and a debt security with the same maturity but of lesser quality.
An investment cannot be made directly to an index.
6
Investment Results – (Unaudited)
Angel Oak Multi-Strategy Income Fund
Total Return Based on a $1,000,000 Investment
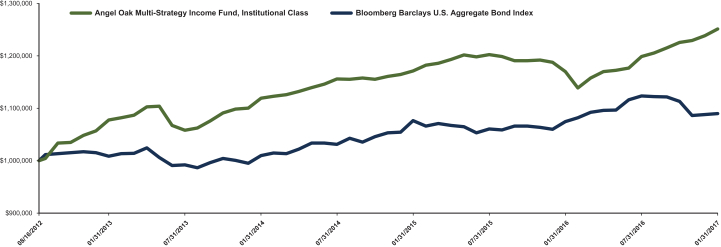
The Fund is the successor to the investment performance of the Angel Oak Multi-Strategy Income Fund (the “Predecessor Multi-Strategy Income Fund”) as a result of the reorganization of the Predecessor Multi-Strategy Income Fund into the Fund on April 10, 2015. Accordingly, the performance information shown in the chart above and table below for periods prior to April 10, 2015 is that of the Predecessor Multi-Strategy Income Fund. The Predecessor Multi-Strategy Income Fund was also advised by the Adviser and had the same investment objective, policies, and strategies as the Fund.
The chart above assumes an initial investment of $1,000,000 made on August 16, 2012 (commencement of operations). Returns shown include the reinvestment of all dividends. Returns shown do not reflect the deduction of taxes that a shareholder would pay on Fund distributions or the redemption of Fund shares. In the absence of fee waivers and reimbursements, when they are necessary to keep expenses at the expense cap, total return would be reduced. Past performance is not predictive of future performance. Investment return and principal value will fluctuate so that your shares, when redeemed, may be worth more or less than the original cost. Index returns do not reflect the effects of fees or expenses. It is not possible to invest directly in an index.
Total Returns(1)
(For the year ended January 31, 2017)
| | | | | | | | | | | | | | | | |
| | | Average Annual Returns | |
| | | One Year | | | Three Year | | | Five Year | | | Since Inception(2) | |
Angel Oak Multi-Strategy Income Fund, Institutional Class | | | 6.96 | % | | | 3.78 | % | | | N/A | | | | 5.15 | % |
Angel Oak Multi-Strategy Income Fund, Class A without load | | | 6.64 | % | | | 3.53 | % | | | 7.09 | % | | | 7.95 | % |
Angel Oak Multi-Strategy Income Fund, Class A with load | | | 4.24 | % | | | 2.75 | % | | | 6.59 | % | | | 7.51 | % |
Angel Oak Multi-Strategy Income Fund, Class C without load | | | 5.87 | % | | | N/A | | | | N/A | | | | 1.66 | % |
Angel Oak Multi-Strategy Income Fund, Class C with load | | | 4.88 | % | | | N/A | | | | N/A | | | | 1.66 | % |
Bloomberg Barclays U.S. Aggregate Bond Index(3) | | | 1.45 | % | | | 2.59 | % | | | N/A | | | | 1.95 | %(4) |
(1) Return figures reflect any change in price per share and assume the reinvestment of all distributions. Total returns for Class A Shares, with load, include the maximum 2.25% sales charge. Total returns for Class C Shares, with load, include the maximum 1.00% deferred sales charge.
(2) Inception date is August 16, 2012 for Institutional Class Shares, June 28, 2011 for Class A Shares, and August 4, 2015 for Class C Shares.
(3) The Bloomberg Barclays U.S. Aggregate Bond Index measures the performance of the U.S. investment-grade, fixed-rate bond market, including government and credit securities, agency pass-through securities, asset-backed securities and commercial mortgage-backed securities. Performance figures include the change in value of the bonds in the index and the reinvestment of interest. The index return does not reflect expenses, which have been deducted from the Fund’s return. You cannot invest directly in an index; however, an individual can invest in exchange-traded funds or other investments vehicles that attempt to track the performance of a benchmark index.
(4) The return shown for the Bloomberg Barclays U.S. Aggregate Bond Index is from the inception date of the Institutional Class Shares. The Bloomberg Barclays U.S. Aggregate Bond Index return from the inception date of Class A Shares is 2.88% and 1.92% for Class C Shares, respectively.
7
Investment Results – (Unaudited) (continued)
Angel Oak Flexible Income Fund
Total Return Based on a $1,000,000 Investment
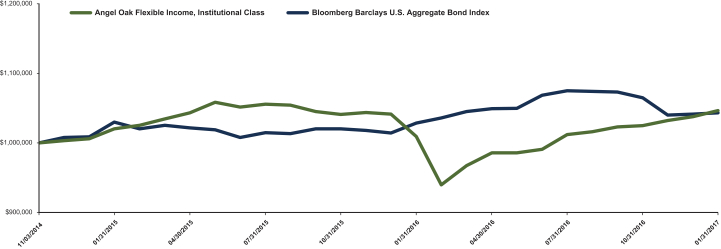
The chart above assumes an initial investment of $1,000,000 made on November 3, 2014 (commencement of operations). Returns shown include the reinvestment of all dividends. Returns shown do not reflect the deduction of taxes that a shareholder would pay on Fund distributions or the redemption of Fund shares. In the absence of fee waivers and reimbursements, when they are necessary to keep expenses at the expense cap, total return would be reduced. Past performance is not predictive of future performance. Investment return and principal value will fluctuate so that your shares, when redeemed, may be worth more or less than the original cost. Index returns do not reflect the effects of fees or expenses. It is not possible to invest directly in an index.
Total Returns(1)
(For the year ended January 31, 2017)
| | | | | | | | |
| | | Average Annual Returns | |
| | | One Year | | | Since Inception(2) | |
Angel Oak Flexible Income Fund, Institutional Class | | | 3.69 | % | | | 2.03 | % |
Angel Oak Flexible Income Fund, Class A without load | | | 3.47 | % | | | 1.80 | % |
Angel Oak Flexible Income Fund, Class A with load | | | 1.14 | % | | | 0.77 | % |
Angel Oak Flexible Income Fund, Class C without load | | | 2.73 | % | | | -1.59 | % |
Angel Oak Flexible Income Fund, Class C with load | | | 1.75 | % | | | -1.59 | % |
Bloomberg Barclays U.S. Aggregate Bond Index(3) | | | 1.45 | % | | | 1.90 | %(4) |
(1) Return figures reflect any change in price per share and assume the reinvestment of all distributions. Total returns for Class A Shares, with load, include the maximum 2.25% sales charge. Total returns for Class C Shares, with load, include the maximum 1.00% deferred sales charge.
(2) Inception date is November 3, 2014 for Institutional Class and Class A Shares and August 4, 2015 for Class C Shares.
(3) The Bloomberg Barclays U.S. Aggregate Bond Index measures the performance of the U.S. investment-grade, fixed-rate bond market, including government and credit securities, agency pass-through securities, asset-backed securities and commercial mortgage-backed securities. Performance figures include the change in value of the bonds in the index and the reinvestment of interest. The index return does not reflect expenses, which have been deducted from the Fund’s return. You cannot invest directly in an index; however, an individual can invest in exchange-traded funds or other investments vehicles that attempt to track the performance of a benchmark index.
(4) The return shown for the Bloomberg Barclays U.S. Aggregate Bond Index is from the inception date of the Institutional Class and Class A Shares. The Bloomberg Barclays U.S. Aggregate Bond Index return from the inception date of the Class C Shares is 1.92%.
8
Investment Results – (Unaudited) (continued)
Angel Oak High Yield Opportunities Fund
Total Return Based on a $1,000,000 Investment

The Fund is the successor to the investment performance of the Rainier High Yield Fund (the “Predecessor High Yield Fund”) as a result of the reorganization of the Predecessor High Yield Fund into the Fund on April 15, 2016. Accordingly, the performance information shown in the chart above and table below for periods prior to April 15, 2016 is that of the Predecessor High Yield Fund’s Institutional Shares and Original Shares for the Fund’s Institutional Class and Class A shares, respectively. The Predecessor High Yield Fund was managed by the same portfolio managers as the Fund and had substantially the same investment objectives, policies, and strategies as the Fund.
The chart above assumes an initial investment of $1,000,000 made on March 31, 2009 (commencement of operations). Returns shown include the reinvestment of all dividends. Returns shown do not reflect the deduction of taxes that a shareholder would pay on Fund distributions or the redemption of Fund shares. In the absence of fee waivers and reimbursements, when they are necessary to keep expenses at the expense cap, total return would be reduced. Past performance is not predictive of future performance. Investment return and principal value will fluctuate so that your shares, when redeemed, may be worth more or less than the original cost. Index returns do not reflect the effects of fees or expenses. It is not possible to invest directly in an index.
Total Returns(1)
(For the period ended January 31, 2017)
| | | | | | | | | | | | | | | | |
| | | Average Annual Returns | |
| | | One Year | | | Three Year | | | Five Year | | | Since Inception(2) | |
Angel Oak High Yield Opportunities Fund, Institutional Class | | | 20.77 | % | | | 5.69 | % | | | 6.93 | % | | | 10.31 | % |
Angel Oak High Yield Opportunities Fund, Class A without load | | | 20.53 | % | | | 5.47 | % | | | N/A | | | | 6.25 | % |
Angel Oak High Yield Opportunities Fund, Class A with load | | | 17.84 | % | | | 4.67 | % | | | N/A | | | | 5.72 | % |
Bank of America Merrill Lynch U.S. High Yield Index(3) | | | 20.98 | % | | | 4.93 | % | | | 7.03 | % | | | 13.00 | %(4) |
(1) Return figures reflect any change in price per share and assume the reinvestment of all distributions. Total returns for Class A Shares, with load, include the maximum 2.25% sales charge.
(2) Institutional Class Shares commenced operations on March 31, 2009 and Class A Shares commenced operations on July 31, 2012.
(3) The Bank of America Merrill Lynch U.S. High Yield Index tracks the performance of below investment grade, but not in default, U.S. dollar denominated corporate bonds publicly issued in the U.S. domestic market, and includes issues with a credit rating of BBB or below, as rated by Moody’s and S&P. The index return does not reflect expenses, which have been deducted from the Fund’s return. You cannot invest directly in an index; however, an individual can invest in exchange-traded funds or other investments vehicles that attempt to track the performance of a benchmark index.
(4) The return shown for the Bank of America Merrill Lynch U.S. High Yield Index is from the inception date of the Institutional Class Shares.The Bank of America Merrill Lynch U.S. High Yield Index return from the inception date of Class A Shares is 6.43%.
9
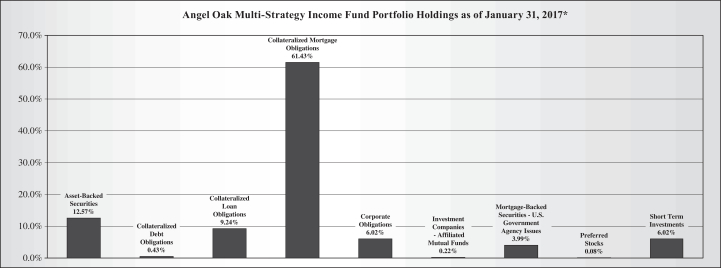
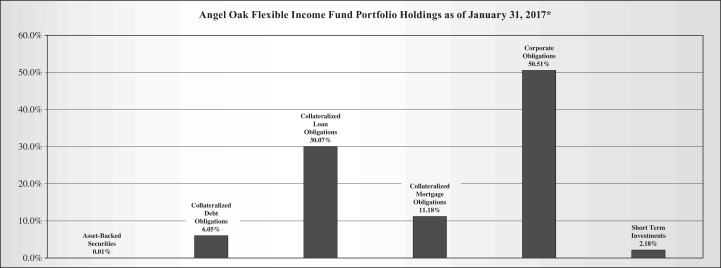
Portfolio Holdings – (Unaudited)
The investment objective of Angel Oak Multi-Strategy Income Fund is current income.
The investment objective of Angel Oak Flexible Income Fund is to seek current income with a secondary objective of total return.
The investment objective of Angel Oak High Yield Opportunities Fund is to earn a high level of current income with a secondary objective of capital appreciation.

* As a percentage of total investments.
10
Summary of Funds’ Expenses – (Unaudited)
As a shareholder of the Funds, you incur two types of costs: (1) transaction costs, including sales charges (loads) on purchase payments; and (2) ongoing costs, including management fees, distribution and/or service (12b-1) fees and other expenses of the Funds. This Example is intended to help you understand your ongoing costs (in dollars) of investing in the Funds and to compare these costs with the ongoing costs of investing in other mutual funds. The Example is based on an investment of $1,000 invested at the beginning of the period, and held for the entire period from August 1, 2016 to January 31, 2017.
Actual Expenses
The first lines of the tables below provide information about actual account values and actual expenses. You may use the information in these lines, together with the amount you invested, to estimate the expenses that you paid over the period. Simply divide your account value by $1,000 (for example, an $8,600 account value divided by $1,000 = $8.60), then multiply the result by the numbers in the first lines under the heading entitled “Expenses Paid During the Period” to estimate the expenses you paid on your account during this period.
Hypothetical Example for Comparison Purposes
The second lines of the tables below provide information about hypothetical account values and hypothetical expenses based on the Funds’ actual expense ratios and an assumed rate of return of 5% per year before expenses, which is not the Funds’ actual return. The hypothetical account values and expenses may not be used to estimate the actual ending account balance or expenses you paid for the period. You may use this information to compare the ongoing costs of investing in the Funds and other funds. To do so, compare this 5% hypothetical example with the 5% hypothetical examples that appear in the shareholder reports of other funds.
Please note that the expenses shown in the table are meant to highlight your ongoing costs only and do not reflect any transactional costs, such as sales charges (loads), redemption fees or exchange fees. Therefore, the second lines of the tables below are useful in comparing ongoing costs only and will not help you determine the relative costs of owning different funds. In addition, if these transactoinal costs were included, your costs would have been higher.
| | | | | | | | | | |
| Angel Oak Multi-Strategy Income Fund | | Beginning
Account Value,
August 1, 2016 | | Ending
Account Value,
January 31, 2017 | | Expenses Paid
During Period(1) | | Annualized
Expense Ratio |
Class A | | Actual | | $1,000.00 | | $1,041.90 | | $6.93 | | 1.35% |
| | | Hypothetical(2) | | $1,000.00 | | $1,018.35 | | $6.85 | | 1.35% |
Class C | | Actual | | $1,000.00 | | $1,038.20 | | $10.76 | | 2.10% |
| | | Hypothetical(2) | | $1,000.00 | | $1,014.58 | | $10.63 | | 2.10% |
Institutional Class | | Actual | | $1,000.00 | | $1,043.70 | | $5.65 | | 1.10% |
| | | Hypothetical(2) | | $1,000.00 | | $1,019.61 | | $5.58 | | 1.10% |
| | | | | | | | | | |
| Angel Oak Flexible Income Fund | | Beginning
Account Value,
August 1, 2016 | | Ending
Account Value,
January 31, 2017 | | Expenses Paid
During Period(1) | | Annualized
Expense Ratio |
Class A | | Actual | | $1,000.00 | | $1,033.30 | | $5.37 | | 1.05% |
| | | Hypothetical(2) | | $1,000.00 | | $1,019.86 | | $5.33 | | 1.05% |
Class C | | Actual | | $1,000.00 | | $1,029.90 | | $9.08 | | 1.78% |
| | | Hypothetical(2) | | $1,000.00 | | $1,016.19 | | $9.02 | | 1.78% |
Institutional Class | | Actual | | $1,000.00 | | $1,034.10 | | $4.09 | | 0.80% |
| | | Hypothetical(2) | | $1,000.00 | | $1,021.11 | | $4.06 | | 0.80% |
(1) Expenses are equal to the Funds’ annualized expense ratios, multiplied by the average account value over the period, multiplied by 184/366 (to reflect the one-half year period). The annualized expense ratios reflects fee waiver and expense limitation arrangements, including interest expense, in effect during the period. The “Financial Highlights” tables in the Funds’ financial statements, included in the report, also show the gross expense ratios, without such reimbursements.
(2) Hypothetical assumes 5% annual return before expenses.
11
| | | | | | | | | | |
| Angel Oak High Yield Opportunities Fund | | Beginning
Account Value,
August 1, 2016 | | Ending
Account Value,
January 31, 2017 | | Expenses Paid
During Period(1) | | Annualized
Expense Ratio |
Class A | | Actual | | $1,000.00 | | $1,072.60 | | $4.70 | | 0.90% |
| | | Hypothetical(2) | | $1,000.00 | | $1,020.67 | | $4.58 | | 0.90% |
Institutional Class | | Actual | | $1,000.00 | | $1,074.00 | | $3.40 | | 0.65% |
| | | Hypothetical(2) | | $1,000.00 | | $1,021.93 | | $3.31 | | 0.65% |
(1) Expenses are equal to the Funds’ annualized expense ratios, multiplied by the average account value over the period, multiplied by 184/365 (to reflect the one-half year period). The annualized expense ratios reflects fee waiver and expense limitation arrangements, including interest expense, in effect during the period. The “Financial Highlights” tables in the Funds’ financial statements, included in the report, also show the gross expense ratios, without such reimbursements.
(2) Hypothetical assumes 5% annual return before expenses.
12
Angel Oak Multi-Strategy Income Fund
Schedule of Investments
January 31, 2017
| | | | | | | | |
| | | Principal
Amount | | | Value | |
Asset-Backed Securities – 13.19% | | | | | | | | |
ACE Securities Corp. Home Equity Loan Trust, Series 2006-HE2, Class A2C,
0.931%, 5/25/2036 (a) | | $ | 2,099,909 | | | $ | 2,055,983 | |
Ally Auto Receivables Trust, Series 2017-1, Class A1, 0.830%, 2/15/2018 | | | 5,000,000 | | | | 5,006,250 | |
Ally Auto Receivables Trust, Series 2014-SN2, Class A4, 1.210%, 2/20/2019 | | | 2,732,198 | | | | 2,739,230 | |
Ally Auto Receivables Trust, Series 2014-3, Class A3, 1.280%, 6/17/2019 | | | 1,400,617 | | | | 1,402,404 | |
Ally Auto Receivables Trust, Series 2017-1, Class A3, 1.700%, 6/15/2021 | | | 5,000,000 | | | | 5,006,250 | |
American Express Credit Account Master Trust, Series 2015-1, Class A, 1.058%, 1/15/2020 (a) | | | 9,500,000 | | | | 9,515,704 | |
American Express Credit Account Master Trust, Series 2008-2, Class A, 1.798%, 9/15/2020 (a) | | | 6,550,000 | | | | 6,630,585 | |
AmeriCredit Automobile Receivables Trust, Series 2013-2, Class D, 2.420%, 5/8/2019 | | | 10,000,000 | | | | 10,056,410 | |
AMSR Trust, Series 2016-SFR1, Class A, 2.168%, 11/17/2033 (a)(b) | | | 7,000,000 | | | | 7,074,543 | |
Barclays Dryrock Issuance Trust, Series 2014-2, Class A, 1.108%, 3/16/2020 (a) | | | 10,826,000 | | | | 10,856,107 | |
Bear Stearns Asset Backed Securities Trust, Series 2007-SD3, Class A, 1.021%, 5/25/2037 (a) | | | 80,570 | | | | 70,877 | |
BMW Vehicle Lease Trust, Series 2015-1, Class A4, 1.340%, 6/20/2018 | | | 500,000 | | | | 500,768 | |
BMW Vehicle Lease Trust, Series 2015-2, Class A4, 1.550%, 2/20/2019 | | | 11,340,000 | | | | 11,351,683 | |
BMW Vehicle Lease Trust, Series 2016-2, Class A3, 1.430%, 9/20/2019 | | | 10,000,000 | | | | 9,996,310 | |
Business Loan Express Business Loan Trust, Series 2007-AA, Class A, 1.177%, 10/20/2040 (a)(b) | | | 7,513,700 | | | | 6,085,563 | |
Cajun Global LLC, Series 2011-1A, Class A2, 5.955%, 2/20/2041 (b) | | | 6,168,409 | | | | 6,174,466 | |
Capital One Multi-Asset Execution Trust, Series 2015-A1, Class A1, 1.390%, 1/15/2021 | | | 5,000,000 | | | | 5,002,900 | |
CarMax Auto Owner Trust, Series 2017-1, Class A1, 0.950%, 2/15/2018 (a) | | | 9,000,000 | | | | 8,998,335 | |
CarMax Auto Owner Trust, Series 2015-3, Class A2B, 1.154%, 11/15/2018 (a) | | | 939,823 | | | | 941,623 | |
CarMax Auto Owner Trust, Series 2016-1, Class A2B, 1.234%, 4/15/2019 (a) | | | 9,540,090 | | | | 9,566,821 | |
CarMax Auto Owner Trust, Series 2015-1, Class A3, 1.380%, 11/15/2019 | | | 3,797,023 | | | | 3,797,073 | |
CarMax Auto Owner Trust, Series 2017-1, Class A3, 1.980%, 11/15/2021 | | | 10,000,000 | | | | 9,974,070 | |
Carrington Mortgage Loan Trust, Series 2006-NC5, Class A5, 0.831%, 1/25/2037 (a) | | | 4,773,100 | | | | 3,941,602 | |
Carrington Mortgage Loan Trust, Series 2006-NC5, Class A2, 0.866%, 1/25/2037 (a) | | | 3,307,349 | | | | 2,794,372 | |
Chase Issuance Trust, Series 2015-A2, Class A2, 1.590%, 2/18/2020 | | | 8,673,000 | | | | 8,701,352 | |
Chase Issuance Trust, Series 2015-A7, Class A7, 1.620%, 7/15/2020 | | | 10,000,000 | | | | 10,026,870 | |
Chase Issuance Trust, Series 2017-A1, Class A, 1.080%, 1/18/2022 (a) | | | 17,500,000 | | | | 17,505,145 | |
Citibank Credit Card Issuance Trust, Series 2016-A3, Class A3, 1.170%, 12/7/2023 (a) | | | 10,000,000 | | | | 10,060,260 | |
Colony American Homes, Series 2015-1A, Class A, 1.968%, 7/17/2032 (a)(b) | | | 4,973,060 | | | | 4,990,366 | |
Credit-Based Asset Servicing and Securitization LLC, Series 2006-CB4, Class AV3, 0.906%, 5/25/2036 (a) | | | 19,934,909 | | | | 15,624,942 | |
Credit-Based Asset Servicing and Securitization LLC, Series 2007-CB1, Class AF1B, 3.871%, 1/25/2037 (a) | | | 7,587,276 | | | | 4,002,372 | |
Credit-Based Asset Servicing and Securitization LLC, Series 2007-CB1, Class AF4, 3.871%, 1/25/2037 (a) | | | 2,001,794 | | | | 1,052,203 | |
Credit-Based Asset Servicing and Securitization LLC, Series 2007-CB1, Class AF3, 3.871%, 1/25/2037 (a) | | | 10,008,969 | | | | 5,281,242 | |
Credit-Based Asset Servicing and Securitization LLC, Series 2007-CB1, Class AF2, 3.871%, 1/25/2037 (a) | | | 14,737,206 | | | | 7,775,512 | |
Credit-Based Asset Servicing and Securitization LLC, Series 2007-CB1, Class AF6, 3.871%, 1/25/2037 (a) | | | 12,015,632 | | | | 6,327,011 | |
Dell Equipment Finance Trust, Series 2015-1, Class A3, 1.300%, 3/23/2020 (b) | | | 7,970,758 | | | | 7,971,855 | |
Discover Card Execution Note Trust, Series 2016-A1, Class A1, 1.640%, 7/15/2021 | | | 3,650,000 | | | | 3,654,263 | |
Discover Card Execution Note Trust, Series 2017-A1, Class A1, 1.252%, 7/15/2024 (a) | | | 5,750,000 | | | | 5,785,972 | |
Drive Auto Receivables Trust, Series 2017-AA, Class A1, 0.970%, 2/15/2018 (b) | | | 8,000,000 | | | | 8,020,000 | |
Drive Auto Receivables Trust, Series 2016-CA, Class A2, 1.410%, 1/15/2019 (b) | | | 5,500,000 | | | | 5,508,657 | |
Drive Auto Receivables Trust, Series 2016-CA, Class A3, 1.670%, 11/15/2019 (b) | | | 4,000,000 | | | | 3,994,112 | |
Enterprise Fleet Financing LLC, Series 2017-1, Class A2, 2.130%, 7/20/2022 (b) | | | 1,500,000 | | | | 1,504,023 | |
See accompanying notes which are an integral part of these financial statements.
13
Angel Oak Multi-Strategy Income Fund
Schedule of Investments – (continued)
January 31, 2017
| | | | | | | | |
| | | Principal
Amount | | | Value | |
Asset-Backed Securities – (continued) | | | | | | | | |
Exeter Automobile Receivables Trust, Series 2015-2A, Class A, 1.540%, 11/15/2019 (b) | | $ | 3,091,640 | | | $ | 3,099,307 | |
Fieldstone Mortgage Investment Trust, Series 2007-1, Class 2A3, 1.096%, 4/25/2047 (a) | | | 13,591,183 | | | | 9,990,933 | |
Fifth Third Auto Trust, Series 2015-1, Class A3, 1.420%, 3/16/2020 | | | 6,982,000 | | | | 7,000,055 | |
Flagship Credit Auto Trust, Series 2017-1, Class A, 1.930%, 12/15/2021 (b) | | | 5,000,000 | | | | 5,014,855 | |
Ford Credit Auto Lease Trust, Series 2015-A, Class A3, 1.130%, 6/15/2018 | | | 6,401,030 | | | | 6,408,493 | |
Ford Credit Auto Owner Trust, Series 2017-A, Class A1, 0.840%, 2/15/2018 | | | 9,000,000 | | | | 9,005,724 | |
Ford Credit Auto Owner Trust, Series 2017-A, Class A4, 1.920%, 4/15/2022 | | | 5,000,000 | | | | 5,007,815 | |
GM Financial Automobile Leasing Trust, Series 2015-3, Class A4, 1.810%, 11/20/2019 | | | 5,210,000 | | | | 5,235,831 | |
GSAA Home Equity Trust, Series 2005-14, Class 2A2, 1.006%, 12/25/2035 (a) | | | 1,290,530 | | | | 991,069 | |
GSAA Home Equity Trust, Series 2005-14, Class 2A3, 1.106%, 12/25/2035 (a) | | | 553,490 | | | | 499,295 | |
GSAA Home Equity Trust, Series 2006-1, Class A1, 0.846%, 1/25/2036 (a) | | | 1,681,924 | | | | 984,069 | |
GSAA Home Equity Trust, Series 2005-15, Class 2A2, 1.021%, 1/25/2036 (a) | | | 4,198,805 | | | | 2,820,023 | |
GSAA Home Equity Trust, Series 2006-10, Class AF2, 5.825%, 6/25/2036 (a) | | | 3,609,630 | | | | 1,982,405 | |
GSAA Home Equity Trust, Series 2007-1, Class 1A2, 0.941%, 2/25/2037 (a) | | | 3,065,150 | | | | 1,681,063 | |
GSAA Home Equity Trust, Series 2007-2, Class AF4A, 5.983%, 3/25/2037 (a) | | | 2,979,236 | | | | 1,541,671 | |
GSAA Home Equity Trust, Series 2006-20, Class 1A2, 0.951%, 12/25/2046 (a) | | | 18,080,971 | | | | 9,984,077 | |
GSAA Home Equity Trust, Series 2007-5, Class 1F4A, 6.032%, 3/25/2047 (a) | | | 7,631,263 | | | | 5,104,354 | |
HOA Funding LLC, Series 2014-1A, Class A2, 4.846%, 8/20/2044 (b) | | | 9,550,000 | | | | 8,722,111 | |
HOA Funding LLC, Series 2015-1A, Class B, 9.000%, 8/20/2044 (b) | | | 1,000,000 | | | | 962,980 | |
Huntington Auto Trust, Series 2016-1, Class A1, 0.850%, 12/15/2017 | | | 10,292,932 | | | | 10,313,610 | |
Huntington Auto Trust, Series 2016-1, Class A2, 1.290%, 5/15/2019 | | | 5,500,000 | | | | 5,504,010 | |
Hyundai Auto Lease Securitization Trust, Series 2017-A, Class A1, 0.820%, 1/16/2018 (b) | | | 4,500,000 | | | | 4,505,625 | |
Hyundai Auto Lease Securitization Trust, Series 2017-A, Class A2A, 1.560%, 7/15/2019 (b) | | | 5,000,000 | | | | 5,006,380 | |
Hyundai Auto Lease Securitization Trust, Series 2016-C, Class A3, 1.490%, 2/18/2020 (b) | | | 5,000,000 | | | | 4,992,390 | |
Hyundai Auto Lease Securitization Trust, Series 2017-A, Class A4, 2.130%, 4/15/2021 (b) | �� | | 8,000,000 | | | | 8,024,360 | |
Hyundai Auto Receivables Trust, Series 2015-B, Class A3, 1.120%, 11/15/2019 | | | 3,972,661 | | | | 3,968,410 | |
JGWPT XXVII LLC, Series 2012-3A, Class B, 6.170%, 9/15/2067 (b) | | | 986,788 | | | | 1,153,650 | |
JGWPT XXXII LLC, Series 2014-2A, Class A, 3.610%, 1/17/2073 (b) | | | 5,306,895 | | | | 5,175,948 | |
JGWPT XXXIII LLC, Series 2014-3A, Class A, 3.500%, 6/15/2077 (b) | | | 8,938,773 | | | | 8,641,281 | |
Lehman XS Trust, Series 2007-9, Class WFIO, 0.550%, 4/25/2037 (a)(c) | | | 48,604,339 | | | | 840,952 | |
MASTR Asset Backed Securities Trust, Series 2005-NC2, Class A3, 1.256%, 11/25/2035 (a) | | | 24,683,823 | | | | 16,916,120 | |
Mercedes-Benz Auto Receivables Trust, Series 2014-1, Class A4, 1.310%, 11/16/2020 | | | 3,560,000 | | | | 3,568,355 | |
Morgan Stanley Mortgage Loan Trust, Series 2007-1XS, Class 2A2, 5.826%, 9/25/2046 (a) | | | 16,437,282 | | | | 9,415,242 | |
Morgan Stanley Mortgage Loan Trust, Series 2007-1XS, Class 2A6, 5.858%, 9/25/2046 (a) | | | 6,339,671 | | | | 3,693,721 | |
Morgan Stanley Mortgage Loan Trust, Series 2007-1XS, Class 2A3, 5.919%, 9/25/2046 (a) | | | 15,768,489 | | | | 8,672,858 | |
Morgan Stanley Mortgage Loan Trust, Series 2007-3XS, Class 2A3S, 5.858%, 1/25/2047 (a) | | | 2,380,529 | | | | 1,487,071 | |
Morgan Stanley Mortgage Loan Trust, Series 2007-3XS, Class 2A4S, 5.963%, 1/25/2047 (a) | | | 9,603,239 | | | | 7,018,479 | |
Morgan Stanley Mortgage Loan Trust, Series 2007-10XS, Class A2, 6.250%, 7/25/2047 (a) | | | 2,281,575 | | | | 1,661,856 | |
Nissan Auto Lease Trust, Series 2016-A, Class A4, 1.650%, 10/15/2021 | | | 9,750,000 | | | | 9,768,535 | |
Nissan Auto Receivables Owner Trust, Series 2013-C, Class A3, 0.670%, 8/15/2018 | | | 107,590 | | | | 107,623 | |
Option One Mortgage Loan Trust, Series 2007-3, Class 2A3, 0.996%, 4/25/2037 (a) | | | 3,826,161 | | | | 2,417,965 | |
Ownit Mortgage Loan Trust, Series 2006-1, Class AF2, 3.563%, 10/25/2035 (a) | | | 12,222,569 | | | | 7,907,147 | |
Pretium Mortgage Credit Partners LLC, Series 2016-NPL3, Class A1, 4.375%, 5/27/2031 (b) | | | 7,013,940 | | | | 7,065,983 | |
Progress Residential Trust, Series 2016-SFR1, Class A, 2.268%, 9/17/2033 (a)(b) | | | 5,926,077 | | | | 5,987,548 | |
Residential Asset Mortgage Products, Inc. Trust, Series 2007-RS2, Class A2,
1.036%, 5/25/2037 (a) | | | 6,552,625 | | | | 6,208,291 | |
SolarCity LMC II LLC, Series 2014-1, Class A, 4.590%, 4/20/2044 (b) | | | 1,939,080 | | | | 1,934,453 | |
Soundview Home Loan Trust, Series 2007-OPT1, Class X, 0.049%, 6/25/2037 (a)(c) | | | 563,841,424 | | | | 1,800,910 | |
Stone Street Receivables Funding, LLC, Series 2015-1A, Class C, 5.600%, 12/15/2054 (b) | | | 1,227,000 | | | | 1,110,786 | |
See accompanying notes which are an integral part of these financial statements.
14
Angel Oak Multi-Strategy Income Fund
Schedule of Investments – (continued)
January 31, 2017
| | | | | | | | |
| | | Principal
Amount | | | Value | |
Asset-Backed Securities – (continued) | | | | | | | | |
STORE Master Funding, LLC, Series 2012-1A, Class A, 5.770%, 8/20/2042 (b) | | $ | 6,120,998 | | | $ | 6,449,702 | |
Toyota Auto Receivables Owner Trust, Series 2014-A, Class A4, 1.180%, 6/17/2019 | | | 1,200,000 | | | | 1,202,580 | |
VOLT L LLC, Series 2016-NPL10, Class A1, 3.500%, 9/25/2046 (b) | | | 10,389,513 | | | | 10,464,266 | |
VOLT LII LLC, Series 2016-NPL12, Class A1, 3.625%, 11/26/2046 (b) | | | 9,767,534 | | | | 9,790,791 | |
VOLT LIII LLC, Series 2016-NP13, Class A1, 3.875%, 12/26/2046 (a)(b) | | | 9,931,857 | | | | 10,033,331 | |
VOLT XLIV LLC, Series 2016-NPL4, Class A1, 4.250%, 4/25/2046 (b) | | | 4,013,108 | | | | 4,072,916 | |
VOLT XLV LLC, Series 2016-NPL5, Class A1, 4.000%, 5/25/2046 (b) | | | 2,500,634 | | | | 2,529,083 | |
VOLT XLVII LLC, Series 2016-NPL7, Class A1, 3.750%, 6/25/2046 (a)(b) | | | 8,256,413 | | | | 8,319,682 | |
VOLT XLVIII LLC, Series 2016-NPL8, Class A1, 3.500%, 7/25/2046 (a)(b) | | | 13,058,298 | | | | 13,143,229 | |
VOLT XXII LLC, Series 2015-NPL4, Class A1, 3.500%, 2/25/2055 (b) | | | 192,127 | | | | 192,487 | |
VOLT XXV LLC, Series 2015-NPL8, Class A1, 3.500%, 6/26/2045 (a)(b) | | | 7,473,325 | | | | 7,487,322 | |
VOLT XXXI LLC, Series 2015-NPL2, Class A1, 3.375%, 2/25/2055 (b) | | | 323,003 | | | | 323,772 | |
VOLT XXXIII LLC, Series 2015-NPL5, Class A1, 3.500%, 3/25/2055 (a)(b) | | | 955,774 | | | | 957,571 | |
VOLT XXXIV LLC, Series 2015-NPL7, Class A1, 3.250%, 2/25/2055 (a)(b) | | | 2,147,222 | | | | 2,149,861 | |
VOLT XXXIX LLC, Series 2015-NPL13, Class A1, 4.125%, 10/25/2045 (b) | | | 784,729 | | | | 789,860 | |
VOLT XXXV LLC, Series 2016-NPL9, Class A1, 3.500%, 9/25/2046 (b) | | | 9,504,814 | | | | 9,485,675 | |
| | | | | | | | |
| | |
TOTAL ASSET-BACKED SECURITIES –
(Cost $611,653,504) | | | | | | | 595,623,903 | |
| | | | | | | | |
Collateralized Debt Obligations – 0.45% | | | | | | | | |
Financial Institution Note Securitization Ltd., Series 2015-1A, Class A, 5.000%, 7/30/2026 (b)(j) | | | 3,000,000 | | | | 3,000,000 | |
Financial Institution Note Securitization Ltd., Series 2015-1A, Class C, 7.000%, 7/30/2026 (b)(j) | | | 6,275,000 | | | | 6,306,375 | |
Financial Institution Note Securitization Ltd., Series 2015-1, 11.660%, 7/30/2026
(Acquired 10/20/2015, Cost $11,231,000) (a)(b)(d)(j) | | | 11,231,000 | | | | 11,174,845 | |
| | | | | | | | |
| | |
TOTAL COLLATERALIZED DEBT OBLIGATIONS –
(Cost $20,506,000) | | | | | | | 20,481,220 | |
| | | | | | | | |
Collateralized Loan Obligations – 9.70% | | | | | | | | |
ACAS CLO Ltd., Series 2012-1A, Class DR, 5.247%, 9/20/2023 (a)(b) | | | 3,000,000 | | | | 3,003,132 | |
ALM XVI Ltd., Series 2015-16A, Class D, 6.373%, 7/15/2027 (a)(b) | | | 1,250,000 | | | | 1,237,560 | |
Apidos CLO X, Series 2012-10A, Class E, 7.289%, 10/30/2022 (a)(b) | | | 4,000,000 | | | | 4,000,228 | |
Apidos CLO XI, Series 2012-11A, Class DR, 4.934%, 10/17/2028 (a)(b) | | | 3,950,000 | | | | 3,887,124 | |
Apidos CLO XIV, Series 2013-14A, Class E, 5.423%, 4/15/2025 (a)(b) | | | 3,000,000 | | | | 2,869,449 | |
Ares XLI CLO Ltd., Series 2016-41A, Class D, 5.089%, 1/15/2029 (a)(b) | | | 3,000,000 | | | | 2,999,808 | |
Ares XXVII CLO Ltd., Series 2013-2A, Class E, 5.889%, 7/28/2025 (a)(b) | | | 5,500,000 | | | | 5,388,834 | |
Ares XXXIII CLO Ltd., Series 2015-1A, Class CR, 5.163%, 12/5/2025 (a)(b) | | | 8,000,000 | | | | 8,094,608 | |
Arrowpoint CLO Ltd., Series 2014-3A, Class D, 6.123%, 10/15/2026 (a)(b)(e) | | | 11,000,000 | | | | 11,028,809 | |
BlueMountain CLO Ltd., Series 2012-2A, Class DR, 5.034%, 11/20/2028 (a)(b) | | | 10,000,000 | | | | 10,200,000 | |
Bristol Park CLO Ltd., Series 2016-1A, Class D, 4.984%, 4/15/2029 (a)(b) | | | 8,000,000 | | | | 7,999,376 | |
Carlyle Global Market Strategies CLO Ltd., Series 2013-2A, Class E, 6.024%, 4/18/2025 (a)(b) | | | 4,750,000 | | | | 4,757,310 | |
Carlyle Global Market Strategies CLO Ltd., Series 2016-3A, Class D, 7.788%,
10/20/2029 (a)(b) | | | 500,000 | | | | 500,000 | |
Catamaran CLO Ltd., Series 2012-1A, Class D, 5.357%, 12/20/2023 (a)(b) | | | 13,750,000 | | | | 13,767,820 | |
Cathedral Lake CLO Ltd., Series 2015-3A, Class D, 6.382%, 1/15/2026 (a)(b) | | | 5,000,000 | | | | 5,018,185 | |
CIFC Funding Ltd., Series 2012-2A, Class B3L, 7.942%, 12/5/2024 (a)(b) | | | 2,000,000 | | | | 1,911,330 | |
CIFC Funding Ltd., Series 2012-3A, Class B2L, 6.887%, 1/29/2025 (a)(b)(e) | | | 9,750,000 | | | | 9,759,028 | |
CIFC Funding Ltd., Series 2012-3A, Class B3L, 7.787%, 1/29/2025 (a)(b) | | | 1,000,000 | | | | 952,284 | |
Crown Point CLO Ltd., Series 2012-1A, Class B1L, 5.911%, 11/21/2022 (a)(b)(e) | | | 5,000,000 | | | | 5,003,275 | |
Crown Point CLO Ltd., Series 2012-1A, Class B2L, 7.411%, 11/21/2022
(Acquired 01/28/2014 through 12/17/2015, Cost $5,194,369) (a)(b)(d) | | | 5,250,000 | | | | 5,259,072 | |
See accompanying notes which are an integral part of these financial statements.
15
Angel Oak Multi-Strategy Income Fund
Schedule of Investments – (continued)
January 31, 2017
| | | | | | | | |
| | | Principal
Amount | | | Value | |
Collateralized Loan Obligations – (continued) | | | | | | | | |
Doral CLO I Ltd., Series 2012-3A, Class C, 5.493%, 12/19/2022 (a)(b)(e) | | $ | 13,000,000 | | | $ | 13,016,835 | |
Dryden XXXVI Senior Loan Fund, Series 2014-36A, Class DR, 5.287%, 1/15/2028 (a)(b) | | | 3,000,000 | | | | 3,028,893 | |
Fortress Credit BSL II Ltd., Series 2013-2A, Class D, 4.875%, 10/19/2025 (a)(b) | | | 7,750,000 | | | | 7,830,274 | |
Fortress Credit Opportunities VII CLO Ltd., Series 2016-7A, Class D, 6.564%, 12/15/2028 (a)(b) | | | 4,000,000 | | | | 4,048,792 | |
Highbridge Loan Management Ltd., Series 2012-1A, Class DR, 6.747%, 9/20/2022 (a)(b) | | | 4,500,000 | | | | 4,503,708 | |
JFIN CLO Ltd., Series 2015-2A, Class D, 5.423%, 10/19/2026 (a)(b) | | | 10,000,000 | | | | 10,038,110 | |
JFIN CLO Ltd., Series 2015-2A, Class E, 7.880%, 10/19/2026
(Acquired 01/05/2017, Cost $1,468,493) (a)(b)(d) | | | 1,500,000 | | | | 1,462,453 | |
JFIN Revolver CLO Ltd., Series 2013-1A, Class D, 4.780%, 1/20/2021 (a)(b) | | | 11,010,000 | | | | 11,078,691 | |
JFIN Revolver CLO Ltd., Series 2014-2A, Class C, 3.661%, 2/20/2022 (a)(b) | | | 4,000,000 | | | | 4,009,620 | |
JFIN Revolver CLO Ltd., Series 2014-2A, Class D, 3.661%, 2/20/2022 (a)(b) | | | 5,000,000 | | | | 4,899,735 | |
JFIN Revolver CLO Ltd., Series 2015-3A, Class C, 3.270%, 4/20/2023 (a)(b)(e) | | | 14,000,000 | | | | 13,889,722 | |
JFIN Revolver CLO Ltd., Series 2015-3A, Class D, 4.330%, 4/20/2023 (a)(b)(e) | | | 11,000,000 | | | | 10,985,876 | |
JMP Credit Advisors CLO II Ltd., Series 2013-1A, Class D, 4.873%, 4/30/2023 (a)(b) | | | 4,000,000 | | | | 3,999,916 | |
JMP Credit Advisors CLO III Ltd., Series 2014-1A, Class D, 6.123%, 10/17/2025 (a)(b) | | | 18,600,000 | | | | 18,879,930 | |
JMP Credit Advisors CLO III Ltd., Series 2014-1A, Class E, 8.373%, 10/17/2025
(Acquired 09/02/2014, Cost $7,610,791) (a)(b)(d) | | | 7,650,000 | | | | 7,668,000 | |
KCAP Senior Funding I LLC, Series 2013-1A, Class D, 6.280%, 7/20/2024 (a)(b) | | | 4,500,000 | | | | 4,483,566 | |
LCM XIII LP, Series 13A, Class DR, 4.928%, 7/19/2027 (a)(b) | | | 3,500,000 | | | | 3,499,926 | |
LCM XIV LP, Series 14A, Class D, 4.523%, 7/15/2025 (a)(b) | | | 3,325,000 | | | | 3,326,636 | |
Madison Park Funding Ltd., Series 2012-9A, Class E, 6.156%, 8/15/2022 (a)(b) | | | 2,000,000 | | | | 2,000,386 | |
Madison Park Funding XV Ltd., Series 2014-15A, Class D, 6.487%, 1/27/2026 (a)(b) | | | 5,000,000 | | | | 4,986,565 | |
Monroe Capital BSL CLO Ltd., Series 2015-1A, Class D, 4.866%, 5/22/2027 (a)(b) | | | 3,500,000 | | | | 3,421,870 | |
Muir Woods CLO Ltd., Series 2012-1A, Class D, 5.959%, 9/14/2023 (a)(b) | | | 3,500,000 | | | | 3,505,856 | |
NewStar Clarendon Fund CLO LLC, Series 2014-1A, Class D, 5.388%, 1/25/2027 (a)(b) | | | 7,465,000 | | | | 7,082,113 | |
OFSI Fund VII Ltd., Series 2014-7A, Class D, 6.024%, 10/18/2026 (a)(b)(e) | | | 10,600,000 | | | | 10,621,582 | |
OFSI Fund VII Ltd., Series 2014-7A, Class E, 8.274%, 10/18/2026
(Acquired 08/05/2014, Cost $7,000,000) (a)(b)(d) | | | 7,000,000 | | | | 7,002,975 | |
OZLM Funding II Ltd., Series 2012-2A, Class DR, 8.187%, 10/30/2027 (a)(b) | | | 4,300,000 | | | | 4,335,613 | |
OZLM VII Ltd., Series 2014-7A, Class D, 6.023%, 7/17/2026 (a)(b) | | | 3,000,000 | | | | 2,858,265 | |
Saranac CLO I Ltd., Series 2013-1A, Class D, 4.582%, 10/26/2024 (a)(b) | | | 4,000,000 | | | | 3,876,664 | |
Saratoga Investment Corp. Ltd., Series 2013-1A, Class BR, 3.417%, 10/20/2025 (a)(b) | | | 19,284,000 | | | | 19,511,378 | |
Saratoga Investment Corp. Ltd., Series 2013-1A, Class DR, 5.583%, 10/20/2025 (a)(b) | | | 14,000,000 | | | | 14,085,036 | |
Saratoga Investment Corp. Ltd., Series 2013-1A, Class ER, 7.533%, 10/20/2025
(Acquired 11/07/2016, Cost $13,100,000) (a)(b)(d) | | | 13,100,000 | | | | 13,099,411 | |
Sound Harbor Loan Fund Ltd., Series 2014-1A, Class C, 5.799%, 10/30/2026 (a)(b)(e) | | | 28,400,000 | | | | 28,461,514 | |
Sound Point CLO II Ltd., Series 2013-1A, Class B2L, 5.532%, 4/26/2025 (a)(b) | | | 5,000,000 | | | | 4,730,280 | |
Steele Creek CLO Ltd., Series 2014-1A, Class E2R, 7.687%, 8/21/2026
(Acquired 01/30/2017, Cost $6,250,000) (a)(b)(d) | | | 6,250,000 | | | | 6,250,000 | |
Steele Creek CLO Ltd., Series 2014-1A, Class E2, 7.861%, 8/21/2026
(Acquired 07/18/2014, Cost $1,985,855) (a)(b)(d) | | | 2,000,000 | | | | 2,000,776 | |
Steele Creek CLO Ltd., Series 2014-1X, Class E2, 7.861%, 8/21/2026
(Acquired 02/05/2015, Cost $490,420) (a)(d)(f) | | | 500,000 | | | | 500,194 | |
Symphony CLO VIII Ltd., Series 2012-8A, Class DR, 5.060%, 1/9/2023 (a)(b) | | | 1,950,000 | | | | 1,952,720 | |
Symphony CLO XII Ltd., Series 2013-12A, Class E, 5.923%, 10/15/2025 (a)(b) | | | 2,000,000 | | | | 1,970,982 | |
Symphony CLO XVIII Ltd., Series 2016-18A, Class D, 4.906%, 1/23/2028 (a)(b) | | | 5,000,000 | | | | 4,999,120 | |
Symphony CLO XVIII Ltd., Series 2016-18A, Class E, 7.296%, 1/23/2028 (a)(b) | | | 5,000,000 | | | | 4,854,845 | |
TCP Waterman CLO LLC, Series 2016-1A, Class B, 4.366%, 12/15/2028 (a)(b) | | | 3,000,000 | | | | 2,947,878 | |
TICC CLO LLC, Series 2012-1A, Class D1, 6.575%, 8/25/2023 (a)(b) | | | 8,000,000 | | | | 8,120,792 | |
See accompanying notes which are an integral part of these financial statements.
16
Angel Oak Multi-Strategy Income Fund
Schedule of Investments – (continued)
January 31, 2017
| | | | | | | | |
| | | Principal
Amount | | | Value | |
Collateralized Loan Obligations – (continued) | | | | | | | | |
Tralee CLO III Ltd., Series 2014-3A, Class D2R, 5.113%, 7/20/2026 (a)(b) | | $ | 6,000,000 | | | $ | 6,006,840 | |
Tralee CLO III Ltd., Series 2014-3A, Class E, 8.030%, 7/20/2026
(Acquired 12/30/2014 through 09/09/2015, Cost $5,477,867) (a)(b)(d)(e) | | | 5,540,000 | | | | 5,550,266 | |
Trinitas CLO III Ltd., Series 2015-3A, Class D1, 5.173%, 7/15/2027 (a)(b)(e) | | | 10,250,000 | | | | 10,080,506 | |
Trinitas CLO IV Ltd., Series 2016-4A, Class E, 9.654%, 4/18/2028
(Acquired 10/27/2016 through 12/15/2016, Cost $4,479,313) (a)(d)(b) | | | 4,500,000 | | | | 4,567,046 | |
Venture XI CLO Ltd., Series 2012-11A, Class CR, 3.852%, 11/14/2022 (a)(b) | | | 2,000,000 | | | | 2,020,218 | |
Venture XXIII CLO Ltd., Series 2016-23A, Class E, 8.725%, 7/19/2028 (a)(b) | | | 3,250,000 | | | | 3,278,912 | |
Voya CLO Ltd., Series 2012-3A, Class ER, 6.880%, 10/15/2022 (a)(b) | | | 5,000,000 | | | | 5,005,375 | |
| | | | | | | | |
| | |
TOTAL COLLATERALIZED LOAN OBLIGATIONS –
(Cost $430,233,562) | | | | | | | 437,973,893 | |
| | | | | | | | |
Collateralized Mortgage Obligations – 64.44% | | | | | | | | |
Adjustable Rate Mortgage Trust, Series 2005-3, Class 7A1, 2.936%, 7/25/2035 (a) | | | 1,233,671 | | | | 1,165,150 | |
Adjustable Rate Mortgage Trust, Series 2005-8, Class 3A1, 3.160%, 11/25/2035 (a) | | | 11,461,769 | | | | 10,080,466 | |
Adjustable Rate Mortgage Trust, Series 2005-8, Class 3A21, 3.160%, 11/25/2035 (a) | | | 7,949,913 | | | | 6,862,635 | |
Adjustable Rate Mortgage Trust, Series 2005-10, Class 3A12, 3.124%, 1/25/2036 (a) | | | 1,464 | | | | 26 | |
Adjustable Rate Mortgage Trust, Series 2005-12, Class 2A1, 3.400%, 3/25/2036 (a) | | | 783,707 | | | | 618,841 | |
Adjustable Rate Mortgage Trust, Series 2006-1, Class 2A1, 4.225%, 3/25/2036 (a) | | | 566,606 | | | | 439,134 | |
Adjustable Rate Mortgage Trust, Series 2006-3, Class 4A2, 0.891%, 8/25/2036 (a) | | | 22,304,490 | | | | 14,026,468 | |
Adjustable Rate Mortgage Trust, Series 2006-3, Class 4A11, 0.951%, 8/25/2036 (a) | | | 727,123 | | | | 516,107 | |
Adjustable Rate Mortgage Trust, Series 2007-1, Class 5A1, 0.906%, 3/25/2037 (a) | | | 1,967,655 | | | | 1,607,578 | |
Adjustable Rate Mortgage Trust, Series 2007-1, Class 5A22, 0.986%, 3/25/2037 (a) | | | 5,701,776 | | | | 3,863,118 | |
Adjustable Rate Mortgage Trust, Series 2007-1, Class 3A22, 3.589%, 3/25/2037 (a) | | | 1,224,116 | | | | 1,045,092 | |
Adjustable Rate Mortgage Trust, Series 2007-2, Class 1A21, 4.890%, 6/25/2037 (a) | | | 5,576,071 | | | | 5,008,600 | |
American Home Mortgage Assets Trust, Series 2007-3, Class 3A1, 1.471%, 9/25/2027 (a) | | | 332,889 | | | | 311,697 | |
American Home Mortgage Assets Trust, Series 2006-1, Class XC, 2.387%, 5/25/2046 (a)(c) | | | 50,219,524 | | | | 5,193,352 | |
American Home Mortgage Assets Trust, Series 2006-2, Class 1A1, 1.556%, 9/25/2046 (a) | | | 1,829,511 | | | | 1,275,407 | |
American Home Mortgage Assets Trust, Series 2006-4, Class 1A12, 0.966%, 10/25/2046 (a) | | | 18,106,734 | | | | 12,113,006 | |
American Home Mortgage Assets Trust, Series 2007-1, Class A1, 1.296%, 2/25/2047 (a)(e) | | | 58,948,897 | | | | 35,777,442 | |
American Home Mortgage Assets Trust, Series 2007-5, Class XP, 2.864%, 6/25/2047 (a)(c) | | | 46,972,907 | | | | 5,340,162 | |
American Home Mortgage Investment Trust, Series 2005-2, Class 1A1, 1.071%, 9/25/2045 (a) | | | 17,193,647 | | | | 14,638,035 | |
American Home Mortgage Investment Trust, Series 2005-2, Class 2A1, 2.341%, 9/25/2045 (a) | | | 1,116,450 | | | | 1,005,877 | |
American Home Mortgage Investment Trust, Series 2005-4, Class 3A1, 1.056%, 11/25/2045 (a) | | | 14,331,911 | | | | 11,493,218 | |
American Home Mortgage Investment Trust, Series 2006-3, Class 11A1, 0.951%, 12/25/2046 (a) | | | 3,999,769 | | | | 3,368,174 | |
American Home Mortgage Investment Trust, Series 2007-1, Class Ga1A, 0.931%, 5/25/2047 (a) | | | 21,934,069 | | | | 17,401,766 | |
American Home Mortgage Investment Trust, Series 2007-1, Class GA1C, 0.961%, 5/25/2047 (a) | | | 14,393,118 | | | | 9,090,679 | |
BAMLL Re-REMIC Trust, Series 2015-FR11, Class A705, 1.857%, 9/27/2044 (a)(b) | | | 5,000,000 | | | | 4,859,065 | |
Bank of America Alternative Loan Trust, Series 2005-6, Class 5A2, 5.500%, 7/25/2035 | | | 1,731,404 | | | | 1,471,367 | |
Bank of America Commercial Mortgage Trust, Series 2015-UBS7, Class D, 3.167%, 9/15/2048 | | | 4,000,000 | | | | 3,216,320 | |
Bank of America Commercial Mortgage Trust, Series 2016-UB10, Class C, 4.913%, 7/15/2049 (a) | | | 8,000,000 | | | | 8,489,728 | |
Bank of America Commercial Mortgage Trust, Series 2007-5, Class AJ, 5.981%, 2/10/2051 (a) | | | 5,000,000 | | | | 4,648,245 | |
Bank of America Funding Trust, Series 2005-F, Class 4A1, 3.191%, 9/20/2035 (a) | | | 2,474,265 | | | | 2,124,755 | |
Bank of America Funding Trust, Series 2005-H, Class 1A1, 3.277%, 11/20/2035 (a) | | | 420,905 | | | | 368,664 | |
Bank of America Funding Trust, Series 2007-C, Class 1A3, 3.096%, 5/20/2036 (a) | | | 16,915 | | | | 16,041 | |
Bank of America Funding Trust, Series 2007-C, Class 4A3, 3.109%, 5/20/2036 (a) | | | 17,672,018 | | | | 17,403,456 | |
Bank of America Funding Trust, Series 2007-C, Class 4A2, 3.109%, 5/20/2036 (a) | | | 2,973,831 | | | | 2,902,955 | |
Bank of America Funding Trust, Series 2006-5, Class 1A4, 6.000%, 9/25/2036 | | | 7,500,997 | | | | 6,516,529 | |
See accompanying notes which are an integral part of these financial statements.
17
Angel Oak Multi-Strategy Income Fund
Schedule of Investments – (continued)
January 31, 2017
| | | | | | | | |
| | | Principal
Amount | | | Value | |
Collateralized Mortgage Obligations – (continued) | | | | | | | | |
Bank of America Funding Trust, Series 2006-H, Class 6A1, 0.967%, 10/20/2036 (a) | | $ | 19,421,926 | | | $ | 16,846,695 | |
Bank of America Funding Trust, Series 2006-I, Class 2A2, 2.876%, 12/20/2036 (a) | | | 15,519 | | | | 14,942 | |
Bank of America Funding Trust, Series 2007-3, Class TA4, 1.186%, 4/25/2037 (a) | | | 4,898,685 | | | | 3,440,478 | |
Bank of America Funding Trust, Series 2007-D, Class 3A3, 3.077%, 6/20/2037 (a) | | | 3,511,610 | | | | 3,368,526 | |
Bank of America Funding Trust, Series 2007-D, Class 3A1, 3.233%, 6/20/2037 (a) | | | 454,722 | | | | 431,434 | |
Bank of America Funding Trust, Series 2007-A, Class 2A5, 1.007%, 2/20/2047 (a) | | | 4,102,985 | | | | 3,596,709 | |
Bank of America Mortgage Trust, Series 2005-I, Class 4A1, 3.121%, 10/25/2035 (a) | | | 3,462,335 | | | | 3,358,787 | |
Bank of America Mortgage Trust, Series 2005-K, Class 2A1, 3.498%, 12/25/2035 (a) | | | 422,680 | | | | 398,109 | |
BBCMS Trust, Series 2014-BXO, Class E, 4.517%, 8/15/2027 (a)(b) | | | 8,000,000 | | | | 7,961,472 | |
BCAP LLC, Series 2013-RR1, Class 6A2, 3.306%, 5/26/2036 (a)(b) | | | 7,482,252 | | | | 5,284,018 | |
BCAP LLC Trust, Series 2013-RR7, Class 4A3, 3.702%, 12/27/2034 (a)(b) | | | 9,013,000 | | | | 8,943,050 | |
BCAP LLC Trust, Series 2014-RR1, Class 1A2, 3.044%, 3/26/2035 (a)(b) | | | 3,693,643 | | | | 3,446,162 | |
BCAP LLC Trust, Series 2012-RR1, Class 7A3, 1.256%, 4/26/2035 (a)(b) | | | 1,182,570 | | | | 1,176,332 | |
BCAP LLC Trust, Series 2012-RR7, Class 3A4, 1.086%, 2/26/2036 (a)(b) | | | 27,162,723 | | | | 23,201,637 | |
BCAP LLC Trust, Series 2012-RR7, Class 3A1, 1.086%, 2/26/2036 (a)(b) | | | 1,665,272 | | | | 1,665,633 | |
BCAP LLC Trust, Series 2015-RR2, Class 26A2, 3.054%, 3/28/2036 (a)(b) | | | 6,729,753 | | | | 5,899,079 | |
BCAP LLC Trust, Series 2014-RR2, Class 8A1, 0.856%, 5/26/2036 (a)(b) | | | 3,614,745 | | | | 3,536,114 | |
BCAP LLC Trust, Series 2010-RR7, Class 9A12, 2.722%, 5/26/2036 (a)(b) | | | 3,186,801 | | | | 2,790,439 | |
BCAP LLC Trust, Series 2014-RR2, Class 6A8, 0.996%, 10/26/2036 (a)(b) | | | 17,649,182 | | | | 13,834,788 | |
BCAP LLC Trust, Series 2006-AA2, Class A1, 0.941%, 1/25/2037 (a) | | | 13,351,620 | | | | 11,320,892 | |
BCAP LLC Trust, Series 2007-AA1, Class 2A1, 0.951%, 3/25/2037 (a) | | | 3,556,054 | | | | 3,205,694 | |
BCAP LLC Trust, Series 2007-AA3, Class 1A2, 1.041%, 4/25/2037 (a) | | | 37,965 | | | | 31,342 | |
BCAP LLC Trust, Series 2007-AA2, Class 12A1, 0.981%, 5/25/2047 (a) | | | 116,357 | | | | 96,102 | |
BCAP LLC Trust, Series 2007-AA3, Class 2A1A, 0.991%, 5/25/2047 (a) | | | 8,657,534 | | | | 7,138,942 | |
BCAP LLC Trust, Series 2008-IND1, Class A1, 1.956%, 10/25/2047 (a)(e) | | | 39,022,260 | | | | 35,366,070 | |
Bear Stearns Adjustable Rate Mortgage Trust, Series 2005-1, Class 4A1, 3.191%, 3/25/2035 (a) | | | 2,035,279 | | | | 1,983,206 | |
Bear Stearns Adjustable Rate Mortgage Trust, Series 2005-12, Class 23A1, 2.991%, 2/25/2036 (a) | | | 943,857 | | | | 847,417 | |
Bear Stearns Adjustable Rate Mortgage Trust, Series 2006-2, Class 3A1, 3.145%, 7/25/2036 (a) | | | 2,107,653 | | | | 1,910,497 | |
Bear Stearns Adjustable Rate Mortgage Trust, Series 2006-2, Class 3A2, 3.145%, 7/25/2036 (a) | | | 7,157,517 | | | | 6,411,639 | |
Bear Stearns Adjustable Rate Mortgage Trust, Series 2007-2, Class 3A1, 3.456%, 12/25/2046 (a) | | | 5,636,427 | | | | 5,013,974 | |
Bear Stearns ALT-A Trust, Series 2006-8, Class 3A1, 0.916%, 2/25/2034 (a) | | | 1,961,463 | | | | 1,738,677 | |
Bear Stearns ALT-A Trust, Series 2005-5, Class 21A1, 2.986%, 7/25/2035 (a) | | | 3,044,475 | | | | 2,890,139 | |
Bear Stearns ALT-A Trust, Series 2005-5, Class 22A1, 3.176%, 7/25/2035 (a) | | | 5,325,585 | | | | 4,825,630 | |
Bear Stearns ALT-A Trust, Series 2005-7, Class 22A1, 3.149%, 9/25/2035 (a)(e) | | | 28,753,485 | | | | 25,333,488 | |
Bear Stearns ALT-A Trust, Series 2005-7, Class 21A1, 3.269%, 9/25/2035 (a) | | | 9,713,066 | | | | 8,603,358 | |
Bear Stearns ALT-A Trust, Series 2005-8, Class 11A1, 1.311%, 10/25/2035 (a) | | | 19,757,677 | | | | 18,134,703 | |
Bear Stearns ALT-A Trust, Series 2005-10, Class 11A1, 1.271%, 1/25/2036 (a) | | | 1,977,592 | | | | 1,767,485 | |
Bear Stearns ALT-A Trust, Series 2006-1, Class 11A1, 1.251%, 2/25/2036 (a) | | | 7,699,089 | | | | 6,882,577 | |
Bear Stearns ALT-A Trust, Series 2006-4, Class 11A1, 1.091%, 8/25/2036 (a) | | | 438,812 | | | | 370,247 | |
Bear Stearns Asset Backed Securities Trust, Series 2004-AC6, Class A2, 1.171%, 11/25/2034 (a) | | | 2,625,174 | | | | 2,169,772 | |
Bear Stearns Asset Backed Securities Trust, Series 2005-AC5, Class 1A2, 1.756%, 8/25/2035 (a) | | | 3,326,454 | | | | 2,755,082 | |
Bear Stearns Asset Backed Securities Trust, Series 2007-AC6, Class A1, 6.500%, 10/25/2037 | | | 3,259,472 | | | | 2,503,822 | |
Bear Stearns Commercial Mortgage Securities Trust, Series 2007-PW15, Class AMFX, 5.363%, 2/11/2044 (b) | | | 2,000,000 | | | | 1,924,064 | |
Bear Stearns Commercial Mortgage Securities Trust, Series 2007-PW15, Class AM, 5.363%, 2/11/2044 (e) | | | 2,000,000 | | | | 1,944,404 | |
Bear Stearns Commercial Mortgage Securities Trust, Series 2007-PW17, Class AJ, 5.888%, 6/11/2050 (a) | | | 5,000,000 | | | | 5,063,730 | |
Bear Stearns Mortgage Funding Trust, Series 2006-AR1, Class 1A1, 0.981%, 7/25/2036 (a) | | | 1,534,795 | | | | 1,304,465 | |
See accompanying notes which are an integral part of these financial statements.
18
Angel Oak Multi-Strategy Income Fund
Schedule of Investments – (continued)
January 31, 2017
| | | | | | | | |
| | | Principal
Amount | | | Value | |
Collateralized Mortgage Obligations – (continued) | | | | | | | | |
Bear Stearns Mortgage Funding Trust, Series 2006-AR3, Class 1A1, 0.951%, 10/25/2036 (a)(e) | | $ | 25,689,380 | | | $ | 21,933,207 | |
Bear Stearns Mortgage Funding Trust, Series 2006-AR5, Class 2A1, 0.961%, 1/25/2037 (a) | | | 23,522,804 | | | | 21,187,625 | |
Bear Stearns Mortgage Funding Trust, Series 2007-AR5, Class 2A2, 1.001%, 6/25/2037 (a) | | | 103,576 | | | | 75,996 | |
CD Mortgage Trust, Series 2006-CD3, Class AJ, 5.688%, 10/15/2048 (e) | | | 10,000,000 | | | | 5,619,430 | |
CD Mortgage Trust, Series 2017-CD3, Class D, 3.250%, 2/10/2050 | | | 4,000,000 | | | | 3,164,800 | |
CD Mortgage Trust, Series 2017-CD3, Class C, 4.563%, 2/10/2050 | | | 6,500,000 | | | | 6,719,505 | |
CFCRE Commercial Mortgage Trust, Series 2015-RUM, Class B, 2.917%, 7/15/2030 (a)(b) | | | 5,000,000 | | | | 5,063,270 | |
CFCRE Commercial Mortgage Trust, Series 2011-C1, Class F, 5.000%, 4/15/2044 (a)(b)(g) | | | 7,931,000 | | | | 2,810,754 | |
CFCRE Commercial Mortgage Trust, Series 2011-C1, Class E, 6.180%, 4/15/2044 (a)(b) | | | 601,075 | | | | 271,530 | |
Chase Mortgage Finance Trust, Series 2007-S2, Class 1A9, 6.000%, 3/25/2037 | | | 2,105,124 | | | | 1,764,460 | |
Chase Mortgage Finance Trust, Series 2007-A2, Class 7A1, 4.130%, 7/25/2037 (a) | | | 909,602 | | | | 862,232 | |
ChaseFlex Trust, Series 2006-1, Class A4, 4.593%, 6/25/2036 (a) | | | 32,783,747 | | | | 27,511,006 | |
ChaseFlex Trust, Series 2007-1, Class 2A10, 1.271%, 2/25/2037 (a) | | | 4,142,990 | | | | 2,746,168 | |
ChaseFlex Trust, Series 2007-1, Class 2A6, 6.000%, 2/25/2037 | | | 2,875,314 | | | | 2,406,460 | |
Chevy Chase Funding LLC Mortgage-Backed Certificates, Series 2005-1A, Class A1, 0.921%, 1/25/2036 (a)(b) | | | 8,442,981 | | | | 7,794,830 | |
Chevy Chase Funding LLC Mortgage-Backed Certificates, Series 2005-1A, Class A2, 0.971%, 1/25/2036 (a)(b) | | | 6,680,752 | | | | 5,967,508 | |
Chevy Chase Funding LLC Mortgage-Backed Certificates, Series 2005-4A, Class NIO, 0.397%, 4/25/2037 (a)(b)(c) | | | 58,576,776 | | | | 1,243,175 | |
Chevy Chase Funding LLC Mortgage-Backed Certificates, Series 2005-4A, Class IO, 1.311%, 4/25/2037 (a)(b)(c) | | | 58,576,776 | | | | 3,055,248 | |
Chevy Chase Funding LLC Mortgage-Backed Certificates, Series 2007-1A, Class A1, 0.901%, 2/25/2048 (a)(b) | | | 11,595,215 | | | | 9,257,828 | |
CIM Trust, Series 2016-5, Class A, 4.500%, 10/25/2021 (b) | | | 9,137,338 | | | | 9,126,638 | |
Citigroup Commercial Mortgage Trust, Series 2014-GC19, Class D, 4.901%, 3/10/2047 (a)(b) | | | 2,000,000 | | | | 1,723,712 | |
Citigroup Commercial Mortgage Trust, Series 2016-C1, Class C, 4.954%, 5/10/2049 (a) | | | 8,000,000 | | | | 7,978,784 | |
Citigroup Mortgage Loan Trust, Inc., Series 2005-2, Class 1A4, 2.967%, 5/25/2035 (a) | | | 478,598 | | | | 459,755 | |
Citigroup Mortgage Loan Trust, Inc., Series 2005-12, Class 2A1, 1.384%, 8/25/2035 (a)(b) | | | 6,996,648 | | | | 5,853,956 | |
Citigroup Mortgage Loan Trust, Inc., Series 2005-4, Class A, 3.043%, 8/25/2035 (a) | | | 1,639,913 | | | | 1,609,707 | |
Citigroup Mortgage Loan Trust, Inc., Series 2005-3, Class 2A4, 3.225%, 8/25/2035 (a) | | | 166,689 | | | | 156,516 | |
Citigroup Mortgage Loan Trust, Inc., Series 2005-5, Class 1A2, 3.798%, 8/25/2035 (a) | | | 391,200 | | | | 331,080 | |
Citigroup Mortgage Loan Trust, Inc., Series 2005-7, Class 2A2A, 3.417%, 9/25/2035 (a) | | | 6,405,390 | | | | 5,935,471 | |
Citigroup Mortgage Loan Trust, Inc., Series 2006-AR2, Class 1A1, 3.159%, 3/25/2036 (a) | | | 1,249,822 | | | | 1,190,510 | |
Citigroup Mortgage Loan Trust, Inc., Series 2006-AR6, Class 1A1, 3.141%, 8/25/2036 (a) | | | 2,778,914 | | | | 2,600,597 | |
CitiMortgage Alternative Loan Trust, Series 2006-A5, Class 1A8, 6.000%, 10/25/2036 | | | 951,552 | | | | 855,177 | |
CitiMortgage Alternative Loan Trust, Series 2006-A7, Class 1A1, 6.000%, 12/25/2036 | | | 1,042,608 | | | | 888,129 | |
CitiMortgage Alternative Loan Trust, Series 2007-A2, Class 1A2, 4.644%, 2/25/2037 (a)(c) | | | 25,294,325 | | | | 3,975,408 | |
CitiMortgage Alternative Loan Trust, Series 2007-A2, Class 1A4, 6.000%, 2/25/2037 | | | 2,532,118 | | | | 2,274,189 | |
Commercal Mortgage Pass Through Certificates, Series 2014-CR14, Class D, 4.602%,
2/10/2047 (a)(b) | | | 10,000,000 | | | | 8,970,530 | |
Commercial Mortgage Loan Trust, Series 2008-LS1, Class AM, 6.096%, 12/10/2049 (a)(e) | | | 14,077,973 | | | | 8,667,329 | |
Commercial Mortgage Trust, Series 2013-CR13, Class D, 4.751%, 12/10/2023 (a)(b) | | | 5,000,000 | | | | 4,847,440 | |
Commercial Mortgage Trust, Series 2014-TWC, Class F, 5.018%, 2/13/2032 (a)(b) | | | 5,000,000 | | | | 5,010,970 | |
Commercial Mortgage Trust, Series 2016-SAVA, Class A, 2.487%, 10/15/2034 (a)(b) | | | 10,000,000 | | | | 10,066,016 | |
Commercial Mortgage Trust, Series 2013-CR9, Class D, 4.256%, 7/10/2045 (a)(b) | | | 5,000,000 | | | | 4,531,895 | |
Commercial Mortgage Trust, Series 2012-CR4, Class D, 4.571%, 10/15/2045 (a)(b) | | | 3,000,000 | | | | 2,761,614 | |
Commercial Mortgage Trust, Series 2013-CR6, Class E, 4.171%, 3/10/2046 (a)(b) | | | 6,146,000 | | | | 4,490,839 | |
Commercial Mortgage Trust, Series 2013-CR8, Class ASFL, 1.404%, 6/10/2046 (a)(b) | | | 4,000,000 | | | | 4,024,768 | |
See accompanying notes which are an integral part of these financial statements.
19
Angel Oak Multi-Strategy Income Fund
Schedule of Investments – (continued)
January 31, 2017
| | | | | | | | |
| | | Principal
Amount | | | Value | |
Collateralized Mortgage Obligations – (continued) | | | | | | | | |
Commercial Mortgage Trust, Series 2013-CR12, Class D, 5.082%, 10/10/2046 (a)(b) | | $ | 5,000,000 | | | $ | 4,632,045 | |
Commercial Mortgage Trust, Series 2013-CR11, Class D, 5.169%, 10/10/2046 (a)(b) | | | 5,000,000 | | | | 4,823,870 | |
Commercial Mortgage Trust, Series 2006-C8, Class AJ, 5.377%, 12/10/2046 | | | 4,126,456 | | | | 4,141,118 | |
Commercial Mortgage Trust, Series 2014-CR15, Class D, 4.761%, 2/10/2047 (a)(b) | | | 250,000 | | | | 231,483 | |
Commercial Mortgage Trust, Series 2014-CR17, Class D, 4.799%, 5/10/2047 (a)(b) | | | 9,000,000 | | | | 8,291,736 | |
Commercial Mortgage Trust, Series 2014-CR19, Class D, 4.718%, 8/10/2047 (a)(b) | | | 11,000,000 | | | | 9,462,343 | |
Commercial Mortgage Trust, Series 2014-UBS4, Class C, 4.781%, 8/10/2047 (a) | | | 5,000,000 | | | | 4,997,190 | |
Commercial Mortgage Trust, Series 2014-LC17, Class D, 3.687%, 10/10/2047 (b) | | | 4,000,000 | | | | 3,074,660 | |
Commercial Mortgage Trust, Series 2015-DC1, Class AM, 3.724%, 2/10/2048 | | | 5,000,000 | | | | 5,053,890 | |
Commercial Mortgage Trust, Series 2015-DC1, Class D, 4.353%, 2/10/2048 (a)(b) | | | 7,000,000 | | | | 5,664,673 | |
Commercial Mortgage Trust, Series 2015-CR22, Class D, 4.126%, 3/10/2048 (a)(b) | | | 10,000,000 | | | | 8,275,340 | |
Commercial Mortgage Trust, Series 2015-CR26, Class D, 3.494%, 10/10/2048 (a) | | | 5,000,000 | | | | 3,614,790 | |
Commercial Mortgage Trust, Series 2015-PC1, Class C, 4.441%, 7/10/2050 (a) | | | 5,000,000 | | | | 4,604,950 | |
Commercial Mortgage Trust, Series 2015-CR24, Class C, 4.374%, 8/10/2055 (a) | | | 5,000,000 | | | | 4,991,670 | |
CountryWide Alternative Loan Trust, Series 2004-J10, Class 1A3, 4.250%, 10/25/2034 | | | 332,335 | | | | 327,756 | |
CountryWide Alternative Loan Trust, Series 2005-1CB, Class 1A4, 5.500%, 3/25/2035 | | | 1,287,332 | | | | 1,253,345 | |
CountryWide Alternative Loan Trust, Series 2005-3CB, Class 1A11, 5.500%, 3/25/2035 | | | 798,568 | | | | 797,040 | |
CountryWide Alternative Loan Trust, Series 2005-7CB, Class 2A2, 4.294%, 4/25/2035 (a)(c) | | | 30,050,507 | | | | 4,280,364 | |
CountryWide Alternative Loan Trust, Series 2005-16, Class X2, 1.717%, 6/25/2035 (a)(c) | | | 32,345,015 | | | | 2,221,003 | |
CountryWide Alternative Loan Trust, Series 2005-24, Class 1AX, 0.959%, 7/20/2035 (a)(c) | | | 33,000,061 | | | | 1,003,664 | |
CountryWide Alternative Loan Trust, Series 2005-26CB, Class A1, 1.256%, 7/25/2035 (a) | | | 1,757,658 | | | | 1,296,963 | |
CountryWide Alternative Loan Trust, Series 2005-J6, Class 1A4, 5.500%, 7/25/2035 | | | 1,436,052 | | | | 1,355,979 | |
CountryWide Alternative Loan Trust, Series 2005-27, Class 2X1, 1.023%, 8/25/2035 (a)(c) | | | 57,663,269 | | | | 2,322,388 | |
CountryWide Alternative Loan Trust, Series 2005-J9, Class 1A6, 5.500%, 8/25/2035 | | | 1,360,957 | | | | 1,165,156 | |
CountryWide Alternative Loan Trust, Series 2005-38, Class X, 2.881%, 9/25/2035 (a)(c) | | | 98,258,933 | | | | 5,553,791 | |
CountryWide Alternative Loan Trust, Series 2005-J10, Class 1A1, 1.256%, 10/25/2035 (a) | | | 648,524 | | | | 474,052 | |
CountryWide Alternative Loan Trust, Series 2005-44, Class 1X, 1.553%, 10/25/2035 (a)(c) | | | 54,538,175 | | | | 3,894,735 | |
CountryWide Alternative Loan Trust, Series 2005-51, Class 3A3A, 1.097%, 11/20/2035 (a) | | | 3,341,032 | | | | 2,715,547 | |
CountryWide Alternative Loan Trust, Series 2005-51, Class 3X2, 1.783%, 11/20/2035 (a)(c) | | | 18,406,468 | | | | 1,338,592 | |
CountryWide Alternative Loan Trust, Series 2005-51, Class 2X, 1.801%, 11/20/2035 (a)(c) | | | 26,553,894 | | | | 1,788,431 | |
CountryWide Alternative Loan Trust, Series 2005-51, Class 4X, 1.855%, 11/20/2035 (a)(c) | | | 44,926,634 | | | | 3,404,185 | |
CountryWide Alternative Loan Trust, Series 2005-59, Class 2X, 1.945%, 11/20/2035 (a)(c) | | | 142,371,215 | | | | 9,517,658 | |
CountryWide Alternative Loan Trust, Series 2005-51, Class 1X, 2.112%, 11/20/2035 (a)(c) | | | 54,834,404 | | | | 4,955,988 | |
CountryWide Alternative Loan Trust, Series 2005-J11, Class 1A4, 1.156%, 11/25/2035 (a) | | | 7,537,322 | | | | 4,976,773 | |
CountryWide Alternative Loan Trust, Series 2005-56, Class 4X, 2.057%, 11/25/2035 (a)(c) | | | 53,531,579 | | | | 4,038,529 | |
CountryWide Alternative Loan Trust, Series 2005-J13, Class 2A3, 5.500%, 11/25/2035 | | | 254,182 | | | | 228,574 | |
CountryWide Alternative Loan Trust, Series 2005-65CB, Class 2A4, 5.500%, 12/25/2035 | | | 1,591,194 | | | | 1,464,570 | |
CountryWide Alternative Loan Trust, Series 2005-J14, Class A8, 5.500%, 12/25/2035 | | | 4,142,230 | | | | 3,513,821 | |
CountryWide Alternative Loan Trust, Series 2006-OA3, Class X, 2.120%, 5/25/2036 (a)(c) | | | 47,791,272 | | | | 4,142,595 | |
CountryWide Alternative Loan Trust, Series 2006-J8, Class A2, 6.000%, 2/25/2037 | | | 2,712,093 | | | | 1,805,571 | |
CountryWide Alternative Loan Trust, Series 2007-22, Class 2A16, 6.500%, 9/25/2037 | | | 13,759,625 | | | | 10,201,951 | |
CountryWide Alternative Loan Trust, Series 2006-OA2, Class X1, 5.407%, 5/20/2046 (a)(c) | | | 50,190,485 | | | | 3,711,737 | |
CountryWide Alternative Loan Trust, Series 2006-OA10, Class XNB, 1.540%,
8/25/2046 (a)(c) | | | 80,760,530 | | | | 4,782,719 | |
CountryWide Alternative Loan Trust, Series 2006-OA10, Class XBI, 2.180%, 8/25/2046 (a)(c) | | | 90,507,407 | | | | 8,772,973 | |
CountryWide Alternative Loan Trust, Series 2006-OA17, Class 2X, 1.405%, 12/20/2046 (a)(c) | | | 10,930,714 | | | | 739,747 | |
CountryWide Alternative Loan Trust, Series 2007-OA3, Class 1A2, 0.936%, 4/25/2047 (a) | | | 12,632 | | | | 9,293 | |
CountryWide Alternative Loan Trust Resecuritization, Series 2005-58R, Class A, 2.065%, 12/20/2035 (a)(b)(c) | | | 149,352,142 | | | | 10,896,135 | |
See accompanying notes which are an integral part of these financial statements.
20
Angel Oak Multi-Strategy Income Fund
Schedule of Investments – (continued)
January 31, 2017
| | | | | | | | |
| | | Principal
Amount | | | Value | |
Collateralized Mortgage Obligations – (continued) | | | | | | | | |
CountryWide Alternative Loan Trust Resecuritization, Series 2005-59R, Class A, 2.210%, 12/20/2035 (a)(b)(c) | | $ | 35,136,476 | | | $ | 2,474,838 | |
CountryWide Atlernative Loan Trust, Series 2005-51, Class 3X1, 0.873%, 11/20/2035 (a)(c) | | | 57,306,843 | | | | 1,179,318 | |
CountryWide Home Loan Mortgage Pass-Through Trust, Series 2004-HYB3, Class 2A, 2.796%, 6/20/2034 (a) | | | 1,081,015 | | | | 1,020,269 | |
CountryWide Home Loan Mortgage Pass-Through Trust, Series 2004-11, Class 3A1, 3.071%, 7/25/2034 (a) | | | 772,940 | | | | 758,159 | |
CountryWide Home Loan Mortgage Pass-Through Trust, Series 2005-7, Class 3X, 0.854%, 3/25/2035 (a)(c) | | | 2,772,768 | | | | 108,252 | |
CountryWide Home Loan Mortgage Pass-Through Trust, Series 2005-2, Class 1A1, 1.396%, 3/25/2035 (a) | | | 1,961,486 | | | | 1,647,986 | |
CountryWide Home Loan Mortgage Pass-Through Trust, Series 2005-2, Class 2X, 1.638%, 3/25/2035 (a)(c) | | | 26,535,715 | | | | 1,239,987 | |
CountryWide Home Loan Mortgage Pass-Through Trust, Series 2005-1, Class 1X, 1.641%, 3/25/2035 (a)(c) | | | 11,643,481 | | | | 819,410 | |
CountryWide Home Loan Mortgage Pass-Through Trust, Series 2005-9, Class 1X, 1.635%, 5/25/2035 (a)(c) | | | 75,982,529 | | | | 4,266,647 | |
CountryWide Home Loan Mortgage Pass-Through Trust, Series 2005-HYB8, Class 3A1, 3.130%, 12/20/2035 (a) | | | 597,485 | | | | 493,487 | |
CountryWide Home Loan Mortgage Pass-Through Trust, Series 2006-12, Class X, 0.232%, 7/25/2036 (a)(c) | | | 70,650,290 | | | | 578,131 | |
CountryWide Home Loan Mortgage Pass-Through Trust, Series 2007-HYB1, Class 2A1, 2.971%, 3/25/2037 (a) | | | 2,215,538 | | | | 1,858,874 | |
Credit Suisse Commercial Mortgage Trust, Series 2007-C4, Class B, 5.939%, 9/15/2039 (a)(b) | | | 6,500,000 | | | | 6,424,148 | |
Credit Suisse First Boston Mortgage Securities Corp., Series 2005-4, Class 2A7, 1.206%, 6/25/2035 (a) | | | 1,193,680 | | | | 1,005,881 | |
Credit Suisse First Boston Mortgage Securities Corp., Series 2005-9, Class 4A2, 1.106%, 10/25/2035 (a) | | | 2,309,392 | | | | 1,935,305 | |
Credit Suisse First Boston Mortgage Securities Corp., Series 2005-9, Class 2A1, 5.500%, 10/25/2035 | | | 1,076,140 | | | | 1,016,383 | |
Credit Suisse First Boston Mortgage Securities Corp., Series 2005-10, Class 6A12, 5.500%, 11/25/2035 | | | 5,368,254 | | | | 4,703,675 | |
Credit Suisse Mortgage Capital Certificates, Series 2006-2, Class 6A8, 5.750%, 3/25/2036 | | | 2,119,090 | | | | 1,963,686 | |
Credit Suisse Mortgage Trust, Series 2015-2R, Class 3A2, 0.966%, 4/27/2036 (a)(b) | | | 16,089,605 | | | | 9,223,479 | |
Credit Suisse Mortgage Trust, Series 2016-NXSR, Class C, 4.365%, 12/15/2049 (a) | | | 5,000,000 | | | | 4,900,649 | |
CSAIL Commercial Mortgage Trust, Series 2015-C1, Class D, 3.945%, 4/15/2050 (a)(b) | | | 2,000,000 | | | | 1,708,352 | |
CSAIL Commercial Mortgage Trust, Series 2015-C2, Class D, 4.211%, 6/15/2057 (a) | | | 10,000,000 | | | | 7,411,040 | |
Deustche Alt-A Securities, Inc. Mortgage Loan Trust, Series 2005-5, Class 2A7, 5.500%, 11/25/2035 | | | 656,208 | | | | 535,307 | |
Deutchse Alt-A Securities, Inc. Mortgage Loan Trust, Series 2007-AR2, Class A4, 0.906%, 3/25/2037 (a) | | | 2,748,363 | | | | 2,476,138 | |
Deutsche Alt-A Securities, Inc. Mortgage Loan Trust, Series 2005-AR1, Class 1A1, 1.066%, 8/25/2035 (a) | | | 6,378,809 | | | | 5,296,785 | |
Deutsche Alt-A Securities, Inc. Mortgage Loan Trust, Series 2005-5, Class 2A1, 0.956%, 11/25/2035 (a) | | | 2,464,295 | | | | 1,368,312 | |
Deutsche Alt-A Securities, Inc. Mortgage Loan Trust, Series 2005-5, Class 2A4, 5.500%, 11/25/2035 | | | 4,357,186 | | | | 3,833,884 | |
Deutsche Alt-A Securities, Inc. Mortgage Loan Trust, Series 2006-AR1, Class 1A3, 1.101%, 2/25/2036 (a) | | | 8,424,202 | | | | 7,526,334 | |
See accompanying notes which are an integral part of these financial statements.
21
Angel Oak Multi-Strategy Income Fund
Schedule of Investments – (continued)
January 31, 2017
| | | | | | | | |
| | | Principal
Amount | | | Value | |
Collateralized Mortgage Obligations – (continued) | | | | | | | | |
Deutsche Alt-A Securities, Inc. Mortgage Loan Trust, Series 2006-AR1, Class 3A1, 3.130%, 2/25/2036 (a) | | $ | 1,146,596 | | | $ | 1,058,881 | |
Deutsche Alt-A Securities, Inc. Mortgage Loan Trust, Series 2006-AR1, Class 2A1, 3.510%, 2/25/2036 (a) | | | 1,305,883 | | | | 1,017,048 | |
Deutsche Alt-A Securities, Inc. Mortgage Loan Trust, Series 2006-AR2, Class 1A2, 0.936%, 5/25/2036 (a) | | | 35,532,269 | | | | 30,293,746 | |
Deutsche Alt-A Securities, Inc. Mortgage Loan Trust, Series 2006-AR3, Class A2, 0.891%, 8/25/2036 (a) | | | 251,284 | | | | 208,578 | |
Deutsche Alt-A Securities, Inc. Mortgage Loan Trust, Series 2006-AR4, Class A2, 0.961%, 12/25/2036 (a)(e) | | | 28,386,347 | | | | 18,153,949 | |
Deutsche Alt-A Securities, Inc. Mortgage Loan Trust, Series 2006-AR6, Class A6, 0.946%, 2/25/2037 (a) | | | 4,254,886 | | | | 3,574,406 | |
Deutsche Alt-A Securities, Inc. Mortgage Loan Trust, Series 2007-AR2, Class A1, 0.921%, 3/25/2037 (a) | | | 8,757,079 | | | | 7,278,420 | |
Deutsche Alt-A Securities, Inc. Mortgage Loan Trust, Series 2007-AR3, Class 2A5, 0.956%, 6/25/2037 (a) | | | 1,028,335 | | | | 805,875 | |
Deutsche Alt-A Securities, Inc. Mortgage Loan Trust, Series 2007-AR1, Class A4, 0.931%, 1/25/2047 (a) | | | 650,593 | | | | 560,862 | |
Deutsche Alt-A Securities, Inc. Mortgage Loan Trust, Series 2006-OA1, Class A1, 0.956%, 2/25/2047 (a) | | | 1,893,530 | | | | 1,576,487 | |
Deutsche Alt-A Securities, Inc. Mortgage Loan Trust, Series 2007-2, Class 2A1, 1.056%, 9/25/2047 (a) | | | 3,826,090 | | | | 3,027,539 | |
Deutsche Alt-A Securities, Inc. Mortgage Loan Trust, Series 2007-3, Class 1A1, 2.471%, 10/25/2047 (a) | | | 33,600,571 | | | | 30,929,769 | |
Deutsche Alt-B Securities, Inc. Mortgage Loan Trust, Series 2006-AB2, Class A8, 5.734%, 6/25/2036 (a) | | | 8,002,497 | | | | 6,714,119 | |
Deutsche Alt-B Securities, Inc. Mortgage Loan Trust, Series 2006-AB2, Class A1, 5.888%, 6/25/2036 (a) | | | 919,372 | | | | 772,540 | |
Deutsche Alt-B Securities, Inc. Mortgage Loan Trust, Series 2006-AB2, Class A2, 6.160%, 6/25/2036 (a) | | | 4,290,589 | | | | 3,607,617 | |
Deutsche Alt-B Securities, Inc. Mortgage Loan Trust, Series 2006-AB2, Class A3, 6.270%, 6/25/2036 (a) | | | 1,236,724 | | | | 1,039,449 | |
Deutsche Alt-B Securities, Inc. Mortgage Loan Trust, Series 2006-AB3, Class A1, 6.250%, 7/25/2036 (a) | | | 547,402 | | | | 458,513 | |
Deutsche Alt-B Securities, Inc. Mortgage Loan Trust, Series 2006-AB3, Class A5B, 6.300%, 7/25/2036 (a) | | | 530,705 | | | | 435,921 | |
Deutsche Alt-B Securities, Inc. Mortgage Loan Trust, Series 2006-AB3, Class A2, 6.420%, 7/25/2036 (a) | | | 5,470,432 | | | | 4,522,220 | |
Deutsche Alt-B Securities, Inc. Mortgage Loan Trust, Series 2006-AB4, Class A4B, 6.000%, 10/25/2036 (a) | | | 15,865,334 | | | | 14,183,418 | |
Deutsche Bank Commercial Mortgage Trust, Series 2016-C1, Class C, 3.352%, 5/10/2049 (a) | | | 6,000,000 | | | | 5,654,058 | |
Deutsche Mortgage Securities, Inc. Re-REMIC Trust, Series 2007-WM1, Class A1, 4.009%, 6/27/2037 (a)(b)(e) | | | 9,747,609 | | | | 9,806,017 | |
DSLA Mortgage Loan Trust, Series 2007-AR1, Class 2A1A, 0.876%, 4/19/2037 (a) | | | 1,074,477 | | | | 933,004 | |
DSLA Mortgage Loan Trust, Series 2005-AR1, Class 1A, 1.039%, 2/19/2045 (a)(e) | | | 43,736,155 | | | | 36,313,299 | |
DSLA Mortgage Loan Trust, Series 2005-AR2, Class 2A1A, 0.946%, 3/19/2045 (a) | | | 11,025,157 | | | | 9,826,822 | |
DSLA Mortgage Loan Trust, Series 2006-AR1, Class 1A1A, 1.494%, 3/19/2046 (a) | | | 6,840,515 | | | | 5,959,159 | |
DSLA Mortgage Loan Trust, Series 2006-AR1, Class 2A1A, 1.514%, 4/19/2047 (a) | | | 424,297 | | | | 368,607 | |
EQTY Mezzanine Trust, Series 2014-INMZ, Class M, 5.516%, 5/8/2031 (a)(b) | | | 4,587,238 | | | | 4,421,607 | |
See accompanying notes which are an integral part of these financial statements.
22
Angel Oak Multi-Strategy Income Fund
Schedule of Investments – (continued)
January 31, 2017
| | | | | | | | |
| | | Principal
Amount | | | Value | |
Collateralized Mortgage Obligations – (continued) | | | | | | | | |
EQTY Mortgage Trust, Series 2014-INNS, Class E, 4.216%, 5/8/2031 (a)(b) | | $ | 5,750,000 | | | $ | 5,657,218 | |
First Horizon Alternative Mortgage Securities Trust, Series 2005-FA8, Class 1A5, 5.125%, 11/25/2035 | | | 1,785,760 | | | | 1,523,519 | |
First Horizon Alternative Mortgage Securities Trust, Series 2005-FA8, Class 1A18, 5.500%, 11/25/2035 | | | 17,196 | | | | 14,705 | |
First Horizon Alternative Mortgage Securities Trust, Series 2006-AA2, Class 2A1, 2.850%, 5/25/2036 (a) | | | 1,547,983 | | | | 1,293,806 | |
First Horizon Mortgage Pass-Through Trust, Series 2005-AR4, Class 4A3, 3.021%, 9/25/2035 (a) | | | 186,312 | | | | 179,462 | |
First Horizon Mortgage Pass-Through Trust, Series 2005-AR5, Class 2A1, 2.993%, 11/25/2035 (a) | | | 2,315,552 | | | | 2,141,163 | |
FNBA Mortgage Loan Trust, Series 2004-AR1, Class A3, 1.249%, 8/19/2034 (a) | | | 14,786 | | | | 14,294 | |
GMAC Mortgage Corp. Loan Trust, Series 2005-AR5, Class 5A1, 3.538%, 9/19/2035 (a) | | | 475,228 | | | | 439,374 | |
GMACM Mortgage Loan Trust, Series 2005-AF1, Class A11, 5.750%, 7/25/2035 | | | 586,021 | | | | 491,990 | |
GMACM Mortgage Loan Trust, Series 2005-AR6, Class 4A1, 3.509%, 11/19/2035 (a) | | | 2,584,143 | | | | 2,358,082 | |
Great Wolf Trust, Series 2015-WFMZ, Class M, 7.755%, 5/15/2032 (a)(b) | | | 5,000,000 | | | | 4,932,340 | |
GreenPoint Mortgage Funding Trust, Series 2006-AR1, Class A1A, 1.061%, 2/25/2036 (a) | | | 5,590,056 | | | | 4,881,293 | |
GreenPoint Mortgage Funding Trust, Series 2007-AR2, Class 2A1, 0.956%, 5/25/2037 (a) | | | 10,882,683 | | | | 9,446,876 | |
GreenPoint Mortgage Funding Trust, Series 2007-AR3, Class A1, 0.976%, 6/25/2037 (a) | | | 9,301,318 | | | | 7,993,664 | |
GreenPoint Mortgage Funding Trust, Series 2007-AR1, Class 2A1A, 0.956%, 3/25/2047 (a) | | | 27,174,264 | | | | 23,375,655 | |
GS Mortgage Securities Re-Remic Trust, Series 2015-FRR1, Class K3A, 3.446%, 6/27/2041 (a) | | | 10,000,000 | | | | 9,751,680 | |
GS Mortgage Securities Resecuritization Trust, Series 2014-5R, Class 3B, 0.886%,
2/26/2037 (a)(b) | | | 22,830,149 | | | | 13,748,681 | |
GS Mortgage Securities Trust, Series 2007-GG10, Class AM, 5.797%, 8/10/2045 (a) | | | 2,000,000 | | | | 2,006,254 | |
GS Mortgage Securities Trust, Series 2012-GCJ9, Class D, 4.852%, 11/10/2045 (a)(b) | | | 3,690,000 | | | | 3,482,736 | |
GS Mortgage Securities Trust, Series 2013-GC14, Class C, 4.764%, 8/10/2046 (a)(b) | | | 6,600,000 | | | | 6,931,808 | |
GS Mortgage Securities Trust, Series 2014-GC20, Class D, 4.867%, 4/10/2047 (a)(b) | | | 5,000,000 | | | | 4,035,265 | |
GS Mortgage Securities Trust, Series 2015-GC32, Class C, 4.412%, 7/10/2048 (a) | | | 2,000,000 | | | | 2,001,830 | |
GS Mortgage Securities Trust, Series 2015-GC34, Class C, 4.654%, 10/10/2048 (a) | | | 7,000,000 | | | | 7,192,129 | |
GS Mortgage Securities Trust, Series 2015-GS1, Class C, 4.423%, 11/10/2048 (a) | | | 10,000,000 | | | | 10,120,661 | |
GS Mortgage Securities Trust, Series 2016-GS3, Class D, 2.620%, 10/10/2049 (b) | | | 2,500,000 | | | | 1,813,138 | |
GS Mortgage Securities Trust, Series 2016-GS3, Class C, 4.000%, 10/10/2049 (a) | | | 7,000,000 | | | | 6,877,794 | |
GS Mortgage Securities Trust, Series 2016-GS4, Class D, 3.233%, 11/10/2049 (b) | | | 10,000,000 | | | | 7,747,060 | |
GSR Mortgage Loan Trust, Series 2005-AR3, Class 4A1, 3.193%, 5/25/2035 (a) | | | 8,525,523 | | | | 8,321,021 | |
GSR Mortgage Loan Trust, Series 2005-AR3, Class 8A1, 3.215%, 5/25/2035 (a) | | | 3,963,796 | | | | 3,864,947 | |
GSR Mortgage Loan Trust, Series 2006-AR1, Class 2A4, 3.289%, 1/25/2036 (a) | | | 5,745,656 | | | | 5,573,947 | |
GSR Mortgage Loan Trust, Series 2006-AR1, Class 2A1, 3.289%, 1/25/2036 (a) | | | 2,270,256 | | | | 2,181,653 | |
GSR Mortgage Loan Trust, Series 2006-AR1, Class 3A1, 3.545%, 1/25/2036 (a) | | | 646,594 | | | | 598,331 | |
GSR Mortgage Loan Trust, Series 2006-2F, Class 3A4, 6.000%, 2/25/2036 | | | 798,527 | | | | 641,674 | |
GSR Mortgage Loan Trust, Series 2006-2F, Class 3A6, 6.000%, 2/25/2036 | | | 4,414,458 | | | | 3,599,324 | |
GSR Mortgage Loan Trust, Series 2006-1F, Class 2A5, 6.000%, 2/25/2036 | | | 2,530,029 | | | | 2,380,350 | |
GSR Mortgage Loan Trust, Series 2007-2F, Class 3A7, 6.000%, 3/25/2037 | | | 18,925,519 | | | | 18,036,095 | |
GSR Mortgage Loan Trust, Series 2007-2F, Class 3A3, 6.000%, 3/25/2037 | | | 870,845 | | | | 807,784 | |
GSR Mortgage Loan Trust, Series 2007-3F, Class 4A1, 1.056%, 5/25/2037 (a) | | | 11,364,028 | | | | 6,353,923 | |
GSR Mortgage Loan Trust, Series 2007-AR2, Class 1A1, 3.197%, 5/25/2037 (a) | | | 463,157 | | | | 398,469 | |
GSR Mortgage Loan Trust, Series 2007-AR1, Class 2A1, 3.228%, 3/25/2047 (a) | | | 16,213,034 | | | | 14,830,305 | |
HarborView Mortgage Loan Trust, Series 2004-7, Class X1, 0.500%, 11/19/2034 (a)(c) | | | 5,360,491 | | | | 134,757 | |
HarborView Mortgage Loan Trust, Series 2005-1, Class X, 1.379%, 3/19/2035 (a)(c) | | | 20,633,894 | | | | 1,270,305 | |
HarborView Mortgage Loan Trust, Series 2005-3, Class 2A1A, 1.009%, 6/19/2035 (a) | | | 2,164,082 | | | | 1,962,175 | |
HarborView Mortgage Loan Trust, Series 2005-3, Class X2, 1.843%, 6/19/2035 (a)(c) | | | 68,588,777 | | | | 4,893,672 | |
HarborView Mortgage Loan Trust, Series 2005-9, Class 2X, 1.527%, 6/20/2035 (a)(b)(c) | | | 20,798,458 | | | | 1,535,009 | |
See accompanying notes which are an integral part of these financial statements.
23
Angel Oak Multi-Strategy Income Fund
Schedule of Investments – (continued)
January 31, 2017
| | | | | | | | |
| | | Principal
Amount | | | Value | |
Collateralized Mortgage Obligations – (continued) | | | | | | | | |
HarborView Mortgage Loan Trust, Series 2005-4, Class 3A1, 3.107%, 7/19/2035 (a) | | $ | 2,377,324 | | | $ | 2,105,746 | |
HarborView Mortgage Loan Trust, Series 2005-12, Class X2B, 1.480%, 10/19/2035 (a)(c) | | | 20,293,595 | | | | 1,026,856 | |
HarborView Mortgage Loan Trust, Series 2006-10, Class 2A1A, 0.949%, 11/19/2036 (a)(e) | | | 22,141,534 | | | | 18,575,219 | |
HarborView Mortgage Loan Trust, Series 2006-11, Class A1A, 0.906%, 12/19/2036 (a) | | | 4,482,673 | | | | 3,803,826 | |
HarborView Mortgage Loan Trust, Series 2006-12, Class 2A2A, 0.959%, 1/19/2038 (a) | | | 16,418,212 | | | | 14,505,063 | |
HarborView Mortgage Loan Trust, Series 2007-2, Class 2A1A, 0.916%, 5/25/2038 (a)(e) | | | 25,036,012 | | | | 19,541,809 | |
HarborView Mortgage Loan Trust, Series 2005-15, Class 2A11, 1.009%, 10/20/2045 (a) | | | 1,988,378 | | | | 1,694,341 | |
HarborView Mortgage Loan Trust, Series 2005-15, Class X1, 2.360%, 10/20/2045 (a)(c) | | | 13,592,881 | | | | 1,141,000 | |
HarborView Mortgage Loan Trust, Series 2006-14, Class 2A1A, 0.886%, 1/25/2047 (a) | | | 11,215,120 | | | | 9,431,075 | |
HarborView Mortgage Loan Trust, Series 2007-3, Class 2A1A, 0.936%, 5/19/2047 (a)(e) | | | 35,975,018 | | | | 31,108,893 | |
Hilton USA Trust, Series 2016-SFP, Class D, 4.927%, 11/5/2035 (a)(b) | | | 5,000,000 | | | | 5,048,755 | |
Hilton USA Trust, Series 2016-SFP, Class F, 6.155%, 11/5/2035 (a)(b) | | | 2,500,000 | | | | 2,431,068 | |
HomeBanc Mortgage Trust, Series 2005-1, Class A1, 1.256%, 3/25/2035 (a) | | | 17,482,215 | | | | 15,581,794 | |
HomeBanc Mortgage Trust, Series 2005-3, Class A1, 1.011%, 7/25/2035 (a)(e) | | | 8,153,144 | | | | 7,960,755 | |
HomeBanc Mortgage Trust, Series 2005-4, Class A1, 1.041%, 10/25/2035 (a) | | | 13,918,867 | | | | 13,475,481 | |
HomeBanc Mortgage Trust, Series 2005-4, Class A2, 1.101%, 10/25/2035 (a) | | | 2,867,594 | | | | 2,816,806 | |
HomeBanc Mortgage Trust, Series 2005-5, Class A1, 1.031%, 1/25/2036 (a) | | | 4,813,446 | | | | 4,321,079 | |
HomeBanc Mortgage Trust, Series 2006-2, Class A2, 0.991%, 12/25/2036 (a) | | | 5,551,564 | | | | 5,011,197 | |
IMPAC CMB Trust, Series 2004-6, Class 1A2, 1.536%, 10/25/2034 (a) | | | 6,955,188 | | | | 6,568,821 | |
IMPAC CMB Trust, Series 2004-10, Class 3A1, 1.456%, 3/25/2035 (a) | | | 166,765 | | | | 155,318 | |
IMPAC CMB Trust, Series 2005-4, Class 1A1A, 1.311%, 5/25/2035 (a) | | | 325,645 | | | | 305,535 | |
IMPAC CMB Trust, Series 2005-3, Class A1, 1.251%, 8/25/2035 (a) | | | 13,789,828 | | | | 12,554,562 | |
IMPAC CMB Trust, Series 2005-5, Class A4, 1.516%, 8/25/2035 (a) | | | 5,894,343 | | | | 5,104,996 | |
IMPAC CMB Trust, Series 2005-6, Class 1A2, 1.051%, 10/25/2035 (a) | | | 5,038,964 | | | | 4,295,026 | |
IMPAC CMB Trust, Series 2005-6, Class 1A1, 1.271%, 10/25/2035 (a) | | | 19,776,548 | | | | 17,207,653 | |
IMPAC CMB Trust, Series 2005-7, Class A2, 1.051%, 11/25/2035 (a) | | | 4,644,234 | | | | 3,899,146 | |
IMPAC CMB Trust, Series 2005-7, Class A1, 1.291%, 11/25/2035 (a)(e) | | | 38,859,919 | | | | 33,000,815 | |
IMPAC CMB Trust, Series 2007-A, Class A, 1.021%, 5/25/2037 (a)(b) | | | 2,664,715 | | | | 2,548,736 | |
IMPAC Secured Assets CMN Owner Trust, Series 2005-2, Class A2C, 1.051%, 3/25/2036 (a) | | | 4,966,303 | | | | 3,653,337 | |
IMPAC Secured Assets CMN Owner Trust, Series 2005-2, Class A2D, 1.201%, 3/25/2036 (a) | | | 1,645,370 | | | | 1,221,904 | |
IMPAC Secured Assets Trust, Series 2007-1, Class A2, 0.916%, 3/25/2037 (a) | | | 5,735,427 | | | | 4,811,404 | |
IMPAC Secured Assets Trust, Series 2006-2, Class 1A2B, 0.941%, 8/25/2036 (a) | | | 12,248,096 | | | | 10,158,852 | |
IMPAC Secured Assets Trust, Series 2006-2, Class 1A2C, 1.051%, 8/25/2036 (a) | | | 7,197,173 | | | | 5,505,291 | |
IMPAC Secured Assets Trust, Series 2006-4, Class A1, 0.946%, 1/25/2037 (a) | | | 15,998,557 | | | | 12,134,329 | |
IMPAC Secured Assets Trust, Series 2007-2, Class 1A1C, 1.136%, 5/25/2037 (a) | | | 13,704,551 | | | | 10,543,637 | |
IndyMac Index Mortgage Loan Trust, Series 2004-AR8, Class 2A2A, 1.571%, 11/25/2034 (a) | | | 1,054,488 | | | | 893,757 | |
IndyMac Index Mortgage Loan Trust, Series 2005-AR4, Class AX2, 1.701%, 3/25/2035 (a)(c) | | | 42,239,966 | | | | 2,114,068 | |
IndyMac Index Mortgage Loan Trust, Series 2005-AR12, Class AX2, 2.122%, 7/25/2035 (a)(c) | | | 52,100,998 | | | | 4,259,100 | |
IndyMac Index Mortgage Loan Trust, Series 2005-AR15, Class A1, 3.070%, 9/25/2035 (a)(e) | | | 16,577,362 | | | | 14,419,586 | |
IndyMac Index Mortgage Loan Trust, Series 2005-AR1, Class 3A1, 3.204%, 11/25/2035 (a) | | | 3,434,052 | | | | 3,263,734 | |
IndyMac Index Mortgage Loan Trust, Series 2005-AR1, Class 2A1, 3.396%, 11/25/2035 (a) | | | 536,278 | | | | 490,417 | |
IndyMac Index Mortgage Loan Trust, Series 2006-AR9, Class 3A3, 2.982%, 6/25/2036 (a) | | | 1,700,588 | | | | 1,657,202 | |
IndyMac Index Mortgage Loan Trust, Series 2006-AR19, Class 3A1, 3.344%, 8/25/2036 (a) | | | 6,373,613 | | | | 5,652,675 | |
IndyMac Index Mortgage Loan Trust, Series 2006-AR27, Class 2A2, 0.956%, 10/25/2036 (a) | | | 9,226,870 | | | | 8,199,015 | |
IndyMac Index Mortgage Loan Trust, Series 2006-AR29, Class A2, 0.836%, 11/25/2036 (a) | | | 507,935 | | | | 433,101 | |
IndyMac Index Mortgage Loan Trust, Series 2007-AR5, Class 2A1, 3.174%, 5/25/2037 (a) | | | 890,430 | | | | 709,609 | |
IndyMac Index Mortgage Loan Trust, Series 2007-AR5, Class 1A1, 3.231%, 5/25/2037 (a) | | | 2,997,855 | | | | 1,858,811 | |
IndyMac Index Mortgage Loan Trust, Series 2007-AR13, Class 4A1, 2.994%, 7/25/2037 (a) | | | 6,059,950 | | | | 4,462,953 | |
IndyMac Index Mortgage Loan Trust, Series 2006-AR13, Class A1, 3.262%, 7/25/2037 (a) | | | 626,895 | | | | 557,858 | |
See accompanying notes which are an integral part of these financial statements.
24
Angel Oak Multi-Strategy Income Fund
Schedule of Investments – (continued)
January 31, 2017
| | | | | | | | |
| | | Principal
Amount | | | Value | |
Collateralized Mortgage Obligations – (continued) | | | | | | | | |
IndyMac Index Mortgage Loan Trust, Series 2007-FLX5, Class 2A1, 0.951%, 8/25/2037 (a) | | $ | 7,414,332 | | | $ | 6,436,230 | |
IndyMac Index Mortgage Loan Trust, Series 2007-AR7, Class 1A1, 3.249%, 11/25/2037 (a) | | | 4,395,012 | | | | 4,175,662 | |
IndyMac Index Mortgage Loan Trust, Series 2006-AR12, Class A1, 0.961%, 9/25/2046 (a) | | | 8,613,563 | | | | 7,419,878 | |
Jefferies Resecuritization Trust, Series 2009-R2, Class 5A, 3.575%, 1/26/2036 (a)(b) | | | 2,289,444 | | | | 2,199,075 | |
JPMBB Commercial Mortgage Securities Trust, Series 2014-C19, Class C, 4.667%, 4/15/2047 (a) | | | 5,000,000 | | | | 5,088,710 | |
JPMBB Commercial Mortgage Securities Trust, Series 2014-C23, Class RIM, 4.304%, 9/15/2047 (b) | | | 5,000,000 | | | | 4,643,030 | |
JPMBB Commercial Mortgage Securities Trust, Series 2014-C22, Class D, 4.560%,
9/15/2047 (a)(b) | | | 8,000,000 | | | | 6,585,336 | |
JPMBB Commercial Mortgage Securities Trust, Series 2014-C24, Class D, 3.925%,
11/15/2047 (a)(b) | | | 3,660,000 | | | | 3,033,126 | |
JPMBB Commercial Mortgage Securities Trust, Series 2015-C31, Class C, 4.618%, 8/15/2048 (a) | | | 10,000,000 | | | | 9,406,610 | |
JPMorgan Alternative Loan Trust, Series 2006-A2, Class 1A4, 1.041%, 5/25/2036 (a) | | | 3,340,963 | | | | 2,760,083 | |
JPMorgan Chase Commercial Mortgage Securities Trust, Series 2016-WPT, Class D, 4.517%, 10/15/2033 (a)(b) | | | 3,000,000 | | | | 3,045,000 | |
JPMorgan Chase Commercial Mortgage Securities Corp., Series 2012-LC9, Class E, 4.412%, 12/15/2047 (a)(b) | | | 4,000,000 | | | | 3,803,612 | |
JPMorgan Chase Commercial Mortgage Securities Trust, Series 2014-INN, Class E, 4.368%, 6/15/2029 (a)(b) | | | 1,000,000 | | | | 1,000,111 | |
JPMorgan Chase Commercial Mortgage Securities Trust, Series 2014-INMZ, Class M, 6.996%, 6/15/2029 (Acquired 10/30/2015, Cost $4,989,331) (a)(b)(d) | | | 5,000,000 | | | | 5,053,230 | |
JPMorgan Chase Commercial Mortgage Securities Trust, Series 2014-FL6, Class B, 3.048%, 11/15/2031 (a)(b) | | | 1,300,000 | | | | 1,313,390 | |
JPMorgan Chase Commercial Mortgage Securities Trust, Series 2005-CB12, Class B, 5.277%, 9/12/2037 (a) | | | 10,000,000 | | | | 8,564,230 | |
JPMorgan Chase Commercial Mortgage Securities Trust, Series 2007-CB18, Class AJ, 5.502%, 6/12/2047 (a) | | | 10,000,000 | | | | 8,310,370 | |
JPMorgan Chase Commercial Mortgage Securities Trust, Series 2007-LDPX, Class AM, 5.464%, 1/15/2049 (a) | | | 3,000,000 | | | | 2,995,821 | |
JPMorgan Chase Commercial Mortgage Securities Trust, Series 2016-JP2, Class A4, 2.822%, 8/15/2049 (a) | | | 6,820,000 | | | | 6,636,808 | |
JPMorgan Chase Commercial Mortgage Securities Trust, Series 2007-LD12, Class B, 6.044%, 2/15/2051 (a) | | | 4,357,000 | | | | 4,360,520 | |
JPMorgan Mortgage Trust, Series 2005-A6, Class 7A1, 3.162%, 8/25/2035 (a) | | | 27,474 | | | | 26,830 | |
JPMorgan Mortgage Trust, Series 2005-A8, Class 3A1, 3.094%, 11/25/2035 (a) | | | 412,883 | | | | 384,897 | |
JPMorgan Mortgage Trust, Series 2005-A8, Class 1A1, 3.132%, 11/25/2035 (a) | | | 989,167 | | | | 926,824 | |
JPMorgan Mortgage Trust, Series 2005-S3, Class 1A14, 5.500%, 1/25/2036 | | | 3,312,911 | | | | 3,105,158 | |
JPMorgan Mortgage Trust, Series 2006-A1, Class 2A2, 3.066%, 2/25/2036 (a) | | | 526,176 | | | | 483,577 | |
JPMorgan Mortgage Trust, Series 2006-A5, Class 2A1, 3.172%, 8/25/2036 (a) | | | 501,745 | | | | 447,599 | |
JPMorgan Mortgage Trust, Series 2006-A6, Class 3A2, 3.058%, 10/25/2036 (a) | | | 795,179 | | | | 698,366 | |
JPMorgan Mortgage Trust, Series 2006-A6, Class 2A4L, 3.145%, 10/25/2036 (a) | | | 2,338,213 | | | | 2,172,448 | |
JPMorgan Mortgage Trust, Series 2007-A4, Class 3A3, 4.613%, 6/25/2037 (a) | | | 5,004,597 | | | | 4,547,943 | |
JPMorgan Resecuritization Trust, Series 2010-6, Class 3A8, 3.032%, 3/26/2034 (a)(b) | | | 1,271,819 | | | | 1,136,880 | |
LB-UBS Commercial Mortgage Trust, Series 2008-C1, Class AJ, 6.120%, 4/15/2041 (a) | | | 4,023,765 | | | | 2,064,537 | |
Lehman XS Trust, Series 2005-5N, Class 3A1A, 1.056%, 11/25/2035 (a) | | | 3,948,101 | | | | 3,471,182 | |
LSTAR Securities Investment Ltd., Series 2017-1, Class A, 2.766%, 1/1/2022 (a)(b) | | | 5,000,000 | | | | 4,998,960 | |
LSTAR Securities Investment Trust, Series 2016-5, Class A1, 3.771%, 11/1/2021 (a)(b) | | | 3,798,504 | | | | 3,776,841 | |
Luminent Mortgage Trust, Series 2007-1, Class 1A1, 0.916%, 11/25/2036 (a) | | | 6,394,722 | | | | 5,415,760 | |
Luminent Mortgage Trust, Series 2006-7, Class 2A1, 0.926%, 12/25/2036 (a) | | | 14,276,955 | | | | 12,341,985 | |
See accompanying notes which are an integral part of these financial statements.
25
Angel Oak Multi-Strategy Income Fund
Schedule of Investments – (continued)
January 31, 2017
| | | | | | | | |
| | | Principal
Amount | | | Value | |
Collateralized Mortgage Obligations – (continued) | | | | | | | | |
Luminent Mortgage Trust, Series 2006-6, Class A1, 0.971%, 10/25/2046 (a)(e) | | $ | 27,297,589 | | | $ | 23,727,746 | |
MASTR Adjustable Rate Mortgages Trust, Series 2003-3, Class 3AX, 0.399%, 9/25/2033 (a)(c) | | | 6,039,326 | | | | 108,835 | |
MASTR Adjustable Rate Mortgages Trust, Series 2004-15, Class 2A2, 3.543%, 12/25/2034 (a) | | | 31,664 | | | | 30,432 | |
MASTR Adjustable Rate Mortgages Trust, Series 2005-1, Class 9A1, 2.981%, 1/25/2035 (a) | | | 483,682 | | | | 479,022 | |
MASTR Adjustable Rate Mortgages Trust, Series 2005-2, Class 5A1, 3.049%, 3/25/2035 (a) | | | 2,126,886 | | | | 2,124,655 | |
MASTR Adjustable Rate Mortgages Trust, Series 2005-6, Class 7A1, 3.068%, 6/25/2035 (a) | | | 1,244,134 | | | | 1,170,444 | |
MASTR Adjustable Rate Mortgages Trust, Series 2005-7, Class 2A1, 3.053%, 9/25/2035 (a) | | | 3,163,700 | | | | 2,822,185 | |
MASTR Adjustable Rate Mortgages Trust, Series 2005-8, Class 3A1, 3.437%, 12/25/2035 (a) | | | 19,349,662 | | | | 17,319,069 | |
MASTR Adjustable Rate Mortgages Trust, Series 2007-2, Class A1, 0.921%, 3/25/2047 (a) | | | 2,444,522 | | | | 2,205,587 | |
MASTR Alternative Loan Trust, Series 2006-2, Class 1A2, 6.000%, 3/25/2036 | | | 1,017,305 | | | | 946,621 | |
MASTR Asset Securitization Trust, Series 2005-2, Class 1A6, 5.250%, 11/25/2035 | | | 49,061 | | | | 44,087 | |
MASTR Resecuritization Trust, Series 2008-3, Class A1, 1.191%, 8/25/2037 (a)(b) | | | 13,422,144 | | | | 9,922,293 | |
Merrill Lynch Alternative Note Asset Trust, Series 2007-OAR3, Class A1, 0.946%, 7/25/2047 (a) | | | 4,752,992 | | | | 3,981,330 | |
Merrill Lynch Alternative Note Asset Trust, Series 20007-OAR5, Class X, 0.800%, 10/25/2047 (a)(c) | | | 190,752,850 | | | | 6,617,407 | |
Merrill Lynch Mortgage Investors Trust, Series 2005-A7, Class 2A1, 3.329%, 9/25/2035 (a) | | | 14,716,837 | | | | 13,721,007 | |
Merrill Lynch Mortgage Investors Trust, Series 2005-2, Class 1A, 2.543%, 10/25/2035 (a) | | | 7,029,088 | | | | 7,017,083 | |
Merrill Lynch-CFC Commercial Mortgage Trust, Series 2006-1, Class B, 5.872%, 2/12/2039 (a) | | | 231,136 | | | | 230,075 | |
ML-CFC Commercial Mortgage Trust, Series 2007-7, Class AM, 5.739%, 6/12/2050 (a) | | | 1,000,000 | | | | 995,485 | |
Morgan Stanley Bank of America Merrill Lynch Trust, Series 2014-C14, Class D, 4.830%, 2/15/2047 (a)(b) | | | 5,000,000 | | | | 4,481,695 | |
Morgan Stanley Bank of America Merrill Lynch Trust, Series 2014-C15, Class D, 4.894%, 4/15/2047 (a)(b) | | | 5,000,000 | | | | 4,561,550 | |
Morgan Stanley Bank of America Merrill Lynch Trust, Series 2014-C16, Class D, 4.756%, 6/15/2047 (a)(b) | | | 10,000,000 | | | | 8,407,260 | |
Morgan Stanley Bank of America Merrill Lynch Trust, Series 2014-C17, Class C, 4.452%, 8/15/2047 (a)(h) | | | 10,000,000 | | | | 10,225,050 | |
Morgan Stanley Bank of America Merrill Lynch Trust, Series 2015-C22, Class D, 4.242%, 4/15/2048 (a)(b) | | | 3,000,000 | | | | 2,483,907 | |
Morgan Stanley Bank of America Merrill Lynch Trust, Series 2015-C24, Class C, 4.353%, 5/15/2048 (a) | | | 3,500,000 | | | | 3,342,945 | |
Morgan Stanley Bank of America Merrill Lynch Trust, Series 2016-C29, Class C, 4.753%, 5/15/2049 (a) | | | 10,400,000 | | | | 10,644,046 | |
Morgan Stanley Capital I Trust, Series 2017-PRME, Class A, 1.670%, 2/15/2034 (a)(b) | | | 2,250,000 | | | | 2,253,121 | |
Morgan Stanley Capital I Trust, Series 2016-PSQ, Class C, 3.954%, 1/10/2038 (a)(b) | | | 5,000,000 | | | | 4,722,360 | |
Morgan Stanley Capital I Trust, Series 2007-HQ11, Class D, 5.587%, 2/12/2044 (a) | | | 6,000,000 | | | | 5,585,586 | |
Morgan Stanley Capital I Trust, Series 2007-IQ13, Class AJ, 5.438%, 3/15/2044 (e) | | | 10,000,000 | | | | 8,430,620 | |
Morgan Stanley Capital I Trust, Series 2007-IQ14, Class AM, 5.707%, 4/15/2049 (a)(e) | | | 10,000,000 | | | | 9,874,770 | |
Morgan Stanley Capital I Trust, Series 2007-IQ14, Class AMFX, 5.707%, 4/15/2049 (a)(e) | | | 4,700,000 | | | | 4,641,142 | |
Morgan Stanley Capital I Trust, Series 2007-IQ16, Class AJFX, 6.093%, 12/12/2049 (a) | | | 2,000,000 | | | | 1,886,672 | |
Morgan Stanley Mortgage Loan Trust, Series 2005-3AR, Class 3A, 2.936%, 7/25/2035 (a) | | | 1,973,920 | | | | 1,713,635 | |
Morgan Stanley Mortgage Loan Trust, Series 2005-3AR, Class 1A, 3.423%, 7/25/2035 (a)(e) | | | 17,388,411 | | | | 14,589,607 | |
Morgan Stanley Mortgage Loan Trust, Series 2005-9AR, Class 1A, 1.061%, 12/25/2035 (a) | | | 3,678,820 | | | | 2,969,132 | |
Morgan Stanley Mortgage Loan Trust, Series 2005-11AR, Class A1, 1.051%, 1/25/2036 (a) | | | 1,665,266 | | | | 1,238,610 | |
Morgan Stanley Mortgage Loan Trust, Series 2006-3AR, Class 1A1, 1.006%, 3/25/2036 (a) | | | 7,532,463 | | | | 6,033,759 | |
Morgan Stanley Mortgage Loan Trust, Series 2006-3AR, Class 1A3, 1.016%, 3/25/2036 (a) | | | 4,551,415 | | | | 3,679,132 | |
Morgan Stanley Mortgage Loan Trust, Series 2006-3AR, Class 1AX, 3.182%, 3/25/2036 (a)(c) | | | 56,604,030 | | | | 6,670,219 | |
Morgan Stanley Mortgage Loan Trust, Series 2006-3AR, Class 2A1, 3.276%, 3/25/2036 (a)(h) | | | 16,263,886 | | | | 13,515,029 | |
Morgan Stanley Mortgage Loan Trust, Series 2006-3AR, Class 2A3, 3.276%, 3/25/2036 (a) | | | 3,865,568 | | | | 3,256,037 | |
See accompanying notes which are an integral part of these financial statements.
26
Angel Oak Multi-Strategy Income Fund
Schedule of Investments – (continued)
January 31, 2017
| | | | | | | | |
| | | Principal
Amount | | | Value | |
Collateralized Mortgage Obligations – (continued) | | | | | | | | |
Morgan Stanley Mortgage Loan Trust, Series 2007-11AR, Class 2A5, 2.209%, 6/25/2037 (a) | | $ | 1,189,888 | | | $ | 771,894 | |
Morgan Stanley Mortgage Loan Trust, Series 2007-11AR, Class 2A3, 2.848%, 6/25/2037 (a) | | | 3,160,475 | | | | 2,167,517 | |
Morgan Stanley Mortgage Loan Trust, Series 2007-15AR, Class 2A1, 3.094%, 11/25/2037 (a) | | | 12,012,411 | | | | 10,646,876 | |
Morgan Stanley Mortgage Loan Trust, Series 2007-6XS, Class 2A5S, 6.000%, 2/25/2047 (a) | | | 4,610,992 | | | | 3,299,045 | |
Morgan Stanley Re-REMIC Trust, Series 2010-R6, Class 4B, 0.946%, 2/26/2037 (a)(b) | | | 13,089,631 | | | | 11,062,832 | |
Morgan Stanley Resecuritization Trust, Series 2015-R4, Class CB3, 0.598%, 8/26/2047 (a)(b) | | | 1,010,309 | | | | 665,407 | |
Morgan Stanley Resecuritization Trust, Series 2015-R4, Class CB2, 0.598%, 8/26/2047 (a)(b) | | | 5,146,000 | | | | 3,715,005 | |
MortgageIT Securities Corp. Mortgage Loan Trust, Series 2007-2, Class A1, 1.271%, 9/25/2037 (a) | | | 17,521,880 | | | | 15,933,136 | |
MortgageIT Securities Corp. Mortgage Loan Trust, Series 2007-1, Class 2A12, 0.921%, 6/25/2047 (a) | | | 6,109,469 | | | | 4,660,926 | |
MortgageIT Securities Corp. Mortgage Loan Trust, Series 2007-1, Class 2A14, 1.051%, 6/25/2047 (a) | | | 5,616,408 | | | | 4,181,157 | |
MortgageIT Trust, Series 2006-1, Class 1A2, 0.971%, 4/25/2036 (a) | | | 5,745,175 | | | | 4,412,145 | |
MortgageIT Trust, Series 2006-1, Class 2A1A, 0.981%, 4/25/2036 (a) | | | 6,299,218 | | | | 5,373,800 | |
Motel 6 Trust, Series 2015-M6MZ, Class M, 8.230%, 2/5/2020 (b) | | | 4,956,687 | | | | 5,030,220 | |
Motel 6 Trust, Series 2015-MTL6, Class F, 5.000%, 2/5/2030 (b) | | | 5,000,000 | | | | 4,849,810 | |
MSCG Trust, Series 2016-SNR, Class C, 5.205%, 11/15/2034 (b) | | | 5,000,000 | | | | 5,041,115 | |
Nomura Asset Acceptance Corp. Alternative Loan Trust, Series 2005-AR4, Class 3A1, 3.553%, 8/25/2035 (a) | | | 5,170,448 | | | | 5,069,738 | |
Nomura Asset Acceptance Corp. Alternative Loan Trust, Series 2006-AR1, Class 2A1, 3.638%, 2/25/2036 (a) | | | 1,560,443 | | | | 1,287,628 | |
Nomura Asset Acceptance Corp. Alternative Loan Trust, Series 2006-AR3, Class A1A, 0.931%, 10/25/2036 (a) | | | 2,728,203 | | | | 2,178,339 | |
Nomura Asset Acceptance Corp. Alternative Loan Trust, Series 2006-AR4, Class A3, 0.941%, 12/25/2036 (a) | | | 395,642 | | | | 329,582 | |
Nomura Resecuritization Trust, Series 2014-6R, Class 3A2, 1.016%, 1/26/2036 (a)(b) | | | 7,037,372 | | | | 5,787,816 | |
Nomura Resecuritization Trust, Series 2015-2R, Class 3A1, 1.003%, 11/26/2036 (a)(b) | | | 3,052,816 | | | | 2,911,336 | |
OCP CLO Ltd., Series 2012-2A, Class ER, 9.183%, 11/22/2025 (a)(b) | | | 3,000,000 | | | | 3,027,282 | |
PHH Alternative Mortgage Trust, Series 2007-1, Class 1A1, 0.931%, 2/25/2037 (a) | | | 5,273,053 | | | | 4,398,623 | |
PHH Alternative Mortgage Trust, Series 2007-2, Class 1A3, 1.101%, 5/25/2037 (a) | | | 5,259,877 | | | | 4,912,541 | |
PHH Alternative Mortgage Trust, Series 2007-2, Class 2A5, 1.306%, 5/25/2037 (a) | | | 10,099,710 | | | | 6,918,544 | |
PHH Alternative Mortgage Trust, Series 2007-2, Class 2A2, 6.000%, 5/25/2037 | | | 1,317,193 | | | | 1,182,388 | |
Prime Mortgage Trust, Series 2005-4, Class 2A4, 1.256%, 10/25/2035 (a) | | | 81,227 | | | | 74,306 | |
RAIT Trust, Series 2015-FL5, Class A, 2.867%, 1/15/2031 (a)(b) | | | 889,836 | | | | 894,284 | |
RAIT Trust, Series 2015-FL4, Class B, 3.067%, 12/15/2031 (a)(b) | | | 491,609 | | | | 492,073 | |
RAIT Trust, Series 2015-FL4, Class D, 5.017%, 12/15/2031 (a)(b) | | | 2,949,513 | | | | 3,019,900 | |
Residential Accredit Loans, Inc. Trust, Series 2005-QA4, Class A31, 3.510%, 4/25/2035 (a) | | | 6,781,598 | | | | 6,317,947 | |
Residential Accredit Loans, Inc. Trust, Series 2005-QS7, Class A1, 5.500%, 6/25/2035 | | | 5,084,490 | | | | 4,684,386 | |
Residential Accredit Loans, Inc. Trust, Series 2005-QS11, Class A2, 1.256%, 7/25/2035 (a) | | | 631,743 | | | | 527,848 | |
Residential Accredit Loans, Inc. Trust, Series 2005-QA7, Class A22, 3.496%, 7/25/2035 (a) | | | 4,974,494 | | | | 4,561,347 | |
Residential Accredit Loans, Inc. Trust, Series 2005-QA8, Class CB21, 3.764%, 7/25/2035 (a) | | | 783,326 | | | | 642,328 | |
Residential Accredit Loans, Inc. Trust, Series 2005-QS12, Class A10, 2.106%, 8/25/2035 (a) | | | 8,238,682 | | | | 6,419,746 | |
Residential Accredit Loans, Inc. Trust, Series 2005-QS12, Class A3, 5.500%, 8/25/2035 | | | 2,050,450 | | | | 1,930,523 | |
Residential Accredit Loans, Inc. Trust, Series 2005-QS12, Class A4, 5.500%, 8/25/2035 | | | 12,645,495 | | | | 11,412,041 | |
Residential Accredit Loans, Inc. Trust, Series 2005-QS13, Class 1A1, 1.156%, 9/25/2035 (a) | | | 337,200 | | | | 237,614 | |
Residential Accredit Loans, Inc. Trust, Series 2005-QS14, Class 2A1, 6.000%, 9/25/2035 | | | 12,479,745 | | | | 9,362,941 | |
Residential Accredit Loans, Inc. Trust, Series 2005-QS16, Class A1, 1.456%, 11/25/2035 (a) | | | 1,403,837 | | | | 1,029,839 | |
Residential Accredit Loans, Inc. Trust, Series 2005-QA13, Class 2A1, 4.080%, 12/25/2035 (a) | | | 11,180,357 | | | | 10,142,104 | |
See accompanying notes which are an integral part of these financial statements.
27
Angel Oak Multi-Strategy Income Fund
Schedule of Investments – (continued)
January 31, 2017
| | | | | | | | |
| | | Principal
Amount | | | Value | |
Collateralized Mortgage Obligations – (continued) | | | | | | | | |
Residential Accredit Loans, Inc. Trust, Series 2005-QS17, Class A10, 6.000%, 12/25/2035 | | $ | 3,248,103 | | | $ | 2,886,829 | |
Residential Accredit Loans, Inc. Trust, Series 2006-QS1, Class A5, 1.666%, 1/25/2036 (a) | | | 14,287,408 | | | | 10,734,558 | |
Residential Accredit Loans, Inc. Trust, Series 2006-QS2, Class 1A10, 1.256%, 2/25/2036 (a) | | | 11,908,180 | | | | 8,180,670 | |
Residential Accredit Loans, Inc. Trust, Series 2006-QS2, Class 1A2, 1.256%, 2/25/2036 (a) | | | 1,201,471 | | | | 832,988 | |
Residential Accredit Loans, Inc. Trust, Series 2006-QS2, Class 1A14, 1.456%, 2/25/2036 (a) | | | 11,223,880 | | | | 7,854,168 | |
Residential Accredit Loans, Inc. Trust, Series 2006-QS2, Class 1A5, 1.756%, 2/25/2036 (a) | | | 2,027,442 | | | | 1,452,162 | |
Residential Accredit Loans, Inc. Trust, Series 2006-QS2, Class 1A9, 5.500%, 2/25/2036 | | | 4,045,423 | | | | 3,515,104 | |
Residential Accredit Loans, Inc. Trust, Series 2006-QS3, Class 1A8, 1.156%, 3/25/2036 (a) | | | 4,971,666 | | | | 3,699,546 | |
Residential Accredit Loans, Inc. Trust, Series 2006-QS3, Class 1A1, 1.456%, 3/25/2036 (a) | | | 9,215,092 | | | | 6,720,179 | |
Residential Accredit Loans, Inc. Trust, Series 2006-QS3, Class 1A14, 6.000%, 3/25/2036 | | | 4,733,205 | | | | 4,252,354 | |
Residential Accredit Loans, Inc. Trust, Series 2006-QA4, Class A, 0.936%, 5/25/2036 (a) | | | 4,179,747 | | | | 3,614,770 | |
Residential Accredit Loans, Inc. Trust, Series 2006-QS5, Class A1, 6.000%, 5/25/2036 | | | 3,139,304 | | | | 2,686,475 | |
Residential Accredit Loans, Inc. Trust, Series 2006-QS5, Class A9, 6.000%, 5/25/2036 | | | 4,485,221 | | | | 3,800,140 | |
Residential Accredit Loans, Inc. Trust, Series 2006-QS7, Class A1, 6.000%, 6/25/2036 | | | 2,721,055 | | | | 2,283,351 | |
Residential Accredit Loans, Inc. Trust, Series 2006-QS7, Class A3, 6.000%, 6/25/2036 | | | 3,369,633 | | | | 2,842,481 | |
Residential Accredit Loans, Inc. Trust, Series 2006-QA5, Class 1A2, 0.936%, 7/25/2036 (a) | | | 2,806,264 | | | | 1,812,131 | |
Residential Accredit Loans, Inc. Trust, Series 2006-QS9, Class 1A8, 1.406%, 7/25/2036 (a) | | | 3,043,590 | | | | 1,997,611 | |
Residential Accredit Loans, Inc. Trust, Series 2006-QS9, Class 1A10, 6.500%, 7/25/2036 | | | 4,377,264 | | | | 3,762,009 | |
Residential Accredit Loans, Inc. Trust, Series 2006-QA7, Class 1A1, 0.946%, 8/25/2036 (a) | | | 16,992,273 | | | | 14,877,007 | |
Residential Accredit Loans, Inc. Trust, Series 2006-QS10, Class A5, 1.056%, 8/25/2036 (a) | | | 2,405,344 | | | | 1,516,600 | |
Residential Accredit Loans, Inc. Trust, Series 2006-QS10, Class A4, 5.750%, 8/25/2036 | | | 418,460 | | | | 334,239 | |
Residential Accredit Loans, Inc. Trust, Series 2006-QS8, Class A1, 6.000%, 8/25/2036 | | | 5,950,590 | | | | 4,991,301 | |
Residential Accredit Loans, Inc. Trust, Series 2006-QS10, Class A1, 6.000%, 8/25/2036 | | | 4,563,135 | | | | 3,803,638 | |
Residential Accredit Loans, Inc. Trust, Series 2006-QS11, Class 1A8, 6.000%, 8/25/2036 | | | 6,463,332 | | | | 5,188,821 | |
Residential Accredit Loans, Inc. Trust, Series 2006-QS10, Class A10, 6.000%, 8/25/2036 | | | 591,784 | | | | 497,621 | |
Residential Accredit Loans, Inc. Trust, Series 2006-QS10, Class A15, 6.000%, 8/25/2036 | | | 772,463 | | | | 627,746 | |
Residential Accredit Loans, Inc. Trust, Series 2006-QS12, Class 2A18, 5.750%, 9/25/2036 | | | 819,705 | | | | 671,235 | |
Residential Accredit Loans, Inc. Trust, Series 2006-QS12, Class 2A4, 6.000%, 9/25/2036 | | | 8,278,807 | | | | 7,025,710 | |
Residential Accredit Loans, Inc. Trust, Series 2006-QS14, Class A15, 1.056%, 11/25/2036 (a) | | | 4,606,640 | | | | 2,904,054 | |
Residential Accredit Loans, Inc. Trust, Series 2006-QS16, Class A10, 6.000%, 11/25/2036 | | | 3,221,223 | | | | 2,598,174 | |
Residential Accredit Loans, Inc. Trust, Series 2006-QS14, Class A13, 6.500%, 11/25/2036 | | | 2,418,275 | | | | 2,064,503 | |
Residential Accredit Loans, Inc. Trust, Series 2006-QS14, Class A1, 6.500%, 11/25/2036 | | | 1,245,849 | | | | 1,045,899 | |
Residential Accredit Loans, Inc. Trust, Series 2006-QA11, Class A1, 0.926%, 12/25/2036 (a) | | | 352,926 | | | | 286,010 | |
Residential Accredit Loans, Inc. Trust, Series 2006-QA10, Class A2, 0.936%, 12/25/2036 (a) | | | 1,356,020 | | | | 1,152,193 | |
Residential Accredit Loans, Inc. Trust, Series 2006-QA10, Class A1, 0.941%, 12/25/2036 (a) | | | 5,575,781 | | | | 4,839,884 | |
Residential Accredit Loans, Inc. Trust, Series 2006-QS17, Class A7, 6.000%, 12/25/2036 | | | 6,545,282 | | | | 5,525,076 | |
Residential Accredit Loans, Inc. Trust, Series 2006-QS17, Class A6, 6.250%, 12/25/2036 | | | 15,254,077 | | | | 13,154,521 | |
Residential Accredit Loans, Inc. Trust, Series 2007-QS1, Class 1A5, 1.306%, 1/25/2037 (a) | | | 2,308,854 | | | | 1,540,797 | |
Residential Accredit Loans, Inc. Trust, Series 2007-QS1, Class 2A10, 6.000%, 1/25/2037 | | | 4,675,488 | | | | 3,740,886 | |
Residential Accredit Loans, Inc. Trust, Series 2007-QS2, Class A4, 6.250%, 1/25/2037 | | | 2,621,833 | | | | 2,159,984 | |
Residential Accredit Loans, Inc. Trust, Series 2007-QS3, Class AP, 0.000%, 2/25/2037 | | | 1,336,644 | | | | 684,766 | |
Residential Accredit Loans, Inc. Trust, Series 2007-QS3, Class AV, 0.341%, 2/25/2037 (a)(c) | | | 66,552,629 | | | | 1,030,967 | |
Residential Accredit Loans, Inc. Trust, Series 2007-QS5, Class AP, 0.000%, 3/25/2037 | | | 750,822 | | | | 425,838 | |
Residential Accredit Loans, Inc. Trust, Series 2007-QS4, Class 3A4, 6.000%, 3/25/2037 | | | 7,624,708 | | | | 6,583,684 | |
Residential Accredit Loans, Inc. Trust, Series 2007-QS6, Class AP, 0.000%, 4/25/2037 | | | 1,289,008 | | | | 759,049 | |
Residential Accredit Loans, Inc. Trust, Series 2007-QS6, Class A1, 1.101%, 4/25/2037 (a) | | | 6,498,562 | | | | 4,097,389 | |
Residential Accredit Loans, Inc. Trust, Series 2007-QA3, Class A1, 0.856%, 5/25/2037 (a) | | | 3,133,062 | | | | 2,465,967 | |
Residential Accredit Loans, Inc. Trust, Series 2007-QA3, Class A3, 0.946%, 5/25/2037 (a) | | | 19,895,949 | | | | 16,955,149 | |
Residential Accredit Loans, Inc. Trust, Series 2007-QS7, Class 1A1, 6.000%, 5/25/2037 | | | 18,944,334 | | | | 17,078,639 | |
See accompanying notes which are an integral part of these financial statements.
28
Angel Oak Multi-Strategy Income Fund
Schedule of Investments – (continued)
January 31, 2017
| | | | | | | | |
| | | Principal
Amount | | | Value | |
Collateralized Mortgage Obligations – (continued) | | | | | | | | |
Residential Accredit Loans, Inc. Trust, Series 2007-QS8, Class A13, 6.000%, 6/25/2037 | | $ | 1,670,925 | | | $ | 1,401,420 | |
Residential Accredit Loans, Inc. Trust, Series 2007-QS9, Class AP, 0.000%, 7/25/2037 | | | 2,765,063 | | | | 1,537,522 | |
Residential Accredit Loans, Inc. Trust, Series 2007-QS10, Class A1, 6.500%, 9/25/2037 | | | 6,213,367 | | | | 5,537,794 | |
Residential Accredit Loans, Inc. Trust, Series 2006-QO9, Class AXP, 0.250%, 12/25/2046 (a)(c) | | | 116,109,082 | | | | 1,371,480 | |
Residential Asset Securitization Trust, Series 2004-A9, Class A4, 5.250%, 12/25/2034 | | | 6,939,859 | | | | 6,975,162 | |
Residential Asset Securitization Trust, Series 2005-A3, Class AX, 0.308%, 4/25/2035 (a)(c) | | | 35,716,833 | | | | 518,823 | |
Residential Asset Securitization Trust, Series 2005-A4, Class A1, 1.221%, 4/25/2035 (a) | | | 5,338,462 | | | | 4,192,828 | |
Residential Asset Securitization Trust, Series 2005-A10, Class A3, 5.500%, 9/25/2035 | | | 3,798,462 | | | | 3,283,839 | |
Residential Asset Securitization Trust, Series 2005-A11, Class 1AX, 0.305%, 10/25/2035 (a)(c) | | | 44,986,079 | | | | 661,925 | |
Residential Asset Securitization Trust, Series 2005-A11, Class 1A1, 1.221%, 10/25/2035 (a) | | | 4,402,588 | | | | 3,583,324 | |
Residential Asset Securitization Trust, Series 2005-A11, Class 1A3, 5.500%, 10/25/2035 | | | 4,040,968 | | | | 3,681,128 | |
Residential Asset Securitization Trust, Series 2005-A12, Class A10, 1.206%, 11/25/2035 (a) | | | 1,823,546 | | | | 1,400,693 | |
Residential Asset Securitization Trust, Series 2005-A14, Class A3, 5.500%, 12/25/2035 | | | 1,123,254 | | | | 891,397 | |
Residential Funding Mortgage Securities Trust, Series 2005-SA5, Class 2A, 3.746%, 11/25/2035 (a) | | | 684,007 | | | | 637,366 | |
Residential Funding Mortgage Securities Trust, Series 2006-SA1, Class 1A1, 3.741%, 2/25/2036 (a) | | | 2,853,558 | | | | 2,715,800 | |
Residential Funding Mortgage Securities Trust, Series 2006-S6, Class A14, 6.000%, 7/25/2036 | | | 376,662 | | | | 358,111 | |
Residential Funding Mortgage Securities Trust, Series 2006-S7, Class A7, 6.250%, 8/25/2036 | | | 178,603 | | | | 165,941 | |
Residential Funding Mortgage Securities Trust, Series 2006-S10, Class 1A3, 6.000%, 10/25/2036 | | | 1,536,080 | | | | 1,405,716 | |
Residential Funding Mortgage Securities Trust, Series 2007-S1, Class A7, 6.000%, 1/25/2037 | | | 4,781,726 | | | | 4,348,745 | |
Residential Funding Mortgage Securities Trust, Series 2007-S6, Class 2A5, 1.256%, 6/25/2037 (a) | | | 2,967,753 | | | | 2,387,456 | |
Sequoia Mortgage Trust, Series 2004-7, Class A3B, 2.310%, 8/20/2034 (a) | | | 139,793 | | | | 136,079 | |
Sequoia Mortgage Trust, Series 2007-3, Class 2AA1, 3.102%, 7/20/2037 (a) | | | 829,675 | | | | 694,819 | |
Sequoia Mortgage Trust, Series 2007-2, Class 2AA1, 3.202%, 1/20/2038 (a) | | | 1,209,750 | | | | 1,037,039 | |
Sequoia Mortgage Trust, Series 2014-3, Class AI01, 0.250%, 10/25/2044 (b)(c) | | | 8,195,357 | | | | 54,191 | |
Sequoia Mortgage Trust, Series 2007-1, Class 5A1, 3.254%, 10/20/2046 (a) | | | 7,393,233 | | | | 6,547,891 | |
Sequoia Mortgage Trust, Series 2007-1, Class 2A1, 2.985%, 2/20/2047 (a) | | | 1,293,994 | | | | 1,163,064 | |
SG Commercial Mortgage Securities Trust, Series 2016-C5, Class C, 4.846%, 10/10/2048 (a) | | | 4,000,000 | | | | 3,984,072 | |
Station Place Securitization Trust, Series 2016-1, Class C, 3.771%, 2/25/2017 (a) | | | 15,000,000 | | | | 15,000,000 | |
Structured Adjustable Rate Mortgage Loan Trust, Series 2005-1, Class 4A2, 3.041%, 2/25/2035 (a) | | | 503,442 | | | | 476,583 | |
Structured Adjustable Rate Mortgage Loan Trust, Series 2005-1, Class 5A2, 3.055%, 2/25/2035 (a) | | | 1,088,063 | | | | 1,027,125 | |
Structured Adjustable Rate Mortgage Loan Trust, Series 2005-1, Class 1A1, 3.083%, 2/25/2035 (a) | | | 5,806,004 | | | | 5,489,785 | |
Structured Adjustable Rate Mortgage Loan Trust, Series 2005-4, Class 5A, 3.223%, 3/25/2035 (a) | | | 2,996,413 | | | | 2,884,952 | |
Structured Adjustable Rate Mortgage Loan Trust, Series 2005-9, Class AX, 0.902%, 5/25/2035 (a)(c) | | | 81,266,940 | | | | 1,912,292 | |
Structured Adjustable Rate Mortgage Loan Trust, Series 2005-17, Class 5A1, 3.004%, 8/25/2035 (a) | | | 6,456,347 | | | | 5,864,216 | |
Structured Adjustable Rate Mortgage Loan Trust, Series 2005-17, Class 3A1, 3.081%, 8/25/2035 (a) | | | 57,046 | | | | 54,362 | |
Structured Adjustable Rate Mortgage Loan Trust, Series 2005-18, Class 6A1, 3.087%, 9/25/2035 (a) | | | 1,763,804 | | | | 1,665,373 | |
Structured Adjustable Rate Mortgage Loan Trust, Series 2005-18, Class 7A3, 3.319%, 9/25/2035 (a) | | | 17,249,361 | | | | 15,007,134 | |
See accompanying notes which are an integral part of these financial statements.
29
Angel Oak Multi-Strategy Income Fund
Schedule of Investments – (continued)
January 31, 2017
| | | | | | | | |
| | | Principal
Amount | | | Value | |
Collateralized Mortgage Obligations – (continued) | | | | | | | | |
Structured Adjustable Rate Mortgage Loan Trust, Series 2007-4, Class 1A2, 0.976%, 5/25/2037 (a) | | $ | 10,177,613 | | | $ | 8,843,440 | |
Structured Adjustable Rate Mortgage Loan Trust, Series 2007-8, Class 1A2, 2.271%, 9/25/2037 (a) | | | 2,436,999 | | | | 2,098,585 | |
Structured Asset Mortgage Investments II Trust, Series 2004-AR7, Class X, 0.876%, 4/19/2035 (a)(c) | | | 26,800,310 | | | | 782,810 | |
Structured Asset Mortgage Investments II Trust, Series 2006-AR7, Class A1BG, 0.876%, 8/25/2036 (a) | | | 10,114,740 | | | | 8,384,674 | |
Structured Asset Mortgage Investments II Trust, Series 2007-AR6, Class A1, 2.096%,
8/25/2047 (a)(e) | | | 21,895,177 | | | | 18,947,452 | |
Structured Asset Securities Corp. Mortgage Pass-Through Certificates, Series 2003-6A, Class 2A1, 3.148%, 3/25/2033 (a) | | | 61,943 | | | | 59,914 | |
Structured Asset Securities Corp. Trust, Series 2005-10, Class 5A4, 5.750%, 12/25/2034 | | | 395,530 | | | | 373,826 | |
Structured Asset Securities Corp. Trust, Series 2005-17, Class 5A1, 5.500%, 10/25/2035 | | | 8,700,948 | | | | 7,126,729 | |
Thornburg Mortgage Securities Trust, Series 2006-4, Class A2C, 3.168%, 7/25/2036 (a) | | | 3,572,013 | | | | 1,190,277 | |
UBS-Barclays Commercial Mortgage Trust, Series 2012-C3, Class C, 4.958%, 8/10/2049 (a)(b) | | | 2,000,000 | | | | 2,106,730 | |
UBS-Barclays Commercial Mortgage Trust, Series 2012-C2, Class F, 4.885%, 5/10/2063 (a)(b) | | | 7,000,000 | | | | 5,054,175 | |
Wachovia Bank Commercial Mortgage Trust, Series 2007-C30, Class AJ, 5.413%, 12/15/2043 (a) | | | 15,000,000 | | | | 15,150,165 | |
Wachovia Bank Commercial Mortgage Trust, Series 2006-C26, Class AJ, 6.107%, 6/15/2045 (a) | | | 7,705,000 | | | | 5,747,398 | |
Wachovia Bank Commercial Mortgage Trust, Series 2006-C28, Class B, 5.672%, 10/15/2048 (a) | | | 7,250,000 | | | | 7,077,341 | |
Wachovia Bank Commercial Mortgage Trust, Series 2007-C32, Class B, 5.716%, 6/15/2049 (a)(g) | | | 8,500,000 | | | | 7,607,500 | |
Wachovia Bank Commercial Mortgage Trust, Series 2007-C33, Class B, 5.965%, 2/15/2051 (a) | | | 5,000,000 | | | | 4,918,830 | |
Wachovia Bank Commercial Mortgage Trust, Series 2007-C33, Class D, 5.965%, 2/15/2051 (a) | | | 2,000,000 | | | | 1,832,138 | |
Wachovia Mortgage Loan Trust LLC, Series 2006-AMN1, Class A2, 0.906%, 8/25/2036 (a) | | | 34,616,494 | | | | 22,853,325 | |
Wachovia Mortgage Loan Trust LLC, Series 2006-AMN1, Class A3, 0.996%, 8/25/2036 (a) | | | 4,136,261 | | | | 2,751,267 | |
Wachovia Mortgage Loan Trust LLC, Series 2006-ALT1, Class A1, 0.836%, 1/25/2037 (a) | | | 3,164,332 | | | | 2,161,131 | |
Wachovia Mortgage Loan Trust LLC, Series 2006-ALT1, Class A2, 0.936%, 1/25/2037 (a) | | | 5,352,856 | | | | 3,716,568 | |
Washington Mutual Mortgage Pass-Through Certificates Trust, Series 2003-S12, Class 3A, 5.000%, 11/25/2018 | | | 217,787 | | | | 217,485 | |
Washington Mutual Mortgage Pass-Through Certificates Trust, Series 2005-AR4, Class A5, 2.792%, 4/25/2035 (a) | | | 2,466,017 | | | | 2,505,367 | |
Washington Mutual Mortgage Pass-Through Certificates Trust, Series 2005-AR18, Class 3A1, 2.635%, 1/25/2036 (a) | | | 4,923,411 | | | | 4,831,698 | |
Washington Mutual Mortgage Pass-Through Certificates Trust, Series 2006-AR12, Class 1A4, 2.851%, 10/25/2036 (a) | | | 7,273,151 | | | | 6,693,612 | |
Washington Mutual Mortgage Pass-Through Certificates Trust, Series 2006-AR14, Class 2A2, 2.631%, 11/25/2036 (a) | | | 435,670 | | | | 377,440 | |
Washington Mutual Mortgage Pass-Through Certificates Trust, Series 2007-HY3, Class 3A3, 3.871%, 3/25/2037 (a) | | | 2,025,981 | | | | 1,853,965 | |
Washington Mutual Mortgage Pass-Through Certificates Trust, Series 2007-HY7, Class 2A1, 2.616%, 7/25/2037 (a) | | | 765,210 | | | | 617,648 | |
Washington Mutual Mortgage Pass-Through Certificates Trust, Series 2005-AR8, Class X, 1.539%, 7/25/2045 (a)(c) | | | 43,653,208 | | | | 2,168,560 | |
Washington Mutual Mortgage Pass-Through Certificates Trust, Series 2005-AR11, Class X, 1.437%, 8/25/2045 (a)(c) | | | 82,430,765 | | | | 4,082,136 | |
Washington Mutual Mortgage Pass-Through Certificates Trust, Series 2005-AR19, Class A1B2, 1.166%, 12/25/2045 (a) | | | 218,050 | | | | 198,488 | |
Washington Mutual Mortgage Pass-Through Certificates Trust, Series 2006-AR1, Class 2A1A, 1.666%, 1/25/2046 (a) | | | 3,720,376 | | | | 3,639,469 | |
Washington Mutual Mortgage Pass-Through Certificates Trust, Series 2006-AR10, Class 3A2, 5.997%, 8/25/2046 (a) | | | 158,763 | | | | 142,851 | |
See accompanying notes which are an integral part of these financial statements.
30
Angel Oak Multi-Strategy Income Fund
Schedule of Investments – (continued)
January 31, 2017
| | | | | | | | |
| | | Principal
Amount | | | Value | |
Collateralized Mortgage Obligations – (continued) | | | | | | | | |
Washington Mutual Mortgage Pass-Through Certificates Trust, Series 2006-AR13, Class 2A, 2.103%, 10/25/2046 (a) | | $ | 2,634,508 | | | $ | 2,420,715 | |
Washington Mutual Mortgage Pass-Through Certificates WMALT Trust, Series 2005-3, Class 1CB3, 1.206%, 5/25/2035 (a) | | | 5,057,480 | | | | 3,768,622 | |
Washington Mutual Mortgage Pass-Through Certificates WMALT Trust, Series 2005-4, Class CB9, 1.156%, 6/25/2035 (a) | | | 162,611 | | | | 123,565 | |
Washington Mutual Mortgage Pass-Through Certificates WMALT Trust, Series 2005-AR1, Class A1A, 1.016%, 12/25/2035 (a) | | | 8,025,486 | | | | 6,765,581 | |
Washington Mutual Mortgage Pass-Through Certificates WMALT Trust, Series 2005-10, Class 4CB1, 5.750%, 12/25/2035 | | | 684,447 | | | | 639,051 | |
Washington Mutual Mortgage Pass-Through Certificates WMALT Trust, Series 2005-11, Class A2, 5.750%, 1/25/2036 | | | 4,927,932 | | | | 4,405,911 | |
Washington Mutual Mortgage Pass-Through Certificates WMALT Trust, Series 2006-8, Class A1, 0.876%, 10/25/2036 (a) | | | 16,358,623 | | | | 9,080,737 | |
Washington Mutual Mortgage Pass-Through Certificates WMALT Trust, Series 2006-8, Class A5, 4.563%, 10/25/2036 (a) | | | 11,561,400 | | | | 7,440,616 | |
Washington Mutual Mortgage Pass-Through Certificates WMALT Trust, Series 2007-HY1, Class A2A, 0.916%, 2/25/2037 (a) | | | 11,682,179 | | | | 9,278,068 | |
Washington Mutual Mortgage Pass-Through Certificates WMALT Trust, Series 2007-HY1, Class A3A, 0.986%, 2/25/2037 (a) | | | 11,755,631 | | | | 9,189,941 | |
Washington Mutual Mortgage Pass-Through Certificates WMALT Trust, Series 2007-OC2, Class A3, 1.066%, 6/25/2037 (a) | | | 3,336,193 | | | | 2,973,405 | |
Washington Mutual Mortgage Pass-Through Certificates WMALT Trust, Series 2006-AR3, Class A1A, 1.566%, 5/25/2046 (a) | | | 16,850,683 | | | | 13,125,250 | |
Washington Mutual Mortgage Pass-Through Certificates WMALT Trust, Series 2006-AR8, Class 3X1, 0.945%, 10/25/2046 (a)(c) | | | 32,376,967 | | | | 1,390,332 | |
Washington Mutual Mortgage Pass-Through Certificates WMALT Trust, Series 2006-AR8, Class 2A, 1.446%, 10/25/2046 (a)(e) | | | 20,048,262 | | | | 15,839,771 | |
Washington Mutual Mortgage Pass-Through Certificates WMALT Trust, Series 2007-OA3, Class 2A, 1.346%, 2/25/2047 (a) | | | 5,923,780 | | | | 4,573,567 | |
Wells Fargo Alternative Loan Trust, Series 2007-PA1, Class A8, 1.296%, 3/25/2037 (a) | | | 7,981,534 | | | | 6,268,026 | |
Wells Fargo Alternative Loan Trust, Series 2007-PA6, Class A1, 3.160%, 12/28/2037 (a) | | | 561,667 | | | | 528,380 | |
Wells Fargo Commercial Mortgage Trust, Series 2016-BNK1, Class C, 3.071%, 8/15/2049 | | | 2,000,000 | | | | 1,845,588 | |
Wells Fargo Commercial Mortgage Trust, Series 2015-NXS2, Class A5, 3.767%, 7/15/2058 (a) | | | 6,000,000 | | | | 6,259,734 | |
Wells Fargo Commercial Mortgage Trust, Series 2016-LC25, Class C, 4.437%, 12/15/2059 (a) | | | 8,000,000 | | | | 7,776,136 | |
Wells Fargo Mortgage Backed Securities Trust, Series 2005-2, Class 2A1, 4.750%, 4/25/2020 | | | 6,696 | | | | 6,729 | |
Wells Fargo Mortgage Backed Securities Trust, Series 2003-L, Class 1A4, 2.885%, 11/25/2033 (a) | | | 20,815 | | | | 21,206 | |
Wells Fargo Mortgage Backed Securities Trust, Series 2005-AR2, Class 2A5, 3.039%, 3/25/2035 (a) | | | 153,931 | | | | 155,042 | |
Wells Fargo Mortgage Backed Securities Trust, Series 2005-AR16, Class 7A2, 3.082%, 10/25/2035 (a) | | | 377,946 | | | | 89,231 | |
Wells Fargo Mortgage Backed Securities Trust, Series 2005-8, Class A1, 5.500%, 10/25/2035 | | | 12,880 | | | | 13,161 | |
Wells Fargo Mortgage Backed Securities Trust, Series 2006-AR11, Class A1, 3.033%, 8/25/2036 (a) | | | 1,105,748 | | | | 1,017,466 | |
Wells Fargo Mortgage Backed Securities Trust, Series 2006-AR14, Class 1A3, 3.062%, 10/25/2036 (a) | | | 2,938,823 | | | | 2,862,684 | |
Wells Fargo Mortgage Backed Securities Trust, Series 2007-10, Class 2A5, 6.250%, 7/25/2037 | | | 5,777 | | | | 5,551 | |
Wells Fargo Mortgage Backed Securities Trust, Series 2007-15, Class A1, 6.000%, 11/25/2037 | | | 1,996,161 | | | | 1,896,800 | |
WFCG Commercial Mortgage Trust, Series 2015-BXRP, Class G, 3.787%, 11/15/2029 (a)(b) | | | 6,427,417 | | | | 6,123,664 | |
See accompanying notes which are an integral part of these financial statements.
31
Angel Oak Multi-Strategy Income Fund
Schedule of Investments – (continued)
January 31, 2017
| | | | | | | | |
| | | Principal
Amount | | | Value | |
Collateralized Mortgage Obligations – (continued) | | | | | | | | |
WF-RBS Commercial Mortgage Trust, Series 2011-C4, Class E, 5.248%, 6/15/2044 (a)(b) | | $ | 8,704,568 | | | $ | 8,801,615 | |
WF-RBS Commercial Mortgage Trust, Series 2013-C14, Class D, 3.997%, 6/15/2046 (a)(b) | | | 8,470,000 | | | | 8,040,351 | |
WF-RBS Commercial Mortgage Trust, Series 2013-C17, Class D, 5.124%, 12/15/2046 (a)(b) | | | 5,000,000 | | | | 4,867,370 | |
WF-RBS Commercial Mortgage Trust, Series 2014-C20, Class C, 4.513%, 5/15/2047 (a) | | | 5,000,000 | | | | 5,088,345 | |
| | | | | | | | |
| | |
TOTAL COLLATERALIZED MORTGAGE OBLIGATIONS –
(Cost $2,963,720,919) | | | | | | | 2,910,392,617 | |
| | | | | | | | |
Corporate Obligations – 6.32% | | | | | | | | |
Financial – 6.32% | | | | | | | | |
Atlantic Capital Bancshares, Inc., 6.250%, 9/30/2025 (b) | | | 3,000,000 | | | | 3,110,562 | |
Avidbank Holdings, Inc., 6.875%, 11/15/2025 (a)(b) | | | 8,000,000 | | | | 8,122,664 | |
Banc of California, Inc., 5.250%, 4/15/2025 | | | 7,250,000 | | | | 7,117,332 | |
Bank of Commerce Holdings, 6.875%, 12/10/2025 (a)(b) | | | 9,000,000 | | | | 9,090,000 | |
Brand Group Holdings, Inc., 8.500%, 6/27/2024 (b) | | | 10,000,000 | | | | 10,213,640 | |
Cadence Financial Corp., 6.500%, 3/11/2025 (a)(b) | | | 11,000,000 | | | | 10,232,849 | |
Capital Bancorp, Inc., 6.950%, 12/1/2025
(Acquired 11/16/2015 through 03/09/2016, Cost $6,239,123) (a)(d) | | | 6,250,000 | | | | 6,396,637 | |
ConnectOne Bancorp, Inc., 5.750%, 7/1/2025 (a) | | | 10,750,000 | | | | 11,054,064 | |
Empire Bancorp, Inc., 7.375%, 12/17/2025
(Acquired 12/16/2015, Cost $7,500,000) (d) | | | 7,500,000 | | | | 7,558,882 | |
EverBank Financial Corp., 6.000%, 3/15/2026 (a) | | | 5,000,000 | | | | 5,236,030 | |
EverBank Financial Corp., 5.750%, 7/2/2025 | | | 2,000,000 | | | | 2,039,104 | |
Fidelity Bank, 5.875%, 5/31/2030 (a) | | | 16,000,000 | | | | 16,436,944 | |
Financial Institutions, Inc., 6.000%, 4/15/2030 (a) | | | 4,500,000 | | | | 4,559,706 | |
First Midwest Bancorp, Inc., 5.875%, 9/29/2026 | | | 8,500,000 | | | | 8,816,574 | |
First NBC Bank Holding Co., 5.750%, 2/18/2025 | | | 13,500,000 | | | | 12,082,500 | |
First Priority Bank, 7.000%, 11/30/2025 (b) | | | 6,000,000 | | | | 6,046,194 | |
Franklin Financial Network, Inc., 6.875%, 3/30/2026 (a) | | | 1,250,000 | | | | 1,346,060 | |
Franklin Financial Network, Inc., 7.000%, 7/1/2026 (a) | | | 2,000,000 | | | | 2,066,288 | |
Great Southern Bancorp, Inc., 5.250%, 8/15/2026 (a) | | | 3,256,000 | | | | 3,348,916 | |
Jeff Davis Bancshares, Inc., 6.750%, 1/15/2027 (b) | | | 5,000,000 | | | | 5,000,000 | |
Lakeland Bancorp, Inc., 5.125%, 9/30/2026 (a) | | | 2,900,000 | | | | 2,918,647 | |
Luther Burbank Corp., 6.500%, 9/30/2024 | | | 21,450,000 | | | | 23,640,217 | |
Marquis Bancorp, Inc., 7.000%, 10/30/2026 | | | 4,000,000 | | | | 4,000,000 | |
Metropolitan Bancgroup, Inc., 6.500%, 7/1/2026 | | | 2,500,000 | | | | 2,508,160 | |
Midland States Bancorp, Inc., 6.500%, 6/18/2025 | | | 15,000,000 | | | | 15,080,085 | |
NexBank Capital, Inc., 5.500%, 3/16/2026 | | | 5,000,000 | | | | 5,032,580 | |
Noah Bank, 9.000%, 4/17/2025
(Acquired 04/15/2015 through 03/09/2016, Cost $4,518,689) (d) | | | 4,500,000 | | | | 4,555,912 | |
Oconomowoc Bancshares, Inc., 6.875%, 11/17/2025 (b) | | | 7,500,000 | | | | 7,591,553 | |
Old Second Bancorp, Inc., 5.750%, 12/31/2026 (a) | | | 1,300,000 | | | | 1,333,558 | |
Opus Bank, 5.500%, 7/1/2026 (a) | | | 1,750,000 | | | | 1,771,023 | |
Pinnacle Financial Partners, Inc., 5.250%, 11/16/2026 (a)(b) | | | 2,000,000 | | | | 2,027,500 | |
Plaza Bancorp, 7.125%, 6/26/2025 (b) | | | 5,000,000 | | | | 5,061,465 | |
Preferred Bank, 6.000%, 6/15/2026 (a) | | | 4,938,000 | | | | 5,178,728 | |
RBB Bancorp, 6.500%, 3/31/2026 | | | 6,000,000 | | | | 6,097,242 | |
Revere Bank, 5.625%, 9/30/2026 (a) | | | 6,500,000 | | | | 6,543,622 | |
Southern National Bancorp of Virginia, Inc., 5.875%, 1/31/2027 (b) | | | 2,000,000 | | | | 2,000,000 | |
See accompanying notes which are an integral part of these financial statements.
32
Angel Oak Multi-Strategy Income Fund
Schedule of Investments – (continued)
January 31, 2017
| | | | | | | | |
| | | Principal
Amount | | | Value | |
Corporate Obligations – (continued) | | | | | | | | |
Financial – (continued) | | | | | | | | |
Southside Bancshares, Inc., 5.500%, 9/30/2026 (a) | | $ | 3,000,000 | | | $ | 3,134,409 | |
Sterling Bancorp, Inc., 7.000%, 4/15/2026 (a) | | | 6,750,000 | | | | 6,794,010 | |
Synovus Financial Corp., 5.750%, 12/15/2025 (a) | | | 11,610,000 | | | | 12,225,330 | |
Tri-County Financial Group, Inc., 7.000%, 10/15/2026 | | | 7,500,000 | | | | 7,550,340 | |
Union Bankshares Corp., 5.000%, 12/15/2026 (a) | | | 3,300,000 | | | | 3,397,004 | |
United Financial Bancorp, Inc., 5.750%, 10/1/2024 | | | 13,700,000 | | | | 14,003,811 | |
USAmeriBancorp, Inc., 6.250%, 4/1/2026 | | | 1,000,000 | | | | 1,025,930 | |
Your Community Bank, 6.250%, 12/15/2025 (a) | | | 2,000,000 | | | | 2,080,472 | |
| | | | | | | | |
| | |
TOTAL CORPORATE OBLIGATIONS –
(Cost $280,439,181) | | | | | | | 285,426,544 | |
| | | | | | | | |
| | |
Investment Companies – 0.23% | | | Shares | | | | | |
Affiliated Mutual Funds – 0.23% | | | | | | | | |
Angel Oak High Yield Opportunities Fund | | | 894,010 | | | | 10,629,784 | |
| | | | | | | | |
| | |
TOTAL INVESTMENT COMPANIES –
(Cost $10,284,062) | | | | | | | 10,629,784 | |
| | | | | | | | |
| | |
Mortgage Backed Securities – U.S. Government Agency Issues – 4.18% | |
| Principal
Amount |
| | | | |
Federal Home Loan Mortgage Corp., Series KJ08, Class A2, 2.356%, 8/25/2022 | | $ | 1,000,000 | | | | 996,006 | |
Federal Home Loan Mortgage Corp., Series KJ11, Class A2, 2.932%, 1/25/2023 | | | 4,000,000 | | | | 4,079,828 | |
Federal Home Loan Mortgage Corp., Series 2016-KF14, Class B, 9.424%, 1/25/2023 (a)(b) | | | 8,081,160 | | | | 9,483,063 | |
Federal Home Loan Mortgage Corp., Series K724, Class A2, 3.062%, 11/25/2023 (a) | | | 3,500,000 | | | | 3,609,851 | |
Federal Home Loan Mortgage Corp., Series KJ10, Class A2, 2.912%, 12/25/2023 | | | 2,032,000 | | | | 2,065,280 | |
Federal Home Loan Mortgage Corp., Series 2014-DN1, Class M3, 5.256%, 2/25/2024 (a) | | | 8,052,000 | | | | 8,868,046 | |
Federal Home Loan Mortgage Corp., Series 2014-HQ2, Class M2, 2.971%, 9/25/2024 (a) | | | 7,000,000 | | | | 7,183,113 | |
Federal Home Loan Mortgage Corp., Series 2015-K44, Class C, 3.685%, 1/25/2025 (a)(b) | | | 5,000,000 | | | | 4,317,500 | |
Federal Home Loan Mortgage Corp., Series 2015-DN1, Class M3, 4.921%, 1/25/2025 (a) | | | 5,000,000 | | | | 5,354,250 | |
Federal Home Loan Mortgage Corp., Series 2015-HQ1, Class M3, 4.571%, 3/25/2025 (a) | | | 1,650,000 | | | | 1,759,558 | |
Federal Home Loan Mortgage Corp., Series 2016-KSW1, Class B, 2.802%, 2/25/2026 (a)(b) | | | 8,816,500 | | | | 9,414,603 | |
Federal Home Loan Mortgage Corp., Series 2016-KF21, Class B, 6.021%, 7/25/2026 (a)(b) | | | 3,386,000 | | | | 3,445,739 | |
Federal Home Loan Mortgage Corp., Series K061, Class A2, 3.347%, 11/25/2026 | | | 4,000,000 | | | | 4,142,472 | |
Federal Home Loan Mortgage Corp., Series 2015-HQA1, Class M2, 3.406%, 3/25/2028 (a) | | | 2,613,471 | | | | 2,674,631 | |
Federal Home Loan Mortgage Corp., Series 2015-DNA3, Class M2, 3.621%, 4/25/2028 (a) | | | 3,000,000 | | | | 3,108,762 | |
Federal Home Loan Mortgage Corp., Series 2015-HQA2, Class M2, 3.571%, 5/25/2028 (a) | | | 3,243,585 | | | | 3,328,726 | |
Federal Home Loan Mortgage Corp., Series 2016-DNA1, Class M1, 2.221%, 7/25/2028 (a) | | | 1,246,462 | | | | 1,252,502 | |
Federal Home Loan Mortgage Corp., Series 2016-HQA1, Class M2, 3.506%, 9/25/2028 (a) | | | 5,000,000 | | | | 5,182,880 | |
Federal Home Loan Mortgage Corp., Series 2016-HQA2, Class M1, 1.956%, 11/25/2028 (a) | | | 3,109,844 | | | | 3,137,587 | |
Federal Home Loan Mortgage Corp., Series 2016-HQA2, Class M3, 5.906%, 11/25/2028 (a) | | | 5,000,000 | | | | 5,577,975 | |
Federal Home Loan Mortgage Corp., Series 2016-DNA3, Class M1, 1.871%, 12/25/2028 (a) | | | 3,177,331 | | | | 3,191,741 | |
Federal Home Loan Mortgage Corp., Series 2016-DNA3, Class M2, 2.771%, 12/25/2028 (a) | | | 2,734,000 | | | | 2,779,207 | |
Federal Home Loan Mortgage Corp., Series 2016-HQA3, Class M2, 2.106%, 3/26/2029 (a) | | | 2,261,074 | | | | 2,268,269 | |
Federal Home Loan Mortgage Corp., Series 2016-HQA4, Class M2, 2.056%, 4/25/2029 (a) | | | 4,500,000 | | | | 4,476,244 | |
Federal Home Loan Mortgage Corp., Series 2017-DNA1, Class M1, 1.979%, 7/25/2029 (a) | | | 1,500,000 | | | | 1,500,000 | |
Federal Home Loan Mortgage Corp., Series 2016-K723, Class B, 3.582%, 10/25/2039 (a) | | | 10,000,000 | | | | 9,466,740 | |
Federal Home Loan Mortgage Corp., Series 2016-K58, Class B, 3.739%, 9/25/2049 (a)(b) | | | 10,000,000 | | | | 9,339,270 | |
See accompanying notes which are an integral part of these financial statements.
33
Angel Oak Multi-Strategy Income Fund
Schedule of Investments – (continued)
January 31, 2017
| | | | | | | | |
| | | Principal
Amount | | | Value | |
Mortgage Backed Securities – U.S. Government Agency Issues – (continued) | | | | | | | | |
Federal National Mortgage Association, Series 2015-M4, Class ABV2, 2.369%, 7/25/2022 | | $ | 2,101,417 | | | $ | 2,091,208 | |
Federal National Mortgage Association, Series 2016-M13, Class FA, 1.225%, 11/25/2023 (a) | | | 2,998,675 | | | | 3,008,892 | |
Federal National Mortgage Association, Series 2014-C03, Class 1M2, 3.771%, 7/25/2024 (a) | | | 5,000,000 | | | | 5,104,080 | |
Federal National Mortgage Association, Series 2014-C04, Class 2M2, 5.756%, 11/25/2024 (a) | | | 4,889,609 | | | | 5,330,255 | |
Federal National Mortgage Association, Series 2016-M11, Class A1, 2.080%, 7/25/2026 | | | 4,572,588 | | | | 4,469,600 | |
Federal National Mortgage Association, Series 2015-C04, Class 2M2, 6.321%, 4/25/2028 (a) | | | 4,000,000 | | | | 4,413,648 | |
Federal National Mortgage Association, Series 2016-C03, Class 1M2, 6.056%, 10/25/2028 (a) | | | 2,000,000 | | | | 2,181,984 | |
Federal National Mortgage Association, Series 2016-C05, Class 2M1, 2.106%, 1/25/2029 (a) | | | 4,831,632 | | | | 4,882,229 | |
Federal National Mortgage Association, Series 2016-C04, Class 1M1, 2.206%, 1/25/2029 (a) | | | 4,856,736 | | | | 4,893,122 | |
Federal National Mortgage Association, Series 2016-C04, Class 1M2, 5.021%, 1/25/2029 (a) | | | 5,000,000 | | | | 5,302,925 | |
Federal National Mortgage Association, Series 2016-C05, Class 2M2, 5.206%, 1/25/2029 (a) | | | 6,500,000 | | | | 6,908,668 | |
Federal National Mortgage Association, Series 2016-C06, Class 1M1, 2.056%, 4/25/2029 (a) | | | 6,900,933 | | | | 6,971,391 | |
Federal National Mortgage Association, Series 2016-C06, Class 1M2, 5.006%, 4/25/2029 (a) | | | 5,000,000 | | | | 5,308,015 | |
Federal National Mortgage Association, Series 2015-22, Class IN, 3.000%, 3/25/2044 (c) | | | 12,048,729 | | | | 1,441,281 | |
Government National Mortgage Association, Series 2012-20, Class CI, 3.500%, 4/20/2035 (c) | | | 7,550,439 | | | | 453,902 | |
Government National Mortgage Association, Series 2012-7, Class PI, 3.500%, 1/20/2038 (c) | | | 7,345,235 | | | | 390,399 | |
Government National Mortgage Association, Series 2014-118, Class HI, 4.000%, 3/20/2040 (c) | | | 6,797,590 | | | | 830,951 | |
Government National Mortgage Association, Series 2014-55, Class IO, 3.500%, 8/20/2041 (c) | | | 14,802,194 | | | | 1,406,801 | |
Government National Mortgage Association, Series 2013-37, Class IQ, 4.000%, 2/20/2043 (c) | | | 1,751,116 | | | | 242,192 | |
Government National Mortgage Association, Series 2014-11, Class IO, 3.500%, 1/20/2044 (c) | | | 7,881,677 | | | | 1,323,286 | |
| | | | | | | | |
| | |
TOTAL MORTGAGE BACKED SECURITIES – U.S. GOVERNMENT AGENCY ISSUES –
(Cost $184,618,240) | | | | | | | 188,958,672 | |
| | | | | | | | |
| | |
Preferred Stocks – 0.08% | | | Shares | | | | | |
Financial – 0.08% | | | | | | | | |
Morgan Stanley | | | 130,497 | | | | 2,963,587 | |
Wells Fargo & Co. | | | 23,990 | | | | 575,520 | |
| | | | | | | | |
TOTAL PREFERRED STOCKS –
(Cost $3,481,416) | | | | | | | 3,539,107 | |
| | | | | | | | |
Short Term Investments – 6.31% | | | | | | | | |
Money Market Funds – 6.31% | | | | | | | | |
Fidelity Institutional Money Market Government Portfolio, Institutional Class, 0.43% (i) | | | 285,007,714 | | | | 285,007,714 | |
| | | | | | | | |
| | |
TOTAL SHORT TERM INVESTMENTS –
(Cost $285,007,714) | | | | | | | 285,007,714 | |
| | | | | | | | |
| | |
TOTAL INVESTMENTS – 104.90% –
(Cost $4,789,944,598) | | | | | | | 4,738,033,454 | |
| | | | | | | | |
| | |
Liabilities in Excess of Other Assets – (4.90%) | | | | | | | (221,430,636 | ) |
| | | | | | | | |
| | |
NET ASSETS – 100.00% | | | | | | $ | 4,516,602,818 | |
| | | | | | | | |
| (a) | Variable or Floating Rate Security. Rate disclosed as of January 31, 2017. |
| (b) | Security exempt from registration under Rule 144A or Section 4(a)(2) of the Securities Act of 1933. The security may be resold in transactions exempt from registration, normally to qualified institutional buyers. These securities are determined to be liquid by the Adviser, under the procedures established by the Fund’s Board of Trustees, unless otherwise denoted. At January 31, 2017, the value of these securities amounted to $1,261,045,178 or 27.92% of net assets. |
See accompanying notes which are an integral part of these financial statements.
34
Angel Oak Multi-Strategy Income Fund
Schedule of Investments – (continued)
January 31, 2017
| (c) | Interest Only Security. |
| (d) | Illiquid security. At January 31, 2017, the value of these securities amounted to $88,099,700 or 1.95% of net assets. |
| (e) | All or a portion of the security has been pledged as collateral in connection with open credit agreements. At January 31, 2017, the value of securities pledged amounted to $516,077,386. |
| (f) | Security exempt from registration under Regulation S of the Securities Act of 1933. Such securities are treated as liquid securities according to the Fund’s liquidity guidelines. At January 31, 2017, the value of these securities amounted to $500,194 or 0.01% of net assets. |
| (g) | As of January 31, 2017, the Fund has fair valued this security. The value of these securities amounted to $10,418,254 or 0.23% of net assets. |
| (h) | All or a portion of the security has been pledged as collateral in connection with open reverse repurchase agreements. At January 31, 2017, the value of securities pledged amounted to $23,740,079. |
| (i) | Rate disclosed is the seven day yield as of January 31, 2017. |
| (j) | See Note 5 to the Financial Statements. |
Schedule of Open Futures Contracts
| | | | | | | | | | | | | | | | |
Futures Contracts | | Expiration
Month | | | Number of
Contracts | | | Notional
Value | | | Unrealized
Appreciation /
(Depreciation) | |
90 Day Euro$ Future | | | March 2017 | | | | (524 | ) | | $ | (129,591,750 | ) | | $ | 201,841 | |
90 Day Euro$ Future | | | September 2017 | | | | (414 | ) | | | (102,097,575 | ) | | | 55,476 | |
5 Year ERIS Aged Standard Swap Future | | | September 2020 | | | | 787 | | | | 75,717,034 | | | | (5,772 | ) |
5 Year ERIS Aged Standard Swap Future | | | December 2020 | | | | 661 | | | | 64,740,389 | | | | 1,808,353 | |
5 Year ERIS Aged Standard Swap Future | | | March 2021 | | | | 52 | | | | 5,117,611 | | | | (9,838 | ) |
5 Year ERIS Aged Standard Swap Future | | | June 2021 | | | | 119 | | | | 11,765,661 | | | | 327,214 | |
5 Year ERIS Aged Standard Swap Future | | | December 2021 | | | | 83 | | | | 8,481,936 | | | | 144,709 | |
7 Year ERIS Aged Standard Swap Future | | | December 2022 | | | | 212 | | | | 20,642,949 | | | | (19,318 | ) |
7 Year ERIS Aged Standard Swap Future | | | June 2023 | | | | 215 | | | | 21,515,502 | | | | 518,976 | |
7 Year ERIS Aged Standard Swap Future | | | September 2023 | | | | 16 | | | | 1,583,422 | | | | 67,392 | |
10 Year ERIS Aged Standard Swap Future | | | June 2024 | | | | 6 | | | | 513,864 | | | | 37,212 | |
10 Year ERIS Aged Standard Swap Future | | | December 2024 | | | | 951 | | | | 84,955,112 | | | | (4,670,121 | ) |
10 Year ERIS Aged Standard Swap Future | | | March 2025 | | | | 18 | | | | 1,619,838 | | | | 10,557 | |
10 Year ERIS Aged Standard Swap Future | | | June 2025 | | | | 235 | | | | 21,851,828 | | | | (907,813 | ) |
10 Year ERIS Aged Standard Swap Future | | | September 2025 | | | | 478 | | | | 44,753,467 | | | | (455,699 | ) |
10 Year ERIS Aged Standard Swap Future | | | December 2025 | | | | 100 | | | | 9,658,260 | | | | 108,761 | |
10 Year ERIS Aged Standard Swap Future | | | March 2026 | | | | 121 | | | | 11,755,961 | | | | (68,389 | ) |
10 Year ERIS Aged Standard Swap Future | | | June 2026 | | | | 242 | | | | 24,201,016 | | | | 1,359,256 | |
10 Year ERIS Aged Standard Swap Future | | | September 2026 | | | | 163 | | | | 16,394,801 | | | | 957,017 | |
10 Year ERIS Aged Standard Swap Future | | | December 2026 | | | | 285 | | | | 30,103,467 | | | | 625,121 | |
10 Year ERIS Aged Standard Swap Future | | | March 2027 | | | | 86 | | | | 9,117,892 | | | | (44,299 | ) |
| | | | | | | | | | | | | | | | |
| | | | | | | | | | | | | | $ | 40,636 | |
| | | | | | | | | | | | | | | | |
Schedule of Open Reverse Repurchase Agreements
| | | | | | | | | | | | | | | | | | | | |
Counterparty | | Interest
Rate | | | Trade
Date | | | Maturity
Date | | | Net Closing
Amount | | | Face Value | |
Bank of America Merrill Lynch | | | 2.720 | % | | | 1/3/2017 | | | | 2/3/2017 | | | $ | 6,870,054 | | | $ | 6,854,000 | |
Bank of America Merrill Lynch | | | 2.470 | % | | | 1/3/2017 | | | | 2/3/2017 | | | | 7,587,103 | | | | 7,571,000 | |
| | | | | | | | | | | | | | | | | | | | |
| | | | | | | | | | | | | | | | | | $ | 14,425,000 | |
| | | | | | | | | | | | | | | | | | | | |
A reverse repurchase agreement, although structured as a sale and repurchase obligation, acts as a financing transaction under which the Fund will effectively pledge certain assets as collateral to secure a short-term loan. Generally, the other party to the agreement makes the loan in an amount less than the fair value of the pledged collateral. At the maturity of the reverse repurchase agreement, the Fund will be required to repay the loan and interest and correspondingly receive back its collateral. While used as collateral, the pledged assets continue to pay principal and interest which are for the benefit of the Fund.
See accompanying notes which are an integral part of these financial statements.
35
Angel Oak Flexible Income Fund
Schedule of Investments
January 31, 2017
| | | | | | | | |
| | | Principal
Amount | | | Value | |
Asset-Backed Securities – 0.01% | | | | | | | | |
Morgan Stanley Mortgage Loan Trust, Series 2007-3XS, Class 2A4S, 5.963%, 1/25/2047 (a) | | $ | 22,612 | | | $ | 16,526 | |
| | | | | | | | |
| | |
TOTAL ASSET-BACKED SECURITIES –
(Cost $18,315) | | | | | | | 16,526 | |
| | | | | | | | |
Collateralized Debt Obligations – 6.03% | | | | | | | | |
Financial Institution Note Securitization Ltd., Series 2015-1A, Class C, 7.000%, 7/30/2026 (b)(f) | | | 3,725,000 | | | | 3,743,625 | |
Financial Institution Note Securitization Ltd., Series 2015-1, 11.660%, 7/30/2026
(Acquired 10/20/2015, Cost $6,666,000) (a)(b)(c)(f) | | | 6,666,000 | | | | 6,632,670 | |
| | | | | | | | |
| | |
TOTAL COLLATERALIZED DEBT OBLIGATIONS –
(Cost $10,391,000) | | | | | | | 10,376,295 | |
| | | | | | | | |
Collateralized Loan Obligations – 29.95% | | | | | | | | |
AIMCO CLO Ltd., Series 2015-AA, Class E, 8.843%, 1/15/2028 (a)(b) | | | 3,000,000 | | | | 3,044,784 | |
Apidos CLO X, Series 2012-10A, Class D, 5.539%, 10/30/2022 (a)(b) | | | 6,500,000 | | | | 6,500,702 | |
Apidos CLO X, Series 2012-10A, Class E, 7.289%, 10/30/2022 (a)(b) | | | 2,000,000 | | | | 2,000,114 | |
Apidos CLO XIV, Series 2013-14A, Class E, 5.423%, 4/15/2025 (a)(b) | | | 3,000,000 | | | | 2,869,449 | |
Carlyle Global Market Strategies CLO Ltd., Series 2013-2A, Class E, 6.024%, 4/18/2025 (a)(b) | | | 2,000,000 | | | | 2,003,078 | |
Cathedral Lake CLO Ltd., Series 2015-3A, Class D, 6.382%, 1/15/2026 (a)(b) | | | 2,000,000 | | | | 2,007,274 | |
CIFC Funding Ltd., Series 2012-2A, Class B2R, 6.692%, 12/5/2024 (a)(b) | | | 4,500,000 | | | | 4,502,043 | |
CIFC Funding Ltd., Series 2012-3A, Class B2L, 6.887%, 1/29/2025 (a)(b) | | | 250,000 | | | | 250,231 | |
Dryden XXXVI Senior Loan Fund, Series 2014-36A, Class DR, 5.287%, 1/15/2028 (a)(b) | | | 2,000,000 | | | | 2,019,262 | |
Gallatin CLO IV Ltd., Series 2012-1A, Class D, 5.523%, 10/15/2023 (a)(b) | | | 3,000,000 | | | | 3,003,636 | |
JFIN CLO Ltd., Series 2015-2A, Class D, 5.423%, 10/19/2026 (a)(b) | | | 2,000,000 | | | | 2,007,622 | |
JMP Credit Advisors CLO III Ltd., Series 2014-1A, Class E, 8.373%, 10/17/2025
(Acquired 03/11/2015, Cost $2,990,109) (a)(b)(c) | | | 3,000,000 | | | | 3,007,059 | |
KVK CLO Ltd., Series 2012-1A, Class D, 6.123%, 7/15/2023 (a)(b) | | | 3,000,000 | | | | 3,006,630 | |
LCM XXI LP, Series 21A, Class D, 6.130%, 4/20/2028 (a)(b) | | | 2,400,000 | | | | 2,426,861 | |
Muir Woods CLO Ltd., Series 2012-1A, Class D, 5.959%, 9/14/2023 (a)(b) | | | 3,500,000 | | | | 3,505,856 | |
OZLM Funding V Ltd., Series 2013-5A, Class C, 4.523%, 1/17/2026 (a)(b) | | | 2,250,000 | | | | 2,252,027 | |
OZLM VII Ltd., Series 2014-7A, Class D, 6.023%, 7/17/2026 (a)(b) | | | 900,000 | | | | 857,480 | |
Sound Harbor Loan Fund Ltd., Series 2014-1A, Class C, 7.887%, 10/30/2026
(Acquired 08/06/2015, Cost $1,984,143) (a)(b)(c) | | | 2,000,000 | | | | 1,995,076 | |
Venture XXIII CLO Ltd., Series 2016-23A, Class E, 8.725%, 7/19/2028 (a)(b) | | | 4,250,000 | | | | 4,287,808 | |
| | | | | | | | |
| | |
TOTAL COLLATERALIZED LOAN OBLIGATIONS –
(Cost $50,836,241) | | | | | | | 51,546,992 | |
| | | | | | | | |
Collateralized Mortgage Obligations – 11.13% | | | | | | | | |
American Home Mortgage Investment Trust, Series 2005-2, Class 1A1, 1.071%, 9/25/2045 (a) | | | 10,192 | | | | 8,677 | |
Citigroup Mortgage Loan Trust, Inc., Series 2005-2, Class 1A4, 2.967%, 5/25/2035 (a) | | | 3,313 | | | | 3,182 | |
CitiMortgage Alternative Loan Trust, Series 2006-A5, Class 1A8, 6.000%, 10/25/2036 | | | 7,558 | | | | 6,792 | |
Commercial Mortgage Loan Trust, Series 2008-LS1, Class AM, 6.096%, 12/10/2049 (a) | | | 14,092 | | | | 8,676 | |
CountryWide Alternative Loan Trust, Series 2006-OA10, Class XBI, 2.180%, 8/25/2046 (a)(d) | | | 4,247,100 | | | | 411,676 | |
Deutsche Alt-A Securities, Inc. Mortgage Loan Trust, Series 2005-5, Class 2A1, 0.956%, 11/25/2035 (a) | | | 17,993 | | | | 9,991 | |
JPMorgan Chase Commercial Mortgage Securities Trust, Series 2007-LD12, Class B, 6.044%, 2/15/2051 (a) | | | 7,000,000 | | | | 7,005,656 | |
LB-UBS Commercial Mortgage Trust, Series 2007-C6, Class C, 6.201%, 7/15/2040 (a) | | | 5,241,000 | | | | 5,169,701 | |
MASTR Adjustable Rate Mortgages Trust, Series 2005-8, Class 3A1, 3.437%, 12/25/2035 (a) | | | 13,371 | | | | 11,968 | |
See accompanying notes which are an integral part of these financial statements.
36
Angel Oak Flexible Income Fund
Schedule of Investments – (continued)
January 31, 2017
| | | | | | | | |
| | | Principal
Amount | | | Value | |
Collateralized Mortgage Obligations – (continued) | | | | | | | | |
Morgan Stanley Capital I Trust, Series 2007-HQ11, Class D, 5.587%, 2/12/2044 (a) | | $ | 2,000,000 | | | $ | 1,861,862 | |
Residential Accredit Loans, Inc. Trust, Series 2005-QS14, Class 2A1, 6.000%, 9/25/2035 | | | 5,819 | | | | 4,366 | |
Residential Accredit Loans, Inc. Trust, Series 2006-QS10, Class A4, 5.750%, 8/25/2036 | | | 24,930 | | | | 19,912 | |
Residential Accredit Loans, Inc. Trust, Series 2006-QS8, Class A1, 6.000%, 8/25/2036 | | | 5,696 | | | | 4,778 | |
Wachovia Bank Commercial Mortgage Trust, Series 2007-C33, Class D, 5.965%, 2/15/2051 (a) | | | 5,000,000 | | | | 4,580,345 | |
Washington Mutual Mortgage Pass-Through Certificates WMALT Trust, Series 2005-AR1, Class A1A, 1.016%, 12/25/2035 (a) | | | 31,272 | | | | 26,363 | |
Wells Fargo Alternative Loan Trust, Series 2007-PA6, Class A1, 3.160%, 12/28/2037 (a) | | | 26,466 | | | | 24,897 | |
| | | | | | | | |
| | |
TOTAL COLLATERALIZED MORTGAGE OBLIGATIONS –
(Cost $19,221,638) | | | | | | | 19,158,842 | |
| | | | | | | | |
| | |
Corporate Obligations – 50.31% | | | | | | | | |
Financial – 50.31% | | | | | | | | |
Atlantic Capital Bancshares, Inc., 6.250%, 9/30/2025 (b) | | | 2,900,000 | | | | 3,006,877 | |
Bank of America Corp., 5.875%, 1/5/2021 | | | 3,945,000 | | | | 4,399,432 | |
Cadence Financial Corp., 6.500%, 3/11/2025 (a)(b) | | | 10,000,000 | | | | 9,302,590 | |
Capital One Bank USA, National Association, 3.375%, 2/15/2023 | | | 2,000,000 | | | | 2,003,098 | |
Capital One Bank USA, National Association, 2.400%, 9/5/2019 | | | 1,225,000 | | | | 1,229,607 | |
Citigroup, Inc., 1.700%, 4/27/2018 | | | 2,000,000 | | | | 1,997,650 | |
Citigroup, Inc., 2.350%, 8/2/2021 | | | 376,000 | | | | 368,618 | |
Citizens Financial Group, Inc., 4.300%, 12/3/2025 | | | 1,764,000 | | | | 1,794,115 | |
ConnectOne Bancorp, Inc., 5.750%, 7/1/2025 (a) | | | 3,000,000 | | | | 3,084,855 | |
EverBank Financial Corp., 6.000%, 3/15/2026 (a) | | | 2,490,000 | | | | 2,607,543 | |
EverBank Financial Corp., 5.750%, 7/2/2025 | | | 3,000,000 | | | | 3,058,656 | |
First Midwest Bancorp, Inc., 5.875%, 9/29/2026 | | | 1,000,000 | | | | 1,037,244 | |
Franklin Financial Network, Inc., 6.875%, 3/30/2026 (a) | | | 1,500,000 | | | | 1,615,272 | |
Franklin Financial Network, Inc., 7.000%, 7/1/2026 (a) | | | 2,000,000 | | | | 2,066,288 | |
Great Southern Bancorp, Inc., 5.250%, 8/15/2026 (a) | | | 2,844,000 | | | | 2,925,159 | |
JPMorgan Chase & Co., 6.300%, 4/23/2019 | | | 515,000 | | | | 562,220 | |
JPMorgan Chase & Co., 2.453%, 6/11/2020 (a) | | | 1,000,000 | | | | 1,005,900 | |
JPMorgan Chase & Co., 2.700%, 5/18/2023 | | | 2,000,000 | | | | 1,952,676 | |
KeyBank National Association, 1.700%, 6/1/2018 | | | 4,095,000 | | | | 4,098,108 | |
Lakeland Bancorp, Inc., 5.125%, 9/30/2026 (a) | | | 1,700,000 | | | | 1,710,931 | |
Luther Burbank Corp., 6.500%, 9/30/2024 | | | 1,000,000 | | | | 1,102,108 | |
Morgan Stanley, 5.950%, 12/28/2017 | | | 2,000,000 | | | | 2,077,844 | |
Morgan Stanley, 2.625%, 11/17/2021 | | | 3,000,000 | | | | 2,960,640 | |
OceanFirst Financial Corp., 1.000%, 9/30/2026 (a) | | | 300,000 | | | | 307,760 | |
Old Line Bancshares, Inc., 5.625%, 8/15/2026 (a) | | | 1,000,000 | | | | 1,016,486 | |
Old Second Bancorp, Inc., 5.750%, 12/31/2026 (a) | | | 1,750,000 | | | | 1,795,175 | |
Opus Bank, 5.500%, 7/1/2026 (a) | | | 2,750,000 | | | | 2,783,036 | |
Pinnacle Financial Partners, Inc., 5.250%, 11/16/2026 (a)(b) | | | 1,000,000 | | | | 1,013,750 | |
PNC Bank, National Association, 1.450%, 7/29/2019 | | | 1,000,000 | | | | 988,219 | |
PNC Bank, National Association, 2.400%, 10/18/2019 | | | 2,250,000 | | | | 2,269,892 | |
Preferred Bank, 6.000%, 6/15/2026 (a) | | | 1,862,000 | | | | 1,952,773 | |
RBB Bancorp, 6.500%, 3/31/2026 | | | 4,000,000 | | | | 4,064,828 | |
Revere Bank, 5.625%, 9/30/2026 (a) | | | 1,000,000 | | | | 1,006,711 | |
Southern National Bancorp of Virginia, Inc., 5.875%, 1/31/2027 (b) | | | 2,750,000 | | | | 2,750,000 | |
SunTrust Banks, Inc., 2.900%, 3/3/2021 | | | 2,000,000 | | | | 2,024,690 | |
See accompanying notes which are an integral part of these financial statements.
37
Angel Oak Flexible Income Fund
Schedule of Investments – (continued)
January 31, 2017
| | | | | | | | |
| | | Principal
Amount | | | Value | |
Corporate Obligations – (continued) | | | | | | | | |
Financial – (continued) | | | | | | | | |
Synovus Financial Corp., 5.750%, 12/15/2025 (a) | | $ | 1,356,000 | | | $ | 1,427,868 | |
USAmeriBancorp, Inc., 6.250%, 4/1/2026 | | | 4,000,000 | | | | 4,103,720 | |
Your Community Bank, 6.250%, 12/15/2025 (a) | | | 3,000,000 | | | | 3,120,708 | |
| | | | | | | | |
| | |
TOTAL CORPORATE OBLIGATIONS –
(Cost $86,138,735) | | | | | | | 86,593,047 | |
| | | | | | | | |
| | |
Short Term Investments – 2.17% | | | Shares | | | | | |
Money Market Funds – 2.17% | | | | | | | | |
Fidelity Institutional Money Market Government Portfolio, Institutional Class, 0.43% (e) | | | 3,741,398 | | | | 3,741,398 | |
| | | | | | | | |
| | |
TOTAL SHORT TERM INVESTMENTS –
(Cost $3,741,398) | | | | | | | 3,741,398 | |
| | | | | | | | |
| | |
TOTAL INVESTMENTS – 99.60% –
(Cost $170,347,327) | | | | | | | 171,433,100 | |
| | | | | | | | |
| | |
Other Assets in Excess of Liabilities – 0.40% | | | | | | | 685,286 | |
| | | | | | | | |
| | |
NET ASSETS – 100.00% | | | | | | $ | 172,118,386 | |
| | | | | | | | |
| (a) | Variable or Floating Rate Security. Rate disclosed as of January 31, 2017. |
| (b) | Security exempt from registration under Rule 144A or Section 4(a)(2) of the Securities Act of 1933. The security may be resold in transactions exempt from registration, normally to qualified institutional buyers. These securities are determined to be liquid by the Adviser, under the procedures established by the Fund’s Board of Trustees, unless otherwise denoted. At January 31, 2017, the value of these securities amounted to $77,996,503 or 45.32% of net assets. |
| (c) | Illiquid security. At January 31, 2017, the value of these securities amounted to $11,634,805 or 6.76% of net assets. |
| (d) | Interest Only Security. |
| (e) | Rate disclosed is the seven day yield as of January 31, 2017. |
| (f) | See Note 5 to the Financial Statements. |
Schedule of Open Futures Contracts
| | | | | | | | | | | | | | | | |
Futures Contracts | | Expiration
Month | | | Number of
Contracts | | | Notional
Value | | | Unrealized
Depreciation | |
U.S. 5 Year Note Future | | | March 2017 | | | | (76 | ) | | $ | (8,957,906 | ) | | $ | (4,422 | ) |
3 Year ERIS Aged Standard Swap Future | | | March 2020 | | | | 21 | | | | 2,114,918 | | | | (7,919 | ) |
5 Year ERIS Aged Standard Swap Future | | | March 2022 | | | | 62 | | | | 6,357,685 | | | | (42,098 | ) |
7 Year ERIS Aged Standard Swap Future | | | March 2024 | | | | 17 | | | | 1,753,040 | | | | (15,171 | ) |
10 Year ERIS Aged Standard Swap Future | | | March 2026 | | | | 15 | | | | 1,457,350 | | | | (16,109 | ) |
| | | | | | | | | | | | | | | | |
| | | | | | | | | | | | | | $ | (85,719 | ) |
| | | | | | | | | | | | | | | | |
See accompanying notes which are an integral part of these financial statements.
38
Angel Oak High Yield Opportunities Fund
Schedule of Investments
January 31, 2017
| | | | | | | | |
| | | Principal
Amount | | | Value | |
Collateralized Loan Obligations – 9.17% | | | | | | | | |
Arrowpoint CLO Ltd., Series 2014-3A, Class E, 8.373%, 10/15/2026 (a)(b) | | $ | 500,000 | | | $ | 500,273 | |
Carlyle Global Market Strategies CLO Ltd., Series 2016-3A, Class D, 7.788%, 10/20/2029 (a)(b) | | | 500,000 | | | | 500,000 | |
Catamaran CLO Ltd., Series 2016-1A, Class D, 7.581%, 1/18/2029 (a)(b) | | | 500,000 | | | | 479,158 | |
JFIN CLO Ltd., Series 2015-2A, Class E, 7.880%, 10/19/2026
(Acquired 01/05/2017, Cost $489,375) (a)(b)(c) | | | 500,000 | | | | 487,484 | |
LCM XXI LP, Series 21A, Class E, 8.680%, 4/20/2028 (a)(b) | | | 1,000,000 | | | | 1,013,183 | |
OZLM VII Ltd., Series 2014-7A, Class D, 6.023%, 7/17/2026 (a)(b) | | | 500,000 | | | | 476,378 | |
Trinitas CLO IV Ltd., Series 2016-4A, Class E, 9.654%, 4/18/2028
(Acquired 12/15/2016, Cost $501,782) (a)(b)(c) | | | 500,000 | | | | 507,450 | |
Venture XXIII CLO Ltd., Series 2016-23A, Class E, 8.725%, 7/19/2028 (a)(b) | | | 500,000 | | | | 504,448 | |
| | | | | | | | |
| | |
TOTAL COLLATERALIZED LOAN OBLIGATIONS –
(Cost $4,383,279) | | | | | | | 4,468,374 | |
| | | | | | | | |
| | |
Common Stocks – 0.08% | | | Shares | | | | | |
Energy – 0.08% | | | | | | | | |
Calumet Specialty Products Partners LP | | | 9,500 | | | | 37,525 | |
| | | | | | | | |
| | |
TOTAL COMMON STOCKS –
(Cost $218,223) | | | | | | | 37,525 | |
| | | | | | | | |
| | |
Corporate Obligations – 88.10% | |
| Principal
Amount |
| | | | |
Basic Materials – 12.85% | | | | | | | | |
Alcoa Nederland Holding BV, 7.000%, 9/30/2026 (b)(d) | | $ | 500,000 | | | | 548,750 | |
Blue Cube Spinco, Inc., 9.750%, 10/15/2023 | | | 250,000 | | | | 298,125 | |
Cascades, Inc., 5.750%, 7/15/2023 (b)(d) | | | 250,000 | | | | 254,062 | |
Consolidated Energy Finance SA, 6.750%, 10/15/2019 (b)(d) | | | 550,000 | | | | 554,125 | |
CVR Partners LP / CVR Nitrogen Finance Corp., 9.250%, 6/15/2023 (b) | | | 1,500,000 | | | | 1,603,125 | |
FMG Resources Ltd., 9.750%, 3/1/2022 (b)(d) | | | 250,000 | | | | 291,250 | |
Hexion, Inc., 6.625%, 4/15/2020 | | | 150,000 | | | | 140,625 | |
Kaiser Aluminum Corp., 5.875%, 5/15/2024 | | | 250,000 | | | | 262,500 | |
Kissner Holdings LP / Kissner Milling Co. Ltd. / BSC Holding, Inc. / Kissner USA, 8.375%, 12/1/2022 (b)(d) | | | 1,000,000 | | | | 1,040,000 | |
Teck Resources Ltd., 8.500%, 6/1/2024 (b)(d) | | | 250,000 | | | | 291,562 | |
Tronox Finance LLC, 7.500%, 3/15/2022 (b) | | | 250,000 | | | | 245,000 | |
United States Steel Corp., 8.375%, 7/1/2021 (b) | | | 250,000 | | | | 278,125 | |
Versum Materials, Inc., 5.500%, 9/30/2024 (b) | | | 435,000 | | | | 453,488 | |
| | | | | | | | |
| | | | | | | 6,260,737 | |
| | | | | | | | |
Communications – 4.55% | | | | | | | | |
Cable One, Inc., 5.750%, 6/15/2022 (b) | | | 150,000 | | | | 157,125 | |
Cincinnati Bell, Inc., 7.000%, 7/15/2024 (b) | | | 250,000 | | | | 264,688 | |
CommScope Technologies Finance LLC, 6.000%, 6/15/2025 (b) | | | 500,000 | | | | 535,315 | |
CSC Holdings LLC, 5.500%, 4/15/2027 (b) | | | 500,000 | | | | 508,750 | |
Frontier Communications Corp., 11.000%, 9/15/2025 | | | 500,000 | | | | 507,500 | |
Windstream Services LLC, 7.500%, 6/1/2022 | | | 250,000 | | | | 243,125 | |
| | | | | | | | |
| | | | | | | 2,216,503 | |
| | | | | | | | |
See accompanying notes which are an integral part of these financial statements.
39
Angel Oak High Yield Opportunities Fund
Schedule of Investments – (continued)
January 31, 2017
| | | | | | | | |
| | | Principal
Amount | | | Value | |
Consumer, Cyclical – 14.55% | | | | | | | | |
BCD Acquisition, Inc., 9.625%, 9/15/2023 (b) | | $ | 1,500,000 | | | $ | 1,612,500 | |
Century Communities, Inc., 6.875%, 5/15/2022 (b) | | | 1,000,000 | | | | 1,037,500 | |
Dana, Inc., 5.500%, 12/15/2024 | | | 250,000 | | | | 261,250 | |
Deck Chassis Acquisition, Inc., 10.000%, 6/15/2023 (b) | | | 250,000 | | | | 268,125 | |
Dollar Tree, Inc., 5.750%, 3/1/2023 | | | 250,000 | | | | 266,000 | |
Ferrellgas LP / Ferrellgas Finance Corp., 6.750%, 6/15/2023 (a) | | | 525,000 | | | | 526,313 | |
FirstCash, Inc., 6.750%, 4/1/2021 | | | 500,000 | | | | 526,250 | |
Hilton Grand Vacations Borrower LLC / Hilton Grand Vacations Borrower, Inc., 6.125%, 12/1/2024 (b) | | | 355,000 | | | | 372,750 | |
Lions Gate Entertainment Corp., 5.875%, 11/1/2024 (b)(d) | | | 300,000 | | | | 306,750 | |
MGM Resorts International, 7.750%, 3/15/2022 | | | 375,000 | | | | 437,700 | |
MPG Holdco I, Inc., 7.375%, 10/15/2022 | | | 400,000 | | | | 432,000 | |
TRI Pointe Group, Inc. / TRI Pointe Homes, Inc., 5.875%, 6/15/2024 | | | 1,000,000 | | | | 1,040,000 | |
| | | | | | | | |
| | | | | | | 7,087,138 | |
| | | | | | | | |
Consumer, Non-cyclical – 8.62% | | | | | | | | |
Ashtead Capital, Inc., 5.625%, 10/1/2024 (b) | | | 200,000 | | | | 211,000 | |
Cenveo Corp., 6.000%, 8/1/2019 (b) | | | 750,000 | | | | 671,250 | |
Dean Foods Co., 6.500%, 3/15/2023 (b) | | | 500,000 | | | | 523,750 | |
HealthSouth Corp., 5.750%, 9/15/2025 | | | 250,000 | | | | 251,875 | |
JBS USA LUX SA / JBS USA Finance, Inc., 7.250%, 6/1/2021 (b) | | | 95,000 | | | | 98,610 | |
JBS USA LUX SA / JBS USA Finance, Inc., 5.750%, 6/15/2025 (b) | | | 250,000 | | | | 257,875 | |
Midas Intermediate Holdco II LLC / Midas Intermediate Holdco II Finance, Inc., 7.875%, 10/1/2022 (b) | | | 175,000 | | | | 180,688 | |
Minerva Luxembourg SA, 6.500%, 9/20/2026 (b)(d) | | | 500,000 | | | | 498,750 | |
MPH Acquisition Holdings LLC, 7.125%, 6/1/2024 (b) | | | 350,000 | | | | 372,312 | |
Select Medical Corp., 6.375%, 6/1/2021 | | | 100,000 | | | | 99,500 | |
Vector Group Ltd., 7.750%, 2/15/2021 | | | 500,000 | | | | 521,625 | |
Vector Group Ltd., 6.125%, 2/1/2025 (b) | | | 500,000 | | | | 515,000 | |
| | | | | | | | |
| | | | | | | 4,202,235 | |
| | | | | | | | |
Energy – 15.54% | | | | | | | | |
Antero Resources Corp., 5.625%, 6/1/2023 | | | 500,000 | | | | 512,500 | |
Calumet Specialty Products Partners LP / Calumet Finance Corp., 6.500%, 4/15/2021 | | | 900,000 | | | | 783,000 | |
Cheniere Corpus Christi Holdings LLC, 5.875%, 3/31/2025 (b) | | | 1,100,000 | | | | 1,167,375 | |
Enviva Partners LP / Enviva Partners Finance Corp., 8.500%, 11/1/2021 (b) | | | 1,000,000 | | | | 1,075,000 | |
Hilcorp. Energy I LP / Hilcorp. Finance Co., 5.750%, 10/1/2025 (b) | | | 250,000 | | | | 253,437 | |
Parker Drilling Co., 7.500%, 8/1/2020 | | | 300,000 | | | | 273,000 | |
PBF Holding Co. LLC / PBF Finance Corp., 7.000%, 11/15/2023 | | | 1,250,000 | | | | 1,278,125 | |
Regency Energy Partners LP / Regency Energy Finance Corp., 5.500%, 4/15/2023 | | | 500,000 | | | | 522,720 | |
Shelf Drilling Holdings Ltd., 9.500%, 11/2/2020 (b) | | | 905,950 | | | | 819,885 | |
SM Energy Co., 6.500%, 11/15/2021 | | | 100,000 | | | | 103,625 | |
Tesoro Corp., 5.125%, 12/15/2026 (b) | | | 500,000 | | | | 523,125 | |
Williams Partners LP / ACMP Finance Corp., 4.875%, 5/15/2023 | | | 250,000 | | | | 257,909 | |
| | | | | | | | |
| | | | | | | 7,569,701 | |
| | | | | | | | |
Financial – 10.97% | | | | | | | | |
Aircastle Ltd., 5.500%, 2/15/2022 | | | 250,000 | | | | 263,725 | |
Alliance Data Systems Corp., 6.375%, 4/1/2020 (b) | | | 250,000 | | | | 254,375 | |
See accompanying notes which are an integral part of these financial statements.
40
Angel Oak High Yield Opportunities Fund
Schedule of Investments – (continued)
January 31, 2017
| | | | | | | | |
| | | Principal
Amount | | | Value | |
Financial – (continued) | | | | | | | | |
Avison Young Canada, Inc., 9.500%, 12/15/2021
(Acquired 12/20/2016, Cost $245,257) (b)(c)(d) | | $ | 250,000 | | | $ | 246,250 | |
Credit Acceptance Corp., 7.375%, 3/15/2023 | | | 200,000 | | | | 206,212 | |
Jefferies Finance LLC / JFIN Co-Issuer Corp., 7.375%, 4/1/2020 (b) | | | 1,000,000 | | | | 1,015,000 | |
Jefferies Finance LLC / JFIN Co-Issuer Corp., 7.500%, 4/15/2021 (b) | | | 500,000 | | | | 505,625 | |
Navient Corp., 5.500%, 1/25/2023 | | | 600,000 | | | | 568,500 | |
NewStar Financial, Inc., 7.250%, 5/1/2020 | | | 1,000,000 | | | | 1,012,500 | |
Ocwen Loan Servicing LLC, 8.375%, 11/15/2022 (b) | | | 500,000 | | | | 510,000 | |
QCP SNF REIT LLC, 8.125%, 11/1/2023 (b) | | | 750,000 | | | | 761,250 | |
| | | | | | | | |
| | | | | | | 5,343,437 | |
| | | | | | | | |
Industrial – 15.22% | | | | | | | | |
ATS Automation Tooling Systems, Inc., 6.500%, 6/15/2023 (b)(d) | | | 338,000 | | | | 350,675 | |
Berry Plastics Corp., 6.000%, 10/15/2022 | | | 100,000 | | | | 106,375 | |
BMC East LLC, 5.500%, 10/1/2024 (b) | | | 135,000 | | | | 138,334 | |
Boise Cascade Co., 5.625%, 9/1/2024 (b) | | | 500,000 | | | | 511,250 | |
Bombardier, Inc., 6.125%, 1/15/2023 (b)(d) | | | 750,000 | | | | 736,875 | |
General Cable Corp., 5.750%, 10/1/2022 | | | 600,000 | | | | 598,500 | |
Griffon Corp., 5.250%, 3/1/2022 | | | 750,000 | | | | 760,312 | |
Grinding Media, Inc. / MC Grinding Media Canada, Inc., 7.375%, 12/15/2023 (b) | | | 500,000 | | | | 529,375 | |
Hornbeck Offshore Services, Inc., 5.875%, 4/1/2020 | | | 100,000 | | | | 75,000 | |
Kenan Advantage Group, Inc., 7.875%, 7/31/2023 (b) | | | 625,000 | | | | 642,969 | |
PaperWorks Industries, Inc., 9.500%, 8/15/2019 (b) | | | 1,000,000 | | | | 867,400 | |
Shape Technologies Group, Inc., 7.625%, 2/1/2020 (b) | | | 600,000 | | | | 618,000 | |
Techniplas LLC, 10.000%, 5/1/2020 (Acquired 04/24/2015, Cost $1,000,000) (b)(c) | | | 1,000,000 | | | | 945,000 | |
US Concrete, Inc., 6.375%, 6/1/2024 (b) | | | 250,000 | | | | 265,313 | |
Zebra Technologies Corp., 7.250%, 10/15/2022 | | | 250,000 | | | | 270,625 | |
| | | | | | | | |
| | | | | | | 7,416,003 | |
| | | | | | | | |
Technology – 2.55% | | | | | | | | |
Amkor Technology, Inc., 6.625%, 6/1/2021 | | | 600,000 | | | | 614,676 | |
Diamond 1 Finance Corp. / Diamond 2 Finance Corp., 7.125%, 6/15/2024 (b) | | | 575,000 | | | | 629,898 | |
| | | | | | | | |
| | | | | | | 1,244,574 | |
| | | | | | | | |
Utilities – 3.25% | | | | | | | | |
AmeriGas Partners LP / AmeriGas Finance Corp., 5.500%, 5/20/2025 | | | 250,000 | | | | 257,187 | |
Dynegy, Inc., 8.000%, 1/15/2025 (b) | | | 1,000,000 | | | | 965,000 | |
NRG Energy, Inc., 6.250%, 7/15/2022 | | | 100,000 | | | | 103,500 | |
NRG Energy, Inc., 6.625%, 3/15/2023 | | | 250,000 | | | | 258,750 | |
| | | | | | | | |
| | | | | | | 1,584,437 | |
| | | | | | | | |
| | |
TOTAL CORPORATE OBLIGATIONS –
(Cost $41,930,906) | | | | | | | 42,924,765 | |
| | | | | | | | |
See accompanying notes which are an integral part of these financial statements.
41
Angel Oak High Yield Opportunities Fund
Schedule of Investments – (continued)
January 31, 2017
| | | | | | | | |
| | | Shares | | | Value | |
| | |
Short Term Investments – 1.10% | | | | | | | | |
Money Market Funds – 1.10% | | | | | | | | |
Fidelity Institutional Money Market Government Portfolio, Institutional Class, 0.43% (e) | | | 536,800 | | | $ | 536,800 | |
| | | | | | | | |
| | |
TOTAL SHORT TERM INVESTMENTS –
(Cost $536,800) | | | | | | | 536,800 | |
| | | | | | | | |
| | |
TOTAL INVESTMENTS – 98.45% –
(Cost $47,069,208) | | | | | | | 47,967,464 | |
| | | | | | | | |
| | |
Other Assets in Excess of Liabilities – 1.55% | | | | | | | 756,485 | |
| | | | | | | | |
| | |
NET ASSETS – 100.00% | | | | | | $ | 48,723,949 | |
| | | | | | | | |
| (a) | Variable or Floating Rate Security. Rate disclosed as of January 31, 2017. |
| (b) | Security exempt from registration under Rule 144A or Section 4(a)(2) of the Securities Act of 1933. The security may be resold in transactions exempt from registration, normally to qualified institutional buyers. These securities are determined to be liquid by the Adviser, under the procedures established by the Fund’s Board of Trustees, unless otherwise denoted. At January 31, 2017, the value of these securities amounted to $32,752,010 or 67.22% of net assets. |
| (c) | Illiquid security. At January 31, 2017, the value of these securities amounted to $2,186,184 or 4.49% of net assets. |
| (d) | U.S. dollar denominated foreign security. |
| (e) | Rate disclosed is the seven day yield as of January 31, 2017. |
See accompanying notes which are an integral part of these financial statements.
42
Statements of Assets and Liabilities
January 31, 2017
| | | | | | | | | | | | |
| | | Multi-Strategy
Income Fund | | | Flexible
Income Fund | | | High Yield
Opportunities Fund | |
Assets | | | | | | | | | | | | |
Investments in securities at fair value (cost $4,779,660,536, $170,347,327, and $47,069,208 respectively) | | $ | 4,727,403,670 | | | $ | 171,433,100 | | | $ | 47,967,464 | |
Investments in affiliates, at value (cost $10,284,062, $0, and $0, respectively) | | | 10,629,784 | | | | – | | | | – | |
Cash | | | 181,621 | | | | – | | | | – | |
Deposit at broker for futures contracts | | | 7,808,071 | | | | 304,319 | | | | – | |
Deposit at brokers for reverse repurchase agreements | | | 973,195 | | | | – | | | | – | |
Receivable for fund shares sold | | | 31,302,842 | | | | 588,308 | | | | 10,000 | |
Receivable for investments sold | | | 90,165,945 | | | | – | | | | – | |
Dividends and interest receivable | | | 16,960,890 | | | | 1,469,841 | | | | 801,578 | |
Prepaid expenses | | | 92,304 | | | | 28,297 | | | | 14,838 | |
| | | | | | | | | | | | |
Total Assets | | | 4,885,518,322 | | | | 173,823,865 | | | | 48,793,880 | |
| | | | | | | | | | | | |
| | | |
Liabilities | | | | | | | | | | | | |
Payable for reverse repurchase agreements | | | 14,425,000 | | | | – | | | | – | |
Payable for credit agreements | | | 250,000,000 | | | | – | | | | – | |
Payable for fund shares redeemed | | | 13,869,821 | | | | 378,166 | | | | 1,853 | |
Payable for investments purchased | | | 79,952,173 | | | | 1,105,778 | | | | – | |
Payable for distributions to shareholders | | | 3,809,391 | | | | 29,896 | | | | 26,550 | |
Interest payable for credit and reverse repurchase agreements | | | 1,857,533 | | | | – | | | | – | |
Variation margin on futures contracts | | | 994,028 | | | | 27,155 | | | | – | |
Payable to Adviser | | | 3,559,387 | | | | 110,576 | | | | 6,283 | |
Payable to administrator, fund accountant, and transfer agent | | | 140,046 | | | | 12,072 | | | | 6,038 | |
Payable to custodian | | | 19,343 | | | | 657 | | | | 172 | |
12b-1 fees accrued | | | 129,203 | | | | 2,425 | | | | 151 | |
Other accrued expenses | | | 159,579 | | | | 38,754 | | | | 28,884 | |
| | | | | | | | | | | | |
Total Liabilities | | | 368,915,504 | | | | 1,705,479 | | | | 69,931 | |
| | | | | | | | | | | | |
Net Assets | | $ | 4,516,602,818 | | | $ | 172,118,386 | | | $ | 48,723,949 | |
| | | | | | | | | | | | |
| | | |
Net Assets consist of: | | | | | | | | | | | | |
Paid-in capital | | $ | 4,864,331,828 | | | $ | 206,747,895 | | | $ | 48,880,866 | |
Accumulated undistributed net investment income (loss) | | | 4,602,838 | | | | 47,067 | | | | 1,895 | |
Accumulated net realized loss from investment transactions | | | (300,461,340 | ) | | | (35,676,630 | ) | | | (1,057,068 | ) |
Net unrealized appreciation (depreciation) on investments | | | (52,256,866 | ) | | | 1,085,773 | | | | 898,256 | |
Net unrealized appreciation on investments in affiliates | | | 345,722 | | | | – | | | | – | |
Net unrealized appreciation (depreciation) on futures contracts | | | 40,636 | | | | (85,719 | ) | | | – | |
| | | | | | | | | | | | |
Net Assets | | $ | 4,516,602,818 | | | $ | 172,118,386 | | | $ | 48,723,949 | |
| | | | | | | | | | | | |
| | | |
Class A: | | | | | | | | | | | | |
Net Assets | | $ | 431,536,283 | | | $ | 6,784,522 | | | $ | 745,086 | |
| | | | | | | | | | | | |
Shares outstanding (unlimited number of shares authorized, no par value) | | | 38,190,228 | | | | 719,847 | | | | 62,503 | |
| | | | | | | | | | | | |
Net asset value (“NAV”) and redemption price per share | | $ | 11.30 | | | $ | 9.42 | | | $ | 11.92 | |
| | | | | | | | | | | | |
Offering price per share (NAV/0.9775) (a) | | $ | 11.56 | | | $ | 9.64 | | | $ | 12.20 | |
| | | | | | | | | | | | |
| | | |
Class C | | | | | | | | | | | | |
Net Assets | | $ | 47,540,874 | | | $ | 875,481 | | | $ | – | |
| | | | | | | | | | | | |
Shares outstanding (unlimited number of shares authorized, no par value) | | | 4,233,291 | | | | 93,444 | | | | – | |
| | | | | | | | | | | | |
Net asset value (“NAV”) and offering price per share | | $ | 11.23 | | | $ | 9.37 | | | $ | – | |
| | | | | | | | | | | | |
Minimum redemption price per share (NAV*0.99) (b) | | $ | 11.12 | | | $ | 9.28 | | | $ | – | |
| | | | | | | | | | | | |
| | | |
Institutional Class: | | | | | | | | | | | | |
Net Assets | | $ | 4,037,525,661 | | | $ | 164,458,383 | | | $ | 47,978,863 | |
| | | | | | | | | | | | |
Shares outstanding (unlimited number of shares authorized, no par value) | | | 357,990,600 | | | | 17,469,091 | | | | 4,036,101 | |
| | | | | | | | | | | | |
Net asset value (“NAV”) and offering and redemption price per share | | $ | 11.28 | | | $ | 9.41 | | | $ | 11.89 | |
| | | | | | | | | | | | |
| (a) | Class A Shares impose a maximum 2.25% sales charge on purchases |
| (b) | A contingent deferred sales charge (“CDSC”) of 1.00% may be charged. |
See accompanying notes which are an integral part of these financial statements.
43
Statements of Operations
For the year or period ended January 31, 2017
| | | | | | | | | | | | | | | | |
| | | Multi-Strategy
Income Fund | | | Flexible
Income Fund | | | High Yield
Opportunities Fund (a) | | | High Yield
Opportunities Fund (b) | |
Investment Income | | | | | | | | | | | | | | | | |
Dividend income | | $ | 170,972 | | | $ | – | | | $ | 26,953 | | | $ | – | |
Dividends from affiliate investments | | | 298,445 | | | | – | | | | – | | | | – | |
Interest income | | | 292,942,021 | | | | 11,831,057 | | | | 2,479,015 | | | | 3,442,569 | |
| | | | | | | | | | | | | | | | |
Total Investment Income | | | 293,411,438 | | | | 11,831,057 | | | | 2,505,968 | | | | 3,442,569 | |
| | | | | | | | | | | | | | | | |
| | | | |
Expenses | | | | | | | | | | | | | | | | |
Investment Advisory | | | 38,581,189 | | | | 1,798,400 | | | | 197,038 | | | | 287,269 | |
12b-1 – Class A | | | 1,081,367 | | | | 22,149 | | | | 1,476 | | | | – | |
12b-1 – Class C | | | 295,096 | | | | 9,182 | | | | – | | | | – | |
12b-1 – Original Shares (See Note 1) | | | – | | | | – | | | | – | | | | 4,590 | |
Fund accounting | | | 637,197 | | | | 93,776 | | | | 24,697 | | | | – | |
Administration | | | 558,576 | | | | 103,255 | | | | 20,095 | | | | 26,270 | |
Transfer agent | | | 269,889 | | | | 72,405 | | | | 21,179 | | | | 11,155 | |
Custodian | | | 235,020 | | | | 17,545 | | | | 3,757 | | | | – | |
Printing | | | 185,851 | | | | 17,162 | | | | 4,723 | | | | 1,687 | |
Legal | | | 177,979 | | | | 17,568 | | | | 4,797 | | | | 1,025 | |
Registration | | | 174,870 | | | | 78,296 | | | | 27,149 | | | | 28,927 | |
Trustee | | | 154,624 | | | | 43,778 | | | | 27,740 | | | | 5,413 | |
Audit | | | 72,057 | | | | 30,251 | | | | 24,000 | | | | 17,601 | |
Insurance | | | 65,398 | | | | 4,994 | | | | 133 | | | | – | |
Compliance | | | 33,128 | | | | 33,128 | | | | 23,672 | | | | 4,097 | |
Miscellaneous | | | 94,875 | | | | 15,724 | | | | 3,021 | | | | 7,337 | |
Interest | | | 6,148,818 | | | | 85,219 | | | | 503 | | | | 101 | |
| | | | | | | | | | | | | | | | |
Total Expenses | | | 48,765,934 | | | | 2,442,832 | | | | 383,980 | | | | 395,472 | |
| | | | | | | | | | | | | | | | |
Fees contractually recouped (waived) by Adviser (See Note 4) | | | 1,703,216 | | | | (579,174 | ) | | | (149,074 | ) | | | (51,282) | |
Fees voluntarily waived by Adviser (See Note 4) | | | – | | | | (78,373 | ) | | | – | | | | – | |
| | | | | | | | | | | | | | | | |
Net operating expenses | | | 50,469,150 | | | | 1,785,285 | | | | 234,906 | | | | 344,190 | |
| | | | | | | | | | | | | | | | |
Net Investment Income | | | 242,942,288 | | | | 10,045,772 | | | | 2,271,062 | | | | 3,098,379 | |
| | | | | | | | | | | | | | | | |
| | | | |
Realized and Unrealized Gain (Loss) on Investments | | | | | | | | | | | | | | | | |
Net realized loss on investments | | | (127,143,010 | ) | | | (30,132,279 | ) | | | (152,565 | ) | | | (315,424 | ) |
Net realized loss on futures contracts | | | (46,226,758 | ) | | | (1,026,169 | ) | | | – | | | | – | |
Net realized gain on swap agreements | | | 1,518,076 | | | | – | | | | – | | | | – | |
Net change in unrealized appreciation (depreciation) on investments | | | 165,082,177 | | | | 23,276,454 | | | | 4,155,170 | | | | (4,172,780 | ) |
Net change in unrealized appreciation (depreciation) on investments in affiliates | | | 345,722 | | | | – | | | | – | | | | – | |
Net change in unrealized appreciation (depreciation) on futures contracts | | | 50,234,195 | | | | 815,628 | | | | – | | | | – | |
Net change in unrealized appreciation (depreciation) on swap agreements | | | 198,761 | | | | – | | | | – | | | | – | |
| | | | | | | | | | | | | | | | |
Net realized and unrealized gain (loss) on investments | | | 44,009,163 | | | | (7,066,366 | ) | | | 4,002,605 | | | | (4,488,204 | ) |
| | | | | | | | | | | | | | | | |
Net increase/decrease in net assets resulting from operations | | $ | 286,951,451 | | | $ | 2,979,406 | | | $ | 6,273,667 | | | $ | (1,389,825 | ) |
| | | | | | | | | | | | | | | | |
| (a) | For the period April 1, 2016 to January 31, 2017. Original Shares of the Predecessor High Yield Fund converted into Class A Shares at the close of business on April 15, 2016. See Note 1 to the Financial Statements. |
| (b) | For the year ended March 31, 2016. See Note 1 to the Financial Statements. |
See accompanying notes which are an integral part of these financial statements.
44
Statement of Cash Flows
For the year ended January 31, 2017
| | | | |
| | | Multi-Strategy
Income Fund | |
CASH FLOWS FROM OPERATING ACTIVITIES: | | | | |
Net increase in net assets resulting from operations | | $ | 286,951,451 | |
Net adjustments to reconcile net increase in net assets from operations to net cash provided by operating activities: | | | | |
Net amortization and accretion of premium and discount | | | (52,352,540 | ) |
Net realized paydown gains on mortgage backed and other asset backed securities | | | (71,390,330 | ) |
Proceeds from sales of short-term investments, net | | | (108,806,742 | ) |
Purchases of investments | | | (2,760,387,259 | ) |
Proceeds from sales of long-term investments | | | 3,402,391,409 | |
Net change in unrealized appreciation on investments | | | (165,427,899 | ) |
Net change in unrealized appreciation on futures contracts | | | (50,234,195 | ) |
Net change in unrealized appreciation on swap agreements | | | (198,761 | ) |
Net realized loss on investments | | | 127,143,010 | |
Net realized loss on futures contracts | | | 46,226,758 | |
Net realized gain on swap agreements | | | (1,518,076 | ) |
Change in assets and liabilities: | | | | |
Decrease in deposits at broker for futures | | | 6,132,459 | |
Decrease in deposits at broker for reverse repurchase agreements | | | 14,912,918 | |
Increase in receivable for investments sold | | | (64,379,457 | ) |
Decrease in dividends and interest receivable | | | 9,935,674 | |
Decrease in premiums paid on swaps | | | 3,867,722 | |
Decrease in prepaid expenses | | | 73,803 | |
Increase in payable for investments purchased | | | 20,391,881 | |
Decrease in interest payable for credit and reverse repurchase agreements | | | (759,109 | ) |
Change in variation margin paid on futures contracts | | | 990,670 | |
Decrease in payable for swap collateral posted | | | (2,030,000 | ) |
Increase in payable to Adviser | | | 160,427 | |
Decrease in payable to administrator, fund accountant and transfer agent | | | (192,790 | ) |
Decrease in payable to custodian | | | (26,156 | ) |
Increase in 12b-1 fees accrued | | | 12,338 | |
Decrease in other accrued expenses | | | (161,668 | ) |
| | | | |
Net cash provided by operating activities | | | 641,325,538 | |
| | | | |
CASH FLOWS FROM FINANCING ACTIVITIES: | | | | |
Proceeds from shares sold | | | 2,252,989,827 | |
Payment on shares redeemed | | | (2,498,467,286 | ) |
Distributions paid to shareholders | | | (62,687,185 | ) |
Purchases of reverse repurchase agreements | | | 14,425,000 | |
Proceeds from reverse repurchase agreements | | | (322,426,000 | ) |
Decrease in payable for credit agreements | | | (25,000,000 | ) |
| | | | |
Net cash used in financing activities | | | (641,165,644 | ) |
| | | | |
Net change in cash | | $ | 159,894 | |
| | | | |
CASH: | | | | |
Beginning Balance | | | 21,727 | |
| | | | |
Ending Balance | | $ | 181,621 | |
| | | | |
SUPPLEMENTAL DISCLOSURES: | | | | |
Cash paid for interest | | $ | 6,907,927 | |
Non-cash financing activities - distributions reinvested | | | 224,821,626 | |
Non-cash financing activities - increase in receivable for Fund shares sold | | | 12,952,294 | |
Non-cash financing activities - increase in payable for Fund shares redeemed | | | 29,000,725 | |
See accompanying notes which are an integral part of these financial statements.
45
Angel Oak Multi-Strategy Income Fund
Statements of Changes in Net Assets
| | | | | | | | |
| | | For the Year Ended
January 31, 2017 | | | For the Year Ended
January 31, 2016 | |
Increase in Net Assets due to: | | | | | | | | |
Operations | | | | | | | | |
Net investment income | | $ | 242,942,288 | | | $ | 266,870,275 | |
Net realized loss on investments, futures contracts and swap agreements | | | (171,851,692 | ) | | | (4,596,434 | ) |
Net change in unrealized appreciation (depreciation) on investments, futures contracts and swap agreements | | | 215,860,855 | | | | (289,393,808 | ) |
| | | | | | | | |
Net increase (decrease) in net assets resulting from operations | | | 286,951,451 | | | | (27,119,967 | ) |
| | | | | | | | |
Distributions | | | | | | | | |
From net investment income, Class A | | | (27,049,575 | ) | | | (32,038,746 | ) |
From net investment income, C Class (a) | | | – | | | | (502,750 | ) |
From net investment income, Class C (b) | | | (1,775,232 | ) | | | (411,096 | ) |
From net investment income, Institutional Class | | | (257,403,136 | ) | | | (264,789,663 | ) |
| | | | | | | | |
Total Distributions | | | (286,227,943 | ) | | | (297,742,255 | ) |
| | | | | | | | |
Capital Transactions – Class A | | | | | | | | |
Proceeds from shares sold | | | 187,469,506 | | | | 322,167,551 | |
Proceeds from exchange of C Class shares (a) | | | – | | | | 70,864,905 | |
Reinvestment of distributions | | | 23,110,077 | | | | 28,030,269 | |
Amound paid for shares redeemed | | | (249,883,094 | ) | | | (290,990,081 | ) |
| | | | | | | | |
Total Class A | | | (39,303,511 | ) | | | 130,072,644 | |
| | | | | | | | |
Capital Transactions – C Class (a) | | | | | | | | |
Proceeds from shares sold | | | – | | | | – | |
Reinvestment of distributions | | | – | | | | 326,234 | |
Amound paid for shares redeemed | | | – | | | | (3,117,006 | ) |
Amount paid for exchange into Class A shares | | | – | | | | (70,864,905 | ) |
| | | | | | | | |
Total C Class | | | – | | | | (73,655,677 | ) |
| | | | | | | | |
Capital Transactions – Class C (b) | | | | | | | | |
Proceeds from shares sold | | | 33,378,280 | | | | 18,239,993 | |
Reinvestment of distributions | | | 1,599,725 | | | | 393,383 | |
Amound paid for shares redeemed | | | (5,307,489 | ) | | | (177,644 | ) |
| | | | | | | | |
Total Class C | | | 29,670,516 | | | | 18,455,732 | |
| | | | | | | | |
Capital Transactions – Institutional Class | | | | | | | | |
Proceeds from shares sold | | | 2,045,094,335 | | | | 2,763,782,722 | |
Proceeds from shares issued from transfers in-kind (c) | | | – | | | | 18,025,048 | |
Reinvestment of distributions | | | 200,111,824 | | | | 197,734,578 | |
Amound paid for shares redeemed | | | (2,214,275,978 | ) | | | (1,729,351,717 | ) |
| | | | | | | | |
Total Institutional Class | | | 30,930,181 | | | | 1,250,190,631 | |
| | | | | | | | |
Net increase in net assets resulting from capital transactions | | | 21,297,186 | | | | 1,325,063,330 | |
| | | | | | | | |
Total Increase in Net Assets | | | 22,020,694 | | | | 1,000,201,108 | |
| | | | | | | | |
| (a) | C Class shares converted into Class A shares at the close of business on April 2, 2015. See Note 1 to the Financial Statements. |
| (b) | Class C shares commenced operations on August 4, 2015. |
| (c) | See Note 6 to the Financial Statements. |
See accompanying notes which are an integral part of these financial statements.
46
Angel Oak Multi-Strategy Income Fund
Statements of Changes in Net Assets – (continued)
| | | | | | | | |
| | | For the Year Ended
January 31, 2017 | | | For the Year Ended
January 31, 2016 | |
Net Assets | | | | | | | | |
Beginning of period | | $ | 4,494,582,124 | | | $ | 3,494,381,016 | |
| | | | | | | | |
End of period | | $ | 4,516,602,818 | | | $ | 4,494,582,124 | |
| | | | | | | | |
Accumulated undistributed net investment income (loss) included in net assets at end of period | | $ | 4,602,838 | | | $ | 9,553,466 | |
| | | | | | | | |
Share Transactions – Class A | | | | | | | | |
Shares sold | | | 16,805,890 | | | | 26,867,601 | |
Shares issued from exchange of C Class shares (a) | | | – | | | | 5,814,025 | |
Shares issued in reinvestment of distributions | | | 2,075,958 | �� | | | 2,369,967 | |
Shares redeemed | | | (22,450,059 | ) | | | (24,458,192 | ) |
| | | | | | | | |
Total Class A | | | (3,568,211 | ) | | | 10,593,401 | |
| | | | | | | | |
Share Transactions – C Class (a) | | | | | | | | |
Shares sold | | | – | | | | 26,963 | |
Shares issued in reinvestment of distributions | | | – | | | | – | |
Shares redeemed | | | – | | | | (257,149 | ) |
Shares redeemed in exchange of Class A shares | | | – | | | | (5,833,438 | ) |
| | | | | | | | |
Total C Class | | | – | | | | (6,063,624 | ) |
| | | | | | | | |
Share Transactions – Class C (b) | | | | | | | | |
Shares sold | | | 2,998,961 | | | | 1,548,408 | |
Shares issued in reinvestment of distributions | | | 143,809 | | | | 34,100 | |
Shares redeemed | | | (476,590 | ) | | | (15,397 | ) |
| | | | | | | | |
Total Class C | | | 2,666,180 | | | | 1,567,111 | |
| | | | | | | | |
Share Transactions – Institutional Class | | | | | | | | |
Shares sold | | | 183,666,000 | | | | 231,293,126 | |
Shares issued from transfers-in-kind (c) | | | – | | | | 1,540,070 | |
Shares issued in reinvestment of distributions | | | 17,989,160 | | | | 16,757,899 | |
Shares redeemed | | | (199,124,672 | ) | | | (146,487,378 | ) |
| | | | | | | | |
Total Class Institutional Class | | | 2,530,488 | | | | 103,103,717 | |
| | | | | | | | |
Net increase in share transactions | | | 1,628,457 | | | | 109,200,605 | |
| | | | | | | | |
| (a) | C Class shares converted into Class A shares at the close of business on April 2, 2015. See Note 1 to the Financial Statements. |
| (b) | Class C shares commenced operations on August 4, 2015. |
| (c) | See Note 6 to the Financial Statements. |
See accompanying notes which are an integral part of these financial statements.
47
Angel Oak Flexible Income Fund
Statements of Changes in Net Assets
| | | | | | | | |
| | | For the Year Ended
January 31, 2017 | | | For the Year Ended
January 31, 2016 | |
Increase (Decrease) in Net Assets due to: | | | | | | | | |
Operations | | | | | | | | |
Net investment income | | $ | 10,045,772 | | | $ | 15,051,593 | |
Net realized loss on investments and futures contracts | | | (31,158,448 | ) | | | (4,124,102 | ) |
Net change in unrealized appreciation (depreciation) on investments and futures contracts | | | 24,092,082 | | | | (23,099,039 | ) |
| | | | | | | | |
Net increase (decrease) in net assets resulting from operations | | | 2,979,406 | | | | (12,171,548 | ) |
| | | | | | | | |
Distributions | | | | | | | | |
From net investment income, Class A | | | (431,628 | ) | | | (2,493,916 | ) |
From net investment income, Class C (a) | | | (43,003 | ) | | | (9,925 | ) |
From net investment income, Institutional Class | | | (9,861,671 | ) | | | (12,604,909 | ) |
| | | | | | | | |
Total Distributions | | | (10,336,302 | ) | | | (15,108,750 | ) |
| | | | | | | | |
Capital Transactions – Class A | | | | | | | | |
Proceeds from shares sold | | | 8,635,264 | | | | 123,018,639 | |
Reinvestment of distributions | | | 413,109 | | | | 2,475,097 | |
Amound paid for shares redeemed | | | (17,111,572 | ) | | | (105,485,747 | ) |
| | | | | | | | |
Total Class A | | | (8,063,199 | ) | | | 20,007,989 | |
| | | | | | | | |
Capital Transactions – Class C (a) | | | | | | | | |
Proceeds from shares sold | | | 1,387,070 | | | | 673,700 | |
Reinvestment of distributions | | | 34,583 | | | | 8,969 | |
Amound paid for shares redeemed | | | (1,193,956 | ) | | | – | |
| | | | | | | | |
Total Class C | | | 227,697 | | | | 682,669 | |
| | | | | | | | |
Capital Transactions – Institutional Class | | | | | | | | |
Proceeds from shares sold | | | 94,747,348 | | | | 451,363,171 | |
Reinvestment of distributions | | | 9,657,535 | | | | 12,443,392 | |
Amound paid for shares redeemed | | | (231,111,397 | ) | | | (144,554,801 | ) |
| | | | | | | | |
Total Institutional Class | | | (126,706,514 | ) | | | 319,251,762 | |
| | | | | | | | |
Net increase (decrease) in net assets resulting from capital transactions | | | (134,542,016 | ) | | | 339,942,420 | |
| | | | | | | | |
Total Increase (Decrease) in Net Assets | | | (141,898,912 | ) | | | 312,662,122 | |
| | | | | | | | |
Net Assets | | | | | | | | |
Beginning of period | | | 314,017,298 | | | | 1,355,176 | |
| | | | | | | | |
End of period | | $ | 172,118,386 | | | $ | 314,017,298 | |
| | | | | | | | |
Accumulated undistributed net investment income included in net assets at end of period | | $ | 47,067 | | | $ | 282,101 | |
| | | | | | | | |
Share Transactions – Class A | | | | | | | | |
Shares sold | | | 934,357 | | | | 11,936,554 | |
Shares issued in reinvestment of distributions | | | 44,871 | | | | 245,335 | |
Shares redeemed | | | (1,840,819 | ) | | | (10,621,515 | ) |
| | | | | | | | |
Total Class A | | | (861,591 | ) | | | 1,560,374 | |
| | | | | | | | |
Share Transactions – Class C (a) | | | | | | | | |
Shares sold | | | 150,073 | | | | 66,902 | |
Shares issued in reinvestment of distributions | | | 3,741 | | | | 910 | |
Shares redeemed | | | (128,182 | ) | | | – | |
| | | | | | | | |
Total Class C | | | 25,632 | | | | 67,812 | |
| | | | | | | | |
Share Transactions – Institutional Class | | | | | | | | |
Shares sold | | | 10,320,625 | | | | 44,203,750 | |
Shares issued in reinvestment of distributions | | | 1,046,744 | | | | 1,237,977 | |
Shares redeemed | | | (25,088,714 | ) | | | (14,363,900 | ) |
| | | | | | | | |
Total Class Institutional Class | | | (13,721,345 | ) | | | 31,077,827 | |
| | | | | | | | |
Net increase (decrease) in share transactions | | | (14,557,304 | ) | | | 32,706,013 | |
| | | | | | | | |
| (a) | Class commenced operations on August 4, 2015. |
See accompanying notes which are an integral part of these financial statements.
48
Angel Oak High Yield Opportunities Fund
Statements of Changes in Net Assets
| | | | | | | | | | | | |
| | | For the Period Ended
January 31, 2017 (a) | | | For the Year Ended
March 31, 2016 | | | For the Year Ended
March 31, 2015 | |
Increase (Decrease) in Net Assets due to: | | | | | | | | | | | | |
Operations | | | | | | | | | |
Net investment income | | $ | 2,271,062 | | | $ | 3,098,379 | | | $ | 2,910,250 | |
Net realized loss on investment transactions and futures contracts | | | (152,565 | ) | | | (315,424 | ) | | | (127,374 | ) |
Net change in unrealized appreciation (depreciation) on investments and futures contracts | | | 4,155,170 | | | | (4,172,780 | ) | | | (1,890,197 | ) |
| | | | | | | | | | | | |
Net increase (decrease) in net assets resulting from operations | | | 6,273,667 | | | | (1,389,825 | ) | | | 892,679 | |
| | | | | | | | | | | | |
Distributions | | | | | | | | | | | | |
From net investment income, Class A (b) | | | (35,040 | ) | | | (97,497 | ) | | | (90,268 | ) |
From net investment income, Institutional Class | | | (2,204,303 | ) | | | (3,020,750 | ) | | | (2,819,898 | ) |
From net realized gains, Original Shares | | | – | | | | – | | | | (28,943 | ) |
From net realized gains, Institutional Shares | | | – | | | | – | | | | (699,738 | ) |
| | | | | | | | | | | | |
Total Distributions | | | (2,239,343 | ) | | | (3,118,247 | ) | | | (3,638,847 | ) |
| | | | | | | | | | | | |
Capital Transactions – Class A (b) | | | | | | | | | | | | |
Proceeds from shares sold | | | 113,053 | | | | 236,449 | | | | 2,291,746 | |
Reinvestment of distributions | | | 35,040 | | | | 97,497 | | | | 119,211 | |
Amound paid for shares redeemed | | | (176,439 | ) | | | (1,714,506 | ) | | | (96,803 | ) |
| | | | | | | | | | | | |
Total Class A | | | (28,346 | ) | | | (1,380,560 | ) | | | 2,314,154 | |
| | | | | | | | | | | | |
Capital Transactions – Institutional Class (c) | | | | | | | | | | | | |
Proceeds from shares sold | | | 29,317,256 | | | | 1,437,383 | | | | 9,147,962 | |
Reinvestment of distributions | | | 1,548,412 | | | | 2,286,239 | | | | 2,660,002 | |
Amound paid for shares redeemed | | | (24,390,327 | ) | | | (14,425,990 | ) | | | (3,842,769 | ) |
| | | | | | | | | | | | |
Total Institutional Class | | | 6,475,341 | | | | (10,702,368 | ) | | | 7,965,195 | |
| | | | | | | | | | | | |
Net increase (decrease) in net assets resulting from capital transactions | | | 6,446,995 | | | | (12,082,928 | ) | | | 10,279,349 | |
| | | | | | | | | | | | |
Total Increase (Decrease) in Net Assets | | | 10,481,319 | | | | (16,591,000 | ) | | | 7,533,181 | |
| | | | | | | | | | | | |
Net Assets | | | | | | | | | | | | |
Beginning of period | | | 38,242,630 | | | | 54,833,630 | | | | 47,300,449 | |
| | | | | | | | | | | | |
End of period | | $ | 48,723,949 | | | $ | 38,242,630 | | | $ | 54,833,630 | |
| | | | | | | | | | | | |
Accumulated undistributed net investment income (loss) included in net assets at end of period | | $ | 1,895 | | | $ | (11,374 | ) | | $ | 9,692 | |
| | | | | | | | | | | | |
Share Transactions – Class A (b) | | | | | | | | | | | | |
Shares sold | | | 9,658 | | | | 20,876 | | | | 185,248 | |
Shares issued in reinvestment of distributions | | | 3,048 | | | | 8,637 | | | | 10,049 | |
Shares redeemed | | | (15,434 | ) | | | (158,021 | ) | | | (8,176 | ) |
| | | | | | | | | | | | |
Total Class A | | | (2,728 | ) | | | (128,508 | ) | | | 187,121 | |
| | | | | | | | | | | | |
Share Transactions – Institutional Class (c) | | | | | | | | | | | | |
Shares sold | | | 2,538,778 | | | | 129,128 | | | | 755,299 | |
Shares issued in reinvestment of distributions | | | 134,624 | | | | 205,607 | | | | 223,037 | |
Shares redeemed | | | (2,121,960 | ) | | | (1,338,742 | ) | | | (321,544 | ) |
| | | | | | | | | | | | |
Total Class Institutional Class | | | 551,442 | | | | (1,004,007 | ) | | | 656,792 | |
| | | | | | | | | | | | |
Net increase (decrease) in share transactions | | | 548,714 | | | | (1,132,515 | ) | | | 843,913 | |
| | | | | | | | | | | | |
| (a) | For the period April 1, 2016 to January 31, 2017. See Note 1 to the Financial Statements. |
| (b) | Original Shares of the Predecessor Fund converted into Class A Shares at the close of business on April 15, 2016. See Note 1 to the Financial Statements. |
| (c) | Institutional Shares of the Predecessor Fund converted into Institutional Class Shares at the close of business on April 15, 2016. See Note 1 to the Financial Statements. |
See accompanying notes which are an integral part of these financial statements.
49
Angel Oak Multi-Strategy Income Fund – Class A
Financial Highlights
(For a share outstanding during each period)
| | | | | | | | | | | | | | | | | | | | |
| | | For the
Year Ended
January 31, 2017 | | | For the
Year Ended
January 31, 2016 | | | For the
Year Ended
January 31, 2015 | | | For the
Year Ended
January 31, 2014 | | | For the
Year Ended
January 31, 2013 | |
Selected Per Share Data: | | | | | | | | | | | | | | | | | | | | |
Net asset value, beginning of period | | $ | 11.28 | | | $ | 12.08 | | | $ | 12.17 | | | $ | 12.35 | | | $ | 10.67 | |
| | | | | | | | | | | | | | | | | | | | |
| | | | | |
Income from investment operations: | | | | | | | | | | | | | | | | | | | | |
Net investment income | | | 0.60 | | | | 0.66 | | | | 0.62 | | | | 0.54 | | | | 0.60 | |
Net realized and unrealized gain (loss) on investments | | | 0.12 | | | | (0.69 | ) | | | (0.09 | ) | | | (0.13 | ) | | | 1.74 | |
| | | | | | | | | | | | | | | | | | | | |
Total from investment operations | | | 0.72 | | | | (0.03 | ) | | | 0.53 | | | | 0.41 | | | | 2.34 | |
| | | | | | | | | | | | | | | | | | | | |
Less distributions to shareholders: | | | | | | | | | | | | | | | | | | | | |
From net investment income | | | (0.70 | ) | | | (0.77 | ) | | | (0.62 | ) | | | (0.58 | ) | | | (0.61 | ) |
From net realized gain | | | – | | | | – | | | | – | | | | (0.01 | ) | | | (0.05 | ) |
| | | | | | | | | | | | | | | | | | | | |
Total Distributions | | | (0.70 | ) | | | (0.77 | ) | | | (0.62 | ) | | | (0.59 | ) | | | (0.66 | ) |
| | | | | | | | | | | | | | | | | | | | |
| | | | | |
Net asset value, end of period | | $ | 11.30 | | | $ | 11.28 | | | $ | 12.08 | | | $ | 12.17 | | | $ | 12.35 | |
| | | | | | | | | | | | | | | | | | | | |
| | | | | |
Total Return (a) | | | 6.64 | % | | | -0.33 | % | | | 4.41 | % | | | 3.52 | % | | | 22.57 | % |
| | | | | |
Ratios and Supplemental Data: | | | | | | | | | | | | | | | | | | | | |
Net assets, end of period (000’s omitted) | | $ | 431,536 | | | $ | 470,926 | | | $ | 376,374 | | | $ | 760,039 | | | $ | 486,444 | |
Ratio of expenses to average net assets after waiver and reimbursement (recapture) (b)(c)(d) | | | 1.38 | % | | | 1.41 | % | | | 1.46 | % | | | 1.68 | % | | | 1.60 | % |
Ratio of net investment income to average net assets before waiver and reimbursement (recapture) | | | 5.42 | % | | | 5.68 | % | | | 4.69 | % | | | 4.36 | % | | | 4.39 | % |
Ratio of net investment income to average net assets after waiver and reimbursement (recapture) | | | 5.38 | % | | | 5.69 | % | | | 4.86 | % | | | 4.60 | % | | | 5.02 | % |
Portfolio turnover rate | | | 64.45 | % | | | 43.68 | % | | | 54.36 | % | | | 61.70 | % | | | 54.56 | % |
| (a) | Total return does not include the effects of sales charges. |
| | | | | | | | | | | | | | | | | | | | |
(b) Ratio of expenses to average net assets before waiver and reimbursement (recapture) | | | 1.34 | % | | | 1.43 | % | | | 1.62 | % | | | 1.91 | % | | | 2.23 | % |
(c) Ratio of expenses to average net assets before waiver and reimbursement (recapture) excluding interest expense | | | 1.20 | % | | | 1.25 | % | | | 1.40 | % | | | 1.47 | % | | | 1.90 | % |
(d) Ratio of expenses to average net assets after waiver and reimbursement (recapture) excluding interest expense | | | 1.24 | % | | | 1.24 | % | | | 1.24 | % | | | 1.24 | % | | | 1.26 | % |
See accompanying notes which are an integral part of these financial statements.
50
Angel Oak Multi-Strategy Income Fund – Class C
Financial Highlights
(For a share outstanding during each period)
| | | | | | | | |
| | | For the Year Ended
January 31, 2017 | | | For the Period Ended
January 31, 2016 (a) | |
Selected Per Share Data: | | | | | | | | |
Net asset value, beginning of period | | $ | 11.26 | | | $ | 12.06 | |
| | | | | | | | |
| | |
Income from investment operations: | | | | | | | | |
Net investment income | | | 0.56 | | | | 0.32 | |
Net realized and unrealized gain (loss) on investments | | | 0.08 | | | | (0.70 | ) |
| | | | | | | | |
Total from investment operations | | | 0.64 | | | | (0.38 | ) |
| | | | | | | | |
Less distributions to shareholders: | | | | | | | | |
From net investment income | | | (0.67 | ) | | | (0.42 | ) |
| | | | | | | | |
Total Distributions | | | (0.67 | ) | | | (0.42 | ) |
| | | | | | | | |
| | |
Net asset value, end of period | | $ | 11.23 | | | $ | 11.26 | |
| | | | | | | | |
| | |
Total Return (b) | | | 5.87 | % | | | (3.20 | %) (c) |
| | |
Ratios and Supplemental Data: | | | | | | | | |
Net assets, end of period (000’s omitted) | | $ | 47,541 | | | $ | 17,650 | |
Ratio of expenses to average net assets after waiver and reimbursement (recapture) (d)(e)(f) | | | 2.12 | % | | | 2.21 | % (g) |
Ratio of net investment income to average net assets before waiver and reimbursement (recapture) | | | 4.45 | % | | | 5.65 | % (g) |
Ratio of net investment income to average net assets after waiver and reimbursement (recapture) | | | 4.41 | % | | | 5.65 | % (g) |
Portfolio turnover rate | | | 64.45 | % | | | 43.68 | % (c) |
| (a) | Class commenced operations on August 4, 2015. |
| (b) | Total return does not include the effects of sales charges. |
| | | | | | | | |
(d) Ratio of expenses to average net assets before waiver and reimbursement (recapture) | | | 2.08 | % | | | 2.21 | % (g) |
(e) Ratio of expenses to average net assets before waiver and reimbursement (recapture) excluding interest expense | | | 1.95 | % | | | 1.99 | % (g) |
(f) Ratio of expenses to average net assets after waiver and reimbursement (recapture) excluding interest expense | | | 1.99 | % | | | 1.99 | % (g) |
See accompanying notes which are an integral part of these financial statements.
51
Angel Oak Multi-Strategy Income Fund – Institutional Class
Financial Highlights
(For a share outstanding during each period)
| | | | | | | | | | | | | | | | | | | | |
| | | For the
Year Ended
January 31, 2017 | | | For the
Year Ended
January 31, 2016 | | | For the
Year Ended
January 31, 2015 | | | For the
Year Ended
January 31, 2014 | | | For the
Period Ended
January 31, 2013 (a) | |
Selected Per Share Data: | | | | | | | | | | | | | | | | | | | | |
Net asset value, beginning of period | | $ | 11.27 | | | $ | 12.07 | | | $ | 12.17 | | | $ | 12.34 | | | $ | 11.71 | |
| | | | | | | | | | | | | | | | | | | | |
| | | | | |
Income from investment operations: | | | | | | | | | | | | | | | | | | | | |
Net investment income | | | 0.63 | | | | 0.72 | | | | 0.60 | | | | 0.56 | | | | 0.25 | |
Net realized and unrealized gain (loss) on investments | | | 0.12 | | | | (0.72 | ) | | | (0.05 | ) | | | (0.10 | ) | | | 0.65 | |
| | | | | | | | | | | | | | | | | | | | |
Total from investment operations | | | 0.75 | | | | – | | | | 0.55 | | | | 0.46 | | | | 0.90 | |
| | | | | | | | | | | | | | | | | | | | |
Less distributions to shareholders: | | | | | | | | | | | | | | | | | | | | |
From net investment income | | | (0.74 | ) | | | (0.80 | ) | | | (0.65 | ) | | | (0.62 | ) | | | (0.22 | ) |
From net realized gain | | | – | | | | – | | | | – | | | | (0.01 | ) | | | (0.05 | ) |
| | | | | | | | | | | | | | | | | | | | |
Total Distributions | | | (0.74 | ) | | | (0.80 | ) | | | (0.65 | ) | | | (0.63 | ) | | | (0.27 | ) |
| | | | | | | | | | | | | | | | | | | | |
| | | | | |
Net asset value, end of period | | $ | 11.28 | | | $ | 11.27 | | | $ | 12.07 | | | $ | 12.17 | | | $ | 12.34 | |
| | | | | | | | | | | | | | | | | | | | |
| | | | | |
Total Return | | | 6.96 | % | | | -0.09 | % | | | 4.60 | % | | | 3.88 | % | | | 7.75 | % (b) |
| | | | | |
Ratios and Supplemental Data: | | | | | | | | | | | | | | | | | | | | |
Net assets, end of period (000’s omitted) | | $ | 4,037,526 | | | $ | 4,006,007 | | | $ | 3,045,031 | | | $ | 1,287,772 | | | $ | 445,187 | |
Ratio of expenses to average net assets after waiver and reimbursement (recapture) (c)(d)(e) | | | 1.13 | % | | | 1.19 | % | | | 1.21 | % | | | 1.43 | % | | | 1.34 | % (f) |
Ratio of net investment income to average net assets before waiver and reimbursement (recapture) | | | 5.67 | % | | | 6.18 | % | | | 4.84 | % | | | 4.58 | % | | | 4.52 | % (f) |
Ratio of net investment income to average net assets after waiver and reimbursement (recapture) | | | 5.63 | % | | | 6.19 | % | | | 5.01 | % | | | 4.81 | % | | | 5.07 | % (f) |
Portfolio turnover rate | | | 64.45 | % | | | 43.68 | % | | | 54.36 | % | | | 61.70 | % | | | 54.56 | % (b) |
| (a) | Class commenced operations on August 16, 2012. |
| | | | | | | | | | | | | | | | | | | | |
(c) Ratio of expenses to average net assets before waiver and reimbursement (recapture) | | | 1.09 | % | | | 1.21 | % | | | 1.37 | % | | | 1.66 | % | | | 1.89 | % (f) |
(d) Ratio of expenses to average net assets before waiver and reimbursement (recapture) excluding interest expense | | | 0.95 | % | | | 1.00 | % | | | 1.15 | % | | | 1.22 | % | | | 1.54 | % (f) |
(e) Ratio of expenses to average net assets after waiver and reimbursement (recapture) excluding interest expense | | | 0.99 | % | | | 0.99 | % | | | 0.99 | % | | | 0.99 | % | | | 0.99 | % (f) |
See accompanying notes which are an integral part of these financial statements.
52
Angel Oak Flexible Income Fund – Class A
Financial Highlights
(For a share outstanding during each period)
| | | | | | | | | | | | |
| | | For the Year Ended
January 31, 2017 | | | For the Year Ended
January 31, 2016 | | | For the Period Ended
January 31, 2015 (a) | |
Selected Per Share Data: | | | | | | | | | | | | |
Net asset value, beginning of period | | $ | 9.56 | | | $ | 10.14 | | | $ | 10.00 | |
| | | | | | | | | | | | |
| | | |
Income from investment operations: | | | | | | | | | | | | |
Net investment income | | | 0.48 | | | | 0.47 | | | | 0.10 | (b) |
Net realized and unrealized gain (loss) on investments | | | (0.17 | ) | | | (0.60 | ) | | | 0.11 | |
| | | | | | | | | | | | |
Total from investment operations | | | 0.31 | | | | (0.13 | ) | | | 0.21 | |
| | | | | | | | | | | | |
Less distributions to shareholders: | | | | | | | | | | | | |
From net investment income | | | (0.45 | ) | | | (0.45 | ) | | | (0.07 | ) |
| | | | | | | | | | | | |
Total Distributions | | | (0.45 | ) | | | (0.45 | ) | | | (0.07 | ) |
| | | | | | | | | | | | |
| | | |
Net asset value, end of period | | $ | 9.42 | | | $ | 9.56 | | | $ | 10.14 | |
| | | | | | | | | | | | |
| | | |
Total Return (c) | | | 3.47 | % | | | -1.36 | % | | | 1.98 | % (d)(e) |
| | | |
Ratios and Supplemental Data: | | | | | | | | | | | | |
Net assets, end of period (000’s omitted) | | $ | 6,785 | | | $ | 15,125 | | | $ | 214 | |
Ratio of expenses to average net assets after waiver and reimbursement (f)(g)(h) | | | 1.13 | % | | | 1.20 | % | | | 1.24 | % (i) |
Ratio of net investment income (loss) to average net assets before waiver and reimbursement | | | 4.44 | % | | | 4.62 | % | | | -255.74 | % (i) |
Ratio of net investment income to average net assets after waiver and reimbursement | | | 4.78 | % | | | 4.89 | % | | | 3.93 | % (i) |
Portfolio turnover rate | | | 84.42 | % | | | 100.93 | % | | | 6.41 | % (d) |
|
(a) Class commenced operations on November 3, 2014. | |
(b) Calculated based on average shares outstanding during the period. | |
(c) Total return does not include the effects of sales charges. | |
(d) Not Annualized. | |
(e) Total Return was calculated using the traded NAV. | |
(f) Ratio of expenses to average net assets before waiver and reimbursement | | | 1.47 | % | | | 1.47 | % | | | 260.91 | % (i) |
(g) Ratio of expenses to average net assets before waiver and reimbursement excluding interest expense | | | 1.42 | % | | | 1.37 | % | | | 260.91 | % (i) |
(h) Ratio of expenses to average net assets after waiver and reimbursement excluding interest expense | | | 1.08 | % | | | 1.10 | % | | | 1.24 | % (i) |
(i) Annualized. | |
See accompanying notes which are an integral part of these financial statements.
53
Angel Oak Flexible Income Fund – Class C
Financial Highlights
(For a share outstanding during each period)
| | | | | | | | |
| | | For the Year Ended
January 31, 2017 | | | For the Period Ended
January 31, 2016 (a) | |
Selected Per Share Data: | | | | | | | | |
Net asset value, beginning of period | | $ | 9.55 | | | $ | 10.28 | |
| | | | | | | | |
| | |
Income from investment operations: | | | | | | | | |
Net investment income | | | 0.35 | | | | 0.20 | |
Net realized and unrealized loss on investments | | | (0.11 | ) | | | (0.70 | ) |
| | | | | | | | |
Total from investment operations | | | 0.24 | | | | (0.50 | ) |
| | | | | | | | |
Less distributions to shareholders: | | | | | | | | |
From net investment income | | | (0.42 | ) | | | (0.23 | ) |
| | | | | | | | |
Total Distributions | | | (0.42 | ) | | | (0.23 | ) |
| | | | | | | | |
| | |
Net asset value, end of period | | $ | 9.37 | | | $ | 9.55 | |
| | | | | | | | |
| | |
Total Return (b) | | | 2.73 | % | | | -4.97 | % (c) |
| | |
Ratios and Supplemental Data: | | | | | | | | |
Net assets, end of period (000’s omitted) | | $ | 875 | | | $ | 648 | |
Ratio of expenses to average net assets after waiver and reimbursement (d)(e)(f) | | | 1.84 | % | | | 1.97 | % (g) |
Ratio of net investment income (loss) to average net assets before waiver and reimbursement | | | 3.58 | % | | | 4.05 | % (g) |
Ratio of net investment income to average net assets after waiver and reimbursement | | | 3.89 | % | | | 4.39 | % (g) |
Portfolio turnover rate | | | 84.42 | % | | | 100.93 | % (c) |
| | |
(a) Class commenced operations on August 4, 2015. | | | | | | | | |
(b) Total return does not include the effects of sales charges. | | | | | | | | |
(c) Not Annualized. | | | | | | | | |
(d) Ratio of expenses to average net assets before waiver and reimbursement | | | 2.15 | % | | | 2.32 | % (g) |
(e) Ratio of expenses to average net assets before waiver and reimbursement excluding interest expense | | | 2.12 | % | | | 2.19 | % (g) |
(f) Ratio of expenses to average net assets after waiver and reimbursement excluding interest expense | | | 1.81 | % | | | 1.85 | % (g) |
(g) Annualized. | | | | | | | | |
See accompanying notes which are an integral part of these financial statements.
54
Angel Oak Flexible Income Fund – Institutional Class
Financial Highlights
(For a share outstanding during each period)
| | | | | | | | | | | | |
| | | For the Year Ended
January 31, 2017 | | | For the Year Ended
January 31, 2016 | | | For the Period Ended
January 31, 2015 (a) | |
Selected Per Share Data: | | | | | | | | | | | | |
Net asset value, beginning of period | | $ | 9.56 | | | $ | 10.14 | | | $ | 10.00 | |
| | | | | | | | | | | | |
| | | |
Income from investment operations: | | | | | | | | | | | | |
Net investment income | | | 0.47 | | | | 0.46 | | | | 0.13 | (b) |
Net realized and unrealized gain (loss) on investments | | | (0.14 | ) | | | (0.57 | ) | | | 0.08 | |
| | | | | | | | | | | | |
Total from investment operations | | | 0.33 | | | | (0.11 | ) | | | 0.21 | |
| | | | | | | | | | | | |
Less distributions to shareholders: | | | | | | | | | | | | |
From net investment income | | | (0.48 | ) | | | (0.47 | ) | | | (0.07 | ) |
| | | | | | | | | | | | |
Total Distributions | | | (0.48 | ) | | | (0.47 | ) | | | (0.07 | ) |
| | | | | | | | | | | | |
| | | |
Net asset value, end of period | | $ | 9.41 | | | $ | 9.56 | | | $ | 10.14 | |
| | | | | | | | | | | | |
| | | |
Total Return | | | 3.69 | % | | | -1.11 | % | | | 2.03 | % (c)(d) |
| | | |
Ratios and Supplemental Data: | | | | | | | | | | | | |
Net assets, end of period (000’s omitted) | | $ | 164,458 | | | $ | 298,244 | | | $ | 1,142 | |
Ratio of expenses to average net assets after waiver and reimbursement (e)(f)(g) | | | 0.87 | % | | | 0.97 | % | | | 0.99 | % (h) |
Ratio of net investment income (loss) to average net assets before waiver and reimbursement | | | 4.66 | % | | | 4.81 | % | | | -167.87 | % (h) |
Ratio of net investment income to average net assets after waiver and reimbursement | | | 4.98 | % | | | 5.10 | % | | | 5.48 | % (h) |
Portfolio turnover rate | | | 84.42 | % | | | 100.93 | % | | | 6.41 | % (c) |
|
(a) Class commenced operations on November 3, 2014. | |
(b) Calculated based on average shares outstanding during the period. | |
(c) Not Annualized. | |
(d) Total Return was calculated using the traded NAV. | |
(e) Ratio of expenses to average net assets before waiver and reimbursement | | | 1.19 | % | | | 1.26 | % | | | 174.34 | % (h) |
(f) Ratio of expenses to average net assets before waiver and reimbursement excluding interest expense | | | 1.15 | % | | | 1.14 | % | | | 174.34 | % (h) |
(g) Ratio of expenses to average net assets after waiver and reimbursement excluding interest expense | | | 0.83 | % | | | 0.85 | % | | | 0.99 | % (h) |
(h) Annualized. | | | | | | | | | | | | |
See accompanying notes which are an integral part of these financial statements.
55
Angel Oak High Yield Opportunities Fund – Class A
Financial Highlights
(For a share outstanding during each period)
| | | | | | | | | | | | | | | | | | | | |
| | | For the
Period Ended
January 31, 2017 (a) | | | For the
Year Ended
March 31, 2016 | | | For the
Year Ended
March 31, 2015 | | | For the
Year Ended
March 31, 2014 | | | For the
Period Ended
March 31, 2013 (b) | |
Selected Per Share Data: | | | | | | | | | | | | | | | | | | | | |
Net asset value, beginning of period | | $ | 10.80 | | | $ | 11.73 | | | $ | 12.34 | | | $ | 12.43 | | | $ | 12.26 | |
| | | | | | | | | | | | | | | | | | | | |
| | | | | |
Income from investment operations: | | | | | | | | | | | | | | | | | | | | |
Net investment income | | | 0.59 | | | | 0.64 | (c) | | | 0.63 | (c) | | | 0.66 | (c) | | | 0.49 | (c) |
Net realized and unrealized gain (loss) on investments | | | 1.10 | | | | (0.94 | ) | | | (0.46 | ) | | | 0.18 | | | | 0.35 | |
| | | | | | | | | | | | | | | | | | | | |
Total from investment operations | | | 1.69 | | | | (0.30 | ) | | | 0.17 | | | | 0.84 | | | | 0.84 | |
| | | | | | | | | | | | | | | | | | | | |
Less distributions to shareholders: | | | | | | | | | | | | | | | | | | | | |
From net investment income | | | (0.57 | ) | | | (0.63 | ) | | | (0.62 | ) | | | (0.69 | ) | | | (0.48 | ) |
From net realized gain | | | – | | | | – | | | | (0.16 | ) | | | (0.24 | ) | | | (0.19 | ) |
| | | | | | | | | | | | | | | | | | | | |
Total Distributions | | | (0.57 | ) | | | (0.63 | ) | | | (0.78 | ) | | | (0.93 | ) | | | (0.67 | ) |
| | | | | | | | | | | | | | | | | | | | |
| | | | | |
Net asset value, end of period | | $ | 11.92 | | | $ | 10.80 | | | $ | 11.73 | | | $ | 12.34 | | | $ | 12.43 | |
| | | | | | | | | | | | | | | | | | | | |
| | | | | |
Total Return (d) | | | 16.00 | % (e) | | | -2.57 | % | | | 1.46 | % | | | 7.07 | % | | | 7.01 | % (e) |
| | | | | |
Ratios and Supplemental Data: | | | | | | | | | | | | | | | | | | | | |
Net assets, end of period (000’s omitted) | | $ | 745 | | | $ | 705 | | | $ | 2,273 | | | $ | 82 | | | $ | 11 | |
Ratio of expenses to average net assets after waiver and reimbursement (f) | | | 0.90 | % (g) | | | 0.90 | % | | | 0.90 | % | | | 0.90 | % | | | 0.90 | % (g) |
Ratio of net investment income to average net assets before waiver and reimbursement | | | 5.70 | % (g) | | | N/A | | | | N/A | | | | N/A | | | | N/A | |
Ratio of net investment income to average net assets after waiver and reimbursement | | | 6.13 | % (g) | | | 5.62 | % | | | 5.29 | % | | | 5.33 | % | | | 5.90 | % (g) |
Portfolio turnover rate | | | 70.87 | % (e) | | | 35.45 | % | | | 33.69 | % | | | 28.71 | % | | | 32.74 | % (e) |
|
(a) For the period April 1, 2016 to January 31, 2017. See Note 1 to the Financial Statements. | |
(b) Class commenced operations on July 31, 2012. | |
(c) Calculated based on average shares outstanding during the period. | |
(d) Total return does not include the effects of sales charges. | |
(e) Not annualized. | |
(f) Ratio of expenses to average net assets before waiver and reimbursement | | | 1.33 | % (g) | | | 1.11 | % | | | 1.11 | % | | | 1.00 | % | | | 1.03 | % (g) |
(g) Annualized. | |
See accompanying notes which are an integral part of these financial statements.
56
Angel Oak High Yield Opportunities Fund – Institutional Class
Financial Highlights
(For a share outstanding during each period)
| | | | | | | | | | | | | | | | | | | | | | | | |
| | | For the
Period Ended
January 31, 2017 (a) | | | For the
Year Ended
March 31, 2016 | | | For the
Year Ended
March 31, 2015 | | | For the
Year Ended
March 31, 2014 | | | For the
Year Ended
March 31, 2013 | | | For the
Year Ended
March 31, 2012 | |
Selected Per Share Data: | | | | | | | | | | | | | | | | | | | | | | | | |
Net asset value, beginning of period | | $ | 10.77 | | | $ | 11.71 | | | $ | 12.32 | | | $ | 12.43 | | | $ | 12.12 | | | $ | 12.06 | |
| | | | | | | | | | | | | | | | | | | | | | | | |
| | | | | | |
Income from investment operations: | | | | | | | | | | | | | | | | | | | | | | | | |
Net investment income | | | 0.60 | | | | 0.67 | (b) | | | 0.67 | (b) | | | 0.72 | | | | 0.76 | | | | 0.78 | |
Net realized and unrealized gain (loss) on investments | | | 1.12 | | | | (0.94 | ) | | | (0.46 | ) | | | 0.13 | | | | 0.50 | | | | 0.12 | |
| | | | | | | | | | | | | | | | | | | | | | | | |
Total from investment operations | | | 1.72 | | | | (0.27 | ) | | | 0.21 | | | | 0.85 | | | | 1.26 | | | | 0.90 | |
| | | | | | | | | | | | | | | | | | | | | | | | |
Less distributions to shareholders: | | | | | | | | | | | | | | | | | | | | | | | | |
From net investment income | | | (0.60 | ) | | | (0.67 | ) | | | (0.66 | ) | | | (0.72 | ) | | | (0.75 | ) | | | (0.78 | ) |
From net realized gain | | | – | | | | – | | | | (0.16 | ) | | | (0.24 | ) | | | (0.20 | ) | | | (0.06 | ) |
| | | | | | | | | | | | | | | | | | | | | | | | |
Total Distributions | | | (0.60 | ) | | | (0.67 | ) | | | (0.82 | ) | | | (0.96 | ) | | | (0.95 | ) | | | (0.84 | ) |
| | | | | | | | | | | | | | | | | | | | | | | | |
| | | | | | |
Net asset value, end of period | | $ | 11.89 | | | $ | 10.77 | | | $ | 11.71 | | | $ | 12.32 | | | $ | 12.43 | | | | 12.12 | |
| | | | | | | | | | | | | | | | | | | | | | | | |
| | | | | | |
Total Return | | | 16.28 | % (c) | | | -2.30 | % | | | 1.78 | % | | | 7.16 | % | | | 10.74 | % | | | 7.81 | % |
| | | | | | |
Ratios and Supplemental Data: | | | | | | | | | | | | | | | | | | | | | | | | |
Net assets, end of period (000’s omitted) | | $ | 47,979 | | | $ | 37,538 | | | $ | 52,561 | | | $ | 47,219 | | | $ | 42,690 | | | $ | 37,800 | |
Ratio of expenses to average net assets after waiver and reimbursement (d) | | | 0.65 | % (e) | | | 0.65 | % | | | 0.65 | % | | | 0.65 | % | | | 0.65 | % | | | 0.65 | % |
Ratio of net investment income to average net assets before waiver and reimbursement | | | 5.91 | % (e) | | | N/A | | | | N/A | | | | N/A | | | | N/A | | | | N/A | |
Ratio of net investment income to average net assets after waiver and reimbursement | | | 6.33 | % (e) | | | 5.94 | % | | | 5.51 | % | | | 5.85 | % | | | 6.14 | % | | | 6.55 | % |
Portfolio turnover rate | | | 70.87 | % (c) | | | 34.45 | % | | | 33.69 | % | | | 28.71 | % | | | 32.74 | % | | | 42.05 | % |
| (a) | For the period April 1, 2016 to January 31, 2017. See Note 1 to the Financial Statements. |
| (b) | Calculated based on average shares outstanding during the period. |
| | | | | | | | | | | | | | | | | | | | | | | | |
(d) Ratio of expenses to average net assets before waiver and reimbursement | | | 1.07 | % (e) | | | 0.74 | % | | | 0.73 | % | | | 0.75 | % | | | 0.78 | % | | | 0.73 | % |
See accompanying notes which are an integral part of these financial statements.
57
Angel Oak Funds
Notes to the Financial Statements
January 31, 2017
NOTE 1. ORGANIZATION
Angel Oak Funds Trust (the “Trust”) is a Delaware statutory trust organized on June 20, 2014 and registered with the U.S. Securities and Exchange Commission as an open-end management investment company, as defined in the Investment Company Act of 1940 (the “1940 Act”), as amended. The Trust consists of three series, Angel Oak Multi-Strategy Income Fund (the “Multi-Strategy Income Fund”), Angel Oak Flexible Income Fund (the “Flexible Income Fund”), and Angel Oak High Yield Opportunities Fund (the “High Yield Opportunities Fund”) (the “Funds”). The Funds offer three classes of shares to investors, Class A shares, Class C shares, and Institutional Class shares. The Angel Oak Multi-Strategy Income Fund’s Class A shares commenced operations on June 28, 2011, Class C shares commenced operations on August 4, 2015, and the Institutional Class shares commenced operations on August 16, 2012. The Angel Oak Flexible Income Fund’s Class A and Institutional Class shares commenced operations on November 3, 2014 and the Class C shares commenced on August 4, 2015. The Angel Oak High Yield Opportunities Fund Class A shares commenced operations on July 31, 2012, Institutional Class shares commenced operations on March 31, 2009, and Class C shares have not commenced operations as of January 31, 2017. Class A shares charge a 2.25% front-end sales charge and a 0.25% 12b-1 fee. Class C shares charge a 1.00% deferred sales charge on shares redeemed within one year of purchase and a 1.00% 12b-1 fees. Institutional Class shares do not charge front-end or back-end sales charges and no 12b-1 fees.
The investment objective of the Multi-Strategy Income Fund is current income. The investment objective of the Flexible Income Fund is to seek current income with a secondary objective of total return. The investment objective of High Yield Opportunities Fund is to earn a high level of current income with a secondary objective of capital appreciation. The Multi-Strategy Income Fund and High Yield Opportunities Fund are diversified series of the Trust while the Flexible Income Fund is a non-diversified series of the Trust.
The Multi-Strategy Income Fund is the successor in interest to a fund (the “Predecessor Fund”) having the same name and investment objective that was included as a series of another investment company, Valued Advisers Trust, and that was also advised by the Multi-Strategy Income Fund’s investment adviser, Angel Oak Capital Advisors, LLC (the “Adviser”). On March 26, 2015, the shareholders of the Predecessor Fund approved the reorganization of the Predecessor Fund with and into the Multi-Strategy Income Fund, and effective as of the close of business on April 10, 2015, the assets and liabilities of the Predecessor Fund were transferred to the Trust in exchange for shares of the Multi-Strategy Income Fund. Costs incurred by the Multi-Strategy Income Fund in connection with the reorganization were paid by the Adviser. The Predecessor Fund ceased offering its C Class shares and converted them into Class A shares effective as of the close of business April 2, 2015.
The High Yield Opportunities Fund is the successor in interest to the Rainier High Yield Fund (the “Predecessor High Yield Fund”), which had the same investment objective and was included as a series of another investment company, Rainier Investment Management Mutual Funds (“Predecessor Trust”), and that was advised by Rainier Investment Management, LLC. On April 15, 2016, the shareholders of the Predecessor High Yield Fund approved the reorganization of the Original Shares and Institutional Shares of the Predecessor High Yield Fund with and into the Class A shares and Institutional Class shares of the Angel Oak High Yield Opportunities Fund, and effective as of the close of business on April 15, 2016, the assets and liabilities of the Predecessor High Yield Fund were transferred to the Trust in exchange for shares in the Angel Oak High Yield Opportunities Fund. Costs incurred by the Angel Oak High Yield Opportunities Fund in connection with the reorganization were paid by the Adviser. The fiscal year end of the Predecessor High Yield Fund was March 31, 2016. The reporting period covered by this annual report for the High Yield Opportunities Fund is April 1, 2016 through January 31, 2017. Operations prior to April 15, 2016 were for the Predecessor High Yield Fund. Net assets and shares outstanding on April 15, 2016 were $705,808 and 64,250 for Original Shares and $37,954,151 and 3,463,606 for Institutional Shares, respectively, all of which were transferred into the Trust at NAV at the close of business on April 15, 2016.
NOTE 2. SIGNIFICANT ACCOUNTING POLICIES
The following is a summary of significant accounting policies consistently followed by the Funds in the preparation of its financial statements in accordance with the generally accepted accounting principles in the United States of America (“GAAP”). The Funds follow the Investment company accounting and reporting guidance of the Financial Accounting Standards Board (“FASB”) Accounting Codification Topic 946 Financial Services-Investment Companies.
Securities Valuation and fair value measurements – The Funds have adopted authoritative fair valuation accounting standards which establish an authoritative definition of fair value and set out a hierarchy for measuring fair value. These standards require additional disclosures about the various inputs and valuation techniques used to develop the measurements of fair value and a discussion in
58
Angel Oak Funds
Notes to the Financial Statements - (continued)
January 31, 2017
NOTE 2. SIGNIFICANT ACCOUNTING POLICIES – (continued)
changes in valuation techniques and related inputs, if any, during the period. In addition, these standards require expanded disclosure for each major category of assets. These inputs are summarized in the three broad levels listed below:
| | • | | Level 1 – Quoted prices in active markets for identical securities |
| | • | | Level 2 – other significant observable inputs (including, but not limited to, quoted prices for similar securities, interest rates, prepayment speeds, credit risk, etc.) |
| | • | | Level 3 – significant unobservable inputs (including the Fund’s own assumptions in determining fair value of investments based on the best information available) |
The inputs or methodology used for valuing securities are not an indication of the risks associated with investing in those securities.
Investments in registered open-end management investment companies, including money market funds, will be valued based upon the net asset value (“NAV”) of such investments and are categorized as Level 1 of the fair value hierarchy.
Fair values for long-term debt securities, including asset-backed securities, collateralized loan obligations, collateralized mortgage obligations, corporate obligations and mortgage-backed securities are normally determined on the basis of valuations provided by independent pricing services. Vendors typically value such securities based on one or more inputs, including but not limited to, benchmark yields, transactions, bids, offers, quotations from dealers and trading systems, new issues, spreads and other relationships observed in the markets among comparable securities; and pricing models such as yield measurers calculated using factors such as cash flows, financial or collateral performance and other reference data. In addition to these inputs, mortgage-backed and asset-backed obligations may utilize cash flows, prepayment information, default rates, delinquency and loss assumptions, collateral characteristics, credit enhancements and specific deal information. Securities that use similar valuation techniques and inputs are categorized as Level 2 of the fair value hierarchy. To the extent the significant inputs are unobservable; the values generally would be categorized as Level 3.
Equity securities, including preferred stocks, that are traded on a national securities exchange, except those listed on the NASDAQ Global Market®, NASDAQ Global Select Market® and the NASDAQ Capital Market® exchanges (collectively, “NASDAQ”), are valued at the last sale price at the close of that exchange. Securities traded on NASDAQ will be valued at the NASDAQ Official Closing Price (“NOCP”). If, on a particular day, an exchange-listed or NASDAQ security does not trade, then: (i) the security shall be valued at the mean between the most recent quoted bid and asked prices at the close of the exchange; or (ii) the security shall be valued at the latest sales price on the Composite Market (defined below) for the day such security is being valued. “Composite Market” means a consolidation of the trade information provided by national securities and foreign exchanges and over-the-counter markets (“OTC”) as published by a pricing service. In the event market quotations or Composite Market pricing are not readily available, Fair Value will be determined in accordance with the procedures adopted by the Board of Trustees (“Board”). All equity securities that are not traded on a listed exchange are valued at the last sale price at the close of the over-the counter market. If a non-exchange listed security does not trade on a particular day, then the mean between the last quoted bid and asked price will be used as long as it continues to reflect the value of the security. If the mean is not available, then bid price can be used as long as the bid price continues to reflect the value of the security. Otherwise Fair Value will be determined in accordance with the procedures adopted by the Board. These securities will generally be categorized as Level 3 securities. When using the market quotations or close prices provided by the pricing service and when the market is considered active, the security will be classified as a Level 1 security. Sometimes, an equity security owned by the funds will be valued by the pricing service with factors other than market quotations or when the market is considered inactive. When this happens, the security will be classified as a Level 2 security.
Short term debt securities having a maturity of 60 days or less are generally valued at amortized cost, which approximates fair market value. These investments are categorized as Level 2 of the fair value hierarchy. Reverse repurchase agreements and repurchase agreements are priced at their acquisition cost, which represents fair value. These securities will generally be categorized as Level 2 securities.
Financial derivative instruments, such as futures contracts, that are traded on a national securities or commodities exchange are typically valued at the settlement price determined by the relevant exchange. Swaps, such as credit default swaps, interest-rate swaps and currency swaps, are valued by a Pricing Service. To the extent these securities are actively traded and valuation adjustments are not applied, they are categorized as Level 1 of the fair value hierarchy. Over-the-counter financial derivative instruments, such as
59
Angel Oak Funds
Notes to the Financial Statements - (continued)
January 31, 2017
NOTE 2. SIGNIFICANT ACCOUNTING POLICIES – (continued)
certain futures contracts or swap agreements, derive their values from underlying asset prices, indices, reference rates, other inputs or a combination of these factors. These instruments are normally valued on the basis of evaluations provided by independent pricing services or broker dealer quotations. Derivatives that use similar valuation techniques as described above are typically categorized as Level 2 of the fair value hierarchy.
Securities may be fair valued in accordance with the fair valuation procedures approved by the Board. The Valuation Oversight Committee is generally responsible for overseeing the Funds’ valuation processes and reports periodically to the Board. The Valuation Oversight Committee has delegated to the Pricing Committee the day to day responsibilities for making all necessary determinations of the fair value of portfolio securities and other assets for which market quotations are not readily available or if the prices obtained from brokers and dealers or independent pricing services are deemed to be unreliable indicators of market or fair value. The Pricing Committee reports periodically to the Valuation Oversight Committee.
The following is a summary of the inputs used to value each Fund’s net assets as of January 31, 2017:
| | | | | | | | | | | | | | | | |
Multi-Strategy Income Fund | |
| Assets | | Level 1 | | | Level 2 | | | Level 3 | | | Total | |
Asset-Backed Securities | | $ | – | | | $ | 595,623,903 | | | $ | – | | | $ | 595,623,903 | |
Collateralized Debt Obligations | | | – | | | | 20,481,220 | | | | – | | | | 20,481,220 | |
Collateralized Loan Obligations | | | – | | | | 437,973,893 | | | | – | | | | 437,973,893 | |
Collateralized Mortgage Obligations | | | – | | | | 2,899,974,363 | | | | 10,418,254 | | | | 2,910,392,617 | |
Corporate Obligations | | | – | | | | 285,426,544 | | | | – | | | | 285,426,544 | |
Investment Companies | | | 10,629,784 | | | | – | | | | – | | | | 10,629,784 | |
Mortgage-Backed Securities – U.S. Government Agency Issues | | | – | | | | 188,958,672 | | | | – | | | | 188,958,672 | |
Preferred Stocks | | | 3,539,107 | | | | – | | | | – | | | | 3,539,107 | |
Short Term Investments | | | 285,007,714 | | | | – | | | | – | | | | 285,007,714 | |
Total | | | 299,176,605 | | | | 4,428,438,595 | | | | 10,418,254 | | | | 4,738,033,454 | |
Other Financial Instruments* | | | | | | | | | | | | | | | | |
Futures Contracts | | | 40,636 | | | | – | | | | – | | | | 40,636 | |
Reverse Repurchase Agreements | | | – | | | | (14,425,000 | ) | | | – | | | | (14,425,000 | ) |
Total | | $ | 40,636 | | | $ | (14,425,000 | ) | | $ | – | | | $ | (14,384,364 | ) |
| * | Other financial instruments are derivative instruments not reflected in the Schedule of Investments, such as futures and reverse repurchase agreements. Futures are reflected at the unrealized appreciation (depreciation) on the instrument. |
See the Schedule of Investments for further disaggregation of investment categories. Transfers between levels are recognized at the end of the reporting period. For the year ended January 31, 2017, there were no transfers into or out of Level 1. Below is a reconciliation that details the transfer of securities between Level 2 and Level 3 in the Multi-Strategy Income Fund during the reporting period. Transfers from Level 2 to Level 3 are due to increased significant unobservable inputs. See the summary of quantitative information about Level 3 Fair Value Measurements for more information.
| | | | |
Transfers into Level 2 | | $ | – | |
Transfers out of Level 2 | | | (10,418,254 | ) |
Net Transfers out of Level 2 | | $ | (10,418,254 | ) |
Transfers into Level 3 | | $ | 10,418,254 | |
Transfers out of Level 3 | | | – | |
Net Transfers into Level 3 | | $ | 10,418,254 | |
60
Angel Oak Funds
Notes to the Financial Statements - (continued)
January 31, 2017
NOTE 2. SIGNIFICANT ACCOUNTING POLICIES – (continued)
The following is a reconciliation of investments in which significant unobservable inputs (Level 3) were used in determining fair value:
| | | | | | | | | | | | | | | | | | | | | | | | | | | | | | | | | | | | | | | | |
Angel Oak
Multi-Strategy
Income Fund | | Balance
as of
01/31/2016 | | | Accrued
Discounts/
Premiums | | | Net
Realized
Gain
(Loss) | | | Change in
Net
Unrealized
Depreciation | | | Purchases | | | Sales | | | Transfers
Into
Level 3 | | | Transfers
Out of
Level 3 | | | Balance
as of
01/31/2017 | | | Net
Change in
Unrealized
Depreciation
on securities
held at
01/31/2017 | |
Collateralized Mortgage Obligations | | $ | – | | | $ | – | | | $ | – | | | $ | – | | | $ | – | | | $ | – | | | $ | 10,418,254 | | | $ | – | | | $ | 10,418,254 | | | $ | (4,353,424 | ) |
The following is a summary of quantitative information about Level 3 Fair Value Measurements:
| | | | | | | | | | |
Angel Oak
Multi-Strategy
Income Fund | | Fair Value as
of 01/31/2017 | | Valuation
Techniques | | Unobservable Input | | Range | | Impact to valuation from an increase to input |
Collateralized Mortgage Obligations | | $7,607,500 | | Consensus Pricing | | Third party & broker quote inputs | | $89.50 - $98.96 | | When a broker quote is provided as a fair value method, both the fund and the broker may consider the following: significant changes in the default rate, conditional prepayment rate, loss severity and expected yield-to-maturity assumptions, which would result in direct and proportional changes in the price level. |
Collateralized Mortgage Obligations | | $2,810,754 | | Consensus Pricing | | Third party & broker quote inputs | | $34.85 - $88.86 | | When a broker quote is provided as a fair value method, both the fund and the broker may consider the following: significant changes in the default rate, conditional prepayment rate, loss severity and expected yield-to-maturity assumptions, which would result in direct and proportional changes in the price level. |
| | | | | | | | | | | | | | | | |
Flexible Income Fund | |
| Assets | | Level 1 | | | Level 2 | | | Level 3 | | | Total | |
Asset-Backed Securities | | $ | – | | | $ | 16,526 | | | $ | – | | | $ | 16,526 | |
Collateralized Debt Obligations | | | – | | | | 10,376,295 | | | | – | | | | 10,376,295 | |
Collateralized Loan Obligations | | | – | | | | 51,546,992 | | | | – | | | | 51,546,992 | |
Collateralized Mortgage Obligations | | | – | | | | 19,158,842 | | | | – | | | | 19,158,842 | |
Corporate Obligations | | | – | | | | 86,593,047 | | | | – | | | | 86,593,047 | |
Short Term Investments | | | 3,741,398 | | | | – | | | | – | | | | 3,741,398 | |
Total | | $ | 3,741,398 | | | $ | 167,691,702 | | | $ | – | | | $ | 171,433,100 | |
Other Financial Instruments* | | | | | | | | | | | | | | | | |
Futures Contracts | | $ | (85,719 | ) | | $ | – | | | $ | – | | | $ | (85,719 | ) |
Total | | $ | (85,719 | ) | | $ | – | | | $ | – | | | $ | (85,719 | ) |
| * | Other financial instruments are derivative instruments not reflected in the Schedule of Investments, such as futures. Futures are reflected at the unrealized appreciation (depreciation) on the instrument. |
See the Schedule of Investments for further disaggregation of investment categories. During the year ended January 31, 2017, the Flexible Income Fund did not recognize any transfers to or from Levels 1, 2 or 3. Transfers between levels are recognized at the end of the reporting period.
61
Angel Oak Funds
Notes to the Financial Statements - (continued)
January 31, 2017
NOTE 2. SIGNIFICANT ACCOUNTING POLICIES – (continued)
| | | | | | | | | | | | | | | | |
High Yield Opportunities Fund | |
| Assets | | Level 1 | | | Level 2 | | | Level 3 | | | Total | |
Collateralized Loan Obligations | | $ | – | | | $ | 4,468,374 | | | $ | – | | | $ | 4,468,374 | |
Common Stocks | | | 37,525 | | | | – | | | | – | | | | 37,525 | |
Corporate Obligations | | | – | | | | 42,924,765 | | | | – | | | | 42,924,765 | |
Short Term Investments | | | 536,800 | | | | – | | | | – | | | | 536,800 | |
Total | | | 574,325 | | | | 47,393,139 | | | | – | | | | 47,967,464 | |
See the Schedule of Investments for further disaggregation of investment categories. During the period ended January 31, 2017, the High Yield Opportunities Fund did not recognize any transfers to or from Levels 1, 2 or 3. Transfers between levels are recognized at the end of the reporting period.
Federal Income Taxes – The Funds intend to elect and continue to qualify to be taxed as “regulated investment companies” under Subchapter M of the Internal Revenue Code of 1986, as amended. If so qualified, the Funds generally will not be subject to federal income tax to the extent they distribute substantially all of their net investment income and capital gains to shareholders. The Funds generally intend to operate in a manner such that they will not be liable for federal income or excise taxes.
The Funds have adopted financial reporting rules regarding recognition and measurement of tax positions taken or expected to be taken on a tax return. The Funds recognize interest and penalties, if any, related to unrecognized tax benefits as income tax expense on the Statements of Operations. During the fiscal year ended January 31, 2017, the Funds did not incur any interest or penalties.
Security Transactions and Income Recognition – Investment security transactions are accounted for on trade date. Gains and losses realized on sales of securities are determined on a specific identification basis. Interest income and expense is recorded on an accrual basis. Discounts and premiums on securities purchased are accreted or amortized using the effective yield method, based on each securities estimated life. Dividend income and corporate transactions, if any, are recorded on the ex-date. Paydown gains and losses on mortgage-related and other asset-backed securities are recorded as components of interest income on the Statements of Operations. Payments received from certain investments held by the Funds may be comprised of dividends, capital gains and return of capital. The Funds originally estimate the expected classification of such payments. The amounts may subsequently be reclassified upon receipt of the information from the issuer. The actual character of distributions to the Funds’ shareholders will be reflected in the Form 1099 received by shareholders after the end of the calendar year.
Expenses – Expenses incurred by the Trust that do not relate to a specific fund of the Trust are allocated to the individual funds based on each fund’s relative net assets or another appropriate basis. Expenses attributable to any class are borne by that class. Income, realized gains and losses, unrealized appreciation and depreciation and expenses are allocated to each class based on the net assets in relation to the relative net assets of each Fund.
Dividends and Distributions – Distributions from each Fund’s net investment income are accrued daily and typically paid monthly. The Funds intend to distribute their net realized long term capital gains and their net realized short term capital gains, if any, at least annually. Dividends to shareholders, which are determined in accordance with income tax regulations, are recorded on the ex-dividend date. The treatment for financial reporting purposes of distributions made to shareholders during the period from net investment income or net realized capital gains may differ from their ultimate treatment for federal income tax purposes. These differences are caused primarily by differences in the timing of the recognition of certain components of income, expense or realized capital gain for federal income tax purposes. Where such differences are permanent in nature, they are reclassified in the components of the net assets based on their ultimate characterization for federal income tax purposes. Any such reclassifications will have no effect on net assets, results of operations or net asset values per share of the Funds. For the period ended January 31, 2017, certain
62
Angel Oak Funds
Notes to the Financial Statements - (continued)
January 31, 2017
NOTE 2. SIGNIFICANT ACCOUNTING POLICIES – (continued)
differences were reclassified. These differences were primarily related to paydown losses and swap interest; the amounts did not affect net assets. The reclassifications were as follows:
| | | | | | | | | | |
| | | Paid-in capital | | Accumulated net
investment income (loss) | | | Accumulated net realized gain (loss)
from investment transactions | |
| Multi-Strategy Income Fund | | $0 | | $ | 38,335,027 | | | $ | (38,335,027 | ) |
| Flexible Income Fund | | $0 | | $ | 55,496 | | | $ | (55,496 | ) |
| High Yield Opportunities Fund | | $0 | | $ | (18,450 | ) | | $ | 18,450 | |
Share Valuation – The NAV per share of a class of shares of each Fund is calculated by dividing the sum of the value of the securities held by the Fund, plus cash and other assets, attributable to that class, minus all liabilities (including estimated accrued expenses) attributable to that class by the total number of shares of that class outstanding, rounded to the nearest cent. The Funds’ NAV will not be calculated on the days on which the New York Stock Exchange is closed for trading.
Use of Estimates – The preparation of financial statements in conformity with GAAP requires management to make estimates and assumptions that affect the reported amounts of assets and liabilities and disclosure of contingent assets and liabilities at the date of the financial statements, as well as the reported amounts of revenues and expenses during the period. Actual results could differ from those estimates.
Indemnifications – Under the Trust’s organizational documents, the Trust will indemnify its officers and trustees for certain liabilities that may arise from performance of their duties to the Funds. Additionally, in the normal course of business, the Funds enter into contracts that contain a variety of representatives and warranties which provide general indemnifications. The Funds’ maximum exposure under these arrangements is unknown, as this would involve future claims that may be made against the Funds that have not yet occurred.
Repurchase Agreements – Repurchase agreements are transactions by which the Funds purchase a security and simultaneously commit to resell that security to the seller (a bank or securities dealer) at an agreed upon price on an agreed upon date. The resale price reflects the purchase price plus an agreed upon market rate of interest which is unrelated to the coupon rate or the date of maturity of the purchased security. A repurchase agreement is accounted for as an investment by the Funds, collateralized by securities, which are delivered to the Funds’ custodian or to an agent bank under a tri-party agreement. The securities are marked-to-market daily and additional securities are acquired as needed, to ensure that their value equals or exceeds the repurchase price plus accrued interest. Repurchase agreements involve certain risks not associated with direct investments in the underlying securities. In the event of a default or bankruptcy by the seller, the Funds will seek to liquidate such collateral. The exercise of the Funds’ right to liquidate such collateral could involve certain costs or delays, and, to the extent that proceeds from any sale upon a default of the obligation to repurchase were less than the repurchase price, the Funds could suffer a loss.
Reverse Repurchase Agreements – A reverse repurchase agreement is the sale by the Funds of a security to a party for a specified price, with the simultaneous agreement by the Funds to repurchase that security from that party on a future date at a higher price. Securities sold under reverse repurchase agreements are reflected as a liability on the Statements of Assets and Liabilities. Interest payments made are recorded as a component of interest expense on the Statements of Operations. Reverse repurchase agreements involve the risk that the counterparty will become subject to bankruptcy or other insolvency proceedings or fail to return a security to the Funds. In such situations, the Funds may incur losses as a result of a possible decline in the value of the underlying security during the period while the Funds’ seek to enforce their rights, a possible lack of access to income on the underlying security during this period, or expenses of enforcing their rights. The Funds will segregate assets determined to be liquid by the Adviser or otherwise covered its obligations under reverse repurchase agreement.
Secured Borrowings
The Funds have adopted guidance requiring entities to present gross obligations for secured borrowings by the type of collateral pledged and remaining time to maturity.
63
Angel Oak Funds
Notes to the Financial Statements - (continued)
January 31, 2017
NOTE 2. SIGNIFICANT ACCOUNTING POLICIES – (continued)
| | | | | | | | | | | | | | | | | | | | |
| Multi-Strategy Income Fund | |
Reverse Repurchase Agreements and Reverse
Repurchase-to-Maturity Transactions | | Overnight and
Continuous | | | Up to 30 Days | | | 30-90 Days | | | Greater than
90 Days | | | Total | |
Collateralized Mortgage Obligations | | $ | – | | | $ | 14,425,000 | | | $ | – | | | $ | – | | | $ | 14,425,000 | |
Total | | $ | – | | | $ | 14,425,000 | | | $ | – | | | $ | – | | | $ | 14,425,000 | |
Gross amount of reverse repurchase agreements in Balance Sheet Offsetting Information Table | | | $ | 14,425,000 | |
Amounts related to agreements not included in offsetting disclosure in Balance Sheet Offsetting Information Table | | | $ | – | |
Mortgage-Backed and Asset-Backed Securities Risks – Prepayment risk is associated with mortgage-backed and asset-backed securities, including collateralized loan obligations (“CLOs”). If interest rates fall, the underlying debt may be repaid ahead of schedule, reducing the value of the Funds’ investments. If interest rates rise, there may be fewer prepayments, which would cause the average bond maturity to rise, increasing the potential for the Funds to lose money. The value of these securities may be significantly affected by changes in interest rates, the market’s perception of issuers, and the creditworthiness of the parties involved. The ability of the Funds to successfully utilize these instruments may depend on the ability of the Funds’ Adviser to forecast interest rates and other economic factors correctly. These securities may have a structure that makes their reaction to interest rate changes and other factors difficult to predict, making their value highly volatile. Certain mortgage-backed securities may be secured by pools of mortgages on single-family, multi-family properties, as well as commercial properties. Similarly, asset-backed securities may be secured by pools of loans, such as corporate loans, student loans, automobile loans and credit card receivables. The credit risk on such securities is affected by homeowners or borrowers defaulting on their loans. The values of assets underlying mortgage-backed and asset-backed securities, including CLOs, may decline and therefore may not be adequate to cover underlying investors. Mortgage-backed securities and other securities issued by participants in housing and commercial real estate finance, as well as other real estate-related markets have experienced extraordinary weakness and volatility in recent years. Possible legislation in the area of residential mortgages, credit cards, corporate loans and other loans that may collateralize the securities in which the Funds may invest could negatively impact the value of the Funds’ investments. To the extent the Funds focus their investments in particular types of mortgage-backed or asset-backed securities, including CLOs, the Funds may be more susceptible to risk factors affecting such types of securities.
Preferred Stocks – The Funds may invest in preferred stock. Preferred stock is a class of stock having a preference over common stock as to the payment of dividends and the recovery of investment should a company be liquidated, although preferred stock is usually junior to the debt securities of the issuer. Preferred stock typically does not possess voting rights and its market value may change based on changes in interest rates. The fundamental risk of investing in preferred stock is the risk that the value of the stock might decrease.
Futures Contracts – The Funds may enter into futures contracts to hedge various investments for risk management as well as speculative purposes. Initial margin deposits are made upon entering into futures contracts and can be either cash or securities. Secondary margin limits are required to be maintained while futures are held, as defined by each contract.
During the period a futures contract is open, changes in the value of the contract are recognized as unrealized gains or losses by “marking-to-market” on a daily basis to reflect the fair value of the contract at the end of each day’s trading. Variation margin receivables or payables represent the difference between the change in unrealized appreciation and depreciation on the open contracts and the cash deposits made on the margin accounts. When the contract is closed, the Funds record a realized gain or loss equal to the difference between the proceeds from the closing transaction and the Funds’ cost of entering into a contract. The use of futures contracts involves the risk of illiquid markets or imperfect correlation between the value of the instruments and the underlying securities, or that the counterparty will fail to perform its obligations.
Futures contracts are valued at the settlement price established each day by the board of trade or exchange on which they are traded. Should market conditions move unexpectedly, the Funds may not achieve the anticipated benefits of the futures contract and may realize a loss. See Note 3 for information on futures contract activity during the year ended January 31, 2017.
Options – A Fund may purchase call and put options on specific securities, and may write and sell covered or uncovered call and put options for hedging purposes in pursuing its investment objectives. A put option gives the purchaser of the option the right to sell, and obligates the writer to buy, the underlying security at a stated exercise price, typically at any time prior to the expiration of the option
64
Angel Oak Funds
Notes to the Financial Statements - (continued)
January 31, 2017
NOTE 2. SIGNIFICANT ACCOUNTING POLICIES – (continued)
for American options or only at expiration for European options. A call option gives the purchaser of the option the right to buy, and obligates the writer to sell, the underlying security at a stated exercise price, typically at any time prior to the expiration of the option. A covered call option is a call option with respect to which the seller of the option owns the underlying security. The sale of such an option exposes the seller during the term of the option to possible loss of opportunity to realize appreciation in the market price of the underlying security or to possible continued holding of a security that might otherwise have been sold to protect against depreciation in the market price of the security. A covered put option is a put option with respect to which cash or liquid securities have been placed in a segregated account on the books of a Fund or with a custodian to fulfill the obligation undertaken. The sale of such an option exposes the seller during the term of the option to a decline in price of the underlying security while depriving the seller of the opportunity to invest the segregated assets.
A Fund may close out a position when writing options by purchasing an option on the same underlying security with the same exercise price and expiration date as the option that it has previously written on the security. In such a case, the applicable Fund will realize a profit or loss if the amount paid to purchase an option is less or more than the amount received from the sale of the option. See Note 3 for information on option activity during the year ended January 31, 2017.
Swaps – The Funds may enter into swap contracts to hedge various investments for risk management or to pursue their investment objective. The Funds may invest in credit default swaps, total return swaps, interest rate swaps, equity swaps, currency swaps, options on foregoing swaps, and other types of swaps. Such transactions are subject to market risk, liquidity risk, risk of default by the other party to the transaction, known as “counterparty risk,” regulatory risk and risk of imperfect correlation between the value of such instruments and the underlying assets and may involve commissions or other costs. Swap agreements are valued by a pricing service and unrealized appreciation or depreciation is recorded daily as the difference between the prior day and current day closing price. See Note 3 for information on swap activity during the year ended January 31, 2017.
NOTE 3. DERIVATIVE TRANSACTIONS
The following tables present a summary of the value of derivative instruments as of January 31, 2017 and the effect of derivative instruments on the Statements of Assets and Liabilities as of January 31, 2017.
| | | | | | | | |
| Multi-Strategy Income Fund | |
| Derivatives | | Type of Derivative Risk | | Statements of Assets and Liabilities Location | | Liabilities | |
| Futures Contracts | | Interest Rate | | Variation Margin on Futures Contracts | | $ | 994,028 | |
The effect of derivative instruments on the Statement of Operations for the year ended January 31, 2017:
| | | | | | | | |
| Derivatives | | Type of Derivative Risk | | Location of Gain/(Loss) on Derivatives in Income | | Realized
Gain (Loss) on
Derivatives | |
| Futures Contracts | | Interest Rate | | Net realized loss on futures contracts | | $ | (46,226,758 | ) |
| Options | | Equity | | Net realized loss on investments | | $ | (14,115,075 | ) |
| Swaps | | Credit Contracts | | Net realized gain on swap agreements | | $ | 1,518,076 | |
| | | | | | | | |
| Derivatives | | Type of Derivative Risk | | Location of Gain on Derivatives in Income | | Change in Unrealized
Appreciation (Depreciation) on
Derivatives | |
| Futures Contracts | | Interest Rate | | Net change in unrealized appreciation (depreciation) on futures contracts | | $ | 50,234,195 | |
| Swaps | | Credit Contracts | | Net change in unrealized appreciation (depreciation) on swap agreements | | $ | 198,761 | |
65
Angel Oak Funds
Notes to the Financial Statements - (continued)
January 31, 2017
NOTE 3. DERIVATIVE TRANSACTIONS – (continued)
The average monthly notional value of long and short futures contracts during the year ended January 31, 2017 was $506,660,545 and ($376,217,302), respectively. The average monthly market value of purchased options during the year ended January 31, 2017 was $2,297,563. The average monthly notional value of long and short swap agreements during the year ended January 31, 2017 was $10,769,231 and ($2,307,692), respectively.
| | | | | | | | |
| Flexible Income Fund | |
| Derivatives | | Type of Derivative Risk | | Statements of Assets and Liabilities Location | | Liabilities | |
| Futures Contracts | | Interest Rate | | Variation Margin on Futures Contracts | | $ | 27,155 | |
The effect of derivative instruments on the Statements of Operations for the year ended January 31, 2017:
| | | | | | | | |
| Derivatives | | Type of Derivative Risk | | Location of Loss on Derivatives in Income | | Realized
Loss on Derivatives | |
| Futures Contracts | | Interest Rate | | Net realized loss on futures contracts | | $ | (1,026,169 | ) |
| Options | | Equity | | Net realized loss on investments | | $ | (679,395 | ) |
| | | | | | | | |
| Derivatives | | Type of Derivative Risk | | Location of Gain on Derivatives in Income | | Change in Unrealized
Appreciation (Depreciation) on
Derivatives | |
| Futures Contracts | | Interest Rate | | Net change in unrealized appreciation (depreciation) on futures contracts | | $ | 815,628 | |
The average monthly notional value of long and short futures contracts during the year ended January 31, 2017 was $6,369,540 and ($11,516,391), respectively. The average monthly market value of purchased options during the year ended January 31, 2017 was $200,360.
Balance Sheet Offsetting Information
During the ordinary course of business, the Funds may enter into transactions subject to enforceable netting agreements or other similar arrangements (“netting agreements”). Generally, the right to offset in netting agreements allows the Funds to offset any exposure to a specific counterparty with any collateral received or delivered to that counterparty based on the terms of the agreement. Generally, the Funds manage their cash collateral and securities collateral on a counterparty basis. As of January 31, 2017, the Funds were not subject to any netting agreements.
The following table provides a summary of offsetting financial liabilities and derivatives and the effect of derivative instruments on the Statements of Assets and Liabilities as of January 31, 2017.
| | | | | | | | | | | | | | | | | | | | | | | | |
| Multi-Strategy Income Fund | |
| | | | | | | | | | | | Gross Amounts Not Offset in Statements of
Assets and Liabilities | |
| | | Gross Amounts of
Recognized Liabilities | | | Gross Amounts Offset
in Statements of Assets
and Liabilities | | | Net Amounts of Liabilities
Presented in Statements
of Assets and Liabilities | | | Financial
Instruments | | | Cash Collateral
Pledged | | | Net Amount | |
| Futures Contracts | | | $994,028 | | | | $– | | | | $994,028 | | | | $– | | | | $994,028 | | | | $– | |
| Reverse Repurchase Agreements | | | 14,425,000 | | | | – | | | | 14,425,000 | | | | 14,425,000 | | | | – | | | | – | |
| | | | $15,419,028 | | | | $– | | | | $15,419,028 | | | | $14,425,000 | | | | $994,028 | | | | $– | |
66
Angel Oak Funds
Notes to the Financial Statements - (continued)
January 31, 2017
NOTE 3. DERIVATIVE TRANSACTIONS – (continued)
| | | | | | | | | | | | | | | | | | | | |
| Flexible Income Fund | |
| | | | | | | | | | | | Gross Amounts Not Offset in Statements of
Assets and Liabilities | |
| | | Gross Amounts of
Recognized Liabilities | | | Gross Amounts Offset
in Statements of Assets
and Liabilities | | | Net Amounts of Liabilities
Presented in Statements
of Assets and Liabilities | | | Financial
Instruments | | Cash Collateral
Pledged | | Net Amount | |
| Futures Contracts | | | $27,155 | | | | $– | | | | $27,155 | | | $– | | $27,155 | | | $– | |
In some instances, the collateral amounts disclosed in the tables were adjusted due to the requirement to limit the collateral amounts to avoid the effect of overcollateralization. Actual collateral received/pledged may be more than the amounts disclosed herein.
NOTE 4. FEES AND OTHER RELATED PARTY TRANSACTIONS
Under the terms of the investment advisory agreement, on behalf of the Funds’ (the “Agreement”), the Adviser manages the Funds’ investments subject to oversight of the Trustees. As compensation for its management services, Multi-Strategy Income Fund is obligated to pay the Adviser a fee computed and accrued daily and paid monthly at an annual rate of 0.89% of the average daily net assets of the Fund. As compensation for its management services, Flexible Income Fund is obligated to pay the Adviser a fee computed and accrued daily and paid monthly at an annual rate of 0.89% of the average daily net assets of the Fund. Effective April 15, 2016, as compensation for its management services, High Yield Opportunities Fund is obligated to pay the Adviser a fee computed and accrued daily and paid monthly at an annual rate of 0.55% of the average daily net assets of the Funds. For the period April 1, 2016 through April 15, 2016, as compensation for its management services, the Predecessor High Yield Fund was obligated to pay Rainier Investment Management, LLC a fee computed and accrued daily and paid at an annual rate of 0.55% of the average daily net assets of the Fund, which amounted to $9,050 and is included in the Investment Advisory Expense on the Statements of Operations.
The Adviser contractually agreed to waive or limit its fees and to assume other expenses of the Multi-Strategy Income Fund and the Flexible Income Fund until May 31, 2017, so that the Total Annual Fund Operating Expenses of each Fund do not exceed 0.99% and 0.85%, for the Multi-Strategy Income Fund and the Flexible Income Fund, respectively. Effective December 1, 2016, the Adviser also voluntarily agreed to waive its fees and/or reimburse certain expenses to limit the Total Annual Fund Operating Expenses after Fee Waiver/Expense Reimbursement to 0.69% of the Flexible Income Fund’s average daily net assets. This voluntary waiver is in addition to the contractual fee waiver/expense limitation agreement discussed above and may be discontinued at any time. Fees waived under this voluntary waiver are not subject to recoupment by the Adviser. The Adviser has contractually agreed to waive or limit its fees and to assume other expenses of the High Yield Opportunities Fund until May 31, 2018, so that the Total Annual Fund Operating Expenses do not exceed 0.65%. These operating expense limitations do not apply to front-end sales loads, brokerage fees and commissions, borrowing costs (such as interest and dividend expenses on securities sold short), taxes, 12b-1 fees, extraordinary expenses and indirect expenses (such as “acquired funds fees and expenses”). In addition, the Adviser has contractually agreed through July 15, 2017 to waive the amount of the Multi-Strategy Income Fund’s management fee to the extent necessary to offset the proportionate share of the management fees incurred by the Fund through its investment in an underlying fund for which the Adviser also serves as investment adviser. This arrangement may only be changed or eliminated by the Board of Trustees upon 60 days’ written notice to the Adviser.
The contractual waiver and/or reimbursement by the Adviser with respect to the Funds is subject to repayment by the Funds within 36 months following the fiscal year in which that particular waiver and/or reimbursement occurred, provided that the Funds are able to make the repayment without exceeding the expense limitations described above. During the period ended January 31, 2017, Multi-Strategy Income Fund repaid $1,703,216 of previously waived expenses to the Adviser, the Flexible Income Fund contractually waived $579,174 of expenses, and the High Yield Opportunities Fund waived $149,074 of expenses. Expense limitation agreement specifically refers to amounts that are contractually waived, see Statement of Operations. The amounts subject to repayment by the Funds, pursuant to the aforementioned conditions at January 31, 2017 are included in the table below. Fees waived by the Predecessor High Yield Fund are not subject to recoupment by the Angel Oak High Yield Opportunities Fund. The difference between the recoverable amount in the table below and the amount listed in the Statement of Operations is related to the amount waived by the Predecessor High Yield Fund prior to the reorganization. During the period April 1, 2016 through April 15, 2016 the Predecessor High Yield Fund waived $186 of expenses.
67
Angel Oak Funds
Notes to the Financial Statements - (continued)
January 31, 2017
NOTE 4. FEES AND OTHER RELATED PARTY TRANSACTIONS – (continued)
| | | | | | |
| | | Recoverable through
January 31, 2018 | | Recoverable through
January 31, 2019 | | Recoverable through
January 31, 2020 |
| Multi-Strategy Income Fund | | $4,750,559 | | $1,118,919 | | N/A |
| Flexible Income Fund | | $131,604 | | $860,519 | | $579,174 |
| High Yield Opportunities Fund | | N/A | | N/A | | $148,887 |
Quasar Distributors, LLC (the “Distributor”) acts as the Funds’ principal underwriter in a continuous public offering of the Funds’ shares. The Funds have adopted a Distribution Plan in accordance with Rule 12b-1 under the 1940 Act with respect to the Class A and Class C shares. The Distribution Plan provides that the Funds may pay a fee to the Distributor at an annual rate of up to 0.25% of the average daily net assets of Class A shares and an annual rate of up to 1.00% of the average daily net assets of Class C shares. No distribution fees are paid by Institutional Class shares. These fees may be used by the Distributor to provide compensation for sales support, distribution activities or shareholder servicing activities. For the year or period ended January 31, 2017, Multi-Strategy Income Fund, Flexible Income Fund, and High Yield Opportunities Fund incurred distribution fees of $1,376,463, $31,331 and $1,476, respectively. For the year ended March 31, 2016, the Predecessor High Yield Fund incurred distribution fees of $4,590.
U.S. Bancorp Fund Services, LLC (“USBFS”), an indirect wholly-owned subsidiary of U.S. Bancorp, serves as the Funds’ Administrator (“Administrator”) and, in that capacity, performs various administrative and accounting services for the Funds. USBFS also serves as the Funds’ fund accountants and transfer agent. The Administrator prepares various federal and state regulatory filings, reports and returns for the Funds; prepares reports and materials to be supplied to the trustees; monitors the activities of the Funds’ custodians; coordinates the preparation and payment of the Funds’ expenses and reviews the Funds’ expense accruals. As compensation for its services, the Administrator is entitled to a monthly fee at an annual rate based upon the average daily net assets of the Funds. U.S. Bank, N.A. (the “Custodian”) serves as custodian to the Funds. Both the Administrator and Custodian are affiliates of the Distributor.
NOTE 5. SECURITIZATION TRANSACTION
On November 5, 2015, the Multi-Strategy Income Fund and the Flexible Income Fund participated in the offering of the Financial Institution Note Securitization 2015-1, LTD (FINS 2015-1). As part of the offering, Multi-Strategy Income Fund purchased $12,927,000 of Class A notes, $6,275,000 of Class C notes and 11,231,000 preferred shares and Flexible Income Fund purchased $7,673,000 of Class A notes, $3,725,000 of Class C notes and 6,666,666 preferred shares of FINS 2015-1. The Adviser has been named as the collateral surveillance and analysis provider of FINS 2015-1. The collateral manager may consult with the collateral surveillance and analysis provider prior to making certain decisions; however, the collateral manager will not be required to follow any position taken by or recommendation made by the collateral surveillance and analysis provider in any such consultation.
NOTE 6. INVESTMENT TRANSACTIONS
For the year or period ended January 31, 2017, purchases and sales of investment securities, other than short-term investments and short-term U.S. government obligations, were as follows:
| | | | | | | | |
| | | Purchases | | | Sales | |
| Multi-Strategy Income Fund | | $ | 2,760,387,258 | | | $ | 3,402,391,409 | |
| Flexible Income Fund | | $ | 163,035,449 | | | $ | 316,454,609 | |
| High Yield Opportunities Fund | | $ | 33,989,565 | | | $ | 28,964,890 | |
During the year ended January 31, 2017, the Multi-Strategy Income Fund and Flexible Income Fund purchased, in accordance with the Rule 17a-7 procedures adopted by the Trust, securities eligible for investment by each Fund at a value of $112,316,294 and $10,366,250, respectively. During the year ended January 31, 2017, the Multi-Strategy Income Fund and Flexible Income Fund sold, in accordance with Rule 17a-7 procedures adopted by the Trust, securities for investment by each Fund at a value of $22,449,165 and $69,185,478, respectively.
68
Angel Oak Funds
Notes to the Financial Statements - (continued)
January 31, 2017
NOTE 6. INVESTMENT TRANSACTIONS – (continued)
During the year ended January 31, 2016, the Multi-Strategy Income Fund accepted, in accordance with the Rule 17a-7 procedures adopted by the Trust, securities and cash eligible for investment by the Fund as consideration for Fund shares issued at a value of $18,025,048.
For the year or period ended January 31, 2017, there were no long-term purchases or sales of U.S. Government securities for the Funds.
NOTE 7. TRANSACTIONS WITH AFFILIATES
The Funds’ transactions with affiliates represent holdings for which the respective Fund and the underlying investee fund have the same investment advisor or where the investee fund’s investment advisor is under common control with the Fund’s investment advisor.
The Multi-Strategy Income Fund had the following transactions during the year ended January 31, 2017, with affiliates:
| | | | | | | | | | | | | | | | | | | | | | | | | | | | |
| | | Share Activity | | | Year Ended January 31, 2017 | |
| Security Name | | Balance
January 31,
2016 | | | Purchases | | | Sales | | | Balance
January 31,
2017 | | | Value | | | Dividends
Credited
to Income | | | Amount
of Gain
(Loss)
realized
on Sale of
Shares | |
Angel Oak High Yield Opportunities Fund | | | – | | | | 894,010 | | | | – | | | | 894,010 | | | $ | 10,629,784 | | | $ | 298,445 | | | $ | – | |
NOTE 8. BENEFICIAL OWNERSHIP
The beneficial ownership, either directly or indirectly, of 25% or more of the voting securities of a fund creates a presumption of control of a fund, under Section 2(a)(9) of the 1940 Act. At January 31, 2017, UBS Wealth Management USA (“UBS”) owned, as record shareholder, 26% of the outstanding shares of Multi-Strategy Income Fund. At January 31, 2017, Charles Schwab & Co. (“Schwab”) and UBS owned, as record shareholders, 61% and 30%, respectively, of the outstanding shares of Flexible Income Fund. It is not known whether UBS, Schwab, or any other underlying beneficial owners owned or controlled 25% or more of the voting securities of the Funds. At January 31, 2017, no shareholder held more than 25% of the outstanding shares of the High Yield Fund.
NOTE 9. FEDERAL TAX INFORMATION
The tax characterization of distributions paid for the year ended January 31, 2017 and January 31, 2016 were as follows:
| | | | | | | | | | | | | | | | |
| | | Multi-Strategy Income Fund | | | Flexible Income Fund | |
| | | 2017 | | | 2016 | | | 2017 | | | 2016 | |
| Distributions paid from: | | | | | | | | | | | | | | | | |
| Ordinary Income | | $ | 286,227,943 | | | $ | 297,742,255 | | | $ | 10,336,302 | | | $ | 15,108,750 | |
| Net Long-Term Capital Gain | | | – | | | | – | | | | – | | | | – | |
| Total | | $ | 286,227,943 | | | $ | 297,742,255 | | | $ | 10,336,302 | | | $ | 15,108,750 | |
The tax characterization of distributions paid for the period/year ended January 31, 2017, March 31, 2016 and March 31, 2015 were as follows:
| | | | | | | | | | | | |
| | | High Yield Opportunities Fund | |
| | | 2017 | | | 2016 | | | 2015 | |
| Distributions paid from: | | | | | | | | | | | | |
| Ordinary Income | | | $2,239,343 | | | | $3,118,247 | | | | $3,009,861 | |
| Net Long-Term Capital Gain | | | – | | | | – | | | | 628,986 | |
| Total | | | $2,239,343 | | | | $3,118,247 | | | | $3,638,847 | |
69
Angel Oak Funds
Notes to the Financial Statements - (continued)
January 31, 2017
NOTE 9. FEDERAL TAX INFORMATION – (continued)
At January 31, 2017, the components of distributable earnings (accumulated losses) on a tax basis were as follows:
| | | | | | | | | | | | |
| | | Multi-Strategy
Income Fund | | | Flexible Income
Fund | | | High Yield
Opportunities
Fund | |
| Tax Cost of Investments | | $ | 4,790,042,666 | | | $ | 170,405,534 | | | $ | 47,051,208 | |
| Unrealized Appreciation | | | 70,757,366 | | | | 2,214,736 | | | | 1,650,381 | |
| Unrealized Depreciation | | | (122,766,578 | ) | | | (1,187,170 | ) | | | (734,125 | ) |
| Net Unrealized Appreciation (Depreciation) | | $ | (52,009,212 | ) | | $ | 1,027,566 | | | $ | 916,256 | |
| Undistributed Ordinary Income | | | 8,512,677 | | | | 135,170 | | | | 28,445 | |
| Undistributed Long-Term Gain (Loss) | | | – | | | | – | | | | – | |
| Distributable Earnings | | $ | 8,512,677 | | | $ | 135,170 | | | $ | 28,445 | |
| Other Accumulated Gain (Loss) | | | (304,232,475 | ) | | | (35,792,245 | ) | | | (1,101,618 | ) |
| Total Accumulated Gain (Loss) | | $ | (347,729,010 | ) | | $ | (34,629,509 | ) | | $ | (156,917 | ) |
As of January 31, 2017, Multi-Strategy Income Fund, Flexible Income Fund, and High Yield Opportunities Fund had available for federal tax purposes an unused capital loss carryforward of $300,420,704, $35,762,349 and $1,075,068, respectively, which is available for offset against future taxable net capital gains.
To the extent these carryforwards are used to offset futures gains, it is probably that the amount offset will not be distributed to shareholders. The carryforward expires as follows:
| | | | | | | | | | | | |
| | | Multi-Strategy
Income Fund | | | Flexible Income
Fund | | | High Yield
Opportunities Fund | |
| No expiration short-term | | $ | 111,214,290 | | | $ | 24,908,021 | | | $ | 514,274 | |
| No expiration long-term | | $ | 189,206,414 | | | $ | 10,854,328 | | | $ | 560,794 | |
| Total | | $ | 300,420,704 | | | $ | 35,762,349 | | | $ | 1,075,068 | |
Certain capital losses incurred after October 31 and within the current taxable year, are deemed to arise on the on the first business day of the Funds’ following taxable year. For the tax period ended January 31, 2017, the Multi-Strategy Income Fund, Flexible Income Fund, and High Yield Opportunities Fund did not defer any post-October losses.
NOTE 10. CREDIT AGREEMENTS
In August 2015, the Multi-Strategy Income Fund entered into a $375 million secured, committed, margin facility (the “Facility”) with Société Générale, which expires in April 2017. Under the Facility, interest is charged on floating rate loans based on the 3-month LIBOR rate plus 1.35% and is payable on the last day of each interest period, which was 2.38% as of January 31, 2017. For the year ended January 31, 2017, the average principal balance and interest rate was approximately $267,281,421 and 2.10%, respectively. The Multi-Strategy Income Fund is required to pay a commitment fee under the Facility if the level of debt outstanding falls below a certain percentage. During the reporting period the Multi-Strategy Income Fund was required to pay these commitment fees. These expenses, including the commitment fee, are included in the Interest expense line item that is reflected in the Statements of Operations. Under the terms of the Facility, the Multi-Strategy Income Fund is also required to satisfy certain collateral requirements and maintain a certain level of net assets. As of January 31, 2017, the outstanding principal balance under the Facility was $250 million. The amount of the maximum loan outstanding during the period was $275 million.
U.S. Bank, N.A. made available to Multi-Strategy Income Fund and Flexible Income Fund a $150,000,000 and $50,000,000, respectively, unsecured uncommitted credit facility, pursuant to a Loan Agreement effective August 5, 2015, expiring on June 8, 2016, for the purposes of having cash available to satisfy redemption requests. Principal is due twenty days after the initial advance and at the maturity. Interest is payable monthly in arrears. Under the credit facility, the interest rate paid by the Funds on outstanding borrowings is equal to the one-month LIBOR, plus 1.75%, which was 2.20% as of June 8, 2016. For the period from February 1, 2016
70
Angel Oak Funds
Notes to the Financial Statements - (continued)
January 31, 2017
NOTE 10. CREDIT AGREEMENTS – (continued)
to June 8, 2016, the average principal balance and interest rate was $217,054 and 2.19%, respectively for the Flexible Income Fund. The Multi-Strategy Income Fund did not borrow under this arrangement, during this period. The maximum loan outstanding during the period for the Flexible Income Fund was $3,500,000 from February 2, 2016 through February 4, 2016 and February 17, 2016 through February 21, 2016.
U.S. Bank, N.A. made available to the Predecessor Trust a $200,000,000 unsecured credit facility, pursuant to a Loan Agreement effective December 18, 2015, expiring on April 15, 2016, intended to provide short-term financing, if necessary, subject to certain restrictions, in connection with shareholder redemptions. Under the credit facility, the interest rate paid by the Predecessor High Yield Fund on outstanding borrowings is equal to the prime rate, which was 3 1/2% as of April 15, 2016. For the period from April 1, 2016 to April 15, 2016, the average principal balance and interest rate was $31,733 and 3.50%. The maximum loan outstanding during the period for the Predecessor High Yield Fund was $230,000 on April 4, 2016.
U.S. Bank, N.A. has made available to the Multi-Strategy Income Fund, Flexible Income Fund, and High Yield Opportunities Fund a $200,000,000 unsecured credit facility, pursuant to a Loan Agreement (“Agreement”) effective June 8, 2016, expiring on May 25, 2017, for the purposes of having cash available to satisfy redemption requests. Principal is due twenty days after the initial advance and at the maturity. Interest is payable monthly in arrears. Under the credit facility, the interest rate paid by the Funds on outstanding borrowings is equal to the one-month LIBOR, plus 1.75%, which was 2.53% as of January 31, 2017. For the period from June 8, 2016 to January 31, 2017, the average principal balance and interest rate was $29,874 and 2.31%, respectively for the High Yield Opportunities Fund. The Multi-Strategy Income Fund and Flexible Income Fund did not borrow under this arrangement, during this period. The maximum loan outstanding during the period for the High Yield Opportunities Fund was $2,295,000 on September 14, 2016. As of January 31, 2017, the Funds had no outstanding borrowings under this agreement.
NOTE 11. NEW ACCOUNTING PRONOUNCEMENTS
In October 2016, the U.S. Securities and Exchange Commission adopted new rules and amended existing rules (together, “final rules”) intended to modernize the reporting and disclosure of information by registered investment companies. In part, the final rules amend Regulation S-X and require standardized, enhanced disclosure about derivatives in investment company financial statements, as well as other amendments. The compliance date for the amendments to Regulation S-X is August 1, 2017. Management is currently evaluating the impact that the adoption of the amendments to Regulation S-X will have on the financial statements and related disclosures.
NOTE 12. SUBSEQUENT EVENT
Management of the Funds has evaluated the need for disclosures and/or adjustments resulting from subsequent events through the date these financial statements were issued. This evaluation did not result in any subsequent events that necessitated disclosures and/or adjustments other than the event listed below.
Post-Effective Amendment No. 18 to the Trust’s registration statement on Form N-1A was filed on January 31, 2017 for initial registration of Class T shares for each of the three Funds in the Trust.
71
REPORT OF THE INDEPENDENT REGISTERED PUBLIC ACCOUNTING FIRM
To the Shareholders and Board of Trustees of
Angel Oak Funds Trust
We have audited the accompanying statements of assets and liabilities, including the schedules of investments, of Angel Oak Funds Trust comprising Angel Oak Multi-Strategy Income Fund, Angel Oak Flexible Income Fund, and Angel Oak High Yield Opportunities Fund (the “Funds”) as of January 31, 2017, and the related statements of operations and cash flows for the year then ended, the statements of changes in net assets for each of the two years in the period then ended, and the financial highlights for each of the periods indicated in the period then ended for Angel Oak Multi-Strategy Income Fund, the related statement of operations for the year then ended, the statements of changes in net assets for each of the two years in the period then ended, and the financial highlights for each of the periods indicated in the period then ended for Angel Oak Flexible Income Fund, and the related statements of operations and changes in net assets and the financial highlights for the period April 1, 2016 through January 31, 2017 for Angel Oak High Yield Opportunities Fund. These financial statements and financial highlights are the responsibility of the Funds’ management. Our responsibility is to express an opinion on these financial statements and financial highlights based on our audits. Angel Oak High Yield Opportunities Fund’s financial statements and financial highlights for the periods ended prior to January 31, 2017, were audited by other auditors whose report dated May 23, 2016, expressed an unqualified opinion on those financial statements and financial highlights.
We conducted our audits in accordance with the standards of the Public Company Accounting Oversight Board (United States). Those standards require that we plan and perform the audit to obtain reasonable assurance about whether the financial statements and financial highlights are free of material misstatement. An audit includes examining, on a test basis, evidence supporting the amounts and disclosures in the financial statements. Our procedures included confirmation of securities owned as of January 31, 2017, by correspondence with the custodian and brokers or by other appropriate auditing procedures where replies from brokers or counterparties were not received. An audit also includes assessing the accounting principles used and significant estimates made by management, as well as evaluating the overall financial statement presentation. We believe that our audits provide a reasonable basis for our opinion.
In our opinion, the financial statements and financial highlights referred to above present fairly, in all material respects, the financial position of each of the Funds constituting Angel Oak Funds Trust as of January 31, 2017, the results of their operations, cash flows, changes in their net assets and the financial highlights for each of the periods indicated above, in conformity with accounting principles generally accepted in the United States of America.

COHEN & COMPANY, LTD.
Cleveland, Ohio
March 29, 2017
72
Additional Information (Unaudited)
1. Shareholder Notification of Federal Tax Status
For the taxable year ended January 31, 2017, certain dividends paid by the Funds may be subject to a maximum tax rate of 20% as provided for by the Jobs and Growth Tax Relief Reconciliation Act of 2003. The Funds intend to designate the maximum amount allowable as taxed at a maximum rate of 20%.
For the taxable year ended January 31, 2017, the Multi-Strategy Income Fund, Flexible Income Fund, and High Yield Opportunities Fund paid qualified dividend income of 0.06%, 0.00%, and 0.18%, respectively.
For the taxable year ended January 31, 2017, the percentage of ordinary income dividends paid by the Multi-Strategy Income Fund, Flexible Income Fund, and High Yield Opportunities Fund that qualifies for the dividends received deduction available to corporations was 0.06%, 0.00%, and 0.18%, respectively.
For the taxable year ended January 31, 2017, the Multi-Strategy Income Fund, Flexible Income Fund, and High Yield Opportunities Fund did not pay any ordinary income distributions that are designated as short-term capital gain distributions under Internal Revenue Section 871(k)2(c).
For the taxable year ended January 31, 2017, the Multi-Strategy Income Fund, Flexible Income Fund, and High Yield Opportunities Fund the percentage of taxable ordinary income distributions that are designated as interest related dividends under Internal Revenue 871(k)1(c) was 76.58%, 79.88%, and 92.19%, respectively.
2. Disclosure of Portfolio Holdings
The Funds will file a complete schedule of portfolio holdings with the Securities and Exchange Commission (“SEC”) for the first and third quarters of each fiscal year on Form N-Q. The Fund’s Form N-Q will be available on the website of the SEC at http://www.sec.gov. The Funds’ Forms N-Q may be reviewed and copied at the Securities and Exchange Commission’s Public Reference Room in Washington, D.C. Information on the operation of the Public Reference Room may be obtained by call 1-800-SEC-0330.
3. Proxy Voting Policies and Procedures
A description of the policies and procedures that the Funds use to determine how to vote proxies related to portfolio securities and information regarding how the Funds voted those proxies during the most recent twelve month period ended June 30, is available without charge upon request by (1) calling the Funds at (855) 751-4324 and (2) from Trust documents filed with the SEC on the SEC’s website at www.sec.gov.
4. Compensation of Trustees
Each Trustee who is not an “interested person” of the Trust (i.e., an “Independent Trustee”) receives an annual retainer of $40,000, paid quarterly as well as $8,500 for attending each regularly scheduled meeting in person. Independent Trustees are permitted reimbursement for out-of-pocket expenses incurred in connection with attendance at meetings. The Funds’ Statement of Additional Information includes additional information about the Trustees and is available upon request by calling toll free 1-855-444-9243.
5. Statement Regarding the Basis for the Approval of the Continuance of Investment Advisory Agreement
Pursuant to Section 15(c) of the Investment Company Act of 1940, as amended (the “1940 Act”), at the in-person meeting held on September 28-29, 2016 (the “Meeting”), the Board of Trustees (the “Board”) of Angel Oak Funds Trust (the “Trust”) considered the approval of the continuance of the Investment Advisory Agreement (the “Investment Advisory Agreement” or the “Agreement”) between the Trust, on behalf of the Angel Oak Multi-Strategy Income Fund (the “Multi-Strategy Income Fund”) and the Angel Oak Flexible Income Fund (the “Flexible Income Fund”) (each, a “Fund” and, collectively, the “Funds”), and Angel Oak Capital Advisors, LLC (the “Adviser” or “Angel Oak”) for a one-year period.
73
The Multi-Strategy Income Fund is the successor in interest to a fund having the same name and investment objective that was included as a series of another investment company, Valued Advisers Trust, and that was also advised by Angel Oak (the “Predecessor Multi-Strategy Income Fund”). The Predecessor Multi-Strategy Income Fund was reorganized into the Fund on April 10, 2015.
The relevant provisions of the 1940 Act specifically provide that it is the duty of the Board to request and evaluate such information as the Board determines is necessary to allow it to properly consider the renewal of the Agreement, and it is the duty of the Adviser to furnish the Trustees with information that is responsive to their request. Accordingly, in determining whether to renew the Investment Advisory Agreement between the Adviser and the Trust with respect to the Funds, the Board requested, and the Adviser provided, information and data relevant to the Board’s consideration. This included materials prepared by the Adviser and by the Funds’ administrator that provided the Board with information regarding the fees and expenses of each Fund, as compared to other similar mutual funds.
Following their review and consideration, the Trustees determined that the Investment Advisory Agreement with respect to the Funds would enable shareholders of the Funds to obtain high quality services at a cost that is appropriate, reasonable, and in the best interests of the Funds and their shareholders. Accordingly, the Board, including those Trustees who are not considered to be “interested persons” of the Trust, as that term is defined in the 1940 Act (the “Independent Trustees”), unanimously approved the adoption of the Investment Advisory Agreement. In reaching their decision, the Trustees requested and obtained from the Adviser such information as they deemed reasonably necessary to evaluate the Investment Advisory Agreement. The Trustees also carefully considered the comparative fee and expense information prepared by the Adviser. In considering the Investment Advisory Agreement with respect to the Funds, the Trustees evaluated a number of factors that they believed, in light of their reasonable business judgment, to be relevant. They based their decision on the following considerations, among others, although they did not identify any one specific consideration or any particular information that was controlling of their decision:
The nature, extent and quality of the advisory services to be provided. The Trustees concluded that Angel Oak is capable of providing high quality services to each Fund, as indicated by the nature and quality of services provided in the past to each Fund, Angel Oak’s management capabilities demonstrated with respect to each Fund, the professional qualifications and experience of the portfolio managers of each Fund, Angel Oak’s investment and management oversight processes, and the competitive investment performance of the Funds. The Trustees also determined that Angel Oak proposed to provide investment advisory services that were of the same quality as services it provided to each Fund in the past, and that these services are appropriate in scope and extent in light of the Funds’ operations, the competitive landscape of the investment company business and investor needs. On the basis of the Trustees’ assessment of the nature, extent and quality of the advisory services to be provided by Angel Oak, the Trustees concluded that Angel Oak is capable of generating a level of long-term investment performance that is appropriate in light of each Fund’s investment objective, policies and strategies and competitive with many other comparable investment companies.
The investment performance of the Funds. With respect to each Fund, the Trustees concluded on the basis of information derived from independent third-party data that Angel Oak had achieved investment performance that was competitive relative to comparable funds over longer-term trailing periods, and the Trustees took into consideration the fact that Angel Oak focuses on long-term performance results with respect to its management of the Funds and that the Funds may have periods of underperformance when measured on a more short-term basis. The Trustees took note of the fact that, over the previous twelve months, there had been a significant decrease in interest rates on the intermediate and the long end of the U.S. yield curve, as well as volatility with respect to credit spreads, each of which had detracted from the Funds’ performance relative to their benchmarks and peer groups during that time period.
With respect to the Flexible Income Fund (which commenced investment operations in November 2014), the Trustees noted that the Fund’s Institutional Class shares had underperformed the Fund’s peer group (based on the category average) and its benchmark index, the Barclays U.S. Aggregate Bond Index, over the trailing one-year period ended July 31, 2016 and since the Fund’s inception. The Trustees noted that the Adviser had recently taken certain steps intended to improve the Fund’s performance, including the adoption of a policy to concentrate the Fund’s investments in banks and diversified financials.
With respect to the Multi-Strategy Income Fund (which commenced operations in June 2011), the Trustees noted that the Fund’s Institutional Class shares had outperformed the Fund’s peer group (based on the category average) over the three- and five-year periods ended July 31, 2016 and since the Fund’s inception and had underperformed its peer group for the one-year period ended July 31, 2016. The Trustees also noted that the Fund’s Institutional Class shares had outperformed the Fund’s benchmark index, the Barclays U.S. Aggregate Bond Index, over the three- and five-year periods ended July 31, 2016 and since the Fund’s inception and had underperformed its benchmark index for the one-year period ended July 31, 2016.
The Trustees also noted that, in response to a request by the Trustees, Angel Oak had provided information comparing each Fund’s performance with that of a group of mutual funds determined to be direct competitors of the Fund.
74
On the basis of the Trustees’ assessment of the nature, extent and quality of advisory services provided by Angel Oak, the Trustees concluded that Angel Oak is capable of generating a level of long-term investment performance that is appropriate in light of each Fund’s investment objectives, policies and strategies and competitive with many other investment companies.
The cost of advisory services to be provided and the level of profitability. On the basis of comparative information derived from the expense data that was provided to the Board, the Trustees determined that the overall projected expense ratio of each Fund is generally higher than the average expense ratio for funds in their respective peer groups. However, the Board noted that the quality of services provided by Angel Oak and the past performance of the Funds demonstrated that the proposed advisory fee still offered an appropriate value for the Funds and their shareholders. The Trustees also noted that, in response to a request from the Trustees, Angel Oak had provided information comparing each Fund’s expense ratio to those of a group of mutual funds determined to be direct competitors of the Fund. In addition, the Trustees noted that Angel Oak had proposed to renew its contractual commitment for the benefit of Fund shareholders to limit the operating expenses of each of the classes of shares of the Funds for an additional year through May 31, 2018.
The Board also reviewed the fees that Angel Oak charges its other clients for discretionary portfolio management services, noting that the firm has a variety of account types with different fee arrangements.
The Board took into account the unique management requirements involved in managing a registered investment company as opposed to other types of client accounts.
The Board also considered Angel Oak’s current level of profitability with respect to the Funds, and noted that Angel Oak’s profitability was acceptable and not excessive and consistent with applicable industry averages. They noted that Angel Oak is committed to using its own resources to help grow the Funds. They also noted that Angel Oak had also provided information regarding its methodology for attributing profitability to the Funds as opposed to its other lines of business. The Trustees also took into consideration the nature and extent of expenses that are borne directly by Angel Oak from its own financial resources to help to market and promote the Funds. Accordingly, on the basis of the Board’s review of the fees to be charged by Angel Oak for investment advisory services, the investment advisory and other services provided to the Funds by Angel Oak, and the estimated profitability of Angel Oak’s relationship with each Fund, the Board concluded that the level of investment advisory fees and Angel Oak’s profitability are appropriate in light of the investment advisory fees, overall expense ratios and investment performance of comparable investment companies and the historical profitability of the relationship between each Fund and Angel Oak. The Trustees considered the profitability of Angel Oak both before and after the impact of the marketing-related expenses that Angel Oak incurs out of its own resources in connection with its management of the Funds.
The extent to which economies of scale may be realized as the Funds grow and whether the advisory fees reflect possible economies of scale. While it was noted that the Funds’ investment advisory fees will not decrease as the Funds’ assets grow because they are not subject to investment advisory fee breakpoints, the Trustees concluded that the Funds’ investment advisory fees are appropriate in light of the projected size of the Funds, and appropriately reflect the current economic environment for Angel Oak and the competitive nature of the mutual fund market. The Trustees then noted that they will have the opportunity to periodically re-examine whether the Funds have achieved economies of scale, and the appropriateness of investment advisory fees payable to Angel Oak with respect to the Funds, in the future, at which time the implementation of fee breakpoints on the Funds could be considered. Finally, the Trustees noted the improvements made to the Adviser’s infrastructure and services provided to the Funds, which had been funded by the advisory fees received by the Adviser.
Benefits to Angel Oak from its relationship with the Funds (and any corresponding benefits to the Funds). The Trustees concluded that other benefits derived by Angel Oak from its relationship with the Funds are reasonable and fair and consistent with industry practice and the best interests of the Funds and their shareholders.
Other Considerations. In approving the Investment Advisory Agreement, the Trustees determined that Angel Oak has made a substantial commitment to the recruitment and retention of high quality personnel and maintains the financial, compliance and operational resources reasonably necessary to manage the Funds in a professional manner that is consistent with the best interests of each Fund and its shareholders. The Trustees also concluded that Angel Oak has made a significant entrepreneurial commitment to the management and success of the Funds, which entails a substantial financial and professional commitment, including the Operating Expense Limitation Agreement under which Angel Oak has undertaken to waive a portion of its fees to the benefit of Fund shareholders to the extent necessary in accordance with the terms of the Operating Expense Limitation Agreement. The Board noted that those waivers were subject to recoupment under the terms of the Operating Expense Limitation Agreement and that Angel Oak had recouped previously waived fees with respect to the Multi-Strategy Income Fund. The Board also considered matters with respect to the brokerage practices of Angel Oak, including its best-execution procedures, and noted that these were reasonable and consistent with standard industry practice.
75
Following further discussion and the consideration of questions raised by the Independent Trustees, the Trustees determined that they had received sufficient information relating to the Funds in order to consider the approval of the Investment Advisory Agreement. It was noted that, in making their determinations, the Trustees had considered and relied upon not only the materials provided to them for use at the Meeting with respect to the proposed contract renewal, but also the information about the Funds and Angel Oak that had been provided to them throughout the past year in connection with their regular Board meetings at which they engage in the ongoing oversight of the Funds and their operations. In reaching their conclusion with respect to the continuation of the Investment Advisory Agreement and the level of fees paid under the Agreement, the Trustees did not identify any one single factor as being controlling, but, rather, the Board took note of a combination of factors that had influenced their decision making process. They noted the level and quality of investment advisory services provided by the Adviser to each of the Funds, and they found that these services continued to benefit the shareholders of the Funds and also reflected management’s overall commitment to the continued growth and development of the Funds.
6. Trustees and Officers
The business of the Fund is managed under the direction of the Board. The Board formulates the general policies of the Fund and meets periodically to review the Fund’s performance, monitor investment activities and practices, and discuss other matters affecting the Fund. The Trustees are fiduciaries for the Fund’s shareholders and are governed by the laws of the State of Delaware in this regard. The names and addresses of the Trustees and officers of the Trust are listed below along with a description of their principal occupations over at least the last five years. The address of each Trustee and Officer of the Trust is c/o Angel Oak Capital Advisers, LLC, One Buckhead Plaza, 3060 Peachtree Road NW, Suite 500, Atlanta, GA 30305. The Fund’s Statement of Additional Information includes additional information about the Trustees and is available upon request by calling toll free 1-855-751-4324.
| | | | | | | | |
Name and
year of birth | | Position with
the Trust and
tenure | | Funds in
complex
overseen by
Trustee | | Principle occupation(s)
during the past five years | | Other directorships held
during the past five years |
Independent Trustees of the Trust(1) |
Ira P. Cohen 1959 | | Independent Trustee and Chairman, since 2014; indefinite term | | 3 | | Executive Vice President, Recognos Financial (investment industry data analysis provider) (since 2015); Independent financial services consultant (since 2005). | | Trustee, Valued Advisers Trust (since 2010) (15 portfolios); Trustee, Griffin Institutional Access Real Estate Fund (since April 2014)(1 portfolio); Trustee, Griffin Institutional Access Credit Fund (since January 2017) (1 portfolio). |
Alvin R. Albe, Jr. 1953 | | Independent Trustee, since 2014; indefinite term | | 3 | | Retired; Senior Advisor, The TCW Group, Inc. (asset manager), (2008-2013). | | Director, Syntroleum Corporation (renewable energy firm) (1988-2014). |
Keith M. Schappert 1951 | | Independent Trustee, since 2014; indefinite term | | 3 | | President, Schappert Consulting LLC (investment industry consulting) (since 2008). | | Trustee, Mirae Asset Discovery Funds (since 2010) (6 portfolios); Trustee, Metropolitan Series Fund, Inc. (since 2009) (30 portfolios); Trustee, Met Investors Series Trust (since 2012) (45 portfolios); Director, The Commonfund (investment management) (since 2012); Director, Calamos Asset Management, Inc. (investment management) (since 2012). |
Interested Trustee of the Trust: |
Sreeniwas (Sreeni) V. Prabhu 1974 | | Interested Trustee, since April 2015; indefinite term | | 3 | | Chief Investment Officer, Portfolio Manager, Co-Founder, Angel Oak Capital Advisors, LLC (since 2009) | | None. |
| (1) | The Trustees of the Trust who are not “interested persons” of the Trust as defined in the 1940 Act (“Independent Trustees”). |
76
| | | | | | |
Name and
year of birth | | Position within Trust | | Term of office and length of time served | | Principle occupation(s) during past five years |
Officers of the Trust |
Dory S. Black, Esq. 1975 | | President | | Since 2015; indefinite term | | General Counsel, Angel Oak (since 2014); General Counsel, EARNEST Partners, LLC (investment management firm) (2014); Vice-President and Assistant General Counsel, GE Asset Management Incorporated (2004 – 2014). |
R. Adam Langley 1967 | | Chief Compliance Officer | | Since 2015; indefinite term | | Chief Compliance Officer, Angel Oak Capital Advisors, LLC (since 2015); Compliance Manager, Invesco Advisers, Ltd. (2013 – 2015); Compliance Officer, Macquarie Group (2013); Chief Compliance Officer, Aspen Partners, Ltd. (2003 – 2013). |
Lu Chang, CFA, FRM 1975 | | Secretary | | Since 2015; indefinite term | | Chief Risk Officer, Angel Oak Capital Advisors, LLC (since 2014); Vice-President and Finance Manager, Wells Fargo Advisors, LLC (investment advisory firm) (2010–2014). |
Daniel Fazioli 1981 | | Treasurer | | Since 2015; indefinite term | | Controller, Angel Oak Capital Advisors, LLC (since 2015); Controller, Tang Capital Partners, LP (2014–2015); Associate, Goldman Sachs & Company, Inc. (2010–2014). |
Each Trustee holds office for an indefinite term and until the earlier of: the Trust’s next meeting of shareholders and the election and qualification of his/her successor; or until the date a trustee dies, resigns or is removed in accordance with the Trust’s Declaration of Trust and By-laws. Each Trustee shall serve during the lifetime of the Trust until he or she: (a) dies; (b) resigns; (c) has reached the mandatory retirement age, if any, as set by the Trustees; (d) is declared incompetent by a court of appropriate jurisdiction; or (e) is removed, or, if sooner, until the next meeting of shareholders called for the purpose of electing Trustees and until the election and qualification of his or her successor. Each officer holds office at the pleasure of the Board and serves for a period of one year, or until his or her successor is duly elected and qualified.
6. Change in Independent Registered Public Accounting Firm
Deloitte & Touche LLP was previously the principal accountant for Angel Oak High Yield Opportunities Fund (formerly the “Rainier High Yield Fund”). On April 15, 2016 that firm resigned and Cohen & Company, LTD was engaged as principal accountants. The decision to change accountants was approved by the audit committee of the Board of Trustees.
During the fiscal year ended March 31, 2016, there were no: (1) disagreements with Deloitte & Touche LLP on any matter of accounting principles or practices, financial statement disclosure or auditing scope or procedures, which disagreements if not resolved to their satisfaction would have caused them to make reference in connection with their opinion to the subject matter of the disagreements, or (2) reportable events.
The audit reports of Deloitte & Touche LLP on the financial statements of the Angel Oak High Yield Opportunities Fund as of and for the year ended March 31, 2016 did not contain any adverse opinion or disclaimer of opinion, nor were they qualified or modified as to uncertainty, audit scope or accounting principles.
77
ANGEL OAK FUNDS TRUST
Notice of Privacy Policy & Practices
Your privacy is important to us. We are committed to maintaining the confidentiality, integrity and security of your personal information. When you provide personal information, we believe that you should be aware of policies to protect the confidentiality of that information.
We collect the following nonpublic personal information about you:
| | • | | Information we receive from you on or in applications or other forms, correspondence, or conversations, including, but not limited to, your name, address, phone number, social security number, assets, income and date of birth; and |
| | • | | Information about your transactions with us, our affiliates, or others, including, but not limited to, your account number and balance, payments history, parties to transactions, cost basis information, and other financial information. |
We do not disclose any nonpublic personal information about our current or former shareholders to nonaffiliated third parties, except as permitted by law. For example, we are permitted by law to disclose all of the information we collect, as described above, to our transfer agent to process your transactions. Furthermore, we restrict access to your nonpublic personal information to those persons who require such information to provide products or services to you. We maintain physical, electronic, and procedural safeguards that comply with federal standards to guard your nonpublic personal information.
In the event that you hold shares of the Funds through a financial intermediary, including, but not limited to, a broker-dealer, bank, or trust company, the privacy policy of your financial intermediary would govern how your nonpublic personal information would be shared with nonaffiliated third parties.
78
INVESTMENT ADVISER
Angel Oak Capital Advisors, LLC
One Buckhead Plaza
3060 Peachtree Road NW
Suite 500
Atlanta, GA 30305
DISTRIBUTOR
Quasar Distributors, LLC
615 East Michigan Street
Milwaukee, WI 53202
INDEPENDENT REGISTERED PUBLIC ACCOUNTING FIRM
Cohen & Company, Ltd.
1350 Euclid Avenue, Suite 800
Cleveland, OH 44115
LEGAL COUNSEL
Dechert LLP
1900 K Street NW
Washington, DC 20006
CUSTODIAN
U.S. Bank National Association
1555 North Rivercenter Drive, Suite 302
Milwaukee, WI 53202
ADMINISTRATOR, TRANSFER AGENT, AND FUND ACCOUNTANT
U.S Bancorp Fund Services, LLC
615 East Michigan Street
Milwaukee, WI 53202
This report is intended only for the information of shareholders or those who have received the Funds’ prospectus which contains information about the Funds’ management fee and expenses. Please read the prospectus carefully before investing.
Item 2. Code of Ethics.
The registrant has adopted a code of ethics that applies to the registrant’s principal executive officer and principal financial officer. The registrant has not made any substantive amendments to its code of ethics during the period covered by this report. The registrant has not granted any waivers from any provisions of the code of ethics during the period covered by this report.
A copy of the registrant’s Code of Ethics is filed herewith.
Item 3. Audit Committee Financial Expert.
The registrant’s board of trustees has determined that there is at least one audit committee financial expert serving on its audit committee. Mr. Alvin Albe, Jr. is the “audit committee financial expert” and is considered to be “independent” as each term is defined in Item 3 of Form N-CSR.
Item 4. Principal Accountant Fees and Services.
The registrant has engaged its principal accountant to perform audit services, audit-related services, tax services and other services during the past two fiscal years. “Audit services” refer to performing an audit of the registrant’s annual financial statements or services that are normally provided by the accountant in connection with statutory and regulatory filings or engagements for those fiscal years. “Audit-related services” refer to the assurance and related services by the principal accountant that are reasonably related to the performance of the audit. “Tax services” refer to professional services rendered by the principal accountant for tax compliance, tax advice, and tax planning. The following table details the aggregate fees billed or expected to be billed for each of the last two fiscal years for audit fees, audit-related fees, tax fees and other fees by the principal accountant.
| | | | | | | | |
| | | FYE 01/31/2017 | | | FYE 01/31/2016 | |
Audit Fees | | $ | 105,000 | | | $ | 75,000 | |
Audit-Related Fees | | $ | 0 | | | $ | 0 | |
Tax Fees | | $ | 12,000 | | | $ | 8,000 | |
All Other Fees | | $ | 0 | | | $ | 0 | |
The audit committee has adopted pre-approval policies and procedures that require the audit committee to pre-approve all audit and non-audit services of the registrant, including services provided to any entity affiliated with the registrant.
The percentage of fees billed by Cohen & Company, Ltd. applicable to non-audit services pursuant to waiver of pre-approval requirement were as follows:
| | | | | | | | |
| | | FYE 01/31/2017 | | | FYE 01/31/2016 | |
Audit-Related Fees | | | 0 | % | | | 0 | % |
Tax Fees | | | 0 | % | | | 0 | % |
All Other Fees | | | 0 | % | | | 0 | % |
1
All of the principal accountant’s hours spent on auditing the registrant’s financial statements were attributed to work performed by full-time permanent employees of the principal accountant. (If more than 50 percent of the accountant’s hours were spent to audit the registrant’s financial statements for the most recent fiscal year, state how many hours were attributed to work performed by persons other than the principal accountant’s full-time, permanent employees.) The following table indicates the non-audit fees billed or expected to be billed by the registrant’s accountant for services to the registrant and to the registrant’s investment adviser (and any other controlling entity, etc.—not sub-adviser) for the last two years. The audit committee of the board of trustees/directors has considered whether the provision of non-audit services that were rendered to the registrant’s investment adviser is compatible with maintaining the principal accountant’s independence and has concluded that the provision of such non-audit services by the accountant has not compromised the accountant’s independence.
| | | | | | | | |
Non-Audit Related Fees | | FYE 01/31/2017 | | | FYE 01/31/2016 | |
Registrant | | $ | 0 | | | $ | 0 | |
Registrant’s Investment Adviser | | $ | 0 | | | $ | 0 | |
Item 5. Audit Committee of Listed Registrants.
Not applicable to registrants who are not listed issuers (as defined in Rule 10A-3 under the Securities Exchange Act of 1934).
Item 6. Investments.
Schedule of Investments is included as part of the report to shareholders filed under Item 1 of this Form.
Item 7. Disclosure of Proxy Voting Policies and Procedures for Closed-End Management Investment Companies.
Not applicable to open-end investment companies.
Item 8. Portfolio Managers of Closed-End Management Investment Companies.
Not applicable to open-end investment companies.
Item 9. Purchases of Equity Securities by Closed-End Management Investment Company and Affiliated Purchasers.
Not applicable to open-end investment companies.
Item 10. Submission of Matters to a Vote of Security Holders.
There have been no material changes to the procedures by which shareholders may recommend nominees to the registrant’s board of trustees.
2
Item 11. Controls and Procedures.
| (a) | The Registrant’s [President/Principal Executive Officer] and [Treasurer/Principal Financial Officer] have reviewed the Registrant’s disclosure controls and procedures (as defined in Rule 30a-3(c) under the Investment Company Act of 1940 (the “Act”)) as of a date within 90 days of the filing of this report, as required by Rule 30a-3(b) under the Act and Rules 13a-15(b) or 15d-15(b) under the Securities Exchange Act of 1934. Based on their review, such officers have concluded that the disclosure controls and procedures are effective in ensuring that information required to be disclosed in this report is appropriately recorded, processed, summarized and reported and made known to them by others within the Registrant and by the Registrant’s service provider. |
| (b) | There were no changes in the Registrant’s internal control over financial reporting (as defined in Rule 30a-3(d) under the Act) that occurred during the second fiscal quarter of the period covered by this report that has materially affected, or is reasonably likely to materially affect, the Registrant’s internal control over financial reporting. |
Item 12. Exhibits.
| (a) | (1) Any code of ethics or amendment thereto, that is the subject of the disclosure required by Item 2, to the extent that the registrant intends to satisfy Item 2 requirements through filing an exhibit. Filed herewith |
(2) A separate certification for each principal executive officer and principal financial officer pursuant to Section 302 of the Sarbanes-Oxley Act of 2002. Filed herewith.
(3) Any written solicitation to purchase securities under Rule 23c-1 under the Act sent or given during the period covered by the report by or on behalf of the registrant to 10 or more persons. Not applicable to open-end investment companies.
| (b) | Certifications pursuant to Section 906 of the Sarbanes-Oxley Act of 2002. Furnished herewith. |
3
SIGNATURES
Pursuant to the requirements of the Securities Exchange Act of 1934 and the Investment Company Act of 1940, the registrant has duly caused this report to be signed on its behalf by the undersigned, thereunto duly authorized.
| | |
(Registrant) | | Angel Oak Funds Trust |
| |
| By (Signature and Title)* | | /s/ Dory S. Black |
| | Dory S. Black, President (Principal Executive Officer) |
Date March 27, 2017
Pursuant to the requirements of the Securities Exchange Act of 1934 and the Investment Company Act of 1940, this report has been signed below by the following persons on behalf of the registrant and in the capacities and on the dates indicated.
| | |
| By (Signature and Title)* | | /s/ Dory S. Black |
| | Dory S. Black, President (Principal Executive Officer) |
Date March 27, 2017
| | |
| By (Signature and Title)* | | /s/ Daniel Fazioli |
| | Daniel Fazioli, Treasurer (Principal Financial Officer) |
Date March 27, 2017
| * | Print the name and title of each signing officer under his or her signature. |