As filed with the U.S. Securities and Exchange Commission on 04/04/19
UNITED STATES
SECURITIES AND EXCHANGE COMMISSION
Washington, D.C. 20549
FORMN-CSR
CERTIFIED SHAREHOLDER REPORT OF REGISTERED
MANAGEMENT INVESTMENT COMPANIES
Investment Company Act file number811-22980
Angel Oak Funds Trust
(Exact name of registrant as specified in charter)
One Buckhead Plaza
3060 Peachtree Rd. NW, Suite 500
Atlanta, Georgia 30305
(Address of principal executive offices) (Zip code)
Dory S. Black, Esq., President
One Buckhead Plaza
3060 Peachtree Rd. NW, Suite 500
Atlanta, Georgia 30305
(Name and address of agent for service)
Copy to:
Douglas P. Dick
Stephen T. Cohen
Dechert LLP
1900 K Street NW
Washington, DC 20006
404-953-4900
Registrant’s telephone number, including area code
Date of fiscal year end: January 31
Date of reporting period: January 31, 2019
Item 1. Reports to Stockholders.
ANNUAL REPORT
January 31, 2019

Angel Oak Multi-Strategy Income Fund
Angel Oak Financials Income Fund
(formerly known as Angel Oak Flexible Income Fund)
Angel Oak High Yield Opportunities Fund
Angel Oak UltraShort Income Fund
Angel Oak Capital Advisors, LLC
One Buckhead Plaza
3060 Peachtree Road NW
Suite 500
Atlanta, GA 30305
(404)953-4900
Beginning on January 1, 2021, as permitted by regulations adopted by the U.S. Securities and Exchange Commission, paper copies of the Funds’ shareholder reports will no longer be sent by mail, unless you specifically request paper copies of the reports from the Funds or from your financial intermediary, such as a broker-dealer or bank. Instead, the reports will be made available on a website, and you will be notified by mail each time a report is posted and provided with a website link to access the report.
If you already elected to receive shareholder reports electronically, you will not be affected by this change and you need not take any action. You may elect to receive shareholder reports and other communications from the Funds electronically by contacting your financial intermediary (such as broker-dealer or bank) or, if you are a direct investor, by calling(855) 751-4324.
You may elect to receive all future reports in paper free of charge. If you invest through a financial intermediary, you can contact your financial intermediary to request that you continue to receive paper copies of your shareholder reports. If you invest directly with the Funds, you can call (855)751-4324 to let the Funds know you wish to continue receiving paper copies of your shareholder reports. Your election to receive reports in paper will apply to all Funds held in your account if you invest through a financial intermediary or all funds held with the Fund complex if you invest directly with the Funds.
Table of Contents
Dear Shareholder,
2018 will go down as one of the most challenging years in the post-crisis period with fewer asset classes beating inflation than in 2008. Fears of a global and domestic growth slowdown, U.S. recession worries, and trade wars all weighed on risk assets. Most importantly, the U.S. Federal Reserve System’s (the “Fed”) tightening campaign, coupled with the reduction in its bond portfolio (“Quantitative Tightening”) increased volatility and sent most global asset classes lower on the year, including risk-free alternatives that historically offset any weakness in risk portfolios. Interestingly, the current economic expansion is still robust, driven by historically accommodative monetary policy, generationally low unemployment rates, and tax cuts.
Despite recent headlines regarding an impending recession, we are cautiously optimistic about the economic outlook for 2019 and expect this expansion will continue, becoming the longest since the American Civil War. While it is impossible to predict the exact timing of the end of the expansion, we expect that it will last well beyond 2019 and into 2020. Growth will likely slow into 2019 and 2020 as the impact of tax cuts and fiscal stimulus begins to fade, but we do not foresee a recession in the near term. We do not expect last year’s pace of robust economic growth to continue, but a solid2%-3% growth rate is reasonable given the current data.
Market participants are closely watching the shape of the yield curve because it has historically been an excellent indication of potential volatility in the marketplace and a recession. In the past, the Fed has tended to tighten too far too fast sending the U.S. economy into recession. We do ultimately believe the Fed’s Federal Open Market Committee (“FOMC”) will eventually tighten the U.S. into recession, but this expansion will last far longer than market participants expect. Recent rhetoric points to the FOMC dramatically slowing their pace of tightening.
As Fed Chairman Jerome Powell said at the Atlanta Fed’s economic conference on January 4, 2019, the FOMC will continue to reduce the size of their balance sheet in the form of Quantitative Tightening but will be more data-dependent with respect to increases in the target rate. Most enlightening from the Atlanta Fed’s economic conference on January 4, 2019, he reiterated, “[The Fed] will be prepared to adjust policy quickly and flexibly, and to use all of our tools to support the economy, should that be appropriate to keep the expansion on track, to keep the labor market strong and to keep inflation near 2%.” The bottom line is the FOMC is not looking to overtighten in 2019, but to support robust growth over the medium term. We think a pause in 2019 is warranted, and are-steepening of the U.S. yield curve is quite possible as the growth picture stabilizes.
In early 2018, we improved the credit quality across our fund complex. This higher-quality positioning dampened net asset value (“NAV”) volatility during the recent market turmoil enabling us to rotate into more attractive assets. Significant opportunities have begun to emerge in various areas of the U.S. structured credit landscape in 2019, and we see the best risk-adjusted returns in legacy and new issuenon-agency residential mortgage-backed securities (“RMBS”), U.S. financials, shorter duration commercial mortgage-backed securities (“CMBS”), collateralized loan obligations (“CLOs”), and asset-backed securities (“ABS”).
Thank you for your continued support.
Respectfully yours,
Sreeniwas V. Prabhu
Chief Executive Officer and Chief Investment Officer
The opinions expressed are subject to change at any time, are not guaranteed and should not be considered investment advice.
Must be accompanied or preceded by a prospectus.
Mutual fund investing involves risk. Principal loss is possible.
The Angel Oak Funds are distributed by Quasar Distributors, LLC.
1
Angel Oak Multi-Strategy Income Fund
| 1. | How did the Fund perform during the period? |
For the12-month period ended January 31, 2019, the Fund’s Institutional Shares (ANGIX) returned 3.05%, while the Fund’s A Shares (ANGLX) and C Shares (ANGCX) returned 2.72% and 2.04%, respectively. During the same period, the Fund’s benchmark, the Bloomberg Barclays Aggregate Bond Index, returned 2.25%.
| 2. | What were the main contributors to and detractors from the Fund’s performance during the period? |
Duration and credit strategies benefited the Fund relative to the benchmark. Duration positioning short of the index was a positive contributor to relative performance as interest rates rose for most of the term structure for the12-month period ended January 31, 2019. The2-year Treasury yield finished up 32 basis points to 2.46% while the10-year Treasury yield fell 8 basis points to 2.63%, flattening the2-year/10-year Treasury spread curve (“2s/10s Curve”) 45 basis points from 62 to 17 basis points. LIBOR rates continued to move higher given the four interest rate hikes by the U.S. Federal Reserve’s (the “Fed”) Federal Open Market Committee (“FOMC”).1-month and3-month LIBOR rose 101 and 93 basis points, respectively. The floating rate bond allocation based primarily onfront-end LIBOR floaters was beneficial to Fund performance relative to the Fund’s benchmark. The flattening of the U.S. yield curve continued to be a focus for market participants during the period as the 2s/10s Curve neared inversion, and market volatility increased sharply in the fourth quarter of 2018.
All three primary sectors of the Fund were positive contributors to performance for the12-month period ended January 31, 2019 withnon-agency residential mortgage-backed securities (“NA RMBS”) up approximately 4.41%, contributing 2.79% to the Fund. The NA RMBS sector had another strong year in 2018 after several years of post-crisis outperformance. The fundamental tailwinds of the broad-based housing recovery have resulted in solid improvement in home equity in the U.S. The combined effect of increased home equity and ongoing amortization has resulted inloan-to-value ratios (“LTVs”) falling below 60% on average for the legacy NA RMBS allocation in the Fund. This has resulted in rising Sharpe ratios for NA RMBS as it continues to exhibit high current carry and lower spread volatility amid spread widening events such as late 2018. Across all of fixed income, 2018 was a year defined by supply and NA RMBS was no different. It was the busiest supply year in the post-crisis period, with over $115 billion of new issuance coming to market. In fact, it was the first year since the crisis where the NA RMBS market actually grew in the total amount of bonds outstanding. Heavy supply weighed on spreads across fixed income and prices moved slightly lower on the year within the space. However, that was more than offset by a positive income return from high-quality, floating rate securities. We sought to be at the senior part of the capital structure inAlt-A and Option ARMsub-sectors as LIBOR moved sharply higher in 2018. Increased prepayment rates provided another tailwind for the asset class, resulting in positive total return and positive excess return for the year.
The commercial mortgage-backed securities (“CMBS”) allocation was a positive contributor to Fund performance as well. CMBS was up 3.68%, contributing 39 basis points to Fund performance. After a strong start early in the period, CMBS gave back their gains later in the period in sympathy with the widening in the broader credit markets. 2018new-issue volumes finished at $93.11 billion,in-line with 2017 volume of $94.3 billion, a very healthy technical for us to observe. In summary, CMBS investors digested over $90 billion of new bonds, and the risk retention structures of these bond transactions continues to be well received as spreads in September reached their tightest levels in a10-year span.
Collateralized Loan Obligations (“CLOs”) were also a positive contributor to the Fund for the period due to the defensive positioning with an overweight toAAA-rated tranches. The CLO allocation was up 3.20% in total return, contributing 38 basis points to Fund performance. CLO spreads began widening from post-crisis tights set earlier in 2018, amidst high supply. General corporate credit spread widening contributed to this phenomenon. Rising risk premiums were orderly until late October, at which point spreads started to widen rapidly intoyear-end. Macro weakness, pooryear-end liquidity and forced selling from fixed income funds facing redemptions exacerbated the latest move. In anticipation of a more volatile market due to a more aggressive Fed and continued froth in the bank loan market, we began shifting our credit exposure in CLOs up the capital stack from BBB/BB to AAA/AA over the last 12 to 18 months. The CLO market has a high ‘beta’ with spread moves that exceed moves in investment grade and high yield corporate bond spreads, which provides significant sector rotation opportunities. The recent widening in the fourth quarter was no different. Moving high in the capital stack softens price volatility and helped the allocation outperform versus the broader CLO market.
| 3. | What is your outlook heading into 2019, and how is the Fund positioned? |
Despite recent headlines of an impending recession, we are cautiously optimistic on the economic outlook for 2019 and expect this will be the longest expansion since the American Civil War. While it is impossible to predict the exact timing of the end of
2
the expansion, expectations are it will last well beyond 2019 and into 2020. Growth will likely slow into 2019 and 2020 as the impact of tax cuts and fiscal stimulus begin to fade, but we don’t foresee a recession in the near term. We do not expect last year’s pace of robust economic growth to continue, but a solid2-3% is reasonable given the current data.
The labor market is very healthy at the moment. The unemployment rate is at 3.9% and wages are rising at approximately 3.1% per annum. Payrolls have added an average of 220,000 jobs over the last four months, well ahead of the 100,000 per month required to continue the downtrend in the unemployment rate, which could remain below 4% throughout 2019.
In early 2018, we improved the credit quality across our fund complex. Significant opportunities have begun to emerge in various areas of the U.S. structured credit landscape in 2019, and we see the best risk-adjusted returns in legacy and new issue NA RMBS, U.S. financials, and shorter duration CMBS, CLOs and asset-backed securities (“ABS”).
Past performance is not a guarantee of future results.
Mutual fund investing involves risk; Principal loss is possible. Investments in debt securities typically decrease when interest rates rise. This risk is usually greater forlonger-term debt securities. Investments in lower rated andnon-rated securities present a greater risk of loss to principal and interest than higher rated securities. Investments inasset-backed andmortgage-backed securities include additional risks that investors should be aware of including credit risk, prepayment risk, possible illiquidity and default, as well as increased susceptibility to adverse economic developments. Derivatives involve risks different from, and in certain cases, greater than the risks presented by more traditional investments. Derivatives may involve certain costs and risks such as illiquidity, interest rate, market, credit, management and the risk that a position could not be closed when most advantageous. Investments in derivatives could lose more than the amount invested. Investments in foreign securities involve greater volatility and political, economic and currency risks and differences in accounting methods. The Fund can make short sales of securities, which involves the risk that losses in securities may exceed the original amount invested. For more information on these risks and other risks of the Fund, please see the Prospectus.
Definitions:
Alt-A: A classification of mortgages with a risk profile falling between prime and subprime. These loans are usually issued to top credit quality borrowers with good credit histories.
Basis Point (bps): One hundredth of one percent. Used to denote the percentage change in a financial instrument.
Beta: A measure of a stock’s risk of volatility compared to the overall market.
Duration: Measures a portfolio’s sensitivity to changes in interest rates. Generally, the longer the duration, the greater the price change relative to interest rate movements
2s/10s Curve: Refers to the divergence between the10-year U.S. Treasury bond and the2-year Treasury note. In normal economic circumstances, the yield on the10-year should be greater than the2-year, creating a positive spread. This signals some combination of positive future growth expectations, positive future inflation expectations, and basic recognition that more adverse economic events are likelier to transpire over a longer timeframe than a shorter timeframe. Thus investors are compensated for taking on the higher risk of longer-duration bonds in the form of higher yields.
Bloomberg Barclays Aggregate Bond Index: An unmanaged index that measures the performance of the investment-grade universe of bonds issued in the United States. The index includes institutionally traded U.S. Treasury, government-sponsored, mortgage and corporate securities. It is not possible to invest directly in an index.
LIBOR: A benchmark rate that some of the world’s leading banks charge each other for short-term loans. It stands for Intercontinental Exchange London Interbank Offered Rate and serves as the first step to calculating interest rates on various loans throughout the world.
Option ARM: An option adjustable-rate mortgage (ARM) is a type of mortgage where the mortgagor (borrower) has several options as to which type of payment is made to the mortgagee (lender). In addition to having the choice of making payments of interest and principal that amounts to those made in conventional mortgages, option ARMs also have alternative payment options where the mortgagor can make significantly smaller payments by making interest-only payments or minimum payments.
3
Sharpe ratio: A statistical measure that uses standard deviation and excess return to determine reward per unit of risk. A higher Sharpe ratio implies a better historical risk-adjusted performance. The Sharpe ratio has been calculated since inception using the3-month Treasury bill for the risk-free rate of return.
Spread: The difference in yield between LIBOR and a debt security with the same maturity but of lesser quality.
Tranche: A portion of debt or structured financing. Each portion, or tranche, is one of several related securities offered at the same time but with different risks, rewards, and maturities.
4
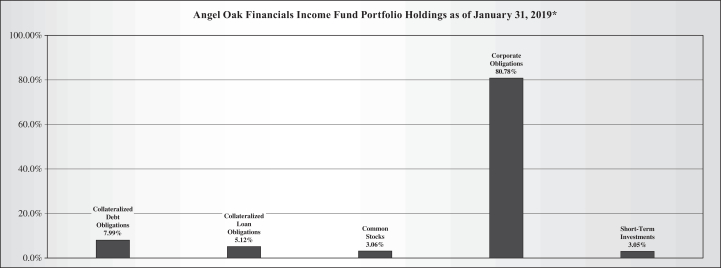
Angel Oak Financials Income Fund
| 1. | How did the Fund perform during the period? |
For the12-month period ended January 31, 2019, the Fund’s Institutional Shares (ANFIX) returned 3.61%, while the Fund’s A Shares (ANFLX) and C Shares (AFLCX) returned 3.36% and 2.69%, respectively. During the same period, the Fund’s benchmark, the Bloomberg Barclays Aggregate Bond Index, returned 2.25%.
| 2. | What were the main contributors to and detractors from the Fund’s performance during the period? |
There were some significant headwinds that created some challenges for investors in the banking sector in 2018. Interest rates rose, equity valuations collapsed in the second half of the year and credit spreads widened significantly in the fourth quarter. On the other hand, the sector delivered record earnings: higher interest rates resulted in improved net interest margins, credit quality is back topre-crisis levels and lower tax rates helped boost the bottom line. Despite the headwinds, the Fund performed very well and ended the year as the top performing fund based upon total return among the 250 funds in Morningstar’s corporate bond category for the one year period ended December 31, 2018.
The focus of the Fund shifted more explicitly toward the financial sector in 2018. To emphasize the shift, the name of the fund was changed from Angel Oak Flexible Income Fund to Angel Oak Financials Income Fund effective December 16, 2018. The financial sector now accounts for over 90% of the Fund’s assets. There are three areas of primary focus within the financial sector: community bank debt,non-bank financials debt and community bank equity. The Fund’s asset allocation is comprised of 71% of assets in community bank debt, 18% of assets innon-bank financials, and 3% of assets in community bank equities.
Given the attractiveness of community bank debt, the allocation to Collateralized Loan Obligations (“CLOs”) fell below 3% in 2018, the lowest level since the Fund’s inception. CLOs only contributed marginally to the Fund’s performance in 2018.
| 3. | What is your outlook heading into 2019, and how is the Fund positioned? |
The Fund is focused on three main asset classes in the current environment: community bank debt,non-bank financials debt and community bank equities. Community bank debt offers the highest risk/reward potential over the next18-24 months, in our view.
Our conviction in community bank debt as an asset class is based on the underlying strength of the sector, including higher capital bases, strengthened regulatory oversight and earnings tailwinds. The niche market characteristics and ensuing market dislocation allows investors to extract excess yield. Community bank debt offers credit spreads of250-400 basis points above those of larger institutions with a similar credit profile. Relative to larger banks, community banks have (1) more transparent business models; (2) alow-cost, “sticky” deposit base; (3) lending portfolios tied to local relationships; and (4) balance sheet structures that benefit from higher rates. Additionally, we believe that more-nimble community banks can drive more innovation and higher growth than larger institutions. Community bank debt offers spreads of approximately 350 basis points on average, compared with approximately 150 basis points for investment grade corporate bonds. Finally, increasing consolidation in the banking industry provides the potential for enhanced total return from price appreciation.
Small-capnon-bank financial institution debt (including insurance companies, Real Estate Investment Trusts (“REITs”), Business Development Companies (“BDCs”) and asset managers) is a similarly dislocated market, in our view. With little analyst coverage or institutional following, investors can extract relatively high coupons. This space is more nascent than the community bank debt market, and has really only emerged in size over the past year or so. As such, coupons may be higher than they are for community bank debt, but issuance is smaller and more episodic. We believe the best risk/reward potential in thenon-banks sector over the near to medium term is in shorter duration, rated senior debt.
For 2019, we feel there will be a bifurcation between bank debt and equity performance. While bank equities are underpinned by the same strong industry fundamentals, asset quality is key to bank debt performance whereas equity valuations are based on investors’ perceptions of future earnings growth and the multiple they are willing to pay for that growth. From an asset quality perspective, sector trends remain pristine. By contrast, we see fewer catalysts to drive meaningful equities outperformance from a sector perspective in 2019 as we believe earnings growth has peaked. We do however see stock specific opportunities in community bank equities, which is reflected in our equities allocation, where we have a value bias.
With the increased volatility and downward pressure seen across fixed income and equity markets in the fourth quarter of 2018, we are closely monitoring asset quality trends, including real-time data points amassed through our due diligence process in a particularly robust primary issue market. We remain disciplined in our credit underwriting, with particular emphasis on interest
5
rate risk given increased lending and deposit competition, and on credit risk, as we move into the later innings of the economic cycle. We expect the next credit cycle will be driven by the corporate sector, as higher rates and growing leverage will eventually drive higher defaults and restructurings. On the other hand, the U.S. consumer remains strong, underwriting has become more conservative and banks are in a strong position to absorb loss rates moving towards cycle averages over time.
We do not anticipate oursub-sector allocations within financial services will change materially in 2019.
Past performance is not a guarantee of future results.
Mutual fund investing involves risk; Principal loss is possible. Investments in debt securities typically decrease when interest rates rise. This risk is usually greater forlonger-term debt securities. Investments in lower rated andnon-rated securities present a greater risk of loss to principal and interest than higher rated securities. Investments inasset-backed andmortgage-backed securities include additional risks that investors should be aware of including credit risk, prepayment risk, possible illiquidity and default, as well as increased susceptibility to adverse economic developments. Derivatives involve risks different from, and in certain cases, greater than the risks presented by more traditional investments. Derivatives may involve certain costs and risks such as illiquidity, interest rate, market, credit, management and the risk that a position could not be closed when most advantageous. Investments in derivatives could lose more than the amount invested. Investments in foreign securities involve greater volatility and political, economic and currency risks and differences in accounting methods. The Fund can make short sales of securities, which involves the risk that losses in securities may exceed the original amount invested. For more information on these risks and other risks of the Fund, please see the Prospectus.
Definitions:
Basis Point (bps): One hundredth of one percent. Used to denote the percentage change in a financial instrument.
Bloomberg Barclays Aggregate Bond Index: An unmanaged index that measures the performance of the investment-grade universe of bonds issued in the United States. The index includes institutionally traded U.S. Treasury, government-sponsored, mortgage and corporate securities. It is not possible to invest directly in an index.
Spread: The difference in yield between two bonds of similar maturity but different credit quality.
Duration: Measures a portfolio’s sensitivity to changes in interest rates. Generally, the longer the duration, the greater the price change relative to interest rate movements
Morningstar Rankings represent a fund’s total-return rank relative to all funds that have the same Morningstar Category. The highest rank is 1 and the lowest is based on the total number of funds ranked in the category. It is based on the Morningstar total return, which includes both income and capital gains or losses and is not adjusted for sales charges or redemption fees.
6
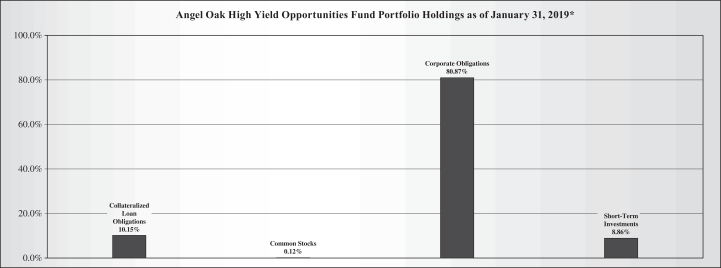
Angel Oak High Yield Opportunities Fund
| 1. | How did the Fund perform during the period? |
For the12-month period ended January 31, 2019, the Fund’s Institutional Shares (ANHIX) returned 0.74% while the Fund’s A Shares (ANHAX) returned 0.41%. During the same period, the Fund’s benchmark, the Bloomberg Barclays U.S. Corporate High Yield Bond Index, returned 1.73%.
| 2. | What were the main contributors to and detractors from the Fund’s performance during the period? |
The portfolio’s 10% allocation to collateralized loan obligations (“CLOs”) was a significant positive contributor to performance during the period. CLOs are floating rate instruments and benefited as interest rates rose during the year. The Fund’s CLO allocation is generally comprised of CLOs with short duration and defensive profiles, which outperformed the corporate bond allocation and the benchmark.
For the second consecutive year, the energy sector was the largest positive contributor to corporate bond performance during the period. Oil prices declined due to rising production from U.S. shale producers and the ramp up of production from OPEC to offset the expected reduction in supply from Iran as sanctions were imposed and compounded by softening demand growth as the pace of global economic growth slowed. The positive contribution was primarily the result of selection and was broad based. Additionally, the portfolio benefited from the underweight to exploration and production companies in favor of refining and pipeline companies which are less directly exposed to the price level of oil within the energy sector allocation.
The largest detractors from the corporate bond performance came from the communications and consumernon-cyclical sectors. The performance was driven by a combination of allocation and selection. The portfolio was underweight both sectors which outperformed the benchmark during the period. In addition, performance was further negatively impacted by specific holdings in a printing company and a food and beverage company, both of which underperformed due to competitive pressures and deteriorating operating performance.
| 3. | What is your outlook heading into 2019, and how is the Fund positioned? |
Despite the marketsell-off in late 2018, triggered by the U.S. Federal Reserve Chairman’s comments regarding interest rates being far below neutral and that therun-off of the balance sheet was on auto-pilot, interpreted by the market that the Federal Reserve would programmatically continue to tighten monetary policy, pulling forward the timeline of a recession, the U.S. economic fundamentals appear to be in good shape and supportive of continued economic expansion, especially since the Federal Reserve has since communicated its willingness to be patient and flexible with regard to monetary policy.
The U.S. economy continues to be a consumer-driven economy with the consumer accounting for approximately 70% of economic activity. Unemployment is at the lowest level going back to the 1960s; wage gains are beginning to accelerate; and household leverage is at the lowest levels since the early 2000s, as measured by the percentage of disposable income allocated to debt service and total debt to disposable income.
Corporate earnings growth will slow in 2019 as the benefit of the Tax Cut and Jobs Act fades. However, earnings growth is expected to be positive. As interest rates rise and the pace of economic growth slows, corporations are increasingly focusing on the balance sheet, deemphasizing levered share buybacks and dividends in favor of debt reduction to drive stronger enterprise valuation multiples. For high yield issuers in aggregate, credit profiles have steadily improved with J.P. Morgan’s credit fundamentals update for the third quarter of 2018 indicating leverage has steadily improved for nine consecutive quarters.
Within this context we believe the portfolio is positioned to benefit from the continued economic expansion while also reflecting current valuations and the potential for increased volatility. We are overweight the basic industries, consumer cyclicals and capital goods sectors reflecting our expectation for a continuation of the economic expansion and favorable view on the U.S. housing sector supported by increasing household formation by the millennial generation and favorable supply/demand fundamentals. Given the magnitude of monetary policy tightening to date, and the flatness of the yield curve indicating the economy’s increased sensitivity to the level of interest rates on economic growth, we remain cognizant of taking advantage of opportunities to reduce positions where the risk/reward balance is no longer attractive.
7
Past performance is not a guarantee of future results.
Mutual fund investing involves risk; Principal loss is possible. Investments in debt securities typically decrease when interest rates rise. This risk is usually greater forlonger-term debt securities. Investments in lower rated andnon-rated securities present a greater risk of loss to principal and interest than higher rated securities. Investments inasset-backed andmortgage-backed securities include additional risks that investors should be aware of including credit risk, prepayment risk, possible illiquidity and default, as well as increased susceptibility to adverse economic developments. Derivatives involve risks different from, and in certain cases, greater than the risks presented by more traditional investments. Derivatives may involve certain costs and risks such as illiquidity, interest rate, market, credit, management and the risk that a position could not be closed when most advantageous. Investments in derivatives could lose more than the amount invested. Investments in foreign securities involve greater volatility and political, economic and currency risks and differences in accounting methods. For more information on these risks and other risks of the Fund, please see the Prospectus.
Definitions
OPEC: Organization of Petroleum Exporting Countries.
Bloomberg Barclays U.S. Corporate High Yield Bond Index: An unmanaged market value-weighted index that covers the universe of fixed rate,non-investment grade debt. It is not possible to invest directly in an index.
Duration: Measures a portfolio’s sensitivity to changes in interest rates. Generally, the longer the duration, the greater the price change relative to interest rate movements
8
Angel Oak UltraShort Income Fund
| 1. | How did the Fund perform during the period? |
For the period since inception (April 2, 2018) through January 31, 2019, the Fund’s Institutional Shares (AOUIX) returned 2.60%, while the Fund’s A Shares (AOUAX) returned 2.12% (April 30, 2018 inception for the A shares). During the same period, the Fund’s benchmark, the Bloomberg Barclays 9-12 Month U.S. Treasury Bill Index, returned 1.84% since April 3, 2018 and 1.77% since April 30, 2018.
| 2. | What were the main contributors to and detractors from the Fund’s performance during the period? |
Credit strategies were the primary benefit to the Fund relative to the benchmark. Duration positioning short of the index was a mixed contributor since inception.1-yr reference rates rose through the first seven months of the period and then fell thereafter. Overall, the interest rate duration was short of the Fund’s benchmark for the whole period but was positioned even shorter during the falling interest rate period. The1-year Treasury yield finished up 47 basis points to 2.55%, peaking at 2.74% in November 2018 before falling 19 basis points to end the period. LIBOR rates continued to move higher given the four hikes by the U.S. Federal Reserve’s (the “Fed”) Federal Open Market Committee (“FOMC”).1-month and3-month LIBOR rose 64 and 43 basis points, respectively. The floating rate bond allocation based primarily onfront-end LIBOR floaters was beneficial to Fund performance relative to the Fund’s benchmark as1-month LIBOR rates rose rapidly throughout most of the period. On average throughout the return period, interest rate duration strategies were a positive contributor to Fund performance given the move higher in short term rates.
Credit strategies were the primary drivers of performance as the Fund’s overweight to credit, particularly structured credit, over government bonds drove positive relative performance. Residential mortgage-backed securities (“RMBS”), asset-backed securities (“ABS”), and collateralized loan obligations (“CLOs”), the largest asset classes within the Fund, were all positive contributors to Fund performance. RMBS produced a positive total return of 3.00%, contributing 63 basis points to Fund performance. The RMBS allocation is a targeted mix of primarily new issue sectors. Portfolio managers continue to believe the inherent bias within new issue mortgage credit and the dislocation with respect to new issue sectors remains significant. The RMBS allocation was primarily positioned within a targeted mix ofnon-qualified mortgages(“non-QM”),non-performing loans (“NPL”), andre-performing loans (“RPL”), along with legacy and prime 2.0. The higher current weighted average coupon of the underlyingnon-QM collateral is a primary factor for the attractive convexity characteristics of the sector. The sharp rise in Treasury yields in 2018 had an almost insignificant impact on prepayment speeds fornon-QM collateral. Additionally, spreads on NPL andnon-QM moved wider in 2018, creating the opportunity to rotate from ABS into RMBS in the fourth quarter of 2018, limiting price volatility and leading to significant total return opportunities for early 2019. The RMBS allocation remained between20-40% of Fund assets throughout most of the period.
The ABS allocation was a positive contributor to Fund performance as well. ABS was up 2.83%, contributing 150 basis points to Fund performance. The focus of the ABS allocation was within short duration, high credit quality assets. The primary overweight within the ABS allocation was to auto ABS. Thede-levering structures were a significant driver to price stability as credit protection increases each month and principal is paid off. This defensive positioning for approximately 50% of the Fund was a key driver to net asset value (“NAV”) stability in the fourth quarter of 2018 as credit spreads widened across broader U.S. credit. While the majority of the ABS allocation was in fixed-rate tranches, price returns were still net positive, up 0.40% as spreads were marginally tighter overall. The de-levering structures were a catalyst to tighter spreads over time as individual bonds seasoned. Sector selection was a positive contributor as subprime auto tightened relative to prime auto and credit card ABS.
CLOs were also a positive contributor to the Fund for the period due to the defensive positioning with a focus inAAA-rated tranches. The CLO allocation was up 2.21% in total return, contributing 22 basis points to Fund performance. The CLO allocation was a targeted allocation based on the current availability of X tranches. Portfolio managers focused on short maturity(1-2yr weighted average life) X tranches with high credit enhancement and limited optionality. The floating rate nature of the asset class helped to create positive total returns. During the period, spreads on X tranches widened by approximately10-20 basis points, leading a price return of-0.24%. However, the floating rate nature helped limit price volatility and the positive income return of 2.45% offset marginally wider spreads for the short duration asset class. The CLO allocation was a function of the ability to source this attractive area of the U.S. credit markets but is not expected to be a consistent allocation over time.
The commercial mortgage-backed securities (“CMBS”) allocation was a contributor to Fund performance, creating a positive total return of 1.87% and contributing 28 basis points to Fund performance. The focus of the allocation was within floating rate agency CMBS and served the purpose of liquidity and price stability.
9
| 3. | What is your outlook heading into 2019, and how is the Fund positioned? |
The Fund continues to focus across a diversified mix of primarily structured credit. Recently, the allocation to new issue RMBS has increased as the Fund has decreased the exposure to ABS and CMBS. New issue sectors of RMBS were the most sensitive to spread changes in the fourth quarter of 2018, creating more opportunities innon-QM and NPL. The Fund decreased the exposure to agency CMBS. The ABS allocation looked to increased diversification across U.S. sectors while decreasing the absolute allocation within the Fund.
2019 is expected to see increased volatility with similar new issue supply across structured credit. This backdrop should provide opportunities for relative outperformance and sector rotation within the various areas of U.S. credit. The increased short term yield environment and flattening U.S. yield curve have made short duration credit inherently attractive with continued limited volatility given the short maturity nature of the market. This should lead to investor inflows across short term mutual funds. In early 2018, we improved the credit quality across our fund complex. Significant opportunities have begun to emerge in various areas of the U.S. structured credit landscape in 2019, and we see the best risk-adjusted returns in new issuenon-agency RMBS, short-duration CMBS, CLO X tranches; and seasoned floating-rate non-agency CMBS.
Past performance is not a guarantee of future results.
Mutual fund investing involves risk; Principal loss is possible. Investments in debt securities typically decrease when interest rates rise. This risk is usually greater forlonger-term debt securities. Investments in lower rated andnon-rated securities present a greater risk of loss to principal and interest than higher rated securities. Investments inasset-backed andmortgage-backed securities include additional risks that investors should be aware of including credit risk, prepayment risk, possible illiquidity and default, as well as increased susceptibility to adverse economic developments. Derivatives involve risks different from, and in certain cases, greater than the risks presented by more traditional investments. Derivatives may involve certain costs and risks such as illiquidity, interest rate, market, credit, management and the risk that a position could not be closed when most advantageous. Investments in derivatives could lose more than the amount invested. Investments in foreign securities involve greater volatility and political, economic and currency risks and differences in accounting methods. The Fund can make short sales of securities, which involves the risk that losses in securities may exceed the original amount invested. For more information on these risks and other risks of the Fund, please see the Prospectus.
Definitions:
Basis Point (bps): One hundredth of one percent. Used to denote the percentage change in a financial instrument.
Bloomberg Barclays9-12 Month U.S. Treasury Bill Index: Measures the performance of U.S. Treasury bills, notes, and bonds with a remaining maturity between9-12 months. The index does not include trading and management costs. It is not possible to invest directly in an index.
Duration: Measures a portfolio’s sensitivity to changes in interest rates. Generally, the longer the duration, the greater the price change relative to interest rate movements
LIBOR: A benchmark rate that some of the world’s leading banks charge each other for short-term loans. It stands for Intercontinental Exchange London Interbank Offered Rate and serves as the first step to calculating interest rates on various loans throughout the world.
Spread: The difference in yield between LIBOR and a debt security with the same maturity but of lesser quality.
Tranche: A portion of debt or structured financing. Each portion, or tranche, is one of several related securities offered at the same time but with different risks, rewards, and maturities.
Diversification does not guarantee a profit or protect against a loss in declining markets.
10
Investment Results – (Unaudited)
Angel Oak Multi-Strategy Income Fund
Total Return Based on a $1,000,000 Investment
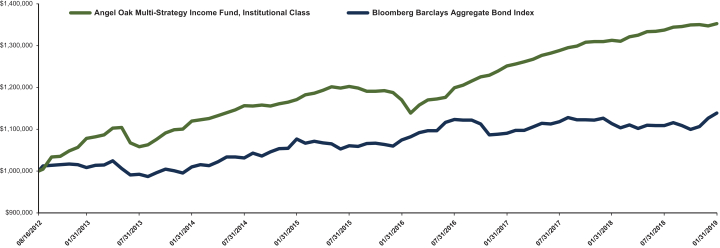
The Fund is the successor to the investment performance of the Angel Oak Multi-Strategy Income Fund (the “Predecessor Multi-Strategy Income Fund”) as a result of the reorganization of the Predecessor Multi-Strategy Income Fund into the Fund on April 10, 2015. Accordingly, the performance information shown in the chart above and table below for periods prior to April 10, 2015 is that of the Predecessor Multi-Strategy Income Fund. The Predecessor Multi-Strategy Income Fund was also advised by the Adviser and had the same investment objective, policies, and strategies as the Fund.
The chart above assumes an initial investment of $1,000,000 made on August 16, 2012 (commencement of operations). Returns shown include the reinvestment of all dividends. Returns shown do not reflect the deduction of taxes that a shareholder would pay on Fund distributions or the redemption of Fund shares. In the absence of fee waivers and reimbursements, when they are necessary to keep expenses at the expense cap, total return would be reduced. Past performance is not predictive of future performance. Investment return and principal value will fluctuate so that your shares, when redeemed, may be worth more or less than the original cost. Index returns do not reflect the effects of fees or expenses. It is not possible to invest directly in an index.
Total Returns(1)
(For the year ended January 31, 2019)
| | | | | | | | | | | | | | | | |
| | | Average Annual Returns | |
| | | One Year | | | Three Year | | | Five Year | | | Since Inception(2) | |
Angel Oak Multi-Strategy Income Fund, Institutional Class | | | 3.05 | % | | | 4.95 | % | | | 3.85 | % | | | 4.78 | % |
Angel Oak Multi-Strategy Income Fund, Class A without load | | | 2.72 | % | | | 4.67 | % | | | 3.60 | % | | | 6.81 | % |
Angel Oak Multi-Strategy Income Fund, Class A with load | | | 0.40 | % | | | 3.88 | % | | | 3.13 | % | | | 6.50 | % |
Angel Oak Multi-Strategy Income Fund, Class C without load | | | 2.04 | % | | | 3.93 | % | | | N/A | | | | 2.40 | % |
Angel Oak Multi-Strategy Income Fund, Class C with load | | | 1.06 | % | | | 3.93 | % | | | N/A | | | | 2.40 | % |
Bloomberg Barclays Aggregate Bond
Index(3) | | | 2.25 | % | | | 1.95 | % | | | 2.44 | % | | | 2.03 | %(4) |
(1) Return figures reflect any change in price per share and assume the reinvestment of all distributions. Total returns for Class A Shares, with load, include the maximum 2.25% sales charge. Total returns for Class C Shares, with load, include the maximum 1.00% deferred sales charge.
(2) Inception date is August 16, 2012 for Institutional Class Shares, June 28, 2011 for Class A Shares, and August 4, 2015 for Class C Shares.
(3) The Bloomberg Barclays Aggregate Bond Index measures the performance of the investment-grade, fixed-rate bond market, including government and credit securities, agency pass-through securities, asset-backed securities and commercial mortgage-backed securities. Performance figures include the change in value of the bonds in the index and the reinvestment of interest. The index return does not reflect expenses, which have been deducted from the Fund’s return. You cannot invest directly in an index; however, an individual can invest in exchange-traded funds or other investments vehicles that attempt to track the performance of a benchmark index.
(4) The return shown for the Bloomberg Barclays Aggregate Bond Index is from the inception date of the Institutional Class Shares. The Bloomberg Barclays Aggregate Bond Index return from the inception date of Class A Shares is 2.70% and for Class C Shares is 2.08%.
11
Investment Results – (Unaudited) (continued)
Angel Oak Financials Income Fund
Total Return Based on a $1,000,000 Investment
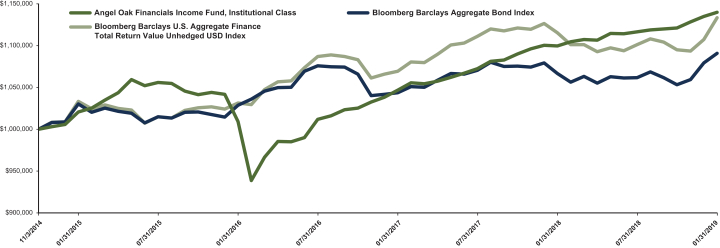
The chart above assumes an initial investment of $1,000,000 made on November 3, 2014 (commencement of operations). Returns shown include the reinvestment of all dividends. Returns shown do not reflect the deduction of taxes that a shareholder would pay on Fund distributions or the redemption of Fund shares. In the absence of fee waivers and reimbursements, when they are necessary to keep expenses at the expense cap, total return would be reduced. Past performance is not predictive of future performance. Investment return and principal value will fluctuate so that your shares, when redeemed, may be worth more or less than the original cost. Index returns do not reflect the effects of fees or expenses. It is not possible to invest directly in an index.
Total Returns(1)
(For the year ended January 31, 2019)
| | | | | | | | | | | | |
| | | Average Annual Returns | |
| | | One Year | | | Three Year | | | Since Inception(2) | |
Angel Oak Financials Income Fund, Institutional Class | | | 3.61 | % | | | 4.09 | % | | | 3.09 | % |
Angel Oak Financials Income Fund, Class A without load | | | 3.36 | % | | | 3.84 | % | | | 2.84 | % |
Angel Oak Financials Income Fund, Class A with load | | | 1.01 | % | | | 3.05 | % | | | 2.29 | % |
Angel Oak Financials Income Fund, Class C without load | | | 2.69 | % | | | 3.07 | % | | | 1.15 | % |
Angel Oak Financials Income Fund, Class C with load | | | 1.71 | % | | | 3.07 | % | | | 1.15 | % |
Bloomberg Barclays Aggregate Bond Index(3) | | | 2.25 | % | | | 1.95 | % | | | 2.04 | %(4) |
Bloomberg Barclays U.S. Aggregate Finance Total Return Value Unhedged USD Index(5) | | | 1.59 | % | | | 3.15 | % | | | 2.95 | %(6) |
(1) Return figures reflect any change in price per share and assume the reinvestment of all distributions. Total returns for Class A Shares, with load, include the maximum 2.25% sales charge. Total returns for Class C Shares, with load, include the maximum 1.00% deferred sales charge.
(2) Inception date is November 3, 2014 for Institutional Class and Class A Shares and August 4, 2015 for Class C Shares.
(3) The Bloomberg Barclays Aggregate Bond Index measures the performance of the investment-grade, fixed-rate bond market, including government and credit securities, agency pass-through securities, asset-backed securities and commercial mortgage-backed securities. Performance figures include the change in value of the bonds in the index and the reinvestment of interest. The index return does not reflect expenses, which have been deducted from the Fund’s return. You cannot invest directly in an index; however, an individual can invest in exchange-traded funds or other investments vehicles that attempt to track the performance of a benchmark index.
(4) The return shown for the Bloomberg Barclays Aggregate Bond Index is from the inception date of the Institutional Class and Class A Shares. The Bloomberg Barclays Aggregate Bond Index return from the inception date of the Class C Shares is 2.08%.
12
(5) The Bloomberg Barclays U.S. Aggregate Finance Total Return Value Unhedged USD Index is the Financial Institutions component of the Bloomberg Barclays U.S. Credit Index. Performance figures include the change in value of the bonds in the index and the reinvestment of interest. The index return does not reflect expenses, which have been deducted from the Fund’s return. You cannot invest directly in an index; however, an individual can invest in exchange-traded funds or other investments vehicles that attempt to track the performance of a benchmark index.
(6) The return shown for the Bloomberg Barclays U.S. Aggregate Finance Total Return Value Unhedged Index is from the inception date of the Institutional Class and Class A Shares. The Bloomberg Barclays U.S. Aggregate Finance Total Return Value Unhedged Index return from the inception date of the Class C Shares is 3.17%.
13
Investment Results – (Unaudited) (continued)
Angel Oak High Yield Opportunities Fund
Total Return Based on a $1,000,000 Investment

The Fund is the successor to the investment performance of the Rainier High Yield Fund (the “Predecessor High Yield Fund”) as a result of the reorganization of the Predecessor High Yield Fund into the Fund on April 15, 2016. Accordingly, the performance information shown in the chart above and table below for periods prior to April 15, 2016 is that of the Predecessor High Yield Fund’s Institutional Shares and Original Shares for the Fund’s Institutional Class and Class A shares, respectively. The Predecessor High Yield Fund was managed by the same portfolio managers as the Fund and had substantially the same investment objectives, policies, and strategies as the Fund.
The chart above assumes an initial investment of $1,000,000 made on March 31, 2009 (commencement of operations). Returns shown include the reinvestment of all dividends. Returns shown do not reflect the deduction of taxes that a shareholder would pay on Fund distributions or the redemption of Fund shares. In the absence of fee waivers and reimbursements, when they are necessary to keep expenses at the expense cap, total return would be reduced. Past performance is not predictive of future performance. Investment return and principal value will fluctuate so that your shares, when redeemed, may be worth more or less than the original cost. Index returns do not reflect the effects of fees or expenses. It is not possible to invest directly in an index.
Total Returns(1)
(For the year ended January 31, 2019)
| | | | | | | | | | | | | | | | |
| | | Average Annual Returns | |
| | | One Year | | | Three Year | | | Five Year | | | Since Inception(2) | |
Angel Oak High Yield Opportunities Fund, Institutional Class | | | 0.74 | % | | | 9.03 | % | | | 4.85 | % | | | 8.91 | % |
Angel Oak High Yield Opportunities Fund, Class A without load | | | 0.41 | % | | | 8.77 | % | | | 4.61 | % | | | 5.34 | % |
Angel Oak High Yield Opportunities Fund, Class A with load | | | -1.88 | % | | | 7.96 | % | | | 4.13 | % | | | 4.98 | % |
ICE Bank of America Merrill Lynch High Yield Index(3)(4) | | | 1.57 | % | | | 9.46 | % | | | 4.61 | % | | | 11.13 | %(5) |
Bloomberg Barclays U.S. Corporate High Yield Bond Index(4)(6) | | | 1.73 | % | | | 9.41 | % | | | 4.61 | % | | | 11.16 | %(7) |
(1) Return figures reflect any change in price per share and assume the reinvestment of all distributions. Total returns for Class A Shares, with load, include the maximum 2.25% sales charge.
(2) Inception date is March 31, 2009 for Institutional Class Shares and July 31, 2012 for Class A Shares.
(3) The ICE Bank of America Merrill Lynch High Yield Index tracks the performance of below investment grade, but not in default, U.S. dollar denominated corporate bonds publicly issued in the U.S. domestic market, and includes issues with a credit rating of BBB or below, as rated by Moody’s and S&P.The index return does not reflect expenses, which have been deducted from the Fund’s return. You cannot invest directly in an index; however, an individual can invest in exchange-traded funds or other investments vehicles that attempt to track the performance of a benchmark index.
14
(4) Effective April 1, 2018, the benchmark index changed from the ICE Bank of America Merrill Lynch High Yield Index to the Bloomberg Barclays U.S. Corporate High Yield Bond Index. The benchmark index was changed to more accurately reflect the Fund’s investment style.
(5) The return shown for the ICE Bank of America Merrill Lynch High Yield Index is from the inception date of the Institutional Class Shares. The ICE Bank of America Merrill Lynch High Yield Index return from the inception date of Class A Shares is 5.72%.
(6) The Bloomberg Barclays U.S. Corporate High Yield Bond Index is an unmanaged market value-weighted index that covers the universe of fixed-rate,non-investment grade debt. The index return does not reflect expenses, which have been deducted from the Fund’s return. You cannot invest directly in an index; however, an individual can invest in exchange-traded funds or other investments vehicles that attempt to track the performance of a benchmark index.
(7) The return shown for the Bloomberg Barclays U.S. Corporate High Yield Bond Index is from the inception date of the Institutional Class Shares. The Bloomberg Barclays U.S. Corporate High Yield Bond Index return from the inception date of Class A Shares is 5.72%.
15
Investment Results – (Unaudited) (continued)
Angel Oak UltraShort Income Fund
Total Return Based on a $1,000,000 Investment
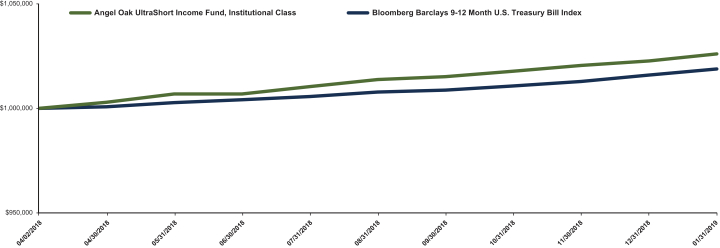
The chart above assumes an initial investment of $1,000,000 made on April 2, 2018 (commencement of operations). Returns shown include the reinvestment of all dividends. Returns shown do not reflect the deduction of taxes that a shareholder would pay on Fund distributions or the redemption of Fund shares. In the absence of fee waivers and reimbursements, when they are necessary to keep expenses at the expense cap, total return would be reduced. Past performance is not predictive of future performance. Investment return and principal value will fluctuate so that your shares, when redeemed, may be worth more or less than the original cost. Index returns do not reflect the effects of fees or expenses. It is not possible to invest directly in an index.
Cumulative Returns(1)
(For the period ended January 31, 2019)
| | | | |
| | | Since Inception(2) | |
Angel Oak UltraShort Income Fund, Institutional Class | | | 2.60 | % |
Angel Oak UltraShort Income Fund, Class A | | | 2.12 | % |
Bloomberg Barclays9-12 Month U.S. Treasury Bill Index(3) | | | 1.88 | %(4) |
(1) Return figures reflect any change in price per share and assume the reinvestment of all distributions.
(2) Inception date is April 2, 2018 for Institutional Class and April 30, 2018 for Class A Shares.
(3) The Bloomberg Barclays9-12 Month U.S. Treasury Bill Index measures the performance of U.S. Treasury bills, notes, and bonds with a remaining maturity between9-12 months. Performance figures include the change in value of the bonds in the index and the reinvestment of interest. The index return does not reflect expenses, which have been deducted from the Fund’s return. You cannot invest directly in an index; however, an individual can invest in exchange-traded funds or other investments vehicles that attempt to track the performance of a benchmark index.
(4) The return shown for the Bloomberg Barclays9-12 Month U.S. Treasury Bill Index is from the inception date of the Institutional Class. The Bloomberg Barclays9-12 Month U.S. Treasury Bill Index return from the inception date of the Class A Shares is 1.81%.
16
Summary of Funds’ Expenses – (Unaudited)
As a shareholder of the Funds, you incur two types of costs: (1) transaction costs, including sales charges (loads) on purchase payments; and (2) ongoing costs, including management fees, distribution and/or service(12b-1) fees and other expenses of the Funds. This Example is intended to help you understand your ongoing costs (in dollars) of investing in the Funds and to compare these costs with the ongoing costs of investing in other mutual funds.
Actual Expenses
The first lines of the tables below provide information about actual account values and actual expenses. You may use the information in these lines, together with the amount you invested, to estimate the expenses that you paid over the period. Simply divide your account value by $1,000 (for example, an $8,600 account value divided by $1,000 = $8.60), then multiply the result by the numbers in the first lines under the heading entitled “Expenses Paid During the Period” to estimate the expenses you paid on your account during this period.
Hypothetical Example for Comparison Purposes
The second lines of the tables below provide information about hypothetical account values and hypothetical expenses based on the Funds’ actual expense ratios and an assumed rate of return of 5% per year before expenses, which is not the Funds’ actual return. The hypothetical account values and expenses may not be used to estimate the actual ending account balance or expenses you paid for the period. You may use this information to compare the ongoing costs of investing in the Funds and other funds. To do so, compare this 5% hypothetical example with the 5% hypothetical examples that appear in the shareholder reports of other funds.
Please note that the expenses shown in the table are meant to highlight your ongoing costs only and do not reflect any transactional costs, such as sales charges (loads), redemption fees or exchange fees. Therefore, the second lines of the tables below are useful in comparing ongoing costs only and will not help you determine the relative costs of owning different funds. In addition, if these transactoinal costs were included, your costs would have been higher.
| | | | | | | | | | |
| Angel Oak Multi-Strategy Income Fund | | Beginning
Account Value,
August 1, 2018 | | Ending
Account Value,
January 31, 2019 | | Expenses Paid
During Period(1) | | Annualized
Expense Ratio |
Class A | | Actual | | $1,000.00 | | $1,011.10 | | $7.00 | | 1.38% |
| | | Hypothetical(2) | | $1,000.00 | | $1,018.25 | | $7.02 | | 1.38% |
Class C | | Actual | | $1,000.00 | | $1,007.40 | | $10.83 | | 2.14% |
| | | Hypothetical(2) | | $1,000.00 | | $1,014.42 | | $10.87 | | 2.14% |
Institutional Class | | Actual | | $1,000.00 | | $1,011.40 | | $5.73 | | 1.13% |
| | | Hypothetical(2) | | $1,000.00 | | $1,019.51 | | $5.75 | | 1.13% |
| | | | | | | | | | |
| Angel Oak Financials Income Fund | | Beginning
Account Value,
August 1, 2018 | | Ending
Account Value,
January 31, 2019 | | Expenses Paid
During Period(1) | | Annualized
Expense Ratio |
Class A | | Actual | | $1,000.00 | | $1,018.40 | | $4.78 | | 0.94% |
| | | Hypothetical(2) | | $1,000.00 | | $1,020.47 | | $4.79 | | 0.94% |
Class C | | Actual | | $1,000.00 | | $1,015.90 | | $8.59 | | 1.69% |
| | | Hypothetical(2) | | $1,000.00 | | $1,016.69 | | $8.59 | | 1.69% |
Institutional Class | | Actual | | $1,000.00 | | $1,020.80 | | $3.51 | | 0.69% |
| | | Hypothetical(2) | | $1,000.00 | | $1,021.73 | | $3.52 | | 0.69% |
| | | | | | | | | | |
| Angel Oak High Yield Opportunities Fund | | Beginning
Account Value,
August 1, 2018 | | Ending
Account Value,
January 31, 2019 | | Expenses Paid
During Period(1) | | Annualized
Expense Ratio |
Class A | | Actual | | $1,000.00 | | $1,002.60 | | $4.54 | | 0.90% |
| | | Hypothetical(2) | | $1,000.00 | | $1,020.67 | | $4.58 | | 0.90% |
Institutional Class | | Actual | | $1,000.00 | | $1,004.70 | | $3.28 | | 0.65% |
| | | Hypothetical(2) | | $1,000.00 | | $1,021.93 | | $3.31 | | 0.65% |
17
Summary of Funds’ Expenses – (Unaudited) (continued)
| | | | | | | | | | |
| Angel Oak UltraShort Income Fund | | Beginning
Account Value,
August 1, 2018 | | Ending
Account Value,
January 31, 2019 | | Expenses Paid
During Period(1) | | Annualized
Expense Ratio |
Class A | | Actual | | $1,000.00 | | $1,014.20 | | $2.54 | | 0.50% |
| | | Hypothetical(2) | | $1,000.00 | | $1,022.68 | | $2.55 | | 0.50% |
Institutional Class | | Actual | | $1,000.00 | | $1,015.50 | | $1.27 | | 0.25% |
| | | Hypothetical(2) | | $1,000.00 | | $1,023.95 | | $1.28 | | 0.25% |
(1) Expenses are equal to the Fund’s annualized expense ratio, multiplied by the average account value over the period, multiplied by the number of days (184) in the most recent six month period and divided by the number of days in the most recent twelve month period (365). The annualized expense ratios reflects fee waiver and expense limitation arrangements, including interest expense, in effect during the period. The “Financial Highlights” tables in the Funds’ financial statements, included in the report, also show the gross expense ratios, without such reimbursements.
(2) Hypothetical assumes 5% annual return before expenses.
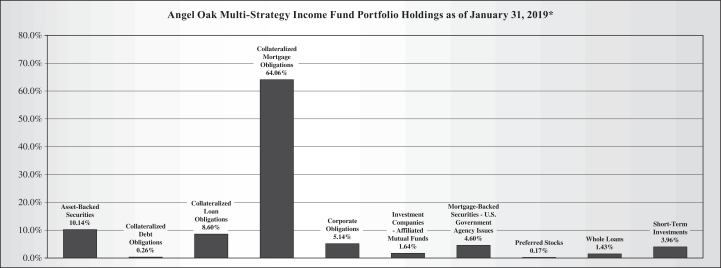
Portfolio Holdings – (Unaudited)
The investment objective of Angel Oak Multi-Strategy Income Fund is to seek current income.
The investment objective of Angel Oak Financials Income Fund is to seek current income with a secondary objective of total return.
18
Portfolio Holdings – (Unaudited) (continued)
The investment objective of Angel Oak High Yield Opportunities Fund is to earn a high level of current income with a secondary objective of capital appreciation.
The investment objective of Angel Oak UltraShort Income Fund is to provide current income while seeking to minimize price volatility and maintain liquidity.
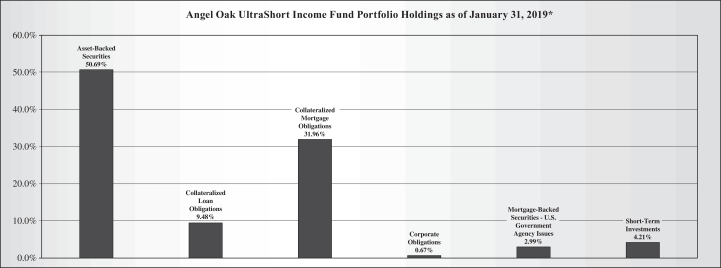
* As a percentage of total investments.
19
Angel Oak Multi-Strategy Income Fund
Consolidated Schedule of Investments
January 31, 2019
| | | | | | | | |
| | | Principal
Amount | | | Value | |
| Asset-Backed Securities – 10.62% | | | | | | |
ACC Trust, Series2018-1, Class C, 6.810%, 2/21/2023 (a) | | $ | 1,800,000 | | | $ | 1,824,604 | |
Accredited Mortgage Loan Trust, Series2005-4, Class M1,
2.910% (1 Month LIBOR USD + 0.400%), 12/25/2035 (b) | | | 1,128,000 | | | | 1,099,676 | |
American Credit Acceptance Receivables Trust, Series2016-1A, Class C, 5.550%, 6/13/2022 (a) | | | 4,634,161 | | | | 4,686,175 | |
Bayview Financial Mortgage Pass-Through Trust, Series2005-D, Class APO,
0.000%, 12/28/2035 (c) | | | 703,292 | | | | 605,825 | |
Bear Stearns Asset Backed Securities Trust, Series2007-SD3, Class A,
2.760% (1 Month LIBOR USD + 0.250%), 5/25/2037 (b) | | | 53,245 | | | | 51,387 | |
CarFinance Capital Auto Trust, Series2015-1A, Class E, 5.490%, 1/18/2022 (a) | | | 2,250,000 | | | | 2,269,764 | |
Citigroup Mortgage Loan Trust, Inc., Series2006-WF1, Class A2D, 4.980%, 3/25/2036 (d) | | | 4,990,139 | | | | 3,610,939 | |
CPS Auto Receivables Trust, Series2018-D, Class A, 3.060%, 1/18/2022 (a) | | | 3,034,877 | | | | 3,043,711 | |
CPS Auto Receivables Trust, Series2018-A, Class B, 2.770%, 4/18/2022 (a) | | | 1,779,000 | | | | 1,769,769 | |
CPS Auto Receivables Trust, Series2017-D, Class E, 5.300%, 6/17/2024 (a) | | | 3,700,000 | | | | 3,719,862 | |
Credibly Asset Securitization LLC, Series2018-1A, Class A, 4.800%, 11/15/2023 (a) | | | 937,000 | | | | 961,724 | |
Credit Acceptance Auto Loan Trust, Series2017-2A, Class A, 2.550%, 2/17/2026 (a) | | | 1,000,000 | | | | 994,399 | |
Credit Acceptance Auto Loan Trust, Series2017-3A, Class A, 2.650%, 6/15/2026 (a) | | | 4,500,000 | | | | 4,474,201 | |
CWHEQ Revolving Home Equity Loan Resecuritization Trust, Series2006-RES, Class 4P1A, 2.829% (1 Month LIBOR USD + 0.320%), 3/15/2034 (a)(b) | | | 3,238,473 | | | | 3,177,719 | |
CWHEQ Revolving Home Equity Loan Resecuritization Trust, Series2006-RES, Class 5A1A, 2.739% (1 Month LIBOR USD + 0.230%), 4/15/2035 (a)(b) | | | 11,051,939 | | | | 10,724,282 | |
CWHEQ Revolving Home Equity Loan Trust, Series2006-C, Class 1A,
2.689% (1 Month LIBOR USD + 0.180%), 5/15/2036 (b) | | | 27,550,788 | | | | 26,849,455 | |
DT Auto Owner Trust, Series2018-1A, Class B, 3.040%, 1/18/2022 (a) | | | 3,000,000 | | | | 3,002,964 | |
DT Auto Owner Trust, Series2016-1A, Class D, 4.660%, 12/15/2022 (a) | | | 7,376,677 | | | | 7,460,299 | |
Evergreen Credit Card Trust, Series2019-1, Class A,
3.056% (1 Month LIBOR USD + 0.480%), 1/17/2023 (a)(b) | | | 6,000,000 | | | | 6,014,922 | |
Exeter Automobile Receivables Trust, Series2018-3A, Class A, 2.900%, 1/18/2022 (a) | | | 2,209,956 | | | | 2,210,118 | |
Exeter Automobile Receivables Trust, Series2019-1A, Class A, 3.200%, 4/15/2022 (a) | | | 1,335,000 | | | | 1,338,539 | |
Finance of America Structured Securities Trust, Series2018-HB1, Class A, 3.375%, 9/25/2028 (a) | | | 1,511,571 | | | | 1,516,492 | |
First Investors Auto Owner Trust, Series2017-3A, Class E, 4.920%, 8/15/2024 (a) | | | 1,500,000 | | | | 1,503,208 | |
Flagship Credit Auto Trust, Series2015-2, Class B, 3.080%, 12/15/2021 (a) | | | 1,002,877 | | | | 1,005,012 | |
Flagship Credit Auto Trust, Series2015-2, Class D, 5.980%, 8/15/2022 (a) | | | 1,500,000 | | | | 1,530,376 | |
Flagship Credit Auto Trust, Series2017-4, Class D, 3.580%, 1/16/2024 (a) | | | 3,000,000 | | | | 2,977,200 | |
Fremont Home Loan Trust, Series2006-D, Class 1A1,
2.650% (1 Month LIBOR USD + 0.140%), 11/25/2036 (b) | | | 1,442,467 | | | | 985,782 | |
Genesis Sales Finance Master Trust, Series2019-AA, Class A, 4.680%, 8/20/2023 (a) | | | 1,400,000 | | | | 1,410,980 | |
GLS Auto Receivables Trust, Series2018-2A, Class A, 3.250%, 4/18/2022 (a) | | | 1,234,638 | | | | 1,235,688 | |
GLS Auto Receivables Trust, Series2018-3A, Class A, 3.350%, 8/15/2022 (a) | | | 1,952,644 | | | | 1,957,563 | |
Golden Credit Card Trust, Series2017-4, Class A,
3.029% (1 Month LIBOR USD + 0.520%), 7/15/2024 (a)(b) | | | 2,000,000 | | | | 2,001,378 | |
GoldenTree Loan Opportunities IX Ltd., Series2014-9A, Class AR2,
3.862% (3 Month LIBOR USD + 1.110%), 10/29/2029 (a)(b) | | | 7,975,000 | | | | 7,944,280 | |
Goodgreen Trust, Series2017-2A, Class A, 3.260%, 10/15/2053 (a) | | | 8,880,273 | | | | 8,793,353 | |
GSAA Home Equity Trust, Series2005-14, Class 2A2,
2.760% (1 Month LIBOR USD + 0.250%), 12/25/2035 (b) | | | 2,047,156 | | | | 1,578,706 | |
GSAA Home Equity Trust, Series2005-14, Class 2A3,
2.860% (1 Month LIBOR USD + 0.350%), 12/25/2035 (b) | | | 6,214,620 | | | | 5,798,713 | |
GSAA Home Equity Trust, Series2005-15, Class 2A2,
2.760% (1 Month LIBOR USD + 0.250%), 1/25/2036 (b) | | | 2,999,066 | | | | 2,064,956 | |
See accompanying notes which are an integral part of these financial statements.
20
Angel Oak Multi-Strategy Income Fund
Consolidated Schedule of Investments – (continued)
January 31, 2019
| | | | | | | | |
| | | Principal
Amount | | | Value | |
| Asset-Backed Securities – (continued) | | | | | | |
GSAA Home Equity Trust, Series2006-10, Class AF2, 5.825%, 6/25/2036 (e) | | $ | 11,668,066 | | | $ | 5,702,114 | |
GSAA Home Equity Trust, Series2006-16, Class A2,
2.680% (1 Month LIBOR USD + 0.170%), 10/25/2036 (b) | | | 1,918,381 | | | | 990,282 | |
GSAA Home Equity Trust, Series2006-18, Class AF3A, 5.772%, 11/25/2036 (e) | | | 3,404,718 | | | | 1,892,247 | |
GSAA Home Equity Trust, Series2006-20, Class 1A2,
2.690% (1 Month LIBOR USD + 0.180%), 1/25/2037 (b) | | | 14,802,991 | | | | 8,394,406 | |
GSAA Home Equity Trust, Series2006-20, Class A4A,
2.740% (1 Month LIBOR USD + 0.230%), 1/25/2037 (b) | | | 3,942,662 | | | | 2,647,293 | |
GSAA Home Equity Trust, Series2007-1, Class 1A2,
2.680% (1 Month LIBOR USD + 0.170%), 2/25/2037 (b) | | | 2,495,673 | | | | 1,331,664 | |
GSAA Home Equity Trust, Series2007-4, Class A2,
2.710% (1 Month LIBOR USD + 0.200%), 3/25/2037 (b) | | | 1,643,859 | | | | 845,918 | |
GSAA Home Equity Trust, Series2007-2, Class AF4A, 5.983%, 3/25/2037 (d) | | | 2,498,224 | | | | 1,285,371 | |
GSAA Home Equity Trust, Series2007-5, Class 2A1A,
2.630% (1 Month LIBOR USD + 0.120%), 5/25/2037 (b) | | | 6,483,781 | | | | 6,069,091 | |
GSAA Home Equity Trust, Series2007-5, Class 1F4A, 6.032%, 5/25/2037 (d) | | | 6,318,174 | | | | 4,091,453 | |
GSAA Home Equity Trust, Series2007-10, Class A2A, 6.500%, 11/25/2037 | | | 2,826,453 | | | | 2,251,680 | |
GSAA Trust, Series2007-3, Class 1A1A,
2.580% (1 Month LIBOR USD + 0.070%), 3/25/2037 (b) | | | 9,231,078 | | | | 6,744,327 | |
GSAMP Trust, Series2007-FM2, Class A2D,
2.750% (1 Month LIBOR USD + 0.240%), 1/25/2037 (b) | | | 25,561,965 | | | | 18,580,481 | |
Harvest SBA Loan Trust, Series2018-1, Class A,
4.760% (1 Month LIBOR USD + 2.250%), 9/26/2044 (a)(b) | | | 3,177,857 | | | | 3,151,010 | |
Hero Funding, Series2017-3A, Class A1, 3.190%, 9/20/2048 (a) | | | 4,271,898 | | | | 4,247,416 | |
Hertz Vehicle Financing II LP, Series2019-1A, Class A, 3.710%, 3/25/2023 (a)(f) | | | 4,500,000 | | | | 4,499,165 | |
Hertz Vehicle Financing II LP, Series2019-1A, Class B, 4.100%, 3/25/2023 (a)(f) | | | 1,500,000 | | | | 1,504,755 | |
HOA Funding LLC, Series2014-1A, Class A2, 4.846%, 8/20/2044 (a) | | | 9,150,000 | | | | 9,063,633 | |
HOA Funding LLC, Series2015-1A, Class B, 9.000%, 8/20/2044 (a) | | | 1,000,000 | | | | 989,829 | |
Home Equity Loan Trust, Series 2007-FRE1, Class 2AV2,
2.670% (1 Month LIBOR USD + 0.160%), 4/25/2037 (b) | | | 718,880 | | | | 717,186 | |
Home Partners of America Trust, Series2017-1, Class A,
3.325% (1 Month LIBOR USD + 0.817%), 7/19/2034 (a)(b) | | | 2,973,761 | | | | 2,958,413 | |
Home Partners of America Trust, Series2017-1, Class C,
4.058% (1 Month LIBOR USD + 1.550%), 7/19/2034 (a)(b) | | | 2,822,453 | | | | 2,824,914 | |
Home Partners of America Trust, Series2017-1, Class D,
4.408% (1 Month LIBOR USD + 1.900%), 7/19/2034 (a)(b) | | | 2,822,453 | | | | 2,828,456 | |
Home Partners of America Trust, Series2018-1, Class F,
4.858% (1 Month LIBOR USD + 2.350%), 7/17/2037 (a)(b) | | | 6,100,000 | | | | 6,038,420 | |
Invitation Homes Trust, Series 2017-SFR2, Class F,
5.508% (1 Month LIBOR USD + 3.000%), 12/19/2036 (a)(b) | | | 4,000,000 | | | | 4,028,688 | |
Invitation Homes Trust, Series 2018-SFR1, Class E,
4.508% (1 Month LIBOR USD + 2.000%), 3/19/2037 (a)(b) | | | 1,375,000 | | | | 1,373,621 | |
Legacy Mortgage Asset Trust, Series2018-SL1, Class A, 4.000%, 2/25/2058 (a)(d) | | | 8,509,531 | | | | 8,534,175 | |
Legacy Mortgage Asset Trust, Series2018-GS1, Class A1, 4.000%, 3/25/2058 (a)(d) | | | 24,302,050 | | | | 24,346,134 | |
Legacy Mortgage Asset Trust, Series2018-GS1, Class A2, 4.250%, 3/25/2058 (a)(d) | | | 21,378,000 | | | | 21,201,225 | |
Legacy Mortgage Asset Trust, Series2018-GS2, Class A1, 4.000%, 4/25/2058 (a)(d) | | | 9,530,354 | | | | 9,536,806 | |
Legacy Mortgage Asset Trust, Series2018-GS3, Class A1, 4.000%, 6/25/2058 (a)(d) | | | 21,479,463 | | | | 21,286,921 | |
Legacy Mortgage Asset Trust, Series2018-GS3, Class A2, 4.250%, 6/25/2058 (a)(d) | | | 13,000,000 | | | | 13,081,601 | |
Legacy Mortgage Asset Trust, Series2019-GS1, Class A1, 4.000%, 1/25/2059 (a)(d) | | | 20,000,000 | | | | 20,018,000 | |
See accompanying notes which are an integral part of these financial statements.
21
Angel Oak Multi-Strategy Income Fund
Consolidated Schedule of Investments – (continued)
January 31, 2019
| | | | | | | | |
| | | Principal
Amount | | | Value | |
| Asset-Backed Securities – (continued) | | | | | | |
Legacy Mortgage Asset Trust, Series 2017-RPL1, Class A,
4.252% (1 Month LIBOR USD + 1.750%), 1/28/2070 (a)(b) | | $ | 11,592,223 | | | $ | 11,799,399 | |
Lehman XS Trust, Series2005-3, Class 3A3A, 5.280%, 9/25/2035 (d) | | | 2,300,374 | | | | 2,226,877 | |
Lehman XS Trust, Series2007-9, Class WFIO, 0.550%, 4/25/2037 (e)(g)(h) | | | 35,034,642 | | | | 211,434 | |
LoanCore Issuer Ltd., Series 2018-CRE1, Class C,
5.059% (1 Month LIBOR USD + 2.550%), 5/15/2028 (a)(b) | | | 3,250,000 | | | | 3,216,580 | |
MASTR Asset Backed Securities Trust, Series2005-NC2, Class A3,
3.010% (1 Month LIBOR USD + 0.500%), 11/25/2035 (b) | | | 19,957,304 | | | | 14,290,667 | |
Mercedes-Benz Auto Lease Trust, Series2019-A, Class A2, 3.010%, 2/16/2021 | | | 2,000,000 | | | | 2,005,876 | |
Merrill Lynch Mortgage Investors Trust, Series 2006-WMC2, Class A1, 2.750%, 3/25/2037 (e) | | | 28,465,251 | | | | 10,816,795 | |
MFA LLC, Series 2018-NPL1, Class A1, 3.875%, 5/26/2048 (a)(d) | | | 16,143,475 | | | | 16,166,156 | |
MFA LLC, Series 2018-NPL2, Class A1, 4.164%, 7/27/2048 (a)(d) | | | 3,136,808 | | | | 3,114,847 | |
Morgan Stanley ABS Capital I Inc. Trust, Series2007-HE6, Class A1,
2.570% (1 Month LIBOR USD + 0.060%), 5/25/2037 (b) | | | 3,108,392 | | | | 2,785,315 | |
Morgan Stanley ABS Capital I Inc. Trust, Series2007-HE6, Class A2,
2.650% (1 Month LIBOR USD + 0.140%), 5/25/2037 (b) | | | 10,223,985 | | | | 9,368,370 | |
Morgan Stanley ABS Capital I Inc. Trust, Series2007-HE6, Class A3,
2.690% (1 Month LIBOR USD + 0.180%), 5/25/2037 (b) | | | 23,503,413 | | | | 21,568,307 | |
Morgan Stanley ABS Capital I Inc. Trust, Series2007-NC3, Class A1,
2.710% (1 Month LIBOR USD + 0.200%), 5/25/2037 (a)(b) | | | 1,402,646 | | | | 1,005,149 | |
Morgan Stanley ABS Capital I Inc. Trust, Series2007-HE6, Class A4,
2.760% (1 Month LIBOR USD + 0.250%), 5/25/2037 (b) | | | 3,384,491 | | | | 3,075,552 | |
Morgan Stanley ABS Capital I Trust, Series2006-NC4, Class A2C,
2.660% (1 Month LIBOR USD + 0.150%), 6/25/2036 (b) | | | 1,857,373 | | | | 1,712,894 | |
Morgan Stanley Mortgage Loan Trust, Series 2006-13AX, Class A1,
2.690% (1 Month LIBOR USD + 0.180%), 10/25/2036 (b) | | | 1,612,620 | | | | 834,728 | |
Morgan Stanley Mortgage Loan Trust, Series 2006-13AX, Class A2,
2.850% (1 Month LIBOR USD + 0.340%), 10/25/2036 (b) | | | 17,252,790 | | | | 8,918,053 | |
Morgan Stanley Mortgage Loan Trust, Series2007-7AX, Class 2A1,
2.630% (1 Month LIBOR USD + 0.120%), 4/25/2037 (b) | | | 11,680,234 | | | | 5,811,547 | |
Morgan Stanley Mortgage Loan Trust, Series2007-8XS, Class A5,
3.040% (1 Month LIBOR USD + 0.530%), 4/25/2037 (b) | | | 22,252,502 | | | | 12,187,539 | |
Morgan Stanley Mortgage Loan Trust, Series2007-8XS, Class A9,
3.050% (1 Month LIBOR USD + 0.540%), 4/25/2037 (b) | | | 22,252,502 | | | | 12,134,311 | |
Morgan Stanley Mortgage Loan Trust, Series2007-8XS, Class A2, 6.000%, 4/25/2037 | | | 22,883,555 | | | | 14,172,449 | |
Morgan Stanley Mortgage Loan Trust, Series2007-1XS, Class 2A2, 5.826%, 9/25/2046 (d) | | | 14,597,365 | | | | 7,362,780 | |
Morgan Stanley Mortgage Loan Trust, Series2007-1XS, Class 2A6, 5.858%, 9/25/2046 (d) | | | 5,630,037 | | | | 2,840,061 | |
Morgan Stanley Mortgage Loan Trust, Series2007-1XS, Class 2A3, 5.919%, 9/25/2046 (d) | | | 14,003,434 | | | | 7,686,373 | |
Morgan Stanley Mortgage Loan Trust, Series2007-1XS, Class 2A4C, 6.104%, 9/25/2046 (d) | | | 10,554,566 | | | | 5,100,494 | |
Morgan Stanley Mortgage Loan Trust, Series2007-3XS, Class 2A3S, 5.858%, 1/25/2047 (d) | | | 2,003,707 | | | | 1,263,489 | |
Morgan Stanley Mortgage Loan Trust, Series2007-3XS, Class 2A4S, 5.963%, 1/25/2047 (d) | | | 7,573,459 | | | | 5,269,923 | |
Morgan Stanley Mortgage Loan Trust, Series 2007-10XS, Class A2, 6.250%, 2/25/2047 (e) | | | 10,643,360 | | | | 7,497,928 | |
Mosaic Solar Loan Trust, Series2019-1A, Class B, 0.000%, 12/21/2043 (a)(c)(f) | | | 3,190,000 | | | | 2,360,600 | |
Mosaic Solar Loan Trust, Series2019-1A, Class A, 4.370%, 12/21/2043 (a)(f) | | | 5,000,000 | | | | 5,013,000 | |
Mosaic Solar Loan Trust, Series2018-2GS, Class A, 4.200%, 2/22/2044 (a) | | | 9,956,866 | | | | 10,012,147 | |
Mosaic Solar Loans LLC, Series2017-2A, Class D, 0.000%, 6/22/2043 (a)(c) | | | 4,242,965 | | | | 3,946,997 | |
New Century Home Equity Loan Trust, Series2006-1, Class A2B,
2.690% (1 Month LIBOR USD + 0.180%), 5/25/2036 (b) | | | 913,190 | | | | 863,177 | |
See accompanying notes which are an integral part of these financial statements.
22
Angel Oak Multi-Strategy Income Fund
Consolidated Schedule of Investments – (continued)
January 31, 2019
| | | | | | | | |
| | | Principal
Amount | | | Value | |
| Asset-Backed Securities – (continued) | | | | | | |
Newtek Small Business Loan Trust, Series2018-1, Class B,
5.510% (1 Month LIBOR USD + 3.000%), 2/25/2044 (a)(b) | | $ | 3,093,631 | | | $ | 3,059,725 | |
Peaks CLO Ltd., Series2018-3A, Class A1,
4.426% (3 Month LIBOR USD + 1.650%), 1/27/2031 (a)(b) | | | 13,500,000 | | | | 13,537,895 | |
Peaks CLO Ltd., Series2018-3A, Class B1,
5.156% (3 Month LIBOR USD + 2.380%), 1/27/2031 (a)(b) | | | 9,750,000 | | | | 9,749,171 | |
Pepper Residential Securities Trust, Series 22A, Class A1U,
3.638% (1 Month LIBOR USD + 1.000%), 6/21/2060 (a)(b) | | | 4,750,000 | | | | 4,764,032 | |
PFCA Home Equity Investment Trust, Series2003-GP1, Class A, 3.846%, 10/25/2033 (a)(e) | | | 6,879,701 | | | | 6,910,102 | |
PFCA Home Equity Investment Trust, Series 2003-IFC4, Class A, 3.790%, 10/22/2034 (a)(e) | | | 7,649,736 | | | | 7,649,499 | |
Pretium Mortgage Credit Partners I LLC, Series 2018-NPL4, Class A1, 4.826%, 9/25/2058 (a)(d) | | | 3,423,611 | | | | 3,426,719 | |
Progress Residential Trust, Series 2018-SFR1, Class E, 4.380%, 3/19/2035 (a) | | | 5,500,000 | | | | 5,472,528 | |
Progress Residential Trust, Series 2018-SFR1, Class F, 4.778%, 3/19/2035 (a) | | | 3,205,000 | | | | 3,181,498 | |
PRPM LLC, Series2018-3A, Class A1, 4.483%, 10/25/2023 (a)(e) | | | 11,995,444 | | | | 11,960,885 | |
RAAC Series Trust, Series2005-SP3, Class M1,
3.040% (1 Month LIBOR USD + 0.530%), 12/25/2035 (b) | | | 1,239,895 | | | | 1,243,886 | |
RAMP Trust, Series2006-RS2, Class A3A,
2.810% (1 Month LIBOR USD + 0.300%), 3/25/2036 (b) | | | 1,628,447 | | | | 1,586,288 | |
RCO V Mortgage LLC, Series2018-2, Class A1, 4.458%, 10/25/2023 (a)(d) | | | 7,768,419 | | | | 7,778,689 | |
Residential Asset Mortgage Products, Inc. Trust, Series2007-RS2, Class A2,
2.790% (1 Month LIBOR USD + 0.280%), 8/25/2035 (b) | | | 2,992,353 | | | | 2,896,813 | |
RESIMAC Bastille Trust Series, Series 2018-1NCA, Class A1,
3.363% (1 Month LIBOR USD + 0.850%), 12/5/2059 (a)(b) | | | 2,965,000 | | | | 2,972,241 | |
Skopos Auto Receivables Trust, Series2018-1A, Class B, 3.930%, 5/16/2022 (a) | | | 5,500,000 | | | | 5,518,574 | |
Skopos Auto Receivables Trust, Series2015-2A, Class D, 4.000%, 12/16/2024 (a) | | | 2,500,000 | | | | 2,477,470 | |
SolarCity LMC II LLC, Series2014-1, Class A, 4.590%, 4/20/2044 (a) | | | 1,690,359 | | | | 1,680,296 | |
Starwood Waypoint Homes Trust, Series2017-1, Class E,
5.109% (1 Month LIBOR USD + 2.600%), 1/22/2035 (a)(b) | | | 9,283,000 | | | | 9,295,291 | |
Stone Street Receivables Funding, LLC, Series2015-1A, Class C, 5.600%, 12/15/2054 (a) | | | 1,039,088 | | | | 974,074 | |
Synchrony Credit Card Master Note Trust, Series2017-2, Class C, 3.010%, 10/15/2025 | | | 6,520,000 | | | | 6,410,581 | |
Terwin Mortgage Trust, Series 2005-18AL, Class PX, 1.953%, 1/25/2037 (a)(e)(h) | | | 36,903,777 | | | | 3,316,727 | |
Tesla Auto Lease Trust, Series2018-B, Class B, 4.120%, 10/20/2021 (a) | | | 2,250,000 | | | | 2,268,313 | |
Towd Point Mortgage Trust, Series2017-4, Class A4, 2.810%, 6/25/2057 (a)(e) | | | 11,729,047 | | | | 11,300,479 | |
Towd Point Mortgage Trust, Series2017-4, Class M2, 3.250%, 6/25/2057 (a)(e) | | | 6,500,000 | | | | 5,944,439 | |
Trillium Credit Card Trust II, Series2019-1A, Class A, 0.000%, 1/26/2024 (a)(e)(f) | | | 7,000,000 | | | | 7,000,000 | |
United Auto Credit Securitization Trust, Series2018-2, Class C, 3.780%, 5/10/2023 (a) | | | 2,600,000 | | | | 2,608,736 | |
Veros Automobile Receivables Trust, Series2018-1, Class A, 3.630%, 5/15/2023 (a) | | | 4,631,286 | | | | 4,649,483 | |
Veros Automobile Receivables Trust, Series2018-1, Class B, 4.050%, 2/15/2024 (a) | | | 750,000 | | | | 755,506 | |
Veros Automobile Receivables Trust, Series2018-1, Class D, 5.740%, 8/15/2025 (a) | | | 3,100,000 | | | | 3,116,953 | |
VOLT LXV LLC, Series 2018-NPL1, Class A2, 5.000%, 4/27/2048 (a)(d) | | | 8,750,000 | | | | 8,737,610 | |
VOLT LXXII LLC, Series 2018-NPL8, Class A1A, 4.213%, 10/26/2048 (a)(d) | | | 8,670,530 | | | | 8,644,839 | |
Westlake Automobile Receivables Trust, Series2018-1A, Class F, 5.600%, 7/15/2024 (a) | | | 3,000,000 | | | | 3,010,719 | |
WhiteHorse VIII Ltd., Series2014-1A, Class CR,
4.491% (3 Month LIBOR USD + 1.950%), 5/1/2026 (a)(b)(i) | | | 17,500,000 | | | | 17,091,585 | |
WhiteHorse X Ltd., Series2015-10A, Class CR,
4.923% (3 Month LIBOR USD + 2.150%), 4/17/2027 (a)(b) | | | 5,000,000 | | | | 4,830,755 | |
See accompanying notes which are an integral part of these financial statements.
23
Angel Oak Multi-Strategy Income Fund
Consolidated Schedule of Investments – (continued)
January 31, 2019
| | | | | | | | |
| | | Principal
Amount | | | Value | |
| Asset-Backed Securities – (continued) | | | | | | |
WhiteHorse X Ltd., Series2015-10A, Class DR,
5.773% (3 Month LIBOR USD + 3.000%), 4/17/2027 (a)(b) | | $ | 2,500,000 | | | $ | 2,404,605 | |
| | | | | | | | |
| | |
TOTAL ASSET-BACKED SECURITIES –
(Cost – $788,430,473) | | | | | | | 770,117,536 | |
| | | | | | | | |
Collateralized Debt Obligations – 0.27% | | | | | | | | |
Financial Institution Note Securitization Ltd., Series2015-1A, Class A,
5.000%, 7/30/2026 (a)(j) | | | 2,263,291 | | | | 2,293,076 | |
Financial Institution Note Securitization Ltd., Series2015-1A, Class C,
7.000%, 7/30/2026 (a)(j) | | | 6,275,000 | | | | 6,359,248 | |
Financial Institution Note Securitization Ltd., Series2015-1, 11.660%, 7/30/2026 (a)(g)(j)(k) | | | 11,231,000 | | | | 11,174,845 | |
| | | | | | | | |
| | |
TOTAL COLLATERALIZED DEBT OBLIGATIONS –
(Cost – $19,769,291) | | | | | | | 19,827,169 | |
| | | | | | | | |
| Collateralized Loan Obligations – 9.01% | | | | | | |
A Voce CLO Ltd., Series2014-1A, Class A2R,
4.337% (3 Month LIBOR USD + 1.550%), 7/15/2026 (a)(b) | | | 11,600,000 | | | | 11,536,084 | |
ACIS CLO Ltd., Series2014-4A, Class B,
4.311% (3 Month LIBOR USD + 1.770%), 5/1/2026 (a)(b) | | | 1,989,560 | | | | 1,983,834 | |
AIMCO CLO, Series2014-AA, Class DR,
6.011% (3 Month LIBOR USD + 3.250%), 7/20/2026 (a)(b)(i) | | | 9,440,000 | | | | 9,426,775 | |
Allegro CLO III Ltd., Series2015-1X, Class B1R,
4.121% (3 Month LIBOR USD + 1.350%), 7/25/2027 (b)(l) | | | 4,500,000 | | | | 4,440,245 | |
ALM XII Ltd., Series2015-12A, Class A2B2,
4.129% (3 Month LIBOR USD + 1.350%), 4/16/2027 (a)(b) | | | 3,500,000 | | | | 3,459,536 | |
ALM XII Ltd., Series2015-12A, Class A2A2,
4.129% (3 Month LIBOR USD + 1.350%), 4/16/2027 (a)(b) | | | 6,000,000 | | | | 5,928,336 | |
Anchorage Capital CLO Ltd., Series2018-1RA, Class A1,
3.787% (3 Month LIBOR USD + 0.990%), 4/13/2031 (a)(b) | | | 17,500,000 | | | | 17,216,552 | |
Apidos CLO XVI, Series2013-16A, Class BR,
4.711% (3 Month LIBOR USD + 1.950%), 1/19/2025 (a)(b) | | | 4,500,000 | | | | 4,506,363 | |
Apidos CLO XVI, Series2014-16A, Class D,
7.261% (3 Month LIBOR USD + 4.500%), 1/21/2025 (a)(b) | | | 6,250,000 | | | | 6,046,837 | |
Ares XLVII CLO Ltd., Series2018-47A, Class A1,
3.707% (3 Month LIBOR USD + 0.920%), 4/15/2030 (a)(b) | | | 7,000,000 | | | | 6,893,334 | |
Ares XXXIII CLO Ltd., Series2015-1A, Class D,
8.981% (3 Month LIBOR USD + 6.230%), 12/5/2025 (a)(b) | | | 2,600,000 | | | | 2,600,200 | |
Ares XXXIX CLO Ltd., Series2016-39A, Class E,
10.030% (3 Month LIBOR USD + 7.250%), 7/18/2028 (a)(b) | | | 7,000,000 | | | | 7,006,335 | |
Ares XXXVII CLO Ltd., Series2015-4A, Class SUB, 0.000%, 10/15/2030 (a)(e)(g) | | | 3,000,000 | | | | 2,130,000 | |
Arrowpoint CLO Ltd., Series2015-4A, Class E,
9.680% (3 Month LIBOR USD + 6.900%), 4/18/2027 (a)(b) | | | 5,000,000 | | | | 5,003,060 | |
Atlas Senior Loan Fund III Ltd., Series2013-1A, Class BR,
3.940% (3 Month LIBOR USD + 1.300%), 11/17/2027 (a)(b) | | | 13,500,000 | | | | 13,255,623 | |
Atlas Senior Loan Fund XI Ltd., Series2018-11A, Class A1L,
3.865% (3 Month LIBOR USD + 1.100%), 7/26/2031 (a)(b) | | | 7,500,000 | | | | 7,426,845 | |
Babson CLO Ltd., Series2015-IA, Class AR,
3.751% (3 Month LIBOR USD + 0.990%), 1/20/2031 (a)(b) | | | 31,500,000 | | | | 31,102,564 | |
Ballyrock CLO Ltd., Series2016-1A, Class E1,
10.037% (3 Month LIBOR USD + 7.250%), 10/16/2028 (a)(b) | | | 3,125,000 | | | | 3,127,666 | |
See accompanying notes which are an integral part of these financial statements.
24
Angel Oak Multi-Strategy Income Fund
Consolidated Schedule of Investments – (continued)
January 31, 2019
| | | | | | | | |
| | | Principal
Amount | | | Value | |
| Collateralized Loan Obligations – (continued) | | | | | | |
Barings Middle Market CLO Ltd., Series2018-II, Class COM, 0.000%, 1/15/2031 (e)(g) | | $ | 1,500,000 | | | $ | 1,468,410 | |
Benefit Street Partners CLO IV Ltd., Series2014-IVA, Class DR,
10.011% (3 Month LIBOR USD + 7.250%), 1/20/2029 (a)(b)(g) | | | 6,000,000 | | | | 5,984,766 | |
BlueMountain CLO Ltd., Series2015-1A, Class C,
6.547% (3 Month LIBOR USD + 3.750%), 4/13/2027 (a)(b) | | | 1,250,000 | | | | 1,251,146 | |
BlueMountain CLO Ltd., Series2016-1A, Class BR,
4.111% (3 Month LIBOR USD + 1.350%), 4/20/2027 (a)(b) | | | 4,500,000 | | | | 4,423,482 | |
BlueMountain CLO Ltd., Series2016-2A, Class D,
9.645% (3 Month LIBOR USD + 7.000%), 8/20/2028 (a)(b) | | | 1,500,000 | | | | 1,487,188 | |
Carlyle Global Market Strategies CLO Ltd., Series2013-2A, Class ER,
8.030% (3 Month LIBOR USD + 5.250%), 1/18/2029 (a)(b)(g) | | | 8,437,500 | | | | 7,971,657 | |
Carlyle Global Market Strategies CLO Ltd., Series2012-4A, Class BR,
4.661% (3 Month LIBOR USD + 1.900%), 1/22/2029 (a)(b) | | | 1,500,000 | | | | 1,499,974 | |
Carlyle Global Market Strategies CLO Ltd., Series2016-3A, Class D,
9.761% (3 Month LIBOR USD + 7.000%), 10/20/2029 (a)(b) | | | 500,000 | | | | 502,601 | |
Cent CLO Ltd., Series2013-19, Class C,
6.052% (3 Month LIBOR USD + 3.300%), 10/29/2025 (a)(b) | | | 4,248,000 | | | | 4,246,263 | |
Cerberus Loan Funding XXII LP, Series2018-1A, Class C,
5.137% (3 Month LIBOR USD + 2.350%), 4/15/2030 (a)(b) | | | 2,500,000 | | | | 2,358,292 | |
CIFC Funding Ltd., Series2012-2RA, Class A2,
4.011% (3 Month LIBOR USD + 1.250%), 1/20/2028 (a)(b) | | | 5,000,000 | | | | 4,895,595 | |
CIFC Funding Ltd., Series2015-3A, Class AR,
3.631% (3 Month LIBOR USD + 0.870%), 4/19/2029 (a)(b) | | | 35,000,000 | | | | 34,583,080 | |
Crown Point CLO Ltd., Series2018-6A, Class B,
4.605% (3 Month LIBOR USD + 1.800%), 10/20/2028 (a)(b) | | | 4,500,000 | | | | 4,489,110 | |
Cutwater Ltd., Series2014-2A, Class CR,
6.537% (3 Month LIBOR USD + 3.750%), 1/15/2027 (a)(b) | | | 2,000,000 | | | | 1,992,110 | |
Denali Capital Clo XII Ltd., Series2016-12R, Class A1R,
3.837% (3 Month LIBOR USD + 1.050%), 4/15/2031 (a)(b) | | | 14,000,000 | | | | 13,824,762 | |
Dryden 38 Senior Loan Fund, Series2015-38X, Class SUB, 0.000%, 7/15/2030 (e)(g)(l) | | | 3,000,000 | | | | 2,070,000 | |
Dryden CLO Ltd., Series2018-57A, Class A,
3.624% (3 Month LIBOR USD + 1.010%), 5/15/2031 (a)(b) | | | 7,262,500 | | | | 7,174,377 | |
Dryden XXV Senior Loan Fund, Series2012-25A, Class BRR,
4.137% (3 Month LIBOR USD + 1.350%), 10/15/2027 (a)(b) | | | 7,730,000 | | | | 7,627,415 | |
Eaton Vance CLO Ltd., Series2013-1A, Class DR,
10.387% (3 Month LIBOR USD + 7.600%), 1/15/2028 (a)(b) | | | 4,400,000 | | | | 4,400,084 | |
Elevation CLO Ltd., Series2016-5A, Class X,
3.571% (3 Month LIBOR USD + 0.800%), 10/15/2031 (a)(b) | | | 1,145,833 | | | | 1,145,833 | |
Figueroa CLO Ltd., Series2014-CR, Class 1A, 4.887%, 1/15/2027 (a)(e) | | | 6,300,000 | | | | 6,229,125 | |
Flagship CLO VIII Ltd., Series2014-8A, Class BRR,
4.179% (3 Month LIBOR USD + 1.400%), 1/16/2026 (a)(b) | | | 13,500,000 | | | | 13,288,293 | |
Flagship CLO VIII Ltd., Series2014-8A, Class DR,
5.829% (3 Month LIBOR USD + 3.050%), 1/16/2026 (a)(b) | | | 5,000,000 | | | | 4,891,075 | |
Flatiron CLO Ltd., Series2013-1A, Class A1R,
3.933% (3 Month LIBOR USD + 1.160%), 1/20/2026 (a)(b) | | | 4,629,645 | | | | 4,637,214 | |
Flatiron CLO Ltd., Series2018-1A, Class A,
3.723% (3 Month LIBOR USD + 0.950%), 4/17/2031 (a)(b) | | | 12,750,000 | | | | 12,559,643 | |
See accompanying notes which are an integral part of these financial statements.
25
Angel Oak Multi-Strategy Income Fund
Consolidated Schedule of Investments – (continued)
January 31, 2019
| | | | | | | | |
| | | Principal
Amount | | | Value | |
| Collateralized Loan Obligations – (continued) | | | | | | |
Fortress Credit Opportunities VII CLO Ltd., Series2016-7A, Class B,
5.738% (3 Month LIBOR USD + 2.950%), 12/15/2028 (a)(b) | | $ | 3,000,000 | | | $ | 3,000,000 | |
Fortress Credit Opportunities VII CLO Ltd., Series2016-7A, Class D,
8.418% (3 Month LIBOR USD + 5.630%), 12/15/2028 (a)(b) | | | 4,000,000 | | | | 4,000,000 | |
Gallatin CLO IX Ltd., Series2018-1A, Class E,
8.231% (3 Month LIBOR USD + 5.470%), 1/21/2028 (a)(b) | | | 1,000,000 | | | | 961,899 | |
Gallatin CLO VIII Ltd., Series2017-1A, Class E,
8.187% (3 Month LIBOR USD + 5.400%), 7/15/2027 (a)(b) | | | 5,000,000 | | | | 4,791,365 | |
Garrison Funding Ltd., Series2016-1A, Class B,
5.831% (3 Month LIBOR USD + 3.070%), 10/20/2028 (a)(b) | | | 2,000,000 | | | | 1,999,948 | |
Garrison Funding Ltd., Series2016-1A, Class D,
9.411% (3 Month LIBOR USD + 6.650%), 10/20/2028 (a)(b) | | | 4,000,000 | | | | 3,990,028 | |
Halcyon Loan Advisors Funding Ltd., Series2018-1A, Class A2,
4.269% (3 Month LIBOR USD + 1.800%), 7/21/2031 (a)(b) | | | 5,000,000 | | | | 4,936,270 | |
Highbridge Loan Management Ltd., Series2015-7A, Class BR,
3.796% (3 Month LIBOR USD + 1.180%), 3/15/2027 (a)(b) | | | 2,480,000 | | | | 2,421,172 | |
Hildene TruPS Financials Note Securitization Ltd., Series2018-1A, Class A1,
4.143% (3 Month LIBOR USD + 1.360%), 10/12/2038 (a)(b) | | | 5,460,925 | | | | 5,406,316 | |
Hildene TruPS Financials Note Securitization Ltd., Series2018-1A, Class B,
6.823% (3 Month LIBOR USD + 4.040%), 10/12/2038 (a)(b) | | | 3,400,000 | | | | 3,349,000 | |
Hull Street CLO Ltd., Series2014-CR, Class 1A, 5.480%, 10/18/2026 (a)(e) | | | 6,300,000 | | | | 6,265,350 | |
Jackson Mill CLO Ltd., Series2015-1A, Class DR,
5.587% (3 Month LIBOR USD + 2.800%), 4/15/2027 (a)(b) | | | 4,500,000 | | | | 4,413,902 | |
JFIN MM CLO Ltd., Series2014-1A, Class A,
4.361% (3 Month LIBOR USD + 1.600%), 4/20/2025 (a)(b) | | | 1,077,402 | | | | 1,077,386 | |
JMP Credit Advisors CLO IIIR Ltd., Series2014-1RA, Class B,
4.073% (3 Month LIBOR USD + 1.300%), 1/17/2028 (a)(b) | | | 4,141,000 | | | | 4,048,316 | |
KCAP F3C Senior Funding LLC, Series2017-1A, Class B,
5.292% (3 Month LIBOR USD + 2.500%), 12/20/2029 (a)(b) | | | 19,900,000 | | | | 19,881,991 | |
KVK CLO Ltd., Series2013-1A, Class BR,
4.247% (3 Month LIBOR USD + 1.450%), 1/14/2028 (a)(b) | | | 4,535,000 | | | | 4,453,270 | |
LCM XVIII LP, Series 18A, Class A1R,
3.781% (3 Month LIBOR USD + 1.020%), 7/21/2031 (a)(b) | | | 8,704,000 | | | | 8,605,575 | |
LCM XXI LP, Series 21A, Class ER, 8.511% (3 Month LIBOR USD + 5.750%), 4/20/2028 (a)(b) | | | 538,000 | | | | 520,838 | |
Madison Park Funding XII Ltd., Series2014-12A, Class E, 6.845%, 7/20/2026 (a)(e) | | | 940,000 | | | | 939,530 | |
Madison Park Funding XV Ltd., Series2014-15A, Class DR,
8.205% (3 Month LIBOR USD + 5.440%), 1/27/2026 (a)(b) | | | 2,500,000 | | | | 2,477,698 | |
Madison Park Funding XVI Ltd., Series2015-16A, Class D,
8.261% (3 Month LIBOR USD + 5.500%), 4/20/2026 (a)(b) | | | 1,500,000 | | | | 1,480,055 | |
Magnetite XVI Ltd., Series2015-16A, Class BR,
3.980% (3 Month LIBOR USD + 1.200%), 1/18/2028 (a)(b) | | | 1,237,000 | | | | 1,212,716 | |
Man GLG US CLO Ltd., Series2018-2A, Class CR, 0.000%, 10/16/2028 (a)(e) | | | 5,500,000 | | | | 5,335,000 | |
Man GLG US CLO Ltd., Series2018-2A, Class DR,
8.887% (3 Month LIBOR USD + 6.100%), 10/16/2028 (a)(b) | | | 3,000,000 | | | | 2,799,054 | |
Marathon CLO V Ltd., Series2013-5A, Class A2R,
4.096% (3 Month LIBOR USD + 1.450%), 11/21/2027 (a)(b) | | | 9,000,000 | | | | 8,900,631 | |
Marathon CLO VII Ltd., Series2014-7A, Class C,
6.565% (3 Month LIBOR USD + 3.800%), 10/28/2025 (a)(b) | | | 3,000,000 | | | | 3,005,820 | |
See accompanying notes which are an integral part of these financial statements.
26
Angel Oak Multi-Strategy Income Fund
Consolidated Schedule of Investments – (continued)
January 31, 2019
| | | | | | | | |
| | | Principal
Amount | | | Value | |
| Collateralized Loan Obligations – (continued) | | | | | | |
MidOcean Credit CLO VI, Series2016-6A, Class E,
10.101% (3 Month LIBOR USD + 7.340%), 1/22/2029 (a)(b) | | $ | 5,000,000 | | | $ | 5,022,040 | |
MMCF CLO LLC, Series2017-1A, Class D,
9.167% (3 Month LIBOR USD + 6.380%), 1/15/2028 (a)(b)(g) | | | 3,000,000 | | | | 2,932,698 | |
Monroe Capital BSL CLO Ltd., Series2015-1A, Class CR,
5.127% (3 Month LIBOR USD + 2.450%), 5/22/2027 (a)(b) | | | 18,900,000 | | | | 18,665,886 | |
Neuberger Berman CLO XIX Ltd., Series2015-19A, Class DR2,
8.337% (3 Month LIBOR USD + 5.550%), 7/15/2027 (a)(b) | | | 4,000,000 | | | | 3,861,208 | |
Newstar Exeter Fund CLO LLC, Series2015-1RA, Class CR,
5.511% (3 Month LIBOR USD + 2.750%), 1/20/2027 (a)(b) | | | 3,000,000 | | | | 2,974,047 | |
Newstar Exeter Fund CLO LLC, Series2015-1RA, Class DR,
6.661% (3 Month LIBOR USD + 3.900%), 1/20/2027 (a)(b) | | | 3,000,000 | | | | 2,988,690 | |
Oaktree CLO Ltd., Series2014-2A, Class D, 0.000%, 10/20/2026 (a)(e) | | | 4,000,000 | | | | 3,968,000 | |
Oaktree CLO Ltd., Series2014-2A, Class C,
6.361% (3 Month LIBOR USD + 3.600%), 10/20/2026 (a)(b)(i) | | | 12,500,000 | | | | 12,475,175 | |
OCP CLO Ltd., Series2015-8A, Class D, 0.000%, 4/17/2027 (a)(e) | | | 884,000 | | | | 870,740 | |
OCP CLO Ltd., Series2015-8A, Class A2AR,
4.223% (3 Month LIBOR USD + 1.450%), 4/17/2027 (a)(b) | | | 9,000,000 | | | | 8,917,389 | |
OCP CLO Ltd., Series2015-8A, Class CR,
5.573% (3 Month LIBOR USD + 2.800%), 4/17/2027 (a)(b) | | | 2,000,000 | | | | 1,969,000 | |
Octagon Investment Partners Ltd., Series2015-1A, Class BR,
3.987% (3 Month LIBOR USD + 1.200%), 7/15/2027 (a)(b) | | | 1,085,000 | | | | 1,054,057 | |
Octagon Investment Partners XXI Ltd., Series2014-1A, Class C,
6.264% (3 Month LIBOR USD + 3.650%), 11/14/2026 (a)(b) | | | 2,250,000 | | | | 2,250,000 | |
OZLM XI Ltd., Series2015-11A, Class DR,
9.751% (3 Month LIBOR USD + 7.000%), 10/30/2030 (a)(b) | | | 2,650,000 | | | | 2,665,142 | |
OZLM XVIII Ltd., Series2018-18A, Class A,
3.807% (3 Month LIBOR USD + 1.020%), 4/15/2031 (a)(b) | | | 5,000,000 | | | | 4,902,865 | |
Peaks CLO Ltd., Series2017-2A, Class B,
5.961% (3 Month LIBOR USD + 3.200%), 7/20/2029 (a)(b) | | | 2,100,000 | | | | 2,105,720 | |
Peaks CLO Ltd., Series2017-2A, Class D,
8.511% (3 Month LIBOR USD + 5.750%), 7/20/2029 (a)(b) | | | 4,950,000 | | | | 4,982,462 | |
Recette CLO Ltd., Series2015-1A, Class BR,
4.061% (3 Month LIBOR USD + 1.300%), 10/20/2027 (a)(b) | | | 2,250,000 | | | | 2,205,878 | |
Regatta X Funding Ltd., Series2017-3A, Class SUB, 0.000%, 1/17/2031 (a)(e)(g) | | | 2,500,000 | | | | 2,150,000 | |
Regatta X Funding Ltd., Series2017-3A, Class A,
3.893% (3 Month LIBOR USD + 1.120%), 1/17/2031 (a)(b) | | | 5,000,000 | | | | 4,956,690 | |
Regatta XI Funding Ltd., Series2018-1A, Class A,
3.843% (3 Month LIBOR USD + 1.070%), 7/17/2031 (a)(b) | | | 14,500,000 | | | | 14,330,930 | |
SCOF-2 Ltd., Series2015-2A, Class CR,
5.047% (3 Month LIBOR USD + 2.260%), 7/15/2028 (a)(b) | | | 4,400,000 | | | | 4,369,886 | |
SCOF-2 Ltd., Series2015-2A, Class ER,
8.497% (3 Month LIBOR USD + 5.710%), 7/15/2028 (a)(b) | | | 3,500,000 | | | | 3,346,389 | |
Seneca Park CLO Ltd., Series2014-1A, Class D,
6.273% (3 Month LIBOR USD + 3.500%), 7/17/2026 (a)(b) | | | 3,000,000 | | | | 3,011,214 | |
Symphony CLO XII Ltd., Series2013-12A, Class CR,
4.887% (3 Month LIBOR USD + 2.100%), 10/15/2025 (a)(b) | | | 2,500,000 | | | | 2,472,367 | |
Symphony CLO XII Ltd., Series2013-12A, Class DR,
6.037% (3 Month LIBOR USD + 3.250%), 10/15/2025 (a)(b) | | | 8,830,000 | | | | 8,836,781 | |
See accompanying notes which are an integral part of these financial statements.
27
Angel Oak Multi-Strategy Income Fund
Consolidated Schedule of Investments – (continued)
January 31, 2019
| | | | | | | | |
| | | Principal
Amount | | | Value | |
| Collateralized Loan Obligations – (continued) | | | | | | |
Symphony CLO XII Ltd., Series2013-12A, Class E,
7.687% (3 Month LIBOR USD + 4.900%), 10/15/2025 (a)(b) | | $ | 2,000,000 | | | $ | 1,941,794 | |
Symphony CLO XIV Ltd., Series2014-14A, Class B1R,
4.647% (3 Month LIBOR USD + 1.850%), 7/14/2026 (a)(b) | | | 23,000,000 | | | | 22,999,448 | |
TCI-Flatiron CLO Ltd., Series2016-1A, Class D,
7.123% (3 Month LIBOR USD + 4.350%), 7/17/2028 (a)(b) | | | 2,500,000 | | | | 2,504,088 | |
TCP Waterman CLO Ltd., Series2016-1A, Class A2,
5.788% (3 Month LIBOR USD + 3.000%), 12/15/2028 (a)(b) | | | 2,000,000 | | | | 2,000,988 | |
TCP Waterman CLO Ltd., Series2016-1A, Class B,
6.238% (3 Month LIBOR USD + 3.450%), 12/15/2028 (a)(b) | | | 3,000,000 | | | | 3,000,642 | |
THL Credit Wind River CLO Ltd., Series2012-1A, Class ER,
10.167% (3 Month LIBOR USD + 7.380%), 1/15/2026 (a)(b) | | | 9,500,000 | | | | 9,506,802 | |
THL Credit Wind River CLO Ltd., Series2012-2A, Class INC, 0.000%, 1/20/2026 (a)(e)(g) | | | 5,000,000 | | | | 2,500,000 | |
Tralee CLO V Ltd., Series2018-5A, Class C, 4.959%, 10/20/2028 (a)(e) | | | 6,300,000 | | | | 6,166,125 | |
Trinitas CLO I Ltd., Series2014-1A, Class CR,
5.287% (3 Month LIBOR USD + 2.500%), 4/15/2026 (a)(b) | | | 4,250,000 | | | | 4,221,971 | |
Trinitas CLO V Ltd., Series2016-5A, Class E,
10.171% (3 Month LIBOR USD + 7.400%), 10/25/2028 (a)(b) | | | 5,000,000 | | | | 5,009,515 | |
Venture CLO Ltd., Series2015-25A, Class E,
9.961% (3 Month LIBOR USD + 7.200%), 4/20/2029 (a)(b) | | | 4,500,000 | | | | 4,504,397 | |
Venture XII CLO Ltd., Series2012-12A, Class BRR,
3.907% (3 Month LIBOR USD + 1.200%), 3/2/2026 (a)(b) | | | 9,000,000 | | | | 8,809,839 | |
Vibrant CLO IV Ltd., Series2016-4A, Class E,
9.511% (3 Month LIBOR USD + 6.750%), 7/20/2028 (a)(b) | | | 1,750,000 | | | | 1,745,615 | |
Voya CLO Ltd., Series2016-2A, Class D,
9.711% (3 Month LIBOR USD + 6.950%), 7/19/2028 (a)(b) | | | 3,600,000 | | | | 3,618,389 | |
Voya CLO Ltd., Series2012-4A, Class DR,
10.437% (3 Month LIBOR USD + 7.650%), 10/15/2028 (a)(b)(g) | | | 4,000,000 | | | | 4,018,820 | |
Voya CLO Ltd., Series2014-2A, Class ER,
10.473% (3 Month LIBOR USD + 7.700%), 4/17/2030 (a)(b) | | | 2,000,000 | | | | 1,842,130 | |
Voya CLO Ltd., Series2013-1A, Class A1AR,
3.997% (3 Month LIBOR USD + 1.210%), 10/15/2030 (a)(b) | | | 3,500,000 | | | | 3,493,448 | |
Voya CLO Ltd., Series2016-1A, Class A1R,
3.831% (3 Month LIBOR USD + 1.070%), 1/20/2031 (a)(b) | | | 6,000,000 | | | | 5,956,512 | |
Voya CLO Ltd., Series2013-2A, Class A1R,
3.741% (3 Month LIBOR USD + 0.970%), 4/25/2031 (a)(b) | | | 6,437,500 | | | | 6,352,969 | |
Voya Ltd., Series2012-4X, Class DR,
10.437% (3 Month LIBOR USD + 7.650%), 10/15/2028 (b)(g)(l) | | | 3,650,000 | | | | 3,667,173 | |
Woodmont Trust, Series2017-1A, Class D,
7.830% (3 Month LIBOR USD + 5.050%), 4/18/2029 (a)(b) | | | 3,000,000 | | | | 2,985,882 | |
York CLO Ltd., Series2015-1A, Class F,
10.011% (3 Month LIBOR USD + 7.250%), 1/22/2031 (a)(b)(g) | | | 2,405,000 | | | | 2,140,450 | |
Z Capital Credit Partners CLO Ltd., Series2015-1A, Class CR,
4.629% (3 Month LIBOR USD + 1.850%), 7/16/2027 (a)(b) | | | 8,300,000 | | | | 7,862,283 | |
| | | | | | | | |
| | |
TOTAL COLLATERALIZED LOAN OBLIGATIONS –
(Cost – $657,179,174) | | | | | | | 653,499,348 | |
| | | | | | | | |
See accompanying notes which are an integral part of these financial statements.
28
Angel Oak Multi-Strategy Income Fund
Consolidated Schedule of Investments – (continued)
January 31, 2019
| | | | | | | | |
| | | Principal
Amount | | | Value | |
| Collateralized Mortgage Obligations – 67.14% | | | | | | |
Adjustable Rate Mortgage Trust, Series2005-3, Class 7A1, 4.457%, 7/25/2035 (e) | | $ | 714,518 | | | $ | 691,199 | |
Adjustable Rate Mortgage Trust, Series2005-5, Class 6A21,
2.740% (1 Month LIBOR USD + 0.230%), 9/25/2035 (b) | | | 126,462 | | | | 126,295 | |
Adjustable Rate Mortgage Trust, Series2005-10, Class 5A1,
3.030% (1 Month LIBOR USD + 0.520%), 1/25/2036 (b) | | | 3,882,051 | | | | 3,728,924 | |
Adjustable Rate Mortgage Trust, Series2005-10, Class 3A12, 3.950%, 1/25/2036 (e) | | | 2,992 | | | | 39 | |
Adjustable Rate Mortgage Trust, Series2005-11, Class 2A3, 4.123%, 2/25/2036 (e) | | | 9,308,121 | | | | 8,719,122 | |
Adjustable Rate Mortgage Trust, Series2005-12, Class 2A1, 4.162%, 3/25/2036 (e) | | | 2,405,561 | | | | 2,189,820 | |
Adjustable Rate Mortgage Trust, Series2006-1, Class 2A1, 4.596%, 3/25/2036 (e) | | | 413,874 | | | | 342,057 | |
Adjustable Rate Mortgage Trust, Series2006-3, Class 4A2,
2.630% (1 Month LIBOR USD + 0.120%), 8/25/2036 (b) | | | 17,283,827 | | | | 10,605,823 | |
Adjustable Rate Mortgage Trust, Series2006-3, Class 4A11,
2.690% (1 Month LIBOR USD + 0.180%), 8/25/2036 (b) | | | 539,624 | | | | 361,197 | |
Adjustable Rate Mortgage Trust, Series2007-1, Class 5A1,
2.660% (1 Month LIBOR USD + 0.150%), 3/25/2037 (b) | | | 1,294,452 | | | | 1,279,107 | |
Adjustable Rate Mortgage Trust, Series2007-1, Class 5A22,
2.740% (1 Month LIBOR USD + 0.230%), 3/25/2037 (b) | | | 5,474,840 | | | | 3,626,255 | |
Adjustable Rate Mortgage Trust, Series2007-1, Class 3A22, 4.518%, 3/25/2037 (e) | | | 884,596 | | | | 854,436 | |
Adjustable Rate Mortgage Trust, Series2007-2, Class 1A21, 4.341%, 6/25/2037 (e) | | | 4,037,909 | | | | 3,573,719 | |
Adjustable Rate Mortgage Trust, Series2007-2, Class 1A1, 4.341%, 6/25/2037 (e) | | | 3,773,404 | | | | 3,584,273 | |
Alternative Loan Trust, Series2007-20, Class A1,
3.010% (1 Month LIBOR USD + 0.500%), 8/25/2047 (b) | | | 5,072,848 | | | | 3,356,957 | |
American Home Mortgage Assets Trust, Series2007-3, Class 22A1, 6.250%, 6/25/2037 (d) | | | 662,544 | | | | 561,273 | |
American Home Mortgage Assets Trust, Series2006-1, Class XC, 1.329%, 5/25/2046 (e)(h) | | | 44,943,556 | | | | 3,712,023 | |
American Home Mortgage Assets Trust, Series2006-1, Class 2A1,
2.700% (1 Month LIBOR USD + 0.190%), 5/25/2046 (b) | | | 19,990,239 | | | | 18,047,488 | |
American Home Mortgage Assets Trust, Series2006-1, Class 1A1,
2.720% (1 Month LIBOR USD + 0.210%), 5/25/2046 (b) | | | 17,912,781 | | | | 16,409,397 | |
American Home Mortgage Assets Trust, Series2006-2, Class 1A1,
3.212% (12 Month US Treasury Average + 0.960%), 9/25/2046 (b) | | | 1,913,318 | | | | 1,771,538 | |
American Home Mortgage Assets Trust, Series2006-4, Class 1A12,
2.720% (1 Month LIBOR USD + 0.210%), 10/25/2046 (b) | | | 19,280,321 | | | | 13,863,958 | |
American Home Mortgage Assets Trust, Series2006-3, Class 1A1,
3.222% (12 Month US Treasury Average + 0.970%), 10/25/2046 (b) | | | 2,093,784 | | | | 1,985,990 | |
American Home Mortgage Assets Trust, Series2006-6, Class XP, 1.182%, 12/25/2046 (e)(h) | | | 119,000,219 | | | | 8,029,064 | |
American Home Mortgage Assets Trust, Series2007-1, Class A1,
2.952% (12 Month US Treasury Average + 0.700%), 2/25/2047 (b)(i) | | | 64,849,505 | | | | 40,326,859 | |
American Home Mortgage Assets Trust, Series2007-5, Class XP, 1.704%, 6/25/2047 (e)(h) | | | 69,776,797 | | | | 6,948,234 | |
American Home Mortgage Investment Trust, Series2005-2, Class 5A4A,
5.383%, 9/25/2035 (d) | | | 2,610,183 | | | | 2,197,628 | |
American Home Mortgage Investment Trust, Series2006-3, Class 22A1,
4.623% (6 Month LIBOR USD + 1.750%), 12/25/2036 (b) | | | 7,776,032 | | | | 7,022,613 | |
American Home Mortgage Investment Trust, Series2006-3, Class 3A2,
6.750%, 12/25/2036 (d) | | | 6,455,529 | | | | 3,000,730 | |
American Home Mortgage Investment Trust, Series2005-2, Class 1A1,
3.110% (1 Month LIBOR USD + 0.600%), 9/25/2045 (b) | | | 11,699,563 | | | | 11,184,162 | |
American Home Mortgage Investment Trust, Series2005-2, Class 2A1,
5.646% (1 Month LIBOR USD + 3.140%), 9/25/2045 (b) | | | 814,767 | | | | 695,611 | |
American Home Mortgage Investment Trust, Series2005-4, Class 1A1,
3.090% (1 Month LIBOR USD + 0.580%), 11/25/2045 (b) | | | 9,920,165 | | | | 9,460,166 | |
See accompanying notes which are an integral part of these financial statements.
29
Angel Oak Multi-Strategy Income Fund
Consolidated Schedule of Investments – (continued)
January 31, 2019
| | | | | | | | |
| | | Principal
Amount | | | Value | |
| Collateralized Mortgage Obligations – (continued) | | | | | | |
American Home Mortgage Investment Trust, Series2006-2, Class 1A2,
2.830% (1 Month LIBOR USD + 0.320%), 6/25/2046 (b) | | $ | 11,910,393 | | | $ | 5,338,119 | |
American Home Mortgage Investment Trust, Series2006-3, Class 11A1,
2.870% (1 Month LIBOR USD + 0.360%), 12/25/2046 (b) | | | 20,570,460 | | | | 19,448,362 | |
American Home Mortgage Investment Trust, Series2006-3, Class 12A1,
2.890% (1 Month LIBOR USD + 0.380%), 12/25/2046 (b) | | | 10,217,702 | | | | 9,704,283 | |
American Home Mortgage Investment Trust, Series2007-2, Class 11A1,
2.740% (1 Month LIBOR USD + 0.230%), 3/25/2047 (b) | | | 7,710,277 | | | | 4,989,605 | |
American Home Mortgage Investment Trust, Series2007-1, Class GA1A,
2.670% (1 Month LIBOR USD + 0.160%), 5/25/2047 (b) | | | 29,831,316 | | | | 25,454,316 | |
American Home Mortgage Investment Trust, Series2007-1, Class GA1C,
2.700% (1 Month LIBOR USD + 0.190%), 5/25/2047 (b) | | | 39,436,726 | | | | 30,121,890 | |
Ashford Hospitality Trust, Series 2018-KEYS, Class F,
8.509% (1 Month LIBOR USD + 6.000%), 6/15/2035 (a)(b) | | | 8,000,000 | | | | 7,954,624 | |
Atrium Hotel Portfolio Trust, Series 2018-ATRM, Class E,
5.909% (1 Month LIBOR USD + 3.400%), 6/15/2035 (a)(b) | | | 2,625,000 | | | | 2,616,760 | |
Bank of America Alternative Loan Trust, Series2005-4, Class CB5, 5.500%, 5/25/2035 | | | 3,223,944 | | | | 3,231,539 | |
Bank of America Alternative Loan Trust, Series2005-7, Class 3CB1, 6.000%, 8/25/2035 | | | 3,360,230 | | | | 3,135,094 | |
Bank of America Alternative Loan Trust, Series2005-8, Class 1CB3,
2.760% (1 Month LIBOR USD + 0.250%), 9/25/2035 (b) | | | 6,333,473 | | | | 5,807,516 | |
Bank of America Alternative Loan Trust, Series2005-10, Class 1CB4, 5.500%, 11/25/2035 | | | 846,434 | | | | 841,351 | |
Bank of America Alternative Loan Trust, Series2005-12, Class 3CB1, 6.000%, 1/25/2036 | | | 7,187,816 | | | | 6,981,497 | |
Bank of America Alternative Loan Trust, Series2006-7, Class A2, 5.707%, 10/25/2036 (e) | | | 4,967,094 | | | | 2,803,194 | |
Bank of America Alternative Loan Trust, Series2006-7, Class A6, 5.859%, 10/25/2036 (d) | | | 5,445,761 | | | | 3,117,638 | |
Bank of America Alternative Loan Trust, Series2006-7, Class A4, 5.998%, 10/25/2036 (d) | | | 14,615,962 | | | | 9,165,231 | |
Bank of America Alternative Loan Trust, Series2006-9, Class 30PO, 0.000%, 1/25/2037 (c) | | | 297,345 | | | | 191,962 | |
Bank of America Alternative Loan Trust, Series2007-1, Class 3A16,
3.110% (1 Month LIBOR USD + 0.600%), 4/25/2037 (b) | | | 4,761,026 | | | | 3,796,875 | |
Bank of America Commercial Mortgage Trust, Series 2015-UBS7, Class D, 3.167%, 9/17/2048 | | | 2,500,000 | | | | 2,108,890 | |
Bank of America Funding Trust, Series2009-R14, Class 2A,
10.245% (1 Month LIBOR USD + 15.013%), 7/26/2035 (a)(b)(m) | | | 562,651 | | | | 605,646 | |
Bank of America Funding Trust, Series2005-F, Class 4A1, 4.372%, 9/20/2035 (e) | | | 5,138,631 | | | | 4,737,797 | |
Bank of America Funding Trust, Series2005-H, Class 1A1, 4.624%, 11/20/2035 (e) | | | 253,905 | | | | 231,749 | |
Bank of America Funding Trust, Series2007-C, Class 4A2, 4.371%, 5/20/2036 (e) | | | 2,007,859 | | | | 1,971,778 | |
Bank of America Funding Trust, Series2006-H, Class 6A1,
2.696% (1 Month LIBOR USD + 0.190%), 10/20/2036 (b) | | | 13,806,730 | | | | 12,213,958 | |
Bank of America Funding Trust, Series2007-2, Class TA4,
2.910% (1 Month LIBOR USD + 0.400%), 3/25/2037 (b) | | | 10,665,153 | | | | 9,160,332 | |
Bank of America Funding Trust, Series2007-2, Class 1A16,
3.110% (1 Month LIBOR USD + 0.600%), 3/25/2037 (b) | | | 5,124,130 | | | | 4,049,959 | |
Bank of America Funding Trust, Series2014-R1, Class A2,
2.656% (1 Month LIBOR USD + 0.150%), 6/26/2037 (a)(b) | | | 8,536,563 | | | | 7,240,123 | |
Bank of America Funding Trust, Series2006-H, Class 4A1, 4.445%, 9/20/2046 (e) | | | 214,002 | | | | 194,628 | |
Bank of America Funding Trust, Series2007-A, Class 2A5,
2.736% (1 Month LIBOR USD + 0.230%), 2/20/2047 (b) | | | 2,783,041 | | | | 2,659,343 | |
Bank of America Funding Trust, Series2007-B, Class A1,
2.716% (1 Month LIBOR USD + 0.210%), 4/20/2047 (b) | | | 6,858,721 | | | | 6,145,435 | |
Bank of America Funding Trust, Series2007-C, Class 7A1,
2.716% (1 Month LIBOR USD + 0.210%), 5/20/2047 (b) | | | 923,184 | | | | 842,972 | |
See accompanying notes which are an integral part of these financial statements.
30
Angel Oak Multi-Strategy Income Fund
Consolidated Schedule of Investments – (continued)
January 31, 2019
| | | | | | | | |
| | | Principal
Amount | | | Value | |
| Collateralized Mortgage Obligations – (continued) | | | | | | |
Bank of America Funding Trust, Series2007-C, Class 7A4,
2.726% (1 Month LIBOR USD + 0.220%), 5/20/2047 (b) | | $ | 4,667,976 | | | $ | 4,247,550 | |
Bank of America Funding Trust, Series2007-D, Class 1A16,
2.716% (1 Month LIBOR USD + 0.210%), 6/20/2047 (b) | | | 861,659 | | | | 759,568 | |
Bank of America Mortgage Trust, Series2007-1, Class 1A4, 6.000%, 3/25/2037 | | | 2,119,245 | | | | 2,026,344 | |
BBCMS Trust, Series2014-BXO, Class E,
6.259% (1 Month LIBOR USD + 3.750%), 8/16/2027 (a)(b) | | | 8,000,000 | | | | 8,012,856 | |
BCAP LLC, Series2013-RR1, Class 6A2, 4.170%, 5/28/2036 (a)(e) | | | 6,449,644 | | | | 5,289,276 | |
BCAP LLC Trust, Series2013-RR7, Class 4A3, 4.607%, 12/27/2034 (a)(e) | | | 9,013,000 | | | | 8,902,681 | |
BCAP LLC Trust, Series2014-RR1, Class 1A2, 4.554%, 3/27/2035 (a)(e) | | | 3,693,643 | | | | 3,741,801 | |
BCAP LLC Trust, Series2010-RR6, Class 1410, 4.376%, 12/27/2035 (a)(e) | | | 8,491,596 | | | | 7,005,966 | |
BCAP LLC Trust, Series2012-RR4, Class 4A7,
2.786% (1 Month LIBOR USD + 0.280%), 2/26/2036 (a)(b) | | | 3,445,500 | | | | 2,707,691 | |
BCAP LLC Trust, Series2015-RR2, Class 26A2, 4.760%, 3/28/2036 (a)(e) | | | 6,729,753 | | | | 6,809,359 | |
BCAP LLC Trust, Series2010-RR7, Class 9A12, 4.194%, 5/28/2036 (a)(e) | | | 3,186,801 | | | | 2,752,147 | |
BCAP LLC Trust, Series2006-AA2, Class A1,
2.680% (1 Month LIBOR USD + 0.170%), 1/25/2037 (b) | | | 14,947,355 | | | | 14,102,859 | |
BCAP LLC Trust, Series2007-AA3, Class 1A1A,
2.720% (1 Month LIBOR USD + 0.210%), 4/25/2037 (b) | | | 2,799,780 | | | | 2,759,855 | |
BCAP LLC Trust, Series2007-AA3, Class 2A1A,
2.730% (1 Month LIBOR USD + 0.220%), 5/25/2047 (b) | | | 15,819,181 | | | | 14,699,041 | |
BCAP LLC Trust, Series 2008-IND1, Class A1,
3.710% (1 Month LIBOR USD + 1.200%), 10/25/2047 (b)(i) | | | 33,281,416 | | | | 31,099,653 | |
BDS, Series2018-FL1, Class B, 3.759% (1 Month LIBOR USD + 1.250%), 1/15/2035 (a)(b) | | | 3,350,049 | | | | 3,315,386 | |
Bear Stearns Adjustable Rate Mortgage Trust, Series2005-6, Class 1A1, 4.441%, 8/25/2035 (e) | | | 5,807,753 | | | | 5,295,405 | |
Bear Stearns Adjustable Rate Mortgage Trust, Series2005-12, Class 23A1, 4.183%, 2/25/2036 (e) | | | 617,540 | | | | 576,209 | |
Bear Stearns Adjustable Rate Mortgage Trust, Series2006-2, Class 2A1, 4.033%, 7/25/2036 (e) | | | 5,197,595 | | | | 4,921,577 | |
Bear Stearns Adjustable Rate Mortgage Trust, Series2006-2, Class 3A1, 4.174%, 7/25/2036 (e) | | | 1,215,893 | | | | 1,171,918 | |
Bear StearnsALT-A Trust, Series2006-8, Class 3A1,
2.670% (1 Month LIBOR USD + 0.160%), 2/25/2034 (b) | | | 1,418,257 | | | | 1,356,001 | |
Bear StearnsALT-A Trust, Series2004-5, Class 4A1, 3.863%, 6/25/2034 (e) | | | 993,998 | | | | 993,075 | |
Bear StearnsALT-A Trust, Series2005-1, Class A1,
3.070% (1 Month LIBOR USD + 0.560%), 1/25/2035 (b) | | | 206,269 | | | | 206,217 | |
Bear StearnsALT-A Trust, Series2005-5, Class 22A1, 4.174%, 7/25/2035 (e) | | | 3,308,292 | | | | 3,119,851 | |
Bear StearnsALT-A Trust, Series2005-5, Class 21A1, 4.249%, 7/25/2035 (e) | | | 1,828,530 | | | | 1,843,232 | |
Bear StearnsALT-A Trust, Series2005-7, Class 22A1, 4.310%, 9/25/2035 (e)(i) | | | 25,945,911 | | | | 22,241,172 | |
Bear StearnsALT-A Trust, Series2005-7, Class 21A1, 4.427%, 9/25/2035 (e) | | | 5,855,822 | | | | 5,600,526 | |
Bear Stearns Asset Backed Securities Trust, Series2004-AC6, Class A2,
2.910% (1 Month LIBOR USD + 0.400%), 11/25/2034 (b) | | | 1,998,493 | | | | 1,809,441 | |
Bear Stearns Asset Backed Securities Trust, Series2005-AC5, Class 1A2,
3.510% (1 Month LIBOR USD + 1.000%), 8/25/2035 (b) | | | 2,565,734 | | | | 2,201,156 | |
Bear Stearns Asset Backed Securities Trust, Series2007-AC6, Class A1, 6.500%, 10/25/2037 | | | 2,740,684 | | | | 1,997,073 | |
Bear Stearns Mortgage Funding Trust, Series2006-AR1, Class 1A1,
2.720% (1 Month LIBOR USD + 0.210%), 7/25/2036 (b) | | | 1,212,751 | | | | 1,142,362 | |
Bear Stearns Mortgage Funding Trust, Series2006-AR3, Class 1A1,
2.690% (1 Month LIBOR USD + 0.180%), 10/25/2036 (b)(i) | | | 40,876,713 | | | | 36,993,875 | |
Bear Stearns Mortgage Funding Trust, Series2007-AR1, Class 1A1,
2.670% (1 Month LIBOR USD + 0.160%), 1/25/2037 (b) | | | 8,791,607 | | | | 8,412,372 | |
See accompanying notes which are an integral part of these financial statements.
31
Angel Oak Multi-Strategy Income Fund
Consolidated Schedule of Investments – (continued)
January 31, 2019
| | | | | | | | |
| | | Principal
Amount | | | Value | |
| Collateralized Mortgage Obligations – (continued) | | | | | | |
Bear Stearns Mortgage Funding Trust, Series2007-AR5, Class 1X2, 0.500%, 6/25/2037 (h) | | $ | 8,762,614 | | | $ | 171,292 | |
Bear Stearns Mortgage Funding Trust, Series2006-AR2, Class 2A1,
2.740% (1 Month LIBOR USD + 0.230%), 9/25/2046 (b) | | | 2,418,080 | | | | 2,411,916 | |
BENCHMARK Mortgage Trust, Series2018-B1, Class XA, 0.527%, 1/18/2051 (e)(h) | | | 37,648,503 | | | | 1,409,522 | |
BTH Mortgage-Backed Securities Trust, Series2018-3, Class A,
4.847% (1 Month LIBOR USD + 2.500%), 7/6/2020 (b) | | | 5,000,000 | | | | 5,013,120 | |
BTH Mortgage-Backed Securities Trust, Series2018-17, Class A,
5.020% (1 Month LIBOR USD + 2.500%), 8/6/2020 (a)(b) | | | 5,938,000 | | | | 5,990,142 | |
BX Commercial Mortgage Trust, Series2018-IND, Class E,
4.209% (1 Month LIBOR USD + 1.700%), 11/15/2035 (a)(b) | | | 6,490,315 | | | | 6,429,384 | |
BX Commercial Mortgage Trust, Series2018-IND, Class F,
4.309% (1 Month LIBOR USD + 1.800%), 11/15/2035 (a)(b) | | | 2,745,903 | | | | 2,720,124 | |
BX Commercial Mortgage Trust, Series2018-IND, Class G,
4.559% (1 Month LIBOR USD + 2.050%), 11/15/2035 (a)(b) | | | 4,493,295 | | | | 4,445,487 | |
BX Trust, Series 2018-EXCL, Class C,
4.484% (1 Month LIBOR USD + 1.975%), 9/15/2037 (a)(b) | | | 8,493,145 | | | | 8,429,234 | |
BXP Trust, Series 2017-CQHP, Class F,
6.509% (1 Month LIBOR USD + 4.000%), 11/15/2034 (a)(b) | | | 4,500,000 | | | | 4,526,797 | |
CAMB Commercial Mortgage Trust, Series 2019-LIFE, Class F,
5.050% (1 Month LIBOR USD + 2.550%), 12/15/2037 (a)(b)(f) | | | 4,250,000 | | | | 4,271,275 | |
CAMB Commercial Mortgage Trust, Series 2019-LIFE, Class G,
5.750% (1 Month LIBOR USD + 3.250%), 12/15/2037 (a)(b)(f) | | | 9,000,000 | | | | 9,045,054 | |
Chase Mortgage Finance Trust, Series2007-S2, Class 1A9, 6.000%, 3/25/2037 | | | 1,744,439 | | | | 1,502,046 | |
ChaseFlex Trust, Series2005-2, Class 5A6, 5.000%, 6/25/2035 | | | 2,981,693 | | | | 2,560,073 | |
ChaseFlex Trust, Series2007-1, Class 2A10,
3.010% (1 Month LIBOR USD + 0.500%), 2/25/2037 (b) | | | 3,105,193 | | | | 1,812,352 | |
ChaseFlex Trust, Series2007-1, Class 2A6, 6.000%, 2/25/2037 | | | 2,155,056 | | | | 1,823,007 | |
ChaseFlex Trust, Series2007-2, Class A1,
2.790% (1 Month LIBOR USD + 0.280%), 5/25/2037 (b) | | | 3,363,014 | | | | 3,237,426 | |
Chevy Chase Funding LLC Mortgage-Backed Certificates, Series2004-2A, Class A2,
2.830% (1 Month LIBOR USD + 0.320%), 5/25/2035 (a)(b) | | | 5,459,781 | | | | 5,387,215 | |
Chevy Chase Funding LLC Mortgage-Backed Certificates, Series2004-3A, Class A1,
2.760% (1 Month LIBOR USD + 0.250%), 8/25/2035 (a)(b) | | | 2,862,405 | | | | 2,828,843 | |
Chevy Chase Funding LLC Mortgage-Backed Certificates, Series2004-4A, Class A2,
2.800% (1 Month LIBOR USD + 0.290%), 10/25/2035 (a)(b) | | | 6,078,476 | | | | 5,978,843 | |
Chevy Chase Funding LLC Mortgage-Backed Certificates, Series2005-1A, Class A1,
2.660% (1 Month LIBOR USD + 0.150%), 1/25/2036 (a)(b) | | | 5,647,234 | | | | 5,503,416 | |
Chevy Chase Funding LLC Mortgage-Backed Certificates, Series2005-1A, Class A2,
2.710% (1 Month LIBOR USD + 0.200%), 1/25/2036 (a)(b) | | | 6,026,394 | | | | 5,918,528 | |
Chevy Chase Funding LLC Mortgage-Backed Certificates, Series2005-AA, Class A1,
2.710% (1 Month LIBOR USD + 0.200%), 1/25/2036 (a)(b) | | | 5,568,897 | | | | 5,479,082 | |
Chevy Chase Funding LLC Mortgage-Backed Certificates, Series2005-2A, Class A1,
2.690% (1 Month LIBOR USD + 0.180%), 5/25/2036 (a)(b) | | | 4,319,817 | | | | 4,177,423 | |
Chevy Chase Funding LLC Mortgage-Backed Certificates, Series2005-BA, Class A1,
2.710% (1 Month LIBOR USD + 0.200%), 6/25/2036 (a)(b) | | | 3,330,628 | | | | 3,157,239 | |
Chevy Chase Funding LLC Mortgage-Backed Certificates, Series2005-3A, Class A2,
2.740% (1 Month LIBOR USD + 0.230%), 7/25/2036 (a)(b) | | | 10,158,637 | | | | 9,775,860 | |
Chevy Chase Funding LLC Mortgage-Backed Certificates, Series2005-4A, Class NIO,
0.403%, 4/25/2037 (a)(e)(h) | | | 41,708,324 | | | | 694,360 | |
See accompanying notes which are an integral part of these financial statements.
32
Angel Oak Multi-Strategy Income Fund
Consolidated Schedule of Investments – (continued)
January 31, 2019
| | | | | | | | |
| | | Principal
Amount | | | Value | |
| Collateralized Mortgage Obligations – (continued) | | | | | | |
Chevy Chase Funding LLC Mortgage-Backed Certificates, Series2005-CA, Class A1,
2.720% (1 Month LIBOR USD + 0.210%), 10/25/2046 (a)(b) | | $ | 1,864,108 | | | $ | 1,801,998 | |
Chevy Chase Funding LLC Mortgage-Backed Certificates, Series2005-CA, Class A2,
2.790% (1 Month LIBOR USD + 0.280%), 10/25/2046 (a)(b) | | | 12,226,296 | | | | 12,065,593 | |
Chevy Chase Funding LLC Mortgage-Backed Certificates, Series2006-1A, Class A1,
2.660% (1 Month LIBOR USD + 0.150%), 12/25/2046 (a)(b) | | | 6,804,245 | | | | 6,496,863 | |
Chevy Chase Funding LLC Mortgage-Backed Certificates, Series2006-2A, Class A1,
2.640% (1 Month LIBOR USD + 0.130%), 4/25/2047 (a)(b) | | | 19,684,192 | | | | 19,023,472 | |
Chevy Chase Funding LLC Mortgage-Backed Certificates, Series2006-2A, Class A2,
2.690% (1 Month LIBOR USD + 0.180%), 4/25/2047 (a)(b) | | | 10,821,911 | | | | 9,028,633 | |
Chevy Chase Funding LLC Mortgage-Backed Certificates, Series2006-3A, Class A2,
2.690% (1 Month LIBOR USD + 0.180%), 8/25/2047 (a)(b) | | | 7,159,167 | | | | 6,167,937 | |
Chevy Chase Funding LLC Mortgage-Backed Certificates, Series2006-4A, Class A1,
2.640% (1 Month LIBOR USD + 0.130%), 11/25/2047 (a)(b) | | | 1,946,682 | | | | 1,701,936 | |
Chevy Chase Funding LLC Mortgage-Backed Certificates, Series2006-4A, Class A2,
2.690% (1 Month LIBOR USD + 0.180%), 11/25/2047 (a)(b) | | | 4,042,196 | | | | 3,281,002 | |
Chevy Chase Funding LLC Mortgage-Backed Certificates, Series2007-1A, Class A1,
2.640% (1 Month LIBOR USD + 0.130%), 2/25/2048 (a)(b) | | | 11,785,782 | | | | 10,757,401 | |
Chimera Special Holdings 4.347%, 5/11/2019 (e)(g) | | | 39,383,911 | | | | 39,482,371 | |
Citicorp. Mortgage Securities, Inc., Series2005-2, Class 1APO, 0.000%, 3/25/2035 (c) | | | 38,621 | | | | 30,430 | |
Citigroup Commercial Mortgage Trust, Series 2019-SMRT, Class E, 4.744%, 1/11/2036 (a)(e) | | | 5,000,000 | | | | 5,004,700 | |
Citigroup Commercial Mortgage Trust, Series 2018TBR, Class F,
6.159% (1 Month LIBOR USD + 3.650%), 12/15/2036 (a)(b) | | | 4,250,000 | | | | 4,249,974 | |
Citigroup Commercial Mortgage Trust, Series2017-P7, Class D, 3.250%, 4/15/2050 (a) | | | 5,000,000 | | | | 4,012,725 | |
Citigroup Mortgage Loan Trust, Series2007-AR1, Class A2,
2.670% (1 Month LIBOR USD + 0.160%), 1/25/2037 (b) | | | 8,303,286 | | | | 7,403,202 | |
Citigroup Mortgage Loan Trust, Series2009-5, Class 10A1,
2.756% (1 Month LIBOR USD + 0.250%), 2/25/2037 (a)(b) | | | 1,941,265 | | | | 1,032,332 | |
Citigroup Mortgage Loan Trust, Series2007-6, Class 1A2A, 3.789%, 3/25/2037 (e) | | | 5,378,801 | | | | 4,809,487 | |
Citigroup Mortgage Loan Trust, Series2018-C, Class A1, 4.125%, 3/25/2059 (a)(d) | | | 13,042,541 | | | | 13,077,547 | |
Citigroup Mortgage Loan Trust, Inc., Series2005-12, Class 2A1,
3.310% (1 Month LIBOR USD + 0.800%), 8/25/2035 (a)(b) | | | 4,549,341 | | | | 4,244,085 | |
Citigroup Mortgage Loan Trust, Inc., Series2005-3, Class 2A2, 4.365%, 8/25/2035 (e) | | | 1,234,971 | | | | 1,245,488 | |
Citigroup Mortgage Loan Trust, Inc., Series2005-9, Class 22A3, 6.000%, 10/25/2035 | | | 2,992,822 | | | | 2,203,875 | |
Citigroup Mortgage Loan Trust, Inc., Series2005-7, Class 2A2A, 4.703%, 11/25/2035 (e) | | | 3,632,470 | | | | 3,185,647 | |
Citigroup Mortgage Loan Trust, Inc., Series2006-AR2, Class 1A1, 4.250%, 3/25/2036 (e) | | | 731,450 | | | | 693,887 | |
Citigroup Mortgage Loan Trust, Inc., Series2014-6, Class 2A1,
2.706% (1 Month LIBOR USD + 0.200%), 4/25/2038 (a)(b) | | | 1,411,226 | | | | 1,373,827 | |
Citigroup Mortgage Loan Trust, Inc., Series2017-RP2, Class A1, 3.250%, 7/25/2067 (a)(e) | | | 22,089,901 | | | | 21,830,433 | |
CitiMortgage Alternative Loan Trust, Series2006-A4, Class 1A5,
3.160% (1 Month LIBOR USD + 0.650%), 9/25/2036 (b) | | | 3,024,559 | | | | 2,486,163 | |
CitiMortgage Alternative Loan Trust, Series2006-A6, Class 1APO, 0.000%, 11/25/2036 (c) | | | 100,160 | | | | 61,416 | |
CitiMortgage Alternative Loan Trust, Series2006-A7, Class 1A9,
3.160% (1 Month LIBOR USD + 0.650%), 12/25/2036 (b) | | | 8,393,669 | | | | 6,523,753 | |
CitiMortgage Alternative Loan Trust, Series2006-A7, Class 1A1, 6.000%, 12/25/2036 (e) | | | 747,554 | | | | 662,154 | |
CitiMortgage Alternative Loan Trust, Series2007-A1, Class 1A2,
3.060% (1 Month LIBOR USD + 0.550%), 1/25/2037 (b) | | | 15,613,513 | | | | 12,995,938 | |
CitiMortgage Alternative Loan Trust, Series2007-A2, Class 1A1,
3.110% (1 Month LIBOR USD + 0.600%), 2/25/2037 (b) | | | 13,177,074 | | | | 10,478,370 | |
See accompanying notes which are an integral part of these financial statements.
33
Angel Oak Multi-Strategy Income Fund
Consolidated Schedule of Investments – (continued)
January 31, 2019
| | | | | | | | |
| | | Principal
Amount | | | Value | |
| Collateralized Mortgage Obligations – (continued) | | | | | | |
CitiMortgage Alternative Loan Trust, Series2007-A2, Class 1A4, 6.000%, 2/25/2037 | | $ | 1,850,838 | | | $ | 1,679,543 | |
CitiMortgage Alternative Loan Trust, Series2007-A3, Class APO, 0.000%, 3/25/2037 (c) | | | 175,406 | | | | 100,982 | |
CitiMortgage Alternative Loan Trust, Series2007-A3, Class 1A2,
3.110% (1 Month LIBOR USD + 0.600%), 3/25/2037 (b) | | | 4,878,435 | | | | 3,928,940 | |
CitiMortgage Alternative Loan Trust, Series2007-A4, Class APO, 0.000%, 4/25/2037 (c) | | | 258,920 | | | | 156,904 | |
CitiMortgage Alternative Loan Trust, Series2007-A4, Class 1A9,
3.110% (1 Month LIBOR USD + 0.600%), 4/25/2037 (b) | | | 3,221,759 | | | | 2,565,306 | |
CitiMortgage Alternative Loan Trust, Series2007-A5, Class 1A3,
3.010% (1 Month LIBOR USD + 0.500%), 5/25/2037 (b) | | | 8,652,622 | | | | 6,788,934 | |
CitiMortgage Alternative Loan Trust, Series2007-A6, Class 1A1,
3.110% (1 Month LIBOR USD + 0.600%), 6/25/2037 (b) | | | 3,486,326 | | | | 2,784,692 | |
COLT Mortgage Loan Trust, Series2017-1, Class A3, 3.074%, 5/27/2047 (a)(e) | | | 973,896 | | | | 974,728 | |
COLT Mortgage Loan Trust, Series2017-1, Class M1, 4.189%, 5/27/2047 (a)(e) | | | 4,000,000 | | | | 4,046,816 | |
COLT Mortgage Loan Trust, Series2017-2, Class A1A, 2.415%, 10/25/2047 (a)(e) | | | 5,548,501 | | | | 5,548,490 | |
COLT Mortgage Loan Trust, Series2017-2, Class B1, 4.563%, 10/25/2047 (a)(e) | | | 2,991,914 | | | | 3,029,400 | |
COLT Mortgage Loan Trust, Series2018-1, Class B1, 4.362%, 2/25/2048 (a)(e) | | | 3,761,000 | | | | 3,741,574 | |
COLT Mortgage Loan Trust, Series2018-2, Class A1, 3.470%, 7/27/2048 (a) | | | 10,903,081 | | | | 10,926,130 | |
COLT Mortgage Loan Trust, Series2018-2, Class M1, 4.189%, 7/27/2048 (a) | | | 2,191,723 | | | | 2,196,356 | |
COLT Mortgage Loan Trust, Series2019-1, Class A2, 0.000%, 3/25/2049 (a) | | | 9,312,000 | | | | 9,311,833 | |
COLT Mortgage Loan Trust, Series2019-1, Class A1, 3.705%, 3/25/2049 (a) | | | 5,000,000 | | | | 4,999,936 | |
Commercial Mortgage Loan Trust, Series2008-LS1, Class AM, 6.082%, 12/10/2049 (e) | | | 13,398,067 | | | | 7,498,885 | |
Commercial Mortgage Trust, Series2014-TWC, Class F,
6.764% (1 Month LIBOR USD + 4.250%), 2/13/2032 (a)(b) | | | 5,000,000 | | | | 5,012,500 | |
Commercial Mortgage Trust, Series2013-CR8, Class ASFL,
3.259% (1 Month LIBOR USD + 0.740%), 6/12/2046 (a)(b) | | | 3,530,350 | | | | 3,562,804 | |
Commercial Mortgage Trust, Series 2013-CR12, Class D, 5.086%, 10/15/2046 (a)(e) | | | 5,000,000 | | | | 4,404,170 | |
Commercial Mortgage Trust, Series2015-DC1, Class D, 4.351%, 2/12/2048 (a)(e) | | | 5,000,000 | | | | 4,444,245 | |
CountryWide Alternative Loan Trust, Series2004-J10, Class 1A3, 4.250%, 10/25/2034 | | | 69,173 | | | | 68,865 | |
CountryWide Alternative Loan Trust, Series 2004-32CB, Class 2A2,
2.910% (1 Month LIBOR USD + 0.400%), 2/25/2035 (b) | | | 1,346,085 | | | | 1,217,520 | |
CountryWide Alternative Loan Trust, Series2005-3CB, Class 1A4, 5.250%, 3/25/2035 | | | 733,743 | | | | 724,977 | |
CountryWide Alternative Loan Trust, Series2005-7CB, Class 2A2,
2.540% (1 Month LIBOR USD + 5.050%), 4/25/2035 (b)(g)(h)(m) | | | 24,054,238 | | | | 3,164,840 | |
CountryWide Alternative Loan Trust, Series2005-14, Class 2X, 0.656%, 5/25/2035 (e)(g)(h) | | | 39,690,727 | | | | 1,071,253 | |
CountryWide Alternative Loan Trust, Series2005-16, Class X2, 0.721%, 6/25/2035 (e)(g)(h) | | | 32,552,036 | | | | 1,615,753 | |
CountryWide Alternative Loan Trust, Series2005-24, Class 1AX, 0.333%, 7/20/2035 (e)(g)(h) | | | 21,794,497 | | | | 608,328 | |
CountryWide Alternative Loan Trust, Series2005-24, Class 4A1,
2.742% (1 Month LIBOR USD + 0.230%), 7/20/2035 (b) | | | 8,070,441 | | | | 7,775,095 | |
CountryWide Alternative Loan Trust, Series2005-24, Class 2A1A,
3.562% (12 Month US Treasury Average + 1.310%), 7/20/2035 (b) | | | 1,079,966 | | | | 990,610 | |
CountryWide Alternative Loan Trust, Series 2005-26CB, Class A7,
2.810% (1 Month LIBOR USD + 0.300%), 7/25/2035 (b)(i) | | | 9,117,934 | | | | 7,446,106 | |
CountryWide Alternative Loan Trust, Series2005-27, Class 2X1, 0.394%, 8/25/2035 (e)(g)(h) | | | 41,102,263 | | | | 1,476,804 | |
CountryWide Alternative Loan Trust, Series2005-27, Class 1X1, 1.254%, 8/25/2035 (e)(g)(h) | | | 11,133,429 | | | | 397,218 | |
CountryWide Alternative Loan Trust, Series2005-27, Class 1A4, 2.865%, 8/25/2035 (e) | | | 1,436,746 | | | | 1,248,581 | |
CountryWide Alternative Loan Trust, Series2005-27, Class 1A5, 2.955%, 8/25/2035 (e) | | | 1,060,122 | | | | 1,043,431 | |
CountryWide Alternative Loan Trust, Series2005-J12, Class 2A1,
3.050% (1 Month LIBOR USD + 0.540%), 8/25/2035 (b) | | | 8,127,055 | | | | 5,522,058 | |
CountryWide Alternative Loan Trust, Series2005-J9, Class 1A6, 5.500%, 8/25/2035 | | | 1,014,252 | | | | 856,410 | |
See accompanying notes which are an integral part of these financial statements.
34
Angel Oak Multi-Strategy Income Fund
Consolidated Schedule of Investments – (continued)
January 31, 2019
| | | | | | | | |
| | | Principal
Amount | | | Value | |
| Collateralized Mortgage Obligations – (continued) | | | | | | |
CountryWide Alternative Loan Trust, Series2005-38, Class X, 0.616%, 9/25/2035 (e)(g)(h) | | $ | 106,676,681 | | | $ | 3,513,930 | |
CountryWide Alternative Loan Trust, Series2005-41, Class 2X2, 0.660%, 9/25/2035 (e)(h) | | | 6,137,336 | | | | 366,620 | |
CountryWide Alternative Loan Trust, Series2005-41, Class 1A1,
2.840% (1 Month LIBOR USD + 0.330%), 9/25/2035 (b) | | | 962,787 | | | | 847,879 | |
CountryWide Alternative Loan Trust, Series 2005-37T1, Class A5,
2.960% (1 Month LIBOR USD + 0.450%), 9/25/2035 (b) | | | 9,453,089 | | | | 7,121,607 | |
CountryWide Alternative Loan Trust, Series 2005-42CB, Class A4,
3.190% (1 Month LIBOR USD + 0.680%), 10/25/2035 (b) | | | 2,816,552 | | | | 2,166,624 | |
CountryWide Alternative Loan Trust, Series2005-51, Class 3X2, 0.193%, 11/20/2035 (e)(h) | | | 26,367,701 | | | | 1,666,439 | |
CountryWide Alternative Loan Trust, Series2005-51, Class 4X, 0.357%, 11/20/2035 (e)(h) | | | 31,759,579 | | | | 1,946,354 | |
CountryWide Alternative Loan Trust, Series2005-59, Class 2X, 0.731%, 11/20/2035 (e)(h) | | | 156,899,328 | | | | 7,895,959 | |
CountryWide Alternative Loan Trust, Series2005-51, Class 1X, 1.019%, 11/20/2035 (e)(h) | | | 42,235,408 | | | | 3,369,541 | |
CountryWide Alternative Loan Trust, Series2005-56, Class 4X, 0.984%, 11/25/2035 (e)(h) | | | 42,746,492 | | | | 2,634,253 | |
CountryWide Alternative Loan Trust, Series2005-56, Class 3A1,
2.800% (1 Month LIBOR USD + 0.290%), 11/25/2035 (b) | | | 780,826 | | | | 676,286 | |
CountryWide Alternative Loan Trust, Series2005-J11, Class 1A4,
2.910% (1 Month LIBOR USD + 0.400%), 11/25/2035 (b) | | | 5,533,570 | | | | 3,766,436 | |
CountryWide Alternative Loan Trust, Series2005-63, Class 3A1, 4.121%, 11/25/2035 (e) | | | 3,938,183 | | | | 3,699,439 | |
CountryWide Alternative Loan Trust, Series2005-61, Class 1A1,
3.030% (1 Month LIBOR USD + 0.520%), 12/25/2035 (b) | | | 2,741,105 | | | | 2,621,615 | |
CountryWide Alternative Loan Trust, Series2005-J14, Class A8, 5.500%, 12/25/2035 | | | 2,997,663 | | | | 2,653,546 | |
CountryWide Alternative Loan Trust, Series 2005-70CB, Class A4, 5.500%, 12/25/2035 | | | 7,377,027 | | | | 6,860,834 | |
CountryWide Alternative Loan Trust, Series 2005-75CB, Class A3, 5.500%, 1/25/2036 | | | 2,483,188 | | | | 2,353,488 | |
CountryWide Alternative Loan Trust, Series2006-OA3, Class X, 1.315%, 5/25/2036 (e)(h) | | | 34,467,998 | | | | 2,219,980 | |
CountryWide Alternative Loan Trust, Series 2006-24CB, Class A5,
3.110% (1 Month LIBOR USD + 0.600%), 8/25/2036 (b) | | | 6,144,813 | | | | 4,024,914 | |
CountryWide Alternative Loan Trust, Series 2006-19CB, Class A9,
3.210% (1 Month LIBOR USD + 0.700%), 8/25/2036 (b) | | | 3,378,147 | | | | 2,505,862 | |
CountryWide Alternative Loan Trust, Series 2006-26CB, Class A15,
6.000% (1 Month LIBOR USD + 0.550%), 9/25/2036 (b) | | | 925,705 | | | | 732,262 | |
CountryWide Alternative Loan Trust, Series 2006-29T1, Class 2A13,
2.810% (1 Month LIBOR USD + 0.300%), 10/25/2036 (b) | | | 2,811,376 | | | | 1,900,667 | |
CountryWide Alternative Loan Trust, Series 2006-27CB, Class A4, 6.000%, 11/25/2036 | | | 1,039,759 | | | | 923,613 | |
CountryWide Alternative Loan Trust, Series 2006-40T1, Class 1A5, 6.000%, 1/25/2037 | | | 985,734 | | | | 871,147 | |
CountryWide Alternative Loan Trust, Series2006-J8, Class A2, 6.000%, 2/25/2037 | | | 2,113,609 | | | | 1,480,706 | |
CountryWide Alternative Loan Trust, Series2007-AL1, Class XP, 0.830%, 6/25/2037 (e)(h) | | | 30,331,232 | | | | 2,042,899 | |
CountryWide Alternative Loan Trust, Series2006-OA1, Class 1X, 0.469%, 3/20/2046 (e)(h) | | | 21,182,883 | | | | 913,533 | |
CountryWide Alternative Loan Trust, Series2006-OA2, Class X1P, 0.996%, 5/20/2046 (e)(h) | | | 55,434,226 | | | | 2,506,181 | |
CountryWide Alternative Loan Trust, Series2006-OA7, Class 1X, 0.736%, 6/25/2046 (e)(h) | | | 31,279,440 | | | | 540,728 | |
CountryWide Alternative Loan Trust, Series 2006-OA10, Class XNB, 0.605%, 8/25/2046 (e)(h) | | | 49,635,185 | | | | 2,579,243 | |
CountryWide Alternative Loan Trust, Series 2006-OA10, Class XPP, 0.790%, 8/25/2046 (e)(h) | | | 27,527,697 | | | | 1,135,050 | |
CountryWide Alternative Loan Trust, Series 2006-OA11, Class A1B,
2.700% (1 Month LIBOR USD + 0.190%), 9/25/2046 (b) | | | 1,622,954 | | | | 1,474,830 | |
CountryWide Alternative Loan Trust, Series 2006-OA17, Class 2A1,
2.579% (11th District Cost of Funds Index + 1.500%), 12/20/2046 (b) | | | 3,365,792 | | | | 2,721,997 | |
CountryWide Alternative Loan Trust, Series2007-OA7, Class A1A,
2.690% (1 Month LIBOR USD + 0.180%), 5/25/2047 (b) | | | 852,246 | | | | 809,921 | |
CountryWide Alternative Loan Trust, Series2007-13, Class A1, 6.000%, 6/25/2047 | | | 4,220,933 | | | | 3,668,443 | |
CountryWide Alternative Loan Trust, Series 2007-OA10, Class X, 2.000%, 9/25/2047 (e)(h) | | | 4,197,434 | | | | 337,805 | |
See accompanying notes which are an integral part of these financial statements.
35
Angel Oak Multi-Strategy Income Fund
Consolidated Schedule of Investments – (continued)
January 31, 2019
| | | | | | | | |
| | | Principal
Amount | | | Value | |
| Collateralized Mortgage Obligations – (continued) | | | | | | |
CountryWide Alternative Loan Trust Resecuritization, Series2005-58R, Class A,
0.438%, 12/20/2035 (a)(e)(h) | | $ | 108,801,098 | | | $ | 4,737,853 | |
CountryWide Alternative Loan Trust Resecuritization, Series2005-59R, Class A,
0.556%, 12/20/2035 (a)(e)(h) | | | 25,617,230 | | | | 1,270,794 | |
CountryWide Home Loan Mortgage Pass-Through Trust, Series 2004-HYB3, Class 2A,
3.621%, 6/20/2034 (e) | | | 787,839 | | | | 772,665 | |
CountryWide Home Loan Mortgage Pass-Through Trust, Series2004-25, Class 1X,
0.479%, 2/25/2035 (e)(g)(h) | | | 25,341,195 | | | | 639,992 | |
CountryWide Home Loan Mortgage Pass-Through Trust, Series2004-25, Class 2X,
0.544%, 2/25/2035 (e)(g)(h) | | | 42,663,317 | | | | 918,669 | |
CountryWide Home Loan Mortgage Pass-Through Trust, Series2004-25, Class 2A3,
3.250% (1 Month LIBOR USD + 0.740%), 2/25/2035 (b) | | | 2,662,581 | | | | 2,496,342 | |
CountryWide Home Loan Mortgage Pass-Through Trust, Series2005-2, Class 2X,
0.738%, 3/25/2035 (e)(g)(h) | | | 17,916,078 | | | | 607,265 | |
CountryWide Home Loan Mortgage Pass-Through Trust, Series2005-7, Class 3X,
0.856%, 3/25/2035 (e)(g)(h) | | | 1,761,655 | | | | 64,619 | |
CountryWide Home Loan Mortgage Pass-Through Trust, Series2005-1, Class 1X,
1.061%, 3/25/2035 (e)(g)(h) | | | 7,800,871 | | | | 394,880 | |
CountryWide Home Loan Mortgage Pass-Through Trust, Series2005-7, Clas 3A2,
2.981%, 3/25/2035 (e) | | | 6,485,328 | | | | 5,798,564 | |
CountryWide Home Loan Mortgage Pass-Through Trust, Series2005-2, Class 1A1,
3.150% (1 Month LIBOR USD + 0.640%), 3/25/2035 (b) | | | 1,410,015 | | | | 1,303,700 | |
CountryWide Home Loan Mortgage Pass-Through Trust, Series2005-11, Class 4X,
0.732%, 4/25/2035 (e)(h) | | | 15,743,421 | | | | 345,222 | |
CountryWide Home Loan Mortgage Pass-Through Trust, Series2005-9, Class 1X,
0.743%, 5/25/2035 (e)(g)(h) | | | 65,105,044 | | | | 2,316,307 | |
CountryWide Home Loan Mortgage Pass-Through Trust, Series2006-8, Class 1A1,
6.000%, 5/25/2036 | | | 3,155,122 | | | | 2,978,949 | |
CountryWide Home Loan Mortgage Pass-Through Trust, Series2006-12, Class X,
0.194%, 7/25/2036 (e)(g)(h) | | | 48,801,363 | | | | 375,429 | |
CountryWide Home Loan Mortgage Pass-Through Trust, Series 2007-HYB1, Class 2A1,
3.517%, 3/25/2037 (e) | | | 1,686,525 | | | | 1,583,208 | |
CountryWide Home Loan Mortgage Pass-Through Trust, Series2007-4, Class 1A1,
6.000%, 5/25/2037 | | | 1,833,073 | | | | 1,456,369 | |
CountryWide Home Loan Mortgage Pass-Through Trust, Series2007-7, Class A3,
5.750%, 6/25/2037 | | | 1,273,611 | | | | 1,119,199 | |
CountryWide Home Loan Mortgage Pass-Through Trust, Series2007-J2, Class 2A1,
3.160% (1 Month LIBOR USD + 0.650%), 7/25/2037 (b) | | | 6,827,841 | | | | 3,645,965 | |
Credit Suisse First Boston Mortgage Securities Corp., Series2004-AR8, Class 8M1,
3.660% (1 Month LIBOR USD + 1.150%), 9/25/2034 (b) | | | 782,673 | | | | 773,151 | |
Credit Suisse First Boston Mortgage Securities Corp., Series2005-9, Class 4A2,
2.860% (1 Month LIBOR USD + 0.350%), 10/25/2035 (b) | | | 1,604,405 | | | | 1,388,935 | |
Credit Suisse First Boston Mortgage Securities Corp., Series2005-10, Class 6A12,
5.500%, 11/25/2035 | | | 3,831,345 | | | | 3,391,782 | |
Credit Suisse Mortgage Capital Certificates, Series2006-2, Class 6A8, 5.750%, 3/25/2036 | | | 2,028,722 | | | | 1,864,114 | |
Credit Suisse Mortgage Trust, Series2017-HD, Class E,
6.159% (1 Month LIBOR USD + 3.650%), 2/18/2031 (a)(b) | | | 8,000,000 | | | | 8,015,424 | |
Credit Suisse Mortgage Trust, Series2015-6R, Class 1A2, 4.096%, 7/27/2035 (a)(e) | | | 6,832,883 | | | | 5,711,463 | |
Credit Suisse Mortgage Trust, Series2010-20R, Class 5A4, 3.500%, 9/27/2035 (a)(e) | | | 9,254,289 | | | | 9,335,791 | |
See accompanying notes which are an integral part of these financial statements.
36
Angel Oak Multi-Strategy Income Fund
Consolidated Schedule of Investments – (continued)
January 31, 2019
| | | | | | | | |
| | | Principal
Amount | | | Value | |
| Collateralized Mortgage Obligations – (continued) | | | | | | |
Credit Suisse Mortgage Trust, Series2014-3R, Class 1A1,
2.956% (1 Month LIBOR USD + 0.450%), 3/27/2036 (a)(b) | | $ | 5,333,888 | | | $ | 5,160,409 | |
Credit Suisse Mortgage Trust, Series 2016-NXSR, Class C, 4.362%, 12/17/2049 (e) | | | 5,000,000 | | | | 4,874,195 | |
CSAIL Commercial Mortgage Trust, Series2018-C14, Class C, 4.894%, 11/17/2051 (e) | | | 9,000,000 | | | | 8,924,796 | |
CSAIL Commercial Mortgage Trust, Series2015-C2, Class AS, 3.849%, 6/15/2057 (e) | | | 4,500,000 | | | | 4,629,096 | |
CSMC Mortgage-Backed Trust, Series2006-4, Class 1A3, 6.000%, 5/25/2036 | | | 1,673,933 | | | | 1,463,836 | |
CSMC Mortgage-Backed Trust, Series2006-9, Class 2A1, 5.500%, 11/25/2036 | | | 842,066 | | | | 806,040 | |
CSMC Trust, Series 2018-RPL7, Class A1, 4.000%, 8/26/2058 (a) | | | 43,078,289 | | | | 43,192,231 | |
CSMCM Trust, Series 2018-RPL1, 3.247%, 7/25/2057 (a)(e)(g) | | | 19,099,383 | | | | 16,438,190 | |
CSWF Trust, Series2018-TOP, Class E,
4.759% (1 Month LIBOR USD + 2.250%), 8/15/2035 (a)(b) | | | 6,000,000 | | | | 5,984,928 | |
CSWF Trust, Series2018-TOP, Class G,
5.759% (1 Month LIBOR USD + 3.250%), 8/15/2035 (a)(b) | | | 7,000,000 | | | | 6,971,909 | |
DBGS Mortgage Trust, Series 2018-BIOD, Class F,
4.509% (1 Month LIBOR USD + 2.000%), 5/15/2035 (a)(b) | | | 4,176,625 | | | | 4,057,888 | |
Deephaven Residential Mortgage Trust, Series2017-1A, Class A3, 3.485%, 12/26/2046 (a)(e) | | | 497,804 | | | | 495,160 | |
Deephaven Residential Mortgage Trust, Series2017-1A, Class M1, 4.498%, 12/26/2046 (a)(e) | | | 3,250,000 | | | | 3,248,840 | |
Deephaven Residential Mortgage Trust, Series2017-2A, Class A3, 2.708%, 6/25/2047 (a)(e) | | | 1,780,920 | | | | 1,779,711 | |
Deephaven Residential Mortgage Trust, Series2017-2A, Class M1, 3.897%, 6/25/2047 (a)(e) | | | 2,633,086 | | | | 2,652,605 | |
Deephaven Residential Mortgage Trust, Series2017-2A, Class B1, 5.269%, 6/25/2047 (a)(e) | | | 6,050,570 | | | | 6,063,016 | |
Deephaven Residential Mortgage Trust, Series2017-3A, Class A1, 2.577%, 10/25/2047 (a)(e) | | | 3,237,464 | | | | 3,238,241 | |
Deephaven Residential Mortgage Trust, Series2017-3A, Class M1, 3.511%, 10/25/2047 (a)(e) | | | 3,830,165 | | | | 3,856,976 | |
Deephaven Residential Mortgage Trust, Series2017-3A, Class B1, 4.814%, 10/25/2047 (a)(e) | | | 1,729,894 | | | | 1,745,368 | |
Deephaven Residential Mortgage Trust, Series2018-1A, Class A2, 3.027%, 12/25/2057 (a)(e) | | | 1,025,165 | | | | 1,035,961 | |
Deephaven Residential Mortgage Trust, Series2018-1A, Class B1, 4.340%, 12/25/2057 (a)(e) | | | 5,400,000 | | | | 5,322,283 | |
Deephaven Residential Mortgage Trust, Series2018-2A, Class M1, 4.375%, 4/25/2058 (a) | | | 2,628,524 | | | | 2,632,138 | |
Deephaven Residential Mortgage Trust, Series2018-2A, Class B1, 4.776%, 4/25/2058 (a) | | | 3,178,762 | | | | 3,183,244 | |
Deephaven Residential Mortgage Trust, Series2018-4A, Class A1, 4.080%, 10/25/2058 (a) | | | 8,748,251 | | | | 8,837,667 | |
Deephaven Residential Mortgage Trust, Series2018-4A, Class B2, 6.125%, 10/25/2058 (a) | | | 6,710,000 | | | | 6,675,665 | |
DeustcheAlt-A Securities, Inc. Mortgage Loan Trust, Series2005-5, Class 2A7,
5.500%, 11/25/2035 | | | 443,270 | | | | 365,087 | |
DeutchseAlt-A Securities, Inc. Mortgage Loan Trust, Series2007-AR2, Class A4,
2.645% (1 Month LIBOR USD + 0.135%), 3/25/2037 (b) | | | 1,532,338 | | | | 1,457,679 | |
DeutscheAlt-A Securities, Inc. Mortgage Loan Trust, Series2005-3, Class 2A1,
5.575%, 6/25/2020 (e) | | | 44,923 | | | | 45,706 | |
DeutscheAlt-A Securities, Inc. Mortgage Loan Trust, Series2005-2, Class 1A5,
3.010% (1 Month LIBOR USD + 0.500%), 4/25/2035 (b) | | | 673,190 | | | | 640,338 | |
DeutscheAlt-A Securities, Inc. Mortgage Loan Trust, Series2005-AR1, Class 1A1,
2.820% (1 Month LIBOR USD + 0.310%), 8/25/2035 (b) | | | 4,120,315 | | | | 3,646,610 | |
DeutscheAlt-A Securities, Inc. Mortgage Loan Trust, Series2005-5, Class 2A4,
5.500%, 11/25/2035 | | | 2,943,330 | | | | 2,617,203 | |
DeutscheAlt-A Securities, Inc. Mortgage Loan Trust, Series2005-6, Class 1A4,
5.500%, 12/25/2035 | | | 750,078 | | | | 706,627 | |
DeutscheAlt-A Securities, Inc. Mortgage Loan Trust, Series2006-AR1, Class 1A3,
2.840% (1 Month LIBOR USD + 0.330%), 2/25/2036 (b) | | | 24,242,742 | | | | 23,276,668 | |
DeutscheAlt-A Securities, Inc. Mortgage Loan Trust, Series2006-AR1, Class 3A1,
4.049%, 2/25/2036 (e) | | | 752,721 | | | | 716,728 | |
DeutscheAlt-A Securities, Inc. Mortgage Loan Trust, Series2006-AR1, Class 2A1,
4.174%, 2/25/2036 (e) | | | 923,496 | | | | 767,366 | |
See accompanying notes which are an integral part of these financial statements.
37
Angel Oak Multi-Strategy Income Fund
Consolidated Schedule of Investments – (continued)
January 31, 2019
| | | | | | | | |
| | | Principal
Amount | | | Value | |
| Collateralized Mortgage Obligations – (continued) | | | | | | |
DeutscheAlt-A Securities, Inc. Mortgage Loan Trust, Series2006-AR2, Class 1A2,
2.690% (1 Month LIBOR USD + 0.180%), 5/25/2036 (b) | | $ | 24,861,342 | | | $ | 23,349,921 | |
DeutscheAlt-A Securities, Inc. Mortgage Loan Trust, Series2006-AR3, Class A2,
2.630% (1 Month LIBOR USD + 0.120%), 8/25/2036 (b) | | | 1,206,734 | | | | 1,139,486 | |
DeutscheAlt-A Securities, Inc. Mortgage Loan Trust, Series2006-AR4, Class A2,
2.700% (1 Month LIBOR USD + 0.190%), 12/25/2036 (b)(i) | | | 22,106,253 | | | | 13,171,746 | |
DeutscheAlt-A Securities, Inc. Mortgage Loan Trust, Series2006-AR6, Class A4,
2.680% (1 Month LIBOR USD + 0.170%), 2/25/2037 (b) | | | 2,181,615 | | | | 2,109,656 | |
DeutscheAlt-A Securities, Inc. Mortgage Loan Trust, Series2006-AR6, Class A6,
2.700% (1 Month LIBOR USD + 0.190%), 2/25/2037 (b) | | | 2,780,685 | | | | 2,479,047 | |
DeutscheAlt-A Securities, Inc. Mortgage Loan Trust, Series2007-AR2, Class A1,
2.660% (1 Month LIBOR USD + 0.150%), 3/25/2037 (b) | | | 14,699,729 | | | | 13,828,872 | |
DeutscheAlt-A Securities, Inc. Mortgage Loan Trust, Series 2007-BAR1, Class A3,
2.670% (1 Month LIBOR USD + 0.160%), 3/25/2037 (b)(i) | | | 22,865,483 | | | | 15,961,365 | |
DeutscheAlt-A Securities, Inc. Mortgage Loan Trust, Series 2007-BAR1, Class A4,
2.750% (1 Month LIBOR USD + 0.240%), 3/25/2037 (b) | | | 74,705,946 | | | | 9,569,608 | |
DeutscheAlt-A Securities, Inc. Mortgage Loan Trust, Series2007-AB1, Class PO,
0.000%, 4/25/2037 (c) | | | 935,401 | | | | 663,296 | |
DeutscheAlt-A Securities, Inc. Mortgage Loan Trust, Series2007-AB1, Class A1,
2.810% (1 Month LIBOR USD + 0.300%), 4/25/2037 (b) | | | 20,424,018 | | | | 14,264,298 | |
DeutscheAlt-A Securities, Inc. Mortgage Loan Trust, Series2007-AR3, Class 2A5,
2.710% (1 Month LIBOR USD + 0.200%), 6/25/2037 (b) | | | 20,328,390 | | | | 18,512,475 | |
DeutscheAlt-A Securities, Inc. Mortgage Loan Trust, Series2007-AR3, Class 2A4,
2.860% (1 Month LIBOR USD + 0.350%), 6/25/2037 (b) | | | 28,079,013 | | | | 24,489,336 | |
DeutscheAlt-A Securities, Inc. Mortgage Loan Trust, Series2007-AR1, Class A4,
2.670% (1 Month LIBOR USD + 0.160%), 1/25/2047 (b) | | | 608,406 | | | | 591,264 | |
DeutscheAlt-A Securities, Inc. Mortgage Loan Trust, Series2007-AR1, Class A2,
2.690% (1 Month LIBOR USD + 0.180%), 1/25/2047 (b) | | | 742,786 | | | | 654,101 | |
DeutscheAlt-A Securities, Inc. Mortgage Loan Trust, Series2007-AR1, Class A5,
2.750% (1 Month LIBOR USD + 0.240%), 1/25/2047 (b) | | | 1,991,014 | | | | 1,725,213 | |
DeutscheAlt-A Securities, Inc. Mortgage Loan Trust, Series2007-OA1, Class A1,
2.660% (1 Month LIBOR USD + 0.150%), 2/25/2047 (b) | | | 10,242,384 | | | | 8,491,622 | |
DeutscheAlt-A Securities, Inc. Mortgage Loan Trust, Series2006-OA1, Class A1,
2.710% (1 Month LIBOR USD + 0.200%), 2/25/2047 (b) | | | 11,055,410 | | | | 10,455,897 | |
DeutscheAlt-A Securities, Inc. Mortgage Loan Trust, Series2007-OA3, Class A1,
2.650% (1 Month LIBOR USD + 0.140%), 7/25/2047 (b)(i) | | | 51,265,370 | | | | 48,970,168 | |
DeutscheAlt-A Securities, Inc. Mortgage Loan Trust, Series2007-OA4, Class 1A1B,
2.640% (1 Month LIBOR USD + 0.130%), 8/25/2047 (b) | | | 10,654,148 | | | | 9,974,360 | |
DeutscheAlt-A Securities, Inc. Mortgage Loan Trust, Series2007-OA4, Class 1A1A,
2.700% (1 Month LIBOR USD + 0.190%), 8/25/2047 (b) | | | 11,716,542 | | | | 11,190,610 | |
DeutscheAlt-A Securities, Inc. Mortgage Loan Trust, Series2007-OA4, Class 2A1,
2.710% (1 Month LIBOR USD + 0.200%), 8/25/2047 (b)(i) | | | 20,664,157 | | | | 19,611,070 | |
DeutscheAlt-A Securities, Inc. Mortgage Loan Trust, Series2007-OA5, Class A1A,
2.710% (1 Month LIBOR USD + 0.200%), 8/25/2047 (b) | | | 2,148,170 | | | | 1,999,519 | |
DeutscheAlt-A Securities, Inc. Mortgage Loan Trust, Series2007-OA4, Class A4,
2.720% (1 Month LIBOR USD + 0.210%), 8/25/2047 (b) | | | 33,327,672 | | | | 32,246,956 | |
DeutscheAlt-A Securities, Inc. Mortgage Loan Trust, Series2007-2, Class 2A1,
2.810% (1 Month LIBOR USD + 0.300%), 9/25/2047 (b) | | | 19,655,998 | | | | 17,138,654 | |
See accompanying notes which are an integral part of these financial statements.
38
Angel Oak Multi-Strategy Income Fund
Consolidated Schedule of Investments – (continued)
January 31, 2019
| | | | | | | | |
| | | Principal
Amount | | | Value | |
| Collateralized Mortgage Obligations – (continued) | | | | | | |
DeutscheAlt-A Securities, Inc. Mortgage Loan Trust, Series2007-3, Class 1A1,
4.220% (1 Month LIBOR USD + 1.700%), 10/25/2047 (b) | | $ | 35,787,581 | | | $ | 33,746,937 | |
DeutscheAlt-B Securities, Inc. Mortgage Loan Trust, Series2006-AB1, Class A2D, 5.720%, 2/25/2036 (e) | | | 6,747,939 | | | | 6,676,762 | |
DeutscheAlt-B Securities, Inc. Mortgage Loan Trust, Series2006-AB2, Class A1, 5.301%, 6/25/2036 (e) | | | 684,696 | | | | 668,056 | |
DeutscheAlt-B Securities, Inc. Mortgage Loan Trust, Series2006-AB2, Class A8, 5.301%, 6/25/2036 (e) | | | 5,681,901 | | | | 5,495,330 | |
DeutscheAlt-B Securities, Inc. Mortgage Loan Trust, Series2006-AB2, Class A2, 5.301%, 6/25/2036 (e) | | | 3,046,387 | | | | 2,966,840 | |
DeutscheAlt-B Securities, Inc. Mortgage Loan Trust, Series2006-AB2, Class A3, 5.301%, 6/25/2036 (e) | | | 961,247 | | | | 935,467 | |
DeutscheAlt-B Securities, Inc. Mortgage Loan Trust, Series2006-AB2, Class A5B,
5.301%, 6/25/2036 (d) | | | 666,601 | | | | 639,616 | |
DeutscheAlt-B Securities, Inc. Mortgage Loan Trust, Series2006-AB3, Class A1, 6.250%, 7/25/2036 (e) | | | 373,651 | | | | 330,607 | |
DeutscheAlt-B Securities, Inc. Mortgage Loan Trust, Series2006-AB3, Class A5B,
6.300%, 7/25/2036 (d) | | | 362,240 | | | | 328,628 | |
DeutscheAlt-B Securities, Inc. Mortgage Loan Trust, Series2006-AB3, Class A2, 6.420%, 7/25/2036 (e) | | | 3,734,107 | | | | 3,304,614 | |
DeutscheAlt-B Securities, Inc. Mortgage Loan Trust, Series2006-AB4, Class A4B,
6.000%, 10/25/2036 (d) | | | 11,182,348 | | | | 10,683,917 | |
Deutsche Mortgage Securities, Inc.Re-REMIC Trust, Series2007-WM1, Class A1,
3.637%, 6/27/2037 (a)(e)(i) | | | 25,100,978 | | | | 24,797,532 | |
DSLA Mortgage Loan Trust, Series2005-AR2, Class C, 0.000%, 3/19/2045 | | | 1 | | | | 500,641 | |
DSLA Mortgage Loan Trust, Series2006-AR2, Class 1A1A,
2.696% (1 Month LIBOR USD + 0.190%), 10/19/2036 (b) | | | 15,124,457 | | | | 13,466,438 | |
DSLA Mortgage Loan Trust, Series2006-AR2, Class 2A1A,
2.706% (1 Month LIBOR USD + 0.200%), 10/19/2036 (b) | | | 28,986,663 | | | | 26,271,569 | |
DSLA Mortgage Loan Trust, Series2007-AR1, Class 2A1A,
2.646% (1 Month LIBOR USD + 0.140%), 3/19/2037 (b)(i) | | | 42,164,150 | | | | 39,270,593 | |
DSLA Mortgage Loan Trust, Series2007-AR1, Class 1A1A,
2.646% (1 Month LIBOR USD + 0.140%), 3/19/2037 (b)(i) | | | 45,816,349 | | | | 42,429,284 | |
DSLA Mortgage Loan Trust, Series2004-AR1, Class A2A,
3.326% (1 Month LIBOR USD + 0.820%), 9/19/2044 (b) | | | 1,698,504 | | | | 1,661,037 | |
DSLA Mortgage Loan Trust, Series2004-AR4, Class X2, 0.359%, 1/19/2045 (e)(g)(h) | | | 29,299,312 | | | | 449,598 | |
DSLA Mortgage Loan Trust, Series2005-AR1, Class C, 0.000%, 2/19/2045 (e) | | | 1,000,000 | | | | 9,186 | |
DSLA Mortgage Loan Trust, Series2005-AR1, Class X2, 0.855%, 3/19/2045 (e)(h) | | | 55,803,395 | | | | 1,382,641 | |
DSLA Mortgage Loan Trust, Series2005-AR1, Class 1A,
2.776% (1 Month LIBOR USD + 0.270%), 3/19/2045 (b)(i) | | | 33,359,900 | | | | 30,829,518 | |
DSLA Mortgage Loan Trust, Series2005-AR2, Class 2A1A,
2.716% (1 Month LIBOR USD + 0.210%), 6/19/2045 (b) | | | 7,752,241 | | | | 7,432,391 | |
DSLA Mortgage Loan Trust, Series2005-AR2, Class 2A1C,
2.726% (1 Month LIBOR USD + 0.220%), 6/19/2045 (b) | | | 5,620,919 | | | | 5,443,939 | |
DSLA Mortgage Loan Trust, Series2005-AR4, Class 2A1A,
2.766% (1 Month LIBOR USD + 0.260%), 8/19/2045 (b) | | | 2,509,702 | | | | 2,454,855 | |
DSLA Mortgage Loan Trust, Series2005-AR4, Class 1A,
2.766% (1 Month LIBOR USD + 0.260%), 8/19/2045 (b) | | | 318,357 | | | | 280,796 | |
See accompanying notes which are an integral part of these financial statements.
39
Angel Oak Multi-Strategy Income Fund
Consolidated Schedule of Investments – (continued)
January 31, 2019
| | | | | | | | |
| | | Principal
Amount | | | Value | |
| Collateralized Mortgage Obligations – (continued) | | | | | | |
DSLA Mortgage Loan Trust, Series2005-AR5, Class 2A1A,
2.836% (1 Month LIBOR USD + 0.330%), 9/19/2045 (b) | | $ | 14,921,251 | | | $ | 12,212,477 | |
DSLA Mortgage Loan Trust, Series2006-AR1, Class 1A1A,
3.172% (12 Month US Treasury Average + 0.920%), 3/19/2046 (b) | | | 18,412,924 | | | | 16,959,224 | |
Ellington Financial Mortgage Trust, Series2017-1, Class A1, 2.687%, 10/25/2047 (a)(e) | | | 4,755,112 | | | | 4,755,887 | |
Ellington Financial Mortgage Trust, Series2017-1, Class B1, 5.178%, 10/25/2047 (a)(e) | | | 1,564,564 | | | | 1,567,715 | |
Ellington Financial Mortgage Trust, Series2018-1, Class AFLA,
3.260% (1 Month LIBOR USD + 0.750%), 10/25/2058 (a)(b) | | | 2,113,164 | | | | 2,118,491 | |
Ellington Financial Mortgage Trust, Series2018-1, Class AFLB,
3.410% (1 Month LIBOR USD + 0.900%), 10/25/2058 (a)(b) | | | 10,543,628 | | | | 10,570,208 | |
Ellington Financial Mortgage Trust, Series2018-1, Class B1, 5.574%, 10/25/2058 (a) | | | 6,416,080 | | | | 6,432,255 | |
First Horizon Alternative Mortgage Securities Trust, Series2005-AA9, Class 3A1,
4.044%, 11/25/2035 (e) | | | 2,711,866 | | | | 2,450,198 | |
First Horizon Alternative Mortgage Securities Trust, Series2005-FA8, Class 1A18,
5.500%, 11/25/2035 | | | 12,505 | | | | 10,919 | |
First Horizon Alternative Mortgage Securities Trust, Series2006-FA1, Class 1A8,
3.010% (1 Month LIBOR USD + 0.500%), 4/25/2036 (b) | | | 5,475,840 | | | | 3,493,723 | |
First Horizon Alternative Mortgage Securities Trust, Series2006-FA1, Class 1A3, 5.750%, 4/25/2036 | | | 332,412 | | | | 275,062 | |
First Horizon Alternative Mortgage Securities Trust, Series2006-FA1, Class 1A12,
6.000%, 4/25/2036 | | | 324,195 | | | | 274,393 | |
First Horizon Alternative Mortgage Securities Trust, Series2006-AA2, Class 2A1,
3.903%, 5/25/2036 (e) | | | 945,676 | | | | 855,859 | |
First Horizon Alternative Mortgage Securities Trust, Series2006-FA3, Class A13, 6.000%, 7/25/2036 | | | 2,094,510 | | | | 1,842,264 | |
First Horizon Alternative Mortgage Securities Trust, Series2006-FA3, Class A3, 6.000%, 7/25/2036 | | | 10,837,028 | | | | 9,436,776 | |
First Horizon Alternative Mortgage Securities Trust, Series2006-FA3, Class A2, 6.000%, 7/25/2036 | | | 2,035,803 | | | | 1,790,628 | |
First Horizon Alternative Mortgage Securities Trust, Series2006-AA8, Class 2A1,
3.953%, 1/25/2037 (e) | | | 972,370 | | | | 792,844 | |
First Horizon Alternative Mortgage Securities Trust, Series2006-AA7, Class A1,
4.074%, 1/25/2037 (e) | | | 87,925 | | | | 80,442 | |
First Horizon Alternative Mortgage Securities Trust, Series2007-FA5, Class A9, 7.000%, 11/25/2037 | | | 12,765,973 | | | | 8,446,478 | |
First Horizon Mortgage Pass-Through Trust, Series2005-AR4, Class 4A3, 4.591%, 9/25/2035 (e) | | | 118,909 | | | | 109,005 | |
First Horizon Mortgage Pass-Through Trust, Series2005-AR5, Class 2A1, 4.695%, 11/25/2035 (e) | | | 1,168,386 | | | | 1,115,159 | |
Flagstar Mortgage Trust, Series2018-6RR, Class 1A2,
3.210% (1 Month LIBOR USD + 0.700%), 10/25/2048 (a)(b) | | | 4,369,599 | | | | 4,348,113 | |
FNBA Mortgage Loan Trust, Series2004-AR1, Class A3,
2.986% (1 Month LIBOR USD + 0.480%), 8/19/2034 (b) | | | 4,931 | | | | 4,873 | |
Galton Funding Mortgage Trust, Series2017-1, Class A21, 3.500%, 7/25/2056 (a)(e) | | | 13,844,626 | | | | 13,778,435 | |
GMAC Mortgage Corp. Loan Trust, Series2005-AR5, Class 5A1, 4.156%, 9/19/2035 (e) | | | 244,204 | | | | 228,945 | |
GMACM Mortgage Loan Trust, Series2006-AR1, Class 1A1, 4.001%, 4/19/2036 (e) | | | 1,448,332 | | | | 1,345,816 | |
GPMT Ltd., Series2018-FL1, Class A,
3.403% (1 Month LIBOR USD + 0.900%), 11/21/2035 (a)(b) | | | 850,000 | | | | 846,631 | |
GreenPoint Mortgage Funding Trust, Series2006-OH1, Class A1,
2.690% (1 Month LIBOR USD + 0.180%), 1/25/2037 (b) | | | 8,709,056 | | | | 8,110,613 | |
See accompanying notes which are an integral part of these financial statements.
40
Angel Oak Multi-Strategy Income Fund
Consolidated Schedule of Investments – (continued)
January 31, 2019
| | | | | | | | |
| | | Principal
Amount | | | Value | |
| Collateralized Mortgage Obligations – (continued) | | | | | | |
GreenPoint Mortgage Funding Trust, Series2007-AR1, Class 3A2,
2.670% (1 Month LIBOR USD + 0.160%), 2/25/2037 (b) | | $ | 2,150,059 | | | $ | 2,127,656 | |
GreenPoint Mortgage Funding Trust, Series2007-AR1, Class 3A3,
2.740% (1 Month LIBOR USD + 0.230%), 2/25/2037 (b) | | | 18,620,049 | | | | 15,879,308 | |
GreenPoint Mortgage Funding Trust, Series2007-AR2, Class 2A1,
2.710% (1 Month LIBOR USD + 0.200%), 5/25/2037 (b) | | | 6,625,956 | | | | 6,265,815 | |
GreenPoint Mortgage Funding Trust, Series2007-AR3, Class A1,
2.730% (1 Month LIBOR USD + 0.220%), 6/25/2037 (b) | | | 5,633,658 | | | | 5,159,045 | |
GreenPoint Mortgage Funding Trust, Series2005-AR4, Class 4A1A,
3.130% (1 Month LIBOR USD + 0.620%), 10/25/2045 (b) | | | 2,162,401 | | | | 1,918,487 | |
GreenPoint MTA Trust, Series2005-AR1, Class X1, 1.035%, 6/25/2045 (e)(g)(h) | | | 13,824,879 | | | | 583,838 | |
GreenPoint MTA Trust, Series2005-AR3, Class X1, 1.180%, 8/25/2045 (e)(g)(h) | | | 38,974,818 | | | | 2,673,400 | |
GS Mortgage Securities Corp. II, Series 2018-RIVR, Class G,
5.109% (1 Month LIBOR USD + 2.600%), 7/16/2035 (a)(b) | | | 5,000,000 | | | | 4,931,590 | |
GS Mortgage Securities Corp. Trust, Series2018-TWR, Class A,
3.409% (1 Month LIBOR USD + 0.900%), 7/15/2031 (a)(b) | | | 250,000 | | | | 250,314 | |
GS Mortgage Securities Corp. Trust, Series 2018-3PCK, Class A,
3.959% (1 Month LIBOR USD + 1.450%), 9/15/2031 (a)(b) | | | 5,000,000 | | | | 4,894,330 | |
GS Mortgage Securities Trust, Series 2018-HART, Class D,
4.709% (1 Month LIBOR USD + 2.200%), 10/15/2031 (a)(b) | | | 4,250,000 | | | | 4,239,541 | |
GS Mortgage Securities Trust, Series 2018-HART, Class E,
5.259% (1 Month LIBOR USD + 2.750%), 10/15/2031 (a)(b) | | | 7,300,000 | | | | 7,318,243 | |
GS Mortgage Securities Trust, Series 2018-HART, Class F,
6.409% (1 Month LIBOR USD + 3.900%), 10/15/2031 (a)(b) | | | 1,250,000 | | | | 1,252,861 | |
GS Mortgage Securities Trust, Series 2018-CHLL, Class F,
5.809% (1 Month LIBOR USD + 3.300%), 2/17/2037 (a)(b) | | | 12,500,000 | | | | 12,539,438 | |
GS Mortgage Securities Trust, Series 2014-GC20, Class C, 4.965%, 4/12/2047 (e) | | | 1,750,000 | | | | 1,731,664 | |
GS Mortgage Securities Trust, Series 2014-GC22, Class C, 4.689%, 6/12/2047 (e) | | | 293,000 | | | | 297,454 | |
GS Mortgage Securities Trust, Series 2014-GC24, Class D, 4.529%, 9/12/2047 (a)(e)(i) | | | 12,000,000 | | | | 10,469,748 | |
GS Mortgage Securities Trust, Series 2015-GC34, Class C, 4.653%, 10/13/2048 (e)(i) | | | 7,000,000 | | | | 7,028,945 | |
GS Mortgage Securities Trust, Series2015-GS1, Class C, 4.421%, 11/13/2048 (e) | | | 10,100,000 | | | | 9,980,052 | |
GSAA Resecuritization Mortgage Trust, Series2005-R1, Class 1A1,
3.010% (1 Month LIBOR USD + 0.500%), 4/25/2035 (a)(b) | | | 1,934,792 | | | | 1,574,888 | |
GSMSC Resecuritization Trust, Series2014-3R, Class 1B,
2.686% (1 Month LIBOR USD + 0.180%), 11/26/2036 (a)(b) | | | 10,304,676 | | | | 6,765,875 | |
GSMSC Resecuritization Trust, Series2014-5R, Class 3B2,
2.620% (1 Month LIBOR USD + 0.150%), 2/26/2037 (a)(b) | | | 5,707,000 | | | | 5,112,930 | |
GSMSC Resecuritization Trust, Series2014-5R, Class 3B1,
2.620% (1 Month LIBOR USD + 0.150%), 2/26/2037 (a)(b) | | | 5,707,000 | | | | 5,231,361 | |
GSMSC Resecuritization Trust, Series2014-5R, Class 3B3,
2.620% (1 Month LIBOR USD + 0.150%), 2/26/2037 (a)(b) | | | 5,707,000 | | | | 4,727,165 | |
GSMSC Resecuritization Trust, Series2014-5R, Class 3B4,
2.620% (1 Month LIBOR USD + 0.150%), 2/26/2037 (a)(b) | | | 5,709,149 | | | | 3,858,374 | |
GSR Mortgage Loan Trust, Series2005-AR3, Class 8A1, 3.921%, 5/25/2035 (e) | | | 1,968,507 | | | | 1,940,090 | |
GSR Mortgage Loan Trust, Series2005-AR3, Class 5A1, 4.095%, 5/25/2035 (e) | | | 2,753,245 | | | | 2,713,833 | |
GSR Mortgage Loan Trust, Series2005-6F, Class 3A1,
3.010% (1 Month LIBOR USD + 0.500%), 7/25/2035 (b) | | | 1,219,055 | | | | 1,185,471 | |
GSR Mortgage Loan Trust, Series2005-AR5, Class 2A3, 4.191%, 10/25/2035 (e) | | | 1,421,327 | | | | 1,276,154 | |
GSR Mortgage Loan Trust, Series2006-1F, Class 2A5, 6.000%, 2/25/2036 | | | 1,790,259 | | | | 1,700,774 | |
See accompanying notes which are an integral part of these financial statements.
41
Angel Oak Multi-Strategy Income Fund
Consolidated Schedule of Investments – (continued)
January 31, 2019
| | | | | | | | |
| | | Principal
Amount | | | Value | |
| Collateralized Mortgage Obligations – (continued) | | | | | | |
GSR Mortgage Loan Trust, Series2006-2F, Class 3A4, 6.000%, 2/25/2036 | | $ | 511,917 | | | $ | 435,524 | |
GSR Mortgage Loan Trust, Series2006-7F, Class 4A2, 6.500%, 8/25/2036 | | | 1,355,497 | | | | 981,649 | |
GSR Mortgage Loan Trust, Series2007-AR1, Class 2A1, 4.169%, 3/25/2037 (e) | | | 10,836,970 | | | | 10,085,589 | |
GSR Mortgage Loan Trust, Series2007-2F, Class 3A3, 6.000%, 3/25/2037 | | | 612,355 | | | | 587,669 | |
GSR Mortgage Loan Trust, Series2007-2F, Class 3A7, 6.000%, 3/25/2037 | | | 13,307,865 | | | | 12,854,107 | |
GSR Mortgage Loan Trust, Series2007-3F, Class 4A1,
2.810% (1 Month LIBOR USD + 0.300%), 4/25/2037 (b) | | | 7,499,390 | | | | 3,925,331 | |
GSR Mortgage Loan Trust, Series2007-AR2, Class 1A1, 3.841%, 5/25/2037 (e) | | | 272,713 | | | | 243,872 | |
HarborView Mortgage Loan Trust, Series2004-7, Class X1, 0.500%, 11/19/2034 (e)(g)(h) | | | 3,671,843 | | | | 49,809 | |
HarborView Mortgage Loan Trust, Series2004-8, Class 2A4A,
3.306% (1 Month LIBOR USD + 0.800%), 11/19/2034 (b) | | | 376,600 | | | | 367,280 | |
HarborView Mortgage Loan Trust, Series2004-9, Class 4A2,
3.286% (1 Month LIBOR USD + 0.780%), 12/19/2034 (b) | | | 4,617,905 | | | | 4,200,982 | |
HarborView Mortgage Loan Trust, Series2004-11, Class X1, 0.270%, 1/19/2035 (e)(h) | | | 11,034,040 | | | | 225,889 | |
HarborView Mortgage Loan Trust, Series2005-1, Class X, 0.000%, 3/19/2035 (e)(g)(h) | | | 13,978,311 | | | | 657,023 | |
HarborView Mortgage Loan Trust, Series2005-2, Class X, 0.545%, 5/19/2035 (e)(h) | | | 10,813,328 | | | | 363,425 | |
HarborView Mortgage Loan Trust, Series2005-3, Class X2, 0.490%, 6/19/2035 (e)(g)(h) | | | 107,405,954 | | | | 4,355,741 | |
HarborView Mortgage Loan Trust, Series2005-4, Class 3A1, 4.096%, 7/19/2035 (e) | | | 1,591,646 | | | | 1,486,985 | |
HarborView Mortgage Loan Trust, Series2005-4, Class 1A, 4.734%, 7/19/2035 (e) | | | 792,001 | | | | 766,885 | |
HarborView Mortgage Loan Trust, Series2005-8, Class 2A2A,
3.752% (12 Month US Treasury Average + 1.500%), 9/19/2035 (b) | | | 3,464,417 | | | | 3,206,197 | |
HarborView Mortgage Loan Trust, Series2005-12, Class X2B, 0.152%, 10/19/2035 (e)(h) | | | 15,149,213 | | | | 630,677 | |
HarborView Mortgage Loan Trust, Series2005-16, Class X3, 0.635%, 1/19/2036 (e)(h) | | | 14,143,258 | | | | 825,500 | |
HarborView Mortgage Loan Trust, Series2005-16, Class 3A1A,
2.970% (1 Month LIBOR USD + 0.500%), 1/19/2036 (b) | | | 1,676,958 | | | | 1,413,746 | |
HarborView Mortgage Loan Trust, Series2005-13, Class X, 0.000%, 2/19/2036 (e)(g)(h) | | | 27,037,399 | | | | 469,153 | |
HarborView Mortgage Loan Trust, Series2006-13, Class X, 0.765%, 6/19/2036 (e)(h) | | | 26,110,212 | | | | 790,043 | |
HarborView Mortgage Loan Trust, Series2006-10, Class 2A1A,
2.686% (1 Month LIBOR USD + 0.180%), 11/19/2036 (b)(i) | | | 33,031,306 | | | | 31,499,546 | |
HarborView Mortgage Loan Trust, Series2006-11, Class A1A,
2.676% (1 Month LIBOR USD + 0.170%), 12/19/2036 (b) | | | 4,377,741 | | | | 3,986,279 | |
HarborView Mortgage Loan Trust, Series2006-12, Class 2A2A,
2.696% (1 Month LIBOR USD + 0.190%), 12/19/2036 (b)(i) | | | 27,669,883 | | | | 26,248,232 | |
HarborView Mortgage Loan Trust, Series2006-12, Class 2A13,
2.746% (1 Month LIBOR USD + 0.240%), 12/19/2036 (b) | | | 1,909,461 | | | | 1,768,543 | |
HarborView Mortgage Loan Trust, Series2006-SB1, Class A1A,
3.102% (12 Month US Treasury Average + 0.850%), 12/19/2036 (b) | | | 10,987,792 | | | | 10,334,227 | |
HarborView Mortgage Loan Trust, Series2006-14, Class 2A1A,
2.656% (1 Month LIBOR USD + 0.150%), 2/19/2037 (b) | | | 44,637,657 | | | | 41,858,739 | |
HarborView Mortgage Loan Trust, Series2007-1, Class 2A1A,
2.636% (1 Month LIBOR USD + 0.130%), 3/19/2037 (b) | | | 21,086,739 | | | | 19,940,759 | |
HarborView Mortgage Loan Trust, Series2007-2, Class 2A1A,
2.670% (1 Month LIBOR USD + 0.160%), 4/25/2037 (b)(i) | | | 27,216,415 | | | | 24,396,195 | |
HarborView Mortgage Loan Trust, Series2007-3, Class 2A1A,
2.706% (1 Month LIBOR USD + 0.200%), 5/19/2037 (b)(i) | | | 43,504,353 | | | | 41,708,537 | |
HarborView Mortgage Loan Trust, Series2007-6, Class 2A1A,
2.696% (1 Month LIBOR USD + 0.190%), 8/19/2037 (b) | | | 2,972,825 | | | | 2,861,787 | |
HarborView Mortgage Loan Trust, Series2007-6, Class 1A1A,
2.706% (1 Month LIBOR USD + 0.200%), 8/19/2037 (b)(i) | | | 28,656,974 | | | | 26,075,640 | |
See accompanying notes which are an integral part of these financial statements.
42
Angel Oak Multi-Strategy Income Fund
Consolidated Schedule of Investments – (continued)
January 31, 2019
| | | | | | | | |
| | | Principal
Amount | | | Value | |
| Collateralized Mortgage Obligations – (continued) | | | | | | |
HarborView Mortgage Loan Trust, Series2007-5, Class A1A,
2.696% (1 Month LIBOR USD + 0.190%), 9/19/2037 (b) | | $ | 7,704,949 | | | $ | 7,282,363 | |
HarborView Mortgage Loan Trust, Series2007-7, Class 1A1,
3.510% (1 Month LIBOR USD + 1.000%), 10/25/2037 (b) | | | 27,010,486 | | | | 24,577,489 | |
HarborView Mortgage Loan Trust, Series2007-7, Class 2A1A,
3.510% (1 Month LIBOR USD + 1.000%), 10/25/2037 (b) | | | 3,277,005 | | | | 3,268,767 | |
HarborView Mortgage Loan Trust, Series2005-11, Class X, 0.370%, 8/19/2045 (e)(g)(h) | | | 19,070,472 | | | | 659,152 | |
HarborView Mortgage Loan Trust, Series2005-15, Class X1, 0.936%, 10/20/2045 (e)(h) | | | 10,805,188 | | | | 539,244 | |
HarborView Mortgage Loan Trust, Series2005-15, Class 2A11,
2.776% (1 Month LIBOR USD + 0.270%), 10/20/2045 (b) | | | 4,295,086 | | | | 4,149,585 | |
HarborView Mortgage Loan Trust, Series2005-15, Class 3A11,
4.252% (12 Month US Treasury Average + 2.000%), 10/20/2045 (b) | | | 6,294,307 | | | | 6,070,689 | |
HarborView Mortgage Loan Trust, Series2006-4, Class X1, 0.936%, 5/19/2046 (e)(h) | | | 77,259,724 | | | | 4,588,069 | |
HarborView Mortgage Loan Trust, Series2006-5, Class X2, 0.664%, 7/19/2046 (e)(g)(h) | | | 21,785,360 | | | | 560,080 | |
HarborView Mortgage Loan Trust, Series2006-13, Class A,
2.686% (1 Month LIBOR USD + 0.180%), 11/19/2046 (b) | | | 10,982,318 | | | | 9,629,153 | |
HMH Trust, Series2017-NSS, Class E, 6.292%, 7/5/2031 (a) | | | 7,100,000 | | | | 7,089,066 | |
HomeBanc Mortgage Trust, Series2005-1, Class A1,
2.760% (1 Month LIBOR USD + 0.250%), 3/25/2035 (b) | | | 10,921,361 | | | | 9,916,792 | |
HomeBanc Mortgage Trust, Series2005-1, Class A2,
2.820% (1 Month LIBOR USD + 0.310%), 3/25/2035 (b) | | | 434,145 | | | | 382,476 | |
HomeBanc Mortgage Trust, Series2005-3, Class A1,
2.750% (1 Month LIBOR USD + 0.240%), 7/25/2035 (b)(i) | | | 2,388,642 | | | | 2,352,645 | |
HomeBanc Mortgage Trust, Series2005-4, Class A2,
2.840% (1 Month LIBOR USD + 0.330%), 10/25/2035 (b) | | | 1,414,105 | | | | 1,386,684 | |
HomeBanc Mortgage Trust, Series2005-5, Class A1,
2.770% (1 Month LIBOR USD + 0.260%), 1/25/2036 (b) | | | 6,319,529 | | | | 6,191,609 | |
HomeBanc Mortgage Trust, Series2006-2, Class A1,
2.690% (1 Month LIBOR USD + 0.180%), 12/25/2036 (b) | | | 1,297,119 | | | | 1,261,367 | |
HomeBanc Mortgage Trust, Series2006-2, Class A2,
2.730% (1 Month LIBOR USD + 0.220%), 12/25/2036 (b) | | | 3,240,753 | | | | 3,150,867 | |
HomeBanc Mortgage Trust, Series2006-1, Class 3A2, 3.606%, 4/25/2037 (e) | | | 9,702,138 | | | | 8,923,716 | |
Homeward Opportunities Fund I Trust, Series2018-1, Class A3, 3.999%, 6/25/2048 (a) | | | 1,030,272 | | | | 1,027,574 | |
Homeward Opportunities Fund I Trust, Series2018-1, Class B1, 5.295%, 6/25/2048 (a) | | | 3,964,213 | | | | 3,973,652 | |
IMPAC CMB Trust, Series2004-4, Class 1A1,
3.150% (1 Month LIBOR USD + 0.640%), 9/25/2034 (b) | | | 4,147,946 | | | | 4,031,414 | |
IMPAC CMB Trust, Series2004-6, Class 1A2,
3.290% (1 Month LIBOR USD + 0.780%), 10/25/2034 (b) | | | 4,683,275 | | | | 4,557,618 | |
IMPAC CMB Trust, Series2004-10, Class 3A1,
3.210% (1 Month LIBOR USD + 0.700%), 3/25/2035 (b) | | | 570,163 | | | | 531,856 | |
IMPAC CMB Trust, Series2005-3, Class A3,
2.870% (1 Month LIBOR USD + 0.360%), 8/25/2035 (b) | | | 10,910,498 | | | | 10,506,351 | |
IMPAC CMB Trust, Series2005-3, Class A1,
2.990% (1 Month LIBOR USD + 0.480%), 8/25/2035 (b) | | | 11,944,943 | | | | 11,333,661 | |
IMPAC CMB Trust, Series2005-6, Class 1A2,
2.790% (1 Month LIBOR USD + 0.280%), 10/25/2035 (b) | | | 3,506,268 | | | | 3,304,275 | |
IMPAC CMB Trust, Series2005-6, Class 1A1,
3.010% (1 Month LIBOR USD + 0.500%), 10/25/2035 (b) | | | 32,982,509 | | | | 31,767,763 | |
See accompanying notes which are an integral part of these financial statements.
43
Angel Oak Multi-Strategy Income Fund
Consolidated Schedule of Investments – (continued)
January 31, 2019
| | | | | | | | |
| | | Principal
Amount | | | Value | |
| Collateralized Mortgage Obligations – (continued) | | | | | | |
IMPAC CMB Trust, Series2005-7, Class A2,
2.790% (1 Month LIBOR USD + 0.280%), 11/25/2035 (b) | | $ | 3,567,530 | | | $ | 3,180,232 | |
IMPAC CMB Trust, Series2005-7, Class A1,
3.030% (1 Month LIBOR USD + 0.520%), 11/25/2035 (b)(i) | | | 29,850,760 | | | | 28,266,282 | |
IMPAC CMB Trust, Series2007-A, Class A,
3.010% (1 Month LIBOR USD + 0.500%), 5/25/2037 (a)(b) | | | 2,069,039 | | | | 2,013,481 | |
IMPAC Secured Assets CMN Owner Trust, Series2005-2, Class A2D,
2.940% (1 Month LIBOR USD + 0.430%), 3/25/2036 (b) | | | 1,249,185 | | | | 1,031,970 | |
IMPAC Secured Assets Trust, Series2006-2, Class 1A2B,
2.680% (1 Month LIBOR USD + 0.170%), 8/25/2036 (b) | | | 13,775,301 | | | | 11,800,983 | |
IMPAC Secured Assets Trust, Series2006-2, Class 1A2C,
2.790% (1 Month LIBOR USD + 0.280%), 8/25/2036 (b) | | | 5,952,828 | | | | 4,957,253 | |
IMPAC Secured Assets Trust, Series2006-3, Class A1,
2.680% (1 Month LIBOR USD + 0.170%), 11/25/2036 (b) | | | 15,274,621 | | | | 14,314,871 | |
IMPAC Secured Assets Trust, Series2006-4, Class A1,
2.700% (1 Month LIBOR USD + 0.190%), 1/25/2037 (b) | | | 11,725,247 | | | | 9,592,506 | |
IMPAC Secured Assets Trust, Series2007-1, Class A2,
2.670% (1 Month LIBOR USD + 0.160%), 3/25/2037 (b) | | | 4,967,107 | | | | 4,639,481 | |
IMPAC Secured Assets Trust, Series2007-2, Class 1A1C,
2.890% (1 Month LIBOR USD + 0.380%), 5/25/2037 (b) | | | 10,804,421 | | | | 9,130,459 | |
IndyMac Index Mortgage Loan Trust, Series2004-AR2, Class AX2, 3.431%, 6/25/2034 (e)(g)(h) | | | 20,176,811 | | | | 11,613,127 | |
IndyMac Index Mortgage Loan Trust, Series2004-AR8, Class 2A2A,
3.310% (1 Month LIBOR USD + 0.800%), 11/25/2034 (b) | | | 773,213 | | | | 726,684 | |
IndyMac Index Mortgage Loan Trust, Series2005-AR2, Class AX2, 0.742%, 2/25/2035 (e)(g)(h) | | | 22,284,336 | | | | 518,935 | |
IndyMac Index Mortgage Loan Trust, Series2005-AR4, Class AX2, 0.642%, 3/25/2035 (e)(g)(h) | | | 27,787,064 | | | | 1,307,826 | |
IndyMac Index Mortgage Loan Trust, Series2005-AR6, Class 2A1,
2.990% (1 Month LIBOR USD + 0.480%), 4/25/2035 (b) | | | 2,694,982 | | | | 2,578,392 | |
IndyMac Index Mortgage Loan Trust, Series2005-AR8, Class AX2, 0.880%, 5/25/2035 (e)(h) | | | 4,406,663 | | | | 143,833 | |
IndyMac Index Mortgage Loan Trust, Series2005-AR8, Class 2A1A,
2.970% (1 Month LIBOR USD + 0.460%), 5/25/2035 (b) | | | 4,315,574 | | | | 4,120,795 | |
IndyMac Index Mortgage Loan Trust, Series2005-AR5, Class 2A1, 3.693%, 5/25/2035 (e) | | | 1,857,927 | | | | 1,771,175 | |
IndyMac Index Mortgage Loan Trust, Series 2005-AR12, Class AX2,
0.865%, 7/25/2035 (e)(g)(h) | | | 37,267,005 | | | | 995,476 | |
IndyMac Index Mortgage Loan Trust, Series 2005-AR12, Class 2A1A,
2.990% (1 Month LIBOR USD + 0.480%), 7/25/2035 (b) | | | 12,397,294 | | | | 12,114,066 | |
IndyMac Index Mortgage Loan Trust, Series 2005-AR14, Class 2X,
0.623%, 8/25/2035 (e)(h) | | | 39,036,612 | | | | 1,714,176 | |
IndyMac Index Mortgage Loan Trust, Series 2005-AR14, Class 2A1A,
2.810% (1 Month LIBOR USD + 0.300%), 8/25/2035 (b) | | | 7,451,855 | | | | 6,987,277 | |
IndyMac Index Mortgage Loan Trust, Series 2005-AR13, Class 1A1, 3.984%, 8/25/2035 (e) | | | 3,793,745 | | | | 3,177,743 | |
IndyMac Index Mortgage Loan Trust, Series2006-R1, Class A3, 3.791%, 12/25/2035 (e) | | | 3,194,306 | | | | 2,934,216 | |
IndyMac Index Mortgage Loan Trust, Series2006-AR9, Class 3A3, 3.627%, 6/25/2036 (e) | | | 1,088,546 | | | | 1,073,424 | |
IndyMac Index Mortgage Loan Trust, Series 2006-AR15, Class A2,
2.720% (1 Month LIBOR USD + 0.210%), 7/25/2036 (b) | | | 6,774,822 | | | | 6,202,241 | |
IndyMac Index Mortgage Loan Trust, Series 2006-AR13, Class A3, 3.683%, 7/25/2036 (e) | | | 5,416,370 | | | | 4,779,340 | |
IndyMac Index Mortgage Loan Trust, Series 2006-AR19, Class 3A1, 3.949%, 8/25/2036 (e) | | | 4,747,105 | | | | 4,374,201 | |
IndyMac Index Mortgage Loan Trust, Series 2006-AR25, Class 5A1, 3.833%, 9/25/2036 (e) | | | 8,913,844 | | | | 8,101,668 | |
IndyMac Index Mortgage Loan Trust, Series 2005-AR18, Class 1X, 1.107%, 10/25/2036 (e)(h) | | | 27,261,951 | | | | 1,047,540 | |
See accompanying notes which are an integral part of these financial statements.
44
Angel Oak Multi-Strategy Income Fund
Consolidated Schedule of Investments – (continued)
January 31, 2019
| | | | | | | | |
| | | Principal
Amount | | | Value | |
| Collateralized Mortgage Obligations – (continued) | | | | | | |
IndyMac Index Mortgage Loan Trust, Series 2006-AR27, Class 2A2,
2.710% (1 Month LIBOR USD + 0.200%), 10/25/2036 (b) | | $ | 6,463,083 | | | $ | 6,038,110 | |
IndyMac Index Mortgage Loan Trust, Series 2006-AR29, Class A2,
2.590% (1 Month LIBOR USD + 0.080%), 11/25/2036 (b) | | | 361,802 | | | | 335,488 | |
IndyMac Index Mortgage Loan Trust, Series 2006-AR31, Class A3, 3.924%, 11/25/2036 (e) | | | 4,942,859 | | | | 4,871,874 | |
IndyMac Index Mortgage Loan Trust, Series 2006-AR35, Class 2A1A,
2.680% (1 Month LIBOR USD + 0.170%), 1/25/2037 (b) | | | 3,137,384 | | | | 3,010,204 | |
IndyMac Index Mortgage Loan Trust, Series 2006-AR39, Class A1,
2.690% (1 Month LIBOR USD + 0.180%), 2/25/2037 (b) | | | 3,584,494 | | | | 3,420,303 | |
IndyMac Index Mortgage Loan Trust, Series2007-AR1, Class 3A1, 3.279%, 3/25/2037 (e) | | | 1,838,275 | | | | 1,673,459 | |
IndyMac Index Mortgage Loan Trust, Series2007-AR5, Class 2A1, 3.607%, 5/25/2037 (e) | | | 569,971 | | | | 511,585 | |
IndyMac Index Mortgage Loan Trust, Series2007-AR7, Class 2A1, 3.280%, 6/25/2037 (e) | | | 406,996 | | | | 372,738 | |
IndyMac Index Mortgage Loan Trust, Series2007-AR1, Class 2A1, 3.745%, 6/25/2037 (e) | | | 8,073,577 | | | | 6,939,845 | |
IndyMac Index Mortgage Loan Trust, Series2007-AR9, Class 2A1, 3.863%, 6/25/2037 (e) | | | 4,851,156 | | | | 3,780,545 | |
IndyMac Index Mortgage Loan Trust, Series2007-AR2, Class A1, 4.204%, 6/25/2037 (e) | | | 1,076,529 | | | | 1,019,833 | |
IndyMac Index Mortgage Loan Trust, Series 2007-FLX4, Class 2A1,
2.690% (1 Month LIBOR USD + 0.180%), 7/25/2037 (b) | | | 6,376,844 | | | | 6,065,272 | |
IndyMac Index Mortgage Loan Trust, Series 2007-FLX4, Class 1A1,
2.710% (1 Month LIBOR USD + 0.200%), 7/25/2037 (b)(i) | | | 22,872,670 | | | | 21,372,680 | |
IndyMac Index Mortgage Loan Trust, Series 2007-AR13, Class 4A1, 3.499%, 7/25/2037 (e) | | | 4,783,361 | | | | 3,926,532 | |
IndyMac Index Mortgage Loan Trust, Series 2007-FLX5, Class 2A1,
2.690% (1 Month LIBOR USD + 0.180%), 8/25/2037 (b) | | | 5,141,370 | | | | 4,745,438 | |
IndyMac Index Mortgage Loan Trust, Series 2005-16IP, Class AX, 0.974%, 7/25/2045 (e)(g)(h) | | | 27,733,679 | | | | 1,311,165 | |
IndyMac Index Mortgage Loan Trust, Series2006-AR2, Class 1A1A,
2.730% (1 Month LIBOR USD + 0.220%), 4/25/2046 (b) | | | 19,941,382 | | | | 18,547,001 | |
IndyMac Index Mortgage Loan Trust, Series2006-AR4, Class A2A,
2.760% (1 Month LIBOR USD + 0.250%), 5/25/2046 (b) | | | 19,296,004 | | | | 18,155,668 | |
IndyMac Index Mortgage Loan Trust, Series2006-AR6, Class 1A1A,
3.172% (12 Month US Treasury Average + 0.920%), 6/25/2046 (b) | | | 4,033,466 | | | | 3,737,712 | |
IndyMac Index Mortgage Loan Trust, Series 2006-AR14, Class 1A3A,
2.710% (1 Month LIBOR USD + 0.200%), 11/25/2046 (b) | | | 9,167,250 | | | | 8,379,188 | |
IndyMac Index Mortgage Loan Trust, Series2007-AR2, Class A1,
2.660% (1 Month LIBOR USD + 0.150%), 3/25/2047 (b) | | | 16,772,533 | | | | 13,720,267 | |
IndyMac Index Mortgage Loan Trust, Series2007-AR2, Class A3,
2.870% (1 Month LIBOR USD + 0.360%), 3/25/2047 (b) | | | 11,590,719 | | | | 9,567,640 | |
InTown Hotel Portfolio Trust, Series 2018-STAY, Class F,
6.359% (1 Month LIBOR USD + 3.850%), 1/18/2033 (a)(b) | | | 3,000,000 | | | | 3,023,547 | |
Jefferies Resecuritization Trust, Series2009-R2, Class 5A, 3.845%, 1/28/2036 (a)(e) | | | 1,497,317 | | | | 1,450,345 | |
JP Morgan Alternative Loan Trust, Series2006-A2, Class 1A4,
2.780% (1 Month LIBOR USD + 0.270%), 5/25/2036 (b) | | | 2,330,379 | | | | 2,255,243 | |
JP Morgan Alternative Loan Trust, Series2006-S2, Class A5, 6.380%, 5/25/2036 (d) | | | 8,948,025 | | | | 7,438,395 | |
JP Morgan Chase Commercial Mortgage Securities Trust, Series2014-FL6, Class B,
4.789% (1 Month LIBOR USD + 2.280%), 11/17/2031 (a)(b) | | | 897,473 | | | | 899,438 | |
JP Morgan Chase Commercial Mortgage Securities Trust, Series 2018-ASH8, Class F,
6.509% (1 Month LIBOR USD + 4.000%), 2/15/2035 (a)(b) | | | 3,250,000 | | | | 3,241,836 | |
JP Morgan Chase Commercial Mortgage Securities Trust, Series 2005-CB12, Class B,
5.383%, 9/12/2037 (e) | | | 8,865,847 | | | | 7,713,163 | |
JP Morgan Chase Commercial Mortgage Securities Trust, Series 2007-CB18, Class AJ,
5.502%, 6/12/2047 (e) | | | 5,000,000 | | | | 3,746,640 | |
See accompanying notes which are an integral part of these financial statements.
45
Angel Oak Multi-Strategy Income Fund
Consolidated Schedule of Investments – (continued)
January 31, 2019
| | | | | | | | |
| | | Principal
Amount | | | Value | |
| Collateralized Mortgage Obligations – (continued) | | | | | | |
JP Morgan Mortgage Trust, Series2005-A6, Class 7A1, 4.351%, 8/25/2035 (e) | | $ | 16,581 | | | $ | 16,202 | |
JP Morgan Mortgage Trust, Series2005-S3, Class 1A14, 5.500%, 1/25/2036 | | | 2,332,388 | | | | 2,205,369 | |
JP Morgan Mortgage Trust, Series2006-A6, Class 3A2, 4.084%, 10/25/2036 (e) | | | 467,507 | | | | 410,450 | |
JP Morgan Mortgage Trust, Series2006-A6, Class 2A4L, 4.296%, 10/25/2036 (e) | | | 1,417,727 | | | | 1,353,593 | |
JP Morgan Mortgage Trust, Series2007-A3, Class 1A1, 3.994%, 5/25/2037 (e) | | | 949,104 | | | | 869,720 | |
JP Morgan Mortgage Trust, Series2007-A4, Class 3A3, 3.673%, 6/25/2037 (e) | | | 2,994,002 | | | | 2,853,143 | |
JPMBB Commercial Mortgage Securities Trust, Series2014-C23, Class RIM,
4.304%, 9/17/2047 (a) | | | 5,000,000 | | | | 4,906,870 | |
Key Commercial Mortgage Securities Trust, Series2018-S1, Class A3, 4.498%, 10/20/2053 (a) | | | 3,750,000 | | | | 3,934,193 | |
LB-UBS Commercial Mortgage Trust, Series2007-C6, Class C, 6.315%, 7/15/2040 (e) | | | 2,500,000 | | | | 2,315,893 | |
LB-UBS Commercial Mortgage Trust, Series2008-C1, Class AJ, 6.319%, 4/15/2041 (e) | | | 3,529,141 | | | | 3,092,586 | |
LCCM, Series 2017-LC26, Class C, 4.706%, 7/12/2050 (a) | | | 9,000,000 | | | | 8,982,639 | |
Lehman Mortgage Trust, Series2007-5, Class PO1, 0.000%, 6/25/2037 (c) | | | 94,699 | | | | 79,071 | |
Lehman Mortgage Trust, Series2007-9, Class AP, 0.000%, 10/25/2037 (c) | | | 167,023 | | | | 141,926 | |
Lehman XS Trust, Series2006-18N, Class A3,
2.690% (1 Month LIBOR USD + 0.180%), 12/25/2036 (b)(i) | | | 14,866,196 | | | | 13,436,752 | |
Lehman XS Trust, Series2007-18N, Class 2A1,
3.360% (1 Month LIBOR USD + 0.850%), 10/25/2037 (b) | | | 1,519,630 | | | | 1,418,964 | |
Lehman XS Trust, Series2006-GP1, Class A3A,
2.740% (1 Month LIBOR USD + 0.230%), 5/25/2046 (b) | | | 10,775,280 | | | | 10,017,509 | |
Lehman XS Trust, Series2006-10N, Class 1A3A,
2.720% (1 Month LIBOR USD + 0.210%), 7/25/2046 (b) | | | 3,147,142 | | | | 3,021,864 | |
Lehman XS Trust, Series2006-16N, Class A4A,
2.700% (1 Month LIBOR USD + 0.190%), 11/25/2046 (b) | | | 8,654,655 | | | | 8,221,584 | |
Lehman XS Trust, Series2007-4N, Class 2AX, 1.221%, 3/25/2047 (e)(h) | | | 44,319,815 | | | | 3,076,105 | |
Lehman XS Trust, Series2007-4N, Class 1A3,
2.750% (1 Month LIBOR USD + 0.240%), 3/25/2047 (b)(i) | | | 30,893,958 | | | | 27,203,891 | |
Lehman XS Trust, Series2007-15N, Class 3A1,
2.756% (1 Month LIBOR USD + 0.250%), 8/25/2047 (b)(i) | | | 27,690,600 | | | | 24,722,057 | |
LSTAR Commercial Mortgage Trust, Series2017-5, Class C, 4.870%, 3/10/2050 (a)(e)(i) | | | 8,500,000 | | | | 7,985,742 | |
LSTAR Securities Investment Ltd., Series2017-8, Class A,
4.170% (1 Month LIBOR USD + 1.650%), 11/1/2022 (a)(b) | | | 2,673,841 | | | | 2,698,462 | |
Luminent Mortgage Trust, Series2006-1, Class X, 1.033%, 4/25/2036 (e)(h) | | | 50,895,032 | | | | 1,474,175 | |
Luminent Mortgage Trust, Series2006-3, Class 12A1,
2.720% (1 Month LIBOR USD + 0.210%), 5/25/2036 (b) | | | 5,078,419 | | | | 4,817,297 | |
Luminent Mortgage Trust, Series2006-5, Class X, 1.010%, 7/25/2036 (e)(h) | | | 49,836,244 | | | | 1,831,582 | |
Luminent Mortgage Trust, Series2006-5, Class A1A,
2.700% (1 Month LIBOR USD + 0.190%), 7/25/2036 (b) | | | 12,587,464 | | | | 9,956,521 | |
Luminent Mortgage Trust, Series2007-1, Class 1A1,
2.670% (1 Month LIBOR USD + 0.160%), 11/25/2036 (b) | | | 4,471,664 | | | | 4,061,295 | |
Luminent Mortgage Trust, Series2006-7, Class 2A1,
2.680% (1 Month LIBOR USD + 0.170%), 12/25/2036 (b) | | | 22,292,560 | | | | 20,258,475 | |
Luminent Mortgage Trust, Series2007-2, Class 1A2,
2.790% (1 Month LIBOR USD + 0.280%), 5/25/2037 (b) | | | 7,991,402 | | | | 7,388,930 | |
Luminent Mortgage Trust, Series2006-2, Class A1A,
2.710% (1 Month LIBOR USD + 0.200%), 2/25/2046 (b) | | | 11,610,772 | | | | 10,345,117 | |
Luminent Mortgage Trust, Series2006-6, Class A1,
2.710% (1 Month LIBOR USD + 0.200%), 10/25/2046 (b)(i) | | | 20,492,769 | | | | 19,481,389 | |
See accompanying notes which are an integral part of these financial statements.
46
Angel Oak Multi-Strategy Income Fund
Consolidated Schedule of Investments – (continued)
January 31, 2019
| | | | | | | | |
| | | Principal
Amount | | | Value | |
| Collateralized Mortgage Obligations – (continued) | | | | | | |
Luminent Mortgage Trust, Series2006-6, Class A2B,
2.750% (1 Month LIBOR USD + 0.240%), 10/25/2046 (b) | | $ | 1,192,942 | | | $ | 1,000,488 | |
MASTR Adjustable Rate Mortgages Trust, Series2004-15, Class 2A2, 4.552%, 12/25/2034 (e) | | | 17,597 | | | | 16,965 | |
MASTR Adjustable Rate Mortgages Trust, Series2005-1, Class 9A1, 4.682%, 1/25/2035 (e) | | | 190,269 | | | | 188,281 | |
MASTR Adjustable Rate Mortgages Trust, Series2005-2, Class 3A1, 3.968%, 3/25/2035 (e) | | | 407,697 | | | | 403,183 | |
MASTR Adjustable Rate Mortgages Trust, Series2005-2, Class 5A1, 4.508%, 3/25/2035 (e) | | | 982,676 | | | | 975,704 | |
MASTR Adjustable Rate Mortgages Trust, Series2005-6, Class 3AX, 0.433%, 7/25/2035 (e)(h) | | | 8,934,801 | | | | 195,976 | |
MASTR Adjustable Rate Mortgages Trust, Series2005-7, Class 2A1, 4.018%, 9/25/2035 (e) | | | 1,773,765 | | | | 1,711,731 | |
MASTR Adjustable Rate Mortgages Trust, Series2005-8, Class 3A1,
4.763% (12 Month LIBOR USD + 1.750%), 12/25/2035 (b) | | | 12,137,508 | | | | 11,358,874 | |
MASTR Adjustable Rate Mortgages Trust, Series2006-2, Class 3A1, 4.516%, 1/25/2036 (e) | | | 2,792,246 | | | | 2,790,314 | |
MASTR Adjustable Rate Mortgages Trust, Series2007-2, Class A1,
2.660% (1 Month LIBOR USD + 0.150%), 3/25/2047 (b) | | | 1,636,634 | | | | 1,509,593 | |
MASTR Alternative Loan Trust, Series2007-1, Class 15PO, 0.000%, 11/25/2021 (c) | | | 11,553 | | | | 5,664 | |
MASTR Alternative Loan Trust, Series2004-6, Class 30PO, 0.000%, 7/25/2034 (c) | | | 170,063 | | | | 139,586 | |
MASTR Alternative Loan Trust, Series2005-5, Class 3A1, 5.750%, 8/25/2035 | | | 2,050,411 | | | | 1,756,913 | |
MASTR Alternative Loan Trust, Series2006-1, Class A2,
3.210% (1 Month LIBOR USD + 0.700%), 2/25/2036 (b) | | | 3,070,173 | | | | 1,838,011 | |
MASTR Alternative Loan Trust, Series2006-2, Class 1A2, 6.000%, 3/25/2036 | | | 672,249 | | | | 654,748 | |
MASTR Alternative Loan Trust, Series2007-HF1, Class 4A1, 7.000%, 10/25/2047 | | | 18,561,497 | | | | 15,255,676 | |
MASTR Asset Securitization Trust, Series2005-2, Class PO, 0.000%, 11/25/2035 (c) | | | 61,010 | | | | 51,002 | |
MASTR Asset Securitization Trust, Series2007-1, Class AP, 0.000%, 11/25/2037 (c) | | | 2,440 | | | | 2,248 | |
MASTR Resecuritization Trust, Series2008-4, Class A1, 6.000%, 6/27/2036 (a)(e) | | | 2,520,431 | | | | 2,308,690 | |
MASTR Resecuritization Trust, Series2008-3, Class A1, 2.970%, 8/25/2037 (a)(e) | | | 9,014,999 | | | | 7,044,392 | |
Merrill Lynch Alternative Note Asset Trust, Series2007-A2, Class A3A,
2.620% (1 Month LIBOR USD + 0.110%), 3/25/2037 (b) | | | 18,258,756 | | | | 8,305,251 | |
Merrill Lynch Mortgage Backed Securities Trust, Series2007-1, Class 1A1, 4.003%, 4/25/2037 (e) | | | 3,514,811 | | | | 3,325,499 | |
Merrill Lynch Mortgage Investors Trust, Series2003-B, Class A1,
3.190% (1 Month LIBOR USD + 0.680%), 4/25/2028 (b) | | | 2,974,990 | | | | 2,862,506 | |
Merrill Lynch Mortgage Investors Trust, Series2004-A, Class A1,
2.970% (1 Month LIBOR USD + 0.460%), 4/25/2029 (b) | | | 944,474 | | | | 930,691 | |
Merrill Lynch Mortgage Investors Trust, Series2005-3, Class 3A, 4.244%, 11/25/2035 (e) | | | 10,168,286 | | | | 10,342,356 | |
Merrill Lynch Mortgage Investors Trust, Series2005-A9, Class 2A1E, 4.385%, 12/25/2035 (e) | | | 2,896,239 | | | | 2,833,025 | |
Merrill Lynch Mortgage Investors Trust, Series2006-A3, Class 3A1, 4.150%, 5/25/2036 (e) | | | 1,564,748 | | | | 1,484,927 | |
Merrill Lynch Mortgage Investors Trust, Series2006-AF2, Class AV1,
2.670% (1 Month LIBOR USD + 0.160%), 9/25/2037 (b) | | | 9,520,129 | | | | 7,503,118 | |
Merrill Lynch Mortgage Investors Trust, Series2006-AF2, Class AV2C,
2.740% (1 Month LIBOR USD + 0.230%), 9/25/2037 (b) | | | 15,870,735 | | | | 12,699,381 | |
ML-CFC Commercial Mortgage Trust, Series2007-7, Class AM, 5.750%, 6/12/2050 (e) | | | 7,575 | | | | 7,596 | |
Monticello Funding, LLCClass A, 4.807%, 1/31/2020 (a)(e)(g) | | | 14,500,000 | | | | 14,490,938 | |
Morgan Stanley Bank of America Merrill Lynch Trust, Series2013-C7, Class H,
4.223%, 2/16/2046 (a)(e)(g) | | | 10,318,259 | | | | 4,309,772 | |
Morgan Stanley Bank of America Merrill Lynch Trust, Series2013-C7, Class G,
4.223%, 2/16/2046 (a)(e) | | | 1,000,000 | | | | 655,611 | |
Morgan Stanley Bank of America Merrill Lynch Trust, Series2014-C16, Class D,
4.754%, 6/17/2047 (a)(e) | | | 5,000,000 | | | | 4,649,550 | |
Morgan Stanley Bank of America Merrill Lynch Trust, Series2015-C22, Class D,
4.237%, 4/15/2048 (a)(e) | | | 3,000,000 | | | | 2,666,118 | |
See accompanying notes which are an integral part of these financial statements.
47
Angel Oak Multi-Strategy Income Fund
Consolidated Schedule of Investments – (continued)
January 31, 2019
| | | | | | | | |
| | | Principal
Amount | | | Value | |
| Collateralized Mortgage Obligations – (continued) | | | | | | |
Morgan Stanley Bank of America Merrill Lynch Trust, Series2016-C29, Class C,
4.751%, 5/17/2049 (e)(i) | | $ | 10,400,000 | | | $ | 10,527,296 | |
Morgan Stanley Bank of America Merrill Lynch Trust, Series2017-C33, Class D,
3.356%, 5/15/2050 (a) | | | 2,000,000 | | | | 1,633,534 | |
Morgan Stanley Capital I Trust, Series 2017-ASHF, Class D,
4.709% (1 Month LIBOR USD + 2.200%), 11/15/2034 (a)(b) | | | 4,750,000 | | | | 4,714,256 | |
Morgan Stanley Capital I Trust, Series2017-CLS, Class F,
5.109% (1 Month LIBOR USD + 2.600%), 11/15/2034 (a)(b) | | | 1,750,000 | | | | 1,721,524 | |
Morgan Stanley Capital I Trust, Series2016-PSQ, Class C, 3.826%, 1/12/2038 (a)(e) | | | 5,000,000 | | | | 4,763,720 | |
Morgan Stanley Capital I Trust 2017-JWDR, Series 2017-JWDR, Class E,
5.559% (1 Month LIBOR USD + 3.050%), 11/15/2034 (a)(b) | | | 4,250,000 | | | | 4,212,694 | |
Morgan Stanley Capital I Trust 2017-JWDR, Series 2017-JWDR, Class F,
6.559% (1 Month LIBOR USD + 4.050%), 11/15/2034 (a)(b) | | | 4,250,000 | | | | 4,196,714 | |
Morgan Stanley Mortgage Loan Trust, Series2005-1, Class 4A1,
2.810% (1 Month LIBOR USD + 0.300%), 3/25/2035 (b) | | | 3,123,475 | | | | 2,943,272 | |
Morgan Stanley Mortgage Loan Trust, Series2005-3AR, Class 1A, 3.951%, 7/25/2035 (e)(i) | | | 12,648,054 | | | | 10,215,454 | |
Morgan Stanley Mortgage Loan Trust, Series2005-3AR, Class 3A, 4.070%, 7/25/2035 (e) | | | 1,186,805 | | | | 1,122,354 | |
Morgan Stanley Mortgage Loan Trust, Series2005-6AR, Class 5A1, 4.205%, 11/25/2035 (e) | | | 3,090,734 | �� | | | 2,459,316 | |
Morgan Stanley Mortgage Loan Trust, Series2005-9AR, Class 1A,
2.800% (1 Month LIBOR USD + 0.290%), 12/25/2035 (b) | | | 3,330,521 | | | | 2,949,859 | |
Morgan Stanley Mortgage Loan Trust, Series 2005-11AR, Class A1,
2.790% (1 Month LIBOR USD + 0.280%), 1/25/2036 (b) | | | 1,166,019 | | | | 906,918 | |
Morgan Stanley Mortgage Loan Trust, Series2006-3AR, Class 1AX, 1.936%, 3/25/2036 (e)(h) | | | 38,056,078 | | | | 3,607,183 | |
Morgan Stanley Mortgage Loan Trust, Series2006-3AR, Class 1A1,
2.760% (1 Month LIBOR USD + 0.250%), 3/25/2036 (b) | | | 5,064,239 | | | | 4,127,284 | |
Morgan Stanley Mortgage Loan Trust, Series2006-3AR, Class 1A3,
2.770% (1 Month LIBOR USD + 0.260%), 3/25/2036 (b) | | | 3,060,012 | | | | 2,494,950 | |
Morgan Stanley Mortgage Loan Trust, Series2006-3AR, Class 2A1, 4.088%, 3/25/2036 (e)(n) | | | 11,161,118 | | | | 9,674,044 | |
Morgan Stanley Mortgage Loan Trust, Series2006-3AR, Class 2A3, 4.088%, 3/25/2036 (e) | | | 3,123,408 | | | | 2,705,758 | |
Morgan Stanley Mortgage Loan Trust, Series2006-5AR, Class AX, 1.555%, 4/25/2036 (e)(h) | | | 35,904,712 | | | | 2,759,672 | |
Morgan Stanley Mortgage Loan Trust, Series2006-7, Class 4A2,
3.260% (1 Month LIBOR USD + 0.750%), 6/25/2036 (b) | | | 5,636,120 | | | | 4,104,380 | |
Morgan Stanley Mortgage Loan Trust, Series2006-9AR, Class A1,
2.680% (1 Month LIBOR USD + 0.170%), 8/25/2036 (b) | | | 2,723,674 | | | | 1,398,045 | |
Morgan Stanley Mortgage Loan Trust, Series2006-11, Class 2A3, 6.000%, 8/25/2036 | | | 3,548,140 | | | | 2,961,714 | |
Morgan Stanley Mortgage Loan Trust, Series2006-11, Class 2A2, 6.000%, 8/25/2036 | | | 1,167,983 | | | | 974,942 | |
Morgan Stanley Mortgage Loan Trust, Series2006-11, Class 1A6, 6.231%, 8/25/2036 (d) | | | 3,198,889 | | | | 1,369,051 | |
Morgan Stanley Mortgage Loan Trust, Series2006-11, Class 1A3, 6.424%, 8/25/2036 (d) | | | 3,986,267 | | | | 1,704,117 | |
Morgan Stanley Mortgage Loan Trust, Series 2007-11AR, Class 2A5, 2.972%, 6/25/2037 (e) | | | 842,873 | | | | 560,055 | |
Morgan Stanley Mortgage Loan Trust, Series 2007-11AR, Class 2A3, 3.611%, 6/25/2037 (e) | | | 2,293,532 | | | | 1,718,002 | |
Morgan Stanley Mortgage Loan Trust, Series2007-12, Class 3A22, 6.000%, 8/25/2037 | | | 4,498,354 | | | | 3,721,394 | |
Morgan Stanley Mortgage Loan Trust, Series 2007-15AR, Class 2A1, 3.658%, 11/25/2037 (e) | | | 8,209,663 | | | | 7,521,709 | |
Morgan Stanley Mortgage Loan Trust, Series2007-6XS, Class 2A5S, 6.000%, 2/25/2047 (d) | | | 3,762,951 | | | | 2,640,154 | |
Morgan StanleyRe-REMIC Trust, Series2012-R1, Class 1B,
2.686% (1 Month LIBOR USD + 0.180%), 2/26/2037 (a)(b) | | | 17,899,609 | | | | 16,497,211 | |
Morgan StanleyRe-REMIC Trust, Series2010-R6, Class 4B,
2.696% (1 Month LIBOR USD + 0.190%), 2/26/2037 (a)(b) | | | 12,396,198 | | | | 11,206,783 | |
Morgan Stanley Resecuritization Trust, Series2013-R7, Class 1B,
2.666% (1 Month LIBOR USD + 0.160%), 12/27/2046 (a)(b) | | | 9,391,117 | | | | 8,690,869 | |
See accompanying notes which are an integral part of these financial statements.
48
Angel Oak Multi-Strategy Income Fund
Consolidated Schedule of Investments – (continued)
January 31, 2019
| | | | | | | | |
| | | Principal
Amount | | | Value | |
| Collateralized Mortgage Obligations – (continued) | | | | | | |
Morgan Stanley Resecuritization Trust, Series2015-R4, Class CB2, 3.332%, 8/27/2047 (a)(e) | | $ | 5,146,000 | | | $ | 4,512,023 | |
Morgan Stanley Resecuritization Trust, Series2015-R4, Class CB3, 3.332%, 8/27/2047 (a)(e) | | | 1,010,309 | | | | 838,550 | |
MortgageIT Mortgage Loan Trust, Series2006-1, Class 1X, 1.487%, 4/25/2036 (e)(h) | | | 20,893,537 | | | | 1,213,350 | |
MortgageIT Securities Corp. Mortgage Loan Trust, Series2007-2, Class A1,
3.010% (1 Month LIBOR USD + 0.500%), 9/25/2037 (b)(i) | | | 18,394,879 | | | | 17,505,615 | |
MortgageIT Securities Corp. Mortgage Loan Trust, Series2007-1, Class 2A12,
2.660% (1 Month LIBOR USD + 0.150%), 6/25/2047 (b) | | | 4,228,551 | | | | 3,603,351 | |
MortgageIT Securities Corp. Mortgage Loan Trust, Series2007-1, Class 1A1,
2.740% (1 Month LIBOR USD + 0.230%), 6/25/2047 (b) | | | 7,537,590 | | | | 7,265,558 | |
MortgageIT Securities Corp. Mortgage Loan Trust, Series2007-1, Class 2A14,
2.790% (1 Month LIBOR USD + 0.280%), 6/25/2047 (b) | | | 3,887,095 | | | | 3,345,277 | |
MortgageIT Trust, Series2005-2, Class 1A1,
3.030% (1 Month LIBOR USD + 0.520%), 5/25/2035 (b) | | | 387,377 | | | | 378,082 | |
MortgageIT Trust, Series2006-1, Class 2A1A,
2.720% (1 Month LIBOR USD + 0.210%), 4/25/2036 (b) | | | 4,901,279 | | | | 4,538,722 | |
MSCG Trust, Series2016-SNR, Class C, 5.205%, 11/16/2034 (a) | | | 4,250,000 | | | | 4,226,944 | |
New Residential Mortgage Loan Trust, Series 2019-NQM1, Class A1, 3.675%, 1/25/2049 (a) | | | 1,867,000 | | | | 1,869,894 | |
New Residential Mortgage Loan Trust, Series 2019-NQM1, Class A1, 5.492%, 1/25/2049 (a) | | | 8,400,000 | | | | 8,450,392 | |
New Residential Mortgage Loan Trust, Series 2019-NQM1, Class B1, 5.492%, 1/25/2049 (a) | | | 2,750,000 | | | | 2,648,745 | |
Nomura Asset Acceptance Corp. Alternative Loan Trust, Series2005-AR4, Class 3A1,
4.656%, 8/25/2035 (e) | | | 2,238,721 | | | | 2,234,924 | |
Nomura Asset Acceptance Corp. Alternative Loan Trust, Series2006-AR1, Class 2A1,
4.338%, 2/25/2036 (e) | | | 1,102,405 | | | | 914,289 | |
Nomura Asset Acceptance Corp. Alternative Loan Trust, Series2006-AR3, Class A1A,
2.670% (1 Month LIBOR USD + 0.160%), 10/25/2036 (b) | | | 1,891,197 | | | | 1,650,154 | |
Nomura Asset Acceptance Corp. Alternative Loan Trust, Series2006-AR4, Class A3,
2.680% (1 Month LIBOR USD + 0.170%), 12/25/2036 (b) | | | 282,885 | | | | 239,852 | |
Nomura Resecuritization Trust, Series2018-1R, Class 1A1,
3.410% (1 Month LIBOR USD + 0.900%), 7/28/2036 (a)(b) | | | 4,892,837 | | | | 4,892,235 | |
Nomura Resecuritization Trust, Series2015-2R, Class 3A1,
2.329% (1 Month LIBOR USD + 0.150%), 11/26/2036 (a)(b) | | | 2,232,677 | | | | 2,204,166 | |
Nomura Resecuritization Trust, Series2018-1R, Class 2A1,
3.410% (1 Month LIBOR USD + 0.900%), 1/26/2037 (a)(b) | | | 4,842,484 | | | | 4,847,234 | |
Nomura Resecuritization Trust, Series2014-3R, Class 4A15,
2.367% (1 Month LIBOR USD + 0.160%), 3/26/2037 (a)(b) | | | 6,425,173 | | | | 3,467,878 | |
Nomura Resecuritization Trust, Series2018-1R, Class 3A1,
3.410% (1 Month LIBOR USD + 0.900%), 3/26/2037 (a)(b) | | | 4,866,767 | | | | 4,862,275 | |
NRPL Trust, Series2018-2A, Class A1, 3.033%, 7/25/2067 (a)(e) | | | 7,879,722 | | | | 7,851,599 | |
OBX Trust, Series 2018-EXP1, Class 2A1,
3.360% (1 Month LIBOR USD + 0.850%), 4/27/2048 (a)(b) | | | 14,476,125 | | | | 14,504,354 | |
OBX Trust, Series2018-1, Class A2, 3.160% (1 Month LIBOR USD + 0.650%), 6/25/2057 (a)(b) | | | 3,055,959 | | | | 3,045,163 | |
OBX Trust, Series 2018-EXP2, Class 2A1B,
3.260% (1 Month LIBOR USD + 0.750%), 7/25/2058 (a)(b)(n) | | | 28,086,227 | | | | 27,868,671 | |
OBX Trust, Series 2018-EXP2, Class 2A1A,
3.260% (1 Month LIBOR USD + 0.750%), 7/25/2058 (a)(b) | | | 1,550,892 | | | | 1,540,941 | |
Pepper Residential Securities Trust, Series 21A, Class A1U,
3.390% (1 Month LIBOR USD + 0.880%), 1/16/2060 (a)(b) | | | 1,299,015 | | | | 1,301,074 | |
PHH Alternative Mortgage Trust, Series2007-2, Class 4PO, 0.000%, 5/25/2022 (c) | | | 3,613 | | | | 3,515 | |
PHH Alternative Mortgage Trust, Series2007-1, Class 21PO, 0.000%, 2/25/2037 (c) | | | 30,012 | | | | 20,730 | |
See accompanying notes which are an integral part of these financial statements.
49
Angel Oak Multi-Strategy Income Fund
Consolidated Schedule of Investments – (continued)
January 31, 2019
| | | | | | | | |
| | | Principal
Amount | | | Value | |
| Collateralized Mortgage Obligations – (continued) | | | | | | |
PHH Alternative Mortgage Trust, Series2007-1, Class 1A1,
2.670% (1 Month LIBOR USD + 0.160%), 2/25/2037 (b) | | $ | 3,926,687 | | | $ | 3,222,271 | |
PHH Alternative Mortgage Trust, Series2007-2, Class 1A3,
2.840% (1 Month LIBOR USD + 0.330%), 5/25/2037 (b) | | | 3,361,522 | | | | 3,032,342 | |
PHH Alternative Mortgage Trust, Series2007-2, Class 2A5,
3.060% (1 Month LIBOR USD + 0.550%), 5/25/2037 (b) | | | 6,906,815 | | | | 5,357,540 | |
PHH Alternative Mortgage Trust, Series2007-2, Class 2A2, 6.000%, 5/25/2037 | | | 1,558,479 | | | | 1,441,345 | |
Prime Mortgage Trust, Series2005-4, Class 2A4,
3.010% (1 Month LIBOR USD + 0.500%), 10/25/2035 (b) | | | 42,997 | | | | 41,548 | |
PRPM LLC, Series2019-1A, Class A1, 4.500%, 1/25/2024 (a)(d)(f) | | | 8,250,000 | | | | 8,257,425 | |
RAIT Trust, Series2017-FL7, Class C,
5.009% (1 Month LIBOR USD + 2.500%), 6/15/2037 (a)(b) | | | 7,000,000 | | | | 7,001,855 | |
RBSSP Resecuritization Trust, Series2009-3, Class 3A3, 5.750%, 9/26/2035 (a) | | | 3,528,432 | | | | 3,296,773 | |
RCO Trust, Series 2018-VFS1, Class B1, 6.547%, 12/26/2053 (a) | | | 4,188,000 | | | | 4,208,383 | |
Ready Capital Mortgage Trust, Series2019-5, Class E, 5.665%, 2/25/2052 (a)(e) | | | 5,250,000 | | | | 4,216,695 | |
Ready Capital Mortgage Trust, Series2019-5, Class D, 5.665%, 2/25/2052 (a)(e) | | | 8,233,000 | | | | 7,528,016 | |
ReadyCap Commercial Mortgage Trust, Series2017-FL1, Class A,
3.360% (1 Month LIBOR USD + 0.850%), 5/25/2034 (a)(b) | | | 30,093 | | | | 30,130 | |
ReadyCap Commercial Mortgage Trust, Series2017-FL1, Class C,
4.760% (1 Month LIBOR USD + 2.250%), 5/25/2034 (a)(b) | | | 1,750,000 | | | | 1,752,805 | |
ReadyCap Commercial Mortgage Trust, Series2018-4, Class D, 5.423%, 2/25/2051 (a)(e) | | | 7,000,000 | | | | 6,624,870 | |
Residential Accredit Loans, Inc. Trust, Series2005-QS9, Class AP, 0.000%, 6/25/2035 (c) | | | 31,388 | | | | 25,259 | |
Residential Accredit Loans, Inc. Trust, Series2005-QS7, Class A1, 5.500%, 6/25/2035 | | | 3,420,964 | | | | 3,222,274 | |
Residential Accredit Loans, Inc. Trust, Series 2005-QS11, Class A2,
3.010% (1 Month LIBOR USD + 0.500%), 7/25/2035 (b) | | | 473,475 | | | | 407,405 | |
Residential Accredit Loans, Inc. Trust, Series2005-QA7, Class A22, 4.432%, 7/25/2035 (e) | | | 3,022,672 | | | | 2,878,817 | |
Residential Accredit Loans, Inc. Trust, Series2005-QA8, Class CB21, 4.592%, 7/25/2035 (e) | | | 493,673 | | | | 407,158 | |
Residential Accredit Loans, Inc. Trust, Series 2005-QS12, Class A10,
3.860% (1 Month LIBOR USD + 1.350%), 8/25/2035 (b) | | | 5,985,597 | | | | 5,369,050 | |
Residential Accredit Loans, Inc. Trust, Series 2005-QS10, Class 3A3, 5.500%, 8/25/2035 | | | 1,476,768 | | | | 1,348,104 | |
Residential Accredit Loans, Inc. Trust, Series 2005-QS12, Class A4, 5.500%, 8/25/2035 | | | 7,838,951 | | | | 7,612,351 | |
Residential Accredit Loans, Inc. Trust, Series 2005-QS13, Class AP, 0.000%, 9/25/2035 (c) | | | 432,970 | | | | 278,754 | |
Residential Accredit Loans, Inc. Trust, Series 2005-QS13, Class 1A1,
2.910% (1 Month LIBOR USD + 0.400%), 9/25/2035 (b) | | | 560,057 | | | | 436,195 | |
Residential Accredit Loans, Inc. Trust, Series 2005-QS13, Class 2A1,
3.210% (1 Month LIBOR USD + 0.700%), 9/25/2035 (b) | | | 3,205,830 | | | | 2,770,334 | |
Residential Accredit Loans, Inc. Trust, Series 2005-QA10, Class A31, 4.747%, 9/25/2035 (e) | | | 2,168,883 | | | | 1,960,074 | |
Residential Accredit Loans, Inc. Trust, Series 2005-QS13, Class 1A6, 5.500%, 9/25/2035 | | | 1,027,595 | | | | 980,501 | |
Residential Accredit Loans, Inc. Trust, Series 2005-QS14, Class 2A1, 6.000%, 9/25/2035 | | | 7,464,461 | | | | 5,672,154 | |
Residential Accredit Loans, Inc. Trust, Series 2005-QS16, Class A1,
3.210% (1 Month LIBOR USD + 0.700%), 11/25/2035 (b) | | | 951,514 | | | | 783,848 | |
Residential Accredit Loans, Inc. Trust, Series 2005-QS17, Class AP, 0.000%, 12/25/2035 (c) | | | 762,891 | | | | 576,522 | |
Residential Accredit Loans, Inc. Trust, Series 2005-QA13, Class 2A1, 4.809%, 12/25/2035 (e) | | | 7,778,645 | | | | 7,178,810 | |
Residential Accredit Loans, Inc. Trust, Series 2005-QS17, Class A1, 6.000%, 12/25/2035 | | | 4,203,256 | | | | 4,061,980 | |
Residential Accredit Loans, Inc. Trust, Series 2005-QS17, Class A10, 6.000%, 12/25/2035 | | | 5,810,876 | | | | 5,744,057 | |
Residential Accredit Loans, Inc. Trust, Series2006-QS1, Class A5,
3.420% (1 Month LIBOR USD + 0.910%), 1/25/2036 (b) | | | 10,106,980 | | | | 8,303,147 | |
Residential Accredit Loans, Inc. Trust, Series2006-QA1, Class A21, 4.866%, 1/25/2036 (e) | | | 5,449,520 | | | | 5,027,160 | |
See accompanying notes which are an integral part of these financial statements.
50
Angel Oak Multi-Strategy Income Fund
Consolidated Schedule of Investments – (continued)
January 31, 2019
| | | | | | | | |
| | | Principal
Amount | | | Value | |
| Collateralized Mortgage Obligations – (continued) | | | | | | |
Residential Accredit Loans, Inc. Trust, Series2006-QS2, Class 1A17,
2.990% (1 Month LIBOR USD + 0.480%), 2/25/2036 (b) | | $ | 6,394,269 | | | $ | 5,345,616 | |
Residential Accredit Loans, Inc. Trust, Series2006-QS2, Class 1A10,
3.010% (1 Month LIBOR USD + 0.500%), 2/25/2036 (b) | | | 4,443,571 | | | | 3,627,589 | |
Residential Accredit Loans, Inc. Trust, Series2006-QS2, Class 1A2,
3.010% (1 Month LIBOR USD + 0.500%), 2/25/2036 (b) | | | 830,955 | | | | 678,241 | |
Residential Accredit Loans, Inc. Trust, Series2006-QS2, Class 1A14,
3.210% (1 Month LIBOR USD + 0.700%), 2/25/2036 (b) | | | 10,534,015 | | | | 8,721,153 | |
Residential Accredit Loans, Inc. Trust, Series2006-QS2, Class 1A5,
3.510% (1 Month LIBOR USD + 1.000%), 2/25/2036 (b) | | | 1,402,209 | | | | 1,173,199 | |
Residential Accredit Loans, Inc. Trust, Series2006-QS2, Class 1A9, 5.500%, 2/25/2036 | | | 2,797,874 | | | | 2,630,379 | |
Residential Accredit Loans, Inc. Trust, Series2006-QS3, Class 2AP, 0.000%, 3/25/2036 (c) | | | 1,064,387 | | | | 762,373 | |
Residential Accredit Loans, Inc. Trust, Series2006-QS3, Class 1A8,
2.910% (1 Month LIBOR USD + 0.400%), 3/25/2036 (b) | | | 3,366,657 | | | | 2,686,629 | |
Residential Accredit Loans, Inc. Trust, Series2006-QS3, Class 1A1,
3.210% (1 Month LIBOR USD + 0.700%), 3/25/2036 (b) | | | 6,240,173 | | | | 5,049,323 | |
Residential Accredit Loans, Inc. Trust, Series2006-QS3, Class 1A10, 6.000%, 3/25/2036 | | | 380,888 | | | | 357,230 | |
Residential Accredit Loans, Inc. Trust, Series2006-QS3, Class 1A14, 6.000%, 3/25/2036 | | | 3,205,178 | | | | 3,059,118 | |
Residential Accredit Loans, Inc. Trust, Series2006-QA3, Class A2,
2.810% (1 Month LIBOR USD + 0.300%), 4/25/2036 (b) | | | 24,010,996 | | | | 22,318,821 | |
Residential Accredit Loans, Inc. Trust, Series2006-QS4, Class A2, 6.000%, 4/25/2036 | | | 1,429,139 | | | | 1,325,138 | |
Residential Accredit Loans, Inc. Trust, Series2006-QS5, Class AP, 0.000%, 5/25/2036 (c) | | | 194,515 | | | | 142,817 | |
Residential Accredit Loans, Inc. Trust, Series2006-QS5, Class A1, 6.000%, 5/25/2036 | | | 2,123,742 | | | | 1,949,372 | |
Residential Accredit Loans, Inc. Trust, Series2006-QS5, Class A9, 6.000%, 5/25/2036 | | | 3,034,256 | | | | 2,784,943 | |
Residential Accredit Loans, Inc. Trust, Series2006-QS7, Class A3, 6.000%, 6/25/2036 | | | 2,356,882 | | | | 2,174,631 | |
Residential Accredit Loans, Inc. Trust, Series2006-QS7, Class A1, 6.000%, 6/25/2036 | | | 1,931,224 | | | | 1,815,335 | |
Residential Accredit Loans, Inc. Trust, Series2006-QS9, Class 1AP, 0.000%, 7/25/2036 (c) | | | 72,663 | | | | 53,066 | |
Residential Accredit Loans, Inc. Trust, Series2006-QS9, Class 2AP, 0.000%, 7/25/2036 (c) | | | 62,978 | | | | 24,179 | |
Residential Accredit Loans, Inc. Trust, Series2006-QA5, Class 1A1,
2.690% (1 Month LIBOR USD + 0.180%), 7/25/2036 (b) | | | 168,969 | | | | 106,741 | |
Residential Accredit Loans, Inc. Trust, Series2006-QA5, Class 1A2,
2.690% (1 Month LIBOR USD + 0.180%), 7/25/2036 (b) | | | 9,136,074 | | | | 5,768,672 | |
Residential Accredit Loans, Inc. Trust, Series2006-QA6, Class A1,
2.700% (1 Month LIBOR USD + 0.190%), 7/25/2036 (b) | | | 3,677,873 | | | | 3,447,623 | |
Residential Accredit Loans, Inc. Trust, Series2006-QA6, Class A3,
2.700% (1 Month LIBOR USD + 0.190%), 7/25/2036 (b) | | | 3,170,532 | | | | 3,005,056 | |
Residential Accredit Loans, Inc. Trust, Series2006-QS9, Class 1A8,
3.160% (1 Month LIBOR USD + 0.650%), 7/25/2036 (b) | | | 2,267,810 | | | | 1,728,554 | |
Residential Accredit Loans, Inc. Trust, Series2006-QS9, Class 1A10, 6.500%, 7/25/2036 | | | 3,261,545 | | | | 3,075,373 | |
Residential Accredit Loans, Inc. Trust, Series2006-QA7, Class 2A1,
2.695% (1 Month LIBOR USD + 0.185%), 8/25/2036 (b) | | | 11,297,047 | | | | 10,689,052 | |
Residential Accredit Loans, Inc. Trust, Series2006-QA7, Class 1A1,
2.700% (1 Month LIBOR USD + 0.190%), 8/25/2036 (b) | | | 18,201,213 | | | | 16,854,578 | |
Residential Accredit Loans, Inc. Trust, Series 2006-QS10, Class A4, 5.750%, 8/25/2036 | | | 2,980,330 | | | | 2,752,355 | |
Residential Accredit Loans, Inc. Trust, Series 2006-QS10, Class A1, 6.000%, 8/25/2036 | | | 4,061,947 | | | | 3,768,463 | |
Residential Accredit Loans, Inc. Trust, Series2008-QR1, Class 1A4, 6.000%, 8/25/2036 | | | 1,181,056 | | | | 1,020,126 | |
Residential Accredit Loans, Inc. Trust, Series 2006-QS11, Class 1A8, 6.000%, 8/25/2036 | | | 4,627,068 | | | | 4,156,033 | |
Residential Accredit Loans, Inc. Trust, Series 2006-QS11, Class 1A2, 6.000%, 8/25/2036 | | | 4,644,254 | | | | 4,133,981 | |
Residential Accredit Loans, Inc. Trust, Series 2006-QS10, Class A10, 6.000%, 8/25/2036 | | | 427,251 | | | | 383,312 | |
See accompanying notes which are an integral part of these financial statements.
51
Angel Oak Multi-Strategy Income Fund
Consolidated Schedule of Investments – (continued)
January 31, 2019
| | | | | | | | |
| | | Principal
Amount | | | Value | |
| Collateralized Mortgage Obligations – (continued) | | | | | | |
Residential Accredit Loans, Inc. Trust, Series 2006-QS10, Class A15, 6.000%, 8/25/2036 | | $ | 557,696 | | | $ | 500,125 | |
Residential Accredit Loans, Inc. Trust, Series2006-QS8, Class A1, 6.000%, 8/25/2036 | | | 3,868,738 | | | | 3,570,923 | |
Residential Accredit Loans, Inc. Trust, Series2006-QS8, Class A2, 6.000%, 8/25/2036 | | | 1,806,761 | | | | 1,663,682 | |
Residential Accredit Loans, Inc. Trust, Series 2006-QS11, Class 1A1, 6.500%, 8/25/2036 | | | 6,587,773 | | | | 6,026,508 | |
Residential Accredit Loans, Inc. Trust, Series 2006-QS12, Class AP, 0.000%, 9/25/2036 (c) | | | 249,402 | | | | 184,447 | |
Residential Accredit Loans, Inc. Trust, Series2006-QA8, Class A2,
2.690% (1 Month LIBOR USD + 0.180%), 9/25/2036 (b) | | | 892,661 | | | | 819,052 | |
Residential Accredit Loans, Inc. Trust, Series2006-QA8, Class A1,
2.700% (1 Month LIBOR USD + 0.190%), 9/25/2036 (b) | | | 1,426,933 | | | | 1,315,048 | |
Residential Accredit Loans, Inc. Trust, Series 2006-QS12, Class 2A7,
3.160% (1 Month LIBOR USD + 0.650%), 9/25/2036 (b) | | | 5,960,987 | | | | 4,644,509 | |
Residential Accredit Loans, Inc. Trust, Series 2006-QS12, Class 2A18, 5.750%, 9/25/2036 | | | 608,527 | | | | 556,178 | |
Residential Accredit Loans, Inc. Trust, Series 2006-QS12, Class 2A4, 6.000%, 9/25/2036 | | | 6,145,967 | | | | 5,684,571 | |
Residential Accredit Loans, Inc. Trust, Series 2006-QS15, Class AP, 0.000%, 10/25/2036 (c) | | | 228,688 | | | | 142,480 | |
Residential Accredit Loans, Inc. Trust, Series 2006-QS15, Class A5, 6.500%, 10/25/2036 | | | 2,259,981 | | | | 2,174,207 | |
Residential Accredit Loans, Inc. Trust, Series 2006-QS15, Class A1, 6.500%, 10/25/2036 | | | 31,854,219 | | | | 30,179,675 | |
Residential Accredit Loans, Inc. Trust, Series 2006-QS16, Class AP, 0.000%, 11/25/2036 (c) | | | 240,499 | | | | 140,368 | |
Residential Accredit Loans, Inc. Trust, Series 2006-QS14, Class A15,
2.810% (1 Month LIBOR USD + 0.300%), 11/25/2036 (b) | | | 3,220,971 | | | | 2,309,282 | |
Residential Accredit Loans, Inc. Trust, Series 2006-QS16, Class A1,
2.910% (1 Month LIBOR USD + 0.400%), 11/25/2036 (b) | | | 23,582,644 | | | | 17,435,710 | |
Residential Accredit Loans, Inc. Trust, Series 2006-QS16, Class A7, 6.000%, 11/25/2036 | | | 787,600 | | | | 708,888 | |
Residential Accredit Loans, Inc. Trust, Series 2006-QS16, Class A3,
6.000% (1 Month LIBOR USD + 0.550%), 11/25/2036 (b) | | | 16,473,232 | | | | 14,590,260 | |
Residential Accredit Loans, Inc. Trust, Series 2006-QS16, Class A10, 6.000%, 11/25/2036 | | | 6,443,947 | | | | 5,827,287 | |
Residential Accredit Loans, Inc. Trust, Series 2006-QS14, Class A1, 6.500%, 11/25/2036 | | | 1,474,926 | | | | 1,345,159 | |
Residential Accredit Loans, Inc. Trust, Series 2006-QS14, Class A13, 6.500%, 11/25/2036 | | | 1,690,862 | | | | 1,542,438 | |
Residential Accredit Loans, Inc. Trust, Series 2006-QA11, Class A1,
2.680% (1 Month LIBOR USD + 0.170%), 12/25/2036 (b) | | | 249,276 | | | | 211,098 | |
Residential Accredit Loans, Inc. Trust, Series 2006-QA10, Class A2,
2.690% (1 Month LIBOR USD + 0.180%), 12/25/2036 (b) | | | 972,270 | | | | 909,021 | |
Residential Accredit Loans, Inc. Trust, Series 2006-QA10, Class A1,
2.695% (1 Month LIBOR USD + 0.185%), 12/25/2036 (b) | | | 4,012,680 | | | | 3,710,738 | |
Residential Accredit Loans, Inc. Trust, Series 2006-QS18, Class 2A1,
2.960% (1 Month LIBOR USD + 0.450%), 12/25/2036 (b) | | | 10,852,893 | | | | 7,751,267 | |
Residential Accredit Loans, Inc. Trust, Series 2006-QS17, Class A7, 6.000%, 12/25/2036 | | | 4,439,250 | | | | 4,099,940 | |
Residential Accredit Loans, Inc. Trust, Series 2006-QS17, Class A6, 6.250%, 12/25/2036 | | | 10,345,873 | | | | 9,547,978 | |
Residential Accredit Loans, Inc. Trust, Series2007-QS1, Class 1AP, 0.000%, 1/25/2037 (c) | | | 268,673 | | | | 173,447 | |
Residential Accredit Loans, Inc. Trust, Series2007-QS1, Class 2AP, 0.000%, 1/25/2037 (c) | | | 1,515,385 | | | | 968,662 | |
Residential Accredit Loans, Inc. Trust, Series2007-QA1, Class A3,
2.680% (1 Month LIBOR USD + 0.170%), 1/25/2037 (b) | | | 3,943,287 | | | | 3,601,936 | |
Residential Accredit Loans, Inc. Trust, Series2007-QS1, Class 2A4,
3.060% (1 Month LIBOR USD + 0.550%), 1/25/2037 (b) | | | 18,558,011 | | | | 14,420,985 | |
Residential Accredit Loans, Inc. Trust, Series2007-QS1, Class 2A10, 6.000%, 1/25/2037 | | | 3,259,896 | | | | 2,841,606 | |
Residential Accredit Loans, Inc. Trust, Series2007-QS3, Class AP, 0.000%, 2/25/2037 (c) | | | 800,624 | | | | 448,973 | |
Residential Accredit Loans, Inc. Trust, Series2007-QS3, Class AV, 0.361%, 2/25/2037 (e)(g)(h) | | | 47,675,580 | | | | 703,453 | |
Residential Accredit Loans, Inc. Trust, Series2007-QA2, Class A3,
2.660% (1 Month LIBOR USD + 0.150%), 2/25/2037 (b) | | | 10,801,109 | | | | 10,024,758 | |
See accompanying notes which are an integral part of these financial statements.
52
Angel Oak Multi-Strategy Income Fund
Consolidated Schedule of Investments – (continued)
January 31, 2019
| | | | | | | | |
| | | Principal
Amount | | | Value | |
| Collateralized Mortgage Obligations – (continued) | | | | | | |
Residential Accredit Loans, Inc. Trust, Series2007-QH1, Class A1,
2.670% (1 Month LIBOR USD + 0.160%), 2/25/2037 (b) | | $ | 11,204,520 | | | $ | 10,772,429 | |
Residential Accredit Loans, Inc. Trust, Series2007-QS3, Class A2, 6.000%, 2/25/2037 (i) | | | 21,498,810 | | | | 19,931,525 | |
Residential Accredit Loans, Inc. Trust, Series2007-QS5, Class AP, 0.000%, 3/25/2037 (c) | | | 592,713 | | | | 336,217 | |
Residential Accredit Loans, Inc. Trust, Series2007-QS5, Class A7, 0.000%, 3/25/2037 (c) | | | 383,141 | | | | 227,509 | |
Residential Accredit Loans, Inc. Trust, Series2007-QS4, Class 4A3, 0.000%, 3/25/2037 (c) | | | 807,421 | | | | 78,411 | |
Residential Accredit Loans, Inc. Trust, Series2007-QS5, Class A1, 5.500%, 3/25/2037 | | | 748,556 | | | | 663,873 | |
Residential Accredit Loans, Inc. Trust, Series2007-QS4, Class 3A4, 6.000%, 3/25/2037 | | | 5,634,634 | | | | 4,888,333 | |
Residential Accredit Loans, Inc. Trust, Series2007-QS6, Class AP, 0.000%, 4/25/2037 (c) | | | 922,124 | | | | 530,209 | |
Residential Accredit Loans, Inc. Trust, Series2007-QS6, Class A1,
2.840% (1 Month LIBOR USD + 0.330%), 4/25/2037 (b) | | | 6,760,427 | | | | 5,316,738 | |
Residential Accredit Loans, Inc. Trust, Series2007-QS6, Class A29, 6.000%, 4/25/2037 | | | 1,652,262 | | | | 1,534,695 | |
Residential Accredit Loans, Inc. Trust, Series2007-QA3, Class A1,
2.610% (1 Month LIBOR USD + 0.100%), 5/25/2037 (b) | | | 7,669,344 | | | | 6,957,046 | |
Residential Accredit Loans, Inc. Trust, Series2007-QA3, Class A3,
2.700% (1 Month LIBOR USD + 0.190%), 5/25/2037 (b) | | | 23,260,431 | | | | 21,290,040 | |
Residential Accredit Loans, Inc. Trust, Series2007-QS7, Class 1A5,
2.910% (1 Month LIBOR USD + 0.400%), 5/25/2037 (b) | | | 7,048,688 | | | | 5,530,091 | |
Residential Accredit Loans, Inc. Trust, Series2007-QS7, Class 1A7,
3.060% (1 Month LIBOR USD + 0.550%), 5/25/2037 (b) | | | 1,049,180 | | | | 856,149 | |
Residential Accredit Loans, Inc. Trust, Series2007-QS7, Class 1A1, 6.000%, 5/25/2037 | | | 13,242,536 | | | | 12,176,433 | |
Residential Accredit Loans, Inc. Trust, Series2007-QS8, Class A13, 6.000%, 6/25/2037 | | | 1,224,044 | | | | 1,171,413 | |
Residential Accredit Loans, Inc. Trust, Series2007-QS9, Class AP, 0.000%, 7/25/2037 (c) | | | 1,962,996 | | | | 1,068,665 | |
Residential Accredit Loans, Inc. Trust, Series2007-QH6, Class A1,
2.700% (1 Month LIBOR USD + 0.190%), 7/25/2037 (b) | | | 12,204,195 | | | | 11,820,763 | |
Residential Accredit Loans, Inc. Trust, Series2007-QH7, Class 2A1,
2.810% (1 Month LIBOR USD + 0.300%), 8/25/2037 (b)(i) | | | 25,210,491 | | | | 23,809,392 | |
Residential Accredit Loans, Inc. Trust, Series2007-QH9, Class A1, 3.482%, 11/25/2037 (e) | | | 4,717,752 | | | | 4,075,793 | |
Residential Accredit Loans, Inc. Trust, Series2006-QO9, Class 1A3A,
2.710% (1 Month LIBOR USD + 0.200%), 12/25/2046 (b)(i) | | | 33,112,269 | | | | 29,104,393 | |
Residential Accredit Loans, Inc. Trust, Series2007-QO4, Class A1A,
2.700% (1 Month LIBOR USD + 0.190%), 5/25/2047 (b) | | | 2,576,450 | | | | 2,443,822 | |
Residential Asset Securitization Trust, Series2007-A8, Class 3A1, 6.203%, 8/25/2022 (e) | | | 978,673 | | | | 842,945 | |
Residential Asset Securitization Trust, Series2004-A9, Class A4, 5.250%, 12/25/2034 | | | 6,781,033 | | | | 6,899,620 | |
Residential Asset Securitization Trust, Series2005-A3, Class AX, 0.317%, 4/25/2035 (e)(g)(h) | | | 26,412,051 | | | | 382,288 | |
Residential Asset Securitization Trust, Series2005-A4, Class A1,
2.960% (1 Month LIBOR USD + 0.450%), 4/25/2035 (b) | | | 4,250,747 | | | | 3,137,396 | |
Residential Asset Securitization Trust, Series 2005-A6CB, Class A2, 5.500%, 6/25/2035 | | | 5,645,795 | | | | 5,419,110 | |
Residential Asset Securitization Trust, Series 2005-A6CB, Class A1, 5.500%, 6/25/2035 | | | 5,260,487 | | | | 4,860,206 | |
Residential Asset Securitization Trust, Series2005-A10, Class A3, 5.500%, 9/25/2035 | | | 5,820,577 | | | | 5,404,429 | |
Residential Asset Securitization Trust, Series2005-A10, Class A4, 5.500%, 9/25/2035 | | | 1,635,465 | | | | 1,532,175 | |
Residential Asset Securitization Trust, Series2005-A11, Class PO, 0.000%, 10/25/2035 (c) | | | 995,239 | | | | 628,397 | |
Residential Asset Securitization Trust, Series2005-A11, Class 1A1,
2.960% (1 Month LIBOR USD + 0.450%), 10/25/2035 (b) | | | 3,215,822 | | | | 2,509,650 | |
Residential Asset Securitization Trust, Series2005-A11, Class 1A3, 5.500%, 10/25/2035 | | | 2,889,191 | | | | 2,658,024 | |
Residential Asset Securitization Trust, Series2005-A12, Class A10,
2.960% (1 Month LIBOR USD + 0.450%), 11/25/2035 (b) | | | 1,407,215 | | | | 1,010,634 | |
Residential Asset Securitization Trust, Series2005-A12, Class A6,
3.010% (1 Month LIBOR USD + 0.500%), 11/25/2035 (b) | | | 6,910,802 | | | | 5,130,441 | |
See accompanying notes which are an integral part of these financial statements.
53
Angel Oak Multi-Strategy Income Fund
Consolidated Schedule of Investments – (continued)
January 31, 2019
| | | | | | | | |
| | | Principal
Amount | | | Value | |
| Collateralized Mortgage Obligations – (continued) | | | | | | |
Residential Asset Securitization Trust, Series2005-A14, Class A3, 5.500%, 12/25/2035 | | $ | 904,873 | | | $ | 766,717 | |
Residential Asset Securitization Trust, Series2006-A4, Class 2A1,
3.210% (1 Month LIBOR USD + 0.700%), 5/25/2036 (b) | | | 1,441,670 | | | | 1,293,214 | |
Residential Asset Securitization Trust, Series2006-A2, Class A5,
3.210% (1 Month LIBOR USD + 0.700%), 5/25/2036 (b) | | | 2,347,855 | | | | 1,256,227 | |
Residential Asset Securitization Trust, Series 2006-A7CB, Class 3A1, 6.500%, 7/25/2036 | | | 7,680,581 | | | | 4,575,706 | |
Residential Asset Securitization Trust, Series2006-A8, Class 2A3, 6.000%, 8/25/2036 | | | 6,473,502 | | | | 3,526,557 | |
Residential Asset Securitization Trust, Series2006-A8, Class 2A1, 6.500%, 8/25/2036 | | | 1,682,151 | | | | 990,619 | |
Residential Asset Securitization Trust, Series2006-A8, Class 2A4, 6.500%, 8/25/2036 | | | 10,633,147 | | | | 6,757,865 | |
Residential Asset Securitization Trust, Series2006-A8, Class 2A2, 6.750%, 8/25/2036 | | | 10,706,058 | | | | 7,014,620 | |
Residential Asset Securitization Trust, Series 2006-A14C, Class 2A4, 6.000%, 12/25/2036 | | | 3,235,541 | | | | 1,925,859 | |
Residential Asset Securitization Trust, Series2006-A16, Class 2A1, 6.000%, 2/25/2037 | | | 8,882,851 | | | | 4,842,922 | |
Residential Asset Securitization Trust, Series2006-A16, Class 2A3, 6.609%, 2/25/2037 (e) | | | 23,784,562 | | | | 13,237,512 | |
Residential Asset Securitization Trust, Series2007-A6, Class 1A4, 6.000%, 6/25/2037 | | | 3,308,816 | | | | 3,005,960 | |
Residential Asset Securitization Trust, Series2007-A7, Class A6, 6.000%, 7/25/2037 | | | 3,672,357 | | | | 2,688,720 | |
Residential Funding Mortgage Securities Trust, Series2005-S7, Class AP, 0.000%, 11/25/2035 (c) | | | 141,490 | | | | 115,855 | |
Residential Funding Mortgage Securities Trust, Series2005-SA5, Class 2A,
4.670%, 11/25/2035 (e) | | | 443,361 | | | | 422,996 | |
Residential Funding Mortgage Securities Trust, Series2005-S9, Class AP, 0.000%, 12/25/2035 (c) | | | 387,880 | | | | 308,165 | |
Residential Funding Mortgage Securities Trust, Series2006-S2, Class AP, 0.000%, 2/25/2036 (c) | | | 37,750 | | | | 30,827 | |
Residential Funding Mortgage Securities Trust, Series2006-SA1, Class 1A1, 4.638%, 2/25/2036 (e) | | | 1,770,172 | | | | 1,611,349 | |
Residential Funding Mortgage Securities Trust, Series2006-S4, Class AP, 0.000%, 4/25/2036 (c) | | | 226,601 | | | | 186,953 | |
Residential Funding Mortgage Securities Trust, Series2006-S5, Class A4, 0.000%, 6/25/2036 (c) | | | 85,572 | | | | 64,029 | |
Residential Funding Mortgage Securities Trust, Series2006-S5, Class A10, 6.000%, 6/25/2036 | | | 427,960 | | | | 419,075 | |
Residential Funding Mortgage Securities Trust, Series2006-S5, Class A12, 6.000%, 6/25/2036 | | | 1,275,052 | | | | 1,275,572 | |
Residential Funding Mortgage Securities Trust, Series2006-S5, Class A9, 6.000%, 6/25/2036 | | | 1,654,983 | | | | 1,620,925 | |
Residential Funding Mortgage Securities Trust, Series2006-S6, Class A14, 6.000%, 7/25/2036 | | | 252,377 | | | | 239,838 | |
Residential Funding Mortgage Securities Trust, Series2006-S7, Class A7, 6.250%, 8/25/2036 | | | 119,175 | | | | 113,914 | |
Residential Funding Mortgage Securities Trust, Series2006-S9, Class A4, 5.750%, 9/25/2036 | | | 8,633,417 | | | | 8,317,425 | |
Residential Funding Mortgage Securities Trust, Series2006-S10, Class 1AP,
0.000%, 10/25/2036 (c) | | | 53,839 | | | | 38,786 | |
Residential Funding Mortgage Securities Trust, Series2006-S10, Class 1A3, 6.000%, 10/25/2036 | | | 1,016,756 | | | | 967,924 | |
Residential Funding Mortgage Securities Trust, Series2006-S11, Class AP,
0.000%, 11/25/2036 (c) | | | 82,843 | | | | 58,093 | |
Residential Funding Mortgage Securities Trust, Series2006-S12, Class 2AP,
0.000%, 12/25/2036 (c) | | | 50,777 | | | | 39,818 | |
Residential Funding Mortgage Securities Trust, Series2007-S1, Class A7, 6.000%, 1/25/2037 | | | 3,247,329 | | | | 3,101,524 | |
Residential Funding Mortgage Securities Trust, Series2007-S5, Class AP, 0.000%, 5/25/2037 (c) | | | 483,754 | | | | 364,376 | |
Rosslyn Portfolio Trust, Series 2017-ROSS, Class E,
5.509% (1 Month LIBOR USD + 3.000%), 6/15/2033 (a)(b) | | | 4,750,000 | | | | 4,726,013 | |
Sequoia Mortgage Trust, Series2003-8, Class A1,
3.143% (1 Month LIBOR USD + 0.640%), 1/20/2034 (b) | | | 981,822 | | | | 963,496 | |
Sequoia Mortgage Trust, Series2004-4, Class A,
3.214% (6 Month LIBOR USD + 0.520%), 5/20/2034 (b) | | | 1,571,305 | | | | 1,517,385 | |
Sequoia Mortgage Trust, Series2004-7, Class A3B,
3.614% (6 Month LIBOR USD + 1.100%), 8/20/2034 (b) | | | 81,727 | | | | 79,679 | |
Sequoia Mortgage Trust, Series2005-2, Class XA, 0.502%, 3/20/2035 (e)(h) | | | 11,481,543 | | | | 168,584 | |
See accompanying notes which are an integral part of these financial statements.
54
Angel Oak Multi-Strategy Income Fund
Consolidated Schedule of Investments – (continued)
January 31, 2019
| | | | | | | | |
| | | Principal
Amount | | | Value | |
| Collateralized Mortgage Obligations – (continued) | | | | | | |
Sequoia Mortgage Trust, Series2007-3, Class 1A1,
2.703% (1 Month LIBOR USD + 0.200%), 7/20/2036 (b) | | $ | 668,021 | | | $ | 635,952 | |
Sequoia Mortgage Trust, Series2007-2, Class 2AA1, 3.889%, 1/20/2038 (e) | | | 729,316 | | | | 683,774 | |
Sequoia Mortgage Trust, Series2014-3, Class AI01, 0.250%, 10/25/2044 (a)(h) | | | 6,031,996 | | | | 58,046 | |
Sequoia Mortgage Trust, Series2007-1, Class 5A1, 3.866%, 10/20/2046 (e) | | | 5,133,443 | | | | 4,468,010 | |
Sequoia Mortgage Trust, Series2007-1, Class 2A1, 4.130%, 2/20/2047 (e) | | | 1,576,991 | | | | 1,500,429 | |
SG Residential Mortgage Trust, Series2018-1, Class A3, 3.735%, 4/25/2048 (a) | | | 2,278,826 | | | | 2,282,139 | |
SG Residential Mortgage Trust, Series2018-1, Class M1, 4.330%, 4/25/2048 (a) | | | 6,571,715 | | | | 6,582,808 | |
STACR Trust, Series 2018-DNA2, Class M2,
4.660% (1 Month LIBOR USD + 2.150%), 12/26/2030 (a)(b) | | | 5,500,000 | | | | 5,441,452 | |
STACR Trust, Series 2018-DNA3, Class M2,
4.610% (1 Month LIBOR USD + 2.100%), 9/25/2048 (a)(b) | | | 5,500,000 | | | | 5,400,593 | |
Structured Adjustable Rate Mortgage Loan Trust, Series2004-9XS, Class A,
2.880% (1 Month LIBOR USD + 0.370%), 7/25/2034 (b) | | | 158,757 | | | | 157,476 | |
Structured Adjustable Rate Mortgage Loan Trust, Series2005-4, Class 5A,
4.417%, 3/25/2035 (e) | | | 1,686,974 | | | | 1,667,124 | |
Structured Adjustable Rate Mortgage Loan Trust, Series2005-9, Class AX,
0.187%, 5/25/2035 (e)(h) | | | 48,610,299 | | | | 1,121,197 | |
Structured Adjustable Rate Mortgage Loan Trust, Series2005-18, Class 3A1,
4.300%, 9/25/2035 (e) | | | 4,918,310 | | | | 4,586,260 | |
Structured Adjustable Rate Mortgage Loan Trust, Series2005-23, Class 4A1,
4.147%, 1/25/2036 (e) | | | 1,542,121 | | | | 1,457,184 | |
Structured Adjustable Rate Mortgage Loan Trust, Series2007-4, Class 1A2,
2.730% (1 Month LIBOR USD + 0.220%), 5/25/2037 (b) | | | 6,365,799 | | | | 6,010,817 | |
Structured Adjustable Rate Mortgage Loan Trust, Series2007-6, Class 2A1,
2.700% (1 Month LIBOR USD + 0.190%), 7/25/2037 (b) | | | 764,223 | | | | 718,411 | |
Structured Adjustable Rate Mortgage Loan Trust, Series2007-8, Class 1A2,
4.020% (1 Month LIBOR USD + 1.500%), 9/25/2037 (b) | | | 1,733,030 | | | | 1,673,383 | |
Structured Asset Mortgage Investments II Trust, Series2004-AR7, Class X,
0.584%, 4/19/2035 (e)(g)(h) | | | 16,638,814 | | | | 439,614 | |
Structured Asset Mortgage Investments II Trust, Series2006-AR7, Class A1BG,
2.630% (1 Month LIBOR USD + 0.120%), 8/25/2036 (b) | | | 7,645,008 | | | | 7,087,366 | |
Structured Asset Mortgage Investments II Trust, Series2005-AR2, Class 1X,
0.778%, 5/25/2045 (e)(g)(h) | | | 18,174,994 | | | | 716,149 | |
Structured Asset Securities Corp. Mortgage Loan Trust, Series2006-RF3, Class 4A,
4.497%, 10/25/2036 (a)(e) | | | 596,716 | | | | 588,454 | |
Structured Asset Securities Corp. Mortgage Pass-Through Certificates, Series2003-6A, Class 2A1, 4.574%, 3/25/2033 (e) | | | 53,408 | | | | 53,757 | |
Structured Asset Securities Corp. Trust, Series2005-10, Class 5A4, 5.750%, 12/25/2034 | | | 58,556 | | | | 56,679 | |
Structured Asset Securities Corp. Trust, Series2005-1, Class AP, 0.000%, 2/25/2035 (c) | | | 62,999 | | | | 45,906 | |
Sutherland Commercial Mortgage Loans, Series 2017-SBC6, Class A, 3.192%, 4/25/2023 (a)(e) | | | 2,649,870 | | | | 2,632,702 | |
Sutherland Commercial Mortgage Loans, Series 2017-SBC6, Class B, 5.031%, 6/25/2024 (a)(e) | | | 7,000,000 | | | | 6,989,535 | |
TBW Mortgage-Backed Trust Series, Series2006-3, Class 2A1, 6.500%, 7/25/2036 | | | 4,316,742 | | | | 3,206,455 | |
Tharaldson Hotel Portfolio Trust, Series2018-THL, Class F,
6.465% (1 Month LIBOR USD + 3.952%), 11/11/2034 (a)(b) | | | 2,316,126 | | | | 2,281,949 | |
Toorak Mortgage Ltd., Series2018-1, Class A1, 4.336%, 8/25/2021 (a)(d) | | | 12,000,000 | | | | 11,915,616 | |
UBS-Barclays Commercial Mortgage Trust, Series2012-C2, Class F, 4.892%, 5/11/2063 (a)(e) | | | 7,000,000 | | | | 4,970,084 | |
Velocity Commercial Capital Loan Trust, Series2017-1, Class AFX, 3.000%, 5/25/2047 (a)(e) | | | 866,084 | | | | 862,363 | |
See accompanying notes which are an integral part of these financial statements.
55
Angel Oak Multi-Strategy Income Fund
Consolidated Schedule of Investments – (continued)
January 31, 2019
| | | | | | | | |
| | | Principal
Amount | | | Value | |
| Collateralized Mortgage Obligations – (continued) | | | | | | |
Velocity Commercial Capital Loan Trust, Series2017-1, Class AFL,
3.760% (1 Month LIBOR USD + 1.250%), 5/25/2047 (a)(b) | | $ | 541,303 | | | $ | 542,657 | |
Velocity Commercial Capital Loan Trust, Series2017-2, Class AFX, 3.070%, 11/25/2047 (a)(e) | | | 5,188,976 | | | | 5,147,246 | |
Velocity Commercial Capital Loan Trust, Series2018-1, Class A, 3.590%, 4/25/2048 (a) | | | 4,406,784 | | | | 4,413,495 | |
Velocity Commercial Capital Loan Trust, Series2018-1, Class M1, 3.910%, 4/25/2048 (a) | | | 4,101,433 | | | | 4,109,385 | |
Velocity Commercial Capital Loan Trust, Series2018-1, Class M2, 4.260%, 4/25/2048 (a) | | | 1,436,961 | | | | 1,439,777 | |
Velocity Commercial Capital Loan Trust, Series2018-1, Class M3, 4.410%, 4/25/2048 (a) | | | 838,708 | | | | 842,020 | |
Velocity Commercial Capital Loan Trust, Series2018-1, Class M6, 7.260%, 4/25/2048 (a) | | | 814,828 | | | | 816,196 | |
Velocity Commercial Capital Loan Trust, Series2018-2, Class M1, 4.260%, 10/25/2048 (a) | | | 1,745,936 | | | | 1,760,007 | |
Verus Securitization Trust, Series 2017-SG1A, Class A1, 2.690%, 11/25/2047 (a)(e) | | | 11,276,077 | | | | 11,190,187 | |
Verus Securitization Trust, Series 2017-SG1A, Class B1, 3.615%, 11/25/2047 (a)(d) | | | 8,711,571 | | | | 8,650,756 | |
Verus Securitization Trust, Series2018-1, Class A1, 2.929%, 1/25/2058 (a)(e) | | | 3,418,450 | | | | 3,424,818 | |
Verus Securitization Trust, Series2018-1, Class A2, 3.031%, 1/25/2058 (a)(e) | | | 828,546 | | | | 830,115 | |
Verus Securitization Trust, Series 2018-INV1, Class B1, 4.553%, 3/25/2058 (a) | | | 9,443,551 | | | | 9,413,133 | |
Verus Securitization Trust, Series 2018-INV1, Class B2, 5.648%, 3/25/2058 (a)(e) | | | 6,700,000 | | | | 6,714,626 | |
Verus Securitization Trust, Series2018-3, Class M1, 4.595%, 10/25/2058 (a)(e) | | | 8,000,000 | | | | 8,061,896 | |
Verus Securitization Trust, Series 2018-INV2, Class A3, 4.705%, 10/25/2058 (a) | | | 7,091,863 | | | | 7,106,969 | |
Verus Securitization Trust, Series2018-3, Class B1, 5.694%, 10/25/2058 (a)(e) | | | 3,400,000 | | | | 3,437,903 | |
VMC Finance LLC, Series2018-FL1, Class D,
5.908% (1 Month LIBOR USD + 3.400%), 3/16/2035 (a)(b) | | | 4,500,000 | | | | 4,517,924 | |
VMC Finance LLC, Series2018-FL1, Class C,
4.758% (1 Month LIBOR USD + 2.250%), 4/15/2035 (a)(b) | | | 6,750,000 | | | | 6,748,502 | |
Wachovia Bank Commercial Mortgage Trust, Series2007-C33, Class D, 5.773%, 2/15/2051 (e) | | | 7,000,000 | | | | 478,695 | |
Wachovia Mortgage Loan Trust LLC, Series 2006-AMN1, Class A2,
2.446% (1 Month LIBOR USD + 0.150%), 8/25/2036 (b) | | | 29,235,166 | | | | 17,116,400 | |
Wachovia Mortgage Loan Trust LLC, Series 2006-AMN1, Class A1,
2.446% (1 Month LIBOR USD + 0.050%), 8/25/2036 (b) | | | 6,915,581 | | | | 3,905,906 | |
Wachovia Mortgage Loan Trust LLC, Series 2006-AMN1, Class A3,
2.446% (1 Month LIBOR USD + 0.240%), 8/25/2036 (b) | | | 3,436,760 | | | | 2,077,154 | |
Wachovia Mortgage Loan Trust LLC, Series 2006-ALT1, Class A1,
2.590% (1 Month LIBOR USD + 0.080%), 1/25/2037 (b) | | | 11,305,736 | | | | 7,706,973 | |
Wachovia Mortgage Loan Trust LLC, Series 2006-ALT1, Class A2,
2.690% (1 Month LIBOR USD + 0.180%), 1/25/2037 (b) | | | 3,873,142 | | | | 2,610,769 | |
Washington Mutual Mortgage Pass-Through Certificates Trust, Series2004-AR3, Class B1,
3.952%, 6/25/2034 (e) | | | 1,468,808 | | | | 1,446,604 | |
Washington Mutual Mortgage Pass-Through Certificates Trust, Series2005-AR4, Class A5,
3.735%, 4/25/2035 (e) | | | 1,477,759 | | | | 1,505,637 | |
Washington Mutual Mortgage Pass-Through Certificates Trust, Series 2005-AR16, Class 1A2,
4.270%, 12/25/2035 (e) | | | 26,496,592 | | | | 26,913,701 | |
Washington Mutual Mortgage Pass-Through Certificates Trust, Series 2005-AR18, Class 1A2, 4.307%, 1/25/2036 (e)(i) | | | 30,513,085 | | | | 30,981,155 | |
Washington Mutual Mortgage Pass-Through Certificates Trust, Series 2006-AR10, Class 1A1, 3.872%, 9/25/2036 (e) | | | 694,195 | | | | 649,940 | |
Washington Mutual Mortgage Pass-Through Certificates Trust, Series 2006-AR12, Class 1A4, 3.883%, 10/25/2036 (e) | | | 4,924,381 | | | | 4,770,405 | |
Washington Mutual Mortgage Pass-Through Certificates Trust, Series 2006-AR14, Class 2A3, 3.703%, 11/25/2036 (e) | | | 1,555,350 | | | | 1,488,341 | |
Washington Mutual Mortgage Pass-Through Certificates Trust, Series 2006-AR14, Class 2A2, 3.703%, 11/25/2036 (e) | | | 289,515 | | | | 272,389 | |
See accompanying notes which are an integral part of these financial statements.
56
Angel Oak Multi-Strategy Income Fund
Consolidated Schedule of Investments – (continued)
January 31, 2019
| | | | | | | | |
| | | Principal
Amount | | | Value | |
| Collateralized Mortgage Obligations – (continued) | | | | | | |
Washington Mutual Mortgage Pass-Through Certificates Trust, Series2007-HY6, Class 1A1, 3.593%, 6/25/2037 (e) | | $ | 4,016,378 | | | $ | 3,845,095 | |
Washington Mutual Mortgage Pass-Through Certificates Trust, Series 2004-AR10, Class X,
0.439%, 7/25/2044 (e)(g)(h) | | | 28,959,362 | | | | 834,464 | |
Washington Mutual Mortgage Pass-Through Certificates Trust, Series 2005-AR11, Class X,
0.299%, 8/25/2045 (e)(g)(h) | | | 69,707,260 | | | | 1,937,722 | |
Washington Mutual Mortgage Pass-Through Certificates Trust, Series 2005-AR13, Class X,
0.328%, 10/25/2045 (e)(g)(h) | | | 97,846,470 | | | | 2,737,353 | |
Washington Mutual Mortgage Pass-Through Certificates Trust, Series 2005-AR15, Class X,
0.755%, 11/25/2045 (e)(g)(h) | | | 46,649,318 | | | | 2,543,741 | |
Washington Mutual Mortgage Pass-Through Certificates Trust, Series 2005-AR19, Class A1B2,
2.920% (1 Month LIBOR USD + 0.410%), 12/25/2045 (b) | | | 140,357 | | | | 137,689 | |
Washington Mutual Mortgage Pass-Through Certificates Trust, Series2006-AR1, Class 2A1A,
3.322% (12 Month US Treasury Average + 1.070%), 1/25/2046 (b) | | | 2,575,115 | | | | 2,522,044 | |
Washington Mutual Mortgage Pass-Through Certificates Trust, Series2006-AR7, Class CXPP,
0.254%, 7/25/2046 (e)(h) | | | 25,112,024 | | | | 276,986 | |
Washington Mutual Mortgage Pass-Through Certificates Trust, Series2006-AR7, Class 2A,
3.232% (12 Month US Treasury Average + 0.980%), 7/25/2046 (b) | | | 3,865,555 | | | | 3,605,554 | |
Washington Mutual Mortgage Pass-Through Certificates Trust, Series2006-AR9, Class 2XPP, 0.704%, 8/25/2046 (e)(h) | | | 10,150,006 | | | | 325,155 | |
Washington Mutual Mortgage Pass-Through Certificates Trust, Series2006-AR9, Class 2A,
2.579% (11th District Cost of Funds Index + 1.500%), 8/25/2046 (b) | | | 12,111,506 | | | | 11,435,308 | |
Washington Mutual Mortgage Pass-Through Certificates Trust, Series2006-AR9, Class 1A,
3.252% (12 Month US Treasury Average + 1.000%), 8/25/2046 (b) | | | 5,051,219 | | | | 4,658,189 | |
Washington Mutual Mortgage Pass-Through Certificates Trust, Series 2006-AR13, Class 1A,
3.132% (12 Month US Treasury Average + 0.880%), 10/25/2046 (b) | | | 7,297,249 | | | | 6,603,193 | |
Washington Mutual Mortgage Pass-Through Certificates Trust, Series 2006-AR17, Class 1A,
2.977% (12 Month US Treasury Average + 0.820%), 12/25/2046 (b) | | | 10,182,756 | | | | 9,377,504 | |
Washington Mutual Mortgage Pass-Through Certificates Trust, Series2007-OA2, Class 1A,
2.952% (12 Month US Treasury Average + 0.700%), 3/25/2047 (b) | | | 11,608,812 | | | | 10,472,042 | |
Washington Mutual Mortgage Pass-Through Certificates WMALT Trust, Series2003-MS7, Class P, 0.000%, 3/25/2033 (c) | | | 4,232 | | | | 3,738 | |
Washington Mutual Mortgage Pass-Through Certificates WMALT Trust, Series2005-4, Class CB9, 2.910% (1 Month LIBOR USD + 0.400%), 6/25/2035 (b) | | | 162,952 | | | | 139,810 | |
Washington Mutual Mortgage Pass-Through Certificates WMALT Trust, Series2005-4, Class CB3, 2.960% (1 Month LIBOR USD + 0.450%), 6/25/2035 (b)(i) | | | 17,753,776 | | | | 14,683,332 | |
Washington Mutual Mortgage Pass-Through Certificates WMALT Trust, Series2005-7, Class 3CB, 6.500%, 8/25/2035 | | | 962,171 | | | | 846,266 | |
Washington Mutual Mortgage Pass-Through Certificates WMALT Trust, Series2005-9, Class 5A3, 3.860% (1 Month LIBOR USD + 1.350%), 11/25/2035 (b) | | | 3,198,423 | | | | 2,496,728 | |
Washington Mutual Mortgage Pass-Through Certificates WMALT Trust, Series2005-AR1, Class A1A, 2.770% (1 Month LIBOR USD + 0.260%), 12/25/2035 (b) | | | 5,357,612 | | | | 4,807,246 | |
Washington Mutual Mortgage Pass-Through Certificates WMALT Trust, Series2005-10, Class 4CB3, 3.110% (1 Month LIBOR USD + 0.600%), 12/25/2035 (b) | | | 3,827,690 | | | | 3,353,018 | |
Washington Mutual Mortgage Pass-Through Certificates WMALT Trust, Series2005-11, Class A2, 5.750%, 1/25/2036 | | | 3,819,768 | | | | 3,449,197 | |
Washington Mutual Mortgage Pass-Through Certificates WMALT Trust, Series2006-AR1, Class A1A, 2.760% (1 Month LIBOR USD + 0.250%), 2/25/2036 (b) | | | 5,265,212 | | | | 4,530,273 | |
See accompanying notes which are an integral part of these financial statements.
57
Angel Oak Multi-Strategy Income Fund
Consolidated Schedule of Investments – (continued)
January 31, 2019
| | | | | | | | |
| | | Principal
Amount | | | Value | |
| Collateralized Mortgage Obligations – (continued) | | | | | | |
Washington Mutual Mortgage Pass-Through Certificates WMALT Trust, Series2006-1, Class 2XB1, 7.000%, 2/25/2036 | | $ | 6,267,791 | | | $ | 5,463,815 | |
Washington Mutual Mortgage Pass-Through Certificates WMALT Trust, Series2006-8, Class A1,
2.630% (1 Month LIBOR USD + 0.120%), 10/25/2036 (b) | | | 13,554,615 | | | | 7,333,724 | |
Washington Mutual Mortgage Pass-Through Certificates WMALT Trust, Series2006-8, Class A3B, 4.510%, 10/25/2036 (d) | | | 3,865,132 | | | | 2,431,233 | |
Washington Mutual Mortgage Pass-Through Certificates WMALT Trust, Series2006-8, Class A5,
4.510%, 10/25/2036 (d) | | | 9,579,677 | | | | 6,416,247 | |
Washington Mutual Mortgage Pass-Through Certificates WMALT Trust, Series2006-8, Class A4,
4.510%, 10/25/2036 (d) | | | 10,323,433 | | | | 6,526,381 | |
Washington Mutual Mortgage Pass-Through Certificates WMALT Trust, Series 2006-AR10, Class A2A, 2.680% (1 Month LIBOR USD + 0.170%), 12/25/2036 (b) | | | 17,352,802 | | | | 15,450,831 | |
Washington Mutual Mortgage Pass-Through Certificates WMALT Trust, Series2007-HY1, Class A1, 2.600% (1 Month LIBOR USD + 0.090%), 2/25/2037 (b) | | | 11,231,744 | | | | 7,421,936 | |
Washington Mutual Mortgage Pass-Through Certificates WMALT Trust, Series2007-HY1, Class A2A, 2.670% (1 Month LIBOR USD + 0.160%), 2/25/2037 (b) | | | 8,736,864 | | | | 6,971,493 | |
Washington Mutual Mortgage Pass-Through Certificates WMALT Trust, Series2007-HY1, Class A3A, 2.740% (1 Month LIBOR USD + 0.230%), 2/25/2037 (b) | | | 8,791,189 | | | | 7,000,310 | |
Washington Mutual Mortgage Pass-Through Certificates WMALT Trust, Series2007-3, Class A19, 6.000%, 4/25/2037 (i) | | | 10,857,352 | | | | 10,647,208 | |
Washington Mutual Mortgage Pass-Through Certificates WMALT Trust, Series2007-OC2, Class A3, 2.820% (1 Month LIBOR USD + 0.310%), 6/25/2037 (b) | | | 2,459,443 | | | | 2,225,336 | |
Washington Mutual Mortgage Pass-Through Certificates WMALT Trust, Series2006-AR8, Class 3X1, 0.191%, 10/25/2046 (e)(h) | | | 23,630,647 | | | | 817,904 | |
Washington Mutual Mortgage Pass-Through Certificates WMALT Trust, Series2006-AR8, Class 2A, 3.102% (12 Month US Treasury Average + 0.850%), 10/25/2046 (b)(i) | | | 21,061,566 | | | | 17,756,269 | |
Washington Mutual Mortgage Pass-Through Certificates WMALT Trust, Series2006-AR9, Class CX2P, 0.260%, 11/25/2046 (e)(h) | | | 59,718,719 | | | | 677,031 | |
Washington Mutual Mortgage Pass-Through Certificates WMALT Trust, Series2006-AR9, Class 1A, 3.082% (12 Month US Treasury Average + 0.830%), 11/25/2046 (b) | | | 8,995,066 | | | | 8,158,696 | |
Washington Mutual Mortgage Pass-Through Certificates WMALT Trust, Series2007-OA1, Class 2A, 2.972% (12 Month US Treasury Average + 0.720%), 12/25/2046 (b) | | | 8,725,625 | | | | 7,729,490 | |
Washington Mutual Mortgage Pass-Through Certificates WMALT Trust, Series2007-OA3, Class 2A, 3.002% (12 Month US Treasury Average + 0.750%), 2/25/2047 (b) | | | 21,676,242 | | | | 19,239,052 | |
Washington Mutual Mortgage Pass-Through Certificates WMALT Trust, Series2007-OA3, Class 5A, 2.329% (11th District Cost of Funds Index + 1.250%), 4/25/2047 (b) | | | 1,663,418 | | | | 1,416,920 | |
Washington Mutual Pass-Through Certificates Trust, Series2005-AR1, Class X,
0.434%, 1/25/2045 (e)(g)(h) | | | 57,008,605 | | | | 1,225,172 | |
Wells Fargo Alternative Loan Trust, Series2007-PA1, Class A9,
3.000% (1 Month LIBOR USD + 0.490%), 3/25/2037 (b) | | | 2,246,970 | | | | 1,853,067 | |
Wells Fargo Alternative Loan Trust, Series2007-PA1, Class A8,
3.050% (1 Month LIBOR USD + 0.540%), 3/25/2037 (b) | | | 4,998,143 | | | | 4,118,555 | |
Wells Fargo Alternative Loan Trust, Series2007-PA3, Class 4A1, 6.500%, 7/25/2037 | | | 3,671,457 | | | | 3,341,231 | |
Wells Fargo Alternative Loan Trust, Series2007-PA3, Class 4A3, 6.500%, 7/25/2037 | | | 4,027,578 | | | | 3,665,321 | |
Wells Fargo Commercial Mortgage Trust, Series2015-C27, Class C, 3.894%, 2/18/2048 | | | 100,000 | | | | 95,956 | |
Wells Fargo Commercial Mortgage Trust, Series 2016-LC25, Class C, 4.420%, 12/17/2059 (e) | | | 8,000,000 | | | | 7,912,808 | |
Wells Fargo Mortgage Backed Securities Trust, Series2005-2, Class 2A1, 4.750%, 4/25/2020 | | | 1,237 | | | | 1,240 | |
Wells Fargo Mortgage Backed Securities Trust, Series2003-L, Class 1A4, 4.741%, 11/25/2033 (e) | | | 12,803 | | | | 12,747 | |
See accompanying notes which are an integral part of these financial statements.
58
Angel Oak Multi-Strategy Income Fund
Consolidated Schedule of Investments – (continued)
January 31, 2019
| | | | | | | | |
| | | Principal
Amount | | | Value | |
| Collateralized Mortgage Obligations – (continued) | | | | | | |
Wells Fargo Mortgage Backed Securities Trust, Series2005-AR2, Class 2A5,
4.522%, 3/25/2035 (e) | | $ | 82,736 | | | $ | 81,956 | |
Wells Fargo Mortgage Backed Securities Trust, Series2005-8, Class A1, 5.500%, 10/25/2035 | | | 7,883 | | | | 7,931 | |
Wells Fargo Mortgage Backed Securities Trust, Series 2006-AR11, Class A1,
4.521%, 8/25/2036 (e) | | | 484,504 | | | | 468,359 | |
Wells Fargo Mortgage Backed Securities Trust, Series 2006-AR13, Class A2,
4.622%, 9/25/2036 (e) | | | 581,104 | | | | 587,438 | |
Wells Fargo Mortgage Backed Securities Trust, Series 2006-AR12, Class 1A1,
4.712%, 9/25/2036 (e) | | | 906,528 | | | | 919,935 | |
Wells Fargo Mortgage Backed Securities Trust, Series2006-11, Class A18, 6.000%, 9/25/2036 | | | 1,343,046 | | | | 1,291,881 | |
Wells Fargo Mortgage Backed Securities Trust, Series 2006-AR14, Class 1A3,
4.668%, 10/25/2036 (e) | | | 1,772,910 | | | | 1,711,990 | |
Wells Fargo Mortgage Backed Securities Trust, Series2007-10, Class 1A8,
6.000%, 7/25/2037 (d) | | | 2,077,435 | | | | 2,074,526 | |
Wells Fargo Mortgage Backed Securities Trust, Series2007-10, Class 1A5, 6.000%, 7/25/2037 | | | 933,204 | | | | 931,898 | |
Wells Fargo Mortgage Backed Securities Trust, Series2007-10, Class 1A7, 6.000%, 7/25/2037 | | | 792,134 | | | | 791,025 | |
Wells Fargo Mortgage Backed Securities Trust, Series2007-10, Class 1A18, 6.000%, 7/25/2037 | | | 288,950 | | | | 288,545 | |
Wells Fargo Mortgage Backed Securities Trust, Series2007-10, Class 2A5, 6.250%, 7/25/2037 | | | 46,743 | | | | 46,268 | |
Wells Fargo Mortgage Backed Securities Trust, Series2007-13, Class A3,
0.000%, 9/25/2037 (c) | | | 19,911 | | | | 16,464 | |
Wells Fargo Mortgage Backed Securities Trust, Series2007-15, Class A1, 6.000%, 11/25/2037 | | | 1,666,144 | | | | 1,647,786 | |
Wells Fargo Mortgage Backed Securities Trust, Series2007-17, Class APO,
0.000%, 1/25/2038 (c) | | | 50,452 | | | | 40,785 | |
WFCG Commercial Mortgage Trust, Series 2015-BXRP, Class G,
5.529% (1 Month LIBOR USD + 3.020%), 11/15/2029 (a)(b) | | | 6,427,417 | | | | 6,387,638 | |
WFRBS Commercial Mortgage Trust, Series2014-C24, Class C, 4.290%, 11/18/2047 (e) | | | 801,000 | | | | 772,704 | |
WF-RBS Commercial Mortgage Trust, Series2014-C20, Class C, 4.513%, 5/17/2047 (e) | | | 2,000,000 | | | | 1,955,838 | |
| | | | | | | | |
| | |
TOTAL COLLATERALIZED MORTGAGE OBLIGATIONS –
(Cost – $4,920,324,723) | | | | | | | 4,866,141,590 | |
| | | | | | | | |
| Corporate Obligations – 5.39% | | | | | | |
| Consumer, Cyclical – 0.06% | | | | | | |
Century Communities, Inc., 6.875%, 5/15/2022 | | | 4,504,000 | | | | 4,548,590 | |
| | | | | | | | |
Energy – 0.07% | | | | | | | | |
Shelf Drilling Holdings Ltd., 8.250%, 2/15/2025 (a) | | | 5,000,000 | | | | 4,556,250 | |
| | | | | | | | |
Financial – 5.26% | | | | | | | | |
Ambac Assurance Corp., 5.100%, 6/7/2020 (a)(i) | | | 207,460 | | | | 279,552 | |
Ambac LSNI LLC, 7.803% (3 Month LIBOR USD + 5.000%), 2/12/2023 (a)(b)(i) | | | 662,711 | | | | 670,166 | |
Ameris Bancorp, 5.750% (3 Month LIBOR USD + 3.616%), 3/15/2027 (b) | | | 4,000,000 | | | | 4,052,555 | |
Arbor Realty Trust, Inc., 5.625%, 5/1/2023 | | | 5,000,000 | | | | 5,128,605 | |
Atlantic Capital Bancshares, Inc., 6.250% (3 Month LIBOR USD + 4.680%), 9/30/2025 (a)(b) | | | 2,000,000 | | | | 2,029,521 | |
Avidbank Holdings, Inc., 6.875% (3 Month LIBOR USD + 5.367%), 11/15/2025 (a)(b) | | | 8,000,000 | | | | 8,175,441 | |
Banc of California, Inc., 5.250%, 4/15/2025 | | | 4,650,000 | | | | 4,669,383 | |
Bank of Commerce Holdings, 6.875% (3 Month LIBOR USD + 5.260%), 12/10/2025 (a)(b) | | | 9,000,000 | | | | 9,171,730 | |
Business Development Corp. of America, 4.750%, 12/30/2022 (a) | | | 6,000,000 | | | | 6,016,049 | |
Cadence BanCorp, 4.875%, 6/28/2019 (a) | | | 200,000 | | | | 200,139 | |
Cadence BanCorp, 6.500% (3 Month LIBOR USD + 4.663%), 3/11/2025 (a)(b) | | | 10,500,000 | | | | 10,738,033 | |
Capital Bancorp, Inc., 6.950% (3 Month LIBOR USD + 5.337%), 12/1/2025 (a)(b) | | | 6,250,000 | | | | 6,393,600 | |
See accompanying notes which are an integral part of these financial statements.
59
Angel Oak Multi-Strategy Income Fund
Consolidated Schedule of Investments – (continued)
January 31, 2019
| | | | | | | | |
| | | Principal
Amount | | | Value | |
| Corporate Obligations – (continued) | | | | | | |
| Financial – (continued) | | | | | | |
Citadel LP, 5.375%, 1/17/2023 (a) | | $ | 2,000,000 | | | $ | 2,009,043 | |
ConnectOne Bancorp, Inc., 5.750% (3 Month LIBOR USD + 3.930%), 7/1/2025 (b) | | | 10,125,000 | | | | 10,327,581 | |
Durant Bancorp, Inc., 5.875% (3 Month LIBOR USD + 3.742%), 3/15/2027 (a)(b) | | | 1,200,000 | | | | 1,222,086 | |
Ellington Financial LLC, 5.250%, 9/1/2022 | | | 4,000,000 | | | | 3,916,933 | |
Empire Bancorp, Inc., 7.375%, 12/17/2025 (a) | | | 7,500,000 | | | | 7,824,436 | |
Fidelity Bank, 5.875% (3 Month LIBOR USD + 3.630%), 5/31/2030 (b) | | | 16,000,000 | | | | 16,287,174 | |
Fidelity Financial Corp., 5.750% (3 Month LIBOR USD + 3.910%), 9/30/2027 (a)(b) | | | 5,000,000 | | | | 5,068,934 | |
Fifth Third Bank, 2.200%, 10/30/2020 | | | 1,500,000 | | | | 1,479,680 | |
Financial Institutions, Inc., 6.000% (3 Month LIBOR USD + 3.944%), 4/15/2030 (b) | | | 4,000,000 | | | | 4,086,027 | |
First Bancshares, Inc., 6.400% (3 Month LIBOR USD + 3.390%), 5/1/2033 (b) | | | 2,000,000 | | | | 2,089,760 | |
First Busey Corp., 4.750% (3 Month London Interbank Bid Rate GBP + 2.919%), 5/25/2027 (b) | | | 200,000 | | | | 204,400 | |
First Charter Capital Trust, 4.478% (3 Month LIBOR USD + 1.690%), 9/15/2035 (b) | | | 4,000,000 | | | | 3,885,780 | |
First Commonwealth Bank, 4.875% (3 Month LIBOR USD + 1.845%), 6/1/2028 (b) | | | 3,000,000 | | | | 2,986,097 | |
First Midwest Bancorp, Inc., 5.875%, 9/29/2026 | | | 8,500,000 | | | | 8,985,196 | |
First National of Nebraska, Inc., 4.375% (3 Month LIBOR USD + 1.600%), 10/1/2028 (a)(b) | | | 4,500,000 | | | | 4,464,887 | |
First NBC Bank Holding Co., 5.750%, 2/18/2025 (g)(o)(p) | | | 13,500,000 | | | | 2,700,000 | |
First Priority Bank, 7.000%, 11/30/2025 (a) | | | 6,000,000 | | | | 6,220,196 | |
Franklin Financial Network, Inc., 7.000% (3 Month LIBOR USD + 6.040%), 7/1/2026 (b) | | | 2,000,000 | | | | 2,062,826 | |
Goldman Sachs Group, Inc., 3.272% (3 Month LIBOR USD + 1.201%), 9/29/2025 (b) | | | 1,500,000 | | | | 1,457,561 | |
Great Southern Bancorp, Inc., 5.250% (3 Month LIBOR USD + 4.087%), 8/15/2026 (b) | | | 1,000,000 | | | | 1,004,572 | |
Hanmi Financial Corp., 5.450% (3 Month LIBOR USD + 3.315%), 3/30/2027 (b) | | | 5,400,000 | | | | 5,441,734 | |
Hildene Collateral Management Co. LLC, 5.500%, 12/28/2042 (a) | | | 2,000,000 | | | | 2,088,487 | |
Home BancShares, Inc., 5.625% (3 Month LIBOR USD + 3.575%), 4/15/2027 (b) | | | 950,000 | | | | 962,101 | |
Investar Holding Corp., 6.000% (3 Month LIBOR USD + 3.945%), 3/30/2027 (b) | | | 1,500,000 | | | | 1,530,256 | |
Jeff Davis Bancshares, Inc., 6.750% (3 Month LIBOR USD + 4.690%), 1/15/2027 (a)(b) | | | 5,000,000 | | | | 5,137,163 | |
JPMorgan Chase & Co., 3.041% (3 Month LIBOR USD + 0.500%), 2/1/2027 (b) | | | 1,673,000 | | | | 1,507,323 | |
JPMorgan Chase & Co., 3.753% (3 Month LIBOR USD + 0.950%), 9/30/2034 (b) | | | 3,400,000 | | | | 2,928,913 | |
KeyCorp Capital I, 3.537% (3 Month LIBOR USD + 0.740%), 7/1/2028 (b) | | | 5,000,000 | | | | 4,404,850 | |
Kingstone Cos, Inc., 5.500%, 12/30/2022 | | | 3,000,000 | | | | 2,937,972 | |
Lakeland Bancorp, Inc., 5.125% (3 Month LIBOR USD + 3.970%), 9/30/2026 (b) | | | 2,900,000 | | | | 2,903,503 | |
Luther Burbank Corp., 6.500%, 9/30/2024 (a) | | | 19,800,000 | | | | 20,620,964 | |
Malvern Bancorp, Inc., 6.125% (3 Month LIBOR USD + 4.145%), 2/15/2027 (b) | | | 2,750,000 | | | | 2,806,983 | |
Marble Point Loan Financing Ltd. / MPLF Funding I LLC, 7.500%, 10/16/2025 (a) | | | 2,500,000 | | | | 2,500,000 | |
Marquis Bancorp, Inc., 7.000% (3 Month LIBOR USD + 5.760%), 10/30/2026 (a)(b) | | | 4,000,000 | | | | 4,119,059 | |
Metropolitan Bancgroup, Inc., 6.500% (3 Month LIBOR USD + 5.545%), 7/1/2026 (a)(b) | | | 2,500,000 | | | | 2,566,050 | |
Metropolitan Bank Holding Corp., 6.250% (3 Month LIBOR USD + 4.260%), 3/15/2027 (a)(b) | | | 1,000,000 | | | | 1,022,439 | |
Midland States Bancorp, Inc., 6.500%, 6/18/2025 | | | 15,000,000 | | | | 15,692,861 | |
Millennium Consolidated Holdings LLC, 7.500%, 6/30/2023 (a) | | | 1,000,000 | | | | 1,008,193 | |
MM Finished Lots Holdings LLC, 7.250%, 1/31/2024 (a) | | | 2,000,000 | | | | 2,005,000 | |
New York Community Bancorp, Inc., 5.900% (3 Month LIBOR USD + 2.780%), 11/6/2028 (b) | | | 5,000,000 | | | | 5,012,919 | |
NexBank Capital, Inc., 5.500% (3 Month LIBOR USD + 4.355%), 3/16/2026 (a)(b) | | | 1,800,000 | | | | 1,778,380 | |
Noah Bank, 9.000%, 4/17/2025 | | | 4,500,000 | | | | 4,761,863 | |
Oconomowoc Bancshares, Inc., 6.875%, 11/17/2025 (a) | | | 6,500,000 | | | | 6,821,107 | |
Orrstown Financial Services, Inc., 6.000% (3 Month LIBOR USD + 3.160%), 12/30/2028 (a)(b) | | | 2,000,000 | | | | 2,042,731 | |
Plaza Bancorp, 7.125%, 6/26/2025 (a) | | | 5,000,000 | | | | 5,247,304 | |
PNC Bank NA, 2.600%, 7/21/2020 | | | 3,000,000 | | | | 2,987,099 | |
PNC Bank NA, 2.500%, 1/22/2021 | | | 1,300,000 | | | | 1,287,556 | |
PNC Bank NA, 2.450%, 7/28/2022 | | | 2,000,000 | | | | 1,952,592 | |
See accompanying notes which are an integral part of these financial statements.
60
Angel Oak Multi-Strategy Income Fund
Consolidated Schedule of Investments – (continued)
January 31, 2019
| | | | | | | | |
| | | Principal
Amount | | | Value | |
| Corporate Obligations – (continued) | | | | | | |
| Financial – (continued) | | | | | | |
Preferred Bank, 6.000% (3 Month LIBOR USD + 4.673%), 6/15/2026 (b) | | $ | 4,938,000 | | | $ | 5,007,605 | |
RBB Bancorp, 6.500% (3 Month LIBOR USD + 5.160%), 3/31/2026 (a)(b) | | | 4,000,000 | | | | 4,144,364 | |
ReadyCap Holdings LLC, 7.500%, 2/15/2022 (a) | | | 3,000,000 | | | | 3,072,840 | |
Renasant Corp., 8.500%, 6/27/2024 (a) | | | 10,000,000 | | | | 10,389,154 | |
Revere Bank, 5.625% (3 Month LIBOR USD + 4.409%), 9/30/2026 (b) | | | 6,500,000 | | | | 6,580,950 | |
Simmons First National Corp., 5.000% (3 Month LIBOR USD + 2.150%), 4/1/2028 (b) | | | 5,250,000 | | | | 5,243,454 | |
Southcoast Capital, 3.837%, 9/30/2035 (e) | | | 4,000,000 | | | | 3,520,000 | |
Southern National Bancorp of Virginia, Inc.,
5.875% (3 Month LIBOR USD + 3.950%), 1/31/2027 (a)(b) | | | 1,000,000 | | | | 1,016,667 | |
Southside Bancshares, Inc. 5.500%, (3 Month LIBOR USD + 4.297%), 9/30/2026 (b) | | | 3,000,000 | | | | 3,028,127 | |
Sterling Bancorp, Inc., 7.000% (3 Month LIBOR USD + 5.820%), 4/15/2026 (a)(b) | | | 6,750,000 | | | | 6,941,724 | |
Synovus Financial Corp., 5.750% (3 Month LIBOR USD + 4.182%), 12/15/2025 (b) | | | 5,021,000 | | | | 5,096,315 | |
TIAA FSB Holdings, Inc., 5.750%, 7/2/2025 | | | 1,750,000 | | | | 1,816,750 | |
TIAA FSB Holdings, Inc., 6.000% (3 Month LIBOR USD + 4.704%), 3/15/2026 (b) | | | 5,000,000 | | | | 5,134,263 | |
TIAA FSB Holdings, Inc., 4.329%, 1/7/2035 (e) | | | 5,000,000 | | | | 4,750,000 | |
Towne Bank, 4.500% (3 Month LIBOR USD + 2.550%), 7/30/2027 (b) | | | 6,500,000 | | | | 6,475,234 | |
Tri-County Financial Group, Inc., 7.000% (3 Month LIBOR USD + 5.862%), 10/15/2026 (b) | | | 7,500,000 | | | | 7,729,543 | |
Trinitas Capital Management LLC, 7.750%, 6/15/2023 (a) | | | 3,000,000 | | | | 3,000,000 | |
United Financial Bancorp, Inc., 5.750%, 10/1/2024 | | | 10,400,000 | | | | 10,585,848 | |
United Insurance Holdings Corp., 6.250%, 12/15/2027 | | | 7,000,000 | | | | 7,273,081 | |
USAmeriBancorp, Inc., 6.250% (3 Month LIBOR USD + 4.945%), 4/1/2026 (a)(b) | | | 3,000,000 | | | | 3,083,429 | |
Wachovia Capital Trust II, 3.287% (3 Month LIBOR USD + 0.500%), 1/15/2027 (b) | | | 4,000,000 | | | | 3,578,880 | |
Wells Fargo & Co., 2.150%, 1/30/2020 | | | 3,775,000 | | | | 3,749,803 | |
WSFS Cap Trust, 4.070%, 6/1/2035 (a)(e) | | | 4,000,000 | | | | 3,560,000 | |
WT Holdings, Inc., 7.000%, 4/30/2023 (a) | | | 2,700,000 | | | | 2,715,755 | |
Your Community Bank, 6.250% (3 Month LIBOR USD + 4.590%), 12/15/2025 (b) | | | 2,000,000 | | | | 2,034,859 | |
ZAIS Group LLC, 7.000%, 11/15/2023 (a) | | | 2,000,000 | | | | 2,018,842 | |
| | | | | | | | |
| | | | | | | 381,430,832 | |
| | | | | | | | |
| | |
TOTAL CORPORATE OBLIGATIONS –
(Cost – $394,181,706) | | | | | | | 390,535,672 | |
| | | | | | | | |
| | |
Investment Companies – 1.72% | | | Shares | | | | | |
| Affiliated Mutual Funds – 1.72% | | | | | | |
Angel Oak Financials Income Fund, Institutional Class | | | 3,324,904 | | | | 30,988,109 | |
Angel Oak High Yield Opportunities Fund, Institutional Class | | | 1,919,715 | | | | 21,788,768 | |
Angel Oak UltraShort Income Fund, Institutional Class | | | 7,151,375 | | | | 71,656,778 | |
| | | | | | | | |
| | |
TOTAL INVESTMENT COMPANIES
(Cost – $125,493,058) | | | | | | | 124,433,655 | |
| | | | | | | | |
| | |
Mortgage Backed Securities – U.S. Government Agency Issues – 4.82% | |
| Principal
Amount |
| | | | |
Federal Home Loan Mortgage Corp., Series 2016-KF14, Class B,
11.303% (1 Month LIBOR USD + 8.800%), 1/25/2023 (a)(b) | | $ | 2,237,974 | | | | 2,404,598 | |
Federal Home Loan Mortgage Corp., Series 2017-KF28, Class B,
6.503% (1 Month LIBOR USD + 4.000%), 1/25/2024 (a)(b) | | | 1,385,834 | | | | 1,428,861 | |
See accompanying notes which are an integral part of these financial statements.
61
Angel Oak Multi-Strategy Income Fund
Consolidated Schedule of Investments – (continued)
January 31, 2019
| | | | | | | | |
| | | Principal
Amount | | | Value | |
| Mortgage Backed Securities – U.S. Government Agency Issues – (continued) | | | | | | |
Federal Home Loan Mortgage Corp., Series2014-DN1, Class M3,
7.010% (1 Month LIBOR USD + 4.500%), 2/26/2024 (b) | | $ | 5,000,000 | | | $ | 5,609,505 | |
Federal Home Loan Mortgage Corp., Series 2017-KF36, Class B,
5.153% (1 Month LIBOR USD + 2.650%), 8/25/2024 (a)(b) | | | 4,461,268 | | | | 4,573,246 | |
Federal Home Loan Mortgage Corp., Series 2017-K728, Class B,
3.647%, 9/25/2024 (a)(e) | | | 6,000,000 | | | | 6,062,556 | |
Federal Home Loan Mortgage Corp., Series 2018-KF42, Class B,
4.703% (1 Month LIBOR USD + 2.200%), 12/25/2024 (a)(b) | | | 5,158,848 | | | | 5,174,155 | |
Federal Home Loan Mortgage Corp., Series2015-DN1, Class M3,
6.660% (1 Month LIBOR USD + 4.150%), 1/27/2025 (b) | | | 3,802,430 | | | | 4,071,251 | |
Federal Home Loan Mortgage Corp., Series 2018-K731, Class B,
3.910%, 2/25/2025 (a) | | | 8,750,000 | | | | 8,676,220 | |
Federal Home Loan Mortgage Corp., Series 2018-KF44, Class B,
4.653% (1 Month LIBOR USD + 2.150%), 2/25/2025 (a)(b) | | | 4,407,743 | | | | 4,405,010 | |
Federal Home Loan Mortgage Corp., Series2015-HQ1, Class M3,
6.310% (1 Month LIBOR USD + 3.800%), 3/25/2025 (b) | | | 1,650,000 | | | | 1,747,040 | |
Federal Home Loan Mortgage Corp., Series KJ20, Class A2, 3.799%, 12/25/2025 | | | 4,785,000 | | | | 4,946,250 | |
Federal Home Loan Mortgage Corp., Series KF16, Class A,
3.133% (1 Month LIBOR USD + 0.630%), 3/25/2026 (b) | | | 215,667 | | | | 215,936 | |
Federal Home Loan Mortgage Corp., Series 2017-KSW2, Class B,
5.153% (1 Month LIBOR USD + 2.650%), 5/25/2027 (a)(b) | | | 7,941,733 | | | | 7,898,737 | |
Federal Home Loan Mortgage Corp., Series 2017-KF33, Class B,
5.053% (1 Month LIBOR USD + 2.550%), 6/25/2027 (a)(b) | | | 2,285,202 | | | | 2,342,560 | |
Federal Home Loan Mortgage Corp., Series 2017-KF37, Class B,
5.253% (1 Month LIBOR USD + 2.750%), 6/25/2027 (a)(b) | | | 7,338,869 | | | | 7,449,195 | |
Federal Home Loan Mortgage Corp., Series2017-K66, Class B, 4.036%, 7/25/2027 (a)(e) | | | 7,250,000 | | | | 7,180,277 | |
Federal Home Loan Mortgage Corp., Series2017-K67, Class B, 3.944%, 8/25/2027 (a)(e) | | | 2,300,000 | | | | 2,277,232 | |
Federal Home Loan Mortgage Corp., Series2017-K69, Class B, 3.726%, 9/25/2027 (a)(e) | | | 500,000 | | | | 483,535 | |
Federal Home Loan Mortgage Corp., Series K070, Class X1, 0.327%, 11/25/2027 (e)(h) | | | 60,835,232 | | | | 1,594,187 | |
Federal Home Loan Mortgage Corp., Series2017-K71, Class C, 3.753%, 11/25/2027 (a)(e) | | | 2,600,000 | | | | 2,391,893 | |
Federal Home Loan Mortgage Corp., Series 2017-KF40, Class B,
5.203% (1 Month LIBOR USD + 2.700%), 11/25/2027 (a)(b) | | | 3,265,207 | | | | 3,314,139 | |
Federal Home Loan Mortgage Corp., Series 2018-SB48, Class A10F, 3.370%, 2/25/2028 (e) | | | 4,420,040 | | | | 4,474,725 | |
Federal Home Loan Mortgage Corp., Series 2015-HQA1, Class M2,
5.160% (1 Month LIBOR USD + 2.650%), 3/27/2028 (b) | | | 841,763 | | | | 852,963 | |
Federal Home Loan Mortgage Corp., Series2018-K76, Class C, 4.205%, 4/25/2028 (a)(e) | | | 8,000,000 | | | | 7,457,632 | |
Federal Home Loan Mortgage Corp., Series2018-K77, Class C, 4.159%, 5/25/2028 (a) | | | 8,750,000 | | | | 8,123,272 | |
Federal Home Loan Mortgage Corp., Series 2015-HQA2, Class M2,
5.310% (1 Month LIBOR USD + 2.800%), 5/25/2028 (b) | | | 1,319,948 | | | | 1,346,179 | |
Federal Home Loan Mortgage Corp., Series2018-K80, Class B, 4.229%, 7/25/2028 (a)(e) | | | 2,750,000 | | | | 2,686,816 | |
Federal Home Loan Mortgage Corp., Series 2018-KR07, Class B, 4.081%, 9/25/2028 (a)(e) | | | 2,250,000 | | | | 2,028,994 | |
Federal Home Loan Mortgage Corp., Series 2016-HQA1, Class M2,
5.260% (1 Month LIBOR USD + 2.750%), 9/25/2028 (b) | | | 1,869,099 | | | | 1,896,898 | |
Federal Home Loan Mortgage Corp., Series2018-K84, Class B, 4.182%, 10/25/2028 (a)(e) | | | 4,500,000 | | | | 4,505,989 | |
Federal Home Loan Mortgage Corp., Series 2016-DNA2, Class M2,
4.710% (1 Month LIBOR USD + 2.200%), 10/25/2028 (b) | | | 1,471,578 | | | | 1,482,228 | |
Federal Home Loan Mortgage Corp., Series K087, Class X1, 0.363%, 12/25/2028 (h) | | | 213,500,000 | | | | 6,878,757 | |
Federal Home Loan Mortgage Corp., Series 2016-HQA3, Class M3,
6.360% (1 Month LIBOR USD + 3.850%), 3/26/2029 (b) | | | 3,900,000 | | | | 4,335,162 | |
See accompanying notes which are an integral part of these financial statements.
62
Angel Oak Multi-Strategy Income Fund
Consolidated Schedule of Investments – (continued)
January 31, 2019
| | | | | | | | |
| | | Principal
Amount | | | Value | |
| Mortgage Backed Securities – U.S. Government Agency Issues – (continued) | | | | | | |
Federal Home Loan Mortgage Corp., Series 2017-DNA2, Class M2,
5.960% (1 Month LIBOR USD + 3.450%), 10/25/2029 (b) | | $ | 2,170,000 | | | $ | 2,347,552 | |
Federal Home Loan Mortgage Corp., Series 2017-DNA3, Class M2,
5.010% (1 Month LIBOR USD + 2.500%), 3/25/2030 (b) | | | 10,750,000 | | | | 11,012,762 | |
Federal Home Loan Mortgage Corp., Series 2017-HQA3, Class M2,
4.860% (1 Month LIBOR USD + 2.350%), 4/25/2030 (b) | | | 6,000,000 | | | | 6,085,176 | |
Federal Home Loan Mortgage Corp., Series 2018-HQA1, Class M2,
4.810% (1 Month LIBOR USD + 2.300%), 9/25/2030 (b) | | | 7,800,000 | | | | 7,754,432 | |
Federal Home Loan Mortgage Corp., Series K156, Class A2, 3.700%, 1/25/2033 | | | 2,500,000 | | | | 2,597,538 | |
Federal Home Loan Mortgage Corp., Series 4658, Class CE, 3.000%, 7/15/2040 | | | 1,363,555 | | | | 1,371,502 | |
Federal Home Loan Mortgage Corp., Series Q004, Class A4H, 2.793%, 8/25/2046 (e) | | | 6,250,127 | | | | 6,296,647 | |
Federal Home Loan Mortgage Corp., Series 2017-SC02, Class M1, 3.864%, 5/25/2047 (a)(e) | | | 7,893,687 | | | | 7,947,301 | |
Federal Home Loan Mortgage Corp., Series2016-K58, Class B, 3.739%, 9/25/2049 (a)(e) | | | 5,000,000 | | | | 4,953,235 | |
Federal Home Loan Mortgage Corp., Series 2017-K724, Class B, 3.487%, 12/25/2049 (a)(e) | | | 1,500,000 | | | | 1,483,497 | |
Federal Home Loan Mortgage Corp., Series2017-K61, Class B, 3.683%, 12/25/2049 (a)(e) | | | 6,250,000 | | | | 6,175,144 | |
Federal Home Loan Mortgage Corp., Series2017-K62, Class B, 3.875%, 1/25/2050 (a)(e) | | | 7,940,000 | | | | 7,893,138 | |
Federal Home Loan Mortgage Corp., Series2017-K65, Class B, 4.073%, 7/25/2050 (a)(e) | | | 6,000,000 | | | | 5,942,562 | |
Federal Home Loan Mortgage Corp., Series2019-K87, Class C, 4.322%, 1/25/2051 (a)(e) | | | 4,500,000 | | | | 4,246,164 | |
Federal Home Loan Mortgage Corp., Series2019-K87, Class B, 4.322%, 1/25/2051 (a)(e) | | | 6,000,000 | | | | 6,000,264 | |
Federal Home Loan Mortgage Corp., Series2018-K79, Class C, 4.211%, 7/25/2051 (a)(e) | | | 4,400,000 | | | | 4,327,479 | |
Federal National Mortgage Association, Series2016-M6, Class ASQ2, 1.785%, 6/25/2019 | | | 38,175 | | | | 38,067 | |
Federal National Mortgage Association, Series2014-C04, Class 2M2,
7.510% (1 Month LIBOR USD + 5.000%), 11/25/2024 (b) | | | 3,132,243 | | | | 3,478,109 | |
Federal National Mortgage Association, Series2018-M12, Class FA3,
3.170% (1 Month LIBOR USD + 0.700%), 6/25/2025 (b) | | | 7,992,543 | | | | 7,985,445 | |
Federal National Mortgage Association, Series2015-C03, Class 1M2,
7.510% (1 Month LIBOR USD + 5.000%), 7/25/2025 (b) | | | 2,821,977 | | | | 3,174,738 | |
Federal National Mortgage Association, Series2017-T1, Class A, 2.898%, 6/25/2027 | | | 10,087,366 | | | | 9,554,733 | |
Federal National Mortgage Association, Pool AN7838, 3.020%, 12/1/2027 | | | 7,522,000 | | | | 7,583,853 | |
Federal National Mortgage Association, Series2013-24, Class LC, 1.500%, 3/25/2028 | | | 6,795,313 | | | | 6,564,945 | |
Federal National Mortgage Association, Series2015-C04, Class 2M2,
8.060% (1 Month LIBOR USD + 5.550%), 4/25/2028 (b) | | | 2,987,432 | | | | 3,367,514 | |
Federal National Mortgage Association, Pool AN8506, 3.410%, 5/1/2028 | | | 9,000,000 | | | | 9,092,556 | |
Federal National Mortgage Association, Series2016-C04, Class 1M1,
3.960% (1 Month LIBOR USD + 1.450%), 1/25/2029 (b) | | | 1,704,506 | | | | 1,713,700 | |
Federal National Mortgage Association, Series2016-C05, Class 2M2,
6.960% (1 Month LIBOR USD + 4.450%), 1/25/2029 (b) | | | 5,000,000 | | | | 5,486,220 | |
Federal National Mortgage Association, Series2016-C06, Class 1M1,
3.810% (1 Month LIBOR USD + 1.300%), 4/25/2029 (b) | | | 3,798,110 | | | | 3,822,023 | |
Federal National Mortgage Association, Series2017-C02, Class 2M1,
3.660% (1 Month LIBOR USD + 1.150%), 9/25/2029 (b) | | | 1,188,479 | | | | 1,192,444 | |
Federal National Mortgage Association, Series2017-C03, Class 1M2,
5.510% (1 Month LIBOR USD + 3.000%), 10/25/2029 (b) | | | 8,500,000 | | | | 9,019,580 | |
Federal National Mortgage Association, Series2017-C04, Class 2M1,
3.360% (1 Month LIBOR USD + 0.850%), 11/26/2029 (b) | | | 2,094,685 | | | | 2,098,816 | |
Federal National Mortgage Association, Series2017-C04, Class 2M2,
5.360% (1 Month LIBOR USD + 2.850%), 11/26/2029 (b) | | | 5,000,000 | | | | 5,190,450 | |
Federal National Mortgage Association, Series2017-C05, Class 1M2,
4.710% (1 Month LIBOR USD + 2.200%), 1/25/2030 (b) | | | 3,000,000 | | | | 3,056,262 | |
See accompanying notes which are an integral part of these financial statements.
63
Angel Oak Multi-Strategy Income Fund
Consolidated Schedule of Investments – (continued)
January 31, 2019
| | | | | | | | |
| | | Principal
Amount | | | Value | |
| Mortgage Backed Securities – U.S. Government Agency Issues – (continued) | | | | | | |
Federal National Mortgage Association, Series2017-C06, Class 1M2,
5.160% (1 Month LIBOR USD + 2.650%), 2/25/2030 (b) | | $ | 1,800,000 | | | $ | 1,862,404 | |
Federal National Mortgage Association, Series2017-C07, Class 2M2,
5.010% (1 Month LIBOR USD + 2.500%), 5/28/2030 (b) | | | 4,750,000 | | | | 4,841,267 | |
Federal National Mortgage Association, Series2018-C01, Class 1M2,
4.760% (1 Month LIBOR USD + 2.250%), 7/25/2030 (b) | | | 3,000,000 | | | | 3,040,194 | |
Federal National Mortgage Association, Series2018-C02, Class 2M1,
3.160% (1 Month LIBOR USD + 0.650%), 8/26/2030 (b) | | | 3,294,642 | | | | 3,297,778 | |
Federal National Mortgage Association, Series2018-C02, Class 2B1,
6.510% (1 Month LIBOR USD + 4.000%), 8/26/2030 (b) | | | 8,500,000 | | | | 8,442,157 | |
Federal National Mortgage Association, Series2018-C03, Class 1M2,
4.660% (1 Month LIBOR USD + 2.150%), 10/25/2030 (b) | | | 6,700,000 | | | | 6,708,388 | |
Federal National Mortgage Association, Series2018-C04, Class 2M2,
5.060% (1 Month LIBOR USD + 2.550%), 12/26/2030 (b) | | | 9,400,000 | | | | 9,470,951 | |
Federal National Mortgage Association, Series2018-C05, Class 1M2,
4.860% (1 Month LIBOR USD + 2.350%), 1/27/2031 (b) | | | 3,361,499 | | | | 3,357,889 | |
Federal National Mortgage Association, Series2018-C06, Class 2M2,
4.610% (1 Month LIBOR USD + 2.100%), 3/25/2031 (b) | | | 7,900,000 | | | | 7,796,289 | |
Federal National Mortgage Association, Series2015-22, Class IN, 3.000%, 3/25/2044 (h) | | | 7,155,979 | | | | 816,826 | |
Government National Mortgage Association, Series2014-118, Class HI, 4.000%, 3/20/2040 (h) | | | 4,064,917 | | | | 365,042 | |
| | | | | | | | |
| | |
TOTAL MORTGAGE BACKED SECURITIES – U.S. GOVERNMENT AGENCY
ISSUES –
(Cost – $346,197,860) | | | | | | | 349,169,031 | |
| | | | | | | | |
| | |
| Preferred Stocks – 0.18% | | Shares | | | | |
Financial – 0.04% | | | | | | | | |
Morgan Stanley | | | 130,497 | | | | 2,595,585 | |
Wells Fargo & Co. | | | 23,990 | | | | 574,561 | |
| | | | | | | | |
| | | | | | | 3,170,146 | |
| | | | | | | | |
Real Estate Investment Trust – 0.14% | | | | | | | | |
Ready Capital Corp., 6.500%, 4/30/2021 | | | 228,000 | | | | 5,779,800 | |
Sotherly Hotels LP, 7.250%, 2/15/2021 | | | 120,000 | | | | 3,043,200 | |
TriState Capital Holdings, Inc. | | | 40,000 | | | | 1,045,200 | |
| | | | | | | | |
| | | | | | | 9,868,200 | |
| | | | | | | | |
| | |
TOTAL PREFERRED STOCKS
(Cost – $13,181,416) | | | | | | | 13,038,346 | |
| | | | | | | | |
| | |
| Whole Loans – 1.50% | | Principal
Amount | | | | |
Agency High Balance Residential Mortgages, 4.500% to 5.500%, 05/19/2048 to 12/01/2048 (g) | | $ | 59,649,891 | | | | 59,080,337 | |
Agency High Balance Residential Mortgages, 4.125% to 5.125%, 09/15/2036 to 12/10/2037 (e)(g) | | | 4,471,255 | | | | 4,279,645 | |
Residential Second Lien Mortgages, 4.949% to 11.149%, 09/01/2023 to 02/01/2049 (g) | | | 27,332,123 | | | | 28,406,355 | |
Residential Transition Loans, 6.990% to 11.500%, 02/01/2019 to 06/01/2019 (g)(h) | | | 17,158,987 | | | | 17,178,496 | |
| | | | | | | | |
| | |
TOTAL WHOLE LOANS
(Cost – $109,515,801) | | | | | | | 108,944,833 | |
| | | | | | | | |
See accompanying notes which are an integral part of these financial statements.
64
Angel Oak Multi-Strategy Income Fund
Consolidated Schedule of Investments – (continued)
January 31, 2019
| | | | | | | | |
| Short-Term Investments – 4.15% | | Shares | | | Value | |
Money Market Funds – 4.15% | | | | | | | | |
Fidelity Institutional Money Market Government Portfolio, Institutional Class, 2.270% (q) | | | 300,695,175 | | | $ | 300,695,175 | |
| | | | | | | | |
| | |
TOTAL SHORT – TERM INVESTMENTS
(Cost – $300,695,175) | | | | | | | 300,695,175 | |
| | | | | | | | |
| | |
TOTAL INVESTMENTS – 104.80%
(Cost – $7,674,968,677) | | | | | | | 7,596,402,355 | |
| | |
Liabilities in Excess of Other Assets – (4.80%) | | | | | | | (348,238,585 | ) |
| | | | | | | | |
| | |
NET ASSETS – 100.00% | | | | | | $ | 7,248,163,770 | |
| | | | | | | | |
| (a) | Security exempt from registration under Rule 144A or Section 4(a)(2) of the Securities Act of 1933. The security may be resold in transactions exempt from registration, normally to qualified institutional buyers. These securities are determined to be liquid by the Adviser, under the procedures established by the Fund’s Board of Trustees, unless otherwise denoted. At January 31, 2019, the value of these securities amounted to $2,557,453,239 or 35.28% of net assets. |
| (b) | Variable or Floating Rate Security based on a reference index and spread. Rate disclosed is the rate in effect as of January 31, 2019. |
| (c) | Principal Only Security. |
| (d) | Step-up bond that pays an initial coupon rate for the first period and then a higher coupon rate for the following periods. Rate disclosed is the rate in effect as of January 31, 2019. |
| (e) | Variable Rate Security. The coupon is based on an underlying pool of assets. Rate disclosed is the rate in effect as of January 31, 2019. |
| (f) | Security purchased on a when-issued basis. On January 31, 2019, the total value of investments purchased on a when-issued basis was $41,951,274 or 0.58% of net assets. |
| (g) | Illiquid security. At January 31, 2019, the value of these securities amounted to $289,675,923 or 4.00% of net assets. |
| (h) | Interest Only Security. |
| (i) | All or a portion of the security has been pledged as collateral in connection with open credit agreements. At January 31, 2019, the value of securities pledged amounted to $902,741,433. |
| (j) | See Note 5 to the Financial Statements. |
| (k) | Variable rate security. The coupon is based on an underlying pool of community bank subordinated debt. The rate reported is the rate in effect as of January 31, 2019. |
| (l) | Security exempt from registration under Regulation S of the Securities Act of 1933. These securities are determined to be liquid by the Adviser, under the procedures established by the Fund’s Board of Trustees, unless otherwise denoted. At January 31, 2019, the value of securities pledged amounted to $10,177,418 or 0.14% of net assets. |
| (m) | Inverse floating rate security whose interest rate moves in the opposite direction of reference interest rates. Reference interest rates are typically based on a negative multiplier or slope. Interest rate may also be subject to a cap or floor. |
| (n) | All or a portion of the security has been pledged as collateral in connection with open reverse repurchase agreements. At January 31, 2019, the value of securities pledged amounted to $37,542,715. |
| (o) | As of January 31, 2019, the Fund has fair valued these securities. The value of these securities amounted to $2,700,000 or 0.04% of net assets. Value determined using significant unobservable inputs. |
| (p) | Non-income producing security. Item identified as in default as to the payment of interest. |
| (q) | Rate disclosed is the seven day yield as of January 31, 2019. |
See accompanying notes which are an integral part of these financial statements.
65
Angel Oak Multi-Strategy Income Fund
Consolidated Schedule of Investments – (continued)
January 31, 2019
Consolidated Schedule of Open Futures Contracts
| | | | | | | | | | | | | | | | |
Short Futures Contracts | | Expiration
Month | | | Number of
Contracts | | | Notional
Value | | | Unrealized
Appreciation
(Depreciation) | |
90 Day Euro$ Future | | | March 2019 | | | | (3,796 | ) | | $ | (923,898,950 | ) | | $ | (1,539,844 | ) |
3 Year ERIS Aged Standard Swap Future | | | June 2020 | | | | (227 | ) | | | (22,022,677 | ) | | | (100,289 | ) |
5 Year ERIS Aged Standard Swap Future | | | September 2020 | | | | (846 | ) | | | (86,727,859 | ) | | | (477,652 | ) |
3 Year ERIS Aged Standard Swap Future | | | December 2020 | | | | (173 | ) | | | (17,189,713 | ) | | | (120,892 | ) |
5 Year ERIS Aged Standard Swap Future | | | December 2020 | | | | (661 | ) | | | (66,614,324 | ) | | | (456,354 | ) |
4 Year ERIS Aged Standard Swap Future | | | March 2021 | | | | (27 | ) | | | (2,624,470 | ) | | | (21,932 | ) |
5 Year ERIS Aged Standard Swap Future | | | March 2021 | | | | (52 | ) | | | (5,216,167 | ) | | | (42,411 | ) |
3 Year ERIS Aged Standard Swap Future | | | March 2021 | | | | (526 | ) | | | (51,404,560 | ) | | | (432,951 | ) |
5 Year ERIS Aged Standard Swap Future | | | June 2021 | | | | (115 | ) | | | (11,486,292 | ) | | | (108,847 | ) |
3 Year ERIS Aged Standard Swap Future | | | June 2021 | | | | (1,395 | ) | | | (136,285,641 | ) | | | (1,326,227 | ) |
4 Year ERIS Aged Standard Swap Future | | | June 2021 | | | | (33 | ) | | | (3,164,571 | ) | | | (31,238 | ) |
4 Year ERIS Aged Standard Swap Future | | | September 2021 | | | | (490 | ) | | | (48,265,882 | ) | | | (530,719 | ) |
3 Year ERIS Aged Standard Swap Future | | | September 2021 | | | | (915 | ) | | | (90,684,552 | ) | | | (991,036 | ) |
5 Year ERIS Aged Standard Swap Future | | | December 2021 | | | | (6 | ) | | | (579,818 | ) | | | (7,243 | ) |
3 Year ERIS Aged Standard Swap Future | | | December 2021 | | | | (320 | ) | | | (32,166,656 | ) | | | (390,688 | ) |
4 Year ERIS Aged Standard Swap Future | | | March 2022 | | | | (366 | ) | | | (35,889,960 | ) | | | (490,403 | ) |
4 Year ERIS Aged Standard Swap Future | | | June 2022 | | | | (1,572 | ) | | | (152,618,878 | ) | | | (2,287,732 | ) |
5 Year ERIS Aged Standard Swap Future | | | September 2022 | | | | (117 | ) | | | (11,479,607 | ) | | | (184,661 | ) |
4 Year ERIS Aged Standard Swap Future | | | December 2022 | | | | (29 | ) | | | (2,923,119 | ) | | | (49,494 | ) |
5 Year ERIS Aged Standard Swap Future | | | December 2022 | | | | (36 | ) | | | (3,564,792 | ) | | | (61,067 | ) |
7 Year ERIS Aged Standard Swap Future | | | December 2022 | | | | (83 | ) | | | (8,436,643 | ) | | | (140,395 | ) |
5 Year ERIS Aged Standard Swap Future | | | June 2023 | | | | (1,006 | ) | | | (98,179,463 | ) | | | (1,901,239 | ) |
5 Year ERIS Aged Standard Swap Future | | | March 2024 | | | | (39 | ) | | | (3,939,780 | ) | | | (20,611 | ) |
7 Year ERIS Aged Standard Swap Future | | | September 2024 | | | | (25 | ) | | | (2,468,287 | ) | | | (58,158 | ) |
10 Year ERIS Aged Standard Swap Future | | | December 2024 | | | | (529 | ) | | | (58,190,000 | ) | | | (1,297,372 | ) |
10 Year ERIS Aged Standard Swap Future | | | September 2025 | | | | (178 | ) | | | (18,841,656 | ) | | | (475,598 | ) |
7 Year ERIS Aged Standard Swap Future | | | December 2025 | | | | (5 | ) | | | (505,433 | ) | | | (13,740 | ) |
10 Year ERIS Aged Standard Swap Future | | | September 2026 | | | | (186 | ) | | | (18,419,487 | ) | | | (541,781 | ) |
10 Year ERIS Aged Standard Swap Future | | | March 2027 | | | | (589 | ) | | | (55,190,301 | ) | | | (1,639,616 | ) |
10 Year ERIS Aged Standard Swap Future | | | June 2027 | | | | (13 | ) | | | (1,183,319 | ) | | | (38,927 | ) |
10 Year ERIS Aged Standard Swap Future | | | September 2027 | | | | (94 | ) | | | (9,362,015 | ) | | | (299,371 | ) |
10 Year ERIS Aged Standard Swap Future | | | December 2027 | | | | (47 | ) | | | (4,663,552 | ) | | | (152,543 | ) |
10 Year ERIS Aged Standard Swap Future | | | March 2028 | | | | (48 | ) | | | (4,641,773 | ) | | | (157,013 | ) |
10 Year ERIS Aged Standard Swap Future | | | June 2028 | | | | (105 | ) | | | (10,139,451 | ) | | | (349,807 | ) |
10 Year ERIS Aged Standard Swap Future | | | December 2028 | | | | (190 | ) | | | (19,548,302 | ) | | | (680,409 | ) |
10 Year ERIS Aged Standard Swap Future | | | March 2029 | | | | (177 | ) | | | (18,203,565 | ) | | | (190,795 | ) |
| | | | | | | | | | | | | | | | |
Total | | | | | | | | | | | | | | $ | (17,609,055 | ) |
| | | | | | | | | | | | | | | | |
Consolidated Schedule of Open Reverse Repurchase Agreements
| | | | | | | | | | | | | | | | | | | | |
Counterparty | | Interest
Rate | | | Trade
Date | | | Maturity
Date | | | Net Closing
Amount | | | Face Value | |
Bank of America Merrill Lynch | | | 4.450 | % | | | 1/3/2019 | | | | 2/1/2019 | | | $ | 4,627,529 | | | $ | 4,611,000 | |
RBC Capital Markets | | | 3.207 | % | | | 1/4/2019 | | | | 2/4/2019 | | | | 23,514,762 | | | | 23,450,000 | |
| | | | | | | | | | | | | | | | | | | | |
| | | | | | | | | | | | | | | | | | $ | 28,061,000 | |
| | | | | | | | | | | | | | | | | | | | |
See accompanying notes which are an integral part of these financial statements.
66
Angel Oak Multi-Strategy Income Fund
Consolidated Schedule of Open Reverse Repurchase Agreements – (continued)
January 31, 2019
A reverse repurchase agreement, although structured as a sale and repurchase obligation, acts as a financing transaction under which the Fund will effectively pledge certain assets as collateral to secure a short-term loan. Generally, the other party to the agreement makes the loan in an amount less than the fair value of the pledged collateral. At the maturity of the reverse repurchase agreement, the Fund will be required to repay the loan and interest and correspondingly receive back its collateral. While used as collateral, the pledged assets continue to pay principal and interest which are for the benefit of the Fund.
See accompanying notes which are an integral part of these financial statements.
67
Angel Oak Financials Income Fund
Schedule of Investments
January 31, 2019
| | | | | | | | |
| | | Principal
Amount | | | Value | |
Collateralized Debt Obligations – 7.92% | | | | | | | | |
Financial Institution Note Securitization Ltd., Series2015-1A, Class C, 7.000%, 7/30/2026 (a)(b) | | $ | 3,725,000 | | | $ | 3,775,012 | |
Financial Institution Note Securitization Ltd., Series2015-1, 11.660%, 7/30/2026 (a)(b)(c)(d) | | | 6,666,000 | | | | 6,632,670 | |
| | | | | | | | |
| | |
TOTAL COLLATERALIZED DEBT OBLIGATIONS –
(Cost – $10,391,000) | | | | | | | 10,407,682 | |
| | | | | | | | |
Collateralized Loan Obligations – 5.08% | | | | | | | | |
Ares XXXIX CLO Ltd., Series2016-39A, Class E,
10.030% (3 Month LIBOR USD + 7.250%), 7/18/2028 (a)(e) | | | 2,000,000 | | | | 2,001,810 | |
Carlyle Global Market Strategies CLO Ltd., Series2013-2A, Class ER,
8.030% (3 Month LIBOR USD + 5.250%), 1/18/2029 (a)(d)(e) | | | 2,000,000 | | | | 1,889,578 | |
Hildene TruPS Financials Note Securitization Ltd., Series2018-1A, Class A1,
4.143% (3 Month LIBOR USD + 1.360%), 10/12/2038 (a)(e) | | | 1,820,308 | | | | 1,802,105 | |
Hildene TruPS Financials Note Securitization Ltd., Series2018-1A, Class B,
6.823% (3 Month LIBOR USD + 4.040%), 10/12/2038 (a)(e) | | | 1,000,000 | | | | 985,000 | |
| | | | | | | | |
| | |
TOTAL COLLATERALIZED LOAN OBLIGATIONS –
(Cost – $6,847,763) | | | | | | | 6,678,493 | |
| | | | | | | | |
| | |
Common Stocks – 3.04% | | | Shares | | | | | |
| Financial – 3.04% | | | | | | |
Atlantic Capital Bancshares, Inc. (f) | | | 21,116 | | | | 381,777 | |
Central Valley Community Bancorp | | | 9,835 | | | | 194,438 | |
Chemung Financial Corp. | | | 5,884 | | | | 246,657 | |
Codorus Valley Bancorp, Inc. | | | 11,790 | | | | 260,559 | |
Community Financial Corp. | | | 9,407 | | | | 277,977 | |
Community West Bancshares | | | 27,432 | | | | 278,435 | |
Eagle Bancorp Montana, Inc. | | | 13,161 | | | | 235,319 | |
Entegra Financial Corp. (f) | | | 9,391 | | | | 219,374 | |
ESSA Bancorp, Inc. | | | 10,400 | | | | 156,624 | |
Financial Institutions, Inc. | | | 9,528 | | | | 255,541 | |
First Bank | | | 26,322 | | | | 295,859 | |
First United Corp. | | | 18,661 | | | | 302,308 | |
Pathfinder Bancorp, Inc. | | | 12,684 | | | | 180,113 | |
Sandy Spring Bancorp, Inc. | | | 8,230 | | | | 268,380 | |
Severn Bancorp, Inc. | | | 19,490 | | | | 160,793 | |
Summit Financial Group, Inc. | | | 11,693 | | | | 275,136 | |
| | | | | | | | |
| | |
TOTAL COMMON STOCKS
(Cost – $4,424,512) | | | | | | | 3,989,290 | |
| | | | | | | | |
| | |
Corporate Obligations – 80.07% | |
| Principal
Amount |
| | | | |
Financial – 80.07% | | | | | | | | |
Allegiance Bank, 5.250% (3 Month LIBOR USD + 3.030%), 12/15/2027 (e) | | $ | 1,000,000 | | | | 1,001,708 | |
Ameris Bancorp, 5.750% (3 Month LIBOR USD + 3.616%), 3/15/2027 (e) | | | 2,960,000 | | | | 2,998,890 | |
Arbor Realty Trust, Inc., 5.625%, 5/1/2023 | | | 2,000,000 | | | | 2,051,442 | |
Atlantic Capital Bancshares, Inc., 6.250% (3 Month LIBOR USD + 4.680%), 9/30/2025 (a)(e) | | | 2,605,000 | | | | 2,643,451 | |
Banc of California, Inc., 5.250%, 4/15/2025 | | | 2,000,000 | | | | 2,008,337 | |
BankUnited, Inc., 4.875%, 11/17/2025 | | | 1,719,000 | | | | 1,761,195 | |
See accompanying notes which are an integral part of these financial statements.
68
Angel Oak Financials Income Fund
Schedule of Investments – (continued)
January 31, 2019
| | | | | | | | |
| | | Principal
Amount | | | Value | |
| Corporate Obligations – (continued) | | | | | | |
| Financial – (continued) | | | | | | |
BNC Bancorp, 5.500% (3 Month LIBOR USD + 3.590%), 10/1/2024 (e) | | $ | 1,200,000 | | | $ | 1,210,708 | |
Business Development Corp. of America, 4.750%, 12/30/2022 (a) | | | 2,000,000 | | | | 2,005,350 | |
Capital One Financial Corp., 3.200%, 1/30/2023 | | | 1,000,000 | | | | 984,149 | |
ConnectOne Bancorp, Inc., 5.750% (3 Month LIBOR USD + 3.930%), 7/1/2025 (e) | | | 2,600,000 | | | | 2,652,021 | |
ConnectOne Bancorp, Inc., 5.200% (3 Month LIBOR USD + 2.840%), 2/1/2028 (e) | | | 1,950,000 | | | | 1,952,681 | |
Cullen/Frost Capital Trust II, 4.288% (3 Month LIBOR USD + 1.550%), 3/1/2034 (e) | | | 825,000 | | | | 714,589 | |
Dime Community Bancshares, Inc., 4.500% (3 Month LIBOR USD + 2.660%), 6/15/2027 (e) | | | 650,000 | | | | 661,550 | |
Fidelity Financial Corp., 5.750% (3 Month LIBOR USD + 3.910%), 9/30/2027 (a)(e) | | | 3,000,000 | | | | 3,041,360 | |
FineMark Holdings, Inc., 5.875% (3 Month LIBOR USD + 2.970%), 6/30/2028 (e) | | | 2,000,000 | | | | 1,975,000 | |
First Midwest Bancorp, Inc., 5.875%, 9/29/2026 | | | 1,000,000 | | | | 1,057,082 | |
First National of Nebraska, Inc., 4.375% (3 Month LIBOR USD + 1.600%), 10/1/2028 (a)(e) | | | 3,000,000 | | | | 2,976,591 | |
First Paragould Bankshares, Inc., 5.250% (3 Month LIBOR USD + 3.095%), 12/15/2027 (a)(e) | | | 2,250,000 | | | | 2,247,897 | |
Franklin Financial Network, Inc., 7.000% (3 Month LIBOR USD + 6.040%), 7/1/2026 (e) | | | 2,000,000 | | | | 2,062,826 | |
Goldman Sachs Group, Inc., 3.272% (3 Month LIBOR USD + 1.201%), 9/29/2025 (e) | | | 1,000,000 | | | | 971,708 | |
Great Southern Bancorp, Inc., 5.250% (3 Month LIBOR USD + 4.087%), 8/15/2026 (e) | | | 1,000,000 | | | | 1,004,572 | |
Heritage Commerce Corp., 5.250% (3 Month LIBOR USD + 3.365%), 6/1/2027 (e) | | | 2,000,000 | | | | 2,007,935 | |
Hildene Collateral Management Co., LLC 5.500%, 12/28/2042 (a) | | | 2,000,000 | | | | 2,088,487 | |
Home BancShares, Inc., 5.625% (3 Month LIBOR USD + 3.575%), 4/15/2027 (e) | | | 2,600,000 | | | | 2,633,117 | |
Independent Bank Group, Inc., 5.000% (3 Month LIBOR USD + 2.830%), 12/31/2027 (e) | | | 1,750,000 | | | | 1,753,035 | |
Investar Holding Corp., 6.000% (3 Month LIBOR USD + 3.945%), 3/30/2027 (e) | | | 2,500,000 | | | | 2,550,428 | |
Kingstone Cos, Inc., 5.500%, 12/30/2022 | | | 2,850,000 | | | | 2,791,074 | |
Lakeland Bancorp, Inc., 5.125% (3 Month LIBOR USD + 3.970%), 9/30/2026 (e) | | | 2,145,000 | | | | 2,147,591 | |
Luther Burbank Corp., 6.500%, 9/30/2024 (a) | | | 1,000,000 | | | | 1,041,463 | |
Malvern Bancorp, Inc., 6.125% (3 Month LIBOR USD + 4.145%), 2/15/2027 (e) | | | 1,000,000 | | | | 1,020,721 | |
Marble Point Loan Financing Ltd. / MPLF Funding I LLC, 7.500%, 10/16/2025 (a) | | | 2,500,000 | | | | 2,500,000 | |
MB Financial Bank NA, 4.000% (3 Month LIBOR USD + 1.873%), 12/1/2027 (e) | | | 2,800,000 | | | | 2,718,376 | |
Metropolitan Bank Holding Corp., 6.250% (3 Month LIBOR USD + 4.260%), 3/15/2027 (a)(e) | | | 1,200,000 | | | | 1,226,927 | |
Millennium Consolidated Holdings LLC, 7.500%, 6/30/2023 (a) | | | 1,000,000 | | | | 1,008,193 | |
NexBank Capital, Inc., 5.500% (3 Month LIBOR USD + 4.355%), 3/16/2026 (e) | | | 200,000 | | | | 197,598 | |
NexBank Capital, Inc., 5.500% (3 Month LIBOR USD + 4.355%), 3/16/2026 (a)(e) | | | 2,000,000 | | | | 1,975,978 | |
Orrstown Financial Services, Inc., 6.000% (3 Month LIBOR USD + 3.160%), 12/30/2028 (a)(e) | | | 2,000,000 | | | | 2,042,731 | |
Peapack Gladstone Financial Corp., 4.750% (3 Month LIBOR USD + 2.540%), 12/15/2027 (e) | | | 2,250,000 | | | | 2,232,235 | |
Preferred Bank, 6.000% (3 Month LIBOR USD + 4.673%), 6/15/2026 (e) | | | 1,862,000 | | | | 1,888,246 | |
RBB Bancorp, 6.500% (3 Month LIBOR USD + 5.160%), 3/31/2026 (a)(e) | | | 2,800,000 | | | | 2,901,055 | |
ReadyCap Holdings LLC, 7.500%, 2/15/2022 (a) | | | 2,000,000 | | | | 2,048,560 | |
Revere Bank, 5.625% (3 Month LIBOR USD + 4.409%), 9/30/2026 (e) | | | 1,000,000 | | | | 1,012,454 | |
Silver Queen Financial Services, Inc., 5.500% (3 Month LIBOR USD + 3.338%), 12/1/2027 (a)(e) | | | 2,800,000 | | | | 2,821,330 | |
Simmons First National Corp., 5.000% (3 Month LIBOR USD + 2.150%), 4/1/2028 (e) | | | 2,000,000 | | | | 1,997,506 | |
SmartFinancial, Inc., 5.625% (3 Month LIBOR USD + 2.550%), 10/2/2028 (a)(e) | | | 1,250,000 | | | | 1,259,618 | |
Southern National Bancorp of Virginia, Inc.,
5.875% (3 Month LIBOR USD + 3.950%), 1/31/2027 (a)(e) | | | 1,000,000 | | | | 1,016,667 | |
TIAA FSB Holdings, Inc., 5.750%, 7/2/2025 | | | 1,000,000 | | | | 1,038,143 | |
TIAA FSB Holdings, Inc., 6.000% (3 Month LIBOR USD + 4.704%), 3/15/2026 (e) | | | 1,490,000 | | | | 1,530,010 | |
Towne Bank, 4.500% (3 Month LIBOR USD + 2.550%), 7/30/2027 (e) | | | 2,500,000 | | | | 2,490,475 | |
Trinitas Capital Management LLC, 7.750%, 6/15/2023 (a) | | | 2,250,000 | | | | 2,250,000 | |
United Insurance Holdings Corp., 6.250%, 12/15/2027 | | | 3,000,000 | | | | 3,117,035 | |
USAmeriBancorp, Inc., 6.250% (3 Month LIBOR USD + 4.945%), 4/1/2026 (a)(e) | | | 2,000,000 | | | | 2,055,619 | |
Wachovia Capital Trust II, 3.287% (3 Month LIBOR USD + 0.500%), 1/15/2027 (e) | | | 1,000,000 | | | | 894,720 | |
See accompanying notes which are an integral part of these financial statements.
69
Angel Oak Financials Income Fund
Schedule of Investments – (continued)
January 31, 2019
| | | | | | | | |
| | | Principal
Amount | | | Value | |
| Corporate Obligations – (continued) | | | | | | |
| Financial – (continued) | | | | | | |
Wells Fargo & Co., 2.625%, 7/22/2022 | | $ | 1,000,000 | | | $ | 981,557 | |
WT Holdings, Inc., 7.000%, 4/30/2023 (a) | | | 2,000,000 | | | | 2,011,670 | |
Your Community Bank, 6.250% (3 Month LIBOR USD + 4.590%), 12/15/2025 (e) | | | 2,000,000 | | | | 2,034,859 | |
ZAIS Group LLC, 7.000%, 11/15/2023 (a) | | | 2,000,000 | | | | 2,018,842 | |
| | | | | | | | |
| | |
TOTAL CORPORATE OBLIGATIONS –
(Cost – $104,898,110) | | | | | | | 105,287,362 | |
| | | | | | | | |
| | |
Short-Term Investments – 3.02% | | | Shares | | | | | |
Money Market Funds – 3.02% | | | | | | | | |
Fidelity Institutional Money Market Government Portfolio, Institutional Class, 2.270% (g) | | | 3,976,949 | | | | 3,976,949 | |
| | | | | | | | |
| | |
TOTAL SHORT-TERM INVESTMENTS
(Cost – $3,976,949) | | | | | | | 3,976,949 | |
| | | | | | | | |
| | |
TOTAL INVESTMENTS – 99.13%
(Cost – $130,538,334) | | | | | | | 130,339,776 | |
| | |
Other Assets in Excess of Liabilities – 0.87% | | | | | | | 1,148,234 | |
| | | | | | | | |
| | |
NET ASSETS – 100.00% | | | | | | $ | 131,488,010 | |
| | | | | | | | |
| (a) | Security exempt from registration under Rule 144A or Section 4(a)(2) of the Securities Act of 1933. The security may be resold in transactions exempt from registration, normally to qualified institutional buyers. These securities are determined to be liquid by the Adviser, under the procedures established by the Fund’s Board of Trustees, unless otherwise denoted. At January 31, 2019, the value of these securities amounted to $60,267,965 or 45.84% of net assets. |
| (b) | See Note 5 to the Financial Statements. |
| (c) | Variable rate security. The coupon is based on an underlying pool of community bank subordinated debt. The rate reported is the rate in effect as of January 31, 2019. |
| (d) | Illiquid security. At January 31, 2019, the value of these securities amounted to $8,522,248 or 6.48% of net assets. |
| (e) | Variable or Floating Rate Security based on a reference index and spread. Rate disclosed is the rate in effect as of January 31, 2019. |
| (f) | Non-income producing security. |
| (g) | Rate disclosed is the seven day yield as of January 31, 2019. |
See accompanying notes which are an integral part of these financial statements.
70
Angel Oak High Yield Opportunities Fund
Schedule of Investments
January 31, 2019
| | | | | | | | |
| | | Principal
Amount | | | Value | |
Collateralized Loan Obligations – 10.62% | | | | | | | | |
BlueMountain CLO Ltd., Series2016-2A, Class D,
9.645% (3 Month LIBOR USD + 7.000%), 8/20/2028 (a)(b) | | $ | 500,000 | | | $ | 495,938 | |
Carlyle Global Market Strategies CLO Ltd., Series2016-3A, Class D,
9.761% (3 Month LIBOR USD + 7.000%), 10/20/2029 (a)(b) | | | 500,000 | | | | 502,601 | |
Garrison Funding Ltd., Series2016-1A, Class D,
9.411% (3 Month LIBOR USD + 6.650%), 10/20/2028 (a)(b) | | | 500,000 | | | | 498,753 | |
LCM XXI LP, Series 21A, Class ER, 8.511% (3 Month LIBOR USD + 5.750%), 4/20/2028 (a)(b) | | | 500,000 | | | | 484,051 | |
Madison Park Funding XII Ltd., Series2014-12A, Class E, 6.845%, 7/20/2026 (b)(c) | | | 500,000 | | | | 499,750 | |
MidOcean Credit CLO VI, Series2016-6A, Class E,
10.101% (3 Month LIBOR USD + 7.340%), 1/22/2029 (a)(b) | | | 500,000 | | | | 502,204 | |
MMCF CLO LLC, Series2017-1A, Class D,
9.167% (3 Month LIBOR USD + 6.380%), 1/15/2028 (a)(b)(d) | | | 500,000 | | | | 488,783 | |
OCP CLO Ltd., Series2015-8A, Class D, 0.000%, 4/17/2027 (b)(c) | | | 500,000 | | | | 492,500 | |
Venture XXIII Ltd., Series2016-23A, Class ER,
8.711% (3 Month LIBOR USD + 5.950%), 7/19/2028 (a)(b) | | | 1,000,000 | | | | 973,037 | |
West CLO Ltd., Series2014-1A, Class D,
7.680% (3 Month LIBOR USD + 4.900%), 7/18/2026 (a)(b) | | | 500,000 | | | | 499,972 | |
| | | | | | | | |
| | |
TOTAL COLLATERALIZED LOAN OBLIGATIONS –
(Cost – $5,461,693) | | | | | | | 5,437,589 | |
| | | | | | | | |
| | |
Common Stocks – 0.12% | | | Shares | | | | | |
Cenveo Corp. (b)(d)(e) | | | 4,630 | | | | 62,505 | |
| | | | | | | | |
| | |
TOTAL COMMON STOCKS
(Cost – $490,470) | | | | | | | 62,505 | |
| | | | | | | | |
| | |
Corporate Obligations – 84.66% | |
| Principal
Amount |
| | | | |
| Basic Materials – 17.03% | | | | | | |
Alcoa Nederland Holding BV, 7.000%, 9/30/2026 (b)(f) | | $ | 500,000 | | | | 530,000 | |
Big River Steel LLC / BRS Finance Corp., 7.250%, 9/1/2025 (b) | | | 100,000 | | | | 105,250 | |
Blue Cube Spinco LLC, 9.750%, 10/15/2023 | | | 250,000 | | | | 279,375 | |
Cascades, Inc., 5.750%, 7/15/2023 (b)(f) | | | 128,000 | | | | 125,120 | |
Cleveland-Cliffs, Inc., 5.750%, 3/1/2025 | | | 205,000 | | | | 198,850 | |
Coeur Mining, Inc., 5.875%, 6/1/2024 | | | 1,000,000 | | | | 927,400 | |
Consolidated Energy Finance SA 6.500%, 5/15/2026 (b)(f) | | | 750,000 | | | | 736,875 | |
Consolidated Energy Finance SA, 6.875%, 6/15/2025 (b)(f) | | | 240,000 | | | | 237,600 | |
Cornerstone Chemical Co., 6.750%, 8/15/2024 (b) | | | 175,000 | | | | 165,812 | |
CVR Partners LP / CVR Nitrogen Finance Corp., 9.250%, 6/15/2023 (b) | | | 1,000,000 | | | | 1,048,750 | |
FMG Resources Ltd., 5.125%, 5/15/2024 (b)(f) | | | 250,000 | | | | 247,812 | |
Kaiser Aluminum Corp., 5.875%, 5/15/2024 | | | 250,000 | | | | 254,375 | |
Kissner Holdings LP / Kissner Milling Co. Ltd. / BSC Holding, Inc. / Kissner USA,
8.375%, 12/1/2022 (b)(f) | | | 1,000,000 | | | | 1,022,500 | |
Mercer International, Inc., 7.375%, 1/15/2025 (b) | | | 750,000 | | | | 765,000 | |
Mercer International, Inc., 5.500%, 1/15/2026 | | | 250,000 | | | | 233,125 | |
Schweitzer-Mauduit International, Inc., 6.875%, 10/1/2026 (b) | | | 500,000 | | | | 481,250 | |
Teck Resources Ltd., 8.500%, 6/1/2024 (b)(f) | | | 250,000 | | | | 269,998 | |
United States Steel Corp., 6.250%, 3/15/2026 | | | 250,000 | | | | 227,500 | |
Venator Finance Sarl / Venator Materials Corp., 5.750%, 7/15/2025 (b) | | | 500,000 | | | | 416,250 | |
See accompanying notes which are an integral part of these financial statements.
71
Angel Oak High Yield Opportunities Fund
Schedule of Investments – (continued)
January 31, 2019
| | | | | | | | |
| | | Principal
Amount | | | Value | |
| Corporate Obligations – (continued) | | | | | | |
| Basic Materials – (continued) | | | | | | |
Versum Materials, Inc., 5.500%, 9/30/2024 (b) | | $ | 435,000 | | | $ | 442,613 | |
| | | | | | | | |
| | |
| | | | | | | 8,715,455 | |
| | | | | | | | |
Communications – 5.82% | | | | | | | | |
AMC Networks, Inc., 4.750%, 8/1/2025 | | | 500,000 | | | | 484,375 | |
Cable One, Inc., 5.750%, 6/15/2022 (b) | | | 150,000 | | | | 152,812 | |
Cincinnati Bell, Inc., 7.000%, 7/15/2024 (b) | | | 250,000 | | | | 216,250 | |
CommScope Technologies Finance LLC, 6.000%, 6/15/2025 (b) | | | 500,000 | | | | 473,750 | |
CSC Holdings LLC, 5.500%, 4/15/2027 (b) | | | 500,000 | | | | 489,990 | |
Frontier Communications Corp., 11.000%, 9/15/2025 | | | 250,000 | | | | 162,344 | |
Gray Television, Inc., 7.000%, 5/15/2027 (b) | | | 250,000 | | | | 259,475 | |
Lamar Media Corp., 5.750%, 2/1/2026 (b)(g) | | | 250,000 | | | | 259,837 | |
Radiate Holdco LLC / Radiate Finance, Inc., 6.875%, 2/15/2023 (b) | | | 250,000 | | | | 241,563 | |
T-Mobile USA, Inc., 4.750%, 2/1/2028 | | | 250,000 | | | | 240,625 | |
| | | | | | | | |
| | | | | | | 2,981,021 | |
| | | | | | | | |
Consumer, Cyclical – 13.84% | | | | | | | | |
American Axle & Manufacturing, Inc., 6.500%, 4/1/2027 | | | 1,000,000 | | | | 961,250 | |
Aramark Services, Inc., 5.000%, 2/1/2028 (b) | | | 100,000 | | | | 97,875 | |
BCD Acquisition, Inc., 9.625%, 9/15/2023 (b) | | | 1,000,000 | | | | 1,062,500 | |
Boyd Gaming Corp., 6.000%, 8/15/2026 | | | 500,000 | | | | 501,875 | |
Century Communities, Inc., 6.875%, 5/15/2022 | | | 1,000,000 | | | | 1,009,900 | |
Century Communities, Inc., 5.875%, 7/15/2025 | | | 500,000 | | | | 462,500 | |
Deck Chassis Acquisition, Inc., 10.000%, 6/15/2023 (b) | | | 250,000 | | | | 241,875 | |
Ferrellgas LP / Ferrellgas Finance Corp., 6.750%, 6/15/2023 (c) | | | 525,000 | | | | 461,344 | |
Gateway Casinos & Entertainment Ltd., 8.250%, 3/1/2024 (b)(f) | | | 250,000 | | | | 258,750 | |
Hilton Grand Vacations Borrower LLC / Hilton Grand Vacations Borrower, Inc., 6.125%, 12/1/2024 | | | 355,000 | | | | 361,212 | |
Lithia Motors, Inc., 5.250%, 8/1/2025 (b) | | | 250,000 | | | | 242,188 | |
TRI Pointe Group, Inc. / TRI Pointe Homes, Inc., 5.875%, 6/15/2024 | | | 1,000,000 | | | | 967,500 | |
Wabash National Corp., 5.500%, 10/1/2025 (b) | | | 500,000 | | | | 457,500 | |
| | | | | | | | |
| | | | | | | 7,086,269 | |
| | | | | | | | |
Consumer,Non-cyclical – 5.80% | | | | | | | | |
Ashtead Capital, Inc., 5.625%, 10/1/2024 (b) | | | 200,000 | | | | 205,750 | |
Cimpress NV, 7.000%, 6/15/2026 (b)(f) | | | 200,000 | | | | 196,000 | |
Dean Foods Co., 6.500%, 3/15/2023 (b) | | | 250,000 | | | | 195,195 | |
Encompass Health Corp., 5.750%, 9/15/2025 | | | 250,000 | | | | 253,750 | |
Hologic, Inc., 4.375%, 10/15/2025 (b) | | | 100,000 | | | | 98,712 | |
JBS USA LUX SA / JBS USA Finance, Inc., 5.750%, 6/15/2025 (b) | | | 250,000 | | | | 250,312 | |
Matthews International Corp., 5.250%, 12/1/2025 (b) | | | 250,000 | | | | 236,250 | |
Minerva Luxembourg SA, 6.500%, 9/20/2026 (b)(f) | | | 500,000 | | | | 480,625 | |
Select Medical Corp., 6.375%, 6/1/2021 | | | 100,000 | | | | 100,875 | |
Teva Pharmaceutical Finance Netherlands III BV, 6.000%, 4/15/2024 | | | 200,000 | | | | 203,551 | |
United Rentals North America, Inc., 6.500%, 12/15/2026 | | | 500,000 | | | | 520,000 | |
Vector Group Ltd., 6.125%, 2/1/2025 (b) | | | 250,000 | | | | 220,313 | |
| | | | | | | | |
| | | | | | | 2,961,333 | |
| | | | | | | | |
Energy – 13.72% | | | | | | | | |
Antero Resources Corp., 5.625%, 6/1/2023 | | | 500,000 | | | | 500,625 | |
See accompanying notes which are an integral part of these financial statements.
72
Angel Oak High Yield Opportunities Fund
Schedule of Investments – (continued)
January 31, 2019
| | | | | | | | |
| | | Principal
Amount | | | Value | |
| Corporate Obligations – (continued) | | | | | | |
| Energy – (continued) | | | | | | |
Calumet Specialty Products Partners LP / Calumet Finance Corp., 6.500%, 4/15/2021 | | $ | 900,000 | | | $ | 846,000 | |
Cheniere Energy Partners LP, 5.250%, 10/1/2025 | | | 1,000,000 | | | | 1,008,740 | |
Enviva Partners LP / Enviva Partners Finance Corp., 8.500%, 11/1/2021 | | | 1,000,000 | | | | 1,045,620 | |
Hilcorp. Energy I LP / Hilcorp. Finance Co., 5.750%, 10/1/2025 (b) | | | 250,000 | | | | 244,375 | |
PBF Holding Co. LLC / PBF Finance Corp., 7.000%, 11/15/2023 (c) | | | 1,000,000 | | | | 1,007,200 | |
PBF Logistics LP / PBF Logistics Finance Corp., 6.875%, 5/15/2023 | | | 250,000 | | | | 255,938 | |
Shelf Drilling Holdings Ltd., 8.250%, 2/15/2025 (b) | | | 1,500,000 | | | | 1,366,875 | |
Targa Resources Partners LP / Targa Resources Partners Finance Corp., 6.500%, 7/15/2027 (b) | | | 100,000 | | | | 103,374 | |
USA Compression Partners LP / USA Compression Finance Corp., 6.875%, 4/1/2026 | | | 250,000 | | | | 251,250 | |
Warrior Met Coal, Inc., 8.000%, 11/1/2024 (b) | | | 390,000 | | | | 394,485 | |
| | | | | | | | |
| | | | | | | 7,024,482 | |
| | | | | | | | |
Financial – 8.02% | | | | | | | | |
Credit Acceptance Corp., 7.375%, 3/15/2023 | | | 115,000 | | | | 118,306 | |
Fidelity & Guaranty Life Holdings, Inc., 5.500%, 5/1/2025 (b) | | | 100,000 | | | | 96,750 | |
goeasy Ltd., 7.875%, 11/1/2022 (b)(f) | | | 250,000 | | | | 262,500 | |
Hunt Companies, Inc., 6.250%, 2/15/2026 (b) | | | 500,000 | | | | 451,250 | |
Jefferies Finance LLC / JFINCo-Issuer Corp., 7.375%, 4/1/2020 (b) | | | 1,000,000 | | | | 1,006,250 | |
Jefferies Finance LLC / JFINCo-Issuer Corp., 7.500%, 4/15/2021 (b) | | | 500,000 | | | | 506,875 | |
Lions Gate Capital Holdings LLC 5.875%, 11/1/2024 (b) | | | 300,000 | | | | 296,250 | |
MPT Operating Partnership LP / MPT Finance Corp., 5.000%, 10/15/2027 | | | 500,000 | | | | 488,000 | |
Nationstar Mortgage Holdings, Inc., 8.125%, 7/15/2023 (b) | | | 400,000 | | | | 405,880 | |
Starwood Property Trust, Inc., 3.625%, 2/1/2021 | | | 250,000 | | | | 247,030 | |
WeWork Cos, Inc., 7.875%, 5/1/2025 (b) | | | 250,000 | | | | 227,530 | |
| | | | | | | | |
| | | | | | | 4,106,621 | |
| | | | | | | | |
Industrial – 14.08% | | | | | | | | |
American Woodmark Corp., 4.875%, 3/15/2026 (b) | | | 250,000 | | | | 233,125 | |
ATS Automation Tooling Systems, Inc., 6.500%, 6/15/2023 (b)(f) | | | 353,000 | | | | 361,825 | |
BMC East LLC, 5.500%, 10/1/2024 (b) | | | 135,000 | | | | 129,262 | |
Boise Cascade Co., 5.625%, 9/1/2024 (b) | | | 500,000 | | | | 486,250 | |
Bombardier, Inc., 6.125%, 1/15/2023 (b)(f) | | | 500,000 | | | | 484,350 | |
Bombardier, Inc., 7.500%, 12/1/2024 (b)(f) | | | 1,000,000 | | | | 972,500 | |
Cleaver-Brooks, Inc., 7.875%, 3/1/2023 (b) | | | 100,000 | | | | 99,250 | |
Cloud Crane LLC, 10.125%, 8/1/2024 (b) | | | 300,000 | | | | 320,250 | |
Covanta Holding Corp., 5.875%, 7/1/2025 | | | 500,000 | | | | 491,875 | |
Energizer Holdings, Inc., 7.750%, 1/15/2027 (b) | | | 1,000,000 | | | | 1,032,850 | |
frontdoor, Inc., 6.750%, 8/15/2026 (b) | | | 520,000 | | | | 517,400 | |
FXI Holdings, Inc., 7.875%, 11/1/2024 (b) | | | 250,000 | | | | 236,875 | |
Griffon Corp., 5.250%, 3/1/2022 | | | 300,000 | | | | 295,125 | |
Grinding Media, Inc. /Moly-Cop AltaSteel Ltd., 7.375%, 12/15/2023 (b) | | | 500,000 | | | | 507,500 | |
Kratos Defense & Security Solutions, Inc., 6.500%, 11/30/2025 (b) | | | 250,000 | | | | 258,125 | |
MAI Holdings, Inc., 9.500%, 6/1/2023 (b)(d) | | | 250,000 | | | | 237,500 | |
New Enterprise Stone & Lime Co., Inc., 6.250%, 3/15/2026 (b) | | | 100,000 | | | | 95,750 | |
Resideo Funding, Inc., 6.125%, 11/1/2026 (b) | | | 100,000 | | | | 103,250 | |
US Concrete, Inc., 6.375%, 6/1/2024 | | | 350,000 | | | | 341,600 | |
| | | | | | | | |
| | | | | | | 7,204,662 | |
| | | | | | | | |
See accompanying notes which are an integral part of these financial statements.
73
Angel Oak High Yield Opportunities Fund
Schedule of Investments – (continued)
January 31, 2019
| | | | | | | | |
| | | Principal
Amount | | | Value | |
| Corporate Obligations – (continued) | | | | | | |
Technology – 2.65% | | | | | | | | |
CDK Global, Inc., 5.875%, 6/15/2026 | | $ | 250,000 | | | $ | 256,325 | |
CDW LLC / CDW Finance Corp., 5.000%, 9/1/2025 | | | 250,000 | | | | 249,062 | |
Change Healthcare Holdings LLC / Change Healthcare Finance, Inc., 5.750%, 3/1/2025 (b) | | | 250,000 | | | | 240,313 | |
Dell International LLC / EMC Corp., 7.125%, 6/15/2024 (b) | | | 575,000 | | | | 607,108 | |
| | | | | | | | |
| | | | | | | 1,352,808 | |
| | | | | | | | |
Utilities – 3.70% | | | | | | | | |
AmeriGas Partners LP / AmeriGas Finance Corp., 5.500%, 5/20/2025 | | | 250,000 | | | | 246,250 | |
Rockpoint Gas Storage Canada Ltd., 7.000%, 3/31/2023 (b)(f) | | | 500,000 | | | | 490,000 | |
Talen Energy Supply LLC, 10.500%, 1/15/2026 (b) | | | 125,000 | | | | 116,250 | |
Vistra Energy Corp., 8.000%, 1/15/2025 (b) | | | 500,000 | | | | 536,250 | |
Vistra Operations Co LLC, 5.625%, 2/15/2027 (b)(g) | | | 500,000 | | | | 503,437 | |
| | | | | | | | |
| | | | | | | 1,892,187 | |
| | | | | | | | |
| | |
TOTAL CORPORATE OBLIGATIONS –
(Cost – $44,047,846) | | | | | | | 43,324,838 | |
| | | | | | | | |
| | |
Short-Term Investments – 9.27% | | | Shares | | | | | |
Money Market Funds – 9.27% | | | | | | | | |
Fidelity Institutional Money Market Government Portfolio, Institutional Class, 2.270% (h) | | | 4,744,688 | | | | 4,744,688 | |
| | | | | | | | |
| | |
TOTAL SHORT-TERM INVESTMENTS
(Cost – $4,744,688) | | | | | | | 4,744,688 | |
| | | | | | | | |
| | |
TOTAL INVESTMENTS – 104.67%
(Cost – $54,744,697) | | | | | | | 53,569,620 | |
| | |
Liabilities in Excess of Other Assets – (4.67%) | | | | | | | (2,389,457 | ) |
| | | | | | | | |
| | |
NET ASSETS – 100.00% | | | | | | $ | 51,180,163 | |
| | | | | | | | |
| (a) | Variable or Floating Rate Security based on a reference index and spread. Rate disclosed is the rate in effect as of January 31, 2019. |
| (b) | Security exempt from registration under Rule 144A or Section 4(a)(2) of the Securities Act of 1933. The security may be resold in transactions exempt from registration, normally to qualified institutional buyers. These securities are determined to be liquid by the Adviser, under the procedures established by the Fund’s Board of Trustees, unless otherwise denoted. At January 31, 2019, the value of these securities amounted to $32,364,261 or 63.24% of net assets. |
| (c) | Variable Rate Security. The coupon is based on an underlying pool of assets. Rate disclosed is the rate in effect as of January 31, 2019. |
| (d) | Illiquid security. At January 31, 2019, the value of these securities amounted to $788,788 or 1.54% of net assets. |
| (e) | As of January 31, 2019, the Fund has fair valued these securities. The value of these securities amounted to $62,505 or 0.12% of net assets. Value determined using significant unobservable inputs. |
| (f) | U.S. dollar denominated foreign security. |
| (g) | Security issued on a when-issued basis. On January 31, 2019, the total value of investments purchased on a when-issued basis was $763,274 or 1.49% of net assets. |
| (h) | Rate disclosed is the seven day yield as of January 31, 2019. |
See accompanying notes which are an integral part of these financial statements.
74
Angel Oak UltraShort Income Fund
Schedule of Investments
January 31, 2019
| | | | | | | | |
| | | Principal
Amount | | | Value | |
| Asset-Backed Securities – 50.52% | | | | | | |
ACC Trust, Series2018-1, Class A, 3.700%, 12/21/2020 (a) | | $ | 1,042,483 | | | $ | 1,044,906 | |
ACC Trust, Series2018-1, Class C, 6.810%, 2/21/2023 (a) | | | 1,000,000 | | | | 1,013,669 | |
American Credit Acceptance Receivables Trust, Series2018-1, Class B, 3.160%, 11/10/2021 (a) | | | 790,000 | | | | 789,415 | |
American Credit Acceptance Receivables Trust, Series2018-3, Class B, 3.490%, 6/13/2022 (a) | | | 500,000 | | | | 499,292 | |
American Credit Acceptance Receivables Trust, Series2017-1, Class D, 3.540%, 3/13/2023 (a) | | | 3,000,000 | | | | 3,006,771 | |
CarFinance Capital Auto Trust, Series2015-1A, Class E, 5.490%, 1/18/2022 (a) | | | 500,000 | | | | 504,392 | |
CPS Auto Receivables Trust, Series2018-D, Class A, 3.060%, 1/18/2022 (a) | | | 520,265 | | | | 521,779 | |
CPS Auto Receivables Trust, Series2018-A, Class B, 2.770%, 4/18/2022 (a) | | | 250,000 | | | | 248,703 | |
CPS Auto Receivables Trust, Series2017-D, Class E, 5.300%, 6/17/2024 (a) | | | 500,000 | | | | 502,684 | |
Credibly Asset Securitization LLC, Series2018-1A, Class A, 4.800%, 11/15/2023 (a) | | | 100,000 | | | | 102,639 | |
Credit Acceptance Auto Loan Trust, Series2017-2A, Class A, 2.550%, 2/17/2026 (a) | | | 1,995,000 | | | | 1,983,826 | |
Credit Acceptance Auto Loan Trust, Series2018-1A, Class A, 3.010%, 2/16/2027 (a) | | | 1,000,000 | | | | 995,798 | |
DT Auto Owner Trust, Series2018-2A, Class B, 3.430%, 5/16/2022 (a) | | | 2,000,000 | | | | 2,004,704 | |
DT Auto Owner Trust, Series2016-1A, Class D, 4.660%, 12/15/2022 (a) | | | 1,909,532 | | | | 1,931,179 | |
Evergreen Credit Card Trust, Series2019-1, Class A,
3.056% (1 Month LIBOR USD + 0.480%), 1/17/2023 (a)(b) | | | 1,500,000 | | | | 1,503,730 | |
Exeter Automobile Receivables Trust, Series2018-3A, Class A, 2.900%, 1/18/2022 (a) | | | 1,038,679 | | | | 1,038,755 | |
Exeter Automobile Receivables Trust, Series2019-1A, Class A, 3.200%, 4/15/2022 (a) | | | 3,000,000 | | | | 3,007,953 | |
Exeter Automobile Receivables Trust, Series2017-2A, Class B, 2.820%, 5/16/2022 (a) | | | 1,971,000 | | | | 1,967,448 | |
Finance of America Structured Securities Trust, Series2018-HB1, Class A, 3.375%, 9/25/2028 (a) | | | 343,539 | | | | 344,657 | |
First Investors Auto Owner Trust, Series2017-2A, Class D, 3.560%, 9/15/2023 (a) | | | 1,895,000 | | | | 1,885,627 | |
First Investors Auto Owner Trust, Series2016-2A, Class E, 5.750%, 9/15/2023 (a) | | | 1,000,000 | | | | 1,024,059 | |
First Investors Auto Owner Trust, Series2017-3A, Class E, 4.920%, 8/15/2024 (a) | | | 500,000 | | | | 501,069 | |
Flagship Credit Auto Trust, Series2016-4, Class B, 2.410%, 10/15/2021 (a)(c) | | | 2,000,000 | | | | 1,993,108 | |
Flagship Credit Auto Trust, Series2015-2, Class B, 3.080%, 12/15/2021 (a) | | | 353,126 | | | | 353,878 | |
Flagship Credit Auto Trust, Series2015-2, Class D, 5.980%, 8/15/2022 (a) | | | 300,000 | | | | 306,075 | |
Flagship Credit Auto Trust, Series2017-4, Class D, 3.580%, 1/16/2024 (a) | | | 310,000 | | | | 307,644 | |
Genesis Sales Finance Master Trust, Series2019-AA, Class A, 4.680%, 8/20/2023 (a) | | | 100,000 | | | | 100,784 | |
GLS Auto Receivables Trust, Series2018-2A, Class A, 3.250%, 4/18/2022 (a) | | | 331,892 | | | | 332,174 | |
GLS Auto Receivables Trust, Series2018-3A, Class A, 3.350%, 8/15/2022 (a) | | | 877,593 | | | | 879,804 | |
Golden Credit Card Trust, Series2017-4, Class A,
3.029% (1 Month LIBOR USD + 0.520%), 7/15/2024 (a)(b) | | | 750,000 | | | | 750,517 | |
Hertz Vehicle Financing II LP, Series2019-1A, Class A, 3.710%, 3/25/2023 (a)(d) | | | 500,000 | | | | 499,907 | |
Hertz Vehicle Financing II LP, Series2019-1A, Class B, 4.100%, 3/25/2023 (a)(d) | | | 500,000 | | | | 501,585 | |
Mercedes-Benz Auto Lease Trust, Series2019-A, Class A2, 3.010%, 2/16/2021 | | | 500,000 | | | | 501,469 | |
MFA LLC, Series 2018-NPL2, Class A1, 4.164%, 7/27/2048 (a)(e) | | | 896,231 | | | | 889,956 | |
Mosaic Solar Loans LLC, Series2017-2A, Class D, 0.000%, 6/22/2043 (a)(f) | | | 487,697 | | | | 453,678 | |
Pepper Residential Securities Trust, Series 22A, Class A1U,
3.638% (1 Month LIBOR USD + 1.000%), 6/21/2060 (a)(b) | | | 250,000 | | | | 250,739 | |
Popular ABS Mortgage Pass-Through Trust, Series2005-6, Class A3, 3.826%, 1/25/2036 (c) | | | 759,478 | | | | 759,354 | |
Pretium Mortgage Credit Partners I LLC, Series 2018-NPL4, Class A1, 4.826%, 9/25/2058 (a)(e) | | | 1,467,262 | | | | 1,468,594 | |
PRPM LLC, Series2018-3A, Class A1, 4.483%, 10/25/2023 (a)(c) | | | 967,375 | | | | 964,588 | |
RAAC Series Trust, Series2005-SP3, Class M1,
3.040% (1 Month LIBOR USD + 0.530%), 12/25/2035 (b) | | | 309,974 | | | | 310,972 | |
RCO Mortgage LLC, Series2017-1, Class A1, 3.375%, 8/25/2022 (a)(e) | | | 1,177,966 | | | | 1,176,304 | |
RCO V Mortgage LLC, Series2018-2, Class A1, 4.458%, 10/25/2023 (a)(e) | | | 971,052 | | | | 972,336 | |
RESIMAC Bastille Trust Series, Series 2018-1NCA, Class A1,
3.363% (1 Month LIBOR USD + 0.850%), 12/5/2059 (a)(b) | | | 847,143 | | | | 849,212 | |
Santander Drive Auto Receivables Trust, Series2017-2, Class D, 3.490%, 7/17/2023 | | | 1,799,000 | | | | 1,793,495 | |
See accompanying notes which are an integral part of these financial statements.
75
Angel Oak UltraShort Income Fund
Schedule of Investments – (continued)
January 31, 2019
| | | | | | | | |
| | | Principal
Amount | | | Value | |
| Asset-Backed Securities – (continued) | | | | | | |
Skopos Auto Receivables Trust, Series2015-2A, Class D, 4.000%, 12/16/2024 (a) | | $ | 1,500,000 | | | $ | 1,486,482 | |
Tesla Auto Lease Trust, Series2018-B, Class B, 4.120%, 10/20/2021 (a) | | | 250,000 | | | | 252,035 | |
Tidewater Auto Receivables Trust, Series2018-AA, Class A2, 3.120%, 7/15/2022 (a) | | | 2,152,425 | | | | 2,154,078 | |
Trillium Credit Card Trust II, Series2019-1A, Class A, 0.000%, 1/26/2024 (a)(c)(d) | | | 2,000,000 | | | | 2,000,000 | |
United Auto Credit Securitization Trust, Series2018-2, Class C, 3.780%, 5/10/2023 (a) | | | 1,180,000 | | | | 1,183,965 | |
Verizon Owner Trust, Series2017-3A, Class A1B,
2.776% (1 Month LIBOR USD + 0.270%), 4/20/2022 (a)(b) | | | 2,425,000 | | | | 2,427,900 | |
Veros Automobile Receivables Trust, Series2018-1, Class A, 3.630%, 5/15/2023 (a) | | | 798,498 | | | | 801,635 | |
Veros Automobile Receivables Trust, Series2018-1, Class B, 4.050%, 2/15/2024 (a) | | | 250,000 | | | | 251,835 | |
Veros Automobile Receivables Trust, Series2018-1, Class D, 5.740%, 8/15/2025 (a) | | | 500,000 | | | | 502,734 | |
VOLT LXXII LLC, Series 2018-NPL8, Class A1A, 4.213%, 10/26/2048 (a)(e) | | | 481,696 | | | | 480,269 | |
Westlake Automobile Receivables Trust, Series2017-2A, Class A2A, 1.800%, 7/15/2020 (a) | | | 122,749 | | | | 122,868 | |
Westlake Automobile Receivables Trust, Series2018-2A, Class A2B,
2.839% (1 Month LIBOR USD + 0.330%), 9/15/2021 (a)(b) | | | 2,488,396 | | | | 2,493,373 | |
Westlake Automobile Receivables Trust, Series2018-1A, Class F, 5.600%, 7/15/2024 (a) | | | 500,000 | | | | 501,787 | |
World Financial Network Credit Card Master Trust, Series2016-C, Class M, 1.980%, 8/15/2023 | | | 352,000 | | | | 347,313 | |
| | | | | | | | |
| | |
TOTAL ASSET-BACKED SECURITIES –
(Cost – $57,681,082) | | | | | | | 57,845,502 | |
| | | | | | | | |
| Collateralized Loan Obligations – 9.44% | | | | | | |
Elevation CLO Ltd., Series2016-5A, Class X,
3.571% (3 Month LIBOR USD + 0.800%), 10/15/2031 (a)(b) | | | 916,667 | | | | 916,667 | |
Flatiron CLO Ltd., Series2013-1A, Class A1R,
3.933% (3 Month LIBOR USD + 1.160%), 1/20/2026 (a)(b) | | | 799,666 | | | | 800,973 | |
Halcyon Loan Advisors Funding Ltd., Series2014-3A, Class AR,
3.861% (3 Month LIBOR USD + 1.100%), 10/22/2025 (a)(b) | | | 1,061,876 | | | | 1,060,767 | |
Hull Street CLO Ltd., Series2014-1A, Class AR,
4.000% (3 Month LIBOR USD + 1.220%), 10/18/2026 (a)(b) | | | 1,261,441 | | | | 1,258,796 | |
JFIN MM CLO Ltd., Series2014-1A, Class A,
4.361% (3 Month LIBOR USD + 1.600%), 4/20/2025 (a)(b) | | | 580,140 | | | | 580,131 | |
Mountain View CLO Ltd., Series2014-1A, Class ARR,
3.587% (3 Month LIBOR USD + 0.800%), 10/15/2026 (a)(b) | | | 1,448,927 | | | | 1,439,625 | |
OZLM Funding Ltd., Series2012-1A, Class X,
3.661% (3 Month LIBOR USD + 0.900%), 7/22/2029 (a)(b) | | | 418,750 | | | | 418,331 | |
Palmer Square CLO Ltd., Series2018-3A, Class A1,
3.466% (3 Month LIBOR USD + 0.850%), 8/15/2026 (a)(b) | | | 381,168 | | | | 380,188 | |
Peaks CLO Ltd., Series2014-1A, Class X,
3.671% (3 Month LIBOR USD + 0.900%), 7/25/2030 (a)(b) | | | 1,000,000 | | | | 1,000,000 | |
Peaks CLO Ltd., Series2018-3, Class X,
3.676% (3 Month LIBOR USD + 0.900%), 1/27/2031 (a)(b) | | | 1,500,000 | | | | 1,500,000 | |
TICP CLO VI Ltd., Series2016-5A, Class X,
3.473% (3 Month LIBOR USD + 0.700%), 7/17/2031 (a)(b) | | | 1,458,000 | | | | 1,458,000 | |
| | | | | | | | |
| | |
TOTAL COLLATERALIZED LOAN OBLIGATIONS –
(Cost – $10,822,083) | | | | | | | 10,813,478 | |
| | | | | | | | |
| Collateralized Mortgage Obligations – 31.86% | | | | | | |
Arroyo Mortgage Trust, Series2018-1, Class A2, 4.016%, 4/25/2048 (a) | | | 1,731,544 | | | | 1,728,282 | |
COLT Mortgage Loan Trust, Series2018-1, Class A2, 2.981%, 2/25/2048 (a) | | | 148,587 | | | | 146,904 | |
See accompanying notes which are an integral part of these financial statements.
76
Angel Oak UltraShort Income Fund
Schedule of Investments – (continued)
January 31, 2019
| | | | | | | | |
| | | Principal
Amount | | | Value | |
| Collateralized Mortgage Obligations – (continued) | | | | | | |
COLT Mortgage Loan Trust, Series2018-2, Class A1, 3.470%, 7/27/2048 (a) | | $ | 1,667,697 | | | $ | 1,671,223 | |
COLT Mortgage Loan Trust, Series2019-1, Class A2, 0.000%, 3/25/2049 (a) | | | 1,000,000 | | | | 999,982 | |
Deephaven Residential Mortgage Trust, Series2017-1A, Class A3, 3.485%, 12/26/2046 (a)(c) | | | 92,449 | | | | 91,958 | |
Deephaven Residential Mortgage Trust, Series2017-2A, Class B1, 5.269%, 6/25/2047 (a)(c) | | | 1,000,000 | | | | 1,002,057 | |
Deephaven Residential Mortgage Trust, Series2017-3A, Class A1, 2.577%, 10/25/2047 (a)(c) | | | 598,931 | | | | 599,075 | |
Deephaven Residential Mortgage Trust, Series2018-1A, Class A2, 3.027%, 12/25/2057 (a)(c) | | | 538,944 | | | | 544,619 | |
Deephaven Residential Mortgage Trust, Series2018-1A, Class M1, 3.939%, 12/25/2057 (a)(c) | | | 740,000 | | | | 734,681 | |
Deephaven Residential Mortgage Trust, Series2018-1A, Class B1, 4.340%, 12/25/2057 (a)(c) | | | 2,000,000 | | | | 1,971,216 | |
Deephaven Residential Mortgage Trust, Series2018-4A, Class A1, 4.080%, 10/25/2058 (a) | | | 972,028 | | | | 981,963 | |
Ellington Financial Mortgage Trust, Series2017-1, Class A2, 2.739%, 10/25/2047 (a) | | | 1,056,691 | | | | 1,040,368 | |
Ellington Financial Mortgage Trust, Series2017-1, Class A3, 2.841%, 10/25/2047 (a) | | | 3,096,634 | | | | 3,081,145 | |
Ellington Financial Mortgage Trust, Series2018-1, Class AFLA,
3.260% (1 Month LIBOR USD + 0.750%), 10/25/2058 (a)(b) | | | 931,319 | | | | 933,667 | |
Galton Funding Mortgage Trust, Series2017-1, Class A21,
3.500%, 7/25/2056 (a)(c) | | | 573,865 | | | | 571,121 | |
GPMT Ltd., Series2018-FL1, Class A,
3.403% (1 Month LIBOR USD + 0.900%), 11/21/2035 (a)(b) | | | 2,276,000 | | | | 2,266,980 | |
GS Mortgage Securities Corp. Trust, Series2018-TWR, Class A,
3.409% (1 Month LIBOR USD + 0.900%), 7/15/2031 (a)(b) | | | 500,000 | | | | 500,627 | |
GS Mortgage Securities Corp. Trust, Series 2017-STAY, Class A,
3.359% (1 Month LIBOR USD + 0.850%), 7/15/2032 (a)(b) | | | 208,656 | | | | 207,743 | |
IndyMac Index Mortgage Loan Trust, Series 2005-AR12, Class 2A1A,
2.990% (1 Month LIBOR USD + 0.480%), 7/25/2035 (b) | | | 475,473 | | | | 464,610 | |
LSTAR Securities Investment Ltd., Series2017-8, Class A,
4.170% (1 Month LIBOR USD + 1.650%), 11/1/2022 (a)(b) | | | 1,383,021 | | | | 1,395,756 | |
New Residential Mortgage Loan Trust, Series 2019-NQM1, Class A1, 3.675%, 1/25/2049 (a) | | | 500,000 | | | | 500,775 | |
NRPL Trust, Series2018-2A, Class A1, 3.033%, 7/25/2067 (a)(c) | | | 984,965 | | | | 981,450 | |
OBX Trust, Series 2018-EXP1, Class 2A1,
3.360% (1 Month LIBOR USD + 0.850%), 4/27/2048 (a)(b) | | | 877,341 | | | | 879,052 | |
Pepper Residential Securities Trust, Series 21A, Class A1U,
3.390% (1 Month LIBOR USD + 0.880%), 1/16/2060 (a)(b) | | | 433,005 | | | | 433,691 | |
PRPM LLC, Series2019-1A, Class A1, 4.500%, 1/25/2024 (a)(d)(e) | | | 2,000,000 | | | | 2,001,800 | |
SG Residential Mortgage Trust, Series2018-1, Class A3, 3.735%, 4/25/2048 (a) | | | 651,093 | | | | 652,040 | |
Structured Adjustable Rate Mortgage Loan Trust, Series2004-9XS, Class A,
2.880% (1 Month LIBOR USD + 0.370%), 7/25/2034 (b) | | | 337,358 | | | | 334,637 | |
Toorak Mortgage Ltd., Series2018-1, Class A1, 4.336%, 8/25/2021 (a)(e) | | | 2,000,000 | | | | 1,985,936 | |
Velocity Commercial Capital Loan Trust, Series2018-2, Class M1, 4.260%, 10/25/2048 (a) | | | 242,491 | | | | 244,445 | |
Verus Securitization Trust, Series 2017-SG1A, Class A3, 2.825%, 11/25/2047 (a)(e) | | | 2,722,589 | | | | 2,711,865 | |
Verus Securitization Trust, Series 2017-SG1A, Class B1, 3.615%, 11/25/2047 (a)(e) | | | 740,000 | | | | 734,834 | |
Verus Securitization Trust, Series 2018-INV1, Class A2, 3.849%, 3/25/2058 (a) | | | 1,655,688 | | | | 1,645,311 | |
Verus Securitization Trust, Series 2018-INV1, Class B2, 5.648%, 3/25/2058 (a)(c) | | | 235,000 | | | | 235,513 | |
Verus Securitization Trust, Series2018-2, Class A1, 3.677%, 7/25/2058 (a) | | | 1,703,268 | | | | 1,705,627 | |
Verus Securitization Trust, Series 2018-INV2, Class A3, 4.705%, 10/25/2058 (a) | | | 495,380 | | | | 496,435 | |
| | | | | | | | |
| | |
TOTAL COLLATERALIZED MORTGAGE OBLIGATIONS –
(Cost – $36,368,425) | | | | | | | 36,477,388 | |
| | | | | | | | |
| Corporate Obligations – 0.66% | | | | | | |
| Consumer,Non-cyclical – 0.21% | | | | | | |
Teva Pharmaceutical Finance IV LLC, 2.250%, 3/18/2020 | | | 250,000 | | | | 244,225 | |
| | | | | | | | |
See accompanying notes which are an integral part of these financial statements.
77
Angel Oak UltraShort Income Fund
Schedule of Investments – (continued)
January 31, 2019
| | | | | | | | |
| | | Principal
Amount | | | Value | |
| Corporate Obligations – (continued) | | | | | | |
Industrial – 0.45% | | | | | | | | |
Arconic, Inc. 6.150%, 8/15/2020 | | $ | 500,000 | | | $ | 515,625 | |
| | | | | | | | |
| | |
TOTAL CORPORATE OBLIGATIONS –
(Cost – $756,751) | | | | | | | 759,850 | |
| | | | | | | | |
Mortgage Backed Securities – U.S. Government Agency Issues – 2.98% | | | | | | | | |
Federal National Mortgage Association, Series2014-M12, Class FA,
2.770% (1 Month LIBOR USD + 0.300%), 10/25/2021 (b) | | | 1,233,499 | | | | 1,231,857 | |
Federal National Mortgage Association, Series2017-M5, Class FA1,
3.140% (1 Month LIBOR USD + 0.670%), 4/25/2024 (b) | | | 456,671 | | | | 457,451 | |
Federal National Mortgage Association, Series2017-M11, Class FA,
2.940% (1 Month LIBOR USD + 0.470%), 9/1/2024 (b) | | | 1,718,565 | | | | 1,722,353 | |
| | | | | | | | |
| |
TOTAL MORTGAGE BACKED SECURITIES – U.S. GOVERNMENT AGENCY ISSUES –
(Cost – $3,410,709) | | | | 3,411,661 | |
| | | | | | | | |
| | |
Short-Term Investments – 4.20% | | | Shares | | | | | |
Money Market Funds – 4.20% | | | | | | | | |
Fidelity Institutional Money Market Government Portfolio, Institutional Class, 2.270% (g) | | | 4,807,967 | | | | 4,807,967 | |
| | | | | | | | |
| | |
TOTAL SHORT-TERM INVESTMENTS
(Cost – $4,807,967) | | | | | | | 4,807,967 | |
| | | | | | | | |
| | |
TOTAL INVESTMENTS – 99.66%
(Cost – $113,847,017) | | | | | | | 114,115,846 | |
| | |
Other Assets in Excess of Liabilities – 0.34% | | | | | | | 383,624 | |
| | | | | | | | |
| | |
NET ASSETS – 100.00% | | | | | | $ | 114,499,470 | |
| | | | | | | | |
| (a) | Security exempt from registration under Rule 144A or Section 4(a)(2) of the Securities Act of 1933. The security may be resold in transactions exempt from registration, normally to qualified institutional buyers. These securities are determined to be liquid by the Adviser, under the procedures established by the Fund’s Board of Trustees, unless otherwise denoted. At January 31, 2019, the value of these securities amounted to $100,624,519 or 87.88% of net assets. |
| (b) | Variable or Floating Rate Security based on a reference index and spread. Rate disclosed is the rate in effect as of January 31, 2019. |
| (c) | Variable Rate Security. The coupon is based on an underlying pool of assets. Rate disclosed is the rate in effect as of January 31, 2019. |
| (d) | Security issued on a when-issued basis. On January 31, 2019, the total value of investments purchased on a when-issued basis was $5,003,292 or 4.37% of net assets. |
| (e) | Step-up bond that pays an initial coupon rate for the first period and then a higher coupon rate for the following periods. Rate disclosed is the rate in effect as of January 31, 2019. |
| (f) | Principal Only Security. |
| (g) | Rate disclosed is the seven day yield as of January 31, 2019. |
See accompanying notes which are an integral part of these financial statements.
78
Angel Oak UltraShort Income Fund
Schedule of Open Futures Contracts – (continued)
January 31, 2019
| | | | | | | | | | | | | | | | |
Long Futures Contracts | | Expiration
Month | | | Number of
Long (Short)
Contracts | | | Notional
Value | | | Unrealized
Appreciation
(Depreciation) | |
90 Day Euro$ Future | | | December 2019 | | | | 24 | | | $ | 5,843,400 | | | $ | 6,716 | |
| | | | | | | | | | | | | | | | |
| | | | | | | | | | | | | | $ | 6,716 | |
| | | | | | | | | | | | | | | | |
Short Futures Contracts | | | | | | | | | | | | |
2 Year ERIS Aged Standard Swap Future | | | December 2019 | | | | (81 | ) | | | (8,031,766 | ) | | | (17,626 | ) |
90 Day Euro$ Future | | | September 2020 | | | | (24 | ) | | | (5,854,500 | ) | | | (8,184 | ) |
2 Year ERIS Aged Standard Swap Future | | | September 2020 | | | | (65 | ) | | | (6,454,032 | ) | | | (22,935 | ) |
3 Year ERIS Aged Standard Swap Future | | | December 2020 | | | | (58 | ) | | | (5,763,025 | ) | | | (40,530 | ) |
2 Year ERIS Aged Standard Swap Future | | | December 2020 | | | | (39 | ) | | | (3,908,950 | ) | | | (28,686 | ) |
2 Year ERIS Aged Standard Swap Future | | | March 2021 | | | | (61 | ) | | | (6,119,459 | ) | | | (13,260 | ) |
3 Year ERIS Aged Standard Swap Future | | | September 2021 | | | | (22 | ) | | | (2,180,394 | ) | | | (1,719 | ) |
3 Year ERIS Aged Standard Swap Future | | | December 2021 | | | | (24 | ) | | | (2,412,499 | ) | | | (30,151 | ) |
| | | | | | | | | | | | | | | | |
Total | | | | | | | | | | | | | | $ | (163,091 | ) |
| | | | | | | | | | | | | | | | |
Long/Short Total | | | | | | | | | | | | | | $ | (156,376 | ) |
| | | | | | | | | | | | | | | | |
See accompanying notes which are an integral part of these financial statements.
79
Statements of Assets and Liabilities
January 31, 2019
| | | | | | | | | | | | | | | | |
| | | Multi-Strategy
Income Fund (c) | | | Financials
Income Fund | | | High Yield
Opportunities Fund | | | UltraShort
Income Fund | |
Assets | | | | | | | | | | | | | | | | |
Investments in unaffiliated securities, at value (cost $7,549,475,619, $130,538,334, $54,744,697, and $113,847,017 respectively) | | $ | 7,471,968,700 | | | $ | 130,339,776 | | | $ | 53,569,620 | | | $ | 114,115,846 | |
Investments in affiliated securities, at value (cost $125,493,058, $0, $0, and $0 respectively) | | | 124,433,655 | | | | – | | | | – | | | | – | |
Cash | | | 8,212 | | | | – | | | | – | | | | – | |
Deposit at broker for futures | | | 6,902,556 | | | | – | | | | – | | | | 97,875 | |
Deposit at brokers for reverse repurchase agreements | | | 1,233,315 | | | | – | | | | – | | | | – | |
Receivable for fund shares sold | | | 79,411,608 | | | | 514,110 | | | | 27,711 | | | | 726,025 | |
Receivable for investments sold | | | 16,072,166 | | | | – | | | | 201,274 | | | | 8,172,593 | |
Dividends and interest receivable | | | 24,295,221 | | | | 1,385,820 | | | | 779,153 | | | | 231,687 | |
Prepaid expenses | | | 99,567 | | | | 35,037 | | | | 17,636 | | | | 4,644 | |
| | | | | | | | | | | | | | | | |
Total Assets | | | 7,724,425,000 | | | | 132,274,743 | | | | 54,595,394 | | | | 123,348,670 | |
| | | | | | | | | | | | | | | | |
| | | | |
Liabilities | | | | | | | | | | | | | | | | |
Payable for reverse repurchase agreements | | | 28,061,000 | | | | – | | | | – | | | | – | |
Payable for credit agreements | | | 250,000,000 | | | | – | | | | – | | | | – | |
Payable for fund shares redeemed | | | 25,752,754 | | | | 627,796 | | | | 12,293 | | | | 53,138 | |
Payable for investments purchased | | | 154,784,028 | | | | – | | | | 3,286,897 | | | | 8,674,912 | |
Payable for distributions to shareholders | | | 6,929,365 | | | | 48,732 | | | | 56,614 | | | | 13,244 | |
Variation margin on futures contracts | | | 2,693,523 | | | | – | | | | – | | | | 34,393 | |
Interest payable for credit and reverse repurchase agreements | | | 1,343,303 | | | | – | | | | – | | | | – | |
Payable to Adviser | | | 5,277,415 | | | | 32,248 | | | | 11,362 | | | | 3,677 | |
Payable to administrator, fund accountant, and transfer agent | | | 405,791 | | | | 24,043 | | | | 16,916 | | | | 19,586 | |
Payable to custodian | | | 62,492 | | | | 1,008 | | | | 470 | | | | 1,200 | |
12b-1 fees accrued | | | 210,895 | | | | 3,410 | | | | 562 | | | | 1,558 | |
Other accrued expenses | | | 740,664 | | | | 49,496 | | | | 30,117 | | | | 47,492 | |
| | | | | | | | | | | | | | | | |
Total Liabilities | | | 476,261,230 | | | | 786,733 | | | | 3,415,231 | | | | 8,849,200 | |
| | | | | | | | | | | | | | | | |
Net Assets | | $ | 7,248,163,770 | | | $ | 131,488,010 | | | $ | 51,180,163 | | | $ | 114,499,470 | |
| | | | | | | | | | | | | | | | |
| | | | |
Net Assets consist of: | | | | | | | | | | | | | | | | |
Paid-in capital | | $ | 7,756,369,662 | | | $ | 167,319,085 | | | $ | 53,674,028 | | | $ | 114,424,366 | |
Total distributable earnings (accumulated deficit) | | | (508,205,892 | ) | | | (35,831,075 | ) | | | (2,493,865 | ) | | | 75,104 | |
| | | | | | | | | | | | | | | | |
Net Assets | | $ | 7,248,163,770 | | | $ | 131,488,010 | | | $ | 51,180,163 | | | $ | 114,499,470 | |
| | | | | | | | | | | | | | | | |
Class A: | | | | | | | | | | | | | | | | |
Net Assets | | $ | 590,385,883 | | | $ | 7,085,884 | | | $ | 2,753,827 | | | $ | 7,903,178 | |
| | | | | | | | | | | | | | | | |
Shares outstanding (unlimited number of shares authorized, no par value) | | | 53,470,070 | | | | 759,273 | | | | 241,682 | | | | 788,659 | |
| | | | | | | | | | | | | | | | |
Net asset value (“NAV”) per share | | $ | 11.04 | | | $ | 9.33 | | | $ | 11.39 | | | $ | 10.02 | |
| | | | | | | | | | | | | | | | |
Offering price per share (NAV/0.9775) (a) | | $ | 11.30 | | | $ | 9.55 | | | $ | 11.66 | | | $ | – | |
| | | | | | | | | | | | | | | | |
| | | | |
Class C | | | | | | | | | | | | | | | | |
Net Assets | | $ | 102,486,712 | | | $ | 2,038,665 | | | $ | – | | | $ | – | |
| | | | | | | | | | | | | | | | |
Shares outstanding (unlimited number of shares authorized, no par value) | | | 9,361,290 | | | | 220,489 | | | | – | | | | – | |
| | | | | | | | | | | | | | | | |
Net asset value (“NAV”) and offering price per share | | $ | 10.95 | | | $ | 9.25 | | | $ | – | | | $ | – | |
| | | | | | | | | | | | | | | | |
Minimum redemption price per share (NAV*0.99) (b) | | $ | 10.84 | | | $ | 9.15 | | | $ | – | | | $ | – | |
| | | | | | | | | | | | | | | | |
| | | | |
Institutional Class: | | | | | | | | | | | | | | | | |
Net Assets | | $ | 6,555,291,175 | | | $ | 122,363,461 | | | $ | 48,426,336 | | | $ | 106,596,292 | |
| | | | | | | | | | | | | | | | |
Shares outstanding (unlimited number of shares authorized, no par value) | | | 594,652,821 | | | | 13,135,203 | | | | 4,266,203 | | | | 10,640,443 | |
| | | | | | | | | | | | | | | | |
Net asset value (“NAV”) and offering price per share | | $ | 11.02 | | | $ | 9.32 | | | $ | 11.35 | | | $ | 10.02 | |
| | | | | | | | | | | | | | | | |
| (a) | Class A shares impose a maximum 2.25% sales charge on purchases. This fee is not charged to shareholders of the UltraShort Income Fund. |
| (b) | A contingent deferred sales charge (“CDSC”) of 1.00% may be charged. |
| (c) | Statement has been consolidated. See Note 1 in the Notes to Financial Statements for basis of consolidation. |
See accompanying notes which are an integral part of these financial statements.
80
Statements of Operations
For the Year or Period Ended January 31, 2019
| | | | | | | | | | | | | | | | |
| | | Multi-Strategy
Income Fund (b) | | | Financials
Income Fund | | | High Yield
Opportunities Fund | | | UltraShort Income
Fund (a) | |
Investment Income | | | | | | | | | | | | | | | | |
Interest | | $ | 419,617,718 | | | $ | 6,930,914 | | | $ | 3,312,974 | | | $ | 1,963,780 | |
Dividends from unaffiliated investments | | | 707,274 | | | | 27,330 | | | | – | | | | – | |
Dividends from affiliated investments | | | 4,287,641 | | | | – | | | | – | | | | – | |
| | | | | | | | | | | | | | | | |
Total Investment Income | | | 424,612,633 | | | | 6,958,244 | | | | 3,312,974 | | | | 1,963,780 | |
| | | | | | | | | | | | | | | | |
| | | | |
Expenses | | | | | | | | | | | | | | | | |
Investment Advisory (See Note 4) | | | 61,975,865 | | | | 1,095,746 | | | | 277,056 | | | | 275,254 | |
12b-1 – Class A | | | 1,479,630 | | | | 21,125 | | | | 4,298 | | | | 2,458 | |
12b-1 – Class C | | | 950,336 | | | | 15,377 | | | | – | | | | – | |
Fund accounting | | | 960,242 | | | | 34,840 | | | | 32,727 | | | | 27,544 | |
Printing | | | 922,327 | | | | 25,869 | | | | 7,886 | | | | 5,614 | |
Administration | | | 784,804 | | | | 44,083 | | | | 25,678 | | | | 25,993 | |
Legal | | | 687,515 | | | | 41,893 | | | | 9,383 | | | | 32,601 | |
Transfer agent | | | 570,944 | | | | 46,208 | | | | 26,493 | | | | 26,244 | |
Custodian | | | 408,395 | | | | 5,969 | | | | 2,527 | | | | 5,373 | |
Registration | | | 264,916 | | | | 53,894 | | | | 38,458 | | | | 16,651 | |
Trustee | | | 184,058 | | | | 32,676 | | | | 31,099 | | | | 23,022 | |
Audit | | | 69,727 | | | | 29,230 | | | | 24,184 | | | | 24,204 | |
Insurance | | | 67,107 | | | | 1,751 | | | | 511 | | | | 188 | |
Compliance | | | 20,392 | | | | 20,435 | | | | 20,435 | | | | 16,393 | |
Miscellaneous | | | 111,109 | | | | 3,942 | | | | 1,610 | | | | 2,144 | |
Interest & Commissions | | | 10,531,206 | | | | 3,234 | | | | 18 | | | | – | |
| | | | | | | | | | | | | | | | |
Total Expenses | | | 79,988,573 | | | | 1,476,272 | | | | 502,363 | | | | 483,683 | |
| | | | | | | | | | | | | | | | |
Fees contractually recouped (waived) by Adviser (See Note 4) | | | 1,118,919 | | | | – | | | | (170,618 | ) | | | (20,922 | ) |
Fees voluntarily waived by Adviser (See Note 4) | | | – | | | | (587,025 | ) | | | – | | | | (297,198 | ) |
| | | | | | | | | | | | | | | | |
Net operating expenses | | | 81,107,492 | | | | 889,247 | | | | 331,745 | | | | 165,563 | |
| | | | | | | | | | | | | | | | |
Net Investment Income | | | 343,505,141 | | | | 6,068,997 | | | | 2,981,229 | | | | 1,798,217 | |
| | | | | | | | | | | | | | | | |
| | | | |
Realized and Unrealized Gain (Loss) on Investments | | | | | | | | | | | | | | | | |
Net realized gain (loss) on investments in unaffiliated securities | | | (85,247,868 | ) | | | 38,651 | | �� | | (81,711 | ) | | | (9,588 | ) |
Net realized gain (loss) on investments in affiliated securities | | | 3,996 | | | | – | | | | – | | | | – | |
Net realized gain (loss) on futures contracts | | | 23,844,869 | | | | – | | | | – | | | | (17,843 | ) |
Net change in unrealized appreciation (depreciation) on investments in unaffiliated securities | | | (43,640,078 | ) | | | (1,759,747 | ) | | | (2,558,255 | ) | | | 268,829 | |
Net change in unrealized appreciation (depreciation) on investments in affiliated securities | | | (1,426,229 | ) | | | – | | | | – | | | | – | |
Net change in unrealized appreciation (depreciation) on futures contracts | | | (31,843,689 | ) | | | – | | | | – | | | | (156,376 | ) |
| | | | | | | | | | | | | | | | |
Net realized and unrealized gain (loss) on investments | | | (138,308,999 | ) | | | (1,721,096 | ) | | | (2,639,966 | ) | | | 85,022 | |
| | | | | | | | | | | | | | | | |
Net increase (decrease) in net assets resulting from operations | | $ | 205,196,142 | | | $ | 4,347,901 | | | $ | 341,263 | | | $ | 1,883,239 | |
| | | | | | | | | | | | | | | | |
| (a) | Class A Shares commenced operations on April 30, 2018 and Institutional Class Shares commenced operations on April 2, 2018. |
| (b) | Statement has been consolidated. See Note 1 in the Notes to Financial Statements for basis of consolidation. |
See accompanying notes which are an integral part of these financial statements.
81
Angel Oak Multi-Strategy Income Fund
Consolidated Statement of Cash Flows (a)
For the Year Ended January 31, 2019
| | | | |
CASH FLOWS FROM OPERATING ACTIVITIES: | | | | |
Net increase in net assets resulting from operations | | $ | 205,196,142 | |
Net adjustments to reconcile net increase in net assets from operations to net cash used in operating activities: | | | | |
Net amortization and accretion of premium and discount | | | (27,254,569 | ) |
Net realized paydown gains on mortgage backed and other asset backed securities | | | (83,289,355 | ) |
Purchases of short-term investments, net | | | (10,339,780 | ) |
Purchases of investments | | | (5,961,469,245 | ) |
Proceeds from sales of long-term investments | | | 5,108,927,245 | |
Net change in unrealized depreciation on investments | | | 45,066,307 | |
Net change in unrealized depreciation on futures contracts | | | 31,843,689 | |
Net realized loss on investments | | | 85,243,872 | |
Net realized gain on futures contracts | | | (23,844,869 | ) |
Change in assets and liabilities: | | | | |
Decrease in deposits at broker for futures | | | 218,442 | |
Increase in deposits at brokers for reverse repurchase agreements | | | (351,465 | ) |
Decrease in receivable for investments sold | | | 17,772,184 | |
Increase in dividends and interest receivable | | | (4,904,330 | ) |
Decrease in prepaid expenses | | | 23,638 | |
Decrease in payable for investments purchased | | | (13,840,695 | ) |
Increase in interest payable for credit and reverse repurchase agreements | | | 573,901 | |
Change in variation margin paid on futures contracts | | | (4,909,813 | ) |
Increase in payable to Adviser | | | 232,622 | |
Increase in payable to administrator, fund accountant and transfer agent | | | 67,469 | |
Increase in payable to custodian | | | 7,489 | |
Increase in12b-1 fees accrued | | | 25,442 | |
Increase in other accrued expenses | | | 340,096 | |
| | | | |
Net cash used in operating activities | | | (634,665,583 | ) |
| | | | |
CASH FLOWS FROM FINANCING ACTIVITIES: | | | | |
Proceeds from shares sold | | | 3,478,918,078 | |
Payment on shares redeemed | | | (2,779,502,320 | ) |
Distributions paid to shareholders | | | (79,498,963 | ) |
Purchases of reverse repurchase agreements | | | 28,061,000 | |
Proceeds from reverse repurchase agreements | | | (13,304,000 | ) |
| | | | |
Net cash provided by financing activities | | | 634,673,795 | |
| | | | |
Net change in cash | | $ | 8,212 | |
| | | | |
CASH: | | | | |
Beginning Balance | | | – | |
| | | | |
Ending Balance | | $ | 8,212 | |
| | | | |
SUPPLEMENTAL DISCLOSURES: | | | | |
Cash paid for interest | | $ | 9,957,305 | |
Non-cash financing activities - distributions reinvested | | | 260,429,262 | |
Non-cash financing activities - decrease in receivable for fund shares sold | | | (14,553,061 | ) |
Non-cash financing activities - increase in payable for fund shares redeemed | | | (12,733,125 | ) |
| (a) | Statement has been consolidated. See Note 1 in the Notes to Financial Statements for basis of consolidation. |
See accompanying notes which are an integral part of these financial statements.
82
Angel Oak Multi-Strategy Income Fund
Consolidated Statements of Changes in Net Assets
| | | | | | | | |
| | | For the Year Ended
January 31, 2019 (c) | | | For the Year Ended
January 31, 2018 | |
Increase (Decrease) in Net Assets due to: | | | | | | | | |
Operations | | | | | | | | |
Net investment income (loss) | | $ | 343,505,141 | | | $ | 277,988,334 | |
Net realized gain (loss) on investment transactions and futures contracts | | | (61,399,003 | ) | | | (48,014,751 | ) |
Net change in unrealized appreciation (depreciation) on investments and futures contracts | | | (76,909,996 | ) | | | 32,605,127 | |
| | | | | | | | |
Net increase (decrease) in net assets resulting from operations | | | 205,196,142 | | | | 262,578,710 | |
| | | | | | | | |
Distributions to Shareholders | | | | | | | | |
Distributions, Class A | | | (27,574,577 | ) | | | (24,673,972 | ) (a) |
Distributions, Class C | | | (3,809,688 | ) | | | (2,929,709 | ) (a) |
Distributions, Institutional Class | | | (310,374,827 | ) | | | (258,888,961 | ) (a) |
| | | | | | | | |
Total Distributions | | | (341,759,092 | ) | | | (286,492,642 | ) |
| | | | | | | | |
Capital Transactions – Class A | | | | | | | | |
Proceeds from shares sold | | | 268,588,629 | | | | 268,295,121 | |
Reinvestment of distributions | | | 22,432,061 | | | | 19,859,051 | |
Amount paid for shares redeemed | | | (227,801,206 | ) | | | (179,075,833 | ) |
| | | | | | | | |
Total Class A | | | 63,219,484 | | | | 109,078,339 | |
| | | | | | | | |
Capital Transactions – Class C | | | | | | | | |
Proceeds from shares sold | | | 34,718,380 | | | | 49,322,310 | |
Reinvestment of distributions | | | 3,267,836 | | | | 2,539,842 | |
Amount paid for shares redeemed | | | (20,483,167 | ) | | | (12,057,134 | ) |
| | | | | | | | |
Total Class C | | | 17,503,049 | | | | 39,805,018 | |
| | | | | | | | |
Capital Transactions – Institutional Class | | | | | | | | |
Proceeds from shares sold | | | 3,161,058,008 | | | | 3,117,379,557 | |
Reinvestment of distributions | | | 234,729,365 | | | | 200,477,206 | |
Amount paid for shares redeemed | | | (2,543,951,072 | ) | | | (1,507,261,120 | ) |
| | | | | | | | |
Total Institutional Class | | | 851,836,301 | | | | 1,810,595,643 | |
| | | | | | | | |
Net increase (decrease) in net assets resulting from capital transactions | | | 932,558,834 | | | | 1,959,479,000 | |
| | | | | | | | |
Total Increase (Decrease) in Net Assets | | | 795,995,884 | | | | 1,935,565,068 | |
| | | | | | | | |
Net Assets | | | | | | | | |
Beginning of period | | | 6,452,167,886 | | | | 4,516,602,818 | |
| | | | | | | | |
End of period | | $ | 7,248,163,770 | | | $ | 6,452,167,886 | (b) |
| | | | | | | | |
Share Transactions – Class A | | | | | | | | |
Shares sold | | | 24,002,941 | | | | 23,750,422 | |
Shares issued in reinvestment of distributions | | | 2,009,374 | | | | 1,757,226 | |
Shares redeemed | | | (20,388,854 | ) | | | (15,851,267 | ) |
| | | | | | | | |
Total Class A | | | 5,623,461 | | | | 9,656,381 | |
| | | | | | | | |
Share Transactions – Class C | | | | | | | | |
Shares sold | | | 3,132,816 | | | | 4,396,656 | |
Shares issued in reinvestment of distributions | | | 295,076 | | | | 226,429 | |
Shares redeemed | | | (1,847,924 | ) | | | (1,075,054 | ) |
| | | | | | | | |
Total Class C | | | 1,579,968 | | | | 3,548,031 | |
| | | | | | | | |
Share Transactions – Institutional Class | | | | | | | | |
Shares sold | | | 283,672,672 | | | | 276,522,183 | |
Shares issued in reinvestment of distributions | | | 21,058,587 | | | | 17,774,617 | |
Shares redeemed | | | (228,686,822 | ) | | | (133,679,016 | ) |
| | | | | | | | |
Total Institutional Class | | | 76,044,437 | | | | 160,617,784 | |
| | | | | | | | |
Net increase (decrease) in share transactions | | | 83,247,866 | | | | 173,822,196 | |
| | | | | | | | |
| (a) | These amounts are comprised entirely of net investment income. |
| (b) | Includes accumulated net investment loss of ($2,438,397). |
| (c) | Statement has been consolidated. See Note 1 in the Notes to Financial Statements for basis of consolidation. |
See accompanying notes which are an integral part of these financial statements.
83
Angel Oak Financials Income Fund
Statements of Changes in Net Assets
| | | | | | | | |
| | | For the Year Ended
January 31, 2019 | | | For the Year Ended
January 31, 2018 | |
Increase (Decrease) in Net Assets due to: | | | | | | | | |
Operations |
Net investment income (loss) | | $ | 6,068,997 | | | $ | 6,725,084 | |
Net realized gain (loss) on investment transactions and futures contracts | | | 38,651 | | | | 15,422 | |
Net change in unrealized appreciation (depreciation) on investments and futures contracts | | | (1,759,747 | ) | | | 561,135 | |
| | | | | | | | |
Net increase (decrease) in net assets resulting from operations | | | 4,347,901 | | | | 7,301,641 | |
| | | | | | | | |
Distributions to Shareholders | | | | | | | | |
Distributions, Class A | | | (386,348 | ) | | | (329,014 | ) (a) |
Distributions, Class C | | | (61,211 | ) | | | (36,838 | ) (a) |
Distributions, Institutional Class | | | (5,476,487 | ) | | | (6,623,243 | ) (a) |
| | | | | | | | |
Total Distributions | | | (5,924,046 | ) | | | (6,989,095 | ) |
| | | | | | | | |
Capital Transactions – Class A | | | | | | | | |
Proceeds from shares sold | | | 3,327,487 | | | | 8,528,682 | |
Reinvestment of distributions | | | 370,754 | | | | 319,168 | |
Amount paid for shares redeemed | | | (5,875,413 | ) | | | (6,275,887 | ) |
| | | | | | | | |
Total Class A | | | (2,177,172 | ) | | | 2,571,963 | |
| | | | | | | | |
Capital Transactions – Class C | | | | | | | | |
Proceeds from shares sold | | | 826,217 | | | | 764,434 | |
Reinvestment of distributions | | | 45,602 | | | | 28,664 | |
Amount paid for shares redeemed | | | (279,619 | ) | | | (202,768 | ) |
| | | | | | | | |
Total Class C | | | 592,200 | | | | 590,330 | |
| | | | | | | | |
Capital Transactions – Institutional Class | | | | | | | | |
Proceeds from shares sold | | | 65,146,324 | | | | 114,072,225 | |
Reinvestment of distributions | | | 4,993,847 | | | | 6,007,069 | |
Amount paid for shares redeemed | | | (52,827,103 | ) | | | (178,336,460 | ) |
| | | | | | | | |
Total Institutional Class | | | 17,313,068 | | | | (58,257,166 | ) |
| | | | | | | | |
Net increase (decrease) in net assets resulting from capital transactions | | | 15,728,096 | | | | (55,094,873 | ) |
| | | | | | | | |
Total Increase (Decrease) in Net Assets | | | 14,151,951 | | | | (54,782,327 | ) |
| | | | | | | | |
Net Assets | | | | | | | | |
Beginning of period | | | 117,336,059 | | | | 172,118,386 | |
| | | | | | | | |
End of period | | $ | 131,488,010 | | | $ | 117,336,059 | (b) |
| | | | | | | | |
Share Transactions – Class A | | | | | | | | |
Shares sold | | | 355,918 | | | | 902,191 | |
Shares issued in reinvestment of distributions | | | 39,535 | | | | 33,780 | |
Shares redeemed | | | (628,374 | ) | | | (663,624 | ) |
| | | | | | | | |
Total Class A | | | (232,921 | ) | | | 272,347 | |
| | | | | | | | |
Share Transactions – Class C | | | | | | | | |
Shares sold | | | 89,355 | | | | 81,443 | |
Shares issued in reinvestment of distributions | | | 4,909 | | | | 3,056 | |
Shares redeemed | | | (30,042 | ) | | | (21,676 | ) |
| | | | | | | | |
Total Class C | | | 64,222 | | | | 62,823 | |
| | | | | | | | |
Share Transactions – Institutional Class | | | | | | | | |
Shares sold | | | 6,957,112 | | | | 12,076,198 | |
Shares issued in reinvestment of distributions | | | 533,561 | | | | 637,491 | |
Shares redeemed | | | (5,641,905 | ) | | | (18,896,345 | ) |
| | | | | | | | |
Total Institutional Class | | | 1,848,768 | | | | (6,182,656 | ) |
| | | | | | | | |
Net increase (decrease) in share transactions | | | 1,680,069 | | | | (5,847,486 | ) |
| | | | | | | | |
| (a) | These amounts are comprised entirely of net investment income. |
| (b) | Includes accumulated net investment loss of ($210,264). |
See accompanying notes which are an integral part of these financial statements.
84
Angel Oak High Yield Opportunities Fund
Statements of Changes in Net Assets
| | | | | | | | |
| | | For the Year Ended
January 31, 2019 | | | For the Year Ended
January 31, 2018 | |
Increase (Decrease) in Net Assets due to: | | | | | | | | |
Operations | | | | | | | | |
Net investment income (loss) | | $ | 2,981,229 | | | $ | 2,977,917 | |
Net realized gain (loss) on investment transactions | | | (81,711 | ) | | | (271,416 | ) |
Net change in unrealized appreciation (depreciation) on investments | | | (2,558,255 | ) | | | 484,922 | |
| | | | | | | | |
Net increase (decrease) in net assets resulting from operations | | | 341,263 | | | | 3,191,423 | |
| | | | | | | | |
Distributions to Shareholders | | | | | | | | |
Distributions, Class A | | | (98,028 | ) | | | (63,290 | ) (a) |
Distributions, Institutional Class | | | (2,861,920 | ) | | | (2,846,851 | ) (a) |
| | | | | | | | |
Total Distributions | | | (2,959,948 | ) | | | (2,910,141 | ) |
| | | | | | | | |
Capital Transactions – Class A | | | | | | | | |
Proceeds from shares sold | | | 2,035,119 | | | | 1,186,813 | |
Reinvestment of distributions | | | 97,975 | | | | 63,260 | |
Amount paid for shares redeemed | | | (580,470 | ) | | | (705,498 | ) |
| | | | | | | | |
Total Class A | | | 1,552,624 | | | | 544,575 | |
| | | | | | | | |
Capital Transactions – Institutional Class | | | | | | | | |
Proceeds from shares sold | | | 1,972,685 | | | | 14,233,332 | |
Reinvestment of distributions | | | 2,064,850 | | | | 2,027,904 | |
Amount paid for shares redeemed | | | (4,604,828 | ) | | | (12,997,525 | ) |
| | | | | | | | |
Total Institutional Class | | | (567,293 | ) | | | 3,263,711 | |
| | | | | | | | |
Net increase (decrease) in net assets resulting from capital transactions | | | 985,331 | | | | 3,808,286 | |
| | | | | | | | |
Total Increase (Decrease) in Net Assets | | | (1,633,354 | ) | | | 4,089,568 | |
| | | | | | | | |
Net Assets | | | | | | | | |
Beginning of period | | | 52,813,517 | | | | 48,723,949 | |
| | | | | | | | |
End of period | | $ | 51,180,163 | | | $ | 52,813,517 | (b) |
| | | | | | | | |
Share Transactions – Class A | | | | | | | | |
Shares sold | | | 175,016 | | | | 99,255 | |
Shares issued in reinvestment of distributions | | | 8,532 | | | | 5,284 | |
Shares redeemed | | | (50,060 | ) | | | (58,848 | ) |
| | | | | | | | |
Total Class A | | | 133,488 | | | | 45,691 | |
| | | | | | | | |
Share Transactions – Institutional Class | | | | | | | | |
Shares sold | | | 171,186 | | | | 1,194,397 | |
Shares issued in reinvestment of distributions | | | 179,271 | | | | 169,997 | |
Shares redeemed | | | (396,962 | ) | | | (1,087,787 | ) |
| | | | | | | | |
Total Institutional Class | | | (46,505 | ) | | | 276,607 | |
| | | | | | | | |
Net increase (decrease) in share transactions | | | 86,983 | | | | 322,298 | |
| | | | | | | | |
| (a) | These amounts are comprised entirely of net investment income. |
| (b) | Includes accumulated net investment loss of ($29,536). |
See accompanying notes which are an integral part of these financial statements.
85
Angel Oak UltraShort Income Fund
Statements of Changes in Net Assets
| | | | |
| | | For the Period Ended
January 31, 2019 | |
Increase (Decrease) in Net Assets due to: | | | | |
Operations |
Net investment income (loss) | | $ | 1,798,217 | |
Net realized gain (loss) on investment transactions | | | (27,431 | ) |
Net change in unrealized appreciation (depreciation) on investments and futures contracts | | | 112,453 | |
| | | | |
Net increase (decrease) in net assets resulting from operations | | | 1,883,239 | |
| | | | |
Distributions to Shareholders | | | | |
Distributions, Class A (a) | | | (26,050 | ) |
Distributions, Institutional Class (b) | | | (1,782,085 | ) |
| | | | |
Total Distributions | | | (1,808,135 | ) |
| | | | |
Capital Transactions – Class A (a) | | | | |
Proceeds from shares sold | | | 7,976,386 | |
Reinvestment of distributions | | | 16,397 | |
Amount paid for shares redeemed | | | (96,652 | ) |
| | | | |
Total Class A | | | 7,896,131 | |
| | | | |
Capital Transactions – Institutional Class (b) | | | | |
Proceeds from shares sold | | | 118,511,344 | |
Reinvestment of distributions | | | 1,737,394 | |
Amount paid for shares redeemed | | | (13,720,503 | ) |
| | | | |
Total Institutional Class | | | 106,528,235 | |
| | | | |
Net increase (decrease) in net assets resulting from capital transactions | | | 114,424,366 | |
| | | | |
Total Increase (Decrease) in Net Assets | | | 114,499,470 | |
| | | | |
Net Assets | | | | |
Beginning of period | | | – | |
| | | | |
End of period | | $ | 114,499,470 | |
| | | | |
Share Transactions – Class A (a) | | | | |
Shares sold | | | 796,670 | |
Shares issued in reinvestment of distributions | | | 1,637 | |
Shares redeemed | | | (9,648 | ) |
| | | | |
Total Class A | | | 788,659 | |
| | | | |
Share Transactions – Institutional Class (b) | | | | |
Shares sold | | | 11,837,291 | |
Shares issued in reinvestment of distributions | | | 173,410 | |
Shares redeemed | | | (1,370,258 | ) |
| | | | |
Total Institutional Class | | | 10,640,443 | |
| | | | |
Net increase (decrease) in share transactions | | | 11,429,102 | |
| | | | |
| (a) | Class A Shares commenced operations on April 30, 2018. |
| (b) | Institutional Class Shares commenced operations on April 2, 2018. |
See accompanying notes which are an integral part of these financial statements.
86
Angel Oak Multi-Strategy Income Fund – Class A
Consolidated Financial Highlights
(For a share outstanding during each year)
| | | | | | | | | | | | | | | | | | | | |
| | | For the
Year Ended
January 31, 2019 | | | For the
Year Ended
January 31, 2018 | | | For the
Year Ended
January 31, 2017 | | | For the
Year Ended
January 31, 2016 | | | For the
Year Ended
January 31, 2015 | |
Selected Per Share Data: | | | | | | | | | | | | | | | | | | | | |
Net asset value, beginning of year | | $ | 11.26 | | | $ | 11.30 | | | $ | 11.28 | | | $ | 12.08 | | | $ | 12.17 | |
| | | | | | | | | | | | | | | | | | | | |
| | | | | |
Income from investment operations: | | | | | | | | | | | | | | | | | | | | |
Net investment income (loss) | | | 0.52 | | | | 0.54 | | | | 0.60 | | | | 0.66 | | | | 0.62 | |
Net realized and unrealized gain (loss) on investments | | | (0.22 | ) | | | (0.02 | ) | | | 0.12 | | | | (0.69 | ) | | | (0.09 | ) |
| | | | | | | | | | | | | | | | | | | | |
Total from investment operations | | | 0.30 | | | | 0.52 | | | | 0.72 | | | | (0.03 | ) | | | 0.53 | |
| | | | | | | | | | | | | | | | | | | | |
Less distributions to shareholders: | | | | | | | | | | | | | | | | | | | | |
From net investment income | | | (0.52 | ) | | | (0.56 | ) | | | (0.70 | ) | | | (0.77 | ) | | | (0.62 | ) |
| | | | | | | | | | | | | | | | | | | | |
Total Distributions | | | (0.52 | ) | | | (0.56 | ) | | | (0.70 | ) | | | (0.77 | ) | | | (0.62 | ) |
| | | | | | | | | | | | | | | | | | | | |
| | | | | |
Net asset value, end of year | | $ | 11.04 | | | $ | 11.26 | | | $ | 11.30 | | | $ | 11.28 | | | $ | 12.08 | |
| | | | | | | | | | | | | | | | | | | | |
| | | | | |
Total Return (a) | | | 2.72 | % | | | 4.69 | % | | | 6.64 | % | | | -0.33 | % | | | 4.41 | % |
| | | | | |
Ratios and Supplemental Data: | | | | | | | | | | | | | | | | | | | | |
Net assets, end of period (000’s omitted) | | $ | 590,386 | | | $ | 538,699 | | | $ | 431,536 | | | $ | 470,926 | | | $ | 376,374 | |
Ratio of expenses to average net assets after waiver and reimbursement (recapture) (b)(c)(d) | | | 1.37 | % | | | 1.40 | % | | | 1.38 | % | | | 1.41 | % | | | 1.46 | % |
Ratio of net investment income (loss) to average net assets before waiver and reimbursement (recapture) | | | 4.69 | % | | | 4.80 | % | | | 5.42 | % | | | 5.68 | % | | | 4.69 | % |
Ratio of net investment income (loss) to average net assets after waiver and reimbursement (recapture) | | | 4.67 | % | | | 4.76 | % | | | 5.38 | % | | | 5.69 | % | | | 4.86 | % |
Portfolio turnover rate | | | 71.49 | % | | | 81.13 | % | | | 64.45 | % | | | 43.68 | % | | | 54.36 | % |
|
(a) Total return does not include the effects of sales charges. | |
(b) Ratio of expenses to average net assets before waiver and reimbursement (recapture). | | | 1.35 | % | | | 1.36 | % | | | 1.34 | % | | | 1.43 | % | | | 1.62 | % |
(c) Ratio of expenses to average net assets before waiver and reimbursement (recapture) excluding interest expense. | | | 1.20 | % | | | 1.20 | % | | | 1.20 | % | | | 1.25 | % | | | 1.40 | % |
(d) Ratio of expenses to average net assets after waiver and reimbursement (recapture) excluding interest expense. | | | 1.22 | % | | | 1.24 | % | | | 1.24 | % | | | 1.24 | % | | | 1.24 | % |
See accompanying notes which are an integral part of these financial statements.
87
Angel Oak Multi-Strategy Income Fund – Class C
Consolidated Financial Highlights
(For a share outstanding during each period)
| | | | | | | | | | | | | | | | |
| | | For the
Year Ended
January 31, 2019 | | | For the
Year Ended
January 31, 2018 | | | For the
Year Ended
January 31, 2017 | | | For the
Period Ended
January 31, 2016 (a) | |
Selected Per Share Data: | | | | | | | | | | | | | | | | |
Net asset value, beginning of period | | $ | 11.17 | | | $ | 11.23 | | | $ | 11.26 | | | $ | 12.06 | |
| | | | | | | | | | | | | | | | |
| | | | |
Income from investment operations: | | | | | | | | | | | | | | | | |
Net investment income (loss) | | | 0.44 | | | | 0.46 | | | | 0.56 | | | | 0.32 | |
Net realized and unrealized gain (loss) on investments | | | (0.22 | ) | | | (0.03 | ) | | | 0.08 | | | | (0.70 | ) |
| | | | | | | | | | | | | | | | |
Total from investment operations | | | 0.22 | | | | 0.43 | | | | 0.64 | | | | (0.38 | ) |
| | | | | | | | | | | | | | | | |
Less distributions to shareholders: | | | | | | | | | | | | | | | | |
From net investment income | | | (0.44 | ) | | | (0.49 | ) | | | (0.67 | ) | | | (0.42 | ) |
| | | | | | | | | | | | | | | | |
Total Distributions | | | (0.44 | ) | | | (0.49 | ) | | | (0.67 | ) | | | (0.42 | ) |
| | | | | | | | | | | | | | | | |
| | | | |
Net asset value, end of period | | $ | 10.95 | | | $ | 11.17 | | | $ | 11.23 | | | $ | 11.26 | |
| | | | | | | | | | | | | | | | |
| | | | |
Total Return (b) | | | 2.04 | % | | | 3.90 | % | | | 5.87 | % | | | -3.20 | % (c) |
| | | | |
Ratios and Supplemental Data: | | | | | | | | | | | | | | | | |
Net assets, end of period (000’s omitted) | | $ | 102,487 | | | $ | 86,923 | | | $ | 47,541 | | | $ | 17,650 | |
Ratio of expenses to average net assets after waiver and reimbursement
(recapture) (d)(e)(f) | | | 2.12 | % | | | 2.15 | % | | | 2.12 | % | | | 2.21 | % (g) |
Ratio of net investment income (loss) to average net assets before waiver and reimbursement (recapture) | | | 3.94 | % | | | 4.03 | % | | | 4.45 | % | | | 5.65 | % (g) |
Ratio of net investment income (loss) to average net assets after waiver and reimbursement (recapture) | | | 3.92 | % | | | 3.99 | % | | | 4.41 | % | | | 5.65 | % (g) |
Portfolio turnover rate | | | 71.49 | % | | | 81.13 | % | | | 64.45 | % | | | 43.68 | % (c) |
|
(a) Class commenced operations on August 4, 2015. | |
(b) Total return does not include the effects of sales charges. | |
(c) Not Annualized. | |
(d) Ratio of expenses to average net assets before waiver and reimbursement (recapture). | | | 2.10 | % | | | 2.11 | % | | | 2.08 | % | | | 2.21 | % (g) |
(e) Ratio of expenses to average net assets before waiver and reimbursement (recapture) excluding interest expense. | | | 1.95 | % | | | 1.95 | % | | | 1.95 | % | | | 1.99 | % (g) |
(f) Ratio of expenses to average net assets after waiver and reimbursement (recapture) excluding interest expense. | | | 1.97 | % | | | 1.99 | % | | | 1.99 | % | | | 1.99 | % (g) |
(g) Annualized. | |
See accompanying notes which are an integral part of these financial statements.
88
Angel Oak Multi-Strategy Income Fund – Institutional Class
Consolidated Financial Highlights
(For a share outstanding during each year)
| | | | | | | | | | | | | | | | | | | | |
| | | For the
Year Ended
January 31, 2019 | | | For the
Year Ended
January 31, 2018 | | | For the
Year Ended
January 31, 2017 | | | For the
Year Ended
January 31, 2016 | | | For the
Year Ended
January 31, 2015 | |
Selected Per Share Data: | | | | | | | | | | | | | | | | | | | | |
Net asset value, beginning of year | | $ | 11.23 | | | $ | 11.28 | | | $ | 11.27 | | | $ | 12.07 | | | $ | 12.17 | |
| | | | | | | | | | | | | | | | | | | | |
| | | | | |
Income from investment operations: | | | | | | | | | | | | | | | | | | | | |
Net investment income (loss) | | | 0.55 | | | | 0.57 | | | | 0.63 | | | | 0.72 | | | | 0.60 | |
Net realized and unrealized gain (loss) on investments | | | (0.21 | ) | | | (0.03 | ) | | | 0.12 | | | | (0.72 | ) | | | (0.05 | ) |
| | | | | | | | | | | | | | | | | | | | |
Total from investment operations | | | 0.34 | | | | 0.54 | | | | 0.75 | | | | – | | | | 0.55 | |
| | | | | | | | | | | | | | | | | | | | |
Less distributions to shareholders: | | | | | | | | | | | | | | | | | | | | |
From net investment income | | | (0.55 | ) | | | (0.59 | ) | | | (0.74 | ) | | | (0.80 | ) | | | (0.65 | ) |
| | | | | | | | | | | | | | | | | | | | |
Total Distributions | | | (0.55 | ) | | | (0.59 | ) | | | (0.74 | ) | | | (0.80 | ) | | | (0.65 | ) |
| | | | | | | | | | | | | | | | | | | | |
| | | | | |
Net asset value, end of year | | $ | 11.02 | | | $ | 11.23 | | | $ | 11.28 | | | $ | 11.27 | | | $ | 12.07 | |
| | | | | | | | | | | | | | | | | | | | |
| | | | | |
Total Return | | | 3.05 | % | | | 4.88 | % | | | 6.96 | % | | | -0.09 | % | | | 4.60 | % |
| | | | | |
Ratios and Supplemental Data: | | | | | | | | | | | | | | | | | | | | |
Net assets, end of period (000’s omitted) | | $ | 6,555,291 | | | $ | 5,826,546 | | | $ | 4,037,526 | | | $ | 4,006,007 | | | $ | 3,045,031 | |
Ratio of expenses to average net assets after waiver and reimbursement (recapture) (a)(b)(c) | | | 1.12 | % | | | 1.15 | % | | | 1.13 | % | | | 1.19 | % | | | 1.21 | % |
Ratio of net investment income (loss) to average net assets before waiver and reimbursement (recapture) | | | 4.94 | % | | | 5.06 | % | | | 5.67 | % | | | 6.18 | % | | | 4.84 | % |
Ratio of net investment income (loss) to average net assets after waiver and reimbursement (recapture) | | | 4.92 | % | | | 5.02 | % | | | 5.63 | % | | | 6.19 | % | | | 5.01 | % |
Portfolio turnover rate | | | 71.49 | % | | | 81.13 | % | | | 64.45 | % | | | 43.68 | % | | | 54.36 | % |
| | | | | |
(a) Ratio of expenses to average net assets before waiver and reimbursement (recapture). | | | 1.10 | % | | | 1.11 | % | | | 1.09 | % | | | 1.21 | % | | | 1.37 | % |
(b) Ratio of expenses to average net assets before waiver and reimbursement (recapture) excluding interest expense. | | | 0.95 | % | | | 0.95 | % | | | 0.95 | % | | | 1.00 | % | | | 1.15 | % |
(c) Ratio of expenses to average net assets after waiver and reimbursement (recapture) excluding interest expense. | | | 0.97 | % | | | 0.99 | % | | | 0.99 | % | | | 0.99 | % | | | 0.99 | % |
See accompanying notes which are an integral part of these financial statements.
89
Angel Oak Financials Income Fund – Class A
Financial Highlights
(For a share outstanding during each period)
| | | | | | | | | | | | | | | | | | | | |
| | | For the
Year Ended
January 31, 2019 | | | For the
Year Ended
January 31, 2018 | | | For the
Year Ended
January 31, 2017 | | | For the
Year Ended
January 31, 2016 | | | For the
Period Ended
January 31, 2015 (a) | |
Selected Per Share Data: | | | | | | | | | | | | | | | | | | | | |
Net asset value, beginning of period | | $ | 9.45 | | | $ | 9.42 | | | $ | 9.56 | | | $ | 10.14 | | | $ | 10.00 | |
| | | | | | | | | | | | | | | | | | | | |
| | | | | |
Income from investment operations: | | | | | | | | | | | | | | | | | | | | |
Net investment income (loss) | | | 0.44 | | | | 0.40 | | | | 0.48 | | | | 0.47 | | | | 0.10 | (b) |
Net realized and unrealized gain (loss) on investments | | | (0.13 | ) | | | 0.03 | | | | (0.17 | ) | | | (0.60 | ) | | | 0.11 | |
| | | | | | | | | | | | | | | | | | | | |
Total from investment operations | | | 0.31 | | | | 0.43 | | | | 0.31 | | | | (0.13 | ) | | | 0.21 | |
| | | | | | | | | | | | | | | | | | | | |
Less distributions to shareholders: | | | | | | | | | | | | | | | | | | | | |
From net investment income | | | (0.43 | ) | | | (0.40 | ) | | | (0.45 | ) | | | (0.45 | ) | | | (0.07 | ) |
| | | | | | | | | | | | | | | | | | | | |
Total Distributions | | | (0.43 | ) | | | (0.40 | ) | | | (0.45 | ) | | | (0.45 | ) | | | (0.07 | ) |
| | | | | | | | | | | | | | | | | | | | |
| | | | | |
Net asset value, end of period | | $ | 9.33 | | | $ | 9.45 | | | $ | 9.42 | | | $ | 9.56 | | | $ | 10.14 | |
| | | | | | | | | | | | | | | | | | | | |
| | | | | |
Total Return (c) | | | 3.36 | % | | | 4.69 | % | | | 3.47 | % | | | -1.36 | % | | | 1.98 | % (d)(e) |
| | | | | |
Ratios and Supplemental Data: | | | | | | | | | | | | | | | | | | | | |
Net assets, end of period (000’s omitted) | | $ | 7,086 | | | $ | 9,377 | | | $ | 6,785 | | | $ | 15,125 | | | $ | 214 | |
Ratio of expenses to average net assets after waiver and reimbursement (f)(g)(h) | | | 0.94 | % | | | 0.94 | % | | | 1.13 | % | | | 1.20 | % | | | 1.24 | % (i) |
Ratio of net investment income (loss) to average net assets before waiver and reimbursement | | | 4.22 | % | | | 3.74 | % | | | 4.44 | % | | | 4.62 | % | | | -255.74 | % (i) |
Ratio of net investment income (loss) to average net assets after waiver and reimbursement | | | 4.70 | % | | | 4.16 | % | | | 4.78 | % | | | 4.89 | % | | | 3.93 | % (i) |
Portfolio turnover rate | | | 45.27 | % | | | 101.75 | % | | | 84.42 | % | | | 100.93 | % | | | 6.41 | % (d) |
| | | |
(a) Class commenced operations on November 3, 2014. | | | | | | | | | | | | | |
(b) Calculated based on average shares outstanding during the period. | | | | | | | | | | | | | |
(c) Total return does not include the effects of sales charges. | | | | | | | | | | | | | |
(d) Not Annualized. | | | | | | | | | | | | | | | | | | | | |
(e) Total Return was calculated using the traded NAV. | | | | | | | | | | | | | |
(f) Ratio of expenses to average net assets before waiver and reimbursement. | | | 1.42 | % | | | 1.36 | % | | | 1.47 | % | | | 1.47 | % | | | 260.91 | % (i) |
(g) Ratio of expenses to average net assets before waiver and reimbursement excluding interest expense. | | | 1.42 | % | | | 1.36 | % | | | 1.42 | % | | | 1.37 | % | | | 260.91 | % (i) |
(e) Ratio of expenses to average net assets after waiver and reimbursement excluding interest expense. | | | 0.94 | % | | | 0.94 | % | | | 1.08 | % | | | 1.10 | % | | | 1.24 | % (i) |
(i) Annualized. | |
See accompanying notes which are an integral part of these financial statements.
90
Angel Oak Financials Income Fund – Class C
Financial Highlights
(For a share outstanding during each period)
| | | | | | | | | | | | | | | | |
| | | For the
Year Ended
January 31, 2019 | | | For the
Year Ended
January 31, 2018 | | | For the
Year Ended
January 31, 2017 | | | For the
Period Ended
January 31, 2016 (a) | |
Selected Per Share Data: | | | | | | | | | | | | | | | | |
Net asset value, beginning of period | | $ | 9.37 | | | $ | 9.37 | | | $ | 9.55 | | | $ | 10.28 | |
| | | | | | | | | | | | | | | | |
| | | | |
Income from investment operations: | | | | | | | | | | | | | | | | |
Net investment income (loss) | | | 0.37 | | | | 0.33 | | | | 0.35 | | | | 0.20 | |
Net realized and unrealized gain (loss) on investments | | | (0.12 | ) | | | 0.02 | | | | (0.11 | ) | | | (0.70 | ) |
| | | | | | | | | | | | | | | | |
Total from investment operations | | | 0.25 | | | | 0.35 | | | | 0.24 | | | | (0.50 | ) |
| | | | | | | | | | | | | | | | |
Less distributions to shareholders: | | | | | | | | | | | | | | | | |
From net investment income | | | (0.37 | ) | | | (0.35 | ) | | | (0.42 | ) | | | (0.23 | ) |
| | | | | | | | | | | | | | | | |
Total Distributions | | | (0.37 | ) | | | (0.35 | ) | | | (0.42 | ) | | | (0.23 | ) |
| | | | | | | | | | | | | | | | |
| | | | |
Net asset value, end of period | | $ | 9.25 | | | $ | 9.37 | | | $ | 9.37 | | | $ | 9.55 | |
| | | | | | | | | | | | | | | | |
| | | | |
Total Return (b) | | | 2.69 | % | | | 3.80 | % | | | 2.73 | % | | | -4.97 | % (c) |
| | | | |
Ratios and Supplemental Data: | | | | | | | | | | | | | | | | |
Net assets, end of period (000’s omitted) | | $ | 2,039 | | | $ | 1,465 | | | $ | 875 | | | $ | 648 | |
Ratio of expenses to average net assets after waiver and reimbursement (d)(e)(f) | | | 1.69 | % | | | 1.69 | % | | | 1.84 | % | | | 1.97 | % (g) |
Ratio of net investment income (loss) to average net assets before waiver and reimbursement | | | 3.49 | % | | | 2.99 | % | | | 3.58 | % | | | 4.05 | % (g) |
Ratio of net investment income (loss) to average net assets after waiver and reimbursement | | | 3.97 | % | | | 3.41 | % | | | 3.89 | % | | | 4.39 | % (g) |
Portfolio turnover rate | | | 45.27 | % | | | 101.75 | % | | | 84.42 | % | | | 100.93 | % (c) |
| | | | |
(a) Class commenced operations on August 4, 2015. | | | | | | | | | | | | | | | | |
(b) Total return does not include the effects of sales charges. | | | | | | | | | | | | | | | | |
(c) Not Annualized. | | | | | | | | | | | | | | | | |
(d) Ratio of expenses to average net assets before waiver and reimbursement. | | | 2.17 | % | | | 2.11 | % | | | 2.15 | % | | | 2.32 | % (g) |
(e) Ratio of expenses to average net assets before waiver and reimbursement excluding interest expense. | | | 2.17 | % | | | 2.11 | % | | | 2.12 | % | | | 2.19 | % (g) |
(f) Ratio of expenses to average net assets after waiver and reimbursement excluding interest expense. | | | 1.69 | % | | | 1.69 | % | | | 1.81 | % | | | 1.85 | % (g) |
(g) Annualized. | | | | | | | | | | | | | | | | |
See accompanying notes which are an integral part of these financial statements.
91
Angel Oak Financials Income Fund – Institutional Class
Financial Highlights
(For a share outstanding during each period)
| | | | | | | | | | | | | | | | | | | | |
| | | For the
Year Ended
January 31, 2019 | | | For the
Year Ended
January 31, 2018 | | | For the
Year Ended
January 31, 2017 | | | For the
Year Ended
January 31, 2016 | | | For the
Period Ended
January 31, 2015 (a) | |
Selected Per Share Data: | | | | | | | | | | | | | | | | | | | | |
Net asset value, beginning of period | | $ | 9.44 | | | $ | 9.41 | | | $ | 9.56 | | | $ | 10.14 | | | $ | 10.00 | |
| | | | | | | | | | | | | | | | | | | | |
| | | | | |
Income from investment operations: | | | | | | | | | | | | | | | | | | | | |
Net investment income (loss) | | | 0.46 | | | | 0.41 | | | | 0.47 | | | | 0.46 | | | | 0.13 | (b) |
Net realized and unrealized gain (loss) on investments | | | (0.13 | ) | | | 0.05 | | | | (0.14 | ) | | | (0.57 | ) | | | 0.08 | |
| | | | | | | | | | | | | | | | | | | | |
Total from investment operations | | | 0.33 | | | | 0.46 | | | | 0.33 | | | | (0.11 | ) | | | 0.21 | |
| | | | | | | | | | | | | | | | | | | | |
Less distributions to shareholders: | | | | | | | | | | | | | | | | | | | | |
From net investment income | | | (0.45 | ) | | | (0.43 | ) | | | (0.48 | ) | | | (0.47 | ) | | | (0.07 | ) |
| | | | | | | | | | | | | | | | | | | | |
Total Distributions | | | (0.45 | ) | | | (0.43 | ) | | | (0.48 | ) | | | (0.47 | ) | | | (0.07 | ) |
| | | | | | | | | | | | | | | | | | | | |
| | | | | |
Net asset value, end of period | | $ | 9.32 | | | $ | 9.44 | | | $ | 9.41 | | | $ | 9.56 | | | $ | 10.14 | |
| | | | | | | | | | | | | | | | | | | | |
| | | | | |
Total Return | | | 3.61 | % | | | 4.97 | % | | | 3.69 | % | | | -1.11 | % | | | 2.03 | % (c)(d) |
| | | | | |
Ratios and Supplemental Data: | | | | | | | | | | | | | | | | | | | | |
Net assets, end of period (000’s omitted) | | $ | 122,363 | | | $ | 106,494 | | | $ | 164,458 | | | $ | 298,244 | | | $ | 1,142 | |
Ratio of expenses to average net assets after waiver and reimbursement (e)(f)(g) | | | 0.69 | % | | | 0.69 | % | | | 0.87 | % | | | 0.97 | % | | | 0.99 | % (h) |
Ratio of net investment income (loss) to average net assets before waiver and reimbursement | | | 4.48 | % | | | 3.98 | % | | | 4.66 | % | | | 4.81 | % | | | -167.87 | % (h) |
Ratio of net investment income (loss) to average net assets after waiver and reimbursement | | | 4.96 | % | | | 4.39 | % | | | 4.98 | % | | | 5.10 | % | | | 5.48 | % (h) |
Portfolio turnover rate | | | 45.27 | % | | | 101.75 | % | | | 84.42 | % | | | 100.93 | % | | | 6.41 | % (c) |
| | | |
(a) Class commenced operations on November 3, 2014. | | | | | | | | | | | | | |
(b) Calculated based on average shares outstanding during the period. | | | | | | | | | |
(c) Not Annualized. | | | | | | | | | | | | | | | | | | | | |
(d) Total Return was calculated using the traded NAV. | | | | | | | | | |
(e) Ratio of expenses to average net assets before waiver and reimbursement. | | | 1.17 | % | | | 1.10 | % | | | 1.19 | % | | | 1.26 | % | | | 174.34 | % (h) |
(f) Ratio of expenses to average net assets before waiver and reimbursement excluding interest expense. | | | 1.17 | % | | | 1.10 | % | | | 1.15 | % | | | 1.14 | % | | | 174.34 | % (h) |
(g) Ratio of expenses to average net assets after waiver and reimbursement excluding interest expense. | | | 0.69 | % | | | 0.69 | % | | | 0.83 | % | | | 0.85 | % | | | 0.99 | % (h) |
(h) Annualized. | | | | | | | | | | | | | | | | | | | | |
See accompanying notes which are an integral part of these financial statements.
92
Angel Oak High Yield Opportunities Fund – Class A
Financial Highlights
(For a share outstanding during each period)
| | | | | | | | | | | | | | | | | | | | | | | | |
| | | For the
Year Ended
January 31, 2019 | | | For the
Year Ended
January 31, 2018 | | | For the
Period Ended
January 31, 2017 (a) | | | For the
Year Ended
March 31, 2016 | | | For the
Year Ended
March 31, 2015 | | | For the
Year Ended
March 31, 2014 | |
Selected Per Share Data: | | | | | | | | | | | | | | | | | | | | | | | | |
Net asset value, beginning of period | | $ | 12.00 | | | $ | 11.92 | | | $ | 10.80 | | | $ | 11.73 | | | $ | 12.34 | | | $ | 12.43 | |
| | | | | | | | | | | | | | | | | | | | | | | | |
| | | | | | |
Income from investment operations: | | | | | | | | | | | | | | | | | | | | | | | | |
Net investment income (loss) | | | 0.65 | | | | 0.68 | | | | 0.59 | (b) | | | 0.64 | (b) | | | 0.63 | (b) | | | 0.66 | (b) |
Net realized and unrealized gain (loss) on investments | | | (0.61 | ) | | | 0.06 | | | | 1.10 | | | | (0.94 | ) | | | (0.46 | ) | | | 0.18 | |
| | | | | | | | | | | | | | | | | | | | | | | | |
Total from investment operations | | | 0.04 | | | | 0.74 | | | | 1.69 | | | | (0.30 | ) | | | 0.17 | | | | 0.84 | |
| | | | | | | | | | | | | | | | | | | | | | | | |
Less distributions to shareholders: | | | | | | | | | | | | | | | | | | | | | | | | |
From net investment income | | | (0.65 | ) | | | (0.66 | ) | | | (0.57 | ) | | | (0.63 | ) | | | (0.62 | ) | | | (0.69 | ) |
From net realized gain | | | – | | | | – | | | | – | | | | – | | | | (0.16 | ) | | | (0.24 | ) |
| | | | | | | | | | | | | | | | | | | | | | | | |
Total Distributions | | | (0.65 | ) | | | (0.66 | ) | | | (0.57 | ) | | | (0.63 | ) | | | (0.78 | ) | | | (0.93 | ) |
| | | | | | | | | | | | | | | | | | | | | | | | |
| | | | | | |
Net asset value, end of period | | $ | 11.39 | | | $ | 12.00 | | | $ | 11.92 | | | $ | 10.80 | | | $ | 11.73 | | | $ | 12.34 | |
| | | | | | | | | | | | | | | | | | | | | | | | |
| | | | | | |
Total Return (c) | | | 0.41 | % | | | 6.34 | % | | | 16.00 | % (d) | | | -2.57 | % | | | 1.46 | % | | | 7.07 | % |
| | | | | | |
Ratios and Supplemental Data: | | | | | | | | | | | | | | | | | | | | | | | | |
Net assets, end of period (000’s omitted) | | $ | 2,754 | | | $ | 1,298 | | | $ | 745 | | | $ | 705 | | | $ | 2,273 | | | $ | 82 | |
Ratio of expenses to average net assets after waiver and reimbursement (e) | | | 0.90 | % | | | 0.90 | % | | | 0.90 | % (f) | | | 0.90 | % | | | 0.90 | % | | | 0.90 | % |
Ratio of net investment income (loss) to average net assets before waiver and reimbursement | | | 5.28 | % | | | 5.34 | % | | | 5.70 | % (f) | | | N/A | | | | N/A | | | | N/A | |
Ratio of net investment income (loss) to average net assets after waiver and reimbursement | | | 5.62 | % | | | 5.71 | % | | | 6.13 | % (f) | | | 5.62 | % | | | 5.29 | % | | | 5.33 | % |
Portfolio turnover rate | | | 33.27 | % | | | 45.86 | % | | | 70.87 | % (d) | | | 35.45 | % | | | 33.69 | % | | | 28.71 | % |
| | |
(a) For the period April 1, 2016 to January 31, 2017. See Note 1 to the Financial Statements. | | | | | | | | | |
(b) Calculated based on average shares outstanding during the period. | | | | | |
(c) Total return does not include the effects of sales charges. | | | | | |
(d) Not annualized. | | | | | | | | | | | | | | | | | | | | | |
(e) Ratio of expenses to average net assets before waiver and reimbursement. | | | 1.24 | % | | | 1.27 | % | | | 1.33 | % (f) | | | 1.11 | % | | | 1.11 | % | | | 1.00 | % |
(f) Annualized. | | | | | | | | | | | | | | | | | | | | | | | | |
See accompanying notes which are an integral part of these financial statements.
93
Angel Oak High Yield Opportunities Fund – Institutional Class
Financial Highlights
(For a share outstanding during each period)
| | | | | | | | | | | | | | | | | | | | | | | | |
| | | For the
Year Ended
January 31, 2019 | | | For the
Year Ended
January 31, 2018 | | | For the
Period Ended
January 31, 2017 (a) | | | For the
Year Ended
March 31, 2016 | | | For the
Year Ended
March 31, 2015 | | | For the
Year Ended
March 31, 2014 | |
Selected Per Share Data: | | | | | | | | | | | | | | | | | | | | | | | | |
Net asset value, beginning of period | | $ | 11.95 | | | $ | 11.89 | | | $ | 10.77 | | | $ | 11.71 | | | $ | 12.32 | | | $ | 12.43 | |
| | | | | | | | | | | | | | | | | | | | | | | | |
| | | | | | |
Income from investment operations: | | | | | | | | | | | | | | | | | | | | | | | | |
Net investment income (loss) | | | 0.69 | | | | 0.71 | | | | 0.60 | | | | 0.67 | (b) | | | 0.67 | (b) | | | 0.72 | |
Net realized and unrealized gain (loss) on investments | | | (0.61 | ) | | | 0.04 | | | | 1.12 | | | | (0.94 | ) | | | (0.46 | ) | | | 0.13 | |
| | | | | | | | | | | | | | | | | | | | | | | | |
Total from investment operations | | | 0.08 | | | | 0.75 | | | | 1.72 | | | | (0.27 | ) | | | 0.21 | | | | 0.85 | |
| | | | | | | | | | | | | | | | | | | | | | | | |
Less distributions to shareholders: | | | | | | | | | | | | | | | | | | | | | | | | |
From net investment income | | | (0.68 | ) | | | (0.69 | ) | | | (0.60 | ) | | | (0.67 | ) | | | (0.66 | ) | | | (0.72 | ) |
From net realized gain | | | – | | | | – | | | | – | | | | – | | | | (0.16 | ) | | | (0.24 | ) |
| | | | | | | | | | | | | | | | | | | | | | | | |
Total Distributions | | | (0.68 | ) | | | (0.69 | ) | | | (0.60 | ) | | | (0.67 | ) | | | (0.82 | ) | | | (0.96 | ) |
| | | | | | | | | | | | | | | | | | | | | | | | |
| | | | | | |
Net asset value, end of period | | $ | 11.35 | | | $ | 11.95 | | | $ | 11.89 | | | $ | 10.77 | | | $ | 11.71 | | | $ | 12.32 | |
| | | | | | | | | | | | | | | | | | | | | | | | |
| | | | | | |
Total Return | | | 0.74 | % | | | 6.53 | % | | | 16.28 | % (c) | | | -2.30 | % | | | 1.78 | % | | | 7.16 | % |
| | | | | | |
Ratios and Supplemental Data: | | | | | | | | | | | | | | | | | | | | | | | | |
Net assets, end of period (000’s omitted) | | $ | 48,426 | | | $ | 51,516 | | | $ | 47,979 | | | $ | 37,538 | | | $ | 52,561 | | | $ | 47,219 | |
Ratio of expenses to average net assets after waiver and reimbursement (d) | | | 0.65 | % | | | 0.65 | % | | | 0.65 | % (e) | | | 0.65 | % | | | 0.65 | % | | | 0.65 | % |
Ratio of net investment income (loss) to average net assets before waiver and reimbursement | | | 5.59 | % | | | 5.61 | % | | | 5.91 | % (e) | | | N/A | | | | N/A | | | | N/A | |
Ratio of net investment income (loss) to average net assets after waiver and reimbursement | | | 5.93 | % | | | 5.98 | % | | | 6.33 | % (e) | | | 5.94 | % | | | 5.51 | % | | | 5.85 | % |
Portfolio turnover rate | | | 33.27 | % | | | 45.86 | % | | | 70.87 | % (c) | | | 35.45 | % | | | 33.69 | % | | | 28.71 | % |
| |
(a) For the period April 1, 2016 to January 31, 2017. See Note 1 to the Financial Statements. | | | | | |
(b) Calculated based on average shares outstanding during the period. | | | | | |
(c) Not Annualized. | | | | | | | | | | | | | | | | | | | | | | | | |
(d) Ratio of expenses to average net assets before waiver and reimbursement. | | | 0.99 | % | | | 1.02 | % | | | 1.07 | % (e) | | | 0.74 | % | | | 0.73 | % | | | 0.75 | % |
(e) Annualized. | | | | | | | | | | | | | | | | | | | | | | | | |
See accompanying notes which are an integral part of these financial statements.
94
Angel Oak UltraShort Income Fund – Class A
Financial Highlights
(For a share outstanding during each period)
| | | | |
| | | For the
Period Ended
January 31, 2019 (a) | |
Selected Per Share Data: | | | | |
Net asset value, beginning of period | | $ | 10.01 | |
| | | | |
| |
Income from investment operations: | | | | |
Net investment income (loss) | | | 0.20 | |
Net realized and unrealized gain (loss) on investments | | | 0.01 | |
| | | | |
Total from investment operations | | | 0.21 | |
| | | | |
Less distributions to shareholders: | | | | |
From net investment income | | | (0.20 | ) |
From net realized gain | | | (0.00 | ) (b) |
| | | | |
Total Distributions | | | (0.20 | ) |
| | | | |
| |
Net asset value, end of period | | $ | 10.02 | |
| | | | |
| |
Total Return | | | 2.12 | % (c) |
| |
Ratios and Supplemental Data: | | | | |
Net assets, end of period (000’s omitted) | | $ | 7,903 | |
Ratio of expenses to average net assets after waiver and reimbursement (d) | | | 0.50 | % (e) |
Ratio of net investment income (loss) to average net assets before waiver and reimbursement | | | 2.32 | % (e) |
Ratio of net investment income (loss) to average net assets after waiver and reimbursement | | | 2.76 | % (e) |
Portfolio turnover rate | | | 178.59 | % (c) |
| |
(a) Class commenced operations on April 30, 2018. | | | | |
(b) Less than (0.005). | | | | |
(c) Not annualized. | | | | |
(d) Ratio of expenses to average net assets before waiver and reimbursement. | | | 0.94 | %(e) |
(e) Annualized. | | | | |
See accompanying notes which are an integral part of these financial statements.
95
Angel Oak UltraShort Income Fund – Institutional Class
Financial Highlights
(For a share outstanding during each period)
| | | | |
| | | For the Period Ended
January 31, 2019 (a) | |
Selected Per Share Data: | | | | |
Net asset value, beginning of period | | $ | 10.00 | |
| | | | |
| |
Income from investment operations: | | | | |
Net investment income (loss) | | | 0.24 | |
Net realized and unrealized gain (loss) on investments | | | 0.02 | |
| | | | |
Total from investment operations | | | 0.26 | |
| | | | |
Less distributions to shareholders: | | | | |
From net investment income | | | (0.24 | ) |
From net realized gain | | | (0.00 | ) (b) |
| | | | |
Total Distributions | | | (0.24 | ) |
| | | | |
| |
Net asset value, end of period | | $ | 10.02 | |
| | | | |
| |
Total Return | | | 2.60 | % (c) |
| |
Ratios and Supplemental Data: | | | | |
Net assets, end of period (000’s omitted) | | $ | 106,596 | |
Ratio of expenses to average net assets after waiver and reimbursement (d) | | | 0.26 | % (e) |
Ratio of net investment income (loss) to average net assets before waiver and reimbursement | | | 2.37 | % (e) |
Ratio of net investment income (loss) to average net assets after waiver and reimbursement | | | 2.88 | % (e) |
Portfolio turnover rate | | | 178.59 | % |
| |
(a) Class commenced operations on April 2, 2018. | | | | |
(b) Less than (0.005). | | | | |
(c) Not annualized. | | | | |
(d) Ratio of expenses to average net assets before waiver and reimbursement. | | | 0.77 | % (e) |
(e) Annualized. | | | | |
See accompanying notes which are an integral part of these financial statements.
96
Angel Oak Funds
Notes to the Financial Statements
January 31, 2019
NOTE 1. ORGANIZATION
Angel Oak Funds Trust (the “Trust”) is a Delaware statutory trust organized on June 20, 2014 and registered with the U.S. Securities and Exchange Commission as anopen-end management investment company, as defined in the Investment Company Act of 1940 as amended (the “1940 Act”). The Trust consists of four series, Angel Oak Multi-Strategy Income Fund (the “Multi-Strategy Income Fund”), Angel Oak Financials Income Fund (formerly Angel Oak Flexible Income Fund) (the “Financials Income Fund”), Angel Oak High Yield Opportunities Fund (the “High Yield Opportunities Fund”), and Angel Oak UltraShort Income Fund (the “UltraShort Income Fund”) (the “Funds”). The Funds (except the UltraShort Income Fund) offer four classes of shares to investors, Class A shares, Class C shares, Institutional Class shares, and Class T shares. The UltraShort Income Fund offers three classes of shares to investors; Class A, Class C, and Institutional Class. The Multi-Strategy Income Fund’s Class A shares commenced operations on June 28, 2011, Class C shares commenced operations on August 4, 2015, Institutional Class shares commenced operations on August 16, 2012, and Class T shares have not commenced operations as of January 31, 2019. Financials Income Fund’s Class A and Institutional Class shares commenced operations on November 3, 2014, Class C shares commenced on August 4, 2015, and Class T shares have not commenced operations as of January 31, 2019. High Yield Opportunities Fund Class A shares commenced operations on July 31, 2012, Institutional Class shares commenced operations on March 31, 2009, and Class C and Class T shares have not commenced operations as of January 31, 2019. UltraShort Income Fund’s Class A shares commenced operations on April 30, 2018, Institutional Class Shares commenced operations on April 2, 2018, and Class C shares have not commenced operations as of January 31, 2019. Class A shares charge a 2.25%front-end sales charge and a 0.25%12b-1 fee. Effective May 31, 2018, the UltraShort Income Fund no longer charges afront-end sales charge on Class A Shares. Class T shares charge a 2.50%front-end sales charge and a 0.25%12b-1 fee. Class C shares charge a 1.00% deferred sales charge on shares redeemed within one year of purchase and a 1.00%12b-1 fee. Institutional Class shares do not chargefront-end orback-end sales charges and are not subject to a12b-1 fee.
The investment objective of the Multi-Strategy Income Fund is current income. The investment objective of the Financials Income Fund is to seek current income with a secondary objective of total return. The investment objective of High Yield Opportunities Fund is to earn a high level of current income with a secondary objective of capital appreciation. The investment objective of the UltraShort Income Fund is to provide current income while seeking to minimize price volatility and maintain liquidity. The Multi-Strategy Income Fund, Financials Income Fund, and High Yield Opportunities Fund are diversified series of the Trust. The UltraShort Income Fund is a non-diversified series of the Trust, which means that it can invest a higher percentage of its assets in any one issuer. Investing in a non-diversified fund may entail greater risks than is normally associated with more widely diversified funds.
The Multi-Strategy Income Fund is the successor in interest to a fund (the “Predecessor Fund”) having the same name and investment objective that was included as a series of another investment company, Valued Advisers Trust, and that was also advised by the Multi- Strategy Income Fund’s investment adviser, Angel Oak Capital Advisors, LLC (the “Adviser”). On March 26, 2015, the shareholders of the Predecessor Fund approved the reorganization of the Predecessor Fund with and into the Multi-Strategy Income Fund, and effective as of the close of business on April 10, 2015, the assets and liabilities of the Predecessor Fund were transferred to the Trust in exchange for shares of the Multi-Strategy Income Fund. Costs incurred by the Multi-Strategy Income Fund in connection with the reorganization were paid by the Adviser. The Predecessor Fund ceased offering its C Class shares and converted them into Class A shares effective as of the close of business April 2, 2015.
The High Yield Opportunities Fund is the successor in interest to the Rainier High Yield Fund (the “Predecessor High Yield Fund”), which had the same investment objective and was included as a series of another investment company, Rainier Investment Management Mutual Funds (“Predecessor Trust”), and that was advised by Rainier Investment Management, LLC. On April 15, 2016, the shareholders of the Predecessor High Yield Fund approved the reorganization of the Original Shares and Institutional Shares of the Predecessor High Yield Fund with and into the Class A shares and Institutional Class shares of the Angel Oak High Yield Opportunities Fund, and effective as of the close of business on April 15, 2016, the assets and liabilities of the Predecessor High Yield Fund were transferred to the Trust in exchange for shares in the Angel Oak High Yield Opportunities Fund. Costs incurred by the Angel Oak High Yield Opportunities Fund in connection with the reorganization were paid by the Adviser. The fiscal year end of the Predecessor High Yield Fund was March 31, 2016. The reporting period ended January 31, 2017 for the High Yield Opportunities Fund was April 1, 2016 through January 31, 2017. Operations prior to April 15, 2016 were for the Predecessor High Yield Fund. Net assets and shares outstanding on April 15, 2016 were $705,808 and 64,250 for Original Shares and $37,954,151 and 3,463,606 for Institutional Shares, respectively, all of which were transferred into the Trust at NAV at the close of business on April 15, 2016.
97
Angel Oak Funds
Notes to the Financial Statements - (continued)
January 31, 2019
NOTE 1. ORGANIZATION – (continued)
Wholly-Owned Subsidiaries – As part of its investment strategies, Multi-Strategy Income Fund invests directly or, to comply with certain regulations, through wholly-owned and controlled subsidiaries formed by the Fund, Hyperion Loan Funding Trust (“Hyperion”) and Titan Loan Funding Trust (“Titan”), each a statutory trust organized under the laws of the state of Delaware, each incorporated on August 2, 2018. Hyperion and Titan act as investment vehicles in order to purchase residential and commercial real estate whole loans, participations in such loans, or instruments representing the right to receive interest payments and principal due on such loans. The allocation of the Multi-Strategy Income Fund’s investments, if any, in Hyperion or Titan will vary over time and might not include all of the types of investments described above.
At January 31, 2019, investments in Hyperion and Titan represented 1.26% and 0.24% of the total net assets of the Multi-Strategy Income Fund, respectively.
The consolidated financial statements of the Multi-Strategy Income Fund includes the investment activity and financial statements of Hyperion and Titan. All intercompany accounts and transactions have been eliminated in consolidation. Because the Multi-Strategy Income Fund may invest a substantial portion of its assets in its respective subsidiaries, the Multi-Strategy Income Fund may be considered to be investing indirectly in some of those investments through its subsidiary. For that reason, references to the Multi-Strategy Income Fund may also encompass it subsidiaries.
At January 31, 2019, investments held by Hyperion and Titan include whole loans, valued at $91,766,337 and $17,178,496, respectively. In addition, Hyperion and Titan held $5,000 and $3,212 in cash, respectively.
NOTE 2. SIGNIFICANT ACCOUNTING POLICIES
The following is a summary of significant accounting policies consistently followed by the Funds in the preparation of its financial statements in accordance with the accounting principles generally accepted in the United States of America (“GAAP”). The Funds follow the investment company accounting and reporting guidance of the Financial Accounting Standards Board (“FASB”) Accounting Codification Topic 946 “Financial Services-Investment Companies”.
Securities Valuation and Fair Value Measurements – The Funds have adopted authoritative fair valuation accounting standards which establish an authoritative definition of fair value and set out a hierarchy for measuring fair value. These standards require additional disclosures about the various inputs and valuation techniques used to develop the measurements of fair value and a discussion in changes in valuation techniques and related inputs, if any, during the period. In addition, these standards require expanded disclosure for each major category of assets. These inputs are summarized in the three broad levels listed below:
| | • | | Level 1 – quoted prices in active markets for identical securities |
| | • | | Level 2 – other significant observable inputs (including, but not limited to, quoted prices for similar securities, interest rates, prepayment speeds, credit risk, etc.) |
| | • | | Level 3 – significant unobservable inputs (including the Fund’s own assumptions in determining fair value of investments based on the best information available) |
The inputs or methodology used for valuing securities are not an indication of the risks associated with investing in those securities.
Investments in registeredopen-end management investment companies, including money market funds, will be valued based upon the net asset value (“NAV”) of such investments and are categorized as Level 1 of the fair value hierarchy.
Fair values for long-term debt securities, including asset-backed securities, collateralized loan obligations, collateralized mortgage obligations, corporate obligations, whole loans, and mortgage-backed securities are normally determined on the basis of valuations provided by independent pricing services. Vendors typically value such securities based on one or more inputs, including but not limited to, benchmark yields, transactions, bids, offers, quotations from dealers and trading systems, new issues, spreads and other relationships observed in the markets among comparable securities; and pricing models such as yield measurers calculated using factors such as cash flows, financial or collateral performance and other reference data. In addition to these inputs, mortgage-backed and asset-backed obligations may utilize cash flows, prepayment information, default rates, delinquency and loss assumptions, collateral characteristics, credit enhancements and specific deal information. Securities that use similar valuation techniques and
98
Angel Oak Funds
Notes to the Financial Statements - (continued)
January 31, 2019
NOTE 2. SIGNIFICANT ACCOUNTING POLICIES – (continued)
inputs are categorized as Level 2 of the fair value hierarchy. To the extent the significant inputs are unobservable; the values generally would be categorized as Level 3.
Equity securities, including preferred stocks, that are traded on a national securities exchange, except those listed on the Nasdaq Global Market®, Nasdaq Global Select Market® and the Nasdaq Capital Market® exchanges (collectively, “Nasdaq”), are valued at the last sale price at the close of that exchange. Securities traded on Nasdaq will be valued at the Nasdaq Official Closing Price (“NOCP”). If, on a particular day, an exchange-listed or Nasdaq security does not trade, then: (i) the security shall be valued at the mean between the most recent quoted bid and asked prices at the close of the exchange; or (ii) the security shall be valued at the latest sales price on the Composite Market (defined below) for the day such security is being valued. “Composite Market” means a consolidation of the trade information provided by national securities and foreign exchanges andover-the-counter markets (“OTC”) as published by a pricing service. In the event market quotations or Composite Market pricing are not readily available, Fair Value will be determined in accordance with the procedures adopted by the Board of Trustees (“Board”). All equity securities that are not traded on a listed exchange are valued at the last sale price at the close of theover-the counter market. If anon-exchange listed security does not trade on a particular day, then the mean between the last quoted bid and asked price will be used as long as it continues to reflect the value of the security. If the mean is not available, then bid price can be used as long as the bid price continues to reflect the value of the security. Otherwise Fair Value will be determined in accordance with the procedures adopted by the Board. These securities will generally be categorized as Level 3 securities. When using the market quotations or close prices provided by the pricing service and when the market is considered active, the security will be classified as a Level 1 security. Sometimes, an equity security owned by the funds will be valued by the pricing service with factors other than market quotations or when the market is considered inactive. When this happens, the security will be classified as a Level 2 security.
Short term debt securities having a maturity of 60 days or less are generally valued at amortized cost, provided such amount approximates fair market value. These investments are categorized as Level 2 of the fair value hierarchy. Reverse repurchase agreements and repurchase agreements are priced at their acquisition cost, and assessed for credit adjustments, which represents fair value. These securities will generally be categorized as Level 2 securities.
Financial derivative instruments, such as futures contracts, that are traded on a national securities or commodities exchange are typically valued at the settlement price determined by the relevant exchange. Swaps, such as credit default swaps, interest-rate swaps and currency swaps, are valued by a Pricing Service. To the extent these securities are actively traded and valuation adjustments are not applied, they are categorized as Level 1 of the fair value hierarchy.Over-the-counter financial derivative instruments, such as certain futures contracts or swap agreements, derive their values from underlying asset prices, indices, reference rates, other inputs or a combination of these factors. These instruments are normally valued on the basis of evaluations provided by independent pricing services or broker dealer quotations. Derivatives that use similar valuation techniques as described above are typically categorized as Level 2 of the fair value hierarchy.
Securities may be fair valued in accordance with the fair valuation procedures approved by the Board. The Valuation and Risk Oversight Committee is generally responsible for overseeing the Funds’ valuation processes and reports quarterly to the Board. The Valuation and Risk Management Oversight Committee has delegated to the Valuation Committee of Angel Oak Capital Advisors, LLC (the “Adviser”) the day to day responsibilities for making all necessary determinations of the fair value of portfolio securities and other assets for which market quotations are not readily available or if the prices obtained from brokers and dealers or independent pricing services are deemed to be unreliable indicators of market or fair value. Representatives of the Adviser’s Valuation Committee reports quarterly to the Valuation and Risk Management Oversight Committee.
The following is a summary of the inputs used to value each Fund’s net assets as of January 31, 2019:
| | | | | | | | | | | | | | | | |
Multi-Strategy Income Fund | |
| Assets | | Level 1 | | | Level 2 | | | Level 3 | | | Total | |
Asset-Backed Securities | | $ | – | | | $ | 770,117,536 | | | $ | – | | | $ | 770,117,536 | |
Collateralized Debt Obligations | | | – | | | | 19,827,169 | | | | – | | | | 19,827,169 | |
Collateralized Loan Obligations | | | – | | | | 653,499,348 | | | | – | | | | 653,499,348 | |
Collateralized Mortgage Obligations | | | – | | | | 4,866,141,590 | | | | – | | | | 4,866,141,590 | |
99
Angel Oak Funds
Notes to the Financial Statements - (continued)
January 31, 2019
NOTE 2. SIGNIFICANT ACCOUNTING POLICIES – (continued)
| | | | | | | | | | | | | | | | |
| Assets | | Level 1 | | | Level 2 | | | Level 3 | | | Total | |
Corporate Obligations | | $ | – | | | $ | 387,835,672 | | | $ | 2,700,000 | | | $ | 390,535,672 | |
Investment Companies | | | 124,433,655 | | | | – | | | | – | | | | 124,433,655 | |
Mortgage-Backed Securities – U.S. Government Agency Issues | | | – | | | | 349,169,031 | | | | – | | | | 349,169,031 | |
Preferred Stocks | | | 13,038,346 | | | | – | | | | – | | | | 13,038,346 | |
Whole Loans | | | – | | | | 108,944,833 | | | | – | | | | 108,944,833 | |
Short-Term Investments | | | 300,695,175 | | | | – | | | | – | | | | 300,695,175 | |
Total | | $ | 438,167,176 | | | $ | 7,155,535,179 | | | $ | 2,700,000 | | | $ | 7,596,402,355 | |
Other Financial Instruments* | | | | | | | | | | | | | | | | |
Liabilities | | | | | | | | | | | | | | | | |
Futures Contracts | | $ | (17,609,055 | ) | | $ | – | | | $ | – | | | $ | (17,609,055 | ) |
Reverse Repurchase Agreements | | $ | – | | | $ | (28,061,000 | ) | | $ | – | | | $ | (28,061,000 | ) |
| * | Other financial instruments are derivative instruments, such as futures and reverse repurchase agreements. Futures are reflected at the unrealized appreciation (depreciation) on the instrument as reflected in the consolidated Schedule of Investments. |
See the consolidated Schedule of Investments for further disaggregation of investment categories. For the year ended January 31, 2019, the Multi-Strategy Income Fund did not recognize any transfers to or from Level 3. See the summary of quantitative information about Level 3 Fair Value Measurements for more information.
The following is a reconciliation of investments in which significant unobservable inputs (Level 3) were used in determining fair value:
| | | | | | | | | | | | | | | | | | | | | | | | | | | | | | | | | | | | |
Multi-Strategy
Income Fund | | Balance as of
01/31/2018 | | | Discounts/
Premiums | | | Net Realized
Gain (Loss) | | | Change in
Net
Unrealized
Appreciation
(Depreciation) | | | Purchases | | | Sales | | | Transfers
Into Level 3 | | | Transfers
Out of
Level 3 | | | Balance as of
01/31/2019 | |
Corporate Obligations | | $ | 2,700,000 | | | $ | – | | | $ | – | | | $ | – | | | $ | – | | | $ | – | | | $ | – | | | $ | – | | | $ | 2,700,000 | |
The total change in unrealized appreciation (depreciation) included in the consolidated Statements of Operations attributable to Level 3 investments still held at January 31, 2019 is $0.
The following is a summary of quantitative information about Level 3 Fair Value Measurements:
| | | | | | | | |
Multi-Strategy Income Fund | | Fair Value as
of 01/31/2019 | | Valuation
Techniques | | Unobservable
Input | | Range/Weighted Average
Unobservable Input* |
Corporate Obligations | | $2,700,000 | | Consensus Pricing | | Third party | | $20.00 |
| * | Table presents information for one security, which is valued at $20.00 as of January 31, 2019. |
| | | | | | | | | | | | | | | | |
Financials Income Fund | |
| Assets | | Level 1 | | | Level 2 | | | Level 3 | | | Total | |
Collateralized Debt Obligations | | $ | – | | | $ | 10,407,682 | | | $ | – | | | $ | 10,407,682 | |
Collateralized Loan Obligations | | | – | | | | 6,678,493 | | | | – | | | | 6,678,493 | |
Common Stocks | | | 3,989,290 | | | | – | | | | – | | | | 3,989,290 | |
Corporate Obligations | | | – | | | | 105,287,362 | | | | – | | | | 105,287,362 | |
Short-Term Investments | | | 3,976,949 | | | | – | | | | – | | | | 3,976,949 | |
Total | | $ | 7,966,239 | | | $ | 122,373,537 | | | $ | – | | | $ | 130,339,776 | |
See the Schedule of Investments for further disaggregation of investment categories. During the year ended January 31, 2019, the Financials Income Fund did not recognize any transfers to or from Level 3.
100
Angel Oak Funds
Notes to the Financial Statements - (continued)
January 31, 2019
NOTE 2. SIGNIFICANT ACCOUNTING POLICIES – (continued)
| | | | | | | | | | | | | | | | |
High Yield Opportunities Fund | |
| Assets | | Level 1 | | | Level 2 | | | Level 3 | | | Total | |
Collateralized Loan Obligations | | $ | – | | | $ | 5,437,589 | | | $ | – | | | $ | 5,437,589 | |
Common Stocks | | | – | | | | – | | | | 62,505 | | | | 62,505 | |
Corporate Obligations | | | – | | | | 43,324,838 | | | | – | | | | 43,324,838 | |
Short-Term Investments | | | 4,744,688 | | | | – | | | | – | | | | 4,744,688 | |
Total | | $ | 4,744,688 | | | $ | 48,762,427 | | | $ | – | | | $ | 53,569,620 | |
See the Schedule of Investments for further disaggregation of investment categories. See the summary of quantitative information about Level 3 Fair Value Measurements for more information.
The following is a reconciliation of investments in which significant unobservable inputs (Level 3) were used in determining fair value:
| | | | | | | | | | | | | | | | | | | | | | | | | | | | | | | | | | | | |
High Yield
Opportunities
Fund | | Balance as of
01/31/2018 | | | Discounts/
Premiums | | | Net Realized
Gain (Loss) | | | Change in
Net
Unrealized
Appreciation
(Depreciation) | | | Purchases | | | Sales | | | Transfers
Into Level 3 | | | Transfers
Out of
Level 3 | | | Balance as of
01/31/2019 | |
Common Stocks | | $ | – | | | $ | – | | | $ | – | | | $ | – | | | $ | – | | | $ | – | | | $ | 62,505 | | | $ | – | | | $ | 62,505 | |
The total change in unrealized appreciation (depreciation) included in the Statements of Operations attributable to Level 3 investments still held at January 31, 2019 is $(427,965).
The following is a summary of quantitative information about Level 3 Fair Value Measurements:
| | | | | | | | |
High Yield
Opportunities
Fund | | Fair Value as
of 01/31/2019 | | Valuation
Techniques | | Unobservable
Input | | Range/Weighted Average
Unobservable Input* |
Common Stocks | | $62,505 | | Broker Quote | | Third party | | $13.50 |
| * | Table presents information for one security, which is valued at $13.50 as of January 31, 2019. |
| | | | | | | | | | | | | | | | |
UltraShort Income Fund | |
| Assets | | Level 1 | | | Level 2 | | | Level 3 | | | Total | |
Asset-Backed Securities | | $ | – | | | $ | 57,845,502 | | | $ | – | | | $ | 57,845,502 | |
Collateralized Loan Obligations | | | – | | | | 10,813,478 | | | | – | | | | 10,813,478 | |
Collateralized Mortgage Obligations | | | – | | | | 36,477,388 | | | | – | | | | 36,477,388 | |
Corporate Obligations | | | – | | | | 759,850 | | | | – | | | | 759,850 | |
Mortgage-Backed Securities – U.S. Government Agency Issues | | | – | | | | 3,411,661 | | | | – | | | | 3,411,661 | |
Short-Term Investments | | | 4,807,967 | | | | – | | | | – | | | | 4,807,967 | |
Total | | | 4,807,967 | | | | 109,307,879 | | | | – | | | | 114,115,846 | |
Other Financial Instruments* | | | | | | | | | | | | | | | | |
Assets | | | | | | | | | | | | | | | | |
Futures Contracts | | $ | 6,716 | | | $ | – | | | $ | – | | | $ | 6,716 | |
Liabilities | | | | | | | | | | | | | | | | |
Futures Contracts | | $ | (163,092 | ) | | $ | – | | | $ | – | | | $ | (163,092 | ) |
| * | Other financial instruments are derivative instruments, such as futures. Futures are reflected at the unrealized appreciation (depreciation) on the instrument as presented in the Schedule of Investments. |
See the Schedule of Investments for further disaggregation of investment categories. During the period ended January 31, 2019, the UltraShort Income Fund did not recognize any transfers to or from Level 3.
101
Angel Oak Funds
Notes to the Financial Statements - (continued)
January 31, 2019
NOTE 2. SIGNIFICANT ACCOUNTING POLICIES – (continued)
Federal Income Taxes – The Funds intend to elect and continue to qualify to be taxed as “regulated investment companies” under Subchapter M of the Internal Revenue Code of 1986, as amended. If so qualified, the Funds generally will not be subject to federal income tax to the extent they distribute substantially all of their net investment income and capital gains to shareholders. The Funds generally intend to operate in a manner such that they will not be liable for federal income or excise taxes.
The Funds have adopted financial reporting rules regarding recognition and measurement of tax positions taken or expected to be taken on a tax return. The Funds recognize interest and penalties, if any, related to unrecognized tax benefits as income tax expense on the Statements of Operations. During the year or period ended January 31, 2019, the Funds did not incur any interest or penalties. The Funds have reviewed all open tax years and major jurisdictions and concluded that no provision for income tax would be required in the Funds’ financial statements. The Funds’ Federal and state income and Federal excise tax returns for tax years for which the applicable statutes of limitations have not expired are subject to examination by the Internal Revenue Service and state departments of revenue.
Security Transactions and Income Recognition – Investment security transactions are accounted for on trade date. Gains and losses realized on sales of securities are determined on a specific identification basis. Interest income and expense is recorded on an accrual basis. Discounts and premiums on securities purchased are accreted or amortized using the effective yield method, based on each securities estimated life and recoverable principal and recorded in interest income on the Statements of Operations. Dividend income and corporate transactions, if any, are recorded on theex-date. Paydown gains and losses on mortgage-related and other asset-backed securities are recorded as components of interest income on the Statements of Operations. Payments received from certain investments held by the Funds may be comprised of dividends, capital gains and return of capital. The Funds originally estimate the expected classification of such payments. The amounts may subsequently be reclassified upon receipt of the information from the issuer. The actual character of distributions to the Funds’ shareholders will be reflected in the Form 1099 received by shareholders after the end of the calendar year.
Expenses – Expenses incurred by the Trust that do not relate to a specific fund of the Trust are allocated to the individual Funds based on each Fund’s relative net assets or another appropriate basis. Expenses attributable to any class are borne by that class. Income, realized gains and losses, unrealized appreciation and depreciation and expenses are allocated to each class based on the net assets in relation to the relative net assets of each Fund.
Distributions to Shareholders – Distributions from each Fund’s net investment income are accrued daily and typically paid monthly. The Funds intend to distribute their net realized long term capital gains and their net realized short term capital gains, if any, at least annually. Distributions to shareholders, which are determined in accordance with income tax regulations, are recorded on theex-dividend date. The treatment for financial reporting purposes of distributions made to shareholders during the period from net investment income or net realized capital gains may differ from their ultimate treatment for federal income tax purposes. These differences are caused primarily by differences in the timing of the recognition of certain components of income, expense or realized capital gain for federal income tax purposes. Where such differences are permanent in nature, they are reclassified in the components of the net assets based on their ultimate characterization for federal income tax purposes. Any such reclassifications will have no effect on net assets, results of operations or net asset values per share of the Funds. For the year or period ended January 31, 2019, certain differences were reclassified. These differences were primarily related to paydown losses; the amounts did not affect net assets. The reclassifications were as follows:
| | | | |
| | | Paid-in capital | | Distributable
earnings/(accumulated
deficit) |
| Multi-Strategy Income Fund | | $ – | | $ – |
| Financials Income Fund | | $(62,033) | | $62,033 |
| High Yield Opportunities Fund | | $ – | | $ – |
| UltraShort Income Fund | | $ – | | $ – |
Share Valuation – The NAV per share of a class of shares of each Fund is calculated by dividing the sum of the value of the securities held by the Fund, plus cash and other assets, attributable to that class, minus all liabilities (including estimated accrued expenses) attributable to that class by the total number of shares of that class outstanding, rounded to the nearest cent. The Funds’ NAV will not be calculated on the days on which the New York Stock Exchange is closed for trading.
102
Angel Oak Funds
Notes to the Financial Statements - (continued)
January 31, 2019
NOTE 2. SIGNIFICANT ACCOUNTING POLICIES – (continued)
Use of Estimates – The preparation of financial statements in conformity with GAAP requires management to make estimates and assumptions that affect the reported amounts of assets and liabilities and disclosure of contingent assets and liabilities at the date of the financial statements, as well as the reported amounts of revenues and expenses during the period. Actual results could differ from those estimates.
Indemnifications – Under the Trust’s organizational documents, the Trust will indemnify its officers and trustees for certain liabilities that may arise from performance of their duties to the Funds. Additionally, in the normal course of business, the Funds enter into contracts that contain a variety of representatives and warranties which provide general indemnifications. The Funds’ maximum exposure under these arrangements is unknown, as this would involve future claims that may be made against the Funds that have not yet occurred.
Repurchase Agreements – Repurchase agreements are transactions by which the Funds purchase a security and simultaneously commit to resell that security to the seller (a bank or securities dealer) at an agreed upon price on an agreed upon date. The resale price reflects the purchase price plus an agreed upon market rate of interest which is unrelated to the coupon rate or the date of maturity of the purchased security. A repurchase agreement is accounted for as an investment by the Funds, collateralized by securities, which are delivered to the Funds’ custodian or to an agent bank under atri-party agreement. The securities aremarked-to-market daily and additional securities are acquired as needed, to ensure that their value equals or exceeds the repurchase price plus accrued interest. Repurchase agreements involve certain risks not associated with direct investments in the underlying securities. In the event of a default or bankruptcy by the seller, the Funds will seek to liquidate such collateral. The exercise of the Funds’ right to liquidate such collateral could involve certain costs or delays, and, to the extent that proceeds from any sale upon a default of the obligation to repurchase were less than the repurchase price, the Funds could suffer a loss.
Reverse Repurchase Agreements – A reverse repurchase agreement is the sale by the Funds of a security to a party for a specified price, with the simultaneous agreement by the Funds to repurchase that security from that party on a future date at a higher price. Securities sold under reverse repurchase agreements are reflected as a liability on the Statements of Assets and Liabilities. Interest payments made are recorded as a component of interest expense on the Statements of Operations. Reverse repurchase agreements involve the risk that the counterparty will become subject to bankruptcy or other insolvency proceedings or fail to return a security to the Funds. In such situations, the Funds may incur losses as a result of a possible decline in the value of the underlying security during the period while the Funds’ seek to enforce their rights, a possible lack of access to income on the underlying security during this period, or expenses of enforcing their rights. The Funds will segregate assets determined to be liquid by the Adviser or otherwise cover its obligations under reverse repurchase agreement.
The gross obligations for secured borrowing by the type of collateral pledged and remaining time to maturity is as follows:
| | | | | | | | | | | | | | | | | | | | |
| Multi-Strategy Income Fund | |
| Reverse Repurchase Agreements | | Overnight and
Continuous | | | Up to 30 Days | | | 30-90 Days | | | Greater than
90 Days | | | Total | |
Collateralized Mortgage Obligations | | $ | – | | | $ | 28,061,000 | | | $ | – | | | $ | – | | | $ | 28,061,000 | |
Total | | $ | – | | | $ | 28,061,000 | | | $ | – | | | $ | – | | | $ | 28,061,000 | |
Gross amount of reverse repurchase agreements in Balance Sheet Offsetting Information Table | | | $ | 28,061,000 | |
Amounts related to agreements not included in offsetting disclosure in Balance Sheet Offsetting Information Table | | | $ | – | |
Asset-Backed, Mortgage-Backed, and Whole Loan Securities Risks – Prepayment risk is associated with mortgage-backed and asset-backed securities, including collateralized loan obligations (“CLOs”). If interest rates fall, the underlying debt may be repaid ahead of schedule, reducing the value of the Funds’ investments. If interest rates rise, there may be fewer prepayments, which would cause the average bond maturity to rise, increasing the potential for the Funds to lose money. The value of these securities may be significantly affected by changes in interest rates, the market’s perception of issuers, and the creditworthiness of the parties involved. The ability of the Funds to successfully utilize these instruments may depend on the ability of the Funds’ Adviser to forecast interest rates and other economic factors correctly. These securities may have a structure that makes their reaction to interest rate changes and other factors difficult to predict, making their value highly volatile. Certain mortgage-backed securities may be secured by pools of mortgages on single-family, multi-family properties, as well as commercial properties. Similarly, asset-backed securities may be secured by pools of
103
Angel Oak Funds
Notes to the Financial Statements - (continued)
January 31, 2019
NOTE 2. SIGNIFICANT ACCOUNTING POLICIES – (continued)
loans, such as corporate loans, student loans, automobile loans and credit card receivables. Whole loans are sold in entirety rather than being pooled with other mortgages. Whole loans are mortgage loans sold to an investor in a secondary market. The investor purchasing the loan assumes full responsibility of the loan and all the contractual terms and rights associated with the funds. The credit risk on such securities is affected by homeowners or borrowers defaulting on their loans. The values of assets underlying mortgage-backed and asset-backed securities, including CLOs, may decline and therefore may not be adequate to cover underlying investors. Mortgage-backed securities and other securities issued by participants in housing and commercial real estate finance, as well as other real estate-related markets have experienced extraordinary weakness and volatility in recent years. Possible legislation in the area of residential mortgages, credit cards, corporate loans and other loans that may collateralize the securities in which the Funds may invest could negatively impact the value of the Funds’ investments. To the extent the Funds focus their investments in particular types of mortgage-backed or asset-backed securities, including whole loans and CLOs, the Funds may be more susceptible to risk factors affecting such types of securities.
Subordinated Debt of Banks and Diversified Financial Companies – The Funds may invest in subordinated debt securities, sometimes also called “junior debt,” are debt securities for which the issuer’s obligations to make principal and interest payment are secondary to the issuer’s payment obligations to more senior debt securities. Such investments will consist primarily of debt issued by community banks or savings intuitions (or their holding companies), which are subordinated to senior debt issued by the banks and depots held by the bank, but are senior to trust preferred obligations, preferred stock and common stock issued by the bank.
Investment Company Securities – The Funds may invest in the securities of other investment companies, including ETFs,closed-end funds andopen-end (mutual) funds (also called underlying funds). When a Fund invests in underlying funds it will indirectly bear its proportionate share of any fees and expenses payable directly by the underlying fund. In connection with its investments in other investment companies, a Fund will incur higher expenses, many of which may be duplicative. Furthermore, because the Funds invest in shares of ETFs and underlying funds their performances are directly related to the ability of the ETFs and underlying funds to meet their respective investment objectives, as well as the allocation of each Fund’s assets among the ETFs and underlying funds by the Adviser. Accordingly, the Funds’ investment performance will be influenced by the investment strategies of and risks associated with the ETFs and underlying funds in direct proportion to the amount of assets the Funds allocate to the ETFs and underlying funds utilizing such strategies.
Common and Preferred Stock – The Funds may invest in common stock. Common stock represents an equity (ownership) interest in a company, and usually possesses voting rights and earns dividends. Dividends on common stock are not fixed but are declared at the discretion of the issuer. Common stock generally represents the riskiest investment in a company. In addition, common stock generally has the greatest appreciation and depreciation potential because increases and decreases in earnings are usually reflected in a company’s stock price. The Funds may also invest in preferred stock. Preferred stock is a class of stock having a preference over common stock as to the payment of dividends and the recovery of investment should a company be liquidated, although preferred stock is usually junior to the debt securities of the issuer. Preferred stock typically does not possess voting rights and its market value may change based on changes in interest rates.
The fundamental risk of investing in common and preferred stock is the risk that the value of the stock might decrease. Stock values fluctuate in response to the activities of an individual company or in response to general market and/or economic conditions. Historically, common stocks have provided greater long-term returns and have entailed greater short-term risks than preferred stocks, fixed-income and money market investments. The market value of all securities, including common and preferred stocks, is based upon the market’s perception of value and not necessarily the book value of an issuer or other objective measures of a company’s worth. If you invest in the Fund, you should be willing to accept the risks of the stock market and should consider an investment in the Fund only as a part of your overall investment portfolio.
Futures Contracts – The Funds may enter into futures contracts to hedge various investments for risk management as well as speculative purposes. Initial margin deposits are made upon entering into futures contracts and can be either cash or securities. Secondary margin limits are required to be maintained while futures are held, as defined by each contract.
During the period a futures contract is open, changes in the value of the contract are recognized as unrealized gains or losses by“marking-to-market” on a daily basis to reflect the fair value of the contract at the end of each day’s trading. Variation margin receivables or payables represent the difference between the change in unrealized appreciation and depreciation on the open contracts
104
Angel Oak Funds
Notes to the Financial Statements - (continued)
January 31, 2019
NOTE 2. SIGNIFICANT ACCOUNTING POLICIES – (continued)
and the cash deposits made on the margin accounts. When the contract is closed, the Funds record a realized gain or loss equal to the difference between the proceeds from the closing transaction and the Funds’ cost of entering into a contract. The use of futures contracts involves the risk of illiquid markets or imperfect correlation between the value of the instruments and the underlying securities, or that the counterparty will fail to perform its obligations.
Futures contracts are valued at the settlement price established each day by the board of trade or exchange on which they are traded. Should market conditions move unexpectedly, the Funds may not achieve the anticipated benefits of the futures contract and may realize a loss. See Note 3 for information on futures contract activity during the year or period ended January 31, 2019.
Options – A Fund may purchase call and put options on specific securities, and may write and sell covered or uncovered call and put options for hedging purposes in pursuing its investment objectives. A put option gives the purchaser of the option the right to sell, and obligates the writer to buy, the underlying security at a stated exercise price, typically at any time prior to the expiration of the option for American options or only at expiration for European options. A call option gives the purchaser of the option the right to buy, and obligates the writer to sell, the underlying security at a stated exercise price, typically at any time prior to the expiration of the option. A covered call option is a call option with respect to which the seller of the option owns the underlying security. The sale of such an option exposes the seller during the term of the option to possible loss of opportunity to realize appreciation in the market price of the underlying security or to possible continued holding of a security that might otherwise have been sold to protect against depreciation in the market price of the security. A covered put option is a put option with respect to which cash or liquid securities have been placed in a segregated account on the books of a Fund or with a custodian to fulfill the obligation undertaken. The sale of such an option exposes the seller during the term of the option to a decline in price of the underlying security while depriving the seller of the opportunity to invest the segregated assets.
A Fund may close out a position when writing options by purchasing an option on the same underlying security with the same exercise price and expiration date as the option that it has previously written on the security. In such a case, the applicable Fund will realize a profit or loss if the amount paid to purchase an option is less or more than the amount received from the sale of the option. See Note 3. The Funds did not hold any options during the year or period ended January 31, 2019.
Swaps – The Funds may enter into swap contracts to hedge various investments for risk management or to pursue their investment objective. The Funds may invest in credit default swaps, total return swaps, interest rate swaps, equity swaps, currency swaps, options on foregoing swaps, and other types of swaps. Such transactions are subject to market risk, liquidity risk, risk of default by the other party to the transaction, known as “counterparty risk,” regulatory risk and risk of imperfect correlation between the value of such instruments and the underlying assets and may involve commissions or other costs. Swap agreements are valued by a pricing service and unrealized appreciation or depreciation is recorded daily as the difference between the prior day and current day closing price. The Funds did not hold any swaps during the year or period ended January 31, 2019.
NOTE 3. DERIVATIVE TRANSACTIONS
The following tables present a summary of the value of derivative instruments as of January 31, 2019 and the effect of derivative instruments on the Consolidated Statements of Assets and Liabilities as of January 31, 2019 for the Multi-Strategy Income Fund.
| | | | | | |
| Multi-Strategy Income Fund |
| Derivatives | | Type of Derivative Risk | | Consolidated Statements of Assets and Liabilities
Location | | Liabilities |
| Futures Contracts | | Interest Rate | | Variation Margin on Futures Contracts | | $ 2,693,523 |
The effect of derivative instruments on the Consolidated Statement of Operations for the year ended January 31, 2019 for the Multi-Strategy Income Fund:
| | | | | | |
| Derivatives | | Type of Derivative Risk | | Location of Gain (Loss) on Derivatives in Income | | Realized Gain (Loss) on
Derivatives |
| Futures Contracts | | Interest Rate | | Net realized gain (loss) on futures contracts | | $ 23,844,869 |
105
Angel Oak Funds
Notes to the Financial Statements - (continued)
January 31, 2019
NOTE 3. DERIVATIVE TRANSACTIONS – (continued)
| | | | | | |
| Derivatives | | Type of Derivative Risk | | Location of Gain (Loss) on Derivatives in Income | | Change in Unrealized Appreciation (Depreciation) on
Derivatives |
| Futures Contracts | | Interest Rate | | Net change in unrealized appreciation (depreciation) on futures contracts | | $(31,843,689) |
For the Multi-Strategy Income Fund the average monthly notional value of long and short futures contracts during the year ended January 31, 2019 was $859,520,036 and ($911,042,211), respectively.
The following tables present a summary of the value of derivative instruments as of January 31, 2019 and the effect of derivative instruments on the Statements of Assets and Liabilities as of January 31, 2019 for the UltraShort Income Fund.
| | | | | | |
| UltraShort Income Fund |
| Derivatives | | Type of Derivative Risk | | Statements of Assets and Liabilities Location | | Liabilities |
| Futures Contracts | | Interest Rate | | Variation Margin on Futures Contracts | | $ 34,393 |
The effect of derivative instruments on the Statements of Operations for the period ended January 31, 2019 for the UltraShort Income Fund:
| | | | | | |
Derivatives | | Type of Derivative Risk | | Location of Gain (Loss) on Derivatives in Income | | Realized Gain (Loss) on
Derivatives |
| Futures Contracts | | Interest Rate | | Net realized gain (loss) on futures contracts | | $ (17,843) |
| | | | | | |
| Derivatives | | Type of Derivative Risk | | Location of Gain (Loss) on Derivatives in Income | | Change in Unrealized
Appreciation
(Depreciation)
on Derivatives |
| Futures Contracts | | Interest Rate | | Net change in unrealized appreciation (depreciation) on futures contracts | | $(156,376) |
For the UltraShort Income Fund the average monthly notional value of long and short futures contracts during the period ended January 31, 2019 was $8,215,774 and ($6,480,591), respectively.
Balance Sheet Offsetting Information
During the ordinary course of business, the Funds may enter into transactions subject to enforceable netting agreements or other similar arrangements (“netting agreements”). Generally, the right to offset in netting agreements allows the Funds to offset any exposure to a specific counterparty with any collateral received or delivered to that counterparty based on the terms of the agreement. Generally, the Funds manage their cash collateral and securities collateral on a counterparty basis. As of January 31, 2019, the Funds were not subject to any netting agreements.
The following table provides a summary of offsetting financial liabilities and derivatives and the effect of derivative instruments on the Statements of Assets and Liabilities as of January 31, 2019.
| | | | | | | | | | | | |
| Multi-Strategy Income Fund |
| | | | | | | | | Gross Amounts Not Offset in Consolidated
Statements of Assets and Liabilities |
| | | Gross Amounts of
Recognized Liabilities | | Gross Amounts Offset in
Consolidated Statements
of Assets and Liabilities | | Net Amounts of
Liabilities Presented in
Consolidated Statements
of Assets and Liabilities | | Financial
Instruments | | Cash Collateral
Pledged | | Net Amount |
| Futures Contracts | | $2,693,523 | | $– | | $2,693,523 | | $– | | $ 2,693,523 | | $– |
| Reverse Repurchase Agreements | | $28,061,000 | | $– | | $28,061,000 | | $28,061,000 | | $– | | $– |
| Total | | $30,754,523 | | $– | | $30,754,523 | | $28,061,000 | | $ 2,693,523 | | $– |
106
Angel Oak Funds
Notes to the Financial Statements - (continued)
January 31, 2019
NOTE 3. DERIVATIVE TRANSACTIONS – (continued)
| | | | | | | | | | | | |
| UltraShort Income Fund |
| | | | | | | | | Gross Amounts Not Offset in Consolidated
Statements of Assets and Liabilities |
| | | Gross Amounts of
Recognized Liabilities | | Gross Amounts Offset in
Consolidated Statements
of Assets and Liabilities | | Net Amounts of
Liabilities Presented in
Consolidated Statements
of Assets and Liabilities | | Financial
Instruments | | Cash Collateral
Pledged | | Net Amount |
| Futures Contracts | | $34,393 | | $– | | $34,393 | | $– | | $34,393 | | $– |
In some instances, the collateral amounts disclosed in the tables were adjusted due to the requirement to limit the collateral amounts to avoid the effect of overcollateralization. Actual collateral received/pledged may be more than the amounts disclosed herein.
NOTE 4. FEES AND OTHER RELATED PARTY TRANSACTIONS
Under the terms of the investment advisory agreement, on behalf of the Funds (the “Agreement”), the Adviser manages the Funds’ investments subject to oversight of the Trustees. As compensation for its management services, Multi-Strategy Income Fund, Financials Income Fund, High Yield Opportunities Fund, and UltraShort Income Fund are obligated to pay the Adviser a fee computed and accrued daily and paid monthly at an annual rate of 0.89%, 0.89%, 0.55%, and 0.44%, respectively, of the average daily net assets of the Fund. The Multi-Strategy Income Fund waives its Advisory Fee on the assets invested in affiliated mutual funds.
The Adviser has entered into a subadvisory agreement with Parks Capital Management, LLC (the “Subadviser”) pursuant to which the Subadviser is compensated out of the investment advisory fees that the Adviser receives from the Multi-Strategy Income Fund and the Financials Income Fund at a rate of 0.445%. The Subadviser began managing a portion of Financials Income Fund’s portfolio in July 2018. As of January 31, 2019, the Subadviser has not begun managing a portion of the Multi-Strategy Income Fund’s portfolio.
The Adviser contractually agreed to waive or limit its fees and to assume other expenses of the Multi-Strategy Income Fund, the Financials Income Fund, High Yield Opportunities Fund and UltraShort Income Fund until May 31, 2020, so that the Total Annual Fund Operating Expenses of each Fund do not exceed 0.99%, 0.85%, 0.65% and 0.49%, respectively. Effective December 1, 2016, the Adviser also voluntarily agreed to waive its fees and/or reimburse certain expenses to limit the Total Annual Fund Operating Expenses after Fee Waiver/Expense Reimbursement to 0.69% of the Financials Income Fund’s average daily net assets. Effective May 7, 2018, the Adviser also voluntarily agreed to waive its fees and/or reimburse certain expenses to limit the Total Annual Fund Operating Expenses after Fee Waiver/Expense Reimbursement to 0.25% of the UltraShort Income Fund’s average daily net assets. These voluntary waivers are in addition to the contractual fee waiver/expense limitation agreement discussed above and may be discontinued at any time. Fees waived under these voluntary waivers are not subject to recoupment by the Adviser. These operating expense limitations do not apply tofront-end sales loads, brokerage fees and commissions, borrowing costs (such as interest and dividend expenses on securities sold short), taxes,12b-1 fees, extraordinary expenses and indirect expenses (such as “acquired funds fees and expenses”). In addition, the Adviser has contractually agreed through May 31, 2020 to waive the amount of the Multi-Strategy Income Fund’s management fee to the extent necessary to offset the proportionate share of the management fees incurred by the Fund through its investment in underlying funds for which the Adviser also serves as investment adviser. This arrangement may only be changed or eliminated by the Board of Trustees upon 60 days’ written notice to the Adviser.
The contractual waiver and/or reimbursement by the Adviser with respect to the Funds is subject to repayment by the Funds within 36 months following the month in which that particular waiver and/or reimbursement occurred, provided that the Funds are able to make the repayment without exceeding the expense limitations described above. During the period ended January 31, 2019, Multi- Strategy Income Fund repaid $1,118,919 of previously waived expenses to the Adviser, the High Yield Opportunities Fund waived $170,618 of expenses, and the UltraShort Income Fund waived $20,922 of expenses. During the year ended January 31, 2019, the Financials Income Fund had $860,519 of previously waived expenses expire. The expense limitation agreement specifically refers to amounts that are contractually waived, see Statements of Operations. The amounts subject to repayment by the Funds, pursuant to the aforementioned conditions at January 31, 2019 are included in the table below. Fees waived by the Predecessor High Yield Fund are not subject to recoupment by the Angel Oak High Yield Opportunities Fund.
107
Angel Oak Funds
Notes to the Financial Statements - (continued)
January 31, 2019
NOTE 4. FEES AND OTHER RELATED PARTY TRANSACTIONS – (continued)
| | | | | | |
| | | Recoverable
through
January 31, 2020 | | Recoverable
through
January 31, 2021 | | Recoverable
through
January 31, 2022 |
| Multi-Strategy Income Fund | | $– | | $– | | $– |
| Flexible Income Fund | | $579,174 | | $– | | $– |
| High Yield Opportunities Fund | | $148,887 | | $184,315 | | $170,618 |
| UltraShort Income Fund | | N/A | | N/A | | $20,922 |
Quasar Distributors, LLC (the “Distributor”) acts as the Funds’ principal underwriter in a continuous public offering of the Funds’ shares. The Funds have adopted a Distribution Plan in accordance with Rule12b-1 under the 1940 Act with respect to the Class A, Class C shares, and Class T shares, as applicable. The Distribution Plan provides that the Funds may pay a fee to the Distributor at an annual rate of up to 0.25% of the average daily net assets of Class A shares and Class T shares and an annual rate of up to 1.00% of the average daily net assets of Class C shares. No distribution fees are paid by Institutional Class shares. These fees may be used by the Distributor to provide compensation for sales support, distribution activities or shareholder servicing activities. For the period ended January 31, 2019, Multi-Strategy Income Fund, Financials Income Fund, High Yield Opportunities Fund, and UltraShort Income Fund incurred distribution fees of $2,429,966, $36,502, $4,298, and $2,458, respectively.
U.S. Bancorp Fund Services, LLC, doing business as U.S. Bank Global Fund Services (“Fund Services”), an indirect wholly-owned subsidiary of U.S. Bancorp, serves as the Funds’ Administrator (“Administrator”) and, in that capacity, performs various administrative and accounting services for the Funds. Fund Services also serves as the Funds’ fund accountants and transfer agent. The Administrator prepares various federal and state regulatory filings, reports and returns for the Funds; prepares reports and materials to be supplied to the trustees; monitors the activities of the Funds’ custodians; coordinates the preparation and payment of the Funds’ expenses and reviews the Funds’ expense accruals. As compensation for its services, the Administrator is entitled to a monthly fee at an annual rate based upon the average daily net assets of the Funds. U.S. Bank, N.A. (the “Custodian”) serves as custodian to the Funds. Both the Administrator and Custodian are affiliates of the Distributor.
Certain officers, Trustees and shareholders of the Funds are also owners or employees of the Adviser.
NOTE 5. SECURITIZATION TRANSACTION
On November 5, 2015, the Multi-Strategy Income Fund and the Financials Income Fund participated in the offering of the Financial Institution Note Securitization2015-1, LTD (FINS2015-1). As part of the offering, Multi-Strategy Income Fund purchased $12,927,000 of Class A notes, $6,275,000 of Class C notes and 11,231,000 preferred shares and Financials Income Fund purchased $7,673,000 of Class A notes, $3,725,000 of Class C notes and 6,666,666 preferred shares of FINS2015-1. In February 2016, Financials Income Fund sold $7,673,000 of Class A notes. See Schedule of Investments (consolidated where applicable) for current shares held. The Adviser has been named as the collateral surveillance and analysis provider of FINS2015-1. The collateral manager may consult with the collateral surveillance and analysis provider prior to making certain decisions; however, the collateral manager will not be required to follow any position taken by or recommendation made by the collateral surveillance and analysis provider in any such consultation.
NOTE 6. INVESTMENT TRANSACTIONS
For the period ended January 31, 2019, purchases and sales of investment securities, other than short-term investments and short-term U.S. government obligations, were as follows:
| | | | | | | | |
| | | Purchases | | | Sales | |
| Multi-Strategy Income Fund | | $ | 5,961,469,244 | | | $ | 5,108,927,245 | |
| Financials Income Fund | | $ | 53,662,650 | | | $ | 54,085,746 | |
| High Yield Opportunities Fund | | $ | 15,912,251 | | | $ | 16,940,747 | |
| UltraShort Income Fund | | $ | 231,977,728 | | | $ | 122,925,890 | |
108
Angel Oak Funds
Notes to the Financial Statements - (continued)
January 31, 2019
NOTE 6. INVESTMENT TRANSACTIONS – (continued)
For the year ended January 31, 2019, there were $905,552,753 of long-term purchases and $1,122,557,463 of sales of U.S. Government securities for the Multi-Strategy Income Fund. For the year ended January 31, 2019, there were $1,915,200 of long-term purchases and $1,914,900 of sales of U.S. Government securities for the Financials Income Fund. For the period ended January 31, 2019, there were $12,632,397 of long-term purchases and $9,202,758 of sales of U.S. Government securities for the UltraShort Income Fund. There were no long-term purchases or sales of U.S. Government securities for the High Yield Opportunities Fund. These amounts are included in the aggregate purchases and sales of investment securities displayed in the table above.
During the year ended January 31, 2019, the Multi-Strategy Income Fund purchased securities from a Fund within the Trust as well as from other affiliated Funds of the Adviser, in accordance with the Rule17a-7 procedures adopted by the Trust, securities eligible for investment at a value of $14,077,126. During the year ended January 31, 2019, the Financials Income Fund purchased securities from other affiliated Funds of the Adviser, in accordance with the Rule17a-7 procedures adopted by the Trust, securities eligible for investment at a value of $822,993. During the year ended January 31, 2019, the Financials Income Fund sold securities to another Fund within the Trust, in accordance with the Rule17a-7 procedures adopted by the Trust, securities eligible for investment at a value of $3,729,186. The Financials Income Fund experienced a loss of $11,357 on the sale of these securities.
NOTE 7. TRANSACTIONS WITH AFFILIATES
The Funds’ transactions with affiliates represent holdings for which the respective Fund and the underlying investee fund have the same investment advisor or where the investee fund’s investment advisor is under common control with the Fund’s investment advisor.
The Multi-Strategy Income Fund had the following transactions during the year ended January 31, 2019, with affiliates:
| | | | | | | | | | | | | | | | | | | | | | | | | | | | | | | | |
| | | Share Activity | | | Year Ended January 31, 2019 | |
| Security Name | | Balance
February 1,
2018 | | | Purchases | | | Sales | | | Balance
January 31,
2019 | | | Value | | | Dividend
Income | | | Net
Realized
Gain
(Loss) on
Investments
in Affiliates | | | Net Change
in Unrealized
Appreciation
(Depreciation) on
Investments
in Affiliates | |
Financials Income Fund | | | 2,111,932 | | | | 1,212,972 | | | | – | | | | 3,324,904 | | | $ | 30,988,109 | | | $ | 1,441,511 | | | $ | – | | | $ | (386,536 | ) |
High Yield Opportunities Fund | | | 1,809,838 | | | | 109,877 | | | | – | | | | 1,919,715 | | | $ | 21,788,768 | | | $ | 1,265,078 | | | $ | – | | | $ | (1,103,809 | ) |
UltraShort Income Fund | | | – | | | | 7,550,975 | | | | 399,600 | | | | 7,151,375 | | | $ | 71,656,778 | | | $ | 1,581,052 | | | $ | 3,996 | | | $ | 64,116 | |
Total | | | 3,921,770 | | | | 8,873,824 | | | | 399,600 | | | | 12,395,994 | | | $ | 124,433,655 | | | $ | 4,287,641 | | | $ | 3,996 | | | $ | (1,426,229 | ) |
NOTE 8. BENEFICIAL OWNERSHIP
The beneficial ownership, either directly or indirectly, of 25% or more of the voting securities of a fund creates a presumption of control of a fund, under Section 2(a)(9) of the 1940 Act. At January 31, 2019, UBS Wealth Management USA (“UBS”) owned, as record shareholder, 42% of the outstanding shares of Financials Income Fund. It is not known whether UBS, or any other underlying beneficial owners owned or controlled 25% or more of the voting securities of the Funds. At January 31, 2019, Angel Oak Multi-Strategy Income Fund owned, as beneficial shareholders owned 43% of the outstanding shares of High Yield Opportunities Fund and 63% of the outstanding shares of the UltraShort Income Fund. At January 31, 2019, no shareholder held more than 25% of the outstanding shares of the Multi-Strategy Income Fund.
NOTE 9. FEDERAL TAX INFORMATION
The tax characterization of distributions paid for the year or period ended January 31, 2019 and January 31, 2018 were as follows:
| | | | | | | | |
| | | Multi-Strategy Income Fund | | Financials Income Fund |
| | | 2019 | | 2018 | | 2019 | | 2018 |
| Distributions paid from: | | | | | | | | |
| Ordinary Income | | $341,759,092 | | $286,492,642 | | $5,924,046 | | $6,989,095 |
| Net Long-Term Capital Gain | | – | | – | | – | | – |
| Total | | $341,759,092 | | $286,492,642 | | $5,924,046 | | $6,989,095 |
109
Angel Oak Funds
Notes to the Financial Statements - (continued)
January 31, 2019
NOTE 9. FEDERAL TAX INFORMATION – (continued)
| | | | | | | | |
| | | High Yield Opportunities Fund | | UltraShort Income Fund |
| | | 2019 | | 2018 | | 2019 | | 2018* |
| Distributions paid from: | | | | | | | | |
| Ordinary Income | | $2,959,948 | | $2,910,141 | | $1,793,313 | | $– |
| Net Long-Term Capital Gain | | – | | – | | 14,822 | | – |
| Total | | $2,959,948 | | $2,910,141 | | $1,808,135 | | $– |
| * | Fund commenced operations on April 2, 2018. |
At January 31, 2019, the components of distributable earnings (accumulated deficit) on a tax basis were as follows:
| | | | | | | | | | | | | | | | |
| | | Multi-Strategy
Income Fund | | | Financials Income
Fund | | | High Yield
Opportunities Fund | | | UltraShort Income
Fund | |
| Tax Cost of Investments | | $ | 7,657,493,323 | | | $ | 130,590,684 | | | $ | 54,744,697 | | | $ | 113,690,641 | |
| Unrealized Appreciation* | | | 93,322,488 | | | | 1,118,104 | | | | 632,798 | | | | 327,713 | |
| Unrealized Depreciation* | | | (172,022,511 | ) | | | (1,369,012 | ) | | | (1,807,875 | ) | | | (58,884 | ) |
| Net Unrealized Appreciation (Depreciation)* | | $ | (78,700,023 | ) | | $ | (250,908 | ) | | $ | (1,175,077 | ) | | $ | 268,829 | |
| Undistributed Ordinary Income | | | 7,314,897 | | | | 111,954 | | | | 60,602 | | | | 37,282 | |
| Undistributed Long-Term Gain (Loss) | | | — | | | | — | | | | — | | | | — | |
| Accumulated Gain (Loss) | | $ | 7,314,897 | | | $ | 111,954 | | | $ | 60,602 | | | $ | 37,282 | |
| Other Accumulated Gain (Loss) | | | (436,820,766 | ) | | | (35,692,121 | ) | | | (1,379,390 | ) | | | (231,007 | ) |
| Distributable Earnings (Accumulated Deficit) | | $ | (508,205,892 | ) | | $ | (35,831,075 | ) | | $ | (2,493,865 | ) | | $ | 75,104 | |
| * | Represents aggregated amounts of Fund’s investments, reverse repurchase agreements and futures. |
The temporary differences between book basis and tax basis in the funds are primarily attributable to wash sale loss deferrals, distributions payable,mark-to-markets, and other temporary differences.
As of January 31, 2019, the Multi-Strategy Income Fund, Financials Income Fund, High Yield Opportunities Fund, and UltraShort Income Fund had available for federal tax purposes an unused capital loss carryforward of $429,889,531, $35,643,389, $1,322,776, and $0, respectively, which is available for offset against future taxable net capital gains. The Financials Income Fund utilized $9,785 of capital loss carryforward.
To the extent these carryforwards are used to offset futures gains, it is probably that the amount offset will not be distributed to shareholders. The carryforward expires as follows:
| | | | | | | | | | | | | | | | |
| | | Multi-Strategy
Income Fund | | | Financials
Income Fund | | | High Yield
Opportunities Fund | | | UltraShort
Income Fund | |
| No expiration short-term | | $ | 172,154,820 | | | $ | 23,452,876 | | | $ | 269,003 | | | $ | — | |
| No expiration long-term | | $ | 257,734,711 | | | $ | 12,190,513 | | | $ | 1,053,773 | | | $ | — | |
| Total | | $ | 429,889,531 | | | $ | 35,643,389 | | | $ | 1,322,776 | | | $ | — | |
Certain capital losses incurred after October 31 and within the current taxable year, are deemed to arise on the first business day of the Funds’ following taxable year. For the tax year ended January 31, 2019, the Multi-Strategy Income Fund, Financials Income Fund and High Yield Opportunities Fund, did not defer any post-October losses. For the tax period ended January 31, 2019, the UltraShort Income Fund deferred $217,763 of post-October losses.
110
Angel Oak Funds
Notes to the Financial Statements - (continued)
January 31, 2019
NOTE 10. CREDIT AGREEMENTS
In August 2015, as amended October 2018, the Multi-Strategy Income Fund entered into a $400 million secured, committed, margin facility (the “Facility”) with Société Générale, which expires in April 2019. Under the Facility, interest is charged on a floating rate based on the3-month LIBOR rate plus 1.10% and is payable on the last day of each interest period, which was 3.91% as of January 31, 2019. Under the previous terms, there was a maximum commitment of $375,000,000 and interest was charged on a floating rate based on the 3-month LIBOR rate plus 1.35%. For the year ended January 31, 2019, the average principal balance and interest rate was approximately $261,506,849 and 3.62%, respectively. The Multi-Strategy Income Fund is required to pay a commitment fee under the Facility on undrawn amounts, and additional fee if the level of debt outstanding falls below a certain percentage. During the reporting period the Multi-Strategy Income Fund was required to pay these commitment fees on undrawn amounts, which was 0.25% as of January 31, 2019. For the year ended January 31, 2019, these expenses, including interest expense and commitment fees, amounted to $9,919,321 and is included in the Interest and Commissions expense line item that is reflected in the Statements of Operations (consolidated where applicable). Under the terms of the Facility, the Multi-Strategy Income Fund is also required to satisfy certain collateral requirements and maintain a certain level of net assets. For additional information, see the Consolidated Schedule of Investments. As of January 31, 2019, the outstanding principal balance under the Facility was $250 million. The amount of the maximum loan outstanding during the period was $400 million from December 21, 2018 through January 17, 2019.
U.S. Bank, N.A. has made available to the Multi-Strategy Income Fund, Financials Income Fund, High Yield Opportunities Fund, and UltraShort Income Fund a $320,000,000 unsecured credit facility, pursuant to a Loan Agreement (“Agreement”) effective June 8, 2016, as amended May 24, 2018, expiring on May 23, 2019, for the purposes of having cash available to satisfy redemption requests. Advances under the Facility would be limited to the lesser of $320,000,000 or 20% of the unencumbered assets of the Multi-Strategy Income Fund, the Financials Income Fund, or the UltraShort Income Fund; or 15% of the unencumbered assets of the High Yield Opportunities Fund. Principal is due 45 days after the initial advance and at the maturity. Interest is payable monthly in arrears. Under the credit facility, the interest rate paid by the Funds on outstanding borrowings is equal to theone-month LIBOR, plus 1.75%, which was 4.26% as of January 31, 2019. For the period from February 1, 2018 to January 31, 2019, the average principal balance and interest rate was $73,332 and 4.08%, respectively for the Multi-Strategy Income Fund, $90,822 and 3.51%, respectively for the Financials Income Fund, and $521 and 3.38%, respectively for the High Yield Opportunities Fund. The UltraShort Income Fund did not borrow under this arrangement during this period. The maximum loan outstanding during the year for the Multi-Strategy Income Fund was $17,783,000 on October 31, 2018. The maximum loan outstanding during the year for the Financials Income Fund was $12,436,000 on February 1, 2018. The maximum loan outstanding during the year for the High Yield Opportunities Fund was $99,000 on February 14, 2018. As of January 31, 2019, the Funds had no outstanding borrowings under this agreement.
NOTE 11. NEW ACCOUNTING PRONOUNCEMENTS
In March 2017, the Financial Accounting Standards Board issued Accounting Standards Update (“ASU”)No. 2017-08, Receivables—Nonrefundable Fees and Other Costs (Subtopic310-20): Premium Amortization on Purchased Callable Debt Securities. The amendments in the ASU shorten the amortization period for certain callable debt securities, held at a premium, to be amortized to the earliest call date. The ASU does not require an accounting change for securities held at a discount; which continues to be amortized to estimated maturity. The ASU is effective for fiscal years and interim periods within those fiscal years beginning after December 15, 2018. Management is currently evaluating the impact, if any, of applying this provision.
In August 2018, FASB issued ASU2018-13, Fair Value Measurement (Topic 820): Disclosure Framework—Changes to the Disclosure Requirements for Fair Value Measurement (“ASU2018-13”). The primary focus of ASU2018-13 is to improve the effectiveness of the disclosure requirements for fair value measurements. The changes affect all companies that are required to include fair value measurement disclosures. In general, the amendments in ASU2018-13 are effective for all entities for fiscal years and interim periods within those fiscal years, beginning after December 15, 2019. An entity is permitted to early adopt the removed or modified disclosures upon the issuance of ASU2018-13 and may delay adoption of the additional disclosures, which are required for public companies only, until their effective date. Management has evaluated ASU2018-13 and has adopted the disclosure framework.
NOTE 12. SUBSEQUENT EVENT
Management of the Funds has evaluated the need for disclosures and/or adjustments resulting from subsequent events through the date these financial statements were issued. This evaluation did not result in any subsequent events that necessitated disclosures and/or adjustments.
111
REPORT OF THE INDEPENDENT REGISTERED PUBLIC ACCOUNTING FIRM
To the Shareholders and Board of Trustees of
Angel Oak Funds Trust
Opinion on the Financial Statements
We have audited the accompanying consolidated statement of assets and liabilities, including the consolidated schedules of investments, open futures contracts, and open reverse repurchase agreements of Angel Oak Multi-Strategy Income Fund, and the accompanying statements of assets and liabilities, including the schedules of investments and open futures contracts, of Angel Oak Financials Income Fund, Angel Oak High Yield Opportunities Fund, and Angel Oak UltraShort Income Fund (collectively with Angel Oak Multi-Strategy Income Fund, the “Funds”), each a series of Angel Oak Funds Trust, as of January 31, 2019, and the related consolidated statements of operations and cash flows for the year then ended, the consolidated statements of changes in net assets for each of the two years in the period then ended, including the related notes, and the consolidated financial highlights for each of the five years in the period then ended of Angel Oak Multi-Strategy Income Fund, and the related statement of operations for the year then ended, the statements of changes in net assets for each of the two years in the period then ended, including the related notes, and the financial highlights for each of the five periods in the period then ended for Angel Oak Financials Income Fund (formerly known as Angel Oak Flexible Income Fund), and the related statement of operations for the year then ended, the statements of changes in net assets for each of the two years in the period then ended, including the related notes, and the financial highlights for each of the three periods in the period then ended for Angel Oak High Yield Opportunities Fund, and the related statement of operations, statement of changes in net assets, and financial highlights for the period April 2, 2018 (commencement of operations) through January 31, 2019, including the related notes for Angel Oak UltraShort Income Fund (for the Funds collectively referred to as the “financial statements”). In our opinion, the financial statements present fairly, in all material respects, the financial position of the each of the Funds as of January 31, 2019, the results of their operations, their cash flows (Angel Oak Multi-Strategy Income Fund only), the changes in their net assets, and the financial highlights for each of the periods indicated above, in conformity with accounting principles generally accepted in the United States of America.
Angel Oak High Yield Opportunities Fund’s financial highlights for the periods ended March 31, 2016, and prior were audited by other auditors whose report dated May 23, 2016, expressed an unqualified opinion on those financial highlights.
Basis for Opinion
These financial statements are the responsibility of the Funds’ management. Our responsibility is to express an opinion on the Funds’ financial statements based on our audits. We are a public accounting firm registered with the Public Company Accounting Oversight Board (United States) (“PCAOB”) and are required to be independent with respect to the Funds in accordance with the U.S. federal securities laws and the applicable rules and regulations of the Securities and Exchange Commission and the PCAOB.
We conducted our audits in accordance with the standards of the PCAOB. Those standards require that we plan and perform the audit to obtain reasonable assurance about whether the financial statements are free of material misstatement, whether due to error or fraud.
Our audits included performing procedures to assess the risks of material misstatement of the financial statements, whether due to error or fraud, and performing procedures that respond to those risks. Such procedures included examining, on a test basis, evidence regarding the amounts and disclosures in the financial statements. Our procedures included confirmation of securities owned as of January 31, 2019, by correspondence with the custodian and brokers, or by other appropriate auditing procedures where replies from brokers or counterparties were not received. Our audits also included evaluating the accounting principles used and significant estimates made by management, as well as evaluating the overall presentation of the financial statements. We believe that our audits provide a reasonable basis for our opinion.
We have served as the auditor of one or more funds advised by Angel Oak Capital Advisors, LLC since 2011.

COHEN & COMPANY, LTD.
Cleveland, Ohio
March 29, 2019
112
Additional Information (Unaudited)
1. Shareholder Notification of Federal Tax Status
For the tax year ended January 31, 2019, certain dividends paid by the Funds may be subject to a maximum tax rate of 20% as provided for by the Jobs and Growth Tax Relief Reconciliation Act of 2003. The Funds intend to designate the maximum amount allowable as taxed at a maximum rate of 20%.
For the taxable year ended January 31, 2019, the Multi-Strategy Income Fund, Financials Income Fund, High Yield Opportunities Fund, and UltraShort Income Fund paid qualified dividend income of 0.00%, 0.00%, 0.00% and 0.00%, respectively.
For the taxable year ended January 31, 2019, the percentage of ordinary income dividends paid by the Multi-Strategy Income Fund, Financials Income Fund, High Yield Opportunities Fund, and UltraShort Income Fund that qualifies for the dividends received deduction available to corporations was 0.00%, 0.00%, 0.00% and 0.00%, respectively.
For the taxable year ended January 31, 2019, the Multi-Strategy Income Fund, Financials Income Fund, High Yield Opportunities Fund, and UltraShort Income Fund did not pay any ordinary income distributions that are designated as short-term capital gain distributions under Internal Revenue Section 871(k)2(c).
For the taxable year ended January 31, 2019, the Multi-Strategy Income Fund, Financials Income Fund, High Yield Opportunities Fund, and UltraShort Income Fund the percentage of taxable ordinary income distributions that are designated as interest related dividends under Internal Revenue 871(k)1(c) was 93.29%, 74.98%, 99.92% and 0.00%, respectively.
2. Disclosure of Portfolio Holdings
The Fund will file a complete schedule of portfolio holdings with the Securities and Exchange”) for the first and third quarters of each fiscal year on FormN-Q or Part F of FormN-PORT (beginning with filings after March 31, 2019). The Fund’s FormsN-Q or Part F of FormN-PORT are available on the SEC’s website at www.sec.gov and may be reviewed and copied at the SEC’s Public Reference Room in Washington, D.C. Information on the operation of the Public Reference Room may be obtained by calling1-800-732-0330.
3. Proxy Voting Policies and Procedures
A description of the policies and procedures that the Funds use to determine how to vote proxies related to portfolio securities and information regarding how the Funds voted those proxies during the most recent twelve month period ended June 30, is available without charge upon request by (1) calling the Funds at (855)751-4324 and (2) from Trust documents filed with the SEC on the SEC’s website at www.sec.gov.
4. Statement Regarding the Basis for the Approval of the Continuance of Investment Advisory Agreement
Pursuant to Section 15(c) of the Investment Company Act of 1940, as amended (the “1940 Act”), at the telephonic meeting held on August 22, 2018 and thein-person meeting held on September26-27, 2018 (the “Meetings”), the Board of Trustees (the “Board”) of Angel Oak Funds Trust (the “Trust”) considered the approval of the continuance of the Investment Advisory Agreement (the “Investment Advisory Agreement” or the “Agreement”) between the Trust, on behalf of the Angel Oak Multi-Strategy Income Fund (the “Multi-Strategy Income Fund”), the Angel Oak Flexible Income Fund (the “Flexible Income Fund”), and the Angel Oak High Yield Opportunities Fund (the “High Yield Opportunities Fund”) (each, a “Fund” and, collectively, the “Funds”), and Angel Oak Capital Advisors, LLC (the “Adviser” or “Angel Oak”) for aone-year period. The Multi-Strategy Income Fund is the successor in interest to a fund having the same name and investment objective that was included as a series of another investment company, Valued Advisers Trust, and that was also advised by Angel Oak (the “Predecessor Multi-Strategy Income Fund”). The Predecessor Multi-Strategy Income Fund was reorganized into the Fund on April 10, 2015. The High Yield Opportunities Fund is the successor to the investment performance of the Rainier High Yield Fund (the “Predecessor High Yield Fund”) as a result of the reorganization of the Predecessor High Yield Fund into the Fund on April 15, 2016.
The relevant provisions of the 1940 Act specifically provide that it is the duty of the Board to request and evaluate such information as the Board determines is necessary to allow it to properly consider the renewal of the Agreement, and it is the duty of the Adviser to furnish the Trustees with information that is responsive to their request. Accordingly, in determining whether to renew the Investment Advisory Agreement between the Adviser and the Trust with respect to the Funds, the Board requested, and the Adviser provided, information and data relevant to the Board’s consideration. This included materials prepared by the Adviser, the Funds’ administrator and an independent third-party data provider (the “Outside Data Provider”) that provided the Board with information regarding the fees and expenses of each Fund, as compared to other similar mutual funds.
113
Following their review and consideration, the Trustees determined that the Investment Advisory Agreement with respect to the Funds would enable shareholders of the Funds to obtain high quality services at a cost that is appropriate, reasonable, and in the best interests of the Funds and their shareholders. Accordingly, the Board, including those Trustees who are not considered to be “interested persons” of the Trust, as that term is defined in the 1940 Act (the “Independent Trustees”), unanimously approved the continuance of the Investment Advisory Agreement. In reaching their decision, the Trustees requested and obtained from the Adviser such information as they deemed reasonably necessary to evaluate the Investment Advisory Agreement. The Trustees also carefully considered the comparative fee and expense information prepared by the Adviser. In considering the Investment Advisory Agreement with respect to the Funds, the Trustees evaluated a number of factors that they believed, in light of their reasonable business judgment, to be relevant. They based their decision on the following considerations, among others, although they did not identify any one specific consideration or any particular information that was controlling of their decision:
The nature, extent and quality of the advisory services to be provided.The Trustees concluded that Angel Oak is capable of providing high quality services to each Fund, as indicated by the nature and quality of services provided in the past to each Fund, Angel Oak’s management capabilities demonstrated with respect to each Fund, the professional qualifications and experience of the portfolio managers of each Fund, Angel Oak’s investment and management oversight processes, and the competitive investment performance of the Funds. The Trustees also determined that Angel Oak proposed to provide investment advisory services that were of the same quality as services it provided to each Fund in the past, and that these services are appropriate in scope and extent in light of the Funds’ operations, the competitive landscape of the investment company business and investor needs. The Trustees took into account Angel Oak’s oversight of Parks Capital Management, LLC (“Parks Capital”) in connection with Parks Capital serving as asub-adviser with respect to a limited portion of the assets of the Flexible Income Fund and, potentially in the future, a limited portion of the assets of Multi-Strategy Income. On the basis of the Trustees’ assessment of the nature, extent and quality of the advisory services provided by Angel Oak, the Trustees concluded that Angel Oak is capable of continuing to generate a level of long-term investment performance that is appropriate in light of each Fund’s investment objective, policies and strategies and competitive with many other comparable investment companies.
The investment performance of the Funds. With respect to each Fund, the Trustees concluded on the basis of information derived from independent third-party data that Angel Oak had achieved investment performance that was competitive relative to the Fund’s category, as established by the Outside Data Provider, and a smaller peer group of comparable funds over longer-term trailing periods, and the Trustees took into consideration the fact that Angel Oak focuses on long-term performance results with respect to its management of the Funds and that the Funds may have periods of underperformance when measured on a more short-term basis. In considering the performance of the Funds, the Trustees reviewed reports comparing each Fund’s performance to: (i) the Fund’s category; (ii) a peer group of comparable mutual funds; and (iii) the Fund’s benchmark index.
With respect to the Multi-Strategy Income Fund (which commenced operations in June 2011), the Trustees noted that the Fund’s Institutional Class shares had ranked in the third quartile of the Fund’s peer group over theone-, three- and five-year periods ended June 30, 2018 and in the second quartile over the period since the Fund’s inception. They observed that the Fund’s Institutional Class shares had ranked in the first quartile of the Fund’s category over theone- and five-year periods ended June 30, 2018 and since the Fund’s inception and had ranked in the second quartile over the three-year period ended June 30, 2018. The Trustees also noted that the Multi-Strategy Income Fund’s Institutional Class shares had outperformed the Fund’s benchmark index, the Bloomberg Barclays U.S. Aggregate Bond Index, over theone-, three- and five-year periods ended June 30, 2018 and since the Fund’s inception.
With respect to the Flexible Income Fund (which commenced operations in November 2014), the Trustees observed that the Fund’s Institutional Class shares had ranked in the first quartile of the Fund’s peer group for theone-year period and in the fourth quartile for the three-year period ended June 30, 2018, and had ranked in the second quartile over the period since the Fund’s inception. The Trustees noted that the Fund’s Institutional Class shares had ranked in the first quartile of the Fund’s category over theone-year period and in the fourth quartile over the three-year period ended June 30, 2018 and had ranked in the first quartile over the period since the Fund’s inception. The Trustees further noted that the Fund’s Institutional Class shares had outperformed the Fund’s benchmark index, the Bloomberg Barclays U.S. Aggregate Bond Index, over theone-year and three-year periods ended June 30, 2018 and over the period since the Fund’s inception.
With respect to the High Yield Opportunities Fund (which commenced operations in March 2009), the Trustees noted that the Fund’s Institutional Class shares had ranked in the first quartile of the Fund’s peer group over the three- and five- year periods and in the second quartile over theone-year period ended June 30, 2018 and had ranked in the second quartile over the period since the Fund’s inception. They observed that the Fund’s Institutional Class shares had ranked in the first quartile of the Fund’s category over theone-, three- and five-year periods ended June 30, 2018 and had ranked in the fourth quartile over the period since the Fund’s inception. The Trustees also noted that the Fund’s Institutional Class shares had outperformed the Fund’s benchmark index, the Bloomberg Barclays U.S. Corporate High Yield Bond Index, and its former benchmark index, the Bank of America Merrill Lynch U.S. High Yield Index, over theone-, three- and five-year periods ended June 30, 2018 and had underperformed over the period since the Fund’s inception.
114
On the basis of the Trustees’ assessment of the nature, extent and quality of advisory services provided by Angel Oak, the Trustees concluded that Angel Oak is capable of generating a level of long-term investment performance that is appropriate in light of each Fund’s investment objectives, policies and strategies and competitive with many other investment companies.
The cost of advisory services provided and the level of profitability. On the basis of comparative information derived from the expense data that was provided to the Board, the Trustees determined that the management fee and net expense ratio of the Flexible Income Fund and Multi-Strategy Income Fund was generally higher, and lower in the case of High Yield Opportunities Fund, than the median management fee and net expense ratio for funds in their respective peer groups. However, the Board noted that the quality of services provided by Angel Oak and the past performance of the Funds demonstrated that the advisory fee still offered an appropriate value for the Funds and their shareholders. In addition, the Trustees noted that Angel Oak had renewed its contractual commitment for the benefit of Fund shareholders to limit the operating expenses of each of the classes of shares of the Funds for an additional year through May 31, 2020.
The Board also reviewed the fees that Angel Oak charges its other clients for discretionary portfolio management services, noting that the firm has a variety of account types with different fee arrangements. The Board took into account the unique management requirements involved in managing a registered investment company as opposed to other types of client accounts.
The Board also considered Angel Oak’s current level of profitability with respect to each Fund, and noted that Angel Oak’s profitability was acceptable and not excessive and consistent with applicable industry averages. They noted that Angel Oak is committed to using its own resources to help improve the services it provides for the benefit of the Funds. They also noted that Angel Oak had provided information regarding its methodology for attributing profitability to each Fund, as opposed to its other lines of business. The Trustees also took into consideration the nature and extent of expenses that are borne directly by Angel Oak from its own financial resources to help to market and promote the Funds. Accordingly, on the basis of the Board’s review of the fees to be charged by Angel Oak for the investment advisory and other services provided to the Funds by Angel Oak, and the estimated profitability of Angel Oak’s relationship with each Fund, the Board concluded that the level of investment advisory fees and Angel Oak’s profitability are appropriate in light of the investment advisory fees, overall expense ratios and investment performance of comparable investment companies and the historical profitability of the relationship between each Fund and Angel Oak. The Trustees considered the profitability of Angel Oak both before and after the impact of the marketing-related expenses that Angel Oak incurs out of its own resources in connection with its management of the Funds.
The extent to which economies of scale may be realized as the Funds grow and whether the advisory fees reflect possible economies of scale. While it was noted that each Fund’s investment advisory fee will not decrease as the Fund’s assets grow because the Funds are not subject to investment advisory fee breakpoints, the Trustees concluded that each Fund’s investment advisory fee was appropriate in light of the projected size of the Fund and appropriately reflected the current economic environment for Angel Oak and the competitive nature of the mutual fund market. The Trustees then noted that they would have the opportunity to periodicallyre-examine whether each Fund had achieved economies of scale and the appropriateness of investment advisory fees payable to Angel Oak with respect to each Fund, in the future, at which time the implementation of fee breakpoints could be considered. Finally, the Trustees noted the improvements made to the Adviser’s infrastructure and services provided to each Fund, which had been funded by the advisory fees received by the Adviser.
Benefits to Angel Oak from its relationship with the Funds (and any corresponding benefits to the Funds). The Trustees concluded that other benefits derived by Angel Oak from its relationship with the Funds are reasonable and fair and consistent with industry practice and the best interests of the Funds and their shareholders.
Other Considerations. In approving the Investment Advisory Agreement, the Trustees determined that Angel Oak has made a substantial commitment to the recruitment and retention of high quality personnel, and maintains the financial, compliance and operational resources reasonably necessary to manage the Funds in a professional manner that is consistent with the best interests of each Fund and its shareholders. The Trustees also concluded that Angel Oak has made a significant entrepreneurial commitment to the management and success of the Funds, which entails a substantial financial and professional commitment, including the Operating Expense Limitation Agreement under which Angel Oak has undertaken to waive a portion of its fees to the benefit of Fund shareholders to the extent necessary in accordance with the terms of the Operating Expense Limitation Agreement. The Trustees observed that those waivers were subject to recoupment under the terms of the Operating Expense Limitation Agreement and that Angel Oak had recouped previously-waived fees with respect to the Multi-Strategy Income Fund. The Board also considered matters with respect to the brokerage practices of Angel Oak, including its best-execution procedures, and noted that these were reasonable and consistent with standard industry practice.
Following further discussion and the consideration of questions raised by the Independent Trustees, the Trustees determined that they had received sufficient information relating to the Funds in order to consider the approval of the Investment Advisory Agreement. It
115
was noted that, in making their determinations, the Trustees had considered and relied upon not only the materials provided to them for use at the Meetings with respect to the proposed contract renewal, but also the information about the Funds and Angel Oak that had been provided to them throughout the past year in connection with their regular Board meetings at which they engage in the ongoing oversight of the Funds and their operations. In reaching their conclusion with respect to the continuation of the Investment Advisory Agreement and the level of fees paid under the Agreement, the Trustees did not identify any one single factor as being controlling, but, rather, the Board took note of a combination of factors that had influenced their decision making process. They noted the level and quality of investment advisory services provided by the Adviser to each of the Funds, and they found that these services continued to benefit the shareholders of the Funds and also reflected management’s overall commitment to the continued growth and development of the Funds.
5. Compensation of Trustees
Each Trustee who is not an “interested person” of the Trust (i.e., an “Independent Trustee”) receives an annual retainer of $50,000 (pro-rated for any periods less than one year), paid quarterly as well as $10,000 for attending each regularly scheduled meeting in person in connection with his or her service on the Board of the Trust and other funds advised by the Adviser. In addition, each Committee Chairman receives additional annual compensation of $12,000. Independent Trustees are permitted reimbursement forout-of-pocket expenses incurred in connection with attendance at meetings. The Funds’ Statement of Additional Information includes additional information about the Trustees and is available upon request by calling toll free1-855-444-9243.
6. Trustees and Officers
The business of each Fund is managed under the direction of the Board. The Board formulates the general policies of each Fund and meets periodically to review each Fund’s performance, monitor investment activities and practices, and discuss other matters affecting the Fund. The Trustees are fiduciaries for each Fund’s shareholders and are governed by the laws of the State of Delaware in this regard. The names and addresses of the Trustees and officers of the Trust are listed below along with a description of their principal occupations over at least the last five years. The address of each Trustee and Officer of the Trust is c/o Angel Oak Capital Advisors, LLC, One Buckhead Plaza, 3060 Peachtree Road NW, Suite 500, Atlanta, GA 30305. The Fund’s Statement of Additional Information includes additional information about the Trustees and is available upon request by calling toll free1-855-751-4324.
| | | | | | | | | | |
Name and
Year of Birth | | Position with
the Trust | | Term of Office
and Length of
Time Served | | Principal Occupation(s)
During Past 5 Years | | Number of
Portfolios
in Fund
Complex(1)
Overseen
by Trustee | | Other Directorships Held
During the Past 5 Years |
Independent Trustees of the Trust(2) |
Ira P. Cohen 1959 | | Independent Trustee, Chairman | | Trustee
since 2014,
Chairman
since 2017;
indefinite
terms | | Executive Vice President, Recognos Financial (investment industry data analysis provider) (since 2015); Independent financial services consultant (since 2005). | | 5 | | Trustee, Valued Advisers Trust (since 2010) (12 portfolios); Trustee, Griffin Institutional Access Credit Fund (since April 2017); Trustee, Griffin Institutional Access Real Estate Access Fund (since 2014); Trustee, Angel Oak Strategic Credit Fund (since December 2017). |
Alvin R. Albe, Jr. 1953 | | Independent Trustee | | Since 2014;
indefinite
term | | Retired; Senior Advisor, The TCW Group, Inc. (asset manager) (2008 – 2013). | | 5 | | Director, Syntroleum Corporation (renewable energy firm) (1988 –2014); Trustee, Angel Oak Strategic Credit Fund (since December 2017). |
116
| | | | | | | | | | |
| Name and Year of Birth | | Position with
the Trust | | Term of Office
and Length of
Time Served | | Principal Occupation(s)
During Past 5 Years | | Number of
Portfolios
in Fund
Complex(1)
Overseen
by Trustee | | Other Directorships Held
During the Past 5 Years |
Keith M. Schappert 1951 | | Independent Trustee | | Since 2014;
indefinite
term | | President, Schappert Consulting LLC (investment industry consulting) (since 2008). | | 5 | | Trustee, Mirae Asset Discovery Funds (since 2010) (4 portfolios); Trustee, Metropolitan Series Fund, Inc. (2009 – 2015) (30 portfolios); Trustee, Met Investors Series Trust (2012 – 2015) (45 portfolios); Director, Commonfund Capital, Inc. (private equity business) (since 2015); Director, The Commonfund (investment management) (since 2012); Director, Calamos Asset Management, Inc. (investment management) (2012 – 2017); Trustee, Angel Oak Strategic Credit Fund (since December 2017). |
Andrea N. Mullins 1967 | | Independent Trustee | | Since 2019;
indefinite
term | | Private Investor; Independent Contractor, SWM Advisors (since 2014); Retired from Eagle Funds in 2010 as Chief Financial Officer | | 5 | | Trustee, Valued Advisors Trust (since 2013, Chairperson since 2017) (12 portfolios); Trustee, Angel Oak Strategic Credit Fund (since February 2019). |
James E. Stueve 1964 | | Independent Trustee | | Since 2019;
indefinite
term | | Stueve Insights LLC (consulting) (since 2018); President and Global Head of Distribution, Ridgeworth Investments (2007 – 2017) | | 5 | | Chairman, Mutual Fund Education Alliance (2013 – 2016); Trustee and Finance Chair, Foundation for Financial Planning (2012 – 2016); Trustee, Angel Oak Strategic Credit Fund (since February 2019). |
Interested Trustees of the Trust |
Sreeniwas (Sreeni) V. Prabhu 1974 | | Interested Trustee | | Since 2015;
indefinite
term | | Chief Investment Officer, Portfolio Manager,Co-Founder, Angel Oak Capital Advisors, LLC (since 2009). | | 5 | | Trustee, Angel Oak Strategic Credit Fund (since December 2017). |
Samuel R. Dunlap, III 1979 | | Interested Trustee | | Since 2019;
indefinite
term | | Managing Director and Senior Portfolio Manager, Angel Oak Capital Advisors, LLC (since 2009) | | 5 | | Trustee, Angel Oak Strategic Credit Fund (since February 2019). |
| (1) | The Fund Complex includes each series of the Trust and the Angel Oak Strategic Credit Fund. |
| (2) | The Trustees of the Trust who are not “interested persons” of the Trust as defined in the 1940 Act (“Independent Trustees”). |
117
| | | | | | |
Name and
Year of Birth | | Position with the Trust | | Term of Office and Length of Time Served | | Principal Occupation(s) During Past 5 Years |
Officers of the Trust |
Dory S. Black, Esq. 1975 | | President | | Since 2015; indefinite term | | General Counsel, Angel Oak (since 2014); General Counsel, EARNEST Partners, LLC (investment management firm) (2014); Vice-President and Assistant General Counsel, GE Asset Management Incorporated (2004 – 2014). |
Adam Langley 1967 | | Chief Compliance Officer | | Since 2015; indefinite term | | Chief Compliance Officer, Angel Oak Capital Advisors, LLC (since 2015); Chief Compliance Officer, Angel Oak Strategic Credit Fund (since 2017); Chief Compliance Officer, Angel Oak Capital Partners II, LLC (since 2016); Chief Compliance Officer, Buckhead One Financial Opportunities, LLC (since 2015); Chief Compliance Officer of Falcon I, LLC (since 2018); Chief Compliance Officer of Hawks I, LLC (since 2019); Compliance Manager, Invesco Advisers, Ltd. (2013 – 2015); Compliance Officer, Macquarie Group (2013). |
Lu Chang, CFA, FRM, CAIA 1975 | | Secretary | | Since 2015; indefinite term | | Chief Risk Officer, Angel Oak Capital Advisors, LLC (since 2014); Vice-President and Finance Manager, Wells Fargo Advisors, LLC (investment advisory firm) (2004 – 2014). |
Daniel Fazioli 1981 | | Treasurer | | Since 2015; indefinite term | | Controller, Angel Oak Capital Advisors, LLC (since 2015); Controller, Tang Capital Partners, LP (2014 – 2015); Associate, Goldman Sachs & Company, Inc. (2010 – 2014). |
Each Trustee holds office for an indefinite term and until the earlier of: the Trust’s next meeting of shareholders and the election and qualification of his/her successor; or until the date a trustee dies, resigns or is removed in accordance with the Trust’s Declaration of Trust andBy-laws. Each Trustee shall serve during the lifetime of the Trust until he or she: (a) dies; (b) resigns; (c) has reached the mandatory retirement age, if any, as set by the Trustees; (d) is declared incompetent by a court of appropriate jurisdiction; or (e) is removed, or, if sooner, until the next meeting of shareholders called for the purpose of electing Trustees and until the election and qualification of his or her successor. Each officer holds office at the pleasure of the Board.
118
ANGEL OAK FUNDS TRUST
Notice of Privacy Policy & Practices
Your privacy is important to us. We are committed to maintaining the confidentiality, integrity and security of your personal information. When you provide personal information, we
believe that you should be aware of policies to protect the confidentiality of that information.
We collect the following nonpublic personal information about you:
| | • | | Information we receive from you on or in applications or other forms, correspondence, or conversations, including, but not limited to, your name, address, phone number, social security number, assets, income and date of birth; and |
| | • | | Information about your transactions with us, our affiliates, or others, including, but not limited to, your account number and balance, payments history, parties to transactions, cost basis information, and other financial information. |
We do not disclose any nonpublic personal information about our current or former shareholders to nonaffiliated third parties, except as permitted by law. For example, we are permitted by law to disclose all of the information we collect, as described above, to our transfer agent to process your transactions. Furthermore, we restrict access to your nonpublic personal information to those persons who require such information to provide products or services to you. We maintain physical, electronic, and procedural safeguards that comply with federal standards to guard your nonpublic personal information.
In the event that you hold shares of the Funds through a financial intermediary, including, but not limited to, a broker-dealer, bank, or trust company, the privacy policy of your financial intermediary would govern how your nonpublic personal information would be shared with nonaffiliated third parties.
119
INVESTMENT ADVISER
Angel Oak Capital Advisors, LLC
One Buckhead Plaza
3060 Peachtree Road NW
Suite 500
Atlanta, GA 30305
SUB-ADVISER
Parks Capital Management, LLC
401 Park Ave. South
Suite 850
New York, NY 10016
DISTRIBUTOR
Quasar Distributors, LLC
777 East Wisconsin Avenue
Milwaukee, WI 53202
INDEPENDENT REGISTERED PUBLIC ACCOUNTING FIRM
Cohen & Company, Ltd.
1350 Euclid Avenue, Suite 800
Cleveland, OH 44115
LEGAL COUNSEL
Dechert LLP
1900 K Street NW
Washington, DC 20006
CUSTODIAN
U.S. Bank National Association
1555 North Rivercenter Drive, Suite 302
Milwaukee, WI 53202
ADMINISTRATOR, TRANSFER AGENT, AND FUND ACCOUNTANT
U.S Bancorp Fund Services, LLC
615 East Michigan Street
Milwaukee, WI 53202
This report is intended only for the information of shareholders or those who have received the Funds’ prospectus which contains information about the Funds’ management fee and expenses. Please read the prospectus carefully before investing.
Item 2. Code of Ethics.
The registrant has adopted a code of ethics that applies to the registrant’s principal executive officer and principal financial officer. The registrant has not made any substantive amendments to its code of ethics during the period covered by this report. The registrant has not granted any waivers from any provisions of the code of ethics during the period covered by this report.
A copy of the registrant’s Code of Ethics is filed herewith.
Item 3. Audit Committee Financial Expert.
The registrant’s board of trustees has determined that there is at least one audit committee financial expert serving on its audit committee. Mr. Alvin Albe, Jr. is the “audit committee financial expert” and is considered to be “independent” as each term is defined in Item 3 ofForm N-CSR.
Item 4. Principal Accountant Fees and Services.
The registrant has engaged its principal accountant to perform audit services, audit-related services, tax services and other services during the past two fiscal years. “Audit services” refer to performing an audit of the registrant’s annual financial statements or services that are normally provided by the accountant in connection with statutory and regulatory filings or engagements for those fiscal years. “Audit-related services” refer to the assurance and related services by the principal accountant that are reasonably related to the performance of the audit. “Tax services” refer to professional services rendered by the principal accountant for tax compliance, tax advice, and tax planning. The following table details the aggregate fees billed or expected to be billed for each of the last two fiscal years for audit fees, audit-related fees, tax fees and other fees by the principal accountant.
| | | | | | | | |
| | | FYE 01/31/2019 | | | FYE 01/31/2018 | |
Audit Fees | | $ | 115,000 | | | $ | 95,000 | |
Audit-Related Fees | | $ | 0 | | | $ | 0 | |
Tax Fees | | $ | 16,000 | | | $ | 15,900 | |
All Other Fees | | $ | 0 | | | $ | 0 | |
The audit committee has adoptedpre-approval policies and procedures that require the audit committee topre-approve all audit andnon-audit services of the registrant, including services provided to any entity affiliated with the registrant.
The percentage of fees billed by Cohen & Company, Ltd. applicable tonon-audit services pursuant to waiver ofpre-approval requirement were as follows:
| | | | | | | | |
| | | FYE 01/31/2019 | | | FYE 01/31/2018 | |
Audit-Related Fees | | | 0 | % | | | 0 | % |
Tax Fees | | | 0 | % | | | 0 | % |
All Other Fees | | | 0 | % | | | 0 | % |
1
All of the principal accountant’s hours spent on auditing the registrant’s financial statements were attributed to work performed byfull-time permanent employees of the principal accountant.
The following table indicates thenon-audit fees billedor expected to be billed by the registrant’s accountant for services to the registrant and to the registrant’s investment adviser (and any other controlling entity, etc.—notsub-adviser) for the last two years. The audit committee of the board of trustees/directors has considered whether the provision ofnon-audit services that were rendered to the registrant’s investment adviser is compatible with maintaining the principal accountant’s independence and has concluded that the provision of suchnon-audit services by the accountant has not compromised the accountant’s independence.
| | | | | | | | |
Non-Audit Related Fees | | FYE 01/31/2019 | | | FYE 01/31/2018 | |
Registrant | | $ | 16,000 | | | $ | 15,900 | |
Registrant’s Investment Adviser | | $ | 0 | | | $ | 0 | |
Item 5. Audit Committee of Listed Registrants.
Not applicable to registrants who are not listed issuers (as defined in Rule10A-3 under the Securities Exchange Act of 1934).
Item 6. Investments.
Schedule of Investments is included as part of the report to shareholders filed under Item 1 of this Form.
Item 7. Disclosure of Proxy Voting Policies and Procedures forClosed-End Management Investment Companies.
Not applicable toopen-end investment companies.
Item 8. Portfolio Managers ofClosed-End Management Investment Companies.
Not applicable toopen-end investment companies.
Item 9. Purchases of Equity Securities byClosed-End Management Investment Company and Affiliated Purchasers.
Not applicable toopen-end investment companies.
Item 10. Submission of Matters to a Vote of Security Holders.
There have been no material changes to the procedures by which shareholders may recommend nominees to the registrant’s board of trustees.
2
Item 11. Controls and Procedures.
| (a) | The Registrant’s Principal Executive Officer and Principal Financial Officer have reviewed the Registrant’s disclosure controls and procedures (as defined in Rule30a-3(c) under the Investment Company Act of 1940 (the “Act”)) as of a date within 90 days of the filing of this report, as required by Rule30a-3(b) under the Act and Rules13a-15(b) or15d-15(b) under the Securities Exchange Act of 1934. Based on their review, such officers have concluded that the disclosure controls and procedures are effective in ensuring that information required to be disclosed in this report is appropriately recorded, processed, summarized and reported and made known to them by others within the Registrant and by the Registrant’s service provider. |
| (b) | There were no changes in the Registrant’s internal control over financial reporting (as defined in Rule30a-3(d) under the Act) that occurred during the second fiscal quarter of the period covered by this report that have materially affected, or are reasonably likely to materially affect, the Registrant’s internal control over financial reporting. |
Item 12. Disclosure of Securities Lending Activities forClosed-End Management Investment Companies
Not applicable toopen-end investment companies.
Item 13. Exhibits.
| (a) | (1)Any code of ethics or amendment thereto, that is the subject of the disclosure required by Item 2, to the extent that the registrant intends to satisfy Item 2 requirements through filing an exhibit.Filed herewith |
(2)A separate certification for each principal executive officer and principal financial officer pursuant to Section 302 of the Sarbanes-Oxley Act of 2002.Filed herewith.
(3)Any written solicitation to purchase securities under Rule 23c-1 under the Act sent or given during the period covered by the report by or on behalf of the registrant to 10 or more persons.Not applicable toopen-end investment companies.
(4)Change in the registrant’s independent public accountant.There was no change in the registrant’s independent public accountant for the period covered by this report.
| (b) | Certifications pursuant to Section 906 of the Sarbanes-Oxley Act of 2002. Filed herewith. |
3
SIGNATURES
Pursuant to the requirements of the Securities Exchange Act of 1934 and the Investment Company Act of 1940, the registrant has duly caused this report to be signed on its behalf by the undersigned, thereunto duly authorized.
|
(Registrant) Angel Oak Funds Trust |
|
By (Signature and Title)* /s/ Dory S. Black |
| Dory S. Black, President (Principal Executive Officer) |
|
Date 3/29/2019 |
Pursuant to the requirements of the Securities Exchange Act of 1934 and the Investment Company Act of 1940, this report has been signed below by the following persons on behalf of the registrant and in the capacities and on the dates indicated.
|
By (Signature and Title)* /s/ Dory S. Black |
| Dory S. Black, President (Principal Executive Officer) |
|
Date 3/29/2019 |
|
By (Signature and Title)*/s/ Daniel Fazioli |
| Daniel Fazioli, Treasurer (Principal Financial Officer) |
|
Date 3/29/2019 |
* Print the name and title of each signing officer under his or her signature.