UNITED STATES
SECURITIES AND EXCHANGE COMMISSION
Washington, D.C. 20549
FORM N-CSR
CERTIFIED SHAREHOLDER REPORT OF REGISTERED
MANAGEMENT INVESTMENT COMPANIES
Investment Company Act file number 811-22980
Angel Oak Funds Trust
(Exact name of registrant as specified in charter)
3344 Peachtree Rd. NE, Suite 1725
Atlanta, Georgia 30326
(Address of principal executive offices) (Zip code)
Dory S. Black, Esq., President
3344 Peachtree Rd. NE, Suite 1725
Atlanta, Georgia 30326
(Name and address of agent for service)
Copy to:
Douglas P. Dick
Stephen T. Cohen
Dechert LLP
1900 K Street NW
Washington, DC 20006
(404) 953-4900
Registrant’s telephone number, including area code
Date of fiscal year end: January 31
Date of reporting period: January 31, 2022
Item 1. Reports to Stockholders.

Annual Report
January 31, 2022
Angel Oak Multi-Strategy Income Fund
Angel Oak Financials Income Fund
Angel Oak High Yield Opportunities Fund
Angel Oak UltraShort Income Fund
Angel Oak Core Impact Fund
Angel Oak Capital Advisors, LLC
3344 Peachtree Road NE
Suite 1725
Atlanta, GA 30326
(404) 953-4900
Table of Contents
Dear Shareholder,
Chairman Jerome Powell has pivoted from a transitory to persistent view of inflation (the “Powell Pivot”), and the time to prepare for interest rate liftoff is here. Fears of a Federal Reserve (Fed) behind the curve on inflation had markets on edge heading into the final days of 2021. Unlike in 2018, when Powell pivoted from “a long way from neutral” to suddenly dovish rhetoric and subsequent easing, Powell pivoted to a more hawkish tone on November 30 in his Senate Banking Committee testimony, when he offered a mea culpa, stating it was time to retire the word “transitory.” On December 1, he went on to tell the House Financial Services Committee, “We’ve seen inflation be more persistent. We’ve seen the factors that are causing higher inflation to be more persistent. Policy has adapted to that and will continue to adapt.” This is a significant shift away from his previous transitory stance and emphasis on maximum employment. In fact, Powell suddenly shifted, noting persistent inflation might hamper maximum employment: “To get back to the kind of great labor market we had before the pandemic, we are going to need price stability, and in a sense, the risk of persistent inflation is also a major risk to getting back to such a labor market.” We were not expecting this policy U-turn, especially considering the recent rise of the omicron variant, but like in 2021, we expect our positioning toward high-quality income in shorter-duration areas of U.S. structured credit, high yield, and financials will continue to outperform in 2022.
As we expected in our 2021 outlook, inflation and growth were brisk in 2021, and more importantly, our persistent view steered us away from long-duration, more interest rate sensitive areas of traditional fixed income, where yields pale in comparison to the recent inflation levels, which were last seen in the 1980s. We favored high-quality, short-duration areas of U.S. structured credit, notably mortgage and consumer collateral, select high-yield issuers, and select tranches of collateralized loan obligation (CLO) tranches. This view and positioning resulted in positive performance amid a yield-starved world at the zero-bound challenged by rising rates. Like 2021, we believe 2022 will continue to be driven by strong growth, persistent inflation pressures, and a robust consumer, and despite the unexpected pivot toward liftoff, financial conditions will remain extraordinarily accommodative. Amid a backdrop of solid growth, we expect a benign credit environment driven by lower but still solid earnings and extraordinarily low default expectations. Therefore, we continue to target similar positioning in 2022 and especially favor amortizing areas of mortgage- and consumer-centric areas of structured credit backed by rising collateral values.
The year 2021 was defined by historic growth and inflation amid a V-shaped recovery that will rival anything in recent economic history. Real gross domestic product (GDP) averaged 5.6%, and the headline Consumer Price Index (CPI) averaged 4.6%, which sent risk assets, particularly those benefiting from higher inflation, soaring. Long-duration fixed income, despite the rally in rates in the second half of 2021, had its worst year since 2013, the year of the taper tantrum. Our structured credit, high-yield, and financials strategies had solid performance despite the rising rate environment and waffling credit markets in the second half of 2021 due to high current income, spread compression on favorable fundamentals, and short-duration profiles. We expect that the higher yield profile relative to the duration will continue to stand out as a performance differentiator in 2022, as we expect U.S. real GDP to average 4%, headline CPI to average 5%, and the headline unemployment rate to descend to its pre-COVID-19 level of 3.5% by the end of 2022. We remain in the persistent inflation camp, as we wrote extensively about in our 2021 Mid-Year Outlook. After the Powell Pivot and the January 26th Federal Open Market Comittee (FOMC) meeting, we now expect two to three target rate hikes in 2022 and the 10-year note yield to end the year at approximately 2.25%. Expectations for an even tighter labor market amid the “Great Resignation” will further enhance an incredibly robust U.S. consumer, as it should result in more wage growth. Wage growth is expected to continue, as the U.S. consumer has already accumulated a $2.2 trillion war chest of excess savings since March 2020!1 As the U.S. consumer is saving and earning more, household debt ratios are at historic lows. A strong U.S. consumer credit profile coupled with pent-up demand because of the pandemic should further support our view for solid growth and high inflation in 2022. This environment should continue to pressure risk-free rates and long-duration fixed income as market participants price in more Fed tightening in the future but recognize how easy financial conditions remain, reinvigorating the bear curve-steepening trend witnessed in the first half of 2021.
It’s important to emphasize that even with the Powell Pivot, financial conditions are still near their most favorable point in the history of the Goldman Sachs Financial Conditions Index. Moreover, the 10-year real yield is extremely negative, and we expect it will remain near these levels in 2022. Recall that this sustained level of negative real yields has only occurred twice before in the post-WWII era, in the mid-1970s and the early 1980s, lasting several years in both instances. This backdrop will support not only our consensus view of solid growth and inflation but also a favorable earnings environment, low default expectations, and stable credit spreads. In fact, corporate profit margins are at levels last seen in the 1950s! Even if these subside in 2022, we believe that they will likely remain at historically attractive levels. The last time the Fed began tightening on the front end, in 2015, high-yield spreads tightened into 2017. It wasn’t until Powell’s first pivot in 2018 that credit spreads began to widen as the market began to price in the fact that the Fed had gone too far, and a slowdown was imminent. Moreover, in the past 13 hiking cycles since 1955, U.S. corporate BBB spreads on average were 47 basis points tighter in the 12 months following the first hike.2
1 Source: Morgan Stanley
2 Source: Deutsche Bank
1
While broader credit markets took a pause in the second half of 2021 due to new COVID-19 variants and the Powell Pivot, we remain constructive toward credit, particularly U.S. structured credit. We are positioning for a longer-term expansion in areas of mortgage- and consumer-centric structured credit with attractive income and the potential for spread tightening and price appreciation in 2022. In addition to a brisk recovery of growth and inflation, 2021 brought a historic supply of new issuance in the credit markets, particularly in U.S. structured credit. After issuance came to a grinding halt in 2020 due to the pandemic, the V-shaped recovery, improving consumer confidence, and a growing appetite for attractive financing on the heels of post-COVID-19 accommodation sent issuance to post-global financial crisis (GFC) highs across all subsectors in 2021. Technical headwinds of heavy supply began to weigh on credit spreads in some of our more favored areas of structured credit toward the end of 2021 and into 2022 despite improving fundamentals. We will seek to take advantage of any technical weakness into 2022. We will continue to target de-leveraging, short-duration areas of U.S. structured credit, and select areas of high yield and financials within corporate credit as markets navigate potential interest rate liftoff in 2022.
Thank you for your continued support.
Respectfully yours,
Sam Dunlap
Chief Investment Officer, Public Strategies
The opinions expressed are subject to change at any time, are not guaranteed, and should not be considered investment advice. Please refer to the Schedule of Investments in this report for a complete list of Funds’ holdings.
Must be accompanied or preceded by a prospectus.
Mutual fund investing involves risk. Principal loss is possible.
The Angel Oak Funds are distributed by Quasar Distributors, LLC.
Definitions:
Basis Point (bps): One hundredth of one percent. Used to denote the percentage change in a financial instrument.
Spread: The difference in yield between two bonds of similar maturity but different credit quality.
2
Angel Oak Multi-Strategy Income Fund
How did the Fund perform during the period?
For the 12-month period that ended January 31, 2022, the Fund’s Institutional Shares (ANGIX) returned 2.87%, while the Fund’s A Shares (ANGLX) and C Shares (ANGCX) returned 2.71%1 and 1.78%1, respectively. During the same period, the Fund’s benchmark, the Bloomberg U.S. Aggregate Bond Index, returned -2.97%.
What were the main contributors to and detractors from the Fund’s performance during the period?
The primary positive contributor to performance was higher current income and duration short of the benchmark due to an overweight to predominately amortizing areas of U.S. structured credit. The Fund’s current income of 4.76% was a positive contributor relative to the benchmark, offsetting a decline in prices of approximately -1.92%. Prices were lower during the period, notably during the second half due to the rise of new COVID-19 variants, concerns surrounding the Powell Pivot, surging inflation, and robust new issue supply in structured credit. The effective duration of the Fund continues to be much lower than the benchmark. The duration of the strategy was approximately 2.8-3.1 throughout 2022 compared to the benchmark, which was in the range of 6.0-6.5 during the period. The portfolio’s duration remains well short of the benchmark, and we believe this profile could lead to continued outperformance in the year ahead.
For the period, the majority of the allocation and contribution to the Fund came from non-agency residential mortgage-backed securities (NA RMBS). NA RMBS currently stands at approximately 63.21% of the Fund and had a total return of approximately 4.32%, contributing approximately 2.84% to the Fund’s performance. The asset-backed securities (ABS) allocation, approximately 9.55% of the allocation, was up approximately 3.07% total return, contributing approximately 0.29% to performance. The corporate bond allocation, approximately 4.88% of the allocation, was up 3.71% total return, contributing approximately 0.24%. The collateralized loan obligation (CLO) allocation, approximately 4.09% of the Fund was up 8.45% total return, contributing approximately 0.52%. Finally, the non-agency commercial mortgage-backed securities (NA CMBS) allocation, currently 3.37% of the Fund, was up approximately 6.36%, contributing approximately 0.19%. The only detractor to performance was the agency CMBS and U.S. Treasury portion of the portfolio, detracting approximately 0.25% during the period due to higher rates.
As we expected in our 2021 outlook, inflation and growth were brisk in 2021. More importantly, our persistent view steered us away from long-duration, more interest rate sensitive areas of traditional fixed income, where yields pale in comparison to the recent inflation levels, which were last seen in the early 1980s. We favored high-quality, short-duration areas of U.S. structured credit, notably mortgage and consumer collateral, select high-yield issuers, and select tranches of CLOs. This view and positioning resulted in positive performance amid a yield-starved world at the zero-bound challenged by rising interest rates. Our structured credit, high-yield, and financials strategies had solid performance despite the rising rate environment and waffling credit markets in the second half of 2021 due to high current income, favorable credit fundamentals, and short-duration profiles.
What is your outlook heading into 2022, and how is the Fund positioned?
Like 2021, we believe that 2022 will continue to be driven by strong growth, persistent inflation pressures, and a robust consumer and, despite the unexpected Powell Pivot toward liftoff, financial conditions should remain extraordinarily accommodative. Amid a backdrop of solid growth, we expect a benign credit environment driven by lower but still solid earnings and extraordinarily low default expectations. Therefore, we continue to target similar positioning in 2022 and especially favor amortizing areas of mortgage- and consumer-centric areas of structured credit backed by rising collateral values.
The higher yield profile relative to the duration will continue to stand out as a performance differentiator in 2022, as we expect U.S. real GDP to average 4%, headline CPI to average 5%, and the headline unemployment rate to descend to its pre-COVID-19 level of 3.5% by the end of 2022. We remain in the persistent inflation camp. After the Powell Pivot and the January 26th FOMC meeting, we now expect two to three target rate hikes in 2022 and the 10-year note yield to end the year at approximately 2.25%. Expectations for an even tighter labor market amid the “Great Resignation” will further enhance an incredibly robust U.S. consumer, as it should result in more wage growth. Wage growth is expected to continue, as the U.S. consumer has already accumulated a $2.2 trillion war chest of excess savings since March 2020!2 As the U.S. consumer is saving and earning more, household debt ratios are at historic lows. A strong U.S. consumer credit profile coupled with pent-up demand because of the COVID-19 pandemic should further support our view for solid growth and high inflation in 2022. This environment should continue to pressure risk-free rates and long-duration fixed income as market participants price in more Fed tightening in the future but recognize how easy financial conditions remain, reinvigorating the bear curve-steepening trend witnessed in the first half of 2021.
1Returns presented are without load. Please reference the investments results section of the report for with load returns.
2 Source: Morgan Stanley
3
While broader credit markets took a pause in the second half of 2021 due to the rising COVID-19 variants and the Powell Pivot, we remain constructive toward credit, particularly U.S. structured credit. We are positioning for a longer-term expansion in areas of mortgage- and consumer-centric structured credit with attractive income and the potential for spread tightening and price appreciation in 2022. In addition to a brisk recovery of growth and inflation, 2021 brought a historic supply of new issuance in the credit markets, particularly in U.S. structured credit. After issuance came to a grinding halt in 2020 due to the pandemic, the V-shaped recovery, improving consumer confidence, and growing appetite for attractive financing on the heels of post-COVID-19 accommodation sent issuance to post-GFC highs across all subsectors. Technical headwinds of heavy supply began to weigh on credit spreads in some of our more favored areas of structured credit toward the end of 2021 and into 2022 despite improving fundamentals. We will seek to take advantage of any technical weakness into 2022.
As of 1/31/22, the subsidized and unsubsidized 30-Day SEC yield for ANGIX were 3.79% and 3.79%, respectively.
Past performance is not a guarantee of future results.
Investments in debt securities typically decrease when interest rates rise. This risk is usually greater for longer-term debt securities. Investments in lower rated and non-rated securities present a greater risk of loss to principal and interest than higher rated securities. Investments in asset-backed and mortgage-backed securities include additional risks that investors should be aware of including credit risk, prepayment risk, possible illiquidity and default, as well as increased susceptibility to adverse economic developments. Derivatives involve risks different from, and in certain cases, greater than the risks presented by more traditional investments. Derivatives may involve certain costs and risks such as illiquidity, interest rate, market, credit, management and the risk that a position could not be closed when most advantageous. Investing in derivatives could lose more than the amount invested. The Fund may use leverage, which may exaggerate the effect of any increase or decrease in the value of securities in the Fund’s portfolio or higher and duplicative expenses when it invests in mutual funds, ETFs, and other investment companies. For more information on these risks and other risks of the Fund, please see the Prospectus.
Definitions:
Bloomberg U.S. Aggregate Bond Index: An unmanaged index that measures the performance of the investment-grade universe of bonds issued in the United States. The index includes institutionally traded U.S. Treasury, government-sponsored, mortgage, and corporate securities. It is not possible to invest directly in an index.
Current Income: Represents return from interest and amortized/accrued cost basis.
Duration: Measures a portfolio’s sensitivity to changes in interest rates. Generally, the longer the duration, the greater the price change relative to interest rate movements.
Tranche: A portion of debt or structured financing. Each portion, or tranche, is one of several related securities offered at the same time but with different risks, rewards, and maturities.
4
Angel Oak Financials Income Fund
How did the Fund perform during the period?
For the 12-month period that ended January 31, 2022, the Fund’s Institutional Shares (ANFIX) returned 5.64%, while the Fund’s A Shares (ANFLX) and C Shares (AFLCX) returned 5.48%1 and 4.63%1, respectively. During the same period, the Fund’s benchmark, the Bloomberg U.S. Aggregate Bond Index, returned -2.97%, and the Bloomberg U.S. Aggregate 3-5 Year Index, which most closely matches the Fund’s duration profile, returned -2.82%.
What were the main contributors to and detractors from the Fund’s performance during the period?
The financial sector accounts for substantially all of the Fund’s assets. There are three areas of primary focus within the financial sector: community bank debt, non-bank financials debt, and community bank equity. The Fund’s financial sector asset allocation (98% of Fund assets) comprises 75% of assets in community bank debt, 21% of assets in non-bank financials, and 4% of assets in community bank equities. In addition, 2% of Fund assets are in cash and other assets.
Financials debt outperformed the broader corporate credit market due to the fundamental strength of the sector as well as its short-duration profile. Additionally, the investor base of the underlying bonds tends toward buy-and-hold investors, which contributes to the low relative volatility.
| | • | | Capital: Tier 1 and total regulatory capital remain near multi-decade highs for U.S. commercial banks. We are seeing increasing capital optimization since the Fed has loosened COVID-19-related restrictions on capital management and allowed banks to resume managing their excess capital. |
| | • | | Asset Quality: A large majority of banks have emerged largely unscathed from any potential COVID-19-related credit cycle. Loan deferrals have returned to performing status, and non-performing assets are at the lowest levels in 15 years. We do expect we could see some modest normalization over 2022 as the benefits from stimulus programs roll off, but banks remain well reserved for any modest increase in credit costs. |
| | • | | Excess Liquidity: Banks are flush with liquidity given the various stimulus plans, including the paycheck protection program (PPP). Loan to deposit ratios are hovering near 50%, and cash is running at approximately double normalized levels. |
What is your outlook for 2022, and how is the Fund positioned?
We maintain a high degree of conviction toward the financial sector broadly heading into 2022, with positive tailwinds to growth driven by the continued economic recovery and the expected Fed Funds rate hikes. We see compelling opportunities across community bank debt, small-cap non-bank financials debt, and select pockets of financial services preferred and common equity.
The outlook is particularly bright for the banking sector in 2022, with the Fed poised to raise rates, loan growth inflecting positively, and significant excess liquidity available for deployment. Mergers and acquisitions (M&A) continue to accelerate from COVID-19 lows and have hit 20-plus-year highs in terms of “mega deals” (deal value more than $500 million). In the banking sector, we see the best relative value in the community bank sub-sector, in both subordinated debt and small-cap equities.
Fundamentally, banks should benefit from stronger net interest income and earnings as (1) net interest margin (NIM) expands from a combination of higher rates, low deposit betas, and an asset mix shift from cash and investments to loans, and (2) higher-earning asset balances as PPP forgiveness runs its course and organic loan growth accelerates.
We believe community bank debt offers one of the best risk/reward opportunities across investment-grade credit, with its excess yield, short-duration, and low volatility profile. Bank debt issuance remains robust, with expected community bank debt issuance in the range of $8-$10 billion annually. While spreads compressed in 2021 as the market continued to mature, and the investor base expanded to see broader participation from banks, we expect spreads will begin to normalize toward 2019 levels as banks’ excess liquidity gets redeployed into lending opportunities.
On the equity side, despite relative outperformance in 2021, banking sector valuations remain attractive relative to historical levels and the broader market. We expect NIM expansion and higher loan growth will benefit valuation multiples, and we see value in the smaller banks, which tend to be more asset sensitive. Additionally, smaller banks could see outsized returns as likely consolidation targets in an accelerating M&A environment.
1Returns presented are without load. Please reference the investments results section of the report for with load returns.
5
Across the financial services landscape more broadly, we are most positive on investment-grade, small-cap insurance senior debt and residential mortgage REIT common and preferred equities.
Senior debt opportunities in small-cap insurance have been expanding over the past several years, but the sector remains a niche investment opportunity that provides corresponding excess yield for investment-grade debt in a highly regulated industry. We are most favorable on the property and casualty and the fronting sub-segments. Industry fundamentals remain positive, with premium pricing increases expected to persist in 2022.
Additionally, we have a positive bias to hybrid and non-agency mortgage REITs (mREITs) within the residential mREIT universe, given expectations for robust home price appreciation, a strong consumer, still-low interest rates, and the prospects for a reduced Government Sponsored Entity (GSE) footprint. Upside to book value and dividends, along with attractive valuation and dividend yields, drives our constructive view on common equity, and we see selective opportunities within preferred equity as well.
We do not anticipate any meaningful credit deterioration in 2022. Nonperforming asset levels remain strong, sitting at the lowest level in 15 years. Industry profitability remains solid, and capital levels continue to increase, providing a sizable cushion for any adverse credit events as well as currency for inorganic growth opportunities. We remain disciplined in our underwriting, with particular emphasis on credit and interest rate risks.
We do not anticipate our sub-sector allocations within financial services will change materially in 2022.
Past performance is not a guarantee of future results.
Mutual fund investing involves risk; principal loss is possible. Investments in debt securities typically decrease when interest rates rise. This risk is usually greater for longer-term debt securities. Investments in lower-rated and nonrated securities present a greater risk of loss to principal and interest than higher-rated securities do. Investments in asset-backed and mortgage-backed securities include additional risks that investors should be aware of, including credit risk, prepayment risk, possible illiquidity, and default, as well as increased susceptibility to adverse economic developments. Derivatives involve risks different from—and in certain cases, greater than—the risks presented by more traditional investments. Derivatives may involve certain costs and risks such as illiquidity, interest rate, market, credit, management, and the risk that a position could not be closed when most advantageous. Investing in derivatives could lead to losses that are greater than the amount invested. The Fund may make short sales of securities, which involves the risk that losses may exceed the original amount invested. The Fund may use leverage, which may exaggerate the effect of any increase or decrease in the value of securities in the Fund’s portfolio or the Fund’s net asset value, and therefore may increase the volatility of the Fund. Investments in foreign securities involve greater volatility and political, economic, and currency risks and differences in accounting methods. These risks are increased for emerging markets. Investments in fixed-income instruments typically decrease in value when interest rates rise. The Fund will incur higher and duplicative costs when it invests in mutual funds, ETFs, and other investment companies. There is also the risk that the Fund may suffer losses due to the investment practices of the underlying funds. For more information on these risks and other risks of the Fund, please see the Prospectus.
Definitions:
Bloomberg U.S. Aggregate Bond Index: An unmanaged index that measures the performance of the investment-grade universe of bonds issued in the United States. The index includes institutionally traded U.S. Treasury, government-sponsored, mortgage and corporate securities. It is not possible to invest directly in an index.
Bloomberg U.S. Aggregate 3-5 Year Index: An index that tracks bonds with 3-5 year maturities within the Bloomberg U.S. Aggregate Bond Index.
Duration: Measures a portfolio’s sensitivity to changes in interest rates. Generally, the longer the duration, the greater the price change relative to interest rate movements.
Spread: The difference in yield between two bonds of similar maturity but different credit quality.
Tier 1 Capital: Tier 1 capital comprises common equity, retained earnings, and perpetual preferred stock. Tier 1 capital represents the core source of funding that the bank uses to ensure long term viability and acts as a cushion to protect depositors against loss.
6
Angel Oak High Yield Opportunities Fund
How did the Fund perform during the period?
For the 12-month period that ended January 31, 2022, the Fund’s Institutional Shares (ANHIX) returned 3.62%, while the Fund’s A Shares (ANHAX) returned 3.34%1. During the same period, the Fund’s benchmark, the Bloomberg U.S. Corporate High Yield Index, returned 2.06%.
What were the main contributors to and detractors from the Fund’s performance during the period?
The corporate bond allocation, which accounted for more than 99% of the asset allocation, returned 4.44%, outperforming the benchmark return of 2.06%, and contributed 4.26% to the total return of the Fund. Within the corporate bond allocation, the largest positive contributor to performance was the basic industry sector, and the positive attribution was primarily driven by selection. The contribution was broad-based across holdings, with the biggest contribution from a supplier of metallurgical coal necessary in the production of virgin steel that was in strong demand and saw record prices in 2021.
With contribution on par with basic industry, the communications sector was the second-largest positive contributor to performance. The positive attribution was evenly split between allocation and selection. Being underweight, one of only two sectors with a negative return for the period accounted for the positive attribution from allocation. The positive attribution from selection was from being overweight on advertising dependent issuers in the television and radio subsectors that have benefited from the economic recovery more so than the utility-like cable and telecom issuers.
The largest detractor from corporate bond performance was the electrics sector. The negative attribution was due to selection and attributable to an independent power producer whose primary market is the PJM region of the U.S. where where capacity prices have been weak; they had an unexpected loss due to winter storm Uri, and liquidity is under pressure due to the need to post additional collateral related to existing hedges that are now underwater as forward prices have risen.
The finance companies sector was also a detractor. The negative attribution was due to selection and our exposure to several mortgage originators that underperformed, with rising interest rates negatively impacting mortgage origination volumes and margins.
What is your outlook for 2022, and how is the Fund positioned?
Although pandemic-related fiscal stimulus is tailing off, and the Fed is beginning to tighten monetary policy with the wind down of asset purchases, and are expected to raise interest rates and shrink the size of their holdings of mortgages and treasuries, the fundamental outlook for high yield corporate credit is generally favorable, reflecting expectations for above-trend economic growth supported by an improving employment market, excess household savings, record net worth, and household debt payments as a percentage of disposable income near historic lows. In a rising rate environment, we believe that high-yield corporate bonds with less than half the duration, more than three times as much credit spread, and almost double the total yield, look well positioned relative to the investment-grade Bloomberg U.S. Corporate Bond Index.
While the ultimate goal of the Fed is to orchestrate a soft landing by slowing growth and reducing inflationary pressures just enough to avoid tipping the economy into recession, corporations are in a strong position with record margins, strong free cash flow generation, and declining leverage. That said, we are sensitive to the fact that we are entering a period of tightening monetary policy that includes accelerated tapering of asset purchases, interest rate increases, and the potential reduction of the size of the Fed’s balance sheet. The compressed nature of events has the potential for increased risk asset volatility. As such, we are focused on risk/reward and the risk of idiosyncratic events, underscoring our emphasis on credit selection.
Past performance is not a guarantee of future results.
Mutual fund investing involves risk; principal loss is possible. Investments in debt securities typically decrease when interest rates rise. This risk is usually greater for longer-term debt securities. Investments in lower-rated and nonrated securities present a greater risk of loss to principal and interest than higher-rated securities do. Investments in asset-backed and mortgage-backed securities include additional risks that investors should be aware of, including credit risk, prepayment risk, possible illiquidity, and default, as well as increased susceptibility to adverse economic developments. Derivatives involve risks different from—and in certain cases, greater than— the risks presented by more traditional investments. Derivatives may involve certain costs and risks such as illiquidity, interest rate, market, credit, management, and the risk that a position could not be closed when most advantageous. Investing in derivatives could lead to losses that are greater than the amount invested. For more information on these risks and other risks of the Fund, please see the Prospectus.
1Returns presented are without load. Please reference the investments results section of the report for with load returns.
7
Definitions:
Bloomberg U.S. Corporate High Yield Bond Index: An unmanaged market value-weighted index that covers the universe of fixed rate, non-investment-grade debt. It is not possible to invest directly in an index.
Spread: The difference in yield between two bonds of similar maturity but different credit quality.
Duration: Measures a portfolio’s sensitivity to changes in interest rates. Generally, the longer the duration, the greater the price change relative to interest rate movements.
Free Cash Flow: A financial performance calculation that measures how much operating cash flows exceed capital expenditures.
8
Angel Oak UltraShort Income Fund
How did the Fund perform during the period?
For the 12-month period that ended January 31, 2022, the Fund’s Institutional Shares (AOUIX) returned 0.51%, while the Fund’s A Shares (AOUAX) returned 0.27%. During the same period, the Fund’s benchmark, the Bloomberg U.S. Treasury Bill 9-12 Month Total Return Index, was down -0.26%.
What were the main contributors to and detractors from the Fund’s performance during the period?
Credit strategies and higher current income were the primary benefits to Fund performance relative to the benchmark. Duration positioning short of the index was a contributor relative to the benchmark, as short-term Treasury yields increased, particularly throughout the second half of the year. Spread duration longer than the benchmark was a net contributor due to higher income and modestly tighter credit spreads of approximately 20 basis points year over year. Short-term rates repriced higher in the final quarter as markets repriced Fed expectations. To start 2021, markets expected the Fed to be on hold through 2023 as most economists predicted inflation pressures would be more transitory than persistent. The resurgence of inflationary pressures following the decrease in COVID-19 cases from the COVID-19 delta variant in early Q3 shifted market participants’ view that short-term inflation pressures would be sustained for many months. Subsequently, short-term rates repriced the FOMC’s hiking path in 2022, from zero hikes to over six hikes in just a few months. The one-year swap rate increased 70 basis points, from 0.18% to 0.88%, while the two-year swap rate increased 1.14%, from 0.19% to 1.33%. Overall, the interest rate duration remained short of the Fund’s benchmark, in the range of 0.5 to 0.75, benefiting performance as short-term rates rose in the final few months of the fiscal year.
The Fund’s overweight to credit, particularly structured credit, over government bonds provided for higher current income than the benchmark. The current yield of the benchmark was very low throughout the majority of the year, while the average distribution yield of the Fund was 1.31%. For the fiscal year, income return was 1.30% for the Fund while price return was -0.79%, netting a total return of 0.51%.
Residential mortgage-backed securities (RMBS), asset-backed securities (ABS), and collateralized loan obligations (CLOs), the largest credit asset classes within the Fund, were all positive contributors to Fund performance. RMBS produced a total return of 0.69% and contributed 22 basis points to Fund performance. The RMBS allocation is a targeted mix of primarily new-issue subsectors. Portfolio managers found particular value in new-issue sectors of RMBS credit but shortened spread duration during the middle of the year, as spreads tightened in the first half. The strategy focused on areas of non-Qualified Mortgage (non-QM) seniors, Reperforming Loan/Non-Performing Loans (RPL/NPL), and prime jumbo seniors, which subsequently saw measurable spread tightening as markets normalized throughout the first half of 2021. Additionally, portfolio managers viewed underlying call risk in the first half of 2021 as mispriced. Calling seasoned non-QM deals is less efficient due to the underlying owners of the call rights and their ability to warehouse loans of called collateral and/or resecuritize into new deals. This focus on seasoned, increasingly callable tranches provided a shorter-duration profile for the allocation while taking advantage of the inefficiency of non-QM callability. This was an attractive allocation for the Fund while spreads and short-term interest rates were low during the middle of 2021. The allocation to non-agency RMBS was reduced during the year, as total return opportunities were limited in the sector. The allocation fell approximately 7%, from 35% to 28%.
The ABS allocation was a positive contributor to Fund performance. ABS had a total return of approximately 88 basis points, contributing 42 basis points to Fund performance. The allocation to ABS increased throughout the period, from 36% to 42%, mainly as a rotation from non-agency RMBS. The focus of the ABS allocation was within short-duration, high-credit quality assets. As spreads continued to tighten for high-quality assets in the first half of the year, the focus of the allocation was within amortizing loans of senior and mezzanine tranches of ABS. Auto ABS started the year as an outperformer within short-duration ABS markets. Given the shifting relative value landscape, the Fund rotated from auto to consumer ABS throughout the period. Senior tranches of consumer loan ABS tend to be rated AA through BBB and begin to amortize on the first remittance date, while AA-BBB-rated auto ABS do not receive principal paydowns for many months. Given the current macro backdrop, the portfolio focused on senior and mezzanine consumer loan ABS, while rotating out of auto ABS. The consumer loan allocation started the period at approximately 10% of the Fund and ended the period at approximately 22% of the Fund. Conversely, auto ABS started the period at 20% of the Fund and ended the period at 16% of the Fund.
CLOs were the best-performing asset class of the top three allocations. CLOs exhibited a total return of approximately 1.23%, contributing 19 basis points to Fund performance. The CLO allocation primarily consists of AAA-rated tranches, and the floating rate nature of the asset class was an attractive organic fit for the targeted duration below the benchmark. The CLO allocation consists of a combination of X classes and very seasoned AAA/AA/A-rated tranches. Given the specific cashflow window of the X-tranche structure, the Fund was focused on acquiring these tranches in the primary market when they were available. The
9
allocation remained in the 10% to 15% range throughout most of the fiscal year while finishing the year down only 1% year over year, or at approximately 12%. Within the sector, the X-tranche allocation increased from 28% to 41% during the fiscal year. The CLO allocation ended the period at a current yield-to-worst of 2.33% and a weighted average life of 1.5, with over 85% AAA-rated tranches.
The government allocation is a strategic allocation in the Fund that provides many benefits, including improved diversification, low correlation to credit, and enhanced liquidity. The government allocation is a combination of cash, US Treasuries, agencies, and agency-backed securities. The government allocation was near unchanged at approximately 14% of Fund assets. Within the allocation, US Treasuries were reduced while cash and equivalents and agency CMBS were increased. The government allocation was a net detractor to performance of 3 basis points to the Fund.
What is your outlook heading into 2022, and how is the Fund positioned?
The sharp repricing of Fed expectations and the prospect for higher interest rates in 2022 will be the key drivers of performance for ultrashort strategies over the intermediate term. The current market expectation for interest rate increases in 2022 is six, which would increase the Fed Funds’ target rate above 1.5% by the end of the year. This rate path is very bullish for rising income within the Fund, but expected volatility is higher than a year prior. Simultaneously, higher total return opportunities are becoming available, with a steeper yield curve and a steeper credit term structure. Looking forward, the potential for price appreciation has increased compared to a year prior.
The Fund continues to focus across a diversified mix of primarily structured credit. Recently, the Fund has increased the allocation to ABS and short-duration corporate bonds to focus on high-current-income, limited-duration, and attractive-spread profiles. The effective duration of the Fund was reduced initially in the prior year but may increase in the future if markets price in an overly hawkish FOMC. Heading into 2022, the Fund has maintained a higher allocation to AAA-rated assets, at approximately 45%. The coming year should provide significant opportunity in the ultrashort markets.
As of 1/31/22, the subsidized and unsubsidized 30-Day SEC yield for AOUIX were 1.30% and 1.09%, respectively.
Past performance is not a guarantee of future results.
Investing involves risk. Principal loss is possible. The Fund’s derivative investments have risks, including the imperfect correlation between the value of such instruments and the underlying asset, rate or index, which creates the possibility that the loss on such instruments may be greater than the gain in the value of the underlying asset, rate or index; the loss of principal; the possible default of the other party to the transaction; and illiquidity of the derivative investments. The Fund may invest in illiquid securities and restricted securities. Investments in restricted securities could have the effect of increasing the amount of the Fund’s assets invested in illiquid securities if qualified institutional buyers are unwilling to purchase these securities. Changes in interest rates generally will cause the value of fixed-income instruments held by the Fund to vary inversely to such changes. Below investment grade instruments are commonly referred to as “junk” or high-yield instruments and are regarded as predominantly speculative with respect to the issuer’s capacity to pay interest and repay principal. Lower grade instruments may be particularly susceptible to economic downturns. The price paid by the Fund for asset-backed securities, including CLOs, the yield the Fund expects to receive from such securities and the average life of such securities are based on a number of factors, including the anticipated rate of prepayment of the underlying assets. Mortgage-backed securities are subject to the general risks associated with investing in real estate securities; that is, they may lose value if the value of the underlying real estate to which a pool of mortgages relates declines. For more information on these risks and other risks of the Fund, please see the Prospectus.
Definitions:
Average Distribution Yield: The sum of the twelve monthly distributions during the period divided by the end of period NAV of AOUIX.
Basis point (bps): One hundredth of one percent. Used to denote the percentage change in a financial instrument.
Bloomberg 9-12 Month U.S. Treasury Bill Index: Measures the performance of U.S. Treasury bills, notes and bonds with a remaining maturity between 9-12 months. The index does not include trading and management costs. It is not possible to invest directly in an index.
Current Yield: A bond’s current yield is an investment’s annual income, including both interest payments and dividends payments, which are then divided by the current price of the security.
Distribution Yield: The distribution yield is calculated by annualizing actual dividends distributed for the monthly period ended on the date shown and dividing by the net asset value on the last business day for the same period. The yield does not include long-or short-term capital gains distributions or the return of capital.
Duration: Measures a portfolio’s sensitivity to changes in interest rates. Generally, the longer the duration, the greater the price change relative to interest rate movements.
Income Return: The positive/negative return from interest and accrued/amortized income.
Spread: The difference in yield between two bonds of similar maturity but different credit quality.
Tranche: A portion of debt or structured financing. Each portion, or tranche, is one of several related securities offered at the same time but with different risks, rewards and maturities.
Weighted Average Life (WAL): Average length of time that each dollar of unpaid principal on a loan, a mortgage or an amortizing bond remains outstanding.
Yield-to-Worst (YTW): The lowest potential yield that can be received on a bond without the issuer actually defaulting. Loss-adjusted (LA) takes into account Angel Oak Capital’s assumptions for prepayment speeds and defaults.
Diversification does not guarantee a profit or protect against a loss in declining markets.
10
Angel Oak Core Impact Fund
How did the Fund perform during the period?
For the period ended January 31, 2022, the Fund’s Institutional Shares (AOIIX) returned -1.28%. During the same period, the Fund’s benchmark, the Bloomberg U.S. Aggregate Bond Index returned -1.53%.
What were the main contributors to and detractors from the Fund’s performance during the period?
The primary positive contributor to performance was duration short of the benchmark. The Fund’s current income was approximately 0.46% and prices were down approximately -1.74%. Prices were lower during the period due to rising rates, concerns surrounding the Powell Pivot, surging inflation, and robust new issue supply in structured credit. The duration of the strategy was approximately 4.2-4.4 throughout the period compared to the benchmark, which was in the range of 6.5-6.7 during the period. The portfolio’s duration is short of the benchmark, and we believe this profile could potentially lead to continued outperformance in the year ahead.
For the period, the largest allocation in the Fund was the asset-backed securities (ABS) allocation, approximately 27.48% of the allocation, which was up approximately 0.12% total return but detracted approximately -0.04% as the portfolio was ramping. The corporate bond allocation, approximately 24.34% of the allocation, was up 0.79% total return, but detracted approximately -0.07% as the portfolio was ramping. The agency commercial mortgage-backed securities (CMBS) allocation, approximately 20.64% of the allocation, was down approximately -3.95%, detracting -0.48%. The non-agency residential mortgage-backed securities (NA RMBS) was approximately 9.78% of the Fund and had a total return of approximately -0.15% but contributed approximately 0.02% to the Fund’s performance as the Fund was ramping. The non-agency CMBS (NA CMBS) allocation, currently 6.59% of the Fund, was up approximately 0.54%, contributing approximately 0.03%. Finally, the agency RMBS allocation, approximately 5.27% of the Fund, was down approximately -1.83% total return, detracting approximately -0.09%.
The Fund seeks total return while giving special consideration to positive aggregate environmental, social, and/or governance (ESG) impact outcomes. The Fund allocates to fixed income securities that have a positive impact on the global environment across all levels of society and utilizes active engagement with issuers to positively impact their ESG factors by promoting sustainable practices. In addition to our ESG considerations, the Fund was positioned consistent with our 2021 outlook. Inflation and growth were brisk in 2021, and more importantly, our persistent view steered us away from long-duration, more interest rate-sensitive areas of traditional fixed income. We favored shorter-duration areas of U.S. structured credit, notably mortgage and consumer collateral, and select corporate issuers with higher current income profiles relative to the benchmark. This view and positioning resulted in outperformance of the index amid a yield-starved world at the zero-bound challenged by rising rates.
What is your outlook heading into 2022, and how is the Fund positioned?
Like 2021, we believe that 2022 will continue to be driven by strong growth, persistent inflation pressures, and a robust consumer and, despite the unexpected Powell Pivot toward liftoff, financial conditions will likely remain extraordinarily accommodative. Amid a backdrop of solid growth, we expect a benign credit environment driven by lower but still solid earnings and extraordinarily low default expectations. Therefore, we continue to target similar positioning in 2022 and especially favor amortizing areas of mortgage- and consumer-centric areas of structured credit backed by rising collateral values.
The higher yield profile relative to the duration will continue to stand out as a performance differentiator in 2022, as we expect U.S. real GDP to average 4%, headline CPI to average 5%, and the headline unemployment rate to descend to its pre-COVID-19 level of 3.5% by the end of 2022. We remain in the persistent inflation camp. After the Powell Pivot and the January 26th FOMC meeting, we now expect four target rate hikes in 2022 and the 10-year note yield to end the year at approximately 2.25%. Expectations for an even tighter labor market amid the “Great Resignation” will further enhance an incredibly robust U.S. consumer, as it should result in more wage growth. Wage growth is expected to continue, as the U.S. consumer has already accumulated a $2.2 trillion war chest of excess savings since March 2020!1 As the U.S. consumer is saving and earning more, household debt ratios are at historic lows. A strong U.S. consumer credit profile coupled with pent-up demand because of the pandemic should further support our view for solid growth and high inflation in 2022. This environment should continue to pressure risk-free rates and long-duration fixed income as market participants price in more Fed tightening in the future but recognize how easy financial conditions remain, reinvigorating the bear curve-steepening trend witnessed in the first half of 2021.
While broader credit markets took a pause in the second half of 2021 due to the rising COVID-19 variants and the Powell Pivot, we remain constructive toward credit, particularly U.S. structured credit. We are positioning for a longer-term expansion in areas of mortgage- and consumer-centric structured credit with attractive income and the potential for spread tightening and price appreciation in 2022. In addition to a brisk recovery of growth and inflation, 2021 brought a historic supply of new issuance in
1 Source: Morgan Stanley
11
the credit markets, particularly in U.S. structured credit. After issuance came to a grinding halt in 2020 due to the pandemic, the V-shaped recovery, improving consumer confidence, and growing appetite for attractive financing on the heels of post-COVID-19 accommodation sent issuance to post-GFC highs across all subsectors. Technical headwinds of heavy supply began to weigh on credit spreads in some of our more favored areas of structured credit toward the end of 2021 and into 2022 despite improving fundamentals, and we will seek to take advantage of any technical weakness into 2022.
We are also excited about growing ESG issuance in structured credit. Although COVID-19 roiled the financial markets over the course of 2020 and into the first quarter of 2021, the flow of capital into sustainable investment strategies actually accelerated over that period. This was in part driven by the focus that COVID-19 brought to social issues such as employment stability, access to healthcare, income inequality, and racial justice. While climate-related issues remain top of mind for many investors, we believe that the opportunity to support socially responsible initiatives through targeted investment strategies will be a significant driver of growth in the issuance of sustainable investment securities for the foreseeable future.
While we expect the issuance of specifically labeled ESG investment securities will continue to grow, we believe much of the opportunity to deploy the Fund’s capital into environmentally sustainable and socially responsible investments in 2022 will come from traditional structured instruments with desirable environmental and social attributes. Angel Oak’s strategies have utilized a data-driven approach to opportunistically identify RMBS, CMBS, ABS, and collateralized loan obligations (CLOs) that align with specific ESG and sustainable impact themes. The sustainable impact themes on which we focus today are broadening access to housing, expanding access to consumer credit, embedding environmental sustainability, and strengthening corporate governance.
In order to target the Fund’s corporate credit allocation, Angel Oak Capital Advisors, LLC (the “Adviser” or “Angel Oak”) utilizes proprietary scorecard-based methodologies to identify investment securities issued by companies with positive social or environmental impacts and strong governance factors. Scores are developed from publicly available data sources as well as active engagement with issuers. These engagement activities are designed to enable Angel Oak to work collaboratively with senior management to establish concrete objectives to improve the social and environmental impact of the applicable issuer’s business model.
The Fund currently focuses on two segments of the corporate credit markets when deploying capital into sustainable impact themes that Angel Oak believes have positive aggregate ESG outcomes.
| | • | | Financial institutions such as community banks and insurance companies that have been identified using Angel Oak’s proprietary scorecard methodology as Responsible Financial Institutions (RFIs) that rate highly on environmental, social, and governance factors. |
| | • | | Issuers of high-yield debt securities across a broad range of industries that have positive ESG factors or that have implemented best-in-class strategies to transition away from carbon-intensive processes toward more sustainable business models. |
Past performance is not a guarantee of future results.
Investments in debt securities typically decrease when interest rates rise. This risk is usually greater for longer-term debt securities. Investments in lower rated and non-rated securities present a greater risk of loss to principal and interest than higher rated securities. Investments in asset-backed and mortgage-backed securities include additional risks that investors should be aware of including credit risk, prepayment risk, possible illiquidity and default, as well as increased susceptibility to adverse economic developments. Derivatives involve risks different from, and in certain cases, greater than the risks presented by more traditional investments. Derivatives may involve certain costs and risks such as illiquidity, interest rate, market, credit, management and the risk that a position could not be closed when most advantageous. Investing in derivatives could lose more than the amount invested. The Fund may use leverage, which may exaggerate the effect of any increase or decrease in the value of securities in the Fund’s portfolio or higher and duplicative expenses when it invests in mutual funds, ETFs, and other investment companies. For more information on these risks and other risks of the Fund, please see the Prospectus.
ESG investment strategies limit the universe of investment opportunities available to any Fund and will affect a Fund’s exposure to certain issuers, sectors, regions, and types of investments, which may result in a Fund forgoing opportunities to buy or sell certain securities when it might otherwise be advantageous to do so. Adhering to a Fund’s ESG investment strategy may also affect the Fund’s performance relative to similar funds that do not seek to invest in companies based on their ESG impact. Securities of issuers that the Adviser has identified as having favorable ESG characteristics may shift into and out of favor depending on market and economic conditions, and certain investments may be dependent on U.S. and foreign government policies, including tax incentives and subsidies, which may change without notice. ESG determinations are inherently subjective and investors’ views may differ as to what constitutes a positive or negative aggregate ESG impact outcome. There is no guarantee that the Adviser’s views, security selection criteria, or investment judgment will reflect the beliefs or values of any particular investor. In addition, there can be no assurance that issuers in which any Fund invests will be successful in their efforts to offer solutions that generate a positive ESG impact. When assessing whether an issuer meets any related Fund’s investment strategy and criteria, the Adviser may rely on third-party data that it believes to be reliable, but it does not guarantee the accuracy of such third-party data.
Definitions:
Spread: The difference in yield between two bonds of similar maturity but different credit quality.
Current Income: Represents return from interest and amortized/accrued cost basis.
Bloomberg U.S. Aggregate Bond Index: An unmanaged index that measures the performance of the investment-grade universe of bonds issued in the United States. The index includes institutionally traded U.S. Treasury, government-sponsored, mortgage, and corporate securities. It is not possible to invest directly in an index.
Duration: Measures a portfolio’s sensitivity to changes in interest rates. Generally, the longer the duration, the greater the price change relative to interest rate movements.
Powell Pivot: A change in policy announced by U.S. Federal Reserve Bank chairman Jerome Powell in November 2021 signaling that inflation has become a permanent, rather than transitory, aspect of the economy.
Tranche: A portion of debt or structured financing. Each portion, or tranche, is one of several related securities offered at the same time but with different risks, rewards, and maturities.
12
Investment Results – (Unaudited)
Angel Oak Multi-Strategy Income Fund
Total Return Based on a $500,000 Investment
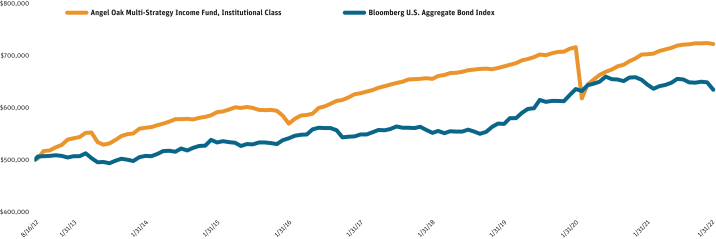
The Fund is the successor to the investment performance of the Angel Oak Multi-Strategy Income Fund (the “Predecessor Multi-Strategy Income Fund”) as a result of the reorganization of the Predecessor Multi-Strategy Income Fund into the Fund on April 10, 2015. Accordingly, the performance information shown in the chart above and table below for periods prior to April 10, 2015 is that of the Predecessor Multi-Strategy Income Fund. The Predecessor Multi-Strategy Income Fund was also advised by the Fund’s investment adviser, Angel Oak Capital Advisors, LLC (the “Adviser”), and had the same investment objective, policies, and strategies as the Fund.
The chart above assumes an initial investment of $500,000 made on August 16, 2012 (commencement of operations). Returns shown include the reinvestment of all dividends. Returns shown do not reflect the deduction of taxes that a shareholder would pay on Fund distributions or the redemption of Fund shares. In the absence of fee waivers and reimbursements, when they are necessary to keep expenses at the expense cap, total return would be reduced. Past performance is not predictive of future performance. Investment return and principal value will fluctuate so that your shares, when redeemed, may be worth more or less than the original cost. Index returns do not reflect the effects of fees or expenses. It is not possible to invest directly in an index.
Total Returns(1)
(For the year ended January 31, 2022)
| | | | | | | | | | | | | | | | | | | | |
| | | Average Annual Returns | |
| | | One Year | | | Three Year | | | Five Year | | | Ten Year | | | Since Inception(2) | |
Angel Oak Multi-Strategy Income Fund, Institutional Class | | | 2.87 | % | | | 2.20 | % | | | 2.90 | % | | | N/A | | | | 3.96 | % |
Angel Oak Multi-Strategy Income Fund, Class A without load | | | 2.71 | % | | | 1.97 | % | | | 2.66 | % | | | 4.85 | % | | | 5.42 | % |
Angel Oak Multi-Strategy Income Fund, Class A with load | | | 0.40 | % | | | 1.21 | % | | | 2.19 | % | | | 4.61 | % | | | 5.19 | % |
Angel Oak Multi-Strategy Income Fund, Class C without load | | | 1.78 | % | | | 1.18 | % | | | 1.89 | % | | | N/A | | | | 1.83 | % |
Angel Oak Multi-Strategy Income Fund, Class C with load | | | 0.80 | % | | | 1.18 | % | | | 1.89 | % | | | N/A | | | | 1.83 | % |
Bloomberg U.S. Aggregate Bond Index(3) | | | (2.97 | %) | | | 3.67 | % | | | 3.08 | % | | | 2.59 | % | | | 2.55 | %(4) |
(1) Return figures reflect any change in price per share and assume the reinvestment of all distributions. Total returns for Class A Shares, with load, include the maximum 2.25% sales charge. Total returns for Class C Shares, with load, include the maximum 1.00% deferred sales charge.
(2) Inception date is August 16, 2012 for Institutional Class Shares, June 28, 2011 for Class A Shares, and August 4, 2015 for Class C Shares.
(3) The Bloomberg U.S. Aggregate Bond Index (formerly Bloomberg Barclays U.S. Aggregate Bond Index) measures the performance of the investment-grade, fixed-rate bond market, including government and credit securities, agency pass-through securities, asset-backed securities and commercial mortgage-backed securities. Performance figures include the change in value of the bonds in the index and the reinvestment of interest. The index return does not reflect expenses, which have been deducted from the Fund’s return. You cannot invest directly in an index; however, an individual can invest in exchange-traded funds or other investment vehicles that attempt to track the performance of a benchmark index.
13
Investment Results – (Unaudited) (continued)
(4) The return shown for the Bloomberg U.S. Aggregate Bond Index is from the inception date of the Institutional Class Shares. The Bloomberg U.S. Aggregate Bond Index return from the inception date of Class A Shares is 2.97% and for Class C Shares is 2.81%.
14
Investment Results – (Unaudited) (continued)
Angel Oak Financials Income Fund
Total Return Based on a $500,000 Investment
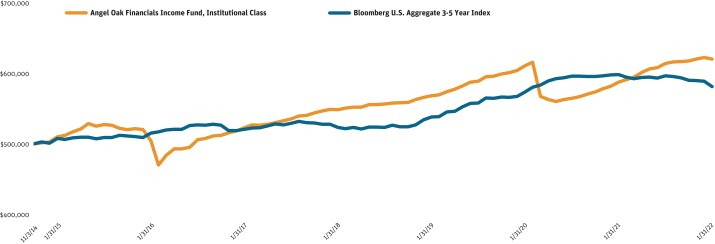
The chart above assumes an initial investment of $500,000 made on November 3, 2014 (commencement of operations). Returns shown include the reinvestment of all dividends. Returns shown do not reflect the deduction of taxes that a shareholder would pay on Fund distributions or the redemption of Fund shares. In the absence of fee waivers and reimbursements, when they are necessary to keep expenses at the expense cap, total return would be reduced. Past performance is not predictive of future performance. Investment return and principal value will fluctuate so that your shares, when redeemed, may be worth more or less than the original cost. Index returns do not reflect the effects of fees or expenses. It is not possible to invest directly in an index.
Total Returns(1)
(For the year ended January 31, 2022)
| | | | | | | | | | | | | | | | |
| | | Average Annual Returns | |
| | | One Year | | | Three Year | | | Five Year | | | Since Inception(2) | |
Angel Oak Financials Income Fund, Institutional Class | | | 5.64 | % | | | 3.00 | % | | | 3.52 | % | | | 3.05 | % |
Angel Oak Financials Income Fund, Class A without load | | | 5.48 | % | | | 2.78 | % | | | 3.28 | % | | | 2.82 | % |
Angel Oak Financials Income Fund, Class A with load | | | 3.14 | % | | | 2.02 | % | | | 2.80 | % | | | 2.49 | % |
Angel Oak Financials Income Fund, Class C without load | | | 4.63 | % | | | 2.02 | % | | | 2.51 | % | | | 1.55 | % |
Angel Oak Financials Income Fund, Class C with load | | | 3.63 | % | | | 2.02 | % | | | 2.51 | % | | | 1.55 | % |
Bloomberg U.S. Aggregate 3-5 Year Index(3) | | | (2.82 | %) | | | 2.64 | % | | | 2.26 | % | | | 2.12 | %(4) |
(1) Return figures reflect any change in price per share and assume the reinvestment of all distributions. Total returns for Class A Shares, with load, include the maximum 2.25% sales charge. Total returns for Class C Shares, with load, include the maximum 1.00% deferred sales charge.
(2) Inception date is November 3, 2014 for Institutional Class and Class A Shares and August 4, 2015 for Class C Shares.
(3) The Bloomberg U.S. Aggregate 3-5 Year Index (formerly Bloomberg Barclays U.S. Aggregate 3-5 Year Index) tracks bonds with 3-5 year maturities within the Bloomberg U.S. Aggregate Bond Index. Performance figures include the change in value of the bonds in the index and the reinvestment of interest. The index return does not reflect expenses, which have been deducted from the Fund’s return. You cannot invest directly in an index; however, an individual can invest in exchange-traded funds or other investment vehicles that attempt to track the performance of a benchmark index.
(4) The return shown for the Bloomberg U.S. Aggregate 3-5 Year Index is from the inception date of the Institutional Class and Class A Shares. The Bloomberg U.S. Aggregate 3-5 Year Index return from the inception date of the Class C Shares is 2.11%.
15
Investment Results – (Unaudited) (continued)
Angel Oak High Yield Opportunities Fund
Total Return Based on a $500,000 Investment
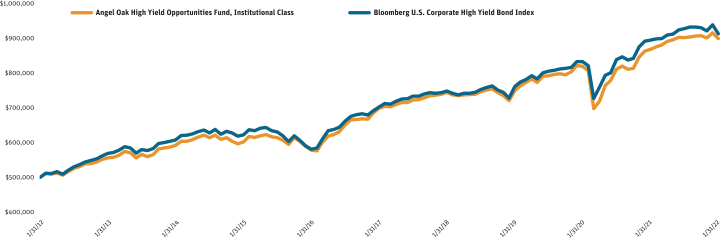
The Fund is the successor to the investment performance of the Rainier High Yield Fund (the “Predecessor High Yield Fund”) as a result of the reorganization of the Predecessor High Yield Fund into the Fund on April 15, 2016. Accordingly, the performance information shown in the chart above and table below for periods prior to April 15, 2016 is that of the Predecessor High Yield Fund’s Institutional Shares and Original Shares for the Fund’s Institutional Class and Class A shares, respectively. The Predecessor High Yield Fund was managed by the same portfolio managers as the Fund and when the Predecessor High Yield Fund was reorganized into the Fund had substantially the same investment objectives, policies, and strategies as the Fund.
The chart above assumes an initial investment of $500,000 made on January 31, 2012. Returns shown include the reinvestment of all dividends. Returns shown do not reflect the deduction of taxes that a shareholder would pay on Fund distributions or the redemption of Fund shares. In the absence of fee waivers and reimbursements, when they are necessary to keep expenses at the expense cap, total return would be reduced. Past performance is not predictive of future performance. Investment return and principal value will fluctuate so that your shares, when redeemed, may be worth more or less than the original cost. Index returns do not reflect the effects of fees or expenses. It is not possible to invest directly in an index.
Total Returns(1)
(For the year ended January 31, 2022)
| | | | | | | | | | | | | | | | | | | | |
| | | Average Annual Returns | |
| | | One Year | | | Three Year | | | Five Year | | | Ten Year | | | Since Inception(2) | |
Angel Oak High Yield Opportunities Fund, Institutional Class | | | 3.62 | % | | | 6.26 | % | | | 5.19 | % | | | 6.05 | % | | | 8.29 | % |
Angel Oak High Yield Opportunities Fund, Class A without load | | | 3.34 | % | | | 6.01 | % | | | 4.93 | % | | | N/A | | | | 5.55 | % |
Angel Oak High Yield Opportunities Fund, Class A with load | | | 1.03 | % | | | 5.21 | % | | | 4.46 | % | | | N/A | | | | 5.30 | % |
Bloomberg U.S. Corporate High Yield Bond Index(3) | | | 2.06 | % | | | 6.26 | % | | | 5.40 | % | | | 6.21 | % | | | 9.99 | %(4) |
(1) Return figures reflect any change in price per share and assume the reinvestment of all distributions. Total returns for Class A Shares, with load, include the maximum 2.25% sales charge.
(2) Inception date is March 31, 2009 for Institutional Class Shares and July 31, 2012 for Class A Shares.
(3) The Bloomberg U.S. Corporate High Yield Bond Index (formerly Bloomberg Barclays U.S. Corporate High Yield Bond Index) is an unmanaged market value-weighted index that covers the universe of fixed-rate, non-investment grade debt. The index return does not reflect expenses, which have been deducted from the Fund’s return. You cannot invest directly in an index; however, an individual can invest in exchange-traded funds or other investment vehicles that attempt to track the performance of a benchmark index.
(4) The return shown for the Bloomberg U.S. Corporate High Yield Bond Index is from the inception date of the Institutional Class Shares. The Bloomberg U.S. Corporate High Yield Bond Index return from the inception date of Class A Shares is 5.89%.
16
Investment Results – (Unaudited) (continued)
Angel Oak UltraShort Income Fund
Total Return Based on a $500,000 Investment
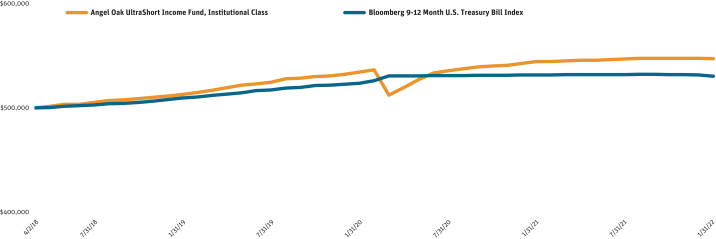
The chart above assumes an initial investment of $500,000 made on April 2, 2018 (commencement of operations). Returns shown include the reinvestment of all dividends. Returns shown do not reflect the deduction of taxes that a shareholder would pay on Fund distributions or the redemption of Fund shares. In the absence of fee waivers and reimbursements, when they are necessary to keep expenses at the expense cap, total return would be reduced. Past performance is not predictive of future performance. Investment return and principal value will fluctuate so that your shares, when redeemed, may be worth more or less than the original cost. Index returns do not reflect the effects of fees or expenses. It is not possible to invest directly in an index.
Total Returns(1)
(For the year ended January 31, 2022)
| | | | | | | | | | | | |
| | | Average Annual Returns | |
| | | One Year | | | Three Year | | | Since Inception(2) | |
Angel Oak UltraShort Income Fund, Institutional Class | | | 0.51 | % | | | 2.17 | % | | | 2.38 | % |
Angel Oak UltraShort Income Fund, Class A | | | 0.27 | % | | | 1.89 | % | | | 2.08 | % |
Bloomberg 9-12 Month U.S. Treasury Bill Index(3) | | | (0.26 | %) | | | 1.35 | % | | | 1.54 | %(4) |
(1) Return figures reflect any change in price per share and assume the reinvestment of all distributions.
(2) Inception date is April 2, 2018 for Institutional Class and April 30, 2018 for Class A Shares.
(3) The Bloomberg 9-12 Month U.S. Treasury Bill Index (formerly Bloomberg Barclays 9-12 Month U.S. Treasury Bill Index) measures the performance of U.S. Treasury bills, notes, and bonds with a remaining maturity between 9-12 months. Performance figures include the change in value of the bonds in the index and the reinvestment of interest. The index return does not reflect expenses, which have been deducted from the Fund’s return. You cannot invest directly in an index; however, an individual can invest in exchange-traded funds or other investment vehicles that attempt to track the performance of a benchmark index.
(4) The return shown for the Bloomberg 9-12 Month U.S. Treasury Bill Index is from the inception date of the Institutional Class Shares. The Bloomberg 9-12 Month U.S. Treasury Bill Index return from the inception date of the Class A Shares is 1.56%.
17
Investment Results – (Unaudited) (continued)
Angel Oak Core Impact Fund
Total Return Based on a $500,000 Investment
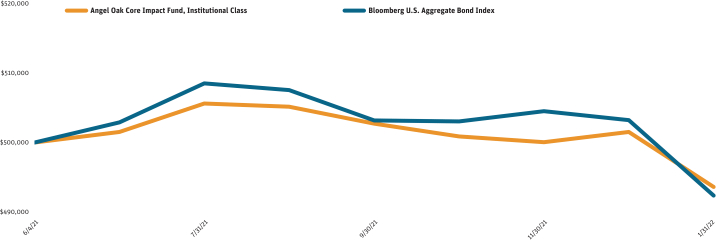
The chart above assumes an initial investment of $500,000 made on June 4, 2021 (commencement of operations). Returns shown include the reinvestment of all dividends. Returns shown do not reflect the deduction of taxes that a shareholder would pay on Fund distributions or the redemption of Fund shares. In the absence of fee waivers and reimbursements, when they are necessary to keep expenses at the expense cap, total return would be reduced. Past performance is not predictive of future performance. Investment return and principal value will fluctuate so that your shares, when redeemed, may be worth more or less than the original cost. Index returns do not reflect the effects of fees or expenses. It is not possible to invest directly in an index.
Cumulative Returns(1)
(For the period ended January 31, 2022)
| | | | |
| | | Since Inception(2) | |
Angel Oak Core Impact Fund, Institutional Class | | | (1.28 | %) |
Bloomberg U.S. Aggregate Bond Index(3) | | | (1.53 | %) |
(1) Return figures reflect any change in price per share and assume the reinvestment of all distributions.
(2) Inception date is June 4, 2021.
(3) The Bloomberg U.S. Aggregate Bond Index (formerly Bloomberg Barclays U.S. Aggregate Bond Index) measures the performance of the investment-grade, fixed-rate bond market, including government and credit securities, agency pass-through securities, asset-backed securities and commercial mortgage-backed securities. Performance figures include the change in value of the bonds in the index and the reinvestment of interest. The index return does not reflect expenses, which have been deducted from the Fund’s return. You cannot invest directly in an index; however, an individual can invest in exchange-traded funds or other investment vehicles that attempt to track the performance of a benchmark index.
18
Summary of Funds’ Expenses – (Unaudited)
As a shareholder of the Funds, you incur two types of costs: (1) transaction costs, including sales charges (loads) on purchase payments; and (2) ongoing costs, including management fees, distribution and/or service (12b-1) fees and other expenses of the Funds. This example is intended to help you understand your ongoing costs (in dollars) of investing in the Funds and to compare these costs with the ongoing costs of investing in other mutual funds. The example is based on an investment of $1,000 invested at the beginning of the period and held for the entire period.
Actual Expenses
The first lines of the tables below provide information about actual account values and actual expenses. You may use the information in these lines, together with the amount you invested, to estimate the expenses that you paid over the period. Simply divide your account value by $1,000 (for example, an $8,600 account value divided by $1,000 = $8.60), then multiply the result by the numbers in the first lines under the heading entitled “Expenses Paid During Period” to estimate the expenses you paid on your account during this period.
Hypothetical Example for Comparison Purposes
The second lines of the tables below provide information about hypothetical account values and hypothetical expenses based on the Funds’ actual expense ratios and an assumed rate of return of 5% per year before expenses, which is not the Funds’ actual return. The hypothetical account values and expenses may not be used to estimate the actual ending account balance or expenses you paid for the period. You may use this information to compare the ongoing costs of investing in the Funds and other funds. To do so, compare this 5% hypothetical example with the 5% hypothetical examples that appear in the shareholder reports of other funds.
Please note that the expenses shown in the table are meant to highlight your ongoing costs only and do not reflect any transactional costs, such as sales charges (loads), redemption fees or exchange fees. Therefore, the second lines of the tables below are useful in comparing ongoing costs only and will not help you determine the relative costs of owning different funds. In addition, if these transactional costs were included, your costs would have been higher.
| | | | | | | | | | |
| Angel Oak Multi-Strategy Income Fund | | Beginning
Account Value,
August 1, 2021 | | Ending
Account Value,
January 31, 2022 | | Expenses Paid
During Period(1) | | Annualized
Expense Ratio |
Class A | | Actual | | $1,000.00 | | $1,003.10 | | $6.61 | | 1.31% |
| | | Hypothetical(2) | | $1,000.00 | | $1,018.60 | | $6.67 | | 1.31% |
Class C | | Actual | | $1,000.00 | | $998.40 | | $10.38 | | 2.06% |
| | | Hypothetical(2) | | $1,000.00 | | $1,014.82 | | $10.46 | | 2.06% |
Institutional Class | | Actual | | $1,000.00 | | $1,003.50 | | $5.35 | | 1.06% |
| | | Hypothetical(2) | | $1,000.00 | | $1,019.86 | | $5.40 | | 1.06% |
| | | | | | | | | | |
| Angel Oak Financials Income Fund | | Beginning
Account Value,
August 1, 2021 | | Ending
Account Value,
January 31, 2022 | | Expenses Paid
During Period(1) | | Annualized
Expense Ratio |
Class A | | Actual | | $1,000.00 | | $1,010.50 | | $4.76 | | 0.94% |
| | | Hypothetical(2) | | $1,000.00 | | $1,020.47 | | $4.79 | | 0.94% |
Class C | | Actual | | $1,000.00 | | $1,005.80 | | $8.54 | | 1.69% |
| | | Hypothetical(2) | | $1,000.00 | | $1,016.69 | | $8.59 | | 1.69% |
Institutional Class | | Actual | | $1,000.00 | | $1,010.70 | | $3.50 | | 0.69% |
| | | Hypothetical(2) | | $1,000.00 | | $1,021.73 | | $3.52 | | 0.69% |
| | | | | | | | | | |
| Angel Oak High Yield Opportunities Fund | | Beginning
Account Value,
August 1, 2021 | | Ending
Account Value,
January 31, 2022 | | Expenses Paid
During Period(1) | | Annualized
Expense Ratio |
Class A | | Actual | | $1,000.00 | | $996.60 | | $4.53 | | 0.90% |
| | | Hypothetical(2) | | $1,000.00 | | $1,020.67 | | $4.58 | | 0.90% |
Institutional Class | | Actual | | $1,000.00 | | $997.80 | | $3.27 | | 0.65% |
| | | Hypothetical(2) | | $1,000.00 | | $1,021.93 | | $3.31 | | 0.65% |
19
Summary of Funds’ Expenses – (Unaudited) (continued)
| | | | | | | | | | |
| Angel Oak UltraShort Income Fund | | Beginning
Account Value,
August 1, 2021 | | Ending
Account Value,
January 31, 2022 | | Expenses Paid
During Period(1) | | Annualized
Expense Ratio |
Class A | | Actual | | $1,000.00 | | $999.30 | | $2.82 | | 0.56% |
| | | Hypothetical(2) | | $1,000.00 | | $1,022.38 | | $2.85 | | 0.56% |
Institutional Class | | Actual | | $1,000.00 | | $1,000.50 | | $1.56 | | 0.31% |
| | | Hypothetical(2) | | $1,000.00 | | $1,023.64 | | $1.58 | | 0.31% |
| | | | | | | | | | |
| Angel Oak Core Impact Fund | | Beginning
Account Value,
August 1,
2021 | | Ending
Account Value,
January 31, 2022 | | Expenses Paid
During Period(1) | | Annualized
Expense Ratio |
Institutional Class | | Actual | | $1,000.00 | | $976.30 | | $2.94 | | 0.59% |
| | | Hypothetical(2) | | $1,000.00 | | $1,022.23 | | $3.01 | | 0.59% |
(1) Expenses are equal to the Fund’s annualized expense ratio, multiplied by the average account value over the period, multiplied by the number of days 184 in the most recent six month period and divided by the number of days in the most recent twelve month period (365). The annualized expense ratios reflect fee waiver and expense limitation arrangements, including interest expense, in effect during the period. The “Financial Highlights” tables in the Funds’ financial statements, included in the report, also show the gross expense ratios, without such reimbursements.
(2) Hypothetical assumes 5% annual return before expenses.
20
Portfolio Holdings – (Unaudited)
The investment objective of Angel Oak Multi-Strategy Income Fund is to seek current income.
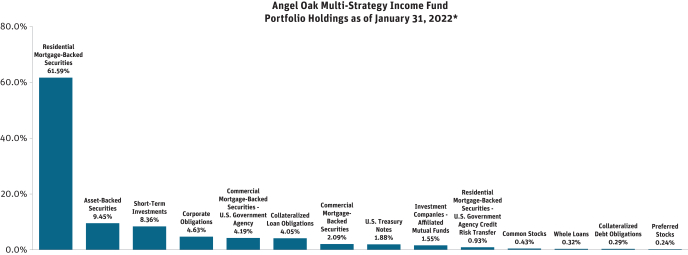
The investment objective of Angel Oak Financials Income Fund is to seek current income with a secondary objective of total return.
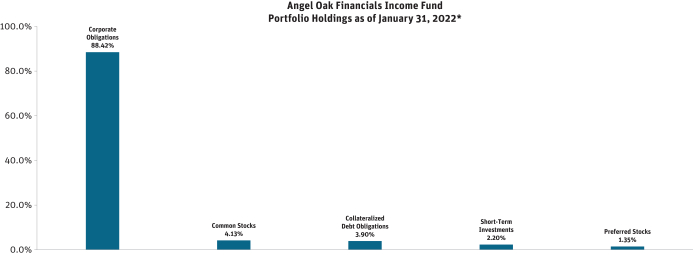
* As a percentage of total investments. The percentages presented in the table above may differ from those in the Schedule of Investments because the percentages in the Schedule of Investments are calculated based on net assets.
21
Portfolio Holdings – (Unaudited) (continued)
The investment objective of Angel Oak High Yield Opportunities Fund is to earn a high level of current income with a secondary objective of capital appreciation.
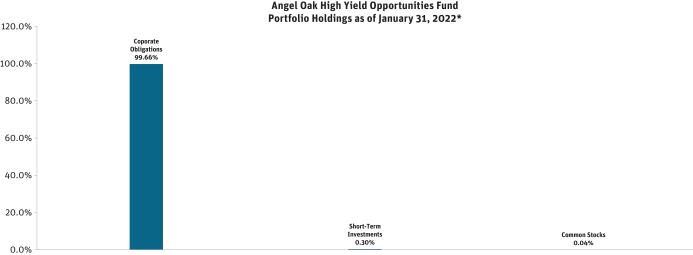
The investment objective of Angel Oak UltraShort Income Fund is to provide current income while seeking to minimize price volatility and maintain liquidity.
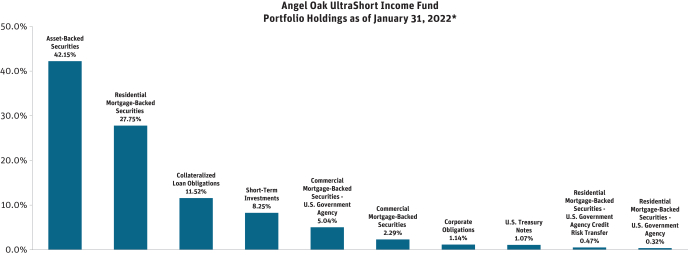
* As a percentage of total investments. The percentages presented in the table above may differ from those in the Schedule of Investments because the percentages in the Schedule of Investments are calculated based on net assets.
22
Portfolio Holdings – (Unaudited) (continued)
The investment objective of Angel Oak Core Impact Fund is seek total return while giving special consideration to positive aggregate environmental, social, and governance (“ESG”) outcomes.
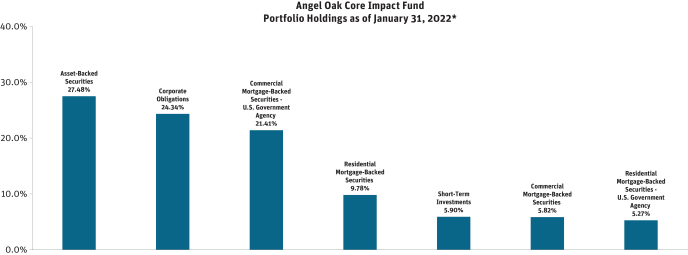
* As a percentage of total investments. The percentages presented in the table above may differ from those in the Schedule of Investments because the percentages in the Schedule of Investments are calculated based on net assets.
23
Statement of Assets and Liabilities
January 31, 2022
| | | | | | | | | | | | | | | | | | | | | | | | | |
| | | Multi-Strategy
Income Fund (a) | | Financials
Income Fund | | High Yield
Opportunities Fund | | Ultra Short
Income Fund | | Core
Impact Fund |
Assets | | | | | | | | | | | | | | | | | | | | | | | | | |
Investments in unaffiliated securities at fair value* | | | $ | 7,861,790,986 | | | | $ | 162,498,900 | | | | $ | 73,589,771 | | | | $ | 1,671,871,837 | | | | $ | 39,084,005 | |
Investments in affiliated securities at fair value* | | | | 123,455,827 | | | | | — | | | | | — | | | | | — | | | | | — | |
Cash | | | | 1,331,676 | | | | | — | | | | | — | | | | | 2,903,791 | | | | | — | |
Deposit at broker for reverse repurchase agreements | | | | 2,742,000 | | | | | — | | | | | — | | | | | — | | | | | — | |
Deposit at broker for futures | | | | 3,311,696 | | | | | — | | | | | — | | | | | 486,138 | | | | | — | |
Receivable for fund shares sold | | | | 30,214,886 | | | | | 1,437,099 | | | | | — | | | | | 6,784,122 | | | | | — | |
Receivable for investments sold | | | | 219,039,641 | | | | | 1,842,960 | | | | | — | | | | | — | | | | | — | |
Dividends and interest receivable | | | | 25,812,431 | | | | | 1,563,033 | | | | | 1,166,473 | | | | | 1,902,226 | | | | | 145,431 | |
Prepaid expenses | | | | 153,661 | | | | | 29,327 | | | | | 19,601 | | | | | 131,683 | | | | | 3,483 | |
| | | | | | | | | | | | | | | | | | | | | | | | | |
Total Assets | | | | 8,267,852,804 | | | | | 167,371,319 | | | | | 74,775,845 | | | | | 1,684,079,797 | | | | | 39,232,919 | |
| | | | | | | | | | | | | | | | | | | | | | | | | |
Liabilities | | | | | | | | | | | | | | | | | | | | | | | | | |
Payable for reverse repurchase agreements | | | | 134,796,000 | | | | | — | | | | | — | | | | | — | | | | | — | |
TBA sale commitments at fair value | | | | 199,756,600 | | | | | — | | | | | — | | | | | — | | | | | — | |
Payable for credit commitment agreements | | | | 300,000,000 | | | | | — | | | | | — | | | | | — | | | | | — | |
Payable for investments purchased | | | | 367,916,443 | | | | | — | | | | | — | | | | | 16,069,713 | | | | | — | |
Payable for Fund shares redeemed | | | | 23,720,330 | | | | | 299,344 | | | | | 138,769 | | | | | 3,182,485 | | | | | — | |
Payable for distributions to shareholders | | | | 7,585,990 | | | | | 187,993 | | | | | 230,218 | | | | | 347,686 | | | | | 55,219 | |
Interest payable for credit and reverse repurchase agreements | | | | 895,058 | | | | | — | | | | | — | | | | | — | | | | | — | |
Variation margin on futures contracts | | | | 30,483 | | | | | — | | | | | — | | | | | — | | | | | — | |
Payable to Adviser | | | | 5,314,635 | | | | | 71,641 | | | | | 25,667 | | | | | 334,309 | | | | | 3,702 | |
Payable to administrator, fund accountant, and transfer agent | | | | 428,799 | | | | | 23,177 | | | | | 14,744 | | | | | 113,285 | | | | | 8,932 | |
Payable to custodian | | | | 54,846 | | | | | 1,001 | | | | | 1,605 | | | | | 11,499 | | | | | 498 | |
12b-1 fees accrued | | | | 133,343 | | | | | 3,840 | | | | | 1,027 | | | | | 37,125 | | | | | — | |
Other accrued expenses | | | | 221,313 | | | | | 36,914 | | | | | 26,356 | | | | | 113,677 | | | | | 31,974 | |
| | | | | | | | | | | | | | | | | | | | | | | | | |
Total Liabilities | | | | 1,040,853,840 | | | | | 623,910 | | | | | 438,386 | | | | | 20,209,779 | | | | | 100,325 | |
| | | | | | | | | | | | | | | | | | | | | | | | | |
Net Assets | | | $ | 7,226,998,964 | | | | $ | 166,747,409 | | | | $ | 74,337,459 | | | | $ | 1,663,870,018 | | | | $ | 39,132,594 | |
| | | | | | | | | | | | | | | | | | | | | | | | | |
| | | | | |
Net Assets consist of: | | | | | | | | | | | | | | | | | | | | | | | | | |
Paid-in capital | | | $ | 8,292,753,918 | | | | $ | 212,801,753 | | | | $ | 77,205,551 | | | | $ | 1,673,585,979 | | | | $ | 40,198,518 | |
Total distributable earnings (accumulated deficit) | | | | (1,065,754,954 | ) | | | | (46,054,344 | ) | | | | (2,868,092 | ) | | | | (9,715,961 | ) | | | | (1,065,924 | ) |
| | | | | | | | | | | | | | | | | | | | | | | | | |
Net Assets | | | $ | 7,226,998,964 | | | | $ | 166,747,409 | | | | $ | 74,337,459 | | | | $ | 1,663,870,018 | | | | $ | 39,132,594 | |
| | | | | | | | | | | | | | | | | | | | | | | | | |
| | | | | |
Class A: | | | | | | | | | | | | | | | | | | | | | | | | | |
Net Assets | | | $ | 335,439,147 | | | | $ | 4,217,010 | | | | $ | 4,834,429 | | | | $ | 171,327,681 | | | | $ | — | |
| | | | | | | | | | | | | | | | | | | | | | | | | |
Shares outstanding (unlimited number of shares authorized, no par value) | | | | 32,764,841 | | | | | 470,621 | | | | | 417,075 | | | | | 17,137,509 | | | | | — | |
| | | | | | | | | | | | | | | | | | | | | | | | | |
Net asset value (“NAV”) per share | | | $ | 10.24 | | | | $ | 8.96 | | | | $ | 11.59 | | | | $ | 10.00 | | | | $ | — | |
| | | | | | | | | | | | | | | | | | | | | | | | | |
Offering price per share (NAV/0.9775) (b) | | | $ | 10.48 | | | | $ | 9.17 | | | | $ | 11.86 | | | | $ | 10.00 | | | | $ | — | |
| | | | | | | | | | | | | | | | | | | | | | | | | |
| | | | | |
Class C: | | | | | | | | | | | | | | | | | | | | | | | | | |
Net Assets | | | $ | 71,444,952 | | | | $ | 3,452,285 | | | | $ | — | | | | $ | — | | | | $ | — | |
| | | | | | | | | | | | | | | | | | | | | | | | | |
Shares outstanding (unlimited number of shares authorized, no par value) | | | | 7,049,807 | | | | | 389,421 | | | | | — | | | | | — | | | | | — | |
| | | | | | | | | | | | | | | | | | | | | | | | | |
Net asset value (“NAV”) and offering price per share | | | $ | 10.13 | | | | $ | 8.87 | | | | $ | — | | | | $ | — | | | | $ | — | |
| | | | | | | | | | | | | | | | | | | | | | | | | |
Minimum redemption price per share (NAV*0.99) (c) | | | $ | 10.03 | | | | $ | 8.78 | | | | $ | — | | | | $ | — | | | | $ | — | |
| | | | | | | | | | | | | | | | | | | | | | | | | |
| | | | | |
Institutional Class: | | | | | | | | | | | | | | | | | | | | | | | | | |
Net Assets | | | $ | 6,820,114,865 | | | | $ | 159,078,114 | | | | $ | 69,503,030 | | | | $ | 1,492,542,337 | | | | $ | 39,132,594 | |
| | | | | | | | | | | | | | | | | | | | | | | | | |
Shares outstanding (unlimited number of shares authorized, no par value) | | | | 667,910,910 | | | | | 17,789,584 | | | | | 6,021,234 | | | | | 149,105,840 | | | | | 4,004,872 | |
| | | | | | | | | | | | | | | | | | | | | | | | | |
Net asset value (“NAV”) and offering price per share | | | $ | 10.21 | | | | $ | 8.94 | | | | $ | 11.54 | | | | $ | 10.01 | | | | $ | 9.77 | |
| | | | | | | | | | | | | | | | | | | | | | | | | |
| | | | | |
*Identified Cost: | | | | | | | | | | | | | | | | | | | | | | | | | |
Investments in unaffiliated securities | | | $ | 8,032,779,588 | | | | $ | 160,360,967 | | | | $ | 74,001,429 | | | | $ | 1,674,877,598 | | | | $ | 40,099,745 | |
Investments in affiliated securities | | | | 126,552,243 | | | | | — | | | | | — | | | | | — | | | | | — | |
Proceeds from TBA sale commitments | | | | 204,187,500 | | | | | — | | | | | — | | | | | — | | | | | — | |
| (a) | Statement has been consolidated. See Note 1 in the Notes to Financial Statements for basis of consolidation. |
| (b) | Class A shares impose a maximum 2.25% sales charge on purchases. This fee is not charged to shareholders of the UltraShort Income Fund. |
| (c) | A contingent deferred sales charge (“CDSC”) of 1.00% may be charged. |
See accompanying notes which are an integral part of these financial statements.
24
Statement of Operations
For the Year or Period Ended January 31, 2022
| | | | | | | | | | | | | | | | | | | | | | | | | |
| | | Multi-Strategy
Income Fund (a) | | Financials
Income Fund | | High Yield
Opportunities Fund | | Ultra Short
Income Fund | | Core
Impact Fund (b) |
Investment Income | | | | | | | | | | | | | | | | | | | | | | | | | |
Interest | | | $ | 388,369,062 | | | | $ | 6,681,468 | | | | $ | 4,273,402 | | | | $ | 18,208,545 | | | | $ | 465,520 | |
Dividends from unaffiliated investments | | | | 3,493,571 | | | | | 402,240 | | | | | — | | | | | — | | | | | — | |
Dividends from affiliated investments | | | | 4,757,407 | | | | | — | | | | | — | | | | | — | | | | | — | |
| | | | | | | | | | | | | | | | | | | | | | | | | |
Total Investment Income | | | | 396,620,040 | | | | | 7,083,708 | | | | | 4,273,402 | | | | | 18,208,545 | | | | | 465,520 | |
| | | | | | | | | | | | | | | | | | | | | | | | | |
| | | | | |
Expenses | | | | | | | | | | | | | | | | | | | | | | | | | |
Investment Advisory (See Note 5) | | | | 61,533,794 | | | | | 1,407,953 | | | | | 408,758 | | | | | 5,966,864 | | | | | 114,677 | |
Interest expense | | | | 4,747,839 | | | | | 1,108 | | | | | 38 | | | | | — | | | | | — | |
12b-1 – Class A | | | | 964,326 | | | | | 7,976 | | | | | 10,127 | | | | | 323,954 | | | | | — | |
12b-1 – Class C | | | | 787,924 | | | | | 40,046 | | | | | — | | | | | — | | | | | — | |
Fund accounting | | | | 1,270,385 | | | | | 30,874 | | | | | 39,470 | | | | | 309,735 | | | | | 10,056 | |
Administration | | | | 685,457 | | | | | 33,258 | | | | | 23,848 | | | | | 150,418 | | | | | 10,931 | |
Transfer agent | | | | 585,348 | | | | | 60,652 | | | | | 28,143 | | | | | 102,955 | | | | | 8,801 | |
Legal | | | | 472,013 | | | | | 9,620 | | | | | 4,803 | | | | | 93,166 | | | | | 13,961 | |
Custodian | | | | 354,953 | | | | | 6,199 | | | | | 8,318 | | | | | 62,494 | | | | | 1,767 | |
Registration | | | | 306,796 | | | | | 85,434 | | | | | 63,315 | | | | | 288,804 | | | | | 6,081 | |
Printing | | | | 269,221 | | | | | 7,902 | | | | | 4,324 | | | | | 32,554 | | | | | 2,626 | |
Trustee | | | | 245,530 | | | | | 38,657 | | | | | 36,127 | | | | | 70,581 | | | | | 15,815 | |
Audit & tax | | | | 100,350 | | | | | 31,576 | | | | | 24,080 | | | | | 28,497 | | | | | 26,697 | |
Insurance | | | | 57,792 | | | | | 1,308 | | | | | 651 | | | | | 7,482 | | | | | 90 | |
Compliance | | | | 13,291 | | | | | 13,291 | | | | | 13,291 | | | | | 13,291 | | | | | 8,445 | |
Miscellaneous | | | | 1,742,881 | | | | | 8,126 | | | | | 4,240 | | | | | 17,955 | | | | | 2,604 | |
| | | | | | | | | | | | | | | | | | | | | | | | | |
Total Expenses | | | | 74,137,900 | | | | | 1,783,980 | | | | | 669,533 | | | | | 7,468,750 | | | | | 222,551 | |
| | | | | | | | | | | | | | | | | | | | | | | | | |
Fees contractually recouped (waived) by Adviser (See Note 5) | | | | (786,925 | ) | | | | — | | | | | (176,290 | ) | | | | (298,340 | ) | | | | (87,232 | ) |
Fees voluntarily waived by Adviser (See Note 5) | | | | — | | | | | (642,662 | ) | | | | — | | | | | (2,706,248 | ) | | | | — | |
| | | | | | | | | | | | | | | | | | | | | | | | | |
Net Expenses | | | | 73,350,975 | | | | | 1,141,318 | | | | | 493,243 | | | | | 4,464,162 | | | | | 135,319 | |
| | | | | | | | | | | | | | | | | | | | | | | | | |
Net Investment Income (Loss) | | | $ | 323,269,065 | | | | $ | 5,942,390 | | | | $ | 3,780,159 | | | | $ | 13,744,383 | | | | $ | 330,201 | |
| | | | | | | | | | | | | | | | | | | | | | | | | |
| | | | |
Realized and Unrealized Gain (Loss) on Investments | | | | | | | | | | | | | | | | | | | | | |
Net realized gain (loss) on investments in unaffiliated securities | | | $ | 11,005,546 | | | | $ | 963,613 | | | | $ | 636,570 | | | | $ | (29,440 | ) | | | $ | (11,870 | ) |
Net realized gain (loss) on investments in affiliated securities | | | | 380,819 | | | | | — | | | | | — | | | | | — | | | | | — | |
Net realized gain (loss) on futures | | | | (446,644 | ) | | | | — | | | | | — | | | | | (366,669 | ) | | | | — | |
Net change in unrealized appreciation (depreciation) on unaffiliated investments | | | | (144,960,822 | ) | | | | 1,603,657 | | | | | (1,827,827 | ) | | | | (9,990,615 | ) | | | | (1,015,740 | ) |
Net change in unrealized appreciation (depreciation) on affiliated investments | | | | (1,513,615 | ) | | | | — | | | | | — | | | | | — | | | | | — | |
Net change in unrealized appreciation (depreciation) on TBA sale commitments | | | | 4,430,900 | | | | | — | | | | | — | | | | | — | | | | | — | |
Net change in unrealized appreciation (depreciation) on futures contracts | | | | 1,647,776 | | | | | — | | | | | — | | | | | 2,007,760 | | | | | — | |
| | | | | | | | | | | | | | | | | | | | | | | | | |
Net Realized and Unrealized Gain (Loss) on Investments | | | | (129,456,040 | ) | | | | 2,567,270 | | | | | (1,191,257 | ) | | | | (8,378,964 | ) | | | | (1,027,610 | ) |
| | | | | | | | | | | | | | | | | | | | | | | | | |
Net increase (decrease) in net assets resulting from operations | | | $ | 193,813,025 | | | | $ | 8,509,660 | | | | $ | 2,588,902 | | | | $ | 5,365,419 | | | | $ | (697,409 | ) |
| | | | | | | | | | | | | | | | | | | | | | | | | |
| (a) | Statement has been consolidated. See Notes 1 in the Notes to Financial Statements for basis of consolidation. |
| (b) | Fund commenced operations on June 4, 2021. |
See accompanying notes which are an integral part of these financial statements.
25
Angel Oak Multi-Strategy Income Fund
Consolidated Statement of Cash Flows (a)
For the Year Ended January 31, 2022
| | | | | |
CASH FLOWS FROM OPERATING ACTIVITIES: | | | | | |
Net increase (decrease) in net assets resulting from operations | | | $ | 193,813,025 | |
Net adjustments to reconcile net increase in net assets from operations to net cash provided by (used in) operating activities: | | | | | |
Net amortization and accretion of premium and discount | | | | (23,923,923 | ) |
Net realized paydown gains on mortgage backed and other asset backed securities | | | | (64,476,698 | ) |
Purchases of short-term investments, net | | | | (612,531,601 | ) |
Purchases of investments | | | | (4,656,407,682 | ) |
Proceeds from of TBA sale commitments | | | | 204,187,500 | |
Proceeds from sales of long-term investments | | | | 3,977,685,819 | |
Net change in unrealized (appreciation) depreciation on investments | | | | 146,474,437 | |
Net change in unrealized (appreciation) depreciation on futures contracts | | | | (1,647,776 | ) |
Net change in unrealized (appreciation) depreciation on TBA sale commitments | | | | (4,430,900 | ) |
Net realized (gain) loss on investments | | | | (11,386,365 | ) |
Net realized (gain) loss on futures contracts | | | | 446,644 | |
Change in: | | | | | |
Receivable for investments sold | | | | (151,725,622 | ) |
Dividends and interest receivable | | | | (3,061,175 | ) |
Prepaid expenses | | | | 20,387 | |
Payable for investments purchased | | | | 239,394,542 | |
Interest payable for credit and reverse repurchase agreements | | | | 6,662 | |
Payable to Adviser | | | | 679,330 | |
Payable to administrator, fund accountant and transfer agent | | | | 19,816 | |
Payable to custodian | | | | (37,350 | ) |
12b-1 fees accrued | | | | (25,241 | ) |
Other accrued expenses | | | | 19,504 | |
| | | | | |
Net cash provided by (used in) operating activities | | | | (766,906,667 | ) |
| | | | | |
CASH FLOWS FROM FINANCING ACTIVITIES: | | | | | |
Proceeds from shares sold | | | | 3,699,585,648 | |
Payment on shares redeemed | | | | (2,918,754,614 | ) |
Distributions paid to shareholders | | | | (86,084,458 | ) |
Purchases of reverse repurchase agreements | | | | 134,796,000 | |
Proceeds from reverse repurchase agreements | | | | (156,100,000 | ) |
Payment on borrowings | | | | 100,000,000 | |
| | | | | |
Net cash provided by (used in) financing activities | | | | 773,442,576 | |
| | | | | |
Net change in cash | | | | 6,535,909 | |
| | | | | |
CASH: | | | | | |
Beginning Balance | | | | 818,980 | |
| | | | | |
Ending Balance | | | $ | 7,354,889 | |
| | | | | |
SUPPLEMENTAL DISCLOSURES: | | | | | |
Cash paid for interest | | | $ | 4,741,177 | |
Cash held in money market investments | | | $ | 667,438,506 | |
Non-cash financing activities - distributions reinvested | | | $ | 240,079,941 | |
Non-cash financing activities - (increase) decrease in receivable for fund shares sold | | | $ | (64,597,939 | ) |
Non-cash financing activities - increase (decrease) in payable for fund shares redeemed | | | $ | (6,416,351 | ) |
| |
RECONCILIATION OF RESTRICTED AND UNRESTRICTED CASH AT THE BEGINNING OF YEAR TO THE STATEMENTS OF ASSETS AND LIABILITIES: | | | | | |
Cash | | | | 568,913 | |
Deposit at broker for futures | | | | 250,067 | |
| |
RECONCILIATION OF RESTRICTED AND UNRESTRICTED CASH AT THE END OF YEAR TO THE STATEMENTS OF ASSETS AND LIABILITIES: | | | | | |
Cash | | | | 1,331,676 | |
Deposit at broker for reverse repurchase agreements | | | | 2,742,000 | |
Deposit at broker for futures | | | | 3,311,696 | |
Variation Margin on Futures Contracts | | | | (30,483 | ) |
| (a) | Statement has been consolidated. See Note 1 in the notes to Financial Statements for basis of consolidation. |
See accompanying notes which are an integral part of these financial statements.
26
Angel Oak Multi-Strategy Income Fund
Consolidated Statements of Changes in Net Assets
| | | | | | | | | | |
| | | For the Year Ended
January 31, 2022 (a) | | For the Year Ended
January 31, 2021 (a) |
Increase (Decrease) in Net Assets due to: | | | | | | | | | | |
Operations | | | | | | | | | | |
Net investment income (loss) | | | $ | 323,269,065 | | | | $ | 289,396,693 | |
Net realized gain (loss) on investment transactions and futures contracts | | | | 10,939,721 | | | | | (424,672,361 | ) |
Net change in unrealized appreciation (depreciation) on investments, TBA sale commitments and futures contracts | | | | (140,395,761 | ) | | | | (43,147,724 | ) |
| | | | | | | | | | |
Net increase (decrease) in net assets resulting from operations | | | | 193,813,025 | | | | | (178,423,392 | ) |
| | | | | | | | | | |
Distributions to Shareholders | | | | | | | | | | |
Distributions, Class A | | | | (17,292,024 | ) | | | | (17,105,979 | ) |
Distributions, Class C | | | | (3,008,479 | ) | | | | (3,574,699 | ) |
Distributions, Institutional Class | | | | (308,374,494 | ) | | | | (263,765,172 | ) |
| | | | | | | | | | |
Total distributions to shareholders | | | | (328,674,997 | ) | | | | (284,445,850 | ) |
| | | | | | | | | | |
Capital Transactions – Class A | | | | | | | | | | |
Proceeds from shares sold | | | | 113,767,630 | | | | | 168,363,355 | |
Reinvestment of distributions | | | | 13,013,210 | | | | | 12,530,889 | |
Amount paid for shares redeemed | | | | (181,260,631 | ) | | | | (250,622,515 | ) |
| | | | | | | | | | |
Total Class A | | | | (54,479,791 | ) | | | | (69,728,271 | ) |
| | | | | | | | | | |
Capital Transactions – Class C | | | | | | | | | | |
Proceeds from shares sold | | | | 8,258,202 | | | | | 13,981,794 | |
Reinvestment of distributions | | | | 2,240,601 | | | | | 2,821,148 | |
Amount paid for shares redeemed | | | | (25,344,980 | ) | | | | (37,873,553 | ) |
| | | | | | | | | | |
Total Class C | | | | (14,846,177 | ) | | | | (21,070,611 | ) |
| | | | | | | | | | |
Capital Transactions – Institutional Class | | | | | | | | | | |
Proceeds from shares sold | | | | 3,512,961,877 | | | | | 3,997,524,094 | |
Reinvestment of distributions | | | | 224,826,130 | | | | | 195,426,988 | |
Amount paid for shares redeemed | | | | (2,718,565,354 | ) | | | | (4,993,145,685 | ) |
| | | | | | | | | | |
Total Institutional Class | | | | 1,019,222,653 | | | | | (800,194,603 | ) |
| | | | | | | | | | |
Net increase (decrease) in net assets resulting from capital transactions | | | | 949,896,685 | | | | | (890,993,485 | ) |
| | | | | | | | | | |
Total Increase (Decrease) in Net Assets | | | | 815,034,713 | | | | | (1,353,862,727 | ) |
| | | | | | | | | | |
Net Assets | | | | | | | | | | |
Beginning of period | | | | 6,411,964,251 | | | | | 7,765,826,978 | |
| | | | | | | | | | |
End of period | | | $ | 7,226,998,964 | | | | $ | 6,411,964,251 | |
| | | | | | | | | | |
Share Transactions – Class A | | | | | | | | | | |
Shares sold | | | | 10,926,212 | | | | | 16,504,029 | |
Shares issued in reinvestment of distributions | | | | 1,252,277 | | | | | 1,228,182 | |
Shares redeemed | | | | (17,436,419 | ) | | | | (24,403,707 | ) |
| | | | | | | | | | |
Total Class A | | | | (5,257,930 | ) | | | | (6,671,496 | ) |
| | | | | | | | | | |
Share Transactions – Class C | | | | | | | | | | |
Shares sold | | | | 803,571 | | | | | 1,370,759 | |
Shares issued in reinvestment of distributions | | | | 217,730 | | | | | 279,597 | |
Shares redeemed | | | | (2,459,811 | ) | | | | (3,737,484 | ) |
| | | | | | | | | | |
Total Class C | | | | (1,438,510 | ) | | | | (2,087,128 | ) |
| | | | | | | | | | |
Share Transactions – Institutional Class | | | | | | | | | | |
Shares sold | | | | 338,829,057 | | | | | 394,413,362 | |
Shares issued in reinvestment of distributions | | | | 21,692,531 | | | | | 19,186,968 | |
Shares redeemed | | | | (262,126,642 | ) | | | | (489,582,268 | ) |
| | | | | | | | | | |
Total Institutional Class | | | | 98,394,946 | | | | | (75,981,938 | ) |
| | | | | | | | | | |
Net increase (decrease) in share transactions | | | | 91,698,506 | | | | | (84,740,562 | ) |
| | | | | | | | | | |
| (a) | Statement has been consolidated. See Note 1 in the Notes to Financial Statements for basis of consolidation. |
See accompanying notes which are an integral part of these financial statements.
27
Angel Oak Financials Income Fund
Statements of Changes in Net Assets
| | | | | | | | | | |
| | | For the Year Ended
January 31, 2022 | | For the Year Ended
January 31, 2021 |
Increase (Decrease) in Net Assets due to: | | | | | | |
Operations | | | | | | | | | | |
Net investment income (loss) | | | $ | 5,942,390 | | | | $ | 7,097,843 | |
Net realized gain (loss) on investment transactions | | | | 963,613 | | | | | (13,769,485 | ) |
Net change in unrealized appreciation (depreciation) on investments | | | | 1,603,657 | | | | | (4,986,669 | ) |
| | | | | | | | | | |
Net increase (decrease) in net assets resulting from operations | | | | 8,509,660 | | | | | (11,658,311 | ) |
| | | | | | | | | | |
Distributions to Shareholders | | | | | | | | | | |
Distributions, Class A | | | | (111,005 | ) | | | | (254,753 | ) |
Return of capital, Class A | | | | — | | | | | (6,989 | ) |
Distributions, Class C | | | | (114,065 | ) | | | | (212,378 | ) |
Return of capital, Class C | | | | — | | | | | (5,826 | ) |
Distributions, Institutional Class | | | | (5,723,833 | ) | | | | (6,913,082 | ) |
Return of capital, Institutional Class | | | | — | | | | | (189,527 | ) |
| | | | | | | | | | |
Total distributions to shareholders | | | | (5,948,903 | ) | | | | (7,582,555 | ) |
| | | | | | | | | | |
Capital Transactions – Class A | | | | | | | | | | |
Proceeds from shares sold | | | | 2,220,664 | | | | | 1,047,372 | |
Reinvestment of distributions | | | | 102,282 | | | | | 236,034 | |
Amount paid for shares redeemed | | | | (913,442 | ) | | | | (11,165,410 | ) |
| | | | | | | | | | |
Total Class A | | | | 1,409,504 | | | | | (9,882,004 | ) |
| | | | | | | | | | |
Capital Transactions – Class C | | | | | | | | | | |
Proceeds from shares sold | | | | 463,088 | | | | | 1,754,895 | |
Reinvestment of distributions | | | | 82,346 | | | | | 171,672 | |
Amount paid for shares redeemed | | | | (2,734,308 | ) | | | | (2,027,050 | ) |
| | | | | | | | | | |
Total Class C | | | | (2,188,874 | ) | | | | (100,483 | ) |
| | | | | | | | | | |
Capital Transactions – Institutional Class | | | | | | |
Proceeds from shares sold | | | | 60,879,854 | | | | | 79,289,170 | |
Reinvestment of distributions | | | | 3,282,293 | | | | | 4,327,984 | |
Amount paid for shares redeemed | | | | (41,849,423 | ) | | | | (190,014,760 | ) |
| | | | | | | | | | |
Total Institutional Class | | | | 22,312,724 | | | | | (106,397,606 | ) |
| | | | | | | | | | |
Net increase (decrease) in net assets resulting from capital transactions | | | | 21,533,354 | | | | | (116,380,093 | ) |
| | | | | | | | | | |
Total Increase (Decrease) in Net Assets | | | | 24,094,111 | | | | | (135,620,959 | ) |
| | | | | | | | | | |
Net Assets | | | | | | | | | | |
Beginning of period | | | | 142,653,298 | | | | | 278,274,257 | |
| | | | | | | | | | |
End of period | | | $ | 166,747,409 | | | | $ | 142,653,298 | |
| | | | | | | | | | |
Share Transactions – Class A | | | | | | | | | | |
Shares sold | | | | 246,833 | | | | | 113,606 | |
Shares issued in reinvestment of distributions | | | | 11,405 | | | | | 26,601 | |
Shares redeemed | | | | (102,033 | ) | | | | (1,255,302 | ) |
| | | | | | | | | | |
Total Class A | | | | 156,205 | | | | | (1,115,095 | ) |
| | | | | | | | | | |
Share Transactions – Class C | | | | | | | | | | |
Shares sold | | | | 52,396 | | | | | 199,714 | |
Shares issued in reinvestment of distributions | | | | 9,286 | | | | | 19,753 | |
Shares redeemed | | | | (309,154 | ) | | | | (230,840 | ) |
| | | | | | | | | | |
Total Class C | | | | (247,472 | ) | | | | (11,373 | ) |
| | | | | | | | | | |
Share Transactions – Institutional Class | | | | | | |
Shares sold | | | | 6,814,124 | | | | | 8,772,324 | |
Shares issued in reinvestment of distributions | | | | 366,628 | | | | | 489,301 | |
Shares redeemed | | | | (4,675,741 | ) | | | | (20,941,153 | ) |
| | | | | | | | | | |
Total Institutional Class | | | | 2,505,011 | | | | | (11,679,528 | ) |
| | | | | | | | | | |
Net increase (decrease) in share transactions | | | | 2,413,744 | | | | | (12,805,996 | ) |
| | | | | | | | | | |
See accompanying notes which are an integral part of these financial statements.
28
Angel Oak High Yield Opportunities Fund
Statements of Changes in Net Assets
| | | | | | | | | | |
| | | For the Year Ended
January 31, 2022 | | For the Year Ended
January 31, 2021 |
Increase (Decrease) in Net Assets due to: | | | | | | | | | | |
Operations | | | | | | | | | | |
Net investment income (loss) | | | $ | 3,780,159 | | | | $ | 3,957,250 | |
Net realized gain (loss) on investment transactions | | | | 636,570 | | | | | (1,480,307 | ) |
Net change in unrealized appreciation (depreciation) on investments | | | | (1,827,827 | ) | | | | 329,569 | |
| | | | | | | | | | |
Net increase (decrease) in net assets resulting from operations | | | | 2,588,902 | | | | | 2,806,512 | |
| | | | | | | | | | |
Distributions to Shareholders | | | | | | | | | | |
Distributions, Class A | | | | (198,482 | ) | | | | (349,968 | ) |
Distributions, Institutional Class | | | | (3,642,787 | ) | | | | (3,574,917 | ) |
| | | | | | | | | | |
Total distributions to shareholders | | | | (3,841,269 | ) | | | | (3,924,885 | ) |
| | | | | | | | | | |
Capital Transactions – Class A | | | | | | | | | | |
Proceeds from shares sold | | | | 2,916,252 | | | | | 1,132,686 | |
Reinvestment of distributions | | | | 197,215 | | | | | 349,623 | |
Amount paid for shares redeemed | | | | (2,181,125 | ) | | | | (5,119,991 | ) |
| | | | | | | | | | |
Total Class A | | | | 932,342 | | | | | (3,637,682 | ) |
| | | | | | | | | | |
Capital Transactions – Institutional Class | | | | | | | | | | |
Proceeds from shares sold | | | | 4,653,761 | | | | | 16,208,449 | |
Reinvestment of distributions | | | | 757,305 | | | | | 741,538 | |
Amount paid for shares redeemed | | | | (2,985,257 | ) | | | | (12,530,487 | ) |
| | | | | | | | | | |
Total Institutional Class | | | | 2,425,809 | | | | | 4,419,500 | |
| | | | | | | | | | |
Net increase (decrease) in net assets resulting from capital transactions | | | | 3,358,151 | | | | | 781,818 | |
| | | | | | | | | | |
Total Increase (Decrease) in Net Assets | | | | 2,105,784 | | | | | (336,555 | ) |
| | | | | | | | | | |
Net Assets | | | | | | | | | | |
Beginning of period | | | | 72,231,675 | | | | | 72,568,230 | |
| | | | | | | | | | |
End of period | | | $ | 74,337,459 | | | | $ | 72,231,675 | |
| | | | | | | | | | |
Share Transactions – Class A | | | | | | | | | | |
Shares sold | | | | 245,813 | | | | | 100,343 | |
Shares issued in reinvestment of distributions | | | | 16,652 | | | | | 31,803 | |
Shares redeemed | | | | (183,742 | ) | | | | (454,641 | ) |
| | | | | | | | | | |
Total Class A | | | | 78,723 | | | | | (322,495 | ) |
| | | | | | | | | | |
Share Transactions – Institutional Class | | | | | | | | | | |
Shares sold | | | | 392,064 | | | | | 1,450,815 | |
Shares issued in reinvestment of distributions | | | | 64,201 | | | | | 67,522 | |
Shares redeemed | | | | (252,371 | ) | | | | (1,233,464 | ) |
| | | | | | | | | | |
Total Institutional Class | | | | 203,894 | | | | | 284,873 | |
| | | | | | | | | | |
Net increase (decrease) in share transactions | | | | 282,617 | | | | | (37,622 | ) |
| | | | | | | | | | |
See accompanying notes which are an integral part of these financial statements.
29
Angel Oak Ultra Short Income Fund
Statements of Changes in Net Assets
| | | | | | | | | | |
| | | For the Year Ended
January 31, 2022 | | For the Year Ended
January 31, 2021 |
Increase (Decrease) in Net Assets due to: | | | | | | | | | | |
Operations | | | | | | | | | | |
Net investment income (loss) | | | $ | 13,744,383 | | | | $ | 10,857,482 | |
Net realized gain (loss) on investment transactions and futures contracts | | | | (396,109 | ) | | | | (4,001,163 | ) |
Net change in unrealized appreciation (depreciation) on investments and futures contracts | | | | (7,982,855 | ) | | | | 4,361,309 | |
| | | | | | | | | | |
Net increase (decrease) in net assets resulting from operations | | | | 5,365,419 | | | | | 11,217,628 | |
| | | | | | | | | | |
Distributions to Shareholders | | | | | | | | | | |
Distributions, Class A | | | | (1,370,158 | ) | | | | (704,448 | ) |
Distributions, Institutional Class | | | | (15,915,163 | ) | | | | (10,533,725 | ) |
| | | | | | | | | | |
Total distributions to shareholders | | | | (17,285,321 | ) | | | | (11,238,173 | ) |
| | | | | | | | | | |
Capital Transactions – Class A | | | | | | | | | | |
Proceeds from shares sold | | | | 173,304,337 | | | | | 57,413,686 | |
Reinvestment of distributions | | | | 1,266,990 | | | | | 660,509 | |
Amount paid for shares redeemed | | | | (68,418,315 | ) | | | | (42,837,141 | ) |
| | | | | | | | | | |
Total Class A | | | | 106,153,012 | | | | | 15,237,054 | |
| | | | | | | | | | |
Capital Transactions – Institutional Class | | | | | | | | | | |
Proceeds from shares sold | | | | 1,725,634,613 | | | | | 857,339,413 | |
Reinvestment of distributions | | | | 12,276,225 | | | | | 7,773,806 | |
Amount paid for shares redeemed | | | | (1,031,046,901 | ) | | | | (426,389,181 | ) |
| | | | | | | | | | |
Total Institutional Class | | | | 706,863,937 | | | | | 438,724,038 | |
| | | | | | | | | | |
Net increase (decrease) in net assets resulting from capital transactions | | | | 813,016,949 | | | | | 453,961,092 | |
| | | | | | | | | | |
Total Increase (Decrease) in Net Assets | | | | 801,097,047 | | | | | 453,940,547 | |
| | | | | | | | | | |
Net Assets | | | | | | | | | | |
Beginning of period | | | | 862,772,971 | | | | | 408,832,424 | |
| | | | | | | | | | |
End of period | | | $ | 1,663,870,018 | | | | $ | 862,772,971 | |
| | | | | | | | | | |
Share Transactions – Class A | | | | | | | | | | |
Shares sold | | | | 17,237,092 | | | | | 5,723,104 | |
Shares issued in reinvestment of distributions | | | | 126,149 | | | | | 66,239 | |
Shares redeemed | | | | (6,810,400 | ) | | | | (4,295,858 | ) |
| | | | | | | | | | |
Total Class A | | | | 10,552,841 | | | | | 1,493,485 | |
| | | | | | | | | | |
Share Transactions – Institutional Class | | | | | | | | | | |
Shares sold | | | | 171,455,363 | | | | | 85,602,077 | |
Shares issued in reinvestment of distributions | | | | 1,220,931 | | | | | 778,651 | |
Shares redeemed | | | | (102,493,351 | ) | | | | (42,751,682 | ) |
| | | | | | | | | | |
Total Institutional Class | | | | 70,182,943 | | | | | 43,629,046 | |
| | | | | | | | | | |
Net increase (decrease) in share transactions | | | | 80,735,784 | | | | | 45,122,531 | |
| | | | | | | | | | |
See accompanying notes which are an integral part of these financial statements.
30
Angel Oak Core Impact Fund
Statement of Changes in Net Assets
| | | | | |
| | | For the Period Ended
January 31, 2022 (a) |
Increase (Decrease) in Net Assets due to: | | | | | |
Operations | | | | | |
Net investment income (loss) | | | $ | 330,201 | |
Net realized gain (loss) on investment transactions | | | | (11,870 | ) |
Net change in unrealized appreciation (depreciation) on investments | | | | (1,015,740 | ) |
| | | | | |
Net increase (decrease) in net assets resulting from operations | | | | (697,409 | ) |
| | | | | |
Distributions to Shareholders | | | | | |
Distributions, Institutional Class | | | | (368,515 | ) |
| | | | | |
Total distributions to shareholders | | | | (368,515 | ) |
| | | | | |
Capital Transactions – Institutional Class | | | | | |
Proceeds from shares sold | | | | 40,197,500 | |
Reinvestment of distributions | | | | 1,018 | |
Amount paid for shares redeemed | | | | — | |
| | | | | |
Total Institutional Class | | | | 40,198,518 | |
| | | | | |
Net increase (decrease) in net assets resulting from capital transactions | | | | 40,198,518 | |
| | | | | |
Total Increase (Decrease) in Net Assets | | | | 39,132,594 | |
| | | | | |
Net Assets | | | | | |
Beginning of period | | | | — | |
| | | | | |
End of period | | | $ | 39,132,594 | |
| | | | | |
Share Transactions – Institutional Class | | | | | |
Shares sold | | | | 4,004,770 | |
Shares issued in reinvestment of distributions | | | | 102 | |
Shares redeemed | | | | — | |
| | | | | |
Total Institutional Class | | | | 4,004,872 | |
| | | | | |
Net increase (decrease) in share transactions | | | | 4,004,872 | |
| | | | | |
| (a) | Fund commenced operations on June 4, 2021. |
See accompanying notes which are an integral part of these financial statements.
31
Angel Oak Multi-Strategy Income Fund – Class A
Consolidated Financial Highlights (a)
(For a share outstanding during each period)
| | | | | | | | | | | | | | | | | | | | | | | | | |
| | | For the
Year Ended
January 31, 2022 | | For the
Year Ended
January 31, 2021 | | For the
Year Ended
January 31, 2020 | | For the
Year Ended
January 31, 2019 | | For the
Year Ended
January 31, 2018 |
Selected Per Share Data: | | | | | | | | | | | | | | | | | | | | | | | | | |
Net asset value, beginning of period | | | $ | 10.43 | | | | $ | 11.10 | | | | $ | 11.04 | | | | $ | 11.26 | | | | $ | 11.30 | |
| | | | | | | | | | | | | | | | | | | | | | | | | |
| | | | | |
Income from investment operations: | | | | | | | | | | | | | | | | | | | | | | | | | |
Net investment income (loss) | | | | 0.47 | | | | | 0.46 | | | | | 0.50 | | | | | 0.52 | | | | | 0.54 | |
Net realized and unrealized gain (loss) on investments | | | | (0.19 | ) | | | | (0.68 | ) | | | | 0.06 | | | | | (0.22 | ) | | | | (0.02 | ) |
| | | | | | | | | | | | | | | | | | | | | | | | | |
Total from investment operations | | | | 0.28 | | | | | (0.22 | ) | | | | 0.56 | | | | | 0.30 | | | | | 0.52 | |
| | | | | | | | | | | | | | | | | | | | | | | | | |
Less distributions to shareholders: | | | | | | | | | | | | | | | | | | | | | | | | | |
From net investment income | | | | (0.47 | ) | | | | (0.45 | ) | | | | (0.50 | ) | | | | (0.52 | ) | | | | (0.56 | ) |
| | | | | | | | | | | | | | | | | | | | | | | | | |
Total distributions | | | | (0.47 | ) | | | | (0.45 | ) | | | | (0.50 | ) | | | | (0.52 | ) | | | | (0.56 | ) |
| | | | | | | | | | | | | | | | | | | | | | | | | |
| | | | | |
Net asset value, end of period | | | $ | 10.24 | | | | $ | 10.43 | | | | $ | 11.10 | | | | $ | 11.04 | | | | $ | 11.26 | |
| | | | | | | | | | | | | | | | | | | | | | | | | |
| | | | | |
Total return (b)(c) | | | | 2.71 | % | | | | (1.76 | %) | | | | 5.08 | % | | | | 2.72 | % | | | | 4.69 | % |
| | | | | |
Ratios and Supplemental Data: | | | | | | | | | | | | | | | | | | | | | | | | | |
Net assets, end of period (000’s omitted) | | | $ | 335,439 | | | | $ | 396,711 | | | | $ | 496,114 | | | | $ | 590,386 | | | | $ | 538,699 | |
Ratio of expenses to average net assets before waiver and reimbursement/recoupment (d) | | | | 1.29 | % | | | | 1.40 | % | | | | 1.37 | % | | | | 1.35 | % | | | | 1.36 | % |
Ratio of expenses to average net assets before waiver and reimbursement/recoupment excluding interest expense (d) | | | | 1.20 | % | | | | 1.21 | % | | | | 1.20 | % | | | | 1.20 | % | | | | 1.20 | % |
Ratio of expenses to average net assets after waiver and reimbursement/recoupment (d) | | | | 1.28 | % | | | | 1.38 | % | | | | 1.36 | % | | | | 1.37 | % | | | | 1.40 | % |
Ratio of expenses to average net assets after waiver and reimbursement/recoupment excluding interest expense (d) | | | | 1.19 | % | | | | 1.19 | % | | | | 1.19 | % | | | | 1.22 | % | | | | 1.24 | % |
Ratio of net investment income (loss) to average net assets before waiver and reimbursement/recoupment (d) | | | | 4.42 | % | | | | 4.41 | % | | | | 4.46 | % | | | | 4.69 | % | | | | 4.80 | % |
Ratio of net investment income (loss) to average net assets after waiver and reimbursement/recoupment (d) | | | | 4.43 | % | | | | 4.43 | % | | | | 4.47 | % | | | | 4.67 | % | | | | 4.76 | % |
Portfolio turnover rate (c) | | | | 55.99 | % | | | | 67.45 | % | | | | 62.94 | % | | | | 71.49 | % | | | | 81.13 | % |
|
(a) Financial Highlights have been consolidated. See Note 1 in the Notes to Financial Statements for basis of consolidation. | |
(b) Total return does not include the effect of sales charges. | | | | | | | | | | | | | | | | | | | | | |
(c) Not annualized for periods less than one year. | | | | | | | | | | | | | | | | | | | | | |
(d) Annualized for periods less than one year. | | | | | | | | | | | | | | | | | | | | | |
See accompanying notes which are an integral part of these financial statements.
32
Angel Oak Multi-Strategy Income Fund – Class C
Consolidated Financial Highlights (a)
(For a share outstanding during each period)
| | | | | | | | | | | | | | | | | | | | | | | | | |
| | | For the
Year Ended
January 31, 2022 | | For the
Year Ended
January 31, 2021 | | For the
Year Ended
January 31, 2020 | | For the
Year Ended
January 31, 2019 | | For the
Year Ended
January 31, 2018 |
Selected Per Share Data: | | | | | | | | | | | | | | | | | | | | | | | | | |
Net asset value, beginning of period | | | $ | 10.34 | | | | $ | 11.00 | | | | $ | 10.95 | | | | $ | 11.17 | | | | $ | 11.23 | |
| | | | | | | | | | | | | | | | | | | | | | | | | |
| | | | | |
Income from investment operations: | | | | | | | | | | | | | | | | | | | | | | | | | |
Net investment income (loss) | | | | 0.38 | | | | | 0.37 | | | | | 0.41 | | | | | 0.44 | | | | | 0.46 | |
Net realized and unrealized gain (loss) on investments | | | | (0.20 | ) | | | | (0.66 | ) | | | | 0.06 | | | | | (0.22 | ) | | | | (0.03 | ) |
| | | | | | | | | | | | | | | | | | | | | | | | | |
Total from investment operations | | | | 0.18 | | | | | (0.29 | ) | | | | 0.47 | | | | | 0.22 | | | | | 0.43 | |
| | | | | | | | | | | | | | | | | | | | | | | | | |
Less distributions to shareholders: | | | | | | | | | | | | | | | | | | | | | | | | | |
From net investment income | | | | (0.39 | ) | | | | (0.37 | ) | | | | (0.42 | ) | | | | (0.44 | ) | | | | (0.49 | ) |
| | | | | | | | | | | | | | | | | | | | | | | | | |
Total distributions | | | | (0.39 | ) | | | | (0.37 | ) | | | | (0.42 | ) | | | | (0.44 | ) | | | | (0.49 | ) |
| | | | | | | | | | | | | | | | | | | | | | | | | |
| | | | | |
Net asset value, end of period | | | $ | 10.13 | | | | $ | 10.34 | | | | $ | 11.00 | | | | $ | 10.95 | | | | $ | 11.17 | |
| | | | | | | | | | | | | | | | | | | | | | | | | |
| | | | | |
Total return (b)(c) | | | | 1.78 | % | | | | (2.41 | %) | | | | 4.27 | % | | | | 2.04 | % | | | | 3.90 | % |
| | | | | |
Ratios and Supplemental Data: | | | | | | | | | | | | | | | | | | | | | | | | | |
Net assets, end of period (000’s omitted) | | | $ | 71,445 | | | | $ | 87,743 | | | | $ | 116,328 | | | | $ | 102,487 | | | | $ | 86,923 | |
Ratio of expenses to average net assets before waiver and reimbursement/recoupment (d) | | | | 2.04 | % | | | | 2.15 | % | | | | 2.12 | % | | | | 2.10 | % | | | | 2.11 | % |
Ratio of expenses to average net assets before waiver and reimbursement/recoupment excluding interest expense (d) | | | | 1.95 | % | | | | 1.96 | % | | | | 1.95 | % | | | | 1.95 | % | | | | 1.95 | % |
Ratio of expenses to average net assets after waiver and reimbursement/recoupment (d) | | | | 2.03 | % | | | | 2.13 | % | | | | 2.11 | % | | | | 2.12 | % | | | | 2.15 | % |
Ratio of expenses to average net assets after waiver and reimbursement/recoupment excluding interest expense (d) | | | | 1.94 | % | | | | 1.94 | % | | | | 1.94 | % | | | | 1.97 | % | | | | 1.99 | % |
Ratio of net investment income (loss) to average net assets before waiver and reimbursement/recoupment (d) | | | | 3.69 | % | | | | 3.67 | % | | | | 3.70 | % | | | | 3.94 | % | | | | 4.03 | % |
Ratio of net investment income (loss) to average net assets after waiver and reimbursement/recoupment (d) | | | | 3.70 | % | | | | 3.69 | % | | | | 3.71 | % | | | | 3.92 | % | | | | 3.99 | % |
Portfolio turnover rate (c) | | | | 55.99 | % | | | | 67.45 | % | | | | 62.94 | % | | | | 71.49 | % | | | | 81.13 | % |
|
(a) Financial Highlights have been consolidated. See Note 1 in the Notes to Financial Statements for basis of consolidation. | |
(b) Total return does not include the effect of sales charges. | | | | | | | | | | | | | | | | | | | | | |
(c) Not annualized for periods less than one year. | | | | | | | | | | | | | | | | | | | | | | | | | |
(d) Annualized for periods less than one year. | | | | | | | | | | | | | | | | | | | | | | | | | |
See accompanying notes which are an integral part of these financial statements.
33
Angel Oak Multi-Strategy Income Fund – Institutional Class
Consolidated Financial Highlights (a)
(For a share outstanding during each period)
| | | | | | | | | | | | | | | | | | | | | | | | | |
| | | For the
Year Ended
January 31, 2022 | | For the
Year Ended
January 31, 2021 | | For the
Year Ended
January 31, 2020 | | For the
Year Ended
January 31, 2019 | | For the
Year Ended
January 31, 2018 |
Selected Per Share Data: | | | | | | | | | | | | | | | | | | | | | | | | | |
Net asset value, beginning of period | | | $ | 10.41 | | | | $ | 11.08 | | | | $ | 11.02 | | | | $ | 11.23 | | | | $ | 11.28 | |
| | | | | | | | | | | | | | | | | | | | | | | | | |
| | | | | |
Income from investment operations: | | | | | | | | | | | | | | | | | | | | | | | | | |
Net investment income (loss) | | | | 0.49 | | | | | 0.48 | | | | | 0.53 | | | | | 0.55 | | | | | 0.57 | |
Net realized and unrealized gain (loss) on investments | | | | (0.19 | ) | | | | (0.68 | ) | | | | 0.06 | | | | | (0.21 | ) | | | | (0.03 | ) |
| | | | | | | | | | | | | | | | | | | | | | | | | |
Total from investment operations | | | | 0.30 | | | | | (0.20 | ) | | | | 0.59 | | | | | 0.34 | | | | | 0.54 | |
| | | | | | | | | | | | | | | | | | | | | | | | | |
Less distributions to shareholders: | | | | | | | | | | | | | | | | | | | | | | | | | |
From net investment income | | | | (0.50 | ) | | | | (0.47 | ) | | | | (0.53 | ) | | | | (0.55 | ) | | | | (0.59 | ) |
| | | | | | | | | | | | | | | | | | | | | | | | | |
Total distributions | | | | (0.50 | ) | | | | (0.47 | ) | | | | (0.53 | ) | | | | (0.55 | ) | | | | (0.59 | ) |
| | | | | | | | | | | | | | | | | | | | | | | | | |
| | | | | |
Net asset value, end of period | | | $ | 10.21 | | | | $ | 10.41 | | | | $ | 11.08 | | | | $ | 11.02 | | | | $ | 11.23 | |
| | | | | | | | | | | | | | | | | | | | | | | | | |
| | | | | |
Total return (b) | | | | 2.87 | % | | | | (1.60 | %) | | | | 5.45 | % | | | | 3.05 | % | | | | 4.88 | % |
| | | | | |
Ratios and Supplemental Data: | | | | | | | | | | | | | | | | | | | | | | | | | |
Net assets, end of period (000’s omitted) | | | $ | 6,820,115 | | | | $ | 5,927,510 | | | | $ | 7,153,385 | | | | $ | 6,555,291 | | | | $ | 5,826,546 | |
Ratio of expenses to average net assets before waiver and reimbursement/recoupment (c) | | | | 1.04 | % | | | | 1.15 | % | | | | 1.12 | % | | | | 1.10 | % | | | | 1.11 | % |
Ratio of expenses to average net assets before waiver and reimbursement/recoupment excluding interest expense (c) | | | | 0.95 | % | | | | 0.96 | % | | | | 0.95 | % | | | | 0.95 | % | | | | 0.95 | % |
Ratio of expenses to average net assets after waiver and reimbursement/recoupment (c) | | | | 1.03 | % | | | | 1.13 | % | | | | 1.11 | % | | | | 1.12 | % | | | | 1.15 | % |
Ratio of expenses to average net assets after waiver and reimbursement/recoupment excluding interest expense (c) | | | | 0.94 | % | | | | 0.94 | % | | | | 0.94 | % | | | | 0.97 | % | | | | 0.99 | % |
Ratio of net investment income (loss) to average net assets before waiver and reimbursement/recoupment (c) | | | | 4.69 | % | | | | 4.65 | % | | | | 4.70 | % | | | | 4.94 | % | | | | 5.06 | % |
Ratio of net investment income (loss) to average net assets after waiver and reimbursement/recoupment (c) | | | | 4.70 | % | | | | 4.67 | % | | | | 4.71 | % | | | | 4.92 | % | | | | 5.02 | % |
Portfolio turnover rate (b) | | | | 55.99 | % | | | | 67.45 | % | | | | 62.94 | % | | | | 71.49 | % | | | | 81.13 | % |
| (a) | Financial Highlights have been consolidated. See Note 1 in the Notes to Financial Statements for basis of consolidation. |
| (b) | Not annualized for periods less than one year. |
| (c) | Annualized for periods less than one year. |
See accompanying notes which are an integral part of these financial statements.
34
Angel Oak Financials Income Fund – Class A
Financial Highlights
(For a share outstanding during each period)
| | | | | | | | | | | | | | | | | | | | | | | | | |
| | | For the
Year Ended
January 31, 2022 | | For the
Year Ended
January 31, 2021 | | For the
Year Ended
January 31, 2020 | | For the
Year Ended
January 31, 2019 | | For the
Year Ended
January 31, 2018 |
Selected Per Share Data: | | | | | | | | | | | | | | | | | | | | | | | | | |
Net asset value, beginning of period | | | $ | 8.80 | | | | $ | 9.60 | | | | $ | 9.33 | | | | $ | 9.45 | | | | $ | 9.42 | |
| | | | | | | | | | | | | | | | | | | | | | | | | |
| | | | | |
Income from investment operations: | | | | | | | | | | | | | | | | | | | | | | | | | |
Net investment income (loss) | | | | 0.33 | | | | | 0.34 | | | | | 0.40 | | | | | 0.44 | | | | | 0.40 | |
Net realized and unrealized gain (loss) on investments | | | | 0.15 | | | | | (0.75 | ) | | | | 0.27 | | | | | (0.13 | ) | | | | 0.03 | |
| | | | | | | | | | | | | | | | | | | | | | | | | |
Total from investment operations | | | | 0.48 | | | | | (0.41 | ) | | | | 0.67 | | | | | 0.31 | | | | | 0.43 | |
| | | | | | | | | | | | | | | | | | | | | | | | | |
Less distributions to shareholders: | | | | | | | | | | | | | | | | | | | | | | | | | |
From net investment income | | | | (0.32 | ) | | | | (0.38 | ) | | | | (0.40 | ) | | | | (0.43 | ) | | | | (0.40 | ) |
Return of capital | | | | – | | | | | (0.01 | ) | | | | – | | | | | – | | | | | – | |
| | | | | | | | | | | | | | | | | | | | | | | | | |
Total distributions | | | | (0.32 | ) | | | | (0.39 | ) | | | | (0.40 | ) | | | | (0.43 | ) | | | | (0.40 | ) |
| | | | | | | | | | | | | | | | | | | | | | | | | |
| | | | | |
Net asset value, end of period | | | $ | 8.96 | | | | $ | 8.80 | | | | $ | 9.60 | | | | $ | 9.33 | | | | $ | 9.45 | |
| | | | | | | | | | | | | | | | | | | | | | | | | |
| | | | | |
Total return (a)(b) | | | | 5.48 | % | | | | (4.16 | %) | | | | 7.39 | % | | | | 3.36 | % | | | | 4.69 | % |
| | | | | |
Ratios and Supplemental Data: | | | | | | | | | | | | | | | | | | | | | | | | | |
Net assets, end of period (000’s omitted) | | | $ | 4,217 | | | | $ | 2,765 | | | | $ | 13,720 | | | | $ | 7,086 | | | | $ | 9,377 | |
Ratio of expenses to average net assets before waiver and reimbursement/recoupment (c) | | | | 1.35 | % | | | | 1.39 | % | | | | 1.34 | % | | | | 1.42 | % | | | | 1.36 | % |
Ratio of expenses to average net assets before waiver and reimbursement/recoupment excluding interest expense (c) | | | | 1.35 | % | | | | 1.37 | % | | | | 1.34 | % | | | | 1.42 | % | | | | 1.36 | % |
Ratio of expenses to average net assets after waiver and reimbursement/recoupment (c) | | | | 0.94 | % | | | | 0.96 | % | | | | 0.94 | % | | | | 0.94 | % | | | | 0.94 | % |
Ratio of expenses to average net assets after waiver and reimbursement/recoupment excluding interest expense (c) | | | | 0.94 | % | | | | 0.94 | % | | | | 0.94 | % | | | | 0.94 | % | | | | 0.94 | % |
Ratio of net investment income (loss) to average net assets before waiver and reimbursement/recoupment (c) | | | | 3.14 | % | | | | 3.63 | % | | | | 3.78 | % | | | | 4.22 | % | | | | 3.74 | % |
Ratio of net investment income (loss) to average net assets after waiver and reimbursement/recoupment (c) | | | | 3.55 | % | | | | 4.06 | % | | | | 4.18 | % | | | | 4.70 | % | | | | 4.16 | % |
Portfolio turnover rate (b) | | | | 32.33 | % | | | | 29.83 | % | | | | 35.55 | % | | | | 45.27 | % | | | | 101.75 | % |
| | | | |
(a) Total return does not include the effect of sales charges. | | | | | | | | | | | | | | | | | | | | | |
(b) Not annualized for periods less than one year. | | | | | | | | | | | | | | | | | | | | | | | | | |
(c) Annualized for periods less than one year. | | | | | | | | | | | | | | | | | | | | | | | | | |
See accompanying notes which are an integral part of these financial statements.
35
Angel Oak Financials Income Fund – Class C
Financial Highlights
(For a share outstanding during each period)
| | | | | | | | | | | | | | | | | | | | | | | | | |
| | | For the
Year Ended
January 31, 2022 | | For the
Year Ended
January 31, 2021 | | For the
Year Ended
January 31, 2020 | | For the
Year Ended
January 31, 2019 | | For the
Year Ended
January 31, 2018 |
Selected Per Share Data: | | | | | | | | | | | | | | | | | | | | | | | | | |
Net asset value, beginning of period | | | $ | 8.72 | | | | $ | 9.51 | | | | $ | 9.25 | | | | $ | 9.37 | | | | $ | 9.37 | |
| | | | | | | | | | | | | | | | | | | | | | | | | |
| | | | | |
Income from investment operations: | | | | | | | | | | | | | | | | | | | | | | | | | |
Net investment income (loss) | | | | 0.24 | | | | | 0.30 | | | | | 0.34 | | | | | 0.37 | | | | | 0.33 | |
Net realized and unrealized gain (loss) on investments | | | | 0.16 | | | | | (0.76 | ) | | | | 0.26 | | | | | (0.12 | ) | | | | 0.02 | |
| | | | | | | | | | | | | | | | | | | | | | | | | |
Total from investment operations | | | | 0.40 | | | | | (0.46 | ) | | | | 0.60 | | | | | 0.25 | | | | | 0.35 | |
| | | | | | | | | | | | | | | | | | | | | | | | | |
Less distributions to shareholders: | | | | | | | | | | | | | | | | | | | | | | | | | |
From net investment income | | | | (0.25 | ) | | | | (0.32 | ) | | | | (0.34 | ) | | | | (0.37 | ) | | | | (0.35 | ) |
Return of capital | | | | – | | | | | (0.01 | ) | | | | – | | | | | – | | | | | – | |
| | | | | | | | | | | | | | | | | | | | | | | | | |
Total distributions | | | | (0.25 | ) | | | | (0.33 | ) | | | | (0.34 | ) | | | | (0.37 | ) | | | | (0.35 | ) |
| | | | | | | | | | | | | | | | | | | | | | | | | |
| | | | | |
Net asset value, end of period | | | $ | 8.87 | | | | $ | 8.72 | | | | $ | 9.51 | | | | $ | 9.25 | | | | $ | 9.37 | |
| | | | | | | | | | | | | | | | | | | | | | | | | |
| | | | | |
Total return (a)(b) | | | | 4.63 | % | | | | (4.79 | %) | | | | 6.59 | % | | | | 2.69 | % | | | | 3.80 | % |
| | | | | |
Ratios and Supplemental Data: | | | | | | | | | | | | | | | | | | | | | | | | | |
Net assets, end of period (000’s omitted) | | | $ | 3,452 | | | | $ | 5,553 | | | | $ | 6,162 | | | | $ | 2,039 | | | | $ | 1,465 | |
Ratio of expenses to average net assets before waiver and reimbursement/recoupment (c) | | | | 2.10 | % | | | | 2.15 | % | | | | 2.09 | % | | | | 2.17 | % | | | | 2.11 | % |
Ratio of expenses to average net assets before waiver and reimbursement/recoupment excluding interest expense (c) | | | | 2.10 | % | | | | 2.12 | % | | | | 2.09 | % | | | | 2.17 | % | | | | 2.11 | % |
Ratio of expenses to average net assets after waiver and reimbursement/recoupment (c) | | | | 1.69 | % | | | | 1.72 | % | | | | 1.69 | % | | | | 1.69 | % | | | | 1.69 | % |
Ratio of expenses to average net assets after waiver and reimbursement/recoupment excluding interest expense (c) | | | | 1.69 | % | | | | 1.69 | % | | | | 1.69 | % | | | | 1.69 | % | | | | 1.69 | % |
Ratio of net investment income (loss) to average net assets before waiver and reimbursement/recoupment (c) | | | | 2.38 | % | | | | 2.97 | % | | | | 3.02 | % | | | | 3.49 | % | | | | 2.99 | % |
Ratio of net investment income (loss) to average net assets after waiver and reimbursement/recoupment (c) | | | | 2.79 | % | | | | 3.40 | % | | | | 3.42 | % | | | | 3.97 | % | | | | 3.41 | % |
Portfolio turnover rate (b) | | | | 32.33 | % | | | | 29.83 | % | | | | 35.55 | % | | | | 45.27 | % | | | | 101.75 | % |
| | | | |
(a) Total return does not include the effect of sales charges. | | | | | | | | | | | | | | | | | | | | | |
(b) Not annualized for periods less than one year. | | | | | | | | | | | | | | | | | | | | | | | | | |
(c) Annualized for periods less than one year. | | | | | | | | | | | | | | | | | | | | | | | | | |
See accompanying notes which are an integral part of these financial statements.
36
Angel Oak Financials Income Fund – Institutional Class
Financial Highlights
(For a share outstanding during each period)
| | | | | | | | | | | | | | | | | | | | | | | | | |
| | | For the
Year Ended
January 31, 2022 | | For the
Year Ended
January 31, 2021 | | For the
Year Ended
January 31, 2020 | | For the
Year Ended
January 31, 2019 | | For the
Year Ended
January 31, 2018 |
Selected Per Share Data: | | | | | | | | | | | | | | | | | | | | | | | | | |
Net asset value, beginning of period | | | $ | 8.79 | | | | $ | 9.58 | | | | $ | 9.32 | | | | $ | 9.44 | | | | $ | 9.41 | |
| | | | | | | | | | | | | | | | | | | | | | | | | |
| | | | | |
Income from investment operations: | | | | | | | | | | | | | | | | | | | | | | | | | |
Net investment income (loss) | | | | 0.34 | | | | | 0.38 | | | | | 0.43 | | | | | 0.46 | | | | | 0.41 | |
Net realized and unrealized gain (loss) on investments | | | | 0.15 | | | | | (0.76 | ) | | | | 0.26 | | | | | (0.13 | ) | | | | 0.05 | |
| | | | | | | | | | | | | | | | | | | | | | | | | |
Total from investment operations | | | | 0.49 | | | | | (0.38 | ) | | | | 0.69 | | | | | 0.33 | | | | | 0.46 | |
| | | | | | | | | | | | | | | | | | | | | | | | | |
Less distributions to shareholders: | | | | | | | | | | | | | | | | | | | | | | | | | |
From net investment income | | | | (0.34 | ) | | | | (0.40 | ) | | | | (0.43 | ) | | | | (0.45 | ) | | | | (0.43 | ) |
Return of capital | | | | – | | | | | (0.01 | ) | | | | – | | | | | – | | | | | – | |
| | | | | | | | | | | | | | | | | | | | | | | | | |
Total distributions | | | | (0.34 | ) | | | | (0.41 | ) | | | | (0.43 | ) | | | | (0.45 | ) | | | | (0.43 | ) |
| | | | | | | | | | | | | | | | | | | | | | | | | |
| | | | | |
Net asset value, end of period | | | $ | 8.94 | | | | $ | 8.79 | | | | $ | 9.58 | | | | $ | 9.32 | | | | $ | 9.44 | |
| | | | | | | | | | | | | | | | | | | | | | | | | |
| | | | | |
Total return (a) | | | | 5.64 | % | | | | (3.81 | %) | | | | 7.55 | % | | | | 3.61 | % | | | | 4.97 | % |
| | | | | |
Ratios and Supplemental Data: | | | | | | | | | | | | | | | | | | | | | | | | | |
Net assets, end of period (000’s omitted) | | | $ | 159,078 | | | | $ | 134,335 | | | | $ | 258,392 | | | | $ | 122,363 | | | | $ | 106,494 | |
Ratio of expenses to average net assets before waiver and reimbursement/recoupment (b) | | | | 1.10 | % | | | | 1.14 | % | | | | 1.09 | % | | | | 1.17 | % | | | | 1.10 | % |
Ratio of expenses to average net assets before waiver and reimbursement/recoupment excluding interest expense (b) | | | | 1.10 | % | | | | 1.12 | % | | | | 1.09 | % | | | | 1.17 | % | | | | 1.10 | % |
Ratio of expenses to average net assets after waiver and reimbursement/recoupment (b) | | | | 0.69 | % | | | | 0.71 | % | | | | 0.69 | % | | | | 0.69 | % | | | | 0.69 | % |
Ratio of expenses to average net assets after waiver and reimbursement/recoupment excluding interest expense (b) | | | | 0.69 | % | | | | 0.69 | % | | | | 0.69 | % | | | | 0.69 | % | | | | 0.69 | % |
Ratio of net investment income (loss) to average net assets before waiver and reimbursement/recoupment (b) | | | | 3.38 | % | | | | 3.91 | % | | | | 4.02 | % | | | | 4.48 | % | | | | 3.98 | % |
Ratio of net investment income (loss) to average net assets after waiver and reimbursement/recoupment (b) | | | | 3.79 | % | | | | 4.34 | % | | | | 4.42 | % | | | | 4.96 | % | | | | 4.39 | % |
Portfolio turnover rate (a) | | | | 32.33 | % | | | | 29.83 | % | | | | 35.55 | % | | | | 45.27 | % | | | | 101.75 | % |
| | | | | |
(a) Not annualized for periods less than one year. | | | | | | | | | | | | | | | | | | | | | | | | | |
(b) Annualized for periods less than one year. | | | | | | | | | | | | | | | | | | | | | | | | | |
See accompanying notes which are an integral part of these financial statements.
37
Angel Oak High Yield Opportunities Fund – Class A
Financial Highlights
(For a share outstanding during each period)
| | | | | | | | | | | | | | | | | | | | | | | | | |
| | | For the
Year Ended
January 31, 2022 | | For the
Year Ended
January 31, 2021 | | For the
Year Ended
January 31, 2020 | | For the
Year Ended
January 31, 2019 | | For the
Year Ended
January 31, 2018 |
Selected Per Share Data: | | | | | | | | | | | | | | | | | | | | | | | | | |
Net asset value, beginning of period | | | $ | 11.78 | | | | $ | 11.76 | | | | $ | 11.39 | | | | $ | 12.00 | | | | $ | 11.92 | |
| | | | | | | | | | | | | | | | | | | | | | | | | |
| | | | | |
Income from investment operations: | | | | | | | | | | | | | | | | | | | | | | | | | |
Net investment income (loss) | | | | 0.58 | | | | | 0.58 | | | | | 0.64 | | | | | 0.65 | | | | | 0.68 | |
Net realized and unrealized gain (loss) on investments | | | | (0.19 | ) | | | | 0.03 | (d) | | | | 0.37 | | | | | (0.61 | ) | | | | 0.06 | |
| | | | | | | | | | | | | | | | | | | | | | | | | |
Total from investment operations | | | | 0.39 | | | | | 0.61 | | | | | 1.01 | | | | | 0.04 | | | | | 0.74 | |
| | | | | | | | | | | | | | | | | | | | | | | | | |
Less distributions to shareholders: | | | | | | | | | | | | | | | | | | | | | | | | | |
From net investment income | | | | (0.58 | ) | | | | (0.59 | ) | | | | (0.64 | ) | | | | (0.65 | ) | | | | (0.66 | ) |
| | | | | | | �� | | | | | | | | | | | | | | | | | | |
Total distributions | | | | (0.58 | ) | | | | (0.59 | ) | | | | (0.64 | ) | | | | (0.65 | ) | | | | (0.66 | ) |
| | | | | | | | | | | | | | | | | | | | | | | | | |
| | | | | |
Net asset value, end of period | | | $ | 11.59 | | | | $ | 11.78 | | | | $ | 11.76 | | | | $ | 11.39 | | | | $ | 12.00 | |
| | | | | | | | | | | | | | | | | | | | | | | | | |
| | | | | |
Total return (a)(b) | | | | 3.34 | % | | | | 5.68 | % | | | | 9.08 | % | | | | 0.41 | % | | | | 6.34 | % |
| | | | | |
Ratios and Supplemental Data: | | | | | | | | | | | | | | | | | | | | | | | | | |
Net assets, end of period (000’s omitted) | | | $ | 4,834 | | | | $ | 3,986 | | | | $ | 7,771 | | | | $ | 2,754 | | | | $ | 1,298 | |
Ratio of expenses to average net assets before waiver and reimbursement/recoupment (c) | | | | 1.14 | % | | | | 1.14 | % | | | | 1.14 | % | | | | 1.24 | % | | | | 1.27 | % |
Ratio of expenses to average net assets after waiver and reimbursement/recoupment (c) | | | | 0.90 | % | | | | 0.90 | % | | | | 0.90 | % | | | | 0.90 | % | | | | 0.90 | % |
Ratio of net investment income (loss) to average net assets before waiver and reimbursement/recoupment (c) | | | | 4.60 | % | | | | 5.18 | % | | | | 5.20 | % | | | | 5.28 | % | | | | 5.34 | % |
Ratio of net investment income (loss) to average net assets after waiver and reimbursement/recoupment (c) | | | | 4.84 | % | | | | 5.42 | % | | | | 5.44 | % | | | | 5.62 | % | | | | 5.71 | % |
Portfolio turnover rate (b) | | | | 38.15 | % | | | | 58.02 | % | | | | 35.80 | % | | | | 33.27 | % | | | | 45.86 | % |
| | | | |
(a) Total return does not include the effect of sales charges. | | | | | | | | | | | | | | | | | | | | | |
(b) Not annualized for periods less than one year. | | | | | | | | | | | | | | | | | | | | | | | | | |
(c) Annualized for periods less than one year. | | | | | | | | | | | | | | | | | | | | | | | | | |
(d) Net realized and unrealized gain (loss) per share includes balancing amounts necessary to reconcile the change in net asset value per share for the period, and may not reconcile with the aggregate gain/(loss) in the Statements of Operations due to share transactions for the period. | |
See accompanying notes which are an integral part of these financial statements.
38
Angel Oak High Yield Opportunities Fund – Institutional Class
Financial Highlights
(For a share outstanding during each period)
| | | | | | | | | | | | | | | | | | | | | | | | | |
| | | For the
Year Ended
January 31, 2022 | | For the
Year Ended
January 31, 2021 | | For the
Year Ended
January 31, 2020 | | For the
Year Ended
January 31, 2019 | | For the
Year Ended
January 31, 2018 |
Selected Per Share Data: | | | | | | | | | | | | | | | | | | | | | | | | | |
Net asset value, beginning of period | | | $ | 11.73 | | | | $ | 11.71 | | | | $ | 11.35 | | | | $ | 11.95 | | | | $ | 11.89 | |
| | | | | | | | | | | | | | | | | | | | | | | | | |
| | | | | |
Income from investment operations: | | | | | | | | | | | | | | | | | | | | | | | | | |
Net investment income (loss) | | | | 0.60 | | | | | 0.63 | | | | | 0.67 | | | | | 0.69 | | | | | 0.71 | |
Net realized and unrealized gain (loss) on investments | | | | (0.18 | ) | | | | 0.01 | (c) | | | | 0.36 | | | | | (0.61 | ) | | | | 0.04 | |
| | | | | | | | | | | | | | | | | | | | | | | | | |
Total from investment operations | | | | 0.42 | | | | | 0.64 | | | | | 1.03 | | | | | 0.08 | | | | | 0.75 | |
| | | | | | | | | | | | | | | | | | | | | | | | | |
Less distributions to shareholders: | | | | | | | | | | | | | | | | | | | | | | | | | |
From net investment income | | | | (0.61 | ) | | | | (0.62 | ) | | | | (0.67 | ) | | | | (0.68 | ) | | | | (0.69 | ) |
| | | | | | | | | | | | | | | | | | | | | | | | | |
Total distributions | | | | (0.61 | ) | | | | (0.62 | ) | | | | (0.67 | ) | | | | (0.68 | ) | | | | (0.69 | ) |
| | | | | | | | | | | | | | | | | | | | | | | | | |
| | | | | |
Net asset value, end of period | | | $ | 11.54 | | | | $ | 11.73 | | | | $ | 11.71 | | | | $ | 11.35 | | | | $ | 11.95 | |
| | | | | | | | | | | | | | | | | | | | | | | | | |
| | | | | |
Total return (a) | | | | 3.62 | % | | | | 5.97 | % | | | | 9.28 | % | | | | 0.74 | % | | | | 6.53 | % |
| | | | | |
Ratios and Supplemental Data: | | | | | | | | | | | | | | | | | | | | | | | | | |
Net assets, end of period (000’s omitted) | | | $ | 69,503 | | | | $ | 68,245 | | | | $ | 64,797 | | | | $ | 48,426 | | | | $ | 51,516 | |
Ratio of expenses to average net assets before waiver and reimbursement/recoupment (b) | | | | 0.89 | % | | | | 0.89 | % | | | | 0.89 | % | | | | 0.99 | % | | | | 1.02 | % |
Ratio of expenses to average net assets after waiver and reimbursement/recoupment (b) | | | | 0.65 | % | | | | 0.65 | % | | | | 0.65 | % | | | | 0.65 | % | | | | 0.65 | % |
Ratio of net investment income (loss) to average net assets before waiver and reimbursement/recoupment (b) | | | | 4.86 | % | | | | 5.41 | % | | | | 5.52 | % | | | | 5.59 | % | | | | 5.61 | % |
Ratio of net investment income (loss) to average net assets after waiver and reimbursement/recoupment (b) | | | | 5.10 | % | | | | 5.65 | % | | | | 5.76 | % | | | | 5.93 | % | | | | 5.98 | % |
Portfolio turnover rate (a) | | | | 38.15 | % | | | | 58.02 | % | | | | 35.80 | % | | | | 33.27 | % | | | | 45.86 | % |
|
(a) Not annualized for periods less than one year. | |
(b) Annualized for periods less than one year. | |
(c) Net realized and unrealized gain (loss) per share includes balancing amounts necessary to reconcile the change in net asset value per share for the period, and may not reconcile with the aggregate gain/(loss) in the Statements of Operations due to share transactions for the period. | |
See accompanying notes which are an integral part of these financial statements.
39
Angel Oak Ultra Short Income Fund – Class A
Financial Highlights
(For a share outstanding during each period)
| | | | | | | | | | | | | | | | | | | | |
| | | For the
Year Ended
January 31, 2022 | | For the
Year Ended
January 31, 2021 | | For the
Year Ended
January 31, 2020 | | For the
Period Ended
January 31, 2019 (a) |
Selected Per Share Data: | | | | | | | | | | | | | | | | | | | | |
Net asset value, beginning of period | | | $ | 10.08 | | | | $ | 10.12 | | | | $ | 10.02 | | | | $ | 10.01 | |
| | | | | | | | | | | | | | | | | | | | |
| | | | |
Income from investment operations: | | | | | | | | | | | | | | | | | | | | |
Net investment income (loss) | | | | 0.08 | | | | | 0.19 | | | | | 0.29 | | | | | 0.20 | |
Net realized and unrealized gain (loss) on investments | | | | (0.05 | ) | | | | (0.04 | )(b) | | | | 0.10 | | | | | 0.01 | |
| | | | | | | | | | | | | | | | | | | | |
Total from investment operations | | | | 0.03 | | | | | 0.15 | | | | | 0.39 | | | | | 0.21 | |
| | | | | | | | | | | | | | | | | | | | |
Less distributions to shareholders: | | | | | | | | | | | | | | | | | | | | |
From net investment income | | | | (0.11 | ) | | | | (0.19 | ) | | | | (0.29 | ) | | | | (0.20 | ) |
From net realized gain | | | | – | | | | | – | | | | | – | | | | | – | (c) |
| | | | | | | | | | | | | | | | | | | | |
Total distributions | | | | (0.11 | ) | | | | (0.19 | ) | | | | (0.29 | ) | | | | (0.20 | ) |
| | | | | | | | | | | | | | | | | | | | |
| | | | |
Net asset value, end of period | | | $ | 10.00 | | | | $ | 10.08 | | | | $ | 10.12 | | | | $ | 10.02 | |
| | | | | | | | | | | | | | | | | | | | |
| | | | |
Total return (d) | | | | 0.27 | % | | | | 1.52 | % | | | | 3.92 | % | | | | 2.12 | % |
| | | | |
Ratios and Supplemental Data: | | | | | | | | | | | | | | | | | | | | |
Net assets, end of period (000’s omitted) | | | $ | 171,328 | | | | $ | 66,366 | | | | $ | 51,529 | | | | $ | 7,903 | |
Ratio of expenses to average net assets before waiver and reimbursement/recoupment (e) | | | | 0.78 | % | | | | 0.79 | % | | | | 0.84 | % | | | | 0.94 | % |
Ratio of expenses to average net assets after waiver and reimbursement/recoupment (e) | | | | 0.56 | % | | | | 0.51 | % | | | | 0.50 | % | | | | 0.50 | % |
Ratio of net investment income (loss) to average net assets before waiver and reimbursement/recoupment (e) | | | | 0.56 | % | | | | 1.45 | % | | | | 2.22 | % | | | | 2.32 | % |
Ratio of net investment income (loss) to average net assets after waiver and reimbursement/recoupment (e) | | | | 0.78 | % | | | | 1.73 | % | | | | 2.56 | % | | | | 2.76 | % |
Portfolio turnover rate (d) | | | | 91.83 | % | | | | 81.48 | % | | | | 156.42 | % | | | | 178.59 | % |
| (a) | Class commenced operations on April 30, 2018. |
| (b) | Net realized and unrealized gain (loss) per share includes balancing amounts necessary to reconcile the change in net asset value per share for the period, and may not reconcile with the aggregate gain/(loss) in the Statements of Operations due to share transactions for the period. |
| (d) | Not annualized for periods less than one year. |
| (e) | Annualized for periods less than one year. |
See accompanying notes which are an integral part of these financial statements.
40
Angel Oak Ultra Short Income Fund – Institutional Class
Financial Highlights
(For a share outstanding during each period)
| | | | | | | | | | | | | | | | | | | | |
| | | For the
Year Ended
January 31, 2022 | | For the
Year Ended
January 31, 2021 | | For the
Year Ended
January 31, 2020 | | For the
Period Ended
January 31, 2019 (a) |
Selected Per Share Data: | | | | | | | | | | | | | | | | | | | | |
Net asset value, beginning of period | | | $ | 10.09 | | | | $ | 10.12 | | | | $ | 10.02 | | | | $ | 10.00 | |
| | | | | | | | | | | | | | | | | | | | |
| | | | |
Income from investment operations: | | | | | | | | | | | | | | | | | | | | |
Net investment income (loss) | | | | 0.11 | | | | | 0.21 | | | | | 0.31 | | | | | 0.24 | |
Net realized and unrealized gain (loss) on investments | | | | (0.06 | ) | | | | (0.03 | )(b) | | | | 0.10 | | | | | 0.02 | |
| | | | | | | | | | | | | | | | | | | | |
Total from investment operations | | | | 0.05 | | | | | 0.18 | | | | | 0.41 | | | | | 0.26 | |
| | | | | | | | | | | | | | | | | | | | |
Less distributions to shareholders: | | | | | | | | | | | | | | | | | | | | |
From net investment income | | | | (0.13 | ) | | | | (0.21 | ) | | | | (0.31 | ) | | | | (0.24 | ) |
From net realized gain | | | | – | | | | | – | | | | | – | | | | | – | (c) |
| | | | | | | | | | | | | | | | | | | | |
Total distributions | | | | (0.13 | ) | | | | (0.21 | ) | | | | (0.31 | ) | | | | (0.24 | ) |
| | | | | | | | | | | | | | | | | | | | |
| | | | |
Net asset value, end of period | | | $ | 10.01 | | | | $ | 10.09 | | | | $ | 10.12 | | | | $ | 10.02 | |
| | | | | | | | | | | | | | | | | | | | |
| | | | |
Total return (d) | | | | 0.51 | % | | | | 1.87 | % | | | | 4.16 | % | | | | 2.60 | % |
| | | | |
Ratios and Supplemental Data: | | | | | | | | | | | | | | | | | | | | |
Net assets, end of period (000’s omitted) | | | $ | 1,492,542 | | | | $ | 796,407 | | | | $ | 357,303 | | | | $ | 106,596 | |
Ratio of expenses to average net assets before waiver and reimbursement/recoupment (e) | | | | 0.53 | % | | | | 0.54 | % | | | | 0.59 | % | | | | 0.77 | % |
Ratio of expenses to average net assets after waiver and reimbursement/recoupment (e) | | | | 0.31 | % | | | | 0.26 | % | | | | 0.25 | % | | | | 0.26 | % |
Ratio of net investment income (loss) to average net assets before waiver and reimbursement/recoupment (e) | | | | 0.82 | % | | | | 1.67 | % | | | | 2.58 | % | | | | 2.37 | % |
Ratio of net investment income (loss) to average net assets after waiver and reimbursement/recoupment (e) | | | | 1.04 | % | | | | 1.95 | % | | | | 2.92 | % | | | | 2.88 | % |
Portfolio turnover rate (d) | | | | 91.83 | % | | | | 81.48 | % | | | | 156.42 | % | | | | 178.59 | % |
| (a) | Class commenced operations on April 30, 2018. |
| (b) | Net realized and unrealized gain (loss) per share includes balancing amounts necessary to reconcile the change in net asset value per share for the period, and may not reconcile with the aggregate gain/(loss) in the Statements of Operations due to share transactions for the period. |
| (d) | Not annualized for periods less than one year. |
| (e) | Annualized for periods less than one year. |
See accompanying notes which are an integral part of these financial statements.
41
Angel Oak Core Impact Fund – Institutional Class
Financial Highlights
(For a share outstanding during each period)
| | | | | |
| | | For the
Period Ended
January 31, 2022 (a) |
Selected Per Share Data: | | | | | |
Net asset value, beginning of period | | | $ | 10.00 | |
| | | | | |
| |
Income from investment operations: | | | | | |
Net investment income (loss) | | | | 0.09 | |
Net realized and unrealized gain (loss) on investments | | | | (0.22 | ) |
| | | | | |
Total from investment operations | | | | (0.13 | ) |
| | | | | |
Less distributions to shareholders: | | | | | |
From net investment income | | | | (0.10 | ) |
| | | | | |
Total distributions | | | | (0.10 | ) |
| | | | | |
| |
Net asset value, end of period | | | $ | 9.77 | |
| | | | | |
| |
Total return (b) | | | | (1.28 | %) |
| |
Ratios and Supplemental Data: | | | | | |
Net assets, end of period (000’s omitted) | | | $ | 39,133 | |
Ratio of expenses to average net assets before waiver and reimbursement/recoupment (c) | | | | 0.97 | % |
Ratio of expenses to average net assets after waiver and reimbursement/recoupment (c) | | | | 0.59 | % |
Ratio of net investment income (loss) to average net assets before waiver and reimbursement/recoupment (c) | | | | 1.06 | % |
Ratio of net investment income (loss) to average net assets after waiver and reimbursement/recoupment (c) | | | | 1.44 | % |
Portfolio turnover rate (b) | | | | 21.25 | % |
| (a) | Class commenced operations on June 4, 2021. |
| (b) | Not annualized for periods less than one year. |
| (c) | Annualized for periods less than one year. |
See accompanying notes which are an integral part of these financial statements.
42
Angel Oak Multi-Strategy Income Fund
Consolidated Schedule of Investments
January 31, 2022
| | | | | | | | |
| | | Principal
Amount | | | Value | |
Asset-Backed Securities – 10.44% | | | | | | | | |
ACC Trust, Series 2019-1, Class B, 4.470%, 10/20/2022 (a) | | $ | 549,440 | | | $ | 552,160 | |
ACC Trust, Series 2019-2, Class C, 5.240%, 10/20/2024 (a) | | | 3,800,000 | | | | 3,855,917 | |
Affirm Asset Securitization Trust, Series 2021-A, Class D, 3.490%, 8/15/2025 (a) | | | 3,000,000 | | | | 3,015,444 | |
Affirm Asset Securitization Trust, Series 2021-A, Class E, 5.650%, 8/15/2025 (a) | | | 1,550,000 | | | | 1,570,155 | |
Affirm Asset Securitization Trust, Series 2021-B, Class D, 2.540%, 8/17/2026 (a) | | | 4,500,000 | | | | 4,484,106 | |
Affirm Asset Securitization Trust, Series 2021-B, Class E, 4.610%, 8/17/2026 (a) | | | 1,900,000 | | | | 1,897,171 | |
American Credit Acceptance Receivables Trust, Series 2019-4, Class F, 5.370%, 9/12/2026 (a) | | | 800,000 | | | | 825,380 | |
American Credit Acceptance Receivables Trust, Series 2020-4, Class E, 3.650%, 12/14/2026 (a) | | | 3,000,000 | | | | 3,061,161 | |
American Credit Acceptance Receivables Trust, Series 2021-1, Class E, 2.290%, 3/15/2027 (a) | | | 3,500,000 | | | | 3,480,543 | |
American Credit Acceptance Receivables Trust, Series 2020-3, Class F, 5.940%, 6/14/2027 (a) | | | 5,650,000 | | | | 5,919,256 | |
American Credit Acceptance Receivables Trust, Series 2021-1, Class F, 4.010%, 11/15/2027 (a) | | | 650,000 | | | | 651,172 | |
American Credit Acceptance Receivables Trust, Series 2021-4, Class E, 3.120%, 2/14/2028 (a) | | | 1,000,000 | | | | 982,825 | |
American Credit Acceptance Receivables Trust, Series 2022-1, Class F, 4.870%, 11/13/2028 (a) | | | 1,540,000 | | | | 1,543,607 | |
Aqua Finance Trust, Series 2021-A, Class C, 3.140%, 7/17/2046 (a) | | | 1,700,000 | | | | 1,680,457 | |
Avant Credit Card Master Trust, Series 2021-1A, Class C, 2.160%, 4/15/2027 (a) | | | 2,500,000 | | | | 2,453,400 | |
Avant Loans Funding Trust, Series 2021-REV1, Class B, 1.640%, 7/15/2030 (a) | | | 1,793,000 | | | | 1,800,012 | |
Avis Budget Rental Car Funding LLC, Series 2019-2A, Class D, 3.040%, 9/20/2025 (a) | | | 5,250,000 | | | | 5,186,585 | |
Avis Budget Rental Car Funding LLC, Series 2020-1A, Class D, 3.340%, 8/20/2026 (a) | | | 4,750,000 | | | | 4,628,457 | |
BHG Securitization Trust, Series 2021-B, Class D, 3.170%, 10/17/2034 (a) | | | 1,170,000 | | | | 1,134,675 | |
Carvana Auto Receivables Trust, Series 2019-3A, Class E, 4.600%, 7/15/2026 (a) | | | 8,439,000 | | | | 8,749,513 | |
Carvana Auto Receivables Trust, Series 2021-N1, Class E, 2.880%, 1/10/2028 (a) | | | 3,300,000 | | | | 3,263,063 | |
Carvana Auto Receivables Trust, Series 2021-N1, Class F, 4.550%, 1/10/2028 (a) | | | 2,500,000 | | | | 2,495,672 | |
Carvana Auto Receivables Trust, Series 2021-N2, Class E, 2.900%, 3/10/2028 (a) | | | 35,900,000 | | | | 35,035,564 | |
Carvana Auto Receivables Trust, Series 2021-P2, Class D, 2.020%, 5/10/2028 | | | 5,000,000 | | | | 4,869,335 | |
Carvana Auto Receivables Trust, Series 2021-N3, Class E, 3.160%, 6/12/2028 (a) | | | 7,310,000 | | | | 7,215,672 | |
Carvana Auto Receivables Trust, Series 2021-N4, Class E, 4.530%, 9/10/2028 (a) | | | 6,870,000 | | | | 6,756,714 | |
Chase Auto Credit Linked Notes, Series 2021-2, Class E, 2.280%, 12/25/2028 (a) | | | 1,017,201 | | | | 1,017,754 | |
Conn’s Receivables Funding LLC, Series 2020-A, Class C, 4.200%, 6/15/2025 (a) | | | 872,068 | | | | 877,426 | |
Consumer Loan Bond Credit Trust, Series 2017-P2, Class CL1, 0.000%, 1/15/2024 (a) | | | 125,000 | | | | 1,615,243 | |
Consumer Loan Underlying Bond CLUB Credit Trust, Series 2019-P2, Class C, 4.410%, 10/15/2026 (a) | | | 17,822,000 | | | | 18,068,603 | |
Consumer Loan Underlying Bond CLUB Credit Trust, Series 2020-P1, Class C, 4.610%, 3/15/2028 (a) | | | 18,725,000 | | | | 19,063,885 | |
Consumer Loan Underlying Bond Credit Trust, Series 2018-P3, Class C, 5.540%, 1/15/2026 (a) | | | 3,948,969 | | | | 3,961,780 | |
Consumer Loan Underlying Bond Credit Trust, Series 2019-P1, Class C, 4.660%, 7/15/2026 (a) | | | 5,000,000 | | | | 5,065,840 | |
Consumer Underlying Bond Securitization, Series 2018-1, Class A, 4.790%, 2/17/2026 (a) | | | 827,984 | | | | 834,156 | |
Continental Credit Card ABS LLC, Series 2019-1A, Class B, 4.950%, 8/15/2026 (a) | | | 3,700,000 | | | | 3,753,143 | |
Continental Finance Credit Card ABS Master Trust, Series 2020-1A, Class A, 2.240%, 12/15/2028 (a) | | | 1,500,000 | | | | 1,502,797 | |
See accompanying notes which are an integral part of these financial statements.
43
Angel Oak Multi-Strategy Income Fund
Consolidated Schedule of Investments – (continued)
January 31, 2022
| | | | | | | | |
| | | Principal
Amount | | | Value | |
Asset-Backed Securities – (continued) | | | | | | | | |
Continental Finance Credit Card ABS Master Trust, Series 2020-1A, Class B, 3.660%, 12/15/2028 (a) | | $ | 1,500,000 | | | $ | 1,504,488 | |
Continental Finance Credit Card ABS Master Trust, Series 2020-1A, Class C, 5.750%, 12/15/2028 (a) | | | 1,700,000 | | | | 1,711,341 | |
CPS Auto Receivables Trust, Series 2018-B, Class E, 5.610%, 12/16/2024 (a) | | | 12,123,000 | | | | 12,531,678 | |
CPS Auto Receivables Trust, Series 2019-C, Class E, 4.300%, 7/15/2025 (a) | | | 8,856,000 | | | | 9,169,733 | |
CPS Auto Receivables Trust, Series 2020-A, Class E, 4.090%, 12/15/2025 (a) | | | 10,000,000 | | | | 10,253,920 | |
CPS Auto Receivables Trust, Series 2019-C, Class F, 6.940%, 9/15/2026 (a) | | | 3,500,000 | | | | 3,709,902 | |
CPS Auto Receivables Trust, Series 2020-A, Class F, 6.930%, 3/15/2027 (a) | | | 2,500,000 | | | | 2,605,287 | |
CPS Auto Receivables Trust, Series 2020-C, Class E, 4.220%, 5/15/2027 (a) | | | 4,625,000 | | | | 4,768,162 | |
CPS Auto Receivables Trust, Series 2021-D, Class D, 2.310%, 10/15/2027 (a) | | | 7,240,000 | | | | 7,054,084 | |
CPS Auto Receivables Trust, Series 2021-A, Class E, 2.530%, 3/15/2028 (a) | | | 9,320,000 | | | | 9,229,959 | |
CPS Auto Receivables Trust, Series 2021-B, Class E, 3.410%, 6/15/2028 (a) | | | 12,750,000 | | | | 12,631,144 | |
CPS Auto Receivables Trust, Series 2021-D, Class E, 4.060%, 12/15/2028 (a) | | | 3,750,000 | | | | 3,694,534 | |
CPS Auto Receivables Trust, Series 2022-A, Class E, 4.880%, 4/16/2029 (a)(b) | | | 5,400,000 | | | | 5,391,997 | |
DT Auto Owner Trust, Series 2021-1A, Class E, 2.380%, 1/18/2028 (a) | | | 2,225,000 | | | | 2,213,857 | |
DT Auto Owner Trust, Series 2021-4A, Class E, 3.340%, 7/17/2028 (a) | | | 3,000,000 | | | | 2,939,205 | |
DT Auto Owner Trust, Series 2021-3A, Class E, 2.650%, 9/15/2028 (a) | | | 5,250,000 | | | | 5,108,449 | |
Exeter Automobile Receivables Trust, Series 2020-1A, Class E, 3.740%, 1/15/2027 (a) | | | 13,000,000 | | | | 13,300,391 | |
Exeter Automobile Receivables Trust, Series 2020-3A, Class F, 5.560%, 6/15/2027 (a) | | | 4,750,000 | | | | 4,911,576 | |
Exeter Automobile Receivables Trust, Series 2021-4A, Class E, 4.020%, 1/17/2028 (a) | | | 2,000,000 | | | | 2,014,124 | |
Exeter Automobile Receivables Trust, Series 2021-2A, Class E, 2.900%, 7/17/2028 (a) | | | 4,000,000 | | | | 3,968,956 | |
Fat Brands Fazoli’s Native LLC, Series 2021-1, Class A2, 6.000%, 7/25/2051 (a) | | | 2,000,000 | | | | 2,008,854 | |
First Investors Auto Owner Trust, Series 2019-2A, Class F, 5.690%, 7/15/2026 (a) | | | 3,170,000 | | | | 3,267,069 | |
First Investors Auto Owner Trust, Series 2021-1A, Class D, 1.620%, 3/15/2027 (a) | | | 1,250,000 | | | | 1,238,154 | |
First Investors Auto Owner Trust, Series 2021-1A, Class E, 3.350%, 4/15/2027 (a) | | | 1,000,000 | | | | 1,009,122 | |
Flagship Credit Auto Trust, Series 2020-1, Class E, 3.520%, 6/15/2027 (a) | | | 839,000 | | | | 848,800 | |
Flagship Credit Auto Trust, Series 2020-3, Class E, 4.980%, 12/15/2027 (a) | | | 2,150,000 | | | | 2,261,697 | |
Flagship Credit Auto Trust, Series 2021-1, Class E, 2.720%, 4/17/2028 (a) | | | 2,600,000 | | | | 2,570,623 | |
Flagship Credit Auto Trust, Series 2020-4, Class E, 3.840%, 7/17/2028 (a) | | | 10,700,000 | | | | 10,889,529 | |
Flagship Credit Auto Trust, Series 2021-2, Class E, 3.160%, 9/15/2028 (a) | | | 4,100,000 | | | | 4,040,562 | |
Flagship Credit Auto Trust, Series 2021-4, Class E, 4.030%, 3/15/2029 (a) | | | 4,000,000 | | | | 3,946,312 | |
Foundation Finance Trust, Series 2021-1A, Class A, 1.270%, 5/15/2041 (a) | | | 2,213,376 | | | | 2,172,220 | |
Foundation Finance Trust, Series 2021-1A, Class B, 1.870%, 5/15/2041 (a) | | | 5,000,000 | | | | 4,941,555 | |
Foundation Finance Trust, Series 2021-2A, Class D, 5.730%, 1/15/2042 (a) | | | 1,590,000 | | | | 1,595,354 | |
Foursight Capital Automobile Receivables Trust, Series 2020-1, Class E, 3.490%, 4/15/2026 (a) | | | 1,100,000 | | | | 1,125,909 | |
Foursight Capital Automobile Receivables Trust, Series 2019-1, Class F, 5.570%, 11/16/2026 (a) | | | 1,600,000 | | | | 1,650,114 | |
Foursight Capital Automobile Receivables Trust, Series 2021-1, Class D, 1.320%, 3/15/2027 (a) | | | 6,250,000 | | | | 6,077,462 | |
Foursight Capital Automobile Receivables Trust, Series 2021-1, Class E, 2.980%, 4/15/2027 (a) | | | 5,105,000 | | | | 5,072,236 | |
Foursight Capital Automobile Receivables Trust, Series 2020-1, Class F, 4.620%, 6/15/2027 (a) | | | 1,250,000 | | | | 1,288,482 | |
Foursight Capital Automobile Receivables Trust, Series 2021-2, Class E, 3.350%, 10/15/2027 (a) | | | 2,500,000 | | | | 2,491,520 | |
Foursight Capital Automobile Receivables Trust, Series 2021-2, Class F, 4.190%, 2/15/2029 (a) | | | 900,000 | | | | 897,723 | |
See accompanying notes which are an integral part of these financial statements.
44
Angel Oak Multi-Strategy Income Fund
Consolidated Schedule of Investments – (continued)
January 31, 2022
| | | | | | | | |
| | | Principal
Amount | | | Value | |
Asset-Backed Securities – (continued) | | | | | | | | |
Foursight Capital Automobile Receivables Trust, Series 2022-1, Class E, 4.690%, 8/15/2029 (a) | | $ | 4,500,000 | | | $ | 4,507,407 | |
FREED ABS Trust, Series 2018-2, Class C, 5.880%, 10/20/2025 (a) | | | 4,004,067 | | | | 4,024,936 | |
FREED ABS Trust, Series 2019-2, Class C, 4.860%, 11/18/2026 (a) | | | 16,220,000 | | | | 16,449,335 | |
FREED ABS Trust, Series 2020-FP1, Class B, 3.060%, 3/18/2027 (a) | | | 1,281,748 | | | | 1,289,441 | |
FREED ABS Trust, Series 2021-1CP, Class C, 2.830%, 3/20/2028 (a) | | | 2,200,000 | | | | 2,220,781 | |
FREED ABS Trust, Series 2021-3FP, Class D, 2.370%, 11/20/2028 (a) | | | 2,780,000 | | | | 2,715,443 | |
GLS Auto Receivables Issuer Trust, Series 2019-2A, Class D, 4.520%, 2/17/2026 (a) | | | 11,500,000 | | | | 11,814,663 | |
GLS Auto Receivables Issuer Trust, Series 2019-3A, Class D, 3.840%, 5/15/2026 (a) | | | 19,000,000 | | | | 19,491,739 | |
GLS Auto Receivables Issuer Trust, Series 2019-4A, Class D, 4.090%, 8/15/2026 (a) | | | 3,000,000 | | | | 3,068,637 | |
GLS Auto Receivables Issuer Trust, Series 2020-1A, Class D, 3.680%, 11/16/2026 (a) | | | 16,800,000 | | | | 17,067,775 | |
GLS Auto Receivables Issuer Trust, Series 2020-4A, Class E, 3.510%, 10/15/2027 (a) | | | 1,000,000 | | | | 1,006,852 | |
GLS Auto Receivables Issuer Trust, Series 2021-1A, Class E, 3.140%, 1/18/2028 (a) | | | 2,000,000 | | | | 1,995,306 | |
GLS Auto Receivables Issuer Trust, Series 2021-3A, Class E, 3.200%, 10/16/2028 (a) | | | 7,500,000 | | | | 7,422,982 | |
GLS Auto Receivables Issuer Trust, Series 2021-4A, Class E, 4.430%, 10/16/2028 (a) | | | 5,000,000 | | | | 4,970,935 | |
GLS Auto Receivables Trust, Series 2021-2A, Class E, 2.870%, 5/15/2028 (a) | | | 2,000,000 | | | | 1,965,798 | |
Goldman Home Improvement Trust, Series 2021-GRN2, Class D, 4.000%, 6/25/2051 (a) | | | 2,621,000 | | | | 2,525,509 | |
Goldman Home Improvement Trust, Series 2021-GRN2, Class A, 1.150%, 6/26/2051 (a) | | | 3,435,373 | | | | 3,380,342 | |
Goldman Home Improvement Trust, Series 2021-GRN2, Class C, 2.770%, 6/26/2051 (a) | | | 9,644,000 | | | | 9,350,572 | |
Goodgreen Trust, Series 2017-2A, Class A, 3.260%, 10/15/2053 (a) | | | 4,823,256 | | | | 4,829,097 | |
GoodLeap Sustainable Home Solutions Trust, Series 2021-3CS, Class A, 2.100%, 5/20/2048 (a) | | | 1,373,234 | | | | 1,326,305 | |
GoodLeap Sustainable Home Solutions Trust, Series 2021-4GS, Class A, 1.930%, 7/20/2048 (a) | | | 3,735,261 | | | | 3,627,940 | |
Helios Issuer LLC, Series 2021-B, Class A, 1.620%, 7/20/2048 (a) | | | 2,605,987 | | | | 2,520,492 | |
Hertz Vehicle Financing LLC, Series 2021-1A, Class C, 2.050%, 12/25/2025 (a) | | | 5,500,000 | | | | 5,423,231 | |
Hertz Vehicle Financing LLC, Series 2021-1A, Class D, 3.980%, 12/25/2025 (a) | | | 7,000,000 | | | | 6,934,270 | |
Hertz Vehicle Financing LP, Series 2021-2A, Class D, 4.340%, 12/25/2027 (a) | | | 5,000,000 | | | | 4,945,935 | |
JP Morgan Chase Bank, Series 2020-1, Class E, 3.715%, 1/25/2028 (a) | | | 427,942 | | | | 432,928 | |
LendingClub Receivables Trust, Series 2019-7, Class R2, 0.000%, 1/15/2027 (a)(c) | | | 1,679,730 | | | | 573,879 | |
LendingClub Receivables Trust, Series 2019-7, Class R1, 0.000%, 1/15/2027 (a)(c) | | | 8,602,377 | | | | 2,939,002 | |
LendingClub Receivables Trust, Series 2019-1, Class CERT, 6.000%, 7/17/2045 (a) | | | 932,340 | | | | 7,568,511 | |
LendingClub Receivables Trust, Series 2020-6A, Class A, 2.750%, 11/15/2047 (a) | | | 2,476,125 | | | | 2,493,760 | |
Lendingpoint Asset Securitization Trust, Series 2022-A, Class E, 7.020%, 6/15/2029 (a) | | | 3,320,000 | | | | 3,324,665 | |
LendingPoint Asset Securitization Trust, Series 2020-REV1, Class A, 2.731%, 10/15/2028 (a) | | | 3,000,000 | | | | 3,035,547 | |
LendingPoint Asset Securitization Trust, Series 2021-B, Class C, 3.210%, 2/15/2029 (a) | | | 2,000,000 | | | | 1,959,344 | |
LL ABS Trust, Series 2020-1A, Class B, 3.790%, 1/17/2028 (a) | | | 1,900,000 | | | | 1,931,192 | |
LL ABS Trust, Series 2020-1A, Class C, 6.540%, 1/17/2028 (a) | | | 2,200,000 | | | | 2,309,076 | |
Marlette Funding Trust, Series 2018-1A, Class D, 4.850%, 3/15/2028 (a) | | | 3,578,755 | | | | 3,592,204 | |
Marlette Funding Trust, Series 2018-2A, Class C, 4.370%, 7/17/2028 (a) | | | 321,180 | | | | 321,873 | |
Marlette Funding Trust, Series 2019-4A, Class C, 3.760%, 12/15/2029 (a) | | | 2,750,000 | | | | 2,814,083 | |
Marlette Funding Trust, Series 2021-1A, Class D, 2.470%, 6/16/2031 (a) | | | 3,000,000 | | | | 2,980,406 | |
Marlette Funding Trust, Series 2021-3A, Class D, 2.530%, 12/15/2031 (a) | | | 2,500,000 | | | | 2,466,490 | |
Mercury Financial Credit Card Master Trust, Series 2021-1A, Class B, 2.330%, 3/20/2026 (a) | | | 5,000,000 | | | | 4,911,745 | |
Mosaic Solar Loan Trust, Series 2019-1A, Class B, 0.000%, 12/21/2043 (a)(d) | | | 1,729,432 | | | | 1,660,502 | |
Mosaic Solar Loan Trust, Series 2021-2A, Class B, 2.100%, 4/22/2047 (a) | | | 1,264,376 | | | | 1,216,441 | |
Newtek Small Business Loan Trust, Series 2018-1, Class B,
4.000% (PRIME + 0.750%), 2/25/2044 (a)(e) | | | 1,586,866 | | | | 1,605,110 | |
Pagaya AI Debt Selection Trust, Series 2021-1, Class B, 2.130%, 11/15/2027 (a) | | | 7,996,704 | | | | 7,964,189 | |
See accompanying notes which are an integral part of these financial statements.
45
Angel Oak Multi-Strategy Income Fund
Consolidated Schedule of Investments – (continued)
January 31, 2022
| | | | | | | | |
| | | Principal
Amount | | | Value | |
Asset-Backed Securities – (continued) | | | | | | | | |
Pagaya AI Debt Selection Trust, Series 2021-1, Class C, 4.090%, 11/15/2027 (a) | | $ | 1,499,382 | | | $ | 1,496,376 | |
Pagaya AI Debt Selection Trust, Series 2021-3, Class B, 1.740%, 5/15/2029 (a) | | | 4,000,000 | | | | 3,914,912 | |
Pagaya AI Debt Selection Trust, Series 2021-3, Class C, 3.270%, 5/15/2029 (a) | | | 3,000,000 | | | | 2,954,853 | |
Pagaya AI Debt Trust, Series 2022-1, Class A, 2.030%, 10/15/2029 (a)(b) | | | 7,000,000 | | | | 7,019,005 | |
Pagaya AI Debt Trust, Series 2022-1, Class B, 3.340%, 10/15/2029 (a)(b) | | | 4,000,000 | | | | 4,010,736 | |
Pagaya AI Debt Trust, Series 2022-1, Class C, 4.890%, 10/15/2029 (a)(b) | | | 5,000,000 | | | | 5,085,455 | |
Prosper Marketplace Issuance Trust, Series 2019-3A, Class D, 6.550%, 9/15/2025 (a) | | | 10,000,000 | | | | 10,068,670 | |
Santander Consumer Auto Receivables Trust, Series 2021-AA, Class E, 3.280%, 3/15/2027 (a) | | | 1,750,000 | | | | 1,764,366 | |
Santander Consumer Auto Receivables Trust, Series 2021-AA, Class F, 5.790%, 8/15/2028 (a) | | | 500,000 | | | | 522,785 | |
Santander Consumer Auto Receivables Trust, Series 2020-BA, Class F, 7.030%, 8/15/2028 (a) | | | 1,900,000 | | | | 2,061,703 | |
Santander Retail Auto Lease Trust, Series 2021-C, Class D, 1.390%, 8/20/2026 (a) | | | 4,000,000 | | | | 3,946,244 | |
Stone Street Receivables Funding LLC, Series 2015-1A, Class C, 5.600%, 12/15/2054 (a) | | | 724,516 | | | | 680,863 | |
Tesla Auto Lease Trust, Series 2021-A, Class E, 2.640%, 3/20/2025 (a) | | | 3,350,000 | | | | 3,336,074 | |
Theorem Funding Trust, Series 2020-1A, Class B, 3.950%, 10/15/2026 (a) | | | 3,800,000 | | | | 3,851,646 | |
Theorem Funding Trust, Series 2020-1A, Class C, 6.250%, 10/15/2026 (a) | | | 1,000,000 | | | | 1,033,622 | |
UNIFY Auto Receivables Trust, Series 2021-1A, Class B, 1.290%, 11/16/2026 (a) | | | 5,000,000 | | | | 4,925,705 | |
United Auto Credit Securitization Trust, Series 2021-1, Class E, 2.580%, 6/10/2026 (a) | | | 5,700,000 | | | | 5,680,056 | |
United Auto Credit Securitization Trust, Series 2021-1, Class F, 4.300%, 9/10/2027 (a) | | | 1,035,000 | | | | 1,042,367 | |
Upgrade Master Pass-Thru Trust, Series 2019-ST3, Class A, 3.750%, 11/15/2025 (a) | | | 1,932,556 | | | | 1,952,198 | |
Upgrade Master Pass-Thru Trust, Series 2019-ST4, Class A, 3.750%, 12/15/2025 (a) | | | 1,072,851 | | | | 1,082,867 | |
Upgrade Master Pass-Thru Trust, Series 2019-ST5, Class A, 3.750%, 1/15/2026 (a) | | | 875,196 | | | | 883,380 | |
Upgrade Master Pass-Thru Trust, Series 2021-PT2, Class A, 4.971%, 5/15/2027 (a) | | | 17,075,522 | | | | 17,192,695 | |
Upstart Pass-Through Trust, Series 2021-ST6, Class CERT, 9.000%, 8/20/2027 (a) | | | 5,450,000 | | | | 5,600,693 | |
Upstart Pass-Through Trust, Series 2021-ST7, Class CERT, 6.500%, 9/20/2029 (a) | | | 1,500,000 | | | | 1,575,929 | |
Upstart Pass-Through Trust, Series 2021-ST8, Class CERT, 6.500%, 10/20/2029 (a) | | | 2,370,000 | | | | 2,664,888 | |
Upstart Pass-Through Trust, Series 2021-ST9, Class CERT, 4.500%, 11/20/2029 (a) | | | 1,629,000 | | | | 2,126,671 | |
Upstart Pass-Through Trust, Series 2022-ST1, Class CERT, 0.000%, 3/20/2030 (a) | | | 2,400,000 | | | | 2,871,860 | |
Upstart Securitization Trust, Series 2019-1, Class CERT, 0.000%, 4/20/2026 (a) | | | 20,143 | | | | 1,215,894 | |
Upstart Securitization Trust, Series 2019-3, Class C, 5.381%, 1/21/2030 (a) | | | 11,370,000 | | | | 11,682,686 | |
Upstart Securitization Trust, Series 2019-3, Class CERT, 6.500%, 1/21/2030 (a)(f) | | | 17,192 | | | | 3,947,473 | |
Upstart Securitization Trust, Series 2020-3, Class C, 6.250%, 11/20/2030 (a) | | | 10,427,000 | | | | 10,994,667 | |
Upstart Securitization Trust, Series 2021-1, Class C, 4.060%, 3/20/2031 (a) | | | 8,200,000 | | | | 8,236,457 | |
Upstart Securitization Trust, Series 2021-2, Class C, 3.610%, 6/20/2031 (a) | | | 5,500,000 | | | | 5,451,160 | |
Upstart Securitization Trust, Series 2021-3, Class C, 3.280%, 7/20/2031 (a) | | | 7,000,000 | | | | 6,933,143 | |
Upstart Securitization Trust, Series 2021-4, Class C, 3.190%, 9/20/2031 (a) | | | 5,250,000 | | | | 5,169,518 | |
Upstart Securitization Trust, Series 2021-5, Class B, 2.490%, 11/20/2031 (a) | | | 3,000,000 | | | | 2,928,360 | |
Upstart Securitization Trust, Series 2021-5, Class C, 4.150%, 11/20/2031 (a) | | | 9,400,000 | | | | 9,460,282 | |
USASF Receivables LLC, Series 2020-1A, Class D, 9.350%, 3/15/2027 (a) | | | 6,700,000 | | | | 6,993,145 | |
Veros Automobile Receivables Trust, Series 2020-1, Class C, 2.990%, 6/15/2025 (a) | | | 2,410,000 | | | | 2,435,753 | |
Veros Automobile Receivables Trust, Series 2020-1, Class D, 5.640%, 2/15/2027 (a) | | | 6,755,000 | | | | 6,840,721 | |
Westlake Automobile Receivables Trust, Series 2019-3A, Class F, 4.720%, 4/15/2026 (a) | | | 5,000,000 | | | | 5,077,035 | |
Westlake Automobile Receivables Trust, Series 2020-3A, Class F, 5.110%, 5/17/2027 (a) | | | 8,750,000 | | | | 8,956,465 | |
Westlake Automobile Receivables Trust, Series 2021-1A, Class F, 3.910%, 9/15/2027 (a) | | | 4,000,000 | | | | 3,991,996 | |
Westlake Automobile Receivables Trust, Series 2021-3A, Class F, 4.250%, 6/15/2028 (a) | | | 3,000,000 | | | | 2,959,026 | |
| | | | | | | | |
| | |
TOTAL ASSET-BACKED SECURITIES
(Cost – $753,072,217) | | | | | | $ | 754,571,797 | |
| | | | | | | | |
See accompanying notes which are an integral part of these financial statements.
46
Angel Oak Multi-Strategy Income Fund
Consolidated Schedule of Investments – (continued)
January 31, 2022
| | | | | | | | |
| | | Principal
Amount | | | Value | |
Collateralized Debt Obligations – 0.32% | | | | | | | | |
Anchorage Credit Funding Ltd., Series 2020-11A, Class E, 7.050%, 4/25/2038 (a) | | $ | 3,500,000 | | | $ | 3,280,882 | |
Anchorage Credit Funding Ltd., Series 2020-12A, Class D, 5.927%, 10/25/2038 (a) | | | 4,500,000 | | | | 4,497,012 | |
Hildene TruPS Financials Note Securitization Ltd., Series 2018-1A, Class A1,
1.591% (3 Month LIBOR USD + 1.360%), 10/12/2038 (a)(c)(e) | | | 4,498,486 | | | | 4,475,994 | |
Hildene TruPS Financials Note Securitization Ltd., Series 2018-1A, Class B, 4.271% (3 Month LIBOR USD + 4.040%), 10/12/2038 (a)(c)(e) | | | 3,400,000 | | | | 3,298,000 | |
Hildene TruPS Financials Note Securitization Ltd., Series 2019-2A, Class A1,
1.920% (3 Month LIBOR USD + 1.760%), 5/23/2039 (a)(c)(e) | | | 3,801,179 | | | | 3,772,670 | |
Hildene TruPS Financials Note Securitization Ltd., Series 2019-2A, Class A2,
2.610% (3 Month LIBOR USD + 2.450%), 5/23/2039 (a)(c)(e) | | | 4,000,000 | | | | 3,980,000 | |
| | | | | | | | |
| | |
TOTAL COLLATERALIZED DEBT OBLIGATIONS
(Cost – $23,472,982) | | | | | | $ | 23,304,558 | |
| | | | | | | | |
Collateralized Loan Obligations – 4.47% | | | | | | | | |
ABPCI Direct Lending Fund CLO Ltd., Series 2020-8A, Class D,
6.004% (3 Month LIBOR USD + 5.750%), 4/20/2032 (a)(e) | | | 2,500,000 | | | | 2,499,932 | |
ABPCI Direct Lending Fund CLO Ltd., Series 2017-1A, Class ER,
7.854% (3 Month LIBOR USD + 7.600%), 4/20/2032 (a)(c)(e) | | | 1,750,000 | | | | 1,693,568 | |
AIMCO CLO Ltd., Series 2017-AA, Class SUB, 0.000%, 7/20/2029 (a)(c)(g) | | | 4,350,000 | | | | 3,262,500 | |
Allegro CLO Ltd., Series 2014-1RX, Class SUB, 13.000%, 10/21/2028 (c)(g)(h) | | | 4,000,000 | | | | 1,080,000 | |
ALM CLO Ltd., Series 2020-1A, Class SUB, 0.000%, 10/15/2029 (a)(c)(g) | | | 6,000,000 | | | | 5,040,000 | |
Antares CLO Ltd., Series 2019-1A, Class D, 4.904% (3 Month LIBOR USD + 4.650%), 7/21/2031 (a)(e) | | | 2,000,000 | | | | 2,006,036 | |
Apidos CLO Warehouse, Series 2020-33A, Class SUB, 0.000%, 7/24/2031 (a)(c)(g) | | | 2,000,000 | | | | 1,720,000 | |
Apidos CLO Warehouse, Series 2021-38A, Class SUB, 0.000%, 1/23/2034 (a)(c)(g) | | | 3,000,000 | | | | 2,595,000 | |
Ares CLO Ltd., Series 2015-4A, Class SUB, 0.000%, 10/15/2026 (a)(c)(g) | | | 3,000,000 | | | | 1,590,000 | |
Babson CLO Ltd., Series 2016-1A, Class ER, 6.259% (3 Month LIBOR USD + 6.000%), 7/23/2030 (a)(e)(i) | | | 4,300,000 | | | | 4,068,411 | |
Bain Capital Credit CLO Ltd., Series 2021-2A, Class SUB, 0.000%, 7/17/2034 (a)(c)(g) | | | 2,000,000 | | | | 1,440,000 | |
Barings CLO Ltd., Series 2018-2A, Class SUB, 0.000%, 4/15/2030 (a)(c)(g) | | | 5,000,000 | | | | 3,370,000 | |
Barings CLO Ltd., Series 2015-2A, Class DR,
3.204% (3 Month LIBOR USD + 2.950%), 10/21/2030 (a)(e) | | | 1,250,000 | | | | 1,254,482 | |
Barings CLO Ltd., Series 2021-2A, Class SUB, 0.000%, 7/15/2034 (a)(c)(g) | | | 5,000,000 | | | | 4,200,000 | |
Barings Middle Market CLO Ltd., Series 2018-II, Class COM, 0.000%, 1/15/2031 (c)(g) | | | 1,500,000 | | | | 1,342,927 | |
Barings Middle Market CLO Ltd., Series 2021-IA, Class D, 8.904% (3 Month LIBOR USD + 8.650%), 7/20/2033 (a)(c)(e) | | | 1,000,000 | | | | 979,180 | |
BlackRock Elbert CLO Ltd., Series 5A, Class D, 5.603% (3 Month LIBOR USD + 5.400%), 12/15/2031 (a)(e) | | | 2,250,000 | | | | 2,249,892 | |
BlackRock Elbert CLO Ltd., Series 5I, Class E, 9.603% (3 Month LIBOR USD + 9.400%), 12/15/2031 (c)(e) | | | 5,625,000 | | | | 5,626,710 | |
BlueMountain CLO Ltd., Series 2019-24A, Class SUB, 0.000%, 4/21/2031 (a)(c)(g) | | | 2,900,000 | | | | 2,291,000 | |
BlueMountain CLO Ltd., Series 2021-31A, Class SUB, 0.000%, 4/19/2034 (a)(c)(g) | | | 5,000,000 | | | | 4,050,000 | |
Carlyle CLO Ltd., Series 2017-3A, Class SUB, 0.000%, 7/20/2029 (a)(c)(g) | | | 5,525,000 | | | | 2,652,000 | |
CBAM LLC, Series 2021-15A, Class INC, 0.000%, 1/15/2036 (a)(c)(g) | | | 2,500,000 | | | | 2,125,000 | |
Cedar Funding CLO Ltd., Series 2016-6A, Class SUB, 0.000%, 10/20/2028 (a)(c)(g) | | | 3,000,000 | | | | 2,430,000 | |
Cedar Funding CLO Ltd., Series 2019-10X, Class SUB, 0.000%, 10/20/2032 (c)(g)(h) | | | 3,800,000 | | | | 3,040,000 | |
Cerberus Loan Funding LP, Series 2020-1A, Class D,
5.424% (3 Month LIBOR USD + 5.300%), 10/15/2031 (a)(e) | | | 3,500,000 | | | | 3,503,570 | |
See accompanying notes which are an integral part of these financial statements.
47
Angel Oak Multi-Strategy Income Fund
Consolidated Schedule of Investments – (continued)
January 31, 2022
| | | | | | | | |
| | | Principal
Amount | | | Value | |
Collateralized Loan Obligations – (continued) | | | | | | | | |
Cerberus Loan Funding LP, Series 2020-2A, Class D,
5.291% (3 Month LIBOR USD + 5.050%), 10/15/2032 (a)(e) | | $ | 2,500,000 | | | $ | 2,499,940 | |
Chenango Park CLO Ltd., Series 2018-1X, Class SUB, 0.000%, 4/15/2030 (c)(g)(h) | | | 1,500,000 | | | | 855,495 | |
Chenango Park CLO Ltd., Series 2018-1A, Class SUB, 0.000%, 4/15/2030 (a)(c)(g) | | | 1,500,000 | | | | 855,495 | |
CIFC Funding Ltd., Series 2015-2X, Class INC, 0.000%, 4/15/2030 (c)(g)(h) | | | 5,000,000 | | | | 2,500,000 | |
Diamond CLO Ltd., Series 2019-1A, Class E, 8.308% (3 Month LIBOR USD + 8.050%), 4/25/2029 (a)(c)(e) | | | 4,750,000 | | | | 4,758,084 | |
East West Investment Management CLO Ltd., Series 2019-FAL, Class D, 4.964% (3 Month LIBOR USD + 4.710%), 1/20/2033 (a)(e) | | | 5,000,000 | | | | 5,043,815 | |
Eaton Vance CLO Ltd., Series 2019-1A, Class SUB, 0.000%, 4/15/2031 (a)(c)(g) | | | 5,000,000 | | | | 4,100,000 | |
First Eagle Commercial Loan Funding LLC, Series 2016-1A, Class CR, 5.258% (3 Month LIBOR USD + 5.000%), 1/26/2032 (a)(e) | | | 10,500,000 | | | | 10,493,196 | |
Garrison Funding Ltd., Series 2018-2RA, Class BR,
3.330% (3 Month LIBOR USD + 3.170%), 11/20/2029 (a)(e) | | | 6,550,000 | | | | 6,521,180 | |
Garrison MML CLO LP, Series 2019-1A, Class B,
4.104% (3 Month LIBOR USD + 3.850%), 7/21/2031 (a)(e) | | | 3,100,000 | | | | 3,109,997 | |
Generate CLO Ltd, Series 2A, Class SUB, 0.000%, 10/22/2027 (a)(c)(g) | | | 4,000,000 | | | | 2,280,000 | |
Generate CLO Ltd, Series 4A, Class SUB, 0.000%, 1/22/2030 (a)(c)(g) | | | 5,500,000 | | | | 3,685,000 | |
Golub Capital Partners CLO Ltd., Series 2020-1A, Class C, 3.904% (3 Month LIBOR USD + 3.650%), 10/22/2029 (a)(e) | | | 8,000,000 | | | | 8,055,440 | |
Golub Capital Partners CLO Ltd., Series 2019-45A, Class C, 4.054% (3 Month LIBOR USD + 3.800%), 10/20/2031 (a)(e) | | | 5,350,000 | | | | 5,352,777 | |
Great Lakes CLO Ltd., Series 2021-5A, Class E, 7.741% (3 Month LIBOR USD + 7.500%), 4/15/2033 (a)(c)(e) | | | 9,950,000 | | | | 9,498,748 | |
ICG US CLO Ltd., Series 2020-1A, Class SUB, 0.000%, 10/22/2031 (a)(c)(g) | | | 1,000,000 | | | | 720,000 | |
ICG US CLO Ltd., Series 2021-1A, Class E, 6.571% (3 Month LIBOR USD + 6.330%), 4/17/2034 (a)(e) | | | 2,000,000 | | | | 1,906,432 | |
Jay Park CLO Ltd., Series 2016-1X, Class SUB, 0.000%, 10/20/2027 (c)(g)(h) | | | 4,000,000 | | | | 1,880,000 | |
LCM Ltd., Series 33A, Class INC, 0.000%, 7/20/2034 (a)(c)(g) | | | 4,800,000 | | | | 3,888,000 | |
Madison Park Funding Ltd., Series 2015-17A, Class DR, 3.855% (3 Month LIBOR USD + 3.600%), 7/22/2030 (a)(e) | | | 3,575,000 | | | | 3,580,155 | |
Marble Point CLO Ltd., Series 2020-1A, Class SUB, 0.000%, 4/20/2033 (a)(c)(g) | | | 2,600,000 | | | | 1,846,000 | |
Marble Point CLO Ltd., Series 2021-2A, Class INC, 0.000%, 7/25/2050 (a)(c)(g) | | | 2,500,000 | | | | 1,575,000 | |
Marble Point CLO Ltd., Series 2021-3A, Class INC, 0.000%, 10/17/2051 (a)(c)(g) | | | 3,000,000 | | | | 2,340,000 | |
MCF CLO LLC, Series 2017-3A, Class ER, 9.404% (3 Month LIBOR USD + 9.150%), 7/20/2033 (a)(c)(e) | | | 3,000,000 | | | | 2,938,041 | |
MCF CLO Ltd., Series 2018-1A, Class E, 7.571% (3 Month LIBOR USD + 7.330%), 7/18/2030 (a)(c)(e) | | | 1,000,000 | | | | 963,638 | |
Monroe Capital MML CLO Ltd., Series 2018-2A, Class E, 7.410% (3 Month LIBOR USD + 7.250%), 11/22/2030 (a)(c)(e) | | | 5,150,000 | | | | 5,136,512 | |
Monroe Capital MML CLO Ltd., Series 2020-1A, Class D, 7.060% (3 Month LIBOR USD + 6.900%), 8/20/2031 (a)(e) | | | 11,000,000 | | | | 11,002,354 | |
Monroe Capital MML CLO Ltd., Series 2020-1A, Class E, 9.010% (3 Month LIBOR USD + 8.850%), 8/20/2031 (a)(c)(e) | | | 3,250,000 | | | | 3,249,873 | |
Monroe Capital MML CLO Ltd., Series 2019-2A, Class D, 5.259% (3 Month LIBOR USD + 5.000%), 10/22/2031 (a)(e) | | | 1,700,000 | | | | 1,699,974 | |
Monroe Capital MML CLO Ltd., Series 2021-1A, Class E, 8.700% (3 Month LIBOR USD + 8.540%), 5/20/2033 (a)(c)(e) | | | 3,486,461 | | | | 3,478,913 | |
See accompanying notes which are an integral part of these financial statements.
48
Angel Oak Multi-Strategy Income Fund
Consolidated Schedule of Investments – (continued)
January 31, 2022
| | | | | | | | |
| | | Principal
Amount | | | Value | |
Collateralized Loan Obligations – (continued) | | | | | | | | |
Monroe Capital MML CLO Ltd., Series 2019-1A, Class ER, 8.520% (3 Month LIBOR USD + 8.360%), 11/22/2033 (a)(c)(e) | | $ | 4,440,822 | | | $ | 4,345,069 | |
Neuberger Berman CLO Ltd., Series 2016-23A, Class SUB, 0.000%, 10/18/2027 (a)(c)(g) | | | 2,500,000 | | | | 1,275,000 | |
Northwoods Capital Ltd., Series 2018-17A, Class SUB, 0.000%, 4/22/2031 (a)(c)(g) | | | 2,650,000 | | | | 1,987,500 | |
Oaktree CLO Ltd., Series 2019-4A, Class SUB, 0.000%, 10/20/2032 (a)(c)(g) | | | 3,500,000 | | | | 2,800,000 | |
Oaktree CLO Ltd., Series 2021-1A, Class SUB, 0.000%, 7/17/2034 (a)(c)(g) | | | 10,000,000 | | | | 7,600,000 | |
OCP CLO Ltd., Series 2021-21A, Class SUB, 0.000%, 7/20/2034 (a)(c)(g) | | | 3,000,000 | | | | 2,400,000 | |
OCP CLO Ltd., Series 2021-22A, Class SUB, 0.000%, 12/4/2034 (a)(c)(g) | | | 3,000,000 | | | | 2,610,000 | |
Octagon Investment Partners Ltd., Series 2018-18A, Class SUB, 0.000%, 12/16/2024 (a)(c)(g) | | | 4,000,000 | | | | 1,200,000 | |
Octagon Ltd., Series 2021-1A, Class SUB, 0.000%, 7/20/2034 (a)(c)(g) | | | 4,000,000 | | | | 3,280,000 | |
OZLM Ltd., Series 2015-12A, Class E,
6.949% (3 Month LIBOR USD + 6.650%), 4/30/2027 (a)(c)(e) | | | 1,000,000 | | | | 946,025 | |
OZLM Ltd., Series 2017-17A, Class SUB, 0.000%, 7/22/2030 (a)(c)(g) | | | 7,000,000 | | | | 3,430,000 | |
PPM CLO Ltd., Series 2020-4A, Class SUB, 0.190%, 10/20/2031 (a)(c)(g) | | | 2,500,000 | | | | 1,925,000 | |
Race Point CLO Ltd., Series 2013-8X, Class ER, 7.010% (3 Month LIBOR USD + 6.850%), 2/20/2030 (e)(h) | | | 2,500,000 | | | | 2,354,768 | |
Regatta Funding Ltd., Series 2017-3A, Class SUB, 0.000%, 1/17/2031 (a)(c)(g) | | | 2,500,000 | | | | 1,675,000 | |
Regatta Funding Ltd., Series 2021-5A, Class SUB, 0.000%, 1/22/2035 (a)(c)(g) | | | 3,000,000 | | | | 2,430,000 | |
Rockford Tower CLO Ltd., Series 2019-1A, Class SUB, 0.000%, 4/20/2032 (a)(c)(g) | | | 2,500,000 | | | | 1,975,000 | |
Rockford Tower CLO Ltd., Series 2019-1A, Class ER, 6.574% (3 Month LIBOR USD + 6.320%), 4/20/2034 (a)(e) | | | 5,000,000 | | | | 4,773,275 | |
RR Ltd., Series 2018-5A, Class SUB, 0.000%, 10/15/2031 (a)(c)(g) | | | 4,000,000 | | | | 3,200,000 | |
RR Ltd., Series 2019-6A, Class DR,
6.091% (3 Month LIBOR USD + 5.850%), 4/15/2036 (a)(e)(i) | | | 2,000,000 | | | | 1,964,816 | |
Saranac CLO Ltd., Series 2020-8A, Class E, 8.280% (3 Month LIBOR USD + 8.120%), 2/22/2033 (a)(e) | | | 5,250,000 | | | | 5,159,779 | |
Sound Point CLO Ltd., Series 2017-3A, Class D, 6.754% (3 Month LIBOR USD + 6.500%), 10/21/2030 (a)(e)(i) | | | 3,800,000 | | | | 3,609,810 | |
Sound Point CLO Ltd., Series 2014-1RA, Class E, 6.341% (3 Month LIBOR USD + 6.100%), 7/18/2031 (a)(e)(i) | | | 4,500,000 | | | | 4,028,144 | |
Steele Creek CLO Ltd., Series 2018-1A, Class C,
2.141% (3 Month LIBOR USD + 1.900%), 4/15/2031 (a)(e) | | | 4,500,000 | | | | 4,340,525 | |
Steele Creek CLO Ltd., Series 2016-1A, Class CR,
2.103% (3 Month LIBOR USD + 1.900%), 6/16/2031 (a)(e)(i) | | | 17,756,577 | | | | 17,495,129 | |
Steele Creek CLO Ltd., Series 2016-1A, Class FR,
7.103% (3 Month LIBOR USD + 6.900%), 6/16/2031 (a)(c)(e) | | | 1,000,000 | | | | 698,804 | |
Stewart Park CLO Ltd., Series 2015-1A, Class ER,
5.521% (3 Month LIBOR USD + 5.280%), 1/15/2030 (a)(e)(i) | | | 5,250,000 | | | | 4,978,449 | |
Strata CLO Ltd., Series 2021-1A, Class SUB, 0.000%, 10/20/2033 (a)(c)(g) | | | 3,000,000 | | | | 2,520,000 | |
TCP Whitney CLO Ltd., Series 2017-1A, Class ER,
8.302% (3 Month LIBOR USD + 8.160%), 8/22/2033 (a)(c)(e) | | | 4,000,000 | | | | 3,916,724 | |
TCW CLO Ltd., Series 2021-1A, Class SUB, 0.000%, 3/20/2034 (a)(c)(g) | | | 5,000,000 | | | | 3,950,000 | |
THL Credit Wind River CLO Ltd., Series 2013-2A, Class INC, 0.000%, 1/20/2026 (a)(c)(g) | | | 3,000,000 | | | | 960,000 | |
Trinitas CLO Ltd., Series 2017-6A, Class ER,
7.074% (3 Month LIBOR USD + 6.816%), 1/25/2034 (a)(e)(i) | | | 2,850,000 | | | | 2,765,093 | |
Venture CLO Ltd., Series 2020-40A, Class D2,
5.430% (3 Month LIBOR USD + 5.260%), 11/24/2031 (a)(e)(i) | | | 9,000,000 | | | | 9,066,906 | |
Vibrant CLO Ltd., Series 2021-12A, Class SUB, 0.000%, 1/20/2034 (a)(c)(g) | | | 4,350,000 | | | | 3,088,500 | |
See accompanying notes which are an integral part of these financial statements.
49
Angel Oak Multi-Strategy Income Fund
Consolidated Schedule of Investments – (continued)
January 31, 2022
| | | | | | | | |
| | | Principal
Amount | | | Value | |
Collateralized Loan Obligations – (continued) | | | | | | | | |
Voya CLO Ltd., Series 2019-1A, Class SUB, 0.000%, 4/16/2029 (a)(c)(g) | | $ | 4,900,000 | | | $ | 3,969,000 | |
Voya CLO Ltd., Series 2014-2A, Class ER, 7.941% (3 Month LIBOR USD + 7.700%), 4/17/2030 (a)(c)(e) | | | 2,000,000 | | | | 1,518,508 | |
Wellfleet CLO Ltd., Series 2015-1A, Class SUB, 0.000%, 10/20/2027 (a)(c)(g) | | | 4,900,000 | | | | 2,597,000 | |
Wellfleet CLO Ltd., Series 2019-XA, Class E, 9.544% (3 Month LIBOR USD + 9.290%), 7/20/2032 (a)(c)(e) | | | 1,500,000 | | | | 1,408,895 | |
Woodmont Trust, Series 2020-7A, Class D, 5.641% (3 Month LIBOR USD + 5.400%), 1/15/2032 (a)(e) | | | 13,000,000 | | | | 13,109,915 | |
| | | | | | | | |
| | |
TOTAL COLLATERALIZED LOAN OBLIGATIONS
(Cost – $335,762,637) | | | | | | $ | 323,276,901 | |
| | | | | | | | |
Commercial Mortgage-Backed Securities – 2.31% | | | | | | | | |
BBCMS Mortgage Trust, Series 2020-BID, Class A, 2.246% (1 Month LIBOR USD + 2.140%), 10/15/2037 (a)(e) | | | 5,000,000 | | | | 5,015,635 | |
BBCMS Mortgage Trust, Series 2020-C7, Class A5, 2.037%, 4/17/2053 | | | 5,000,000 | | | | 4,808,100 | |
BTH Mortgage-Backed Securities Trust, Series 2018-3, Class A, 2.602% (1 Month LIBOR USD + 2.500%), 6/7/2022 (e) | | | 2,392,246 | | | | 2,412,721 | |
BX Commercial Mortgage Trust, Series 2021-VOLT, Class F, 2.506% (1 Month LIBOR USD + 2.400%), 9/15/2036 (a)(e)(i) | | | 9,000,000 | | | | 8,895,285 | |
BX Commercial Mortgage Trust, Series 2021-VOLT, Class G, 2.956% (1 Month LIBOR USD + 2.850%), 9/15/2036 (a)(e) | | | 3,000,000 | | | | 2,976,657 | |
Capital Funding Mortgage Trust, Series 2020-9, Class B, 15.900% (1 Month LIBOR USD + 14.900%), 11/28/2022 (a)(e) | | | 4,750,000 | | | | 4,783,606 | |
Capital Funding Mortgage Trust, Series 2021-19, Class B, 16.460% (1 Month LIBOR USD + 15.210%), 11/6/2023 (a)(e) | | | 4,825,000 | | | | 4,832,416 | |
Citigroup Commercial Mortgage Trust, Series 2021-PRM2, Class F, 3.857% (1 Month LIBOR USD + 3.750%), 10/15/2038 (a)(e) | | | 5,980,000 | | | | 5,994,968 | |
Commercial Mortgage Trust, Series 2020-SBX, Class A, 1.670%, 1/10/2038 (a) | | | 500,000 | | | | 487,156 | |
Commercial Mortgage Trust, Series 2013-CR8, Class ASFL, 0.844% (1 Month LIBOR USD + 0.740%), 6/12/2046 (a)(e) | | | 1,226,460 | | | | 1,221,120 | |
Extended Stay America Trust, Series 2021-ESH, Class E, 2.957% (1 Month LIBOR USD + 2.850%), 7/15/2038 (a)(e)(i) | | | 993,883 | | | | 995,745 | |
Extended Stay America Trust, Series 2021-ESH, Class F, 3.807% (1 Month LIBOR USD + 3.700%), 7/15/2038 (a)(e) | | | 5,267,581 | | | | 5,277,447 | |
Greystone CRE Notes Ltd., Series 2021-HC2, Class C, 3.353% (1 Month LIBOR USD + 3.250%), 12/15/2039 (a)(c)(e) | | | 3,000,000 | | | | 3,010,530 | |
Greystone CRE Notes Ltd., Series 2021-HC2, Class D, 4.103% (1 Month LIBOR USD + 4.000%), 12/15/2039 (a)(c)(e) | | | 2,250,000 | | | | 2,257,897 | |
GS Mortgage Securities Corp. Trust, Series 2018-TWR, Class G, 4.031% (1 Month LIBOR USD + 3.925%), 7/15/2031 (a)(e) | | | 500,000 | | | | 431,847 | |
Harvest SBA Loan Trust, Series 2018-1, Class A, 2.352% (1 Month LIBOR USD + 2.250%), 9/26/2044 (a)(e) | | | 1,503,576 | | | | 1,465,102 | |
HGI CRE Ltd., Series 2021-FL2, Class D, 2.256% (1 Month LIBOR USD + 2.150%), 9/19/2036 (a)(e)(i) | | | 3,500,000 | | | | 3,459,697 | |
JP Morgan Chase Commercial Mortgage Securities Trust, Series 2018-PTC, Class A,
1.556% (1 Month LIBOR USD + 1.450%), 4/15/2031 (a)(e)(i) | | | 3,500,000 | | | | 3,491,806 | |
JP Morgan Chase Commercial Mortgage Securities Trust, Series 2021-NYAH, Class H,
3.496% (1 Month LIBOR USD + 3.390%), 6/15/2038 (a)(e) | | | 5,000,000 | | | | 4,999,970 | |
See accompanying notes which are an integral part of these financial statements.
50
Angel Oak Multi-Strategy Income Fund
Consolidated Schedule of Investments – (continued)
January 31, 2022
| | | | | | | | |
| | | Principal
Amount | | | Value | |
Commercial Mortgage-Backed Securities – (continued) | | | | | | | | |
LB-UBS Commercial Mortgage Trust, Series 2007-C6, Class C, 6.859%, 7/15/2040 (c)(g) | | $ | 696,915 | | | $ | 348,056 | |
Med Trust, Series 2021-MDLN, Class F,
4.107% (1 Month LIBOR USD + 4.000%), 11/15/2038 (a)(e) | | | 3,500,000 | | | | 3,469,571 | |
Med Trust, Series 2021-MDLN, Class G,
5.357% (1 Month LIBOR USD + 5.250%), 11/15/2038 (a)(e) | | | 2,155,000 | | | | 2,133,603 | |
Morgan Stanley Bank of America Merrill Lynch Trust, Series 2013-C7, Class H, 4.213%, 2/16/2046 (a)(c)(g) | | | 10,318,259 | | | | 65,996 | |
Morgan Stanley Bank of America Merrill Lynch Trust, Series 2013-C7, Class G, 4.213%, 2/16/2046 (a)(c)(g) | | | 1,000,000 | | | | 138,888 | |
MTRO Commercial Mortgage Trust, Series 2019-TECH, Class E,
2.156% (1 Month LIBOR USD + 2.050%), 12/15/2033 (a)(e) | | | 6,000,000 | | | | 5,817,810 | |
Ready Capital Mortgage Financing LLC, Series 2021-FL6, Class D,
2.508% (1 Month LIBOR USD + 2.400%), 7/25/2036 (a)(e)(i) | | | 1,000,000 | | | | 983,489 | |
Ready Capital Mortgage Financing LLC, Series 2021-FL6, Class E,
3.008% (1 Month LIBOR USD + 2.900%), 7/25/2036 (a)(e)(i) | | | 1,500,000 | | | | 1,505,477 | |
SLG Office Trust, Series 2021-OVA, Class A, 2.585%, 7/15/2041 (a) | | | 500,000 | | | | 493,450 | |
SMR Mortgage Trust, Series 2022-IND, Class D,
4.010% (TSFR1M + 3.950%), 2/15/2039 (a)(b)(e) | | | 2,250,000 | | | | 2,250,000 | |
Sutherland Commercial Mortgage Loans, Series 2017-SBC6, Class A,
3.192%, 4/25/2023 (a)(g) | | | 398,453 | | | | 399,645 | |
Sutherland Commercial Mortgage Loans, Series 2017-SBC6, Class B,
5.031%, 6/25/2024 (a)(g) | | | 7,000,000 | | | | 7,099,890 | |
X-CALI Mortgage Trust, Series 2020-1, Class B1,
9.150% (1 Month LIBOR USD + 7.500%), 2/15/2023 (a)(e) | | | 2,700,000 | | | | 2,732,800 | |
X-CALI Mortgage Trust, Series 2021-9, Class B1,
9.000% (1 Month LIBOR USD + 8.000%), 3/1/2024 (a)(e) | | | 1,215,000 | | | | 1,229,141 | |
X-Caliber Funding LLC, 7.000%, 10/1/2022 (a) | | | 3,693,316 | | | | 3,697,102 | |
X-Caliber Funding LLC, Series 2021-MI3, Class B1,
8.000% (1 Month LIBOR USD + 7.000%), 5/6/2023 (a)(e) | | | 2,200,000 | | | | 2,204,235 | |
X-Caliber Funding LLC, Series 2021-GA5, Class B1,
8.000% (1 Month LIBOR USD + 7.000%), 5/21/2023 (a)(e) | | | 1,025,000 | | | | 1,043,281 | |
X-Caliber Funding LLC, 12.000%, 8/15/2023 (a) | | | 5,615,000 | | | | 5,612,144 | |
X-Caliber Funding LLC, 5.000%, 10/15/2024 (a) | | | 300,000 | | | | 296,502 | |
X-Caliber Funding LLC, 8.000% (1 Month LIBOR USD + 7.000%), 10/15/2024 (a)(e) | | | 4,125,000 | | | | 4,207,166 | |
X-Caliber Funding LLC, 11.000%, 10/15/2024 (a) | | | 4,000,000 | | | | 3,978,604 | |
X-Caliber Funding LLC, 18.900%, 10/15/2024 (a)(g) | | | 900,000 | | | | 892,786 | |
X-Caliber Funding LLC, 7.500% (1 Month LIBOR USD + 6.500%), 11/6/2024 (a)(e) | | | 1,628,000 | | | | 1,626,849 | |
X-Caliber Funding LLC, Series 2021-7, Class B2, 0.000%, 1/6/2026 (a) | | | 1,788,000 | | | | 1,790,414 | |
X-Caliber Funding LLC, Series 2021-CT6, Class B2, 5.250%, 1/6/2026 (a) | | | 2,180,000 | | | | 2,186,254 | |
X-Caliber Funding LLC, Series 2021-CT6, Class B1,
7.000% (1 Month LIBOR USD + 6.000%), 1/6/2026 (a)(e) | | | 9,375,000 | | | | 9,396,216 | |
X-Caliber Funding LLC, Series 2021-7, Class A,
4.000% (1 Month LIBOR USD + 3.000%), 1/15/2026 (a)(e) | | | 3,950,000 | | | | 3,959,938 | |
X-Caliber Funding LLC, Series 2021-7, Class B1,
7.000% (1 Month LIBOR USD + 6.000%), 1/15/2026 (a)(e) | | | 165,000 | | | | 165,380 | |
X-Caliber Mortgage Trust, Series 2019-1, Class B1,
16.290% (1 Month LIBOR USD + 14.140%), 11/6/2022 (a)(e) | | | 5,950,000 | | | | 5,913,770 | |
X-Caliber Mortgage Trust, Series 2020-2, Class B1,
9.550% (1 Month LIBOR USD + 7.500%), 2/15/2023 (a)(e) | | | 7,000,000 | | | | 7,134,225 | |
See accompanying notes which are an integral part of these financial statements.
51
Angel Oak Multi-Strategy Income Fund
Consolidated Schedule of Investments – (continued)
January 31, 2022
| | | | | | | | |
| | | Principal
Amount | | | Value | |
Commercial Mortgage-Backed Securities – (continued) | | | | | | | | |
X-Caliber Mortgage Trust, Series 2021-CT2, Class B1,
7.750% (1 Month LIBOR USD + 6.750%), 4/6/2023 (a)(e) | | $ | 1,237,000 | | | $ | 1,239,250 | |
X-Caliber Mortgage Trust, Series 2020-5, Class A,
4.250% (1 Month LIBOR USD + 3.250%), 10/16/2023 (a)(e) | | | 5,000,000 | | | | 5,034,185 | |
X-Caliber Mortgage Trust, Series 2020-5, Class B1,
9.250% (1 Month LIBOR USD + 8.250%), 10/16/2023 (a)(e) | | | 7,000,000 | | | | 7,193,767 | |
X-Caliber Mortgage Trust, Series 2021-WY4, Class B1,
9.000% (1 Month LIBOR USD + 8.000%), 5/6/2024 (a)(e) | | | 2,020,000 | | | | 2,013,532 | |
X-Caliber Mortgage Trust, Series 2021-10, Class B1,
9.000% (1 Month LIBOR USD + 8.000%), 6/17/2024 (a)(e) | | | 2,000,000 | | | | 2,025,994 | |
| | | | | | | | |
| | |
TOTAL COMMERCIAL MORTGAGE-BACKED SECURITIES
(Cost – $171,895,654) | | | | | | $ | 167,097,115 | |
| | | | | | | | |
Commercial Mortgage-Backed Securities – U.S. Government Agency – 4.63% | | | | | | | | |
Federal Home Loan Mortgage Corp., Series K-F10, Class A,
0.481% (1 Month LIBOR USD + 0.380%), 7/25/2022 (e) | | | 94,972 | | | | 95,057 | |
Federal Home Loan Mortgage Corp., Series 2016-KF25, Class B,
5.101% (1 Month LIBOR USD + 5.000%), 10/25/2023 (a)(e) | | | 130,091 | | | | 130,253 | |
Federal Home Loan Mortgage Corp., Series 2020-KI05, Class B,
2.401% (1 Month LIBOR USD + 2.300%), 7/25/2024 (a)(e) | | | 2,312,743 | | | | 2,292,731 | |
Federal Home Loan Mortgage Corp., Series K-F35, Class A,
0.451% (1 Month LIBOR USD + 0.350%), 8/25/2024 (e) | | | 942,466 | | | | 945,008 | |
Federal Home Loan Mortgage Corp., Series K-F34, Class A,
0.461% (1 Month LIBOR USD + 0.360%), 8/25/2024 (e) | | | 492,032 | | | | 493,336 | |
Federal Home Loan Mortgage Corp., Series 2017-KF34, Class B,
2.801% (1 Month LIBOR USD + 2.700%), 8/25/2024 (a)(e) | | | 739,953 | | | | 740,928 | |
Federal Home Loan Mortgage Corp., Series 2017-KF35, Class B,
2.851% (1 Month LIBOR USD + 2.750%), 8/25/2024 (a)(e) | | | 2,206,219 | | | | 2,217,376 | |
Federal Home Loan Mortgage Corp., Series 2017-KF41, Class B,
2.601% (1 Month LIBOR USD + 2.500%), 11/25/2024 (a)(e) | | | 645,991 | | | | 570,122 | |
Federal Home Loan Mortgage Corp., Series 2018-KF42, Class B,
2.301% (1 Month LIBOR USD + 2.200%), 12/25/2024 (a)(e) | | | 1,987,149 | | | | 1,987,796 | |
Federal Home Loan Mortgage Corp., Series K-F53, Class A,
0.491% (1 Month LIBOR USD + 0.390%), 10/25/2025 (e) | | | 131,266 | | | | 131,568 | |
Federal Home Loan Mortgage Corp., Series 2019-KF58, Class B,
2.251% (1 Month LIBOR USD + 2.150%), 1/25/2026 (a)(e) | | | 1,410,058 | | | | 1,404,663 | |
Federal Home Loan Mortgage Corp., Series K F16, Class A,
0.731% (1 Month LIBOR USD + 0.630%), 3/25/2026 (e) | | | 18,128 | | | | 18,090 | |
Federal Home Loan Mortgage Corp., Series 2019-KF64, Class B,
2.401% (1 Month LIBOR USD + 2.300%), 6/25/2026 (a)(e) | | | 2,489,526 | | | | 2,513,567 | |
Federal Home Loan Mortgage Corp., Series K-F74, Class AL,
0.541% (1 Month LIBOR USD + 0.440%), 1/25/2027 (e) | | | 758,937 | | | | 762,588 | |
Federal Home Loan Mortgage Corp., Series 2020-KF74, Class B,
2.251% (1 Month LIBOR USD + 2.150%), 1/25/2027 (a)(e) | | | 3,035,747 | | | | 3,040,935 | |
Federal Home Loan Mortgage Corp., Series 2017-KSW3, Class B,
2.851% (1 Month LIBOR USD + 2.750%), 5/25/2027 (a)(e) | | | 2,550,970 | | | | 2,586,860 | |
Federal Home Loan Mortgage Corp., Series 2017-KF33, Class B,
2.651% (1 Month LIBOR USD + 2.550%), 6/25/2027 (a)(e) | | | 921,939 | | | | 918,094 | |
See accompanying notes which are an integral part of these financial statements.
52
Angel Oak Multi-Strategy Income Fund
Consolidated Schedule of Investments – (continued)
January 31, 2022
| | | | | | | | |
| | | Principal
Amount | | | Value | |
Commercial Mortgage-Backed Securities – U.S. Government Agency – (continued) | | | | | | | | |
Federal Home Loan Mortgage Corp., Series 2017-KF37, Class B,
2.851% (1 Month LIBOR USD + 2.750%), 6/25/2027 (a)(e) | | $ | 996,824 | | | $ | 986,814 | |
Federal Home Loan Mortgage Corp., Series K-739, Class A2, 1.336%, 9/25/2027 | | | 12,000,000 | | | | 11,642,652 | |
Federal Home Loan Mortgage Corp., Series K-740, Class A2, 1.470%, 9/25/2027 | | | 22,000,000 | | | | 21,424,370 | |
Federal Home Loan Mortgage Corp., Series K-F93, Class AS,
0.360% (SOFR30A + 0.310%), 10/25/2027 (e) | | | 11,720,720 | | | | 11,760,653 | |
Federal Home Loan Mortgage Corp., Series K-741, Class A2, 1.603%, 12/25/2027 | | | 5,000,000 | | | | 4,900,975 | |
Federal Home Loan Mortgage Corp., Series 2018-KF50, Class B,
2.001% (1 Month LIBOR USD + 1.900%), 7/25/2028 (a)(e) | | | 2,351,147 | | | | 2,320,890 | |
Federal Home Loan Mortgage Corp., Series 2018-KW07, Class B, 4.081%, 9/25/2028 (a)(g) | | | 2,250,000 | | | | 2,275,171 | |
Federal Home Loan Mortgage Corp., Series K-G02, Class A1, 2.044%, 11/25/2028 | | | 1,500,000 | | | | 1,514,880 | |
Federal Home Loan Mortgage Corp., Series 2018-KF54, Class B,
2.301% (1 Month LIBOR USD + 2.200%), 11/25/2028 (e) | | | 4,675,785 | | | | 4,588,395 | |
Federal Home Loan Mortgage Corp., Series KF-127, Class AS,
0.260% (SOFR30A + 0.210%), 12/26/2028 (e) | | | 5,999,893 | | | | 6,007,392 | |
Federal Home Loan Mortgage Corp., Series K-F59, Class A,
0.641% (1 Month LIBOR USD + 0.540%), 2/25/2029 (e) | | | 71,611 | | | | 72,036 | |
Federal Home Loan Mortgage Corp., Series 2019-KF59, Class B,
2.451% (1 Month LIBOR USD + 2.350%), 2/25/2029 (a)(e) | | | 3,580,565 | | | | 3,607,036 | |
Federal Home Loan Mortgage Corp., Series 2019-KF61, Class B,
2.301% (1 Month LIBOR USD + 2.200%), 3/25/2029 (a)(e) | | | 1,289,819 | | | | 1,299,358 | |
Federal Home Loan Mortgage Corp., Series K-S12, Class A,
0.751% (1 Month LIBOR USD + 0.650%), 8/25/2029 (e) | | | 1,250,000 | | | | 1,250,667 | |
Federal Home Loan Mortgage Corp., Series 2019-KG02, Class B,
3.679%, 8/25/2029 (a)(g) | | | 6,000,000 | | | | 5,954,868 | |
Federal Home Loan Mortgage Corp., Series 2020-KF76, Class B,
2.851% (1 Month LIBOR USD + 2.750%), 1/25/2030 (a)(e) | | | 11,695,825 | | | | 11,697,696 | |
Federal Home Loan Mortgage Corp., Series K-108, Class A2, 1.517%, 3/25/2030 | | | 8,000,000 | | | | 7,598,112 | |
Federal Home Loan Mortgage Corp., Series K-109, Class A2, 1.558%, 4/25/2030 | | | 8,471,000 | | | | 8,045,324 | |
Federal Home Loan Mortgage Corp., Series K-116, Class A2, 1.378%, 7/25/2030 | | | 13,000,000 | | | | 12,214,514 | |
Federal Home Loan Mortgage Corp., Series K-117, Class A2, 1.406%, 8/25/2030 | | | 8,000,000 | | | | 7,516,808 | |
Federal Home Loan Mortgage Corp., Series K-F88, Class AS,
0.400% (SOFR30A + 0.350%), 9/25/2030 (e) | | | 3,193,644 | | | | 3,208,252 | |
Federal Home Loan Mortgage Corp., Series K-F90, Class AS,
0.430% (SOFR30A + 0.380%), 9/25/2030 (e) | | | 6,670,452 | | | | 6,702,984 | |
Federal Home Loan Mortgage Corp., Series K-118, Class A2, 1.493%, 9/25/2030 | | | 10,000,000 | | | | 9,395,560 | |
Federal Home Loan Mortgage Corp., Series K-SG1, Class A2, 1.503%, 9/25/2030 | | | 10,000,000 | | | | 9,611,570 | |
Federal Home Loan Mortgage Corp., Series K-119, Class A2, 1.566%, 9/25/2030 | | | 12,000,000 | | | | 11,396,004 | |
Federal Home Loan Mortgage Corp., Series K-120, Class A2, 1.500%, 10/25/2030 | | | 10,000,000 | | | | 9,430,500 | |
Federal Home Loan Mortgage Corp., Series K-121, Class A2, 1.547%, 10/25/2030 | | | 17,000,000 | | | | 16,203,482 | |
Federal Home Loan Mortgage Corp., Series K-F94, Class AS,
0.390% (SOFR30A + 0.340%), 11/25/2030 (e) | | | 4,471,224 | | | | 4,500,269 | |
Federal Home Loan Mortgage Corp., Series K-G04, Class X1, 0.853%, 11/25/2030 (f)(g) | | | 36,967,136 | | | | 2,289,449 | |
Federal Home Loan Mortgage Corp., Series K-G04, Class A2, 1.487%, 11/25/2030 | | | 35,000,000 | | | | 33,076,190 | |
Federal Home Loan Mortgage Corp., Series K-122, Class A2, 1.521%, 11/25/2030 | | | 23,000,000 | | | | 21,689,805 | |
Federal Home Loan Mortgage Corp., Series K-123, Class A2, 1.621%, 12/25/2030 | | | 10,000,000 | | | | 9,531,130 | |
Federal Home Loan Mortgage Corp., Series K-124, Class A2, 1.658%, 12/25/2030 | | | 12,000,000 | | | | 11,437,236 | |
Federal Home Loan Mortgage Corp., Series K-F95, Class AS,
0.350% (SOFR30A + 0.300%), 12/26/2030 (e) | | | 1,622,019 | | | | 1,631,971 | |
See accompanying notes which are an integral part of these financial statements.
53
Angel Oak Multi-Strategy Income Fund
Consolidated Schedule of Investments – (continued)
January 31, 2022
| | | | | | | | |
| | | Principal
Amount | | | Value | |
Commercial Mortgage-Backed Securities – U.S. Government Agency – (continued) | | | | | | | | |
Federal Home Loan Mortgage Corp., Series 2021-MN1, Class M2,
3.800% (SOFR30A + 3.750%), 1/25/2051 (a)(e) | | $ | 3,700,000 | | | $ | 3,745,791 | |
Federal National Mortgage Association, Series 2020-M52, Class A2, 1.321%, 10/25/2030 (g) | | | 8,000,000 | | | | 7,616,328 | |
Federal National Mortgage Association, Series 2021-M1G, Class A2, 1.510%, 11/25/2030 (g) | | | 3,500,000 | | | | 3,310,860 | |
Federal National Mortgage Association, Series 2019-01, Class M10,
3.358% (1 Month LIBOR USD + 3.250%), 10/15/2049 (a)(e) | | | 2,000,000 | | | | 1,998,492 | |
Federal National Mortgage Association, Series 2019-01, Class B10,
5.608% (1 Month LIBOR USD + 5.500%), 10/25/2049 (a)(e) | | | 1,500,000 | | | | 1,523,650 | |
Federal National Mortgage Association, Series 2019-01, Class CE,
8.858% (1 Month LIBOR USD + 8.750%), 10/25/2049 (a)(e) | | | 2,000,000 | | | | 2,153,616 | |
Federal National Mortgage Association, Series 2020-01, Class M7,
2.058% (1 Month LIBOR USD + 1.950%), 3/25/2050 (a)(e) | | | 2,339,768 | | | | 2,326,883 | |
Federal National Mortgage Association, Series 2020-01, Class M10,
3.858% (1 Month LIBOR USD + 3.750%), 3/25/2050 (a)(e) | | | 5,500,000 | | | | 5,579,316 | |
Federal National Mortgage Association, Series 2020-01, Class CE,
7.608% (1 Month LIBOR USD + 7.500%), 3/25/2050 (a)(e) | | | 8,000,000 | | | | 8,687,984 | |
| | | | | | | | |
| | |
TOTAL COMMERCIAL MORTGAGE-BACKED SECURITIES – U.S. GOVERNMENT AGENCY
(Cost – $348,458,674) | | | | | | $ | 334,574,905 | |
| | | | | | | | |
| | |
| Common Stocks – 0.47% | | Shares | | | | |
Financial – 0.47% | | | | | | | | |
Annaly Capital Management, Inc. | | | 826,922 | | | | 6,532,684 | |
Ellington Financial, Inc. | | | 250,000 | | | | 4,442,500 | |
New Residential Investment Corp. | | | 625,000 | | | | 6,656,250 | |
PennyMac Mortgage Investment Trust | | | 200,000 | | | | 3,564,000 | |
Redwood Trust, Inc. | | | 1,056,366 | | | | 13,024,992 | |
| | | | | | | | |
| | |
TOTAL COMMON STOCKS
(Cost – $35,813,473) | | | | | | $ | 34,220,426 | |
| | | | | | | | |
| | |
| Corporate Obligations – 5.12% | | Principal
Amount | | | | |
Basic Materials – 0.75% | | | | | | | | |
Big River Steel LLC / BRS Finance Corp., 6.625%, 1/31/2029 (a) | | $ | 6,240,000 | | | | 6,595,212 | |
Clearwater Paper Corp., 4.750%, 8/15/2028 (a) | | | 4,700,000 | | | | 4,695,535 | |
Copper Mountain Mining Corp., 8.000%, 4/9/2026 (a)(h) | | | 4,400,000 | | | | 4,625,720 | |
CVR Partners LP / CVR Nitrogen Finance Corp., 6.125%, 6/15/2028 (a) | | | 3,500,000 | | | | 3,561,705 | |
Mercer International, Inc., 5.500%, 1/15/2026 | | | 2,600,000 | | | | 2,622,386 | |
Mercer International, Inc., 5.125%, 2/1/2029 | | | 2,100,000 | | | | 2,074,642 | |
Methanex Corp., 5.125%, 10/15/2027 | | | 7,800,000 | | | | 7,918,950 | |
Resolute Forest Products, Inc., 4.875%, 3/1/2026 (a) | | | 1,800,000 | | | | 1,779,966 | |
Sylvamo Corp., 7.000%, 9/1/2029 (a) | | | 17,000,000 | | | | 17,499,630 | |
Taseko Mines Ltd., 7.000%, 2/15/2026 (a) | | | 3,000,000 | | | | 3,046,050 | |
| | | | | | | | |
| | |
| | | | | | | 54,419,796 | |
| | | | | | | | |
Communications – 0.21% | | | | | | | | |
Consolidated Communications, Inc., 6.500%, 10/1/2028 (a) | | | 3,900,000 | | | | 4,025,580 | |
DIRECTV Holdings LLC / DIRECTV Financing Co., Inc., 5.875%, 8/15/2027 (a) | | | 4,900,000 | | | | 4,929,890 | |
See accompanying notes which are an integral part of these financial statements.
54
Angel Oak Multi-Strategy Income Fund
Consolidated Schedule of Investments – (continued)
January 31, 2022
| | | | | | | | |
| | | Principal
Amount | | | Value | |
Corporate Obligations – (continued) | | | | | | | | |
Communications – (continued) | | | | | | | | |
Gray Escrow, Inc., 5.375%, 11/15/2031 (a) | | $ | 4,500,000 | | | $ | 4,442,197 | |
Townsquare Media, Inc., 6.875%, 2/1/2026 (a) | | | 1,600,000 | | | | 1,663,952 | |
| | | | | | | | |
| | |
| | | | | | | 15,061,619 | |
| | | | | | | | |
Consumer, Cyclical – 0.75% | | | | | | | | |
American Airlines, Inc. / AAdvantage Loyalty IP Ltd., 5.500%, 4/20/2026 (a) | | | 2,600,000 | | | | 2,658,500 | |
American Axle & Manufacturing, Inc., 5.000%, 10/1/2029 | | | 16,000,000 | | | | 14,803,840 | |
Beazer Homes USA, Inc., 5.875%, 10/15/2027 | | | 3,400,000 | | | | 3,489,675 | |
Brookfield Residential Properties, Inc. / Brookfield Residential US Corp., 6.250%, 9/15/2027 (a) | | | 1,300,000 | | | | 1,342,490 | |
Brookfield Residential Properties, Inc. / Brookfield Residential US LLC,
5.000%, 6/15/2029 (a) | | | 1,800,000 | | | | 1,779,741 | |
Century Communities, Inc., 6.750%, 6/1/2027 | | | 4,300,000 | | | | 4,478,719 | |
Delta Air Lines, Inc. / SkyMiles IP Ltd., 4.750%, 10/20/2028 (a) | | | 2,200,000 | | | | 2,350,137 | |
FirstCash, Inc., 4.625%, 9/1/2028 (a) | | | 3,900,000 | | | | 3,726,157 | |
Ford Motor Credit Co., LLC 2.900%, 2/16/2028 | | | 2,600,000 | | | | 2,479,620 | |
Goodyear Tire & Rubber Co., 5.000%, 7/15/2029 (a) | | | 2,200,000 | | | | 2,204,785 | |
Hawaiian Brand Intellectual Property Ltd. / HawaiianMiles Loyalty Ltd.,
5.750%, 1/20/2026 (a) | | | 1,300,000 | | | | 1,331,493 | |
Lithia Motors, Inc., 4.375%, 1/15/2031 (a) | | | 3,500,000 | | | | 3,525,463 | |
Spirit Loyalty Cayman Ltd. / Spirit IP Cayman Ltd., 8.000%, 9/20/2025 (a) | | | 2,040,000 | | | | 2,212,798 | |
United Airlines, Inc., 4.375%, 4/15/2026 (a) | | | 3,100,000 | | | | 3,082,547 | |
White Cap Buyer LLC, 6.875%, 10/15/2028 (a) | | | 4,800,000 | | | | 4,930,992 | |
| | | | | | | | |
| | |
| | | | | | | 54,396,957 | |
| | | | | | | | |
Consumer, Non-cyclical – 0.08% | | | | | | | | |
Mozart Debt Merger Sub, Inc., 5.250%, 10/1/2029 (a) | | | 900,000 | | | | 876,883 | |
NESCO Holdings, Inc., 5.500%, 4/15/2029 (a) | | | 1,700,000 | | | | 1,686,060 | |
Prime Security Services Borrower LLC / Prime Finance, Inc., 3.375%, 8/31/2027 (a) | | | 900,000 | | | | 836,892 | |
Rent-A-Center, Inc., 6.375%, 2/15/2029 (a) | | | 2,100,000 | | | | 2,161,163 | |
| | | | | | | | |
| | |
| | | | | | | 5,560,998 | |
| | | | | | | | |
Energy – 0.09% | | | | | | | | |
Renewable Energy Group, Inc., 5.875%, 6/1/2028 (a) | | | 2,200,000 | | | | 2,213,167 | |
SunCoke Energy, Inc., 4.875%, 6/30/2029 (a) | | | 4,500,000 | | | | 4,399,268 | |
| | | | | | | | |
| | |
| | | | | | | 6,612,435 | |
| | | | | | | | |
Financial – 3.01% | | | | | | | | |
Arbor Realty Trust, Inc., 5.750%, 4/1/2024 (a) | | | 3,000,000 | | | | 3,061,119 | |
Arbor Realty Trust, Inc., 4.500%, 3/15/2027 (a) | | | 11,500,000 | | | | 11,306,100 | |
B. Riley Financial, Inc., 6.375%, 2/28/2025 (m) | | | 7,000,000 | | | | 7,089,600 | |
Banc of California, Inc., 5.250%, 4/15/2025 | | | 4,650,000 | | | | 4,841,614 | |
Bank of Commerce Holdings, 5.416% (3 Month LIBOR USD + 5.260%), 12/10/2025 (a)(e) | | | 2,500,000 | | | | 2,500,223 | |
CenterState Bank Corp., 5.750% (SOFR + 5.617%), 6/1/2030 (e) | | | 500,000 | | | | 551,246 | |
Citadel LP, 5.375%, 1/17/2023 (a) | | | 2,000,000 | | | | 2,052,847 | |
Customers Bank, 6.125% (3 Month LIBOR USD + 3.443%), 6/26/2029 (a)(e) | | | 1,000,000 | | | | 1,081,598 | |
Empire Bancorp, Inc., 7.375%, 12/17/2025 (a) | | | 4,500,000 | | | | 4,532,616 | |
See accompanying notes which are an integral part of these financial statements.
55
Angel Oak Multi-Strategy Income Fund
Consolidated Schedule of Investments – (continued)
January 31, 2022
| | | | | | | | |
| | | Principal
Amount | | | Value | |
Corporate Obligations – (continued) | | | | | | | | |
Financial – (continued) | | | | | | | | |
Enact Holdings, Inc., 6.500%, 8/15/2025 (a) | | $ | 4,300,000 | | | $ | 4,553,850 | |
Fidelity Bank, 5.875% (3 Month LIBOR USD + 3.630%), 5/31/2030 (e) | | | 2,000,000 | | | | 2,098,428 | |
Financial Institutions, Inc., 6.000% (3 Month LIBOR USD + 3.944%), 4/15/2030 (e) | | | 2,000,000 | | | | 2,121,998 | |
First Bancshares, Inc., 6.400% (3 Month LIBOR USD + 3.390%), 5/1/2033 (e) | | | 1,000,000 | | | | 1,119,947 | |
First Charter Capital Trust, 1.893% (3 Month LIBOR USD + 1.690%), 9/15/2035 (c)(e) | | | 1,000,000 | | | | 954,359 | |
First Midwest Bancorp, Inc., 5.875%, 9/29/2026 | | | 4,285,000 | | | | 4,877,686 | |
First National of Nebraska, Inc., 4.375% (3 Month LIBOR USD + 1.600%), 10/1/2028 (a)(e) | | | 1,250,000 | | | | 1,279,254 | |
First NBC Bank Holding Co., 5.750%, 2/18/2025 (c)(j)(k) | | | 13,500,000 | | | | 1,312,200 | |
Freedom Mortgage Corp., 7.625%, 5/1/2026 (a) | | | 5,600,000 | | | | 5,355,952 | |
Georgia Banking Co., Inc., 4.125% (SOFR + 3.400%), 6/15/2031 (a)(e) | | | 4,000,000 | | | | 3,928,245 | |
Hanmi Financial Corp., 3.750% (SOFR + 3.100%), 9/1/2031 (e) | | | 3,300,000 | | | | 3,324,904 | |
HAT Holdings I LLC / HAT Holdings II LLC, 3.375%, 6/15/2026 (a) | | | 900,000 | | | | 868,419 | |
Howard Hughes Corp., 5.375%, 8/1/2028 (a) | | | 4,800,000 | | | | 4,890,984 | |
Jacksonville Bancorp, Inc., 3.953% (3 Month LIBOR USD + 3.750%), 9/15/2038 (a)(e) | | | 1,200,000 | | | | 1,201,884 | |
Kingstone Cos, Inc., 5.500%, 12/30/2022 | | | 2,000,000 | | | | 2,000,157 | |
LD Holdings Group LLC, 6.125%, 4/1/2028 (a) | | | 2,100,000 | | | | 1,875,972 | |
Luther Burbank Corp., 6.500%, 9/30/2024 (a) | | | 5,800,000 | | | | 6,079,867 | |
MGIC Investment Corp., 5.250%, 8/15/2028 | | | 5,200,000 | | | | 5,384,938 | |
Midland States Bancorp, Inc., 5.000% (SOFR + 3.610%), 9/30/2029 (e) | | | 750,000 | | | | 785,934 | |
Millennium Consolidated Holdings LLC, 7.500%, 6/30/2023 (a) | | | 1,000,000 | | | | 1,025,169 | |
MM Finished Lots Holdings LLC, 7.250%, 1/31/2024 (a) | | | 40,927 | | | | 41,236 | |
Nationstar Mortgage Holdings, Inc., 6.000%, 1/15/2027 (a) | | | 4,400,000 | | | | 4,570,016 | |
Nationstar Mortgage Holdings, Inc., 5.500%, 8/15/2028 (a) | | | 8,700,000 | | | | 8,542,487 | |
NMI Holdings, Inc., 7.375%, 6/1/2025 (a) | | | 8,307,000 | | | | 9,227,582 | |
Noah Bank, 9.000%, 4/17/2025 (c) | | | 4,500,000 | | | | 4,615,665 | |
Northern Bancorp, Inc., 4.750% (SOFR + 3.275%), 12/30/2029 (a)(e) | | | 1,000,000 | | | | 1,044,993 | |
OneMain Finance Corp., 3.500%, 1/15/2027 | | | 600,000 | | | | 572,757 | |
OneMain Finance Corp., 4.000%, 9/15/2030 | | | 1,600,000 | | | | 1,498,920 | |
Park Intermediate Holdings LLC / PK Domestic Property LLC / PK Finance, 4.875%, 5/15/2029 (a) | | | 1,800,000 | | | | 1,780,191 | |
PennyMac Financial Services, Inc., 5.375%, 10/15/2025 (a) | | | 4,800,000 | | | | 4,806,792 | |
PennyMac Financial Services, Inc., 4.250%, 2/15/2029 (a) | | | 900,000 | | | | 819,275 | |
PennyMac Financial Services, Inc., 5.750%, 9/15/2031 (a) | | | 900,000 | | | | 861,584 | |
PHH Mortgage Corp., 7.875%, 3/15/2026 (a) | | | 4,300,000 | | | | 4,370,391 | |
PRA Group, Inc., 5.000%, 10/1/2029 (a) | | | 3,600,000 | | | | 3,559,554 | |
Preferred Bank, 3.375% (SOFR + 2.780%), 6/15/2031 (e) | | | 1,500,000 | | | | 1,505,925 | |
Preferred Pass-Through Trust, 4.608% (N/A + 0.000%), 12/29/2049 (a)(l) | | | 1,000,000 | | | | 920,000 | |
Radian Group, Inc., 4.875%, 3/15/2027 | | | 6,800,000 | | | | 7,050,954 | |
Ready Capital Corp., 6.200%, 7/30/2026 (m) | | | 8,000,000 | | | | 8,192,000 | |
Ready Capital Corp., 5.750%, 2/15/2026 (m) | | | 4,500,000 | | | | 4,602,600 | |
Realogy Group LLC / Realogy Co-Issuer Corp., 5.250%, 4/15/2030 (a) | | | 4,000,000 | | | | 3,848,120 | |
Renasant Corp., 4.500% (SOFR + 4.025%), 9/15/2035 (e) | | | 4,000,000 | | | | 4,164,057 | |
Southcoast Capital, 1.632%, 9/30/2035 (c) | | | 4,000,000 | | | | 3,240,000 | |
Starwood Property Trust, Inc., 5.500%, 11/1/2023 (a) | | | 2,200,000 | | | | 2,265,890 | |
Starwood Property Trust, Inc., 4.750%, 3/15/2025 | | | 4,300,000 | | | | 4,402,598 | |
Sterling Bancorp, Inc., 6.059% (3 Month LIBOR USD + 5.820%), 4/15/2026 (a)(e) | | | 2,050,000 | | | | 2,051,051 | |
Sterling Bancorp, Inc., 4.000% (SOFR + 2.530%), 12/30/2029 (e) | | | 4,000,000 | | | | 4,120,020 | |
StoneX Group, Inc., 8.625%, 6/15/2025 (a) | | | 4,400,000 | | | | 4,671,942 | |
See accompanying notes which are an integral part of these financial statements.
56
Angel Oak Multi-Strategy Income Fund
Consolidated Schedule of Investments – (continued)
January 31, 2022
| | | | | | | | |
| | | Principal
Amount | | | Value | |
Corporate Obligations – (continued) | | | | | | | | |
Financial – (continued) | | | | | | | | |
TIAA FSB Holdings, Inc., 2.114%, 1/7/2035 (c) | | $ | 5,000,000 | | | $ | 4,825,000 | |
Trinitas Capital Management LLC, 6.000%, 7/30/2026 (a) | | | 2,000,000 | | | | 1,935,257 | |
Trinity Capital, Inc., 7.000%, 1/16/2025 (m) | | | 2,500,000 | | | | 2,618,750 | |
United Wholesale Mortgage LLC, 5.500%, 11/15/2025 (a) | | | 2,200,000 | | | | 2,134,418 | |
United Wholesale Mortgage LLC, 5.500%, 4/15/2029 (a) | | | 9,600,000 | | | | 8,804,304 | |
Western Alliance Bank, 5.250% (SOFR + 5.120%), 6/1/2030 (e) | | | 3,000,000 | | | | 3,208,259 | |
WSFS Cap Trust, 1.890%, 6/1/2035 (a)(c) | | | 4,000,000 | | | | 3,820,000 | |
Zais Group LLC, 7.000%, 11/15/2023 (a) | | | 451,200 | | | | 450,466 | |
| | | | | | | | |
| | |
| | | | | | | 217,200,164 | |
| | | | | | | | |
Industrial – 0.20% | | | | | | | | |
Brundage-Bone Concrete Pumping Holdings, Inc., 6.000%, 2/1/2026 (a) | | | 1,700,000 | | | | 1,723,095 | |
Covanta Holding Corp., 4.875%, 12/1/2029 (a) | | | 2,700,000 | | | | 2,695,423 | |
Dycom Industries, Inc., 4.500%, 4/15/2029 (a) | | | 1,100,000 | | | | 1,079,007 | |
II-VI, Inc., 5.000%, 12/15/2029 (a) | | | 400,000 | | | | 399,886 | |
Roller Bearing Co. of America, Inc., 4.375%, 10/15/2029 (a) | | | 2,200,000 | | | | 2,180,486 | |
Seaspan Corp., 5.500%, 8/1/2029 (a) | | | 1,800,000 | | | | 1,783,080 | |
Weekley Homes LLC / Weekley Finance Corp., 4.875%, 9/15/2028 (a) | | | 4,600,000 | | | | 4,531,575 | |
| | | | | | | | |
| | |
| | | | | | | 14,392,552 | |
| | | | | | | | |
Technology – 0.03% | | | | | | | | |
Seagate HDD Cayman, 3.375%, 7/15/2031 | | | 2,400,000 | | | | 2,232,420 | |
| | | | | | | | |
| | |
TOTAL CORPORATE OBLIGATIONS
(Cost – $380,700,513) | | | | | | $ | 369,876,941 | |
| | | | | | | | |
| | |
| Investment Companies – 1.71% | | Shares | | | | |
Affiliated Mutual Funds – 1.71% | | | | | | | | |
Angel Oak Core Impact Fund, Institutional Class | | | 3,985,110 | | | | 38,934,526 | |
Angel Oak Financials Income Fund, Institutional Class | | | 5,147,772 | | | | 46,021,081 | |
Angel Oak High Yield Opportunities Fund, Institutional Class | | | 3,336,241 | | | | 38,500,220 | |
| | | | | | | | |
| | |
TOTAL INVESTMENT COMPANIES
(Cost – $126,552,243) | | | | | | $ | 123,455,827 | |
| | | | | | | | |
| | |
Preferred Stocks – 0.27% | | | | | | | | |
Financial – 0.06% | | | | | | | | |
Morgan Stanley, 4.000% (3 Month LIBOR USD + 0.700%) (e) | | | 130,497 | | | | 3,104,524 | |
TriState Capital Holdings, Inc., 6.375% (3 Month LIBOR USD + 4.088%) (e) | | | 40,000 | | | | 1,042,000 | |
| | | | | | | | |
| | |
| | | | | | | 4,146,524 | |
| | | | | | | | |
Real Estate Investment Trust – 0.21% | | | | | | | | |
AGNC Investment Corp., 6.500% (3 Month LIBOR USD + 4.993%) (e) | | | 129,224 | | | | 3,247,399 | |
Dynex Capital, Inc., 6.900% (3 Month LIBOR USD + 5.461%) (e) | | | 320,000 | | | | 8,064,000 | |
MFA Financial, Inc., 6.500% (3 Month LIBOR USD + 5.345%) (e) | | | 168,900 | | | | 3,888,078 | |
| | | | | | | | |
| | |
| | | | | | | 15,199,477 | |
| | | | | | | | |
| | |
TOTAL PREFERRED STOCKS
(Cost – $18,688,937) | | | | | | $ | 19,346,001 | |
| | | | | | | | |
See accompanying notes which are an integral part of these financial statements.
57
Angel Oak Multi-Strategy Income Fund
Consolidated Schedule of Investments – (continued)
January 31, 2022
| | | | | | | | |
| | | Principal
Amount | | | Value | |
Residential Mortgage-Backed Securities – 68.05% | | | | | | | | |
Accredited Mortgage Loan Trust, Series 2005-4, Class M1,
0.508% (1 Month LIBOR USD + 0.400%), 12/25/2035 (e) | | $ | 362,391 | | | $ | 362,306 | |
Adjustable Rate Mortgage Trust, Series 2005-3, Class 7A1, 2.653%, 7/25/2035 (g) | | | 394,975 | | | | 399,001 | |
Adjustable Rate Mortgage Trust, Series 2005-11, Class 2A3, 3.039%, 2/25/2036 (g) | | | 6,965,949 | | | | 6,164,816 | |
Adjustable Rate Mortgage Trust, Series 2005-12, Class 2A1, 2.894%, 3/25/2036 (g) | | | 1,712,473 | | | | 1,599,931 | |
Adjustable Rate Mortgage Trust, Series 2006-1, Class 2A1, 3.449%, 3/25/2036 (g) | | | 827,051 | | | | 671,377 | |
Adjustable Rate Mortgage Trust, Series 2006-3, Class 4A11,
0.468% (1 Month LIBOR USD + 0.360%), 8/25/2036 (e) | | | 1,573,953 | | | | 984,706 | |
Adjustable Rate Mortgage Trust, Series 2007-1, Class 3A22, 3.336%, 3/25/2037 (g) | | | 367,806 | | | | 371,977 | |
Adjustable Rate Mortgage Trust, Series 2007-1, Class 2A1, 3.645%, 3/25/2037 (g) | | | 3,503,926 | | | | 3,350,889 | |
Adjustable Rate Mortgage Trust, Series 2007-2, Class 1A1, 3.772%, 6/25/2037 (g) | | | 1,880,978 | | | | 1,881,644 | |
Adjustable Rate Mortgage Trust, Series 2007-2, Class 1A21, 3.772%, 6/25/2037 (g) | | | 1,988,800 | | | | 1,856,790 | |
Agate Bay Mortgage Trust, Series 2015-4, Class B4, 3.541%, 6/25/2045 (a)(g) | | | 2,018,000 | | | | 2,049,005 | |
American Home Mortgage Assets Trust, Series 2007-3, Class 22A1, 6.750%, 6/25/2037 (n) | | | 339,395 | | | | 341,337 | |
American Home Mortgage Assets Trust, Series 2006-1, Class 2A1,
0.298% (1 Month LIBOR USD + 0.190%), 5/25/2046 (e)(i) | | | 23,100,576 | | | | 21,410,192 | |
American Home Mortgage Assets Trust, Series 2006-1, Class 1A2,
0.298% (1 Month LIBOR USD + 0.190%), 5/25/2046 (e) | | | 1,850,585 | | | | 1,782,761 | |
American Home Mortgage Assets Trust, Series 2006-1, Class XC,
2.834%, 5/25/2046 (c)(f)(g) | | | 19,543,775 | | | | 2,175,300 | |
American Home Mortgage Assets Trust, Series 2006-2, Class 1A1,
1.047% (12 Month US Treasury Average + 0.960%), 9/25/2046 (e) | | | 1,186,646 | | | | 1,173,644 | |
American Home Mortgage Assets Trust, Series 2006-6, Class XP,
2.424%, 12/25/2046 (c)(f)(g) | | | 69,158,606 | | | | 6,084,436 | |
American Home Mortgage Assets Trust, Series 2007-1, Class A1,
0.787% (12 Month US Treasury Average + 0.700%), 2/25/2047 (e)(i) | | | 51,948,167 | | | | 30,206,924 | |
American Home Mortgage Assets Trust, Series 2007-5, Class XP, 2.733%, 6/25/2047 (c)(f) | | | 19,939,967 | | | | 1,569,136 | |
American Home Mortgage Investment Trust, Series 2005-2, Class 5A4A,
5.883%, 9/25/2035 (n) | | | 4,497,015 | | | | 3,484,098 | |
American Home Mortgage Investment Trust, Series 2006-3, Class 22A1,
2.095% (6 Month LIBOR USD + 1.750%), 12/25/2036 (e) | | | 4,383,237 | | | | 4,061,735 | |
American Home Mortgage Investment Trust, Series 2006-3, Class 3A2, 6.750%, 12/25/2036 (n) | | | 6,305,532 | | | | 2,890,853 | |
American Home Mortgage Investment Trust, Series 2007-A, Class 13A1,
6.600%, 1/25/2037 (a)(n) | | | 2,238,217 | | | | 966,831 | |
American Home Mortgage Investment Trust, Series 2005-2, Class 1A1,
0.689% (1 Month LIBOR USD + 0.600%), 9/25/2045 (e) | | | 6,561,587 | | | | 6,314,162 | |
American Home Mortgage Investment Trust, Series 2005-2, Class 2A1,
3.232% (1 Month LIBOR USD + 3.140%), 9/25/2045 (e) | | | 492,545 | | | | 474,447 | |
American Home Mortgage Investment Trust, Series 2007-2, Class 11A1,
0.568% (1 Month LIBOR USD + 0.460%), 3/25/2047 (e) | | | 4,156,102 | | | | 2,115,252 | |
American Home Mortgage Investment Trust, Series 2007-1, Class GA1A,
0.268% (1 Month LIBOR USD + 0.160%), 5/25/2047 (e)(i) | | | 20,420,373 | | | | 15,693,751 | |
American Home Mortgage Investment Trust, Series 2007-1, Class GA1C,
0.298% (1 Month LIBOR USD + 0.190%), 5/25/2047 (e)(i) | | | 11,887,698 | | | | 6,876,938 | |
Banc of America Funding Trust, Series 2009-R14, Class 2A,
14.819% (-2 x 1 Month LIBOR USD + 15.013%), 7/26/2035 (a)(e)(o) | | | 344,930 | | | | 400,305 | |
Banc of America Funding Trust, Series 2015-R8, Class 3A2, 3.071%, 8/28/2035 (a)(g) | | | 1,864,081 | | | | 1,789,429 | |
Banc of America Funding Trust, Series 2007-8, Class 2A1, 7.000%, 10/25/2037 | | | 4,221,889 | | | | 3,507,663 | |
See accompanying notes which are an integral part of these financial statements.
58
Angel Oak Multi-Strategy Income Fund
Consolidated Schedule of Investments – (continued)
January 31, 2022
| | | | | | | | |
| | | Principal
Amount | | | Value | |
Residential Mortgage-Backed Securities – (continued) | | | | | | | | |
Bank of America Alternative Loan Trust, Series 2005-10, Class 1CB4, 5.500%, 11/25/2035 | | $ | 402,559 | | | $ | 401,594 | |
Bank of America Alternative Loan Trust, Series 2006-7, Class A2, 5.707%, 10/25/2036 (g) | | | 3,681,502 | | | | 2,012,305 | |
Bank of America Alternative Loan Trust, Series 2006-7, Class A6, 6.359%, 10/25/2036 (n) | | | 4,036,279 | | | | 2,197,576 | |
Bank of America Alternative Loan Trust, Series 2006-7, Class A4, 6.498%, 10/25/2036 (n) | | | 10,833,031 | | | | 5,614,663 | |
Bank of America Alternative Loan Trust, Series 2006-9, Class 30PO, 0.000%, 1/25/2037 (d) | | | 177,902 | | | | 102,484 | |
Bank of America Alternative Loan Trust, Series 2007-1, Class 3A16,
0.708% (1 Month LIBOR USD + 0.600%), 4/25/2037 (e) | | | 2,588,423 | | | | 1,838,948 | |
Bank of America Funding Trust, Series 2005-F, Class 4A1, 2.579%, 9/20/2035 (g) | | | 1,981,867 | | | | 1,855,864 | |
Bank of America Funding Trust, Series 2007-C, Class 4A2, 2.924%, 5/20/2036 (g) | | | 868,661 | | | | 883,198 | |
Bank of America Funding Trust, Series 2006-H, Class 6A1,
0.484% (1 Month LIBOR USD + 0.380%), 10/20/2036 (e) | | | 7,794,939 | | | | 6,946,904 | |
Bank of America Funding Trust, Series 2007-2, Class 1A16,
0.708% (1 Month LIBOR USD + 0.600%), 3/25/2037 (e) | | | 2,665,892 | | | | 1,950,745 | |
Bank of America Funding Trust, Series 2014-R1, Class A2,
0.402% (1 Month LIBOR USD + 0.150%), 6/26/2037 (a)(e) | | | 4,970,454 | | | | 4,423,704 | |
Bank of America Funding Trust, Series 2007-A, Class 2A1,
0.424% (1 Month LIBOR USD + 0.320%), 2/20/2047 (e) | | | 2,087,376 | | | | 1,961,042 | |
Bank of America Funding Trust, Series 2007-A, Class 2A5,
0.564% (1 Month LIBOR USD + 0.460%), 2/20/2047 (e) | | | 1,284,157 | | | | 1,183,909 | |
Bank of America Funding Trust, Series 2007-B, Class A1,
0.524% (1 Month LIBOR USD + 0.420%), 4/20/2047 (e) | | | 3,344,820 | | | | 2,975,762 | |
Bank of America Funding Trust, Series 2007-C, Class 7A4,
0.544% (1 Month LIBOR USD + 0.440%), 5/20/2047 (e) | | | 2,471,129 | | | | 2,366,494 | |
Bank of America Mortgage Trust, Series 2007-1, Class 1A4, 6.000%, 3/25/2037 | | | 987,822 | | | | 939,761 | |
Bayview Financial Mortgage Pass-Through Trust, Series 2005-D, Class APO, 0.000%, 12/28/2035 (d) | | | 395,495 | | | | 350,260 | |
BCAP LLC Trust, Series 2012-RR1, Class 3A4, 5.500%, 10/26/2035 (a)(g) | | | 1,713,388 | | | | 1,627,427 | |
BCAP LLC Trust, Series 2010-RR6, Class 1410, 3.638%, 12/27/2035 (a)(g) | | | 5,500,865 | | | | 4,645,150 | |
BCAP LLC Trust, Series 2012-RR4, Class 4A7,
0.382% (1 Month LIBOR USD + 0.280%), 2/26/2036 (a)(e) | | | 2,294,714 | | | | 1,570,351 | |
BCAP LLC Trust, Series 2010-RR7, Class 9A12, 2.017%, 5/28/2036 (a)(g) | | | 1,474,010 | | | | 1,448,837 | |
BCAP LLC Trust, Series 2013-RR1, Class 6A2, 2.917%, 5/28/2036 (a)(g) | | | 3,358,958 | | | | 2,779,686 | |
BCAP LLC Trust, Series 2012-RR11, Class 1A2, 0.272%, 1/27/2037 (a)(g) | | | 1,141,421 | | | | 1,058,426 | |
BCAP LLC Trust, Series 2010-RR9, Class 7A2, 2.654%, 1/28/2037 (a)(g) | | | 6,741,759 | | | | 6,465,832 | |
BCAP LLC Trust, Series 2007-AA3, Class 1A1A,
0.528% (1 Month LIBOR USD + 0.420%), 4/25/2037 (e) | | | 1,280,291 | | | | 1,173,293 | |
BCAP LLC Trust, Series 2008-IND1, Class A1,
1.308% (1 Month LIBOR USD + 1.200%), 10/25/2047 (e)(i) | | | 22,471,568 | | | | 21,647,356 | |
Bear Stearns Adjustable Rate Mortgage Trust, Series 2005-6, Class 1A1,
2.446%, 8/25/2035 (g) | | | 2,205,495 | | | | 2,031,885 | |
Bear Stearns Adjustable Rate Mortgage Trust, Series 2006-2, Class 3A1,
3.003%, 7/25/2036 (g) | | | 437,311 | | | | 429,468 | |
Bear Stearns ALT-A Trust, Series 2004-5, Class 4A1, 2.798%, 6/25/2034 (g) | | | 525,299 | | | | 534,955 | |
Bear Stearns ALT-A Trust, Series 2005-5, Class 21A1, 2.964%, 7/25/2035 (g) | | | 471,743 | | | | 474,432 | |
Bear Stearns ALT-A Trust, Series 2005-7, Class 21A1, 2.627%, 9/25/2035 (g) | | | 3,118,248 | | | | 2,955,453 | |
Bear Stearns ALT-A Trust, Series 2005-7, Class 22A1, 2.876%, 9/25/2035 (g)(i) | | | 15,340,763 | | | | 11,793,211 | |
Bear Stearns Asset Backed Securities Trust, Series 2005-AC5, Class 1A2,
1.108% (1 Month LIBOR USD + 1.000%), 8/25/2035 (e) | | | 1,646,366 | | | | 1,310,300 | |
See accompanying notes which are an integral part of these financial statements.
59
Angel Oak Multi-Strategy Income Fund
Consolidated Schedule of Investments – (continued)
January 31, 2022
| | | | | | | | |
| | | Principal
Amount | | | Value | |
Residential Mortgage-Backed Securities – (continued) | | | | | | | | |
Bear Stearns Asset Backed Securities Trust, Series 2007-SD3, Class A,
0.608% (1 Month LIBOR USD + 0.500%), 5/25/2037 (e) | | $ | 28,471 | | | $ | 27,140 | |
Bear Stearns Asset Backed Securities Trust, Series 2007-AC6, Class A1,
6.500%, 10/25/2037 | | | 2,346,376 | | | | 1,704,431 | |
Bear Stearns Mortgage Funding Trust, Series 2006-AR1, Class 1A1,
0.318% (1 Month LIBOR USD + 0.210%), 7/25/2036 (e) | | | 554,014 | | | | 534,262 | |
Bear Stearns Mortgage Funding Trust, Series 2006-AR3, Class 1A1,
0.288% (1 Month LIBOR USD + 0.180%), 10/25/2036 (e)(i) | | | 18,628,331 | | | | 17,565,827 | |
Bear Stearns Mortgage Funding Trust, Series 2007-AR1, Class 1A1,
0.268% (1 Month LIBOR USD + 0.160%), 1/25/2037 (e) | | | 4,282,210 | | | | 4,016,015 | |
Bellemeade Re Ltd., Series 2018-1A, Class M2,
3.008% (1 Month LIBOR USD + 2.900%), 4/25/2028 (a)(e) | | | 13,000,000 | | | | 13,026,572 | |
Bellemeade Re Ltd., Series 2018-3A, Class M2,
2.858% (1 Month LIBOR USD + 2.750%), 10/25/2028 (a)(e) | | | 28,196,741 | | | | 28,299,997 | |
Bellemeade Re Ltd., Series 2019-2A, Class M2,
3.208% (1 Month LIBOR USD + 3.100%), 4/25/2029 (a)(e) | | | 22,150,000 | | | | 22,205,596 | |
Bellemeade Re Ltd., Series 2019-2A, Class B1,
4.208% (1 Month LIBOR USD + 4.100%), 4/25/2029 (a)(e) | | | 9,180,000 | | | | 9,318,673 | |
Bellemeade Re Ltd., Series 2019-4A, Class M1C,
2.608% (1 Month LIBOR USD + 2.500%), 10/25/2029 (a)(e) | | | 13,499,500 | | | | 13,484,151 | |
Bellemeade Re Ltd., Series 2020-4A, Class M2B,
3.708% (1 Month LIBOR USD + 3.600%), 6/25/2030 (a)(e) | | | 2,836,822 | | | | 2,847,599 | |
Bellemeade Re Ltd., Series 2020-4A, Class B1,
5.108% (1 Month LIBOR USD + 5.000%), 6/25/2030 (a)(e) | | | 2,500,000 | | | | 2,506,395 | |
Bellemeade Re Ltd., Series 2020-2A, Class M1C,
4.108% (1 Month LIBOR USD + 4.000%), 8/26/2030 (a)(e) | | | 3,219,989 | | | | 3,244,532 | |
Bellemeade Re Ltd., Series 2021-1A, Class M2,
4.900% (SOFR30A + 4.850%), 3/25/2031 (a)(e) | | | 5,750,000 | | | | 6,124,929 | |
Bellemeade Re Ltd., Series 2021-2A, Class M2,
2.950% (SOFR30A + 2.900%), 6/25/2031 (a)(e) | | | 13,250,000 | | | | 12,984,748 | |
Bellemeade Re Ltd., Series 2022-1, Class M1C,
3.700% (SOFR30A + 3.700%), 1/26/2032 (a)(e) | | | 1,750,000 | | | | 1,763,702 | |
Bellemeade Re Ltd., Series 2022-1, Class M2,
4.600% (SOFR30A + 4.600%), 1/26/2032 (a)(e) | | | 3,750,000 | | | | 3,779,021 | |
BNC Mortgage Loan Trust, Series 2006-2, Class A5,
0.728% (1 Month LIBOR USD + 0.620%), 11/25/2036 (e)(i) | | | 33,000,000 | | | | 21,815,541 | |
Boston Lending Trust, Series 2021-1, Class A, 2.000%, 7/25/2061 (a)(g) | | | 4,596,678 | | | | 4,567,747 | |
BRAVO Residential Funding Trust, Series 2019-NQM1, Class M1, 2.997%, 7/25/2059 (a)(g) | | | 5,025,000 | | | | 5,047,959 | |
BRAVO Residential Funding Trust, Series 2019-NQM1, Class B1, 4.006%, 7/25/2059 (a)(g) | | | 4,782,000 | | | | 4,801,042 | |
BRAVO Residential Funding Trust, Series 2019-NQM1, Class B2, 5.689%, 7/25/2059 (a)(g) | | | 1,500,000 | | | | 1,512,454 | |
BRAVO Residential Funding Trust, Series 2019-NQM2, Class B2, 4.797%, 11/25/2059 (a)(g) | | | 3,000,000 | | | | 3,006,657 | |
BRAVO Residential Funding Trust, Series 2021-NQM3, Class A2, 1.853%, 4/25/2060 (a)(g) | | | 4,232,661 | | | | 4,232,365 | |
Cascade MH Asset Trust, Series 2021-MH1, Class B3, 7.595%, 2/25/2046 (a)(g) | | | 3,000,000 | | | | 2,752,326 | |
Chase Mortgage Finance Corp., Series 2021-CL1, Class M2,
1.400% (SOFR30A + 1.350%), 2/25/2050 (a)(e) | | | 2,475,985 | | | | 2,494,738 | |
Chase Mortgage Finance Corp., Series 2021-CL1, Class M3,
1.600% (SOFR30A + 1.550%), 2/25/2050 (a)(e) | | | 2,935,918 | | | | 2,958,164 | |
Chase Mortgage Finance Corp., Series 2021-CL1, Class M4,
2.700% (SOFR30A + 2.650%), 2/25/2050 (a)(e) | | | 3,037,208 | | | | 3,060,227 | |
See accompanying notes which are an integral part of these financial statements.
60
Angel Oak Multi-Strategy Income Fund
Consolidated Schedule of Investments – (continued)
January 31, 2022
| | | | | | | | |
| | | Principal
Amount | | | Value | |
Residential Mortgage-Backed Securities – (continued) | | | | | | | | |
Chase Mortgage Finance Corp., Series 2021-CL1, Class M5,
3.300% (SOFR30A + 3.250%), 2/25/2050 (a)(e) | | $ | 1,214,733 | | | $ | 1,223,941 | |
Chase Mortgage Finance Corp., Series 2021-CL1, Class B,
6.550% (SOFR30A + 6.500%), 2/25/2050 (a)(e) | | | 2,159,000 | | | | 2,175,367 | |
Chase Mortgage Finance Trust, Series 2006-A1, Class 2A2, 2.847%, 9/25/2036 (g) | | | 1,134,479 | | | | 1,068,628 | |
Chase Mortgage Finance Trust, Series 2006-S2, Class 2A6, 6.000%, 10/25/2036 | | | 797,674 | | | | 499,564 | |
Chase Mortgage Finance Trust, Series 2007-S2, Class 1A9, 6.000%, 3/25/2037 | | | 2,139,088 | | | | 1,454,313 | |
ChaseFlex Trust, Series 2005-2, Class 5A6, 5.000%, 6/25/2035 | | | 1,590,461 | | | | 1,333,802 | |
ChaseFlex Trust, Series 2007-1, Class 2A10,
0.608% (1 Month LIBOR USD + 0.500%), 2/25/2037 (e) | | | 2,392,443 | | | | 996,443 | |
ChaseFlex Trust, Series 2007-1, Class 2A6, 6.000%, 2/25/2037 | | | 1,660,395 | | | | 1,305,707 | |
ChaseFlex Trust, Series 2007-2, Class A1,
0.388% (1 Month LIBOR USD + 0.280%), 5/25/2037 (e) | | | 3,493,779 | | | | 3,356,644 | |
Chevy Chase Funding LLC Mortgage-Backed Certificates, Series 2004-2A, Class A2,
0.428% (1 Month LIBOR USD + 0.320%), 5/25/2035 (a)(e) | | | 2,475,662 | | | | 2,489,791 | |
Chevy Chase Funding LLC Mortgage-Backed Certificates, Series 2004-3A, Class A1,
0.358% (1 Month LIBOR USD + 0.250%), 8/27/2035 (a)(e) | | | 1,818,981 | | | | 1,875,490 | |
Chevy Chase Funding LLC Mortgage-Backed Certificates, Series 2004-4A, Class A2,
0.688% (1 Month LIBOR USD + 0.580%), 10/25/2035 (a)(e) | | | 3,423,867 | | | | 3,647,120 | |
Chevy Chase Funding LLC Mortgage-Backed Certificates, Series 2005-1A, Class A1,
0.258% (1 Month LIBOR USD + 0.150%), 1/25/2036 (a)(e) | | | 2,570,879 | | | | 2,455,413 | |
Chevy Chase Funding LLC Mortgage-Backed Certificates, Series 2005-1A, Class A2,
0.308% (1 Month LIBOR USD + 0.200%), 1/25/2036 (a)(e) | | | 2,867,094 | | | | 2,724,101 | |
Chevy Chase Funding LLC Mortgage-Backed Certificates, Series 2005-AA, Class A1,
0.308% (1 Month LIBOR USD + 0.200%), 1/25/2036 (a)(e) | | | 1,609,156 | | | | 1,590,608 | |
Chevy Chase Funding LLC Mortgage-Backed Certificates, Series 2005-2A, Class A1,
0.288% (1 Month LIBOR USD + 0.180%), 5/25/2036 (a)(e) | | | 3,136,364 | | | | 2,985,749 | |
Chevy Chase Funding LLC Mortgage-Backed Certificates, Series 2005-3A, Class A2,
0.338% (1 Month LIBOR USD + 0.230%), 7/25/2036 (a)(e) | | | 4,335,093 | | | | 4,374,443 | |
Chevy Chase Funding LLC Mortgage-Backed Certificates, Series 2005-4A, Class NIO,
0.414%, 4/25/2037 (a)(c)(f)(g) | | | 22,047,488 | | | | 326,722 | |
Chevy Chase Funding LLC Mortgage-Backed Certificates, Series 2005-CA, Class A1,
0.318% (1 Month LIBOR USD + 0.210%), 10/25/2046 (a)(e) | | | 635,250 | | | | 660,641 | |
Chevy Chase Funding LLC Mortgage-Backed Certificates, Series 2006-1A, Class A1,
0.258% (1 Month LIBOR USD + 0.150%), 12/25/2046 (a)(e) | | | 3,725,998 | | | | 3,822,393 | |
Chevy Chase Funding LLC Mortgage-Backed Certificates, Series 2006-2A, Class A1,
0.238% (1 Month LIBOR USD + 0.130%), 4/25/2047 (a)(e) | | | 10,387,402 | | | | 10,268,384 | |
Chevy Chase Funding LLC Mortgage-Backed Certificates, Series 2006-2A, Class A2,
0.288% (1 Month LIBOR USD + 0.180%), 4/25/2047 (a)(e) | | | 5,254,568 | | | | 4,763,166 | |
Chevy Chase Funding LLC Mortgage-Backed Certificates, Series 2006-4A, Class A1,
0.238% (1 Month LIBOR USD + 0.130%), 11/25/2047 (a)(e) | | | 1,038,676 | | | | 997,155 | |
Chevy Chase Funding LLC Mortgage-Backed Certificates, Series 2006-4A, Class A2,
0.288% (1 Month LIBOR USD + 0.180%), 11/25/2047 (a)(e) | | | 4,410,458 | | | | 3,776,459 | |
Chevy Chase Funding LLC Mortgage-Backed Certificates, Series 2007-1A, Class A1,
0.238% (1 Month LIBOR USD + 0.130%), 2/25/2048 (a)(e)(i) | | | 8,813,603 | | | | 8,844,839 | |
CIM Trust, Series 2019-J1, Class B5, 3.975%, 8/25/2049 (a)(g) | | | 613,000 | | | | 569,206 | |
CIM Trust, Series 2021-J1, Class B4, 2.659%, 3/25/2051 (a)(g) | | | 1,385,491 | | | | 1,032,425 | |
CIM Trust, Series 2021-J1, Class B6, 2.659%, 3/25/2051 (a)(g) | | | 1,416,978 | | | | 507,297 | |
CIM Trust, Series 2021-J1, Class B5, 2.659%, 3/25/2051 (a)(g) | | | 810,000 | | | | 487,813 | |
See accompanying notes which are an integral part of these financial statements.
61
Angel Oak Multi-Strategy Income Fund
Consolidated Schedule of Investments – (continued)
January 31, 2022
| | | | | | | | |
| | | Principal
Amount | | | Value | |
Residential Mortgage-Backed Securities – (continued) | | | | | | | | |
CIM Trust, Series 2021-J2, Class B6, 2.675%, 4/25/2051 (a)(g) | | $ | 1,438,139 | | | $ | 534,913 | |
CIM Trust, Series 2021-J2, Class B4, 2.675%, 4/25/2051 (a)(g) | | | 1,643,912 | | | | 1,273,770 | |
CIM Trust, Series 2021-J2, Class B5, 2.675%, 4/25/2051 (a)(g) | | | 718,000 | | | | 444,168 | |
CIM Trust, Series 2021-J3, Class B5, 2.621%, 6/25/2051 (a)(g) | | | 481,000 | | | | 270,010 | |
CIM Trust, Series 2021-J3, Class B6, 2.621%, 6/25/2051 (a)(g) | | | 800,773 | | | | 277,654 | |
CIM Trust, Series 2021-J3, Class B4, 2.621%, 6/25/2051 (a)(g) | | | 1,281,000 | | | | 857,590 | |
Citicorp Mortgage Securities, Inc., Series 2005-2, Class 1APO, 0.000%, 3/25/2035 (d) | | | 36,525 | | | | 24,339 | |
Citigroup Mortgage Loan Trust, Series 2005-12, Class 2A1,
0.908% (1 Month LIBOR USD + 0.800%), 8/25/2035 (a)(e) | | | 2,153,889 | | | | 1,967,536 | |
Citigroup Mortgage Loan Trust, Series 2005-3, Class 2A2, 2.770%, 8/25/2035 (g) | | | 388,839 | | | | 389,769 | |
Citigroup Mortgage Loan Trust, Series 2005-7, Class 2A2A, 2.619%, 11/25/2035 (g) | | | 1,812,316 | | | | 1,569,729 | |
Citigroup Mortgage Loan Trust, Series 2006-4, Class 2A1A, 6.000%, 12/25/2035 | | | 509,887 | | | | 520,072 | |
Citigroup Mortgage Loan Trust, Series 2007-AR1, Class A2,
0.428% (1 Month LIBOR USD + 0.320%), 1/25/2037 (e) | | | 3,485,094 | | | | 3,333,367 | |
Citigroup Mortgage Loan Trust, Series 2007-6, Class 1A2A, 2.946%, 3/25/2037 (g) | | | 3,162,712 | | | | 2,743,833 | |
Citigroup Mortgage Loan Trust, Series 2019-IMC1, Class B1, 3.970%, 7/25/2049 (a)(g) | | | 3,000,000 | | | | 2,998,704 | |
Citigroup Mortgage Loan Trust, Series 2019-E, Class A2, 4.875%, 11/25/2070 (a)(n) | | | 10,982,000 | | | | 11,133,563 | |
Citigroup Mortgage Loan Trust, Inc., Series 2005-9, Class 22A3, 6.000%, 10/25/2035 | | | 1,390,866 | | | | 1,225,880 | |
CitiMortgage Alternative Loan Trust, Series 2006-A4, Class 1A5,
0.758% (1 Month LIBOR USD + 0.650%), 9/25/2036 (e) | | | 1,863,917 | | | | 1,423,912 | |
CitiMortgage Alternative Loan Trust, Series 2006-A4, Class 1A3, 6.000%, 9/25/2036 | | | 3,482,572 | | | | 3,420,541 | |
CitiMortgage Alternative Loan Trust, Series 2006-A6, Class 1APO, 0.000%, 11/25/2036 (d) | | | 77,614 | | | | 41,593 | |
CitiMortgage Alternative Loan Trust, Series 2006-A7, Class 1A9,
0.758% (1 Month LIBOR USD + 0.650%), 12/25/2036 (e) | | | 4,910,902 | | | | 3,799,098 | |
CitiMortgage Alternative Loan Trust, Series 2006-A7, Class 1A1, 6.000%, 12/25/2036 (g) | | | 2,555,987 | | | | 2,515,763 | |
CitiMortgage Alternative Loan Trust, Series 2007-A3, Class APO, 0.000%, 3/25/2037 (d) | | | 137,689 | | | | 69,780 | |
CitiMortgage Alternative Loan Trust, Series 2007-A3, Class 1A2,
0.708% (1 Month LIBOR USD + 0.600%), 3/25/2037 (e) | | | 2,810,476 | | | | 2,185,184 | |
CitiMortgage Alternative Loan Trust, Series 2007-A4, Class APO, 0.000%, 4/25/2037 (d) | | | 132,871 | | | | 69,552 | |
CitiMortgage Alternative Loan Trust, Series 2007-A4, Class 1A9,
0.708% (1 Month LIBOR USD + 0.600%), 4/25/2037 (e) | | | 1,774,134 | | | | 1,447,560 | |
CitiMortgage Alternative Loan Trust, Series 2007-A5, Class 1A3,
0.608% (1 Month LIBOR USD + 0.500%), 5/25/2037 (e) | | | 4,726,839 | | | | 3,849,580 | |
CitiMortgage Alternative Loan Trust, Series 2007-A6, Class 1A1,
0.708% (1 Month LIBOR USD + 0.600%), 6/25/2037 (e) | | | 1,937,919 | | | | 1,575,770 | |
COLT Mortgage Loan Trust, Series 2020-2R, Class B1, 4.118%, 10/26/2065 (a)(g) | | | 3,605,000 | | | | 3,619,853 | |
CountryWide Alternative Loan Trust, Series 2004-32CB, Class 2A2,
0.508% (1 Month LIBOR USD + 0.400%), 2/25/2035 (e) | | | 746,389 | | | | 661,602 | |
CountryWide Alternative Loan Trust, Series 2005-3CB, Class 1A4, 5.250%, 3/25/2035 | | | 422,215 | | | | 410,948 | |
CountryWide Alternative Loan Trust, Series 2005-14, Class 2X, 2.185%, 5/25/2035 (c)(f)(g) | | | 23,160,355 | | | | 1,516,378 | |
CountryWide Alternative Loan Trust, Series 2005-16, Class X2, 2.312%, 6/25/2035 (c)(f)(g) | | | 20,377,633 | | | | 1,210,676 | |
CountryWide Alternative Loan Trust, Series 2005-24, Class 4A1,
0.564% (1 Month LIBOR USD + 0.460%), 7/20/2035 (e) | | | 4,456,194 | | | | 4,366,740 | |
CountryWide Alternative Loan Trust, Series 2005-24, Class 2A1A,
1.397% (12 Month US Treasury Average + 1.310%), 7/20/2035 (e) | | | 544,325 | | | | 509,458 | |
CountryWide Alternative Loan Trust, Series 2005-24, Class 1AX, 1.503%, 7/20/2035 (c)(f)(g) | | | 11,832,343 | | | | 359,135 | |
CountryWide Alternative Loan Trust, Series 2005-26CB, Class A7,
0.408% (1 Month LIBOR USD + 0.300%), 7/25/2035 (e)(i) | | | 5,067,134 | | | | 3,973,581 | |
CountryWide Alternative Loan Trust, Series 2005-27, Class 2X1, 1.454%, 8/25/2035 (c)(f)(g) | | | 25,865,759 | | | | 944,540 | |
See accompanying notes which are an integral part of these financial statements.
62
Angel Oak Multi-Strategy Income Fund
Consolidated Schedule of Investments – (continued)
January 31, 2022
| | | | | | | | |
| | | Principal
Amount | | | Value | |
Residential Mortgage-Backed Securities – (continued) | | | | | | | | |
CountryWide Alternative Loan Trust, Series 2005-27, Class 1A4, 1.994%, 8/25/2035 (g) | | $ | 654,892 | | | $ | 578,476 | |
CountryWide Alternative Loan Trust, Series 2005-27, Class 1A5, 2.084%, 8/25/2035 (g) | | | 548,640 | | | | 547,955 | |
CountryWide Alternative Loan Trust, Series 2005-J9, Class 1A6, 5.500%, 8/25/2035 | | | 699,031 | | | | 583,862 | |
CountryWide Alternative Loan Trust, Series 2005-41, Class 1A1,
0.768% (1 Month LIBOR USD + 0.660%), 9/25/2035 (e) | | | 440,296 | | | | 335,321 | |
CountryWide Alternative Loan Trust, Series 2005-38, Class X, 1.993%, 9/25/2035 (c)(f)(g) | | | 55,057,143 | | | | 2,633,989 | |
CountryWide Alternative Loan Trust, Series 2005-41, Class 2X2, 2.559%, 9/25/2035 (c)(f)(g) | | | 3,993,890 | | | | 376,288 | |
CountryWide Alternative Loan Trust, Series 2005-42CB, Class A4,
0.788% (1 Month LIBOR USD + 0.680%), 10/25/2035 (e) | | | 1,270,153 | | | | 843,229 | |
CountryWide Alternative Loan Trust, Series 2005-44, Class 1X, 2.338%, 10/25/2035 (c)(f)(g) | | | 21,307,000 | | | | 1,451,433 | |
CountryWide Alternative Loan Trust, Series 2005-51, Class 3X2, 2.243%, 11/20/2035 (c)(f)(g) | | | 14,664,964 | | | | 951,844 | |
CountryWide Alternative Loan Trust, Series 2005-51, Class 4X, 2.326%, 11/20/2035 (c)(f)(g) | | | 18,724,788 | | | | 1,185,279 | |
CountryWide Alternative Loan Trust, Series 2005-51, Class 1X, 2.536%, 11/20/2035 (c)(f)(g) | | | 20,661,378 | | | | 1,722,105 | |
CountryWide Alternative Loan Trust, Series 2005-J11, Class 1A4,
0.508% (1 Month LIBOR USD + 0.400%), 11/25/2035 (e) | | | 2,893,977 | | | | 1,848,126 | |
CountryWide Alternative Loan Trust, Series 2005-56, Class 3A1,
0.688% (1 Month LIBOR USD + 0.580%), 11/25/2035 (e) | | | 77,739 | | | | 78,349 | |
CountryWide Alternative Loan Trust, Series 2005-56, Class 4X, 2.027%, 11/25/2035 (c)(f)(g) | | | 25,579,276 | | | | 1,594,638 | |
CountryWide Alternative Loan Trust, Series 2005-61, Class 1A1,
0.628% (1 Month LIBOR USD + 0.520%), 12/25/2035 (e) | | | 1,425,901 | | | | 1,392,954 | |
CountryWide Alternative Loan Trust, Series 2005-70CB, Class A4, 5.500%, 12/25/2035 | | | 3,970,525 | | | | 3,613,496 | |
CountryWide Alternative Loan Trust, Series 2005-J14, Class A8, 5.500%, 12/25/2035 | | | 1,702,389 | | | | 1,525,392 | |
CountryWide Alternative Loan Trust, Series 2005-75CB, Class A3, 5.500%, 1/25/2036 | | | 1,448,396 | | | | 1,221,415 | |
CountryWide Alternative Loan Trust, Series 2005-85CB, Class 2A5,
1.208% (1 Month LIBOR USD + 1.100%), 2/25/2036 (e) | | | 1,538,795 | | | | 1,338,051 | |
CountryWide Alternative Loan Trust, Series 2006-HY10, Class 1X, 0.476%, 5/25/2036 (c)(f)(g) | | | 3,485,346 | | | | 44,731 | |
CountryWide Alternative Loan Trust, Series 2006-OA3, Class X, 2.418%, 5/25/2036 (c)(f)(g) | | | 18,282,217 | | | | 1,171,908 | |
CountryWide Alternative Loan Trust, Series 2006-24CB, Class A5,
0.708% (1 Month LIBOR USD + 0.600%), 8/25/2036 (e) | | | 4,245,346 | | | | 2,239,518 | |
CountryWide Alternative Loan Trust, Series 2006-26CB, Class A15,
6.000% (1 Month LIBOR USD + 0.550%), 9/25/2036 (e) | | | 696,744 | | | | 488,807 | |
CountryWide Alternative Loan Trust, Series 2006-29T1, Class 2A13,
0.408% (1 Month LIBOR USD + 0.300%), 10/25/2036 (e) | | | 1,802,799 | | | | 915,701 | |
CountryWide Alternative Loan Trust, Series 2006-27CB, Class A4, 6.000%, 11/25/2036 | | | 673,930 | | | | 599,291 | |
CountryWide Alternative Loan Trust, Series 2006-36T2, Class 1A4, 5.750%, 12/25/2036 | | | 7,182,987 | | | | 4,739,960 | |
CountryWide Alternative Loan Trust, Series 2006-40T1, Class 1A5, 6.000%, 1/25/2037 | | | 603,805 | | | | 522,980 | |
CountryWide Alternative Loan Trust, Series 2006-J8, Class A2, 6.000%, 2/25/2037 | | | 2,893,783 | | | | 1,877,087 | |
CountryWide Alternative Loan Trust, Series 2006-OA1, Class 1X, 2.490%, 3/20/2046 (c)(f) | | | 12,851,377 | | | | 876,066 | |
CountryWide Alternative Loan Trust, Series 2006-OA8, Class 1A1,
0.488% (1 Month LIBOR USD + 0.380%), 7/25/2046 (e) | | | 3,633,477 | | | | 3,160,631 | |
CountryWide Alternative Loan Trust, Series 2006-OA10, Class XAD, 2.002%, 8/25/2046 (c)(f)(n) | | | 25,996,697 | | | | 1,466,474 | |
CountryWide Alternative Loan Trust, Series 2006-OA10, Class XPP, 2.002%, 8/25/2046 (c)(f)(g) | | | 14,906,741 | | | | 563,132 | |
CountryWide Alternative Loan Trust, Series 2006-OA10, Class XNB, 2.105%, 8/25/2046 (c)(f)(g) | | | 24,387,372 | | | | 1,225,173 | |
CountryWide Alternative Loan Trust, Series 2007-OA3, Class 1A1,
0.388% (1 Month LIBOR USD + 0.280%), 4/25/2047 (e) | | | 4,583,193 | | | | 4,276,559 | |
See accompanying notes which are an integral part of these financial statements.
63
Angel Oak Multi-Strategy Income Fund
Consolidated Schedule of Investments – (continued)
January 31, 2022
| | | | | | | | |
| | | Principal
Amount | | | Value | |
Residential Mortgage-Backed Securities – (continued) | | | | | | | | |
CountryWide Alternative Loan Trust, Series 2007-20, Class A1,
0.608% (1 Month LIBOR USD + 0.500%), 8/25/2047 (e) | | $ | 3,374,644 | | | $ | 1,565,089 | |
CountryWide Alternative Loan Trust, Series 2007-OA10, Class X,
2.000%, 9/25/2047 (c)(f)(g) | | | 2,306,550 | | | | 85,536 | |
CountryWide Alternative Loan Trust Resecuritization, Series 2005-59R, Class A, 2.210%, 12/20/2035 (a)(f)(g) | | | 13,967,942 | | | | 725,509 | |
CountryWide Alternative Loan Trust Resecuritization, Series 2005-58R, Class A, 2.526%, 12/20/2035 (a)(f)(g) | | | 47,463,562 | | | | 3,307,308 | |
CountryWide Home Loan Mortgage Pass-Through Trust, Series 2004-20, Class X,
1.786%, 10/25/2034 (c)(f)(g) | | | 7,182,845 | | | | 336,861 | |
CountryWide Home Loan Mortgage Pass-Through Trust, Series 2004-25, Class 2A3,
0.848% (1 Month LIBOR USD + 0.740%), 2/25/2035 (e) | | | 1,563,456 | | | | 1,497,839 | |
CountryWide Home Loan Mortgage Pass-Through Trust, Series 2004-29, Class 1X, 1.495%, 2/25/2035 (c)(f)(g) | | | 4,069,909 | | | | 147,652 | |
CountryWide Home Loan Mortgage Pass-Through Trust, Series 2004-25, Class 1X, 1.856%, 2/25/2035 (c)(f)(g) | | | 16,102,959 | | | | 721,203 | |
CountryWide Home Loan Mortgage Pass-Through Trust, Series 2005-2, Class 1A1,
0.748% (1 Month LIBOR USD + 0.640%), 3/25/2035 (e) | | | 809,884 | | | | 757,950 | |
CountryWide Home Loan Mortgage Pass-Through Trust, Series 2005-7, Class 3X, 0.858%, 3/25/2035 (c)(f)(g) | | | 1,108,785 | | | | 37,835 | |
CountryWide Home Loan Mortgage Pass-Through Trust, Series 2005-1, Class 1X, 2.188%, 3/25/2035 (c)(f)(g) | | | 3,801,586 | | | | 304,070 | |
CountryWide Home Loan Mortgage Pass-Through Trust, Series 2005-2, Class 2X, 2.299%, 3/25/2035 (c)(f)(g) | | | 9,981,375 | | | | 643,649 | |
CountryWide Home Loan Mortgage Pass-Through Trust, Series 2005-7, Clas 3A2, 2.588%, 3/25/2035 (g) | | | 4,088,465 | | | | 3,568,024 | |
CountryWide Home Loan Mortgage Pass-Through Trust, Series 2005-11, Class 4X, 2.010%, 4/25/2035 (f)(g) | | | 6,290,345 | | | | 252,557 | |
CountryWide Home Loan Mortgage Pass-Through Trust, Series 2006-HYB1, Class 3A1, 2.691%, 3/20/2036 (g) | | | 5,323,929 | | | | 4,614,409 | |
CountryWide Home Loan Mortgage Pass-Through Trust, Series 2006-8, Class 1A1, 6.000%, 5/25/2036 | | | 1,378,976 | | | | 1,249,332 | |
CountryWide Home Loan Mortgage Pass-Through Trust, Series 2006-12, Class X, 0.162%, 7/25/2036 (c)(f)(g) | | | 18,387,342 | | | | 98,997 | |
CountryWide Home Loan Mortgage Pass-Through Trust, Series 2007-4, Class 1A1, 6.000%, 5/25/2037 | | | 1,443,753 | | | | 1,120,074 | |
CountryWide Home Loan Mortgage Pass-Through Trust, Series 2007-7, Class A3, 5.750%, 6/25/2037 | | | 760,111 | | | | 618,968 | |
CountryWide Home Loan Mortgage Pass-Through Trust, Series 2007-J2, Class 2A1,
0.758% (1 Month LIBOR USD + 0.650%), 7/25/2037 (e) | | | 4,575,168 | | | | 1,205,177 | |
CountryWide Home Loan Mortgage Pass-Through Trust, Series 2007-18, Class 2A1, 6.500%, 11/25/2037 | | | 2,096,756 | | | | 1,332,910 | |
CountryWide Home Loan Mortgage Pass-Through Trust, Series 2007-8, Class 1A12, 5.875%, 1/25/2038 | | | 2,866,196 | | | | 2,279,179 | |
Credit Suisse First Boston Mortgage Securities Corp., Series 2005-7, Class 2A1, 5.250%, 8/25/2035 (i) | | | 8,491,166 | | | | 6,319,856 | |
Credit Suisse First Boston Mortgage Securities Corp., Series 2005-10, Class 6A12, 5.500%, 11/25/2035 | | | 2,369,554 | | | | 1,980,018 | |
Credit Suisse Mortgage Trust, Series 2015-6R, Class 1A2, 2.662%, 7/27/2035 (a)(g) | | | 6,803,821 | | | | 5,888,333 | |
See accompanying notes which are an integral part of these financial statements.
64
Angel Oak Multi-Strategy Income Fund
Consolidated Schedule of Investments – (continued)
January 31, 2022
| | | | | | | | |
| | | Principal
Amount | | | Value | |
Residential Mortgage-Backed Securities – (continued) | | | | | | | | |
Credit Suisse Mortgage Trust, Series 2014-3R, Class 1A1,
2.273% (1 Month LIBOR USD + 0.450%), 3/27/2036 (a)(e) | | $ | 391,142 | | | $ | 394,897 | |
Credit Suisse Mortgage Trust, Series 2021-AFC1, Class B1, 3.251%, 3/25/2056 (a)(g) | | | 3,031,450 | | | | 3,037,852 | |
Credit Suisse Mortgage Trust, Series 2021-AFC1, Class B2, 4.255%, 3/25/2056 (a)(g) | | | 1,539,950 | | | | 1,542,905 | |
Credit Suisse Mortgage Trust, Series 2021-INV1, Class AIOS, 0.040%, 7/25/2056 (a)(f)(g) | | | 130,361,537 | | | | 225,134 | |
Credit Suisse Mortgage Trust, Series 2021-INV1, Class AX4, 0.400%, 7/25/2056 (a)(f)(g) | | | 8,889,563 | | | | 139,513 | |
Credit Suisse Mortgage Trust, Series 2021-INV1, Class A3, 2.500%, 7/25/2056 (a)(g) | | | 25,153,867 | | | | 25,563,674 | |
Credit Suisse Mortgage Trust, Series 2021-INV1, Class B3, 3.081%, 7/25/2056 (a)(g) | | | 4,445,939 | | | | 4,314,428 | |
Credit Suisse Mortgage Trust, Series 2021-INV1, Class B5, 3.081%, 7/25/2056 (a)(g) | | | 1,699,862 | | | | 1,231,737 | |
Credit Suisse Mortgage Trust, Series 2021-INV1, Class B4, 3.081%, 7/25/2056 (a)(g) | | | 2,484,053 | | | | 2,206,520 | |
Credit Suisse Mortgage Trust, Series 2021-INV1, Class B6, 3.081%, 7/25/2056 (a)(g) | | | 1,323,281 | | | | 531,373 | |
Credit Suisse Mortgage Trust, Series 2021-INV1, Class B1, 3.081%, 7/25/2056 (a)(g) | | | 5,884,717 | | | | 5,906,161 | |
Credit Suisse Mortgage Trust, Series 2021-INV1, Class B2, 3.081%, 7/25/2056 (a)(g) | | | 5,491,213 | | | | 5,429,849 | |
Credit Suisse Mortgage Trust, Series 2021-INV2, Class AIOS,
0.040%, 11/25/2056 (a)(c)(f)(g) | | | 379,470,616 | | | | 697,846 | |
Credit Suisse Mortgage Trust, Series 2021-INV2, Class AX1, 0.120%, 11/25/2056 (a)(c)(f)(g) | | | 343,565,226 | | | | 1,882,737 | |
Credit Suisse Mortgage Trust, Series 2021-INV2, Class AX4, 0.150%, 11/25/2056 (a)(f)(g) | | | 22,122,700 | | | | 151,386 | |
Credit Suisse Mortgage Trust, Series 2021-INV2, Class A3X, 0.500%, 11/25/2056 (a)(f)(g) | | | 197,730,217 | | | | 4,498,362 | |
Credit Suisse Mortgage Trust, Series 2021-INV2, Class A15X, 0.500%, 11/25/2056 (a)(f)(g) | | | 14,443,856 | | | | 328,598 | |
Credit Suisse Mortgage Trust, Series 2021-INV2, Class A5A, 2.500%, 11/25/2056 (a)(g) | | | 19,210,526 | | | | 18,858,147 | |
Credit Suisse Mortgage Trust, Series 2021-INV2, Class B1, 3.270%, 11/25/2056 (a)(g)(p) | | | 9,807,391 | | | | 10,003,656 | |
Credit Suisse Mortgage Trust, Series 2021-INV2, Class B4, 3.270%, 11/25/2056 (a)(g) | | | 4,511,135 | | | | 4,096,286 | |
Credit Suisse Mortgage Trust, Series 2021-INV2, Class B3, 3.270%, 11/25/2056 (a)(g) | | | 8,042,287 | | | | 7,908,158 | |
Credit Suisse Mortgage Trust, Series 2021-INV2, Class B2, 3.270%, 11/25/2056 (a)(g) | | | 8,238,095 | | | | 8,267,752 | |
Credit Suisse Mortgage Trust, Series 2021-INV2, Class B5, 3.270%, 11/25/2056 (a)(g) | | | 2,941,839 | | | | 2,463,355 | |
Credit Suisse Mortgage Trust, Series 2021-INV2, Class B6, 3.270%, 11/25/2056 (a)(g) | | | 2,364,643 | | | | 1,017,932 | |
Credit Suisse Mortgage Trust, Series 2021-INV2, Class A11X,
4.100% (SOFR30A + 4.100%), 11/25/2056 (a)(e)(f) | | | 24,108,189 | | | | 3,288,333 | |
Credit Suisse Mortgage Trust, Series 2017-RPL3, Class B5, 4.389%, 8/25/2057 (a)(g) | | | 10,529,581 | | | | 10,509,680 | |
Credit Suisse Mortgage Trust, Series 2020-RPL4, Class XS, 1.614%, 1/25/2060 (a)(f)(g) | | | 228,978,207 | | | | 10,127,477 | |
Credit Suisse Mortgage Trust, Series 2020-RPL4, Class B3, 3.944%, 1/25/2060 (a)(g) | | | 7,204,424 | | | | 6,554,145 | |
Credit Suisse Mortgage Trust, Series 2020-RPL4, Class B4, 3.944%, 1/25/2060 (a)(g) | | | 7,205,554 | | | | 6,044,624 | |
Credit Suisse Mortgage Trust, Series 2021-NQM8, Class A2, 2.303%, 10/25/2066 (a)(g) | | | 2,162,298 | | | | 2,163,781 | |
CSMC Mortgage-Backed Trust, Series 2006-4, Class 1A1,
0.808% (1 Month LIBOR USD + 0.700%), 5/25/2036 (e) | | | 1,904,350 | | | | 1,062,166 | |
CSMC Mortgage-Backed Trust, Series 2006-4, Class 1A3, 6.000%, 5/25/2036 | | | 1,244,762 | | | | 977,643 | |
CSMC Trust, Series 2021-NQM7, Class A2, 1.961%, 10/25/2066 (a)(g) | | | 3,735,243 | | | | 3,733,394 | |
CSMCM Trust, Series 2018-RPL3, Class CERT, 2.741%, 7/25/2050 (a)(c) | | | 11,692,903 | | | | 11,527,320 | |
CSMCM Trust, Series 2018-RPL1, Class CERT, 3.154%, 7/25/2057 (a)(c)(g) | | | 13,996,706 | | | | 13,890,163 | |
Deephaven Residential Mortgage Trust, Series 2021-4, Class A1, 1.931%, 11/25/2066 (a)(g) | | | 1,949,662 | | | | 1,951,331 | |
Deutsche Alt-A Securities, Inc. Mortgage Loan Trust, Series 2005-2, Class 1A5,
0.608% (1 Month LIBOR USD + 0.500%), 4/25/2035 (e) | | | 391,773 | | | | 363,632 | |
Deutsche Alt-A Securities, Inc. Mortgage Loan Trust, Series 2005-AR1, Class 1A1,
0.418% (1 Month LIBOR USD + 0.310%), 8/25/2035 (e) | | | 2,559,454 | | | | 2,259,486 | |
Deutsche Alt-A Securities, Inc. Mortgage Loan Trust, Series 2005-5, Class 2A4,
5.500%, 11/25/2035 | | | 4,019,249 | | | | 3,441,856 | |
Deutsche Alt-A Securities, Inc. Mortgage Loan Trust, Series 2005-5, Class 2A7,
5.500%, 11/25/2035 | | | 262,419 | | | | 216,528 | |
Deutsche Alt-A Securities, Inc. Mortgage Loan Trust, Series 2005-6, Class 1A4,
5.500%, 12/25/2035 | | | 435,372 | | | | 432,228 | |
See accompanying notes which are an integral part of these financial statements.
65
Angel Oak Multi-Strategy Income Fund
Consolidated Schedule of Investments – (continued)
January 31, 2022
| | | | | | | | |
| | | Principal
Amount | | | Value | |
Residential Mortgage-Backed Securities – (continued) | | | | | | | | |
Deutsche Alt-A Securities, Inc. Mortgage Loan Trust, Series 2006-AR1, Class 2A1,
2.811%, 2/25/2036 (g) | | $ | 485,798 | | | $ | 446,706 | |
Deutsche Alt-A Securities, Inc. Mortgage Loan Trust, Series 2006-AR3, Class A2,
0.348% (1 Month LIBOR USD + 0.240%), 8/25/2036 (e)(i) | | | 3,031,654 | | | | 3,029,498 | |
Deutsche Alt-A Securities, Inc. Mortgage Loan Trust, Series 2006-AR5, Class 1A1,
0.368% (1 Month LIBOR USD + 0.260%), 10/25/2036 (e) | | | 7,821,241 | | | | 3,337,253 | |
Deutsche Alt-A Securities, Inc. Mortgage Loan Trust, Series 2006-AR4, Class A2,
0.488% (1 Month LIBOR USD + 0.380%), 12/25/2036 (e) | | | 10,546,686 | | | | 5,097,551 | |
Deutsche Alt-A Securities, Inc. Mortgage Loan Trust, Series 2007-BAR1, Class A4,
0.588% (1 Month LIBOR USD + 0.480%), 3/25/2037 (e) | | | 76,432,950 | | | | 8,119,702 | |
Deutsche Alt-A Securities, Inc. Mortgage Loan Trust, Series 2007-AB1, Class PO, 0.000%, 4/25/2037 (d) | | | 529,677 | | | | 337,583 | |
Deutsche Alt-A Securities, Inc. Mortgage Loan Trust, Series 2007-AR3, Class 2A4,
0.808% (1 Month LIBOR USD + 0.700%), 6/25/2037 (e)(i) | | | 21,394,725 | | | | 20,280,958 | |
Deutsche Alt-A Securities, Inc. Mortgage Loan Trust, Series 2007-AR1, Class A1,
0.348% (1 Month LIBOR USD + 0.240%), 1/25/2047 (e)(i) | | | 9,336,875 | | | | 9,247,381 | |
Deutsche Alt-A Securities, Inc. Mortgage Loan Trust, Series 2007-AR1, Class A2,
0.468% (1 Month LIBOR USD + 0.360%), 1/25/2047 (e) | | | 1,219,858 | | | | 1,064,241 | |
Deutsche Alt-A Securities, Inc. Mortgage Loan Trust, Series 2007-OA2, Class A1,
0.857% (12 Month US Treasury Average + 0.770%), 4/25/2047 (e) | | | 746,846 | | | | 742,323 | |
Deutsche Alt-A Securities, Inc. Mortgage Loan Trust, Series 2007-OA4, Class 1A1B,
0.238% (1 Month LIBOR USD + 0.130%), 8/25/2047 (e) | | | 5,787,428 | | | | 5,481,985 | |
Deutsche Alt-A Securities, Inc. Mortgage Loan Trust, Series 2007-OA4, Class 1A1A,
0.298% (1 Month LIBOR USD + 0.190%), 8/25/2047 (e) | | | 6,364,530 | | | | 6,244,418 | |
Deutsche Alt-A Securities, Inc. Mortgage Loan Trust, Series 2007-OA5, Class A1A,
0.308% (1 Month LIBOR USD + 0.200%), 8/25/2047 (e) | | | 1,552,835 | | | | 1,468,236 | |
Deutsche Alt-A Securities, Inc. Mortgage Loan Trust, Series 2007-OA4, Class 2A1,
0.308% (1 Month LIBOR USD + 0.200%), 8/25/2047 (e)(i) | | | 8,235,421 | | | | 8,059,718 | |
Deutsche Alt-A Securities, Inc. Mortgage Loan Trust, Series 2007-OA4, Class A4,
0.318% (1 Month LIBOR USD + 0.210%), 8/25/2047 (e)(i) | | | 18,103,925 | | | | 17,482,598 | |
Deutsche Alt-B Securities, Inc. Mortgage Loan Trust, Series 2006-AB1, Class A2B,
5.600%, 2/25/2036 (g) | | | 4,221,699 | | | | 4,280,309 | |
Deutsche Alt-B Securities, Inc. Mortgage Loan Trust, Series 2006-AB1, Class A2D,
5.720%, 2/25/2036 (g) | | | 4,206,481 | | | | 4,202,102 | |
Deutsche Alt-B Securities, Inc. Mortgage Loan Trust, Series 2006-AB2, Class A8, 5.734%, 6/25/2036 (g) | | | 3,529,262 | | | | 3,426,613 | |
Deutsche Alt-B Securities, Inc. Mortgage Loan Trust, Series 2006-AB2, Class A1, 5.888%, 6/25/2036 (g) | | | 425,293 | | | | 416,324 | |
Deutsche Alt-B Securities, Inc. Mortgage Loan Trust, Series 2006-AB2, Class A2, 6.160%, 6/25/2036 (g) | | | 1,892,236 | | | | 1,849,064 | |
Deutsche Alt-B Securities, Inc. Mortgage Loan Trust, Series 2006-AB2, Class A3, 6.270%, 6/25/2036 (g) | | | 597,070 | | | | 617,109 | |
Deutsche Alt-B Securities, Inc. Mortgage Loan Trust, Series 2006-AB2, Class A5B, 6.593%, 6/25/2036 (n) | | | 414,053 | | | | 393,109 | |
Deutsche Alt-B Securities, Inc. Mortgage Loan Trust, Series 2006-AB3, Class A2, 6.420%, 7/25/2036 (g)(i) | | | 2,181,152 | | | | 2,074,314 | |
Deutsche Alt-B Securities, Inc. Mortgage Loan Trust, Series 2006-AB3, Class A5B, 6.800%, 7/25/2036 (n) | | | 211,561 | | | | 196,307 | |
Deutsche Alt-B Securities, Inc. Mortgage Loan Trust, Series 2006-AB4, Classs A1C, 6.000%, 10/25/2036 (g) | | | 5,480,859 | | | | 5,356,570 | |
See accompanying notes which are an integral part of these financial statements.
66
Angel Oak Multi-Strategy Income Fund
Consolidated Schedule of Investments – (continued)
January 31, 2022
| | | | | | | | |
| | | Principal
Amount | | | Value | |
Residential Mortgage-Backed Securities – (continued) | | | | | | | | |
Deutsche Alt-B Securities, Inc. Mortgage Loan Trust, Series 2006-AB4, Class A4B, 6.500%, 10/25/2036 (i)(n) | | $ | 7,374,236 | | | $ | 7,150,752 | |
Deutsche Mortgage Securities, Inc. REMIC Trust, Series 2007-WM1, Class A1, 3.082%, 6/27/2037 (a)(g)(i) | | | 13,570,813 | | | | 14,738,187 | |
Deutsche Mortgage Securities, Inc. REMIC Trust, Series 2009-RS6, Class A2B, 2.986%, 8/25/2037 (a)(g)(i) | | | 8,769,947 | | | | 8,653,482 | |
DSLA Mortgage Loan Trust, Series 2005-AR2, Class C, 0.000%, 3/19/2045 | | | 1 | | | | 503,453 | |
DSLA Mortgage Loan Trust, Series 2006-AR2, Class 2A1A,
0.303% (1 Month LIBOR USD + 0.200%), 10/19/2036 (e)(i) | | | 21,098,567 | | | | 18,669,172 | |
DSLA Mortgage Loan Trust, Series 2007-AR1, Class 1A1A,
0.243% (1 Month LIBOR USD + 0.140%), 3/19/2037 (e)(i) | | | 38,104,594 | | | | 35,258,104 | |
DSLA Mortgage Loan Trust, Series 2007-AR1, Class 2A1A,
0.243% (1 Month LIBOR USD + 0.140%), 3/19/2037 (e)(i) | | | 24,274,977 | | | | 22,997,191 | |
DSLA Mortgage Loan Trust, Series 2004-AR1, Class A2A,
0.923% (1 Month LIBOR USD + 0.820%), 9/19/2044 (e) | | | 815,496 | | | | 774,277 | |
DSLA Mortgage Loan Trust, Series 2004-AR1, Class X2, 2.152%, 9/19/2044 (c)(f)(g) | | | 16,808,887 | | | | 898,502 | |
DSLA Mortgage Loan Trust, Series 2004-AR2, Class C, 0.000%, 11/19/2044 (j) | | | 1,000 | | | | 1 | |
DSLA Mortgage Loan Trust, Series 2004-AR2, Class X2, 2.257%, 11/19/2044 (c)(f)(g) | | | 16,171,766 | | | | 886,504 | |
DSLA Mortgage Loan Trust, Series 2004-AR4, Class 1A1A,
0.823% (1 Month LIBOR USD + 0.720%), 1/19/2045 (e) | | | 8,953,841 | | | | 8,180,650 | |
DSLA Mortgage Loan Trust, Series 2004-AR4, Class X2, 2.254%, 1/19/2045 (c)(f)(g) | | | 13,589,977 | | | | 729,279 | |
DSLA Mortgage Loan Trust, Series 2005-AR1, Class C, 0.000%, 2/19/2045 (j) | | | 1,000,000 | | | | 9,517 | |
DSLA Mortgage Loan Trust, Series 2005-AR1, Class 1A,
0.643% (1 Month LIBOR USD + 0.540%), 3/19/2045 (e)(i) | | | 20,335,176 | | | | 18,316,360 | |
DSLA Mortgage Loan Trust, Series 2005-AR1, Class X2, 2.530%, 3/19/2045 (c)(f)(g) | | | 24,353,734 | | | | 1,348,320 | |
DSLA Mortgage Loan Trust, Series 2005-AR2, Class 2A1A,
0.523% (1 Month LIBOR USD + 0.420%), 6/19/2045 (e) | | | 3,852,592 | | | | 3,831,352 | |
DSLA Mortgage Loan Trust, Series 2005-AR2, Class 2A1C,
0.543% (1 Month LIBOR USD + 0.440%), 6/19/2045 (e) | | | 2,028,368 | | | | 1,929,483 | |
DSLA Mortgage Loan Trust, Series 2005-AR4, Class 2A1A,
0.623% (1 Month LIBOR USD + 0.520%), 8/19/2045 (e) | | | 1,196,596 | | | | 1,157,121 | |
DSLA Mortgage Loan Trust, Series 2005-AR4, Class 1A,
0.623% (1 Month LIBOR USD + 0.520%), 8/19/2045 (e) | | | 169,469 | | | | 145,491 | |
DSLA Mortgage Loan Trust, Series 2006-AR1, Class 1A1A,
1.007% (12 Month US Treasury Average + 0.920%), 3/19/2046 (e) | | | 10,075,233 | | | | 9,529,055 | |
Eagle RE Ltd., Series 2018-1, Class M2,
3.108% (1 Month LIBOR USD + 3.000%), 11/27/2028 (a)(e) | | | 11,508,500 | | | | 11,563,695 | |
Eagle RE Ltd., Series 2019-1, Class M2,
3.408% (1 Month LIBOR USD + 3.300%), 4/25/2029 (a)(e) | | | 25,903,000 | | | | 26,074,633 | |
Eagle RE Ltd., Series 2019-1, Class B1,
4.608% (1 Month LIBOR USD + 4.500%), 4/25/2029 (a)(e) | | | 7,909,125 | | | | 8,017,860 | |
Eagle RE Ltd., Series 2020-1, Class M1C,
1.908% (1 Month LIBOR USD + 1.800%), 1/25/2030 (a)(e) | | | 3,500,000 | | | | 3,433,594 | |
Eagle RE Ltd., Series 2020-1, Class M2,
2.108% (1 Month LIBOR USD + 2.000%), 1/25/2030 (a)(e) | | | 23,461,850 | | | | 23,021,448 | |
Eagle RE Ltd., Series 2020-1, Class B1,
2.958% (1 Month LIBOR USD + 2.850%), 1/25/2030 (a)(e) | | | 2,000,000 | | | | 1,987,062 | |
Eagle RE Ltd., Series 2020-2, Class M2,
5.708% (1 Month LIBOR USD + 5.600%), 10/25/2030 (a)(e) | | | 10,406,000 | | | | 10,510,768 | |
See accompanying notes which are an integral part of these financial statements.
67
Angel Oak Multi-Strategy Income Fund
Consolidated Schedule of Investments – (continued)
January 31, 2022
| | | | | | | | |
| | | Principal
Amount | | | Value | |
Residential Mortgage-Backed Securities – (continued) | | | | | | | | |
Eagle RE Ltd., Series 2021-1, Class M2, 4.500% (SOFR30A + 4.450%), 10/25/2033 (a)(e) | | $ | 6,000,000 | | | $ | 6,255,792 | |
Ellington Financial Mortgage Trust, Series 2020-2, Class B2, 4.804%, 10/25/2065 (a)(g) | | | 3,626,000 | | | | 3,640,994 | |
First Horizon Alternative Mortgage Securities Trust, Series 2005-AA9, Class 3A1, 2.521%, 11/25/2035 (g) | | | 1,097,897 | | | | 969,661 | |
First Horizon Alternative Mortgage Securities Trust, Series 2005-FA8, Class 1A18, 5.500%, 11/25/2035 | | | 7,166 | | | | 6,301 | |
First Horizon Alternative Mortgage Securities Trust, Series 2006-FA1, Class 1A8,
0.608% (1 Month LIBOR USD + 0.500%), 4/25/2036 (e) | | | 3,894,486 | | | | 2,000,516 | |
First Horizon Alternative Mortgage Securities Trust, Series 2006-FA1, Class 1A12, 6.000%, 4/25/2036 | | | 230,572 | | | | 162,192 | |
First Horizon Alternative Mortgage Securities Trust, Series 2006-AA2, Class 2A1, 2.442%, 5/25/2036 (g) | | | 470,791 | | | | 434,691 | |
First Horizon Mortgage Pass-Through Trust, Series 2005-AR4, Class 4A3, 2.612%, 9/25/2035 (g) | | | 43,087 | | | | 40,455 | |
Flagstar Mortgage Trust, Series 2021-9INV, Class AX1, 0.505%, 10/25/2041 (a)(f)(g) | | | 276,883,708 | | | | 3,819,057 | |
Flagstar Mortgage Trust, Series 2021-9INV, Class B6C, 3.005%, 10/25/2041 (a)(g) | | | 1,827,125 | | | | 878,752 | |
Flagstar Mortgage Trust, Series 2021-9INV, Class B5, 3.005%, 10/25/2041 (a)(g) | | | 1,491,274 | | | | 1,126,098 | |
Flagstar Mortgage Trust, Series 2021-9INV, Class B4, 3.005%, 10/25/2041 (a)(g) | | | 596,324 | | | | 553,879 | |
Flagstar Mortgage Trust, Series 2017-2, Class B5, 4.077%, 10/25/2047 (a)(g) | | | 1,153,000 | | | | 1,105,518 | |
Flagstar Mortgage Trust, Series 2018-2, Class B5, 4.035%, 4/25/2048 (a)(g) | | | 2,917,445 | | | | 2,908,722 | |
Flagstar Mortgage Trust, Series 2018-6RR, Class B5, 4.946%, 10/25/2048 (a)(g) | | | 2,478,000 | | | | 2,523,355 | |
Flagstar Mortgage Trust, Series 2021-1, Class B6C, 3.101%, 2/27/2051 (a)(g) | | | 2,932,342 | | | | 1,142,786 | |
Flagstar Mortgage Trust, Series 2021-1, Class B5, 3.130%, 2/27/2051 (a)(g) | | | 1,222,000 | | | | 907,579 | |
Flagstar Mortgage Trust, Series 2021-1, Class B4, 3.130%, 2/27/2051 (a)(g) | | | 2,864,097 | | | | 2,611,040 | |
Flagstar Mortgage Trust, Series 2021-2, Class B6C, 2.557%, 4/25/2051 (a)(g) | | | 1,792,016 | | | | 641,146 | |
Flagstar Mortgage Trust, Series 2021-2, Class B4, 2.798%, 4/25/2051 (a)(g) | | | 1,340,188 | | | | 940,269 | |
Flagstar Mortgage Trust, Series 2021-2, Class B5, 2.798%, 4/25/2051 (a)(g) | | | 1,343,000 | | | | 779,335 | |
Flagstar Mortgage Trust, Series 2021-4, Class B6C, 2.514%, 6/25/2051 (a)(g) | | | 3,378,231 | | | | 1,256,408 | |
Flagstar Mortgage Trust, Series 2021-4, Class B4, 2.716%, 6/25/2051 (a)(g) | | | 1,726,262 | | | | 1,464,110 | |
Flagstar Mortgage Trust, Series 2021-4, Class B5, 2.716%, 6/25/2051 (a)(g) | | | 1,479,794 | | | | 1,111,146 | |
Flagstar Mortgage Trust, Series 2021-6INV, Class B6C, 3.406%, 8/25/2051 (a)(g) | | | 10,794,270 | | | | 6,367,939 | |
Flagstar Mortgage Trust, Series 2021-6INV, Class B5, 3.511%, 8/25/2051 (a)(g) | | | 3,133,612 | | | | 2,663,476 | |
Flagstar Mortgage Trust, Series 2021-6INV, Class B2, 3.511%, 8/25/2051 (a)(g) | | | 13,927,164 | | | | 14,181,530 | |
Flagstar Mortgage Trust, Series 2021-6INV, Class B4, 3.511%, 8/25/2051 (a)(g) | | | 8,703,536 | | | | 8,044,792 | |
Flagstar Mortgage Trust, Series 2021-6INV, Class B1, 3.511%, 8/25/2051 (a)(g) | | | 5,921,868 | | | | 6,126,018 | |
Flagstar Mortgage Trust, Series 2021-6INV, Class B3, 3.511%, 8/25/2051 (a)(g) | | | 12,186,268 | | | | 12,167,733 | |
Flagstar Mortgage Trust, Series 2021-10IN, Class A6, 2.500%, 10/25/2051 (a)(g) | | | 14,327,049 | | | | 14,313,438 | |
Flagstar Mortgage Trust, Series 2021-10IN, Class B6C, 3.428%, 10/25/2051 (a)(g) | | | 14,177,432 | | | | 9,239,773 | |
Flagstar Mortgage Trust, Series 2021-10IN, Class B5, 3.526%, 10/25/2051 (a)(g) | | | 1,260,314 | | | | 1,039,153 | |
Flagstar Mortgage Trust, Series 2021-10IN, Class B4, 3.526%, 10/25/2051 (a)(g) | | | 9,136,568 | | | | 8,290,759 | |
GMAC Mortgage Corp. Loan Trust, Series 2005-AR5, Class 5A1, 3.099%, 9/19/2035 (g) | | | 68,518 | | | | 65,763 | |
GMAC Mortgage Corp. Loan Trust, Series 2006-AR1, Class 1A1, 2.889%, 4/19/2036 (g) | | | 784,364 | | | | 712,331 | |
Grand Avenue Mortgage Loan Trust, Series 2017-RPL1, Class A1, 3.250%, 8/25/2064 (a) | | | 3,136,758 | | | | 3,142,169 | |
Greenpoint Mortgage Funding Trust, Series 2005-AR1, Class X1,
2.595%, 6/25/2045 (c)(f)(g) | | | 18,216,001 | | | | 1,236,611 | |
Greenpoint Mortgage Funding Trust, Series 2005-AR3, Class X1,
2.830%, 8/25/2045 (c)(f)(g) | | | 24,350,982 | | | | 2,295,689 | |
GreenPoint Mortgage Funding Trust, Series 2006-AR3, Class 4X, 1.000%, 4/25/2036 (c)(f) | | | 25,544,359 | | | | 912,342 | |
GreenPoint Mortgage Funding Trust, Series 2006-OH1, Class A1,
0.288% (1 Month LIBOR USD + 0.180%), 1/26/2037 (e) | | | 9,634,015 | | | | 9,024,365 | |
See accompanying notes which are an integral part of these financial statements.
68
Angel Oak Multi-Strategy Income Fund
Consolidated Schedule of Investments – (continued)
January 31, 2022
| | | | | | | | |
| | | Principal
Amount | | | Value | |
Residential Mortgage-Backed Securities – (continued) | | | | | | | | |
GreenPoint Mortgage Funding Trust, Series 2007-AR3, Class A1,
0.548% (1 Month LIBOR USD + 0.440%), 6/25/2037 (e) | | $ | 2,998,820 | | | $ | 2,974,601 | |
GreenPoint Mortgage Funding Trust, Series 2005-AR4, Class 4A1A,
0.728% (1 Month LIBOR USD + 0.620%), 10/25/2045 (e) | | | 1,553,606 | | | | 1,471,531 | |
GreenPoint Mortgage Funding Trust, Series 2005-AR4, Class X4,
2.797%, 10/25/2045 (c)(f)(g) | | | 13,432,648 | | | | 973,437 | |
GS Mortgage-Backed Securities Corp. Trust, Series 2020-PJ6, Class AX1,
0.040%, 1/25/2043 (a)(c)(f)(g) | | | 396,184,044 | | | | 524,151 | |
GS Mortgage-Backed Securities Corp. Trust, Series 2020-PJ6, Class AX4, 0.250%, 1/25/2043 (a)(f)(g) | | | 41,339,886 | | | | 227,617 | |
GS Mortgage-Backed Securities Corp. Trust, Series 2020-PJ6, Class B4,
2.790%, 3/25/2044 (a)(g) | | | 1,850,080 | | | | 1,627,440 | |
GS Mortgage-Backed Securities Corp. Trust, Series 2020-PJ6, Class B5, 2.790%, 4/25/2045 (a)(g) | | | 1,586,897 | | | | 1,260,752 | |
GS Mortgage-Backed Securities Corp. Trust, Series 2019-PJ1, Class B4,
4.237%, 8/25/2049 (a)(g) | | | 1,500,000 | | | | 1,472,770 | |
GS Mortgage-Backed Securities Corp. Trust, Series 2019-PJ1, Class B5,
4.237%, 8/25/2049 (a)(g) | | | 577,000 | | | | 580,223 | |
GS Mortgage-Backed Securities Corp. Trust, Series 2019-PJ3, Class B6,
4.002%, 3/25/2050 (a)(g) | | | 1,825,422 | | | | 1,525,569 | |
GS Mortgage-Backed Securities Corp. Trust, Series 2020-PJ5, Class AIOS,
0.215%, 3/25/2051 (f)(g) | | | 194,296,199 | | | | 744,154 | |
GS Mortgage-Backed Securities Corp. Trust, Series 2020-PJ5, Class AX1,
0.288%, 3/25/2051 (f)(g) | | | 169,082,652 | | | | 856,065 | |
GS Mortgage-Backed Securities Corp. Trust, Series 2020-PJ5, Class B4,
3.288%, 3/25/2051 (g) | | | 2,212,757 | | | | 2,195,146 | |
GS Mortgage-Backed Securities Corp. Trust, Series 2020-PJ5, Class B5,
3.288%, 3/25/2051 (g) | | | 1,809,907 | | | | 1,571,483 | |
GS Mortgage-Backed Securities Corp. Trust, Series 2020-PJ6, Class AIOS,
0.218%, 5/25/2051 (a)(f)(g) | | | 423,212,793 | | | | 2,227,369 | |
GS Mortgage-Backed Securities Corp. Trust, Series 2020-PJ6, Class B6,
2.790%, 5/25/2051 (a)(g) | | | 1,709,317 | | | | 963,959 | |
GS Mortgage-Backed Securities Corp. Trust, Series 2021-PJ1, Class AIOS,
0.220%, 6/25/2051 (a)(f)(g) | | | 351,205,674 | | | | 2,217,161 | |
GS Mortgage-Backed Securities Corp. Trust, Series 2021-PJ1, Class AX1,
0.265%, 6/25/2051 (a)(f)(g) | | | 330,244,109 | | | | 2,202,398 | |
GS Mortgage-Backed Securities Corp. Trust, Series 2021-PJ1, Class B4,
2.765%, 6/25/2051 (a)(g) | | | 2,432,800 | | | | 2,028,097 | |
GS Mortgage-Backed Securities Corp. Trust, Series 2021-PJ1, Class B6,
2.765%, 6/25/2051 (a)(g) | | | 2,079,428 | | | | 757,931 | |
GS Mortgage-Backed Securities Corp. Trust, Series 2021-PJ1, Class B5,
2.765%, 6/25/2051 (a)(g) | | | 1,039,000 | | | | 636,365 | |
GS Mortgage-Backed Securities Corp. Trust, Series 2021-PJ3, Class B4,
2.654%, 8/25/2051 (a)(g) | | | 1,298,104 | | | | 1,112,872 | |
GS Mortgage-Backed Securities Corp. Trust, Series 2021-PJ3, Class B6,
2.654%, 8/25/2051 (a)(g) | | | 2,208,829 | | | | 797,973 | |
GS Mortgage-Backed Securities Corp. Trust, Series 2021-PJ3, Class B5,
2.654%, 8/25/2051 (a)(g) | | | 1,298,104 | | | | 863,449 | |
See accompanying notes which are an integral part of these financial statements.
69
Angel Oak Multi-Strategy Income Fund
Consolidated Schedule of Investments – (continued)
January 31, 2022
| | | | | | | | |
| | | Principal
Amount | | | Value | |
Residential Mortgage-Backed Securities – (continued) | | | | | | | | |
GS Mortgage-Backed Securities Corp. Trust, Series 2021-PJ4, Class AX1,
0.022%, 9/25/2051 (a)(f)(g) | | $ | 541,417,442 | | | $ | 351,380 | |
GS Mortgage-Backed Securities Corp. Trust, Series 2021-PJ4, Class A6,
2.500%, 9/25/2051 (a)(g) | | | 9,383,470 | | | | 9,613,234 | |
GS Mortgage-Backed Securities Corp. Trust, Series 2021-PJ4, Class B1,
2.622%, 9/25/2051 (a)(g) | | | 5,189,981 | | | | 5,033,913 | |
GS Mortgage-Backed Securities Corp. Trust, Series 2021-PJ4, Class B5,
2.622%, 9/25/2051 (a)(g) | | | 1,244,000 | | | | 708,006 | |
GS Mortgage-Backed Securities Corp. Trust, Series 2021-PJ4, Class B4,
2.622%, 9/25/2051 (a)(g) | | | 2,747,117 | | | | 2,035,053 | |
GS Mortgage-Backed Securities Corp. Trust, Series 2021-PJ4, Class B2,
2.622%, 9/25/2051 (a)(g) | | | 8,176,575 | | | | 7,816,217 | |
GS Mortgage-Backed Securities Corp. Trust, Series 2021-PJ4, Class B6,
2.622%, 9/25/2051 (a)(g) | | | 2,489,114 | | | | 906,344 | |
GS Mortgage-Backed Securities Corp. Trust, Series 2021-PJ5, Class B5,
2.592%, 10/25/2051 (a)(g) | | | 1,194,000 | | | | 686,329 | |
GS Mortgage-Backed Securities Corp. Trust, Series 2021-PJ5, Class B6,
2.592%, 10/25/2051 (a)(g) | | | 2,987,778 | | | | 1,087,136 | |
GS Mortgage-Backed Securities Corp. Trust, Series 2021-PJ5, Class B4,
2.592%, 10/25/2051 (a)(g) | | | 3,818,789 | | | | 3,030,621 | |
GS Mortgage-Backed Securities Corp. Trust, Series 2021-PJ6, Class AX1,
0.027%, 11/25/2051 (a)(c)(f)(g) | | | 923,423,979 | | | | 1,230,924 | |
GS Mortgage-Backed Securities Corp. Trust, Series 2021-PJ6, Class A2,
2.500%, 11/25/2051 (a)(g) | | | 18,652,863 | | | | 18,750,977 | |
GS Mortgage-Backed Securities Corp. Trust, Series 2021-PJ6, Class B6,
2.683%, 11/25/2051 (a)(g) | | | 4,670,429 | | | | 1,735,578 | |
GS Mortgage-Backed Securities Corp. Trust, Series 2021-PJ6, Class B4,
2.683%, 11/25/2051 (a)(g) | | | 5,626,616 | | | | 4,768,247 | |
GS Mortgage-Backed Securities Corp. Trust, Series 2021-PJ6, Class B5,
2.683%, 11/25/2051 (a)(g) | | | 1,038,000 | | | | 605,025 | |
GS Mortgage-Backed Securities Corp. Trust, Series 2021-INV1, Class B3,
3.040%, 12/25/2051 (a)(g) | | | 4,285,454 | | | | 4,106,018 | |
GS Mortgage-Backed Securities Corp. Trust, Series 2021-INV1, Class B1,
3.040%, 12/25/2051 (a)(g) | | | 4,131,942 | | | | 4,111,485 | |
GS Mortgage-Backed Securities Corp. Trust, Series 2021-INV1, Class B2,
3.040%, 12/25/2051 (a)(g) | | | 4,131,942 | | | | 4,042,696 | |
GS Mortgage-Backed Securities Corp. Trust, Series 2021-INV1, Class B6,
3.046%, 12/25/2051 (a)(g) | | | 2,473,320 | | | | 1,002,498 | |
GS Mortgage-Backed Securities Corp. Trust, Series 2021-INV1, Class B5,
3.046%, 12/25/2051 (a)(g) | | | 1,837,189 | | | | 1,456,016 | |
GS Mortgage-Backed Securities Corp. Trust, Series 2021-INV1, Class B4,
3.046%, 12/25/2051 (a)(g) | | | 3,061,322 | | | | 2,702,023 | |
GS Mortgage-Backed Securities Corp. Trust, Series 2021-PJ7, Class B4,
2.731%, 1/25/2052 (a)(g) | | | 7,807,479 | | | | 6,792,616 | |
GS Mortgage-Backed Securities Corp. Trust, Series 2021-PJ7, Class B2,
2.731%, 1/25/2052 (a)(g) | | | 13,318,582 | | | | 12,628,081 | |
GS Mortgage-Backed Securities Corp. Trust, Series 2021-PJ7, Class B6,
2.731%, 1/25/2052 (a)(g) | | | 3,252,733 | | | | 1,114,321 | |
See accompanying notes which are an integral part of these financial statements.
70
Angel Oak Multi-Strategy Income Fund
Consolidated Schedule of Investments – (continued)
January 31, 2022
| | | | | | | | |
| | | Principal
Amount | | | Value | |
Residential Mortgage-Backed Securities – (continued) | | | | | | | | |
GS Mortgage-Backed Securities Corp. Trust, Series 2021-PJ7, Class B1,
2.731%, 1/25/2052 (a)(g) | | $ | 8,725,831 | | | $ | 8,423,124 | |
GS Mortgage-Backed Securities Corp. Trust, Series 2021-PJ7, Class B5, 2.731%, 1/25/2052 (a)(g) | | | 1,836,705 | | | | 1,207,700 | |
GS Mortgage-Backed Securities Corp. Trust, Series 2021-PJ8, Class B4, 2.780%, 1/25/2052 (a)(g) | | | 3,977,876 | | | | 3,281,072 | |
GS Mortgage-Backed Securities Corp. Trust, Series 2021-PJ8, Class B6, 2.780%, 1/25/2052 (a)(g) | | | 3,091,101 | | | | 1,172,356 | |
GS Mortgage-Backed Securities Corp. Trust, Series 2021-PJ8, Class B5, 2.780%, 1/25/2052 (a)(g) | | | 1,237,000 | | | | 752,457 | |
GS Mortgage-Backed Securities Corp. Trust, Series 2021-HP1, Class B2, 3.225%, 1/25/2052 (a)(g)(p) | | | 11,174,999 | | | | 11,137,574 | |
GS Mortgage-Backed Securities Corp. Trust, Series 2021-HP1, Class B6, 3.225%, 1/25/2052 (a)(g) | | | 4,356,793 | | | | 2,210,101 | |
GS Mortgage-Backed Securities Corp. Trust, Series 2021-HP1, Class B4, 3.225%, 1/25/2052 (a)(g) | | | 3,788,017 | | | | 3,436,239 | |
GS Mortgage-Backed Securities Corp. Trust, Series 2021-HP1, Class B5, 3.225%, 1/25/2052 (a)(g) | | | 1,515,406 | | | | 1,310,278 | |
GS Mortgage-Backed Securities Corp. Trust, Series 2021-HP1, Class B3, 3.225%, 1/25/2052 (a)(g) | | | 3,788,017 | | | | 3,704,010 | |
GS Mortgage-Backed Securities Corp. Trust, Series 2021-HP1, Class B1,
3.225%, 1/25/2052 (a)(g) | | | 4,734,275 | | | | 4,791,390 | |
GS Mortgage-Backed Securities Corp. Trust, Series 2021-PJ9, Class A2,
2.500%, 2/25/2052 (a)(g) | | | 9,560,643 | | | | 9,474,319 | |
GS Mortgage-Backed Securities Corp. Trust, Series 2021-PJ9, Class A8,
2.500%, 2/25/2052 (a)(g) | | | 28,242,570 | | | | 28,129,826 | |
GS Mortgage-Backed Securities Corp. Trust, Series 2021-PJ9, Class B4,
2.943%, 2/25/2052 (a)(g) | | | 3,466,998 | | | | 3,079,017 | |
GS Mortgage-Backed Securities Corp. Trust, Series 2021-PJ9, Class B5,
2.943%, 2/25/2052 (a)(g) | | | 1,300,496 | | | | 1,000,024 | |
GS Mortgage-Backed Securities Corp. Trust, Series 2021-PJ9, Class B6,
2.943%, 2/26/2052 (a)(g) | | | 5,679,016 | | | | 2,263,537 | |
GS Mortgage-Backed Securities Corp. Trust, Series 2021-PJ10, Class A8,
2.500%, 3/25/2052 (a)(g) | | | 4,814,039 | | | | 4,879,501 | |
GS Mortgage-Backed Securities Corp. Trust, Series 2020-RPL1, Class B1,
3.795%, 7/25/2059 (a)(g) | | | 6,323,000 | | | | 6,259,606 | |
GS Mortgage-Backed Securities Trust, Series 2021-PJ2, Class AIOS,
0.220%, 7/25/2051 (a)(f)(g) | | | 367,077,803 | | | | 2,021,497 | |
GS Mortgage-Backed Securities Trust, Series 2021-PJ2, Class B6, 2.731%, 7/25/2051 (a)(g) | | | 2,352,235 | | | | 842,361 | |
GS Mortgage-Backed Securities Trust, Series 2021-PJ2, Class B5, 2.731%, 7/25/2051 (a)(g) | | | 1,069,000 | | | | 669,652 | |
GS Mortgage-Backed Securities Trust, Series 2021-PJ2, Class B2, 2.731%, 7/25/2051 (a)(g) | | | 5,638,148 | | | | 5,659,252 | |
GS Mortgage-Backed Securities Trust, Series 2021-PJ2, Class B3, 2.731%, 7/25/2051 (a)(g) | | | 4,176,117 | | | | 4,139,463 | |
GS Mortgage-Backed Securities Trust, Series 2021-PJ2, Class B1, 2.731%, 7/25/2051 (a)(g) | | | 6,264,175 | | | | 6,405,238 | |
GS Mortgage-Backed Securities Trust, Series 2021-PJ2, Class B4, 2.731%, 7/25/2051 (a)(g) | | | 1,253,030 | | | | 1,059,316 | |
GS Mortgage-Backed Securities Trust, Series 2021-PJ11, Class A2, 2.500%, 4/25/2052 (a)(g) | | | 1,475,845 | | | | 1,479,378 | |
GS Mortgage-Backed Securities Trust, Series 2021-MM1, Class B5, 2.735%, 4/25/2052 (a)(g) | | | 849,000 | | | | 513,563 | |
GS Mortgage-Backed Securities Trust, Series 2021-MM1, Class B6, 2.735%, 4/25/2052 (a)(g) | | | 2,037,580 | | | | 751,857 | |
GS Mortgage-Backed Securities Trust, Series 2021-MM1, Class B1, 2.735%, 4/25/2052 (a)(g) | | | 4,899,876 | | | | 4,758,906 | |
See accompanying notes which are an integral part of these financial statements.
71
Angel Oak Multi-Strategy Income Fund
Consolidated Schedule of Investments – (continued)
January 31, 2022
| | | | | | | | |
| | | Principal
Amount | | | Value | |
Residential Mortgage-Backed Securities – (continued) | | | | | | | | |
GS Mortgage-Backed Securities Trust, Series 2021-MM1, Class B3,
2.735%, 4/25/2052 (a)(g) | | $ | 2,703,792 | | | $ | 2,560,539 | |
GS Mortgage-Backed Securities Trust, Series 2021-MM1, Class B4,
2.735%, 4/25/2052 (a)(g) | | | 1,523,773 | | | | 1,107,029 | |
GS Mortgage-Backed Securities Trust, Series 2021-MM1, Class B2,
2.735%, 4/25/2052 (a)(g) | | | 4,900,871 | | | | 4,648,859 | |
GS Mortgage-Backed Securities Trust, Series 2021-PJ11, Class B5,
2.874%, 4/25/2052 (a)(g) | | | 1,606,000 | | | | 1,052,229 | |
GS Mortgage-Backed Securities Trust, Series 2021-PJ11, Class B4,
2.874%, 4/25/2052 (a)(g) | | | 1,300,000 | | | | 1,008,554 | |
GS Mortgage-Backed Securities Trust, Series 2021-PJ11, Class B6,
2.874%, 4/25/2052 (a)(g) | | | 2,944,289 | | | | 1,198,143 | |
GS Mortgage-Backed Securities Trust, Series 2022-GR1, Class B5,
3.214%, 6/25/2052 (a)(g) | | | 1,233,000 | | | | 1,027,800 | |
GS Mortgage-Backed Securities Trust, Series 2022-GR1, Class B4,
3.214%, 6/25/2052 (a)(g) | | | 3,946,000 | | | | 3,540,552 | |
GS Mortgage-Backed Securities Trust, Series 2022-GR1, Class B3,
3.214%, 6/25/2052 (a)(g) | | | 4,440,000 | | | | 4,250,297 | |
GS Mortgage-Backed Securities Trust, Series 2022-GR1, Class B2,
3.214%, 6/25/2052 (a)(g) | | | 10,854,000 | | | | 10,582,281 | |
GS Mortgage-Backed Securities Trust, Series 2022-GR1, Class B6,
3.214%, 6/25/2052 (a)(g) | | | 5,675,047 | | | | 2,989,252 | |
GS Mortgage-Backed Securities Trust, Series 2022-GR1, Class B1,
3.214%, 6/25/2052 (a)(g) | | | 6,659,000 | | | | 6,592,663 | |
GSAA Home Equity Trust, Series 2005-14, Class 2A2,
0.608% (1 Month LIBOR USD + 0.500%), 12/25/2035 (e) | | | 1,601,384 | | | | 1,117,005 | |
GSAA Home Equity Trust, Series 2005-14, Class 2A3,
0.808% (1 Month LIBOR USD + 0.700%), 12/25/2035 (e) | | | 3,250,215 | | | | 3,076,439 | |
GSAA Home Equity Trust, Series 2005-15, Class 2A2,
0.608% (1 Month LIBOR USD + 0.500%), 1/25/2036 (e) | | | 2,009,646 | | | | 1,227,468 | |
GSAA Home Equity Trust, Series 2006-10, Class AF2, 5.825%, 6/25/2036 (g) | | | 9,579,943 | | | | 3,599,970 | |
GSAA Home Equity Trust, Series 2006-16, Class A2,
0.448% (1 Month LIBOR USD + 0.340%), 10/27/2036 (e) | | | 1,543,615 | | | | 746,662 | |
GSAA Home Equity Trust, Series 2006-18, Class AF3A, 5.772%, 11/25/2036 (g) | | | 6,747,590 | | | | 3,613,651 | |
GSAA Home Equity Trust, Series 2006-20, Class 1A2,
0.468% (1 Month LIBOR USD + 0.360%), 1/25/2037 (e) | | | 10,949,660 | | | | 5,687,538 | |
GSAA Home Equity Trust, Series 2006-20, Class A4A,
0.568% (1 Month LIBOR USD + 0.460%), 1/25/2037 (e) | | | 2,627,120 | | | | 1,677,180 | |
GSAA Home Equity Trust, Series 2007-1, Class 1A2,
0.448% (1 Month LIBOR USD + 0.340%), 2/25/2037 (e) | | | 1,938,205 | | | | 1,012,495 | |
GSAA Home Equity Trust, Series 2007-2, Class AV1,
0.188% (1 Month LIBOR USD + 0.080%), 3/25/2037 (e) | | | 3,493,684 | | | | 918,961 | |
GSAA Home Equity Trust, Series 2007-3, Class 1A1A,
0.248% (1 Month LIBOR USD + 0.140%), 3/25/2037 (e) | | | 6,127,168 | | | | 4,381,562 | |
GSAA Home Equity Trust, Series 2007-4, Class A2,
0.508% (1 Month LIBOR USD + 0.400%), 3/25/2037 (e) | | | 1,298,341 | | | | 526,337 | |
GSAA Home Equity Trust, Series 2007-2, Class AF4A, 6.483%, 3/25/2037 (n) | | | 2,092,403 | | | | 1,037,995 | |
GSAA Home Equity Trust, Series 2007-5, Class 2A1A,
0.348% (1 Month LIBOR USD + 0.240%), 5/25/2037 (e) | | | 2,808,818 | | | | 2,739,847 | |
See accompanying notes which are an integral part of these financial statements.
72
Angel Oak Multi-Strategy Income Fund
Consolidated Schedule of Investments – (continued)
January 31, 2022
| | | | | | | | |
| | | Principal
Amount | | | Value | |
Residential Mortgage-Backed Securities – (continued) | | | | | | | | |
GSAA Home Equity Trust, Series 2007-5, Class 1F4A, 6.032%, 5/25/2037 (n) | | $ | 4,982,888 | | | $ | 3,340,543 | |
GSAA Home Equity Trust, Series 2007-10, Class A2A, 6.500%, 11/25/2037 | | | 2,369,911 | | | | 1,439,427 | |
GSMBS PT, Series 2022-LTV1, 3.286%, 12/25/2051 (a) | | | 330,282,439 | | | | 338,726,770 | |
GSMSC Resecuritization Trust, Series 2014-5R, Class 3B4,
0.254% (1 Month LIBOR USD + 0.150%), 2/26/2037 (a)(e) | | | 5,709,149 | | | | 4,701,056 | |
GSMSC Resecuritization Trust, Series 2014-5R, Class 3B2,
0.254% (1 Month LIBOR USD + 0.150%), 2/26/2037 (a)(e) | | | 5,707,000 | | | | 5,412,376 | |
GSMSC Resecuritization Trust, Series 2014-5R, Class 3B3,
0.254% (1 Month LIBOR USD + 0.150%), 2/26/2037 (a)(e) | | | 5,707,000 | | | | 5,136,329 | |
GSMSC Resecuritization Trust, Series 2014-5R, Class 3B1,
0.254% (1 Month LIBOR USD + 0.150%), 2/26/2037 (a)(e) | | | 5,700,341 | | | | 5,641,582 | |
GSR Mortgage Loan Trust, Series 2005-AR3, Class 8A1, 2.189%, 5/25/2035 (g) | | | 653,089 | | | | 676,996 | |
GSR Mortgage Loan Trust, Series 2005-AR3, Class 5A1, 2.423%, 5/25/2035 (g) | | | 1,216,504 | | | | 1,175,672 | |
GSR Mortgage Loan Trust, Series 2005-6F, Class 3A6,
0.438% (1 Month LIBOR USD + 0.330%), 7/25/2035 (e) | | | 2,175,017 | | | | 1,959,583 | |
GSR Mortgage Loan Trust, Series 2005-6F, Class 3A1,
0.608% (1 Month LIBOR USD + 0.500%), 7/25/2035 (e) | | | 646,505 | | | | 614,166 | |
GSR Mortgage Loan Trust, Series 2005-AR5, Class 2A3, 2.605%, 10/25/2035 (g) | | | 947,229 | | | | 751,937 | |
GSR Mortgage Loan Trust, Series 2006-1F, Class 2A5, 6.000%, 2/25/2036 | | | 1,029,226 | | | | 865,076 | |
GSR Mortgage Loan Trust, Series 2006-2F, Class 3A4, 6.000%, 2/25/2036 | | | 315,135 | | | | 253,320 | |
GSR Mortgage Loan Trust, Series 2006-6F, Class 3A1, 6.500%, 7/25/2036 | | | 6,838,833 | | | | 5,083,619 | |
GSR Mortgage Loan Trust, Series 2007-AR1, Class 2A1, 2.755%, 3/25/2037 (g) | | | 5,787,661 | | | | 4,653,615 | |
GSR Mortgage Loan Trust, Series 2007-2F, Class 3A7, 6.000%, 3/25/2037 | | | 6,921,813 | | | | 5,985,846 | |
GSR Mortgage Loan Trust, Series 2007-2F, Class 3A3, 6.000%, 3/25/2037 | | | 318,511 | | | | 276,121 | |
GSR Mortgage Loan Trust, Series 2007-3F, Class 4A1,
0.408% (1 Month LIBOR USD + 0.300%), 4/25/2037 (e) | | | 5,001,305 | | | | 1,999,567 | |
HarborView Mortgage Loan Trust, Series 2004-7, Class X1, 0.500%, 11/19/2034 (c)(f)(g) | | | 1,830,398 | | | | 22,318 | |
HarborView Mortgage Loan Trust, Series 2004-9, Class 4A2,
0.883% (1 Month LIBOR USD + 0.780%), 12/19/2034 (e) | | | 2,528,304 | | | | 2,298,043 | |
HarborView Mortgage Loan Trust, Series 2004-11, Class X1, 2.210%, 1/19/2035 (c)(f)(g) | | | 7,822,941 | | | | 640,793 | |
HarborView Mortgage Loan Trust, Series 2005-1, Class X, 2.050%, 3/19/2035 (c)(f)(g) | | | 6,928,954 | | | | 438,319 | |
HarborView Mortgage Loan Trust, Series 2005-3, Class X2, 2.376%, 6/19/2035 (c)(f)(g) | | | 53,271,470 | | | | 3,528,862 | |
HarborView Mortgage Loan Trust, Series 2005-4, Class 3A1, 2.662%, 7/19/2035 (g) | | | 940,700 | | | | 871,750 | |
HarborView Mortgage Loan Trust, Series 2005-8, Class 2XA1, 1.316%, 9/19/2035 (c)(f)(g) | | | 24,232,967 | | | | 901,442 | |
HarborView Mortgage Loan Trust, Series 2005-8, Class 2A2A,
1.587% (12 Month US Treasury Average + 1.500%), 9/19/2035 (e) | | | 1,411,352 | | | | 1,339,004 | |
HarborView Mortgage Loan Trust, Series 2005-12, Class X2B, 1.621%, 10/19/2035 (c)(f)(g) | | | 9,043,418 | | | | 607,645 | |
HarborView Mortgage Loan Trust, Series 2005-10, Class X, 1.967%, 11/19/2035 (c)(f)(g) | | | 37,694,350 | | | | 577,214 | |
HarborView Mortgage Loan Trust, Series 2005-13, Class X, 1.280%, 2/19/2036 (c)(f)(g) | | | 17,484,479 | | | | 392,264 | |
HarborView Mortgage Loan Trust, Series 2006-10, Class 2A1A,
0.283% (1 Month LIBOR USD + 0.180%), 11/19/2036 (e)(i) | | | 19,041,353 | | | | 18,561,834 | |
HarborView Mortgage Loan Trust, Series 2006-9, Class 2A1A,
0.523% (1 Month LIBOR USD + 0.420%), 11/19/2036 (e) | | | 709,560 | | | | 637,600 | |
HarborView Mortgage Loan Trust, Series 2006-12, Class 2A2A,
0.293% (1 Month LIBOR USD + 0.190%), 12/19/2036 (e)(i) | | | 27,995,114 | | | | 26,794,908 | |
HarborView Mortgage Loan Trust, Series 2006-SB1, Class A1A,
0.937% (12 Month US Treasury Average + 0.850%), 12/19/2036 (e) | | | 5,669,705 | | | | 5,363,665 | |
HarborView Mortgage Loan Trust, Series 2006-14, Class 2A1A,
0.253% (1 Month LIBOR USD + 0.150%), 2/19/2037 (e)(i) | | | 17,941,540 | | | | 16,718,053 | |
See accompanying notes which are an integral part of these financial statements.
73
Angel Oak Multi-Strategy Income Fund
Consolidated Schedule of Investments – (continued)
January 31, 2022
| | | | | | | | |
| | | Principal
Amount | | | Value | |
Residential Mortgage-Backed Securities – (continued) | | | | | | | | |
HarborView Mortgage Loan Trust, Series 2007-1, Class 2A1A,
0.363% (1 Month LIBOR USD + 0.260%), 3/19/2037 (e) | | $ | 24,363,296 | | | $ | 23,262,367 | |
HarborView Mortgage Loan Trust, Series 2007-2, Class 2A1A,
0.268% (1 Month LIBOR USD + 0.320%), 4/25/2037 (e)(i) | | | 14,038,292 | | | | 12,695,557 | |
HarborView Mortgage Loan Trust, Series 2007-3, Class 2A1A,
0.303% (1 Month LIBOR USD + 0.200%), 5/19/2037 (e)(i) | | | 20,901,435 | | | | 20,381,805 | |
HarborView Mortgage Loan Trust, Series 2007-6, Class 2A1A,
0.293% (1 Month LIBOR USD + 0.190%), 8/19/2037 (e) | | | 1,845,905 | | | | 1,788,704 | |
HarborView Mortgage Loan Trust, Series 2007-6, Class 1A1A,
0.303% (1 Month LIBOR USD + 0.200%), 8/19/2037 (e)(i) | | | 19,192,762 | | | | 17,830,652 | |
HarborView Mortgage Loan Trust, Series 2007-5, Class A1A,
0.293% (1 Month LIBOR USD + 0.190%), 9/19/2037 (e) | | | 4,587,546 | | | | 4,396,167 | |
HarborView Mortgage Loan Trust, Series 2007-7, Class 1A1,
1.108% (1 Month LIBOR USD + 1.000%), 10/25/2037 (e)(i) | | | 15,984,556 | | | | 16,037,241 | |
HarborView Mortgage Loan Trust, Series 2005-11, Class X, 2.542%, 8/19/2045 (c)(f)(g) | | | 10,069,731 | | | | 702,918 | |
HarborView Mortgage Loan Trust, Series 2005-15, Class 2A11,
0.644% (1 Month LIBOR USD + 0.540%), 10/20/2045 (e) | | | 3,566,616 | | | | 3,539,624 | |
HarborView Mortgage Loan Trust, Series 2005-15, Class 3A11,
2.087% (12 Month US Treasury Average + 2.000%), 10/20/2045 (e) | | | 3,182,664 | | | | 2,970,588 | |
HarborView Mortgage Loan Trust, Series 2006-4, Class 1A2A,
0.483% (1 Month LIBOR USD + 0.380%), 5/19/2046 (e) | | | 5,344,371 | | | | 3,121,674 | |
HarborView Mortgage Loan Trust, Series 2006-13, Class A,
0.283% (1 Month LIBOR USD + 0.180%), 11/19/2046 (e) | | | 5,695,985 | | | | 5,079,947 | |
Home RE Ltd., Series 2019-1, Class M2,
3.358% (1 Month LIBOR USD + 3.250%), 5/25/2029 (a)(e) | | | 20,083,000 | | | | 20,221,613 | |
Home RE Ltd., Series 2020-1, Class M1C,
4.258% (1 Month LIBOR USD + 4.150%), 10/25/2030 (a)(e) | | | 2,500,000 | | | | 2,531,430 | |
Home RE Ltd., Series 2020-1, Class M2,
5.358% (1 Month LIBOR USD + 5.250%), 10/25/2030 (a)(e) | | | 1,750,000 | | | | 1,802,703 | |
Home RE Ltd., Series 2021-1, Class M1C,
2.408% (1 Month LIBOR USD + 2.300%), 7/25/2033 (a)(e) | | | 9,182,587 | | | | 9,252,026 | |
Home RE Ltd., Series 2021-1, Class B1,
3.758% (1 Month LIBOR USD + 3.650%), 7/25/2033 (a)(e) | | | 3,333,042 | | | | 3,310,584 | |
Home RE Ltd., Series 2021-2, Class M2, 3.300% (SOFR30A + 3.250%), 1/25/2034 (a)(e) | | | 11,250,000 | | | | 11,137,579 | |
HomeBanc Mortgage Trust, Series 2005-1, Class A1,
0.608% (1 Month LIBOR USD + 0.500%), 3/25/2035 (e) | | | 5,240,110 | | | | 4,777,214 | |
HomeBanc Mortgage Trust, Series 2005-1, Class A2,
0.728% (1 Month LIBOR USD + 0.620%), 3/25/2035 (e) | | | 833,218 | | | | 742,127 | |
HomeBanc Mortgage Trust, Series 2005-5, Class A1,
0.628% (1 Month LIBOR USD + 0.520%), 1/25/2036 (e) | | | 2,196,886 | | | | 2,178,048 | |
HomeBanc Mortgage Trust, Series 2006-1, Class 3A2, 2.458%, 4/25/2037 (g) | | | 4,901,916 | | | | 4,784,540 | |
HSI Asset Loan Obligation Trust, Series 2007-AR1, Class 2A1, 2.719%, 1/25/2037 (g) | | | 510,879 | | | | 449,949 | |
IMPAC CMB Trust, Series 2004-10, Class 3A1,
0.808% (1 Month LIBOR USD + 0.700%), 3/25/2035 (e) | | | 2,421,011 | | | | 2,258,150 | |
IMPAC CMB Trust, Series 2005-6, Class 1A2,
0.388% (1 Month LIBOR USD + 0.280%), 10/25/2035 (e) | | | 2,004,208 | | | | 1,933,590 | |
IMPAC CMB Trust, Series 2005-6, Class 1A1,
0.608% (1 Month LIBOR USD + 0.500%), 10/25/2035 (e)(i) | | | 20,043,036 | | | | 19,488,806 | |
See accompanying notes which are an integral part of these financial statements.
74
Angel Oak Multi-Strategy Income Fund
Consolidated Schedule of Investments – (continued)
January 31, 2022
| | | | | | | | |
| | | Principal
Amount | | | Value | |
Residential Mortgage-Backed Securities – (continued) | | | | | | | | |
IMPAC CMB Trust, Series 2005-7, Class A2,
0.388% (1 Month LIBOR USD + 0.280%), 11/25/2035 (e) | | $ | 1,692,702 | | | $ | 1,547,329 | |
IMPAC CMB Trust, Series 2005-7, Class A1,
0.628% (1 Month LIBOR USD + 0.520%), 11/25/2035 (e)(i) | | | 15,199,772 | | | | 14,780,654 | |
IMPAC CMB Trust, Series 2005-8, Class 1M1,
0.738% (1 Month LIBOR USD + 0.630%), 2/25/2036 (e) | | | 1,828,756 | | | | 1,707,890 | |
IMPAC Secured Assets CMN Owner Trust, Series 2005-2, Class A2D,
0.968% (1 Month LIBOR USD + 0.860%), 3/25/2036 (e) | | | 653,016 | | | | 588,427 | |
IMPAC Secured Assets Trust, Series 2006-2, Class 1A2B,
0.448% (1 Month LIBOR USD + 0.340%), 8/25/2036 (e) | | | 6,014,853 | | | | 5,587,509 | |
IMPAC Secured Assets Trust, Series 2006-2, Class 1A2C,
0.668% (1 Month LIBOR USD + 0.560%), 8/25/2036 (e)(i) | | | 4,315,056 | | | | 3,249,366 | |
IMPAC Secured Assets Trust, Series 2006-3, Class A7,
0.648% (1 Month LIBOR USD + 0.540%), 11/25/2036 (e)(i) | | | 21,534,213 | | | | 17,660,488 | |
IMPAC Secured Assets Trust, Series 2006-4, Class A1,
0.488% (1 Month LIBOR USD + 0.380%), 1/25/2037 (e) | | | 7,522,784 | | | | 6,885,243 | |
IMPAC Secured Assets Trust, Series 2006-4, Class A2C,
0.628% (1 Month LIBOR USD + 0.520%), 1/25/2037 (e)(i) | | | 22,578,076 | | | | 21,337,952 | |
IMPAC Secured Assets Trust, Series 2007-1, Class A2,
0.428% (1 Month LIBOR USD + 0.160%), 3/25/2037 (e) | | | 625,296 | | | | 613,651 | |
IMPAC Secured Assets Trust, Series 2007-1, Class A3,
0.588% (1 Month LIBOR USD + 0.240%), 3/25/2037 (e) | | | 8,232,278 | | | | 7,264,648 | |
IMPAC Secured Assets Trust, Series 2007-2, Class 1A1C,
0.488% (1 Month LIBOR USD + 0.380%), 5/25/2037 (e)(i) | | | 14,816,000 | | | | 12,446,003 | |
IndyMac Index Mortgage Loan Trust, Series 2004-AR2, Class AX2,
2.755%, 6/25/2034 (c)(f)(g) | | | 7,754,719 | | | | 7,377,793 | |
IndyMac Index Mortgage Loan Trust, Series 2004-AR8, Class 2A2A,
0.908% (1 Month LIBOR USD + 0.800%), 11/25/2034 (e) | | | 471,276 | | | | 449,515 | |
IndyMac Index Mortgage Loan Trust, Series 2004-AR12, Class AX2,
2.015%, 12/25/2034 (c)(f)(g) | | | 2,510,354 | | | | 140,630 | |
IndyMac Index Mortgage Loan Trust, Series 2005-AR2, Class AX2,
2.067%, 2/25/2035 (c)(f)(g) | | | 12,407,483 | | | | 352,124 | |
IndyMac Index Mortgage Loan Trust, Series 2005-AR4, Class AX2,
2.128%, 3/25/2035 (c)(f)(g) | | | 15,722,764 | | | | 871,246 | |
IndyMac Index Mortgage Loan Trust, Series 2005-AR6, Class 2A1,
0.588% (1 Month LIBOR USD + 0.480%), 4/25/2035 (e) | | | 2,491,337 | | | | 2,271,975 | |
IndyMac Index Mortgage Loan Trust, Series 2005-AR8, Class 2A1A,
0.568% (1 Month LIBOR USD + 0.460%), 5/25/2035 (e) | | | 2,869,157 | | | | 2,686,179 | |
IndyMac Index Mortgage Loan Trust, Series 2005-AR8, Class AX2, 2.312%, 5/25/2035 (c)(f)(g) | | | 20,335,564 | | | | 1,130,983 | |
IndyMac Index Mortgage Loan Trust, Series 2005-AR5, Class 2A1, 2.502%, 5/25/2035 (g) | | | 1,055,339 | | | | 985,261 | |
IndyMac Index Mortgage Loan Trust, Series 2005-AR10, Class AX, 2.330%, 6/25/2035 (c)(f)(g) | | | 33,256,616 | | | | 1,861,207 | |
IndyMac Index Mortgage Loan Trust, Series 2005-AR7, Class 4A1, 3.071%, 6/25/2035 (g) | | | 900,712 | | | | 873,061 | |
IndyMac Index Mortgage Loan Trust, Series 2005-AR12, Class AX2, 2.561%, 7/25/2035 (c)(f)(g) | | | 52,124,257 | | | | 2,765,296 | |
IndyMac Index Mortgage Loan Trust, Series 2005-AR14, Class 2X, 2.224%, 8/25/2035 (c)(f)(g) | | | 24,247,189 | | | | 1,614,717 | |
IndyMac Index Mortgage Loan Trust, Series 2005-AR13, Class 1A1, 2.773%, 8/25/2035 (g) | | | 2,301,835 | | | | 1,629,632 | |
See accompanying notes which are an integral part of these financial statements.
75
Angel Oak Multi-Strategy Income Fund
Consolidated Schedule of Investments – (continued)
January 31, 2022
| | | | | | | | |
| | | Principal
Amount | | | Value | |
Residential Mortgage-Backed Securities – (continued) | | | | | | | | |
IndyMac Index Mortgage Loan Trust, Series 2005-AR19, Class A1, 2.734%, 10/25/2035 (g) | | $ | 5,061,819 | | | $ | 4,755,746 | |
IndyMac Index Mortgage Loan Trust, Series 2006-AR25, Class 5A1, 2.842%, 9/25/2036 (g) | | | 5,008,781 | | | | 4,514,469 | |
IndyMac Index Mortgage Loan Trust, Series 2007-AR1, Class 3A1, 2.825%, 3/25/2037 (g) | | | 983,393 | | | | 983,978 | |
IndyMac Index Mortgage Loan Trust, Series 2007-AR1, Class 2A1, 2.871%, 6/25/2037 (g) | | | 5,646,542 | | | | 4,770,814 | |
IndyMac Index Mortgage Loan Trust, Series 2007-AR9, Class 2A1, 3.007%, 6/25/2037 (g) | | | 3,777,124 | | | | 2,879,404 | |
IndyMac Index Mortgage Loan Trust, Series 2007-AR2, Class A1, 3.251%, 6/25/2037 (g) | | | 449,090 | | | | 413,907 | |
IndyMac Index Mortgage Loan Trust, Series 2007-FLX4, Class 2A1,
0.288% (1 Month LIBOR USD + 0.180%), 7/25/2037 (e) | | | 6,774,599 | | | | 6,414,834 | |
IndyMac Index Mortgage Loan Trust, Series 2007-AR13, Class 4A1, 2.825%, 7/25/2037 (g) | | | 3,669,597 | | | | 2,982,124 | |
IndyMac Index Mortgage Loan Trust, Series 2007-FLX5, Class 2A1,
0.288% (1 Month LIBOR USD + 0.180%), 8/25/2037 (e) | | | 3,515,338 | | | | 3,294,691 | |
IndyMac Index Mortgage Loan Trust, Series 2005-16IP, Class AX, 2.452%, 7/25/2045 (c)(f)(g) | | | 16,087,429 | | | | 921,713 | |
IndyMac Index Mortgage Loan Trust, Series 2006-AR14, Class 1A3A,
0.508% (1 Month LIBOR USD + 0.400%), 11/25/2046 (e) | | | 5,360,991 | | | | 5,457,875 | |
IndyMac Index Mortgage Loan Trust, Series 2007-AR2, Class A3,
0.468% (1 Month LIBOR USD + 0.360%), 3/25/2047 (e) | | | 8,206,662 | | | | 6,289,684 | |
JP Morgan Alternative Loan Trust, Series 2006-A7, Class 1A4,
0.568% (1 Month LIBOR USD + 0.460%), 12/25/2036 (e) | | | 1,338,193 | | | | 1,322,234 | |
JP Morgan Alternative Loan Trust, Series 2007-A2, Class 11A1,
0.468% (1 Month LIBOR USD + 0.360%), 6/25/2037 (e)(i) | | | 30,961,126 | | | | 22,032,680 | |
JP Morgan Chase Bank, Series 2019-CL1, Class M2,
1.808% (1 Month LIBOR USD + 1.700%), 4/25/2047 (a)(e) | | | 5,643,495 | | | | 5,649,183 | |
JP Morgan Chase Bank, Series 2019-CL1, Class M4,
2.708% (1 Month LIBOR USD + 2.600%), 4/25/2047 (a)(e) | | | 2,089,397 | | | | 2,067,345 | |
JP Morgan Chase Bank, Series 2021-CL1, Class M5,
3.700% (SOFR30A + 3.650%), 3/27/2051 (a)(e) | | | 521,940 | | | | 526,934 | |
JP Morgan Chase Bank, Series 2021-CL1, Class B,
6.950% (SOFR30A + 6.900%), 3/27/2051 (a)(e) | | | 1,151,000 | | | | 1,162,025 | |
JP Morgan Chase Bank, Series 2020-CL1, Class M2,
2.608% (1 Month LIBOR USD + 2.500%), 10/25/2057 (a)(e) | | | 4,494,470 | | | | 4,531,518 | |
JP Morgan Chase Bank, Series 2020-CL1, Class M4,
4.458% (1 Month LIBOR USD + 4.350%), 10/25/2057 (a)(e) | | | 1,437,055 | | | | 1,497,156 | |
JP Morgan Chase Bank, Series 2020-CL1, Class M5,
5.708% (1 Month LIBOR USD + 5.600%), 10/25/2057 (a)(e) | | | 2,760,090 | | | | 2,884,352 | |
JP Morgan Chase Bank, Series 2020-CL1, Class B,
10.108% (1 Month LIBOR USD + 10.000%), 10/25/2057 (a)(e) | | | 6,746,057 | | | | 7,371,012 | |
JP Morgan Mortgage Trust, Series 2005-A6, Class 7A1, 2.954%, 8/25/2035 (g) | | | 5,817 | | | | 5,988 | |
JP Morgan Mortgage Trust, Series 2005-ALT1, Class 2A1, 2.488%, 10/25/2035 (g) | | | 7,056,743 | | | | 6,228,218 | |
JP Morgan Mortgage Trust, Series 2005-A8, Class 3A1, 2.601%, 11/25/2035 (g) | | | 1,801,162 | | | | 1,770,810 | |
JP Morgan Mortgage Trust, Series 2005-S3, Class 1A14, 5.500%, 1/25/2036 | | | 1,221,259 | | | | 1,083,026 | |
JP Morgan Mortgage Trust, Series 2006-A6, Class 3A2, 2.539%, 10/25/2036 (g) | | | 598,902 | | | | 533,157 | |
JP Morgan Mortgage Trust, Series 2006-A6, Class 2A4L, 2.869%, 10/25/2036 (g) | | | 647,692 | | | | 628,368 | |
JP Morgan Mortgage Trust, Series 2006-A6, Class 1A4L, 3.226%, 10/25/2036 (g) | | | 1,939,357 | | | | 1,775,621 | |
JP Morgan Mortgage Trust, Series 2006-A7, Class 2A3, 3.111%, 1/25/2037 (g) | | | 1,360,795 | | | | 1,309,121 | |
JP Morgan Mortgage Trust, Series 2007-A4, Class 3A3, 2.645%, 6/25/2037 (g) | | | 1,622,693 | | | | 1,564,571 | |
JP Morgan Mortgage Trust, Series 2018-1, Class B1, 3.683%, 6/25/2048 (a)(g) | | | 2,731,345 | | | | 2,810,516 | |
JP Morgan Mortgage Trust, Series 2017-4, Class B4, 3.924%, 11/25/2048 (a)(g) | | | 7,062,591 | | | | 7,052,682 | |
JP Morgan Mortgage Trust, Series 2019-1, Class B6, 4.129%, 5/25/2049 (a)(g) | | | 3,682,336 | | | | 3,506,556 | |
See accompanying notes which are an integral part of these financial statements.
76
Angel Oak Multi-Strategy Income Fund
Consolidated Schedule of Investments – (continued)
January 31, 2022
| | | | | | | | |
| | | Principal
Amount | | | Value | |
Residential Mortgage-Backed Securities – (continued) | | | | | | | | |
JP Morgan Mortgage Trust, Series 2019-1, Class B5, 4.508%, 5/25/2049 (a)(g) | | $ | 1,751,511 | | | $ | 1,750,166 | |
JP Morgan Mortgage Trust, Series 2019-LTV1, Class B6, 4.440%, 6/25/2049 (a)(g) | | | 2,809,413 | | | | 2,820,221 | |
JP Morgan Mortgage Trust, Series 2019-LTV1, Class B4, 4.659%, 6/25/2049 (a)(g) | | | 6,603,594 | | | | 6,733,658 | |
JP Morgan Mortgage Trust, Series 2019-LTV1, Class B5, 4.659%, 6/25/2049 (a)(g) | | | 2,439,080 | | | | 2,453,015 | |
JP Morgan Mortgage Trust, Series 2019-6, Class B4, 4.172%, 12/25/2049 (a)(g) | | | 4,793,049 | | | | 4,852,881 | |
JP Morgan Mortgage Trust, Series 2019-6, Class B5, 4.172%, 12/25/2049 (a)(g) | | | 1,919,339 | | | | 1,884,041 | |
JP Morgan Mortgage Trust, Series 2019-7, Class AX1, 0.066%, 2/25/2050 (a)(c)(f)(g) | | | 33,011,800 | | | | 19,345 | |
JP Morgan Mortgage Trust, Series 2019-7, Class B6, 2.957%, 2/25/2050 (a)(c)(g) | | | 1,306,069 | | | | 1,011,637 | |
JP Morgan Mortgage Trust, Series 2019-7, Class B5, 3.884%, 2/25/2050 (a)(g) | | | 1,199,000 | | | | 1,129,736 | |
JP Morgan Mortgage Trust, Series 2019-7, Class B4, 3.884%, 2/25/2050 (a)(g) | | | 3,033,660 | | | | 3,016,183 | |
JP Morgan Mortgage Trust, Series 2019-8, Class AX1, 0.095%, 3/25/2050 (a)(c)(f)(g) | | | 78,717,052 | | | | 133,662 | |
JP Morgan Mortgage Trust, Series 2019-8, Class B6, 3.699%, 3/25/2050 (a)(g)(j) | | | 2,413,775 | | | | 2,145,595 | |
JP Morgan Mortgage Trust, Series 2019-8, Class B5, 4.095%, 3/25/2050 (a)(g) | | | 1,834,999 | | | | 1,785,524 | |
JP Morgan Mortgage Trust, Series 2019-9, Class B6, 3.448%, 5/25/2050 (a)(g) | | | 5,085,988 | | | | 4,480,232 | |
JP Morgan Mortgage Trust, Series 2019-9, Class B5, 3.813%, 5/25/2050 (a)(g) | | | 2,614,804 | | | | 2,590,094 | |
JP Morgan Mortgage Trust, Series 2019-9, Class B4, 3.813%, 5/25/2050 (a)(g) | | | 2,941,175 | | | | 3,007,225 | |
JP Morgan Mortgage Trust, Series 2020-1, Class B6, 3.102%, 6/25/2050 (a)(g) | | | 3,526,987 | | | | 3,092,931 | |
JP Morgan Mortgage Trust, Series 2020-1, Class B4, 3.857%, 6/25/2050 (a)(g) | | | 4,040,651 | | | | 4,028,275 | |
JP Morgan Mortgage Trust, Series 2020-1, Class B5, 3.857%, 6/25/2050 (a)(g) | | | 2,239,943 | | | | 2,223,677 | |
JP Morgan Mortgage Trust, Series 2020-LTV1, Class B6, 4.171%, 6/25/2050 (a)(g) | | | 9,309,591 | | | | 9,095,350 | |
JP Morgan Mortgage Trust, Series 2020-LTV1, Class B5, 4.296%, 6/25/2050 (a)(g) | | | 2,914,941 | | | | 2,955,937 | |
JP Morgan Mortgage Trust, Series 2020-2, Class B3A, 3.671%, 7/25/2050 (a)(g) | | | 8,641,232 | | | | 8,826,759 | |
JP Morgan Mortgage Trust, Series 2020-3, Class B5, 3.849%, 8/25/2050 (a)(g) | | | 1,716,667 | | | | 1,712,970 | |
JP Morgan Mortgage Trust, Series 2020-LTV2, Class B6, 4.019%, 11/25/2050 (a)(g) | | | 8,729,436 | | | | 8,264,305 | |
JP Morgan Mortgage Trust, Series 2020-LTV2, Class B5, 4.088%, 11/25/2050 (a)(g) | | | 3,174,114 | | | | 3,210,857 | |
JP Morgan Mortgage Trust, Series 2020-LTV2, Class B4, 4.088%, 11/25/2050 (a)(g) | | | 7,737,024 | | | | 7,826,975 | |
JP Morgan Mortgage Trust, Series 2020-5, Class B6, 3.482%, 12/25/2050 (a)(g) | | | 4,062,829 | | | | 3,458,512 | |
JP Morgan Mortgage Trust, Series 2020-5, Class B4, 3.619%, 12/25/2050 (a)(g) | | | 3,630,772 | | | | 3,604,122 | |
JP Morgan Mortgage Trust, Series 2020-5, Class B5, 3.619%, 12/25/2050 (a)(g) | | | 1,814,418 | | | | 1,723,274 | |
JP Morgan Mortgage Trust, Series 2020-9, Class B6, 2.853%, 5/25/2051 (a)(g) | | | 1,075,745 | | | | 696,049 | |
JP Morgan Mortgage Trust, Series 2021-3, Class B6, 2.859%, 7/25/2051 (a)(g) | | | 3,197,860 | | | | 1,413,147 | |
JP Morgan Mortgage Trust, Series 2021-3, Class B4, 2.967%, 7/25/2051 (a)(g) | | | 2,153,176 | | | | 1,925,738 | |
JP Morgan Mortgage Trust, Series 2021-3, Class B5, 2.967%, 7/25/2051 (a)(g) | | | 2,593,019 | | | | 1,923,857 | |
JP Morgan Mortgage Trust, Series 2021-6, Class B6, 2.688%, 10/25/2051 (a)(g) | | | 4,692,922 | | | | 1,826,903 | |
JP Morgan Mortgage Trust, Series 2021-6, Class B2, 2.849%, 10/25/2051 (a)(g) | | | 13,070,282 | | | | 12,616,900 | |
JP Morgan Mortgage Trust, Series 2021-6, Class B3, 2.863%, 10/25/2051 (a)(g) | | | 13,070,282 | | | | 12,363,820 | |
JP Morgan Mortgage Trust, Series 2021-6, Class B4, 2.863%, 10/25/2051 (a)(g) | | | 3,844,605 | | | | 3,359,220 | |
JP Morgan Mortgage Trust, Series 2021-6, Class B5, 2.863%, 10/25/2051 (a)(g) | | | 3,075,881 | | | | 2,470,120 | |
JP Morgan Mortgage Trust, Series 2021-7, Class B6, 2.709%, 11/25/2051 (a)(g) | | | 2,871,998 | | | | 1,065,836 | |
JP Morgan Mortgage Trust, Series 2021-7, Class B5, 2.820%, 11/25/2051 (a)(g) | | | 1,884,974 | | | | 1,247,025 | |
JP Morgan Mortgage Trust, Series 2021-7, Class B4, 2.820%, 11/25/2051 (a)(g) | | | 1,884,974 | | | | 1,637,686 | |
JP Morgan Mortgage Trust, Series 2021-8, Class B6, 2.324%, 12/25/2051 (a)(g) | | | 3,256,473 | | | | 1,268,259 | |
JP Morgan Mortgage Trust, Series 2021-10, Class B6, 2.467%, 12/25/2051 (a)(g) | | | 4,063,990 | | | | 1,558,187 | |
JP Morgan Mortgage Trust, Series 2021-10, Class B5, 2.827%, 12/25/2051 (a)(g) | | | 2,510,805 | | | | 1,900,134 | |
JP Morgan Mortgage Trust, Series 2021-8, Class B4, 2.869%, 12/25/2051 (a)(g) | | | 3,213,911 | | | | 2,824,616 | |
JP Morgan Mortgage Trust, Series 2021-8, Class B5, 2.869%, 12/25/2051 (a)(g) | | | 2,295,228 | | | | 1,635,940 | |
JP Morgan Mortgage Trust, Series 2021-15, Class B6, 3.129%, 6/25/2052 (a)(g) | | | 8,527,583 | | | | 4,027,023 | |
JP Morgan Mortgage Trust, Series 2021-15, Class B5, 3.129%, 6/25/2052 (a)(g) | | | 4,262,743 | | | | 3,591,881 | |
JP Morgan Mortgage Trust, Series 2021-15, Class B4, 3.129%, 6/25/2052 (a)(g) | | | 5,329,927 | | | | 4,793,203 | |
See accompanying notes which are an integral part of these financial statements.
77
Angel Oak Multi-Strategy Income Fund
Consolidated Schedule of Investments – (continued)
January 31, 2022
| | | | | | | | |
| | | Principal
Amount | | | Value | |
Residential Mortgage-Backed Securities – (continued) | | | | | | | | |
JP Morgan Mortgage Trust, Series 2021-15, Class B3, 3.129%, 6/25/2052 (a)(g) | | $ | 9,161,404 | | | $ | 8,914,422 | |
JP Morgan Mortgage Trust, Series 2022-1, Class B6, 3.106%, 7/25/2052 (a)(g) | | | 6,039,914 | | | | 2,466,949 | |
JP Morgan Mortgage Trust, Series 2022-1, Class B5, 3.106%, 7/25/2052 (a)(g) | | | 7,047,000 | | | | 5,603,204 | |
JP Morgan Mortgage Trust, Series 2022-1, Class B4, 3.106%, 7/25/2052 (a)(g) | | | 14,500,000 | | | | 12,810,417 | |
Lake Summit Mortgage Trust, Series 2019-1, 8.440%, 8/15/2049 (c)(g) | | | 5,165,658 | | | | 5,309,211 | |
Lake Summit Mortgage Trust, Series 2019-1B, 6.026%, 8/28/2049 (g) | | | 298,484,916 | | | | 300,947,715 | |
Lake Summit Mortgage Trust, Series C, 7.850%, 6/25/2051 (g) | | | 11,518,159 | | | | 11,481,232 | |
Legacy Mortgage Asset Trust, Series 2019-GS2, Class A1, 3.750%, 1/25/2059 (a)(n) | | | 6,500,007 | | | | 6,552,696 | |
Legacy Mortgage Asset Trust, Series 2021-GS1, Class A2, 3.844%, 10/25/2066 (a)(n) | | | 4,000,000 | | | | 4,295,952 | |
Lehman Mortgage Trust, Series 2007-5, Class PO1, 0.000%, 6/25/2037 (d) | | | 18,398 | | | | 14,109 | |
Lehman Mortgage Trust, Series 2007-9, Class AP, 0.000%, 10/25/2037 (d) | | | 19,512 | | | | 15,185 | |
Lehman XS Trust, Series 2005-3, Class 3A3A, 4.983%, 9/25/2035 (n) | | | 1,370,658 | | | | 1,350,886 | |
Lehman XS Trust, Series 2007-9, Class WFIO, 0.550%, 4/25/2037 (c)(f) | | | 21,137,366 | | | | 89,179 | |
Lehman XS Trust, Series 2007-12N, Class 2A1,
0.288% (1 Month LIBOR USD + 0.180%), 7/25/2037 (e) | | | 4,457,813 | | | | 4,084,093 | |
Lehman XS Trust, Series 2006-10N, Class 1A3A,
0.528% (1 Month LIBOR USD + 0.420%), 7/25/2046 (e) | | | 1,624,697 | | | | 1,674,184 | |
Lehman XS Trust, Series 2006-GP4, Class 3A4,
0.808% (1 Month LIBOR USD + 0.700%), 8/25/2046 (e) | | | 5,940,503 | | | | 5,382,072 | |
LSTAR Securities Investment Ltd., Series 2019-4, Class A1,
2.602% (1 Month LIBOR USD + 2.500%), 5/1/2024 (a)(e) | | | 5,600,863 | | | | 5,568,076 | |
Luminent Mortgage Trust, Series 2006-1, Class A1,
0.828% (1 Month LIBOR USD + 0.720%), 4/25/2036 (e) | | | 4,116,154 | | | | 3,776,308 | |
Luminent Mortgage Trust, Series 2006-1, Class X, 2.820%, 4/25/2036 (c)(f)(g) | | | 28,932,788 | | | | 1,868,190 | |
Luminent Mortgage Trust, Series 2006-3, Class 12X, 1.000%, 5/25/2036 (c)(f) | | | 9,570,825 | | | | 218,933 | |
Luminent Mortgage Trust, Series 2006-3, Class 12A1,
0.528% (1 Month LIBOR USD + 0.420%), 5/27/2036 (e) | | | 1,936,397 | | | | 1,832,107 | |
Luminent Mortgage Trust, Series 2006-5, Class A1A,
0.488% (1 Month LIBOR USD + 0.380%), 7/25/2036 (e)(i) | | | 27,957,311 | | | | 21,216,216 | |
Luminent Mortgage Trust, Series 2006-5, Class X, 2.118%, 7/25/2036 (c)(f)(g) | | | 30,822,703 | | | | 2,095,759 | |
Luminent Mortgage Trust, Series 2007-1, Class 1A1,
0.428% (1 Month LIBOR USD + 0.320%), 11/25/2036 (e) | | | 2,645,156 | | | | 2,526,944 | |
Luminent Mortgage Trust, Series 2006-7, Class 2A1,
0.278% (1 Month LIBOR USD + 0.170%), 12/26/2036 (e) | | | 10,293,831 | | | | 9,600,974 | |
Luminent Mortgage Trust, Series 2007-2, Class 1A2,
0.668% (1 Month LIBOR USD + 0.560%), 5/26/2037 (e) | | | 4,551,439 | | | | 4,282,954 | |
Luminent Mortgage Trust, Series 2006-2, Class X, 2.152%, 2/25/2046 (c)(f)(g) | | | 35,259,510 | | | | 1,659,348 | |
Luminent Mortgage Trust, Series 2006-6, Class A1,
0.508% (1 Month LIBOR USD + 0.400%), 10/25/2046 (e)(i) | | | 10,883,654 | | | | 10,617,679 | |
MASTR Adjustable Rate Mortgages Trust, Series 2004-15, Class 2A2, 2.493%, 12/25/2034 (g) | | | 5,882 | | | | 5,963 | |
MASTR Adjustable Rate Mortgages Trust, Series 2005-2, Class 5A1, 2.480%, 3/25/2035 (g) | | | 17,016 | | | | 17,704 | |
MASTR Adjustable Rate Mortgages Trust, Series 2005-7, Class 2A1, 2.589%, 9/25/2035 (g) | | | 1,647,303 | | | | 1,631,876 | |
MASTR Adjustable Rate Mortgages Trust, Series 2006-2, Class 3A1, 2.319%, 1/25/2036 (g) | | | 1,114,239 | | | | 1,101,678 | |
MASTR Alternative Loan Trust, Series 2007-1, Class 15PO, 0.000%, 10/1/2033 (d) | | | 10,790 | | | | 3,887 | |
MASTR Alternative Loan Trust, Series 2004-6, Class 30PO, 0.000%, 7/25/2034 (d) | | | 98,576 | | | | 90,963 | |
MASTR Alternative Loan Trust, Series 2005-5, Class 3A1, 5.750%, 8/25/2035 | | | 2,110,253 | | | | 1,694,907 | |
MASTR Alternative Loan Trust, Series 2006-1, Class A2,
0.808% (1 Month LIBOR USD + 0.700%), 2/25/2036 (e) | | | 2,193,619 | | | | 842,244 | |
See accompanying notes which are an integral part of these financial statements.
78
Angel Oak Multi-Strategy Income Fund
Consolidated Schedule of Investments – (continued)
January 31, 2022
| | | | | | | | |
| | | Principal
Amount | | | Value | |
Residential Mortgage-Backed Securities – (continued) | | | | | | | | |
MASTR Alternative Loan Trust, Series 2006-2, Class 1A2, 6.000%, 3/25/2036 | | $ | 383,512 | | | $ | 383,462 | |
MASTR Alternative Loan Trust, Series 2007-HF1, Class 4A1, 7.000%, 10/25/2047 | | | 17,028,186 | | | | 11,875,763 | |
MASTR Asset Securitization Trust, Series 2005-2, Class PO, 0.000%, 11/25/2035 (d) | | | 34,653 | | | | 25,534 | |
MASTR Asset Securitization Trust, Series 2007-1, Class AP, 0.000%, 11/25/2037 (c)(d) | | | 403 | | | | 335 | |
MASTR Resecuritization Trust, Series 2008-4, Class A1, 6.000%, 6/27/2036 (a)(g) | | | 1,658,223 | | | | 1,542,007 | |
Mello Mortgage Capital Acceptance, Series 2018-MTG1, Class B5, 3.773%, 3/25/2048 (a)(g) | | | 1,499,000 | | | | 1,396,953 | |
Mello Mortgage Capital Acceptance, Series 2018-MTG1, Class B4, 3.773%, 3/25/2048 (a)(g) | | | 1,799,000 | | | | 1,842,307 | |
Mello Mortgage Capital Acceptance, Series 2021-MTG1, Class B6, 2.653%, 4/25/2051 (a)(g) | | | 1,532,628 | | | | 523,578 | |
Mello Mortgage Capital Acceptance, Series 2021-MTG1, Class B5, 2.653%, 4/25/2051 (a)(g) | | | 562,652 | | | | 374,020 | |
Mello Mortgage Capital Acceptance, Series 2021-MTG1, Class B4, 2.653%, 4/25/2051 (a)(g) | | | 1,126,285 | | | | 945,866 | |
Mello Mortgage Capital Acceptance, Series 2021-MTG2, Class B4, 2.688%, 6/25/2051 (a)(g) | | | 1,721,230 | | | | 1,437,606 | |
Mello Mortgage Capital Acceptance, Series 2021-MTG2, Class B5, 2.688%, 6/25/2051 (a)(g) | | | 349,000 | | | | 199,180 | |
Mello Mortgage Capital Acceptance, Series 2021-MTG2, Class B6, 2.688%, 6/25/2051 (a)(g) | | | 1,209,493 | | | | 443,465 | |
Mello Mortgage Capital Acceptance, Series 2021-MTG3, Class B6, 2.918%, 7/25/2051 (a)(g) | | | 1,137,709 | | | | 409,341 | |
Mello Mortgage Capital Acceptance, Series 2021-MTG3, Class B5, 2.918%, 7/25/2051 (a)(g) | | | 488,000 | | | | 297,005 | |
Mello Mortgage Capital Acceptance, Series 2021-INV4, Class B6, 3.220%, 12/26/2051 (a)(g) | | | 4,039,472 | | | | 2,156,888 | |
Mello Mortgage Capital Acceptance, Series 2021-INV4, Class B2, 3.220%, 12/26/2051 (a)(g) | | | 9,306,831 | | | | 9,397,861 | |
Mello Mortgage Capital Acceptance, Series 2021-INV4, Class B3, 3.220%, 12/26/2051 (a)(g) | | | 2,808,594 | | | | 2,792,925 | |
Mello Mortgage Capital Acceptance, Series 2021-INV4, Class B5, 3.220%, 12/26/2051 (a)(g) | | | 1,228,884 | | | | 1,053,803 | |
Mello Mortgage Capital Acceptance, Series 2021-INV4, Class B4, 3.220%, 12/26/2051 (a)(g) | | | 3,161,412 | | | | 2,925,833 | |
Mello Mortgage Capital Acceptance, Series 2021-INV4, Class B1, 3.220%, 12/26/2051 (a)(g) | | | 5,794,594 | | | | 5,946,725 | |
Mello Warehouse Securitization Trust, Series 2020-1, Class F,
4.108% (1 Month LIBOR USD + 4.000%), 10/27/2053 (a)(e) | | | 8,250,000 | | | | 8,357,514 | |
Mello Warehouse Securitization Trust, Series 2020-1, Class G,
5.608% (1 Month LIBOR USD + 5.500%), 10/27/2053 (a)(e) | | | 15,000,000 | | | | 15,156,165 | |
Mello Warehouse Securitization Trust, Series 2020-2, Class F,
3.358% (1 Month LIBOR USD + 3.250%), 11/25/2053 (a)(e) | | | 5,500,000 | | | | 5,485,915 | |
Mello Warehouse Securitization Trust, Series 2020-2, Class G,
4.858% (1 Month LIBOR USD + 4.750%), 11/25/2053 (a)(e) | | | 6,000,000 | | | | 6,026,508 | |
Mello Warehouse Securitization Trust, Series 2021-2, Class E,
2.858% (1 Month LIBOR USD + 2.750%), 4/26/2055 (a)(e) | | | 4,500,000 | | | | 4,488,318 | |
Mello Warehouse Securitization Trust, Series 2021-2, Class F,
4.858% (1 Month LIBOR USD + 4.750%), 4/26/2055 (a)(e) | | | 5,000,000 | | | | 5,035,830 | |
Mello Warehouse Securitization Trust, Series 2021-3, Class B,
1.258% (1 Month LIBOR USD + 1.150%), 11/26/2055 (a)(e) | | | 5,500,000 | | | | 5,540,167 | |
Mello Warehouse Securitization Trust, Series 2021-3, Class C,
1.458% (1 Month LIBOR USD + 1.350%), 11/26/2055 (a)(e)(p) | | | 52,500,000 | | | | 52,884,825 | |
Mello Warehouse Securitization Trust, Series 2021-3, Class D,
2.108% (1 Month LIBOR USD + 2.000%), 11/26/2055 (a)(e) | | | 46,750,000 | | | | 47,092,678 | |
Mello Warehouse Securitization Trust, Series 2021-3, Class E,
3.358% (1 Month LIBOR USD + 3.250%), 11/26/2055 (a)(e) | | | 41,500,000 | | | | 41,804,195 | |
Mello Warehouse Securitization Trust, Series 2021-3, Class F,
5.258% (1 Month LIBOR USD + 5.150%), 11/26/2055 (a)(e) | | | 18,750,000 | | | | 18,887,438 | |
Merrill Lynch Mortgage Backed Securities Trust, Series 2007-1, Class 1A1,
2.754%, 4/25/2037 (g) | | | 1,822,205 | | | | 1,717,551 | |
Merrill Lynch Mortgage Investors Trust, Series 2003-B, Class A1,
0.788% (1 Month LIBOR USD + 0.680%), 4/25/2028 (e) | | | 1,251,528 | | | | 1,226,538 | |
Merrill Lynch Mortgage Investors Trust, Series 2004-A, Class A1,
0.568% (1 Month LIBOR USD + 0.460%), 4/25/2029 (e) | | | 933,086 | | | | 903,327 | |
See accompanying notes which are an integral part of these financial statements.
79
Angel Oak Multi-Strategy Income Fund
Consolidated Schedule of Investments – (continued)
January 31, 2022
| | | | | | | | |
| | | Principal
Amount | | | Value | |
Residential Mortgage-Backed Securities – (continued) | | | | | | | | |
Merrill Lynch Mortgage Investors Trust, Series 2005-A9, Class 2A1E, 2.479%, 12/25/2035 (g) | | $ | 1,189,209 | | | $ | 1,171,442 | |
Merrill Lynch Mortgage Investors Trust, Series 2006-A3, Class 3A1, 2.652%, 5/25/2036 (g) | | | 607,896 | | | | 550,505 | |
Merrill Lynch Mortgage Investors Trust, Series 2007-MLN1, Class A1,
0.358% (1 Month LIBOR USD + 0.250%), 3/25/2037 (e) | | | 27,000,113 | | | | 24,162,266 | |
Merrill Lynch Mortgage Investors Trust, Series 2006-WMC2, Class A1,
0.588% (1 Month LIBOR USD + 0.480%), 3/25/2037 (e) | | | 24,301,490 | | | | 8,063,915 | |
Merrill Lynch Mortgage Investors Trust, Series 2006-AF2, Class AV2B,
0.258% (1 Month LIBOR USD + 0.150%), 9/25/2037 (e) | | | 5,766,256 | | | | 4,305,439 | |
Merrill Lynch Mortgage Investors Trust, Series 2006-AF2, Class AV1,
0.268% (1 Month LIBOR USD + 0.160%), 9/25/2037 (e) | | | 5,560,812 | | | | 4,204,947 | |
Merrill Lynch Mortgage Investors Trust, Series 2006-AF2, Class AV2C,
0.338% (1 Month LIBOR USD + 0.230%), 9/25/2037 (e)
| | | 10,587,890 | | | | 8,109,678 | |
MFA Trust, Series 2021-AEI2, Class B6, 2.758%, 10/25/2051 (a)(g) | | | 4,188,184 | | | | 2,140,300 | |
MFA Trust, Series 2021-AEI2, Class B4, 3.302%, 10/25/2051 (a)(g) | | | 2,899,282 | | | | 2,629,043 | |
MFA Trust, Series 2021-AEI2, Class B1, 3.302%, 10/25/2051 (a)(g) | | | 3,271,539 | | | | 3,298,281 | |
MFA Trust, Series 2021-AEI2, Class B2, 3.302%, 10/25/2051 (a)(g) | | | 6,016,209 | | | | 5,984,233 | |
MFA Trust, Series 2021-AEI2, Class B5, 3.302%, 10/25/2051 (a)(g) | | | 2,092,595 | | | | 1,761,686 | |
MFA Trust, Series 2021-RPL1, Class A2, 2.072%, 7/25/2060 (a)(g) | | | 4,106,000 | | | | 3,871,145 | |
MFA Trust, Series 2021-RPL1, Class M2, 2.855%, 7/25/2060 (a)(g) | | | 4,500,000 | | | | 4,451,094 | |
Morgan Stanley ABS Capital, Inc. Trust, Series 2007-HE6, Class A1,
0.168% (1 Month LIBOR USD + 0.060%), 5/25/2037 (e) | | | 5,496,396 | | | | 5,173,350 | |
Morgan Stanley ABS Capital, Inc. Trust, Series 2007-HE6, Class A3,
0.288% (1 Month LIBOR USD + 0.180%), 5/25/2037 (e)(i) | | | 15,963,569 | | | | 14,939,745 | |
Morgan Stanley ABS Capital, Inc. Trust, Series 2007-HE6, Class A4,
0.358% (1 Month LIBOR USD + 0.250%), 5/25/2037 (e) | | | 2,298,754 | | | | 2,118,564 | |
Morgan Stanley Mortgage Loan Trust, Series 2005-1, Class 4A1,
0.408% (1 Month LIBOR USD + 0.300%), 3/25/2035 (e) | | | 1,410,142 | | | | 1,323,992 | |
Morgan Stanley Mortgage Loan Trust, Series 2005-3AR, Class 3A, 2.329%, 7/25/2035 (g) | | | 893,334 | | | | 840,516 | |
Morgan Stanley Mortgage Loan Trust, Series 2005-3AR, Class 1A, 2.360%, 7/25/2035 (g)(i) | | | 8,686,115 | | | | 6,893,057 | |
Morgan Stanley Mortgage Loan Trust, Series 2005-6AR, Class 5A1, 2.663%, 11/25/2035 (g) | | | 2,319,133 | | | | 1,845,596 | |
Morgan Stanley Mortgage Loan Trust, Series 2005-9AR, Class 1A,
0.398% (1 Month LIBOR USD + 0.290%), 12/25/2035 (e) | | | 1,851,680 | | | | 1,542,042 | |
Morgan Stanley Mortgage Loan Trust, Series 2006-3AR, Class 1A1,
0.358% (1 Month LIBOR USD + 0.250%), 3/25/2036 (e) | | | 2,308,055 | | | | 1,829,669 | |
Morgan Stanley Mortgage Loan Trust, Series 2006-3AR, Class 1A3,
0.368% (1 Month LIBOR USD + 0.260%), 3/25/2036 (e) | | | 1,394,606 | | | | 1,107,799 | |
Morgan Stanley Mortgage Loan Trust, Series 2006-3AR, Class 2A1, 3.024%, 3/25/2036 (g) | | | 6,654,600 | | | | 5,892,482 | |
Morgan Stanley Mortgage Loan Trust, Series 2006-3AR, Class 2A3, 3.024%, 3/25/2036 (g) | | | 3,382,352 | | | | 2,997,728 | |
Morgan Stanley Mortgage Loan Trust, Series 2006-3AR, Class 1AX,
3.819%, 3/25/2036 (c)(f)(g) | | | 17,344,154 | | | | 1,983,408 | |
Morgan Stanley Mortgage Loan Trust, Series 2006-5AR, Class AX,
3.021%, 4/25/2036 (c)(f)(g) | | | 19,030,452 | | | | 1,519,182 | |
Morgan Stanley Mortgage Loan Trust, Series 2006-7, Class 4A2,
0.858% (1 Month LIBOR USD + 0.750%), 6/25/2036 (e) | | | 3,860,042 | | | | 1,899,044 | |
Morgan Stanley Mortgage Loan Trust, Series 2006-9AR, Class A1,
0.448% (1 Month LIBOR USD + 0.340%), 8/25/2036 (e) | | | 2,103,047 | | | | 875,404 | |
Morgan Stanley Mortgage Loan Trust, Series 2006-11, Class 2A3, 6.000%, 8/25/2036 | | | 2,407,775 | | | | 1,816,601 | |
Morgan Stanley Mortgage Loan Trust, Series 2006-11, Class 1A6, 6.731%, 8/25/2036 (n) | | | 2,722,201 | | | | 1,046,199 | |
Morgan Stanley Mortgage Loan Trust, Series 2006-11, Class 1A3, 6.924%, 8/25/2036 (n) | | | 3,392,246 | | | | 1,304,427 | |
See accompanying notes which are an integral part of these financial statements.
80
Angel Oak Multi-Strategy Income Fund
Consolidated Schedule of Investments – (continued)
January 31, 2022
| | | | | | | | |
| | | Principal
Amount | | | Value | |
Residential Mortgage-Backed Securities – (continued) | | | | | | | | |
Morgan Stanley Mortgage Loan Trust, Series 2006-13AX, Class A2,
0.448% (1 Month LIBOR USD + 0.340%), 10/25/2036 (e) | | $ | 13,046,585 | | | $ | 5,572,118 | |
Morgan Stanley Mortgage Loan Trust, Series 2007-8XS, Class A5,
0.638% (1 Month LIBOR USD + 0.530%), 4/25/2037 (e) | | | 17,901,744 | | | | 8,546,615 | |
Morgan Stanley Mortgage Loan Trust, Series 2007-8XS, Class A9,
0.648% (1 Month LIBOR USD + 0.540%), 4/25/2037 (e) | | | 17,901,744 | | | | 8,639,400 | |
Morgan Stanley Mortgage Loan Trust, Series 2007-8XS, Class A2, 6.000%, 4/25/2037 (g) | | | 18,409,415 | | | | 10,046,054 | |
Morgan Stanley Mortgage Loan Trust, Series 2007-12, Class 3A22, 6.000%, 8/25/2037 | | | 2,744,957 | | | | 2,111,259 | |
Morgan Stanley Mortgage Loan Trust, Series 2007-15AR, Class 2A1, 2.791%, 11/25/2037 (g) | | | 6,298,970 | | | | 5,926,103 | |
Morgan Stanley Mortgage Loan Trust, Series 2007-1XS, Class 2A2, 5.826%, 9/25/2046 (n) | | | 12,185,952 | | | | 5,495,706 | |
Morgan Stanley Mortgage Loan Trust, Series 2007-1XS, Class 2A6, 5.858%, 9/25/2046 (n) | | | 4,699,982 | | | | 2,120,679 | |
Morgan Stanley Mortgage Loan Trust, Series 2007-1XS, Class 2A3, 5.919%, 9/25/2046 (n) | | | 11,690,135 | | | | 5,263,238 | |
Morgan Stanley Mortgage Loan Trust, Series 2007-1XS, Class 2A4C, 6.104%, 9/25/2046 (n) | | | 8,811,003 | | | | 3,924,148 | |
Morgan Stanley Mortgage Loan Trust, Series 2007-3XS, Class 2A3S, 5.858%, 1/25/2047 (n) | | | 1,586,070 | | | | 962,399 | |
Morgan Stanley Mortgage Loan Trust, Series 2007-3XS, Class 2A4S, 5.963%, 1/25/2047 (n) | | | 5,994,907 | | | | 3,343,330 | |
Morgan Stanley Mortgage Loan Trust, Series 2007-6XS, Class 2A5S, 6.000%, 2/25/2047 (n) | | | 2,743,924 | | | | 1,837,779 | |
Morgan Stanley Resecuritization Trust, Series 2015-R4, Class CB3, 0.928%, 8/27/2047 (a)(g) | | | 1,010,309 | | | | 734,863 | |
Morgan Stanley Residential Mortgage Loan Trust, Series 2010-R6, Class 4B,
0.483% (1 Month LIBOR USD + 0.190%), 2/26/2037 (a)(e) | | | 6,435,140 | | | | 6,033,202 | |
Morgan Stanley Residential Mortgage Loan Trust, Series 2021-1, Class B6,
2.954%, 3/25/2051 (a)(g) | | | 1,124,310 | | | | 413,544 | |
Morgan Stanley Residential Mortgage Loan Trust, Series 2021-1, Class B5,
2.954%, 3/25/2051 (a)(g) | | | 988,000 | | | | 609,642 | |
Morgan Stanley Residential Mortgage Loan Trust, Series 2021-1, Class B4,
2.954%, 3/25/2051 (a)(g) | | | 831,223 | | | | 629,316 | |
Morgan Stanley Residential Mortgage Loan Trust, Series 2021-3, Class B6,
2.810%, 6/25/2051 (a)(g) | | | 938,058 | | | | 333,470 | |
Morgan Stanley Residential Mortgage Loan Trust, Series 2021-3, Class B5,
2.823%, 6/25/2051 (a)(g) | | | 781,000 | | | | 451,138 | |
Morgan Stanley Residential Mortgage Loan Trust, Series 2021-3, Class B4,
2.823%, 6/25/2051 (a)(g) | | | 1,093,000 | | | | 775,271 | |
Morgan Stanley Residential Mortgage Loan Trust, Series 2021-4, Class B6,
2.935%, 7/25/2051 (a)(g) | | | 827,000 | | | | 302,417 | |
Morgan Stanley Residential Mortgage Loan Trust, Series 2021-4, Class B2,
2.939%, 7/25/2051 (a)(g) | | | 3,675,204 | | | | 3,506,247 | |
Morgan Stanley Residential Mortgage Loan Trust, Series 2021-4, Class B1,
2.939%, 7/25/2051 (a)(g) | | | 7,757,228 | | | | 7,556,525 | |
Morgan Stanley Residential Mortgage Loan Trust, Series 2021-4, Class B4,
2.939%, 7/25/2051 (a)(g) | | | 1,240,000 | | | | 891,560 | |
Morgan Stanley Residential Mortgage Loan Trust, Series 2021-4, Class B5, 2.939%, 7/25/2051 (a)(g) | | | 690,000 | | | | 412,576 | |
Morgan Stanley Residential Mortgage Loan Trust, Series 2021-4, Class B3,
2.939%, 7/25/2051 (a)(g) | | | 2,177,277 | | | | 1,997,118 | |
Morgan Stanley Residential Mortgage Loan Trust, Series 2021-5, Class B6, 2.993%, 8/25/2051 (a)(g) | | | 1,196,715 | | | | 449,925 | |
Morgan Stanley Residential Mortgage Loan Trust, Series 2021-5, Class B1,
2.997%, 8/25/2051 (a)(g)(p) | | | 13,267,182 | | | | 13,126,563 | |
Morgan Stanley Residential Mortgage Loan Trust, Series 2021-5, Class B5,
2.997%, 8/25/2051 (a)(g) | | | 956,000 | | | | 581,324 | |
See accompanying notes which are an integral part of these financial statements.
81
Angel Oak Multi-Strategy Income Fund
Consolidated Schedule of Investments – (continued)
January 31, 2022
| | | | | | | | |
| | | Principal
Amount | | | Value | |
Residential Mortgage-Backed Securities – (continued) | | | | | | | | |
Morgan Stanley Residential Mortgage Loan Trust, Series 2021-5, Class B2,
2.997%, 8/25/2051 (a)(g) | | $ | 6,397,332 | | | $ | 6,225,506 | |
Morgan Stanley Residential Mortgage Loan Trust, Series 2021-5, Class B4,
2.997%, 8/25/2051 (a)(g) | | | 2,132,774 | | | | 1,669,702 | |
Morgan Stanley Residential Mortgage Loan Trust, Series 2021-5, Class B3,
2.997%, 8/25/2051 (a)(g) | | | 4,501,312 | | | | 4,229,582 | |
Mortgage Insurance-Linked Notes, Series 2019-1, Class M2,
3.308% (1 Month LIBOR USD + 3.200%), 2/26/2029 (a)(e) | | | 4,464,215 | | | | 4,497,844 | |
Mortgage Insurance-Linked Notes, Series 2019-1, Class M2,
3.008% (1 Month LIBOR USD + 2.900%), 11/26/2029 (a)(e) | | | 2,921,294 | | | | 2,925,031 | |
Mortgage Insurance-Linked Notes, Series 2020-1, Class M1C,
1.858% (1 Month LIBOR USD + 1.750%), 1/25/2030 (a)(e) | | | 11,700,000 | | | | 11,483,866 | |
Mortgage Insurance-Linked Notes, Series 2020-1, Class M2A,
2.108% (1 Month LIBOR USD + 2.000%), 1/25/2030 (a)(e) | | | 21,731,174 | | | | 21,332,929 | |
Mortgage Insurance-Linked Notes, Series 2020-1, Class M1B,
1.558% (1 Month LIBOR USD + 1.450%), 2/25/2030 (a)(e) | | | 13,150,000 | | | | 13,089,102 | |
Mortgage Insurance-Linked Notes, Series 2020-2, Class M2,
5.708% (1 Month LIBOR USD + 5.600%), 10/25/2030 (a)(e) | | | 18,355,471 | | | | 18,516,669 | |
Mortgage Insurance-Linked Notes, Series 2020-2, Class B1,
7.708% (1 Month LIBOR USD + 7.600%), 10/25/2030 (a)(e) | | | 7,870,678 | | | | 8,028,981 | |
Mortgage Insurance-Linked Notes, Series 2021-2, Class M1B,
3.750% (SOFR30A + 3.700%), 11/25/2031 (a)(e) | | | 3,100,541 | | | | 3,178,563 | |
Mortgage Insurance-Linked Notes, Series 2021-2, Class M2,
5.050% (SOFR30A + 5.000%), 11/25/2031 (a)(e) | | | 2,214,672 | | | | 2,320,194 | |
Mortgage Insurance-Linked Notes, Series 2021-1, Class M2,
3.200% (SOFR30A + 3.150%), 12/27/2033 (a)(e) | | | 3,250,000 | | | | 3,217,507 | |
MortgageIT Mortgage Loan Trust, Series 2006-1, Class 2A1A,
0.528% (1 Month LIBOR USD + 0.420%), 4/25/2036 (e) | | | 2,591,007 | | | | 2,374,648 | |
MortgageIT Mortgage Loan Trust, Series 2006-1, Class 1X, 2.805%, 4/25/2036 (c)(f)(g) | | | 10,705,881 | | | | 865,035 | |
MortgageIT Securities Corp. Mortgage Loan Trust, Series 2007-1, Class 2A12,
0.408% (1 Month LIBOR USD + 0.300%), 6/25/2047 (e) | | | 2,803,904 | | | | 2,704,887 | |
MortgageIT Securities Corp. Mortgage Loan Trust, Series 2007-1, Class 1A1,
0.568% (1 Month LIBOR USD + 0.460%), 6/25/2047 (e) | | | 4,331,818 | | | | 4,029,344 | |
MortgageIT Securities Corp. Mortgage Loan Trust, Series 2007-1, Class 2A14,
0.668% (1 Month LIBOR USD + 0.560%), 6/25/2047 (e) | | | 2,591,827 | | | | 2,265,438 | |
New Residential Mortgage Loan Trust, Series 2019-1A, Class B6B, 3.232%, 9/25/2057 (a)(g) | | | 6,216,305 | | | | 5,985,686 | |
New Residential Mortgage Loan Trust, Series 2019-6A, Class B5IA, 1.750%, 9/25/2059 (a)(f)(g) | | | 16,091,880 | | | | 1,384,706 | |
New Residential Mortgage Loan Trust, Series 2019-6A, Class B6, 4.514%, 9/25/2059 (a)(g) | | | 20,826,150 | | | | 14,974,710 | |
Nomura Asset Acceptance Corp. Alternative Loan Trust, Series 2006-AP1, Class A3,
5.654%, 1/25/2036 (g) | | | 3,565,832 | | | | 1,731,829 | |
Nomura Asset Acceptance Corp. Alternative Loan Trust, Series 2006-AR1, Class 2A1,
2.984%, 2/25/2036 (g) | | | 659,935 | | | | 563,640 | |
Nomura Asset Acceptance Corp. Alternative Loan Trust, Series 2006-AR3, Class A1A,
0.428% (1 Month LIBOR USD + 0.320%), 10/27/2036 (e) | | | 960,587 | | | | 878,430 | |
Nomura Asset Acceptance Corp. Alternative Loan Trust, Series 2006-AR4, Class A3,
0.448% (1 Month LIBOR USD + 0.340%), 12/26/2036 (e) | | | 135,806 | | | | 128,970 | |
Nomura Resecuritization Trust, Series 2014-6R, Class 3A2,
0.622% (1 Month LIBOR USD + 0.260%), 1/26/2036 (a)(e) | | | 2,972,092 | | | | 2,770,346 | |
See accompanying notes which are an integral part of these financial statements.
82
Angel Oak Multi-Strategy Income Fund
Consolidated Schedule of Investments – (continued)
January 31, 2022
| | | | | | | | |
| | | Principal
Amount | | | Value | |
Residential Mortgage-Backed Securities – (continued) | | | | | | | | |
Nomura Resecuritization Trust, Series 2015-2R, Class 3A1,
0.328% (1 Month LIBOR USD + 0.150%), 11/26/2036 (a)(e) | | $ | 1,156,235 | | | $ | 1,162,313 | |
Nomura Resecuritization Trust, Series 2014-3R, Class 4A15,
2.088% (1 Month LIBOR USD + 0.160%), 3/26/2037 (a)(e) | | | 4,658,168 | | | | 4,167,378 | |
Oaktown Re III Ltd., Series 2019-1A, Class M2,
2.658% (1 Month LIBOR USD + 2.550%), 7/25/2029 (a)(e) | | | 1,921,930 | | | | 1,917,158 | |
Oaktown Re III Ltd., Series 2019-1A, Class B1A,
3.608% (1 Month LIBOR USD + 3.500%), 7/25/2029 (a)(e) | | | 1,200,000 | | | | 1,202,948 | |
Oaktown Re III Ltd., Series 2019-1A, Class B1B,
4.458% (1 Month LIBOR USD + 4.350%), 7/25/2029 (a)(e) | | | 1,620,000 | | | | 1,640,342 | |
Oaktown Re Ltd., Series 2018-1A, Class M2,
2.958% (1 Month LIBOR USD + 2.850%), 7/25/2028 (a)(e) | | | 6,000,000 | | | | 6,042,090 | |
OBX Trust, Series 2021-INV3, Class A3, 2.500%, 10/25/2051 (a)(g) | | | 1,461,491 | | | | 1,464,005 | |
Oceanview Mortgage Trust, Series 2021-5, Class B5, 2.986%, 10/15/2051 (a)(g) | | | 734,000 | | | | 459,570 | |
Oceanview Mortgage Trust, Series 2021-5, Class B4, 2.986%, 10/15/2051 (a)(g) | | | 1,715,000 | | | | 1,282,992 | |
Onslow Bay Mortgage Loan Trust, Series 2021-NQM4, Class A1, 1.957%, 10/25/2061 (a)(g) | | | 9,532,018 | | | | 9,534,429 | |
PFCA Home Equity Investment Trust, Series 2003-GP1, Class A, 3.601%, 10/25/2033 (a)(g) | | | 4,272,472 | | | | 4,425,790 | |
PFCA Home Equity Investment Trust, Series 2003-IFC4, Class A, 4.389%, 10/22/2034 (a)(g) | | | 2,981,012 | | | | 3,088,039 | |
PHH Alternative Mortgage Trust, Series 2007-1, Class 21PO, 0.000%, 2/25/2037 (d) | | | 14,013 | | | | 11,141 | |
PHH Alternative Mortgage Trust, Series 2007-1, Class 1A1,
0.428% (1 Month LIBOR USD + 0.320%), 2/25/2037 (e) | | | 4,796,200 | | | | 4,241,097 | |
PHH Alternative Mortgage Trust, Series 2007-2, Class 1A3,
0.768% (1 Month LIBOR USD + 0.660%), 5/26/2037 (e) | | | 1,335,132 | | | | 1,226,258 | |
Prime Mortgage Trust, Series 2007-2, Class A2, 6.000%, 4/25/2037 | | | 2,835,440 | | | | 2,395,731 | |
PRPM LLC, Series 2021-10, Class A2, 4.826%, 12/31/2049 (a)(n) | | | 6,500,000 | | | | 6,495,294 | |
PRPM LLC, Series 2021-RPL1, Class M1, 2.680%, 7/25/2051 (a)(g) | | | 6,167,000 | | | | 6,121,950 | |
RAMP Trust, Series 2006-RS2, Class A3A,
0.708% (1 Month LIBOR USD + 0.300%), 3/25/2036 (e) | | | 757,099 | | | | 740,479 | |
Rate Mortgage Trust, Series 2021-J1, Class B6, 2.717%, 7/25/2051 (a)(g) | | | 737,919 | | | | 246,005 | |
Rate Mortgage Trust, Series 2021-J1, Class B4, 2.717%, 7/25/2051 (a)(g) | | | 1,291,000 | | | | 896,362 | |
Rate Mortgage Trust, Series 2021-J1, Class B5, 2.717%, 7/25/2051 (a)(g) | | | 922,000 | | | | 511,456 | |
Rate Mortgage Trust, Series 2021-HB1, Class B5, 2.708%, 12/25/2051 (a)(g) | | | 575,000 | | | | 327,462 | |
Rate Mortgage Trust, Series 2021-HB1, Class B6, 2.708%, 12/25/2051 (a)(g) | | | 1,340,138 | | | | 453,433 | |
Rate Mortgage Trust, Series 2021-HB1, Class B4, 2.708%, 12/25/2051 (a)(g) | | | 2,669,620 | | | | 2,160,331 | |
Rate Mortgage Trust, Series 2022-J1, Class B5, 2.750%, 1/25/2052 (a)(g) | | | 632,000 | | | | 358,602 | |
Rate Mortgage Trust, Series 2022-J1, Class B4, 2.750%, 1/25/2052 (a)(g) | | | 3,793,000 | | | | 2,810,812 | |
Rate Mortgage Trust, Series 2022-J1, Class B6, 2.750%, 1/25/2052 (a)(g) | | | 1,112,723 | | | | 395,761 | |
RBSSP Resecuritization Trust, Series 2009-3, Class 3A3, 5.750%, 9/26/2035 (a)(g) | | | 1,849,728 | | | | 1,696,835 | |
RBSSP Resecuritization Trust, Series 2009-12, Class 19A2, 2.590%, 12/27/2035 (a)(g) | | | 8,419,854 | | | | 7,935,948 | |
RBSSP Resecuritization Trust, Series 2013-2, Class 2A2,
0.294% (1 Month LIBOR USD + 0.190%), 12/22/2036 (a)(e) | | | 5,937,283 | | | | 5,273,109 | |
Residential Accredit Loans, Inc. Trust, Series 2005-QS7, Class A1, 5.500%, 6/25/2035 | | | 1,675,166 | | | | 1,619,763 | |
Residential Accredit Loans, Inc. Trust, Series 2005-QS11, Class A2,
0.608% (1 Month LIBOR USD + 0.500%), 7/25/2035 (e) | | | 273,503 | | | | 205,476 | |
Residential Accredit Loans, Inc. Trust, Series 2005-QA7, Class A22, 2.991%, 7/25/2035 (g) | | | 1,415,085 | | | | 1,363,256 | |
Residential Accredit Loans, Inc. Trust, Series 2005-QA8, Class CB21, 3.438%, 7/25/2035 (g) | | | 535,464 | | | | 436,300 | |
Residential Accredit Loans, Inc. Trust, Series 2005-QS12, Class A10,
1.458% (1 Month LIBOR USD + 1.350%), 8/25/2035 (e) | | | 3,089,144 | | | | 2,650,850 | |
Residential Accredit Loans, Inc. Trust, Series 2005-QS10, Class 3A3, 5.500%, 8/25/2035 | | | 905,325 | | | | 814,048 | |
See accompanying notes which are an integral part of these financial statements.
83
Angel Oak Multi-Strategy Income Fund
Consolidated Schedule of Investments – (continued)
January 31, 2022
| | | | | | | | |
| | | Principal
Amount | | | Value | |
Residential Mortgage-Backed Securities – (continued) | | | | | | | | |
Residential Accredit Loans, Inc. Trust, Series 2005-QS13, Class AP, 0.000%, 9/25/2035 (d) | | $ | 229,254 | | | $ | 132,021 | |
Residential Accredit Loans, Inc. Trust, Series 2005-QS13, Class 2A1,
0.808% (1 Month LIBOR USD + 0.700%), 9/25/2035 (e) | | | 3,788,340 | | | | 3,296,923 | |
Residential Accredit Loans, Inc. Trust, Series 2005-QS13, Class 1A6, 5.500%, 9/25/2035 | | | 528,300 | | | | 510,352 | |
Residential Accredit Loans, Inc. Trust, Series 2005-QS13, Class 2A4, 5.750%, 9/25/2035 | | | 2,183,228 | | | | 2,137,064 | |
Residential Accredit Loans, Inc. Trust, Series 2005-QS14, Class 2A1, 6.000%, 9/25/2035 | | | 6,459,155 | | | | 4,595,844 | |
Residential Accredit Loans, Inc. Trust, Series 2005-QS15, Class 3A, 6.000%, 10/25/2035 | | | 6,136,980 | | | | 6,154,366 | |
Residential Accredit Loans, Inc. Trust, Series 2005-QS16, Class A1,
0.808% (1 Month LIBOR USD + 0.700%), 11/25/2035 (e) | | | 482,006 | | | | 386,529 | |
Residential Accredit Loans, Inc. Trust, Series 2005-QS17, Class AP, 0.000%, 12/25/2035 (d) | | | 479,598 | | | | 316,650 | |
Residential Accredit Loans, Inc. Trust, Series 2005-QA13, Class 2A1, 3.954%, 12/25/2035 (g) | | | 4,309,423 | | | | 4,153,930 | |
Residential Accredit Loans, Inc. Trust, Series 2005-QS17, Class A1, 6.000%, 12/25/2035 | | | 2,448,786 | | | | 2,395,650 | |
Residential Accredit Loans, Inc. Trust, Series 2006-QS1, Class A5,
1.018% (1 Month LIBOR USD + 0.910%), 1/25/2036 (e) | | | 4,395,140 | | | | 3,680,609 | |
Residential Accredit Loans, Inc. Trust, Series 2006-QS2, Class 1A2,
0.608% (1 Month LIBOR USD + 0.500%), 2/25/2036 (e) | | | 488,749 | | | | 385,205 | |
Residential Accredit Loans, Inc. Trust, Series 2006-QS2, Class 1A5,
1.108% (1 Month LIBOR USD + 1.000%), 2/25/2036 (e) | | | 824,748 | | | | 638,456 | |
Residential Accredit Loans, Inc. Trust, Series 2006-QS2, Class 1A9, 5.500%, 2/25/2036 | | | 3,356,188 | | | | 3,043,136 | |
Residential Accredit Loans, Inc. Trust, Series 2006-QS3, Class 2AP, 0.000%, 3/25/2036 (d) | | | 564,323 | | | | 343,127 | |
Residential Accredit Loans, Inc. Trust, Series 2006-QS3, Class 1A8,
0.508% (1 Month LIBOR USD + 0.400%), 3/25/2036 (e) | | | 1,823,920 | | | | 1,415,522 | |
Residential Accredit Loans, Inc. Trust, Series 2006-QS3, Class 1A1,
0.808% (1 Month LIBOR USD + 0.700%), 3/25/2036 (e) | | | 3,380,675 | | | | 2,661,798 | |
Residential Accredit Loans, Inc. Trust, Series 2006-QA3, Class A2,
0.708% (1 Month LIBOR USD + 0.600%), 4/25/2036 (e)(i) | | | 22,025,054 | | | | 21,010,778 | |
Residential Accredit Loans, Inc. Trust, Series 2006-QS4, Class A2, 6.000%, 4/25/2036 | | | 1,391,327 | | | | 1,315,626 | |
Residential Accredit Loans, Inc. Trust, Series 2006-QS5, Class AP, 0.000%, 5/25/2036 (d) | | | 34,197 | | | | 22,458 | |
Residential Accredit Loans, Inc. Trust, Series 2006-QS5, Class A1, 6.000%, 5/25/2036 | | | 1,035,791 | | | | 969,479 | |
Residential Accredit Loans, Inc. Trust, Series 2006-QS5, Class A9, 6.000%, 5/25/2036 | | | 1,479,867 | | | | 1,383,547 | |
Residential Accredit Loans, Inc. Trust, Series 2006-QS9, Class 2AP, 0.000%, 7/25/2036 (d) | | | 14,951 | | | | 5,418 | |
Residential Accredit Loans, Inc. Trust, Series 2006-QS9, Class 1AP, 0.000%, 7/25/2036 (d) | | | 39,492 | | | | 25,568 | |
Residential Accredit Loans, Inc. Trust, Series 2006-QA5, Class 1A2,
0.468% (1 Month LIBOR USD + 0.360%), 7/25/2036 (e) | | | 6,598,044 | | | | 3,738,583 | |
Residential Accredit Loans, Inc. Trust, Series 2006-QA5, Class 1A1,
0.468% (1 Month LIBOR USD + 0.360%), 7/25/2036 (e) | | | 122,029 | | | | 70,919 | |
Residential Accredit Loans, Inc. Trust, Series 2006-QA6, Class A3,
0.488% (1 Month LIBOR USD + 0.380%), 7/25/2036 (e) | | | 1,735,580 | | | | 1,720,092 | |
Residential Accredit Loans, Inc. Trust, Series 2006-QA5, Class 1A3,
0.548% (1 Month LIBOR USD + 0.440%), 7/25/2036 (e) | | | 636,727 | | | | 324,470 | |
Residential Accredit Loans, Inc. Trust, Series 2006-QS9, Class 1A8,
0.758% (1 Month LIBOR USD + 0.650%), 7/25/2036 (e) | | | 1,209,851 | | | | 870,477 | |
Residential Accredit Loans, Inc. Trust, Series 2006-QS9, Class 1A10,
6.500%, 7/25/2036 | | | 1,739,998 | | | | 1,657,866 | |
Residential Accredit Loans, Inc. Trust, Series 2006-QA7, Class 2A1,
0.478% (1 Month LIBOR USD + 0.370%), 8/25/2036 (e) | | | 6,080,230 | | | | 5,859,968 | |
Residential Accredit Loans, Inc. Trust, Series 2006-QA7, Class 1A1,
0.488% (1 Month LIBOR USD + 0.380%), 8/25/2036 (e) | | | 8,110,351 | | | | 7,970,958 | |
Residential Accredit Loans, Inc. Trust, Series 2006-QS10, Class A4, 5.750%, 8/25/2036 | | | 1,603,208 | | | | 1,492,459 | |
See accompanying notes which are an integral part of these financial statements.
84
Angel Oak Multi-Strategy Income Fund
Consolidated Schedule of Investments – (continued)
January 31, 2022
| | | | | | | | |
| | | Principal
Amount | | | Value | |
Residential Mortgage-Backed Securities – (continued) | | | | | | | | |
Residential Accredit Loans, Inc. Trust, Series 2006-QS8, Class A2, 6.000%, 8/25/2036 | | $ | 961,484 | | | $ | 895,848 | |
Residential Accredit Loans, Inc. Trust, Series 2006-QS8, Class A1, 6.000%, 8/25/2036 | | | 2,304,433 | | | | 2,172,181 | |
Residential Accredit Loans, Inc. Trust, Series 2006-QS10, Class A10, 6.000%, 8/25/2036 | | | 229,831 | | | | 210,626 | |
Residential Accredit Loans, Inc. Trust, Series 2006-QS11, Class 1A8, 6.000%, 8/25/2036 | | | 2,603,339 | | | | 2,459,385 | |
Residential Accredit Loans, Inc. Trust, Series 2006-QS11, Class 1A2, 6.000%, 8/25/2036 | | | 2,613,009 | | | | 2,493,448 | |
Residential Accredit Loans, Inc. Trust, Series 2006-QS10, Class A15, 6.000%, 8/25/2036 | | | 300,001 | | | | 274,200 | |
Residential Accredit Loans, Inc. Trust, Series 2006-QS11, Class 1A1, 6.500%, 8/25/2036 | | | 3,706,496 | | | | 3,579,274 | |
Residential Accredit Loans, Inc. Trust, Series 2006-QS12, Class AP, 0.000%, 9/25/2036 (d) | | | 102,271 | | | | 67,887 | |
Residential Accredit Loans, Inc. Trust, Series 2006-QA8, Class A2,
0.468% (1 Month LIBOR USD + 0.360%), 9/25/2036 (e) | | | 488,578 | | | | 491,895 | |
Residential Accredit Loans, Inc. Trust, Series 2006-QS12, Class 2A7,
0.758% (1 Month LIBOR USD + 0.650%), 9/25/2036 (e) | | | 3,278,647 | | | | 2,705,618 | |
Residential Accredit Loans, Inc. Trust, Series 2006-QS12, Class 2A18, 5.750%, 9/25/2036 | | | 334,701 | | | | 309,485 | |
Residential Accredit Loans, Inc. Trust, Series 2006-QS12, Class 2A4, 6.000%, 9/25/2036 | | | 3,380,389 | | | | 3,169,720 | |
Residential Accredit Loans, Inc. Trust, Series 2006-QS15, Class AP, 0.000%, 10/25/2036 (d) | | | 130,876 | | | | 73,305 | |
Residential Accredit Loans, Inc. Trust, Series 2006-QS15, Class A1, 6.500%, 10/25/2036 | | | 24,027,112 | | | | 23,194,957 | |
Residential Accredit Loans, Inc. Trust, Series 2006-QS15, Class A5, 6.500%, 10/25/2036 | | | 1,289,965 | | | | 1,240,882 | |
Residential Accredit Loans, Inc. Trust, Series 2006-QS16, Class AP, 0.000%, 11/25/2036 (d) | | | 103,316 | | | | 55,228 | |
Residential Accredit Loans, Inc. Trust, Series 2006-QS14, Class A15,
0.408% (1 Month LIBOR USD + 0.300%), 11/25/2036 (e) | | | 1,934,529 | | | | 1,309,589 | |
Residential Accredit Loans, Inc. Trust, Series 2006-QS16, Class A3,
6.000% (1 Month LIBOR USD + 0.550%), 11/25/2036 (e) | | | 8,189,914 | | | | 7,613,287 | |
Residential Accredit Loans, Inc. Trust, Series 2006-QS14, Class A13, 6.500%, 11/25/2036 | | | 1,015,539 | | | | 939,127 | |
Residential Accredit Loans, Inc. Trust, Series 2006-QS14, Class A25, 6.500%, 11/25/2036 | | | 6,600,684 | | | | 6,311,310 | |
Residential Accredit Loans, Inc. Trust, Series 2006-QS14, Class A1, 6.500%, 11/25/2036 | | | 998,288 | | | | 922,174 | |
Residential Accredit Loans, Inc. Trust, Series 2006-QA10, Class A2,
0.468% (1 Month LIBOR USD + 0.360%), 12/25/2036 (e) | | | 514,770 | | | | 492,601 | |
Residential Accredit Loans, Inc. Trust, Series 2006-QA10, Class A1,
0.478% (1 Month LIBOR USD + 0.370%), 12/25/2036 (e) | | | 6,937,111 | | | | 6,635,902 | |
Residential Accredit Loans, Inc. Trust, Series 2006-QS18, Class 2A1,
0.558% (1 Month LIBOR USD + 0.450%), 12/25/2036 (e) | | | 5,716,946 | | | | 4,344,107 | |
Residential Accredit Loans, Inc. Trust, Series 2006-QS17, Class A6, 6.250%, 12/25/2036 | | | 5,076,128 | | | | 4,764,931 | |
Residential Accredit Loans, Inc. Trust, Series 2007-QS1, Class 2AP, 0.000%, 1/25/2037 (d) | | | 934,338 | | | | 534,831 | |
Residential Accredit Loans, Inc. Trust, Series 2007-QS1, Class 1AP, 0.000%, 1/25/2037 (d) | | | 41,918 | | | | 24,013 | |
Residential Accredit Loans, Inc. Trust, Series 2007-QS1, Class 1A5,
0.658% (1 Month LIBOR USD + 0.550%), 1/25/2037 (e) | | | 7,726,174 | | | | 5,762,335 | |
Residential Accredit Loans, Inc. Trust, Series 2007-QS1, Class 2A4,
0.658% (1 Month LIBOR USD + 0.550%), 1/25/2037 (e) | | | 10,559,199 | | | | 8,526,448 | |
Residential Accredit Loans, Inc. Trust, Series 2007-QS1, Class 2A10, 6.000%, 1/25/2037 | | | 1,854,827 | | | | 1,759,209 | |
Residential Accredit Loans, Inc. Trust, Series 2007-QS3, Class AP, 0.000%, 2/25/2037 (d) | | | 466,034 | | | | 243,032 | |
Residential Accredit Loans, Inc. Trust, Series 2007-QA2, Class A3,
0.408% (1 Month LIBOR USD + 0.300%), 2/25/2037 (e) | | | 6,588,476 | | | | 6,396,870 | |
Residential Accredit Loans, Inc. Trust, Series 2007-QH1, Class A1,
0.428% (1 Month LIBOR USD + 0.320%), 2/25/2037 (e) | | | 6,930,985 | | | | 6,564,322 | |
Residential Accredit Loans, Inc. Trust, Series 2007-QS3, Class A2, 6.000%, 2/25/2037 (i) | | | 12,620,607 | | | | 11,578,485 | |
Residential Accredit Loans, Inc. Trust, Series 2007-QS5, Class AP, 0.000%, 3/25/2037 (d) | | | 303,644 | | | | 166,670 | |
Residential Accredit Loans, Inc. Trust, Series 2007-QS4, Class 4A3, 0.000%, 3/25/2037 (d) | | | 563,542 | | | | 55,809 | |
Residential Accredit Loans, Inc. Trust, Series 2007-QS5, Class A7, 0.000%, 3/25/2037 (d) | | | 206,723 | | | | 109,468 | |
Residential Accredit Loans, Inc. Trust, Series 2007-QS5, Class A1, 5.500%, 3/25/2037 | | | 403,881 | | | | 358,653 | |
See accompanying notes which are an integral part of these financial statements.
85
Angel Oak Multi-Strategy Income Fund
Consolidated Schedule of Investments – (continued)
January 31, 2022
| | | | | | | | |
| | | Principal
Amount | | | Value | |
Residential Mortgage-Backed Securities – (continued) | | | | | | | | |
Residential Accredit Loans, Inc. Trust, Series 2007-QS6, Class AP, 0.000%, 4/25/2037 (d) | | $ | 367,503 | | | $ | 194,339 | |
Residential Accredit Loans, Inc. Trust, Series 2007-QS6, Class A1,
0.438% (1 Month LIBOR USD + 0.330%), 4/25/2037 (e) | | | 3,627,211 | | | | 2,712,389 | |
Residential Accredit Loans, Inc. Trust, Series 2007-QA3, Class A3,
0.298% (1 Month LIBOR USD + 0.190%), 5/25/2037 (e)(i) | | | 13,164,904 | | | | 12,621,075 | |
Residential Accredit Loans, Inc. Trust, Series 2007-QS7, Class 1A7,
0.658% (1 Month LIBOR USD + 0.550%), 5/25/2037 (e) | | | 600,712 | | | | 452,412 | |
Residential Accredit Loans, Inc. Trust, Series 2007-QS8, Class A13, 6.000%, 6/25/2037 | | | 2,018,436 | | | | 1,954,993 | |
Residential Accredit Loans, Inc. Trust, Series 2007-QS9, Class AP, 0.000%, 7/25/2037 (d) | | | 1,072,265 | | | | 523,193 | |
Residential Accredit Loans, Inc. Trust, Series 2007-QS10, Class A1, 6.500%, 9/25/2037 | | | 8,013,454 | | | | 7,695,728 | |
Residential Accredit Loans, Inc. Trust, Series 2005-QO5, Class X,
1.681%, 1/25/2046 (c)(f)(g) | | | 26,630,561 | | | | 940,192 | |
Residential Accredit Loans, Inc. Trust, Series 2006-QO7, Class X3, 1.500%, 9/25/2046 (c)(f) | | | 16,625,258 | | | | 491,326 | |
Residential Accredit Loans, Inc. Trust, Series 2006-QO9, Class 1A3A,
0.508% (1 Month LIBOR USD + 0.400%), 12/25/2046 (e)(i) | | | 13,028,468 | | | | 12,534,937 | |
Residential Accredit Loans, Inc. Trust, Series 2007-QO5, Class A,
3.207% (12 Month US Treasury Average + 3.120%), 8/25/2047 (e) | | | 24,488,632 | | | | 7,386,188 | |
Residential Asset Securitization Trust, Series 2005-A4, Class A1,
0.558% (1 Month LIBOR USD + 0.450%), 4/25/2035 (e) | | | 3,069,259 | | | | 2,163,671 | |
Residential Asset Securitization Trust, Series 2005-A10, Class A3, 5.500%, 9/25/2035 | | | 4,354,645 | | | | 3,539,273 | |
Residential Asset Securitization Trust, Series 2005-A10, Class A4, 5.500%, 9/25/2035 | | | 1,185,827 | | | | 931,403 | |
Residential Asset Securitization Trust, Series 2005-A11, Class PO, 0.000%, 10/25/2035 (d) | | | 591,686 | | | | 380,784 | |
Residential Asset Securitization Trust, Series 2005-A11, Class 1A1,
0.558% (1 Month LIBOR USD + 0.450%), 10/25/2035 (e) | | | 1,968,992 | | | | 1,452,793 | |
Residential Asset Securitization Trust, Series 2005-A11, Class 1A3, 5.500%, 10/25/2035 | | | 1,773,185 | | | | 1,636,951 | |
Residential Asset Securitization Trust, Series 2005-A12, Class A10,
0.558% (1 Month LIBOR USD + 0.450%), 11/25/2035 (e) | | | 990,689 | | | | 629,195 | |
Residential Asset Securitization Trust, Series 2005-A12, Class A6,
0.608% (1 Month LIBOR USD + 0.500%), 11/25/2035 (e) | | | 3,953,272 | | | | 2,387,436 | |
Residential Asset Securitization Trust, Series 2005-A14, Class A3, 5.500%, 12/25/2035 | | | 672,648 | | | | 536,297 | |
Residential Asset Securitization Trust, Series 2006-A2, Class A5,
0.808% (1 Month LIBOR USD + 0.700%), 5/25/2036 (e) | | | 1,862,933 | | | | 732,103 | |
Residential Asset Securitization Trust, Series 2006-A8, Class 2A3, 6.000%, 8/25/2036 | | | 6,320,271 | | | | 3,390,326 | |
Residential Asset Securitization Trust, Series 2006-A8, Class 2A1, 6.500%, 8/25/2036 | | | 1,642,334 | | | | 897,604 | |
Residential Asset Securitization Trust, Series 2006-A8, Class 2A4, 6.500%, 8/25/2036 | | | 10,381,689 | | | | 6,082,496 | |
Residential Asset Securitization Trust, Series 2006-A8, Class 2A2, 6.750%, 8/25/2036 | | | 10,452,641 | | | | 6,239,505 | |
Residential Asset Securitization Trust, Series 2006-A14C, Class 2A4, 6.000%, 12/25/2036 | | | 3,094,941 | | | | 1,686,040 | |
Residential Asset Securitization Trust, Series 2006-A16, Class 2A1, 6.000%, 2/25/2037 | | | 8,389,186 | | | | 4,009,712 | |
Residential Asset Securitization Trust, Series 2006-A16, Class 2A3, 6.609%, 2/25/2037 (g) | | | 22,499,939 | | | | 12,854,913 | |
Residential Asset Securitization Trust, Series 2007-A6, Class 1A4, 6.000%, 6/25/2037 | | | 2,369,702 | | | | 1,991,358 | |
Residential Asset Securitization Trust, Series 2007-A7, Class A6, 6.000%, 7/25/2037 | | | 4,047,334 | | | | 2,477,005 | |
Residential Funding Mortgage Securities Trust, Series 2005-S7, Class AP,
0.000%, 11/25/2035 (d) | | | 44,744 | | | | 32,714 | |
Residential Funding Mortgage Securities Trust, Series 2006-SA1, Class 1A1,
3.991%, 2/25/2036 (g) | | | 771,990 | | | | 722,656 | |
Residential Funding Mortgage Securities Trust, Series 2006-S4, Class AP,
0.000%, 4/25/2036 (d) | | | 117,475 | | | | 92,810 | |
Residential Funding Mortgage Securities Trust, Series 2006-S5, Class A4,
0.000%, 6/25/2036 (d) | | | 41,222 | | | | 26,684 | |
See accompanying notes which are an integral part of these financial statements.
86
Angel Oak Multi-Strategy Income Fund
Consolidated Schedule of Investments – (continued)
January 31, 2022
| | | | | | | | |
| | | Principal
Amount | | | Value | |
Residential Mortgage-Backed Securities – (continued) | | | | | | | | |
Residential Funding Mortgage Securities Trust, Series 2006-S5, Class A12, 6.000%, 6/25/2036 | | $ | 614,220 | | | $ | 613,672 | |
Residential Funding Mortgage Securities Trust, Series 2006-S5, Class A9, 6.000%, 6/25/2036 | | | 797,241 | | | | 778,118 | |
Residential Funding Mortgage Securities Trust, Series 2006-S7, Class A7, 6.250%, 8/25/2036 | | | 60,158 | | | | 57,795 | |
Residential Funding Mortgage Securities Trust, Series 2006-S9, Class A4, 5.750%, 9/25/2036 | | | 4,870,438 | | | | 4,655,052 | |
Residential Funding Mortgage Securities Trust, Series 2006-S10, Class 1AP, 0.000%, 10/25/2036 (d) | | | 14,284 | | | | 9,011 | |
Residential Funding Mortgage Securities Trust, Series 2006-S10, Class 1A3, 6.000%, 10/25/2036 | | | 490,406 | | | | 473,727 | |
Residential Funding Mortgage Securities Trust, Series 2006-SA4, Class 2A1, 4.605%, 11/25/2036 (g) | | | 989,175 | | | | 935,721 | |
Residential Funding Mortgage Securities Trust, Series 2007-S1, Class A7,
6.000%, 1/25/2037 | | | 1,422,445 | | | | 1,378,129 | |
Residential Funding Mortgage Securities Trust, Series 2007-S5, Class AP,
0.000%, 5/25/2037 (d) | | | 213,758 | | | | 150,432 | |
Residential Mortgage Loan Trust, Series 2019-2, Class B1, 4.713%, 5/25/2059 (a)(g) | | | 12,400,000 | | | | 12,511,786 | |
Residential Mortgage Loan Trust, Series 2019-2, Class B2, 6.037%, 5/25/2059 (a)(g) | | | 10,739,000 | | | | 10,837,971 | |
Residential Mortgage Loan Trust, Series 2020-1, Class B2, 4.665%, 1/25/2060 (a)(g) | | | 1,075,000 | | | | 1,072,831 | |
Rocket Mortgage Trust, Series 2021-2, Class B4, 2.565%, 6/25/2051 (a)(g) | | | 2,576,155 | | | | 2,027,393 | |
Rocket Mortgage Trust, Series 2021-2, Class B5, 2.565%, 6/25/2051 (a)(g) | | | 1,566,000 | | | | 864,197 | |
Rocket Mortgage Trust, Series 2021-2, Class B6, 2.565%, 6/25/2051 (a)(g) | | | 870,254 | | | | 290,926 | |
Rocket Mortgage Trust, Series 2021-4, Class B4, 3.025%, 9/25/2051 (a)(g) | | | 9,611,404 | | | | 8,344,448 | |
Rocket Mortgage Trust, Series 2021-4, Class B2A, 3.025%, 9/25/2051 (a)(g)(p) | | | 16,341,273 | | | | 16,623,748 | |
Rocket Mortgage Trust, Series 2021-4, Class B5, 3.025%, 9/25/2051 (a)(g) | | | 8,171,133 | | | | 5,960,711 | |
Rocket Mortgage Trust, Series 2021-4, Class B6, 3.025%, 9/25/2051 (a)(g) | | | 6,294,411 | | | | 2,558,930 | |
Rocket Mortgage Trust, Series 2021-4, Class B3, 3.025%, 9/25/2051 (a)(g) | | | 7,689,719 | | | | 7,338,137 | |
Rocket Mortgage Trust, Series 2021-6, Class B5, 2.797%, 12/25/2051 (a)(g) | | | 1,948,000 | | | | 1,179,800 | |
Rocket Mortgage Trust, Series 2021-6, Class B6, 2.797%, 12/25/2051 (a)(g) | | | 1,947,847 | | | | 730,234 | |
Rocket Mortgage Trust, Series 2021-6, Class B4, 2.797%, 12/25/2051 (a)(g) | | | 4,858,842 | | | | 4,080,402 | |
Rocket Mortgage Trust, Series 2022-1, Class B3, 2.757%, 1/25/2052 (a)(g) | | | 9,351,000 | | | | 8,685,938 | |
Rocket Mortgage Trust, Series 2022-1, Class B5, 2.757%, 1/25/2052 (a)(g) | | | 2,245,000 | | | | 1,327,783 | |
Rocket Mortgage Trust, Series 2022-1, Class B4, 2.757%, 1/25/2052 (a)(g) | | | 5,237,000 | | | | 4,395,629 | |
Rocket Mortgage Trust, Series 2022-1, Class B6, 2.757%, 1/25/2052 (a)(g) | | | 2,244,537 | | | | 838,326 | |
Saluda Grade Alternative Mortgage Trust, Series 2020-PAC1, Class A2,
6.899%, 8/25/2027 (a) | | | 15,000,000 | | | | 14,987,325 | |
Saluda Grade Alternative Mortgage Trust, Series 2021-MF1, Class A1,
2.805%, 11/25/2029 (a)(g) | | | 14,000,000 | | | | 13,975,290 | |
Saluda Grade Alternative Mortgage Trust, Series 2020-SEQ1, Class C,
0.000%, 5/25/2050 (a)(c)(f)(g) | | | 61,407,518 | | | | 5,027,188 | |
Saluda Grade Alternative Mortgage Trust, Series 2020-SEQ1, Class A1,
3.321%, 5/25/2050 (a)(g) | | | 9,309,745 | | | | 9,293,667 | |
Saluda Grade Alternative Mortgage Trust, Series 2020-SEQ1, Class A2,
5.000%, 5/25/2050 (a)(g) | | | 8,176,278 | | | | 8,300,574 | |
Saluda Grade Alternative Mortgage Trust, Series 2020-SEQ1, Class M1,
7.500%, 5/25/2050 (a)(g) | | | 7,318,000 | | | | 7,717,797 | |
See accompanying notes which are an integral part of these financial statements.
87
Angel Oak Multi-Strategy Income Fund
Consolidated Schedule of Investments – (continued)
January 31, 2022
| | | | | | | | |
| | | Principal
Amount | | | Value | |
Residential Mortgage-Backed Securities – (continued) | | | | | | | | |
Saluda Grade Alternative Mortgage Trust, Series 2020-FIG1, Class A1,
3.568%, 9/25/2050 (a) | | $ | 3,992,783 | | | $ | 4,002,817 | |
Saluda Grade Alternative Mortgage Trust, Series 2020-FIG1, Class M1, 7.000%, 9/25/2050 (a) | | | 15,231,588 | | | | 15,247,855 | |
Saluda Grade Alternative Mortgage Trust, Series 2021-FIG2, Class C,
0.010%, 10/25/2051 (a)(f)(g) | | | 239,362 | | | | 1,491,487 | |
Saluda Grade Alternative Mortgage Trust, Series 2021-FIG2, Class M1,
4.250%, 10/25/2051 (a)(g) | | | 1,449,524 | | | | 1,803,474 | |
Saluda Grade Alternative Mortgage Trust, Series 2021-FIG2, Class M2,
6.000%, 10/25/2051 (a)(g) | | | 1,159,619 | | | | 1,444,216 | |
Saluda Grade Fund Trust, Series 2021-SG1, Class A, 6.000%, 8/15/2051 (a) | | | 26,000,000 | | | | 25,733,396 | |
Saluda Grade Fund Trust, Series 2021-SG1, Class B, 13.500%, 8/15/2051 (a) | | | 6,200,000 | | | | 6,132,501 | |
Sequoia Mortgage Trust, Series 2004-4, Class A,
0.686% (6 Month LIBOR USD + 0.520%), 5/20/2034 (e) | | | 812,737 | | | | 782,731 | |
Sequoia Mortgage Trust, Series 2004-7, Class A3B,
1.258% (6 Month LIBOR USD + 1.100%), 8/20/2034 (e) | | | 36,764 | | | | 36,182 | |
Sequoia Mortgage Trust, Series 2005-2, Class XA, 0.728%, 3/20/2035 (c)(f)(g) | | | 6,212,551 | | | | 81,353 | |
Sequoia Mortgage Trust, Series 2007-1, Class 5A1, 2.343%, 10/20/2046 (g) | | | 2,480,640 | | | | 2,296,591 | |
Sequoia Mortgage Trust, Series 2020-3, Class B4, 3.327%, 4/25/2050 (a)(g) | | | 2,445,638 | | | | 2,325,794 | |
Sequoia Mortgage Trust, Series 2021-1, Class B4, 2.673%, 3/25/2051 (a)(g) | | | 2,580,500 | | | | 2,020,555 | |
Sequoia Mortgage Trust, Series 2021-7, Class B4, 2.872%, 11/25/2051 (a)(g) | | | 1,624,858 | | | | 1,191,952 | |
SG Residential Mortgage Trust, Series 2021-2, Class A1, 1.737%, 12/25/2061 (a)(g) | | | 34,716,996 | | | | 34,627,738 | |
SG Residential Mortgage Trust, Series 2021-2, Class A2, 1.942%, 12/25/2061 (a)(g)(p) | | | 10,231,595 | | | | 10,193,646 | |
Shellpoint Asset Funding Trust, Series 2013-1, Class B4, 3.935%, 7/25/2043 (a)(g) | | | 782,566 | | | | 817,405 | |
Shellpoint Asset Funding Trust, Series 2013-1, Class B5, 3.935%, 7/25/2043 (a)(g) | | | 2,735,122 | | | | 2,500,347 | |
Spruce Hill Mortgage Loan Trust, Series 2020-SH1, Class B2, 4.676%, 1/28/2050 (a)(g) | | | 6,000,000 | | | | 6,029,754 | |
Starwood Mortgage Residential Trust, Series 2021-5, Class A1, 1.920%, 9/25/2066 (a)(g) | | | 9,549,737 | | | | 9,535,212 | |
Starwood Mortgage Residential Trust, Series 2021-5, Class A3, 2.436%, 9/25/2066 (a)(g)(p) | | | 10,959,278 | | | | 10,929,962 | |
Starwood Mortgage Residential Trust, Series 2022-1, Class A1, 0.000%, 12/25/2066 (a)(g) | | | 3,000,000 | | | | 3,022,302 | |
Structured Adjustable Rate Mortgage Loan Trust, Series 2005-18, Class 3A1, 2.729%, 9/25/2035 (g) | | | 2,417,496 | | | | 2,237,482 | |
Structured Adjustable Rate Mortgage Loan Trust, Series 2005-23, Class 4A1,
2.917%, 1/25/2036 (g) | | | 483,124 | | | | 470,548 | |
Structured Adjustable Rate Mortgage Loan Trust, Series 2007-8, Class 1A2,
1.602% (1 Month LIBOR USD + 1.500%), 9/25/2037 (e) | | | 1,017,391 | | | | 992,598 | |
Structured Asset Mortgage Investments Trust, Series 2004-AR1, Class X, 1.559%, 3/19/2034 (c)(f)(g) | | | 6,783,363 | | | | 227,914 | |
Structured Asset Mortgage Investments Trust, Series 2004-AR7, Class X, 1.261%, 4/19/2035 (c)(f)(g) | | | 9,368,449 | | | | 234,370 | |
Structured Asset Mortgage Investments Trust, Series 2005-AR3, Class 1X, 2.693%, 7/25/2035 (c)(f)(g) | | | 13,680,562 | | | | 1,201,550 | |
Structured Asset Mortgage Investments Trust, Series 2006-AR5, Class 1X, 1.621%, 5/25/2036 (c)(f)(g) | | | 12,262,553 | | | | 829,010 | |
Structured Asset Mortgage Investments Trust, Series 2006-AR5, Class 4X, 2.048%, 5/25/2036 (c)(f)(g) | | | 37,738,733 | | | | 3,832,859 | |
Structured Asset Mortgage Investments Trust, Series 2006-AR8, Class X, 0.400%, 10/25/2036 (c)(f) | | | 91,111,213 | | | | 1,740,953 | |
Structured Asset Mortgage Investments Trust, Series 2005-AR2, Class 1X, 2.103%, 5/25/2045 (c)(f)(g) | | | 8,504,422 | | | | 476,571 | |
See accompanying notes which are an integral part of these financial statements.
88
Angel Oak Multi-Strategy Income Fund
Consolidated Schedule of Investments – (continued)
January 31, 2022
| | | | | | | | |
| | | Principal
Amount | | | Value | |
Residential Mortgage-Backed Securities – (continued) | | | | | | | | |
Structured Asset Securities Corp. Mortgage Pass-Through Certificates, Series 2003-6A, Class 2A1, 2.119%, 3/25/2033 (g) | | $ | 18,409 | | | $ | 19,018 | |
TBW Mortgage-Backed Trust Series, Series 2006-3, Class 2A1, 6.500%, 7/25/2036 | | | 3,277,488 | | | | 1,867,241 | |
Terwin Mortgage Trust, Series 2005-18AL, Class PX, 4.110%, 1/25/2037 (a)(c)(f)(g) | | | 26,983,000 | | | | 2,244,716 | |
TH MSR Issuer Trust, Series 2019-FT1, Class A,
2.908% (1 Month LIBOR USD + 2.800%), 6/25/2024 (a)(e) | | | 2,000,000 | | | | 1,993,214 | |
Towd Point Mortgage Trust, Series 2019-SJ2, Class B2, 5.250%, 11/25/2058 (a)(g) | | | 18,375,306 | | | | 18,522,106 | |
Traingle Re Ltd., Series 2020-1, Class M1B,
4.008% (1 Month LIBOR USD + 3.900%), 10/25/2030 (a)(e) | | | 1,019,472 | | | | 1,027,170 | |
Traingle Re Ltd., Series 2021-1, Class M1B,
3.108% (1 Month LIBOR USD + 3.000%), 8/25/2033 (a)(e) | | | 6,095,253 | | | | 6,112,728 | |
Traingle Re Ltd., Series 2021-1, Class M1C,
3.508% (1 Month LIBOR USD + 3.400%), 8/25/2033 (a)(e) | | | 4,720,000 | | | | 4,732,055 | |
Traingle Re Ltd., Series 2021-1, Class M2,
4.008% (1 Month LIBOR USD + 3.900%), 8/25/2033 (a)(e) | | | 7,492,000 | | | | 7,511,105 | |
Traingle Re Ltd., Series 2021-3, Class M1B, 2.950% (SOFR30A + 2.900%), 2/25/2034 (a)(e) | | | 4,700,000 | | | | 4,699,746 | |
Traingle Re Ltd., Series 2021-3, Class M2, 3.800% (SOFR30A + 3.750%), 2/25/2034 (a)(e) | | | 2,200,000 | | | | 2,183,449 | |
Unison Trust, Series 2021-1, Class A, 4.500%, 4/25/2050 (a)(g) | | | 9,735,353 | | | | 9,610,001 | |
Unlock Residential Trust, 6.000%, 5/1/2033 (c)(g)(j) | | | 45,000,000 | | | | 45,000,000 | |
UWM Mortgage Trust, Series 2021-INV1, Class B2, 3.169%, 8/25/2051 (a)(g) | | | 7,593,639 | | | | 7,466,142 | |
UWM Mortgage Trust, Series 2021-INV1, Class B1, 3.169%, 8/25/2051 (a)(g) | | | 6,482,810 | | | | 6,490,252 | |
UWM Mortgage Trust, Series 2021-INV1, Class B5, 3.169%, 8/25/2051 (a)(g) | | | 1,666,244 | | | | 1,331,383 | |
UWM Mortgage Trust, Series 2021-INV1, Class B4, 3.169%, 8/25/2051 (a)(g) | | | 2,222,649 | | | | 1,985,893 | |
UWM Mortgage Trust, Series 2021-INV1, Class B3, 3.169%, 8/25/2051 (a)(g) | | | 4,444,309 | | | | 4,375,337 | |
UWM Mortgage Trust, Series 2021-INV1, Class B6, 3.169%, 8/25/2051 (a)(g) | | | 3,519,607 | | | | 1,601,597 | |
UWM Mortgage Trust, Series 2021-INV2, Class B6, 2.958%, 9/25/2051 (a)(g) | | | 4,568,926 | | | | 2,418,223 | |
UWM Mortgage Trust, Series 2021-INV2, Class B4, 3.260%, 9/25/2051 (a)(g) | | | 2,978,741 | | | | 2,608,731 | |
UWM Mortgage Trust, Series 2021-INV2, Class B5, 3.260%, 9/25/2051 (a)(g) | | | 2,185,139 | | | | 1,775,849 | |
UWM Mortgage Trust, Series 2021-INV2, Class B1, 3.260%, 9/25/2051 (a)(g) | | | 6,554,422 | | | | 6,770,135 | |
UWM Mortgage Trust, Series 2021-INV2, Class B3, 3.260%, 9/25/2051 (a)(g) | | | 5,363,522 | | | | 5,308,970 | |
UWM Mortgage Trust, Series 2021-INV2, Class B2, 3.260%, 9/25/2051 (a)(g) | | | 9,136,859 | | | | 9,259,759 | |
UWM Mortgage Trust, Series 2021-INV3, Class B6, 2.910%, 11/25/2051 (a)(g) | | | 10,301,045 | | | | 5,853,682 | |
UWM Mortgage Trust, Series 2021-INV3, Class B2, 3.247%, 11/25/2051 (a)(g)(p) | | | 18,130,317 | | | | 18,387,568 | |
UWM Mortgage Trust, Series 2021-INV3, Class B5, 3.247%, 11/25/2051 (a)(g) | | | 4,532,579 | | | | 3,827,627 | |
UWM Mortgage Trust, Series 2021-INV3, Class B4, 3.247%, 11/25/2051 (a)(g) | | | 6,180,428 | | | | 5,670,809 | |
UWM Mortgage Trust, Series 2021-INV3, Class B1, 3.247%, 11/25/2051 (a)(g)(p) | | | 14,009,700 | | | | 14,437,192 | |
UWM Mortgage Trust, Series 2021-INV3, Class B3, 3.247%, 11/25/2051 (a)(g) | | | 8,652,201 | | | | 8,611,562 | |
Wachovia Mortgage Loan Trust LLC, Series 2006-AMN1, Class A1,
0.189% (1 Month LIBOR USD + 0.100%), 8/25/2036 (e) | | | 4,957,637 | | | | 2,392,962 | |
Wachovia Mortgage Loan Trust LLC, Series 2006-AMN1, Class A2,
0.389% (1 Month LIBOR USD + 0.300%), 8/25/2036 (e) | | | 21,924,893 | | | | 11,889,080 | |
Wachovia Mortgage Loan Trust LLC, Series 2006-AMN1, Class A3,
0.569% (1 Month LIBOR USD + 0.480%), 8/25/2036 (e) | | | 2,463,743 | | | | 1,456,129 | |
Wachovia Mortgage Loan Trust LLC, Series 2006-ALT1, Class A1,
0.268% (1 Month LIBOR USD + 0.160%), 1/25/2037 (e) | | | 7,633,834 | | | | 4,047,398 | |
Wachovia Mortgage Loan Trust LLC, Series 2006-ALT1, Class A2,
0.468% (1 Month LIBOR USD + 0.360%), 1/25/2037 (e) | | | 2,458,570 | | | | 1,573,377 | |
Washington Mutual Mortgage Pass-Through Certificates Trust, Series 2004-AR3, Class B1, 2.597%, 6/25/2034 (g) | | | 687,982 | | | | 699,341 | |
See accompanying notes which are an integral part of these financial statements.
89
Angel Oak Multi-Strategy Income Fund
Consolidated Schedule of Investments – (continued)
January 31, 2022
| | | | | | | | |
| | | Principal
Amount | | | Value | |
Residential Mortgage-Backed Securities – (continued) | | | | | | | | |
Washington Mutual Mortgage Pass-Through Certificates Trust, Series 2005-AR16, Class 1A2, 2.644%, 12/25/2035 (g)(i) | | $ | 12,605,329 | | | $ | 12,428,174 | |
Washington Mutual Mortgage Pass-Through Certificates Trust, Series 2005-AR18, Class 1A2, 2.814%, 1/25/2036 (g)(i) | | | 13,345,629 | | | | 13,654,287 | |
Washington Mutual Mortgage Pass-Through Certificates Trust, Series 2006-AR14, Class 2A3, 2.420%, 11/25/2036 (g) | | | 777,920 | | | | 747,333 | |
Washington Mutual Mortgage Pass-Through Certificates Trust, Series 2006-AR18, Class 3A1, 2.945%, 1/25/2037 (g) | | | 386,816 | | | | 377,200 | |
Washington Mutual Mortgage Pass-Through Certificates Trust, Series 2007-HY6, Class 1A1, 2.805%, 6/25/2037 (g) | | | 2,187,993 | | | | 2,137,663 | |
Washington Mutual Mortgage Pass-Through Certificates Trust, Series 2004-AR10, Class X, 1.638%, 7/25/2044 (c)(f)(g) | | | 12,434,406 | | | | 427,843 | |
Washington Mutual Mortgage Pass-Through Certificates Trust, Series 2005-AR6, Class X, 1.977%, 4/25/2045 (c)(f)(g) | | | 19,478,025 | | | | 1,427,583 | |
Washington Mutual Mortgage Pass-Through Certificates Trust, Series 2007-OA4, Class 1XPP, 1.068%, 5/25/2047 (c)(f)(g) | | | 82,595,546 | | | | 1,046,899 | |
Washington Mutual Mortgage Pass-Through Certificates Trust, Series 2007-OA5, Class 1XPP, 0.930%, 6/25/2047 (c)(f)(g) | | | 68,674,127 | | | | 635,167 | |
Washington Mutual Mortgage Pass-Through Certificates WMALT Trust, Series 2003-MS7, Class P, 0.000%, 3/25/2033 (d) | | | 603 | | | | 471 | |
Washington Mutual Mortgage Pass-Through Certificates WMALT Trust, Series 2005-5, Class CB11, 1.508% (1 Month LIBOR USD + 1.400%), 7/25/2035 (e) | | | 4,023,466 | | | | 3,689,148 | |
Washington Mutual Mortgage Pass-Through Certificates WMALT Trust, Series 2005-9, Class 5A3, 1.458% (1 Month LIBOR USD + 1.350%), 11/25/2035 (e) | | | 1,919,573 | | | | 1,378,343 | |
Washington Mutual Mortgage Pass-Through Certificates WMALT Trust, Series 2005-AR1, Class A1A, 0.628% (1 Month LIBOR USD + 0.520%), 12/25/2035 (e) | | | 3,073,964 | | | | 2,963,427 | |
Washington Mutual Mortgage Pass-Through Certificates WMALT Trust, Series 2005-11, Class A7, 5.750%, 1/25/2036 | | | 6,923,383 | | | | 6,654,354 | |
Washington Mutual Mortgage Pass-Through Certificates WMALT Trust, Series 2007-HY1, Class A1, 0.198% (1 Month LIBOR USD + 0.090%), 2/25/2037 (e) | | | 7,638,845 | | | | 4,988,686 | |
Washington Mutual Mortgage Pass-Through Certificates WMALT Trust, Series 2007-3, Class A19, 6.000%, 4/25/2037 (i) | | | 5,340,112 | | | | 5,307,217 | |
Washington Mutual Mortgage Pass-Through Certificates WMALT Trust, Series 2006-AR8, Class 3X1, 1.644%, 10/25/2046 (c)(f)(g) | | | 14,346,642 | | | | 736,327 | |
Washington Mutual Mortgage Pass-Through Certificates WMALT Trust, Series 2006-AR9, Class 1A, 0.917% (12 Month US Treasury Average + 0.830%), 11/25/2046 (e) | | | 5,879,245 | | | | 5,209,805 | |
Washington Mutual Mortgage Pass-Through Certificates WMALT Trust, Series 2007-OA3, Class 5A, 1.468% (11th District Cost of Funds Index + 1.250%), 4/25/2047 (e) | | | 3,810,986 | | | | 3,761,577 | |
Washington Mutual Mortgage Pass-Through Certificates WMALT Trust, Series 2007-OA4, Class XPPP, 1.922%, 4/25/2047 (c)(f)(g) | | | 24,959,797 | | | | 1,009,199 | |
Wells Fargo Alternative Loan Trust, Series 2007-PA1, Class A1,
0.428% (1 Month LIBOR USD + 0.320%), 3/25/2037 (e) | | | 3,797,750 | | | | 3,152,436 | |
Wells Fargo Alternative Loan Trust, Series 2007-PA2, Class 1A1, 6.000%, 6/25/2037 | | | 1,094,760 | | | | 1,088,285 | |
Wells Fargo Alternative Loan Trust, Series 2007-PA3, Class 4A3, 6.500%, 7/25/2037 | | | 2,047,811 | | | | 1,870,475 | |
Wells Fargo Alternative Loan Trust, Series 2007-PA3, Class 4A1, 6.500%, 7/25/2037 | | | 1,866,742 | | | | 1,705,086 | |
Wells Fargo Mortgage Backed Securities Trust, Series 2006-AR11, Class A1,
2.833%, 8/25/2036 (g) | | | 172,488 | | | | 167,971 | |
Wells Fargo Mortgage Backed Securities Trust, Series 2006-AR12, Class 1A1,
2.244%, 9/25/2036 (g) | | | 298,670 | | | | 292,783 | |
See accompanying notes which are an integral part of these financial statements.
90
Angel Oak Multi-Strategy Income Fund
Consolidated Schedule of Investments – (continued)
January 31, 2022
| | | | | | | | |
| | | Principal
Amount | | | Value | |
Residential Mortgage-Backed Securities – (continued) | | | | | | | | |
Wells Fargo Mortgage Backed Securities Trust, Series 2006-AR14, Class 1A3,
2.947%, 10/25/2036 (g) | | $ | 620,466 | | | $ | 607,459 | |
Wells Fargo Mortgage Backed Securities Trust, Series 2007-17, Class APO,
0.000%, 1/25/2038 (d) | | | 44,306 | | | | 31,433 | |
Wells Fargo Mortgage Backed Securities Trust, Series 2019-3, Class B4,
3.760%, 7/25/2049 (a)(g) | | | 1,627,000 | | | | 1,606,056 | |
Wells Fargo Mortgage Backed Securities Trust, Series 2019-4, Class B4,
3.538%, 9/25/2049 (a)(g) | | | 2,124,000 | | | | 2,033,422 | |
Wells Fargo Mortgage Backed Securities Trust, Series 2021-1, Class B6,
2.724%, 12/25/2050 (a)(g) | | | 1,583,975 | | | | 616,290 | |
Wells Fargo Mortgage Backed Securities Trust, Series 2021-1, Class B5,
2.724%, 12/25/2050 (a)(g) | | | 1,011,000 | | | | 626,076 | |
Wells Fargo Mortgage Backed Securities Trust, Series 2021-1, Class B4,
2.724%, 12/25/2050 (a)(g) | | | 1,818,000 | | | | 1,355,006 | |
Wells Fargo Mortgage Backed Securities Trust, Series 2022-1, Class B5,
2.988%, 8/25/2051 (a)(g) | | | 1,158,000 | | | | 739,825 | |
Wells Fargo Mortgage Backed Securities Trust, Series 2022-1, Class B6,
2.988%, 8/25/2051 (a)(g) | | | 1,852,327 | | | | 739,721 | |
Wells Fargo Mortgage Backed Securities Trust, Series 2022-1, Class B4,
2.988%, 8/25/2051 (a)(g) | | | 1,620,000 | | | | 1,426,191 | |
Wells Fargo Mortgage Backed Securities Trust, Series 2022-1, Class B2,
2.988%, 8/25/2051 (a)(g) | | | 4,862,000 | | | | 4,698,996 | |
Wells Fargo Mortgage Loan Trust, Series 2010-RR2, Class 1A4, 2.818%, 9/27/2035 (a)(g) | | | 4,405,591 | | | | 3,934,558 | |
Western Mortgage Reference Notes, Series 2021-CL2, Class M4,
5.400% (SOFR30A + 5.350%), 7/25/2059 (a)(e) | | | 19,908,550 | | | | 19,977,015 | |
Western Mortgage Reference Notes, Series 2021-CL2, Class M5,
6.550% (SOFR30A + 6.500%), 7/25/2059 (a)(e) | | | 8,638,678 | | | | 8,666,884 | |
Western Mortgage Reference Notes, Series 2021-CL2, Class B,
8.550% (SOFR30A + 8.500%), 7/25/2059 (a)(e) | | | 6,600,000 | | | | 6,620,275 | |
WinWater Mortgage Loan Trust, Series 2014-1, Class B5, 3.915%, 6/20/2044 (a)(g) | | | 2,370,000 | | | | 2,375,667 | |
WinWater Mortgage Loan Trust, Series 2014-2, Class B5, 4.034%, 9/20/2044 (a)(g) | | | 1,938,000 | | | | 1,850,168 | |
WinWater Mortgage Loan Trust, Series 2015-A, Class B5, 3.815%, 6/20/2045 (a)(g) | | | 3,945,294 | | | | 3,546,148 | |
ZeroDown LLC, Series 2021-SFR1, Class A, 3.861%, 9/25/2024 (a)(g) | | | 20,683,883 | | | | 20,650,913 | |
ZeroDown LLC, Series 2021-SFR1, Class B, 7.677%, 9/25/2024 (a) | | | 5,515,642 | | | | 5,504,362 | |
| | | | | | | | |
| | |
TOTAL RESIDENTIAL MORTGAGE-BACKED SECURITIES
(Cost – $5,046,627,356) | | | | | | $ | 4,918,183,872 | |
| | | | | | | | |
Residential Mortgage-Backed Securities – U.S. Government Agency Credit Risk Transfer – 1.02% | | | | | | | | |
Connecticut Avenue Securities Trust, Series 2019-R02, Class 1M2,
2.408% (1 Month LIBOR USD + 2.300%), 8/25/2031 (a)(e) | | | 1,445,019 | | | | 1,452,024 | |
Connecticut Avenue Securities Trust, Series 2019-R04, Class 2M2,
2.208% (1 Month LIBOR USD + 2.100%), 6/27/2039 (a)(e) | | | 481,184 | | | | 482,087 | |
Connecticut Avenue Securities Trust, Series 2019-R04, Class 2B1,
5.358% (1 Month LIBOR USD + 5.250%), 6/27/2039 (a)(e) | | | 2,606,068 | | | | 2,682,621 | |
Connecticut Avenue Securities Trust, Series 2019-R05, Class 1M2,
2.108% (1 Month LIBOR USD + 2.000%), 7/25/2039 (a)(e) | | | 202,479 | | | | 202,859 | |
Connecticut Avenue Securities Trust, Series 2019-R06, Class 2B1,
3.858% (1 Month LIBOR USD + 3.750%), 9/25/2039 (a)(e) | | | 2,322,582 | | | | 2,347,986 | |
See accompanying notes which are an integral part of these financial statements.
91
Angel Oak Multi-Strategy Income Fund
Consolidated Schedule of Investments – (continued)
January 31, 2022
| | | | | | | | |
| | | Principal
Amount | | | Value | |
Residential Mortgage-Backed Securities – U.S. Government Agency Credit Risk Transfer – (continued) | | | | | | | | |
Connecticut Avenue Securities Trust, Series 2019-R07, Class 1M2,
2.208% (1 Month LIBOR USD + 2.100%), 10/25/2039 (a)(e) | | $ | 1,990,593 | | | $ | 1,998,064 | |
Connecticut Avenue Securities Trust, Series 2019-HRP1, Class B1,
9.358% (1 Month LIBOR USD + 9.250%), 11/25/2039 (a)(e) | | | 2,500,000 | | | | 2,659,375 | |
Connecticut Avenue Securities Trust, Series 2020-R02, Class 2B1,
3.108% (1 Month LIBOR USD + 3.000%), 1/25/2040 (a)(e) | | | 3,017,089 | | | | 3,020,860 | |
Federal Home Loan Mortgage Corp., Series 2021-HQA4, Class B2,
7.050% (SOFR30A + 7.000%), 12/26/2041 (a)(e) | | | 5,550,000 | | | | 5,529,188 | |
Federal Home Loan Mortgage Corp., Series 2018-SPI2, Class B, 3.807%, 5/25/2048 (a)(g) | | | 5,335,476 | | | | 5,193,755 | |
Federal Home Loan Mortgage Corp., Series 2018-SPI3, Class B, 4.148%, 8/25/2048 (a)(g) | | | 10,219,254 | | | | 10,113,934 | |
Federal Home Loan Mortgage Corp., Series 2018-SPI4, Class B, 4.501%, 11/25/2048 (a)(g) | | | 22,591,636 | | | | 22,463,451 | |
Federal Home Loan Mortgage Corp., Series 2019-DNA4, Class M2,
2.058% (1 Month LIBOR USD + 1.950%), 10/25/2049 (a)(e) | | | 1,087,351 | | | | 1,091,432 | |
Federal Home Loan Mortgage Corp., Series 2019-HQA4, Class M2,
2.158% (1 Month LIBOR USD + 2.050%), 11/26/2049 (a)(e) | | | 1,874,981 | | | | 1,881,433 | |
Federal Home Loan Mortgage Corp., Series 2020-HQA1, Class B1,
2.458% (1 Month LIBOR USD + 2.350%), 1/25/2050 (a)(e) | | | 4,899,856 | | | | 4,887,606 | |
Federal Home Loan Mortgage Corp., Series 2020-DNA2, Class B1,
2.608% (1 Month LIBOR USD + 2.500%), 2/25/2050 (a)(e) | | | 3,800,000 | | | | 3,809,500 | |
Federal Home Loan Mortgage Corp., Series 2021-DNA1, Class B1,
2.700% (SOFR30A + 2.650%), 1/25/2051 (a)(e) | | | 2,153,143 | | | | 2,139,686 | |
Federal National Mortgage Association, Series 2015-C03, Class 1M2,
5.108% (1 Month LIBOR USD + 5.000%), 7/25/2025 (e) | | | 977,469 | | | | 1,006,524 | |
Federal National Mortgage Association, Series 2017-C06, Class 2M2,
2.908% (1 Month LIBOR USD + 2.800%), 2/25/2030 (e) | | | 1,049,018 | | | | 1,071,009 | |
| | | | | | | | |
| | |
TOTAL RESIDENTIAL MORTGAGE-BACKED SECURITIES – U.S. GOVERNMENT AGENCY CREDIT RISK TRANSFER
(Cost – $72,361,135) | | | | | | $ | 74,033,394 | |
| | | | | | | | |
U.S. Treasury Notes – 2.08% | | | | | | | | |
0.625%, 10/15/2024 | | | 44,000,000 | | | | 43,192,187 | |
0.750%, 11/15/2024 | | | 15,000,000 | | | | 14,757,422 | |
2.125%, 11/30/2024 | | | 50,000,000 | | | | 51,074,219 | |
2.250%, 12/31/2024 | | | 40,000,000 | | | | 41,015,625 | |
| | | | | | | | |
| | |
TOTAL U.S. TREASURY NOTES
(Cost – $152,622,468) | | | | | | $ | 150,039,453 | |
| | | | | | | | |
Whole Loans – 0.36% | | | | | | | | |
Agency High Balance Residential Mortgages,
4.500% to 5.125%, 5/24/2048 to 6/5/2048 | | | 1,632,153 | | | | 1,669,517 | |
Agency High Balance Residential Mortgages, 2.5000%, 4/26/2037 to 8/24/2037 (c) | | | 2,338,515 | | | | 2,216,712 | |
Gateway Mount Pleasant CRE, 5.300%, 8/1/2028 | | | 13,493,866 | | | | 11,684,914 | |
Savannah Grand, 6.900%, 2/6/2022 | | | 4,600,000 | | | | 4,589,467 | |
Valley Oaks Nursing Home, 12.500%, 3/31/2022 | | | 5,665,493 | | | | 5,666,507 | |
| | | | | | | | |
| | |
TOTAL WHOLE LOANS
(Cost – $25,865,036) | | | | | | $ | 25,827,117 | |
| | | | | | | | |
See accompanying notes which are an integral part of these financial statements.
92
Angel Oak Multi-Strategy Income Fund
Consolidated Schedule of Investments – (continued)
January 31, 2022
| | | | | | | | |
| | | Shares | | | Value | |
Short-Term Investments – 9.24% | | | | | | | | |
Money Market Funds – 9.24% | | | | | | | | |
First American Government Obligations Fund, Class U, 0.026% (q) | | | 667,438,506 | | | $ | 667,438,506 | |
| | | | | | | | |
| | |
TOTAL SHORT-TERM INVESTMENTS
(Cost – $667,438,506) | | | | | | $ | 667,438,506 | |
| | | | | | | | |
| | |
TOTAL INVESTMENTS – 110.49%
(Cost – $8,159,331,831) | | | | | | $ | 7,985,246,813 | |
| | | | | | | | |
| | |
TBA Sales Commitments – (2.76%) | |
| Principal
Amount |
| | | | |
Residential Mortgage-Backed Securities – U.S. Government Agency – (2.76%) | | | | | | | | |
Federal National Mortgage Association, 2.500%, 2/15/2047 | | $ | (200,000,000 | ) | | | (199,756,600 | ) |
| | | | | | | | |
| | |
TOTAL TBA SALES COMMITMENTS
(Proceeds Received – $204,187,500) | | | | | | $ | (199,756,600 | ) |
| | | | | | | | |
| | |
Liabilities in Excess of Other Assets – (7.73%) | | | | | | | (558,491,249 | ) |
| | | | | | | | |
| | |
NET ASSETS – 100.00% | | | | | | $ | 7,226,998,964 | |
| | | | | | | | |
LIBOR: London Inter-Bank Offered Rate
SOFR: Secured Overnight Financing Rate
SOFR30A: Secured Overnight Financing Rate 30 Day Average
TSFR3M 1 Month Term Secured Overnight Financing Rate
| (a) | Security exempt from registration under Rule 144A or Section 4(a)(2) of the Securities Act of 1933. The security may be resold in transactions exempt from registration, normally to qualified institutional buyers. These securities are determined to be liquid by the Adviser, under the procedures established by the Fund’s Board of Trustees, unless otherwise denoted. At January 31, 2022, the value of these securities amounted to $4,293,151,343 or 59.40% of net assets. |
| (b) | Security issued on a when-issued basis. On January 31, 2022, the total value of investments purchased on a when-issued basis was $23,757,193 or 0.33% of net assets. |
| (c) | Illiquid security. At January 31, 2022, the value of these securities amounted to $400,718,296 or 5.54% of net assets. |
| (d) | Principal only security. |
| (e) | Variable or floating rate security based on a reference index and spread. Certain securities are fixed to variable and currently in the fixed phase. Rate disclosed is the rate in effect as of January 31, 2022. |
| (f) | Interest only security. |
| (g) | Variable rate security. The coupon is based on an underlying pool of assets. Rate disclosed is the rate in effect as of January 31, 2022. |
| (h) | Security exempt from registration under Regulation S of the Securities Act of 1933. Such securities are treated as liquid securities according to the Fund’s liquidity guidelines. At January 31, 2022, the value of securities pledged amounted to $16,335,983 or 0.23% of net assets. |
| (i) | All or a portion of the security has been pledged as collateral in connection with open credit agreements. At January 31, 2022, the value of securities pledged amounted to $793,230,992. |
| (j) | As of January 31, 2022, the Fund has fair valued these securities under the procedures established by the Fund’s Board of Trustees. The value of these securities amounted to $48,467,313 or 0.67% of net assets. Value determined using significant unobservable inputs. |
| (k) | Non-income producing security. Item identified as in default as to the payment of interest. |
| (l) | Auction rate security. Rate disclosed is the rate in effect as of January 31, 2022. |
| (m) | Security issued as a “Baby Bond”, with a par value of $25 per bond. The principal balance disclosed above represents the issuer’s outstanding principal that corresponds to the bonds held in the Fund. |
See accompanying notes which are an integral part of these financial statements.
93
Angel Oak Multi-Strategy Income Fund
Consolidated Schedule of Investments – (continued)
January 31, 2022
| (n) | Step-up bond that pays an initial coupon rate for the first period and then a higher coupon rate for the following periods. Rate disclosed is the rate in effect as of January 31, 2022. |
| (o) | Inverse floating rate security whose interest rate moves in the opposite direction of reference interest rates. Reference interest rates are typically based on a negative multiplier or slope. Interest rate may also be subject to a cap or floor. |
| (p) | All or a portion of the security has been pledged as collateral in connection with open reverse repurchase agreements. At January 31, 2022, the value of securities pledged amounted to $157,724,734. |
| (q) | Rate disclosed is the seven day yield as of January 31, 2022. |
Consolidated Schedule of Open Futures Contracts
| | | | | | | | | | | | | | |
| Short Futures Contracts | | Expiration
Month | | Number of
Contracts | | | Notional Value | | | Value &
Unrealized
Appreciation
(Depreciation) | |
USD IRS 10 Year Prime Future | | March 2022 | | | (1,067 | ) | | $ | (105,232,875 | ) | | $ | 1,570,258 | |
7 Year ERIS Aged Standard Swap Future | | March 2029 | | | (214 | ) | | | (20,950,600 | ) | | | (82,069 | ) |
10 Year ERIS Aged Standard Swap Future | | December 2030 | | | (600 | ) | | | (56,361,240 | ) | | | 1,146,660 | |
| | | | | | | | | | | | | | |
Total | | | | | | | | | | | | | 2,634,849 | |
| | | | | | | | | | | | | | |
| Long Futures Contracts | | | | | | | | | | | |
3 Year ERIS Aged Standard Swap Future | | December 2024 | | | 674 | | | | 66,014,930 | | | | (987,073 | ) |
| | | | | | | | | | | | | | |
Long/Short Total | | | | | | | | | | | | $ | 1,647,776 | |
| | | | | | | | | | | | | | |
Consolidated Schedule of Open Reverse Repurchase Agreements
| | | | | | | | | | | | | | | | | | | | |
| Counterparty | | Interest
Rate | | | Trade
Date | | | Maturity Date | | | Net Closing
Amount | | | Face Value | |
J.P. Morgan Securities LLC | | | 0.875 | % | | | 11/30/2021 | | | | 2/28/2022 | | | $ | 51,061,502 | | | $ | 50,950,000 | |
J.P. Morgan Securities LLC | | | 0.975 | % | | | 11/30/2021 | | | | 2/28/2022 | | | | 84,050,454 | | | | 83,846,000 | |
| | | | | | | | | | | | | | | | | | | | |
| | | | | | | | | | | | | | | | | | $ | 134,796,000 | |
| | | | | | | | | | | | | | | | | | | | |
A reverse repurchase agreement, although structured as a sale and repurchase obligation, acts as a financing transaction under which the Fund will effectively pledge certain assets as collateral to secure a short-term loan. Generally, the other party to the agreement makes the loan in an amount less than the fair value of the pledged collateral. At the maturity of the reverse repurchase agreement, the Fund will be required to repay the loan and interest and correspondingly receive back its collateral. While used as collateral, the pledged assets continue to pay principal and interest which are for the benefit of the Fund.
See accompanying notes which are an integral part of these financial statements.
94
Angel Oak Financials Income Fund
Schedule of Investments
January 31, 2022
| | | | | | | | |
| | | Principal
Amount | | | Value | |
Collateralized Debt Obligations – 3.80% | | | | | | | | |
Hildene TruPS Financials Note Securitization Ltd., Series 2018-1A, Class A1,
1.591% (3 Month LIBOR USD + 1.360%), 10/12/2038 (a)(b)(c) | | $ | 1,499,495 | | | $ | 1,491,998 | |
Hildene TruPS Financials Note Securitization Ltd., Series 2018-1A, Class B,
4.271% (3 Month LIBOR USD + 4.040%), 10/12/2038 (a)(b)(c) | | | 1,000,000 | | | | 970,000 | |
Hildene TruPS Financials Note Securitization Ltd., Series 2019-2A, Class A1,
1.920% (3 Month LIBOR USD + 1.760%), 5/23/2039 (a)(b)(c) | | | 1,900,590 | | | | 1,886,335 | |
Hildene TruPS Financials Note Securitization Ltd., Series 2019-2A, Class A2,
2.610% (3 Month LIBOR USD + 2.450%), 5/23/2039 (a)(b)(c) | | | 2,000,000 | | | | 1,990,000 | |
| | | | | | | | |
| | |
TOTAL COLLATERALIZED DEBT OBLIGATIONS
(Cost – $6,361,428) | | | | | | $ | 6,338,333 | |
| | | | | | | | |
| | |
| Common Stocks – 4.02% | | Shares | | | | |
Financial – 4.02% | | | | | | | | |
AmeriServ Financial, Inc. | | | 89,766 | | | | 385,096 | |
Arrow Financial Corp. | | | 17,100 | | | | 604,998 | |
Bank7 Corp. | | | 21,400 | | | | 516,810 | |
Berkshire Hills Bancorp, Inc. | | | 7,000 | | | | 207,130 | |
Central Valley Community Bancorp | | | 19,000 | | | | 425,600 | |
City Holding Co. | | | 5,500 | | | | 441,155 | |
Community Financial Corp. | | | 10,800 | | | | 427,680 | |
Eagle Bancorp Montana, Inc. | | | 28,506 | | | | 649,937 | |
Financial Institutions, Inc. | | | 16,594 | | | | 534,991 | |
First United Corp. | | | 36,500 | | | | 727,445 | |
Greene County Bancorp, Inc. | | | 22,248 | | | | 840,529 | |
Hingham Institution for Savings | | | 1,000 | | | | 387,830 | |
Sterling Bancorp, Inc. (d) | | | 93,000 | | | | 553,350 | |
| | | | | | | | |
| | |
TOTAL COMMON STOCKS
(Cost – $5,775,993) | | | | | | $ | 6,702,551 | |
| | | | | | | | |
| | |
| Corporate Obligations – 86.17% | | Principal
Amount | | | | |
Financial – 86.17% | | | | | | | | |
A10 Capital LLC, 5.875%, 8/17/2026 (c) | | $ | 1,000,000 | | | | 998,693 | |
Allegiance Bancshares, Inc., 4.700% (SOFR + 3.392%), 10/1/2029 (a) | | | 1,000,000 | | | | 1,028,351 | |
Allegiance Bank, 5.250% (3 Month LIBOR USD + 3.030%), 12/15/2027 (a)(c) | | | 1,000,000 | | | | 1,007,965 | |
Amalgamated Financial Corp., 3.250% (SOFR + 2.300%), 11/15/2031 (a) | | | 2,000,000 | | | | 1,976,363 | |
Arbor Realty Trust, Inc., 5.750%, 4/1/2024 (c) | | | 1,500,000 | | | | 1,530,560 | |
Arbor Realty Trust, Inc., 4.500%, 3/15/2027 (c) | | | 2,500,000 | | | | 2,457,848 | |
B. Riley Financial, Inc., 5.500%, 3/31/2026 (e) | | | 1,000,000 | | | | 1,007,200 | |
Banc of California, Inc., 5.250%, 4/15/2025 | | | 500,000 | | | | 520,604 | |
BankFinancial Corp., 3.750% (SOFR + 2.990%), 5/15/2031 (a)(c) | | | 2,000,000 | | | | 1,945,568 | |
BankGuam Holding Co., 4.750% (SOFR + 4.130%), 7/1/2031 (a)(c) | | | 2,000,000 | | | | 1,959,736 | |
Business Development Corp. of America, 4.750%, 12/30/2022 (c) | | | 2,000,000 | | | | 2,029,960 | |
Byline Bancorp, Inc., 6.000% (SOFR + 5.880%), 7/1/2030 (a) | | | 1,000,000 | | | | 1,076,644 | |
Cadence Bancorp, 4.750% (3 Month LIBOR USD + 3.030%), 6/30/2029 (a) | | | 2,500,000 | | | | 2,625,338 | |
CB Financial Services, Inc., 3.875% (SOFR + 2.800%), 12/15/2031 (a)(c) | | | 1,000,000 | | | | 985,686 | |
Central Pacific Financial Corp., 4.750% (SOFR + 4.560%), 11/1/2030 (a) | | | 1,000,000 | | | | 1,041,080 | |
Civista Bancshares, Inc., 3.250% (SOFR + 2.190%), 12/31/2031 (a)(c) | | | 2,500,000 | | | | 2,463,357 | |
See accompanying notes which are an integral part of these financial statements.
95
Angel Oak Financials Income Fund
Schedule of Investments – (continued)
January 31, 2022
| | | | | | | | |
| | | Principal
Amount | | | Value | |
Corporate Obligations – (continued) | | | | | | | | |
Financial – (continued) | | | | | | | | |
Clear Street Holdings LLC, 5.875%, 5/15/2026 (c) | | $ | 2,000,000 | | | $ | 1,989,958 | |
ConnectOne Bancorp, Inc., 5.200% (3 Month LIBOR USD + 2.840%), 2/1/2028 (a) | | | 1,950,000 | | | | 1,975,158 | |
Cowen, Inc., 7.250%, 5/6/2024 (c) | | | 1,000,000 | | | | 1,065,981 | |
CRB Group, Inc., 6.500% (SOFR + 6.380%), 9/1/2030 (a)(c) | | | 1,000,000 | | | | 1,129,248 | |
Dickinson Financial Corp., 4.250% (SOFR + 4.030%), 11/15/2030 (a)(c) | | | 1,250,000 | | | | 1,261,519 | |
Dime Community Bancshares, Inc., 4.500% (3 Month LIBOR USD + 2.660%), 6/15/2027 (a) | | | 650,000 | | | | 655,009 | |
Equity Bancshares, Inc., 7.000% (SOFR + 6.880%), 6/30/2030 (a) | | | 1,000,000 | | | | 1,100,059 | |
FedNat Holding Co., 7.750%, 3/15/2029 | | | 2,500,000 | | | | 2,637,500 | |
Fidelity Bank, 5.875% (3 Month LIBOR USD + 3.630%), 5/31/2030 (a) | | | 2,000,000 | | | | 2,098,428 | |
Fidelity Financial Corp., 5.750% (3 Month LIBOR USD + 3.910%), 9/30/2027 (a)(c) | | | 3,000,000 | | | | 3,027,047 | |
Financial Institutions, Inc., 6.000% (3 Month LIBOR USD + 3.944%), 4/15/2030 (a) | | | 1,500,000 | | | | 1,591,499 | |
First Bancshares, Inc., 6.400% (3 Month LIBOR USD + 3.390%), 5/1/2033 (a) | | | 2,500,000 | | | | 2,799,868 | |
First Business Financial Services, Inc., 5.500% (SOFR + 4.332%), 8/15/2029 (a)(c) | | | 3,000,000 | | | | 3,075,083 | |
First Financial Bancorp, 5.250% (SOFR + 5.090%), 5/15/2030 (a) | | | 1,000,000 | | | | 1,051,619 | |
First Foundation, Inc., 3.500% (SOFR + 2.040%), 2/1/2032 (a) | | | 1,000,000 | | | | 994,595 | |
First Internet Bancorp, 3.750% (SOFR + 3.110%), 9/1/2031 (a) | | | 1,000,000 | | | | 966,755 | |
First Northwest Bancorp, 3.750% (SOFR + 3.000%), 3/30/2031 (a) | | | 1,500,000 | | | | 1,463,993 | |
Firstsun Capital Bancorp, 6.000% (SOFR + 5.890%), 7/1/2030 (a)(c) | | | 2,000,000 | | | | 2,127,912 | |
Flushing Financial Corp., 3.125% (SOFR + 2.035%), 12/1/2031 (a) | | | 3,000,000 | | | | 2,965,727 | |
FS Bancorp, Inc., 3.750% (SOFR + 3.370%), 2/15/2031 (a) | | | 1,000,000 | | | | 1,015,938 | |
Happy Bancshares, Inc., 5.500% (SOFR + 5.345%), 7/31/2030 (a)(c) | | | 3,000,000 | | | | 3,166,359 | |
Homestreet, Inc., 6.500%, 6/1/2026 | | | 3,000,000 | | | | 3,167,012 | |
Horizon Bancorp, Inc., 5.625% (SOFR + 5.490%), 7/1/2030 (a) | | | 1,000,000 | | | | 1,074,772 | |
Independent Bank Corp., 5.950% (SOFR + 5.825%), 5/31/2030 (a)(c) | | | 750,000 | | | | 788,348 | |
Independent Bank Group, Inc., 5.000% (3 Month LIBOR USD + 2.830%), 12/31/2027 (a) | | | 1,750,000 | | | | 1,760,806 | |
Investar Holding Corp., 6.000% (3 Month LIBOR USD + 3.945%), 3/30/2027 (a) | | | 2,500,000 | | | | 2,508,020 | |
Jamesmark Bancshares, Inc., 3.750% (SOFR + 3.050%), 10/1/2031 (a)(c) | | | 850,000 | | | | 828,905 | |
Kingstone Cos, Inc., 5.500%, 12/30/2022 | | | 4,350,000 | | | | 4,350,341 | |
Level One Bancorp, Inc., 4.750% (SOFR + 3.110%), 12/18/2029 (a) | | | 1,000,000 | | | | 1,030,637 | |
Limestone Bancorp, Inc., 5.750% (3 Month LIBOR USD + 3.950%), 7/31/2029 (a)(c) | | | 1,000,000 | | | | 1,030,371 | |
Malvern Bancorp, Inc., 6.125% (3 Month LIBOR USD + 4.145%), 2/15/2027 (a) | | | 500,000 | | | | 500,333 | |
Marble Point Loan Financing Ltd. / MPLF Funding I LLC, 7.500%, 10/16/2025 (c) | | | 3,500,000 | | | | 3,362,743 | |
Mercantile Bank Corp., 3.250% (SOFR + 2.120%), 1/30/2032 (a)(c) | | | 3,000,000 | | | | 2,954,007 | |
Metropolitan Bank Holding Corp., 6.250% (3 Month LIBOR USD + 4.260%), 3/15/2027 (a)(c) | | | 1,200,000 | | | | 1,203,127 | |
Midwest Bankcentre, Inc., 3.625% (SOFR + 2.950%), 6/15/2031 (a)(c) | | | 1,500,000 | | | | 1,466,166 | |
Millennium Consolidated Holdings LLC, 7.500%, 6/30/2023 (c) | | | 1,000,000 | | | | 1,025,170 | |
Narragansett Financial Corp., 3.875% (SOFR + 3.190%), 5/15/2031 (a)(c) | | | 2,000,000 | | | | 1,968,667 | |
National Bank of Indianapolis Corp., 5.500% (3 Month LIBOR USD + 4.209%), 9/15/2029 (a)(c) | | | 2,000,000 | | | | 2,052,945 | |
New York Community Bancorp, Inc., 5.900% (3 Month LIBOR USD + 2.780%), 11/6/2028 (a) | | | 2,000,000 | | | | 2,130,407 | |
NexBank Capital, Inc., 6.375% (3 Month LIBOR USD + 4.585%), 9/30/2027 (a)(c) | | | 1,750,000 | | | | 1,788,022 | |
NexBank Capital, Inc., 4.000% (SOFR + 3.390%), 8/15/2031 (a)(c) | | | 3,000,000 | | | | 2,989,472 | |
Northpointe Bancshares, Inc., 6.000% (TSFR3M + 4.905%), 9/30/2029 (a)(c) | | | 1,000,000 | | | | 1,071,517 | |
Oakstar Bancshares, Inc., 4.250% (SOFR + 3.516%), 4/15/2031 (a)(c) | | | 1,000,000 | | | | 987,544 | |
Olney Bancshares of Texas, Inc., 4.000% (SOFR + 3.320%), 3/15/2031 (a)(c) | | | 1,250,000 | | | | 1,219,759 | |
Pacific Western Bank, 3.250% (SOFR + 2.520%), 5/1/2031 (a) | | | 2,000,000 | | | | 1,998,302 | |
Peapack-Gladstone Financial Corp., 3.500% (SOFR + 3.260%), 12/30/2030 (a) | | | 1,500,000 | | | | 1,508,754 | |
Preferred Bank, 3.375% (SOFR + 2.780%), 6/15/2031 (a) | | | 4,000,000 | | | | 4,015,801 | |
Primis Financial Corp., 5.875% (3 Month LIBOR USD + 3.950%), 1/31/2027 (a)(c) | | | 1,000,000 | | | | 1,000,413 | |
See accompanying notes which are an integral part of these financial statements.
96
Angel Oak Financials Income Fund
Schedule of Investments – (continued)
January 31, 2022
| | | | | | | | |
| | | Principal
Amount | | | Value | |
Corporate Obligations – (continued) | | | | | | | | |
Financial – (continued) | | | | | | | | |
RBB Bancorp, 4.000% (SOFR + 3.290%), 4/1/2031 (a) | | $ | 3,000,000 | | | $ | 3,054,763 | |
Ready Capital Corp., 5.750%, 2/15/2026 (e) | | | 1,000,000 | | | | 1,022,800 | |
Renasant Corp., 3.000% (SOFR + 1.910%), 12/1/2031 (a) | | | 3,700,000 | | | | 3,640,448 | |
River Financial Corp., 4.000% (SOFR + 3.420%), 3/15/2031 (a)(c) | | | 1,000,000 | | | | 1,003,824 | |
Sandy Spring Bancorp, Inc., 4.250% (SOFR + 2.882%), 11/15/2029 (a) | | | 1,250,000 | | | | 1,277,493 | |
SmartFinancial, Inc., 5.625% (3 Month LIBOR USD + 2.550%), 10/2/2028 (a)(c) | | | 1,250,000 | | | | 1,290,027 | |
South Street Securities Funding LLC, 6.250%, 12/30/2026 (c) | | | 1,000,000 | | | | 978,988 | |
Sterling Bancorp, Inc., 6.059% (3 Month LIBOR USD + 5.820%), 4/15/2026 (a)(c) | | | 2,000,000 | | | | 2,001,025 | |
Sterling Bancorp, Inc., 4.000% (SOFR + 2.530%), 12/30/2029 (a) | | | 1,800,000 | | | | 1,854,009 | |
Summit Financial Group, Inc., 3.250% (SOFR + 2.300%), 12/1/2031 (a)(c) | | | 1,000,000 | | | | 987,510 | |
Texas State Bankshares, Inc., 5.750% (3 Month LIBOR USD + 3.550%), 6/15/2029 (a)(c) | | | 2,000,000 | | | | 2,072,884 | |
Trinitas Capital Management LLC, 6.000%, 7/30/2026 (c) | | | 2,000,000 | | | | 1,935,257 | |
Trinity Capital, Inc., 4.250%, 12/15/2026 | | | 2,000,000 | | | | 1,972,014 | |
Trustmark Corp., 3.625% (SOFR + 3.387%), 12/1/2030 (a) | | | 2,000,000 | | | | 2,039,496 | |
United Insurance Holdings Corp., 6.250%, 12/15/2027 | | | 2,000,000 | | | | 2,020,000 | |
Western Alliance Bancorp, 3.000% (SOFR + 2.250%), 6/15/2031 (a) | | | 2,000,000 | | | | 2,003,482 | |
WhiteHorse Finance, Inc., 4.000%, 12/15/2026 | | | 1,000,000 | | | | 977,938 | |
Zais Group LLC, 7.000%, 11/15/2023 (c) | | | 960,000 | | | | 958,436 | |
| | | | | | | | |
| | |
TOTAL CORPORATE OBLIGATIONS
(Cost – $142,503,980) | | | | | | $ | 143,686,963 | |
| | | | | | | | |
| | |
Preferred Stocks – 1.32% | | | Shares | | | | | |
Financial – 1.32% | | | | | | | | |
First Guaranty Bancshares, Inc. 6.750% | | | 40,000 | | | | 1,068,000 | |
TriState Capital Holdings, Inc., 6.375% (3 Month LIBOR USD + 4.088%) (a) | | | 43,321 | | | | 1,128,512 | |
| | | | | | | | |
| | |
TOTAL PREFERRED STOCKS
(Cost – $2,145,025) | | | | | | $ | 2,196,512 | |
| | | | | | | | |
| | |
Short-Term Investments – 2.14% | | | | | | | | |
Money Market Funds – 2.14% | | | | | | | | |
First American Government Obligations Fund, Class U, 0.026% (f) | | | 3,574,541 | | | | 3,574,541 | |
| | | | | | | | |
| | |
TOTAL SHORT-TERM INVESTMENTS
(Cost – $3,574,541) | | | | | | $ | 3,574,541 | |
| | | | | | | | |
| | |
TOTAL INVESTMENTS – 97.45%
(Cost – $160,360,967) | | | | | | $ | 162,498,900 | |
| | |
Other Assets in Excess of Liabilities – 2.55% | | | | | | | 4,248,508 | |
| | | | | | | | |
| | |
NET ASSETS – 100.00% | | | | | | $ | 166,747,409 | |
| | | | | | | | |
| LIBOR: | London Inter-Bank Offered Rate |
| SOFR: | Secured Overnight Financing Rate |
| TSFR3M | 3 Month Term Secured Overnight Financing Rate |
| (a) | Variable or floating rate security based on a reference index and spread. Certain securities are fixed to variable and currently in the fixed phase. Rate disclosed is the rate in effect as of January 31, 2022. |
See accompanying notes which are an integral part of these financial statements.
97
Angel Oak Financials Income Fund
Schedule of Investments – (continued)
January 31, 2022
| (b) | Illiquid security. At January 31, 2022, the value of these securities amounted to $6,338,333 or 3.80% of net assets. |
| (c) | Security exempt from registration under Rule 144A or Section 4(a)(2) of the Securities Act of 1933. The security may be resold in transactions exempt from registration, normally to qualified institutional buyers. These securities are determined to be liquid by the Adviser, under the procedures established by the Fund’s Board of Trustees, unless otherwise denoted. At January 31, 2022, the value of these securities amounted to $75,525,941 or 45.29% of net assets. |
| (d) | Non-income producing security. |
| (e) | Security issued as a “Baby Bond”, with a par value of $25 per bond. The principal balance disclosed above represents the issuer’s outstanding principal that corresponds to the bonds held in the Fund. |
| (f) | Rate disclosed is the seven day yield as of January 31, 2022. |
See accompanying notes which are an integral part of these financial statements.
98
Angel Oak High Yield Opportunities Fund
Schedule of Investments
January 31, 2022
| | | | | | | | |
| | | Shares | | | Value | |
Common Stocks – 0.03% | | | | | | | | |
Consumer, Non-cyclical – 0.03% | | | | | | | | |
Cenveo Corp. (a)(b)(c) | | | 4,630 | | | $ | 27,780 | |
| | | | | | | | |
| | |
TOTAL COMMON STOCKS
(Cost – $490,470) | | | | | | $ | 27,780 | |
| | | | | | | | |
| | |
| Corporate Obligations – 98.66% | | Principal
Amount | | | | |
Basic Materials – 12.87% | | | | | | | | |
Arconic Corp., 6.125%, 2/15/2028 (c) | | $ | 250,000 | | | | 259,745 | |
Big River Steel LLC / BRS Finance Corp., 6.625%, 1/31/2029 (c) | | | 800,000 | | | | 845,540 | |
Cleveland-Cliffs, Inc., 5.875%, 6/1/2027 | | | 750,000 | | | | 776,284 | |
Compass Minerals International, Inc., 6.750%, 12/1/2027 (c) | | | 500,000 | | | | 524,362 | |
Consolidated Energy Finance SA, 6.500%, 5/15/2026 (c) | | | 1,250,000 | | | | 1,273,494 | |
Copper Mountain Mining Corp., 8.000%, 4/9/2026 (c)(d) | | | 1,000,000 | | | | 1,051,300 | |
CVR Partners LP / CVR Nitrogen Finance Corp., 6.125%, 6/15/2028 (c) | | | 1,000,000 | | | | 1,017,630 | |
Hecla Mining Co., 7.250%, 2/15/2028 | | | 500,000 | | | | 535,570 | |
Mercer International, Inc., 5.125%, 2/1/2029 | | | 750,000 | | | | 740,944 | |
Methanex Corp., 5.125%, 10/15/2027 | | | 500,000 | | | | 507,625 | |
Schweitzer-Mauduit International, Inc., 6.875%, 10/1/2026 (c) | | | 500,000 | | | | 498,082 | |
Sylvamo Corp, 7.000%, 9/1/2029 (c) | | | 1,000,000 | | | | 1,029,390 | |
Taseko Mines Ltd., 7.000%, 2/15/2026 (c) | | | 500,000 | | | | 507,675 | |
| | | | | | | | |
| | |
| | | | | | | 9,567,641 | |
| | | | | | | | |
Communications – 9.54% | | | | | | | | |
AMC Networks, Inc., 4.750%, 8/1/2025 | | | 500,000 | | | | 504,710 | |
Cars.com, Inc., 6.375%, 11/1/2028 (c) | | | 500,000 | | | | 520,800 | |
Consolidated Communications, Inc., 6.500%, 10/1/2028 (c) | | | 500,000 | | | | 516,100 | |
CSC Holdings LLC, 5.500%, 4/15/2027 (c) | | | 500,000 | | | | 509,336 | |
Cumulus Media New Holdings, Inc., 6.750%, 7/1/2026 (c) | | | 542,000 | | | | 558,249 | |
DIRECTV Holdings LLC / DIRECTV Financing Co., Inc., 5.875%, 8/15/2027 (c) | | | 1,000,000 | | | | 1,006,100 | |
Entercom Media Corp., 6.500%, 5/1/2027 (c) | | | 100,000 | | | | 95,213 | |
Entercom Media Corp., 6.750%, 3/31/2029 (c) | | | 200,000 | | | | 186,345 | |
Gray Escrow, Inc., 5.375%, 11/15/2031 (c) | | | 1,000,000 | | | | 987,155 | |
Lamar Media Corp., 4.875%, 1/15/2029 | | | 250,000 | | | | 254,375 | |
Nexstar Broadcasting, Inc., 5.625%, 7/15/2027 (c) | | | 250,000 | | | | 256,614 | |
Outfront Media Capital LLC / Outfront Media Capital Corp., 5.000%, 8/15/2027 (c) | | | 250,000 | | | | 248,725 | |
Terrier Media Buyer, Inc., 8.875%, 12/15/2027 (c) | | | 250,000 | | | | 263,619 | |
Townsquare Media, Inc., 6.875%, 2/1/2026 (c) | | | 300,000 | | | | 311,991 | |
Univision Communications, Inc., 6.625%, 6/1/2027 (c) | | | 250,000 | | | | 262,876 | |
Urban One, Inc., 7.375%, 2/1/2028 (c) | | | 600,000 | | | | 610,869 | |
| | | | | | | | |
| | |
| | | | | | | 7,093,077 | |
| | | | | | | | |
Consumer, Cyclical – 17.62% | | | | | | | | |
American Airlines, Inc. / AAdvantage Loyalty IP Ltd., 5.500%, 4/20/2026 (c) | | | 500,000 | | | | 511,250 | |
American Axle & Manufacturing, Inc., 5.000%, 10/1/2029 | | | 1,000,000 | | | | 925,240 | |
Aramark Services, Inc., 6.375%, 5/1/2025 (c) | | | 500,000 | | | | 517,500 | |
Arrow Bidco LLC, 9.500%, 3/15/2024 (c) | | | 500,000 | | | | 507,422 | |
Beacon Roofing Supply, Inc., 4.500%, 11/15/2026 (c) | | | 250,000 | | | | 254,685 | |
Brookfield Residential Properties, Inc. / Brookfield Residential US LLC, 5.000%, 6/15/2029 (c) | | | 250,000 | | | | 247,186 | |
See accompanying notes which are an integral part of these financial statements.
99
Angel Oak High Yield Opportunities Fund
Schedule of Investments – (continued)
January 31, 2022
| | | | | | | | |
| | | Principal
Amount | | | Value | |
Corporate Obligations – (continued) | | | | | | | | |
Consumer, Cyclical – (continued) | | | | | | | | |
Carnival Corp., 6.000%, 5/1/2029 (c) | | $ | 100,000 | | | $ | 96,335 | |
CD&R Smokey Buyer, Inc., 6.750%, 7/15/2025 (c) | | | 250,000 | | | | 260,586 | |
Clarios Global LP, 6.750%, 5/15/2025 (c) | | | 226,000 | | | | 234,738 | |
Delta Air Lines, Inc. / SkyMiles IP Ltd., 4.750%, 10/20/2028 (c) | | | 500,000 | | | | 534,122 | |
FirstCash, Inc., 4.625%, 9/1/2028 (c) | | | 500,000 | | | | 477,712 | |
Ford Motor Co., 9.000%, 4/22/2025 | | | 1,000,000 | | | | 1,183,255 | |
Ford Motor Co., 3.250%, 2/12/2032 | | | 200,000 | | | | 191,468 | |
Ford Motor Credit Co. LLC, 3.625%, 6/17/2031 | | | 500,000 | | | | 495,105 | |
Goodyear Tire & Rubber Co., 5.000%, 7/15/2029 (c) | | | 500,000 | | | | 501,087 | |
Hawaiian Brand Intellectual Property Ltd. / HawaiianMiles Loyalty Ltd., 5.750%, 1/20/2026 (c) | | | 500,000 | | | | 512,112 | |
Installed Building Products, Inc., 5.750%, 2/1/2028 (c) | | | 100,000 | | | | 102,794 | |
International Game Technology PLC, 5.250%, 1/15/2029 (c) | | | 200,000 | | | | 204,620 | |
Lithia Motors, Inc., 4.625%, 12/15/2027 (c) | | | 250,000 | | | | 256,565 | |
Lithia Motors, Inc., 4.375%, 1/15/2031 (c) | | | 500,000 | | | | 503,638 | |
Marriott Ownership Resorts, Inc., 4.750%, 1/15/2028 | | | 500,000 | | | | 497,048 | |
Mileage Plus Holdings LLC / Mileage Plus Intellectual Property Assets Ltd., 6.500%, 6/20/2027 (c) | | | 250,000 | | | | 266,044 | |
New Red Finance, Inc., 4.375%, 1/15/2028 (c) | | | 250,000 | | | | 245,814 | |
Party City Holdings, Inc., 8.750%, 2/15/2026 (c) | | | 250,000 | | | | 251,875 | |
Ritchie Bros Holdings, Inc., 4.750%, 12/15/2031 (c) | | | 470,000 | | | | 474,000 | |
Six Flags Theme Parks, Inc., 7.000%, 7/1/2025 (c) | | | 250,000 | | | | 260,923 | |
Spirit Loyalty Cayman Ltd. / Spirit IP Cayman Ltd., 8.000%, 9/20/2025 (c) | | | 300,000 | | | | 325,412 | |
Suburban Propane Partners LP / Suburban Energy Finance Corp., 5.000%, 6/1/2031 (c) | | | 100,000 | | | | 98,633 | |
TRI Pointe Group, Inc. / TRI Pointe Homes, Inc., 5.875%, 6/15/2024 | | | 850,000 | | | | 892,381 | |
United Airlines, Inc., 4.375%, 4/15/2026 (c) | | | 500,000 | | | | 497,185 | |
Univar Solutions USA, Inc. / Washington, 5.125%, 12/1/2027 (c) | | | 250,000 | | | | 254,688 | |
White Cap Buyer LLC, 6.875%, 10/15/2028 (c) | | | 500,000 | | | | 513,645 | |
| | | | | | | | |
| | |
| | | | | | | 13,095,068 | |
| | | | | | | | |
Consumer, Non-cyclical – 11.78% | | | | | | | | |
Catalent Pharma Solutions, Inc., 5.000%, 7/15/2027 (c) | | | 250,000 | | | | 256,000 | |
CPI CG, Inc., 8.625%, 3/15/2026 (c) | | | 250,000 | | | | 256,514 | |
JBS USA LUX SA / JBS USA Finance, Inc., 6.500%, 4/15/2029 (c) | | | 750,000 | | | | 813,795 | |
Korn Ferry, 4.625%, 12/15/2027 (c) | | | 250,000 | | | | 253,764 | |
Mozart Debt Merger Sub, Inc., 5.250%, 10/1/2029 (c) | | | 500,000 | | | | 487,157 | |
NESCO Holdings, Inc., 5.500%, 4/15/2029 (c) | | | 100,000 | | | | 99,180 | |
Performance Food Group, Inc., 4.250%, 8/1/2029 (c) | | | 500,000 | | | | 470,005 | |
Prime Security Services Borrower LLC / Prime Finance, Inc., 3.375%, 8/31/2027 (c) | | | 750,000 | | | | 697,410 | |
Primo Water Holdings, Inc., 4.375%, 4/30/2029 (c) | | | 1,000,000 | | | | 963,360 | |
Rent-A-Center, Inc., 6.375%, 2/15/2029 (c) | | | 500,000 | | | | 514,562 | |
Sabre GLBL, Inc., 9.250%, 4/15/2025 (c) | | | 100,000 | | | | 112,042 | |
Sabre GLBL, Inc., 7.375%, 9/1/2025 (c) | | | 100,000 | | | | 102,658 | |
Select Medical Corp., 6.250%, 8/15/2026 (c) | | | 1,000,000 | | | | 1,028,315 | |
ServiceMaster Co. LLC, 7.450%, 8/15/2027 | | | 500,000 | | | | 616,722 | |
Simmons Foods, Inc., 4.625%, 3/1/2029 (c) | | | 250,000 | | | | 240,151 | |
Sotheby’s, 7.375%, 10/15/2027 (c) | | | 810,000 | | | | 843,846 | |
Sotheby’s/Bidfair Holdings, Inc., 5.875%, 6/1/2029 (c) | | | 500,000 | | | | 507,065 | |
See accompanying notes which are an integral part of these financial statements.
100
Angel Oak High Yield Opportunities Fund
Schedule of Investments – (continued)
January 31, 2022
| | | | | | | | |
| | | Principal
Amount | | | Value | |
Corporate Obligations – (continued) | | | | | | | | |
Consumer, Non-cyclical – (continued) | | | | | | | | |
TreeHouse Foods, Inc., 4.000%, 9/1/2028 | | $ | 250,000 | | | $ | 234,164 | |
US Foods, Inc., 6.250%, 4/15/2025 (c) | | | 250,000 | | | | 258,739 | |
| | | | | | | | |
| | |
| | | | | | | 8,755,449 | |
| | | | | | | | |
Energy – 20.99% | | | | | | | | |
Antero Midstream Partners LP / Antero Midstream Finance Corp., 5.750%, 3/1/2027 (c) | | | 250,000 | | | | 254,199 | |
Antero Midstream Partners LP / Antero Midstream Finance Corp., 5.750%, 1/15/2028 (c) | | | 1,250,000 | | | | 1,275,812 | |
Antero Resources Corp., 8.375%, 7/15/2026 (c) | | | 162,000 | | | | 180,884 | |
Archrock Partners LP / Archrock Partners Finance Corp., 6.875%, 4/1/2027 (c) | | | 700,000 | | | | 718,963 | |
Atlantica Sustainable Infrastructure PLC, 4.125%, 6/15/2028 (c) | | | 250,000 | | | | 239,307 | |
Calumet Specialty Products Partners LP / Calumet Finance Corp., 8.125%, 1/15/2027 (c) | | | 600,000 | | | | 603,405 | |
CITGO Petroleum Corp., 7.000%, 6/15/2025 (c) | | | 500,000 | | | | 504,245 | |
CNX Resources Corp., 6.000%, 1/15/2029 (c) | | | 100,000 | | | | 103,163 | |
Comstock Resources, Inc., 6.750%, 3/1/2029 (c) | | | 100,000 | | | | 103,042 | |
Comstock Resources, Inc., 5.875%, 1/15/2030 (c) | | | 100,000 | | | | 99,550 | |
Continental Resources, Inc., 5.750%, 1/15/2031 (c) | | | 100,000 | | | | 114,154 | |
Crestwood Midstream Partners LP / Crestwood Midstream Finance Corp., 6.000%, 2/1/2029 (c) | | | 500,000 | | | | 505,090 | |
CrownRock LP / CrownRock Finance, Inc., 5.000%, 5/1/2029 (c) | | | 250,000 | | | | 252,740 | |
DCP Midstream LP, 7.375% (3 Month LIBOR USD + 5.148%), 6/15/2023 (e) | | | 500,000 | | | | 480,265 | |
Encino Acquisition Partners Holdings LLC, 8.500%, 5/1/2028 (c) | | | 250,000 | | | | 253,178 | |
EnLink Midstream LLC, 5.625%, 1/15/2028 (c) | | | 100,000 | | | | 102,885 | |
Enviva Partners LP / Enviva Partners Finance Corp., 6.500%, 1/15/2026 (c) | | | 750,000 | | | | 775,605 | |
Hilcorp Energy I LP / Hilcorp Finance Co., 5.750%, 2/1/2029 (c) | | | 900,000 | | | | 919,485 | |
New Fortress Energy, Inc., 6.750%, 9/15/2025 (c) | | | 250,000 | | | | 237,330 | |
New Fortress Energy, Inc., 6.500%, 9/30/2026 (c) | | | 500,000 | | | | 468,388 | |
PBF Holding Co. LLC / PBF Finance Corp., 6.000%, 2/15/2028 | | | 500,000 | | | | 352,480 | |
PBF Logistics LP / PBF Logistics Finance Corp., 6.875%, 5/15/2023 | | | 250,000 | | | | 245,950 | |
Range Resources Corp., 8.250%, 1/15/2029 | | | 100,000 | | | | 110,686 | |
Renewable Energy Group, Inc., 5.875%, 6/1/2028 (c) | | | 300,000 | | | | 301,796 | |
Shelf Drilling Holdings Ltd., 8.250%, 2/15/2025 (c) | | | 1,500,000 | | | | 1,168,590 | |
SunCoke Energy, Inc., 4.875%, 6/30/2029 (c) | | | 500,000 | | | | 488,808 | |
Tallgrass Energy Partners LP / Tallgrass Energy Finance Corp., 7.500%, 10/1/2025 (c) | | | 500,000 | | | | 526,500 | |
Tallgrass Energy Partners LP / Tallgrass Energy Finance Corp., 6.000%, 12/31/2030 (c) | | | 500,000 | | | | 478,163 | |
Transocean, Inc., 11.500%, 1/30/2027 (c) | | | 113,000 | | | | 112,317 | |
USA Compression Partners LP / USA Compression Finance Corp., 6.875%, 4/1/2026 | | | 250,000 | | | | 254,804 | |
USA Compression Partners LP / USA Compression Finance Corp., 6.875%, 9/1/2027 | | | 750,000 | | | | 770,910 | |
Venture Global Calcasieu Pass LLC, 4.125%, 8/15/2031 (c) | | | 250,000 | | | | 252,064 | |
Venture Global Calcasieu Pass LLC, 3.875%, 11/1/2033 (c) | | | 250,000 | | | | 247,946 | |
Warrior Met Coal, Inc., 7.875%, 12/1/2028 (c) | | | 2,000,000 | | | | 2,102,470 | |
| | | | | | | | |
| | |
| | | | | | | 15,605,174 | |
| | | | | | | | |
Financial – 14.98% | | | | | | | | |
Coinbase Global, Inc., 3.375%, 10/1/2028 (c) | | | 1,000,000 | | | | 896,755 | |
Credit Acceptance Corp., 6.625%, 3/15/2026 | | | 500,000 | | | | 515,690 | |
Enact Holdings, Inc., 6.500%, 8/15/2025 (c) | | | 500,000 | | | | 529,517 | |
Freedom Mortgage Corp., 7.625%, 5/1/2026 (c) | | | 500,000 | | | | 478,210 | |
Global Aircraft Leasing Co. Ltd., 6.250% Cash or 7.250% PIK, 9/15/2024 (c) | | | 268,452 | | | | 252,278 | |
See accompanying notes which are an integral part of these financial statements.
101
Angel Oak High Yield Opportunities Fund
Schedule of Investments – (continued)
January 31, 2022
| | | | | | | | |
| | | Principal
Amount | | | Value | |
Corporate Obligations – (continued) | | | | | | | | |
Financial – (continued) | | | | | | | | |
goeasy Ltd., 5.375%, 12/1/2024 (c) | | $ | 250,000 | | | $ | 255,250 | |
goeasy Ltd., 4.375%, 5/1/2026 (c) | | | 500,000 | | | | 500,705 | |
HAT Holdings I LLC / HAT Holdings II LLC, 3.375%, 6/15/2026 (c) | | | 750,000 | | | | 723,682 | |
Howard Hughes Corp., 5.375%, 8/1/2028 (c) | | | 250,000 | | | | 254,739 | |
LD Holdings Group LLC, 6.125%, 4/1/2028 (c) | | | 500,000 | | | | 446,660 | |
LPL Holdings, Inc., 4.625%, 11/15/2027 (c) | | | 500,000 | | | | 504,397 | |
MGIC Investment Corp., 5.250%, 8/15/2028 | | | 250,000 | | | | 258,891 | |
MPT Operating Partnership LP / MPT Finance Corp., 3.500%, 3/15/2031 | | | 500,000 | | | | 481,467 | |
Nationstar Mortgage Holdings, Inc., 6.000%, 1/15/2027 (c) | | | 750,000 | | | | 778,980 | |
NMI Holdings, Inc., 7.375%, 6/1/2025 (c) | | | 250,000 | | | | 277,705 | |
Park Intermediate Holdings LLC / PK Domestic Property LLC / PK Finance, 4.875%, 5/15/2029 (c) | | | 250,000 | | | | 247,249 | |
PennyMac Financial Services, Inc., 5.375%, 10/15/2025 (c) | | | 500,000 | | | | 500,708 | |
PennyMac Financial Services, Inc., 5.750%, 9/15/2031 (c) | | | 250,000 | | | | 239,329 | |
PRA Group, Inc., 7.375%, 9/1/2025 (c) | | | 250,000 | | | | 265,430 | |
PRA Group, Inc., 5.000%, 10/1/2029 (c) | | | 500,000 | | | | 494,383 | |
Realogy Group LLC / Realogy Co-Issuer Corp., 5.250%, 4/15/2030 (c) | | | 500,000 | | | | 481,015 | |
Starwood Property Trust, Inc., 5.500%, 11/1/2023 (c) | | | 500,000 | | | | 514,975 | |
StoneX Group, Inc., 8.625%, 6/15/2025 (c) | | | 100,000 | | | | 106,180 | |
United Wholesale Mortgage LLC, 5.500%, 11/15/2025 (c) | | | 500,000 | | | | 485,095 | |
United Wholesale Mortgage LLC, 5.500%, 4/15/2029 (c) | | | 500,000 | | | | 458,558 | |
Uniti Group LP / Uniti Group Finance, Inc. / CSL Capital LLC, 6.500%, 2/15/2029 (c) | | | 200,000 | | | | 189,500 | |
| | | | | | | | |
| | |
| | | | | | | 11,137,348 | |
| | | | | | | | |
Industrial – 8.92% | | | | | | | | |
Bombardier, Inc., 7.500%, 12/1/2024 (c) | | | 200,000 | | | | 207,287 | |
Brundage-Bone Concrete Pumping Holdings, Inc., 6.000%, 2/1/2026 (c) | | | 250,000 | | | | 253,396 | |
Builders FirstSource, Inc., 5.000%, 3/1/2030 (c) | | | 250,000 | | | | 256,375 | |
Cargo Aircraft Management, Inc., 4.750%, 2/1/2028 (c) | | | 500,000 | | | | 503,952 | |
Cloud Crane LLC, 10.125%, 8/1/2024 (c) | | | 220,000 | | | | 225,299 | |
Cornerstone Building Brands, Inc., 6.125%, 1/15/2029 (c) | | | 100,000 | | | | 103,337 | |
Covanta Holding Corp., 5.000%, 9/1/2030 | | | 250,000 | | | | 248,044 | |
Dycom Industries, Inc., 4.500%, 4/15/2029 (c) | | | 100,000 | | | | 98,091 | |
Fortress Transportation and Infrastructure Investors LLC, 9.750%, 8/1/2027 (c) | | | 250,000 | | | | 274,060 | |
Great Lakes Dredge & Dock Corp., 5.250%, 6/1/2029 (c) | | | 100,000 | | | | 102,417 | |
Griffon Corp., 5.750%, 3/1/2028 | | | 350,000 | | | | 350,303 | |
II-VI, Inc., 5.000%, 12/15/2029 (c) | | | 500,000 | | | | 499,858 | |
Kratos Defense & Security Solutions, Inc., 6.500%, 11/30/2025 (c) | | | 250,000 | | | | 257,774 | |
MasTec, Inc., 4.500%, 8/15/2028 (c) | | | 500,000 | | | | 507,125 | |
Matthews International Corp., 5.250%, 12/1/2025 (c) | | | 250,000 | | | | 255,781 | |
MIWD Holdco LLC / MIWD Finance Corp., 5.500%, 2/1/2030 (c) | | | 100,000 | | | | 99,409 | |
Moog, Inc., 4.250%, 12/15/2027 (c) | | | 250,000 | | | | 251,200 | |
Mueller Water Products, Inc., 4.000%, 6/15/2029 (c) | | | 300,000 | | | | 294,465 | |
Roller Bearing Co. of America, Inc., 4.375%, 10/15/2029 (c) | | | 500,000 | | | | 495,565 | |
Seaspan Corp., 5.500%, 8/1/2029 (c) | | | 500,000 | | | | 495,300 | |
Spirit AeroSystems, Inc., 7.500%, 4/15/2025 (c) | | | 100,000 | | | | 104,266 | |
SRM Escrow Issuer LLC, 6.000%, 11/1/2028 (c) | | | 250,000 | | | | 257,190 | |
See accompanying notes which are an integral part of these financial statements.
102
Angel Oak High Yield Opportunities Fund
Schedule of Investments – (continued)
January 31, 2022
| | | | | | | | |
| | | Principal
Amount | | | Value | |
Corporate Obligations – (continued) | | | | | | | | |
Industrial – (continued) | | | | | | | | |
Vertiv Group Corp., 4.125%, 11/15/2028 (c) | | $ | 500,000 | | | $ | 488,128 | |
| | | | | | | | |
| | |
| | | | | | | 6,628,622 | |
| | | | | | | | |
Technology – 0.25% | | | | | | | | |
Seagate HDD Cayman, 3.375%, 7/15/2031 | | | 200,000 | | | | 186,035 | |
| | | | | | | | |
| | |
| | | | | | | 186,035 | |
| | | | | | | | |
Utilities – 1.71% | | | | | | | | |
AmeriGas Partners LP / AmeriGas Finance Corp., 5.500%, 5/20/2025 | | | 250,000 | | | | 258,465 | |
Rockpoint Gas Storage Canada Ltd., 7.000%, 3/31/2023 (c) | | | 500,000 | | | | 500,622 | |
Talen Energy Supply LLC, 10.500%, 1/15/2026 (c) | | | 625,000 | | | | 291,491 | |
Talen Energy Supply LLC, 6.625%, 1/15/2028 (c) | | | 250,000 | | | | 220,554 | |
| | | | | | | | |
| | |
| | | | | | | 1,271,132 | |
| | | | | | | | |
| | |
TOTAL CORPORATE OBLIGATIONS
(Cost – $73,288,514) | | | | | | $ | 73,339,546 | |
| | | | | | | | |
| | |
| Short-Term Investments – 0.30% | | Shares | | | | |
Money Market Funds – 0.30% | | | | | | | | |
First American Government Obligations Fund, Class U, 0.026% (f) | | | 222,445 | | | | 222,445 | |
| | | | | | | | |
| | |
TOTAL SHORT-TERM INVESTMENTS
(Cost – $222,445) | | | | | | $ | 222,445 | |
| | | | | | | | |
| | |
TOTAL INVESTMENTS – 98.99%
(Cost – $74,001,429) | | | | | | $ | 73,589,771 | |
| | |
Other Assets in Excess of Liabilities – 1.01% | | | | | | | 747,689 | |
| | | | | | | | |
| | |
NET ASSETS – 100.00% | | | | | | $ | 74,337,459 | |
| | | | | | | | |
| LIBOR: | London Inter-Bank Offered Rate |
| (a) | As of January 31, 2022, the Fund has fair valued these securities under the procedures established by the Fund’s Board of Trustees. The value of these securities amounted to $27,780 or 0.04% of net assets. Value determined using significant unobservable inputs. |
| (b) | Illiquid security. At January 31, 2022, the value of these securities amounted to $27,780 or 0.04% of net assets. |
| (c) | Security exempt from registration under Rule 144A or Section 4(a)(2) of the Securities Act of 1933. The security may be resold in transactions exempt from registration, normally to qualified institutional buyers. These securities are determined to be liquid by the Adviser, under the procedures established by the Fund’s Board of Trustees, unless otherwise denoted. At January 31, 2022, the value of these securities amounted to $60,498,444 or 81.38% of net assets. |
| (d) | Security exempt from registration under Regulation S of the Securities Act of 1933. Such securities are treated as liquid securities according to the Fund’s liquidity guidelines. At January 31, 2022, the value of securities pledged amounted to $1,051,300 or 1.41% of net assets. |
| (e) | Variable or floating rate security based on a reference index and spread. Certain securities are fixed to variable and currently in the fixed phase. Rate disclosed is the rate in effect as of January 31, 2022. |
| (f) | Rate disclosed is the seven day yield as of January 31, 2022. |
See accompanying notes which are an integral part of these financial statements.
103
Angel Oak UltraShort Income Fund
Schedule of Investments
January 31, 2022
| | | | | | | | |
| | | Principal
Amount | | | Value | |
Asset-Backed Securities – 42.35% | | | | | | | | |
ACC Auto Trust, Series 2021-A, Class A, 1.080%, 4/15/2027 (a) | | $ | 3,813,301 | | | $ | 3,799,115 | |
ACC Auto Trust, Series 2021-A, Class B, 1.790%, 4/15/2027 (a) | | | 4,611,000 | | | | 4,538,750 | |
ACC Trust, Series 2019-1, Class B, 4.470%, 10/20/2022 (a) | | | 62,436 | | | | 62,745 | |
ACC Trust, Series 2019-2, Class B, 3.630%, 8/20/2023 (a) | | | 1,640,503 | | | | 1,651,729 | |
ACC Trust, Series 2021-1, Class A, 0.740%, 11/20/2023 (a) | | | 840,634 | | | | 840,887 | |
ACC Trust, Series 2019-1, Class C, 6.410%, 2/20/2024 (a) | | | 3,000,000 | | | | 3,053,217 | |
ACC Trust, Series 2021-1, Class B, 1.430%, 7/22/2024 (a) | | | 2,000,000 | | | | 1,999,808 | |
ACC Trust, Series 2019-2, Class C, 5.240%, 10/20/2024 (a) | | | 1,000,000 | | | | 1,014,715 | |
Affirm Asset Securitization Trust, Series 2020-A, Class A, 2.100%, 2/18/2025 (a) | | | 26,528,000 | | | | 26,604,268 | |
Affirm Asset Securitization Trust, Series 2020-A, Class B, 3.540%, 2/18/2025 (a) | | | 1,800,000 | | | | 1,806,349 | |
Affirm Asset Securitization Trust, Series 2020-A, Class C, 6.230%, 2/18/2025 (a) | | | 2,500,000 | | | | 2,510,048 | |
Affirm Asset Securitization Trust, Series 2021-A, Class D, 3.490%, 8/15/2025 (a) | | | 1,610,000 | | | | 1,618,288 | |
Affirm Asset Securitization Trust, Series 2021-A, Class E, 5.650%, 8/15/2025 (a) | | | 550,000 | | | | 557,152 | |
Affirm Asset Securitization Trust, Series 2021-B, Class D, 2.540%, 8/17/2026 (a) | | | 250,000 | | | | 249,117 | |
Affirm Asset Securitization Trust, Series 2021-Z2, Class A, 1.170%, 11/15/2026 (a) | | | 3,667,078 | | | | 3,646,638 | |
Ally Auto Receivables Trust, Series 2019-4, Class A3, 1.840%, 6/15/2024 | | | 336,735 | | | | 338,813 | |
American Credit Acceptance Receivables Trust, Series 2020-2, Class B, 2.480%, 9/13/2024 (a) | | | 1,756,268 | | | | 1,763,232 | |
American Credit Acceptance Receivables Trust, Series 2021-2, Class A, 0.370%, 10/15/2024 (a) | | | 932,832 | | | | 933,176 | |
American Credit Acceptance Receivables Trust, Series 2019-3, Class C, 2.760%, 9/12/2025 (a) | | | 915,783 | | | | 919,578 | |
American Credit Acceptance Receivables Trust, Series 2021-2, Classs C, 0.970%, 7/13/2027 (a) | | | 1,500,000 | | | | 1,489,287 | |
American Express Credit Account Master Trust, Series 2017-5, Class A,
0.483% (1 Month LIBOR USD + 0.380%), 2/18/2025 (b) | | | 1,980,000 | | | | 1,985,071 | |
American Express Credit Account Master Trust, Series 2017-5, Class B,
0.683% (1 Month LIBOR USD + 0.580%), 2/18/2025 (b) | | | 2,555,000 | | | | 2,563,858 | |
American Express Credit Account Master Trust, Series 2018-3, Class A,
0.423% (1 Month LIBOR USD + 0.320%), 10/15/2025 (b) | | | 5,400,000 | | | | 5,427,481 | |
Aqua Finance Trust, Series 2019-A, Class A, 3.140%, 7/16/2040 (a) | | | 981,056 | | | | 995,374 | |
Aqua Finance Trust, Series 2021-A, Class A, 1.540%, 7/17/2046 (a) | | | 3,225,160 | | | | 3,176,302 | |
Aqua Finance Trust, Series 2020-AA, Class A, 1.900%, 7/17/2046 (a) | | | 6,234,313 | | | | 6,229,669 | |
Arivo Acceptance Auto Loan Receivables Trust, Series 2021-1A, Class A, 1.190%, 1/15/2027 (a) | | | 1,086,531 | | | | 1,084,913 | |
Avant Credit Card Master Trust, Series 2021-1A, Class A, 1.370%, 4/15/2027 (a) | | | 3,500,000 | | | | 3,427,844 | |
Avant Credit Card Master Trust, Series 2021-1A, Class B, 1.620%, 4/15/2027 (a) | | | 2,250,000 | | | | 2,204,498 | |
Avant Loans Funding Trust, Series 2021-REV1, Class A, 1.210%, 7/15/2030 (a) | | | 2,000,000 | | | | 2,000,464 | |
Avid Automobile Receivables Trust, Series 2019-1, Class D, 4.030%, 7/15/2026 (a) | | | 1,000,000 | | | | 1,023,608 | |
Barclays Dryrock Issuance Trust, Series 2019-1, Class A, 1.960%, 5/15/2025 | | | 2,251,000 | | | | 2,268,164 | |
BHG Securitization Trust, Series 2021-B, Class A, 0.900%, 10/17/2034 (a) | | | 2,603,922 | | | | 2,578,581 | |
CarMax Auto Owner Trust, Series 2018-1, Class D, 3.370%, 7/15/2024 | | | 2,259,000 | | | | 2,271,465 | |
CarNow Auto Receivables Trust, Series 2021-1A, Class A, 0.970%, 10/15/2024 (a) | | | 911,830 | | | | 912,939 | |
CarNow Auto Receivables Trust, Series 2021-1A, Class D, 3.640%, 2/17/2026 (a) | | | 1,250,000 | | | | 1,240,790 | |
Carvana Auto Receivables Trust, Series 2021-N1, Class B, 1.090%, 1/10/2028 | | | 6,115,661 | | | | 6,096,078 | |
Carvana Auto Receivables Trust, Series 2021-N1, Class C, 1.300%, 1/10/2028 | | | 5,000,000 | | | | 4,985,200 | |
Carvana Auto Receivables Trust, Series 2021-N2, Class C, 1.070%, 3/10/2028 | | | 1,500,000 | | | | 1,483,316 | |
Carvana Auto Receivables Trust, Series 2021-P2, Class N, 1.880%, 5/10/2028 (a) | | | 849,126 | | | | 851,246 | |
Carvana Auto Receivables Trust, Series 2021-N3, Class C, 1.020%, 6/12/2028 | | | 4,000,000 | | | | 3,952,472 | |
See accompanying notes which are an integral part of these financial statements.
104
Angel Oak UltraShort Income Fund
Schedule of Investments – (continued)
January 31, 2022
| | | | | | | | |
| | | Principal
Amount | | | Value | |
Asset-Backed Securities – (continued) | | | | | | | | |
Carvana Auto Receivables Trust, Series 2021-N3, Class N, 2.530%, 6/12/2028 (a) | | $ | 1,698,716 | | | $ | 1,703,399 | |
Carvana Auto Receivables Trust, Series 2021-P3, Class N, 1.990%, 9/10/2028 (a) | | | 1,293,797 | | | | 1,297,019 | |
Carvana Auto Receivables Trust, Series 2021-P4, Class N, 2.150%, 9/10/2028 (a) | | | 4,500,000 | | | | 4,507,182 | |
Carvana Auto Receivables Trust, Series 2021-N4, Class N, 2.990%, 9/10/2028 (a) | | | 3,000,000 | | | | 3,008,913 | |
CFMT Issuer Trust, Series 2021-GRN1, Class A, 1.100%, 3/20/2041 (a) | | | 2,515,103 | | | | 2,517,583 | |
CFMT LLC, Series 2021-AL1, Class B, 1.390%, 9/22/2031 (a) | | | 4,364,229 | | | | 4,360,140 | |
Chase Auto Credit Linked Notes, Series 2020-1, Class B, 0.991%, 1/25/2028 (a) | | | 427,942 | | | | 427,969 | |
Chase Auto Credit Linked Notes, Series 2020-1, Class C, 1.389%, 1/25/2028 (a) | | | 1,176,842 | | | | 1,180,383 | |
Chase Auto Credit Linked Notes, Series 2020-2, Class B, 0.840%, 2/25/2028 (a) | | | 537,343 | | | | 537,289 | |
Chase Auto Credit Linked Notes, Series 2020-2, Class C, 1.139%, 2/25/2028 (a) | | | 537,343 | | | | 536,585 | |
Chase Auto Credit Linked Notes, Series 2021-1, Class B, 0.875%, 9/25/2028 (a) | | | 3,659,852 | | | | 3,647,346 | |
Chase Auto Credit Linked Notes, Series 2021-1, Class C, 1.024%, 9/25/2028 (a) | | | 1,568,508 | | | | 1,563,275 | |
Chase Auto Credit Linked Notes, Series 2021-2, Class D, 1.138%, 12/25/2028 (a) | | | 1,302,017 | | | | 1,299,759 | |
Chase Issuance Trust, Series 2017-A2, Class A,
0.506% (1 Month LIBOR USD + 0.400%), 3/15/2024 (b) | | | 3,600,000 | | | | 3,610,483 | |
CIG Auto Receivables Trust, Series 2020-1A, Class B, 1.550%, 1/13/2025 (a) | | | 1,000,000 | | | | 1,003,589 | |
Conn’s Receivables Funding LLC, Series 2020-A, Class C, 4.200%, 6/15/2025 (a) | | | 112,525 | | | | 113,216 | |
Conn’s Receivables Funding LLC, Series 2021-A, Class A, 1.050%, 5/15/2026 (a) | | | 1,578,462 | | | | 1,580,612 | |
Consumer Loan Underlying Bond CLUB Certificate Trust, Series 2019-HP1, Class A, 2.590%, 12/15/2026 (a) | | | 401,723 | | | | 403,331 | |
Consumer Loan Underlying Bond CLUB Certificate Trust, Series 2019-HP1, Class B, 3.480%, 12/15/2026 (a) | | | 5,829,000 | | | | 5,899,811 | |
Consumer Loan Underlying Bond CLUB Certificate Trust, Series 2019-33, Class PT, 11.263%, 10/17/2044 (a)(c) | | | 2,419,251 | | | | 2,403,156 | |
Consumer Loan Underlying Bond CLUB Credit Trust, Series 2019-P2, Class B, 2.830%, 10/15/2026 (a) | | | 240,102 | | | | 240,982 | |
Consumer Loan Underlying Bond CLUB Credit Trust, Series 2019-P2, Class C, 4.410%, 10/15/2026 (a) | | | 1,200,000 | | | | 1,216,604 | |
Consumer Loan Underlying Bond Credit Trust, Series 2018-P1, Class C, 5.210%, 7/15/2025 (a) | | | 85,289 | | | | 85,687 | |
Consumer Loan Underlying Bond Credit Trust, Series 2018-P2, Class C, 5.210%, 10/15/2025 (a) | | | 582,764 | | | | 585,337 | |
Consumer Loan Underlying Bond Credit Trust, Series 2018-P3, Class C, 5.540%, 1/15/2026 (a) | | | 1,712,160 | | | | 1,717,715 | |
Consumer Loan Underlying Bond Credit Trust, Series 2019-P1, Class B, 3.280%, 7/15/2026 (a) | | | 128,785 | | | | 129,210 | |
Consumer Underlying Bond Securitization, Series 2018-1, Class A, 4.790%, 2/17/2026 (a) | | | 827,984 | | | | 834,156 | |
Continental Finance Credit Card ABS Master Trust, Series 2020-1A, Class A, 2.240%, 12/15/2028 (a) | | | 500,000 | | | | 500,933 | |
Continental Finance Credit Card ABS Master Trust, Series 2021-A, Class A, 2.550%, 12/17/2029 (a) | | | 2,000,000 | | | | 1,984,542 | |
CPS Auto Receivables Trust, Series 2018-B, Class D, 4.260%, 3/15/2024 (a) | | | 721,922 | | | | 731,563 | |
CPS Auto Receivables Trust, Series 2018-B, Class E, 5.610%, 12/16/2024 (a) | | | 200,000 | | | | 206,742 | |
CPS Auto Receivables Trust, Series 2019-C, Class D, 3.170%, 6/16/2025 (a) | | | 200,000 | | | | 203,252 | |
CPS Auto Receivables Trust, Series 2019-C, Class E, 4.300%, 7/15/2025 (a) | | | 900,000 | | | | 931,883 | |
CPS Auto Receivables Trust, Series 2020-C, Class C, 1.710%, 8/15/2026 (a) | | | 2,100,000 | | | | 2,113,612 | |
CPS Auto Receivables Trust, Series 2021-A, Class C, 0.830%, 9/15/2026 (a) | | | 1,000,000 | | | | 995,367 | |
CPS Auto Receivables Trust, Series 2021-B, Class C, 1.230%, 3/15/2027 (a) | | | 1,600,000 | | | | 1,588,789 | |
CPS Auto Receivables Trust, Series 2020-C, Class E, 4.220%, 5/15/2027 (a) | | | 2,925,000 | | | | 3,015,540 | |
CPS Auto Receivables Trust, Series 2021-D, Class D, 2.310%, 10/15/2027 (a) | | | 2,000,000 | | | | 1,948,642 | |
CPS Auto Receivables Trust, Series 2021-B, Class E, 3.410%, 6/15/2028 (a) | | | 500,000 | | | | 495,339 | |
CPS Auto Trust, Series 2018-C, Class D, 4.400%, 6/17/2024 (a) | | | 67,309 | | | | 68,238 | |
CPS Auto Trust, Series 2021-C, Class C, 1.210%, 6/15/2027 (a) | | | 5,000,000 | | | | 4,952,525 | |
See accompanying notes which are an integral part of these financial statements.
105
Angel Oak UltraShort Income Fund
Schedule of Investments – (continued)
January 31, 2022
| | | | | | | | |
| | | Principal
Amount | | | Value | |
Asset-Backed Securities – (continued) | | | | | | | | |
Credit Acceptance Auto Loan Trust, Series 2020-2A, Class B, 1.930%, 9/15/2029 (a) | | $ | 400,000 | | | $ | 400,954 | |
Donlen Fleet Lease Funding LLC, Series 2021-2, Class B, 0.980%, 12/11/2034 (a) | | | 1,500,000 | | | | 1,475,627 | |
Drive Auto Receivables Trust, Series 2018-3, Class D, 4.300%, 9/16/2024 | | | 586,087 | | | | 593,522 | |
DT Auto Owner Trust, Series 2020-1A, Class B, 2.160%, 5/15/2024 (a) | | | 1,633,232 | | | | 1,641,519 | |
DT Auto Owner Trust, Series 2021-1A, Class B, 0.620%, 9/15/2025 (a) | | | 1,200,000 | | | | 1,195,171 | |
DT Auto Owner Trust, Series 2021-3A, Class C, 0.870%, 5/17/2027 (a) | | | 2,582,000 | | | | 2,541,421 | |
DT Auto Owner Trust, Series 2021-3A, Class E, 2.650%, 9/15/2028 (a) | | | 500,000 | | | | 486,519 | |
Ellington Financial Mortgage Trust, Series 2022-1, Class A1, 2.206%, 1/25/2067 (a)(c) | | | 2,000,000 | | | | 2,013,826 | |
ENVA LLC, Series 2019-A, Class C, 7.620%, 6/20/2026 (a) | | | 1,958,772 | | | | 1,984,240 | |
Evergreen Credit Card Trust, Series 2019-2, Class C, 2.620%, 9/16/2024 (a) | | | 1,900,000 | | | | 1,918,440 | |
Exeter Automobile Receivables Trust, Series 2017-3A, Class C, 3.680%, 7/17/2023 (a) | | | 2,663,496 | | | | 2,689,574 | |
Exeter Automobile Receivables Trust, Series 2020-2A, Class B, 2.080%, 7/15/2024 (a) | | | 1,506,284 | | | | 1,510,584 | |
Exeter Automobile Receivables Trust, Series 2020-1A, Class D, 2.730%, 12/15/2025 (a) | | | 9,500,000 | | | | 9,684,813 | |
Fair Square Issuance Trust, Series 2020-AA, Class A, 2.900%, 9/20/2024 (a) | | | 1,500,000 | | | | 1,503,104 | |
FHF Trust, Series 2021-2A, Class A, 0.830%, 12/15/2026 (a) | | | 2,723,255 | | | | 2,700,758 | |
FHF Trust, Series 2021-1A, Class A, 1.270%, 3/15/2027 (a) | | | 3,606,117 | | | | 3,590,264 | |
First Investors Auto Owner Trust, Series 2017-2A, Class D, 3.560%, 9/15/2023 (a) | | | 311,117 | | | | 311,771 | |
First Investors Auto Owner Trust, Series 2017-2A, Class E, 5.480%, 10/15/2024 (a) | | | 2,000,000 | | | | 2,008,038 | |
First Investors Auto Owner Trust, Series 2020-1A, Class D, 3.150%, 4/15/2026 (a) | | | 1,000,000 | | | | 1,018,487 | |
First Investors Auto Owner Trust, Series 2019-2A, Class F, 5.690%, 7/15/2026 (a) | | | 500,000 | | | | 515,311 | |
First Investors Auto Owner Trust, Series 2019-1A, Class F, 6.150%, 7/15/2026 (a) | | | 450,000 | | | | 466,378 | |
First Investors Auto Owner Trust, Series 2021-1A, Class B, 0.890%, 3/15/2027 (a) | | | 1,450,000 | | | | 1,442,388 | |
First Investors Auto Owner Trust, Series 2021-2A, Class C, 1.470%, 11/15/2027 (a) | | | 2,402,000 | | | | 2,369,638 | |
Flagship Credit Auto Trust, Series 2017-4, Class E, 5.020%, 2/18/2025 (a) | | | 3,750,000 | | | | 3,827,869 | |
Flagship Credit Auto Trust, Series 2020-2, Class B, 2.610%, 4/15/2026 (a) | | | 4,000,000 | | | | 4,033,776 | |
Flagship Credit Auto Trust, Series 2020-3, Class D, 2.500%, 9/15/2026 (a) | | | 585,000 | | | | 591,916 | |
Flagship Credit Auto Trust, Series 2021-3, Class C, 1.460%, 9/15/2027 (a) | | | 5,000,000 | | | | 4,896,080 | |
Foundation Finance Trust, Series 2020-1A, Class A, 3.540%, 7/15/2040 (a) | | | 1,567,617 | | | | 1,612,919 | |
Foundation Finance Trust, Series 2021-1A, Class A, 1.270%, 5/15/2041 (a) | | | 1,475,584 | | | | 1,448,147 | |
Foundation Finance Trust, Series 2021-2A, Class A, 2.190%, 1/15/2042 (a) | | | 1,691,035 | | | | 1,696,049 | |
Foursight Capital Automobile Receivables Trust, Series 2018-2, Class E, 5.500%, 10/15/2024 (a) | | | 600,000 | | | | 612,520 | |
Foursight Capital Automobile Receivables Trust, Series 2019-1, Class B, 2.780%, 1/15/2025 (a) | | | 995,866 | | | | 1,002,535 | |
Foursight Capital Automobile Receivables Trust, Series 2020-1, Class B, 2.270%, 2/15/2025 (a) | | | 2,000,000 | | | | 2,015,186 | |
Foursight Capital Automobile Receivables Trust, Series 2020-1, Class C, 2.410%, 8/15/2025 (a) | | | 1,750,000 | | | | 1,764,655 | |
Foursight Capital Automobile Receivables Trust, Series 2021-1, Class B, 0.870%, 1/15/2026 (a) | | | 10,160,000 | | | | 9,987,544 | |
Foursight Capital Automobile Receivables Trust, Series 2020-1, Class E, 3.490%, 4/15/2026 (a) | | | 5,540,000 | | | | 5,670,489 | |
Foursight Capital Automobile Receivables Trust, Series 2021-1, Class C, 1.020%, 9/15/2026 (a) | | | 4,300,000 | | | | 4,210,762 | |
Foursight Capital Automobile Receivables Trust, Series 2019-1, Class F, 5.570%, 11/16/2026 (a) | | | 2,600,000 | | | | 2,681,435 | |
Foursight Capital Automobile Receivables Trust, Series 2020-1, Class F, 4.620%, 6/15/2027 (a) | | | 1,400,000 | | | | 1,443,100 | |
Foursight Capital Automobile Receivables Trust, Series 2021-2, Class B, 1.310%, 7/15/2027 (a) | | | 3,000,000 | | | | 2,966,625 | |
See accompanying notes which are an integral part of these financial statements.
106
Angel Oak UltraShort Income Fund
Schedule of Investments – (continued)
January 31, 2022
| | | | | | | | |
| | | Principal
Amount | | | Value | |
Asset-Backed Securities – (continued) | | | | | | | | |
FREED ABS Trust, Series 2018-2, Class C, 5.880%, 10/20/2025 (a) | | $ | 1,377,744 | | | $ | 1,384,924 | |
FREED ABS Trust, Series 2019-2, Class B, 3.190%, 11/18/2026 (a) | | | 1,907,255 | | | | 1,914,911 | |
FREED ABS Trust, Series 2020-FP1, Class B, 3.060%, 3/18/2027 (a) | | | 894,375 | | | | 899,743 | |
FREED ABS Trust, Series 2020-2CP, Class B, 5.500%, 6/18/2027 (a) | | | 544,965 | | | | 550,967 | |
FREED ABS Trust, Series 2020-3FP, Class B, 4.180%, 9/18/2027 (a) | | | 102,775 | | | | 103,382 | |
FREED ABS Trust, Series 2021-2, Class A, 0.680%, 6/19/2028 (a) | | | 928,533 | | | | 930,183 | |
FREED ABS Trust, Series 2021-2, Class B, 1.030%, 6/19/2028 (a) | | | 500,000 | | | | 499,627 | |
FREED ABS Trust, Series 2021-3FP, Class C, 1.600%, 11/20/2028 (a) | | | 4,750,000 | | | | 4,697,337 | |
Genesis Sales Finance Master Trust, Series 2020-AA, Class A, 1.650%, 9/22/2025 (a) | | | 2,000,000 | | | | 1,986,046 | |
Genesis Sales Finance Master Trust, Series 2021-AA, Class A, 1.200%, 12/20/2026 (a) | | | 2,000,000 | | | | 1,964,646 | |
GLS Auto Receivables Issuer Trust, Series 2020-3A, Class B, 1.380%, 8/15/2024 (a) | | | 911,677 | | | | 915,270 | |
GLS Auto Receivables Issuer Trust, Series 2020-2A, Class A, 1.580%, 8/15/2024 (a) | | | 460,921 | | | | 462,584 | |
GLS Auto Receivables Issuer Trust, Series 2019-4A, Class B, 2.780%, 9/15/2024 (a) | | | 1,122,589 | | | | 1,131,693 | |
GLS Auto Receivables Issuer Trust, Series 2019-1A, Class C, 3.870%, 12/16/2024 (a) | | | 2,000,000 | | | | 2,032,768 | |
GLS Auto Receivables Issuer Trust, Series 2021-4, Class A, 0.840%, 7/15/2025 (a) | | | 2,854,210 | | | | 2,850,885 | |
GLS Auto Receivables Issuer Trust, Series 2019-4A, Class D, 4.090%, 8/15/2026 (a) | | | 1,750,000 | | | | 1,790,038 | |
GLS Auto Receivables Issuer Trust, Series 2020-1A, Class D, 3.680%, 11/16/2026 (a) | | | 450,000 | | | | 457,173 | |
GLS Auto Receivables Issuer Trust, Series 2021-4, Class C, 1.940%, 10/15/2027 (a) | | | 2,000,000 | | | | 1,986,720 | |
GLS Auto Receivables Trust, Series 2021-2A, Class B, 0.770%, 9/15/2025 (a) | | | 2,250,000 | | | | 2,230,868 | |
Golden Credit Card Trust, Series 2017-4A, Class A,
0.623% (1 Month LIBOR USD + 0.520%), 7/15/2024 (a)(b) | | | 6,375,000 | | | | 6,394,807 | |
Goldman Home Improvement Trust, Series 2021-GRN2, Class A, 1.150%, 6/26/2051 (a) | | | 3,817,081 | | | | 3,755,935 | |
Hertz Vehicle Financing III LLC, Series 2022-1A, Class A, 1.990%, 6/25/2026 (a) | | | 3,300,000 | | | | 3,297,512 | |
Hertz Vehicle Financing LLC, Series 2021-1A, Class A, 1.210%, 12/25/2025 (a) | | | 5,000,000 | | | | 4,906,405 | |
Hertz Vehicle Financing LLC, Series 2021-1A, Class C, 2.050%, 12/25/2025 (a) | | | 2,000,000 | | | | 1,972,084 | |
LAD Auto Receivables Trust, Series 2021-1A, Class A, 1.300%, 8/17/2026 (a) | | | 3,003,167 | | | | 2,995,298 | |
Lendbuzz Securitization Trust, Series 2021-1A, Class A, 1.460%, 6/15/2026 (a) | | | 4,224,138 | | | | 4,207,494 | |
LendingClub Receivables Trust, Series 2020-6A, Class A, 2.750%, 11/15/2047 (a) | | | 1,650,750 | | | | 1,662,507 | |
Lendingpoint Asset Securitization Trust, Series 2021-A, Class A, 1.000%, 12/15/2028 (a) | | | 5,948,831 | | | | 5,953,786 | |
Lendingpoint Asset Securitization Trust, Series 2021-A, Class B, 1.460%, 12/15/2028 (a) | | | 3,750,000 | | | | 3,753,746 | |
Lendingpoint Asset Securitization Trust, Series 2021-B, Class A, 1.110%, 2/15/2029 (a) | | | 5,011,494 | | | | 5,015,844 | |
Lendingpoint Asset Securitization Trust, Series 2022-A, Class B, 2.410%, 6/15/2029 (a) | | | 1,750,000 | | | | 1,751,402 | |
LendingPoint Asset Securitization Trust, Series 2020-REV1, Class A, 2.731%, 10/15/2028 (a) | | | 2,000,000 | | | | 2,023,698 | |
LendingPoint Pass-Through Trust, Series 2022-ST1, Class A, 2.500%, 3/15/2028 (a) | | | 2,000,000 | | | | 2,001,236 | |
LL ABS Trust, Series 2020-1A, Class A, 2.330%, 1/17/2028 (a) | | | 152,863 | | | | 153,776 | |
LL ABS Trust, Series 2020-1A, Class C, 6.540%, 1/17/2028 (a) | | | 2,200,000 | | | | 2,309,076 | |
LL ABS Trust, Series 2021-1A, Class A, 1.070%, 5/15/2029 (a) | | | 4,383,076 | | | | 4,365,421 | |
LL ABS Trust, Series 2021-1A, Class B, 2.170%, 5/15/2029 (a) | | | 1,000,000 | | | | 985,735 | |
LP LMS Asset Securitization Trust, Series 2021-2A, Class A, 1.750%, 1/15/2029 (a) | | | 1,596,119 | | | | 1,588,338 | |
Marlette Funding Trust, Series 2018-1A, Class D, 4.850%, 3/15/2028 (a) | | | 186,832 | | | | 187,534 | |
Marlette Funding Trust, Series 2018-3A, Class C, 4.630%, 9/15/2028 (a) | | | 327,286 | | | | 327,474 | |
Marlette Funding Trust, Series 2019-1A, Class B, 3.940%, 4/16/2029 (a) | | | 47,960 | | | | 48,017 | |
Marlette Funding Trust, Series 2019-2A, Class B, 3.530%, 7/16/2029 (a) | | | 266,464 | | | | 267,104 | |
Marlette Funding Trust, Series 2019-4A, Class C, 3.760%, 12/15/2029 (a) | | | 11,000,000 | | | | 11,256,333 | |
Marlette Funding Trust, Series 2020-1A, Class C, 2.800%, 3/15/2030 (a) | | | 2,000,000 | | | | 2,019,662 | |
Marlette Funding Trust, Series 2020-1A, Class D, 3.540%, 3/15/2030 (a) | | | 13,750,000 | | | | 14,048,348 | |
Marlette Funding Trust, Series 2021-1A, Class A, 0.600%, 6/16/2031 (a) | | | 770,667 | | | | 770,198 | |
Marlette Funding Trust, Series 2021-1A, Class C, 1.410%, 6/16/2031 (a) | | | 1,100,000 | | | | 1,081,262 | |
Marlette Funding Trust, Series 2021-1A, Class D, 2.470%, 6/16/2031 (a) | | | 1,000,000 | | | | 993,469 | |
See accompanying notes which are an integral part of these financial statements.
107
Angel Oak UltraShort Income Fund
Schedule of Investments – (continued)
January 31, 2022
| | | | | | | | |
| | | Principal
Amount | | | Value | |
Asset-Backed Securities – (continued) | | | | | | | | |
Marlette Funding Trust, Series 2021-2A, Class B, 1.060%, 9/15/2031 (a) | | $ | 3,250,000 | | | $ | 3,210,704 | |
Marlette Funding Trust, Series 2021-3A, Class B, 1.300%, 12/15/2031 (a) | | | 3,000,000 | | | | 2,970,783 | |
Mercury Financial Credit Card Master Trust, Series 2021-1A, Class A, 1.540%, 3/20/2026 (a) | | | 14,012,000 | | | | 14,004,069 | |
Mission Lane Credit Card Master Trust, Series 2021-A, Class A, 1.590%, 9/15/2026 (a) | | | 2,000,000 | | | | 1,981,962 | |
Octane Receivables Trust, Series 2020-1A, Class A, 1.710%, 2/20/2025 (a) | | | 2,392,561 | | | | 2,398,394 | |
Octane Receivables Trust, Series 2021-2A, Class A, 1.210%, 9/20/2028 (a) | | | 1,147,700 | | | | 1,138,701 | |
Oportun Issuance Trust, Series 2021-C, Class A, 2.180%, 10/8/2031 (a) | | | 2,000,000 | | | | 1,987,702 | |
Pagaya AI Debt Selection Trust, Series 2020-3, Class A, 2.100%, 5/17/2027 (a) | | | 1,421,740 | | | | 1,427,336 | |
Pagaya AI Debt Selection Trust, Series 2021-1, Class A, 1.180%, 11/15/2027 (a) | | | 8,503,407 | | | | 8,476,851 | |
Pagaya AI Debt Selection Trust, Series 2021-1, Class B, 2.130%, 11/15/2027 (a) | | | 8,646,436 | | | | 8,611,279 | |
Pagaya AI Debt Selection Trust, Series 2021-HG1, Class A, 1.220%, 1/16/2029 (a) | | | 2,679,315 | | | | 2,669,061 | |
Pagaya AI Debt Selection Trust, Series 2021-HG1, Class B, 1.820%, 1/16/2029 (a) | | | 2,813,913 | | | | 2,805,120 | |
Pagaya AI Debt Selection Trust, Series 2021-3, Class A, 1.150%, 5/15/2029 (a) | | | 27,493,197 | | | | 27,356,034 | |
Pagaya AI Debt Selection Trust, Series 2021-3, Class B, 1.740%, 5/15/2029 (a) | | | 3,000,000 | | | | 2,936,184 | |
Pagaya AI Debt Trust, Series 2022-1, Class A, 2.030%, 10/15/2029 (a)(d) | | | 3,000,000 | | | | 3,008,145 | |
Pagaya AI Debt Trust, Series 2022-1, Class B, 3.340%, 10/15/2029 (a)(d) | | | 1,000,000 | | | | 1,002,684 | |
PMIT, Series 2019-3A, Class C, 4.940%, 9/15/2025 (a) | | | 578,499 | | | | 581,396 | |
Purchasing Power Funding LLC, Series 2021-A, Class A, 1.570%, 10/15/2025 (a) | | | 2,500,000 | | | | 2,488,475 | |
Skopos Auto Receivables Trust, Series 2019-1A, Class D, 5.240%, 4/15/2025 (a) | | | 1,000,000 | | | | 1,023,843 | |
SpringCastle America Funding LLC, Series 2020-AA, Class A, 1.970%, 9/25/2037 (a) | | | 14,832,433 | | | | 14,860,941 | |
Tesla Auto Lease Trust, Series 2020-A, Class D, 2.330%, 2/20/2024 (a) | | | 4,000,000 | | | | 4,033,176 | |
Tesla Auto Lease Trust, Series 2020-A, Class E, 4.640%, 8/20/2024 (a) | | | 700,000 | | | | 719,275 | |
Tesla Auto Lease Trust, Series 2021-A, Class B, 1.020%, 3/20/2025 (a) | | | 3,000,000 | | | | 2,973,033 | |
Theorem Funding Trust, Series 2020-1A, Class B, 3.950%, 10/15/2026 (a) | | | 1,250,000 | | | | 1,266,989 | |
Theorem Funding Trust, Series 2021-1A, Class A, 1.210%, 12/15/2027 (a) | | | 3,096,829 | | | | 3,094,717 | |
Theorem Funding Trust, Series 2021-1A, Class B, 1.840%, 12/15/2027 (a) | | | 2,000,000 | | | | 1,976,642 | |
Theorem Funding Trust, Series 2022-1A, Class A, 1.850%, 2/15/2028 (a)(d) | | | 5,000,000 | | | | 5,004,140 | |
Tidewater Auto Receivables Trust, Series 2020-AA, Class B, 1.610%, 3/15/2025 (a) | | | 2,000,000 | | | | 2,007,044 | |
Tricolor Auto Securitization Trust, Series 2021-1A, Class A, 0.740%, 4/15/2024 (a) | | | 2,154,114 | | | | 2,154,971 | |
Tricolor Auto Securitization Trust, Series 2021-1A, Class C, 1.330%, 9/16/2024 (a) | | | 7,000,000 | | | | 6,963,229 | |
UNIFY Auto Receivables Trust, Series 2021-1A, Class B, 1.290%, 11/16/2026 (a) | | | 1,450,000 | | | | 1,428,454 | |
United Auto Credit Securitization Trust, Series 2019-1, Class F, 6.050%, 1/12/2026 (a) | | | 3,110,000 | | | | 3,120,953 | |
Upgrade Master Pass-Thru Trust, Series 2019-ST1, Class A, 4.000%, 7/15/2025 (a) | | | 144,279 | | | | 145,266 | |
Upgrade Master Pass-Thru Trust, Series 2019-ST3, Class A, 3.750%, 11/15/2025 (a) | | | 1,700,362 | | | | 1,717,644 | |
Upgrade Master Pass-Thru Trust, Series 2019-ST4, Class A, 3.750%, 12/15/2025 (a) | | | 34,444 | | | | 34,766 | |
Upgrade Master Pass-Thru Trust, Series 2019-ST5, Class A, 3.750%, 1/15/2026 (a) | | | 97,244 | | | | 98,153 | |
Upstart Pass-Through Trust, Series 2020-ST6, Class A, 3.000%, 1/20/2027 (a) | | | 1,278,897 | | | | 1,293,345 | |
Upstart Pass-Through Trust, Series 2021-ST1, Class A, 2.750%, 2/20/2027 (a) | | | 4,972,775 | | | | 4,998,081 | |
Upstart Pass-Through Trust, Series 2021-ST2, Class A, 2.500%, 4/20/2027 (a) | | | 6,504,273 | | | | 6,543,390 | |
Upstart Pass-Through Trust, Series 2021-ST3, Class A, 2.000%, 5/20/2027 (a) | | | 6,487,011 | | | | 6,487,485 | |
Upstart Pass-Through Trust, Series 2021-ST4, Class A, 2.000%, 7/20/2027 (a) | | | 5,542,507 | | | | 5,535,157 | |
Upstart Pass-Through Trust, Series 2021-ST5, Class A, 2.000%, 7/20/2027 (a) | | | 4,087,932 | | | | 4,118,934 | |
Upstart Pass-Through Trust, Series 2021-ST6, Class A, 1.850%, 8/20/2027 (a) | | | 8,098,125 | | | | 8,068,307 | |
Upstart Pass-Through Trust, Series 2020-ST1, Class A, 3.750%, 2/20/2028 (a) | | | 1,444,118 | | | | 1,465,230 | |
Upstart Pass-Through Trust, Series 2020-ST2, Class A, 3.500%, 3/20/2028 (a) | | | 5,142,063 | | | | 5,206,642 | |
Upstart Pass-Through Trust, Series 2020-ST3, Class A, 3.350%, 4/20/2028 (a) | | | 5,051,668 | | | | 5,113,323 | |
Upstart Pass-Through Trust, Series 2021-ST7, Class A, 1.850%, 9/20/2029 (a) | | | 2,641,798 | | | | 2,629,542 | |
Upstart Pass-Through Trust, Series 2021-ST8, Class A, 1.750%, 10/20/2029 (a) | | | 4,580,652 | | | | 4,534,529 | |
Upstart Pass-Through Trust, Series 2021-ST10, Class A, 2.250%, 1/20/2030 (a) | | | 4,900,140 | | | | 4,861,585 | |
See accompanying notes which are an integral part of these financial statements.
108
Angel Oak UltraShort Income Fund
Schedule of Investments – (continued)
January 31, 2022
| | | | | | | | |
| | | Principal
Amount | | | Value | |
Asset-Backed Securities – (continued) | | | | | | | | |
Upstart Pass-Through Trust, Series 2022-ST1, Class A, 2.600%, 3/20/2030 (a) | | $ | 4,000,000 | | | $ | 4,018,720 | |
Upstart Pass-Through Trust, Series 2021-1, Class A, 0.870%, 3/20/2031 (a) | | | 2,902,089 | | | | 2,895,646 | |
Upstart Securitization Trust, Series 2018-1, Class D, 6.147%, 8/20/2025 (a) | | | 262,077 | | | | 263,155 | |
Upstart Securitization Trust, Series 2019-1, Class D, 6.480%, 4/20/2026 (a) | | | 5,000,000 | | | | 5,103,060 | |
Upstart Securitization Trust, Series 2019-2, Class C, 4.783%, 9/20/2029 (a) | | | 5,000,000 | | | | 5,088,990 | |
Upstart Securitization Trust, Series 2019-3, Class B, 3.829%, 1/21/2030 (a) | | | 14,737,213 | | | | 14,847,021 | |
Upstart Securitization Trust, Series 2019-3, Class C, 5.381%, 1/21/2030 (a) | | | 1,900,000 | | | | 1,952,252 | |
Upstart Securitization Trust, Series 2020-1, Class A, 2.322%, 4/22/2030 (a) | | | 173,614 | | | | 174,271 | |
Upstart Securitization Trust, Series 2020-2, Class A, 2.309%, 11/20/2030 (a) | | | 468,050 | | | | 470,103 | |
Upstart Securitization Trust, Series 2020-3, Class B, 3.014%, 11/20/2030 (a) | | | 8,148,000 | | | | 8,261,876 | |
Upstart Securitization Trust, Series 2021-1, Class B, 1.890%, 3/20/2031 (a) | | | 3,900,000 | | | | 3,893,518 | |
Upstart Securitization Trust, Series 2021-1, Class C, 4.060%, 3/20/2031 (a) | | | 800,000 | | | | 803,557 | |
Upstart Securitization Trust, Series 2021-2, Class A, 0.910%, 6/20/2031 (a) | | | 3,190,173 | | | | 3,186,731 | |
Upstart Securitization Trust, Series 2021-2, Class C, 3.610%, 6/20/2031 (a) | | | 250,000 | | | | 247,780 | |
Upstart Securitization Trust, Series 2021-3, Class A, 0.830%, 7/20/2031 (a) | | | 1,923,170 | | | | 1,921,726 | |
Upstart Securitization Trust, Series 2021-3, Class B, 1.660%, 7/20/2031 (a) | | | 500,000 | | | | 494,185 | |
Upstart Securitization Trust, Series 2021-4, Class A, 0.840%, 9/20/2031 (a) | | | 12,293,399 | | | | 12,202,194 | |
Upstart Securitization Trust, Series 2021-5, Class B, 2.490%, 11/20/2031 (a) | | | 1,000,000 | | | | 976,120 | |
US Auto Funding, Series 2021-1A, Class A, 0.790%, 7/15/2024 (a) | | | 2,785,407 | | | | 2,780,268 | |
US Auto Funding, Series 2021-1A, Class B, 1.490%, 3/17/2025 (a) | | | 1,676,000 | | | | 1,672,212 | |
USASF Receivables LLC, Series 2020-1A, Class C, 5.940%, 8/15/2024 (a) | | | 2,000,000 | | | | 2,070,680 | |
USASF Receivables LLC, Series 2020-1A, Class A, 2.470%, 8/15/2023 (a) | | | 550,012 | | | | 551,416 | |
USASF Receivables LLC, Series 2020-1A, Class D, 9.350%, 3/15/2027 (a) | | | 1,300,000 | | | | 1,356,879 | |
Verizon Master Trust, Series 2021-2, Class B, 1.280%, 4/20/2028 | | | 4,800,000 | | | | 4,763,141 | |
Veros Automobile Receivables Trust, Series 2020-1, Class A, 1.670%, 9/15/2023 (a) | | | 23,530 | | | | 23,594 | |
Veros Automobile Receivables Trust, Series 2020-1, Class B, 2.190%, 6/15/2025 (a) | | | 300,000 | | | | 301,885 | |
Veros Automobile Receivables Trust, Series 2021-1, Class A, 0.920%, 10/15/2026 (a) | | | 1,059,064 | | | | 1,057,026 | |
Westgate Resorts LLC, Series 2020-1A, Class A, 2.713%, 3/20/2034 (a) | | | 4,683,922 | | | | 4,737,960 | |
Westlake Automobile Receivables Trust, Series 2020-1A, Class A2, 1.440%, 9/15/2023 (a) | | | 282,796 | | | | 283,297 | |
Westlake Automobile Receivables Trust, Series 2018-3A, Class D, 4.000%, 10/16/2023 (a) | | | 431,265 | | | | 434,853 | |
Westlake Automobile Receivables Trust, Series 2019-3A, Class E, 3.590%, 3/15/2025 (a) | | | 13,580,000 | | | | 13,974,160 | |
Westlake Automobile Receivables Trust, Series 2021-2A, Class E, 2.380%, 3/15/2027 (a) | | | 2,250,000 | | | | 2,199,787 | |
World Financial Network Credit Card Master Trust, Series 2019-B, Class M, 3.040%, 4/15/2026 | | | 3,365,000 | | | | 3,402,883 | |
| | | | | | | | |
| | |
TOTAL ASSET-BACKED SECURITIES
(Cost – $706,622,028) | | | | | | $ | 704,655,775 | |
| | | | | | | | |
Collateralized Loan Obligations – 11.58% | | | | | | | | |
Atrium CLO, Series 12A, Class AR,
1.089% (3 Month LIBOR USD + 0.830%), 4/22/2027 (a)(b) | | | 4,469,935 | | | | 4,472,474 | |
Audax Senior Debt CLO LLC, Series 2020-1A, Class A,
1.864% (3 Month LIBOR USD + 1.610%), 1/22/2030 (a)(b) | | | 5,000,000 | | | | 5,002,730 | |
Barings Middle Market CLO Ltd., Series 2021-IA, Class X,
1.399% (3 Month LIBOR USD + 1.250%), 7/20/2033 (a)(b) | | | 4,000,000 | | | | 3,999,992 | |
Black Diamond CLO Ltd., Series 2017-1A, Class A1AR,
1.309% (3 Month LIBOR USD + 1.050%), 4/24/2029 (a)(b) | | | 3,809,375 | | | | 3,809,371 | |
BNPP IP CLO Ltd., Series 2014-2A, Class CR,
2.532% (3 Month LIBOR USD + 2.400%), 10/30/2025 (a)(b) | | | 3,740,543 | | | | 3,745,694 | |
See accompanying notes which are an integral part of these financial statements.
109
Angel Oak UltraShort Income Fund
Schedule of Investments – (continued)
January 31, 2022
| | | | | | | | |
| | | Principal
Amount | | | Value | |
Collateralized Loan Obligations – (continued) | | | | | | | | |
Cathedral Lake CLO Ltd., Series 2021-6A, Class X,
1.258% (3 Month LIBOR USD + 1.000%), 4/25/2034 (a)(b) | | $ | 3,578,947 | | | $ | 3,578,944 | |
Cedar Funding CLO Ltd., Series 2014-4A, Class X,
1.159% (3 Month LIBOR USD + 0.900%), 7/24/2034 (a)(b) | | | 2,261,904 | | | | 2,261,902 | |
Cerberus Loan Funding LP, Series 2021-6A, Class A,
1.641% (3 Month LIBOR USD + 1.400%), 11/22/2033 (a)(b) | | | 5,903,512 | | | | 5,903,495 | |
Cerberus Loan Funding LP, Series 2018-4RA, Class A1TR,
1.654% (3 Month LIBOR USD + 1.530%), 10/15/2030 (a)(b) | | | 3,000,000 | | | | 3,002,919 | |
CIFC Funding Ltd., Series 2015-3A, Class AR,
1.118% (3 Month LIBOR USD + 0.870%), 4/19/2029 (a)(b) | | | 4,892,128 | | | | 4,894,765 | |
Elevation CLO Ltd., Series 2021-13A, Class X,
1.241% (3 Month LIBOR USD + 1.000%), 7/17/2034 (a)(b) | | | 2,800,000 | | | | 2,799,997 | |
Elevation CLO Ltd., Series 2021-14A, Class X,
1.069% (3 Month LIBOR USD + 0.950%), 10/20/2034 (a)(b) | | | 3,750,000 | | | | 3,751,054 | |
First Eagle Commercial Loan Funding LLC, Series 2016-1A, Class A1AR,
1.948% (3 Month LIBOR USD + 1.690%), 1/26/2032 (a)(b) | | | 10,000,000 | | | | 9,992,760 | |
Gallatin CLO Ltd., Series 2018-1A, Class A,
1.305% (3 Month LIBOR USD + 1.050%), 1/21/2028 (a)(b) | | | 1,500,255 | | | | 1,501,337 | |
Golub Capital Partners CLO Ltd., Series 2015-25A, Class AR,
1.520% (3 Month LIBOR USD + 1.380%), 5/5/2030 (a)(b) | | | 5,000,000 | | | | 5,009,780 | |
Great Lakes CLO Ltd., Series 2021-5A, Class AX,
1.191% (3 Month LIBOR USD + 0.950%), 4/15/2033 (a)(b) | | | 3,082,857 | | | | 3,082,854 | |
Halcyon Loan Advisors Funding Ltd., Series 2014-3A, Class B1R,
1.959% (3 Month LIBOR USD + 1.700%), 10/22/2025 (a)(b) | | | 1,872,290 | | | | 1,874,334 | |
Halcyon Loan Advisors Funding Ltd., Series 2015-2A, Class CR,
2.408% (3 Month LIBOR USD + 2.150%), 7/26/2027 (a)(b) | | | 5,884,000 | | | | 5,887,377 | |
Hayfin Kingsland XI Ltd., Series 2019-2A, Class XR,
1.204% (3 Month LIBOR USD + 0.950%), 10/20/2034 (a)(b) | | | 3,300,000 | | | | 3,299,997 | |
Highbridge Loan Management Ltd., Series 2015-7A, Class BR,
1.336% (3 Month LIBOR USD + 1.180%), 3/15/2027 (a)(b) | | | 4,000,000 | | | | 3,995,228 | |
ICG US CLO Ltd., Series 2015-1X, Class A1R,
1.388% (3 Month LIBOR USD + 1.140%), 10/19/2028 (b)(e) | | | 2,280,655 | | | | 2,283,574 | |
Jamestown CLO IX Ltd., Series 2016-9A, Class XRR,
1.158% (3 Month LIBOR USD + 0.900%), 7/25/2034 (a)(b) | | | 4,000,000 | | | | 3,999,996 | |
Lake Shore MM CLO IV Ltd., Series 2021-1A, Class X,
1.180% (3 Month LIBOR USD + 1.180%), 10/17/2033 (a)(b) | | | 4,750,000 | | | | 4,749,957 | |
LCM LP, Series 20A, Class AR, 1.294% (3 Month LIBOR USD + 1.040%), 10/20/2027 (a)(b) | | | 927,148 | | | | 927,361 | |
Marble Point CLO Ltd., Series 2020-3A, Class X,
1.098% (3 Month LIBOR USD + 0.850%), 1/19/2034 (a)(b) | | | 1,666,666 | | | | 1,666,664 | |
Medalist Partners Corporate Finance CLO Ltd., Series 2020-1A, Class X,
1.141% (3 Month LIBOR USD + 0.900%), 4/18/2033 (a)(b) | | | 1,200,000 | | | | 1,200,000 | |
MidOcean Credit CLO, Series 2015-4A, Class CR,
1.891% (3 Month LIBOR USD + 1.650%), 4/15/2027 (a)(b) | | | 1,085,047 | | | | 1,085,208 | |
Monroe Capital MML CLO Ltd., Series 2017-1A, Class AR,
1.559% (3 Month LIBOR USD + 1.300%), 4/23/2029 (a)(b) | | | 5,000,000 | | | | 5,004,310 | |
Monroe Capital MML CLO Ltd., Series 2018-1A, Class A,
1.691% (3 Month LIBOR USD + 1.450%), 4/15/2030 (a)(b) | | | 2,500,000 | | | | 2,494,142 | |
Monroe Capital Mml Clo XII Ltd., Series 2021-2A, Class X,
1.000% (3 Month LIBOR USD + 1.000%), 9/14/2033 (a)(b) | | | 5,000,000 | | | | 5,000,290 | |
See accompanying notes which are an integral part of these financial statements.
110
Angel Oak UltraShort Income Fund
Schedule of Investments – (continued)
January 31, 2022
| | | | | | | | |
| | | Principal
Amount | | | Value | |
Collateralized Loan Obligations – (continued) | | | | | | | | |
Mountain View CLO Ltd., Series 2016-1A, Class XR,
1.038% (3 Month LIBOR USD + 0.800%), 4/14/2033 (a)(b) | | $ | 2,526,316 | | | $ | 2,526,316 | |
Mountain View CLO XIV Ltd., Series 2019-1A, Class XR,
0.991% (3 Month LIBOR USD + 0.750%), 10/16/2034 (a)(b) | | | 3,806,250 | | | | 3,806,246 | |
Neuberger Berman CLO Ltd., Series 2017-26A, Class AR,
1.161% (3 Month LIBOR USD + 0.920%), 10/18/2030 (a)(b) | | | 9,000,000 | | | | 9,001,998 | |
Neuberger Berman CLO Ltd., Series 2015-20A, Class XR,
1.191% (3 Month LIBOR USD + 0.950%), 7/17/2034 (a)(b) | | | 4,500,000 | | | | 4,499,995 | |
Northwoods Capital Ltd., Series 2019-20A, Class X,
1.058% (3 Month LIBOR USD + 0.800%), 1/26/2032 (a)(b) | | | 642,936 | | | | 643,090 | |
OZLM Ltd., Series 2015-12A, Class A2R,
1.899% (3 Month LIBOR USD + 1.600%), 4/30/2027 (a)(b) | | | 2,400,000 | | | | 2,400,814 | |
OZLM Ltd., Series 2015-14A, Class X,
1.241% (3 Month LIBOR USD + 1.000%), 7/17/2034 (a)(b) | | | 866,667 | | | | 866,666 | |
Saranac CLO Ltd., Series 2014-2A, Class A1AR,
1.390% (3 Month LIBOR USD + 1.230%), 11/20/2029 (a)(b) | | | 6,887,648 | | | | 6,881,952 | |
Sculptor CLO Ltd., Series 25A, Class X,
0.991% (3 Month LIBOR USD + 0.750%), 1/15/2031 (a)(b) | | | 2,500,000 | | | | 2,499,997 | |
Silver Creek CLO Ltd., Series 2014-1A, Class AR,
1.494% (3 Month LIBOR USD + 1.240%), 7/22/2030 (a)(b) | | | 2,758,841 | | | | 2,758,389 | |
Sound Point CLO Ltd., Series 2013-2RA, Class A1,
1.191% (3 Month LIBOR USD + 0.950%), 4/16/2029 (a)(b) | | | 3,673,309 | | | | 3,679,139 | |
Symphony CLO Ltd., Series 2014-14A, Class AR,
1.188% (3 Month LIBOR USD + 0.950%), 7/14/2026 (a)(b) | | | 931,085 | | | | 931,528 | |
Symphony CLO Ltd., Series 2021-25A, Class X,
0.948% (3 Month LIBOR USD + 0.700%), 4/19/2034 (a)(b) | | | 1,000,000 | | | | 999,999 | |
TCI-Flatiron CLO Ltd., Series 2016-1A, Class X,
0.991% (3 Month LIBOR USD + 0.750%), 1/17/2032 (a)(b) | | | 500,000 | | | | 500,000 | |
TCP Waterman CLO Ltd., Series 2016-1A, Class A1J,
2.503% (3 Month LIBOR USD + 2.300%), 12/15/2028 (a)(b) | | | 2,699,062 | | | | 2,699,899 | |
TCW CLO AMR Ltd., Series 2019-1A, Class XR,
1.155% (3 Month LIBOR USD + 1.000%), 8/16/2034 (a)(b) | | | 3,733,333 | | | | 3,733,330 | |
TCW CLO Ltd., Series 2020-1A, Class XRR,
1.024% (3 Month LIBOR USD + 0.850%), 4/20/2034 (a)(b) | | | 3,428,571 | | | | 3,428,026 | |
TCW CLO Ltd., Series 2021-2A, Class X,
1.258% (3 Month LIBOR USD + 1.000%), 7/25/2034 (a)(b) | | | 4,000,000 | | | | 3,999,996 | |
THL Credit Lake Shore MM CLO Ltd., Series 2019-1A, Class X,
1.241% (3 Month LIBOR USD + 1.000%), 4/15/2033 (a)(b) | | | 3,000,000 | | | | 2,999,997 | |
Venture CLO Ltd., Series 2019-38A, Class XR,
1.299% (3 Month LIBOR USD + 1.000%), 7/30/2032 (a)(b) | | | 2,612,500 | | | | 2,618,185 | |
Venture CLO Ltd., Series 2016-23A, Class XR2,
1.298% (3 Month LIBOR USD + 1.050%), 7/19/2034 (a)(b) | | | 3,268,421 | | | | 3,268,418 | |
Voya CLO Ltd., Series 2015-2A, Class AR,
1.229% (3 Month LIBOR USD + 0.970%), 7/23/2027 (a)(b) | | | 2,415,481 | | | | 2,415,143 | |
Wellfleet CLO Ltd., Series 2019-XA, Class X,
1.254% (3 Month LIBOR USD + 1.000%), 7/20/2032 (a)(b) | | | 3,750,000 | | | | 3,749,996 | |
WhiteHorse CLO Ltd., Series 2014-1A, Class CR,
2.082% (3 Month LIBOR USD + 1.950%), 5/1/2026 (a)(b) | | | 3,927,167 | | | | 3,931,545 | |
See accompanying notes which are an integral part of these financial statements.
111
Angel Oak UltraShort Income Fund
Schedule of Investments – (continued)
January 31, 2022
| | | | | | | | |
| | | Principal
Amount | | | Value | |
Collateralized Loan Obligations – (continued) | | | | | | | | |
WhiteHorse CLO Ltd., Series 2014-9A, Class C,
2.941% (3 Month LIBOR USD + 2.700%), 7/17/2026 (a)(b) | | $ | 2,157,040 | | | $ | 2,157,025 | |
Wind River CLO Ltd., Series 2015-2A, Class BR,
1.489% (3 Month LIBOR USD + 1.250%), 10/15/2027 (a)(b) | | | 1,143,296 | | | | 1,144,189 | |
Z Capital Credit Partners CLO Ltd., Series 2015-1A, Class CR,
2.091% (3 Month LIBOR USD + 1.850%), 7/16/2027 (a)(b) | | | 4,250,000 | | | | 4,251,479 | |
| | | | | | | | |
| | |
TOTAL COLLATERALIZED LOAN OBLIGATIONS
(Cost – $192,608,819) | | | | | | $ | 192,671,863 | |
| | | | | | | | |
Commercial Mortgage-Backed Securities – 2.30% | | | | | | | | |
ACRES Commercial Realty Ltd., Series 2021-FL1, Class A,
1.303% (1 Month LIBOR USD + 1.200%), 6/17/2036 (a)(b) | | | 2,000,000 | | | | 1,990,430 | |
BBCMS Trust, Series 2018-RR1, Class D,
2.156% (1 Month LIBOR USD + 2.050%), 2/15/2033 (a)(b) | | | 704,890 | | | | 709,059 | |
BDS, Series 2021-FL8, Class B, 1.453% (1 Month LIBOR USD + 1.350%), 1/18/2036 (a)(b)(f) | | | 2,000,000 | | | | 1,992,294 | |
BX Commercial Mortgage Trust, Series 2021-VOLT, Class B,
1.056% (1 Month LIBOR USD + 0.950%), 9/15/2036 (a)(b) | | | 2,000,000 | | | | 1,984,432 | |
BXP Trust, Series 2017-CQHP, Class A,
0.956% (1 Month LIBOR USD + 0.850%), 11/15/2034 (a)(b) | | | 1,000,000 | | | | 960,300 | |
BXP Trust, Series 2017-CQHP, Class C,
1.356% (1 Month LIBOR USD + 1.250%), 11/15/2034 (a)(b) | | | 3,000,000 | | | | 2,903,571 | |
CSMC Trust, Series 2017-PFHP, Class A,
1.056% (1 Month LIBOR USD + 0.950%), 12/16/2030 (a)(b) | | | 330,000 | | | | 332,751 | |
Extended Stay America Trust, Series 2021-ESH, Class B,
1.487% (1 Month LIBOR USD + 1.380%), 7/15/2038 (a)(b) | | | 1,391,436 | | | | 1,394,043 | |
Greystone CRE Notes Ltd., Series 2021-HC2, Class A,
1.903% (1 Month LIBOR USD + 1.800%), 12/15/2039 (a)(b) | | | 5,000,000 | | | | 5,017,500 | |
GS Mortgage-Backed Securities Corp. Trust, Series 2018-TWR, Class B,
1.306% (1 Month LIBOR USD + 1.200%), 7/15/2031 (a)(b) | | | 775,000 | | | | 767,204 | |
GS Mortgage-Backed Securities Trust, Series 2018-HART, Class B,
1.410% (1 Month LIBOR USD + 1.300%), 10/15/2031 (a)(b) | | | 683,000 | | | | 671,011 | |
InTown Hotel Portfolio Trust, Series 2018-STAY, Class A,
1.207% (1 Month LIBOR USD + 0.950%), 1/18/2033 (a)(b) | | | 2,815,000 | | | | 2,815,859 | |
JP Morgan Chase Commercial Mortgage Securities Trust, Series 2018-PTC, Class A,
1.556% (1 Month LIBOR USD + 1.450%), 4/15/2031 (a)(b) | | | 1,253,000 | | | | 1,250,067 | |
JP Morgan Chase Commercial Mortgage Securities Trust, Series 2019-MFP, Class A,
1.066% (1 Month LIBOR USD + 0.960%), 7/15/2036 (a)(b) | | | 765,000 | | | | 758,286 | |
LoanCore Issuer Ltd., Series 2021-CRE5, Class A,
1.403% (1 Month LIBOR USD + 1.300%), 7/15/2036 (a)(b) | | | 1,000,000 | | | | 999,623 | |
Motel Trust, Series 2021-MTL6, Class B,
1.306% (1 Month LIBOR USD + 1.200%), 9/15/2038 (a)(b) | | | 1,800,000 | | | | 1,806,646 | |
Natixis Commercial Mortgage Securities Trust, Series 2019-MILE, Class A,
1.606% (1 Month LIBOR USD + 1.500%), 7/15/2036 (a)(b) | | | 1,000,000 | | | | 1,000,413 | |
Ready Capital Mortgage Financing LLC, Series 2021-FL6, Class B,
1.708% (1 Month LIBOR USD + 1.600%), 7/25/2036 (a)(b) | | | 1,950,000 | | | | 1,927,819 | |
Velocity Commercial Capital Loan Trust, Series 2021-2, Class A, 1.520%, 8/25/2051 (a)(c) | | | 4,692,540 | | | | 4,606,995 | |
Velocity Commercial Capital Loan Trust, Series 2021-3, Class A, 1.960%, 10/25/2051 (a)(c) | | | 2,961,051 | | | | 2,933,762 | |
See accompanying notes which are an integral part of these financial statements.
112
Angel Oak UltraShort Income Fund
Schedule of Investments – (continued)
January 31, 2022
| | | | | | | | |
| | | Principal
Amount | | | Value | |
Commercial Mortgage-Backed Securities – (continued) | | | | | | | | |
Velocity Commercial Capital Loan Trust, Series 2021-4, Class A, 2.520%, 12/25/2051 (a)(c) | | $ | 1,477,496 | | | $ | 1,462,610 | |
| | | | | | | | |
| | |
TOTAL COMMERCIAL MORTGAGE-BACKED SECURITIES
(Cost – $38,549,020) | | | | | | $ | 38,284,675 | |
| | | | | | | | |
Commercial Mortgage-Backed Securities – U.S. Government Agency – 5.06% | | | | | | | | |
Federal Home Loan Mortgage Corp., Series K-F15, Class A,
0.771% (1 Month LIBOR USD + 0.670%), 2/25/2023 (b) | | | 195,175 | | | | 196,023 | |
Federal Home Loan Mortgage Corp., Series K-F29, Class A,
0.461% (1 Month LIBOR USD + 0.360%), 2/25/2024 (b) | | | 1,346,011 | | | | 1,351,113 | |
Federal Home Loan Mortgage Corp., Series 2020-KI05, Class B,
2.401% (1 Month LIBOR USD + 2.300%), 7/25/2024 (a)(b) | | | 404,730 | | | | 401,228 | |
Federal Home Loan Mortgage Corp., Series K-F35, Class A,
0.451% (1 Month LIBOR USD + 0.350%), 8/25/2024 (b) | | | 504,219 | | | | 505,580 | |
Federal Home Loan Mortgage Corp., Series K-F34, Class A,
0.461% (1 Month LIBOR USD + 0.360%), 8/25/2024 (b) | | | 54,670 | | | | 54,815 | |
Federal Home Loan Mortgage Corp., Series K-F51, Class A,
0.501% (1 Month LIBOR USD + 0.400%), 8/25/2025 (b) | | | 7,186,808 | | | | 7,192,716 | |
Federal Home Loan Mortgage Corp., Series K-F53, Class A,
0.491% (1 Month LIBOR USD + 0.390%), 10/25/2025 (b) | | | 295,348 | | | | 296,029 | |
Federal Home Loan Mortgage Corp., Series K-F60, Class A,
0.591% (1 Month LIBOR USD + 0.490%), 2/25/2026 (b) | | | 1,735,261 | | | | 1,743,404 | |
Federal Home Loan Mortgage Corp., Series K-F62, Class A,
0.581% (1 Month LIBOR USD + 0.480%), 4/25/2026 (b) | | | 1,423,874 | | | | 1,428,665 | |
Federal Home Loan Mortgage Corp., Series K-F64, Class A,
0.541% (1 Month LIBOR USD + 0.440%), 6/25/2026 (b) | | | 1,093,439 | | | | 1,095,948 | |
Federal Home Loan Mortgage Corp., Series K-F68, Class A,
0.591% (1 Month LIBOR USD + 0.490%), 7/27/2026 (b) | | | 7,035,532 | | | | 7,079,426 | |
Federal Home Loan Mortgage Corp., Series K-F74, Class AL,
0.541% (1 Month LIBOR USD + 0.440%), 1/25/2027 (b) | | | 3,794,684 | | | | 3,812,940 | |
Federal Home Loan Mortgage Corp., Series K-F74, Class AS,
0.580% (MSOFR1MC + 0.530%), 1/25/2027 (b) | | | 474,335 | | | | 475,896 | |
Federal Home Loan Mortgage Corp., Series K-F81, Class AS,
0.450% (SOFR30A + 0.400%), 6/25/2027 (b) | | | 3,235,043 | | | | 3,244,800 | |
Federal Home Loan Mortgage Corp., Series K-F86, Class AS,
0.370% (SOFR30A + 0.320%), 8/25/2027 (b) | | | 14,373,250 | | | | 14,412,934 | |
Federal Home Loan Mortgage Corp., Series K-F86, Class AL,
0.391% (1 Month LIBOR USD + 0.290%), 8/25/2027 (b) | | | 4,384,440 | | | | 4,394,945 | |
Federal Home Loan Mortgage Corp., Series K-F93, Class AS,
0.360% (SOFR30A + 0.310%), 10/25/2027 (b) | | | 2,357,933 | | | | 2,365,967 | |
Federal Home Loan Mortgage Corp., Series K-F93, Class AL,
0.381% (1 Month LIBOR USD + 0.280%), 10/25/2027 (b) | | | 2,757,817 | | | | 2,769,537 | |
Federal Home Loan Mortgage Corp., Series K-F100, Class AS,
0.230% (SOFR30A + 0.180%), 1/25/2028 (b) | | | 4,681,437 | | | | 4,680,894 | |
Federal Home Loan Mortgage Corp., Series K-F43, Class A,
0.341% (1 Month LIBOR USD + 0.240%), 1/25/2028 (b) | | | 2,974,777 | | | | 2,987,072 | |
Federal Home Loan Mortgage Corp., Series K-F48, Class A,
0.391% (1 Month LIBOR USD + 0.290%), 6/25/2028 (b) | | | 1,294,582 | | | | 1,303,147 | |
Federal Home Loan Mortgage Corp., Series K-F59, Class A,
0.641% (1 Month LIBOR USD + 0.540%), 2/25/2029 (b) | | | 504,860 | | | | 507,851 | |
See accompanying notes which are an integral part of these financial statements.
113
Angel Oak UltraShort Income Fund
Schedule of Investments – (continued)
January 31, 2022
| | | | | | | | |
| | | Principal
Amount | | | Value | |
Commercial Mortgage-Backed Securities – U.S. Government Agency – (continued) | | | | | | | | |
Federal Home Loan Mortgage Corp., Series K-F61, Class A,
0.631% (1 Month LIBOR USD + 0.530%), 3/25/2029 (b) | | $ | 2,579,639 | | | $ | 2,591,964 | |
Federal Home Loan Mortgage Corp., Series K-S12, Class A,
0.751% (1 Month LIBOR USD + 0.650%), 8/25/2029 (b) | | | 3,200,000 | | | | 3,201,709 | |
Federal Home Loan Mortgage Corp., Series K-F84, Class AL,
0.401% (1 Month LIBOR USD + 0.300%), 7/25/2030 (b) | | | 3,452,206 | | | | 3,473,054 | |
Federal Home Loan Mortgage Corp., Series K-F92, Class AS,
0.410% (SOFR30A + 0.360%), 10/25/2030 (b) | | | 794,650 | | | | 798,265 | |
Federal Home Loan Mortgage Corp., Series K-F91, Class AL,
0.431% (1 Month LIBOR USD + 0.330%), 10/25/2030 (b) | | | 1,608,105 | | | | 1,611,991 | |
Federal Home Loan Mortgage Corp., Series K-F96, Class AS,
0.350% (SOFR30A + 0.300%), 11/25/2030 (b) | | | 803,242 | | | | 805,558 | |
Federal Home Loan Mortgage Corp., Series K-F94, Class AL,
0.401% (1 Month LIBOR USD + 0.300%), 11/25/2030 (b) | | | 1,788,489 | | | | 1,795,454 | |
Federal Home Loan Mortgage Corp., Series K-F99, Class AS,
0.250% (SOFR30A + 0.200%), 12/26/2030 (b) | | | 1,797,100 | | | | 1,795,802 | |
Federal National Mortgage Association, Series 2013-M2, Class AFL,
0.458% (1 Month LIBOR USD + 0.350%), 1/25/2023 (b) | | | 2,621,199 | | | | 2,628,248 | |
Federal National Mortgage Association, 2.460%, 2/1/2023 | | | 1,180,443 | | | | 1,194,303 | |
Federal National Mortgage Association, 2.500%, 9/1/2024 | | | 1,989,266 | | | | 1,971,691 | |
| | | | | | | | |
| | |
TOTAL COMMERCIAL MORTGAGE-BACKED SECURITIES – U.S. GOVERNMENT AGENCY
(Cost – $84,107,527) | | | | | | $ | 84,168,969 | |
| | | | | | | | |
| | |
Corporate Obligations – 1.15% | | | | | | | | |
Basic Materials – 0.18% | | | | | | | | |
Compass Minerals International, Inc., 4.875%, 7/15/2024 (a) | | | 3,000,000 | | | | 3,051,248 | |
| | | | | | | | |
Consumer, Non-cyclical – 0.22% | | | | | | | | |
Prime Security Services Borrower LLC / Prime Finance, Inc., 5.250%, 4/15/2024 (a) | | | 3,500,000 | | | | 3,612,000 | |
| | | | | | | | |
Energy – 0.24% | | | | | | | | |
Occidental Petroleum Corp., 6.950%, 7/1/2024 | | | 1,000,000 | | | | 1,091,005 | |
Western Midstream Operating LP, 4.000%, 7/1/2022 | | | 2,800,000 | | | | 2,797,830 | |
| | | | | | | | |
| | |
| | | | | | | 3,888,835 | |
| | | | | | | | |
Financial – 0.51% | | | | | | | | |
goeasy Ltd., 5.375%, 12/1/2024 (a) | | | 1,000,000 | | | | 1,021,000 | |
Millennium Consolidated Holdings LLC, 7.500%, 6/30/2023 (a) | | | 2,000,000 | | | | 2,050,339 | |
OneMain Finance Corp., 6.125%, 3/15/2024 | | | 1,275,000 | | | | 1,337,143 | |
Starwood Property Trust, Inc., 5.500%, 11/1/2023 (a) | | | 4,000,000 | | | | 4,119,800 | |
| | | | | | | | |
| | |
| | | | | | | 8,528,282 | |
| | | | | | | | |
| | |
TOTAL CORPORATE OBLIGATIONS
(Cost – $19,215,423) | | | | | | $ | 19,080,365 | |
| | | | | | | | |
Residential Mortgage-Backed Securities – 27.88% | | | | | | | | |
Banc of America Funding Corp., Series 2015-R3, Class 7A1,
0.313% (1 Month LIBOR USD + 0.205%), 4/29/2037 (a)(b) | | | 5,186,062 | | | | 5,171,614 | |
Bellemeade Re Ltd., Series 2018-3A, Class M1B,
1.958% (1 Month LIBOR USD + 1.850%), 10/25/2028 (a)(b) | | | 1,505,100 | | | | 1,508,884 | |
See accompanying notes which are an integral part of these financial statements.
114
Angel Oak UltraShort Income Fund
Schedule of Investments – (continued)
January 31, 2022
| | | | | | | | |
| | | Principal
Amount | | | Value | |
Residential Mortgage-Backed Securities – (continued) | | | | | | | | |
Bellemeade Re Ltd., Series 2019-3A, Class M1C,
2.058% (1 Month LIBOR USD + 1.950%), 7/25/2029 (a)(b) | | $ | 1,397,350 | | | $ | 1,400,896 | |
BRAVO Residential Funding Trust, Series 2019-NQM1, Class A1, 2.666%, 7/25/2059 (a)(c) | | | 1,455,410 | | | | 1,462,747 | |
BRAVO Residential Funding Trust, Series 2021-NQM3, Class A2, 1.853%, 4/25/2060 (a)(c) | | | 4,232,661 | | | | 4,232,365 | |
BRAVO Residential Funding Trust, Series 2020-NQM1, Class A2, 1.789%, 5/25/2060 (a)(c) | | | 1,595,627 | | | | 1,581,504 | |
BRAVO Residential Funding Trust, Series 2020-NQM1, Class A3, 2.406%, 5/25/2060 (a)(c) | | | 1,105,224 | | | | 1,104,700 | |
Bunker Hill Loan Depositary Trust, Series 2019-2, Class A3, 3.185%, 7/25/2049 (a)(g) | | | 6,368,456 | | | | 6,343,664 | |
Bunker Hill Loan Depositary Trust, Series 2020-1, Class A1, 1.724%, 2/25/2055 (a)(c) | | | 2,185,544 | | | | 2,169,650 | |
Bunker Hill Loan Depositary Trust, Series 2019-3, Class A3, 3.135%, 11/25/2059 (a)(g) | | | 2,517,921 | | | | 2,520,766 | |
Cascade Funding Mortgage Trust, Series 2021-HB6, Class A, 0.898%, 6/25/2036 (a)(c) | | | 1,756,516 | | | | 1,752,869 | |
Chase Home Lending Mortgage Trust, Series 2019-ATR2, Class A11,
1.008% (1 Month LIBOR USD + 0.900%), 8/25/2049 (a)(b) | | | 1,909,151 | | | | 1,892,589 | |
CIM Trust, Series 2019-INV1, Class A2,
1.108% (1 Month LIBOR USD + 1.000%), 2/25/2049 (a)(b) | | | 93,130 | | | | 92,379 | |
CIM Trust, Series 2019-INV2, Class A11,
1.052% (1 Month LIBOR USD + 0.950%), 5/25/2049 (a)(b) | | | 318,640 | | | | 314,956 | |
CIM Trust, Series 2021-NR2, Class A1, 2.568%, 7/25/2059 (a)(g) | | | 3,993,241 | | | | 3,991,200 | |
Citigroup Mortgage Loan Trust, Series 2019-IMC1, Class A3, 3.030%, 7/25/2049 (a)(c) | | | 458,359 | | | | 465,312 | |
COLT Funding LLC, Series 2021-3R, Class A3, 1.513%, 12/26/2064 (a)(c) | | | 1,339,204 | | | | 1,339,747 | |
COLT Mortgage Loan Trust, Series 2020-2, Class A1, 1.853%, 3/25/2065 (a)(c) | | | 1,040,562 | | | | 1,039,806 | |
COLT Mortgage Loan Trust, Series 2020-2, Class A3, 3.698%, 3/25/2065 (a)(c) | | | 1,710,000 | | | | 1,717,820 | |
COLT Mortgage Loan Trust, Series 2020-3, Class A1, 1.506%, 4/27/2065 (a)(c) | | | 1,771,196 | | | | 1,774,565 | |
COLT Mortgage Loan Trust, Series 2020-3, Class A3, 2.380%, 4/27/2065 (a)(c) | | | 516,368 | | | | 516,351 | |
COLT Mortgage Loan Trust, Series 2020-1R, Class A2, 1.512%, 9/25/2065 (a)(c) | | | 1,993,574 | | | | 1,991,698 | |
COLT Mortgage Loan Trust, Series 2020-1R, Class A3, 1.769%, 9/25/2065 (a)(c) | | | 3,205,667 | | | | 3,185,039 | |
COLT Mortgage Loan Trust, Series 2021-3, Class A1, 0.956%, 9/27/2066 (a)(c) | | | 10,702,784 | | | | 10,690,947 | |
COLT Mortgage Loan Trust, Series 2021-5, Class A1, 1.726%, 11/25/2066 (a)(c) | | | 3,900,945 | | | | 3,900,278 | |
COLT Mortgage Loan Trust, Series 2021-6, Class A1, 1.907%, 12/27/2066 (a)(c) | | | 6,662,243 | | | | 6,684,815 | |
COLT Mortgage Loan Trust, Series 2022-1, Class A1, 2.284%, 12/27/2066 (a)(c) | | | 5,000,000 | | | | 5,038,945 | |
COLT Mortgage Pass-Through Certificates, Series 2021-1R, Class A3,
1.421%, 5/25/2065 (a)(c) | | | 1,204,693 | | | | 1,201,435 | |
Credit Suisse Mortgage Capital Certificates, Series 2020-SPT1, Class A2,
2.229%, 4/25/2065 (a)(g) | | | 10,000,000 | | | | 10,170,350 | |
Credit Suisse Mortgage Capital Certificates, Series 2020-SPT1, Class A3,
2.734%, 4/25/2065 (a)(g) | | | 5,000,000 | | | | 4,997,680 | |
Credit Suisse Mortgage Trust, Series 2021-NQM8, Class A2, 2.303%, 10/25/2066 (a)(c) | | | 4,861,745 | | | | 4,865,081 | |
CSMC Trust, Series 2019-AFC1, Class A2, 2.776%, 8/25/2049 (a)(g) | | | 1,169,875 | | | | 1,171,705 | |
CSMC Trust, Series 2019-AFC1, Class A3, 2.877%, 8/25/2049 (a)(g) | | | 2,612,033 | | | | 2,630,782 | |
CSMC Trust, Series 2020-AFC1, Class A3, 2.514%, 2/25/2050 (a)(c) | | | 800,490 | | | | 804,757 | |
CSMC Trust, Series 2019-NQM1, Class A1, 2.656%, 10/25/2059 (a)(g) | | | 2,717,178 | | | | 2,720,211 | |
CSMC Trust, Series 2021-NQM1, Class A1, 0.809%, 5/25/2065 (a)(c) | | | 244,096 | | | | 244,119 | |
CSMC Trust, Series 2020-NQM1, Class A3, 1.722%, 5/25/2065 (a)(g) | | | 2,623,260 | | | | 2,611,833 | |
CSMC Trust, Series 2021-NQM3, Class A3, 1.632%, 4/25/2066 (a)(c) | | | 7,848,484 | | | | 7,676,280 | |
CSMC Trust, Series 2021-NQM5, Class A3, 1.349%, 5/25/2066 (a)(c) | | | 4,190,301 | | | | 4,161,204 | |
CSMC Trust, Series 2021-NQM8, Class A1, 1.841%, 10/25/2066 (a)(c) | | | 4,861,745 | | | | 4,867,380 | |
CSMC Trust, Series 2021-NQM7, Class A2, 1.961%, 10/25/2066 (a)(c) | | | 4,612,835 | | | | 4,610,552 | |
CSMC Trust, Series 2022-NQM1, Class A3, 2.675%, 11/25/2066 (a)(c) | | | 10,000,000 | | | | 10,077,320 | |
Deephaven Residential Mortgage Trust, Series 2021-1, Class A1, 0.715%, 5/25/2065 (a)(c) | | | 2,089,745 | | | | 2,071,299 | |
Deephaven Residential Mortgage Trust, Series 2020-2, Class A1, 1.692%, 5/25/2065 (a) | | | 2,041,011 | | | | 2,030,581 | |
See accompanying notes which are an integral part of these financial statements.
115
Angel Oak UltraShort Income Fund
Schedule of Investments – (continued)
January 31, 2022
| | | | | | | | |
| | | Principal
Amount | | | Value | |
Residential Mortgage-Backed Securities – (continued) | | | | | | | | |
Deephaven Residential Mortgage Trust, Series 2021-4, Class A1, 1.931%, 11/25/2066 (a)(c) | | $ | 4,874,155 | | | $ | 4,878,327 | |
Flagstar Mortgage Trust, Series 2018-6RR, Class 1A2,
0.808% (1 Month LIBOR USD + 0.700%), 10/25/2048 (a)(b) | | | 1,575,517 | | | | 1,579,890 | |
Flagstar Mortgage Trust, Series 2021-10IN, Class A6, 2.500%, 10/25/2051 (a)(c) | | | 4,775,683 | | | | 4,771,146 | |
FWD Securitization Trust, Series 2019-INV1, Class A2, 3.010%, 6/25/2049 (a)(c) | | | 887,914 | | | | 913,170 | |
FWD Securitization Trust, Series 2020-INV1, Class A2, 2.340%, 1/25/2050 (a)(c) | | | 2,374,712 | | | | 2,418,345 | |
Galton Funding Mortgage Trust, Series 2017-1, Class A21, 3.500%, 7/25/2056 (a)(c) | | | 76,329 | | | | 75,575 | |
GCAT Trust, Series 2019-NQM3, Class A3, 3.043%, 11/25/2059 (a)(c) | | | 14,397,190 | | | | 14,320,755 | |
GCAT Trust, Series 2020-NQM1, Class A3, 2.554%, 1/25/2060 (a)(g) | | | 511,259 | | | | 510,436 | |
GCAT Trust, Series 2020-NQM2, Class A1, 1.555%, 4/25/2065 (a)(g) | | | 1,330,666 | | | | 1,323,443 | |
GCAT Trust, Series 2021-NQM7, Class A1, 1.915%, 8/25/2066 (a)(c) | | | 3,000,000 | | | | 3,003,405 | |
GS Mortgage-Backed Securities Corp. Trust, Series 2014-EB1A, Class B2,
2.443%, 7/25/2044 (a)(c) | | | 2,390,443 | | | | 2,436,937 | |
GS Mortgage-Backed Securities Corp. Trust, Series 2020-PJ2, Class A1,
3.500%, 7/25/2050 (a)(c) | | | 303,183 | | | | 294,909 | |
GS Mortgage-Backed Securities Corp. Trust, Series 2021-PJ4, Class A6,
2.500%, 9/25/2051 (a)(c) | | | 3,412,171 | | | | 3,495,721 | |
GS Mortgage-Backed Securities Corp. Trust, Series 2021-PJ9, Class A8,
2.500%, 2/25/2052 (a)(c) | | | 9,414,190 | | | | 9,376,609 | |
GS Mortgage-Backed Securities Corp. Trust, Series 2021-PJ10, Class A8,
2.500%, 3/25/2052 (a)(c) | | | 4,814,039 | | | | 4,879,501 | |
GS Mortgage-Backed Securities Corp. Trust, Series 2021-NQM1, Class A3,
1.532%, 7/25/2061 (a)(c) | | | 2,517,393 | | | | 2,517,283 | |
GS Mortgage-Backed Securities Trust, Series 2020-PJ1, Class A1, 3.500%, 5/25/2050 (a)(c) | | | 269,056 | | | | 274,078 | |
GS Mortgage-Backed Securities Trust, Series 2020-NQM1, Class A2,
1.791%, 9/25/2060 (a)(c) | | | 726,541 | | | | 719,599 | |
Home Re Ltd., Series 2018-1, Class M1,
1.708% (1 Month LIBOR USD + 1.600%), 10/25/2028 (a)(b) | | | 473,496 | | | | 474,536 | |
Home RE Ltd., Series 2021-1, Class M1A,
1.158% (1 Month LIBOR USD + 1.050%), 7/25/2033 (a)(b) | | | 1,706,480 | | | | 1,706,557 | |
Imperial Fund Mortgage Trust, Series 2021-NQM1, Class A3, 1.617%, 6/25/2056 (a)(c) | | | 2,031,903 | | | | 2,007,436 | |
JP Morgan Mortgage Trust, Series 2018-1, Class B1, 3.683%, 6/25/2048 (a)(c) | | | 910,448 | | | | 936,839 | |
JP Morgan Mortgage Trust, Series 2019-1, Class A11,
1.058% (1 Month LIBOR USD + 0.950%), 5/25/2049 (a)(b) | | | 187,200 | | | | 186,859 | |
JP Morgan Mortgage Trust, Series 2019-3, Class A11,
1.058% (1 Month LIBOR USD + 0.950%), 9/25/2049 (a)(b) | | | 672,777 | | | | 663,345 | |
JP Morgan Mortgage Trust, Series 2019-5, Class A11,
1.008% (1 Month LIBOR USD + 0.900%), 11/25/2049 (a)(b) | | | 659,546 | | | | 660,474 | |
JP Morgan Mortgage Trust, Series 2019-6, Class A3, 3.500%, 12/25/2049 (a)(c) | | | 3,299,813 | | | | 3,396,768 | |
JP Morgan Mortgage Trust, Series 2019-LTV3, Class A3, 3.500%, 3/25/2050 (a)(c) | | | 774,282 | | | | 789,962 | |
JP Morgan Mortgage Trust, Series 2019-INV3, Class A11,
1.102% (1 Month LIBOR USD + 1.000%), 5/25/2050 (a)(b) | | | 844,985 | | | | 824,216 | |
JP Morgan Mortgage Trust, Series 2020-7, Class A11,
0.902% (1 Month LIBOR USD + 0.800%), 1/25/2051 (a)(b) | | | 1,127,096 | | | | 1,135,543 | |
JP Morgan Mortgage Trust, Series 2021-1, Class A11,
0.700% (SOFR30A + 0.650%), 6/25/2051 (a)(b) | | | 4,820,656 | | | | 4,832,202 | |
JP Morgan Mortgage Trust, Series 2021-6, Class A6, 2.500%, 10/25/2051 (a)(c) | | | 3,354,362 | | | | 3,437,024 | |
LHOME Mortgage Trust, Series 2020-RTL1, Class A1, 3.228%, 10/25/2024 (a) | | | 500,000 | | | | 503,847 | |
See accompanying notes which are an integral part of these financial statements.
116
Angel Oak UltraShort Income Fund
Schedule of Investments – (continued)
January 31, 2022
| | | | | | | | |
| | | Principal
Amount | | | Value | |
Residential Mortgage-Backed Securities – (continued) | | | | | | | | |
LSTAR Securities Investment Ltd., Series 2019-4, Class A1,
2.602% (1 Month LIBOR USD + 2.500%), 5/1/2024 (a)(b) | | $ | 1,954,073 | | | $ | 1,942,634 | |
Mello Mortgage Capital Accepatance, Series 2021-MTG2, Class A10,
2.500%, 6/25/2051 (a)(c) | | | 4,246,891 | | | | 4,189,095 | |
METLIFE Securitization Trust, Series 2020-INV1, Class A5, 3.000%, 5/25/2050 (a)(c) | | | 2,481,406 | | | | 2,528,773 | |
MFA Trust, Series 2021-INV1, Class A2, 1.057%, 1/25/2056 (a)(c) | | | 1,180,364 | | | | 1,182,621 | |
MFA Trust, Series 2020-NQM3, Class A2, 1.324%, 1/26/2065 (a)(c) | | | 1,083,145 | | | | 1,079,290 | |
MFA Trust, Series 2020-NQM1, Class A3, 2.300%, 3/25/2065 (a)(c) | | | 1,405,716 | | | | 1,408,648 | |
Mill City Mortgage Loan Trust, Series 2019-GS2, Class A1, 2.750%, 8/25/2059 (a)(c) | | | 484,666 | | | | 485,607 | |
Mill City Mortgage Loan Trust, Series 2021-NMR1, Class A1, 1.125%, 11/25/2060 (a)(c) | | | 1,694,993 | | | | 1,658,274 | |
Mortgage Insurance-Linked Notes, Series 2020-1, Class M1A,
1.058% (1 Month LIBOR USD + 0.950%), 1/25/2030 (a)(b) | | | 3,055,118 | | | | 3,040,353 | |
Mortgage Insurance-Linked Notes, Series 2020-2, Class B1,
7.708% (1 Month LIBOR USD + 7.600%), 10/25/2030 (a)(b) | | | 13,136,000 | | | | 13,400,204 | |
New Residential Mortgage Loan Trust, Series 2021-INV1, Class A6, 2.500%, 6/25/2051 (a)(c) | | | 2,790,176 | | | | 2,775,087 | |
New Residential Mortgage Loan Trust, Series 2019-NQM5, Class A1,
2.710%, 11/25/2059 (a)(c) | | | 755,281 | | | | 754,418 | |
New Residential Mortgage Loan Trust, Series 2019-NQM5, Class A3,
3.065%, 11/25/2059 (a)(c) | | | 568,004 | | | | 566,759 | |
New Residential Mortgage Loan Trust, Series 2020-NQM2, Class A1,
1.650%, 5/25/2060 (a)(c) | | | 799,345 | | | | 797,167 | |
NLT Trust, Series 2021-INV2, Class A3, 1.520%, 8/25/2056 (a)(c) | | | 2,325,965 | | | | 2,315,136 | |
NMLT Trust, Series 2021-INV1, Class A3, 1.797%, 5/25/2056 (a)(c) | | | 1,783,289 | | | | 1,772,056 | |
OBX Trust, Series 2018-EXP1, Class 2A2,
1.108% (1 Month LIBOR USD + 1.000%), 4/27/2048 (a)(b) | | | 344,333 | | | | 345,260 | |
OBX Trust, Series 2019-EXP2, Class 2A1A,
1.008% (1 Month LIBOR USD + 0.900%), 6/25/2059 (a)(b) | | | 10,915 | | | | 10,856 | |
OBX Trust, Series 2020-EXP1, Class 2A1,
0.858% (1 Month LIBOR USD + 0.750%), 1/26/2060 (a)(b) | | | 849,233 | | | | 847,738 | |
OBX Trust, Series 2021-NQM3, Class A2, 1.260%, 7/25/2061 (a)(c) | | | 3,570,242 | | | | 3,548,039 | |
OBX Trust, Series 2022-NQM1, Class A1, 2.305%, 11/25/2061 (a)(c) | | | 5,000,000 | | | | 5,034,500 | |
OBX Trust, Series 2021-NQM1, Class A3, 1.329%, 2/25/2066 (a)(c) | | | 6,876,854 | | | | 6,840,599 | |
Onslow Bay Mortgage Loan Trust, Series 2021-NQM4, Class A1, 1.957%, 10/25/2061 (a)(c) | | | 5,013,841 | | | | 5,015,110 | |
Onslow Bay Mortgage Loan Trust, Series 2021-NQM4, Class A2, 2.162%, 10/25/2061 (a)(c) | | | 8,514,952 | | | | 8,520,452 | |
Onslow Bay Mortgage Loan Trust, Series 2021-NQM4, Class A3, 2.367%, 10/25/2061 (a)(c) | | | 7,685,666 | | | | 7,681,178 | |
Pepper Residential Securities Trust, Series 21A, Class A1U,
0.983% (1 Month LIBOR USD + 0.880%), 1/16/2060 (a)(b) | | | 51,014 | | | | 50,805 | |
Pepper Residential Securities Trust, Series 23A, Class A1U,
1.053% (1 Month LIBOR USD + 0.950%), 8/18/2060 (a)(b) | | | 70,489 | | | | 70,688 | |
PNMAC Issuer Trust, Series 2018-FT1, Class A,
2.458% (1 Month LIBOR USD + 2.350%), 4/25/2023 (a)(b)(f) | | | 5,000,000 | | | | 5,001,065 | |
Pretium Mortgage Credit Partners LLC, Series 2021-NPL3, Class A1, 1.868%, 7/25/2051 (a)(g) | | | 4,804,952 | | | | 4,770,702 | |
PRKCM Trust, Series 2021-AFC2, Class A1, 2.061%, 11/25/2056 (a)(c) | | | 7,903,427 | | | | 7,913,661 | |
PRPM LLC, Series 2021-6, Class A1, 1.793%, 7/25/2026 (a)(g) | | | 2,679,888 | | | | 2,689,493 | |
PRPM LLC, Series 2021-9, Class A1, 2.363%, 10/25/2026 (a)(c) | | | 2,716,324 | | | | 2,710,647 | |
RCO Mortgage LLC, Series 2022-1, Class A1, 2.981%, 1/25/2027 (a)(g) | | | 5,000,000 | | | | 5,024,275 | |
Residential Mortgage Loan Trust, Series 2019-2, Class A3, 3.220%, 5/25/2059 (a)(c) | | | 868,120 | | | | 868,948 | |
Residential Mortgage Loan Trust, Series 2020-1, Class A1, 2.376%, 1/25/2060 (a)(c) | | | 9,572,950 | | | | 9,527,507 | |
Residential Mortgage Loan Trust, Series 2020-1, Class A3, 2.684%, 1/25/2060 (a)(c) | | | 1,237,917 | | | | 1,235,354 | |
See accompanying notes which are an integral part of these financial statements.
117
Angel Oak UltraShort Income Fund
Schedule of Investments – (continued)
January 31, 2022
| | | | | | | | |
| | | Principal
Amount | | | Value | |
Residential Mortgage-Backed Securities – (continued) | | | | | | | | |
RESIMAC Bastille Trust, Series 2018-1NCA, Class A1,
0.951% (1 Month LIBOR USD + 0.850%), 12/5/2059 (a)(b) | | $ | 109,152 | | | $ | 109,371 | |
Saluda Grade Alternative Mortgage Trust, Series 2021-MF1, Class A1,
2.805%, 11/25/2029 (a)(c) | | | 5,000,000 | | | | 4,991,175 | |
SG Residential Mortgage Trust, Series 2019-3, Class A1, 2.703%, 9/25/2059 (a)(c) | | | 2,510,533 | | | | 2,517,801 | |
SG Residential Mortgage Trust, Series 2019-3, Class A2, 2.877%, 9/25/2059 (a)(c) | | | 362,722 | | | | 363,543 | |
SG Residential Mortgage Trust, Series 2021-2, Class A1, 1.737%, 12/25/2061 (a)(c) | | | 14,878,712 | | | | 14,840,459 | |
SG Residential Mortgage Trust, Series 2021-2, Class A2, 1.942%, 12/25/2061 (a)(c) | | | 4,959,571 | | | | 4,941,176 | |
Spruce Hill Mortgage Loan Trust, Series 2020-SH1, Class A1, 2.521%, 1/28/2050 (a)(c) | | | 528,120 | | | | 529,406 | |
Spruce Hill Mortgage Loan Trust, Series 2020-SH1, Class A2, 2.624%, 1/28/2050 (a)(c) | | | 258,886 | | | | 261,738 | |
Starwood Mortgage Residential Trust, Series 2019-INV1, Class A3, 2.916%, 9/25/2049 (a)(c) | | | 8,364,129 | | | | 8,497,144 | |
Starwood Mortgage Residential Trust, Series 2020-1, Class A1, 2.275%, 2/25/2050 (a)(c) | | | 3,723,320 | | | | 3,781,735 | |
Starwood Mortgage Residential Trust, Series 2020-INV1, Class A3,
1.593%, 11/25/2055 (a)(c) | | | 2,488,231 | | | | 2,477,654 | |
Starwood Mortgage Residential Trust, Series 2021-4, Class A1, 1.162%, 8/25/2056 (a)(c) | | | 830,556 | | | | 823,205 | |
Starwood Mortgage Residential Trust, Series 2020-2, Class A1, 2.718%, 4/25/2060 (a)(c) | | | 871,731 | | | | 881,355 | |
Starwood Mortgage Residential Trust, Series 2021-2, Class A3, 1.431%, 5/25/2065 (a)(c) | | | 857,487 | | | | 853,127 | |
Starwood Mortgage Residential Trust, Series 2021-5, Class A1, 1.920%, 9/25/2066 (a)(c) | | | 5,968,586 | | | | 5,959,507 | |
Starwood Mortgage Residential Trust, Series 2021-5, Class A2, 2.178%, 9/25/2066 (a)(c) | | | 5,409,926 | | | | 5,389,206 | |
Starwood Mortgage Residential Trust, Series 2021-5, Class A3, 2.436%, 9/25/2066 (a)(c) | | | 4,774,869 | | | | 4,762,096 | |
Starwood Mortgage Residential Trust, Series 2021-6, Class A1, 1.920%, 11/25/2066 (a)(c) | | | 3,617,303 | | | | 3,625,684 | |
Starwood Mortgage Residential Trust, Series 2022-1, Class A1, 0.000%, 12/25/2066 (a)(c) | | | 2,000,000 | | | | 2,014,868 | |
Towd Point Mortgage Trust, Series 2017-2, Class A1, 2.750%, 4/25/2057 (a)(c) | | | 1,618,942 | | | | 1,636,007 | |
Towd Point Mortgage Trust, Series 2017-6, Class A1, 2.750%, 10/25/2057 (a)(c) | | | 195,985 | | | | 198,431 | |
Towd Point Mortgage Trust, Series 2019-HY2, Class A1,
1.108% (1 Month LIBOR USD + 1.000%), 5/28/2058 (a)(b) | | | 5,615,427 | | | | 5,684,256 | |
Towd Point Mortgage Trust, Series 2019-SJ1, Class M2, 4.750%, 11/25/2058 (a)(c) | | | 2,900,000 | | | | 2,923,232 | |
Towd Point Mortgage Trust, Series 2019-SJ2, Class B2, 5.250%, 11/25/2058 (a)(c) | | | 2,000,000 | | | | 2,015,978 | |
Traingle Re Ltd., Series 2021-1, Class M1B,
3.108% (1 Month LIBOR USD + 3.000%), 8/25/2033 (a)(b) | | | 872,927 | | | | 875,430 | |
Verus Securitization Trust, Series 2019-INV2, Class A1, 2.913%, 7/25/2059 (a)(c) | | | 5,183,848 | | | | 5,200,311 | |
Verus Securitization Trust, Series 2019-3, Class A3, 3.040%, 7/25/2059 (a)(g) | | | 404,428 | | | | 404,704 | |
Verus Securitization Trust, Series 2019-4, Class A1, 2.642%, 10/25/2059 (a)(g) | | | 2,503,577 | | | | 2,519,407 | |
Verus Securitization Trust, Series 2019-INV3, Class A2, 2.947%, 11/25/2059 (a)(c) | | | 2,210,797 | | | | 2,219,063 | |
Verus Securitization Trust, Series 2020-INV1, Class A1, 1.977%, 3/25/2060 (a)(c) | | | 5,215,294 | | | | 5,207,633 | |
Verus Securitization Trust, Series 2020-2, Class A1, 2.226%, 4/25/2060 (a)(c) | | | 579,342 | | | | 579,377 | |
Verus Securitization Trust, Series 2020-5, Class A2, 1.578%, 5/25/2065 (a)(g) | | | 1,525,507 | | | | 1,531,795 | |
Verus Securitization Trust, Series 2021-3, Class A2, 1.283%, 6/25/2066 (a)(c) | | | 1,243,805 | | | | 1,242,265 | |
Verus Securitization Trust, Series 2021-4, Class A1, 0.938%, 7/25/2066 (a)(c) | | | 12,766,168 | | | | 12,697,371 | |
Verus Securitization Trust, Series 2021-4, Class A2, 1.247%, 7/25/2066 (a)(c) | | | 1,281,791 | | | | 1,275,505 | |
Verus Securitization Trust, Series 2021-5, Class A3, 1.373%, 9/25/2066 (a)(c) | | | 3,205,666 | | | | 3,190,942 | |
Verus Securitization Trust, Series 2021-8, Class A3, 2.491%, 11/25/2066 (a)(c) | | | 2,234,291 | | | | 2,245,288 | |
Visio Trust, Series 2021-1R, Class A3, 1.688%, 5/25/2056 (a) | | | 2,497,803 | | | | 2,486,385 | |
Wells Fargo Mortgage Backed Securities Trust, Series 2020-2, Class A3,
3.000%, 2/25/2050 (a)(c) | | | 674,928 | | | | 681,554 | |
WinWater Mortgage Loan Trust, Series 2015-A, Class AX1, 0.315%, 6/20/2045 (a)(c)(h) | | | 8,931,551 | | | | 23,669 | |
ZH Trust, Series 2021-1`, Class A, 2.253%, 2/19/2027 (a)(f) | | | 1,750,000 | | | | 1,721,031 | |
See accompanying notes which are an integral part of these financial statements.
118
Angel Oak UltraShort Income Fund
Schedule of Investments – (continued)
January 31, 2022
| | | | | | | | |
| | | Principal
Amount | | | Value | |
Residential Mortgage-Backed Securities – (continued) | | | | | | | | |
ZH Trust, Series 2021-2, Class A, 2.349%, 10/19/2027 (a)(f) | | $ | 2,000,000 | | | $ | 1,990,947 | |
| | | | | | | | |
| | |
TOTAL RESIDENTIAL MORTGAGE-BACKED SECURITIES
(Cost – $464,450,538) | | | | | | $ | 463,917,242 | |
| | | | | | | | |
Residential Mortgage-Backed Securities – U.S. Government Agency – 0.32% | | | | | | | | |
Federal Home Loan Mortgage Corp., Series 5078, Class AB, 2.000%, 9/25/2035 | | | 4,123,849 | | | | 4,153,409 | |
Federal Home Loan Mortgage Corp., Series 4360, Class DN, 3.000%, 5/15/2040 | | | 82,104 | | | | 82,138 | |
Federal National Mortgage Association, Series 2017-61, Class K, 3.500%, 8/25/2046 | | | 1,123,230 | | | | 1,133,759 | |
| | | | | | | | |
| | |
TOTAL RESIDENTIAL MORTGAGE-BACKED SECURITIES – U.S. GOVERNMENT AGENCY
(Cost – $5,410,622) | | | | | | $ | 5,369,306 | |
| | | | | | | | |
Residential Mortgage-Backed Securities – U.S. Government Agency Credit Risk Transfer – 0.47% | | | | | |
Connecticut Avenue Securities Trust, Series 2019-R03, Class 1M2,
2.258% (1 Month LIBOR USD + 2.150%), 9/25/2031 (a)(b) | | | 479,320 | | | | 481,718 | |
Connecticut Avenue Securities Trust, Series 2019-R04, Class 2M2,
2.208% (1 Month LIBOR USD + 2.100%), 6/27/2039 (a)(b) | | | 254,656 | | | | 255,134 | |
Connecticut Avenue Securities Trust, Series 2019-R05, Class 1M2,
2.108% (1 Month LIBOR USD + 2.000%), 7/25/2039 (a)(b) | | | 132,624 | | | | 132,873 | |
Connecticut Avenue Securities Trust, Series 2020-R02, Class 2M2,
2.108% (1 Month LIBOR USD + 2.000%), 1/25/2040 (a)(b) | | | 966,442 | | | | 971,505 | |
Federal Home Loan Mortgage Corp., Series 2018-HRP1, Class M2,
1.758% (1 Month LIBOR USD + 1.650%), 5/25/2043 (a)(b) | | | 798,068 | | | | 799,592 | |
Federal Home Loan Mortgage Corp., Series 2019-HQA3, Class M2,
1.958% (1 Month LIBOR USD + 1.850%), 9/27/2049 (a)(b) | | | 709,226 | | | | 713,219 | |
Federal Home Loan Mortgage Corp., Series 2019-HQA4, Class M2,
2.158% (1 Month LIBOR USD + 2.050%), 11/26/2049 (a)(b) | | | 693,518 | | | | 695,904 | |
Federal Home Loan Mortgage Corp., Series 2020-DNA1, Class M2,
1.808% (1 Month LIBOR USD + 1.700%), 1/25/2050 (a)(b) | | | 731,197 | | | | 733,941 | |
Federal Home Loan Securities Trust, Series 2016-SC02, Class M2, 3.661%, 10/25/2046 (c) | | | 3,000,000 | | | | 3,063,063 | |
Federal National Mortgage Association, Series 2015-C02, Class 2M2,
4.108% (1 Month LIBOR USD + 4.000%), 5/27/2025 (b) | | | 26,724 | | | | 26,799 | |
| | | | | | | | |
| | |
TOTAL RESIDENTIAL MORTGAGE-BACKED SECURITIES – U.S. GOVERNMENT AGENCY CREDIT RISK TRANSFER
(Cost – $7,795,297) | | | | | | $ | 7,873,748 | |
| | | | | | | | |
U.S. Treasury Notes – 1.08% | | | | | | | | |
0.125%, 12/15/2023 | | | 5,000,000 | | | | 4,907,813 | |
0.125%, 2/15/2024 | | | 5,000,000 | | | | 4,896,094 | |
0.750%, 11/15/2024 | | | 3,000,000 | | | | 2,951,484 | |
2.250%, 12/31/2024 | | | 5,000,000 | | | | 5,126,953 | |
| | | | | | | | |
| | |
TOTAL U.S. TREASURY NOTES
(Cost – $18,121,949) | | | | | | $ | 17,882,344 | |
| | | | | | | | |
| | |
Short-Term Investments – 8.29% | | | | | | | | |
U.S. Treasury Bills – 2.40% | | | | | | | | |
0.040%, 2/17/22 (i) | | | 15,000,000 | | | | 14,999,717 | |
0.060%, 3/22/22 (i) | | | 15,000,000 | | | | 14,998,826 | |
See accompanying notes which are an integral part of these financial statements.
119
Angel Oak UltraShort Income Fund
Schedule of Investments – (continued)
January 31, 2022
| | | | | | | | |
| | | Principal
Amount | | | Value | |
Short-Term Investments – (continued) | | | | | | | | |
U.S. Treasury Bills – (continued) | | | | | | | | |
0.710%, 12/29/22 (i) | | $ | 10,000,000 | | | $ | 9,934,397 | |
| | | | | | | | |
| | |
| | | | | | | 39,932,940 | |
| | | | | | | | |
| | |
| Money Market Funds – 5.89% | | Shares | | | | |
First American Government Obligations Fund, Class U, 0.026% (j) | | | 98,034,610 | | | | 98,034,610 | |
| | | | | | | | |
| | |
TOTAL SHORT-TERM INVESTMENTS
(Cost – $137,996,375) | | | | | | $ | 137,967,550 | |
| | | | | | | | |
| | |
TOTAL INVESTMENTS – 100.48%
(Cost – $1,674,877,598) | | | | | | $ | 1,671,871,837 | |
| | |
Liabilities in Excess of Other Assets – (0.48%) | | | | | | | (8,001,820 | ) |
| | | | | | | | |
| | |
NET ASSETS – 100.00% | | | | | | $ | 1,663,870,018 | |
| | | | | | | | |
| LIBOR: | London Inter-Bank Offered Rate |
| MSOFR1MC: | 1 Month Secured Overnight Financing Rate Index |
| SOFR30A: | Secured Overnight Financing Rate 30 Day Average |
| (a) | Security exempt from registration under Rule 144A or Section 4(a)(2) of the Securities Act of 1933. The security may be resold in transactions exempt from registration, normally to qualified institutional buyers. These securities are determined to be liquid by the Adviser, under the procedures established by the Fund’s Board of Trustees, unless otherwise denoted. At January 31, 2022, the value of these securities amounted to $1,372,543,536 or 82.49% of net assets. |
| (b) | Variable or floating rate security based on a reference index and spread. Certain securities are fixed to variable and currently in the fixed phase. Rate disclosed is the rate in effect as of January 31, 2022. |
| (c) | Variable rate security. The coupon is based on an underlying pool of assets. Rate disclosed is the rate in effect as of January 31, 2022. |
| (d) | Security issued on a when-issued basis. On January 31, 2022, the total value of investments purchased on a when-issued basis was $9,014,969 or 0.54% of net assets. |
| (e) | Security exempt from registration under Regulation S of the Securities Act of 1933. Such securities are treated as liquid securities according to the Fund’s liquidity guidelines. At January 31, 2022, the value of securities pledged amounted to $2,283,574 or 0.14% of net assets. |
| (f) | Illiquid security. At January 31, 2022, the value of these securities amounted to $10,705,338 or 0.64% of net assets. |
| (g) | Step-up bond that pays an initial coupon rate for the first period and then a higher coupon rate for the following periods. Rate disclosed is the rate in effect as of January 31, 2022. |
| (h) | Interest only security. |
| (i) | Rate disclosed is the effective yield as of January 31, 2022. |
| (j) | Rate disclosed is the seven day yield as of January 31, 2022. |
See accompanying notes which are an integral part of these financial statements.
120
Angel Oak UltraShort Income Fund
Schedule of Investments – (continued)
January 31, 2022
Schedule of Open Futures Contracts
| | | | | | | | | | | | | | | | |
| Short Futures Contracts | | Expiration
Month | | | Number of
Contracts | | | Notional Value | | | Value &
Unrealized
Appreciation
(Depreciation) | |
2 Year ERIS Aged Standard Swap Future | | | March 2022 | | | | (45 | ) | | $ | (4,630,599 | ) | | $ | (44,556 | ) |
3 Year ERIS Aged Standard Swap Future | | | June 2022 | | | | (42 | ) | | | (4,473,252 | ) | | | (207,603 | ) |
3 Year ERIS Aged Standard Swap Future | | | September 2022 | | | | (40 | ) | | | (4,277,416 | ) | | | (70,276 | ) |
2 Year ERIS Aged Standard Swap Future | | | September 2022 | | | | (100 | ) | | | (10,036,020 | ) | | | 21,454 | |
2 Year ERIS Aged Standard Swap Future | | | March 2023 | | | | (155 | ) | | | (15,393,081 | ) | | | 101,107 | |
3 Year ERIS Aged Standard Swap Future | | | March 2023 | | | | (50 | ) | | | (5,180,415 | ) | | | (90,490 | ) |
2 Year ERIS Aged Standard Swap Future | | | June 2023 | | | | (391 | ) | | | (38,692,695 | ) | | | 343,842 | |
2 Year ERIS Aged Standard Swap Future | | | September 2023 | | | | (501 | ) | | | (49,377,107 | ) | | | 696,089 | |
4 Year ERIS Aged Standard Swap Future | | | September 2023 | | | | (7 | ) | | | (758,494 | ) | | | (11,268 | ) |
2 Year ERIS Aged Standard Swap Future | | | December 2023 | | | | (125 | ) | | | (12,327,213 | ) | | | 173,600 | |
2 Year ERIS Aged Standard Swap Future | | | March 2024 | | | | (102 | ) | | | (10,014,054 | ) | | | 7,701 | |
3 Year ERIS Aged Standard Swap Future | | | September 2024 | | | | (34 | ) | | | (3,294,882 | ) | | | 68,279 | |
| | | | | | | | | | | | | | | | |
Total | | | | | | | | | | | | | | $ | 987,879 | |
| | | | | | | | | | | | | | | | |
See accompanying notes which are an integral part of these financial statements.
121
Angel Oak Core Impact Fund
Schedule of Investments
January 31, 2022
| | | | | | | | |
| | | Principal
Amount | | | Value | |
Asset-Backed Securities – 27.45% | | | | | | | | |
Foundation Finance Trust, Series 2021-1A, Class B, 1.870%, 5/15/2041 (a) | | $ | 596,000 | | | $ | 589,033 | |
Foundation Finance Trust, Series 2021-2A, Class D, 5.730%, 1/15/2042 (a) | | | 500,000 | | | | 501,683 | |
Goldman Home Improvement Trust, Series 2021-GRN2, Class D, 4.000%, 6/25/2051 (a) | | | 500,000 | | | | 481,783 | |
Goldman Home Improvement Trust, Series 2021-GRN2, Class A, 1.150%, 6/26/2051 (a) | | | 381,708 | | | | 375,594 | |
GoodLeap Sustainable Home Solutions Trust, Series 2021-3CS, Class A, 2.100%, 5/20/2048 (a) | | | 457,745 | | | | 442,102 | |
GoodLeap Sustainable Home Solutions Trust, Series 2021-4GS, Class A, 1.930%, 7/20/2048 (a) | | | 933,815 | | | | 906,985 | |
Helios Issuer LLC, Series 2021-B, Class A, 1.620%, 7/20/2048 (a) | | | 947,632 | | | | 916,543 | |
Loanpal Solar Loan Ltd., Series 2021-1GS, Class A, 2.290%, 1/20/2048 (a) | | | 393,780 | | | | 388,300 | |
Marlette Funding Trust, Series 2019-4A, Class C, 3.760%, 12/15/2029 (a) | | | 750,000 | | | | 767,477 | |
Marlette Funding Trust, Series 2020-1A, Class D, 3.540%, 3/15/2030 (a) | | | 893,000 | | | | 912,376 | |
Marlette Funding Trust, Series 2021-1A, Class D, 2.470%, 6/16/2031 (a) | | | 242,000 | | | | 240,419 | |
Mercury Financial Credit Card Master Trust, Series 2021-1A, Class A, 1.540%, 3/20/2026 (a) | | | 400,000 | | | | 399,774 | |
Mission Lane Credit Card Master Trust, Series 2021-A, Class A, 1.590%, 9/15/2026 (a) | | | 1,500,000 | | | | 1,486,471 | |
Mosaic Solar Loan Trust, Series 2021-2A, Class B, 2.100%, 4/22/2047 (a) | | | 468,635 | | | | 450,868 | |
Mosaic Solar Loans LLC, Series 2017-2A, Class A, 3.820%, 6/22/2043 (a) | | | 76,952 | | | | 80,112 | |
Tesla Auto Lease Trust, Series 2020-A, Class E, 4.640%, 8/20/2024 (a) | | | 300,000 | | | | 308,261 | |
Tesla Auto Lease Trust, Series 2021-A, Class E, 2.640%, 3/20/2025 (a) | | | 500,000 | | | | 497,922 | |
Tricolor Auto Securitization Trust, Series 2021-1A, Class C, 1.330%, 9/16/2024 (a) | | | 1,000,000 | | | | 994,747 | |
| | | | | | | | |
| | |
TOTAL ASSET-BACKED SECURITIES
(Cost – $10,901,295) | | | | | | $ | 10,740,450 | |
| | | | | | | | |
| | |
Commercial Mortgage-Backed Securities – 5.82% | | | | | | | | |
BX Commercial Mortgage Trust, Series 2021-VOLT, Class F,
2.506% (1 Month LIBOR USD + 2.400%), 9/15/2036 (a)(b) | | | 1,000,000 | | | | 988,365 | |
JP Morgan Chase Commercial Mortgage Securities Trust, Series 2021-NYAH, Class H, 3.496% (1 Month LIBOR USD + 3.390%), 6/15/2038 (a)(b) | | | 300,000 | | | | 299,998 | |
SLG Office Trust, Series 2021-OVA, Class A, 2.585%, 7/15/2041 (a) | | | 500,000 | | | | 493,450 | |
X-Caliber Funding LLC, Series 2021-LBC, 5.000%, 10/15/2024 (a) | | | 500,000 | | | | 494,170 | |
| | | | | | | | |
| | |
TOTAL COMMERCIAL MORTGAGE-BACKED SECURITIES
(Cost – $2,313,108) | | | | | | $ | 2,275,983 | |
| | | | | | | | |
| | |
Commercial Mortgage-Backed Securities – U.S. Government Agency – 21.38% | | | | | | | | |
Federal Home Loan Mortgage Corp., Series 2019-KF58, Class B,
2.251% (1 Month LIBOR USD + 2.150%), 1/25/2026 (a)(b) | | | 302,155 | | | | 300,999 | |
Federal Home Loan Mortgage Corp., Series K-G02, Class A1, 2.044%, 11/25/2028 | | | 500,000 | | | | 504,960 | |
Federal Home Loan Mortgage Corp., Series 2021-P009, Class A1, 1.132%, 11/25/2029 | | | 489,800 | | | | 472,857 | |
Federal Home Loan Mortgage Corp., Series K-SG1, Class A2, 1.503%, 9/25/2030 | | | 975,000 | | | | 937,128 | |
Federal Home Loan Mortgage Corp., Series K-G04, Class A2, 1.487%, 11/25/2030 | | | 1,066,000 | | | | 1,007,406 | |
Federal Home Loan Mortgage Corp., Series 2021-P009, Class A2, 1.878%, 1/25/2031 | | | 500,000 | | | | 497,745 | |
Federal Home Loan Mortgage Corp., Series K-G05, Class A2, 2.000%, 1/25/2031 | | | 1,400,000 | | | | 1,378,565 | |
Federal National Mortgage Association, Series 2021-M1G, Class A2, 1.510%, 11/25/2030 (c) | | | 1,500,000 | | | | 1,418,940 | |
Federal National Mortgage Association, Series 2021-M3G, Class A2, 1.250%, 1/25/2031 (c) | | | 2,000,000 | | | | 1,849,160 | |
| | | | | | | | |
| | |
TOTAL COMMERCIAL MORTGAGE-BACKED SECURITIES – U.S. GOVERNMENT AGENCY
(Cost – $8,773,882) | | | | | | $ | 8,367,760 | |
| | | | | | | | |
See accompanying notes which are an integral part of these financial statements.
122
Angel Oak Core Impact Fund
Schedule of Investments – (continued)
January 31, 2022
| | | | | | | | |
| | | Principal
Amount | | | Value | |
Corporate Obligations – 24.31% | | | | | | | | |
Basic Materials – 2.01% | | | | | | | | |
Compass Minerals International, Inc., 6.750%, 12/1/2027 (a) | | $ | 750,000 | | | $ | 786,544 | |
| | | | | | | | |
Consumer, Cyclical – 6.25% | | | | | | | | |
American Axle & Manufacturing, Inc., 5.000%, 10/1/2029 | | | 1,000,000 | | | | 925,240 | |
Ford Motor Co., 3.250%, 2/12/2032 | | | 300,000 | | | | 287,202 | |
Ford Motor Credit Co. LLC, 3.625%, 6/17/2031 | | | 500,000 | | | | 495,105 | |
Suburban Propane Partners LP / Suburban Energy Finance Corp., 5.000%, 6/1/2031 (a) | | | 750,000 | | | | 739,747 | |
| | | | | | | | |
| | |
| | | | | | | 2,447,294 | |
| | | | | | | | |
Consumer, Non-cyclical – 1.25% | | | | | | | | |
Mozart Debt Merger Sub, Inc., 5.250%, 10/1/2029 (a) | | | 500,000 | | | | 487,158 | |
| | | | | | | | |
Energy – 5.36% | | | | | | | | |
New Fortress Energy, Inc., 6.750%, 9/15/2025 (a) | | | 625,000 | | | | 593,325 | |
Renewable Energy Group, Inc., 5.875%, 6/1/2028 (a) | | | 1,000,000 | | | | 1,005,985 | |
Venture Global Calcasieu Pass LLC, 4.125%, 8/15/2031 (a) | | | 250,000 | | | | 252,064 | |
Venture Global Calcasieu Pass LLC, 3.875%, 11/1/2033 (a) | | | 250,000 | | | | 247,946 | |
| | | | | | | | |
| | |
| | | | | | | 2,099,320 | |
| | | | | | | | |
Financial – 7.54% | | | | | | | | |
Amalgamated Financial Corp., 3.250% (SOFR + 2.300%), 11/15/2031 (b) | | | 400,000 | | | | 395,273 | |
Congressional Bancshares, Inc., 4.000% (SOFR + 2.890%), 1/1/2032 (a)(b)(d) | | | 500,000 | | | | 500,000 | |
HAT Holdings I LLC / HAT Holdings II LLC, 3.375%, 6/15/2026 (a) | | | 250,000 | | | | 241,227 | |
Mercantile Bank Corp., 3.250% (SOFR + 2.120%), 1/30/2032 (a)(b) | | | 500,000 | | | | 492,334 | |
OneMain Finance Corp., 3.500%, 1/15/2027 | | | 300,000 | | | | 286,379 | |
Preferred Bank, 3.375% (SOFR + 2.780%), 6/15/2031 (b) | | | 250,000 | | | | 250,988 | |
Renasant Corp., 3.000% (SOFR + 1.910%), 12/1/2031 (b) | | | 300,000 | | | | 295,171 | |
Starwood Property Trust, Inc., 3.625%, 7/15/2026 (a) | | | 500,000 | | | | 487,295 | |
| | | | | | | | |
| | |
| | | | | | | 2,948,667 | |
| | | | | | | | |
Industrial – 1.90% | | | | | | | | |
Covanta Holding Corp., 4.875%, 12/1/2029 (a) | | | 250,000 | | | | 249,576 | |
Seaspan Corp., 5.500%, 8/1/2029 (a) | | | 500,000 | | | | 495,300 | |
| | | | | | | | |
| | |
| | | | | | | 744,876 | |
| | | | | | | | |
| | |
TOTAL CORPORATE OBLIGATIONS
(Cost – $9,785,060) | | | | | | $ | 9,513,859 | |
| | | | | | | | |
Residential Mortgage-Backed Securities – 9.77% | | | | | | | | |
Imperial Fund Mortgage Trust, Series 2021-NQM1, Class A3, 1.617%, 6/25/2056 (a)(c) | | | 406,381 | | | | 401,487 | |
LHOME Mortgage Trust, Series 2020-RTL1, Class A1, 3.228%, 10/25/2024 (a) | | | 300,000 | | | | 302,308 | |
MFA Trust, Series 2021-RPL1, Class A2, 2.072%, 7/25/2060 (a)(c) | | | 500,000 | | | | 471,401 | |
MFA Trust, Series 2021-RPL1, Class M2, 2.855%, 7/25/2060 (a)(c) | | | 500,000 | | | | 494,566 | |
Oaktown Re Ltd., Series 2018-1A, Class M1,
1.658% (1 Month LIBOR USD + 1.550%), 7/25/2028 (a)(b) | | | 330,485 | | | | 321,385 | |
PRPM LLC, Series 2021-RPL1, Class M1, 2.680%, 7/25/2051 (a)(c) | | | 1,000,000 | | | | 992,695 | |
SG Residential Mortgage Trust, Series 2019-3, Class A1, 2.703%, 9/25/2059 (a)(c) | | | 280,334 | | | | 281,146 | |
See accompanying notes which are an integral part of these financial statements.
123
Angel Oak Core Impact Fund
Schedule of Investments – (continued)
January 31, 2022
| | | | | | | | |
| | | Principal
Amount | | | Value | |
Residential Mortgage-Backed Securities – (continued) | | | | | | | | |
Towd Point Mortgage Trust, Series 2020-4, Class M1, 2.875%, 10/25/2060 (a) | | $ | 565,000 | | | $ | 557,490 | |
| | | | | | | | |
| | |
TOTAL RESIDENTIAL MORTGAGE-BACKED SECURITIES
(Cost – $3,906,321) | | | | | | $ | 3,822,478 | |
| | | | | | | | |
Residential Mortgage-Backed Securities – U.S. Government Agency – 5.26% | | | | | | | | |
Federal Home Loan Mortgage Corp., 2.000%, 6/1/2036 | | | 470,644 | | | | 472,627 | |
Government National Mortgage Assocation, 2.500%, 4/20/2051 | | | 282,279 | | | | 284,185 | |
Government National Mortgage Association, 2.000%, 5/20/2036 | | | 277,462 | | | | 278,526 | |
Government National Mortgage Association, 2.500%, 2/20/2051 | | | 266,878 | | | | 269,680 | |
Government National Mortgage Association, 2.500%, 4/20/2051 | | | 282,421 | | | | 285,386 | |
Government National Mortgage Association, 2.500%, 4/20/2051 | | | 284,609 | | | | 287,954 | |
Government National Mortgage Association, 2.500%, 4/20/2051 | | | 178,904 | | | | 180,111 | |
| | | | | | | | |
| | |
TOTAL RESIDENTIAL MORTGAGE-BACKED SECURITIES – U.S. GOVERNMENT AGENCY
(Cost – $2,115,073) | | | | | | $ | 2,058,469 | |
| | | | | | | | |
| | |
| Short-Term Investments – 5.89% | | Shares | | | | |
Money Market Funds – 5.89% | | | | | | | | |
First American Government Obligations Fund, Class U, 0.026% (e) | | | 2,305,006 | | | | 2,305,006 | |
| | | | | | | | |
| | |
TOTAL SHORT-TERM INVESTMENTS
(Cost – $2,305,006) | | | | | | $ | 2,305,006 | |
| | | | | | | | |
| | |
TOTAL INVESTMENTS – 99.88%
(Cost – $40,099,745) | | | | | | $ | 39,084,005 | |
| | |
Other Assets in Excess of Liabilities – 0.12% | | | | | | | 48,589 | |
| | | | | | | | |
| | |
NET ASSETS – 100.00% | | | | | | $ | 39,132,594 | |
| | | | | | | | |
| LIBOR: | London Inter-Bank Offered Rate |
| SOFR: | Secured Overnight Financing Rate |
| (a) | Security exempt from registration under Rule 144A or Section 4(a)(2) of the Securities Act of 1933. The security may be resold in transactions exempt from registration, normally to qualified institutional buyers. These securities are determined to be liquid by the Adviser, under the procedures established by the Fund’s Board of Trustees, unless otherwise denoted. At January 31, 2022, the value of these securities amounted to $23,718,411 or 60.61% of net assets. |
| (b) | Variable or floating rate security based on a reference index and spread. Certain securities are fixed to variable and currently in the fixed phase. Rate disclosed is the rate in effect as of January 31, 2022. |
| (c) | Variable rate security. The coupon is based on an underlying pool of assets. Rate disclosed is the rate in effect as of January 31, 2022. |
| (d) | As of January 31, 2022, the Fund has fair valued these securities under the procedures established by the Fund’s Board of Trustees. The value of these securities amounted to $500,000 or 1.28% of net assets. Value determined using significant unobservable inputs. |
| (e) | Rate disclosed is the seven day yield as of January 31, 2022. |
See accompanying notes which are an integral part of these financial statements.
124
Angel Oak Funds Trust
Notes to the Financial Statements
January 31, 2022
NOTE 1. ORGANIZATION
Angel Oak Funds Trust (the “Trust”) is a Delaware statutory trust organized on June 20, 2014, and registered with the U.S. Securities and Exchange Commission as an open-end management investment company, as defined in the Investment Company Act of 1940 as amended (the “1940 Act”). The Trust consists of five series, Angel Oak Multi-Strategy Income Fund (the “Multi- Strategy Income Fund”), Angel Oak Financials Income Fund (the “Financials Income Fund”), Angel Oak High Yield Opportunities Fund (the “High Yield Opportunities Fund”), Angel Oak UltraShort Income Fund (the “UltraShort Income Fund”), and Angel Oak Core Impact Fund (the “Core Impact Fund”) (together, the “Funds”). Please see the table below for a summary of class specific information:
| | | | | | | | | | | | | | | | | | | | | | |
| | | Ticker | | | Investment
Objective | | | Commencement of
Operations | | Front-End
Sales Charge | | | Back-End
Sales Charge | | | 12b-1 Fees | |
Multi-Strategy Income Fund | | | | | | | | | | | |
Class A | | | ANGIX | | | | Current Income | | | 6/28/2011 | | | 2.25 | % | | | N/A | | | | 0.25 | % |
Class C | | | ANGCX | | | 8/4/2015 | | | N/A | | | | 1.00 | % | | | 1.00 | % |
Institutional Class | | | ANGIX | | | 8/16/2012 | | | N/A | | | | N/A | | | | N/A | |
Financials Income Fund | | | | | | | | | | | |
Class A | | | ANFLX | | |
| Current Income & Capital
Appreciation |
| | 11/3/2014 | | | 2.25 | % | | | N/A | | | | 0.25 | % |
Class C | | | AFLCX | | | 8/4/2015 | | | N/A | | | | 1.00 | % | | | 1.00 | % |
Institutional Class | | | ANFIX | | | 11/3/2014 | | | N/A | | | | N/A | | | | N/A | |
High Yield Opportunities Fund | | | | | | | | | | | |
Class A | | | ANHAX | | |
| Current Income & Capital
Appreciation |
| | 7/31/2012 | | | 2.25 | % | | | N/A | | | | 0.25 | % |
Class C | | | ANHCX | | | N/A | | | N/A | | | | 1.00 | % | | | 1.00 | % |
Institutional Class | | | ANHIX | | | 3/31/2009 | | | N/A | | | | N/A | | | | N/A | |
UltraShort Income Fund | | | | | | | | | | | |
Class A | | | AOUAX | | |
| Current Income, Minimize
Price Volatility, and
Maintain Liquidity |
| | 4/30/2018 | | | N/A | | | | N/A | | | | 0.25 | % |
Class A1 | | | AOUNX | | | N/A | | | 1.50 | % | | | 0.50 | % | | | 0.25 | % |
Institutional Class | | | AOUIX | | | 4/2/2018 | | | N/A | | | | N/A | | | | N/A | |
Core Impact Fund | | | | | | | | | | | |
Class A | | | AOIMX | | |
| Total Return While Giving
Special Consideration to
Positive Aggregate ESG
Outcomes |
| | N/A | | | 2.25 | % | | | N/A | | | | 0.25 | % |
Class C | | | AOICX | | | N/A | | | N/A | | | | 1.00 | % | | | 1.00 | % |
Institutional Class | | | AOIIX | | | 6/4/2021 | | | N/A | | | | N/A | | | | N/A | |
The Multi-Strategy Income Fund, Financials Income Fund, High Yield Opportunities Fund, and UltraShort Income Fund are diversified series of the Trust. The Core Impact Fund is a non-diversified series of the Trust, which means that it can invest a higher percentage of assets in any one issuer. Investing in a non-diversified fund may entail greater risks than is normally associated with more widely diversified funds.
The Financials Income Fund commenced operations on November 3, 2014, under the name “Angel Oak Flexible Income Fund.” On March 16, 2016, shareholders approved a change to the Fund’s fundamental investment policy on the concentration of investments. On December 16, 2018, the Fund’s name was changed to “Angel Oak Financials Income Fund,” and the Fund adopted a new investment policy pursuant to Rule 35d-1 under the 1940 Act and made certain other changes to the Fund’s investment strategies. As a result, the Fund’s performance during periods prior to these dates may have differed had the Fund’s current investment policies and strategies been in place at those times.
Wholly-Owned Subsidiaries – As part of its investment strategy, the Multi-Strategy Income Fund invests directly or, to comply with certain regulations, through its wholly owned and controlled subsidiaries, Hyperion Loan Funding Trust (“Hyperion”) and Titan Loan Funding Trust (“Titan”), each a statutory trust organized under the laws of the state of Delaware and incorporated on August 2, 2018. Hyperion and Titan act as investment vehicles in order to purchase residential and commercial real estate whole loans, participations in such loans, or instruments representing the right to receive interest payments and principal due on such loans. The allocation of the Multi-Strategy Income Fund’s investments, if any, in Hyperion or Titan will vary over time and might not include all of the types of investments described below.
125
Angel Oak Funds Trust
Notes to the Financial Statements - (continued)
January 31, 2022
NOTE 1. ORGANIZATION – (continued)
On January 31, 2022, investments in Hyperion and Titan represented 0.36% and 0.00% of the total net assets of the Multi-Strategy Income Fund, respectively.
The consolidated financial statements of the Multi-Strategy Income Fund include the investment activity and financial statements of Hyperion and Titan. All intercompany accounts and transactions have been eliminated in consolidation. Because the Multi-Strategy Income Fund may invest a substantial portion of its assets in its respective subsidiaries, the Multi-Strategy Income Fund may be considered to be investing indirectly in some of those investments through its subsidiary. For that reason, references to the Multi-Strategy Income Fund may also encompass its subsidiaries.
At January 31, 2022, investments held by Hyperion and Titan included whole loans, valued at $25,827,117 and $–, respectively. In addition, Hyperion and Titan held $755,025 and $1,000 in cash, respectively.
NOTE 2. SIGNIFICANT ACCOUNTING POLICIES
The following is a summary of significant accounting policies consistently followed by the Funds in the preparation of their financial statements in accordance with the accounting principles generally accepted in the United States of America (“GAAP”). The Funds follow the investment company accounting and reporting guidance of the Financial Accounting Standards Board (“FASB”) Accounting Codification Topic 946 “Financial Services-Investment Companies”.
Securities Valuation and Fair Value Measurements: The Funds record their investments at fair value and in accordance with fair valuation accounting standards. The Funds have adopted fair valuation accounting standards which establish an authoritative definition of fair value and set out a hierarchy for measuring fair value. These standards require additional disclosures about the various inputs and valuation techniques used to develop the measurements of fair value and a discussion in changes in valuation techniques and related inputs, if any, during the period. In addition, these standards require expanded disclosure for each major category of assets. These inputs are summarized in the three broad levels listed below:
| | • | | Level 1: quoted prices in active markets for identical securities |
| | • | | Level 2: other significant observable inputs (including, but not limited to, quoted prices for similar securities, interest rates, prepayment speeds, credit risk, etc.) |
| | • | | Level 3: significant unobservable inputs (including the Funds’ own assumptions in determining fair value of investments based on the best information available) |
The inputs or methodology used for valuing securities are not an indication of the risks associated with investing in those securities.
Investments in registered open-end management investment companies, including money market funds, will be valued based upon the net asset value (“NAV”) of such investments and are categorized as Level 1 of the fair value hierarchy.
Fair values for long-term debt securities, including asset-backed securities (“ABS”), collateralized loan obligations (“CLO”), collateralized mortgage obligations (“CMO”), corporate obligations, whole loans, and mortgage-backed securities (“MBS”) are normally determined on the basis of valuations provided by independent pricing services. Vendors typically value such securities based on one or more inputs, including but not limited to, benchmark yields, transactions, bids, offers, quotations from dealers and trading systems, new issues, spreads and other relationships observed in the markets among comparable securities; and pricing models such as yield measurers calculated using factors such as cash flows, financial or collateral performance and other reference data. In addition to these inputs, MBS and ABS may utilize cash flows, prepayment information, default rates, delinquency and loss assumptions, collateral characteristics, credit enhancements and specific deal information. Securities that use similar valuation techniques and inputs are categorized as Level 2 of the fair value hierarchy. To the extent the significant inputs are unobservable; the values generally would be categorized as Level 3.
Equity securities, including preferred stocks, that are traded on a national securities exchange, except those listed on the Nasdaq Global Market®, Nasdaq Global Select Market® and the Nasdaq Capital Market® exchanges (collectively, “Nasdaq”), are valued at the last sale price at the close of that exchange. Securities traded on Nasdaq will be valued at the Nasdaq Official Closing Price (“NOCP”). If, on a particular day, an exchange-listed or Nasdaq security does not trade, then: (i) the security shall
126
Angel Oak Funds Trust
Notes to the Financial Statements - (continued)
January 31, 2022
NOTE 2. SIGNIFICANT ACCOUNTING POLICIES – (continued)
be valued at the mean between the most recent quoted bid and asked prices at the close of the exchange; or (ii) the security shall be valued at the latest sales price on the Composite Market (defined below) for the day such security is being valued. “Composite Market” means a consolidation of the trade information provided by national securities and foreign exchanges and over-the-counter markets (“OTC”) as published by a pricing service. In the event market quotations or Composite Market pricing are not readily available, fair value will be determined in accordance with the procedures adopted by the Board of Trustees (“Board”). All equity securities that are not traded on a listed exchange are valued at the last sale price at the close of the over- the counter market. If a non-exchange listed security does not trade on a particular day, then the mean between the last quoted bid and asked price will be used as long as it continues to reflect the value of the security. If the mean is not available, then bid price can be used as long as the bid price continues to reflect the value of the security. Otherwise fair value will be determined in accordance with the procedures adopted by the Board. These securities will generally be categorized as Level 3 securities. When using the market quotations or close prices provided by the pricing service and when the market is considered active, the security will be classified as a Level 1 security. Sometimes, an equity security owned by the Funds will be valued by the pricing service with factors other than market quotations or when the market is considered inactive. When this happens, the security will be classified as a Level 2 security.
Short term debt securities having a maturity of 60 days or less are generally valued at amortized cost, which approximates fair market value. These investments are categorized as Level 2 of the fair value hierarchy. Reverse repurchase agreements and repurchase agreements are priced at their acquisition cost, and assessed for credit adjustments, which represents fair value. These securities will generally be categorized as Level 2 securities.
Financial derivative instruments, such as futures contracts, that are traded on a national securities or commodities exchange are typically valued at the settlement price determined by the relevant exchange. Swaps, such as credit default swaps, interest-rate swaps and currency swaps, are valued by a pricing service. To the extent these securities are actively traded and valuation adjustments are not applied, they are categorized as Level 1 of the fair value hierarchy. Over-the-counter financial derivative instruments, such as certain futures contracts or swap agreements, derive their values from underlying asset prices, indices, reference rates, other inputs or a combination of these factors. These instruments are normally valued on the basis of evaluations provided by independent pricing services or broker dealer quotations. Derivatives that use similar valuation techniques as described above are typically categorized as Level 2 of the fair value hierarchy.
Securities may be fair valued in accordance with the fair valuation procedures approved by the Board. The Valuation and Risk Management Oversight Committee is generally responsible for overseeing the Funds’ valuation processes and reports quarterly to the Board. The Valuation and Risk Management Oversight Committee has delegated to the Valuation Committee of the Adviser the day-to-day responsibilities for making all necessary determinations of the fair value of portfolio securities and other assets for which market quotations are not readily available or if the prices obtained from independent pricing services are deemed to be unreliable indicators of market or fair value. Representatives of the Adviser’s Valuation Committee report quarterly to the Valuation and Risk Management Oversight Committee.
127
Angel Oak Funds Trust
Notes to the Financial Statements - (continued)
January 31, 2022
NOTE 2. SIGNIFICANT ACCOUNTING POLICIES – (continued)
The following is a summary of the investments by their inputs used to value each Fund’s net assets as of January 31, 2022:
| | | | | | | | |
| Multi-Strategy Income Fund |
| | | Level 1 | | Level 2 | | Level 3 | | Total |
Assets | | | | | | | | |
Asset-Backed Securities | | $– | | $ 754,571,797 | | $– | | $ 754,571,797 |
Collateralized Debt Obligations | | – | | 23,304,558 | | – | | 23,304,558 |
Collateralized Loan Obligations | | – | | 323,276,901 | | – | | 323,276,901 |
Commercial Mortgage-Backed Securities | | – | | 167,097,115 | | – | | 167,097,115 |
Commercial Mortgage-Backed Securities – U.S. Government Agency | | – | | 334,574,905 | | – | | 334,574,905 |
Common Stocks | | 34,220,426 | | – | | – | | 34,220,426 |
Corporate Obligations | | – | | 368,564,741 | | 1,312,200 | | 369,876,941 |
Investment Companies | | 123,455,827 | | – | | – | | 123,455,827 |
Preferred Stocks | | 19,346,001 | | – | | – | | 19,346,001 |
Residential Mortgage-Backed Securities | | – | | 4,871,028,759 | | 47,155,113 | | 4,918,183,872 |
Residential Mortgage-Backed Securities – U.S. Government Agency Credit Risk Transfer | | – | | 74,033,394 | | – | | 74,033,394 |
U.S. Treasury Notes | | – | | 150,039,453 | | – | | 150,039,453 |
Whole Loans | | – | | 25,827,117 | | – | | 25,827,117 |
Short-Term Investments | | 667,438,506 | | – | | – | | 667,438,506 |
Total | | $844,460,760 | | $7,092,318,740 | | $48,467,313 | | $7,985,246,813 |
Other Financial Instruments | | | | | | | | |
Assets | | | | | | | | |
Futures Contracts* | | $2,716,918 | | $– | | $– | | $2,716,918 |
Liabilities | | | | | | | | |
Futures Contracts* | | 1,069,142 | | – | | – | | 1,069,142 |
TBA Sales Commitments | | – | | 199,756,600 | | – | | 199,756,600 |
Reverse Repurchase Agreements | | – | | 134,796,000 | | – | | 134,796,000 |
Total | | $1,647,776 | | $(334,552,600) | | $– | | $(332,904,824) |
| * | Futures are reflected at the unrealized appreciation (depreciation) on the instrument as presented in the Consolidated Schedule of Investments. |
See the Consolidated Schedule of Investments for further disaggregation of investment categories. During the year ended January 31, 2022, the Fund recognized $2,145,595 of transfers from Level 2 to Level 3 for securities lacking observable market data due to a decrease in relevant market activity. See the summary of quantitative information about Level 3 Fair Value Measurements for more information.
The following is a reconciliation of investments in which significant unobservable inputs (Level 3) were used in determining fair value:
| | | | | | | | | | | | | | | | | | |
Multi-Strategy
Income Fund | | Balance as of
1/31/21 | | Amortization/
Accretion/
Paydowns | | Net Realized
Gain (Loss) | | Change in Net
Unrealized
Appreciation
(Depreciation) | | Purchases | | Sales | | Transfers Into
Level 3 | | Transfers
Out of
Level 3 | | Balance as
of 1/31/22 |
Corporate Obligations | | $3,710,523 | | $(712,226) | | $(155,040) | | $311,903 | | $– | | $(1,842,960) | | $– | | $– | | $1,312,200 |
Residential Mortgage-Backed Securities | | $9,518 | | $(150,518) | | $– | | $150,518 | | $45,000,000 | | $– | | $2,145,595 | | $– | | $47,155,113 |
The total change in unrealized appreciation (depreciation) included in the Consolidated Statement of Operations attributable to Level 3 investments still held at January 31, 2022 is $221,156.
128
Angel Oak Funds Trust
Notes to the Financial Statements - (continued)
January 31, 2022
NOTE 2. SIGNIFICANT ACCOUNTING POLICIES – (continued)
The following is a summary of quantitative information about Level 3 Fair Value Measurements:
| | | | | | | | | | |
| Multi-Strategy Income Fund | | Fair Value as of
1/31/22 | | Valuation Techniques | | Unobservable Input | | Range | | Weighted Average
Unobservable Input |
| Corporate Obligations | | $1,312,200 | | Consensus
Pricing | | Third party | | $9.72* | | N/A |
| Residential Mortgage-Backed Securities | | $45,000,000 | | Model
Valuation | | Value of the
collateral of
underlying
loans | | $100.00* | | N/A |
| Residential Mortgage-Backed Securities | | $9,518 | | Model
Valuation | | Value of the
call rights and
value of the
collateral of
the deal | | $0.10-$0.95 | | $0.95 |
| Residential Mortgage-Backed Securities | | $2,145,595 | | Model
Technique | | Limited trading
of callable first
loss pieces | | $88.89* | | N/A |
| * | Each input presents information for one security and reflects the value as of January 31, 2022. |
| | | | | | | | | | | | | | | | |
| Financials Income Fund | |
| | | Level 1 | | | Level 2 | | | Level 3 | | | Total | |
Assets | | | | | | | | | | | | | | | | |
Collateralized Debt Obligations | | | $– | | | | $6,338,333 | | | | $– | | | | $6,338,333 | |
Common Stocks | | | 6,702,551 | | | | – | | | | – | | | | 6,702,551 | |
Corporate Obligations | | | – | | | | 143,686,963 | | | | – | | | | 143,686,963 | |
Preferred Stocks | | | 2,196,512 | | | | – | | | | – | | | | 2,196,512 | |
Short-Term Investments | | | 3,574,541 | | | | – | | | | – | | | | 3,574,541 | |
Total | | | $12,473,604 | | | | $150,025,296 | | | | $– | | | | $162,498,900 | |
See the Schedule of Investments for further disaggregation of investment categories. During the year ended January 31, 2022, the Fund did not recognize any transfers to or from Level 3. See the summary of quantitative information about Level 3 Fair Value Measurements for more information.
The following is a reconciliation of investments in which significant unobservable inputs (Level 3) were used in determining fair value:
| | | | | | | | | | | | | | | | | | | | | | | | | | | | | | | | | | | | |
| Financials Income Fund | | Balance as of
1/31/21 | | | Amortization/
Accretion | | | Net
Realized
Gain
(Loss) | | | Change in Net
Unrealized
Appreciation
(Depreciation) | | | Purchases | | | Sales | | | Transfers Into
Level 3 | | | Transfers
Out of
Level 3 | | | Balance as
of 1/31/22 | |
Corporate Obligations | | $ | 1,685,523 | | | $ | – | | | $ | (155,040 | ) | | $ | 312,477 | | | $ | – | | | $ | (1,842,960 | ) | | $ | – | | | $ | – | | | $ | – | |
| | | | | | | | | | | | | | | | |
| High Yield Opportunities Fund | |
| | | Level 1 | | | Level 2 | | | Level 3 | | | Total | |
Assets | | | | | | | | | | | | | | | | |
Common Stocks | | | $– | | | | $– | | | | $27,780 | | | | $27,780 | |
Corporate Obligations | | | – | | | | 73,339,546 | | | | – | | | | 73,339,546 | |
Short-Term Investments | | | 222,445 | | | | – | | | | – | | | | 222,245 | |
Total | | | $222,445 | | | | $73,339,546 | | | | $27,780 | | | | $73,589,771 | |
See the Schedule of Investments for further disaggregation of investment categories. For the year ended January 31, 2022, the High Yield Opportunities Fund did not recognize any transfers to or from Level 3. See the summary of quantitative information about Level 3 Fair Value Measurements for more information.
129
Angel Oak Funds Trust
Notes to the Financial Statements - (continued)
January 31, 2022
NOTE 2. SIGNIFICANT ACCOUNTING POLICIES – (continued)
The following is a reconciliation of investments in which significant unobservable inputs (Level 3) were used in determining fair value:
| | | | | | | | | | | | | | | | | | |
High Yield Opportunities
Fund | | Balance as of
1/31/21 | | Amortization/
Accretion | | Net Realized
Gain (Loss) | | Change in Net
Unrealized
Appreciation
(Depreciation) | | Purchases | | Sales | | Transfers
Into
Level 3 | | Transfers
Out of
Level 3 | | Balance
as of
1/31/22 |
| Common Stocks | | $53,245 | | $– | | $– | | $(25,465) | | $– | | $– | | $– | | $– | | $27,780 |
The total change in unrealized appreciation (depreciation) included in the Statements of Operations attributable to Level 3 investments still held at January 31, 2022 is $(25,465).
The following is a summary of quantitative information about Level 3 Fair Value Measurements:
| | | | | | | | |
| High Yield Opportunities Fund | | Fair
Value as
of
1/31/22 | | Valuation
Techniques | | Unobservable
Input | | Range/
Weighted
Average
Unobservable
Input* |
| Common Stocks | | $27,780 | | Broker Quote | | Third party | | $6.00 |
| * | Table presents information for one security, which is valued at $6.00 as of January 31, 2022. |
| | | | | | | | | | | | | | | | |
| UltraShort Income Fund | |
| | | Level 1 | | | Level 2 | | | Level 3 | | | Total | |
Assets | | | | | | | | | | | | | | | | |
Asset-Backed Securities | | | $– | | | | $704,655,775 | | | | $– | | | | $704,655,775 | |
Collateralized Loan Obligations | | | – | | | | 192,671,863 | | | | – | | | | 192,671,863 | |
Commercial Mortgage-Backed Securities | | | – | | | | 38,284,675 | | | | – | | | | 38,284,675 | |
Commercial Mortgage-Backed Securities – U.S. Government Agency | | | – | | | | 84,168,969 | | | | – | | | | 84,168,969 | |
Corporate Obligations | | | – | | | | 19,080,365 | | | | – | | | | 19,080,365 | |
Residential Mortgage-Backed Securities | | | – | | | | 463,917,242 | | | | – | | | | 463,917,242 | |
Residential Mortgage-Backed Securities – U.S. Government Agency | | | – | | | | 5,369,306 | | | | – | | | | 5,369,306 | |
Residential Mortgage-Backed Securities – U.S. Government Agency Credit Risk Transfer | | | – | | | | 7,873,748 | | | | – | | | | 7,873,748 | |
U.S. Treasury Notes | | | – | | | | 17,882,344 | | | | – | | | | 17,882,344 | |
Short-Term Investments | | | 98,034,610 | | | | 39,932,940 | | | | – | | | | 137,967,550 | |
Total | | | $98,034,610 | | | | $1,573,837,227 | | | | $– | | | | $1,671,871,837 | |
Other Financial Instruments | | | | | | | | | | | | | | | | |
Assets | | | | | | | | | | | | | | | | |
Futures Contracts* | | | $1,412,072 | | | | $– | | | | $– | | | | $1,412,072 | |
Liabilities | | | | | | | | | | | | | | | | |
Futures Contracts* | | | 424,193 | | | | – | | | | – | | | | 424,193 | |
Total | | | $987,879 | | | | $– | | |
| $
– |
| | | $987,879 | |
| * | Futures are reflected at the unrealized appreciation (depreciation) on the instrument as presented in the Schedule of Investments. |
130
Angel Oak Funds Trust
Notes to the Financial Statements - (continued)
January 31, 2022
NOTE 2. SIGNIFICANT ACCOUNTING POLICIES – (continued)
See the Schedule of Investments for further disaggregation of investment categories. During the year ended January 31, 2022, the UltraShort Income Fund did not recognize any transfers to or from Level 3.
| | | | | | | | | | | | | | | | |
| Core Impact Fund | |
| | | Level 1 | | | Level 2 | | | Level 3 | | | Total | |
Assets | | | | | | | | | | | | | | | | |
Asset-Backed Securities | | | $– | | | | $10,740,450 | | | | $– | | | | $10,740,450 | |
Commercial Mortgage-Backed Securities | | | – | | | | 2,275,983 | | | | – | | | | 2,275,983 | |
Commercial Mortgage-Backed Securities – U.S. Government Agency | | | – | | | | 8,367,760 | | | | – | | | | 8,367,760 | |
Corporate Obligations | | | – | | | | 9,013,859 | | | | 500,000 | | | | 9,513,859 | |
Residential Mortgage-Backed Securities | | | – | | | | 3,822,478 | | | | – | | | | 3,822,478 | |
Residential Mortgage-Backed Securities – U.S. Government Agency | | | – | | | | 2,058,469 | | | | – | | | | 2,058,469 | |
Short-Term Investments | | | 2,305,006 | | | | – | | | | – | | | | 2,305,006 | |
Total | | | $2,305,006 | | | | $36,278,999 | | | | $500,000 | | | | $39,084,005 | |
See the Schedule of Investments for further disaggregation of investment categories. During the period ended January 31, 2022, the Core Impact Fund did not recognize any transfers to or from Level 3. See the summary of quantitative information about Level 3 Fair Value Measurements for more information.
The following is a reconciliation of investments in which significant unobservable inputs (Level 3) were used in determining fair value:
| | | | | | | | | | | | | | | | | | |
| Core Impact Fund | | Balance as of
1/31/21 | | Amortization/
Accretion | | Net Realized
Gain (Loss) | | Change in Net
Unrealized
Appreciation
(Depreciation) | | Purchases | | Sales | | Transfers
Into
Level 3 | | Transfers
Out of
Level 3 | | Balance
as of
1/31/22 |
| Corporate Obligations | | $– | | $– | | $– | | $– | | $500,000 | | $– | | $– | | $– | | $500,000 |
The total change in unrealized appreciation (depreciation) included in the Statements of Operations attributable to Level 3 investments still held at January 31, 2022 is $-.
The following is a summary of quantitative information about Level 3 Fair Value Measurements:
| | | | | | | | | | | | | | |
| Core Impact Fund | | Fair Value
as of
1/31/22 | | | Valuation
Techniques | | | Unobservable Input | | Range/
Weighted
Average
Unobservable
Input* | |
Corporate Obligations | | $ | 500,000 | | | | Consensus Pricing | | | Trading colors
of comparable
securities and
other deals
with similar
coupons and
characteristics | | $ | 100.00 | |
| * | Table presents information for one security, which is valued at $100.00 as of January 31, 2022. |
Federal Income Taxes: The Funds intend to elect and continue to qualify to be taxed as “regulated investment companies” under Subchapter M of the Internal Revenue Code of 1986, as amended. If so qualified, the Funds generally will not be subject to federal income tax to the extent they distribute substantially all of their net investment income and capital gains to shareholders. The Funds generally intend to operate in a manner such that they will not be liable for federal income or excise taxes.
131
Angel Oak Funds Trust
Notes to the Financial Statements - (continued)
January 31, 2022
NOTE 2. SIGNIFICANT ACCOUNTING POLICIES – (continued)
The Funds have adopted financial reporting rules regarding recognition and measurement of tax positions taken or expected to be taken on a tax return. The Funds recognize interest and penalties, if any, related to unrecognized tax benefits as income tax expense on the Statements of Operations. During the year or period ended January 31, 2022, the Funds did not incur any interest or penalties. The Funds have reviewed all open tax years and major jurisdictions and concluded that no provision for income tax is required in the Funds’ financial statements. The Funds’ Federal and state income and Federal excise tax returns for which the applicable statutes of limitations have not expired are subject to examination by the Internal Revenue Services and state departments of revenue.
Security Transactions and Income Recognition: Investment security transactions are accounted for on trade date. Gains and losses realized on sales of securities are determined on a specific identification basis. Interest income and expense is recorded on an accrual basis. Discounts and premiums on securities purchased are accreted or amortized using the effective yield method, based on each security’s estimated life and recoverable principal and recorded in interest income on the Statements of Operations. Dividend income and corporate transactions, if any, are recorded on the ex-date. Paydown gains and losses on mortgage-related and other ABS are recorded as components of interest income on the Statements of Operations. Payments received from certain investments held by the Funds may be comprised of dividends, capital gains and return of capital. The Funds originally estimate the expected classification of such payments. The amounts may subsequently be reclassified upon receipt of the information from the issuer. The actual character of distributions to the Funds’ shareholders will be reflected in the Form 1099 received by shareholders after the end of the calendar year.
Expenses: Expenses incurred by the Trust that do not relate to a specific Fund are allocated to the individual Funds based on each Fund’s relative net assets or another appropriate basis. Expenses attributable to any class are borne by that class. Income, realized gains and losses, unrealized appreciation and depreciation and expenses are allocated to each class based on the net assets in relation to the relative net assets of each Fund.
Dividends and Distributions: Distributions from each Fund’s net investment income are accrued daily and typically paid monthly. The Funds intend to distribute their net realized long term capital gains and their net realized short term capital gains, if any, at least annually. Distributions to shareholders, which are determined in accordance with income tax regulations, are recorded on the ex-dividend date. The treatment for financial reporting purposes of distributions made to shareholders during the period from net investment income or net realized capital gains may differ from their ultimate treatment for federal income tax purposes. These differences are caused primarily by differences in the timing of the recognition of certain components of income, expense or realized capital gain for federal income tax purposes. Where such differences are permanent in nature, they are reclassified in the components of the net assets based on their ultimate characterization for federal income tax purposes. Any such reclassifications will have no effect on net assets, results of operations or NAV per share of the Funds. For the year or period ended January 31, 2022, certain differences were reclassified. These differences were primarily related to dividend reclassifications; the amounts did not affect net assets. The reclassifications were as follows:
| | | | | | | | |
| | | Paid-in capital | | | Distributable
earnings (accumulated
deficit) | |
Multi-Strategy Income Fund | | $ | – | | | $ | – | |
Financials Income Fund | | $ | 1 | | | $ | (1 | ) |
High Yield Opportunities Fund | | $ | – | | | $ | – | |
UltraShort Income Fund | | $ | – | | | $ | – | |
Core Impact Fund | | $ | – | | | $ | – | |
Share Valuation: The NAV per share of a class of shares of each Fund is calculated by dividing the sum of the value of the securities held by the Fund, plus cash and other assets, attributable to that class, minus all liabilities (including estimated accrued expenses) attributable to that class by the total number of shares of that class outstanding, rounded to the nearest cent. The Funds’ NAV will not be calculated on the days on which the New York Stock Exchange is closed for trading.
Use of Estimates: The preparation of financial statements in conformity with GAAP requires management to make estimates and assumptions that affect the reported amounts of assets and liabilities and disclosure of contingent assets and liabilities at
132
Angel Oak Funds Trust
Notes to the Financial Statements - (continued)
January 31, 2022
NOTE 2. SIGNIFICANT ACCOUNTING POLICIES – (continued)
the date of the financial statements, as well as the reported amounts of income and expenses during the period. Actual results could differ from those estimates.
Indemnifications: Under the Trust’s organizational documents, the Trust will indemnify its officers and trustees for certain liabilities that may arise from performance of their duties to the Funds. Additionally, in the normal course of business, the Funds enter into contracts that contain a variety of representations and warranties which provide general indemnifications. The Funds’ maximum exposure under these arrangements is unknown, as this would involve future claims that may be made against the Funds that have not yet occurred.
Cash and Cash Equivalents: Cash and cash equivalents are highly liquid assets including coin, currency and short-term investments that typically mature in 30-90 days. Short-term investments can include U.S. Government and government agency securities, investment grade money market instruments, investment grade fixed-income securities, repurchase agreements, commercial paper and cash equivalents. Cash equivalents are extremely low risk assets that are liquid and easily converted into cash. These investments are only considered equivalents if they are readily available and are not restricted by some agreement. When the Adviser believes market, economic or political conditions are unfavorable for investors, the Adviser may invest up to 100% of a Fund’s net assets in cash, cash equivalents or other short-term investments. Unfavorable market or economic conditions may include excessive volatility or a prolonged general decline in the securities markets or the U.S. economy. The Adviser also may invest in these types of securities or hold cash while looking for suitable investment opportunities or to maintain liquidity. Included in Investments in unaffiliated securities at fair value on the Statements of Assets and Liabilities are investments in First American money market funds held at major financial institutions as follows:
| | |
| |
Multi-Strategy Income Fund | | $667,438,506 |
Financials Income Fund | | $3,574,541 |
High Yield Opportunities Fund | | $222,445 |
UltraShort Income Fund | | $98,034,610 |
Core Impact Fund | | $2,305,006 |
Reverse Repurchase Agreements: A reverse repurchase agreement is the sale by the Funds of a security to a party for a specified price, with the simultaneous agreement by the Funds to repurchase that security from that party on a future date at a higher price. Proceeds from securities sold under reverse repurchase agreements are reflected as a liability on the Statements of Assets and Liabilities. Interest payments made are recorded as a component of interest expense on the Statements of Operations. Reverse repurchase agreements involve the risk that the counterparty will become subject to bankruptcy or other insolvency proceedings or fail to return a security to the Funds. In such situations, the Funds may incur losses as a result of a possible decline in the value of the underlying security during the period while the Funds seek to enforce their rights, a possible lack of access to income on the underlying security during this period, or expenses of enforcing its rights. The Funds will segregate assets determined to be liquid by the Adviser or otherwise cover its obligations under reverse repurchase agreements.
The gross obligations for secured borrowing by the type of collateral pledged and remaining time to maturity on reverse repurchase contracts is as follows:
| | | | | | | | | | |
| Multi-Strategy Income Fund |
| Reverse Repurchase Agreements | | Overnight and Continuous | | Up to 30 Days | | 30-90 Days | | Greater than
90 Days | | Total |
Residential Mortgage-Backed Securities | | $– | | $– | | $134,796,000 | | $– | | $134,796,000 |
Total | | $– | | $– | | $134,796,000 | | $– | | $134,796,000 |
Gross amount of reverse repurchase agreements in Balance Sheet Offsetting Information Table | | $134,796,000 |
Amounts related to agreements not included in offsetting disclosure in Balance Sheet Offsetting Information Table | | $– |
133
Angel Oak Funds Trust
Notes to the Financial Statements - (continued)
January 31, 2022
NOTE 3. RISKS ASSOCIATED WITH PORTFOLIO ASSETS
Asset-Backed and Mortgage-Backed Securities and Whole Loan Risks: Prepayment risk is associated with mortgage-backed and ABS, including CLOs, and whole loans. If interest rates fall, the underlying debt may be repaid ahead of schedule, reducing the value of the Funds’ investments. If interest rates rise, there may be fewer prepayments, which would cause the average bond maturity to rise, increasing the potential for the Funds to lose money. The value of these securities may be significantly affected by changes in interest rates, the market’s perception of issuers, and the creditworthiness of the parties involved. The ability of the Funds to successfully utilize these instruments may depend on the ability of the Funds’ Adviser to forecast interest rates and other economic factors correctly. These securities may have a structure that makes their reaction to interest rate changes and other factors difficult to predict, making their value highly volatile. Certain MBS may be secured by pools of mortgages on single-family, multi-family properties, as well as commercial properties. Similarly, ABS may be secured by pools of loans, such as corporate loans, student loans, automobile loans and credit card receivables. Whole loans are sold in their entirety rather than being pooled with other mortgages. Whole loans are mortgage loans sold to an investor in a secondary market. The investor purchasing the loan assumes full responsibility of the loan and all the contractual terms and rights associated with the funds. The credit risk on such loans is affected by homeowners or borrowers defaulting on their loans. The values of assets underlying mortgage-backed and ABS, including CLOs, may decline and therefore may not be adequate to cover underlying investors. To the extent the Funds focus their investments in particular types of mortgage-backed or ABS, including CLOs, and whole loans, the Funds may be more susceptible to risk factors affecting such types of investments.
Subordinated Debt of Banks and Diversified Financial Companies: The Funds may invest in subordinated debt securities, sometimes also called “junior debt”, which are debt securities for which the issuer’s obligations to make principal and interest payments are secondary to the issuer’s payment obligations to more senior debt securities. Such investments will consist primarily of debt issued by community banks or savings intuitions (or their holding companies), which are subordinated to senior debt issued by the banks and deposits held by the bank, but are senior to trust preferred obligations, preferred stock and common stock issued by the bank.
Investment Company Securities: The Funds may invest in the securities of other investment companies, including exchange-traded funds (“ETFs”), closed-end funds and open-end (mutual) funds (also called underlying funds). When a Fund invests in underlying funds it will indirectly bear its proportionate share of any fees and expenses payable directly by the underlying fund. In connection with its investments in other investment companies, a Fund will incur higher expenses, many of which may be duplicative. Furthermore, because the Funds may invest in shares of ETFs and underlying funds, their performances are directly related to the ability of the ETFs and underlying funds to meet their respective investment objectives as well as the allocation of each Fund’s assets among the ETFs and underlying funds by the Adviser. Accordingly, the Funds’ investment performance will be influenced by the investment strategies of, and risks associated with, the ETFs and underlying funds in direct proportion to the amount of assets the Funds allocate to the ETFs and underlying funds utilizing such strategies.
High Yield Securities: The Funds may invest in below investment grade securities. These “high-yield” securities, also known as “junk bonds,” will generally be rated BB or lower by S&P or will be of equivalent quality rating from another Nationally Recognized Statistical Ratings Organization, or if unrated, considered by the Adviser to be of comparable quality.
Structured Products: The Funds may invest in certain structured products. Normally, structured products are privately offered and sold (that is, they are not registered under the securities laws); however, an active dealer market may exist for structured products that qualify for Rule 144A transactions. The risks of an investment in a structured product depend largely on the type of the collateral securities and the class of the structured product in which the Funds invest. In addition to the normal interest rate, default and other risks of fixed income securities, structured products carry additional risks, including the possibility that distributions from collateral securities will not be adequate to make interest or other payments, the quality of the collateral may decline in value or default, the Funds may invest in structured products that are subordinate to other classes, values may be volatile and disputes with the issuer may produce unexpected investment results.
Common and Preferred Stocks: The Funds may invest in common stock and preferred stock. Common stock represents an equity (ownership) interest in a company, and usually possesses voting rights and earns dividends. Dividends on common stock are not fixed but are declared at the discretion of the issuer. Common stock generally represents the riskiest investment in a company. In addition, common stock generally has the greatest appreciation and depreciation potential because increases and decreases
134
Angel Oak Funds Trust
Notes to the Financial Statements - (continued)
January 31, 2022
NOTE 3. RISKS ASSOCIATED WITH PORTFOLIO ASSETS – (continued)
in earnings are usually reflected in a company’s stock price. The Funds may also invest in preferred stock. Preferred stock is a class of stock having a preference over common stock as to the payment of dividends and the recovery of investment should a company be liquidated, although preferred stock is usually junior to the debt securities of the issuer. Preferred stock typically does not possess voting rights and its market value may change based on changes in interest rates.
The fundamental risk of investing in stock is the risk that the value of the stock might decrease. Stock values fluctuate in response to the activities of an individual company or in response to general market and/or economic conditions. Historically, common stocks have provided greater long-term returns and have entailed greater short-term risks than preferred stocks, fixed-income and money market investments. The market values of all securities, including common and preferred stocks, is based upon the market’s perception of value and not necessarily the book value of an issuer or other objective measures of a company’s worth. If you invest in the Funds, you should be willing to accept the risks of the stock market (to the extent that a Fund invests in common stock) and should consider an investment in the Funds only as a part of your overall investment portfolio.
Futures Contracts: The Funds may enter into futures contracts to hedge various investments for risk management as well as speculative purposes. Initial margin deposits are made upon entering into futures contracts and can be either cash or securities. Secondary margin limits are required to be maintained while futures are held, as defined by each contract.
During the period a futures contract is open, changes in the value of the contract are recognized as unrealized gains or losses by “marking-to-market” on a daily basis to reflect the fair value of the contract at the end of each day’s trading. Variation margin receivables or payables represent the difference between the change in unrealized appreciation and depreciation on the open contracts and the cash deposits made on the margin accounts. When the contract is closed, the Funds record a realized gain or loss equal to the difference between the proceeds from the closing transaction and the Fund’s cost of entering into a contract. The use of futures contracts involves the risk of illiquid markets or imperfect correlation between the value of the instruments and the underlying securities, or that the counterparty will fail to perform its obligations.
Futures contracts are valued at the settlement price established each day by the board of trade or exchange on which they are traded. Should market conditions move unexpectedly, the Funds may not achieve the anticipated benefits of the futures contract and may realize a loss. See Note 4 for information on futures contract activity during the year ended January 31, 2022.
To-Be-Announced Securities: The Funds may invest in to-be-announced securities (“TBAs”). TBAs is a term that is generally used to describe forward-settling MBS. These TBAs are generally issued by U.S. Government Agencies or U.S. Government Sponsored Entities such as Freddie Mac, Fannie Mae and Ginnie Mae. The actual mortgage-backed security that will be delivered to the buyer at the time TBA trades are entered is not known, however, the terms of the acceptable pools of loans that will comprise the mortgage-backed security are determined at the time the trade is entered into (coupon rate, maturity, credit quality, etc.). Investment in TBAs will generally increase the Funds’ exposure to interest rate risk and could also expose the Funds to counterparty default risk. In order to mitigate counterparty default risk, the Funds only enter TBAs with counterparties for which the risk of default is determined to be remote.
NOTE 4. DERIVATIVE TRANSACTIONS
The following tables present a summary of the value of derivative instruments as of January 31, 2022, and the effect of derivative instruments on the Consolidated Statement of Assets and Liabilities as of January 31, 2022, for the Multi-Strategy Income Fund.
| | | | | | |
| Multi-Strategy Income Fund |
| Derivatives | | Type of
Derivative Risk | | Consolidated Statement of Assets and
Liabilities Location | | Liabilities |
| Futures Contracts | | Interest Rate | | Variation margin on futures contracts | | $30,483 |
135
Angel Oak Funds Trust
Notes to the Financial Statements - (continued)
January 31, 2022
NOTE 4. DERIVATIVE TRANSACTIONS – (continued)
The effect of derivative instruments on the Consolidated Statement of Operations for the year ended January 31, 2022, for the Multi-Strategy Income Fund:
| | | | | | |
| Derivatives | | Type of
Derivative Risk | | Location of Gain (Loss) on Derivatives in Income | | Realized Gain (Loss) on
Derivatives |
| Futures Contracts | | Interest Rate | | Net realized gain (loss) on futures contracts | | $(446,644) |
| | | | | | |
| Derivatives | | Type of
Derivative Risk | | Location of Gain (Loss) on Derivatives in Income | | Change in Unrealized
Appreciation (Depreciation) on
Derivatives |
| Futures Contracts | | Interest Rate | | Net change in unrealized appreciation (depreciation) on futures contracts | | $1,647,776 |
For the Multi-Strategy Income Fund the average monthly notional value of long and short futures contracts during the year ended January 31, 2022, was $15,336,237 and $(48,205,084), respectively.
The following tables present a summary of the value of derivative instruments as of January 31, 2022, and the effect of derivative instruments on the Statements of Assets and Liabilities as of January 31, 2022, for the UltraShort Income Fund.
| | | | | | |
| UltraShort Income Fund |
| Derivatives | | Type of
Derivative Risk | | Statements of Assets and Liabilities
Location | | Liabilities |
| Futures Contracts | | Interest Rate | | Deposit at broker for futures | | $6,931* |
| * | Deposit at brokers for futures on the Statements of Assets and Liabilities include the daily change in variation margin as of January 31, 2022. |
The effect of derivative instruments on the Statements of Operations for the year ended January 31, 2022, for the UltraShort Income Fund:
| | | | | | |
| Derivatives | | Type of
Derivative Risk | | Location of Gain (Loss) on Derivatives in Income | | Realized Gain (Loss) on
Derivatives |
| Futures Contracts | | Interest Rate | | Net realized gain (loss) on futures contracts | | $(366,669) |
| | | | | | |
| Derivatives | | Type of
Derivative Risk | | Location of Gain (Loss) on Derivatives in Income | | Change in Unrealized
Appreciation (Depreciation) on
Derivatives |
| Futures Contracts | | Interest Rate | | Net change in unrealized appreciation (depreciation) on futures contracts | | $2,007,760 |
For the UltraShort Income Fund the average monthly notional value of short futures contracts during the year ended January 31, 2022, was $(118,888,053).
Balance Sheet Offsetting Information
During the ordinary course of business, the Funds may enter into transactions subject to enforceable netting agreements or other similar arrangements (“netting agreements”). Generally, the right to offset in netting agreements allows the Funds to offset any exposure to a specific counterparty with any collateral received or delivered to that counterparty based on the terms of the agreement. Generally, the Funds manage their cash collateral and securities collateral on a counterparty basis. As of January 31, 2022, the Funds were not subject to any netting agreements.
136
Angel Oak Funds Trust
Notes to the Financial Statements - (continued)
January 31, 2022
NOTE 4. DERIVATIVE TRANSACTIONS – (continued)
The following table provides a summary of offsetting financial liabilities and derivatives and the effect of derivative instruments on the Statements of Assets and Liabilities as of January 31, 2022.
| | | | | | | | | | | | |
| Multi-Strategy Income Fund |
| | | | | | | | | Gross Amounts Not Offset in Consolidated
Statement of Assets and Liabilities |
| | | Gross Amounts of
Recognized Liabilities | | Gross Amounts Offset in
Consolidated
Statement of Assets
and Liabilities | | Net Amounts of
Liabilities Presented in
Consolidated
Statement of Assets and Liabilities | | Financial
Instruments | | Cash Collateral
Pledged | | Net Amount |
Futures Contracts | | $30,483 | | $– | | $30,483 | | $– | | $30,483 | | $– |
Reverse Repurchase Agreements | | $134,796,000 | | $– | | $134,796,000 | | $134,796,000 | | $– | | $– |
| | | | | | | | | | | | | | | | | | | | | | | | |
| UltraShort Income Fund | |
| | | | | | | | | | | | Gross Amounts Not Offset in Statements of Assets and Liabilities | |
| | | Gross Amounts of
Recognized Liabilities | | | Gross Amounts Offset in
Statements of Assets
and Liabilities | | | Net Amounts of
Liabilities Presented in
Statements of Assets and Liabilities | | | Financial
Instruments | | | Cash Collateral
Pledged | | | Net Amount | |
Futures Contracts* | | $ | 6,931 | | | $ | – | | | $ | 6,931 | | | $ | – | | | $ | 6,931 | | | $ | – | |
| * | Deposit at brokers for futures on the Statements of Assets and Liabilities include the daily change in variation margin as of January 31, 2022. |
In some instances, the actual collateral received/pledged may be more than the amounts disclosed herein.
NOTE 5. FEES AND OTHER RELATED PARTY TRANSACTIONS
Under the terms of the investment advisory agreement, on behalf of the Funds (the “Agreement”), the Adviser manages the Funds’ investments subject to oversight of the Trustees. As compensation for its management services, Multi-Strategy Income Fund, Financials Income Fund, High Yield Opportunities Fund, UltraShort Income Fund, and Core Impact Fund are obligated to pay the Adviser a fee computed and accrued daily and paid monthly at an annual rate of 0.89%, 0.89%, 0.55%, 0.44%, and 0.50% respectively, of the average daily net assets of the Fund.
The Adviser contractually agreed through May 31, 2023, to waive or limit its fees and to assume other expenses of the Multi-Strategy Income Fund, the Financials Income Fund, the High Yield Opportunities Fund, UltraShort Income Fund, and the Core Impact Fund until May 31, 2023, so that the Total Annual Fund Operating Expenses of each Fund do not exceed 0.99%, 0.85%, 0.65%, 0.35% and 0.59%, respectively. This arrangement may only be changed or eliminated by the Board of Trustees upon 60 days’ written notice to the Adviser.
Effective December 1, 2016, the Adviser also voluntarily agreed to waive its fees and/or reimburse certain expenses to limit the total annual fund operating expenses after Fee Waiver/Expense Reimbursement to 0.69% of the Financials Income Fund’s average daily net assets. For the period February 1, 2021, through December 31, 2021, the Adviser also voluntarily agreed to waive its fees and/or reimburse certain expenses to limit the Total Annual Fund Operating Expenses after Fee Waiver/Expense Reimbursement to 0.30% of the UltraShort Income Fund’s average daily net assets. These voluntary waivers are in addition to the contractual fee waiver/expense limitation agreement discussed above and may be discontinued at any time.
During the year ended January 31, 2022, the Adviser voluntarily waived $642,662 and $2,706,248 of the Financials Income Fund and UltraShort Income Fund’s expenses, respectively. Fees waived under these voluntary waivers are not subject to recoupment by the Adviser. These operating expense limitations do not apply to front-end sales loads, brokerage fees and commissions, borrowing costs (such as interest and dividend expenses on securities sold short), taxes, 12b-1 fees, extraordinary expenses and indirect expenses (such as “acquired funds fees and expenses”).
137
Angel Oak Funds Trust
Notes to the Financial Statements - (continued)
January 31, 2022
NOTE 5. FEES AND OTHER RELATED PARTY TRANSACTIONS – (continued)
The contractual waiver and/or reimbursement by the Adviser with respect to the Funds is subject to repayment by the Funds within 36 months following the month in which that particular waiver and/or reimbursement occurred, provided that the Funds are able to make the repayment without exceeding the expense limitations described above or the expense limitation in effect at the time of the reimbursement (whichever is lower). During the year or period ended January 31, 2022, the Adviser waived $176,290 of the High Yield Opportunities Fund’s expenses, $298,340 of the UltraShort Income Fund’s expenses, and $87,232 of the Core Impact Fund’s expenses. During the year ended January 31, 2022, the High Yield Opportunities Fund and UltraShort Income Fund had $170,618 and $20,922 of previously waived expenses expire, respectively. The expense limitation agreement specifically refers to amounts that are contractually waived, see Statements of Operations. The amounts subject to repayment by the Funds, pursuant to the aforementioned conditions at January 31, 2022, are included in the table below.
| | | | | | |
| | | Recoverable during
the year ending
1/31/23 | | Recoverable during
the year ending
1/31/24 | | Recoverable during
the year ending
1/31/25 |
| Multi-Strategy Income Fund | | $– | | $– | | $– |
| Financials Income Fund | | $– | | $– | | $– |
| High Yield Opportunities Fund | | $166,530 | | $170,565 | | $176,290 |
| UltraShort Income Fund | | $– | | $– | | $298,340 |
| Core Impact Fund | | $– | | $– | | $87,232 |
In addition, the Adviser has contractually agreed through May 31, 2023, to waive the amount of the Multi-Strategy Income Fund’s management fee to the extent necessary to offset the proportionate share of the management fees incurred by the Fund through its investment in underlying funds for which the Adviser also serves as investment adviser (affiliated investments). This contractual waiver is not subject to recoupment by the Adviser. This arrangement may only be changed or eliminated by the Board of Trustees upon 60 days’ written notice to the Adviser. During the year ended January 31, 2022, the Adviser waived $786,925 of the Multi-Strategy Income Fund’s management fees of underlying Funds.
Quasar Distributors, LLC (the “Distributor”) acts as the Funds’ principal underwriter in a continuous public offering of the Funds’ shares. The Funds have adopted a Distribution Plan in accordance with Rule 12b-1 under the 1940 Act with respect to the Class A, Class A1, and Class C shares, as applicable. The Distribution Plan provides that the Funds will pay a fee to the Distributor at an annual rate of up to 0.25% of the average daily net assets of Class A shares and Class A1 shares and at an annual rate of up to 1.00% of the average daily net assets of Class C shares. No distribution fees are paid by Institutional Class shares. These fees may be used by the Distributor to provide compensation for sales support, distribution activities or shareholder servicing activities.
U.S. Bancorp Fund Services, LLC, doing business as U.S. Bank Global Fund Services (“Fund Services”), an indirect wholly-owned subsidiary of U.S. Bancorp, serves as the Funds’ Administrator (“Administrator”) and, in that capacity, performs various administrative and accounting services for the Funds. Fund Services also serves as the Funds’ fund accountant and transfer agent. The Administrator prepares various federal and state regulatory filings, reports and returns for the Funds; prepares reports and materials to be supplied to the Trustees; monitors the activities of the Funds’ custodian; coordinates the preparation and payment of the Funds’ expenses and reviews the Funds’ expense accruals. As compensation for its services, the Administrator is entitled to a monthly fee at an annual rate based upon the average daily net assets of the Funds. U.S. Bank, N.A. (the “Custodian”) serves as custodian to the Funds.
Certain officers, Trustees and shareholders of the Funds are also owners or employees of the Adviser.
NOTE 6. SECURITIZATION TRANSACTION
On November 5, 2015, the Multi-Strategy Income Fund and the Financials Income Fund participated in the offering of the Financial Institution Note Securitization 2015-1, LTD (FINS 2015-1). As part of the offering, Multi Strategy Income Fund purchased $12,927,000 of Class A notes, $6,275,000 of Class C notes and 11,231,000 preferred shares and Financials Income Fund purchased $7,673,000 of Class A notes, $3,725,000 of Class C notes and 6,666,666 preferred shares of FINS 2015-1. The Adviser was named as the collateral surveillance and analysis provider of FINS 2015-1. The collateral manager may consult with
138
Angel Oak Funds Trust
Notes to the Financial Statements - (continued)
January 31, 2022
NOTE 6. SECURITIZATION TRANSACTION – (continued)
the collateral surveillance and analysis provider prior to making certain decisions; however, the collateral manager will not be required to follow any position taken by or recommendation made by the collateral surveillance and analysis provider in any such consultation. Prior to January 31, 2022, the Multi-Strategy Income Fund and the Financials Income Fund sold all Class A notes, Class C notes and preferred shares previously held in FINS 2015-1 to a third party. The Multi-Strategy Income Fund and Financials Income Fund realized losses of $38,363 and $22,770, respectively, on the sale of the Preferred Shares.
NOTE 7. INVESTMENT TRANSACTIONS
For the year or period ended January 31, 2022, purchases and sales of investment securities, other than short-term investments and short-term U.S. Government securities, were as follows:
| | | | |
| | | Purchases | | Sales |
| Multi-Strategy Income Fund | | $4,656,407,682 | | $3,976,769,785 |
| Financials Income Fund | | $70,294,897 | | $48,110,518 |
| High Yield Opportunities Fund | | $31,261,876 | | $27,715,003 |
| UltraShort Income Fund | | $1,842,889,005 | | $1,059,351,319 |
| Core Impact Fund | | $45,268,024 | | $7,360,021 |
For the year or period ended January 31, 2022, purchases and sales of long-term U.S. Government securities, were as follows:
| | | | |
| | | Purchases | | Sales |
| Multi-Strategy Income Fund | | $636,705,431 | | $847,037,309 |
| Financials Income Fund | | $– | | $– |
| High Yield Opportunities Fund | | $– | | $– |
| UltraShort Income Fund | | $217,322,686 | | $241,976,149 |
| Core Impact Fund | | $11,329,198 | | $413,801 |
During the year ended January 31, 2022, the Multi-Strategy Income Fund sold securities to a Fund within the Trust as well as to other affiliated funds sponsored by the Adviser, in accordance with the Rule 17a-7 procedures adopted by the Trust, at a value of $65,645,767. The Multi-Strategy Income Fund experienced a gain of $1,459,503 on the sale of these securities. During the year ended January 31, 2022, the Financials Income Fund purchased securities from an affiliated Fund, in accordance with the Rule 17a-7 procedures adopted by the Trust, at a value of $6,638,358. During the year ended January 31, 2022, the UltraShort Income Fund purchased securities from a Fund within the Trust as well as from an affiliated fund, in accordance with the Rule 17a-7 procedures adopted by the Trust, at a value of $27,633,730.
NOTE 8. TRANSACTIONS WITH AFFILIATES
The Funds’ transactions with affiliates represent purchases and sales of Investee Funds for which the respective purchasing and underlying Investee Fund have the same investment adviser.
The Multi-Strategy Income Fund had the following transactions during the year ended January 31, 2022, with affiliates:
| | | | | | | | | | | | | | | | |
| | | Year Ended January 31, 2022 |
| Security Name | | Value as of
2/1/21 | | Purchases | | Sales | | Net Change in
Unrealized
Appreciation
(Depreciation) on
Investments in
Affiliates | | Value as of
1/31/22 | | Share
Balance | | Dividend
Income | | Net Realized
Gain (Loss) on
Investments
in Affiliates |
Core Impact Fund | | $– | | $40,000,000 | | $– | | $(1,065,474) | | $38,934,526 | | 3,985,110 | | $367,035 | | $– |
Financials Income Fund | | 45,248,915 | | – | | – | | 772,166 | | 46,021,081 | | 5,147,772 | | 1,750,913 | | – |
High Yield Opportunities Fund | | 39,134,106 | | – | | – | | (633,886) | | 38,500,220 | | 3,336,241 | | 2,045,377 | | – |
UltraShort Income Fund | | 78,159,032 | | – | | (77,953,430) | | (586,421) | | – | | – | | 594,082 | | 380,819 |
Total | | $162,542,053 | | $40,000,000 | | $(77,953,430) | | $(1,513,615) | | $123,455,827 | | 12,469,123 | | $4,757,407 | | $380,819 |
139
Angel Oak Funds Trust
Notes to the Financial Statements - (continued)
January 31, 2022
NOTE 9. BENEFICIAL OWNERSHIP
The beneficial ownership, either directly or indirectly, of 25% or more of the voting securities of a fund creates a presumption of control of a fund, under Section 2(a)(9) of the 1940 Act. At January 31, 2022, the Multi-Strategy Income Fund owned, as beneficial shareholder, 52% of the outstanding shares of High Yield Opportunities Fund, 28% of the outstanding shares of Financials Income Fund, and over 99% of the outstanding shares of Core Impact Fund. At January 31, 2022, National Financial Services, LLC (“NFS”) and Charles Schwab (“Schwab”) owned, as record shareholders, 27% and 32% of the outstanding shares of UltraShort Income Fund, respectively. It is not known whether NFS or Schwab, or any other underlying beneficial owners owned or controlled 25% or more of the voting securities of the Funds. At January 31, 2022, no shareholder held more than 25% of the outstanding shares of the Multi-Strategy Income Fund.
NOTE 10. FEDERAL TAX INFORMATION
The tax characterization of distributions paid for the year or period ended January 31, 2022, and January 31, 2021, were as follows:
| | | | | | | | | | | | | | |
| | | Multi-Strategy Income Fund | | | Financials Income Fund | |
| | | 2022 | | 2021 | | | 2022 | | | 2021 | |
Distributions paid from: | | | | | | | | | | | | | | |
Ordinary Income | | 328,674,997 | | | 284,445,850 | | | | 5,948,903 | | | | 7,380,213 | |
Net Long-Term Capital Gain | | – | | | – | | | | – | | | | – | |
Return of Capital | | – | | | – | | | | – | | | | 202,342 | |
Total | | 328,674,997 | | | 284,445,850 | | | | 5,948,903 | | | | 7,582,555 | |
| | | | | | | | | | | | | | |
| | | High Yield Opportunities Fund | | | UltraShort Income Fund | |
| | | 2022 | | 2021 | | | 2022 | | | 2021 | |
Distributions paid from: | | | | | | | | | | | | | | |
Ordinary Income | | 3,841,269 | | | 3,924,885 | | | | 17,285,321 | | | | 11,238,173 | |
Net Long-Term Capital Gain | | – | | | – | | | | – | | | | – | |
Total | | 3,841,269 | | | 3,924,885 | | | | 17,285,321 | | | | 11,238,173 | |
| | | | | | |
| | | Core Impact Fund | |
| | | 2022 | | 2021* | |
| Distributions paid from: | | | | | | |
| Ordinary Income | | 368,515 | | | – | |
| Net Long-Term Capital Gain | | – | | | – | |
| Total | | 368,515 | | | – | |
| * | Fund commenced operations on June 4, 2021. |
140
Angel Oak Funds Trust
Notes to the Financial Statements - (continued)
January 31, 2022
NOTE 10. FEDERAL TAX INFORMATION – (continued)
At January 31, 2022, the components of distributable earnings (accumulated deficit) on a tax basis were as follows:
| | | | | | | | | | |
| | | Multi-Strategy
Income Fund | | Financials
Income Fund | | High Yield
Opportunities
Fund | | UltraShort
Income Fund | | Core Impact
Fund |
Tax Cost of Investments | | $8,155,288,054 | | $160,658,135 | | $74,064,392 | | $1,675,886,235 | | $40,106,242 |
Unrealized Appreciation* | | 105,644,733 | | 3,081,758 | | 1,807,964 | | 2,884,421 | | 6,517 |
Unrealized Depreciation* | | (275,685,974) | | (1,240,993) | | (2,282,585) | | (5,910,941) | | (1,028,754) |
Net Unrealized Appreciation (Depreciation)* | | $(170,041,241) | | $1,840,765 | | $(474,621) | | $(3,026,520) | | $(1,022,237) |
Undistributed Ordinary Income | | 13,322,949 | | 190,019 | | 270,475 | | 364,054 | | 55,980 |
Undistributed Long-Term Gain (Loss) | | – | | – | | – | | – | | – |
Accumulated Gain (Loss) | | $13,322,949 | | $190,019 | | $270,475 | | $364,054 | | $55,980 |
Other Accumulated Gain (Loss) | | (909,036,662) | | (48,085,128) | | (2,663,946) | | (7,053,495) | | (99,667) |
Distributable Earnings (Accumulated Deficit) | | $(1,065,754,954) | | $(46,054,344) | | $(2,868,092) | | $(9,715,961) | | $(1,065,924) |
| * | Represents aggregated amounts of Funds’ investments, reverse repurchase agreements and futures. |
The temporary differences between book basis and tax basis in the Funds are primarily attributable to wash sales, partnership adjustments, amortization of callable bonds, and mark to market on futures contracts.
As of January 31, 2022, the Funds had available for federal tax purposes an unused capital loss carryforward, which is available for offset against future taxable net capital gains, as follows.
| | |
| |
Multi-Strategy Income Fund | | $901,449,566 |
Financials Income Fund | | $47,897,135 |
High Yield Opportunities Fund | | $2,433,728 |
UltraShort Income Fund | | $6,705,809 |
Core Impact Fund | | $44,448 |
For the year ended January 31, 2022, the Multi-Strategy Income Fund, Financials Income Fund, and High Yield Opportunities Fund utilized $12,257,470, $917,808, and $617,969 of capital loss carryforward, respectively.
To the extent these carryforwards are used to offset futures gains, it is probable that the amount offset will not be distributed to shareholders. The carryforward expires as follows:
| | | | | | | | | | |
| | | Multi-Strategy
Income Fund | | Financials
Income Fund | | High Yield
Opportunities
Fund | | UltraShort
Income Fund | | Core Impact
Fund |
No expiration short-term | | $434,090,134 | | $34,335,175 | | $1,517,225 | | $6,705,809 | | $44,448 |
No expiration long-term | | $467,359,432 | | $13,561,960 | | $916,503 | | $– | | $– |
Total | | $901,449,566 | | $47,897,135 | | $2,433,728 | | $6,705,809 | | $44,448 |
Certain capital losses incurred after October 31 and within the current taxable year, are deemed to arise on the first business day of the Funds’ following taxable year. For the tax year or period ended January 31, 2022, the Multi-Strategy Income Fund, Financials Income Fund, High Yield Opportunities Fund, UltraShort Income Fund, and Core Impact Fund did not defer any post-October losses.
141
Angel Oak Funds Trust
Notes to the Financial Statements - (continued)
January 31, 2022
NOTE 11. CREDIT AGREEMENTS
In August 2015, as amended August 12, 2020, the Multi-Strategy Income Fund entered into a $400 million secured, committed, margin facility (the “Facility”) with Société Générale, which expires in April 2022. Under the Facility, interest is charged a floating rate based on the 3-month LIBOR rate plus 1.60% and is payable on the last day of each interest period, which was 1.91% as of January 31, 2022. For the year ended January 31, 2022, the average principal balance and interest rate was approximately $237,605,476 and 1.82%, respectively. The Multi-Strategy Income Fund is required to pay a commitment fee under the Facility on undrawn amounts, and an additional fee if the level of debt outstanding falls below a certain percentage. During the reporting period the Multi-Strategy Income Fund was required to pay these commitment fees on undrawn amounts, which was 0.40% as of January 31, 2022. For the year ended January 31, 2022, these expense and commitment fees, amounted to $4,433,805 and is included in the Interest and Commissions expense line item that is reflected in the Consolidated Statements of Operations. Under the terms of the Facility, the Multi-Strategy Income Fund is also required to satisfy certain collateral requirements and maintain a certain level of net assets. For additional information, see the Consolidated Schedule of Investments. As of January 31, 2022, the outstanding principal balance under the Facility was $300 million. The amount of the maximum loan outstanding during the period was $400 million from September 30, 2021 through October 12, 2021.
U.S. Bank, N.A. has made available to the Multi-Strategy Income Fund, Financials Income Fund, High Yield Opportunities Fund, UltraShort Income Fund, and Core Impact Fund a $600,000,000 secured credit facility, pursuant to a Loan Agreement (“Agreement”) effective June 8, 2016, expiring on April 29, 2022, for the purposes of having cash available to satisfy redemption requests. Advances under the Agreement would be limited to the lesser of $600,000,000 or 20% of the unencumbered assets of the Financials Income Fund, the UltraShort Income Fund, or the Core Impact Fund; or 15% of the unencumbered assets of the High Yield Opportunities Fund; or 10% of the unencumbered assets of the Multi-Strategy Income Fund. Principal is due 45 days after the initial advance and at the maturity. Interest is payable monthly in arrears. Under the credit facility, the interest rate paid by the Funds on outstanding borrowings is equal to the one-month LIBOR, plus 1.75%, which was 1.86% as of January 31, 2022. For the year ended January 31, 2022, the Funds’ activity under the credit facility was as follows:
| | | | | | | | |
| | | Average
Principal
Balance | | Average
Interest Rate | | Maximum
Loan
Outstanding | | Period Loan was Outstanding |
Multi-Strategy Income Fund | | $8,219 | | 1.88% | | $3,000,000 | | November 23, 2021 |
Financials Income Fund | | $20,000 | | 1.88% | | $3,500,000 | | July 14, 2021, through July 15, 2021 |
High Yield Opportunities Fund | | $2,000 | | 1.87% | | $80,000 | | August 6, 2021, through August 8, 2021 |
As of January 31, 2022, the Funds had no outstanding borrowings under this agreement.
NOTE 12. ACCOUNTING PRONOUNCEMENTS
In March 2020, FASB issued ASU 2020-04, Reference Rate Reform. The amendments in ASU No. 2020-04 provide optional expedients and exceptions for applying U.S. GAAP to contracts, hedging relationships, and other transactions affected by reference rate reform if certain criteria are met. In January 2021, the FASB issued ASU No. 2021-01, which clarifies that certain provisions in Topic 848, if elected by an entity, apply to derivative instruments that use an interest rate for margining, discounting, or contract price alignment that is modified as a result of reference rate reform. The ASUs are effective for all entities as of March 12, 2020 through December 31, 2022. The Funds did not utilize the optional expedients and exceptions provided by ASU No. 2020-04 and ASU No. 2021-01 during the year or period ended January 31, 2022.
In October 2020, the FASB issued Accounting Standards Update 2020-08, Codification Improvements to Subtopic 310-20, Receivables–Nonrefundable Fees and Other Costs (“ASU 2020-08”). The ASU 2020-08 clarifies that an entity should reevaluate whether a callable debt security is within the scope of ASC paragraph 310-20-35-33 for each reporting period. The guidance is effective for public business entities for fiscal years, and interim periods within those fiscal years, beginning after December 15, 2020. Early application is not permitted. All entities should apply ASU 2020-08 on a prospective basis as of the beginning of the period of adoption for existing or newly purchased callable debt securities. Management adopted ASU 2020-08 as of February 1, 2021, and it did not have a material impact on its accounting and disclosures.
142
Angel Oak Funds Trust
Notes to the Financial Statements - (continued)
January 31, 2022
NOTE 13. MACROECONOMIC RISKS
The COVID-19 pandemic, the Russian-Ukrainian war, and resulting supply chain disruptions, geopolitical risks, and economic sanctions have disrupted economic markets and the prolonged economic impact is uncertain. The operational and financial performance of the issuers of securities in which the Funds invest depends on future developments, including the duration, spread, and conclusion of these global events, and such uncertainty may in turn impact the value of the Funds’ investments.
NOTE 14. SUBSEQUENT EVENT
Management of the Funds has evaluated the need for disclosures and/or adjustments resulting from subsequent events through the date these financial statements were issued. This evaluation did not result in any subsequent events that necessitated disclosures and/or adjustments other than the following:
Effective February 4, 2022, Sreeniwas V. Prabhu has resigned from the Board, and Cheryl M. Pate has been appointed to the Board.
143
REPORT OF INDEPENDENT REGISTERED PUBLIC ACCOUNTING FIRM
To the Shareholders and Board of Trustees of
Angel Oak Funds Trust
Opinion on the Financial Statements
We have audited the accompanying statements of assets and liabilities (consolidated for the Angel Oak Multi-Strategy Income Fund), including the schedules of investments (consolidated for the Angel Oak Multi-Strategy Income Fund), of Angel Oak Funds Trust comprising the funds listed below (the “Funds”) as of January 31, 2022, the related statements of operations, changes in net assets, the related notes, and the financial highlights (consolidated for the Angel Oak Multi-Strategy Income Fund), and the consolidated statement of cash flows of Angel Oak Multi-Strategy Income Fund, for each of the periods indicated below (collectively referred to as the “financial statements”). In our opinion, the financial statements present fairly, in all material respects, the financial position of each of the Funds as of January 31, 2022, the results of their operations, the changes in net assets, and the financial highlights of the Funds, and the cash flows of the Angel Oak Multi-Strategy Income Fund for each of the periods indicated below in conformity with accounting principles generally accepted in the United States of America.
| | | | | | |
| Fund Name | | Statements of
Operations and
Cash Flows* | | Statements of
Changes in Net
Assets* | | Financial Highlights* |
Angel Oak Multi-Strategy Income Fund, Angel Oak Financials Income Fund and Angel Oak High Yield Opportunities Fund | | For the year ended January 31, 2022 | | For the years ended January 31, 2022 and 2021 | | For the years ended January 31, 2022, 2021, 2020, 2019, and 2018 |
Angel Oak UltraShort Income Fund | | For the year ended January 31, 2022 | | For the years ended January 31, 2022 and 2021 | | For the years ended January 31, 2022, 2021 and 2020, and for the period from April 30, 2018 (commencement of operations) through January 31, 2019 |
Angel Oak Core Impact Fund | | For the period from June 4, 2021 (commencement of operations) through January 31, 2022 |
| * | Consolidated for the Angel Oak Multi-Strategy Income Fund. |
Basis for Opinion
These financial statements are the responsibility of the Funds’ management. Our responsibility is to express an opinion on the Funds’ financial statements based on our audits. We are a public accounting firm registered with the Public Company Accounting Oversight Board (United States) (“PCAOB”) and are required to be independent with respect to the Funds in accordance with the U.S. federal securities laws and the applicable rules and regulations of the Securities and Exchange Commission and the PCAOB.
We conducted our audits in accordance with the standards of the PCAOB. Those standards require that we plan and perform the audit to obtain reasonable assurance about whether the financial statements are free of material misstatement whether due to error or fraud.
Our audits included performing procedures to assess the risks of material misstatement of the financial statements, whether due to error or fraud, and performing procedures that respond to those risks. Such procedures included examining, on a test basis, evidence regarding the amounts and disclosures in the financial statements. Our procedures included confirmation of securities owned as of January 31, 2022, by correspondence with the custodian, issuers, counterparties, and brokers; when replies were not received from brokers, we performed other auditing procedures. Our audits also included evaluating the accounting principles used and significant estimates made by management, as well as evaluating the overall presentation of the financial statements. We believe that our audits provide a reasonable basis for our opinion.
We have served as the auditor of one or more funds advised by Angel Oak Capital Advisors, LLC since 2011.

Cleveland, Ohio
March 31, 2022
144
Additional Information (Unaudited)
1. Shareholder Notification of Federal Tax Status
For the taxable year ended January 31, 2022, certain dividends paid by the Funds may be subject to a maximum tax rate of 20% as provided for by the Jobs and Growth Tax Relief Reconciliation Act of 2003. The Funds intend to designate the maximum amount allowable as taxed at a maximum rate of 20%.
For the taxable year ended January 31, 2022, the Multi-Strategy Income Fund, Financials Income Fund, High Yield Opportunities Fund, UltraShort Income Fund, and Core Impact Fund paid qualified dividend income of 0.00%, 0.00%, 0.00%, 0.00% and 0.00%, respectively.
For the taxable year ended January 31, 2022, the percentage of ordinary income dividends paid by the Multi-Strategy Income Fund, Financials Income Fund, High Yield Opportunities Fund, UltraShort Income Fund, and Core Impact Fund that qualifies for the dividends received deduction available to corporations was 0.00%, 0.00%, 0.00%, 0.00% and 0.00%, respectively.
For the taxable year ended January 31, 2022, the Multi-Strategy Income Fund, Financials Income Fund, High Yield Opportunities Fund, UltraShort Income Fund, and Core Impact Fund did not pay any ordinary income distributions that are designated as short-term capital gain distributions under Internal Revenue Section 871(k)2(c).
For the taxable year ended January 31, 2022, the percentage of taxable ordinary income distributions for the Multi-Strategy Income Fund, Financials Income Fund, High Yield Opportunities Fund, UltraShort Income Fund, and Core Impact Fund that are designated as interest related dividends under Internal Revenue 871(k)1(c) was 72.43%, 91.85%, 98.12%, 100.00% and 100.00%, respectively.
2. Disclosure of Portfolio Holdings
The Funds will file a complete schedule of portfolio holdings with the Securities and Exchange Commission (“SEC”) for the first and third quarters of each fiscal year on Part F of Form N-PORT. The Funds’ Part F of Form N-PORT is available on the SEC’s website at http://www.sec.gov and may be reviewed and copied at the SEC’s Public Reference Room in Washington, D.C. Information on the operation of the Public Reference Room may be obtained by calling (800) SEC-0230.
3. Proxy Voting Policies and Procedures
A description of the policies and procedures that the Funds use to determine how to vote proxies related to portfolio securities and information regarding how the Funds voted those proxies during the most recent twelve month period ended June 30, is available without charge upon request by (1) calling the Funds at (855) 751-4324 and (2) from Trust documents filed with the SEC on the SEC’s website at www.sec.gov.
4. Statement Regarding the Basis for the Approval of the Continuance of Investment Advisory Agreement
Pursuant to Section 15(c) of the Investment Company Act of 1940, as amended (the “1940 Act”), at a telephonic meeting held on August 17, 2021 and a virtual meeting held on September 22-23, 2021 (the “Meetings”), the Board of Trustees (the “Board”) of Angel Oak Funds Trust (the “Trust”) considered the approval of the continuance of the Investment Advisory Agreement (the “Investment Advisory Agreement” or the “Agreement”) between the Trust, on behalf of the Angel Oak Multi-Strategy Income Fund (the “Multi-Strategy Income Fund”), the Angel Oak Financials Income Fund (the “Financials Income Fund”) (formerly the Angel Oak Flexible Income Fund), the Angel Oak High Yield Opportunities Fund (the “High Yield Opportunities Fund”), and the Angel Oak UltraShort Income Fund (each, a “Fund” and, collectively, the “Funds”), and Angel Oak Capital Advisors, LLC (the “Adviser” or “Angel Oak”) for a one-year period. The Multi-Strategy Income Fund is the successor in interest to a fund having the same name and investment objective that was included as a series of another investment company, Valued Advisers Trust, and that was also advised by Angel Oak (the “Predecessor Multi-Strategy Income Fund”). The Predecessor Multi-Strategy Income Fund was reorganized into the Fund on April 10, 2015. The High Yield Opportunities Fund is the successor to the investment performance of the Rainier High Yield Fund (the “Predecessor High Yield Fund”) as a result of the reorganization of the Predecessor High Yield Fund into the Fund on April 15, 2016.
The relevant provisions of the 1940 Act specifically provide that it is the duty of the Board to request and evaluate such information as the Board determines is necessary to allow it to properly consider the renewal of the Agreement, and it is the duty of the Adviser to furnish the Trustees with information that is responsive to their request. Accordingly, in determining whether to renew the Investment Advisory Agreement between the Adviser and the Trust with respect to the Funds, the Board
145
requested, and the Adviser provided, information and data relevant to the Board’s consideration. This included materials prepared by the Adviser, the Funds’ administrator and an independent third-party data provider (the “Outside Data Provider”) that provided the Board with information regarding the fees and expenses of each Fund, as compared to other similar mutual funds.
Following their review and consideration, the Trustees determined that the Investment Advisory Agreement with respect to the Funds would enable shareholders of the Funds to obtain high quality services at a cost that is appropriate, reasonable, and in the best interests of the Funds and their shareholders. Accordingly, the Board, including those Trustees who are not considered to be “interested persons” of the Trust, as that term is defined in the 1940 Act (the “Independent Trustees”), unanimously approved the continuance of the Investment Advisory Agreement. In reaching their decision, the Trustees requested and obtained from the Adviser such information as they deemed reasonably necessary to evaluate the Investment Advisory Agreement. The Trustees also carefully considered profitability data and the comparative fee and expense information prepared by the Adviser. In considering the Investment Advisory Agreement with respect to the Funds, the Trustees evaluated a number of factors that they believed, in light of their reasonable business judgment, to be relevant. They based their decision on the following considerations, among others, although they did not identify any one specific consideration or any particular information that was controlling of their decision:
The nature, extent and quality of the advisory services to be provided. The Trustees concluded that Angel Oak is capable of providing high quality services to each Fund, as indicated by the nature and quality of services provided in the past to each Fund and other registered investment companies advised by Angel Oak (the “Angel Oak Funds”), Angel Oak’s management capabilities demonstrated with respect to each Fund, the professional qualifications and experience of the portfolio managers of each Fund, Angel Oak’s investment and management oversight processes, and the competitive investment performance of the Funds. The Trustees also determined that Angel Oak proposed to provide investment advisory services that were of the same quality as services it provided to each Fund in the past, and that these services are appropriate in scope and extent in light of the Funds’ operations, the competitive landscape of the investment company business and investor needs. On the basis of the Trustees’ assessment of the nature, extent and quality of the advisory services provided by Angel Oak, the Trustees concluded that Angel Oak is capable of continuing to generate a level of long-term investment performance that is appropriate in light of each Fund’s investment objective, policies and strategies and competitive with many other comparable investment companies.
The investment performance of the Funds. With respect to each Fund, the Trustees concluded on the basis of information derived from independent third-party data that Angel Oak had achieved investment performance that was competitive relative to the Fund’s category, as established by the Outside Data Provider, and a smaller peer group of comparable funds over longer-term trailing periods, and the Trustees took into consideration the fact that Angel Oak focuses on long-term performance results with respect to its management of the Funds and the Funds may have periods of underperformance when measured on a more short-term basis. In considering the performance of the Funds, the Trustees reviewed reports comparing each Fund’s performance to: (i) the Fund’s category; (ii) a peer group of comparable mutual funds; and (iii) the Fund’s benchmark index.
With respect to the Multi-Strategy Income Fund (which commenced operations in June 2011), the Trustees noted that the Fund’s Institutional Class shares had ranked in the third quartile of the Fund’s peer group over the one-, three- and five-year periods ended June 30, 2021, and in the first quartile over the ten-year period ended June 30, 2021 and the period since the Fund’s inception. They noted that the Fund’s Institutional Class shares had ranked in the fourth quartile of the Fund’s category over the one-, three- and five-year periods ended June 30, 2021, in the first quartile over the ten-year period ended June 30, 2021, and in the third quartile over the period since the Fund’s inception. The Trustees also noted that the Multi-Strategy Income Fund’s Institutional Class shares had outperformed the Fund’s benchmark index, the Bloomberg U.S. Aggregate Bond Index (formerly, the Bloomberg Barclays U.S. Aggregate Bond Index), over the one-, five-, and ten-year periods ended June 30, 2021 and since the Fund’s inception and underperformed the benchmark index during the three-year period ended June 30, 2021.
With respect to the Financials Income Fund (which commenced operations in November 2014), the Trustees observed that the Fund’s Institutional Class shares had ranked in the first quartile of the Fund’s peer group for the one- and five-year periods ended June 30, 2021 and the period since the Fund’s inception and had ranked in the fourth quartile over the three-year period ended June 30, 2021. They noted that the Fund’s Institutional Class shares had ranked in the first quartile of the Fund’s category over the one- and five-year periods ended June 30, 2021 and the period since the Fund’s inception and had ranked in the fourth quartile over the three-year period ended June 30, 2021. The Trustees further noted that the Fund’s Institutional Class shares had outperformed the Fund’s benchmark index, the Bloomberg U.S. Aggregate 3-5 Year Index (formerly, the Bloomberg Barclays U.S. Aggregate 3-5 Year Index), over the one- and five-year periods ended June 30, 2021, and since the Fund’s inception and underperformed the benchmark index during the three-year period ended June 30, 2021.
146
With respect to the High Yield Opportunities Fund (which commenced operations in March 2009), the Trustees noted that the Fund’s Institutional Class shares had ranked in the second quartile of the Fund’s peer group over the one-year period ended June 30, 2021, in the third quartile over the three-year period ended June 30, 2021, in the first quartile over the five- and ten-year periods ended June 30, 2021, and in the fourth quartile over the period since the Fund’s inception. They observed that the Fund’s Institutional Class shares had ranked in the second quartile of the Fund’s category over the one- and three-year periods ended June 30, 2021, in the first quartile over the five- and ten-year periods ended June 30, 2021, and in the fourth quartile over the period since the Fund’s inception. The Trustees also noted that the Fund’s Institutional Class shares had outperformed the Fund’s benchmark index, the Bloomberg U.S. Corporate High Yield Bond Index (formerly, the Bloomberg Barclays U.S. Corporate High Yield Bond Index), over the one- and ten-year periods ended June 30, 2021 and underperformed the benchmark index during the three- and five-year periods ended June 30, 2021 and over the period since the Fund’s inception.
With respect to the UltraShort Income Fund (which commenced operations in April 2018), the Trustees observed that the Fund’s Institutional Class shares had ranked in the second quartile of the Fund’s peer group for the one-year period ended June 30, 2021 and in the first quartile for the three-year period ended June 30, 2021 and the period since the Fund’s inception. They noted that the Fund’s Institutional Class shares had ranked in the first quartile of the Fund’s category over the one- and three-year periods ended June 30, 2021 and over the period since the Fund’s inception. The Trustees further noted that the Fund’s Institutional Class shares had outperformed the Fund’s benchmark index, the Bloomberg U.S. Treasury: 9-12 Months Index (formerly, the Bloomberg Barclays U.S. Treasury: 9-12 Months Index), over the one- and three-year periods ended June 30, 2021 and since the Fund’s inception.
On the basis of the Trustees’ assessment of the nature, extent and quality of advisory services provided by Angel Oak, the Trustees concluded that Angel Oak is capable of generating a level of long-term investment performance that is appropriate in light of each Fund’s investment objectives, policies and strategies and competitive with many other investment companies.
The cost of advisory services provided and the level of profitability. On the basis of comparative information derived from the expense data provided to the Board, the Trustees determined that the management fee of each of the Financials Income Fund, UltraShort Income Fund and Multi-Strategy Income Fund was higher than the median management fee in their respective peer groups and categories. They further observed that the management fees of the High Yield Opportunities Fund was equal to the median management fee in its peer group and category. The Trustees also determined that the net expense ratio of the Financials Income Fund was higher than the median net expense ratio in its peer group and category. They noted that the net expense ratios of each of the UltraShort Income Fund and the High Yield Opportunities Fund was lower than the median net expense ratio for funds in their respective peer groups and that the net expense ratio of the Multi-Strategy Income Fund was equal to the median net expense ratio in its peer group. The Board noted that the quality of services provided by Angel Oak and the past long-term performance of the Angel Oak Funds demonstrated that the advisory fee still offered an appropriate value for the Funds and their shareholders. In addition, the Trustees noted that Angel Oak had renewed its contractual commitment for the benefit of Fund shareholders to limit the operating expenses of each of the classes of shares of the Funds for an additional year through May 31, 2023.
The Board also reviewed the fees that Angel Oak charges its other clients for discretionary portfolio management services, noting that the firm has a variety of account types with different fee arrangements, including non-U.S. registered funds (UCITS funds) and sub-advised funds that have investment strategies similar to certain of the Angel Oak Funds. The Board considered the management fee rates of such funds. The Board took into account the unique management requirements involved in managing a registered investment company as opposed to other types of client accounts.
The Board also reviewed detailed profitability information and considered Angel Oak’s current level of profitability with respect to each Fund, and noted that Angel Oak’s profitability was acceptable and not excessive and consistent with applicable industry averages and that Angel Oak is committed to using its own resources to help improve the services it provides for the benefit of the Funds. The Trustees also noted that Angel Oak had provided information regarding its methodology for attributing profitability to each Fund, as opposed to its other lines of business. The Trustees also took into consideration the nature and extent of expenses that are borne directly by Angel Oak from its own financial resources to help to market and promote the Funds. Accordingly, on the basis of the Board’s review of the fees to be charged by Angel Oak for investment advisory services, the investment advisory and other services provided to the Funds by Angel Oak, and the estimated profitability of Angel Oak’s relationship with each Fund, the Board concluded that the level of investment advisory fees and Angel Oak’s profitability are appropriate in light of the investment advisory fees, overall expense ratios and investment performance of comparable investment companies and the historical profitability of the relationship between each Fund and Angel Oak. The Trustees considered the profitability of Angel Oak both before and after the impact of the marketing-related expenses that Angel Oak incurs out of its own resources in connection with its management of the Funds.
147
The extent to which economies of scale may be realized as the Funds grow and whether the advisory fees reflect possible economies of scale. While it was noted that each Fund’s investment advisory fee will not decrease as the Fund’s assets grow because the Funds are not subject to investment advisory fee breakpoints, the Trustees concluded that each Fund’s investment advisory fee was appropriate in light of the projected size of the Fund and appropriately reflected the current economic environment for Angel Oak and the competitive nature of the mutual fund market. The Trustees then noted that they would have the opportunity to periodically re-examine whether each Fund had achieved economies of scale and the appropriateness of investment advisory fees payable to Angel Oak with respect to each Fund, in the future, at which time the implementation of fee breakpoints could be considered. Finally, the Trustees noted the continued improvements made to the Adviser’s infrastructure and services provided to each Fund, which had been funded by the advisory fees received by the Adviser.
Benefits to Angel Oak from its relationship with the Funds (and any corresponding benefits to the Funds). The Trustees concluded that other benefits derived by Angel Oak from its relationship with the Funds are reasonable and fair and consistent with industry practice and the best interests of the Funds and their shareholders.
Other Considerations. In approving the Investment Advisory Agreement, the Trustees determined that Angel Oak has made a substantial commitment to the recruitment and retention of high quality personnel, and maintains the financial, compliance and operational resources reasonably necessary to manage the Funds in a professional manner that is consistent with the best interests of each Fund and its shareholders. The Trustees also concluded that Angel Oak has made a significant entrepreneurial commitment to the management and success of the Funds, which entails a substantial financial and professional commitment, including the Operating Expense Limitation Agreement under which Angel Oak has undertaken to waive a portion of its fees to the benefit of Fund shareholders to the extent necessary in accordance with the terms of the Operating Expense Limitation Agreement. The Trustees observed that those waivers were subject to recoupment under the terms of the Operating Expense Limitation Agreement and that Angel Oak had recouped previously-waived fees with respect to the Multi-Strategy Income Fund. The Board also considered matters with respect to the brokerage practices of Angel Oak, including its best-execution procedures, and noted that these were reasonable and consistent with standard industry practice.
Following further discussion and the consideration of questions raised by the Independent Trustees, the Trustees determined that they had received sufficient information relating to each Fund in order to consider the approval of the Investment Advisory Agreement. It was noted that, in making their determinations, the Trustees had considered and relied upon not only the materials provided to them for use at the Meetings with respect to the proposed contract renewal, but also the information about the Funds and Angel Oak that had been provided to them at the Meetings and throughout the past year in connection with their regular Board meetings. In reaching their conclusion with respect to the continuation of the Investment Advisory Agreement and the level of fees paid under the Investment Advisory Agreement, the Trustees did not identify any one single factor as being controlling, but, rather, the Board took note of a combination of factors that had influenced their decision-making process. They noted the level and quality of investment advisory services provided by the Adviser to each of the Funds, and they found that these services continued to benefit the shareholders of the Funds and also reflected management’s overall commitment to the continued growth and development of the Funds.
5. Compensation of Trustees
Each Trustee who is not an “interested person” (i.e., an “Independent Trustee”) of the Fund Complex (which includes affiliated registrants not disclosed in this report) receives an annual retainer of $65,000, (pro-rated for any periods less than one year), paid quarterly as well as $12,000 for attending each regularly scheduled meeting in connection with his or her service on the Board of the Fund Complex. In addition, each Committee Chairman as well as the Chairman of the Board receive additional annual compensation of $12,000 (pro-rated for any periods less than one year). Independent Trustees are eligible for reimbursement of out-of-pocket expenses incurred in connection with attendance at meetings. The Funds’ Statement of Additional Information includes additional information about the Trustees and is available upon request by calling toll free (855) 751-4324.
Prior to November 1, 2021, the Independent Trustees received an annual retainer of $58,000 (pro-rated for any periods less than one year), paid quarterly as well as $12,000 for attending each regularly scheduled meeting in connection with his or her service on the Board of the Fund Complex. In addition, each Committee Chairman received additional annual compensation of $12,000 (pro-rated for any periods less than one year).
6. Trustees and Officers
The business of each Fund is managed under the direction of the Board. The Board formulates the general policies of each Fund and meets periodically to review each Fund’s performance, monitor investment activities and practices, and discuss other
148
matters affecting the Funds’. The Trustees are fiduciaries for each Fund’s shareholders and are governed by the laws of the State of Delaware in this regard. The names and addresses of the Trustees and officers of the Trust are listed below along with a description of their principal occupations over at least the last five years. The address of each Trustee and Officer of the Trust is c/o Angel Oak Capital Advisors, LLC, 3344 Peachtree Road NE, Suite 1725, Atlanta, GA 30326. The Funds’ Statement of Additional Information includes additional information about the Trustees and is available upon request by calling toll free (855) 751-4324.
| | | | | | | | | | |
Name and
Year of Birth | | Position with
the Trust | | Term of Office
and Length of
Time Served | | Principal
Occupation(s) During
Past 5 Years | | Number of
Portfolios
in Fund
Complex(1)
Overseen
by Trustee | | Other Directorships Held
During the Past 5 Years |
Independent Trustees(2) |
Ira P. Cohen 1959 | | Independent Trustee, Chairman | | Trustee since 2014, Chairman since 2017; indefinite terms | | Executive Vice President, Recognos Financial (investment industry data analysis provider) (2015 – 2021); Independent financial services consultant (since 2005). | | 9 | | Trustee, Valued Advisers Trust (since 2010); Trustee, Griffin Institutional Access Credit Fund (since 2017); Trustee, Griffin Institutional Access Real Estate Access Fund (since 2014); Trustee, Angel Oak Strategic Credit Fund (since 2017); Trustee, Angel Oak Financial Strategies Income Term Trust (since 2018); Trustee, Angel Oak Dynamic Financial Strategies Income Term Trust (since 2019); Trustee, U.S. Fixed Income Trust (since 2019); Trustee, Angel Oak Credit Opportunities Term Trust (since 2021). |
Alvin R. Albe, Jr. 1953 | | Independent Trustee | | Since 2014; indefinite term | | Retired. | | 9 | | Trustee, Angel Oak Strategic Credit Fund (since 2017); Trustee, Angel Oak Financial Strategies Income Term Trust (since 2018); Trustee, Angel Oak Dynamic Financial Strategies Income Term Trust (since 2019); Trustee, Angel Oak Credit Opportunities Term Trust (since 2021). |
149
| | | | | | | | | | |
Name and
Year of Birth | | Position with
the Trust | | Term of Office
and Length of
Time Served | | Principal
Occupation(s) During
Past 5 Years | | Number of
Portfolios
in Fund
Complex(1)
Overseen
by Trustee | | Other Directorships Held
During the Past 5 Years |
Keith M. Schappert 1951 | | Independent Trustee | | Since 2014; indefinite term | | President, Schappert Consulting LLC (investment industry consulting) (since 2008). | | 9 | | Trustee, Mirae Asset Discovery Funds (since 2010); Director, Commonfund Capital, Inc. (since 2015); Director, The Commonfund (since 2012); Director, Calamos Asset Management, Inc. (2012 – 2017); Trustee, Angel Oak Strategic Credit Fund (since 2017); Trustee, Angel Oak Financial Strategies Income Term Trust (since 2018); Trustee, Angel Oak Dynamic Financial Strategies Income Term Trust (since 2019); Trustee, Angel Oak Credit Opportunities Term Trust (since 2021). |
Andrea N. Mullins 1967 | | Independent Trustee | | Since 2019; indefinite term | | Private Investor; Independent Contractor, SWM Advisors (since 2014). | | 9 | | Trustee, Valued Advisors Trust (since 2013, Chairperson since 2017); Trustee, Angel Oak Strategic Credit Fund (since 2019); Trustee, Angel Oak Financial Strategies Income Term Trust (since 2019); Trustee, Angel Oak Dynamic Financial Strategies Income Term Trust (since 2019); Trustee, Angel Oak Credit Opportunities Term Trust (since 2021); Trustee and Audit Committee Chair, Cushing Mutual Funds Trust (since 2021); Trustee and Audit Committee Chair, Cushing MLP & Infrastructure Fund (since 2021); Trustee and Audit Committee Chair, Cushing Nextgen Infrastructure Income Fund (since 2021). |
150
| | | | | | | | | | |
Name and
Year of Birth | | Position with
the Trust | | Term of Office
and Length of
Time Served | | Principal
Occupation(s) During
Past 5 Years | | Number of
Portfolios
in Fund
Complex(1)
Overseen
by Trustee | | Other Directorships Held
During the Past 5 Years |
Interested Trustees |
Samuel R. Dunlap, III 1979 | | Interested Trustee | | Since 2019; indefinite term | | Chief Investment Officer-Public Strategies, Angel Oak Capital Advisors, LLC (investment management) (since 2009). | | 9 | | Trustee, Angel Oak Strategic Credit Fund (since 2019); Trustee, Angel Oak Dynamic Financial Strategies Income Term Trust (since 2019); Trustee, Angel Oak Credit Opportunities Term Trust (since 2021): Trustee, Angel Oak Financial Strategies Income Term Trust (since 2022). |
Cheryl M. Pate 1976 | | Interested Trustee | | Since 2022; indefinite term | | Portfolio Manager, Angel Oak Capital Advisors, LLC (investment management) (since 2017). | | 8 | | Trustee, Angel Oak Strategic Credit Fund (since 2022); Trustee, Angel Oak Dynamic Financial Strategies Income Term Trust (since 2022); Trustee, Angel Oak Credit Opportunities Term Trust (since 2022). |
| (1) | The Fund Complex includes each series of the Trust, Angel Oak Strategic Credit Fund, Angel Oak Financial Strategies Income Term Trust, Angel Oak Dynamic Financial Strategies Income Term Trust, and Angel Oak Credit Opportunities Term Trust. |
| (2) | The Trustees of the Trust who are not “interested persons” of the Trust as defined in the 1940 Act (“Independent Trustees”). |
151
| | | | | | |
Name and Year of Birth | | Position with the Trust | | Term of Office and Length of Time Served | | Principal Occupation(s) During Past 5 Years |
Officers |
Dory S. Black, Esq. 1975 | | President | | Since 2015; indefinite term | | General Counsel, Angel Oak Companies (since 2014). |
Adam Langley 1967 | | Chief Compliance Officer | | Since 2015; indefinite term | | Chief Compliance Officer, Angel Oak Capital Advisors, LLC (since 2015); Chief Compliance Officer, Buckhead One Financial Opportunities, LLC (since 2015); Chief Compliance Officer, Angel Oak Capital Partners II, LLC (since 2016); Chief Compliance Officer of Falcons I, LLC (since 2018); Chief Compliance Officer, Hawks I, LLC (since 2018); Chief Compliance Officer, Angel Oak Commercial Real Estate Solutions (since 2021); Chief Compliance Officer, Angel Oak Strategic Credit Fund (since 2017); Chief Compliance Officer, Angel Oak Financial Strategies Income Term Trust (since 2018); Chief Compliance Officer, Angel Oak Dynamic Financial Strategies Income Term Trust (since 2019); Chief Compliance Officer, Angel Oak Credit Opportunities Fund (since 2021); Chief Operating Officer, Angel Oak Capital Advisors, LLC (since 2021). |
John Hsu 1965 | | Secretary | | Since 2020; indefinite term | | Chief Risk Officer, Angel Oak Capital Advisors, LLC (since 2020), Head of Treasury Strategies, Angel Oak Capital Advisors, LLC (since 2018), Head of Capital Markets, Angel Oak Capital Advisors, LLC (2014-2018). |
Daniel Fazioli 1981 | | Treasurer | | Since 2015; indefinite term | | Chief Accounting Officer, Angel Oak Capital Advisors, LLC (since 2015). |
Each Trustee holds office for an indefinite term and until the earlier of: the Trust’s next meeting of shareholders and the election and qualification of his/her successor; or until the date a trustee dies, resigns or is removed in accordance with the Trust’s Declaration of Trust and By-laws. Each Trustee shall serve during the lifetime of the Trust until he or she: (a) dies; (b) resigns; (c) has reached the mandatory retirement age, if any, as set by the Trustees; (d) is declared incompetent by a court of appropriate jurisdiction; or (e) is removed, or, if sooner, until the next meeting of shareholders called for the purpose of electing Trustees and until the election and qualification of his or her successor. Each officer holds office at the pleasure of the Board.
152
ANGEL OAK FUNDS TRUST
Notice of Privacy Policy & Practices
Your privacy is important to us. We are committed to maintaining the confidentiality, integrity and security of your personal information. When you provide personal information, we believe that you should be aware of policies to protect confidentiality of that information.
We collect the following nonpublic personal information about you:
| | • | | Information we receive from you on or in applications or other forms, correspondence, or conversations, including, but not limited to, your name, address, phone number, social security number, assets, income and date of birth; and |
| | • | | Information about your transactions with us, our affiliates, or others, including, but not limited to, your account number and balance, payments history, parties to transactions, cost basis information, and other financial information. |
We do not disclose any nonpublic personal information about our current or former shareholders to nonaffiliated third parties, except as permitted by law. For example, we are permitted by law to disclose all of the information we collect, as described above, to our transfer agent to process your transactions. Furthermore, we restrict access to your nonpublic personal information to those persons who require such information to provide products or services to you. We maintain physical, electronic, and procedural safeguards that comply with federal standards to guard your nonpublic personal information.
In the event that you hold shares of the Fund through a financial intermediary, including, but not limited to, a broker-dealer, bank, or trust company, the privacy policy of your financial intermediary would govern how your nonpublic personal information would be shared with nonaffiliated third parties.
153
INVESTMENT ADVISER
Angel Oak Capital Advisors, LLC
3344 Peachtree Road NE, Suite 1725
Atlanta, GA 30326
DISTRIBUTOR
Quasar Distributors, LLC
111 East Kilbourn Avenue, Suite 220
Milwaukee, WI 53202
INDEPENDENT REGISTERED PUBLIC ACCOUNTING FIRM
Cohen & Company, Ltd.
1350 Euclid Avenue, Suite 800
Cleveland, OH 44115
LEGAL COUNSEL
Dechert LLP
1900 K Street NW
Washington, DC 20006
CUSTODIAN
U.S. Bank National Association
1555 North Rivercenter Drive, Suite 302
Milwaukee, WI 53202
ADMINISTRATOR, TRANSFER AGENT, AND FUND ACCOUNTANT
U.S Bancorp Fund Services, LLC
615 East Michigan Street
Milwaukee, WI 53202
This report is intended only for the information of shareholders or those who have received the Funds’ prospectus which contains information about the Funds’ management fee and expenses. Please read the prospectus carefully before investing.
AR-AOFT
(b) Not applicable.
Item 2. Code of Ethics.
The registrant has adopted a code of ethics that applies to the registrant’s Principal Executive Officer and Principal Financial Officer. The registrant has not made any substantive amendments to its code of ethics during the period covered by this report. The registrant has not granted any waivers from any provisions of the code of ethics during the period covered by this report.
A copy of the registrant’s Code of Ethics is filed herewith.
Item 3. Audit Committee Financial Expert.
The registrant’s board of trustees has determined that there is at least one audit committee financial expert serving on its audit committee. Mr. Alvin R. Albe, Jr. is the “audit committee financial expert” and is considered to be “independent” as each term is defined in Item 3 of Form N-CSR.
Item 4. Principal Accountant Fees and Services.
The registrant has engaged its principal accountant to perform audit services, audit-related services, tax services and other services during the past two fiscal years. “Audit services” refer to performing an audit of the registrant’s annual financial statements or services that are normally provided by the accountant in connection with statutory and regulatory filings or engagements for those fiscal years. “Audit-related services” refer to the assurance and related services by the principal accountant that are reasonably related to the performance of the audit. “Tax services” refer to professional services rendered by the principal accountant for tax compliance, tax advice, and tax planning. The following table details the aggregate fees billed or expected to be billed for each of the last two fiscal years for audit fees, audit-related fees, tax fees and other fees by the principal accountant.
| | | | | | | | |
| | | FYE 1/31/2022 | | | FYE 1/31/2021 | |
(a) Audit Fees | | $ | 182,500 | | | $ | 160,000 | |
(b) Audit-Related Fees | | $ | 0 | | | $ | 0 | |
(c) Tax Fees | | $ | 20,000 | | | $ | 16,000 | |
(d) All Other Fees | | $ | 0 | | | $ | 0 | |
The Audit, Financial and Administrative Oversight Committee has not adopted written pre-approval policies and procedures. Instead, the Committee has the duty and responsibility to pre-approve all auditing services and permissible non-auditing services to be provided to the Funds in accordance with its Charter and the 1940 Act. In addition, the Committee considers matters with respect to the principal accountant’s independence each year. The Committee did not approve any of the audit- related, tax or other non-audit fees described above pursuant to the “de minimis exceptions” set forth in Rule 2-01(c)(7)(i)(C) and Rule 2-01(c)(7)(ii) of Regulation S-X.
1
The Audit, Financial and Administrative Oversight Committee also has the duty and responsibility to pre-approve those non-audit services provided to the Funds’ investment adviser (and entities controlling, controlled by or under common control with the investment adviser that provide ongoing services to the Funds) where the engagement relates directly to the operations or financial reporting of the Funds in accordance with the Charter of the Committee and the 1940 Act. The Committee considered whether the provision of any non-audit services rendered to the Adviser and any entity controlling, controlled by, or under common control with the Adviser that provides ongoing services to the Funds that were not pre-approved by the Committee because the engagement did not relate directly to the operations and financial reporting of the Funds is compatible with maintaining the principal accountant’s independence.
The percentage of fees billed by Cohen & Company, Ltd. applicable to non-audit services pursuant to a waiver of the pre-approval requirement were as follows:
| | | | | | | | |
| | | FYE 1/31/2022 | | | FYE 1/31/2021 | |
Audit-Related Fees | | | 0 | % | | | 0 | % |
Tax Fees | | | 0 | % | | | 0 | % |
All Other Fees | | | 0 | % | | | 0 | % |
All of the principal accountant’s hours spent on auditing the registrant’s financial statements were attributed to work performed by full-time permanent employees of the principal accountant.
The following table indicates the non-audit fees billed or expected to be billed by the registrant’s accountant for services to the registrant and to the registrant’s investment adviser (and any other controlling entity) for the last two years. The audit committee of the board of trustees has considered whether the provision of non-audit services that were rendered to the registrant’s investment adviser is compatible with maintaining the principal accountant’s independence and has concluded that the provision of such non-audit services by the accountant has not compromised the accountant’s independence.
| | | | | | | | |
Non-Audit Related Fees | | FYE 1/31/2022 | | | FYE 1/31/2021 | |
Registrant | | $ | 20,000 | | | $ | 16,000 | |
Registrant’s Investment Adviser | | $ | 0 | | | $ | 0 | |
The registrant has not been identified by the U.S. Securities and Exchange Commission as having filed an annual report issued by a registered public accounting firm branch or office that is located in a foreign jurisdiction where the Public Company Accounting Oversight Board is unable to inspect or completely investigate because of a position taken by an authority in that jurisdiction.
The registrant is not a foreign issuer.
2
Item 5. Audit Committee of Listed Registrants.
Not applicable to registrants who are not listed issuers (as defined in Rule 10A-3 under the Securities Exchange Act of 1934).
Item 6. Investments.
Schedule of Investments is included as part of the report to shareholders filed under Item 1 of this Form.
Item 7. Disclosure of Proxy Voting Policies and Procedures for Closed-End Management Investment Companies.
Not applicable to open-end investment companies.
Item 8. Portfolio Managers of Closed-End Management Investment Companies.
Not applicable to open-end investment companies.
Item 9. Purchases of Equity Securities by Closed-End Management Investment Company and Affiliated Purchasers.
Not applicable to open-end investment companies.
Item 10. Submission of Matters to a Vote of Security Holders.
There have been no material changes to the procedures by which shareholders may recommend nominees to the registrant’s board of trustees.
Item 11. Controls and Procedures.
| (a) | The Registrant’s Principal Executive Officer and Principal Financial Officer have reviewed the Registrant’s disclosure controls and procedures (as defined in Rule 30a-3(c) under the Investment Company Act of 1940 (the “Act”)) as of a date within 90 days of the filing of this report, as required by Rule 30a-3(b) under the Act and Rules 13a-15(b) or 15d-15(b) under the Securities Exchange Act of 1934. Based on their review, such officers have concluded that the disclosure controls and procedures are effective in ensuring that information required to be disclosed in this report is appropriately recorded, processed, summarized and reported and made known to them by others within the Registrant and by the Registrant’s service provider. |
| (b) | There were no changes in the Registrant’s internal controls over financial reporting (as defined in Rule 30a-3(d) under the Act) that occurred during the period covered by this report that have materially affected, or are reasonably likely to materially affect, the Registrant’s internal control over financial reporting. |
3
Item 12. Disclosure of Securities Lending Activities for Closed-End Management Investment Companies
Not applicable to open-end investment companies.
Item 13. Exhibits.
4
SIGNATURES
Pursuant to the requirements of the Securities Exchange Act of 1934 and the Investment Company Act of 1940, the registrant has duly caused this report to be signed on its behalf by the undersigned, thereunto duly authorized.
| | | | |
| (Registrant) | | Angel Oak Funds Trust | | |
| | | | |
| | |
| By (Signature and Title)* | | /s/ Dory S. Black | | |
| | Dory S. Black, President (Principal Executive Officer) | | |
| |
| Date April 8, 2022 | | |
Pursuant to the requirements of the Securities Exchange Act of 1934 and the Investment Company Act of 1940, this report has been signed below by the following persons on behalf of the registrant and in the capacities and on the dates indicated.
| | | | |
| By (Signature and Title)* | | /s/ Dory S. Black | | |
| | Dory S. Black, President (Principal Executive Officer) | | |
| |
| Date April 8, 2022 | | |
| | |
| By (Signature and Title)* | | /s/ Daniel Fazioli | | |
| | Daniel Fazioli, Treasurer (Principal Financial Officer) | | |
| |
| Date April 8, 2022 | | |
| * | Print the name and title of each signing officer under his or her signature. |
5