Earnings Release | March 31, 2019

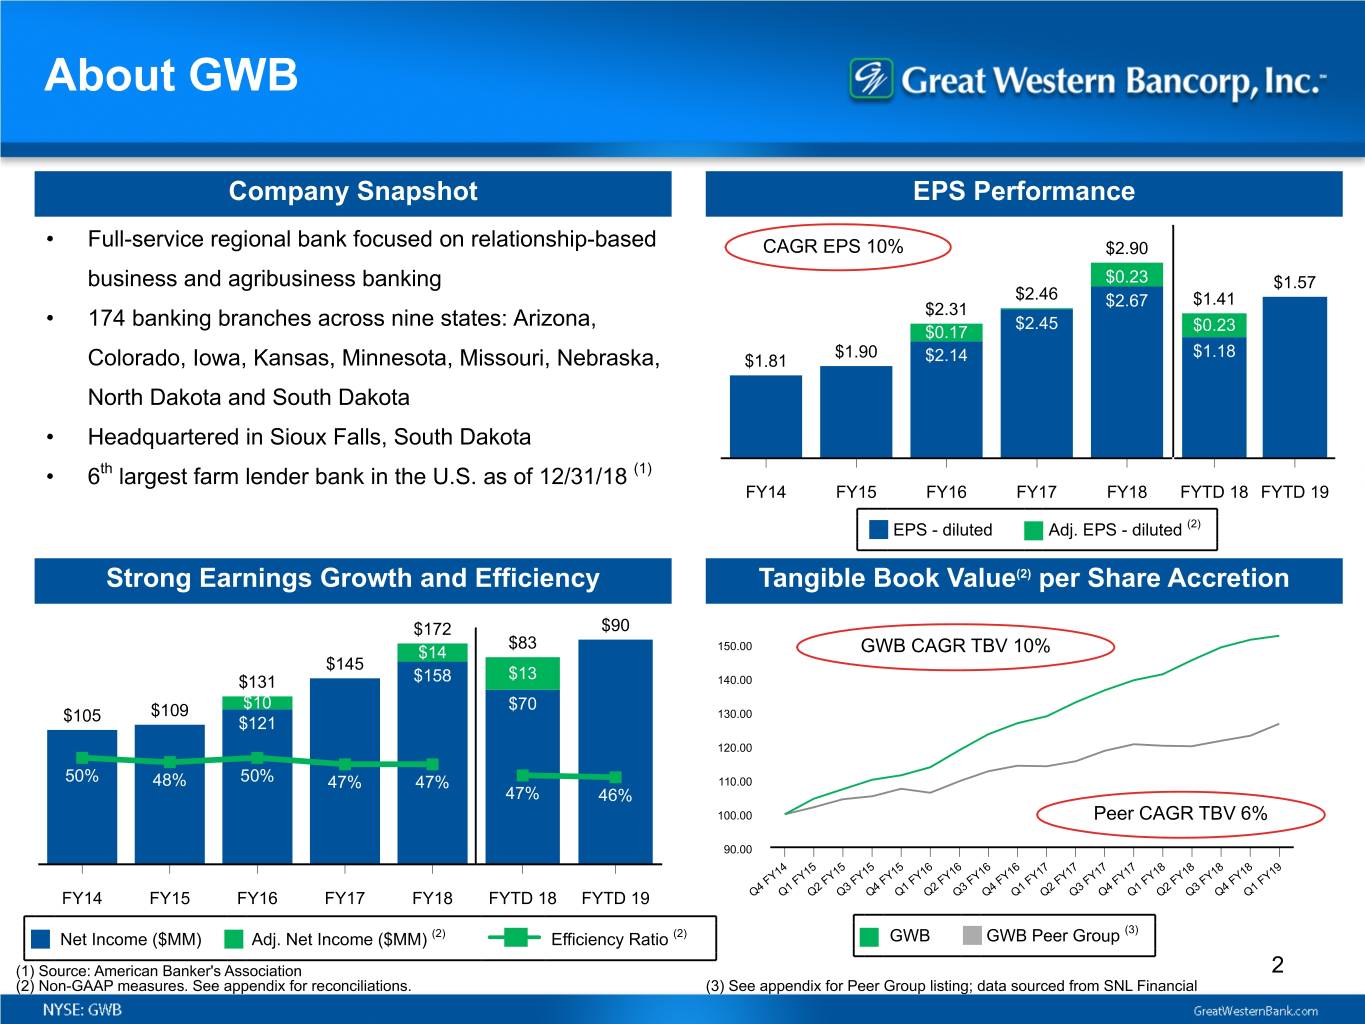
About GWB Company Snapshot EPS Performance • Full-service regional bank focused on relationship-based CAGR EPS 10% $2.90 business and agribusiness banking $0.23 $1.57 $2.46 $2.67 $1.41 $2.31 • 174 banking branches across nine states: Arizona, $2.45 $0.17 $0.23 $1.90 $1.18 Colorado, Iowa, Kansas, Minnesota, Missouri, Nebraska, $1.81 $2.14 North Dakota and South Dakota • Headquartered in Sioux Falls, South Dakota • 6th largest farm lender bank in the U.S. as of 12/31/18 (1) FY14 FY15 FY16 FY17 FY18 FYTD 18 FYTD 19 EPS - diluted Adj. EPS - diluted (2) Strong Earnings Growth and Efficiency Tangible Book Value(2) per Share Accretion $172 $90 $83 $14 150.00 GWB CAGR TBV 10% $145 $13 $131 $158 140.00 $10 $70 $109 130.00 $105 $121 120.00 50% 48% 50% 47% 47% 110.00 47% 46% 100.00 Peer CAGR TBV 6% 90.00 14 15 15 15 15 16 16 16 16 17 17 17 17 18 18 18 18 19 Y Y Y Y Y Y Y Y Y Y Y Y Y Y Y Y Y Y F F F F F F F F F F F F F F F F F F 4 1 2 3 4 1 2 3 4 1 2 3 4 1 2 3 4 1 FY14 FY15 FY16 FY17 FY18 FYTD 18 FYTD 19 Q Q Q Q Q Q Q Q Q Q Q Q Q Q Q Q Q Q (3) Net Income ($MM) Adj. Net Income ($MM) (2) Efficiency Ratio (2) GWB GWB Peer Group (1) Source: American Banker's Association 2 (2) Non-GAAP measures. See appendix for reconciliations. (3) See appendix for Peer Group listing; data sourced from SNL Financial

Executing on Strategy Focused • Total loans remained steady at $9.77 billion during the quarter with FYTD loan growth at 3.8% Business • Loan growth was primarily driven by non-owner occupied commercial real estate Banking Franchise with • Deposit balances increased by $355.1 million, or 3.5%, during the quarter resulting in FYTD deposit Agribusiness growth of $734.9 million, or 7.6% Expertise Strong • Fully diluted EPS(1) of $0.78 for the quarter compared to $0.79 for 1QFY19, a decrease of 1.3% Profitability and • Profitability remains strong with ROTCE(1) of 16.9% and ROAA of 1.44% for the quarter Growth Driven by (1) a Highly Efficient • Efficiency ratio of 45.6% for the quarter compared to 46.1% for the prior quarter Operating Model • All regulatory capital ratios remain above minimums to be considered "well capitalized" Strong Capital • Strong earnings support an increased quarterly dividend to $0.30 per share Generation and Attractive ◦ Dividend payable May 24, 2019 to stockholders of record as of the close of business on Dividend May 10, 2019 • Net charge-offs of $5.9 million during the quarter represent 0.25% of average total loans on an Risk annualized basis Management • Loans graded "Substandard" increased by 2.5% to $258.9 million, loans graded "Watch" decreased Driving Strong Credit Quality by 6.4% to $301.1 million, nonaccrual loans decreased by 12.5% to $121.6 million compared to December 31, 2018 (1) This is a non-GAAP measure. See appendix for reconciliation. 3

Revenue Revenue Highlights Net Interest Income ($MM) and NIM • Net interest income (FTE) decreased 1.4% to $104.9 million $204.4 $211.3 compared to 1QFY19 $106.4 ◦ Higher interest expense associated with the cost of $104.9 deposits partially offset by higher yield on loans and 3.91% investments 3.81% 3.78% 3.75% • NIM (FTE) down 6 basis points and adjusted NIM (FTE) (2) down 5 3.83% 3.81% 3.79% basis points compared to 1QFY19 3.76% • Noninterest income, excluding the change in fair value of fair value option loans and the net gain (loss) on related derivatives, decreased 3.7% compared to 1QFY19 1QFY19 2QFY19 FYTD 18 FYTD 19 Net Interest Income (FTE) NIM (FTE) Adjusted NIM (FTE) (2) NIM Analysis Noninterest Income (1) (0.08)% Wealth management, $2,117 0.05% Mortgage banking (0.01)% (0.01)% 3.81% (0.04)% income, net, $991 3.75% Service charges, $1,460 3.81% 0.03% 3.76% Other, $1,920 Other Service fees, $1,907 1QFY19 2QFY19 Time Cash & Deposits Interchange income, Nonaccruals Core LoansNOW/Svgs/ Investments MMDA $3,136 Increased liquidity OD/NSF fees, $3,706 NIM (FTE) Adjusted NIM (FTE) (2) (1) Chart excludes changes related to loans and derivatives at fair value which netted $3.0 million for the quarter and loss on sale of securities. Dollars in thousands. 4 (2) Adjusted NIM (FTE) is a non-GAAP measure. See appendix for reconciliations.

Earnings, Expenses & Provision Highlights Net Income ($MM) (1) • Adjusted net income of $44.5 million, a decrease of 2.8% $46 $45 $90 over 1QFY19 $41 $83 $13 ◦ Strong ROAA of 1.44% and 16.9% ROTCE(1) • Efficiency ratio(1) was 45.6%, down from 46.1% for 1QFY19 1.40% 1.48% 1.44% 1.46% • Provision for loan losses was $7.7 million, an increase of 1.20% $2.5 million compared to 1QFY19 • Noninterest expense decreased 0.9% to $56.6 million from 2QFY18 1QFY19 2QFY19 FYTD 18 FYTD 19 1QFY19 Net Income Adjusted net income (1) ROAA Noninterest Expense ($MM) Provision for Loan Losses ($MM) Sustained peer-leading $12.9 efficiency ratio $114.0 $113.7 $59.1 $56.6 $9.5 $7.7 48.6% 45.6% 47.2% 45.8% $4.9 2QFY18 2QFY19 FYTD 18 FYTD 19 2QFY18 2QFY19 FYTD 18 FYTD 19 Noninterest expense Efficiency Ratio (1) 5 (1) Efficiency ratio, adjusted net income, and ROTCE are non-GAAP measures. See appendix for reconciliations.

Balance Sheet Overview Balance Sheet Highlights Total Loans ($MM) • Outstanding loans increased $3.4 million during the 3.8% FYTD growth $9,416 $9,771 quarter, with FYTD growth at 3.8% $8,683 $8,969 $7,325 $864 ▪ Commercial real estate grew $139.5 million, or $6,787 $7,819 2.8%, for the quarter mainly in the non-owner occupied segment • Deposits grew $355.1 million, or 3.5%, during the quarter, resulting in FYTD growth of 7.6% • Key capital ratios declined modestly during the fiscal FY14 FY15 FY16 FY17 FY18 2QFY19 period as a result of stock repurchase activity and strong loan growth Total Loans Loans Acquired Deposits ($MM) Capital 7.6% FYTD growth $10,468 $9,733 $8,978 12.9% 13.0% $8,605 12.1% 12.2% 12.5% 12.4% $7,387 $863 1.08% $7,052 11.8% 12.0% $7,742 10.9% 11.1% 11.4% 11.4% 0.65% 0.40% 0.36% 0.32% 0.32% 9.2% 9.6% 9.2% 8.2% 8.3% 8.5% FY14 FY15 FY16 FY17 FY18 2QFY19 FY14 FY15 FY16 FY17 FY18 2QFY19 Total Deposits Deposits Acquired Cost of Deposits Tier 1 Capital Total Capital TCE / TA (1) (1) TCE / TA is a non-GAAP measure. See appendix for reconciliation. 6

Asset Quality Watch Loans ($MM) Net Charge-offs / Average Total Loans(2) 0.88% $328 $343 $310 $312 $301 $288 $84 $123 $121 $92 $132 $259 0.54% $156 0.44% $205 $209 $189 $180 0.26% $132 0.18% 0.20% 0.14% 0.13% 0.12% 4.2% 4.2% 3.8% 3.5% 3.6% 3.1% 0.10% 0.14% 0.02% 0.06% 0.04% 0.05% 0.08% FY14 FY15 FY16 FY17 FY18 2QFY19 FY11 FY12 FY13 FY14 FY15 FY16 FY17 FY18 FYTD 19 Ag Loans Non Ag Loans Total Loans Ag Loans Non Ag Loans Total Loans Substandard Loans ($MM) Credit Quality $253 $259 83.8% $242 $233 $72 $81 $184 $71 60.2% $111 55.9% $187 51.1% $172 45.9% 45.1% $126 $162 $130 $131 0.42% 0.38% 0.67% 0.31% $91 2.8% 2.5% 2.6% 2.7% 2.6% 0.99% 0.6% 1.12% 1.14% 1.9% $54 0.79% 0.93% $35 0.17% 0.33% FY14 FY15 FY16 FY17 FY18 2QFY19 FY14 FY15 FY16 FY17 FY18 2QFY19 Ag Loans Non Ag Loans Total Loans NALs / Ag Loans NALs / Non Ag Loans Reserves / NALs (1) Comprehensive Credit-Related Coverage is a non-GAAP measure. (2) Annualized for partial periods 7

Proven Business Strategy Focused Business Banking Franchise with Agribusiness Expertise Attract and Retain High-Quality Relationship Bankers Invest in Organic Growth While Optimizing Footprint Deepen Customer Relationships Explore Accretive Strategic Acquisition Opportunities Strong Profitability and Growth Driven by a Highly Efficient Operating Model Strong Capital Generation and Attractive Dividend Risk Management Driving Stable Credit Quality 8

Disclosures Forward-Looking Statements: This presentation contains forward-looking statements within the meaning of the Private Securities Litigation Reform Act of 1995. Statements about Great Western Bancorp, Inc.’s expectations, beliefs, plans, strategies, predictions, forecasts, objectives, assumptions or future events or performance are not historical facts and may be forward-looking. These statements are often, but not always, made through the use of words or phrases such as “anticipates,” “believes,” “can,” “could,” “may,” “predicts,” “potential,” “should,” “will,” “estimate,” “plans,” “projects,” “continuing,” “ongoing,” “expects,” “views,” “intends” and similar words or phrases. In particular, the statements included in this Earnings Release concerning Great Western Bancorp, Inc.’s expected performance and strategy, the outlook for its agricultural lending segment and the interest rate environment are not historical facts and are forward-looking. Accordingly, the forward-looking statements in this Earnings Release are only predictions and involve estimates, known and unknown risks, assumptions and uncertainties, that could cause actual results to differ materially from those expressed. All forward-looking statements are necessarily only estimates of future results, and there can be no assurance that actual results will not differ materially from expectations, and, therefore, you are cautioned not to place undue reliance on such statements. Any forward-looking statements are qualified in their entirety by reference to the factors discussed in the sections titled “Item 1A. Risk Factors” and "Cautionary Note Regarding Forward-Looking Statements" in Great Western Bancorp, Inc.’s Annual Report on Form 10-K for the most recently ended fiscal year, and in other periodic filings with the Securities and Exchange Commission. Further, any forward-looking statement speaks only as of the date on which it is made, and Great Western Bancorp, Inc. undertakes no obligation to update any forward- looking statement to reflect events or circumstances after the date on which the statement is made or to reflect the occurrence of unanticipated events. Non-GAAP Financial Measures: This presentation contains non-GAAP measures which our management relies on in making financial and operational decisions about our business and which exclude certain items that we do not consider reflective of our business performance. We believe that the presentation of these measures provides investors with greater transparency and supplemental data relating to our financial condition and results of operations. These non-GAAP measures should be considered in context with our GAAP results. A reconciliation of these non-GAAP measures appears in our earnings release dated April 25, 2019 and in Appendix 1 to this presentation. Our earnings release and this presentation are available in the Investor Relations section of our website at www.greatwesternbank.com. Our earnings release and this presentation are also available as part of our Current Report on Form 8-K filed with the Securities and Exchange Commission on April 25, 2019. Explanatory Note: In this presentation, all financial information presented refers to the financial results of Great Western Bancorp, Inc. combined with those of its predecessor, Great Western Bancorporation, Inc. 9

Appendix 1 Non-GAAP Measures

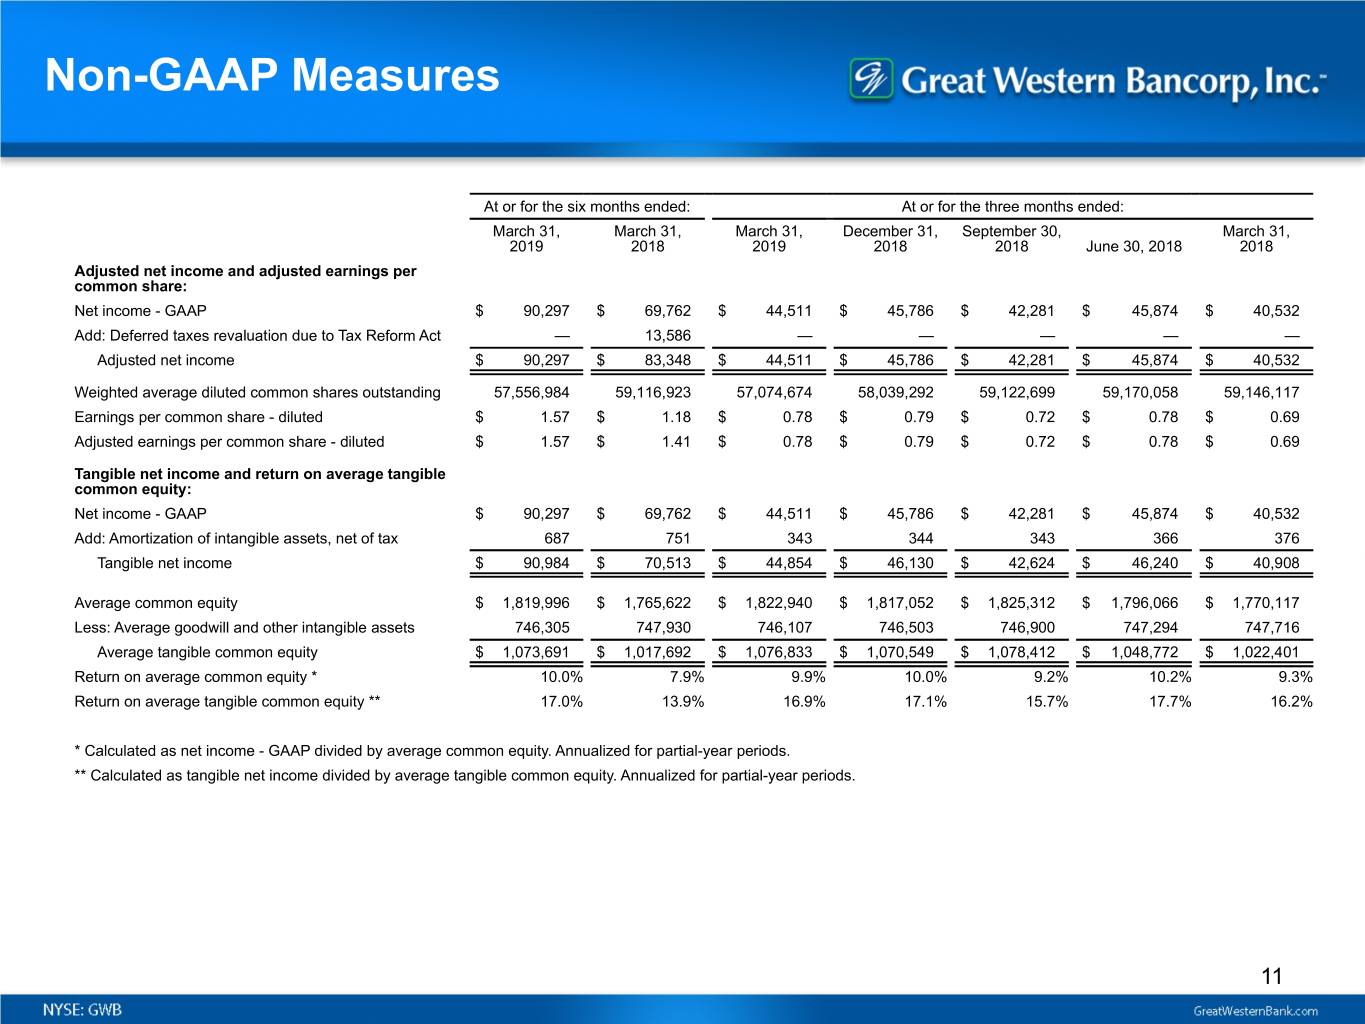
Non-GAAP Measures At or for the six months ended: At or for the three months ended: March 31, March 31, March 31, December 31, September 30, March 31, 2019 2018 2019 2018 2018 June 30, 2018 2018 Adjusted net income and adjusted earnings per common share: Net income - GAAP $ 90,297 $ 69,762 $ 44,511 $ 45,786 $ 42,281 $ 45,874 $ 40,532 Add: Deferred taxes revaluation due to Tax Reform Act — 13,586 — — — — — Adjusted net income $ 90,297 $ 83,348 $ 44,511 $ 45,786 $ 42,281 $ 45,874 $ 40,532 Weighted average diluted common shares outstanding 57,556,984 59,116,923 57,074,674 58,039,292 59,122,699 59,170,058 59,146,117 Earnings per common share - diluted $ 1.57 $ 1.18 $ 0.78 $ 0.79 $ 0.72 $ 0.78 $ 0.69 Adjusted earnings per common share - diluted $ 1.57 $ 1.41 $ 0.78 $ 0.79 $ 0.72 $ 0.78 $ 0.69 Tangible net income and return on average tangible common equity: Net income - GAAP $ 90,297 $ 69,762 $ 44,511 $ 45,786 $ 42,281 $ 45,874 $ 40,532 Add: Amortization of intangible assets, net of tax 687 751 343 344 343 366 376 Tangible net income $ 90,984 $ 70,513 $ 44,854 $ 46,130 $ 42,624 $ 46,240 $ 40,908 Average common equity $ 1,819,996 $ 1,765,622 $ 1,822,940 $ 1,817,052 $ 1,825,312 $ 1,796,066 $ 1,770,117 Less: Average goodwill and other intangible assets 746,305 747,930 746,107 746,503 746,900 747,294 747,716 Average tangible common equity $ 1,073,691 $ 1,017,692 $ 1,076,833 $ 1,070,549 $ 1,078,412 $ 1,048,772 $ 1,022,401 Return on average common equity * 10.0% 7.9% 9.9% 10.0% 9.2% 10.2% 9.3% Return on average tangible common equity ** 17.0% 13.9% 16.9% 17.1% 15.7% 17.7% 16.2% * Calculated as net income - GAAP divided by average common equity. Annualized for partial-year periods. ** Calculated as tangible net income divided by average tangible common equity. Annualized for partial-year periods. 11

Non-GAAP Measures At or for the six months ended: At or for the three months ended: March 31, March 31, March 31, December 31, September 30, March 31, 2019 2018 2019 2018 2018 June 30, 2018 2018 Adjusted net interest income and adjusted net interest margin (fully-tax equivalent basis): Net interest income - GAAP $ 208,369 $ 201,176 $ 103,475 $ 104,894 $ 101,990 $ 104,672 $ 100,553 Add: Tax equivalent adjustment 2,932 3,181 1,442 1,490 1,687 1,729 1,616 Net interest income (FTE) 211,301 204,357 104,917 106,384 103,677 106,401 102,169 Add: Current realized derivative gain (loss) 426 (4,116) 405 21 (419) (830) (1,640) Adjusted net interest income (FTE) $ 211,727 $ 200,241 $ 105,322 $ 106,405 $ 103,258 $ 105,571 $ 100,529 Average interest-earning assets $ 11,216,179 $ 10,492,091 $ 11,345,559 $ 11,086,800 $ 10,857,168 $ 10,748,078 $ 10,571,300 Net interest margin (FTE) * 3.78% 3.91% 3.75% 3.81% 3.79% 3.97% 3.92% Adjusted net interest margin (FTE) ** 3.79% 3.83% 3.76% 3.81% 3.77% 3.94% 3.86% * Calculated as net interest income (FTE) divided by average interest earning assets. Annualized for partial-year periods. ** Calculated as adjusted net interest income (FTE) divided by average interest earning assets. Annualized for partial-year periods. Adjusted interest income and adjusted yield (fully-tax equivalent basis), on non-ASC 310-30 loans: Interest income - GAAP $ 241,889 $ 211,746 $ 121,528 $ 120,361 $ 115,284 $ 112,760 $ 106,811 Add: Tax equivalent adjustment 2,932 3,181 1,442 1,490 1,687 1,729 1,616 Interest income (FTE) 244,821 214,927 122,970 121,851 116,971 114,489 108,427 Add: Current realized derivative gain (loss) 426 (4,116) 405 21 (419) (830) (1,640) Adjusted interest income (FTE) $ 245,247 $ 210,811 $ 123,375 $ 121,872 $ 116,552 $ 113,659 $ 106,787 Average non-ASC 310-30 loans $ 9,525,498 $ 8,952,914 $ 9,615,096 $ 9,435,901 $ 9,299,318 $ 9,220,931 $ 9,064,899 Yield (FTE) * 5.15% 4.81% 5.19% 5.12% 4.99% 4.98% 4.85% Adjusted yield (FTE) ** 5.16% 4.72% 5.20% 5.12% 4.97% 4.94% 4.78% * Calculated as interest income (FTE) divided by average loans. Annualized for partial-year periods. ** Calculated as adjusted interest income (FTE) divided by average loans. Annualized for partial-year periods. 12

Non-GAAP Measures At or for the six months ended: At or for the three months ended: March 31, March 31, March 31, December 31, September 30, March 31, 2019 2018 2019 2018 2018 June 30, 2018 2018 Efficiency ratio: Total revenue - GAAP $ 243,312 $ 236,592 $ 121,698 $ 121,614 $ 121,245 $ 123,611 $ 119,295 Add: Tax equivalent adjustment 2,932 3,181 1,442 1,490 1,687 1,729 1,616 Total revenue (FTE) $ 246,244 $ 239,773 $ 123,140 $ 123,104 $ 122,932 $ 125,340 $ 120,911 Noninterest expense $ 113,686 $ 114,012 $ 56,580 $ 57,106 $ 59,550 $ 57,863 $ 59,144 Less: Amortization of intangible assets 788 852 394 394 394 416 426 Tangible noninterest expense $ 112,898 $ 113,160 $ 56,186 $ 56,712 $ 59,156 $ 57,447 $ 58,718 Efficiency ratio * 45.8% 47.2% 45.6% 46.1% 48.1% 45.8% 48.6% * Calculated as the ratio of tangible noninterest expense to total revenue (FTE). Tangible common equity and tangible common equity to tangible assets: Total stockholders' equity $ 1,852,394 $ 1,788,698 $ 1,852,394 $ 1,812,008 $ 1,840,551 $ 1,816,741 $ 1,788,698 Less: Goodwill and other intangible assets 745,947 747,545 745,947 746,341 746,735 747,129 747,545 Tangible common equity $ 1,106,447 $ 1,041,153 $ 1,106,447 $ 1,065,667 $ 1,093,816 $ 1,069,612 $ 1,041,153 Total assets $ 12,830,162 $ 11,992,317 $ 12,830,162 $ 12,573,641 $ 12,116,808 $ 12,009,048 $ 11,992,317 Less: Goodwill and other intangible assets 745,947 747,545 745,947 746,341 746,735 747,129 747,545 Tangible assets $ 12,084,215 $ 11,244,772 $ 12,084,215 $ 11,827,300 $ 11,370,073 $ 11,261,919 $ 11,244,772 Tangible common equity to tangible assets 9.2% 9.3% 9.2% 9.0% 9.6% 9.5% 9.3% Tangible book value per share: Total stockholders' equity $ 1,852,394 $ 1,788,698 $ 1,852,394 $ 1,812,008 $ 1,840,551 $ 1,816,741 $ 1,788,698 Less: Goodwill and other intangible assets 745,947 747,545 745,947 746,341 746,735 747,129 747,545 Tangible common equity $ 1,106,447 $ 1,041,153 $ 1,106,447 $ 1,065,667 $ 1,093,816 $ 1,069,612 $ 1,041,153 Common shares outstanding 56,938,435 58,896,189 56,938,435 56,938,435 58,917,147 58,911,563 58,896,189 Book value per share - GAAP $ 32.53 $ 30.37 $ 32.53 $ 31.82 $ 31.24 $ 30.84 $ 30.37 Tangible book value per share $ 19.43 $ 17.68 $ 19.43 $ 18.72 $ 18.57 $ 18.16 $ 17.68 13

Non-GAAP Measures Comprehensive Credit-Related Coverage ($MM) GWB Legacy - Loans at Amortized GWB Legacy - HF Financial Corp. Other Acquired Cost Loans at Fair Value Acquired Loans Loans Total ALLL $ 64,737 $ — $ 1,249 $ 2,017 $ 68,003 Remaining Loan Discount $ — $ — $ 10,950 $ 4,305 $ 15,255 Fair Value Adjustment (Credit) $ — $ 6,374 $ — $ — $ 6,374 Total ALLL / Discount / FV Adj. $ 64,737 $ 6,374 $ 12,199 $ 6,322 $ 89,632 Total Loans $ 8,382,631 $ 835,822 $ 459,114 $ 93,344 $ 9,770,911 ALLL / Total Loans 0.77% —% 0.27% 2.16% 0.70% Discount / Total Loans —% —% 2.39% 4.61% 0.16% FV Adj. / Total Loans —% 0.76% —% —% 0.07% Total Coverage / Total Loans (1) 0.77% 0.76% 2.66% 6.77% 0.93% (1) Comprehensive Credit-Related Coverage is a non-GAAP measure that Management believes is useful to demonstrate that the FV adjustments related to credit and remaining loan discounts consider credit risk and should be considered as part of total coverage. 14

Appendix 2 Accounting for Loans at FV and Related Derivatives

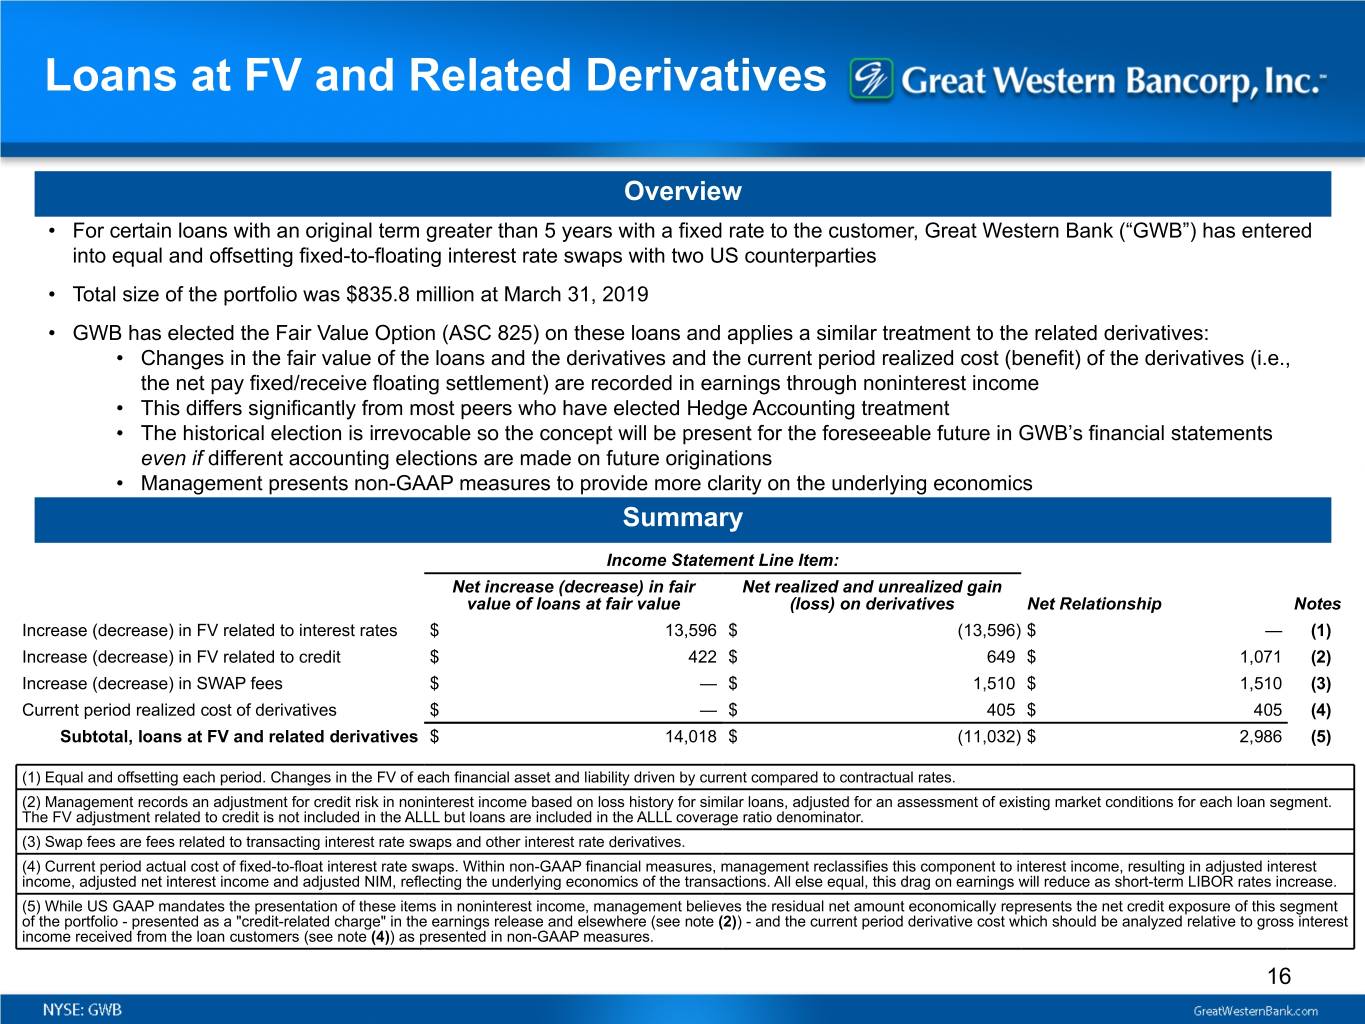
Loans at FV and Related Derivatives Overview • For certain loans with an original term greater than 5 years with a fixed rate to the customer, Great Western Bank (“GWB”) has entered into equal and offsetting fixed-to-floating interest rate swaps with two US counterparties • Total size of the portfolio was $835.8 million at March 31, 2019 • GWB has elected the Fair Value Option (ASC 825) on these loans and applies a similar treatment to the related derivatives: • Changes in the fair value of the loans and the derivatives and the current period realized cost (benefit) of the derivatives (i.e., the net pay fixed/receive floating settlement) are recorded in earnings through noninterest income • This differs significantly from most peers who have elected Hedge Accounting treatment • The historical election is irrevocable so the concept will be present for the foreseeable future in GWB’s financial statements even if different accounting elections are made on future originations • Management presents non-GAAP measures to provide more clarity on the underlying economics Summary Income Statement Line Item: Net increase (decrease) in fair Net realized and unrealized gain value of loans at fair value (loss) on derivatives Net Relationship Notes Increase (decrease) in FV related to interest rates $ 13,596 $ (13,596) $ — (1) Increase (decrease) in FV related to credit $ 422 $ 649 $ 1,071 (2) Increase (decrease) in SWAP fees $ — $ 1,510 $ 1,510 (3) Current period realized cost of derivatives $ — $ 405 $ 405 (4) Subtotal, loans at FV and related derivatives $ 14,018 $ (11,032) $ 2,986 (5) (1) Equal and offsetting each period. Changes in the FV of each financial asset and liability driven by current compared to contractual rates. (2) Management records an adjustment for credit risk in noninterest income based on loss history for similar loans, adjusted for an assessment of existing market conditions for each loan segment. The FV adjustment related to credit is not included in the ALLL but loans are included in the ALLL coverage ratio denominator. (3) Swap fees are fees related to transacting interest rate swaps and other interest rate derivatives. (4) Current period actual cost of fixed-to-float interest rate swaps. Within non-GAAP financial measures, management reclassifies this component to interest income, resulting in adjusted interest income, adjusted net interest income and adjusted NIM, reflecting the underlying economics of the transactions. All else equal, this drag on earnings will reduce as short-term LIBOR rates increase. (5) While US GAAP mandates the presentation of these items in noninterest income, management believes the residual net amount economically represents the net credit exposure of this segment of the portfolio - presented as a "credit-related charge" in the earnings release and elsewhere (see note (2)) - and the current period derivative cost which should be analyzed relative to gross interest income received from the loan customers (see note (4)) as presented in non-GAAP measures. 16


