
Earnings Release | June 30, 2020
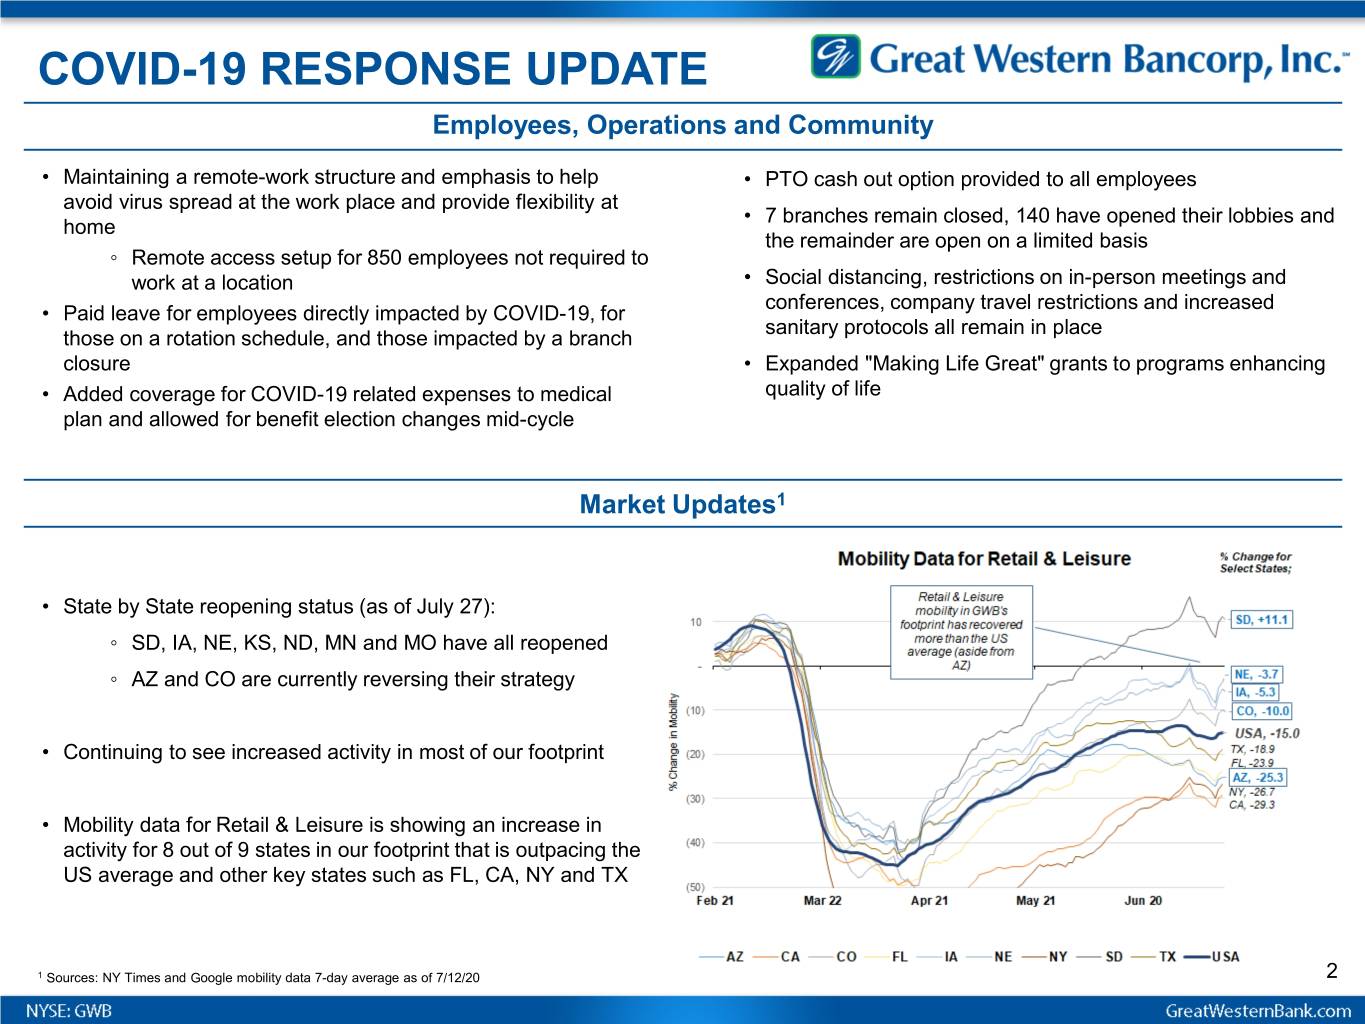
COVID-19 RESPONSE UPDATE Employees, Operations and Community • Maintaining a remote-work structure and emphasis to help • PTO cash out option provided to all employees avoid virus spread at the work place and provide flexibility at • 7 branches remain closed, 140 have opened their lobbies and home the remainder are open on a limited basis ◦ Remote access setup for 850 employees not required to work at a location • Social distancing, restrictions on in-person meetings and conferences, company travel restrictions and increased • Paid leave for employees directly impacted by COVID-19, for sanitary protocols all remain in place those on a rotation schedule, and those impacted by a branch closure • Expanded "Making Life Great" grants to programs enhancing • Added coverage for COVID-19 related expenses to medical quality of life plan and allowed for benefit election changes mid-cycle Market Updates1 • State by State reopening status (as of July 27): ◦ SD, IA, NE, KS, ND, MN and MO have all reopened ◦ AZ and CO are currently reversing their strategy • Continuing to see increased activity in most of our footprint • Mobility data for Retail & Leisure is showing an increase in activity for 8 out of 9 states in our footprint that is outpacing the US average and other key states such as FL, CA, NY and TX 1 Sources: NY Times and Google mobility data 7-day average as of 7/12/20 2
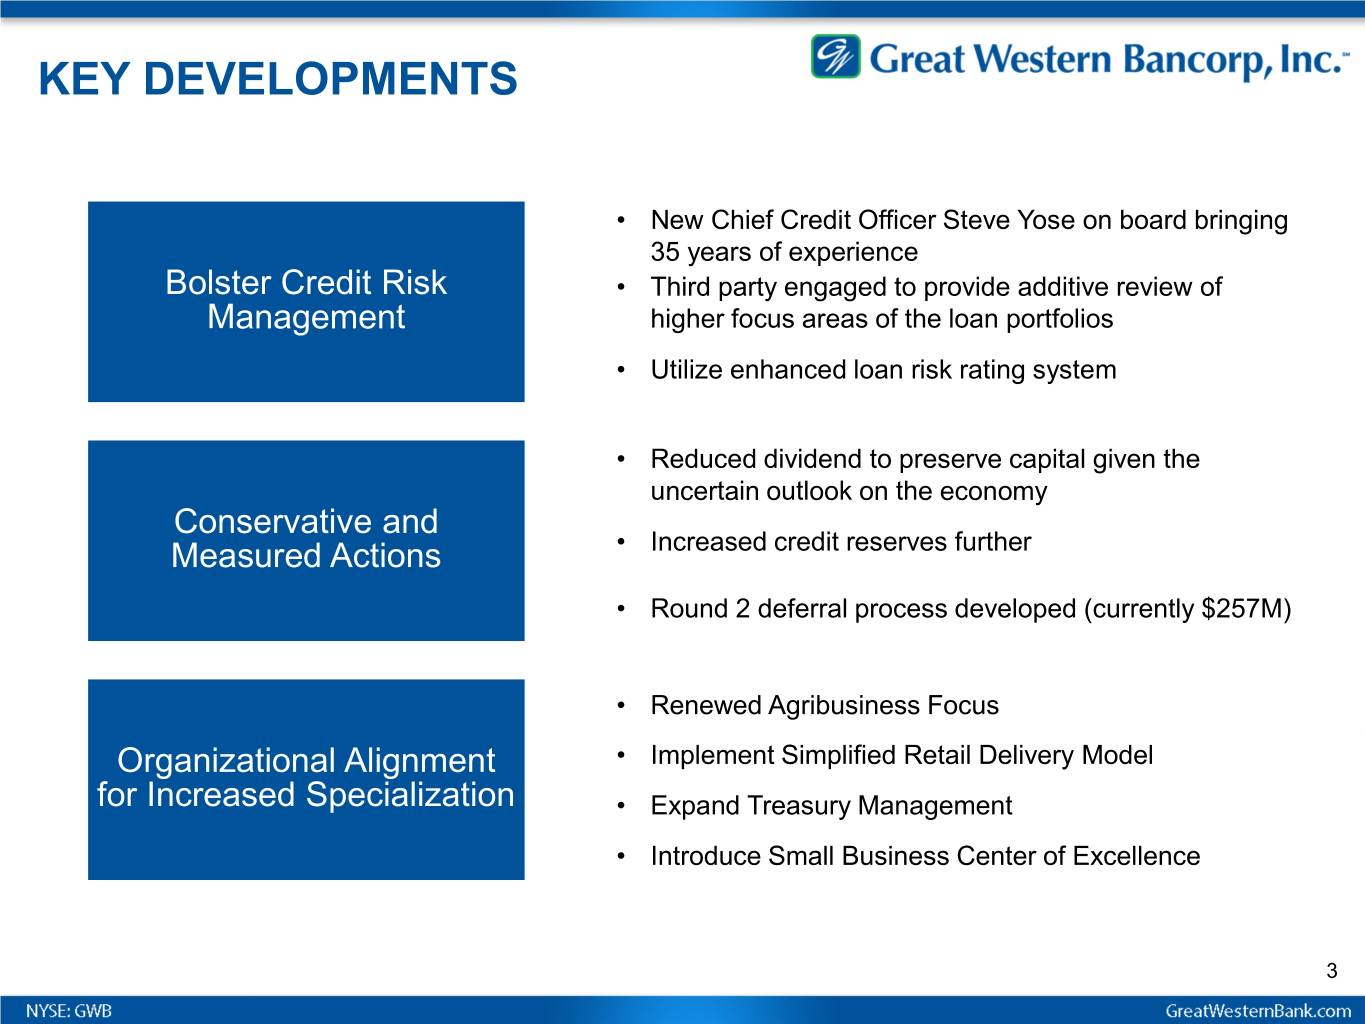
KEY DEVELOPMENTS • New Chief Credit Officer Steve Yose on board bringing 35 years of experience Bolster Credit Risk • Third party engaged to provide additive review of Management higher focus areas of the loan portfolios • Utilize enhanced loan risk rating system • Reduced dividend to preserve capital given the uncertain outlook on the economy Conservative and Measured Actions • Increased credit reserves further • Round 2 deferral process developed (currently $257M) • Renewed Agribusiness Focus Organizational Alignment • Implement Simplified Retail Delivery Model for Increased Specialization • Expand Treasury Management • Introduce Small Business Center of Excellence 3
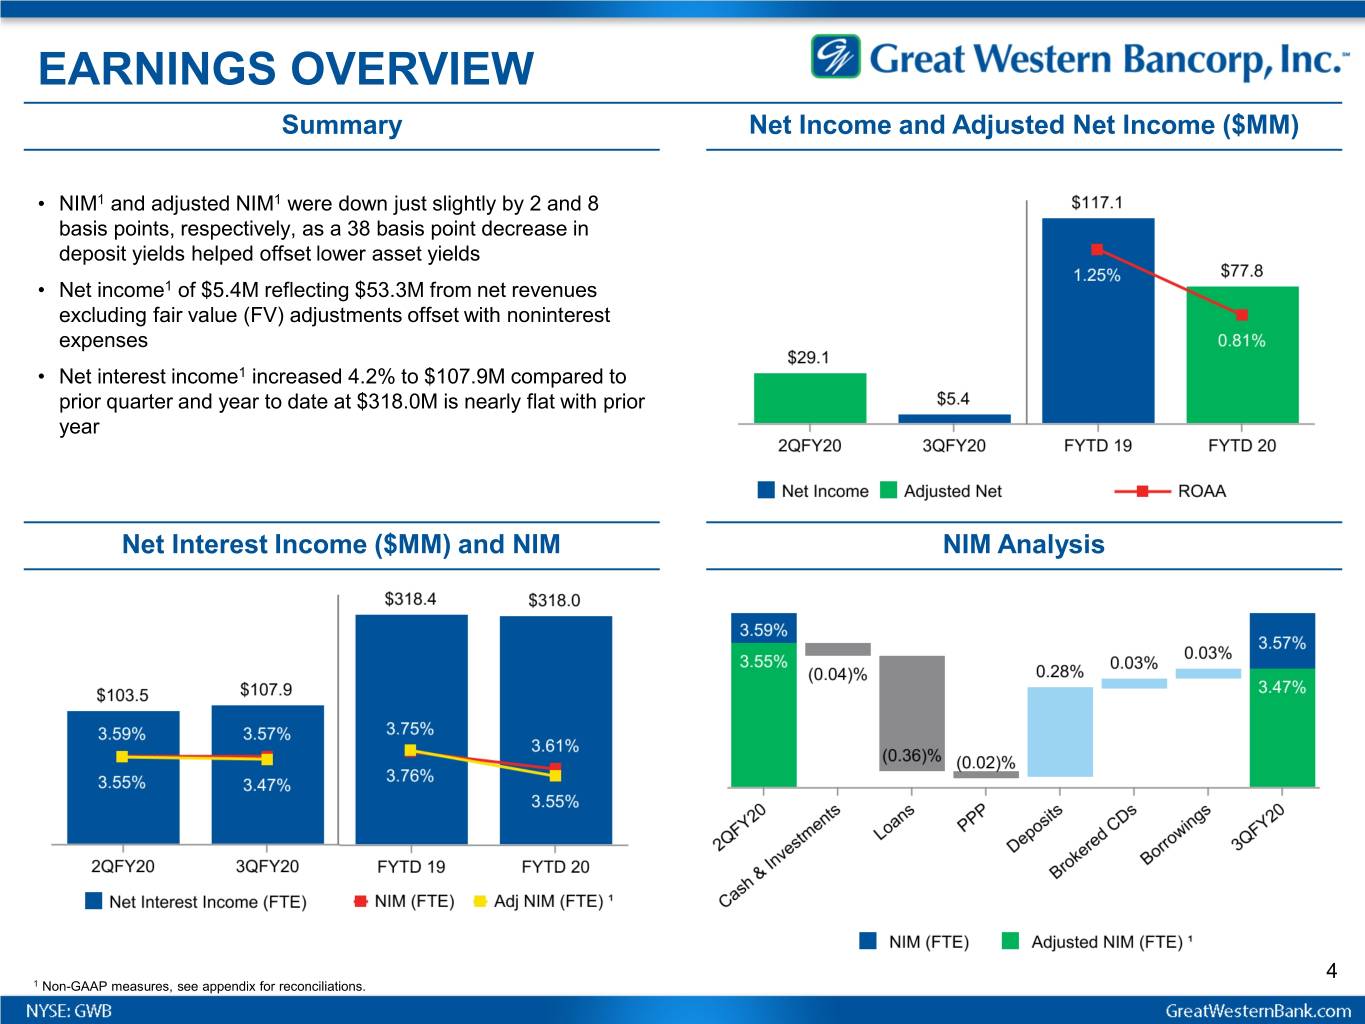
EARNINGS OVERVIEW Summary Net Income and Adjusted Net Income ($MM) • NIM1 and adjusted NIM1 were down just slightly by 2 and 8 basis points, respectively, as a 38 basis point decrease in deposit yields helped offset lower asset yields • Net income1 of $5.4M reflecting $53.3M from net revenues excluding fair value (FV) adjustments offset with noninterest expenses • Net interest income1 increased 4.2% to $107.9M compared to prior quarter and year to date at $318.0M is nearly flat with prior year Net Interest Income ($MM) and NIM NIM Analysis 4 1 Non-GAAP measures, see appendix for reconciliations.
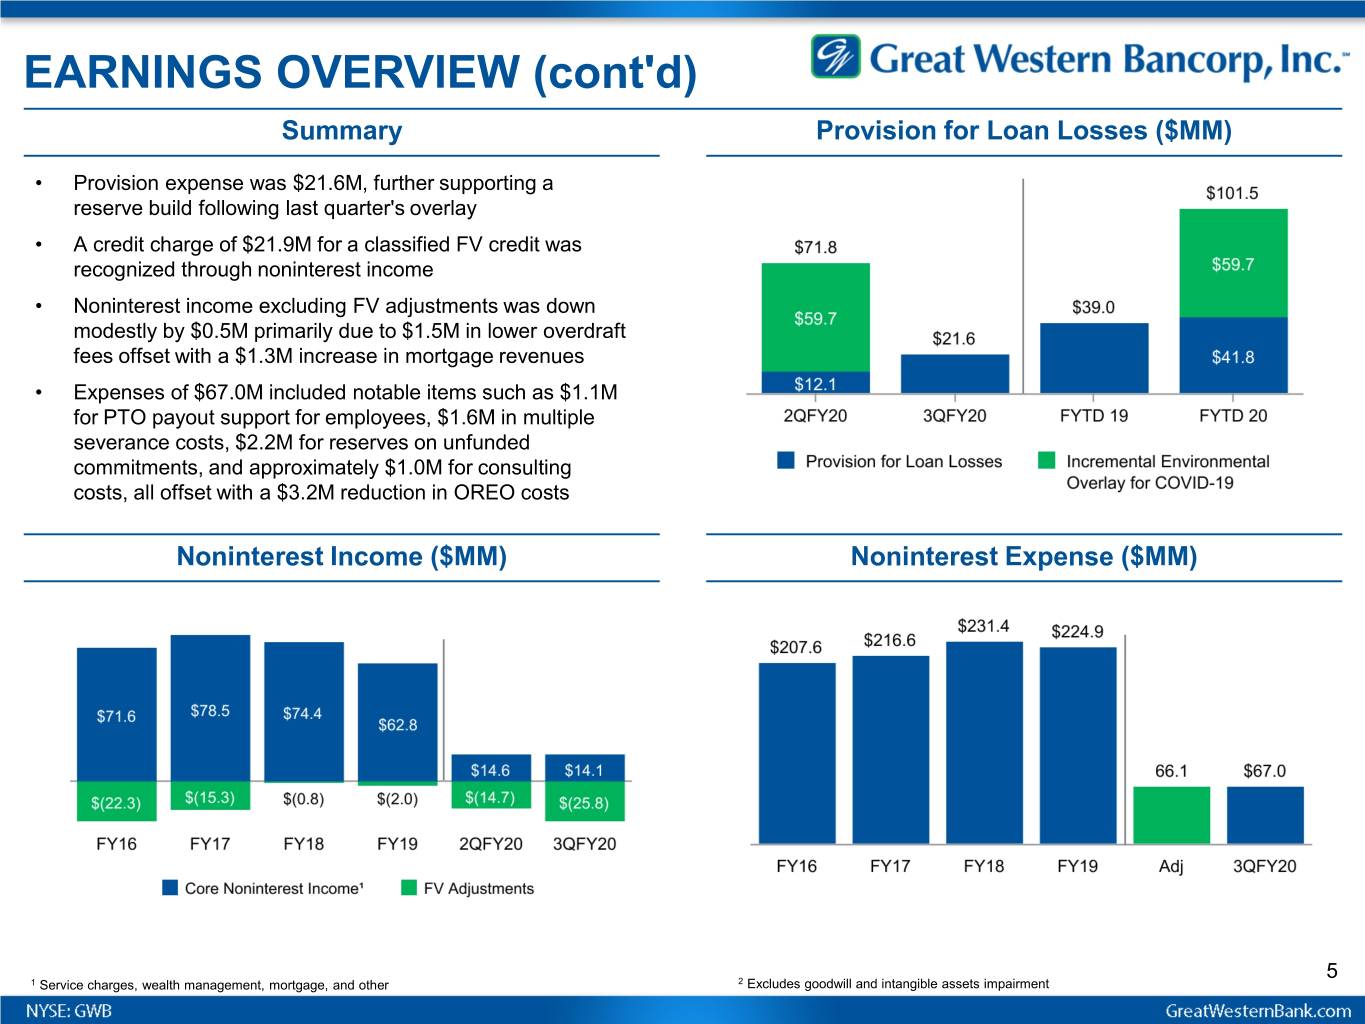
EARNINGS OVERVIEW (cont'd) Summary Provision for Loan Losses ($MM) • Provision expense was $21.6M, further supporting a reserve build following last quarter's overlay • A credit charge of $21.9M for a classified FV credit was recognized through noninterest income • Noninterest income excluding FV adjustments was down modestly by $0.5M primarily due to $1.5M in lower overdraft fees offset with a $1.3M increase in mortgage revenues • Expenses of $67.0M included notable items such as $1.1M for PTO payout support for employees, $1.6M in multiple severance costs, $2.2M for reserves on unfunded commitments, and approximately $1.0M for consulting costs, all offset with a $3.2M reduction in OREO costs Noninterest Income ($MM) Noninterest Expense ($MM) 5 1 Service charges, wealth management, mortgage, and other 2 Excludes goodwill and intangible assets impairment
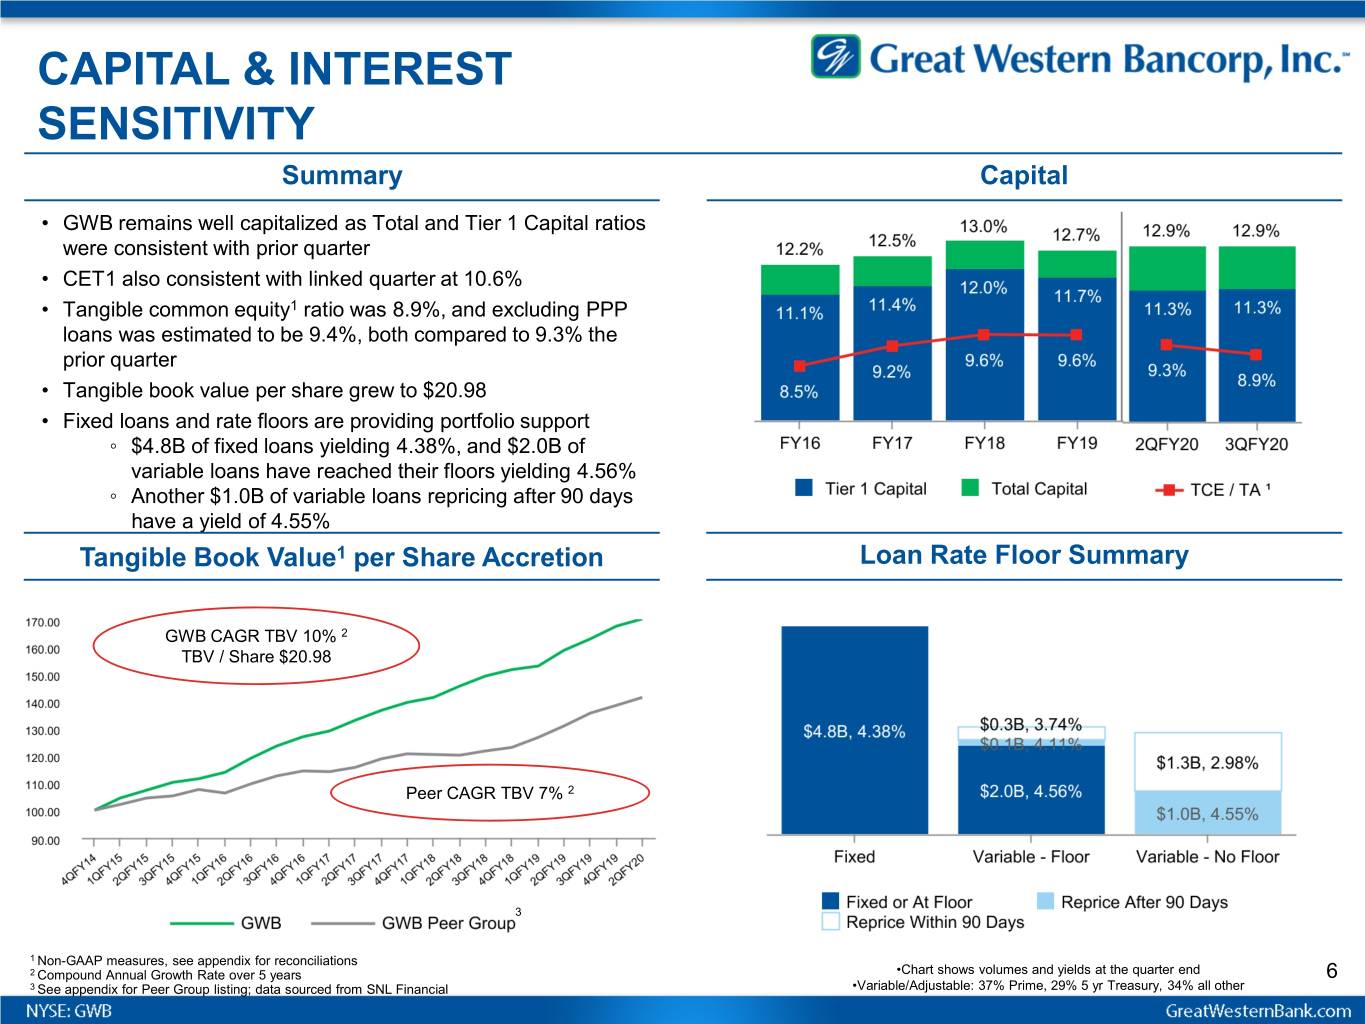
CAPITAL & INTEREST SENSITIVITY Summary Capital • GWB remains well capitalized as Total and Tier 1 Capital ratios were consistent with prior quarter • CET1 also consistent with linked quarter at 10.6% • Tangible common equity1 ratio was 8.9%, and excluding PPP loans was estimated to be 9.4%, both compared to 9.3% the prior quarter • Tangible book value per share grew to $20.98 • Fixed loans and rate floors are providing portfolio support ◦ $4.8B of fixed loans yielding 4.38%, and $2.0B of variable loans have reached their floors yielding 4.56% ◦ Another $1.0B of variable loans repricing after 90 days have a yield of 4.55% Tangible Book Value1 per Share Accretion Loan Rate Floor Summary GWB CAGR TBV 10% 2 TBV / Share $20.98 Peer CAGR TBV 7% 2 3 1 Non-GAAP measures, see appendix for reconciliations 2 Compound Annual Growth Rate over 5 years •Chart shows volumes and yields at the quarter end 6 3 See appendix for Peer Group listing; data sourced from SNL Financial •Variable/Adjustable: 37% Prime, 29% 5 yr Treasury, 34% all other
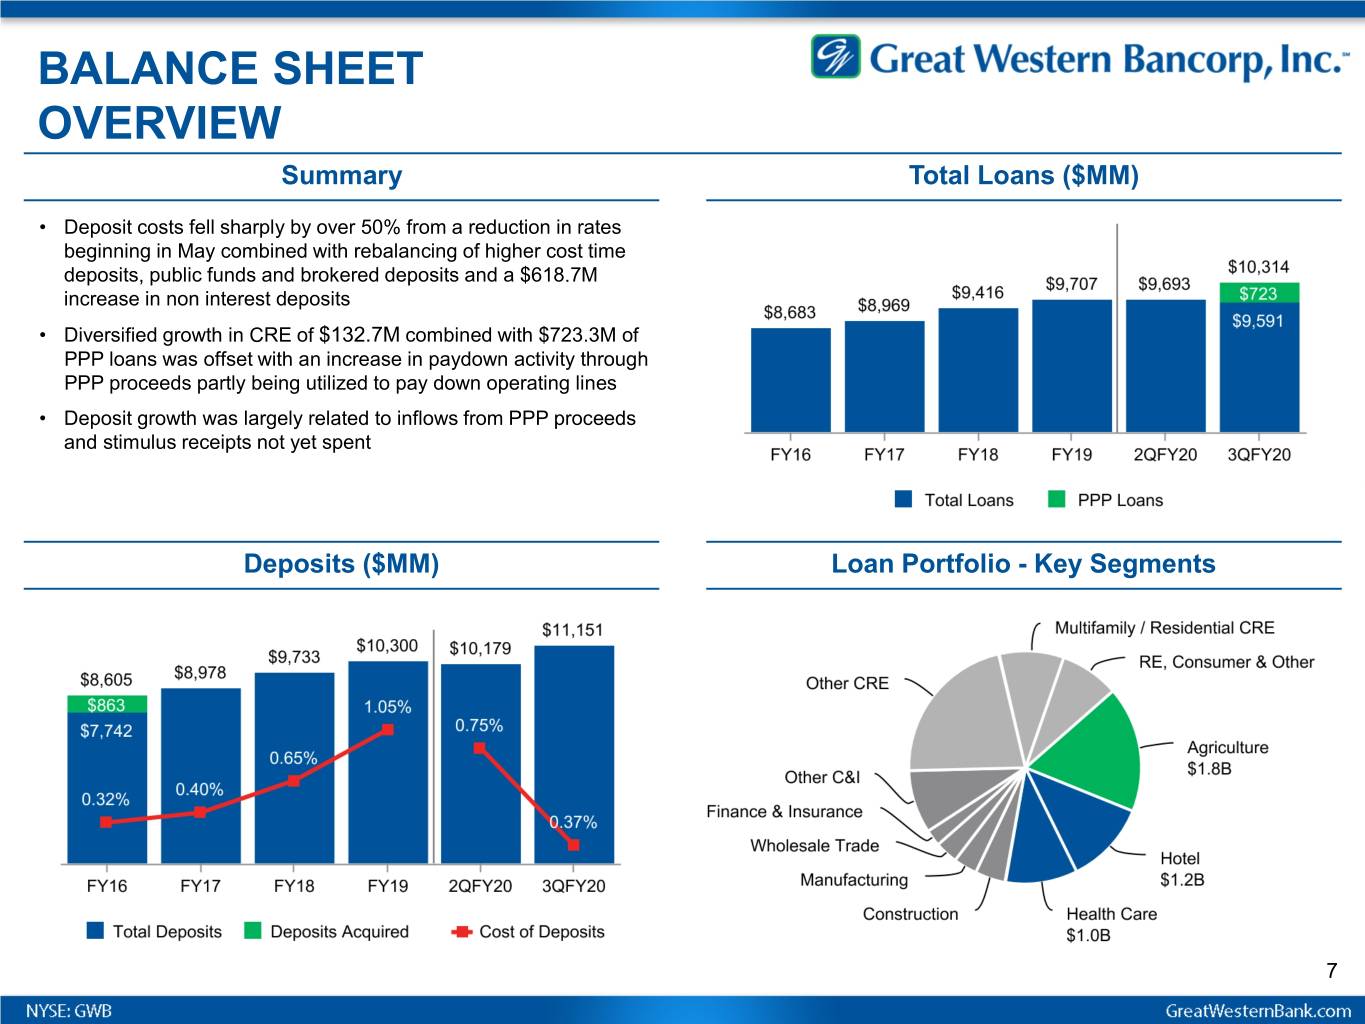
BALANCE SHEET OVERVIEW Summary Total Loans ($MM) • Deposit costs fell sharply by over 50% from a reduction in rates beginning in May combined with rebalancing of higher cost time deposits, public funds and brokered deposits and a $618.7M increase in non interest deposits • Diversified growth in CRE of $132.7M combined with $723.3M of PPP loans was offset with an increase in paydown activity through PPP proceeds partly being utilized to pay down operating lines • Deposit growth was largely related to inflows from PPP proceeds and stimulus receipts not yet spent Deposits ($MM) Loan Portfolio - Key Segments 7
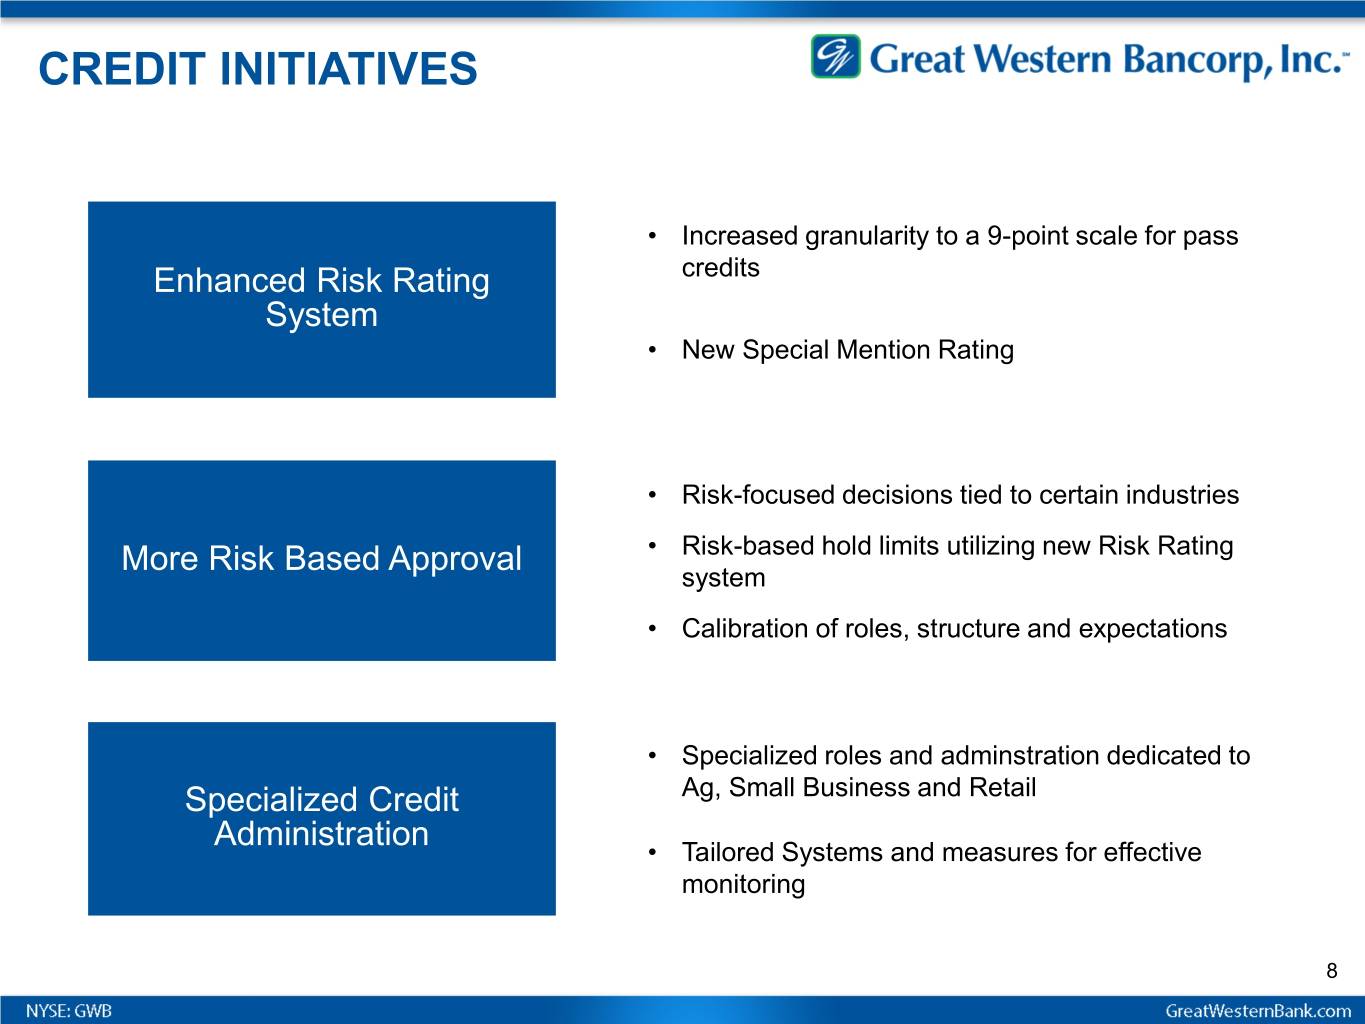
CREDIT INITIATIVES • Increased granularity to a 9-point scale for pass Enhanced Risk Rating credits System • New Special Mention Rating • Risk-focused decisions tied to certain industries More Risk Based Approval • Risk-based hold limits utilizing new Risk Rating system • Calibration of roles, structure and expectations • Specialized roles and adminstration dedicated to Specialized Credit Ag, Small Business and Retail Administration • Tailored Systems and measures for effective monitoring 8
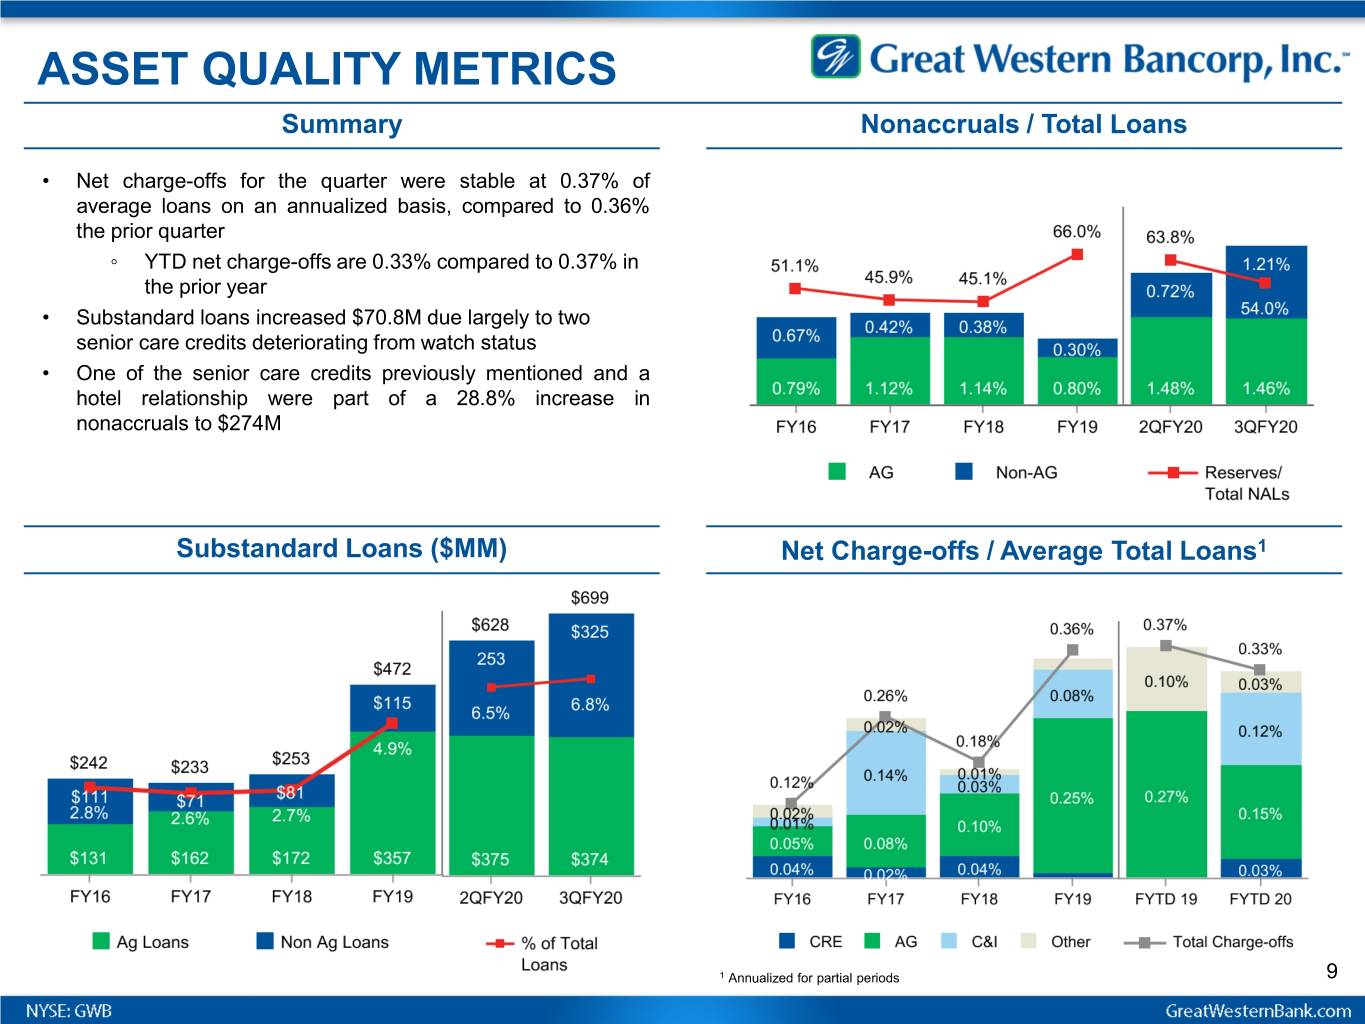
ASSET QUALITY METRICS Summary Nonaccruals / Total Loans • Net charge-offs for the quarter were stable at 0.37% of average loans on an annualized basis, compared to 0.36% the prior quarter ◦ YTD net charge-offs are 0.33% compared to 0.37% in the prior year • Substandard loans increased $70.8M due largely to two senior care credits deteriorating from watch status • One of the senior care credits previously mentioned and a hotel relationship were part of a 28.8% increase in nonaccruals to $274M Substandard Loans ($MM) Net Charge-offs / Average Total Loans1 1 Annualized for partial periods 9
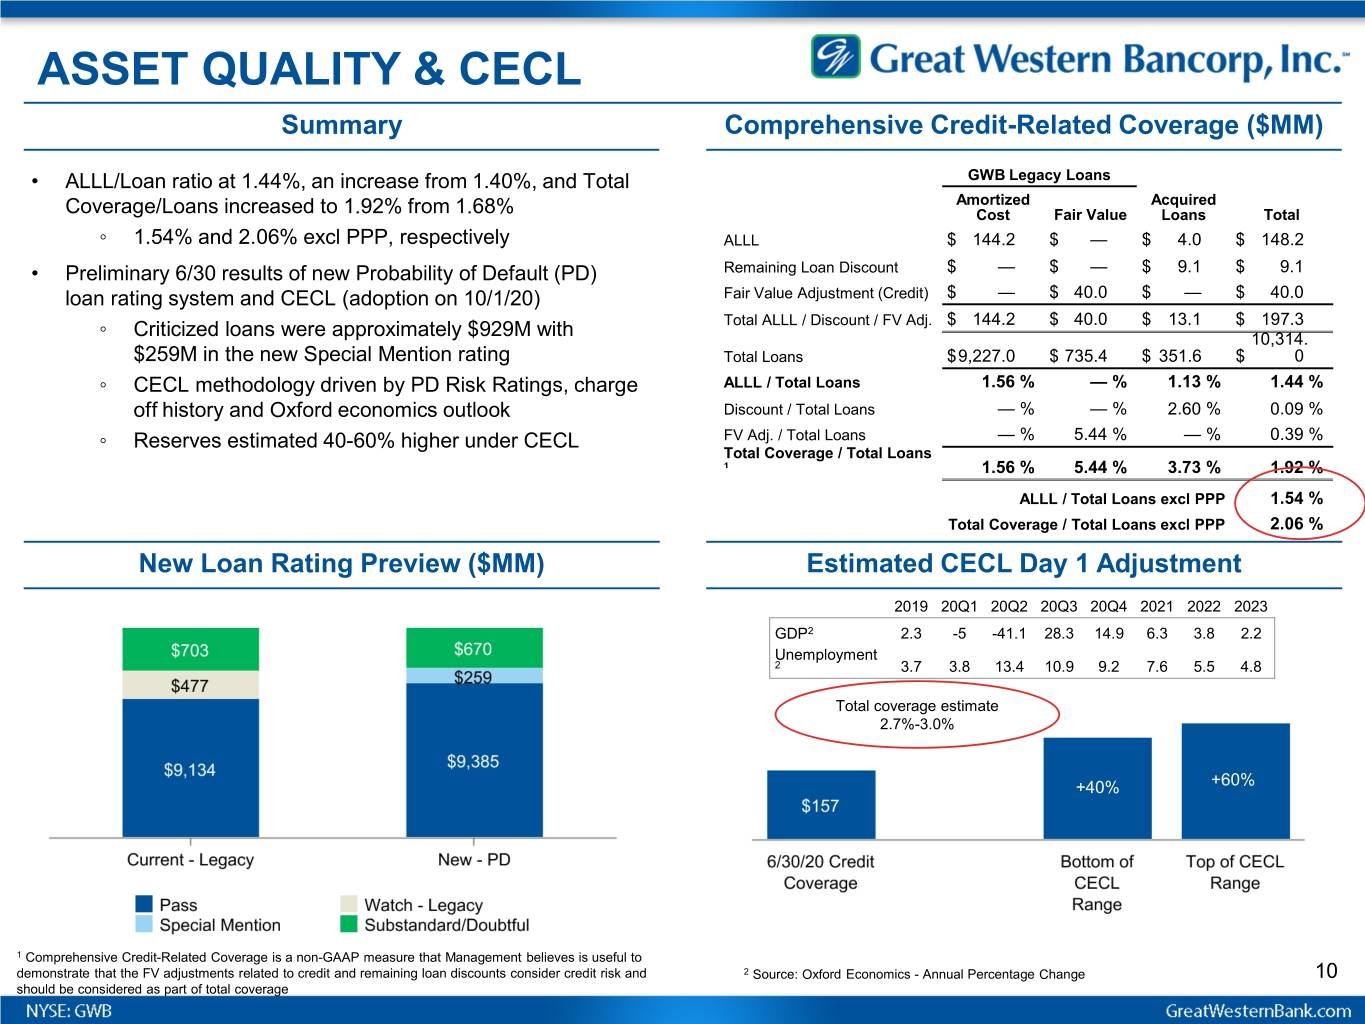
ASSET QUALITY & CECL Summary Comprehensive Credit-Related Coverage ($MM) • ALLL/Loan ratio at 1.44%, an increase from 1.40%, and Total GWB Legacy Loans Amortized Acquired Coverage/Loans increased to 1.92% from 1.68% Cost Fair Value Loans Total ◦ 1.54% and 2.06% excl PPP, respectively ALLL $ 144.2 $ — $ 4.0 $ 148.2 • Preliminary 6/30 results of new Probability of Default (PD) Remaining Loan Discount $ — $ — $ 9.1 $ 9.1 loan rating system and CECL (adoption on 10/1/20) Fair Value Adjustment (Credit) $ — $ 40.0 $ — $ 40.0 Total ALLL / Discount / FV Adj. $ 144.2 $ 40.0 $ 13.1 $ 197.3 ◦ Criticized loans were approximately $929M with 10,314. $259M in the new Special Mention rating Total Loans $9,227.0 $ 735.4 $ 351.6 $ 0 ◦ CECL methodology driven by PD Risk Ratings, charge ALLL / Total Loans 1.56 % — % 1.13 % 1.44 % off history and Oxford economics outlook Discount / Total Loans — % — % 2.60 % 0.09 % ◦ Reserves estimated 40-60% higher under CECL FV Adj. / Total Loans — % 5.44 % — % 0.39 % Total Coverage / Total Loans ¹ 1.56 % 5.44 % 3.73 % 1.92 % ALLL / Total Loans excl PPP 1.54 % Total Coverage / Total Loans excl PPP 2.06 % New Loan Rating Preview ($MM) Estimated CECL Day 1 Adjustment 2019 20Q1 20Q2 20Q3 20Q4 2021 2022 2023 GDP2 2.3 -5 -41.1 28.3 14.9 6.3 3.8 2.2 Unemployment 2 3.7 3.8 13.4 10.9 9.2 7.6 5.5 4.8 Total coverage estimate 2.7%-3.0% +40% +60% 1 Comprehensive Credit-Related Coverage is a non-GAAP measure that Management believes is useful to demonstrate that the FV adjustments related to credit and remaining loan discounts consider credit risk and 2 Source: Oxford Economics - Annual Percentage Change 10 should be considered as part of total coverage
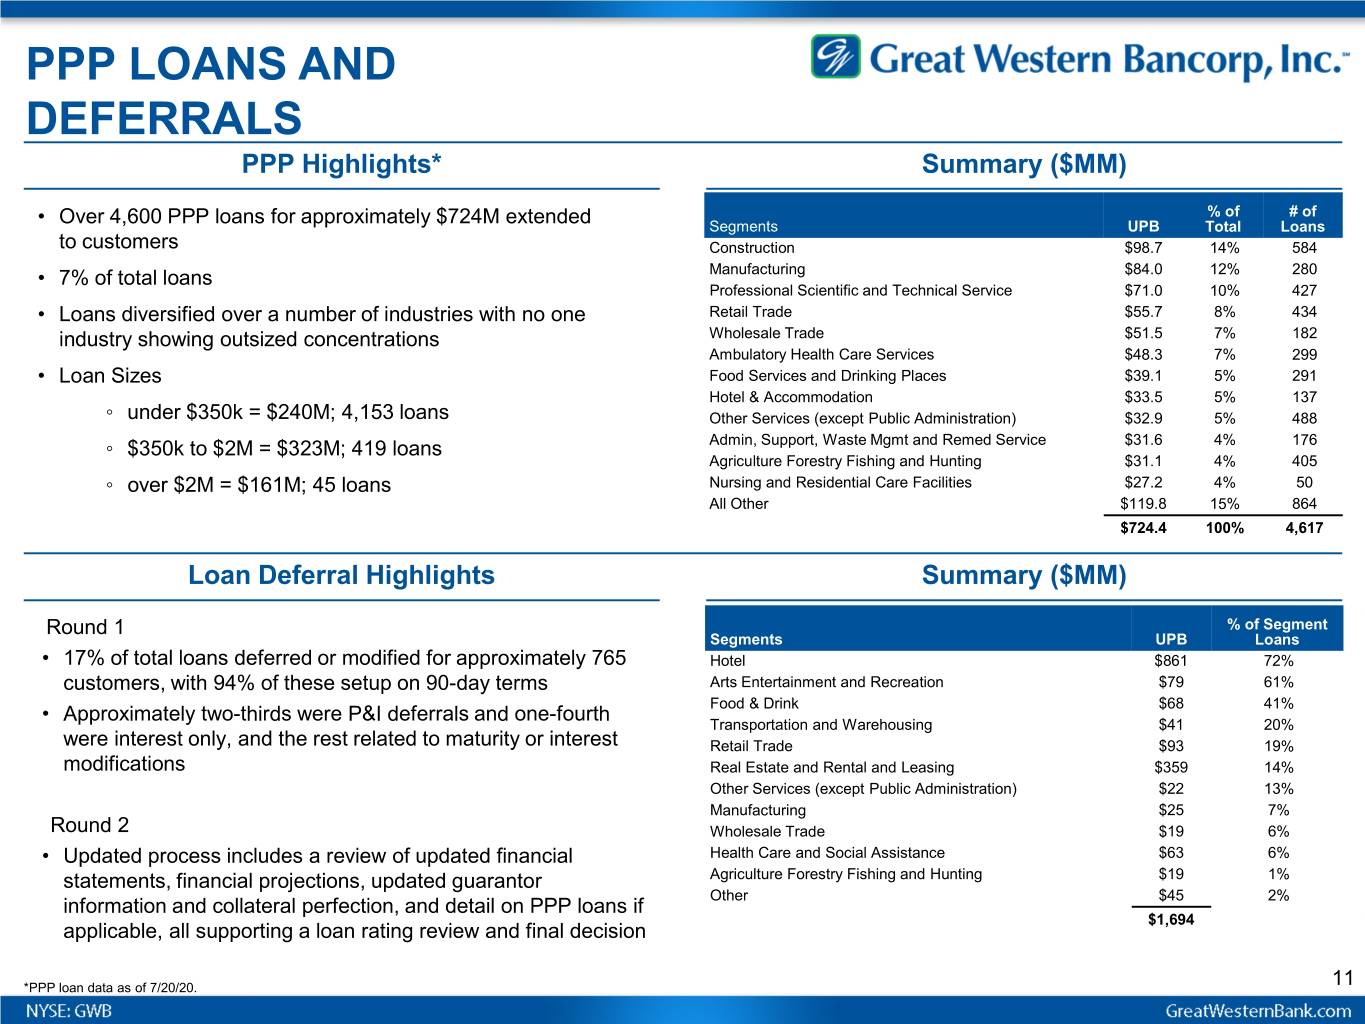
PPP LOANS AND DEFERRALS PPP Highlights* Summary ($MM) % of # of • Over 4,600 PPP loans for approximately $724M extended Segments UPB Total Loans to customers Construction $98.7 14% 584 • 7% of total loans Manufacturing $84.0 12% 280 Professional Scientific and Technical Service $71.0 10% 427 • Loans diversified over a number of industries with no one Retail Trade $55.7 8% 434 industry showing outsized concentrations Wholesale Trade $51.5 7% 182 Ambulatory Health Care Services $48.3 7% 299 • Loan Sizes Food Services and Drinking Places $39.1 5% 291 Hotel & Accommodation $33.5 5% 137 ◦ under $350k = $240M; 4,153 loans Other Services (except Public Administration) $32.9 5% 488 ◦ $350k to $2M = $323M; 419 loans Admin, Support, Waste Mgmt and Remed Service $31.6 4% 176 Agriculture Forestry Fishing and Hunting $31.1 4% 405 ◦ over $2M = $161M; 45 loans Nursing and Residential Care Facilities $27.2 4% 50 All Other $119.8 15% 864 $724.4 100% 4,617 Loan Deferral Highlights Summary ($MM) Round 1 % of Segment Segments UPB Loans • 17% of total loans deferred or modified for approximately 765 Hotel $861 72% customers, with 94% of these setup on 90-day terms Arts Entertainment and Recreation $79 61% Food & Drink $68 41% • Approximately two-thirds were P&I deferrals and one-fourth Transportation and Warehousing $41 20% were interest only, and the rest related to maturity or interest Retail Trade $93 19% modifications Real Estate and Rental and Leasing $359 14% Other Services (except Public Administration) $22 13% Manufacturing $25 7% Round 2 Wholesale Trade $19 6% • Updated process includes a review of updated financial Health Care and Social Assistance $63 6% statements, financial projections, updated guarantor Agriculture Forestry Fishing and Hunting $19 1% Other $45 2% information and collateral perfection, and detail on PPP loans if $1,694 applicable, all supporting a loan rating review and final decision *PPP loan data as of 7/20/20. 11
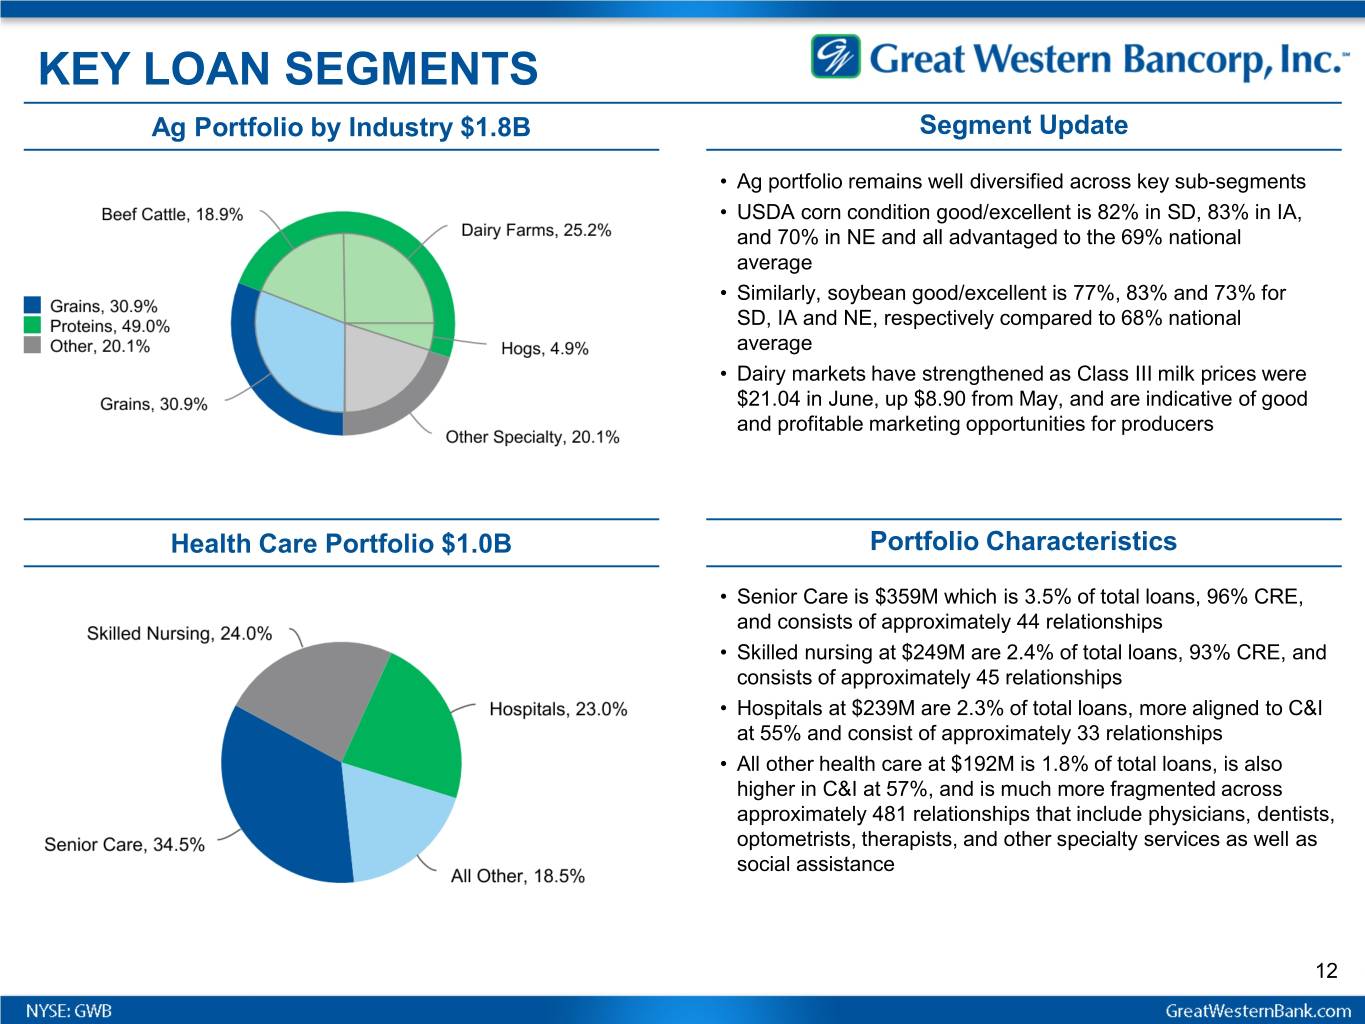
KEY LOAN SEGMENTS Ag Portfolio by Industry $1.8B Segment Update • Ag portfolio remains well diversified across key sub-segments • USDA corn condition good/excellent is 82% in SD, 83% in IA, and 70% in NE and all advantaged to the 69% national average • Similarly, soybean good/excellent is 77%, 83% and 73% for SD, IA and NE, respectively compared to 68% national average • Dairy markets have strengthened as Class III milk prices were $21.04 in June, up $8.90 from May, and are indicative of good and profitable marketing opportunities for producers Health Care Portfolio $1.0B Portfolio Characteristics • Senior Care is $359M which is 3.5% of total loans, 96% CRE, and consists of approximately 44 relationships • Skilled nursing at $249M are 2.4% of total loans, 93% CRE, and consists of approximately 45 relationships • Hospitals at $239M are 2.3% of total loans, more aligned to C&I at 55% and consist of approximately 33 relationships • All other health care at $192M is 1.8% of total loans, is also higher in C&I at 57%, and is much more fragmented across approximately 481 relationships that include physicians, dentists, optometrists, therapists, and other specialty services as well as social assistance 12
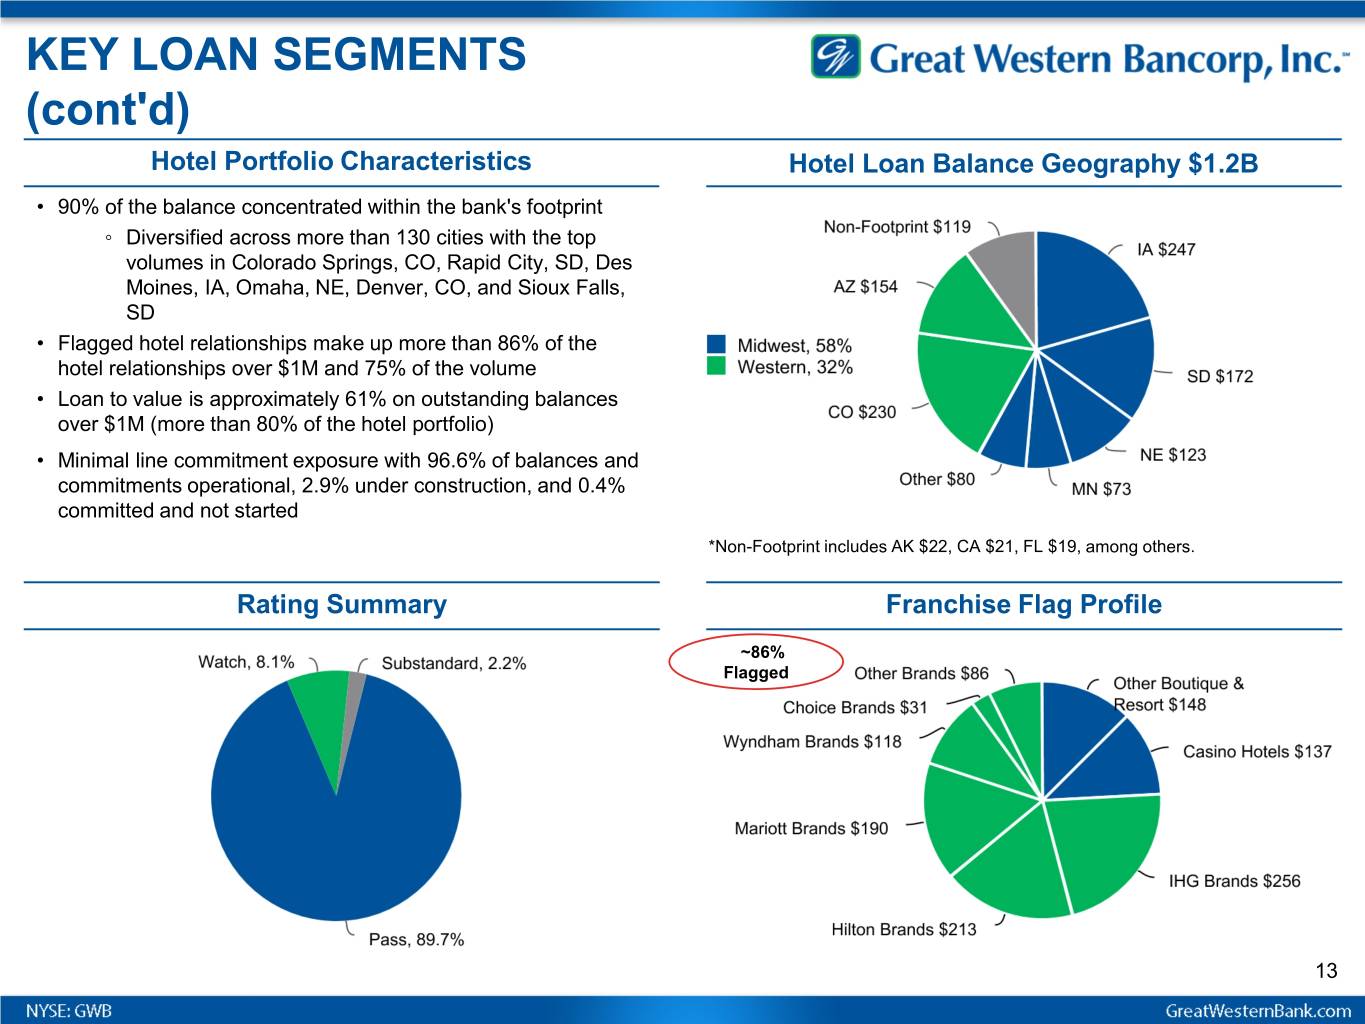
KEY LOAN SEGMENTS (cont'd) Hotel Portfolio Characteristics Hotel Loan Balance Geography $1.2B • 90% of the balance concentrated within the bank's footprint ◦ Diversified across more than 130 cities with the top volumes in Colorado Springs, CO, Rapid City, SD, Des Moines, IA, Omaha, NE, Denver, CO, and Sioux Falls, SD • Flagged hotel relationships make up more than 86% of the hotel relationships over $1M and 75% of the volume • Loan to value is approximately 61% on outstanding balances over $1M (more than 80% of the hotel portfolio) • Minimal line commitment exposure with 96.6% of balances and commitments operational, 2.9% under construction, and 0.4% committed and not started *Non-Footprint includes AK $22, CA $21, FL $19, among others. Rating Summary Franchise Flag Profile ~86% Flagged 13
DISCLOSURES Forward-Looking Statements: This press release contains forward-looking statements within the meaning of the Private Securities Litigation Reform Act of 1995. Statements about Great Western Bancorp, Inc.’s expectations, beliefs, plans, strategies, predictions, forecasts, objectives, assumptions or future events or performance are not historical facts and may be forward-looking. These statements are often, but not always, made through the use of words or phrases such as “anticipates,” “believes,” “can,” “could,” “may,” “predicts,” “potential,” “should,” “will,” “estimate,” “plans,” “projects,” “continuing,” “ongoing,” “expects,” “views,” “intends” and similar words or phrases. In particular, the statements included in this press release concerning Great Western Bancorp, Inc.’s expected performance and strategy, strategies for managing troubled loans, the impact on the business arising from the COVID-19 outbreak and the interest rate environment are not historical facts and are forward-looking. Accordingly, the forward-looking statements in this press release are only predictions and involve estimates, known and unknown risks, assumptions and uncertainties that could cause actual results to differ materially from those expressed. All forward-looking statements are necessarily only estimates of future results, and there can be no assurance that actual results will not differ materially from expectations, and, therefore, you are cautioned not to place undue reliance on such statements. Any forward-looking statements are qualified in their entirety by reference to the factors discussed in the sections titled “Item 1A. Risk Factors” and "Cautionary Note Regarding Forward-Looking Statements" in Great Western Bancorp, Inc.’s Annual Report on Form 10-K for the most recently ended fiscal year, Form 10-Q for the quarters ended June 30, 2020, March 31, 2020 and December 31, 2019 and in other periodic filings with the Securities and Exchange Commission. Further, any forward-looking statement speaks only as of the date on which it is made, and Great Western Bancorp, Inc. undertakes no obligation to update any forward-looking statement to reflect events or circumstances after the date on which the statement is made or to reflect the occurrence of unanticipated events. Non-GAAP Financial Measures: This presentation contains non-GAAP measures which our management relies on in making financial and operational decisions about our business and which exclude certain items that we do not consider reflective of our business performance. We believe that the presentation of these measures provides investors with greater transparency and supplemental data relating to our financial condition and results of operations. These non-GAAP measures should be considered in context with our GAAP results. A reconciliation of these non-GAAP measures appears in our earnings release dated July 29, 2020 and in Appendix 1 to this presentation. Our earnings release and this presentation are available in the Investor Relations section of our website at www.greatwesternbank.com. Our earnings release and this presentation are also available as part of our Current Report on Form 8-K filed with the Securities and Exchange Commission on July 29, 2020. Explanatory Note: In this presentation, all financial information presented refers to the financial results of Great Western Bancorp, Inc. combined with those of its predecessor, Great Western Bancorporation, Inc. Also note loan balance information is presented using unpaid principal balances (UPB) unless otherwise noted. 14
Appendix 1 Non-GAAP Measures
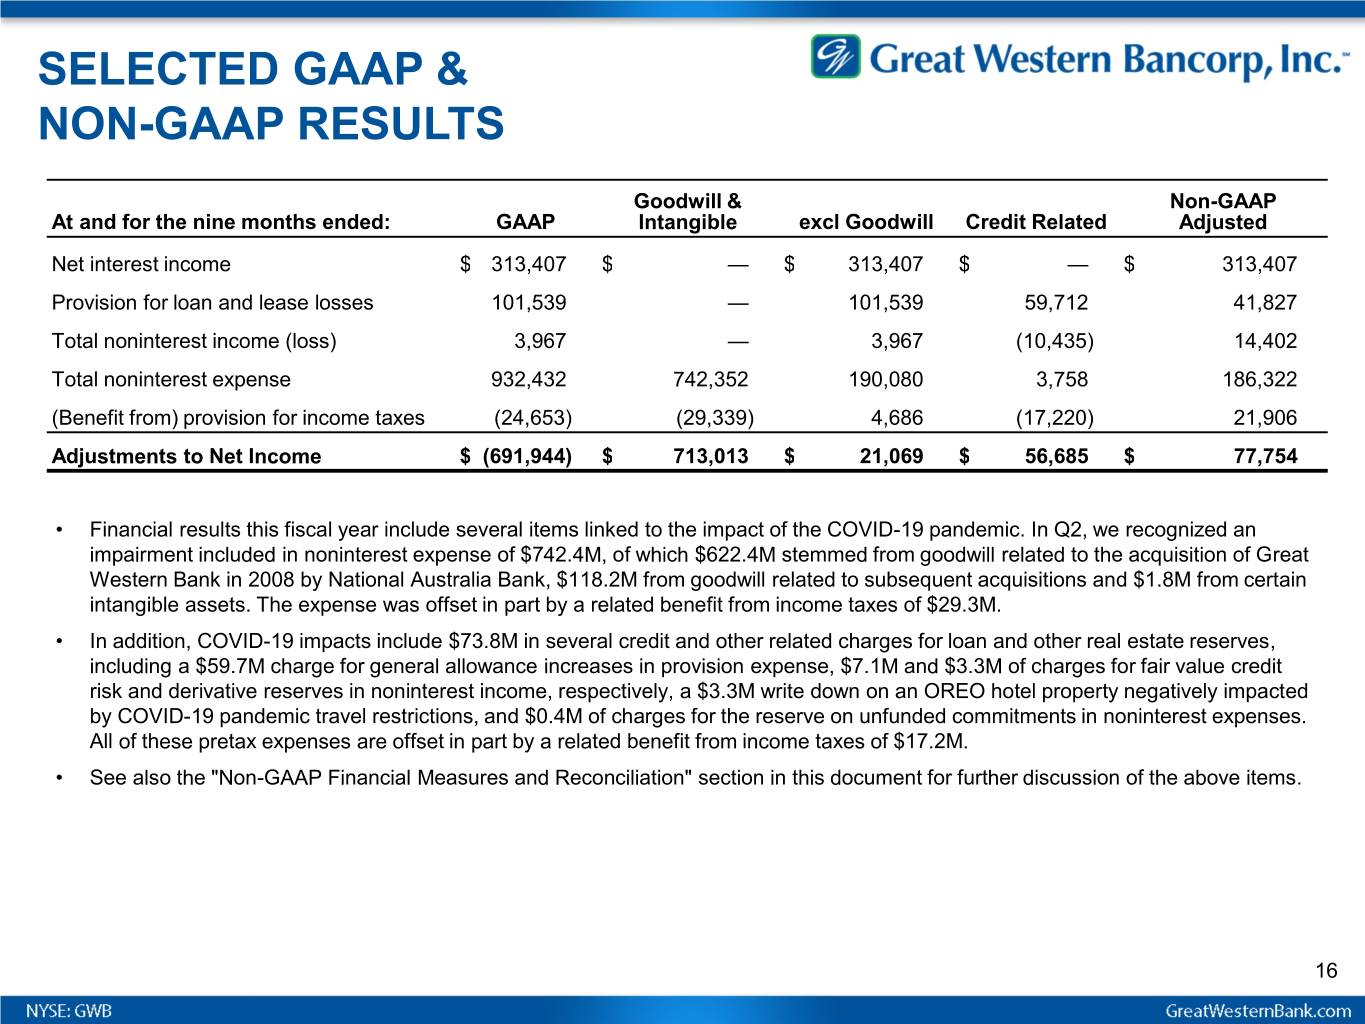
SELECTED GAAP & NON-GAAP RESULTS Goodwill & Non-GAAP At and for the nine months ended: GAAP Intangible excl Goodwill Credit Related Adjusted Net interest income $ 313,407 $ — $ 313,407 $ — $ 313,407 Provision for loan and lease losses 101,539 — 101,539 59,712 41,827 Total noninterest income (loss) 3,967 — 3,967 (10,435) 14,402 Total noninterest expense 932,432 742,352 190,080 3,758 186,322 (Benefit from) provision for income taxes (24,653) (29,339) 4,686 (17,220) 21,906 Adjustments to Net Income $ (691,944) $ 713,013 $ 21,069 $ 56,685 $ 77,754 • Financial results this fiscal year include several items linked to the impact of the COVID-19 pandemic. In Q2, we recognized an impairment included in noninterest expense of $742.4M, of which $622.4M stemmed from goodwill related to the acquisition of Great Western Bank in 2008 by National Australia Bank, $118.2M from goodwill related to subsequent acquisitions and $1.8M from certain intangible assets. The expense was offset in part by a related benefit from income taxes of $29.3M. • In addition, COVID-19 impacts include $73.8M in several credit and other related charges for loan and other real estate reserves, including a $59.7M charge for general allowance increases in provision expense, $7.1M and $3.3M of charges for fair value credit risk and derivative reserves in noninterest income, respectively, a $3.3M write down on an OREO hotel property negatively impacted by COVID-19 pandemic travel restrictions, and $0.4M of charges for the reserve on unfunded commitments in noninterest expenses. All of these pretax expenses are offset in part by a related benefit from income taxes of $17.2M. • See also the "Non-GAAP Financial Measures and Reconciliation" section in this document for further discussion of the above items. 16
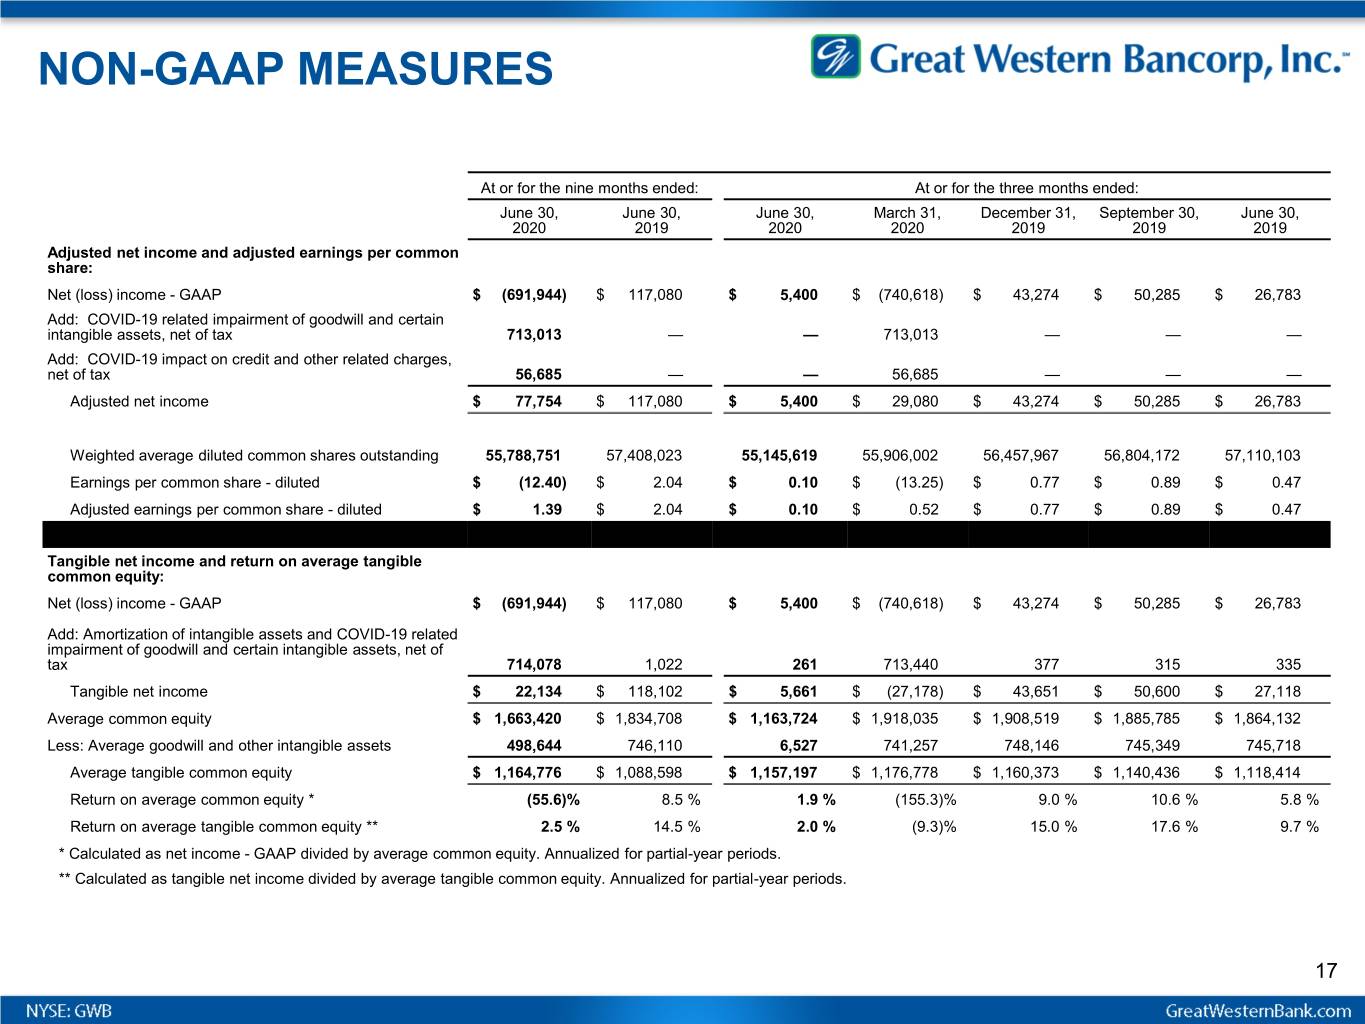
NON-GAAP MEASURES At or for the nine months ended: At or for the three months ended: June 30, June 30, June 30, March 31, December 31, September 30, June 30, 2020 2019 2020 2020 2019 2019 2019 Adjusted net income and adjusted earnings per common share: Net (loss) income - GAAP $ (691,944) $ 117,080 $ 5,400 $ (740,618) $ 43,274 $ 50,285 $ 26,783 Add: COVID-19 related impairment of goodwill and certain intangible assets, net of tax 713,013 — — 713,013 — — — Add: COVID-19 impact on credit and other related charges, net of tax 56,685 — — 56,685 — — — Adjusted net income $ 77,754 $ 117,080 $ 5,400 $ 29,080 $ 43,274 $ 50,285 $ 26,783 Weighted average diluted common shares outstanding 55,788,751 57,408,023 55,145,619 55,906,002 56,457,967 56,804,172 57,110,103 Earnings per common share - diluted $ (12.40) $ 2.04 $ 0.10 $ (13.25) $ 0.77 $ 0.89 $ 0.47 Adjusted earnings per common share - diluted $ 1.39 $ 2.04 $ 0.10 $ 0.52 $ 0.77 $ 0.89 $ 0.47 Tangible net income and return on average tangible common equity: x x x x x Net (loss) income - GAAP $ (691,944) $ 117,080 $ 5,400 $ (740,618) $ 43,274 $ 50,285 $ 26,783 Add: Amortization of intangible assets and COVID-19 related impairment of goodwill and certain intangible assets, net of tax 714,078 1,022 261 713,440 377 315 335 Tangible net income $ 22,134 $ 118,102 $ 5,661 $ (27,178) $ 43,651 $ 50,600 $ 27,118 Average common equity $ 1,663,420 $ 1,834,708 $ 1,163,724 $ 1,918,035 $ 1,908,519 $ 1,885,785 $ 1,864,132 Less: Average goodwill and other intangible assets 498,644 746,110 6,527 741,257 748,146 745,349 745,718 Average tangible common equity $ 1,164,776 $ 1,088,598 $ 1,157,197 $ 1,176,778 $ 1,160,373 $ 1,140,436 $ 1,118,414 Return on average common equity * (55.6)% 8.5 % 1.9 % (155.3)% 9.0 % 10.6 % 5.8 % Return on average tangible common equity ** 2.5 % 14.5 % 2.0 % (9.3)% 15.0 % 17.6 % 9.7 % * Calculated as net income - GAAP divided by average common equity. Annualized for partial-year periods. ** Calculated as tangible net income divided by average tangible common equity. Annualized for partial-year periods. 17
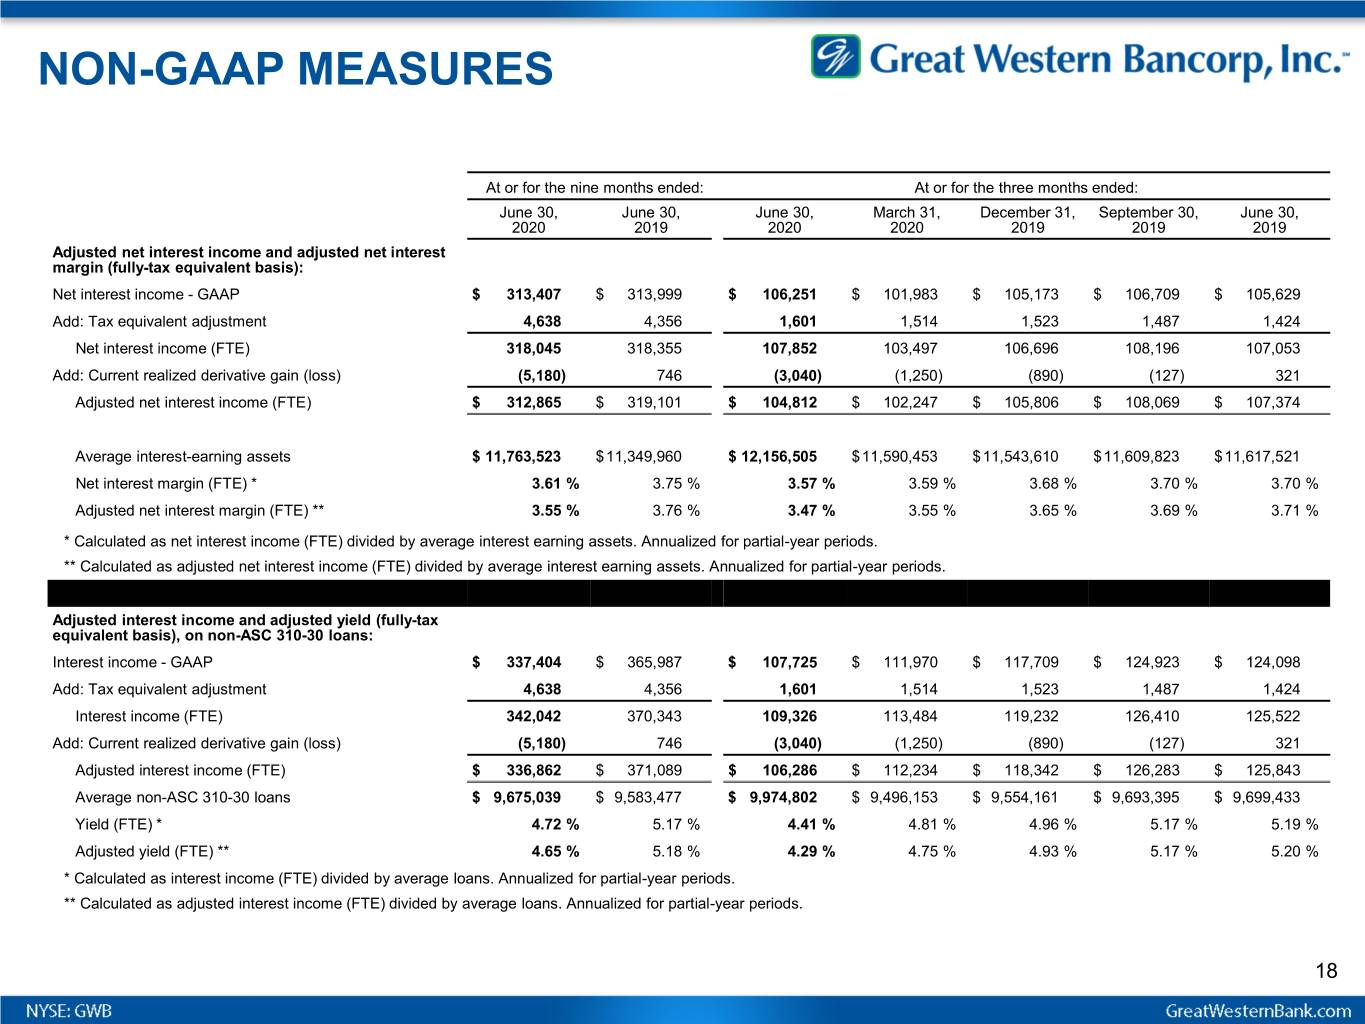
NON-GAAP MEASURES At or for the nine months ended: At or for the three months ended: June 30, June 30, June 30, March 31, December 31, September 30, June 30, 2020 2019 2020 2020 2019 2019 2019 Adjusted net interest income and adjusted net interest margin (fully-tax equivalent basis): Net interest income - GAAP $ 313,407 $ 313,999 $ 106,251 $ 101,983 $ 105,173 $ 106,709 $ 105,629 Add: Tax equivalent adjustment 4,638 4,356 1,601 1,514 1,523 1,487 1,424 Net interest income (FTE) 318,045 318,355 107,852 103,497 106,696 108,196 107,053 Add: Current realized derivative gain (loss) (5,180) 746 (3,040) (1,250) (890) (127) 321 Adjusted net interest income (FTE) $ 312,865 $ 319,101 $ 104,812 $ 102,247 $ 105,806 $ 108,069 $ 107,374 Average interest-earning assets $ 11,763,523 $11,349,960 $ 12,156,505 $11,590,453 $11,543,610 $11,609,823 $11,617,521 Net interest margin (FTE) * 3.61 % 3.75 % 3.57 % 3.59 % 3.68 % 3.70 % 3.70 % Adjusted net interest margin (FTE) ** 3.55 % 3.76 % 3.47 % 3.55 % 3.65 % 3.69 % 3.71 % * Calculated as net interest income (FTE) divided by average interest earning assets. Annualized for partial-year periods. ** Calculated as adjusted net interest income (FTE) divided by average interest earning assets. Annualized for partial-year periods. Adjusted interest income and adjusted yield (fully-tax equivalent basis), on non-ASC 310-30 loans: x x x x x Interest income - GAAP $ 337,404 $ 365,987 $ 107,725 $ 111,970 $ 117,709 $ 124,923 $ 124,098 Add: Tax equivalent adjustment 4,638 4,356 1,601 1,514 1,523 1,487 1,424 Interest income (FTE) 342,042 370,343 109,326 113,484 119,232 126,410 125,522 Add: Current realized derivative gain (loss) (5,180) 746 (3,040) (1,250) (890) (127) 321 Adjusted interest income (FTE) $ 336,862 $ 371,089 $ 106,286 $ 112,234 $ 118,342 $ 126,283 $ 125,843 Average non-ASC 310-30 loans $ 9,675,039 $ 9,583,477 $ 9,974,802 $ 9,496,153 $ 9,554,161 $ 9,693,395 $ 9,699,433 Yield (FTE) * 4.72 % 5.17 % 4.41 % 4.81 % 4.96 % 5.17 % 5.19 % Adjusted yield (FTE) ** 4.65 % 5.18 % 4.29 % 4.75 % 4.93 % 5.17 % 5.20 % * Calculated as interest income (FTE) divided by average loans. Annualized for partial-year periods. ** Calculated as adjusted interest income (FTE) divided by average loans. Annualized for partial-year periods. 18
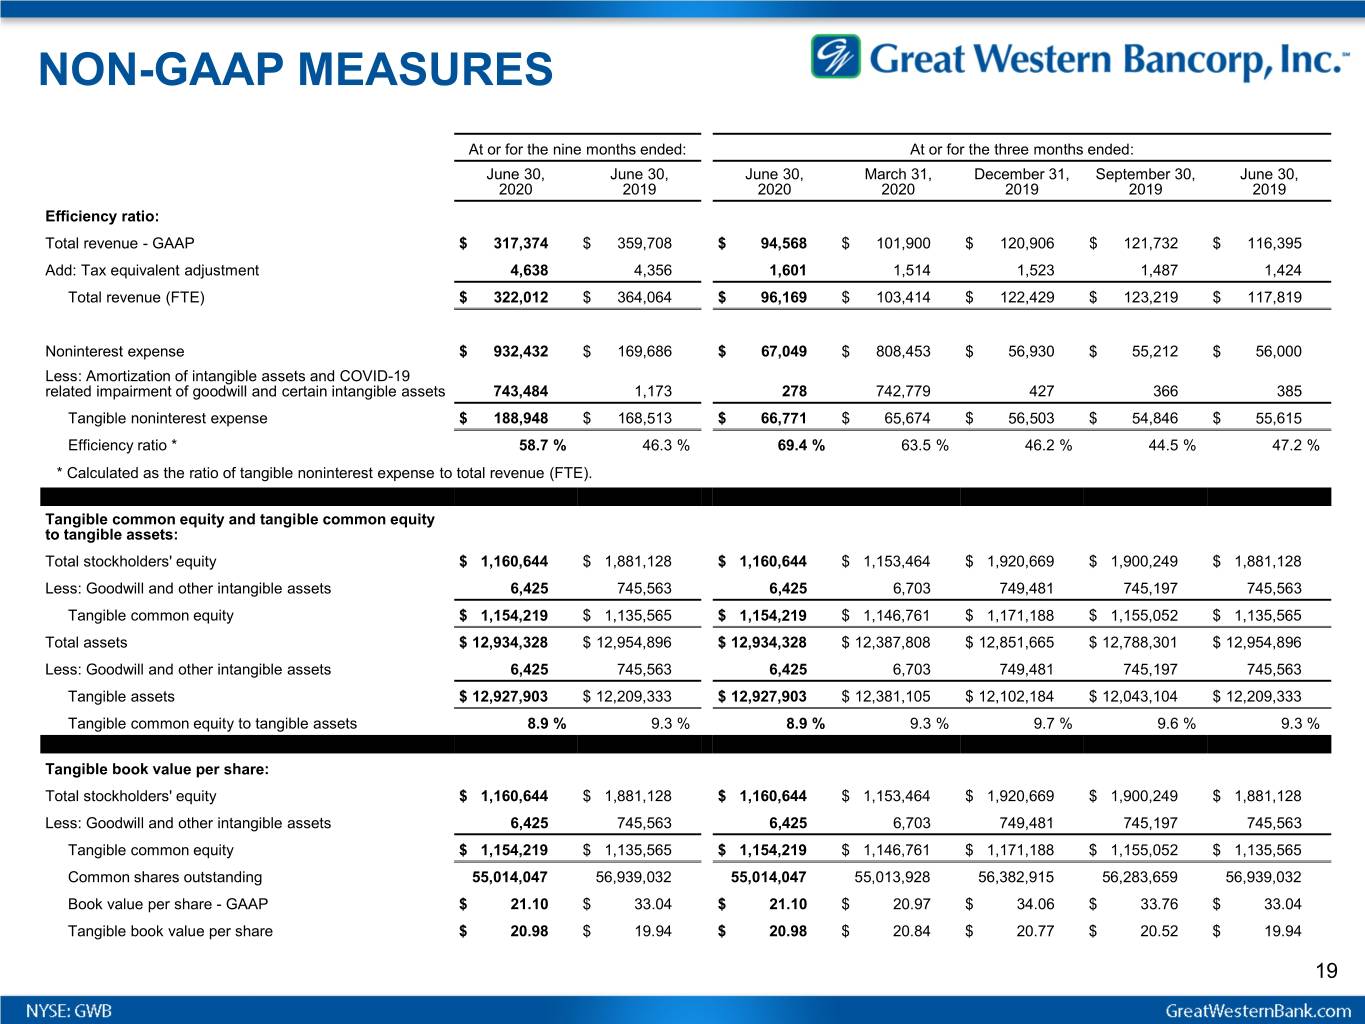
NON-GAAP MEASURES At or for the nine months ended: At or for the three months ended: June 30, June 30, June 30, March 31, December 31, September 30, June 30, 2020 2019 2020 2020 2019 2019 2019 Efficiency ratio: Total revenue - GAAP $ 317,374 $ 359,708 $ 94,568 $ 101,900 $ 120,906 $ 121,732 $ 116,395 Add: Tax equivalent adjustment 4,638 4,356 1,601 1,514 1,523 1,487 1,424 Total revenue (FTE) $ 322,012 $ 364,064 $ 96,169 $ 103,414 $ 122,429 $ 123,219 $ 117,819 Noninterest expense $ 932,432 $ 169,686 $ 67,049 $ 808,453 $ 56,930 $ 55,212 $ 56,000 Less: Amortization of intangible assets and COVID-19 related impairment of goodwill and certain intangible assets 743,484 1,173 278 742,779 427 366 385 Tangible noninterest expense $ 188,948 $ 168,513 $ 66,771 $ 65,674 $ 56,503 $ 54,846 $ 55,615 Efficiency ratio * 58.7 % 46.3 % 69.4 % 63.5 % 46.2 % 44.5 % 47.2 % * Calculated as the ratio of tangible noninterest expense to total revenue (FTE). Tangible common equity and tangible common equity to tangible assets: x x x x x Total stockholders' equity $ 1,160,644 $ 1,881,128 $ 1,160,644 $ 1,153,464 $ 1,920,669 $ 1,900,249 $ 1,881,128 Less: Goodwill and other intangible assets 6,425 745,563 6,425 6,703 749,481 745,197 745,563 Tangible common equity $ 1,154,219 $ 1,135,565 $ 1,154,219 $ 1,146,761 $ 1,171,188 $ 1,155,052 $ 1,135,565 Total assets $ 12,934,328 $ 12,954,896 $ 12,934,328 $ 12,387,808 $ 12,851,665 $ 12,788,301 $ 12,954,896 Less: Goodwill and other intangible assets 6,425 745,563 6,425 6,703 749,481 745,197 745,563 Tangible assets $ 12,927,903 $ 12,209,333 $ 12,927,903 $ 12,381,105 $ 12,102,184 $ 12,043,104 $ 12,209,333 Tangible common equity to tangible assets 8.9 % 9.3 % 8.9 % 9.3 % 9.7 % 9.6 % 9.3 % x x x x x x Tangible book value per share: x x x x x Total stockholders' equity $ 1,160,644 $ 1,881,128 $ 1,160,644 $ 1,153,464 $ 1,920,669 $ 1,900,249 $ 1,881,128 Less: Goodwill and other intangible assets 6,425 745,563 6,425 6,703 749,481 745,197 745,563 Tangible common equity $ 1,154,219 $ 1,135,565 $ 1,154,219 $ 1,146,761 $ 1,171,188 $ 1,155,052 $ 1,135,565 Common shares outstanding 55,014,047 56,939,032 55,014,047 55,013,928 56,382,915 56,283,659 56,939,032 Book value per share - GAAP $ 21.10 $ 33.04 $ 21.10 $ 20.97 $ 34.06 $ 33.76 $ 33.04 Tangible book value per share $ 20.98 $ 19.94 $ 20.98 $ 20.84 $ 20.77 $ 20.52 $ 19.94 19
Appendix 2 Accounting for Loans at FV and Related Derivatives
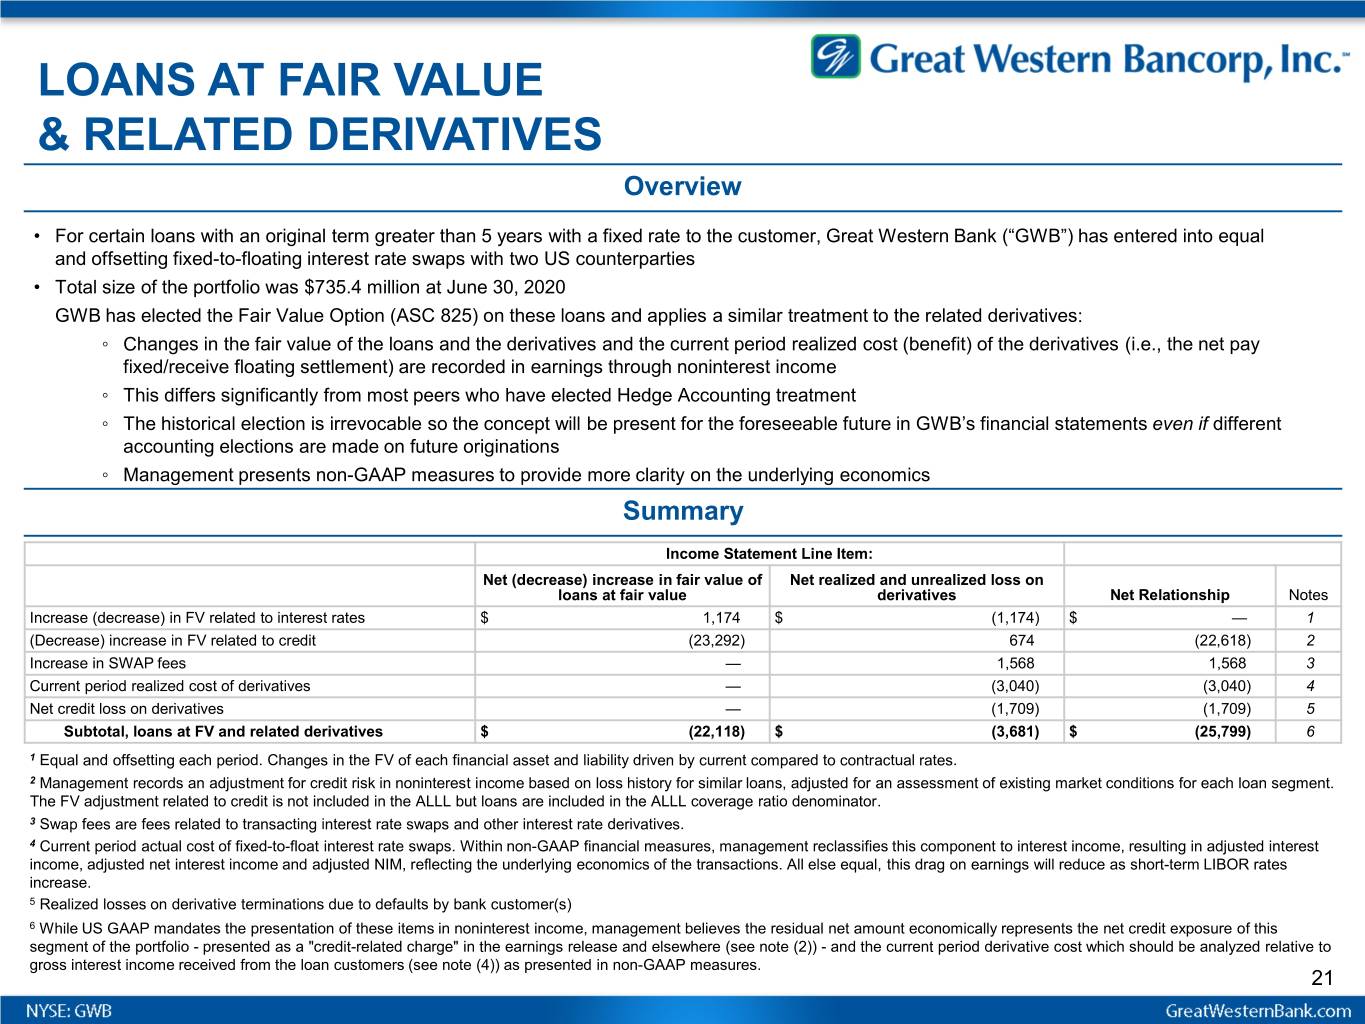
LOANS AT FAIR VALUE & RELATED DERIVATIVES Overview • For certain loans with an original term greater than 5 years with a fixed rate to the customer, Great Western Bank (“GWB”) has entered into equal and offsetting fixed-to-floating interest rate swaps with two US counterparties • Total size of the portfolio was $735.4 million at June 30, 2020 GWB has elected the Fair Value Option (ASC 825) on these loans and applies a similar treatment to the related derivatives: ◦ Changes in the fair value of the loans and the derivatives and the current period realized cost (benefit) of the derivatives (i.e., the net pay fixed/receive floating settlement) are recorded in earnings through noninterest income ◦ This differs significantly from most peers who have elected Hedge Accounting treatment ◦ The historical election is irrevocable so the concept will be present for the foreseeable future in GWB’s financial statements even if different accounting elections are made on future originations ◦ Management presents non-GAAP measures to provide more clarity on the underlying economics Summary x Income Statement Line Item: x x Net (decrease) increase in fair value of Net realized and unrealized loss on x loans at fair value derivatives Net Relationship Notes Increase (decrease) in FV related to interest rates $ 1,174 $ (1,174) $ — 1 (Decrease) increase in FV related to credit (23,292) 674 (22,618) 2 Increase in SWAP fees — 1,568 1,568 3 Current period realized cost of derivatives — (3,040) (3,040) 4 Net credit loss on derivatives — (1,709) (1,709) 5 Subtotal, loans at FV and related derivatives $ (22,118) $ (3,681) $ (25,799) 6 1 Equal and offsetting each period. Changes in the FV of each financial asset and liability driven by current compared to contractual rates. 2 Management records an adjustment for credit risk in noninterest income based on loss history for similar loans, adjusted for an assessment of existing market conditions for each loan segment. The FV adjustment related to credit is not included in the ALLL but loans are included in the ALLL coverage ratio denominator. 3 Swap fees are fees related to transacting interest rate swaps and other interest rate derivatives. 4 Current period actual cost of fixed-to-float interest rate swaps. Within non-GAAP financial measures, management reclassifies this component to interest income, resulting in adjusted interest income, adjusted net interest income and adjusted NIM, reflecting the underlying economics of the transactions. All else equal, this drag on earnings will reduce as short-term LIBOR rates increase. 5 Realized losses on derivative terminations due to defaults by bank customer(s) 6 While US GAAP mandates the presentation of these items in noninterest income, management believes the residual net amount economically represents the net credit exposure of this segment of the portfolio - presented as a "credit-related charge" in the earnings release and elsewhere (see note (2)) - and the current period derivative cost which should be analyzed relative to gross interest income received from the loan customers (see note (4)) as presented in non-GAAP measures. 21


