UNITED STATES
SECURITIES AND EXCHANGE COMMISSION
Washington, D.C. 20549
FORM N-CSR
CERTIFIED SHAREHOLDER REPORT OF
REGISTERED MANAGEMENT INVESTMENT COMPANIES
Investment Company Act file number: 811-22985
SMEAD FUNDS TRUST
(Exact name of registrant as specified in charter)
600 University Street, Suite 2412
Seattle, WA 98101
(Address of principal executive offices) (Zip code)
Cole W. Smead
Smead Capital Management, Inc.
600 University Street, Suite 2412
Seattle, WA 98101
Copy to:
Pamela M. Krill, Esq
Godfrey & Kahn, S.C.
780 North Water Street
Milwaukee, WI 53202
(Name and address of agent for service)
Registrant’s telephone number, including area code: (877) 807-4122
Date of fiscal year end: November 30
Date of reporting period: November 30, 2015
Item 1. Report to Shareholders.
Annual Report

November 30, 2015
Investment Adviser
Smead Capital Management, Inc.
600 University Street,
Suite 2412
Seattle, Washington 98101
Phone: 877-807-4122
www.smeadfunds.com
Table of Contents
Dear Shareholders:
From a portfolio return perspective, the Smead Value Fund’s (the “Fund”) Investor Share Class (SMVLX) returned 6.25% during the 2015 fiscal year that ended on November 30, 2015. In comparison, the S&P 500 Index produced a return of 2.74% and the Russell 1000 Value Index returned -1.11% over the same period. The turnover rate in the portfolio for the fiscal year was 20.26%, somewhat higher than the last couple years of activity, but still inside of what we believe is typical for our style of investing.
The Fund’s best performing stocks were NVR Inc. (NVR), eBay Inc. (EBAY) and Home Depot Inc. (HD). The worst performing stocks in the Fund were Navient Corp. (NAVI), Nordstrom Inc. (JWN) and Franklin Resources Inc. (BEN). The sectors that provided the best attribution in the Fund were Consumer Discretionary, and our lack of ownership in Energy and Industrials. The sectors that hurt the return of the portfolio were Information Technology, Financials and Consumer Staples.
The Fund’s assets during the 2015 fiscal year grew from $938 million to $1.319 billion. We are very thankful for the trust that investors, both longer-term and newly initiated, have placed with the Fund. During the year, new distribution partners were added. We will continue to seek out distribution partners in the future, but will continue to engage partners we feel are aligned with the best interests of shareholders.
In the portfolio, we continue to believe there are greater opportunities available in US Large Cap equities than the current consensus among investors and stockpickers. The future is always unknown, which is no different than every year we have been investors. We believe many investors have a distinct picture of a weak US economy and a poor equity return environment going forward. As contrarians, we are beholden to not be part of this chorus.
We believe that the strength of the US economy over the next 3-5 years will benefit the companies in our portfolio and may frustrate the broad indices. A strong economy that is underpinned by increasing consumer confidence may broaden the opportunity set for companies like Bank of America (BAC), NVR (NVR) and American Express (AXP) in adding customers to their rolls and bringing new revenue streams in their already loyal customer bases. Housing and auto purchases will be a key economic driver by increasing demand for capital, and tightening labor markets, creating tailwinds for rising tides in personal incomes. We believe that many brilliant economists are looking in rear-view mirrors as they use the poor wage growth story of the last 10-year picture to describe why we will have terrible things for years to come.
The Federal Reserve’s Household Debt Service Ratio, which tracks the amount of gross income that services debt, continues to bump along the lowest levels since 1981 when they began recording the data. We trust this far more than we trust the brilliant economists and their dour predictions. This gives us confidence in our consumer-oriented businesses like Nordstrom (JWN), Gannett (GCI) and TEGNA (TGNA) to grow their companies going forward.
As we mentioned earlier, we are very thankful for the trust provided by our fellow shareholders in the past and going forward. Our shareholders, like us, are contrarians and we welcome the opportunity for like-minded investors to join us on this journey.
Warmest Regards,
| | | | |
 | |  | |  |
William Smead Lead Portfolio Manager | | Tony Scherrer, CFA Co-Portfolio Manager | | Cole Smead, CFA Co-Portfolio Manager |
3
Past performance is not a guarantee of future results.
The information provided herein represents the opinion of Smead Capital Management, Inc. and is not intended to be a forecast of future events, a guarantee of future results, nor investment advice.
Mutual fund investing involves risk. Principal loss is possible.
Fund holdings are subject to change at any time and should not be considered recommendations to buy or sell any security. Please refer to the Schedule of Investments in this report for a complete list of fund holdings as of the date of this report.
The S&P 500® Index is a broad based unmanaged index of 500 stocks, which is widely recognized as representative of the equity market in general. The Russell 1000® Value Index measures the performance of those Russell 1000® companies with lower price-to- book ratios and lower forecasted growth values. You cannot invest directly in an index. Frank Russell Company is the source and owner of the trademarks, service marks and copyrights related to the Russell Indexes. Russell® is a trademark of Russell Investment Group.
4
SMEAD VALUE FUND
Expense Example
(Unaudited)
As a shareholder of the Fund, you incur two types of costs: (1) transaction costs, including sales charges (loads) on purchase payments and (2) ongoing costs, including management fees, distribution (12b-1) fees, shareholder servicing fees and other fund expenses. This Example is intended to help you understand your ongoing costs (in dollars) of investing in the Fund, and to compare these costs with the ongoing costs of investing in other mutual funds. The Example is based on an investment of $1,000 invested at the beginning of the period and held for the entire period as indicated below.
Actual Expenses
The first line of the following table provides information about actual account values and actual expenses. If you purchase Class A shares of the Fund you will pay a maximum initial sales charge of 5.75% when you invest. Class A shares are also subject to a contingent deferred sales charge of 1.00% for purchases of $1,000,000 or more that are redeemed within eighteen months of purchase. In addition, you will be assessed fees for outgoing wire transfers, returned checks and stop payment orders at prevailing rates charged by Boston Financial Data Services, Inc., the Fund’s transfer agent. To the extent the Fund invests in shares of exchange traded funds (“ETFs”) or other investment companies as part of its investment strategy, you will indirectly bear your proportionate share of any fees and expenses charged by the underlying funds in which the Fund invests in addition to the expenses of the Fund. Actual expenses of the underlying funds are expected to vary among the various underlying funds. These expenses are not included in the example. The example includes, but is not limited to, advisory fees, fund administration and accounting, custody and transfer agent fees. You may use the information in this line, together with the amount you invested, to estimate the expenses that you paid over the period. Simply divide your account value by $1,000 (for example, an $8,600 account value divided by $1,000 = 8.6), then multiply the result by the number in the first line under the heading entitled “Expenses Paid During Period” to estimate the expenses you paid on your account during this period.
Hypothetical Example for Comparison Purposes
The second line of the table provides information about hypothetical account values and hypothetical expenses based on the Fund’s actual expense ratio and an assumed rate of return of 5% per year before expenses, which is not the Fund’s actual return. The hypothetical account values and expenses may not be used to estimate the actual ending account balance or expenses you paid for the period. You may use this information to compare the ongoing costs of investing in the Fund and other funds. To do so, compare this 5% hypothetical example with the 5% hypothetical examples that appear in the shareholder reports of other funds. Please note that the expenses shown in the table are meant to highlight your ongoing costs only and do not reflect any transactional costs, such as sales charges (loads), redemption fees or exchange fees. Therefore, the second line of the table is useful in comparing ongoing costs only, and will not help you determine the relative total costs of owning different funds. In addition, if these transactional costs were included, your costs would have been higher.
5
SMEAD VALUE FUND
Expense Example (Continued)
(Unaudited)
| | | | | | | | | | | | | | | | | | | | | | | | | | | | | | |
| | | Beginning
Account
Value
6/1/15 | | Actual
Ending
Account
Value
11/30/15 | | Hypothetical
Ending
Account
Value | | Actual
Expenses
Paid
During
Period(1) | | Hypothetical
Expenses
Paid During
Period(1) | | Net
Expense
Ratio
During
Period(2) |
Investor Class | | | $ | 1,000.00 | | | | $ | 1,020.90 | | | | $ | 1,018.75 | | | | $ | 6.38 | | | | $ | 6.38 | | | | | 1.26 | % |
Class A | | | | 1,000.00 | | | | | 1,020.90 | | | | | 1,018.75 | | | | | 6.38 | | | | | 6.38 | | | | | 1.26 | |
Class I1 | | | | 1,000.00 | | | | | 1,022.10 | | | | | 1,020.10 | | | | | 5.02 | | | | | 5.01 | | | | | 0.99 | |
Class R1 | | | | 1,000.00 | | | | | 1,019.50 | | | | | 1,017.00 | | | | | 8.15 | | | | | 8.14 | | | | | 1.59 | |
Class R2 | | | | 1,000.00 | | | | | 1,020.20 | | | | | 1,017.75 | | | | | 7.39 | | | | | 7.38 | | | | | 1.44 | |
Class Y | | | | 1,000.00 | | | | | 1,023.10 | | | | | 1,020.86 | | | | | 4.26 | | | | | 4.26 | | | | | 0.84 | |
| (1) | Investor Class, Class A, Class I1, Class R1, Class R2 and Class Y expenses are calculated using each Class’ annualized net expense ratio (as disclosed), multiplied by the average account value over the period, and multiplied by 183/365 (to reflect the most recent one-half year period). |
6
SMEAD VALUE FUND
Investment Highlights
(Unaudited)
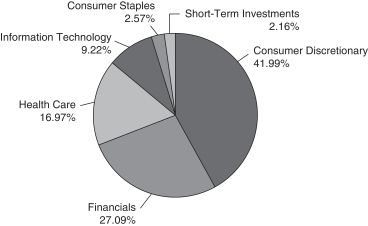
The Fund seeks long-term capital appreciation through concentrated positions. Therefore, the Fund maintains approximately 25-30 companies in its portfolio. The Fund invests in U.S. large capitalization companies through ownership of common stock.
Sector Breakdown
(% of Investments as of November 30, 2015)
Continued
7
SMEAD VALUE FUND
Investment Highlights (Continued)
(Unaudited)
Average Annual Total Returns as of November 30, 2015
| | | | | | | | | | | | | | | | | | | | |
| | | Inception
Date | | 1 Year | | 5 Years | | Since
Inception |
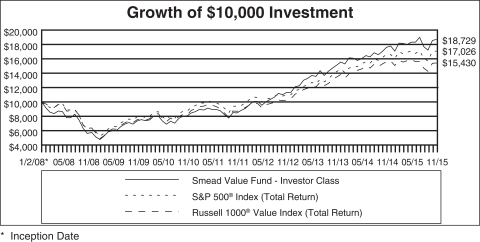
Smead Value Fund – Investor Class | | | | 1/2/2008 | | | | | 6.25% | | | | | 18.33% | | | | | 8.25% | |
Smead Value Fund – Class A | | | | 1/24/2014 | | | | | 6.23% | | | | | N/A | | | | | 11.68% | |
Smead Value Fund – Class I1 | | | | 12/18/2009 | | | | | 6.51% | | | | | 18.62% | | | | | 16.99% | |
Smead Value Fund – Class R1 | | | | 11/21/2014 | | | | | 5.91% | | | | | N/A | | | | | 6.62% | |
Smead Value Fund – Class R2 | | | | 11/21/2014 | | | | | 6.07% | | | | | N/A | | | | | 6.77% | |
Smead Value Fund – Class Y | | | | 11/21/2014 | | | | | 6.69% | | | | | N/A | | | | | 7.38% | |
S&P 500® Index (Total Return) | | | | | | | | | 2.74% | | | | | 14.39% | | | | | 6.80% | |
Russell 1000 Value Index (Total Return) | | | | | | | | | -1.11% | | | | | 13.47% | | | | | 5.45% | |
Performance data quoted represents past performance and does not guarantee future results. The investment return and principal value of an investment will fluctuate so that an investor’s shares, when redeemed, may be worth more or less than their original cost. Current performance of the Fund may be lower or higher than the performance quoted. Performance data current to the most recent month end may be obtained by calling 877-807-4122.
Investment performance reflects fee waivers in effect. In the absence of such waivers, total returns would be reduced.
The returns shown assume reinvestment of Fund distributions and do not reflect the deduction of taxes that a shareholder would pay on Fund distributions or the redemption of Fund shares. The following graph illustrates performance of a hypothetical investment made in the Fund and a broad-based securities index on the Fund’s inception date. The graph does not reflect any future performance.
The S&P 500® Index includes 500 common stocks, most of which are listed on the New York Stock Exchange. The S&P 500® Index is a market capitalization-weighted index representing approximately two-thirds of the total market value of all domestic common stocks.
The Russell 1000 Value Index measures the performance of those Russell 1000 Value Index companies with lower price-to-book ratios and lower forecasted growth values.
Frank Russell Company is the source and owner of the trademarks, service marks and copyrights related to the Russell Indexes. Russell® is a trademark of Russell Investment Group.
One cannot invest directly in an index.
Continued
8
SMEAD VALUE FUND
Investment Highlights (Continued)
(Unaudited)
Continued
9
SMEAD VALUE FUND
|
| Schedule of Investments |
|
| November 30, 2015 |
| | | | | | | | | | |
| | | Shares | | Value |
COMMON STOCKS 97.73% | | | | | | | | | | |
| | |
Banks 13.49% | | | | | | | | | | |
Bank of America Corp. | | | | 3,407,319 | | | | $ | 59,389,570 | |
JPMorgan Chase & Co. | | | | 948,662 | | | | | 63,256,782 | |
Wells Fargo & Co. | | | | 1,003,463 | | | | | 55,290,812 | |
| | | | | | | | | | |
| | | | | | | | | 177,937,164 | |
| | | | | | | | | | |
| | |
Consumer Durables & Apparel 6.05% | | | | | | | | | | |
NVR, Inc. (a) | | | | 47,437 | | | | | 79,811,804 | |
| | | | | | | | | | |
| | |
Consumer Services 5.18% | | | | | | | | | | |
H&R Block, Inc. | | | | 1,440,848 | | | | | 52,864,713 | |
Starbucks Corp. | | | | 252,732 | | | | | 15,515,217 | |
| | | | | | | | | | |
| | | | | | | | | 68,379,930 | |
| | | | | | | | | | |
| | |
Diversified Financials 9.14% | | | | | | | | | | |
American Express Co. | | | | 812,499 | | | | | 58,207,428 | |
Berkshire Hathaway, Inc. – Class B (a) | | | | 464,730 | | | | | 62,315,646 | |
| | | | | | | | | | |
| | | | | | | | | 120,523,074 | |
| | | | | | | | | | |
| | |
Food & Staples Retailing 2.57% | | | | | | | | | | |
Walgreens Boots Alliance, Inc. | | | | 402,831 | | | | | 33,849,889 | |
| | | | | | | | | | |
| | |
Insurance 4.43% | | | | | | | | | | |
Aflac, Inc. | | | | 894,968 | | | | | 58,387,712 | |
| | | | | | | | | | |
| | |
Media 20.08% | | | | | | | | | | |
Comcast Corp. – Class A | | | | 627,634 | | | | | 38,310,779 | |
Gannett Co., Inc. | | | | 3,076,409 | | | | | 52,545,066 | |
News Corp. – Class A | | | | 3,453,556 | | | | | 49,558,529 | |
Tegna, Inc. | | | | 2,772,468 | | | | | 78,322,221 | |
Walt Disney Co. | | | | 406,092 | | | | | 46,079,259 | |
| | | | | | | | | | |
| | | | | | | | | 264,815,854 | |
| | | | | | | | | | |
| | |
Pharmaceuticals, Biotechnology & Life Sciences 16.95% | | | | | | | | | | |
Amgen, Inc. | | | | 487,632 | | | | | 78,557,515 | |
Gilead Sciences, Inc. | | | | 375,785 | | | | | 39,818,178 | |
Johnson & Johnson | | | | 215,095 | | | | | 21,776,218 | |
Merck & Co., Inc. | | | | 769,587 | | | | | 40,795,807 | |
Pfizer, Inc. | | | | 1,302,532 | | | | | 42,683,974 | |
| | | | | | | | | | |
| | | | | | | | | 223,631,692 | |
| | | | | | | | | | |
The accompanying notes are an integral part of these financial statements.
10
SMEAD VALUE FUND
|
| Schedule of Investments (Continued) |
|
| November 30, 2015 |
| | | | | | | | | | |
| | | Shares | | Value |
| | |
Retailing 10.63% | | | | | | | | | | |
Cabela’s, Inc. – Class A (a) | | | | 1,192,872 | | | | $ | 55,909,910 | |
Home Depot, Inc. | | | | 340,161 | | | | | 45,540,755 | |
Nordstrom, Inc. | | | | 688,062 | | | | | 38,744,771 | |
| | | | | | | | | | |
| | | | | | | | | 140,195,436 | |
| | | | | | | | | | |
| | |
Software & Services 9.21% | | | | | | | | | | |
Accenture PLC – Class A (b) | | | | 323,610 | | | | | 34,697,464 | |
eBay, Inc. (a) | | | | 1,337,489 | | | | | 39,576,300 | |
PayPal Holdings, Inc. (a) | | | | 1,337,489 | | | | | 47,159,862 | |
| | | | | | | | | | |
| | | | | | | | | 121,433,626 | |
| | | | | | | | | | |
TOTAL COMMON STOCKS (Cost $1,097,380,124) | | | | | | | | | 1,288,966,181 | |
| | | | | | | | | | |
| | |
SHORT-TERM INVESTMENTS 2.16% | | | | | | | | | | |
| | |
Money Market Fund 2.16% | | | | | | | | | | |
State Street Institutional Liquid Reserves | | | | 28,423,246 | | | | $ | 28,423,246 | |
| | | | | | | | | | |
TOTAL SHORT-TERM INVESTMENTS (Cost $28,423,246) | | | | | | | | | 28,423,246 | |
| | | | | | | | | | |
TOTAL INVESTMENTS (Cost $1,125,803,370) 99.89% | | | | | | | | | 1,317,389,427 | |
Other Assets in Excess of Liabilities 0.11% | | | | | | | | | 1,508,870 | |
| | | | | | | | | | |
TOTAL NET ASSETS 100.00% | | | | | | | | $ | 1,318,898,297 | |
| | | | | | | | | | |
| (a) | Non-income producing security. |
| (b) | Foreign issued security. |
The Global Industry Classification Standard (GICS®) was developed by and/or is the exclusive property of MSCI, Inc. and Standard & Poor Financial Services LLC (“S&P”). GICS® is a service mark of MSCI and S&P and has been licensed for use by Smead Capital Management, Inc.
The accompanying notes are an integral part of these financial statements.
11
SMEAD VALUE FUND
|
| Statement of Assets and Liabilities |
|
| November 30, 2015 |
| | | | | |
Assets | | | | | |
Investments, at value (cost $1,125,803,370) | | | $ | 1,317,389,427 | |
Receivable for Fund shares sold | | | | 2,763,825 | |
Dividends and interest receivable | | | | 2,041,132 | |
Due from Adviser | | | | 648,042 | |
Other assets | | | | 2 | |
| | | | | |
Total Assets | | | | 1,322,842,428 | |
| | | | | |
| |
Liabilities | | | | | |
Payable for Fund shares redeemed | | | | 2,383,752 | |
Payable to Advisor | | | | 803,796 | |
Payable to Administrator | | | | 160,334 | |
Payable for distribution fees | | | | 109,257 | |
Payable for shareholder servicing fees | | | | 155,716 | |
Accrued expenses and other liabilities | | | | 331,276 | |
| | | | | |
Total Liabilities | | | | 3,944,131 | |
| | | | | |
Net Assets | | | $ | 1,318,898,297 | |
| | | | | |
| |
Net Assets Consist Of: | | | | | |
Paid-in capital | | | $ | 1,086,801,245 | |
Accumulated undistributed net investment income | | | | 8,072,678 | |
Accumulated undistributed net realized gain from investments | | | $ | 32,438,317 | |
Net unrealized appreciation on investments | | | $ | 191,586,057 | |
| | | | | |
Net Assets | | | $ | 1,318,898,297 | |
| | | | | |
Investor Class Shares | | | | | |
Net assets | | | | 385,927,865 | |
Shares of beneficial interest outstanding (unlimited number of shares authorized, $0.001 par value) | | | | 9,284,212 | |
Net asset value, offering price and redemption price per share | | | $ | 41.57 | |
| | | | | |
| |
Class A Shares | | | | | |
Net assets | | | | 148,499,574 | |
Shares of beneficial interest outstanding (unlimited number of shares authorized, $0.001 par value) | | | | 3,580,495 | |
Net asset value, offering price and redemption price per share(1) | | | $ | 41.47 | |
| | | | | |
Maximum offering price per share (41.47/0.9425)(2) | | | $ | 44.00 | |
| | | | | |
| |
Class I1 Shares | | | | | |
Net assets | | | | 781,146,347 | |
Shares of beneficial interest outstanding (unlimited number of shares authorized, $0.001 par value) | | | | 18,748,601 | |
Net asset value, offering price and redemption price per share | | | $ | 41.66 | |
| | | | | |
The accompanying notes are an integral part of these financial statements.
12
SMEAD VALUE FUND
|
| Statement of Assets and Liabilities (Continued) |
|
| November 30, 2015 |
| | | | | |
Class R1 Shares | | | | | |
Net assets | | | | 553,128 | |
Shares of beneficial interest outstanding (unlimited number of shares authorized, $0.001 par value) | | | | 13,389 | |
Net asset value, offering price and redemption price per share | | | $ | 41.31 | |
| | | | | |
| |
Class R2 Shares | | | | | |
Net assets | | | | 1,579,103 | |
Shares of beneficial interest outstanding (unlimited number of shares authorized, $0.001 par value) | | | | 38,182 | |
Net asset value, offering price and redemption price per share | | | $ | 41.36 | |
| | | | | |
| |
Class Y Shares | | | | | |
Net assets | | | | 1,192,280 | |
Shares of beneficial interest outstanding (unlimited number of shares authorized, $0.001 par value) | | | | 28,593 | |
Net asset value, offering price and redemption price per share | | | $ | 41.70 | |
| | | | | |
| (1) | A contingent deferred sales charge (“CDSC”) of 1.00% may be charged on shares redeemed within eighteen months of purchase. Redemption price per share is equal to net asset value less any redemption or CDSC fees. |
| (2) | Reflects a maximum sales charge of 5.75%. |
The accompanying notes are an integral part of these financial statements.
13
SMEAD VALUE FUND
|
| Statement of Operations |
|
| For the Year Ended November 30, 2015 |
| | | | | |
Investment Income | | | | | |
Dividend income | | | $ | 21,722,088 | |
Interest income | | | | 33,740 | |
| | | | | |
Total Investment Income | | | | 21,755,828 | |
| | | | | |
| |
Expenses | | | | | |
Management fees | | | | 8,295,978 | |
Distribution fees – Investor Class | | | | 967,870 | |
Distribution fees – Class A | | | | 186,755 | |
Distribution fees – Class R1 | | | | 725 | |
Distribution fees – Class R2 | | | | 1,494 | |
Shareholder servicing fees – Investor Class | | | | 548,152 | |
Shareholder servicing fees – Class A | | | | 66,993 | |
Shareholder servicing fees – Class I1 | | | | 754,300 | |
Shareholder servicing fees – Class R1 | | | | 243 | |
Shareholder servicing fees – Class R2 | | | | 211 | |
Administration fees | | | | 355,145 | |
Transfer agent fees and expenses | | | | 504,875 | |
Fund accounting fees | | | | 226,362 | |
Federal and state registration fees | | | | 182,304 | |
Custody fees | | | | 67,664 | |
Reports to shareholders | | | | 100,340 | |
Legal fees | | | | 329,160 | |
Audit and tax fees | | | | 20,976 | |
Chief Compliance Officer fees | | | | 29,425 | |
Trustees’ fees | | | | 98,146 | |
Other expenses | | | | 298,448 | |
| | | | | |
Total Expenses | | | | 13,035,566 | |
Expense Waiver by Adviser (Note 3) | | | | (635,630 | ) |
| | | | | |
Net Expenses | | | | 12,399,936 | |
| | | | | |
| |
Net Investment Income | | | | 9,355,892 | |
| | | | | |
| |
Realized and Unrealized Gain on Investments | | | | | |
Net realized gain from investments | | | | 32,478,200 | |
Change in net unrealized appreciation on investments | | | | 27,147,262 | |
| | | | | |
Net Realized and Unrealized Gain on Investments | | | | 59,625,462 | |
| | | | | |
Net Increase in Net Assets from Operations | | | $ | 68,981,354 | |
| | | | | |
The accompanying notes are an integral part of these financial statements.
14
SMEAD VALUE FUND
|
| Statements of Changes in Net Assets |
|
| |
| | | | | | | | | | |
| | | Year Ended
November 30, 2015 | | Year Ended
November 30, 2014 |
From Operations | | | | | | | | | | |
Net investment income | | | $ | 9,355,892 | | | | $ | 4,478,768 | |
Net realized gain from investments | | | | 32,478,200 | | | | | 37,646,248 | |
Change in net unrealized appreciation on investments | | | | 27,147,262 | | | | | 75,090,520 | |
| | | | | | | | | | |
Net increase in net assets from operations | | | | 68,981,354 | | | | | 117,215,536 | |
| | | | | | | | | | |
| | |
From Distributions | | | | | | | | | | |
Net investment income – Investor Class | | | | (1,451,149 | ) | | | | (791,967 | ) |
Net investment income – Class A | | | | (155,831 | ) | | | | — | |
Net investment income – Class I1 | | | | (3,481,919 | ) | | | | (1,573,913 | ) |
Net investment income – Class R1 | | | | (31 | ) | | | | — | |
Net investment income – Class R2 | | | | (32 | ) | | | | — | |
Net investment income – Class Y | | | | (5,557 | ) | | | | — | |
Net realized gain on investments – Investor class | | | | (14,609,477 | ) | | | | (7,083,918 | ) |
Net realized gain on investments – Class A | | | | (1,168,196 | ) | | | | — | |
Net realized gain on investments – Class I1 | | | | (21,783,612 | ) | | | | (9,116,270 | ) |
Net realized gain on investments – Class R1 | | | | (201 | ) | | | | — | |
Net realized gain on investments – Class R2 | | | | (201 | ) | | | | — | |
Net realized gain on investments – Class Y | | | | (32,353 | ) | | | | — | |
| | | | | | | | | | |
Net decrease in net assets resulting from distributions paid | | | | (42,688,559 | ) | | | | (18,566,068 | ) |
| | | | | | | | | | |
| | |
From Capital Share Transactions | | | | | | | | | | |
Proceeds from shares sold | | | | 618,487,920 | | | | | 515,491,504 | |
Issued in reinvestment of dividends and distributions | | | | 21,546,098 | | | | | 11,380,090 | |
Payments for shares redeemed | | | | (285,378,505 | ) | | | | (254,639,601 | ) |
| | | | | | | | | | |
Net increase in net assets from
capital share transactions | | | | 354,655,513 | | | | | 272,231,993 | |
| | | | | | | | | | |
Total Increase in Net Assets | | | | 380,948,308 | | | | | 370,881,461 | |
| | | | | | | | | | |
| | |
Net Assets | | | | | | | | | | |
Beginning of year | | | | 937,949,989 | | | | | 567,068,528 | |
| | | | | | | | | | |
End of year | | | $ | 1,318,898,297 | | | | $ | 937,949,989 | |
| | | | | | | | | | |
| | |
Accumulated Undistributed
Net Investment Income | | | $ | 8,072,678 | | | | $ | 3,811,305 | |
| | | | | | | | | | |
The accompanying notes are an integral part of these financial statements.
15
SMEAD VALUE FUND
| | | | |
| Financial Highlights |
|
| November 30, 2015 |
| | | | | | | | | | | | | | | | | | | | | | | | | | | | | | | | | | | |
| | | | |
Income from investment operations | | Less distributions paid |
| | | Net Asset
Value,
Beginning
of Period | | Net
investment
income | | Net realized
and
unrealized
gain on
investments | | Total
from
investment
operations | | Distributions
from net
investment
income | | Distributions
from net
realized gain
on
investments | | Total
distributions
paid |
Investor Class | | | | | | | | | | | | | | | | | | | | | | | | | | | | | | | | | | | |
Year Ended November 30, 2015 | | | $ | 40.98 | | | | $ | 0.27 | (4) | | | $ | 2.11 | | | | $ | 2.38 | | | | $ | (0.16 | ) | | | $ | (1.63 | ) | | | $ | (1.79 | ) |
Year Ended November 30, 2014 | | | | 36.35 | | | | | 0.18 | (4) | | | | 5.62 | | | | | 5.80 | | | | | (0.12 | ) | | | | (1.05 | ) | | | | (1.17 | ) |
Year Ended November 30, 2013 | | | | 27.61 | | | | | 0.13 | | | | | 9.04 | | | | | 9.17 | | | | | (0.15 | ) | | | | (0.28 | ) | | | | (0.43 | ) |
Year Ended November 30, 2012 | | | | 20.83 | | | | | 0.06 | | | | | 6.84 | | | | | 6.90 | | | | | (0.12 | ) | | | | — | | | | | (0.12 | ) |
Year Ended November 30, 2011 | | | | 19.82 | | | | | 0.09 | | | | | 0.94 | | | | | 1.03 | | | | | (0.02 | ) | | | | — | | | | | (0.02 | ) |
| | | | | | | |
Class A | | | | | | | | | | | | | | | | | | | | | | | | | | | | | | | | | | | |
Year Ended November 30, 2015 | | | | 40.95 | | | | | 0.30 | (4) | | | | 2.07 | | | | | 2.37 | | | | | (0.22 | ) | | | | (1.63 | ) | | | | (1.85 | ) |
Period Ended November 30, 2014(5) | | | | 35.45 | | | | | 0.07 | (4) | | | | 5.43 | | | | | 5.50 | | | | | — | | | | | — | | | | | — | |
| | | | | | | |
Class I1 | | | | | | | | | | | | | | | | | | | | | | | | | | | | | | | | | | | |
Year Ended November 30, 2015 | | | | 41.07 | | | | | 0.39 | (4) | | | | 2.09 | | | | | 2.48 | | | | | (0.26 | ) | | | | (1.63 | ) | | | | (1.89 | ) |
Year Ended November 30, 2014 | | | | 36.40 | | | | | 0.27 | (4) | | | | 5.63 | | | | | 5.90 | | | | | (0.18 | ) | | | | (1.05 | ) | | | | (1.23 | ) |
Year Ended November 30, 2013 | | | | 27.61 | | | | | 0.18 | | | | | 9.08 | | | | | 9.26 | | | | | (0.19 | ) | | | | (0.28 | ) | | | | (0.47 | ) |
Year Ended November 30, 2012 | | | | 20.84 | | | | | 0.21 | | | | | 6.74 | | | | | 6.95 | | | | | (0.18 | ) | | | | — | | | | | (0.18 | ) |
Year Ended November 30, 2011 | | | | 19.85 | | | | | 0.14 | | | | | 0.94 | | | | | 1.08 | | | | | (0.09 | ) | | | | — | | | | | (0.09 | ) |
| | | | | | | |
Class R1 | | | | | | | | | | | | | | | | | | | | | | | | | | | | | | | | | | | |
Year Ended November 30, 2015 | | | | 40.95 | | | | | 0.35 | (4) | | | | 1.89 | | | | | 2.24 | | | | | (0.25 | ) | | | | (1.63 | ) | | | | (1.88 | ) |
Period Ended November 30, 2014(6) | | | | 40.63 | | | | | 0.00 | (4)(7) | | | | 0.32 | | | | | 0.32 | | | | | — | | | | | — | | | | | — | |
| | | | | | | |
Class R2 | | | | | | | | | | | | | | | | | | | | | | | | | | | | | | | | | | | |
Year Ended November 30, 2015 | | | | 40.95 | | | | | 0.17 | (4) | | | | 2.13 | | | | | 2.30 | | | | | (0.26 | ) | | | | (1.63 | ) | | | | (1.89 | ) |
Period Ended November 30, 2014(6) | | | | 40.63 | | | | | 0.00 | (4)(7) | | | | 0.32 | | | | | 0.32 | | | | | — | | | | | — | | | | | — | |
| | | | | | | |
Class Y | | | | | | | | | | | | | | | | | | | | | | | | | | | | | | | | | | | |
Year Ended November 30, 2015 | | | | 41.06 | | | | | 0.42 | (4) | | | | 2.13 | | | | | 2.55 | | | | | (0.28 | ) | | | | (1.63 | ) | | | | (1.91 | ) |
Period Ended November 30, 2014(6) | | | | 40.74 | | | | | 0.01 | (4) | | | | 0.31 | | | | | 0.32 | | | | | — | | | | | — | | | | | — | |
| (1) | Total return in the above table represents the rate that the investor would have earned or lost on an investment in the Fund, assuming reinvestment of dividends. |
| (2) | Not annualized for periods of less than one year. |
| (3) | Annualized for periods of less than one year. |
| (4) | Based on average shares outstanding. |
| (5) | Class A shares commenced operations on January 27, 2014. |
| (6) | Class R1 shares, Class R2 shares and Class Y shares commenced operations on November 25, 2014. |
| (7) | Amount is less than $0.005. |
The accompanying notes are an integral part of these financial statements.
16
| | | | | | | | | | | | | | | | | | | | | | | | | | | | | | | | | | | | | | |
| | | | | | | Ratio of expenses
to average net assets | | Ratio of net investment
income to average net assets | | |
Net Asset
Value,
End of
Period | | Total
Return(1)(2) | | Net assets
at end of
period
(000’s) | | Before
waivers and
recoupment
of expenses(3) | | After
waivers and
recoupment
of expenses(3) | | Before
waivers and
recoupment
of expenses(3) | | After
waivers and
recoupment
of expenses(3) | | Portfolio
turnover
rate(2) |
| | | | | | | | | | | | | | | | | | | | | | | | | | | | | | | | | | | | | | | |
| | $ | 41.57 | | | | | 6.25% | | | | $ | 385,928 | | | | | 1.34 | % | | | | 1.26 | % | | | | 0.61 | % | | | | 0.67 | % | | | | 20.26 | % |
| | | 40.98 | | | | | 16.45% | | | | | 366,067 | | | | | 1.26 | % | | | | 1.25 | % | | | | 0.46 | % | | | | 0.47 | % | | | | 12.70 | % |
| | | 36.35 | | | | | 33.74% | | | | | 253,512 | | | | | 1.28 | % | | | | 1.35 | % | | | | 0.54 | % | | | | 0.47 | % | | | | 11.32 | % |
| | | 27.61 | | | | | 33.27% | | | | | 51,955 | | | | | 1.49 | % | | | | 1.40 | % | | | | 0.67 | % | | | | 0.76 | % | | | | 10.95 | % |
| | | 20.83 | | | | | 5.19% | | | | | 15,644 | | | | | 1.60 | % | | | | 1.40 | % | | | | 0.25 | % | | | | 0.45 | % | | | | 15.98 | % |
| | | | | | | |
| | | | | | | | | | | | | | | | | | | | | | | | | | | | | | | | | | | | | | | |
| | | 41.47 | | | | | 6.23% | | | | | 148,500 | | | | | 1.30 | % | | | | 1.26 | % | | | | 0.74 | % | | | | 0.76 | % | | | | 20.26 | % |
| | | 40.95 | | | | | 15.51% | | | | | 27,378 | | | | | 1.45 | % | | | | 1.44 | % | | | | 0.20 | % | | | | 0.21 | % | | | | 12.70 | % |
| | | | | | | |
| | | | | | | | | | | | | | | | | | | | | | | | | | | | | | | | | | | | | | | |
| | | 41.66 | | | | | 6.51% | | | | | 781,146 | | | | | 1.07 | % | | | | 0.99 | % | | | | 0.90 | % | | | | 0.96 | % | | | | 20.26 | % |
| | | 41.07 | | | | | 16.75% | | | | | 544,490 | | | | | 1.01 | % | | | | 1.00 | % | | | | 0.71 | % | | | | 0.72 | % | | | | 12.70 | % |
| | | 36.40 | | | | | 34.10% | | | | | 313,557 | | | | | 1.03 | % | | | | 1.10 | % | | | | 0.79 | % | | | | 0.72 | % | | | | 11.32 | % |
| | | 27.61 | | | | | 33.57% | | | | | 67,188 | | | | | 1.20 | % | | | | 1.15 | % | | | | 0.93 | % | | | | 0.98 | % | | | | 10.95 | % |
| | | 20.84 | | | | | 5.46% | | | | | 34,163 | | | | | 1.31 | % | | | | 1.15 | % | | | | 0.54 | % | | | | 0.70 | % | | | | 15.98 | % |
| | | | | | | |
| | | | | | | | | | | | | | | | | | | | | | | | | | | | | | | | | | | | | | | |
| | | 41.31 | | | | | 5.91% | | | | | 553 | | | | | 1.64 | % | | | | 1.59 | % | | | | 0.85 | % | | | | 0.88 | % | | | | 20.26 | % |
| | | 40.95 | | | | | 0.79% | | | | | 5 | | | | | 1.57 | % | | | | 1.57 | % | | | | 0.23 | % | | | | 0.23 | % | | | | 12.70 | % |
| | | | | | | |
| | | | | | | | | | | | | | | | | | | | | | | | | | | | | | | | | | | | | | | |
| | | 41.36 | | | | | 6.07% | | | | | 1,579 | | | | | 1.55 | % | | | | 1.44 | % | | | | 0.35 | % | | | | 0.44 | % | | | | 20.26 | % |
| | | 40.95 | | | | | 0.79% | | | | | 5 | | | | | 1.62 | % | | | | 1.44 | % | | | | 0.18 | % | | | | 0.36 | % | | | | 12.70 | % |
| | | | | | | |
| | | | | | | | | | | | | | | | | | | | | | | | | | | | | | | | | | | | | | | |
| | | 41.70 | | | | | 6.69% | | | | | 1,192 | | | | | 0.95 | % | | | | 0.84 | % | | | | 0.94 | % | | | | 1.04 | % | | | | 20.26 | % |
| | | 41.06 | | | | | 0.79% | | | | | 5 | | | | | 0.85 | % | | | | 0.82 | % | | | | 0.95 | % | | | | 0.98 | % | | | | 12.70 | % |
17
SMEAD VALUE FUND
Notes to Financial Statements
November 30, 2015
The Smead Value Fund (the “Fund”) is a non-diversified series of Smead Funds Trust, a Delaware statutory trust (the “Trust”) organized on July 17, 2014. Pursuant to a reorganization that took place on November 21, 2014, the Fund is the successor to the Smead Value Fund, a series of the Trust for Professional Managers (the “Predecessor Fund”). As a result of the reorganization the Fund assumed the performance and accounting history of the Predecessor Fund prior to the date of the reorganization. The Trust is registered under the Investment Company Act of 1940, as amended (the “1940 Act”), as an open-end management investment company. The Fund is an investment company and accordingly follows the investment company accounting and reporting guidance of the Financial Accounting Standards Board (FASB) Accounting Standard Codification Topic 946 Financial Services-Investment Companies. The Fund’s investment objective is long-term capital appreciation. The Trust may issue an unlimited number of interests (or shares) of beneficial interest each with a par value of $0.001. The Fund currently offers six classes of shares: Investor Class, Class A, Class I1, Class R1, Class R2 and Class Y shares. Class C, Class I2, Class R3 and Class R4 shares are not yet in operation. Each class of shares of the Fund has identical rights and privileges except with respect to the distribution fees, and voting rights on matters affecting a single class of shares. The classes differ principally in their respective distribution and shareholder servicing expenses. Costs incurred by the Fund in connection with the organization, registration and the initial public offering of shares were paid by Smead Capital Management, Inc. (the “Adviser”).
| (2) | Significant Accounting Policies |
The following is a summary of significant accounting policies consistently followed by the Fund in the preparation of the financial statements. These policies are in conformity with generally accepted accounting principles in the United States of America (“GAAP”).
Each security owned by the Fund that is listed on a securities exchange is valued at its last sale price on that exchange on the date as of which assets are valued. When the security is listed on more than one exchange, the Fund will use the price of the exchange that the Fund generally considers to be the principal exchange on which the security is traded.
Fund securities listed on The NASDAQ Stock Market, Inc. (“NASDAQ”) will be valued at the NASDAQ Official Closing Price (“NOCP”), which may not necessarily represent the last sale price. If the NOCP is not available, such securities shall be valued at the last sale price on the day of valuation. If there has been no sale on such exchange or on NASDAQ on such day, the security is valued at the mean between the most recent bid and asked prices on such day. Over-the-counter securities that are not traded on NSADAQ shall be valued at the most recent trade price.
Debt securities other than short-term instruments are valued at the mean between the closing bid and asked prices provided by a pricing service (“Pricing Service”). If the
18
SMEAD VALUE FUND
Notes to Financial Statements (Continued)
November 30, 2015
closing bid and asked prices are not readily available, the Pricing Service may provide a price determined by a matrix pricing method or other analytical pricing models. Short-term debt securities, such as commercial paper, bankers acceptances and U.S. Treasury Bills, having a maturity of less than 60 days are valued at amortized cost which approximates par value. If a short-term debt security has a maturity of greater than 60 days, it is valued at market price.
Redeemable securities issued by open-end, registered investment companies, including money market funds, are valued at the net asset value (“NAV”) of such companies for purchase and/or redemption orders placed on that day.
When market quotations are not readily available, any security or other asset is valued at its fair value as determined under fair value pricing procedures approved by the Trust’s Board of Trustees (the “Board of Trustees”). These fair value pricing procedures will also be used to price a security when corporate events, events in the securities market and/or world events cause the Adviser to believe that a security’s last sale price may not reflect its actual fair market value. The intended effect of using fair value pricing procedures is to ensure that the Fund is accurately priced.
The Fund’s Valuation Procedures include fair valuation accounting standards that establish an authoritative definition of fair value and set out a hierarchy for measuring fair value. These standards require additional disclosures about the various inputs used to develop the measurements of fair value. These inputs are summarized in the three broad levels listed below:
| | Level 1—unadjusted | quoted prices in active markets for identical securities. |
| | Level 2—other | significant observable inputs (including unadjusted quoted prices for similar securities, interest rates, prepayment speeds, credit risk, etc.). |
| | Level 3—significant | unobservable inputs (including the Fund’s own assumptions in determining the fair value of investments). |
The inputs or methodology used for valuing securities are not necessarily an indication of the risk associated with investing in those securities. The following table summarizes the valuations of the Fund’s investments by each fair value hierarchy level as of November 30, 2015:
| | | | | | | | | | | | | | | | | | | | |
| | | Level 1 | | Level 2 | | Level 3 | | Total |
Equity | | | | | | | | | | | | | | | | | | | | |
Common Stocks(1) | | | $ | 1,288,966,181 | | | | $ | — | | | | $ | — | | | | $ | 1,288,966,181 | |
| | | | | | | | | | | | | | | | | | | | |
Total Equity | | | | 1,288,966,181 | | | | | — | | | | | — | | | | | 1,288,966,181 | |
Short-Term Investment | | | | — | | | | | 28,423,246 | | | | | — | | | | | 28,423,246 | |
| | | | | | | | | | | | | | | | | | | | |
Total Investments in Securities | | | $ | 1,288,966,181 | | | | $ | 28,423,246 | | | | $ | — | | | | $ | 1,317,389,427 | |
| | | | | | | | | | | | | | | | | | | | |
| | (1) | See the Schedule of Investments for industry classification. |
No Level 3 securities were held in the Fund at November 30, 2015. For the year ended November 30, 2015, there were no transfers between levels for the Fund. It is the Fund’s policy to record transfers between levels as of the end of the reporting
19
SMEAD VALUE FUND
Notes to Financial Statements (Continued)
November 30, 2015
period. The Fund did not hold financial derivative instruments during the reporting period.
The NAV per share of the Fund is calculated by dividing the sum of the value of the securities held by the Fund, plus cash or other assets, minus all liabilities (including estimated accrued expenses) by the total number of shares outstanding for the Fund, rounded to the nearest cent. The Fund’s shares will not be priced on the days on which the New York Stock Exchange is closed for trading.
The preparation of financial statements in conformity with GAAP requires management to make estimates and assumptions that affect the reported amounts of assets and liabilities and disclosure of contingent assets and liabilities at the date of the financial statements and the reported amounts of revenues and expenses during the reporting period. Actual results could differ from those estimates.
| | (d) | Allocation of Income, Expenses and Gains/Losses |
Income, expenses (other than those deemed attributable to a specific share class—distribution and shareholder servicing fees), and gains and losses of the Fund are allocated daily to each class of shares based upon the ratio of net assets represented by each class as a percentage of the net assets of the Fund. Expenses deemed directly attributable to a class of shares are recorded by the specific class. Most Fund expenses are allocated by class based on relative net assets. Rule 12b-1 fees are expensed at 0.25% of average daily net assets of the Investor Class and Class A shares and 0.50% of the average daily net assets of the Class R1 and Class R2 shares.
The Fund complies with the requirements of Subchapter M of the Internal Revenue Code of 1986, as amended, necessary to qualify as a regulated investment company and makes the requisite distributions of income and capital gains to its shareholders sufficient to relieve it from all or substantially all federal income taxes. Therefore, no federal income tax provision has been provided.
As of and during the year ended November 30, 2015, the Fund did not have a liability for any unrecognized tax benefits. The Fund recognizes interest and penalties, if any, related to unrecognized tax benefits as income tax expense in the statement of operations. During the year ended November 30, 2015, the Fund did not incur any interest or penalties.
20
SMEAD VALUE FUND
Notes to Financial Statements (Continued)
November 30, 2015
As of November 30, 2015, the components of accumulated earnings on a tax basis were as follows:
| | | | | |
Cost basis of investments for federal income tax purposes | | | $ | 1,125,841,333 | |
| | | | | |
Gross tax unrealized appreciation | | | | 208,407,968 | |
Gross tax unrealized depreciation | | | | (16,859,874 | ) |
| | | | | |
Net tax unrealized appreciation | | | $ | 191,548,094 | |
| | | | | |
Undistributed ordinary income | | | $ | 8,072,678 | |
Undistributed long-term capital gain | | | | 32,476,280 | |
| | | | | |
Total distributable earnings | | | $ | 40,548,958 | |
| | | | | |
Other accumulated losses | | | | — | |
| | | | | |
Total accumulated gains | | | $ | 232,097,052 | |
| | | | | |
The tax basis of investments for tax and financial reporting purposes differs principally due to the deferral of losses on wash sales.
| | (f) | Distributions to Shareholders |
The Fund will distribute any net investment income and any net realized long or short- term capital gains at least annually. Distributions from net realized gains for book purposes may include short-term capital gains. All short-term capital gains are included in ordinary income for tax purposes. Distributions to shareholders are recorded on the ex-dividend date. The Fund may also pay a special distribution at the end of the calendar year to comply with federal tax requirements. Income and capital gains distributions may differ from GAAP, primarily due to timing differences in the recognition of income, gains and losses by the Fund. GAAP requires that certain components of net assets relating to permanent differences be reclassified between the components of net assets. These reclassifications have no effect on net assets or net asset value per share. For the year ended November 30, 2015, the Fund had no such reclassifications.
The tax character of distributions paid during the years ended November 30, 2015 and November 30, 2014 was as follows:
| | | | | | | | | | |
| | | November 30, 2015 | | November 30, 2014 |
Ordinary Income | | | $ | 13,056,599 | | | | $ | 6,269,087 | |
Long-Term Capital Gain | | | $ | 29,631,960 | | | | $ | 12,296,981 | |
21
SMEAD VALUE FUND
Notes to Financial Statements (Continued)
November 30, 2015
On December 17, 2015, the Fund declared and paid distributions from ordinary income and long-term capital gains to shareholders of record on December 16, 2015.
| | | | | | | | | | | | | | | |
| | | Distributions Paid from | | Total
Distributions
Paid |
Class | | Ordinary
Income | | Long-Term
Capital Gain | |
Investor Class | | | $ | 1,908,602 | | | | $ | 9,354,729 | | | | $ | 11,263,331 | |
Class A | | | | 1,086,725 | | | | | 3,661,639 | | | | | 4,748,364 | |
Class I1 | | | | 6,340,998 | | | | | 19,381,556 | | | | | 25,722,553 | |
Class R1 | | | | 3,889 | | | | | 13,267 | | | | | 17,156 | |
Class R2 | | | | 11,374 | | | | | 35,726 | | | | | 47,100 | |
Class Y | | | | 10,525 | | | | | 28,749 | | | | | 39,274 | |
Investment transactions are recorded on the trade date. The Fund determines the gain or loss from investment transactions based on the first in, first out method. Dividend income, less foreign withholding tax, is recognized on the ex-dividend date and interest income is recognized on an accrual basis.
The Fund has an Investment Advisory Agreement (the “Agreement”) with the Adviser to furnish investment advisory services to the Fund. Under the terms of the Agreement, the Fund compensates the Adviser for its management services at the annual rate of 0.75% of the Fund’s average daily net assets.
The Adviser has contractually agreed to waive its management fee and/or reimburse the Fund’s other expenses at least through March 31, 2016 to the extent necessary to ensure that the Fund’s operating expenses do not exceed 1.26%, 1.26%, 0.99%, 1.59%, 1.44% and 0.84% (the “Expense Limitation Cap”) of the Fund’s average daily net assets for the Investor Class, Class A, Class I1, Class R1, Class R2 and Class Y shares, respectively. Any such waiver or reimbursement is subject to later adjustment to allow the Adviser to recoup amounts waived or reimbursed to the extent actual fees and expenses for a fiscal period are less than the Expense Limitation Cap in place at the time of waiver; provided, however, that the Adviser shall only be entitled to recoup such amounts over the following three fiscal years. For the year ended November 30, 2015, the Adviser waived expenses of $635,630. The following table shows the waived or reimbursed expenses subject to potential recovery expiring on November 30:
| | | | | | | | | | |
Year Incurred | | Expiration Year | | Smead Value Fund |
2014 | | | | 2017 | | | | $ | 12,412 | |
2015 | | | | 2018 | | | | | 635,630 | |
| (4) | Distribution Plan and Shareholder Servicing Plan |
The Fund has adopted a plan pursuant to Rule 12b-1 (the “12b-1 Plan”), which authorizes it to pay ALPS Distributors, Inc. (the “Distributor”) a distribution fee of 0.25% of the Fund’s average daily net assets of Investor Class and Class A shares and 0.50% of the Fund’s average daily net assets of Class R1 and Class R2 shares
22
SMEAD VALUE FUND
Notes to Financial Statements (Continued)
November 30, 2015
for services to prospective Fund shareholders and distribution of Fund shares. During the year ended November 30, 2015, the Fund accrued expenses of $1,156,844 pursuant to the 12b-1 Plan. As of November 30, 2015, the Fund owed the Distributor fees of $109,257.
The Fund has also adopted a shareholder servicing plan (the “Shareholder Servicing Plan”). The Shareholder Servicing Plan also authorizes payment of a shareholder servicing fee to the Distributor up to 0.25% of the average daily net assets attributable to the respective class. The Fund implemented 0.14% for the shareholder servicing fee for the Investor Class shares of the Fund, 0.09% for the shareholder servicing fee for the Class A shares of the Fund, 0.16% for the shareholder servicing fee for the Class R1 shares of the Fund, 0.12% for the shareholder servicing fee for the Class I1 shares of the Fund and 0.07% for the shareholder servicing fee for the Class R2 shares of the Fund. For those share classes that currently charge less than the maximum shareholder servicing fee, the Fund may increase such fee, but not beyond the maximum of 0.25%, only after providing affected shareholders with 30 day’s prior written notice. The following table details the Shareholder Servicing Plan fees paid for the year ended November 30, 2015.
| | | | | |
Investor Class | | | $ | 548,152 | |
Class A | | | | 66,993 | |
Class I1 | | | | 754,300 | |
Class R1 | | | | 243 | |
Class R2 | | | | 211 | |
| (5) | Accounting, Custody, Administration and Transfer Agent Fees |
State Street Bank and Trust Company (“State Street”) serves as the Fund’s accounting agent, custodian of the Fund’s investments and administrator of the Fund. For its services, the Fund pays State Street a fee that is calculated daily and paid monthly at an annual rate based on the aggregate average daily net assets of the Fund, along with transactional and out-of-pocket fees.
Boston Financial Data Services, Inc. (“BFDS”) is the Fund’s transfer and dividend disbursing agent. BFDS receives a monthly fee and is reimbursed for certain out-of-pocket expenses.
23
SMEAD VALUE FUND
Notes to Financial Statements (Continued)
November 30, 2015
| (6) | Capital Share Transactions |
Transactions in shares of the Fund were as follows:
| | | | | | | | | | | | | | | | | | | | |
| | | For The Year Ended
November 30, 2015 | | For The Year Ended
November 30, 2014 |
| | | Shares | | Amount | | Shares | | Amount |
Shares sold | | | | | | | | | | | | | | | | | | | | |
Investor Class | | | | 3,373,372 | | | | $ | 136,144,008 | | | | | 6,094,155 | | | | $ | 227,566,140 | |
Class A* | | | | 3,117,920 | | | | | 126,080,357 | | | | | 769,690 | | | | | 29,513,438 | |
Class I1 | | | | 8,771,583 | | | | | 353,035,556 | | | | | 6,862,280 | | | | | 258,396,926 | |
Class R1** | | | | 14,339 | | | | | 577,329 | | | | | 123 | | | | | 5,000 | |
Class R2** | | | | 38,229 | | | | | 1,514,210 | | | | | 123 | | | | | 5,000 | |
Class Y** | | | | 28,319 | | | | | 1,136,460 | | | | | 123 | | | | | 5,000 | |
| | | | |
Reinvestment of dividends and distributions | | | | | | | | | | | | | | | | | | | | |
Investor Class | | | | 407,070 | | | | | 15,423,912 | | | | | 218,738 | | | | | 7,738,935 | |
Class A* | | | | 12,112 | | | | | 457,948 | | | | | — | | | | | — | |
Class I1 | | | | 148,518 | | | | | 5,625,863 | | | | | 102,945 | | | | | 3,641,155 | |
Class R1** | | | | 6 | | | | | 232 | | | | | — | | | | | — | |
Class R2** | | | | 6 | | | | | 233 | | | | | — | | | | | — | |
Class Y** | | | | 1,001 | | | | | 37,910 | | | | | — | | | | | — | |
| | | | |
Shares redeemed | | | | | | | | | | | | | | | | | | | | |
Investor Class | | | | (3,428,809 | ) | | | | (138,569,477 | ) | | | | (4,353,783 | ) | | | | (163,107,200 | ) |
Class A* | | | | (218,056 | ) | | | | (8,727,265 | ) | | | | (101,171 | ) | | | | (3,836,885 | ) |
Class I1 | | | | (3,430,158 | ) | | | | (137,998,297 | ) | | | | (2,320,081 | ) | | | | (87,695,516 | ) |
Class R1** | | | | (1,079 | ) | | | | (42,895 | ) | | | | — | | | | | — | |
Class R2** | | | | (176 | ) | | | | (7,184 | ) | | | | — | | | | | — | |
Class Y** | | | | (850 | ) | | | | (33,387 | ) | | | | — | | | | | — | |
| | | | | | | | | | | | | | | | | | | | |
Total increase in net assets from capital share transactions | | | | 8,833,347 | | | | $ | 354,655,513 | | | | | 7,273,142 | | | | $ | 272,231,993 | |
| | | | | | | | | | | | | | | | | | | | |
| * | Class A shares commenced operations on January 27, 2014. |
| ** | Class R1 shares, Class R2 shares and Class Y shares commenced operations on November 25, 2014. |
| (7) | Investment Transactions |
The aggregate purchases and sales of securities, excluding short-term investments, for the Fund for the year ended November 30, 2015, were $560,198,496 and $217,028,219, respectively. There were no purchases or sales of U.S. government securities for the Fund.
24
SMEAD VALUE FUND
Notes to Financial Statements (Continued)
November 30, 2015
The beneficial ownership, either directly or indirectly, of more than 25% of the voting securities of a fund creates a presumption of control of the fund, under Section 2(a)(9) of the 1940 Act. At November 30, 2015, National Financial Services LLC, for the benefit of its customers, held 39.40% of the outstanding shares of the Investor Class. At November 30, 2015, Merrill Lynch Pierce Fenner & Smith for the benefit of its customers, held 31.83%, 61.11%, 99.03% and 99.66% of outstanding shares of the Class A, Class I1, Class R1 and Class R2, respectively. At November 30, 2015, Mid Atlantic Trust Company, the 401k service provider for Smead Capital Management Inc., for the benefit of employees of Smead Capital Management Inc., held 93.60% of outstanding shares of the Class Y.
Management has evaluated the possibility of subsequent events through the date of issuance and determined that there are no material events that would require adjustment to or disclosure in the Fund’s financial statements.
25
SMEAD VALUE FUND
Report of Independent Registered Public Accounting Firm
To the Shareholders of Smead Value Fund and
Board of Trustees of Smead Funds Trust
We have audited the accompanying statement of assets and liabilities, including the schedule of investments, of Smead Funds Trust comprising Smead Value Fund (the “Fund”) as of November 30, 2015, and the related statement of operations for the year then ended, the statements of changes in net assets for each of the two years in the period then ended, and the financial highlights for each of the five years in the period then ended. These financial statements and financial highlights are the responsibility of the Fund’s management. Our responsibility is to express an opinion on these financial statements and financial highlights based on our audits.
We conducted our audits in accordance with the standards of the Public Company Accounting Oversight Board (United States). Those standards require that we plan and perform the audit to obtain reasonable assurance about whether the financial statements and financial highlights are free of material misstatement. An audit includes examining, on a test basis, evidence supporting the amounts and disclosures in the financial statements. Our procedures included confirmation of securities owned as of November 30, 2015, by correspondence with the custodian. An audit also includes assessing the accounting principles used and significant estimates made by management, as well as evaluating the overall financial statement presentation. We believe that our audits provide a reasonable basis for our opinion.
In our opinion, the financial statements and financial highlights referred to above present fairly, in all material respects, the financial position of Smead Value Fund as of November 30, 2015, the results of its operations for the year then ended, the changes in its net assets for each of the two years in the period then ended, and the financial highlights for each of the five years in the period then ended, in conformity with accounting principles generally accepted in the United States of America.

COHEN FUND AUDIT SERVICES, LTD.
Cleveland, Ohio
January 28, 2016
26
SMEAD VALUE FUND
Notice of Privacy Policy & Practices
We collect non-public personal information about you from the following sources:
| • | | information we receive about you on applications or other forms; |
| • | | information you give us orally; and |
| • | | information about your transactions with us or others. |
We do not disclose any non-public personal information about our shareholders or former shareholders without the shareholder’s authorization, except as permitted by law or in response to inquiries from governmental authorities. We may share information with affiliated parties and unaffiliated third parties with whom we have contracts for servicing the Fund. We will provide unaffiliated third parties with only the information necessary to carry out their assigned responsibility. All shareholder records will be disposed of in accordance with applicable law. We maintain physical, electronic and procedural safeguards to protect your non-public personal information and require third parties to treat your non-public personal information with the same high degree of confidentiality.
In the event that you hold shares of the Fund through a financial intermediary, including, but not limited to, a broker-dealer, bank or trust company, the privacy policy of your financial intermediary would govern how your non-public personal information would be shared with unaffiliated third parties.
27
SMEAD VALUE FUND
Additional Information (Continued)
(Unaudited)
Tax Information
The Fund designated 100% of its ordinary income distribution for the year ended November 30, 2015, as qualified dividend income under the Jobs and Growth Tax Relief Reconciliation Act of 2003.
For the year ended November 30, 2015, 100% of dividends paid from net ordinary income qualified for the dividends received deduction available to corporate shareholders.
Indemnifications
Under the Trust’s organizational documents, its officers and trustees are indemnified against certain liabilities arising out of the performance of their duties to the Fund. In addition, in the normal course of business, the Fund enters into contracts that provide general indemnifications to other parties. The Fund’s maximum exposure under these arrangements is unknown as this would involve future claims that may be made against the Fund that have not yet occurred. However, the Fund has not had prior claims or losses pursuant to these contracts and expects the risk of loss to be remote.
Information about Trustees
The business and affairs of the Trust are managed under the direction of the Board of Trustees. Information pertaining to the Trustees of the Trust is set forth below. The Statement of Additional Information includes additional information about the Trustees and is available, without charge, upon request by calling 877-807-4122.
| | | | | | | | | | |
Independent Trustees |
Name and Age | | Position(s)
Held with
the Trust | | Term of Office and Length of Time Served | | Number of
Portfolios
in Trust
Overseen
by Trustee | | Principal
Occupation(s)
During the Past
Five Years | | Other Directorships
Held by
Trustee
During the Past
Five Years |
| | | | | |
Gregory A. Demopulos(1) Age: 56 | | Trustee | | Indefinite Term; Since September 2014 | | 1 | | Chairman and Chief Executive Officer, Omeros Corp. (biopharmaceutical company) (since 1994). | | Director, Onconome, Inc. (since 2004). |
| | | | | |
Peter M. Musser(1) Age: 58 | | Trustee | | Indefinite Term; Since September 2014 | | 1 | | Principal, Angeline Properties, LLC (a private investment firm) (since 2014); and Principal and Senior Equity Portfolio Manager with Rainier Investment Management (from 1994 to 2013). | | Trustee, Lawrence University (since 2012); Trustee, Berry College (since 2010); and Director, Boys and Girls Clubs of King County (since 2008). |
28
SMEAD VALUE FUND
Additional Information (Continued)
(Unaudited)
| | | | | | | | | | |
Name and Age | | Position(s)
Held with
the Trust | | Term of Office and Length of Time Served | | Number of
Portfolios
in Trust
Overseen
by Trustee | | Principal
Occupation(s)
During the Past
Five Years | | Other Directorships
Held by
Trustee
During the Past
Five Years |
| | | | | |
Walter F. Walker(1) Age: 60 | | Trustee | | Indefinite Term; Since September 2014 | | 1 | | Principal, Hana Road Capital LLC (hedge fund) (since 2007). | | Advisory Council, Stone Arch Capital (since 2005). |
| | | | | |
Nancy A. Zevenbergen(1) Age: 56 | | Trustee | | Indefinite Term; Since September 2014 | | 1 | | Founder and Chief Investment Officer, Zevenbergen Capital Investments LLC (since 1987). | | Director, Seattle Pacific Foundation (since 1993); Director, Anduin Foundation (since 2010); and Director, evenstar3 Inc. (since 2005). |
| | |
Interested Trustees and Officers | | | | |
| | | | | |
William W. Smead(1)(2) Age: 57 | | Trustee, Chairman, President and Chief Executive Officer | | Indefinite Term; Since September 2014 | | 1 | | Chief Investment Officer of the Adviser (since 2007). | | None. |
| | | | | |
Cole W. Smead(1)(2) Age: 31 | | Trustee, Treasurer, Principal Financial and Accounting Officer | | Indefinite Term; Since September 2014 | | 1 | | Managing Director of the Adviser (since 2007). | | None. |
29
| | | | | | | | | | |
Name and Age | | Position(s)
Held with
the Trust | | Term of Office and Length of Time Served | | Number of
Portfolios
in Trust
Overseen
by Trustee | | Principal
Occupation(s)
During the Past
Five Years | | Other Directorships
Held by
Trustee
During the Past
Five Years |
| | | | | |
Steven J. LeMire(1) Age: 46 | | Chief Compliance Officer | | Indefinite Term; Since September 2014 | | N/A | | Chief Compliance Officer of the Adviser (since 2014); Relationship Manager with Viceroy Investment Advisors, LLC (from 2013 to 2014); Co-Founder and Managing Principal of HCL Advisors, LLC (from 2012 to 2013); Senior Manager and Director at UBS Global AM-Americas and served as Vice President and Assistant Treasurer (from 2007 to 2011). | | N/A |
| | | | | |
Lisa Martin(1) Age: 54 | | Secretary | | Indefinite Term; Since September 2014 | | N/A | | Chief Operating Officer/Chief Financial Officer of the Adviser (since 2007). | | N/A |
| (1) | This persons business address is 600 University Street, Suite 2412, Seattle, WA 98101. |
| (2) | Mr. William Smead and Mr. Cole Smead are each deemed to be an “interested person” of the Fund under the 1940 Act because of their positions with Smead Capital Management, Inc. |
30
A NOTE ON FORWARD LOOKING STATEMENTS (Unaudited)
Except for historical information contained in this report for the Fund, the matters discussed in this report may constitute forward-looking statements made pursuant to the safe-harbor provisions of the Private Securities Litigation Reform Act of 1995. These include any adviser or portfolio manager predictions, assessments, analyses or outlooks for individual securities, industries, market sectors and/or markets. These statements involve risks and uncertainties. In addition to the general risks described for the Fund in the current Prospectus, other factors bearing on this report include the accuracy of the Adviser’s or portfolio managers’ forecasts and predictions, and the appropriateness of the investment programs designed by the adviser or portfolio managers to implement their strategies efficiently and effectively. Any one or more of these factors, as well as other risks affecting the securities markets and investment instruments generally, could cause the actual results of the Fund to differ materially as compared to benchmarks associated with the Fund.
ADDITIONAL INFORMATION (Unaudited)
The Fund has adopted proxy voting policies and procedures that delegate to the Adviser the authority to vote proxies. A description of the Fund’s proxy voting policies and procedures is available without charge, upon request, by calling the Fund toll free at 877-807-4122. A description of these policies and procedures is also included in the Fund’s Statement of Additional Information, which is available on the SEC’s website at http://www.sec.gov.
The Fund’s proxy voting record for the most recent 12-month period ended June 30 is available without charge, upon request, by calling, toll free, 877-807-4122, or by accessing the SEC’s website at http://www.sec.gov.
The Fund files its complete schedule of portfolio holdings with the SEC four times each fiscal year at quarter-ends. The Fund files the schedule of portfolio holdings with the SEC on Form N-CSR (second and fourth quarters) and on Form N-Q (first and third quarters). Shareholders may view the Fund’s Forms N-CSR and N-Q on the SEC’s website at www.sec.gov. Forms N-CSR and N-Q may also be reviewed and copied at the SEC’s Public Reference Room in Washington, D.C. Information on the SEC’s Public Reference Room may be obtained by calling 1-202-551-8090 (direct) or 1-800-SEC-0330 (general SEC number).
HOUSEHOLDING (Unaudited)
In an effort to decrease costs, the Fund intends to reduce the number of duplicate prospectuses and annual and semi-annual reports you receive by sending only one copy of each to those addresses shared by two or more accounts and to shareholders the Fund reasonably believes are from the same family or household. Once implemented, if you would like to discontinue householding for your accounts, please call toll-free at 877-807-4122 to request individual copies of these documents. Once the Fund receives notice to stop householding, the Fund will begin sending individual copies 30 days after receiving your request. This policy does not apply to account statements.
SMEAD VALUE FUND
| | |
| |
Investment Adviser | | Smead Capital Management, Inc. 600 University Street, Suite 2412 Seattle, Washington 98101 |
| |
Legal Counsel | | Godfrey & Kahn, S.C. 780 North Water Street Milwaukee, Wisconsin 53202 |
| |
Independent Registered Public Accounting Firm | | Cohen Fund Audit Services, Ltd. 1350 Euclid Avenue Suite 800 Cleveland, Ohio 44115 |
| |
Custodian, Fund Accountant and Fund Administrator | | State Street Bank and Trust Company One Lincoln Street Boston, Massachusetts 02111 |
| |
Transfer Agent | | Boston Financial Data Services, Inc. 2000 Crown Colony Drive Quincy, Massachusetts 02169 |
| |
Distributor | | ALPS Distributors, Inc. 1290 Broadway Suite 1100 Denver, Colorado 80203 |
This report is intended for shareholders of the Fund and may not be used as sales literature unless preceded or accompanied by a current prospectus.
Item 2. Code of Ethics.
| (a) | As of November 30, 2015, the Registrant had adopted a code of ethics, as defined in Item 2(b) of Form N-CSR, that applies to the Registrant’s principal executive officer, principal financial officer, principal accounting officer or controller, or persons performing similar functions (the “Code of Ethics”). |
| (c) | There have been no amendments to the Registrant’s Code of Ethics during the reporting period for this form N-CSR. |
| (d) | During the period covered by the report, the Registrant did not grant any waivers to the provisions of the Code of Ethics. |
| (f) | The Code of Ethics is included with this Form N-CSR as Exhibit 12(a)(1). |
Item 3. Audit Committee Financial Expert.
| (a)(1) | The Registrant’s Board of Trustees has determined that there is at least one member who qualifies as an “Audit Committee Financial Expert” serving on its Audit Committee. |
| (a)(2) | Mr. Walter F. Walker and Mr. Peter M. Musser serve as the “Audit Committee Financial Experts” and are considered to be “Independent Trustees” as each term is defined in Item 3 of Form N-CSR. |
Item 4. Principal Accountant Fees and Services.
On November 21, 2014, the Registrant was the accounting and performance survivor in a reorganization with Smead Value Fund (the “Predecessor Fund”), a series of the Trust for Professional Managers. Fees paid for periods prior to November 21, 2014 were for services rendered to the Predecessor Fund.
| | | | | | | | |
| Fiscal Year Ended | | (a) Audit Fees | | (b) Audit-Related Fees | | (c)1 Tax Fees | | (d) All Other Fees |
November 30, 2015 | | $15,000 | | $ - | | $3,000 | | $ - |
November 30, 2014 | | $15,550 | | $ - | | $3,500 | | $ - |
1 The Tax Fees are the aggregate fees billed for professional services rendered by Cohen Fund Audit Services, Ltd. for the review of Form 1120-RIC, Form 8613, and review of excise tax distribution calculations.
| (e)(1) | Audit Committee Pre-Approval Policies and Procedures. The Registrant’s Audit Committee pre-approves all audit and non-audit services to be performed by the Registrant’s accountant before the accountant is engaged by the Registrant to perform such services. |
| (e)(2) | The percentage of services described in each of paragraphs (b) through (d) of this Item that were approved by the Audit Committee pursuant to paragraph (c)(7)(i)(C) and (c)(7)(ii) of Rule 2-01 of Regulation S-X are as follows: None. |
| (g) | There were no non-audit fees billed by Registrant’s accountant for the Registrant’s fiscal years ended November 30, 2015 and November 30, 2014. |
Item 5. Audit Committee of Listed Registrants.
Not applicable.
Item 6. Investments.
| (a) | Included as part of the Report to Shareholders under Item 1 of this Form N-CSR. |
Item 7. Disclosure of Proxy Voting Policies and Procedures for Closed-End Management Investment Companies.
Not applicable.
Item 8. Portfolio Managers of Closed-end Management Investment Companies.
Not applicable.
Item 9. Purchases of Equity Securities by Closed-End Management Investment Company and Affiliated Purchasers.
Not applicable.
Item 10. Submission of Matters to a Vote of Security Holders.
During the period ended November 30, 2015, there were no material changes to the procedures by which shareholders may recommend nominees to the Registrant’s Board of Trustees.
Item 11. Controls and Procedures.
| (a) | The Registrant’s principal executive and principal financial officers, or persons performing similar functions, have concluded that the Registrant’s disclosure controls and procedures (as defined in Rule 30a-3(c) under the Investment Company Act of 1940 (the “Act”)) are effective, as of a date within 90 days of the filing date of this Form N-CSR, based on the evaluation of these controls and procedures required by the Act and under the Securities Exchange Act of 1934. |
| (b) | There were no changes in the Registrant’s internal control over financial reporting (as defined in Rule 30a-3(d) under the Act) that occurred during the second fiscal quarter of the period covered by this report that have materially affected, or is reasonably likely to materially affect, the Registrant’s internal control over financial reporting. |
Item 12. Exhibits.
| | |
(a)(1) | | The Code of Ethics of the Registrant for the period covered by this report as required pursuant to Item 2 of this Form N-CSR is filed herewith. |
| |
(a)(2) | | Certifications of the Registrant pursuant to Rule 30a-2(a) under the Act are filed herewith. |
| |
(a)(3) | | Not Applicable. |
| |
(b) | | Certifications of the Registrant pursuant to Rule 30a-2(b) under the Act are furnished herewith. |
SIGNATURES
Pursuant to the requirements of the Securities Exchange Act of 1934 and the Investment Company Act of 1940, the Registrant has duly caused this report to be signed on its behalf by the undersigned, thereunto duly authorized.
| | |
| Smead Funds Trust |
|
| By: /s/ Cole W. Smead |
| Cole W. Smead |
| President |
| (Principal Executive Officer) |
Date: February 4, 2016
Pursuant to the requirements of the Securities Exchange Act of 1934 and the Investment Company Act of 1940, this report has been signed below by the following persons on behalf of the Registrant and in the capacities and on the dates indicated.
| | |
| By: /s/ Cole W. Smead |
| Cole W. Smead |
| President |
| (Principal Executive Officer) |
|
Date: February 4, 2016 |
|
| By: /s/ Steven J. LeMire |
| Steven J. LeMire |
| Treasurer |
| (Principal Financial Officer) |
|
Date: February 4, 2016 |