UNITED STATES
SECURITIES AND EXCHANGE COMMISSION
Washington, D.C. 20549
FORMN-CSR
CERTIFIED SHAREHOLDER REPORT OF
REGISTERED MANAGEMENT INVESTMENT COMPANIES
Investment Company Act file number:811-22985
SMEAD FUNDS TRUST
(Exact name of registrant as specified in charter)
1001 Fourth Avenue, Suite 4305
Seattle, WA 98154
(Address of principal executive offices) (Zip code)
Cole W. Smead
Smead Capital Management, Inc.
1001 Fourth Avenue, Suite 4305
Seattle, WA 98154
Copy to:
Pamela M. Krill, Esq
Godfrey & Kahn, S.C.
833 East Michigan Street, Suite 1800
Milwaukee, WI 53202
(Name and address of agent for service)
Registrant’s telephone number, including area code: (877)701-2883
Date of fiscal year end: November 30
Date of reporting period: November 30, 2019
Item 1. Report to Shareholders.
2
Annual Report

November 30, 2019
Investment Adviser
Smead Capital Management, Inc.
1001 4th Avenue
Suite 4305
Seattle, Washington 98154
Phone:877-807-4122
www.smeadfunds.com
Beginning in March 2021 for the Fund, as permitted by regulations adopted by the Securities and Exchange Commission, paper copies of the reports from the Fund like this one will no longer be sent by mail, unless you specifically request paper copies of the reports from the Fund or from your financial intermediary, such as a broker-dealer or bank. Instead, the reports will be made available on a website available on the Fund’s website (https://smeadcap.com/smead-value-fund), and you will be notified by mail each time a report is posted and provided with a website link to access the report.
If you already elected to receive shareholder reports electronically, you will not be affected by this change and you need not take any action. If you invest through a financial intermediary, you may elect to receive shareholder reports and other communications electronically from the Fund by contacting your financial intermediary (such as a broker-dealer or bank). If you invest directly with the Fund, you will receive shareholder reports electronically beginning in March 2021.
You may elect to receive all future shareholder reports in paper free of charge. You can request to continue receiving paper copies of your shareholder reports by contacting your financial intermediary or, if you invest directly with the Fund, calling877-807-4122 to let the Fund know of your request. Your election to receive shareholder reports in paper will apply to all funds held with the Fund or through your financial intermediary.
Table of Contents
Dear Shareholders:
The 2019 fiscal year for the Smead Value Fund (SMVLX) started in a December swoon and ended with a very strong November. For the fiscal year, the Fund earned 12.38% versus a gain for the S&P 500 Index of 16.11% and a gain in the Russell 1000 Value Index of 11.33%. In the fiscal fourth quarter, the Fund earned 7.40% versus 7.86% for the S&P 500 Index and 8.26% for the Russell 1000 Value Index.
The popular FANG stocks (Facebook, Amazon, Netflix and Google) made a big comeback from their 2018 swoon and led to another year in the last ten of growth stock dominance. In the same way that the strength of the S&P 500 Index performance came from a bounce back from 2018, so did the performance of our portfolio on individual stocks. Our best performers were Target (TGT), NVR (NVR) and Lennar (LEN). Target enjoyed being underestimated by Amazon’s entry into the grocery business in 2017 to storm back as a winner in 2019. The home builders, NVR and Lennar, repeated their 2017 performance when they soared after being at the bottom of the 2018 teeter-totter ride.
On the downside was Walgreens (WBA), Occidental Petroleum (OXY) and Kroger (KR). Walgreens suffered from the wrath of mighty Amazon, who pushed themselves up on the teeter-totter by scaring everyone in the pharmacy business with their entry on a tiny scale. Occidental is a position we are building on the way down like we usually do, but so far their end of the board hasn’t hit the ground. We sold Kroger in 2019 because, in the two years we owned the stock, insiders never called their broker to buy. In our world of buying meritorious businesses at depressed prices, getting behind for a while comes with the territory, but if the people running the company aren’t willing to take risk on the shares, why should we?
Teeter-Totter Stock Market
One way of thinking about the share price of a common stock is the price range as a teeter-totter. When the psychology of investors is very negative, enthusiasm for the company hits the ground. On the other end, when everyone is in love with a company’s shares, their end of the board can’t seem to get any higher. Where is the board end hitting the ground currently and who is stuck up in the air on a psychological high?
A good way to track this psychological movement is through the lens of the weighting of various sectors of the S&P 500 Index over long periods. Below is a chart of the S&P 500 weighting in energy all the way back to 1990:
1
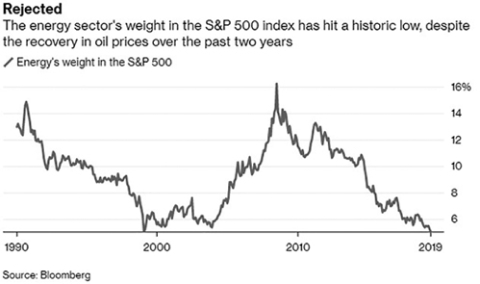
To say that energy is bumping along the ground from a psychological standpoint would be a massive understatement. On our playground at school in the 1960s and 1970s, energy would be digging a hole in the ground.
The opposite of this comes in the technology sector of the S&P 500 Index, which isn’t traceable for the last ten years. In 1999 at the end of the year, tech was 35% of the S&P 500 Index. Since then, Amazon, Netflix, Facebook and Alphabet/Google have conveniently been moved to the consumer discretionary and communications services category of the S&P 500 Index. If you add them back in to tech, you realize that index investors are as committed to tech today as they were in 1999 at well more than 30% of the index.
In defense of buy and hold investors, the stock market teeter-totter actually sits on historically-rising ground. As companies succeed in growing their business, profits, free cash flow and their moat, the swing from ground to airborne starts from progressively higher and higher ground levels. Remember, Warren Buffett says, “My favorite holding period is forever!”
However, for the discerning value manager like Smead Capital Management, we want to enter participation when the psychological situation is grounded, which runs the risk of digging a temporary hole. After all, Jesse Livermore, considered to be the greatest stock market operator of the 1920s said, “Only liars buy right at the bottom!”
2
We would toss out the idea that, if long-term bonds had a teeter-totter, it would be the interest rate chart of the last 50 years below:
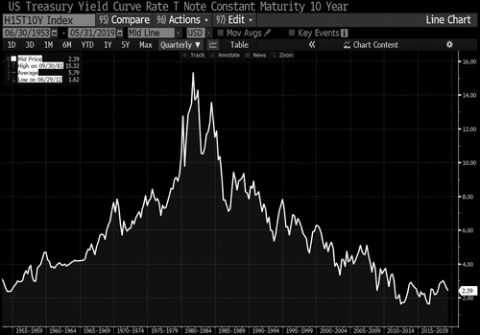
Source: Bloomberg.
Treasury bonds are stuck at the top of the teeter-totter board and don’t have the future growth in profits, free cash flow and moat to overcome serious over-valuation.
Putting this together, we believe the teeter-totter is high on tech stocks and long-term bonds and very low on energy and other inflation beneficiaries. We bought shares of OXY and Macerich (MAC), an owner of Class A entertainment malls in large U.S. metropolitan areas. Ironically, some very outspoken investors are mad that the leaders of OXY traded expensive long-term debt for ownership of Anadarko Petroleum. The debt is at the top of the teeter-totter and oil assets in the ground are at the bottom. If/when investors see the next wave ofun-seeable inflation the next five years, we believe they will buy shares of asset-heavy companies and push that end of the board higher.
On the other hand, inflation would reduce the value of future profits and reduceprice-to-earnings multiples on growth stocks. This would drop their seats toward the ground. Simultaneously, a jump in inflation and interest rates would send bond investors into a free-fall.
3
In conclusion, rely on us at the Smead Value Fund to shop for what we believe to be wonderful companies when they are stuck on the low end of the teeter-totter. We thank our shareholders and partners for the privilege of your ongoing trust.
Warmest regards,
| | | | |
 | |  | |  |
William Smead Lead Portfolio Manager | | Tony Scherrer, CFA Co-Portfolio Manager | | Cole Smead, CFA Co-Portfolio Manager |
The information contained herein represents the opinion of Smead Capital Management and is not intended to be a forecast of future events, a guarantee of future results, nor investment advice.
The Smead Value Fund’s investment objective, risks, charges and expenses must be considered carefully before investing. The statutory and summary prospectuses contain this and other important information about the Fund, and it may be obtained by calling877-807-4122, or visiting www.smeadfunds.com. Read it carefully before investing.
Past performance is not a guarantee of future results.
The information provided herein represents the opinion of Smead Capital Management, Inc. and is not intended to be a forecast of future events, a guarantee of future results, nor investment advice.
Must be preceded or accompanied by a prospectus.
Mutual fund investing involves risk. Principal loss is possible.
Fund holdings are subject to change at any time and should not be considered recommendations to buy or sell any security. Please refer to the Schedule of Investments in this report for a complete list of Fund holdings as of the date of this report.
Free cash flow (FCF) is a measure of how much cash a business generates after accounting for capital expenditures such as buildings or equipment. Moat refers to a business’ ability to maintain competitive advantages over its competitors in order to protect its long-term profits and market share from competing firms. Treasury Bonds is a marketable U.S. government debt security with a fixed interest rate and a maturity between 10 and 30 years. Theprice-to-earnings ratio (P/E ratio) is the ratio for valuing a company that measures its current share price relative to itsper-share earnings (EPS). Theprice-to-earnings ratio is also sometimes known as the price multiple or the earnings multiple.
The S&P 500® Index is a broad based unmanaged index of 500 stocks, which is widely recognized as representative of the equity market in general. Standard & Poor’s®, S&P®, S&P 500® and Standard & Poor’s 500® are trade names or trademarks of Standard & Poor’s Financial Services, LLC. The Russell 1000® Value Index measures the performance of those Russell 1000® companies with lowerprice-to book ratios and lower forecasted growth values. Frank Russell Company is the source and owner of the trademarks, service marks and copyrights related to the Russell Indexes. Russell® is a trademark of Russell Investment Group. You cannot invest directly in an index.
4
SMEAD VALUE FUND
Expense Example
(Unaudited)
As a shareholder of the Fund, you incur two types of costs: (1) transaction costs, including sales charges (loads) on purchase payments and (2) ongoing costs, including management fees, distribution(12b-1) fees, shareholder servicing fees and other Fund expenses. This Example is intended to help you understand your ongoing costs (in dollars) of investing in the Fund, and to compare these costs with the ongoing costs of investing in other mutual funds. The Example is based on an investment of $1,000 invested at the beginning of the period and held for the entire period as indicated below.
Actual Expenses
The second and fourth columns of the following table provides information about actual account values and actual expenses of each Class of the Fund. If you purchase Class A shares of the Fund you will pay a maximum initial sales charge of 5.75% when you invest. Class A shares are also subject to a contingent deferred sales charge of 1.00% for purchases of $1,000,000 or more that are redeemed within eighteen months of purchase. In addition, you will be assessed fees for outgoing wire transfers, returned checks and stop payment orders at prevailing rates charged by UMB Fund Services, Inc., the Fund’s transfer agent. To the extent the Fund invests in shares of exchange traded funds (“ETFs”) or other investment companies as part of its investment strategy, you will indirectly bear your proportionate share of any fees and expenses charged by the underlying funds in which the Fund invests in addition to the expenses of the Fund. Actual expenses of the underlying funds are expected to vary among the various underlying funds. These expenses are not included in the Example. The Example includes, but is not limited to, advisory fees, fund administration and accounting, custody and transfer agent fees. You may use the information in the first column, together with the amount you invested, to estimate the expenses that you paid over the period. Simply divide your account value by $1,000 (for example, an $8,600 account value divided by $1,000 = 8.6), then multiply the result by the applicable number under the column entitled “Actual Expenses Paid During Period” to estimate the expenses you paid on your account during this period.
Hypothetical Example for Comparison Purposes
The third and fifth column of the table provides information about hypothetical account values and hypothetical expenses based on the Fund’s actual expense ratio and an assumed rate of return of 5% per year before expenses, which is not the Fund’s actual return. The hypothetical account values and expenses may not be used to estimate the actual ending account balance or expenses you paid for the period. You may use this information to compare the ongoing costs of investing in the Fund and other funds. To do so, compare this 5% hypothetical example with the 5% hypothetical examples that appear in the shareholder reports of other funds. Please note that the expenses shown in the table are meant to highlight your ongoing costs only and do not reflect any transactional costs, such as sales charges (loads), redemption fees or exchange fees. Therefore, the third column of the table is useful in comparing ongoing costs only, and will not help you determine the relative total costs of owning different funds. In addition, if these transactional costs were included, your costs would have been higher.
5
SMEAD VALUE FUND
Expense Example (Continued)
(Unaudited)
| | | | | | | | | | | | | | | | | | | | | | | | | | | | | | |
| | | Beginning
Account
Value
6/1/19 | | Actual
Ending
Account
Value
11/30/19 | | Hypothetical
Ending
Account
Value | | Actual
Expense
Paid
During
Period(1) | | Hypothetical
Expenses
Paid During
Period(1) | | Net
Expense
Ratio
During
Period(2) |
Investor Class | | | $ | 1,000.00 | | | | $ | 1,155.80 | | | | $ | 1,018.95 | | | | $ | 6.59 | | | | $ | 6.17 | | | | | 1.22 | % |
Class A | | | | 1,000.00 | | | | | 1,155.80 | | | | | 1,018.95 | | | | | 6.59 | | | | | 6.17 | | | | | 1.22 | |
Class I1 | | | | 1,000.00 | | | | | 1,157.30 | | | | | 1,020.26 | | | | | 5.19 | | | | | 4.86 | | | | | 0.96 | |
Class R1 | | | | 1,000.00 | | | | | 1,153.90 | | | | | 1,017.45 | | | | | 8.21 | | | | | 7.69 | | | | | 1.52 | |
Class R2 | | | | 1,000.00 | | | | | 1,154.30 | | | | | 1,017.85 | | | | | 7.78 | | | | | 7.28 | | | | | 1.44 | |
Class Y | | | | 1,000.00 | | | | | 1,157.80 | | | | | 1,020.86 | | | | | 4.54 | | | | | 4.26 | | | | | 0.84 | |
| (1) | Investor Class, Class A, Class I1, Class R1, Class R2 and Class Y expenses are calculated using each Class’ annualized net expense ratio (as disclosed), multiplied by the average account value over the period, and multiplied by 183/365 (to reflect the most recentone-half year period). |
6
SMEAD VALUE FUND
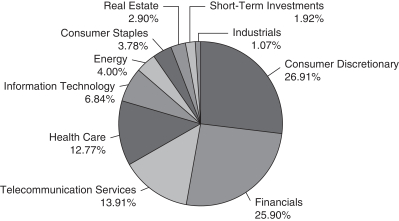
Investment Highlights
(Unaudited)
The Fund seeks long-term capital appreciation through concentrated positions. Therefore, the Fund maintains approximately25-30 companies in its portfolio. The Fund invests in U.S. large capitalization companies through ownership of common stock.
Sector Breakdown
(% of Investments as of November 30, 2019)
Continued
7
SMEAD VALUE FUND
Investment Highlights (Continued)
(Unaudited)
Average Annual Total Returns for the period ended
November 30, 2019
| | | | | | | | | | | | | | | | | | | | | | | | | |
| | | Inception
Date | | 1 Year | | 5 Years | | 10 Years | | Since
Inception |
Smead Value Fund – Investor Class | | | | 1/2/2008 | | | | | 12.38% | | | | | 9.41% | | | | | 14.17% | | | | | 8.91% | |
| | | | | |
Smead Value Fund – Class A | | | | 1/27/2014 | | | | | 12.35% | | | | | 9.45% | | | | | N/A | | | | | 10.72% | |
| | | | | |
Smead Value Fund – Class I1 | | | | 12/18/2009 | | | | | 12.67% | | | | | 9.71% | | | | | N/A | | | | | 14.35% | |
| | | | | |
Smead Value Fund – Class R1 | | | | 11/25/2014 | | | | | 12.01% | | | | | 9.11% | | | | | N/A | | | | | 9.24% | |
| | | | | |
Smead Value Fund – Class R2 | | | | 11/25/2014 | | | | | 12.12% | | | | | 9.89% | | | | | N/A | | | | | 10.02% | |
| | | | | |
Smead Value Fund – Class Y | | | | 11/25/2014 | | | | | 12.81% | | | | | 9.87% | | | | | N/A | | | | | 10.00% | |
| | | | | |
S&P 500® Index (Total Return) | | | | | | | | | 16.11% | | | | | 10.98% | | | | | 13.44% | | | | | 8.89% | |
| | | | | |
Russell 1000® Value Index (Total Return) | | | | | | | | | 11.33% | | | | | 7.83% | | | | | 11.69% | | | | | 7.02% | |
Performance data quoted represents past performance and does not guarantee future results. The investment return and principal value of an investment will fluctuate so that an investor’s shares, when redeemed, may be worth more or less than their original cost. Current performance of the Fund may be lower or higher than the performance quoted. Performance data current to the most recent month end may be obtained by calling877-807-4122.
Investment performance reflects fee waivers in effect. In the absence of such waivers, total returns would be reduced.
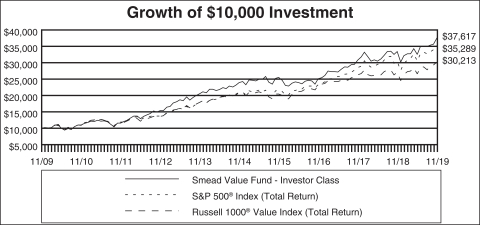
The returns shown assume reinvestment of Fund distributions and do not reflect the deduction of taxes that a shareholder would pay on Fund distributions or the redemption of Fund shares. The following graph illustrates performance of a hypothetical investment made in the Fund and broad-based securities indices on the Fund’s inception date. The graph does not reflect any future performance.
The S&P 500® Index is a broad based unmanaged index of 500 stocks, which is widely recognized as representative of the equity market in general.
Standard & Poor’s®, S&P®, S&P 500® and Standard & Poor’s 500® are trade names or trademarks of Standard & Poor’s Financial Services, LLC.
The Russell 1000® Value Index measures the performance of those Russell 1000® companies with lowerprice-to-book ratios and lower forecasted growth values.
Frank Russell Company is the source and owner of the trademarks, service marks and copyrights related to the Russell Indexes. Russell® is a trademark of Russell Investment Group.
One cannot invest directly in an index.
Continued
8
SMEAD VALUE FUND
Investment Highlights (Continued)
(Unaudited)
Continued
9
SMEAD VALUE FUND
|
| Schedule of Investments |
|
| November 30, 2019 |
| | | | | | | | | | |
| | | Shares | | Value |
COMMON STOCKS 97.94% | | | | | | | | | | |
| | |
Banks 12.60% | | | | | | | | | | |
Bank of America Corp. | | | | 1,748,245 | | | | $ | 58,251,523 | |
JPMorgan Chase & Co. | | | | 480,056 | | | | | 63,252,179 | |
Wells Fargo & Co. | | | | 820,892 | | | | | 44,705,778 | |
| | | | | | | | | | |
| | | | | | | | | 166,209,480 | |
| | | | | | | | | | |
| | |
Capital Goods 1.06% | | | | | | | | | | |
Cummins, Inc. | | | | 76,730 | | | | | 14,030,848 | |
| | | | | | | | | | |
| | |
Consumer Durables & Apparel 10.90% | | | | | | | | | | |
Lennar Corp. – Class A | | | | 859,124 | | | | | 51,246,746 | |
NVR, Inc. (a) | | | | 24,401 | | | | | 92,525,908 | |
| | | | | | | | | | |
| | | | | | | | | 143,772,654 | |
| | | | | | | | | | |
| | |
Consumer Services 1.12% | | | | | | | | | | |
Starbucks Corp. | | | | 173,685 | | | | | 14,837,910 | |
| | | | | | | | | | |
| | |
Diversified Financials 9.42% | | | | | | | | | | |
American Express Co. | | | | 625,113 | | | | | 75,088,574 | |
Berkshire Hathaway, Inc. – Class B (a) | | | | 223,128 | | | | | 49,155,098 | |
| | | | | | | | | | |
| | | | | | | | | 124,243,672 | |
| | | | | | | | | | |
| | |
Energy 3.99% | | | | | | | | | | |
Occidental Petroleum Corp. | | | | 1,366,495 | | | | | 52,705,712 | |
| | | | | | | | | | |
| | |
Food & Staples Retailing 3.77% | | | | | | | | | | |
Walgreens Boots Alliance, Inc. | | | | 835,205 | | | | | 49,778,218 | |
| | | | | | | | | | |
| | |
Insurance 3.85% | | | | | | | | | | |
Aflac, Inc. | | | | 926,293 | | | | | 50,797,908 | |
| | | | | | | | | | |
| | |
Media & Entertainment 13.89% | | | | | | | | | | |
Comcast Corp. – Class A | | | | 915,252 | | | | | 40,408,376 | |
Discovery, Inc. – Class A (a) | | | | 2,593,807 | | | | | 85,440,002 | |
Walt Disney Co. | | | | 379,101 | | | | | 57,464,130 | |
| | | | | | | | | | |
| | | | | | | | | 183,312,508 | |
| | | | | | | | | | |
| | |
Pharmaceuticals, Biotechnology & Life Sciences 12.75% | | | | | | | | | | |
Amgen, Inc. | | | | 368,661 | | | | | 86,532,110 | |
Merck & Co., Inc. | | | | 539,860 | | | | | 47,064,995 | |
Pfizer, Inc. | | | | 899,592 | | | | | 34,652,284 | |
| | | | | | | | | | |
| | | | | | | | | 168,249,389 | |
| | | | | | | | | | |
The accompanying notes are an integral part of these financial statements.
10
SMEAD VALUE FUND
|
| Schedule of Investments (Continued) |
|
| November 30, 2019 |
| | | | | | | | | | |
| | | Shares | | Value |
| | |
Real Estate 2.90% | | | | | | | | | | |
Macerich Co. (The) – REIT | | | | 1,421,176 | | | | $ | 38,272,270 | |
| | | | | | | | | | |
| | |
Retailing 14.86% | | | | | | | | | | |
Booking Holdings, Inc. (a) | | | | 6,737 | | | | | 12,827,450 | |
eBay, Inc. | | | | 881,792 | | | | | 31,321,252 | |
Home Depot, Inc. | | | | 249,660 | | | | | 55,052,527 | |
Target Corp. | | | | 774,432 | | | | | 96,811,744 | |
| | | | | | | | | | |
| | | | | | | | | 196,012,973 | |
| | | | | | | | | | |
| | |
Semiconductors & Semiconductor Equipment 2.79% | | | | | | | | | | |
Qualcomm, Inc. | | | | 440,866 | | | | | 36,834,354 | |
| | | | | | | | | | |
| | |
Software & Services 4.04% | | | | | | | | | | |
Accenture PLC – Class A (b) | | | | 192,300 | | | | | 38,683,068 | |
PayPal Holdings, Inc. (a) | | | | 134,940 | | | | | 14,574,869 | |
| | | | | | | | | | |
| | | | | | | | | 53,257,937 | |
| | | | | | | | | | |
TOTAL COMMON STOCKS (Cost $881,933,751) | | | | | | | | | 1,292,315,833 | |
| | | | | | | | | | |
| | |
SHORT-TERM INVESTMENTS 1.92% | | | | | | | | | | |
| | |
Money Market Fund 1.92% | | | | | | | | | | |
State Street Institutional U.S. Government Money Market – Premier Class 0.13% (c) | | | | 25,319,508 | | | | | 25,319,508 | |
| | | | | | | | | | |
TOTAL SHORT-TERM INVESTMENTS (Cost $25,319,508) | | | | | | | | | 25,319,508 | |
| | | | | | | | | | |
TOTAL INVESTMENTS (Cost $907,253,259) 99.86% | | | | | | | | | 1,317,635,341 | |
Other Assets in Excess of Liabilities 0.14% | | | | | | | | | 1,867,505 | |
| | | | | | | | | | |
TOTAL NET ASSETS 100.00% | | | | | | | | $ | 1,319,502,846 | |
| | | | | | | | | | |
| (a) | Non-income producing security. |
| (b) | Foreign issued security. |
| (c) | The rate shown is the1-month performance for the month ended November 30, 2019. |
The Global Industry Classification Standard (GICS®) was developed by and/or is the exclusive property of MSCI, Inc. (“MSCI”) and Standard & Poor Financial Services LLC (“S&P”). GICS® is a service mark of MSCI and S&P and has been licensed for use by Smead Capital Management, Inc.
The accompanying notes are an integral part of these financial statements.
11
SMEAD VALUE FUND
|
| Statement of Assets and Liabilities |
|
| November 30, 2019 |
| | | | | |
Assets | | | | | |
Investments, at value (cost $907,253,259) | | | $ | 1,317,635,341 | |
Receivable for Fund shares sold | | | | 127,133 | |
Dividends and interest receivable | | | | 3,537,492 | |
| | | | | |
Total Assets | | | | 1,321,299,966 | |
| | | | | |
| |
Liabilities | | | | | |
Payable for Fund shares redeemed | | | | 418,344 | |
Payable to Adviser | | | | 1,006,463 | |
Payable to Administrator | | | | 8,307 | |
Payable for distribution fees | | | | 48,009 | |
Payable for shareholder servicing fees | | | | 172,896 | |
Accrued expenses and other liabilities | | | | 143,101 | |
| | | | | |
Total Liabilities | | | | 1,797,120 | |
| | | | | |
Net Assets | | | $ | 1,319,502,846 | |
| | | | | |
| |
Net Assets Consist Of: | | | | | |
Paid-in capital | | | $ | 859,203,576 | |
Total distributable earnings (loss) | | | | 460,299,270 | |
| | | | | |
Net Assets | | | $ | 1,319,502,846 | |
| | | | | |
| |
Investor Class Shares | | | | | |
Net assets | | | | 117,804,833 | |
Shares of beneficial interest outstanding (unlimited number of shares authorized, $0.001 par value) | | | | 2,285,434 | |
Net asset value, offering price and redemption price per share | | | $ | 51.55 | |
| | | | | |
| |
Class A Shares | | | | | |
Net assets | | | | 119,180,543 | |
Shares of beneficial interest outstanding (unlimited number of shares authorized, $0.001 par value) | | | | 2,327,742 | |
Net asset value, offering price and redemption price per share(1) | | | $ | 51.20 | |
| | | | | |
Maximum offering price per share ($51.20/0.9425)(2) | | | $ | 54.32 | |
| | | | | |
| |
Class I1 Shares | | | | | |
Net assets | | | | 1,066,127,686 | |
Shares of beneficial interest outstanding (unlimited number of shares authorized, $0.001 par value) | | | | 20,642,229 | |
Net asset value, offering price and redemption price per share | | | $ | 51.65 | |
| | | | | |
The accompanying notes are an integral part of these financial statements.
12
SMEAD VALUE FUND
|
| Statement of Assets and Liabilities (Continued) |
|
| November 30, 2019 |
| | | | | |
| |
Class R1 Shares | | | | | |
Net assets | | | | 871,845 | |
Shares of beneficial interest outstanding (unlimited number of shares authorized, $0.001 par value) | | | | 17,277 | |
Net asset value, offering price and redemption price per share | | | $ | 50.46 | |
| | | | | |
| |
Class R2 Shares | | | | | |
Net assets | | | | 74,464 | |
Shares of beneficial interest outstanding (unlimited number of shares authorized, $0.001 par value) | | | | 1,420 | |
Net asset value, offering price and redemption price per share | | | $ | 52.43 | |
| | | | | |
| |
Class Y Shares | | | | | |
Net assets | | | | 15,443,475 | |
Shares of beneficial interest outstanding (unlimited number of shares authorized, $0.001 par value) | | | | 298,527 | |
Net asset value, offering price and redemption price per share | | | $ | 51.73 | |
| | | | | |
| (1) | A contingent deferred sales charge (“CDSC”) of 1.00% may be charged on shares redeemed within eighteen months of purchase. Redemption price per share is equal to net asset value less any redemption or CDSC fees. |
| (2) | Reflects a maximum sales charge of 5.75%. |
The accompanying notes are an integral part of these financial statements.
13
SMEAD VALUE FUND
|
| Statement of Operations |
|
| November 30, 2019 |
| | | | | |
Investment Income | | | | | |
Dividend income | | | $ | 22,642,869 | |
Interest income | | | | 634,810 | |
| | | | | |
Total Investment Income | | | | 23,277,679 | |
| | | | | |
| |
Expenses | | | | | |
Management fees | | | | 8,854,557 | |
Distribution fees – Investor Class | | | | 290,283 | |
Distribution fees – Class A | | | | 279,919 | |
Distribution fees – Class I3(1) | | | | 1 | |
Distribution fees – Class R1 | | | | 3,933 | |
Distribution fees – Class R2 | | | | 160 | |
Distribution fees – Class S(1) | | | | 3 | |
Shareholder servicing fees – Investor Class | | | | 153,185 | |
Shareholder servicing fees – Class A | | | | 147,844 | |
Shareholder servicing fees – Class I1 | | | | 1,093,383 | |
Shareholder servicing fees – Class R1 | | | | 1,528 | |
Shareholder servicing fees – Class R2 | | | | 25 | |
Administration fees | | | | 231,606 | |
Transfer agent fees and expenses | | | | 200,952 | |
Fund accounting fees | | | | 202,091 | |
Federal and state registration fees | | | | 206,733 | |
Custody fees | | | | 71,118 | |
Reports to shareholders | | | | 63,685 | |
Legal fees | | | | 104,199 | |
Audit and tax fees | | | | 19,445 | |
Trustees’ fees | | | | 130,046 | |
Other expenses | | | | 41,070 | |
| | | | | |
Total Expenses | | | | 12,095,766 | |
Expense Waiver by Adviser (Note 3) | | | | (2,541 | ) |
| | | | | |
Net Expenses | | | | 12,093,225 | |
| | | | | |
| |
Net Investment Income | | | | 11,184,454 | |
| | | | | |
| |
Realized and Unrealized Gain on Investments | | | | | |
Net realized gain from investments | | | | 40,806,135 | |
Change in net unrealized appreciation on investments | | | | 89,889,579 | |
| | | | | |
Net Realized and Unrealized Gain on Investments | | | | 130,695,714 | |
| | | | | |
Net Increase in Net Assets from Operations | | | $ | 141,880,168 | |
| | | | | |
| (1) | Class I3 shares and Class S shares liquidated at the close of business on March 22, 2019. |
The accompanying notes are an integral part of these financial statements.
14
SMEAD VALUE FUND
|
| Statements of Changes in Net Assets |
| | | | | | | | | | |
| | | Year Ended
November 30, 2019 | | Year Ended
November 30, 2018 |
From Operations | | | | | | | | | | |
Net investment income | | | $ | 11,184,454 | | | | $ | 7,971,740 | |
Net realized gain from investments | | | | 40,806,135 | | | | | 79,980,515 | |
Change in net unrealized appreciation
on investments | | | | 89,889,579 | | | | | 18,121,698 | |
| | | | | | | | | | |
Net increase in net assets from operations | | | | 141,880,168 | | | | | 106,073,953 | |
| | | | | | | | | | |
| | |
From Distributions | | | | | | | | | | |
Investor Class | | | | (8,575,782 | ) | | | | (6,844,729 | ) |
Class A | | | | (7,780,661 | ) | | | | (7,098,232 | ) |
Class I1 | | | | (60,404,012 | ) | | | | (43,681,051 | ) |
Class I3(1) | | | | (200 | ) | | | | — | |
Class R1 | | | | (50,814 | ) | | | | (77,076 | ) |
Class R2 | | | | (600 | ) | | | | (55,652 | ) |
Class S(1) | | | | (199 | ) | | | | — | |
Class Y | | | | (892,627 | ) | | | | (636,744 | ) |
| | | | | | | | | | |
Net decrease in net assets resulting from
distributions paid | | | | (77,704,895 | ) | | | | (58,393,484 | ) |
| | | | | | | | | | |
| | |
From Capital Share Transactions | | | | | | | | | | |
Proceeds from shares sold | | | | 308,757,473 | | | | | 242,573,761 | |
Issued in reinvestment of dividends
and distributions | | | | 42,244,900 | | | | | 27,708,127 | |
Payments for shares redeemed | | | | (333,178,883 | ) | | | | (313,572,364 | ) |
| | | | | | | | | | |
Net increase (decrease) in net assets from
capital share transactions | | | | 17,823,490 | | | | | (43,290,476 | ) |
| | | | | | | | | | |
Total Increase in Net Assets | | | | 81,998,763 | | | | | 4,389,993 | |
| | | | | | | | | | |
| | |
Net Assets | | | | | | | | | | |
Beginning of year | | | | 1,237,504,083 | | | | | 1,233,114,090 | |
| | | | | | | | | | |
End of year | | | $ | 1,319,502,846 | | | | $ | 1,237,504,083 | |
| | | | | | | | | | |
| (1) | Class I3 shares and Class S shares liquidated at the close of business on March 22, 2019. |
The accompanying notes are an integral part of these financial statements.
15
SMEAD VALUE FUND
| | | | |
| Financial Highlights |
|
| November 30, 2019 |
| | | | | | | | | | | | | | | | | | | | | | | | | | | | | | | | | | | |
| | | | |
Income from investment operations | | Less distributions paid |
| | | Net Asset
Value,
Beginning
of Period | | Net
investment
income(1) | | Net realized
and
unrealized
gain/(loss) on
investments | | Total from
investment
operations | | Distributions
from net
investment
income | | Distributions
from net
realized gain
on
investments | | Total
distributions
paid |
Investor Class | | | | | | | | | | |
November 30, 2019 | | | $ | 49.13 | | | | $ | 0.33 | | | | $ | 5.19 | | | | $ | 5.52 | | | | $ | — | | | | $ | (3.10 | ) | | | $ | (3.10 | ) |
November 30, 2018 | | | | 47.29 | | | | | 0.19 | | | | | 3.75 | | | | | 3.94 | | | | | (0.10 | ) | | | | (2.00 | ) | | | | (2.10 | ) |
November 30, 2017 | | | | 39.79 | | | | | 0.15 | | | | | 8.57 | | | | | 8.72 | | | | | (0.19 | ) | | | | (1.03 | ) | | | | (1.22 | ) |
November 30, 2016 | | | | 41.57 | | | | | 0.23 | | | | | (0.81 | ) | | | | (0.58 | ) | | | | (0.20 | ) | | | | (1.00 | ) | | | | (1.20 | ) |
November 30, 2015 | | | | 40.98 | | | | | 0.27 | | | | | 2.11 | | | | | 2.38 | | | | | (0.16 | ) | | | | (1.63 | ) | | | | (1.79 | ) |
| | | | | | | |
Class A | | | | | | | | | | | | | | | | | | | | | | | | | | | | | | | | | | | |
November 30, 2019 | | | | 48.82 | | | | | 0.33 | | | | | 5.15 | | | | | 5.48 | | | | | — | | | | | (3.10 | ) | | | | (3.10 | ) |
November 30, 2018 | | | | 47.03 | | | | | 0.22 | | | | | 3.72 | | | | | 3.94 | | | | | (0.15 | ) | | | | (2.00 | ) | | | | (2.15 | ) |
November 30, 2017 | | | | 39.62 | | | | | 0.20 | | | | | 8.50 | | | | | 8.70 | | | | | (0.26 | ) | | | | (1.03 | ) | | | | (1.29 | ) |
November 30, 2016 | | | | 41.47 | | | | | 0.24 | | | | | (0.79 | ) | | | | (0.55 | ) | | | | (0.30 | ) | | | | (1.00 | ) | | | | (1.30 | ) |
November 30, 2015 | | | | 40.95 | | | | | 0.30 | | | | | 2.07 | | | | | 2.37 | | | | | (0.22 | ) | | | | (1.63 | ) | | | | (1.85 | ) |
| | | | | | | |
Class I1 | | | | | | | | | | | | | | | | | | | | | | | | | | | | | | | | | | | |
November 30, 2019 | | | | 49.10 | | | | | 0.47 | | | | | 5.19 | | | | | 5.66 | | | | | (0.01 | ) | | | | (3.10 | ) | | | | (3.11 | ) |
November 30, 2018 | | | | 47.33 | | | | | 0.33 | | | | | 3.72 | | | | | 4.05 | | | | | (0.28 | ) | | | | (2.00 | ) | | | | (2.28 | ) |
November 30, 2017 | | | | 39.87 | | | | | 0.28 | | | | | 8.56 | | | | | 8.84 | | | | | (0.35 | ) | | | | (1.03 | ) | | | | (1.38 | ) |
November 30, 2016 | | | | 41.66 | | | | | 0.33 | | | | | (0.79 | ) | | | | (0.46 | ) | | | | (0.33 | ) | | | | (1.00 | ) | | | | (1.33 | ) |
November 30, 2015 | | | | 41.07 | | | | | 0.39 | | | | | 2.09 | | | | | 2.48 | | | | | (0.26 | ) | | | | (1.63 | ) | | | | (1.89 | ) |
| | | | | | | |
Class R1 | | | | | | | | | | | | | | | | | | | | | | | | | | | | | | | | | | | |
November 30, 2019 | | | | 48.30 | | | | | 0.19 | | | | | 5.07 | | | | | 5.26 | | | | | — | | | | | (3.10 | ) | | | | (3.10 | ) |
November 30, 2018 | | | | 46.57 | | | | | 0.06 | | | | | 3.69 | | | | | 3.75 | | | | | (0.02 | ) | | | | (2.00 | ) | | | | (2.02 | ) |
November 30, 2017 | | | | 39.33 | | | | | 0.06 | | | | | 8.45 | | | | | 8.51 | | | | | (0.24 | ) | | | | (1.03 | ) | | | | (1.27 | ) |
November 30, 2016 | | | | 41.31 | | | | | 0.12 | | | | | (0.81 | ) | | | | (0.69 | ) | | | | (0.29 | ) | | | | (1.00 | ) | | | | (1.29 | ) |
November 30, 2015 | | | | 40.95 | | | | | 0.35 | | | | | 1.89 | | | | | 2.24 | | | | | (0.25 | ) | | | | (1.63 | ) | | | | (1.88 | ) |
| | | | | | | |
Class R2 | | | | | | | | | | | | | | | | | | | | | | | | | | | | | | | | | | | |
November 30, 2019 | | | | 50.01 | | | | | 0.32 | | | | | 5.20 | | | | | 5.52 | | | | | — | | | | | (3.10 | ) | | | | (3.10 | ) |
November 30, 2018 | | | | 46.73 | | | | | (0.16 | ) | | | | 5.49 | | | | | 5.33 | | | | | (0.05 | ) | | | | (2.00 | ) | | | | (2.05 | ) |
November 30, 2017 | | | | 39.40 | | | | | 0.08 | | | | | 8.47 | | | | | 8.55 | | | | | (0.19 | ) | | | | (1.03 | ) | | | | (1.22 | ) |
November 30, 2016 | | | | 41.36 | | | | | 0.16 | | | | | (0.80 | ) | | | | (0.64 | ) | | | | (0.32 | ) | | | | (1.00 | ) | | | | (1.32 | ) |
November 30, 2015 | | | | 40.95 | | | | | 0.17 | | | | | 2.13 | | | | | 2.30 | | | | | (0.26 | ) | | | | (1.63 | ) | | | | (1.89 | ) |
| | | | | | | |
Class Y | | | | | | | | | | | | | | | | | | | | | | | | | | | | | | | | | | | |
November 30, 2019 | | | | 49.19 | | | | | 0.53 | | | | | 5.19 | | | | | 5.72 | | | | | (0.08 | ) | | | | (3.10 | ) | | | | (3.18 | ) |
November 30, 2018 | | | | 47.40 | | | | | 0.40 | | | | | 3.73 | | | | | 4.13 | | | | | (0.34 | ) | | | | (2.00 | ) | | | | (2.34 | ) |
November 30, 2017 | | | | 39.92 | | | | | 0.35 | | | | | 8.57 | | | | | 8.92 | | | | | (0.41 | ) | | | | (1.03 | ) | | | | (1.44 | ) |
November 30, 2016 | | | | 41.70 | | | | | 0.37 | | | | | (0.78 | ) | | | | (0.41 | ) | | | | (0.37 | ) | | | | (1.00 | ) | | | | (1.37 | ) |
November 30, 2015 | | | | 41.06 | | | | | 0.42 | | | | | 2.13 | | | | | 2.55 | | | | | (0.28 | ) | | | | (1.63 | ) | | | | (1.91 | ) |
The accompanying notes are an integral part of these financial statements.
16
| | | | | | | | | | | | | | | | | | | | | | | | | | | | | | | | | | | | | | |
| | | | | | | Ratio of expenses
to average net assets | | Ratio of net investment income
(loss) to average net assets | | |
Net Asset
Value,
End of
Period | | Total
Return(2) | | Net assets
at end of
period
(000’s) | | Before
waivers and
recoupment
of expenses | | After
waivers and
recoupment
of expenses | |
Before
waivers and
recoupment
of expenses | | After
waivers and
recoupments
of expenses | | Portfolio
turnover
rate |
| | | | | | | | | | | | | | | | | | | | | | | | | | | | | | | | | | | | | | | |
| | | $51.55 | | | | | 12.38 | % | | | $ | 117,805 | | | | | 1.24 | % | | | | 1.24 | % | | | $ | 0.71 | % | | | | 0.71 | % | | | | 20.75 | % |
| | | 49.13 | | | | | 8.65 | % | | | | 136,278 | | | | | 1.24 | % | | | | 1.26 | % | | | | 0.43 | % | | | | 0.41 | % | | | | 10.98 | % |
| | | 47.29 | | | | | 22.51 | % | | | | 155,602 | | | | | 1.25 | % | | | | 1.23 | %(3) | | | | 0.34 | % | | | | 0.36 | %(4) | | | | 20.04 | % |
| | | 39.79 | | | | | (1.34 | )% | | | | 216,244 | | | | | 1.26 | % | | | | 1.26 | % | | | | 0.60 | % | | | | 0.60 | % | | | | 23.67 | % |
| | | 41.57 | | | | | 6.25 | % | | | | 385,928 | | | | | 1.34 | % | | | | 1.26 | % | | | | 0.61 | % | | | | 0.67 | % | | | | 20.26 | % |
| | | | | | | |
| | | | | | | | | | | | | | | | | | | | | | | | | | | | | | | | | | | | | | | |
| | | 51.20 | | | | | 12.35 | % | | | | 119,181 | | | | | 1.24 | % | | | | 1.24 | % | | | | 0.72 | % | | | | 0.72 | % | | | | 20.75 | % |
| | | 48.82 | | | | | 8.80 | % | | | | 122,653 | | | | | 1.19 | % | | | | 1.19 | % | | | | 0.47 | % | | | | 0.47 | % | | | | 10.98 | % |
| | | 47.03 | | | | | 22.51 | % | | | | 163,989 | | | | | 1.18 | % | | | | 1.16 | %(3) | | | | 0.45 | % | | | | 0.46 | %(4) | | | | 20.04 | % |
| | | 39.62 | | | | | (1.28 | )% | | | | 152,921 | | | | | 1.22 | % | | | | 1.22 | % | | | | 0.64 | % | | | | 0.64 | % | | | | 23.67 | % |
| | | 41.47 | | | | | 6.23 | % | | | | 148,500 | | | | | 1.30 | % | | | | 1.26 | % | | | | 0.74 | % | | | | 0.76 | % | | | | 20.26 | % |
| | | | | | | |
| | | | | | | | | | | | | | | | | | | | | | | | | | | | | | | | | | | | | | | |
| | | 51.65 | | | | | 12.67 | % | | | | 1,066,128 | | | | | 0.97 | % | | | | 0.97 | % | | | | 1.00 | % | | | | 1.00 | % | | | | 20.75 | % |
| | | 49.10 | | | | | 8.93 | % | | | | 963,978 | | | | | 0.97 | % | | | | 0.98 | % | | | | 0.72 | % | | | | 0.70 | % | | | | 10.98 | % |
| | | 47.33 | | | | | 22.86 | % | | | | 897,547 | | | | | 0.98 | % | | | | 0.96 | %(3) | | | | 0.65 | % | | | | 0.67 | %(4) | | | | 20.04 | % |
| | | 39.87 | | | | | (1.05 | )% | | | | 736,903 | | | | | 1.00 | % | | | | 0.99 | % | | | | 0.86 | % | | | | 0.87 | % | | | | 23.67 | % |
| | | 41.66 | | | | | 6.51 | % | | | | 781,146 | | | | | 1.07 | % | | | | 0.99 | % | | | | 0.90 | % | | | | 0.96 | % | | | | 20.26 | % |
| | | | | | | |
| | | | | | | | | | | | | | | | | | | | | | | | | | | | | | | | | | | | | | | |
| | | 50.46 | | | | | 12.01 | % | | | | 872 | | | | | 1.55 | % | | | | 1.55 | % | | | | 0.43 | % | | | | 0.43 | % | | | | 20.75 | % |
| | | 48.30 | | | | | 8.47 | % | | | | 792 | | | | | 1.50 | % | | | | 1.50 | % | | | | 0.12 | % | | | | 0.12 | % | | | | 10.98 | % |
| | | 46.57 | | | | | 22.14 | % | | | | 1,779 | | | | | 1.49 | % | | | | 1.48 | %(3) | | | | 0.13 | % | | | | 0.15 | %(4) | | | | 20.04 | % |
| | | 39.33 | | | | | (1.62 | )% | | | | 1,447 | | | | | 1.54 | % | | | | 1.54 | % | | | | 0.33 | % | | | | 0.33 | % | | | | 23.67 | % |
| | | 41.31 | | | | | 5.91 | % | | | | 553 | | | | | 1.64 | % | | | | 1.59 | % | | | | 0.85 | % | | | | 0.88 | % | | | | 20.26 | % |
| | | | | | | |
| | | | | | | | | | | | | | | | | | | | | | | | | | | | | | | | | | | | | | | |
| | | 52.43 | | | | | 12.12 | % | | | | 74 | | | | | 1.44 | % | | | | 1.44 | % | | | | 0.66 | % | | | | 0.66 | % | | | | 20.75 | % |
| | | 50.01 | | | | | 11.88 | % | | | | 10 | | | | | 1.44 | % | | | | 1.49 | % | | | | (0.28 | )% | | | | (0.33 | )% | | | | 10.98 | % |
| | | 46.73 | | | | | 22.28 | % | | | | 1,263 | | | | | 1.43 | % | | | | 1.41 | %(3) | | | | 0.18 | % | | | | 0.20 | %(4) | | | | 20.04 | % |
| | | 39.40 | | | | | (1.51 | )% | | | | 1,841 | | | | | 1.49 | % | | | | 1.44 | % | | | | 0.37 | % | | | | 0.42 | % | | | | 23.67 | % |
| | | 41.36 | | | | | 6.07 | % | | | | 1,579 | | | | | 1.55 | % | | | | 1.44 | % | | | | 0.35 | % | | | | 0.44 | % | | | | 20.26 | % |
| | | | | | | |
| | | | | | | | | | | | | | | | | | | | | | | | | | | | | | | | | | | | | | | |
| | | 51.73 | | | | | 12.81 | % | | | | 15,443 | | | | | 0.86 | % | | | | 0.84 | % | | | | 1.12 | % | | | | 1.14 | % | | | | 20.75 | % |
| | | 49.19 | | | | | 9.11 | % | | | | 13,787 | | | | | 0.86 | % | | | | 0.84 | % | | | | 0.84 | % | | | | 0.86 | % | | | | 10.98 | % |
| | | 47.40 | | | | | 23.04 | % | | | | 12,934 | | | | | 0.83 | % | | | | 0.81 | %(3) | | | | 0.80 | % | | | | 0.82 | %(4) | | | | 20.04 | % |
| | | 39.92 | | | | | (0.93 | )% | | | | 10,978 | | | | | 0.88 | % | | | | 0.84 | % | | | | 0.93 | % | | | | 0.97 | % | | | | 23.67 | % |
| | | 41.70 | | | | | 6.69 | % | | | | 1,192 | | | | | 0.95 | % | | | | 0.84 | % | | | | 0.94 | % | | | | 1.04 | % | | | | 20.26 | % |
17
SMEAD VALUE FUND
| | | | |
| Financial Highlights (Continued) |
|
| November 30, 2019 |
| (1) | Based on average shares outstanding. |
| (2) | Total return in the above table represents the rate that the investor would have earned or lost on an investment in the Fund, assuming reinvestment of dividends. |
| (3) | Includes anon-recurring reimbursement from service provider. Excluding thisnon-recurring reimbursement, the Ratio of expenses to average net assets after waivers and recoupment of expenses would have been 1.25%, 1.18%, 0.98%, 1.49%, 1.43% and 0.83%, respectively. |
| (4) | Includes anon-recurring reimbursement from service provider. Excluding thisnon-recurring reimbursement, the Ratio of net investment income to average net assets after waivers and recoupment of expenses would have been 0.34%, 0.45%, 0.65%, 0.13%, 0.18% and 0.80%, respectively. |
The accompanying notes are an integral part of these financial statements.
18
SMEAD VALUE FUND
Notes to Financial Statements
November 30, 2019
The Smead Value Fund (the “Fund”) is anon-diversified series of Smead Funds Trust, a Delaware statutory trust (the “Trust”) organized on July 17, 2014. The Trust is registered under the Investment Company Act of 1940, as amended (the “1940 Act”), as anopen-end management investment company. The Fund is an investment company and accordingly follows the investment company accounting and reporting guidance of the Financial Accounting Standards Board (FASB) Accounting Standard Codification Topic 946 Financial Services-Investment Companies. The Fund’s investment objective is long-term capital appreciation. The Trust may issue an unlimited number of interests (or shares) of beneficial interest, each with a par value of $0.001. The Fund currently offers six classes of shares: Investor Class, Class A, Class I1, Class R1, Class R2 and Class Y shares. On March 22, 2019, Class I3 and Class S shares of the Fund were liquidated. Class C, Class I2, Class R3 and Class R4 shares are not yet in operation and thus not currently offered by the Fund. Each class of shares of the Fund has identical rights and privileges except with respect to the distribution and shareholder servicing fees, and voting rights on matters affecting a single class of shares. The classes differ principally in their respective distribution and shareholder servicing expenses. Costs incurred by the Fund in connection with the organization, registration and the initial public offering of shares were paid by Smead Capital Management, Inc., the Fund’s investment adviser (the “Adviser”).
| (2) | Significant Accounting Policies |
The following is a summary of significant accounting policies consistently followed by the Fund in the preparation of the financial statements. These policies are in conformity with generally accepted accounting principles in the United States of America (“GAAP”).
Each security owned by the Fund that is listed on a securities exchange is valued at its last sale price on that exchange on the date as of which assets are valued. When the security is listed on more than one exchange, the Fund will use the price of the exchange that the Fund generally considers to be the principal exchange on which the security is traded.
Fund securities listed on The NASDAQ Stock Market, Inc. (“NASDAQ”) will be valued at the NASDAQ Official Closing Price (“NOCP”), which may not necessarily represent the last sale price. If the NOCP is not available, such securities shall be valued at the last sale price on the day of valuation. If there has been no sale on such exchange or on NASDAQ on such day, the security is valued at the mean between the most recent bid and asked prices on such day.Over-the-counter securities that are not traded on NASDAQ shall be valued at the most recent trade price.
Debt securities other than short-term instruments are valued at the mean between the closing bid and asked prices provided by a pricing service (“Pricing Service”). If the closing bid and ask prices are not readily available, the Pricing Service may provide a price determined by a matrix pricing method or other analytical pricing models.
19
SMEAD VALUE FUND
Notes to Financial Statements (Continued)
November 30, 2019
Short-term debt securities, such as commercial paper, bankers acceptances and U.S. Treasury Bills having a maturity of less than 60 days, are valued at amortized cost which approximates fair value. If a short-term debt security has a maturity of greater than 60 days, it is valued at market price.
Redeemable securities issued byopen-end, registered investment companies, including money market funds, are valued at the net asset value (“NAV”) of such companies for purchase and/or redemption orders placed on that day.
When market quotations are not readily available, any security or other asset is valued at its fair value as determined under fair value pricing procedures approved by the Trust’s Board of Trustees (the “Board of Trustees”). These fair value pricing procedures will also be used to price a security when corporate events, events in the securities market and/or world events cause the Adviser to believe that a security’s last sale price may not reflect its actual fair market value. The intended effect of using fair value pricing procedures is to ensure that the Fund is accurately priced.
The Fund’s Valuation Procedures include fair valuation accounting standards that establish an authoritative definition of fair value and set out a hierarchy for measuring fair value. These standards require additional disclosures about the various inputs used to develop the measurements of fair value. These inputs are summarized in the three broad levels listed below:
| | Level 1— | unadjusted quoted prices in active markets for identical securities. |
| | Level 2— | other significant observable inputs (including unadjusted quoted prices for similar securities, interest rates, prepayment speeds, credit risk, etc.). |
| | Level 3— | significant unobservable inputs (including the Fund’s own assumptions in determining the fair value of investments). |
The inputs or methodology used for valuing securities are not necessarily an indication of the risk associated with investing in those securities. The following table summarizes the valuations inputs of the Fund’s investments by each fair value hierarchy level as of November 30, 2019:
| | | | | | | | | | | | | | | | | | | | |
| | | Level 1 | | Level 2 | | Level 3 | | Total |
Equity | | | | | | | | | | | | | | | | | | | | |
Common Stocks(1) | | | $ | 1,292,315,833 | | | | $ | — | | | | $ | — | | | | $ | 1,292,315,833 | |
| | | | | | | | | | | | | | | | | | | | |
Total Equity | | | | 1,292,315,833 | | | | | — | | | | | — | | | | | 1,292,315,833 | |
Short-Term Investments | | | | — | | | | | 25,319,508 | | | | | — | | | | | 25,319,508 | |
| | | | | | | | | | | | | | | | | | | | |
Total Investments in Securities | | | $ | 1,292,315,833 | | | | $ | 25,319,508 | | | | $ | — | | | | $ | 1,317,635,341 | |
| | | | | | | | | | | | | | | | | | | | |
| | (1) | See the Schedule of Investments for industry classification. |
No Level 3 securities were held in the Fund at November 30, 2019. For the year ended November 30, 2019, there were no transfers between levels for the Fund. It is the Fund’s policy to record transfers between levels as of the end of the reporting period. The Fund did not hold financial derivative instruments during the reporting period.
20
SMEAD VALUE FUND
Notes to Financial Statements (Continued)
November 30, 2019
The NAV per share of the Fund is calculated by dividing the sum of the value of the securities held by the Fund, plus cash or other assets, minus all liabilities (including estimated accrued expenses) by the total number of shares outstanding for the Fund, rounded to the nearest cent. The Fund’s shares will not be priced on the days on which the New York Stock Exchange is closed for trading.
The preparation of financial statements in conformity with GAAP requires management to make estimates and assumptions that affect the reported amounts of assets and liabilities and disclosure of contingent assets and liabilities at the date of the financial statements and the reported amounts of revenues and expenses during the reporting period. Actual results could differ from those estimates.
| | (d) | Allocation of Income, Expenses and Gains/Losses |
Income, expenses (other than those deemed attributable to a specific share class – distribution and shareholder servicing fees), and gains and losses of the Fund are allocated daily to each class of shares based upon the ratio of net assets represented by each class as a percentage of the net assets of the Fund. Expenses deemed directly attributable to a class of shares are recorded by the specific class. Most Fund expenses are allocated by class based on relative net assets. Rule12b-1 fees are expensed at 0.25% of average daily net assets of the Investor Class and Class A shares, and 0.50% of the average daily net assets of the Class R1 and Class R2 shares. A separate shareholder servicing fee is authorized up to 0.25% of the average daily net assets attributable to Class A shares, Class C shares, Investor Class shares, Class I1 shares, Class I2 shares, Class A1 shares and Class R2 shares, respectively. However, as of November 30, 2019, those fees were expensed at the following rates: 0.17% for the Investor Class shares, 0.17% for Class A shares, 0.15% for Class I1 shares, 0.25% for Class R1 shares, and 0.10% for Class R2 shares.
The Fund complies with the requirements of Subchapter M of the Internal Revenue Code of 1986, as amended, necessary to qualify as a regulated investment company and makes the requisite distributions of income and capital gains to its shareholders sufficient to relieve it from all or substantially all federal income taxes. Therefore, no federal income tax provision has been provided.
As of and during the year ended November 30, 2019, the Fund did not have a liability for any unrecognized tax benefits. The Fund recognizes interest and penalties, if any, related to unrecognized tax benefits as income tax expense in the statement of operations. During the year ended November 30, 2019, the Fund did not incur any interest or penalties.
21
SMEAD VALUE FUND
Notes to Financial Statements (Continued)
November 30, 2019
As of November 30, 2019, the components of accumulated earnings on a tax basis were as follows:
| | | | | |
Cost basis of investments for federal income tax purposes | | | $ | 908,038,762 | |
| | | | | |
Gross tax unrealized appreciation | | | | 437,637,395 | |
Gross tax unrealized depreciation | | | | (28,040,816 | ) |
| | | | | |
Net tax unrealized appreciation | | | $ | 409,596,579 | |
| | | | | |
Undistributed ordinary income | | | $ | 10,445,849 | |
Undistributed long-term capital gain | | | | 40,256,842 | |
| | | | | |
Total distributable earnings | | | $ | 50,702,691 | |
| | | | | |
Other accumulated losses | | | | — | |
| | | | | |
Total accumulated gains | | | $ | 460,299,270 | |
| | | | | |
The tax basis of investments for tax and financial reporting purposes differs principally due to the deferral of losses on wash sales.
| | (f) | Distributions to Shareholders |
The Fund will distribute any net investment income and any net realized long or short- term capital gains at least annually. Distributions from net realized gains for book purposes may includeshort-term capital gains. All short-term capital gains are included in ordinary income for tax purposes. Distributions to shareholders are recorded on theex-dividend date. The Fund may also pay a special distribution at the end of the calendar year to comply with federal tax requirements. Income and capital gains distributions may differ from GAAP, primarily due to timing differences in the recognition of income, gains and losses by the Fund. GAAP requires that certain components of net assets relating to permanent differences be reclassified between the components of net assets. These reclassifications have no effect on net assets or net asset value per share. For the year ended November 30, 2019, no permanent adjustments were recorded.
| | | | | | |
Total Distributable
Earnings (Loss) | | | Paid-in Capital | |
| $ | — | | | $ | — | |
The tax character of distributions paid during the years ended November 30, 2019 and November 30, 2018 was as follows:
| | | | | | | | | | |
| | | November 30, 2019 | | November 30, 2018 |
Ordinary Income | | | $ | 225,316 | | | | $ | 6,231,400 | |
Long-Term Capital Gain | | | $ | 77,479,579 | | | | $ | 52,162,084 | |
22
SMEAD VALUE FUND
Notes to Financial Statements (Continued)
November 30, 2019
On December 19, 2019, the Fund declared and paid distributions from ordinary income and long-term capital gains to shareholders of record on December 18, 2019.
| | | | | | | | | | | | | | | |
| | | Distributions Paid from | | Total
Distributions
Paid |
Class | | Ordinary
Income | | Realized
Gain/Loss |
Investor Class | | | $ | 811,397 | | | | $ | 3,601,703 | | | | $ | 4,413,100 | |
Class A | | | | 844,574 | | | | | 3,665,783 | | | | | 4,510,357 | |
Class I1 | | | | 10,176,548 | | | | | 32,495,971 | | | | | 42,672,519 | |
Class R1 | | | | — | | | | | 14,007 | | | | | 14,007 | |
Class R2 | | | | 558 | | | | | 2,236 | | | | | 2,794 | |
Class Y | | | | 168,305 | | | | | 477,159 | | | | | 645,464 | |
Investment transactions are recorded on the trade date. The Fund determines the gain or loss from investment transactions based on the first in, first out method. Dividend income, less foreign withholding tax, is recognized on theex-dividend date and interest income is recognized on an accrual basis.
The Fund has an Investment Advisory Agreement (the “Agreement”) with the Adviser to furnish investment advisory services to the Fund. Under the terms of the Agreement, the Fund compensates the Adviser for its management services at the annual rate of 0.75% of the Fund’s average daily net assets.
The Adviser has contractually agreed to waive its management fee and/or reimburse the Fund’s other expenses at least through March 31, 2020 to the extent necessary to ensure that the Fund’s operating expenses do not exceed 1.26%, 1.26%, 0.99%, 1.59%, 1.44% and 0.84% (the “Expense Limitation Cap”) of the Fund’s average daily net assets for the Investor Class, Class A, Class I1, Class R1, Class R2 and Class Y shares, respectively. Any such waiver or reimbursement is subject to later adjustment to allow the Adviser to recoup amounts waived or reimbursed to the extent actual fees and expenses for a fiscal period are less than the Expense Limitation Cap in place at the time of waiver; provided, however, that the Adviser shall only be entitled to recoup such amounts over the following three fiscal years. For the year ended November 30, 2019, the Adviser waived expenses of $2,541. The following table shows the waived or reimbursed expenses subject to potential recovery expiring on November 30:
| | | | | | | | | | |
Year incurred | | | Expiration Year | | | Smead Value Fund | |
| | 2017 | | | | 2020 | | | $ | 524 | |
| | 2018 | | | | 2021 | | | | 2,235 | |
| | 2019 | | | | 2022 | | | | 2,541 | |
| (4) | Distribution Plan and Shareholder Servicing Plan |
The Fund has adopted a plan pursuant to Rule12b-1 (the“12b-1 Plan”), which authorizes it to pay ALPS Distributors, Inc. (the “Distributor”) a fee at an annual rate of 0.25% of the Fund’s average daily net assets of Investor Class and Class A shares
23
SMEAD VALUE FUND
Notes to Financial Statements (Continued)
November 30, 2019
and 0.50% of the Fund’s average daily net assets of Class R1 and Class R2 shares for services to current and prospective Fund shareholders and distribution of Fund shares (this fee is referred to as the “Rule 12b-1 Fee”). The Distributor may pay any or all of the Rule12b-1 Fee to other persons (including the Adviser, brokerage firms, depository institutions and other firms) for providing these services to the Fund and its shareholders. In addition, under the 12b-1 Plan, a portion of the Rule 12b-1 Fee (no more than 0.25% of the Fund’s average daily net assets, subject to the maximum annual rate of each share class) may be paid forsub-accounting services provided to beneficial owners whose shares are held of record in omnibus accounts, other group accounts or accounts traded through registered clearing agents, as well as account maintenance and personal service to shareholders. These services may include, but are not limited to, assisting in, establishing and maintaining shareholder accounts and records, assisting with purchase and redemption requests, arranging for bank wires, monitoring dividend payments from the Fund to shareholders and receiving and answering correspondence. During the year ended November 30, 2019, the Fund accrued expenses of $574,299 pursuant to the12b-1 Plan. As of November 30, 2019, the Fund owed the Distributor Rule 12b-1 Fees equal to $48,009.
The Fund has also adopted a shareholder servicing plan (the “Shareholder Servicing Plan”). The Shareholder Servicing Plan authorizes payment of a shareholder servicing fee to financial intermediaries and other service providers of up to 0.25% of the average daily net assets attributable to the Class A shares, Class C shares, Investor Class shares, Class I1 shares, Class I2 shares, Class R1 shares and Class R2 shares, respectively (this fee is referred to as the “Shareholder Servicing Fee”). However, as of November 30, 2019, these Shareholder Servicing Fees were expensed at the following rates: 0.17% for the Investor Class shares of the Fund, 0.17% for the Class A shares of the Fund, 0.15% for the Class I1 shares of the Fund, 0.25% for the Class R1 shares of the Fund, and 0.10% for the Class R2 shares of the Fund. There is no Shareholder Servicing Fee for the Class Y shares. For those share classes that currently charge less than the maximum Shareholder Servicing Fee permitted under the Shareholder Servicing Plan, the Fund may increase such fee, but not beyond the maximum of 0.25%, only after providing affected shareholders with 30 days’ prior written notice. The following table details the Shareholder Servicing Fees paid for the year ended November 30, 2019.
| | | | | |
Investor Class | | | $ | 153,185 | |
Class A | | | | 147,844 | |
Class I1 | | | | 1,093,383 | |
Class R1 | | | | 1,528 | |
Class R2 | | | | 25 | |
| (5) | Accounting, Custody, Administration and Transfer Agent Fees |
State Street Bank and Trust Company (“State Street”) serves as the Fund’s accounting agent, custodian of the Fund’s investments and administrator of the Fund. For its services, the Fund pays State Street a fee that is calculated daily and paid monthly at an annual rate based on the aggregate average daily net assets of the Fund, along with transactional andout-of-pocket fees.
24
SMEAD VALUE FUND
Notes to Financial Statements (Continued)
November 30, 2019
UMB Fund Services, Inc. (“UMB”) is the Fund’s transfer and dividend disbursing agent from. UMB receives a fee that is calculated daily and paid monthly at an annual rate based on the average daily net assets of the Fund, and is reimbursed for certainout-of-pocket expenses.
| (6) | Capital Share Transactions |
Transactions in shares of the Fund were as follows:
| | | | | | | | | | | | | | | | | | | | |
| | | For the Year Ended
November 30, 2019 | | For the Year Ended
November 30, 2018 |
| | | Shares | | Amount | | Shares | | Amount |
Proceeds from shares sold | | | | | | | | | | | | | | | | | | | | |
Investor Class | | | | 291,192 | | | | $ | 13,813,435 | | | | | 106,984 | | | | $ | 5,077,191 | |
Class A | | | | 743,884 | | | | | 33,933,212 | | | | | 562,806 | | | | | 26,476,921 | |
Class I1 | | | | 5,637,445 | | | | | 258,925,630 | | | | | 4,410,241 | | | | | 208,827,304 | |
Class I3(1) | | | | — | | | | | — | | | | | 64 | | | | | 3,000 | |
Class R1 | | | | 3,043 | | | | | 134,409 | | | | | 3,731 | | | | | 170,597 | |
Class R2 | | | | 1,226 | | | | | 60,414 | | | | | 1,578 | | | | | 71,706 | |
Class S(1) | | | | — | | | | | — | | | | | 64 | | | | | 3,000 | |
Class Y | | | | 41,229 | | | | | 1,890,373 | | | | | 41,990 | | | | | 1,944,042 | |
| | | | |
Issued in reinvestment of dividends and distributions | | | | | | | | | | | | | | | | | | | | |
Investor Class | | | | 184,024 | | | | | 8,045,556 | | | | | 140,453 | | | | | 6,422,894 | |
Class A | | | | 129,260 | | | | | 5,613,764 | | | | | 101,321 | | | | | 4,597,959 | |
Class I1 | | | | 633,698 | | | | | 27,692,554 | | | | | 352,063 | | | | | 16,050,530 | |
Class I3(1) | | | | 5 | | | | | 200 | | | | | — | | | | | — | |
Class S(1) | | | | 5 | | | | | 199 | | | | | — | | | | | — | |
Class Y | | | | 20,421 | | | | | 892,627 | | | | | 13,960 | | | | | 636,744 | |
| | | | |
Payments for shares redeemed | | | | | | | | | | | | | | | | | | | | |
Investor Class | | | | (963,854 | ) | | | | (44,049,206 | ) | | | | (763,450 | ) | | | | (36,023,479 | ) |
Class A | | | | (1,057,875 | ) | | | | (48,140,073 | ) | | | | (1,638,291 | ) | | | | (78,673,189 | ) |
Class I1 | | | | (5,259,898 | ) | | | | (238,860,176 | ) | | | | (4,096,184 | ) | | | | (194,058,569 | ) |
Class I3(1) | | | | (69 | ) | | | | (3,040 | ) | | | | — | | | | | — | |
Class R1 | | | | (2,152 | ) | | | | (96,172 | ) | | | | (25,555 | ) | | | | (1,182,551 | ) |
Class R2 | | | | — | | | | | — | | | | | (28,400 | ) | | | | (1,375,880 | ) |
Class S(1) | | | | (69 | ) | | | | (3,032 | ) | | | | — | | | | | — | |
Class Y | | | | (43,396 | ) | | | | (2,027,184 | ) | | | | (48,532 | ) | | | | (2,258,696 | ) |
| | | | | | | | | | | | | | | | | | | | |
Total increase (decrease) in net assets from capital share transactions | | | | 358,119 | | | | $ | 17,823,490 | | | | | (865,157 | ) | | | $ | (43,290,476 | ) |
| | | | | | | | | | | | | | | | | | | | |
| (1) | Class I3 shares and Class S shares liquidated at the close of business on March 22, 2019. |
25
SMEAD VALUE FUND
Notes to Financial Statements (Continued)
November 30, 2019
| (7) | Investment Transactions |
The aggregate purchases and sales of securities, excluding short-term investments, for the Fund for the year ended November 30, 2019 were $240,453,541 and $289,519,009, respectively. There were no purchases or sales of U.S. government securities for the Fund.
The beneficial ownership, either directly or indirectly, of more than 25% of the voting securities of a fund creates a presumption of control of the fund, under Section 2(a)(9) of the 1940 Act. At November 30, 2019, Charles Schwab & Company, Inc., for the benefit of its customers, held 25.86% of outstanding shares of Class A. At November 30, 2019, Merrill Lynch Pierce Fenner & Smith, for the benefit of its customers, held 42.90%, 100% and 100% of outstanding shares of Class I1, Class R1 and Class R2, respectively. At November 30, 2019, National Financial Services LLC, for the benefit of its customers, held 57.57% and 48.66% of outstanding shares of Class Y and Investor Class.
General Investment Risks
An investment in the Fund represents an indirect investment in the assets owned by the Fund. As with any mutual fund, the value of the assets owned by the Fund may move up or down, and as a result, an investment in the Fund at any point in time may be worth more or less than the original amount invested.
The Fund’s transactions in listed securities are settled/paid for upon delivery to or from their counterparties; therefore, the risk of counterparty default for listed securities is considered minimal, as delivery of securities sold is only made once the Fund has received payment. Payment is made on a purchase once the securities have been delivered by the counterparty. The trade will fail if either party fails to meet its obligations.
Market and Regulatory Risks
Events in the financial markets and economy may cause volatility and uncertainty and affect Fund performance. Market events may affect a single issuer, industry, sector, or the market as a whole. In addition, because of interdependencies between markets, events in one market may adversely impact other markets or issuers in which the Fund invests in unforeseen ways. Traditionally liquid investments may experience periods of diminished liquidity. During a general downturn in the financial markets, multiple asset classes may decline in value and the Fund may lose value, regardless of the individual results of the securities and other instruments in which the Fund invests. Governmental and regulatory actions, including tax law changes, may also impair Fund management and have unexpected or adverse consequences on particular markets, strategies, or investments. Future market or regulatory events may impact the Fund in unforeseen ways, such as causing the Fund to alter its existing strategies or potentially, to liquidate and close.
26
SMEAD VALUE FUND
Notes to Financial Statements (Continued)
November 30, 2019
Equity Investments Risks
Stock markets are volatile. Equity investments tend to go up or down in value, sometimes rapidly and unpredictably, in response to many factors, including a company’s historical and prospective earnings, the value of its assets, general economic conditions, interest rates, investor perceptions, and market liquidity. Due to the complexities of markets, events in one market or sector may adversely impact other markets or sectors.
In August 2018, FASB issued Accounting Standards Update (“ASU”)2018-13 Fair Value Measurement (Topic 820) Disclosure Framework – Changes to the Disclosure Requirements, which sets forth a methodology for disclosing the fair value hierarchy. Compliance is effective for interim and annual reporting periods in fiscal years that begin after December 15, 2019. Management is currently evaluating the impact of the ASU to the financial statements.
Management has evaluated the possibility of subsequent events through the date of issuance and determined that there are no additional material events that would require adjustment to or disclosure in the Fund’s financial statements.
27
SMEAD VALUE FUND
Report of Independent Registered Public Accounting Firm
To the Shareholders of Smead Value Fund and
Board of Trusteesof Smead Funds Trust
Opinion on the Financial Statements
We have audited the accompanying statement of assets and liabilities, including the schedule of investments, of Smead Funds Trust, comprising Smead Value Fund (the “Fund”)as of November 30, 2019, the related statementof operations for the year then ended, the statements of changes in net assets for each of the two years in the period then ended, including the related notes, and the financial highlights for each of the five years in the period then ended(collectively referred to as the “financial statements”). In our opinion, the financial statements present fairly, in all material respects, the financial position of theFund as of November 30, 2019, the results of its operations for the year then ended, the changes in its net assets for each of the two years in the period then ended, and the financial highlights for each of the five years in the period then ended, in conformity with accounting principles generally accepted in the United States of America.
Basis for Opinion
These financial statements are the responsibility of the Fund’s management. Our responsibility is to express an opinion on the Fund’s financial statements based on our audits. We are a public accounting firm registered with the Public Company Accounting Oversight Board (United States) (“PCAOB”) and are required to be independent with respect to the Fund in accordance with the U.S. federal securities laws and the applicable rules and regulations of the Securities and Exchange Commission and the PCAOB.
We conducted our audits in accordance with the standards of the PCAOB. Those standards require that we plan and perform the audit to obtain reasonable assurance about whether the financial statements are free of material misstatement whether due to error or fraud.
Our audits included performing procedures to assess the risks of material misstatement of the financial statements, whether due to error or fraud, and performing procedures that respond to those risks. Such procedures included examining, on a test basis, evidence regarding the amounts and disclosures in the financial statements. Our procedures included confirmation of securities owned as of November 30, 2019, by correspondence with the custodian. Our audits also included evaluating the accounting principles used and significant estimates made by management, as well as evaluating the overall presentation of the financial statements. We believe that our audits provide a reasonable basis for our opinion.
We have served as the Fund’sauditor since 2007.

COHEN & COMPANY, LTD.
Cleveland, Ohio
January 28, 2020
28
SMEAD VALUE FUND
Basis for Trustees’ Approval of Investment Advisory Agreement
(Unaudited)
The Board of Trustees (the “Trustees”) of Smead Funds Trust (the “Trust”) met on August 7, 2019 to consider the renewal of the Investment Advisory Agreement (the “Agreement”) between the Trust, on behalf of the Smead Value Fund (the “Fund”), a series of the Trust, and Smead Capital Management, Inc., the Fund’s investment adviser (the “Adviser”). Prior to this meeting, the Trustees requested and received materials to assist them in considering the renewal of the Agreement. The materials provided by the Adviser contained information with respect to the factors enumerated below, including a copy of the Agreement, a memorandum prepared by the Trust’s outside legal counsel discussing in detail the Trustees’ fiduciary obligations and the factors they should assess in considering the renewal of the Agreement, detailed comparative performance information provided by the Adviser, as well as the management fees and other expenses of the Fund, due diligence materials relating to the Adviser (including the Adviser’s response to the Independent Trustees’ request for information, the Adviser’s Form ADV and select financial statements of the Adviser) and other pertinent information. Based on their evaluation of the information provided by the Adviser, in conjunction with the Fund’s other service providers, the Trustees, by a unanimous vote (including a separate vote of the Trustees who are not “interested persons,” as that term is defined in the Investment Company Act of 1940, as amended (the “Independent Trustees”)), approved the renewal of the Agreement for an additionalone-year term.
DISCUSSION OF FACTORS CONSIDERED
In considering the renewal of the Agreement and reaching their conclusions, the Trustees reviewed and analyzed various factors that they determined were relevant, including the factors enumerated below.
| 1. | NATURE, EXTENT AND QUALITY OF SERVICES |
The Independent Trustees reviewed and considered the nature, extent and quality of the services provided by the Adviser and expected that they would continue to be of high quality. They noted that the Adviser’s history, experience and reputation were exceptional. The Independent Trustees considered the experience and qualifications of the personnel at the Adviser who were responsible for providing services to the Fund, and the compensation structure of the Adviser. The Independent Trustees also considered the resources, policies, procedures and infrastructure of the Adviser devoted to ensuring compliance with applicable laws and regulations, as well as the Adviser’s commitment to those programs, including the Adviser’s use of third-party compliance and cybersecurity providers to support the Adviser’s own compliance efforts. The Independent Trustees noted that there were currently no known pending regulatory inquiries by the SEC or other regulatory agencies involving the Adviser. The Independent Trustees concluded that the Adviser’s key personnel had sufficient expertise necessary to continue to serve as investment adviser to the Fund and that the nature, overall quality and extent of the management services were satisfactory and reliable.
The Independent Trustees then considered the performance of the Fund. As part of its evaluation, the Independent Trustees reviewed a report prepared by an
29
SMEAD VALUE FUND
Basis for Trustees’ Approval of Investment Advisory Agreement (Continued)
(Unaudited)
independent consulting firm, Broadridge. It was noted that Broadridge recently acquired the 15(c) board consulting services business from Morningstar, the consulting firm that previously provided this service to the Trust, and that the Broadridge report was prepared using the same methodology that the Board relied on in previous years, although the Fund changed its Morningstar category from “large blend” to “large value” in January 2018. Even so, Broadridge continued to use both categories for category and peer selection, with an emphasis on both institutional andno-load retail share classes that have no Rule12b-1 fee and share a high concentration, low turnover, value-oriented strategy The report compared the Fund’s I1 Class shares, which is currently the share class with the most assets, to (i) certain funds determined by Morningstar to be comparable based on investment style, expense structure and asset size (the “Morningstar Performance Peer Group”), (ii) funds included in Morningstar’s Large Value and Large Blend categories (the “Morningstar Categories”), and (iii) the Fund’s benchmark index (the S&P 500 Index). The Independent Trustees examined the performance of the Fund for the1-year,3-year and5-year periods ended June 30, 2019 and noted that the Fund ranked 3rd out of 22 funds, 1st out of 21 funds and 2nd out of 20 funds, respectively, in the Morningstar Performance Peer Group. For the same periods, the Fund ranked 68th out of 559 funds, 46th out of 476 funds and 74th out of 419 funds, respectively, in the Morningstar Category. The Independent Trustees noted that the Fund’s performance lagged the primary benchmark for the 5-year period ended June 30, 2019, but that the Fund outperformed its benchmark for the1-year and 3 year, periods.
The Independent Trustees concluded that the performance obtained by the Adviser for the Fund was satisfactory under current market conditions. Although past performance is not a guarantee or indication of future results, the Independent Trustees determined that the Fund and its shareholders were likely to benefit from the Adviser’s continued management.
| 3. | COSTS OF SERVICES PROVIDED AND PROFITS REALIZED BY THE ADVISER |
The Independent Trustees considered the gross advisory fee rates charged by the Adviser for the Fund, as well as the effective advisory fee rate after taking into consideration the Fund’s expense limitation arrangements with the Adviser. The Independent Trustees discussed Broadridge’s analysis which, as of June 30, 2019, showed that the Fund’s net expenses exceeded the Morningstar Performance Peer Group and Morningstar Category medians by 15 and 24 basis points, respectively. In addition, the Broadridge report noted that, at June 30, 2019 asset levels, the advisory fee of 0.75% fell within the fourth quartile within the Morningstar Category. The Independent Trustees noted that while such fees and expenses were above the median of the Morningstar Performance Peer Group and the Morningstar Category, the long term performance of the Fund was generally quite good. Additionally, it was noted that the Adviser’s investment advisory fee was below what it charged separately managed accounts, albeit slightly higher (by 5 basis points) than the advisory fee charged to an unaffiliated fund to which the Adviser provides subadvisory services. With respect to this unaffiliated fund, the Adviser explained that because it has little or no marketing or investment company oversight responsibilities with
30
SMEAD VALUE FUND
Basis for Trustees’ Approval of Investment Advisory Agreement (Continued)
(Unaudited)
respect to the fund, the cost to provide subadvisory services to this fund is lower than the cost to provide advisory services to the Fund. The Independent Trustees also noted that the expense limitation structure would be in effect for the Fund until at least March 31, 2020.
The Board also reviewed the Adviser’s 2018 and 2017 profitability analysis reports and the Adviser’s unaudited profit and loss statements and balance sheets for the years ended December 31, 2018 and 2017.
The Independent Trustees concluded that the Fund’s expenses and management fees paid to the Adviser were fair and reasonable in light of the comparative performance, expense and advisory fee information. The Independent Trustees further concluded that the Adviser’s profits in connection with the management of the Fund were not excessive and that the Adviser maintained adequate profit levels to support its services to the Fund.
| 4. | EXTENT OF ECONOMIES OF SCALE |
The Independent Trustees compared the Fund’s expenses relative to its Morningstar Performance Peer Group and its Morningstar Category and discussed realized and potential economies of scale. The Independent Trustees noted that, although the Fund did not have advisory fee breakpoints, the Adviser had contractually agreed to limit the expenses of each share class of the Fund so that each share class does not exceed its operating expense limitation. The Independent Trustees discussed the possibility of including breakpoints in the investment advisory fee, and considered the Adviser’s thoughts on this subject. Based upon its review and discussion, the Independent Trustees determined that, while fee breakpoints were not currently necessary for the Fund, they would continue to review whether breakpoints should be incorporated. After further discussion, the Independent Trustees concluded that the current fee structure was reasonable.
| 5. | INDIRECT BENEFITS REALIZED BY THE ADVISER |
The Independent Trustees considered the direct and indirect benefits that have been and may continue to be realized by the Adviser from its association with the Fund. The Independent Trustees concluded that the benefits the Adviser received, such as greater name recognition, growth in separate account management services and increased ability to obtain research or brokerage services, appeared to be reasonable, and in many cases benefited the Fund through growth in assets.
CONCLUSIONS
On the basis of the foregoing and without assigning particular weight to any single conclusion, the Independent Trustees determined to recommend the renewal of the Agreement to the full Board.
31
SMEAD VALUE FUND
Notice of Privacy Policies and Practices
We collect non-public personal information about you from the following sources:
| • | | information we receive about you on applications or other forms; |
| • | | information you give us orally; and |
| • | | information about your transactions with us or others. |
We do not disclose any non-public personal information about our shareholders or former shareholders without the shareholder’s authorization, except as permitted by law or in response to inquiries from governmental authorities. We may share information with affiliated parties and unaffiliated third parties with whom we have contracts for servicing the Fund. We will provide unaffiliated third parties with only the information necessary to carry out their assigned responsibility. All shareholder records will be disposed of in accordance with applicable law. We maintain physical, electronic and procedural safeguards to protect yournon-public personal information and require third parties to treat your non-public personal information with the same high degree of confidentiality.
In the event that you hold shares of the Fund through a financial intermediary, including, but not limited to, a broker-dealer, bank or trust company, the privacy policy of your financial intermediary would govern how yournon-public personal information would be shared with unaffiliated third parties.
32
SMEAD VALUE FUND
Additional Information
(Unaudited)
Tax Information
For the year ended November 30, 2019, 100% of dividends paid from net ordinary income qualified for the dividends received deduction available to corporate shareholders.
Indemnifications
Under the Trust’s organizational documents, its officers and trustees are indemnified against certain liabilities arising out of the performance of their duties to the Fund. In addition, in the normal course of business, the Fund enters into contracts that provide general indemnifications to other parties. The Fund’s maximum exposure under these arrangements is unknown as this would involve future claims that may be made against the Fund that have not yet occurred. However, the Fund has not had prior claims or losses pursuant to these contracts and expects the risk of loss to be remote.
Information about Trustees
The business and affairs of the Trust are managed under the direction of the Board of Trustees. Information pertaining to the Trustees of the Trust is set forth below and is as of November 30, 2019. The Statement of Additional Information includes additional information about the Trustees and is available, without charge, upon request by calling877-807-4122.
| | | | | | | | | | |
Name and Age | | Position(s)
Held with
the Trust | | Term of
Office and
Length of Time Served | | Number of
Portfolios
in Trust
Overseen
by Trustee | | Principal
Occupation(s) During the Past
Five Years | | Other Directorships Held by
Trustee During
the Past Five Years |
Independent Trustees | | | | |
| | | | | |
Gregory A. Demopulos Age: 61 | | Trustee | | Indefinite Term (since September 2014). | | 1 | | Chairman and CEO, Omeros Corp. (biopharmaceutical company) (since 1994). | | Director, Onconome, Inc. (2004 to 2017). |
| | | | | |
Peter M. Musser Age: 63 | | Trustee | | Indefinite Term (since September 2014). | | 1 | | Principal, Angeline Properties, LLC (a private investment firm) (since 2014); and Principal and Senior Equity Portfolio Manager with Rainier Investment Management (from 1994 to 2013). | | Trustee, Lawrence University (since 2012); Trustee, Berry College (since 2010); and Director, Boys and Girls Clubs of King County (2008 to 2016). |
33
SMEAD VALUE FUND
Additional Information (Continued)
(Unaudited)
| | | | | | | | | | |
Name and Age | | Position(s)
Held with
the Trust | | Term of
Office and
Length of Time Served | | Number of
Portfolios
in Trust
Overseen
by Trustee | | Principal
Occupation(s) During the Past
Five Years | | Other Directorships Held by
Trustee During
the Past Five Years |
| | | | | |
Walter F. Walker Age: 65 | | Trustee | | Indefinite Term (since September 2014). | | 1 | | Principal, Hana Road Capital LLC (hedge fund) (since 2007). | | Advisory Council, Stone Arch Capital (since 2005); and Independent Director, Atlas Financial Holdings, Inc. (since 2017). |
| | | | | |
Nancy A. Zevenbergen Age: 60 | | Trustee | | Indefinite Term (since September 2014). | | 1 | | Principal and Chief Investment Officer, Zevenbergen Capital Investments LLC (since 1987). | | Director, Seattle Pacific Foundation (since 1993); Director, Anduin Foundation (since 2010); Director, University of Washington Foster School of Business (since 2014); and Director, evenstar3 Inc. (since 2005). |
| | |
Interested Trustees and Officers | | | | |
| | | | | |
William W. Smead1 Age: 61 | | Trustee and Chairman | | Indefinite Term (since September 2014). | | 1 | | Chief Executive Officer and Chief Investment Officer of the Adviser (since 2007); and President and Chief Executive Officer of the Trust (from September 2014 to January 2016). | | None. |
| | | | | |
Cole W. Smead1 Age: 35 | | Trustee President and Chief Executive Officer | | Indefinite Term (since September 2014). Elected annually (since January 2016). | | 1 | | Managing Director of the Adviser (since 2007). | | Director and Chairman, Smead Funds S.A. (since 2015). |
34
SMEAD VALUE FUND
Additional Information (Continued)
(Unaudited)
| | | | | | | | | | |
Name and Age | | Position(s)
Held with
the Trust | | Term of
Office and
Length of Time Served | | Number of
Portfolios
in Trust
Overseen
by Trustee | | Principal
Occupation(s) During the Past
Five Years | | Other Directorships Held by
Trustee During
the Past Five Years |
| | | | | |
Steven J. LeMire Age: 50 | | Chief Compliance Officer Treasurer, Principal Financial and Accounting Officer | | Elected annually (since September 2014). Elected annually (since January 2016). | | N/A | | Chief Compliance Officer of the Adviser (since 2014). | | N/A |
| | | | | |
Matthew K. Brudvik Age: 35 | | Secretary | | Elected annually (since November 2017). | | N/A | | Vice President – Sales of the Adviser (since 2013). | | N/A |
| 1 | Mr. William Smead and Mr. Cole Smead are each deemed to be an “interested person” of the Fund under the 1940 Act because of his position with Smead Capital Management, Inc. Mr. William Smead and Mr. Cole Smead are father and son, respectively. |
| | The Trustees are subject to retirement after the end of the calendar year in which they attain the age of 72. |
35
A NOTE ON FORWARD LOOKING STATEMENTS (Unaudited)
Except for historical information contained in this report for the Fund, the matters discussed in this report may constituteforward-looking statements made pursuant to the safe-harbor provisions of the Private Securities Litigation Reform Act of 1995. These include any adviser or portfolio manager predictions, assessments, analyses or outlooks for individual securities, industries, market sectors and/or markets. These statements involve risks and uncertainties. In addition to the general risks described for the Fund in the current Prospectus, other factors bearing on this report include the accuracy of the Adviser’s or portfolio managers’ forecasts and predictions, and the appropriateness of the investment programs designed by the adviser or portfolio managers to implement their strategies efficiently and effectively. Any one or more of these factors, as well as other risks affecting the securities markets and investment instruments generally, could cause the actual results of the Fund to differ materially as compared to benchmarks associated with the Fund.
ADDITIONAL INFORMATION (Unaudited)
The Fund has adopted proxy voting policies and procedures that delegate to the Adviser the authority to vote proxies. A description of the Fund’s proxy voting policies and procedures is available without charge, upon request, by calling the Fund toll free at877-807-4122. A description of these policies and procedures is also included in the Fund’s Statement of Additional Information, which is available on the SEC’s website athttp://www.sec.gov.
The Fund’s proxy voting record for the most recent12-month period ended June 30 is available without charge, upon request, by calling, toll free,877-807-4122, or by accessing the SEC’s website athttp://www.sec.gov.
The Fund files its complete schedule of portfolio holdings with the SEC for the first and third quarters of each fiscal year as an exhibit to its reports on FormN-PORT. Shareholders may view the Fund’s FormN-PORT report on the SEC’s website atwww.sec.gov.
HOUSEHOLDING (Unaudited)
In an effort to decrease costs, the Fund intends to reduce the number of duplicate prospectuses and annual andsemi-annual reports you receive by sending only one copy of each to those addresses shared by two or more accounts and to shareholders the Fund reasonably believes are from the same family or household. Once implemented, if you would like to discontinue householding for your accounts, please calltoll-free at877-807-4122 to request individual copies of these documents. Once the Fund receives notice to stop householding, the Fund will begin sending individual copies 30 days after receiving your request. This policy does not apply to account statements.
(This Page Intentionally Left Blank.)
SMEAD VALUE FUND
| | |
| |
Investment Adviser | | Smead Capital Management, Inc.
1001 4th Avenue
Suite 4305
Seattle, Washington 98154 |
| |
Legal Counsel | | Godfrey & Kahn, S.C.
833 East Michigan Street
Suite 1800
Milwaukee, Wisconsin 53202 |
| |
Independent Registered Public Accounting Firm | | Cohen & Company, Ltd.
1350 Euclid Avenue
Suite 800
Cleveland, Ohio 44115
|
| |
Custodian, Fund Accountant and Fund Administrator | | State Street Bank and Trust Company
One Lincoln Street
Boston, Massachusetts 02111 |
| |
Transfer Agent | | UMB Fund Services, Inc.
235 W Galena Street
Milwaukee, WI 53212 |
| |
Distributor | | ALPS Distributors, Inc.
1290 Broadway
Suite 1100
Denver, Colorado 80203 |
This report is intended for shareholders of the Fund and may not be used as sales literature unless preceded or accompanied by a current prospectus.
Item 2. Code of Ethics.
| (a) | As of November 30, 2019, the Registrant had adopted a code of ethics, as defined in Item 2(b) of FormN-CSR, that applies to the Registrant’s principal executive officer, principal financial officer, principal accounting officer or controller, or persons performing similar functions (the “Code of Ethics”). |
| (c) | There have been no amendments to the Registrant’s Code of Ethics during the reporting period for this FormN-CSR. |
| (d) | During the period covered by the report, the Registrant did not grant any waivers to the provisions of the Code of Ethics. |
| (f) | The Code of Ethics is included with this FormN-CSR as Exhibit 13(a)(1). |
Item 3. Audit Committee Financial Expert.
| (a)(1) | The Registrant’s Board of Trustees has determined that there is at least one member who qualifies as an “Audit Committee Financial Expert” serving on its Audit Committee. |
| (a)(2) | Mr. Walter F. Walker and Mr. Peter M. Musser serve as the “Audit Committee Financial Experts” and are considered to be “Independent Trustees” as each term is defined in Item 3 of FormN-CSR. |
Item 4. Principal Accountant Fees and Services.
| | | | | | | | |
| Fiscal Year Ended | | (a) Audit Fees | | (b) Audit-Related Fees | | (c)1 Tax Fees | | (d) All Other Fees |
| November 30, 2019 | | $16,500 | | $ - | | $3,000 | | $ - |
| | | | |
| November 30, 2018 | | $16,500 | | $ - | | $3,000 | | $ - |
| 1 | The Tax Fees are the aggregate fees billed for professional services rendered by Cohen & Company, Ltd. for the review ofForm 1120-RIC and Form 8613, and the review of excise tax distribution calculations. |
| (e)(1) | Audit CommitteePre-Approval Policies and Procedures. The Registrant’s Audit Committeepre-approves all audit andnon-audit services to be performed by the Registrant’s accountant before the accountant is engaged by the Registrant to perform such services. |
| (e)(2) | The percentage of services described in each of paragraphs (b) through (d) of this Item that were approved by the Audit Committee pursuant to paragraph (c)(7)(i)(C) and (c)(7)(ii) of Rule2-01 of RegulationS-X are as follows: None. |
| (g) | There were nonon-audit fees billed by Registrant’s accountant for the Registrant’s fiscal years ended November 30, 2019 and November 30, 2018. |
3
Item 5. Audit Committee of Listed Registrants.
Not applicable.
Item 6. Investments.
| (a) | Included as part of the Report to Shareholders under Item 1 of this FormN-CSR. |
Item 7. Disclosure of Proxy Voting Policies and Procedures forClosed-End Management Investment Companies.
Not applicable.
Item 8. Portfolio Managers ofClosed-End Management Investment Companies.
Not applicable.
Item 9. Purchases of Equity Securities byClosed-End Management Investment Company and Affiliated Purchasers.
Not applicable.
Item 10. Submission of Matters to a Vote of Security Holders.
During the period ended November 30, 2019, there were no material changes to the procedures by which shareholders may recommend nominees to the Registrant’s Board of Trustees.
Item 11. Controls and Procedures.
| (a) | The Registrant’s principal executive and principal financial officers, or persons performing similar functions, have concluded that the Registrant’s disclosure controls and procedures (as defined in Rule30a-3(c) under the Investment Company Act of 1940 (the “Act”)) are effective, as of a date within 90 days of the filing date of this FormN-CSR, based on the evaluation of these controls and procedures required by the Act and under the Securities Exchange Act of 1934. |
| (b) | There were no changes in the Registrant’s internal control over financial reporting (as defined in Rule30a-3(d) under the Act) that occurred during the period covered by this report that have materially affected, or are reasonably likely to materially affect, the Registrant’s internal control over financial reporting. |
Item 12. Disclosure of Securities Lending Activities forClosed-End Management Investment Companies.
Not applicable.
4
Item 13. Exhibits.
| (a)(1) | The Code of Ethics of the Registrant as required pursuant to Item 2 of this FormN-CSR is filed herewith. |
| (a)(2) | Certifications of the Registrant pursuant to Rule30a-2(a) under the Act are filed herewith. |
| (b) | Certifications of the Registrant pursuant to Rule30a-2(b) under the Act are filed herewith. |
5
SIGNATURES
Pursuant to the requirements of the Securities Exchange Act of 1934 and the Investment Company Act of 1940, the Registrant has duly caused this report to be signed on its behalf by the undersigned, thereunto duly authorized.
| | |
Smead Funds Trust |
| |
By: | | /s/ Cole W. Smead |
Cole W. Smead |
President |
(Principal Executive Officer) |
Date: February 4, 2020
Pursuant to the requirements of the Securities Exchange Act of 1934 and the Investment Company Act of 1940, this report has been signed below by the following persons on behalf of the Registrant and in the capacities and on the dates indicated.
| | |
By: | | /s/ Cole W. Smead |
Cole W. Smead |
President |
(Principal Executive Officer) |
Date: February 4, 2020
| | |
By: | | /s/ Steven J. LeMire |
Steven J. LeMire |
Treasurer |
(Principal Financial Officer) |
Date: February 4, 2020