UNITED STATES
SECURITIES AND EXCHANGE COMMISSION
Washington, D.C. 20549
Form N-CSR
CERTIFIED SHAREHOLDER REPORT OF REGISTERED
MANAGEMENT INVESTMENT COMPANIES
Investment Company Act File Number: 811-22983
Eaton Vance NextShares Trust II
(Exact Name of Registrant as Specified in Charter)
Two International Place, Boston, Massachusetts 02110
(Address of Principal Executive Offices)
Maureen A. Gemma
Two International Place, Boston, Massachusetts 02110
(Name and Address of Agent for Services)
(617) 482-8260
(Registrant’s Telephone Number)
September 30
Date of Fiscal Year End
September 30, 2018
Date of Reporting Period
Item 1. Reports to Stockholders

Eaton Vance
Oaktree Diversified Credit NextShares (OKDCC)
Listing Exchange: The NASDAQ Stock Market LLC
Annual Report
September 30, 2018
NextShares® is a registered trademark of NextShares Solutions LLC. All rights reserved.
Commodity Futures Trading Commission Registration. Effective December 31, 2012, the Commodity Futures Trading Commission (“CFTC”) adopted certain regulatory changes that subject registered investment companies and advisers to regulation by the CFTC if a fund invests more than a prescribed level of its assets in certain CFTC-regulated instruments (including futures, certain options and swap agreements) or markets itself as providing investment exposure to such instruments. The Fund has claimed an exclusion from the definition of the term “commodity pool operator” under the Commodity Exchange Act. Accordingly, neither the Fund nor the adviser with respect to the operation of the Fund is subject to CFTC regulation. Because of its management of other strategies, the Fund’s adviser is registered with the CFTC as a commodity pool operator and a commodity trading advisor.
Fund shares are not insured by the FDIC and are not deposits or other obligations of, or guaranteed by, any depository institution. Shares are subject to investment risks, including possible loss of principal invested.
This report must be preceded or accompanied by a current summary prospectus or prospectus. Before investing in NextShares, investors should consider carefully the investment objectives, risks, charges and expenses. This and other important information is contained in the prospectus and summary prospectus, which can be obtained from a financial advisor. Prospective investors should read the prospectus carefully before investing. For further information, please call 1-800-262-1122.
Annual Report September 30, 2018
Eaton Vance
Oaktree Diversified Credit NextShares
Table of Contents
| | | | |
Management’s Discussion of Fund Performance | | | 2 | |
| |
Performance | | | 3 | |
| |
Fund Profile | | | 4 | |
| |
Endnotes and Additional Disclosures | | | 5 | |
| |
Fund Expenses | | | 6 | |
| |
Financial Statements | | | 7 | |
| |
Report of Independent Registered Public Accounting Firm | | | 28 | |
| |
Federal Tax Information | | | 29 | |
| |
Special Meeting of Shareholders | | | 30 | |
| |
Management and Organization | | | 31 | |
| |
Important Notices | | | 34 | |
Eaton Vance
Oaktree Diversified Credit NextShares
September 30, 2018
Management’s Discussion of Fund Performance1
Economic and Market Conditions
Although geopolitical tensions early in the period involving North Korea rattled markets, accommodative central banks, strong corporate earnings, and global growth muffled the impact of these potential sources of volatility. However, as the year progressed, the growing threat of an international trade war and mounting uncertainties about the course of Brexit raised market worries. Signs of decelerating growth outside the U.S. — as well as concerns about rising inflation and interest rates inside the U.S. — led to an uptick in volatility.
U.S. gross domestic product (GDP) growth accelerated through most of the period, reaching a quarterly annualized rate of 4.2% in the second quarter of 2018, the highest level in four years. Corporate earnings and balance sheets also steadily strengthened and the unemployment rate fell to 3.9% during the period from 4.2% at the start of the period. Wages, which had remained stagnant even as the jobless rate fell, began to rise in the latter stages of the period. Inflation increased modestly with the personal consumption expenditures index rising to nearly 2%, the U.S. Federal Reserve (the Fed) target level.
As the U.S. economy showed signs of accumulating strength, the Fed raised rates three times during the period and projected another hike before the end of 2018 as well as three more in 2019.
Outside the U.S., growth in major economies in the eurozone and China slowed during the period. Eurozone countries shifted away from monetary-easing policies while the Central Bank of China cut interest rates. Both actions contributed to a stronger U.S. dollar. Meanwhile, the Bank of Japan curtailed the easing policies it had pursued since the 2008 financial crisis.
As the Fed adhered to its tightening course, spreads between long- and short-term rates — already unusually narrow at the beginning of the period — converged, further flattening the yield curve. Early in the calendar year, a major U.S. tax cut resulted in a surge in U.S. Treasury bill issuances and large- scale corporate cash repatriation, putting pressure on short-term rates.
Later in the period, a strong supply of issuances from merger- and-acquisition transactions — in addition to concerns about increased leverage and weakening fundamentals in the latter stages of the credit cycle — contributed to widening spreads.
Fund Performance
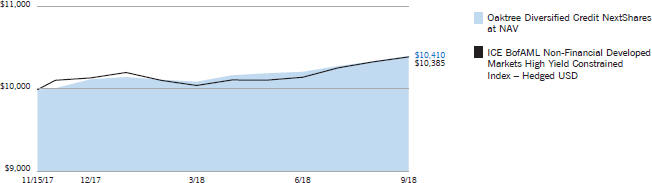
Eaton Vance Oaktree Diversified Credit NextShares (the Fund) had a total return of 4.10% at net asset value (NAV) for the period between the Fund’s inception on November 15, 2017 and its fiscal year ended September 30, 2018. By comparison, the Fund’s primary benchmark, the ICE BofAML Non-Financial Developed Markets High Yield Constrained Index – Hedged USD (the Index),2 returned 3.85%.
Strength in the U.S. economy in 2018 paved the way for a rising-rate environment. The Fund’s strategic allocation to senior loans and other strategies with floating-rate
coupon instruments — such as structured credit, including collateralized loan obligations and certain commercial mortgage-backed securities — benefited Fund performance relative to the Index.
Notably, the returns of these strategies exceeded the Index, with lower volatility and the benefits of a securitized status. This offset the impact of below Index returns from high yield bonds, convertibles, and emerging markets debt held in the Fund during the period.
Market volatility — fueled by an escalating trade war between the U.S. and China — negatively affected the Fund’s convertibles strategies, which are sensitive to equity market movements. However, some of the volatility related to China created buying opportunities for the Fund during the period, particularly in emerging markets debt. The Fund had no allocation to emerging markets debt at the beginning of the period because of the relative risk of such investments, highlighted by emerging markets high yield spreads being similar to U.S. high yield spreads at the time.
Extreme volatility followed in 2018 and the Fund benefited from a negligible allocation early in the period. As spreads widened and opportunities became more attractive, the Fund allocated about 5% of its assets to emerging markets debt at period end.
See Endnotes and Additional Disclosures in this report.
Past performance is no guarantee of future results. Investment return and principal value will fluctuate so that shares, when sold, may be worth more or less than their original cost. Performance is for the stated time period only; due to market volatility, the Fund’s current performance may be lower or higher than indicated. The Fund’s performance at market price will differ from its results at net asset value (NAV). The market price used to calculate the Market Price return is the midpoint between the highest bid and the lowest offer on the exchange on which the shares of the Fund are listed for trading, as of the time that the Fund’s NAV is calculated. If you trade your shares at another time during the day, your return may differ. Returns are historical and are calculated by determining the percentage change in NAV or market price (as applicable) with all distributions reinvested at NAV or closing market price (as applicable) on the payment date of the distribution, and are net of management fees and other expenses. Returns are before taxes unless otherwise noted. Performance less than or equal to one year is cumulative. For performance as of the most recent month-end, including historical trading premiums/discounts relative to NAV, please refer to eatonvance.com.
Eaton Vance
Oaktree Diversified Credit NextShares
September 30, 2018
Performance2,3
Portfolio Manager Bruce A. Karsh, of Oaktree Capital Management, L.P.
| | | | | | | | | | | | | | | | | | | | |
| % Cumulative Total Returns | | Fund
Inception Date | | | Performance
Inception Date | | | One Year | | | Five Years | | | Since
Fund
Inception | |
Fund at NAV | | | 11/15/2017 | | | | 11/15/2017 | | | | — | | | | — | | | | 4.10 | % |
Fund at Market Price | | | 11/15/2017 | | | | 11/15/2017 | | | | — | | | | — | | | | 4.10 | |
ICE BofAML Non-Financial Developed Markets High Yield Constrained Index – Hedged USD | | | — | | | | — | | | | 3.02 | % | | | 5.68 | % | | | 3.85 | % |
Blended Benchmark | | | — | | | | — | | | | 4.10 | | | | 4.92 | | | | 4.26 | |
| | | | | |
| | | | | | | | | | | | | | | | | | | | |
| % Total Annual Operating Expense Ratios4 | | | | | | | | | | | | | | | |
Gross | | | | | | | | | | | | | | | | | | | 1.11 | % |
Net | | | | | | | | | | | | | | | | | | | 0.90 | |
| | | | | |
| | | | | | | | | | | | | | | | | | | | |
| % Distribution Rates/Yields5 | | | | | | | | | | | | | | | |
Distribution Rate at NAV | | | | | | | | | | | | | | | | | | | 4.04 | % |
SEC 30-day Yield – Subsidized | | | | | | | | | | | | | | | | | | | 4.75 | |
SEC 30-day Yield – Unsubsidized | | | | | | | | | | | | | | | | | | | 4.42 | |
Growth of $10,000
This graph shows the change in value of a hypothetical investment of $10,000 in Oaktree Diversified Credit NextShares for the period indicated. For comparison, the same investment is shown in the indicated index.
See Endnotes and Additional Disclosures in this report.
Past performance is no guarantee of future results. Investment return and principal value will fluctuate so that shares, when sold, may be worth more or less than their original cost. Performance is for the stated time period only; due to market volatility, the Fund’s current performance may be lower or higher than indicated. The Fund’s performance at market price will differ from its results at net asset value (NAV). The market price used to calculate the Market Price return is the midpoint between the highest bid and the lowest offer on the exchange on which the shares of the Fund are listed for trading, as of the time that the Fund’s NAV is calculated. If you trade your shares at another time during the day, your return may differ. Returns are historical and are calculated by determining the percentage change in NAV or market price (as applicable) with all distributions reinvested at NAV or closing market price (as applicable) on the payment date of the distribution, and are net of management fees and other expenses. Returns are before taxes unless otherwise noted. Performance less than or equal to one year is cumulative. For performance as of the most recent month-end, including historical trading premiums/discounts relative to NAV, please refer to eatonvance.com.
Eaton Vance
Oaktree Diversified Credit NextShares
September 30, 2018
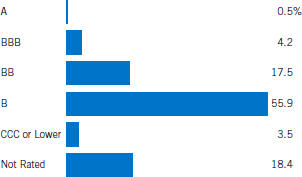
Fund Profile
Credit Quality (% of total investments)6,7
See Endnotes and Additional Disclosures in this report.
Eaton Vance
Oaktree Diversified Credit NextShares
September 30, 2018
Endnotes and Additional Disclosures
| 1 | The views expressed in this report are those of the portfolio manager(s) and are current only through the date stated at the top of this page. These views are subject to change at any time based upon market or other conditions, and Eaton Vance and the Fund(s) disclaim any responsibility to update such views. These views may not be relied upon as investment advice and, because investment decisions are based on many factors, may not be relied upon as an indication of trading intent on behalf of any Eaton Vance fund. This commentary may contain statements that are not historical facts, referred to as “forward looking statements.” The Fund’s actual future results may differ significantly from those stated in any forward looking statement, depending on factors such as changes in securities or financial markets or general economic conditions, the volume of sales and purchases of Fund shares, the continuation of investment advisory, administrative and service contracts, and other risks discussed from time to time in the Fund’s filings with the Securities and Exchange Commission. |
| 2 | ICE BofAML Non-Financial Developed Markets High Yield Constrained Index – Hedged USD is an unmanaged index of below investment grade corporate bonds from developed market countries. The index excludes financial companies, limits issuer exposure to 2%, and is hedged to the US Dollar. ICE® BofAML® indices are not for redistribution or other uses; provided “as is”, without warranties, and with no liability. Eaton Vance has prepared this report and ICE Data Indices, LLC does not endorse it, or guarantee, review, or endorse Eaton Vance’s products. BofAML® is a licensed registered trademark of Bank of America Corporation in the United States and other countries. S&P/LSTA Leveraged Loan Index is an unmanaged index of institutional leverage loan market. The Blended Index consists of 50% ICE BofAML Non-Financial Developed Markets High Yield Constrained Index – Hedged USD and 50% S&P/ LSTA Leveraged Loan Index. Unless otherwise stated, index returns do not reflect the effect of any applicable sales charges, commissions, expenses, taxes or leverage, as applicable. It is not possible to invest directly in an index. Performance since inception for an index, if presented, is the performance since the Fund’s inception. |
| 3 | Shares of NextShares funds are normally bought and sold in the secondary market through a broker, and may not be individually purchased or redeemed from the fund. In the secondary market, buyers and sellers transact with each other, rather than with the fund. Market trading prices of NextShares are linked to the fund’s next-computed net asset value (NAV) and will vary from NAV by a market-determined premium or discount, which may be zero. Buyers and sellers of NextShares will not know the value of their purchases and sales until after the fund’s NAV is determined at the end of the trading day. Market trading prices may vary significantly from anticipated levels. NextShares do not offer investors the opportunity to buy and sell intraday based on current (versus end-of-day) determinations of fund value. NextShares trade execution prices will fluctuate based on changes in NAV. Although limit orders may be used to control trading costs, they cannot be used to control or limit trade execution prices. As a new type of fund, NextShares have a limited operating history and may initially be available through a limited number of brokers. There can be no guarantee that an active trading market for NextShares will develop or be maintained, or that their listing will continue unchanged. Buying and selling NextShares may require payment of brokerage commissions and expose transacting shareholders to other trading costs. Frequent trading may detract from realized investment returns. The return on a shareholder’s NextShares investment will be reduced if the shareholder sells shares at a greater discount or narrower premium to NAV than he or she acquired the shares. |
| | NextShares funds issue and redeem shares only in specified creation unit quantities in transactions by or through authorized participants. In such transactions, a fund issues and redeems shares in exchange for the basket of securities, other instruments and/or cash that the fund specifies each business day. A fund’s basket is not intended to be representative of the fund’s current portfolio positions and may vary significantly from current positions. |
| 4 | Source: Fund prospectus. Net expense ratio reflects a contractual expense reimbursement that continues through 1/31/19. Without the reimbursement, performance would have been lower. The expense ratio for the current reporting period can be found in the Financial Highlights section of this report. |
| 5 | The Distribution Rate is based on the Fund’s last regular distribution per share in the period (annualized) divided by the Fund’s NAV at the end of the period. The Fund’s distributions may be comprised of amounts characterized for federal income tax purposes as tax-exempt income, qualified and non-qualified ordinary dividends, capital gains and nondividend distributions, also known as return of capital. The Fund will determine the federal income tax character of distributions paid to a shareholder after the end of the calendar year. This is reported on the IRS form 1099-DIV and provided to the shareholder shortly after each year-end. The Fund’s distributions are determined by the investment adviser based on its current assessment of the Fund’s long-term return potential. As portfolio and market conditions change, the rate of distributions paid by the Fund could change. The SEC Yield is a standardized measure based on the estimated yield to maturity of a fund’s investments over a 30-day period and is based on the maximum offer price at the date specified. The SEC Yield is not based on the distributions made by the Fund, which may differ. Subsidized yield reflects the effect of fee waivers and expense reimbursements. |
| 6 | Ratings are based on Moody’s Investors Service, Inc. (“Moody’s”), S&P Global Ratings (“S&P”) or Fitch Ratings (“Fitch”), as applicable. If securities are rated differently by the ratings agencies, the lowest rating is applied. Ratings, which are subject to change, apply to the creditworthiness of the issuers of the underlying securities and not to the Fund or its shares. Credit ratings measure the quality of a bond based on the issuer’s creditworthiness, with ratings ranging from AAA, being the highest, to D, being the lowest based on S&P’s measures. Ratings of BBB or higher by S&P or Fitch (Baa or higher by Moody’s) are considered to be investment- grade quality. Credit ratings are based largely on the ratings agency’s analysis at the time of rating. The rating assigned to any particular security is not necessarily a reflection of the issuer’s current financial condition and does not necessarily reflect its assessment of the volatility of a security’s market value or of the liquidity of an investment in the security. Holdings designated as “Not Rated” (if any) are not rated by the national ratings agencies stated above. |
| 7 | Excludes cash and cash equivalents. |
| | Fund profile subject to change due to active management. |
Eaton Vance
Oaktree Diversified Credit NextShares
September 30, 2018
Fund Expenses
Example: As a Fund shareholder, you incur two types of costs: (1) transaction costs, including brokerage commissions on purchases and sales of Fund shares; and (2) ongoing costs, including management fees and other Fund expenses. This Example is intended to help you understand your ongoing costs (in dollars) of Fund investing and to compare these costs with the ongoing costs of investing in other funds. The Example is based on an investment of $1,000 invested at the beginning of the period and held for the entire period (April 1, 2018 – September 30, 2018).
Actual Expenses: The first section of the table below provides information about actual account values and actual expenses. You may use the information in this section, together with the amount you invested, to estimate the expenses that you paid over the period. Simply divide your account value by $1,000 (for example, an $8,600 account value divided by $1,000 = 8.6), then multiply the result by the number in the first section under the heading entitled “Expenses Paid During Period” to estimate the expenses you paid on your account during this period.
Hypothetical Example for Comparison Purposes: The second section of the table below provides information about hypothetical account values and hypothetical expenses based on the actual Fund expense ratio and an assumed rate of return of 5% per year (before expenses), which is not the actual Fund return. The hypothetical account values and expenses may not be used to estimate the actual ending account balance or expenses you paid for the period. You may use this information to compare the ongoing costs of investing in your Fund and other funds. To do so, compare this 5% hypothetical example with the 5% hypothetical examples that appear in the shareholder reports of the other funds.
Please note that the expenses shown in the table are meant to highlight your ongoing costs only and do not reflect any transactional costs, such as brokerage commissions on purchases and sales of Fund shares. Therefore, the second section of the table is useful in comparing ongoing costs only, and will not help you determine the relative total costs of owning different funds. In addition, if these transactional costs were included, your costs would be higher.
| | | | | | | | | | | | | | | | |
| | | Beginning
Account Value
(4/1/18) | | | Ending
Account Value
(9/30/18) | | | Expenses Paid
During Period*
(4/1/18 – 9/30/18) | | | Annualized
Expense
Ratio | |
| | | |
Actual | | | | | | | | | | | | | |
| | $ | 1,000.00 | | | $ | 1,031.20 | | | $ | 4.58 | ** | | | 0.90 | % |
| | | | |
Hypothetical | | | | | | | | | | | | | |
(5% return per year before expenses) | | | | | | | | | | | | | |
| | $ | 1,000.00 | | | $ | 1,020.60 | | | $ | 4.56 | ** | | | 0.90 | % |
| * | Expenses are equal to the Fund’s annualized expense ratio, multiplied by the average account value over the period, multiplied by 183/365 (to reflect the one-half year period). The Example assumes that the $1,000 was invested at the net asset value per share determined at the close of business on March 31, 2018. |
| ** | Absent an allocation of certain expenses to an affiliate, expenses would be higher. |
Eaton Vance
Oaktree Diversified Credit NextShares
September 30, 2018
Portfolio of Investments
| | | | | | | | | | | | |
| Senior Floating-Rate Loans — 36.6%(1) | |
| Borrower/Tranche Description | | | | | Principal
Amount*
(000’s omitted) | | | Value | |
|
| Aerospace and Defense — 1.4% | |
| TransDigm, Inc. | | | | | | | | | |
Term Loan, 4.74%, (1 mo. USD LIBOR + 2.50%), Maturing May 30, 2025 | | | | | | | 746 | | | $ | 749,190 | |
| | | | | | | | | | | $ | 749,190 | |
|
| Business Equipment and Services — 4.8% | |
| Blitz F18-675 GmbH | | | | | | | | | |
Term Loan, 3.75%, (2 mo. EURIBOR + 3.75%), Maturing July 31, 2025 | | | EUR | | | | 450 | | | $ | 527,104 | |
| Fugue Finance B.V. | | | | | | | | | |
Term Loan, 3.25%, (3 mo. EURIBOR + 3.25%), Maturing September 1, 2024 | | | EUR | | | | 400 | | | | 466,646 | |
| Kiloutou NewCo | | | | | | | | | |
Term Loan, 3.50%, (1 mo. EURIBOR + 3.50%), Maturing January 31, 2025 | | | EUR | | | | 230 | | | | 269,649 | |
| Nets Holding A/S | | | | | | | | | |
Term Loan, 3.00%, (3 mo. EURIBOR + 3.00%), Maturing February 6, 2025 | | | EUR | | | | 176 | | | | 205,513 | |
| PI US MergerCo, Inc. | | | | | | | | | |
Term Loan, 5.74%, (1 mo. USD LIBOR + 3.50%), Maturing December 20, 2024 | | | | | | | 498 | | | | 497,065 | |
| Trans Union, LLC | | | | | | | | | |
Term Loan, 4.24%, (1 mo. USD LIBOR + 2.00%), Maturing June 19, 2025 | | | | | | | 499 | | | | 500,690 | |
| | | | | | | | | | | $ | 2,466,667 | |
|
| Cable and Satellite Television — 2.4% | |
| CSC Holdings, LLC | | | | | | | | | |
Term Loan, 4.66%, (1 mo. USD LIBOR + 2.50%), Maturing January 25, 2026 | | | | | | | 1,247 | | | $ | 1,249,680 | |
| | | | | | | | | | | $ | 1,249,680 | |
|
| Chemicals and Plastics — 0.9% | |
| U.S. Silica Company | | | | | | | | | |
Term Loan, 6.25%, (1 mo. USD LIBOR + 4.00%), Maturing May 1, 2025 | | | | | | | 499 | | | $ | 488,616 | |
| | | | | | | | | | | $ | 488,616 | |
|
| Containers and Glass Products — 0.5% | |
| CCP Lux Holding S.a.r.l. | | | | | | | | | |
Term Loan, 3.75%, (3 mo. EURIBOR + 3.75%), Maturing January 10, 2025 | | | EUR | | | | 200 | | | $ | 233,023 | |
| | | | | | | | | | | $ | 233,023 | |
| | | | | | | | | | | | |
| Borrower/Tranche Description | | | | | Principal
Amount*
(000’s omitted) | | | Value | |
|
| Ecological Services and Equipment — 1.9% | |
| ExGen Renewables IV, LLC | | | | | | | | | |
Term Loan, 5.32%, (3 mo. USD LIBOR + 3.00%), Maturing November 28, 2024 | | | | | | | 488 | | | $ | 492,771 | |
| GFL Environmental, Inc. | | | | | | | | | |
Term Loan, 1.00%, Maturing May 30, 2025(2) | | | | | | | 55 | | | | 55,387 | |
Term Loan, 5.14%, (3 mo. USD LIBOR + 2.75%), Maturing May 30, 2025 | | | | | | | 444 | | | | 444,748 | |
| | | | | | | | | | | $ | 992,906 | |
|
| Electronics / Electrical — 4.9% | |
| Financial & Risk US Holdings, Inc. | | | | | | | | | |
Term Loan, Maturing September 14, 2025(3) | | | EUR | | | | 100 | | | $ | 117,016 | |
Term Loan, Maturing October 1, 2025(3) | | | | | | | 750 | | | | 749,264 | |
| Marcel LUX IV S.a.r.l. | | | | | | | | | |
Term Loan, Maturing September 26, 2025(3) | | | EUR | | | | 130 | | | | 151,880 | |
| SolarWinds Holdings, Inc. | | | | | | | | | |
Term Loan, 5.24%, (1 mo. USD LIBOR + 3.00%), Maturing February 5, 2024 | | | | | | | 496 | | | | 499,506 | |
| TriTech Software Systems | | | | | | | | | |
Term Loan, Maturing August 29, 2025(3) | | | | | | | 500 | | | | 502,344 | |
| Vertafore, Inc. | | | | | | | | | |
Term Loan, 5.49%, (1 mo. USD LIBOR + 3.25%), Maturing July 2, 2025 | | | | | | | 500 | | | | 502,723 | |
| | | | | | | | | | | $ | 2,522,733 | |
|
| Financial Intermediaries — 1.1% | |
| Independent Vetcare Holdings Limited | | | | | | | | | |
Term Loan, 5.22%, (1 mo. GBP LIBOR + 4.50%), Maturing January 31, 2024 | | | GBP | | | | 260 | | | $ | 338,884 | |
| Peer Holding III B.V. | | | | | | | | | |
Term Loan, 3.50%, (3 mo. EURIBOR + 3.50%), Maturing March 8, 2025 | | | EUR | | | | 200 | | | | 231,049 | |
| | | | | | | | | | | $ | 569,933 | |
|
| Food Products — 0.4% | |
| Refresco Group B.V. | | | | | | | | | |
Term Loan, 3.25%, (3 mo. EURIBOR + 3.25%), Maturing March 28, 2025 | | | EUR | | | | 200 | | | $ | 230,842 | |
| | | | | | | | | | | $ | 230,842 | |
|
| Health Care — 8.5% | |
| Auris Luxembourg III S.a.r.l. | | | | | | | | | |
Term Loan, Maturing July 20, 2025(3) | | | EUR | | | | 380 | | | $ | 446,478 | |
| | | | |
| | 7 | | See Notes to Financial Statements. |
Eaton Vance
Oaktree Diversified Credit NextShares
September 30, 2018
Portfolio of Investments — continued
| | | | | | | | | | | | |
| Borrower/Tranche Description | | | | | Principal
Amount*
(000’s omitted) | | | Value | |
|
| Health Care (continued) | |
| CHG Healthcare Services, Inc. | | | | | | | | | |
Term Loan, 5.31%, (USD LIBOR + 3.00%), Maturing June 7, 2023(4) | | | | | | | 995 | | | $ | 1,001,529 | |
| CTC AcquiCo GmbH | | | | | | | | | |
Term Loan, 5.56%, (3 mo. USD LIBOR + 3.25%), Maturing March 7, 2025 | | | | | | | 200 | | | | 199,500 | |
| Envision Healthcare Corporation | | | | | | | | | |
Term Loan, Maturing September 26, 2025(3) | | | | | | | 500 | | | | 498,750 | |
| Gentiva Health Services, Inc. | | | | | | | | | |
Term Loan, 6.00%, (1 mo. USD LIBOR + 3.75%), Maturing July 2, 2025 | | | | | | | 500 | | | | 506,562 | |
| Innoviva, Inc. | | | | | | | | | |
Term Loan, 6.81%, (3 mo. USD LIBOR + 4.50%), Maturing August 11, 2022 | | | | | | | 41 | | | | 41,456 | |
| Pearl Intermediate Parent, LLC | | | | | | | | | |
Term Loan, 2.08%, (3 mo. USD LIBOR + 2.75%), Maturing February 14, 2025(2) | | | | | | | 227 | | | | 223,425 | |
Term Loan, 4.92%, (1 mo. USD LIBOR + 2.75%), Maturing February 14, 2025 | | | | | | | 769 | | | | 756,370 | |
| Verscend Holding Corp. | | | | | | | | | |
Term Loan, Maturing August 27, 2025(3) | | | | | | | 750 | | | | 754,219 | |
| | | | | | | | | | | $ | 4,428,289 | |
|
| Industrial Equipment — 0.3% | |
| TI Luxembourg S.A. | | | | | | | | | |
Term Loan, 3.50%, (3 mo. EURIBOR + 3.50%), Maturing February 14, 2025 | | | EUR | | | | 140 | | | $ | 163,563 | |
| | | | | | | | | | | $ | 163,563 | |
|
| Insurance — 3.4% | |
| Asurion, LLC | | | | | | | | | |
Term Loan, 5.24%, (1 mo. USD LIBOR + 3.00%), Maturing November 3, 2024 | | | | | | | 499 | | | $ | 502,624 | |
Term Loan - Second Lien, 8.74%, (1 mo. USD LIBOR + 6.50%), Maturing August 4, 2025 | | | | | | | 250 | | | | 257,552 | |
| Mayfield Agency Borrower, Inc. | | | | | | | | | |
Term Loan, 6.74%, (1 mo. USD LIBOR + 4.50%), Maturing February 28, 2025 | | | | | | | 998 | | | | 1,002,488 | |
| | | | | | | | | | | $ | 1,762,664 | |
|
| Lodging and Casinos — 0.9% | |
| Alpha Group S.a.r.l. | | | | | | | | | |
Term Loan, 3.75%, (3 mo. EURIBOR + 3.75%), Maturing January 31, 2025 | | | EUR | | | | 200 | | | $ | 234,170 | |
| | | | | | | | | | | | |
| Borrower/Tranche Description | | | | | Principal
Amount*
(000’s omitted) | | | Value | |
|
| Lodging and Casinos (continued) | |
| Stars Group Holdings B.V. (The) | | | | | | | | | |
Term Loan, 3.75%, (3 mo. EURIBOR + 3.75%), Maturing July 10, 2025 | | | EUR | | | | 200 | | | $ | 235,185 | |
| | | | | | | | | | | $ | 469,355 | |
|
| Nonferrous Metals / Minerals — 1.0% | |
| American Rock Salt Company, LLC | | | | | | | | | |
Term Loan, 5.99%, (1 mo. USD LIBOR + 3.75%), Maturing March 21, 2025 | | | | | | | 498 | | | $ | 499,832 | |
| | | | | | | | | | | $ | 499,832 | |
|
| Oil and Gas — 1.0% | |
| HFOTCO, LLC | | | | | | | | | |
Term Loan, 5.00%, (1 mo. USD LIBOR + 2.75%), Maturing June 26, 2025 | | | | | | | 499 | | | $ | 501,399 | |
| | | | | | | | | | | $ | 501,399 | |
|
| Retailers (Except Food and Drug) — 0.4% | |
| EG Group Limited | | | | | | | | | |
Term Loan, 5.55%, (3 mo. GBP LIBOR + 4.75%), Maturing February 6, 2025 | | | GBP | | | | 149 | | | $ | 194,970 | |
| | | | | | | | | | | $ | 194,970 | |
|
| Telecommunications — 1.3% | |
| Securus Technologies Holdings, Inc. | | | | | | | | | |
Term Loan, 6.74%, (1 mo. USD LIBOR + 4.50%), Maturing November 1, 2024 | | | | | | | 99 | | | $ | 99,975 | |
Term Loan, Maturing November 1, 2024(3) | | | | | | | 400 | | | | 401,917 | |
| TDC A/S | | | | | | | | | |
Term Loan, 3.50%, (3 mo. EURIBOR + 3.50%), Maturing May 31, 2025 | | | EUR | | | | 160 | | | | 187,381 | |
| | | | | | | | | | | $ | 689,273 | |
|
| Utilities — 1.5% | |
| Brookfield WEC Holdings, Inc. | | | | | | | | | |
Term Loan, 5.99%, (1 mo. USD LIBOR + 3.75%), Maturing August 1, 2025 | | | | | | | 500 | | | $ | 506,615 | |
Term Loan - Second Lien, 8.99%, (1 mo. USD LIBOR + 6.75%), Maturing August 3, 2026 | | | | | | | 250 | | | | 255,104 | |
| | | | | | | | | | | $ | 761,719 | |
| |
Total Senior Floating-Rate Loans
(identified cost $18,974,664) | | | $ | 18,974,654 | |
| | | | |
| | 8 | | See Notes to Financial Statements. |
Eaton Vance
Oaktree Diversified Credit NextShares
September 30, 2018
Portfolio of Investments — continued
| | | | | | | | | | | | |
| Corporate Bonds & Notes — 26.1% | |
| Security | | | | | Principal
Amount*
(000’s omitted) | | | Value | |
|
| Apparel — 0.2% | |
| Samsonite Finco S.a.r.l. | | | | | | | | | |
3.50%, 5/15/26(5) | | | EUR | | | | 110 | | | $ | 124,661 | |
| | | | | | | | | | | $ | 124,661 | |
|
| Building Materials — 0.4% | |
| James Hardie International Finance DAC | | | | | | | | | |
3.625%, 10/1/26(6)(7) | | | EUR | | | | 100 | | | $ | 117,868 | |
| Summit Materials, LLC/Summit Materials Finance Corp. | | | | | | | | | |
6.125%, 7/15/23 | | | | | | | 100 | | | | 101,918 | |
| | | | | | | | | | | $ | 219,786 | |
|
| Chemicals — 0.7% | |
| Braskem Finance, Ltd. | | | | | | | | | |
7.375% to 10/10/18(5)(8) | | | | | | | 75 | | | $ | 75,375 | |
| Chemours Co. (The) | | | | | | | | | |
4.00%, 5/15/26 | | | EUR | | | | 100 | | | | 116,534 | |
| Monitchem HoldCo 3 S.A. | | | | | | | | | |
5.25%, 6/15/21(5) | | | EUR | | | | 150 | | | | 172,883 | |
| | | | | | | | | | | $ | 364,792 | |
|
| Commercial Services — 1.4% | |
| APX Group, Inc. | | | | | | | | | |
7.875%, 12/1/22 | | | | | | | 100 | | | $ | 102,250 | |
| Blitz F18-674 GmbH | | | | | | | | | |
6.00%, 7/30/26(6) | | | EUR | | | | 100 | | | | 117,477 | |
| Carriage Services, Inc. | | | | | | | | | |
6.625%, 6/1/26(6) | | | | | | | 225 | | | | 231,187 | |
| Nexi Capital SpA | | | | | | | | | |
4.125%, 11/1/23(6) | | | EUR | | | | 105 | | | | 123,226 | |
| TMS International Corp. | | | | | | | | | |
7.25%, 8/15/25(6) | | | | | | | 170 | | | | 171,700 | |
| | | | | | | | | | | $ | 745,840 | |
|
| Computers — 0.5% | |
| NCR Corp. | | | | | | | | | |
6.375%, 12/15/23 | | | | | | | 255 | | | $ | 260,419 | |
| | | | | | | | | | | $ | 260,419 | |
|
| Diversified Financial Services — 0.8% | |
| Intrum Justitia AB | | | | | | | | | |
3.125%, 7/15/24(5) | | | EUR | | | | 100 | | | $ | 110,338 | |
| | | | | | | | | | | | |
| Security | | | | | Principal
Amount*
(000’s omitted) | | | Value | |
|
| Diversified Financial Services (continued) | |
| LHC3 PLC | | | | | | | | | |
4.125%, (4.125% cash or 4.875% PIK), 8/15/24(5)(9) | | | EUR | | | | 125 | | | $ | 145,355 | |
| Vantiv, LLC/Vanity Issuer Corp. | | | | | | | | | |
3.875%, 11/15/25(5) | | | GBP | | | | 110 | | | | 140,507 | |
| | | | | | | | | | | $ | 396,200 | |
|
| Electric — 0.5% | |
| Genneia S.A. | | | | | | | | | |
8.75%, 1/20/22(5) | | | | | | | 192 | | | $ | 180,672 | |
8.75%, 1/20/22(6) | | | | | | | 91 | | | | 85,631 | |
| | | | | | | | | | | $ | 266,303 | |
|
| Energy – Alternate Sources — 0.3% | |
| Rio Energy S.A./UGEN S.A./UENSA S.A. | | | | | | | | | |
6.875%, 2/1/25(5) | | | | | | | 200 | | | $ | 164,500 | |
| | | | | | | | | | | $ | 164,500 | |
|
| Entertainment — 0.5% | |
| CPUK Finance, Ltd. | | | | | | | | | |
4.25%, 2/28/47(5) | | | GBP | | | | 110 | | | $ | 143,703 | |
| WMG Acquisition Corp. | | | | | | | | | |
4.125%, 11/1/24(5) | | | EUR | | | | 100 | | | | 120,573 | |
| | | | | | | | | | | $ | 264,276 | |
|
| Environmental Control — 0.4% | |
| Covanta Holding Corp. | | | | | | | | | |
5.875%, 3/1/24 | | | | | | | 180 | | | $ | 184,221 | |
| | | | | | | | | | | $ | 184,221 | |
|
| Foods — 0.5% | |
| Ingles Markets, Inc. | | | | | | | | | |
5.75%, 6/15/23 | | | | | | | 150 | | | $ | 152,625 | |
| Sigma Holdco B.V. | | | | | | | | | |
5.75%, 5/15/26(5) | | | EUR | | | | 115 | | | | 126,324 | |
| | | | | | | | | | | $ | 278,949 | |
|
| Forest Products & Paper — 0.3% | |
| WEPA Hygieneprodukte GmbH | | | | | | | | | |
3.75%, 5/15/24(5) | | | EUR | | | | 110 | | | $ | 126,656 | |
| | | | | | | | | | | $ | 126,656 | |
| | | | |
| | 9 | | See Notes to Financial Statements. |
Eaton Vance
Oaktree Diversified Credit NextShares
September 30, 2018
Portfolio of Investments — continued
| | | | | | | | | | | | |
| Security | | | | | Principal
Amount*
(000’s omitted) | | | Value | |
|
| Health Care – Services — 0.6% | |
| CHS/Community Health Systems, Inc. | | | | | | | | | |
6.25%, 3/31/23 | | | | | | | 295 | | | $ | 281,356 | |
| | | | | | | | | | | $ | 281,356 | |
|
| Home Builders — 0.5% | |
| Century Communities, Inc. | | | | | | | | | |
5.875%, 7/15/25 | | | | | | | 250 | | | $ | 233,200 | |
| | | | | | | | | | | $ | 233,200 | |
|
| Household Products — 0.5% | |
| Diamond BC B.V. | | | | | | | | | |
5.625%, 8/15/25(5) | | | EUR | | | | 120 | | | $ | 130,763 | |
| Prestige Brands, Inc. | | | | | | | | | |
6.375%, 3/1/24(6) | | | | | | | 125 | | | | 127,031 | |
| | | | | | | | | | | $ | 257,794 | |
|
| Insurance — 0.9% | |
| Hub International, Ltd. | | | | | | | | | |
7.00%, 5/1/26(6) | | | | | | | 200 | | | $ | 200,762 | |
| Nationstar Mortgage Holdings, Inc. | | | | | | | | | |
8.125%, 7/15/23(6) | | | | | | | 245 | | | | 257,201 | |
| | | | | | | | | | | $ | 457,963 | |
|
| Iron & Steel — 0.9% | |
| Metinvest B.V. | | | | | | | | | |
8.50%, 4/23/26(6) | | | | | | | 500 | | | $ | 477,675 | |
| | | | | | | | | | | $ | 477,675 | |
|
| Media — 2.1% | |
| Altice France S.A. | | | | | | | | | |
5.625%, 5/15/24(5) | | | EUR | | | | 100 | | | $ | 121,613 | |
| Cablevision S.A. | | | | | | | | | |
6.50%, 6/15/21(5) | | | | | | | 225 | | | | 222,750 | |
| Tele Columbus AG | | | | | | | | | |
3.875%, 5/2/25(5) | | | EUR | | | | 110 | | | | 116,979 | |
| Telenet Finance VI Luxembourg SCA | | | | | | | | | |
4.875%, 7/15/27(5) | | | EUR | | | | 117 | | | | 147,432 | |
| Univision Communications, Inc. | | | | | | | | | |
5.125%, 5/15/23(6) | | | | | | | 105 | | | | 100,800 | |
| UPCB Finance IV, Ltd. | | | | | | | | | |
4.00%, 1/15/27(5) | | | EUR | | | | 104 | | | | 124,357 | |
| Virgin Media Receivables Financing Notes I DAC | | | | | | | | | |
5.50%, 9/15/24(5) | | | GBP | | | | 100 | | | | 131,113 | |
| | | | | | | | | | | | |
| Security | | | | | Principal
Amount*
(000’s omitted) | | | Value | |
|
| Media (continued) | |
| Ziggo Bond Finance B.V. | | | | | | | | | |
4.625%, 1/15/25(5) | | | EUR | | | | 100 | | | $ | 115,374 | |
| | | | | | | | | | | $ | 1,080,418 | |
|
| Metal Fabricate & Hardware — 0.5% | |
| Grinding Media, Inc./Moly-Cop AltaSteel, Ltd. | | | | | | | | | |
7.375%, 12/15/23(6) | | | | | | | 265 | | | $ | 276,459 | |
| | | | | | | | | | | $ | 276,459 | |
|
| Oil & Gas — 2.9% | |
| CITGO Petroleum Corp. | | | | | | | | | |
6.25%, 8/15/22(6) | | | | | | | 375 | | | $ | 375,937 | |
| Comstock Escrow Corp. | | | | | | | | | |
9.75%, 8/15/26(6) | | | | | | | 160 | | | | 160,048 | |
| Oasis Petroleum, Inc. | | | | | | | | | |
6.875%, 1/15/23 | | | | | | | 150 | | | | 152,812 | |
| Rio Oil Finance Trust | | | | | | | | | |
8.20%, 4/6/28(5) | | | | | | | 250 | | | | 256,250 | |
| YPF S.A. | | | | | | | | | |
8.75%, 4/4/24(5) | | | | | | | 82 | | | | 81,898 | |
6.95%, 7/21/27(5) | | | | | | | 508 | | | | 446,253 | |
| | | | | | | | | | | $ | 1,473,198 | |
|
| Packaging & Containers — 1.5% | |
| ARD Finance S.A. | | | | | | | | | |
6.625%, (6.625% cash or 7.375% PIK), 9/15/23(9) | | | EUR | | | | 100 | | | $ | 119,949 | |
| BWAY Holding Co. | | | | | | | | | |
5.50%, 4/15/24(6) | | | | | | | 210 | | | | 206,974 | |
| Guala Closures SpA | | | | | | | | | |
3.50%, (3 mo. EURIBOR + 3.50%), 4/15/24(6)(7)(10) | | | EUR | | | | 100 | | | | 116,975 | |
| Reynolds Group Issuer, Inc./Reynolds Group Issuer, LLC | | | | | | | | | |
7.00%, 7/15/24(6) | | | | | | | 305 | | | | 310,909 | |
| | | | | | | | | | | $ | 754,807 | |
|
| Pharmaceuticals — 1.2% | |
| Bausch Health Companies, Inc. | | | | | | | | | |
5.875%, 5/15/23(6) | | | | | | | 320 | | | $ | 311,840 | |
| Grifols S.A. | | | | | | | | | |
3.20%, 5/1/25(5) | | | EUR | | | | 150 | | | | 176,987 | |
| Nidda Healthcare Holding GmbH | | | | | | | | | |
3.50%, 9/30/24(5) | | | EUR | | | | 130 | | | | 151,395 | |
| | | | | | | | | | | $ | 640,222 | |
| | | | |
| | 10 | | See Notes to Financial Statements. |
Eaton Vance
Oaktree Diversified Credit NextShares
September 30, 2018
Portfolio of Investments — continued
| | | | | | | | | | | | |
| Security | | | | | Principal
Amount*
(000’s omitted) | | | Value | |
|
| Pipelines — 0.8% | |
| Transportadora de Gas del Sur S.A. | | | | | | | | | |
6.75%, 5/2/25(5) | | | | | | | 450 | | | $ | 434,250 | |
| | | | | | | | | | | $ | 434,250 | |
|
| Real Estate — 1.9% | |
| China Aoyuan Property Group, Ltd. | | | | | | | | | |
5.375%, 9/13/22(5) | | | | | | | 400 | | | $ | 355,022 | |
| Hunt Cos., Inc. | | | | | | | | | |
6.25%, 2/15/26(6) | | | | | | | 223 | | | | 208,505 | |
| Kennedy-Wilson, Inc. | | | | | | | | | |
5.875%, 4/1/24 | | | | | | | 250 | | | | 247,500 | |
| Times China Holdings, Ltd. | | | | | | | | | |
6.60%, 3/2/23(5) | | | | | | | 200 | | | | 179,002 | |
| | | | | | | | | | | $ | 990,029 | |
|
| Retail — 0.5% | |
| Rite Aid Corp. | | | | | | | | | |
6.125%, 4/1/23(6) | | | | | | | 115 | | | $ | 103,644 | |
Suburban Propane Partners L.P./Suburban Energy
Finance Corp. | | | | | | | | | |
5.50%, 6/1/24 | | | | | | | 155 | | | | 153,062 | |
| | | | | | | | | | | $ | 256,706 | |
|
| Software — 0.9% | |
| First Data Corp. | | | | | | | | | |
5.75%, 1/15/24(6) | | | | | | | 100 | | | $ | 101,650 | |
| InterXion Holding N.V. | | | | | | | | | |
4.75%, 6/15/25(6) | | | EUR | | | | 105 | | | | 128,069 | |
| TeamSystem SpA | | | | | | | | | |
4.00%, (3 mo. EURIBOR + 4.00%), 4/15/23(6)(10) | | | EUR | | | | 200 | | | | 234,079 | |
| | | | | | | | | | | $ | 463,798 | |
|
| Telecommunications — 3.3% | |
| CommScope, Inc. | | | | | | | | | |
5.50%, 6/15/24(6) | | | | | | | 150 | | | $ | 151,687 | |
| Frontier Communications Corp. | | | | | | | | | |
8.50%, 4/1/26(6) | | | | | | | 160 | | | | 151,800 | |
| Intelsat Jackson Holdings S.A. | | | | | | | | | |
8.00%, 2/15/24(6) | | | | | | | 245 | | | | 258,404 | |
| Level 3 Financing, Inc. | | | �� | | | | | | |
5.375%, 1/15/24 | | | | | | | 155 | | | | 155,657 | |
| Oi S.A. | | | | | | | | | |
10.00%, (10.00% cash or 8.00% cash and 4.00% PIK), 7/27/25(9) | | | | | | | 407 | | | | 421,245 | |
| | | | | | | | | | | | |
| Security | | | | | Principal
Amount*
(000’s omitted) | | | Value | |
|
| Telecommunications (continued) | |
| Plantronics, Inc. | | | | | | | | | |
5.50%, 5/31/23(6) | | | | | | | 150 | | | $ | 149,625 | |
| SES S.A. | | | | | | | | | |
4.625% to 1/2/22(5)(8)(11) | | | EUR | | | | 100 | | | | 120,860 | |
| Sprint Communications, Inc. | | | | | | | | | |
6.00%, 11/15/22 | | | | | | | 150 | | | | 153,375 | |
| Sprint Corp. | | | | | | | | | |
7.875%, 9/15/23 | | | | | | | 45 | | | | 48,594 | |
7.125%, 6/15/24 | | | | | | | 95 | | | | 98,919 | |
| | | | | | | | | | | $ | 1,710,166 | |
|
| Transportation — 0.6% | |
| Moto Finance PLC | | | | | | | | | |
4.50%, 10/1/22(5) | | | GBP | | | | 100 | | | $ | 129,255 | |
| Watco Cos., LLC/Watco Finance Corp. | | | | | | | | | |
6.375%, 4/1/23(6) | | | | | | | 195 | | | | 199,631 | |
| | | | | | | | | | | $ | 328,886 | |
| | | |
Total Corporate Bonds & Notes
(identified cost $13,530,205) | | | | | | | | | | $ | 13,513,530 | |
|
| Foreign Corporate Bonds — 0.8% | |
| Security | | | | | Principal
Amount
(000’s omitted) | | | Value | |
|
| Electric — 0.4% | |
Pampa Energia S.A., 7.50%, 1/24/27(5) | | | | | | $ | 240 | | | $ | 213,504 | |
| | | | | | | | | | | $ | 213,504 | |
|
| Real Estate — 0.4% | |
Logan Property Holdings Co., Ltd., 5.25%, 2/23/23(5) | | | | | | $ | 200 | | | $ | 175,309 | |
| | | | | | | | | | | $ | 175,309 | |
| |
Total Foreign Corporate Bonds
(identified cost $394,978) | | | $ | 388,813 | |
|
| Foreign Government Bonds — 0.6% | |
| Security | | | | | Principal
Amount
(000’s omitted) | | | Value | |
|
| Argentina — 0.3% | |
Republic of Argentina, 5.875%, 1/11/28 | | | | | | $ | 25 | | | $ | 19,863 | |
| | | | |
| | 11 | | See Notes to Financial Statements. |
Eaton Vance
Oaktree Diversified Credit NextShares
September 30, 2018
Portfolio of Investments — continued
| | | | | | | | | | | | |
| Security | | | | | Principal
Amount
(000’s omitted) | | | Value | |
|
| Argentina (continued) | |
Republic of Argentina, 6.625%, 7/6/28 | | | | | | $ | 150 | | | $ | 123,562 | |
| | | | | | | | | | | $ | 143,425 | |
|
| Turkey — 0.3% | |
Republic of Turkey, 6.125%, 10/24/28 | | | | | | $ | 200 | | | $ | 180,802 | |
| | | | | | | | | | | $ | 180,802 | |
| |
Total Foreign Government Bonds
(identified cost $317,418) | | | $ | 324,227 | |
|
| Convertible Bonds — 16.2% | |
| Security | | | | | Principal
Amount*
(000’s omitted) | | | Value | |
|
| Airlines — 0.2% | |
| ANA Holdings, Inc. | | | | | | | | | |
0.00%, 9/19/24(5) | | | JPY | | | | 10,000 | | | $ | 89,443 | |
| | | | | | | | | | | $ | 89,443 | |
|
| Auto Manufacturers — 0.2% | |
| Navistar International Corp. | | | | | | | | | |
4.50%, 10/15/18 | | | | | | | 80 | | | $ | 80,048 | |
| | | | | | | | | | | $ | 80,048 | |
|
| Biotechnology — 0.4% | |
| BioMarin Pharmaceutical, Inc. | | | | | | | | | |
0.599%, 8/1/24 | | | | | | | 35 | | | $ | 37,389 | |
| Illumina, Inc. | | | | | | | | | |
0.00%, 6/15/19 | | | | | | | 35 | | | | 50,950 | |
| Innoviva, Inc. | | | | | | | | | |
2.125%, 1/15/23 | | | | | | | 40 | | | | 40,625 | |
| Ligand Pharmaceuticals, Inc. | | | | | | | | | |
0.75%, 5/15/23(6) | | | | | | | 51 | | | | 62,208 | |
| | | | | | | | | | | $ | 191,172 | |
|
| Building Materials — 0.2% | |
| Cemex SAB de CV | | | | | | | | | |
3.72%, 3/15/20 | | | | | | | 85 | | | $ | 85,842 | |
| | | | | | | | | | | $ | 85,842 | |
| | | | | | | | | | | | |
| Security | | | | | Principal
Amount*
(000’s omitted) | | | Value | |
|
| Chemicals — 0.8% | |
| Brenntag Finance B.V. | | | | | | | | | |
1.875%, 12/2/22(5) | | | | | | | 250 | | | $ | 249,250 | |
| Mitsubishi Chemical Holdings Corp. | | | | | | | | | |
0.00%, 3/29/24(5) | | | JPY | | | | 10,000 | | | | 95,824 | |
| Toray Industries, Inc. | | | | | | | | | |
0.00%, 8/30/19(5) | | | JPY | | | | 10,000 | | | | 92,633 | |
| | | | | | | | | | | $ | 437,707 | |
|
| Coal — 0.5% | |
| RAG-Stiftung | | | | | | | | | |
0.00%, 3/16/23(5) | | | EUR | | | | 200 | | | $ | 247,411 | |
| | | | | | | | | | | $ | 247,411 | |
|
| Commercial Services — 1.5% | |
| Cardtronics, Inc. | | | | | | | | | |
1.00%, 12/1/20 | | | | | | | 115 | | | $ | 111,276 | |
| DP World, Ltd. | | | | | | | | | |
1.75%, 6/19/24(5) | | | | | | | 200 | | | | 197,065 | |
| Huron Consulting Group, Inc. | | | | | | | | | |
1.25%, 10/1/19 | | | | | | | 120 | | | | 117,120 | |
| Macquarie Infrastructure Corp. | | | | | | | | | |
2.875%, 7/15/19 | | | | | | | 120 | | | | 119,224 | |
| Shanghai Port Group BVI Holding Co., Ltd. | | | | | | | | | |
0.00%, 8/9/22(5) | | | | | | | 200 | | | | 209,600 | |
| Square, Inc. | | | | | | | | | |
0.50%, 5/15/23(6) | | | | | | | 30 | | | | 42,570 | |
| | | | | | | | | | | $ | 796,855 | |
|
| Diversified Financial Services — 0.8% | |
| JPMorgan Chase Financial Co., LLC | | | | | | | | | |
0.25%, 5/1/23(6) | | | | | | | 55 | | | $ | 53,212 | |
| Orpar S.A. | | | | | | | | | |
0.00%, 6/20/24(5) | | | EUR | | | | 200 | | | | 240,505 | |
| PRA Group, Inc. | | | | | | | | | |
3.00%, 8/1/20 | | | | | | | 115 | | | | 111,187 | |
| | | | | | | | | | | $ | 404,904 | |
|
| Electric — 0.5% | |
| China Yangtze Power International BVI1 Ltd. | | | | | | | | | |
0.00%, 11/9/21(5) | | | | | | | 200 | | | $ | 217,500 | |
| NRG Energy, Inc. | | | | | | | | | |
2.75%, 6/1/48(6) | | | | | | | 56 | | | | 59,093 | |
| | | | | | | | | | | $ | 276,593 | |
| | | | |
| | 12 | | See Notes to Financial Statements. |
Eaton Vance
Oaktree Diversified Credit NextShares
September 30, 2018
Portfolio of Investments — continued
| | | | | | | | | | | | |
| Security | | | | | Principal
Amount*
(000’s omitted) | | | Value | |
|
| Energy – Alternate Sources — 0.4% | |
| NextEra Energy Partners, L.P. | | | | | | | | | |
1.50%, 9/15/20(6) | | | | | | | 65 | | | $ | 66,821 | |
| Pattern Energy Group, Inc. | | | | | | | | | |
4.00%, 7/15/20 | | | | | | | 125 | | | | 125,309 | |
| | | | | | | | | | | $ | 192,130 | |
|
| Entertainment — 0.1% | |
| Live Nation Entertainment, Inc. | | | | | | | | | |
2.50%, 3/15/23(6) | | | | | | | 59 | | | $ | 63,896 | |
| | | | | | | | | | | $ | 63,896 | |
|
| Health Care – Products — 0.7% | |
| NuVasive, Inc. | | | | | | | | | |
2.25%, 3/15/21 | | | | | | | 40 | | | $ | 50,775 | |
| QIAGEN N.V. | | | | | | | | | |
0.50%, 9/13/23(5) | | | | | | | 200 | | | | 225,500 | |
| Wright Medical Group, Inc. | | | | | | | | | |
1.625%, 6/15/23(6) | | | | | | | 60 | | | | 63,713 | |
| | | | | | | | | | | $ | 339,988 | |
|
| Health Care – Services — 0.2% | |
| Korian S.A. | | | | | | | | | |
2.50% to 1/1/23(5)(8)(11) | | | EUR | | | | 80 | | | $ | 95,292 | |
| | | | | | | | | | | $ | 95,292 | |
|
| Holding Company – Diversified — 0.5% | |
| RWT Holdings, Inc. | | | | | | | | | |
5.625%, 11/15/19 | | | | | | | 105 | | | $ | 106,495 | |
| Seven Group Holdings, Ltd. | | | | | | | | | |
2.20%, 3/5/25(5) | | | AUD | | | | 200 | | | | 154,148 | |
| | | | | | | | | | | $ | 260,643 | |
|
| Internet — 1.0% | |
| Ctrip.com International, Ltd. | | | | | | | | | |
1.00%, 7/1/20 | | | | | | | 87 | | | $ | 85,352 | |
| CyberAgent, Inc. | | | | | | | | | |
0.00%, 2/17/23(5) | | | JPY | | | | 10,000 | | | | 103,916 | |
| Palo Alto Networks, Inc. | | | | | | | | | |
0.75%, 7/1/23(6) | | | | | | | 50 | | | | 52,510 | |
| Pandora Media, Inc. | | | | | | | | | |
1.75%, 12/1/20 | | | | | | | 90 | | | | 87,140 | |
| Q2 Holdings, Inc. | | | | | | | | | |
0.75%, 2/15/23(6) | | | | | | | 38 | | | | 45,004 | |
| | | | | | | | | | | | |
| Security | | | | | Principal
Amount*
(000’s omitted) | | | Value | |
|
| Internet (continued) | |
| Twitter, Inc. | | | | | | | | | |
0.25%, 9/15/19 | | | | | | | 115 | | | $ | 111,635 | |
| Wix.com, Ltd. | | | | | | | | | |
0.00%, 7/1/23(6) | | | | | | | 55 | | | | 58,700 | |
| | | | | | | | | | | $ | 544,257 | |
|
| Investment Companies — 0.3% | |
| Goldman Sachs BDC, Inc. | | | | | | | | | |
4.50%, 4/1/22 | | | | | | | 100 | | | $ | 101,298 | |
| New Mountain Finance Corp. | | | | | | | | | |
5.00%, 6/15/19 | | | | | | | 60 | | | | 60,673 | |
| | | | | | | | | | | $ | 161,971 | |
|
| Iron & Steel — 0.5% | |
| Angang Steel Co., Ltd. | | | | | | | | | |
0.00%, 5/25/23(5) | | | HKD | | | | 2,000 | | | $ | 254,843 | |
| | | | | | | | | | | $ | 254,843 | |
|
| Media — 0.2% | |
| DISH Network Corp. | | | | | | | | | |
3.375%, 8/15/26 | | | | | | | 40 | | | $ | 38,251 | |
| Liberty Media Corp. | | | | | | | | | |
1.00%, 1/30/23 | | | | | | | 25 | | | | 29,277 | |
2.125%, 3/31/48(6) | | | | | | | 55 | | | | 54,442 | |
| | | | | | | | | | | $ | 121,970 | |
|
| Mining — 0.2% | |
| SSR Mining, Inc. | | | | | | | | | |
2.875%, 2/1/33 | | | | | | | 115 | | | $ | 113,203 | |
| | | | | | | | | | | $ | 113,203 | |
|
| Oil & Gas — 0.5% | |
| Ensco Jersey Finance, Ltd. | | | | | | | | | |
3.00%, 1/31/24 | | | | | | | 70 | | | $ | 69,871 | |
| Nabors Industries, Inc. | | | | | | | | | |
0.75%, 1/15/24 | | | | | | | 55 | | | | 43,025 | |
| Whiting Petroleum Corp. | | | | | | | | | |
1.25%, 4/1/20 | | | | | | | 140 | | | | 134,617 | |
| | | | | | | | | | | $ | 247,513 | |
|
| Oil & Gas Services — 0.3% | |
| SEACOR Holdings, Inc. | | | | | | | | | |
3.00%, 11/15/28 | | | | | | | 120 | | | $ | 116,938 | |
| | | | |
| | 13 | | See Notes to Financial Statements. |
Eaton Vance
Oaktree Diversified Credit NextShares
September 30, 2018
Portfolio of Investments — continued
| | | | | | | | | | | | |
| Security | | | | | Principal
Amount*
(000’s omitted) | | | Value | |
|
| Oil & Gas Services (continued) | |
| Weatherford International, Ltd. | | | | | | | | | |
5.875%, 7/1/21 | | | | | | | 35 | | | $ | 33,048 | |
| | | | | | | | | | | $ | 149,986 | |
|
| Pharmaceuticals — 0.5% | |
| Herbalife, Ltd. | | | | | | | | | |
2.625%, 3/15/24(6) | | | | | | | 56 | | | $ | 60,164 | |
| Teva Pharmaceutical Finance Co., LLC | | | | | | | | | |
0.25%, 2/1/26 | | | | | | | 90 | | | | 84,622 | |
| Toho Holdings Co., Ltd. | | | | | | | | | |
0.00%, 6/23/23(5) | | | JPY | | | | 10,000 | | | | 94,504 | |
| | | | | | | | | | | $ | 239,290 | |
|
| Real Estate — 1.5% | |
| ADLER Real Estate AG | | | | | | | | | |
2.50%, 7/19/21(5) | | | EUR | | | | 674 | | | $ | 129,316 | |
| CA Immobilien Anlagen AG | | | | | | | | | |
0.75%, 4/4/25(5) | | | EUR | | | | 100 | | | | 134,740 | |
| Consus Real Estate AG | | | | | | | | | |
4.00%, 11/29/22(5) | | | EUR | | | | 200 | | | | 226,986 | |
| Forestar Group, Inc. | | | | | | | | | |
3.75%, 3/1/20 | | | | | | | 115 | | | | 115,008 | |
| Nexity S.A. | | | | | | | | | |
0.125%, 1/1/23(5) | | | EUR | | | | 235 | | | | 181,743 | |
| | | | | | | | | | | $ | 787,793 | |
|
| Real Estate Investment Trusts (REITs) — 2.2% | |
| Apollo Commercial Real Estate Finance, Inc. | | | | | | | | | |
4.75%, 8/23/22 | | | | | | | 85 | | | $ | 84,536 | |
| Arbor Realty Trust, Inc. | | | | | | | | | |
5.25%, 7/1/21(6) | | | | | | | 55 | | | | 55,619 | |
| Blackstone Mortgage Trust, Inc. | | | | | | | | | |
4.375%, 5/5/22 | | | | | | | 75 | | | | 75,194 | |
| Colony Capital, Inc. | | | | | | | | | |
3.875%, 1/15/21 | | | | | | | 426 | | | | 403,224 | |
| Cromwell SPV Finance Pty, Ltd. | | | | | | | | | |
2.50%, 3/29/25(5) | | | EUR | | | | 100 | | | | 114,363 | |
| IH Merger Sub, LLC | | | | | | | | | |
3.50%, 1/15/22 | | | | | | | 65 | | | | 71,765 | |
| KKR Real Estate Finance Trust, Inc. | | | | | | | | | |
6.125%, 5/15/23(6) | | | | | | | 100 | | | | 102,062 | |
| PennyMac Corp. | | | | | | | | | |
5.375%, 5/1/20 | | | | | | | 120 | | | | 119,829 | |
| | | | | | | | | | | | |
| Security | | | | | Principal
Amount*
(000’s omitted) | | | Value | |
|
| Real Estate Investment Trusts (REITs) (continued) | |
| Redwood Trust, Inc. | | | | | | | | | |
5.625%, 7/15/24 | | | | | | | 60 | | | $ | 59,363 | |
| Resource Capital Corp. | | | | | | | | | |
6.00%, 12/1/18 | | | | | | | 75 | | | | 75,645 | |
| | | | | | | | | | | $ | 1,161,600 | |
|
| Retail — 0.5% | |
| Carrefour S.A. | | | | | | | | | |
0.00%, 3/27/24(5) | | | | | | | 200 | | | $ | 183,250 | |
| EZCORP, Inc. | | | | | | | | | |
2.125%, 6/15/19 | | | | | | | 60 | | | | 59,605 | |
| Vitamin Shoppe, Inc. | | | | | | | | | |
2.25%, 12/1/20 | | | | | | | 50 | | | | 43,438 | |
| | | | | | | | | | | $ | 286,293 | |
|
| Semiconductors — 0.1% | |
| Inphi Corp. | | | | | | | | | |
1.125%, 12/1/20 | | | | | | | 25 | | | $ | 28,931 | |
| | | | | | | | | | | $ | 28,931 | |
|
| Software — 0.4% | |
| Atlassian, Inc. | | | | | | | | | |
0.625%, 5/1/23(6) | | | | | | | 30 | | | $ | 39,332 | |
| Guidewire Software, Inc. | | | | | | | | | |
1.25%, 3/15/25 | | | | | | | 45 | | | | 48,312 | |
| Nuance Communications, Inc. | | | | | | | | | |
1.25%, 4/1/25 | | | | | | | 58 | | | | 59,990 | |
| Verint Systems, Inc. | | | | | | | | | |
1.50%, 6/1/21 | | | | | | | 51 | | | | 52,781 | |
| | | | | | | | | | | $ | 200,415 | |
|
| Telecommunications — 0.2% | |
| Finisar Corp. | | | | | | | | | |
0.50%, 12/15/36 | | | | | | | 90 | | | $ | 82,669 | |
| GCI Liberty, Inc. | | | | | | | | | |
1.75%, 9/30/46(6) | | | | | | | 40 | | | | 44,162 | |
| | | | | | | | | | | $ | 126,831 | |
|
| Transportation — 0.6% | |
| Golar LNG, Ltd. | | | | | | | | | |
2.75%, 2/15/22 | | | | | | | 188 | | | $ | 197,070 | |
| | | | |
| | 14 | | See Notes to Financial Statements. |
Eaton Vance
Oaktree Diversified Credit NextShares
September 30, 2018
Portfolio of Investments — continued
| | | | | | | | | | | | |
| Security | | | | | Principal
Amount*
(000’s omitted) | | | Value | |
|
| Transportation (continued) | |
| Nagoya Railroad Co., Ltd. | | | | | | | | | |
0.00%, 12/11/24(5) | | | JPY | | | | 10,000 | | | $ | 97,056 | |
| | | | | | | | | | | $ | 294,126 | |
|
| Venture Capital — 0.2% | |
| Hercules Capital, Inc. | | | | | | | | | |
4.375%, 2/1/22 | | | | | | | 115 | | | $ | 111,717 | |
| | | | | | | | | | | $ | 111,717 | |
| | | |
Total Convertible Bonds
(identified cost $8,388,907) | | | | | | | | | | $ | 8,392,663 | |
|
| Asset-Backed Securities — 10.6% | |
| Security | | | | | Principal
Amount
(000’s omitted) | | | Value | |
| BSPRT Issuer, Ltd. | | | | | | | | | |
Series 2017-FL1, Class C, 6.408%, (1 mo. USD LIBOR + 4.25%),
6/15/27(6)(10) | | | | | | $ | 250 | | | $ | 253,504 | |
| Dryden Senior Loan Fund | | | | | | | | | |
Series 2016-43A, Class ER, 8.448%, (3 mo. USD LIBOR + 6.10%), 7/20/29(6)(10) | | | | | | | 700 | | | | 701,433 | |
| MidOcean Credit CLO | | | | | | | | | |
Series 2014-3A, Class ER, 8.49%, (3 mo. USD LIBOR + 6.20%),
4/21/31(6)(10) | | | | | | | 500 | | | | 495,927 | |
Series 2017-7A, Class F, 10.439%, (3 mo. USD LIBOR + 8.10%),
7/15/29(6)(10) | | | | | | | 750 | | | | 752,771 | |
| Nassau, Ltd. | | | | | | | | | |
Series 2017-IIA, Class D, 5.019%, (3 mo. USD LIBOR + 2.68%),
1/15/30(6)(10) | | | | | | | 550 | | | | 542,637 | |
| Octagon Investment Partners XIV, Ltd. | | | | | | | | | |
Series 2012-1A, Class ER, 10.689%, (3 mo. USD LIBOR + 8.35%), 7/15/29(6)(10) | | | | | | | 750 | | | | 751,122 | |
| OZLM, Ltd. | | | | | | | | | |
Series 2017-17A, Class D, 8.338%, (3 mo. USD LIBOR + 5.99%),
7/20/30(6)(10) | | | | | | | 250 | | | | 251,072 | |
| Regatta X Funding, Ltd. | | | | | | | | | |
Series 2017-3A, Class D, 5.086%, (3 mo. USD LIBOR + 2.75%),
1/17/31(6)(10) | | | | | | | 250 | | | | 248,312 | |
| TICP CLO I, Ltd. | | | | | | | | | |
Series 2015-1A, Class DR, 4.848%, (3 mo. USD LIBOR + 2.50%),
7/20/27(6)(10) | | | | | | | 500 | | | | 496,271 | |
| | | | | | | | | | |
| Security | | | | Principal
Amount
(000’s omitted) | | | Value | |
| Tralee CLO IV, Ltd. | | | | | | | | |
Series 2017-4A, Class E, 8.448%, (3 mo. USD LIBOR + 6.10%), 1/20/30(6)(10) | | | | $ | 1,000 | | | $ | 995,021 | |
| | | |
Total Asset-Backed Securities
(identified cost $5,456,556) | | | | | | | | $ | 5,488,070 | |
|
| Commercial Mortgage-Backed Securities — 12.8% | |
| Security | | | | Principal
Amount
(000’s omitted) | | | Value | |
| Ashford Hospitality Trust | | | | | | | | |
Series 2018-KEYS, Class F, 8.158%, (1 mo. USD LIBOR + 6.00%), 5/15/35(6)(10) | | | | $ | 300 | | | $ | 302,742 | |
| Barclays Commercial Mortgage Securities Trust | | | | | | | | |
Series 2017-GLKS, Class F, 5.858%, (1 mo. USD LIBOR + 3.70%), 11/15/34(6)(10) | | | | | 500 | | | | 500,878 | |
| BHMS Mortgage Trust | | | | | | | | |
Series 2018-ATLS, Class E, 5.158%, (1 mo. USD LIBOR + 3.00%), 7/15/35(6)(10) | | | | | 300 | | | | 301,231 | |
| BX Trust | | | | | | | | |
Series 2018-GW, Class G, 5.078%, (1 mo. USD LIBOR + 2.92%), 5/15/35(6)(10) | | | | | 250 | | | | 253,060 | |
| CFCRE Commercial Mortgage Trust | | | | | | | | |
Series 2018-TAN, Class E,
6.446%, 2/15/33(6) | | | | | 660 | | | | 675,583 | |
| CGGS Commercial Mortgage Trust | | | | | | | | |
Series 2018-WSS, Class E, 5.308%, (1 mo. USD LIBOR + 3.15%), 2/15/37(6)(10) | | | | | 300 | | | | 303,398 | |
| Citigroup Commercial Mortgage Trust | | | | | | | | |
Series 2018-TBR, Class F, 5.808%, (1 mo. USD LIBOR + 3.65%), 12/15/36(6)(10) | | | | | 400 | | | | 404,522 | |
| Cosmopolitan Hotel Trust | | | | | | | | |
Series 2017-CSMO, Class F, 5.90%, (1 mo. USD LIBOR + 3.74%), 11/15/36(6)(10) | | | | | 1,000 | | | | 1,008,110 | |
| DBCCRE Mortgage Trust | | | | | | | | |
Series 2014-ARCP, Class E, 5.099%, 1/10/34(6)(12) | | | | | 200 | | | | 190,586 | |
| GS Mortgage Securities Corp. Trust | | | | | | | | |
Series 2018-RIVR, Class H, 5.56%, (1 mo. USD LIBOR + 3.40%), 7/15/35(6)(10) | | | | | 300 | | | | 298,392 | |
| Hilton USA Trust | | | | | | | | |
Series 2016-SFP, Class F,
6.155%, 11/5/35(6) | | | | | 500 | | | | 508,006 | |
JP Morgan Chase Commercial Mortgage Securities
Trust: | | | | | | | | |
Series 2018-LAQ, Class E, 5.158%, (1 mo. USD LIBOR + 3.00%), 6/15/35(6)(10) | | | | | 300 | | | | 304,087 | |
Series 2018-PTC, Class D, 5.278%, (1 mo. USD LIBOR + 3.12%), 4/15/31(6)(10) | | | | | 400 | | | | 403,514 | |
| | | | |
| | 15 | | See Notes to Financial Statements. |
Eaton Vance
Oaktree Diversified Credit NextShares
September 30, 2018
Portfolio of Investments — continued
| | | | | | | | | | |
| Security | | | | Principal
Amount
(000’s omitted) | | | Value | |
| Rosslyn Portfolio Trust | | | | | | | | |
Series 2017-ROSS, Class F, 5.908%, (1 mo. USD LIBOR + 3.75%),
6/15/33(6)(10) | | | | $ | 354 | | | $ | 354,782 | |
| SLIDE | | | | | | | | |
Series 2018-FUN, Class F, 5.07%, (1 mo. USD LIBOR + 3.00%),
6/15/31(6)(10) | | | | | 175 | | | | 175,310 | |
| Toorak Mortgage Corp. | | | | | | | | |
Series 2018-1, Class A2, 4.949% to 4/25/21, 8/25/21(6)(13) | | | | | 150 | | | | 150,357 | |
| UBS Commercial Mortgage Trust | | | | | | | | |
Series 2018-NYCH, Class F, 5.979%, (1 mo. USD LIBOR + 3.82%),
2/15/32(6)(10) | | | | | 500 | | | | 498,127 | |
| | | |
Total Commercial Mortgage-Backed Securities
(identified cost $6,564,272) | | | | | | | | $ | 6,632,685 | |
|
| Short-Term Investments — 1.8% | |
| Description | | | | Units | | | Value | |
Eaton Vance Cash Reserves Fund, LLC, 2.19%(14) | | | | | 954,029 | | | $ | 954,029 | |
| |
Total Short-Term Investments
(identified cost $954,029) | | | $ | 954,029 | |
| |
Total Investments — 105.5%
(identified cost $54,581,029) | | | $ | 54,668,671 | |
| |
Less Unfunded Loan Commitments — (0.4)% | | | $ | (219,606 | ) |
| |
Net Investments — 105.1%
(identified cost $54,361,423) | | | $ | 54,449,065 | |
| |
Other Assets, Less Liabilities — (5.1)% | | | $ | (2,652,104 | ) |
| |
Net Assets — 100.0% | | | $ | 51,796,961 | |
The percentage shown for each investment category in the Portfolio of Investments is based on net assets.
| | * | In U.S. dollars unless otherwise indicated. |
| | (1) | Senior floating-rate loans (Senior Loans) often require prepayments from excess cash flows or permit the borrowers to repay at their election. The degree to which borrowers repay, whether as a contractual requirement or at their election, cannot be predicted with accuracy. As a result, the actual remaining maturity may be substantially less than the stated maturities shown. However, Senior Loans will typically have an expected average life of approximately two to four years. Senior Loans typically have rates of interest which are redetermined periodically by reference to a base lending rate, plus a spread. These base lending rates are primarily the London Interbank Offered Rate (“LIBOR”) and secondarily, the prime rate offered by one or more major United States banks (the “Prime Rate”). Base lending rates may be subject to a floor, or minimum rate. |
| | (2) | Unfunded or partially unfunded loan commitments. The stated interest rate reflects the weighted average of the reference rate and spread for the funded portion, if any, and the commitment fees on the portion of the loan that is unfunded. See Note 1G for description. |
| | (3) | This Senior Loan will settle after September 30, 2018, at which time the interest rate will be determined. |
| | (4) | The stated interest rate represents the weighted average interest rate at September 30, 2018 of contracts within the senior loan facility. Interest rates on contracts are primarily redetermined either weekly, monthly or quarterly by reference to the indicated base lending rate and spread and the reset period. |
| | (5) | Security exempt from registration under Regulation S of the Securities Act of 1933, which exempts from registration securities offered and sold outside the United States. Security may not be offered or sold in the United States except pursuant to an exemption from, or in a transaction not subject to, the registration requirements of the Securities Act of 1933. At September 30, 2018, the aggregate value of these securities is $9,096,801 or 17.6% of the Fund’s net assets. |
| | (6) | Security exempt from registration pursuant to Rule 144A under the Securities Act of 1933, as amended. These securities may be sold in certain transactions in reliance on an exemption from registration (normally to qualified institutional buyers). At September 30, 2018, the aggregate value of these securities is $18,501,057 or 35.7% of the Fund’s net assets. |
| | (7) | When-issued security. |
| | (8) | Perpetual security with no stated maturity date but may be subject to calls by the issuer. |
| | (9) | Represents a payment-in-kind security which may pay interest in additional principal at the issuer’s discretion. |
| (10) | Variable rate security. The stated interest rate represents the rate in effect at September 30, 2018. |
| (11) | Security converts to floating rate after the indicated fixed-rate coupon period. |
| (12) | Weighted average fixed-rate coupon that changes/updates monthly. Rate shown is the rate at September 30, 2018. |
| (13) | Multi-step coupon bond. Interest rate represents the rate in effect at September 30, 2018. |
| (14) | Affiliated investment company, available to Eaton Vance portfolios and funds, which invests in high quality, U.S. dollar denominated money market instruments. The rate shown is the annualized seven-day yield as of September 30, 2018. |
| | | | |
| | 16 | | See Notes to Financial Statements. |
Eaton Vance
Oaktree Diversified Credit NextShares
September 30, 2018
Portfolio of Investments — continued
| | | | | | | | | | | | | | | | | | | | | | | | |
| Forward Foreign Currency Exchange Contracts | |
| | | | | |
| Currency Purchased | | | Currency Sold | | | Counterparty | | Settlement
Date | | | Unrealized
Appreciation | | | Unrealized
(Depreciation) | |
| | | | | | | |
| AUD | | | 5,400 | | | USD | | | 3,925 | | | State Street Bank and Trust Company | | | 10/18/18 | | | $ | — | | | $ | (22 | ) |
| AUD | | | 4,800 | | | USD | | | 3,555 | | | State Street Bank and Trust Company | | | 10/18/18 | | | | — | | | | (85 | ) |
| EUR | | | 125,000 | | | USD | | | 145,229 | | | State Street Bank and Trust Company | | | 10/18/18 | | | | 84 | | | | — | |
| EUR | | | 106,000 | | | USD | | | 125,144 | | | State Street Bank and Trust Company | | | 10/18/18 | | | | — | | | | (1,918 | ) |
| HKD | | | 1,943,000 | | | USD | | | 247,796 | | | State Street Bank and Trust Company | | | 10/18/18 | | | | 453 | | | | — | |
| HKD | | | 93,000 | | | USD | | | 11,861 | | | State Street Bank and Trust Company | | | 10/18/18 | | | | 21 | | | | — | |
| HKD | | | 60,000 | | | USD | | | 7,649 | | | State Street Bank and Trust Company | | | 10/18/18 | | | | 17 | | | | — | |
| HKD | | | 44,200 | | | USD | | | 5,635 | | | State Street Bank and Trust Company | | | 10/18/18 | | | | 12 | | | | — | |
| JPY | | | 13,500,000 | | | USD | | | 121,303 | | | State Street Bank and Trust Company | | | 10/18/18 | | | | — | | | | (2,348 | ) |
| USD | | | 148,048 | | | AUD | | | 200,000 | | | State Street Bank and Trust Company | | | 10/18/18 | | | | 3,467 | | | | — | |
| USD | | | 3,712 | | | AUD | | | 5,000 | | | State Street Bank and Trust Company | | | 10/18/18 | | | | 98 | | | | — | |
| USD | | | 2,905 | | | AUD | | | 4,000 | | | State Street Bank and Trust Company | | | 10/18/18 | | | | 13 | | | | — | |
| USD | | | 4,268 | | | AUD | | | 5,900 | | | State Street Bank and Trust Company | | | 10/18/18 | | | | 3 | | | | — | |
| USD | | | 3,443 | | | AUD | | | 4,800 | | | State Street Bank and Trust Company | | | 10/18/18 | | | | — | | | | (26 | ) |
| USD | | | 2,693,796 | | | EUR | | | 2,299,432 | | | State Street Bank and Trust Company | | | 10/18/18 | | | | 20,699 | | | | — | |
| USD | | | 2,657,742 | | | EUR | | | 2,268,656 | | | State Street Bank and Trust Company | | | 10/18/18 | | | | 20,422 | | | | — | |
| USD | | | 1,652,039 | | | EUR | | | 1,410,000 | | | State Street Bank and Trust Company | | | 10/18/18 | | | | 12,909 | | | | — | |
| USD | | | 559,595 | | | EUR | | | 477,676 | | | State Street Bank and Trust Company | | | 10/18/18 | | | | 4,296 | | | | — | |
| USD | | | 241,217 | | | EUR | | | 204,929 | | | State Street Bank and Trust Company | | | 10/18/18 | | | | 2,986 | | | | — | |
| USD | | | 128,226 | | | EUR | | | 109,490 | | | State Street Bank and Trust Company | | | 10/18/18 | | | | 943 | | | | — | |
| USD | | | 39,108 | | | EUR | | | 33,400 | | | State Street Bank and Trust Company | | | 10/18/18 | | | | 280 | | | | — | |
| USD | | | 548,944 | | | GBP | | | 419,089 | | | State Street Bank and Trust Company | | | 10/18/18 | | | | 2,317 | | | | — | |
| USD | | | 535,832 | | | GBP | | | 409,078 | | | State Street Bank and Trust Company | | | 10/18/18 | | | | 2,262 | | | | — | |
| USD | | | 11,136 | | | HKD | | | 87,000 | | | State Street Bank and Trust Company | | | 10/18/18 | | | | 20 | | | | — | |
| USD | | | 11,612 | | | HKD | | | 91,000 | | | State Street Bank and Trust Company | | | 10/18/18 | | | | — | | | | (15 | ) |
| USD | | | 509,579 | | | HKD | | | 3,995,000 | | | State Street Bank and Trust Company | | | 10/18/18 | | | | — | | | | (844 | ) |
| USD | | | 414,769 | | | JPY | | | 46,511,000 | | | State Street Bank and Trust Company | | | 10/18/18 | | | | 4,939 | | | | — | |
| USD | | | 93,255 | | | JPY | | | 10,300,000 | | | State Street Bank and Trust Company | | | 10/18/18 | | | | 2,496 | | | | — | |
| USD | | | 95,856 | | | JPY | | | 10,600,000 | | | State Street Bank and Trust Company | | | 10/18/18 | | | | 2,455 | | | | — | |
| USD | | | 93,839 | | | JPY | | | 10,400,000 | | | State Street Bank and Trust Company | | | 10/18/18 | | | | 2,200 | | | | — | |
| | | | | | | |
| | | | | | | | | | | | | | | | | | | $ | 83,392 | | | $ | (5,258 | ) |
Abbreviations:
| | | | |
| EURIBOR | | – | | Euro Interbank Offered Rate |
| LIBOR | | – | | London Interbank Offered Rate |
| PIK | | – | | Payment In Kind |
Currency Abbreviations:
| | | | |
| AUD | | – | | Australian Dollar |
| EUR | | – | | Euro |
| GBP | | – | | British Pound Sterling |
| HKD | | – | | Hong Kong Dollar |
| JPY | | – | | Japanese Yen |
| USD | | – | | United States Dollar |
| | | | |
| | 17 | | See Notes to Financial Statements. |
Eaton Vance
Oaktree Diversified Credit NextShares
September 30, 2018
Statement of Assets and Liabilities
| | | | |
| Assets | | September 30, 2018 | |
Unaffiliated investments, at value (identified cost, $53,407,394) | | $ | 53,495,036 | |
Affiliated investment, at value (identified cost, $954,029) | | | 954,029 | |
Cash | | | 72,852 | |
Foreign currency, at value (identified cost, $27,675) | | | 27,448 | |
Interest receivable | | | 465,105 | |
Dividends receivable from affiliated investment | | | 2,505 | |
Receivable for investments sold | | | 1,033,979 | |
Receivable for open forward foreign currency exchange contracts | | | 83,392 | |
Total assets | | $ | 56,134,346 | |
| |
| Liabilities | | | | |
Payable for investments purchased | | $ | 3,960,703 | |
Payable for when-issued securities | | | 233,975 | |
Payable for open forward foreign currency exchange contracts | | | 5,258 | |
Payable to affiliates: | | | | |
Investment adviser fee | | | 33,939 | |
Operations agreement fee | | | 2,121 | |
Other | | | 12,108 | |
Accrued expenses | | | 89,281 | |
Total liabilities | | $ | 4,337,385 | |
Net Assets | | $ | 51,796,961 | |
| |
| Sources of Net Assets | | | | |
Paid-in capital | | $ | 51,490,135 | |
Distributable earnings | | | 306,826 | |
Total | | $ | 51,796,961 | |
| |
| Net Asset Value Per Share(1) | | | | |
($51,796,961 ÷ 5,125,000 shares issued and outstanding) | | $ | 10.11 | |
| (1) | Reflects a 2-for-1 stock split effective March 9, 2018 (see Note 8). |
| | | | |
| | 18 | | See Notes to Financial Statements. |
Eaton Vance
Oaktree Diversified Credit NextShares
September 30, 2018
Statement of Operations
| | | | |
| Investment Income | | Period Ended
September 30, 2018(1) | |
Interest (net of foreign taxes, $4,545) | | $ | 1,934,275 | |
Dividends from affiliated investment | | | 90,665 | |
Total investment income | | $ | 2,024,940 | |
| |
| Expenses | | | | |
Investment adviser fee | | $ | 354,793 | |
Operations agreement fee | | | 22,175 | |
Trustees’ fees and expenses | | | 2,672 | |
Custodian fee | | | 55,008 | |
Transfer and dividend disbursing agent fees | | | 12,002 | |
Legal and accounting services | | | 87,644 | |
Printing and postage | | | 8,411 | |
Registration fees | | | 6,412 | |
Listing fee | | | 14,700 | |
Intraday pricing fee | | | 10,476 | |
Miscellaneous | | | 2,275 | |
Total expenses | | $ | 576,568 | |
Deduct — | | | | |
Allocation of expenses to affiliate | | $ | 174,717 | |
Total expense reductions | | $ | 174,717 | |
| |
Net expenses | | $ | 401,851 | |
| |
Net investment income | | $ | 1,623,089 | |
| |
| Realized and Unrealized Gain (Loss) | | | | |
Net realized gain (loss) — | | | | |
Investment transactions | | $ | (140,690 | ) |
Investment transactions — affiliated investment | | | (554 | ) |
Foreign currency transactions | | | (64,339 | ) |
Forward foreign currency exchange contracts | | | 207,236 | |
Net realized gain | | $ | 1,653 | |
Change in unrealized appreciation (depreciation) — | | | | |
Investments | | $ | 87,642 | |
Foreign currency | | | 3,948 | |
Forward foreign currency exchange contracts | | | 78,134 | |
Net change in unrealized appreciation (depreciation) | | $ | 169,724 | |
| |
Net realized and unrealized gain | | $ | 171,377 | |
| |
Net increase in net assets from operations | | $ | 1,794,466 | |
| (1) | For the period from the start of business, November 15, 2017, to September 30, 2018. |
| | | | |
| | 19 | | See Notes to Financial Statements. |
Eaton Vance
Oaktree Diversified Credit NextShares
September 30, 2018
Statement of Changes in Net Assets
| | | | |
| Increase (Decrease) in Net Assets | | Period Ended September 30, 2018(1) | |
From operations — | | | | |
Net investment income | | $ | 1,623,089 | |
Net realized gain | | | 1,653 | |
Net change in unrealized appreciation (depreciation) | | | 169,724 | |
Net increase in net assets from operations | | $ | 1,794,466 | |
Distributions to shareholders | | $ | (1,488,735 | ) |
Transactions in Fund shares — | | | | |
Proceeds from sale of shares | | $ | 51,511,209 | |
Cost of shares redeemed | | | (250,897 | ) |
Transaction fees | | | 230,918 | |
Net increase in net assets from Fund share transactions | | $ | 51,491,230 | |
| |
Net increase in net assets | | $ | 51,796,961 | |
| |
| Net Assets | | | | |
At beginning of period | | $ | — | |
At end of period | | $ | 51,796,961 | |
| |
| Changes in shares outstanding(2) | | | | |
Shares outstanding, beginning of period | | | — | |
Shares sold | | | 5,150,000 | |
Shares redeemed | | | (25,000 | ) |
Shares outstanding, end of period | | | 5,125,000 | |
| (1) | For the period from the start of business, November 15, 2017, to September 30, 2018. |
| (2) | Reflects a 2-for-1 stock split effective March 9, 2018 (see Note 8). |
| | | | |
| | 20 | | See Notes to Financial Statements. |
Eaton Vance
Oaktree Diversified Credit NextShares
September 30, 2018
Financial Highlights
| | | | |
| | | Period Ended September 30, 2018(1)(2) | |
Net asset value — Beginning of period | | $ | 10.000 | |
| |
| Income (Loss) From Operations | | | | |
Net investment income(3) | | $ | 0.321 | |
Net realized and unrealized gain | | | 0.036 | |
| |
Total income from operations | | $ | 0.357 | |
| |
| Less Distributions | | | | |
From net investment income | | $ | (0.293 | ) |
| |
Total distributions | | $ | (0.293 | ) |
| |
Transaction fees | | $ | 0.046 | |
| |
Net asset value — End of period | | $ | 10.110 | |
| |
Total Return on Net Asset Value(4) | | | 4.10 | %(5)(6) |
| |
| Ratios/Supplemental Data | | | | |
Net assets, end of period (000’s omitted) | | $ | 51,797 | |
Ratios (as a percentage of average daily net assets): | | | | |
Expenses | | | 0.90 | %(6)(7) |
Net investment income | | | 3.65 | %(7) |
Portfolio Turnover | | | 152 | %(5) |
| (1) | For the period from the start of business, November 15, 2017, to September 30, 2018. |
| (2) | Per share data reflects a 2-for-1 stock split effective March 9, 2018 (see Note 8). |
| (3) | Computed using average shares outstanding. |
| (4) | Returns are historical and are calculated by determining the percentage change in net asset value with all distributions reinvested and do not reflect the effect of a market-determined premium or discount. Investment returns assume that all distributions have been reinvested at net asset value. |
| (6) | The investment adviser reimbursed certain operating expenses (equal to 0.39% of average daily net assets for the period ended September 30, 2018). Absent this reimbursement, total return would be lower. |
| | | | |
| | 21 | | See Notes to Financial Statements. |
Eaton Vance
Oaktree Diversified Credit NextShares
September 30, 2018
Notes to Financial Statements
1 Significant Accounting Policies
Eaton Vance Oaktree Diversified Credit NextShares (the Fund) is a diversified series of Eaton Vance NextShares Trust II (the Trust), a Massachusetts business trust registered under the Investment Company Act of 1940, as amended (the 1940 Act). The Fund is an exchange-traded managed fund operating pursuant to an order issued by the SEC granting an exemption from certain provisions of the 1940 Act. Individual shares of the Fund may be purchased and sold only on a national securities exchange or alternative trading system through a broker-dealer that offers NextShares, and may not be directly purchased or redeemed from the Fund. Market trading prices for the Fund are directly linked to the Fund’s next-computed net asset value per share (NAV) and will vary from NAV by a market-determined premium or discount, which may be zero. The Fund’s investment objective is total return. The Fund commenced operations on November 15, 2017.
The following is a summary of significant accounting policies of the Fund. The policies are in conformity with accounting principles generally accepted in the United States of America (U.S. GAAP). The Fund is an investment company and follows accounting and reporting guidance in the Financial Accounting Standards Board (FASB) Accounting Standards Codification Topic 946.
A Investment Valuation — The following methodologies are used to determine the market value or fair value of investments.
Senior Floating-Rate Loans. Interests in senior floating-rate loans (Senior Loans) for which reliable market quotations are readily available are valued generally at the average mean of bid and ask quotations obtained from a third party pricing service. Other Senior Loans are valued at fair value by the investment adviser under procedures approved by the Trustees. In fair valuing a Senior Loan, the investment adviser utilizes one or more of the valuation techniques described in (i) through (iii) below to assess the likelihood that the borrower will make a full repayment of the loan underlying such Senior Loan relative to yields on other Senior Loans issued by companies of comparable credit quality. If the investment adviser believes that there is a reasonable likelihood of full repayment, the investment adviser will determine fair value using a matrix pricing approach that considers the yield on the Senior Loan. If the investment adviser believes there is not a reasonable likelihood of full repayment, the investment adviser will determine fair value using analyses that include, but are not limited to: (i) a comparison of the value of the borrower’s outstanding equity and debt to that of comparable public companies; (ii) a discounted cash flow analysis; or (iii) when the investment adviser believes it is likely that a borrower will be liquidated or sold, an analysis of the terms of such liquidation or sale. In certain cases, the investment adviser will use a combination of analytical methods to determine fair value, such as when only a portion of a borrower’s assets are likely to be sold. In conducting its assessment and analyses for purposes of determining fair value of a Senior Loan, the investment adviser will use its discretion and judgment in considering and appraising relevant factors. Fair value determinations are made by the portfolio managers of the Fund based on information available to such managers. The portfolio managers of other funds managed by the investment adviser that invest in Senior Loans may not possess the same information about a Senior Loan borrower as the portfolio managers of the Fund. At times, the fair value of a Senior Loan determined by the portfolio managers of other funds managed by the investment adviser that invest in Senior Loans may vary from the fair value of the same Senior Loan determined by the portfolio managers of the Fund. The fair value of each Senior Loan is periodically reviewed and approved by the investment adviser’s Valuation Committee and by the Trustees based upon procedures approved by the Trustees. Junior Loans (i.e., subordinated loans and second lien loans) are valued in the same manner as Senior Loans.
Debt Obligations. Debt obligations are generally valued on the basis of valuations provided by third party pricing services, as derived from such services’ pricing models. Inputs to the models may include, but are not limited to, reported trades, executable bid and asked prices, broker/dealer quotations, prices or yields of securities with similar characteristics, interest rates, anticipated prepayments, benchmark curves or information pertaining to the issuer, as well as industry and economic events. The pricing services may use a matrix approach, which considers information regarding securities with similar characteristics to determine the valuation for a security. Short-term obligations purchased with a remaining maturity of sixty days or less for which a valuation from a third party pricing service is not readily available may be valued at amortized cost, which approximates fair value.
Derivatives. Forward foreign currency exchange contracts are generally valued at the mean of the average bid and average asked prices that are reported by currency dealers to a third party pricing service at the valuation time. Such third party pricing service valuations are supplied for specific settlement periods and the Fund’s forward foreign currency exchange contracts are valued at an interpolated rate between the closest preceding and subsequent settlement period reported by the third party pricing service.
Foreign Securities and Currencies. Foreign securities and currencies are valued in U.S. dollars, based on foreign currency exchange rate quotations supplied by a third party pricing service. The pricing service uses a proprietary model to determine the exchange rate. Inputs to the model include reported trades and implied bid/ask spreads.
Affiliated Fund. The Fund may invest in Eaton Vance Cash Reserves Fund, LLC (Cash Reserves Fund), an affiliated investment company managed by Eaton Vance Management (EVM). While Cash Reserves Fund is not a registered money market mutual fund, it conducts all of its investment activities in accordance with the requirements of Rule 2a-7 under the 1940 Act. Investments in Cash Reserves Fund are valued at the closing net asset value per unit on the valuation day. Cash Reserves Fund generally values its investment securities based on available market quotations provided by a third party pricing service.
Fair Valuation. Investments for which valuations or market quotations are not readily available or are deemed unreliable are valued at fair value using methods determined in good faith by or at the direction of the Trustees of the Fund in a manner that fairly reflects the security’s value, or the amount that the Fund might reasonably expect to receive for the security upon its current sale in the ordinary course. Each such determination is based on a consideration of relevant factors, which are likely to vary from one pricing context to another. These factors may include, but are not limited to, the type of security, the existence of any contractual restrictions on the security’s disposition, the price and extent of public trading in similar securities of the issuer or of comparable companies or entities, quotations or relevant information obtained from broker/dealers or other market participants, information obtained
Eaton Vance
Oaktree Diversified Credit NextShares
September 30, 2018
Notes to Financial Statements — continued
from the issuer, analysts, and/or the appropriate stock exchange (for exchange-traded securities), an analysis of the company’s or entity’s financial condition, and an evaluation of the forces that influence the issuer and the market(s) in which the security is purchased and sold.
B Investment Transactions — Investment transactions for financial statement purposes are accounted for on a trade date basis. Realized gains and losses on investments sold are determined on the basis of identified cost.
C Income — Interest income is recorded on the basis of interest accrued, adjusted for amortization of premium or accretion of discount. Fees associated with loan amendments are recognized immediately. Dividend income is recorded on the ex-dividend date for dividends received in cash and/or securities. Withholding taxes on foreign interest have been provided for in accordance with the Fund’s understanding of the applicable countries’ tax rules and rates.
D Federal Taxes — The Fund’s policy is to comply with the provisions of the Internal Revenue Code applicable to regulated investment companies and to distribute to shareholders each year substantially all of its net investment income, and all or substantially all of its net realized capital gains. Accordingly, no provision for federal income or excise tax is necessary.
As of September 30, 2018, the Fund had no uncertain tax positions that would require financial statement recognition, de-recognition, or disclosure. The Fund files a U.S. federal income tax return annually after its fiscal year-end, which is subject to examination by the Internal Revenue Service for a period of three years from the date of filing.
E Expenses — The majority of expenses of the Trust are directly identifiable to an individual fund. Expenses which are not readily identifiable to a specific fund are allocated taking into consideration, among other things, the nature and type of expense and the relative size of the funds.
F Foreign Currency Translation — Investment valuations, other assets, and liabilities initially expressed in foreign currencies are translated each business day into U.S. dollars based upon current exchange rates. Purchases and sales of foreign investment securities and income and expenses denominated in foreign currencies are translated into U.S. dollars based upon currency exchange rates in effect on the respective dates of such transactions. Recognized gains or losses on investment transactions attributable to changes in foreign currency exchange rates are recorded for financial statement purposes as net realized gains and losses on investments. That portion of unrealized gains and losses on investments that results from fluctuations in foreign currency exchange rates is not separately disclosed.
G Unfunded Loan Commitments — The Fund may enter into certain loan agreements all or a portion of which may be unfunded. The Fund is obligated to fund these commitments at the borrower’s discretion. These commitments are disclosed in the accompanying Portfolio of Investments. At September 30, 2018, the Fund had sufficient cash and/or securities to cover these commitments.
H Use of Estimates — The preparation of the financial statements in conformity with U.S. GAAP requires management to make estimates and assumptions that affect the reported amounts of assets and liabilities at the date of the financial statements and the reported amounts of income and expense during the reporting period. Actual results could differ from those estimates.
I Indemnifications — Under the Trust’s organizational documents, its officers and Trustees may be indemnified against certain liabilities and expenses arising out of the performance of their duties to the Fund. Under Massachusetts law, if certain conditions prevail, shareholders of a Massachusetts business trust (such as the Trust) could be deemed to have personal liability for the obligations of the Trust. However, the Trust’s Declaration of Trust contains an express disclaimer of liability on the part of Fund shareholders and the By-laws provide that the Trust shall assume the defense on behalf of any Fund shareholders. Moreover, the By-laws also provide for indemnification out of Fund property of any shareholder held personally liable solely by reason of being or having been a shareholder for all loss or expense arising from such liability. Additionally, in the normal course of business, the Fund enters into agreements with service providers that may contain indemnification clauses. The Fund’s maximum exposure under these arrangements is unknown as this would involve future claims that may be made against the Fund that have not yet occurred.
J Forward Foreign Currency Exchange Contracts — The Fund may enter into forward foreign currency exchange contracts for the purchase or sale of a specific foreign currency at a fixed price on a future date. The forward foreign currency exchange contracts are adjusted by the daily exchange rate of the underlying currency and any gains or losses are recorded as unrealized until such time as the contracts have been closed. Risks may arise upon entering these contracts from the potential inability of counterparties to meet the terms of their contracts and from movements in the value of a foreign currency relative to the U.S. dollar.
K When-Issued Securities and Delayed Delivery Transactions — The Fund may purchase or sell securities on a delayed delivery or when-issued basis. Payment and delivery may take place after the customary settlement period for that security. At the time the transaction is negotiated, the price of the security that will be delivered is fixed. The Fund maintains cash and/or security positions for these commitments such that sufficient liquid assets will be available to make payments upon settlement. Securities purchased on a delayed delivery or when-issued basis are marked-to-market daily and begin earning interest on settlement date. Losses may arise due to changes in the market value of the underlying securities or if the counterparty does not perform under the contract.
Eaton Vance
Oaktree Diversified Credit NextShares
September 30, 2018
Notes to Financial Statements — continued
2 Distributions to Shareholders and Income Tax Information
It is the present policy of the Fund to make monthly distributions of all or substantially all of its net investment income and to distribute annually all or substantially all of its net realized capital gains. Distributions are paid in cash and cannot be automatically reinvested in additional shares of the Fund. Distributions to shareholders are recorded on the ex-dividend date. Distributions to shareholders are determined in accordance with income tax regulations, which may differ from U.S. GAAP. As required by U.S. GAAP, only distributions in excess of tax basis earnings and profits are reported in the financial statements as a return of capital. Permanent differences between book and tax accounting relating to distributions are reclassified to paid-in capital. For tax purposes, distributions from short-term capital gains are considered to be from ordinary income.
The tax character of distributions declared for the period ended September 30, 2018 was as follows:
| | | | |
| | | Period Ended September 30, 2018(1) | |
| |
Distributions declared from: | | | | |
Ordinary income | | $ | 1,488,735 | |
| (1) | For the period from the start of business, November 15, 2017, to September 30, 2018. |
During the period ended September 30, 2018, distributable earnings was increased by $1,095 and paid-in capital was decreased by $1,095 due to differences between book and tax accounting for non-deductible expenses. These reclassifications had no effect on the net assets or net asset value per share of the Fund.
As of September 30, 2018, the components of distributable earnings (accumulated loss) on a tax basis were as follows:
| | | | |
Undistributed ordinary income | | $ | 565,687 | |
Deferred capital losses | | $ | (308,404 | ) |
Net unrealized appreciation | | $ | 49,543 | |
At September 30, 2018, the Fund, for federal income tax purposes, had deferred capital losses of $308,404 which would reduce its taxable income arising from future net realized gains on investment transactions, if any, to the extent permitted by the Internal Revenue Code, and thus would reduce the amount of distributions to shareholders, which would otherwise be necessary to relieve the Fund of any liability for federal income or excise tax. The deferred capital losses are treated as arising on the first day of the Fund’s next taxable year and retain the same short-term or long-term character as when originally deferred. Of the deferred capital losses at September 30, 2018, $308,404 are short-term.
The cost and unrealized appreciation (depreciation) of investments, including open derivative contracts, of the Fund at September 30, 2018, as determined on a federal income tax basis, were as follows:
| | | | |
| |
Aggregate cost | | $ | 54,403,134 | |
| |
Gross unrealized appreciation | | $ | 570,724 | |
Gross unrealized depreciation | | | (525,129 | ) |
| |
Net unrealized appreciation | | $ | 45,595 | |
3 Investment Adviser Fee and Other Transactions with Affiliates
The investment adviser fee is earned by EVM as compensation for investment advisory services rendered to the Fund. The fee is computed at an annual rate of 0.80% of the Fund’s average daily net assets up to $500 million and is payable monthly. On net assets of $500 million and over, the annual fee is reduced. For the period ended September 30, 2018, the investment adviser fee amounted to $354,793 or 0.80% (annualized) of the Fund’s average daily net assets. EVM also serves as the administrator of the Fund, but receives no compensation. Pursuant to an investment sub-advisory agreement, EVM has delegated the investment management of the Fund to Oaktree Capital Management, L.P. (Oaktree), a registered investment adviser. EVM pays Oaktree a portion of its investment adviser fee for sub-advisory services provided to the Fund.
The Trust, on behalf of the Fund, has entered into an operations agreement with EVM pursuant to which EVM provides the Fund with services required for it to operate as a NextShares exchange-traded managed fund in accordance with the exemptive order obtained by EVM and the Trust. Pursuant to the
Eaton Vance
Oaktree Diversified Credit NextShares
September 30, 2018
Notes to Financial Statements — continued
agreement, the Fund pays EVM a monthly fee at an annual rate of 0.05% of the Fund’s average daily net assets provided the average net assets of NextShares funds sponsored by EVM (“Covered Assets”) are less than $10 billion. The annual rate is reduced if Covered Assets are $10 billion and above. For the period ended September 30, 2018, the operations agreement fee amounted to $22,175 or 0.05% (annualized) of the Fund’s average daily net assets.
EVM has agreed to reimburse the Fund’s expenses to the extent that total annual operating expenses (relating to ordinary operating expenses only) exceed 0.90% of the Fund’s average daily net assets through January 31, 2019. Thereafter, the reimbursement may be changed or terminated at any time. Pursuant to this agreement, EVM was allocated $174,717 of the Fund’s operating expenses for the period ended September 30, 2018.
Trustees and officers of the Fund who are members of EVM’s organization receive remuneration for their services to the Fund out of the investment adviser fee. Trustees of the Fund who are not affiliated with EVM may elect to defer receipt of all or a percentage of their annual fees in accordance with the terms of the Trustees Deferred Compensation Plan. For the period ended September 30, 2018, no significant amounts have been deferred. Certain officers and Trustees of the Fund are officers of EVM.
4 Purchases and Sales of Investments
Purchases and sales of investments, other than short-term obligations, and including maturities, paydowns and principal repayments on Senior Loans, aggregated $128,905,600 and $75,466,314, respectively, for the period ended September 30, 2018.
5 Financial Instruments
The Fund may trade in financial instruments with off-balance sheet risk in the normal course of its investing activities. These financial instruments may include forward foreign currency exchange contracts and may involve, to a varying degree, elements of risk in excess of the amounts recognized for financial statement purposes. The notional or contractual amounts of these instruments represent the investment the Fund has in particular classes of financial instruments and do not necessarily represent the amounts potentially subject to risk. The measurement of the risks associated with these instruments is meaningful only when all related and offsetting transactions are considered. A summary of obligations under these financial instruments at September 30, 2018 is included in the Portfolio of Investments. At September 30, 2018, the Fund had sufficient cash and/or securities to cover commitments under these contracts.
The Fund is subject to foreign exchange risk in the normal course of pursuing its investment objective. Because the Fund holds foreign currency denominated investments, the value of these investments and related receivables and payables may change due to future changes in foreign currency exchange rates. To hedge against this risk, the Fund enters into forward foreign currency exchange contracts.
The Fund enters into forward foreign currency exchange contracts that may contain provisions whereby the counterparty may terminate the contract under certain conditions, including but not limited to a decline in the Fund’s net assets below a certain level over a certain period of time, which would trigger a payment by the Fund for those derivatives in a liability position. At September 30, 2018, the fair value of derivatives with credit-related contingent features in a net liability position was $5,258. At September 30, 2018, there were no assets pledged by the Fund for such liability.
The over-the-counter (OTC) derivatives in which the Fund invests are subject to the risk that the counterparty to the contract fails to perform its obligations under the contract. To mitigate this risk, the Fund has entered into an International Swaps and Derivatives Association, Inc. Master Agreement (“ISDA Master Agreement”) or similar agreement with its derivative counterparty. The ISDA Master Agreement is a bilateral agreement between the Fund and the counterparty that governs certain OTC derivatives and typically contains, among other things, set-off provisions in the event of a default and/or termination event as defined under the ISDA Master Agreement. Under the ISDA Master Agreement, the Fund may, under certain circumstances, offset with the counterparty certain derivative financial instruments’ payables and/or receivables with collateral held and/or posted and create one single net payment. The provisions of the ISDA Master Agreement typically permit a single net payment in the event of default including the bankruptcy or insolvency of the counterparty. However, bankruptcy or insolvency laws of a particular jurisdiction may impose restrictions on or prohibitions against the right of offset in bankruptcy or insolvency. The ISDA Master Agreement allows the counterparty to OTC derivatives to terminate derivative contracts prior to maturity in the event the Fund’s net assets decline by a stated percentage or the Fund fails to meet the terms of its ISDA Master Agreement, which would cause the counterparty to accelerate payment by the Fund of any net liability owed to it.
The collateral requirements for derivatives traded under the ISDA Master Agreement are governed by a Credit Support Annex to the ISDA Master Agreement. Collateral requirements are determined at the close of business each day and are typically based on changes in market values for each transaction under the ISDA Master Agreement and netted into one amount for such agreement. Generally, the amount of collateral due from or to the counterparty is subject to a minimum transfer threshold amount before a transfer is required. Collateral pledged for the benefit of the Fund and/or counterparty is held in segregated accounts by the Fund’s custodian and cannot be sold, re-pledged, assigned or otherwise used while pledged. The portion of such collateral representing cash, if any, is reflected as deposits for derivatives collateral and, in the case of cash pledged by the counterparty for the benefit of the Fund, a corresponding liability on the Statement of Assets and Liabilities. Securities pledged by the Fund as collateral, if any, are identified as such in the Portfolio of Investments.
Eaton Vance
Oaktree Diversified Credit NextShares
September 30, 2018
Notes to Financial Statements — continued
The fair value of open derivative instruments (not considered to be hedging instruments for accounting disclosure purposes) and whose primary underlying risk exposure is foreign exchange risk at September 30, 2018 was as follows:
| | | | | | | | |
| | | Fair Value | |
| Derivative | | Asset Derivative(1) | | | Liability Derivative(2) | |
| | |
Forward foreign currency exchange contracts | | $ | 83,392 | | | $ | (5,258 | ) |
| (1) | Statement of Assets and Liabilities location: Receivable for open forward foreign currency exchange contracts; Distributable earnings |
| (2) | Statement of Assets and Liabilities location: Payable for open forward foreign currency exchange contracts; Distributable earnings |
The Fund’s derivative assets and liabilities at fair value by type, which are reported gross in the Statement of Assets and Liabilities, are presented in the table above. The following tables present the Fund’s derivative assets and liabilities by counterparty, net of amounts available for offset under a master netting agreement and net of the related collateral received by the Fund for such assets and pledged by the Fund for such liabilities as of September 30, 2018.
| | | | | | | | | | | | | | | | | | | | |
| Counterparty | | Derivative Assets
Subject to
Master Netting
Agreement | | | Derivatives
Available
for Offset | | | Non-cash
Collateral
Received(a) | | | Cash
Collateral
Received(a) | | | Net Amount
of Derivative
Assets(b) | |
| | | | | |
State Street Bank and Trust Company | | $ | 83,392 | | | $ | (5,258 | ) | | $ | — | | | $ | — | | | $ | 78,134 | |
| | | | | |
| Counterparty | | Derivative Liabilities
Subject to Master Netting
Agreement | | | Derivatives
Available
for Offset | | | Non-cash
Collateral
Pledged(a) | | | Cash
Collateral
Pledged(a) | | | Net Amount
of Derivative
Liabilities(c) | |
| | | | | |
State Street Bank and Trust Company | | $ | (5,258 | ) | | $ | 5,258 | | | $ | — | | | $ | — | | | $ | — | |
| (a) | In some instances, the total collateral received and/or pledged may be more than the amount shown due to overcollateralization. |
| (b) | Net amount represents the net amount due from the counterparty in the event of default. |
| (c) | Net amount represents the net amount payable to the counterparty in the event of default. |
The effect of derivative instruments (not considered to be hedging instruments for accounting disclosure purposes) on the Statement of Operations and whose primary underlying risk exposure is foreign exchange risk for the period ended September 30, 2018 was as follows:
| | | | | | | | |
| Derivative | | Realized Gain (Loss)
on Derivatives Recognized
in Income(1) | | | Change in Unrealized
Appreciation (Depreciation) on Derivatives Recognized in Income(2) | |
| | |
Forward foreign currency exchange contracts | | $ | 207,236 | | | $ | 78,134 | |
| (1) | Statement of Operations location: Net realized gain (loss) – Forward foreign currency exchange contracts. |
| (2) | Statement of Operations location: Change in unrealized appreciation (depreciation) – Forward foreign currency exchange contracts. |
The average notional amount of forward foreign currency exchange contracts (based on the absolute value of notional amounts of currency purchased and currency sold) outstanding during the period ended September 30, 2018, which is indicative of the volume of this derivative type, was approximately $8,706,000.
6 Capital Share Transactions
The Trust may issue an unlimited number of shares of capital stock (no par value per share) in one or more series (such as the Fund). The Fund issues and redeems shares only in blocks of 25,000 shares or multiples thereof (“Creation Units”). The Fund issues and redeems Creation Units in return for the securities, other instruments and/or cash (the “Basket”) that the Fund specifies each business day. Creation Units may be purchased or redeemed only by or through Authorized Participants, which are broker-dealers or institutional investors that have entered into agreements with the Fund’s distributor for this
Eaton Vance
Oaktree Diversified Credit NextShares
September 30, 2018
Notes to Financial Statements — continued
purpose. The Fund imposes a transaction fee on Creation Units issued and redeemed to offset the estimated cost to the Fund of processing the transaction, which is paid by the Authorized Participants directly to a third-party administrator. In addition, Authorized Participants pay the Fund a variable charge for converting the Basket to or from the desired portfolio composition. Such variable charges are reflected as Transaction fees on the Statement of Changes in Net Assets.
At September 30, 2018, Eaton Vance Corporation and Oaktree owned in the aggregate 97.5% of the outstanding shares of the Fund.
7 Fair Value Measurements
Under generally accepted accounting principles for fair value measurements, a three-tier hierarchy to prioritize the assumptions, referred to as inputs, is used in valuation techniques to measure fair value. The three-tier hierarchy of inputs is summarized in the three broad levels listed below.
| • | | Level 1 – quoted prices in active markets for identical investments |
| • | | Level 2 – other significant observable inputs (including quoted prices for similar investments, interest rates, prepayment speeds, credit risk, etc.) |
| • | | Level 3 – significant unobservable inputs (including a fund’s own assumptions in determining the fair value of investments) |
In cases where the inputs used to measure fair value fall in different levels of the fair value hierarchy, the level disclosed is determined based on the lowest level input that is significant to the fair value measurement in its entirety. The inputs or methodology used for valuing securities are not necessarily an indication of the risk associated with investing in those securities.
At September 30, 2018, the hierarchy of inputs used in valuing the Fund’s investments and open derivative instruments, which are carried at value, were as follows:
| | | | | | | | | | | | | | | | |
| Asset Description | | Level 1 | | | Level 2 | | | Level 3 | | | Total | |
| | | | |
Senior Floating-Rate Loans (Less Unfunded Loan Commitments) | | $ | — | | | $ | 18,755,048 | | | $ | — | | | $ | 18,755,048 | |
Corporate Bonds & Notes | | | — | | | | 13,513,530 | | | | — | | | | 13,513,530 | |
Foreign Corporate Bonds | | | — | | | | 388,813 | | | | — | | | | 388,813 | |
Foreign Government Bonds | | | — | | | | 324,227 | | | | — | | | | 324,227 | |
Convertible Bonds | | | — | | | | 8,392,663 | | | | — | | | | 8,392,663 | |
Asset-Backed Securities | | | — | | | | 5,488,070 | | | | — | | | | 5,488,070 | |
Commercial Mortgage-Backed Securities | | | — | | | | 6,632,685 | | | | — | | | | 6,632,685 | |
Short-Term Investments | | | — | | | | 954,029 | | | | — | | | | 954,029 | |
| | | | |
Total Investments | | $ | — | | | $ | 54,449,065 | | | $ | — | | | $ | 54,449,065 | |
| | | | |
Forward Foreign Currency Exchange Contracts | | $ | — | | | $ | 83,392 | | | $ | — | | | $ | 83,392 | |
| | | | |
Total | | $ | — | | | $ | 54,532,457 | | | $ | — | | | $ | 54,532,457 | |
| | | | |
Liability Description | | | | | | | | | | | | | | | | |
| | | | |
Forward Foreign Currency Exchange Contracts | | $ | — | | | $ | (5,258 | ) | | $ | — | | | $ | (5,258 | ) |
| | | | |
Total | | $ | — | | | $ | (5,258 | ) | | $ | — | | | $ | (5,258 | ) |
8 Stock Split
The Trustees of the Fund approved a 2-for-1 stock split, effective March 9, 2018. The stock split had no impact on the net assets of the Fund or the overall value of a shareholder’s investment in the Fund.
Eaton Vance
Oaktree Diversified Credit NextShares
September 30, 2018
Report of Independent Registered Public Accounting Firm
To the Trustees of Eaton Vance NextShares Trust II and Shareholders of Eaton Vance Oaktree Diversified Credit NextShares:
Opinion on the Financial Statements and Financial Highlights
We have audited the accompanying statement of assets and liabilities of Eaton Vance Oaktree Diversified Credit NextShares (the “Fund”) (one of the funds constituting Eaton Vance NextShares Trust II), including the portfolio of investments, as of September 30, 2018, the related statement of operations, the statement of changes in net assets, and the financial highlights for the period from the start of business, November 15, 2017, to September 30, 2018, and the related notes. In our opinion, the financial statements and financial highlights present fairly, in all material respects, the financial position of the Fund as of September 30, 2018, and the results of its operations, the changes in its net assets, and the financial highlights for the period from the start of business November 15, 2017, to September 30, 2018, in conformity with accounting principles generally accepted in the United States of America.
Basis for Opinion
These financial statements and financial highlights are the responsibility of the Fund’s management. Our responsibility is to express an opinion on the Fund’s financial statements and financial highlights based on our audits. We are a public accounting firm registered with the Public Company Accounting Oversight Board (United States) (PCAOB) and are required to be independent with respect to the Fund in accordance with the U.S. federal securities laws and the applicable rules and regulations of the Securities and Exchange Commission and the PCAOB.
We conducted our audits in accordance with the standards of the PCAOB. Those standards require that we plan and perform the audit to obtain reasonable assurance about whether the financial statements and financial highlights are free of material misstatement, whether due to error or fraud. The Fund is not required to have, nor were we engaged to perform, an audit of its internal control over financial reporting. As part of our audits we are required to obtain an understanding of internal control over financial reporting but not for the purpose of expressing an opinion on the effectiveness of the Fund’s internal control over financial reporting. Accordingly, we express no such opinion.
Our audits included performing procedures to assess the risks of material misstatement of the financial statements and financial highlights, whether due to error or fraud, and performing procedures that respond to those risks. Such procedures included examining, on a test basis, evidence regarding the amounts and disclosures in the financial statements and financial highlights. Our audits also included evaluating the accounting principles used and significant estimates made by management, as well as evaluating the overall presentation of the financial statements and financial highlights. Our procedures included confirmation of securities owned as of September 30, 2018, by correspondence with the custodian and brokers; when replies were not received from brokers, we performed other auditing procedures. We believe that our audits provide a reasonable basis for our opinion.
/s/ Deloitte & Touche LLP
Boston, Massachusetts
November 21, 2018
We have served as the auditor of one or more Eaton Vance investment companies since 1959.
Eaton Vance
Oaktree Diversified Credit NextShares
September 30, 2018
Federal Tax Information (Unaudited)
The Form 1099-DIV you receive in February 2019 will show the tax status of all distributions paid to your account in calendar year 2018. Shareholders are advised to consult their own tax adviser with respect to the tax consequences of their investment in the Fund.
Eaton Vance
Oaktree Diversified Credit NextShares
September 30, 2018
Special Meeting of Shareholders (Unaudited)
The Fund held a Special Meeting of Shareholders on September 20, 2018 to elect the five Trustees listed below. The other Trustees named herein continue to serve as Trustees. The results of the vote with respect to the Fund were as follows:
| | | | | | | | |
| Nominee for Trustee | | Number of Shares | |
| | For | | | Withheld | |
Mark R. Fetting | | | 5,000,027 | | | | 0 | |
Keith Quinton | | | 5,000,027 | | | | 0 | |
Marcus L. Smith | | | 5,000,027 | | | | 0 | |
Susan J. Sutherland | | | 5,000,027 | | | | 0 | |
Scott E. Wennerholm | | | 5,000,027 | | | | 0 | |
| | Results are rounded to the nearest whole number. |
Eaton Vance
Oaktree Diversified Credit NextShares
September 30, 2018
Management and Organization
Fund Management. The Trustees of Eaton Vance NextShares Trust II (the Trust) are responsible for the overall management and supervision of the Trust’s affairs. The Trustees and officers of the Trust are listed below. Except as indicated, each individual has held the office shown or other offices in the same company for the last five years. Trustees and officers of the Trust hold indefinite terms of office. The “Noninterested Trustees” consist of those Trustees who are not “interested persons” of the Trust, as that term is defined under the 1940 Act. The business address of each Trustee and officer is Two International Place, Boston, Massachusetts 02110. As used below, “EVC” refers to Eaton Vance Corp., “EV” refers to Eaton Vance, Inc., “EVM” refers to Eaton Vance Management, “BMR” refers to Boston Management and Research and “EVD” refers to Eaton Vance Distributors, Inc. EVC and EV are the corporate parent and trustee, respectively, of EVM and BMR. EVD is the Fund’s principal underwriter and a wholly-owned subsidiary of EVC. Each officer affiliated with Eaton Vance may hold a position with other Eaton Vance affiliates that is comparable to his or her position with EVM listed below. Each Trustee oversees 174 portfolios in the Eaton Vance Complex (including all master and feeder funds in a master feeder structure). Each officer serves as an officer of certain other Eaton Vance funds. Each Trustee and officer serves until his or her successor is elected.
| | | | | | |
| Name and Year of Birth | | Position(s) with the Trust | | Trustee
Since(1) | | Principal Occupation(s) and Directorships
During Past Five Years and Other Relevant Experience |
| Interested Trustee |
| | | |
Thomas E. Faust Jr. 1958 | | Trustee | | 2015 | | Chairman, Chief Executive Officer and President of EVC, Director and President of EV, Chief Executive Officer and President of EVM and BMR, and Director of EVD. Trustee and/or officer of 174 registered investment companies. Mr. Faust is an interested person because of his positions with EVM, BMR, EVD, EVC and EV, which are affiliates of the Trust. Directorships in the Last Five Years.(2) Director of EVC and Hexavest Inc. (investment management firm). |
|
| Noninterested Trustees |
| | | |
Mark R. Fetting 1954 | | Trustee | | 2016 | | Private investor. Formerly held various positions at Legg Mason, Inc. (investment management firm) (2000-2012), including President, Chief Executive Officer, Director and Chairman (2008-2012), Senior Executive Vice President (2004-2008) and Executive Vice President (2001-2004). Formerly, President of Legg Mason family of funds (2001-2008). Formerly, Division President and Senior Officer of Prudential Financial Group, Inc. and related companies (investment management firm) (1991-2000). Directorships in the Last Five Years. None. |
| | | |
Cynthia E. Frost 1961 | | Trustee | | 2015 | | Private investor. Formerly, Chief Investment Officer of Brown University (university endowment) (2000-2012); Formerly, Portfolio Strategist for Duke Management Company (university endowment manager) (1995-2000); Formerly, Managing Director, Cambridge Associates (investment consulting company) (1989-1995); Formerly, Consultant, Bain and Company (management consulting firm) (1987-1989); Formerly, Senior Equity Analyst, BA Investment Management Company (1983-1985). Directorships in the Last Five Years. None. |
| | | |
George J. Gorman 1952 | | Trustee | | 2015 | | Principal at George J. Gorman LLC (consulting firm). Formerly, Senior Partner at Ernst & Young LLP (a registered public accounting firm) (1974-2009). Directorships in the Last Five Years. Formerly, Trustee of the BofA Funds Series Trust (11 funds) (2011-2014) and of the Ashmore Funds (9 funds) (2010-2014). |
| | | |
Valerie A. Mosley 1960 | | Trustee | | 2015 | | Chairwoman and Chief Executive Officer of Valmo Ventures (a consulting and investment firm). Former Partner and Senior Vice President, Portfolio Manager and Investment Strategist at Wellington Management Company, LLP (investment management firm) (1992-2012). Former Chief Investment Officer, PG Corbin Asset Management (1990-1992). Formerly worked in institutional corporate bond sales at Kidder Peabody (1986-1990). Directorships in the Last Five Years.(2) Director of Dynex Capital, Inc. (mortgage REIT) (since 2013). |
Eaton Vance
Oaktree Diversified Credit NextShares
September 30, 2018
Management and Organization — continued
| | | | | | |
| Name and Year of Birth | | Position(s) with the Trust | | Trustee
Since(1) | | Principal Occupation(s) and Directorships
During Past Five Years and Other Relevant Experience |
| Noninterested Trustees (continued) |
| | | |
William H. Park 1947 | | Chairperson of the Board and Trustee | | 2016 (Chairperson); 2015 (Trustee) | | Private investor. Formerly, Consultant (management and transactional) (2012-2014). Formerly, Chief Financial Officer, Aveon Group L.P. (investment management firm) (2010-2011). Formerly, Vice Chairman, Commercial Industrial Finance Corp. (specialty finance company) (2006-2010). Formerly, President and Chief Executive Officer, Prizm Capital Management, LLC (investment management firm) (2002-2005). Formerly, Executive Vice President and Chief Financial Officer, United Asset Management Corporation (investment management firm) (1982-2001). Formerly, Senior Manager, Price Waterhouse (now PricewaterhouseCoopers) (a registered public accounting firm) (1972-1981). Directorships in the Last Five Years.(2) None. |
| | | |
Helen Frame Peters 1948 | | Trustee | | 2015 | | Professor of Finance, Carroll School of Management, Boston College. Formerly, Dean, Carroll School of Management, Boston College (2000-2002). Formerly, Chief Investment Officer, Fixed Income, Scudder Kemper Investments (investment management firm) (1998-1999). Formerly, Chief Investment Officer, Equity and Fixed Income, Colonial Management Associates (investment management firm) (1991-1998). Directorships in the Last Five Years.(2) None. |
| | | |
Keith Quinton(3) 1958 | | Trustee | | 2018 | | Independent Investment Committee Member at New Hampshire Retirement System (since 2017). Advisory Committee member at Northfield Information Services, Inc. (risk management analytics provider) (since 2016). Formerly, Portfolio Manager and Senior Quantitative Analyst at Fidelity Investments (investment management firm) (2001-2014). Directorships in the Last Five Years. Director of New Hampshire Municipal Bond Bank (since 2016). |
| | | |
Marcus L. Smith(3) 1966 | | Trustee | | 2018 | | Member of Posse Boston Advisory Board (foundation) (since 2015); Trustee at University of Mount Union (since 2008). Formerly, Portfolio Manager at MFS Investment Management (investment management firm) (1994-2017). Directorships in the Last Five Years. Director of MSCI Inc. (global provider of investment decision support tools) (since 2017). Director of DCT Industrial Trust Inc. (logistics real estate company) (since 2017). |
| | | |
Susan J. Sutherland 1957 | | Trustee | | 2015 | | Private investor. Formerly, Associate, Counsel and Partner at Skadden, Arps, Slate, Meagher & Flom LLP (law firm) (1982-2013). Directorships in the Last Five Years. Formerly, Director of Montpelier Re Holdings Ltd. (global provider of customized insurance and reinsurance products) (2013-2015). |
| | | |
Harriett Tee Taggart 1948 | | Trustee | | 2015 | | Managing Director, Taggart Associates (a professional practice firm). Formerly, Partner and Senior Vice President, Wellington Management Company, LLP (investment management firm) (1983-2006). Ms. Taggart has apprised the Board of Trustees that she intends to retire as a Trustee of all Eaton Vance Funds effective December 31, 2018. Directorships in the Last Five Years.(2) Director of Albemarle Corporation (chemicals manufacturer) (since 2007) and The Hanover Group (specialty property and casualty insurance company) (since 2009). |
| | | |
Scott E. Wennerholm 1959 | | Trustee | | 2016 | | Formerly, Trustee at Wheelock College (postsecondary institution) (2012-2018). Formerly, Consultant at GF Parish Group (executive recruiting firm) (2016-2017). Formerly, Chief Operating Officer and Executive Vice President at BNY Mellon Asset Management (investment management firm) (2005-2011). Formerly, Chief Operating Officer and Chief Financial Officer at Natixis Global Asset Management (investment management firm) (1997-2004). Formerly, Vice President at Fidelity Investments Institutional Services (investment management firm) (1994-1997). Directorships in the Last Five Years. None. |
Eaton Vance
Oaktree Diversified Credit NextShares
September 30, 2018
Management and Organization — continued
| | | | | | |
| Name and Year of Birth | | Position(s) with the Trust | | Officer
Since(4) | | Principal Occupation(s) During Past Five Years |
| Principal Officers who are not Trustees |
| | | |
Payson F. Swaffield 1956 | | President | | 2014 | | Vice President and Chief Income Investment Officer of EVM and BMR. Also Vice President of Calvert Research and Management (“CRM”). |
| | | |
Maureen A. Gemma 1960 | | Vice President, Secretary and Chief Legal Officer | | 2014 | | Vice President of EVM and BMR. Also Vice President of CRM. |
| | | |
James F. Kirchner 1967 | | Treasurer | | 2014 | | Vice President of EVM and BMR. Also Vice President of CRM. |
| | | |
Richard F. Froio 1968 | | Chief Compliance Officer | | 2017 | | Vice President of EVM and BMR since 2017. Formerly, Deputy Chief Compliance Officer (Adviser/Funds) and Chief Compliance Officer (Distribution) at PIMCO (2012-2017) and Managing Director at BlackRock/Barclays Global Investors (2009-2012). |
| (1) | Year first appointed to serve as Trustee for a fund in the Eaton Vance family of funds. Each Trustee has served continuously since appointment unless indicated otherwise. |
| (2) | During their respective tenures, the Trustees (except for Mmes. Frost and Sutherland and Messrs. Fetting, Gorman, Quinton, Smith and Wennerholm) also served as Board members of one or more of the following funds (which operated in the years noted): eUnitsTM 2 Year U.S. Market Participation Trust: Upside to Cap / Buffered Downside (launched in 2012 and terminated in 2014); and eUnitsTM 2 Year U.S. Market Participation Trust II: Upside to Cap / Buffered Downside (launched in 2012 and terminated in 2014). However, Ms. Mosley did not serve as a Board member of eUnitsTM 2 Year U.S. Market Participation Trust: Upside to Cap / Buffered Downside (launched in 2012 and terminated in 2014). |
| (3) | Messrs. Quinton and Smith began serving as Trustees effective October 1, 2018. |
| (4) | Year first elected to serve as officer of a fund in the Eaton Vance family of funds when the officer has served continuously. Otherwise, year of most recent election as an officer of a fund in the Eaton Vance family of funds. Titles may have changed since initial election. |
The SAI for the Fund includes additional information about the Trustees and officers of the Fund and can be obtained without charge on Eaton Vance’s website at www.eatonvance.com or by calling 1-800-262-1122.
Eaton Vance Funds
IMPORTANT NOTICES
Privacy. The Eaton Vance organization is committed to ensuring your financial privacy. Each of the financial institutions identified below has in effect the following policy (“Privacy Policy”) with respect to nonpublic personal information about its customers:
| • | | Only such information received from you, through application forms or otherwise, and information about your Eaton Vance fund transactions will be collected. This may include information such as name, address, social security number, tax status, account balances and transactions. |
| • | | None of such information about you (or former customers) will be disclosed to anyone, except as permitted by law (which includes disclosure to employees necessary to service your account). In the normal course of servicing a customer’s account, Eaton Vance may share information with unaffiliated third parties that perform various required services such as transfer agents, custodians and broker-dealers. |
| • | | Policies and procedures (including physical, electronic and procedural safeguards) are in place that are designed to protect the confidentiality of such information. |
| • | | We reserve the right to change our Privacy Policy at any time upon proper notification to you. Customers may want to review our Privacy Policy periodically for changes by accessing the link on our homepage: www.eatonvance.com. |
Our pledge of privacy applies to the following entities within the Eaton Vance organization: the Eaton Vance Family of Funds, Eaton Vance Management, Eaton Vance Investment Counsel, Eaton Vance Distributors, Inc., Eaton Vance Trust Company, Eaton Vance Management (International) Limited, Eaton Vance Advisers International Ltd., Eaton Vance Management’s Real Estate Investment Group and Boston Management and Research. In addition, our Privacy Policy applies only to those Eaton Vance customers who are individuals and who have a direct relationship with us. If a customer’s account (i.e., fund shares) is held in the name of a third-party financial advisor/broker-dealer, it is likely that only such advisor’s privacy policies apply to the customer. This notice supersedes all previously issued privacy disclosures. For more information about Eaton Vance’s Privacy Policy, please call 1-800-262-1122.
Delivery of Shareholder Documents. The Securities and Exchange Commission (SEC) permits delivery of only one copy of fund shareholder documents, including prospectuses, proxy statements and shareholder reports, to fund investors with multiple accounts at the same residential or post office box address. This practice is often called “householding” and it helps eliminate duplicate mailings to shareholders. Your broker may household the mailing of your documents indefinitely unless you instruct your broker otherwise. If you would prefer that your Eaton Vance documents not be householded, please contact your broker. Your instructions that householding not apply to delivery of your Eaton Vance documents will typically be effective within 30 days of receipt by your broker.
Portfolio Holdings. Each Eaton Vance Fund and its underlying Portfolio(s) (if applicable) will file a schedule of portfolio holdings on Form N-Q with the SEC for the first and third quarters of each fiscal year. The Form N-Q will be available on the Eaton Vance website at www.eatonvance.com, by calling Eaton Vance at 1-800-262-1122 or in the EDGAR database on the SEC’s website at www.sec.gov. Form N-Q may also be reviewed and copied at the SEC’s public reference room in Washington, D.C. (call 1-800-732-0330 for information on the operation of the public reference room).
Proxy Voting. From time to time, funds are required to vote proxies related to the securities held by the funds. The Eaton Vance Funds or their underlying Portfolios (if applicable) vote proxies according to a set of policies and procedures approved by the Funds’ and Portfolios’ Boards. You may obtain a description of these policies and procedures and information on how the Funds or Portfolios voted proxies relating to portfolio securities during the most recent 12-month period ended June 30, without charge, upon request, by calling 1-800-262-1122 and by accessing the SEC’s website at www.sec.gov.
This Page Intentionally Left Blank
This Page Intentionally Left Blank
Investment Adviser and Administrator
Eaton Vance Management
Two International Place
Boston, MA 02110
Sub-Advisor
Oaktree Capital Management, L.P.
333 South Grand Ave.
Los Angeles, CA 90071
Distributor*
Foreside Fund Services, LLC
Three Canal Plaza, Suite 100
Portland, ME 04101
Custodian
State Street Bank and Trust Company
State Street Financial Center, One Lincoln Street
Boston, MA 02111
Transfer and Dividend Disbursing Agent
State Street Bank and Trust Company
State Street Financial Center, One Lincoln Street
Boston, MA 02111
Independent Registered Public Accounting Firm
Deloitte & Touche LLP
200 Berkeley Street
Boston, MA 02116-5022
Fund Offices
Two International Place
Boston, MA 02110
| * | FINRA BrokerCheck. Investors may check the background of their Investment Professional by contacting the Financial Industry Regulatory Authority (FINRA). FINRA BrokerCheck is a free tool to help investors check the professional background of current and former FINRA-registered securities firms and brokers. FINRA BrokerCheck is available by calling 1-800-289-9999 and at www.FINRA.org. The FINRA BrokerCheck brochure describing this program is available to investors at www.FINRA.org. |


30421 9.30.18
Item 2. Code of Ethics
The registrant has adopted a code of ethics applicable to its Principal Executive Officer, Principal Financial Officer and Principal Accounting Officer. The registrant undertakes to provide a copy of such code of ethics to any person upon request, without charge, by calling 1-800-262-1122. The registrant has not amended the code of ethics as described in Form N-CSR during the period covered by this report. The registrant has not granted any waiver, including an implicit waiver, from a provision of the code of ethics as described in Form N-CSR during the period covered by this report.
Item 3. Audit Committee Financial Expert
The registrant’s Board has designated George J. Gorman and William H. Park, each an independent trustee, as audit committee financial experts. Mr. Gorman is a certified public accountant who is the Principal at George J. Gorman LLC (a consulting firm). Previously, Mr. Gorman served in various capacities at Ernst & Young LLP (a registered public accounting firm), including as Senior Partner. Mr. Gorman also has experience serving as an independent trustee and audit committee financial expert of other mutual fund complexes. Mr. Park is a certified public accountant who is a private investor. Previously, he served as a consultant, as the Chief Financial Officer of Aveon Group, L.P. (an investment management firm), as the Vice Chairman of Commercial Industrial Finance Corp. (specialty finance company), as President and Chief Executive Officer of Prizm Capital Management, LLC (investment management firm), as Executive Vice President and Chief Financial Officer of United Asset Management Corporation (an institutional investment management firm) and as a Senior Manager at Price Waterhouse (now PricewaterhouseCoopers) (a registered public accounting firm).
Item 4. Principal Accountant Fees and Services
Eaton Vance Oaktree Diversified Credit NextShares (the “Fund”) is a series of Eaton Vance NextShares Trust II (the “Trust”), a Massachusetts business trust, which, including the Fund, contains a total of 9 series (the “Series”). The Trust is registered under the Investment Company Act of 1940 as an open-end management investment company. This Form N-CSR relates to the Fund’s annual report.
(a)-(d)
The following table presents the aggregate fees billed to the registrant for the initial fiscal period from the commencement of operations on November 15, 2017 to September 30, 2018 by D&T for professional services rendered for the audit of the Fund’s annual financial statements and fees billed for other services rendered by D&T during such periods.
Eaton Vance Oaktree Diversified Credit NextShares
| | | | |
Fiscal Period Ended* | | 9/30/18 | |
Audit Fees | | $ | 37,050 | |
Audit-Related Fees(1) | | $ | 0 | |
Tax Fees(2) | | $ | 16,100 | |
All Other Fees(3) | | $ | 0 | |
| | | | |
Total | | $ | 53,150 | |
| | | | |
| * | Fund commenced operations on November 15, 2017. |
| (1) | Audit-related fees consist of the aggregate fees billed for assurance and related services that are reasonably related to the performance of the audit of the registrant’s financial statements and are not reported under the category of audit fees. |
| (2) | Tax fees consist of the aggregate fees billed for professional services rendered by the principal accountant relating to tax compliance, tax advice, and tax planning and specifically include fees for tax return preparation and other related tax compliance/planning matters. |
| (3) | All other fees consist of the aggregate fees billed for products and services provided by the principal accountant other than audit, audit-related, and tax services. |
The various Series comprising the Trust have differing fiscal year ends (January 31, September 30 and October 31). The following table presents the aggregate audit, audit-related, tax, and other fees billed to all of the Series in the Trust by D&T for the last two fiscal periods of each Series.
| | | | | | | | | | | | |
Fiscal Periods Ended* | | 1/31/17 | | | 1/31/18 | | | 9/30/18 | |
Audit Fees | | $ | 14,000 | | | $ | 14,000 | | | $ | 37,050 | |
Audit-Related Fees(1) | | $ | 0 | | | $ | 0 | | | $ | 0 | |
Tax Fees(2) | | $ | 9,449 | | | $ | 9,591 | | | $ | 16,100 | |
All Other Fees(3) | | $ | 0 | | | $ | 0 | | | $ | 0 | |
| | | | | | | | | | | | |
Total | | $ | 23,449 | | | $ | 23,591 | | | $ | 53,150 | |
| | | | | | | | | | | | |
| * | Information is not presented for fiscal periods ended 9/30/17 and 10/31/17, as no Series in the Trust with such fiscal periods end were in operation during such period. |
| (1) | Audit-related fees consist of the aggregate fees billed for assurance and related services that are reasonably related to the performance of the audit of the registrant’s financial statements and are not reported under the category of audit fees. |
| (2) | Tax fees consist of the aggregate fees billed for professional services rendered by the principal accountant relating to tax compliance, tax advice, and tax planning and specifically include fees for tax return preparation and other related tax compliance/planning matters. |
| (3) | All other fees consist of the aggregate fees billed for products and services provided by the principal accountant other than audit, audit-related, and tax services. |
e)(1) The registrant’s audit committee has adopted policies and procedures relating to the pre-approval of services provided by the registrant’s principal accountant (the “Pre-Approval Policies”). The Pre-Approval Policies establish a framework intended to assist the audit committee in the proper discharge of its pre-approval responsibilities. As a general matter, the Pre-Approval Policies (i) specify certain types of audit, audit-related, tax, and other services determined to be pre-approved by the audit committee; and (ii) delineate specific procedures governing the mechanics of the pre-approval process, including the approval and monitoring of audit and non-audit service fees. Unless a service is specifically pre-approved under the Pre-Approval Policies, it must be separately pre-approved by the audit committee.
The Pre-Approval Policies and the types of audit and non-audit services pre-approved therein must be reviewed and ratified by the registrant’s audit committee at least annually. The registrant’s audit committee maintains full responsibility for the appointment, compensation, and oversight of the work of the registrant’s principal accountant.
(e)(2) No services described in paragraphs (b)-(d) above were approved by the registrant’s audit committee pursuant to the “de minimis exception” set forth in Rule 2-01 (c)(7)(i)(C) of Regulation S-X.
(f) Not applicable.
(g) The following table presents (i) the aggregate non-audit fees (i.e., fees for audit-related, tax, and other services) billed to the Fund (the only series of the Trust) by D&T for the last two fiscal periods of the Fund; and (ii) the aggregate non-audit fees (i.e., fees for audit-related, tax, and other services) billed to the Eaton Vance organization by D&T for the last two fiscal years of each Series.
| | | | | | | | | | | | |
Fiscal Periods Ended* | | 1/31/17 | | | 1/31/18 | | | 9/30/18** | |
Registrant(1) | | $ | 9,449 | | | $ | 9,591 | | | $ | 16,100 | |
Eaton Vance(2) | | $ | 46,000 | | | $ | 148,018 | | | $ | 126,485 | |
| * | Information is not presented for fiscal periods ended 9/30/17 and 10/31/17 as no Series in the Trust with such fiscal periods end were in operation during such period. |
| ** | The table presents the aggregate fees billed to the Fund for the Fund’s fiscal period from November 15, 2017 (commencement of operations) to September 30, 2018. |
| (1) | Includes all of the Series of the Trust. During the fiscal years reported above, certain of the Funds were “feeder” funds in a “master-feeder” fund structure or funds of funds. |
| (2) | Various subsidiaries of Eaton Vance Corp. act in either an investment advisory and/or service provider capacity with respect to the Series and/or their respective “master” funds (if applicable). |
(h) The registrant’s audit committee has considered whether the provision by the registrant’s principal accountant of non-audit services to the registrant’s investment adviser and any entity controlling, controlled by, or under common control with the adviser that provides ongoing services to the registrant that were not pre-approved pursuant to Rule 2-01(c)(7)(ii) of Regulation S-X is compatible with maintaining the principal accountant’s independence.
Item 5. Audit Committee of Listed Registrants
Not applicable.
Item 6. Schedule of Investments
Please see schedule of investments contained in the Report to Stockholders included under Item 1 of this Form N-CSR.
Item 7. Disclosure of Proxy Voting Policies and Procedures for Closed-End Management Investment Companies
Not applicable.
Item 8. Portfolio Managers of Closed-End Management Investment Companies
Not applicable.
Item 9. Purchases of Equity Securities by Closed-End Management Investment Company and Affiliated Purchasers
Not applicable.
Item 10. Submission of Matters to a Vote of Security Holders
No material changes.
Item 11. Controls and Procedures
(a) It is the conclusion of the registrant’s principal executive officer and principal financial officer that the effectiveness of the registrant’s current disclosure controls and procedures (such disclosure controls and procedures having been evaluated within 90 days of the date of this filing) provide reasonable assurance that the information required to be disclosed by the registrant has been recorded, processed, summarized and reported within the time period specified in the Commission’s rules and forms and that the information required to be disclosed by the registrant has been accumulated and communicated to the registrant’s principal executive officer and principal financial officer in order to allow timely decisions regarding required disclosure.
(b) There have been no changes in the registrant’s internal controls over financial reporting during the second fiscal quarter of the period covered by this report that has materially affected, or is reasonably likely to materially affect, the registrant’s internal control over financial reporting.
Item 12. Disclosure of Securities Lending Activities for Closed-End Management Investment Companies
Not applicable.
Item 13. Exhibits
| | |
| |
| (a)(1) | | Registrant’s Code of Ethics – Not applicable (please see Item 2). |
| |
| (a)(2)(i) | | Treasurer’s Section 302 certification. |
| |
| (a)(2)(ii) | | President’s Section 302 certification. |
| |
| (b) | | Combined Section 906 certification. |
Signatures
Pursuant to the requirements of the Securities Exchange Act of 1934 and the Investment Company Act of 1940, the registrant has duly caused this report to be signed on its behalf by the undersigned, thereunto duly authorized.
Eaton Vance NextShares Trust II
| | |
| By: | | /s/ Payson F. Swaffield |
| | Payson F. Swaffield |
| | President |
| |
| Date: | | November 26, 2018 |
Pursuant to the requirements of the Securities Exchange Act of 1934 and the Investment Company Act of 1940, this report has been signed below by the following persons on behalf of the registrant and in the capacities and on the dates indicated.
| | |
| By: | | /s/ James F. Kirchner |
| | James F. Kirchner |
| | Treasurer |
| |
| Date: | | November 26, 2018 |
| | |
| By: | | /s/ Payson F. Swaffield |
| | Payson F. Swaffield |
| | President |
| |
| Date: | | November 26, 2018 |