UNITED STATES
SECURITIES AND EXCHANGE COMMISSION
Washington, D.C. 20549
Form N-CSR
CERTIFIED SHAREHOLDER REPORT OF REGISTERED
MANAGEMENT INVESTMENT COMPANIES
Investment Company Act File Number: 811-22983
Eaton Vance NextShares Trust II
(Exact Name of Registrant as Specified in Charter)
Two International Place, Boston, Massachusetts 02110
(Address of Principal Executive Offices)
Maureen A. Gemma
Two International Place, Boston, Massachusetts 02110
(Name and Address of Agent for Services)
(617) 482-8260
(Registrant’s Telephone Number)
October 31
Date of Fiscal Year End
October 31, 2018
Date of Reporting Period
Item 1. Reports to Stockholders

Eaton Vance
Floating-Rate NextShares (EVFTC)
Listing Exchange: The NASDAQ Stock Market LLC
Annual Report
October 31, 2018
NextShares® is a registered trademark of NextShares Solutions LLC. All rights reserved.
Commodity Futures Trading Commission Registration. Effective December 31, 2012, the Commodity Futures Trading Commission (“CFTC”) adopted certain regulatory changes that subject registered investment companies and advisers to regulation by the CFTC if a fund invests more than a prescribed level of its assets in certain CFTC-regulated instruments (including futures, certain options and swap agreements) or markets itself as providing investment exposure to such instruments. The Fund has claimed an exclusion from the definition of the term “commodity pool operator” under the Commodity Exchange Act. Accordingly, neither the Fund nor the adviser with respect to the operation of the Fund is subject to CFTC regulation. Because of its management of other strategies, the Fund’s adviser is registered with the CFTC as a commodity pool operator and a commodity trading advisor.
Fund shares are not insured by the FDIC and are not deposits or other obligations of, or guaranteed by, any depository institution. Shares are subject to investment risks, including possible loss of principal invested.
This report must be preceded or accompanied by a current summary prospectus or prospectus. Before investing in NextShares, investors should consider carefully the investment objectives, risks, charges and expenses. This and other important information is contained in the prospectus and summary prospectus, which can be obtained from a financial advisor. Prospective investors should read the prospectus carefully before investing. For further information, please call 1-800-262-1122.
Annual Report October 31, 2018
Eaton Vance
Floating-Rate NextShares
Table of Contents
| | | | |
Management’s Discussion of Fund Performance | | | 2 | |
| |
Performance | | | 3 | |
| |
Fund Profile | | | 4 | |
| |
Endnotes and Additional Disclosures | | | 5 | |
| |
Fund Expenses | | | 6 | |
| |
Financial Statements | | | 7 | |
| |
Report of Independent Registered Public Accounting Firm | | | 14 and 53 | |
| |
Federal Tax Information | | | 15 | |
| |
Special Meeting of Shareholders | | | 54 | |
| |
Management and Organization | | | 55 | |
| |
Important Notices | | | 58 | |
Eaton Vance
Floating-Rate NextShares
October 31, 2018
Management’s Discussion of Fund Performance1
Economic and Market Conditions
The U.S. floating-rate loan market experienced a positive return and limited price volatility for the 12-month period ended October 31, 2018. The S&P/LSTA Leveraged Loan Index (the Index),2 a broad barometer of the U.S. loan market, returned 4.54% during the period. For the period as a whole, performance was composed of coupon generation, with loan prices virtually unchanged.
About a month after the period opened, the U.S. Federal Reserve Board announced, in December, its third rate hike for 2017, followed by interest rate hikes in March, June, and September of 2018. Unlike fixed-income securities, the impact of interest rate changes on the value of floating-rate loans is typically reduced by periodic interest rate resets. As a result, the loan market was helped by increasing investor demand for floating-rate loans during this rising interest rate environment.
Technical conditions were positive for most of the period with demand generally outpacing supply. The collateralized loan obligation market was a strong driver of demand, and retail mutual funds saw positive inflows for nine of the period’s 12 months. For the period as a whole, loan prices were relatively stable, beginning at an average price of $98.16 and ending the period at $98.14. Approximately 85% of performing loans ended the period bid at 98% of par value or higher.
With the U.S. economy’s recovery accelerating modestly during the period, health in corporate fundamentals reflected relatively benign conditions. While the high-profile default of iHeartCommunications, an Index component, pushed up the default rate to 2.42% on a 12-month trailing basis ended March 2018, the default rate settled down to 1.92% for the annual period ended October 31, 2018, below its long-term 3% average.
Fund Performance
For the period from inception on November 29, 2017, through October 31, 2018, Eaton Vance Floating-Rate NextShares (the Fund) returned 4.93% at net asset value (NAV). By comparison, the Fund’s benchmark, the Index, returned 4.47% for the same period. The Index is unmanaged and returns do not reflect any applicable sales charges, commissions, or expenses.
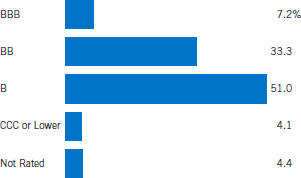
The Fund has maintained underweight exposures, relative to the Index, to lower credit segments of the market, namely the CCC- and D- (defaulted) rating8 tiers within the Index. This positioning may help the Fund limit credit losses over the long run, but may also detract from relative performance versus the Index in times when lower-quality loans perform well. During the period, the Fund’s underweight to CCC-rated loans, which returned 9.09%, detracted from performance versus the Index. However, the Fund’s underweight to D-rated loans, which returned –2.24%, contributed to results versus the Index.
On the sector level, the Fund’s underweight exposure to retailers (except food and drug), was a detractor from relative results during the period, as the sector rallied back after suffering negative returns during the previous one-year period.
Loan selection in the oil and gas sector, which also recovered from negative performance in the previous period, helped results versus the Index. Loan selection in the cable and satellite television sector contributed to Fund performance versus the Index as well. In contrast, loan selection in the electronics/electrical sector detracted from results relative to the Index during the period.
See Endnotes and Additional Disclosures in this report.
Past performance is no guarantee of future results. Investment return and principal value will fluctuate so that shares, when sold, may be worth more or less than their original cost. Performance is for the stated time period only; due to market volatility, the Fund’s current performance may be lower or higher than indicated. The Fund’s performance at market price will differ from its results at net asset value (NAV). The market price used to calculate the Market Price return is the midpoint between the highest bid and the lowest offer on the exchange on which the shares of the Fund are listed for trading, as of the time that the Fund’s NAV is calculated. If you trade your shares at another time during the day, your return may differ. Returns are historical and are calculated by determining the percentage change in NAV or market price (as applicable) with all distributions reinvested at NAV or closing market price (as applicable) on the payment date of the distribution, and are net of management fees and other expenses. Returns are before taxes unless otherwise noted. Performance less than or equal to one year is cumulative. For performance as of the most recent month-end, including historical trading premiums/discounts relative to NAV, please refer to eatonvance.com.
Eaton Vance
Floating-Rate NextShares
October 31, 2018
Performance2,3,4
Portfolio Managers Scott H. Page, CFA and Craig P. Russ
| | | | | | | | | | | | | | | | | | | | | | | | |
| % Average Annual Total Returns | | Fund
Inception Date | | | Performance
Inception Date | | | One Year | | | Five Years | | | Ten Years | | | Since
Fund
Inception | |
Fund at NAV | | | 11/29/2017 | | | | 01/30/2001 | | | | 4.81 | % | | | 3.86 | % | | | 7.10 | % | | | 4.93 | % |
Fund at Market Price | | | 11/29/2017 | | | | 11/29/2017 | | | | — | | | | — | | | | — | | | | 4.93 | |
S&P/LSTA Leveraged Loan Index | | | — | | | | — | | | | 4.54 | % | | | 3.97 | % | | | 7.66 | % | | | 4.47 | % |
| | | | | | |
| | | | | | | | | | | | | | | | | | | | | | | | |
| % Total Annual Operating Expense Ratios5 | | | | | | | | | | | | | | | | | | |
Gross | | | | | | | | | | | | | | | | | | | | | | | 0.88 | % |
Net | | | | | | | | | | | | | | | | | | | | | | | 0.73 | |
Growth of $10,0004
This graph shows the change in value of a hypothetical investment of $10,000 in Floating-Rate NextShares for the period indicated. For comparison, the same investment is shown in the indicated index.

See Endnotes and Additional Disclosures in this report.
Past performance is no guarantee of future results. Investment return and principal value will fluctuate so that shares, when sold, may be worth more or less than their original cost. Performance is for the stated time period only; due to market volatility, the Fund’s current performance may be lower or higher than indicated. The Fund’s performance at market price will differ from its results at net asset value (NAV). The market price used to calculate the Market Price return is the midpoint between the highest bid and the lowest offer on the exchange on which the shares of the Fund are listed for trading, as of the time that the Fund’s NAV is calculated. If you trade your shares at another time during the day, your return may differ. Returns are historical and are calculated by determining the percentage change in NAV or market price (as applicable) with all distributions rein-vested at NAV or closing market price (as applicable) on the payment date of the distribution, and are net of management fees and other expenses. Returns are before taxes unless otherwise noted. Performance less than or equal to one year is cumulative. For performance as of the most recent month-end, including historical trading premiums/discounts relative to NAV, please refer to eatonvance.com.
Eaton Vance
Floating-Rate NextShares
October 31, 2018
Fund Profile6
Top 10 Issuers (% of total investments)7
| | | | |
Bausch Health Companies, Inc. | | | 1.0 | % |
| |
JBS USA, LLC | | | 0.9 | |
| |
Virgin Media Investment Holdings Limited | | | 0.9 | |
| |
TransDigm, Inc. | | | 0.8 | |
| |
Reynolds Group Holdings, Inc. | | | 0.8 | |
| |
Asurion, LLC | | | 0.8 | |
| |
MA FinanceCo., LLC | | | 0.7 | |
| |
Restaurant Brands International, Inc. | | | 0.7 | |
| |
SS&C Technologies, Inc. | | | 0.7 | |
| |
Infor (US), Inc. | | | 0.7 | |
| |
Total | | | 8.0 | % |
Top 10 Sectors (% of total investments)7
| | | | |
Electronics/Electrical | | | 10.3 | % |
| |
Health Care | | | 8.9 | |
| |
Business Equipment and Services | | | 8.3 | |
| |
Telecommunications | | | 4.9 | |
| |
Chemicals and Plastics | | | 4.5 | |
| |
Cable and Satellite Television | | | 4.1 | |
| |
Lodging and Casinos | | | 3.9 | |
| |
Industrial Equipment | | | 3.8 | |
| |
Drugs | | | 3.5 | |
| |
Food Products | | | 3.4 | |
| |
Total | | | 55.6 | % |
Credit Quality (% of bonds, loans and asset-backed securities)8
See Endnotes and Additional Disclosures in this report.
Eaton Vance
Floating-Rate NextShares
October 31, 2018
Endnotes and Additional Disclosures
| 1 | The views expressed in this report are those of the portfolio manager(s) and are current only through the date stated at the top of this page. These views are subject to change at any time based upon market or other conditions, and Eaton Vance and the Fund(s) disclaim any responsibility to update such views. These views may not be relied upon as investment advice and, because investment decisions are based on many factors, may not be relied upon as an indication of trading intent on behalf of any Eaton Vance fund. This commentary may contain statements that are not historical facts, referred to as “forward looking statements.” The Fund’s actual future results may differ significantly from those stated in any forward looking statement, depending on factors such as changes in securities or financial markets or general economic conditions, the volume of sales and purchases of Fund shares, the continuation of investment advisory, administrative and service contracts, and other risks discussed from time to time in the Fund’s filings with the Securities and Exchange Commission. |
| 2 | S&P/LSTA Leveraged Loan Index is an unmanaged index of the institutional leveraged loan market. Unless otherwise stated, index returns do not reflect the effect of any applicable sales charges, commissions, expenses, taxes or leverage, as applicable. It is not possible to invest directly in an index. Performance since inception for an index, if presented, is the performance since the Fund’s inception. |
| 3 | Shares of NextShares funds are normally bought and sold in the secondary market through a broker, and may not be individually purchased or redeemed from the fund. In the secondary market, buyers and sellers transact with each other, rather than with the fund. Market trading prices of NextShares are linked to the fund’s next-computed net asset value (NAV) and will vary from NAV by a market-determined premium or discount, which may be zero. Buyers and sellers of NextShares will not know the value of their purchases and sales until after the fund’s NAV is determined at the end of the trading day. Market trading prices may vary significantly from anticipated levels. NextShares do not offer investors the opportunity to buy and sell intraday based on current (versus end-of-day) determinations of fund value. NextShares trade execution prices will fluctuate based on changes in NAV. Although limit orders may be used to control trading costs, they cannot be used to control or limit trade execution prices. As a new type of fund, NextShares have a limited operating history and may initially be available through a limited number of brokers. There can be no guarantee that an active trading market for NextShares will develop or be maintained, or that their listing will continue unchanged. Buying and selling NextShares may require payment of brokerage commissions and expose transacting shareholders to other trading costs. Frequent trading may detract from realized investment returns. The return on a shareholder’s NextShares investment will be reduced if the shareholder sells shares at a greater discount or narrower premium to NAV than he or she acquired the shares. NextShares funds issue and redeem shares only in specified creation unit quantities in transactions by or through authorized participants. In such transactions, a fund issues and redeems shares in exchange for the basket of securities, other instruments and/or cash that the fund specifies each business day. A fund’s basket is not intended to be representative of the fund’s current portfolio positions and may vary significantly from current positions. |
| 4 | The Fund pursues its investment objective by investing in a separate investment fund (the Portfolio). The returns at NAV for periods before the date the Fund commenced operations are for a mutual fund that invests in the Portfolio (the Portfolio Investor). The performance during such period does not represent the performance of the Fund. The prior investment performance of the Portfolio Investor (rather than the Portfolio itself) is shown because it reflects the expenses typically borne by a retail fund investing in the Portfolio. The Portfolio Investor returns are not adjusted to reflect differences between the total net operating expenses of the Fund and the Portfolio Investor during the periods shown. If such an adjustment were made, the performance presented would be higher, because the Fund’s total net operating expenses are lower than those of the Portfolio Investor. Performance is for a share class of the Portfolio Investor offered at net asset value. Performance presented in the Financial Highlights included in the financial statements is not linked. |
| 5 | Source: Fund prospectus. Net expense ratio reflects a contractual expense reimbursement that continues through 2/28/19. Without the reimbursement, performance would have been lower. The expense ratio for the current reporting period can be found in the Financial Highlights section of this report. |
| 6 | Fund primarily invests in an affiliated investment company (Portfolio) with substantially the same objective(s) and policies as the Fund and may also invest directly. Unless otherwise noted, references to investments are to the aggregate holdings of the Fund and the Portfolio. |
| 7 | Excludes cash and cash equivalents. |
| 8 | Credit ratings are categorized using S&P Global Ratings (“S&P”). Ratings, which are subject to change, apply to the creditworthiness of the issuers of the underlying securities and not to the Fund or its shares. Credit ratings measure the quality of a bond based on the issuer’s creditworthiness, with ratings ranging from AAA, being the highest, to D, being the lowest based on S&P’s measures. Ratings of BBB or higher by S&P are considered to be investment-grade quality. Credit ratings are based largely on the ratings agency’s analysis at the time of rating. The rating assigned to any particular security is not necessarily a reflection of the issuer’s current financial condition and does not necessarily reflect its assessment of the volatility of a security’s market value or of the liquidity of an investment in the security. Holdings designated as “Not Rated” (if any) are not rated by S&P. |
| | Fund profile subject to change due to active management. |
Eaton Vance
Floating-Rate NextShares
October 31, 2018
Fund Expenses
Example: As a Fund shareholder, you incur two types of costs: (1) transaction costs, including brokerage commissions on purchases and sales of Fund shares; and (2) ongoing costs, including management fees and other Fund expenses. This Example is intended to help you understand your ongoing costs (in dollars) of Fund investing and to compare these costs with the ongoing costs of investing in other funds. The Example is based on an investment of $1,000 invested at the beginning of the period and held for the entire period (May 1, 2018 – October 31, 2018).
Actual Expenses: The first section of the table below provides information about actual account values and actual expenses. You may use the information in this section, together with the amount you invested, to estimate the expenses that you paid over the period. Simply divide your account value by $1,000 (for example, an $8,600 account value divided by $1,000 = 8.6), then multiply the result by the number in the first section under the heading entitled “Expenses Paid During Period” to estimate the expenses you paid on your account during this period.
Hypothetical Example for Comparison Purposes: The second section of the table below provides information about hypothetical account values and hypothetical expenses based on the actual Fund expense ratio and an assumed rate of return of 5% per year (before expenses), which is not the actual Fund return. The hypothetical account values and expenses may not be used to estimate the actual ending account balance or expenses you paid for the period. You may use this information to compare the ongoing costs of investing in your Fund and other funds. To do so, compare this 5% hypothetical example with the 5% hypothetical examples that appear in the shareholder reports of the other funds.
Please note that the expenses shown in the table are meant to highlight your ongoing costs only and do not reflect any transactional costs, such as brokerage commissions on purchases and sales of Fund shares. Therefore, the second section of the table is useful in comparing ongoing costs only, and will not help you determine the relative total costs of owning different funds. In addition, if these transactional costs were included, your costs would be higher.
| | | | | | | | | | | | | | | | |
| | | Beginning
Account Value
(5/1/18) | | | Ending
Account Value
(10/31/18) | | | Expenses Paid
During Period*
(5/1/18 – 10/31/18) | | | Annualized
Expense
Ratio | |
| | | |
Actual | | | | | | | | | | | | | |
| | $ | 1,000.00 | | | $ | 1,021.50 | | | $ | 3.87 | ** | | | 0.76 | % |
| | | | |
Hypothetical | | | | | | | | | | | | | |
(5% return per year before expenses) | | | | | | | | | | | | | |
| | $ | 1,000.00 | | | $ | 1,021.40 | | | $ | 3.87 | ** | | | 0.76 | % |
| * | Expenses are equal to the Fund’s annualized expense ratio, multiplied by the average account value over the period, multiplied by 184/365 (to reflect the one-half year period). The Example assumes that the $1,000 was invested at the net asset value per share determined at the close of business on April 30, 2018. The Example reflects the expenses of both the Fund and the Portfolio. |
| ** | Absent an allocation of certain expenses to an affiliate, expenses would be higher. |
Eaton Vance
Floating-Rate NextShares
October 31, 2018
Statement of Assets and Liabilities
| | | | |
| Assets | | October 31, 2018 | |
Investment in Eaton Vance Floating Rate Portfolio, at value (identified cost, $5,388,559) | | $ | 5,378,722 | |
Receivable from affiliate | | | 6,605 | |
Total assets | | $ | 5,385,327 | |
| |
| Liabilities | | | | |
Payable to affiliates: | | | | |
Administration fee | | $ | 679 | |
Operations agreement fee | | | 226 | |
Trustees’ fees | | | 42 | |
Accrued expenses | | | 60,964 | |
Total liabilities | | $ | 61,911 | |
Net Assets | | $ | 5,323,416 | |
| |
| Sources of Net Assets | | | | |
Paid-in capital | | $ | 5,273,573 | |
Distributable earnings | | | 49,843 | |
Total | | $ | 5,323,416 | |
| |
| Net Asset Value Per Share | | | | |
($5,323,416 ÷ 525,000 shares issued and outstanding) | | $ | 10.14 | |
| | | | |
| | 7 | | See Notes to Financial Statements. |
Eaton Vance
Floating-Rate NextShares
October 31, 2018
Statement of Operations
| | | | |
| Investment Income | | Period Ended
October 31, 2018(1) | |
Interest and other income allocated from Portfolio | | $ | 233,993 | |
Dividends allocated from Portfolio | | | 7,092 | |
Expenses, excluding interest expense, allocated from Portfolio | | | (25,406 | ) |
Interest expense allocated from Portfolio | | | (1,178 | ) |
Total investment income from Portfolio | | $ | 214,501 | |
| |
| Expenses | | | | |
Administration fee | | $ | 7,185 | |
Operations agreement fee | | | 2,395 | |
Trustees’ fees and expenses | | | 542 | |
Custodian fee | | | 20,242 | |
Transfer and dividend disbursing agent fees | | | 13,796 | |
Legal and accounting services | | | 28,280 | |
Printing and postage | | | 8,994 | |
Registration fees | | | 1,204 | |
Listing fee | | | 14,700 | |
Intraday pricing fee | | | 11,048 | |
Miscellaneous | | | 1,077 | |
Total expenses | | $ | 109,463 | |
Deduct — | | | | |
Allocation of expenses to affiliate | | $ | 99,258 | |
Total expense reductions | | $ | 99,258 | |
| |
Net expenses | | $ | 10,205 | |
| |
Net investment income | | $ | 204,296 | |
| |
| Realized and Unrealized Gain (Loss) from Portfolio | | | | |
Net realized gain (loss) — | | | | |
Investment transactions | | $ | 29,128 | |
Foreign currency transactions | | | (971 | ) |
Forward foreign currency exchange contracts | | | 13,825 | |
Net realized gain | | $ | 41,982 | |
Change in unrealized appreciation (depreciation) — | | | | |
Investments | | $ | (22,845 | ) |
Foreign currency | | | 255 | |
Forward foreign currency exchange contracts | | | 12,753 | |
Net change in unrealized appreciation (depreciation) | | $ | (9,837 | ) |
| |
Net realized and unrealized gain | | $ | 32,145 | |
| |
Net increase in net assets from operations | | $ | 236,441 | |
| (1) | For the period from the start of business, November 29, 2017, to October 31, 2018. |
| | | | |
| | 8 | | See Notes to Financial Statements. |
Eaton Vance
Floating-Rate NextShares
October 31, 2018
Statement of Changes in Net Assets
| | | | |
| Increase (Decrease) in Net Assets | | Period Ended October 31, 2018(1) | |
From operations — | | | | |
Net investment income | | $ | 204,296 | |
Net realized gain | | | 41,982 | |
Net change in unrealized appreciation (depreciation) | | | (9,837 | ) |
Net increase in net assets from operations | | $ | 236,441 | |
| |
Distributions to shareholders | | $ | (181,598 | ) |
Transactions in Fund shares — | | | | |
Proceeds from sale of shares | | $ | 5,253,967 | |
Transaction fees | | | 13,135 | |
Net increase in net assets from Fund share transactions | | $ | 5,267,102 | |
Other capital — | | | | |
Portfolio transaction fee contributed to Portfolio | | $ | (944 | ) |
Portfolio transaction fee allocated from Portfolio | | | 2,415 | |
Net increase in net assets from other capital | | $ | 1,471 | |
| |
Net increase in net assets | | $ | 5,323,416 | |
| |
| Net Assets | | | | |
At beginning of period | | $ | — | |
At end of period | | $ | 5,323,416 | |
| |
| Changes in shares outstanding | | | | |
Shares outstanding, beginning of period | | | — | |
Shares sold | | | 525,000 | |
Shares outstanding, end of period | | | 525,000 | |
| (1) | For the period from the start of business, November 29, 2017, to October 31, 2018. |
| | | | |
| | 9 | | See Notes to Financial Statements. |
Eaton Vance
Floating-Rate NextShares
October 31, 2018
Financial Highlights
| | | | |
| | | Period Ended October 31, 2018(1) | |
Net asset value — Beginning of period | | $ | 10.000 | |
| |
| Income (Loss) From Operations | | | | |
Net investment income(2) | | $ | 0.392 | |
Net realized and unrealized gain | | | 0.066 | |
| |
Total income from operations | | $ | 0.458 | |
| |
| Less Distributions | | | | |
From net investment income | | $ | (0.346 | ) |
| |
Total distributions | | $ | (0.346 | ) |
| |
Transaction fees(2) | | $ | 0.025 | |
| |
Portfolio transaction fee, net(2) | | $ | 0.003 | |
| |
Net asset value — End of period | | $ | 10.140 | |
| |
Total Return on Net Asset Value(3) | | | 4.93 | %(4)(5) |
| |
| Ratios/Supplemental Data | | | | |
Net assets, end of period (000’s omitted) | | $ | 5,323 | |
Ratios (as a percentage of average daily net assets):(6) | | | | |
Expenses | | | 0.76 | %(4)(7)(8) |
Net investment income | | | 4.20 | %(7) |
Portfolio Turnover of the Portfolio | | | 30 | %(9) |
| (1) | For the period from the start of business, November 29, 2017, to October 31, 2018. |
| (2) | Computed using average shares outstanding. |
| (3) | Returns are historical and are calculated by determining the percentage change in net asset value with all distributions reinvested and do not reflect the effect of a market-determined premium or discount. Investment returns assume that all distributions have been reinvested at net asset value. |
| (4) | The investment adviser and administrator of the Fund reimbursed certain operating expenses (equal to 2.04% of average daily net assets for the period ended October 31, 2018). Absent this reimbursement, total return would be lower. |
| (6) | Includes the Fund’s share of the Portfolio’s allocated expenses. |
| (8) | Includes interest expense, including allocated from the Portfolio, of 0.03% for the period ended October 31, 2018. |
| (9) | For the Portfolio’s year ended October 31, 2018. |
| | | | |
| | 10 | | See Notes to Financial Statements. |
Eaton Vance
Floating-Rate NextShares
October 31, 2018
Notes to Financial Statements
1 Significant Accounting Policies
Eaton Vance Floating-Rate NextShares (the Fund) is a diversified series of Eaton Vance NextShares Trust II (the Trust), a Massachusetts business trust registered under the Investment Company Act of 1940, as amended (the 1940 Act). The Fund is an exchange-traded managed fund operating pursuant to an order issued by the SEC granting an exemption from certain provisions of the 1940 Act. Individual shares of the Fund may be purchased and sold only on a national securities exchange or alternative trading system through a broker-dealer that offers NextShares, and may not be directly purchased or redeemed from the Fund. Market trading prices for the Fund are directly linked to the Fund’s next-computed net asset value per share (NAV) and will vary from NAV by a market-determined premium or discount, which may be zero. The Fund commenced operations on November 29, 2017. The Fund invests all of its investable assets in interests in Eaton Vance Floating Rate Portfolio (the Portfolio), a Massachusetts business trust, having substantially the same investment objective and policies as the Fund. The value of the Fund’s investment in the Portfolio reflects the Fund’s proportionate interest in the net assets of the Portfolio (less than 0.05% at October 31, 2018). The performance of the Fund is directly affected by the performance of the Portfolio. The financial statements of the Portfolio, including the portfolio of investments, are included elsewhere in this report and should be read in conjunction with the Fund’s financial statements.
The following is a summary of significant accounting policies of the Fund. The policies are in conformity with accounting principles generally accepted in the United States of America (U.S. GAAP). The Fund is an investment company and follows accounting and reporting guidance in the Financial Accounting Standards Board (FASB) Accounting Standards Codification Topic 946.
A Investment Valuation — Valuation of securities by the Portfolio is discussed in Note 1A of the Portfolio’s Notes to Financial Statements, which are included elsewhere in this report.
B Income — The Fund’s net investment income or loss consists of the Fund’s pro-rata share of the net investment income or loss of the Portfolio, less all actual and accrued expenses of the Fund.
C Federal Taxes — The Fund’s policy is to comply with the provisions of the Internal Revenue Code applicable to regulated investment companies and to distribute to shareholders each year substantially all of its net investment income, and all or substantially all of its net realized capital gains. Accordingly, no provision for federal income or excise tax is necessary.
As of October 31, 2018, the Fund had no uncertain tax positions that would require financial statement recognition, de-recognition, or disclosure. The Fund files a U.S. federal income tax return annually after its fiscal year-end, which is subject to examination by the Internal Revenue Service for a period of three years from the date of filing.
D Expenses — The majority of expenses of the Trust are directly identifiable to an individual fund. Expenses which are not readily identifiable to a specific fund are allocated taking into consideration, among other things, the nature and type of expense and the relative size of the funds.
E Use of Estimates — The preparation of the financial statements in conformity with U.S. GAAP requires management to make estimates and assumptions that affect the reported amounts of assets and liabilities at the date of the financial statements and the reported amounts of income and expense during the reporting period. Actual results could differ from those estimates.
F Indemnifications — Under the Trust’s organizational documents, its officers and Trustees may be indemnified against certain liabilities and expenses arising out of the performance of their duties to the Fund. Under Massachusetts law, if certain conditions prevail, shareholders of a Massachusetts business trust (such as the Trust) could be deemed to have personal liability for the obligations of the Trust. However, the Trust’s Declaration of Trust contains an express disclaimer of liability on the part of Fund shareholders and the By-laws provide that the Trust shall assume the defense on behalf of any Fund shareholders. Moreover, the By-laws also provide for indemnification out of Fund property of any shareholder held personally liable solely by reason of being or having been a shareholder for all loss or expense arising from such liability. Additionally, in the normal course of business, the Fund enters into agreements with service providers that may contain indemnification clauses. The Fund’s maximum exposure under these arrangements is unknown as this would involve future claims that may be made against the Fund that have not yet occurred.
G Other — Investment transactions are accounted for on a trade date basis.
2 Distributions to Shareholders and Income Tax Information
It is the present policy of the Fund to make monthly distributions of all or substantially all of its net investment income and to distribute annually all or substantially all of its net realized capital gains. Distributions are paid in cash and cannot be automatically reinvested in additional shares of the Fund. Distributions to shareholders are determined in accordance with income tax regulations, which may differ from U.S. GAAP. As required by U.S. GAAP, only distributions in excess of tax basis earnings and profits are reported in the financial statements as a return of capital. Permanent differences between book and tax accounting relating to distributions are reclassified to paid-in capital. For tax purposes, distributions from short-term capital gains are considered to be from ordinary income.
Eaton Vance
Floating-Rate NextShares
October 31, 2018
Notes to Financial Statements — continued
The tax character of distributions declared for the period ended October 31, 2018 was as follows:
| | | | |
| | | Period Ended October 31, 2018(1) | |
Ordinary income | | $ | 181,598 | |
| (1) | For the period from the start of business, November 29, 2017, to October 31, 2018. |
During the period ended October 31, 2018, distributable earnings was decreased by $5,000 and paid-in capital was increased by $5,000 due to differences between book and tax accounting for non-deductible expenses. These reclassifications had no effect on the net assets or net asset value per share of the Fund.
As of October 31, 2018, the components of distributable earnings (accumulated loss) on a tax basis were as follows:
| | | | |
Undistributed ordinary income | | $ | 66,335 | |
Undistributed long-term capital gains | | $ | 42,780 | |
Net unrealized depreciation | | $ | (59,272 | ) |
3 Investment Adviser Fee and Other Transactions with Affiliates
The investment adviser fee is earned by Eaton Vance Management (EVM) as compensation for investment advisory services rendered to the Fund. The fee is computed at an annual rate of 0.575% of the Fund’s average daily net assets that are not invested in other investment companies for which EVM or its affiliates serve as investment adviser and receive an advisory fee (“Direct Assets”) up to $1 billion and is payable monthly. On Direct Assets of $1 billion and over, the annual fee is reduced. For the period ended October 31, 2018, the Fund incurred no investment adviser fee on Direct Assets. To the extent the Fund’s assets are invested in the Portfolio, the Fund is allocated its share of the Portfolio’s investment adviser fee. The Portfolio has engaged Boston Management and Research (BMR), a subsidiary of EVM, to render investment advisory services. See Note 2 of the Portfolio’s Notes to Financial Statements which are included elsewhere in this report. EVM also serves as the administrator of the Fund. The administration fee is earned by EVM as compensation for administrative services rendered to the Fund. The fee is computed at an annual rate of 0.15% of the Fund’s average daily net assets. For the period ended October 31, 2018, the administration fee amounted to $7,185.
The Trust, on behalf of the Fund, has entered into an operations agreement with EVM pursuant to which EVM provides the Fund with services required for it to operate as a NextShares exchange-traded managed fund in accordance with the exemptive order obtained by EVM and the Trust. Pursuant to the agreement, the Fund pays EVM a monthly fee at an annual rate of 0.05% of the Fund’s average daily net assets provided the average net assets of NextShares funds sponsored by EVM (“Covered Assets”) are less than $10 billion. The annual rate is reduced if Covered Assets are $10 billion and above. For the period ended October 31, 2018, the operations agreement fee amounted to $2,395 or 0.05% (annualized) of the Fund’s average daily net assets.
EVM has agreed to reimburse the Fund’s expenses to the extent that total annual operating expenses (relating to ordinary operating expenses only and excluding such expenses as interest, taxes or litigation expenses) exceed 0.73% of the Fund’s average daily net assets through February 28, 2019. Thereafter, the reimbursement may be changed or terminated at any time. Pursuant to this agreement, EVM was allocated $99,258 of the Fund’s operating expenses for the period ended October 31, 2018.
Trustees and officers of the Fund who are members of EVM’s or BMR’s organizations receive remuneration for their services to the Fund out of the investment adviser fee. Certain officers and Trustees of the Fund and the Portfolio are officers of the above organizations.
4 Investment Transactions
For the period ended October 31, 2018, increases and decreases in the Fund’s investment in the Portfolio aggregated $5,358,744 and $228,139, respectively. In addition, a Portfolio transaction fee is imposed by the Portfolio on the combined daily inflows or outflows of the Fund and the Portfolio’s other investors as more fully described at Note 1K of the Portfolio’s Notes to Financial Statements included herein. Such fee is allocated to the Fund based on its pro-rata interest in the Portfolio. The amount of the Portfolio transaction fee imposed on the Fund, if any, and the allocation of such fee are presented as Other capital on the Statement of Changes in Net Assets.
5 Capital Share Transactions
The Trust may issue an unlimited number of shares of capital stock (no par value per share) in one or more series (such as the Fund). The Fund issues and redeems shares only in blocks of 25,000 shares or multiples thereof (“Creation Units”). The Fund issues and redeems Creation Units in return for the securities, other instruments and/or cash (the “Basket”) that the Fund specifies each business day. Creation Units may be purchased or redeemed only by
Eaton Vance
Floating-Rate NextShares
October 31, 2018
Notes to Financial Statements — continued
or through Authorized Participants, which are broker-dealers or institutional investors that have entered into agreements with the Fund’s distributor for this purpose. The Fund imposes a transaction fee on Creation Units issued and redeemed to offset the estimated cost to the Fund of processing the transaction, which is paid by the Authorized Participants directly to a third-party administrator. In addition, Authorized Participants pay the Fund a variable charge for converting the Basket to or from the desired portfolio composition. Such variable charges are reflected as Transaction fees on the Statement of Changes in Net Assets.
At October 31, 2018, EVM owned approximately 94.9% of the outstanding shares of the Fund.
Eaton Vance
Floating-Rate NextShares
October 31, 2018
Report of Independent Registered Public Accounting Firm
To the Trustees of Eaton Vance NextShares Trust II and Shareholders of Eaton Vance Floating-Rate NextShares:
Opinion on the Financial Statements and Financial Highlights
We have audited the accompanying statement of assets and liabilities of Eaton Vance Floating-Rate NextShares (the “Fund”) (one of the funds constituting Eaton Vance NextShares Trust II), as of October 31, 2018, and the related statements of operations and changes in net assets, and the financial highlights for the period from the start of business, November 29, 2017, to October 31, 2018, and the related notes. In our opinion, the financial statements and financial highlights present fairly, in all material respects, the financial position of the Fund as of October 31, 2018, and the results of its operations, the changes in its net assets, and the financial highlights for the period from the start of business, November 29, 2017, to October 31, 2018, in conformity with accounting principles generally accepted in the United States of America.
Basis for Opinion
These financial statements and financial highlights are the responsibility of the Fund’s management. Our responsibility is to express an opinion on the Fund’s financial statements and financial highlights based on our audit. We are a public accounting firm registered with the Public Company Accounting Oversight Board (United States) (PCAOB) and are required to be independent with respect to the Fund in accordance with the U.S. federal securities laws and the applicable rules and regulations of the Securities and Exchange Commission and the PCAOB.
We conducted our audit in accordance with the standards of the PCAOB. Those standards require that we plan and perform the audit to obtain reasonable assurance about whether the financial statements and financial highlights are free of material misstatement, whether due to error or fraud. The Fund is not required to have, nor were we engaged to perform, an audit of its internal control over financial reporting. As part of our audit we are required to obtain an understanding of internal control over financial reporting but not for the purpose of expressing an opinion on the effectiveness of the Fund’s internal control over financial reporting. Accordingly, we express no such opinion.
Our audit included performing procedures to assess the risks of material misstatement of the financial statements and financial highlights, whether due to error or fraud, and performing procedures that respond to those risks. Such procedures included examining, on a test basis, evidence regarding the amounts and disclosures in the financial statements and financial highlights. Our audit also included evaluating the accounting principles used and significant estimates made by management, as well as evaluating the overall presentation of the financial statements and financial highlights. We believe that our audit provides a reasonable basis for our opinion.
/s/ Deloitte & Touche LLP
Boston, Massachusetts
December 17, 2018
We have served as the auditor of one or more Eaton Vance investment companies since 1959.
Eaton Vance
Floating-Rate NextShares
October 31, 2018
Federal Tax Information (Unaudited)
The Form 1099-DIV you receive in February 2019 will show the tax status of all distributions paid to your account in calendar year 2018. Shareholders are advised to consult their own tax adviser with respect to the tax consequences of their investment in the Fund. As required by the Internal Revenue Code and/or regulations, shareholders must be notified regarding the status of capital gains dividends.
Capital Gains Dividends. The Fund hereby designates as a capital gain dividend with respect to the taxable year ended October 31, 2018, $42,780 or, if subsequently determined to be different, the net capital gain of such year.
Eaton Vance
Floating Rate Portfolio
October 31, 2018
Portfolio of Investments
| | | | | | | | | | | | |
| Senior Floating-Rate Loans — 89.2%(1) | |
| Borrower/Tranche Description | | | | | Principal Amount* (000’s omitted) | | | Value | |
|
| Aerospace and Defense — 1.2% | |
| Accudyne Industries, LLC | | | | | | | | | |
Term Loan, 5.30%, (1 mo. USD LIBOR + 3.00%), Maturing August 18, 2024 | | | | | | | 7,043 | | | $ | 7,028,385 | |
| IAP Worldwide Services, Inc. | | | | | | | | | |
Revolving Loan, 1.46%, (3 mo. USD LIBOR + 5.50%), Maturing July 18, 2019(2) | | | | | | | 5,347 | | | | 5,361,524 | |
Term Loan - Second Lien, 8.89%, (3 mo. USD LIBOR + 6.50%), Maturing July 18, 2019(3) | | | | | | | 7,084 | | | | 5,722,813 | |
| TransDigm, Inc. | | | | | | | | | |
Term Loan, 4.80%, (1 mo. USD LIBOR + 2.50%), Maturing June 9, 2023 | | | | | | | 63,700 | | | | 63,490,203 | |
Term Loan, 4.80%, (1 mo. USD LIBOR + 2.50%), Maturing August 22, 2024 | | | | | | | 28,179 | | | | 28,089,162 | |
Term Loan, 4.80%, (1 mo. USD LIBOR + 2.50%), Maturing May 30, 2025 | | | | | | | 8,217 | | | | 8,184,600 | |
| Wesco Aircraft Hardware Corp. | | | | | | | | | |
Term Loan, 5.31%, (1 mo. USD LIBOR + 3.00%), Maturing November 30, 2020 | | | | | | | 11,700 | | | | 11,670,750 | |
| WP CPP Holdings, LLC | | | | | | | | | |
Term Loan, 6.28%, (3 mo. USD LIBOR + 3.75%), Maturing April 30, 2025 | | | | | | | 7,825 | | | | 7,860,455 | |
| | | | | | | | | | | $ | 137,407,892 | |
| | | |
| Automotive — 1.9% | | | | | | | | | |
| American Axle and Manufacturing, Inc. | | | | | | | | | |
Term Loan, 4.62%, (USD LIBOR + 2.25%), Maturing April 6,
2024(4) | | | | | | | 38,049 | | | $ | 38,049,375 | |
| Apro, LLC | | | | | | | | | |
Term Loan, 6.34%, (2 mo. USD LIBOR + 4.00%), Maturing August 8, 2024 | | | | | | | 2,891 | | | | 2,905,162 | |
| Belron Finance US, LLC | | | | | | | | | |
Term Loan, 2.50%, (3 mo. EURIBOR + 2.50%), Maturing November 7, 2024 | | | EUR | | | | 2,750 | | | | 3,127,768 | |
Term Loan, 4.59%, (3 mo. USD LIBOR + 2.25%), Maturing November 7, 2024 | | | | | | | 6,129 | | | | 6,166,992 | |
| Chassix, Inc. | | | | | | | | | |
Term Loan, 7.91%, (USD LIBOR + 5.50%), Maturing November 15, 2023(4) | | | | | | | 9,062 | | | | 9,095,506 | |
| CS Intermediate Holdco 2, LLC | | | | | | | | | |
Term Loan, 4.30%, (1 mo. USD LIBOR + 2.00%), Maturing November 2, 2023 | | | | | | | 5,176 | | | | 5,191,920 | |
| Dayco Products, LLC | | | | | | | | | |
Term Loan, 6.56%, (3 mo. USD LIBOR + 4.25%), Maturing May 19, 2023 | | | | | | | 11,484 | | | | 11,584,817 | |
| | | | | | | | | | | | |
| Borrower/Tranche Description | | | | | Principal Amount* (000’s omitted) | | | Value | |
| | | |
| Automotive (continued) | | | | | | | | | |
| FCA US, LLC | | | | | | | | | |
Term Loan, 4.30%, (1 mo. USD LIBOR + 2.00%), Maturing December 31, 2018 | | | | | | | 10,000 | | | $ | 10,020,310 | |
| Garrett LX III S.a.r.l. | | | | | | | | | |
Term Loan, 2.75%, (3 mo. EURIBOR + 2.75%), Maturing September 30, 2025 | | | EUR | | | | 5,650 | | | | 6,370,146 | |
Term Loan, 4.89%, (3 mo. USD LIBOR + 2.50%), Maturing September 30, 2025 | | | | | | | 3,350 | | | | 3,347,906 | |
| Goodyear Tire & Rubber Company (The) | | | | | | | | | |
Term Loan - Second Lien, 4.32%, (USD LIBOR + 2.00%), Maturing March 7, 2025(4) | | | | | | | 16,217 | | | | 16,176,457 | |
| Horizon Global Corporation | | | | | | | | | |
Term Loan, 8.30%, (1 mo. USD LIBOR + 6.00%), Maturing June 30, 2021 | | | | | | | 8,335 | | | | 8,147,886 | |
| L&W, Inc. | | | | | | | | | |
Term Loan, 6.29%, (1 mo. USD LIBOR + 4.00%), Maturing May 22, 2025 | | | | | | | 9,451 | | | | 9,492,662 | |
| Tenneco, Inc. | | | | | | | | | |
Term Loan, 5.05%, (1 mo. USD LIBOR + 2.75%), Maturing October 1, 2025 | | | | | | | 43,075 | | | | 43,007,717 | |
| TI Group Automotive Systems, LLC | | | | | | | | | |
Term Loan, 3.50%, (3 mo. EURIBOR + 2.75%, Floor 0.75%), Maturing June 30, 2022 | | | EUR | | | | 7,784 | | | | 8,855,407 | |
Term Loan, 4.80%, (1 mo. USD LIBOR + 2.50%), Maturing June 30, 2022 | | | | | | | 17,703 | | | | 17,636,581 | |
| Tower Automotive Holdings USA, LLC | | | | | | | | | |
Term Loan, 5.06%, (1 mo. USD LIBOR + 2.75%), Maturing March 7, 2024 | | | | | | | 15,119 | | | | 15,124,933 | |
| Visteon Corporation | | | | | | | | | |
Term Loan, 4.05%, (USD LIBOR + 1.75%), Maturing March 25,
2024(4) | | | | | | | 2,500 | | | | 2,484,375 | |
| | | | | | | | | | | $ | 216,785,920 | |
| | | |
| Beverage and Tobacco — 0.2% | | | | | | | | | |
| Arctic Glacier U.S.A., Inc. | | | | | | | | | |
Term Loan, 5.80%, (1 mo. USD LIBOR + 3.50%), Maturing March 20, 2024 | | | | | | | 5,566 | | | $ | 5,586,439 | |
| Arterra Wines Canada, Inc. | | | | | | | | | |
Term Loan, 5.09%, (3 mo. USD LIBOR + 2.75%), Maturing December 15, 2023 | | | | | | | 4,129 | | | | 4,145,759 | |
| Flavors Holdings, Inc. | | | | | | | | | |
Term Loan, 8.14%, (3 mo. USD LIBOR + 5.75%), Maturing April 3, 2020 | | | | | | | 13,668 | | | | 12,950,523 | |
Term Loan - Second Lien, 12.39%, (3 mo. USD LIBOR + 10.00%), Maturing October 3, 2021 | | | | | | | 3,000 | | | | 2,625,000 | |
| | | | | | | | | | | $ | 25,307,721 | |
| | | | |
| | 16 | | See Notes to Financial Statements. |
Eaton Vance
Floating Rate Portfolio
October 31, 2018
Portfolio of Investments — continued
| | | | | | | | | | | | |
| Borrower/Tranche Description | | | | | Principal Amount* (000’s omitted) | | | Value | |
|
| Brokerage/Securities Dealers / Investment Houses — 0.3% | |
| Advisor Group, Inc. | | | | | | | | | |
Term Loan, 6.04%, (1 mo. USD LIBOR + 3.75%), Maturing August 15, 2025 | | | | | | | 7,075 | | | $ | 7,117,011 | |
| Aretec Group, Inc. | | | | | | | | | |
Term Loan, 6.51%, (1 mo. USD LIBOR + 4.25%), Maturing October 1, 2025 | | | | | | | 14,225 | | | | 14,318,345 | |
| OZ Management L.P. | | | | | | | | | |
Term Loan, 7.06%, (1 mo. USD LIBOR + 4.75%), Maturing April 11, 2023 | | | | | | | 6,040 | | | | 6,085,300 | |
| Resolute Investment Managers, Inc. | | | | | | | | | |
Term Loan - Second Lien, 10.03%, (3 mo. USD LIBOR + 7.50%), Maturing April 30, 2023 | | | | | | | 3,800 | | | | 3,847,500 | |
| | | | | | | | | | | $ | 31,368,156 | |
|
| Building and Development — 2.3% | |
American Builders & Contractors Supply
Co., Inc. | | | | | | | | | |
Term Loan, 4.30%, (1 mo. USD LIBOR + 2.00%), Maturing October 31, 2023 | | | | | | | 33,623 | | | $ | 33,358,848 | |
| Beacon Roofing Supply, Inc. | | | | | | | | | |
Term Loan, 4.53%, (1 mo. USD LIBOR + 2.25%), Maturing January 2, 2025 | | | | | | | 6,592 | | | | 6,543,023 | |
| Brookfield Property REIT, Inc. | | | | | | | | | |
Term Loan, 4.79%, (1 mo. USD LIBOR + 2.50%), Maturing August 27, 2025 | | | | | | | 11,175 | | | | 11,023,087 | |
| Capital Automotive L.P. | | | | | | | | | |
Term Loan, 4.81%, (1 mo. USD LIBOR + 2.50%), Maturing March 24, 2024 | | | | | | | 4,793 | | | | 4,794,460 | |
| Core & Main L.P. | | | | | | | | | |
Term Loan, 5.32%, (3 mo. USD LIBOR + 3.00%), Maturing August 1, 2024 | | | | | | | 13,632 | | | | 13,643,656 | |
| CPG International, Inc. | | | | | | | | | |
Term Loan, 6.25%, (6 mo. USD LIBOR + 3.75%), Maturing May 5, 2024 | | | | | | | 15,419 | | | | 15,525,389 | |
| DTZ U.S. Borrower, LLC | | | | | | | | | |
Term Loan, 5.55%, (1 mo. USD LIBOR + 3.25%), Maturing August 21, 2025 | | | | | | | 69,825 | | | | 69,905,788 | |
| Henry Company, LLC | | | | | | | | | |
Term Loan, 6.30%, (1 mo. USD LIBOR + 4.00%), Maturing October 5, 2023 | | | | | | | 10,189 | | | | 10,205,887 | |
| Pisces Midco, Inc. | | | | | | | | | |
Term Loan, Maturing April 12, 2025(5) | | | | | | | 9,800 | | | | 9,777,538 | |
| Quikrete Holdings, Inc. | | | | | | | | | |
Term Loan, 5.05%, (1 mo. USD LIBOR + 2.75%), Maturing November 15, 2023 | | | | | | | 38,680 | | | | 38,593,474 | |
| | | | | | | | | | | | |
| Borrower/Tranche Description | | | | | Principal Amount* (000’s omitted) | | | Value | |
|
| Building and Development (continued) | |
| RE/MAX International, Inc. | |
Term Loan, 5.05%, (1 mo. USD LIBOR + 2.75%), Maturing December 15, 2023 | | | | | | | 21,424 | | | $ | 21,530,928 | |
| Realogy Group, LLC | |
Term Loan, 4.53%, (1 mo. USD LIBOR + 2.25%), Maturing February 8, 2025 | | | | | | | 10,822 | | | | 10,803,902 | |
| Summit Materials Companies I, LLC | |
Term Loan, 4.30%, (1 mo. USD LIBOR + 2.00%), Maturing November 21, 2024 | | | | | | | 7,543 | | | | 7,518,251 | |
| Werner FinCo L.P. | |
Term Loan, 6.26%, (1 mo. USD LIBOR + 4.00%), Maturing July 24, 2024 | | | | | | | 8,371 | | | | 8,308,361 | |
| WireCo WorldGroup, Inc. | |
Term Loan, 7.30%, (1 mo. USD LIBOR + 5.00%), Maturing September 30, 2023 | | | | | | | 7,869 | | | | 7,943,188 | |
| | | | | | | | | | | $ | 269,475,780 | |
|
| Business Equipment and Services — 8.3% | |
| Acosta Holdco, Inc. | |
Term Loan, 5.55%, (1 mo. USD LIBOR + 3.25%), Maturing September 26, 2021 | | | | | | | 12,482 | | | $ | 9,309,175 | |
| Adtalem Global Education, Inc. | |
Term Loan, 5.30%, (1 mo. USD LIBOR + 3.00%), Maturing April 11, 2025 | | | | | | | 4,539 | | | | 4,582,119 | |
| AlixPartners, LLP | |
Term Loan, 5.05%, (1 mo. USD LIBOR + 2.75%), Maturing April 4, 2024 | | | | | | | 34,577 | | | | 34,653,119 | |
| Altran Technologies S.A. | |
Term Loan, 2.75%, (3 mo. EURIBOR + 2.75%), Maturing March 20, 2025 | | | EUR | | | | 16,241 | | | | 18,477,802 | |
| AppLovin Corporation | |
Term Loan, 6.06%, (3 mo. USD LIBOR + 3.75%), Maturing August 15, 2025 | | | | | | | 18,700 | | | | 18,881,166 | |
| ASGN Incorporated | |
Term Loan, 4.30%, (1 mo. USD LIBOR + 2.00%), Maturing April 2, 2025 | | | | | | | 5,481 | | | | 5,497,224 | |
| Blitz F18-675 GmbH | |
Term Loan, 3.75%, (3 mo. EURIBOR + 3.75%), Maturing July 31, 2025 | | | EUR | | | | 16,825 | | | | 19,243,999 | |
| Bracket Intermediate Holding Corp. | |
Term Loan, 6.57%, (2 mo. USD LIBOR + 4.25%), Maturing September 5, 2025 | | | | | | | 11,000 | | | | 11,041,250 | |
| Brand Energy & Infrastructure Services, Inc. | |
Term Loan, 6.73%, (3 mo. USD LIBOR + 4.25%), Maturing June 21, 2024 | | | | | | | 5,950 | | | | 5,983,155 | |
| | | | |
| | 17 | | See Notes to Financial Statements. |
Eaton Vance
Floating Rate Portfolio
October 31, 2018
Portfolio of Investments — continued
| | | | | | | | | | |
| Borrower/Tranche Description | | | | Principal Amount* (000’s omitted) | | | Value | |
|
| Business Equipment and Services (continued) | |
| Camelot UK Holdco Limited | |
Term Loan, 5.55%, (1 mo. USD LIBOR + 3.25%), Maturing October 3, 2023 | | | | | 23,043 | | | $ | 23,065,595 | |
| Cast and Crew Payroll, LLC | |
Term Loan, 5.06%, (1 mo. USD LIBOR + 2.75%), Maturing September 27, 2024 | | | | | 9,228 | | | | 9,243,831 | |
| Ceridian HCM Holding, Inc. | |
Term Loan, 5.55%, (1 mo. USD LIBOR + 3.25%), Maturing April 30, 2025 | | | | | 22,650 | | | | 22,706,625 | |
| Change Healthcare Holdings, LLC | |
Term Loan, 5.05%, (1 mo. USD LIBOR + 2.75%), Maturing March 1, 2024 | | | | | 82,523 | | | | 82,529,082 | |
| CPM Holdings, Inc. | |
Term Loan, 5.80%, (1 mo. USD LIBOR + 3.50%), Maturing April 11, 2022 | | | | | 3,433 | | | | 3,441,085 | |
Term Loan, Maturing October 24, 2025(5) | | | | | 4,050 | | | | 4,080,375 | |
| Crossmark Holdings, Inc. | |
Term Loan, 5.89%, (3 mo. USD LIBOR + 3.50%), Maturing December 20, 2019 | | | | | 35,294 | | | | 14,999,914 | |
| Cypress Intermediate Holdings III, Inc. | |
Term Loan, 5.31%, (1 mo. USD LIBOR + 3.00%), Maturing April 26, 2024 | | | | | 18,976 | | | | 19,019,188 | |
| Duff & Phelps Corporation | |
Term Loan, 5.55%, (1 mo. USD LIBOR + 3.25%), Maturing February 13, 2025 | | | | | 14,004 | | | | 14,011,695 | |
| EAB Global, Inc. | |
Term Loan, 6.41%, (USD LIBOR + 3.75%), Maturing November 15,
2024(4) | | | | | 14,527 | | | | 14,436,206 | |
| Education Management, LLC | |
Revolving Loan, 0.00%, Maturing March 31, 2019(2)(3)(6) | | | | | 10,413 | | | | 1,964,928 | |
Term Loan, 0.00%, Maturing July 2,
2020(3)(6) | | | | | 4,614 | | | | 870,597 | |
Term Loan, 0.00%, Maturing July 2,
2020(3)(6) | | | | | 10,387 | | | | 0 | |
| EIG Investors Corp. | |
Term Loan, 6.06%, (3 mo. USD LIBOR + 3.75%), Maturing February 9, 2023 | | | | | 52,603 | | | | 52,849,653 | |
| Element Materials Technology Group US Holdings, Inc. | |
Term Loan, 5.80%, (1 mo. USD LIBOR + 3.50%), Maturing June 28, 2024 | | | | | 4,293 | | | | 4,319,391 | |
| Extreme Reach, Inc. | |
Term Loan, 8.56%, (1 mo. USD LIBOR + 6.25%), Maturing February 7, 2020 | | | | | 8,973 | | | | 8,984,160 | |
| First Data Corporation | |
Term Loan, 4.29%, (1 mo. USD LIBOR + 2.00%), Maturing July 8, 2022 | | | | | 46,485 | | | | 46,434,249 | |
| | | | | | | | | | |
| Borrower/Tranche Description | | | | Principal Amount* (000’s omitted) | | | Value | |
|
| Business Equipment and Services (continued) | |
| Garda World Security Corporation | |
Term Loan, 5.83%, (CIDOR + 4.25%), Maturing May 24, 2024 | | CAD | | | 14,292 | | | $ | 10,883,821 | |
Term Loan, 5.83%, (3 mo. USD LIBOR + 3.50%), Maturing May 24, 2024 | | | | | 20,499 | | | | 20,591,561 | |
| Gartner, Inc. | |
Term Loan, 4.05%, (1 mo. USD LIBOR + 1.75%), Maturing March 20, 2022 | | | | | 2,775 | | | | 2,790,609 | |
| Global Payments, Inc. | |
Term Loan, 4.05%, (1 mo. USD LIBOR + 1.75%), Maturing April 21, 2023 | | | | | 6,329 | | | | 6,338,510 | |
Term Loan, 4.09%, (1 mo. USD LIBOR + 1.75%), Maturing October 17, 2025 | | | | | 6,000 | | | | 6,000,000 | |
| IG Investment Holdings, LLC | |
Term Loan, 5.84%, (USD LIBOR + 3.50%), Maturing May 23, 2025(4) | | | | | 32,625 | | | | 32,828,463 | |
| Information Resources, Inc. | |
Term Loan, 6.57%, (3 mo. USD LIBOR + 4.25%), Maturing January 18, 2024 | | | | | 15,932 | | | | 15,958,934 | |
| ION Trading Technologies S.a.r.l. | |
Term Loan, 4.25%, (3 mo. EURIBOR + 3.25%, Floor 1.00%), Maturing November 21, 2024 | | EUR | | | 4,340 | | | | 4,872,711 | |
| Iron Mountain, Inc. | |
Term Loan, 4.05%, (1 mo. USD LIBOR + 1.75%), Maturing January 2, 2026 | | | | | 9,975 | | | | 9,858,498 | |
| J.D. Power and Associates | |
Term Loan, 6.05%, (1 mo. USD LIBOR + 3.75%), Maturing September 7, 2023 | | | | | 13,088 | | | | 13,153,191 | |
| KAR Auction Services, Inc. | |
Term Loan, 4.69%, (3 mo. USD LIBOR + 2.25%), Maturing March 11, 2021 | | | | | 14,171 | | | | 14,184,480 | |
| Kronos Incorporated | |
Term Loan, 5.34%, (3 mo. USD LIBOR + 3.00%), Maturing November 1, 2023 | | | | | 67,621 | | | | 67,807,273 | |
| LegalZoom.com, Inc. | |
Term Loan, 6.54%, (1 mo. USD LIBOR + 4.25%), Maturing November 21, 2024 | | | | | 8,262 | | | | 8,333,964 | |
| Monitronics International, Inc. | |
Term Loan, 7.89%, (3 mo. USD LIBOR + 5.50%), Maturing September 30, 2022 | | | | | 22,635 | | | | 22,153,917 | |
| PGX Holdings, Inc. | |
Term Loan, 7.56%, (1 mo. USD LIBOR + 5.25%), Maturing September 29, 2020 | | | | | 10,269 | | | | 10,050,600 | |
| Ping Identity Corporation | |
Term Loan, 6.05%, (1 mo. USD LIBOR + 3.75%), Maturing January 24, 2025 | | | | | 6,259 | | | | 6,306,257 | |
| | | | |
| | 18 | | See Notes to Financial Statements. |
Eaton Vance
Floating Rate Portfolio
October 31, 2018
Portfolio of Investments — continued
| | | | | | | | | | |
| Borrower/Tranche Description | | | | Principal Amount* (000’s omitted) | | | Value | |
|
| Business Equipment and Services (continued) | |
| Pre-Paid Legal Services, Inc. | |
Term Loan, 5.55%, (1 mo. USD LIBOR + 3.25%), Maturing May 1, 2025 | | | | | 5,092 | | | $ | 5,127,133 | |
| Prime Security Services Borrower, LLC | |
Term Loan, 5.05%, (1 mo. USD LIBOR + 2.75%), Maturing May 2, 2022 | | | | | 17,258 | | | | 17,290,599 | |
| Red Ventures, LLC | |
Term Loan, 6.05%, (1 mo. USD LIBOR + 3.75%), Maturing November 8, 2024 | | | | | 12,365 | | | | 12,416,211 | |
Term Loan, Maturing November 8,
2024(5) | | | | | 4,617 | | | | 4,644,645 | |
| ServiceMaster Company | |
Term Loan, 4.80%, (1 mo. USD LIBOR + 2.50%), Maturing November 8, 2023 | | | | | 14,580 | | | | 14,636,759 | |
| SMG Holdings, Inc. | |
Term Loan, 5.30%, (1 mo. USD LIBOR + 3.00%), Maturing January 23, 2025 | | | | | 2,687 | | | | 2,694,054 | |
| Solera, LLC | |
Term Loan, 5.05%, (1 mo. USD LIBOR + 2.75%), Maturing March 3, 2023 | | | | | 27,263 | | | | 27,275,594 | |
| Spin Holdco, Inc. | |
Term Loan, 5.69%, (3 mo. USD LIBOR + 3.25%), Maturing November 14, 2022 | | | | | 45,390 | | | | 45,481,162 | |
| Tempo Acquisition, LLC | |
Term Loan, 5.30%, (1 mo. USD LIBOR + 3.00%), Maturing May 1, 2024 | | | | | 9,529 | | | | 9,542,773 | |
| Trans Union, LLC | |
Term Loan, 4.30%, (1 mo. USD LIBOR + 2.00%), Maturing April 10, 2023 | | | | | 10,605 | | | | 10,602,019 | |
Term Loan, 4.30%, (1 mo. USD LIBOR + 2.00%), Maturing June 19, 2025 | | | | | 5,212 | | | | 5,210,541 | |
| Travelport Finance (Luxembourg) S.a.r.l. | |
Term Loan, 4.81%, (3 mo. USD LIBOR + 2.50%), Maturing March 17, 2025 | | | | | 22,554 | | | | 22,554,925 | |
| Vestcom Parent Holdings, Inc. | |
Term Loan, 6.30%, (1 mo. USD LIBOR + 4.00%), Maturing December 19, 2023 | | | | | 12,992 | | | | 13,024,075 | |
| WASH Multifamily Laundry Systems, LLC | |
Term Loan, 5.55%, (1 mo. USD LIBOR + 3.25%), Maturing May 14, 2022 | | | | | 1,540 | | | | 1,541,507 | |
| West Corporation | |
Term Loan, 6.03%, (USD LIBOR + 3.50%), Maturing October 10, 2024(4) | | | | | 3,940 | | | | 3,901,953 | |
Term Loan, 6.53%, (USD LIBOR + 4.00%), Maturing October 10, 2024(4) | | | | | 15,936 | | | | 15,894,461 | |
| Worldpay, LLC | |
Term Loan, 4.03%, (1 mo. USD LIBOR + 1.75%), Maturing October 14, 2023 | | | | | 3,537 | | | | 3,535,288 | |
Term Loan, 4.03%, (1 mo. USD LIBOR + 1.75%), Maturing August 9, 2024 | | | | | 20,771 | | | | 20,763,418 | |
| | | | | | | | | | | | |
| Borrower/Tranche Description | | | | | Principal Amount* (000’s omitted) | | | Value | |
|
| Business Equipment and Services (continued) | |
| ZPG PLC | |
Term Loan, 3.75%, (1 mo. EURIBOR + 3.75%), Maturing June 30, 2025 | | | EUR | | | | 4,975 | | | $ | 5,664,868 | |
Term Loan, 5.47%, (1 mo. GBP LIBOR + 4.75%), Maturing June 30, 2025 | | | GBP | | | | 8,675 | | | | 11,127,197 | |
| | | | | | | | | | | $ | 955,667,554 | |
|
| Cable and Satellite Television — 4.1% | |
| Altice France S.A. | |
Term Loan, 6.28%, (1 mo. USD LIBOR + 4.00%), Maturing August 14, 2026 | | | | | | | 5,000 | | | $ | 4,940,000 | |
| Altice US Finance I Corporation | |
Term Loan, Maturing January 10, 2026(5) | | | | | | | 13,075 | | | | 13,058,656 | |
| Charter Communications Operating, LLC | |
Term Loan, 4.31%, (1 mo. USD LIBOR + 2.00%), Maturing April 30, 2025 | | | | | | | 43,938 | | | | 43,992,748 | |
| Cogeco Communications (USA) II L.P. | |
Term Loan, 4.68%, (1 mo. USD LIBOR + 2.38%), Maturing January 3, 2025 | | | | | | | 6,165 | | | | 6,143,745 | |
| CSC Holdings, LLC | |
Term Loan, 4.53%, (1 mo. USD LIBOR + 2.25%), Maturing July 17, 2025 | | | | | | | 34,375 | | | | 34,245,642 | |
Term Loan, 4.78%, (1 mo. USD LIBOR + 2.50%), Maturing January 25, 2026 | | | | | | | 17,345 | | | | 17,401,729 | |
| Numericable Group S.A. | |
Term Loan, 3.00%, (3 mo. EURIBOR + 3.00%), Maturing July 31, 2025 | | | EUR | | | | 9,853 | | | | 11,128,840 | |
Term Loan, 5.05%, (1 mo. USD LIBOR + 2.75%), Maturing July 31, 2025 | | | | | | | 23,033 | | | | 22,428,180 | |
Term Loan, 5.97%, (1 mo. USD LIBOR + 3.69%), Maturing January 31, 2026 | | | | | | | 4,588 | | | | 4,505,248 | |
| Radiate Holdco, LLC | |
Term Loan, 5.30%, (1 mo. USD LIBOR + 3.00%), Maturing February 1, 2024 | | | | | | | 23,609 | | | | 23,489,512 | |
| Telenet Financing USD, LLC | |
Term Loan, 4.53%, (1 mo. USD LIBOR + 2.25%), Maturing August 15, 2026 | | | | | | | 30,025 | | | | 29,943,692 | |
| Telenet International Finance S.a.r.l. | |
Term Loan, 2.50%, (6 mo. EURIBOR + 2.50%), Maturing December 15, 2027 | | | EUR | | | | 20,500 | | | | 23,174,356 | |
| Unitymedia Finance, LLC | |
Term Loan, 4.53%, (1 mo. USD LIBOR + 2.25%), Maturing September 30, 2025 | | | | | | | 1,500 | | | | 1,499,883 | |
Term Loan, 4.53%, (1 mo. USD LIBOR + 2.25%), Maturing January 15, 2026 | | | | | | | 20,100 | | | | 20,089,226 | |
| Unitymedia Hessen GmbH & Co. KG | |
Term Loan, 2.75%, (6 mo. EURIBOR + 2.75%), Maturing January 15, 2027 | | | EUR | | | | 18,000 | | | | 20,512,296 | |
| | | | |
| | 19 | | See Notes to Financial Statements. |
Eaton Vance
Floating Rate Portfolio
October 31, 2018
Portfolio of Investments — continued
| | | | | | | | | | | | |
| Borrower/Tranche Description | | | | | Principal Amount* (000’s omitted) | | | Value | |
|
| Cable and Satellite Television (continued) | |
| UPC Financing Partnership | |
Term Loan, 4.78%, (1 mo. USD LIBOR + 2.50%), Maturing January 15, 2026 | | | | | | | 27,535 | | | $ | 27,462,044 | |
| Virgin Media Bristol, LLC | |
Term Loan, 4.78%, (1 mo. USD LIBOR + 2.50%), Maturing January 15, 2026 | | | | | | | 79,100 | | | | 79,142,398 | |
| Virgin Media Investment Holdings Limited | |
Term Loan, 3.97%, (1 mo. GBP LIBOR + 3.25%), Maturing January 15, 2027 | | | GBP | | | | 14,425 | | | | 18,430,830 | |
| Ziggo Secured Finance B.V. | |
Term Loan, 3.00%, (6 mo. EURIBOR + 3.00%), Maturing April 15, 2025 | | | EUR | | | | 22,850 | | | | 25,881,060 | |
| Ziggo Secured Finance Partnership | |
Term Loan, 4.78%, (1 mo. USD LIBOR + 2.50%), Maturing April 15, 2025 | | | | | | | 48,481 | | | | 47,583,361 | |
| | | | | | | | | | | $ | 475,053,446 | |
|
| Chemicals and Plastics — 4.4% | |
| Alpha 3 B.V. | |
Term Loan, 5.39%, (3 mo. USD LIBOR + 3.00%), Maturing January 31, 2024 | | | | | | | 15,632 | | | $ | 15,657,927 | |
| Aruba Investments, Inc. | |
Term Loan, 5.55%, (1 mo. USD LIBOR + 3.25%), Maturing February 2, 2022 | | | | | | | 3,815 | | | | 3,822,280 | |
| Ashland, Inc. | |
Term Loan, 4.04%, (1 mo. USD LIBOR + 1.75%), Maturing May 17, 2024 | | | | | | | 6,246 | | | | 6,268,061 | |
| Axalta Coating Systems US Holdings, Inc. | |
Term Loan, 4.14%, (3 mo. USD LIBOR + 1.75%), Maturing June 1, 2024 | | | | | | | 42,503 | | | | 42,452,970 | |
| Caldic B.V. | |
Term Loan, 3.00%, (3 mo. EURIBOR + 3.00%), Maturing July 18, 2024 | | | EUR | | | | 500 | | | | 565,617 | |
Term Loan, 3.00%, (3 mo. EURIBOR + 3.00%), Maturing July 18, 2024 | | | EUR | | | | 1,500 | | | | 1,696,852 | |
| Chemours Company (The) | |
Term Loan, 2.50%, (3 mo. EURIBOR + 2.00%, Floor 0.50%), Maturing March 21, 2025 | | | EUR | | | | 6,441 | | | | 7,350,063 | |
| Emerald Performance Materials, LLC | |
Term Loan, 5.80%, (1 mo. USD LIBOR + 3.50%), Maturing August 1, 2021 | | | | | | | 5,268 | | | | 5,299,884 | |
Term Loan - Second Lien, 10.05%, (1 mo. USD LIBOR + 7.75%), Maturing August 1, 2022 | | | | | | | 5,000 | | | | 5,016,665 | |
| Ferro Corporation | |
Term Loan, 4.64%, (3 mo. USD LIBOR + 2.25%), Maturing February 14, 2024 | | | | | | | 3,814 | | | | 3,818,934 | |
| | | | | | | | | | |
| Borrower/Tranche Description | | | | Principal Amount* (000’s omitted) | | | Value | |
|
| Chemicals and Plastics (continued) | |
| Ferro Corporation (continued) | |
Term Loan, 4.64%, (3 mo. USD LIBOR + 2.25%), Maturing February 14, 2024 | | | | | 3,897 | | | $ | 3,901,955 | |
Term Loan, 4.64%, (3 mo. USD LIBOR + 2.25%), Maturing February 14, 2024 | | | | | 9,186 | | | | 9,197,073 | |
| Flint Group GmbH | |
Term Loan, 5.49%, (3 mo. USD LIBOR + 3.00%), Maturing September 7, 2021 | | | | | 2,741 | | | | 2,631,970 | |
| Flint Group US, LLC | |
Term Loan, 5.49%, (3 mo. USD LIBOR + 3.00%), Maturing September 7, 2021 | | | | | 16,579 | | | | 15,921,258 | |
| Gemini HDPE, LLC | |
Term Loan, 5.03%, (3 mo. USD LIBOR + 2.50%), Maturing August 7, 2024 | | | | | 9,986 | | | | 10,015,455 | |
| H.B. Fuller Company | |
Term Loan, 4.28%, (1 mo. USD LIBOR + 2.00%), Maturing October 20, 2024 | | | | | 23,856 | | | | 23,811,572 | |
| Ineos US Finance, LLC | |
Term Loan, 2.50%, (1 mo. EURIBOR + 2.00%, Floor 0.50%), Maturing March 31, 2024 | | EUR | | | 33,944 | | | | 38,390,870 | |
Term Loan, 4.30%, (1 mo. USD LIBOR + 2.00%), Maturing March 31, 2024 | | | | | 7,568 | | | | 7,572,542 | |
| Invictus U.S., LLC | |
Term Loan, 5.30%, (1 mo. USD LIBOR + 3.00%), Maturing March 28, 2025 | | | | | 5,572 | | | | 5,603,343 | |
| Kraton Polymers, LLC | |
Term Loan, 2.75%, (3 mo. EURIBOR + 2.00%, Floor 0.75%), Maturing March 5, 2025 | | EUR | | | 6,355 | | | | 7,205,544 | |
Term Loan, 4.80%, (1 mo. USD LIBOR + 2.50%), Maturing March 5, 2025 | | | | | 9,650 | | | | 9,642,637 | |
| MacDermid, Inc. | |
Term Loan, 4.80%, (1 mo. USD LIBOR + 2.50%), Maturing June 7, 2020 | | | | | 4,906 | | | | 4,913,832 | |
Term Loan, 3.50%, (1 mo. EURIBOR + 2.75%, Floor 0.75%), Maturing June 7, 2023 | | EUR | | | 2,997 | | | | 3,410,201 | |
Term Loan, 5.30%, (1 mo. USD LIBOR + 3.00%), Maturing June 7, 2023 | | | | | 27,074 | | | | 27,073,857 | |
| Messer Industries, LLC | |
Term Loan, Maturing October 1, 2025(5) | | EUR | | | 4,275 | | | | 4,873,099 | |
Term Loan, Maturing October 1, 2025(5) | | | | | 31,300 | | | | 31,350,862 | |
| Orion Engineered Carbons GmbH | |
Term Loan, 4.39%, (3 mo. USD LIBOR + 2.00%), Maturing July 25, 2024 | | | | | 7,182 | | | | 7,213,576 | |
| PMHC II, Inc. | |
Term Loan, 6.15%, (USD LIBOR + 3.50%), Maturing March 31, 2025(4) | | | | | 4,179 | | | | 4,096,256 | |
| | | | |
| | 20 | | See Notes to Financial Statements. |
Eaton Vance
Floating Rate Portfolio
October 31, 2018
Portfolio of Investments — continued
| | | | | | | | | | | | |
| Borrower/Tranche Description | | | | | Principal Amount* (000’s omitted) | | | Value | |
|
| Chemicals and Plastics (continued) | |
| PQ Corporation | |
Term Loan, 5.03%, (3 mo. USD LIBOR + 2.50%), Maturing February 8, 2025 | | | | | | | 31,560 | | | $ | 31,573,238 | |
| Proampac PG Borrower, LLC | |
Term Loan, 5.84%, (USD LIBOR + 3.50%), Maturing November 18, 2023(4) | | | | | | | 8,491 | | | | 8,516,196 | |
| Schenectady International Group, Inc. | |
Term Loan, 7.19%, (3 mo. USD LIBOR + 4.75%), Maturing October 15, 2025 | | | | | | | 11,375 | | | | 11,339,453 | |
| Sonneborn Refined Products B.V. | |
Term Loan, 6.05%, (1 mo. USD LIBOR + 3.75%), Maturing December 10, 2020 | | | | | | | 917 | | | | 928,212 | |
| Sonneborn, LLC | |
Term Loan, 6.05%, (1 mo. USD LIBOR + 3.75%), Maturing December 10, 2020 | | | | | | | 5,195 | | | | 5,259,852 | |
| Spectrum Holdings III Corp. | |
Term Loan, 5.55%, (1 mo. USD LIBOR + 3.25%), Maturing January 31, 2025 | | | | | | | 4,823 | | | | 4,786,847 | |
| Starfruit Finco B.V. | |
Term Loan, 3.75%, (6 mo. EURIBOR + 3.75%), Maturing October 1, 2025 | | | EUR | | | | 5,425 | | | | 6,204,157 | |
Term Loan, 5.51%, (1 mo. USD LIBOR + 3.25%), Maturing October 1, 2025 | | | | | | | 35,725 | | | | 35,708,245 | |
| Tata Chemicals North America, Inc. | |
Term Loan, 5.19%, (3 mo. USD LIBOR + 2.75%), Maturing August 7, 2020 | | | | | | | 5,654 | | | | 5,639,489 | |
| Trinseo Materials Operating S.C.A. | |
Term Loan, 4.30%, (1 mo. USD LIBOR + 2.00%), Maturing September 9, 2024 | | | | | | | 4,075 | | | | 4,052,555 | |
| Tronox Blocked Borrower, LLC | |
Term Loan, 5.30%, (1 mo. USD LIBOR + 3.00%), Maturing September 23, 2024 | | | | | | | 12,921 | | | | 12,912,811 | |
| Tronox Finance, LLC | |
Term Loan, 5.30%, (1 mo. USD LIBOR + 3.00%), Maturing September 23, 2024 | | | | | | | 29,817 | | | | 29,798,796 | |
| Unifrax I, LLC | |
Term Loan, 5.89%, (3 mo. USD LIBOR + 3.50%), Maturing April 4, 2024 | | | | | | | 8,573 | | | | 8,600,006 | |
| Univar, Inc. | |
Term Loan, 4.55%, (1 mo. USD LIBOR + 2.25%), Maturing July 1, 2024 | | | | | | | 22,626 | | | | 22,642,129 | |
| Venator Materials Corporation | |
Term Loan, 5.30%, (1 mo. USD LIBOR + 3.00%), Maturing August 8, 2024 | | | | | | | 4,282 | | | | 4,284,426 | |
| Versum Materials, Inc. | |
Term Loan, 4.39%, (3 mo. USD LIBOR + 2.00%), Maturing September 29, 2023 | | | | | | | 5,758 | | | | 5,774,295 | |
| | | | | | | | | | | $ | 506,795,862 | |
| | | | | | | | | | | | |
| Borrower/Tranche Description | | | | | Principal Amount* (000’s omitted) | | | Value | |
|
| Clothing / Textiles — 0.1% | |
| Tumi, Inc. | |
Term Loan, 4.05%, (1 mo. USD LIBOR + 1.75%), Maturing April 25, 2025 | | | | | | | 10,249 | | | $ | 10,246,566 | |
| | | | | | | | | | | $ | 10,246,566 | |
|
| Conglomerates — 0.1% | |
| Penn Engineering & Manufacturing Corp. | |
Term Loan, 5.04%, (1 mo. USD LIBOR + 2.75%), Maturing June 27, 2024 | | | | | | | 2,814 | | | $ | 2,823,170 | |
| SGB-SMIT Management GmbH | |
Term Loan, 4.00%, (6 mo. EURIBOR + 4.00%), Maturing July 18, 2024 | | | EUR | | | | 6,713 | | | | 6,728,580 | |
| | | | | | | | | | | $ | 9,551,750 | |
|
| Containers and Glass Products — 2.7% | |
| Anchor Glass Container Corporation | |
Term Loan, 5.08%, (USD LIBOR + 2.75%), Maturing December 7, 2023(4) | | | | | | | 5,576 | | | $ | 4,990,558 | |
| Berlin Packaging, LLC | |
Term Loan, 5.28%, (USD LIBOR + 3.00%), Maturing November 7, 2025(4) | | | | | | | 8,783 | | | | 8,787,554 | |
| Berry Global, Inc. | |
Term Loan, Maturing January 6,
2021(5) | | | | | | | 1,000 | | | | 999,286 | |
Term Loan, 4.28%, (1 mo. USD LIBOR + 2.00%), Maturing October 1, 2022 | | | | | | | 15,319 | | | | 15,330,569 | |
Term Loan, 4.28%, (1 mo. USD LIBOR + 2.00%), Maturing January 19, 2024 | | | | | | | 7,388 | | | | 7,385,195 | |
| BWAY Holding Company | |
Term Loan, 5.66%, (3 mo. USD LIBOR + 3.25%), Maturing April 3, 2024 | | | | | | | 28,062 | | | | 27,939,585 | |
| Consolidated Container Company, LLC | |
Term Loan, 5.05%, (1 mo. USD LIBOR + 2.75%), Maturing May 22, 2024 | | | | | | | 6,247 | | | | 6,263,648 | |
| Crown Americas, LLC | |
Term Loan, 2.38%, (1 mo. EURIBOR + 2.38%), Maturing April 3, 2025 | | | EUR | | | | 6,658 | | | | 7,608,049 | |
Term Loan, 4.28%, (1 mo. USD LIBOR + 2.00%), Maturing April 3, 2025 | | | | | | | 6,964 | | | | 6,988,302 | |
| Flex Acquisition Company, Inc. | |
Term Loan, 5.26%, (1 mo. USD LIBOR + 3.00%), Maturing December 29, 2023 | | | | | | | 41,582 | | | | 41,574,381 | |
Term Loan, 5.51%, (1 mo. USD LIBOR + 3.25%), Maturing June 29, 2025 | | | | | | | 17,531 | | | | 17,582,709 | |
| Libbey Glass, Inc. | |
Term Loan, 5.28%, (1 mo. USD LIBOR + 3.00%), Maturing April 9, 2021 | | | | | | | 10,347 | | | | 10,334,336 | |
| | | | |
| | 21 | | See Notes to Financial Statements. |
Eaton Vance
Floating Rate Portfolio
October 31, 2018
Portfolio of Investments — continued
| | | | | | | | | | | | |
| Borrower/Tranche Description | | | | | Principal Amount* (000’s omitted) | | | Value | |
|
| Containers and Glass Products (continued) | |
| Pelican Products, Inc. | |
Term Loan, 5.77%, (1 mo. USD LIBOR + 3.50%), Maturing May 1, 2025 | | | | | | | 7,057 | | | $ | 7,072,013 | |
| Reynolds Group Holdings, Inc. | |
Term Loan, 5.05%, (1 mo. USD LIBOR + 2.75%), Maturing February 5, 2023 | | | | | | | 60,040 | | | | 60,166,657 | |
| Ring Container Technologies Group, LLC | |
Term Loan, 5.05%, (1 mo. USD LIBOR + 2.75%), Maturing October 31, 2024 | | | | | | | 9,954 | | | | 9,965,975 | |
| SIG Combibloc Holdings S.C.A. | |
Term Loan, 2.50%, (3 mo. EURIBOR + 2.50%), Maturing September 5, 2025 | | | EUR | | | | 4,500 | | | | 5,156,816 | |
| Trident TPI Holdings, Inc. | |
Term Loan, 5.55%, (1 mo. USD LIBOR + 3.25%), Maturing October 17, 2024 | | | | | | | 19,298 | | | | 19,177,406 | |
| Verallia Packaging S.A.S | |
Term Loan, 2.75%, (1 mo. EURIBOR + 2.75%), Maturing October 29, 2022 | | | EUR | | | | 31,357 | | | | 35,590,292 | |
Term Loan, 3.25%, (1 mo. EURIBOR + 3.25%), Maturing August 29, 2025 | | | EUR | | | | 16,850 | | | | 19,167,167 | |
| | | | | | | | | | | $ | 312,080,498 | |
|
| Cosmetics / Toiletries — 0.2% | |
| KIK Custom Products, Inc. | |
Term Loan, 6.30%, (1 mo. USD LIBOR + 4.00%), Maturing May 15, 2023 | | | | | | | 25,180 | | | $ | 25,132,421 | |
| | | | | | | | | | | $ | 25,132,421 | |
|
| Drugs — 3.2% | |
| Albany Molecular Research, Inc. | |
Term Loan, 5.55%, (1 mo. USD LIBOR + 3.25%), Maturing August 30, 2024 | | | | | | | 15,370 | | | $ | 15,394,726 | |
| Alkermes, Inc. | |
Term Loan, 4.54%, (1 mo. USD LIBOR + 2.25%), Maturing March 23, 2023 | | | | | | | 19,075 | | | | 19,158,385 | |
| Amneal Pharmaceuticals, LLC | |
Term Loan, 5.81%, (1 mo. USD LIBOR + 3.50%), Maturing May 4, 2025 | | | | | | | 40,614 | | | | 40,850,351 | |
| Arbor Pharmaceuticals, Inc. | |
Term Loan, 7.49%, (6 mo. USD LIBOR + 5.00%), Maturing July 5, 2023 | | | | | | | 29,557 | | | | 29,631,291 | |
| Bausch Health Companies, Inc. | |
Term Loan, 5.27%, (1 mo. USD LIBOR + 3.00%), Maturing June 1, 2025 | | | | | | | 72,332 | | | | 72,508,176 | |
| Endo Luxembourg Finance Company I S.a.r.l. | |
Term Loan, 6.56%, (1 mo. USD LIBOR + 4.25%), Maturing April 29, 2024 | | | | | | | 52,115 | | | | 52,353,740 | |
| | | | | | | | | | | | |
| Borrower/Tranche Description | | | | | Principal Amount* (000’s omitted) | | | Value | |
|
| Drugs (continued) | |
| Horizon Pharma, Inc. | |
Term Loan, 5.31%, (1 mo. USD LIBOR + 3.00%), Maturing March 29, 2024 | | | | | | | 15,931 | | | $ | 15,991,204 | |
| Jaguar Holding Company II | |
Term Loan, 4.80%, (1 mo. USD LIBOR + 2.50%), Maturing August 18, 2022 | | | | | | | 67,931 | | | | 67,808,660 | |
| Mallinckrodt International Finance S.A. | |
Term Loan, 5.14%, (3 mo. USD LIBOR + 2.75%), Maturing September 24, 2024 | | | | | | | 24,432 | | | | 24,179,097 | |
Term Loan, 5.52%, (6 mo. USD LIBOR + 3.00%), Maturing February 24, 2025 | | | | | | | 9,701 | | | | 9,650,726 | |
| PharMerica Corporation | |
Term Loan, 5.78%, (1 mo. USD LIBOR + 3.50%), Maturing December 6, 2024 | | | | | | | 11,650 | | | | 11,707,870 | |
Term Loan - Second Lien, 10.03%, (1 mo. USD LIBOR + 7.75%), Maturing December 7, 2025 | | | | | | | 4,650 | | | | 4,655,813 | |
| | | | | | | | | | | $ | 363,890,039 | |
|
| Ecological Services and Equipment — 0.8% | |
| Advanced Disposal Services, Inc. | |
Term Loan, 4.46%, (1 week USD LIBOR + 2.25%), Maturing November 10, 2023 | | | | | | | 39,148 | | | $ | 39,196,471 | |
| Clean Harbors, Inc. | |
Term Loan, 4.05%, (1 mo. USD LIBOR + 1.75%), Maturing June 27, 2024 | | | | | | | 3,135 | | | | 3,144,458 | |
| EnergySolutions, LLC | |
Term Loan, 6.14%, (3 mo. USD LIBOR + 3.75%), Maturing May 9, 2025 | | | | | | | 16,758 | | | | 16,904,633 | |
| GFL Environmental, Inc. | |
Term Loan, 5.14%, (3 mo. USD LIBOR + 2.75%), Maturing May 30, 2025 | | | | | | | 25,287 | | | | 24,979,248 | |
Term Loan, 7.00%, (3 mo. USD Prime + 1.75%), Maturing May 30, 2025 | | | | | | | 3,149 | | | | 3,110,789 | |
| Wastequip, LLC | |
Term Loan, 5.79%, (1 mo. USD LIBOR + 3.50%), Maturing March 20, 2025 | | | | | | | 1,493 | | | | 1,501,363 | |
| Wrangler Buyer Corp. | |
Term Loan, 5.01%, (1 mo. USD LIBOR + 2.75%), Maturing September 27, 2024 | | | | | | | 7,945 | | | | 7,958,468 | |
| | | | | | | | | | | $ | 96,795,430 | |
|
| Electronics / Electrical — 10.5% | |
| Almonde, Inc. | |
Term Loan, 5.89%, (3 mo. USD LIBOR + 3.50%), Maturing June 13, 2024 | | | | | | | 45,404 | | | $ | 45,204,887 | |
| | | | |
| | 22 | | See Notes to Financial Statements. |
Eaton Vance
Floating Rate Portfolio
October 31, 2018
Portfolio of Investments — continued
| | | | | | | | | | |
| Borrower/Tranche Description | | | | Principal Amount* (000’s omitted) | | | Value | |
|
| Electronics / Electrical (continued) | |
| Answers Finance, LLC | |
Term Loan - Second Lien, 9.00%, (3 mo. USD Prime + 7.90%, Cap 1.10%), Maturing September 15, 2021 | | | | | 4,622 | | | $ | 4,529,110 | |
| Applied Systems, Inc. | |
Term Loan, 5.39%, (3 mo. USD LIBOR + 3.00%), Maturing September 19, 2024 | | | | | 29,309 | | | | 29,410,723 | |
| Aptean, Inc. | |
Term Loan, 6.64%, (3 mo. USD LIBOR + 4.25%), Maturing December 20, 2022 | | | | | 12,682 | | | | 12,714,086 | |
Term Loan - Second Lien, 11.89%, (3 mo. USD LIBOR + 9.50%), Maturing December 14, 2023 | | | | | 4,335 | | | | 4,356,675 | |
| Avast Software B.V. | |
Term Loan, 4.89%, (3 mo. USD LIBOR + 2.50%), Maturing September 30, 2023 | | | | | 16,787 | | | | 16,870,885 | |
| Barracuda Networks, Inc. | |
Term Loan, 5.54%, (1 mo. USD LIBOR + 3.25%), Maturing February 12, 2025 | | | | | 17,955 | | | | 17,988,666 | |
| Blackhawk Network Holdings, Inc. | |
Term Loan, 5.39%, (3 mo. USD LIBOR + 3.00%), Maturing June 15, 2025 | | | | | 9,401 | | | | 9,431,992 | |
| BMC Software Finance, Inc. | |
Term Loan, 4.75%, (3 mo. EURIBOR + 4.75%), Maturing October 2, 2025 | | EUR | | | 3,450 | | | | 3,954,453 | |
Term Loan, 6.65%, (3 mo. USD LIBOR + 4.25%), Maturing October 2, 2025 | | | | | 37,350 | | | | 37,513,406 | |
| Campaign Monitor Finance Pty. Limited | |
Term Loan, 7.49%, (3 mo. USD LIBOR + 5.25%), Maturing March 18, 2021 | | | | | 12,999 | | | | 12,136,903 | |
| Celestica, Inc. | |
Term Loan, 4.29%, (1 mo. USD LIBOR + 2.00%), Maturing June 27, 2025 | | | | | 4,713 | | | | 4,686,676 | |
| Cohu, Inc. | |
Term Loan, 5.40%, (3 mo. USD LIBOR + 3.00%), Maturing September 20, 2025 | | | | | 10,525 | | | | 10,544,734 | |
| CommScope, Inc. | |
Term Loan, 4.30%, (1 mo. USD LIBOR + 2.00%), Maturing December 29, 2022 | | | | | 4,600 | | | | 4,617,175 | |
| CPI International, Inc. | |
Term Loan, 5.80%, (1 mo. USD LIBOR + 3.50%), Maturing July 26, 2024 | | | | | 11,297 | | | | 11,311,594 | |
| Cypress Semiconductor Corporation | |
Term Loan, 4.31%, (1 mo. USD LIBOR + 2.00%), Maturing July 5, 2021 | | | | | 10,915 | | | | 10,912,974 | |
| DigiCert, Inc. | |
Term Loan, 6.30%, (1 mo. USD LIBOR + 4.00%), Maturing October 31, 2024 | | | | | 18,823 | | | | 18,849,152 | |
| | | | | | | | | | |
| Borrower/Tranche Description | | | | Principal Amount* (000’s omitted) | | | Value | |
|
| Electronics / Electrical (continued) | |
| Electro Rent Corporation | |
Term Loan, 7.49%, (3 mo. USD LIBOR + 5.00%), Maturing January 31, 2024 | | | | | 13,018 | | | $ | 13,164,579 | |
| Energizer Holdings, Inc. | |
Term Loan, 4.31%, (1 mo. USD LIBOR + 2.00%), Maturing June 30, 2022 | | | | | 8,276 | | | | 8,294,048 | |
Term Loan, Maturing June 20, 2025(5) | | | | | 6,525 | | | | 6,563,008 | |
| Entegris, Inc. | |
Term Loan, 4.55%, (1 mo. USD LIBOR + 2.25%), Maturing April 30, 2021 | | | | | 2,248 | | | | 2,256,419 | |
| Epicor Software Corporation | |
Term Loan, 5.56%, (1 mo. USD LIBOR + 3.25%), Maturing June 1, 2022 | | | | | 16,694 | | | | 16,740,145 | |
| Exact Merger Sub, LLC | |
Term Loan, 6.64%, (3 mo. USD LIBOR + 4.25%), Maturing September 27, 2024 | | | | | 7,004 | | | | 7,063,352 | |
| EXC Holdings III Corp. | |
Term Loan, 5.89%, (3 mo. USD LIBOR + 3.50%), Maturing December 2, 2024 | | | | | 5,434 | | | | 5,481,484 | |
| Financial & Risk US Holdings, Inc. | |
Term Loan, 6.05%, (1 mo. USD LIBOR + 3.75%), Maturing October 1, 2025 | | | | | 14,225 | | | | 14,118,313 | |
| Flexera Software, LLC | |
Term Loan, 5.56%, (1 mo. USD LIBOR + 3.25%), Maturing February 26, 2025 | | | | | 11,302 | | | | 11,342,342 | |
| GlobalLogic Holdings, Inc. | |
Term Loan, 1.63%, Maturing August 1, 2025(2) | | | | | 763 | | | | 768,695 | |
Term Loan, 5.55%, (1 mo. USD LIBOR + 3.25%), Maturing August 1, 2025 | | | | | 5,338 | | | | 5,380,867 | |
| Go Daddy Operating Company, LLC | |
Term Loan, 4.55%, (1 mo. USD LIBOR + 2.25%), Maturing February 15, 2024 | | | | | 58,907 | | | | 59,040,296 | |
| GoodRx, Inc. | |
Term Loan, 5.28%, (1 mo. USD LIBOR + 3.00%), Maturing October 10, 2025 | | | | | 3,525 | | | | 3,544,828 | |
| GTCR Valor Companies, Inc. | |
Term Loan, 5.14%, (3 mo. USD LIBOR + 2.75%), Maturing June 16, 2023 | | | | | 22,302 | | | | 22,336,982 | |
Term Loan, 3.00%, (3 mo. EURIBOR + 3.00%), Maturing June 20, 2023 | | EUR | | | 2,970 | | | | 3,384,996 | |
| Hyland Software, Inc. | |
Term Loan, 5.55%, (1 mo. USD LIBOR + 3.25%), Maturing July 1, 2024 | | | | | 34,373 | | | | 34,565,962 | |
| Infoblox, Inc. | |
Term Loan, 6.80%, (1 mo. USD LIBOR + 4.50%), Maturing November 7, 2023 | | | | | 17,452 | | | | 17,604,703 | |
| | | | |
| | 23 | | See Notes to Financial Statements. |
Eaton Vance
Floating Rate Portfolio
October 31, 2018
Portfolio of Investments — continued
| | | | | | | | | | |
| Borrower/Tranche Description | | | | Principal Amount* (000’s omitted) | | | Value | |
|
| Electronics / Electrical (continued) | |
| Infor (US), Inc. | |
Term Loan, 5.14%, (3 mo. USD LIBOR + 2.75%), Maturing February 1, 2022 | | | | | 84,472 | | | $ | 84,286,945 | |
| Informatica, LLC | |
Term Loan, 3.50%, (3 mo. EURIBOR + 3.50%), Maturing August 5, 2022 | | EUR | | | 6,011 | | | | 6,865,402 | |
Term Loan, 5.55%, (1 mo. USD LIBOR + 3.25%), Maturing August 5, 2022 | | | | | 40,411 | | | | 40,581,248 | |
| Lattice Semiconductor Corporation | |
Term Loan, 6.53%, (1 mo. USD LIBOR + 4.25%), Maturing March 10, 2021 | | | | | 5,957 | | | | 5,993,907 | |
| MA FinanceCo., LLC | |
Term Loan, 4.55%, (1 mo. USD LIBOR + 2.25%), Maturing November 19, 2021 | | | | | 40,454 | | | | 40,190,647 | |
Term Loan, 4.80%, (1 mo. USD LIBOR + 2.50%), Maturing June 21, 2024 | | | | | 5,895 | | | | 5,850,690 | |
| MACOM Technology Solutions Holdings, Inc. | |
Term Loan, 4.55%, (1 mo. USD LIBOR + 2.25%), Maturing May 17, 2024 | | | | | 19,414 | | | | 18,831,132 | |
| Marcel LUX IV S.a.r.l. | |
Term Loan, Maturing September 26, 2025(5) | | EUR | | | 2,650 | | | | 3,019,347 | |
Term Loan, Maturing September 26, 2025(5) | | | | | 3,250 | | | | 3,262,188 | |
| Microchip Technology Incorporated | |
Term Loan, 4.31%, (1 mo. USD LIBOR + 2.00%), Maturing May 29, 2025 | | | | | 27,537 | | | | 27,461,223 | |
| MTS Systems Corporation | |
Term Loan, 5.54%, (1 mo. USD LIBOR + 3.25%), Maturing July 5, 2023 | | | | | 851 | | | | 855,149 | |
| Prometric Holdings, Inc. | |
Term Loan, 5.31%, (1 mo. USD LIBOR + 3.00%), Maturing January 29, 2025 | | | | | 3,358 | | | | 3,370,718 | |
| Renaissance Holding Corp. | |
Term Loan, 5.55%, (1 mo. USD LIBOR + 3.25%), Maturing May 30, 2025 | | | | | 14,389 | | | | 14,340,979 | |
Term Loan - Second Lien, 9.30%, (1 mo. USD LIBOR + 7.00%), Maturing May 29, 2026 | | | | | 2,175 | | | | 2,170,922 | |
| Resideo Funding, Inc. | |
Term Loan, 4.49%, (3 mo. USD LIBOR + 2.00%), Maturing October 24, 2025 | | | | | 4,650 | | | | 4,673,250 | |
| Rocket Software, Inc. | |
Term Loan, 6.14%, (3 mo. USD LIBOR + 3.75%), Maturing October 14, 2023 | | | | | 12,666 | | | | 12,714,808 | |
| Seattle Spinco, Inc. | |
Term Loan, 4.80%, (1 mo. USD LIBOR + 2.50%), Maturing June 21, 2024 | | | | | 39,810 | | | | 39,523,571 | |
| SGS Cayman L.P. | |
Term Loan, 7.76%, (3 mo. USD LIBOR + 5.38%), Maturing April 23, 2021 | | | | | 1,129 | | | | 1,077,278 | |
| | | | | | | | | | |
| Borrower/Tranche Description | | | | Principal Amount* (000’s omitted) | | | Value | |
|
| Electronics / Electrical (continued) | |
| SkillSoft Corporation | |
Term Loan, 7.05%, (1 mo. USD LIBOR + 4.75%), Maturing April 28, 2021 | | | | | 61,434 | | | $ | 56,857,622 | |
| SolarWinds Holdings, Inc. | |
Term Loan, 5.30%, (1 mo. USD LIBOR + 3.00%), Maturing February 5, 2024 | | | | | 27,290 | | | | 27,384,902 | |
| Southwire Company | |
Term Loan, 4.29%, (1 mo. USD LIBOR + 2.00%), Maturing May 19, 2025 | | | | | 6,858 | | | | 6,884,387 | |
| Sparta Systems, Inc. | |
Term Loan, 5.79%, (1 mo. USD LIBOR + 3.50%), Maturing August 21, 2024 | | | | | 3,465 | | | | 3,287,419 | |
| SS&C Technologies Holdings Europe S.a.r.l. | |
Term Loan, 4.55%, (1 mo. USD LIBOR + 2.25%), Maturing April 16, 2025 | | | | | 20,387 | | | | 20,311,663 | |
| SS&C Technologies, Inc. | |
Term Loan, 4.55%, (1 mo. USD LIBOR + 2.25%), Maturing April 16, 2025 | | | | | 11,625 | | | | 11,600,297 | |
Term Loan, 4.55%, (1 mo. USD LIBOR + 2.25%), Maturing April 16, 2025 | | | | | 52,597 | | | | 52,403,671 | |
| SurveyMonkey, Inc. | |
Term Loan, 6.06%, (1 mo. USD LIBOR + 3.75%), Maturing October 10, 2025 | | | | | 13,520 | | | | 13,587,797 | |
| Sutherland Global Services, Inc. | |
Term Loan, 7.76%, (3 mo. USD LIBOR + 5.38%), Maturing April 23, 2021 | | | | | 4,849 | | | | 4,627,933 | |
| Switch, Ltd. | |
Term Loan, 4.55%, (1 mo. USD LIBOR + 2.25%), Maturing June 27, 2024 | | | | | 2,814 | | | | 2,823,755 | |
| Tibco Software, Inc. | |
Term Loan, 5.80%, (1 mo. USD LIBOR + 3.50%), Maturing December 4, 2020 | | | | | 24,789 | | | | 24,834,991 | |
| TriTech Software Systems | |
Term Loan, 6.05%, (1 mo. USD LIBOR + 3.75%), Maturing August 29, 2025 | | | | | 12,050 | | | | 12,100,212 | |
| TTM Technologies, Inc. | |
Term Loan, 4.76%, (1 mo. USD LIBOR + 2.50%), Maturing September 28, 2024 | | | | | 3,424 | | | | 3,426,393 | |
| Uber Technologies | |
Term Loan, 5.78%, (1 mo. USD LIBOR + 3.50%), Maturing July 13, 2023 | | | | | 49,779 | | | | 49,887,700 | |
Term Loan, 6.28%, (1 mo. USD LIBOR + 4.00%), Maturing April 4, 2025 | | | | | 28,285 | | | | 28,378,179 | |
| Ultra Clean Holdings, Inc. | |
Term Loan, 6.80%, (1 mo. USD LIBOR + 4.50%), Maturing August 27, 2025 | | | | | 11,200 | | | | 11,018,000 | |
| | | | |
| | 24 | | See Notes to Financial Statements. |
Eaton Vance
Floating Rate Portfolio
October 31, 2018
Portfolio of Investments — continued
| | | | | | | | | | | | |
| Borrower/Tranche Description | | | | | Principal Amount* (000’s omitted) | | | Value | |
|
| Electronics / Electrical (continued) | |
| Verifone Systems, Inc. | |
Term Loan, 6.32%, (3 mo. USD LIBOR + 4.00%), Maturing August 20, 2025 | | | | | | | 11,500 | | | $ | 11,523,000 | |
| Veritas Bermuda, Ltd. | |
Term Loan, 6.82%, (USD LIBOR + 4.50%), Maturing January 27, 2023(4) | | | | | | | 22,663 | | | | 21,683,357 | |
| Vero Parent, Inc. | |
Term Loan, 7.30%, (1 mo. USD LIBOR + 5.00%), Maturing August 16, 2024 | | | | | | | 18,167 | | | | 18,236,895 | |
| Wall Street Systems Delaware, Inc. | |
Term Loan, 4.00%, (3 mo. EURIBOR + 3.00%, Floor 1.00%), Maturing November 21, 2024 | | | EUR | | | | 6,600 | | | | 7,556,617 | |
Term Loan, 5.39%, (3 mo. USD LIBOR + 3.00%), Maturing November 21, 2024 | | | | | | | 8,436 | | | | 8,394,069 | |
| Western Digital Corporation | |
Term Loan, 4.04%, (1 mo. USD LIBOR + 1.75%), Maturing April 29, 2023 | | | | | | | 11,464 | | | | 11,411,935 | |
| | | | | | | | | | | $ | 1,209,975,308 | |
|
| Equipment Leasing — 0.8% | |
| Avolon TLB Borrower 1 (US), LLC | |
Term Loan, 4.28%, (1 mo. USD LIBOR + 2.00%), Maturing January 15, 2025 | | | | | | | 77,318 | | | $ | 77,205,115 | |
| Delos Finance S.a.r.l. | |
Term Loan, 4.14%, (3 mo. USD LIBOR + 1.75%), Maturing October 6, 2023 | | | | | | | 1,000 | | | | 1,002,679 | |
| IBC Capital Limited | |
Term Loan, 6.09%, (3 mo. USD LIBOR + 3.75%), Maturing September 11, 2023 | | | | | | | 6,965 | | | | 6,965,000 | |
| United Rentals, Inc. | |
Term Loan, Maturing October 1, 2025(5) | | | | | | | 11,925 | | | | 11,992,078 | |
| | | | | | | | | | | $ | 97,164,872 | |
|
| Financial Intermediaries — 2.8% | |
| Citco Funding, LLC | |
Term Loan, 4.80%, (1 mo. USD LIBOR + 2.50%), Maturing March 31, 2022 | | | | | | | 33,550 | | | $ | 33,675,966 | |
| Clipper Acquisitions Corp. | |
Term Loan, 4.03%, (1 mo. USD LIBOR + 1.75%), Maturing December 27, 2024 | | | | | | | 13,200 | | | | 13,216,645 | |
| Ditech Holding Corporation | |
Term Loan, 8.30%, (1 mo. USD LIBOR + 6.00%), Maturing June 30, 2022 | | | | | | | 36,853 | | | | 34,273,405 | |
| Donnelley Financial Solutions, Inc. | |
Term Loan, 5.22%, (1 week USD LIBOR + 3.00%), Maturing October 2, 2023 | | | | | | | 3,317 | | | | 3,325,436 | |
| | | | | | | | | | |
| Borrower/Tranche Description | | | | Principal Amount* (000’s omitted) | | | Value | |
|
| Financial Intermediaries (continued) | |
| EIG Management Company, LLC | |
Term Loan, 6.06%, (3 mo. USD LIBOR + 3.75%), Maturing February 22, 2025 | | | | | 3,010 | | | $ | 3,030,568 | |
| Evergood 4 ApS | |
Term Loan, Maturing February 6,
2025(5) | | EUR | | | 1,362 | | | | 1,555,988 | |
Term Loan, Maturing February 6,
2025(5) | | EUR | | | 7,263 | | | | 8,298,601 | |
| Focus Financial Partners, LLC | |
Term Loan, 4.80%, (1 mo. USD LIBOR + 2.50%), Maturing July 3, 2024 | | | | | 22,419 | | | | 22,481,854 | |
| Fortress Investment Group, LLC | |
Term Loan, 4.30%, (1 mo. USD LIBOR + 2.00%), Maturing December 27, 2022 | | | | | 11,208 | | | | 11,217,745 | |
| Franklin Square Holdings L.P. | |
Term Loan, 4.81%, (1 mo. USD LIBOR + 2.50%), Maturing August 1, 2025 | | | | | 6,525 | | | | 6,553,469 | |
| Freedom Mortgage Corporation | |
Term Loan, 7.05%, (1 mo. USD LIBOR + 4.75%), Maturing February 23, 2022 | | | | | 35,199 | | | | 35,507,193 | |
| Greenhill & Co., Inc. | |
Term Loan, 6.05%, (USD LIBOR + 3.75%), Maturing October 12,
2022(4) | | | | | 12,200 | | | | 12,275,935 | |
| GreenSky Holdings, LLC | |
Term Loan, 5.56%, (1 mo. USD LIBOR + 3.25%), Maturing March 31, 2025 | | | | | 15,845 | | | | 15,924,602 | |
| Guggenheim Partners, LLC | |
Term Loan, 5.05%, (1 mo. USD LIBOR + 2.75%), Maturing July 21, 2023 | | | | | 36,961 | | | | 37,238,334 | |
| Harbourvest Partners, LLC | |
Term Loan, 4.53%, (1 mo. USD LIBOR + 2.25%), Maturing March 1, 2025 | | | | | 15,776 | | | | 15,808,639 | |
| Jefferies Finance, LLC | |
Term Loan, 4.94%, (3 mo. USD LIBOR + 2.50%), Maturing August 2, 2024 | | | | | 1,980 | | | | 1,987,425 | |
| LPL Holdings, Inc. | |
Term Loan, 4.53%, (1 mo. USD LIBOR + 2.25%), Maturing September 23, 2024 | | | | | 16,358 | | | | 16,409,593 | |
| MIP Delaware, LLC | |
Term Loan, 5.39%, (3 mo. USD LIBOR + 3.00%), Maturing March 9, 2020 | | | | | 1,554 | | | | 1,557,506 | |
| Ocwen Financial Corporation | |
Term Loan, 7.28%, (1 mo. USD LIBOR + 5.00%), Maturing December 5, 2020 | | | | | 2,832 | | | | 2,847,696 | |
| Sesac Holdco II, LLC | |
Term Loan, 5.30%, (1 mo. USD LIBOR + 3.00%), Maturing February 23, 2024 | | | | | 10,428 | | | | 10,415,292 | |
| StepStone Group L.P. | |
Term Loan, 6.29%, (1 mo. USD LIBOR + 4.00%), Maturing March 14, 2025 | | | | | 6,940 | | | | 7,000,851 | |
| | | | |
| | 25 | | See Notes to Financial Statements. |
Eaton Vance
Floating Rate Portfolio
October 31, 2018
Portfolio of Investments — continued
| | | | | | | | | | | | |
| Borrower/Tranche Description | | | | | Principal Amount* (000’s omitted) | | | Value | |
|
| Financial Intermediaries (continued) | |
| Victory Capital Holdings, Inc. | |
Term Loan, 5.14%, (3 mo. USD LIBOR + 2.75%), Maturing February 12, 2025 | | | | | | | 3,942 | | | $ | 3,958,028 | |
| Virtus Investment Partners, Inc. | |
Term Loan, 4.91%, (3 mo. USD LIBOR + 2.50%), Maturing June 1, 2024 | | | | | | | 7,245 | | | | 7,271,984 | |
| Walker & Dunlop, Inc. | |
Term Loan, 5.30%, (1 mo. USD LIBOR + 3.00%), Maturing December 11, 2020 | | | | | | | 11,554 | | | | 11,626,251 | |
| | | | | | | | | | | $ | 317,459,006 | |
|
| Food Products — 3.4% | |
| Alphabet Holding Company, Inc. | |
Term Loan, 5.80%, (1 mo. USD LIBOR + 3.50%), Maturing September 26, 2024 | | | | | | | 36,557 | | | $ | 34,991,993 | |
| Badger Buyer Corp. | |
Term Loan, 5.80%, (1 mo. USD LIBOR + 3.50%), Maturing September 30, 2024 | | | | | | | 5,029 | | | | 5,026,082 | |
| CHG PPC Parent, LLC | |
Term Loan, 5.05%, (1 mo. USD LIBOR + 2.75%), Maturing March 31, 2025 | | | | | | | 8,703 | | | | 8,692,309 | |
| Del Monte Foods, Inc. | |
Term Loan, 5.56%, (3 mo. USD LIBOR + 3.25%), Maturing February 18, 2021 | | | | | | | 26,384 | | | | 23,481,327 | |
| Dole Food Company, Inc. | |
Term Loan, 5.05%, (USD LIBOR + 2.75%), Maturing April 6, 2024(4) | | | | | | | 19,843 | | | | 19,819,821 | |
| Froneri International PLC | |
Term Loan, 2.63%, (3 mo. EURIBOR + 2.63%), Maturing January 22, 2025 | | | EUR | | | | 28,850 | | | | 32,892,859 | |
Term Loan, 3.98%, (1 mo. GBP LIBOR + 3.25%), Maturing January 22, 2025 | | | GBP | | | | 12,010 | | | | 15,450,213 | |
| Hearthside Food Solutions, LLC | |
Term Loan, 5.30%, (1 mo. USD LIBOR + 3.00%), Maturing May 23, 2025 | | | | | | | 10,329 | | | | 10,170,719 | |
| High Liner Foods Incorporated | |
Term Loan, 5.65%, (3 mo. USD LIBOR + 3.25%), Maturing April 24, 2021 | | | | | | | 15,165 | | | | 14,368,488 | |
| HLF Financing S.a.r.l. | |
Term Loan, 5.55%, (1 mo. USD LIBOR + 3.25%), Maturing August 18, 2025 | | | | | | | 16,350 | | | | 16,431,750 | |
| Jacobs Douwe Egberts International B.V. | |
Term Loan, 2.75%, (3 mo. EURIBOR + 2.00%, Floor 0.75%), Maturing July 1, 2022 | | | EUR | | | | 3,602 | | | | 4,105,150 | |
Term Loan, 4.63%, (3 mo. USD LIBOR + 2.25%), Maturing July 1, 2022 | | | | | | | 20,951 | | | | 20,996,351 | |
Term Loan, Maturing November 1, 2025(5) | | | | | | | 9,000 | | | | 9,019,692 | |
| | | | | | | | | | | | |
| Borrower/Tranche Description | | | | | Principal Amount* (000’s omitted) | | | Value | |
|
| Food Products (continued) | |
| JBS USA, LLC | |
Term Loan, 4.84%, (3 mo. USD LIBOR + 2.50%), Maturing October 30, 2022 | | | | | | | 104,702 | | | $ | 104,824,990 | |
| Mastronardi Produce Limited | |
Term Loan, 5.51%, (1 mo. USD LIBOR + 3.25%), Maturing May 1, 2025 | | | | | | | 3,317 | | | | 3,341,563 | |
| Nomad Foods Europe Midco Limited | |
Term Loan, 2.75%, (1 mo. EURIBOR + 2.75%), Maturing May 15, 2024 | | | EUR | | | | 6,800 | | | | 7,755,176 | |
Term Loan, 4.53%, (1 mo. USD LIBOR + 2.25%), Maturing May 15, 2024 | | | | | | | 16,909 | | | | 16,852,144 | |
| Post Holdings, Inc. | |
Term Loan, 4.29%, (1 mo. USD LIBOR + 2.00%), Maturing May 24, 2024 | | | | | | | 12,176 | | | | 12,171,595 | |
| Refresco Group B.V. | |
Term Loan, 3.25%, (3 mo. EURIBOR + 3.25%), Maturing March 28, 2025 | | | EUR | | | | 13,118 | | | | 14,864,892 | |
Term Loan, 4.80%, (3 mo. GBP LIBOR + 4.00%), Maturing March 28, 2025 | | | GBP | | | | 1,500 | | | | 1,915,759 | |
| Restaurant Technologies, Inc. | |
Term Loan, 5.65%, (3 mo. USD LIBOR + 3.25%), Maturing October 1, 2025 | | | | | | | 9,350 | | | | 9,396,750 | |
| Valeo F1 Company Limited (Ireland) | |
Term Loan, 3.75%, (3 mo. EURIBOR + 3.75%), Maturing August 27, 2024 | | | EUR | | | | 6,000 | | | | 6,778,912 | |
| | | | | | | | | | | $ | 393,348,535 | |
|
| Food Service — 1.8% | |
| 1011778 B.C. Unlimited Liability Company | |
Term Loan, 4.55%, (1 mo. USD LIBOR + 2.25%), Maturing February 16, 2024 | | | | | | | 84,725 | | | $ | 84,486,890 | |
| Aramark Services, Inc. | |
Term Loan, 4.05%, (1 mo. USD LIBOR + 1.75%), Maturing March 11, 2025 | | | | | | | 9,606 | | | | 9,624,436 | |
| Del Frisco’s Restaurant Group, Inc. | |
Term Loan, 8.31%, (1 mo. USD LIBOR + 6.00%), Maturing June 27, 2025 | | | | | | | 7,456 | | | | 7,307,186 | |
| Dhanani Group, Inc. | |
Term Loan, 6.05%, (1 mo. USD LIBOR + 3.75%), Maturing July 20, 2025 | | | | | | | 7,307 | | | | 7,279,287 | |
| IRB Holding Corp. | |
Term Loan, 5.46%, (2 mo. USD LIBOR + 3.25%), Maturing February 5, 2025 | | | | | | | 27,566 | | | | 27,576,313 | |
| KFC Holding Co. | |
Term Loan, 4.04%, (1 mo. USD LIBOR + 1.75%), Maturing April 3, 2025 | | | | | | | 20,046 | | | | 20,073,952 | |
| | | | |
| | 26 | | See Notes to Financial Statements. |
Eaton Vance
Floating Rate Portfolio
October 31, 2018
Portfolio of Investments — continued
| | | | | | | | | | | | |
| Borrower/Tranche Description | | | | | Principal Amount* (000’s omitted) | | | Value | |
|
| Food Service (continued) | |
| NPC International, Inc. | |
Term Loan, 5.80%, (1 mo. USD LIBOR + 3.50%), Maturing April 19, 2024 | | | | | | | 8,984 | | | $ | 9,028,688 | |
| Seminole Hard Rock Entertainment, Inc. | |
Term Loan, 5.15%, (3 mo. USD LIBOR + 2.75%), Maturing May 14, 2020 | | | | | | | 3,908 | | | | 3,922,281 | |
| TKC Holdings, Inc. | |
Term Loan, 6.06%, (1 mo. USD LIBOR + 3.75%), Maturing February 1, 2023 | | | | | | | 10,613 | | | | 10,631,948 | |
| US Foods, Inc. | |
Term Loan, 4.30%, (1 mo. USD LIBOR + 2.00%), Maturing June 27, 2023 | | | | | | | 12,329 | | | | 12,325,980 | |
| Welbilt, Inc. | |
Term Loan, 4.78%, (1 mo. USD LIBOR + 2.50%), Maturing October 23, 2025 | | | | | | | 13,716 | | | | 13,715,769 | |
| | | | | | | | | | | $ | 205,972,730 | |
|
| Food / Drug Retailers — 0.9% | |
| Albertsons, LLC | |
Term Loan, 5.05%, (1 mo. USD LIBOR + 2.75%), Maturing August 25, 2021 | | | | | | | 14,664 | | | $ | 14,659,812 | |
Term Loan, 5.38%, (3 mo. USD LIBOR + 3.00%), Maturing December 21, 2022 | | | | | | | 8,588 | | | | 8,576,691 | |
Term Loan, 5.31%, (3 mo. USD LIBOR + 3.00%), Maturing June 22, 2023 | | | | | | | 51,899 | | | | 51,663,884 | |
Term Loan, Maturing October 29, 2025(5) | | | | | | | 2,650 | | | | 2,632,113 | |
| Diplomat Pharmacy, Inc. | |
Term Loan, 6.81%, (1 mo. USD LIBOR + 4.50%), Maturing December 20, 2024 | | | | | | | 5,330 | | | | 5,356,147 | |
| Holland & Barrett International | |
Term Loan, 4.25%, (3 mo. EURIBOR + 4.25%), Maturing August 9, 2024 | | | EUR | | | | 4,675 | | | | 5,151,176 | |
Term Loan, 6.05%, (3 mo. GBP LIBOR + 5.25%), Maturing September 2, 2024 | | | GBP | | | | 11,175 | | | | 13,641,113 | |
| | | | | | | | | | | $ | 101,680,936 | |
|
| Health Care — 8.4% | |
| Acadia Healthcare Company, Inc. | |
Term Loan, 4.80%, (1 mo. USD LIBOR + 2.50%), Maturing February 11, 2022 | | | | | | | 3,054 | | | $ | 3,065,239 | |
| ADMI Corp. | |
Term Loan, 5.30%, (1 mo. USD LIBOR + 3.00%), Maturing April 30, 2025 | | | | | | | 22,718 | | | | 22,806,799 | |
| Akorn, Inc. | |
Term Loan, 7.81%, (1 mo. USD LIBOR + 5.50%), Maturing April 16, 2021 | | | | | | | 17,825 | | | | 16,543,981 | |
| | | | | | | | | | |
| Borrower/Tranche Description | | | | Principal Amount* (000’s omitted) | | | Value | |
|
| Health Care (continued) | |
| Alliance Healthcare Services, Inc. | |
Term Loan, 6.80%, (1 mo. USD LIBOR + 4.50%), Maturing October 24, 2023 | | | | | 11,503 | | | $ | 11,581,580 | |
Term Loan - Second Lien, 12.30%, (1 mo. USD LIBOR + 10.00%), Maturing April 24, 2024 | | | | | 5,575 | | | | 5,588,938 | |
| Argon Medical Devices, Inc. | |
Term Loan, 6.05%, (1 mo. USD LIBOR + 3.75%), Maturing January 23, 2025 | | | | | 7,114 | | | | 7,160,194 | |
| Athletico Management, LLC | |
Term Loan, Maturing October 31,
2025(5) | | | | | 6,900 | | | | 6,934,500 | |
| Auris Luxembourg III S.a.r.l. | |
Term Loan, 3.00%, (3 mo. EURIBOR + 3.00%), Maturing January 17, 2022 | | EUR | | | 2,488 | | | | 2,824,511 | |
Term Loan, 5.39%, (3 mo. USD LIBOR + 3.00%), Maturing January 17, 2022 | | | | | 2,947 | | | | 2,946,701 | |
| Avantor, Inc. | |
Term Loan, 6.30%, (1 mo. USD LIBOR + 4.00%), Maturing November 21, 2024 | | | | | 18,262 | | | | 18,407,530 | |
| BioClinica, Inc. | |
Term Loan, 6.75%, (3 mo. USD LIBOR + 4.25%), Maturing October 20, 2023 | | | | | 10,714 | | | | 10,178,642 | |
| BW NHHC Holdco, Inc. | |
Term Loan, 7.29%, (1 mo. USD LIBOR + 5.00%), Maturing May 15, 2025 | | | | | 11,771 | | | | 11,564,516 | |
| Carestream Dental Equipment, Inc. | |
Term Loan, 5.64%, (3 mo. USD LIBOR + 3.25%), Maturing September 1, 2024 | | | | | 6,143 | | | | 6,119,926 | |
| CHG Healthcare Services, Inc. | |
Term Loan, 5.45%, (USD LIBOR + 3.00%), Maturing June 7, 2023(4) | | | | | 36,550 | | | | 36,716,462 | |
| Community Health Systems, Inc. | |
Term Loan, 5.56%, (3 mo. USD LIBOR + 3.25%), Maturing January 27, 2021 | | | | | 15,985 | | | | 15,692,159 | |
| Concentra, Inc. | |
Term Loan, 5.03%, (1 mo. USD LIBOR + 2.75%), Maturing June 1, 2022 | | | | | 10,800 | | | | 10,840,824 | |
| Convatec, Inc. | |
Term Loan, 4.64%, (3 mo. USD LIBOR + 2.25%), Maturing October 31, 2023 | | | | | 5,688 | | | | 5,729,263 | |
| CPI Holdco, LLC | |
Term Loan, 5.89%, (3 mo. USD LIBOR + 3.50%), Maturing March 21, 2024 | | | | | 11,276 | | | | 11,346,579 | |
| CryoLife, Inc. | |
Term Loan, 5.64%, (3 mo. USD LIBOR + 3.25%), Maturing November 14, 2024 | | | | | 5,533 | | | | 5,581,603 | |
| CTC AcquiCo GmbH | |
Term Loan, 3.00%, (3 mo. EURIBOR + 3.00%), Maturing March 7, 2025 | | EUR | | | 11,928 | | | | 13,528,709 | |
| | | | |
| | 27 | | See Notes to Financial Statements. |
Eaton Vance
Floating Rate Portfolio
October 31, 2018
Portfolio of Investments — continued
| | | | | | | | | | |
| Borrower/Tranche Description | | | | Principal Amount* (000’s omitted) | | | Value | |
|
| Health Care (continued) | |
| DJO Finance, LLC | |
Term Loan, 5.60%, (USD LIBOR + 3.25%), Maturing June 8, 2020(4) | | | | | 25,682 | | | $ | 25,660,011 | |
| Elsan SAS | |
Term Loan, 3.75%, (1 mo. EURIBOR + 3.75%), Maturing October 31, 2022 | | EUR | | | 8,500 | | | | 9,733,161 | |
| Envision Healthcare Corporation | |
Term Loan, 6.05%, (1 mo. USD LIBOR + 3.75%), Maturing October 10, 2025 | | | | | 57,850 | | | | 56,769,304 | |
| Equian, LLC | |
Term Loan, 5.54%, (1 mo. USD LIBOR + 3.25%), Maturing May 20, 2024 | | | | | 11,313 | | | | 11,323,871 | |
| Gentiva Health Services, Inc. | |
Term Loan, 6.06%, (1 mo. USD LIBOR + 3.75%), Maturing July 2, 2025 | | | | | 26,555 | | | | 26,653,781 | |
| GHX Ultimate Parent Corporation | |
Term Loan, 5.64%, (3 mo. USD LIBOR + 3.25%), Maturing June 28, 2024 | | | | | 10,424 | | | | 10,423,611 | |
| Greatbatch Ltd. | |
Term Loan, 5.28%, (1 mo. USD LIBOR + 3.00%), Maturing October 27, 2022 | | | | | 10,600 | | | | 10,653,672 | |
| Grifols Worldwide Operations USA, Inc. | |
Term Loan, 4.47%, (1 week USD LIBOR + 2.25%), Maturing January 31, 2025 | | | | | 42,907 | | | | 42,989,735 | |
| Hanger, Inc. | |
Term Loan, 5.80%, (1 mo. USD LIBOR + 3.50%), Maturing March 6, 2025 | | | | | 12,089 | | | | 12,074,138 | |
| HCA, Inc. | |
Term Loan, 4.30%, (1 mo. USD LIBOR + 2.00%), Maturing March 13, 2025 | | | | | 4,080 | | | | 4,103,581 | |
| Indivior Finance S.a.r.l. | |
Term Loan, 7.03%, (3 mo. USD LIBOR + 4.50%), Maturing December 18, 2022 | | | | | 9,056 | | | | 9,032,989 | |
| Inovalon Holdings, Inc. | |
Term Loan, 5.81%, (1 mo. USD LIBOR + 3.50%), Maturing April 2, 2025 | | | | | 16,139 | | | | 16,139,438 | |
| IQVIA, Inc. | |
Term Loan, 4.39%, (3 mo. USD LIBOR + 2.00%), Maturing March 7, 2024 | | | | | 9,675 | | | | 9,708,769 | |
Term Loan, 4.39%, (3 mo. USD LIBOR + 2.00%), Maturing January 17, 2025 | | | | | 12,548 | | | | 12,585,506 | |
| Kinetic Concepts, Inc. | |
Term Loan, 5.64%, (3 mo. USD LIBOR + 3.25%), Maturing February 2, 2024 | | | | | 27,502 | | | | 27,636,524 | |
| KUEHG Corp. | |
Term Loan, 6.14%, (3 mo. USD LIBOR + 3.75%), Maturing February 21, 2025 | | | | | 38,501 | | | | 38,744,900 | |
Term Loan - Second Lien, 10.64%, (3 mo. USD LIBOR + 8.25%), Maturing August 18, 2025 | | | | | 4,425 | | | | 4,491,375 | |
| | | | | | | | | | |
| Borrower/Tranche Description | | | | Principal Amount* (000’s omitted) | | | Value | |
|
| Health Care (continued) | |
| Medical Solutions, LLC | |
Term Loan, 6.05%, (1 mo. USD LIBOR + 3.75%), Maturing June 9, 2024 | | | | | 8,407 | | | $ | 8,431,018 | |
| MedPlast Holdings, Inc. | |
Term Loan, 6.15%, (3 mo. USD LIBOR + 3.75%), Maturing July 2, 2025 | | | | | 7,225 | | | | 7,283,703 | |
| MPH Acquisition Holdings, LLC | |
Term Loan, 5.14%, (3 mo. USD LIBOR + 2.75%), Maturing June 7, 2023 | | | | | 49,976 | | | | 49,933,374 | |
| National Mentor Holdings, Inc. | |
Term Loan, 5.39%, (3 mo. USD LIBOR + 3.00%), Maturing January 31, 2021 | | | | | 5,306 | | | | 5,305,900 | |
| Navicure, Inc. | |
Term Loan, 6.05%, (1 mo. USD LIBOR + 3.75%), Maturing November 1, 2024 | | | | | 8,842 | | | | 8,878,823 | |
| New Millennium Holdco, Inc. | |
Term Loan, 8.80%, (1 mo. USD LIBOR + 6.50%), Maturing December 21, 2020 | | | | | 3,250 | | | | 1,787,228 | |
| One Call Corporation | |
Term Loan, 7.53%, (1 mo. USD LIBOR + 5.25%), Maturing November 25, 2022 | | | | | 20,649 | | | | 19,435,476 | |
| Ortho-Clinical Diagnostics S.A. | |
Term Loan, 5.54%, (1 mo. USD LIBOR + 3.25%), Maturing June 30, 2025 | | | | | 51,798 | | | | 51,684,402 | |
| Parexel International Corporation | |
Term Loan, 5.05%, (1 mo. USD LIBOR + 2.75%), Maturing September 27, 2024 | | | | | 36,115 | | | | 35,685,887 | |
| Press Ganey Holdings, Inc. | |
Term Loan, 5.05%, (1 mo. USD LIBOR + 2.75%), Maturing October 23, 2023 | | | | | 13,121 | | | | 13,151,112 | |
| Prospect Medical Holdings, Inc. | |
Term Loan, 7.81%, (1 mo. USD LIBOR + 5.50%), Maturing February 22, 2024 | | | | | 13,358 | | | | 13,433,013 | |
| R1 RCM, Inc. | |
Term Loan, 7.65%, (3 mo. USD LIBOR + 5.25%), Maturing May 8, 2025 | | | | | 6,758 | | | | 6,758,063 | |
| RadNet, Inc. | |
Term Loan, 6.22%, (3 mo. USD LIBOR + 3.75%), Maturing June 30, 2023 | | | | | 15,148 | | | | 15,223,499 | |
| Select Medical Corporation | |
Term Loan, 4.78%, (1 mo. USD LIBOR + 2.50%), Maturing March 6, 2025 | | | | | 22,262 | | | | 22,362,305 | |
| Sotera Health Holdings, LLC | |
Term Loan, 5.30%, (1 mo. USD LIBOR + 3.00%), Maturing May 15, 2022 | | | | | 13,887 | | | | 13,912,784 | |
| Sound Inpatient Physicians | |
Term Loan, 5.30%, (1 mo. USD LIBOR + 3.00%), Maturing June 27, 2025 | | | | | 5,636 | | | | 5,649,965 | |
| | | | |
| | 28 | | See Notes to Financial Statements. |
Eaton Vance
Floating Rate Portfolio
October 31, 2018
Portfolio of Investments — continued
| | | | | | | | | | | | |
| Borrower/Tranche Description | | | | | Principal Amount* (000’s omitted) | | | Value | |
|
| Health Care (continued) | |
| Surgery Center Holdings, Inc. | |
Term Loan, 5.57%, (3 mo. USD LIBOR + 3.25%), Maturing September 2, 2024 | | | | | | | 18,884 | | | $ | 18,872,447 | |
| Syneos Health, Inc. | |
Term Loan, 4.30%, (1 mo. USD LIBOR + 2.00%), Maturing August 1, 2024 | | | | | | | 4,105 | | | | 4,103,744 | |
| Team Health Holdings, Inc. | |
Term Loan, 5.05%, (1 mo. USD LIBOR + 2.75%), Maturing February 6, 2024 | | | | | | | 41,470 | | | | 39,344,593 | |
| Tecomet, Inc. | |
Term Loan, 5.78%, (1 mo. USD LIBOR + 3.50%), Maturing May 1, 2024 | | | | | | | 8,616 | | | | 8,644,205 | |
| U.S. Anesthesia Partners, Inc. | |
Term Loan, 5.30%, (1 mo. USD LIBOR + 3.00%), Maturing June 23, 2024 | | | | | | | 15,862 | | | | 15,911,969 | |
| Universal Health Services, Inc. | |
Term Loan, Maturing October 18, 2025(5) | | | | | | | 5,600 | | | | 5,628,000 | |
| Universal Hospital Services, Inc. | |
Term Loan, Maturing October 18, 2025(5) | | | | | | | 5,750 | | | | 5,793,125 | |
| Verscend Holding Corp. | |
Term Loan, 6.80%, (1 mo. USD LIBOR + 4.50%), Maturing August 27, 2025 | | | | | | | 26,200 | | | | 26,412,875 | |
| Wink Holdco, Inc. | |
Term Loan, 5.30%, (1 mo. USD LIBOR + 3.00%), Maturing December 2, 2024 | | | | | | | 5,260 | | | | 5,256,962 | |
| | | | | | | | | | | $ | 962,767,494 | |
|
| Home Furnishings — 0.6% | |
| Bright Bidco B.V. | |
Term Loan, 5.86%, (USD LIBOR + 3.50%), Maturing June 30, 2024(4) | | | | | | | 18,386 | | | $ | 18,052,908 | |
| Serta Simmons Bedding, LLC | |
Term Loan, 5.77%, (1 mo. USD LIBOR + 3.50%), Maturing November 8, 2023 | | | | | | | 56,548 | | | | 51,416,212 | |
| | | | | | | | | | | $ | 69,469,120 | |
|
| Industrial Equipment — 3.9% | |
| AL Alpine AT Bidco GmbH | |
Term Loan, Maturing September 30, 2025(5) | | | | | | | 2,875 | | | $ | 2,882,187 | |
Term Loan, Maturing September 30, 2025(5) | | | EUR | | | | 5,500 | | | | 6,270,069 | |
| Altra Industrial Motion Corp. | |
Term Loan, 4.30%, (1 mo. USD LIBOR + 2.00%), Maturing October 1, 2025 | | | | | | | 9,425 | | | | 9,413,219 | |
| Apex Tool Group, LLC | |
Term Loan, 6.05%, (1 mo. USD LIBOR + 3.75%), Maturing February 1, 2022 | | | | | | | 27,384 | | | | 27,068,905 | |
| | | | | | | | | | |
| Borrower/Tranche Description | | | | Principal Amount* (000’s omitted) | | | Value | |
|
| Industrial Equipment (continued) | |
| CFSP Acquisition Corp. | |
Term Loan, 1.00%, Maturing March 20, 2025(2) | | | | | 1,031 | | | $ | 1,022,945 | |
Term Loan, 5.29%, (1 mo. USD LIBOR + 3.00%), Maturing March 20, 2025 | | | | | 4,546 | | | | 4,512,380 | |
| Clark Equipment Company | |
Term Loan, 4.38%, (USD LIBOR + 2.00%), Maturing May 18, 2024(4) | | | | | 21,386 | | | | 21,346,022 | |
| Delachaux S.A. | |
Term Loan, 3.75%, (3 mo. EURIBOR + 3.75%), Maturing October 28, 2021 | | EUR | | | 3,000 | | | | 3,438,302 | |
Term Loan, 5.89%, (3 mo. USD LIBOR + 3.50%), Maturing October 28, 2021 | | | | | 7,407 | | | | 7,462,972 | |
| DexKo Global, Inc. | |
Term Loan, 3.75%, (3 mo. EURIBOR + 3.75%), Maturing July 24, 2024 | | EUR | | | 3,001 | | | | 3,424,725 | |
Term Loan, 3.75%, (3 mo. EURIBOR + 3.75%), Maturing July 24, 2024 | | EUR | | | 7,502 | | | | 8,561,813 | |
Term Loan, 5.80%, (1 mo. USD LIBOR + 3.50%), Maturing July 24, 2024 | | | | | 12,144 | | | | 12,192,468 | |
| DXP Enterprises, Inc. | |
Term Loan, 7.05%, (1 mo. USD LIBOR + 4.75%), Maturing August 29, 2023 | | | | | 5,742 | | | | 5,785,065 | |
| Engineered Machinery Holdings, Inc. | |
Term Loan, 5.64%, (3 mo. USD LIBOR + 3.25%), Maturing July 19, 2024 | | | | | 9,512 | | | | 9,432,526 | |
| EWT Holdings III Corp. | |
Term Loan, 5.30%, (1 mo. USD LIBOR + 3.00%), Maturing December 20, 2024 | | | | | 28,309 | | | | 28,273,246 | |
| Filtration Group Corporation | |
Term Loan, 3.50%, (3 mo. EURIBOR + 3.50%), Maturing March 29, 2025 | | EUR | | | 4,403 | | | | 5,022,240 | |
Term Loan, 5.30%, (1 mo. USD LIBOR + 3.00%), Maturing March 29, 2025 | | | | | 21,815 | | | | 21,933,549 | |
| Gardner Denver, Inc. | |
Term Loan, 3.00%, (1 mo. EURIBOR + 3.00%), Maturing July 30, 2024 | | EUR | | | 6,269 | | | | 7,138,544 | |
Term Loan, 5.05%, (1 mo. USD LIBOR + 2.75%), Maturing July 30, 2024 | | | | | 11,651 | | | | 11,695,888 | |
| Gates Global, LLC | |
Term Loan, 3.00%, (3 mo. EURIBOR + 3.00%), Maturing April 1, 2024 | | EUR | | | 9,530 | | | | 10,826,052 | |
Term Loan, 5.05%, (1 mo. USD LIBOR + 2.75%), Maturing April 1, 2024 | | | | | 38,250 | | | | 38,359,648 | |
| Hamilton Holdco, LLC | |
Term Loan, 4.40%, (3 mo. USD LIBOR + 2.00%), Maturing July 2, 2025 | | | | | 9,950 | | | | 9,959,396 | |
| | | | |
| | 29 | | See Notes to Financial Statements. |
Eaton Vance
Floating Rate Portfolio
October 31, 2018
Portfolio of Investments — continued
| | | | | | | | | | | | |
| Borrower/Tranche Description | | | | | Principal Amount* (000’s omitted) | | | Value | |
|
| Industrial Equipment (continued) | |
| Harsco Corporation | |
Term Loan, 4.56%, (1 mo. USD LIBOR + 2.25%), Maturing December 6, 2024 | | | | | | | 3,630 | | | $ | 3,647,412 | |
| Hayward Industries, Inc. | |
Term Loan, 5.79%, (1 mo. USD LIBOR + 3.50%), Maturing August 5, 2024 | | | | | | | 4,950 | | | | 4,983,259 | |
| LTI Holdings, Inc. | |
Term Loan, 5.80%, (1 mo. USD LIBOR + 3.50%), Maturing September 6, 2025 | | | | | | | 5,900 | | | | 5,903,687 | |
| Milacron, LLC | |
Term Loan, 4.80%, (1 mo. USD LIBOR + 2.50%), Maturing September 28, 2023 | | | | | | | 28,781 | | | | 28,844,334 | |
| Minimax GmbH & Co. KG | |
Term Loan, 3.25%, (1 mo. EURIBOR + 3.25%), Maturing July 31, 2025 | | | EUR | | | | 3,475 | | | | 3,979,535 | |
Term Loan, 5.30%, (1 mo. USD LIBOR + 3.00%), Maturing July 31, 2025 | | | | | | | 5,075 | | | | 5,106,719 | |
| Paladin Brands Holding, Inc. | |
Term Loan, 7.89%, (3 mo. USD LIBOR + 5.50%), Maturing August 15, 2022 | | | | | | | 13,783 | | | | 13,834,355 | |
| Pro Mach Group, Inc. | |
Term Loan, 5.28%, (1 mo. USD LIBOR + 3.00%), Maturing March 7, 2025 | | | | | | | 2,662 | | | | 2,653,307 | |
| Rexnord, LLC | |
Term Loan, 4.29%, (1 mo. USD LIBOR + 2.00%), Maturing August 21, 2024 | | | | | | | 23,084 | | | | 23,148,608 | |
| Robertshaw US Holding Corp. | |
Term Loan, 5.81%, (1 mo. USD LIBOR + 3.50%), Maturing February 28, 2025 | | | | | | | 22,934 | | | | 22,704,630 | |
| Shape Technologies Group, Inc. | |
Term Loan, 5.30%, (USD LIBOR + 3.00%), Maturing April 20,
2025(4) | | | | | | | 9,900 | | | | 9,894,000 | |
| Tank Holding Corp. | |
Term Loan, 5.81%, (USD LIBOR + 3.50%), Maturing March 17, 2022(4) | | | | | | | 8,365 | | | | 8,392,337 | |
| Terex Corporation | |
Term Loan, 4.29%, (2 mo. USD LIBOR + 2.00%), Maturing January 31, 2024 | | | | | | | 2,955 | | | | 2,951,306 | |
| Thermon Industries, Inc. | |
Term Loan, 6.01%, (1 mo. USD LIBOR + 3.75%), Maturing October 24, 2024 | | | | | | | 3,654 | | | | 3,681,481 | |
| Titan Acquisition Limited | |
Term Loan, 5.30%, (1 mo. USD LIBOR + 3.00%), Maturing March 28, 2025 | | | | | | | 36,417 | | | | 34,383,730 | |
| Wittur GmbH | |
Term Loan, 5.00%, (3 mo. EURIBOR + 4.00%, Floor 1.00%), Maturing March 31, 2022 | | | EUR | | | | 14,300 | | | | 16,389,238 | |
| | | | | | | | | | | $ | 446,520,099 | |
| | | | | | | | | | | | |
| Borrower/Tranche Description | | | | | Principal Amount* (000’s omitted) | | | Value | |
|
| Insurance — 2.8% | |
| Alliant Holdings I, Inc. | |
Term Loan, 5.28%, (1 mo. USD LIBOR + 3.00%), Maturing May 9, 2025 | | | | | | | 26,870 | | | $ | 26,876,246 | |
| AmWINS Group, Inc. | |
Term Loan, 5.05%, (1 mo. USD LIBOR + 2.75%), Maturing January 25, 2024 | | | | | | | 36,969 | | | | 37,108,065 | |
| Asurion, LLC | |
Term Loan, 5.30%, (1 mo. USD LIBOR + 3.00%), Maturing August 4, 2022 | | | | | | | 28,197 | | | | 28,275,965 | |
Term Loan, 5.30%, (1 mo. USD LIBOR + 3.00%), Maturing November 3, 2023 | | | | | | | 33,383 | | | | 33,466,785 | |
Term Loan, 5.30%, (1 mo. USD LIBOR + 3.00%), Maturing November 3, 2024 | | | | | | | 2,244 | | | | 2,250,547 | |
Term Loan - Second Lien, 8.80%, (1 mo. USD LIBOR + 6.50%), Maturing August 4, 2025 | | | | | | | 28,975 | | | | 29,789,922 | |
| Financiere CEP SAS | |
Term Loan, 4.25%, (3 mo. EURIBOR + 4.25%), Maturing January 16, 2025 | | | EUR | | | | 5,725 | | | | 6,461,728 | |
| FrontDoor, Inc. | |
Term Loan, 4.81%, (1 mo. USD LIBOR + 2.50%), Maturing August 14, 2025 | | | | | | | 5,675 | | | | 5,717,562 | |
| Hub International Limited | |
Term Loan, 5.49%, (3 mo. USD LIBOR + 3.00%), Maturing April 25, 2025 | | | | | | | 57,506 | | | | 57,444,286 | |
| NFP Corp. | |
Term Loan, 5.30%, (1 mo. USD LIBOR + 3.00%), Maturing January 8, 2024 | | | | | | | 39,637 | | | | 39,567,338 | |
| Sedgwick Claims Management Services, Inc. | |
Term Loan, 5.05%, (1 mo. USD LIBOR + 2.75%), Maturing March 1, 2021 | | | | | | | 12,336 | | | | 12,348,796 | |
| USI, Inc. | |
Term Loan, 5.39%, (3 mo. USD LIBOR + 3.00%), Maturing May 16, 2024 | | | | | | | 37,627 | | | | 37,457,272 | |
| | | | | | | | | | | $ | 316,764,512 | |
|
| Leisure Goods / Activities / Movies — 3.3% | |
| AMC Entertainment Holdings, Inc. | |
Term Loan, 4.53%, (1 mo. USD LIBOR + 2.25%), Maturing December 15, 2023 | | | | | | | 9,999 | | | $ | 10,015,201 | |
| Ancestry.com Operations, Inc. | |
Term Loan, 5.55%, (1 mo. USD LIBOR + 3.25%), Maturing October 19, 2023 | | | | | | | 47,618 | | | | 47,796,818 | |
| Bombardier Recreational Products, Inc. | |
Term Loan, 4.30%, (1 mo. USD LIBOR + 2.00%), Maturing May 23, 2025 | | | | | | | 43,993 | | | | 43,947,557 | |
| Bright Horizons Family Solutions, Inc. | |
Term Loan, 4.05%, (1 mo. USD LIBOR + 1.75%), Maturing November 7, 2023 | | | | | | | 10,466 | | | | 10,483,615 | |
| | | | |
| | 30 | | See Notes to Financial Statements. |
Eaton Vance
Floating Rate Portfolio
October 31, 2018
Portfolio of Investments — continued
| | | | | | | | | | |
| Borrower/Tranche Description | | | | Principal Amount* (000’s omitted) | | | Value | |
|
| Leisure Goods / Activities / Movies (continued) | |
| CDS U.S. Intermediate Holdings, Inc. | |
Term Loan, 6.14%, (3 mo. USD LIBOR + 3.75%), Maturing July 8, 2022 | | | | | 10,514 | | | $ | 10,401,160 | |
| ClubCorp Holdings, Inc. | |
Term Loan, 5.14%, (3 mo. USD LIBOR + 2.75%), Maturing September 18, 2024 | | | | | 21,148 | | | | 20,848,831 | |
| Crown Finance US, Inc. | |
Term Loan, 2.63%, (1 mo. EURIBOR + 2.63%), Maturing February 28, 2025 | | EUR | | | 9,652 | | | | 10,978,235 | |
Term Loan, 4.80%, (1 mo. USD LIBOR + 2.50%), Maturing February 28, 2025 | | | | | 25,333 | | | | 25,260,618 | |
| Delta 2 (LUX) S.a.r.l. | |
Term Loan, 4.80%, (1 mo. USD LIBOR + 2.50%), Maturing February 1, 2024 | | | | | 33,135 | | | | 32,828,763 | |
| Emerald Expositions Holding, Inc. | |
Term Loan, 5.05%, (1 mo. USD LIBOR + 2.75%), Maturing May 22, 2024 | | | | | 18,842 | | | | 18,841,536 | |
| Etraveli Holding AB | |
Term Loan, 4.50%, (3 mo. EURIBOR + 4.50%), Maturing August 2, 2024 | | EUR | | | 8,800 | | | | 10,054,537 | |
| Lindblad Expeditions, Inc. | |
Term Loan, 5.80%, (1 mo. USD LIBOR + 3.50%), Maturing March 21, 2025 | | | | | 278 | | | | 280,827 | |
Term Loan, 5.80%, (1 mo. USD LIBOR + 3.50%), Maturing March 21, 2025 | | | | | 2,154 | | | | 2,176,412 | |
| Live Nation Entertainment, Inc. | |
Term Loan, 4.06%, (1 mo. USD LIBOR + 1.75%), Maturing October 31, 2023 | | | | | 42,417 | | | | 42,529,245 | |
| Match Group, Inc. | |
Term Loan, 4.78%, (1 mo. USD LIBOR + 2.50%), Maturing November 16, 2022 | | | | | 7,797 | | | | 7,855,352 | |
| Sabre GLBL, Inc. | |
Term Loan, 4.30%, (1 mo. USD LIBOR + 2.00%), Maturing February 22, 2024 | | | | | 995 | | | | 995,964 | |
| SeaWorld Parks & Entertainment, Inc. | |
Term Loan, 5.30%, (1 mo. USD LIBOR + 3.00%), Maturing March 31, 2024 | | | | | 21,259 | | | | 21,258,584 | |
| SRAM, LLC | |
Term Loan, 5.10%, (2 mo. USD LIBOR + 2.75%), Maturing March 15, 2024 | | | | | 22,639 | | | | 22,695,349 | |
| Steinway Musical Instruments, Inc. | |
Term Loan, 6.03%, (1 mo. USD LIBOR + 3.75%), Maturing February 13, 2025 | | | | | 9,826 | | | | 9,837,907 | |
| Travel Leaders Group, LLC | |
Term Loan, 6.29%, (1 mo. USD LIBOR + 4.00%), Maturing January 25, 2024 | | | | | 11,372 | | | | 11,506,537 | |
| | | | | | | | | | | | |
| Borrower/Tranche Description | | | | | Principal Amount* (000’s omitted) | | | Value | |
|
| Leisure Goods / Activities / Movies (continued) | |
| UFC Holdings, LLC | |
Term Loan, 5.56%, (1 mo. USD LIBOR + 3.25%), Maturing August 18, 2023 | | | | | | | 15,484 | | | $ | 15,591,831 | |
| | | | | | | | | | | $ | 376,184,879 | |
|
| Lodging and Casinos — 4.0% | |
| Aristocrat Technologies, Inc. | |
Term Loan, 4.22%, (3 mo. USD LIBOR + 1.75%), Maturing October 19, 2024 | | | | | | | 14,979 | | | $ | 14,943,821 | |
| Azelis Finance S.A. | |
Term Loan, Maturing July 31, 2025(5) | | | EUR | | | | 4,600 | | | | 5,272,604 | |
| Boyd Gaming Corporation | |
Term Loan, 4.47%, (1 week USD LIBOR + 2.25%), Maturing September 15, 2023 | | | | | | | 12,113 | | | | 12,148,608 | |
| Churchill Downs Incorporated | |
Term Loan, 4.31%, (1 mo. USD LIBOR + 2.00%), Maturing December 27, 2024 | | | | | | | 3,474 | | | | 3,486,777 | |
| CityCenter Holdings, LLC | |
Term Loan, 4.55%, (1 mo. USD LIBOR + 2.25%), Maturing April 18, 2024 | | | | | | | 40,326 | | | | 40,294,100 | |
| Eldorado Resorts, LLC | |
Term Loan, 4.56%, (1 mo. USD LIBOR + 2.25%), Maturing April 17, 2024 | | | | | | | 11,596 | | | | 11,625,461 | |
| ESH Hospitality, Inc. | |
Term Loan, 4.30%, (1 mo. USD LIBOR + 2.00%), Maturing August 30, 2023 | | | | | | | 26,492 | | | | 26,510,745 | |
| Four Seasons Hotels Limited | |
Term Loan, 4.30%, (1 mo. USD LIBOR + 2.00%), Maturing November 30, 2023 | | | | | | | 9,137 | | | | 9,145,821 | |
| Global Business Travel Holdings Limited | |
Term Loan, 4.84%, (3 mo. USD LIBOR + 2.50%), Maturing July 20, 2025 | | | | | | | 3,000 | | | | 3,022,500 | |
| Golden Nugget, Inc. | |
Term Loan, 5.23%, (USD LIBOR + 2.75%), Maturing October 4,
2023(4) | | | | | | | 45,242 | | | | 45,393,666 | |
| GVC Holdings PLC | |
Term Loan, 2.75%, (3 mo. EURIBOR + 2.75%), Maturing March 29, 2024 | | | EUR | | | | 16,575 | | | | 18,869,688 | |
Term Loan, 4.30%, (3 mo. GBP LIBOR + 3.50%), Maturing March 29, 2024 | | | GBP | | | | 7,500 | | | | 9,635,432 | |
Term Loan, 4.80%, (1 mo. USD LIBOR + 2.50%), Maturing March 29, 2024 | | | | | | | 12,537 | | | | 12,560,507 | |
| Hanjin International Corp. | |
Term Loan, 4.94%, (3 mo. USD LIBOR + 2.50%), Maturing October 18, 2020 | | | | | | | 5,650 | | | | 5,650,000 | |
| Hilton Worldwide Finance, LLC | |
Term Loan, 4.03%, (1 mo. USD LIBOR + 1.75%), Maturing October 25, 2023 | | | | | | | 47,618 | | | | 47,710,115 | |
| | | | |
| | 31 | | See Notes to Financial Statements. |
Eaton Vance
Floating Rate Portfolio
October 31, 2018
Portfolio of Investments — continued
| | | | | | | | | | | | |
| Borrower/Tranche Description | | | | | Principal Amount* (000’s omitted) | | | Value | |
|
| Lodging and Casinos (continued) | |
| Hospitality Investors Trust | |
Term Loan, 5.29%, (1 mo. USD LIBOR + 3.00%), Maturing May 1, 2019 | | | | | | | 5,100 | | | $ | 5,085,210 | |
| Las Vegas Sands, LLC | |
Term Loan, 4.05%, (1 mo. USD LIBOR + 1.75%), Maturing March 27, 2025 | | | | | | | 17,085 | | | | 17,047,045 | |
| MGM Growth Properties Operating Partnership L.P. | |
Term Loan, 4.30%, (1 mo. USD LIBOR + 2.00%), Maturing March 21, 2025 | | | | | | | 29,030 | | | | 28,975,929 | |
| Playa Resorts Holding B.V. | |
Term Loan, 5.05%, (1 mo. USD LIBOR + 2.75%), Maturing April 29, 2024 | | | | | | | 28,083 | | | | 27,713,996 | |
| Richmond UK Bidco Limited | |
Term Loan, 4.98%, (1 mo. GBP LIBOR + 4.25%), Maturing March 3, 2024 | | | GBP | | | | 2,914 | | | | 3,629,751 | |
| Stars Group Holdings B.V. (The) | |
Term Loan, 3.75%, (3 mo. EURIBOR + 3.75%), Maturing July 10, 2025 | | | EUR | | | | 11,225 | | | | 12,863,657 | |
Term Loan, 5.89%, (3 mo. USD LIBOR + 3.50%), Maturing July 10, 2025 | | | | | | | 54,189 | | | | 54,426,265 | |
| VICI Properties 1, LLC | |
Term Loan, 4.28%, (1 mo. USD LIBOR + 2.00%), Maturing December 20, 2024 | | | | | | | 25,293 | | | | 25,265,511 | |
| Wyndham Hotels & Resorts, Inc. | |
Term Loan, 4.05%, (1 mo. USD LIBOR + 1.75%), Maturing May 30, 2025 | | | | | | | 14,900 | | | | 14,913,037 | |
| | | | | | | | | | | $ | 456,190,246 | |
|
| Nonferrous Metals / Minerals — 0.6% | |
| CD&R Hydra Buyer, Inc. | |
Term Loan, 7.50%, (0.00% Cash, 7.50% PIK), Maturing August 15, 2021(3)(7) | | | | | | | 561 | | | $ | 478,401 | |
| Dynacast International, LLC | |
Term Loan, 5.64%, (3 mo. USD LIBOR + 3.25%), Maturing January 28, 2022 | | | | | | | 14,797 | | | | 14,833,648 | |
| Murray Energy Corporation | |
Term Loan, 9.78%, (3 mo. USD LIBOR + 7.25%), Maturing October 17, 2022 | | | | | | | 22,036 | | | | 20,089,883 | |
| Noranda Aluminum Acquisition Corporation | |
Term Loan, 0.00%, Maturing February 28, 2019(3)(6) | | | | | | | 2,878 | | | | 221,866 | |
| Oxbow Carbon, LLC | |
Term Loan, 5.80%, (1 mo. USD LIBOR + 3.50%), Maturing January 4, 2023 | | | | | | | 7,098 | | | | 7,125,057 | |
Term Loan - Second Lien, 9.80%, (1 mo. USD LIBOR + 7.50%), Maturing January 4, 2024 | | | | | | | 8,500 | | | | 8,691,250 | |
| | | | | | | | | | | | |
| Borrower/Tranche Description | | | | | Principal Amount* (000’s omitted) | | | Value | |
|
| Nonferrous Metals / Minerals (continued) | |
| Rain Carbon GmbH | |
Term Loan, 2.75%, (6 mo. EURIBOR + 2.75%), Maturing January 16, 2025 | | | EUR | | | | 15,625 | | | $ | 17,794,999 | |
| | | | | | | | | | | $ | 69,235,104 | |
|
| Oil and Gas — 1.8% | |
| Ameriforge Group, Inc. | |
Term Loan, 9.39%, (3 mo. USD LIBOR + 7.00%), Maturing June 8, 2022 | | | | | | | 21,660 | | | $ | 21,822,267 | |
| Apergy Corporation | |
Term Loan, 4.81%, (1 mo. USD LIBOR + 2.50%), Maturing May 9, 2025 | | | | | | | 3,926 | | | | 3,934,383 | |
| BCP Raptor, LLC | |
Term Loan, 6.64%, (2 mo. USD LIBOR + 4.25%), Maturing June 24, 2024 | | | | | | | 4,707 | | | | 4,658,400 | |
| Centurion Pipeline Company, LLC | |
Term Loan, 5.64%, (3 mo. USD LIBOR + 3.25%), Maturing September 29, 2025 | | | | | | | 3,225 | | | | 3,253,219 | |
| CITGO Petroleum Corporation | |
Revolving Loan, 0.51%, Maturing July 23, 2019(2) | | | | | | | 12,500 | | | | 12,418,750 | |
Term Loan, 5.90%, (3 mo. USD LIBOR + 3.50%), Maturing July 29, 2021 | | | | | | | 15,600 | | | | 15,612,995 | |
| Delek US Holdings, Inc. | |
Term Loan, 4.55%, (1 mo. USD LIBOR + 2.25%), Maturing March 31, 2025 | | | | | | | 5,303 | | | | 5,310,004 | |
| Fieldwood Energy, LLC | |
Term Loan, 7.55%, (1 mo. USD LIBOR + 5.25%), Maturing April 11, 2022 | | | | | | | 25,506 | | | | 25,728,777 | |
Term Loan - Second Lien, 9.55%, (1 mo. USD LIBOR + 7.25%), Maturing April 11, 2023 | | | | | | | 2,952 | | | | 2,826,402 | |
| Green Plains Renewable Energy, Inc. | |
Term Loan, 7.81%, (1 mo. USD LIBOR + 5.50%), Maturing August 18, 2023 | | | | | | | 11,212 | | | | 11,342,558 | |
| McDermott Technology Americas, Inc. | |
Term Loan, 7.30%, (1 mo. USD LIBOR + 5.00%), Maturing May 10, 2025 | | | | | | | 14,229 | | | | 14,128,901 | |
| Medallion Midland Acquisition, LLC | |
Term Loan, 5.55%, (1 mo. USD LIBOR + 3.25%), Maturing October 30, 2024 | | | | | | | 1,925 | | | | 1,912,156 | |
| MEG Energy Corp. | |
Term Loan, 5.81%, (1 mo. USD LIBOR + 3.50%), Maturing December 31, 2023 | | | | | | | 9,748 | | | | 9,782,133 | |
| PSC Industrial Holdings Corp. | |
Term Loan, 6.04%, (1 mo. USD LIBOR + 3.75%), Maturing October 3, 2024 | | | | | | | 9,305 | | | | 9,327,949 | |
| | | | |
| | 32 | | See Notes to Financial Statements. |
Eaton Vance
Floating Rate Portfolio
October 31, 2018
Portfolio of Investments — continued
| | | | | | | | | | | | |
| Borrower/Tranche Description | | | | | Principal Amount* (000’s omitted) | | | Value | |
|
| Oil and Gas (continued) | |
| Sheridan Investment Partners II L.P. | |
Term Loan, 5.82%, (3 mo. USD LIBOR + 3.50%), Maturing December 16, 2020 | | | | | | | 938 | | | $ | 850,796 | |
Term Loan, 5.82%, (3 mo. USD LIBOR + 3.50%), Maturing December 16, 2020 | | | | | | | 2,514 | | | | 2,281,289 | |
Term Loan, 5.82%, (3 mo. USD LIBOR + 3.50%), Maturing December 16, 2020 | | | | | | | 18,071 | | | | 16,399,503 | |
| Sheridan Production Partners I, LLC | |
Term Loan, 5.83%, (3 mo. USD LIBOR + 3.50%), Maturing October 1, 2019 | | | | | | | 1,419 | | | | 1,357,813 | |
Term Loan, 5.83%, (3 mo. USD LIBOR + 3.50%), Maturing October 1, 2019 | | | | | | | 2,324 | | | | 2,222,987 | |
Term Loan, 5.83%, (3 mo. USD LIBOR + 3.50%), Maturing October 1, 2019 | | | | | | | 17,536 | | | | 16,776,219 | |
| Southcross Energy Partners L.P. | |
Term Loan, 6.64%, (3 mo. USD LIBOR + 4.25%), Maturing August 4, 2021 | | | | | | | 7,687 | | | | 6,884,234 | |
| Ultra Resources, Inc. | |
Term Loan, 5.47%, (3 mo. USD LIBOR + 3.00%), Maturing April 12, 2024 | | | | | | | 15,825 | | | | 14,865,609 | |
| | | | | | | | | | | $ | 203,697,344 | |
|
| Publishing — 1.0% | |
| Ascend Learning, LLC | |
Term Loan, 5.30%, (1 mo. USD LIBOR + 3.00%), Maturing July 12, 2024 | | | | | | | 13,921 | | | $ | 13,938,122 | |
| Getty Images, Inc. | |
Term Loan, 5.80%, (1 mo. USD LIBOR + 3.50%), Maturing October 18, 2019 | | | | | | | 44,096 | | | | 43,690,504 | |
| Harland Clarke Holdings Corp. | |
Term Loan, 7.14%, (3 mo. USD LIBOR + 4.75%), Maturing November 3, 2023 | | | | | | | 11,901 | | | | 11,186,515 | |
| Lamar Media Corporation | |
Term Loan, 4.06%, (1 mo. USD LIBOR + 1.75%), Maturing March 14, 2025 | | | | | | | 6,070 | | | | 6,089,730 | |
| LSC Communications, Inc. | |
Term Loan, 7.80%, (1 mo. USD LIBOR + 5.50%), Maturing September 30, 2022 | | | | | | | 9,636 | | | | 9,684,180 | |
| Merrill Communications, LLC | |
Term Loan, 7.78%, (3 mo. USD LIBOR + 5.25%), Maturing June 1, 2022 | | | | | | | 3,413 | | | | 3,446,869 | |
| Multi Color Corporation | |
Term Loan, 4.30%, (1 mo. USD LIBOR + 2.00%), Maturing October 31, 2022 | | | | | | | 3,428 | | | | 3,427,793 | |
Term Loan, 4.30%, (1 mo. USD LIBOR + 2.00%), Maturing October 31, 2024 | | | | | | | 9,609 | | | | 9,640,632 | |
| | | | | | | | | | | | |
| Borrower/Tranche Description | | | | | Principal Amount* (000’s omitted) | | | Value | |
|
| Publishing (continued) | |
| ProQuest, LLC | |
Term Loan, 5.55%, (1 mo. USD LIBOR + 3.25%), Maturing October 24, 2021 | | | | | | | 14,126 | | | $ | 14,202,793 | |
| Tweddle Group, Inc. | |
Term Loan, 6.95%, (3 mo. USD LIBOR + 4.50%), Maturing September 17, 2023 | | | | | | | 2,730 | | | | 2,648,646 | |
| | | | | | | | | | | $ | 117,955,784 | |
|
| Radio and Television — 2.3% | |
| ALM Media Holdings, Inc. | |
Term Loan, 6.89%, (3 mo. USD LIBOR + 4.50%), Maturing July 31, 2020 | | | | | | | 8,238 | | | $ | 7,537,664 | |
| AP NMT Acquisition B.V. | |
Term Loan, 8.15%, (3 mo. USD LIBOR + 5.75%), Maturing August 13, 2021 | | | | | | | 3,743 | | | | 3,750,094 | |
| CBS Radio, Inc. | |
Term Loan, 5.04%, (1 mo. USD LIBOR + 2.75%), Maturing November 18, 2024 | | | | | | | 15,128 | | | | 15,075,891 | |
| Cumulus Media New Holdings, Inc. | |
Term Loan, 6.81%, (1 mo. USD LIBOR + 4.50%), Maturing May 15, 2022 | | | | | | | 49,053 | | | | 48,447,944 | |
| E.W. Scripps Company (The) | |
Term Loan, 4.30%, (1 mo. USD LIBOR + 2.00%), Maturing October 2, 2024 | | | | | | | 4,133 | | | | 4,134,110 | |
| Entravision Communications Corporation | |
Term Loan, 5.05%, (1 mo. USD LIBOR + 2.75%), Maturing November 29, 2024 | | | | | | | 12,029 | | | | 11,898,195 | |
| Gray Television, Inc. | |
Term Loan, 4.52%, (1 mo. USD LIBOR + 2.25%), Maturing February 7, 2024 | | | | | | | 5,810 | | | | 5,819,696 | |
| Hubbard Radio, LLC | |
Term Loan, 5.31%, (1 mo. USD LIBOR + 3.00%), Maturing March 28, 2025 | | | | | | | 9,823 | | | | 9,834,894 | |
| iHeartCommunications, Inc. | |
Term Loan, 0.00%, Maturing January 30, 2019(6) | | | | | | | 33,740 | | | | 24,538,665 | |
Term Loan, 0.00%, Maturing July 30, 2019(6) | | | | | | | 5,384 | | | | 3,906,615 | |
| Mission Broadcasting, Inc. | |
Term Loan, Maturing January 17, 2024(5) | | | | | | | 4,341 | | | | 4,344,249 | |
| NEP/NCP Holdco, Inc. | |
Term Loan, 5.47%, (3 mo. USD LIBOR + 3.25%), Maturing October 20, 2025 | | | | | | | 3,750 | | | | 3,770,509 | |
| Nexstar Broadcasting, Inc. | |
Term Loan, Maturing January 17, 2024(5) | | | | | | | 27,134 | | | | 27,156,969 | |
| Raycom TV Broadcasting, LLC | |
Term Loan, 4.55%, (1 mo. USD LIBOR + 2.25%), Maturing August 23, 2024 | | | | | | | 12,103 | | | | 12,125,443 | |
| | | | |
| | 33 | | See Notes to Financial Statements. |
Eaton Vance
Floating Rate Portfolio
October 31, 2018
Portfolio of Investments — continued
| | | | | | | | | | | | |
| Borrower/Tranche Description | | | | | Principal Amount* (000’s omitted) | | | Value | |
|
| Radio and Television (continued) | |
| Sinclair Television Group, Inc. | |
Term Loan, 4.56%, (1 mo. USD LIBOR + 2.25%), Maturing January 3, 2024 | | | | | | | 14,222 | | | $ | 14,230,576 | |
| Univision Communications, Inc. | |
Term Loan, 5.05%, (1 mo. USD LIBOR + 2.75%), Maturing March 15, 2024 | | | | | | | 67,419 | | | | 64,792,932 | |
| | | | | | | | | | | $ | 261,364,446 | |
|
| Retailers (Except Food and Drug) — 2.4% | |
| Ascena Retail Group, Inc. | |
Term Loan, 6.81%, (1 mo. USD LIBOR + 4.50%), Maturing August 21, 2022 | | | | | | | 14,167 | | | $ | 13,781,404 | |
| Bass Pro Group, LLC | |
Term Loan, 7.30%, (1 mo. USD LIBOR + 5.00%), Maturing September 25, 2024 | | | | | | | 12,573 | | | | 12,592,639 | |
| BJ’s Wholesale Club, Inc. | |
Term Loan, 5.28%, (1 mo. USD LIBOR + 3.00%), Maturing February 3, 2024 | | | | | | | 18,496 | | | | 18,558,616 | |
| CDW, LLC | |
Term Loan, 4.06%, (1 mo. USD LIBOR + 1.75%), Maturing August 17, 2023 | | | | | | | 20,931 | | | | 20,986,790 | |
| Coinamatic Canada, Inc. | |
Term Loan, 5.55%, (1 mo. USD LIBOR + 3.25%), Maturing May 14, 2022 | | | | | | | 270 | | | | 269,963 | |
| David’s Bridal, Inc. | |
Term Loan, 6.32%, (3 mo. USD LIBOR + 4.00%), Maturing October 11, 2019 | | | | | | | 23,569 | | | | 18,933,388 | |
| Evergreen Acqco 1 L.P. | |
Term Loan, 6.22%, (3 mo. USD LIBOR + 3.75%), Maturing July 9, 2019 | | | | | | | 23,918 | | | | 23,289,751 | |
| Global Appliance, Inc. | |
Term Loan, 6.31%, (1 mo. USD LIBOR + 4.00%), Maturing September 29, 2024 | | | | | | | 12,029 | | | | 11,953,322 | |
| Go Wireless, Inc. | |
Term Loan, 8.80%, (1 mo. USD LIBOR + 6.50%), Maturing December 22, 2024 | | | | | | | 4,720 | | | | 4,631,115 | |
| Harbor Freight Tools USA, Inc. | |
Term Loan, 4.80%, (1 mo. USD LIBOR + 2.50%), Maturing August 18, 2023 | | | | | | | 5,846 | | | | 5,765,038 | |
| Hoya Midco, LLC | |
Term Loan, 5.80%, (1 mo. USD LIBOR + 3.50%), Maturing June 30, 2024 | | | | | | | 14,017 | | | | 13,973,319 | |
| J. Crew Group, Inc. | |
Term Loan, 5.35%, (USD LIBOR + 3.00%), Maturing March 5, 2021(3)(4) | | | | | | | 26,063 | | | | 21,350,492 | |
| LSF9 Atlantis Holdings, LLC | |
Term Loan, 8.28%, (1 mo. USD LIBOR + 6.00%), Maturing May 1, 2023 | | | | | | | 12,279 | | | | 11,849,145 | |
| | | | | | | | | | | | |
| Borrower/Tranche Description | | | | | Principal Amount* (000’s omitted) | | | Value | |
|
| Retailers (Except Food and Drug) (continued) | |
| Neiman Marcus Group Ltd., LLC | |
Term Loan, 5.53%, (1 mo. USD LIBOR + 3.25%), Maturing October 25, 2020 | | | | | | | 23,377 | | | $ | 21,326,662 | |
| Party City Holdings, Inc. | |
Term Loan, 5.06%, (1 mo. USD LIBOR + 2.75%), Maturing August 19, 2022 | | | | | | | 7,698 | | | | 7,736,244 | |
| PetSmart, Inc. | |
Term Loan, 5.28%, (1 mo. USD LIBOR + 3.00%), Maturing March 11, 2022 | | | | | | | 43,855 | | | | 37,303,911 | |
| PFS Holding Corporation | |
Term Loan, 5.78%, (1 mo. USD LIBOR + 3.50%), Maturing January 31, 2021 | | | | | | | 9,980 | | | | 5,738,356 | |
| Pier 1 Imports (U.S.), Inc. | |
Term Loan, 5.89%, (3 mo. USD LIBOR + 3.50%), Maturing April 30, 2021 | | | | | | | 9,455 | | | | 7,067,846 | |
| Radio Systems Corporation | |
Term Loan, 5.05%, (1 mo. USD LIBOR + 2.75%), Maturing May 2, 2024 | | | | | | | 4,691 | | | | 4,702,352 | |
| Shutterfly, Inc. | |
Term Loan, 5.06%, (1 mo. USD LIBOR + 2.75%), Maturing August 17, 2024 | | | | | | | 6,185 | | | | 6,198,675 | |
| Staples, Inc. | |
Term Loan, 6.34%, (3 mo. USD LIBOR + 4.00%), Maturing September 12, 2024 | | | | | | | 6,774 | | | | 6,761,112 | |
| | | | | | | | | | | $ | 274,770,140 | |
|
| Steel — 0.9% | |
| Aleris International, Inc. | |
Term Loan, Maturing February 27,
2023(5) | | | | | | | 3,000 | | | $ | 3,032,499 | |
| Atkore International, Inc. | |
Term Loan, 5.14%, (3 mo. USD LIBOR + 2.75%), Maturing December 22, 2023 | | | | | | | 19,438 | | | | 19,474,417 | |
| GrafTech Finance, Inc. | |
Term Loan, 5.80%, (1 mo. USD LIBOR + 3.50%), Maturing February 12, 2025 | | | | | | | 34,538 | | | | 34,753,674 | |
| Neenah Foundry Company | |
Term Loan, 8.84%, (2 mo. USD LIBOR + 6.50%), Maturing December 13, 2022 | | | | | | | 8,903 | | | | 8,858,609 | |
| Phoenix Services International, LLC | |
Term Loan, 6.03%, (1 mo. USD LIBOR + 3.75%), Maturing March 1, 2025 | | | | | | | 9,776 | | | | 9,867,524 | |
| Zekelman Industries, Inc. | |
Term Loan, 4.62%, (3 mo. USD LIBOR + 2.25%), Maturing June 14, 2021 | | | | | | | 30,122 | | | | 30,117,646 | |
| | | | | | | | | | | $ | 106,104,369 | |
| | | | |
| | 34 | | See Notes to Financial Statements. |
Eaton Vance
Floating Rate Portfolio
October 31, 2018
Portfolio of Investments — continued
| | | | | | | | | | | | |
| Borrower/Tranche Description | | | | | Principal Amount* (000’s omitted) | | | Value | |
|
| Surface Transport — 0.6% | |
| Agro Merchants NAI Holdings, LLC | |
Term Loan, 6.14%, (3 mo. USD LIBOR + 3.75%), Maturing December 6, 2024 | | | | | | | 11,406 | | | $ | 11,484,273 | |
| Avis Budget Car Rental, LLC | |
Term Loan, 4.31%, (1 mo. USD LIBOR + 2.00%), Maturing February 13, 2025 | | | | | | | 5,716 | | | | 5,705,370 | |
| Hertz Corporation (The) | |
Term Loan, 5.06%, (1 mo. USD LIBOR + 2.75%), Maturing June 30, 2023 | | | | | | | 10,401 | | | | 10,362,434 | |
| Kenan Advantage Group, Inc. | |
Term Loan, 5.30%, (1 mo. USD LIBOR + 3.00%), Maturing July 31, 2022 | | | | | | | 1,821 | | | | 1,821,248 | |
Term Loan, 5.30%, (1 mo. USD LIBOR + 3.00%), Maturing July 31, 2022 | | | | | | | 6,568 | | | | 6,569,844 | |
| PODS, LLC | |
Term Loan, 5.03%, (3 mo. USD LIBOR + 2.75%), Maturing December 6, 2024 | | | | | | | 6,881 | | | | 6,849,550 | |
| Stena International S.a.r.l. | |
Term Loan, 5.39%, (1 mo. USD LIBOR + 3.00%), Maturing March 3, 2021 | | | | | | | 25,437 | | | | 24,801,531 | |
| XPO Logistics, Inc. | |
Term Loan, 4.51%, (3 mo. USD LIBOR + 2.00%), Maturing February 24, 2025 | | | | | | | 6,775 | | | | 6,799,464 | |
| | | | | | | | | | | $ | 74,393,714 | |
|
| Telecommunications — 4.9% | |
| CenturyLink, Inc. | |
Term Loan, 5.05%, (1 mo. USD LIBOR + 2.75%), Maturing January 31, 2025 | | | | | | | 73,787 | | | $ | 73,030,401 | |
| Ciena Corporation | |
Term Loan, 4.28%, (1 mo. USD LIBOR + 2.00%), Maturing September 26, 2025 | | | | | | | 13,175 | | | | 13,212,048 | |
| Colorado Buyer, Inc. | |
Term Loan, 5.28%, (1 mo. USD LIBOR + 3.00%), Maturing May 1, 2024 | | | | | | | 16,572 | | | | 16,561,456 | |
| Consolidated Communications, Inc. | |
Term Loan, 5.31%, (1 mo. USD LIBOR + 3.00%), Maturing October 4, 2023 | | | | | | | 878 | | | | 867,192 | |
| Digicel International Finance Limited | |
Term Loan, 5.57%, (3 mo. USD LIBOR + 3.25%), Maturing May 28, 2024 | | | | | | | 14,649 | | | | 14,062,830 | |
| eircom Finco S.a.r.l. | |
Term Loan, 3.25%, (1 mo. EURIBOR + 3.25%), Maturing April 19, 2024 | | | EUR | | | | 34,450 | | | | 39,310,034 | |
| Frontier Communications Corp. | |
Term Loan, 6.06%, (1 mo. USD LIBOR + 3.75%), Maturing June 15, 2024 | | | | | | | 21,478 | | | | 20,833,781 | |
| | | | | | | | | | | | |
| Borrower/Tranche Description | | | | | Principal Amount* (000’s omitted) | | | Value | |
|
| Telecommunications (continued) | |
| Gamma Infrastructure III B.V. | |
Term Loan, 3.50%, (3 mo. EURIBOR + 3.50%), Maturing January 9, 2025 | | | EUR | | | | 16,287 | | | $ | 18,527,822 | |
| Global Eagle Entertainment, Inc. | |
Term Loan, 10.02%, (6 mo. USD LIBOR + 7.50%), Maturing January 6, 2023 | | | | | | | 19,052 | | | | 19,718,523 | |
| Intelsat Jackson Holdings S.A. | |
Term Loan, 6.04%, (1 mo. USD LIBOR + 3.75%), Maturing November 27, 2023 | | | | | | | 35,250 | | | | 35,298,469 | |
Term Loan, 6.79%, (1 mo. USD LIBOR + 4.50%), Maturing January 2, 2024 | | | | | | | 18,300 | | | | 19,291,256 | |
| IPC Corp. | |
Term Loan, 7.03%, (3 mo. USD LIBOR + 4.50%), Maturing August 6, 2021 | | | | | | | 11,591 | | | | 11,184,967 | |
| Level 3 Financing, Inc. | |
Term Loan, 4.53%, (1 mo. USD LIBOR + 2.25%), Maturing February 22, 2024 | | | | | | | 35,850 | | | | 35,917,219 | |
| Lumentum Holdings | |
Term Loan, Maturing August 7, 2025(5) | | | | | | | 7,175 | | | | 7,210,875 | |
| Mitel Networks Corporation | |
Term Loan, 6.05%, (1 mo. USD LIBOR + 3.75%), Maturing September 25, 2023 | | | | | | | 4,724 | | | | 4,777,420 | |
| Onvoy, LLC | |
Term Loan, 6.89%, (3 mo. USD LIBOR + 4.50%), Maturing February 10, 2024 | | | | | | | 12,830 | | | | 12,444,736 | |
| Plantronics, Inc. | |
Term Loan, 4.80%, (1 mo. USD LIBOR + 2.50%), Maturing July 2, 2025 | | | | | | | 16,250 | | | | 16,232,223 | |
| SBA Senior Finance II, LLC | |
Term Loan, 4.31%, (1 mo. USD LIBOR + 2.00%), Maturing April 11, 2025 | | | | | | | 33,070 | | | | 33,042,123 | |
| Sprint Communications, Inc. | |
Term Loan, 4.81%, (1 mo. USD LIBOR + 2.50%), Maturing February 2, 2024 | | | | | | | 61,781 | | | | 61,742,256 | |
| Syniverse Holdings, Inc. | |
Term Loan, 7.28%, (1 mo. USD LIBOR + 5.00%), Maturing March 9, 2023 | | | | | | | 11,343 | | | | 11,405,387 | |
| TDC A/S | |
Term Loan, 3.50%, (1 mo. EURIBOR + 3.50%), Maturing May 31, 2025 | | | EUR | | | | 43,285 | | | | 49,410,149 | |
| Telesat Canada | |
Term Loan, 4.89%, (3 mo. USD LIBOR + 2.50%), Maturing November 17, 2023 | | | | | | | 49,781 | | | | 49,858,511 | |
| Zayo Group, LLC | |
Term Loan, 4.55%, (1 mo. USD LIBOR + 2.25%), Maturing January 19, 2024 | | | | | | | 4,000 | | | | 4,010,624 | |
| | | | | | | | | | | $ | 567,950,302 | |
| | | | |
| | 35 | | See Notes to Financial Statements. |
Eaton Vance
Floating Rate Portfolio
October 31, 2018
Portfolio of Investments — continued
| | | | | | | | | | | | |
| Borrower/Tranche Description | | | | | Principal Amount* (000’s omitted) | | | Value | |
|
| Utilities — 1.7% | |
| Brookfield WEC Holdings, Inc. | |
Term Loan, 6.05%, (1 mo. USD LIBOR + 3.75%), Maturing August 1, 2025 | | | | | | | 28,625 | | | $ | 28,857,578 | |
| Calpine Construction Finance Company L.P. | |
Term Loan, 4.80%, (1 mo. USD LIBOR + 2.50%), Maturing January 15, 2025 | | | | | | | 2,648 | | | | 2,647,302 | |
| Calpine Corporation | |
Term Loan, 4.06%, (1 mo. USD LIBOR + 1.75%), Maturing December 31, 2019 | | | | | | | 4,827 | | | | 4,828,387 | |
Term Loan, 4.89%, (3 mo. USD LIBOR + 2.50%), Maturing May 31, 2023 | | | | | | | 5,255 | | | | 5,243,305 | |
Term Loan, 4.89%, (3 mo. USD LIBOR + 2.50%), Maturing January 15, 2024 | | | | | | | 47,252 | | | | 47,150,112 | |
| Dayton Power & Light Company (The) | |
Term Loan, 4.31%, (1 mo. USD LIBOR + 2.00%), Maturing August 24, 2022 | | | | | | | 5,453 | | | | 5,473,323 | |
| Granite Acquisition, Inc. | |
Term Loan, 5.89%, (3 mo. USD LIBOR + 3.50%), Maturing December 19, 2021 | | | | | | | 1,707 | | | | 1,716,284 | |
Term Loan, 5.90%, (3 mo. USD LIBOR + 3.50%), Maturing December 19, 2021 | | | | | | | 37,472 | | | | 37,678,349 | |
| Lightstone Generation, LLC | |
Term Loan, 6.05%, (1 mo. USD LIBOR + 3.75%), Maturing January 30, 2024 | | | | | | | 1,183 | | | | 1,168,198 | |
Term Loan, 6.05%, (1 mo. USD LIBOR + 3.75%), Maturing January 30, 2024 | | | | | | | 22,026 | | | | 21,750,380 | |
| Longview Power, LLC | |
Term Loan, 8.53%, (3 mo. USD LIBOR + 6.00%), Maturing April 13, 2021 | | | | | | | 3,531 | | | | 3,070,089 | |
| Talen Energy Supply, LLC | |
Term Loan, 6.30%, (1 mo. USD LIBOR + 4.00%), Maturing July 15, 2023 | | | | | | | 6,165 | | | | 6,195,096 | |
Term Loan, 6.30%, (1 mo. USD LIBOR + 4.00%), Maturing April 15, 2024 | | | | | | | 11,182 | | | | 11,216,522 | |
| USIC Holdings, Inc. | |
Term Loan, 5.55%, (1 mo. USD LIBOR + 3.25%), Maturing December 8, 2023 | | | | | | | 7,969 | | | | 8,006,941 | |
| Vistra Energy Corp. | |
Term Loan, 4.29%, (1 mo. USD LIBOR + 2.00%), Maturing December 31, 2025 | | | | | | | 12,643 | | | | 12,619,606 | |
| Vistra Operations Company, LLC | |
Term Loan, Maturing December 14, 2023(5) | | | | | | | 2,500 | | | | 2,505,208 | |
| | | | | | | | | | | $ | 200,126,680 | |
| | | |
Total Senior Floating-Rate Loans
(identified cost $10,411,896,801) | | | | | | | | | | $ | 10,264,654,655 | |
| | | | | | | | | | | | |
|
| Corporate Bonds & Notes — 2.4% | |
| Security | | | Principal
Amount*
(000’s omitted) | | | Value | |
|
| Automotive — 0.1% | |
| Tenneco, Inc. | |
4.875%, (3 mo. EURIBOR + 4.875%), 4/15/24(8)(9) | | | EUR | | | | 6,000 | | | $ | 6,867,443 | |
| | | | | | | | | | | $ | 6,867,443 | |
|
| Business Equipment and Services — 0.1% | |
| Travelport Corporate Finance PLC | |
6.00%, 3/15/26(8) | | | | | | | 15,600 | | | $ | 15,678,000 | |
| | | | | | | | | | | $ | 15,678,000 | |
|
| Cable and Satellite Television — 0.0%(10) | |
| Virgin Media Secured Finance PLC | |
5.25%, 1/15/26(8) | | | | | | | 3,635 | | | $ | 3,403,269 | |
| | | | | | | | | | | $ | 3,403,269 | |
|
| Chemicals and Plastics — 0.2% | |
| Hexion, Inc. | |
6.625%, 4/15/20 | | | | | | | 16,525 | | | $ | 14,665,937 | |
| PQ Corp. | |
6.75%, 11/15/22(8) | | | | | | | 4,000 | | | | 4,135,000 | |
| | | | | | | | | | | $ | 18,800,937 | |
|
| Containers and Glass Products — 0.3% | |
| Reynolds Group Issuer, Inc./Reynolds Group Issuer, LLC | |
5.75%, 10/15/20 | | | | | | | 23,743 | | | $ | 23,772,818 | |
5.936%, (3 mo. USD LIBOR + 3.50%), 7/15/21(8)(9) | | | | | | | 9,925 | | | | 10,049,062 | |
| | | | | | | | | | | $ | 33,821,880 | |
|
| Drugs — 0.4% | |
| Bausch Health Companies, Inc. | |
6.50%, 3/15/22(8) | | | | | | | 11,092 | | | $ | 11,507,950 | |
7.00%, 3/15/24(8) | | | | | | | 14,419 | | | | 15,135,480 | |
5.50%, 11/1/25(8) | | | | | | | 19,675 | | | | 19,355,281 | |
| | | | | | | | | | | $ | 45,998,711 | |
|
| Entertainment — 0.1% | |
| Vue International Bidco PLC | |
4.932%, (3 mo. EURIBOR + 5.25%), 7/15/20(8)(9) | | | EUR | | | | 8,625 | | | $ | 9,791,090 | |
| | | | | | | | | | | $ | 9,791,090 | |
| | | | |
| | 36 | | See Notes to Financial Statements. |
Eaton Vance
Floating Rate Portfolio
October 31, 2018
Portfolio of Investments — continued
| | | | | | | | | | | | |
| Security | | | Principal
Amount*
(000’s omitted) | | | Value | |
|
| Food Products — 0.0%(10) | |
| Iceland Bondco PLC | |
5.063%, (3 mo. GBP LIBOR + 4.25%), 7/15/20(8)(9) | | | GBP | | | | 1,428 | | | $ | 1,825,413 | |
| | | | | | | | | | | $ | 1,825,413 | |
|
| Health Care — 0.7% | |
| Avantor, Inc. | |
6.00%, 10/1/24(8) | | | | | | | 13,105 | | | $ | 13,105,000 | |
| CHS/Community Health Systems, Inc. | |
5.125%, 8/1/21 | | | | | | | 7,500 | | | | 7,143,750 | |
6.25%, 3/31/23 | | | | | | | 16,650 | | | | 15,375,442 | |
| HCA, Inc. | |
4.75%, 5/1/23 | | | | | | | 9,766 | | | | 9,888,075 | |
| RegionalCare Hospital Partners Holdings, Inc. | |
8.25%, 5/1/23(8) | | | | | | | 10,550 | | | | 11,196,188 | |
| Tenet Healthcare Corp. | |
6.00%, 10/1/20 | | | | | | | 12,500 | | | | 12,831,875 | |
4.375%, 10/1/21 | | | | | | | 9,700 | | | | 9,639,375 | |
| | | | | | | | | | | $ | 79,179,705 | |
|
| Leisure Goods / Activities / Movies — 0.0%(10) | |
| National CineMedia, LLC | |
6.00%, 4/15/22 | | | | | | | 5,250 | | | $ | 5,328,750 | |
| | | | | | | | | | | $ | 5,328,750 | |
|
| Oil and Gas — 0.1% | |
| CITGO Petroleum Corp. | |
6.25%, 8/15/22(8) | | | | | | | 11,500 | | | $ | 11,385,000 | |
| | | | | | | | | | | $ | 11,385,000 | |
|
| Radio and Television — 0.1% | |
| iHeartCommunications, Inc. | |
9.00%, 12/15/19(6) | | | | | | | 8,994 | | | $ | 6,520,650 | |
| Univision Communications, Inc. | |
6.75%, 9/15/22(8) | | | | | | | 2,629 | | | | 2,688,153 | |
5.125%, 2/15/25(8) | | | | | | | 5,500 | | | | 5,040,750 | |
| | | | | | | | | | | $ | 14,249,553 | |
|
| Retailers (Except Food and Drug) — 0.1% | |
| Fresh Market, Inc. (The) | |
9.75%, 5/1/23(8) | | | | | | | 12,550 | | | $ | 9,224,250 | |
| | | | | | | | | | | $ | 9,224,250 | |
| | | | | | | | | | | | |
| Security | | | Principal
Amount*
(000’s omitted) | | | Value | |
|
| Telecommunications — 0.1% | |
| Wind Tre SpA | |
2.75%, (3 mo. EURIBOR + 2.75%), 1/20/24(8)(9) | | | EUR | | | | 6,675 | | | $ | 7,016,467 | |
| | | | | | | | | | | $ | 7,016,467 | |
|
| Utilities — 0.1% | |
| Calpine Corp. | |
6.00%, 1/15/22(8) | | | | | | | 3,000 | | | $ | 3,026,250 | |
5.875%, 1/15/24(8) | | | | | | | 5,000 | | | | 5,012,500 | |
5.25%, 6/1/26 (8) | | | | | | | 10,925 | | | | 10,078,312 | |
| | | | | | | | | | | $ | 18,117,062 | |
| |
Total Corporate Bonds & Notes
(identified cost $291,386,078) | | | $ | 280,687,530 | |
|
| Asset-Backed Securities — 2.1% | |
| Security | | | | | Principal
Amount
(000’s omitted) | | | Value | |
| Alinea CLO, Ltd. | |
Series 2018-1A, Class D, 5.407%, (3 mo. USD LIBOR + 3.10%), 7/20/31(8)(9) | | | | | | $ | 2,500 | | | $ | 2,491,165 | |
Series 2018-1A, Class E, 8.307%, (3 mo. USD LIBOR + 6.00%), 7/20/31(8)(9) | | | | | | | 3,000 | | | | 3,005,393 | |
| AMMC CLO XII, Ltd. | | | | | | | | | |
Series 2013-12A, Class ER, 8.521%, (3 mo. USD LIBOR + 6.18%), 11/10/30(8)(9) | | | | | | | 3,525 | | | | 3,539,463 | |
| Apidos CLO XX | | | | | | | | | |
Series 2015-20A, Class DR, 8.136%, (3 mo. USD LIBOR + 5.70%), 7/16/31(8)(9) | | | | | | | 2,375 | | | | 2,380,821 | |
| Ares XLIX CLO, Ltd. | |
Series 2018-49A, Class D, 5.343%, (3 mo. USD LIBOR + 3.00%), 7/22/30(8)(9) | | | | | | | 2,500 | | | | 2,508,792 | |
Series 2018-49A, Class E, 8.043%, (3 mo. USD LIBOR + 5.70%), 7/22/30(8)(9) | | | | | | | 3,500 | | | | 3,481,208 | |
| Ares XXXIIR CLO, Ltd. | | | | | | | | | |
Series 2014-32RA, Class C, 5.214%, (3 mo. USD LIBOR + 2.90%), 5/15/30(8)(9) | | | | | | | 5,000 | | | | 4,982,965 | |
| Ares XXXVR CLO, Ltd. | | | | | | | | | |
Series 2015-35RA, Class E, 8.039%, (3 mo. USD LIBOR + 5.70%), 7/15/30(8)(9) | | | | | | | 4,000 | | | | 4,015,292 | |
| Babson CLO, Ltd. | |
Series 2015-IA, Class DR, 5.069%, (3 mo. USD LIBOR + 2.60%), 1/20/31(8)(9) | | | | | | | 2,500 | | | | 2,473,390 | |
Series 2016-1A, Class DR, 5.527%, (3 mo. USD LIBOR + 3.05%), 7/23/30(8)(9) | | | | | | | 1,250 | | | | 1,252,523 | |
| | | | |
| | 37 | | See Notes to Financial Statements. |
Eaton Vance
Floating Rate Portfolio
October 31, 2018
Portfolio of Investments — continued
| | | | | | | | | | |
| Security | | | | Principal
Amount
(000’s omitted) | | | Value | |
| Babson CLO, Ltd. (continued) | |
Series 2016-1A, Class ER, 8.477%, (3 mo. USD LIBOR + 6.00%),
7/23/30(8)(9) | | | | $ | 3,500 | | | $ | 3,513,603 | |
Series 2018-1A, Class C, 5.036%, (3 mo. USD LIBOR + 2.60%), 4/15/31(8)(9) | | | | | 3,500 | | | | 3,475,146 | |
| Bain Capital Credit CLO, Ltd. | |
Series 2018-1A, Class D, 5.177%, (3 mo. USD LIBOR + 2.70%), 4/23/31(8)(9) | | | | | 5,000 | | | | 4,964,795 | |
Series 2018-1A, Class E, 7.827%, (3 mo. USD LIBOR + 5.35%), 4/23/31(8)(9) | | | | | 3,000 | | | | 2,926,734 | |
| Benefit Street Partners CLO, Ltd. | |
Series 2015-8A, Class DR, 8.069%, (3 mo. USD LIBOR + 5.60%),
1/20/31(8)(9) | | | | | 5,401 | | | | 5,339,942 | |
Series 2018-14A, Class D, 5.069%, (3 mo. USD LIBOR + 2.60%),
4/20/31(8)(9) | | | | | 1,500 | | | | 1,489,350 | |
Series 2018-5BA, Class C, 5.399%, (3 mo. USD LIBOR + 2.93%),
4/20/31(8)(9) | | | | | 5,000 | | | | 4,965,010 | |
Series 2018-5BA, Class D, 8.419%, (3 mo. USD LIBOR + 5.95%),
4/20/31(8)(9) | | | | | 3,500 | | | | 3,449,348 | |
| Betony CLO 2, Ltd. | |
Series 2018-1A, Class C, 5.009%, (3 mo. USD LIBOR + 2.90%), 4/30/31(8)(9) | | | | | 2,500 | | | | 2,482,885 | |
Series 2018-1A, Class D, 7.759%, (3 mo. USD LIBOR + 5.65%), 4/30/31(8)(9) | | | | | 4,450 | | | | 4,472,530 | |
| BlueMountain CLO, Ltd. | |
Series 2018-1A, Class D, 5.389%, (3 mo. USD LIBOR + 3.05%), 7/30/30(8)(9) | | | | | 2,500 | | | | 2,505,137 | |
Series 2018-1A, Class E, 8.289%, (3 mo. USD LIBOR + 5.95%), 7/30/30(8)(9) | | | | | 2,000 | | | | 1,987,212 | |
| Canyon Capital CLO, Ltd. | |
Series 2012-1RA, Class E, 8.136%, (3 mo. USD LIBOR + 5.70%),
7/15/30(8)(9) | | | | | 4,875 | | | | 4,855,310 | |
Series 2016-1A, Class ER, 8.186%, (3 mo. USD LIBOR + 5.75%),
7/15/31(8)(9) | | | | | 4,000 | | | | 3,954,308 | |
Series 2016-2A, Class ER, 8.436%, (3 mo. USD LIBOR + 6.00%),
10/15/31(8)(9) | | | | | 4,500 | | | | 4,477,113 | |
Series 2017-1A, Class E, 8.686%, (3 mo. USD LIBOR + 6.25%), 7/15/30(8)(9) | | | | | 3,250 | | | | 3,257,429 | |
Series 2018-1A, Class D, 5.336%, (3 mo. USD LIBOR + 2.90%), 7/15/31(8)(9) | | | | | 3,000 | | | | 2,979,024 | |
Series 2018-1A, Class E, 8.186%, (3 mo. USD LIBOR + 5.75%), 7/15/31(8)(9) | | | | | 2,750 | | | | 2,718,169 | |
| Carlyle CLO, Ltd. | |
Series C17A, Class CR, 5.32%, (3 mo. USD LIBOR + 2.80%), 4/30/31(8)(9) | | | | | 5,000 | | | | 4,983,250 | |
Series C17A, Class DR, 8.52%, (3 mo. USD LIBOR + 6.00%), 4/30/31(8)(9) | | | | | 3,500 | | | | 3,526,911 | |
| Carlyle Global Market Strategies CLO, Ltd. | |
Series 2014-3RA, Class C, 5.038%, (3 mo. USD LIBOR + 2.95%),
7/27/31(8)(9) | | | | | 1,000 | | | | 1,002,304 | |
| | | | | | | | | | |
| Security | | | | Principal
Amount
(000’s omitted) | | | Value | |
| Carlyle Global Market Strategies CLO, Ltd. (continued) | |
Series 2014-3RA, Class D, 7.488%, (3 mo. USD LIBOR + 5.40%), 7/27/31(8)(9) | | | | $ | 2,150 | | | $ | 2,138,665 | |
Series 2014-4RA, Class C, 5.336%, (3 mo. USD LIBOR + 2.90%), 7/15/30(8)(9) | | | | | 2,000 | | | | 1,996,568 | |
Series 2014-4RA, Class D, 8.086%, (3 mo. USD LIBOR + 5.65%), 7/15/30(8)(9) | | | | | 3,500 | | | | 3,498,411 | |
| Dryden CLO, Ltd. | |
Series 2018-55A, Class D, 5.286%, (3 mo. USD LIBOR + 2.85%), 4/15/31(8)(9) | | | | | 1,500 | | | | 1,489,409 | |
Series 2018-55A, Class E, 7.836%, (3 mo. USD LIBOR + 5.40%), 4/15/31(8)(9) | | | | | 2,000 | | | | 1,996,480 | |
| Dryden Senior Loan Fund | |
Series 2015-40A, Class DR, 5.414%, (3 mo. USD LIBOR + 3.10%), 8/15/31(8)(9) | | | | | 3,000 | | | | 3,004,659 | |
Series 2015-41A, Class DR, 5.036%, (3 mo. USD LIBOR + 2.60%), 4/15/31(8)(9) | | | | | 5,000 | | | | 4,943,380 | |
Series 2015-41A, Class ER, 7.736%, (3 mo. USD LIBOR + 5.30%), 4/15/31(8)(9) | | | | | 1,268 | | | | 1,256,805 | |
Series 2016-42A, Class DR, 5.366%, (3 mo. USD LIBOR + 2.93%), 7/15/30(8)(9) | | | | | 2,500 | | | | 2,496,550 | |
Series 2016-42A, Class ER, 7.986%, (3 mo. USD LIBOR + 5.55%), 7/15/30(8)(9) | | | | | 3,500 | | | | 3,513,416 | |
| Galaxy XV CLO, Ltd. | |
Series 2013-15A, Class ER, 9.081%, (3 mo. USD LIBOR + 6.65%), 10/15/30(8)(9) | | | | | 2,500 | | | | 2,529,587 | |
| Galaxy XXV CLO, Ltd. | |
Series 2018-25A, Class D, 5.692%, (3 mo. USD LIBOR + 3.10%), 10/25/31(8)(9) | | | | | 2,500 | | | | 2,505,346 | |
Series 2018-25A, Class E, 8.542%, (3 mo. USD LIBOR + 5.95%), 10/25/31(8)(9) | | | | | 3,500 | | | | 3,514,194 | |
| Golub Capital Partners CLO, Ltd. | |
Series 2015-22A, Class ER, 8.469%, (3 mo. USD LIBOR + 6.00%), 1/20/31(8)(9) | | | | | 2,500 | | | | 2,508,467 | |
Series 2018-37A, Class D, 5.486%, (3 mo. USD LIBOR + 3.30%), 7/20/30(8)(9) | | | | | 4,000 | | | | 4,008,542 | |
Series 2018-37A, Class E, 7.936%, (3 mo. USD LIBOR + 5.75%), 7/20/30(8)(9) | | | | | 4,750 | | | | 4,727,357 | |
| ICG US CLO, Ltd. | |
Series 2018-2A, Class D, 5.418%, (3 mo. USD LIBOR + 3.10%), 7/22/31(8)(9) | | | | | 2,000 | | | | 2,003,644 | |
Series 2018-2A, Class E, 8.068%, (3 mo. USD LIBOR + 5.75%), 7/22/31(8)(9) | | | | | 3,000 | | | | 2,983,791 | |
| Madison Park Funding XXV, Ltd. | | | | | | | | |
Series 2017-25A, Class D, 8.59%, (3 mo. USD LIBOR + 6.10%), 4/25/29(8)(9) | | | | | 1,500 | | | | 1,509,564 | |
| Neuberger Berman CLO XXII, Ltd. | |
Series 2016-22A, Class DR, 5.549%, (3 mo. USD LIBOR + 3.10%), 10/17/30(8)(9) | | | | | 2,500 | | | | 2,505,678 | |
| | | | |
| | 38 | | See Notes to Financial Statements. |
Eaton Vance
Floating Rate Portfolio
October 31, 2018
Portfolio of Investments — continued
| | | | | | | | | | |
| Security | | | | Principal
Amount
(000’s omitted) | | | Value | |
| Neuberger Berman CLO XXII, Ltd. (continued) | |
Series 2016-22A, Class ER, 8.509%, (3 mo. USD LIBOR + 6.06%),
10/17/30(8)(9) | | | | $ | 3,000 | | | $ | 2,992,377 | |
| Neuberger Berman Loan Advisers CLO, Ltd. | | | | | | | | |
Series 2018-28A, Class E, 8.069%, (3 mo. USD LIBOR + 5.60%), 4/20/30(8)(9) | | | | | 1,950 | | | | 1,956,542 | |
| Oak Hill Credit Partners VII, Ltd. | | | | | | | | |
Series 2012-7A, Class ER, 9.822%, (3 mo. USD LIBOR + 7.50%), 11/20/27(8)(9) | | | | | 900 | | | | 900,872 | |
| Palmer Square CLO, Ltd. | |
Series 2013-2A, Class CRR, 5.649%, (3 mo. USD LIBOR + 3.20%),
10/17/31(8)(9) | | | | | 2,500 | | | | 2,505,668 | |
Series 2013-2A, Class DRR, 8.299%, (3 mo. USD LIBOR + 5.85%),
10/17/31(8)(9) | | | | | 3,000 | | | | 3,014,169 | |
Series 2018-1A, Class C, 4.945%, (3 mo. USD LIBOR + 2.50%), 4/18/31(8)(9) | | | | | 3,000 | | | | 2,978,742 | |
Series 2018-1A, Class D, 7.595%, (3 mo. USD LIBOR + 5.15%), 4/18/31(8)(9) | | | | | 2,000 | | | | 1,950,116 | |
Series 2018-2A, Class D, 7.862%, (3 mo. USD LIBOR + 5.60%), 7/16/31(8)(9) | | | | | 2,000 | | | | 1,989,166 | |
| Regatta XIII Funding, Ltd. | |
Series 2018-2A, Class C, 5.433%, (3 mo. USD LIBOR + 3.10%), 7/15/31(8)(9) | | | | | 2,500 | | | | 2,504,498 | |
Series 2018-2A, Class D, 8.283%, (3 mo. USD LIBOR + 5.95%), 7/15/31(8)(9) | | | | | 5,000 | | | | 4,924,475 | |
| Regatta XIV Funding, Ltd. | |
Series 2018-3A, Class D, 5.412%, (3 mo. USD LIBOR + 3.20%), 10/25/31(8)(9) | | | | | 2,500 | | | | 2,505,522 | |
Series 2018-3A, Class E, 8.162%, (3 mo. USD LIBOR + 5.95%), 10/25/31(8)(9) | | | | | 4,500 | | | | 4,476,429 | |
| Regatta XV Funding, Ltd. | | | | | | | | |
Series 2018-4A, Class D, 8.898%, (3 mo. USD LIBOR + 6.50%), 10/25/31(8)(9) | | | | | 3,875 | | | | 3,856,175 | |
| Upland CLO, Ltd. | |
Series 2016-1A, Class CR, 5.369%, (3 mo. USD LIBOR + 2.90%), 4/20/31(8)(9) | | | | | 4,500 | | | | 4,484,601 | |
Series 2016-1A, Class DR, 8.369%, (3 mo. USD LIBOR + 5.90%), 4/20/31(8)(9) | | | | | 4,625 | | | | 4,617,591 | |
| Vibrant CLO 1X, Ltd. | |
Series 2018-9A, Class C, 5.442%, (3 mo. USD LIBOR + 3.20%), 7/20/31(8)(9) | | | | | 2,500 | | | | 2,504,609 | |
Series 2018-9A, Class D, 8.492%, (3 mo. USD LIBOR + 6.25%), 7/20/31(8)(9) | | | | | 3,500 | | | | 3,482,335 | |
| Vibrant CLO X, Ltd. | |
Series 2018-10A, Class C, 5.688%, (3 mo. USD LIBOR + 3.25%), 10/20/31(8)(9) | | | | | 5,000 | | | | 5,010,735 | |
Series 2018-10A, Class D, 8.628%, (3 mo. USD LIBOR + 6.19%), 10/20/31(8)(9) | | | | | 5,000 | | | | 4,971,315 | |
| | | | | | | | | | |
| Security | | | | Principal
Amount
(000’s omitted) | | | Value | |
| Voya CLO, Ltd. | |
Series 2016-3A, Class CR, 5.721%, (3 mo. USD LIBOR + 3.25%),
10/18/31(8)(9) | | | | $ | 2,000 | | | $ | 2,000,000 | |
Series 2016-3A, Class DR, 8.551%, (3 mo. USD LIBOR + 6.08%),
10/18/31(8)(9) | | | | | 3,375 | | | | 3,349,688 | |
Series 2018-1A, Class C, 4.943%, (3 mo. USD LIBOR + 2.60%),
4/19/31(8)(9) | | | | | 5,000 | | | | 4,929,395 | |
Series 2018-2A, Class E, 7.624%, (3 mo. USD LIBOR + 5.25%),
7/15/31(8)(9) | | | | | 2,500 | | | | 2,468,975 | |
| Webster Park CLO, Ltd. | |
Series 2015-1A, Class CR, 5.369%, (3 mo. USD LIBOR + 2.90%),
7/20/30(8)(9) | | | | | 2,000 | | | | 2,003,068 | |
Series 2015-1A, Class DR, 7.969%, (3 mo. USD LIBOR + 5.50%),
7/20/30(8)(9) | | | | | 2,500 | | | | 2,509,733 | |
| Wind River CLO, Ltd. | |
Series 2013-1A, Class DR, 8.769%, (3 mo. USD LIBOR + 6.30%),
7/20/30(8)(9) | | | | | 3,000 | | | | 2,976,594 | |
| |
Total Asset-Backed Securities
(identified cost $240,396,466) | | | $ | 240,450,425 | |
|
| Common Stocks — 1.2% | |
| Security | | | | Shares | | | Value | |
|
| Aerospace and Defense — 0.2% | |
IAP Global Services, LLC(3)(11)(12)(13) | | | | | 950 | | | $ | 11,146,150 | |
IAP Global Services, LLC(3)(11)(12)(13) | | | | | 1,627 | | | | 14,316,933 | |
| | | | $ | 25,463,083 | |
|
| Automotive — 0.0%(10) | |
Dayco Products, LLC(11)(12) | | | | | 88,506 | | | $ | 3,186,216 | |
| | | | $ | 3,186,216 | |
|
| Business Equipment and Services — 0.0% | |
Education Management Corp.(3)(11)(12) | | | | | 65,471,595 | | | $ | 0 | |
| | | | $ | 0 | |
|
| Electronics/Electrical — 0.1% | |
Answers Corp.(3)(11)(12) | | | | | 906,100 | | | $ | 6,605,469 | |
| | | | $ | 6,605,469 | |
|
| Health Care — 0.0%(10) | |
New Millennium Holdco, Inc.(11)(12) | | | | | 421,318 | | | $ | 37,918 | |
| | | | $ | 37,918 | |
| | | | |
| | 39 | | See Notes to Financial Statements. |
Eaton Vance
Floating Rate Portfolio
October 31, 2018
Portfolio of Investments — continued
| | | | | | | | | | | | |
| Security | | | | |
Shares | | | Value | |
|
| Nonferrous Metals/Minerals — 0.0% | |
ASP United/GHX Holding, LLC(3)(11)(12) | | | | | | | 304,664 | | | $ | 0 | |
| | | | $ | 0 | |
|
| Oil and Gas — 0.5% | |
AFG Holdings, Inc.(3)(11)(12) | | | | | | | 498,342 | | | $ | 33,887,256 | |
Fieldwood Energy, Inc.(11)(12) | | | | | | | 51,241 | | | | 2,536,430 | |
Fieldwood Energy, Inc.(11)(12) | | | | | | | 221,919 | | | | 10,984,990 | |
Paragon Offshore Finance Company,
Class A(11)(12) | | | | | | | 42,177 | | | | 40,861 | |
Paragon Offshore Finance Company,
Class B(11)(12) | | | | | | | 21,089 | | | | 838,288 | |
Samson Resources II, LLC, Class A(11)(12) | | | | | | | 435,055 | | | | 10,278,174 | |
Southcross Holdings Group, LLC(3)(11)(12) | | | | | | | 1,281 | | | | 0 | |
Southcross Holdings L.P., Class A(11)(12) | | | | | | | 1,281 | | | | 752,588 | |
| | | | $ | 59,318,587 | |
|
| Publishing — 0.3% | |
ION Media Networks, Inc.(3)(11)(12) | | | | | | | 28,605 | | | $ | 27,460,514 | |
Tweddle Group, Inc.(3)(11)(12) | | | | | | | 19,500 | | | | 1,097,265 | |
| | | | $ | 28,557,779 | |
|
| Radio and Television — 0.1% | |
Cumulus Media, Inc., Class A(11)(12) | | | | | | | 551,505 | | | $ | 8,029,913 | |
Cumulus Media, Inc., Class B(11)(12) | | | | | | | 93,069 | | | | 1,524,005 | |
| | | | | | | | | | | $ | 9,553,918 | |
| |
Total Common Stocks
(identified cost $57,881,840) | | | $ | 132,722,970 | |
|
| Convertible Preferred Stocks — 0.0% | |
| Security | | | | | Shares | | | Value | |
|
| Business Equipment and Services — 0.0% | |
Education Management Corp.,
Series A-1(3)(11)(12) | | | | | | | 72,851 | | | $ | 0 | |
| |
Total Convertible Preferred Stocks
(identified cost $5,141,580) | | | $ | 0 | |
| | | |
| Exchange-Traded Funds — 0.5% | | | | | | | | | | | | |
| Security | | | | | Shares | | | Value | |
SPDR Blackstone/GSO Senior Loan ETF | | | | | | | 1,100,000 | | | $ | 51,722,000 | |
| |
Total Exchange-Traded Funds
(identified cost $52,107,000) | | | $ | 51,722,000 | |
| | | | | | | | | | |
| Short-Term Investments — 6.9% | |
| Description | | | | Units | | | Value | |
Eaton Vance Cash Reserves Fund, LLC, 2.28%(14) | | | | | 792,403,522 | | | $ | 792,324,282 | |
| |
Total Short-Term Investments
(identified cost $792,404,815) | | | $ | 792,324,282 | |
| |
Total Investments — 102.3%
(identified cost $11,851,214,580) | | | $ | 11,762,561,862 | |
| |
Less Unfunded Loan Commitments — (0.2)% | | | $ | (23,119,312 | ) |
| |
Net Investments — 102.1%
(identified cost $11,828,095,268) | | | $ | 11,739,442,550 | |
| |
Other Assets, Less Liabilities — (2.1)% | | | $ | (237,053,535 | ) |
| |
Net Assets — 100.0% | | | $ | 11,502,389,015 | |
The percentage shown for each investment category in the Portfolio of Investments is based on net assets.
| | * | In U.S. dollars unless otherwise indicated. |
| | (1) | Senior floating-rate loans (Senior Loans) often require prepayments from excess cash flows or permit the borrowers to repay at their election. The degree to which borrowers repay, whether as a contractual requirement or at their election, cannot be predicted with accuracy. As a result, the actual remaining maturity may be substantially less than the stated maturities shown. However, Senior Loans will typically have an expected average life of approximately two to four years. Senior Loans typically have rates of interest which are redetermined periodically by reference to a base lending rate, plus a spread. These base lending rates are primarily the London Interbank Offered Rate (“LIBOR”) and secondarily, the prime rate offered by one or more major United States banks (the “Prime Rate”). Base lending rates may be subject to a floor, or minimum rate. |
| | (2) | Unfunded or partially unfunded loan commitments. The stated interest rate reflects the weighted average of the reference rate and spread for the funded portion, if any, and the commitment fees on the portion of the loan that is unfunded. See Note 1F for description. |
| | (3) | For fair value measurement disclosure purposes, security is categorized as Level 3 (see Note 10). |
| | (4) | The stated interest rate represents the weighted average interest rate at October 31, 2018 of contracts within the senior loan facility. Interest rates on contracts are primarily redetermined either weekly, monthly or quarterly by reference to the indicated base lending rate and spread and the reset period. |
| | (5) | This Senior Loan will settle after October 31, 2018, at which time the interest rate will be determined. |
| | (6) | Issuer is in default with respect to interest and/or principal payments. For a variable rate security, interest rate has been adjusted to reflect non-accrual status. |
| | (8) | Security exempt from registration pursuant to Rule 144A under the Securities Act of 1933, as amended. These securities may be sold in certain transactions in reliance on an exemption from registration (normally to qualified institutional buyers). At October 31, 2018, the |
| | | | |
| | 40 | | See Notes to Financial Statements. |
Eaton Vance
Floating Rate Portfolio
October 31, 2018
Portfolio of Investments — continued
| | aggregate value of these securities is $415,971,283 or 3.6% of the Portfolio’s net assets. |
| | (9) | Variable rate security. The stated interest rate represents the rate in effect at October 31, 2018. |
| (10) | Amount is less than 0.05%. |
| (11) | Non-income producing security. |
| (12) | Security was acquired in connection with a restructuring of a Senior Loan and may be subject to restrictions on resale. |
| (13) | Affiliated company (see Note 9). |
| (14) | Affiliated investment company, available to Eaton Vance portfolios and funds, which invests in high quality, U.S. dollar denominated money market instruments. The rate shown is the annualized seven-day yield as of October 31, 2018. |
| | | | | | | | | | | | | | | | | | | | | | | | |
| Forward Foreign Currency Exchange Contracts | |
| | | | | |
| Currency Purchased | | | Currency Sold | | | Counterparty | | Settlement
Date | | | Unrealized
Appreciation | | | Unrealized
(Depreciation) | |
| | | | | | | |
| USD | | | 11,120,148 | | | CAD | | | 14,400,647 | | | HSBC Bank USA, N.A. | | | 11/30/18 | | | $ | 175,877 | | | $ | — | |
| USD | | | 2,907,113 | | | EUR | | | 2,515,625 | | | HSBC Bank USA, N.A. | | | 11/30/18 | | | | 51,633 | | | | — | |
| USD | | | 2,307,763 | | | EUR | | | 2,000,000 | | | HSBC Bank USA, N.A. | | | 11/30/18 | | | | 37,568 | | | | — | |
| USD | | | 10,466,922 | | | EUR | | | 9,050,000 | | | JPMorgan Chase Bank, N.A. | | | 11/30/18 | | | | 194,291 | | | | — | |
| USD | | | 2,864,093 | | | EUR | | | 2,481,116 | | | JPMorgan Chase Bank, N.A. | | | 11/30/18 | | | | 47,784 | | | | — | |
| USD | | | 182,408,737 | | | EUR | | | 154,726,601 | | | State Street Bank and Trust Company | | | 11/30/18 | | | | 6,778,972 | | | | — | |
| USD | | | 10,281,791 | | | EUR | | | 8,812,500 | | | State Street Bank and Trust Company | | | 11/30/18 | | | | 278,744 | | | | — | |
| USD | | | 4,064,813 | | | EUR | | | 3,475,000 | | | State Street Bank and Trust Company | | | 11/30/18 | | | | 120,350 | | | | — | |
| USD | | | 3,482,010 | | | EUR | | | 2,991,750 | | | State Street Bank and Trust Company | | | 11/30/18 | | | | 86,083 | | | | — | |
| USD | | | 2,839,751 | | | EUR | | | 2,487,727 | | | State Street Bank and Trust Company | | | 11/30/18 | | | | 15,939 | | | | — | |
| USD | | | 4,572,295 | | | EUR | | | 4,029,486 | | | State Street Bank and Trust Company | | | 11/30/18 | | | | — | | | | (1,564 | ) |
| USD | | | 253,320,610 | | | EUR | | | 215,735,220 | | | Goldman Sachs International | | | 12/6/18 | | | | 8,299,733 | | | | — | |
| USD | | | 5,676,331 | | | EUR | | | 4,891,556 | | | HSBC Bank USA, N.A. | | | 12/6/18 | | | | 120,756 | | | | — | |
| USD | | | 6,573,835 | | | EUR | | | 5,650,000 | | | State Street Bank and Trust Company | | | 12/6/18 | | | | 156,858 | | | | — | |
| USD | | | 5,226,664 | | | EUR | | | 4,500,000 | | | State Street Bank and Trust Company | | | 12/6/18 | | | | 115,797 | | | | — | |
| USD | | | 1,955,042 | | | GBP | | | 1,499,665 | | | Citibank, N.A. | | | 12/31/18 | | | | 32,010 | | | | — | |
| USD | | | 215,299,362 | | | EUR | | | 187,400,000 | | | Goldman Sachs International | | | 1/31/19 | | | | 1,270,453 | | | | — | |
| USD | | | 74,273,239 | | | GBP | | | 57,720,231 | | | State Street Bank and Trust Company | | | 1/31/19 | | | | 142,695 | | | | — | |
| | | | | | | |
| | | | | | | | | | | | | | | | | | | $ | 17,925,543 | | | $ | (1,564 | ) |
Abbreviations:
| | | | |
| CIDOR | | – | | Canada Three Month Interbank Rate |
| EURIBOR | | – | | Euro Interbank Offered Rate |
| LIBOR | | – | | London Interbank Offered Rate |
| PIK | | – | | Payment In Kind |
Currency Abbreviations:
| | | | |
| CAD | | – | | Canadian Dollar |
| EUR | | – | | Euro |
| GBP | | – | | British Pound Sterling |
| USD | | – | | United States Dollar |
| | | | |
| | 41 | | See Notes to Financial Statements. |
Eaton Vance
Floating Rate Portfolio
October 31, 2018
Statement of Assets and Liabilities
| | | | |
| Assets | | October 31, 2018 | |
Investments — | | | | |
Unaffiliated investments, at value (identified cost, $11,033,345,045) | | $ | 10,921,655,185 | |
Affiliated investment fund, at value (identified cost, $792,404,815) | | | 792,324,282 | |
Affiliated companies, at value (identified cost, $2,345,408) | | | 25,463,083 | |
Total Investments, at value (identified cost, $11,828,095,268) | | $ | 11,739,442,550 | |
Cash | | | 31,521,846 | |
Deposits for derivatives collateral — forward foreign currency exchange contracts | | | 15,081,086 | |
Foreign currency, at value (identified cost, $22,086,014) | | | 22,079,260 | |
Interest receivable | | | 30,629,718 | |
Dividends receivable from affiliated investment fund | | | 1,567,644 | |
Receivable for investments sold | | | 25,868,463 | |
Receivable for open forward foreign currency exchange contracts | | | 17,925,543 | |
Prepaid expenses | | | 1,002,074 | |
Total assets | | $ | 11,885,118,184 | |
|
| Liabilities | |
Cash collateral due to brokers | | $ | 15,081,086 | |
Payable for investments purchased | | | 361,663,562 | |
Payable for open forward foreign currency exchange contracts | | | 1,564 | |
Payable to affiliates: | | | | |
Investment adviser fee | | | 4,679,124 | |
Trustees’ fees | | | 8,458 | |
Accrued expenses | | | 1,295,375 | |
Total liabilities | | $ | 382,729,169 | |
Commitments and contingencies (Note 11) | | | | |
Net Assets applicable to investors’ interest in Portfolio | | $ | 11,502,389,015 | |
| | | | |
| | 42 | | See Notes to Financial Statements. |
Eaton Vance
Floating Rate Portfolio
October 31, 2018
Statement of Operations
| | | | |
| Investment Income | | Year Ended October 31, 2018 | |
Interest and other income | | $ | 502,159,387 | |
Dividends | | | 1,232,000 | |
Dividends from affiliated investment fund | | | 13,588,718 | |
Total investment income | | $ | 516,980,105 | |
|
| Expenses | |
Investment adviser fee | | $ | 50,843,513 | |
Trustees’ fees and expenses | | | 101,500 | |
Custodian fee | | | 2,043,358 | |
Legal and accounting services | | | 1,361,837 | |
Interest expense and fees | | | 2,537,609 | |
Miscellaneous | | | 324,051 | |
Total expenses | | $ | 57,211,868 | |
| |
Net investment income | | $ | 459,768,237 | |
| |
| Realized and Unrealized Gain (Loss) | | | | |
Net realized gain (loss) — | | | | |
Investment transactions | | $ | 66,257,804 | |
Investment transactions — affiliated investment fund | | | (57,554 | ) |
Foreign currency transactions | | | 128,120 | |
Forward foreign currency exchange contracts | | | 33,191,789 | |
Net realized gain | | $ | 99,520,159 | |
Change in unrealized appreciation (depreciation) — | | | | |
Investments | | $ | (63,144,625 | )(1) |
Investments — affiliated investment fund | | | (43,748 | ) |
Foreign currency | | | 473,817 | |
Forward foreign currency exchange contracts | | | 12,200,578 | |
Net change in unrealized appreciation (depreciation) | | $ | (50,513,978 | ) |
| |
Net realized and unrealized gain | | $ | 49,006,181 | |
| |
Net increase in net assets from operations | | $ | 508,774,418 | |
| (1) | Includes net change in unrealized appreciation (depreciation) from affiliated companies of $(1,218,309) (see Note 9). |
| | | | |
| | 43 | | See Notes to Financial Statements. |
Eaton Vance
Floating Rate Portfolio
October 31, 2018
Statements of Changes in Net Assets
| | | | | | | | |
| | | Year Ended October 31, | |
| Increase (Decrease) in Net Assets | | 2018 | | | 2017 | |
From operations — | | | | | | | | |
Net investment income | | $ | 459,768,237 | | | $ | 382,779,648 | |
Net realized gain (loss) | | | 99,520,159 | | | | (88,514,652 | ) |
Net change in unrealized appreciation (depreciation) | | | (50,513,978 | ) | | | 220,389,016 | |
Net increase in net assets from operations | | $ | 508,774,418 | | | $ | 514,654,012 | |
Capital transactions — | |
Contributions | | $ | 1,754,720,809 | | | $ | 1,996,903,668 | |
Withdrawals | | | (561,884,656 | ) | | | (921,329,117 | ) |
Portfolio transaction fee | | | 4,812,064 | | | | — | |
Net increase in net assets from capital transactions | | $ | 1,197,648,217 | | | $ | 1,075,574,551 | |
| | |
Net increase in net assets | | $ | 1,706,422,635 | | | $ | 1,590,228,563 | |
|
| Net Assets | |
At beginning of year | | $ | 9,795,966,380 | | | $ | 8,205,737,817 | |
At end of year | | $ | 11,502,389,015 | | | $ | 9,795,966,380 | |
| | | | |
| | 44 | | See Notes to Financial Statements. |
Eaton Vance
Floating Rate Portfolio
October 31, 2018
Financial Highlights
| | | | | | | | | | | | | | | | | | | | |
| | | Year Ended October 31, | |
| Ratios/Supplemental Data | | 2018 | | | 2017 | | | 2016 | | | 2015 | | | 2014 | |
Ratios (as a percentage of average daily net assets): | | | | | | | | | | | | | | | | | | | | |
Expenses(1) | | | 0.54 | % | | | 0.56 | % | | | 0.58 | % | | | 0.55 | % | | | 0.52 | % |
Net investment income | | | 4.38 | % | | | 4.07 | % | | | 4.58 | % | | | 4.27 | % | | | 3.89 | % |
Portfolio Turnover | | | 30 | % | | | 42 | % | | | 27 | % | | | 19 | % | | | 34 | % |
| | | | | |
Total Return | | | 5.05 | % | | | 5.69 | % | | | 7.10 | % | | | 0.56 | % | | | 2.23 | % |
| | | | | |
Net assets, end of year (000’s omitted) | | $ | 11,502,389 | | | $ | 9,795,966 | | | $ | 8,205,738 | | | $ | 9,936,014 | | | $ | 13,901,215 | |
| (1) | Excludes the effect of custody fee credits, if any, of less than 0.005%. Effective September 1, 2015, custody fee credits, which were earned on cash deposit balances, were discontinued by the custodian. |
| | | | |
| | 45 | | See Notes to Financial Statements. |
Eaton Vance
Floating Rate Portfolio
October 31, 2018
Notes to Financial Statements
1 Significant Accounting Policies
Eaton Vance Floating Rate Portfolio (the Portfolio) is a Massachusetts business trust registered under the Investment Company Act of 1940, as amended (the 1940 Act), as a diversified, open-end management investment company. The Portfolio’s investment objective is to provide a high level of current income. The Declaration of Trust permits the Trustees to issue interests in the Portfolio. At October 31, 2018, Eaton Vance Floating-Rate Fund, Eaton Vance Floating-Rate & High Income Fund and Eaton Vance Floating-Rate NextShares held an interest of 85.6%, 14.4%, and less than 0.05%, respectively, in the Portfolio.
The following is a summary of significant accounting policies of the Portfolio. The policies are in conformity with accounting principles generally accepted in the United States of America (U.S. GAAP). The Portfolio is an investment company and follows accounting and reporting guidance in the Financial Accounting Standards Board (FASB) Accounting Standards Codification Topic 946.
A Investment Valuation — The following methodologies are used to determine the market value or fair value of investments.
Senior Floating-Rate Loans. Interests in senior floating-rate loans (Senior Loans) for which reliable market quotations are readily available are valued generally at the average mean of bid and ask quotations obtained from a third party pricing service. Other Senior Loans are valued at fair value by the investment adviser under procedures approved by the Trustees. In fair valuing a Senior Loan, the investment adviser utilizes one or more of the valuation techniques described in (i) through (iii) below to assess the likelihood that the borrower will make a full repayment of the loan underlying such Senior Loan relative to yields on other Senior Loans issued by companies of comparable credit quality. If the investment adviser believes that there is a reasonable likelihood of full repayment, the investment adviser will determine fair value using a matrix pricing approach that considers the yield on the Senior Loan. If the investment adviser believes there is not a reasonable likelihood of full repayment, the investment adviser will determine fair value using analyses that include, but are not limited to: (i) a comparison of the value of the borrower’s outstanding equity and debt to that of comparable public companies; (ii) a discounted cash flow analysis; or (iii) when the investment adviser believes it is likely that a borrower will be liquidated or sold, an analysis of the terms of such liquidation or sale. In certain cases, the investment adviser will use a combination of analytical methods to determine fair value, such as when only a portion of a borrower’s assets are likely to be sold. In conducting its assessment and analyses for purposes of determining fair value of a Senior Loan, the investment adviser will use its discretion and judgment in considering and appraising relevant factors. Fair value determinations are made by the portfolio managers of the Portfolio based on information available to such managers. The portfolio managers of other funds managed by the investment adviser that invest in Senior Loans may not possess the same information about a Senior Loan borrower as the portfolio managers of the Portfolio. At times, the fair value of a Senior Loan determined by the portfolio managers of other funds managed by the investment adviser that invest in Senior Loans may vary from the fair value of the same Senior Loan determined by the portfolio managers of the Portfolio. The fair value of each Senior Loan is periodically reviewed and approved by the investment adviser’s Valuation Committee and by the Trustees based upon procedures approved by the Trustees. Junior Loans (i.e., subordinated loans and second lien loans) are valued in the same manner as Senior Loans.
Debt Obligations. Debt obligations are generally valued on the basis of valuations provided by third party pricing services, as derived from such services’ pricing models. Inputs to the models may include, but are not limited to, reported trades, executable bid and asked prices, broker/dealer quotations, prices or yields of securities with similar characteristics, interest rates, anticipated prepayments, benchmark curves or information pertaining to the issuer, as well as industry and economic events. The pricing services may use a matrix approach, which considers information regarding securities with similar characteristics to determine the valuation for a security. Short-term debt obligations purchased with a remaining maturity of sixty days or less for which a valuation from a third party pricing service is not readily available may be valued at amortized cost, which approximates fair value.
Equity Securities. Equity securities listed on a U.S. securities exchange generally are valued at the last sale or closing price on the day of valuation or, if no sales took place on such date, at the mean between the closing bid and asked prices on the exchange where such securities are principally traded. Equity securities listed on the NASDAQ Global or Global Select Market generally are valued at the NASDAQ official closing price. Unlisted or listed securities for which closing sales prices or closing quotations are not available are valued at the mean between the latest available bid and asked prices or, in the case of preferred equity securities that are not listed or traded in the over-the-counter market, by a third party pricing service that uses various techniques that consider factors including, but not limited to, prices or yields of securities with similar characteristics, benchmark yields, broker/dealer quotes, quotes of underlying common stock, issuer spreads, as well as industry and economic events.
Derivatives. Forward foreign currency exchange contracts are generally valued at the mean of the average bid and average asked prices that are reported by currency dealers to a third party pricing service at the valuation time. Such third party pricing service valuations are supplied for specific settlement periods and the Portfolio’s forward foreign currency exchange contracts are valued at an interpolated rate between the closest preceding and subsequent settlement period reported by the third party pricing service.
Foreign Securities and Currencies. Foreign securities and currencies are valued in U.S. dollars, based on foreign currency exchange rate quotations supplied by a third party pricing service. The pricing service uses a proprietary model to determine the exchange rate. Inputs to the model include reported trades and implied bid/ask spreads.
Affiliated Fund. The Portfolio may invest in Eaton Vance Cash Reserves Fund, LLC (Cash Reserves Fund), an affiliated investment company managed by Eaton Vance Management (EVM). While Cash Reserves Fund is not a registered money market mutual fund, it conducts all of its investment activities in accordance with the requirements of Rule 2a-7 under the 1940 Act. Investments in Cash Reserves Fund are valued at the closing net asset value per unit on the valuation day. Cash Reserves Fund generally values its investment securities based on available market quotations provided by a third party pricing service.
Eaton Vance
Floating Rate Portfolio
October 31, 2018
Notes to Financial Statements — continued
Fair Valuation. Investments for which valuations or market quotations are not readily available or are deemed unreliable are valued at fair value using methods determined in good faith by or at the direction of the Trustees of the Portfolio in a manner that fairly reflects the security’s value, or the amount that the Portfolio might reasonably expect to receive for the security upon its current sale in the ordinary course. Each such determination is based on a consideration of relevant factors, which are likely to vary from one pricing context to another. These factors may include, but are not limited to, the type of security, the existence of any contractual restrictions on the security’s disposition, the price and extent of public trading in similar securities of the issuer or of comparable companies or entities, quotations or relevant information obtained from broker/dealers or other market participants, information obtained from the issuer, analysts, and/or the appropriate stock exchange (for exchange-traded securities), an analysis of the company’s or entity’s financial condition, and an evaluation of the forces that influence the issuer and the market(s) in which the security is purchased and sold.
B Investment Transactions — Investment transactions for financial statement purposes are accounted for on a trade date basis. Realized gains and losses on investments sold are determined on the basis of identified cost.
C Income — Interest income is recorded on the basis of interest accrued, adjusted for amortization of premium or accretion of discount. Fees associated with loan amendments are recognized immediately. Dividend income is recorded on the ex-dividend date for dividends received in cash and/or securities. Distributions from investment companies are recorded as dividend income, capital gains or return of capital based on the nature of the distribution.
D Federal Taxes — The Portfolio has elected to be treated as a partnership for federal tax purposes. No provision is made by the Portfolio for federal or state taxes on any taxable income of the Portfolio because each investor in the Portfolio is ultimately responsible for the payment of any taxes on its share of taxable income. Since at least one of the Portfolio’s investors is a regulated investment company that invests all or substantially all of its assets in the Portfolio, the Portfolio normally must satisfy the applicable source of income and diversification requirements (under the Internal Revenue Code) in order for its investors to satisfy them. The Portfolio will allocate, at least annually among its investors, each investor’s distributive share of the Portfolio’s net investment income, net realized capital gains and losses and any other items of income, gain, loss, deduction or credit.
As of October 31, 2018, the Portfolio had no uncertain tax positions that would require financial statement recognition, de-recognition, or disclosure. The Portfolio files a U.S. federal income tax return annually after its fiscal year-end, which is subject to examination by the Internal Revenue Service for a period of three years from the date of filing.
E Foreign Currency Translation — Investment valuations, other assets, and liabilities initially expressed in foreign currencies are translated each business day into U.S. dollars based upon current exchange rates. Purchases and sales of foreign investment securities and income and expenses denominated in foreign currencies are translated into U.S. dollars based upon currency exchange rates in effect on the respective dates of such transactions. Recognized gains or losses on investment transactions attributable to changes in foreign currency exchange rates are recorded for financial statement purposes as net realized gains and losses on investments. That portion of unrealized gains and losses on investments that results from fluctuations in foreign currency exchange rates is not separately disclosed.
F Unfunded Loan Commitments — The Portfolio may enter into certain loan agreements all or a portion of which may be unfunded. The Portfolio is obligated to fund these commitments at the borrower’s discretion. These commitments are disclosed in the accompanying Portfolio of Investments. At October 31, 2018, the Portfolio had sufficient cash and/or securities to cover these commitments.
G Use of Estimates — The preparation of the financial statements in conformity with U.S. GAAP requires management to make estimates and assumptions that affect the reported amounts of assets and liabilities at the date of the financial statements and the reported amounts of income and expense during the reporting period. Actual results could differ from those estimates.
H Indemnifications — Under the Portfolio’s organizational documents, its officers and Trustees may be indemnified against certain liabilities and expenses arising out of the performance of their duties to the Portfolio. Under Massachusetts law, if certain conditions prevail, interestholders in the Portfolio could be deemed to have personal liability for the obligations of the Portfolio. However, the Portfolio’s Declaration of Trust contains an express disclaimer of liability on the part of Portfolio interestholders and the By-laws provide that the Portfolio shall assume the defense on behalf of any Portfolio interestholder. Moreover, the By-laws also provide for indemnification out of Portfolio property of any interestholder held personally liable solely by reason of being or having been an interestholder for all loss or expense arising from such liability. Additionally, in the normal course of business, the Portfolio enters into agreements with service providers that may contain indemnification clauses. The Portfolio’s maximum exposure under these arrangements is unknown as this would involve future claims that may be made against the Portfolio that have not yet occurred.
I Forward Foreign Currency Exchange Contracts — The Portfolio may enter into forward foreign currency exchange contracts for the purchase or sale of a specific foreign currency at a fixed price on a future date. The forward foreign currency exchange contracts are adjusted by the daily exchange rate of the underlying currency and any gains or losses are recorded as unrealized until such time as the contracts have been closed. Risks may arise upon entering these contracts from the potential inability of counterparties to meet the terms of their contracts and from movements in the value of a foreign currency relative to the U.S. dollar.
J When-Issued Securities and Delayed Delivery Transactions — The Portfolio may purchase or sell securities on a delayed delivery or when-issued basis. Payment and delivery may take place after the customary settlement period for that security. At the time the transaction is negotiated, the price of the security that will be delivered is fixed. The Portfolio maintains cash and/or security positions for these commitments such that sufficient liquid assets will be available to make payments upon settlement. Securities purchased on a delayed delivery or when-issued basis are marked-to-market daily and begin
Eaton Vance
Floating Rate Portfolio
October 31, 2018
Notes to Financial Statements — continued
earning interest on settlement date. Losses may arise due to changes in the market value of the underlying securities or if the counterparty does not perform under the contract.
K Capital Transactions — To seek to protect the Portfolio (and, indirectly, other investors in the Portfolio) against the costs of accommodating investor inflows and outflows, the Portfolio imposes a fee (“Portfolio transaction fee”) on inflows and outflows by Portfolio investors. The Portfolio transaction fee is sized to cover the estimated cost to the Portfolio of, in connection with issuing interests, converting the cash and/or other instruments it receives to the desired composition and, in connection with redeeming its interests, converting Portfolio holdings to cash and/or other instruments to be distributed. Such fee, which may vary over time, is limited to amounts that have been authorized by the Board of Trustees and determined by EVM to be appropriate. The maximum Portfolio transaction fee is 2% of the amount of net contributions or withdrawals. The Portfolio transaction fee is recorded as a component of capital transactions on the Statements of Changes in Net Assets.
2 Investment Adviser Fee and Other Transactions with Affiliates
The investment adviser fee is earned by Boston Management and Research (BMR), a subsidiary of EVM, as compensation for investment advisory services rendered to the Portfolio. Pursuant to the investment advisory agreement and subsequent fee reduction agreements between the Portfolio and BMR, the fee is computed at an annual rate of 0.575% of the Portfolio’s average daily net assets up to $1 billion, 0.525% from $1 billion up to $2 billion, 0.490% from $2 billion up to $5 billion, 0.460% from $5 billion up to $10 billion, 0.435% from $10 billion up to $15 billion, 0.415% from $15 billion up to $20 billion, 0.400% from $20 billion up to $25 billion and 0.390% of average daily net assets of $25 billion or more, and is payable monthly. The fee reductions cannot be terminated or reduced without the approval of a majority vote of the Trustees of the Portfolio who are not interested persons of BMR or the Portfolio and by the vote of a majority of the holders of interests in the Portfolio. For the year ended October 31, 2018, the Portfolio’s investment adviser fee amounted to $50,843,513 or 0.48% of the Portfolio’s average daily net assets. The Portfolio invests its cash in Cash Reserves Fund. EVM does not currently receive a fee for advisory services provided to Cash Reserves Fund.
Trustees and officers of the Portfolio who are members of EVM’s or BMR’s organizations receive remuneration for their services to the Portfolio out of the investment adviser fee. Trustees of the Portfolio who are not affiliated with the investment adviser may elect to defer receipt of all or a percentage of their annual fees in accordance with the terms of the Trustees Deferred Compensation Plan. For the year ended October 31, 2018, no significant amounts have been deferred. Certain officers and Trustees of the Portfolio are officers of the above organizations.
3 Purchases and Sales of Investments
Purchases and sales of investments, other than short-term obligations, and including maturities and principal repayments on Senior Loans, aggregated $4,475,889,958 and $2,975,076,273, respectively, for the year ended October 31, 2018.
4 Federal Income Tax Basis of Investments
The cost and unrealized appreciation (depreciation) of investments, including open derivative contracts, of the Portfolio at October 31, 2018, as determined on a federal income tax basis, were as follows:
| | | | |
| |
Aggregate cost | | $ | 11,829,235,765 | |
| |
Gross unrealized appreciation | | $ | 136,225,270 | |
Gross unrealized depreciation | | | (226,018,485 | ) |
| |
Net unrealized depreciation | | $ | (89,793,215 | ) |
5 Financial Instruments
The Portfolio may trade in financial instruments with off-balance sheet risk in the normal course of its investing activities. These financial instruments may include forward foreign currency exchange contracts and may involve, to a varying degree, elements of risk in excess of the amounts recognized for financial statement purposes. The notional or contractual amounts of these instruments represent the investment the Portfolio has in particular classes of financial instruments and do not necessarily represent the amounts potentially subject to risk. The measurement of the risks associated with these instruments is meaningful only when all related and offsetting transactions are considered. A summary of obligations under these financial instruments at October 31, 2018 is included in the Portfolio of Investments. At October 31, 2018, the Portfolio had sufficient cash and/or securities to cover commitments under these contracts.
The Portfolio is subject to foreign exchange risk in the normal course of pursuing its investment objective. Because the Portfolio holds foreign currency denominated investments, the value of these investments and related receivables and payables may change due to future changes in foreign currency exchange rates. To hedge against this risk, the Portfolio enters into forward foreign currency exchange contracts.
Eaton Vance
Floating Rate Portfolio
October 31, 2018
Notes to Financial Statements — continued
The Portfolio enters into forward foreign currency exchange contracts that may contain provisions whereby the counterparty may terminate the contract under certain conditions, including but not limited to a decline in the Portfolio’s net assets below a certain level over a certain period of time, which would trigger a payment by the Portfolio for those derivatives in a liability position. At October 31, 2018, the fair value of derivatives with credit related contingent features in a net liability position was $1,564. At October 31, 2018, there were no assets pledged by the Portfolio for such liability.
The over-the-counter (OTC) derivatives in which the Portfolio invests are subject to the risk that the counterparty to the contract fails to perform its obligations under the contract. To mitigate this risk, the Portfolio has entered into an International Swaps and Derivatives Association, Inc. Master Agreement (“ISDA Master Agreement”) or similar agreement with substantially all its derivative counterparties. An ISDA Master Agreement is a bilateral agreement between the Portfolio and a counterparty that governs certain OTC derivatives and typically contains, among other things, set-off provisions in the event of a default and/or termination event as defined under the relevant ISDA Master Agreement. Under an ISDA Master Agreement, the Portfolio may, under certain circumstances, offset with the counterparty certain derivative financial instruments’ payables and/or receivables with collateral held and/or posted and create one single net payment. The provisions of the ISDA Master Agreement typically permit a single net payment in the event of default including the bankruptcy or insolvency of the counterparty. However, bankruptcy or insolvency laws of a particular jurisdiction may impose restrictions on or prohibitions against the right of offset in bankruptcy or insolvency. Certain ISDA Master Agreements allow counterparties to OTC derivatives to terminate derivative contracts prior to maturity in the event the Portfolio’s net assets decline by a stated percentage or the Portfolio fails to meet the terms of its ISDA Master Agreements, which would cause the counterparty to accelerate payment by the Portfolio of any net liability owed to it.
The collateral requirements for derivatives traded under an ISDA Master Agreement are governed by a Credit Support Annex to the ISDA Master Agreement. Collateral requirements are determined at the close of business each day and are typically based on changes in market values for each transaction under an ISDA Master Agreement and netted into one amount for such agreement. Generally, the amount of collateral due from or to a counterparty is subject to a minimum transfer threshold amount before a transfer is required, which may vary by counterparty. Collateral pledged for the benefit of the Portfolio and/or counterparty is held in segregated accounts by the Portfolio’s custodian and cannot be sold, re-pledged, assigned or otherwise used while pledged. The portion of such collateral representing cash, if any, is reflected as deposits for derivatives collateral and, in the case of cash pledged by a counterparty for the benefit of the Portfolio, a corresponding liability on the Statement of Assets and Liabilities. Securities pledged by the Portfolio as collateral, if any, are identified as such in the Portfolio of Investments. The carrying amount of the liability for cash collateral due to brokers at October 31, 2018 approximated its fair value. If measured at fair value, such liability would have been considered as Level 2 in the fair value hierarchy (see Note 10) at October 31, 2018.
The fair value of open derivative instruments (not considered to be hedging instruments for accounting disclosure purposes) and whose primary underlying risk exposure is foreign exchange risk at October 31, 2018 was as follows:
| | | | | | | | |
| | | Fair Value | |
| Derivative | | Asset Derivative | | | Liability Derivative | |
Forward foreign currency exchange contracts | | $ | 17,925,543 | (1) | | $ | (1,564 | )(2) |
| | |
Total Derivatives subject to master netting or similar agreements | | $ | 17,925,543 | | | $ | (1,564 | ) |
| (1) | Statement of Assets and Liabilities location: Receivable for open forward foreign currency exchange contracts. |
| (2) | Statement of Assets and Liabilities location: Payable for open forward foreign currency exchange contracts. |
The Portfolio’s derivative assets and liabilities at fair value by type, which are reported gross in the Statement of Assets and Liabilities, are presented in the table above. The following tables present the Portfolio’s derivative assets and liabilities by counterparty, net of amounts available for offset under a master netting agreement and net of the related collateral received by the Portfolio for such assets and pledged by the Portfolio for such liabilities as of October 31, 2018.
| | | | | | | | | | | | | | | | | | | | |
| Counterparty | | Derivative Assets
Subject to
Master Netting
Agreement | | | Derivatives
Available
for Offset | | | Non-cash
Collateral
Received(a) | | | Cash Collateral
Received(a) | | | Net Amount
of Derivative
Assets(b) | |
| | | | | |
Citibank N.A. | | $ | 32,010 | | | $ | — | | | $ | — | | | $ | — | | | $ | 32,010 | |
Goldman Sachs International | | | 9,570,186 | | | | — | | | | — | | | | (9,570,186 | ) | | | — | |
HSBC Bank USA, N.A. | | | 385,834 | | | | — | | | | (385,834 | ) | | | — | | | | — | |
JPMorgan Chase Bank, N.A. | | | 242,075 | | | | — | | | | — | | | | (220,039 | ) | | | 22,036 | |
State Street Bank and Trust Company | | | 7,695,438 | | | | (1,564 | ) | | | (7,693,874 | ) | | | — | | | | — | |
| | | | | |
| | | $ | 17,925,543 | | | $ | (1,564 | ) | | $ | (8,079,708 | ) | | $ | (9,790,225 | ) | | $ | 54,046 | |
Eaton Vance
Floating Rate Portfolio
October 31, 2018
Notes to Financial Statements — continued
| | | | | | | | | | | | | | | | | | | | |
| Counterparty | | Derivative Liabilities
Subject to
Master Netting
Agreement | | | Derivatives
Available
for Offset | | | Non-cash
Collateral
Pledged(a) | | | Cash
Collateral
Pledged(a) | | | Net Amount
of Derivative
Liabilities(c) | |
| | | | | |
State Street Bank and Trust Company | | $ | (1,564 | ) | | $ | 1,564 | | | $ | — | | | $ | — | | | $ | — | |
| (a) | In some instances, the total collateral received and/or pledged may be more than the amount shown due to overcollateralization. |
| (b) | Net amount represents the net amount due from the counterparty in the event of default. |
| (c) | Net amount represents the net amount payable to the counterparty in the event of default. |
The effect of derivative instruments (not considered to be hedging instruments for accounting disclosure purposes) on the Statement of Operations and whose primary underlying risk exposure is foreign exchange risk for the year ended October 31, 2018 was as follows:
| | | | | | | | |
| Derivative | | Realized Gain (Loss)
on Derivatives Recognized
in Income(1) | | | Change in Unrealized
Appreciation (Depreciation) on
Derivatives Recognized in Income(2) | |
| | |
Forward foreign currency exchange contracts | | $ | 33,191,789 | | | $ | 12,200,578 | |
| (1) | Statement of Operations location: Net realized gain (loss) – Forward foreign currency exchange contracts. |
| (2) | Statement of Operations location: Change in unrealized appreciation (depreciation) – Forward foreign currency exchange contracts. |
The average notional amount of forward foreign currency exchange contracts (based on the absolute value of notional amounts of currency purchased and currency sold) outstanding during the year ended October 31, 2018, which is indicative of the volume of this derivative type, was approximately $626,707,000.
6 Line of Credit
The Portfolio participates with another portfolio and fund managed by EVM and its affiliates in a $875 million unsecured line of credit agreement with a group of banks, which is in effect through March 11, 2019. Borrowings are made by the Portfolio solely to facilitate the handling of unusual and/or unanticipated short-term cash requirements. Interest is charged to the Portfolio based on its borrowings at an amount above a prime rate, the London Interbank Offered Rate (LIBOR) or the Federal Funds rate. In addition, a fee computed at an annual rate of 0.15% on the daily unused portion of the line of credit is allocated among the participating portfolios and fund at the end of each quarter. Also included in interest expense and fees on the Statement of Operations is approximately $1,273,000 of amortization of upfront fees paid by the Portfolio in connection with the annual renewal of the Agreement. The unamortized balance of upfront fees at October 31, 2018 is $453,953 and is included in prepaid expenses on the Statement of Assets and Liabilities. Because the line of credit is not available exclusively to the Portfolio, it may be unable to borrow some or all of its requested amounts at any particular time. The Portfolio did not have any significant borrowings or allocated fees during the year ended October 31, 2018.
7 Risks Associated with Foreign Investments
Investing in securities issued by companies whose principal business activities are outside the United States may involve significant risks not present in domestic investments. For example, there is generally less publicly available information about foreign companies, particularly those not subject to the disclosure and reporting requirements of the U.S. securities laws. Certain foreign issuers are generally not bound by uniform accounting, auditing, and financial reporting requirements and standards of practice comparable to those applicable to domestic issuers. Investments in foreign securities also involve the risk of possible adverse changes in investment or exchange control regulations, expropriation or confiscatory taxation, limitation on the removal of funds or other assets of the Portfolio, political or financial instability or diplomatic and other developments which could affect such investments. Foreign securities markets, while growing in volume and sophistication, are generally not as developed as those in the United States, and securities of some foreign issuers (particularly those located in developing countries) may be less liquid and more volatile than securities of comparable U.S. companies. In general, there is less overall governmental supervision and regulation of foreign securities markets, broker/dealers and issuers than in the United States.
8 Credit Risk
The Portfolio invests primarily in below investment grade floating-rate loans, which are considered speculative because of the credit risk of their issuers. Changes in economic conditions or other circumstances are more likely to reduce the capacity of issuers of these securities to make principal and interest payments. Such companies are more likely to default on their payments of interest and principal owed than issuers of investment grade bonds. An economic downturn generally leads to a higher non-payment rate, and a loan or other debt obligation may lose significant value before a default occurs. Lower rated investments also may be subject to greater price volatility than higher rated investments. Moreover, the specific collateral used to secure a loan may decline in value or become illiquid, which would adversely affect the loan’s value.
Eaton Vance
Floating Rate Portfolio
October 31, 2018
Notes to Financial Statements — continued
9 Investments in Affiliated Companies
An affiliated company is a company in which a fund has a direct or indirect ownership of, control of, or voting power of 5 percent or more of the outstanding voting shares, or a company that is under common ownership or control with a fund. At October 31, 2018, the value of the Portfolio’s investment in affiliated companies was $25,463,083, which represents 0.22% of the Portfolio’s net assets. Transactions in affiliated companies by the Portfolio for the year ended October 31, 2018 were as follows:
| | | | | | | | | | | | | | | | | | | | | | | | | | | | | | | | |
| Name of affiliated company | | Shares, Beginning of Year | | | Gross
Additions | | | Gross
Reductions | | | Shares, End of Year | | | Value, End of Year | | | Dividend
Income | | | Realized
Gain (Loss) | | | Change in Unrealized Appreciation
(Depreciation) | |
| | | | | | | | |
Common Stock* | | | | | | | | | | | | | | | | | | | | | | | | | | | | | | | | |
IAP Global Services, LLC(1)(2)(3) | | | 2,577 | | | | — | | | | — | | | | 2,577 | | | $ | 25,463,083 | | | $ | — | | | $ | — | | | $ | (1,218,309 | ) |
| * | The related industry is the same as the presentation in the Portfolio of Investments. |
| (1) | For fair value measurement disclosure purposes, security is categorized as Level 3 (see Note 10). |
| (2) | Non-income producing security. |
| (3) | Security was acquired in connection with a restructuring of a Senior Loan and may be subject to restrictions on resale. |
10 Fair Value Measurements
Under generally accepted accounting principles for fair value measurements, a three-tier hierarchy to prioritize the assumptions, referred to as inputs, is used in valuation techniques to measure fair value. The three-tier hierarchy of inputs is summarized in the three broad levels listed below.
| • | | Level 1 – quoted prices in active markets for identical investments |
| • | | Level 2 – other significant observable inputs (including quoted prices for similar investments, interest rates, prepayment speeds, credit risk, etc.) |
| • | | Level 3 – significant unobservable inputs (including a fund’s own assumptions in determining the fair value of investments) |
In cases where the inputs used to measure fair value fall in different levels of the fair value hierarchy, the level disclosed is determined based on the lowest level input that is significant to the fair value measurement in its entirety. The inputs or methodology used for valuing securities are not necessarily an indication of the risk associated with investing in those securities.
At October 31, 2018, the hierarchy of inputs used in valuing the Portfolio’s investments and open derivative instruments, which are carried at value, were as follows:
| | | | | | | | | | | | | | | | |
| Asset Description | | Level 1 | | | Level 2 | | | Level 3* | | | Total | |
| | | | |
Senior Floating-Rate Loans (Less Unfunded Loan Commitments) | | $ | — | | | $ | 10,210,926,246 | | | $ | 30,609,097 | | | $ | 10,241,535,343 | |
Corporate Bonds & Notes | | | — | | | | 280,687,530 | | | | — | | | | 280,687,530 | |
Asset-Backed Securities | | | — | | | | 240,450,425 | | | | — | | | | 240,450,425 | |
Common Stocks | | | 8,029,913 | | | | 30,179,470 | | | | 94,513,587 | | | | 132,722,970 | |
Convertible Preferred Stocks | | | — | | | | — | | | | 0 | | | | 0 | |
Exchange-Traded Funds | | | 51,722,000 | | | | — | | | | — | | | | 51,722,000 | |
Short-Term Investments | | | — | | | | 792,324,282 | | | | — | | | | 792,324,282 | |
| | | | |
Total Investments | | $ | 59,751,913 | | | $ | 11,554,567,953 | | | $ | 125,122,684 | | | $ | 11,739,442,550 | |
| | | | |
Forward Foreign Currency Exchange Contracts | | $ | — | | | $ | 17,925,543 | | | $ | — | | | $ | 17,925,543 | |
| | | | |
Total | | $ | 59,751,913 | | | $ | 11,572,493,496 | | | $ | 125,122,684 | | | $ | 11,757,368,093 | |
| | | | |
Liability Description | | | | | | | | | | | | | | | | |
| | | | |
Forward Foreign Currency Exchange Contracts | | $ | — | | | $ | (1,564 | ) | | $ | — | | | $ | (1,564 | ) |
| | | | |
Total | | $ | — | | | $ | (1,564 | ) | | $ | — | | | $ | (1,564 | ) |
| * | None of the unobservable inputs for Level 3 assets, individually or collectively, had a material impact on the Portfolio. |
Eaton Vance
Floating Rate Portfolio
October 31, 2018
Notes to Financial Statements — continued
Level 3 investments at the beginning and/or end of the period in relation to net assets were not significant and accordingly, a reconciliation of Level 3 assets for the year ended October 31, 2018 is not presented.
11 Legal Proceedings
In May 2015, the Portfolio was served with an amended complaint filed in an adversary proceeding in the United States Bankruptcy Court for the Southern District of New York. The adversary proceeding was filed by the Motors Liquidation Company Avoidance Action Trust (“AAT”) against the former holders of a $1.5 billion term loan issued by General Motors Corp. (“GM”) in 2006 (the “Term Loan Lenders”) who received a full repayment of the term loan pursuant to a court order in the GM bankruptcy proceeding. The court order was made with the understanding that the term loan was fully secured at the time of GM’s bankruptcy filing in June 2009. The AAT is seeking (1) a determination from the Bankruptcy Court that the security interest held by the Term Loan Lenders was not perfected at the time GM filed for Chapter 11 Bankruptcy protection and thus the Term Loan Lenders should have been treated in the same manner as GM’s unsecured creditors, (2) disgorgement of any interest payments made to the Term Loan Lenders within ninety days of GM’s filing for Chapter 11 Bankruptcy protection, and (3) disgorgement of the $1.5 billion term loan repayment that was made to the Term Loan Lenders. The value of the payment received under the term loan agreement by the Portfolio is approximately $10,668,000 (equal to 0.09% of net assets at October 31, 2018). The Portfolio cannot predict the outcome of these proceedings or the effect, if any, on the Portfolio’s net asset value. The attorneys’ fees and costs related to these actions are expensed by the Portfolio as incurred.
Eaton Vance
Floating Rate Portfolio
October 31, 2018
Report of Independent Registered Public Accounting Firm
To the Trustees and Investors of Eaton Vance Floating Rate Portfolio:
Opinion on the Financial Statements and Financial Highlights
We have audited the accompanying statement of assets and liabilities of Eaton Vance Floating Rate Portfolio (the “Portfolio”), including the portfolio of investments, as of October 31, 2018, the related statement of operations for the year then ended, the statements of changes in net assets for each of the two years in the period then ended, the financial highlights for each of the five years in the period then ended, and the related notes. In our opinion, the financial statements and financial highlights present fairly, in all material respects, the financial position of the Portfolio as of October 31, 2018, and the results of its operations for the year then ended, the changes in its net assets for each of the two years in the period then ended, and the financial highlights for each of the five years in the period then ended, in conformity with accounting principles generally accepted in the United States of America.
Basis for Opinion
These financial statements and financial highlights are the responsibility of the Portfolio’s management. Our responsibility is to express an opinion on the Portfolio’s financial statements and financial highlights based on our audits. We are a public accounting firm registered with the Public Company Accounting Oversight Board (United States) (PCAOB) and are required to be independent with respect to the Portfolio in accordance with the U.S. federal securities laws and the applicable rules and regulations of the Securities and Exchange Commission and the PCAOB.
We conducted our audits in accordance with the standards of the PCAOB. Those standards require that we plan and perform the audit to obtain reasonable assurance about whether the financial statements and financial highlights are free of material misstatement, whether due to error or fraud. The Portfolio is not required to have, nor were we engaged to perform, an audit of its internal control over financial reporting. As part of our audits we are required to obtain an understanding of internal control over financial reporting but not for the purpose of expressing an opinion on the effectiveness of the Portfolio’s internal control over financial reporting. Accordingly, we express no such opinion.
Our audits included performing procedures to assess the risks of material misstatement of the financial statements and financial highlights, whether due to error or fraud, and performing procedures that respond to those risks. Such procedures included examining, on a test basis, evidence regarding the amounts and disclosures in the financial statements and financial highlights. Our audits also included evaluating the accounting principles used and significant estimates made by management, as well as evaluating the overall presentation of the financial statements and financial highlights. Our procedures included confirmation of securities and senior loans owned as of October 31, 2018, by correspondence with the custodian, brokers, and selling or agent banks; when replies were not received from brokers and selling or agent banks, we performed other auditing procedures. We believe that our audits provide a reasonable basis for our opinion.
/s/ Deloitte & Touche LLP
Boston, Massachusetts
December 17, 2018
We have served as the auditor of one or more Eaton Vance investment companies since 1959.
Eaton Vance Floating-Rate NextShares
Eaton Vance Floating Rate Portfolio
October 31, 2018
Special Meeting of Shareholders (Unaudited)
Eaton Vance Floating-Rate NextShares
The Fund held a Special Meeting of Shareholders on September 20, 2018 to elect the five Trustees listed below. The other Trustees named herein continue to serve as Trustees. The results of the vote with respect to the Fund were as follows:
| | | | | | | | |
| | | Number of Shares | |
| Nominee for Trustee | | For | | | Withheld | |
Mark R. Fetting | | | 498,000 | | | | 0 | |
Keith Quinton | | | 498,000 | | | | 0 | |
Marcus L. Smith | | | 498,000 | | | | 0 | |
Susan J. Sutherland | | | 498,000 | | | | 0 | |
Scott E. Wennerholm | | | 498,000 | | | | 0 | |
| Results | are rounded to the nearest whole number. |
Each nominee was also elected a Trustee of Eaton Vance Floating Rate Portfolio.
Eaton Vance Floating Rate Portfolio
The Portfolio held a Special Meeting of Interestholders on September 20, 2018 to elect the five Trustees listed below. The other Trustees named herein continue to serve as Trustees. The results of the vote with respect to the Fund’s interest in the Portfolio were as follows:
| | | | | | |
| | | Interest in the Portfolio | |
| Nominee for Trustee | | For | | Withheld | |
Mark R. Fetting | | 99% | | | 1 | % |
Keith Quinton | | 99% | | | 1 | % |
Marcus L. Smith | | 99% | | | 1 | % |
Susan J. Sutherland | | 99% | | | 1 | % |
Scott E. Wennerholm | | 99% | | | 1 | % |
| Results | are rounded to the nearest whole number. |
Eaton Vance
Floating-Rate NextShares
October 31, 2018
Management and Organization
Fund Management. The Trustees of Eaton Vance NextShares Trust II (the Trust), and Eaton Vance Floating Rate Portfolio (the Portfolio) are responsible for the overall management and supervision of the Trust’s and Portfolio’s affairs. The Trustees and officers of the Trust and the Portfolio are listed below. Except as indicated, each individual has held the office shown or other offices in the same company for the last five years. Trustees and officers of the Trust and the Portfolio hold indefinite terms of office. The “Noninterested Trustees” consist of those Trustees who are not “interested persons” of the Trust and the Portfolio, as that term is defined under the 1940 Act. The business address of each Trustee and officer is Two International Place, Boston, Massachusetts 02110. As used below, “EVC” refers to Eaton Vance Corp., “EV” refers to Eaton Vance, Inc., “EVM” refers to Eaton Vance Management, “BMR” refers to Boston Management and Research and “EVD” refers to Eaton Vance Distributors, Inc. EVC and EV are the corporate parent and trustee, respectively, of EVM and BMR. EVD is the Fund’s principal underwriter, the Portfolio’s placement agent and a wholly-owned subsidiary of EVC. Each officer affiliated with Eaton Vance may hold a position with other Eaton Vance affiliates that is comparable to his or her position with EVM listed below. Each Trustee oversees 174 portfolios in the Eaton Vance Complex (including all master and feeder funds in a master feeder structure). Each officer serves as an officer of certain other Eaton Vance funds. Each Trustee and officer serves until his or her successor is elected.
| | | | | | |
| Name and Year of Birth | | Position(s) with the Trust and the Portfolio | | Trustee Since(1) | | Principal Occupation(s) and Directorships During Past Five Years and Other Relevant Experience |
| Interested Trustee | | | | | | |
| | | |
Thomas E. Faust Jr. 1958 | | Trustee | | 2007 | | Chairman, Chief Executive Officer and President of EVC, Director and President of EV, Chief Executive Officer and President of EVM and BMR, and Director of EVD. Trustee and/or officer of 174 registered investment companies. Mr. Faust is an interested person because of his positions with EVM, BMR, EVD, EVC and EV, which are affiliates of the Trust and the Portfolio. Directorships in the Last Five Years.(2) Director of EVC and Hexavest Inc. (investment management firm). |
|
| Noninterested Trustees |
| | | |
Mark R. Fetting 1954 | | Trustee | | 2016 | | Private investor. Formerly held various positions at Legg Mason, Inc. (investment management firm) (2000-2012), including President, Chief Executive Officer, Director and Chairman (2008-2012), Senior Executive Vice President (2004-2008) and Executive Vice President (2001-2004). Formerly, President of Legg Mason family of funds (2001-2008). Formerly, Division President and Senior Officer of Prudential Financial Group, Inc. and related companies (investment management firm) (1991-2000). Directorships in the Last Five Years. None. |
| | | |
Cynthia E. Frost 1961 | | Trustee | | 2014 | | Private investor. Formerly, Chief Investment Officer of Brown University (university endowment) (2000-2012). Formerly, Portfolio Strategist for Duke Management Company (university endowment manager) (1995-2000). Formerly, Managing Director, Cambridge Associates (investment consulting company) (1989-1995). Formerly, Consultant, Bain and Company (management consulting firm) (1987-1989). Formerly, Senior Equity Analyst, BA Investment Management Company (1983-1985). Directorships in the Last Five Years. None. |
| | | |
George J. Gorman 1952 | | Trustee | | 2014 | | Principal at George J. Gorman LLC (consulting firm). Formerly, Senior Partner at Ernst & Young LLP (a registered public accounting firm) (1974-2009). Directorships in the Last Five Years. Formerly, Trustee of the BofA Funds Series Trust (11 funds) (2011-2014) and of the Ashmore Funds (9 funds) (2010-2014). |
| | | |
Valerie A. Mosley 1960 | | Trustee | | 2014 | | Chairwoman and Chief Executive Officer of Valmo Ventures (a consulting and investment firm). Former Partner and Senior Vice President, Portfolio Manager and Investment Strategist at Wellington Management Company, LLP (investment management firm) (1992-2012). Former Chief Investment Officer, PG Corbin Asset Management (1990-1992). Formerly worked in institutional corporate bond sales at Kidder Peabody (1986-1990). Directorships in the Last Five Years.(2) Director of Dynex Capital, Inc. (mortgage REIT) (since 2013). |
Eaton Vance
Floating-Rate NextShares
October 31, 2018
Management and Organization — continued
| | | | | | |
| Name and Year of Birth | | Position(s) with the Trust and the Portfolio | | Trustee Since(1) | | Principal Occupation(s) and Directorships During Past Five Years and Other Relevant Experience |
| Noninterested Trustees (continued) | | |
| | | |
William H. Park 1947 | | Chairperson of the Board and Trustee | | 2016 (Chairperson); 2003 (Trustee) | | Private investor. Formerly, Consultant (management and transactional) (2012-2014). Formerly, Chief Financial Officer, Aveon Group L.P. (investment management firm) (2010-2011). Formerly, Vice Chairman, Commercial Industrial Finance Corp. (specialty finance company) (2006-2010). Formerly, President and Chief Executive Officer, Prizm Capital Management, LLC (investment management firm) (2002-2005). Formerly, Executive Vice President and Chief Financial Officer, United Asset Management Corporation (investment management firm) (1982-2001). Formerly, Senior Manager, Price Waterhouse (now PricewaterhouseCoopers) (a registered public accounting firm) (1972-1981). Directorships in the Last Five Years.(2) None. |
| | | |
Helen Frame Peters 1948 | | Trustee | | 2008 | | Professor of Finance, Carroll School of Management, Boston College. Formerly, Dean, Carroll School of Management, Boston College (2000-2002). Formerly, Chief Investment Officer, Fixed Income, Scudder Kemper Investments (investment management firm) (1998-1999). Formerly, Chief Investment Officer, Equity and Fixed Income, Colonial Management Associates (investment management firm) (1991-1998). Directorships in the Last Five Years.(2) None. |
| | | |
Keith Quinton(3) 1958 | | Trustee | | 2018 | | Independent Investment Committee Member at New Hampshire Retirement System (since 2017). Advisory Committee member at Northfield Information Services, Inc. (risk management analytics provider) (since 2016). Formerly, Portfolio Manager and Senior Quantitative Analyst at Fidelity Investments (investment management firm) (2001-2014). Directorships in the Last Five Years. Director of New Hampshire Municipal Bond Bank (since 2016). |
| | | |
Marcus L. Smith(3) 1966 | | Trustee | | 2018 | | Member of Posse Boston Advisory Board (foundation) (since 2015); Trustee at University of Mount Union (since 2008). Formerly, Portfolio Manager at MFS Investment Management (investment management firm) (1994-2017). Directorships in the Last Five Years. Director of MSCI Inc. (global provider of investment decision support tools) (since 2017). Director of DCT Industrial Trust Inc. (logistics real estate company) (since 2017). |
| | | |
Susan J. Sutherland 1957 | | Trustee | | 2015 | | Private investor. Formerly, Associate, Counsel and Partner at Skadden, Arps, Slate, Meagher & Flom LLP (law firm) (1982-2013). Directorships in the Last Five Years. Formerly, Director of Montpelier Re Holdings Ltd. (global provider of customized insurance and reinsurance products) (2013-2015). |
| | | |
Harriett Tee Taggart 1948 | | Trustee | | 2011 | | Managing Director, Taggart Associates (a professional practice firm). Formerly, Partner and Senior Vice President, Wellington Management Company, LLP (investment management firm) (1983-2006). Ms. Taggart has apprised the Board of Trustees that she intends to retire as a Trustee of all Eaton Vance Funds effective December 31, 2018. Directorships in the Last Five Years.(2) Director of Albemarle Corporation (chemicals manufacturer) (since 2007) and The Hanover Group (specialty property and casualty insurance company) (since 2009). |
| | | |
Scott E. Wennerholm 1959 | | Trustee | | 2016 | | Formerly, Trustee at Wheelock College (postsecondary institution) (2012-2018). Formerly, Consultant at GF Parish Group (executive recruiting firm) (2016-2017). Formerly, Chief Operating Officer and Executive Vice President at BNY Mellon Asset Management (investment management firm) (2005-2011). Formerly, Chief Operating Officer and Chief Financial Officer at Natixis Global Asset Management (investment management firm) (1997-2004). Formerly, Vice President at Fidelity Investments Institutional Services (investment management firm) (1994-1997). Directorships in the Last Five Years. None. |
Eaton Vance
Floating-Rate NextShares
October 31, 2018
Management and Organization — continued
| | | | | | |
| Name and Year of Birth | | Position(s) with the
Trust and the Portfolio | | Officer Since(4) | | Principal Occupation(s) During Past Five Years |
| Principal Officers who are not Trustees | | |
| | | |
Payson F. Swaffield 1956 | | President | | 2003 | | Vice President and Chief Income Investment Officer of EVM and BMR. Also Vice President of Calvert Research and Management (“CRM”). |
| | | |
Maureen A. Gemma 1960 | | Vice President, Secretary and Chief Legal Officer | | 2005 | | Vice President of EVM and BMR. Also Vice President of CRM. |
| | | |
James F. Kirchner 1967 | | Treasurer | | 2007 | | Vice President of EVM and BMR. Also Vice President of CRM. |
| | | |
Richard F. Froio 1968 | | Chief Compliance Officer | | 2017 | | Vice President of EVM and BMR since 2017. Formerly Deputy Chief Compliance Officer (Adviser/Funds) and Chief Compliance Officer (Distribution) at PIMCO (2012-2017) and Managing Director at BlackRock/Barclays Global Investors (2009-2012). |
| (1) | Year first appointed to serve as Trustee for a fund in the Eaton Vance family of funds. Each Trustee has served continuously since appointment unless indicated otherwise. |
| (2) | During their respective tenures, the Trustees (except for Mmes. Frost and Sutherland and Messrs. Fetting, Gorman, Quinton, Smith and Wennerholm) also served as Board members of one or more of the following funds (which operated in the years noted): eUnitsTM 2 Year U.S. Market Participation Trust: Upside to Cap / Buffered Downside (launched in 2012 and terminated in 2014); and eUnitsTM 2 Year U.S. Market Participation Trust II: Upside to Cap / Buffered Downside (launched in 2012 and terminated in 2014). However, Ms. Mosley did not serve as a Board member of eUnitsTM 2 Year U.S. Market Participation Trust: Upside to Cap / Buffered Downside (launched in 2012 and terminated in 2014). |
| (3) | Messrs. Quinton and Smith began serving as Trustees effective October 1, 2018. |
| (4) | Year first elected to serve as officer of a fund in the Eaton Vance family of funds when the officer has served continuously. Otherwise, year of most recent election as an officer of a fund in the Eaton Vance family of funds. Titles may have changed since initial election. |
The SAI for the Fund includes additional information about the Trustees and officers of the Fund and the Portfolio and can be obtained without charge on Eaton Vance’s website at www.eatonvance.com or by calling 1-800-262-1122.
Eaton Vance Funds
IMPORTANT NOTICES
Privacy. The Eaton Vance organization is committed to ensuring your financial privacy. Each of the financial institutions identified below has in effect the following policy (“Privacy Policy”) with respect to nonpublic personal information about its customers:
| • | | Only such information received from you, through application forms or otherwise, and information about your Eaton Vance fund transactions will be collected. This may include information such as name, address, social security number, tax status, account balances and transactions. |
| • | | None of such information about you (or former customers) will be disclosed to anyone, except as permitted by law (which includes disclosure to employees necessary to service your account). In the normal course of servicing a customer’s account, Eaton Vance may share information with unaffiliated third parties that perform various required services such as transfer agents, custodians and broker-dealers. |
| • | | Policies and procedures (including physical, electronic and procedural safeguards) are in place that are designed to protect the confidentiality of such information. |
| • | | We reserve the right to change our Privacy Policy at any time upon proper notification to you. Customers may want to review our Privacy Policy periodically for changes by accessing the link on our homepage: www.eatonvance.com. |
Our pledge of privacy applies to the following entities within the Eaton Vance organization: the Eaton Vance Family of Funds, Eaton Vance Management, Eaton Vance Investment Counsel, Eaton Vance Distributors, Inc., Eaton Vance Trust Company, Eaton Vance Management (International) Limited, Eaton Vance Advisers International Ltd., Eaton Vance Management’s Real Estate Investment Group and Boston Management and Research. In addition, our Privacy Policy applies only to those Eaton Vance customers who are individuals and who have a direct relationship with us. If a customer’s account (i.e., fund shares) is held in the name of a third-party financial advisor/broker-dealer, it is likely that only such advisor’s privacy policies apply to the customer. This notice supersedes all previously issued privacy disclosures. For more information about Eaton Vance’s Privacy Policy, please call 1-800-262-1122.
Delivery of Shareholder Documents. The Securities and Exchange Commission (SEC) permits delivery of only one copy of fund shareholder documents, including prospectuses, proxy statements and shareholder reports, to fund investors with multiple accounts at the same residential or post office box address. This practice is often called “householding” and it helps eliminate duplicate mailings to shareholders. Your broker may household the mailing of your documents indefinitely unless you instruct your broker otherwise. If you would prefer that your Eaton Vance documents not be householded, please contact your broker. Your instructions that householding not apply to delivery of your Eaton Vance documents will typically be effective within 30 days of receipt by your broker.
Portfolio Holdings. Each Eaton Vance Fund and its underlying Portfolio(s) (if applicable) will file a schedule of portfolio holdings on Form N-Q with the SEC for the first and third quarters of each fiscal year. The Form N-Q will be available on the Eaton Vance website at www.eatonvance.com, by calling Eaton Vance at 1-800-262-1122 or in the EDGAR database on the SEC’s website at www.sec.gov. Form N-Q may also be reviewed and copied at the SEC’s public reference room in Washington, D.C. (call 1-800-732-0330 for information on the operation of the public reference room).
Proxy Voting. From time to time, funds are required to vote proxies related to the securities held by the funds. The Eaton Vance Funds or their underlying Portfolios (if applicable) vote proxies according to a set of policies and procedures approved by the Funds’ and Portfolios’ Boards. You may obtain a description of these policies and procedures and information on how the Funds or Portfolios voted proxies relating to portfolio securities during the most recent 12-month period ended June 30, without charge, upon request, by calling 1-800-262-1122 and by accessing the SEC’s website at www.sec.gov.
This Page Intentionally Left Blank
This Page Intentionally Left Blank
Investment Adviser of Eaton Vance Floating Rate Portfolio
Boston Management and Research
Two International Place
Boston, MA 02110
Investment Adviser and Administrator of Eaton Vance Floating-Rate NextShares
Eaton Vance Management
Two International Place
Boston, MA 02110
Distributor*
Foreside Fund Services, LLC
Three Canal Plaza, Suite 100
Portland, ME 04101
Custodian
State Street Bank and Trust Company
State Street Financial Center, One Lincoln Street
Boston, MA 02111
Transfer and Dividend Disbursing Agent
State Street Bank and Trust Company
State Street Financial Center, One Lincoln Street
Boston, MA 02111
Independent Registered Public Accounting Firm
Deloitte & Touche LLP
200 Berkeley Street
Boston, MA 02116-5022
Fund Offices
Two International Place
Boston, MA 02110
| * | FINRA BrokerCheck. Investors may check the background of their Investment Professional by contacting the Financial Industry Regulatory Authority (FINRA). FINRA BrokerCheck is a free tool to help investors check the professional background of current and former FINRA-registered securities firms and brokers. FINRA BrokerCheck is available by calling 1-800-289-9999 and at www.FINRA.org. The FINRA BrokerCheck brochure describing this program is available to investors at www.FINRA.org. |


29113 10.31.18
Item 2. Code of Ethics
The registrant has adopted a code of ethics applicable to its Principal Executive Officer, Principal Financial Officer and Principal Accounting Officer. The registrant undertakes to provide a copy of such code of ethics to any person upon request, without charge, by calling 1-800-262-1122. The registrant has not amended the code of ethics as described in Form N-CSR during the period covered by this report. The registrant has not granted any waiver, including an implicit waiver, from a provision of the code of ethics as described in Form N-CSR during the period covered by this report.
Item 3. Audit Committee Financial Expert
The registrant’s Board has designated George J. Gorman and William H. Park, each an independent trustee, as audit committee financial experts. Mr. Gorman is a certified public accountant who is the Principal at George J. Gorman LLC (a consulting firm). Previously, Mr. Gorman served in various capacities at Ernst & Young LLP (a registered public accounting firm), including as Senior Partner. Mr. Gorman also has experience serving as
an independent trustee and audit committee financial expert of other mutual fund complexes. Mr. Park is a certified public accountant who is a private investor. Previously, he served as a consultant, as the Chief Financial Officer of Aveon Group, L.P. (an investment management firm), as the Vice Chairman of Commercial Industrial Finance Corp. (specialty finance company), as President and Chief Executive Officer of Prizm Capital Management, LLC (investment management firm), as Executive Vice President and Chief Financial Officer of United Asset Management Corporation (an institutional investment management firm) and as a Senior Manager at Price Waterhouse (now PricewaterhouseCoopers) (a registered public accounting firm).
Item 4. Principal Accountant Fees and Services
Eaton Vance Floating-Rate NextShares (the “Fund”) is a series of Eaton Vance NextShares Trust II (the “Trust”), a Massachusetts business trust, which, including the Fund, contains a total of 3 series (the “Series”). The Trust is registered under the Investment Company Act of 1940 as an open-end management investment company. This Form N-CSR relates to the Fund’s annual report.
(a)-(d)
The following table presents the aggregate fees billed to the registrant for the initial fiscal period from the commencement of operations on November 29, 2017 to October 31, 2018 by D&T for professional services rendered for the audit of the Fund’s annual financial statements and fees billed for other services rendered by D&T during such periods.
Eaton Vance Floating-Rate NextShares
| | | | |
Fiscal Period Ended* | | 10/31/18 | |
Audit Fees | | $ | 14,000 | |
Audit-Related Fees(1) | | $ | 0 | |
Tax Fees(2) | | $ | 13,100 | |
All Other Fees(3) | | $ | 0 | |
| | | | |
Total | | $ | 27,100 | |
| | | | |
| * | Registrant commenced operations on November 29, 2017. |
| (1) | Audit-related fees consist of the aggregate fees billed for assurance and related services that are reasonably related to the performance of the audit of the registrant’s financial statements and are not reported under the category of audit fees. |
| (2) | Tax fees consist of the aggregate fees billed for professional services rendered by the principal accountant relating to tax compliance, tax advice, and tax planning and specifically include fees for tax return preparation and other related tax compliance/planning matters. |
| (3) | All other fees consist of the aggregate fees billed for products and services provided by the principal accountant other than audit, audit-related, and tax services. |
The various Series comprising the Trust have differing fiscal year ends (January 31, September 30 and October 31). The following table presents the aggregate audit, audit-related, tax, and other fees billed to all of the Series in the Trust by D&T for the last two fiscal periods of each Series.
| | | | | | | | | | | | | | | | |
Fiscal Periods Ended* | | 1/31/17** | | | 1/31/18 | | | 9/30/18* | | | 10/31/18 | |
Audit Fees | | $ | 14,000 | | | $ | 14,000 | | | $ | 37,050 | | | $ | 14,000 | |
Audit-Related Fees(1) | | $ | 0 | | | $ | 0 | | | $ | 0 | | | $ | 0 | |
Tax Fees(2) | | $ | 9,449 | | | $ | 9,591 | | | $ | 16,100 | | | $ | 13,100 | |
All Other Fees(3) | | $ | 0 | | | $ | 0 | | | $ | 0 | | | $ | 0 | |
| | | | | | | | | | | | | | | | |
Total | | $ | 23,449 | | | $ | 23,591 | | | $ | 53,150 | | | $ | 27,100 | |
| | | | | | | | | | | | | | | | |
| * | Information is not presented for fiscal periods ended 9/30/17and 10/31/17 as no Series in the Trust with such fiscal periods end were in operation during such period. |
| (1) | Audit-related fees consist of the aggregate fees billed for assurance and related services that are reasonably related to the performance of the audit of the registrant’s financial statements and are not reported under the category of audit fees. |
| (2) | Tax fees consist of the aggregate fees billed for professional services rendered by the principal accountant relating to tax compliance, tax advice, and tax planning and specifically include fees for tax return preparation and other related tax compliance/planning matters. |
| (3) | All other fees consist of the aggregate fees billed for products and services provided by the principal accountant other than audit, audit-related, and tax services. |
(e)(1) The registrant’s audit committee has adopted policies and procedures relating to the pre-approval of services provided by the registrant’s principal accountant (the “Pre-Approval Policies”). The Pre-Approval Policies establish a framework intended to assist the audit committee in the proper discharge of its pre-approval responsibilities. As a general matter, the Pre-Approval Policies (i) specify certain types of audit, audit-related, tax, and other services determined to be pre-approved by the audit committee; and (ii) delineate specific procedures governing the mechanics of the pre-approval process, including the approval and monitoring of audit and non-audit service fees. Unless a service is specifically pre-approved under the Pre-Approval Policies, it must be separately pre-approved by the audit committee.
The Pre-Approval Policies and the types of audit and non-audit services pre-approved therein must be reviewed and ratified by the registrant’s audit committee at least annually. The registrant’s audit committee maintains full responsibility for the appointment, compensation, and oversight of the work of the registrant’s principal accountant.
(e)(2) No services described in paragraphs (b)-(d) above were approved by the registrant’s audit committee pursuant to the “de minimis exception” set forth in Rule 2-01 (c)(7)(i)(C) of Regulation S-X.
(f) Not applicable.
(g) The following table presents (i) the aggregate non-audit fees (i.e., fees for audit-related, tax, and other services) billed to the Fund (the only series of the Trust) by D&T for the last two fiscal periods of the Fund; and (ii) the aggregate non-audit fees (i.e., fees for audit-related, tax, and other services) billed to the Eaton Vance organization by D&T for the last two fiscal years of each Series.
| | | | | | | | | | | | | | | | |
Fiscal Periods Ended* | | 1/31/17 | | | 1/31/18 | | | 9/30/18** | | | 10/31/18*** | |
Registrant(1) | | $ | 9,449 | | | $ | 9,591 | | | $ | 16,100 | | | $ | 13,100 | |
Eaton Vance(2) | | $ | 46,000 | | | $ | 148,018 | | | $ | 126,485 | | | $ | 126,485 | |
| * | Information is not presented for fiscal periods ended 9/30/17 or 10/31/17, as no Series in the Trust with such fiscal period ends were in operation during such period. |
| ** | The table presents the aggregate fees billed to the Fund for the Fund’s fiscal period from November 15, 2017 (commencement of operations) to October 31, 2018. |
| *** | The table presents the aggregate fees billed to the Fund for the Fund’s fiscal period from November 29, 2017 (commencement of operations) to October 31, 2018. |
| (1) | Includes all of the Series of the Trust. During the fiscal year reported above, certain of the Funds were “feeder” funds in a “master-feeder” fund structure or funds of funds. |
| (2) | Various subsidiaries of Eaton Vance Corp. act in either an investment advisory and/or service provider capacity with respect to the Series and/or their respective “master” funds (if applicable). |
(h) The registrant’s audit committee has considered whether the provision by the registrant’s principal accountant of non-audit services to the registrant’s investment adviser and any entity controlling, controlled by, or under common control with the adviser that provides ongoing services to the registrant that were not pre-approved pursuant to Rule 2-01(c)(7)(ii) of Regulation S-X is compatible with maintaining the principal accountant’s independence.
Item 5. Audit Committee of Listed Registrants
Not applicable.
Item 6. Schedule of Investments
Please see schedule of investments contained in the Report to Stockholders included under Item 1 of this Form N-CSR.
Item 7. Disclosure of Proxy Voting Policies and Procedures for Closed-End Management Investment Companies
Not applicable.
Item 8. Portfolio Managers of Closed-End Management Investment Companies
Not applicable.
Item 9. Purchases of Equity Securities by Closed-End Management Investment Company and Affiliated Purchasers
Not applicable.
Item 10. Submission of Matters to a Vote of Security Holders
No material changes.
Item 11. Controls and Procedures
(a) It is the conclusion of the registrant’s principal executive officer and principal financial officer that the effectiveness of the registrant’s current disclosure controls and procedures (such disclosure controls and procedures having been evaluated within 90 days of the date of this filing) provide reasonable assurance that the information required to be disclosed by the registrant has been recorded, processed, summarized and reported within the time period specified in the Commission’s rules and forms and that the information required to be
disclosed by the registrant has been accumulated and communicated to the registrant’s principal executive officer and principal financial officer in order to allow timely decisions regarding required disclosure.
(b) There have been no changes in the registrant’s internal controls over financial reporting during the second fiscal quarter of the period covered by this report that has materially affected, or is reasonably likely to materially affect, the registrant’s internal control over financial reporting.
Item 12. Disclosure of Securities Lending Activities for Closed-End Management Investment Companies
Not applicable.
Item 13. Exhibits
| | |
| (a)(1) | | Registrant’s Code of Ethics – Not applicable (please see Item 2). |
| |
| (a)(2)(i) | | Treasurer’s Section 302 certification. |
| |
| (a)(2)(ii) | | President’s Section 302 certification. |
| |
| (b) | | Combined Section 906 certification. |
Signatures
Pursuant to the requirements of the Securities Exchange Act of 1934 and the Investment Company Act of 1940, the registrant has duly caused this report to be signed on its behalf by the undersigned, thereunto duly authorized.
Eaton Vance NextShares Trust II
| | |
| By: | | /s/ Payson F. Swaffield |
| | Payson F. Swaffield |
| | President |
| |
| Date: | | December 21, 2018 |
Pursuant to the requirements of the Securities Exchange Act of 1934 and the Investment Company Act of 1940, this report has been signed below by the following persons on behalf of the registrant and in the capacities and on the dates indicated.
| | |
| By: | | /s/ James F. Kirchner |
| | James F. Kirchner |
| | Treasurer |
| |
| Date: | | December 21, 2018 |
| |
| By: | | /s/ Payson F. Swaffield |
| | Payson F. Swaffield |
| | President |
| |
| Date: | | December 21, 2018 |