UNITED STATES
SECURITIES AND EXCHANGE COMMISSION
Washington, D.C. 20549
Form N-CSR
CERTIFIED SHAREHOLDER REPORT OF REGISTERED
MANAGEMENT INVESTMENT COMPANIES
Investment Company Act File Number: 811-22983
Eaton Vance NextShares Trust II
(Exact Name of Registrant as Specified in Charter)
Two International Place, Boston, Massachusetts 02110
(Address of Principal Executive Offices)
Maureen A. Gemma
Two International Place, Boston, Massachusetts 02110
(Name and Address of Agent for Services)
(617) 482-8260
(Registrant’s Telephone Number)
January 31
Date of Fiscal Year End
January 31, 2021
Date of Reporting Period
| Item 1. | Reports to Stockholders |

Eaton Vance
TABS 5-to-15 Year Laddered Municipal Bond NextShares (EVLMC)
Listing Exchange: The NASDAQ Stock Market LLC
Annual Report
January 31, 2021
NextShares® is a registered trademark of NextShares Solutions LLC. All rights reserved.
Commodity Futures Trading Commission Registration. The Commodity Futures Trading Commission (“CFTC”) has adopted regulations that subject registered investment companies and advisers to regulation by the CFTC if a fund invests more than a prescribed level of its assets in certain CFTC-regulated instruments (including futures, certain options and swap agreements) or markets itself as providing investment exposure to such instruments. The investment adviser has claimed an exclusion from the definition of “commodity pool operator” under the Commodity Exchange Act with respect to its management of the Fund. Accordingly, neither the Fund nor the adviser with respect to the operation of the Fund is subject to CFTC regulation. Because of its management of other strategies, the Fund’s adviser and Parametric Portfolio Associates LLC (Parametric), sub-adviser to the Fund, are registered with the CFTC as commodity pool operators. The adviser and Parametric are also registered as commodity trading advisors.
Fund shares are not insured by the FDIC and are not deposits or other obligations of, or guaranteed by, any depository institution. Shares are subject to investment risks, including possible loss of principal invested.
This report must be preceded or accompanied by a current summary prospectus or prospectus. Before investing in NextShares, investors should consider carefully the investment objective, risks, and charges and expenses. This and other important information is contained in the summary prospectus and prospectus, which can be obtained from a financial intermediary. Prospective investors should read the prospectus carefully before investing. For further information, please call 1-800-262-1122.
Annual Report January 31, 2021
Eaton Vance
TABS 5-to-15 Year Laddered Municipal Bond NextShares
Eaton Vance
TABS 5-to-15 Year Laddered Municipal Bond NextShares
January 31, 2021
Management’s Discussion of Fund Performance1
Economic and Market Conditions
The 12-month period that began on February 1, 2020, was dominated by the outbreak of a novel coronavirus, which causes the disease known as COVID-19. As the outbreak turned into a global pandemic in the opening months of the period, it ended the longest-ever U.S. economic expansion and brought about a global economic slowdown. Credit markets along with equity markets declined in value amid unprecedented volatility.
In response, the U.S. Federal Reserve (the Fed) announced two emergency rate cuts in March 2020 — lowering the federal funds rate to 0.00%-0.25% — along with other measures to shore up credit markets. At its July meeting, the Fed provided additional reassurances that it would maintain rates around zero percent for the foreseeable future and use all the monetary tools at its disposal to support the U.S. economy. These actions helped calm investment markets and initiated a municipal bond rally that began in April and lasted through most of the summer.
The municipal bond rally was also driven by technical market factors, as demand overwhelmed supply. With municipal bonds offering attractive tax-exempt yields versus other fixed-income asset classes, municipal bond funds reported net inflows from May through September 2020, following substantial outflows in March and April.
But midway through August, the municipal rally stalled. Rates hit bottom for the period on August 11, with 10-year municipal bonds yielding 0.58%. From mid-August through October, prices fell and yields rose, driven in part by Congress’ failure to pass a second stimulus bill — $400-$500 billion of which had been projected for state and local government assistance. As issuers rushed to take advantage of low yields in late August and September, increased supply reversed the supply-demand dynamic from earlier in the summer, putting further downward pressure on municipal bond prices and upward pressure on yields.
In November, however, the municipal market reversed course again and closed the period with a strong rally. Joe Biden’s victory in the U.S. presidential election eased the political uncertainties that had dogged investment markets through much of the fall. The announcement that two coronavirus vaccine candidates had proven more than 90% effective in late-stage trials buoyed the markets as well.
In December, municipal bond demand once again exceeded supply, providing an additional tailwind for municipal bond prices. The beginning of the COVID-19 vaccination process and Congress’ passage of a fiscal stimulus bill added more fuel to the rally. While the $900 billion bill failed to provide direct aid to state and local governments, it did include money for some municipal issuers, including schools, colleges, and transportation agencies.
In January 2021, the supply-demand imbalance fueling the rally grew larger, driven by lower issuance of new bonds than the previous January; a large number of bonds maturing or being called; and an acceleration of inflows into tax-exempt municipal funds — driven in part by the anticipation of higher taxes for high-income earners under the new Biden administration.
For the period as a whole, rates declined across the municipal bond yield curve, with the greatest declines occurring at the short end of the curve. The Bloomberg Barclays Municipal Bond Index, a broad measure of the asset class, returned 4.01% during the period — despite a 3.63%
decline in March 2020. Reflecting investors’ “flight to quality” in response to the pandemic, municipal bonds with higher credit ratings outperformed lower rated issues during most of the period. But in the final three months of the period, lower rated issuers outperformed as investors appeared to become more comfortable reaching for yield in an ongoing low-yield environment.
Fund Performance
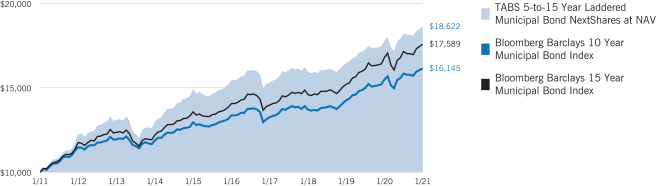
For the 12-month period ended January 31, 2021, Eaton Vance TABS 5-to-15 Year Laddered Municipal Bond NextShares (the Fund) returned 4.80% at net asset value (NAV), outperforming its primary benchmark, the Bloomberg Barclays 10 Year Municipal Bond Index (the Index), which returned 4.21%.
The Index is unmanaged and returns do not reflect any applicable sales charges, commissions, or expenses.
The Fund provides rules-based, approximately equal-weighted exposure in each year across the 5-year to 15-year maturity portion of the yield curve, with the objective of seeking current income exempt from regular federal income tax. Management seeks to add incremental return through active security selection by working with credit analysts to select sectors, issuers, and individual bonds in which to invest.
During the period, the largest contributors to Fund performance versus the Index were active security selection and relative-value trading — a strategy that seeks to take advantage of price and rate differences among similar securities. The extreme market volatility that occurred in March and April 2020 created significant opportunities to employ both strategies to purchase individual bonds at attractive prices, and then benefit as bond prices recovered during the municipal market rally that began in April 2020 and continued for much of the rest of the period.
In particular, the Fund’s overweight positions and security selections in the health care and transportation sectors — two of the hardest-hit sectors in the March-April 2020 market downturn — contributed strongly to the Fund’s returns relative to the Index.
The Fund’s employment of tax-loss harvesting also contributed to performance relative to the Index. In March 2020 when bond valuations declined dramatically, the Fund sold some bonds at a loss and replaced them with higher yielding issues. This had the effect of increasing the Fund’s yield and creating losses that could be used to offset future gains and, thus, decrease tax liabilities at the state level.
In contrast, yield-curve positioning and duration, which were largely determined by the Fund’s equal-weighted laddered structure, detracted from Fund performance versus the Index. With regard to yield-curve positioning, the Fund’s holdings in bonds with maturities shorter than eight years — an area of the curve where the Index had no exposure — underperformed longer-maturity bonds and, thus, detracted from relative returns during the period.
In addition, the Fund had a modestly shorter duration — or sensitivity to interest rate changes — than the Index. This hurt relative performance because the Fund benefited less than the Index from declining interest rates and rising bond prices during the period.
See Endnotes and Additional Disclosures in this report.
Past performance is no guarantee of future results. Investment return and principal value will fluctuate so that shares, when sold, may be worth more or less than their original cost. Performance is for the stated time period only; due to market volatility, Fund performance may be lower or higher than the quoted return. The Fund’s performance at market price will differ from its results at net asset value (NAV). The market price used to calculate the Market Price return is the midpoint between the highest bid and the lowest offer on the exchange on which the shares of the Fund are listed for trading, as of the time that the Fund’s NAV is calculated. If you trade your shares at another time during the day, your return may differ. Returns are historical and are calculated by determining the percentage change in NAV or market price (as applicable) with all distributions reinvested at NAV or closing market price (as applicable) on the payment date of the distribution, and are net of management fees and other expenses. Performance for periods less than or equal to one year is cumulative. For performance as of the most recent month-end, including historical trading premiums/discounts relative to NAV, please refer to eatonvance.com.
Eaton Vance
TABS 5-to-15 Year Laddered Municipal Bond NextShares
January 31, 2021
Performance2,3,4
Portfolio Managers James H. Evans, CFA, Brian C. Barney, CFA and Christopher J. Harshman, CFA, each of Parametric Portfolio Associates LLC
| | | | | | | | | | | | | | | | | | | | | | | | |
| % Average Annual Total Returns | | Fund
Inception Date | | | Performance
Inception Date | | | One Year | | | Five Years | | | Ten Years | | | Since
Fund
Inception | |
| | | | | | |
Fund at NAV | | | 03/30/2016 | | | | 02/01/2010 | | | | 4.80 | % | | | 3.80 | % | | | 6.41 | % | | | 3.89 | % |
Fund at Market Price | | | 03/30/2016 | | | | 03/30/2016 | | | | 4.80 | | | | — | | | | — | | | | 3.89 | |
|
| |
| | | | | | |
Bloomberg Barclays 10 Year Municipal Bond Index | | | — | | | | — | | | | 4.21 | % | | | 3.85 | % | | | 4.90 | % | | | 3.94 | % |
Bloomberg Barclays 15 Year Municipal Bond Index | | | — | | | | — | | | | 4.76 | | | | 4.57 | | | | 5.80 | | | | 4.65 | |
| | | | | | |
| % Total Annual Operating Expense Ratios5 | | | | | | | | | | | | | | | | | | |
| | | | | | |
Gross | | | | | | | | | | | | | | | | | | | | | | | 1.75 | % |
Net | | | | | | | | | | | | | | | | | | | | | | | 0.35 | |
| | | | | | |
| % Distribution Rates/Yields6 | | | | | | | | | | | | | | | | | | |
| | | | | | |
Distribution Rate at NAV | | | | | | | | | | | | | | | | | | | | | | | 1.80 | % |
SEC 30-day Yield - Subsidized | | | | | | | | | | | | | | | | | | | | | | | 0.58 | |
SEC 30-day Yield - Unsubsidized | | | | | | | | | | | | | | | | | | | | | | | –0.82 | |
Growth of $10,000
This graph shows the change in value of a hypothetical investment of $10,000 in TABS 5-to-15 Year Laddered Municipal Bond NextShares for the period indicated. For comparison, the same investment is shown in the indicated index.
See Endnotes and Additional Disclosures in this report.
Past performance is no guarantee of future results. Investment return and principal value will fluctuate so that shares, when sold, may be worth more or less than their original cost. Performance is for the stated time period only; due to market volatility, Fund performance may be lower or higher than the quoted return. The Fund’s performance at market price will differ from its results at net asset value (NAV). The market price used to calculate the Market Price return is the midpoint between the highest bid and the lowest offer on the exchange on which the shares of the Fund are listed for trading, as of the time that the Fund’s NAV is calculated. If you trade your shares at another time during the day, your return may differ. Returns are historical and are calculated by determining the percentage change in NAV or market price (as applicable) with all distributions reinvested at NAV or closing market price (as applicable) on the payment date of the distribution, and are net of management fees and other expenses. Performance for periods less than or equal to one year is cumulative. For performance as of the most recent month-end, including historical trading premiums/discounts relative to NAV, please refer to eatonvance.com.
Eaton Vance
TABS 5-to-15 Year Laddered Municipal Bond NextShares
January 31, 2021
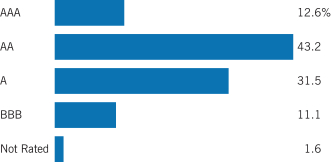
Fund Profile7
Credit Quality (% of total investments)8
See Endnotes and Additional Disclosures in this report.
Eaton Vance
TABS 5-to-15 Year Laddered Municipal Bond NextShares
January 31, 2021
Endnotes and Additional Disclosures
| 1 | The views expressed in this report are those of the portfolio manager(s) and are current only through the date stated at the top of this page. These views are subject to change at any time based upon market or other conditions, and Eaton Vance and the Fund(s) disclaim any responsibility to update such views. These views may not be relied upon as investment advice and, because investment decisions are based on many factors, may not be relied upon as an indication of trading intent on behalf of any Eaton Vance fund. This commentary may contain statements that are not historical facts, referred to as “forward-looking statements.” The Fund’s actual future results may differ significantly from those stated in any forward-looking statement, depending on factors such as changes in securities or financial markets or general economic conditions, the volume of sales and purchases of Fund shares, the continuation of investment advisory, administrative and service contracts, and other risks discussed from time to time in the Fund’s filings with the Securities and Exchange Commission. |
| 2 | Shares of NextShares funds are normally bought and sold in the secondary market through a broker, and may not be individually purchased or redeemed from the fund. In the secondary market, buyers and sellers transact with each other, rather than with the fund. NextShares funds issue and redeem shares only in specified creation unit quantities in transactions by or through Authorized Participants. In such transactions, a fund issues and redeems shares in exchange for the basket of securities, other instruments and/or cash that the fund specifies each business day. By transacting in kind, a NextShares fund can lower its trading costs and enhance fund tax efficiency by avoiding forced sales of securities to meet redemptions. Redemptions may be effected partially or entirely in cash when in-kind delivery is not practicable or deemed not in the best interests of shareholders. A fund’s basket is not intended to be representative of the fund’s current portfolio positions and may vary significantly from current positions. As exchange-traded securities, NextShares can operate with low transfer agency expenses by utilizing the same highly efficient share processing system as used for exchange-listed stocks and exchange-traded funds. Market trading prices of NextShares are linked to the fund’s next-computed net asset value (NAV) and will vary from NAV by a market-determined premium or discount, which may be zero. Buyers and sellers of NextShares will not know the value of their purchases and sales until after the fund’s NAV is determined at the end of the trading day. Market trading prices may vary significantly from anticipated levels. NextShares do not offer investors the opportunity to buy and sell intraday based on current (versus end-of-day) determinations of fund value. NextShares trade execution prices will fluctuate based on changes in NAV. Although limit orders may be used to control trading costs, they cannot be used to control or limit trade execution prices. As a new type of fund, NextShares have a limited operating history and may initially be available through a limited number of brokers. There can be no guarantee that an active trading market for NextShares will develop or be maintained, or that their listing will continue unchanged. Buying and selling NextShares may require payment of brokerage commissions and expose transacting shareholders to other trading costs. Frequent trading may detract from realized investment returns. The return on a shareholder’s NextShares investment will be reduced if the shareholder sells shares at a greater discount or narrower premium to NAV than he or she acquired the shares. |
| 3 | Bloomberg Barclays 10 Year Municipal Bond Index is an unmanaged index of municipal bonds traded in the U.S. with maturities ranging from 8-12 years. Bloomberg Barclays 15 Year Municipal Bond Index is an unmanaged index of municipal bonds traded in the U.S. with maturities ranging from 12-17 years. Unless otherwise stated, index returns do not reflect the effect of any applicable sales charges, commissions, expenses, taxes or leverage, as applicable. It is not possible to invest directly in an index. |
| 4 | The Fund pursues its investment objective by investing in a separate investment fund (the Portfolio). The returns at NAV for periods before the date the Fund commenced operations are for a mutual fund that invests in the Portfolio (the Portfolio Investor). The performance during such period does not represent the performance of the Fund. The prior investment performance of the Portfolio Investor (rather than the Portfolio itself) is shown because it reflects the expenses typically borne by a retail fund investing in the Portfolio. The Portfolio Investor returns are not adjusted to reflect differences between the total net operating expenses of the Fund and the Portfolio Investor during the periods shown. If such an adjustment were made, the performance presented would be higher, because the Fund’s total net operating expenses are lower than those of the Portfolio Investor. Performance is for a share class of the Portfolio Investor offered at net asset value. Performance presented in the Financial Highlights included in the financial statements is not linked. |
Prior to April 15, 2015, the Portfolio Investor had a different name and investment objective and employed a different investment strategy from the Portfolio Investor’s current investment strategy. Performance prior to April 15, 2015 reflects the Portfolio Investor’s performance under its former investment objective and policies.
| 5 | Source: Fund prospectus. Net expense ratio reflects a contractual expense reimbursement that continues through 5/31/21. Without the reimbursement, performance would have been lower. The expense ratios for the current reporting period can be found in the Financial Highlights section of this report. |
| 6 | The Distribution Rate is based on the Fund’s last regular distribution per share in the period (annualized) divided by the Fund’s NAV at the end of the period. The Fund’s distributions may be comprised of amounts characterized for federal income tax purposes as tax-exempt income, qualified and non-qualified ordinary dividends, capital gains and nondividend distributions, also known as return of capital. The Fund will determine the federal income tax character of distributions paid to a shareholder after the end of the calendar year. This is reported on the IRS form 1099-DIV and provided to the shareholder shortly after each year-end. The Fund’s distributions are determined by the investment adviser based on its current assessment of the Fund’s long-term return potential. As portfolio and market conditions change, the rate of distributions paid by the Fund could change. The SEC Yield is a standardized measure based on the estimated yield to maturity of a fund’s investments over a 30-day period and is based on the maximum offer price at the date specified. The SEC Yield is not based on the distributions made by the Fund, which may differ. Subsidized yield reflects the effect of fee waivers and expense reimbursements. |
Eaton Vance
TABS 5-to-15 Year Laddered Municipal Bond NextShares
January 31, 2021
Endnotes and Additional Disclosures — continued
| 7 | The Fund primarily invests in an affiliated investment company (Portfolio) with substantially the same objective(s) and policies as the Fund and may also invest directly. Unless otherwise noted, references to investments are to the aggregate holdings of the Fund and the Portfolio. |
| 8 | For purposes of the Fund’s rating restrictions, ratings are based on Moody’s Investors Service, Inc. (“Moody’s”), S&P Global Ratings (“S&P”) or Fitch Ratings (“Fitch”), as applicable. If securities are rated differently by the ratings agencies, the highest rating is applied. Ratings, which are subject to change, apply to the creditworthiness of the issuers of the underlying securities and not to the Fund or its shares. Credit ratings measure the quality of a bond based on the issuer’s creditworthiness, with ratings ranging from AAA, being the highest, to D, being the lowest based on S&P’s measures. Ratings of BBB or higher by S&P or Fitch (Baa or higher by Moody’s) are considered to be investment-grade quality. Credit ratings are based largely on the ratings agency’s analysis at the time of rating. The rating assigned to any particular security is not necessarily a reflection of the issuer’s current financial condition and does not necessarily reflect its assessment of the volatility of a security’s market value or of the liquidity of an investment in the security. Holdings designated as “Not Rated” (if any) are not rated by the national ratings agencies stated above. |
Fund profile subject to change due to active management.
Additional Information
Yield curve is a graphical representation of the yields offered by bonds of various maturities. The yield curve flattens when long-term interest rates fall and/or short-term interest rates increase, and the yield curve steepens when long-term interest rates increase and/or short-term interest rates fall.
Bloomberg Barclays Municipal Bond Index is an unmanaged index of municipal bonds traded in the U.S.
Duration is a measure of the expected change in price of a bond — in percentage terms — given a one percent change in interest rates, all else being constant. Securities with lower durations tend to be less sensitive to interest rate changes.
Eaton Vance
TABS 5-to-15 Year Laddered Municipal Bond NextShares
January 31, 2021
Fund Expenses
Example: As a Fund shareholder, you incur two types of costs: (1) transaction costs, including brokerage commissions on purchases and sales of Fund shares; and (2) ongoing costs, including management fees and other Fund expenses. This Example is intended to help you understand your ongoing costs (in dollars) of Fund investing and to compare these costs with the ongoing costs of investing in other funds. The Example is based on an investment of $1,000 invested at the beginning of the period and held for the entire period (August 1, 2020 – January 31, 2021).
Actual Expenses: The first section of the table below provides information about actual account values and actual expenses. You may use the information in this section, together with the amount you invested, to estimate the expenses that you paid over the period. Simply divide your account value by $1,000 (for example, an $8,600 account value divided by $1,000 = 8.6), then multiply the result by the number in the first section under the heading entitled “Expenses Paid During Period” to estimate the expenses you paid on your account during this period.
Hypothetical Example for Comparison Purposes: The second section of the table below provides information about hypothetical account values and hypothetical expenses based on the actual Fund expense ratio and an assumed rate of return of 5% per year (before expenses), which is not the actual Fund return. The hypothetical account values and expenses may not be used to estimate the actual ending account balance or expenses you paid for the period. You may use this information to compare the ongoing costs of investing in your Fund and other funds. To do so, compare this 5% hypothetical example with the 5% hypothetical examples that appear in the shareholder reports of the other funds.
Please note that the expenses shown in the table are meant to highlight your ongoing costs only and do not reflect any transactional costs, such as brokerage commissions on purchases and sales of Fund shares. Therefore, the second section of the table is useful in comparing ongoing costs only, and will not help you determine the relative total costs of owning different funds. In addition, if these transactional costs were included, your costs would be higher.
| | | | | | | | | | | | | | | | |
| | | Beginning
Account Value
(8/1/20) | | | Ending
Account Value
(1/31/21) | | | Expenses Paid
During Period*
(8/1/20 – 1/31/21) | | | Annualized
Expense
Ratio | |
| | | | |
Actual | | | | | | | | | | | | | | | | |
| | $ | 1,000.00 | | | $ | 1,022.60 | | | $ | 1.78 | ** | | | 0.35 | % |
| | | | | |
Hypothetical | | | | | | | | | | | | | | | | |
(5% return per year before expenses) | | | | | | | | | | | | | | | | |
| | $ | 1,000.00 | | | $ | 1,023.40 | | | $ | 1.78 | ** | | | 0.35 | % |
| * | Expenses are equal to the Fund’s annualized expense ratio, multiplied by the average account value over the period, multiplied by 184/366 (to reflect the one-half year period). The Example assumes that the $1,000 was invested at the net asset value per share determined at the close of business on July 31, 2020. The Example reflects the expenses of both the Fund and the Portfolio. |
| ** | Absent an allocation of certain expenses to affiliates, expenses would be higher. |
Eaton Vance
TABS 5-to-15 Year Laddered Municipal Bond NextShares
January 31, 2021
Statement of Assets and Liabilities
| | | | |
| Assets | | January 31, 2021 | |
| |
Investment in 5-to-15 Year Laddered Municipal Bond Portfolio, at value (identified cost, $6,943,549) | | $ | 7,697,732 | |
| |
Receivable from affiliates | | | 14,991 | |
| |
Total assets | | $ | 7,712,723 | |
|
| Liabilities | |
| |
Payable to affiliates: | | | | |
| |
Operations agreement fee | | $ | 322 | |
| |
Accrued expenses | | | 63,622 | |
| |
Total liabilities | | $ | 63,944 | |
| |
Net Assets | | $ | 7,648,779 | |
|
| Sources of Net Assets | |
| |
Paid-in capital | | $ | 7,108,119 | |
| |
Distributable earnings | | | 540,660 | |
| |
Total | | $ | 7,648,779 | |
| |
| Net Asset Value Per Share | | | | |
| |
($7,648,779 ÷ 700,000 shares issued and outstanding) | | $ | 10.93 | |
| | | | |
| | 8 | | See Notes to Financial Statements. |
Eaton Vance
TABS 5-to-15 Year Laddered Municipal Bond NextShares
January 31, 2021
Statement of Operations
| | | | |
| Investment Income | | Year Ended
January 31, 2021 | |
| |
Interest allocated from Portfolio | | $ | 173,463 | |
| |
Expenses allocated from Portfolio | | | (26,371 | ) |
| |
Total investment income from Portfolio | | $ | 147,092 | |
| |
| Expenses | | | | |
| |
Operations agreement fee | | $ | 3,723 | |
| |
Trustees’ fees and expenses | | | 500 | |
| |
Custodian fee | | | 41,645 | |
| |
Transfer and dividend disbursing agent fees | | | 13,728 | |
| |
Legal and accounting services | | | 20,902 | |
| |
Printing and postage | | | 12,473 | |
| |
Listing fee | | | 8,176 | |
| |
Intraday pricing fee | | | 13,627 | |
| |
Miscellaneous | | | 5,366 | |
| |
Total expenses | | $ | 120,140 | |
| |
Deduct — | | | | |
| |
Allocation of expenses to affiliates | | $ | 120,140 | |
| |
Total expense reductions | | $ | 120,140 | |
| |
Net expenses | | $ | 0 | |
| |
Net investment income | | $ | 147,092 | |
| |
| Realized and Unrealized Gain (Loss) from Portfolio | | | | |
| |
Net realized gain (loss) — | | | | |
| |
Investment transactions | | $ | 35,409 | |
| |
Net realized gain | | $ | 35,409 | |
| |
Change in unrealized appreciation (depreciation) — | | | | |
| |
Investments | | $ | 160,518 | |
| |
Net change in unrealized appreciation (depreciation) | | $ | 160,518 | |
| |
Net realized and unrealized gain | | $ | 195,927 | |
| |
Net increase in net assets from operations | | $ | 343,019 | |
| | | | |
| | 9 | | See Notes to Financial Statements. |
Eaton Vance
TABS 5-to-15 Year Laddered Municipal Bond NextShares
January 31, 2021
Statements of Changes in Net Assets
| | | | | | | | |
| | | Year Ended January 31, | |
| Increase (Decrease) in Net Assets | | 2021 | | | 2020 | |
| | |
From operations — | | | | | | | | |
| | |
Net investment income | | $ | 147,092 | | | $ | 160,468 | |
| | |
Net realized gain | | | 35,409 | | | | 40,808 | |
| | |
Net change in unrealized appreciation (depreciation) | | | 160,518 | | | | 354,042 | |
| | |
Net increase in net assets from operations | | $ | 343,019 | | | $ | 555,318 | |
| | |
Distributions to shareholders | | $ | (148,830 | ) | | $ | (160,790 | ) |
| | |
Other capital — | | | | | | | | |
| | |
Portfolio transaction fee contributed to Portfolio | | $ | (488 | ) | | $ | (214 | ) |
| | |
Portfolio transaction fee allocated from Portfolio | | | 3,786 | | | | 2,249 | |
| | |
Net increase in net assets from other capital | | $ | 3,298 | | | $ | 2,035 | |
| | |
Net increase in net assets | | $ | 197,487 | | | $ | 396,563 | |
|
| Net Assets | |
| | |
At beginning of year | | $ | 7,451,292 | | | $ | 7,054,729 | |
| | |
At end of year | | $ | 7,648,779 | | | $ | 7,451,292 | |
| | |
| Changes in shares outstanding | | | | | | | | |
| | |
Shares outstanding, beginning of year | | | 700,000 | | | | 700,000 | |
| | |
Shares outstanding, end of year | | | 700,000 | | | | 700,000 | |
| | | | |
| | 10 | | See Notes to Financial Statements. |
Eaton Vance
TABS 5-to-15 Year Laddered Municipal Bond NextShares
January 31, 2021
Financial Highlights
| | | | | | | | | | | | | | | | | | | | |
| | |
| | | Year Ended January 31, | | | Period Ended January 31, 2017(1)(2) | |
| | | 2021 | | | 2020 | | | 2019 | | | 2018(1) | |
| | | | | | |
Net asset value — Beginning of period | | $ | 10.640 | | | $ | 10.080 | | | $ | 9.980 | | | $ | 9.790 | | | $ | 10.000 | |
|
| Income (Loss) From Operations | |
| | | | | |
Net investment income(3) | | $ | 0.210 | | | $ | 0.229 | | | $ | 0.217 | | | $ | 0.229 | | | $ | 0.149 | |
| | | | | |
Net realized and unrealized gain (loss) | | | 0.288 | | | | 0.558 | | | | 0.095 | | | | 0.175 | | | | (0.238 | ) |
| | | | | |
Total income (loss) from operations | | $ | 0.498 | | | $ | 0.787 | | | $ | 0.312 | | | $ | 0.404 | | | $ | (0.089 | ) |
|
| Less Distributions | |
| | | | | |
From net investment income | | $ | (0.213 | ) | | $ | (0.230 | ) | | $ | (0.216 | ) | | $ | (0.214 | ) | | $ | (0.110 | ) |
| | | | | |
Total distributions | | $ | (0.213 | ) | | $ | (0.230 | ) | | $ | (0.216 | ) | | $ | (0.214 | ) | | $ | (0.110 | ) |
| | | | | |
Portfolio transaction fee, net(3) | | $ | 0.005 | | | $ | 0.003 | | | $ | 0.004 | | | $ | 0.000 | (4) | | $ | (0.011 | ) |
| | | | | |
Net asset value — End of period | | $ | 10.930 | | | $ | 10.640 | | | $ | 10.080 | | | $ | 9.980 | | | $ | 9.790 | |
| | | | | |
Total Return on Net Asset Value(5)(6) | | | 4.80 | % | | | 7.92 | % | | | 3.23 | % | | | 4.13 | % | | | (1.03 | )%(7) |
|
| Ratios/Supplemental Data | |
| | | | | |
Net assets, end of period (000’s omitted) | | $ | 7,649 | | | $ | 7,451 | | | $ | 7,055 | | | $ | 6,985 | | | $ | 22,028 | |
| | | | | |
Ratios (as a percentage of average daily net assets):(8) | | | | | | | | | | | | | | | | | | | | |
| | | | | |
Expenses(6) | | | 0.35 | % | | | 0.35 | % | | | 0.35 | % | | | 0.35 | % | | | 0.35 | %(9) |
| | | | | |
Net investment income | | | 1.98 | % | | | 2.21 | % | | | 2.18 | % | | | 2.28 | % | | | 1.77 | %(9) |
| | | | | |
Portfolio Turnover of the Portfolio | | | 51 | % | | | 28 | % | | | 78% | | | | 35 | % | | | 30 | %(7)(10) |
| (1) | Per share data reflect a 2-for-1 share split effective March 9, 2018. |
| (2) | For the period from the start of business, March 30, 2016, to January 31, 2017. |
| (3) | Computed using average shares outstanding. |
| (4) | Amount is less than $0.0005. |
| (5) | Returns are historical and are calculated by determining the percentage change in net asset value with all distributions reinvested and do not reflect the effect of a market-determined premium or discount. Investment returns assume that all distributions have been reinvested at net asset value. |
| (6) | The investment adviser and administrator and the sub-adviser of the Fund and the investment adviser and the sub-adviser of the Portfolio reimbursed certain operating expenses (equal to 1.63%, 1.40%, 1.53%, 0.74% and 1.10% of average daily net assets for the years ended January 31, 2021, 2020, 2019 and 2018 and the period ended January 31, 2017, respectively). Absent this reimbursement, total return would be lower. |
| (8) | Includes the Fund’s share of the Portfolio’s allocated expenses. |
| (10) | For the period from the Portfolio’s start of business, March 28, 2016, to January 31, 2017. |
| | | | |
| | 11 | | See Notes to Financial Statements. |
Eaton Vance
TABS 5-to-15 Year Laddered Municipal Bond NextShares
January 31, 2021
Notes to Financial Statements
1 Significant Accounting Policies
Eaton Vance TABS 5-to-15 Year Laddered Municipal Bond NextShares (the Fund) is a diversified series of Eaton Vance NextShares Trust II (the Trust), a Massachusetts business trust registered under the Investment Company Act of 1940, as amended (the 1940 Act). The Fund is an exchange-traded managed fund operating pursuant to an order issued by the SEC granting an exemption from certain provisions of the 1940 Act. Individual shares of the Fund may be purchased and sold only on a national securities exchange or alternative trading system through a broker-dealer that offers NextShares, and may not be directly purchased or redeemed from the Fund. Market trading prices for the Fund are directly linked to the Fund’s next-computed net asset value per share (NAV) and will vary from NAV by a market-determined premium or discount, which may be zero. The Fund invests all of its investable assets in interests in 5-to-15 Year Laddered Municipal Bond Portfolio (the Portfolio), a Massachusetts business trust, having substantially the same investment objective and policies as the Fund. The value of the Fund’s investment in the Portfolio reflects the Fund’s proportionate interest in the net assets of the Portfolio (0.8% at January 31, 2021). The performance of the Fund is directly affected by the performance of the Portfolio. The financial statements of the Portfolio, including the portfolio of investments, are included elsewhere in this report and should be read in conjunction with the Fund’s financial statements.
The following is a summary of significant accounting policies of the Fund. The policies are in conformity with accounting principles generally accepted in the United States of America (U.S. GAAP). The Fund is an investment company and follows accounting and reporting guidance in the Financial Accounting Standards Board (FASB) Accounting Standards Codification Topic 946.
A Investment Valuation — Valuation of securities by the Portfolio is discussed in Note 1A of the Portfolio’s Notes to Financial Statements, which are included elsewhere in this report.
B Income — The Fund’s net investment income or loss consists of the Fund’s pro-rata share of the net investment income or loss of the Portfolio, less all actual and accrued expenses of the Fund.
C Federal Taxes — The Fund’s policy is to comply with the provisions of the Internal Revenue Code applicable to regulated investment companies and to distribute to shareholders each year substantially all of its taxable, if any, and tax-exempt net investment income, and all or substantially all of its net realized capital gains. Accordingly, no provision for federal income or excise tax is necessary. The Fund intends to satisfy conditions which will enable it to designate distributions from the interest income generated by the Portfolio’s investments in municipal obligations, which are exempt from regular federal income tax when received by the Portfolio, as exempt-interest dividends. The portion of such interest, if any, earned on private activity bonds issued after August 7, 1986, may be considered a tax preference item to shareholders.
As of January 31, 2021, the Fund had no uncertain tax positions that would require financial statement recognition, de-recognition, or disclosure. The Fund files a U.S. federal income tax return annually after its fiscal year-end, which is subject to examination by the Internal Revenue Service for a period of three years from the date of filing.
D Expenses — The majority of expenses of the Trust are directly identifiable to an individual fund. Expenses which are not readily identifiable to a specific fund are allocated taking into consideration, among other things, the nature and type of expense and the relative size of the funds.
E Use of Estimates — The preparation of the financial statements in conformity with U.S. GAAP requires management to make estimates and assumptions that affect the reported amounts of assets and liabilities at the date of the financial statements and the reported amounts of income and expense during the reporting period. Actual results could differ from those estimates.
F Indemnifications — Under the Trust’s organizational documents, its officers and Trustees may be indemnified against certain liabilities and expenses arising out of the performance of their duties to the Fund. Under Massachusetts law, if certain conditions prevail, shareholders of a Massachusetts business trust (such as the Trust) could be deemed to have personal liability for the obligations of the Trust. However, the Trust’s Declaration of Trust contains an express disclaimer of liability on the part of Fund shareholders and the By-laws provide that the Trust shall assume, upon request by the shareholder, the defense on behalf of any Fund shareholders. Moreover, the By-laws also provide for indemnification out of Fund property of any shareholder held personally liable solely by reason of being or having been a shareholder for all loss or expense arising from such liability. Additionally, in the normal course of business, the Fund enters into agreements with service providers that may contain indemnification clauses. The Fund’s maximum exposure under these arrangements is unknown as this would involve future claims that may be made against the Fund that have not yet occurred.
G Other — Investment transactions are accounted for on a trade date basis.
2 Distributions to Shareholders and Income Tax Information
It is the present policy of the Fund to make monthly distributions of all or substantially all of its net investment income and to distribute annually all or substantially all of its net realized capital gains. Distributions are paid in cash and cannot be automatically reinvested in additional shares of the Fund. Distributions to shareholders are recorded on the ex-dividend date. Distributions to shareholders are determined in accordance with income tax regulations, which may differ from U.S. GAAP. As required by U.S. GAAP, only distributions in excess of tax basis earnings and profits are reported in the financial statements as a return of capital. Permanent differences between book and tax accounting relating to distributions are reclassified to paid-in capital. For tax purposes, distributions from short-term capital gains are considered to be from ordinary income.
Eaton Vance
TABS 5-to-15 Year Laddered Municipal Bond NextShares
January 31, 2021
Notes to Financial Statements — continued
The tax character of distributions declared for the years ended January 31, 2021 and January 31, 2020 was as follows:
| | | | | | | | |
| | | Year Ended January 31, | |
| | | 2021 | | | 2020 | |
| | |
Tax-exempt income | | $ | 148,830 | | | $ | 160,790 | |
As of January 31, 2021, the components of distributable earnings (accumulated loss) on a tax basis were as follows:
| | | | |
| | |
Undistributed tax-exempt income | | $ | 11,304 | |
| |
Deferred capital losses | | $ | (62,888 | ) |
| |
Net unrealized appreciation | | $ | 592,244 | |
At January 31, 2021, the Fund, for federal income tax purposes, had deferred capital losses of $62,888 which would reduce its taxable income arising from future net realized gains on investment transactions, if any, to the extent permitted by the Internal Revenue Code, and thus would reduce the amount of distributions to shareholders, which would otherwise be necessary to relieve the Fund of any liability for federal income or excise tax. The deferred capital losses are treated as arising on the first day of the Fund’s next taxable year and retain the same short-term or long-term character as when originally deferred. Of the deferred capital losses at January 31, 2021, $62,888 are short-term.
3 Investment Adviser Fee and Other Transactions with Affiliates
The investment adviser fee is earned by Eaton Vance Management (EVM), a wholly-owned subsidiary of Eaton Vance Corp., as compensation for investment advisory services rendered to the Fund. The fee is computed at an annual rate of 0.32% of the Fund’s average daily net assets that are not invested in other investment companies for which EVM or its affiliates serve as investment adviser and receive an advisory fee (“Direct Assets”) up to $1 billion and is payable monthly. On Direct Assets of $1 billion and over, the annual fee is reduced. For the year ended January 31, 2021, the Fund incurred no investment adviser fee on Direct Assets. To the extent the Fund’s assets are invested in the Portfolio, the Fund is allocated its share of the Portfolio’s investment adviser fee. The Portfolio has engaged Boston Management and Research (BMR), a subsidiary of EVM, to render investment advisory services. See Note 2 of the Portfolio’s Notes to Financial Statements which are included elsewhere in this report. EVM also serves as the administrator of the Fund, but receives no compensation.
Pursuant to a sub-advisory agreement, EVM has delegated the investment management of the Fund to Parametric Portfolio Associates LLC (Parametric), a wholly-owned indirect subsidiary of Eaton Vance Corp. EVM pays Parametric a portion of its investment adviser fee for sub-advisory services provided to the Fund.
The Trust, on behalf of the Fund, has entered into an operations agreement with EVM pursuant to which EVM provides the Fund with services required for it to operate as a NextShares exchange-traded managed fund in accordance with the exemptive order obtained by EVM and the Trust. Pursuant to the agreement, the Fund pays EVM a monthly fee at an annual rate of 0.05% of the Fund’s average daily net assets provided the average net assets of NextShares funds sponsored by EVM (“Covered Assets”) are less than $10 billion. The annual rate is reduced if Covered Assets are $10 billion and above. For the year ended January 31, 2021, the operations agreement fee amounted to $3,723 or 0.05% of the Fund’s average daily net assets.
EVM and Parametric have agreed to reimburse the Fund’s expenses to the extent that total annual operating expenses (relating to ordinary operating expenses only) exceed 0.35% of the Fund’s average daily net assets through May 31, 2021. Thereafter, the reimbursement may be changed or terminated at any time. Pursuant to this agreement, EVM and Parametric were allocated $120,140 in total of the Fund’s operating expenses for the year ended January 31, 2021.
Trustees and officers of the Fund who are members of EVM’s or BMR’s organizations receive remuneration for their services to the Fund out of the investment adviser fee. Certain officers and Trustees of the Fund and the Portfolio are officers of the above organizations.
4 Investment Transactions
For the year ended January 31, 2021, increases and decreases in the Fund’s investment in the Portfolio aggregated $123,847 and $336,721, respectively. In addition, a Portfolio transaction fee is imposed by the Portfolio on the combined daily inflows or outflows of the Fund and the Portfolio’s other investors as more fully described at Note 1H of the Portfolio’s financial statements included herein. Such fee is allocated to the Fund based on its pro-rata interest in the Portfolio. The amount of the Portfolio transaction fee imposed on the Fund, if any, and the allocation of such fee are presented as Other capital on the Statements of Changes in Net Assets.
Eaton Vance
TABS 5-to-15 Year Laddered Municipal Bond NextShares
January 31, 2021
Notes to Financial Statements — continued
5 Capital Share Transactions
The Trust may issue an unlimited number of shares of capital stock (no par value per share) in one or more series (such as the Fund). The Fund issues and redeems shares only in blocks of 25,000 shares or multiples thereof (“Creation Units”). The Fund issues and redeems Creation Units in return for the securities, other instruments and/or cash (the “Basket”) that the Fund specifies each business day. Creation Units may be purchased or redeemed only by or through Authorized Participants, which are broker-dealers or institutional investors that have entered into agreements with the Fund’s distributor for this purpose. The Fund imposes a transaction fee on Creation Units issued and redeemed to offset the estimated cost to the Fund of processing the transaction, which is paid by the Authorized Participants directly to a third-party administrator. In addition, Authorized Participants pay the Fund a variable charge for converting the Basket to or from the desired portfolio composition. Such variable charges are reflected as Transaction fees on the Statements of Changes in Net Assets.
At January 31, 2021, EVM owned approximately 95.6% of the outstanding shares of the Fund.
6 Additional Information
On October 8, 2020, Morgan Stanley and Eaton Vance Corp. (“Eaton Vance”) announced that they had entered into a definitive agreement under which Morgan Stanley would acquire Eaton Vance. Under the Investment Company Act of 1940, as amended, consummation of this transaction may have been deemed to result in the automatic termination of an Eaton Vance Fund’s investment advisory agreement and, where applicable, any related sub-advisory agreement. On November 24, 2020, the Fund’s Board approved a new investment advisory and administrative agreement and a new sub-advisory agreement. The new investment advisory and administrative agreement and new sub-advisory agreement were approved by Fund shareholders at a joint special meeting of shareholders held on February 18, 2021, and became effective upon the consummation of the transaction on March 1, 2021.
Eaton Vance
TABS 5-to-15 Year Laddered Municipal Bond NextShares
January 31, 2021
Report of Independent Registered Public Accounting Firm
To the Trustees of Eaton Vance NextShares Trust II and Shareholders of Eaton Vance TABS 5-to-15 Year Laddered Municipal Bond NextShares:
Opinion on the Financial Statements and Financial Highlights
We have audited the accompanying statement of assets and liabilities of Eaton Vance TABS 5-to-15 Year Laddered Municipal Bond NextShares (the “Fund”) (one of the funds constituting Eaton Vance NextShares Trust II), as of January 31, 2021, the related statement of operations for the year then ended, the statements of changes in net assets for each of the two years in the period then ended, the financial highlights for each of the four years in the period then ended and the period from the start of business, March 30, 2016, to January 31, 2017, and the related notes. In our opinion, the financial statements and financial highlights present fairly, in all material respects, the financial position of the Fund as of January 31, 2021, and the results of its operations for the year then ended, the changes in its net assets for each of the two years in the period then ended, and the financial highlights for each of the four years in the period then ended and the period from the start of business, March 30, 2016, to January 31, 2017, in conformity with accounting principles generally accepted in the United States of America.
Basis for Opinion
These financial statements and financial highlights are the responsibility of the Fund’s management. Our responsibility is to express an opinion on the Fund’s financial statements and financial highlights based on our audits. We are a public accounting firm registered with the Public Company Accounting Oversight Board (United States) (PCAOB) and are required to be independent with respect to the Fund in accordance with the U.S. federal securities laws and the applicable rules and regulations of the Securities and Exchange Commission and the PCAOB.
We conducted our audits in accordance with the standards of the PCAOB. Those standards require that we plan and perform the audit to obtain reasonable assurance about whether the financial statements and financial highlights are free of material misstatement, whether due to error or fraud. The Fund is not required to have, nor were we engaged to perform, an audit of its internal control over financial reporting. As part of our audits we are required to obtain an understanding of internal control over financial reporting but not for the purpose of expressing an opinion on the effectiveness of the Fund’s internal control over financial reporting. Accordingly, we express no such opinion.
Our audits included performing procedures to assess the risks of material misstatement of the financial statements and financial highlights, whether due to error or fraud, and performing procedures that respond to those risks. Such procedures included examining, on a test basis, evidence regarding the amounts and disclosures in the financial statements and financial highlights. Our audits also included evaluating the accounting principles used and significant estimates made by management, as well as evaluating the overall presentation of the financial statements and financial highlights. We believe that our audits provide a reasonable basis for our opinion.
/s/ Deloitte & Touche LLP
Boston, Massachusetts
March 19, 2021
We have served as the auditor of one or more Eaton Vance investment companies since 1959.
Eaton Vance
TABS 5-to-15 Year Laddered Municipal Bond NextShares
January 31, 2021
Federal Tax Information (Unaudited)
The Form 1099-DIV you receive in February 2022 will show the tax status of all distributions paid to your account in calendar year 2021. Shareholders are advised to consult their own tax adviser with respect to the tax consequences of their investment in the Fund. As required by the Internal Revenue Code and/or regulations, shareholders must be notified regarding exempt-interest dividends.
Exempt-Interest Dividends. For the fiscal year ended January 31, 2021, the Fund designates 100% of distributions from net investment income as an exempt-interest dividend.
5-to-15 Year Laddered Municipal Bond Portfolio
January 31, 2021
Portfolio of Investments
| | | | | | | | |
| Tax-Exempt Investments — 89.1% | |
| Security | | Principal
Amount
(000’s omitted) | | | Value | |
|
| Bond Bank — 0.2% | |
| | |
Vermont Bond Bank, (Vermont State Colleges System), 3.00%, 10/1/35 | | $ | 500 | | | $ | 556,515 | |
| | |
Virginia Resources Authority, (Pooled Financing Program), 4.00%, 11/1/35 | | | 1,325 | | | | 1,605,052 | |
| | |
| | | | | | | $ | 2,161,567 | |
|
| Education — 1.3% | |
| | |
Arizona State University, 5.00%, 7/1/35 | | $ | 1,500 | | | $ | 2,025,540 | |
| | |
Arizona State University, 5.00%, 7/1/36 | | | 1,000 | | | | 1,341,300 | |
| | |
Brownsburg 1999 School Building Corp., IN, 5.00%, 2/5/26 | | | 565 | | | | 692,283 | |
| | |
Connecticut Health and Educational Facilities Authority, (Fairfield University), 5.00%, 7/1/25 | | | 875 | | | | 1,043,009 | |
| | |
Connecticut Health and Educational Facilities Authority, (Fairfield University), 5.00%, 7/1/26 | | | 1,000 | | | | 1,226,030 | |
| | |
Louisiana Public Facilities Authority, (Tulane University), 5.00%, 12/15/27 | | | 505 | | | | 627,048 | |
| | |
North Carolina Capital Facilities Finance Agency, (Davidson College), 5.00%, 3/1/29 | | | 200 | | | | 210,152 | |
| | |
Saginaw Valley State University, MI, 5.00%, 7/1/26 | | | 750 | | | | 924,000 | |
| | |
Saginaw Valley State University, MI, 5.00%, 7/1/27 | | | 500 | | | | 613,610 | |
| | |
Saginaw Valley State University, MI, 5.00%, 7/1/28 | | | 1,000 | | | | 1,224,830 | |
| | |
University of Hawaii, 3.00%, 10/1/31 | | | 1,000 | | | | 1,169,760 | |
| | |
University of North Carolina at Greensboro, 5.00%, 4/1/33 | | | 1,010 | | | | 1,132,988 | |
| | |
| | | | | | | $ | 12,230,550 | |
|
| Electric Utilities — 2.1% | |
| | |
Brownsville, TX, Utilities System Revenue, 5.00%, 9/1/29 | | $ | 1,000 | | | $ | 1,191,420 | |
| | |
Energy Northwest, WA, Wind Project Revenue, 5.00%, 7/1/25 | | | 365 | | | | 437,025 | |
| | |
Energy Northwest, WA, Wind Project Revenue, 5.00%, 7/1/26 | | | 1,000 | | | | 1,195,880 | |
| | |
Garland, TX, Electric Utility System Revenue, 5.00%, 3/1/32 | | | 250 | | | | 301,832 | |
| | |
Marquette Board of Light and Power, MI, 5.00%, 7/1/27 | | | 735 | | | | 908,842 | |
| | |
New Braunfels, TX, Utility System Revenue, 4.00%, 7/1/34 | | | 770 | | | | 930,992 | |
| | |
New Braunfels, TX, Utility System Revenue, 4.00%, 7/1/36 | | | 155 | | | | 186,160 | |
| | |
North Carolina Municipal Power Agency No. 1, (Catawba), 5.00%, 1/1/29 | | | 500 | | | | 607,625 | |
| | |
Redding Joint Powers Financing Authority, CA, Electric System Revenue, 5.00%, 6/1/26 | | | 250 | | | | 307,532 | |
| | |
Seattle, WA, Municipal Light and Power Revenue, Green Bonds, 4.00%, 7/1/34 | | | 5,035 | | | | 6,327,082 | |
| | |
Springfield Electric System Revenue, IL, 5.00%, 3/1/27 | | | 250 | | | | 293,425 | |
| | |
Springfield Electric System Revenue, IL, 5.00%, 3/1/28 | | | 250 | | | | 292,765 | |
| | |
Springfield Electric System Revenue, IL, 5.00%, 3/1/29 | | | 250 | | | | 292,215 | |
| | |
Tallahassee, FL, Energy System Revenue, 5.00%, 10/1/27 | | | 300 | | | | 350,103 | |
| | |
Tallahassee, FL, Energy System Revenue, 5.00%, 10/1/28 | | | 400 | | | | 466,008 | |
| | | | | | | | |
| Security | | Principal
Amount
(000’s omitted) | | | Value | |
|
| Electric Utilities (continued) | |
| | |
Tallahassee, FL, Energy System Revenue, 5.00%, 10/1/29 | | $ | 1,120 | | | $ | 1,302,605 | |
| | |
Tallahassee, FL, Energy System Revenue, 5.00%, 10/1/30 | | | 1,500 | | | | 1,741,590 | |
| | |
Tallahassee, FL, Energy System Revenue, 5.00%, 10/1/31 | | | 1,000 | | | | 1,160,660 | |
| | |
Tallahassee, FL, Energy System Revenue, 5.00%, 10/1/33 | | | 300 | | | | 347,724 | |
| | |
Walnut Energy Center Authority, CA, 5.00%, 1/1/33 | | | 250 | | | | 287,070 | |
| | |
| | | | | | | $ | 18,928,555 | |
|
| Escrowed / Prerefunded — 0.1% | |
| | |
South Dakota Building Authority, Prerefunded to 6/1/25, 5.00%, 6/1/28 | | $ | 210 | | | $ | 252,937 | |
| | |
South Dakota Building Authority, Series 2015B, Prerefunded to 6/1/25, 5.00%, 6/1/30 | | | 200 | | | | 240,892 | |
| | |
| | | | | | | $ | 493,829 | |
|
| General Obligations — 28.7% | |
| | |
Abilene Independent School District, TX, (PSF Guaranteed), 4.00%, 2/15/32 | | $ | 700 | | | $ | 846,321 | |
| | |
Addison, TX, 5.00%, 2/15/26 | | | 270 | | | | 296,619 | |
| | |
Anchorage, AK, 5.00%, 9/1/24 | | | 250 | | | | 292,298 | |
| | |
Anchorage, AK, 5.00%, 9/1/25 | | | 100 | | | | 121,204 | |
| | |
Anchorage, AK, 5.00%, 9/1/27 | | | 780 | | | | 939,861 | |
| | |
Belding Area Schools, MI, 5.00%, 5/1/28 | | | 250 | | | | 308,568 | |
| | |
Belding Area Schools, MI, 5.00%, 5/1/30 | | | 250 | | | | 307,255 | |
| | |
Birmingham, AL, 5.00%, 12/1/25 | | | 1,050 | | | | 1,281,452 | |
| | |
Birmingham, AL, 5.00%, 12/1/27 | | | 2,460 | | | | 3,182,379 | |
| | |
Bonneville and Bingham Counties Joint School District No. 93, ID, 5.00%, 9/15/32 | | | 550 | | | | 664,125 | |
| | |
Brookline, MA, 5.00%, 3/15/30 | | | 2,000 | | | | 2,680,740 | |
| | |
Brookline, MA, 5.00%, 3/15/31 | | | 4,075 | | | | 5,434,990 | |
| | |
Burlington, VT, 5.00%, 11/1/27 | | | 305 | | | | 392,544 | |
| | |
Burlington, VT, 5.00%, 11/1/29 | | | 135 | | | | 181,080 | |
| | |
Burlington, VT, 5.00%, 11/1/30 | | | 300 | | | | 400,221 | |
| | |
Burlington, VT, Series 2016A, 5.00%, 11/1/25 | | | 300 | | | | 364,248 | |
| | |
Burlington, VT, Series 2016A, 5.00%, 11/1/26 | | | 150 | | | | 187,874 | |
| | |
Burlington, VT, Series 2019A, 5.00%, 11/1/25 | | | 150 | | | | 182,124 | |
| | |
Burlington, VT, Series 2019A, 5.00%, 11/1/26 | | | 210 | | | | 263,023 | |
| | |
California, 4.00%, 9/1/26 | | | 320 | | | | 385,603 | |
| | |
California, 4.00%, 8/1/36 | | | 5,000 | | | | 5,848,300 | |
| | |
California, 5.00%, 8/1/26 | | | 2,010 | | | | 2,436,783 | |
| | |
California, 5.00%, 8/1/32 | | | 1,590 | | | | 1,974,208 | |
| | |
Cape May County, NJ, 3.00%, 10/1/31 | | | 1,000 | | | | 1,097,130 | |
| | |
Chaffey Joint Union High School District, CA, (Election of 2012), 0.00%, 8/1/33 | | | 1,000 | | | | 761,130 | |
| | |
Clark County, NV, 3.00%, 11/1/36 | | | 3,730 | | | | 4,254,662 | |
| | |
Clark County, NV, 5.00%, 11/1/26 | | | 1,020 | | | | 1,284,129 | |
| | | | |
| | 17 | | See Notes to Financial Statements. |
5-to-15 Year Laddered Municipal Bond Portfolio
January 31, 2021
Portfolio of Investments — continued
| | | | | | | | |
| Security | | Principal
Amount
(000’s omitted) | | | Value | |
|
| General Obligations (continued) | |
| | |
Collin County, TX, 5.00%, 2/15/25 | | $ | 1,605 | | | $ | 1,912,711 | |
| | |
Colonial School District, PA, 5.00%, 2/15/32 | | | 100 | | | | 120,705 | |
| | |
Colonial School District, PA, 5.00%, 2/15/33 | | | 200 | | | | 241,210 | |
| | |
Connecticut, 3.00%, 1/15/33 | | | 4,000 | | | | 4,579,520 | |
| | |
Connecticut, 4.00%, 6/1/30 | | | 1,000 | | | | 1,269,050 | |
| | |
Connecticut, 4.00%, 6/1/32 | | | 1,000 | | | | 1,253,840 | |
| | |
Connecticut, 4.00%, 6/1/33 | | | 600 | | | | 747,078 | |
| | |
Connecticut, 4.00%, 6/1/35 | | | 850 | | | | 1,048,288 | |
| | |
Connecticut, 4.00%, 6/1/36 | | | 1,000 | | | | 1,225,860 | |
| | |
Conroe Independent School District, TX, (PSF Guaranteed), 3.00%, 2/15/34 | | | 1,750 | | | | 2,060,117 | |
| | |
Conroe Independent School District, TX, (PSF Guaranteed), 3.00%, 2/15/36 | | | 1,000 | | | | 1,154,190 | |
| | |
Contra Costa Community College District, CA, (Election of 2014), 4.00%, 8/1/32 | | | 650 | | | | 817,583 | |
| | |
Contra Costa Community College District, CA, (Election of 2014), 4.00%, 8/1/33 | | | 100 | | | | 124,640 | |
| | |
Cook County School District No. 25, IL, (Arlington Heights), 5.00%, 12/15/32 | | | 630 | | | | 795,123 | |
| | |
Cypress-Fairbanks Independent School District, TX, (PSF Guaranteed), 3.00%, 2/15/33 | | | 1,500 | | | | 1,790,805 | |
| | |
Cypress-Fairbanks Independent School District, TX, (PSF Guaranteed), 3.00%, 2/15/36 | | | 2,500 | | | | 2,933,400 | |
| | |
Dallas, TX, 5.00%, 2/15/29 | | | 2,775 | | | | 3,140,689 | |
| | |
Dallas, TX, 5.00%, 2/15/31 | | | 3,615 | | | | 3,939,591 | |
| | |
Delaware, 5.00%, 1/1/27 | | | 2,020 | | | | 2,574,349 | |
| | |
Delaware, 5.00%, 2/1/29 | | | 1,000 | | | | 1,306,330 | |
| | |
Denton County, TX, 4.00%, 7/15/31 | | | 1,500 | | | | 1,837,350 | |
| | |
District of Columbia, 5.00%, 6/1/33 | | | 6,690 | | | | 7,682,595 | |
| | |
Dowagiac Union School District, MI, 4.00%, 5/1/26 | | | 350 | | | | 414,876 | |
| | |
Dublin City School District, OH, 5.00%, 12/1/29 | | | 500 | | | | 665,005 | |
| | |
Easton Area School District, PA, 5.00%, 2/1/31 | | | 1,650 | | | | 2,117,230 | |
| | |
Flower Mound, TX, 5.00%, 3/1/27 | | | 510 | | | | 632,089 | |
| | |
Fort Bend Independent School District, TX, (PSF Guaranteed), 0.875% to 8/1/25
(Put Date), 8/1/50 | | | 2,000 | | | | 2,027,120 | |
| | |
Franklin County, OH, 4.25%, 12/1/35 | | | 1,100 | | | | 1,183,325 | |
| | |
Frisco Independent School District, TX, (PSF Guaranteed), 4.00%, 8/15/30 | | | 400 | | | | 455,600 | |
| | |
Georgia, 5.00%, 2/1/32 | | | 1,000 | | | | 1,251,350 | |
| | |
Granville Exempted Village School District, OH, 5.00%, 12/1/26 | | | 500 | | | | 609,945 | |
| | |
Harlandale Independent School District, TX, 5.00%, 8/1/29 | | | 845 | | | | 1,054,095 | |
| | |
Hawaii, 5.00%, 1/1/30 | | | 4,000 | | | | 5,312,200 | |
| | |
Hennepin County, MN, 5.00%, 12/1/33 | | | 1,000 | | | | 1,259,380 | |
| | |
Homewood, AL, 5.00%, 9/1/28 | | | 2,000 | | | | 2,478,260 | |
| | |
Homewood, AL, 5.00%, 9/1/29 | | | 2,000 | | | | 2,465,000 | |
| | | | | | | | |
| Security | | Principal
Amount
(000’s omitted) | | | Value | |
|
| General Obligations (continued) | |
| | |
Honolulu City and County, HI, 3.00%, 9/1/31 | | $ | 510 | | | $ | 568,451 | |
| | |
Illinois, 5.00%, 9/1/27 | | | 12,035 | | | | 14,618,914 | |
| | |
Illinois, 5.00%, 3/1/28 | | | 2,000 | | | | 2,077,820 | |
| | |
Illinois, 5.00%, 4/1/29 | | | 1,190 | | | | 1,312,713 | |
| | |
Illinois, 5.00%, 3/1/34 | | | 6,000 | | | | 6,194,700 | |
| | |
Illinois, 5.00%, 3/1/35 | | | 1,000 | | | | 1,032,180 | |
| | |
Illinois, 5.50%, 5/1/30 | | | 5,500 | | | | 7,144,610 | |
| | |
Kane, Cook and DuPage Counties School District No. 46, IL, 5.00%, 1/1/29 | | | 1,000 | | | | 1,128,180 | |
| | |
Kane, McHenry, Cook and DeKalb Counties Community Unit School District No. 300, IL, 5.00%, 1/1/28 | | | 2,370 | | | | 3,033,031 | |
| | |
Lakeland, FL, 5.00%, 10/1/25 | | | 635 | | | | 753,199 | |
| | |
Lakeland, FL, 5.00%, 10/1/28 | | | 1,500 | | | | 1,774,440 | |
| | |
Lakeland, FL, 5.00%, 10/1/30 | | | 1,000 | | | | 1,180,700 | |
| | |
Leander Independent School District, TX, (PSF Guaranteed), 0.00%, 8/15/31 | | | 600 | | | | 425,814 | |
| | |
Lewisville Independent School District, TX, (PSF Guaranteed), 4.00%, 8/15/27 | | | 1,600 | | | | 1,858,624 | |
| | |
Los Angeles Community College District, CA, (Election of 2008), 4.00%, 8/1/34 | | | 1,690 | | | | 1,977,046 | |
| | |
Los Angeles Unified School District, CA, 4.00%, 7/1/33 | | | 2,500 | | | | 3,157,475 | |
| | |
Los Angeles Unified School District, CA, 4.00%, 7/1/36 | | | 3,000 | | | | 3,711,900 | |
| | |
Lower Merion School District, PA, 4.00%, 11/15/30 | | | 4,120 | | | | 5,118,894 | |
| | |
Lower Merion School District, PA, 4.00%, 11/15/31 | | | 3,930 | | | | 4,861,449 | |
| | |
Maine, 5.00%, 6/1/30 | | | 2,605 | | | | 3,599,146 | |
| | |
McLean County Public Building Commission, IL, 5.00%, 12/1/28 | | | 200 | | | | 234,696 | |
| | |
Miami-Dade County School District, FL, 5.00%, 3/15/28 | | | 300 | | | | 354,732 | |
| | |
Miami-Dade County, FL, 5.00%, 7/1/29 | | | 1,000 | | | | 1,202,190 | |
| | |
Milpitas Unified School District, CA, (Election of 2012), 4.00%, 8/1/32 | | | 560 | | | | 627,894 | |
| | |
Morris Township, NJ, 3.00%, 11/1/27 | | | 440 | | | | 500,482 | |
| | |
Mountain View-Los Altos Union High School District, CA, 0.00%, 8/1/27 | | | 175 | | | | 167,146 | |
| | |
Navasota Independent School District, TX, (PSF Guaranteed), 5.00%, 2/15/28 | | | 195 | | | | 231,087 | |
| | |
Navasota Independent School District, TX, (PSF Guaranteed), 5.00%, 2/15/29 | | | 340 | | | | 402,472 | |
| | |
Navasota Independent School District, TX, (PSF Guaranteed), 5.00%, 2/15/30 | | | 725 | | | | 857,247 | |
| | |
Navasota Independent School District, TX, (PSF Guaranteed), 5.00%, 2/15/31 | | | 885 | | | | 1,044,486 | |
| | |
Navasota Independent School District, TX, (PSF Guaranteed), 5.00%, 2/15/32 | | | 720 | | | | 848,484 | |
| | |
New Hampshire, 5.00%, 12/1/32 | | | 1,500 | | | | 2,090,385 | |
| | |
New Jersey, 4.00%, 6/1/31 | | | 5,000 | | | | 6,291,050 | |
| | |
New Jersey, 5.00%, 6/1/26 | | | 2,500 | | | | 3,077,100 | |
| | | | |
| | 18 | | See Notes to Financial Statements. |
5-to-15 Year Laddered Municipal Bond Portfolio
January 31, 2021
Portfolio of Investments — continued
| | | | | | | | |
| Security | | Principal
Amount
(000’s omitted) | | | Value | |
|
| General Obligations (continued) | |
| | |
New Jersey, 5.00%, 6/1/27 | | $ | 5,000 | | | $ | 6,308,000 | |
| | |
Oregon, 2.35%, 6/1/25 | | | 165 | | | | 179,065 | |
| | |
Oregon, 2.40%, 12/1/25 | | | 1,050 | | | | 1,148,826 | |
| | |
Oregon, 2.50%, 6/1/26 | | | 1,070 | | | | 1,181,002 | |
| | |
Pasadena, TX, 4.00%, 2/15/28 | | | 500 | | | | 570,795 | |
| | |
Pasadena, TX, 4.00%, 2/15/29 | | | 150 | | | | 170,979 | |
| | |
Pasadena, TX, 4.00%, 2/15/30 | | | 500 | | | | 569,500 | |
| | |
Pasadena, TX, 4.00%, 2/15/31 | | | 650 | | | | 739,512 | |
| | |
Pendleton School District No. 16R, Umatilla County, OR, 0.00%, 6/15/27 | | | 1,060 | | | | 1,007,816 | |
| | |
Pennsylvania, 4.00%, 6/1/30 | | | 5,000 | | | | 5,223,150 | |
| | |
Pennsylvania, 4.00%, 6/15/31 | | | 135 | | | | 149,280 | |
| | |
Philadelphia, PA, 5.00%, 2/1/26 | | | 1,150 | | | | 1,399,079 | |
| | |
Philadelphia, PA, 5.00%, 2/1/31 | | | 1,550 | | | | 2,011,900 | |
| | |
Pittsburg Unified School District, CA, 5.00%, 8/1/28 | | | 920 | | | | 1,192,955 | |
| | |
Port of Seattle, WA, Limited Tax General Obligation Bonds, 5.00%, 6/1/28 | | | 2,000 | | | | 2,304,640 | |
| | |
Ravenswood City School District, CA, (Election of 2016), 5.00%, 8/1/24 | | | 465 | | | | 544,566 | |
| | |
Ravenswood City School District, CA, (Election of 2016), 5.00%, 8/1/25 | | | 485 | | | | 590,895 | |
| | |
Ravenswood City School District, CA, (Election of 2016), 5.00%, 8/1/26 | | | 505 | | | | 637,340 | |
| | |
Ravenswood City School District, CA, (Election of 2016), 5.00%, 8/1/27 | | | 530 | | | | 667,572 | |
| | |
Ravenswood City School District, CA, (Election of 2016), 5.00%, 8/1/28 | | | 555 | | | | 696,297 | |
| | |
Ravenswood City School District, CA, (Election of 2016), 5.00%, 8/1/29 | | | 575 | | | | 719,963 | |
| | |
Romeo Community Schools, MI, 5.00%, 5/1/30 | | | 700 | | | | 859,502 | |
| | |
Romulus, MI, 4.00%, 11/1/31 | | | 250 | | | | 288,643 | |
| | |
Romulus, MI, 4.00%, 11/1/32 | | | 100 | | | | 115,243 | |
| | |
Romulus, MI, 4.00%, 11/1/33 | | | 250 | | | | 287,635 | |
| | |
SCAGO Educational Facilities Corp. for Pickens School District, SC, 5.00%, 12/1/26 | | | 1,650 | | | | 1,968,236 | |
| | |
School District 27J, Adams and Weld Counties and City and County of Broomfield, CO, 4.00%, 12/1/30 | | | 450 | | | | 518,409 | |
| | |
Seguin Independent School District, TX, (PSF Guaranteed), 4.00%, 8/15/29 | | | 300 | | | | 345,279 | |
| | |
Seward County Unified School District No. 480, KS, 5.00%, 9/1/29 | | | 2,000 | | | | 2,388,060 | |
| | |
Southfield Public Schools, MI, 5.00%, 5/1/25 | | | 1,100 | | | | 1,310,738 | |
| | |
Southfield Public Schools, MI, 5.00%, 5/1/27 | | | 1,000 | | | | 1,268,660 | |
| | |
St. Mary’s County, MD, 5.00%, 5/1/28 | | | 1,255 | | | | 1,651,392 | |
| | |
St. Mary’s County, MD, 5.00%, 5/1/30 | | | 1,245 | | | | 1,716,706 | |
| | |
St. Vrain Valley School District RE-1J, CO, 5.00%, 12/15/28 | | | 1,700 | | | | 2,144,431 | |
| | |
St. Vrain Valley School District RE-1J, CO, 5.00%, 12/15/29 | | | 1,000 | | | | 1,256,820 | |
| | | | | | | | |
| Security | | Principal
Amount
(000’s omitted) | | | Value | |
|
| General Obligations (continued) | |
| | |
Stamford, CT, 4.00%, 8/1/27 | | $ | 650 | | | $ | 754,884 | |
| | |
Sun Valley, ID, 5.00%, 9/15/25 | | | 755 | | | | 921,440 | |
| | |
Sun Valley, ID, 5.00%, 9/15/26 | | | 695 | | | | 876,958 | |
| | |
Texas, 4.00%, 8/26/21 | | | 10,000 | | | | 10,224,300 | |
| | |
Torrance Unified School District, CA, (Election of 2014), 5.00%, 8/1/30 | | | 515 | | | | 641,978 | |
| | |
Torrance Unified School District, CA, (Election of 2014), 5.00%, 8/1/31 | | | 450 | | | | 558,189 | |
| | |
Tuloso-Midway Independent School District, TX, (PSF Guaranteed), 4.00%, 8/15/27 | | | 510 | | | | 591,192 | |
| | |
Tuloso-Midway Independent School District, TX, (PSF Guaranteed), 4.00%, 8/15/28 | | | 530 | | | | 614,116 | |
| | |
Tuloso-Midway Independent School District, TX, (PSF Guaranteed), 4.00%, 8/15/29 | | | 545 | | | | 631,230 | |
| | |
Virginia, 3.00%, 6/1/32 | | | 2,000 | | | | 2,364,020 | |
| | |
Virginia Resources Authority, (Pooled Financing Program), 5.00%, 11/1/25 | | | 600 | | | | 735,786 | |
| | |
Washington, 5.00%, 8/1/28 | | | 1,485 | | | | 1,849,315 | |
| | |
Washington, 5.00%, 8/1/29 | | | 1,400 | | | | 1,739,150 | |
| | |
Washington, 5.00%, 8/1/35 | | | 4,410 | | | | 5,080,937 | |
| | |
Will and Kendall Counties Community Consolidated School District No. 202, IL, 4.00%, 1/1/27 | | | 2,825 | | | | 3,347,427 | |
| | |
Will County Community Unit School District No. 365-U, IL, 4.00%, 1/1/30 | | | 360 | | | | 417,913 | |
| | |
Williamson County, TX, Prerefunded to 2/15/24, 5.00%, 2/15/28 | | | 300 | | | | 342,756 | |
| | |
York County, PA, 5.00%, 6/1/27 | | | 1,225 | | | | 1,443,663 | |
| | |
| | | | | | | $ | 261,576,247 | |
|
| Hospital — 13.2% | |
| | |
Allegheny County Hospital Development Authority, PA, (Allegheny Health Network Obligated Group), 5.00%, 4/1/31 | | $ | 1,750 | | | $ | 2,213,767 | |
| | |
Allegheny County Hospital Development Authority, PA, (Allegheny Health Network Obligated Group), 5.00%, 4/1/33 | | | 3,000 | | | | 3,762,810 | |
| | |
Buffalo and Erie County Industrial Land Development Corp., NY, (Catholic Health System, Inc.), 5.00%, 7/1/25 | | | 250 | | | | 292,638 | |
| | |
California Health Facilities Financing Authority, (Adventist Health System/West), 4.00%, 3/1/27 | | | 90 | | | | 96,043 | |
| | |
California Health Facilities Financing Authority, (CommonSpirit Health), 4.00%, 4/1/36 | | | 3,000 | | | | 3,597,120 | |
| | |
California Health Facilities Financing Authority, (El Camino Hospital), 5.00%, 2/1/29 | | | 750 | | | | 931,410 | |
| | |
Charlotte-Mecklenburg Hospital Authority, NC, 5.125%, 1/15/37 | | | 40 | | | | 40,125 | |
| | |
Clarke County Hospital Authority, GA, (Piedmont Healthcare, Inc.), 5.00%, 7/1/30 | | | 335 | | | | 408,583 | |
| | | | |
| | 19 | | See Notes to Financial Statements. |
5-to-15 Year Laddered Municipal Bond Portfolio
January 31, 2021
Portfolio of Investments — continued
| | | | | | | | |
| Security | | Principal
Amount
(000’s omitted) | | | Value | |
|
| Hospital (continued) | |
| | |
Cobb County Kennestone Hospital Authority, GA, (WellStar Health System, Inc.), 4.00%, 4/1/34 | | $ | 100 | | | $ | 120,639 | |
| | |
Cobb County Kennestone Hospital Authority, GA, (WellStar Health System, Inc.), 4.00%, 4/1/35 | | | 290 | | | | 348,957 | |
| | |
Cobb County Kennestone Hospital Authority, GA, (WellStar Health System, Inc.), 4.00%, 4/1/36 | | | 300 | | | | 359,712 | |
| | |
Colorado Health Facilities Authority, (CommonSpirit Health), 5.00%, 8/1/34 | | | 2,000 | | | | 2,548,700 | |
| | |
Colorado Health Facilities Authority, (CommonSpirit Health), 5.00%, 8/1/35 | | | 3,000 | | | | 3,812,760 | |
| | |
Colorado Health Facilities Authority, (CommonSpirit Health), 5.00% to 8/1/26 (Put Date), 8/1/49 | | | 5,000 | | | | 6,038,300 | |
| | |
Colorado Health Facilities Authority, (NCMC, Inc.), Escrowed to Maturity, 5.00%, 5/15/25 | | | 150 | | | | 179,646 | |
| | |
Colorado Health Facilities Authority, (Sanford Health), 5.00%, 11/1/32 | | | 3,000 | | | | 3,970,950 | |
| | |
Geisinger Authority, PA, (Geisinger Health System), 5.00%, 4/1/35 | | | 6,000 | | | | 7,920,900 | |
| | |
Glynn-Brunswick Memorial Hospital Authority, GA, (Southeast Georgia Health System), 4.00%, 8/1/35 | | | 1,000 | | | | 1,177,870 | |
| | |
Greeneville Health and Educational Facilities Board, TN, (Ballad Health), 5.00%, 7/1/32 | | | 1,815 | | | | 1,980,292 | |
| | |
Greeneville Health and Educational Facilities Board, TN, (Ballad Health), 5.00%, 7/1/33 | | | 4,000 | | | | 4,356,800 | |
| | |
Illinois Finance Authority, (Riverside Health System), 4.00%, 11/15/32 | | | 750 | | | | 858,877 | |
| | |
Illinois Finance Authority, (Riverside Health System), 5.00%, 11/15/27 | | | 500 | | | | 618,175 | |
| | |
Illinois Finance Authority, (Rush University Medical Center), 5.00%, 11/15/31 | | | 1,000 | | | | 1,173,010 | |
| | |
Illinois Finance Authority, (Rush University Medical Center), 5.00%, 11/15/32 | | | 1,000 | | | | 1,171,970 | |
| | |
Kentucky Economic Development Finance Authority, (Catholic Health Initiatives), 1.44%, (SIFMA + 1.40%), 2/1/25 (Put Date), 2/1/46(1) | | | 12,715 | | | | 12,687,027 | |
| | |
Knox County Health, Educational and Housing Facility Board, TN, (University Health System, Inc.), 5.00%, 9/1/30 | | | 1,000 | | | | 1,176,060 | |
| | |
Louisiana Public Facilities Authority, (Ochsner Clinic Foundation), 5.00%, 5/15/25 | | | 250 | | | | 296,675 | |
| | |
Louisiana Public Facilities Authority, (Ochsner Clinic Foundation), 5.00%, 5/15/26 | | | 250 | | | | 296,605 | |
| | |
Louisiana Public Facilities Authority, (Ochsner Clinic Foundation), 5.00%, 5/15/27 | | | 250 | | | | 295,255 | |
| | |
Louisville/Jefferson County Metro Government, KY, (Norton Healthcare, Inc.), 5.00%, 10/1/30 | | | 2,000 | | | | 2,428,820 | |
| | |
Louisville/Jefferson County Metro Government, KY, (Norton Healthcare, Inc.), 5.00%, 10/1/31 | | | 1,500 | | | | 1,815,795 | |
| | |
Louisville/Jefferson County Metro Government, KY, (Norton Healthcare, Inc.), 5.00%, 10/1/32 | | | 2,000 | | | | 2,412,340 | |
| | | | | | | | |
| Security | | Principal
Amount
(000’s omitted) | | | Value | |
|
| Hospital (continued) | |
| | |
Maricopa County Industrial Development Authority, AZ, (Banner Health), 0.61%, (SIFMA + 0.57%), 10/18/24 (Put Date), 1/1/35(1) | | $ | 4,730 | | | $ | 4,709,566 | |
| | |
Maryland Health and Higher Educational Facilities Authority, (MedStar Health, Inc.), 5.00%, 8/15/31 | | | 1,000 | | | | 1,161,650 | |
| | |
Massachusetts Development Finance Agency, (Berkshire Retirement Community, Inc.), 5.00%, 7/1/25 | | | 595 | | | | 658,379 | |
| | |
Massachusetts Development Finance Agency, (South Shore Hospital), 5.00%, 7/1/24 | | | 550 | | | | 626,544 | |
| | |
Massachusetts Development Finance Agency, (South Shore Hospital), 5.00%, 7/1/26 | | | 500 | | | | 603,560 | |
| | |
Massachusetts Development Finance Agency, (South Shore Hospital), 5.00%, 7/1/28 | | | 245 | | | | 292,447 | |
| | |
Medford Hospital Facilities Authority, OR, (Asante Health System), 5.00%, 8/15/34 | | | 1,000 | | | | 1,327,260 | |
| | |
Medford Hospital Facilities Authority, OR, (Asante Health System), 5.00%, 8/15/35 | | | 700 | | | | 926,275 | |
| | |
Medford Hospital Facilities Authority, OR, (Asante Health System), 5.00%, 8/15/36 | | | 1,000 | | | | 1,318,470 | |
| | |
Michigan Finance Authority, (Beaumont Health Credit Group), 5.00%, 8/1/28 | | | 1,315 | | | | 1,515,748 | |
| | |
Missouri Health and Educational Facilities Authority, (CoxHealth), 5.00%, 11/15/31 | | | 490 | | | | 577,151 | |
| | |
Missouri Health and Educational Facilities Authority, (Saint Luke’s Health System), 5.00%, 11/15/31 | | | 1,000 | | | | 1,206,710 | |
| | |
Monongalia County Building Commission, WV, (Monongalia Health System Obligated Group), 5.00%, 7/1/23 | | | 400 | | | | 430,812 | |
| | |
Monongalia County Building Commission, WV, (Monongalia Health System Obligated Group), 5.00%, 7/1/24 | | | 500 | | | | 552,655 | |
| | |
Monongalia County Building Commission, WV, (Monongalia Health System Obligated Group), 5.00%, 7/1/28 | | | 1,340 | | | | 1,502,663 | |
| | |
Monongalia County Building Commission, WV, (Monongalia Health System Obligated Group), 5.00%, 7/1/29 | | | 775 | | | | 865,419 | |
| | |
Montgomery County, OH, (Kettering Health Network Obligated Group), 5.00%, 8/1/32(2) | | | 275 | | | | 371,775 | |
| | |
Montgomery County, OH, (Kettering Health Network Obligated Group), 5.00%, 8/1/33(2) | | | 300 | | | | 403,134 | |
| | |
New Hampshire Health and Education Facilities Authority, (Dartmouth-Hitchcock Obligated Group), 5.00%, 8/1/25 | | | 400 | | | | 477,992 | |
| | |
New Hampshire Health and Education Facilities Authority, (Dartmouth-Hitchcock Obligated Group), 5.00%, 8/1/28 | | | 500 | | | | 634,695 | |
| | |
New Hampshire Health and Education Facilities Authority, (Dartmouth-Hitchcock Obligated Group), 5.00%, 8/1/29 | | | 500 | | | | 629,825 | |
| | |
New Jersey Health Care Facilities Financing Authority, (Princeton HealthCare System), 5.00%, 7/1/25 | | | 1,000 | | | | 1,205,600 | |
| | |
New Jersey Health Care Facilities Financing Authority, (Princeton HealthCare System), 5.00%, 7/1/27 | | | 700 | | | | 872,333 | |
| | |
New Jersey Health Care Facilities Financing Authority, (Princeton HealthCare System), 5.00%, 7/1/28 | | | 700 | | | | 870,786 | |
| | | | |
| | 20 | | See Notes to Financial Statements. |
5-to-15 Year Laddered Municipal Bond Portfolio
January 31, 2021
Portfolio of Investments — continued
| | | | | | | | |
| Security | | Principal
Amount
(000’s omitted) | | | Value | |
|
| Hospital (continued) | |
| | |
New Jersey Health Care Facilities Financing Authority, (Princeton HealthCare System), 5.00%, 7/1/30 | | $ | 520 | | | $ | 643,854 | |
| | |
New Jersey Health Care Facilities Financing Authority, (Princeton HealthCare System), 5.00%, 7/1/31 | | | 700 | | | | 864,514 | |
| | |
Norman Regional Hospital Authority, OK, 5.00%, 9/1/25 | | | 1,000 | | | | 1,169,260 | |
| | |
Oregon Facilities Authority, (Samaritan Health Services), 5.00%, 10/1/32 | | | 750 | | | | 899,625 | |
| | |
Pennsylvania Higher Educational Facilities Authority, (University of Pennsylvania Health System), 5.00%, 8/15/33 | | | 2,250 | | | | 2,966,535 | |
| | |
Public Finance Authority, WI, (Renown Regional Medical Center), 4.00%, 6/1/35 | | | 795 | | | | 966,458 | |
| | |
Public Finance Authority, WI, (Renown Regional Medical Center), 5.00%, 6/1/34 | | | 1,320 | | | | 1,737,292 | |
| | |
Public Finance Authority, WI, (Renown Regional Medical Center), 5.00%, 6/1/36 | | | 2,310 | | | | 3,021,272 | |
| | |
Richmond County Hospital Authority, GA, (University Health Services, Inc.), 5.00%, 1/1/28 | | | 1,000 | | | | 1,214,740 | |
| | |
Royal Oak Hospital Finance Authority, MI, (William Beaumont Hospital), 5.00%, 9/1/29 | | | 250 | | | | 283,365 | |
| | |
Southcentral Pennsylvania General Authority, (Hanover Hospital, Inc.), 4.00%, 12/1/30 | | | 150 | | | | 167,435 | |
| | |
Southcentral Pennsylvania General Authority, (Hanover Hospital, Inc.), 5.00%, 12/1/24 | | | 300 | | | | 349,677 | |
| | |
St. Paul Housing and Redevelopment Authority, MN, (Fairview Health Services), 5.00%, 11/15/25 | | | 500 | | | | 604,480 | |
| | |
St. Paul Housing and Redevelopment Authority, MN, (HealthPartners Obligated Group), 5.00%, 7/1/30 | | | 625 | | | | 737,987 | |
| | |
University of Kansas Hospital Authority, (KU Health System), 5.00%, 9/1/27 | | | 1,655 | | | | 1,997,088 | |
| | |
Utah County, UT, (IHC Health Services, Inc.), 5.00% to 8/1/26 (Put Date), 5/15/60 | | | 3,500 | | | | 4,354,420 | |
| | |
Vermont Educational and Health Buildings Financing Agency, (University of Vermont Medical Center), 5.00%, 12/1/25 | | | 335 | | | | 406,512 | |
| | |
Vermont Educational and Health Buildings Financing Agency, (University of Vermont Medical Center), 5.00%, 12/1/26 | | | 300 | | | | 368,916 | |
| | |
Vermont Educational and Health Buildings Financing Agency, (University of Vermont Medical Center), 5.00%, 12/1/27 | | | 205 | | | | 250,742 | |
| | |
Vermont Educational and Health Buildings Financing Agency, (University of Vermont Medical Center), 5.00%, 12/1/28 | | | 500 | | | | 608,575 | |
| | |
Vermont Educational and Health Buildings Financing Agency, (University of Vermont Medical Center), 5.00%, 12/1/30 | | | 400 | | | | 482,240 | |
| | |
Vermont Educational and Health Buildings Financing Agency, (University of Vermont Medical Center), 5.00%, 12/1/31 | | | 300 | | | | 360,573 | |
| | |
Washington Health Care Facilities Authority, (Overlake Hospital Medical Center), 5.00%, 7/1/27 | | | 1,575 | | | | 1,974,467 | |
| | |
Wisconsin Health and Educational Facilities Authority, (Agnesian HealthCare, Inc.), 5.00%, 7/1/26 | | | 400 | | | | 492,324 | |
| | |
| | | | | | | $ | 120,052,431 | |
| | | | | | | | |
| Security | | Principal
Amount
(000’s omitted) | | | Value | |
|
| Housing — 1.7% | |
| | |
Connecticut Housing Finance Authority, 3.60%, 11/15/30 | | $ | 145 | | | $ | 155,700 | |
| | |
Georgia Housing & Finance Authority, 3.65%, 12/1/32 | | | 1,000 | | | | 1,097,690 | |
| | |
Iowa Finance Authority, SFMR, (FHLMC), (FNMA), (GNMA), 1.40%, 7/1/30(2) | | | 300 | | | | 301,548 | |
| | |
Iowa Finance Authority, SFMR, (FHLMC), (FNMA), (GNMA), 1.50%, 1/1/31(2) | | | 300 | | | | 301,794 | |
| | |
Iowa Finance Authority, SFMR, (FHLMC), (FNMA), (GNMA), 1.60%, 7/1/31(2) | | | 300 | | | | 301,734 | |
| | |
Minnesota Housing Finance Agency, (FHLMC), (FNMA), (GNMA), 2.30%, 7/1/21 | | | 750 | | | | 755,070 | |
| | |
Minnesota Housing Finance Agency, 2019 Series A, 4.00%, 8/1/34 | | | 295 | | | | 359,339 | |
| | |
Minnesota Housing Finance Agency, 2019 Series A, 4.00%, 8/1/35 | | | 440 | | | | 532,910 | |
| | |
Minnesota Housing Finance Agency, 2019 Series C, 4.00%, 8/1/33 | | | 525 | | | | 642,852 | |
| | |
Minnesota Housing Finance Agency, 2019 Series C, 4.00%, 8/1/34 | | | 240 | | | | 292,344 | |
| | |
Minnesota Housing Finance Agency, 2019 Series C, 4.00%, 8/1/35 | | | 285 | | | | 345,181 | |
| | |
New York City Housing Development Corp., NY, 2.65%, 11/1/27 | | | 870 | | | | 938,669 | |
| | |
New York City Housing Development Corp., NY, 2.80%, 5/1/29 | | | 655 | | | | 704,721 | |
| | |
New York City Housing Development Corp., NY, 2.85%, 11/1/29 | | | 300 | | | | 322,656 | |
| | |
New York Housing Finance Agency, (FHLMC), (FNMA), (GNMA), 2.20%, 5/1/25 | | | 190 | | | | 202,219 | |
| | |
New York Housing Finance Agency, (FHLMC), (FNMA), (GNMA), 2.25%, 11/1/25 | | | 225 | | | | 241,508 | |
| | |
New York Housing Finance Agency, (FHLMC), (FNMA), (GNMA), 2.40%, 11/1/26 | | | 225 | | | | 245,538 | |
| | |
New York Housing Finance Agency, (FHLMC), (FNMA), (GNMA), 2.50%, 11/1/27 | | | 140 | | | | 151,816 | |
| | |
New York Housing Finance Agency, (FHLMC), (FNMA), (GNMA), 2.60%, 5/1/28 | | | 110 | | | | 119,558 | |
| | |
New York Mortgage Agency, 2.30%, 10/1/30 | | | 1,000 | | | | 1,066,960 | |
| | |
New York Mortgage Agency, 3.65%, 4/1/32 | | | 1,000 | | | | 1,109,200 | |
| | |
Seattle Housing Authority, WA, 2.75%, 12/1/24 | | | 480 | | | | 518,098 | |
| | |
Seattle Housing Authority, WA, 2.875%, 12/1/25 | | | 900 | | | | 993,303 | |
| | |
Seattle Housing Authority, WA, 3.00%, 12/1/26 | | | 920 | | | | 1,032,672 | |
| | |
Tennessee Housing Development Agency, 2.80%, 7/1/26 | | | 250 | | | | 275,965 | |
| | |
Vermont Housing Finance Agency, (FHLMC), (FNMA), (GNMA), 3.85%, 11/1/33 | | | 1,515 | | | | 1,714,056 | |
| | |
Virginia Housing Development Authority, 2.55%, 5/1/27 | | | 630 | | | | 673,753 | |
| | |
Washington Housing Finance Commission, 2.25%, 6/1/25 | | | 105 | | | | 111,864 | |
| | |
Washington Housing Finance Commission, 2.30%, 12/1/25 | | | 130 | | | | 139,675 | |
| | |
Washington Housing Finance Commission, 2.40%, 6/1/26 | | | 105 | | | | 113,079 | |
| | |
| | | | | | | $ | 15,761,472 | |
| | | | |
| | 21 | | See Notes to Financial Statements. |
5-to-15 Year Laddered Municipal Bond Portfolio
January 31, 2021
Portfolio of Investments — continued
| | | | | | | | |
| Security | | Principal
Amount
(000’s omitted) | | | Value | |
|
| Insured – Education — 0.4% | |
| | |
Northern Arizona University, (BAM), 5.00%, 6/1/31 | | $ | 1,100 | | | $ | 1,463,561 | |
| | |
Patterson Joint Unified School District, CA, (Election 2018), (BAM), 5.00%, 8/1/28 | | | 1,065 | | | | 1,315,839 | |
| | |
Patterson Joint Unified School District, CA, (Election 2018), (BAM), 5.00%, 8/1/29 | | | 1,000 | | | | 1,233,090 | |
| | |
| | | | | | | $ | 4,012,490 | |
|
| Insured – Escrowed / Prerefunded — 0.3% | |
| | |
Albertville, AL, (BAM), Prerefunded to 6/1/22, 4.00%, 6/1/28 | | $ | 1,130 | | | $ | 1,187,031 | |
| | |
Albertville, AL, (BAM), Series A, Prerefunded to 6/1/22, 4.00%, 6/1/30 | | | 1,505 | | | | 1,580,957 | |
| | |
New Britain, CT, (BAM), Escrowed to Maturity, 5.00%, 3/1/25 | | | 100 | | | | 119,137 | |
| | |
| | | | | | | $ | 2,887,125 | |
|
| Insured – General Obligations — 0.6% | |
| | |
Fort Bend County Municipal Utility District No. 58, TX, (BAM), 3.00%, 4/1/25(2) | | $ | 300 | | | $ | 330,669 | |
| | |
Fort Bend County Municipal Utility District No. 58, TX, (BAM), 3.00%, 4/1/26(2) | | | 435 | | | | 486,856 | |
| | |
Fort Bend County Municipal Utility District No. 58, TX, (BAM), 3.00%, 4/1/30(2) | | | 725 | | | | 824,890 | |
| | |
Fort Bend County Municipal Utility District No. 58, TX, (BAM), 3.00%, 4/1/32(2) | | | 360 | | | | 405,522 | |
| | |
New Britain, CT, (BAM), 5.00%, 3/1/25 | | | 135 | | | | 159,227 | |
| | |
New Britain, CT, (BAM), Escrowed to Maturity, 5.00%, 3/1/25 | | | 5 | | | | 5,946 | |
| | |
Ogle and Winnebago Counties Community Unit School District No. 223, IL, (BAM), 4.00%, 12/1/25 | | | 470 | | | | 532,158 | |
| | |
Pocono Mountain School District, PA, (AGM), 4.00%, 9/1/27 | | | 690 | | | | 815,766 | |
| | |
Yonkers, NY, (BAM), Series 2019A, 5.00%, 5/1/31 | | | 1,000 | | | | 1,326,070 | |
| | |
Yonkers, NY, (BAM), Series 2019B, 5.00%, 5/1/31 | | | 825 | | | | 1,094,008 | |
| | |
| | | | | | | $ | 5,981,112 | |
|
| Insured – Lease Revenue / Certificates of Participation — 0.7% | |
| | |
Biloxi Public School District, MS, (BAM), 5.00%, 4/1/25 | | $ | 1,350 | | | $ | 1,589,666 | |
| | |
Biloxi Public School District, MS, (BAM), 5.00%, 4/1/29 | | | 1,235 | | | | 1,480,061 | |
| | |
Clermont County Port Authority, OH, (West Clermont Local School District), (BAM), 5.00%, 12/1/26 | | | 250 | | | | 300,848 | |
| | |
Clermont County Port Authority, OH, (West Clermont Local School District), (BAM), 5.00%, 12/1/29 | | | 100 | | | | 119,813 | |
| | |
Highlands County School Board, FL, (BAM), 5.00%, 3/1/26 | | | 400 | | | | 470,540 | |
| | |
Highlands County School Board, FL, (BAM), 5.00%, 3/1/27 | | | 200 | | | | 234,740 | |
| | |
Pasco County School Board, FL, (BAM), 5.00%, 8/1/25 | | | 305 | | | | 365,820 | |
| | |
Pasco County School Board, FL, (BAM), 5.00%, 8/1/26 | | | 355 | | | | 438,613 | |
| | |
Pasco County School Board, FL, (BAM), 5.00%, 8/1/27 | | | 605 | | | | 744,549 | |
| | |
Pasco County School Board, FL, (BAM), 5.00%, 8/1/29 | | | 310 | | | | 379,071 | |
| | |
| | | | | | | $ | 6,123,721 | |
| | | | | | | | |
| Security | | Principal
Amount
(000’s omitted) | | | Value | |
|
| Insured – Other Revenue — 0.5% | |
| | |
New York Dormitory Authority, School Districts Revenue Bond Financing Program, (AGM), 5.00%, 10/1/33 | | $ | 1,250 | | | $ | 1,600,950 | |
| | |
New York Dormitory Authority, School Districts Revenue Bond Financing Program, (AGM), 5.00%, 10/1/34 | | | 1,250 | | | | 1,595,988 | |
| | |
New York Dormitory Authority, School Districts Revenue Bond Financing Program, (AGM), 5.00%, 10/1/35 | | | 1,000 | | | | 1,272,580 | |
| | |
| | | | | | | $ | 4,469,518 | |
|
| Insured – Special Tax Revenue — 0.1% | |
| | |
Successor Agency to Yuba City Redevelopment Agency, CA, (AGM), 5.00%, 9/1/25 | | $ | 420 | | | $ | 506,927 | |
| | |
| | | | | | | $ | 506,927 | |
|
| Insured – Transportation — 1.4% | |
| | |
New Brunswick Parking Authority, NJ, (BAM), 5.00%, 9/1/25 | | $ | 500 | | | $ | 591,005 | |
| | |
New Brunswick Parking Authority, NJ, (BAM), 5.00%, 9/1/26 | | | 320 | | | | 376,352 | |
| | |
New Brunswick Parking Authority, NJ, (BAM), 5.00%, 9/1/27 | | | 375 | | | | 439,755 | |
| | |
New Orleans Aviation Board, LA, (AGM), 5.00%, 1/1/30 | | | 1,000 | | | | 1,274,470 | |
| | |
New Orleans Aviation Board, LA, (AGM), 5.00%, 1/1/31 | | | 1,250 | | | | 1,584,975 | |
| | |
New Orleans Aviation Board, LA, (AGM), 5.00%, 1/1/32 | | | 1,650 | | | | 2,082,795 | |
| | |
New Orleans Aviation Board, LA, (AGM), 5.00%, 1/1/33 | | | 2,450 | | | | 3,078,891 | |
| | |
New Orleans Aviation Board, LA, (AGM), 5.00%, 1/1/34 | | | 2,485 | | | | 3,112,810 | |
| | |
| | | | | | | $ | 12,541,053 | |
|
| Insured – Water and Sewer — 0.1% | |
| | |
Gulf Coast Waste Disposal Authority, TX, (AGM), 5.00%, 10/1/30 | | $ | 250 | | | $ | 300,588 | |
| | |
Western Riverside Water and Wastewater Financing Authority, CA, (AGM), 4.00%, 9/1/28(2) | | | 250 | | | | 308,292 | |
| | |
| | | | | | | $ | 608,880 | |
|
| Lease Revenue / Certificates of Participation — 5.0% | |
| | |
Adams County, CO, Certificates of Participation, 4.00%, 12/1/28 | | $ | 1,000 | | | $ | 1,145,330 | |
| | |
Aspen Fire Protection District, CO, 4.00%, 12/1/29 | | | 150 | | | | 186,261 | |
| | |
Aspen Fire Protection District, CO, 4.00%, 12/1/30 | | | 235 | | | | 290,274 | |
| | |
Aspen Fire Protection District, CO, 4.00%, 12/1/31 | | | 250 | | | | 306,125 | |
| | |
Aspen Fire Protection District, CO, 4.00%, 12/1/32 | | | 205 | | | | 249,626 | |
| | |
Broward County School Board, FL, 5.00%, 7/1/25 | | | 500 | | | | 598,665 | |
| | |
Broward County School Board, FL, 5.00%, 7/1/27 | | | 500 | | | | 608,855 | |
| | |
Broward County School Board, FL, 5.00%, 7/1/29 | | | 500 | | | | 605,025 | |
| | |
California Public Works Board, 5.00%, 11/1/29 | | | 1,000 | | | | 1,257,000 | |
| | |
Canadian County Educational Facilities Authority, OK, (Mustang Public Schools), 5.00%, 9/1/26 | | | 500 | | | | 621,385 | |
| | | | |
| | 22 | | See Notes to Financial Statements. |
5-to-15 Year Laddered Municipal Bond Portfolio
January 31, 2021
Portfolio of Investments — continued
| | | | | | | | |
| Security | | Principal
Amount
(000’s omitted) | | | Value | |
|
| Lease Revenue / Certificates of Participation (continued) | |
| | |
Colorado Department of Transportation, 5.00%, 6/15/30 | | $ | 350 | | | $ | 428,365 | |
| | |
Colorado Department of Transportation, 5.00%, 6/15/31 | | | 310 | | | | 377,949 | |
| | |
Commonwealth Financing Authority, PA, Tobacco Master Settlement Payment Revenue, 5.00%, 6/1/25 | | | 500 | | | | 596,405 | |
| | |
Commonwealth Financing Authority, PA, Tobacco Master Settlement Payment Revenue, 5.00%, 6/1/29 | | | 3,000 | | | | 3,855,570 | |
| | |
Commonwealth Financing Authority, PA, Tobacco Master Settlement Payment Revenue, 5.00%, 6/1/30 | | | 3,000 | | | | 3,830,040 | |
| | |
Eagle County, CO, Certificates of Participation, 5.00%, 12/1/26 | | | 200 | | | | 243,442 | |
| | |
Fountain Valley Public Financing Authority, CA, 4.00%, 11/1/25 | | | 570 | | | | 668,251 | |
| | |
Fountain Valley Public Financing Authority, CA, 4.00%, 11/1/26 | | | 595 | | | | 704,308 | |
| | |
Fountain Valley Public Financing Authority, CA, 4.00%, 11/1/27 | | | 620 | | | | 729,926 | |
| | |
Fountain Valley Public Financing Authority, CA, 4.00%, 11/1/28 | | | 645 | | | | 755,598 | |
| | |
Georgia Municipal Association, Inc., Certificates of Participation, (Atlanta Public Safety), 5.00%, 12/1/28 | | | 410 | | | | 528,740 | |
| | |
Indiana Finance Authority, (Stadium Project), (SPA: U.S. Bank, N.A.), 0.01%, 2/1/35(3) | | | 4,900 | | | | 4,900,000 | |
| | |
Lee County School Board, FL, Certificates of Participation, 5.00%, 8/1/32 | | | 1,495 | | | | 1,823,601 | |
| | |
Oklahoma County Finance Authority, OK, (Deer Creek Public Schools), 5.00%, 12/1/25 | | | 1,405 | | | | 1,706,794 | |
| | |
Oklahoma County Finance Authority, OK, (Deer Creek Public Schools), 5.00%, 12/1/26 | | | 2,000 | | | | 2,418,460 | |
| | |
Oklahoma County Finance Authority, OK, (Midwest City-Del City Public Schools), 5.00%, 10/1/25 | | | 1,000 | | | | 1,207,990 | |
| | |
Oklahoma County Finance Authority, OK, (Midwest City-Del City Public Schools), 5.00%, 10/1/26 | | | 1,000 | | | | 1,246,340 | |
| | |
Orange County School Board, FL, 5.00%, 8/1/32 | | | 1,935 | | | | 2,305,649 | |
| | |
Palm Beach County School Board, FL, 5.00%, 8/1/31 | | | 4,000 | | | | 4,752,480 | |
| | |
Pennington County, SD, Certificates of Participation, 5.00%, 6/1/27 | | | 1,300 | | | | 1,548,807 | |
| | |
Plymouth Intermediate District No. 287, MN, Certificates of Participation, 5.00%, 2/1/30 | | | 385 | | | | 473,523 | |
| | |
Public Finance Authority, WI, (KU Campus Development Corp.), 5.00%, 3/1/29 | | | 500 | | | | 600,110 | |
| | |
Riverside County Public Financing Authority, CA, 5.00%, 11/1/27 | | | 850 | | | | 1,032,487 | |
| | |
Riverside County Public Financing Authority, CA, 5.00%, 11/1/28 | | | 950 | | | | 1,152,949 | |
| | |
South Dakota Building Authority, 5.00%, 6/1/26 | | | 500 | | | | 620,170 | |
| | |
Virginia Public Building Authority, 4.00%, 8/1/35 | | | 1,140 | | | | 1,409,553 | |
| | |
| | | | | | | $ | 45,786,053 | |
| | | | | | | | |
| Security | | Principal
Amount
(000’s omitted) | | | Value | |
|
| Other Revenue — 8.7% | |
| | |
Bexar County, TX, Combination Tax and Revenue Certificates of Obligation, 4.00%, 6/15/34 | | $ | 905 | | | $ | 1,080,832 | |
| | |
Bexar County, TX, Motor Vehicle Rental Tax Revenue, 4.00%, 8/15/33 | | | 690 | | | | 803,719 | |
| | |
Bexar County, TX, Motor Vehicle Rental Tax Revenue, 4.00%, 8/15/34 | | | 810 | | | | 941,009 | |
| | |
Bexar County, TX, Motor Vehicle Rental Tax Revenue, 4.00%, 8/15/35 | | | 510 | | | | 590,998 | |
| | |
District of Columbia, (National Public Radio, Inc.), Prerefunded to 4/1/26, 5.00%, 4/1/28 | | | 1,000 | | | | 1,239,490 | |
| | |
District of Columbia, (National Public Radio, Inc.), Prerefunded to 4/1/26, 5.00%, 4/1/29 | | | 1,000 | | | | 1,239,490 | |
| | |
Fort Myers, FL, Capital Improvement Revenue, 5.00%, 12/1/32 | | | 825 | | | | 992,368 | |
| | |
Fort Myers, FL, Capital Improvement Revenue, 5.00%, 12/1/33 | | | 640 | | | | 767,808 | |
| | |
Fort Myers, FL, Capital Improvement Revenue, 5.00%, 12/1/34 | | | 510 | | | | 610,776 | |
| | |
Hyland Hills Park & Recreation District, CO, 5.00%, 12/15/26 | | | 150 | | | | 189,513 | |
| | |
Kentucky Public Energy Authority, Gas Supply Revenue, 4.00%, 7/1/24 | | | 5,000 | | | | 5,597,950 | |
| | |
Kentucky Public Energy Authority, Gas Supply Revenue, 4.00% to 6/1/25
(Put Date), 12/1/49 | | | 5,000 | | | | 5,712,050 | |
| | |
Kentucky Public Energy Authority, Gas Supply Revenue, 4.00% to 2/1/28 (Put Date), 2/1/50 | | | 19,000 | | | | 22,839,520 | |
| | |
Lancaster Port Authority, OH, Gas Supply Revenue, (Liq: Royal Bank of Canada), 5.00% to 2/1/25 (Put Date), 8/1/49 | | | 5,000 | | | | 5,884,300 | |
| | |
Louisiana Local Government Environmental Facilities and Community Development Authority, (Bossier City), 5.00%, 12/1/32 | | | 2,355 | | | | 3,029,284 | |
| | |
Louisiana Local Government Environmental Facilities and Community Development Authority, (Bossier City), 5.00%, 12/1/34 | | | 2,425 | | | | 3,100,750 | |
| | |
Louisiana Local Government Environmental Facilities and Community Development Authority, (Jefferson Parish), 5.00%, 4/1/27 | | | 500 | | | | 618,270 | |
| | |
Louisiana Local Government Environmental Facilities and Community Development Authority, (Jefferson Parish), 5.00%, 4/1/29 | | | 275 | | | | 337,332 | |
| | |
Mississippi Development Bank, Special Obligation Bond, (East Mississippi Correctional Facility), 5.00%, 8/1/25 | | | 1,000 | | | | 1,183,250 | |
| | |
Mississippi Development Bank, Special Obligation Bond, (Jackson Public School District), 5.00%, 4/1/25 | | | 1,270 | | | | 1,498,333 | |
| | |
New York City Cultural Resources Trust, NY, (Carnegie Hall), 5.00%, 12/1/27 | | | 200 | | | | 250,218 | |
| | |
New York City Cultural Resources Trust, NY, (Carnegie Hall), 5.00%, 12/1/28 | | | 250 | | | | 318,925 | |
| | |
New York City Cultural Resources Trust, NY, (Carnegie Hall), 5.00%, 12/1/29 | | | 325 | | | | 421,005 | |
| | | | |
| | 23 | | See Notes to Financial Statements. |
5-to-15 Year Laddered Municipal Bond Portfolio
January 31, 2021
Portfolio of Investments — continued
| | | | | | | | |
| Security | | Principal
Amount
(000’s omitted) | | | Value | |
|
| Other Revenue (continued) | |
| | |
New York City Cultural Resources Trust, NY, (Carnegie Hall), 5.00%, 12/1/31 | | $ | 250 | | | $ | 322,578 | |
| | |
New York City Cultural Resources Trust, NY, (Carnegie Hall), 5.00%, 12/1/32 | | | 550 | | | | 705,832 | |
| | |
New York City Cultural Resources Trust, NY, (Carnegie Hall), 5.00%, 12/1/33 | | | 200 | | | | 255,614 | |
| | |
New York City Cultural Resources Trust, NY, (Carnegie Hall), 5.00%, 12/1/34 | | | 300 | | | | 382,473 | |
| | |
New York City Cultural Resources Trust, NY, (Carnegie Hall), 5.00%, 12/1/35 | | | 700 | | | | 889,630 | |
| | |
Rhode Island Health and Educational Building Corp., (Barrington), 5.00%, 5/15/28 | | | 1,060 | | | | 1,348,606 | |
| | |
San Diego Association of Governments, CA, (Mid-Coast Corridor Transit), Green Bonds, 1.80%, 11/15/27 | | | 1,000 | | | | 1,044,230 | |
| | |
Tennessee Energy Acquisition Corp., Gas Project Revenue, 4.00% to 11/1/25
(Put Date), 11/1/49 | | | 5,000 | | | | 5,768,350 | |
| | |
Texas Municipal Gas Acquisition and Supply Corp. III, Gas Supply Revenue, 5.00%, 12/15/26(2) | | | 1,000 | | | | 1,236,650 | |
| | |
Texas Municipal Gas Acquisition and Supply Corp. III, Gas Supply Revenue, 5.00%, 12/15/31(2) | | | 2,750 | | | | 3,735,187 | |
| | |
Wisconsin, Environmental Improvement Fund Revenue, 5.00%, 6/1/31 | | | 2,500 | | | | 2,997,475 | |
| | |
Wisconsin, Environmental Improvement Fund Revenue, 5.00%, 6/1/32 | | | 1,000 | | | | 1,198,040 | |
| | |
| | | | | | | $ | 79,131,855 | |
|
| Senior Living / Life Care — 2.0% | |
| | |
Atlantic Beach, FL, (Fleet Landing), 3.00%, 11/15/23 | | $ | 2,500 | | | $ | 2,501,325 | |
| | |
Baltimore County, MD, (Riderwood Village, Inc.), 4.00%, 1/1/30 | | | 1,655 | | | | 1,916,606 | |
| | |
Baltimore County, MD, (Riderwood Village, Inc.), 4.00%, 1/1/31 | | | 250 | | | | 288,672 | |
| | |
Baltimore County, MD, (Riderwood Village, Inc.), 4.00%, 1/1/32 | | | 350 | | | | 402,972 | |
| | |
Baltimore County, MD, (Riderwood Village, Inc.), 4.00%, 1/1/33 | | | 600 | | | | 688,458 | |
| | |
Baltimore County, MD, (Riderwood Village, Inc.), 4.00%, 1/1/34 | | | 685 | | | | 782,496 | |
| | |
Baltimore County, MD, (Riderwood Village, Inc.), 4.00%, 1/1/35 | | | 615 | | | | 700,227 | |
| | |
Bexar County Health Facilities Development Corp., TX, (Army Retirement Residence Foundation), 5.00%, 7/15/33 | | | 875 | | | | 952,989 | |
| | |
Buffalo and Erie County Industrial Land Development Corp., NY, (Orchard Park CCRC, Inc.), 5.00%, 11/15/28 | | | 50 | | | | 56,229 | |
| | |
Buffalo and Erie County Industrial Land Development Corp., NY, (Orchard Park CCRC, Inc.), 5.00%, 11/15/30 | | | 910 | | | | 1,017,653 | |
| | |
California Statewide Communities Development Authority, (American Baptist Homes of the West), 5.00%, 10/1/25 | | | 100 | | | | 117,362 | |
| | | | | | | | |
| Security | | Principal
Amount
(000’s omitted) | | | Value | |
|
| Senior Living / Life Care (continued) | |
| | |
Cumberland County Municipal Authority, PA, (Diakon Lutheran Social Ministries), 2.50%, 1/1/26 | | $ | 640 | | | $ | 673,005 | |
| | |
Cumberland County Municipal Authority, PA, (Diakon Lutheran Social Ministries), 5.00%, 1/1/27 | | | 1,035 | | | | 1,207,576 | |
| | |
East Hempfield Township Industrial Development Authority, PA, (Willow Valley Communities), 5.00%, 12/1/21 | | | 250 | | | | 258,607 | |
| | |
East Hempfield Township Industrial Development Authority, PA, (Willow Valley Communities), 5.00%, 12/1/31 | | | 250 | | | | 287,967 | |
| | |
Illinois Finance Authority, (Presbyterian Homes Obligated Group), 5.00%, 5/1/22 | | | 225 | | | | 236,198 | |
| | |
Missouri Health and Educational Facilities Authority, (Lutheran Senior Services), 3.00%, 2/1/27 | | | 1,000 | | | | 1,073,960 | |
| | |
Missouri Health and Educational Facilities Authority, (Lutheran Senior Services), 5.00%, 2/1/23 | | | 600 | | | | 648,210 | |
| | |
Missouri Health and Educational Facilities Authority, (Lutheran Senior Services), 5.00%, 2/1/29 | | | 600 | | | | 694,476 | |
| | |
Missouri Health and Educational Facilities Authority, (Lutheran Senior Services), 5.00%, 2/1/30 | | | 200 | | | | 230,456 | |
| | |
Missouri Health and Educational Facilities Authority, (Lutheran Senior Services), 5.00%, 2/1/31 | | | 250 | | | | 287,422 | |
| | |
North Carolina Medical Care Commission, (United Methodist Retirement Homes), 5.00%, 10/1/24 | | | 150 | | | | 167,474 | |
| | |
North Carolina Medical Care Commission, (United Methodist Retirement Homes), 5.00%, 10/1/25 | | | 100 | | | | 111,481 | |
| | |
North Carolina Medical Care Commission, (United Methodist Retirement Homes), 5.00%, 10/1/26 | | | 1,100 | | | | 1,223,519 | |
| | |
North Carolina Medical Care Commission, (United Methodist Retirement Homes), 5.00%, 10/1/27 | | | 50 | | | | 55,531 | |
| | |
North Carolina Medical Care Commission, (United Methodist Retirement Homes), 5.00%, 10/1/29 | | | 125 | | | | 138,339 | |
| | |
North Carolina Medical Care Commission, (United Methodist Retirement Homes), 5.00%, 10/1/32 | | | 225 | | | | 247,698 | |
| | |
North Carolina Medical Care Commission, (United Methodist Retirement Homes), Series 2016A, 5.00%, 10/1/30 | | | 230 | | | | 265,703 | |
| | |
North Carolina Medical Care Commission, (United Methodist Retirement Homes), Series 2016A, 5.00%, 10/1/31 | | | 675 | | | | 777,438 | |
| | |
North Carolina Medical Care Commission, (United Methodist Retirement Homes), Series 2017A, 5.00%, 10/1/30 | | | 250 | | | | 275,982 | |
| | |
| | | | | | | $ | 18,286,031 | |
|
| Special Tax Revenue — 4.2% | |
| | |
Los Angeles County Metropolitan Transportation Authority, CA, Sales Tax Revenue, 5.00%, 6/1/32 | | $ | 500 | | | $ | 615,715 | |
| | |
Los Angeles County Metropolitan Transportation Authority, CA, Sales Tax Revenue, Green Bonds, 5.00%, 6/1/34 | | | 7,500 | | | | 9,494,850 | |
| | |
Miami-Dade County, FL, Special Obligation Bonds, 5.00%, 4/1/25 | | | 250 | | | | 298,708 | |
| | |
Miami-Dade County, FL, Special Obligation Bonds, 5.00%, 4/1/26 | | | 1,025 | | | | 1,266,664 | |
| | | | |
| | 24 | | See Notes to Financial Statements. |
5-to-15 Year Laddered Municipal Bond Portfolio
January 31, 2021
Portfolio of Investments — continued
| | | | | | | | |
| Security | | Principal
Amount
(000’s omitted) | | | Value | |
|
| Special Tax Revenue (continued) | |
| | |
Miami-Dade County, FL, Special Obligation Bonds, 5.00%, 4/1/29 | | $ | 900 | | | $ | 1,098,261 | |
| | |
Miami-Dade County, FL, Special Obligation Bonds, 5.00%, 4/1/30 | | | 950 | | | | 1,157,660 | |
| | |
Miami-Dade County, FL, Special Obligation Bonds, 5.00%, 4/1/31 | | | 895 | | | | 1,089,108 | |
| | |
Miami-Dade County, FL, Special Obligation Bonds, 5.00%, 4/1/32 | | | 735 | | | | 893,157 | |
| | |
Miami-Dade County, FL, Special Obligation Bonds, Prerefunded to 10/1/22, 5.00%, 10/1/32 | | | 950 | | | | 1,027,368 | |
| | |
New York City Transitional Finance Authority, NY, Future Tax Revenue, 4.00%, 5/1/36 | | | 2,000 | | | | 2,448,900 | |
| | |
New York City Transitional Finance Authority, NY, Future Tax Revenue, 5.00%, 8/1/33 | | | 1,190 | | | | 1,373,284 | |
| | |
New York Dormitory Authority, Personal Income Tax Revenue, 5.00%, 3/31/21 | | | 2,500 | | | | 2,520,500 | |
| | |
New York Dormitory Authority, Sales Tax Revenue, 5.00%, 3/15/32 | | | 1,800 | | | | 2,169,144 | |
| | |
New York Dormitory Authority, Sales Tax Revenue, 5.00%, 3/15/34 | | | 5,000 | | | | 6,139,800 | |
| | |
Queen Creek, AZ, Excise Tax and State Shared Revenue, 4.00%, 8/1/35 | | | 3,120 | | | | 3,873,418 | |
| | |
Queen Creek, AZ, Excise Tax and State Shared Revenue, 4.00%, 8/1/36 | | | 1,000 | | | | 1,236,890 | |
| | |
Successor Agency to San Mateo Redevelopment Agency, CA, 5.00%, 8/1/26 | | | 100 | | | | 118,645 | |
| | |
Successor Agency to San Mateo Redevelopment Agency, CA, 5.00%, 8/1/29 | | | 140 | | | | 163,892 | |
| | |
Tri-County Metropolitan Transportation District, OR, Payroll Tax Revenue, 5.00%, 9/1/32 | | | 1,000 | | | | 1,245,260 | |
| | |
| | | | | | | $ | 38,231,224 | |
|
| Transportation — 14.8% | |
| | |
Arizona Transportation Board, Highway Revenue, 5.00%, 7/1/27 | | $ | 2,005 | | | $ | 2,501,659 | |
| | |
Bay Area Toll Authority, CA, (San Francisco Bay Area), 2.95% to 4/1/26
(Put Date), 4/1/47 | | | 1,800 | | | | 2,000,898 | |
| | |
Central Florida Expressway Authority, 4.00%, 7/1/35 | | | 3,150 | | | | 3,606,246 | |
| | |
Central Texas Regional Mobility Authority, 4.00%, 1/1/34 | | | 200 | | | | 240,952 | |
| | |
Central Texas Regional Mobility Authority, 4.00%, 1/1/36 | | | 1,490 | | | | 1,783,366 | |
| | |
Central Texas Regional Mobility Authority, 5.00%, 1/1/25 | | | 2,000 | | | | 2,299,000 | |
| | |
Chicago, IL, (O’Hare International Airport), 4.00%, 1/1/35 | | | 5,000 | | | | 6,069,400 | |
| | |
Chicago, IL, (O’Hare International Airport), 4.00%, 1/1/36 | | | 3,500 | | | | 4,234,335 | |
| | |
Chicago, IL, (O’Hare International Airport), 5.00%, 1/1/26 | | | 1,000 | | | | 1,218,610 | |
| | |
Chicago, IL, (O’Hare International Airport), 5.00%, 1/1/28 | | | 150 | | | | 175,992 | |
| | |
Chicago, IL, (O’Hare International Airport), 5.00%, 1/1/29 | | | 150 | | | | 175,356 | |
| | |
Chicago, IL, (O’Hare International Airport), 5.00%, 1/1/30 | | | 500 | | | | 582,830 | |
| | | | | | | | |
| Security | | Principal
Amount
(000’s omitted) | | | Value | |
|
| Transportation (continued) | |
| | |
Chicago, IL, (O’Hare International Airport), 5.00%, 1/1/31 | | $ | 1,000 | | | $ | 1,162,710 | |
| | |
Chicago, IL, (O’Hare International Airport), 5.00%, 1/1/33 | | | 125 | | | | 144,709 | |
| | |
Chicago, IL, (O’Hare International Airport), 5.00%, 1/1/34 | | | 7,500 | | | | 9,759,975 | |
| | |
Chicago, IL, (O’Hare International Airport), 5.25%, 1/1/28 | | | 2,905 | | | | 3,666,691 | |
| | |
Chicago, IL, (O’Hare International Airport), 5.25%, 1/1/29 | | | 3,060 | | | | 3,864,046 | |
| | |
Chicago, IL, (O’Hare International Airport), 5.25%, 1/1/30 | | | 1,000 | | | | 1,248,880 | |
| | |
Chicago, IL, (O’Hare International Airport), 5.25%, 1/1/31 | | | 1,000 | | | | 1,245,310 | |
| | |
Chicago, IL, (O’Hare International Airport), 5.25%, 1/1/32 | | | 2,565 | | | | 3,185,140 | |
| | |
Clark County, NV, Highway Revenue, 5.00%, 7/1/33 | | | 840 | | | | 963,018 | |
| | |
Commonwealth Transportation Board, VA, 5.00%, 9/15/30 | | | 1,240 | | | | 1,541,940 | |
| | |
Denver City and County, CO, Airport System Revenue, 5.00%, 11/15/31 | | | 1,450 | | | | 1,798,493 | |
| | |
Fort Bend County, TX, Toll Road Revenue, 5.00%, 3/1/28 | | | 500 | | | | 589,730 | |
| | |
Fort Bend County, TX, Toll Road Revenue, 5.00%, 3/1/29 | | | 1,000 | | | | 1,176,350 | |
| | |
Fort Bend County, TX, Toll Road Revenue, 5.00%, 3/1/30 | | | 750 | | | | 879,285 | |
| | |
Hawaii, Highway Revenue, 5.00%, 1/1/31 | | | 805 | | | | 1,052,159 | |
| | |
Idaho Housing and Finance Association, Federal Highway Trust Fund, 5.00%, 7/15/25 | | | 650 | | | | 776,171 | |
| | |
Illinois Toll Highway Authority, 5.00%, 1/1/29 | | | 175 | | | | 211,363 | |
| | |
Illinois Toll Highway Authority, 5.00%, 12/1/32 | | | 350 | | | | 420,098 | |
| | |
Kentucky Turnpike Authority, 5.00%, 7/1/33 | | | 300 | | | | 328,944 | |
| | |
Massachusetts Department of Transportation, 5.00%, 1/1/30 | | | 4,860 | | | | 6,393,184 | |
| | |
Metropolitan Transportation Authority, NY, 5.00%, 11/15/41 | | | 415 | | | | 439,286 | |
| | |
Metropolitan Transportation Authority, NY, 5.25%, 11/15/30 | | | 500 | | | | 586,245 | |
| | |
Metropolitan Transportation Authority, NY, Green Bonds, 5.00%, 11/15/25 | | | 5,000 | | | | 5,868,350 | |
| | |
Metropolitan Transportation Authority, NY, Green Bonds, 5.00%, 11/15/26 | | | 5,815 | | | | 7,024,811 | |
| | |
Metropolitan Transportation Authority, NY, Series 2012D, 5.00%, 11/15/28 | | | 1,070 | | | | 1,141,230 | |
| | |
Metropolitan Transportation Authority, NY, Series 2015F, 5.00%, 11/15/28 | | | 640 | | | | 750,496 | |
| | |
New Orleans Aviation Board, LA, 5.00%, 1/1/28 | | | 150 | | | | 186,965 | |
| | |
New York Transportation Development Corp., (Terminal 4 John F. Kennedy International Airport), 5.00%, 12/1/28 | | | 1,200 | | | | 1,547,364 | |
| | |
New York Transportation Development Corp., (Terminal 4 John F. Kennedy International Airport), 5.00%, 12/1/29 | | | 500 | | | | 655,440 | |
| | |
New York Transportation Development Corp., (Terminal 4 John F. Kennedy International Airport), 5.00%, 12/1/30 | | | 1,000 | | | | 1,333,170 | |
| | |
New York Transportation Development Corp., (Terminal 4 John F. Kennedy International Airport), 5.00%, 12/1/31 | | | 600 | | | | 800,286 | |
| | |
North Carolina, Grant Anticipation Revenue Vehicle Bonds, 5.00%, 3/1/26 | | | 3,000 | | | | 3,701,070 | |
| | |
North Carolina, Grant Anticipation Revenue Vehicle Bonds, 5.00%, 3/1/29 | | | 550 | | | | 643,923 | |
| | |
North Carolina, Grant Anticipation Revenue Vehicle Bonds, 5.00%, 3/1/30 | | | 400 | | | | 466,068 | |
| | | | |
| | 25 | | See Notes to Financial Statements. |
5-to-15 Year Laddered Municipal Bond Portfolio
January 31, 2021
Portfolio of Investments — continued
| | | | | | | | |
| Security | | Principal
Amount
(000’s omitted) | | | Value | |
|
| Transportation (continued) | |
| | |
Pennsylvania Turnpike Commission, 5.00%, 12/1/34 | | $ | 250 | | | $ | 341,370 | |
| | |
Pennsylvania Turnpike Commission, 5.00%, 12/1/35 | | | 500 | | | | 680,370 | |
| | |
Pennsylvania Turnpike Commission, 5.00%, 12/1/36 | | | 1,165 | | | | 1,579,321 | |
| | |
Port Authority of New York and New Jersey, 4.00%, 7/15/36 | | | 1,605 | | | | 1,959,946 | |
| | |
Port Authority of New York and New Jersey, 5.00%, 9/1/34 | | | 3,595 | | | | 4,714,159 | |
| | |
Port of Seattle, WA, 5.00%, 3/1/25 | | | 150 | | | | 173,573 | |
| | |
Port of Seattle, WA, 5.00%, 3/1/27 | | | 250 | | | | 288,422 | |
| | |
Port of Seattle, WA, 5.00%, 3/1/29 | | | 250 | | | | 286,410 | |
| | |
Portland, ME, Airport Revenue, Green Bonds, 5.00%, 1/1/29 | | | 225 | | | | 281,923 | |
| | |
Portland, ME, Airport Revenue, Green Bonds, 5.00%, 1/1/31 | | | 370 | | | | 467,399 | |
| | |
Salt Lake City, UT, (Salt Lake City International Airport), 5.00%, 7/1/28 | | | 1,370 | | | | 1,744,243 | |
| | |
Salt Lake City, UT, (Salt Lake City International Airport), 5.00%, 7/1/31 | | | 300 | | | | 383,973 | |
| | |
Salt Lake City, UT, (Salt Lake City International Airport), 5.00%, 7/1/32 | | | 660 | | | | 841,018 | |
| | |
Salt Lake City, UT, (Salt Lake City International Airport), 5.00%, 7/1/33 | | | 600 | | | | 761,388 | |
| | |
Salt Lake City, UT, (Salt Lake City International Airport), 5.00%, 7/1/34 | | | 450 | | | | 569,488 | |
| | |
Texas Transportation Commission, (Central Texas Turnpike System), 0.00%, 8/1/34 | | | 1,000 | | | | 665,650 | |
| | |
Texas Transportation Commission, (Central Texas Turnpike System), 0.00%, 8/1/35 | | | 500 | | | | 315,120 | |
| | |
Triborough Bridge and Tunnel Authority, NY, 5.00%, 11/15/29 | | | 14,400 | | | | 18,188,352 | |
| | |
Wayne County Airport Authority, MI, (Detroit Metropolitan Wayne County Airport), 5.00%, 12/1/31 | | | 2,920 | | | | 3,759,354 | |
| | |
Wayne County Airport Authority, MI, (Detroit Metropolitan Wayne County Airport), 5.00%, 12/1/34 | | | 1,005 | | | | 1,275,616 | |
| | |
Wisconsin, Transportation Revenue, 5.00%, 7/1/31 | | | 3,450 | | | | 3,980,575 | |
| | |
Wisconsin, Transportation Revenue, 5.00%, 7/1/32 | | | 700 | | | | 807,135 | |
| | |
| | | | | | | $ | 134,506,349 | |
|
| Water and Sewer — 3.0% | |
| | |
Buffalo Municipal Water Finance Authority, NY, 5.00%, 7/1/25 | | $ | 300 | | | $ | 359,052 | |
| | |
Buffalo Municipal Water Finance Authority, NY, 5.00%, 7/1/29 | | | 115 | | | | 136,418 | |
| | |
Buffalo Municipal Water Finance Authority, NY, 5.00%, 7/1/30 | | | 100 | | | | 118,529 | |
| | |
Cherokee County Water and Sewerage Authority, GA, 5.00%, 8/1/28 | | | 1,250 | | | | 1,658,687 | |
| | |
Glendale, AZ, Water and Sewer Revenue, 5.00%, 7/1/28 | | | 1,500 | | | | 1,795,260 | |
| | |
Marin Public Financing Authority, CA, (Sausalito-Marin City Sanitary District), 4.00%, 4/1/32 | | | 575 | | | | 683,393 | |
| | |
McAllen, TX, Waterworks and Sewer System Revenue, 4.00%, 2/1/27 | | | 1,000 | | | | 1,160,330 | |
| | |
Memphis, TN, Sanitary Sewerage System Revenue, 4.00%, 10/1/32 | | | 1,895 | | | | 2,228,842 | |
| | | | | | | | |
| Security | | Principal
Amount
(000’s omitted) | | | Value | |
|
| Water and Sewer (continued) | |
| | |
Mesa, AZ, Utility Systems Revenue, 5.00%, 7/1/27 | | $ | 600 | | | $ | 745,344 | |
| | |
Mesa, AZ, Utility Systems Revenue, 5.00%, 7/1/29 | | | 500 | | | | 616,300 | |
| | |
Rapid City, SD, Water Revenue, 4.00%, 11/1/29 | | | 600 | | | | 684,198 | |
| | |
Rapid City, SD, Water Revenue, 4.00%, 11/1/30 | | | 670 | | | | 761,241 | |
| | |
Rapid City, SD, Water Revenue, 5.00%, 11/1/26 | | | 1,000 | | | | 1,218,900 | |
| | |
Rapid City, SD, Water Revenue, 5.00%, 11/1/27 | | | 515 | | | | 627,461 | |
| | |
Richmond, VA, Public Utility Revenue, 4.00%, 1/15/36 | | | 7,205 | | | | 8,946,593 | |
| | |
Spotsylvania County, VA, Water and Sewer System Revenue, 3.00%, 12/1/31 | | | 2,310 | | | | 2,777,313 | |
| | |
St. Joseph Industrial Development Authority, MO, (Sewerage System Improvements), 5.00%, 4/1/26 | | | 500 | | | | 594,780 | |
| | |
Western Riverside Water and Wastewater Financing Authority, CA, 4.00%, 9/1/26(2) | | | 435 | | | | 516,123 | |
| | |
Western Riverside Water and Wastewater Financing Authority, CA, 4.00%, 9/1/27(2) | | | 445 | | | | 539,336 | |
| | |
Wyoming, MI, Water Supply System Revenue, 5.00%, 6/1/27 | | | 505 | | | | 622,771 | |
| | |
Wyoming, MI, Water Supply System Revenue, 5.00%, 6/1/28 | | | 550 | | | | 675,988 | |
| | |
| | | | | | | $ | 27,466,859 | |
| |
Total Tax-Exempt Investments — 89.1%
(identified cost $751,494,120) | | | $ | 811,743,848 | |
| |
Other Assets, Less Liabilities — 10.9% | | | $ | 98,990,394 | |
| | |
Net Assets — 100.0% | | | | | | $ | 910,734,242 | |
The percentage shown for each investment category in the Portfolio of Investments is based on net assets.
At January 31, 2021, the concentration of the Portfolio’s investments in the various states and territories, determined as a percentage of net assets, is less than 10% individually.
The Portfolio invests primarily in debt securities issued by municipalities. The ability of the issuers of the debt securities to meet their obligations may be affected by economic developments in a specific industry or municipality. At January 31, 2021, 4.6% of total investments are backed by bond insurance of various financial institutions and financial guaranty assurance agencies. The aggregate percentage insured by an individual financial institution or financial guaranty assurance agency ranged from 2.2% to 2.4% of total investments.
| (1) | Floating-rate security. The stated interest rate represents the rate in effect at January 31, 2021. |
| (2) | When-issued security. |
| (3) | Variable rate demand obligation that may be tendered at par on any day for payment the same or next business day. The stated interest rate, which generally resets daily, is determined by the remarketing agent and represents the rate in effect at January 31, 2021. |
| | | | |
| | 26 | | See Notes to Financial Statements. |
5-to-15 Year Laddered Municipal Bond Portfolio
January 31, 2021
Portfolio of Investments — continued
Abbreviations:
| | | | |
| | |
| AGM | | – | | Assured Guaranty Municipal Corp. |
| | |
| BAM | | – | | Build America Mutual Assurance Co. |
| | |
| FHLMC | | – | | Federal Home Loan Mortgage Corp. |
| | |
| FNMA | | – | | Federal National Mortgage Association |
| | |
| GNMA | | – | | Government National Mortgage Association |
| | |
| Liq | | – | | Liquidity Provider |
| | |
| PSF | | – | | Permanent School Fund |
| | |
| SFMR | | – | | Single Family Mortgage Revenue |
| | |
| SIFMA | | – | | Securities Industry and Financial Markets Association Municipal Swap Index |
| | |
| SPA | | – | | Standby Bond Purchase Agreement |
| | | | |
| | 27 | | See Notes to Financial Statements. |
5-to-15 Year Laddered Municipal Bond Portfolio
January 31, 2021
Statement of Assets and Liabilities
| | | | |
| Assets | | January 31, 2021 | |
| |
Unaffiliated investments, at value (identified cost, $751,494,120) | | $ | 811,743,848 | |
| |
Cash | | | 96,691,143 | |
| |
Interest receivable | | | 8,012,787 | |
| |
Receivable for investments sold | | | 4,681,160 | |
| |
Receivable from affiliates | | | 10,518 | |
| |
Total assets | | $ | 921,139,456 | |
| |
| Liabilities | | | | |
| |
Payable for when-issued securities | | $ | 9,990,278 | |
| |
Payable to affiliate: | | | | |
| |
Investment adviser fee | | | 243,246 | |
| |
Accrued expenses | | | 171,690 | |
| |
Total liabilities | | $ | 10,405,214 | |
| |
Net Assets applicable to investors’ interest in Portfolio | | $ | 910,734,242 | |
| | | | |
| | 28 | | See Notes to Financial Statements. |
5-to-15 Year Laddered Municipal Bond Portfolio
January 31, 2021
Statement of Operations
| | | | |
| Investment Income | | Year Ended January 31, 2021 | |
| |
Interest | | $ | 18,119,964 | |
| |
Total investment income | | $ | 18,119,964 | |
|
| Expenses | |
| |
Investment adviser fee | | $ | 2,530,236 | |
| |
Trustees’ fees and expenses | | | 42,739 | |
| |
Custodian fee | | | 202,177 | |
| |
Legal and accounting services | | | 65,420 | |
| |
Miscellaneous | | | 26,970 | |
| |
Total expenses | | $ | 2,867,542 | |
| |
Deduct — | | | | |
| |
Allocation of expenses to affiliates | | $ | 100,091 | |
| |
Total expense reductions | | $ | 100,091 | |
| |
Net expenses | | $ | 2,767,451 | |
| |
Net investment income | | $ | 15,352,513 | |
|
| Realized and Unrealized Gain (Loss) | |
| |
Net realized gain (loss) — | | | | |
| |
Investment transactions | | $ | 4,325,390 | |
| |
Net realized gain | | $ | 4,325,390 | |
| |
Change in unrealized appreciation (depreciation) — | | | | |
| |
Investments | | $ | 17,011,685 | |
| |
Net change in unrealized appreciation (depreciation) | | $ | 17,011,685 | |
| |
Net realized and unrealized gain | | $ | 21,337,075 | |
| |
Net increase in net assets from operations | | $ | 36,689,588 | |
| | | | |
| | 29 | | See Notes to Financial Statements. |
5-to-15 Year Laddered Municipal Bond Portfolio
January 31, 2021
Statements of Changes in Net Assets
| | | | | | | | |
| | | Year Ended January 31, | |
| Increase (Decrease) in Net Assets | | 2021 | | | 2020 | |
| | |
From operations — | | | | | | | | |
| | |
Net investment income | | $ | 15,352,513 | | | $ | 14,483,904 | |
| | |
Net realized gain | | | 4,325,390 | | | | 3,670,755 | |
| | |
Net change in unrealized appreciation (depreciation) | | | 17,011,685 | | | | 31,795,434 | |
| | |
Net increase in net assets from operations | | $ | 36,689,588 | | | $ | 49,950,093 | |
| | |
Capital transactions — | | | | | | | | |
| | |
Contributions | | $ | 203,943,194 | | | $ | 100,910,579 | |
| | |
Withdrawals | | | (59,666,246 | ) | | | (34,118,862 | ) |
| | |
Portfolio transaction fee | | | 395,167 | | | | 202,332 | |
| | |
Net increase in net assets from capital transactions | | $ | 144,672,115 | | | $ | 66,994,049 | |
| | |
Net increase in net assets | | $ | 181,361,703 | | | $ | 116,944,142 | |
|
| Net Assets | |
| | |
At beginning of year | | $ | 729,372,539 | | | $ | 612,428,397 | |
| | |
At end of year | | $ | 910,734,242 | | | $ | 729,372,539 | |
| | | | |
| | 30 | | See Notes to Financial Statements. |
5-to-15 Year Laddered Municipal Bond Portfolio
January 31, 2021
Financial Highlights
| | | | | | | | | | | | | | | | | | | | |
| | | Year Ended January 31, | | | Period Ended
January 31, 2017(1) | |
| Ratios/Supplemental Data | | 2021 | | | 2020 | | | 2019 | | | 2018 | |
| | | | | |
Ratios (as a percentage of average daily net assets): | | | | | | | | | | | | | | | | | | | | |
| | | | | |
Expenses(2) | | | 0.35 | % | | | 0.35 | % | | | 0.35 | % | | | 0.35 | % | | | 0.35 | %(3) |
| | | | | |
Net investment income | | | 1.94 | % | | | 2.17 | % | | | 2.16 | % | | | 2.01 | % | | | 1.71 | %(3) |
| | | | | |
Portfolio Turnover | | | 51 | % | | | 28 | % | | | 78 | % | | | 35 | % | | | 30 | %(4) |
| | | | | |
Total Return(2) | | | 4.66 | % | | | 7.88 | % | | | 3.11 | % | | | 3.83 | % | | | (0.80 | )%(4) |
| | | | | |
Net assets, end of period (000’s omitted) | | $ | 910,734 | | | $ | 729,373 | | | $ | 612,428 | | | $ | 676,300 | | | $ | 502,104 | |
| (1) | For the period from the start of business, March 28, 2016, to January 31, 2017. |
| (2) | The investment adviser and sub-adviser reimbursed certain operating expenses (equal to 0.01%, 0.01%, 0.01%, 0.01% and 0.02% of average daily net assets for the years ended January 31, 2021, 2020, 2019 and 2018 and the period ended January 31, 2017, respectively). Absent this reimbursement, total return would be lower. |
| | | | |
| | 31 | | See Notes to Financial Statements. |
5-to-15 Year Laddered Municipal Bond Portfolio
January 31, 2021
Notes to Financial Statements
1 Significant Accounting Policies
5-to-15 Year Laddered Municipal Bond Portfolio (the Portfolio) is a Massachusetts business trust registered under the Investment Company Act of 1940, as amended (the 1940 Act), as a diversified, open-end management investment company. The Portfolio’s investment objective is to seek current income exempt from regular federal income tax. The Declaration of Trust permits the Trustees to issue interests in the Portfolio. At January 31, 2021, Parametric TABS 5-to-15 Year Laddered Municipal Bond Fund and Eaton Vance TABS 5-to-15 Year Laddered Municipal Bond NextShares held an interest of 99.2% and 0.8%, respectively, in the Portfolio.
The following is a summary of significant accounting policies of the Portfolio. The policies are in conformity with accounting principles generally accepted in the United States of America (U.S. GAAP). The Portfolio is an investment company and follows accounting and reporting guidance in the Financial Accounting Standards Board (FASB) Accounting Standards Codification Topic 946.
A Investment Valuation — The following methodologies are used to determine the market value or fair value of investments.
Debt Obligations. Debt obligations are generally valued on the basis of valuations provided by third party pricing services, as derived from such services’ pricing models. Inputs to the models may include, but are not limited to, reported trades, executable bid and ask prices, broker/dealer quotations, prices or yields of securities with similar characteristics, interest rates, anticipated prepayments, benchmark curves or information pertaining to the issuer, as well as industry and economic events. The pricing services may use a matrix approach, which considers information regarding securities with similar characteristics to determine the valuation for a security. Short-term debt obligations purchased with a remaining maturity of sixty days or less for which a valuation from a third party pricing service is not readily available may be valued at amortized cost, which approximates fair value.
Fair Valuation. Investments for which valuations or market quotations are not readily available or are deemed unreliable are valued at fair value using methods determined in good faith by or at the direction of the Trustees of the Portfolio in a manner that most fairly reflects the security’s “fair value”, which is the amount that the Portfolio might reasonably expect to receive for the security upon its current sale in the ordinary course. Each such determination is based on a consideration of relevant factors, which are likely to vary from one pricing context to another. These factors may include, but are not limited to, the type of security, the existence of any contractual restrictions on the security’s disposition, the price and extent of public trading in similar securities of the issuer or of comparable entities, quotations or relevant information obtained from broker/dealers or other market participants, information obtained from the issuer, analysts, and/or the appropriate stock exchange (for exchange-traded securities), an analysis of the entity’s financial statements, and an evaluation of the forces that influence the issuer and the market(s) in which the security is purchased and sold.
B Investment Transactions — Investment transactions for financial statement purposes are accounted for on a trade date basis. Realized gains and losses on investments sold are determined on the basis of identified cost.
C Income — Interest income is recorded on the basis of interest accrued, adjusted for amortization of premium or accretion of discount.
D Federal Taxes — The Portfolio has elected to be treated as a partnership for federal tax purposes. No provision is made by the Portfolio for federal or state taxes on any taxable income of the Portfolio because each investor in the Portfolio is ultimately responsible for the payment of any taxes on its share of taxable income. Since at least one of the Portfolio’s investors is a regulated investment company that invests all or substantially all of its assets in the Portfolio, the Portfolio normally must satisfy the applicable source of income and diversification requirements (under the Internal Revenue Code) in order for its investors to satisfy them. The Portfolio will allocate, at least annually among its investors, each investor’s distributive share of the Portfolio’s net investment income, net realized capital gains and losses and any other items of income, gain, loss, deduction or credit.
As of January 31, 2021, the Portfolio had no uncertain tax positions that would require financial statement recognition, de-recognition, or disclosure. The Portfolio files a U.S. federal income tax return annually after its fiscal year-end, which is subject to examination by the Internal Revenue Service for a period of three years from the date of filing.
E Use of Estimates — The preparation of the financial statements in conformity with U.S. GAAP requires management to make estimates and assumptions that affect the reported amounts of assets and liabilities at the date of the financial statements and the reported amounts of income and expense during the reporting period. Actual results could differ from those estimates.
F Indemnifications — Under the Portfolio’s organizational documents, its officers and Trustees may be indemnified against certain liabilities and expenses arising out of the performance of their duties to the Portfolio. Under Massachusetts law, if certain conditions prevail, interestholders in the Portfolio could be deemed to have personal liability for the obligations of the Portfolio. However, the Portfolio’s Declaration of Trust contains an express disclaimer of liability on the part of Portfolio interestholders. Additionally, in the normal course of business, the Portfolio enters into agreements with service providers that may contain indemnification clauses. The Portfolio’s maximum exposure under these arrangements is unknown as this would involve future claims that may be made against the Portfolio that have not yet occurred.
G When-Issued Securities and Delayed Delivery Transactions — The Portfolio may purchase or sell securities on a delayed delivery or when-issued basis. Payment and delivery may take place after the customary settlement period for that security. At the time the transaction is negotiated, the price of the security that will be delivered is fixed. The Portfolio maintains cash and/or security positions for these commitments such that sufficient liquid assets will be available to make payments upon settlement. Securities purchased on a delayed delivery or when-issued basis are marked-to-market daily and begin earning interest on settlement date. Losses may arise due to changes in the market value of the underlying securities or if the counterparty does not perform under the contract.
5-to-15 Year Laddered Municipal Bond Portfolio
January 31, 2021
Notes to Financial Statements — continued
H Capital Transactions — To seek to protect the Portfolio (and, indirectly, other investors in the Portfolio) against the costs of accommodating investor inflows and outflows, the Portfolio imposes a fee (“Portfolio transaction fee”) on inflows and outflows by Portfolio investors. The Portfolio transaction fee is sized to cover the estimated cost to the Portfolio of, in connection with issuing interests, converting the cash and/or other instruments it receives to the desired composition and, in connection with redeeming its interests, converting Portfolio holdings to cash and/or other instruments to be distributed. Such fee, which may vary over time, is limited to amounts that have been authorized by the Board of Trustees and determined by Eaton Vance Management (EVM) to be appropriate. The maximum Portfolio transaction fee is 2% of the amount of net contributions or withdrawals. The Portfolio transaction fee is recorded as a component of capital transactions on the Statements of Changes in Net Assets.
2 Investment Adviser Fee and Other Transactions with Affiliates
The investment adviser fee is earned by Boston Management and Research (BMR), a subsidiary of EVM and an indirect subsidiary of Eaton Vance Corp., as compensation for investment advisory services rendered to the Portfolio. The fee is computed at an annual rate of 0.32% of the Portfolio’s average daily net assets up to $1 billion and at reduced rates on average daily net assets of $1 billion or more, and is payable monthly. For the year ended January 31, 2021, the Portfolio’s investment adviser fee amounted to $2,530,236 or 0.32% of the Portfolio’s average daily net assets. Pursuant to a sub-advisory agreement, BMR pays Parametric Portfolio Associates LLC (Parametric), a wholly-owned indirect subsidiary of Eaton Vance Corp., a portion of its investment adviser fee for sub-advisory services provided to the Portfolio. Pursuant to a voluntary expense reimbursement, BMR and Parametric were allocated $100,091 in total of the Portfolio’s operating expenses for the year ended January 31, 2021.
Trustees and officers of the Portfolio who are members of EVM’s or BMR’s organizations receive remuneration for their services to the Portfolio out of the investment adviser fee. Trustees of the Portfolio who are not affiliated with the investment adviser may elect to defer receipt of all or a percentage of their annual fees in accordance with the terms of the Trustees Deferred Compensation Plan. For the year ended January 31, 2021, no significant amounts have been deferred. Certain officers and Trustees of the Portfolio are officers of the above organizations.
3 Purchases and Sales of Investments
Purchases and sales of investments, other than short-term obligations, aggregated $457,854,547 and $378,835,498, respectively, for the year ended January 31, 2021.
4 Federal Income Tax Basis of Investments
The cost and unrealized appreciation (depreciation) of investments of the Portfolio at January 31, 2021, as determined on a federal income tax basis, were as follows:
| | | | |
| |
Aggregate cost | | $ | 751,478,888 | |
| |
Gross unrealized appreciation | | $ | 60,286,966 | |
| |
Gross unrealized depreciation | | | (22,006 | ) |
| |
Net unrealized appreciation | | $ | 60,264,960 | |
5 Line of Credit
The Portfolio participates with other portfolios and funds managed by EVM and its affiliates in an $800 million unsecured line of credit agreement with a group of banks, which is in effect through October 26, 2021. Borrowings are made by the Portfolio solely for temporary purposes related to redemptions and other short-term cash needs. Interest is charged to the Portfolio based on its borrowings at an amount above either the Eurodollar rate or Federal Funds rate. In addition, a fee computed at an annual rate of 0.15% on the daily unused portion of the line of credit is allocated among the participating portfolios and funds at the end of each quarter. In connection with the renewal of the agreement in October 2020, an upfront fee and arrangement fee totaling $950,000 was incurred that was allocated to the participating portfolios and funds. Because the line of credit is not available exclusively to the Portfolio, it may be unable to borrow some or all of its requested amounts at any particular time. The Portfolio did not have any significant borrowings or allocated fees during the year ended January 31, 2021.
5-to-15 Year Laddered Municipal Bond Portfolio
January 31, 2021
Notes to Financial Statements — continued
6 Fair Value Measurements
Under generally accepted accounting principles for fair value measurements, a three-tier hierarchy to prioritize the assumptions, referred to as inputs, is used in valuation techniques to measure fair value. The three-tier hierarchy of inputs is summarized in the three broad levels listed below.
| • | | Level 1 – quoted prices in active markets for identical investments |
| • | | Level 2 – other significant observable inputs (including quoted prices for similar investments, interest rates, prepayment speeds, credit risk, etc.) |
| • | | Level 3 – significant unobservable inputs (including a fund’s own assumptions in determining the fair value of investments) |
In cases where the inputs used to measure fair value fall in different levels of the fair value hierarchy, the level disclosed is determined based on the lowest level input that is significant to the fair value measurement in its entirety. The inputs or methodology used for valuing securities are not necessarily an indication of the risk associated with investing in those securities.
At January 31, 2021, the hierarchy of inputs used in valuing the Portfolio’s investments, which are carried at value, were as follows:
| | | | | | | | | | | | | | | | |
| Asset Description | | Level 1 | | | Level 2 | | | Level 3 | | | Total | |
| | | | |
Tax-Exempt Investments | | $ | — | | | $ | 811,743,848 | | | $ | — | | | $ | 811,743,848 | |
| | | | |
Total Investments | | $ | — | | | $ | 811,743,848 | | | $ | — | | | $ | 811,743,848 | |
7 Risks and Uncertainties
Pandemic Risk
An outbreak of respiratory disease caused by a novel coronavirus was first detected in China in December 2019 and subsequently spread internationally. This coronavirus has resulted in closing borders, enhanced health screenings, changes to healthcare service preparation and delivery, quarantines, cancellations, disruptions to supply chains and customer activity, as well as general concern and uncertainty. Health crises caused by outbreaks, such as the coronavirus outbreak, may exacerbate other pre-existing political, social and economic risks and disrupt normal market conditions and operations. The impact of this outbreak has negatively affected the worldwide economy, the economies of individual countries, individual companies, and the market in general, and may continue to do so in significant and unforeseen ways, as may other epidemics and pandemics that may arise in the future. Any such impact could adversely affect the Portfolio’s performance, or the performance of the securities in which the Portfolio invests.
8 Additional Information
On October 8, 2020, Morgan Stanley and Eaton Vance Corp. (“Eaton Vance”) announced that they had entered into a definitive agreement under which Morgan Stanley would acquire Eaton Vance. Under the Investment Company Act of 1940, as amended, consummation of this transaction may have been deemed to result in the automatic termination of an Eaton Vance Fund’s investment advisory agreement and, where applicable, any related sub-advisory agreement. On November 24, 2020, the Portfolio’s Board approved a new investment advisory agreement and a new sub-advisory agreement. The new investment advisory agreement and new sub-advisory agreement were approved by Portfolio interest holders at a joint special meeting of interest holders held on February 19, 2021, and became effective upon the consummation of the transaction on March 1, 2021.
5-to-15 Year Laddered Municipal Bond Portfolio
January 31, 2021
Report of Independent Registered Public Accounting Firm
To the Trustees and Investors of 5-to-15 Year Laddered Municipal Bond Portfolio:
Opinion on the Financial Statements and Financial Highlights
We have audited the accompanying statement of assets and liabilities of 5-to-15 Year Laddered Municipal Bond Portfolio (the “Portfolio”), including the portfolio of investments, as of January 31, 2021, the related statement of operations for the year then ended, the statements of changes in net assets for each of the two years in the period then ended, the financial highlights for each of the four years in the period then ended and the period from the start of business, March 28, 2016, to January 31, 2017, and the related notes. In our opinion, the financial statements and financial highlights present fairly, in all material respects, the financial position of the Portfolio as of January 31, 2021, and the results of its operations for the year then ended, the changes in its net assets for each of the two years in the period then ended, and the financial highlights for each of the four years in the period then ended and the period from the start of business, March 28, 2016, to January 31, 2017, in conformity with accounting principles generally accepted in the United States of America.
Basis for Opinion
These financial statements and financial highlights are the responsibility of the Portfolio’s management. Our responsibility is to express an opinion on the Portfolio’s financial statements and financial highlights based on our audits. We are a public accounting firm registered with the Public Company Accounting Oversight Board (United States) (PCAOB) and are required to be independent with respect to the Portfolio in accordance with the U.S. federal securities laws and the applicable rules and regulations of the Securities and Exchange Commission and the PCAOB.
We conducted our audits in accordance with the standards of the PCAOB. Those standards require that we plan and perform the audit to obtain reasonable assurance about whether the financial statements and financial highlights are free of material misstatement, whether due to error or fraud. The Portfolio is not required to have, nor were we engaged to perform, an audit of its internal control over financial reporting. As part of our audits we are required to obtain an understanding of internal control over financial reporting but not for the purpose of expressing an opinion on the effectiveness of the Portfolio’s internal control over financial reporting. Accordingly, we express no such opinion.
Our audits included performing procedures to assess the risks of material misstatement of the financial statements and financial highlights, whether due to error or fraud, and performing procedures that respond to those risks. Such procedures included examining, on a test basis, evidence regarding the amounts and disclosures in the financial statements and financial highlights. Our audits also included evaluating the accounting principles used and significant estimates made by management, as well as evaluating the overall presentation of the financial statements and financial highlights. Our procedures included confirmation of securities owned as of January 31, 2021, by correspondence with the custodian and brokers; when replies were not received from brokers, we performed other auditing procedures. We believe that our audits provide a reasonable basis for our opinion.
/s/ Deloitte & Touche LLP
Boston, Massachusetts
March 19, 2021
We have served as the auditor of one or more Eaton Vance investment companies since 1959.
Eaton Vance
TABS 5-to-15 Year Laddered Municipal Bond NextShares
January 31, 2021
Board of Trustees’ Contract Approval
Overview of the Contract Review Process
Even though the following description of the Board’s (as defined below) consideration of investment advisory and, as applicable, sub-advisory agreements covers multiple funds, for purposes of this shareholder report, the description is only relevant as to Eaton Vance TABS 5-to-15 Year Laddered Municipal Bond NextShares and 5-to-15 Year Laddered Municipal Bond Portfolio.
| | | | |
| Fund | | Investment Adviser | | Investment Sub-Adviser |
| | |
Eaton Vance TABS 5-to-15 Year Laddered Municipal Bond NextShares | | Eaton Vance Management | | Parametric Portfolio Associates LLC |
| | |
5-to-15 Year Laddered Municipal Bond Portfolio | | Boston Management and Research | | Parametric Portfolio Associates LLC |
At a meeting held on November 24, 2020 (the “November Meeting”), the Board of each Eaton Vance open-end Fund and portfolios in which each such Fund invests, as applicable (each, a “Fund” and, collectively, the “Funds”), including a majority of the Board members (the “Independent Trustees”) who are not “interested persons” (as defined in the Investment Company Act of 1940 (the “1940 Act”)) of the Funds, Eaton Vance Management (“EVM”) or Boston Management and Research (“BMR” and, together with EVM, the “Advisers”), voted to approve a new investment advisory agreement between each Fund and either EVM or BMR (the “New Investment Advisory Agreements”) and, for certain Funds, a new investment sub-advisory agreement between an Adviser and the applicable Sub-Adviser (the “New Investment Sub-Advisory Agreements”(1) and, together with the New Investment Advisory Agreements, the “New Agreements”), each of which is intended to go into effect upon the completion of the Transaction (as defined below), as more fully described below. In voting its approval of the New Agreements at the November Meeting, the Board relied on an order issued by the Securities and Exchange Commission in response to the impacts of the COVID-19 pandemic that provided temporary relief from the in-person meeting requirements under Section 15 of the 1940 Act.
In voting its approval of the New Agreements, the Board of each Fund relied upon the recommendation of its Contract Review Committee, which is a committee comprised exclusively of Independent Trustees. Prior to and during meetings leading up to the November Meeting, the Contract Review Committee reviewed and discussed information furnished by the Advisers, the Sub-Advisers, and Morgan Stanley, as requested by the Independent Trustees, that the Contract Review Committee considered reasonably necessary to evaluate the terms of the New Agreements and to form its recommendation. Such information included, among other things, the terms and anticipated impacts of Morgan Stanley’s pending acquisition of Eaton Vance Corp. (the “Transaction”) on the Funds and their shareholders. In addition to considering information furnished specifically to evaluate the impact of the Transaction on the Funds and their respective shareholders, the Board and its Contract Review Committee also considered information furnished for prior meetings of the Board and its committees, including information provided in connection with the annual contract review process for the Funds, which most recently culminated in April 2020 (the “2020 Annual Approval Process”).
The Board of each Fund, including the Independent Trustees, concluded that the applicable New Investment Advisory Agreement and, as applicable, New Investment Sub-Advisory Agreement, including the fees payable thereunder, was fair and reasonable, and it voted to approve the New Investment Advisory Agreement and, as applicable, New Investment Sub-Advisory Agreement and to recommend that shareholders do so as well.
Shortly after the announcement of the Transaction, the Board, including all of the Independent Trustees, met with senior representatives from the Advisers and Morgan Stanley at its meeting held on October 13, 2020 to discuss certain aspects of the Transaction and the expected impacts of the Transaction on the Funds and their shareholders. As part of the Board’s evaluation process, counsel to the Independent Trustees, on behalf of the Contract Review Committee, requested additional information to assist the Independent Trustees in their evaluation of the New Agreements and the implications of the Transaction, as well as other contractual arrangements that may be affected by the Transaction. The Contract Review Committee considered information furnished by the Advisers and Morgan Stanley, their respective affiliates, and, as applicable, the Sub-Advisers during meetings on November 5, 2020, November 10, 2020, November 13, 2020, November 17, 2020 and November 24, 2020.
During its meetings on November 10, 2020 and November 17, 2020, the Contract Review Committee further discussed the approval of the New Agreements with senior representatives of the Advisers, the Affiliated Sub-Advisers, and Morgan Stanley. The representatives from the Advisers, the Affiliated Sub-Advisers, and Morgan Stanley each made presentations to, and responded to questions from, the Independent Trustees. The Contract Review Committee considered the Advisers’, the Affiliated Sub-Advisers’ and Morgan Stanley’s responses related to the Transaction and specifically to the Funds, as well as information received in connection with the 2020 Annual Approval Process, with respect to its evaluation of the New Agreements. Among other information, the Board considered:
| (1) | With respect to certain of the Funds, the applicable Adviser is currently a party to a sub-advisory agreement (collectively, the “Current Sub-Advisory Agreements”) with Atlanta Capital Management Company, LLC (“Atlanta Capital”), BMO Global Asset Management (Asia) Limited, Eaton Vance Advisers International Ltd. (“EVAIL”), Goldman Sachs Asset Management, L.P., Hexavest Inc. (“Hexavest”), Parametric Portfolio Associates LLC (“Parametric”) or Richard Bernstein Advisors LLC (collectively, the “Sub-Advisers” and, with respect to Atlanta Capital, EVAIL, Hexavest and Parametric, each an affiliate of the Advisers, the “Affiliated Sub-Advisers”). Accordingly, references to the “Sub-Advisers,” the “Affiliated Sub-Advisers” or the “New Sub-Advisory Agreements” are not applicable to all Funds. |
Eaton Vance
TABS 5-to-15 Year Laddered Municipal Bond NextShares
January 31, 2021
Board of Trustees’ Contract Approval — continued
Information about the Transaction and its Terms
| | • | | Information about the material terms and conditions, and expected impacts, of the Transaction that relate to the Funds, including the expected impacts on the businesses conducted by the Advisers, the Affiliated Sub-Advisers and Eaton Vance Distributors, Inc., as the distributor of Fund shares; |
| | • | | Information about the advantages of the Transaction as they relate to the Funds and their shareholders; |
| | • | | A commitment that the Funds would not bear any expenses, directly or indirectly, in connection with the Transaction; |
| | • | | A commitment that, for a period of three years after the Closing, at least 75% of each Fund’s Board members must not be “interested persons” (as defined in the 1940 Act) of the investment adviser (or predecessor investment adviser, if applicable) pursuant to Section 15(f)(1)(A) of the 1940 Act; |
| | • | | A commitment that Morgan Stanley would use its reasonable best efforts to ensure that it did not impose any “unfair burden” (as that term is used in section 15(f)(1)(B) of the 1940 Act) on the Funds as a result of the Transaction; |
| | • | | Information with respect to personnel and/or other resources of the Advisers and their affiliates, including the Affiliated Sub-Advisers, as a result of the Transaction, as well as any expected changes to compensation, including any retention-based compensation intended to incentivize key personnel at the Advisers and their affiliates, including the Affiliated Sub-Advisers; |
| | • | | Information regarding any changes that are expected with respect to the Funds’ slate of officers as a result of the Transaction; |
Information about Morgan Stanley
| | • | | Information about Morgan Stanley’s overall business, including information about the advisory, brokerage and related businesses that Morgan Stanley operates; |
| | • | | Information about Morgan Stanley’s financial condition, including its access to capital and other resources required to support the investment advisory businesses related to the Funds; |
| | • | | Information on how the Funds are expected to fit within Morgan Stanley’s overall business strategy, and any changes that Morgan Stanley contemplates implementing to the Funds in the short- or long-term following the closing of the Transaction (the “Closing”); |
| | • | | Information regarding risk management functions at Morgan Stanley and its affiliates, including how existing risk management protocols and procedures may impact the Funds and/or the businesses of the Advisers and their affiliates, including the Affiliated Sub-Advisers, as they relate to the Funds; |
| | • | | Information on the anticipated benefits of the Transaction to the Funds with respect to potential additional distribution capabilities and the ability to access new markets and customer segments through Morgan Stanley’s distribution network, including, in particular, its institutional client base; |
| | • | | Information regarding the financial condition and reputation of Morgan Stanley, its worldwide presence, experience as a fund sponsor and manager, commitment to maintain a high level of cooperation with, and support to, the Funds, strong client service capabilities, and relationships in the asset management industry; |
Information about the New Agreements for Funds
| | • | | A representation that, after the Closing, all of the Funds will continue to be advised by their current Adviser and Sub-Adviser, as applicable; |
| | • | | Information regarding the terms of the New Agreements, including certain changes as compared to the current investment advisory agreement between each Fund and its Adviser (collectively, the “Current Advisory Agreements”) and, as applicable, the current investment sub-advisory agreement between a Fund and a Sub-Adviser (together with the Current Advisory Agreements, the “Current Agreements”); |
| | • | | Information confirming that the fee rates payable under the New Agreements are not changed as compared to the Current Agreements; |
| | • | | A representation that the New Agreements will not cause any diminution in the nature, extent and quality of services provided by the Advisers and the Sub-Advisers to the Funds and their respective shareholders, including with respect to compliance and other non-advisory services; |
Information about Fund Performance, Fees and Expenses
| | • | | A report from an independent data provider comparing the investment performance of each Fund (including, as relevant, total return data, income data, Sharpe ratios and information ratios) to the investment performance of comparable funds and, as applicable, benchmark indices, over various time periods as of the 2020 Annual Approval Process, as well as performance information as of a more recent date; |
| | • | | A report from an independent data provider comparing each Fund’s total expense ratio (and its components) to those of comparable funds as of the 2020 Annual Approval Process, as well as fee and expense information as of a more recent date; |
| | • | | In certain instances, data regarding investment performance relative to customized groups of peer funds and blended indices identified by the Advisers in consultation with the Portfolio Management Committee of the Board as of the 2020 Annual Approval Process, as well as corresponding performance information as of a more recent date; |
| | • | | Comparative information concerning the fees charged and services provided by the Adviser and the Sub-Adviser to each Fund in managing other accounts (which may include other mutual funds, collective investment funds and institutional accounts) using investment strategies and techniques similar to those used in managing such Fund(s), if any; |
| | • | | Profitability analyses of the Advisers and the Affiliated Sub-Advisers, as applicable, with respect to each of the Funds as of the 2020 Annual Approval Process, as well as information regarding the impact of the Transaction on profitability; |
Eaton Vance
TABS 5-to-15 Year Laddered Municipal Bond NextShares
January 31, 2021
Board of Trustees’ Contract Approval — continued
Information about Portfolio Management and Trading
| | • | | Descriptions of the investment management services currently provided and expected to be provided to each Fund after the Transaction, as well as each of the Funds’ investment strategies and policies; |
| | • | | The procedures and processes used to determine the fair value of Fund assets, when necessary, and actions taken to monitor and test the effectiveness of such procedures and processes; |
| | • | | Information about any changes to the policies and practices of the Advisers and, as applicable, each Fund’s Sub-Adviser with respect to trading, including their processes for seeking best execution of portfolio transactions; |
| | • | | Information regarding the impact on trading and access to capital markets associated with the Funds’ affiliations with Morgan Stanley and its affiliates, including potential restrictions with respect to the Funds’ ability to execute portfolio transactions with Morgan Stanley and its affiliates; |
Information about the Advisers and the Sub-Advisers
| | • | | Information about the financial results and condition of the Advisers and the Affiliated Sub-Advisers since the culmination of the 2020 Annual Approval Process and any material changes in financial condition that are reasonably expected to occur before and after the Closing; |
| | • | | Information regarding contemplated changes to the individual investment professionals whose responsibilities include portfolio management and investment research for the Funds, and, for portfolio managers and certain other investment professionals, information relating to their responsibilities with respect to managing other mutual funds and investment accounts, as applicable, post-Closing; |
| | • | | The Code of Ethics of the Advisers and their affiliates, including the Affiliated Sub-Advisers, together with information relating to compliance with, and the administration of, such codes; |
| | • | | Policies and procedures relating to proxy voting and the handling of corporate actions and class actions; |
| | • | | Information concerning the resources devoted to compliance efforts undertaken by the Advisers and their affiliates, including the Affiliated Sub-Advisers, including descriptions of their various compliance programs and their record of compliance; |
| | • | | Information concerning the business continuity and disaster recovery plans of the Advisers and their affiliates, including the Affiliated Sub-Advisers; |
| | • | | A description of the Advisers’ oversight of the Sub-Advisers, including with respect to regulatory and compliance issues, investment management and other matters; |
Other Relevant Information
| | • | | Information concerning the nature, cost and character of the administrative and other non-investment advisory services provided by the Advisers and their affiliates; |
| | • | | Information concerning oversight of the relationship with the custodian, subcustodians and fund accountants by EVM and/or administrator to each of the Funds; |
| | • | | Confirmation that the Advisers intend to continue to manage the Funds in a manner materially consistent with each Fund’s current investment objective(s) and principal investment strategies; |
| | • | | Information regarding Morgan Stanley’s commitment to maintaining competitive compensation arrangements to attract and retain highly qualified personnel; |
| | • | | Confirmation that the Advisers’ current senior management teams have indicated their strong support of the Transaction; and |
| | • | | Information regarding the fact that Morgan Stanley and Eaton Vance Corp. will each derive benefits from the Transaction and that, as a result, they have a financial interest in the matters that were being considered. |
As indicated above, the Board and its Contract Review Committee also considered information received at its regularly scheduled meetings throughout the year, which included information from portfolio managers and other investment professionals of the Advisers and the Sub-Advisers regarding investment and performance matters, and considered various investment and trading strategies used in pursuing the Funds’ investment objectives. The Board also received information regarding risk management techniques employed in connection with the management of the Funds. The Board and its committees evaluated issues pertaining to industry and regulatory developments, compliance procedures, fund governance and other issues with respect to the Funds, and received and participated in reports and presentations provided by the Advisers and their affiliates, including the Affiliated Sub-Advisers, with respect to such matters.
The Contract Review Committee was advised throughout the evaluation process by Goodwin Procter LLP, independent legal counsel for the Independent Trustees. The members of the Contract Review Committee, with the advice of such counsel, exercised their own business judgment in determining the material factors to be considered in evaluating the New Agreements and the weight to be given to each such factor. The conclusions reached with respect to the New Agreements were based on a comprehensive evaluation of all the information provided and not any single factor. Moreover, each Independent Trustee may have placed varying emphasis on particular factors in reaching conclusions with respect to the New Agreements.
Nature, Extent and Quality of Services
In considering whether to approve the New Agreements, the Board evaluated the nature, extent and quality of services currently provided to each Fund by the Advisers and, as applicable, the Sub-Advisers under the Current Agreements. In evaluating the nature, extent and quality of services to be provided by
Eaton Vance
TABS 5-to-15 Year Laddered Municipal Bond NextShares
January 31, 2021
Board of Trustees’ Contract Approval — continued
the Advisers and the Sub-Advisers under the New Agreements, the Board considered, among other information, the expected impact, if any, of the Transaction on the operations, facilities, organization and personnel of the Advisers and the Sub-Advisers, and that Morgan Stanley and the Advisers have advised the Board that, following the Transaction, there is not expected to be any diminution in the nature, extent and quality of services provided by the Advisers and the Sub-Advisers, as applicable, to the Funds and their shareholders, including compliance and other non-advisory services, and that there are not expected to be any changes in portfolio management personnel as a result of the Transaction.
The Board also considered the financial resources of Morgan Stanley and the Advisers and the importance of having a Fund manager with, or with access to, significant organizational and financial resources. The Board considered the benefits to the Funds of being part of a larger combined organization with greater financial resources following the Transaction, particularly during periods of market disruptions and volatility. In this regard, the Board considered information provided by Morgan Stanley regarding its business and operating structure, scale of operation, leadership and reputation, distribution capabilities, and financial condition, as well as information on how the Funds are expected to fit within Morgan Stanley’s overall business strategy and any changes that Morgan Stanley contemplates in the short- or long-term following the Closing. The Board also noted Morgan Stanley’s and the Advisers’ commitment to keep the Board apprised of developments with respect to its long-term integration plans for the Advisers, the Affiliated Sub-Advisers, and existing Morgan Stanley affiliates and their respective personnel.
The Board considered the Advisers’ and the Sub-Advisers’ management capabilities and investment processes in light of the types of investments held by each Fund, including the education, experience and number of investment professionals and other personnel who provide portfolio management, investment research, and similar services to each Fund. In particular, the Board considered the abilities and experience of the Advisers’ and, as applicable, the Sub-Advisers’ investment professionals in implementing each Fund’s investment strategies. The Board also took into account the resources dedicated to portfolio management and other services, the compensation methods of the Advisers and other factors, including the reputation and resources of the Advisers to recruit and retain highly qualified research, advisory and supervisory investment professionals. With respect to the recruitment and retention of key personnel, the Board noted information from Morgan Stanley and the Advisers regarding the benefits of joining Morgan Stanley. In addition, the Board considered the time and attention devoted to the Funds by senior management, as well as the infrastructure, operational capabilities and support staff in place to assist in the portfolio management and operations of the Funds, including the provision of administrative services. With respect to the foregoing, the Board also considered information from the Advisers and Morgan Stanley regarding the anticipated impact of the Transaction on such matters. The Board also considered the business-related and other risks to which the Advisers or their affiliates may be subject in managing the Funds and in connection with the Transaction.
The Board considered the compliance programs of the Advisers and relevant affiliates thereof, including the Affiliated Sub-Advisers. The Board considered compliance and reporting matters regarding, among other things, personal trading by investment professionals, disclosure of portfolio holdings, late trading, frequent trading, portfolio valuation, business continuity and the allocation of investment opportunities. The Board also considered the responses of the Advisers and their affiliates to requests in recent years from regulatory authorities, such as the Securities and Exchange Commission and the Financial Industry Regulatory Authority. The Board also considered certain information relating to the compliance record of Morgan Stanley and its affiliates, including information requests in recent years from regulatory authorities. With respect to the foregoing, including the compliance programs of the Advisers and the Sub-Advisers, the Board noted information regarding the impacts of the Transaction, as well as the Advisers’ and Morgan Stanley’s commitment to keep the Board apprised of developments with respect to its long-term integration plans for the Advisers, the Affiliated Sub-Advisers and existing Morgan Stanley affiliates and their respective personnel.
The Board considered other administrative services provided and to be provided or overseen by the Advisers and their affiliates, including transfer agency and accounting services. The Board evaluated the benefits to shareholders of investing in a fund that is a part of a large fund complex offering exposure to a variety of asset classes and investment disciplines, as well as the ability, in many cases, to exchange an investment among different funds without incurring additional sales charges. The Board noted information that the Transaction was not expected to have any material impact on such matters in the near-term.
In evaluating the nature, extent and quality of the services to be provided under the New Agreements, the Board also considered investment performance information provided for each Fund in connection with the 2020 Annual Approval Process, as well as information provided as of a more recent date. In this regard, the Board compared each Fund’s investment performance to that of comparable funds identified by an independent data provider (the peer group), as well as appropriate benchmark indices and, for certain Funds, a custom peer group of similarly managed funds. The Board also considered, where applicable, Fund-specific performance explanations based on criteria established by the Board in connection with the 2020 Annual Approval Process and, where applicable, performance explanations as of a more recent date. In addition to the foregoing information, it was also noted that the Board has received and discussed with management information throughout the year at periodic intervals comparing each Fund’s performance against applicable benchmark indices and peer groups. In addition, the Board considered each Fund’s performance in light of overall financial market conditions. Where a Fund’s relative underperformance to its peers was significant during one or more specified periods, the Board noted the explanation from the applicable Adviser concerning the Fund’s relative performance versus its peer group.
After consideration of the foregoing factors, among others, and based on their review of the materials provided and the assurances received from, and recommendations of, the Advisers and Morgan Stanley, the Board determined that the Transaction was not expected to adversely affect the nature, extent and quality of services provided to the Funds by the Advisers and their affiliates, including the Affiliated Sub-Advisers, and that the Transaction was not expected to have an adverse effect on the ability of the Advisers and their affiliates, including the Affiliated Sub-Advisers, to provide those services. The Board concluded that the nature, extent and quality of services expected to be provided by the Advisers and the Sub-Advisers, taken as a whole, are appropriate and expected to be consistent with the terms of the New Agreements.
Eaton Vance
TABS 5-to-15 Year Laddered Municipal Bond NextShares
January 31, 2021
Board of Trustees’ Contract Approval — continued
Management Fees and Expenses
The Board considered contractual fee rates payable by each Fund for advisory and administrative services (referred to collectively as “management fees”) in connection with the 2020 Annual Approval Process, as well as information provided as of a more recent date. As part of its review, the Board considered each Fund’s management fees and total expense ratio over various periods, as compared to those of comparable funds, before and after giving effect to any undertaking to waive fees or reimburse expenses. The Board also considered factors, and, where applicable, certain Fund-specific factors, that had an impact on a Fund’s total expense ratio relative to comparable funds, as identified by the Advisers in response to inquiries from the Contract Review Committee. The Board considered that the New Agreements do not change a Fund’s management fee rate or the computation method for calculating such fees, including any separately executed permanent contractual management fee reduction currently in place for the Fund.
The Board also received and considered, where applicable, information about the services offered and the fee rates charged by the Advisers and the Sub-Advisers to other types of accounts with investment objectives and strategies that are substantially similar to and/or managed in a similar investment style as a Fund. In this regard, the Board received information about the differences in the nature and scope of services the Advisers and the Sub-Advisers, as applicable, provide to the Funds as compared to other types of accounts and the material differences in compliance, reporting and other legal burdens and risks to the Advisers and such Sub-Advisers as between each Fund and other types of accounts.
After considering the foregoing information, and in light of the nature, extent and quality of the services expected to be provided by the Advisers and the Sub-Advisers, the Board concluded that the management fees charged for advisory and related services are reasonable with respect to its approval of the New Agreements.
Profitability and “Fall-Out” Benefits
During the 2020 Annual Approval Process, the Board considered the level of profits realized by the Advisers and relevant affiliates thereof, including the Affiliated Sub-Advisers, in providing investment advisory and administrative services to the Funds and to all Eaton Vance funds as a group. The Board considered the level of profits realized without regard to marketing support or other payments by the Advisers and their affiliates to third parties in respect of distribution or other services. In light of the foregoing factors and the nature, extent and quality of the services rendered, the profits realized by the Advisers and their affiliates, including the Sub-Advisers, were not deemed to be excessive by the Board.
The Board noted that Morgan Stanley and the Advisers are expected to realize, over time, cost savings from the Transaction based on eliminating duplicate corporate overhead expenses. The Board considered, however, information from the Advisers and Morgan Stanley that such cost savings are not expected to be realized immediately upon the Closing and that, accordingly, there are currently no specific expected changes in the levels of profitability associated with the advisory and other services provided to the Funds that are contemplated as a result of the Transaction. The Board noted that it will continue to receive information regarding profitability during its annual contract review processes, including the extent to which cost savings and/or other efficiencies result in changes to profitability levels.
The Board also considered direct or indirect fall-out benefits received by the Advisers and their affiliates, including the Affiliated Sub-Advisers, in connection with their respective relationships with the Funds, including the benefits of research services that may be available to the Advisers and their affiliates as a result of securities transactions effected for the Funds and other investment advisory clients. In evaluating the fall-out benefits to be received by the Advisers and their affiliates under the New Agreements, the Board considered whether the Transaction would have an impact on the fall-out benefits currently realized by the Advisers and their affiliates in connection with services provided pursuant to the Current Advisory Agreements.
The Board of each Fund considered that Morgan Stanley may derive reputational and other benefits from its ability to use the names of the Advisers and their affiliates in connection with operating and marketing the Funds. The Board considered that the Transaction, if completed, would significantly increase Morgan Stanley’s assets under management and expand Morgan Stanley’s investment capabilities.
Economies of Scale
The Board also considered the extent to which the Advisers and their affiliates, on the one hand, and the Funds, on the other hand, can expect to realize benefits from economies of scale as the assets of the Funds increase. The Board acknowledged the difficulty in accurately measuring the benefits resulting from economies of scale, if any, with respect to the management of any specific Fund or group of funds. As part of the 2020 Annual Approval Process, the Board reviewed data summarizing the increases and decreases in the assets of the Funds and of all Eaton Vance funds as a group over various time periods, and evaluated the extent to which the total expense ratio of each Fund and the profitability of the Advisers and their affiliates may have been affected by such increases or decreases.
The Board noted that Morgan Stanley and the Advisers are expected to benefit from possible growth of the Funds resulting from enhanced distribution capabilities, including with respect to the Funds’ potential access to Morgan Stanley’s institutional client base. Based upon the foregoing, the Board concluded that the Funds currently share in the benefits from economies of scale, if any, when they are realized by the Advisers, and that the Transaction is not expected to impede a Fund from continuing to benefit from any future economies of scale realized by its Adviser.
Eaton Vance
TABS 5-to-15 Year Laddered Municipal Bond NextShares
January 31, 2021
Board of Trustees’ Contract Approval — continued
Conclusion
Based on its consideration of the foregoing, and such other information it deemed relevant, including the factors and conclusions described above, the Contract Review Committee recommended to the Board approval of the New Agreements. Based on the recommendation of the Contract Review Committee, the Board, including a majority of the Independent Trustees, unanimously voted to approve the New Agreements for the Funds and recommended that shareholders approve the New Agreements.
Eaton Vance
TABS 5-to-15 Year Laddered Municipal Bond NextShares
January 31, 2021
Management and Organization
Fund Management. The Trustees of Eaton Vance NextShares Trust II (the Trust) and 5-to-15 Year Laddered Municipal Bond Portfolio (the Portfolio) are responsible for the overall management and supervision of the Trust’s and Portfolio’s affairs. The Trustees and officers of the Trust and the Portfolio are listed below. Except as indicated, each individual has held the office shown or other offices in the same company for the last five years. Trustees and officers of the Trust and the Portfolio hold indefinite terms of office. The “noninterested Trustees” consist of those Trustees who are not “interested persons” of the Trust and the Portfolio, as that term is defined under the 1940 Act. The business address of each Trustee and officer is Two International Place, Boston, Massachusetts 02110. As used below, “EVC” refers to Eaton Vance Corp., “EV” refers to EV LLC, “EVM” refers to Eaton Vance Management, “BMR” refers to Boston Management and Research and “EVD” refers to Eaton Vance Distributors, Inc. EV is the trustee of each of EVM and BMR. Effective March 1, 2021, each of EVM, BMR, EVD and EV are indirect wholly-owned subsidiaries of Morgan Stanley. Each officer affiliated with EVM may hold a position with other EVM affiliates that is comparable to his or her position with EVM listed below. Each Trustee oversees 139 portfolios (with the exception of Messrs. Faust and Wennerholm and Ms. Frost who oversee 138 portfolios) in the Eaton Vance Complex (including all master and feeder funds in a master feeder structure). Each officer serves as an officer of certain other Eaton Vance funds. Each Trustee and officer serves until his or her successor is elected.
| | | | | | |
| Name and Year of Birth | | Position(s) with the
Trust and the Portfolio | | Trustee Since(1) | | Principal Occupation(s) and Directorships During Past Five Years and Other Relevant Experience |
|
| Interested Trustee |
| | | |
Thomas E. Faust Jr. 1958 | | Trustee | | 2007 | | Chairman of Morgan Stanley Investment Management, Inc. (MSIM), Manager and President of EV, Chief Executive Officer of EVM and BMR, and Director of EVD. Formerly, Chairman, Chief Executive Officer and President of EVC. Trustee and/or officer of 138 registered investment companies. Mr. Faust is an interested person because of his positions with MSIM, BMR, EVM, EVD, and EV, which are affiliates of the Trust and the Portfolio, and his former position with EVC, which was an affiliate of the Trust prior to March 1, 2021. Directorships in the Last Five Years. Formerly, Director of EVC (2007-2021) and Hexavest Inc. (2012-2021) (investment management firm). |
|
| Noninterested Trustees |
| | | |
Mark R. Fetting 1954 | | Trustee | | 2016 | | Private investor. Formerly held various positions at Legg Mason, Inc. (investment management firm) (2000-2012), including President, Chief Executive Officer, Director and Chairman (2008-2012), Senior Executive Vice President (2004-2008) and Executive Vice President (2001-2004). Formerly, President of Legg Mason family of funds (2001-2008). Formerly, Division President and Senior Officer of Prudential Financial Group, Inc. and related companies (investment management firm) (1991-2000). Other Directorships in the Last Five Years. None. |
| | | |
Cynthia E. Frost 1961 | | Trustee | | 2014 | | Private investor. Formerly, Chief Investment Officer of Brown University (university endowment) (2000-2012). Formerly, Portfolio Strategist for Duke Management Company (university endowment manager) (1995-2000). Formerly, Managing Director, Cambridge Associates (investment consulting company) (1989-1995). Formerly, Consultant, Bain and Company (management consulting firm) (1987-1989). Formerly, Senior Equity Analyst, BA Investment Management Company (1983-1985). Other Directorships in the Last Five Years. None. |
| | | |
George J. Gorman 1952 | | Vice-Chairperson of the Board and Trustee | | 2021 (Vice-Chairperson) 2014 (Trustee) | | Principal at George J. Gorman LLC (consulting firm). Formerly, Senior Partner at Ernst & Young LLP (a registered public accounting firm) (1974-2009). Other Directorships in the Last Five Years. None. |
| | | |
Valerie A. Mosley 1960 | | Trustee | | 2014 | | Chairwoman and Chief Executive Officer of Valmo Ventures (a consulting and investment firm). Founder of Upward Wealth, Inc., dba BrightUP, a fintech platform. Formerly, Partner and Senior Vice President, Portfolio Manager and Investment Strategist at Wellington Management Company, LLP (investment management firm) (1992-2012). Formerly, Chief Investment Officer, PG Corbin Asset Management (1990-1992). Formerly worked in institutional corporate bond sales at Kidder Peabody (1986-1990). Other Directorships in the Last Five Years. Director of DraftKings, Inc. (digital sports entertainment and gaming company) (since September 2020). Director of Groupon, Inc. (e-commerce provider) (since April 2020). Director of Envestnet, Inc. (provider of intelligent systems for wealth management and financial wellness) (since 2018). Formerly, Director of Dynex Capital, Inc. (mortgage REIT) (2013-2020). |
Eaton Vance
TABS 5-to-15 Year Laddered Municipal Bond NextShares
January 31, 2021
Management and Organization — continued
| | | | | | |
| Name and Year of Birth | | Position(s) with the
Trust and the Portfolio | | Trustee Since(1) | | Principal Occupation(s) and Directorships During Past Five Years and Other Relevant Experience |
|
| Noninterested Trustees (continued) |
| | | |
William H. Park 1947 | | Chairperson of the Board and Trustee | | 2016 (Chairperson) 2003 (Trustee) | | Private investor. Formerly, Consultant (management and transactional) (2012-2014). Formerly, Chief Financial Officer, Aveon Group L.P. (investment management firm) (2010-2011). Formerly, Vice Chairman, Commercial Industrial Finance Corp. (specialty finance company) (2006-2010). Formerly, President and Chief Executive Officer, Prizm Capital Management, LLC (investment management firm) (2002-2005). Formerly, Executive Vice President and Chief Financial Officer, United Asset Management Corporation (investment management firm) (1982-2001). Formerly, Senior Manager, Price Waterhouse (now PricewaterhouseCoopers) (a registered public accounting firm) (1972-1981). Other Directorships in the Last Five Years. None. |
| | | |
Helen Frame Peters 1948 | | Trustee | | 2008 | | Professor of Finance, Carroll School of Management, Boston College. Formerly, Dean, Carroll School of Management, Boston College (2000-2002). Formerly, Chief Investment Officer, Fixed Income, Scudder Kemper Investments (investment management firm) (1998-1999). Formerly, Chief Investment Officer, Equity and Fixed Income, Colonial Management Associates (investment management firm) (1991-1998). Other Directorships in the Last Five Years. None. |
| | | |
Keith Quinton 1958 | | Trustee | | 2018 | | Private investor, researcher and lecturer. Independent Investment Committee Member at New Hampshire Retirement System (since 2017). Formerly, Portfolio Manager and Senior Quantitative Analyst at Fidelity Investments (investment management firm) (2001-2014). Other Directorships in the Last Five Years. Director (since 2016) and Chairman (since 2019) of New Hampshire Municipal Bond Bank. |
| | | |
Marcus L. Smith 1966 | | Trustee | | 2018 | | Private investor. Member of Posse Boston Advisory Board (foundation) (since 2015). Formerly, Portfolio Manager at MFS Investment Management (investment management firm) (1994-2017). Other Directorships in the Last Five Years. Director of First Industrial Realty Trust, Inc. (an industrial REIT) (since 2021). Director of MSCI Inc. (global provider of investment decision support tools) (since 2017). Formerly, Director of DCT Industrial Trust Inc. (logistics real estate company) (2017-2018). |
| | | |
Susan J. Sutherland 1957 | | Trustee | | 2015 | | Private investor. Director of Ascot Group Limited and certain of its subsidiaries (insurance and reinsurance) (since 2017). Formerly, Director of Hagerty Holding Corp. (insurance and reinsurance) (2015-2018). Formerly, Associate, Counsel and Partner at Skadden, Arps, Slate, Meagher & Flom LLP (law firm) (1982-2013). Other Directorships in the Last Five Years. Director of Kairos Acquisition Corp. (insurance/InsurTech acquisition company) (since 2021). |
| | | |
Scott E. Wennerholm 1959 | | Trustee | | 2016 | | Private investor. Formerly, Trustee at Wheelock College (postsecondary institution) (2012-2018). Formerly, Consultant at GF Parish Group (executive recruiting firm) (2016-2017). Formerly, Chief Operating Officer and Executive Vice President at BNY Mellon Asset Management (investment management firm) (2005-2011). Formerly, Chief Operating Officer and Chief Financial Officer at Natixis Global Asset Management (investment management firm) (1997-2004). Formerly, Vice President at Fidelity Investments Institutional Services (investment management firm) (1994-1997). Other Directorships in the Last Five Years. None. |
| | | | | | |
| Name and Year of Birth | | Position(s)
with the Trust and the Portfolio | | Officer Since(2) | | Principal Occupation(s) During Past Five Years |
|
| Principal Officers who are not Trustees |
| | | |
Eric A. Stein 1980 | | President | | 2020 | | Vice President and Chief Investment Officer, Fixed Income of EVM and BMR. Prior to November 1, 2020, Mr. Stein was a co-Director of Eaton Vance’s Global Income Investments. Also Vice President of Calvert Research and Management (“CRM”). |
| | | |
Deidre E. Walsh 1971 | | Vice President | | 2009 | | Vice President of EVM and BMR. |
Eaton Vance
TABS 5-to-15 Year Laddered Municipal Bond NextShares
January 31, 2021
Management and Organization — continued
| | | | | | |
| Name and Year of Birth | | Position(s)
with the Trust and the Portfolio | | Officer Since(2) | | Principal Occupation(s) During Past Five Years |
|
| Principal Officers who are not Trustees (continued) |
| | | |
Maureen A. Gemma 1960 | | Secretary and Chief Legal Officer | | 2005 | | Vice President of EVM and BMR. Also Vice President of CRM. |
| | | |
James F. Kirchner 1967 | | Treasurer | | 2007 | | Vice President of EVM and BMR. Also Vice President of CRM. |
| | | |
Richard F. Froio 1968 | | Chief Compliance Officer | | 2017 | | Vice President of EVM and BMR since 2017. Formerly, Deputy Chief Compliance Officer (Adviser/Funds) and Chief Compliance Officer (Distribution) at PIMCO (2012-2017) and Managing Director at BlackRock/Barclays Global Investors (2009-2012). |
| (1) | Year first appointed to serve as Trustee for a fund in the Eaton Vance family of funds. Each Trustee has served continuously since appointment unless indicated otherwise. |
| (2) | Year first elected to serve as officer of a fund in the Eaton Vance family of funds when the officer has served continuously. Otherwise, year of most recent election as an officer of a fund in the Eaton Vance family of funds. Titles may have changed since initial election. |
The SAI for the Fund includes additional information about the Trustees and officers of the Fund and the Portfolio and can be obtained without charge on Eaton Vance’s website at www.eatonvance.com or by calling 1-800-262-1122.
Eaton Vance Funds
IMPORTANT NOTICES
Privacy. The Eaton Vance organization is committed to ensuring your financial privacy. Each entity listed below has adopted privacy policy and procedures (“Privacy Program”) Eaton Vance believes is reasonably designed to protect your personal information and to govern when and with whom Eaton Vance may share your personal information.
| • | | At the time of opening an account, Eaton Vance generally requires you to provide us with certain information such as name, address, social security number, tax status, account numbers, and account balances. This information is necessary for us to both open an account for you and to allow us to satisfy legal requirements such as applicable anti-money laundering reviews and know-your-customer requirements. |
| • | | On an ongoing basis, in the normal course of servicing your account, Eaton Vance may share your information with unaffiliated third parties that perform various services for Eaton Vance and/or your account. These third parties include transfer agents, custodians, broker/dealers and our professional advisers including auditors, accountants, and legal counsel. Eaton Vance may share your personal information with our affiliates. Eaton Vance may also share your information as required or permitted by applicable law. |
| • | | We have adopted a Privacy Program we believe is reasonably designed to protect the confidentiality of your personal information and to prevent unauthorized access to your information. |
| • | | We reserve the right to change our Privacy Program at any time upon proper notification to you. You may want to review our Privacy Program periodically for changes by accessing the link on our homepage: www.eatonvance.com. |
Our pledge of protecting your personal information applies to the following entities within the Eaton Vance organization: the Eaton Vance Family of Funds, Eaton Vance Management, Eaton Vance WaterOak Advisors, Eaton Vance Distributors, Inc., Eaton Vance Trust Company, Eaton Vance Management (International) Limited, Eaton Vance Advisers International Ltd., Eaton Vance Global Advisors Limited, Eaton Vance Management’s Real Estate Investment Group, Boston Management and Research, Calvert Research and Management, and Calvert Funds. This notice supersedes all previously issued privacy disclosures. For more information about Eaton Vance’s Privacy Program or about how your personal information may be used, please call 1-800-262-1122.
Delivery of Shareholder Documents. The Securities and Exchange Commission (SEC) permits delivery of only one copy of fund shareholder documents, including prospectuses, proxy statements and shareholder reports, to fund investors with multiple accounts at the same residential or post office box address. This practice is often called “householding” and it helps eliminate duplicate mailings to shareholders. Your broker may household the mailing of your documents indefinitely unless you instruct your broker otherwise. If you would prefer that your Eaton Vance documents not be householded, please contact your broker. Your instructions that householding not apply to delivery of your Eaton Vance documents will typically be effective within 30 days of receipt by your broker.
Portfolio Holdings. Each Eaton Vance Fund and its underlying Portfolio(s) (if applicable) files a schedule of portfolio holdings on Part F to Form N-PORT with the SEC. Certain information filed on Form N-PORT may be viewed on the Eaton Vance website at www.eatonvance.com, by calling Eaton Vance at 1-800-262-1122 or in the EDGAR database on the SEC’s website at www.sec.gov.
Proxy Voting. From time to time, funds are required to vote proxies related to the securities held by the funds. The Eaton Vance Funds or their underlying Portfolios (if applicable) vote proxies according to a set of policies and procedures approved by the Funds’ and Portfolios’ Boards. You may obtain a description of these policies and procedures and information on how the Funds or Portfolios voted proxies relating to portfolio securities during the most recent 12-month period ended June 30, without charge, upon request, by calling 1-800-262-1122 and by accessing the SEC’s website at www.sec.gov.
This Page Intentionally Left Blank
This Page Intentionally Left Blank
This Page Intentionally Left Blank
Investment Adviser of 5-to-15 Year Laddered Municipal Bond Portfolio
Boston Management and Research
Two International Place
Boston, MA 02110
Investment Adviser and Administrator of Eaton Vance TABS 5-to-15 Year Laddered Municipal Bond NextShares
Eaton Vance Management
Two International Place
Boston, MA 02110
Investment Sub-Adviser
Parametric Portfolio Associates LLC
800 Fifth Avenue, Suite 2800
Seattle, WA 98104
Distributor*
Foreside Fund Services, LLC
Three Canal Plaza, Suite 100
Portland, ME 04101
Custodian
State Street Bank and Trust Company
State Street Financial Center, One Lincoln Street
Boston, MA 02111
Transfer and Dividend Disbursing Agent
State Street Bank and Trust Company
State Street Financial Center, One Lincoln Street
Boston, MA 02111
Independent Registered Public Accounting Firm
Deloitte & Touche LLP
200 Berkeley Street
Boston, MA 02116-5022
Fund Offices
Two International Place
Boston, MA 02110
| * | FINRA BrokerCheck. Investors may check the background of their Investment Professional by contacting the Financial Industry Regulatory Authority (FINRA). FINRA BrokerCheck is a free tool to help investors check the professional background of current and former FINRA-registered securities firms and brokers. FINRA BrokerCheck is available by calling 1-800-289-9999 and at www.FINRA.org. The FINRA BrokerCheck brochure describing this program is available to investors at www.FINRA.org. |


22628 1.31.21
The registrant (sometimes referred to as the “Fund”) has adopted a code of ethics applicable to its Principal Executive Officer, Principal Financial Officer and Principal Accounting Officer. The registrant undertakes to provide a copy of such code of ethics to any person upon request, without charge, by calling 1-800-262-1122. The registrant has not amended the code of ethics as described in Form N-CSR during the period covered by this report. The registrant has not granted any waiver, including an implicit waiver, from a provision of the code of ethics as described in Form N-CSR during the period covered by this report.
| Item 3. | Audit Committee Financial Expert |
The registrant’s Board of Trustees (the “Board”) has designated George J. Gorman and William H. Park, each an independent trustee, as audit committee financial experts. Mr. Gorman is a certified public accountant who is the Principal at George J. Gorman LLC (a consulting firm). Previously, Mr. Gorman served in various capacities at Ernst & Young LLP (a registered public accounting firm), including as Senior Partner. Mr. Gorman
also has experience serving as an independent trustee and audit committee financial expert of other mutual fund complexes. Mr. Park is a certified public accountant who is a private investor. Previously, he served as a consultant, as the Chief Financial Officer of Aveon Group, L.P. (an investment management firm), as the Vice Chairman of Commercial Industrial Finance Corp. (specialty finance company), as President and Chief Executive Officer of Prizm Capital Management, LLC (investment management firm), as Executive Vice President and Chief Financial Officer of United Asset Management Corporation (an institutional investment management firm) and as a Senior Manager at Price Waterhouse (now PricewaterhouseCoopers) (a registered public accounting firm).
| Item 4. | Principal Accountant Fees and Services |
Eaton Vance TABS 5-to-15 Year Laddered Municipal Bond NextShares (the “Fund”) is a series of Eaton Vance NextShares Trust II (the “Trust”), a Massachusetts business trust, which, including the Fund, contains a total of 7 series (the “Series”). The Trust is registered under the Investment Company Act of 1940 as an open-end management investment company. This Form N-CSR relates to the Fund’s annual report.
The following table presents the aggregate fees billed to the registrant for the fiscal years ended January 31, 2020 and January 31, 2021 by the registrant’s principal accountant, Deloitte & Touche LLP (“D&T”), for professional services rendered for the audit of the Fund’s annual financial statements and fees billed for other services rendered by D&T during such periods.
Eaton Vance TABS 5-to-15 Year Laddered Municipal Bond NextShares
| | | | | | | | |
Fiscal Year Ended | | 1/31/20 | | | 1/31/21 | |
Audit Fees | | $ | 14,150 | | | $ | 14,150 | |
Audit-Related Fees(1) | | $ | 0 | | | $ | 0 | |
Tax Fees(2) | | $ | 9,135 | | | $ | 6,625 | |
All Other Fees(3) | | $ | 0 | | | $ | 0 | |
| | | | | | | | |
Total | | $ | 23,285 | | | $ | 20,775 | |
| | | | | | | | |
| (1) | Audit-related fees consist of the aggregate fees billed for assurance and related services that are reasonably related to the performance of the audit of the registrant’s financial statements and are not reported under the category of audit fees. |
| (2) | Tax fees consist of the aggregate fees billed for professional services rendered by the principal accountant relating to tax compliance, tax advice, and tax planning and specifically include fees for tax return preparation and other related tax compliance/planning matters. |
| (3) | All other fees consist of the aggregate fees billed for products and services provided by the principal accountant other than audit, audit-related, and tax services. |
The various Series comprising the Trust have differing fiscal year ends (January 31, September 30 and October 31). The following table presents the aggregate audit, audit-related, tax, and other fees billed to all of the Series in the Trust by D&T for the last two fiscal periods of each Series.
| | | | | | | | |
Fiscal Periods Ended | | 1/31/20 | | | 1/31/21 | |
Audit Fees | | $ | 14,150 | | | $ | 14,150 | |
Audit-Related Fees(1) | | $ | 0 | | | $ | 0 | |
Tax Fees(2) | | $ | 9,135 | | | $ | 6,625 | |
All Other Fees(3) | | $ | 0 | | | $ | 0 | |
| | | | | | | | |
Total | | $ | 23,285 | | | $ | 20,775 | |
| | | | | | | | |
| (1) | Audit-related fees consist of the aggregate fees billed for assurance and related services that are reasonably related to the performance of the audit of the registrant’s financial statements and are not reported under the category of audit fees. |
| (2) | Tax fees consist of the aggregate fees billed for professional services rendered by the principal accountant relating to tax compliance, tax advice, and tax planning and specifically include fees for tax return preparation and other related tax compliance/planning matters. |
| (3) | All other fees consist of the aggregate fees billed for products and services provided by the principal accountant other than audit, audit-related, and tax services. |
(e)(1) The registrant’s audit committee has adopted policies and procedures relating to the pre-approval of services provided by the registrant’s principal accountant (the “Pre-Approval Policies”). The Pre-Approval Policies establish a framework intended to assist the audit committee in the proper discharge of its pre-approval responsibilities. As a general matter, the Pre-Approval Policies (i) specify certain types of audit, audit-related, tax, and other services determined to be pre-approved by the audit committee; and (ii) delineate specific procedures governing the mechanics of the pre-approval process, including the approval and monitoring of audit and non-audit service fees. Unless a service is specifically pre-approved under the Pre-Approval Policies, it must be separately pre-approved by the audit committee.
The Pre-Approval Policies and the types of audit and non-audit services pre-approved therein must be reviewed and ratified by the registrant’s audit committee at least annually. The registrant’s audit committee maintains full responsibility for the appointment, compensation, and oversight of the work of the registrant’s principal accountant.
(e)(2) No services described in paragraphs (b)-(d) above were approved by the registrant’s audit committee pursuant to the “de minimis exception” set forth in Rule 2-01 (c)(7)(i)(C) of Regulation S-X.
(f) Not applicable.
(g) The following table presents (i) the aggregate non-audit fees (i.e., fees for audit-related, tax, and other services) billed to the Fund (the only series of the Trust) by D&T for the last two fiscal years of the Fund; and (ii) the aggregate non-audit fees (i.e., fees for audit-related, tax, and other services) billed to the Eaton Vance organization by D&T for the last two fiscal years of each Series.
| | | | | | | | |
Fiscal Year Ended | | 1/31/20 | | | 1/31/21 | |
Registrant(1) | | $ | 9,135 | | | $ | 6,625 | |
Eaton Vance(2) | | $ | 59,903 | | | $ | 150,300 | |
| (1) | Includes all of the Series of the Trust. During the fiscal year reported above, certain of the Funds were “feeder” funds in a “master-feeder” fund structure or funds of funds. |
| (2) | Various subsidiaries of Morgan Stanley.act in either an investment advisory and/or service provider capacity with respect to the Series and/or their respective “master” funds (if applicable). |
(h) The registrant’s audit committee has considered whether the provision by the registrant’s principal accountant of non-audit services to the registrant’s investment adviser and any entity controlling, controlled by, or under common control with the adviser that provides ongoing services to the registrant that were not pre-approved pursuant to Rule 2-01(c)(7)(ii) of Regulation S-X is compatible with maintaining the principal accountant’s independence.
| Item 5. | Audit Committee of Listed Registrants |
Not applicable.
| Item 6. | Schedule of Investments |
Please see schedule of investments contained in the Report to Stockholders included under Item 1 of this Form N-CSR.
| Item 7. | Disclosure of Proxy Voting Policies and Procedures for Closed-End Management Investment Companies |
Not applicable.
| Item 8. | Portfolio Managers of Closed-End Management Investment Companies |
Not applicable.
| Item 9. | Purchases of Equity Securities by Closed-End Management Investment Company and Affiliated Purchasers |
Not applicable.
| Item 10. | Submission of Matters to a Vote of Security Holders |
No material changes.
| Item 11. | Controls and Procedures |
(a) It is the conclusion of the registrant’s principal executive officer and principal financial officer that the effectiveness of the registrant’s current disclosure controls and procedures (such disclosure controls and procedures having been evaluated within 90 days of the date of this filing) provide reasonable assurance that the information required to be disclosed by the registrant has been recorded, processed, summarized and reported within the time period specified in the Commission’s rules and forms and that the information required to be disclosed by the registrant has been accumulated and communicated to the registrant’s principal executive officer and principal financial officer in order to allow timely decisions regarding required disclosure.
(b) There have been no changes in the registrant’s internal controls over financial reporting during the period covered by this report that has materially affected, or is reasonably likely to materially affect, the registrant’s internal control over financial reporting.
| Item 12. | Disclosure of Securities Lending Activities for Closed-End Management Investment Companies |
Not applicable.
Signatures
Pursuant to the requirements of the Securities Exchange Act of 1934 and the Investment Company Act of 1940, the registrant has duly caused this report to be signed on its behalf by the undersigned, thereunto duly authorized.
| | |
| Eaton Vance NextShares Trust II |
| |
| By: | | /s/ Eric A. Stein |
| | Eric A. Stein |
| | President |
| |
Date: | | March 22, 2021 |
Pursuant to the requirements of the Securities Exchange Act of 1934 and the Investment Company Act of 1940, this report has been signed below by the following persons on behalf of the registrant and in the capacities and on the dates indicated.
| | |
| By: | | /s/ James F. Kirchner |
| | James F. Kirchner |
| | Treasurer |
| |
| Date: | | March 22, 2021 |
| | |
| By: | | /s/ Eric A. Stein |
| | Eric A. Stein |
| | President |
| |
| Date: | | March 22, 2021 |