UNITED STATES
SECURITIES AND EXCHANGE COMMISSION
Washington, D.C. 20549
Form N-CSR
CERTIFIED SHAREHOLDER REPORT OF REGISTERED
MANAGEMENT INVESTMENT COMPANIES
Investment Company Act File Number: 811-22983
Eaton Vance NextShares Trust II
(Exact Name of Registrant as Specified in Charter)
Two International Place, Boston, Massachusetts 02110
(Address of Principal Executive Offices)
Deidre E. Walsh
Two International Place, Boston, Massachusetts 02110
(Name and Address of Agent for Services)
(617) 482-8260
(Registrant’s Telephone Number)
January 31
Date of Fiscal Year End
July 31, 2021
Date of Reporting Period
| Item 1. | Reports to Stockholders |

Eaton Vance
TABS 5-to-15 Year Laddered Municipal Bond NextShares (EVLMC)
Listing Exchange: The NASDAQ Stock Market LLC
Semiannual Report
July 31, 2021
NextShares® is a registered trademark of NextShares Solutions LLC. All rights reserved.
Commodity Futures Trading Commission Registration. The Commodity Futures Trading Commission (“CFTC”) has adopted regulations that subject registered investment companies and advisers to regulation by the CFTC if a fund invests more than a prescribed level of its assets in certain CFTC-regulated instruments (including futures, certain options and swap agreements) or markets itself as providing investment exposure to such instruments. The investment adviser has claimed an exclusion from the definition of “commodity pool operator” under the Commodity Exchange Act with respect to its management of the Fund. Accordingly, neither the Fund nor the adviser with respect to the operation of the Fund is subject to CFTC regulation. Because of its management of other strategies, the Fund’s adviser and Parametric Portfolio Associates LLC (Parametric), sub-adviser to the Fund, are registered with the CFTC as a commodity pool operators. The adviser and Parametric are also registered as commodity trading advisors.
Fund shares are not insured by the FDIC and are not deposits or other obligations of, or guaranteed by, any depository institution. Shares are subject to investment risks, including possible loss of principal invested.
This report must be preceded or accompanied by a current summary prospectus or prospectus. Before investing in NextShares, investors should consider carefully the investment objective, risks, and charges and expenses. This and other important information is contained in the summary prospectus and prospectus, which can be obtained from a financial intermediary. Prospective investors should read the prospectus carefully before investing. For further information, please call 1-800-262-1122.
Semiannual Report July 31, 2021
Eaton Vance
TABS 5-to-15 Year Laddered Municipal Bond NextShares
Eaton Vance
TABS 5-to-15 Year Laddered Municipal Bond NextShares
July 31, 2021
Performance1,2,3
Portfolio Managers James H. Evans, CFA, Brian C. Barney, CFA and Christopher J. Harshman, CFA, each of Parametric Portfolio Associates LLC
| | | | | | | | | | | | | | | | | | | | | | | | | | | | |
| % Average Annual Total Returns | | Fund
Inception Date | | | Performance
Inception Date | | | Six Months | | | One Year | | | Five Years | | | Ten Years | | | Since
Fund
Inception | |
| | | | | | | |
Fund at NAV | | | 03/30/2016 | | | | 02/01/2010 | | | | 1.14 | % | | | 3.44 | % | | | 3.28 | % | | | 5.63 | % | | | 3.75 | % |
Fund at Market Price | | | 03/30/2016 | | | | 03/30/2016 | | | | 1.14 | | | | 3.44 | | | | 3.24 | | | | — | | | | 3.75 | |
|
| |
| | | | | | | |
Bloomberg 10 Year Municipal Bond Index | | | — | | | | — | | | | 0.94 | % | | | 2.81 | % | | | 3.44 | % | | | 4.38 | % | | | 3.75 | % |
Bloomberg 15 Year Municipal Bond Index | | | — | | | | — | | | | 1.50 | | | | 4.10 | | | | 4.10 | | | | 5.22 | | | | 4.50 | |
| | | | | | | |
| % Total Annual Operating Expense Ratios4 | | | | | | | | | | | | | | | | | | | | | |
| | | | | | | |
Gross | | | | | | | | | | | | | | | | | | | | | | | | | | | 1.98 | % |
Net | | | | | | | | | | | | | | | | | | | | | | | | | | | 0.35 | |
| | | | | | | |
| % Distribution Rates/Yields5 | | | | | | | | | | | | | | | | | | | | | |
| | | | | | | |
Distribution Rate at NAV | | | | | | | | | | | | | | | | | | | | | | | | | | | 1.89 | % |
SEC 30-day Yield - Subsidized | | | | | | | | | | | | | | | | | | | | | | | | | | | 0.46 | |
SEC 30-day Yield - Unsubsidized | | | | | | | | | | | | | | | | | | | | | | | | | | | –0.96 | |
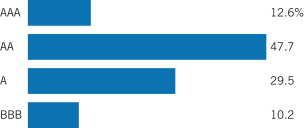
Fund Profile6
Credit Quality (% of total investments)7
See Endnotes and Additional Disclosures in this report.
Past performance is no guarantee of future results. Investment return and principal value will fluctuate so that shares, when sold, may be worth more or less than their original cost. Performance is for the stated time period only; due to market volatility, Fund performance may be lower or higher than the quoted return. The Fund’s performance at market price will differ from its results at net asset value (NAV). The market price used to calculate the Market Price return is the midpoint between the highest bid and the lowest offer on the exchange on which the shares of the Fund are listed for trading, as of the time that the Fund’s NAV is calculated. If you trade your shares at another time during the day, your return may differ. Returns are historical and are calculated by determining the percentage change in NAV or market price (as applicable) with all distributions reinvested at NAV or closing market price (as applicable) on the payment date of the distribution, and are net of management fees and other expenses. Performance for periods less than or equal to one year is cumulative. For performance as of the most recent month-end, including historical trading premiums/discounts relative to NAV, please refer to eatonvance.com.
Eaton Vance
TABS 5-to-15 Year Laddered Municipal Bond NextShares
July 31, 2021
Endnotes and Additional Disclosures
| 1 | Shares of NextShares funds are normally bought and sold in the secondary market through a broker, and may not be individually purchased or redeemed from the fund. In the secondary market, buyers and sellers transact with each other, rather than with the fund. NextShares funds issue and redeem shares only in specified creation unit quantities in transactions by or through Authorized Participants. In such transactions, a fund issues and redeems shares in exchange for the basket of securities, other instruments and/or cash that the fund specifies each business day. By transacting in kind, a NextShares fund can lower its trading costs and enhance fund tax efficiency by avoiding forced sales of securities to meet redemptions. Redemptions may be effected partially or entirely in cash when in-kind delivery is not practicable or deemed not in the best interests of shareholders. A fund’s basket is not intended to be representative of the fund’s current portfolio positions and may vary significantly from current positions. As exchange-traded securities, NextShares can operate with low transfer agency expenses by utilizing the same highly efficient share processing system as used for exchange-listed stocks and exchange-traded funds. Market trading prices of NextShares are linked to the fund’s next-computed net asset value (NAV) and will vary from NAV by a market-determined premium or discount, which may be zero. Buyers and sellers of NextShares will not know the value of their purchases and sales until after the fund’s NAV is determined at the end of the trading day. Market trading prices may vary significantly from anticipated levels. NextShares do not offer investors the opportunity to buy and sell intraday based on current (versus end-of-day) determinations of fund value. NextShares trade execution prices will fluctuate based on changes in NAV. Although limit orders may be used to control trading costs, they cannot be used to control or limit trade execution prices. As a new type of fund, NextShares have a limited operating history and may initially be available through a limited number of brokers. There can be no guarantee that an active trading market for NextShares will develop or be maintained, or that their listing will continue unchanged. Buying and selling NextShares may require payment of brokerage commissions and expose transacting shareholders to other trading costs. Frequent trading may detract from realized investment returns. The return on a shareholder’s NextShares investment will be reduced if the shareholder sells shares at a greater discount or narrower premium to NAV than he or she acquired the shares. |
| 2 | Bloomberg 10 Year Municipal Bond Index is an unmanaged index of municipal bonds traded in the U.S. with maturities ranging from 8-12 years. Bloomberg 15 Year Municipal Bond Index is an unmanaged index of municipal bonds traded in the U.S. with maturities ranging from 12-17 years. Unless otherwise stated, index returns do not reflect the effect of any applicable sales charges, commissions, expenses, taxes or leverage, as applicable. It is not possible to invest directly in an index. Prior to April 15, 2015, the Portfolio Investor had a different name and investment objective and employed a different investment strategy from the Portfolio Investor’s current investment strategy. Performance prior to April 15, 2015 reflects the Portfolio Investor’s performance under its former investment objective and policies. |
| 3 | The Fund pursues its investment objective by investing in a separate investment fund (the Portfolio). The returns at NAV for periods before the date the Fund commenced operations are for a mutual fund that invests in the Portfolio (the Portfolio Investor). The performance during such period does not represent the performance of the Fund. The prior investment performance of the Portfolio Investor (rather than the Portfolio itself) is shown because it reflects the expenses typically borne by a retail fund investing in the Portfolio. The Portfolio Investor returns are not adjusted to reflect differences between the total net operating expenses of |
| | the Fund and the Portfolio Investor during the periods shown. If such an adjustment were made, the performance presented would be higher, because the Fund’s total net operating expenses are lower than those of the Portfolio Investor. Performance is for a share class of the Portfolio Investor offered at net asset value. Performance presented in the Financial Highlights included in the financial statements is not linked. |
| 4 | Source: Fund prospectus. Net expense ratio reflects a contractual expense reimbursement that continues through 5/31/22. Without the reimbursement, performance would have been lower. The expense ratios for the current reporting period can be found in the Financial Highlights section of this report. |
| 5 | The Distribution Rate is based on the Fund’s last regular distribution per share in the period (annualized) divided by the Fund’s NAV at the end of the period. The Fund’s distributions may be comprised of amounts characterized for federal income tax purposes as tax-exempt income, qualified and non-qualified ordinary dividends, capital gains and nondividend distributions, also known as return of capital. The Fund will determine the federal income tax character of distributions paid to a shareholder after the end of the calendar year. This is reported on the IRS form 1099-DIV and provided to the shareholder shortly after each year-end. The Fund’s distributions are determined by the investment adviser based on its current assessment of the Fund’s long-term return potential. As portfolio and market conditions change, the rate of distributions paid by the Fund could change. The SEC Yield is a standardized measure based on the estimated yield to maturity of a fund’s investments over a 30-day period and is based on the maximum offer price at the date specified. The SEC Yield is not based on the distributions made by the Fund, which may differ. Subsidized yield reflects the effect of fee waivers and expense reimbursements. |
| 6 | The Fund primarily invests in an affiliated investment company (Portfolio) with substantially the same objective(s) and policies as the Fund and may also invest directly. Unless otherwise noted, references to investments are to the aggregate holdings of the Fund and the Portfolio. |
| 7 | For purposes of the Fund’s rating restrictions, ratings are based on Moody’s Investors Service, Inc. (“Moody’s”), S&P Global Ratings (“S&P”) or Fitch Ratings (“Fitch”), as applicable. If securities are rated differently by the ratings agencies, the highest rating is applied. Ratings, which are subject to change, apply to the creditworthiness of the issuers of the underlying securities and not to the Fund or its shares. Credit ratings measure the quality of a bond based on the issuer’s creditworthiness, with ratings ranging from AAA, being the highest, to D, being the lowest based on S&P’s measures. Ratings of BBB or higher by S&P or Fitch (Baa or higher by Moody’s) are considered to be investment-grade quality. Credit ratings are based largely on the ratings agency’s analysis at the time of rating. The rating assigned to any particular security is not necessarily a reflection of the issuer’s current financial condition and does not necessarily reflect its assessment of the volatility of a security’s market value or of the liquidity of an investment in the security. Holdings designated as “Not Rated” (if any) are not rated by the national ratings agencies stated above. |
Fund profile subject to change due to active management.
Important Notice to Shareholders
Effective August 24, 2021, the Bloomberg Barclays fixed income indices were rebranded as Bloomberg indices.
Eaton Vance
TABS 5-to-15 Year Laddered Municipal Bond NextShares
July 31, 2021
Fund Expenses
Example: As a Fund shareholder, you incur two types of costs: (1) transaction costs, including brokerage commissions on purchases and sales of Fund shares; and (2) ongoing costs, including management fees and other Fund expenses. This Example is intended to help you understand your ongoing costs (in dollars) of Fund investing and to compare these costs with the ongoing costs of investing in other funds. The Example is based on an investment of $1,000 invested at the beginning of the period and held for the entire period (February 1, 2021 – July 31, 2021).
Actual Expenses: The first section of the table below provides information about actual account values and actual expenses. You may use the information in this section, together with the amount you invested, to estimate the expenses that you paid over the period. Simply divide your account value by $1,000 (for example, an $8,600 account value divided by $1,000 = 8.6), then multiply the result by the number in the first section under the heading entitled “Expenses Paid During Period” to estimate the expenses you paid on your account during this period.
Hypothetical Example for Comparison Purposes: The second section of the table below provides information about hypothetical account values and hypothetical expenses based on the actual Fund expense ratio and an assumed rate of return of 5% per year (before expenses), which is not the actual Fund return. The hypothetical account values and expenses may not be used to estimate the actual ending account balance or expenses you paid for the period. You may use this information to compare the ongoing costs of investing in your Fund and other funds. To do so, compare this 5% hypothetical example with the 5% hypothetical examples that appear in the shareholder reports of the other funds.
Please note that the expenses shown in the table are meant to highlight your ongoing costs only and do not reflect any transactional costs, such as brokerage commissions on purchases and sales of Fund shares. Therefore, the second section of the table is useful in comparing ongoing costs only, and will not help you determine the relative total costs of owning different funds. In addition, if these transactional costs were included, your costs would be higher.
| | | | | | | | | | | | | | | | |
| | | Beginning
Account Value
(2/1/21) | | | Ending
Account Value
(7/31/21) | | | Expenses Paid
During Period*
(2/1/21 – 7/31/21) | | | Annualized
Expense
Ratio | |
| | | | |
Actual | | | | | | | | | | | | | | | | |
| | $ | 1,000.00 | | | $ | 1,011.40 | | | $ | 1.75 | ** | | | 0.35 | % |
| | | | | |
Hypothetical | | | | | | | | | | | | | | | | |
(5% return per year before expenses) | | | | | | | | | | | | | | | | |
| | $ | 1,000.00 | | | $ | 1,023.10 | | | $ | 1.76 | ** | | | 0.35 | % |
| * | Expenses are equal to the Fund’s annualized expense ratio, multiplied by the average account value over the period, multiplied by 181/365 (to reflect the one-half year period). The Example assumes that the $1,000 was invested at the net asset value per share determined at the close of business on January 31, 2021. The Example reflects the expenses of both the Fund and the Portfolio. |
| ** | Absent an allocation of certain expenses to affiliates, expenses would be higher. |
Eaton Vance
TABS 5-to-15 Year Laddered Municipal Bond NextShares
July 31, 2021
Statement of Assets and Liabilities (Unaudited)
| | | | |
| Assets | | July 31, 2021 | |
| |
Investment in 5-to-15 Year Laddered Municipal Bond Portfolio, at value (identified cost, $7,058,262) | | $ | 7,814,984 | |
| |
Receivable from affiliates | | | 3,182 | |
| |
Total assets | | $ | 7,818,166 | |
| |
| Liabilities | | | | |
| |
Payable to affiliates: | | | | |
| |
Operations agreement fee | | $ | 325 | |
| |
Accrued expenses | | | 147,879 | |
| |
Total liabilities | | $ | 148,204 | |
| |
Net Assets | | $ | 7,669,962 | |
| |
| Sources of Net Assets | | | | |
| |
Paid-in capital | | $ | 7,109,064 | |
| |
Distributable earnings | | | 560,898 | |
| |
Total | | $ | 7,669,962 | |
| |
| Net Asset Value Per Share | | | | |
| |
($7,669,962 ÷ 700,000 shares issued and outstanding) | | $ | 10.96 | |
| | | | |
| | 5 | | See Notes to Financial Statements. |
Eaton Vance
TABS 5-to-15 Year Laddered Municipal Bond NextShares
July 31, 2021
Statement of Operations (Unaudited)
| | | | |
| Investment Income | | Six Months Ended
July 31, 2021 | |
| |
Interest allocated from Portfolio | | $ | 78,847 | |
| |
Expenses allocated from Portfolio | | | (13,474 | ) |
| |
Total investment income from Portfolio | | $ | 65,373 | |
| |
| Expenses | | | | |
| |
Operations agreement fee | | $ | 1,886 | |
| |
Trustees’ fees and expenses | | | 250 | |
| |
Custodian fee | | | 5,746 | |
| |
Transfer and dividend disbursing agent fees | | | 6,878 | |
| |
Legal and accounting services | | | 10,331 | |
| |
Printing and postage | | | 2,515 | |
| |
Listing fee | | | 3,570 | |
| |
Intraday pricing fee | | | 5,951 | |
| |
Miscellaneous | | | 885 | |
| |
Total expenses | | $ | 38,012 | |
| |
Deduct — | | | | |
| |
Allocation of expenses to affiliates | | $ | 38,012 | |
| |
Total expense reductions | | $ | 38,012 | |
| |
Net expenses | | $ | 0 | |
| |
Net investment income | | $ | 65,373 | |
| |
| Realized and Unrealized Gain (Loss) from Portfolio | | | | |
| |
Net realized gain (loss) — | | | | |
| |
Investment transactions | | $ | 18,008 | |
| |
Net realized gain | | $ | 18,008 | |
| |
Change in unrealized appreciation (depreciation) — | | | | |
| |
Investments | | $ | 2,539 | |
| |
Net change in unrealized appreciation (depreciation) | | $ | 2,539 | |
| |
Net realized and unrealized gain | | $ | 20,547 | |
| |
Net increase in net assets from operations | | $ | 85,920 | |
| | | | |
| | 6 | | See Notes to Financial Statements. |
Eaton Vance
TABS 5-to-15 Year Laddered Municipal Bond NextShares
July 31, 2021
Statements of Changes in Net Assets
| | | | | | | | |
| Increase (Decrease) in Net Assets | | Six Months Ended
July 31, 2021
(Unaudited) | | | Year Ended
January 31, 2021 | |
| | |
From operations — | | | | | | | | |
| | |
Net investment income | | $ | 65,373 | | | $ | 147,092 | |
| | |
Net realized gain | | | 18,008 | | | | 35,409 | |
| | |
Net change in unrealized appreciation (depreciation) | | | 2,539 | | | | 160,518 | |
| | |
Net increase in net assets from operations | | $ | 85,920 | | | $ | 343,019 | |
| | |
Distributions to shareholders | | $ | (65,682 | ) | | $ | (148,830 | ) |
| | |
Other capital — | | | | | | | | |
| | |
Portfolio transaction fee contributed to Portfolio | | $ | (212 | ) | | $ | (488 | ) |
| | |
Portfolio transaction fee allocated from Portfolio | | | 1,157 | | | | 3,786 | |
| | |
Net increase in net assets from other capital | | $ | 945 | | | $ | 3,298 | |
| | |
Net increase in net assets | | $ | 21,183 | | | $ | 197,487 | |
| | |
| Net Assets | | | | | | | | |
| | |
At beginning of period | | $ | 7,648,779 | | | $ | 7,451,292 | |
| | |
At end of period | | $ | 7,669,962 | | | $ | 7,648,779 | |
| | |
| Changes in shares outstanding | | | | | | | | |
| | |
Shares outstanding, beginning of period | | | 700,000 | | | | 700,000 | |
| | |
Shares outstanding, end of period | | | 700,000 | | | | 700,000 | |
| | | | |
| | 7 | | See Notes to Financial Statements. |
Eaton Vance
TABS 5-to-15 Year Laddered Municipal Bond NextShares
July 31, 2021
Financial Highlights
| | | | | | | | | | | | | | | | | | | | | | | | |
| | | |
| | | Six Months Ended
July 31, 2021
(Unaudited) | | | Year Ended January 31, | | | Period Ended
January 31, 2017(1)(2) | |
| | | 2021 | | | 2020 | | | 2019 | | | 2018(1) | |
| | | | | | | |
Net asset value — Beginning of period | | $ | 10.930 | | | $ | 10.640 | | | $ | 10.080 | | | $ | 9.980 | | | $ | 9.790 | | | $ | 10.000 | |
| | | | | | |
| Income (Loss) From Operations | | | | | | | | | | | | | | | | | | | | | | | | |
| | | | | | |
Net investment income(3) | | $ | 0.093 | | | $ | 0.210 | | | $ | 0.229 | | | $ | 0.217 | | | $ | 0.229 | | | $ | 0.149 | |
| | | | | | |
Net realized and unrealized gain (loss) | | | 0.030 | | | | 0.288 | | | | 0.558 | | | | 0.095 | | | | 0.175 | | | | (0.238 | ) |
| | | | | | |
Total income (loss) from operations | | $ | 0.123 | | | $ | 0.498 | | | $ | 0.787 | | | $ | 0.312 | | | $ | 0.404 | | | $ | (0.089 | ) |
| | | | | | |
| Less Distributions | | | | | | | | | | | | | | | | | | | | | | | | |
| | | | | | |
From net investment income | | $ | (0.094 | ) | | $ | (0.213 | ) | | $ | (0.230 | ) | | $ | (0.216 | ) | | $ | (0.214 | ) | | $ | (0.110 | ) |
| | | | | | |
Total distributions | | $ | (0.094 | ) | | $ | (0.213 | ) | | $ | (0.230 | ) | | $ | (0.216 | ) | | $ | (0.214 | ) | | $ | (0.110 | ) |
| | | | | | |
Portfolio transaction fee, net(3) | | $ | 0.001 | | | $ | 0.005 | | | $ | 0.003 | | | $ | 0.004 | | | $ | 0.000 | (4) | | $ | (0.011 | ) |
| | | | | | |
Net asset value — End of period | | $ | 10.960 | | | $ | 10.930 | | | $ | 10.640 | | | $ | 10.080 | | | $ | 9.980 | | | $ | 9.790 | |
| | | | | | |
Total Return on Net Asset Value(5)(6) | | | 1.14 | %(7) | | | 4.80 | % | | | 7.92 | % | | | 3.23 | % | | | 4.13 | % | | | (1.03 | )%(7) |
| | | | | | |
| Ratios/Supplemental Data | | | | | | | | | | | | | | | | | | | | | | | | |
| | | | | | |
Net assets, end of period (000’s omitted) | | $ | 7,670 | | | $ | 7,649 | | | $ | 7,451 | | | $ | 7,055 | | | $ | 6,985 | | | $ | 22,028 | |
| | | | | | |
Ratios (as a percentage of average daily net assets):(8) | | | | | | | | | | | | | | | | | | | | | | | | |
| | | | | | |
Expenses(6) | | | 0.35 | %(9) | | | 0.35 | % | | | 0.35 | % | | | 0.35 | % | | | 0.35 | % | | | 0.35 | %(9) |
| | | | | | |
Net investment income | | | 1.73 | %(9) | | | 1.98 | % | | | 2.21 | % | | | 2.18 | % | | | 2.28 | % | | | 1.77 | %(9) |
| | | | | | |
Portfolio Turnover of the Portfolio | | | 10 | %(7) | | | 51 | % | | | 28 | % | | | 78 | % | | | 35 | % | | | 30 | %(7)(10) |
| (1) | Per share data reflect a 2-for-1 share split effective March 9, 2018. |
| (2) | For the period from the start of business, March 30, 2016, to January 31, 2017. |
| (3) | Computed using average shares outstanding. |
| (4) | Amount is less than $0.0005. |
| (5) | Returns are historical and are calculated by determining the percentage change in net asset value with all distributions reinvested and do not reflect the effect of a market-determined premium or discount. Investment returns assume that all distributions have been reinvested at net asset value. |
| (6) | The investment adviser and administrator and the sub-adviser of the Fund and the investment adviser and the sub-adviser of the Portfolio reimbursed certain operating expenses (equal to 1.02%, 1.63%, 1.40%, 1.53%, 0.74% and 1.10% of average daily net assets for the six months ended July 31, 2021, the years ended January 31, 2021, 2020, 2019 and 2018 and the period ended January 31, 2017, respectively). Absent this reimbursement, total return would be lower. |
| (8) | Includes the Fund’s share of the Portfolio’s allocated expenses. |
| (10) | For the period from the Portfolio’s start of business, March 28, 2016, to January 31, 2017. |
| | | | |
| | 8 | | See Notes to Financial Statements. |
Eaton Vance
TABS 5-to-15 Year Laddered Municipal Bond NextShares
July 31, 2021
Notes to Financial Statements (Unaudited)
1 Significant Accounting Policies
Eaton Vance TABS 5-to-15 Year Laddered Municipal Bond NextShares (the Fund) is a diversified series of Eaton Vance NextShares Trust II (the Trust), a Massachusetts business trust registered under the Investment Company Act of 1940, as amended (the 1940 Act). The Fund is an exchange-traded managed fund operating pursuant to an order issued by the SEC granting an exemption from certain provisions of the 1940 Act. Individual shares of the Fund may be purchased and sold only on a national securities exchange or alternative trading system through a broker-dealer that offers NextShares, and may not be directly purchased or redeemed from the Fund. Market trading prices for the Fund are directly linked to the Fund’s next-computed net asset value per share (NAV) and will vary from NAV by a market-determined premium or discount, which may be zero. The Fund invests all of its investable assets in interests in 5-to-15 Year Laddered Municipal Bond Portfolio (the Portfolio), a Massachusetts business trust, having substantially the same investment objective and policies as the Fund. The value of the Fund’s investment in the Portfolio reflects the Fund’s proportionate interest in the net assets of the Portfolio (0.8% at July 31, 2021). The performance of the Fund is directly affected by the performance of the Portfolio. The financial statements of the Portfolio, including the portfolio of investments, are included elsewhere in this report and should be read in conjunction with the Fund’s financial statements.
The following is a summary of significant accounting policies of the Fund. The policies are in conformity with accounting principles generally accepted in the United States of America (U.S. GAAP). The Fund is an investment company and follows accounting and reporting guidance in the Financial Accounting Standards Board (FASB) Accounting Standards Codification Topic 946.
A Investment Valuation — Valuation of securities by the Portfolio is discussed in Note 1A of the Portfolio’s Notes to Financial Statements, which are included elsewhere in this report.
B Income — The Fund’s net investment income or loss consists of the Fund’s pro-rata share of the net investment income or loss of the Portfolio, less all actual and accrued expenses of the Fund.
C Federal Taxes — The Fund’s policy is to comply with the provisions of the Internal Revenue Code applicable to regulated investment companies and to distribute to shareholders each year substantially all of its taxable, if any, and tax-exempt net investment income, and all or substantially all of its net realized capital gains. Accordingly, no provision for federal income or excise tax is necessary. The Fund intends to satisfy conditions which will enable it to designate distributions from the interest income generated by the Portfolio’s investments in municipal obligations, which are exempt from regular federal income tax when received by the Portfolio, as exempt-interest dividends. The portion of such interest, if any, earned on private activity bonds issued after August 7, 1986, may be considered a tax preference item to shareholders.
As of July 31, 2021, the Fund had no uncertain tax positions that would require financial statement recognition, de-recognition, or disclosure. The Fund files a U.S. federal income tax return annually after its fiscal year-end, which is subject to examination by the Internal Revenue Service for a period of three years from the date of filing.
D Expenses — The majority of expenses of the Trust are directly identifiable to an individual fund. Expenses which are not readily identifiable to a specific fund are allocated taking into consideration, among other things, the nature and type of expense and the relative size of the funds.
E Use of Estimates — The preparation of the financial statements in conformity with U.S. GAAP requires management to make estimates and assumptions that affect the reported amounts of assets and liabilities at the date of the financial statements and the reported amounts of income and expense during the reporting period. Actual results could differ from those estimates.
F Indemnifications — Under the Trust’s organizational documents, its officers and Trustees may be indemnified against certain liabilities and expenses arising out of the performance of their duties to the Fund. Under Massachusetts law, if certain conditions prevail, shareholders of a Massachusetts business trust (such as the Trust) could be deemed to have personal liability for the obligations of the Trust. However, the Trust’s Declaration of Trust contains an express disclaimer of liability on the part of Fund shareholders and the By-laws provide that the Trust shall assume, upon request by the shareholder, the defense on behalf of any Fund shareholders. Moreover, the By-laws also provide for indemnification out of Fund property of any shareholder held personally liable solely by reason of being or having been a shareholder for all loss or expense arising from such liability. Additionally, in the normal course of business, the Fund enters into agreements with service providers that may contain indemnification clauses. The Fund’s maximum exposure under these arrangements is unknown as this would involve future claims that may be made against the Fund that have not yet occurred.
G Other — Investment transactions are accounted for on a trade date basis.
H Interim Financial Statements — The interim financial statements relating to July 31, 2021 and for the six months then ended have not been audited by an independent registered public accounting firm, but in the opinion of the Fund’s management, reflect all adjustments, consisting only of normal recurring adjustments, necessary for the fair presentation of the financial statements.
2 Distributions to Shareholders and Income Tax Information
It is the present policy of the Fund to make monthly distributions of all or substantially all of its net investment income and to distribute annually all or substantially all of its net realized capital gains. Distributions are paid in cash and cannot be automatically reinvested in additional shares of the Fund. Distributions to shareholders are recorded on the ex-dividend date. Distributions to shareholders are determined in accordance with income tax regulations,
Eaton Vance
TABS 5-to-15 Year Laddered Municipal Bond NextShares
July 31, 2021
Notes to Financial Statements (Unaudited) — continued
which may differ from U.S. GAAP. As required by U.S. GAAP, only distributions in excess of tax basis earnings and profits are reported in the financial statements as a return of capital. Permanent differences between book and tax accounting relating to distributions are reclassified to paid-in capital. For tax purposes, distributions from short-term capital gains are considered to be from ordinary income.
At January 31, 2021, the Fund, for federal income tax purposes, had deferred capital losses of $62,888 which would reduce its taxable income arising from future net realized gains on investment transactions, if any, to the extent permitted by the Internal Revenue Code, and thus would reduce the amount of distributions to shareholders, which would otherwise be necessary to relieve the Fund of any liability for federal income or excise tax. The deferred capital losses are treated as arising on the first day of the Fund’s next taxable year and retain the same short-term or long-term character as when originally deferred. Of the deferred capital losses at January 31, 2021, $62,888 are short-term.
3 Investment Adviser and Administration Fee and Other Transactions with Affiliates
The investment adviser and administration fee is earned by Eaton Vance Management (EVM) as compensation for investment advisory and administrative services rendered to the Fund. On March 1, 2021, Morgan Stanley acquired Eaton Vance Corp. (the “Transaction”) and EVM became an indirect, wholly-owned subsidiary of Morgan Stanley. In connection with the Transaction, the Fund entered into a new investment advisory and administrative agreement (the “New Agreement”) with EVM, which took effect on March 1, 2021. Pursuant to the New Agreement (and the Fund’s investment advisory and administrative agreement with EVM in effect prior to March 1, 2021), the investment adviser and administration fee is computed at an annual rate as a percentage of the Fund’s average daily net assets that are not invested in other investment companies for which EVM or its affiliates serve as investment adviser and receive an advisory fee, as follows and is payable monthly:
| | | | |
| Average Daily Net Assets | | Annual Fee
Rate | |
| |
Up to $1 billion | | | 0.3200 | % |
| |
$1 billion but less than $2.5 billion | | | 0.3075 | % |
| |
$2.5 billion but less than $5 billion | | | 0.2950 | % |
| |
$5 billion and over | | | 0.2875 | % |
For the six months ended July 31, 2021, the Fund incurred no investment adviser and administration fee on such assets. To the extent the Fund’s assets are invested in the Portfolio, the Fund is allocated its pro rata share of the Portfolio’s investment adviser fee. The Portfolio has engaged Boston Management and Research (BMR) to render investment advisory services. See Note 2 of the Portfolio’s Notes to Financial Statements which are included elsewhere in this report.
Pursuant to an investment sub-advisory agreement, EVM has delegated the investment management of the Fund to Parametric Portfolio Associates LLC (Parametric), an affiliate of EVM and, effective March 1, 2021, an indirect, wholly-owned subsidiary of Morgan Stanley. In connection with the Transaction, EVM entered into a new investment sub-advisory agreement with Parametric, which took effect on March 1, 2021. EVM pays Parametric a portion of its investment adviser fee for sub-advisory services provided to the Fund.
The Trust, on behalf of the Fund, has entered into an operations agreement with EVM pursuant to which EVM provides the Fund with services required for it to operate as a NextShares exchange-traded managed fund in accordance with the exemptive order obtained by EVM and the Trust. Pursuant to the agreement, the Fund pays EVM a monthly fee at an annual rate of 0.05% of the Fund’s average daily net assets provided the average net assets of NextShares funds sponsored by EVM (“Covered Assets”) are less than $10 billion. The annual rate is reduced if Covered Assets are $10 billion and above. For the six months ended July 31, 2021, the operations agreement fee amounted to $1,886 or 0.05% (annualized) of the Fund’s average daily net assets.
EVM and Parametric have agreed to reimburse the Fund’s expenses to the extent that total annual operating expenses (relating to ordinary operating expenses only) exceed 0.35% of the Fund’s average daily net assets through May 31, 2022. Thereafter, the reimbursement may be changed or terminated at any time. Pursuant to this agreement, EVM and Parametric were allocated $38,012 in total of the Fund’s operating expenses for the six months ended July 31, 2021.
Trustees and officers of the Fund who are members of EVM’s or BMR’s organizations receive remuneration for their services to the Fund out of the investment adviser fee. Certain officers and Trustees of the Fund and the Portfolio are officers of the above organizations.
4 Investment Transactions
For the six months ended July 31, 2021, increases and decreases in the Fund’s investment in the Portfolio aggregated $49,821 and $19,434, respectively. In addition, a Portfolio transaction fee is imposed by the Portfolio on the combined daily inflows or outflows of the Fund and the Portfolio’s other investors as more fully described at Note 1H of the Portfolio’s financial statements included herein. Such fee is allocated to the Fund based on its pro-rata interest in the Portfolio. The amount of the Portfolio transaction fee imposed on the Fund, if any, and the allocation of such fee are presented as Other capital on the Statements of Changes in Net Assets.
Eaton Vance
TABS 5-to-15 Year Laddered Municipal Bond NextShares
July 31, 2021
Notes to Financial Statements (Unaudited) — continued
5 Capital Share Transactions
The Trust may issue an unlimited number of shares of capital stock (no par value per share) in one or more series (such as the Fund). The Fund issues and redeems shares only in blocks of 25,000 shares or multiples thereof (“Creation Units”). The Fund issues and redeems Creation Units in return for the securities, other instruments and/or cash (the “Basket”) that the Fund specifies each business day. Creation Units may be purchased or redeemed only by or through Authorized Participants, which are broker-dealers or institutional investors that have entered into agreements with the Fund’s distributor for this purpose. The Fund imposes a transaction fee on Creation Units issued and redeemed to offset the estimated cost to the Fund of processing the transaction, which is paid by the Authorized Participants directly to a third-party administrator. In addition, Authorized Participants pay the Fund a variable charge for converting the Basket to or from the desired portfolio composition. Such variable charges are reflected as Transaction fees on the Statements of Changes in Net Assets.
At July 31, 2021, EVM owned approximately 95.6% of the outstanding shares of the Fund.
5-to-15 Year Laddered Municipal Bond Portfolio
July 31, 2021
Portfolio of Investments (Unaudited)
| | | | | | | | |
| Tax-Exempt Municipal Obligations — 96.1% | |
| Security | | Principal
Amount
(000’s omitted) | | | Value | |
| | |
| Bond Bank — 0.2% | | | | | | |
| | |
Vermont Bond Bank, (Vermont State Colleges System), 3.00%, 10/1/35 | | $ | 500 | | | $ | 567,460 | |
| | |
Virginia Resources Authority, (Pooled Financing Program), 4.00%, 11/1/35 | | | 1,175 | | | | 1,415,417 | |
| |
| | | | $ | 1,982,877 | |
|
| Education — 5.0% | |
| | |
Arizona State University: | | | | | | | | |
| | |
5.00%, 7/1/35 | | $ | 1,500 | | | $ | 1,997,130 | |
| | |
5.00%, 7/1/36 | | | 1,000 | | | | 1,327,670 | |
| | |
Brownsburg 1999 School Building Corp., IN, 5.00%, 2/5/26 | | | 565 | | | | 676,881 | |
| | |
Connecticut Health and Educational Facilities Authority, (Fairfield University): | | | | | | | | |
| | |
5.00%, 7/1/25 | | | 875 | | | | 1,023,942 | |
| | |
5.00%, 7/1/26 | | | 1,000 | | | | 1,206,260 | |
| | |
Louisiana Public Facilities Authority, (Tulane University), 5.00%, 12/15/27 | | | 505 | | | | 620,670 | |
| | |
New York Dormitory Authority, (Rochester Institute of Technology): | | | | | | | | |
| | |
5.00%, 7/1/35 | | | 540 | | | | 698,312 | |
| | |
5.00%, 7/1/36 | | | 395 | | | | 509,503 | |
| | |
5.00%, 7/1/37 | | | 840 | | | | 1,080,744 | |
| | |
New York Dormitory Authority, (School Districts Revenue Bond Financing Program): | | | | | | | | |
| | |
5.00%, 10/1/32 | | | 1,500 | | | | 1,974,720 | |
| | |
5.00%, 10/1/33 | | | 1,175 | | | | 1,538,933 | |
| | |
North Carolina Capital Facilities Finance Agency, (Davidson College), 5.00%, 3/1/29 | | | 200 | | | | 205,476 | |
| | |
Oklahoma Agricultural and Mechanical Colleges, (Oklahoma State University): | | | | | | | | |
| | |
4.00%, 9/1/33 | | | 305 | | | | 387,521 | |
| | |
4.00%, 9/1/34 | | | 350 | | | | 443,149 | |
| | |
Saginaw Valley State University, MI: | | | | | | | | |
| | |
5.00%, 7/1/26 | | | 750 | | | | 904,290 | |
| | |
5.00%, 7/1/27 | | | 500 | | | | 609,070 | |
| | |
5.00%, 7/1/28 | | | 1,000 | | | | 1,214,890 | |
| | |
Swarthmore Borough Authority, PA, (Swarthmore College): | | | | | | | | |
| | |
4.00%, 9/15/35(1) | | | 2,245 | | | | 2,845,942 | |
| | |
4.00%, 9/15/37(1) | | | 1,925 | | | | 2,421,727 | |
| | |
Texas A&M University: | | | | | | | | |
| | |
4.00%, 5/15/33 | | | 1,600 | | | | 2,031,552 | |
| | |
4.00%, 5/15/34 | | | 1,000 | | | | 1,265,190 | |
| | |
| University of Florida: | | | | | | |
| | |
4.00%, 7/1/31 | | | 5,000 | | | | 6,343,850 | |
| | | | | | | | |
| Security | | Principal
Amount
(000’s omitted) | | | Value | |
|
| Education (continued) | |
| | |
| University of Florida: (continued) | | | | | | |
| | |
4.00%, 7/1/32 | | $ | 6,465 | | | $ | 8,139,176 | |
| | |
4.00%, 7/1/33 | | | 6,720 | | | | 8,421,974 | |
| | |
University of Hawaii, 3.00%, 10/1/31 | | | 1,000 | | | | 1,150,280 | |
| |
| | | | $ | 49,038,852 | |
|
| Electric Utilities — 2.1% | |
| | |
Brownsville, TX, Utilities System Revenue, 5.00%, 9/1/29 | | $ | 1,000 | | | $ | 1,176,170 | |
| | |
Energy Northwest, WA, Wind Project Revenue: | | | | | | | | |
| | |
5.00%, 7/1/25 | | | 365 | | | | 428,831 | |
| | |
5.00%, 7/1/26 | | | 1,000 | | | | 1,171,490 | |
| | |
Garland, TX, Electric Utility System Revenue, 5.00%, 3/1/32 | | | 250 | | | | 297,573 | |
| | |
Marquette Board of Light and Power, MI, 5.00%, 7/1/27 | | | 735 | | | | 897,369 | |
| | |
New Braunfels, TX, Utility System Revenue, 4.00%, 7/1/34 | | | 770 | | | | 915,692 | |
| | |
North Carolina Municipal Power Agency No. 1, (Catawba), 5.00%, 1/1/29 | | | 500 | | | | 601,735 | |
| | |
Redding Joint Powers Financing Authority, CA, Electric System Revenue, 5.00%, 6/1/26 | | | 250 | | | | 300,542 | |
| | |
Seattle, WA, Municipal Light and Power Revenue, 0.27%, (SIFMA + 0.25%), 11/1/26 (Put Date), 5/1/45(1)(2) | | | 2,000 | | | | 2,000,920 | |
| | |
Seattle, WA, Municipal Light and Power Revenue, Green Bonds, 4.00%, 7/1/34 | | | 5,035 | | | | 6,259,311 | |
| | |
Springfield Electric System Revenue, IL: | | | | | | | | |
| | |
5.00%, 3/1/27 | | | 250 | | | | 290,450 | |
| | |
5.00%, 3/1/28 | | | 250 | | | | 289,870 | |
| | |
5.00%, 3/1/29 | | | 250 | | | | 289,290 | |
| | |
Tallahassee, FL, Energy System Revenue: | | | | | | | | |
| | |
5.00%, 10/1/27 | | | 300 | | | | 344,688 | |
| | |
5.00%, 10/1/28 | | | 400 | | | | 458,764 | |
| | |
5.00%, 10/1/29 | | | 1,120 | | | | 1,284,158 | |
| | |
5.00%, 10/1/30 | | | 1,500 | | | | 1,719,855 | |
| | |
5.00%, 10/1/31 | | | 1,000 | | | | 1,146,230 | |
| | |
5.00%, 10/1/33 | | | 300 | | | | 343,458 | |
| | |
Walnut Energy Center Authority, CA, 5.00%, 1/1/33 | | | 250 | | | | 282,615 | |
| |
| | | | $ | 20,499,011 | |
|
| Escrowed / Prerefunded — 0.5% | |
| | |
Pennington County, SD, Certificates of Participation, Prerefunded to 6/1/25, 5.00%, 6/1/27 | | $ | 1,300 | | | $ | 1,532,895 | |
| | |
Seward County Unified School District No. 480, KS, Prerefunded to 9/1/25, 5.00%, 9/1/29 | | | 2,000 | | | | 2,379,780 | |
| | |
South Dakota Building Authority: | | | | | | | | |
| | |
Prerefunded to 6/1/25, 5.00%, 6/1/28 | | | 210 | | | | 248,063 | |
| | |
Series 2015B, Prerefunded to 6/1/25, 5.00%, 6/1/30 | | | 200 | | | | 236,250 | |
| |
| | | | $ | 4,396,988 | |
| | | | |
| | 12 | | See Notes to Financial Statements. |
5-to-15 Year Laddered Municipal Bond Portfolio
July 31, 2021
Portfolio of Investments (Unaudited) — continued
| | | | | | | | |
| Security | | Principal
Amount
(000’s omitted) | | | Value | |
|
| General Obligations — 29.3% | |
| | |
Addison, TX, 5.00%, 2/15/26 | | $ | 270 | | | $ | 290,282 | |
| | |
Anchorage, AK: | | | | | | | | |
| | |
5.00%, 9/1/25 | | | 100 | | | | 118,818 | |
| | |
5.00%, 9/1/27 | | | 780 | | | | 921,905 | |
| | |
Belding Area Schools, MI: | | | | | | | | |
| | |
5.00%, 5/1/28 | | | 250 | | | | 303,860 | |
| | |
5.00%, 5/1/30 | | | 250 | | | | 302,288 | |
| | |
Birmingham, AL: | | | | | | | | |
| | |
5.00%, 12/1/25 | | | 1,050 | | | | 1,255,758 | |
| | |
5.00%, 12/1/27 | | | 2,460 | | | | 3,123,142 | |
| | |
Bonneville and Bingham Counties Joint School District No. 93, ID, 5.00%, 9/15/32 | | | 450 | | | | 539,190 | |
| | |
Brookline, MA: | | | | | | | | |
| | |
5.00%, 3/15/30 | | | 2,000 | | | | 2,627,860 | |
| | |
5.00%, 3/15/31 | | | 3,825 | | | | 5,000,308 | |
| | |
Burlington, VT: | | | | | | | | |
| | |
5.00%, 11/1/27 | | | 305 | | | | 387,008 | |
| | |
5.00%, 11/1/29 | | | 135 | | | | 179,743 | |
| | |
5.00%, 11/1/30 | | | 300 | | | | 395,952 | |
| | |
Series 2016A, 5.00%, 11/1/26 | | | 150 | | | | 184,946 | |
| | |
Series 2019A, 5.00%, 11/1/26 | | | 210 | | | | 258,924 | |
| | |
California: | | | | | | | | |
| | |
4.00%, 9/1/26 | | | 320 | | | | 378,803 | |
| | |
4.00%, 8/1/36 | | | 5,000 | | | | 5,791,100 | |
| | |
5.00%, 8/1/26 | | | 2,010 | | | | 2,385,769 | |
| | |
5.00%, 12/1/29 | | | 700 | | | | 939,008 | |
| | |
5.00%, 12/1/30 | | | 2,750 | | | | 3,773,935 | |
| | |
5.00%, 12/1/31 | | | 1,550 | | | | 2,167,101 | |
| | |
5.00%, 8/1/32 | | | 1,590 | | | | 1,932,232 | |
| | |
5.00%, 12/1/34 | | | 2,500 | | | | 3,373,875 | |
| | |
5.00%, 12/1/35 | | | 3,000 | | | | 4,040,400 | |
| | |
Cape May County, NJ, 3.00%, 10/1/31 | | | 1,000 | | | | 1,114,870 | |
| | |
Carrollton-Farmers Branch Independent School District, TX, (PSF Guaranteed): | | | | | | | | |
| | |
4.00%, 2/15/32 | | | 650 | | | | 814,353 | |
| | |
4.00%, 2/15/33 | | | 1,000 | | | | 1,248,910 | |
| | |
4.00%, 2/15/34 | | | 1,010 | | | | 1,257,359 | |
| | |
Chaffey Joint Union High School District, CA, (Election of 2012), 0.00%, 8/1/33 | | | 1,000 | | | | 769,880 | |
| | |
Clark County, NV: | | | | | | | | |
| | |
3.00%, 11/1/36 | | | 3,730 | | | | 4,216,355 | |
| | |
5.00%, 11/1/26 | | | 1,020 | | | | 1,258,823 | |
| | |
Colonial School District, PA: | | | | | | | | |
| | |
5.00%, 2/15/32 | | | 100 | | | | 118,679 | |
| | |
5.00%, 2/15/33 | | | 200 | | | | 237,182 | |
| | | | | | | | |
| Security | | Principal
Amount
(000’s omitted) | | | Value | |
|
| General Obligations (continued) | |
| | |
Connecticut: | | | | | | | | |
| | |
3.00%, 1/15/33 | | $ | 4,000 | | | $ | 4,575,400 | |
| | |
4.00%, 6/1/30 | | | 1,000 | | | | 1,262,150 | |
| | |
4.00%, 6/1/32 | | | 1,000 | | | | 1,242,850 | |
| | |
4.00%, 6/1/33 | | | 600 | | | | 743,250 | |
| | |
4.00%, 6/1/35 | | | 850 | | | | 1,042,738 | |
| | |
4.00%, 6/1/36 | | | 1,000 | | | | 1,220,280 | |
| | |
Contra Costa Community College District, CA, (Election of 2014): | | | | | | | | |
| | |
4.00%, 8/1/32 | | | 650 | | | | 804,434 | |
| | |
4.00%, 8/1/33 | | | 100 | | | | 123,379 | |
| | |
Cook County School District No. 25, IL, (Arlington Heights), 5.00%, 12/15/32 | | | 630 | | | | 781,150 | |
| | |
Dallas, TX: | | | | | | | | |
| | |
5.00%, 2/15/29 | | | 1,885 | | | | 2,100,116 | |
| | |
5.00%, 2/15/31 | | | 3,615 | | | | 3,870,327 | |
| | |
Delaware, 5.00%, 2/1/29 | | | 1,000 | | | | 1,279,900 | |
| | |
Denton County, TX, 4.00%, 7/15/31 | | | 1,500 | | | | 1,801,530 | |
| | |
District of Columbia, 5.00%, 6/1/33 | | | 6,690 | | | | 7,555,351 | |
| | |
Dowagiac Union School District, MI, 4.00%, 5/1/26 | | | 350 | | | | 409,696 | |
| | |
Dublin City School District, OH, 5.00%, 12/1/29 | | | 500 | | | | 650,370 | |
| | |
Easton Area School District, PA, 5.00%, 2/1/31 | | | 1,650 | | | | 2,086,375 | |
| | |
Elk Grove Unified School District, CA: | | | | | | | | |
| | |
4.00%, 8/1/32 | | | 3,105 | | | | 3,919,069 | |
| | |
4.00%, 8/1/33 | | | 3,370 | | | | 4,232,450 | |
| | |
Flower Mound, TX, 5.00%, 3/1/27 | | | 510 | | | | 617,804 | |
| | |
Franklin County, OH, Prerefunded to 6/1/23, 4.25%, 12/1/35 | | | 1,100 | | | | 1,183,754 | |
| | |
Frisco Independent School District, TX, (PSF Guaranteed), 4.00%, 8/15/30 | | | 400 | | | | 449,224 | |
| | |
Georgia, 5.00%, 2/1/32 | | | 1,000 | | | | 1,239,200 | |
| | |
Granville Exempted Village School District, OH, 5.00%, 12/1/26 | | | 500 | | | | 601,085 | |
| | |
Harlandale Independent School District, TX, 5.00%, 8/1/29 | | | 845 | | | | 1,044,750 | |
| | |
Hawaii, 5.00%, 1/1/30 | | | 3,730 | | | | 4,861,421 | |
| | |
Hennepin County, MN, 5.00%, 12/1/33 | | | 1,000 | | | | 1,234,900 | |
| | |
Homewood, AL: | | | | | | | | |
| | |
5.00%, 9/1/28 | | | 2,000 | | | | 2,445,900 | |
| | |
5.00%, 9/1/29 | | | 2,000 | | | | 2,444,560 | |
| | |
Honolulu City and County, HI, 3.00%, 9/1/31 | | | 110 | | | | 122,222 | |
| | |
Illinois: | | | | | | | | |
| | |
5.00%, 9/1/27 | | | 12,035 | | | | 14,900,533 | |
| | |
5.00%, 3/1/28 | | | 2,000 | | | | 2,055,480 | |
| | |
5.00%, 4/1/29 | | | 1,190 | | | | 1,328,683 | |
| | |
5.00%, 3/1/34 | | | 6,000 | | | | 6,166,560 | |
| | |
5.00%, 3/1/35 | | | 1,000 | | | | 1,028,110 | |
| | |
5.50%, 5/1/30 | | | 5,500 | | | | 7,405,200 | |
| | | | |
| | 13 | | See Notes to Financial Statements. |
5-to-15 Year Laddered Municipal Bond Portfolio
July 31, 2021
Portfolio of Investments (Unaudited) — continued
| | | | | | | | |
| Security | | Principal
Amount
(000’s omitted) | | | Value | |
|
| General Obligations (continued) | |
| | |
Kane, Cook and DuPage Counties School District No. 46, IL, 5.00%, 1/1/29 | | $ | 1,000 | | | $ | 1,111,950 | |
| | |
Kane, McHenry, Cook and DeKalb Counties Community Unit School District No. 300, IL, 5.00%, 1/1/28 | | | 2,370 | | | | 2,984,920 | |
| | |
Kennewick School District No. 17, WA: | | | | | | | | |
| | |
4.00%, 12/1/33 | | | 1,155 | | | | 1,445,379 | |
| | |
4.00%, 12/1/34 | | | 1,200 | | | | 1,497,444 | |
| | |
Lakeland, FL: | | | | | | | | |
| | |
5.00%, 10/1/25 | | | 635 | | | | 740,410 | |
| | |
5.00%, 10/1/28 | | | 1,500 | | | | 1,752,585 | |
| | |
5.00%, 10/1/30 | | | 1,000 | | | | 1,166,000 | |
| | |
Leander Independent School District, TX, (PSF Guaranteed), 0.00%, 8/15/31 | | | 600 | | | | 431,568 | |
| | |
Lewisville Independent School District, TX, (PSF Guaranteed), 4.00%, 8/15/27 | | | 1,600 | | | | 1,832,048 | |
| | |
Los Angeles Community College District, CA, (Election of 2008), 4.00%, 8/1/34 | | | 1,690 | | | | 1,972,484 | |
| | |
Los Angeles Unified School District, CA: | | | | | | | | |
| | |
4.00%, 7/1/33 | | | 2,500 | | | | 3,122,925 | |
| | |
4.00%, 7/1/36 | | | 3,000 | | | | 3,695,040 | |
| | |
Maine, 5.00%, 6/1/30 | | | 2,605 | | | | 3,524,200 | |
| | |
McLean County Public Building Commission, IL, 5.00%, 12/1/28 | | | 200 | | | | 231,162 | |
| | |
Miami-Dade County School District, FL, 5.00%, 3/15/28 | | | 300 | | | | 349,959 | |
| | |
Miami-Dade County, FL, 5.00%, 7/1/29 | | | 1,000 | | | | 1,180,860 | |
| | |
Milpitas Unified School District, CA, (Election of 2012), 4.00%, 8/1/32 | | | 560 | | | | 619,914 | |
| | |
Morris Township, NJ, 3.00%, 11/1/27 | | | 440 | | | | 493,090 | |
| | |
Mountain View-Los Altos Union High School District, CA, 0.00%, 8/1/27 | | | 175 | | | | 166,857 | |
| | |
Navasota Independent School District, TX, (PSF Guaranteed): | | | | | | | | |
| | |
5.00%, 2/15/28 | | | 195 | | | | 226,416 | |
| | |
5.00%, 2/15/29 | | | 340 | | | | 394,386 | |
| | |
5.00%, 2/15/30 | | | 725 | | | | 840,137 | |
| | |
5.00%, 2/15/31 | | | 885 | | | | 1,023,865 | |
| | |
5.00%, 2/15/32 | | | 720 | | | | 831,874 | |
| | |
New Jersey: | | | | | | | | |
| | |
4.00%, 6/1/31 | | | 5,000 | | | | 6,314,600 | |
| | |
5.00%, 6/1/26 | | | 2,500 | | | | 3,041,425 | |
| | |
5.00%, 6/1/27 | | | 5,000 | | | | 6,268,450 | |
| | |
5.00%, 6/1/28 | | | 10,000 | | | | 12,874,500 | |
| | |
New York, 5.00%, 3/15/31 | | | 3,000 | | | | 4,147,740 | |
| | |
Ohio, (Adult Correctional Building Fund): | | | | | | | | |
| | |
5.00%, 10/1/28 | | | 1,000 | | | | 1,296,430 | |
| | |
5.00%, 10/1/29 | | | 1,500 | | | | 1,987,950 | |
| | |
5.00%, 10/1/30 | | | 1,000 | | | | 1,353,360 | |
| | | | | | | | |
| Security | | Principal
Amount
(000’s omitted) | | | Value | |
|
| General Obligations (continued) | |
| | |
Oregon: | | | | | | | | |
| | |
2.35%, 6/1/25 | | $ | 165 | | | $ | 177,651 | |
| | |
2.40%, 12/1/25 | | | 1,050 | | | | 1,138,347 | |
| | |
2.50%, 6/1/26 | | | 1,070 | | | | 1,170,922 | |
| | |
Pasadena, TX: | | | | | | | | |
| | |
4.00%, 2/15/28 | | | 500 | | | | 562,655 | |
| | |
4.00%, 2/15/29 | | | 150 | | | | 168,572 | |
| | |
4.00%, 2/15/30 | | | 500 | | | | 561,530 | |
| | |
4.00%, 2/15/31 | | | 650 | | | | 729,261 | |
| | |
Pendleton School District No. 16R, Umatilla County, OR, 0.00%, 6/15/27 | | | 1,060 | | | | 1,006,618 | |
| | |
Pennsylvania: | | | | | | | | |
| | |
4.00%, 6/15/31 | | | 135 | | | | 148,415 | |
| | |
Prerefunded to 6/1/22, 4.00%, 6/1/30 | | | 5,000 | | | | 5,163,400 | |
| | |
Philadelphia, PA: | | | | | | | | |
| | |
5.00%, 2/1/26 | | | 1,150 | | | | 1,383,508 | |
| | |
5.00%, 2/1/31 | | | 1,550 | | | | 2,030,608 | |
| | |
Pittsburg Unified School District, CA, 5.00%, 8/1/28 | | | 920 | | | | 1,157,802 | |
| | |
Port of Seattle, WA, Limited Tax General Obligation Bonds, 5.00%, 6/1/28 | | | 2,000 | | | | 2,266,580 | |
| | |
Portland, OR, 5.00%, 6/1/30 | | | 6,515 | | | | 8,827,043 | |
| | |
Ravenswood City School District, CA, (Election of 2016): | | | | | | | | |
| | |
5.00%, 8/1/25 | | | 485 | | | | 575,244 | |
| | |
5.00%, 8/1/26 | | | 505 | | | | 618,999 | |
| | |
5.00%, 8/1/27 | | | 530 | | | | 651,709 | |
| | |
5.00%, 8/1/28 | | | 555 | | | | 680,902 | |
| | |
5.00%, 8/1/29 | | | 575 | | | | 703,524 | |
| | |
Romeo Community Schools, MI, 5.00%, 5/1/30 | | | 700 | | | | 846,405 | |
| | |
Romulus, MI: | | | | | | | | |
| | |
4.00%, 11/1/31 | | | 250 | | | | 286,118 | |
| | |
4.00%, 11/1/32 | | | 100 | | | | 114,396 | |
| | |
4.00%, 11/1/33 | | | 250 | | | | 285,610 | |
| | |
SCAGO Educational Facilities Corp. for Pickens School District, SC, 5.00%, 12/1/26 | | | 1,650 | | | | 1,928,867 | |
| | |
School District 27J, Adams and Weld Counties and City and County of Broomfield, CO, 4.00%, 12/1/30 | | | 450 | | | | 519,408 | |
| | |
Seguin Independent School District, TX, (PSF Guaranteed), 4.00%, 8/15/29 | | | 300 | | | | 341,826 | |
| | |
Southfield Public Schools, MI: | | | | | | | | |
| | |
5.00%, 5/1/25 | | | 1,100 | | | | 1,291,730 | |
| | |
5.00%, 5/1/27 | | | 1,000 | | | | 1,252,630 | |
| | |
St. Mary’s County, MD: | | | | | | | | |
| | |
5.00%, 5/1/28 | | | 1,255 | | | | 1,618,109 | |
| | |
5.00%, 5/1/30 | | | 1,245 | | | | 1,681,410 | |
| | | | |
| | 14 | | See Notes to Financial Statements. |
5-to-15 Year Laddered Municipal Bond Portfolio
July 31, 2021
Portfolio of Investments (Unaudited) — continued
| | | | | | | | |
| Security | | Principal
Amount
(000’s omitted) | | | Value | |
|
| General Obligations (continued) | |
| | |
St. Vrain Valley School District RE-1J, CO: | | | | | | | | |
| | |
5.00%, 12/15/28 | | $ | 1,700 | | | $ | 2,105,824 | |
| | |
5.00%, 12/15/29 | | | 1,000 | | | | 1,235,130 | |
| | |
Stamford, CT, 4.00%, 8/1/27 | | | 650 | | | | 743,847 | |
| | |
Sun Valley, ID: | | | | | | | | |
| | |
5.00%, 9/15/25 | | | 755 | | | | 901,002 | |
| | |
5.00%, 9/15/26 | | | 695 | | | | 857,123 | |
| | |
Texas, 4.00%, 8/26/21 | | | 10,000 | | | | 10,026,500 | |
| | |
Torrance Unified School District, CA, (Election of 2014): | | | | | | | | |
| | |
5.00%, 8/1/30 | | | 515 | | | | 627,837 | |
| | |
5.00%, 8/1/31 | | | 450 | | | | 546,858 | |
| | |
Tuloso-Midway Independent School District, TX, (PSF Guaranteed): | | | | | | | | |
| | |
4.00%, 8/15/27 | | | 510 | | | | 582,201 | |
| | |
4.00%, 8/15/28 | | | 530 | | | | 603,437 | |
| | |
4.00%, 8/15/29 | | | 545 | | | | 620,281 | |
| | |
Virginia, 3.00%, 6/1/32 | | | 2,000 | | | | 2,358,440 | |
| | |
Washington: | | | | | | | | |
| | |
5.00%, 8/1/28 | | | 1,485 | | | | 1,821,872 | |
| | |
5.00%, 8/1/29 | | | 1,400 | | | | 1,716,820 | |
| | |
Wellesley, MA: | | | | | | | | |
| | |
5.00%, 4/1/30 | | | 1,990 | | | | 2,692,768 | |
| | |
5.00%, 4/1/31 | | | 1,985 | | | | 2,747,200 | |
| | |
Will and Kendall Counties Community Consolidated School District No. 202, IL, 4.00%, 1/1/27 | | | 2,825 | | | | 3,305,617 | |
| | |
Will County Community Unit School District No. 365-U, IL, 4.00%, 1/1/30 | | | 360 | | | | 412,531 | |
| | |
York County, PA, 5.00%, 6/1/27 | | | 1,225 | | | | 1,418,513 | |
| |
| | | | $ | 284,672,347 | |
|
| Hospital — 13.0% | |
| | |
Allegheny County Hospital Development Authority, PA, (Allegheny Health Network Obligated Group): | | | | | | | | |
| | |
5.00%, 4/1/31 | | $ | 1,750 | | | $ | 2,193,397 | |
| | |
5.00%, 4/1/33 | | | 3,000 | | | | 3,740,520 | |
| | |
Buffalo and Erie County Industrial Land Development Corp., NY, (Catholic Health System, Inc.), 5.00%, 7/1/25 | | | 250 | | | | 292,130 | |
| | |
California Health Facilities Financing Authority, (Adventist Health System/West), 4.00%, 3/1/27 | | | 90 | | | | 95,354 | |
| | |
California Health Facilities Financing Authority, (CommonSpirit Health), 4.00%, 4/1/36 | | | 3,000 | | | | 3,646,350 | |
| | |
California Health Facilities Financing Authority, (El Camino Hospital), 5.00%, 2/1/29 | | | 750 | | | | 930,877 | |
| | |
Clarke County Hospital Authority, GA, (Piedmont Healthcare, Inc.), 5.00%, 7/1/30 | | | 335 | | | | 402,938 | |
| | | | | | | | |
| Security | | Principal
Amount
(000’s omitted) | | | Value | |
|
| Hospital (continued) | |
| | |
Cobb County Kennestone Hospital Authority, GA, (WellStar Health System, Inc.): | | | | | | | | |
| | |
4.00%, 4/1/34 | | $ | 100 | | | $ | 121,464 | |
| | |
4.00%, 4/1/35 | | | 290 | | | | 351,500 | |
| | |
4.00%, 4/1/36 | | | 300 | | | | 362,454 | |
| | |
Colorado Health Facilities Authority, (CommonSpirit Health): | | | | | | | | |
| | |
5.00%, 8/1/34 | | | 2,000 | | | | 2,560,500 | |
| | |
5.00%, 8/1/35 | | | 3,000 | | | | 3,835,170 | |
| | |
5.00% to 8/1/26 (Put Date), 8/1/49 | | | 5,000 | | | | 5,977,900 | |
| | |
Colorado Health Facilities Authority, (NCMC, Inc.), Escrowed to Maturity, 5.00%, 5/15/25 | | | 150 | | | | 176,253 | |
| | |
Colorado Health Facilities Authority, (Sanford Health), 5.00%, 11/1/32 | | | 3,000 | | | | 3,927,240 | |
| | |
Connecticut Health and Educational Facilities Authority, (Stamford Hospital): | | | | | | | | |
| | |
4.00%, 7/1/26 | | | 600 | | | | 694,542 | |
| | |
4.00%, 7/1/27 | | | 700 | | | | 827,421 | |
| | |
4.00%, 7/1/28 | | | 650 | | | | 780,696 | |
| | |
4.00%, 7/1/29 | | | 500 | | | | 608,460 | |
| | |
4.00%, 7/1/30 | | | 750 | | | | 923,235 | |
| | |
Geisinger Authority, PA, (Geisinger Health System), 5.00%, 4/1/35 | | | 6,000 | | | | 7,857,360 | |
| | |
Glynn-Brunswick Memorial Hospital Authority, GA, (Southeast Georgia Health System), 4.00%, 8/1/35 | | | 1,000 | | | | 1,205,010 | |
| | |
Greeneville Health and Educational Facilities Board, TN, (Ballad Health), 5.00%, 7/1/33 | | | 4,000 | | | | 4,353,040 | |
| | |
Illinois Finance Authority, (Riverside Health System): | | | | | | | | |
| | |
4.00%, 11/15/32 | | | 750 | | | | 852,053 | |
| | |
5.00%, 11/15/27 | | | 500 | | | | 607,830 | |
| | |
Illinois Finance Authority, (Rush University Medical Center): | | | | | | | | |
| | |
5.00%, 11/15/31 | | | 1,000 | | | | 1,161,560 | |
| | |
5.00%, 11/15/32 | | | 1,000 | | | | 1,160,750 | |
| | |
Kentucky Economic Development Finance Authority, (Catholic Health Initiatives), 1.42%, (SIFMA + 1.40%), 2/1/25 (Put Date), 2/1/46(2) | | | 12,715 | | | | 12,824,603 | |
| | |
Knox County Health, Educational and Housing Facility Board, TN, (University Health System, Inc.), 5.00%, 9/1/30 | | | 1,000 | | | | 1,174,450 | |
| | |
Louisiana Public Facilities Authority, (Ochsner Clinic Foundation): | | | | | | | | |
| | |
5.00%, 5/15/25 | | | 250 | | | | 292,848 | |
| | |
5.00%, 5/15/26 | | | 250 | | | | 290,698 | |
| | |
5.00%, 5/15/27 | | | 250 | | | | 289,983 | |
| | |
Louisville/Jefferson County Metro Government, KY, (Norton Healthcare, Inc.): | | | | | | | | |
| | |
5.00%, 10/1/30 | | | 2,000 | | | | 2,412,480 | |
| | |
5.00%, 10/1/31 | | | 1,500 | | | | 1,807,935 | |
| | |
5.00%, 10/1/32 | | | 2,000 | | | | 2,406,000 | |
| | | | |
| | 15 | | See Notes to Financial Statements. |
5-to-15 Year Laddered Municipal Bond Portfolio
July 31, 2021
Portfolio of Investments (Unaudited) — continued
| | | | | | | | |
| Security | | Principal
Amount
(000’s omitted) | | | Value | |
|
| Hospital (continued) | |
| | |
Maricopa County Industrial Development Authority, AZ, (Banner Health), 0.59%, (SIFMA + 0.57%), 10/18/24 (Put Date), 1/1/35(2) | | $ | 4,730 | | | $ | 4,712,641 | |
| | |
Maryland Health and Higher Educational Facilities Authority, (MedStar Health, Inc.), 5.00%, 8/15/31 | | | 1,000 | | | | 1,156,140 | |
| | |
Massachusetts Development Finance Agency, (Berkshire Retirement Community, Inc.), 5.00%, 7/1/25 | | | 485 | | | | 541,347 | |
| | |
Massachusetts Development Finance Agency, (South Shore Hospital): | | | | | | | | |
| | |
5.00%, 7/1/24 | | | 550 | | | | 620,725 | |
| | |
5.00%, 7/1/26 | | | 500 | | | | 602,325 | |
| | |
5.00%, 7/1/28 | | | 245 | | | | 293,106 | |
| | |
Medford Hospital Facilities Authority, OR, (Asante Health System): | | | | | | | | |
| | |
5.00%, 8/15/34 | | | 1,000 | | | | 1,325,510 | |
| | |
5.00%, 8/15/35 | | | 700 | | | | 926,317 | |
| | |
5.00%, 8/15/36 | | | 1,000 | | | | 1,319,870 | |
| | |
Michigan Finance Authority, (Beaumont Health Credit Group), 5.00%, 8/1/28 | | | 1,315 | | | | 1,498,350 | |
| | |
Missouri Health and Educational Facilities Authority, (CoxHealth), 5.00%, 11/15/31 | | | 490 | | | | 564,828 | |
| | |
Missouri Health and Educational Facilities Authority, (Saint Luke’s Health System), 5.00%, 11/15/31 | | | 1,000 | | | | 1,192,390 | |
| | |
Monongalia County Building Commission, WV, (Monongalia Health System Obligated Group): | | | | | | | | |
| | |
5.00%, 7/1/23 | | | 400 | | | | 433,300 | |
| | |
5.00%, 7/1/28 | | | 1,340 | | | | 1,537,663 | |
| | |
5.00%, 7/1/29 | | | 775 | | | | 885,709 | |
| | |
Montgomery County, OH, (Kettering Health Network Obligated Group): | | | | | | | | |
| | |
5.00%, 8/1/32 | | | 275 | | | | 371,685 | |
| | |
5.00%, 8/1/33 | | | 300 | | | | 404,067 | |
| | |
New Hampshire Health and Education Facilities Authority, (Dartmouth-Hitchcock Obligated Group): | | | | | | | | |
| | |
5.00%, 8/1/25 | | | 400 | | | | 472,680 | |
| | |
5.00%, 8/1/28 | | | 500 | | | | 632,530 | |
| | |
5.00%, 8/1/29 | | | 500 | | | | 628,475 | |
| | |
New Jersey Health Care Facilities Financing Authority, (Princeton HealthCare System): | | | | | | | | |
| | |
5.00%, 7/1/25 | | | 1,000 | | | | 1,180,860 | |
| | |
5.00%, 7/1/27 | | | 700 | | | | 857,276 | |
| | |
5.00%, 7/1/28 | | | 700 | | | | 856,135 | |
| | |
5.00%, 7/1/30 | | | 520 | | | | 634,286 | |
| | |
5.00%, 7/1/31 | | | 700 | | | | 852,698 | |
| | |
Norman Regional Hospital Authority, OK, 5.00%, 9/1/25 | | | 1,000 | | | | 1,178,380 | |
| | |
Oregon Facilities Authority, (Samaritan Health Services), 5.00%, 10/1/32 | | | 750 | | | | 887,295 | |
| | | | | | | | |
| Security | | Principal
Amount
(000’s omitted) | | | Value | |
|
| Hospital (continued) | |
| | |
Pennsylvania Economic Development Financing Authority, (UPMC), 4.00%, 10/15/37 | | $ | 1,375 | | | $ | 1,700,036 | |
| | |
Pennsylvania Higher Educational Facilities Authority, (University of Pennsylvania Health System), 5.00%, 8/15/33 | | | 2,250 | | | | 2,937,532 | |
| | |
Public Finance Authority, WI, (Renown Regional Medical Center): | | | | | | | | |
| | |
4.00%, 6/1/35 | | | 795 | | | | 960,519 | |
| | |
5.00%, 6/1/34 | | | 1,320 | | | | 1,728,500 | |
| | |
5.00%, 6/1/36 | | | 2,310 | | | | 3,010,507 | |
| | |
Richmond County Hospital Authority, GA, (University Health Services, Inc.), 5.00%, 1/1/28 | | | 1,000 | | | | 1,211,110 | |
| | |
Royal Oak Hospital Finance Authority, MI, (William Beaumont Hospital), 5.00%, 9/1/29 | | | 250 | | | | 280,035 | |
| | |
Southcentral Pennsylvania General Authority, (Hanover Hospital, Inc.), 4.00%, 12/1/30 | | | 150 | | | | 167,921 | |
| | |
St. Paul Housing and Redevelopment Authority, MN, (Fairview Health Services), 5.00%, 11/15/25 | | | 500 | | | | 592,875 | |
| | |
St. Paul Housing and Redevelopment Authority, MN, (HealthPartners Obligated Group), 5.00%, 7/1/30 | | | 625 | | | | 735,900 | |
| | |
University of Kansas Hospital Authority, (KU Health System), 5.00%, 9/1/27 | | | 1,655 | | | | 1,958,312 | |
| | |
Utah County, UT, (IHC Health Services, Inc.), 5.00% to 8/1/26 (Put Date), 5/15/60 | | | 3,500 | | | | 4,264,365 | |
| | |
Vermont Educational and Health Buildings Financing Agency, (University of Vermont Medical Center): | | | | | | | | |
| | |
5.00%, 12/1/25 | | | 335 | | | | 398,901 | |
| | |
5.00%, 12/1/26 | | | 300 | | | | 362,097 | |
| | |
5.00%, 12/1/27 | | | 205 | | | | 247,216 | |
| | |
5.00%, 12/1/28 | | | 500 | | | | 602,435 | |
| | |
5.00%, 12/1/30 | | | 400 | | | | 481,528 | |
| | |
5.00%, 12/1/31 | | | 300 | | | | 360,672 | |
| | |
Washington Health Care Facilities Authority, (Overlake Hospital Medical Center), 5.00%, 7/1/27 | | | 1,575 | | | | 1,971,947 | |
| | |
Wisconsin Health and Educational Facilities Authority, (Advocate Aurora Health Credit Group), 5.00% to 7/29/26 (Put Date), 8/15/54 | | | 3,550 | | | | 4,342,750 | |
| | |
Wisconsin Health and Educational Facilities Authority, (Agnesian HealthCare, Inc.), 5.00%, 7/1/26 | | | 400 | | | | 486,608 | |
| |
| | | | $ | 126,513,355 | |
|
| Housing — 2.2% | |
| | |
Connecticut Housing Finance Authority, 3.60%, 11/15/30 | | $ | 145 | | | $ | 152,752 | |
| | |
Georgia Housing & Finance Authority, 3.65%, 12/1/32 | | | 1,000 | | | | 1,085,820 | |
| | |
Iowa Finance Authority, SFMR, (FHLMC), (FNMA), (GNMA): | | | | | | | | |
| | |
1.50%, 1/1/31 | | | 300 | | | | 302,097 | |
| | |
1.60%, 7/1/31 | | | 300 | | | | 303,840 | |
| | | | |
| | 16 | | See Notes to Financial Statements. |
5-to-15 Year Laddered Municipal Bond Portfolio
July 31, 2021
Portfolio of Investments (Unaudited) — continued
| | | | | | | | |
| Security | | Principal
Amount
(000’s omitted) | | | Value | |
|
| Housing (continued) | |
| | |
Minnesota Housing Finance Agency: | | | | | | | | |
| | |
2019 Series A, 4.00%, 8/1/34 | | $ | 295 | | | $ | 354,847 | |
| | |
2019 Series A, 4.00%, 8/1/35 | | | 440 | | | | 526,997 | |
| | |
2019 Series C, 4.00%, 8/1/33 | | | 525 | | | | 633,827 | |
| | |
2019 Series C, 4.00%, 8/1/34 | | | 240 | | | | 288,689 | |
| | |
2019 Series C, 4.00%, 8/1/35 | | | 285 | | | | 341,350 | |
| | |
New York City Housing Development Corp., NY: | | | | | | | | |
| | |
2.65%, 11/1/27 | | | 870 | | | | 933,797 | |
| | |
2.80%, 5/1/29 | | | 655 | | | | 705,926 | |
| | |
2.85%, 11/1/29 | | | 300 | | | | 323,238 | |
| | |
New York Housing Finance Agency, (FHLMC), (FNMA), (GNMA): | | | | | | | | |
| | |
2.20%, 5/1/25 | | | 190 | | | | 200,775 | |
| | |
2.25%, 11/1/25 | | | 225 | | | | 239,400 | |
| | |
2.40%, 11/1/26 | | | 225 | | | | 242,557 | |
| | |
2.50%, 11/1/27 | | | 140 | | | | 150,438 | |
| | |
2.60%, 5/1/28 | | | 110 | | | | 118,421 | |
| | |
New York Mortgage Agency: | | | | | | | | |
| | |
2.30%, 10/1/30 | | | 1,000 | | | | 1,050,560 | |
| | |
3.65%, 4/1/32 | | | 1,000 | | | | 1,095,520 | |
| | |
Seattle Housing Authority, WA: | | | | | | | | |
| | |
2.875%, 12/1/25 | | | 900 | | | | 984,294 | |
| | |
3.00%, 12/1/26 | | | 920 | | | | 1,021,117 | |
| | |
Seattle Housing Authority, WA, (Northgate Plaza), 1.00%, 6/1/26 | | | 7,675 | | | | 7,698,716 | |
| | |
Tennessee Housing Development Agency, 2.80%, 7/1/26 | | | 250 | | | | 273,677 | |
| | |
Vermont Housing Finance Agency, (FHLMC), (FNMA), (GNMA), 3.85%, 11/1/33 | | | 1,287 | | | | 1,440,024 | |
| | |
Virginia Housing Development Authority, 2.55%, 5/1/27 | | | 630 | | | | 667,491 | |
| | |
Washington Housing Finance Commission: | | | | | | | | |
| | |
2.25%, 6/1/25 | | | 105 | | | | 111,208 | |
| | |
2.30%, 12/1/25 | | | 130 | | | | 138,649 | |
| | |
2.40%, 6/1/26 | | | 105 | | | | 112,275 | |
| |
| | | | $ | 21,498,302 | |
|
| Insured – Education — 0.7% | |
| | |
New York Dormitory Authority, (School Districts Revenue Bond Financing Program), (AGM), 5.00%, 10/1/33 | | $ | 1,625 | | | $ | 2,120,917 | |
| | |
Patterson Joint Unified School District, CA, (Election 2018): | | | | | | | | |
| | |
(BAM), 5.00%, 8/1/28 | | | 1,065 | | | | 1,294,231 | |
| | |
(BAM), 5.00%, 8/1/29 | | | 1,000 | | | | 1,211,400 | |
| | |
University of Central Florida, (AGM), 4.00%, 10/1/34(1) | | | 1,805 | | | | 2,254,445 | |
| |
| | | | $ | 6,880,993 | |
| | | | | | | | |
| Security | | Principal
Amount
(000’s omitted) | | | Value | |
|
| Insured – Electric Utilities — 0.2% | |
| | |
Municipal Electric Authority of Georgia, (Plant Vogtle Units 3 and 4): | | | | | | | | |
| | |
(AGM), 4.00%, 1/1/36 | | $ | 770 | | | $ | 915,214 | |
| | |
(AGM), 4.00%, 1/1/37 | | | 1,125 | | | | 1,332,933 | |
| |
| | | | $ | 2,248,147 | |
|
| Insured – Escrowed / Prerefunded — 0.0%(3) | |
| | |
New Britain, CT: | | | | | | | | |
| | |
(BAM), Escrowed to Maturity, 5.00%, 3/1/25 | | $ | 5 | | | $ | 5,832 | |
| | |
(BAM), Escrowed to Maturity, 5.00%, 3/1/25 | | | 100 | | | | 116,829 | |
| |
| | | | $ | 122,661 | |
|
| Insured – General Obligations — 1.3% | |
| | |
Fort Bend County Municipal Utility District No. 58, TX: | | | | | | | | |
| | |
(BAM), 3.00%, 4/1/26 | | $ | 185 | | | $ | 204,469 | |
| | |
(BAM), 3.00%, 4/1/30 | | | 725 | | | | 814,247 | |
| | |
(BAM), 3.00%, 4/1/32 | | | 360 | | | | 400,644 | |
| | |
New Britain, CT, (BAM), 5.00%, 3/1/25 | | | 135 | | | | 156,530 | |
| | |
Ogle and Winnebago Counties Community Unit School District No. 223, IL, (BAM), 4.00%, 12/1/25 | | | 470 | | | | 528,116 | |
| | |
Pharr, TX: | | | | | | | | |
| | |
(AGM), 4.00%, 8/15/35 | | | 2,190 | | | | 2,709,512 | |
| | |
(AGM), 4.00%, 8/15/36 | | | 1,945 | | | | 2,401,433 | |
| | |
(AGM), 4.00%, 8/15/37 | | | 2,485 | | | | 3,058,364 | |
| | |
Pocono Mountain School District, PA, (AGM), 4.00%, 9/1/27 | | | 690 | | | | 812,979 | |
| | |
Yonkers, NY: | | | | | | | | |
| | |
(BAM), Series 2019A, 5.00%, 5/1/31 | | | 750 | | | | 978,112 | |
| | |
(BAM), Series 2019B, 5.00%, 5/1/31 | | | 825 | | | | 1,075,924 | |
| |
| | | | $ | 13,140,330 | |
|
| Insured – Housing — 0.2% | |
| | |
California Municipal Finance Authority, (CHF-Davis II, LLC - Orchard Park Student Housing), Green Bonds: | | | | | | | | |
| | |
(BAM), 4.00%, 5/15/35 | | $ | 600 | | | $ | 742,476 | |
| | |
(BAM), 4.00%, 5/15/36 | | | 600 | | | | 739,992 | |
| |
| | | | $ | 1,482,468 | |
|
| Insured – Lease Revenue / Certificates of Participation — 0.5% | |
| | |
Biloxi Public School District, MS, (BAM), 5.00%, 4/1/25 | | $ | 1,350 | | | $ | 1,572,493 | |
| | |
Clermont County Port Authority, OH, (West Clermont Local School District): | | | | | | | | |
| | |
(BAM), 5.00%, 12/1/26 | | | 250 | | | | 297,688 | |
| | |
(BAM), 5.00%, 12/1/29 | | | 100 | | | | 118,180 | |
| | | | |
| | 17 | | See Notes to Financial Statements. |
5-to-15 Year Laddered Municipal Bond Portfolio
July 31, 2021
Portfolio of Investments (Unaudited) — continued
| | | | | | | | |
| Security | | Principal
Amount
(000’s omitted) | | | Value | |
|
| Insured – Lease Revenue / Certificates of Participation (continued) | |
| | |
Highlands County School Board, FL: | | | | | | | | |
| | |
(BAM), 5.00%, 3/1/26 | | $ | 400 | | | $ | 463,948 | |
| | |
(BAM), 5.00%, 3/1/27 | | | 200 | | | | 231,588 | |
| | |
Pasco County School Board, FL: | | | | | | | | |
| | |
(BAM), 5.00%, 8/1/25 | | | 305 | | | | 360,150 | |
| | |
(BAM), 5.00%, 8/1/26 | | | 355 | | | | 432,976 | |
| | |
(BAM), 5.00%, 8/1/27 | | | 605 | | | | 737,888 | |
| | |
(BAM), 5.00%, 8/1/29 | | | 310 | | | | 374,347 | |
| |
| | | | $ | 4,589,258 | |
|
| Insured – Other Revenue — 0.5% | |
| | |
New York Dormitory Authority, School Districts Revenue Bond Financing Program: | | | | | | | | |
| | |
(AGM), 5.00%, 10/1/33 | | $ | 1,250 | | | $ | 1,597,400 | |
| | |
(AGM), 5.00%, 10/1/34 | | | 1,250 | | | | 1,594,538 | |
| | |
(AGM), 5.00%, 10/1/35 | | | 1,000 | | | | 1,274,540 | |
| |
| | | | $ | 4,466,478 | |
|
| Insured – Special Tax Revenue — 0.1% | |
| | |
Successor Agency to Yuba City Redevelopment Agency, CA, (AGM), 5.00%, 9/1/25 | | $ | 420 | | | $ | 496,226 | |
| | |
Vineyard Redevelopment Agency, UT: | | | | | | | | |
| | |
(AGM), 4.00%, 5/1/34(1) | | | 115 | | | | 140,371 | |
| | |
(AGM), 4.00%, 5/1/36(1) | | | 135 | | | | 163,866 | |
| |
| | | | $ | 800,463 | |
|
| Insured – Transportation — 1.3% | |
| | |
New Brunswick Parking Authority, NJ: | | | | | | | | |
| | |
(BAM), 5.00%, 9/1/25 | | $ | 500 | | | $ | 589,190 | |
| | |
(BAM), 5.00%, 9/1/26 | | | 320 | | | | 380,218 | |
| | |
(BAM), 5.00%, 9/1/27 | | | 375 | | | | 444,229 | |
| | |
New Orleans Aviation Board, LA: | | | | | | | | |
| | |
(AGM), 5.00%, 1/1/30 | | | 1,000 | | | | 1,254,880 | |
| | |
(AGM), 5.00%, 1/1/31 | | | 1,250 | | | | 1,560,950 | |
| | |
(AGM), 5.00%, 1/1/32 | | | 1,650 | | | | 2,056,741 | |
| | |
(AGM), 5.00%, 1/1/33 | | | 2,450 | | | | 3,046,771 | |
| | |
(AGM), 5.00%, 1/1/34 | | | 2,485 | | | | 3,082,742 | |
| |
| | | | $ | 12,415,721 | |
|
| Insured – Water and Sewer — 0.1% | |
| | |
Gulf Coast Waste Disposal Authority, TX, (AGM), 5.00%, 10/1/30 | | $ | 250 | | | $ | 296,527 | |
| | |
Hamburg Municipal Authority, PA, Sewer Revenue: | | | | | | | | |
| | |
(AGM), 2.00%, 10/1/32 | | | 370 | | | | 381,781 | |
| | |
(AGM), 2.00%, 10/1/34 | | | 200 | | | | 205,332 | |
| | |
(AGM), 2.00%, 10/1/36 | | | 255 | | | | 259,585 | |
| | | | | | | | |
| Security | | Principal
Amount
(000’s omitted) | | | Value | |
|
| Insured – Water and Sewer (continued) | |
| | |
Western Riverside Water and Wastewater Financing Authority, CA, (AGM), 4.00%, 9/1/28 | | $ | 250 | | | $ | 303,360 | |
| |
| | | | $ | 1,446,585 | |
|
| Lease Revenue / Certificates of Participation — 5.2% | |
| | |
Adams County, CO, Certificates of Participation, 4.00%, 12/1/28 | | $ | 1,000 | | | $ | 1,149,160 | |
| | |
Aspen Fire Protection District, CO: | | | | | | | | |
| | |
4.00%, 12/1/29 | | | 150 | | | | 182,913 | |
| | |
4.00%, 12/1/30 | | | 235 | | | | 284,693 | |
| | |
4.00%, 12/1/31 | | | 250 | | | | 300,602 | |
| | |
4.00%, 12/1/32 | | | 205 | | | | 245,754 | |
| | |
Broward County School Board, FL: | | | | | | | | |
| | |
5.00%, 7/1/25 | | | 500 | | | | 587,015 | |
| | |
5.00%, 7/1/27 | | | 500 | | | | 611,795 | |
| | |
5.00%, 7/1/29 | | | 500 | | | | 605,015 | |
| | |
California Public Works Board: | | | | | | | | |
| | |
4.00%, 5/1/36 | | | 880 | | | | 1,097,237 | |
| | |
5.00%, 11/1/29 | | | 1,000 | | | | 1,233,550 | |
| | |
Canadian County Educational Facilities Authority, OK, (Mustang Public Schools), 5.00%, 9/1/26 | | | 500 | | | | 611,935 | |
| | |
Colorado Department of Transportation: | | | | | | | | |
| | |
5.00%, 6/15/30 | | | 350 | | | | 419,958 | |
| | |
5.00%, 6/15/31 | | | 310 | | | | 371,802 | |
| | |
Commonwealth Financing Authority, PA, Tobacco Master Settlement Payment Revenue: | | | | | | | | |
| | |
5.00%, 6/1/25 | | | 500 | | | | 586,185 | |
| | |
5.00%, 6/1/29 | | | 3,000 | | | | 3,797,550 | |
| | |
5.00%, 6/1/30 | | | 3,000 | | | | 3,771,180 | |
| | |
Eagle County, CO, Certificates of Participation, 5.00%, 12/1/26 | | | 200 | | | | 238,622 | |
| | |
Forsyth County, NC, Limited Obligation Bonds, 5.00%, 4/1/27 | | | 1,300 | | | | 1,626,131 | |
| | |
Fountain Valley Public Financing Authority, CA: | | | | | | | | |
| | |
4.00%, 11/1/25 | | | 570 | | | | 655,848 | |
| | |
4.00%, 11/1/26 | | | 595 | | | | 691,777 | |
| | |
4.00%, 11/1/27 | | | 620 | | | | 717,334 | |
| | |
4.00%, 11/1/28 | | | 645 | | | | 743,782 | |
| | |
Georgia Municipal Association, Inc., Certificates of Participation, (Atlanta Public Safety), 5.00%, 12/1/28 | | | 410 | | | | 519,499 | |
| | |
Indiana Finance Authority, (Stadium Project), (SPA: U.S. Bank, N.A.), 0.04%, 2/1/35(4) | | | 4,900 | | | | 4,900,000 | |
| | |
Lake Houston Redevelopment Authority, TX: | | | | | | | | |
| | |
3.00%, 9/1/37 | | | 300 | | | | 326,034 | |
| | |
4.00%, 9/1/32 | | | 200 | | | | 244,190 | |
| | |
4.00%, 9/1/35 | | | 200 | | | | 241,976 | |
| | |
4.00%, 9/1/36 | | | 200 | | | | 241,304 | |
| | |
5.00%, 9/1/31 | | | 250 | | | | 330,327 | |
| | | | |
| | 18 | | See Notes to Financial Statements. |
5-to-15 Year Laddered Municipal Bond Portfolio
July 31, 2021
Portfolio of Investments (Unaudited) — continued
| | | | | | | | |
| Security | | Principal
Amount
(000’s omitted) | | | Value | |
|
| Lease Revenue / Certificates of Participation (continued) | |
| | |
Lee County School Board, FL, Certificates of Participation, 5.00%, 8/1/32 | | $ | 1,495 | | | $ | 1,805,317 | |
| | |
Oklahoma County Finance Authority, OK, (Deer Creek Public Schools): | | | | | | | | |
| | |
5.00%, 12/1/25 | | | 1,405 | | | | 1,669,941 | |
| | |
5.00%, 12/1/26 | | | 2,000 | | | | 2,377,300 | |
| | |
Oklahoma County Finance Authority, OK, (Midwest City-Del City Public Schools): | | | | | | | | |
| | |
5.00%, 10/1/25 | | | 1,000 | | | | 1,182,480 | |
| | |
5.00%, 10/1/26 | | | 1,000 | | | | 1,219,560 | |
| | |
Orange County School Board, FL, Prerefunded to 8/1/25, 5.00%, 8/1/32 | | | 1,935 | | | | 2,295,819 | |
| | |
Palm Beach County School Board, FL, 5.00%, 8/1/31 | | | 4,000 | | | | 4,704,160 | |
| | |
Palo Alto, CA, Certificates of Participation, 3.00%, 11/1/32 | | | 2,585 | | | | 3,012,456 | |
| | |
Plymouth Intermediate District No. 287, MN, Certificates of Participation, 5.00%, 2/1/30 | | | 385 | | | | 463,967 | |
| | |
Public Finance Authority, WI, (KU Campus Development Corp.), 5.00%, 3/1/29 | | | 500 | | | | 596,975 | |
| | |
Riverside County Public Financing Authority, CA: | | | | | | | | |
| | |
5.00%, 11/1/27 | | | 850 | | | | 1,012,163 | |
| | |
5.00%, 11/1/28 | | | 950 | | | | 1,130,357 | |
| | |
South Dakota Building Authority, 5.00%, 6/1/26 | | | 500 | | | | 606,415 | |
| | |
Virginia Public Building Authority, 4.00%, 8/1/35 | | | 1,140 | | | | 1,395,337 | |
| |
| | | | $ | 50,805,415 | |
|
| Other Revenue — 8.4% | |
| | |
Bexar County, TX, Combination Tax and Revenue Certificates of Obligation, 4.00%, 6/15/34 | | $ | 905 | | | $ | 1,069,918 | |
| | |
Bexar County, TX, Motor Vehicle Rental Tax Revenue: | | | | | | | | |
| | |
4.00%, 8/15/33 | | | 690 | | | | 815,987 | |
| | |
4.00%, 8/15/34 | | | 810 | | | | 955,411 | |
| | |
4.00%, 8/15/35 | | | 510 | | | | 600,734 | |
| | |
District of Columbia, (National Public Radio, Inc.): | | | | | | | | |
| | |
Prerefunded to 4/1/26, 5.00%, 4/1/28 | | | 1,000 | | | | 1,213,240 | |
| | |
Prerefunded to 4/1/26, 5.00%, 4/1/29 | | | 1,000 | | | | 1,213,240 | |
| | |
Fort Myers, FL, Capital Improvement Revenue: | | | | | | | | |
| | |
5.00%, 12/1/32 | | | 825 | | | | 983,540 | |
| | |
5.00%, 12/1/33 | | | 640 | | | | 762,381 | |
| | |
5.00%, 12/1/34 | | | 510 | | | | 606,558 | |
| | |
Hyland Hills Park & Recreation District, CO, 5.00%, 12/15/26 | | | 150 | | | | 185,270 | |
| | |
Kentucky Public Energy Authority, Gas Supply Revenue: | | | | | | | | |
| | |
4.00%, 7/1/24 | | | 5,000 | | | | 5,530,950 | |
| | |
4.00% to 6/1/25 (Put Date), 12/1/49 | | | 5,000 | | | | 5,624,150 | |
| | |
4.00% to 2/1/28 (Put Date), 2/1/50 | | | 19,000 | | | | 22,644,390 | |
| | |
Knoxville, TN, Gas System Revenue, 4.00%, 3/1/33 | | | 3,245 | | | | 3,882,123 | |
| | | | | | | | |
| Security | | Principal
Amount
(000’s omitted) | | | Value | |
|
| Other Revenue (continued) | |
| | |
Lancaster Port Authority, OH, Gas Supply Revenue, (Liq: Royal Bank of Canada), 5.00% to 2/1/25 (Put Date), 8/1/49 | | $ | 5,000 | | | $ | 5,757,350 | |
| | |
Louisiana Local Government Environmental Facilities and Community Development Authority, (Bossier City): | | | | | | | | |
| | |
5.00%, 12/1/32 | | | 2,355 | | | | 3,050,526 | |
| | |
5.00%, 12/1/34 | | | 2,425 | | | | 3,111,639 | |
| | |
Louisiana Local Government Environmental Facilities and Community Development Authority, (Jefferson Parish): | | | | | | | | |
| | |
5.00%, 4/1/27 | | | 500 | | | | 605,335 | |
| | |
5.00%, 4/1/29 | | | 275 | | | | 331,405 | |
| | |
Mississippi Development Bank, Special Obligation Bond, (Jackson Public School District), 5.00%, 4/1/25 | | | 1,270 | | | | 1,478,801 | |
| | |
New York City Cultural Resources Trust, NY, (Carnegie Hall): | | | | | | | | |
| | |
5.00%, 12/1/27 | | | 100 | | | | 125,756 | |
| | |
5.00%, 12/1/29 | | | 325 | | | | 426,780 | |
| | |
5.00%, 12/1/31 | | | 250 | | | | 327,503 | |
| | |
5.00%, 12/1/32 | | | 550 | | | | 719,406 | |
| | |
5.00%, 12/1/33 | | | 200 | | | | 260,984 | |
| | |
5.00%, 12/1/34 | | | 300 | | | | 390,498 | |
| | |
5.00%, 12/1/35 | | | 700 | | | | 909,475 | |
| | |
New York City Educational Construction Fund, NY, 5.00%, 4/1/29 | | | 2,765 | | | | 3,605,228 | |
| | |
Rhode Island Health and Educational Building Corp., (Barrington), 5.00%, 5/15/28 | | | 1,060 | | | | 1,321,385 | |
| | |
Tennessee Energy Acquisition Corp., Gas Project Revenue, 4.00% to 11/1/25 (Put Date), 11/1/49 | | | 5,000 | | | | 5,682,000 | |
| | |
Texas Municipal Gas Acquisition and Supply Corp. III, Gas Supply Revenue: | | | | | | | | |
| | |
5.00%, 12/15/26 | | | 1,000 | | | | 1,225,630 | |
| | |
5.00%, 12/15/31 | | | 1,250 | | | | 1,696,262 | |
| | |
Wisconsin, Environmental Improvement Fund Revenue: | | | | | | | | |
| | |
5.00%, 6/1/31 | | | 2,500 | | | | 2,945,550 | |
| | |
5.00%, 6/1/32 | | | 1,000 | | | | 1,177,380 | |
| |
| | | | $ | 81,236,785 | |
|
| Senior Living / Life Care — 1.9% | |
| | |
Atlantic Beach, FL, (Fleet Landing), 3.00%, 11/15/23 | | $ | 2,500 | | | $ | 2,504,400 | |
| | |
Baltimore County, MD, (Riderwood Village, Inc.): | | | | | | | | |
| | |
4.00%, 1/1/30 | | | 1,655 | | | | 1,980,522 | |
| | |
4.00%, 1/1/31 | | | 250 | | | | 298,040 | |
| | |
4.00%, 1/1/32 | | | 350 | | | | 416,185 | |
| | |
4.00%, 1/1/33 | | | 600 | | | | 712,338 | |
| | |
4.00%, 1/1/34 | | | 685 | | | | 811,910 | |
| | |
4.00%, 1/1/35 | | | 615 | | | | 727,373 | |
| | |
Buffalo and Erie County Industrial Land Development Corp., NY, (Orchard Park CCRC, Inc.): | | | | | | | | |
| | |
5.00%, 11/15/28 | | | 50 | | | | 58,113 | |
| | |
5.00%, 11/15/30 | | | 910 | | | | 1,049,812 | |
| | | | |
| | 19 | | See Notes to Financial Statements. |
5-to-15 Year Laddered Municipal Bond Portfolio
July 31, 2021
Portfolio of Investments (Unaudited) — continued
| | | | | | | | |
| Security | | Principal
Amount
(000’s omitted) | | | Value | |
|
| Senior Living / Life Care (continued) | |
| | |
California Statewide Communities Development Authority, (American Baptist Homes of the West), 5.00%, 10/1/25 | | $ | 100 | | | $ | 118,294 | |
| | |
Cumberland County Municipal Authority, PA, (Diakon Lutheran Social Ministries): | | | | | | | | |
| | |
2.50%, 1/1/26 | | | 640 | | | | 690,816 | |
| | |
5.00%, 1/1/27 | | | 1,035 | | | | 1,226,485 | |
| | |
East Hempfield Township Industrial Development Authority, PA, (Willow Valley Communities): | | | | | | | | |
| | |
5.00%, 12/1/21 | | | 250 | | | | 253,808 | |
| | |
5.00%, 12/1/31 | | | 310 | | | | 359,603 | |
| | |
Illinois Finance Authority, (Presbyterian Homes Obligated Group), 5.00%, 5/1/22 | | | 225 | | | | 232,695 | |
| | |
Missouri Health and Educational Facilities Authority, (Lutheran Senior Services): | | | | | | | | |
| | |
3.00%, 2/1/27 | | | 1,000 | | | | 1,094,610 | |
| | |
5.00%, 2/1/23 | | | 600 | | | | 641,454 | |
| | |
5.00%, 2/1/29 | | | 600 | | | | 703,200 | |
| | |
5.00%, 2/1/30 | | | 200 | | | | 233,346 | |
| | |
5.00%, 2/1/31 | | | 250 | | | | 290,610 | |
| | |
North Carolina Medical Care Commission, (The Forest at Duke), 4.00%, 9/1/41 | | | 715 | | | | 844,301 | |
| | |
North Carolina Medical Care Commission, (United Methodist Retirement Homes): | | | | | | | | |
| | |
5.00%, 10/1/24 | | | 150 | | | | 169,152 | |
| | |
5.00%, 10/1/25 | | | 100 | | | | 112,510 | |
| | |
5.00%, 10/1/26 | | | 1,100 | | | | 1,233,507 | |
| | |
5.00%, 10/1/27 | | | 50 | | | | 55,906 | |
| | |
5.00%, 10/1/29 | | | 125 | | | | 139,129 | |
| | |
5.00%, 10/1/32 | | | 225 | | | | 249,140 | |
| | |
Series 2016A, 5.00%, 10/1/30 | | | 230 | | | | 273,861 | |
| | |
Series 2016A, 5.00%, 10/1/31 | | | 675 | | | | 800,374 | |
| | |
Series 2017A, 5.00%, 10/1/30 | | | 250 | | | | 277,625 | |
| |
| | | | $ | 18,559,119 | |
|
| Special Tax Revenue — 2.8% | |
| | |
Downtown Smyrna Development Authority, GA: | | | | | | | | |
| | |
3.00%, 2/1/36 | | $ | 200 | | | $ | 232,504 | |
| | |
4.00%, 2/1/35 | | | 430 | | | | 540,428 | |
| | |
Los Angeles County Metropolitan Transportation Authority, CA, Sales Tax Revenue, 5.00%, 6/1/32 | | | 500 | | | | 608,550 | |
| | |
Miami-Dade County, FL, Special Obligation Bonds: | | | | | | | | |
| | |
5.00%, 4/1/25 | | | 250 | | | | 292,995 | |
| | |
5.00%, 4/1/26 | | | 1,025 | | | | 1,243,520 | |
| | |
5.00%, 4/1/29 | | | 900 | | | | 1,085,841 | |
| | |
5.00%, 4/1/30 | | | 950 | | | | 1,143,249 | |
| | |
5.00%, 4/1/31 | | | 895 | | | | 1,076,148 | |
| | |
5.00%, 4/1/32 | | | 735 | | | | 883,014 | |
| | | | | | | | |
| Security | | Principal
Amount
(000’s omitted) | | | Value | |
|
| Special Tax Revenue (continued) | |
| | |
New York City Transitional Finance Authority, NY, Future Tax Revenue: | | | | | | | | |
| | |
4.00%, 5/1/36 | | $ | 2,000 | | | $ | 2,471,840 | |
| | |
4.00%, 11/1/36 | | | 1,000 | | | | 1,239,640 | |
| | |
5.00%, 8/1/33 | | | 1,190 | | | | 1,355,529 | |
| | |
New York Dormitory Authority, Sales Tax Revenue: | | | | | | | | |
| | |
5.00%, 3/15/32 | | | 1,800 | | | | 2,135,880 | |
| | |
5.00%, 3/15/34 | | | 5,000 | | | | 6,115,200 | |
| | |
Queen Creek, AZ, Excise Tax and State Shared Revenue: | | | | | | | | |
| | |
4.00%, 8/1/35 | | | 3,120 | | | | 3,862,935 | |
| | |
4.00%, 8/1/36 | | | 1,000 | | | | 1,234,690 | |
| | |
Successor Agency to San Mateo Redevelopment Agency, CA: | | | | | | | | |
| | |
5.00%, 8/1/26 | | | 100 | | | | 117,267 | |
| | |
5.00%, 8/1/29 | | | 140 | | | | 162,138 | |
| | |
Tri-County Metropolitan Transportation District, OR, Payroll Tax Revenue, 5.00%, 9/1/32 | | | 1,000 | | | | 1,222,750 | |
| |
| | | | $ | 27,024,118 | |
|
| Transportation — 16.7% | |
| | |
Arizona Transportation Board, Highway Revenue, 5.00%, 7/1/27 | | $ | 2,005 | | | $ | 2,450,010 | |
| | |
Bay Area Toll Authority, CA, (San Francisco Bay Area), 2.95% to 4/1/26 (Put Date), 4/1/47 | | | 1,800 | | | | 1,983,150 | |
| | |
Central Florida Expressway Authority, 4.00%, 7/1/35 | | | 3,150 | | | | 3,629,934 | |
| | |
Central Texas Regional Mobility Authority: | | | | | | | | |
| | |
4.00%, 1/1/34 | | | 200 | | | | 241,594 | |
| | |
4.00%, 1/1/36 | | | 1,490 | | | | 1,787,851 | |
| | |
5.00%, 1/1/25 | | | 500 | | | | 566,340 | |
| | |
5.00%, 1/1/27 | | | 2,500 | | | | 2,973,025 | |
| | |
5.00%, 1/1/36 | | | 1,130 | | | | 1,498,629 | |
| | |
Chicago, IL, (O’Hare International Airport): | | | | | | | | |
| | |
4.00%, 1/1/35 | | | 5,000 | | | | 6,020,650 | |
| | |
4.00%, 1/1/36 | | | 3,500 | | | | 4,193,525 | |
| | |
5.00%, 1/1/26 | | | 1,000 | | | | 1,201,210 | |
| | |
5.00%, 1/1/28 | | | 150 | | | | 173,352 | |
| | |
5.00%, 1/1/29 | | | 150 | | | | 173,187 | |
| | |
5.00%, 1/1/30 | | | 500 | | | | 577,470 | |
| | |
5.00%, 1/1/31 | | | 1,000 | | | | 1,154,580 | |
| | |
5.00%, 1/1/33 | | | 125 | | | | 144,091 | |
| | |
5.00%, 1/1/34 | | | 7,500 | | | | 9,785,250 | |
| | |
5.25%, 1/1/28 | | | 2,905 | | | | 3,603,013 | |
| | |
5.25%, 1/1/29 | | | 3,060 | | | | 3,792,503 | |
| | |
5.25%, 1/1/30 | | | 1,000 | | | | 1,238,200 | |
| | |
5.25%, 1/1/31 | | | 1,000 | | | | 1,237,210 | |
| | |
5.25%, 1/1/32 | | | 2,565 | | | | 3,173,136 | |
| | | | |
| | 20 | | See Notes to Financial Statements. |
5-to-15 Year Laddered Municipal Bond Portfolio
July 31, 2021
Portfolio of Investments (Unaudited) — continued
| | | | | | | | |
| Security | | Principal
Amount
(000’s omitted) | | | Value | |
|
| Transportation (continued) | |
| | |
Clark County, NV, Highway Revenue, 5.00%, 7/1/33 | | $ | 840 | | | $ | 949,586 | |
| | |
Commonwealth Transportation Board, VA, 5.00%, 9/15/30 | | | 1,240 | | | | 1,519,384 | |
| | |
Denver City and County, CO, Airport System Revenue, 5.00%, 11/15/31 | | | 1,450 | | | | 1,759,966 | |
| | |
Fort Bend County, TX, Toll Road Revenue: | | | | | | | | |
| | |
5.00%, 3/1/28 | | | 500 | | | | 578,580 | |
| | |
5.00%, 3/1/29 | | | 1,000 | | | | 1,156,390 | |
| | |
5.00%, 3/1/30 | | | 750 | | | | 867,292 | |
| | |
Hawaii, Highway Revenue, 5.00%, 1/1/31 | | | 805 | | | | 1,043,369 | |
| | |
Idaho Housing and Finance Association, Federal Highway Trust Fund, 5.00%, 7/15/25 | | | 650 | | | | 766,643 | |
| | |
Illinois Toll Highway Authority: | | | | | | | | |
| | |
5.00%, 1/1/29 | | | 175 | | | | 208,941 | |
| | |
5.00%, 12/1/32 | | | 350 | | | | 415,692 | |
| | |
Kentucky Turnpike Authority, 5.00%, 7/1/33 | | | 300 | | | | 326,415 | |
| | |
Massachusetts Bay Transportation Authority, 4.00%, 7/1/36 | | | 2,900 | | | | 3,630,452 | |
| | |
Massachusetts Department of Transportation, 5.00%, 1/1/30 | | | 4,235 | | | | 5,470,222 | |
| | |
Metropolitan Transportation Authority, NY: | | | | | | | | |
| | |
0.364%, (67% of SOFR + 0.33%), 11/1/35(2) | | | 7,500 | | | | 7,505,550 | |
| | |
0.464%, (67% of SOFR + 0.43%), 11/1/26(2) | | | 3,000 | | | | 3,002,340 | |
| | |
4.00%, 11/15/43 | | | 3,500 | | | | 4,157,755 | |
| | |
5.00%, 11/15/41 | | | 415 | | | | 437,418 | |
| | |
5.25%, 11/15/30 | | | 500 | | | | 592,560 | |
| | |
Series 2012D, 5.00%, 11/15/28 | | | 1,070 | | | | 1,129,385 | |
| | |
Series 2015F, 5.00%, 11/15/28 | | | 640 | | | | 756,941 | |
| | |
Metropolitan Transportation Authority, NY, Green Bonds: | | | | | | | | |
| | |
5.00%, 11/15/25 | | | 5,000 | | | | 5,942,900 | |
| | |
5.00%, 11/15/26 | | | 5,815 | | | | 7,125,643 | |
| | |
New Orleans Aviation Board, LA, 5.00%, 1/1/28 | | | 150 | | | | 184,503 | |
| | |
New York Transportation Development Corp., (Terminal 4 John F. Kennedy International Airport): | | | | | | | | |
| | |
5.00%, 12/1/28 | | | 1,200 | | | | 1,556,952 | |
| | |
5.00%, 12/1/30 | | | 1,000 | | | | 1,351,020 | |
| | |
North Carolina, Grant Anticipation Revenue Vehicle Bonds: | | | | | | | | |
| | |
5.00%, 3/1/26 | | | 3,000 | | | | 3,632,640 | |
| | |
5.00%, 3/1/29 | | | 550 | | | | 635,344 | |
| | |
5.00%, 3/1/30 | | | 400 | | | | 462,244 | |
| | |
Pennsylvania Turnpike Commission: | | | | | | | | |
| | |
4.00%, 12/1/37 | | | 3,850 | | | | 4,729,263 | |
| | |
5.00%, 12/1/34 | | | 250 | | | | 334,503 | |
| | |
5.00%, 12/1/35 | | | 500 | | | | 667,640 | |
| | |
5.00%, 12/1/36 | | | 1,165 | | | | 1,552,724 | |
| | |
Port Authority of New York and New Jersey: | | | | | | | | |
| | |
4.00%, 7/15/36 | | | 1,605 | | | | 1,969,239 | |
| | |
5.00%, 9/1/34 | | | 3,595 | | | | 4,685,579 | |
| | | | | | | | |
| Security | | Principal
Amount
(000’s omitted) | | | Value | |
|
| Transportation (continued) | |
| | |
Port of Seattle, WA: | | | | | | | | |
| | |
5.00%, 3/1/27 | | $ | 250 | | | $ | 284,840 | |
| | |
5.00%, 3/1/29 | | | 250 | | | | 284,510 | |
| | |
Portland, ME, Airport Revenue, Green Bonds: | | | | | | | | |
| | |
5.00%, 1/1/29 | | | 225 | | | | 287,838 | |
| | |
5.00%, 1/1/31 | | | 370 | | | | 478,184 | |
| | |
Salt Lake City, UT, (Salt Lake City International Airport): | | | | | | | | |
| | |
5.00%, 7/1/28 | | | 1,370 | | | | 1,712,020 | |
| | |
5.00%, 7/1/31 | | | 300 | | | | 380,022 | |
| | |
5.00%, 7/1/32 | | | 660 | | | | 833,936 | |
| | |
5.00%, 7/1/33 | | | 600 | | | | 756,132 | |
| | |
5.00%, 7/1/34 | | | 450 | | | | 565,646 | |
| | |
San Francisco City and County Airport Commission, CA, (San Francisco International Airport): | | | | | | | | |
| | |
5.00%, 5/1/35 | | | 1,950 | | | | 2,639,305 | |
| | |
5.00%, 5/1/36 | | | 1,950 | | | | 2,630,550 | |
| | |
Texas Transportation Commission, (Central Texas Turnpike System): | | | | | | | | |
| | |
0.00%, 8/1/34 | | | 1,000 | | | | 682,630 | |
| | |
0.00%, 8/1/35 | | | 500 | | | | 323,370 | |
| | |
Triborough Bridge and Tunnel Authority, NY, 5.00%, 11/15/29 | | | 14,400 | | | | 17,943,696 | |
| | |
Wayne County Airport Authority, MI, (Detroit Metropolitan Wayne County Airport): | | | | | | | | |
| | |
5.00%, 12/1/31 | | | 2,920 | | | | 3,770,742 | |
| | |
5.00%, 12/1/34 | | | 1,005 | | | | 1,289,566 | |
| | |
Wisconsin, Transportation Revenue: | | | | | | | | |
| | |
5.00%, 7/1/31 | | | 3,450 | | | | 3,928,101 | |
| | |
Prerefunded to 7/1/24, 5.00%, 7/1/32 | | | 700 | | | | 797,699 | |
| |
| | | | $ | 162,291,772 | |
|
| Water and Sewer — 3.9% | |
| | |
Buffalo Municipal Water Finance Authority, NY: | | | | | | | | |
| | |
5.00%, 7/1/25 | | $ | 300 | | | $ | 351,702 | |
| | |
5.00%, 7/1/29 | | | 115 | | | | 134,965 | |
| | |
5.00%, 7/1/30 | | | 100 | | | | 117,361 | |
| | |
Glendale, AZ, Water and Sewer Revenue, 5.00%, 7/1/28 | | | 1,500 | | | | 1,760,415 | |
| | |
Hillsborough County, FL, Wastewater Impact Fee: | | | | | | | | |
| | |
5.00%, 5/1/26 | | | 3,000 | | | | 3,625,890 | |
| | |
5.00%, 5/1/27 | | | 2,315 | | | | 2,874,651 | |
| | |
5.00%, 5/1/28 | | | 1,270 | | | | 1,617,231 | |
| | |
5.00%, 5/1/29 | | | 1,220 | | | | 1,589,379 | |
| | |
Marin Public Financing Authority, CA, (Sausalito-Marin City Sanitary District), 4.00%, 4/1/32 | | | 575 | | | | 671,836 | |
| | |
McAllen, TX, Waterworks and Sewer System Revenue, 4.00%, 2/1/27 | | | 1,000 | | | | 1,143,400 | |
| | | | |
| | 21 | | See Notes to Financial Statements. |
5-to-15 Year Laddered Municipal Bond Portfolio
July 31, 2021
Portfolio of Investments (Unaudited) — continued
| | | | | | | | |
| Security | | Principal
Amount
(000’s omitted) | | | Value | |
|
| Water and Sewer (continued) | |
| | |
Memphis, TN, Sanitary Sewerage System Revenue, 4.00%, 10/1/32 | | $ | 1,895 | | | $ | 2,218,893 | |
| | |
Mesa, AZ, Utility Systems Revenue: | | | | | | | | |
| | |
5.00%, 7/1/27 | | | 600 | | | | 731,868 | |
| | |
5.00%, 7/1/29 | | | 500 | | | | 606,635 | |
| | |
Portland, OR, Water System Revenue, 4.00%, 5/1/33 | | | 2,470 | | | | 3,136,776 | |
| | |
Rapid City, SD, Water Revenue: | | | | | | | | |
| | |
4.00%, 11/1/29 | | | 600 | | | | 688,572 | |
| | |
4.00%, 11/1/30 | | | 670 | | | | 767,867 | |
| | |
5.00%, 11/1/26 | | | 1,000 | | | | 1,196,380 | |
| | |
5.00%, 11/1/27 | | | 515 | | | | 614,452 | |
| | |
Richmond, VA, Public Utility Revenue, 4.00%, 1/15/36 | | | 7,205 | | | | 8,811,715 | |
| | |
Spotsylvania County, VA, Water and Sewer System Revenue, 3.00%, 12/1/31 | | | 2,095 | | | | 2,484,733 | |
| | |
St. Joseph Industrial Development Authority, MO, (Sewerage System Improvements), 5.00%, 4/1/26 | | | 500 | | | | 584,080 | |
| | |
Western Riverside Water and Wastewater Financing Authority, CA: | | | | | | | | |
| | |
4.00%, 9/1/26 | | | 435 | | | | 508,002 | |
| | |
4.00%, 9/1/27 | | | 445 | | | | 530,881 | |
| | |
Wyoming, MI, Water Supply System Revenue: | | | | | | | | |
| | |
5.00%, 6/1/27 | | | 505 | | | | 616,256 | |
| | |
5.00%, 6/1/28 | | | 550 | | | | 669,405 | |
| |
| | | | $ | 38,053,345 | |
| |
Total Tax-Exempt Municipal Obligations — 96.1%
(identified cost $873,325,546) | | | $ | 934,165,390 | |
| |
Other Assets, Less Liabilities — 3.9% | | | $ | 37,490,945 | |
| |
Net Assets — 100.0% | | | $ | 971,656,335 | |
The percentage shown for each investment category in the Portfolio of Investments is based on net assets.
At July 31, 2021, the concentration of the Portfolio’s investments in the various states and territories, determined as a percentage of net assets, is as follows:
| | | | |
| |
| New York | | | 10.7% | |
| |
| Others, representing less than 10% individually | | | 85.4% | |
The Portfolio invests primarily in debt securities issued by municipalities. The ability of the issuers of the debt securities to meet their obligations may be affected by economic developments in a specific industry or municipality. At July 31, 2021, 5.1% of total investments are backed by bond insurance of various financial institutions and financial guaranty assurance agencies. The aggregate percentage insured by an individual financial institution or financial guaranty assurance agency ranged from 1.5% to 3.6% of total investments.
| (1) | When-issued security. |
| (2) | Floating-rate security. The stated interest rate represents the rate in effect at July 31, 2021. |
| (3) | Amount is less than 0.05%. |
| (4) | Variable rate demand obligation that may be tendered at par on any day for payment the same or next business day. The stated interest rate, which generally resets daily, is determined by the remarketing agent and represents the rate in effect at July 31, 2021. |
Abbreviations:
| | | | |
| | |
| AGM | | – | | Assured Guaranty Municipal Corp. |
| | |
| BAM | | – | | Build America Mutual Assurance Co. |
| | |
| FHLMC | | – | | Federal Home Loan Mortgage Corp. |
| | |
| FNMA | | – | | Federal National Mortgage Association |
| | |
| GNMA | | – | | Government National Mortgage Association |
| | |
| Liq | | – | | Liquidity Provider |
| | |
| PSF | | – | | Permanent School Fund |
| | |
| SFMR | | – | | Single Family Mortgage Revenue |
| | |
| SIFMA | | – | | Securities Industry and Financial Markets Association Municipal Swap Index |
| | |
| SOFR | | – | | Secured Overnight Financing Rate |
| | |
| SPA | | – | | Standby Bond Purchase Agreement |
| | | | |
| | 22 | | See Notes to Financial Statements. |
5-to-15 Year Laddered Municipal Bond Portfolio
July 31, 2021
Statement of Assets and Liabilities (Unaudited)
| | | | |
| Assets | | July 31, 2021 | |
| |
Unaffiliated investments, at value (identified cost, $873,325,546) | | $ | 934,165,390 | |
| |
Cash | | | 38,942,839 | |
| |
Interest receivable | | | 8,756,641 | |
| |
Receivable for investments sold | | | 75,722 | |
| |
Total assets | | $ | 981,940,592 | |
| |
| Liabilities | | | | |
| |
Payable for when-issued securities | | $ | 9,852,363 | |
| |
Payable to affiliates: | | | | |
| |
Investment adviser fee | | | 263,065 | |
| |
Other | | | 303 | |
| |
Accrued expenses | | | 168,526 | |
| |
Total liabilities | | $ | 10,284,257 | |
| |
Net Assets applicable to investors’ interest in Portfolio | | $ | 971,656,335 | |
| | | | |
| | 23 | | See Notes to Financial Statements. |
5-to-15 Year Laddered Municipal Bond Portfolio
July 31, 2021
Statement of Operations (Unaudited)
| | | | |
| Investment Income | | Six Months Ended
July 31, 2021 | |
| |
Interest | | $ | 9,619,028 | |
| |
Total investment income | | $ | 9,619,028 | |
| |
| Expenses | | | | |
| |
Investment adviser fee | | $ | 1,497,663 | |
| |
Trustees’ fees and expenses | | | 22,738 | |
| |
Custodian fee | | | 112,542 | |
| |
Legal and accounting services | | | 28,270 | |
| |
Miscellaneous | | | 14,651 | |
| |
Total expenses | | $ | 1,675,864 | |
| |
Deduct — | | | | |
| |
Allocation of expenses to affiliates | | $ | 31,294 | |
| |
Total expense reductions | | $ | 31,294 | |
| |
Net expenses | | $ | 1,644,570 | |
| |
Net investment income | | $ | 7,974,458 | |
| |
| Realized and Unrealized Gain (Loss) | | | | |
| |
Net realized gain (loss) — | | | | |
| |
Investment transactions | | $ | 2,190,397 | |
| |
Net realized gain | | $ | 2,190,397 | |
| |
Change in unrealized appreciation (depreciation) — | | | | |
| |
Investments | | $ | 590,116 | |
| |
Net change in unrealized appreciation (depreciation) | | $ | 590,116 | |
| |
Net realized and unrealized gain | | $ | 2,780,513 | |
| |
Net increase in net assets from operations | | $ | 10,754,971 | |
| | | | |
| | 24 | | See Notes to Financial Statements. |
5-to-15 Year Laddered Municipal Bond Portfolio
July 31, 2021
Statements of Changes in Net Assets
| | | | | | | | |
| Increase (Decrease) in Net Assets | | Six Months Ended
July 31, 2021
(Unaudited) | | | Year Ended
January 31, 2021 | |
| | |
From operations — | | | | | | | | |
| | |
Net investment income | | $ | 7,974,458 | | | $ | 15,352,513 | |
| | |
Net realized gain | | | 2,190,397 | | | | 4,325,390 | |
| | |
Net change in unrealized appreciation (depreciation) | | | 590,116 | | | | 17,011,685 | |
| | |
Net increase in net assets from operations | | $ | 10,754,971 | | | $ | 36,689,588 | |
| | |
Capital transactions — | | | | | | | | |
| | |
Contributions | | $ | 71,939,893 | | | $ | 203,943,194 | |
| | |
Withdrawals | | | (21,913,693 | ) | | | (59,666,246 | ) |
| | |
Portfolio transaction fee | | | 140,922 | | | | 395,167 | |
| | |
Net increase in net assets from capital transactions | | $ | 50,167,122 | | | $ | 144,672,115 | |
| | |
Net increase in net assets | | $ | 60,922,093 | | | $ | 181,361,703 | |
| | |
| Net Assets | | | | | | | | |
| | |
At beginning of period | | $ | 910,734,242 | | | $ | 729,372,539 | |
| | |
At end of period | | $ | 971,656,335 | | | $ | 910,734,242 | |
| | | | |
| | 25 | | See Notes to Financial Statements. |
5-to-15 Year Laddered Municipal Bond Portfolio
July 31, 2021
Financial Highlights
| | | | | | | | | | | | | | | | | | | | | | | | |
| | | |
| | | Six Months Ended
July 31, 2021
(Unaudited) | | | Year Ended January 31, | | | Period Ended
January 31, 2017(1) | |
| Ratios/Supplemental Data | | 2021 | | | 2020 | | | 2019 | | | 2018 | |
| | | | | | | |
Ratios (as a percentage of average daily net assets): | | | | | | | | | | | | | | | | | | | | | | | | |
| | | | | | |
Expenses(2) | | | 0.35 | %(3) | | | 0.35 | % | | | 0.35 | % | | | 0.35 | % | | | 0.35 | % | | | 0.35 | %(3) |
| | | | | | |
Net investment income | | | 1.70 | %(3) | | | 1.94 | % | | | 2.17 | % | | | 2.16 | % | | | 2.01 | % | | | 1.71 | %(3) |
| | | | | | |
Portfolio Turnover | | | 10 | %(4) | | | 51 | % | | | 28 | % | | | 78 | % | | | 35 | % | | | 30 | %(4) |
| | | | | | |
Total Return(2) | | | 1.08 | %(4) | | | 4.66 | % | | | 7.88 | % | | | 3.11 | % | | | 3.83 | % | | | (0.80 | )%(4) |
| | | | | | |
Net assets, end of period (000’s omitted) | | $ | 971,656 | | | $ | 910,734 | | | $ | 729,373 | | | $ | 612,428 | | | $ | 676,300 | | | $ | 502,104 | |
| (1) | For the period from the start of business, March 28, 2016, to January 31, 2017. |
| (2) | The investment adviser and sub-adviser reimbursed certain operating expenses (equal to 0.01%, 0.01%, 0.01%, 0.01%, 0.01% and 0.02% of average daily net assets for the six months ended July 31, 2021, the years ended January 31, 2021, 2020, 2019 and 2018 and the period ended January 31, 2017, respectively). Absent this reimbursement, total return would be lower. |
| | | | |
| | 26 | | See Notes to Financial Statements. |
5-to-15 Year Laddered Municipal Bond Portfolio
July 31, 2021
Notes to Financial Statements (Unaudited)
1 Significant Accounting Policies
5-to-15 Year Laddered Municipal Bond Portfolio (the Portfolio) is a Massachusetts business trust registered under the Investment Company Act of 1940, as amended (the 1940 Act), as a diversified, open-end management investment company. The Portfolio’s investment objective is to seek current income exempt from regular federal income tax. The Declaration of Trust permits the Trustees to issue interests in the Portfolio. At July 31, 2021, Parametric TABS 5-to-15 Year Laddered Municipal Bond Fund and Eaton Vance TABS 5-to-15 Year Laddered Municipal Bond NextShares held an interest of 99.2% and 0.8%, respectively, in the Portfolio.
The following is a summary of significant accounting policies of the Portfolio. The policies are in conformity with accounting principles generally accepted in the United States of America (U.S. GAAP). The Portfolio is an investment company and follows accounting and reporting guidance in the Financial Accounting Standards Board (FASB) Accounting Standards Codification Topic 946.
A Investment Valuation — The following methodologies are used to determine the market value or fair value of investments.
Debt Obligations. Debt obligations are generally valued on the basis of valuations provided by third party pricing services, as derived from such services’ pricing models. Inputs to the models may include, but are not limited to, reported trades, executable bid and ask prices, broker/dealer quotations, prices or yields of securities with similar characteristics, interest rates, anticipated prepayments, benchmark curves or information pertaining to the issuer, as well as industry and economic events. The pricing services may use a matrix approach, which considers information regarding securities with similar characteristics to determine the valuation for a security. Short-term debt obligations purchased with a remaining maturity of sixty days or less for which a valuation from a third party pricing service is not readily available may be valued at amortized cost, which approximates fair value.
Fair Valuation. Investments for which valuations or market quotations are not readily available or are deemed unreliable are valued at fair value using methods determined in good faith by or at the direction of the Trustees of the Portfolio in a manner that most fairly reflects the security’s “fair value”, which is the amount that the Portfolio might reasonably expect to receive for the security upon its current sale in the ordinary course. Each such determination is based on a consideration of relevant factors, which are likely to vary from one pricing context to another. These factors may include, but are not limited to, the type of security, the existence of any contractual restrictions on the security’s disposition, the price and extent of public trading in similar securities of the issuer or of comparable entities, quotations or relevant information obtained from broker/dealers or other market participants, information obtained from the issuer, analysts, and/or the appropriate stock exchange (for exchange-traded securities), an analysis of the entity’s financial statements, and an evaluation of the forces that influence the issuer and the market(s) in which the security is purchased and sold.
B Investment Transactions — Investment transactions for financial statement purposes are accounted for on a trade date basis. Realized gains and losses on investments sold are determined on the basis of identified cost.
C Income — Interest income is recorded on the basis of interest accrued, adjusted for amortization of premium or accretion of discount.
D Federal Taxes — The Portfolio has elected to be treated as a partnership for federal tax purposes. No provision is made by the Portfolio for federal or state taxes on any taxable income of the Portfolio because each investor in the Portfolio is ultimately responsible for the payment of any taxes on its share of taxable income. Since at least one of the Portfolio’s investors is a regulated investment company that invests all or substantially all of its assets in the Portfolio, the Portfolio normally must satisfy the applicable source of income and diversification requirements (under the Internal Revenue Code) in order for its investors to satisfy them. The Portfolio will allocate, at least annually among its investors, each investor’s distributive share of the Portfolio’s net investment income, net realized capital gains and losses and any other items of income, gain, loss, deduction or credit.
As of July 31, 2021, the Portfolio had no uncertain tax positions that would require financial statement recognition, de-recognition, or disclosure. The Portfolio files a U.S. federal income tax return annually after its fiscal year-end, which is subject to examination by the Internal Revenue Service for a period of three years from the date of filing.
E Use of Estimates — The preparation of the financial statements in conformity with U.S. GAAP requires management to make estimates and assumptions that affect the reported amounts of assets and liabilities at the date of the financial statements and the reported amounts of income and expense during the reporting period. Actual results could differ from those estimates.
F Indemnifications — Under the Portfolio’s organizational documents, its officers and Trustees may be indemnified against certain liabilities and expenses arising out of the performance of their duties to the Portfolio. Under Massachusetts law, if certain conditions prevail, interestholders in the Portfolio could be deemed to have personal liability for the obligations of the Portfolio. However, the Portfolio’s Declaration of Trust contains an express disclaimer of liability on the part of Portfolio interestholders. Additionally, in the normal course of business, the Portfolio enters into agreements with service providers that may contain indemnification clauses. The Portfolio’s maximum exposure under these arrangements is unknown as this would involve future claims that may be made against the Portfolio that have not yet occurred.
G When-Issued Securities and Delayed Delivery Transactions — The Portfolio may purchase securities on a delayed delivery or when issued basis. Payment and delivery may take place after the customary settlement period for that security. At the time the transaction is negotiated, the price of the security that will be delivered is fixed. The Portfolio maintains cash and/or security positions for these commitments such that sufficient liquid assets will be available to make payments upon settlement. Securities purchased on a delayed delivery or when-issued basis are marked-to-market daily and begin
5-to-15 Year Laddered Municipal Bond Portfolio
July 31, 2021
Notes to Financial Statements (Unaudited) — continued
earning interest on settlement date. Securities purchased on a delayed delivery or when-issued basis are subject to the risk that when delivered they will be worth less than the agreed upon payment price. Losses may also arise if the counterparty does not perform under the contract.
H Capital Transactions — To seek to protect the Portfolio (and, indirectly, other investors in the Portfolio) against the costs of accommodating investor inflows and outflows, the Portfolio imposes a fee (“Portfolio transaction fee”) on inflows and outflows by Portfolio investors. The Portfolio transaction fee is sized to cover the estimated cost to the Portfolio of, in connection with issuing interests, converting the cash and/or other instruments it receives to the desired composition and, in connection with redeeming its interests, converting Portfolio holdings to cash and/or other instruments to be distributed. Such fee, which may vary over time, is limited to amounts that have been authorized by the Board of Trustees and determined by Eaton Vance Management (EVM) to be appropriate. The maximum Portfolio transaction fee is 2% of the amount of net contributions or withdrawals. The Portfolio transaction fee is recorded as a component of capital transactions on the Statements of Changes in Net Assets.
I Interim Financial Statements — The interim financial statements relating to July 31, 2021 and for the six months then ended have not been audited by an independent registered public accounting firm, but in the opinion of the Portfolio’s management, reflect all adjustments, consisting only of normal recurring adjustments, necessary for the fair presentation of the financial statements.
2 Investment Adviser Fee and Other Transactions with Affiliates
The investment adviser fee is earned by Boston Management and Research (BMR) as compensation for investment advisory services rendered to the Portfolio. On March 1, 2021, Morgan Stanley acquired Eaton Vance Corp. (the “Transaction”) and BMR became an indirect, wholly-owned subsidiary of Morgan Stanley. In connection with the Transaction, the Portfolio entered into a new investment advisory agreement (the “New Agreement”) with BMR, which took effect on March 1, 2021. The Portfolio’s prior fee reduction agreement was incorporated into the New Agreement. Pursuant to the New Agreement (and the Portfolio’s investment advisory agreement and related fee reduction agreement with BMR in effect prior to March 1, 2021), the investment adviser fee is computed at an annual rate as a percentage of the Portfolio’s average daily net assets as follows and is payable monthly:
| | | | |
| Average Daily Net Assets | | Annual Fee
Rate | |
| |
Up to $1 billion | | | 0.3200 | % |
| |
$1 billion but less than $2.5 billion | | | 0.3075 | % |
| |
$2.5 billion but less than $5 billion | | | 0.2950 | % |
| |
$5 billion and over | | | 0.2875 | % |
For the six months ended July 31, 2021, the Portfolio’s investment adviser fee amounted to $1,497,663 or 0.32% (annualized) of the Portfolio’s average daily net assets. Pursuant to an investment sub-advisory agreement, BMR has delegated the investment management of the Portfolio to Parametric Portfolio Associates LLC (Parametric), an affiliate of BMR and, effective March 1, 2021, an indirect, wholly-owned subsidiary of Morgan Stanley. In connection with the Transaction, BMR entered into a new investment sub-advisory agreement with Parametric, which took effect on March 1, 2021. BMR pays Parametric a portion of its investment adviser fee for sub-advisory services provided to the Portfolio. Pursuant to a voluntary expense reimbursement, BMR and Parametric were allocated $31,294 in total of the Portfolio’s operating expenses for the six months ended July 31, 2021.
Trustees and officers of the Portfolio who are members of EVM’s or BMR’s organizations receive remuneration for their services to the Portfolio out of the investment adviser fee. Trustees of the Portfolio who are not affiliated with the investment adviser may elect to defer receipt of all or a percentage of their annual fees in accordance with the terms of the Trustees Deferred Compensation Plan. For the six months ended July 31, 2021, no significant amounts have been deferred. Certain officers and Trustees of the Portfolio are officers of the above organizations.
3 Purchases and Sales of Investments
Purchases and sales of investments, other than short-term obligations, aggregated $217,373,856 and $88,862,773, respectively, for the six months ended July 31, 2021.
5-to-15 Year Laddered Municipal Bond Portfolio
July 31, 2021
Notes to Financial Statements (Unaudited) — continued
4 Federal Income Tax Basis of Investments
The cost and unrealized appreciation (depreciation) of investments of the Portfolio at July 31, 2021, as determined on a federal income tax basis, were as follows:
| | | | |
| |
Aggregate cost | | $ | 873,300,634 | |
| |
Gross unrealized appreciation | | $ | 60,956,050 | |
| |
Gross unrealized depreciation | | | (91,294 | ) |
| |
Net unrealized appreciation | | $ | 60,864,756 | |
5 Line of Credit
The Portfolio participates with other portfolios and funds managed by EVM and its affiliates in an $800 million unsecured line of credit agreement with a group of banks, which is in effect through October 26, 2021. Borrowings are made by the Portfolio solely for temporary purposes related to redemptions and other short-term cash needs. Interest is charged to the Portfolio based on its borrowings at an amount above either the Eurodollar rate or Federal Funds rate. In addition, a fee computed at an annual rate of 0.15% on the daily unused portion of the line of credit is allocated among the participating portfolios and funds at the end of each quarter. In connection with the renewal of the agreement in October 2020, an upfront fee and arrangement fee totaling $950,000 was incurred that was allocated to the participating portfolios and funds. Because the line of credit is not available exclusively to the Portfolio, it may be unable to borrow some or all of its requested amounts at any particular time. The Portfolio did not have any significant borrowings or allocated fees during the six months ended July 31, 2021.
6 Fair Value Measurements
Under generally accepted accounting principles for fair value measurements, a three-tier hierarchy to prioritize the assumptions, referred to as inputs, is used in valuation techniques to measure fair value. The three-tier hierarchy of inputs is summarized in the three broad levels listed below.
| • | | Level 1 – quoted prices in active markets for identical investments |
| • | | Level 2 – other significant observable inputs (including quoted prices for similar investments, interest rates, prepayment speeds, credit risk, etc.) |
| • | | Level 3 – significant unobservable inputs (including a fund’s own assumptions in determining the fair value of investments) |
In cases where the inputs used to measure fair value fall in different levels of the fair value hierarchy, the level disclosed is determined based on the lowest level input that is significant to the fair value measurement in its entirety. The inputs or methodology used for valuing securities are not necessarily an indication of the risk associated with investing in those securities.
At July 31, 2021, the hierarchy of inputs used in valuing the Portfolio’s investments, which are carried at value, were as follows:
| | | | | | | | | | | | | | | | |
| Asset Description | | Level 1 | | | Level 2 | | | Level 3 | | | Total | |
| | | | |
Tax-Exempt Municipal Obligations | | $ | — | | | $ | 934,165,390 | | | $ | — | | | $ | 934,165,390 | |
| | | | |
Total Investments | | $ | — | | | $ | 934,165,390 | | | $ | — | | | $ | 934,165,390 | |
7 Risks and Uncertainties
Pandemic Risk
An outbreak of respiratory disease caused by a novel coronavirus was first detected in China in late 2019 and subsequently spread internationally. This coronavirus has resulted in closing borders, enhanced health screenings, changes to healthcare service preparation and delivery, quarantines, cancellations, disruptions to supply chains and customer activity, as well as general concern and uncertainty. Health crises caused by outbreaks, such as the coronavirus outbreak, may exacerbate other pre-existing political, social and economic risks and disrupt normal market conditions and operations. The impact of this outbreak has negatively affected the worldwide economy, the economies of individual countries, individual companies, and the market in general, and may continue to do so in significant and unforeseen ways, as may other epidemics and pandemics that may arise in the future. Any such impact could adversely affect the Portfolio’s performance, or the performance of the securities in which the Portfolio invests.
Eaton Vance
TABS 5-to-15 Year Laddered Municipal Bond NextShares
July 31, 2021
Joint Special Meeting of Shareholders (Unaudited)
Eaton Vance TABS 5-to-15 Year Laddered Municipal Bond NextShares (the “Fund”) held a Joint Special Meeting of Shareholders on February 18, 2021 for the following purposes: (1) to approve a new investment advisory and administrative agreement with Eaton Vance Management to serve as the Fund’s investment adviser and administrator (“Proposal 1”); (2) to approve a new investment sub-advisory agreement with Parametric Portfolio Associates LLC to serve as the Fund’s investment sub-adviser (“Proposal 2”); (3) to provide voting instructions to the Fund, which invests pursuant to a master-feeder arrangement, with respect to the approval of a new investment advisory agreement with Boston Management and Research (“BMR”) to serve as investment adviser to 5-to-15 Year Laddered Municipal Bond Portfolio (“Proposal 3”); and (4) to provide voting instructions to the Fund, which invests pursuant to a master-feeder arrangement, with respect to the approval of a new investment sub-advisory agreement with Parametric Portfolio Associates LLC to serve as investment sub-adviser to 5-to-15 Year Laddered Municipal Bond Portfolio (“Proposal 4”). The shareholder meeting results are as follows:
| | | | | | | | | | | | | | | | |
| | | Number of Shares(1) | |
| | | For | | | Against | | | Abstain(2) | | | Broker
Non-Votes(2) | |
| | | | |
Proposal 1 | | | 678,948.000 | | | | 0 | | | | 1,500.00 | | | | 0 | |
| | | | |
Proposal 2 | | | 678,948.000 | | | | 0 | | | | 1,500.00 | | | | 0 | |
| | | | |
Proposal 3 | | | 678,948.000 | | | | 0 | | | | 1,500.00 | | | | 0 | |
| | | | |
Proposal 4 | | | 678,948.000 | | | | 0 | | | | 1,500.00 | | | | 0 | |
| (1) | Fractional shares were voted proportionately. |
| (2) | Abstentions and broker non-votes (i.e., shares for which a broker returns a proxy but for which (i) the beneficial owner has not voted and (ii) the broker holding the shares does not have discretionary authority to vote on the particular matter) were treated as shares that were present at the meeting for purposes of establishing a quorum, but had the effect of a negative vote on each Proposal. |
Interestholder Meeting
5-to-15 Year Laddered Municipal Bond Portfolio (the “Portfolio”) held a Joint Special Meeting of Interestholders on February 19, 2021 for the following purposes: (1) to approve a new investment advisory agreement with Boston Management and Research to serve as the Portfolio’s investment adviser (“Proposal 1”); and (2) to approve a new investment sub-advisory agreement with Parametric Portfolio Associates LLC to serve as investment sub-adviser to the Portfolio (“Proposal 2”). The interestholder meeting results are as follows:
| | | | | | | | | | | | |
| | | For | | | Against | | | Abstain(1) | |
| | | |
Proposal 1 | | | 95.761 | % | | | 1.310 | % | | | 2.928 | % |
| | | |
Proposal 2 | | | 95.755 | % | | | 1.270 | % | | | 2.974 | % |
Results may not total 100% due to rounding.
| (1) | Abstentions were treated as interests that were present at the meeting for purposes of establishing a quorum, but had the effect of a negative vote on each Proposal. |
Eaton Vance
TABS 5-to-15 Year Laddered Municipal Bond NextShares
July 31, 2021
Liquidity Risk Management Program
The Fund has implemented a written liquidity risk management program (Program) and related procedures to manage its liquidity in accordance with Rule 22e-4 under the Investment Company Act of 1940, as amended (Liquidity Rule). The Liquidity Rule defines “liquidity risk” as the risk that a fund could not meet requests to redeem shares issued by the fund without significant dilution of the remaining investors’ interests in the fund. The Fund’s Board of Trustees/Directors has designated the investment adviser to serve as the administrator of the Program and the related procedures. The administrator has established a Liquidity Risk Management Oversight Committee (Committee) to perform the functions necessary to administer the Program. As part of the Program, the administrator is responsible for identifying illiquid investments and categorizing the relative liquidity of the Fund’s investments in accordance with the Liquidity Rule. Under the Program, the administrator assesses, manages, and periodically reviews the Fund’s liquidity risk, and is responsible for making certain reports to the Fund’s Board of Trustees/Directors and the Securities and Exchange Commission (SEC) regarding the liquidity of the Fund’s investments, and to notify the Board of Trustees/Directors and the SEC of certain liquidity events specified in the Liquidity Rule. The liquidity of the Fund’s portfolio investments is determined based on a number of factors including, but not limited to, relevant market, trading and investment-specific considerations under the Program.
At a meeting of the Fund’s Board of Trustees/Directors on June 8, 2021, the Committee provided a written report to the Fund’s Board of Trustees/Directors pertaining to the operation, adequacy, and effectiveness of implementation of the Program, as well as the operation of the highly liquid investment minimum (if applicable) for the period January 1, 2020 through December 31, 2020 (Review Period). The Program operated effectively during the Review Period, supporting the administrator’s ability to assess, manage and monitor Fund liquidity risk, including during periods of market volatility and net redemptions. During the Review Period, the Fund met redemption requests on a timely basis.
There can be no assurance that the Program will achieve its objectives in the future. Please refer to the Fund’s prospectus for more information regarding the Fund’s exposure to liquidity risk and other principal risks to which an investment in the Fund may be subject.
Eaton Vance
TABS 5-to-15 Year Laddered Municipal Bond NextShares
July 31, 2021
Officers and Trustees
Officers of Eaton Vance TABS 5-to-15 Year Laddered Municipal Bond NextShares and 5-to-15 Year Laddered Municipal Bond Portfolio
Eric A. Stein
President
Deidre E. Walsh
Vice President and Chief Legal Officer
James F. Kirchner
Treasurer
Kimberly M. Roessiger
Secretary
Richard F. Froio
Chief Compliance Officer
Trustees of Eaton Vance TABS 5-to-15 Year Laddered Municipal Bond NextShares and 5-to-15 Year Laddered Municipal Bond Portfolio
George J. Gorman
Chairperson
Thomas E. Faust Jr.*
Mark R. Fetting
Cynthia E. Frost
Valerie A. Mosley
William H. Park
Helen Frame Peters
Keith Quinton
Marcus L. Smith
Susan J. Sutherland
Scott E. Wennerholm
Eaton Vance Funds
| | |
| Privacy Notice | | April 2021 |
| | |
| |
| FACTS | | WHAT DOES EATON VANCE DO WITH YOUR
PERSONAL INFORMATION? |
| | | |
| |
| | |
| Why? | | Financial companies choose how they share your personal information. Federal law gives consumers the right to limit some but not all sharing. Federal law also requires us to tell you how we collect, share, and protect your personal information. Please read this notice carefully to understand what we do. |
| | |
| | | |
| What? | | The types of personal information we collect and share depend on the product or service you have with us. This information can include: ∎ Social Security number and income ∎ investment experience and risk tolerance ∎ checking account number and wire transfer instructions |
| | |
| | | |
| How? | | All financial companies need to share customers’ personal information to run their everyday business. In the section below, we list the reasons financial companies can share their customers’ personal information; the reasons Eaton Vance chooses to share; and whether you can limit this sharing. |
| | |
| | | |
| | | | |
Reasons we can share your
personal information | | Does Eaton Vance share? | | Can you limit this sharing? |
| For our everyday business purposes — such as to process your transactions, maintain your account(s), respond to court orders and legal investigations, or report to credit bureaus | | Yes | | No |
| For our marketing purposes — to offer our products and services to you | | Yes | | No |
| For joint marketing with other financial companies | | No | | We don’t share |
| For our investment management affiliates’ everyday business purposes — information about your transactions, experiences, and creditworthiness | | Yes | | Yes |
| For our affiliates’ everyday business purposes — information about your transactions and experiences | | Yes | | No |
| For our affiliates’ everyday business purposes — information about your creditworthiness | | No | | We don’t share |
| For our investment management affiliates to market to you | | Yes | | Yes |
| For our affiliates to market to you | | No | | We don’t share |
| For nonaffiliates to market to you | | No | | We don’t share |
| | |
| To limit our sharing | | Call toll-free 1-800-262-1122 or email: EVPrivacy@eatonvance.com Please note: If you are a new customer, we can begin sharing your information 30 days from the date we sent this notice. When you are no longer our customer, we continue to share your information as described in this notice. However, you can contact us at any time to limit our sharing. |
| | |
| | | |
| | |
| Questions? | | Call toll-free 1-800-262-1122 or email: EVPrivacy@eatonvance.com |
| | |
| | | |
Eaton Vance Funds
| | |
| Privacy Notice — continued | | April 2021 |
| | |
| Who we are |
| Who is providing this notice? | | Eaton Vance Management, Eaton Vance Distributors, Inc., Eaton Vance Trust Company, Eaton Vance Management (International) Limited, Eaton Vance Advisers International Ltd., Eaton Vance Global Advisors Limited, Eaton Vance Management’s Real Estate Investment Group, Boston Management and Research, Calvert Research and Management, Eaton Vance and Calvert Fund Families and our investment advisory affiliates (“Eaton Vance”) (see Investment Management Affiliates definition below) |
| What we do |
| How does Eaton Vance protect my personal information? | | To protect your personal information from unauthorized access and use, we use security measures that comply with federal law. These measures include computer safeguards and secured files and buildings. We have policies governing the proper handling of customer information by personnel and requiring third parties that provide support to adhere to appropriate security standards with respect to such information. |
| How does Eaton Vance collect my personal information? | | We collect your personal information, for example, when you ∎ open an account or make deposits or withdrawals from your account ∎ buy securities from us or make a wire transfer ∎ give us your contact information We also collect your personal information from others, such as credit bureaus, affiliates, or other companies. |
| Why can’t I limit all sharing? | | Federal law gives you the right to limit only ∎ sharing for affiliates’ everyday business purposes — information about your creditworthiness ∎ affiliates from using your information to market to you ∎ sharing for nonaffiliates to market to you State laws and individual companies may give you additional rights to limit sharing. See below for more on your rights under state law. |
| Definitions |
| Investment Management Affiliates | | Eaton Vance Investment Management Affiliates include registered investment advisers, registered broker-dealers, and registered and unregistered funds. Investment Management Affiliates does not include entities associated with Morgan Stanley Wealth Management, such as Morgan Stanley Smith Barney LLC and Morgan Stanley & Co. |
| Affiliates | | Companies related by common ownership or control. They can be financial and nonfinancial companies. ∎ Our affiliates include companies with a Morgan Stanley name and financial companies such as Morgan Stanley Smith Barney LLC and Morgan Stanley & Co. |
| Nonaffiliates | | Companies not related by common ownership or control. They can be financial and nonfinancial companies. ∎ Eaton Vance does not share with nonaffiliates so they can market to you. |
| Joint marketing | | A formal agreement between nonaffiliated financial companies that together market financial products or services to you. ∎ Eaton Vance doesn’t jointly market. |
| Other important information |
Vermont: Except as permitted by law, we will not share personal information we collect about Vermont residents with Nonaffiliates unless you provide us with your written consent to share such information. California: Except as permitted by law, we will not share personal information we collect about California residents with Nonaffiliates and we will limit sharing such personal information with our Affiliates to comply with California privacy laws that apply to us. |
Eaton Vance Funds
IMPORTANT NOTICES
Delivery of Shareholder Documents. The Securities and Exchange Commission (SEC) permits delivery of only one copy of fund shareholder documents, including prospectuses, proxy statements and shareholder reports, to fund investors with multiple accounts at the same residential or post office box address. This practice is often called “householding” and it helps eliminate duplicate mailings to shareholders. Your broker may household the mailing of your documents indefinitely unless you instruct your broker otherwise. If you would prefer that your Eaton Vance documents not be householded, please contact your broker. Your instructions that householding not apply to delivery of your Eaton Vance documents will typically be effective within 30 days of receipt by your broker.
Portfolio Holdings. Each Eaton Vance Fund and its underlying Portfolio(s) (if applicable) files a schedule of portfolio holdings on Part F to Form N-PORT with the SEC. Certain information filed on Form N-PORT may be viewed on the Eaton Vance website at www.eatonvance.com, by calling Eaton Vance at 1-800-262-1122 or in the EDGAR database on the SEC’s website at www.sec.gov.
Proxy Voting. From time to time, funds are required to vote proxies related to the securities held by the funds. The Eaton Vance Funds or their underlying Portfolios (if applicable) vote proxies according to a set of policies and procedures approved by the Funds’ and Portfolios’ Boards. You may obtain a description of these policies and procedures and information on how the Funds or Portfolios voted proxies relating to portfolio securities during the most recent 12-month period ended June 30, without charge, upon request, by calling 1-800-262-1122 and by accessing the SEC’s website at www.sec.gov.
This Page Intentionally Left Blank
Investment Adviser of 5-to-15 Year Laddered Municipal Bond Portfolio
Boston Management and Research
Two International Place
Boston, MA 02110
Investment Adviser and Administrator of Eaton Vance TABS 5-to-15 Year Laddered Municipal Bond NextShares
Eaton Vance Management
Two International Place
Boston, MA 02110
Investment Sub-Adviser
Parametric Portfolio Associates LLC
800 Fifth Avenue, Suite 2800
Seattle, WA 98104
Distributor*
Foreside Fund Services, LLC
Three Canal Plaza, Suite 100
Portland, ME 04101
Custodian
State Street Bank and Trust Company
State Street Financial Center, One Lincoln Street
Boston, MA 02111
Transfer and Dividend Disbursing Agent
State Street Bank and Trust Company
State Street Financial Center, One Lincoln Street
Boston, MA 02111
Fund Offices
Two International Place
Boston, MA 02110
| * | FINRA BrokerCheck. Investors may check the background of their Investment Professional by contacting the Financial Industry Regulatory Authority (FINRA). FINRA BrokerCheck is a free tool to help investors check the professional background of current and former FINRA-registered securities firms and brokers. FINRA BrokerCheck is available by calling 1-800-289-9999 and at www.FINRA.org. The FINRA BrokerCheck brochure describing this program is available to investors at www.FINRA.org. |


22627 7.31.21
Not required in this filing.
| Item 3. | Audit Committee Financial Expert |
Not required in this filing.
| Item 4. | Principal Accountant Fees and Services |
Not required in this filing.
| Item 5. | Audit Committee of Listed Registrants |
Not applicable.
| Item 6. | Schedule of Investments |
Please see schedule of investments contained in the Report to Stockholders included under Item 1 of this Form N-CSR.
| Item 7. | Disclosure of Proxy Voting Policies and Procedures for Closed-End Management Investment Companies |
Not applicable.
| Item 8. | Portfolio Managers of Closed-End Management Investment Companies |
Not applicable.
| Item 9. | Purchases of Equity Securities by Closed-End Management Investment Company and Affiliated Purchasers |
Not applicable.
| Item 10. | Submission of Matters to a Vote of Security Holders |
No material changes.
| Item 11. | Controls and Procedures |
(a) It is the conclusion of the registrant’s principal executive officer and principal financial officer that the effectiveness of the registrant’s current disclosure controls and procedures (such disclosure controls and procedures having been evaluated within 90 days of the date of this filing) provide reasonable assurance that the information required to be disclosed by the registrant has been recorded, processed, summarized and reported within the time period specified in the Commission’s rules and forms and that the information required to be disclosed by the registrant has been accumulated and communicated to the registrant’s principal executive officer and principal financial officer in order to allow timely decisions regarding required disclosure.
(b) There have been no changes in the registrant’s internal controls over financial reporting during the period covered by this report that has materially affected, or is reasonably likely to materially affect, the registrant’s internal control over financial reporting.
| Item 12. | Disclosure of Securities Lending Activities for Closed-End Management Investment Companies |
Not applicable.
Signatures
Pursuant to the requirements of the Securities Exchange Act of 1934 and the Investment Company Act of 1940, the registrant has duly caused this report to be signed on its behalf by the undersigned, thereunto duly authorized.
Eaton Vance NextShares Trust II
| | |
| By: | | /s/ Eric A. Stein |
| | Eric A. Stein |
| | President |
Date: September 22, 2021
Pursuant to the requirements of the Securities Exchange Act of 1934 and the Investment Company Act of 1940, this report has been signed below by the following persons on behalf of the registrant and in the capacities and on the dates indicated.
| | |
| By: | | /s/ James F. Kirchner |
| | James F. Kirchner |
| | Treasurer |
Date: September 22, 2021
| | |
| By: | | /s/ Eric A. Stein |
| | Eric A. Stein |
| | President |
Date: September 22, 2021