UNITED STATES
SECURITIES AND EXCHANGE COMMISSION
Washington, D.C. 20549
FORM N-CSR
CERTIFIED SHAREHOLDER REPORT OF REGISTERED
MANAGEMENT INVESTMENT COMPANIES
Investment Company Act file number 811-23024
Pacer Funds Trust
(Exact name of registrant as specified in charter)
500 Chesterfield Parkway
Malvern, PA 19355
(Address of principal executive offices) (Zip code)
Joe M. Thomson, President
500 Chesterfield Parkway
Malvern, PA 19355
(Name and address of agent for service)
610-644-8100
Registrant's telephone number, including area code
Date of fiscal year end: April 30
Date of reporting period: May 1, 2018 through October 31, 2018
Item 1. Reports to Stockholders.
| | SEMIANNUAL REPORT | |
| | October 31, 2018 | |
| | Pacer Trendpilot® US Large Cap ETF | | Ticker: PTLC | |
| | Pacer Trendpilot® US Mid Cap ETF | | Ticker: PTMC | |
| | Pacer Trendpilot® 100 ETF | | Ticker: PTNQ | |
| | Pacer Trendpilot® European Index ETF | | Ticker: PTEU | |
| | Pacer Global Cash Cows Dividend ETF | | Ticker: GCOW | |
| | Pacer US Cash Cows 100 ETF | | Ticker: COWZ | |
| | Pacer US Small Cap Cash Cows 100 ETF | | Ticker: CALF | |
| | Pacer Developed Markets International Cash Cows 100 ETF | | Ticker: ICOW | |
| | Pacer WealthShield ETF | | Ticker: PWS | |
| | Pacer Military Times Best Employers ETF | | Ticker: VETS | |
| | Pacer Benchmark Retail Real Estate SCTRSM ETF | | Ticker: RTL | |
| | Pacer Benchmark Industrial Real Estate SCTRSM ETF | | Ticker: INDS | |
| | Pacer Benchmark Data & Infrastructure Real Estate SCTRSM ETF | | Ticker: SRVR | |
| | Pacer US Export Leaders ETF | | Ticker: PEXL | |
| | Pacer CFRA-Stovall Equal Weight Seasonal Rotation ETF | | Ticker: SZNE | |
Pacer Funds
TABLE OF CONTENTS
| | Page |
| Portfolio Allocation | 1 |
| Performance Summary | 5 |
| Expense Example | 20 |
| Schedules of Investments | 22 |
| Statements of Assets and Liabilities | 52 |
| Statements of Operations | 55 |
| Statements of Changes in Net Assets | 58 |
| Financial Highlights | 66 |
| Notes to Financial Statements | 81 |
| Additional Information | 94 |
Pacer Funds
PORTFOLIO ALLOCATION (Unaudited)
As of October 31, 2018
Pacer Trendpilot® US Large Cap ETF
| | Percentage of |
Sector(a) | Net Assets |
| Short-Term Investments | | | 0.1 | % | |
| Investments Purchased with Proceeds from Securities Lending | | | 2.0 | % | |
| Other assets in excess of liabilities | | | 97.9 | % | |
| Total | | | 100.0 | % | |
(a) | The Fund may classify a company in a different category than the The Pacer Trendpilot® US Large Cap Index. |
Pacer Trendpilot® US Mid Cap ETF
| | Percentage of |
Sector(a) | Net Assets |
| Short-Term Investments | | | 99.7 | % | |
| Investments Purchased with Proceeds from Securities Lending | | | 30.0 | % | |
| Liabilities in excess of other assets | | | -29.7 | % | |
| Total | | | 100.0 | % | |
(a) | The Fund may classify a company in a different category than the The Pacer Trendpilot® US Mid Cap Index. |
Pacer Trendpilot® 100 ETF
| | Percentage of |
Sector(a) | Net Assets |
| Technology | | | 20.4 | % | |
| Communications | | | 18.0 | % | |
| Consumer, Non-Cyclical | | | 7.7 | % | |
| Consumer, Cyclical | | | 3.4 | % | |
| Industrial | | | 0.5 | % | |
| Short-Term Investments | | | 0.1 | % | |
| Investments Purchased with Proceeds from Securities Lending | | | 5.8 | % | |
| Other assets in excess of liabilities | | | 44.1 | % | |
| Total | | | 100.0 | % | |
(a) | The Fund may classify a company in a different category than the Pacer nasdaq-100 Trendpilot® Index. |
Pacer Trendpilot® European Index ETF
| | Percentage of |
Country(a) | Net Assets |
| Greece | | | 0.0 | %(b) | |
| Short-Term Investments | | | 99.9 | % | |
| Investments Purchased with Proceeds from Securities Lending | | | 30.0 | % | |
| Liabilities in excess of other assets | | | -29.9 | % | |
| Total | | | 100.0 | % | |
(a) | The Fund generally classifies a company based on its country of incorporation, but may designate a different country in certain circumstances. |
(b) | Less than 0.05% |
Pacer Funds
PORTFOLIO ALLOCATION (Unaudited) (Continued)
As of October 31, 2018
Pacer Global Cash Cows Dividend ETF
| | Percentage of |
Sector(a) | Net Assets |
| Consumer, Non-Cyclical | | | 36.0 | % | |
| Communications | | | 17.3 | % | |
| Consumer, Cyclical | | | 11.2 | % | |
| Basic Materials | | | 9.0 | % | |
| Financial | | | 5.7 | % | |
| Energy | | | 5.6 | % | |
| Technology | | | 4.9 | % | |
| Utilities | | | 4.4 | % | |
| Industrial | | | 4.3 | % | |
| Diversified | | | 1.2 | % | |
| Short-Term Investments | | | 0.1 | % | |
| Investments Purchased with Proceeds from Securities Lending | | | 20.5 | % | |
| Liabilities in excess of other assets | | | -20.2 | % | |
| Total | | | 100.0 | % | |
(a) | The Fund may classify a company in a different category than the Pacer Global Cash Cows Dividend 100 Index. |
Pacer US Cash Cows 100 ETF
| | Percentage of |
Sector(a) | Net Assets |
| Technology | | | 25.2 | % | |
| Consumer, Cyclical | | | 24.5 | % | |
| Consumer, Non-Cyclical | | | 22.3 | % | |
| Communications | | | 7.2 | % | |
| Basic Materials | | | 6.7 | % | |
| Financial | | | 5.3 | % | |
| Energy | | | 4.9 | % | |
| Industrial | | | 3.7 | % | |
| Short-Term Investments | | | 0.2 | % | |
| Investments Purchased with Proceeds from Securities Lending | | | 10.9 | % | |
| Liabilities in excess of other assets | | | -10.9 | % | |
| Total | | | 100.0 | % | |
(a) | The Fund may classify a company in a different category than the Pacer US Cash Cows 100 Index. |
Pacer US Small Cap Cash Cows 100 ETF
| | Percentage of |
Sector(a) | Net Assets |
| Consumer, Cyclical | | | 29.8 | % | |
| Consumer, Non-Cyclical | | | 17.3 | % | |
| Industrial | | | 17.0 | % | |
| Technology | | | 12.5 | % | |
| Energy | | | 7.8 | % | |
| Communications | | | 7.0 | % | |
| Financial | | | 5.8 | % | |
| Basic Materials | | | 2.7 | % | |
| Short-Term Investments | | | 0.1 | % | |
| Investments Purchased with Proceeds from Securities Lending | | | 8.6 | % | |
| Liabilities in excess of other assets | | | -8.6 | % | |
| Total | | | 100.0 | % | |
(a) | The Fund may classify a company in a different category than the Pacer US Small Cap Cash Cows 100 Index. |
Pacer Funds
PORTFOLIO ALLOCATION (Unaudited) (Continued)
As of October 31, 2018
Pacer Developed Markets International Cash Cows 100 ETF
| | Percentage of |
Sector(a) | Net Assets |
| Consumer, Cyclical | | | 25.7 | % | |
| Consumer, Non-Cyclical | | | 20.4 | % | |
| Basic Materials | | | 20.3 | % | |
| Communications | | | 13.7 | % | |
| Industrial | | | 8.5 | % | |
| Energy | | | 5.3 | % | |
| Technology | | | 4.0 | % | |
| Utilities | | | 1.6 | % | |
| Short-Term Investments | | | 0.1 | % | |
| Investments Purchased with Proceeds from Securities Lending | | | 7.0 | % | |
| Liabilities in excess of other assets | | | -6.6 | % | |
| Total | | | 100.0 | % | |
(a) | The Fund may classify a company in a different category than the Pacer Developed Markets International Cash Cows 100 Index. |
Pacer WealthShield ETF
| | Percentage of |
Sector(a) | Net Assets |
| Short-Term Investments | | | 0.4 | % | |
| Other assets in excess of liabilities | | | 99.6 | % | |
| Total | | | 100.0 | % | |
(a) | The Fund may classify a company in a different category than the Pacer WealthShield Index. |
Pacer Military Times Best Employers ETF
| | Percentage of |
Sector(a) | Net Assets |
| Financial | | | 22.7 | % | |
| Industrial | | | 15.4 | % | |
| Technology | | | 14.8 | % | |
| Consumer, Non-Cyclical | | | 14.8 | % | |
| Communications | | | 11.6 | % | |
| Consumer, Cyclical | | | 11.0 | % | |
| Utilities | | | 9.7 | % | |
| Short-Term Investments | | | 0.0 | %(b) | |
| Other assets in excess of liabilities | | | 0.0 | %(b) | |
| Total | | | 100.0 | % | |
(a) | The Fund may classify a company in a different category than the Military Times Best for VETS Total Return Index. |
(b) | Less than 0.05% |
Pacer Benchmark Retail Real Estate SCTRSM ETF
| | Percentage of |
Sector(a) | Net Assets |
| Financial | | | 98.8 | % | |
| Short-Term Investments | | | 1.1 | % | |
| Other assets in excess of liabilities | | | 0.1 | % | |
| Total | | | 100.0 | % | |
(a) | The Fund may classify a company in a different category than the Pacer Benchmark Retail Real Estate SCTRSM Index. |
Pacer Funds
PORTFOLIO ALLOCATION (Unaudited) (Continued)
As of October 31, 2018
Pacer Benchmark Industrial Real Estate SCTRSM ETF
| | Percentage of |
Sector(a) | Net Assets |
| Financial | | | 99.9 | % | |
| Short-Term Investments | | | 0.1 | % | |
| Liabilities in excess of other assets | | | 0.0 | %(b) | |
| Total | | | 100.0 | % | |
(a) | The Fund may classify a company in a different category than the Pacer Benchmark Industrial Real Estate SCTRSM Index. |
(b) | Less than -0.05% |
Pacer Benchmark Data & Infrastructure Real Estate SCTRSM ETF
| | Percentage of |
Sector(a) | Net Assets |
| Financial | | | 92.7 | % | |
| Technology | | | 3.9 | % | |
| Communications | | | 2.9 | % | |
| Short-Term Investments | | | 0.2 | % | |
| Other assets in excess of liabilities | | | 0.3 | % | |
| Total | | | 100.0 | % | |
(a) | The Fund may classify a company in a different category than the Pacer Benchmark Data & Infrastructure Real Estate SCTRSM Index. |
Pacer US Export Leaders ETF
| | Percentage of |
Sector(a) | Net Assets |
| Technology | | | 33.3 | % | |
| Consumer, Non-Cyclical | | | 19.6 | % | |
| Industrial | | | 18.2 | % | |
| Consumer, Cyclical | | | 10.4 | % | |
| Basic Materials | | | 7.2 | % | |
| Communications | | | 6.7 | % | |
| Energy | | | 3.6 | % | |
| Financial | | | 0.9 | % | |
| Short-Term Investments | | | 0.1 | % | |
| Liabilities in excess of other assets | | | 0.0 | %(b) | |
| Total | | | 100.0 | % | |
(a) | The Fund may classify a company in a different category than the Pacer US Export Leaders Index. |
(b) | Less than -0.05% |
Pacer CFRA-Stovall Equal Weight Seasonal Rotation ETF
| | Percentage of |
Sector(a) | Net Assets |
| Industrial | | | 26.3 | % | |
| Consumer, Cyclical | | | 25.5 | % | |
| Basic Materials | | | 17.1 | % | |
| Technology | | | 17.1 | % | |
| Consumer, Non-Cyclical | | | 8.5 | % | |
| Communications | | | 4.2 | % | |
| Financial | | | 1.1 | % | |
| Short-Term Investments | | | 1.0 | % | |
| Liabilities in excess of other assets | | | -0.8 | % | |
| Total | | | 100.0 | % | |
(a) | The Fund may classify a company in a different category than the Pacer CFRA-Stovall Equal Weight Seasonal Rotation Index. |
Pacer Trendpilot® US Large Cap ETF
PERFORMANCE SUMMARY
(Unaudited)
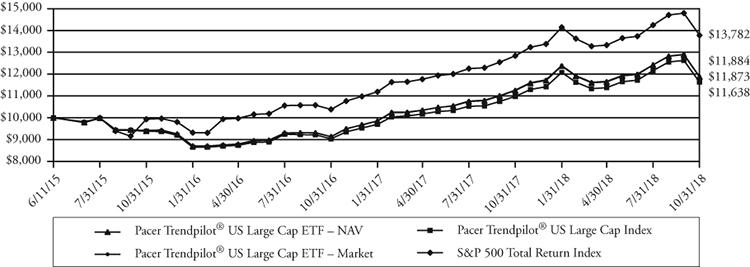
Growth of $10,000
This chart illustrates the performance of a hypothetical $10,000 investment made on June 11, 2015, and is not intended to imply any future performance. The returns shown do not reflect the deduction of taxes that a shareholder would pay on fund distributions or the redemption of fund shares. The chart assumes reinvestment of capital gains and dividends.
The Pacer Trendpilot® US Large Cap Index uses an objective, rules-based methodology to implement a systematic trend-following strategy that directs exposure (i) 100% to the S&P 500 Index, (ii) 50% to the S&P 500 Total Return Index and 50% to 3-Month US Treasury bills, or (iii) 100% to 3-Month US Treasury bills, depending on the relative performance of the S&P 500 Total Return Index and its 200-business day historical simple moving average. The S&P 500 Total Return Index is a total return version of the S&P 500 Index and reflects the reinvestment of dividends paid by the securities in the S&P 500 Index.
The S&P 500 Total Return Index is a total return version of the S&P 500 Index and reflects the reinvestment of dividends paid by the securities in the S&P 500 Index. The S&P 500 Index consists of approximately 500 leading U.S.-listed companies representing approximately 8% of the U.S. equity market capitalization.
Annualized Returns(a)
(For the periods ended October 31, 2018)
| | One Year | Since Inception(b) |
Pacer Trendpilot® US Large Cap ETF – NAV | 5.53% | 5.20% |
Pacer Trendpilot® US Large Cap ETF – Market | 5.48% | 5.23% |
Pacer Trendpilot® US Large Cap Index(c)(d) | 6.19% | 5.85% |
S&P 500 Total Return Index(d) | 7.35% | 9.91% |
(a) | The performance data quoted is historical. Past performance is no guarantee of future results. Current performance may be higher or lower than the performance data quoted. The principal value and investment return of an investment will fluctuate so that investor’s shares, when redeemed, may be worth more or less than the original cost. The returns shown do not reflect the deduction of taxes that a shareholder would pay on Fund distributions or on redemptions of Fund shares. The total annual operating expenses as stated in the fee table to the Fund’s prospectus dated August 31, 2018, is 0.60%. For performance information current to the most recent month-end, please call 1-877-337-0500. |
(b) | Inception date is June 11, 2015. |
(c) | Effective November 1, 2017, the Fund’s investment objective was to track the price and total return performance, before fees and expenses, of the Pacer Trendpilot® US Large Cap Index. Prior to November 1, 2017, the Fund’s investment objective was to track the price and total return performance, before fees and expenses, of the Pacer Wilshire US Large-Cap Trendpilot™ Index. Performance shown for periods beginning November 1, 2017 is that of the Pacer Trendpilot® US Large Cap Index, and performance shown for periods prior to November 1, 2017 is that of the Pacer Wilshire US Large-Cap Trendpilot™ Index. |
(d) | Indexes are unmanaged statistical composites and their returns do not include fees an investor would pay to purchase the securities they represent. Such costs would lower performance. It is not possible to invest directly in an index. |
Pacer Trendpilot® US Mid Cap ETF
PERFORMANCE SUMMARY
(Unaudited)
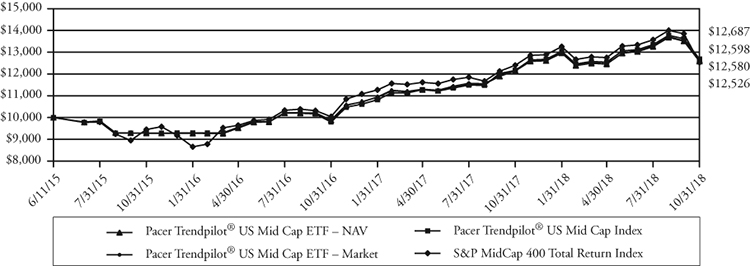
Growth of $10,000
This chart illustrates the performance of a hypothetical $10,000 investment made on June 11, 2015, and is not intended to imply any future performance. The returns shown do not reflect the deduction of taxes that a shareholder would pay on fund distributions or the redemption of fund shares. The chart assumes reinvestment of capital gains and dividends.
The Pacer Trendpilot® US Mid Cap Index uses an objective, rules-based methodology to implement a systematic trend-following strategy that directs exposure (i) 100% to the S&P MidCap 400 Index, (ii) 50% to the S&P MidCap 400 Index and 50% to 3-Month US Treasury bills, or (iii) 100% to 3-Month US Treasury bills, depending on the relative performance of the S&P MidCap 400 Total Return Index and its 200-business day historical simple moving average.
The S&P MidCap 400 Total Return Index is a total return version of the S&P MidCap 400 Index and reflects the reinvestment of dividends paid by the securities in the S&P MidCap 400 Index. The S&P Midcap 400 measures the performance of mid-capitalization stocks in the United States.
Annualized Returns(a)
(For the periods ended October 31, 2018)
| | One Year | Since Inception(b) |
Pacer Trendpilot® US Mid Cap ETF – NAV | 3.61% | 7.02% |
Pacer Trendpilot® US Mid Cap ETF – Market | 3.40% | 7.04% |
Pacer Trendpilot® US Mid Cap Index(c)(d) | 4.02% | 7.66% |
S&P MidCap 400 Total Return Index(d) | 1.02% | 6.87% |
(a) | The performance data quoted is historical. Past performance is no guarantee of future results. Current performance may be higher or lower than the performance data quoted. The principal value and investment return of an investment will fluctuate so that investor’s shares, when redeemed, may be worth more or less than the original cost. The returns shown do not reflect the deduction of taxes that a shareholder would pay on Fund distributions or on redemptions of Fund shares. The total annual operating expenses as stated in the fee table to the Fund’s prospectus dated August 31, 2018, is 0.62%. For performance information current to the most recent month-end, please call 1-877-337-0500. |
(b) | Inception date is June 11, 2015. |
(c) | Effective November 1, 2017, the Fund’s investment objective was to track the price and total return performance, before fees and expenses, of the Pacer Trendpilot® US Mid Cap Index. Prior to November 1, 2017, the Fund’s investment objective was to track the price and total return performance, before fees and expenses, of the Pacer Wilshire US Mind-Cap Trendpilot™ Index. Performance shown for periods beginning November 1, 2017 is that of the Pacer Trendpilot® US Mid Cap Index, and performance shown for periods prior to November 1, 2017 is that of the Pacer Wilshire US Mid-Cap Trendpilot™ Index. |
(d) | Indexes are unmanaged statistical composites and their returns do not include fees an investor would pay to purchase the securities they represent. Such costs would lower performance. It is not possible to invest directly in an index. |
Pacer Trendpilot® 100 ETF
PERFORMANCE SUMMARY
(Unaudited)
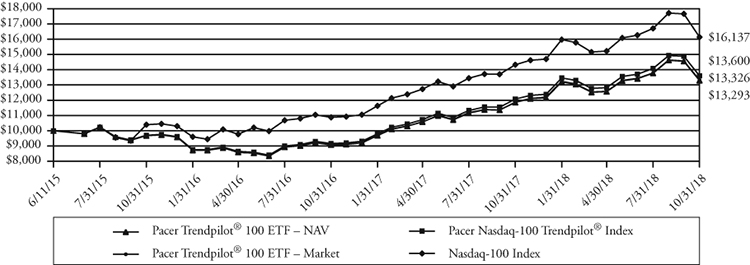
Growth of $10,000
This chart illustrates the performance of a hypothetical $10,000 investment made on June 11, 2015, and is not intended to imply any future performance. The returns shown do not reflect the deduction of taxes that a shareholder would pay on fund distributions or the redemption of fund shares. The chart assumes reinvestment of capital gains and dividends.
Pacer Nasdaq-100 Trendpilot® Index uses an objective, rules-based methodology to implement a systematic trend-following strategy that directs exposure (i) 100% to the Nasdaq-100 Index, (ii) 50% to the Nasdaq-100 Index and 50% to 3-Month US Treasury bills, or (iii) 100% to 3-Month US Treasury bills, depending on the relative performance of the Nasdaq-100 Total Return Index and its 200-business day historical simple moving average. The Nasdaq-100 Total Return Index is a total return version of the Nasdaq-100 Index and reflects the reinvestment of dividends paid by the securities in the Nasdaq-100 Index.
The Nasdaq-100 Index includes approximately 100 of the largest non-financial securities listed on The Nasdaq Stock Market based on market capitalization. The Nasdaq-100 Index comprises securities of companies across major industry groups, including computer, biotechnology, healthcare, telecommunications and transportation. However, it does not contain securities of financial companies, including investment companies. The Nasdaq 100 Index was developed by Nasdaq OMX. There is no minimum market capitalization requirement for inclusion in the Nasdaq-100 Index. Inclusion is determined based on the top 100 largest issuers based on market capitalization meeting all other eligibility requirements.
Annualized Returns(a)
(For the periods ended October 31, 2018)
| | One Year | Since Inception(b) |
Pacer Trendpilot® 100 ETF – NAV | 12.07% | 8.77% |
Pacer Trendpilot® 100 ETF – Market | 12.25% | 8.85% |
Pacer Nasdaq-100 Trendpilot® Index(c) | 12.67% | 9.48% |
Nasdaq-100 Index(c) | 12.67% | 15.16% |
(a) | The performance data quoted is historical. Past performance is no guarantee of future results. Current performance may be higher or lower than the performance data quoted. The principal value and investment return of an investment will fluctuate so that investor’s shares, when redeemed, may be worth more or less than the original cost. The returns shown do not reflect the deduction of taxes that a shareholder would pay on Fund distributions or on redemptions of Fund shares. The total annual operating expenses as stated in the fee table to the Fund’s prospectus dated August 31, 2018, is 0.65%. For performance information current to the most recent month-end, please call 1-877-337-0500. |
(b) | Inception date is June 11, 2015. |
(c) | Indexes are unmanaged statistical composites and their returns do not include fees an investor would pay to purchase the securities they represent. Such costs would lower performance. It is not possible to invest directly in an index. |
Pacer Trendpilot® European Index ETF
PERFORMANCE SUMMARY
(Unaudited)
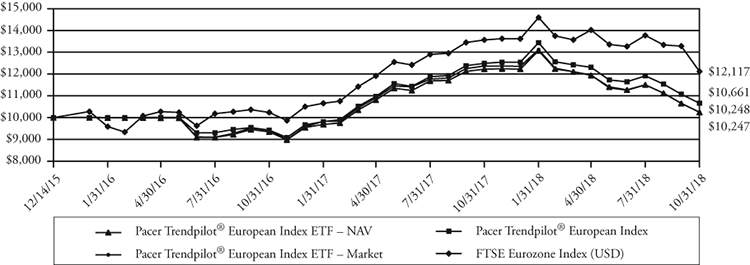
Growth of $10,000
This chart illustrates the performance of a hypothetical $10,000 investment made on December 14, 2015, and is not intended to imply any future performance. The returns shown do not reflect the deduction of taxes that a shareholder would pay on fund distributions or the redemption of fund shares. The chart assumes reinvestment of capital gains and dividends.
The Pacer Trendpilot® European Index uses an objective, rules-based methodology to implement a systematic trend-following strategy that directs exposure (i) 100% to the FTSE Eurozone Index, (ii) 50% to the FTSE Eurozone Index and 50% to 3-Month US Treasury bills, or (iii) 100% to 3-Month US Treasury bills, depending on the relative performance of the FTSE Eurozone Total Return Index and its 200-business day historical simple moving average.
The FTSE Eurozone Index is a rules-based, float-adjusted, market capitalization-weighted index comprised of large- and mid-capitalization stocks providing coverage of the developed markets in the euro zone, including primarily France, Germany, Spain, the Netherlands, and Italy. The FTSE Eurozone Index is a subset of the FTSE Global Equity Index Series, which covers 98% of the world’s investable market capitalization. The FTSE Eurozone Total Return Index is a total return version of the FTSE Eurozone Index and reflects the reinvestment of dividend paid by the securities in the FTSE Eurozone Index.
Annualized Returns(a)
(For the periods ended October 31, 2018)
| | One Year | Since Inception(b) |
Pacer Trendpilot® European Index ETF – NAV | -16.19% | 0.84% |
Pacer Trendpilot® European Index ETF – Market | -17.15% | 0.84% |
Pacer Trendpilot® European Index(c) | -14.64% | 2.25% |
FTSE Eurozone Index (USD)(c) | -10.67% | 6.89% |
(a) | The performance data quoted is historical. Past performance is no guarantee of future results. Current performance may be higher or lower than the performance data quoted. The principal value and investment return of an investment will fluctuate so that investor’s shares, when redeemed, may be worth more or less than the original cost. The returns shown do not reflect the deduction of taxes that a shareholder would pay on Fund distributions or on redemptions of Fund shares. The total annual operating expenses as stated in the fee table to the Fund’s prospectus dated August 31, 2018, is 0.66%. For performance information current to the most recent month-end, please call 1-877-337-0500. |
(b) | Inception date is December 14, 2015. |
(c) | Indexes are unmanaged statistical composites and their returns do not include fees an investor would pay to purchase the securities they represent. Such costs would lower performance. It is not possible to invest directly in an index. |
Pacer Global Cash Cows Dividend ETF
PERFORMANCE SUMMARY
(Unaudited)
Growth of $10,000
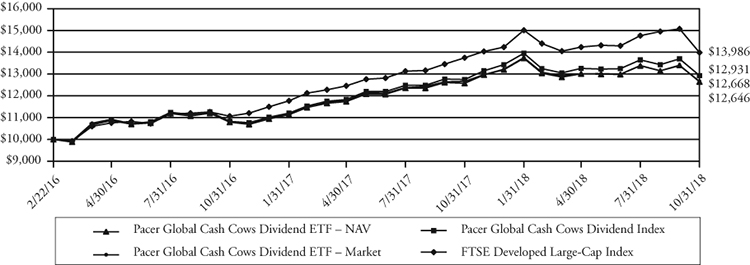
This chart illustrates the performance of a hypothetical $10,000 investment made on February 22, 2016, and is not intended to imply any future performance. The returns shown do not reflect the deduction of taxes that a shareholder would pay on fund distributions or the redemption of fund shares. The chart assumes reinvestment of capital gains and dividends.
The Pacer Global Cash Cows Dividend Index uses an objective, rules-based methodology to provide exposure to global companies with high dividend yield backed by a high free cash flow yield. The initial index universe is derived from the component companies of the FTSE Developed Large Cap Index. The initial universe of companies is screened based on their average projected free cash flows and earnings over each of the next two fiscal years. Companies with negative average projected free cash flows or earnings are removed from the Index universe. Additionally, financial companies, other than real estate investment trusts, are excluded from the Index universe. The remaining companies are ranked by their free cash flow yield for the trailing twelve month period. The 300 companies with the highest free cash flow yield are then ranked by their dividend yield. The equity securities of the 100 companies with the highest dividend yield are included in the Index.
The FTSE Developed Large-Cap Index is a market-capitalization weighted index representing the performance of large-cap stocks in developed markets. The FTSE Developed Large-Cap Total Return Index is a total return version of the FTSE Developed Large-Cap Index and reflects the reinvestment of dividends paid by the securities in the FTSE Developed Large-Cap Index.
Annualized Returns(a)
(For the periods ended October 31, 2018)
| | One Year | Since Inception(b) |
| Pacer Global Cash Cows Dividend ETF – NAV | 0.57% | 9.12% |
| Pacer Global Cash Cows Dividend ETF – Market | 0.01% | 9.18% |
Pacer Global Cash Cows Dividend Index(c) | 1.57% | 10.12% |
FTSE Developed Large-Cap Index(c) | 1.74% | 13.28% |
(a) | The performance data quoted is historical. Past performance is no guarantee of future results. Current performance may be higher or lower than the performance data quoted. The principal value and investment return of an investment will fluctuate so that investor’s shares, when redeemed, may be worth more or less than the original cost. The returns shown do not reflect the deduction of taxes that a shareholder would pay on Fund distributions or on redemptions of Fund shares. The total annual operating expenses as stated in the fee table to the Fund’s prospectus dated August 31, 2018, is 0.60%. For performance information current to the most recent month-end, please call 1-877-337-0500. |
(b) | Inception date is February 22, 2016. |
(c) | Indexes are unmanaged statistical composites and their returns do not include fees an investor would pay to purchase the securities they represent. Such costs would lower performance. It is not possible to invest directly in an index. |
Pacer US Cash Cows 100 ETF
PERFORMANCE SUMMARY
(Unaudited)
Growth of $10,000
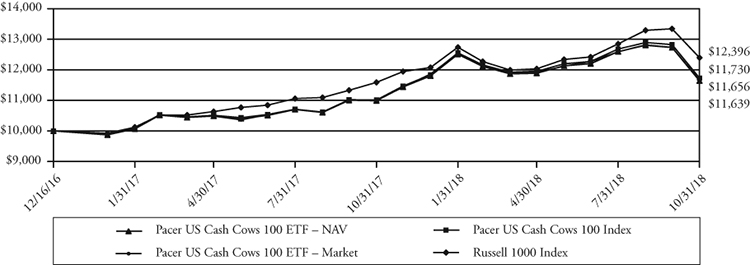
This chart illustrates the performance of a hypothetical $10,000 investment made on December 16, 2016, and is not intended to imply any future performance. The returns shown do not reflect the deduction of taxes that a shareholder would pay on fund distributions or the redemption of fund shares. The chart assumes reinvestment of capital gains and dividends.
The Pacer US Cash Cows 100 Index uses an objective, rules-based methodology to provide exposure to large and mid-capitalization U.S. companies with high free cash flow yields. The initial index universe is derived from the component companies of the Russell 1000 Index. The initial universe of companies is screened based on their average projected free cash flows and earnings over each of the next two fiscal years. Companies with no forward year estimates available for free cash flows or earnings will remain in the Index universe. Companies with negative average projected free cash flows or earnings are removed from the Index universe. Additionally, financial companies, other than real estate investment trusts, are excluded from the Index universe. The remaining companies are ranked by their free cash flow yield for the trailing twelve month period. The equity securities of the 100 companies with the highest free cash flow yield are included in the Index.
The Russell 1000 Index is a market-capitalization weighted index representing the top 1,000 large-cap stocks in the Russell 3000 Index. The Russell 1000 Total Return Index is a total return version of the Russell 1000 Index that reflects the reinvestment of dividends paid by the securities in the Russell 1000 Index.
Annualized Returns(a)
(For the periods ended October 31, 2018)
| | One Year | Since Inception(b) |
| Pacer US Cash Cows 100 ETF – NAV | 5.92% | 8.43% |
| Pacer US Cash Cows 100 ETF – Market | 5.97% | 8.53% |
Pacer US Cash Cows 100 Index(c) | 6.51% | 8.89% |
Russell 1000 Index(c) | 6.98% | 12.15% |
(a) | The performance data quoted is historical. Past performance is no guarantee of future results. Current performance may be higher or lower than the performance data quoted. The principal value and investment return of an investment will fluctuate so that investor’s shares, when redeemed, may be worth more or less than the original cost. The returns shown do not reflect the deduction of taxes that a shareholder would pay on Fund distributions or on redemptions of Fund shares. The total annual operating expenses as stated in the fee table to the Fund’s prospectus dated August 31, 2018, is 0.49%. For performance information current to the most recent month-end, please call 1-877-337-0500. |
(b) | Inception date is December 16, 2016. |
(c) | Indexes are unmanaged statistical composites and their returns do not include fees an investor would pay to purchase the securities they represent. Such costs would lower performance. It is not possible to invest directly in an index. |
Pacer US Small Cap Cash Cows 100 ETF
PERFORMANCE SUMMARY
(Unaudited)
Growth of $10,000
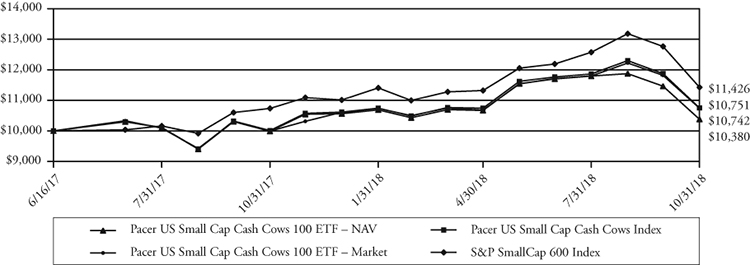
This chart illustrates the performance of a hypothetical $10,000 investment made on June 16, 2017, and is not intended to imply any future performance. The returns shown do not reflect the deduction of taxes that a shareholder would pay on fund distributions or the redemption of fund shares. The chart assumes reinvestment of capital gains and dividends.
The Pacer US Small Cap Cash Cows Index uses an objective, rules-based methodology to provide exposure to small-capitalization U.S. companies with high free cash flow yields. The initial index universe is derived from the component companies of the S&P Small Cap 600 Index. The initial universe of companies is screened based on their average projected free cash flows and earnings over each of the next two fiscal years. Companies with no forward year estimates available for free cash flows or earnings will remain in the Index universe. Companies with negative average projected free cash flows or earnings are removed from the Index universe. Additionally, financial companies, other than real estate investment trusts, are excluded from the Index universe. The remaining companies are ranked by their free cash flow yield for the trailing twelve month period. The equity securities of the 100 companies with the highest free cash flow yield are included in the Index.
The S&P SmallCap 600 Index measures the performance of 600 small sized companies in the US equity market, with market capitalization ranging from $450 million to $2.1 billion USD. The Index does not overlap holdings with the S&P 500 or S&P MidCap 400.
Annualized Returns(a)
(For the period ended October 31, 2018)
| | One Year | Since Inception(b) |
| Pacer US Small Cap Cash Cows 100 ETF – NAV | 7.02% | 4.96% |
| Pacer US Small Cap Cash Cows 100 ETF – Market | 7.49% | 5.34% |
Pacer US Small Cap Cash Cows Index(c) | 7.13% | 5.07% |
S&P SmallCap 600 Index(c) | 5.60% | 9.61% |
(a) | The performance data quoted is historical. Past performance is no guarantee of future results. Current performance may be higher or lower than the performance data quoted. The principal value and investment return of an investment will fluctuate so that investor’s shares, when redeemed, may be worth more or less than the original cost. The returns shown do not reflect the deduction of taxes that a shareholder would pay on Fund distributions or on redemptions of Fund shares. The total annual operating expenses as stated in the fee table to the Fund’s prospectus dated August 31, 2018, is 0.59%. For performance information current to the most recent month-end, please call 1-877-337-0500. |
(b) | Inception date is June 16, 2017. |
(c) | Indexes are unmanaged statistical composites and their returns do not include fees an investor would pay to purchase the securities they represent. Such costs would lower performance. It is not possible to invest directly in an index. |
Pacer Developed Markets International Cash Cows 100 ETF
PERFORMANCE SUMMARY
(Unaudited)
Growth of $10,000
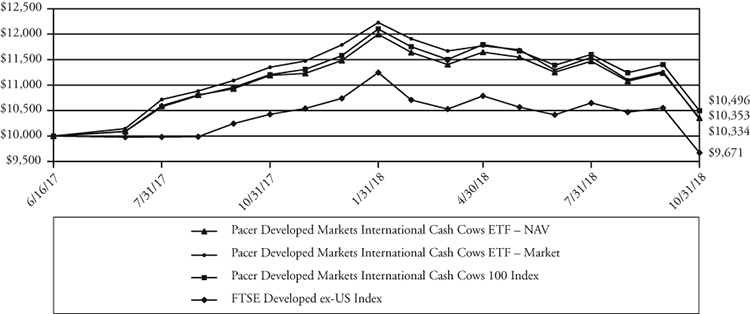
This chart illustrates the performance of a hypothetical $10,000 investment made on June 16, 2017, and is not intended to imply any future performance. The returns shown do not reflect the deduction of taxes that a shareholder would pay on fund distributions or the redemption of fund shares. The chart assumes reinvestment of capital gains and dividends.
The Pacer Developed Markets International Cash Cows 100 Index uses an objective, rules-based methodology to provide exposure to large and mid-capitalization non-U.S. companies in developed markets with high free cash flow yields. The initial index universe is derived from the component companies of the FTSE Developed ex US Index. The initial universe of companies is screened based on their average projected free cash flows and earnings over each of the next two fiscal years. Companies with no forward year estimates available for free cash flows or earnings will remain in the Index universe. Companies with negative average projected free cash flows or earnings are removed from the Index universe. Additionally, financial companies, other than real estate investment trusts, and companies with a market capitalization of less than $3 billion are excluded from the Index universe. The remaining companies are ranked by their average daily trading value (“ADTV”) for the prior three months. The 500 companies with the highest ADTV are then ranked by their free cash flow yield for the trailing twelve month period. The equity securities of the 100 companies with the highest free cash flow yield are included in the Index.
The FTSE Developed ex-US Index is comprised of Large (85%) and Mid (15%) cap stocks providing coverage of Developed markets (24 countries) excluding the US. The index is derived from the FTSE Global Equity Index Series, which covers 98% of the world’s investable market capitalization.
Annualized Returns(a)
(For the period ended October 31, 2018)
| | One Year | Since Inception(b) |
| Pacer Developed Markets International Cash Cows 100 ETF – NAV | -7.45% | 2.57% |
| Pacer Developed Markets International Cash Cows 100 ETF – Market | -8.96% | 2.41% |
Pacer Developed Markets International Cash Cows 100 Index(c) | -6.47% | 3.39% |
FTSE Developed ex-US Index(c) | -7.37% | -0.53% |
(a) | The performance data quoted is historical. Past performance is no guarantee of future results. Current performance may be higher or lower than the performance data quoted. The principal value and investment return of an investment will fluctuate so that investor’s shares, when redeemed, may be worth more or less than the original cost. The returns shown do not reflect the deduction of taxes that a shareholder would pay on Fund distributions or on redemptions of Fund shares. The total annual operating expenses as stated in the fee table to the Fund’s prospectus dated August 31, 2017, is 0.65%. For performance information current to the most recent month-end, please call 1-877-337-0500. |
(b) | Inception date is June 16, 2017. |
(c) | Indexes are unmanaged statistical composites and their returns do not include fees an investor would pay to purchase the securities they represent. Such costs would lower performance. It is not possible to invest directly in an index. |
Pacer WealthShield ETF
PERFORMANCE SUMMARY
(Unaudited)
Growth of $10,000
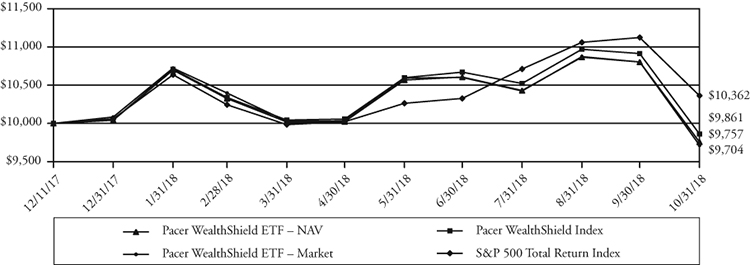
This chart illustrates the performance of a hypothetical $10,000 investment made on December 11, 2017, and is not intended to imply any future performance. The returns shown do not reflect the deduction of taxes that a shareholder would pay on fund distributions or the redemption of fund shares. The chart assumes reinvestment of capital gains and dividends.
The Pacer WealthShield Index uses an objective, rules-based methodology to implement a trend-following strategy that directs some or all of the Index’s exposure to (i) U.S. equity securities or (ii) U.S. Treasury securities depending on the strength of the high-yield corporate (“junk”) bond market relative to U.S. Treasury bonds and the momentum of certain U.S. equity sectors or industries and of long-term U.S. Treasury bonds, as described below.
The S&P 500 Total Return Index is a total return version of the S&P 500 Index and reflects the reinvestment of dividends paid by the securities in the S&P 500 Index. The S&P 500 Index consists of approximately 500 leading U.S.-listed companies representing approximately 8% of the U.S. equity market capitalization.
Cumulative Returns(a)
(For the period ended October 31, 2018)
| | Since Inception(b) |
| Pacer WealthShield ETF – NAV | -2.70% |
| Pacer WealthShield ETF – Market | -2.94% |
Pacer WealthShield Index(c) | -1.81% |
S&P 500 Total Return Index™(c) | 3.62% |
(a) | The performance data quoted is historical. Past performance is no guarantee of future results. Current performance may be higher or lower than the performance data quoted. The principal value and investment return of an investment will fluctuate so that investor’s shares, when redeemed, may be worth more or less than the original cost. The returns shown do not reflect the deduction of taxes that a shareholder would pay on Fund distributions or on redemptions of Fund shares. The total annual operating expenses as stated in the fee table to the Fund’s prospectus dated August 31, 2018, is 0.60%. For performance information current to the most recent month-end, please call 1-877-337-0500. |
(b) | Inception date is December 11, 2017. |
(c) | Indexes are unmanaged statistical composites and their returns do not include fees an investor would pay to purchase the securities they represent. Such costs would lower performance. It is not possible to invest directly in an index. |
Pacer Military Times Best Employers ETF
PERFORMANCE SUMMARY
(Unaudited)
Growth of $10,000
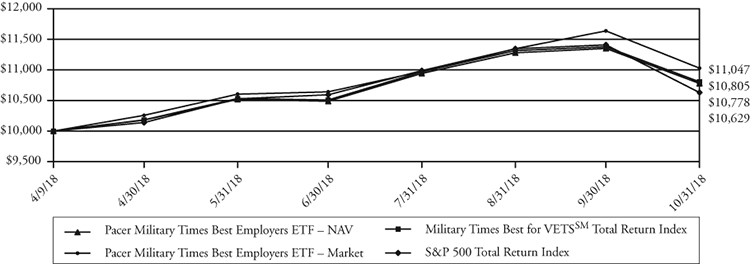
This chart illustrates the performance of a hypothetical $10,000 investment made on April 9, 2018, and is not intended to imply any future performance. The returns shown do not reflect the deduction of taxes that a shareholder would pay on fund distributions or the redemption of fund shares. The chart assumes reinvestment of capital gains and dividends.
The Pacer Military Times Best Employers Index is composed of the U.S.-listed stocks of companies that have been included in the Best for Vets List for the last three consecutive years, have a minimum market capitalization of $200 million, and meet the Index’s liquidity threshold. Index components are equally weighted at the time of each annual reconstitution of the Index, which is effective at the close of business on the third Friday of each September. As of January 11, 2018, the Index was made up of 37 companies and included significant allocations to companies in the financial, industrial, and information technology sectors. Companies previously included in the Index for two consecutive years that are no longer on the Best for Vets List may continue to be included in the Index if the reason that they are no longer on the Best for Vets List is because they did not complete the most recent Best for Vets Survey.
The S&P 500 Total Return Index is a total return version of the S&P 500 Index and reflects the reinvestment of dividends paid by the securities in the S&P 500 Index. The S&P 500 Index consists of approximately 500 leading U.S.-listed companies representing approximately 8% of the U.S. equity market capitalization.
Cumulative Returns(a)
(For the period ended October 31, 2018)
| | Since Inception(b) |
| Pacer Military Times Best Employers ETF – NAV | 5.88% |
| Pacer Military Times Best Employers ETF – Market | 7.70% |
Military Times Best for VETSSM Total Return Index(c) | 6.10% |
S&P 500 Total Return Index(c) | 4.83% |
(a) | The performance data quoted is historical. Past performance is no guarantee of future results. Current performance may be higher or lower than the performance data quoted. The principal value and investment return of an investment will fluctuate so that investor’s shares, when redeemed, may be worth more or less than the original cost. The returns shown do not reflect the deduction of taxes that a shareholder would pay on Fund distributions or on redemptions of Fund shares. The total annual operating expenses as stated in the fee table to the Fund’s prospectus dated August 31, 2018, is 0.60%. For performance information current to the most recent month-end, please call 1-877-337-0500. |
(b) | Inception date is April 9, 2018. |
(c) | Indexes are unmanaged statistical composites and their returns do not include fees an investor would pay to purchase the securities they represent. Such costs would lower performance. It is not possible to invest directly in an index. |
Pacer Benchmark Retail Real Estate SCTRSM ETF
PERFORMANCE SUMMARY
(Unaudited)
Growth of $10,000
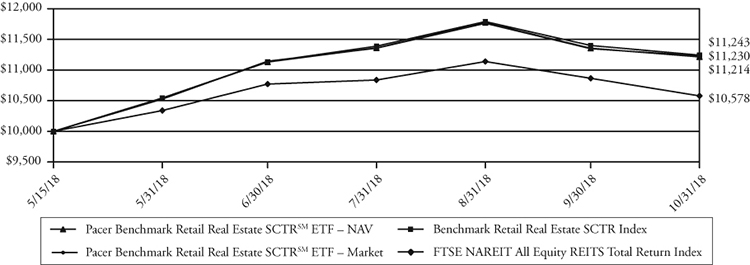
This chart illustrates the performance of a hypothetical $10,000 investment made on May 15, 2018, and is not intended to imply any future performance. The returns shown do not reflect the deduction of taxes that a shareholder would pay on fund distributions or the redemption of fund shares. The chart assumes reinvestment of capital gains and dividends.
The Pacer Benchmark Retail Real Estate SCTRSM Index is generally composed of the U.S.-listed equity securities of companies that derive at least 85% of their earnings or revenues from real estate operations in the retail real estate sector (“Eligible Companies”). At the time of each reconstitution of the Index, Eligible Companies with a market capitalization of more than $200 million and average daily traded volume of at least 10,000 shares are included in the Index (the “Index Constituents”). A significant portion of the Index is expected to be composed of real estate investment trusts (“REITs”).
The FTSE Nareit All Equity REITs Index is a free-float adjusted, market capitalization-weighted index of U.S. equity REITs. Constituents of the index include all tax-qualified REITs with more than 50 percent of total assets in qualifying real estate assets other than mortgages secured by real property.
Cumulative Returns(a)
(For the period ended October 31, 2018)
| | Since Inception(b) |
Pacer Benchmark Retail Real Estate SCTRSM ETF – NAV | 12.13% |
Pacer Benchmark Retail Real Estate SCTRSM ETF – Market | 12.32% |
Benchmark Retail Real Estate SCTR Index(c) | 12.43% |
FTSE NAREIT All Equity REITS Total Return Index(c) | 5.78% |
(a) | The performance data quoted is historical. Past performance is no guarantee of future results. Current performance may be higher or lower than the performance data quoted. The principal value and investment return of an investment will fluctuate so that investor’s shares, when redeemed, may be worth more or less than the original cost. The returns shown do not reflect the deduction of taxes that a shareholder would pay on Fund distributions or on redemptions of Fund shares. The total annual operating expenses as stated in the fee table to the Fund’s prospectus dated April 20, 2018, is 0.60%. For performance information current to the most recent month-end, please call 1-877-337-0500. |
(b) | Inception date is May 15, 2018. |
(c) | Indexes are unmanaged statistical composites and their returns do not include fees an investor would pay to purchase the securities they represent. Such costs would lower performance. It is not possible to invest directly in an index. |
Pacer Benchmark Industrial Real Estate SCTRSM ETF
PERFORMANCE SUMMARY
(Unaudited)
Growth of $10,000
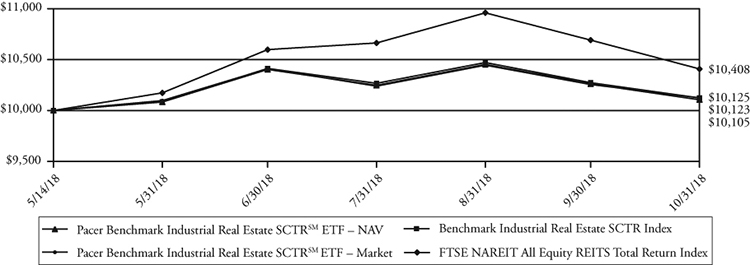
This chart illustrates the performance of a hypothetical $10,000 investment made on May 14, 2018, and is not intended to imply any future performance. The returns shown do not reflect the deduction of taxes that a shareholder would pay on fund distributions or the redemption of fund shares. The chart assumes reinvestment of capital gains and dividends.
The Pacer Benchmark Industrial Real Estate SCTRSM Index is generally composed of the U.S.-listed equity securities of companies that derive at least 85% of their earnings or revenues from real estate operations in the industrial real estate sector (“Industrial Companies”), including companies that derivate at least 85% of their earnings or revenues from self-storage real estate operations (“Self-Storage Companies”). At the time of each reconstitution of the Index, Industrial Companies with a market capitalization of more than $200 million and average daily traded volume of at least 10,000 shares are included in the Index (the “Index Constituents”). A significant portion of the Index is expected to be composed of real estate investment trusts (“REITs”).
The FTSE Nareit All Equity REITs Index is a free-float adjusted, market capitalization-weighted index of U.S. equity REITs. Constituents of the index include all tax-qualified REITs with more than 50 percent of total assets in qualifying real estate assets other than mortgages secured by real property.
Cumulative Returns(a)
(For the period ended October 31, 2018)
| | Since Inception(b) |
Pacer Benchmark Industrial Real Estate SCTRSM ETF – NAV | 1.05% |
Pacer Benchmark Industrial Real Estate SCTRSM ETF – Market | 1.25% |
Benchmark Industrial Real Estate SCTR Index(c) | 1.23% |
FTSE NAREIT All Equity REITS Total Return Index(c) | 4.08% |
(a) | The performance data quoted is historical. Past performance is no guarantee of future results. Current performance may be higher or lower than the performance data quoted. The principal value and investment return of an investment will fluctuate so that investor’s shares, when redeemed, may be worth more or less than the original cost. The returns shown do not reflect the deduction of taxes that a shareholder would pay on Fund distributions or on redemptions of Fund shares. The total annual operating expenses as stated in the fee table to the Fund’s prospectus dated April 20, 2018, is 0.60%. For performance information current to the most recent month-end, please call 1-877-337-0500. |
(b) | Inception date is May 14, 2018. |
(c) | Indexes are unmanaged statistical composites and their returns do not include fees an investor would pay to purchase the securities they represent. Such costs would lower performance. It is not possible to invest directly in an index. |
Pacer Benchmark Data & Infrastructure Real Estate SCTRSM ETF
PERFORMANCE SUMMARY
(Unaudited)
Growth of $10,000
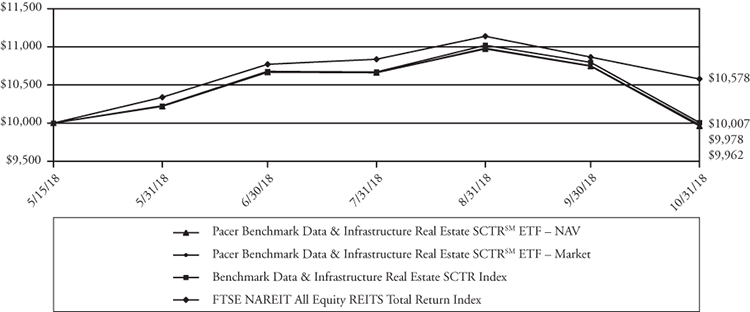
This chart illustrates the performance of a hypothetical $10,000 investment made on May 15, 2018, and is not intended to imply any future performance. The returns shown do not reflect the deduction of taxes that a shareholder would pay on fund distributions or the redemption of fund shares. The chart assumes reinvestment of capital gains and dividends.
The Pacer Benchmark Data & Infrastructure Real Estate SCTRSM Index is generally composed of the U.S.-listed equity securities of companies that derive at least 85% of their earnings or revenues from real estate operations in the data and infrastructure real estate sectors (“Eligible Companies”). At the time of each reconstitution of the Index, Eligible Companies with a market capitalization of more than $200 million and average daily traded volume of at least 10,000 shares are included in the Index (the “Index Constituents”). A significant portion of the Index is expected to be composed of real estate investment trusts (“REITs”).
The FTSE Nareit All Equity REITs Index is a free-float adjusted, market capitalization-weighted index of U.S. equity REITs. Constituents of the index include all tax-qualified REITs with more than 50 percent of total assets in qualifying real estate assets other than mortgages secured by real property.
Cumulative Returns(a)
(For the period ended October 31, 2018)
| | Since Inception(b) |
Pacer Benchmark Data & Infrastructure Real Estate SCTRSM ETF – NAV | -0.38% |
Pacer Benchmark Data & Infrastructure Real Estate SCTRSM ETF – Market | -0.22% |
Benchmark Data & Infrastructure Real Estate SCTR Index(c) | 0.07% |
FTSE NAREIT All Equity REITS Total Return Index(c) | 5.78% |
(a) | The performance data quoted is historical. Past performance is no guarantee of future results. Current performance may be higher or lower than the performance data quoted. The principal value and investment return of an investment will fluctuate so that investor’s shares, when redeemed, may be worth more or less than the original cost. The returns shown do not reflect the deduction of taxes that a shareholder would pay on Fund distributions or on redemptions of Fund shares. The total annual operating expenses as stated in the fee table to the Fund’s prospectus dated April 20, 2018, is 0.60%. For performance information current to the most recent month-end, please call 1-877-337-0500. |
(b) | Inception date is May 15, 2018. |
(c) | Indexes are unmanaged statistical composites and their returns do not include fees an investor would pay to purchase the securities they represent. Such costs would lower performance. It is not possible to invest directly in an index. |
Pacer US Export Leaders ETF
PERFORMANCE SUMMARY
(Unaudited)
Growth of $10,000
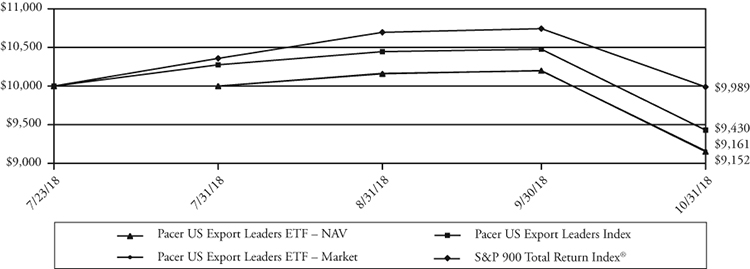
This chart illustrates the performance of a hypothetical $10,000 investment made on July 23, 2018, and is not intended to imply any future performance. The returns shown do not reflect the deduction of taxes that a shareholder would pay on fund distributions or the redemption of fund shares. The chart assumes reinvestment of capital gains and dividends.
The Pacer US Export Leaders Index uses an objective, rules-based methodology to measure the performance of an equal weight portfolio of approximately 100 large- and mid-capitalization U.S. companies with a high percentage of foreign sales and high free cash flow growth. Free cash flow is a company’s cash flow from operations minus its capital expenditures. Construction of the Index begins with an initial universe of the 200 companies across the S&P 900® Index (which is comprised of the S&P 500® Index (“S&P 500”) and S&P MidCap 400® Index (“S&P MidCap 400”)) that have the highest annual foreign sales as a percentage of total sales. The 200 companies are then narrowed to the 100 companies with the highest change in free cash flow growth over the past five years, and those 100 companies are equally weighted to create the Index. The Index is reconstituted and rebalanced to equal-weight quarterly.
The S&P 900® combines the S&P 500® and the S&P MidCap 400® to form an investable benchmark for the mid- to large-cap segment of the U.S. equity market.
Cumulative Returns(a)
(For the period ended October 31, 2018)
| | Since Inception(b) |
| Pacer US Export Leaders ETF – NAV | -8.33% |
| Pacer US Export Leaders ETF – Market | -8.19% |
Pacer US Export Leaders Index(c) | -8.06% |
S&P 900 Total Return Index®(c) | -3.29% |
(a) | The performance data quoted is historical. Past performance is no guarantee of future results. Current performance may be higher or lower than the performance data quoted. The principal value and investment return of an investment will fluctuate so that investor’s shares, when redeemed, may be worth more or less than the original cost. The returns shown do not reflect the deduction of taxes that a shareholder would pay on Fund distributions or on redemptions of Fund shares. The total annual operating expenses as stated in the fee table to the Fund’s prospectus dated August 31, 2018, is 0.60%. For performance information current to the most recent month-end, please call 1-877-337-0500. |
(b) | Inception date is July 23, 2018. |
(c) | Indexes are unmanaged statistical composites and their returns do not include fees an investor would pay to purchase the securities they represent. Such costs would lower performance. It is not possible to invest directly in an index. |
Pacer CFRA-Stovall Equal Weight Seasonal Rotation ETF
PERFORMANCE SUMMARY
(Unaudited)
Growth of $10,000
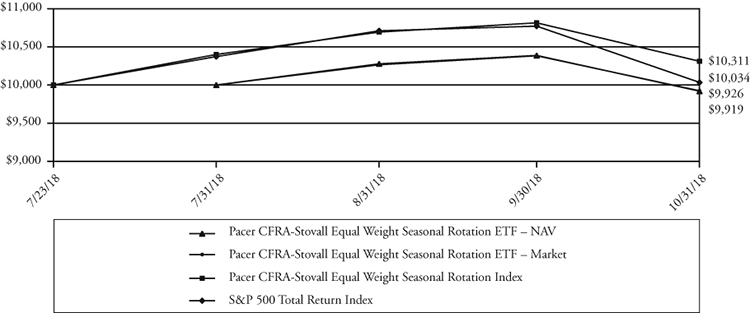
This chart illustrates the performance of a hypothetical $10,000 investment made on July 23, 2018, and is not intended to imply any future performance. The returns shown do not reflect the deduction of taxes that a shareholder would pay on fund distributions or the redemption of fund shares. The chart assumes reinvestment of capital gains and dividends.
The Pacer CFRA-Stovall Equal Weight Seasonal Rotation Index uses an objective, rules-based methodology to track the performance of a semi-annual rotation of certain sectors within the S&P 500 Equal Weight Index (“EWI”). The S&P 500 EWI is an equal-weighted version of the S&P 500, which measures the performance of the large-cap segment of the U.S. equity market.
The S&P 500 Total Return Index is a total return version of the S&P 500 Index and reflects the reinvestment of dividends paid by the securities in the S&P 500 Index. The S&P 500 Index consists of approximately 500 leading U.S.-listed companies representing approximately 8% of the U.S. equity market capitalization.
Cumulative Returns(a)
(For the period ended October 31, 2018)
| | Since Inception(b) |
| Pacer CFRA-Stovall Equal Weight Seasonal Rotation ETF – NAV | 0.39% |
| Pacer CFRA-Stovall Equal Weight Seasonal Rotation ETF – Market | 0.46% |
Pacer CFRA-Stovall Equal Weight Seasonal Rotation Index(c) | 0.37% |
S&P 500 Total Return Index(c) | -2.91% |
(a) | The performance data quoted is historical. Past performance is no guarantee of future results. Current performance may be higher or lower than the performance data quoted. The principal value and investment return of an investment will fluctuate so that investor’s shares, when redeemed, may be worth more or less than the original cost. The returns shown do not reflect the deduction of taxes that a shareholder would pay on Fund distributions or on redemptions of Fund shares. The total annual operating expenses as stated in the fee table to the Fund’s prospectus dated July 16, 2018, is 0.60%. For performance information current to the most recent month-end, please call 1-877-337-0500. |
(b) | Inception date is July 23, 2018. |
(c) | Indexes are unmanaged statistical composites and their returns do not include fees an investor would pay to purchase the securities they represent. Such costs would lower performance. It is not possible to invest directly in an index. |
Pacer Funds
EXPENSE EXAMPLE
For the Periods Ended October 31, 2018 (Unaudited)
As a shareholder of a Fund, you pay ongoing expenses, such as advisory fees, and other fund expenses. The following examples are intended to help you understand the ongoing cost (in dollars) of investing in a Fund and to compare these costs with the ongoing costs of investing in other funds. Please note, the expenses shown in the tables are meant to highlight ongoing costs only and do not reflect any transactional costs. You may pay brokerage commissions on your purchase and sale of Fund shares, which are not reflected in the following examples. Each example is based on an investment of $1,000 invested at the beginning of the period and held for the entire period as indicated below.
Actual Expenses
The columns under the heading entitled “Actual” help you estimate the actual expenses you paid over the period. The “Actual Ending Account Value” shown is derived from a Fund’s actual return and the “Actual Expenses Paid During Period” show the dollar amount that would have been paid by an investor who started with $1,000 in a Fund. To estimate the expenses you paid on your account during this period, simply divide your account value by $1,000 (for example, an $8,600 account value divided by $1,000=8.6), then multiply the result by the number in the column under the heading untitled “Actual Expenses Paid During Period”.
Hypothetical Example for Comparison Purposes
The columns under the heading entitled “Hypothetical” provide information about hypothetical account value and hypothetical expenses based on a Fund’s actual expense ratio and an assumed rate of return of 5% per year before expenses, which is not the Fund’s return. The hypothetical account values and expenses may not be used to estimate the actual ending account balance or expenses you paid for the period. You may use this information to compare the ongoing costs of investing in a Fund and other funds. To do so, compare this 5% hypothetical example with the 5% hypothetical examples that appear in the shareholder reports of other funds.
Please note that the expenses shown in the table are meant to highlight your ongoing costs only and do not reflect any transactional costs which may be applicable to your account. Therefore, the last column of the table (Hypothetical Expenses Paid During Period) is useful in comparing ongoing costs only, and will not help you determine the relative total costs of owning different funds. In addition, if these transactional costs were included, your costs would have been higher.
| | Fund’s Annual | Beginning Account | Ending Account | Expenses Paid |
| | Expense Ratio | Value 05/01/18 | Value 10/31/18 | During Period(a) |
Pacer Trendpilot® US Large Cap ETF | | | | |
| Actual | 0.60% | $1,000.00 | $1,019.50 | $3.05 |
Hypothetical(b) | 0.60% | $1,000.00 | $1,022.18 | $3.06 |
| | | | | |
Pacer Trendpilot® US Mid Cap ETF | | | | |
| Actual | 0.60% | $1,000.00 | $1,010.10 | $3.04 |
Hypothetical(b) | 0.60% | $1,000.00 | $1,022.18 | $3.06 |
| | | | | |
Pacer Trendpilot® 100 ETF | | | | |
| Actual | 0.65% | $1,000.00 | $1,057.70 | $3.37 |
Hypothetical(b) | 0.65% | $1,000.00 | $1,021.93 | $3.21 |
| | | | | |
Pacer Trendpilot® European Index ETF | | | | |
| Actual | 0.65% | $1,000.00 | $ 858.20 | $3.04 |
Hypothetical(b) | 0.65% | $1,000.00 | $1,021.93 | $3.31 |
| | | | | |
| Pacer Global Cash Cows Dividend ETF | | | | |
| Actual | 0.60% | $1,000.00 | $ 971.90 | $2.98 |
Hypothetical(b) | 0.60% | $1,000.00 | $1,022.18 | $3.06 |
| | | | | |
| Pacer U.S. Cash Cows 100 ETF | | | | |
| Actual | 0.49% | $1,000.00 | $ 979.10 | $2.44 |
Hypothetical(b) | 0.49% | $1,000.00 | $1,022.74 | $2.50 |
| | | | | |
| Pacer U.S. Small Cap Cash Cows 100 ETF | | | | |
| Actual | 0.59% | $1,000.00 | $1,001.90 | $2.98 |
Hypothetical(b) | 0.59% | $1,000.00 | $1,022.23 | $3.01 |
| | | | | |
| Pacer Developed Markets International Cash Cows 100 ETF | | | | |
| Actual | 0.65% | $1,000.00 | $ 889.00 | $3.09 |
Hypothetical(b) | 0.65% | $1,000.00 | $1,021.93 | $3.31 |
Pacer Funds
EXPENSE EXAMPLE
For the Periods Ended October 31, 2018 (Unaudited) (Continued)
| | Fund’s Annual | Beginning Account | Ending Account | Expenses Paid |
| | Expense Ratio | Value 05/01/18 | Value 10/31/18 | During Period(a) |
| Pacer WealthShield ETF | | | | |
| Actual | 0.60% | $1,000.00 | $ 970.70 | $2.98 |
Hypothetical(b) | 0.60% | $1,000.00 | $1,022.18 | $3.06 |
| | | | | |
| Pacer Military Times Best Employers ETF | | | | |
| Actual | 0.60% | $1,000.00 | $1,040.20 | $3.09 |
Hypothetical(b) | 0.60% | $1,000.00 | $1,022.18 | $3.06 |
(a) | The dollar amounts shown as expenses paid during the period are equal to the annualized six-month expense ratio multiplied by the average account value during the period, multiplied by the number of days (184) in the most recent six-month period and divided by the number of days in the most recent twelve month period (365). |
(b) | Assumes 5% return before expenses. |
| | Fund’s Annual | Beginning Account | Ending Account | Expenses Paid |
| | Expense Ratio | Value 05/14/18(a) | Value 10/31/18 | During Period |
Pacer Benchmark Industrial Real Estate SCTRSM ETF | | | | |
| Actual | 0.60% | $1,000.00 | $1,010.50 | $2.81(b) |
Hypothetical(d) | 0.60% | $1,000.00 | $1,022.18 | $3.06(c) |
(a) | Inception date of the Fund. |
(b) | The dollar amounts shown as expenses paid during the period are equal to the annualized six-month expense ratio multiplied by the average account value during the period, multiplied by the number of days (170) in the most recent six-month period and divided by the number of days in the most recent twelve month period (365). |
(c) | The dollar amounts shown as expenses paid during the period are equal to the annualized six-month expense ratio multiplied by the average account value during the period, multiplied by the number of days (184) in the most recent six-month period and divided by the number of days in the most recent twelve month period (365). |
(d) | Assumes 5% return before expenses. |
| | Fund’s Annual | Beginning Account | Ending Account | Expenses Paid |
| | Expense Ratio | Value 05/15/18(a) | Value 10/31/18 | During Period(b) |
Pacer Benchmark Retail Real Estate SCTRSM ETF | | | | |
| Actual | 0.60% | $1,000.00 | $1,121.30 | $2.95(b) |
Hypothetical(d) | 0.60% | $1,000.00 | $1,022.18 | $3.06(c) |
| | | | | |
| Pacer Benchmark Data & Infrastructure | | | | |
Real Estate SCTRSM ETF | | | | |
| Actual | 0.60% | $1,000.00 | $ 996.20 | $2.77(b) |
Hypothetical(d) | 0.60% | $1,000.00 | $1,022.18 | $3.06(c) |
(a) | Inception date of the Fund. |
(b) | The dollar amounts shown as expenses paid during the period are equal to the annualized six-month expense ratio multiplied by the average account value during the period, multiplied by the number of days (169) in the most recent six-month period and divided by the number of days in the most recent twelve month period (365). |
(c) | The dollar amounts shown as expenses paid during the period are equal to the annualized six-month expense ratio multiplied by the average account value during the period, multiplied by the number of days (184) in the most recent six-month period and divided by the number of days in the most recent twelve month period (365). |
(d) | Assumes 5% return before expenses. |
| | Fund’s Annual | Beginning Account | Ending Account | Expenses Paid |
| | Expense Ratio | Value 07/23/18(a) | Value 10/31/18 | During Period(b) |
| Pacer US Export Leaders ETF | | | | |
| Actual | 0.60% | $1,000.00 | $ 916.70 | $1.58(b) |
Hypothetical(d) | 0.60% | $1,000.00 | $1,022.18 | $3.06(c) |
| | | | | |
| Pacer CFRA-Stovall Equal Weight Seasonal Rotation ETF | | | | |
| Actual | 0.60% | $1,000.00 | $1,003.90 | $1.65(b) |
Hypothetical(d) | 0.60% | $1,000.00 | $1,022.18 | $3.06(c) |
(a) | Inception date of the Fund. |
(b) | The dollar amounts shown as expenses paid during the period are equal to the annualized six-month expense ratio multiplied by the average account value during the period, multiplied by the number of days (100) in the most recent six-month period and divided by the number of days in the most recent twelve month period (365). |
(c) | The dollar amounts shown as expenses paid during the period are equal to the annualized six-month expense ratio multiplied by the average account value during the period, multiplied by the number of days (184) in the most recent six-month period and divided by the number of days in the most recent twelve month period (365). |
(d) | Assumes 5% return before expenses. |
Pacer Trendpilot® US Large Cap ETF
SCHEDULE OF INVESTMENTS
October 31, 2018 (Unaudited)
| | | Shares | | | Value | |
| SHORT-TERM INVESTMENTS – 0.1% | | | | | | |
| | | | | | | |
| Money Market Funds – 0.1% | | | | | | |
| U.S. Bank Money Market | | | | | | |
| Deposit Account, 2.00% (a) | | | 1,643,709 | | | $ | 1,643,709 | |
| TOTAL SHORT-TERM | | | | | | | | |
| INVESTMENTS | | | | | | | | |
| (Cost $1,643,709) | | | | | | | 1,643,709 | |
| | | | | | | | | |
| INVESTMENTS PURCHASED | | | | | | | | |
| WITH PROCEEDS FROM | | | | | | | | |
| SECURITIES LENDING (b) – 2.0% | | | | | | | | |
| Mount Vernon Liquid | | | | | | | | |
Assets Portfolio, LLC 2.39% (a) | | | | | | | | |
| | | 26,157,581 | | | | 26,157,581 | |
| TOTAL INVESTMENTS | | | | | | | | |
| PURCHASED WITH | | | | | | | | |
| PROCEEDS FROM | | | | | | | | |
| SECURITIES LENDING | | | | | | | | |
| (Cost $26,157,581) | | | | | | | 26,157,581 | |
| Total Investments | | | | | | | | |
| (Cost $27,801,290) – 2.1% | | | | | | | 27,801,290 | |
| Other Assets in Excess | | | | | | | | |
| of Liabilities – 97.9% | | | | | | | 1,293,018,431 | |
| TOTAL NET | | | | | | | | |
| ASSETS – 100.0% | | | | | | $ | 1,320,819,721 | |
Percentages are stated as a percent of net assets.
| (a) | | The rate shown is as of October 31, 2018. |
| (b) | | See Note 5 and 6. |
Categories are shown as a percentage of net assets.
The accompanying notes are an integral part of these financial statements.
Pacer Trendpilot® US Mid Cap ETF
SCHEDULE OF INVESTMENTS
October 31, 2018 (Unaudited)
| | | Shares | | | Value | |
| SHORT-TERM INVESTMENTS – 99.7% | | | | | | |
| | | | | | | |
| Money Market Funds – 4.9% | | | | | | |
| U.S. Bank Money Market | | | | | | |
| Deposit Account, 2.00% (a) | | | 30,857,552 | | | $ | 30,857,552 | |
| | | | | | | | | |
| U.S. Treasury Bill – 94.8% | | | | | | | | |
| 0.00%, 1/17/19 (b)(c) | | | 605,000,000 | | | | 602,106,230 | |
| TOTAL SHORT-TERM | | | | | | | | |
| INVESTMENTS | | | | | | | | |
| (Cost $632,978,393) | | | | | | | 632,963,782 | |
| | | | | | | | | |
| INVESTMENTS PURCHASED | | | | | | | | |
| WITH PROCEEDS FROM | | | | | | | | |
| SECURITIES LENDING – 30.0% | | | | | | | | |
| Mount Vernon Liquid | | | | | | | | |
Assets Portfolio, LLC 2.39% (a) | | | | | | | | |
| | | 190,038,750 | | | | 190,038,750 | |
| TOTAL INVESTMENTS | | | | | | | | |
| PURCHASED WITH | | | | | | | | |
| PROCEEDS FROM | | | | | | | | |
| SECURITIES LENDING | | | | | | | | |
| (Cost $190,038,750) | | | | | | | 190,038,750 | |
| Total Investments | | | | | | | | |
(Cost $823,017,143) – 129.7% | | | | | | | | |
| | | | | | | 823,002,532 | |
| Liabilities in Excess | | | | | | | | |
| of Other Assets – (29.7)% | | | | | | | (188,557,930 | ) |
| TOTAL NET | | | | | | | | |
| ASSETS – 100.0% | | | | | | $ | 634,444,602 | |
Percentages are stated as a percent of net assets.
| (a) | | The rate shown is as of October 31, 2018. |
| (b) | | All or portion of this security is on loan as of October 31, 2018. The Total value of securities on loan is $186,104,270 or 29.3% of net assets. See Note 5 and 6. |
| (c) | | Non-income producing security. |
Categories are shown as a percentage of net assets.
The accompanying notes are an integral part of these financial statements.
Pacer Trendpilot® 100 ETF
SCHEDULE OF INVESTMENTS
October 31, 2018 (Unaudited)
| | | Shares | | | Value | |
| COMMON STOCKS – 50.0% | | | | | | |
| | | | | | | |
| Airlines – 0.1% | | | | | | |
| American Airlines | | | | | | |
| Group, Inc. (a) | | | 9,322 | | | $ | 327,016 | |
| | | | | | | | | |
| Auto Manufacturers – 0.5% | | | | | | | | |
| PACCAR, Inc. | | | 7,143 | | | | 408,651 | |
| Tesla Motors, Inc. (a)(b) | | | 3,478 | | | | 1,173,199 | |
| | | | | | | | 1,581,850 | |
| Beverages – 1.2% | | | | | | | | |
| Monster Beverage Corp. (b) | | | 11,185 | | | | 591,127 | |
| PepsiCo, Inc. | | | 28,624 | | | | 3,216,765 | |
| | | | | | | | 3,807,892 | |
| Biotechnology – 3.2% | | | | | | | | |
| Alexion | | | | | | | | |
| Pharmaceuticals, Inc. (b) | | | 4,521 | | | | 506,669 | |
| Amgen, Inc. | | | 13,099 | | | | 2,525,356 | |
| Biogen, Inc. (b) | | | 4,074 | | | | 1,239,596 | |
| BioMarin | | | | | | | | |
| Pharmaceutical, Inc. (b) | | | 3,566 | | | | 328,678 | |
| Celgene Corp. (b) | | | 14,237 | | | | 1,019,369 | |
| Gilead Sciences, Inc. | | | 26,238 | | | | 1,788,907 | |
| Illumina, Inc. (b) | | | 2,973 | | | | 925,049 | |
| Incyte Corp. (b) | | | 4,320 | | | | 280,022 | |
| Regeneron | | | | | | | | |
| Pharmaceuticals, Inc. (b) | | | 2,159 | | | | 732,419 | |
| Shire PLC – ADR | | | 1,397 | | | | 253,975 | |
| Vertex | | | | | | | | |
| Pharmaceuticals, Inc. (b) | | | 5,230 | | | | 886,276 | |
| | | | | | | | 10,486,316 | |
| Commercial Services – 1.3% | | | | | | | | |
| Automatic Data | | | | | | | | |
| Processing, Inc. | | | 8,865 | | | | 1,277,269 | |
| Cintas Corp. | | | 2,186 | | | | 397,568 | |
| PayPal Holdings, Inc. (b) | | | 23,960 | | | | 2,017,192 | |
| Verisk Analytics, Inc. (b) | | | 3,357 | | | | 402,303 | |
| | | | | | | | 4,094,332 | |
| Computers – 7.1% | | | | | | | | |
| Apple, Inc. | | | 97,754 | | | | 21,394,441 | |
| Check Point Software | | | | | | | | |
| Technologies Ltd. (b) | | | 3,161 | | | | 350,871 | |
| Cognizant Technology | | | | | | | | |
| Solutions Corp. – Class A | | | 11,741 | | | | 810,481 | |
| Seagate Technology PLC | | | 5,819 | | | | 234,098 | |
| Western Digital Corp. | | | 6,048 | | | | 260,487 | |
| | | | | | | | 23,050,378 | |
| Distribution/Wholesale – 0.1% | | | | | | | | |
| Fastenal Co. (a) | | | 5,856 | | | | 301,057 | |
| | | | | | | | | |
| Food – 0.8% | | | | | | | | |
| Mondelez International, | | | | | | | | |
| Inc. – Class A | | | 29,683 | | | | 1,246,092 | |
| The Kraft Heinz Co. | | | 24,677 | | | | 1,356,495 | |
| | | | | | | | 2,602,587 | |
| Healthcare-Products – 0.8% | | | | | | | | |
| Align Technology, Inc. (b) | | | 1,647 | | | | 364,316 | |
| DENTSPLY SIRONA, Inc. | | | 4,640 | | | | 160,683 | |
| Henry Schein, Inc. (b) | | | 3,131 | | | | 259,873 | |
| Hologic, Inc. (b) | | | 5,520 | | | | 215,225 | |
| IDEXX Laboratories, Inc. (b) | | | 1,774 | | | | 376,301 | |
| Intuitive Surgical, Inc. (b) | | | 2,299 | | | | 1,198,193 | |
| | | | | | | | 2,574,591 | |
| Internet – 13.9% | | | | | | | | |
| Alphabet, Inc. – Class A (b) | | | 6,054 | | | | 6,602,371 | |
| Alphabet, Inc. – Class C (b) | | | 7,081 | | | | 7,624,608 | |
| Amazon.com, Inc. (b) | | | 9,869 | | | | 15,770,761 | |
| Baidu, Inc. – ADR (b) | | | 5,684 | | | | 1,080,301 | |
| Booking Holdings, Inc. (b) | | | 963 | | | | 1,805,221 | |
| Ctrip.com International | | | | | | | | |
| Ltd. – ADR (b) | | | 9,443 | | | | 314,263 | |
| eBay, Inc. (b) | | | 20,030 | | | | 581,471 | |
| Expedia Group, Inc. | | | 2,765 | | | | 346,814 | |
| Facebook, Inc. – Class A (b) | | | 48,808 | | | | 7,408,566 | |
| JD.com, Inc. – ADR (b) | | | 18,921 | | | | 445,022 | |
| MercadoLibre, Inc. (a) | | | 895 | | | | 290,428 | |
| Netflix, Inc. (b) | | | 8,816 | | | | 2,660,493 | |
| Symantec Corp. | | | 12,683 | | | | 230,196 | |
| | | | | | | | 45,160,515 | |
| Lodging – 0.3% | | | | | | | | |
| Marriott International, | | | | | | | | |
| Inc. – Class A | | | 7,020 | | | | 820,568 | |
| Wynn Resorts Ltd. | | | 2,230 | | | | 224,338 | |
| | | | | | | | 1,044,906 | |
| Media – 2.4% | | | | | | | | |
| Charter Communications, | | | | | | | | |
| Inc. – Class A (b) | | | 4,695 | | | | 1,504,137 | |
| Comcast Corp. – Class A | | | 92,543 | | | | 3,529,590 | |
| Liberty Global PLC – | | | | | | | | |
| Class A (b) | | | 4,350 | | | | 111,490 | |
| Liberty Global PLC – | | | | | | | | |
| Class C (b) | | | 11,177 | | | | 279,872 | |
| Sirius XM Holdings, Inc. (a) | | | 91,996 | | | | 553,816 | |
| Twenty First Century Fox, | | | | | | | | |
| Inc. – Class B | | | 16,159 | | | | 730,064 | |
| Twenty-First Century Fox, | | | | | | | | |
| Inc. – Class A | | | 21,334 | | | | 971,124 | |
| | | | | | | | 7,680,093 | |
The accompanying notes are an integral part of these financial statements.
Pacer Trendpilot® 100 ETF
SCHEDULE OF INVESTMENTS
October 31, 2018 (Unaudited) (Continued)
| | | Shares | | | Value | |
| COMMON STOCKS – 50.0% (Continued) | | | | | | |
| | | | | | | |
| Pharmaceuticals – 0.4% | | | | | | |
| Express Scripts | | | | | | |
| Holding Co. (b) | | | 11,381 | | | $ | 1,103,616 | |
| Mylan NV (a)(b) | | | 10,566 | | | | 330,187 | |
| | | | | | | | 1,433,803 | |
| Retail – 2.3% | | | | | | | | |
| Costco Wholesale Corp. | | | 8,874 | | | | 2,028,863 | |
| Dollar Tree, Inc. (a)(b) | | | 4,843 | | | | 408,265 | |
| O’Reilly Automotive, Inc. (b) | | | 1,634 | | | | 524,105 | |
| Qurate Retail Group, Inc. | | | | | | | | |
| QVC Group – Class A (b) | | | 8,726 | | | | 191,448 | |
| Ross Stores, Inc. | | | 7,618 | | | | 754,182 | |
| Starbucks Corp. | | | 27,307 | | | | 1,591,179 | |
| Ulta Salon Cosmetics | | | | | | | | |
| & Fragrance, Inc. (b) | | | 1,208 | | | | 331,620 | |
| Walgreens Boots | | | | | | | | |
| Alliance, Inc. (a) | | | 20,084 | | | | 1,602,101 | |
| | | | | | | | 7,431,763 | |
| Semiconductors – 5.3% | | | | | | | | |
| Analog Devices, Inc. (a) | | | 7,601 | | | | 636,280 | |
| Applied Materials, Inc. | | | 19,893 | | | | 654,082 | |
| ASML Holding NV – ADR (a) | | | 1,510 | | | | 260,263 | |
| Broadcom, Inc. | | | 8,738 | | | | 1,952,856 | |
| Intel Corp. | | | 93,323 | | | | 4,374,982 | |
| KLA-Tencor Corp. | | | 3,176 | | | | 290,731 | |
| Lam Research Corp. (a) | | | 3,186 | | | | 451,552 | |
| Maxim Integrated | | | | | | | | |
| Products, Inc. (a) | | | 5,694 | | | | 284,814 | |
| Microchip Technology, Inc. (a) | | | 4,818 | | | | 316,928 | |
| Micron Technology, Inc. (b) | | | 23,476 | | | | 885,515 | |
| NVIDIA Corp. | | | 12,305 | | | | 2,594,263 | |
| QUALCOMM, Inc. (a) | | | 29,732 | | | | 1,869,845 | |
| Skyworks Solutions, Inc. (a) | | | 3,687 | | | | 319,884 | |
| Texas Instruments, Inc. | | | 19,676 | | | | 1,826,523 | |
| Xilinx, Inc. | | | 5,122 | | | | 437,265 | |
| | | | | | | | 17,155,783 | |
| Software – 8.0% | | | | | | | | |
| Activision Blizzard, Inc. | | | 15,431 | | | | 1,065,511 | |
| Adobe Systems, Inc. (b) | | | 9,912 | | | | 2,435,973 | |
| Autodesk, Inc. (a)(b) | | | 4,425 | | | | 571,931 | |
| CA, Inc. | | | 8,396 | | | | 372,447 | |
| Cadence Design | | | | | | | | |
| System, Inc. (b) | | | 5,862 | | | | 261,269 | |
| Cerner Corp. (b) | | | 6,775 | | | | 388,072 | |
| Citrix Systems, Inc. (a)(b) | | | 2,768 | | | | 283,637 | |
| Electronic Arts, Inc. (b) | | | 6,171 | | | | 561,438 | |
| Fiserv, Inc. (b) | | | 8,193 | | | | 649,705 | |
| Intuit, Inc. | | | 5,258 | | | | 1,109,438 | |
| Microsoft Corp. | | | 155,204 | | | | 16,577,339 | |
| NetEase, Inc. – ADR | | | 1,569 | | | | 326,117 | |
| Paychex, Inc. | | | 7,320 | | | | 479,387 | |
| Synopsys, Inc. (b) | | | 2,991 | | | | 267,784 | |
| Take-Two Interactive | | | | | | | | |
| Software, Inc. (b) | | | 2,335 | | | | 300,911 | |
| Workday, Inc. – Class A (b) | | | 2,991 | | | | 397,863 | |
| | | | | | | | 26,048,822 | |
| Telecommunications – 1.8% | | | | | | | | |
| Cisco Systems, Inc. | | | 95,183 | | | | 4,354,622 | |
| T-Mobile US, Inc. (b) | | | 17,145 | | | | 1,175,290 | |
| Vodafone Group PLC – ADR | | | 9,544 | | | | 180,668 | |
| | | | | | | | 5,710,580 | |
| Toys/Games/Hobbies – 0.1% | | | | | | | | |
| Hasbro, Inc. (a) | | | 2,513 | | | | 230,467 | |
| | | | | | | | | |
| Transportation – 0.4% | | | | | | | | |
| CSX Corp. | | | 17,384 | | | | 1,197,062 | |
| JB Hunt Transport | | | | | | | | |
| Services, Inc. (a) | | | 2,239 | | | | 247,656 | |
| | | | | | | | 1,444,718 | |
| TOTAL COMMON STOCKS | | | | | | | | |
| (Cost $128,692,801) | | | | | | | 162,167,469 | |
| | | | | | | | | |
| SHORT-TERM INVESTMENTS – 0.1% | | | | | | | | |
| | | | | | | | | |
| Money Market Funds – 0.1% | | | | | | | | |
| U.S. Bank Money Market | | | | | | | | |
| Deposit Account, 2.00% (c) | | | 460,940 | | | | 460,940 | |
| TOTAL SHORT-TERM | | | | | | | | |
| INVESTMENTS | | | | | | | | |
| (Cost $460,940) | | | | | | | 460,940 | |
The accompanying notes are an integral part of these financial statements.
Pacer Trendpilot® 100 ETF
SCHEDULE OF INVESTMENTS
October 31, 2018 (Unaudited) (Continued)
| | | Shares | | | Value | |
| INVESTMENTS PURCHASED | | | | | | |
| WITH PROCEEDS FROM | | | | | | |
| SECURITIES LENDING – 5.8% | | | | | | |
| Mount Vernon Liquid | | | | | | |
Assets Portfolio, LLC 2.39% (c) | | | | | | |
| | | 18,804,517 | | | $ | 18,804,517 | |
| TOTAL INVESTMENTS | | | | | | | | |
| PURCHASED WITH | | | | | | | | |
| PROCEEDS FROM | | | | | | | | |
| SECURITIES LENDING | | | | | | | | |
| (Cost $18,804,517) | | | | | | | 18,804,517 | |
| Total Investments | | | | | | | | |
(Cost $147,958,258) – 55.9% | | | | | | | | |
| | | | | | | 181,432,926 | |
| Other Assets in Excess | | | | | | | | |
| of Liabilities – 44.1% | | | | | | | 143,202,852 | |
| TOTAL NET | | | | | | | | |
| ASSETS – 100.0% | | | | | | $ | 324,635,778 | |
| ADR | | American Depositary Receipt |
| (a) | | All or portion of this security is on loan as of October 31, 2018. The Total value of securities on loan is $18,632,761 or 5.7% of net assets. See Note 5 and 6. |
| (b) | | Non-income producing security. |
| (c) | | The rate shown is as of October 31, 2018. |
For Fund compliance purposes, the Fund’s industry classifications refer to any one or more of the industry sub-classifications used by one or more widely recognized market indexes or ratings group indexes, and/or they may be defined by Fund management. This definition does not apply for all purposes of this report, which may combine sub-classifications for reporting ease. Categories are shown as a percentage of net assets.
The accompanying notes are an integral part of these financial statements.
Pacer Trendpilot® European Index ETF
SCHEDULE OF INVESTMENTS
October 31, 2018 (Unaudited)
| | | Shares | | | Value | |
| COMMON STOCKS – 0.0% | | | | | | |
| | | | | | | |
| Retail – 0.0% (a) | | | | | | |
| FF Group (b)(c) | | | 1,259 | | | $ | 6,845 | |
| TOTAL COMMON STOCKS | | | | | | | | |
| (Cost $24,367) | | | | | | | 6,845 | |
| | | | | | | | | |
| SHORT-TERM INVESTMENTS – 99.9% | | | | | | | | |
| | | | | | | | | |
| Money Market Funds – 2.0% | | | | | | | | |
| U.S. Bank Money Market | | | | | | | | |
| Deposit Account, 2.00% (d) | | | 3,160,144 | | | | 3,160,144 | |
| | | | | | | | | |
| U.S. Treasury Bill – 97.9% | | | | | | | | |
| 0.00%, 1/10/19 (b) | | | 156,379,000 | | | | 155,705,103 | |
| TOTAL SHORT-TERM | | | | | | | | |
| INVESTMENTS | | | | | | | | |
| (Cost $158,864,070) | | | | | | | 158,865,247 | |
| | | | | | | | | |
| INVESTMENTS PURCHASED | | | | | | | | |
| WITH PROCEEDS FROM | | | | | | | | |
| SECURITIES LENDING (e) – 30.0% | | | | | | | | |
| Mount Vernon Liquid | | | | | | | | |
Assets Portfolio, LLC 2.39% (d) | | | | | | | | |
| | | 47,763,750 | | | | 47,763,750 | |
| TOTAL INVESTMENTS | | | | | | | | |
| PURCHASED WITH | | | | | | | | |
| PROCEEDS FROM | | | | | | | | |
| SECURITIES LENDING | | | | | | | | |
| (Cost $47,763,750) | | | | | | | 47,763,750 | |
| Total Investments | | | | | | | | |
(Cost $206,652,187) – 129.9% | | | | | | | | |
| | | | | | | 206,635,842 | |
| Liabilities in Excess | | | | | | | | |
| of Other Assets – (29.9)% | | | | | | | (47,531,608 | ) |
| TOTAL NET | | | | | | | | |
| ASSETS – 100.0% | | | | | | $ | 159,104,234 | |
| (a) | | Less than 0.05%. |
| (b) | | Non-income producing security. |
| (c) | | As of October 31, 2018, the Fund has fair valued this security. This security is deemed illiquid according to the Fund/s liquidity guidelines. The total value of this security was $6,845 or 0.0% of net assets. |
| (d) | | The rate shown is as of October 31, 2018. |
| (e) | | See Note 5 and 6. |
For Fund compliance purposes, the Fund’s industry classifications refer to any one or more of the industry sub-classifications used by one or more widely recognized market indexes or ratings group indexes, and/or they may be defined by Fund management. This definition does not apply for all purposes of this report, which may combine sub-classifications for reporting ease. Categories are shown as a percentage of net assets.
The accompanying notes are an integral part of these financial statements.
Pacer Global Cash Cows Dividend ETF
SCHEDULE OF INVESTMENTS
October 31, 2018 (Unaudited)
| | | Shares | | | Value | |
| COMMON STOCKS – 94.6% | | | | | | |
| | | | | | | |
| Australia – 8.0% | | | | | | |
| AGL Energy Ltd. | | | 44,510 | | | $ | 567,356 | |
| Amcor Ltd. | | | 66,522 | | | | 626,530 | |
| Aurizon Holdings Ltd. | | | 151,220 | | | | 449,763 | |
| BHP Billiton Ltd. – ADR (a) | | | 79,356 | | | | 3,664,660 | |
| Caltex Australia Ltd. | | | 15,061 | | | | 301,406 | |
| CIMIC Group Ltd. | | | 15,280 | | | | 511,703 | |
| Fortescue Metals Group Ltd. | | | 345,151 | | | | 977,675 | |
| GPT Group | | | 125,275 | | | | 457,762 | |
| Mirvac Group | | | 238,339 | | | | 366,252 | |
| South32 Ltd. | | | 336,013 | | | | 861,370 | |
| Stockland | | | 216,356 | | | | 553,097 | |
| Telstra Corp. Ltd. | | | 1,445,841 | | | | 3,153,527 | |
| Wesfarmers Ltd. | | | 79,640 | | | | 2,629,232 | |
| | | | | | | | 15,120,333 | |
| Canada – 1.4% | | | | | | | | |
| BCE, Inc. | | | 68,000 | | | | 2,643,840 | |
| | | | | | | | | |
| Finland – 1.3% | | | | | | | | |
| Nokia OYJ – ADR (a) | | | 282,029 | | | | 1,585,003 | |
| UPM-Kymmene OYJ | | | 25,995 | | | | 836,478 | |
| | | | | | | | 2,421,481 | |
| France – 4.7% | | | | | | | | |
| Cie Generale des | | | | | | | | |
| Etablissements Michelin | | | 7,703 | | | | 791,684 | |
| Engie SA | | | 167,040 | | | | 2,227,793 | |
| Publicis Groupe SA | | | 10,240 | | | | 594,296 | |
| Sanofi – ADR | | | 100,963 | | | | 4,515,065 | |
| Sodexo SA | | | 6,463 | | | | 659,703 | |
| | | | | | | | 8,788,541 | |
| Germany – 1.8% | | | | | | | | |
| BASF SE | | | 39,536 | | | | 3,046,398 | |
| Deutsche Lufthansa AG | | | 21,861 | | | | 439,750 | |
| | | | | | | | 3,486,148 | |
| Hong Kong – 6.1% | | | | | | | | |
| CK Hutchison Holdings Ltd. | | | 174,953 | | | | 1,761,365 | |
| CK Infrastructure | | | | | | | | |
| Holdings Ltd. | | | 143,539 | | | | 1,048,819 | |
| CLP Holdings Ltd. | | | 127,394 | | | | 1,427,953 | |
| NWS Holdings Ltd. | | | 267,098 | | | | 528,613 | |
| Power Assets Holdings Ltd. | | | 565,722 | | | | 3,776,554 | |
| Sands China Ltd. | | | 504,271 | | | | 1,987,003 | |
| WH Group Ltd. (b) | | | 698,943 | | | | 489,317 | |
| Wynn Macau Ltd. | | | 242,297 | | | | 499,922 | |
| | | | | | | | 11,519,546 | |
| Italy – 0.6% | | | | | | | | |
| Atlantia SpA | | | 54,525 | | | | 1,096,812 | |
| | | | | | | | | |
| Japan – 10.7% | | | | | | | | |
| Bridgestone Corp. | | | 35,861 | | | | 1,386,640 | |
| Canon, Inc. – ADR (a) | | | 64,798 | | | | 1,826,008 | |
| Japan Tobacco, Inc. | | | 119,804 | | | | 3,086,013 | |
| KDDI Corp. | | | 101,583 | | | | 2,533,836 | |
| Lawson, Inc. | | | 5,117 | | | | 323,795 | |
| Mitsubishi Corp. | | | 69,224 | | | | 1,950,922 | |
| Mitsubishi Tanabe | | | | | | | | |
| Pharma Corp. | | | 25,556 | | | | 377,785 | |
| Mitsui & Co. Ltd. | | | 74,342 | | | | 1,242,273 | |
| Nippon Steel & | | | | | | | | |
| Sumitomo Metal Corp. | | | 39,391 | | | | 728,577 | |
| NTT DOCOMO, Inc. | | | 12,151 | | | | 306,319 | |
| NTT DOCOMO, Inc. – ADR | | | 141,652 | | | | 3,386,899 | |
| Subaru Corp. | | | 44,971 | | | | 1,216,790 | |
| Takeda Pharmaceutical | | | | | | | | |
| Co Ltd. – ADR (a) | | | 90,829 | | | | 1,916,492 | |
| | | | | | | | 20,282,349 | |
| Jersey – 0.5% | | | | | | | | |
| WPP PLC – ADR | | | 16,000 | | | | 902,560 | |
| | | | | | | | | |
| Netherlands – 1.0% | | | | | | | | |
| Koninklijke Ahold | | | | | | | | |
| Delhaize NV | | | 52,213 | | | | 1,196,377 | |
| Koninklijke KPN NV | | | 266,185 | | | | 704,287 | |
| | | | | | | | 1,900,664 | |
| New Zealand – 0.2% | | | | | | | | |
| Meridian Energy Ltd. | | | 194,560 | | | | 398,020 | |
| | | | | | | | | |
| Norway – 1.2% | | | | | | | | |
| Norsk Hydro ASA | | | 95,494 | | | | 495,720 | |
| Telenor ASA | | | 100,140 | | | | 1,837,131 | |
| | | | | | | | 2,332,851 | |
| Republic of Korea – 0.8% | | | | | | | | |
| Kangwon Land, Inc. | | | 9,990 | | | | 251,602 | |
| LG Uplus Corp. | | | 19,722 | | | | 279,505 | |
| SK Telecom Co Ltd. – ADR | | | 38,931 | | | | 1,008,702 | |
| | | | | | | | 1,539,809 | |
| Singapore – 0.5% | | | | | | | | |
| Jardine Cycle & Carriage Ltd. | | | 18,014 | | | | 393,664 | |
| Singapore Technologies | | | | | | | | |
| Engineering Ltd. | | | 184,429 | | | | 472,673 | |
| | | | | | | | 866,337 | |
| South Korea – 0.8% | | | | | | | | |
| KT&G Corp. | | | 7,030 | | | | 626,164 | |
| SK Innovation Co. Ltd. | | | 5,013 | | | | 939,209 | |
| | | | | | | | 1,565,373 | |
The accompanying notes are an integral part of these financial statements.
Pacer Global Cash Cows Dividend ETF
SCHEDULE OF INVESTMENTS
October 31, 2018 (Unaudited) (Continued)
| | | Shares | | | Value | |
| COMMON STOCKS – 94.6% (Continued) | | | | | | |
| | | | | | | |
| Spain – 3.1% | | | | | | |
| Aena SME SA (b) | | | 6,589 | | | $ | 1,053,401 | |
| Ferrovial SA | | | 32,740 | | | | 656,365 | |
| Repsol SA | | | 92,024 | | | | 1,649,446 | |
| Telefonica SA – ADR | | | 305,323 | | | | 2,506,702 | |
| | | | | | | | 5,865,914 | |
| Sweden – 1.6% | | | | | | | | |
| Hennes & Mauritz AB (a) | | | 175,339 | | | | 3,098,991 | |
| | | | | | | | | |
| Switzerland – 5.6% | | | | | | | | |
| Novartis AG – ADR (a) | | | 51,960 | | | | 4,544,422 | |
| Roche Holding AG – ADR | | | 142,787 | | | | 4,335,013 | |
| Swisscom AG | | | 3,618 | | | | 1,657,494 | |
| | | | | | | | 10,536,929 | |
| United Kingdom – 9.7% | | | | | | | | |
| Anglo American PLC | | | 72,001 | | | | 1,541,715 | |
| BAE Systems PLC | | | 8,516 | | | | 57,234 | |
| BAE Systems PLC – ADR (a) | | | 33,056 | | | | 890,859 | |
| BT Group PLC – ADR (a) | | | 204,577 | | | | 3,117,753 | |
| GlaxoSmithKline PLC – ADR | | | 96,084 | | | | 3,753,041 | |
| Imperial Brands PLC – ADR | | | 7,623 | | | | 258,039 | |
| Imperial Brands PLC | | | 78,473 | | | | 2,661,071 | |
| Rio Tinto PLC – ADR (a) | | | 67,694 | | | | 3,336,637 | |
| Vodafone Group PLC – ADR | | | 147,591 | | | | 2,793,898 | |
| | | | | | | | 18,410,247 | |
| United States – 35.0% | | | | | | | | |
| AbbVie, Inc. | | | 39,687 | | | | 3,089,633 | |
| Altria Group, Inc. | | | 70,780 | | | | 4,603,531 | |
| AT&T, Inc. | | | 120,973 | | | | 3,711,452 | |
| Bristol-Myers Squibb Co. | | | 67,245 | | | | 3,398,562 | |
| Cummins, Inc. | | | 6,650 | | | | 908,988 | |
| CVS Health Corp. | | | 43,840 | | | | 3,173,578 | |
| Eaton Corp. PLC | | | 19,198 | | | | 1,375,921 | |
| Equinor ASA – ADR (a) | | | 149,163 | | | | 3,833,489 | |
| Exxon Mobil Corp. | | | 48,062 | | | | 3,829,580 | |
| Ford Motor Co. (a) | | | 287,702 | | | | 2,747,554 | |
| General Mills, Inc. | | | 35,821 | | | | 1,568,960 | |
| Gilead Sciences, Inc. | | | 56,513 | | | | 3,853,056 | |
| International Business | | | | | | | | |
| Machines Corp. | | | 27,706 | | | | 3,198,103 | |
| Kellogg Co. (a) | | | 15,888 | | | | 1,040,346 | |
| Kimberly-Clark Corp. | | | 18,673 | | | | 1,947,594 | |
| Las Vegas Sands Corp. | | | 39,726 | | | | 2,027,218 | |
| LyondellBasell Industries | | | | | | | | |
| NV – Class A | | | 17,721 | | | | 1,581,954 | |
| Pfizer, Inc. | | | 108,354 | | | | 4,665,723 | |
| Philip Morris | | | | | | | | |
| International, Inc. | | | 50,196 | | | | 4,420,762 | |
| Procter & Gamble Co. | | | 53,504 | | | | 4,744,735 | |
| QUALCOMM, Inc. (a) | | | 67,058 | | | | 4,217,278 | |
| Target Corp. | | | 25,014 | | | | 2,091,921 | |
| | | | | | | | 66,029,938 | |
| TOTAL COMMON STOCKS | | | | | | | | |
| (Cost $189,719,998) | | | | | | | 178,806,683 | |
| | | | | | | | | |
| REAL ESTATE | | | | | | | | |
| INVESTMENT TRUSTS – 5.0% | | | | | | | | |
| | | | | | | | | |
| Australia – 0.6% | | | | | | | | |
| Dexus | | | 70,270 | | | | 507,570 | |
| Vicinity Centres | | | 344,319 | | | | 646,148 | |
| | | | | | | | 1,153,718 | |
| United States – 4.4% | | | | | | | | |
| AvalonBay Communities, Inc. | | | 6,457 | | | | 1,132,429 | |
| Public Storage (a) | | | 9,039 | | | | 1,857,243 | |
| Simon Property Group, Inc. (a) | | | 19,671 | | | | 3,610,022 | |
| Ventas, Inc. (a) | | | 27,898 | | | | 1,619,200 | |
| | | | | | | | 8,218,894 | |
| TOTAL REAL ESTATE | | | | | | | | |
| INVESTMENT TRUSTS | | | | | | | | |
| (Cost $9,063,646) | | | | | | | 9,372,612 | |
| | | | | | | | | |
| SHORT-TERM INVESTMENTS – 0.1% | | | | | | | | |
| | | | | | | | | |
| Money Market Funds – 0.1% | | | | | | | | |
| U.S. Bank Money Market | | | | | | | | |
| Deposit Account, 2.00% (c) | | | 145,313 | | | | 145,313 | |
| TOTAL SHORT-TERM | | | | | | | | |
| INVESTMENTS | | | | | | | | |
| (Cost $145,313) | | | | | | | 145,313 | |
The accompanying notes are an integral part of these financial statements.
Pacer Global Cash Cows Dividend ETF
SCHEDULE OF INVESTMENTS
October 31, 2018 (Unaudited) (Continued)
| | | Shares | | | Value | |
| INVESTMENTS PURCHASED | | | | | | |
| WITH PROCEEDS FROM | | | | | | |
| SECURITIES LENDING – 20.5% | | | | | | |
| Mount Vernon Liquid | | | | | | |
Assets Portfolio, LLC 2.39% (c) | | | | | | |
| | | 38,789,497 | | | $ | 38,789,497 | |
| TOTAL INVESTMENTS | | | | | | | | |
| PURCHASED WITH | | | | | | | | |
| PROCEEDS FROM | | | | | | | | |
| SECURITIES LENDING | | | | | | | | |
| (Cost $38,789,497) | | | | | | | 38,789,497 | |
| Total Investments | | | | | | | | |
(Cost $237,718,454) – 120.2% | | | | | | | | |
| | | | | | | 227,114,105 | |
| Liabilities in Excess | | | | | | | | |
| of Other Assets – (20.2)% | | | | | | | (38,197,914 | ) |
| TOTAL NET | | | | | | | | |
| ASSETS – 100.0% | | | | | | $ | 188,916,191 | |
| ADR | | American Depositary Receipt. |
| (a) | | All or portion of this security is on loan as of October 31, 2018. The Total value of securities on loan is $37,877,878 or 20.1% of net assets. See Note 5 and 6. |
| (b) | | Security exempt from registration under Rule 144(a) and Regulation S of the Securities Act of 1933. Such securities are treated as liquid securities according to the Fund’s liquidity guidelines. The value of those securities total $1,542,718 or 0.82% of net assets. |
| (c) | | The rate shown is as of October 31, 2018. |
For Fund compliance purposes, the Fund’s industry classifications refer to any one or more of the industry sub-classifications used by one or more widely recognized market indexes or ratings group indexes, and/or they may be defined by Fund management. This definition does not apply for all purposes of this report, which may combine sub-classifications for reporting ease. Categories are shown as a percentage of net assets.
The accompanying notes are an integral part of these financial statements.
Pacer US Cash Cows 100 ETF
SCHEDULE OF INVESTMENTS
October 31, 2018 (Unaudited)
| | | Shares | | | Value | |
| COMMON STOCKS – 96.2% | | | | | | |
| | | | | | | |
| Advertising – 1.2% | | | | | | |
| Omnicom Group, Inc. | | | 28,749 | | | $ | 2,136,626 | |
| | | | | | | | | |
| Aerospace/Defense – 2.2% | | | | | | | | |
| Boeing Co. | | | 10,557 | | | | 3,746,257 | |
| | | | | | | | | |
| Airlines – 3.4% | | | | | | | | |
| Copa Holdings SA – Class A | | | 6,863 | | | | 497,087 | |
| Delta Air Lines, Inc. | | | 60,251 | | | | 3,297,537 | |
| Southwest Airlines Co. | | | 41,164 | | | | 2,021,153 | |
| | | | | | | | 5,815,777 | |
| Apparel – 1.0% | | | | | | | | |
| Michael Kors | | | | | | | | |
| Holdings Ltd. (b) | | | 16,011 | | | | 887,169 | |
| Ralph Lauren Corp. – Class A | | | 6,836 | | | | 886,014 | |
| | | | | | | | 1,773,183 | |
| Auto Manufacturers – 2.2% | | | | | | | | |
| Ford Motor Co. | | | 398,022 | | | | 3,801,110 | |
| | | | | | | | | |
| Auto Parts & Equipment – 2.1% | | | | | | | | |
| Allison Transmission | | | | | | | | |
| Holdings, Inc. | | | 16,037 | | | | 706,911 | |
| Aptiv PLC | | | 24,841 | | | | 1,907,789 | |
| Lear Corp. | | | 8,039 | | | | 1,068,383 | |
| | | | | | | | 3,683,083 | |
| Beverages – 1.3% | | | | | | | | |
| Molson Coors Brewing | | | | | | | | |
| Co. – Class B | | | 34,345 | | | | 2,198,080 | |
| | | | | | | | | |
| Biotechnology – 6.4% | | | | | | | | |
| Amgen, Inc. | | | 18,788 | | | | 3,622,139 | |
| Biogen, Inc. (b) | | | 10,867 | | | | 3,306,502 | |
| Gilead Sciences, Inc. | | | 51,088 | | | | 3,483,180 | |
| United Therapeutics Corp. (b) | | | 5,148 | | | | 570,707 | |
| | | | | | | | 10,982,528 | |
| Chemicals – 3.0% | | | | | | | | |
| Huntsman Corp. | | | 52,501 | | | | 1,148,722 | |
| LyondellBasell Industries | | | | | | | | |
| NV – Class A | | | 33,957 | | | | 3,031,341 | |
| Westlake Chemical Corp. | | | 14,034 | | | | 1,000,624 | |
| | | | | | | | 5,180,687 | |
| Commercial Services – 0.8% | | | | | | | | |
| H&R Block, Inc. | | | 37,624 | | | | 998,541 | |
| ManpowerGroup, Inc. | | | 5,280 | | | | 402,811 | |
| | | | | | | | 1,401,352 | |
| Computers – 7.8% | | | | | | | | |
| DXC Technology Co. | | | 32,450 | | | | 2,363,334 | |
| HP, Inc. | | | 150,884 | | | | 3,642,340 | |
| International Business | | | | | | | | |
| Machines Corp. | | | 25,375 | | | | 2,929,036 | |
| NetApp, Inc. | | | 20,805 | | | | 1,632,984 | |
| Western Digital Corp. | | | 63,965 | | | | 2,754,973 | |
| | | | | | | | 13,322,667 | |
| Diversified Financial Services – 1.7% | | | | | | | | |
| Alliance Data Systems Corp. | | | 14,210 | | | | 2,929,818 | |
| | | | | | | | | |
| Electrical Components | | | | | | | | |
| & Equipment – 0.2% | | | | | | | | |
| Acuity Brands, Inc. | | | 3,155 | | | | 396,394 | |
| | | | | | | | | |
| Electronics – 0.5% | | | | | | | | |
| Gentex Corp. | | | 22,960 | | | | 483,308 | |
| nVent Electric Plc | | | 16,951 | | | | 413,943 | |
| | | | | | | | 897,251 | |
| Entertainment – 0.3% | | | | | | | | |
| Cinemark Holdings, Inc. | | | 12,364 | | | | 513,971 | |
| | | | | | | | | |
| Food – 1.6% | | | | | | | | |
| Pilgrim’s Pride Corp. (b) | | | 31,218 | | | | 551,310 | |
| Tyson Foods, Inc. – Class A | | | 37,619 | | | | 2,254,130 | |
| | | | | | | | 2,805,440 | |
| Forest Products & Paper – 0.2% | | | | | | | | |
| Domtar Corp. | | | 7,941 | | | | 367,748 | |
| | | | | | | | | |
| Healthcare-Services – 0.2% | | | | | | | | |
| MEDNAX, Inc. (b) | | | 9,620 | | | | 397,210 | |
| | | | | �� | | | | |
| Home Builders – 0.8% | | | | | | | | |
| PulteGroup, Inc. | | | 45,899 | | | | 1,127,738 | |
| Thor Industries, Inc. | | | 3,886 | | | | 270,621 | |
| | | | | | | | 1,398,359 | |
| Internet – 1.3% | | | | | | | | |
| Expedia Group, Inc. | | | 11,272 | | | | 1,413,847 | |
| F5 Networks, Inc. (b) | | | 4,781 | | | | 838,014 | |
| | | | | | | | 2,251,861 | |
| Iron/Steel – 0.5% | | | | | | | | |
| Steel Dynamics, Inc. | | | 19,731 | | | | 781,348 | |
| | | | | | | | | |
| Leisure Time – 0.6% | | | | | | | | |
| Harley-Davidson, Inc. | | | 25,641 | | | | 979,999 | |
| | | | | | | | | |
| Lodging – 2.2% | | | | | | | | |
| Las Vegas Sands Corp. | | | 61,503 | | | | 3,138,498 | |
| Wyndham Destinations, Inc. | | | 15,645 | | | | 561,343 | |
| | | | | | | | 3,699,841 | |
| Machinery-Construction | | | | | | | | |
| & Mining – 0.2% | | | | | | | | |
| Terex Corp. | | | 8,360 | | | | 279,140 | |
The accompanying notes are an integral part of these financial statements.
Pacer US Cash Cows 100 ETF
SCHEDULE OF INVESTMENTS
October 31, 2018 (Unaudited) (Continued)
| | | Shares | | | Value | |
| COMMON STOCKS – 96.2% (Continued) | | | | | | |
| | | | | | | |
| Media – 1.8% | | | | | | |
| AMC Networks, Inc. – | | | | | | |
| Class A (b) | | | 8,339 | | | $ | 488,499 | |
| Viacom, Inc. – Class B | | | 82,654 | | | | 2,643,275 | |
| | | | | | | | 3,131,774 | |
| Mining – 3.0% | | | | | | | | |
| Freeport-McMoRan, Inc. | | | 280,059 | | | | 3,262,688 | |
| Newmont Mining Corp. | | | 45,972 | | | | 1,421,454 | |
| Royal Gold, Inc. | | | 5,365 | | | | 411,120 | |
| | | | | | | | 5,095,262 | |
| Oil & Gas – 4.9% | | | | | | | | |
| HollyFrontier Corp. | | | 16,290 | | | | 1,098,598 | |
| Marathon Petroleum Corp. | | | 44,292 | | | | 3,120,371 | |
| PBF Energy, Inc. – Class A | | | 18,743 | | | | 784,395 | |
| Phillips 66 | | | 32,625 | | | | 3,354,502 | |
| | | | | | | | 8,357,866 | |
| Packaging & Containers – 0.6% | | | | | | | | |
| Berry Global Group, Inc. (b) | | | 23,061 | | | | 1,005,921 | |
| | | | | | | | | |
| Pharmaceuticals – 12.0% | | | | | | | | |
| AbbVie, Inc. | | | 39,478 | | | | 3,073,362 | |
| Allergan PLC | | | 19,384 | | | | 3,062,866 | |
| AmerisourceBergen Corp. | | | 25,193 | | | | 2,216,984 | |
| Cardinal Health, Inc. | | | 56,739 | | | | 2,870,993 | |
| CVS Health Corp. | | | 48,250 | | | | 3,492,818 | |
| Express Scripts | | | | | | | | |
| Holding Co. (b) | | | 41,066 | | | | 3,982,170 | |
| Herbalife Ltd. (b) | | | 13,243 | | | | 705,322 | |
| Nektar Therapeutics (b) | | | 17,591 | | | | 680,420 | |
| Premier, Inc. – Class A (b) | | | 11,876 | | | | 534,420 | |
| | | | | | | | 20,619,355 | |
| Retail – 11.9% | | | | | | | | |
| Best Buy Co., Inc. | | | 22,211 | | | | 1,558,324 | |
| Dick’s Sporting Goods, Inc. | | | 15,876 | | | | 561,534 | |
| Foot Locker, Inc. | | | 21,606 | | | | 1,018,507 | |
| Gap, Inc. | | | 28,478 | | | | 777,449 | |
| Kohl’s Corp. | | | 27,737 | | | | 2,100,523 | |
| L Brands, Inc. | | | 33,847 | | | | 1,097,320 | |
| Macy’s, Inc. | | | 40,759 | | | | 1,397,626 | |
| Nordstrom, Inc. | | | 14,512 | | | | 954,454 | |
| Qurate Retail Group, Inc. | | | | | | | | |
| QVC Group – Class A (b) | | | 71,369 | | | | 1,565,836 | |
| Target Corp. | | | 42,024 | | | | 3,514,467 | |
| Urban Outfitters, Inc. (b) | | | 7,468 | | | | 294,687 | |
| Walgreens Boots Alliance, Inc. | | | 54,109 | | | | 4,316,275 | |
| Williams-Sonoma, Inc. | | | 7,116 | | | | 422,548 | |
| Yum China Holdings, Inc. | | | 25,687 | | | | 926,787 | |
| | | | | | | | 20,506,337 | |
| Semiconductors – 11.6% | | | | | | | | |
| Applied Materials, Inc. | | | 88,880 | | | | 2,922,374 | |
| Broadcom, Inc. | | | 15,721 | | | | 3,513,486 | |
| Cypress Semiconductor Corp. | | | 33,423 | | | | 432,494 | |
| KLA-Tencor Corp. | | | 13,964 | | | | 1,278,265 | |
| Lam Research Corp. | | | 18,466 | | | | 2,617,186 | |
| Micron Technology, Inc. (b) | | | 82,236 | | | | 3,101,942 | |
| MKS Instruments, Inc. | | | 4,682 | | | | 345,017 | |
| Qorvo, Inc. (b) | | | 10,618 | | | | 780,529 | |
| QUALCOMM, Inc. | | | 51,939 | | | | 3,266,444 | |
| Skyworks Solutions, Inc. | | | 15,511 | | | | 1,345,734 | |
| Teradyne, Inc. | | | 12,141 | | | | 418,257 | |
| | | | | | | | 20,021,728 | |
| Software – 5.8% | | | | | | | | |
| CA, Inc. | | | 31,794 | | | | 1,410,382 | |
| Citrix Systems, Inc. (b) | | | 10,801 | | | | 1,106,778 | |
| Oracle Corp. | | | 82,739 | | | | 4,040,973 | |
| VMware, Inc. – Class A (b) | | | 24,549 | | | | 3,470,983 | |
| | | | | | | | 10,029,116 | |
| Telecommunications – 2.9% | | | | | | | | |
| Cisco Systems, Inc. | | | 78,412 | | | | 3,587,349 | |
| Juniper Networks, Inc. | | | 31,462 | | | | 920,893 | |
| LogMeIn, Inc. | | | 4,556 | | | | 392,362 | |
| | | | | | | | 4,900,604 | |
| TOTAL COMMON STOCKS | | | | | | | | |
| (Cost $176,860,001) | | | | | | | 165,407,693 | |
| | | | | | | | | |
| REAL ESTATE | | | | | | | | |
| INVESTMENT TRUSTS – 3.6% | | | | | | | | |
| Annaly Capital | | | | | | | | |
| Management, Inc. | | | 351,616 | | | | 3,470,450 | |
| Apple Hospitality REIT, Inc. | | | 22,943 | | | | 370,988 | |
| Duke Realty Corp. | | | 49,931 | | | | 1,376,598 | |
| Rayonier, Inc. | | | 17,577 | | | | 530,825 | |
| Taubman Centers, Inc. | | | 8,443 | | | | 464,450 | |
| TOTAL REAL ESTATE | | | | | | | | |
| INVESTMENT TRUSTS | | | | | | | | |
| (Cost $6,543,993) | | | | | | | 6,213,311 | |
| | | | | | | | | |
| SHORT-TERM INVESTMENTS – 0.2% | | | | | | | | |
| | | | | | | | | |
| Money Market Funds – 0.2% | | | | | | | | |
| U.S. Bank Money Market | | | | | | | | |
| Deposit Account, 2.00% (c) | | | 266,284 | | | | 266,284 | |
| TOTAL SHORT-TERM | | | | | | | | |
| INVESTMENTS | | | | | | | | |
| (Cost $266,284) | | | | | | | 266,284 | |
The accompanying notes are an integral part of these financial statements.
Pacer US Cash Cows 100 ETF
SCHEDULE OF INVESTMENTS
October 31, 2018 (Unaudited) (Continued)
| | | Shares | | | Value | |
| INVESTMENTS PURCHASED | | | | | | |
| WITH PROCEEDS FROM | | | | | | |
| SECURITIES LENDING – 10.9% | | | | | | |
| Mount Vernon Liquid | | | | | | |
Assets Portfolio, LLC 2.39% (c) | | | | | | |
| | | 18,809,270 | | | $ | 18,809,270 | |
| TOTAL INVESTMENTS | | | | | | | | |
| PURCHASED WITH | | | | | | | | |
| PROCEEDS FROM | | | | | | | | |
| SECURITIES LENDING | | | | | | | | |
| (Cost $18,809,270) | | | | | | | 18,809,270 | |
| Total Investments | | | | | | | | |
(Cost $202,479,458) – 110.9% | | | | | | | | |
| | | | | | | 190,696,558 | |
| Liabilities in Excess | | | | | | | | |
| of Other Assets – (10.9)% | | | | | | | (18,729,714 | ) |
| TOTAL NET | | | | | | | | |
| ASSETS – 100.0% | | | | | | $ | 171,966,844 | |
| (a) | | All or portion of this security is on loan as of October 31, 2018. The Total value of securities on loan is $18,411,529 or 10.7% of net assets. See Note 5 and 6. |
| (b) | | Non-income producing security. |
| (c) | | The rate shown is as of October 31, 2018. |
For Fund compliance purposes, the Fund’s industry classifications refer to any one or more of the industry sub-classifications used by one or more widely recognized market indexes or ratings group indexes, and/or they may be defined by Fund management. This definition does not apply for all purposes of this report, which may combine sub-classifications for reporting ease. Categories are shown as a percentage of net assets.
The accompanying notes are an integral part of these financial statements.
Pacer US Small Cap Cash Cows 100 ETF
SCHEDULE OF INVESTMENTS
October 31, 2018 (Unaudited)
| | | Shares | | | Value | |
| COMMON STOCKS – 95.6% | | | | | | |
| | | | | | | |
| Aerospace/Defense – 3.9% | | | | | | |
| Aerojet Rocketdyne | | | | | | |
| Holdings, Inc. (a) | | | 12,213 | | | $ | 431,363 | |
| Kaman Corp. | | | 5,838 | | | | 370,830 | |
| National Presto | | | | | | | | |
| Industries, Inc. (b) | | | 1,253 | | | | 156,211 | |
| | | | | | | | 958,404 | |
| Apparel – 0.9% | | | | | | | | |
| Crocs, Inc. (a) | | | 10,680 | | | | 219,367 | |
| | | | | | | | | |
| Auto Manufacturers – 0.7% | | | | | | | | |
| Wabash National Corp. | | | 11,485 | | | | 173,424 | |
| | | | | | | | | |
| Auto Parts & Equipment – 1.2% | | | | | | | | |
| Cooper-Standard | | | | | | | | |
| Holdings, Inc. (a) | | | 3,155 | | | | 292,311 | |
| | | | | | | | | |
| Biotechnology – 3.1% | | | | | | | | |
| AMAG Pharmaceuticals, | | | | | | | | |
| Inc. (a) | | | 13,545 | | | | 291,217 | |
| Innoviva, Inc. (a) | | | 33,927 | | | | 473,621 | |
| | | | | | | | 764,838 | |
| Building Materials – 3.1% | | | | | | | | |
| Apogee Enterprises, Inc. | | | 5,079 | | | | 183,352 | |
| Boise Cascade Co. | | | 7,989 | | | | 245,981 | |
| Patrick Industries, Inc. (a) | | | 5,654 | | | | 246,006 | |
| Quanex Building | | | | | | | | |
| Products Corp. | | | 7,098 | | | | 105,192 | |
| | | | | | | | 780,531 | |
| Chemicals – 1.8% | | | | | | | | |
| Aceto Corp. | | | 56,812 | | | | 116,464 | |
| Hawkins, Inc. | | | 1,910 | | | | 64,291 | |
| Kraton Corp. (a) | | | 9,478 | | | | 261,024 | |
| | | | | | | | 441,779 | |
| Coal – 2.2% | | | | | | | | |
| CONSOL Energy, Inc. (a) | | | 13,500 | | | | 537,840 | |
| | | | | | | | | |
| Commercial Services – 7.0% | | | | | | | | |
| American Public | | | | | | | | |
| Education, Inc. (a) | | | 3,049 | | | | 99,794 | |
| Cardtronics PLC – Class A (a) | | | 10,082 | | | | 273,827 | |
| Cross Country | | | | | | | | |
| Healthcare, Inc. (a) | | | 9,440 | | | | 83,355 | |
| Heidrick & Struggles | | | | | | | | |
| International, Inc. | | | 2,739 | | | | 94,523 | |
| Korn/Ferry International | | | 8,561 | | | | 386,443 | |
| Navigant Consulting, Inc. | | | 10,776 | | | | 232,762 | |
| Nutrisystem, Inc. | | | 4,514 | | | | 160,518 | |
| Rent-A-Center, Inc. TX (a) | | | 17,873 | | | | 254,690 | |
| TrueBlue, Inc. (a) | | | 6,278 | | | | 146,466 | |
| | | | | | | | 1,732,378 | |
| Computers – 1.2% | | | | | | | | |
| Insight Enterprises, Inc. (a) | | | 5,937 | | | | 306,884 | |
| | | | | | | | | |
| Distribution/Wholesale – 3.4% | | | | | | | | |
| Core-Mark Holding Co, Inc. | | | 9,656 | | | | 370,887 | |
| Fossil Group, Inc. (a)(b) | | | 21,413 | | | | 464,876 | |
| | | | | | | | 835,763 | |
| Diversified Financial Services – 1.5% | | | | | | | | |
| WageWorks, Inc. (a) | | | 9,607 | | | | 382,455 | |
| | | | | | | | | |
| Electronics – 2.1% | | | | | | | | |
| Brady Corp. – Class A | | | 6,759 | | | | 272,320 | |
| Electro Scientific | | | | | | | | |
| Industries, Inc. (a) | | | 8,887 | | | | 257,723 | |
| | | | | | | | 530,043 | |
| Energy-Alternate Sources – 5.1% | | | | | | | | |
| FutureFuel Corp. | | | 12,041 | | | | 197,473 | |
| Renewable Energy | | | | | | | | |
| Group, Inc. (a) | | | 20,476 | | | | 636,394 | |
| REX American | | | | | | | | |
| Resources Corp. (a) | | | 1,012 | | | | 75,060 | |
| SolarEdge Technologies, | | | | | | | | |
| Inc. (a)(b) | | | 9,343 | | | | 361,854 | |
| | | | | | | | 1,270,781 | |
| Food – 2.3% | | | | | | | | |
| Cal-Maine Foods, Inc. | | | 9,204 | | | | 447,958 | |
| John B Sanfilippo & Son, Inc. | | | 1,878 | | | | 118,427 | |
| | | | | | | | 566,385 | |
| Forest Products & Paper – 0.9% | | | | | | | | |
| Schweitzer-Mauduit | | | | | | | | |
| International, Inc. | | | 6,823 | | | | 217,790 | |
| | | | | | | | | |
| Healthcare-Products – 0.6% | | | | | | | | |
| MiMedx Group, Inc. (a)(b) | | | 27,613 | | | | 160,708 | |
| | | | | | | | | |
| Healthcare-Services – 2.1% | | | | | | | | |
| Magellan Health, Inc. (a) | | | 3,855 | | | | 250,806 | |
| Tivity Health, Inc. (a) | | | 7,553 | | | | 259,899 | |
| | | | | | | | 510,705 | |
| Internet – 3.5% | | | | | | | | |
| New Media Investment | | | | | | | | |
| Group, Inc. | | | 17,908 | | | | 251,607 | |
| NIC, Inc. | | | 9,316 | | | | 123,996 | |
| Stamps.com, Inc. (a) | | | 2,451 | | | | 495,519 | |
| | | | | | | | 871,122 | |
The accompanying notes are an integral part of these financial statements.
Pacer US Small Cap Cash Cows 100 ETF
SCHEDULE OF INVESTMENTS
October 31, 2018 (Unaudited) (Continued)
| | | Shares | | | Value | |
| COMMON STOCKS – 95.6% (Continued) | | | | | | |
| | | | | | | |
| Leisure Time – 1.8% | | | | | | |
| Nautilus, Inc. (a) | | | 4,711 | | | $ | 57,616 | |
| Vista Outdoor, Inc. (a) | | | 31,848 | | | | 398,100 | |
| | | | | | | | 455,716 | |
| Machinery-Diversified – 0.4% | | | | | | | | |
| Ichor Holdings Ltd. (a)(b) | | | 5,762 | | | | 102,276 | |
| | | | | | | | | |
| Media – 1.2% | | | | | | | | |
| Gannett Co., Inc. | | | 31,095 | | | | 301,622 | |
| | | | | | | | | |
| Miscellaneous Manufacturing – 5.1% | | | | | | | | |
| Fabrinet (a) | | | 5,731 | | | | 248,267 | |
| Hillenbrand, Inc. | | | 10,639 | | | | 509,608 | |
| Sturm Ruger & Co, Inc. (b) | | | 4,473 | | | | 265,652 | |
| Tredegar Corp. | | | 12,399 | | | | 230,621 | |
| | | | | | | | 1,254,148 | |
| Oil & Gas Services – 0.5% | | | | | | | | |
| Matrix Service Co. (a) | | | 6,634 | | | | 134,869 | |
| | | | | | | | | |
| Pharmaceuticals – 2.3% | | | | | | | | |
| Anika Therapeutics, Inc. (a) | | | 1,518 | | | | 54,284 | |
| Corcept Therapeutics, | | | | | | | | |
| Inc. (a)(b) | | | 15,331 | | | | 180,139 | |
| Diplomat Pharmacy, Inc. (a) | | | 16,403 | | | | 325,435 | |
| | | | | | | | 559,858 | |
| Retail – 21.8% | | | | | | | | |
| Abercrombie & | | | | | | | | |
| Fitch Co. – Class A | | | 27,694 | | | | 545,572 | |
| Barnes & Noble | | | | | | | | |
| Education, Inc. (a) | | | 20,960 | | | | 119,682 | |
| Caleres, Inc. | | | 8,610 | | | | 294,462 | |
| Chico’s FAS, Inc. | | | 45,075 | | | | 345,725 | |
| DSW, Inc. – Class A | | | 15,989 | | | | 424,508 | |
| Express, Inc. (a) | | | 17,803 | | | | 156,844 | |
| GameStop Corp. – Class A (b) | | | 32,449 | | | | 473,755 | |
| Genesco, Inc. (a) | | | 7,739 | | | | 331,152 | |
| Haverty Furniture Cos, Inc. | | | 3,704 | | | | 75,117 | |
| Hibbett Sports, Inc. (a) | | | 12,797 | | | | 223,564 | |
| La-Z-Boy, Inc. | | | 8,003 | | | | 222,483 | |
| MarineMax, Inc. (a) | | | 5,528 | | | | 125,817 | |
| Movado Group, Inc. | | | 3,629 | | | | 139,753 | |
| Office Depot, Inc. | | | 170,308 | | | | 435,989 | |
| PetMed Express, Inc. | | | 3,135 | | | | 87,592 | |
| Red Robin Gourmet | | | | | | | | |
| Burgers, Inc. (a) | | | 4,059 | | | | 122,582 | |
| Shoe Carnival, Inc. | | | 4,558 | | | | 185,647 | |
| Tailored Brands, Inc. | | | 21,601 | | | | 453,837 | |
| The Buckle, Inc. (b) | | | 12,263 | | | | 250,165 | |
| The Cato Corp. – Class A | | | 5,249 | | | | 101,201 | |
| Vera Bradley, Inc. (a) | | | 8,014 | | | | 105,705 | |
| Vitamin Shoppe, Inc. (a) | | | 8,446 | | | | 65,625 | |
| Zumiez, Inc. (a) | | | 5,181 | | | | 120,510 | |
| | | | | | | | 5,407,287 | |
| Semiconductors – 8.8% | | | | | | | | |
| Advanced Energy | | | | | | | | |
| Industries, Inc. (a) | | | 7,374 | | | | 317,303 | |
| Axcelis Technologies, Inc. (a) | | | 4,367 | | | | 75,375 | |
| Cabot Microelectronics Corp. | | | 3,241 | | | | 316,387 | |
| Cohu, Inc. | | | 4,918 | | | | 102,295 | |
| FormFactor, Inc. (a) | | | 10,818 | | | | 132,412 | |
| Kulicke & Soffa | | | | | | | | |
| Industries, Inc. | | | 14,622 | | | | 297,265 | |
| MaxLinear, Inc. (a) | | | 13,447 | | | | 261,006 | |
| Nanometrics, Inc. (a) | | | 4,355 | | | | 139,621 | |
| Rambus, Inc. (a) | | | 19,248 | | | | 167,650 | |
| Rudolph Technologies, Inc. (a) | | | 3,756 | | | | 78,087 | |
| Xperi Corp. | | | 22,922 | | | | 297,986 | |
| | | | | | | | 2,185,387 | |
| Software – 2.5% | | | | | | | | |
| MicroStrategy, Inc. – | | | | | | | | |
| Class A (a) | | | 1,031 | | | | 129,875 | |
| Progress Software Corp. | | | 6,916 | | | | 222,280 | |
| TiVo Corp. | | | 24,270 | | | | 266,970 | |
| | | | | | | | 619,125 | |
| Telecommunications – 2.3% | | | | | | | | |
| CalAmp Corp. (a) | | | 8,930 | | | | 178,064 | |
| NETGEAR, Inc. (a) | | | 4,035 | | | | 223,862 | |
| Oclaro, Inc. (a) | | | 19,213 | | | | 157,931 | |
| | | | | | | | 559,857 | |
| Transportation – 1.1% | | | | | | | | |
| ArcBest Corp. | | | 7,634 | | | | 283,374 | |
| | | | | | | | | |
| Trucking & Leasing – 1.2% | | | | | | | | |
| The Greenbrier Cos., Inc. | | | 6,214 | | | | 294,854 | |
| TOTAL COMMON STOCKS | | | | | | | | |
| (Cost $26,282,534) | | | | | | | 23,711,881 | |
| | | | | | | | | |
| REAL ESTATE | | | | | | | | |
| INVESTMENT TRUSTS – 4.3% | | | | | | | | |
| Apollo Commercial Real | | | | | | | | |
| Estate Finance, Inc. | | | 28,691 | | | | 536,809 | |
| Lexington Realty Trust | | | 68,207 | | | | 529,969 | |
| TOTAL REAL ESTATE | | | | | | | | |
| INVESTMENT TRUSTS | | | | | | | | |
| (Cost $1,129,302) | | | | | | | 1,066,778 | |
The accompanying notes are an integral part of these financial statements.
Pacer US Small Cap Cash Cows 100 ETF
SCHEDULE OF INVESTMENTS
October 31, 2018 (Unaudited) (Continued)
| | | Shares | | | Value | |
| SHORT-TERM INVESTMENTS – 0.1% | | | | | | |
| | | | | | | |
| Money Market Funds – 0.1% | | | | | | |
| U.S. Bank Money Market | | | | | | |
| Deposit Account, 2.00% (c) | | | 19,526 | | | $ | 19,526 | |
| TOTAL SHORT-TERM | | | | | | | | |
| INVESTMENTS | | | | | | | | |
| (Cost $19,526) | | | | | | | 19,526 | |
| | | | | | | | | |
| INVESTMENTS PURCHASED | | | | | | | | |
| WITH PROCEEDS FROM | | | | | | | | |
| SECURITIES LENDING – 8.6% | | | | | | | | |
| Mount Vernon Liquid | | | | | | | | |
| Assets Portfolio, 2.39% (c) | | | 2,135,082 | | | | 2,135,082 | |
| TOTAL INVESTMENTS | | | | | | | | |
| PURCHASED WITH | | | | | | | | |
| PROCEEDS FROM | | | | | | | | |
| SECURITIES LENDING | | | | | | | | |
| (Cost $2,135,082) | | | | | | | 2,135,082 | |
| Total Investments | | | | | | | | |
| (Cost $29,566,444) – | | | | | | | | |
| 108.6% | | | | | | | 26,933,267 | |
| Liabilities in Excess | | | | | | | | |
| of Other Assets – (8.6)% | | | | | | | (2,143,724 | ) |
| TOTAL NET | | | | | | | | |
| ASSETS – 100.0% | | | | | | $ | 24,789,543 | |
| (a) | | Non-income producing security. |
| (b) | | All or portion of this security is on loan as of October 31, 2018. The Total value of securities on loan is $2,034,334 or 8.2% of net assets. See Note 5 and 6. |
| (c) | | The rate shown is as of October 31, 2018. |
For Fund compliance purposes, the Fund’s industry classifications refer to any one or more of the industry sub-classifications used by one or more widely recognized market indexes or ratings group indexes, and/or they may be defined by Fund management. This definition does not apply for all purposes of this report, which may combine sub-classifications for reporting ease. Categories are shown as a percentage of net assets.
The accompanying notes are an integral part of these financial statements.
Pacer Developed Markets International Cash Cows 100 ETF
SCHEDULE OF INVESTMENTS
October 31, 2018 (Unaudited)
| | | Shares | | | Value | |
| COMMON STOCKS – 99.5% | | | | | | |
| | | | | | | |
| Australia – 5.2% | | | | | | |
| BHP Billiton Ltd. – ADR (a) | | | 12,599 | | | $ | 581,822 | |
| BlueScope Steel Ltd. | | | 7,139 | | | | 72,647 | |
| Fortescue Metals Group Ltd. | | | 115,862 | | | | 328,191 | |
| Qantas Airways Ltd. | | | 57,179 | | | | 221,487 | |
| South32 Ltd. | | | 101,530 | | | | 260,273 | |
| | | | | | | | 1,464,420 | |
| Canada – 2.9% | | | | | | | | |
| Imperial Oil Ltd. (a) | | | 10,251 | | | | 320,242 | |
| Magna International, Inc. | | | 5,201 | | | | 256,097 | |
| Teck Resources Ltd. | | | 11,257 | | | | 232,682 | |
| | | | | | | | 809,021 | |
| Denmark – 1.8% | | | | | | | | |
| Carlsberg A/S | | | 2,302 | | | | 253,933 | |
| Pandora A/S | | | 1,850 | | | | 115,742 | |
| Vestas Wind Systems A/S | | | 2,306 | | | | 144,622 | |
| | | | | | | | 514,297 | |
| Finland – 2.0% | | | | | | | | |
| Nokia OYJ – ADR (a) | | | 58,558 | | | | 329,096 | |
| UPM-Kymmene OYJ | | | 6,975 | | | | 224,444 | |
| | | | | | | | 553,540 | |
| France – 7.2% | | | | | | | | |
| Air France-KLM (b) | | | 16,976 | | | | 164,590 | |
| Arkema SA | | | 1,115 | | | | 117,172 | |
| Peugeot SA | | | 9,059 | | | | 215,781 | |
| Publicis Groupe SA | | | 4,489 | | | | 260,526 | |
| Sanofi – ADR | | | 16,050 | | | | 717,756 | |
| Sodexo SA | | | 2,026 | | | | 206,802 | |
| Thales SA | | | 2,568 | | | | 328,675 | |
| | | | | | | | 2,011,302 | |
| Germany – 5.1% | | | | | | | | |
| BASF SE | | | 6,284 | | | | 484,206 | |
| Covestro AG (c) | | | 5,006 | | | | 323,871 | |
| Deutsche Lufthansa AG | | | 16,764 | | | | 337,221 | |
| ProSiebenSat.1 Media SE | | | 12,249 | | | | 283,302 | |
| | | | | | | | 1,428,600 | |
| Hong Kong – 2.1% | | | | | | | | |
| Galaxy Entertainment | | | | | | | | |
| Group Ltd. | | | 53,124 | | | | 287,232 | |
| WH Group Ltd (c) | | | 202,556 | | | | 141,806 | |
| Wynn Macau Ltd. | | | 73,776 | | | | 152,219 | |
| | | | | | | | 581,257 | |
| Italy – 0.5% | | | | | | | | |
| Pirelli & C SpA (b)(c) | | | 17,864 | | | | 131,397 | |
| | | | | | | | | |
| Japan – 29.5% | | | | | | | | |
| Astellas Pharma, Inc. | | | 26,740 | | | | 414,010 | |
| Bandai Namco Holdings, Inc. | | | 2,224 | | | | 79,137 | |
| Bridgestone Corp. | | | 9,852 | | | | 380,948 | |
| Dentsu, Inc. | | | 4,358 | | | | 202,383 | |
| FamilyMart UNY | | | | | | | | |
| Holdings Co Ltd. | | | 1,733 | | | | 201,506 | |
| FUJIFILM Holdings Corp. | | | 7,851 | | | | 340,452 | |
| Japan Tobacco, Inc. | | | 23,785 | | | | 612,674 | |
| Kajima Corp. | | | 18,518 | | | | 238,946 | |
| Konami Holdings Corp. | | | 1,463 | | | | 55,883 | |
| Kubota Corp. | | | 16,752 | | | | 264,564 | |
| Mazda Motor Corp. | | | 13,679 | | | | 148,386 | |
| Mitsubishi Chemical | | | | | | | | |
| Holdings Corp. | | | 41,888 | | | | 327,093 | |
| Mitsui & Co. Ltd. | | | 35,908 | | | | 600,031 | |
| Nexon Co. Ltd. (b) | | | 9,881 | | | | 112,616 | |
| Nikon Corp. | | | 8,862 | | | | 154,487 | |
| Nippon Telegraph & | | | | | | | | |
| Telephone Corp. | | | 13,539 | | | | 569,950 | |
| Nitto Denko Corp. | | | 1,979 | | | | 124,140 | |
| NTT DOCOMO, Inc. – ADR | | | 24,364 | | | | 582,543 | |
| NTT DOCOMO, Inc. | | | 10 | | | | 252 | |
| Persol Holdings Co Ltd. | | | 2,925 | | | | 55,682 | |
| Secom Co Ltd. | | | 2,914 | | | | 238,910 | |
| Shionogi & Co Ltd. | | | 3,236 | | | | 207,407 | |
| Sony Corp. – ADR | | | 13,357 | | | | 723,014 | |
| Subaru Corp. | | | 14,603 | | | | 395,116 | |
| Suzuki Motor Corp. | | | 6,469 | | | | 323,923 | |
| Taisei Corp. | | | 7,191 | | | | 308,136 | |
| Takeda Pharmaceutical | | | | | | | | |
| Co Ltd. – ADR (a) | | | 22,183 | | | | 468,061 | |
| Tosoh Corp. | | | 8,828 | | | | 116,810 | |
| | | | | | | | 8,247,060 | |
| Jersey – 2.5% | | | | | | | | |
| Shire PLC – ADR | | | 3,812 | | | | 693,021 | |
| | | | | | | | | |
| Netherlands – 1.8% | | | | | | | | |
| Koninklijke Ahold | | | | | | | | |
| Delhaize NV | | | 21,577 | | | | 494,402 | |
| | | | | | | | | |
| Norway – 3.3% | | | | | | | | |
| Aker BP ASA | | | 6,519 | | | | 214,985 | |
| Norsk Hydro ASA | | | 33,497 | | | | 173,886 | |
| Telenor ASA | | | 28,431 | | | | 521,585 | |
| | | | | | | | 910,456 | |
| Republic of Korea – 7.6% | | | | | | | | |
| GS Engineering & | | | | | | | | |
| Construction Corp. | | | 1,689 | | | | 61,880 | |
| Hyundai Mobis Co. Ltd. | | | 1,276 | | | | 212,751 | |
| Kia Motors Corp. | | | 6,383 | | | | 159,078 | |
| Lotte Chemical Corp. | | | 483 | | | | 111,261 | |
| NCSoft Corp. | | | 378 | | | | 142,469 | |
| POSCO – ADR | | | 7,930 | | | | 456,927 | |
The accompanying notes are an integral part of these financial statements.
Pacer Developed Markets International Cash Cows 100 ETF
SCHEDULE OF INVESTMENTS
October 31, 2018 (Unaudited) (Continued)
| | | Shares | | | Value | |
| COMMON STOCKS – 99.5% (Continued) | | | | | | |
| | | | | | | |
| Republic of Korea – 7.6% (Continued) | | | | | | |
| Samsung Electronics Co. Ltd. | | | 13,202 | | | $ | 491,216 | |
| Samsung Engineering | | | | | | | | |
| Co Ltd. (b) | | | 3,395 | | | | 54,371 | |
| SK Hynix, Inc. | | | 7,411 | | | | 443,535 | |
| | | | | | | | 2,133,488 | |
| Singapore – 0.6% | | | | | | | | |
| Genting Singapore Ltd. | | | 175,919 | | | | 111,763 | |
| Venture Corp Ltd. | | | 3,958 | | | | 43,776 | |
| | | | | | | | 155,539 | |
| South Korea – 1.0% | | | | | | | | |
| SK Innovation Co. Ltd. | | | 1,522 | | | | 285,154 | |
| | | | | | | | | |
| Spain – 3.7% | | | | | | | | |
| ACS Actividades de | | | | | | | | |
| Construccion y Servicios SA | | | 6,843 | | | | 256,625 | |
| Enagas SA | | | 9,906 | | | | 262,996 | |
| Repsol SA | | | 29,353 | | | | 526,126 | |
| | | | | | | | 1,045,747 | |
| Sweden – 0.7% | | | | | | | | |
| Boliden AB | | | 5,287 | | | | 120,835 | |
| Electrolux AB | | | 3,588 | | | | 74,574 | |
| | | | | | | | 195,409 | |
| Switzerland – 3.7% | | | | | | | | |
| Roche Holding AG – ADR | | | 22,660 | | | | 687,958 | |
| Swisscom AG | | | 767 | | | | 351,381 | |
| | | | | | | | 1,039,339 | |
| United Kingdom – 18.3% | | | | | | | | |
| Anglo American PLC | | | 26,151 | | | | 559,956 | |
| Antofagasta PLC | | | 18,208 | | | | 182,650 | |
| BAE Systems PLC | | | 34,745 | | | | 233,513 | |
| BAE Systems PLC – ADR (a) | | | 899 | | | | 24,228 | |
| Barratt Developments PLC | | | 14,634 | | | | 96,145 | |
| Berkeley Group Holdings PLC | | | 3,436 | | | | 153,760 | |
| Burberry Group PLC | | | 5,269 | | | | 121,968 | |
| Centrica PLC | | | 98,792 | | | | 185,878 | |
| Evraz PLC | | | 39,377 | | | | 273,301 | |
| Fiat Chrysler | | | | | | | | |
| Automobiles NV (b) | | | 29,109 | | | | 443,448 | |
| Imperial Brands Plc – ADR | | | 3,440 | | | | 116,444 | |
| Imperial Brands PLC | | | 13,571 | | | | 460,202 | |
| International Consolidated | | | | | | | | |
| Airlines Group SA | | | 52,375 | | | | 403,951 | |
| J Sainsbury PLC | | | 34,526 | | | | 137,336 | |
| KAZ Minerals Plc | | | 9,694 | | | | 64,284 | |
| Marks & Spencer Group PLC | | | 35,480 | | | | 134,238 | |
| Pearson PLC | | | 12,162 | | | | 139,692 | |
| Persimmon PLC | | | 5,596 | | | | 164,085 | |
| Rio Tinto PLC – ADR (a) | | | 10,722 | | | | 528,487 | |
| Royal Mail PLC | | | 14,945 | | | | 68,579 | |
| Taylor Wimpey PLC | | | 62,895 | | | | 129,834 | |
| Vodafone Group PLC – ADR | | | 23,351 | | | | 442,034 | |
| William Hill Plc | | | 12,400 | | | | 33,316 | |
| | | | | | | | 5,097,329 | |
| TOTAL COMMON STOCKS | | | | | | | | |
| (Cost $30,991,715) | | | | | | | 27,790,778 | |
| | | | | | | | | |
| SHORT-TERM INVESTMENTS – 0.1% | | | | | | | | |
| | | | | | | | | |
| Money Market Funds – 0.1% | | | | | | | | |
| U.S. Bank Money Market | | | | | | | | |
| Deposit Account, 2.00% (d) | | | 23,065 | | | | 23,065 | |
| TOTAL SHORT-TERM | | | | | | | | |
| INVESTMENTS | | | | | | | | |
| (Cost $23,065) | | | | | | | 23,065 | |
| | | | | | | | | |
| INVESTMENTS PURCHASED | | | | | | | | |
| WITH PROCEEDS FROM | | | | | | | | |
| SECURITIES LENDING – 7.0% | | | | | | | | |
| Mount Vernon Liquid | | | | | | | | |
| Assets Portfolio, LLC 2.39% (d) | | | 1,945,516 | | | | 1,945,516 | |
| TOTAL INVESTMENTS | | | | | | | | |
| PURCHASED WITH | | | | | | | | |
| PROCEEDS FROM | | | | | | | | |
| SECURITIES LENDING | | | | | | | | |
| (Cost $1,945,516) | | | | | | | 1,945,516 | |
| Total Investments | | | | | | | | |
| (Cost $32,960,296) – | | | | | | | | |
| 106.6% | | | | | | | 29,759,359 | |
| Liabilities in Excess | | | | | | | | |
| of Other Assets – (6.6)% | | | | | | | (1,842,329 | ) |
| TOTAL NET | | | | | | | | |
| ASSETS – 100.0% | | | | | | $ | 27,917,030 | |
Percentages are stated as a percent of net assets.
| ADR | | American Depositary Receipt. |
| (a) | | All or portion of this security is on loan as of October 31, 2018. The Total value of securities on loan is $1,941,188 or 7.0% of net assets. See Note 5 and 6. |
| (b) | | Non-income producing security. |
| (c) | | Security exempt from registration under Rule 144(a) and Regulation S of the Securities Act of 1933. Such securities are treated as liquid securities according to the Fund’s liquidity guidelines. The value of those securities total $607,483 or 2.2% of net assets. |
| (d) | | The rate shown is as of October 31, 2018. |
For Fund compliance purposes, the Fund’s industry classifications refer to any one or more of the industry sub-classifications used by one or more widely recognized market indexes or ratings group indexes, and/or they may be defined by Fund management. This definition does not apply for all purposes of this report, which may combine sub-classifications for reporting ease. Categories are shown as a percentage of net assets.
The accompanying notes are an integral part of these financial statements.
Pacer WealthShield ETF
SCHEDULE OF INVESTMENTS
October 31, 2018 (Unaudited)
| | | Shares | | | Value | |
| SHORT-TERM INVESTMENTS – 0.4% | | | | | | |
| | | | | | | |
| Money Market Funds – 0.4% | | | | | | |
| U.S. Bank Money Market | | | | | | |
| Deposit Account, 2.00% (a) | | | 341,378 | | | $ | 341,378 | |
| TOTAL SHORT-TERM | | | | | | | | |
| INVESTMENTS | | | | | | | | |
| (Cost $341,378) | | | | | | | 341,378 | |
| Total Investments | | | | | | | | |
| (Cost $341,378) – 0.4% | | | | | | | 341,378 | |
| Other Assets in Excess | | | | | | | | |
| of Liabilities – 99.6% | | | | | | | 92,602,936 | |
| TOTAL NET | | | | | | | | |
| ASSETS – 100.0% | | | | | | $ | 92,944,314 | |
| (a) | | The rate shown is as of October 31, 2018. |
For Fund compliance purposes, the Fund’s industry classifications refer to any one or more of the industry sub-classifications used by one or more widely recognized market indexes or ratings group indexes, and/or they may be defined by Fund management. This definition does not apply for all purposes of this report, which may combine sub-classifications for reporting ease. Categories are shown as a percentage of net assets.
The accompanying notes are an integral part of these financial statements.
Pacer Military Times Best Employers ETF
SCHEDULE OF INVESTMENTS
October 31, 2018 (Unaudited)
| | | Shares | | | Value | |
| COMMON STOCKS – 100.0% | | | | | | |
| | | | | | | |
| Aerospace/Defense – 4.7% | | | | | | |
| Boeing Co. | | | 184 | | | $ | 65,294 | |
| Lockheed Martin Corp. | | | 195 | | | | 57,301 | |
| | | | | | | | 122,595 | |
| Auto Manufacturers – 2.4% | | | | | | | | |
| General Motors Co. | | | 1,710 | | | | 62,569 | |
| | | | | | | | | |
| Banks – 11.1% | | | | | | | | |
| Bank of America Corp. | | | 2,017 | | | | 55,467 | |
| Capital One Financial Corp. | | | 629 | | | | 56,170 | |
| Citigroup, Inc. | | | 876 | | | | 57,343 | |
| JPMorgan Chase & Co. | | | 545 | | | | 59,416 | |
| US Bancorp | | | 1,153 | | | | 60,267 | |
| | | | | | | | 288,663 | |
| Commercial Services – 2.3% | | | | | | | | |
| Booz Allen Hamilton | | | | | | | | |
| Holding Corp. | | | 1,219 | | | | 60,389 | |
| | | | | | | | | |
| Computers – 11.0% | | | | | | | | |
| Accenture PLC – Class A | | | 369 | | | | 58,162 | |
| CACI International, | | | | | | | | |
| Inc. – Class A (a) | | | 321 | | | | 57,286 | |
| DXC Technology Co. | | | 685 | | | | 49,888 | |
| Leidos Holdings, Inc. | | | 882 | | | | 57,136 | |
| Perspecta, Inc. | | | 2,679 | | | | 65,609 | |
| | | | | | | | 288,081 | |
| Distribution/Wholesale – 1.8% | | | | | | | | |
| H&E Equipment | | | | | | | | |
| Services, Inc. | | | 1,954 | | | | 47,072 | |
| | | | | | | | | |
| Diversified Financial Services – 2.2% | | | | | | | | |
| Charles Schwab Corp. | | | 1,229 | | | | 56,829 | |
| | | | | | | | | |
| Electric – 9.7% | | | | | | | | |
| Dominion Energy, Inc. | | | 882 | | | | 62,992 | |
| Exelon Corp. | | | 1,427 | | | | 62,517 | |
| Southern Co. | | | 1,425 | | | | 64,168 | |
| Xcel Energy, Inc. | | | 1,299 | | | | 63,664 | |
| | | | | | | | 253,341 | |
| Environmental Control – 2.3% | | | | | | | | |
| Waste Management, Inc. | | | 686 | | | | 61,376 | |
| | | | | | | | | |
| Food – 2.7% | | | | | | | | |
| Hormel Foods Corp. | | | 1,594 | | | | 69,562 | |
| | | | | | | | | |
| Healthcare-Services – 4.6% | | | | | | | | |
| DaVita, Inc. (a) | | | 900 | | | | 60,606 | |
| Humana, Inc. | | | 188 | | | | 60,237 | |
| | | | | | | | 120,843 | |
| Insurance – 9.4% | | | | | | | | |
| Marsh & McLennan | | | | | | | | |
| Cos., Inc. | | | 741 | | | | 62,800 | |
| Progressive Corp. | | | 924 | | | | 64,403 | |
| Prudential Financial, Inc. | | | 635 | | | | 59,550 | |
| Travelers Cos., Inc. | | | 474 | | | | 59,312 | |
| | | | | | | | 246,065 | |
| Internet – 4.4% | | | | | | | | |
| Amazon.com, Inc. (a) | | | 31 | | | | 49,538 | |
| CDW Corp. | | | 712 | | | | 64,087 | |
| | | | | | | | 113,625 | |
| Lodging – 2.2% | | | | | | | | |
| Hilton Worldwide | | | | | | | | |
| Holdings, Inc. | | | 804 | | | | 57,221 | |
| | | | | | | | | |
| Media – 2.5% | | | | | | | | |
| Comcast Corp. – Class A | | | 1,692 | | | | 64,533 | |
| | | | | | | | | |
| Miscellaneous Manufacturing – 3.9% | | | | | | | | |
| Eaton Corp. PLC | | | 750 | | | | 53,753 | |
| General Electric Co. | | | 4,820 | | | | 48,682 | |
| | | | | | | | 102,435 | |
| Pharmaceuticals – 5.2% | | | | | | | | |
| Express Scripts Holding Co. (a) | | | 708 | | | | 68,655 | |
| Merck & Co., Inc. | | | 910 | | | | 66,985 | |
| | | | | | | | 135,640 | |
| Retail – 4.6% | | | | | | | | |
| Home Depot, Inc. | | | 311 | | | | 54,699 | |
| Walmart, Inc. | | | 651 | | | | 65,282 | |
| | | | | | | | 119,981 | |
| Software – 3.8% | | | | | | | | |
| First Data Corp. – Class A (a) | | | 2,426 | | | | 45,463 | |
| ManTech International | | | | | | | | |
| Corp. VA – Class A | | | 939 | | | | 53,786 | |
| | | | | | | | 99,249 | |
| Telecommunications – 4.8% | | | | | | | | |
| AT&T, Inc. | | | 1,953 | | | | 59,918 | |
| Verizon Communications, Inc. | | | 1,147 | | | | 65,482 | |
| | | | | | | | 125,400 | |
| Transportation – 4.4% | | | | | | | | |
| Union Pacific Corp. | | | 415 | | | | 60,681 | |
| Werner Enterprises, Inc. | | | 1,684 | | | | 54,208 | |
| | | | | | | | 114,889 | |
| TOTAL COMMON STOCKS | | | | | | | | |
| (Cost $2,564,813) | | | | | | | 2,610,358 | |
The accompanying notes are an integral part of these financial statements.
Pacer Military Times Best Employers ETF
SCHEDULE OF INVESTMENTS
October 31, 2018 (Unaudited) (Continued)
| | | Shares | | | Value | |
| SHORT-TERM INVESTMENTS – 0.0% (c) | | | | | | |
| | | | | | | |
| Money Market Funds – 0.0% (c) | | | | | | |
| U.S. Bank Money Market | | | | | | |
| Deposit Account, 2.00% (b) | | | 949 | | | $ | 949 | |
| TOTAL SHORT-TERM | | | | | | | | |
| INVESTMENTS | | | | | | | | |
| (Cost $949) | | | | | | | 949 | |
| Total Investments | | | | | | | | |
(Cost $2,565,762) – 100.0% | | | | | | | | |
| | | | | | | 2,611,307 | |
| Other Assets in Excess | | | | | | | | |
| of Liabilities – 0.0% (c) | | | | | | | 766 | |
| TOTAL NET | | | | | | | | |
| ASSETS – 100.0% | | | | | | $ | 2,612,073 | |
| (a) | | Non-income producing security. |
| (b) | | The rate shown is as of October 31, 2018. |
| (c) | | Less than 0.05%. |
For Fund compliance purposes, the Fund’s industry classifications refer to any one or more of the industry sub-classifications used by one or more widely recognized market indexes or ratings group indexes, and/or they may be defined by Fund management. This definition does not apply for all purposes of this report, which may combine sub-classifications for reporting ease. Categories are shown as a percentage of net assets.
The accompanying notes are an integral part of these financial statements.
Pacer Benchmark Retail Real Estate SCTRSM ETF
SCHEDULE OF INVESTMENTS
October 31, 2018 (Unaudited)
| | | Shares | | | Value | |
| REAL ESTATE | | | | | | |
| INVESTMENT TRUSTS – 98.8% | | | | | | |
| | | | | | | |
| Regional Malls – 30.3% | | | | | | |
| Brookfield Property | | | | | | |
| REIT, Inc. – Class A | | | 6,234 | | | $ | 120,254 | |
| Macerich Co. | | | 2,813 | | | | 145,207 | |
| Simon Property Group, Inc. | | | 2,298 | | | | 421,729 | |
| Taubman Centers, Inc. | | | 2,271 | | | | 124,928 | |
| | | | | | | | 812,118 | |
| Shopping Centers – 39.9% | | | | | | | | |
| Brixmor Property Group, Inc. | | | 9,062 | | | | 146,804 | |
| Federal Realty | | | | | | | | |
| Investment Trust | | | 1,284 | | | | 159,280 | |
| Kimco Realty Corp. | | | 9,180 | | | | 147,706 | |
| Regency Centers Corp. | | | 4,411 | | | | 279,481 | |
| Retail Properties of | | | | | | | | |
| America, Inc. – Class A | | | 8,843 | | | | 108,504 | |
| Urban Edge Properties | | | 4,539 | | | | 93,004 | |
| Weingarten Realty Investors | | | 4,874 | | | | 137,057 | |
| | | | | | | | 1,071,836 | |
| Single Tenant – 28.6% | | | | | | | | |
| Agree Realty Corp. | | | 1,226 | | | | 70,213 | |
| National Retail | | | | | | | | |
| Properties, Inc. | | | 3,326 | | | | 155,490 | |
| Realty Income Corp. | | | 7,018 | | | | 422,975 | |
| Spirit Realty Capital, Inc. | | | 15,258 | | | | 119,318 | |
| | | | | | | | 767,996 | |
| TOTAL REAL ESTATE | | | | | | | | |
| INVESTMENT TRUSTS | | | | | | | | |
| (Cost $2,649,705) | | | | | | | 2,651,950 | |
| | | | | | | | | |
| SHORT-TERM INVESTMENTS – 1.1% | | | | | | | | |
| | | | | | | | | |
| Money Market Funds – 1.1% | | | | | | | | |
| U.S. Bank Money Market | | | | | | | | |
| Deposit Account, 2.00% (a) | | | 28,661 | | | | 28,661 | |
| TOTAL SHORT-TERM | | | | | | | | |
| INVESTMENTS | | | | | | | | |
| (Cost $28,661) | | | | | | | 28,661 | |
| Total Investments | | | | | | | | |
| (Cost $2,678,366) – 99.9% | | | | | | | 2,680,611 | |
| Other Assets in Excess | | | | | | | | |
| of Liabilities – 0.1% | | | | | | | 1,888 | |
| TOTAL NET | | | | | | | | |
| ASSETS – 100.0% | | | | | | $ | 2,682,499 | |
| (a) | | The rate shown is as of October 31, 2018. |
For Fund compliance purposes, the Fund’s industry classifications refer to any one or more of the industry sub-classifications used by one or more widely recognized market indexes or ratings group indexes, and/or they may be defined by Fund management. This definition does not apply for all purposes of this report, which may combine sub-classifications for reporting ease. Categories are shown as a percentage of net assets.
The accompanying notes are an integral part of these financial statements.
Pacer Benchmark Industrial Real Estate SCTRSM ETF
SCHEDULE OF INVESTMENTS
October 31, 2018 (Unaudited)
| | | Shares | | | Value | |
| REAL ESTATE | | | | | | |
| INVESTMENT TRUSTS – 99.9% | | | | | | |
| | | | | | | |
| Diversified – 34.5% | | | | | | |
| Duke Realty Corp. | | | 12,754 | | | $ | 351,628 | |
| Innovative Industrial | | | | | | | | |
| Properties, Inc. | | | 348 | | | | 14,265 | |
| Lexington Realty Trust | | | 11,844 | | | | 92,028 | |
| PS Business Parks, Inc. | | | 909 | | | | 118,715 | |
| WP Carey, Inc. | | | 4,195 | | | | 276,912 | |
| | | | | | | | 853,548 | |
| Storage – 18.5% | | | | | | | | |
| CubeSmart | | | 3,795 | | | | 109,979 | |
| Extra Space Storage, Inc. | | | 1,277 | | | | 115,007 | |
| Global Self Storage, Inc. | | | 180 | | | | 727 | |
| Life Storage, Inc. | | | 1,039 | | | | 97,832 | |
| National Storage | | | | | | | | |
| Affiliates Trust | | | 1,155 | | | | 30,758 | |
| Public Storage | | | 536 | | | | 110,132 | |
| | | | | | | | 464,435 | |
| Warehouse/Industrial – 46.9% | | | | | | | | |
| Americold Realty Trust | | | 1,247 | | | | 30,863 | |
| EastGroup Properties, Inc. | | | 1,211 | | | | 116,002 | |
| First Industrial Realty | | | | | | | | |
| Trust, Inc. | | | 3,621 | | | | 111,165 | |
| Industrial Logistics | | | | | | | | |
| Properties Trust | | | 1,260 | | | | 27,203 | |
| Liberty Property Trust | | | 2,689 | | | | 112,588 | |
| Monmouth Real Estate | | | | | | | | |
| Investment Corp. | | | 4,675 | | | | 69,938 | |
| Prologis, Inc. | | | 5,804 | | | | 374,184 | |
| Rexford Industrial Realty, Inc. | | | 3,567 | | | | 112,967 | |
| STAG Industrial, Inc. | | | 4,017 | | | | 106,290 | |
| Terreno Realty Corp. | | | 2,666 | | | | 99,788 | |
| | | | | | | | 1,160,988 | |
| TOTAL REAL ESTATE | | | | | | | | |
| INVESTMENT TRUSTS | | | | | | | | |
| (Cost $2,559,201) | | | | | | | 2,478,971 | |
| | | | | | | | | |
| SHORT-TERM INVESTMENTS – 0.1% | | | | | | | | |
| | | | | | | | | |
| Money Market Funds – 0.1% | | | | | | | | |
| U.S. Bank Money Market | | | | | | | | |
| Deposit Account, 2.00% (a) | | | 3,365 | | | | 3,365 | |
| TOTAL SHORT-TERM | | | | | | | | |
| INVESTMENTS | | | | | | | | |
| (Cost $3,365) (a) | | | | | | | 3,365 | |
| Total Investments | | | | | | | | |
| (Cost $2,562,566) – | | | | | | | | |
| 100.0% | | | | | | | 2,482,336 | |
| Liabilities in Excess | | | | | | | | |
| of Other Assets – 0.0% (b) | | | | | | | (344 | ) |
| TOTAL NET | | | | | | | | |
| ASSETS – 100.0% | | | | | | $ | 2,481,992 | |
| (a) | | The rate shown is as of October 31, 2018. |
| (b) | | Less than 0.05%. |
For Fund compliance purposes, the Fund’s industry classifications refer to any one or more of the industry sub-classifications used by one or more widely recognized market indexes or ratings group indexes, and/or they may be defined by Fund management. This definition does not apply for all purposes of this report, which may combine sub-classifications for reporting ease. Categories are shown as a percentage of net assets.
The accompanying notes are an integral part of these financial statements.
Pacer Benchmark Data & Infrastructure Real Estate SCTRSM ETF
SCHEDULE OF INVESTMENTS
October 31, 2018 (Unaudited)
| | | Shares | | | Value | |
| COMMON STOCKS – 7.1% | | | | | | |
| | | | | | | |
| Computer Software – 3.9% | | | | | | |
| InterXion Holding NV (a) | | | 3,205 | | | $ | 188,678 | |
| | | | | | | | | |
| Internet Connective Services – 0.2% | | | | | | | | |
| Internap Corp. (a) | | | 888 | | | | 7,610 | |
| | | | | | | | | |
| Real Estate Oper/Develop – 0.3% | | | | | | | | |
| Landmark Infrastructure | | | | | | | | |
| Partners LP | | | 899 | | | | 12,658 | |
| | | | | | | | | |
| Telecom Services – 2.7% | | | | | | | | |
| GDS Holdings Ltd. – ADR (a) | | | 4,868 | | | | 114,252 | |
| Switch, Inc. – Class A | | | 2,030 | | | | 18,006 | |
| | | | | | | | 132,258 | |
| TOTAL COMMON STOCKS | | | | | | | | |
| (Cost $401,700) | | | | | | | 341,204 | |
| | | | | | | | | |
| REAL ESTATE | | | | | | | | |
| INVESTMENT TRUSTS – 92.4% | | | | | | | | |
| | | | | | | | | |
| Diversified – 81.6% | | | | | | | | |
| American Tower Corp. | | | 5,410 | | | | 842,932 | |
| CoreCivic, Inc. | | | 4,970 | | | | 111,626 | |
| CorEnergy Infrastructure | | | | | | | | |
| Trust, Inc. | | | 495 | | | | 17,884 | |
| CoreSite Realty Corp. | | | 729 | | | | 68,424 | |
| Crown Castle | | | | | | | | |
| International Corp. | | | 7,073 | | | | 769,118 | |
| Digital Realty Trust, Inc. | | | 1,946 | | | | 200,944 | |
| Equinix, Inc. | | | 1,850 | | | | 700,669 | |
| Gladstone Land Corp. | | | 650 | | | | 8,132 | |
| Lamar Advertising | | | | | | | | |
| Co. – Class A | | | 3,140 | | | | 230,225 | |
| Outfront Media, Inc. | | | 5,115 | | | | 90,638 | |
| PotlatchDeltic Corp. | | | 2,631 | | | | 95,374 | |
| Rayonier, Inc. | | | 4,389 | | | | 132,548 | |
| SBA Communications | | | | | | | | |
| Corp. (a) | | | 1,558 | | | | 252,661 | |
| The GEO Group, Inc. | | | 4,417 | | | | 97,660 | |
| Uniti Group, Inc. (a) | | | 7,613 | | | | 145,713 | |
| Weyerhaeuser Co. | | | 7,484 | | | | 199,299 | |
| | | | | | | | 3,963,847 | |
| Real Estate | | | | | | | | |
| Management/Service – 0.2% | | | | | | | | |
| Farmland Partners, Inc. | | | 1,454 | | | | 9,960 | |
| | | | | | | | | |
| Storage – 4.2% | | | | | | | | |
| Iron Mountain, Inc. | | | 6,704 | | | | 205,209 | |
| | | | | | | | | |
| Warehouse/Industrial – 6.4% | | | | | | | | |
| CyrusOne, Inc. | | | 3,615 | | | | 192,426 | |
| InfraREIT, Inc. (a) | | | 1,509 | | | | 31,719 | |
| QTS Realty Trust, | | | | | | | | |
| Inc. – Class A | | | 2,210 | | | | 84,687 | |
| | | | | | | | 308,832 | |
| TOTAL REAL ESTATE | | | | | | | | |
| INVESTMENT TRUSTS | | | | | | | | |
| (Cost $4,682,397) | | | | | | | 4,487,848 | |
| | | | | | | | | |
| SHORT-TERM INVESTMENTS – 0.2% | | | | | | | | |
| | | | | | | | | |
| Money Market Funds – 0.2% | | | | | | | | |
| U.S. Bank Money Market | | | | | | | | |
| Deposit Account, 2.00% (b) | | | 10,999 | | | | 10,999 | |
| TOTAL SHORT-TERM | | | | | | | | |
| INVESTMENTS | | | | | | | | |
| (Cost $10,999) | | | | | | | 10,999 | |
| Total Investments | | | | | | | | |
| (Cost $5,095,096) – 99.7% | | | | | | | 4,840,051 | |
| Other Assets in Excess | | | | | | | | |
| of Liabilities – 0.3% | | | | | | | 16,682 | |
| TOTAL NET | | | | | | | | |
| ASSETS – 100.0% | | | | | | $ | 4,856,733 | |
| ADR | | American Depositary Receipt. |
| (a) | | Non-income producing security. |
| (b) | | The rate shown is as of October 31, 2018. |
For Fund compliance purposes, the Fund’s industry classifications refer to any one or more of the industry sub-classifications used by one or more widely recognized market indexes or ratings group indexes, and/or they may be defined by Fund management. This definition does not apply for all purposes of this report, which may combine sub-classifications for reporting ease. Categories are shown as a percentage of net assets.
The accompanying notes are an integral part of these financial statements.
Pacer US Export Leaders ETF
SCHEDULE OF INVESTMENTS
October 31, 2018 (Unaudited)
| | | Shares | | | Value | |
| COMMON STOCKS – 99.0% | | | | | | |
| | | | | | | |
| Aerospace/Defense – 2.2% | | | | | | |
| Boeing Co. | | | 68 | | | $ | 24,131 | |
| MSA Safety, Inc. | | | 264 | | | | 27,572 | |
| | | | | | | | 51,703 | |
| Airlines – 1.3% | | | | | | | | |
| United Continental | | | | | | | | |
| Holdings, Inc. (a) | | | 358 | | | | 30,613 | |
| | | | | | | | | |
| Apparel – 2.8% | | | | | | | | |
| NIKE, Inc. – Class B | | | 276 | | | | 20,711 | |
| PVH Corp. | | | 165 | | | | 19,931 | |
| Skechers U.S.A, Inc. – | | | | | | | | |
| Class A (a) | | | 846 | | | | 24,170 | |
| | | | | | | | 64,812 | |
| Auto Parts & Equipment – 2.6% | | | | | | | | |
| Aptiv PLC | | | 265 | | | | 20,352 | |
| Goodyear Tire & Rubber Co. | | | 990 | | | | 20,849 | |
| Visteon Corp. (a) | | | 222 | | | | 17,547 | |
| | | | | | | | 58,748 | |
| Biotechnology – 0.9% | | | | | | | | |
| Bio-Rad Laboratories, | | | | | | | | |
| Inc. – Class A (a) | | | 74 | | | | 20,191 | |
| | | | | | | | | |
| Chemicals – 4.2% | | | | | | | | |
| Air Products & | | | | | | | | |
| Chemicals, Inc. | | | 148 | | | | 22,844 | |
| Eastman Chemical Co. | | | 236 | | | | 18,490 | |
| International Flavors | | | | | | | | |
| & Fragrances, Inc. | | | 198 | | | | 28,643 | |
| Linde Plc | | | 156 | | | | 25,813 | |
| | | | | | | | 95,790 | |
| Commercial Services – 2.7% | | | | | | | | |
| ManpowerGroup, Inc. | | | 261 | | | | 19,912 | |
| Sabre Corp. | | | 881 | | | | 21,716 | |
| Sotheby’s (a) | | | 473 | | | | 19,866 | |
| | | | | | | | 61,494 | |
| Computers – 7.1% | | | | | | | | |
| Accenture PLC – Class A | | | 154 | | | | 24,273 | |
| Apple, Inc. | | | 103 | | | | 22,543 | |
| DXC Technology Co. | | | 275 | | | | 20,028 | |
| Fortinet, Inc. (a) | | | 400 | | | | 32,872 | |
| Lumentum Holdings, Inc. (a) | | | 424 | | | | 23,172 | |
| NCR Corp. (a) | | | 803 | | | | 21,561 | |
| Western Digital Corp. | | | 404 | | | | 17,400 | |
| | | | | | | | 161,849 | |
| Cosmetics/Personal Care – 1.0% | | | | | | | | |
| Estee Lauder Cos., Inc. – Class A | | | 164 | | | | 22,540 | |
| | | | | | | | | |
| Electrical Components | | | | | | | | |
| & Equipment – 1.8% | | | | | | | | |
| AMETEK, Inc. | | | 330 | | | | 22,136 | |
| Littelfuse, Inc. | | | 104 | | | | 18,841 | |
| | | | | | | | 40,977 | |
| Electronics – 6.2% | | | | | | | | |
| Coherent, Inc. (a) | | | 139 | | | | 17,117 | |
| Gentex Corp. | | | 1,028 | | | | 21,639 | |
| Mettler-Toledo | | | | | | | | |
| International, Inc. (a) | | | 42 | | | | 22,966 | |
| National Instruments Corp. | | | 580 | | | | 28,403 | |
| PerkinElmer, Inc. | | | 320 | | | | 27,674 | |
| Waters Corp. (a) | | | 122 | | | | 23,142 | |
| | | | | | | | 140,941 | |
| Engineering & Construction – 1.1% | | | | | | | | |
| KBR, Inc. | | | 1,338 | | | | 26,466 | |
| | | | | | | | | |
| Food – 1.0% | | | | | | | | |
| Mondelez International, | | | | | | | | |
| Inc. – Class A | | | 526 | | | | 22,081 | |
| | | | | | | | | |
| Healthcare-Products – 5.5% | | | | | | | | |
| DENTSPLY SIRONA, Inc. | | | 662 | | | | 22,925 | |
| LivaNova PLC (a) | | | 185 | | | | 20,718 | |
| The Cooper Cos., Inc. | | | 108 | | | | 27,898 | |
| Thermo Fisher Scientific, Inc. | | | 116 | | | | 27,103 | |
| West Pharmaceutical | | | | | | | | |
| Services, Inc. | | | 258 | | | | 27,327 | |
| | | | | | | | 125,971 | |
| Healthcare-Services – 5.4% | | | | | | | | |
| Acadia Healthcare Co., Inc. (a) | | | 641 | | | | 26,602 | |
| Catalent, Inc. (a) | | | 536 | | | | 21,622 | |
| Charles River Laboratories | | | | | | | | |
| International, Inc. (a) | | | 192 | | | | 23,389 | |
| IQVIA Holdings, Inc. (a) | | | 240 | | | | 29,503 | |
| Syneos Health, Inc. (a) | | | 473 | | | | 21,583 | |
| | | | | | | | 122,699 | |
| Internet – 4.0% | | | | | | | | |
| Alphabet, Inc. – Class A (a) | | | 20 | | | | 21,812 | |
| Booking Holdings, Inc. (a) | | | 12 | | | | 22,495 | |
| F5 Networks, Inc. (a) | | | 142 | | | | 24,890 | |
| Facebook, Inc. – Class A (a) | | | 142 | | | | 21,554 | |
| | | | | | | | 90,751 | |
| Leisure Time – 2.8% | | | | | | | | |
| Carnival Corp. | | | 412 | | | | 23,088 | |
| Norwegian Cruise Line | | | | | | | | |
| Holdings Ltd. (a) | | | 458 | | | | 20,184 | |
| Royal Caribbean Cruises Ltd. | | | 197 | | | | 20,632 | |
| | | | | | | | 63,904 | |
The accompanying notes are an integral part of these financial statements.
Pacer US Export Leaders ETF
SCHEDULE OF INVESTMENTS
October 31, 2018 (Unaudited) (Continued)
| | | Shares | | | Value | |
| COMMON STOCKS – 99.0% (Continued) | | | | | | |
| | | | | | | |
| Machinery-Diversified – 3.8% | | | | | | |
| Cognex Corp. | | | 456 | | | $ | 19,535 | |
| Graco, Inc. | | | 522 | | | | 21,209 | |
| Nordson Corp. | | | 188 | | | | 23,062 | |
| Xylem, Inc. | | | 342 | | | | 22,428 | |
| | | | | | | | 86,234 | |
| Media – 2.7% | | | | | | | | |
| Discovery, Inc. – Class A (a) | | | 1,088 | | | | 35,240 | |
| News Corp. – Class A | | | 2,051 | | | | 27,053 | |
| | | | | | | | 62,293 | |
| Mining – 3.0% | | | | | | | | |
| Freeport-McMoRan, Inc. | | | 1,682 | | | | 19,595 | |
| Newmont Mining Corp. | | | 758 | | | | 23,438 | |
| Royal Gold, Inc. | | | 345 | | | | 26,437 | |
| | | | | | | | 69,470 | |
| Miscellaneous Manufacturing – 0.9% | | | | | | | | |
| ITT, Inc. | | | 391 | | | | 19,746 | |
| | | | | | | | | |
| Office/Business Equipment – 1.1% | | | | | | | | |
| Zebra Technologies | | | | | | | | |
| Corp. – Class A (a) | | | 156 | | | | 25,943 | |
| | | | | | | | | |
| Oil & Gas – 3.2% | | | | | | | | |
| Apache Corp. | | | 559 | | | | 21,147 | |
| Chevron Corp. | | | 221 | | | | 24,674 | |
| Murphy Oil Corp. | | | 844 | | | | 26,890 | |
| | | | | | | | 72,711 | |
| Oil & Gas Services – 0.4% | | | | | | | | |
| McDermott | | | | | | | | |
| International, Inc. (a) | | | 1,252 | | | | 9,678 | |
| | | | | | | | | |
| Packaging & Containers – 1.3% | | | | | | | | |
| Ball Corp. | | | 666 | | | | 29,837 | |
| | | | | | | | | |
| Pharmaceuticals – 3.2% | | | | | | | | |
| Johnson & Johnson | | | 202 | | | | 28,278 | |
| Mylan NV (a) | | | 614 | | | | 19,188 | |
| Zoetis, Inc. | | | 288 | | | | 25,963 | |
| | | | | | | | 73,429 | |
| Retail – 0.9% | | | | | | | | |
| Tiffany & Co. | | | 179 | | | | 19,923 | |
| | | | | | | | | |
| Semiconductors – 21.2% | | | | | | | | |
| Advanced Micro | | | | | | | | |
| Devices, Inc. (a) | | | 1,644 | | | | 29,937 | |
| Analog Devices, Inc. | | | 249 | | | | 20,844 | |
| Applied Materials, Inc. | | | 589 | | | | 19,366 | |
| Broadcom, Inc. | | | 107 | | | | 23,913 | |
| Cirrus Logic, Inc. (a) | | | 580 | | | | 21,715 | |
| Cypress Semiconductor Corp. | | | 1,632 | | | | 21,118 | |
| Integrated Device | | | | | | | | |
| Technology, Inc. (a) | | | 736 | | | | 34,452 | |
| Intel Corp. | | | 556 | | | | 26,065 | |
| IPG Photonics Corp. (a) | | | 159 | | | | 21,235 | |
| KLA-Tencor Corp. | | | 220 | | | | 20,139 | |
| Lam Research Corp. | | | 150 | | | | 21,260 | |
| Microchip Technology, Inc. | | | 245 | | | | 16,116 | |
| Micron Technology, Inc. (a) | | | 520 | | | | 19,614 | |
| MKS Instruments, Inc. | | | 305 | | | | 22,475 | |
| Monolithic Power | | | | | | | | |
| Systems, Inc. | | | 167 | | | | 19,726 | |
| NVIDIA Corp. | | | 96 | | | | 20,240 | |
| Qorvo, Inc. (a) | | | 304 | | | | 22,347 | |
| Silicon Laboratories, Inc. (a) | | | 243 | | | | 19,812 | |
| Skyworks Solutions, Inc. | | | 292 | | | | 25,334 | |
| Synaptics, Inc. (a) | | | 501 | | | | 18,808 | |
| Teradyne, Inc. | | | 613 | | | | 21,118 | |
| Texas Instruments, Inc. | | | 219 | | | | 20,330 | |
| | | | | | | | 485,964 | |
| Software – 3.8% | | | | | | | | |
| Adobe Systems, Inc. (a) | | | 100 | | | | 24,576 | |
| ANSYS, Inc. (a) | | | 134 | | | | 20,039 | |
| Cadence Design | | | | | | | | |
| System, Inc. (a) | | | 568 | | | | 25,316 | |
| Electronic Arts, Inc. (a) | | | 202 | | | | 18,378 | |
| | | | | | | | 88,309 | |
| Transportation – 0.9% | | | | | | | | |
| Expeditors International | | | | | | | | |
| of Washington, Inc. | | | 305 | | | | 20,490 | |
| TOTAL COMMON STOCKS | | | | | | | | |
| (Cost $2,469,180) | | | | | | | 2,265,557 | |
| | | | | | | | | |
| REAL ESTATE | | | | | | | | |
| INVESTMENT TRUSTS – 0.9% | | | | | | | | |
| Rayonier, Inc. | | | 666 | | | | 20,113 | |
| TOTAL REAL ESTATE | | | | | | | | |
| INVESTMENT TRUSTS | | | | | | | | |
| (Cost $22,611) | | | | | | | 20,113 | |
The accompanying notes are an integral part of these financial statements.
Pacer US Export Leaders ETF
SCHEDULE OF INVESTMENTS
October 31, 2018 (Unaudited) (Continued)
| | | Shares | | | Value | |
| SHORT-TERM INVESTMENTS – 0.1% | | | | | | |
| | | | | | | |
| Money Market Funds – 0.1% | | | | | | |
| U.S. Bank Money Market | | | | | | |
| Deposit Account, 2.00% (b) | | | 2,334 | | | $ | 2,334 | |
| TOTAL SHORT-TERM | | | | | | | | |
| INVESTMENTS | | | | | | | | |
| (Cost $2,334) | | | | | | | 2,334 | |
| Total Investments | | | | | | | | |
(Cost $2,494,125) – 100.0% | | | | | | | | |
| | | | | | | 2,288,004 | |
| Liabilities in Excess | | | | | | | | |
| of Other Assets – 0.0% (c) | | | | | | | (53 | ) |
| TOTAL NET | | | | | | | | |
| ASSETS – 100.0% | | | | | | $ | 2,287,951 | |
| (a) | | Non-income producing security. |
| (b) | | The rate shown is as of October 31, 2018. |
| (c) | | Less than 0.05%. |
For Fund compliance purposes, the Fund’s industry classifications refer to any one or more of the industry sub-classifications used by one or more widely recognized market indexes or ratings group indexes, and/or they may be defined by Fund management. This definition does not apply for all purposes of this report, which may combine sub-classifications for reporting ease. Categories are shown as a percentage of net assets.
The accompanying notes are an integral part of these financial statements.
Pacer CFRA-Stovall Equal Weight Seasonal Rotation ETF
SCHEDULE OF INVESTMENTS
October 31, 2018 (Unaudited)
| | | Shares | | | Value | |
| COMMON STOCKS – 99.8% | | | | | | |
| | | | | | | |
| Aerospace/Defense – 3.9% | | | | | | |
| Arconic, Inc. | | | 444 | | | $ | 9,027 | |
| Boeing Co. | | | 28 | | | | 9,936 | |
| General Dynamics Corp. | | | 50 | | | | 8,629 | |
| Harris Corp. | | | 61 | | | | 9,071 | |
| L3 Technologies, Inc. | | | 47 | | | | 8,905 | |
| Lockheed Martin Corp. | | | 30 | | | | 8,816 | |
| Northrop Grumman Corp. | | | 33 | | | | 8,644 | |
| Raytheon Co. | | | 50 | | | | 8,752 | |
| Rockwell Collins, Inc. | | | 71 | | | | 9,089 | |
| TransDigm Group, Inc. (a) | | | 27 | | | | 8,917 | |
| United Technologies Corp. | | | 73 | | | | 9,067 | |
| | | | | | | | 98,853 | |
| Airlines – 1.8% | | | | | | | | |
| Alaska Air Group, Inc. | | | 146 | | | | 8,967 | |
| American Airlines Group, Inc. | | | 253 | | | | 8,875 | |
| Delta Air Lines, Inc. | | | 174 | | | | 9,523 | |
| Southwest Airlines Co. | | | 161 | | | | 7,905 | |
| United Continental | | | | | | | | |
| Holdings, Inc. (a) | | | 111 | | | | 9,492 | |
| | | | | | | | 44,762 | |
| Apparel – 2.7% | | | | | | | | |
| Hanesbrands, Inc. | | | 595 | | | | 10,210 | |
| Michael Kors Holdings Ltd. (a) | | | 144 | | | | 7,979 | |
| NIKE, Inc. – Class B | | | 126 | | | | 9,455 | |
| PVH Corp. | | | 75 | | | | 9,059 | |
| Ralph Lauren Corp. – Class A | | | 80 | | | | 10,369 | |
| Under Armour, | | | | | | | | |
| Inc. – Class A (a) | | | 285 | | | | 6,302 | |
| Under Armour, | | | | | | | | |
| Inc. – Class C (a) | | | 289 | | | | 5,731 | |
| VF Corp. | | | 116 | | | | 9,614 | |
| | | | | | | | 68,719 | |
| Auto Manufacturers – 1.2% | | | | | | | | |
| Ford Motor Co. | | | 1,115 | | | | 10,648 | |
| General Motors Co. | | | 304 | | | | 11,124 | |
| PACCAR, Inc. | | | 143 | | | | 8,181 | |
| | | | | | | | 29,953 | |
| Auto Parts & Equipment – 1.1% | | | | | | | | |
| Aptiv PLC | | | 121 | | | | 9,293 | |
| BorgWarner, Inc. | | | 235 | | | | 9,261 | |
| Goodyear Tire & Rubber Co. | | | 446 | | | | 9,393 | |
| | | | | | | | 27,947 | |
| Building Materials – 3.0% | | | | | | | | |
| Fortune Brands Home | | | | | | | | |
| & Security, Inc. | | | 182 | | | | 8,159 | |
| Johnson Controls | | | | | | | | |
| International Plc | | | 265 | | | | 8,472 | |
| Martin Marietta | | | | | | | | |
| Materials, Inc. | | | 150 | | | | 25,692 | |
| Masco Corp. | | | 264 | | | | 7,920 | |
| Vulcan Materials Co. | | | 251 | | | | 25,386 | |
| | | | | | | | 75,629 | |
| Chemicals – 12.8% | | | | | | | | |
| Air Products & | | | | | | | | |
| Chemicals, Inc. | | | 172 | | | | 26,548 | |
| Albemarle Corp. | | | 288 | | | | 28,575 | |
| CF Industries Holdings, Inc. | | | 563 | | | | 27,041 | |
| DowDuPont, Inc. | | | 423 | | | | 22,808 | |
| Eastman Chemical Co. | | | 298 | | | | 23,348 | |
| FMC Corp. | | | 340 | | | | 26,547 | |
| International Flavors | | | | | | | | |
| & Fragrances, Inc. | | | 213 | | | | 30,813 | |
| Linde Plc | | | 185 | | | | 30,612 | |
| LyondellBasell | | | | | | | | |
| Industries NV – Class A | | | 276 | | | | 24,639 | |
| Mosaic Co. | | | 943 | | | | 29,177 | |
| PPG Industries, Inc. | | | 259 | | | | 27,218 | |
| Sherwin-Williams Co. | | | 59 | | | | 23,215 | |
| | | | | | | | 320,541 | |
| Commercial Services – 7.5% | | | | | | | | |
| Automatic Data | | | | | | | | |
| Processing, Inc. | | | 71 | | | | 10,230 | |
| Cintas Corp. | | | 47 | | | | 8,548 | |
| Ecolab, Inc. | | | 185 | | | | 28,333 | |
| Equifax, Inc. | | | 74 | | | | 7,506 | |
| FleetCor Technologies, Inc. (a) | | | 48 | | | | 9,601 | |
| Gartner, Inc. (a) | | | 67 | | | | 9,884 | |
| Global Payments, Inc. | | | 82 | | | | 9,367 | |
| H&R Block, Inc. | | | 421 | | | | 11,173 | |
| IHS Markit Ltd. (a) | | | 183 | | | | 9,613 | |
| Nielsen Holdings PLC | | | 368 | | | | 9,561 | |
| PayPal Holdings, Inc. (a) | | | 116 | | | | 9,766 | |
| Quanta Services, Inc. (a) | | | 291 | | | | 9,079 | |
| Robert Half International, Inc. | | | 140 | | | | 8,474 | |
| Rollins, Inc. | | | 163 | | | | 9,650 | |
| Total System Services, Inc. | | | 106 | | | | 9,662 | |
| United Rentals, Inc. (a) | | | 60 | | | | 7,204 | |
| Verisk Analytics, Inc. (a) | | | 83 | | | | 9,947 | |
| Western Union Co. | | | 561 | | | | 10,120 | |
| | | | | | | | 187,718 | |
| Computers – 4.1% | | | | | | | | |
| Accenture PLC – Class A | | | 61 | | | | 9,615 | |
| Apple, Inc. | | | 47 | | | | 10,286 | |
The accompanying notes are an integral part of these financial statements.
Pacer CFRA-Stovall Equal Weight Seasonal Rotation ETF
SCHEDULE OF INVESTMENTS
October 31, 2018 (Unaudited) (Continued)
| | | Shares | | | Value | |
| COMMON STOCKS – 99.8% (Continued) | | | | | | |
| | | | | | | |
| Computers – 4.1% (Continued) | | | | | | |
| Cognizant Technology | | | | | | |
| Solutions Corp. – Class A | | | 138 | | | $ | 9,526 | |
| DXC Technology Co. | | | 114 | | | | 8,303 | |
| Fortinet, Inc. (a) | | | 133 | | | | 10,930 | |
| Hewlett Packard | | | | | | | | |
| Enterprise Co. | | | 634 | | | | 9,668 | |
| HP, Inc. | | | 420 | | | | 10,139 | |
| International Business | | | | | | | | |
| Machines Corp. | | | 71 | | | | 8,196 | |
| NetApp, Inc. | | | 123 | | | | 9,654 | |
| Seagate Technology PLC | | | 218 | | | | 8,770 | |
| Western Digital Corp. | | | 185 | | | | 7,968 | |
| | | | | | | | 103,055 | |
| Distribution/Wholesale – 1.3% | | | | | | | | |
| Copart, Inc. (a) | | | 155 | | | | 7,581 | |
| Fastenal Co. | | | 174 | | | | 8,945 | |
| LKQ Corp. (a) | | | 321 | | | | 8,754 | |
| WW Grainger, Inc. | | | 28 | | | | 7,951 | |
| | | | | | | | 33,231 | |
| Diversified Financial Services – 1.1% | | | | | | | | |
| Alliance Data Systems Corp. | | | 44 | | | | 9,072 | |
| MasterCard, Inc. – Class A | | | 48 | | | | 9,488 | |
| Visa, Inc. – Class A | | | 71 | | | | 9,787 | |
| | | | | | | | 28,347 | |
| Electrical Components | | | | | | | | |
| & Equipment – 0.7% | | | | | | | | |
| AMETEK, Inc. | | | 125 | | | | 8,385 | |
| Emerson Electric Co. | | | 130 | | | | 8,824 | |
| | | | | | | | 17,209 | |
| Electronics – 2.9% | | | | | | | | |
| Allegion PLC | | | 115 | | | | 9,859 | |
| Amphenol Corp. – Class A | | | 109 | | | | 9,756 | |
| Corning, Inc. | | | 298 | | | | 9,521 | |
| FLIR Systems, Inc. | | | 167 | | | | 7,734 | |
| Fortive Corp. | | | 116 | | | | 8,613 | |
| Garmin Ltd. | | | 153 | | | | 10,122 | |
| Honeywell International, Inc. | | | 64 | | | | 9,269 | |
| TE Connectivity Ltd. | | | 115 | | | | 8,673 | |
| | | | | | | | 73,547 | |
| Engineering & Construction – 0.7% | | | | | | | | |
| Fluor Corp. | | | 174 | | | | 7,632 | |
| Jacobs Engineering | | | | | | | | |
| Group, Inc. | | | 133 | | | | 9,987 | |
| | | | | | | | 17,619 | |
| Environmental Control – 1.5% | | | | | | | | |
| Pentair PLC | | | 229 | | | | 9,195 | |
| Republic Services, Inc. | | | 134 | | | | 9,739 | |
| Stericycle, Inc. (a) | | | 163 | | | | 8,145 | |
| Waste Management, Inc. | | | 109 | | | | 9,752 | |
| | | | | | | | 36,831 | |
| Forest Products & Paper – 1.0% | | | | | | | | |
| International Paper Co. | | | 545 | | | | 24,721 | |
| | | | | | | | | |
| Hand/Machine Tools – 0.7% | | | | | | | | |
| Snap-On, Inc. | | | 54 | | | | 8,313 | |
| Stanley Black & Decker, Inc. | | | 68 | | | | 7,923 | |
| | | | | | | | 16,236 | |
| Home Builders – 1.1% | | | | | | | | |
| DR Horton, Inc. | | | 245 | | | | 8,810 | |
| Lennar Corp. – Class A | | | 201 | | | | 8,639 | |
| PulteGroup, Inc. | | | 390 | | | | 9,582 | |
| | | | | | | | 27,031 | |
| Home Furnishings – 0.7% | | | | | | | | |
| Leggett & Platt, Inc. | | | 227 | | | | 8,242 | |
| Whirlpool Corp. | | | 85 | | | | 9,330 | |
| | | | | | | | 17,572 | |
| Household Products/Wares – 1.0% | | | | | | | | |
| Avery Dennison Corp. | | | 266 | | | | 24,132 | |
| | | | | | | | | |
| Housewares – 0.3% | | | | | | | | |
| Newell Brands, Inc. | | | 485 | | | | 7,702 | |
| | | | | | | | | |
| Internet – 2.6% | | | | | | | | |
| Amazon.com, Inc. (a) | | | 5 | | | | 7,990 | |
| Booking Holdings, Inc. (a) | | | 5 | | | | 9,373 | |
| eBay, Inc. (a) | | | 309 | | | | 8,970 | |
| Expedia Group, Inc. | | | 81 | | | | 10,160 | |
| F5 Networks, Inc. (a) | | | 54 | | | | 9,465 | |
| Symantec Corp. | | | 525 | | | | 9,529 | |
| VeriSign, Inc. (a) | | | 64 | | | | 9,123 | |
| | | | | | | | 64,610 | |
| Iron/Steel – 1.1% | | | | | | | | |
| Nucor Corp. | | | 464 | | | | 27,432 | |
| | | | | | | | | |
| Leisure Time – 1.4% | | | | | | | | |
| Carnival Corp. | | | 165 | | | | 9,247 | |
| Harley-Davidson, Inc. | | | 238 | | | | 9,096 | |
| Norwegian Cruise Line | | | | | | | | |
| Holdings Ltd. (a) | | | 190 | | | | 8,373 | |
| Royal Caribbean Cruises Ltd. | | | 81 | | | | 8,483 | |
| | | | | | | | 35,199 | |
The accompanying notes are an integral part of these financial statements.
Pacer CFRA-Stovall Equal Weight Seasonal Rotation ETF
SCHEDULE OF INVESTMENTS
October 31, 2018 (Unaudited) (Continued)
| | | Shares | | | Value | |
| COMMON STOCKS – 99.8% (Continued) | | | | | | |
| | | | | | | |
| Lodging – 1.5% | | | | | | |
| Hilton Worldwide | | | | | | |
| Holdings, Inc. | | | 132 | | | $ | 9,394 | |
| Marriott International, | | | | | | | | |
| Inc. – Class A | | | 81 | | | | 9,468 | |
| MGM Resorts International | | | 381 | | | | 10,165 | |
| Wynn Resorts Ltd. | | | 78 | | | | 7,847 | |
| | | | | | | | 36,874 | |
| Machinery-Construction | | | | | | | | |
| & Mining – 0.3% | | | | | | | | |
| Caterpillar, Inc. | | | 70 | | | | 8,492 | |
| | | | | | | | | |
| Machinery-Diversified – 2.5% | | | | | | | | |
| Cummins, Inc. | | | 70 | | | | 9,568 | |
| Deere & Co. | | | 68 | | | | 9,210 | |
| Dover Corp. | | | 114 | | | | 9,444 | |
| Flowserve Corp. | | | 181 | | | | 8,308 | |
| Rockwell Automation, Inc. | | | 53 | | | | 8,730 | |
| Roper Technologies, Inc. | | | 32 | | | | 9,053 | |
| Xylem, Inc. | | | 124 | | | | 8,132 | |
| | | | | | | | 62,445 | |
| Mining – 2.2% | | | | | | | | |
| Freeport-McMoRan, Inc. | | | 2,120 | | | | 24,698 | |
| Newmont Mining Corp. | | | 955 | | | | 29,529 | |
| | | | | | | | 54,227 | |
| Miscellaneous Manufacturing – 2.7% | | | | | | | | |
| 3M Co. | | | 48 | | | | 9,133 | |
| AO Smith Corp. | | | 170 | | | | 7,740 | |
| Eaton Corp. PLC | | | 116 | | | | 8,314 | |
| General Electric Co. | | | 794 | | | | 8,019 | |
| Illinois Tool Works, Inc. | | | 70 | | | | 8,930 | |
| Ingersoll-Rand PLC | | | 97 | | | | 9,306 | |
| Parker-Hannifin Corp. | | | 54 | | | | 8,188 | |
| Textron, Inc. | | | 143 | | | | 7,669 | |
| | | | | | | | 67,299 | |
| Office/Business Equipment – 0.4% | | | | | | | | |
| Xerox Corp. | | | 375 | | | | 10,451 | |
| | | | | | | | | |
| Packaging & Containers – 3.8% | | | | | | | | |
| Ball Corp. | | | 657 | | | | 29,434 | |
| Packaging Corp. of America | | | 254 | | | | 23,320 | |
| Sealed Air Corp. | | | 667 | | | | 21,584 | |
| WestRock Co. | | | 497 | | | | 21,356 | |
| | | | | | | | 95,694 | |
| Retail – 11.4% | | | | | | | | |
| Advance Auto Parts, Inc. | | | 64 | | | | 10,225 | |
| AutoZone, Inc. (a) | | | 14 | | | | 10,269 | |
| Best Buy Co., Inc. | | | 134 | | | | 9,401 | |
| CarMax, Inc. (a) | | | 131 | | | | 8,896 | |
| Chipotle Mexican | | | | | | | | |
| Grill, Inc. (a) | | | 21 | | | | 9,667 | |
| Darden Restaurants, Inc. | | | 88 | | | | 9,376 | |
| Dollar General Corp. | | | 97 | | | | 10,804 | |
| Dollar Tree, Inc. (a) | | | 125 | | | | 10,537 | |
| Foot Locker, Inc. | | | 226 | | | | 10,654 | |
| Gap, Inc. | | | 379 | | | | 10,347 | |
| Genuine Parts Co. | | | 103 | | | | 10,086 | |
| Home Depot, Inc. | | | 50 | | | | 8,794 | |
| Kohl’s Corp. | | | 130 | | | | 9,845 | |
| L Brands, Inc. | | | 364 | | | | 11,801 | |
| Lowe’s Cos., Inc. | | | 92 | | | | 8,760 | |
| Macy’s, Inc. | | | 290 | | | | 9,944 | |
| McDonald’s Corp. | | | 65 | | | | 11,498 | |
| Nordstrom, Inc. | | | 161 | | | | 10,589 | |
| O’Reilly Automotive, Inc. (a) | | | 31 | | | | 9,943 | |
| Ross Stores, Inc. | | | 109 | | | | 10,791 | |
| Starbucks Corp. | | | 192 | | | | 11,188 | |
| Tapestry, Inc. | | | 211 | | | | 8,927 | |
| Target Corp. | | | 120 | | | | 10,036 | |
| Tiffany & Co. | | | 82 | | | | 9,127 | |
| TJX Cos., Inc. | | | 97 | | | | 10,658 | |
| Tractor Supply Co. | | | 121 | | | | 11,119 | |
| Ulta Salon Cosmetics | | | | | | | | |
| & Fragrance, Inc. (a) | | | 38 | | | | 10,432 | |
| Yum! Brands, Inc. | | | 120 | | | | 10,849 | |
| | | | | | | | 284,563 | |
| Semiconductors – 5.9% | | | | | | | | |
| Advanced Micro | | | | | | | | |
| Devices, Inc. (a) | | | 321 | | | | 5,845 | |
| Analog Devices, Inc. | | | 114 | | | | 9,543 | |
| Applied Materials, Inc. | | | 269 | | | | 8,845 | |
| Broadcom, Inc. | | | 44 | | | | 9,834 | |
| Intel Corp. | | | 231 | | | | 10,829 | |
| IPG Photonics Corp. (a) | | | 66 | | | | 8,814 | |
| KLA-Tencor Corp. | | | 101 | | | | 9,246 | |
| Lam Research Corp. | | | 69 | | | | 9,779 | |
| Microchip Technology, Inc. | | | 126 | | | | 8,288 | |
| Micron Technology, Inc. (a) | | | 237 | | | | 8,940 | |
| NVIDIA Corp. | | | 38 | | | | 8,012 | |
| Qorvo, Inc. (a) | | | 139 | | | | 10,218 | |
| QUALCOMM, Inc. | | | 140 | | | | 8,805 | |
| Skyworks Solutions, Inc. | | | 120 | | | | 10,411 | |
| Texas Instruments, Inc. | | | 100 | | | | 9,283 | |
| Xilinx, Inc. | | | 136 | | | | 11,610 | |
| | | | | | | | 148,302 | |
The accompanying notes are an integral part of these financial statements.
Pacer CFRA-Stovall Equal Weight Seasonal Rotation ETF
SCHEDULE OF INVESTMENTS
October 31, 2018 (Unaudited) (Continued)
| | | Shares | | | Value | |
| COMMON STOCKS – 99.8% (Continued) | | | | | | |
| | | | | | | |
| Shipbuilding – 0.4% | | | | | | |
| Huntington Ingalls | | | | | | |
| Industries, Inc. | | | 40 | | | $ | 8,739 | |
| | | | | | | | | |
| Software – 6.6% | | | | | | | | |
| Adobe Systems, Inc. (a) | | | 38 | | | | 9,339 | |
| Akamai Technologies, Inc. (a) | | | 139 | | | | 10,043 | |
| ANSYS, Inc. (a) | | | 55 | | | | 8,225 | |
| Autodesk, Inc. (a) | | | 69 | | | | 8,918 | |
| Broadridge Financial | | | | | | | | |
| Solutions, Inc. | | | 76 | | | | 8,888 | |
| CA, Inc. | | | 239 | | | | 10,602 | |
| Cadence Design | | | | | | | | |
| System, Inc. (a) | | | 227 | | | | 10,117 | |
| Citrix Systems, Inc. (a) | | | 94 | | | | 9,632 | |
| Fidelity National | | | | | | | | |
| Information Services, Inc. | | | 95 | | | | 9,890 | |
| Fiserv, Inc. (a) | | | 129 | | | | 10,230 | |
| Intuit, Inc. | | | 46 | | | | 9,706 | |
| Microsoft Corp. | | | 93 | | | | 9,933 | |
| Oracle Corp. | | | 214 | | | | 10,452 | |
| Paychex, Inc. | | | 141 | | | | 9,234 | |
| Red Hat, Inc. (a) | | | 71 | | | | 12,186 | |
| Salesforce.com, Inc. (a) | | | 67 | | | | 9,195 | |
| Synopsys, Inc. (a) | | | 102 | | | | 9,132 | |
| | | | | | | | 165,722 | |
| Telecommunications – 1.6% | | | | | | | | |
| Arista Networks, Inc. (a) | | | 39 | | | | 8,984 | |
| Cisco Systems, Inc. | | | 222 | | | | 10,156 | |
| Juniper Networks, Inc. | | | 377 | | | | 11,035 | |
| Motorola Solutions, Inc. | | | 83 | | | | 10,172 | |
| | | | | | | | 40,347 | |
| Textiles – 0.3% | | | | | | | | |
| Mohawk Industries, Inc. (a) | | | 56 | | | | 6,985 | |
| | | | | | | | | |
| Toys/Games/Hobbies – 0.7% | | | | | | | | |
| Hasbro, Inc. | | | 100 | | | | 9,171 | |
| Mattel, Inc. (a) | | | 644 | | | | 8,746 | |
| | | | | | | | 17,917 | |
| Transportation – 3.3% | | | | | | | | |
| CH Robinson | | | | | | | | |
| Worldwide, Inc. | | | 101 | | | | 8,992 | |
| CSX Corp. | | | 137 | | | | 9,434 | |
| Expeditors International | | | | | | | | |
| of Washington, Inc. | | | 134 | | | | 9,002 | |
| FedEx Corp. | | | 39 | | | | 8,593 | |
| JB Hunt Transport | | | | | | | | |
| Services, Inc. | | | 81 | | | | 8,959 | |
| Kansas City Southern | | | 86 | | | | 8,769 | |
| Norfolk Southern Corp. | | | 56 | | | | 9,399 | |
| Union Pacific Corp. | | | 64 | | | | 9,358 | |
| United Parcel Service, | | | | | | | | |
| Inc. – Class B | | | 84 | | | | 8,949 | |
| | | | | | | | 81,455 | |
| TOTAL COMMON STOCKS | | | | | | | | |
| (Cost $2,498,961) | | | | | | | 2,498,108 | |
| | | | | | | | | |
| SHORT-TERM INVESTMENTS – 1.0% | | | | | | | | |
| | | | | | | | | |
| Money Market Funds – 1.0% | | | | | | | | |
| U.S. Bank Money Market | | | | | | | | |
| Deposit Account, 2.00% (b) | | | 26,131 | | | | 26,131 | |
| TOTAL SHORT-TERM | | | | | | | | |
| INVESTMENTS | | | | | | | | |
| (Cost $26,131) | | | | | | | 26,131 | |
| Total Investments | | | | | | | | |
| (Cost $2,525,092) – | | | | | | | | |
| 100.8% | | | | | | | 2,524,239 | |
| Liabilities in Excess | | | | | | | | |
| of Other Assets – (0.8)% | | | | | | | (19,630 | ) |
| TOTAL NET | | | | | | | | |
| ASSETS – 100.0% | | | | | | $ | 2,504,609 | |
| (a) | | Non-income producing security. |
| (b) | | The rate shown is as of October 31, 2018. |
For Fund compliance purposes, the Fund’s industry classifications refer to any one or more of the industry sub-classifications used by one or more widely recognized market indexes or ratings group indexes, and/or they may be defined by Fund management. This definition does not apply for all purposes of this report, which may combine sub-classifications for reporting ease. Categories are shown as a percentage of net assets.
The accompanying notes are an integral part of these financial statements.
Pacer Funds
STATEMENTS OF ASSETS & LIABILITIES
October 31, 2018 (Unaudited)
| | | Pacer | | | Pacer | | | | | | Pacer | | | Pacer | |
| | | Trendpilot® | | | Trendpilot® | | | Pacer | | | Trendpilot® | | | Global | |
| | | US Large | | | US Mid | | | Trendpilot® | | | European | | | Cash Cows | |
| | | Cap ETF | | | Cap ETF | | | 100 ETF | | | Index ETF | | | Dividend ETF | |
| ASSETS | | | | | | | | | | | | | | | |
| Investments in Securities, at Value*^ | | $ | 27,801,290 | | | $ | 823,002,532 | | | $ | 181,432,926 | | | $ | 206,635,842 | | | $ | 227,114,105 | |
| Cash | | | 7,992 | | | | 51,364 | | | | — | | | | — | | | | — | |
| Foreign Currency at Value* | | | — | | | | — | | | | — | | | | — | | | | 622 | |
| Interest and Dividends Receivable | | | 1,102,451 | | | | 236,325 | | | | 46,896 | | | | 319,668 | | | | 667,673 | |
| Receivable for Investment Securities Sold | | | 1,318,723,615 | | | | — | | | | 186,885,116 | | | | 674 | | | | — | |
| Receivable for Fund Shares Sold | | | 2,897,280 | | | | 3,102,250 | | | | 24,163,350 | | | | — | | | | — | |
| Securities Lending Income Receivable | | | 7,987 | | | | 15,701 | | | | 2,801 | | | | 1,982 | | | | 22,054 | |
| Total Assets | | | 1,350,540,615 | | | | 826,408,172 | | | | 392,531,089 | | | | 206,958,166 | | | | 227,804,454 | |
| | | | | | | | | | | | | | | | | | | | | |
| LIABILITIES | | | | | | | | | | | | | | | | | | | | |
| Management Fees Payable | | | 667,431 | | | | 322,538 | | | | 178,758 | | | | 90,182 | | | | 98,766 | |
| Payable for Fund Shares Redeemed | | | — | | | | — | | | | 24,720,900 | | | | — | | | | — | |
| Payable for Investment Securities Purchased | | | 2,895,882 | | | | 1,602,282 | | | | 24,191,136 | | | | — | | | | — | |
| Collateral Received for | | | | | | | | | | | | | | | | | | | | |
| Securities Loaned (See Note 5) | | | 26,157,581 | | | | 190,038,750 | | | | 18,804,517 | | | | 47,763,750 | | | | 38,789,497 | |
| Total Liabilities | | | 29,720,894 | | | | 191,963,570 | | | | 67,895,311 | | | | 47,853,932 | | | | 38,888,263 | |
| NET ASSETS | | $ | 1,320,819,721 | | | $ | 634,444,602 | | | $ | 324,635,778 | | | $ | 159,104,234 | | | $ | 188,916,191 | |
| | | | | | | | | | | | | | | | | | | | | |
| NET ASSETS CONSIST OF: | | | | | | | | | | | | | | | | | | | | |
| Paid-in Capital | | $ | 1,247,278,777 | | | $ | 613,200,274 | | | $ | 297,630,300 | | | $ | 192,097,603 | | | $ | 199,674,983 | |
| Total Distributable Earnings/ | | | | | | | | | | | | | | | | | | | | |
| (Accumulated Deficit) | | | 73,540,944 | | | | 21,244,328 | | | | 27,005,478 | | | | (32,993,369 | ) | | | (10,758,792 | ) |
| Net Assets | | $ | 1,320,819,721 | | | $ | 634,444,602 | | | $ | 324,635,778 | | | $ | 159,104,234 | | | $ | 188,916,191 | |
| * Identified Cost: | | | | | | | | | | | | | | | | | | | | |
| Investments in Securities | | $ | 27,801,290 | | | $ | 823,017,143 | | | $ | 147,958,258 | | | $ | 206,652,187 | | | $ | 237,718,454 | |
| Foreign Currencies | | | — | | | | — | | | | — | | | | — | | | | 632 | |
| ^ Includes Loaned securities with a value of | | | | | | | | | | | | | | | | | | | | |
| (See Note 5) | | | 25,727,957 | | | | 186,104,270 | | | | 18,632,761 | | | | 46,796,960 | | | | 37,877,878 | |
| | | | | | | | | | | | | | | | | | | | | |
| Net Asset Value (unlimited shares authorized): | | | | | | | | | | | | | | | | | | | | |
| Net Assets | | $ | 1,320,819,721 | | | $ | 634,444,602 | | | $ | 324,635,778 | | | $ | 159,104,234 | | | $ | 188,916,191 | |
| Shares Outstanding (No Par Value) | | | 45,600,000 | | | | 20,450,000 | | | | 9,850,000 | | | | 6,250,000 | | | | 6,450,000 | |
| Net Asset Value, Offering and | | | | | | | | | | | | | | | | | | | | |
| Redemption Price per Share | | $ | 28.97 | | | $ | 31.02 | | | $ | 32.96 | | | $ | 25.46 | | | $ | 29.29 | |
The accompanying notes are an integral part of these financial statements.
Pacer Funds
STATEMENTS OF ASSETS & LIABILITIES
October 31, 2018 (Unaudited)
| | | | | | | | | Pacer | | | | | | | |
| | | | | | Pacer | | | Developed | | | | | | | |
| | | Pacer | | | US Small | | | Markets | | | | | | Pacer | |
| | | US | | | Cap Cash | | | International | | | Pacer | | | Military Times | |
| | | Cash Cows | | | Cows | | | Cash Cows | | | WealthShield | | | Best Employers | |
| | | 100 ETF | | | 100 ETF | | | 100 ETF | | | ETF | | | ETF | |
| ASSETS | | | | | | | | | | | | | | | |
| Investments in Securities, at Value*^ | | $ | 190,696,558 | | | $ | 26,933,267 | | | $ | 29,759,359 | | | $ | 341,378 | | | $ | 2,611,307 | |
| Cash | | | 341 | | | | — | | | | — | | | | 650 | | | | — | |
| Foreign Currency at Value* | | | — | | | | — | | | | 120 | | | | — | | | | — | |
| Interest and Dividends Receivable | | | 138,270 | | | | 1,627 | | | | 116,813 | | | | 50,937 | | | | 1,406 | |
| Receivable for Investment Securities Sold | | | — | | | | — | | | | — | | | | 92,600,347 | | | | 47,124 | |
| Receivable for Fund Shares Sold | | | 4,220,935 | | | | — | | | | — | | | | — | | | | — | |
| Securities Lending Income Receivable | | | 1,528 | | | | 1,948 | | | | 2,121 | | | | — | | | | — | |
| Total Assets | | | 195,057,632 | | | | 26,936,842 | | | | 29,878,413 | | | | 92,993,312 | | | | 2,659,837 | |
| | | | | | | | | | | | | | | | | | | | | |
| LIABILITIES | | | | | | | | | | | | | | | | | | | | |
| Payable for Investment Securities Purchased | | | 4,215,214 | | | | — | | | | — | | | | 639 | | | | 47,022 | |
| Management Fees Payable | | | 66,304 | | | | 12,217 | | | | 15,867 | | | | 48,359 | | | | 742 | |
| Collateral Received for | | | | | | | | | | | | | | | | | | | | |
| Securities Loaned (See Note 5) | | | 18,809,270 | | | | 2,135,082 | | | | 1,945,516 | | | | — | | | | — | |
| Total Liabilities | | | 23,090,788 | | | | 2,147,299 | | | | 1,961,383 | | | | 48,998 | | | | 47,764 | |
| NET ASSETS | | $ | 171,966,844 | | | $ | 24,789,543 | | | $ | 27,917,030 | | | $ | 92,944,314 | | | $ | 2,612,073 | |
| | | | | | | | | | | | | | | | | | | | | |
| NET ASSETS CONSIST OF: | | | | | | | | | | | | | | | | | | | | |
| Paid-in Capital | | $ | 182,657,096 | | | $ | 27,026,808 | | | $ | 31,299,707 | | | $ | 100,504,873 | | | $ | 2,383,855 | |
| Total Distributable Earnings/ | | | | | | | | | | | | | | | | | | | | |
| (Accumulated Deficit) | | | (10,690,252 | ) | | | (2,237,265 | ) | | | (3,382,677 | ) | | | (7,560,559 | ) | | | 228,218 | |
| Net Assets | | $ | 171,966,844 | | | $ | 24,789,543 | | | $ | 27,917,030 | | | $ | 92,944,314 | | | $ | 2,612,073 | |
| * Identified Cost: | | | | | | | | | | | | | | | | | | | | |
| Investments in Securities | | $ | 202,479,548 | | | $ | 29,566,444 | | | $ | 32,960,296 | | | $ | 341,378 | | | $ | 2,565,762 | |
| Foreign Currencies | | | — | | | | — | | | | 121 | | | | — | | | | — | |
| ^ Includes loaned securities with a value of | | | 18,411,529 | | | | 2,034,334 | | | | 1,941,188 | | | | — | | | | — | |
| | | | | | | | | | | | | | | | | | | | | |
| Net Asset Value (unlimited shares authorized): | | | | | | | | | | | | | | | | | | | | |
| Net Assets | | $ | 171,966,844 | | | $ | 24,789,543 | | | $ | 27,917,030 | | | $ | 92,944,314 | | | $ | 2,612,073 | |
| Shares Outstanding (No Par Value) | | | 6,100,000 | | | | 950,000 | | | | 1,100,000 | | | | 3,850,000 | | | | 100,000 | |
| Net Asset Value, Offering and | | | | | | | | | | | | | | | | | | | | |
| Redemption Price per Share | | $ | 28.19 | | | $ | 26.09 | | | $ | 25.38 | | | $ | 24.14 | | | $ | 26.12 | |
The accompanying notes are an integral part of these financial statements.
Pacer Funds
STATEMENTS OF ASSETS & LIABILITIES
October 31, 2018 (Unaudited)
| | | | | | | | | Pacer | | | | | | | |
| | | | | | | | | Benchmark | | | | | | Pacer | |
| | | Pacer | | | Pacer | | | Data & | | | | | | CFRA-Stovall | |
| | | Benchmark | | | Benchmark | | | Infrastructure | | | Pacer | | | Equal Weight | |
| | | Retail Real | | | Industrial Real | | | Real Estate | | | US Export | | | Seasonal | |
| | | Estate ETF | | | Estate ETF | | | ETF | | | Leaders ETF | | | Rotation ETF | |
| ASSETS | | | | | | | | | | | | | | | |
| Investments in Securities, at Value*^ | | $ | 2,680,611 | | | $ | 2,482,336 | | | $ | 4,840,051 | | | $ | 2,288,004 | | | $ | 2,524,239 | |
| Cash | | | — | | | | — | | | | 22 | | | | — | | | | — | |
| Interest and Dividends Receivable | | | 3,228 | | | | 908 | | | | 10,180 | | | | 1,153 | | | | 2,358 | |
| Receivable for Investment Securities Sold | | | — | | | | — | | | | 13,624 | | | | — | | | | 3,719,255 | |
| Receivable for Fund Shares Sold | | | — | | | | — | | | | 1,214,160 | | | | — | | | | 1,255,180 | |
| Total Assets | | | 2,683,839 | | | | 2,483,244 | | | | 6,078,037 | | | | 2,289,157 | | | | 7,501,032 | |
| | | | | | | | | | | | | | | | | | | | | |
| LIABILITIES | | | | | | | | | | | | | | | | | | | | |
| Payable for Investment Securities Purchased | | | — | | | | — | | | | 1,219,566 | | | | — | | | | 3,742,027 | |
| Payable for Fund Shares Redeemed | | | — | | | | — | | | | — | | | | — | | | | 1,253,100 | |
| Management Fees Payable | | | 1,340 | | | | 1,252 | | | | 1,738 | | | | 1,206 | | | | 1,296 | |
| Total Liabilities | | | 1,340 | | | | 1,252 | | | | 1,221,304 | | | | 1,206 | | | | 4,996,423 | |
| NET ASSETS | | $ | 2,682,499 | | | $ | 2,481,992 | | | $ | 4,856,733 | | | $ | 2,287,951 | | | $ | 2,504,609 | |
| | | | | | | | | | | | | | | | | | | | | |
| NET ASSETS CONSIST OF: | | | | | | | | | | | | | | | | | | | | |
| Paid-in Capital | | $ | 2,461,340 | | | $ | 2,523,485 | | | $ | 4,971,745 | | | $ | 2,498,000 | | | $ | 2,503,080 | |
| Total Distributable Earnings/ | | | | | | | | | | | | | | | | | | | | |
| (Accumulated Deficit) | | | 221,159 | | | | (41,493 | ) | | | (115,012 | ) | | | (210,049 | ) | | | 1,529 | |
| Net Assets | | $ | 2,682,499 | | | $ | 2,481,992 | | | $ | 4,856,733 | | | $ | 2,287,951 | | | $ | 2,504,609 | |
| * Identified Cost: | | | | | | | | | | | | | | | | | | | | |
| Investments in Securities | | $ | 2,678,366 | | | $ | 2,562,566 | | | $ | 5,095,096 | | | $ | 2,494,125 | | | $ | 2,525,092 | |
| | | | | | | | | | | | | | | | | | | | | |
| Net Asset Value (unlimited shares authorized): | | | | | | | | | | | | | | | | | | | | |
| Net Assets | | $ | 2,682,499 | | | $ | 2,481,992 | | | $ | 4,856,733 | | | $ | 2,287,951 | | | $ | 2,504,609 | |
| Shares Outstanding (No Par Value) | | | 100,000 | | | | 100,000 | | | | 200,000 | | | | 100,000 | | | | 100,000 | |
| Net Asset Value, Offering and | | | | | | | | | | | | | | | | | | | | |
| Redemption Price per Share | | $ | 26.82 | | | $ | 24.82 | | | $ | 24.28 | | | $ | 22.88 | | | $ | 25.05 | |
The accompanying notes are an integral part of these financial statements.
Pacer Funds
STATEMENTS OF OPERATIONS
For the Period Ended October 31, 2018 (Unaudited)
| | | Pacer | | | Pacer | | | | | | Pacer | | | Pacer | |
| | | Trendpilot® | | | Trendpilot® | | | Pacer | | | Trendpilot® | | | Global | |
| | | US Large | | | US Mid | | | Trendpilot® | | | European | | | Cash Cows | |
| | | Cap ETF | | | Cap ETF | | | 100 ETF | | | Index ETF | | | Dividend ETF | |
| INVESTMENT INCOME | | | | | | | | | | | | | | | |
| Income: | | | | | | | | | | | | | | | |
| Dividends (net of fees and foreign withholding | | | | | | | | | | | | | | | |
| tax of $18, $1,841, $0, $467,653, and | | | | | | | | | | | | | | | |
| $189,139, respectively) | | $ | 11,147,478 | | | $ | 4,707,253 | | | $ | 1,415,930 | | | $ | 2,697,551 | | | $ | 4,037,877 | |
| Interest | | | 18,926 | | | | 387,489 | | | | 2,761 | | | | 434,661 | | | | 3,599 | |
| Securities Lending Income | | | 72,531 | | | | 159,514 | | | | 32,296 | | | | 7,167 | | | | 100,257 | |
| Total Investment Income | | | 11,238,935 | | | | 5,254,256 | | | | 1,450,987 | | | | 3,139,379 | | | | 4,141,733 | |
| | | | | | | | | | | | | | �� | | | | | | | |
| Expenses: | | | | | | | | | | | | | | | | | | | | |
| Management Fees | | | 3,496,032 | | | | 1,785,596 | | | | 935,833 | | | | 567,522 | | | | 575,272 | |
| Total Expenses | | | 3,496,032 | | | | 1,785,596 | | | | 935,833 | | | | 567,522 | | | | 575,272 | |
| Net Investment Income | | | 7,742,903 | | | | 3,468,660 | | | | 515,154 | | | | 2,571,857 | | | | 3,566,461 | |
| | | | | | | | | | | | | | | | | | | | | |
| REALIZED & UNREALIZED | | | | | | | | | | | | | | | | | | | | |
| GAIN (LOSS) ON INVESTMENTS | | | | | | | | | | | | | | | | | | | | |
| Net Realized Gain (Loss) on: | | | | | | | | | | | | | | | | | | | | |
| Investment Securities | | | (100,484,152 | ) | | | (43,699,433 | ) | | | (10,280,595 | ) | | | (30,030,830 | ) | | | (2,559,825 | ) |
| In-Kind Redemptions | | | 201,588,315 | | | | 63,665,254 | | | | 15,178,162 | | | | 2,953 | | | | 4,696,548 | |
| Foreign Currencies | | | — | | | | — | | | | — | | | | (1,490,317 | ) | | | (86,585 | ) |
| Total | | | 101,104,163 | | | | 19,965,821 | | | | 4,897,567 | | | | (31,518,194 | ) | | | 2,050,138 | |
| Net Change in Unrealized | | | | | | | | | | | | | | | | | | | | |
| Appreciation (Depreciation) of: | | | | | | | | | | | | | | | | | | | | |
| Investments Securities | | | (101,117,977 | ) | | | (25,657,540 | ) | | | 3,263,874 | | | | 2,446,127 | | | | (11,376,485 | ) |
| Foreign Currencies | | | — | | | | — | | | | — | | | | (7,203 | ) | | | (1,531 | ) |
| Total | | | (101,117,977 | ) | | | (25,657,540 | ) | | | 3,263,874 | | | | 2,438,924 | | | | (11,378,016 | ) |
| Net Realized and Unrealized | | | | | | | | | | | | | | | | | | | | |
| Gain on Investments | | | (13,814 | ) | | | (5,691,719 | ) | | | 8,161,441 | | | | (29,079,270 | ) | | | (9,327,878 | ) |
| NET INCREASE (DECREASE) IN NET ASSETS | | | | | | | | | | | | | | | | | | | | |
| RESULTING FROM OPERATIONS | | $ | 7,729,089 | | | $ | (2,223,059 | ) | | $ | 8,676,595 | | | $ | (26,507,413 | ) | | $ | (5,761,417 | ) |
The accompanying notes are an integral part of these financial statements.
Pacer Funds
STATEMENTS OF OPERATIONS
For the Period Ended October 31, 2018 (Unaudited)
| | | | | | | | | Pacer | | | | | | | |
| | | | | | Pacer | | | Developed | | | | | | | |
| | | Pacer | | | US Small | | | Markets | | | | | | Pacer | |
| | | US | | | Cap Cash | | | International | | | Pacer | | | Military Times | |
| | | Cash Cows | | | Cows | | | Cash Cows | | | WealthShield | | | Best Employers | |
| | | 100 ETF | | | 100 ETF | | | 100 ETF | | | ETF | | | ETF | |
| INVESTMENT INCOME | | | | | | | | | | | | | | | |
| Income: | | | | | | | | | | | | | | | |
| Dividends (net of fees and foreign withholding | | | �� | | | | | | | | | | | | |
| tax of $0, $44,462, $0, respectively) | | $ | 1,071,356 | | | $ | 149,668 | | | $ | 471,427 | | | $ | 339,193 | | | $ | 23,597 | |
| Interest | | | 1,242 | | | | 234 | | | | 463 | | | | 371,385 | | | | 39 | |
| Securities Lending Income | | | 12,307 | | | | 10,813 | | | | 12,474 | | | | — | | | | — | |
| Total Investment Income | | | 1,084,905 | | | | 160,715 | | | | 484,364 | | | | 710,578 | | | | 23,636 | |
| | | | | | | | | | | | | | | | | | | | | |
| Expenses: | | | | | | | | | | | | | | | | | | | | |
| Management Fees | | | 230,135 | | | | 51,185 | | | | 92,725 | | | | 248,581 | | | | 7,306 | |
| Total Expenses | | | 230,135 | | | | 51,185 | | | | 92,725 | | | | 248,581 | | | | 7,306 | |
| Net Investment Income | | | 854,770 | | | | 109,530 | | | | 391,639 | | | | 461,997 | | | | 16,330 | |
| | | | | | | | | | | | | | | | | | | | | |
| REALIZED & UNREALIZED | | | | | | | | | | | | | | | | | | | | |
| GAIN (LOSS) ON INVESTMENTS | | | | | | | | | | | | | | | | | | | | |
| Net Realized Gain (Loss) on: | | | | | | | | | | | | | | | | | | | | |
| Investment Securities | | | (1,502,852 | ) | | | (640,119 | ) | | | (731,449 | ) | | | (10,071,987 | ) | | | (8,065 | ) |
| In-Kind Redemptions | | | 3,104,865 | | | | 1,211,035 | | | | 541,943 | | | | 5,092,366 | | | | 189,567 | |
| Foreign Currencies | | | — | | | | — | | | | (8,046 | ) | | | — | | | | — | |
| Total | | | 1,602,013 | | | | 570,916 | | | | (197,552 | ) | | | (4,979,621 | ) | | | 181,502 | |
| Net Change in Unrealized | | | | | | | | | | | | | | | | | | | | |
| Appreciation (Depreciation) of: | | | | | | | | | | | | | | | | | | | | |
| Investments Securities | | | (12,250,715 | ) | | | (2,714,381 | ) | | | (3,564,142 | ) | | | 23,821 | | | | 1,452 | |
| Foreign Currencies | | | — | | | | — | | | | 1,048 | | | | — | | | | — | |
| Total | | | (12,250,715 | ) | | | (2,714,381 | ) | | | (3,563,094 | ) | | | 23,821 | | | | 1,452 | |
| Net Realized and Unrealized | | | | | | | | | | | | | | | | | | | | |
| Gain on Investments | | | (10,648,702 | ) | | | (2,143,465 | ) | | | (3,760,646 | ) | | | (4,955,800 | ) | | | 182,954 | |
| NET INCREASE (DECREASE) IN NET ASSETS | | | | | | | | | | | | | | | | | | | | |
| RESULTING FROM OPERATIONS | | $ | (9,793,932 | ) | | $ | (2,033,935 | ) | | $ | (3,369,007 | ) | | $ | (4,493,803 | ) | | $ | 199,284 | |
The accompanying notes are an integral part of these financial statements.
Pacer Funds
STATEMENTS OF OPERATIONS
For the Period Ended October 31, 2018 (Unaudited)
| | | | | | | | | Pacer | | | | | | | |
| | | | | | | | | Benchmark | | | | | | Pacer | |
| | | Pacer | | | Pacer | | | Data & | | | | | | CFRA-Stovall | |
| | | Benchmark | | | Benchmark | | | Infrastructure | | | Pacer | | | Equal Weight | |
| | | Retail Real | | | Industrial Real | | | Real Estate | | | US Export | | | Seasonal | |
| | | Estate ETF(a) | | | Estate ETF(b) | | | ETF(a) | | | Leaders ETF(c) | | | Rotation ETF(c) | |
| INVESTMENT INCOME | | | | | | | | | | | | | | | |
| Income: | | | | | | | | | | | | | | | |
| Dividends (net of fees and foreign withholding | | | | | | | | | | | | | | | |
| tax of $0, $0 and $0, respectively) | | $ | 63,185 | | | $ | 47,004 | | | $ | 53,846 | | | $ | 6,685 | | | $ | 11,907 | |
| Interest | | | 117 | | | | 50 | | | | 50 | | | | 22 | | | | 42 | |
| Total Investment Income | | | 63,302 | | | | 47,054 | | | | 53,896 | | | | 6,707 | | | | 11,949 | |
| | | | | | | | | | | | | | | | | | | | | |
| Expenses: | | | | | | | | | | | | | | | | | | | | |
| Management Fees | | | 7,481 | | | | 7,030 | | | | 7,671 | | | | 4,021 | | | | 4,183 | |
| Total Expenses | | | 7,481 | | | | 7,030 | | | | 7,671 | | | | 4,021 | | | | 4,183 | |
| Net Investment Income | | | 55,821 | | | | 40,024 | | | | 46,225 | | | | 2,686 | | | | 7,766 | |
| | | | | | | | | | | | | | | | | | | | | |
| REALIZED & UNREALIZED | | | | | | | | | | | | | | | | | | | | |
| GAIN (LOSS) ON INVESTMENTS | | | | | | | | | | | | | | | | | | | | |
| Net Realized Gain (Loss) on: | | | | | | | | | | | | | | | | | | | | |
| Investment Securities | | | (11,226 | ) | | | (9,427 | ) | | | (6,434 | ) | | | (4,389 | ) | | | (110,364 | ) |
| In-Kind Redemptions | | | 216,804 | | | | 35,551 | | | | 131,474 | | | | — | | | | 109,826 | |
| Total | | | 205,578 | | | | 26,124 | | | | 125,040 | | | | (4,389 | ) | | | (538 | ) |
| Net Change in Unrealized | | | | | | | | | | | | | | | | | | | | |
| Appreciation (Depreciation) of: | | | | | | | | | | | | | | | | | | | | |
| Investments Securities | | | 2,245 | | | | (80,230 | ) | | | (255,045 | ) | | | (206,121 | ) | | | (852 | ) |
| Total | | | 2,245 | | | | (80,230 | ) | | | (255,045 | ) | | | (206,121 | ) | | | (852 | ) |
| Net Realized and Unrealized | | | | | | | | | | | | | | | | | | | | |
| Gain (Loss) on Investments | | | 207,823 | | | | (54,106 | ) | | | (130,005 | ) | | | (210,510 | ) | | | (1,390 | ) |
| NET INCREASE (DECREASE) IN NET ASSETS | | | | | | | | | | | | | | | | | | | | |
| RESULTING FROM OPERATIONS | | $ | 263,644 | | | $ | (14,082 | ) | | $ | (83,780 | ) | | $ | (207,824 | ) | | $ | 6,376 | |
| (a) | Fund commenced operations on May 15, 2018. The information presented is from May 15, 2018 to October 31, 2018. |
| (b) | Fund commenced operations on May 14, 2018. The information presented is from May 14, 2018 to October 31, 2018. |
| (c) | Fund commenced operations on July 23, 2018. The information presented is from July 23, 2018 to October 31, 2018. |
The accompanying notes are an integral part of these financial statements.
Pacer Funds
STATEMENTS OF CHANGES IN NET ASSETS
| | | Pacer Trendpilot® | | | Pacer Trendpilot® | |
| | | US Large Cap ETF | | | US Mid Cap ETF | |
| | | For the | | | | | | For the | | | | |
| | | Period Ended | | | For the | | | Period Ended | | | For the | |
| | | October 31, | | | Year Ended | | | October 31, | | | Year Ended | |
| | | 2018 | | | April 30, | | | 2018 | | | April 30, | |
| | | (Unaudited) | | | 2018 | | | (Unaudited) | | | 2018 | |
| OPERATIONS | | | | | | | | | | | | |
| Net Investment Income | | $ | 7,742,903 | | | $ | 8,578,628 | | | $ | 3,468,660 | | | $ | 3,464,938 | |
| Net Realized Gain on Investments | | | 101,104,163 | | | | 9,083,487 | | | | 19,965,821 | | | | 33,031,547 | |
| Change in Unrealized Appreciation of Investments | | | (101,117,977 | ) | | | 45,094,752 | | | | (25,657,540 | ) | | | (2,103,852 | ) |
| Net Increase in Net Assets Resulting from Operations | | | 7,729,089 | | | | 62,756,867 | | | | (2,223,059 | ) | | | 34,392,633 | |
| | | | | | | | | | | | | | | | | |
| DISTRIBUTIONS TO SHAREHOLDERS | | | | | | | | | | | | | | | | |
Dividends and Distributions(a) | | | — | | | | (7,017,355 | ) | | | — | | | | (2,882,696 | ) |
| Total Distributions to Shareholders | | | — | | | | (7,017,355 | ) | | | — | | | | (2,882,696 | ) |
| | | | | | | | | | | | | | | | | |
| CAPITAL SHARE TRANSACTIONS | | | | | | | | | | | | | | | | |
| Proceeds from Shares Sold | | | 637,384,525 | | | | 433,608,925 | | | | 362,547,990 | | | | 278,026,940 | |
| Payments for Shares Redeemed | | | (246,268,800 | ) | | | (23,553,530 | ) | | | (223,470,590 | ) | | | (93,376,700 | ) |
| Net Increase in Net Assets Derived | | | | | | | | | | | | | | | | |
from Capital Share Transactions(b) | | | 391,115,725 | | | | 410,055,395 | | | | 139,077,400 | | | | 184,650,240 | |
| Net Increase in Net Assets | | $ | 398,844,814 | | | $ | 465,794,907 | | | $ | 136,854,341 | | | $ | 216,160,177 | |
| | | | | | | | | | | | | | | | | |
| NET ASSETS | | | | | | | | | | | | | | | | |
| Beginning of Period | | $ | 921,974,907 | | | $ | 456,180,000 | | | $ | 497,590,261 | | | $ | 281,430,084 | |
| End of Period | | $ | 1,320,819,721 | | | $ | 921,974,907 | (c) | | $ | 634,444,602 | | | $ | 497,590,261 | (c) |
(a) | These amounts are comprised of only net investment income. |
(b) | Summary of capital share transactions is as follows: |
| | | | Shares | | | Shares | | | Shares | | | Shares | |
| | Subscriptions | | | 21,650,000 | | | | 15,400,000 | | | | 11,350,000 | | | | 9,250,000 | |
| | Redemptions | | | (8,500,000 | ) | | | (850,000 | ) | | | (7,100,000 | ) | | | (3,100,000 | ) |
| | Net Increase | | | 13,150,000 | | | | 14,550,000 | | | | 4,250,000 | | | | 6,150,000 | |
(c) | Includes undistributed accumulated net investment income of $3,159,758 and $1,152,697, respectively. |
The accompanying notes are an integral part of these financial statements.
Pacer Funds
STATEMENTS OF CHANGES IN NET ASSETS
| | | | | | | | | Pacer Trendpilot® | |
| | | Pacer Trendpilot® 100 ETF | | | European Index ETF | |
| | | For the | | | | | | For the | | | | |
| | | Period Ended | | | For the | | | Period Ended | | | For the | |
| | | October 31, | | | Year Ended | | | October 31, | | | Year Ended | |
| | | 2018 | | | April 30, | | | 2018 | | | April 30, | |
| | | (Unaudited) | | | 2018 | | | (Unaudited) | | | 2018 | |
| OPERATIONS | | | | | | | | | | | | |
| Net Investment Income | | $ | 515,154 | | | $ | 493,443 | | | $ | 2,571,857 | | | $ | 1,341,548 | |
| Net Realized Gain (Loss) on Investments | | | 4,897,567 | | | | (156,453 | ) | | | (31,518,194 | ) | | | 4,836,398 | |
| Change in Unrealized Appreciation of Investments | | | 3,263,874 | | | | 17,873,120 | | | | 2,438,924 | | | | (6,253,723 | ) |
| Net Increase in Net Assets Resulting from Operations | | | 8,676,595 | | | | 18,210,110 | | | | (26,507,413 | ) | | | (75,777 | ) |
| | | | | | | | | | | | | | | | | |
| DISTRIBUTIONS TO SHAREHOLDERS | | | | | | | | | | | | | | | | |
Dividends and Distributions(a) | | | — | | | | (466,293 | ) | | | — | | | | (538,237 | ) |
| Total Distributions to Shareholders | | | — | | | | (466,293 | ) | | | — | | | | (538,237 | ) |
| | | | | | | | | | | | | | | | | |
| CAPITAL SHARE TRANSACTIONS | | | | | | | | | | | | | | | | |
| Proceeds from Shares Sold | | | 134,129,390 | | | | 120,466,075 | | | | 34,541,700 | | | | 174,437,090 | |
| Payments for Shares Redeemed | | | (30,076,575 | ) | | | — | | | | (7,632,915 | ) | | | (46,201,745 | ) |
| Transaction Fees (See Note 1) | | | — | | | | — | | | | 67 | | | | — | |
| Net Increase (Decrease) in Net Assets Derived | | | | | | | | | | | | | | | | |
from Capital Share Transactions(b) | | | 104,052,815 | | | | 120,466,075 | | | | 26,908,852 | | | | 128,235,345 | |
| Net Increase in Net Assets | | $ | 112,729,410 | | | $ | 138,209,892 | | | $ | 401,439 | | | $ | 127,621,331 | |
| | | | | | | | | | | | | | | | | |
| NET ASSETS | | | | | | | | | | | | | | | | |
| Beginning of Period | | $ | 211,906,368 | | | $ | 73,696,476 | | | $ | 158,702,795 | | | $ | 31,081,464 | |
| End of Period | | $ | 324,635,778 | | | $ | 211,906,368 | (c) | | $ | 159,104,234 | | | $ | 158,702,795 | (c) |
(a) | These amounts are comprised of only net investment income. |
(b) | Summary of capital share transactions is as follows: |
| | | | Shares | | | Shares | | | Shares | | | Shares | |
| | Subscriptions | | | 3,950,000 | | | | 4,000,000 | | | | 1,200,000 | | | | 5,750,000 | |
| | Redemptions | | | (900,000 | ) | | | — | | | | (300,000 | ) | | | (1,550,000 | ) |
| | Net Increase (Decrease) | | | 3,050,000 | | | | 4,000,000 | | | | 900,000 | | | | 4,200,000 | |
(c) | Includes undistributed accumulated net investment income of $99,202 and $827,950, respectively. |
The accompanying notes are an integral part of these financial statements.
Pacer Funds
STATEMENTS OF CHANGES IN NET ASSETS
| | | Pacer Global Cash | | | | | | | |
| | | Cows Dividend ETF | | | Pacer US Cash Cows 100 ETF | |
| | | For the | | | | | | For the | | | | |
| | | Period Ended | | | For the | | | Period Ended | | | For the | |
| | | October 31, | | | Year Ended | | | October 31, | | | Year Ended | |
| | | 2018 | | | April 30, | | | 2018 | | | April 30, | |
| | | (Unaudited) | | | 2018 | | | (Unaudited) | | | 2018 | |
| OPERATIONS | | | | | | | | | | | | |
| Net Investment Income | | $ | 3,566,461 | | | $ | 4,087,911 | | | $ | 854,770 | | | $ | 349,496 | |
| Net Realized Gain on Investments | | | 2,050,138 | | | | 6,709,257 | | | | 1,602,013 | | | | 1,042,948 | |
| Change in Unrealized Appreciation of Investments | | | (11,378,016 | ) | | | (1,913,304 | ) | | | (12,250,715 | ) | | | 328,507 | |
| Net Increase in Net Assets Resulting from Operations | | | (5,761,417 | ) | | | 8,883,864 | | | | (9,793,932 | ) | | | 1,720,951 | |
| | | | | | | | | | | | | | | | | |
| DISTRIBUTIONS TO SHAREHOLDERS | | | | | | | | | | | | | | | | |
Dividends and Distributions(a) | | | (3,879,656 | ) | | | (3,669,616 | ) | | | (696,950 | ) | | | (319,520 | ) |
| Total Distributions to Shareholders | | | (3,879,656 | ) | | | (3,669,616 | ) | | | (696,950 | ) | | | (319,520 | ) |
| | | | | | | | | | | | | | | | | |
| CAPITAL SHARE TRANSACTIONS | | | | | | | | | | | | | | | | |
| Proceeds from Shares Sold | | | 49,804,635 | | | | 157,190,990 | | | | 172,181,740 | | | | 29,991,055 | |
| Payments for Shares Redeemed | | | (24,957,850 | ) | | | (58,760,010 | ) | | | (18,705,315 | ) | | | (14,169,800 | ) |
| Transaction Fees (Note 1) | | | 353 | | | | 5,956 | | | | 17 | | | | — | |
| Net Increase in Net Assets Derived | | | | | | | | | | | | | | | | |
from Capital Share Transactions(b) | | | 24,847,138 | | | | 98,436,936 | | | | 153,476,442 | | | | 15,821,255 | |
| Net Increase in Net Assets | | $ | 15,206,065 | | | $ | 103,651,184 | | | $ | 142,985,560 | | | $ | 17,222,686 | |
| | | | | | | | | | | | | | | | | |
| NET ASSETS | | | | | | | | | | | | | | | | |
| Beginning of Period | | $ | 173,710,126 | | | $ | 70,058,942 | | | $ | 28,981,284 | | | $ | 11,758,598 | |
| End of Period | | $ | 188,916,191 | | | $ | 173,710,126 | (c) | | $ | 171,966,844 | | | $ | 28,981,284 | (c) |
(a) | These amounts are comprised of only net investment income. |
(b) | Summary of capital share transactions is as follows: |
| | | | Shares | | | Shares | | | Shares | | | Shares | |
| | Subscriptions | | | 1,600,000 | | | | 5,150,000 | | | | 5,700,000 | | | | 1,050,000 | |
| | Redemptions | | | (800,000 | ) | | | (1,950,000 | ) | | | (600,000 | ) | | | (500,000 | ) |
| | Net Increase | | | 800,000 | | | | 3,200,000 | | | | 5,100,000 | | | | 550,000 | |
(c) | Includes undistributed accumulated net investment income of $672,131 and $38,618, respectively. |
The accompanying notes are an integral part of these financial statements.
Pacer Funds
STATEMENTS OF CHANGES IN NET ASSETS
| | | Pacer US Small Cap | | | Pacer Developed Markets | |
| | | Cash Cows 100 ETF | | | International Cash Cows 100 ETF | |
| | | For the | | | | | | For the | | | | |
| | | Period Ended | | | For the | | | Period Ended | | | For the | |
| | | October 31, | | | Period Ended | | | October 31, | | | Period Ended | |
| | | 2018 | | | April 30, | | | 2018 | | | April 30, | |
| | | (Unaudited) | | | 2018(a) | | | (Unaudited) | | | 2018(a) | |
| OPERATIONS | | | | | | | | | | | | |
| Net Investment Income | | $ | 109,530 | | | $ | 36,151 | | | $ | 391,639 | | | $ | 131,487 | |
| Net Realized Gain on Investments | | | 570,916 | | | | 175,820 | | | | (197,552 | ) | | | 53,481 | |
| Change in Unrealized Appreciation (Depreciation) of Investments | | | (2,714,381 | ) | | | 82,238 | | | | (3,563,094 | ) | | | 360,524 | |
| Net Increase in Net Assets Resulting from Operations | | | (2,033,935 | ) | | | 294,209 | | | | (3,369,007 | ) | | | 545,492 | |
| | | | | | | | | | | | | | | | | |
| DISTRIBUTIONS TO SHAREHOLDERS | | | | | | | | | | | | | | | | |
Dividends and Distributions(b) | | | (90,512 | ) | | | (34,114 | ) | | | (374,484 | ) | | | (70,528 | ) |
| Total Distributions to Shareholders | | | (90,512 | ) | | | (34,114 | ) | | | (374,484 | ) | | | (70,528 | ) |
| | | | | | | | | | | | | | | | | |
| CAPITAL SHARE TRANSACTIONS | | | | | | | | | | | | | | | | |
| Proceeds from Shares Sold | | | 27,554,925 | | | | 8,898,460 | | | | 15,678,420 | | | | 21,155,825 | |
| Payments for Shares Redeemed | | | (5,874,080 | ) | | | (3,925,410 | ) | | | (4,254,830 | ) | | | (1,402,765 | ) |
| Transaction Fees (Note 1) | | | — | | | | — | | | | 2,285 | | | | 6,622 | |
| Net Increase in Net Assets Derived | | | | | | | | | | | | | | | | |
from Capital Share Transactions(c) | | | 21,680,845 | | | | 4,973,050 | | | | 11,425,875 | | | | 19,759,682 | |
| Net Increase in Net Assets | | $ | 19,556,398 | | | $ | 5,233,145 | | | $ | 7,682,384 | | | $ | 20,234,646 | |
| | | | | | | | | | | | | | | | | |
| NET ASSETS | | | | | | | | | | | | | | | | |
| Beginning of Period | | $ | 5,233,145 | | | $ | — | | | $ | 20,234,646 | | | $ | — | |
| End of Period | | $ | 24,789,543 | | | $ | 5,233,145 | (d) | | $ | 27,917,030 | | | $ | 20,234,646 | (d) |
(a) | Fund commenced operations on June 16, 2017. The information presented is from June 16, 2017 to April 30, 2018. |
(b) | These amounts are comprised of only net investment income. |
(c) | Summary of capital share transactions is as follows: |
| | | | Shares | | | Shares | | | Shares | | | Shares | |
| | Subscriptions | | | 950,000 | | | | 350,000 | | | | 550,000 | | | | 750,000 | |
| | Redemptions | | | (200,000 | ) | | | (150,000 | ) | | | (150,000 | ) | | | (50,000 | ) |
| | Net Increase | | | 750,000 | | | | 200,000 | | | | 400,000 | | | | 700,000 | |
(d) | Includes undistributed accumulated net investment income of $2,037 and $60,172, respectively. |
The accompanying notes are an integral part of these financial statements.
Pacer Funds
STATEMENTS OF CHANGES IN NET ASSETS
| | | | | | | | | Pacer Military Times | |
| | | Pacer WealthShield ETF | | | Best Employers ETF | |
| | | For the | | | | | | For the | | | | |
| | | Period Ended | | | For the | | | Period Ended | | | For the | |
| | | October 31, | | | Period Ended | | | October 31, | | | Period Ended | |
| | | 2018 | | | April 30, | | | 2018 | | | April 30, | |
| | | (Unaudited) | | | 2018(a) | | | (Unaudited) | | | 2018(b) | |
| OPERATIONS | | | | | | | | | | | | |
| Net Investment Income | | $ | 461,997 | | | $ | 172,593 | | | $ | 16,330 | | | $ | 342 | |
| Net Realized Loss on Investments | | | (4,979,621 | ) | | | (1,219,932 | ) | | | 181,502 | | | | — | |
| Change in Unrealized Depreciation of Investments | | | 23,821 | | | | (23,821 | ) | | | 1,452 | | | | 44,093 | |
| Net Increase in Net Assets Resulting from Operations | | | (4,493,803 | ) | | | (1,071,160 | ) | | | 199,284 | | | | 44,435 | |
| | | | | | | | | | | | | | | | | |
| DISTRIBUTIONS TO SHAREHOLDERS | | | | | | | | | | | | | | | | |
Dividends and Distributions(c) | | | (518,597 | ) | | | (112,441 | ) | | | (15,501 | ) | | | — | |
| Total Distributions to Shareholders | | | (518,597 | ) | | | (112,441 | ) | | | (15,501 | ) | | | — | |
| | | | | | | | | | | | | | | | | |
| CAPITAL SHARE TRANSACTIONS | | | | | | | | | | | | | | | | |
| Proceeds from Shares Sold | | | 86,646,160 | | | | 83,838,565 | | | | 1,289,730 | | | | 2,489,000 | |
| Payments for Shares Redeemed | | | (51,228,370 | ) | | | (20,116,040 | ) | | | (1,394,875 | ) | | | — | |
| Net Increase in Net Assets Derived | | | | | | | | | | | | | | | | |
from Capital Share Transactions(d) | | | 35,417,790 | | | | 63,722,525 | | | | (105,145 | ) | | | 2,489,000 | |
| Net Increase in Net Assets | | $ | 30,405,390 | | | $ | 62,538,924 | | | $ | 78,638 | | | $ | 2,533,435 | |
| | | | | | | | | | | | | | | | | |
| NET ASSETS | | | | | | | | | | | | | | | | |
| Beginning of Period | | $ | 62,538,924 | | | $ | — | | | $ | 2,533,435 | | | $ | — | |
| End of Period | | $ | 92,944,314 | | | $ | 62,538,924 | (e) | | $ | 2,612,073 | | | $ | 2,533,435 | (e) |
(a) | Fund commenced operations on December 11, 2017. The information presented is from December 11, 2017 to April 30, 2018. |
(b) | Fund commenced operations on April 9, 2018. The information presented is from April 9, 2018 to April 30, 2018. |
(c) | These amounts are comprised of only net investment income. |
(d) | Summary of capital share transactions is as follows: |
| | | | Shares | | | Shares | | | Shares | | | Shares | |
| | Subscriptions | | | 3,300,000 | | | | 3,300,000 | | | | 50,000 | | | | 100,000 | |
| | Redemptions | | | (1,950,000 | ) | | | (800,000 | ) | | | (50,000 | ) | | | — | |
| | Net Increase | | | 1,350,000 | | | | 2,500,000 | | | | — | | | | 100,000 | |
(e) | Includes undistributed accumulated net investment income of $60,273 and $342, respectively. |
The accompanying notes are an integral part of these financial statements.
Pacer Funds
STATEMENTS OF CHANGES IN NET ASSETS
| | | Pacer Benchmark | | | Pacer Benchmark | |
| | | Retail Real Estate ETF | | | Industrial Real Estate ETF | |
| | | For the | | | For the | |
| | | Period Ended | | | Period Ended | |
| | | October 31, | | | October 31, | |
| | | 2018(a) | | | 2018(b) | |
| | | (Unaudited) | | | (Unaudited) | |
| OPERATIONS | | | | | | |
| Net Investment Income | | $ | 55,821 | | | $ | 40,024 | |
| Net Realized Loss on Investments | | | 205,578 | | | | 26,124 | |
| Change in Unrealized Appreciation of Investments | | | 2,245 | | | | (80,230 | ) |
| Net Increase in Net Assets Resulting from Operations | | | 263,644 | | | | (14,082 | ) |
| | | | | | | | | |
| DISTRIBUTIONS TO SHAREHOLDERS | | | | | | | | |
| Dividends and Distributions | | | (42,485 | ) | | | (27,411 | ) |
| Total Distributions to Shareholders | | | (42,485 | ) | | | (27,411 | ) |
| | | | | | | | | |
| CAPITAL SHARE TRANSACTIONS | | | | | | | | |
| Proceeds from Shares Sold | | | 5,126,240 | | | | 7,494,230 | |
| Payments for Shares Redeemed | | | (2,664,900 | ) | | | (4,970,745 | ) |
Net Increase in Net Assets Derived from Capital Share Transactions(c) | | | 2,461,340 | | | | 2,523,485 | |
| Net Increase in Net Assets | | $ | 2,682,499 | | | $ | 2,481,992 | |
| | | | | | | | | |
| NET ASSETS | | | | | | | | |
| Beginning of Period | | $ | — | | | $ | — | |
| End of Period | | $ | 2,682,499 | | | $ | 2,481,992 | |
(a) | Fund commenced operations on May 15, 2018. The information presented is from May 15, 2018 to October 31, 2018. |
(b) | Fund commenced operations on May 14, 2018. The information presented is from May 14, 2018 to October 31, 2018. |
(c) | Summary of capital share transactions is as follows: |
| | | | Shares | | | Shares | |
| | Subscriptions | | | 200,000 | | | | 300,000 | |
| | Redemptions | | | (100,000 | ) | | | (200,000 | ) |
| | Net Increase | | | 100,000 | | | | 100,000 | |
The accompanying notes are an integral part of these financial statements.
Pacer Funds
STATEMENTS OF CHANGES IN NET ASSETS
| | | Pacer Benchmark | | | | |
| | | Data & Infrastructure | | | Pacer US Export | |
| | | Real Estate ETF | | | Leaders ETF | |
| | | For the | | | For the | |
| | | Period Ended | | | Period Ended | |
| | | October 31, | | | October 31, | |
| | | 2018(a) | | | 2018(b) | |
| | | (Unaudited) | | | (Unaudited) | |
| OPERATIONS | | | | | | |
| Net Investment Income | | $ | 46,225 | | | $ | 2,686 | |
| Net Realized Loss on Investments | | | 125,040 | | | | (4,389 | ) |
| Change in Unrealized Appreciation of Investments | | | (255,045 | ) | | | (206,121 | ) |
| Net Increase in Net Assets Resulting from Operations | | | (83,780 | ) | | | (207,824 | ) |
| | | | | | | | | |
| DISTRIBUTIONS TO SHAREHOLDERS | | | | | | | | |
| Dividends and Distributions | | | (31,232 | ) | | | (2,225 | ) |
| Total Distributions to Shareholders | | | (31,232 | ) | | | (2,225 | ) |
| | | | | | | | | |
| CAPITAL SHARE TRANSACTIONS | | | | | | | | |
| Proceeds from Shares Sold | | | 7,548,885 | | | | 2,498,000 | |
| Payments for Shares Redeemed | | | (2,577,140 | ) | | | — | |
Net Increase in Net Assets Derived from Capital Share Transactions(c) | | | 4,971,745 | | | | 2,498,000 | |
| Net Increase in Net Assets | | $ | 4,856,733 | | | $ | 2,287,951 | |
| | | | | | | | | |
| NET ASSETS | | | | | | | | |
| Beginning of Period | | $ | — | | | $ | — | |
| End of Period | | $ | 4,856,733 | | | $ | 2,287,951 | |
(a) | Fund commenced operations on May 15, 2018. The information presented is from May 15, 2018 to October 31, 2018. |
(b) | Fund commenced operations on July 23, 2018. The information presented is from July 23, 2018 to October 31, 2018. |
(c) | Summary of capital share transactions is as follows: |
| | | | Shares | | | Shares | |
| | Subscriptions | | | 300,000 | | | | 100,000 | |
| | Redemptions | | | (100,000 | ) | | | — | |
| | Net Increase | | | 200,000 | | | | 100,000 | |
The accompanying notes are an integral part of these financial statements.
Pacer Funds
STATEMENTS OF CHANGES IN NET ASSETS
| | | Pacer CFRA-Stovall Equal | |
| | | Weight Seasonal Rotation ETF | |
| | | For the | |
| | | Period Ended | |
| | | October 31, | |
| | | 2018(a) | |
| | | (Unaudited) | |
| OPERATIONS | | | |
| Net Investment Income | | $ | 7,766 | |
| Net Realized Loss on Investments | | | (538 | ) |
| Change in Unrealized Appreciation of Investments | | | (852 | ) |
| Net Increase in Net Assets Resulting from Operations | | | 6,376 | |
| | | | | |
| DISTRIBUTIONS TO SHAREHOLDERS | | | | |
| Dividends and Distributions | | | (4,847 | ) |
| Total Distributions to Shareholders | | | (4,847 | ) |
| | | | | |
| CAPITAL SHARE TRANSACTIONS | | | | |
| Proceeds from Shares Sold | | | 3,756,180 | |
| Payments for Shares Redeemed | | | (1,253,100 | ) |
Net Increase in Net Assets Derived from Capital Share Transactions(b) | | | 2,503,080 | |
| Net Increase in Net Assets | | $ | 2,504,609 | |
| | | | | |
| NET ASSETS | | | | |
| Beginning of Period | | $ | — | |
| End of Period | | $ | 2,504,609 | |
(a) | Fund commenced operations on July 23, 2018. The information presented is from July 23, 2018 to October 31, 2018. |
(b) | Summary of capital share transactions is as follows: |
| | | | Shares | |
| | Subscriptions | | | 150,000 | |
| | Redemptions | | | (50,000 | ) |
| | Net Increase | | | 100,000 | |
The accompanying notes are an integral part of these financial statements.
Pacer Trendpilot® US Large Cap ETF
FINANCIAL HIGHLIGHTS
For a capital share outstanding throughout the period
| | | For the | | | | | | | | | | |
| | | Period Ended | | | For the | | | For the | | | For the | |
| | | October 31, 2018 | | | Year Ended | | | Year Ended | | | Period Ended | |
| | | (Unaudited) | | | April 30, 2018 | | | April 30, 2017 | | | April 30, 2016(1) | |
| Net Asset Value, Beginning of Period | | $ | 28.41 | | | $ | 25.48 | | | $ | 21.88 | | | $ | 25.00 | |
| | | | | | | | | | | | | | | | | |
| INCOME (LOSS) FROM INVESTMENT OPERATIONS: | | | | | | | | | | | | | | | | |
Net Investment Income(2) | | | 0.20 | | | | 0.37 | | | | 0.34 | | | | 0.13 | |
| Net Realized and Unrealized Gain (Loss) on Investments | | | 0.36 | (6) | | | 2.83 | | | | 3.52 | | | | (3.15 | ) |
| Total from Investment Operations | | | 0.56 | | | | 3.21 | | | | 3.86 | | | | (3.02 | ) |
| | | | | | | | | | | | | | | | | |
| LESS DISTRIBUTIONS: | | | | | | | | | | | | | | | | |
| Distributions from Net Investment Income | | | — | | | | (0.28 | ) | | | (0.26 | ) | | | (0.10 | ) |
| Total Distributions | | | — | | | | (0.28 | ) | | | (0.26 | ) | | | (0.10 | ) |
| Net Asset Value, End of Period | | $ | 28.97 | | | $ | 28.41 | | | $ | 25.48 | | | $ | 21.88 | |
| Total Return | | | 1.95 | %(3) | | | 12.56 | % | | | 17.72 | % | | | -12.10 | %(3) |
| | | | | | | | | | | | | | | | | |
| SUPPLEMENTAL DATA: | | | | | | | | | | | | | | | | |
| Net Assets at End of Period (000’s) | | $ | 1,320,820 | | | $ | 921,975 | | | $ | 456,180 | | | $ | 365,448 | |
| | | | | | | | | | | | | | | | | |
| RATIOS TO AVERAGE NET ASSETS: | | | | | | | | | | | | | | | | |
| Expenses to Average Net Assets | | | 0.60 | %(4) | | | 0.60 | % | | | 0.60 | % | | | 0.60 | %(4) |
| Net Investment Income to Average Net Assets | | | 1.33 | %(4) | | | 1.32 | % | | | 1.44 | % | | | 0.62 | %(4) |
Portfolio Turnover Rate(5) | | | 2 | %(3) | | | 12 | % | | | 7 | % | | | 317 | %(3) |
| (1) | Commencement of operations on June 11, 2015. |
| (2) | Calculated based on average shares outstanding during the period. |
| (3) | Not annualized. |
| (4) | Annualized. |
| (5) | Excluded impact of in-kind transactions. |
| (6) | Realized and unrealized gains and losses per share in this caption are balancing amounts necessary to reconcile to the change in net asset value for the period and may reconcile with the aggregate gains and losses in the statement of operations due to share transactions for the period. |
The accompanying notes are an integral part of these financial statements.
Pacer Trendpilot® US Mid Cap ETF
FINANCIAL HIGHLIGHTS
For a capital share outstanding throughout the period
| | | For the | | | | | | | | | | |
| | | Period Ended | | | For the | | | For the | | | For the | |
| | | October 31, 2018 | | | Year Ended | | | Year Ended | | | Period Ended | |
| | | (Unaudited) | | | April 30, 2018 | | | April 30, 2017 | | | April 30, 2016(1) | |
| Net Asset Value, Beginning of Period | | $ | 30.72 | | | $ | 28.00 | | | $ | 23.78 | | | $ | 25.00 | |
| | | | | | | | | | | | | | | | | |
| INCOME (LOSS) FROM INVESTMENT OPERATIONS: | | | | | | | | | | | | | | | | |
Net Investment Income (Loss)(2) | | | 0.19 | | | | 0.27 | | | | 0.27 | | | | (0.04 | ) |
| Net Realized and Unrealized Gain (Loss) on Investments | | | 0.11 | (6) | | | 2.66 | | | | 4.13 | | | | (1.16 | ) |
| Total from Investment Operations | | | 0.30 | | | | 2.93 | | | | 4.40 | | | | (1.20 | ) |
| | | | | | | | | | | | | | | | | |
| LESS DISTRIBUTIONS: | | | | | | | | | | | | | | | | |
| Distributions from Net Investment Income | | | — | | | | (0.21 | ) | | | (0.18 | ) | | | — | |
| Distributions from Return of Capital | | | — | | | | — | | | | — | | | | (0.02 | ) |
| Total Distributions | | | — | | | | (0.21 | ) | | | (0.18 | ) | | | (0.02 | ) |
| Net Asset Value, End of Period | | $ | 31.02 | | | $ | 30.72 | | | $ | 28.00 | | | $ | 23.78 | |
| Total Return | | | 1.01 | %(3) | | | 10.42 | % | | | 18.54 | % | | | -4.82 | %(3) |
| | | | | | | | | | | | | | | | | |
| SUPPLEMENTAL DATA: | | | | | | | | | | | | | | | | |
| Net Assets at End of Period (000’s) | | $ | 634,445 | | | $ | 497,590 | | | $ | 281,430 | | | $ | 149,808 | |
| | | | | | | | | | | | | | | | | |
| RATIOS TO AVERAGE NET ASSETS: | | | | | | | | | | | | | | | | |
| Expenses to Average Net Assets | | | 0.60 | %(4) | | | 0.60 | % | | | 0.60 | % | | | 0.60 | %(4) |
| Net Investment Income to Average Net Assets | | | 1.17 | %(4) | | | 0.91 | % | | | 1.02 | % | | | -0.17 | %(4) |
Portfolio Turnover Rate(5) | | | 11 | %(3) | | | 66 | % | | | 27 | % | | | 379 | %(3) |
| (1) | Commencement of operations on June 11, 2015. |
| (2) | Calculated based on average shares outstanding during the period. |
| (3) | Not annualized. |
| (4) | Annualized. |
| (5) | Excluded impact of in-kind transactions. |
| (6) | Realized and unrealized gains and losses per share in this caption are balancing amounts necessary to reconcile to the change in net asset value for the period and may reconcile with the aggregate gains and losses in the statement of operations due to share transactions for the period. |
The accompanying notes are an integral part of these financial statements.
Pacer Trendpilot® 100 ETF
FINANCIAL HIGHLIGHTS
For a capital share outstanding throughout the period
| | | For the | | | | | | | | | | |
| | | Period Ended | | | For the | | | For the | | | For the | |
| | | October 31, 2018 | | | Year Ended | | | Year Ended | | | Period Ended | |
| | | (Unaudited) | | | April 30, 2018 | | | April 30, 2017 | | | April 30, 2016(1) | |
| Net Asset Value, Beginning of Period | | $ | 31.17 | | | $ | 26.32 | | | $ | 21.44 | | | $ | 25.00 | |
| | | | | | | | | | | | | | | | | |
| INCOME (LOSS) FROM INVESTMENT OPERATIONS: | | | | | | | | | | | | | | | | |
Net Investment Income(2) | | | 0.06 | | | | 0.11 | | | | 0.11 | | | | 0.04 | |
| Net Realized and Unrealized Gain (Loss) on Investments | | | 1.74 | | | | 4.83 | | | | 4.84 | | | | (3.55 | ) |
| Total from Investment Operations | | | 1.80 | | | | 4.94 | | | | 4.95 | | | | (3.51 | ) |
| | | | | | | | | | | | | | | | | |
| LESS DISTRIBUTIONS: | | | | | | | | | | | | | | | | |
| Distributions from Net Investment Income | | | — | | | | (0.10 | ) | | | (0.07 | ) | | | (0.05 | ) |
| Total Distributions | | | — | | | | (0.10 | ) | | | (0.07 | ) | | | (0.05 | ) |
| Net Asset Value, End of Period | | $ | 32.97 | | | $ | 31.17 | | | $ | 26.32 | | | $ | 21.44 | |
| Total Return | | | 5.77 | %(3) | | | 18.78 | % | | | 23.11 | % | | | -14.04 | %(3) |
| | | | | | | | | | | | | | | | | |
| SUPPLEMENTAL DATA: | | | | | | | | | | | | | | | | |
| Net Assets at End of Period (000’s) | | $ | 324,636 | | | $ | 211,906 | | | $ | 73,696 | | | $ | 69,689 | |
| | | | | | | | | | | | | | | | | |
| RATIOS TO AVERAGE NET ASSETS: | | | | | | | | | | | | | | | | |
| Expenses to Average Net Assets | | | 0.65 | %(4) | | | 0.65 | % | | | 0.65 | % | | | 0.65 | %(4) |
| Net Investment Income to Average Net Assets | | | 0.36 | %(4) | | | 0.38 | % | | | 0.46 | % | | | 0.18 | %(4) |
Portfolio Turnover Rate(5) | | | 3 | %(3) | | | 3 | % | | | 125 | % | | | 295 | %(3) |
| (1) | Commencement of operations on June 11, 2015. |
| (2) | Calculated based on average shares outstanding during the period. |
| (3) | Not annualized. |
| (4) | Annualized. |
| (5) | Excluded impact of in-kind transactions. |
The accompanying notes are an integral part of these financial statements.
Pacer Trendpilot® European Index ETF
FINANCIAL HIGHLIGHTS
For a capital share outstanding throughout the period
| | | For the | | | | | | | | | | |
| | | Period Ended | | | For the | | | For the | | | For the | |
| | | October 31, 2018 | | | Year Ended | | | Year Ended | | | Period Ended | |
| | | (Unaudited) | | | April 30, 2018 | | | April 30, 2017 | | | April 30, 2016(1) | |
| Net Asset Value, Beginning of Period | | $ | 29.66 | | | $ | 27.03 | | | $ | 24.97 | | | $ | 25.00 | |
| | | | | | | | | | | | | | | | | |
| INCOME (LOSS) FROM INVESTMENT OPERATIONS: | | | | | | | | | | | | | | | | |
Net Investment Gain (Loss)(2) | | | 0.41 | | | | 0.51 | | | | 0.18 | | | | (0.04 | ) |
| Net Realized and Unrealized Gain (Loss) on Investments | | | (4.61 | ) | | | 2.31 | | | | 1.88 | (3) | | | 0.01 | |
| Total from Investment Operations | | | (4.20 | ) | | | 2.82 | | | | 2.06 | | | | (0.03 | ) |
| | | | | | | | | | | | | | | | | |
| LESS DISTRIBUTIONS: | | | | | | | | | | | | | | | | |
| Distributions from Net Investment Income | | | — | | | | (0.19 | ) | | | — | | | | — | |
| Distributions from net realized gain | | | — | | | | — | | | | — | | | | — | |
| Total Distributions | | | — | | | | (0.19 | ) | | | — | | | | — | |
| Net Asset Value, End of Period | | $ | 25.46 | | | $ | 29.66 | | | $ | 27.03 | | | $ | 24.97 | |
| Total Return | | | -14.18 | %(4) | | | 10.43 | % | | | 8.25 | %(5) | | | -0.13 | %(4) |
| | | | | | | | | | | | | | | | | |
| SUPPLEMENTAL DATA: | | | | | | | | | | | | | | | | |
| Net Assets at End of Period (000’s) | | $ | 159,104 | | | $ | 158,703 | | | $ | 31,081 | | | $ | 22,470 | |
| | | | | | | | | | | | | | | | | |
| RATIOS TO AVERAGE NET ASSETS: | | | | | | | | | | | | | | | | |
| Expenses to Average Net Assets | | | 0.65 | %(6) | | | 0.65 | % | | | 0.65 | % | | | 0.65 | %(6) |
| Net Investment Income (Loss) to Average Net Assets | | | 2.95 | %(6) | | | 1.69 | % | | | 0.77 | % | | | -0.39 | %(6) |
Portfolio Turnover Rate(7) | | | 59 | %(4) | | | 228 | % | | | 143 | % | | | 0 | %(4) |
| (1) | Commencement of operations on December 14, 2015. |
| (2) | Calculated based on average shares outstanding during the period. |
| (3) | Includes $0.41 gain derived from contribution from a settlement. See Note 5. |
| (4) | Not annualized. |
| (5) | Before the contribution from a settlement, the total return for the year would have been 6.60%. See Note 8. |
| (6) | Annualized. |
| (7) | Excluded impact of in-kind transactions. |
The accompanying notes are an integral part of these financial statements.
Pacer Global Cash Cows Dividend ETF
FINANCIAL HIGHLIGHTS
For a capital share outstanding throughout the period
| | | For the | | | | | | | | | | |
| | | Period Ended | | | For the | | | For the | | | For the | |
| | | October 31, 2018 | | | Year Ended | | | Year Ended | | | Period Ended | |
| | | (Unaudited) | | | April 30, 2018 | | | April 30, 2017 | | | April 30, 2016(1) | |
| Net Asset Value, Beginning of Period | | $ | 30.75 | | | $ | 28.60 | | | $ | 27.16 | | | $ | 25.00 | |
| | | | | | | | | | | | | | | | | |
| INCOME FROM INVESTMENT OPERATIONS: | | | | | | | | | | | | | | | | |
Net Investment Income(2) | | | 0.58 | | | | 1.07 | | | | 0.88 | | | | 0.23 | |
| Net Realized and Unrealized Gain (Loss) on Investments | | | (1.42 | ) | | | 2.01 | | | | 1.26 | | | | 1.93 | |
| Total from Investment Operations | | | (0.84 | ) | | | 3.08 | | | | 2.14 | | | | 2.16 | |
| | | | | | | | | | | | | | | | | |
| LESS DISTRIBUTIONS: | | | | | | | | | | | | | | | | |
| Distributions from Net Investment Income | | | (0.62 | ) | | | (0.93 | ) | | | (0.70 | ) | | | — | |
| Total Distributions | | | (0.62 | ) | | | (0.93 | ) | | | (0.70 | ) | | | — | |
| Net Asset Value, End of Period | | $ | 29.29 | | | $ | 30.75 | | | $ | 28.60 | | | $ | 27.16 | |
| Total Return | | | -2.81 | %(3) | | | 10.86 | % | | | 8.03 | % | | | 8.64 | %(3) |
| | | | | | | | | | | | | | | | | |
| SUPPLEMENTAL DATA: | | | | | | | | | | | | | | | | |
| Net Assets at End of Period (000’s) | | $ | 188,916 | | | $ | 173,710 | | | $ | 70,059 | | | $ | 5,432 | |
| | | | | | | | | | | | | | | | | |
| RATIOS TO AVERAGE NET ASSETS: | | | | | | | | | | | | | | | | |
| Expenses to Average Net Assets | | | 0.60 | %(4) | | | 0.60 | % | | | 0.60 | % | | | 0.60 | %(4) |
| Net Investment Income to Average Net Assets | | | 3.72 | %(4) | | | 3.50 | % | | | 3.19 | % | | | 4.63 | %(4) |
Portfolio Turnover Rate(5) | | | 35 | %(3) | | | 76 | % | | | 44 | % | | | 0 | %(3) |
| (1) | Commencement of operations on February 22, 2016. |
| (2) | Calculated based on average shares outstanding during the period. |
| (3) | Not annualized. |
| (4) | Annualized. |
| (5) | Excluded impact of in-kind transactions. |
The accompanying notes are an integral part of these financial statements.
Pacer US Cash Cows 100 ETF
FINANCIAL HIGHLIGHTS
For a capital share outstanding throughout the period
| | | For the | | | | | | | |
| | | Period Ended | | | For the | | | For the | |
| | | October 31, 2018 | | | Year Ended | | | Period Ended | |
| | | (Unaudited) | | | April 30, 2018 | | | April 30, 2017(1) | |
| Net Asset Value, Beginning of Period | | $ | 28.98 | | | $ | 26.13 | | | $ | 25.00 | |
| | | | | | | | | | | | | |
| INCOME FROM INVESTMENT OPERATIONS: | | | | | | | | | | | | |
Net Investment Income(2) | | | 0.28 | | | | 0.61 | | | | 0.13 | |
| Net Realized and Unrealized Gain on Investments | | | (0.87 | )(6) | | | 2.84 | | | | 1.09 | |
| Total from Investment Operations | | | (0.59 | ) | | | 3.45 | | | | 1.22 | |
| | | | | | | | | | | | | |
| LESS DISTRIBUTIONS: | | | | | | | | | | | | |
| Distributions from Net Investment Income | | | (0.20 | ) | | | (0.60 | ) | | | (0.09 | ) |
| Total Distributions | | | (0.20 | ) | | | (0.60 | ) | | | (0.09 | ) |
| Net Asset Value, End of Period | | $ | 28.19 | | | $ | 28.98 | | | $ | 26.13 | |
| Total Return | | | -2.09 | %(3) | | | 13.35 | % | | | 4.87 | %(3) |
| | | | | | | | | | | | | |
| SUPPLEMENTAL DATA: | | | | | | | | | | | | |
| Net Assets at End of Period (000’s) | | $ | 171,967 | | | $ | 28,981 | | | $ | 11,759 | |
| | | | | | | | | | | | | |
| RATIOS TO AVERAGE NET ASSETS: | | | | | | | | | | | | |
| Expenses to Average Net Assets | | | 0.49 | %(4) | | | 0.49 | % | | | 0.49 | %(4) |
| Net Investment Income to Average Net Assets | | | 1.82 | %(4) | | | 2.16 | % | | | 1.37 | %(4) |
Portfolio Turnover Rate(5) | | | 60 | %(3) | | | 101 | % | | | 36 | %(3) |
| (1) | Commencement of operations on December 16, 2016. |
| (2) | Calculated based on average shares outstanding during the period. |
| (3) | Not annualized. |
| (4) | Annualized. |
| (5) | Excluded impact of in-kind transactions. |
| (6) | Realized and unrealized gains and losses per share in this caption are balancing amounts necessary to reconcile to the change in net asset value for the period and may reconcile with the aggregate gains and losses in the statement of operations due to share transactions for the period. |
The accompanying notes are an integral part of these financial statements.
Pacer US Small Cap Cash Cows 100 ETF
FINANCIAL HIGHLIGHTS
For a capital share outstanding throughout the period
| | | For the | | | | |
| | | Period Ended | | | For the | |
| | | October 31, 2018 | | | Period Ended | |
| | | (Unaudited) | | | April 30, 2018(1) | |
| Net Asset Value, Beginning of Period | | $ | 26.17 | | | $ | 24.78 | |
| | | | | | | | | |
| INCOME (LOSS) FROM INVESTMENT OPERATIONS: | | | | | | | | |
Net Investment Income(2) | | | 0.83 | | | | 0.28 | |
| Net Realized and Unrealized Gain on Investments | | | (0.78 | )(6) | | | 1.38 | |
| Total from Investment Operations | | | 0.05 | | | | 1.66 | |
| | | | | | | | | |
| LESS DISTRIBUTIONS: | | | | | | | | |
| Distributions from Net Investment Income | | | (0.13 | ) | | | (0.27 | ) |
| Total Distributions | | | (0.13 | ) | | | (0.27 | ) |
| Net Asset Value, End of Period | | $ | 26.09 | | | $ | 26.17 | |
| Total Return | | | 0.19 | %(3) | | | 6.69 | %(3) |
| | | | | | | | | |
| SUPPLEMENTAL DATA: | | | | | | | | |
| Net Assets at End of Period (000’s) | | $ | 24,790 | | | $ | 5,233 | |
| | | | | | | | | |
| RATIOS TO AVERAGE NET ASSETS: | | | | | | | | |
| Expenses to Average Net Assets | | | 0.59 | %(4) | | | 0.59 | %(4) |
| Net Investment Income to Average Net Assets | | | 1.26 | %(4) | | | 1.25 | %(4) |
Portfolio Turnover Rate(5) | | | 60 | %(3) | | | 97 | %(3) |
| (1) | Commencement of operations on June 16, 2017. |
| (2) | Calculated based on average shares outstanding during the period. |
| (3) | Not annualized. |
| (4) | Annualized. |
| (5) | Excluded impact of in-kind transactions. |
| (6 | )Realized and unrealized gains and losses per share in this caption are balancing amounts necessary to reconcile to the change in net asset value for the period and may reconcile with the aggregate gains and losses in the statement of operations due to share transactions for the period. |
The accompanying notes are an integral part of these financial statements.
Pacer Developed Markets International Cash Cows 100 ETF
FINANCIAL HIGHLIGHTS
For a capital share outstanding throughout the period
| | | For the | | | | |
| | | Period Ended | | | For the | |
| | | October 31, 2018 | | | Period Ended | |
| | | (Unaudited) | | | April 30, 2018(1) | |
| Net Asset Value, Beginning of Period | | $ | 28.91 | | | $ | 25.09 | |
| | | | | | | | | |
| INCOME FROM INVESTMENT OPERATIONS: | | | | | | | | |
Net Investment Income(2) | | | 0.38 | | | | 0.60 | |
| Net Realized and Unrealized Gain on Investments | | | (3.56 | ) | | | 3.53 | |
| Total from Investment Operations | | | (3.18 | ) | | | 4.13 | |
| | | | | | | | | |
| LESS DISTRIBUTIONS: | | | | | | | | |
| Distributions from Net Investment Income | | | (0.35 | ) | | | (0.31 | ) |
| Total Distributions | | | (0.35 | ) | | | (0.31 | ) |
| Net Asset Value, End of Period | | $ | 25.38 | | | $ | 28.91 | |
| Total Return | | | -11.10 | %(3) | | | 16.48 | %(3) |
| | | | | | | | | |
| SUPPLEMENTAL DATA: | | | | | | | | |
| Net Assets at End of Period (000’s) | | $ | 27,917 | | | $ | 20,235 | |
| | | | | | | | | |
| RATIOS TO AVERAGE NET ASSETS: | | | | | | | | |
| Expenses to Average Net Assets | | | 0.65 | %(4) | | | 0.65 | %(4) |
| Net Investment Income to Average Net Assets | | | 2.75 | %(4) | | | 2.42 | %(4) |
Portfolio Turnover Rate(5) | | | 41 | %(3) | | | 25 | %(3) |
| (1) | Commencement of operations on June 16, 2017. |
| (2) | Calculated based on average shares outstanding during the period. |
| (3) | Not annualized. |
| (4) | Annualized. |
| (5) | Excluded impact of in-kind transactions. |
The accompanying notes are an integral part of these financial statements.
Pacer WealthShield ETF
FINANCIAL HIGHLIGHTS
For a capital share outstanding throughout the period
| | | For the | | | | |
| | | Period Ended | | | For the | |
| | | October 31, 2018 | | | Period Ended | |
| | | (Unaudited) | | | April 30, 2018(1) | |
| Net Asset Value, Beginning of Period | | $ | 25.02 | | | $ | 25.02 | |
| | | | | | | | | |
| INCOME FROM INVESTMENT OPERATIONS: | | | | | | | | |
Net Investment Income(2) | | | 0.15 | | | | 0.10 | |
| Net Realized and Unrealized Loss on Investments | | | (0.87 | )(6) | | | (0.05 | ) |
| Total from Investment Operations | | | (0.72 | ) | | | 0.05 | |
| | | | | | | | | |
| LESS DISTRIBUTIONS: | | | | | | | | |
| Distributions from Net Investment Income | | | (0.16 | ) | | | (0.05 | ) |
| Total Distributions | | | (0.16 | ) | | | (0.05 | ) |
| Net Asset Value, End of Period | | $ | 24.14 | | | $ | 25.02 | |
| Total Return | | | -2.93 | %(3) | | | 0.23 | %(3) |
| | | | | | | | | |
| SUPPLEMENTAL DATA: | | | | | | | | |
| Net Assets at End of Period (000’s) | | $ | 92,944 | | | $ | 62,539 | |
| | | | | | | | | |
| RATIOS TO AVERAGE NET ASSETS: | | | | | | | | |
| Expenses to Average Net Assets | | | 0.60 | %(4) | | | 0.60 | %(4) |
| Net Investment Income to Average Net Assets | | | 1.12 | %(4) | | | 1.04 | %(4) |
Portfolio Turnover Rate(5) | | | 205 | %(3) | | | 131 | %(3) |
| (1) | Commencement of operations on December 11, 2017. |
| (2) | Calculated based on average shares outstanding during the period. |
| (3) | Not annualized. |
| (4) | Annualized. |
| (5) | Excluded impact of in-kind transactions. |
| (6) | Realized and unrealized gains and losses per share in this caption are balancing amounts necessary to reconcile to the change in net asset value for the period and may reconcile with the aggregate gains and losses in the statement of operations due to share transactions for the period. |
The accompanying notes are an integral part of these financial statements.
Pacer Military Times Best Employers ETF
FINANCIAL HIGHLIGHTS
For a capital share outstanding throughout the period
| | | For the | | | | |
| | | Period Ended | | | For the | |
| | | October 31, 2018 | | | Period Ended | |
| | | (Unaudited) | | | April 30, 2018(1) | |
| Net Asset Value, Beginning of Period | | $ | 25.33 | | | $ | 24.89 | |
| | | | | | | | | |
| INCOME FROM INVESTMENT OPERATIONS: | | | | | | | | |
Net Investment Income(2) | | | 0.18 | (3) | | | — | (3) |
| Net Realized and Unrealized Gain on Investments | | | 0.85 | | | | 0.44 | |
| Total from Investment Operations | | | 1.03 | | | | 0.44 | |
| | | | | | | | | |
| LESS DISTRIBUTIONS: | | | | | | | | |
| Distributions from Net Investment Income | | | (0.24 | ) | | | — | |
| Total Distributions | | | (0.24 | ) | | | — | |
| Net Asset Value, End of Period | | $ | 26.12 | | | $ | 25.33 | |
| Total Return | | | 4.02 | %(4) | | | 1.79 | %(4) |
| | | | | | | | | |
| SUPPLEMENTAL DATA: | | | | | | | | |
| Net Assets at End of Period (000’s) | | $ | 2,612 | | | $ | 2,533 | |
| | | | | | | | | |
| RATIOS TO AVERAGE NET ASSETS: | | | | | | | | |
| Expenses to Average Net Assets | | | 0.60 | %(5) | | | 0.60 | %(5) |
| Net Investment Income to Average Net Assets | | | 1.34 | %(5) | | | 0.25 | %(5) |
Portfolio Turnover Rate(6) | | | 0 | %(4) | | | 0 | %(4) |
| (1) | Commencement of operations on April 9, 2018. |
| (2) | Calculated based on average shares outstanding during the period. |
| (3) | Less than $0.005. |
| (4) | Not annualized. |
| (5) | Annualized. |
| (6) | Excluded impact of in-kind transactions. |
The accompanying notes are an integral part of these financial statements.
Pacer Benchmark Retail Real Estate SCTRSM ETF
FINANCIAL HIGHLIGHTS
For a capital share outstanding throughout the period
| | | For the | |
| | | Period Ended | |
| | | October 31, 2018(1) | |
| Net Asset Value, Beginning of Period | | $ | 24.30 | |
| | | | | |
| INCOME FROM INVESTMENT OPERATIONS: | | | | |
Net Investment Income(2) | | | 0.56 | |
| Net Realized and Unrealized Gain on Investments | | | 2.39 | |
| Total from Investment Operations | | | 2.95 | |
| | | | | |
| LESS DISTRIBUTIONS: | | | | |
| Distributions from Net Investment Income | | | (0.43 | ) |
| Total Distributions | | | (0.43 | ) |
| Net Asset Value, End of Period | | $ | 26.82 | |
| Total Return | | | 12.13 | %(4) |
| | | | | |
| SUPPLEMENTAL DATA: | | | | |
| Net Assets at End of Period (000’s) | | $ | 2,682 | |
| | | | | |
| RATIOS TO AVERAGE NET ASSETS: | | | | |
| Expenses to Average Net Assets | | | 0.60 | %(5) |
| Net Investment Income to Average Net Assets | | | 0.00 | %(3)(5) |
Portfolio Turnover Rate(6) | | | 35 | %(4) |
| (1) | Commencement of operations on May 15, 2018. |
| (2) | Calculated based on average shares outstanding during the period. |
| (3) | Less than 0.5%. |
| (4) | Not annualized. |
| (5) | Annualized. |
| (6) | Excluded impact of in-kind transactions. |
The accompanying notes are an integral part of these financial statements.
Pacer Benchmark Industrial Real Estate SCTRSM ETF
FINANCIAL HIGHLIGHTS
For a capital share outstanding throughout the period
| | | For the | |
| | | Period Ended | |
| | | October 31, 2018(1) | |
| Net Asset Value, Beginning of Period | | $ | 24.83 | |
| | | | | |
| INCOME FROM INVESTMENT OPERATIONS: | | | | |
Net Investment Income(2) | | | 0.40 | |
| Net Realized and Unrealized Gain on Investments | | | (0.14 | ) |
| Total from Investment Operations | | | 0.26 | |
| | | | | |
| LESS DISTRIBUTIONS: | | | | |
| Distributions from Net Investment Income | | | (0.27 | ) |
| Total Distributions | | | (0.27 | ) |
| Net Asset Value, End of Period | | $ | 24.82 | |
| Total Return | | | 1.05 | %(4) |
| | | | | |
| SUPPLEMENTAL DATA: | | | | |
| Net Assets at End of Period (000’s) | | $ | 2,482 | |
| | | | | |
| RATIOS TO AVERAGE NET ASSETS: | | | | |
| Expenses to Average Net Assets | | | 0.60 | %(5) |
| Net Investment Income to Average Net Assets | | | 0.00 | %(5) |
Portfolio Turnover Rate(6) | | | 16 | %(4) |
| (1) | Commencement of operations on May 14, 2018. |
| (2) | Calculated based on average shares outstanding during the period. |
| (3) | Less than 0.5%. |
| (4) | Not annualized. |
| (5) | Annualized. |
| (6) | Excluded impact of in-kind transactions. |
The accompanying notes are an integral part of these financial statements.
Pacer Benchmark Data & Infrastructure Real Estate SCTRSM ETF
FINANCIAL HIGHLIGHTS
For a capital share outstanding throughout the period
| | | For the | |
| | | Period Ended | |
| | | October 31, 2018(1) | |
| Net Asset Value, Beginning of Period | | $ | 24.67 | |
| | | | | |
| INCOME FROM INVESTMENT OPERATIONS: | | | | |
Net Investment Income(2) | | | 0.43 | |
| Net Realized and Unrealized Gain on Investments | | | (0.51 | ) |
| Total from Investment Operations | | | (0.08 | ) |
| | | | | |
| LESS DISTRIBUTIONS: | | | | |
| Distributions from Net Investment Income | | | (0.31 | ) |
| Total Distributions | | | (0.31 | ) |
| Net Asset Value, End of Period | | $ | 24.28 | |
| Total Return | | | -0.38 | %(4) |
| | | | | |
| SUPPLEMENTAL DATA: | | | | |
| Net Assets at End of Period (000’s) | | $ | 4,857 | |
| | | | | |
| RATIOS TO AVERAGE NET ASSETS: | | | | |
| Expenses to Average Net Assets | | | 0.60 | %(5) |
| Net Investment Income to Average Net Assets | | | 0.00 | %(3)(5) |
Portfolio Turnover Rate(6) | | | 9 | %(4) |
| (1) | Commencement of operations on May 15, 2018. |
| (2) | Calculated based on average shares outstanding during the period. |
| (3) | Less than 0.5%. |
| (4) | Not annualized. |
| (5) | Annualized. |
| (6) | Excluded impact of in-kind transactions. |
The accompanying notes are an integral part of these financial statements.
Pacer US Export Leaders ETF
FINANCIAL HIGHLIGHTS
For a capital share outstanding throughout the period
| | | For the | |
| | | Period Ended | |
| | | October 31, 2018(1) | |
| Net Asset Value, Beginning of Period | | $ | 24.98 | |
| | | | | |
| INCOME FROM INVESTMENT OPERATIONS: | | | | |
Net Investment Income(2) | | | 0.03 | |
| Net Realized and Unrealized Gain on Investments | | | (2.11 | ) |
| Total from Investment Operations | | | (2.08 | ) |
| | | | | |
| LESS DISTRIBUTIONS: | | | | |
| Distributions from Net Investment Income | | | (0.02 | ) |
| Total Distributions | | | (0.02 | ) |
| Net Asset Value, End of Period | | $ | 22.88 | |
| Total Return | | | -8.33 | %(3) |
| | | | | |
| SUPPLEMENTAL DATA: | | | | |
| Net Assets at End of Period (000’s) | | $ | 2,288 | |
| | | | | |
| RATIOS TO AVERAGE NET ASSETS: | | | | |
| Expenses to Average Net Assets | | | 0.60 | %(4) |
| Net Investment Income to Average Net Assets | | | 0.40 | %(4) |
Portfolio Turnover Rate(6) | | | 18 | %(3) |
| (1) | Commencement of operations on July 23, 2018. |
| (2) | Calculated based on average shares outstanding during the period. |
| (3) | Not annualized. |
| (4) | Annualized. |
| (5) | Excluded impact of in-kind transactions. |
The accompanying notes are an integral part of these financial statements.
Pacer CFRA-Stovall Equal Weight Seasonal Rotation ETF
FINANCIAL HIGHLIGHTS
For a capital share outstanding throughout the period
| | | For the | |
| | | Period Ended | |
| | | October 31, 2018(1) | |
| Net Asset Value, Beginning of Period | | $ | 25.01 | |
| | | | | |
| INCOME FROM INVESTMENT OPERATIONS: | | | | |
Net Investment Income(2) | | | 0.08 | |
| Net Realized and Unrealized Gain on Investments | | | 0.01 | |
| Total from Investment Operations | | | 0.09 | |
| | | | | |
| LESS DISTRIBUTIONS: | | | | |
| Distributions from Net Investment Income | | | (0.05 | ) |
| Total Distributions | | | (0.05 | ) |
| Net Asset Value, End of Period | | $ | 25.05 | |
| Total Return | | | 0.39 | %(3) |
| | | | | |
| SUPPLEMENTAL DATA: | | | | |
| Net Assets at End of Period (000’s) | | $ | 2,505 | |
| | | | | |
| RATIOS TO AVERAGE NET ASSETS: | | | | |
| Expenses to Average Net Assets | | | 0.60 | %(4) |
| Net Investment Income to Average Net Assets | | | 1.11 | %(4) |
Portfolio Turnover Rate(6) | | | 0 | %(3) |
| (1) | Commencement of operations on July 23, 2018. |
| (2) | Calculated based on average shares outstanding during the period. |
| (3) | Not annualized. |
| (4) | Annualized. |
| (5) | Excluded impact of in-kind transactions. |
The accompanying notes are an integral part of these financial statements.
Pacer Funds
NOTES TO FINANCIAL STATEMENTS
October 31, 2018 (Unaudited)
NOTE 1 – ORGANIZATION
Pacer Trendpilot® US Large Cap ETF, Pacer Trendpilot® US Mid Cap ETF, Pacer Trendpilot® 100 ETF, Pacer Trendpilot® European Index ETF, Pacer Global Cash Cows Dividend ETF, Pacer US Cash Cows 100 ETF, Pacer US Small Cap Cash Cows 100 ETF, Pacer Developed Markets International Cash Cows 100 ETF, Pacer WealthShield ETF, Pacer Military Times Best Employers ETF, Pacer Benchmark Industrial Real Estate SCTRSM ETF, Pacer Benchmark Retail Real Estate SCTRSM ETF, Pacer Benchmark Data & Infrastructure Real Estate SCTRSM, Pacer US Export Leaders ETF, and Pacer CFRA-Stovall Equal Weight Seasonal Rotation Index ETF (individually the “Fund” or collectively the “Funds”) are series of Pacer Funds Trust (the “Trust”), a Delaware statutory trust organized on August 12, 2014. The Trust is registered with the Securities and Exchange Commission (the “SEC”) under the Investment Company Act of 1940, as amended (the “1940 Act”), as an open-end management investment company and the offering of the Funds’ shares (“Shares”) is registered under the Securities Act of 1933, as amended (the “Securities Act”). The investment objectives of the Funds are to seek to track the total return performance, before fees and expenses, of the Pacer Trendpilot® US Large Cap Index, the Pacer Trendpilot® US Mid-Cap Index, the Pacer NASDAQ-100 Trendpilot® Index, the Pacer Trendpilot® European Index, the Pacer Global Cash Cows High Dividends 100 Index, the Pacer US Cash Cows 100 Index, the Pacer US Small Cap Cash Cows Index, the Pacer Developed Markets International Cash Cows 100 Index, the Pacer WealthShield Index, the Military Times Best for VETSSM Index, the Benchmark Industrial Real Estate SCTRSM Index, the Benchmark Retail Real Estate SCTRSM Index, the Benchmark Data & Infrastructure Real Estate SCTRSM Index, the Pacer US Export Leaders ETF and the Pacer CFRA-Stovall Equal Weight Seasonal Rotation Index. Pacer Trendpilot® US Large Cap ETF, Pacer Trendpilot® US Mid Cap ETF, and Pacer Trendpilot® 100 ETF commenced operations on June 11, 2015. Pacer Trendpilot® European Index ETF commenced operations on December 14, 2015. Pacer Global Cash Cows Dividend ETF commenced operations on February 22, 2016. Pacer US Cash Cows 100 ETF commenced operations on December 16, 2016. Pacer US Small Cap Cash Cows 100 ETF and Pacer Developed Markets International Cash Cows 100 ETF commenced operations on June 16, 2017. Pacer WealthShield ETF commenced operations on December 11, 2017. Pacer Military Times Best Employers ETF commenced operations on April 9, 2018. Pacer Benchmark Industrial Real Estate SCTRSM ETF commenced operations on May 14, 2018. Pacer Benchmark Retail Real Estate SCTRSM ETF and Pacer Benchmark Data & Infrastructure Real Estate SCTRSM ETF commenced operations on May 15, 2018. Pacer US Export Leaders ETF, and Pacer CFRA-Stovall Equal Weight Seasonal Rotation Index ETF commenced operations on July 23, 2018. Each of the Funds are non-diversified series of the Trust.
Shares of the Funds are listed and traded on the Cboe BZX Exchange, Inc. (“Cboe”) with the exceptions of Pacer Military Times Best Employers ETF, which is listed and traded on the Nasdaq Stock Market LLC. (“Nasdaq”) and Pacer Benchmark Industrial Real Estate SCTRSM ETF, Pacer Benchmark Retail Real Estate SCTRSM ETF, Pacer Benchmark Data & Infrastructure Real Estate SCTRSM, Pacer US Export Leaders ETF, and Pacer CFRA-Stovall Equal Weight Seasonal Rotation Index ETF, which are listed and traded on the NYSE Arca, Inc. (“NYSE”). Market prices for the shares may be different from their net asset value (“NAV”). The Funds issue and redeem shares on a continuous basis at NAV only in large blocks of shares, called “Creation Units,” which generally consist of 50,000 shares. Creation Units are issued and redeemed principally in-kind for securities included in a specified universe. Once created, Shares generally trade in the secondary market at market prices that change throughout the day in amounts less than a Creation Unit. Except when aggregated in Creation Units, Shares are not redeemable securities of a Fund. Shares of a Fund may only be purchased directly from or redeemed directly to a Fund by certain financial institutions (“Authorized Participants”). An Authorized Participant is either (i) a broker-dealer or other participant in the clearing process through the Continuous Net Settlement System of the National Securities Clearing Corporation or (ii) a DTC participant and, in each case, must have executed a Participant Agreement with Pacer Financial, Inc. (the “Distributor”). Most retail investors do not qualify as Authorized Participants nor have the resources to buy and sell whole Creation Units. Therefore, they are unable to purchase or redeem the shares directly from a Fund. Rather, most retail investors may purchase Shares in the secondary market with the assistance of a broker and are subject to customary brokerage commissions or fees.
The Funds each currently offer one class of Shares, which have no front end sales loads, no deferred sales charges, and no redemption fees. A purchase (i.e., creation) transaction fee is imposed for the transfer and other transaction costs associated with the purchase of Creation Units. Pacer Trendpilot® US Large Cap ETF charges $500, Pacer Trendpilot® US Mid Cap ETF charges $500, Pacer Trendpilot® 100 ETF charges $250, Pacer Trendpilot® European Index ETF charges $2,000, Pacer Global Cash Cows Dividend ETF charges $1,500, Pacer US Cash Cows 100 ETF charges $250, Pacer US Small Cap Cash Cows 100 ETF charges $250, Pacer Developed Markets International Cash Cows 100 ETF charges $1,500, Pacer WealthShield ETF charges $250, Pacer Military Times Best Employers ETF charges $250, Pacer Benchmark Industrial Real Estate SCTRSM ETF charges $250, Pacer Benchmark Retail Real Estate SCTRSM ETF charges $250, Pacer Benchmark Data & Infrastructure Real Estate SCTRSM charges, Pacer US Export Leaders ETF charges, and Pacer CFRA-Stovall Equal Weight Seasonal Rotation Index ETF charges $500 for the standard fixed creation fee. For the Pacer Trendpilot® US Large Cap ETF, Pacer Trendpilot® US Mid Cap ETF, Pacer Trendpilot® 100 ETF, and the Pacer Trendpilot® European Index ETF, the standard fixed creation transaction fee is $200 when the Deposit Securities include only U.S. Treasury bills. In addition, a variable fee may be charged on all cash
Pacer Funds
NOTES TO FINANCIAL STATEMENTS
October 31, 2018 (Unaudited) (Continued)
transactions or substitutes for Creation Units of up to a maximum of 2% as a percentage of the value of the Creation Units subject to the transaction. Variable fees received by each Fund are displayed in the Capital Share Transaction section of the Statement of Changes in Net Assets. Each Fund may issue an unlimited number of shares of beneficial interest, with no par value. Shares of each Fund have equal rights and privileges with respect to such Fund.
NOTE 2 – SIGNIFICANT ACCOUNTING POLICIES
The following is a summary of significant accounting policies consistently followed by the Funds in the preparation of the financial statements. The financial statements have been prepared in conformity with accounting principles generally accepted in the United States of America (“GAAP”). The Funds are investment companies that follow the accounting and reporting guidelines of Accounting Standards Codification Topic 946 applicable to investment companies.
| A. | Investment Valuation. Securities listed on a securities exchange, market or automated quotation system for which quotations are readily available, are valued at the last quoted sale price on the primary exchange or market (foreign or domestic) on which they are traded, except for securities listed on Nasdaq Global Market (“Nasdaq”). If, on a particular day, there is no such reported sale, then the most recent quoted bid price will be used. For securities traded on Nasdaq, the Nasdaq Official Closing Price (“NOCP”) will be used. If a Fund holds foreign shares of a security for which there is no reported volume, and there is an actively trading local version of the security, the last quoted sale price of the local security shall be used. Prices denominated in foreign currencies are converted to U.S. dollar equivalents at the current exchange rate. |
| | |
| | Investments in other open-end investment companies, including money market funds, are valued at the investment company’s net asset value per share, with the exception of exchange-traded open-end investment companies, which are priced as equity securities described above. |
| | |
| | Fixed-income securities are normally valued on the basis of quotes obtained from independent pricing services in accordance with the procedures adopted by the Board of Trustees (the “Board”). The independent pricing services may employ methodologies that utilize market transactions (if the security is actively traded), broker-dealer supplied valuations, or matrix pricing. Short-term securities that have maturities of less than 60 days, at the time of purchase, are valued at amortized cost, which, when combined with accrued interest, approximates market value. |
| | |
| | Any securities for which there are no readily available market quotations and other assets will be valued at their fair value as determined in good faith by the Fair Value Pricing Committee using the Fair Value Procedures approved by the Board. |
| | |
| | As described above, the Funds utilize various methods to measure the fair value of their investments on a recurring basis. GAAP establishes a hierarchy that prioritizes inputs to valuations methods. The three levels of inputs are: |
| | Level 1 – | Unadjusted quoted prices in active markets for identical assets or liabilities that the Funds have the ability to access. |
| | | |
| | Level 2 – | Observable inputs other than quoted prices included in Level 1 that are observable for the asset or liability, either directly or indirectly. These inputs may include quoted prices for the identical instrument on an inactive market, prices for similar instruments, interest rates, prepayment speeds, credit risk, yield curves, default rates and similar data. |
| | | |
| | Level 3 – | Unobservable inputs for the asset or liability, to the extent relevant observable inputs are not available; representing the Funds’ own assumptions about the assumptions a market participant would use in valuing the asset or liability, and would be based on the best information available. |
| | The availability of observable inputs can vary from security to security and is affected by a wide variety of factors, including, for example, the type of security, whether the security is new and not yet established in the marketplace, the liquidity of markets, and other characteristics particular to the security. To the extent that valuation is based on models or inputs that are less observable or unobservable in the market, the determination of fair value requires more judgment. Accordingly, the degree of judgment exercised in determining fair value is greatest for instruments categorized in Level 3. |
| | |
| | The inputs used to measure fair value may fall into different levels of the fair value hierarchy. In such cases, for disclosure purposes, the level in the fair value hierarchy within which the fair value measurement falls in its entirety, is determined based on the lowest level input that is significant to the fair value measurement in its entirety. |
Pacer Funds
NOTES TO FINANCIAL STATEMENTS
October 31, 2018 (Unaudited) (Continued)
| | The following is a summary of the inputs used to value the Funds’ investments as of October 31, 2018: |
| | Pacer Trendpilot® US Large Cap ETF | | | | | | | | | | | | | | | |
| | | | | | | | | | | | | Investments | | | | |
| | | | | | | | | | | | | Measured at | | | | |
| | Description | | Level 1 | | | Level 2 | | | Level 3 | | | Net Asset Value | | | Total | |
| | Short-Term Investments | | $ | — | | | $ | 1,643,709 | | | $ | — | | | $ | — | | | $ | 1,643,709 | |
| | Investments Purchased with | | | | | | | | | | | | | | | | | | | | |
| | Proceeds from Securities Lending | | | — | | | | — | | | | — | | | | 26,157,581 | | | | 26,157,581 | |
| | Total Investments in Securities | | $ | — | | | $ | 1,643,709 | | | $ | — | | | $ | 26,157,581 | | | $ | 27,801,290 | |
| | | | | | | | | | | | | | | | | | | | | | |
| | Pacer Trendpilot® US Mid Cap ETF | | | | | | | | | | | | | | | | | | | | |
| | | | | | | | | | | | | | | | Investments | | | | | |
| | | | | | | | | | | | | | | | Measured at | | | | | |
| | Description | | Level 1 | | | Level 2 | | | Level 3 | | | Net Asset Value | | | Total | |
| | Short-Term Investments | | $ | — | | | $ | 632,963,782 | | | $ | — | | | $ | — | | | $ | 632,963,782 | |
| | Investments Purchased with | | | | | | | | | | | | | | | | | | | | |
| | Proceeds from Securities Lending | | | — | | | | — | | | | — | | | | 190,038,750 | | | | 190,038,750 | |
| | Total Investments in Securities | | $ | — | | | $ | 632,963,782 | | | $ | — | | | $ | 190,038,750 | | | $ | 823,002,532 | |
| | | | | | | | | | | | | | | | | | | | | | |
| | Pacer Trendpilot® 100 ETF | | | | | | | | | | | | | | | | | | | | |
| | | | | | | | | | | | | | | | Investments | | | | | |
| | | | | | | | | | | | | | | | Measured at | | | | | |
| | Description^ | | Level 1 | | | Level 2 | | | Level 3 | | | Net Asset Value | | | Total | |
| | Common Stocks | | $ | 162,167,469 | | | $ | — | | | $ | — | | | $ | — | | | $ | 162,167,469 | |
| | Short-Term Investments | | | — | | | | 460,940 | | | | — | | | | — | | | | 460,940 | |
| | Investments Purchased with | | | | | | | | | | | | | | | | | | | | |
| | Proceeds from Securities Lending | | | — | | | | — | | | | — | | | | 18,804,517 | | | | 18,804,517 | |
| | Total Investments in Securities | | $ | 162,167,469 | | | $ | 460,940 | | | $ | — | | | $ | 18,804,517 | | | $ | 181,432,926 | |
| | | | | | | | | | | | | | | | | | | | | | |
| | ^ See Schedule of Investments for industry breakouts. | | | | | | | | | | | | | | | | | | | | |
| | | | | | | | | | | | | | | | | | | | | | |
| | Pacer Trendpilot® European Index ETF | | | | | | | | | | | | | | | | | | | | |
| | | | | | | | | | | | | | | | Investments | | | | | |
| | | | | | | | | | | | | | | | Measured at | | | | | |
| | Description^ | | Level 1 | | | Level 2 | | | Level 3 | | | Net Asset Value | | | Total | |
| | Common Stocks | | $ | — | | | $ | — | | | $ | 6,845 | | | $ | — | | | $ | 6,845 | |
| | Short-Term Investments | | | — | | | | 158,865,247 | | | | — | | | | — | | | | 158,865,247 | |
| | Investments Purchased with | | | | | | | | | | | | | | | | | | | | |
| | Proceeds from Securities Lending | | | — | | | | — | | | | — | | | | 47,763,750 | | | | 47,763,750 | |
| | Total Investments in Securities | | $ | — | | | $ | 158,865,247 | | | $ | 6,845 | | | $ | 47,763,750 | | | $ | 206,635,842 | |
| | | | | | | | | | | | | | | | | | | | | | |
| | ^ See Schedule of Investments for industry breakouts. | | | | | | | | | | | | | | | | | | | | |
| | | | | | | | | | | | | | | | | | | | | | |
| | Pacer Global Cash Cows Dividend ETF | | | | | | | | | | | | | | | | | | | | |
| | | | | | | | | | | | | | | | Investments | | | | | |
| | | | | | | | | | | | | | | | Measured at | | | | | |
| | Description^ | | Level 1 | | | Level 2 | | | Level 3 | | | Net Asset Value | | | Total | |
| | Common Stocks | | $ | 178,806,683 | | | $ | — | | | $ | — | | | $ | — | | | $ | 178,806,683 | |
| | Real Estate Investment Trusts | | | 9,372,612 | | | | — | | | | — | | | | — | | | | 9,372,612 | |
| | Short-Term Investments | | | — | | | | 145,313 | | | | — | | | | — | | | | 145,313 | |
| | Investments Purchased with | | | | | | | | | | | | | | | | | | | | |
| | Proceeds from Securities Lending | | | — | | | | — | | | | — | | | | 38,789,497 | | | | 38,789,497 | |
| | Total | | $ | 188,179,295 | | | $ | 145,313 | | | $ | — | | | $ | 38,789,497 | | | $ | 227,114,105 | |
| | | | | | | | | | | | | | | | | | | | | | |
| | ^ See Schedule of Investments for country breakouts. | | | | | | | | | | | | | | | | | | | | |
Pacer Funds
NOTES TO FINANCIAL STATEMENTS
October 31, 2018 (Unaudited) (Continued)
| | Pacer US Cash Cows 100 ETF | | | | | | | | | | | | | | | |
| | | | | | | | | | | | | Investments | | | | |
| | | | | | | | | | | | | Measured at | | | | |
| | Description^ | | Level 1 | | | Level 2 | | | Level 3 | | | Net Asset Value | | | Total | |
| | Common Stocks | | $ | 165,407,693 | | | $ | — | | | $ | — | | | $ | — | | | $ | 165,407,693 | |
| | Real Estate Investment Trusts | | | 6,213,311 | | | | — | | | | — | | | | — | | | | 6,213,311 | |
| | Short-Term Investments | | | — | | | | 266,284 | | | | — | | | | — | | | | 266,284 | |
| | Investments Purchased with | | | | | | | | | | | | | | | | | | | | |
| | Proceeds from Securities Lending | | | — | | | | — | | | | — | | | | 18,809,270 | | | | 18,809,270 | |
| | Total Investments in Securities | | $ | 171,621,004 | | | $ | 266,284 | | | $ | — | | | $ | 18,809,270 | | | $ | 190,696,558 | |
| | | | | | | | | | | | | | | | | | | | | | |
| | ^ See Schedule of Investments for industry breakouts. | | | | | | | | | | | | | | | | | | | | |
| | | | | | | | | | | | | | | | | | | | | | |
| | Pacer US Small Cap Cash Cows 100 ETF | | | | | | | | | | | | | | | | | | | | |
| | | | | | | | | | | | | | | | Investments | | | | | |
| | | | | | | | | | | | | | | | Measured at | | | | | |
| | Description^ | | Level 1 | | | Level 2 | | | Level 3 | | | Net Asset Value | | | Total | |
| | Common Stocks | | $ | 23,711,881 | | | $ | — | | | $ | — | | | $ | — | | | $ | 23,711,881 | |
| | Real Estate Investment Trusts | | | 1,066,778 | | | | — | | | | — | | | | — | | | | 1,066,778 | |
| | Short-Term Investments | | | — | | | | 19,526 | | | | — | | | | — | | | | 19,526 | |
| | Investments Purchased with | | | | | | | | | | | | | | | | | | | | |
| | Proceeds from Securities Lending | | | — | | | | — | | | | — | | | | 2,135,082 | | | | 2,135,082 | |
| | Total | | $ | 24,778,659 | | | $ | 19,526 | | | $ | — | | | $ | 2,135,082 | | | $ | 26,933,267 | |
| | | | | | | | | | | | | | | | | | | | | | |
| | ^ See Schedule of Investments for industry breakouts. | | | | | | | | | | | | | | | | | | | | |
| | | | | | | | | | | | | | | | | | | | | | |
| | Pacer Developed Markets International Cash Cows 100 ETF | | | | | | | | | | | | | | | | | | | | |
| | | | | | | | | | | | | | | | Investments | | | | | |
| | | | | | | | | | | | | | | | Measured at | | | | | |
| | Description^ | | Level 1 | | | Level 2 | | | Level 3 | | | Net Asset Value | | | Total | |
| | Common Stocks | | $ | 27,790,778 | | | $ | — | | | $ | — | | | $ | — | | | $ | 27,790,778 | |
| | Short-Term Investments | | | — | | | | 23,065 | | | | — | | | | — | | | | 23,065 | |
| | Investments Purchased with | | | | | | | | | | | | | | | | | | | | |
| | Proceeds from Securities Lending | | | — | | | | — | | | | — | | | | 1,945,516 | | | | 1,945,516 | |
| | Total Investments in Securities | | $ | 27,790,778 | | | $ | 23,065 | | | $ | — | | | $ | 1,945,516 | | | $ | 29,759,359 | |
| | | | | | | | | | | | | | | | | | | | | | |
| | ^ See Schedule of Investments for country breakouts. | | | | | | | | | | | | | | | | | | | | |
| | | | | | | | | | | | | | | | | | | | | | |
| | Pacer WealthShield ETF | | | | | | | | | | | | | | | | | | | | |
| | | | | | | | | | | | | | | | Investments | | | | | |
| | | | | | | | | | | | | | | | Measured at | | | | | |
| | Description | | Level 1 | | | Level 2 | | | Level 3 | | | Net Asset Value | | | Total | |
| | Short-Term Investments | | $ | — | | | $ | 341,378 | | | $ | — | | | $ | — | | | $ | 341,378 | |
| | Total Investments in Securities | | $ | — | | | $ | 341,378 | | | $ | — | | | $ | — | | | $ | 341,378 | |
| | | | | | | | | | | | | | | | | | | | | | |
| | Pacer Military Times Best Employers ETF | | | | | | | | | | | | | | | | | | | | |
| | | | | | | | | | | | | | | | Investments | | | | | |
| | | | | | | | | | | | | | | | Measured at | | | | | |
| | Description^ | | Level 1 | | | Level 2 | | | Level 3 | | | Net Asset Value | | | Total | |
| | Common Stocks | | $ | 2,610,358 | | | $ | — | | | $ | — | | | $ | — | | | $ | 2,610,358 | |
| | Short-Term Investments | | | — | | | | 949 | | | | — | | | | — | | | | 949 | |
| | Total Investments in Securities | | $ | 2,610,358 | | | $ | 949 | | | $ | — | | | $ | — | | | $ | 2,611,307 | |
| | | | | | | | | | | | | | | | | | | | | | |
| | ^ See Schedule of Investments for industry breakouts. | | | | | | | | | | | | | | | | | | | | |
Pacer Funds
NOTES TO FINANCIAL STATEMENTS
October 31, 2018 (Unaudited) (Continued)
| | Pacer Benchmark Retail Real Estate SCTRSM ETF | | | | | | | | | | | | | | | |
| | | | | | | | | | | | | Investments | | | | |
| | | | | | | | | | | | | Measured at | | | | |
| | Description^ | | Level 1 | | | Level 2 | | | Level 3 | | | Net Asset Value | | | Total | |
| | Real Estate Investment Trusts | | $ | 2,651,950 | | | $ | — | | | $ | — | | | $ | — | | | $ | 2,651,950 | |
| | Short-Term Investments | | | — | | | | 28,661 | | | | — | | | | — | | | | 28,661 | |
| | Total Investments in Securities | | $ | 2,651,950 | | | $ | 28,661 | | | $ | — | | | $ | — | | | $ | 2,680,611 | |
| | | | | | | | | | | | | | | | | | | | | | |
| | ^ See Schedule of Investments for industry breakouts. | | | | | | | | | | | | | | | | | | | | |
| | | | | | | | | | | | | | | | | | | | | | |
| | Pacer Benchmark Industrial Real Estate SCTRSM ETF | | | | | | | | | | | | | | | | | | | | |
| | | | | | | | | | | | | | | | Investments | | | | | |
| | | | | | | | | | | | | | | | Measured at | | | | | |
| | Description^ | | Level 1 | | | Level 2 | | | Level 3 | | | Net Asset Value | | | Total | |
| | Real Estate Investment Trusts | | $ | 2,478,971 | | | $ | — | | | $ | — | | | $ | — | | | $ | 2,478,971 | |
| | Short-Term Investments | | | — | | | | 3,365 | | | | — | | | | — | | | | 3,365 | |
| | Total Investments in Securities | | $ | 2,478,971 | | | $ | 3,365 | | | $ | — | | | $ | — | | | $ | 2,482,336 | |
| | | | | | | | | | | | | | | | | | | | | | |
| | ^ See Schedule of Investments for industry breakouts. | | | | | | | | | | | | | | | | | | | | |
| | | | | | | | | | | | | | | | | | | | | | |
| | Pacer Benchmark Data & Infrastructure Real Estate SCTRSM ETF | | | | | | | | | | | | | | | | | |
| | | | | | | | | | | | | | | | Investments | | | | | |
| | | | | | | | | | | | | | | | Measured at | | | | | |
| | Description^ | | Level 1 | | | Level 2 | | | Level 3 | | | Net Asset Value | | | Total | |
| | Common Stocks | | $ | 341,204 | | | $ | — | | | $ | — | | | $ | — | | | $ | 341,204 | |
| | Real Estate Investment Trusts | | | 4,487,848 | | | | — | | | | — | | | | — | | | | 4,487,848 | |
| | Short-Term Investments | | | — | | | | 10,999 | | | | — | | | | — | | | | 10,999 | |
| | Total Investments in Securities | | $ | 4,829,052 | | | $ | 10,999 | | | $ | — | | | $ | — | | | $ | 4,840,051 | |
| | | | | | | | | | | | | | | | | | | | | | |
| | ^ See Schedule of Investments for industry breakouts. | | | | | | | | | | | | | | | | | | | | |
| | | | | | | | | | | | | | | | | | | | | | |
| | Pacer US Export Leaders ETF | | | | | | | | | | | | | | | | | | | | |
| | | | | | | | | | | | | | | | Investments | | | | | |
| | | | | | | | | | | | | | | | Measured at | | | | | |
| | Description^ | | Level 1 | | | Level 2 | | | Level 3 | | | Net Asset Value | | | Total | |
| | Common Stocks | | $ | 2,265,557 | | | $ | — | | | $ | — | | | $ | — | | | $ | 2,265,557 | |
| | Real Estate Investment Trusts | | | 20,113 | | | | — | | | | — | | | | — | | | | 20,113 | |
| | Short-Term Investments | | | — | | | | 2,334 | | | | — | | | | — | | | | 2,334 | |
| | Total Investments in Securities | | $ | 2,285,670 | | | $ | 2,334 | | | $ | — | | | $ | — | | | $ | 2,288,004 | |
| | | | | | | | | | | | | | | | | | | | | | |
| | ^ See Schedule of Investments for industry breakouts. | | | | | | | | | | | | | | | | | | | | |
| | | | | | | | | | | | | | | | | | | | | | |
| | Pacer CFRA-Stovall Equal Weight Seasonal Rotation ETF | | | | | | | | | | | | | | | | | | | | |
| | | | | | | | | | | | | | | | Investments | | | | | |
| | | | | | | | | | | | | | | | Measured at | | | | | |
| | Description^ | | Level 1 | | | Level 2 | | | Level 3 | | | Net Asset Value | | | Total | |
| | Common Stocks | | $ | 2,498,108 | | | $ | — | | | $ | — | | | $ | — | | | $ | 2,498,108 | |
| | Short-Term Investments | | | — | | | | 26,131 | | | | — | | | | — | | | | 26,131 | |
| | Total Investments in Securities | | $ | 2,498,108 | | | $ | 26,131 | | | $ | — | | | $ | — | | | $ | 2,524,239 | |
| | | | | | | | | | | | | | | | | | | | | | |
| | ^ See Schedule of Investments for industry breakouts. | | | | | | | | | | | | | | | | | | | | |
| | The following is a reconciliation of investments in which significant unobservable inputs (Level 3) were used in determining fair value: |
| | | | | | | | | | | Net Change in |
| | | | | | | | | | | Unrealized |
| | | | | Change in Net | | | | | | Appreciation |
| | | Balance | | Unrealized | | | Transfers | Transfers | Balance | (Depreciation) on |
| | Pacer Trendpilot | as of | Net Realized | Appreciation | | | Into | Out of | as of | securities held at |
| | European Index ETF | 4/30/2018 | Gain (Loss) | (Depreciation) | Purchases | Sales | Level 3 | Level 3 | 10/31/2018 | 10/31/2018 |
| | Common Stocks | $ — | $ — | $ — | $ — | $ — | $6,845 | $ — | $6,845 | $(17,523) |
Pacer Funds
NOTES TO FINANCIAL STATEMENTS
October 31, 2018 (Unaudited) (Continued)
| | The following is a summary of quantitative information about Level 3 Fair Value Measurements: |
| | Pacer Trendpilot | Fair Value as | Valuation | Unobservable | Input | |
| | European Index ETF | of 10/31/2018 | Techniques | Input | Values | Impact to valuation from an increase to input |
| | | | | | | Significant changes in the information surrounding |
| | | | Last Trade | | | the company would result in direct and proportional |
| | Common Stocks | $ 6,845 | Price | Stale Data | 4.80 EUR | changes in the fair value of the security. |
| | Transfers between levels are recognized at the end of the reporting period. During the period ended October 31, 2018, the Funds’ recognized no transfers to or from Level 3, except Pacer Trendpilot European Index ETF. |
| | |
| B. | Foreign Currency. Investment securities and other assets and liabilities denominated in foreign currencies are translated into U.S. dollar amounts at the date of valuation. Purchases and sales of investment securities and income and expense items denominated in foreign currencies are translated into U.S. dollar amounts on the respective dates of such transactions. The Funds do not isolate that portion of the results of operations resulting from changes in foreign exchange rates on investments from fluctuations arising from changes in market prices of securities held. Such fluctuations are included with the net realized and unrealized gain or loss from investments. The Funds report net realized foreign exchange gains or losses that arise from sales of foreign currencies, currency gains or losses realized between the trade and settlement dates on securities transactions, and the differences between the amounts of dividends, interest and foreign withholding taxes recorded on the Funds’ books and the U.S. dollar equivalent gains and losses arise from changes in the fair values of assets and liabilities, other than investments in securities at fiscal period end, resulting from changes in exchange rates. |
| | |
| C. | Federal Income Taxes. The Funds comply with the requirements of subchapter M of the Internal Revenue Code of 1986, as amended, necessary to qualify as regulated investment companies and distribute substantially all net taxable investment income and net realized gains to shareholders in a manner which results in no tax cost to the Funds. Therefore, no federal income tax provision is required. As of and during the fiscal period/year ended April 30, 2018, the Funds did not have any tax positions that did not meet the “more-likely-than-not” threshold of being sustained by the applicable tax authority. As of and during the fiscal period/year ended April 30, 2018, the Funds did not have liabilities for any unrecognized tax benefits on uncertain tax positions as income tax expense in the Statement of Operations. The Funds are subject to examination by U.S. taxing authorities for the tax periods since each Fund’s commencement of operations. |
| | |
| D. | Security Transactions and Investment Income. Investment securities transactions are accounted for on the trade date. Gains and losses realized on sales of securities are computed on the basis of highest amortized cost. Dividend income is recorded on the ex-dividend date. Interest income is recorded on an accrual basis. Discounts and premiums on securities purchased are accreted and amortized over the lives of the respective securities. Withholding taxes on foreign dividends have been provided for in accordance with the Funds’ understanding of the applicable tax rules and regulations. |
| | |
| E. | Distributions to Shareholders. Distributions to shareholders from net investment income for the Pacer Global Cash Cows Dividend ETF, Pacer US Cash Cows 100 ETF, Pacer US Small Cap Cash Cows 100 ETF, Pacer Developed Markets International Cash Cows 100 ETF, Pacer WealthShield ETF, Pacer Military Times Best Employers ETF, Pacer US Export Leaders ETF, Pacer Benchmark Industrial Real Estate SCTRSM ETF, Pacer Benchmark Retail Real Estate SCTRSM ETF, Pacer Benchmark Data & Infrastructure Real Estate SCTRSM and Pacer CFRA-Stovall Equal Weight Seasonal Rotation Index ETF are declared and paid on a quarterly basis. The Pacer Trendpilot® US Large Cap ETF, Pacer Trendpilot® Mid Cap ETF, Pacer Trendpilot® 100 ETF, and the Pacer Trendpilot® European Index, are declared and paid on an annual basis. The net realized gains on securities normally are declared and paid on an annual basis for all Funds. Distributions are recorded on the ex-dividend date. |
| | |
| F. | Use of Estimates. The preparation of financial statements in conformity with GAAP requires management to make estimates and assumptions that affect the reported amounts of assets and liabilities and disclosure of contingent assets and liabilities at the date of the financial statements, and the reported amounts of increases and decreases in net assets from operations during the reporting period. Actual results could differ from those estimates. |
| | |
| G. | Share Valuation. The NAV per share of each Fund is calculated by dividing the sum of the value of the securities held by the Fund, plus cash and other assets, minus all liabilities (including estimated accrued expenses) by the total number of shares outstanding for the Fund, rounded to the nearest cent. The Funds’ shares will not be priced on the days on which the Cboe and/or Nasdaq is closed for trading. The offering and redemption price per share for each Fund is equal to the Fund’s net asset value per share. |
| | |
| H. | Guarantees and Indemnifications. In the normal course of business, the Funds enter into contracts with service providers that contain general indemnification clauses. Each Fund’s maximum exposure under these arrangements is unknown as this would involve future claims that may be against the Funds that have not yet occurred. |
Pacer Funds
NOTES TO FINANCIAL STATEMENTS
October 31, 2018 (Unaudited) (Continued)
| I. | Reclassification of Capital Accounts. Additionally, U.S. GAAP requires that certain components of net assets relating to permanent differences be reclassified between financial and tax reporting. These reclassifications have no effect on net assets or net asset value per share. For the fiscal period/year ended April 30, 2018, the following table shows the reclassifications made: |
| | | Undistributed | | | | | | |
| | | Accumulated Net | | Accumulated Net | | | | |
| | | Investment Income/(Loss) | | Realized Gain/(Loss) | | Paid-In Capital |
| | Pacer Trendpilot® US Large Cap ETF | | $ | (114 | ) | | | $ | (7,746,478 | ) | | | $ | 7,746,592 | |
| | Pacer Trendpilot® US Mid Cap ETF | | | 236 | | | | | (29,116,965 | ) | | | | 29,116,729 | |
| | Pacer Trendpilot® 100 ETF | | | — | | | | | (1,101 | ) | | | | 1,101 | |
| | Pacer Trendpilot® European Index ETF | | | 33,643 | | | | | (8,266,147 | ) | | | | 8,232,504 | |
| | Pacer Global Cash Cows Dividend ETF | | | 70,180 | | | | | (8,538,769 | ) | | | | 8,468,589 | |
| | Pacer US Cash Cows 100 ETF | | | — | | | | | (1,666,560 | ) | | | | 1,666,560 | |
| | Pacer US Small Cap Cash Cows 100 ETF | | | — | | | | | (372,913 | ) | | | | 372,913 | |
| | Pacer Developed Markets International Cash Cows 100 ETF | | | (787 | ) | | | | (113,363 | ) | | | | 114,150 | |
| | Pacer WealthShield ETF | | | 121 | | | | | (1,364,679 | ) | | | | 1,364,558 | |
| | Pacer Military Times Best Employers ETF | | | — | | | | | — | | | | | — | |
| | During the fiscal year/period ended April 30, 2018, the Funds’ realized the following net capital gains resulting from in-kind redemptions, in which shareholders exchanged Fund shares for securities held by the Fund rather than for cash. Because such gains are not taxable to the Fund, and are not distributed to shareholders, they have been reclassified from accumulated net realized losses to paid-in-capital. |
| | Pacer Trendpilot® US Large Cap ETF | $ 7,758,960 | |
| | Pacer Trendpilot® US Mid Cap ETF | 29,352,518 | |
| | Pacer Trendpilot® 100 ETF | 1,101 | |
| | Pacer Trendpilot® European Index ETF | 8,363,145 | |
| | Pacer Global Cash Cows Dividend ETF | 8,885,739 | |
| | Pacer US Cash Cows 100 ETF | 1,824,014 | |
| | Pacer US Small Cap Cash Cows 100 ETF | 395,677 | |
| | Pacer Developed Markets International Cash Cows 100 ETF | 123,319 | |
| | Pacer WealthShield ETF | 1,584,842 | |
| | Pacer Military Times Best Employers ETF | — | |
| | Pacer Benchmark Industrial Real Estate SCTRSM ETF, Pacer Benchmark Retail Real Estate SCTRSM ETF, Pacer Benchmark Data & Infrastructure Real Estate SCTRSM, Pacer US Export Leaders ETF, and Pacer CFRA-Stovall Equal Weight Seasonal Rotation Index ETF commenced operations after April 30, 2018. |
NOTE 3 – COMMITMENTS AND OTHER RELATED PARTY TRANSACTIONS
Pacer Advisors, Inc. (“the Adviser”) serves as the investment adviser to the Funds. Pursuant to an Investment Advisory Agreement (“Investment Advisory Agreement”) between the Trust, on behalf of the Funds, and the Adviser, the Adviser provides investment advice to the Funds and oversees the day-to-day operations of the Funds, subject to the direction and control of the Board and the officers of the Trust. The Adviser administers the Funds’ business affairs, provides office facilities and equipment and certain clerical, bookkeeping and administrative services. The Adviser bears the costs of all advisory and non-advisory services required to operate the Funds, in exchange for a single unitary management fee. For services provided to the Funds, Pacer Trendpilot® US Large Cap ETF pays the Adviser 0.60%, Pacer Trendpilot® US Mid Cap ETF pays the Adviser 0.60%, Pacer Trendpilot® 100 ETF pays the Adviser 0.65%, Pacer Trendpilot® European ETF pays the Adviser 0.65%, Pacer Global Cash Cows Dividend ETF pays the Adviser 0.60%, Pacer US Cash Cows 100 ETF pays the Adviser 0.49%, Pacer US Small Cap Cash Cows 100 ETF pays the Adviser 0.59%, Pacer Developed Markets International Cash Cows 100 ETF pays the Adviser 0.65%, Pacer WealthShield ETF pays the Adviser 0.60%, Pacer Military Times Best Employers ETF pays the Adviser 0.60%, Pacer Benchmark Industrial Real Estate SCTRSM ETF pays the Adviser 0.60%, Pacer Benchmark Retail Real Estate SCTRSM ETF pays the Adviser 0.60%, Pacer Benchmark Data & Infrastructure Real Estate SCTRSM pays the Adviser 0.60%, Pacer US Export Leaders ETF pays the Adviser 0.60%, and Pacer CFRA-Stovall Equal Weight Seasonal Rotation Index ETF pays the Adviser 0.60% at an annual rate based on each Fund’s average daily net assets.
The Distributor acts as the Funds’ principal underwriter in a continuous public offering of the Funds’ shares. The Distributor is an affiliate of the Adviser. The Funds did not pay any fees or commissions to the Distributor during the fiscal period ended October 31, 2018.
Certain officers and a Trustee of the Trust are affiliated with the Adviser and Distributor.
Pacer Funds
NOTES TO FINANCIAL STATEMENTS
October 31, 2018 (Unaudited) (Continued)
NOTE 4 – SERVICE AND CUSTODY AGREEMENTS
The Funds have entered into Service Agreements with U.S. Bancorp Fund Services, LLC (“Fund Services” or “Administrator”) doing business as U.S. Global Fund Services and a Custody Agreement with U.S. Bank, N.A., an affiliate of Fund Services. Under these agreements, Fund Services and U.S. Bank, N.A. provide certain transfer agency, administrative, accounting and custody services.
NOTE 5 – SECURITIES LENDING
Pacer ETF’s may lend up to 33 1/3% of the value of the securities in their portfolios to brokers, dealers and financial institutions (but not individuals) under terms of participation in a securities lending program administered by the Securities Lending Agent. The securities lending agreement requires that loans are collateralized at all times in an amount equal to at least 102% of the value of any domestic loaned securities at the time of the loan, plus accrued interest. The use of loans of foreign securities, which are denominated and payable in U.S. dollars, shall be collateralized in an amount equal to 105% of the value of any loaned securities at the time of the loan plus accrued interest. The Funds receive compensation in the form of fees and earn interest on the cash collateral. Due to timing issues of when a security is recalled from loan, the financial statements may differ in presentation. The amount of fees depends on a number of factors including the type of security and length of the loan. The Funds continue to receive interest payments or dividends on the securities loaned during the borrowing period. Gain or loss in the value of securities loaned that may occur during the term of the loan will be for the account of the Funds. The Funds have the right under the terms of the securities lending agreements to recall the securities from the borrower on demand.
As of October 31, 2018, the Funds had loaned securities and received cash collateral for the loans. The cash collateral is invested in the Mount Vernon Liquid Assets Portfolio, LLC of which the investment objective is to seek to maximize income to the extent consistent with the preservation of capital and liquidity and maintain a stable Net Asset Value (“NAV”) of $1.00. Although risk is mitigated by the collateral, the Funds could experience a delay in recovering their securities and possible loss of income or value if the borrower fails to return the borrowed securities. In addition, the Funds bear the risk of loss associated with the investment of cash collateral received.
During the period ended October 31, 2018, the Funds (excluding Pacer WealthShield ETF, Pacer Military Times Best Employers ETF, Pacer Benchmark Industrial Real Estate SCTRSM ETF, Pacer Benchmark Retail Real Estate SCTRSM ETF, Pacer Benchmark Data & Infrastructure Real Estate SCTRSM, Pacer US Export Leaders ETF, and Pacer CFRA-Stovall Equal Weight Seasonal Rotation Index ETF) had loaned securities that were collateralized by cash. The cash collateral received was invested in securities as listed in each Fund’s Schedule of Investments. Income earned from these investments is allocated to each Fund based on each Fund’s portion of total cash collateral received. Securities lending income is disclosed in each Fund’s Statement of Operations as a securities lending credit.
As of October 31, 2018, the Pacer Trendpilot® US Large Cap ETF and Pacer Trendpilot® European Index ETF were still in the process of including the securities out to loan which resulted in collateral still held on the books.
NOTE 6 – SECURED BORROWINGS
The following represents gross obligations for secured borrowings by remaining time to maturity as of October 31, 2018.
Securities Lending Transactions
| | Investments Purchased with Proceeds |
Overnight and Continuous | from Securities Lending Collateral* |
Pacer Trendpilot® US Large Cap ETF | | $ | 26,157,581 | |
Pacer Trendpilot® US Mid Cap ETF | | | 190,038,750 | |
Pacer Trendpilot® 100 ETF | | | 18,804,517 | |
Pacer Trendpilot® European Index ETF | | | 47,763,750 | |
| Pacer Global Cash Cows Dividend ETF | | | 38,789,497 | |
| Pacer US Cash Cows 100 ETF | | | 18,809,270 | |
| Pacer US Small Cap Cash Cows 100 ETF | | | 2,135,082 | |
| Pacer Developed Markets International Cash Cows 100 ETF | | | 1,945,516 | |
| Pacer WealthShield ETF | | | — | |
| Pacer Military Times Best Employers ETF | | | — | |
Pacer Benchmark Retail Real Estate SCTRSM ETF | | | — | |
Pacer Benchmark Industrial Real Estate SCTRSM ETF | | | — | |
Pacer Benchmark Data & Infrastructure Real Estate SCTRSM ETF | | | — | |
| Pacer US Export Leaders ETF | | | — | |
| Pacer CFRA-Stovall Equal Weight Seasonal Rotation ETF | | | — | |
* Proceeds from securities lending (Investments Purchased with Proceeds from Securities Lending Collateral).
Pacer Funds
NOTES TO FINANCIAL STATEMENTS
October 31, 2018 (Unaudited) (Continued)
Due to the absence of a master netting agreement related to the Funds’ participation in securities lending, no additional offsetting disclosures have been made on behalf of the Funds for the total borrowings listed above.
NOTE 7 – OFFSETTING ASSETS AND LIABILITIES
The following is a summary of the Assets and Liabilities for each Fund subject to offsets as of October 31, 2018:
Liabilities
| | | | | | | | | | | | | Gross Amounts Net Offset in the Statements of Assets and Liabilities | | | | |
| | | | | | | Gross Amounts | | | Net Amounts | | | | | | |
| | | | Gross | | | Offset in the | | | Presented in the | | | | | | |
| | | | Amounts of | | | Statement | | | Statements | | | | | | Collateral | | | | |
| | | | Recognized | | | of Assets | | | of Assets | | | Financial | | | Pledged | | | Net | |
Description | | Liabilities | | | and Liabilities | | | and Liabilities | | | Instruments | | | (Received) | | | Amount | |
Pacer Trendpilot® US Large Cap ETF | | | | | | | | | | | | | | | | | | |
| Securities Lending | | $ | 26,157,581 | | | $ | — | | | $ | 26,157,581 | | | $ | 26,157,581 | | | $ | — | | | $ | — | |
Pacer Trendpilot® US Mid Cap ETF | | | | | | | | | | | | | | | | | | | | | | | | |
| Securities Lending | | | 190,038,750 | | | | — | | | | 190,038,750 | | | | 190,038,750 | | | | — | | | | — | |
Pacer Trendpilot® 100 ETF | | | | | | | | | | | | | | | | | | | | | | | | |
| Securities Lending | | | 18,804,517 | | | | — | | | | 18,804,517 | | | | 18,804,517 | | | | — | | | | — | |
Pacer Trendpilot® European Index ETF | | | | | | | | | | | | | | | | | | | | | | | | |
| Securities Lending | | | 47,763,750 | | | | — | | | | 47,763,750 | | | | 47,763,750 | | | | — | | | | — | |
| Pacer Global Cash Cows Dividend ETF | | | | | | | | | | | | | | | | | | | | | | | | |
| Securities Lending | | | 38,789,497 | | | | — | | | | 38,789,497 | | | | 38,789,497 | | | | — | | | | — | |
| Pacer US Cash Cows 100 ETF | | | | | | | | | | | | | | | | | | | | | | | | |
| Securities Lending | | | 18,809,270 | | | | — | | | | 18,809,270 | | | | 18,809,270 | | | | — | | | | — | |
| Pacer US Small Cap Cash Cows 100 ETF | | | | | | | | | | | | | | | | | | | | | | | | |
| Securities Lending | | | 2,135,082 | | | | — | | | | 2,135,082 | | | | 2,135,082 | | | | — | | | | — | |
| Pacer Developed Markets | | | | | | | | | | | | | | | | | | | | | | | | |
| International Cash Cows 100 ETF | | | | | | | | | | | | | | | | | | | | | | | | |
| Securities Lending | | | 1,945,516 | | | | — | | | | 1,945,516 | | | | 1,945,516 | | | | — | | | | — | |
| Pacer WealthShield ETF | | | | | | | | | | | | | | | | | | | | | | | | |
| Securities Lending | | | — | | | | — | | | | — | | | | — | | | | — | | | | — | |
| Pacer Military Times Best Employers ETF | | | | | | | | | | | | | | | | | | | | | | | | |
| Securities Lending | | | — | | | | — | | | | — | | | | — | | | | — | | | | — | |
| Pacer Benchmark Retail | | | | | | | | | | | | | | | | | | | | | | | | |
Real Estate SCTRSM ETF | | | | | | | | | | | | | | | | | | | | | | | | |
| Securities Lending | | | — | | | | — | | | | — | | | | — | | | | — | | | | — | |
| Pacer Benchmark Industrial | | | | | | | | | | | | | | | | | | | | | | | | |
Real Estate SCTRSM ETF | | | | | | | | | | | | | | | | | | | | | | | | |
| Securities Lending | | | — | | | | — | | | | — | | | | — | | | | — | | | | — | |
| Pacer Benchmark Data & | | | | | | | | | | | | | | | | | | | | | | | | |
Infrastructure Real Estate SCTRSM ETF | | | | | | | | | | | | | | | | | | | | | | | | |
| Securities Lending | | | — | | | | — | | | | — | | | | — | | | | — | | | | — | |
| Pacer US Export Leaders ETF | | | | | | | | | | | | | | | | | | | | | | | | |
| Securities Lending | | | — | | | | — | | | | — | | | | — | | | | — | | | | — | |
| Pacer CFRA-Stovall Equal | | | | | | | | | | | | | | | | | | | | | | | | |
| Weight Seasonal Rotation ETF | | | | | | | | | | | | | | | | | | | | | | | | |
| Securities Lending | | | — | | | | — | | | | — | | | | — | | | | — | | | | — | |
Pacer Funds
NOTES TO FINANCIAL STATEMENTS
October 31, 2018 (Unaudited) (Continued)
NOTE 8 – INVESTMENT TRANSACTIONS
For the period ended October 31, 2018, the aggregate purchases and sales of securities by the Funds, excluding short-term securities and in-kind transactions, were as follows:
| | | Purchases | | | Sales | |
Pacer Trendpilot® US Large Cap ETF | | $ | 28,869,276 | | | $ | 18,217,280 | |
Pacer Trendpilot® US Mid Cap ETF | | | 58,075,576 | | | | 54,477,223 | |
Pacer Trendpilot® 100 ETF | | | 7,800,766 | | | | 7,471,245 | |
Pacer Trendpilot® European Index ETF | | | 263,085,746 | | | | 86,451,948 | |
| Pacer Global Cash Cows Dividend ETF | | | 88,313,451 | | | | 64,601,127 | |
| Pacer US Cash Cows 100 ETF | | | 56,303,092 | | | | 55,953,819 | |
| Pacer US Small Cap Cash Cows 100 ETF | | | 10,068,235 | | | | 10,105,955 | |
| Pacer Developed Markets International Cash Cows 100 ETF | | | 12,164,179 | | | | 11,296,643 | |
| Pacer WealthShield ETF | | | 248,687,297 | | | | 177,573,891 | |
| Pacer Military Times Best Employers ETF | | | 245,153 | | | | 5,350 | |
Pacer Benchmark Retail Real Estate SCTRSM ETF | | | 3,811,946 | | | | 925,137 | |
Pacer Benchmark Industrial Real Estate SCTRSM ETF | | | 2,914,187 | | | | 412,362 | |
Pacer Benchmark Data & Infrastructure Real Estate SCTRSM ETF | | | 2,852,447 | | | | 260,143 | |
| Pacer US Export Leaders ETF | | | 436,860 | | | | 434,676 | |
| Pacer CFRA-Stovall Equal Weight Seasonal Rotation ETF | | | — | | | | 20,608 | |
For the period ended October 31, 2018, in-kind transactions associated with creations and redemptions are as follows:
| | | Purchases | | | Sales | |
Pacer Trendpilot® US Large Cap ETF | | $ | 641,726,215 | | | $ | — | |
Pacer Trendpilot® US Mid Cap ETF | | | 288,686,166 | | | | 30,826,630 | |
Pacer Trendpilot® 100 ETF | | | 135,625,405 | | | | 5,348,680 | |
Pacer Trendpilot® European Index ETF | | | 27,693,254 | | | | — | |
| Pacer Global Cash Cows Dividend ETF | | | 26,035,944 | | | | 24,777,821 | |
| Pacer US Cash Cows 100 ETF | | | 168,892,102 | | | | 18,710,340 | |
| Pacer US Small Cap Cash Cows 100 ETF | | | 27,497,530 | | | | 5,765,947 | |
| Pacer Developed Markets International Cash Cows 100 ETF | | | 14,682,170 | | | | 4,075,427 | |
| Pacer WealthShield ETF | | | 77,728,996 | | | | 51,216,810 | |
| Pacer Military Times Best Employers ETF | | | 1,291,087 | | | | 1,634,795 | |
Pacer Benchmark Retail Real Estate SCTRSM ETF | | | 2,426,406 | | | | 2,657,556 | |
Pacer Benchmark Industrial Real Estate SCTRSM ETF | | | 4,988,372 | | | | 4,957,120 | |
Pacer Benchmark Data & Infrastructure Real Estate SCTRSM ETF | | | 3,720,209 | | | | 2,559,334 | |
| Pacer US Export Leaders ETF | | | 2,493,995 | | | | — | |
| Pacer CFRA-Stovall Equal Weight Seasonal Rotation ETF | | | 3,740,401 | | | | — | |
For the period ended October 31, 2018, there were no long-term purchases or sales of U.S. Government Securities for the Funds.
During the fiscal year ended April 30, 2017, Pacer Trendpilot® European Index ETF accepted a cash contribution in the amount of $409,837 to reimburse the Fund from prior securities transactions.
Pacer Funds
NOTES TO FINANCIAL STATEMENTS
October 31, 2018 (Unaudited) (Continued)
NOTE 9 – TAX COST BASIS
The components of tax basis cost of investments and net unrealized appreciation for federal income tax purposes at April 30, 2018 were as follows:
| | | Pacer | | | Pacer | | | | | | Pacer | | | Pacer | |
| | | Trendpilot® | | | Trendpilot® | | | Pacer | | | Trendpilot® | | | Global | |
| | | US Large | | | US Mid | | | Trendpilot® | | | European | | | Cash Cows | |
| | | Cap ETF | | | Cap ETF | | | 100 ETF | | | Index ETF | | | Dividend ETF | |
| Tax cost of investments | | $ | 896,631,194 | | | $ | 591,463,327 | | | $ | 212,336,266 | | | $ | 160,790,032 | | | $ | 212,395,952 | |
| Gross tax unrealized appreciation | | | 138,735,190 | | | | 50,883,288 | | | | 36,734,948 | | | | 892,602 | | | | 10,499,024 | |
| Gross tax unrealized depreciation | | | (38,770,803 | ) | | | (25,877,717 | ) | | | (8,785,154 | ) | | | (3,362,377 | ) | | | (10,758,613 | ) |
| Net tax unrealized appreciation (depreciation) | | | 99,964,387 | | | | 25,005,571 | | | | 27,949,794 | | | | (2,469,775 | ) | | | (259,589 | ) |
| Undistributed ordinary income | | | 3,141,639 | | | | 1,152,697 | | | | 99,202 | | | | 835,849 | | | | 865,710 | |
| Undistributed long-term gain | | | — | | | | — | | | | — | | | | — | | | | — | |
| Total distributable earnings | | | 3,141,639 | | | | 1,152,697 | | | | 99,202 | | | | 835,849 | | | | 865,710 | |
| Other accumulated (loss) | | | (37,294,171 | ) | | | (2,690,881 | ) | | | (9,720,113 | ) | | | (4,852,030 | ) | | | (1,723,840 | ) |
| Total accumulated gain (loss) | | $ | 65,811,855 | | | $ | 23,467,387 | | | $ | 18,328,883 | | | $ | (6,485,956 | ) | | $ | (1,117,719 | ) |
| | | | | | | | | | | | | | | | | | | | | |
| | | | | | | | | | | Pacer | | | | | | | | | |
| | | | | | | Pacer | | | Developed | | | | | | | | | |
| | | Pacer | | | US Small | | | Markets | | | | | | | Pacer | |
| | | US | | | Cap Cash | | | International | | | Pacer | | | Military Times | |
| | | Cash Cows | | | Cows | | | Cash Cows | | | WealthShield | | | Best Employers | |
| | | 100 ETF | | | 100 ETF | | | 100 ETF | | | ETF | | | ETF | |
| Tax cost of investments | | $ | 32,545,520 | | | $ | 5,887,320 | | | $ | 21,131,737 | | | $ | 70,159,839 | | | $ | 2,489,000 | |
| Gross tax unrealized appreciation | | | 1,649,434 | | | | 351,910 | | | | 899,795 | | | | — | | | | 75,346 | |
| Gross tax unrealized depreciation | | | (1,539,596 | ) | | | (375,640 | ) | | | (575,347 | ) | | | (23,821 | ) | | | (31,253 | ) |
| Net tax unrealized appreciation (depreciation) | | | 109,838 | | | | (23,730 | ) | | | 324,448 | | | | (23,821 | ) | | | 44,093 | |
| Undistributed ordinary income | | | 38,618 | | | | 2,037 | | | | 65,836 | | | | 60,273 | | | | 342 | |
| Undistributed long-term gain | | | — | | | | — | | | | — | | | | — | | | | — | |
| Total distributable earnings | | | 38,618 | | | | 2,037 | | | | 65,836 | | | | 60,273 | | | | 342 | |
| Other accumulated (loss) | | | (347,826 | ) | | | (91,125 | ) | | | (29,470 | ) | | | (2,584,611 | ) | | | — | |
| Total accumulated gain (loss) | | $ | (199,370 | ) | | $ | (112,818 | ) | | $ | 360,814 | | | $ | (2,548,159 | ) | | $ | 44,435 | |
The difference between book and tax-basis cost is attributable to the realization for tax purposes of unrealized gains on investments in Real Estate Investment Trusts, partnerships, passive foreign investment companies and wash sales. Under tax law, certain capital and foreign currency losses realized after October 31, and within the taxable year are deemed to arise on the first business day of the Fund’s next taxable year.
At April 30, 2018, the Funds had the following capital loss carryforwards:
| | Short-Term Amount | | Long-Term Amount | | Expires | |
Pacer Trendpilot® US Large Cap ETF | | $ | 37,294,171 | | | | $ | — | | | Indefinite | |
Pacer Trendpilot® US Mid Cap ETF | | | 2,690,881 | | | | | — | | | Indefinite | |
Pacer Trendpilot® 100 ETF | | | 9,715,335 | | | | | 4,778 | | | Indefinite | |
Pacer Trendpilot® European Index ETF | | | 4,852,030 | | | | | — | | | Indefinite | |
| Pacer Global Cash Cows Dividend ETF | | | 1,610,376 | | | | | 113,464 | | | Indefinite | |
| Pacer US Cash Cows 100 ETF | | | 347,826 | | | | | — | | | Indefinite | |
| Pacer US Small Cap Cash Cows 100 ETF | | | 91,125 | | | | | — | | | Indefinite | |
| Pacer Developed Markets International Cash Cows 100 ETF | | | 29,470 | | | | | — | | | Indefinite | |
| Pacer WealthShield ETF | | | 2,584,611 | | | | | — | | | Indefinite | |
| Pacer Military Times Best Employers ETF | | | — | | | | | — | | | Indefinite | |
Pacer Benchmark Industrial Real Estate SCTRSM ETF, Pacer Benchmark Retail Real Estate SCTRSM ETF, Pacer Benchmark Data & Infrastructure Real Estate SCTRSM, Pacer US Export Leaders ETF, and Pacer CFRA-Stovall Equal Weight Seasonal Rotation Index ETF commenced operations after April 30, 2018; therefore, there is no tax information available as of April 30, 2018.
Pacer Funds
NOTES TO FINANCIAL STATEMENTS
October 31, 2018 (Unaudited) (Continued)
NOTE 10 – DISTRIBUTIONS TO SHAREHOLDERS
The tax character of distributions paid by the Funds during the fiscal year/period ended October 31, 2018 was as follows:
| | | Ordinary Income | | | Capital Gains | | | Return of Capital | |
Pacer Trendpilot® US Large Cap ETF | | $ | — | | | $ | — | | | $ | — | |
Pacer Trendpilot® US Mid Cap ETF | | | — | | | | — | | | | — | |
Pacer Trendpilot® 100 ETF | | | — | | | | — | | | | — | |
Pacer Trendpilot® European Index ETF | | | — | | | | — | | | | — | |
| Pacer Global Cash Cows Dividend ETF | | | 3,879,656 | | | | — | | | | — | |
| Pacer US Cash Cows 100 ETF | | | 696,950 | | | | — | | | | — | |
| Pacer US Small Cap Cash Cows 100 ETF | | | 90,512 | | | | — | | | | — | |
| Pacer Developed Markets International Cash Cows 100 ETF | | | 374,484 | | | | — | | | | — | |
| Pacer WealthShield ETF | | | 518,596 | | | | — | | | | — | |
| Pacer Military Times Best Employers ETF | | | 15,501 | | | | — | | | | — | |
Pacer Benchmark Retail Real Estate SCTRSM ETF | | | 42,486 | | | | — | | | | — | |
Pacer Benchmark Industrial Real Estate SCTRSM ETF | | | 27,411 | | | | — | | | | — | |
Pacer Benchmark Data & Infrastructure Real Estate SCTRSM ETF | | | 31,232 | | | | — | | | | — | |
| Pacer US Export Leaders ETF | | | 2,225 | | | | — | | | | — | |
| Pacer CFRA-Stovall Equal Weight Seasonal Rotation ETF | | | 4,847 | | | | — | | | | — | |
The tax character of distributions paid by the Funds during the fiscal year/period ended April 30, 2018 was as follows:
| | | Ordinary Income | | | Capital Gains | | | Return of Capital | |
Pacer Trendpilot® US Large Cap ETF | | $ | 7,017,355 | | | $ | — | | | $ | — | |
Pacer Trendpilot® US Mid Cap ETF | | | 2,882,696 | | | | — | | | | — | |
Pacer Trendpilot® 100 ETF | | | 466,293 | | | | — | | | | — | |
Pacer Trendpilot® European Index ETF | | | 538,237 | | | | — | | | | — | |
| Pacer Global Cash Cows Dividend ETF | | | 3,669,616 | | | | — | | | | — | |
| Pacer US Cash Cows 100 ETF | | | 319,520 | | | | — | | | | — | |
| Pacer US Small Cap Cash Cows 100 ETF | | | 34,114 | | | | — | | | | — | |
| Pacer Developed Markets International Cash Cows 100 ETF | | | 70,528 | | | | — | | | | — | |
| Pacer WealthShield ETF | | | 112,441 | | | | — | | | | — | |
| Pacer Military Times Best Employers ETF | | | — | | | | — | | | | — | |
NOTE 11 – NEW ACCOUNTING PRONOUNCEMENTS
In August 2018, FASB issued ASU 2018-13, Fair Value Measurement (Topic 820): Disclosure Framework—Changes to the Disclosure Requirements for Fair Value Measurement (“ASU 2018-13”). The primary focus of ASU 2018-13 is to improve the effectiveness of the disclosure requirements for fair value measurements. The changes affect all companies that are required to include fair value measurement disclosures. In general, the amendments in ASU 2018-13 are effective for all entities for fiscal years and interim periods within those fiscal years, beginning after December 15, 2019. An entity is permitted to early adopt the removed or modified disclosures upon the issuance of ASU 2018-13 and may delay adoption of the additional disclosures, which are required for public companies only, until their effective date. Management has evaluated the ASU 2018-13 and has adopted the disclosure framework.
NOTE 12 – SUBSEQUENT EVENT
Management of the Funds has evaluated the need for disclosures and/or adjustments resulting from subsequent events through the date these financial statements were issued. The evaluation did not result in any subsequent events that necessitated disclosures and/or adjustments other than below.
Pacer Funds
NOTES TO FINANCIAL STATEMENTS
October 31, 2018 (Unaudited) (Continued)
On December 21, 2018, the following Funds declared distributions from ordinary income to shareholders of record as of December 26, 2018 payable December 27, 2018, as follows:
| | | Ordinary Income | | | Per Share Amount | |
Pacer Trendpilot® US Large Cap ETF | | $ | 14,704,858 | | | $ | 0.28664441 | |
Pacer Trendpilot® US Mid Cap ETF | | $ | 5,930,872 | | | $ | 0.27521448 | |
Pacer Trendpilot® 100 ETF | | $ | 1,575,175 | | | $ | 0.14790376 | |
Pacer Trendpilot® European Index ETF | | $ | 2,870,463 | | | $ | 0.46674195 | |
| Pacer Global Cash Cows Dividend ETF | | $ | 1,694,789 | | | $ | 0.25678622 | |
| Pacer US Cash Cows 100 ETF | | $ | 949,756 | | | $ | 0.14500092 | |
| Pacer US Small Cap Cash Cows 100 ETF | | $ | 78,657 | | | $ | 0.10487600 | |
| Pacer Developed Markets International Cash Cows 100 ETF | | $ | 216,964 | | | $ | 0.20663238 | |
| Pacer WealthShield ETF | | $ | 255,793 | | | $ | 0.06821150 | |
| Pacer Military Times Best Employers ETF | | $ | 9,372 | | | $ | 0.09372000 | |
Pacer Benchmark Retail Real Estate SCTRSM ETF | | $ | 34,528 | | | $ | 0.34528000 | |
Pacer Benchmark Industrial Real Estate SCTRSM ETF | | $ | 15,970 | | | $ | 0.15970000 | |
Pacer Benchmark Data & Infrastructure Real Estate SCTRSM ETF | | $ | 37,013 | | | $ | 0.18506500 | |
| Pacer US Export Leaders ETF | | $ | 3,779 | | | $ | 0.03779000 | |
| Pacer CFRA-Stovall Equal Weight Seasonal Rotation ETF | | $ | 10,983 | | | $ | 0.10983000 | |
Pacer Funds
ADDITIONAL INFORMATION
(Unaudited)
NOTE 1 – FREQUENCY DISTRIBUTION OF PREMIUMS AND DISCOUNTS
Information regarding how often shares of each other Fund traded on the Exchange at a price above (i.e., at a premium) or below (i.e., at a discount) the NAV of the Fund is available on the Funds’ website at www.PacerETFs.com.
NOTE 2 – FEDERAL TAX INFORMATION
Qualified Dividend Income/Dividends Received Deduction
For the fiscal year/period ended April 30, 2018, certain dividends paid by the Funds may be subject to a maximum tax rate of 15%, as provided for by the Jobs and Growth Tax Relief Reconciliation Act of 2003.
The percentage of dividends declared from ordinary income designated as qualified dividend income was as follows:
Pacer Trendpilot® US Large Cap ETF | 100.00% | |
Pacer Trendpilot® US Mid Cap ETF | 100.00% | |
Pacer Trendpilot® 100 ETF | 100.00% | |
Pacer Trendpilot® European Index ETF | 96.34% | |
| Pacer Global Cash Cows Dividend ETF | 92.40% | |
| Pacer US Cash Cows 100 ETF | 95.7% | |
| Pacer US Small Cap Cash Cows 100 ETF | 100.00% | |
| Pacer Developed Markets International Cash Cows 100 ETF | 100.00% | |
| Pacer WealthShield ETF | 72.06% | |
| Pacer Military Times Best Employers ETF | 0.00% | |
For corporate shareholders, the percent of ordinary income distributions qualifying for the corporate dividends received deduction for the fiscal year/period ended April 30, 2018 was as follows:
Pacer Trendpilot® US Large Cap ETF | 100.00% | |
Pacer Trendpilot® US Mid Cap ETF | 100.00% | |
Pacer Trendpilot® 100 ETF | 100.00% | |
Pacer Trendpilot® European Index ETF | 0.00% | |
| Pacer Global Cash Cows Dividend ETF | 29.78% | |
| Pacer US Cash Cows 100 ETF | 96.20% | |
| Pacer US Small Cap Cash Cows 100 ETF | 100.00% | |
| Pacer Developed Markets International Cash Cows 100 ETF | 0.00% | |
| Pacer WealthShield ETF | 72.06% | |
| Pacer Military Times Best Employers ETF | 0.00% | |
Short Term Capital Gains
The percentage of taxable ordinary income distributions that are designated as short-term capital gain distributions under Internal Revenue Section 871(k)(2)(C) for each fund were as follows:
| Pacer Trendpilot™ 750 ETF | 0.00% | |
| Pacer Trendpilot™ 450 ETF | 0.00% | |
| Pacer Trendpilot™ 100 ETF | 0.00% | |
| Pacer Trendpilot™ European ETF | 0.00% | |
| Pacer Global Cash Cows Dividend ETF | 0.00% | |
| Pacer US Cash Cows 100 ETF | 0.00% | |
| Pacer US Small Cap Cash Cows 100 ETF | 0.00% | |
| Pacer Developed Markets International Cash Cows 100 ETF | 0.00% | |
| Pacer WealthShield ETF | 0.00% | |
| Pacer Military Times Best Employers ETF | 0.00% | |
NOTE 3 – DISCLOSURE OF PORTFOLIO HOLDINGS
The Funds file their complete schedule of portfolio holdings for their first and third fiscal quarters with the Securities and Exchange Commission (“SEC”) on Form N-Q. The Funds’ Form N-Q is available on the website of the SEC at http://www.sec.gov. Each Fund’s portfolio holdings are posted on their website at www.paceretfs.com daily.
Pacer Funds
ADDITIONAL INFORMATION
(Unaudited) (Continued)
NOTE 4 – PROXY VOTING POLICIES AND PROCEDURES
A description of the policies and procedures the Funds use to determine how to vote proxies relating to portfolio securities is provided in the Statement of Additional Information (“SAI”). The SAI is available without charge upon request by calling toll-free at (800) 617-0004, by accessing the SEC’s website at http://www.sec.gov, or by accessing the Funds’ website at www.paceretfs.com. Information on how the Fund voted proxies relating to portfolio securities during the year ended June 30 is available without charge, upon request, by calling (800) 617-0004 or by accessing the website of the SEC.
NOTE 5 – BOARD CONSIDERATIONS IN APPROVING THE INVESTMENT ADVISORY AGREEMENT FOR THE FUNDS
Pacer US Export Leaders ETF and Pacer CFRA-Stovall Equal Weight Seasonal Rotation ETF
The Board of Trustees (the “Board”) of Pacer Funds Trust (the “Trust”), including the Trustees who are not “interested persons,” as defined by the Investment Company Act of 1940, as amended, of the Trust (the “Independent Trustees”), at in-person meetings held on March 12, 2018 and June 18, 2018 (each a “Meeting”), called for the purpose of, among other things, considering and voting on the investment advisory agreement (the “Investment Advisory Agreement”) between the Trust and Pacer Advisors, Inc. (the “Advisor”) relating to the Pacer US Export Leaders ETF (“Export ETF”) and the Pacer CFRA-Stovall Equal Weight Seasonal Rotation ETF (“Stovall ETF”), respectively (each a “Fund” and, collectively, the “Funds”). At each Meeting, the Board, including all of the Trust’s Independent Trustees voting separately, unanimously approved the Investment Advisory Agreement as to the subject Fund based on its review of qualitative and quantitative information provided by the Advisor and the Trust’s other service providers.
Prior to approving the Investment Advisory Agreement as to each Fund, the Independent Trustees requested and obtained from the Advisor such information as the Independent Trustees deemed reasonably necessary to evaluate the terms of the Investment Advisory Agreement. The Independent Trustees received assistance and advice from and met separately with independent counsel. In addition, the Independent Trustees received a memorandum from independent counsel regarding the responsibilities of the Board with respect to the approval of investment advisory agreements. Prior to each Meeting, the Board obtained and reviewed a variety of information, including certain comparative information regarding each Fund’s proposed expenses relative to the expenses of other comparable funds.
At each Meeting, the Board, including the Independent Trustees, evaluated a number of factors and various materials, including: (1) a copy of the Investment Advisory Agreement; (2) the Advisor’s responses to a questionnaire designed to provide the Board with information reasonably necessary to evaluate the terms of the Investment Advisory Agreement as to the subject Fund; (3) the Advisor’s Form ADV disclosures; (4) information describing the nature, quality and extent of services that the Advisor is prepared in the future to provide to the subject Fund, and the advisory fees payable to the Advisor for its services with respect to that Fund; (5) certain comparative information regarding each Fund’s expenses relative to the expenses of other funds; (6) a copy of the Trust’s registration statement; and (7) information regarding the financial condition of the Advisor. Representatives from the Advisor presented additional information and participated in question and answer sessions at each Meeting to help the Board evaluate the Advisor’s services, fees and other aspects of the Investment Advisory Agreement.
In considering whether to approve the Investment Advisory Agreement as to each Fund, the Board considered various factors that it determined were relevant, including: (i) the nature, extent and quality of the services to be provided by the Advisor; (ii) the fee to be paid to the Advisor; and (iii) potential economies of scale, as discussed in further detail below.
| | • | Nature, Extent and Quality of Services to be Provided by the Advisor. The Board reviewed the scope of services provided by the Advisor under the Investment Advisory Agreement and determined that the Advisor has been providing and is capable of providing in the future all necessary advisory services required by each Fund, as indicated by the firm’s management capabilities and the professional qualifications and experience of its portfolio management personnel. The Board also considered other services to be provided to each Fund by the Advisor, such as selecting broker-dealers for executing portfolio transactions, monitoring adherence to the Fund’s investment restrictions, and monitoring compliance with various policies and procedures and with applicable securities regulations. Based on the factors above, as well as those discussed below, the Board concluded, within the context of its full deliberations, that it was satisfied with the nature, extent and quality of the services to be provided to each Fund by the Advisor. |
| | | |
| | • | Costs of Services to be Provided to the Funds and Profitability. In considering the advisory fees payable by each Fund to the Advisor and each Fund’s expense ratio, the Board reviewed data compiled by the Advisor from an unaffiliated third party proprietary database comparing the expense ratios and performance of each Fund with the expense ratios and performance of other ETFs having similar investment objectives (each Fund’s “Peer Group”). The Board compared each Fund’s expense ratio to the expense ratios of ETFs in the Fund’s Peer Group, and noted that the Advisor had contractually agreed to pay all operating expenses of each Fund, including the cost of transfer agency, custody, fund administration, legal, audit and other services, except interest, taxes, brokerage commissions and other expenses in connection with the execution of portfolio transactions, and |
Pacer Funds
ADDITIONAL INFORMATION
(Unaudited) (Continued)
| | | extraordinary and non-routine expenses. It was noted that this contractual agreement cannot be changed without shareholder approval. The Board also evaluated the compensation and benefits received by the Advisor from its relationship with each Fund, taking into account assessments of the Advisor’s anticipated profitability at different asset levels. Based on the factors above, as well as those discussed below, the Board concluded, within the context of its full deliberations at each Meeting, that each Fund’s advisory fee was reasonable in light of the nature and quality of the services expected to be rendered by the Advisor. |
| | | |
| | • | Economies of Scale. The Board also reviewed and considered the extent to which economies of scale would be realized by the Advisor as the assets of each Fund grew or may grow in the future. |
Based on its deliberations and its evaluation of the information described above at each Meeting, the Board, including the Independent Trustees, unanimously: (a) concluded that the terms of the Investment Advisory Agreement with respect to each Fund were fair and reasonable; (b) concluded that the Advisor’s fees are reasonable in light of the nature and quality of the services expected to be rendered by the Advisor to each Fund; and (c) agreed to approve the Investment Advisory Agreement as to each Fund for an initial term of two years. In its deliberations, the Board did not identify any particular factor (or conclusion with respect thereto) or single piece of information that was all-important, controlling or determinative of its decision, but considered all of the factors together, and each Trustee may have attributed different weights to the various factors (and conclusions with respect thereto) and information.
Pacer Benchmark Retail Real Estate SCTRSM ETF, Industrial Real Estate SCTRSM ETF, and Data & Infrastructure Real Estate SCTRSM ETF
The Board of Trustees (the “Board”) of Pacer Funds Trust (the “Trust”), including the Trustees who are not “interested persons,” as defined by the Investment Company Act of 1940, of the Trust (the “Independent Trustees”), held an in-person meeting on March 12, 2018 (the “Meeting”) for the purpose of, among other things, the consideration of, and voting on, the proposed approval of the Investment Advisory Agreement between the Trust and the Advisor relating to the Pacer Benchmark Retail Real Estate SCTRSM ETF, Industrial Real Estate SCTRSM ETF, and Data & Infrastructure Real Estate SCTRSM ETF (together, the “New Pacer Funds”). The Board, including all of the Trust’s Independent Trustees voting separately, unanimously approved the Investment Advisory Agreement based on its review of qualitative and quantitative information provided by the Advisor and the Trust’s other service providers.
Prior to deciding to approve or renew, as applicable, the Investment Advisory Agreement, the Independent Trustees requested and obtained from the Advisor such information as the Independent Trustees deemed reasonably necessary to evaluate the terms of the Investment Advisory Agreement. The Independent Trustees received assistance and advice from and met separately with independent counsel. In addition, the Independent Trustees received a memorandum from independent counsel regarding the responsibilities of the Board with respect to the approval or renewal of the Investment Advisory Agreement. Prior to the Meeting, the Board obtained and reviewed a variety of information, including certain comparative information regarding the Fund’s expenses (both actual and, where relevant, proposed), relative to the expenses of other comparable funds.
At the Meeting, the Board, including the Independent Trustees, evaluated a number of factors and various materials in connection with the approval process, including: (1) a copy of the Investment Advisory Agreement; (2) the Advisor’s responses to questionnaires designed to provide the Board with information reasonably necessary to evaluate the terms of the Investment Advisory Agreement; (3) the Advisor’s Form ADV disclosures;(4) information describing the nature, quality and extent of services that the Advisor, where relevant, has provided and is prepared in the future to provide to each Fund, and the advisory fees payable to the Advisor for its services; (5) certain comparative information regarding the Funds’ expenses relative to the expenses of other funds; (6) a copy of the Trust’s registration statement; and (7) information regarding the financial condition of the Advisor. Representatives from the Advisor presented additional information and participated in question and answer sessions at the Meeting to help the Board evaluate the Advisor’s services, fees and other aspects of the Investment Advisory Agreement.
In considering the continuation and/or approval, respectively, of the Investment Advisory Agreement, the Board considered various factors that they determined were relevant, including: (i) the nature, extent and quality of the services to be provided by the Advisor; (ii) the fee to be paid to the Advisor; and (iii) potential economies of scale, as discussed in further detail below.
| | • | Nature, Extent and Quality of Services to be Provided by the Advisor. The Board reviewed the scope of services provided by the Advisor under the Investment Advisory Agreement and determined that the Advisor has been providing, where relevant, and is capable of providing in the future all necessary advisory services required by the Funds, as indicated by the firm’s management capabilities and the professional qualifications and experience of its portfolio management personnel. The Board also considered other services provided or to be provided to the Funds by the Advisor, such as selecting broker-dealers for executing portfolio transactions, monitoring adherence to the Fund’s investment restrictions, and monitoring compliance with various policies and procedures and with applicable securities regulations. Based on the factors above, as well as those discussed below, the Board concluded, within the context of its full deliberations, that it was satisfied with the nature, extent and quality of the services provided and to be provided to the Funds by the Advisor. |
Pacer Funds
ADDITIONAL INFORMATION
(Unaudited) (Continued)
| | • | Costs of Services to be Provided to the Funds and Profitability. In considering the advisory fees payable by the Trust to the Advisor and each Fund’s expense ratio, the Board reviewed data compiled by the Advisor from an unaffiliated third party proprietary database comparing the expense ratios and performance of each Fund with the expense ratios and performance of other ETFs having similar investment objectives (each Fund’s “Peer Group”). The Board compared each Fund’s expense ratio to the expense ratios of ETFs in the Fund’s Peer Group, focusing on whether each Fund charged fees that were within the range of fees charged by the Peer Group. It also noted that the Advisor had contractually agreed to pay all operating expenses of each Fund, including the cost of transfer agency, custody, fund administration, legal, audit and other services, except interest, taxes, brokerage commissions and other expenses in connection with the execution of portfolio transactions, and extraordinary and non-routine expenses. It was noted that this contractual agreement cannot be changed without shareholder approval. The Board also evaluated the compensation and benefits received (or proposed or likely to be received), by the Advisor from its relationship with the Funds, taking into account assessments of the Advisor’s anticipated profitability at different asset levels. Based on the factors above, as well as those discussed below, the Board concluded, within the context of its full deliberations, that each Fund’s advisory fee was reasonable in light of the nature and quality of the services rendered and, where relevant, expected to be rendered by the Advisor. |
| | | |
| | • | Economies of Scale. The Board also reviewed and considered the extent to which economies of scale would be realized by the Advisor as the assets of the Funds grew or may grow in the future. |
Based on the Board’s deliberations and its evaluation of the information described above, the Board, including the Independent Trustees, unanimously: (a) concluded that the terms of the Investment Advisory Agreement with respect to each Fund were and are fair and reasonable; (b) concluded that the Advisor’s fees are reasonable in light of the nature and quality of the services rendered and expected to be rendered by the Advisor to each Fund; and (c) agreed to approve the Investment Advisory Agreement as to each New Pacer Fund for a term of two years. In its deliberations, the Board did not identify any particular factor (or conclusion with respect thereto) or single piece of information that was all-important, controlling or determinative of its decision, but considered all of the factors together, and each Trustee may have attributed different weights to the various factors (and conclusions with respect thereto) and information.
NOTE 6 – TRUSTEES AND OFFICERS
The business of the Funds is managed under the direction of the Board of Trustees. The Board of Trustees formulates the general policies of the Funds and meets periodically to review the Funds’ performance, monitor investment activities and practices, and discuss other matters affecting the Funds. The Trustees are fiduciaries for the Funds’ shareholders and are governed by the laws of the State of Delaware in this regard. The names and addresses of the Trustees and officers of the Trust are listed below along with a description of their principal occupations over at least the last five years. There are currently four Trustees, three of whom are not “interested persons” of the Trust within the meaning of that term under the 1940 Act (“Independent Trustee”). The Trustees, in turn, elect the officers of the Trust to actively supervise its day-to-day operations. The address of each Trustee and officer of the Trust, unless otherwise indicated below, is c/o Pacer Advisors, Inc., 500 Chesterfield Parkway, Malvern, PA 19335. The Funds’ Statement of Additional Information includes additional information about the Trustees and is available upon request by calling toll free (800) 617-0004.
Pacer Funds
ADDITIONAL INFORMATION
(Unaudited) (Continued)
| | | | | Number of | |
| | | | | Portfolios | Other |
| | | Term of | | in Fund | Directorships |
| | Position(s) | Office and | | Complex | held by |
| | Held with | Length of | Principal Occupation(s) | Overseen | Trustee During |
Name and Year of Birth | the Trust | Time Served | During Past 5 Years | By Trustee | Past Five Years |
| | | | | | |
| Interested Trustee | | | | | |
| | | | | | |
| Joe M. Thomson | Trustee , | Indefinite Term; | Founder/President at Pacer Advisors, | 15 | Director, First |
| Born: 1944 | Chairman, | since 2014 | Inc. (since 2005); President and Chief | | Cornerstone Bank |
| | President and | | Compliance Officer, Pacer Financial, | | (2000-2016) |
| | Principal | | Inc. (since 2004) | | |
| | Executive | | | | |
| | Officer | | | | |
| | | | | | |
| Independent Trustees | | | | | |
| | | | | | |
| Deborah G. Wolk | Lead | Indefinite Term; | Self-employed providing accounting | 15 | None |
| Born: 1950 | Independent | since 2015 | services and computer modeling | | |
| | Trustee | | (since 1997) | | |
| | | | | | |
| Jonathan H. Newman, Sr. | Trustee | Indefinite Term; | CEO and Chairman, Newman Wine | 15 | None |
| Born: 1962 | | since 2015 | & Spirits (since 2007) | | |
| | | | | | |
| Dennis J. Ryan | Trustee | Indefinite Term; | Principal/Owner, Brendan Abstract | 15 | None |
| Born: 1947 | | since 2017 | Company, Inc. (title insurance) | | |
| | | | (since 1999) | | |
| | | | | | |
| Officers who are not Trustees: | | | | |
| | | | | | |
| Sean E. O’Hara | Treasurer | Indefinite Term; | Director, Index Design Group (since | N/A | None |
| Born: 1962 | and | since 2014 | 2015); Director, Pacer Financial, Inc. | | |
| | Principal | | (since 2007); Director, Pacer Advisors, | | |
| | Financial | | Inc. (since 2007) | | |
| | Officer | | | | |
| | | | | | |
| Bruce Kavanaugh | Secretary | Indefinite Term; | Vice President, Pacer Advisors, Inc. | N/A | None |
| Born: 1964 | | since 2016 | (since 2004), Vice President, Pacer | | |
| | | | Financial, Inc. (since 2004) | | |
| | | | | | |
| Perpetua Seidenberg | Chief | Indefinite Term; | Compliance Director, Vigilant | N/A | None |
| Gateway Corporate | Compliance | since 2018 | Compliance, LLC (an investment | | |
| Center, Suite 216 | Officer | | management services company) (since | | |
| 223 Wilmington | and AML | | 2014); Auditor, PricewaterhouseCoopers | | |
| West Chester Pike | Officer | | (since 2012) | | |
| Chadds Ford, PA 19317 | | | | | |
| Born: 1990 | | | | | |
Mr. Thomson is an “Interested Person” by reason of his relationship with the Adviser.
Each Trustee shall serve during the lifetime of the Trust until he or she: (a) dies; (b) resigns; (c) has reached the mandatory retirement age, if any, as set by the Trustees; (d) is declared incompetent by a court of appropriate jurisdiction; or (e) is removed, or, if sooner, until the next meeting of shareholders called for the purpose of electing Trustees and until the election and qualification of his or her successor in accordance with the Trust’s Declaration of Trust and By-laws. Each officer holds office at the pleasure of the Board and services for a period of one year, or until his or her successor is duly elected and qualified.
The Statement of Additional Information includes additional information, including compensation, about the Funds’ Trustees.
(This Page Intentionally Left Blank.)
AdvisorPacer Advisors, Inc.
500 Chesterfield Parkway
Malvern, PA 19355
Index Provider
Index Design Group, LLC
500 Chesterfield Parkway
Malvern, PA 19355
Nasdaq Global Indexes
One Liberty Plaza
165 Broadway
New York, NY 10006
S&P Dow Jones Indices, LLC
55 Water Street
New York, NY 10041
Distributor
Pacer Financial, Inc.
500 Chesterfield Parkway
Malvern, PA 19355
Custodian
U.S. Bank National Association
Custody Operations
1555 North Rivercenter Drive
Milwaukee, WI 53212
Transfer Agent
U.S. Bancorp Fund Services, LLC
615 East Michigan Street
Milwaukee, WI 53202
Independent Registered
Public Accounting Firm
Sanville & Company
1514 Old York Rd.
Abington, PA 19001
Legal Counsel
DLA Piper LLP
1650 Market St., Suite 4900
Philadelphia, PA 19103-7300
| | PACER | | | PACER | | | PACER | | | PACER | | | PACER GLOBAL |
| | TRENDPILOT® | | | TRENDPILOT® | | | TRENDPILOT® | | | TRENDPILOT® | | | CASH COWS |
| | US LARGE CAP ETF | | | US MID CAP ETF | | | 100 ETF | | | EUROPEAN INDEX ETF | | | DIVIDEND ETF |
| | | | | | | | | | | | | | |
| | PTLC | | | PTMC | | | PTNQ | | | PTEU | | | GCOW |
| | CUSIP | | | CUSIP | | | CUSIP | | | CUSIP | | | CUSIP |
| | 69374H105 | | | 69374H204 | | | 69374H303 | | | 69374H808 | | | 69374H709 |
| | | | | | | | | | | | | | |
| | PACER US | | | PACER US SMALL | | | PACER DEVELOPED | | | PACER | | | PACER MILITARY |
| | CASH COWS | | | CAP CASH COWS | | | MARKETS INTERNATIONAL | | | WEALTHSHIELD | | | TIMES BEST |
| | 100 ETF | | | 100 ETF | | | CASH COWS 100 ETF | | | ETF | | | EMPLOYERS ETF |
| | | | | | | | | | | | | | |
| | COWZ | | | CALF | | | ICOW | | | PWS | | | VETS |
| | CUSIP | | | CUSIP | | | CUSIP | | | CUSIP | | | CUSIP |
| | 69374H881 | | | 69374H857 | | | 69374H873 | | | 69374H840 | | | 69374H832 |
| | | | | | | | | | | | | | |
| | PACER BENCHMARK | | | PACER BENCHMARK | | | PACER BENCHMARK | | | PACER US | | | PACER CFRA-STOVALL |
| | RETAIL REAL | | | INDUSTRIAL REAL | | | DATA & INFRASTRUCTURE | | | EXPORT LEADERS | | | EQUAL WEIGHT |
| | ESTATE SCTRSM ETF | | | ESTATE SCTRSM ETF | | | REAL ESTATE SCTRSM ETF | | | ETF | | | SEASONAL ROTATION ETF |
| | | | | | | | | | | | | | |
| | RTL | | | INDS | | | SRVR | | | PEXL | | | SZNE |
| | CUSIP | | | CUSIP | | | CUSIP | | | CUSIP | | | CUSIP |
| | 69374H782 | | | 69374H766 | | | 69374H741 | | | 69374H402 | | | 69374H691 |

Item 2. Code of Ethics.
Not applicable for semi-annual reports.
Item 3. Audit Committee Financial Expert.
Not applicable for semi-annual reports.
Item 4. Principal Accountant Fees and Services.
Not applicable for semi-annual reports.
Item 5. Audit Committee of Listed Registrants.
Not applicable for semi-annual reports.
Item 6. Investments.
Schedule of Investments is included as part of the report to shareholders filed under Item 1 of this Form.
Item 7. Disclosure of Proxy Voting Policies and Procedures for Closed-End Management Investment Companies.
Not applicable to open-end investment companies.
Item 8. Portfolio Managers of Closed-End Management Investment Companies.
Not applicable to open-end investment companies.
Item 9. Purchases of Equity Securities by Closed‑End Management Investment Company and Affiliated Purchasers.
Not applicable to open-end investment companies.
Item 10. Submission of Matters to a Vote of Security Holders.
Not Applicable.
Item 11. Controls and Procedures.
| (a) | The Registrant’s [President/Principal Executive Officer] and [Treasurer/Principal Financial Officer] have reviewed the Registrant's disclosure controls and procedures (as defined in Rule 30a-3(c) under the Investment Company Act of 1940 (the “Act”)) as of a date within 90 days of the filing of this report, as required by Rule 30a-3(b) under the Act and Rules 13a-15(b) or 15d‑15(b) under the Securities Exchange Act of 1934. Based on their review, such officers have concluded that the disclosure controls and procedures are effective in ensuring that information required to be disclosed in this report is appropriately recorded, processed, summarized and reported and made known to them by others within the Registrant and by the Registrant’s service provider. |
| (b) | There were no changes in the Registrant's internal control over financial reporting (as defined in Rule 30a-3(d) under the Act) that occurred during the second fiscal quarter of the period covered by this report that have materially affected, or are reasonably likely to materially affect, the Registrant's internal control over financial reporting. |
Item 12. Disclosure of Securities Lending Activities for Closed-End Management Investment Companies
Not applicable to open-end investment companies.
Item 13. Exhibits.
| (a) | (1) Any code of ethics or amendment thereto, that is the subject of the disclosure required by Item 2, to the extent that the registrant intends to satisfy Item 2 requirements through filing an exhibit. Not Applicable |
(2) A separate certification for each principal executive officer and principal financial officer pursuant to Section 302 of the Sarbanes-Oxley Act of 2002. Filed herewith.
(3) Any written solicitation to purchase securities under Rule 23c‑1 under the Act sent or given during the period covered by the report by or on behalf of the registrant to 10 or more persons. Not applicable to open-end investment companies.
| (1) | Change in the registrant’s independent public accountant. There was no change in the registrant’s independent public accountant for the period covered by this report. |
| (b) | Certifications pursuant to Section 906 of the Sarbanes‑Oxley Act of 2002. Furnished herewith. |
SIGNATURES
Pursuant to the requirements of the Securities Exchange Act of 1934 and the Investment Company Act of 1940, the registrant has duly caused this report to be signed on its behalf by the undersigned, thereunto duly authorized.
(Registrant) Pacer Funds Trust
By (Signature and Title) /s/ Joe M. Thomson
Joe M. Thomson, President (Principal Executive Officer)
Date 12/28/18
Pursuant to the requirements of the Securities Exchange Act of 1934 and the Investment Company Act of 1940, this report has been signed below by the following persons on behalf of the registrant and in the capacities and on the dates indicated.
By (Signature and Title) /s/ Joe M. Thomson
Joe M. Thomson, President (Principal Executive Officer)
Date 12/28/18
By (Signature and Title) /s/ Sean E. O’Hara
Sean E. O’Hara, Treasurer (Principal Financial Officer)
Date 12/28/18
* Print the name and title of each signing officer under his or her signature.