As filed with the U.S. Securities and Exchange Commission on 1/6/2021
UNITED STATES
SECURITIES AND EXCHANGE COMMISSION
Washington, D.C. 20549
FORM N-CSR
CERTIFIED SHAREHOLDER REPORT OF REGISTERED
MANAGEMENT INVESTMENT COMPANIES
Investment Company Act file number 811-23024
Pacer Funds Trust
(Exact name of registrant as specified in charter)
500 Chesterfield Parkway
Malvern, PA 19355
(Address of principal executive offices) (Zip code)
Joe M. Thomson, President
500 Chesterfield Parkway
Malvern, PA 19355
(Name and address of agent for service)
610-644-8100
Registrant's telephone number, including area code
Date of fiscal year end: April 30
Date of reporting period: May 1, 2020 through October 31, 2020
Updated July 14, 2017
Item 1. Reports to Stockholders.
Pacer Funds
TABLE OF CONTENTS
| | Page |
Portfolio Allocation | 1 |
Performance Summary | 10 |
Expense Example | 37 |
Schedules of Investments | 40 |
Statements of Assets & Liabilities | 117 |
Statements of Operations | 122 |
Statements of Changes in Net Assets | 127 |
Financial Highlights | 140 |
Notes to Financial Statements | 165 |
Additional Information | 188 |
Pacer Funds
PORTFOLIO ALLOCATION (Unaudited)
As of October 31, 2020
Pacer Trendpilot® US Large Cap ETF
Sector(a) | Percentage of
Net Assets |
Technology | 23.2% |
Consumer, Non-Cyclical | 21.8% |
Communications | 16.9% |
Financial | 13.9% |
Consumer, Cyclical | 8.3% |
Industrial | 8.3% |
Utilities | 3.2% |
Basic Materials | 2.1% |
Energy | 2.0% |
Short-Term Investments | 0.2% |
Investments Purchased with Proceeds from Securities Lending | 2.7% |
Liabilities in Excess of Other Assets | -2.6% |
Total | 100.0% |
(a) | The Fund may classify a company in a different category than the The Pacer Trendpilot® US Large Cap Index. |
Pacer Trendpilot® US Mid Cap ETF
Sector(a) | Percentage of
Net Assets |
Financial | 23.0% |
Industrial | 20.0% |
Consumer, Non-Cyclical | 18.4% |
Consumer, Cyclical | 16.7% |
Technology | 7.6% |
Basic Materials | 3.8% |
Utilities | 3.6% |
Energy | 3.5% |
Communications | 3.2% |
Short-Term Investments | 0.2% |
Investments Purchased with Proceeds from Securities Lending | 22.8% |
Liabilities in excess of other assets | -22.8% |
Total | 100.0% |
(a) | The Fund may classify a company in a different category than the The Pacer Trendpilot® US Mid Cap Index. |
Pacer Trendpilot® 100 ETF
Sector(a) | Percentage of
Net Assets |
Technology | 21.7% |
Communications | 16.3% |
Consumer, Non-Cyclical | 5.9% |
Consumer, Cyclical | 3.9% |
Utilities | 0.3% |
Industrial | 0.2% |
Short-Term Investments | 51.9% |
Investments Purchased with Proceeds from Securities Lending | 0.6% |
Liabilities in Excess of Other Assets | -0.8% |
Total | 100.0% |
(a) | The Fund may classify a company in a different category than the Pacer Nasdaq-100 Trendpilot® Index. |
1
Pacer Funds
PORTFOLIO ALLOCATION (Unaudited) (Continued)
As of October 31, 2020
Pacer Trendpilot® European Index ETF
Country(a) | Percentage of
Net Assets |
Consumer, Non-cyclical | 22.2% |
Financial | 15.7% |
Industrial | 14.3% |
Consumer, Cyclical | 13.0% |
Technology | 10.0% |
Utilities | 7.6% |
Basic Materials | 6.5% |
Communications | 6.6% |
Energy | 3.4% |
Short-Term Investments | 0.2% |
Investments Purchased with Proceeds from Securities Lending | 12.7% |
Liabilities in excess of other assets | -12.2% |
Total | 100.0% |
(a) | The Fund generally classifies a company based on its country of incorporation, but may designate a different country in certain circumstances. |
Pacer Global Cash Cows Dividend ETF
Sector(a) | Percentage of
Net Assets |
Communications | 21.4% |
Consumer, Non-Cyclical | 19.1% |
Basic Materials | 15.7% |
Energy | 15.1% |
Consumer, Cyclical | 8.1% |
Financial | 5.9% |
Utilities | 5.2% |
Technology | 4.2% |
Industrial | 2.8% |
Diversified | 1.6% |
Short-Term Investments | 0.2% |
Investments Purchased with Proceeds from Securities Lending | 16.5% |
Liabilities in excess of other assets | -15.8% |
Total | 100.0% |
(a) | The Fund may classify a company in a different category than the Pacer Global Cash Cows Dividend 100 Index. |
2
Pacer Funds
PORTFOLIO ALLOCATION (Unaudited) (Continued)
As of October 31, 2020
Pacer US Cash Cows 100 ETF
Sector(a) | Percentage of
Net Assets |
Consumer, Non-Cyclical | 31.8% |
Consumer, Cyclical | 23.5% |
Technology | 12.1% |
Communications | 9.7% |
Industrial | 8.8% |
Basic Materials | 6.1% |
Energy | 2.7% |
Utilities | 2.5% |
Financial | 2.4% |
Short-Term Investments | 0.3% |
Investments Purchased with Proceeds from Securities Lending | 10.3% |
Liabilities in excess of other assets | -10.2% |
Total | 100.0% |
(a) | The Fund may classify a company in a different category than the Pacer US Cash Cows 100 Index. |
Pacer US Small Cap Cash Cows 100 ETF
Sector(a) | Percentage of
Net Assets |
Consumer, Cyclical | 37.3% |
Consumer, Non-Cyclical | 27.5% |
Industrial | 23.1% |
Energy | 4.5% |
Technology | 3.7% |
Basic Materials | 1.7% |
Financial | 1.4% |
Communications | 0.6% |
Short-Term Investments | 0.2% |
Investments Purchased with Proceeds from Securities Lending | 3.5% |
Liabilities in excess of other assets | -3.5% |
Total | 100.0% |
(a) | The Fund may classify a company in a different category than the Pacer US Small Cap Cash Cows 100 Index. |
Pacer Developed Markets International Cash Cows 100 ETF
Sector(a) | Percentage of
Net Assets |
Consumer, Cyclical | 24.2% |
Basic Materials | 16.2% |
Industrial | 14.2% |
Communications | 13.0% |
Consumer, Non-Cyclical | 11.8% |
Energy | 8.7% |
Technology | 7.3% |
Utilities | 3.0% |
Financial | 0.7% |
Short-Term Investments | 0.1% |
Investments Purchased with Proceeds from Securities Lending | 13.4% |
Liabilities in excess of other assets | -12.6% |
Total | 100.0% |
(a) | The Fund may classify a company in a different category than the Pacer Developed Markets International Cash Cows 100 Index. |
3
Pacer Funds
PORTFOLIO ALLOCATION (Unaudited) (Continued)
As of October 31, 2020
Pacer WealthShield ETF
Sector(a) | Percentage of
Net Assets |
Consumer, Non-Cyclical | 23.3% |
Communications | 22.3% |
Technology | 21.6% |
Basic Materials | 16.1% |
Consumer, Cyclical | 10.8% |
Industrial | 3.3% |
Financial | 2.1% |
Short-Term Investments | 0.5% |
Investments Purchased with Proceeds from Securities Lending | 13.6% |
Liabilities in excess of other assets | -13.6% |
Total | 100.0% |
(a) | The Fund may classify a company in a different category than the Pacer WealthShield Index. |
Pacer Military Times Best Employers ETF
Sector(a) | Percentage of
Net Assets |
Industrial | 23.1% |
Financial | 22.6% |
Consumer, Non-Cyclical | 17.9% |
Consumer, Cyclical | 9.8% |
Communications | 9.1% |
Technology | 8.7% |
Utilities | 8.1% |
Short-Term Investments | 0.6% |
Other Assets less Liabilities | 0.1% |
Total | 100.0% |
(a) | The Fund may classify a company in a different category than the Military Times Best for VETS Total Return Index. |
Pacer Benchmark Industrial Real Estate SCTRSM ETF
Sector(a) | Percentage of
Net Assets |
Financial | 99.8% |
Investments Purchased with Proceeds from Securities Lending | 18.1% |
Short-Term Investments | 0.2% |
Liabilities in excess of other assets | -18.1% |
Total | 100.0% |
(a) | The Fund may classify a company in a different category than the Benchmark Industrial Real Estate SCTRSM Index. |
Pacer Benchmark Data & Infrastructure Real Estate SCTRSM ETF
Sector(a) | Percentage of
Net Assets |
Financial | 77.8% |
Industrial | 9.2% |
Communications | 12.8% |
Short-Term Investments | 0.3% |
Investments Purchased with Proceeds from Securities Lending | 10.3% |
Liabilities in excess of other assets | -10.4% |
Total | 100.0% |
(a) | The Fund may classify a company in a different category than the Benchmark Data & Infrastructure Real Estate SCTRSM Index. |
4
Pacer Funds
PORTFOLIO ALLOCATION (Unaudited) (Continued)
As of October 31, 2020
Pacer US Export Leaders ETF
Sector(a) | Percentage of
Net Assets |
Technology | 32.8% |
Industrial | 30.6% |
Consumer, Non-Cyclical | 16.0% |
Basic Materials | 9.6% |
Consumer, Cyclical | 3.6% |
Energy | 3.1% |
Communications | 2.0% |
Utilities | 1.1% |
Financial | 0.9% |
Short-Term Investments | 0.3% |
Liabilities in excess of other assets | *0.0% |
Total | 100.0% |
(a) | The Fund may classify a company in a different category than the Pacer US Export Leaders Index. |
Pacer CFRA-Stovall Equal Weight Seasonal Rotation ETF
Sector(a) | Percentage of
Net Assets |
Industrial | 27.4% |
Consumer, Cyclical | 25.7% |
Technology | 17.5% |
Basic Materials | 16.3% |
Consumer, Non-Cyclical | 6.8% |
Communications | 5.0% |
Financial | 0.9% |
Short-Term Investments | 0.1% |
Other assets in excess of liabilities | 0.3% |
Total | 100.0% |
(a) | The Fund may classify a company in a different category than the Pacer CFRA-Stovall Equal Weight Seasonal Rotation Index. |
Pacer US Cash Cows Growth ETF
Sector(a) | Percentage of
Net Assets |
Technology | 29.2% |
Industrial | 21.3% |
Consumer, Cyclical | 16.3% |
Communications | 12.7% |
Consumer, Non-Cyclical | 9.3% |
Basic Materials | 8.5% |
Utilities | 1.5% |
Energy | 0.7% |
Short-Term Investments | 0.5% |
Liabilities in excess of other assets | *0.0% |
Total | 100.0% |
(a) | The Fund may classify a company in a different category than the Pacer US Cash Cows Growth Index. |
5
Pacer Funds
PORTFOLIO ALLOCATION (Unaudited) (Continued)
As of October 31, 2020
Pacer Trendpilot® International ETF
Sector(a) | Percentage of
Net Assets |
Consumer, Non-Cyclical | 25.3% |
Financial | 18.9% |
Industrial | 12.7% |
Consumer, Cyclical | 12.1% |
Communications | 6.5% |
Basic Materials | 6.3% |
Technology | 5.4% |
Diversified | 5.3% |
Energy | 3.9% |
Utilities | 3.3% |
Short-Term Investments | *0.0% |
Other assets in excess of liabilities | 0.3% |
Total | 100.0% |
(a) | The Fund may classify a company in a different category than the Pacer Trendpilot® International Index. |
Pacer Emerging Markets Cash Cows 100 ETF
Sector(a) | Percentage of
Net Assets |
Communications | 21.0% |
Energy | 13.9% |
Basic Materials | 13.8% |
Consumer, Non-Cyclical | 12.2% |
Consumer, Cyclical | 10.7% |
Industrial | 9.9% |
Technology | 9.6% |
Utilities | 5.8% |
Diversified | 2.6% |
Short-Term Investments | 0.2% |
Other assets in excess of liabilities | 0.3% |
Total | 100.0% |
(a) | The Fund may classify a company in a different category than the Pacer Emerging Markets Cash Cows 100 Index. |
Pacer Cash Cows Fund of Funds ETF
Sector(a) | Percentage of
Net Assets |
Affiliated Exchange Traded Funds | 100.0% |
Short-Term Investments | 0.0%* |
Liabilities in excess of other assets | 0.0%* |
Total | 100.0% |
(a) | The Fund may classify a company in a different category than the Pacer Cash Cows Fund of Funds Index. |
6
Pacer Funds
PORTFOLIO ALLOCATION (Unaudited) (Continued)
As of October 31, 2020
Pacer Trendpilot® Fund of Funds ETF
Sector(a) | Percentage of
Net Assets |
Affiliated Exchange Traded Funds | 99.9% |
Short-Term Investments | 0.1% |
Liabilities in excess of other assets | 0.0%* |
Total | 100.0% |
(a) | The Fund may classify a company in a different category than the Pacer Trendpilot® Fund of Funds Index. |
Pacer Trendpilot® US Bond ETF
Sector(a) | Percentage of
Net Assets |
Consumer, Cyclical | 21.9% |
Communications | 18.0% |
Consumer, Non-Cyclical | 14.1% |
Energy | 11.3% |
Financial | 10.5% |
Industrial | 8.8% |
Basic Materials | 8.4% |
Utilities | 3.1% |
Technology | 2.3% |
Short-Term Investments | *0.0% |
Other assets in excess of liabilities | 1.6% |
Total | 100.0% |
(a) | The Fund may classify a company in a different category than the Pacer Trendpilot® US Bond Index. |
Pacer CSOP FTSE China A50 ETF
Sector(a) | Percentage of
Net Assets |
Financial | 46.3% |
Consumer, Non-Cyclical | 29.0% |
Consumer, Cyclical | 8.8% |
Industrial | 8.6% |
Energy | 3.5% |
Basic Materials | 1.7% |
Utilities | 1.1% |
Communications | 0.5% |
Short-Term Investments | 0.5% |
Other Assets in Excess of Liabilities | *0.0% |
Total | 100.0% |
(a) | The Fund may classify a company in a different category than the FTSE China A50 Net Total Return Index. |
7
Pacer Funds
PORTFOLIO ALLOCATION (Unaudited) (Continued)
As of October 31, 2020
Pacer BioThreat Strategy ETF
Sector(a) | Percentage of
Net Assets |
Consumer, Non-Cyclical | 48.6% |
Industrial | 7.6% |
Consumer, Cyclical | 15.4% |
Communications | 12.3% |
Technology | 14.0% |
Basic Materials | 2.0% |
Short-Term Investments | 0.1% |
Other Assets in Excess of Liabilities | *0.0% |
Total | 100.0% |
(a) | The Fund may classify a company in a different category than the BioShares BioThreat Index. |
Pacer Lunt Large Cap Alternator ETF
Sector(a) | Percentage of
Net Assets |
Consumer, Non-Cyclical | 46.3% |
Industrial | 13.5% |
Communications | 10.0% |
Financial | 8.7% |
Technology | 7.7% |
Utilities | 6.9% |
Consumer, Cyclical | 5.7% |
Basic Materials | 0.9% |
Short-Term Investments | 0.1% |
Other Assets in Excess of Liabilities | 0.2% |
Total | 100.0% |
(a) | The Fund may classify a company in a different category than the Lunt Capital U.S. Large Cap Equity Rotation Index. |
Pacer Lunt Midcap Multi-Factor Alternator ETF
Sector(a) | Percentage of
Net Assets |
Consumer, Non-Cyclical | 30.5% |
Industrial | 15.7% |
Consumer, Cyclical | 15.5% |
Technology | 13.9% |
Communications | 8.2% |
Energy | 7.3% |
Financial | 6.4% |
Basic Materials | 2.1% |
Short-Term Investments | 0.4% |
Liabilities in excess of other assets | *0.0% |
Total | 100.0% |
(a) | The Fund may classify a company in a different category than the Lunt Capital U.S. MidCap Multi-Factor Rotation Index. |
8
Pacer Funds
PORTFOLIO ALLOCATION (Unaudited) (Continued)
As of October 31, 2020
Pacer Lunt Large Cap Multi-Factor Alternator ETF
Sector(a) | Percentage of
Net Assets |
Technology | 33.4% |
Consumer, Non-Cyclical | 27.6% |
Communications | 16.8% |
Consumer, Cyclical | 8.4% |
Financial | 8.4% |
Basic Materials | 2.1% |
Industrial | 2.1% |
Utilities | 0.8% |
Energy | 0.3% |
Short-Term Investments | 0.1% |
Other Assets in Excess of Liabilities | *0.0% |
Total | 100.0% |
(a) | The Fund may classify a company in a different category than the Lunt Capital U.S. Large Cap Multi-Factor Rotation Index. |
9
Pacer Trendpilot® US Large Cap ETF
PERFORMANCE SUMMARY
(Unaudited)
Growth of $10,000
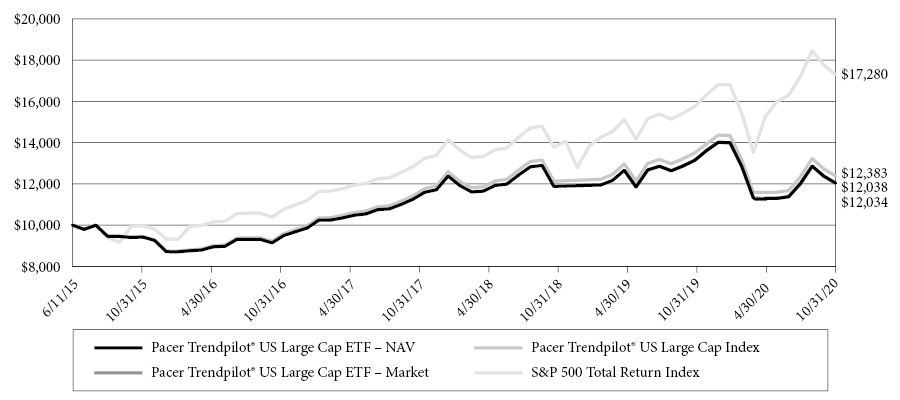
This chart illustrates the performance of a hypothetical $10,000 investment made on June 11, 2015, and is not intended to imply any future performance. The returns shown do not reflect the deduction of taxes that a shareholder would pay on fund distributions or the redemption of fund shares. The chart assumes reinvestment of capital gains and dividends.
The Pacer Trendpilot® US Large Cap Index uses an objective, rules-based methodology to implement a systematic trend-following strategy that directs exposure (i) 100% to the S&P 500 Index, (ii) 50% to the S&P 500 Total Return Index and 50% to 3-Month US Treasury bills, or (iii) 100% to 3-Month US Treasury bills, depending on the relative performance of the S&P 500 Total Return Index and its 200-business day historical simple moving average.
The S&P 500 Index consists of approximately 500 leading U.S.-listed companies representing approximately 8% of the U.S. equity market capitalization.
Annualized Returns(1)
(For the period ended October 31, 2020)
| | One Year | Three Year | Five Year | Since Inception(2) |
Pacer Trendpilot® US Large Cap ETF - NAV | -8.39% | 2.27% | 5.07% | 3.50% |
Pacer Trendpilot® US Large Cap ETF - Market | -8.39% | 2.23% | 5.03% | 3.50% |
Pacer Trendpilot® US Large Cap Index(3) | -7.92% | 2.87% | 5.71% | 4.12% |
S&P 500® Index(3) | 9.71% | 10.42% | 11.71% | 10.68% |
(1) | The performance data quoted is historical. Past performance is no guarantee of future results. Current performance may be higher or lower than the performance data quoted. The principal value and investment return of an investment will fluctuate so that investor’s shares, when redeemed, may be worth more or less than the original cost. The returns shown do not reflect the deduction of taxes that a shareholder would pay on Fund distributions or on redemptions of Fund shares. The total annual operating expenses as stated in the fee table to the Fund’s prospectus dated August 31, 2020, as supplemented October 15, 2020, is 0.60%. For performance information current to the most recent month-end, please call 1-877-337-0500. |
(2) | Inception date is June 11, 2015. |
(3) | Indexes are unmanaged statistical composites and their returns do not include fees an investor would pay to purchase the securities they represent. Such costs would lower performance. It is not possible to invest directly in an index. |
10
Pacer Trendpilot® US Mid Cap ETF
PERFORMANCE SUMMARY
(Unaudited)
Growth of $10,000
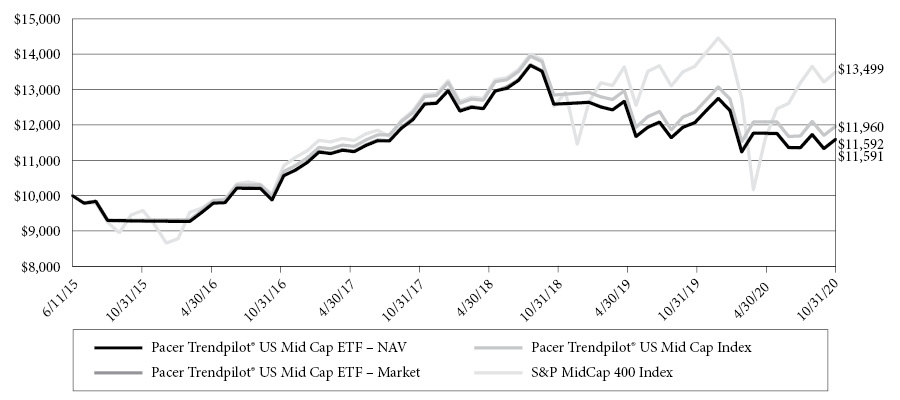
This chart illustrates the performance of a hypothetical $10,000 investment made on June 11, 2015, and is not intended to imply any future performance. The returns shown do not reflect the deduction of taxes that a shareholder would pay on fund distributions or the redemption of fund shares. The chart assumes reinvestment of capital gains and dividends.
The Pacer Trendpilot® US Mid Cap Index uses an objective, rules-based methodology to implement a systematic trend-following strategy that directs exposure (i) 100% to the S&P MidCap 400 Index, (ii) 50% to the S&P MidCap 400 Index and 50% to 3-Month US Treasury bills, or (iii) 100% to 3-Month US Treasury bills, depending on the relative performance of the S&P MidCap 400 Total Return Index and its 200-business day historical simple moving average.
The S&P MidCap 400 Index is a total return version of the S&P MidCap 400 Index and reflects the reinvestment of dividends paid by the securities in the S&P MidCap 400 Index. The S&P Midcap 400 measures the performance of mid-capitalization stocks in the United States.
Annualized Returns(1)
(For the period ended October 31, 2020)
| | One Year | Three Year | Five Year | Since Inception(2) |
Pacer Trendpilot® US Mid Cap ETF - NAV | -3.89% | -1.54% | 4.54% | 2.78% |
Pacer Trendpilot® US Mid Cap ETF - Market | -3.89% | -1.64% | 4.54% | 2.78% |
Pacer Trendpilot® US Mid Cap Index(3) | -3.15% | -1.03% | 5.16% | 3.40% |
S&P MidCap 400 Index(3) | -1.15% | 2.87% | 7.39% | 5.73% |
(1) | The performance data quoted is historical. Past performance is no guarantee of future results. Current performance may be higher or lower than the performance data quoted. The principal value and investment return of an investment will fluctuate so that investor’s shares, when redeemed, may be worth more or less than the original cost. The returns shown do not reflect the deduction of taxes that a shareholder would pay on Fund distributions or on redemptions of Fund shares. The total annual operating expenses as stated in the fee table to the Fund’s prospectus dated August 31, 2020, as supplemented October 15, 2020, is 0.60%. For performance information current to the most recent month-end, please call 1-877-337-0500. |
(2) | Inception date is June 11, 2015. |
(3) | Indexes are unmanaged statistical composites and their returns do not include fees an investor would pay to purchase the securities they represent. Such costs would lower performance. It is not possible to invest directly in an index. |
11
Pacer Trendpilot® 100 ETF
PERFORMANCE SUMMARY
(Unaudited)
Growth of $10,000
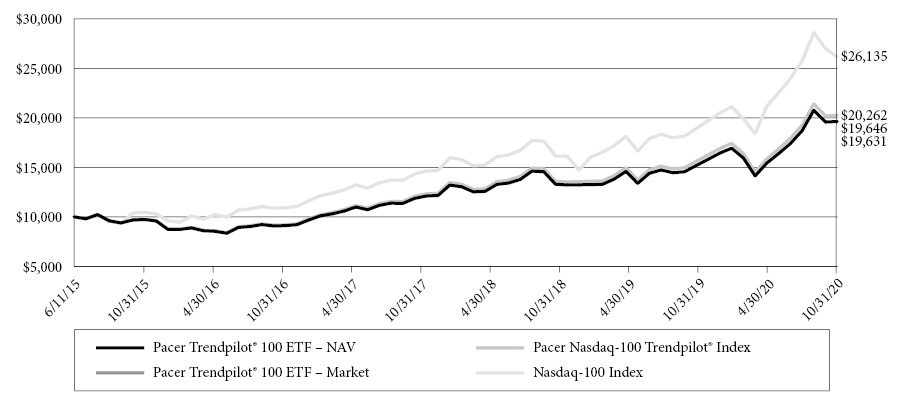
This chart illustrates the performance of a hypothetical $10,000 investment made on June 11, 2015, and is not intended to imply any future performance. The returns shown do not reflect the deduction of taxes that a shareholder would pay on fund distributions or the redemption of fund shares. The chart assumes reinvestment of capital gains and dividends.
Pacer NASDAQ-100 Trendpilot® Index uses an objective, rules-based methodology to implement a systematic trend-following strategy that directs exposure (i) 100% to the NASDAQ-100 Index, (ii) 50% to the NASDAQ-100 Index and 50% to 3-Month US Treasury bills, or (iii) 100% to 3-Month US Treasury bills, depending on the relative performance of the NASDAQ-100 Index and its 200-business day historical simple moving average.
The NASDAQ-100 Index includes approximately 100 of the largest non-financial securities listed on The NASDAQ Stock Market based on market capitalization. The NASDAQ-100 Index comprises securities of companies across major industry groups, including computer, biotechnology, healthcare, telecommunications and transportation. However, it does not contain securities of financial companies, including investment companies. The NASDAQ-100 Index was developed by NASDAQ OMX. There is no minimum market capitalization requirement for inclusion in the NASDAQ-100 Index. Inclusion is determined based on the top 100 largest issuers based on market capitalization meeting all other eligibility requirements.
Annualized Returns(1)
(For the period ended October 31, 2020)
| | One Year | Three Year | Five Year | Since Inception(2) |
Pacer Trendpilot® 100 ETF - NAV | 29.24% | 18.28% | 15.20% | 13.33% |
Pacer Trendpilot® 100 ETF - Market | 29.28% | 18.27% | 15.17% | 13.35% |
Pacer NASDAQ-100 Trendpilot® Index(3) | 29.78% | 18.86% | 15.86% | 14.00% |
NASDAQ-100 Index(3) | 38.02% | 22.20% | 20.24% | 19.51% |
(1) | The performance data quoted is historical. Past performance is no guarantee of future results. Current performance may be higher or lower than the performance data quoted. The principal value and investment return of an investment will fluctuate so that investor’s shares, when redeemed, may be worth more or less than the original cost. The returns shown do not reflect the deduction of taxes that a shareholder would pay on Fund distributions or on redemptions of Fund shares. The total annual operating expenses as stated in the fee table to the Fund’s prospectus dated August 31, 2020, as supplemented October 15, 2020, is 0.65%. For performance information current to the most recent month-end, please call 1-877-337-0500. |
(2) | Inception date is June 11, 2015. |
(3) | Indexes are unmanaged statistical composites and their returns do not include fees an investor would pay to purchase the securities they represent. Such costs would lower performance. It is not possible to invest directly in an index. |
12
Pacer Trendpilot® European Index ETF
PERFORMANCE SUMMARY
(Unaudited)
Growth of $10,000

This chart illustrates the performance of a hypothetical $10,000 investment made on December 14, 2015, and is not intended to imply any future performance. The returns shown do not reflect the deduction of taxes that a shareholder would pay on fund distributions or the redemption of fund shares. The chart assumes reinvestment of capital gains and dividends.
The Pacer Trendpilot® European Index uses an objective, rules-based methodology to implement a systematic trend-following strategy that directs exposure (i) 100% to the FTSE Eurozone Index, (ii) 50% to the FTSE Eurozone Index and 50% to 3-Month US Treasury bills, or (iii) 100% to 3-Month US Treasury bills, depending on the relative performance of the FTSE Eurozone Total Return Index and its 200-business day historical simple moving average.
The FTSE Eurozone Index is a rules-based, float-adjusted, market capitalization-weighted index comprised of large- and mid-capitalization stocks providing coverage of the developed markets in the euro zone, including primarily France, Germany, Spain, the Netherlands, and Italy. The FTSE Eurozone Index is a subset of the FTSE Global Equity Index Series, which covers 98% of the world’s investable market capitalization.
Annualized Returns(1)
(For the period ended October 31, 2020)
| | One Year | Three Year | Since Inception(2) |
Pacer Trendpilot® European Index ETF - NAV | -22.55% | -10.84% | -2.89% |
Pacer Trendpilot® European Index ETF - Market | -22.69% | -11.33% | -2.99% |
Pacer Trendpilot® European Index(3) | -21.54% | -9.48% | -1.55% |
FTSE Eurozone Index (USD)(3) | -9.40% | -3.34% | 4.24% |
(1) | The performance data quoted is historical. Past performance is no guarantee of future results. Current performance may be higher or lower than the performance data quoted. The principal value and investment return of an investment will fluctuate so that investor’s shares, when redeemed, may be worth more or less than the original cost. The returns shown do not reflect the deduction of taxes that a shareholder would pay on Fund distributions or on redemptions of Fund shares. The total annual operating expenses as stated in the fee table to the Fund’s prospectus dated August 31, 2020, as supplemented October 15, 2020, is 0.65%. For performance information current to the most recent month-end, please call 1-877-337-0500. |
(2) | Inception date is December 14, 2015. |
(3) | Indexes are unmanaged statistical composites and their returns do not include fees an investor would pay to purchase the securities they represent. Such costs would lower performance. It is not possible to invest directly in an index. |
13
Pacer Global Cash Cows Dividend ETF
PERFORMANCE SUMMARY
(Unaudited)
Growth of $10,000
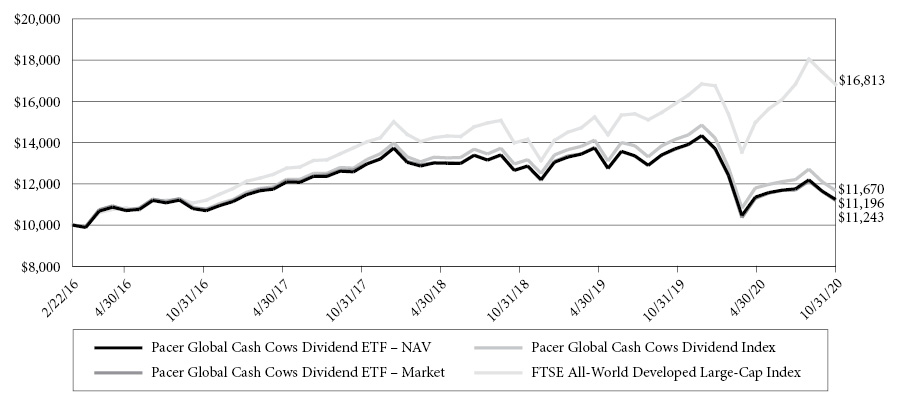
This chart illustrates the performance of a hypothetical $10,000 investment made on February 22, 2016, and is not intended to imply any future performance. The returns shown do not reflect the deduction of taxes that a shareholder would pay on fund distributions or the redemption of fund shares. The chart assumes reinvestment of capital gains and dividends.
The Pacer Global Cash Cows Dividend Index uses an objective, rules-based methodology to provide exposure to global companies with high dividend yield backed by a high free cash flow yield. The initial index universe is derived from the component companies of the FTSE All-World Developed Large Cap Index. The initial universe of companies is screened based on their average projected free cash flows and earnings over each of the next two fiscal years. Companies with negative average projected free cash flows or earnings are removed from the Index universe. Additionally, financial companies, other than real estate investment trusts, are excluded from the Index universe. The remaining companies are ranked by their free cash flow yield for the trailing twelve month period. The 300 companies with the highest free cash flow yield are then ranked by their dividend yield. The equity securities of the 100 companies with the highest dividend yield are included in the Index.
The FTSE All-World Developed Large-Cap Index is a market-capitalization weighted index representing the performance of large-cap stocks in developed markets.
Annualized Returns(1)
(For the period ended October 31, 2020)
| | One Year | Three Year | Since Inception(2) |
Pacer Global Cash Cows Dividend ETF - NAV | -17.92% | -3.66% | 2.53% |
Pacer Global Cash Cows Dividend ETF - Market | -18.11% | -4.03% | 2.44% |
Pacer Global Cash Cows Dividend Index(3) | -17.52% | -2.93% | 3.35% |
FTSE All-World Developed Large-Cap Index(3) | 5.89% | 6.94% | 11.71% |
(1) | The performance data quoted is historical. Past performance is no guarantee of future results. Current performance may be higher or lower than the performance data quoted. The principal value and investment return of an investment will fluctuate so that investor’s shares, when redeemed, may be worth more or less than the original cost. The returns shown do not reflect the deduction of taxes that a shareholder would pay on Fund distributions or on redemptions of Fund shares. The total annual operating expenses as stated in the fee table to the Fund’s prospectus dated August 31, 2020, is 0.60%. For performance information current to the most recent month-end, please call 1-877-337-0500. |
(2) | Inception date is February 22, 2016. |
(3) | Indexes are unmanaged statistical composites and their returns do not include fees an investor would pay to purchase the securities they represent. Such costs would lower performance. It is not possible to invest directly in an index. |
14
Pacer US Cash Cows 100 ETF
PERFORMANCE SUMMARY
(Unaudited)
Growth of $10,000
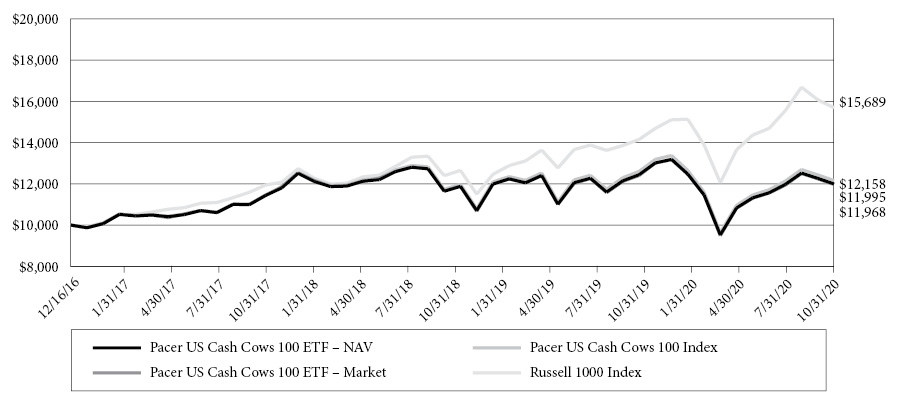
This chart illustrates the performance of a hypothetical $10,000 investment made on December 16, 2016, and is not intended to imply any future performance. The returns shown do not reflect the deduction of taxes that a shareholder would pay on fund distributions or the redemption of fund shares. The chart assumes reinvestment of capital gains and dividends.
The Pacer US Cash Cows 100 Index uses an objective, rules-based methodology to provide exposure to large and mid-capitalization U.S. companies with high free cash flow yields. Companies with high free cash flow yields are commonly referred to as “cash cows.” The initial index universe is derived from the component companies of the Russell 1000® Index. The initial universe of companies is screened based on their average projected free cash flows and earnings over each of the next two fiscal years. Companies with no forward year estimates available for free cash flows or earnings will remain in the Index universe. Companies with negative average projected free cash flows or earnings are removed from the Index universe. Additionally, financial companies, other than real estate investment trusts, are excluded from the Index universe. The remaining companies are ranked by their free cash flow yield for the trailing twelve month period. The equity securities of the 100 companies with the highest free cash flow yield are included in the Index.
The Russell 1000 Index is a market-capitalization weighted index representing the top 1,000 large-cap stocks in the Russell 3000 Index.
Annualized Returns(1)
(For the period ended October 31, 2020)
| | One Year | Three Year | Since Inception(2) |
Pacer US Cash Cows 100 ETF - NAV | -3.59% | 2.96% | 4.81% |
Pacer US Cash Cows 100 ETF - Market | -3.51% | 2.85% | 4.75% |
Pacer US Cash Cows 100 Index(3) | -3.53% | 3.35% | 5.17% |
Russell 1000® Index(3) | 10.87% | 10.63% | 12.33% |
(1) | The performance data quoted is historical. Past performance is no guarantee of future results. Current performance may be higher or lower than the performance data quoted. The principal value and investment return of an investment will fluctuate so that investor’s shares, when redeemed, may be worth more or less than the original cost. The returns shown do not reflect the deduction of taxes that a shareholder would pay on Fund distributions or on redemptions of Fund shares. The total annual operating expenses as stated in the fee table to the Fund’s prospectus dated August 31, 2020, is 0.49%. For performance information current to the most recent month-end, please call 1-877-337-0500. |
(2) | Inception date is December 16, 2016. |
(3) | Indexes are unmanaged statistical composites and their returns do not include fees an investor would pay to purchase the securities they represent. Such costs would lower performance. It is not possible to invest directly in an index. |
15
Pacer US Small Cap Cash Cows 100 ETF
PERFORMANCE SUMMARY
(Unaudited)
Growth of $10,000
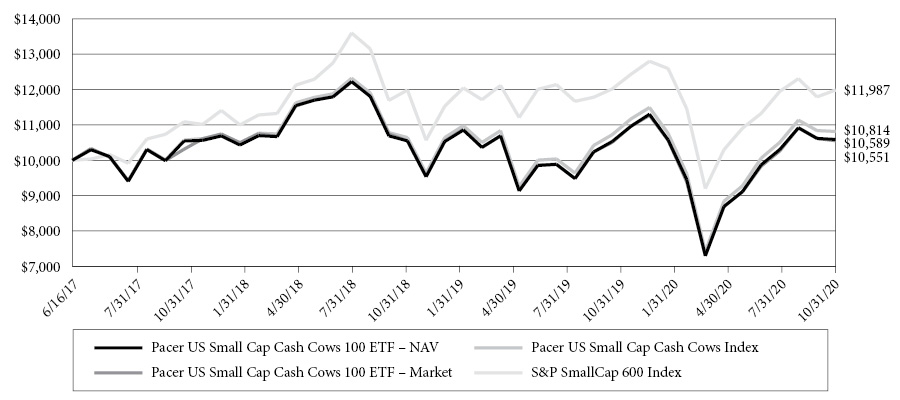
This chart illustrates the performance of a hypothetical $10,000 investment made on June 16, 2017, and is not intended to imply any future performance. The returns shown do not reflect the deduction of taxes that a shareholder would pay on fund distributions or the redemption of fund shares. The chart assumes reinvestment of capital gains and dividends.
The Pacer US Small Cap Cash Cows Index uses an objective, rules-based methodology to provide exposure to small-capitalization U.S. companies with high free cash flow yields. Companies with high free cash flow yields are commonly referred to as “cash cows.” The initial Index universe is derived from the component companies of the S&P Small Cap 600® Index. The initial universe of companies is screened based on their average projected free cash flows and earnings over each of the next two fiscal years. Companies with no forward year estimates available for free cash flows or earnings will remain in the Index universe. Companies with negative average projected free cash flows or earnings are removed from the Index universe. Additionally, financial companies, other than real estate investment trusts, are excluded from the Index universe. The remaining companies are ranked by their free cash flow yield for the trailing twelve month period. The equity securities of the 100 companies with the highest free cash flow yield are included in the Index.
The S&P SmallCap 600® Index measures the performance of 600 small sized companies in the US equity market, with market capitalization ranging from $450 million to $2.1 billion USD. The Index does not overlap holdings with the S&P 500 or S&P MidCap 400.
Annualized Returns(1)
(For the period ended October 31, 2020)
| | One Year | Three Year | Since Inception(2) |
Pacer US Small Cap Cash Cows 100 ETF - NAV | 0.54% | 1.97% | 1.71% |
Pacer US Small Cap Cash Cows 100 ETF - Market | 0.40% | 1.83% | 1.60% |
Pacer US Small Cap Cash Cows Index(3) | 0.44% | 2.11% | 1.85% |
S&P SmallCap 600® Index(3) | -7.72% | 0.20% | 2.33% |
(1) | The performance data quoted is historical. Past performance is no guarantee of future results. Current performance may be higher or lower than the performance data quoted. The principal value and investment return of an investment will fluctuate so that investor’s shares, when redeemed, may be worth more or less than the original cost. The returns shown do not reflect the deduction of taxes that a shareholder would pay on Fund distributions or on redemptions of Fund shares. The total annual operating expenses as stated in the fee table to the Fund’s prospectus dated August 31, 2020, is 0.59%. For performance information current to the most recent month-end, please call 1-877-337-0500. |
(2) | Inception date is June 16, 2017. |
(3) | Indexes are unmanaged statistical composites and their returns do not include fees an investor would pay to purchase the securities they represent. Such costs would lower performance. It is not possible to invest directly in an index. |
16
Pacer Developed Markets International Cash Cows 100 ETF
PERFORMANCE SUMMARY
(Unaudited)
Growth of $10,000
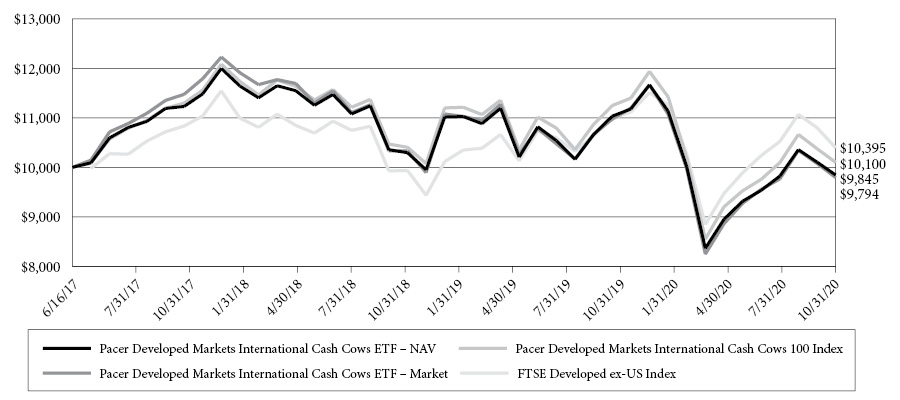
This chart illustrates the performance of a hypothetical $10,000 investment made on June 16, 2017, and is not intended to imply any future performance. The returns shown do not reflect the deduction of taxes that a shareholder would pay on fund distributions or the redemption of fund shares. The chart assumes reinvestment of capital gains and dividends.
The Pacer Developed Markets International Cash Cows 100 Index uses an objective, rules-based methodology to provide exposure to large and mid-capitalization non-U.S. companies in developed markets with high free cash flow yields. The initial index universe is derived from the component companies of the FTSE Developed ex US Index. The initial universe of companies is screened based on their average projected free cash flows and earnings over each of the next two fiscal years. Companies with no forward year estimates available for free cash flows or earnings will remain in the Index universe. Companies with negative average projected free cash flows or earnings are removed from the Index universe. Additionally, financial companies, other than real estate investment trusts, and companies with a market capitalization of less than $3 billion are excluded from the Index universe. The remaining companies are ranked by their average daily trading value (“ADTV”) for the prior three months. The 500 companies with the highest ADTV are then ranked by their free cash flow yield for the trailing twelve month period. The equity securities of the 100 companies with the highest free cash flow yield are included in the Index.
The FTSE Developed ex-US Index is comprised of Large (85%) and Mid (15%) cap stocks providing coverage of Developed markets (24 countries) excluding the US. The index is derived from the FTSE Global Equity Index Series, which covers 98% of the world’s investable market capitalization.
Annualized Returns(1)
(For the period ended October 31, 2020)
| | One Year | Three Year | Since Inception(2) |
Pacer Developed Markets International Cash Cows 100 ETF - NAV | -10.78% | -4.18% | -0.46% |
Pacer Developed Markets International Cash Cows 100 ETF - Market | -10.74% | -4.80% | -0.62% |
Pacer Developed Markets International Cash Cows 100 Index(3) | -10.20% | -3.37% | 0.30% |
FTSE Developed ex-US Index(3) | -5.47% | -1.01% | 1.15% |
(1) | The performance data quoted is historical. Past performance is no guarantee of future results. Current performance may be higher or lower than the performance data quoted. The principal value and investment return of an investment will fluctuate so that investor’s shares, when redeemed, may be worth more or less than the original cost. The returns shown do not reflect the deduction of taxes that a shareholder would pay on Fund distributions or on redemptions of Fund shares. The total annual operating expenses as stated in the fee table to the Fund’s prospectus dated August 31, 2020, is 0.65%. For performance information current to the most recent month-end, please call 1-877-337-0500. |
(2) | Inception date is June 16, 2017. |
(3) | Indexes are unmanaged statistical composites and their returns do not include fees an investor would pay to purchase the securities they represent. Such costs would lower performance. It is not possible to invest directly in an index. |
17
Pacer WealthShield ETF
PERFORMANCE SUMMARY
(Unaudited)
Growth of $10,000

This chart illustrates the performance of a hypothetical $10,000 investment made on December 11, 2017, and is not intended to imply any future performance. The returns shown do not reflect the deduction of taxes that a shareholder would pay on fund distributions or the redemption of fund shares. The chart assumes reinvestment of capital gains and dividends.
The Pacer WealthShield Index uses an objective, rules-based methodology to implement a trend-following strategy that directs some or all of the Index’s exposure to (i) U.S. equity securities or (ii) U.S. Treasury securities depending on the strength of the high-yield corporate (“junk”) bond market relative to U.S. Treasury bonds and the momentum of certain U.S. equity sectors or industries and of long-term U.S. Treasury bonds.
The S&P 500 Index consists of approximately 500 leading U.S.-listed companies representing approximately 8% of the U.S. equity market capitalization.
Annualized Returns(1)
(For the period ended October 31, 2020)
| | One Year | Since Inception(2) |
Pacer WealthShield ETF - NAV | 9.23% | 1.19% |
Pacer WealthShield ETF - Market | 8.93% | 1.06% |
Pacer WealthShield Index(3) | 8.61% | 1.51% |
S&P 500® Index(3) | 9.71% | 9.50% |
(1) | The performance data quoted is historical. Past performance is no guarantee of future results. Current performance may be higher or lower than the performance data quoted. The principal value and investment return of an investment will fluctuate so that investor’s shares, when redeemed, may be worth more or less than the original cost. The returns shown do not reflect the deduction of taxes that a shareholder would pay on Fund distributions or on redemptions of Fund shares. The total annual operating expenses as stated in the fee table to the Fund’s prospectus dated August 31, 2020, is 0.60%. For performance information current to the most recent month-end, please call 1-877-337-0500. |
(2) | Inception date is December 11, 2017. |
(3) | Indexes are unmanaged statistical composites and their returns do not include fees an investor would pay to purchase the securities they represent. Such costs would lower performance. It is not possible to invest directly in an index. |
18
Pacer Military Times Best Employers ETF
PERFORMANCE SUMMARY
(Unaudited)
Growth of $10,000
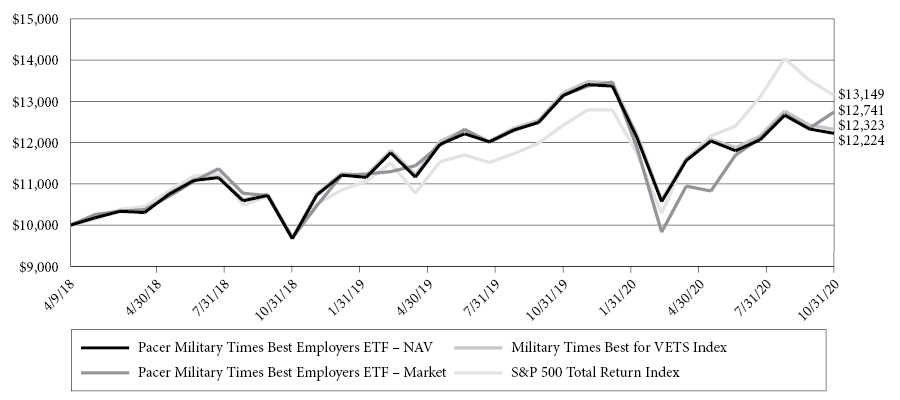
This chart illustrates the performance of a hypothetical $10,000 investment made on April 9, 2018, and is not intended to imply any future performance. The returns shown do not reflect the deduction of taxes that a shareholder would pay on fund distributions or the redemption of fund shares. The chart assumes reinvestment of capital gains and dividends.
The Military Times Best for VETSSM Index is composed of the U.S.-listed stocks of companies that have been included in the Best for Vets List for the last three consecutive years, have a minimum market capitalization of $200 million, and meet the Index’s liquidity threshold. Index components are equally weighted at the time of each annual reconstitution of the Index, which is effective at the close of business on the third Friday of each September. As of June 30, 2019, the Index was made up of 43 companies and included significant allocations to companies in the financial, industrial, and information technology sectors. Companies previously included in the Index for two consecutive years that are no longer on the Best for Vets List may continue to be included in the Index if the reason that they are no longer on the Best for Vets List is because they did not complete the most recent Best for Vets Survey.
The S&P 500 Index consists of approximately 500 leading U.S.-listed companies representing approximately 8% of the U.S. equity market capitalization.
Annualized Returns(1)
(For the period ended October 31, 2020)
| | One Year | Since Inception(2) |
Pacer Military Times Best Employers ETF - NAV | -2.10% | 8.15% |
Pacer Military Times Best Employers ETF - Market | 1.96% | 9.92% |
Military Times Best for VETSSM Index(3) | -1.72% | 8.50% |
S&P 500® Index(3) | 9.71% | 11.28% |
(1) | The performance data quoted is historical. Past performance is no guarantee of future results. Current performance may be higher or lower than the performance data quoted. The principal value and investment return of an investment will fluctuate so that investor’s shares, when redeemed, may be worth more or less than the original cost. The returns shown do not reflect the deduction of taxes that a shareholder would pay on Fund distributions or on redemptions of Fund shares. The total annual operating expenses as stated in the fee table to the Fund’s prospectus dated August 31, 2020, is 0.60%. For performance information current to the most recent month-end, please call 1-877-337-0500. |
(2) | Inception date is April 9, 2018. |
(3) | Indexes are unmanaged statistical composites and their returns do not include fees an investor would pay to purchase the securities they represent. Such costs would lower performance. It is not possible to invest directly in an index. |
19
Pacer Benchmark Industrial Real Estate SCTRSM ETF
PERFORMANCE SUMMARY
(Unaudited)
Growth of $10,000

This chart illustrates the performance of a hypothetical $10,000 investment made on May 14, 2018, and is not intended to imply any future performance. The returns shown do not reflect the deduction of taxes that a shareholder would pay on fund distributions or the redemption of fund shares. The chart assumes reinvestment of capital gains and dividends.
The Benchmark Industrial Real Estate SCTRSM Index is generally composed of the U.S.-listed equity securities of companies that derive at least 85% of their earnings or revenues from real estate operations in the industrial real estate sector (“Industrial Companies”), including companies that derivate at least 85% of their earnings or revenues from self-storage real estate operations (“Self-Storage Companies”). At the time of each reconstitution of the Index, Industrial Companies with a market capitalization of more than $200 million and average daily traded volume of at least 10,000 shares are included in the Index (the “Index Constituents”). A significant portion of the Index is expected to be composed of real estate investment trusts (“REITs”).
The FTSE Nareit All Equity REITs Index is a free-float adjusted, market capitalization-weighted index of U.S. equity REITs. Constituents of the index include all tax-qualified REITs with more than 50% of total assets in qualifying real estate assets other than mortgages secured by real property.
Annualized Returns(1)
(For the period ended October 31, 2020)
| | One Year | Since Inception(2) |
Pacer Benchmark Industrial Real Estate SCTRSM ETF - NAV | 1.01% | 15.45% |
Pacer Benchmark Industrial Real Estate SCTRSM ETF - Market | 0.72% | 15.35% |
Benchmark Industrial Real Estate SCTRSM Index(3) | 2.36% | 16.38% |
FTSE NAREIT All Equity REITS Total Return Index(3) | -16.01% | 3.77% |
(1) | The performance data quoted is historical. Past performance is no guarantee of future results. Current performance may be higher or lower than the performance data quoted. The principal value and investment return of an investment will fluctuate so that investor’s shares, when redeemed, may be worth more or less than the original cost. The returns shown do not reflect the deduction of taxes that a shareholder would pay on Fund distributions or on redemptions of Fund shares. The total annual operating expenses as stated in the fee table to the Fund’s prospectus dated August 31, 2020, is 0.60%. For performance information current to the most recent month-end, please call 1-877-337-0500. |
(2) | Inception date is May 14, 2018. |
(3) | Indexes are unmanaged statistical composites and their returns do not include fees an investor would pay to purchase the securities they represent. Such costs would lower performance. It is not possible to invest directly in an index. |
20
Pacer Benchmark Data & Infrastructure Real Estate SCTRSM ETF
PERFORMANCE SUMMARY
(Unaudited)
Growth of $10,000
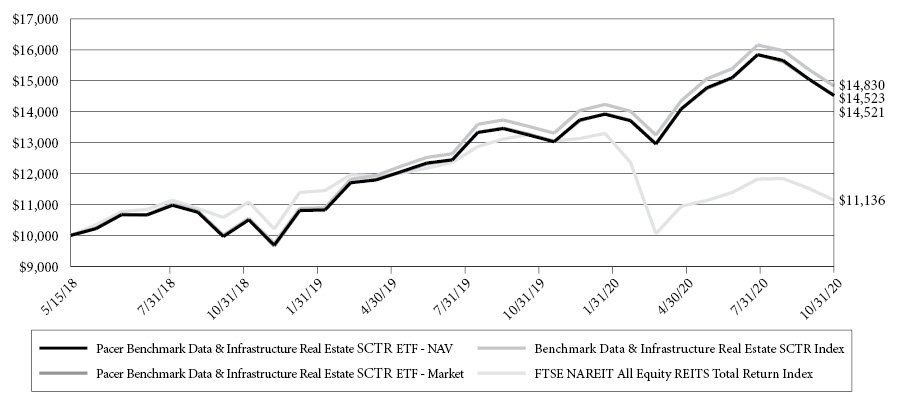
This chart illustrates the performance of a hypothetical $10,000 investment made on May 15, 2018, and is not intended to imply any future performance. The returns shown do not reflect the deduction of taxes that a shareholder would pay on fund distributions or the redemption of fund shares. The chart assumes reinvestment of capital gains and dividends.
The Benchmark Data & Infrastructure Real Estate SCTRSM Index is generally composed of the U.S.-listed equity securities of companies that derive at least 85% of their earnings or revenues from real estate operations in the data and infrastructure real estate sectors (“Eligible Companies”). At the time of each reconstitution of the Index, Eligible Companies with a market capitalization of more than $200 million and average daily traded volume of at least 10,000 shares are included in the Index (the “Index Constituents”). A significant portion of the Index is expected to be composed of real estate investment trusts (“REITs”).
The FTSE Nareit All Equity REITs Index is a free-float adjusted, market capitalization-weighted index of U.S. equity REITs. Constituents of the index include all tax-qualified REITs with more than 50% of total assets in qualifying real estate assets other than mortgages secured by real property.
Annualized Returns(1)
(For the period ended October 31, 2020)
| | One Year | Since Inception(2) |
Pacer Benchmark Data & Infrastructure Real Estate SCTRSM ETF - NAV | 9.67% | 16.36% |
Pacer Benchmark Data & Infrastructure Real Estate SCTRSM ETF - Market | 9.42% | 16.35% |
Benchmark Data & Infrastructure Real Estate SCTRSM Index(3) | 9.67% | 17.35% |
FTSE NAREIT All Equity REITS Total Return Index(3) | -16.01% | 4.46% |
(1) | The performance data quoted is historical. Past performance is no guarantee of future results. Current performance may be higher or lower than the performance data quoted. The principal value and investment return of an investment will fluctuate so that investor’s shares, when redeemed, may be worth more or less than the original cost. The returns shown do not reflect the deduction of taxes that a shareholder would pay on Fund distributions or on redemptions of Fund shares. The total annual operating expenses as stated in the fee table to the Fund’s prospectus dated August 31, 2020, as supplemented September 16, 2020, is 0.60%. For performance information current to the most recent month-end, please call 1-877-337-0500. |
(2) | Inception date is May 15, 2018. |
(3) | Indexes are unmanaged statistical composites and their returns do not include fees an investor would pay to purchase the securities they represent. Such costs would lower performance. It is not possible to invest directly in an index. |
21
Pacer US Export Leaders ETF
PERFORMANCE SUMMARY
(Unaudited)
Growth of $10,000
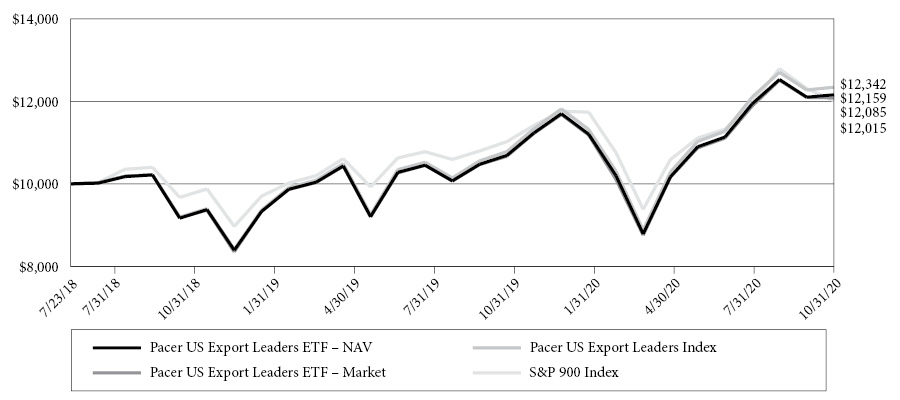
This chart illustrates the performance of a hypothetical $10,000 investment made on July 23, 2018, and is not intended to imply any future performance. The returns shown do not reflect the deduction of taxes that a shareholder would pay on fund distributions or the redemption of fund shares. The chart assumes reinvestment of capital gains and dividends.
The Pacer US Export Leaders Index uses an objective, rules-based methodology to measure the performance of an equal weight portfolio of approximately 100 large- and mid-capitalization U.S. companies with a high percentage of foreign sales and high free cash flow growth. Free cash flow is a company’s cash flow from operations minus its capital expenditures. Construction of the Index begins with an initial universe of the 200 companies across the S&P 900® Index (which is comprised of the S&P 500® Index (“S&P 500”) and S&P MidCap 400® Index (“S&P MidCap 400”)) that have the highest annual foreign sales as a percentage of total sales. The 200 companies are then narrowed to the 100 companies with the highest change in free cash flow growth over the past five years, and those 100 companies are equally weighted to create the Index. The Index is reconstituted and rebalanced to equal-weight quarterly.
The S&P 900® combines the S&P 500® and the S&P MidCap 400® to form an investable benchmark for the mid- to large-cap segment of the U.S. equity market.
Annualized Returns(1)
(For the period ended October 31, 2020)
| | One Year | Since Inception(2) |
Pacer US Export Leaders ETF - NAV | 13.75% | 8.98% |
Pacer US Export Leaders ETF - Market | 13.28% | 8.68% |
Pacer US Export Leaders Index(3) | 14.49% | 9.69% |
S&P 900 IndexTM(3) | 9.01% | 8.41% |
(1) | The performance data quoted is historical. Past performance is no guarantee of future results. Current performance may be higher or lower than the performance data quoted. The principal value and investment return of an investment will fluctuate so that investor’s shares, when redeemed, may be worth more or less than the original cost. The returns shown do not reflect the deduction of taxes that a shareholder would pay on Fund distributions or on redemptions of Fund shares. The total annual operating expenses as stated in the fee table to the Fund’s prospectus dated August 31, 2020, is 0.60%. For performance information current to the most recent month-end, please call 1-877-337-0500. |
(2) | Inception date is July 23, 2018. |
(3) | Indexes are unmanaged statistical composites and their returns do not include fees an investor would pay to purchase the securities they represent. Such costs would lower performance. It is not possible to invest directly in an index. |
22
Pacer CFRA-Stovall Equal Weight Seasonal Rotation ETF
PERFORMANCE SUMMARY
(Unaudited)
Growth of $10,000
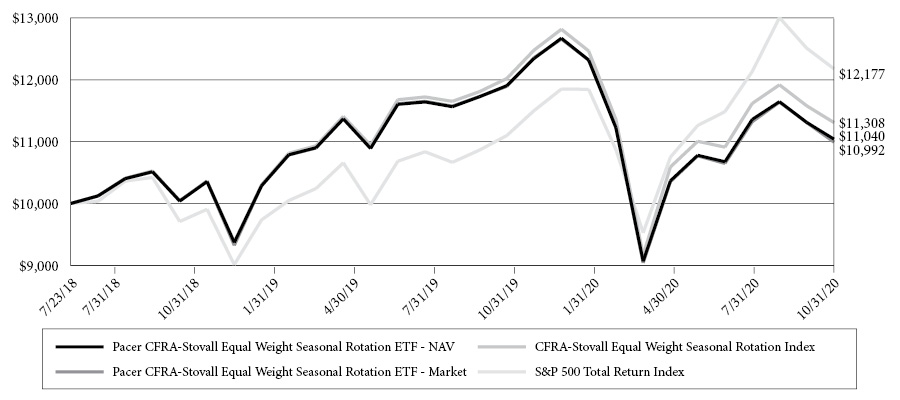
This chart illustrates the performance of a hypothetical $10,000 investment made on July 23, 2018, and is not intended to imply any future performance. The returns shown do not reflect the deduction of taxes that a shareholder would pay on fund distributions or the redemption of fund shares. The chart assumes reinvestment of capital gains and dividends.
The Pacer CFRA-Stovall Equal Weight Seasonal Rotation Index uses an objective, rules-based methodology to track the performance of a semi-annual rotation of certain sectors within the S&P 500 Equal Weight Index (“EWI”). The S&P 500 EWI is an equal-weighted version of the S&P 500®, which measures the performance of the large-cap segment of the U.S. equity market.
The S&P 500 Index consists of approximately 500 leading U.S.-listed companies representing approximately 8% of the U.S. equity market capitalization.
Annualized Returns(1)
(For the period ended October 31, 2020)
| | One Year | Since Inception(2) |
Pacer CFRA-Stovall Equal Weight Seasonal Rotation ETF - NAV | -7.27% | 4.45% |
Pacer CFRA-Stovall Equal Weight Seasonal Rotation ETF - Market | -7.58% | 4.25% |
Pacer CFRA-Stovall Equal Weight Seasonal Rotation Index(3) | -5.93% | 5.55% |
S&P 500® Index(3) | 9.71% | 9.05% |
(1) | The performance data quoted is historical. Past performance is no guarantee of future results. Current performance may be higher or lower than the performance data quoted. The principal value and investment return of an investment will fluctuate so that investor’s shares, when redeemed, may be worth more or less than the original cost. The returns shown do not reflect the deduction of taxes that a shareholder would pay on Fund distributions or on redemptions of Fund shares. The total annual operating expenses as stated in the fee table to the Fund’s prospectus dated August 31, 2020, is 0.60%. For performance information current to the most recent month-end, please call 1-877-337-0500. |
(2) | Inception date is July 23, 2018. |
(3) | Indexes are unmanaged statistical composites and their returns do not include fees an investor would pay to purchase the securities they represent. Such costs would lower performance. It is not possible to invest directly in an index. |
23
Pacer US Cash Cows Growth ETF
PERFORMANCE SUMMARY
(Unaudited)
Growth of $10,000

This chart illustrates the performance of a hypothetical $10,000 investment made on May 2, 2019, and is not intended to imply any future performance. The returns shown do not reflect the deduction of taxes that a shareholder would pay on fund distributions or the redemption of fund shares. The chart assumes reinvestment of capital gains and dividends.
The Pacer US Cash Cows Growth Index uses an objective, rules-based methodology to provide exposure to mid- and large-capitalization U.S. companies with high free cash flow yields. Companies with high free cash flow yields are commonly referred to as “cash cows”.
The S&P 900 Pure Growth Index cis made up of approximately 150 companies that exhibit strong growth characteristics from the S&P 500 and S&P MidCap 400.
Annualized Returns(1)
(For the period ended October 31, 2020)
| | One Year | Since Inception(2) |
Pacer US Cash Cows Growth ETF - NAV | 12.00% | 7.71% |
Pacer US Cash Cows Growth ETF - Market | 11.69% | 7.43% |
Pacer US Cash Cows Growth Index(3) | 12.17% | 7.80% |
S&P 900 Pure Growth Index(3) | 18.95% | 11.71% |
(1) | The performance data quoted is historical. Past performance is no guarantee of future results. Current performance may be higher or lower than the performance data quoted. The principal value and investment return of an investment will fluctuate so that investor’s shares, when redeemed, may be worth more or less than the original cost. The returns shown do not reflect the deduction of taxes that a shareholder would pay on Fund distributions or on redemptions of Fund shares. The total annual operating expenses as stated in the fee table to the Fund’s prospectus dated August 31, 2020, is 0.60%. For performance information current to the most recent month-end, please call 1-877-337-0500. |
(2) | Inception date is May 2, 2019. |
(3) | Indexes are unmanaged statistical composites and their returns do not include fees an investor would pay to purchase the securities they represent. Such costs would lower performance. It is not possible to invest directly in an index. |
24
Pacer Trendpilot International ETF
PERFORMANCE SUMMARY
(Unaudited)
Growth of $10,000

This chart illustrates the performance of a hypothetical $10,000 investment made on May 2, 2019, and is not intended to imply any future performance. The returns shown do not reflect the deduction of taxes that a shareholder would pay on fund distributions or the redemption of fund shares. The chart assumes reinvestment of capital gains and dividends.
The Pacer Trendpilot International Index uses an objective, rules-based methodology to implement a systematic trend-following strategy that directs exposure (i) 100% to the S&P Developed Ex-U.S. LargeCap Index, (ii) 50% to the S&P Developed Ex-U.S. LargeCap Index and 50% to 3-Month US Treasury bills, or (iii) 100% to 3-Month US Treasury bills, depending on the relative performance of the S&P Developed Ex-U.S. LargeCap Index and its 200-business day historical simple moving average (the “200-day moving average”). The calculation of the 200-day moving average for the S&P Developed Ex-U.S. LargeCap Index is based on the total return version of the S&P Developed Ex-U.S. LargeCap Local Currency Index and reflects the reinvestment of dividends paid by the securities in the S&P Developed Ex-U.S. LargeCap Index. The Index is expected to be predominantly invested in the components of the S&P Developed Ex-U.S. LargeCap Index over most short- and long-term periods and is only expected to invest in 3-Month US Treasury bills from time to time in response to adverse market conditions as defined by the “50/50 Indicator” and “T-Bill Indicator” below.
The S&P Developed Ex-US LargeCap Index is a rules-based, float-adjusted, market capitalization-weighted index comprised of large-capitalization stocks providing coverage of the developed markets excluding the United States.
Annualized Returns(1)
(For the period ended October 31, 2020)
| | One Year | Since Inception(2) |
Pacer Trendpilot International ETF - NAV | -14.07% | -7.43% |
Pacer Trendpilot International ETF - Market | -14.26% | -7.25% |
Pacer Trendpilot International Index | -12.76% | -6.32% |
S&P Developed Ex-US Large Cap Index (USD)(3) | -4.96% | -0.64% |
(1) | The performance data quoted is historical. Past performance is no guarantee of future results. Current performance may be higher or lower than the performance data quoted. The principal value and investment return of an investment will fluctuate so that investor’s shares, when redeemed, may be worth more or less than the original cost. The returns shown do not reflect the deduction of taxes that a shareholder would pay on Fund distributions or on redemptions of Fund shares. The total annual operating expenses as stated in the fee table to the Fund’s prospectus dated August 31, 2020, as supplemented October 29, 2020, is 0.65%. For performance information current to the most recent month-end, please call 1-877-337-0500. |
(2) | Inception date is May 2, 2019. |
(3) | Indexes are unmanaged statistical composites and their returns do not include fees an investor would pay to purchase the securities they represent. Such costs would lower performance. It is not possible to invest directly in an index. |
25
Pacer Emerging Markets Cash Cows 100 ETF
PERFORMANCE SUMMARY
(Unaudited)
Growth of $10,000
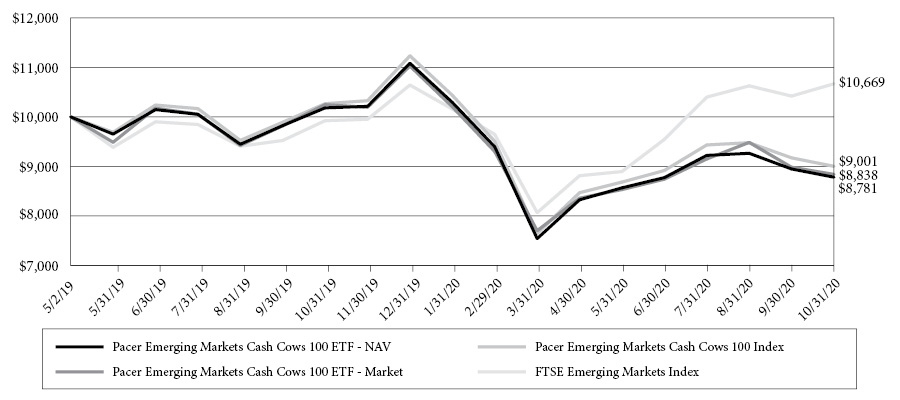
This chart illustrates the performance of a hypothetical $10,000 investment made on May 2, 2019, and is not intended to imply any future performance. The returns shown do not reflect the deduction of taxes that a shareholder would pay on fund distributions or the redemption of fund shares. The chart assumes reinvestment of capital gains and dividends.
The Pacer Emerging Markets Cash Cows 100 Index uses an objective, rules-based methodology to provide exposure to large and mid-capitalization companies in emerging markets with high free cash flow yields.
The FTSE Emerging Markets Index is comprised of all the countries that make up the advanced emerging markets and secondary emerging markets within the FTSE Global Equity Index Series.
Annualized Returns(1)
(For the period ended October 31, 2020)
| | One Year | Since Inception(2) |
Pacer Emerging Markets Cash Cows 100 ETF - NAV | -13.76% | -8.31% |
Pacer Emerging Markets Cash Cows 100 ETF - Market | -13.75% | -7.91% |
Pacer Emerging Markets Cash Cows 100 Index(3) | -12.33% | -6.79% |
FTSE Emerging Markets Index(3) | 7.52% | 4.41% |
(1) | The performance data quoted is historical. Past performance is no guarantee of future results. Current performance may be higher or lower than the performance data quoted. The principal value and investment return of an investment will fluctuate so that investor’s shares, when redeemed, may be worth more or less than the original cost. The returns shown do not reflect the deduction of taxes that a shareholder would pay on Fund distributions or on redemptions of Fund shares. The total annual operating expenses as stated in the fee table to the Fund’s prospectus dated August 31, 2020, is 0.70%. For performance information current to the most recent month-end, please call 1-877-337-0500. |
(2) | Inception date is May 2, 2019. |
(3) | Indexes are unmanaged statistical composites and their returns do not include fees an investor would pay to purchase the securities they represent. Such costs would lower performance. It is not possible to invest directly in an index. |
26
Pacer Cash Cows Fund of Funds ETF
PERFORMANCE SUMMARY
(Unaudited)
Growth of $10,000
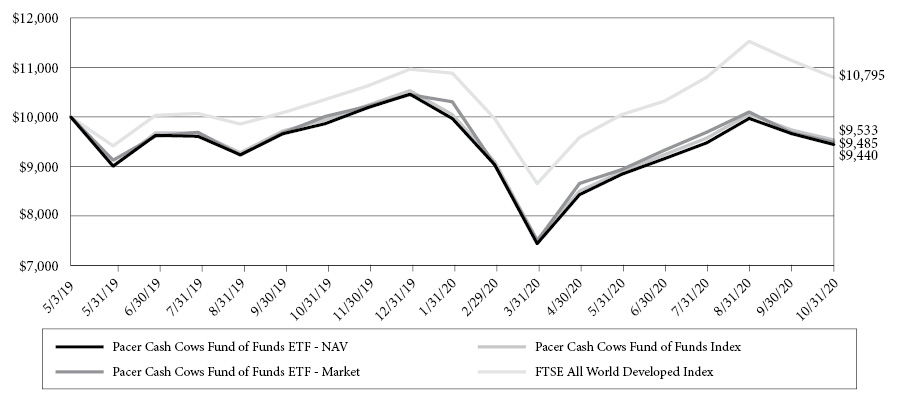
This chart illustrates the performance of a hypothetical $10,000 investment made on May 3, 2019, and is not intended to imply any future performance. The returns shown do not reflect the deduction of taxes that a shareholder would pay on fund distributions or the redemption of fund shares. The chart assumes reinvestment of capital gains and dividends.
The Pacer Cash Cows Fund of Funds Index uses an objective, rules-based approach to construct a portfolio that, as of each quarterly rebalance, is composed of the ETFs listed in the following table, each advised by the Adviser (collectively, the “Cash Cows ETFs”). Each of the Cash Cows ETFs is an index-based ETF that seeks to track the total return performance, before fees and expenses, of the applicable underlying index listed in the following table (collectively, the “Cash Cows Indexes”). Each Cash Cows Index uses an objective, rules-based methodology to provide exposure to companies with high free cash flow yields (commonly referred to as “cash cows”) selected from the applicable “Equity Universe” as indicated in the following table.
Weight | Cash Cows ETF | Cash Cows Index | Equity Universe |
20% | Pacer US Cash Cows 100 ETF | Pacer US Cash Cows 100 ETF | Russell 1000 Index |
20% | Pacer Global Cash Cows Dividend ETF | Pacer Global Cash Cows Dividend Index | FTSE Developed Large Cap Index |
20% | Pacer US Small Cap Cash Cows 100 ETF | Pacer US Small Cap Cash Cows 100 Index | S&P Small Cap 600® Index |
20% | Pacer US Cash Cows Growth ETF | Pacer US Cash Cows Growth Index | S&P 900® Pure Growth Index |
20% | Pacer Developed Markets International Cash Cows 100 ETF | Pacer Developed Markets International Cash Cows 100 Index | FTSE Developed ex US Index |
The FTSE All World Developed Index is a market-capitalization weighted index representing the performance of large and mid cap companies in Developed and Emerging Markets, excluding the USA. The index is derived from the FTSE Global Equity Index Series (GEIS), which covers 98% of the world’s investable market capitalization.
27
Pacer Cash Cows Fund of Funds ETF
PERFORMANCE SUMMARY (Continued)
(Unaudited)
Annualized Returns(1)
(For the period ended October 31, 2020)
| | One Year | Since Inception(2) |
Pacer Cash Cows Fund of Funds ETF - NAV | -4.28% | -3.78% |
Pacer Cash Cows Fund of Funds ETF - Market | -5.24% | -3.47% |
Pacer Cash Cows Fund of Funds Index(3) | -4.08% | -3.15% |
FTSE All World Developed Index(3) | 4.28% | 5.24% |
(1) | The performance data quoted is historical. Past performance is no guarantee of future results. Current performance may be higher or lower than the performance data quoted. The principal value and investment return of an investment will fluctuate so that investor’s shares, when redeemed, may be worth more or less than the original cost. The returns shown do not reflect the deduction of taxes that a shareholder would pay on Fund distributions or on redemptions of Fund shares. The total annual operating expenses as stated in the fee table to the Fund’s prospectus dated August 31, 2020, is 0.15%. For performance information current to the most recent month-end, please call 1-877-337-0500. |
(2) | Inception date is May 3, 2019. |
(3) | Indexes are unmanaged statistical composites and their returns do not include fees an investor would pay to purchase the securities they represent. Such costs would lower performance. It is not possible to invest directly in an index. |
28
Pacer Trendpilot Fund of Funds ETF
PERFORMANCE SUMMARY
(Unaudited)
Growth of $10,000
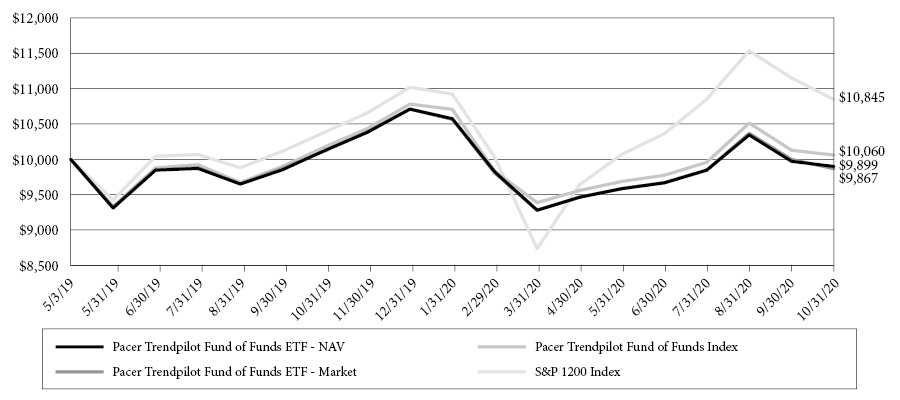
This chart illustrates the performance of a hypothetical $10,000 investment made on May 3, 2019, and is not intended to imply any future performance. The returns shown do not reflect the deduction of taxes that a shareholder would pay on fund distributions or the redemption of fund shares. The chart assumes reinvestment of capital gains and dividends.
The Pacer Trendpilot Fund of Funds Index uses an objective, rules-based approach to construct a portfolio that, as of each quarterly rebalance, is composed of the ETFs listed in the following table, each advised by the Adviser (collectively, the “Trendpilot ETFs”). Each of the Trendpilot ETFs is an index-based ETF that seeks to track the total return performance, before fees and expenses, of the underlying index listed in the following table (collectively, the “Trendpilot Indexes”). Each Trendpilot Index other than the Pacer Trendpilot US Bond Index (collectively, the “Trendpilot Equity Indexes”) uses an objective, rules-based methodology to implement a systematic trend-following strategy that directs exposure (i) 100% to the “Underlying Component” specified in the table below, (ii) 50% to the applicable Underlying Component and 50% to 3-Month US Treasury bills, or (iii) 100% to 3-Month US Treasury bills, depending on the relative performance of the Underlying Component and its 200 business day historical simple moving average (the “200-day moving average”). The calculation of the 200-day moving average for each Underlying Component is based on the total return version of such Underlying Component and reflects the reinvestment of dividends paid by the securities in such Underlying Component. The Pacer Trendpilot US Bond Index (the “Trendpilot Bond Index”) uses an objective, rules-based methodology to implement a systematic trend-following strategy that directs exposure to one of the following positions: (i) 100% to the S&P U.S. High Yield Corporate Bond Index, (ii) 50% to the S&P U.S. High Yield Corporate Bond Index and 50% to the S&P U.S. Treasury Bond 7-10 Year Index or (iii) 100% to S&P U.S. Treasury Bond 7-10 Year Index, depending on the value of the S&P U.S. High Yield Corporate Bond Index divided by the value of the S&P U.S. Treasury Bond 7-10 Year Index (the “Risk Ratio”).
Weight | Trendpilot ETF | Trendpilot Index | Equity Component |
20% | Pacer Trendpilot® US Large Cap ETF | Pacer Trendpilot® US Large Cap Index | S&P 500® Index |
20% | Pacer Trendpilot® US Mid Cap ETF | Pacer Trendpilot® US Mid Cap Index | S&P MidCap 400® Index |
20% | Pacer Trendpilot® 100 ETF | Pacer NASDAQ-100 Trendpilot® Index | NASDAQ-100® Index |
20% | Pacer Trendpilot® International ETF | Pacer Trendpilot® International Index | S&P Developed Ex-US Large Cap Index |
20% | Pacer Trendpilot® US Bond ETF | Pacer Trendpilot® US Bond Index | S&P U.S. High Yield Corporate Bond Index |
The S&P 1200 Index captures approximately 70% of global market capitalization.
29
Pacer Trendpilot Fund of Funds ETF
PERFORMANCE SUMMARY (Continued)
(Unaudited)
Annualized Returns(1)
(For the period ended October 31, 2020)
| | One Year | Since Inception(2) |
Pacer Trendpilot Fund of Funds ETF - NAV | -2.25% | -0.68% |
Pacer Trendpilot Fund of Funds ETF - Market | -2.51% | -0.89% |
Pacer Trendpilot Fund of Funds Index(3) | -1.16% | 0.40% |
S&P 1200 Index(3) | 4.43% | 5.57% |
(1) | The performance data quoted is historical. Past performance is no guarantee of future results. Current performance may be higher or lower than the performance data quoted. The principal value and investment return of an investment will fluctuate so that investor’s shares, when redeemed, may be worth more or less than the original cost. The returns shown do not reflect the deduction of taxes that a shareholder would pay on Fund distributions or on redemptions of Fund shares. The total annual operating expenses as stated in the fee table to the Fund’s prospectus dated August 31, 2020, as supplemented October 15, 2020, is 0.15%. For performance information current to the most recent month-end, please call 1-877-337-0500. |
(2) | Inception date is May 3, 2019. |
(3) | Indexes are unmanaged statistical composites and their returns do not include fees an investor would pay to purchase the securities they represent. Such costs would lower performance. It is not possible to invest directly in an index. |
30
Pacer Trendpilot US Bond ETF
PERFORMANCE SUMMARY
(Unaudited)
Growth of $10,000
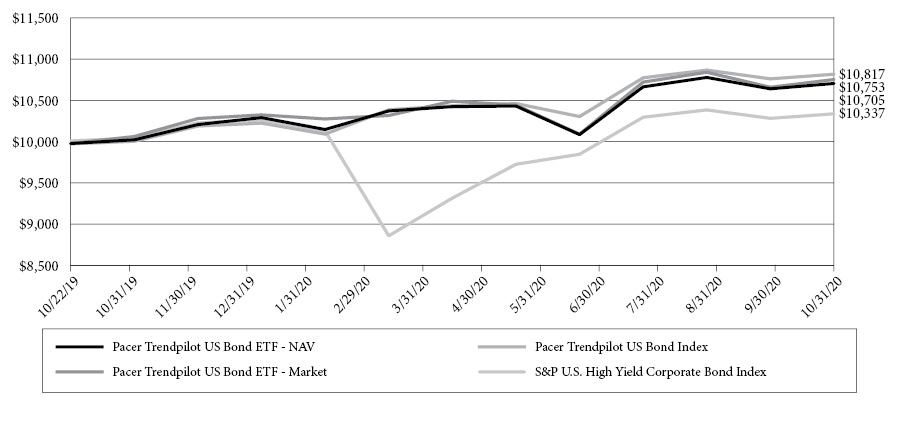
This chart illustrates the performance of a hypothetical $10,000 investment made on October 22, 2019, and is not intended to imply any future performance. The returns shown do not reflect the deduction of taxes that a shareholder would pay on fund distributions or the redemption of fund shares. The chart assumes reinvestment of capital gains and dividends.
The Pacer Trendpilot US Bond Index uses an objective, rules-based methodology to implement a systematic trend-following strategy that directs exposure to one of the following positions: (i) 100% to the S&P U.S. High Yield Corporate Bond Index, (ii) 50% to the S&P U.S. High Yield Corporate Bond Index and 50% to the S&P U.S. Treasury Bond 7-10 Year Index or (iii) 100% to S&P U.S. Treasury Bond 7-10 Year Index.
The S&P U.S. High Yield Corporate Bond Index is designed to track the performance of U.S. dollar-denominated, high-yield corporate bonds issued in the U.S. The S&P U.S. Treasury Bond 7-10 Year Index is designed to measure the performance of U.S. Treasury bonds maturing in 7 to 10 years. The Index uses a “Risk Ratio” to signal a change in the position of the Index. The Risk Ratio is calculated by dividing the value of the S&P U.S. High Yield Corporate Bond Index by the value of the S&P U.S. Treasury Bond 7-10 Year Index.
Annualized Returns(1)
(For the period ended October 31, 2020)
| | One Year | Since Inception(2) |
Pacer Trendpilot US Bond ETF - NAV | 7.30% | 6.87% |
Pacer Trendpilot US Bond ETF - Market | 7.77% | 7.34% |
Pacer Trendpilot US Bond Index(3) | 8.47% | 7.97% |
S&P U.S. High Yield Corporate Bond IndexTM(3) | 3.27% | 3.28% |
(1) | The performance data quoted is historical. Past performance is no guarantee of future results. Current performance may be higher or lower than the performance data quoted. The principal value and investment return of an investment will fluctuate so that investor’s shares, when redeemed, may be worth more or less than the original cost. The returns shown do not reflect the deduction of taxes that a shareholder would pay on Fund distributions or on redemptions of Fund shares. The total annual operating expenses as stated in the fee table to the Fund’s prospectus dated August 31, 2020, is 0.60%. For performance information current to the most recent month-end, please call 1-877-337-0500. |
(2) | Inception date is October 22, 2019. |
(3) | Indexes are unmanaged statistical composites and their returns do not include fees an investor would pay to purchase the securities they represent. Such costs would lower performance. It is not possible to invest directly in an index. |
31
Pacer CSOP FTSE China A50 ETF
PERFORMANCE SUMMARY
(Unaudited)
Growth of $10,000

This chart illustrates the performance of a hypothetical $10,000 investment made on March 10, 2015, and is not intended to imply any future performance. The returns shown do not reflect the deduction of taxes that a shareholder would pay on fund distributions or the redemption of fund shares. The chart assumes reinvestment of capital gains and dividends.
The FTSE China A50 Net Total Return Index® is comprised of the A-Shares issued by the 50 largest companies in the China A-Shares market. The Index is a free float-adjusted market capitalization-weighted index compiled and published by FTSE International Limited, which is not affiliated with the Fund, Pacer Advisors, Inc, CSOP Asset Management Limited or the Fund’s distributor. The Index is a real-time, tradable index comprising of the largest 50 China A-Share companies by full market capitalization of the FTSE China A All Cap Free Index.
Annualized Returns(1)
(For the period ended October 31, 2020)
| | One Year | Three Year | Five Year | Since Inception(2) |
Pacer CSOP FTSE China A50 ETF - NAV | 20.91% | 8.58% | 10.88% | 8.62% |
Pacer CSOP FTSE China A50 ETF - Market | 21.69% | 8.58% | 11.07% | 8.63% |
FTSE China A50 Net Total Return Index®(3) | 21.93% | 9.44% | 10.88% | 9.05% |
(1) | The performance data quoted is historical. Past performance is no guarantee of future results. Current performance may be higher or lower than the performance data quoted. The principal value and investment return of an investment will fluctuate so that investor’s shares, when redeemed, may be worth more or less than the original cost. The returns shown do not reflect the deduction of taxes that a shareholder would pay on Fund distributions or on redemptions of Fund shares. The total annual operating expenses as stated in the fee table to the Fund’s prospectus dated August 31, 2020, is 0.70%. For performance information current to the most recent month-end, please call 1-877-337-0500. |
(2) | Inception date is March 10, 2015. The Fund is the successor to the investment performance of the CSOP FTSE China A50 ETF (the “Predecessor CSOP”) as a result of the reorganization of the Predecessor CSOP Fund into the Fund on January 23, 2020. Accordingly, the performance information shown in the chart and table above for periods prior to January 23, 2020 is that of the Predecessor CSOP Fund’s Shares for the Fund. The Predecessor CSOP Fund was managed by the same portfolio managers as the Fund and had substantially the same investment objectives, policies, and strategies as the Fund. |
(3) | Indexes are unmanaged statistical composites and their returns do not include fees an investor would pay to purchase the securities they represent. Such costs would lower performance. It is not possible to invest directly in an index. |
32
Pacer BioThreat Strategy ETF
PERFORMANCE SUMMARY
(Unaudited)
Growth of $10,000
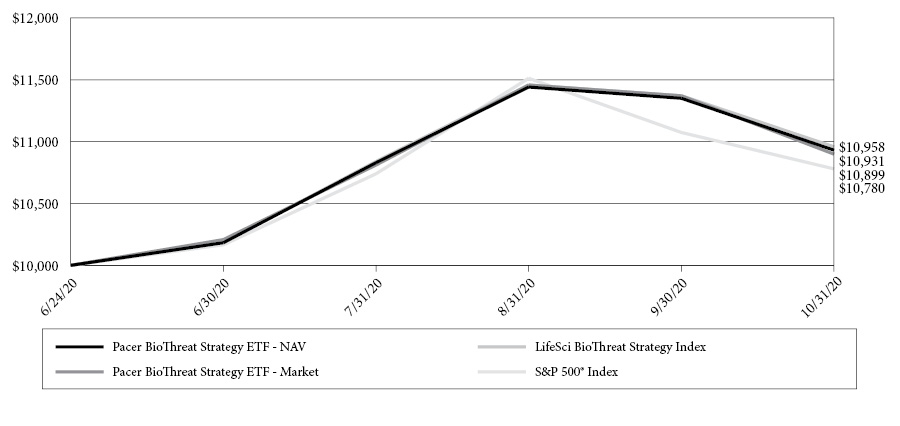
This chart illustrates the performance of a hypothetical $10,000 investment made on June 24, 2020, and is not intended to imply any future performance. The returns shown do not reflect the deduction of taxes that a shareholder would pay on fund distributions or the redemption of fund shares. The chart assumes reinvestment of capital gains and dividends.
The LifeSci BioThreat Strategy Index is generally composed of U.S.-listed stocks of companies whose products or services help protect against, endure, or recover from biological threats to human health. Companies helping to protect against such threats include those that conduct research to identify or anticipate such threats and those developing or producing the tools necessary to detect them. Companies helping to endure biological threats include those offering goods or services to help individuals, organizations, businesses, and governments adapt to requirements for social distancing or remote 2 connectivity. The Index Provider only includes those companies with a minimum market capitalization of $1 billion and a minimum average daily value traded for the last six moths of at least $2 million.
Cumulative Returns(1)
(For the period ended October 31, 2020)
| | Since Inception(2) |
Pacer BioThreat Strategy ETF - NAV | 9.31% |
Pacer BioThreat Strategy ETF - Market | 8.99% |
LifeSci BioThreat Strategy Index(3) | 9.58% |
S&P 500® Index(3) | 7.80% |
(1) | The performance data quoted is historical. Past performance is no guarantee of future results. Current performance may be higher or lower than the performance data quoted. The principal value and investment return of an investment will fluctuate so that investor’s shares, when redeemed, may be worth more or less than the original cost. The returns shown do not reflect the deduction of taxes that a shareholder would pay on Fund distributions or on redemptions of Fund shares. The total annual operating expenses as stated in the fee table to the Fund’s prospectus dated June 23, 2020, is 0.70%. For performance information current to the most recent month-end, please call 1-877-337-0500. |
(2) | Inception date is June 24, 2020. |
(3) | Indexes are unmanaged statistical composites and their returns do not include fees an investor would pay to purchase the securities they represent. Such costs would lower performance. It is not possible to invest directly in an index. |
33
Pacer Lunt Large Cap Alternator ETF
PERFORMANCE SUMMARY
(Unaudited)
Growth of $10,000
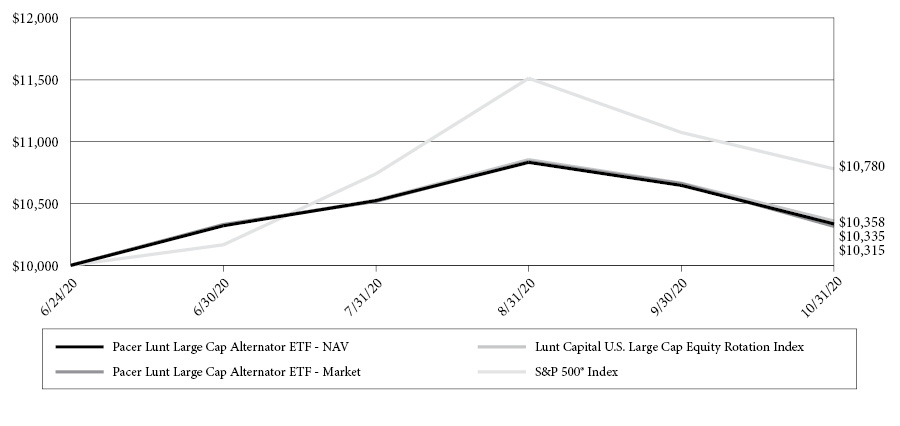
This chart illustrates the performance of a hypothetical $10,000 investment made on June 24, 2020, and is not intended to imply any future performance. The returns shown do not reflect the deduction of taxes that a shareholder would pay on fund distributions or the redemption of fund shares. The chart assumes reinvestment of capital gains and dividends.
The Lunt Capital U.S. Large Cap Equity Rotation Index uses an objective, rules-based methodology to provide exposure to large-capitalization U.S. companies. The Index uses Lunt Capital’s proprietary relative strength methodology to rotate between the holdings of one of two sub-indices, the S&P 500 Low Volatility Index and the S&P 500 High Beta Index (each, a “Sub-Index,” and together, the “Sub-Indices”), that seek to identify the 100 components of the S&P 500 Index that most strongly exhibit a particular trait (e.g., low volatility or high beta). Each Sub-Index is composed of the 100 securities comprising the S&P 500 Index that most strongly exhibit the characteristic screened for by the Sub-Index.
Cumulative Returns(1)
(For the period ended October 31, 2020)
| | Since Inception(2) |
Pacer Lunt Large Cap Alternator ETF - NAV | 3.35% |
Pacer Lunt Large Cap Alternator ETF - Market | 3.15% |
Lunt Capital U.S. Large Cap Equity Rotation Index(3) | 3.58% |
S&P 500® Index(3) | 7.80% |
(1) | The performance data quoted is historical. Past performance is no guarantee of future results. Current performance may be higher or lower than the performance data quoted. The principal value and investment return of an investment will fluctuate so that investor’s shares, when redeemed, may be worth more or less than the original cost. The returns shown do not reflect the deduction of taxes that a shareholder would pay on Fund distributions or on redemptions of Fund shares. The total annual operating expenses as stated in the fee table to the Fund’s prospectus dated June 23, 2020, is 0.60%. For performance information current to the most recent month-end, please call 1-877-337-0500. |
(2) | Inception date is June 24, 2020. |
(3) | Indexes are unmanaged statistical composites and their returns do not include fees an investor would pay to purchase the securities they represent. Such costs would lower performance. It is not possible to invest directly in an index. |
34
Pacer Lunt Midcap Multi-Factor Alternator ETF
PERFORMANCE SUMMARY
(Unaudited)
Growth of $10,000

This chart illustrates the performance of a hypothetical $10,000 investment made on June 24, 2020, and is not intended to imply any future performance. The returns shown do not reflect the deduction of taxes that a shareholder would pay on fund distributions or the redemption of fund shares. The chart assumes reinvestment of capital gains and dividends.
The Lunt Capital U.S. MidCap Multi-Factor Rotation Index uses an objective, rules-based methodology to provide exposure to mid-capitalization U.S. companies. The Index uses Lunt Capital’s proprietary relative strength methodology to rotate between the holdings of the highest and lowest quintile components of four factor-based indices of the S&P MidCap 400 Index (each, a “Sub-Index,” and together, the “Sub-Indices”), that seek to identify the components of the S&P MidCap 400 Index that most strongly exhibit a particular factor. The four factor groups are Momentum, Quality, Value, and Volatility.
Cumulative Returns(1)
(For the period ended October 31, 2020)
| | Since Inception(2) |
Pacer Lunt Midcap Multi-Factor Alternator ETF - NAV | 14.08% |
Pacer Lunt Midcap Multi-Factor Alternator ETF - Market | 13.75% |
Lunt Capital U.S. MidCap Multi-Factor Rotation Index(3) | 14.02% |
S&P MidCap 400® Index(3) | 10.31% |
(1) | The performance data quoted is historical. Past performance is no guarantee of future results. Current performance may be higher or lower than the performance data quoted. The principal value and investment return of an investment will fluctuate so that investor’s shares, when redeemed, may be worth more or less than the original cost. The returns shown do not reflect the deduction of taxes that a shareholder would pay on Fund distributions or on redemptions of Fund shares. The total annual operating expenses as stated in the fee table to the Fund’s prospectus dated June 23, 2020, is 0.60%. For performance information current to the most recent month-end, please call 1-877-337-0500. |
(2) | Inception date is June 24, 2020. |
(3) | Indexes are unmanaged statistical composites and their returns do not include fees an investor would pay to purchase the securities they represent. Such costs would lower performance. It is not possible to invest directly in an index. |
35
Pacer Lunt Large Cap Multi-Factor Alternator ETF
PERFORMANCE SUMMARY
(Unaudited)
Growth of $10,000

This chart illustrates the performance of a hypothetical $10,000 investment made on June 24, 2020, and is not intended to imply any future performance. The returns shown do not reflect the deduction of taxes that a shareholder would pay on fund distributions or the redemption of fund shares. The chart assumes reinvestment of capital gains and dividends.
The Lunt Capital U.S. Large Cap Multi-Factor Rotation Index uses an objective, rules-based methodology to provide exposure to large-capitalization U.S. companies. The Index uses Lunt Capital’s proprietary relative strength methodology to rotate between the holdings of the highest and lowest quintile components of four factor-based indices of the S&P 500 Index (each, a “Sub-Index,” and together, the “Sub-Indices”), that seek to identify the components of the S&P 500 Index that most strongly exhibit a particular factor. The four factor groups are Momentum, Quality, Value, and Volatility.
Cumulative Returns(1)
(For the period ended October 31, 2020)
| | Since Inception(2) |
Pacer Lunt Large Cap Multi-Factor Alternator ETF - NAV | 10.13% |
Pacer Lunt Large Cap Multi-Factor Alternator ETF - Market | 9.62% |
Lunt Capital U.S. Large Cap Multi-Factor Rotation Index(3) | 10.47% |
S&P 500® Index(3) | 7.80% |
(1) | The performance data quoted is historical. Past performance is no guarantee of future results. Current performance may be higher or lower than the performance data quoted. The principal value and investment return of an investment will fluctuate so that investor’s shares, when redeemed, may be worth more or less than the original cost. The returns shown do not reflect the deduction of taxes that a shareholder would pay on Fund distributions or on redemptions of Fund shares. The total annual operating expenses as stated in the fee table to the Fund’s prospectus dated June 23, 2020, is 0.60%. For performance information current to the most recent month-end, please call 1-877-337-0500. |
(2) | Inception date is June 24, 2020. |
(3) | Indexes are unmanaged statistical composites and their returns do not include fees an investor would pay to purchase the securities they represent. Such costs would lower performance. It is not possible to invest directly in an index. |
36
Pacer Funds
EXPENSE EXAMPLE
For the Period Ended October 31, 2020 (Unaudited)
As a shareholder of a Fund, you pay ongoing expenses, such as advisory fees, and other fund expenses. The following examples are intended to help you understand the ongoing cost (in dollars) of investing in a Fund and to compare these costs with the ongoing costs of investing in other funds. Please note, the expenses shown in the tables are meant to highlight ongoing costs only and do not reflect any transactional costs. You may pay brokerage commissions on your purchase and sale of Fund shares, which are not reflected in the following examples. Each example is based on an investment of $1,000 invested at the beginning of the period and held for the entire period as indicated below.
Actual Expenses
The columns under the heading entitled “Actual” help you estimate the actual expenses you paid over the period. The “Actual Ending Account Value” shown is derived from a Fund’s actual return and the “Actual Expenses Paid During Period” show the dollar amount that would have been paid by an investor who started with $1,000 in a Fund. To estimate the expenses you paid on your account during this period, simply divide your account value by $1,000 (for example, an $8,600 account value divided by $1,000=8.6), then multiply the result by the number in the column under the heading untitled “Actual Expenses Paid During Period”.
Hypothetical Example for Comparison Purposes
The columns under the heading entitled “Hypothetical” provide information about hypothetical account value and hypothetical expenses based on a Fund’s actual expense ratio and an assumed rate of return of 5% per year before expenses, which is not the Fund’s return. The hypothetical account values and expenses may not be used to estimate the actual ending account balance or expenses you paid for the period. You may use this information to compare the ongoing costs of investing in a Fund and other funds. To do so, compare this 5% hypothetical example with the 5% hypothetical examples that appear in the shareholder reports of other funds.
Please note that the expenses shown in the table are meant to highlight your ongoing costs only and do not reflect any transactional costs which may be applicable to your account. Therefore, the last column of the table (Hypothetical Expenses Paid During Period) is useful in comparing ongoing costs only and will not help you determine the relative total costs of owning different funds. In addition, if these transactional costs were included, your costs would have been higher.
| | Fund’s Annual
Expense Ratio | Beginning Account
Value 05/01/20 | Ending Account
Value 10/31/20 | Expenses Paid
During Period(a) |
Pacer Trendpilot® US Large Cap ETF | | | | |
Actual | 0.60% | $1,000.00 | $ 860.10 | $ 2.77 |
Hypothetical(b) | 0.60% | $1,000.00 | $ 1,021.88 | $ 3.02 |
Pacer Trendpilot® US Mid Cap ETF | | | | |
Actual | 0.60% | $1,000.00 | $ 975.40 | $ 2.95 |
Hypothetical(b) | 0.60% | $1,000.00 | $ 1,021.88 | $ 3.02 |
Pacer TrendpilotTM 100 ETF | | | | |
Actual | 0.65% | $1,000.00 | $ 1,015.70 | $ 3.26 |
Hypothetical(b) | 0.65% | $1,000.00 | $ 1,021.63 | $ 3.27 |
Pacer Trendpilot® European Index ETF | | | | |
Actual | 0.65% | $1,000.00 | $ 900.80 | $ 3.07 |
Hypothetical(b) | 0.65% | $1,000.00 | $ 1,021.63 | $ 3.27 |
Pacer Global Cash Cows Dividend ETF | | | | |
Actual | 0.60% | $1,000.00 | $ 829.10 | $ 2.73 |
Hypothetical(b) | 0.60% | $1,000.00 | $ 1,021.88 | $ 3.02 |
Pacer U.S. Cash Cows 100 ETF | | | | |
Actual | 0.49% | $1,000.00 | $ 870.50 | $ 2.28 |
Hypothetical(b) | 0.49% | $1,000.00 | $ 1,022.43 | $ 2.46 |
Pacer U.S. Small Cap Cash Cows 100 ETF | | | | |
Actual | 0.59% | $1,000.00 | $ 825.00 | $ 2.68 |
Hypothetical(b) | 0.59% | $1,000.00 | $ 1,021.93 | $ 2.97 |
Pacer Developed Markets International Cash Cows 100 ETF | | | | |
Actual | 0.65% | $1,000.00 | $ 811.10 | $ 2.93 |
Hypothetical(b) | 0.65% | $1,000.00 | $ 1,021.63 | $ 3.27 |
Pacer WealthShield ETF | | | | |
Actual | 0.60% | $1,000.00 | $ 1,040.40 | $ 3.04 |
Hypothetical(b) | 0.60% | $1,000.00 | $ 1,021.88 | $ 3.02 |
37
Pacer Funds
EXPENSE EXAMPLE
For the Period Ended October 31, 2020 (Unaudited) (Continued)
| | Fund’s Annual
Expense Ratio | Beginning Account
Value 05/01/20 | Ending Account
Value 10/31/20 | Expenses Paid
During Period(a) |
Pacer Military Times Best Employers ETF | | | | |
Actual | 0.60% | $1,000.00 | $ 926.30 | $ 2.87 |
Hypothetical(b) | 0.60% | $1,000.00 | $ 1,021.88 | $ 3.02 |
Pacer Benchmark Industrial Real Estate ETF | | | | |
Actual | 0.60% | $1,000.00 | $ 899.70 | $ 2.83 |
Hypothetical(b) | 0.60% | $1,000.00 | $ 1,021.88 | $ 3.02 |
Pacer Benchmark Data & Infrastructure Real Estate ETF | | | | |
Actual | 0.60% | $1,000.00 | $ 1,063.80 | $ 3.08 |
Hypothetical(b) | 0.60% | $1,000.00 | $ 1,021.88 | $ 3.02 |
Pacer US Export Leaders ETF | | | | |
Actual | 0.60% | $1,000.00 | $ 951.30 | $ 2.91 |
Hypothetical(b) | 0.60% | $1,000.00 | $ 1,021.88 | $ 3.02 |
Pacer CFRA-Stovall Equal Weight Seasonal Rotation ETF | | | | |
Actual | 0.60% | $1,000.00 | $ 870.80 | $ 2.79 |
Hypothetical(b) | 0.60% | $1,000.00 | $ 1,021.88 | $ 3.02 |
Pacer US Cash Cows Growth ETF | | | | |
Actual | 0.60% | $1,000.00 | $ 936.70 | $ 2.89 |
Hypothetical(b) | 0.60% | $1,000.00 | $ 1,021.88 | $ 3.02 |
Pacer Trendpilot International ETF | | | | |
Actual | 0.65% | $1,000.00 | $ 915.70 | $ 3.10 |
Hypothetical(b) | 0.65% | $1,000.00 | $ 1,021.63 | $ 3.27 |
Pacer Emerging Markets Cash Cows 100 ETF | | | | |
Actual | 0.70% | $1,000.00 | $ 817.50 | $ 3.16 |
Hypothetical(b) | 0.70% | $1,000.00 | $ 1,021.38 | $ 3.52 |
Pacer Cash Cows Fund of Funds ETF | | | | |
Actual | 0.15% | $1,000.00 | $ 854.70 | $ 0.69 |
Hypothetical(b) | 0.15% | $1,000.00 | $ 1,024.12 | $ 0.75 |
Pacer Trendpilot Fund of Funds ETF | | | | |
Actual | 0.15% | $1,000.00 | $ 934.50 | $ 0.72 |
Hypothetical(b) | 0.15% | $1,000.00 | $ 1,024.12 | $ 0.75 |
Pacer Trendpilot US Bond ETF | | | | |
Actual | 0.60% | $1,000.00 | $ 1,044.90 | $ 3.05 |
Hypothetical(b) | 0.60% | $1,000.00 | $ 1,021.88 | $ 3.02 |
Pacer CSOP FTSE China A50 ETF | | | | |
Actual | 0.70% | $1,000.00 | $ 964.70 | $ 3.42 |
Hypothetical(b) | 0.70% | $1,000.00 | $ 1,021.38 | $ 3.52 |
(a) | The dollar amounts shown as expenses paid during the period are equal to the annualized six-month expense ratio multiplied by the average account value during the period, multiplied by the number of days (184) in the most recent six-month period and divided by the number of days in the most recent twelve-month period (365). |
(b) | Assumes 5% return before expenses. |
38
Pacer Funds
EXPENSE EXAMPLE
For the Period Ended October 31, 2020 (Unaudited) (Continued)
| | Fund’s Annual
Expense Ratio | Beginning Account
Value 06/24/20(a) | Ending Account
Value 10/31/20 | Expenses Paid
During Period(a) |
Pacer BioThreat Strategy ETF | | | | |
Actual | 0.70% | $1,000.00 | $ 854.70 | $ 0.69(b) |
Hypothetical(d) | 0.70% | $1,000.00 | $ 1,021.68 | $ 3.57(c) |
Pacer Lunt Large Cap Alternator ETF | | | | |
Actual | 0.60% | $1,000.00 | $ 934.50 | $ 0.72(b) |
Hypothetical(d) | 0.60% | $1,000.00 | $ 1,022.18 | $ 3.06(c) |
Pacer Lunt Midcap Multi-Factor Alternator ETF | | | | |
Actual | 0.60% | $1,000.00 | $ 1,044.90 | $ 3.05(b) |
Hypothetical(d) | 0.60% | $1,000.00 | $ 1,022.18 | $ 3.06(c) |
Pacer Lunt Large Cap Multi-Factor Alternator ETF | | | | |
Actual | 0.60% | $1,000.00 | $ 964.70 | $ 3.42(b) |
Hypothetical(d) | 0.60% | $1,000.00 | $ 1,022.18 | $ 3.06(c) |
(a) | Inception Date of the Fund. |
(b) | The dollar amounts shown as expenses paid during the period are equal to the annualized six-month expense ratio multiplied by the average account value during the period, multiplied by the number of days (129) in the most recent six-month period and divided by the number of days in the most recent twelve-month period (365). |
(c) | The dollar amounts shown as expenses paid during the period are equal to the annualized six-month expense ratio multiplied by the average account value during the period, multiplied by the number of days (184) in the most recent six-month period and divided by the number of days in the most recent twelve-month period (365). |
(d) | Assumes 5% return before expenses. |
39
Pacer Trendpilot® US Large Cap ETF
SCHEDULE OF INVESTMENTS
October 31, 2020 (Unaudited)
| | | Shares | | | Value | |
COMMON STOCKS — 97.2% | | | | |
| | | | | | | | | |
Advertising — 0.1% | | | | |
Interpublic Group of Cos., Inc. | | | 25,236 | | | $ | 456,519 | |
Omnicom Group, Inc. | | | 14,379 | | | | 678,689 | |
| | | | | | | | 1,135,208 | |
Aerospace/Defense — 1.5% | | | | |
Boeing Co. | | | 35,041 | | | | 5,059,570 | |
General Dynamics Corp. | | | 15,422 | | | | 2,025,371 | |
Howmet Aerospace, Inc. | | | 25,438 | | | | 438,805 | |
L3Harris Technologies, Inc. | | | 14,682 | | | | 2,365,417 | |
Lockheed Martin Corp. | | | 16,268 | | | | 5,695,915 | |
Northrop Grumman Corp. | | | 10,374 | | | | 3,006,593 | |
Raytheon Technologies Corp. | | | 95,742 | | | | 5,200,705 | |
Teledyne Technologies, Inc. (a) | | | 2,372 | | | | 733,304 | |
TransDigm Group, Inc. | | | 3,165 | | | | 1,511,003 | |
| | | | | | | | 26,036,683 | |
Agriculture — 0.7% | | | | |
Altria Group, Inc. | | | 121,964 | | | | 4,400,461 | |
Archer-Daniels-Midland Co. (b) | | | 36,474 | | | | 1,686,558 | |
Philip Morris International, Inc. | | | 101,396 | | | | 7,201,144 | |
| | | | | | | | 13,288,163 | |
Airlines — 0.2% | | | | |
Alaska Air Group, Inc. | | | 8,202 | | | | 310,774 | |
American Airlines Group, Inc. (b) | | | 25,647 | | | | 289,298 | |
Delta Air Lines, Inc. | | | 37,697 | | | | 1,155,036 | |
Southwest Airlines Co. | | | 34,408 | | | | 1,360,148 | |
United Airlines Holdings, Inc. (a) | | | 16,357 | | | | 553,848 | |
| | | | | | | | 3,669,104 | |
Apparel — 0.7% | | | | |
Hanesbrands, Inc. (b) | | | 23,985 | | | | 385,439 | |
NIKE, Inc. - Class B | | | 81,382 | | | | 9,772,351 | |
PVH Corp. | | | 4,894 | | | | 285,271 | |
Ralph Lauren Corp. | | | 3,159 | | | | 211,179 | |
Tapestry, Inc. | | | 17,910 | | | | 398,139 | |
Under Armour, Inc. - Class A (a)(b) | | | 12,333 | | | | 170,689 | |
Under Armour, Inc. - Class C (a)(b) | | | 12,845 | | | | 157,094 | |
VF Corp. | | | 21,537 | | | | 1,447,287 | |
| | | | | | | | 12,827,449 | |
Auto Manufacturers — 0.5% | | | | |
Cummins, Inc. | | | 10,052 | | | | 2,210,334 | |
Ford Motor Co. | | | 253,885 | | | | 1,962,531 | |
General Motors Co. | | | 81,995 | | | | 2,831,288 | |
PACCAR, Inc. | | | 22,724 | | | | 1,940,175 | |
| | | | | | | | 8,944,328 | |
Auto Parts & Equipment — 0.1% | | | | |
Aptiv PLC | | | 16,587 | | | | 1,600,480 | |
BorgWarner, Inc. | | | 13,535 | | | | 473,454 | |
| | | | | | | | 2,073,934 | |
Banks — 4.2% | | | | |
Bank of America Corp. | | | 497,892 | | | | 11,800,040 | |
| | | Shares | | | Value | |
Banks — 4.2% (Continued) | | | | | | | | |
Bank of New York Mellon Corp. | | | 52,299 | | | $ | 1,796,994 | |
Citigroup, Inc. | | | 135,349 | | | | 5,606,156 | |
Citizens Financial Group, Inc. | | | 28,378 | | | | 773,301 | |
Comerica, Inc. (b) | | | 9,628 | | | | 438,170 | |
Fifth Third Bancorp | | | 46,237 | | | | 1,073,623 | |
First Republic Bank | | | 11,052 | | | | 1,394,099 | |
Goldman Sachs Group, Inc. | | | 20,252 | | | | 3,828,438 | |
Huntington Bancshares, Inc. | | | 67,642 | | | | 706,182 | |
JPMorgan Chase & Co. | | | 197,863 | | | | 19,398,489 | |
KeyCorp. | | | 64,352 | | | | 835,289 | |
M&T Bank Corp. (b) | | | 8,637 | | | | 894,620 | |
Morgan Stanley | | | 91,108 | | | | 4,386,850 | |
Northern Trust Corp. | | | 13,934 | | | | 1,090,614 | |
PNC Financial Services Group, Inc. | | | 27,741 | | | | 3,103,663 | |
Regions Financial Corp. | | | 62,989 | | | | 837,754 | |
State Street Corp. | | | 23,853 | | | | 1,404,942 | |
SVB Financial Group (a) | | | 3,326 | | | | 966,868 | |
Truist Financial Corp. | | | 87,549 | | | | 3,687,564 | |
US Bancorp | | | 88,970 | | | | 3,465,382 | |
Wells Fargo & Co. | | | 269,382 | | | | 5,778,244 | |
Zions Bancorp | | | 11,137 | | | | 359,391 | |
| | | | | | | | 73,626,673 | |
Beverages — 1.6% | | | | |
Brown-Forman Corp. - Class B | | | 11,810 | | | | 823,275 | |
Coca-Cola Co. | | | 251,402 | | | | 12,082,380 | |
Constellation Brands, Inc. - Class A | | | 10,959 | | | | 1,810,756 | |
Molson Coors Brewing Co. - Class B (b) | | | 12,325 | | | | 434,579 | |
Monster Beverage Corp. (a) | | | 25,017 | | | | 1,915,552 | |
PepsiCo, Inc. | | | 91,011 | | | | 12,130,856 | |
| | | | | | | | 29,197,398 | |
Biotechnology — 1.7% | | | | |
Alexion Pharmaceuticals, Inc. (a) | | | 14,395 | | | | 1,657,440 | |
Amgen, Inc. | | | 38,274 | | | | 8,303,161 | |
Biogen, Inc. (a) | | | 10,481 | | | | 2,641,946 | |
Bio-Rad Laboratories, Inc. - Class A (a) | | | 1,440 | | | | 844,445 | |
Corteva, Inc. | | | 48,751 | | | | 1,607,808 | |
Gilead Sciences, Inc. | | | 82,923 | | | | 4,821,972 | |
Illumina, Inc. (a) | | | 9,580 | | | | 2,804,066 | |
Incyte Corp. (a) | | | 11,587 | | | | 1,003,898 | |
Regeneron Pharmaceuticals, Inc. (a) | | | 6,745 | | | | 3,666,312 | |
Vertex Pharmaceuticals, Inc. (a) | | | 16,686 | | | | 3,476,695 | |
| | | | | | | | 30,827,743 | |
Building Materials — 0.5% | | | | |
Carrier Global Corp. | | | 53,017 | | | | 1,770,238 | |
Fortune Brands Home & Security, Inc. | | | 9,247 | | | | 747,805 | |
Johnson Controls International PLC | | | 50,970 | | | | 2,151,444 | |
The accompanying notes are an integral part of the financial statements.
40
Pacer Trendpilot® US Large Cap ETF
SCHEDULE OF INVESTMENTS
October 31, 2020 (Unaudited) (Continued)
| | | Shares | | | Value | |
COMMON STOCKS — 97.2% (Continued) |
| | | | | | | | | |
Building Materials — 0.5% (Continued) |
Martin Marietta Materials, Inc. | | | 4,229 | | | $ | 1,126,394 | |
Masco Corp. | | | 18,868 | | | | 1,011,325 | |
Vulcan Materials Co. | | | 8,641 | | | | 1,251,562 | |
| | | | | | | | 8,058,768 | |
Chemicals — 1.8% | | | | |
Air Products & Chemicals, Inc. | | | 14,317 | | | | 3,954,928 | |
Albemarle Corp. (b) | | | 6,824 | | | | 636,065 | |
Celanese Corp. | | | 8,014 | | | | 909,669 | |
CF Industries Holdings, Inc. | | | 14,352 | | | | 396,259 | |
Dow, Inc. | | | 48,517 | | | | 2,207,038 | |
DuPont de Nemours, Inc. (b) | | | 48,454 | | | | 2,756,063 | |
Eastman Chemical Co. | | | 8,971 | | | | 725,216 | |
Ecolab, Inc. | | | 16,501 | | | | 3,029,419 | |
FMC Corp. | | | 8,484 | | | | 871,646 | |
International Flavors & Fragrances, Inc. (b) | | | 6,891 | | | | 707,430 | |
Linde PLC | | | 34,058 | | | | 7,504,340 | |
LyondellBasell Industries NV - Class A | | | 16,648 | | | | 1,139,556 | |
Mosaic Co. | | | 22,980 | | | | 425,130 | |
PPG Industries, Inc. | | | 15,360 | | | | 1,992,499 | |
Sherwin-Williams Co. | | | 5,532 | | | | 3,805,905 | |
| | | | | | | | 31,061,163 | |
Commercial Services — 2.4% | | | | |
Automatic Data Processing, Inc. | | | 28,286 | | | | 4,468,057 | |
Cintas Corp. | | | 5,613 | | | | 1,765,569 | |
Equifax, Inc. | | | 8,033 | | | | 1,097,308 | |
FleetCor Technologies, Inc. (a) | | | 5,865 | | | | 1,295,637 | |
Gartner, Inc. (a) | | | 5,801 | | | | 696,700 | |
Global Payments, Inc. | | | 19,663 | | | | 3,101,642 | |
IHS Markit Ltd. | | | 26,284 | | | | 2,125,587 | |
MarketAxess Holdings, Inc. | | | 2,479 | | | | 1,335,809 | |
Moody’s Corp. | | | 10,492 | | | | 2,758,347 | |
Nielsen Holdings PLC (b) | | | 23,234 | | | | 313,891 | |
PayPal Holdings, Inc. (a) | | | 76,710 | | | | 14,278,032 | |
Quanta Services, Inc. | | | 9,459 | | | | 590,525 | |
Robert Half International, Inc. | | | 7,781 | | | | 394,419 | |
Rollins, Inc. (b) | | | 9,338 | | | | 540,203 | |
S&P Global, Inc. | | | 15,568 | | | | 5,024,261 | |
United Rentals, Inc. (a) | | | 4,958 | | | | 883,962 | |
Verisk Analytics, Inc. | | | 10,629 | | | | 1,891,643 | |
| | | | | | | | 42,561,592 | |
Computers — 7.8% | | | | |
Accenture PLC - Class A | | | 41,354 | | | | 8,970,096 | |
Apple, Inc. | | | 1,049,928 | | | | 114,295,162 | |
Cognizant Technology Solutions Corp. - Class A | | | 35,762 | | | | 2,554,122 | |
DXC Technology Co. | | | 16,889 | | | | 311,096 | |
Fortinet, Inc. (a) | | | 9,429 | | | | 1,040,679 | |
| | | Shares | | | Value | |
Computers — 7.8% (Continued) |
Hewlett Packard Enterprise Co. | | | 84,609 | | | $ | 731,022 | |
HP, Inc. | | | 97,471 | | | | 1,750,579 | |
International Business Machines Corp. | | | 57,836 | | | | 6,457,968 | |
Leidos Holdings, Inc. | | | 8,706 | | | | 722,598 | |
NetApp, Inc. | | | 14,935 | | | | 655,497 | |
Seagate Technology PLC (b) | | | 15,204 | | | | 727,055 | |
Western Digital Corp. | | | 19,377 | | | | 731,094 | |
| | | | | | | | 138,946,968 | |
Cosmetics/Personal Care — 1.7% | | | | |
Colgate-Palmolive Co. | | | 56,094 | | | | 4,425,256 | |
Coty, Inc. - Class A (b) | | | 19,259 | | | | 55,851 | |
Estee Lauder Cos., Inc. - Class A | | | 14,510 | | | | 3,187,266 | |
Procter & Gamble Co. | | | 162,142 | | | | 22,229,668 | |
| | | | | | | | 29,898,041 | |
Distribution/Wholesale — 0.3% | | | | |
Copart, Inc. (a) | | | 13,359 | | | | 1,474,299 | |
Fastenal Co. | | | 37,607 | | | | 1,625,751 | |
LKQ Corp. (a) | | | 20,113 | | | | 643,415 | |
W.W. Grainger, Inc. | | | 2,998 | | | | 1,049,360 | |
| | | | | | | | 4,792,825 | |
Diversified Financial Services — 3.8% | | | | |
American Express Co. | | | 43,958 | | | | 4,010,728 | |
Ameriprise Financial, Inc. | | | 8,525 | | | | 1,371,076 | |
BlackRock, Inc. | | | 9,247 | | | | 5,540,895 | |
Capital One Financial Corp. | | | 30,626 | | | | 2,238,148 | |
Cboe Global Markets, Inc. | | | 7,263 | | | | 590,409 | |
Charles Schwab Corp. | | | 74,542 | | | | 3,064,422 | |
CME Group, Inc. | | | 23,437 | | | | 3,532,425 | |
Discover Financial Services | | | 20,660 | | | | 1,343,107 | |
Franklin Resources, Inc. (b) | | | 18,184 | | | | 340,950 | |
Intercontinental Exchange, Inc. | | | 36,485 | | | | 3,444,184 | |
Invesco Ltd. | | | 24,238 | | | | 317,760 | |
MasterCard, Inc. - Class A | | | 57,249 | | | | 16,524,351 | |
Nasdaq, Inc. | | | 7,525 | | | | 910,450 | |
Raymond James Financial, Inc. | | | 8,231 | | | | 629,178 | |
Synchrony Financial | | | 37,479 | | | | 937,724 | |
T Rowe Price Group, Inc. | | | 15,413 | | | | 1,952,210 | |
Visa, Inc. - Class A (b) | | | 110,834 | | | | 20,139,646 | |
Western Union Co. | | | 27,457 | | | | 533,764 | |
| | | | | | | | 67,421,427 | |
Electric — 3.0% | | | | |
AES Corp. | | | 43,399 | | | | 846,281 | |
Alliant Energy Corp. | | | 15,644 | | | | 864,800 | |
Ameren Corp. | | | 16,069 | | | | 1,303,517 | |
American Electric Power Co., Inc. (b) | | | 32,310 | | | | 2,905,638 | |
CenterPoint Energy, Inc. (b) | | | 32,126 | | | | 678,822 | |
CMS Energy Corp. | | | 18,537 | | | | 1,173,948 | |
Consolidated Edison, Inc. (b) | | | 21,592 | | | | 1,694,756 | |
The accompanying notes are an integral part of the financial statements.
41
Pacer Trendpilot® US Large Cap ETF
SCHEDULE OF INVESTMENTS
October 31, 2020 (Unaudited) (Continued)
| | | Shares | | | Value | |
COMMON STOCKS — 97.2% (Continued) |
| | | | | | | | | |
Electric — 3.0% (Continued) |
Dominion Energy, Inc. | | | 53,635 | | | $ | 4,309,036 | |
DTE Energy Co. | | | 12,620 | | | | 1,557,561 | |
Duke Energy Corp. (b) | | | 47,475 | | | | 4,372,922 | |
Edison International (b) | | | 23,121 | | | | 1,295,701 | |
Entergy Corp. | | | 12,932 | | | | 1,308,977 | |
Evergy, Inc. | | | 14,905 | | | | 822,756 | |
Eversource Energy | | | 20,891 | | | | 1,823,158 | |
Exelon Corp. | | | 63,344 | | | | 2,526,792 | |
FirstEnergy Corp. | | | 35,163 | | | | 1,045,044 | |
NextEra Energy, Inc. | | | 127,724 | | | | 9,350,674 | |
NRG Energy, Inc. | | | 16,575 | | | | 524,102 | |
Pinnacle West Capital Corp. | | | 7,404 | | | | 603,944 | |
PPL Corp. | | | 50,032 | | | | 1,375,880 | |
Public Service Enterprise Group, Inc. (b) | | | 32,987 | | | | 1,918,194 | |
Sempra Energy (b) | | | 18,148 | | | | 2,275,033 | |
Southern Co. | | | 68,372 | | | | 3,927,972 | |
WEC Energy Group, Inc. | | | 20,532 | | | | 2,064,493 | |
Xcel Energy, Inc. | | | 34,199 | | | | 2,394,956 | |
| | | | | | | | 52,964,957 | |
Electrical Components & Equipment — 0.2% | | | | |
AMETEK, Inc. | | | 14,968 | | | | 1,469,858 | |
Emerson Electric Co. (b) | | | 39,876 | | | | 2,583,566 | |
| | | | | | | | 4,053,424 | |
Electronics — 1.4% | | | | |
Agilent Technologies, Inc. | | | 20,345 | | | | 2,077,021 | |
Allegion PLC (b) | | | 6,117 | | | | 602,524 | |
Amphenol Corp. - Class A | | | 19,294 | | | | 2,177,135 | |
Flir Systems, Inc. | | | 8,805 | | | | 305,445 | |
Fortive Corp. | | | 19,199 | | | | 1,182,658 | |
Garmin Ltd. | | | 9,350 | | | | 972,587 | |
Honeywell International, Inc. | | | 45,660 | | | | 7,531,617 | |
Keysight Technologies, Inc. (a) | | | 12,300 | | | | 1,289,901 | |
Mettler-Toledo International, Inc. (a) | | | 1,730 | | | | 1,726,384 | |
PerkinElmer, Inc. | | | 7,285 | | | | 943,772 | |
Roper Technologies, Inc. | | | 6,714 | | | | 2,493,177 | |
TE Connectivity Ltd. | | | 22,082 | | | | 2,139,304 | |
Vontier Corp. (a) | | | 7,697 | | | | 221,218 | |
Waters Corp. (a) | | | 4,336 | | | | 966,148 | |
| | | | | | | | 24,628,891 | |
Engineering & Construction — 0.0% (c) | | | | |
Jacobs Engineering Group, Inc. | | | 8,927 | | | | 848,065 | |
| | | | | | | | | |
Entertainment — 0.0% (c) | | | | |
Live Nation Entertainment, Inc. (a) | | | 9,114 | | | | 444,763 | |
| | | | | | | | | |
Environmental Control — 0.3% | | | | |
Pentair PLC | | | 11,013 | | | | 548,007 | |
| | | Shares | | | Value | |
Environmental Control — 0.3% (Continued) |
Republic Services, Inc. | | | 13,820 | | | $ | 1,218,509 | |
Waste Management, Inc. | | | 25,400 | | | | 2,740,914 | |
| | | | | | | | 4,507,430 | |
Food — 1.2% | | | | |
Campbell Soup Co. (b) | | | 11,083 | | | | 517,244 | |
ConAgra Foods, Inc. | | | 31,737 | | | | 1,113,651 | |
General Mills, Inc. | | | 39,459 | | | | 2,332,816 | |
Hershey Co. | | | 9,699 | | | | 1,333,224 | |
Hormel Foods Corp. (b) | | | 18,103 | | | | 881,435 | |
JM Smucker Co. (b) | | | 7,462 | | | | 837,236 | |
Kellogg Co. (b) | | | 16,339 | | | | 1,027,560 | |
Kroger Co. | | | 52,480 | | | | 1,690,381 | |
Lamb Weston Holdings, Inc. | | | 9,494 | | | | 602,394 | |
McCormick & Co., Inc. | | | 8,002 | | | | 1,444,441 | |
Mondelez International, Inc. - Class A | | | 94,077 | | | | 4,997,370 | |
Sysco Corp. | | | 33,305 | | | | 1,842,100 | |
The Kraft Heinz Co. | | | 40,691 | | | | 1,244,738 | |
Tyson Foods, Inc. - Class A | | | 19,175 | | | | 1,097,385 | |
| | | | | | | | 20,961,975 | |
Forest Products & Paper — 0.1% | | | | |
International Paper Co. | | | 25,565 | | | | 1,118,469 | |
| | | | | | | | | |
Gas — 0.1% | | | | |
Atmos Energy Corp. (b) | | | 7,941 | | | | 727,952 | |
NiSource, Inc. | | | 24,361 | | | | 559,572 | |
| | | | | | | | 1,287,524 | |
Hand/Machine Tools — 0.1% | | | | |
Snap-On, Inc. | | | 3,624 | | | | 570,888 | |
Stanley Black & Decker, Inc. | | | 9,944 | | | | 1,652,693 | |
| | | | | | | | 2,223,581 | |
Healthcare-Products — 4.3% | | | | |
Abbott Laboratories | | | 115,285 | | | | 12,117,606 | |
ABIOMED, Inc. (a) | | | 3,083 | | | | 776,546 | |
Align Technology, Inc. (a) | | | 4,674 | | | | 1,991,498 | |
Baxter International, Inc. | | | 33,335 | | | | 2,585,796 | |
Boston Scientific Corp. (a) | | | 90,411 | | | | 3,098,385 | |
Danaher Corp. | | | 41,216 | | | | 9,460,721 | |
DENTSPLY SIRONA, Inc. | | | 14,498 | | | | 684,161 | |
Edwards Lifesciences Corp. (a) | | | 40,897 | | | | 2,931,906 | |
Henry Schein, Inc. (a) | | | 9,556 | | | | 607,570 | |
Hologic, Inc. (a) | | | 17,595 | | | | 1,210,888 | |
IDEXX Laboratories, Inc. (a) | | | 5,774 | | | | 2,452,911 | |
Intuitive Surgical, Inc. (a) | | | 7,600 | | | | 5,069,808 | |
Medtronic PLC | | | 87,550 | | | | 8,804,903 | |
ResMed, Inc. | | | 9,287 | | | | 1,782,547 | |
STERIS PLC | | | 5,702 | | | | 1,010,337 | |
Stryker Corp. | | | 21,036 | | | | 4,249,482 | |
Teleflex, Inc. | | | 3,172 | | | | 1,009,426 | |
The accompanying notes are an integral part of the financial statements.
42
Pacer Trendpilot® US Large Cap ETF
SCHEDULE OF INVESTMENTS
October 31, 2020 (Unaudited) (Continued)
| | | Shares | | | Value | |
COMMON STOCKS — 97.2% (Continued) |
| | | | | | | | | |
Healthcare-Products — 4.3% (Continued) |
The Cooper Cos., Inc. | | | 3,144 | | | $ | 1,003,093 | |
Thermo Fisher Scientific, Inc. | | | 25,638 | | | | 12,129,851 | |
Varian Medical Systems, Inc. (a) | | | 5,933 | | | | 1,025,222 | |
West Pharmaceutical Services, Inc. | | | 4,881 | | | | 1,327,974 | |
Zimmer Biomet Holdings, Inc. | | | 13,462 | | | | 1,778,330 | |
| | | | | | | | 77,108,961 | |
Healthcare-Services — 2.1% | | | | |
Anthem, Inc. | | | 16,686 | | | | 4,551,941 | |
Catalent, Inc. (a) | | | 10,802 | | | | 948,092 | |
Centene Corp. (a) | | | 38,148 | | | | 2,254,547 | |
DaVita, Inc. (a)(b) | | | 5,825 | | | | 502,406 | |
HCA Healthcare, Inc. | | | 17,269 | | | | 2,140,320 | |
Humana, Inc. | | | 8,648 | | | | 3,452,973 | |
IQVIA Holdings, Inc. (a) | | | 11,956 | | | | 1,841,104 | |
Laboratory Corp. of American Holdings (a) | | | 6,405 | | | | 1,279,527 | |
Quest Diagnostics, Inc. | | | 8,854 | | | | 1,081,428 | |
UnitedHealth Group, Inc. | | | 61,131 | | | | 18,653,513 | |
Universal Health Services, Inc. - Class B | | | 5,365 | | | | 587,736 | |
| | | | | | | | 37,293,587 | |
Home Builders — 0.2% | | | | |
DR Horton, Inc. | | | 21,856 | | | | 1,460,199 | |
Lennar Corp. - Class A | | | 18,269 | | | | 1,283,032 | |
NVR, Inc. (a) | | | 246 | | | | 972,460 | |
PulteGroup, Inc. | | | 16,772 | | | | 683,627 | |
| | | | | | | | 4,399,318 | |
Home Furnishings — 0.1% | | | | |
Leggett & Platt, Inc. | | | 8,636 | | | | 360,380 | |
Whirlpool Corp. (b) | | | 4,293 | | | | 794,033 | |
| | | | | | | | 1,154,413 | |
Household Products/Wares — 0.4% | | | | |
Avery Dennison Corp. | | | 5,586 | | | | 773,046 | |
Church & Dwight Co., Inc. | | | 16,034 | | | | 1,417,245 | |
Clorox Co. (b) | | | 8,109 | | | | 1,680,590 | |
Kimberly-Clark Corp. (b) | | | 22,445 | | | | 2,975,983 | |
| | | | | | | | 6,846,864 | |
Housewares — 0.0% (c) | | | | |
Newell Brands, Inc. | | | 24,954 | | | | 440,688 | |
| | | | | | | | | |
Insurance — 3.3% | | | | |
Aflac, Inc. | | | 43,280 | | | | 1,469,356 | |
Allstate Corp. | | | 21,216 | | | | 1,882,920 | |
American International Group, Inc. | | | 56,803 | | | | 1,788,727 | |
Aon PLC - Class A | | | 15,413 | | | | 2,836,146 | |
Arthur J Gallagher & Co. | | | 12,204 | | | | 1,265,677 | |
Assurant, Inc. | | | 4,060 | | | | 504,942 | |
Berkshire Hathaway, Inc. - Class B (a) | | | 129,507 | | | | 26,147,463 | |
Chubb Ltd. | | | 29,596 | | | | 3,844,816 | |
| | | Shares | | | Value | |
Insurance — 3.3% (Continued) |
Cincinnati Financial Corp. | | | 9,937 | | | $ | 702,943 | |
Everest Re Group Ltd. | | | 2,739 | | | | 539,802 | |
Globe Life, Inc. | | | 6,635 | | | | 538,032 | |
Hartford Financial Services Group, Inc. | | | 23,562 | | | | 907,608 | |
Lincoln National Corp. | | | 13,100 | | | | 459,810 | |
Loews Corp. | | | 16,871 | | | | 585,086 | |
Marsh & McLennan Cos., Inc. | | | 32,891 | | | | 3,402,903 | |
MetLife, Inc. | | | 51,169 | | | | 1,936,747 | |
Principal Financial Group, Inc. | | | 16,785 | | | | 658,308 | |
Progressive Corp. | | | 38,223 | | | | 3,512,694 | |
Prudential Financial, Inc. | | | 26,373 | | | | 1,688,399 | |
Travelers Cos., Inc. | | | 17,081 | | | | 2,061,848 | |
Unum Group (b) | | | 13,515 | | | | 238,675 | |
W R Berkley Corp. | | | 9,714 | | | | 584,006 | |
Willis Towers Watson PLC | | | 8,389 | | | | 1,530,825 | |
| | | | | | | | 59,087,733 | |
Internet — 12.2% | | | | |
Alphabet, Inc. - Class A (a) | | | 19,615 | | | | 31,699,998 | |
Alphabet, Inc. - Class C (a) | | | 19,143 | | | | 31,030,994 | |
Amazon.com, Inc. (a) | | | 27,782 | | | | 84,350,319 | |
Booking Holdings, Inc. (a) | | | 2,724 | | | | 4,419,690 | |
CDW Corp. | | | 9,277 | | | | 1,137,360 | |
eBay, Inc. | | | 42,915 | | | | 2,044,041 | |
Etsy, Inc. (a) | | | 7,898 | | | | 960,318 | |
Expedia Group, Inc. | | | 9,248 | | | | 870,699 | |
F5 Networks, Inc. (a) | | | 4,074 | | | | 541,598 | |
Facebook, Inc. - Class A (a) | | | 157,078 | | | | 41,328,793 | |
Netflix, Inc. (a) | | | 28,700 | | | | 13,653,738 | |
NortonLifeLock, Inc. | | | 37,826 | | | | 778,081 | |
Twitter, Inc. (a) | | | 50,409 | | | | 2,084,916 | |
VeriSign, Inc. (a) | | | 6,903 | | | | 1,316,402 | |
| | | | | | | | 216,216,947 | |
Iron/Steel — 0.1% | | | | |
Nucor Corp. | | | 19,814 | | | | 946,317 | |
| | | | | | | | | |
Leisure Time — 0.1% | | | | |
Carnival Corp. (b) | | | 30,315 | | | | 415,619 | |
Norwegian Cruise Line Holdings Ltd. (a)(b) | | | 16,040 | | | | 266,745 | |
Royal Caribbean Cruises Ltd. (b) | | | 11,267 | | | | 635,684 | |
| | | | | | | | 1,318,048 | |
Lodging — 0.3% | | | | |
Hilton Worldwide Holdings, Inc. (b) | | | 18,477 | | | | 1,622,465 | |
Las Vegas Sands Corp. | | | 22,096 | | | | 1,061,934 | |
Marriott International, Inc. - Class A | | | 17,879 | | | | 1,660,601 | |
MGM Resorts International (b) | | | 26,672 | | | | 548,643 | |
Wynn Resorts Ltd. | | | 6,362 | | | | 460,800 | |
| | | | | | | | 5,354,443 | |
The accompanying notes are an integral part of the financial statements.
43
Pacer Trendpilot® US Large Cap ETF
SCHEDULE OF INVESTMENTS
October 31, 2020 (Unaudited) (Continued)
| | | Shares | | | Value | |
COMMON STOCKS — 97.2% (Continued) |
| | | | | | | | | |
Machinery-Construction & Mining — 0.3% | | | | |
Caterpillar, Inc. | | | 35,112 | | | $ | 5,514,340 | |
| | | | | | | | | |
Machinery-Diversified — 0.7% | | | | |
Deere & Co. | | | 20,481 | | | | 4,626,863 | |
Dover Corp. | | | 9,422 | | | | 1,043,109 | |
Flowserve Corp. (b) | | | 8,597 | | | | 250,345 | |
IDEX Corp. | | | 4,977 | | | | 848,031 | |
Ingersoll Rand, Inc. (a) | | | 22,735 | | | | 794,361 | |
Otis Worldwide Corp. | | | 26,381 | | | | 1,616,628 | |
Rockwell Automation, Inc. | | | 7,598 | | | | 1,801,638 | |
Wabtec Corp. | | | 11,804 | | | | 699,977 | |
Xylem, Inc. | | | 11,687 | | | | 1,018,405 | |
| | | | | | | | 12,699,357 | |
Media — 2.0% | | | | |
Charter Communications, Inc. - Class A (a) | | | 9,797 | | | | 5,915,625 | |
Comcast Corp. - Class A | | | 295,816 | | | | 12,495,268 | |
Discovery, Inc. - Class C (a)(b) | | | 22,174 | | | | 406,228 | |
Discovery, Inc. - Class A (a)(b) | | | 10,481 | | | | 212,135 | |
DISH Network Corp. - Class A (a) | | | 16,645 | | | | 424,281 | |
FOX Corp. - Class A (b) | | | 23,422 | | | | 621,151 | |
FOX Corp. - Class B | | | 10,799 | | | | 282,286 | |
News Corp. - Class B | | | 8,096 | | | | 105,410 | |
News Corp. - Class A | | | 25,277 | | | | 331,887 | |
ViacomCBS, Inc. - Class B (b) | | | 35,168 | | | | 1,004,750 | |
Walt Disney Co. | | | 117,509 | | | | 14,247,966 | |
| | | | | | | | 36,046,987 | |
Mining — 0.3% | | | | |
Freeport-McMoRan, Inc. | | | 94,693 | | | | 1,641,977 | |
Newmont Goldcorp Corp. | | | 53,635 | | | | 3,370,423 | |
| | | | | | | | 5,012,400 | |
Miscellaneous Manufacturing — 1.2% | | | | |
3M Co. | | | 37,656 | | | | 6,023,454 | |
A O Smith Corp. | | | 9,070 | | | | 468,828 | |
Eaton Corp. PLC | | | 27,323 | | | | 2,835,854 | |
General Electric Co. | | | 569,502 | | | | 4,225,705 | |
Illinois Tool Works, Inc. | | | 19,237 | | | | 3,768,144 | |
Parker-Hannifin Corp. | | | 8,379 | | | | 1,745,849 | |
Textron, Inc. | | | 14,938 | | | | 534,780 | |
Trane Technologies PLC | | | 15,575 | | | | 2,067,581 | |
| | | | | | | | 21,670,195 | |
Office/Business Equipment — 0.1% | | | | |
Xerox Holdings Corp. | | | 12,152 | | | | 211,202 | |
Zebra Technologies Corp. - Class A (a) | | | 3,540 | | | | 1,004,085 | |
| | | | | | | | 1,215,287 | |
Oil & Gas — 1.6% | | | | |
Apache Corp. | | | 24,588 | | | | 204,080 | |
Cabot Oil & Gas Corp. (b) | | | 26,826 | | | | 477,235 | |
| | | Shares | | | Value | |
Oil & Gas — 1.6% (Continued) |
Chevron Corp. | | | 125,057 | | | $ | 8,691,462 | |
Concho Resources, Inc. | | | 13,345 | | | | 553,951 | |
ConocoPhillips | | | 71,962 | | | | 2,059,552 | |
Devon Energy Corp. (b) | | | 25,407 | | | | 226,885 | |
Diamondback Energy, Inc. | | | 10,688 | | | | 277,460 | |
EOG Resources, Inc. | | | 37,962 | | | | 1,299,819 | |
Exxon Mobil Corp. | | | 276,192 | | | | 9,009,383 | |
HESS Corp. | | | 16,852 | | | | 627,231 | |
HollyFrontier Corp. | | | 9,714 | | | | 179,806 | |
Marathon Oil Corp. (b) | | | 52,376 | | | | 207,409 | |
Marathon Petroleum Corp. (b) | | | 42,539 | | | | 1,254,901 | |
Occidental Petroleum Corp. (b) | | | 58,148 | | | | 530,891 | |
Phillips 66 | | | 29,169 | | | | 1,361,026 | |
Pioneer Natural Resources Co. | | | 10,790 | | | | 858,452 | |
Valero Energy Corp. | | | 26,766 | | | | 1,033,435 | |
| | | | | | | | 28,852,978 | |
Oil & Gas Services — 0.2% | | | | |
Baker Hughes a GE Co. | | | 42,284 | | | | 624,535 | |
Halliburton Co. | | | 57,193 | | | | 689,748 | |
National Oilwell Varco, Inc. (b) | | | 25,081 | | | | 210,680 | |
Schlumberger Ltd. | | | 90,166 | | | | 1,347,080 | |
TechnipFMC PLC | | | 27,547 | | | | 152,335 | |
| | | | | | | | 3,024,378 | |
Packaging & Containers — 0.3% | | | | |
Amcor PLC | | | 106,638 | | | | 1,112,234 | |
Ball Corp. | | | 21,505 | | | | 1,913,945 | |
Packaging Corp. of America | | | 6,183 | | | | 707,892 | |
Sealed Air Corp. | | | 10,172 | | | | 402,709 | |
WestRock Co. | | | 16,754 | | | | 629,113 | |
| | | | | | | | 4,765,893 | |
Pharmaceuticals — 5.5% | | | | |
AbbVie, Inc. | | | 115,210 | | | | 9,804,371 | |
AmerisourceBergen Corp. | | | 9,869 | | | | 948,115 | |
Becton Dickinson and Co. | | | 19,150 | | | | 4,426,139 | |
Bristol-Myers Squibb Co. | | | 147,008 | | | | 8,592,618 | |
Cardinal Health, Inc. | | | 19,235 | | | | 880,771 | |
Cigna Corp. | | | 24,354 | | | | 4,066,387 | |
CVS Health Corp. | | | 84,935 | | | | 4,764,004 | |
DexCom, Inc. (a) | | | 5,959 | | | | 1,904,377 | |
Eli Lilly & Co. | | | 51,828 | | | | 6,761,481 | |
Johnson & Johnson | | | 171,063 | | | | 23,454,448 | |
McKesson Corp. | | | 10,482 | | | | 1,545,990 | |
Merck & Co., Inc. | | | 163,929 | | | | 12,329,100 | |
Mylan NV (a)(b) | | | 33,842 | | | | 492,063 | |
Perrigo Co. PLC | | | 8,983 | | | | 394,084 | |
Pfizer, Inc. | | | 360,653 | | | | 12,795,968 | |
Zoetis, Inc. | | | 31,190 | | | | 4,945,175 | |
| | | | | | | | 98,105,091 | |
The accompanying notes are an integral part of the financial statements.
44
Pacer Trendpilot® US Large Cap ETF
SCHEDULE OF INVESTMENTS
October 31, 2020 (Unaudited) (Continued)
| | | Shares | | | Value | |
COMMON STOCKS — 97.2% (Continued) |
| | | | | | | | | |
Pipelines — 0.2% | | | | |
Kinder Morgan, Inc. | | | 127,183 | | | $ | 1,513,477 | |
ONEOK, Inc. | | | 26,981 | | | | 782,449 | |
Williams Cos., Inc. | | | 79,183 | | | | 1,519,522 | |
| | | | | | | | 3,815,448 | |
Real Estate — 0.1% | | | | |
CBRE Group, Inc. - Class A (a) | | | 21,804 | | | | 1,098,922 | |
| | | | | | | | | |
Retail — 5.7% | | | | |
Advance Auto Parts, Inc. | | | 4,450 | | | | 655,396 | |
AutoZone, Inc. (a) | | | 1,542 | | | | 1,740,887 | |
Best Buy Co., Inc. | | | 14,889 | | | | 1,660,868 | |
CarMax, Inc. (a) | | | 10,680 | | | | 923,179 | |
Chipotle Mexican Grill, Inc. (a) | | | 1,841 | | | | 2,211,925 | |
Costco Wholesale Corp. | | | 28,975 | | | | 10,362,040 | |
Darden Restaurants, Inc. | | | 8,558 | | | | 786,651 | |
Dollar General Corp. | | | 16,762 | | | | 3,498,397 | |
Dollar Tree, Inc. (a) | | | 15,378 | | | | 1,388,941 | |
Domino’s Pizza, Inc. | | | 2,546 | | | | 963,203 | |
Gap, Inc. | | | 14,016 | | | | 272,611 | |
Genuine Parts Co. | | | 9,424 | | | | 852,212 | |
Home Depot, Inc. | | | 70,538 | | | | 18,813,190 | |
L Brands, Inc. | | | 15,300 | | | | 489,753 | |
Lowe’s Cos., Inc. | | | 49,054 | | | | 7,755,438 | |
McDonald’s Corp. | | | 48,448 | | | | 10,319,424 | |
O’Reilly Automotive, Inc. (a) | | | 4,940 | | | | 2,156,804 | |
Ross Stores, Inc. | | | 23,681 | | | | 2,016,911 | |
Starbucks Corp. | | | 77,243 | | | | 6,717,051 | |
Target Corp. | | | 33,079 | | | | 5,035,286 | |
Tiffany & Co. | | | 6,998 | | | | 915,618 | |
TJX Cos., Inc. | | | 79,239 | | | | 4,025,341 | |
Tractor Supply Co. | | | 7,856 | | | | 1,046,498 | |
Ulta Salon Cosmetics & Fragrance, Inc. (a) | | | 3,743 | | | | 773,940 | |
Walgreens Boots Alliance, Inc. | | | 49,182 | | | | 1,674,155 | |
Walmart, Inc. | | | 90,652 | | | | 12,577,965 | |
Yum! Brands, Inc. | | | 19,746 | | | | 1,842,894 | |
| | | | | | | | 101,476,578 | |
Savings & Loans — 0.0% (c) | | | | |
People’s United Financial, Inc. (b) | | | 29,147 | | | | 310,998 | |
| | | | | | | | | |
Semiconductors — 5.0% | | | | |
Advanced Micro Devices, Inc. (a) | | | 76,390 | | | | 5,751,403 | |
Analog Devices, Inc. | | | 23,954 | | | | 2,839,268 | |
Applied Materials, Inc. | | | 60,335 | | | | 3,573,642 | |
Broadcom, Inc. | | | 25,904 | | | | 9,056,816 | |
Intel Corp. | | | 274,916 | | | | 12,173,280 | |
IPG Photonics Corp. (a) | | | 2,355 | | | | 437,936 | |
KLA Corp. | | | 10,470 | | | | 2,064,475 | |
| | | Shares | | | Value | |
Semiconductors — 5.0% (Continued) |
Lam Research Corp. | | | 9,405 | | | $ | 3,217,262 | |
Maxim Integrated Products, Inc. | | | 17,820 | | | | 1,241,163 | |
Microchip Technology, Inc. | | | 15,519 | | | | 1,630,737 | |
Micron Technology, Inc. (a) | | | 72,152 | | | | 3,632,132 | |
NVIDIA Corp. | | | 39,829 | | | | 19,968,667 | |
Qorvo, Inc. (a) | | | 7,655 | | | | 974,941 | |
QUALCOMM, Inc. | | | 72,996 | | | | 9,004,787 | |
Skyworks Solutions, Inc. | | | 11,129 | | | | 1,572,416 | |
Teradyne, Inc. | | | 10,932 | | | | 960,376 | |
Texas Instruments, Inc. | | | 59,550 | | | | 8,610,334 | |
Xilinx, Inc. | | | 16,564 | | | | 1,965,981 | |
| | | | | | | | 88,675,616 | |
Shipbuilding — 0.0% (c) | | | | |
Huntington Ingalls Industries, Inc. | | | 2,750 | | | | 405,570 | |
| | | | | | | | | |
Software — 10.3% | | | | |
Activision Blizzard, Inc. | | | 50,072 | | | | 3,791,953 | |
Adobe Systems, Inc. (a) | | | 31,506 | | | | 14,086,333 | |
Akamai Technologies, Inc. (a) | | | 10,481 | | | | 996,953 | |
ANSYS, Inc. (a) | | | 5,518 | | | | 1,679,514 | |
Autodesk, Inc. (a) | | | 14,281 | | | | 3,363,747 | |
Broadridge Financial Solutions, Inc. | | | 7,516 | | | | 1,034,202 | |
Cadence Design System, Inc. (a) | | | 18,334 | | | | 2,005,190 | |
Cerner Corp. | | | 20,717 | | | | 1,452,054 | |
Citrix Systems, Inc. | | | 7,547 | | | | 854,849 | |
Electronic Arts, Inc. (a) | | | 19,209 | | | | 2,301,814 | |
Fidelity National Information Services, Inc. | | | 40,047 | | | | 4,989,456 | |
Fiserv, Inc. (a) | | | 37,387 | | | | 3,569,337 | |
Intuit, Inc. | | | 16,974 | | | | 5,341,378 | |
Jack Henry & Associates, Inc. | | | 5,057 | | | | 749,700 | |
Microsoft Corp. | | | 493,118 | | | | 99,841,601 | |
MSCI, Inc. | | | 5,460 | | | | 1,910,126 | |
Oracle Corp. | | | 126,217 | | | | 7,082,036 | |
Paychex, Inc. | | | 20,817 | | | | 1,712,198 | |
Paycom Software, Inc. (a) | | | 3,097 | | | | 1,127,587 | |
Salesforce.com, Inc. (a) | | | 57,653 | | | | 13,391,062 | |
ServiceNow, Inc. (a) | | | 12,333 | | | | 6,136,531 | |
Synopsys, Inc. (a) | | | 9,870 | | | | 2,110,798 | |
Take-Two Interactive Software, Inc. (a) | | | 7,398 | | | | 1,146,098 | |
Tyler Technologies, Inc. (a) | | | 2,624 | | | | 1,008,613 | |
| | | | | | | | 181,683,130 | |
Telecommunications — 2.7% | | | | |
Arista Networks, Inc. (a)(b) | | | 3,570 | | | | 745,773 | |
AT&T, Inc. | | | 462,851 | | | | 12,506,234 | |
CenturyLink, Inc. (b) | | | 64,102 | | | | 552,559 | |
Cisco Systems, Inc. | | | 276,809 | | | | 9,937,443 | |
Corning, Inc. | | | 50,456 | | | | 1,613,078 | |
The accompanying notes are an integral part of the financial statements.
45
Pacer Trendpilot® US Large Cap ETF
SCHEDULE OF INVESTMENTS
October 31, 2020 (Unaudited) (Continued)
| | | Shares | | | Value | |
COMMON STOCKS — 97.2% (Continued) |
| | | | | | | | | |
Telecommunications — 2.7% (Continued) |
Juniper Networks, Inc. | | | 21,799 | | | $ | 429,876 | |
Motorola Solutions, Inc. | | | 11,216 | | | | 1,772,801 | |
T-Mobile US, Inc. (a) | | | 38,118 | | | | 4,176,589 | |
Verizon Communications, Inc. | | | 269,962 | | | | 15,385,135 | |
| | | | | | | | 47,119,488 | |
Textiles — 0.0% (c) | | | | |
Mohawk Industries, Inc. (a) | | | 3,951 | | | | 407,704 | |
| | | | | | | | | |
Toys/Games/Hobbies — 0.0% (c) | | | | |
Hasbro, Inc. | | | 8,269 | | | | 684,012 | |
| | | | | | | | | |
Transportation — 1.8% | | | | |
CH Robinson Worldwide, Inc. (b) | | | 8,905 | | | | 787,469 | |
CSX Corp. | | | 50,833 | | | | 4,012,757 | |
Expeditors International of Washington, Inc. | | | 11,122 | | | | 982,851 | |
FedEx Corp. | | | 15,615 | | | | 4,051,624 | |
JB Hunt Trasport Services, Inc. | | | 5,728 | | | | 697,327 | |
Kansas City Southern | | | 6,589 | | | | 1,160,586 | |
Norfolk Southern Corp. | | | 17,014 | | | | 3,557,968 | |
Old Dominion Freight Line, Inc. | | | 6,286 | | | | 1,196,666 | |
Union Pacific Corp. | | | 44,070 | | | | 7,808,763 | |
United Parcel Service, Inc. - Class B | | | 45,778 | | | | 7,192,182 | |
| | | | | | | | 31,448,193 | |
Water — 0.1% | | | | |
American Water Works Co., Inc. | | | 11,713 | | | | 1,762,924 | |
TOTAL COMMON STOCKS (Cost $1,622,503,022) | | | | | | | 1,723,369,354 | |
| | | | | |
REAL ESTATE INVESTMENT TRUSTS — 2.5% | | | | |
Alexandria Real Estate Equities, Inc. | | | 7,918 | | | | 1,199,736 | |
American Tower Corp. | | | 28,802 | | | | 6,614,379 | |
Apartment Investment and Management Co. - Class A | | | 9,751 | | | | 311,057 | |
AvalonBay Communities, Inc. | | | 9,247 | | | | 1,286,535 | |
Boston Properties, Inc. | | | 9,288 | | | | 672,544 | |
Crown Castle International Corp. | | | 27,140 | | | | 4,239,268 | |
Digital Realty Trust, Inc. | | | 17,206 | | | | 2,482,826 | |
| | | Shares | | | Value | |
REAL ESTATE INVESTMENT TRUSTS — 2.5% (Continued) |
Duke Realty Corp. | | | 23,888 | | | $ | 907,505 | |
Equinix, Inc. | | | 5,685 | | | | 4,157,100 | |
Equity Residential | | | 22,693 | | | | 1,066,117 | |
Essex Property Trust, Inc. | | | 4,486 | | | | 917,791 | |
Extra Space Storage, Inc. (b) | | | 8,474 | | | | 982,560 | |
Federal Realty Investment Trust | | | 4,539 | | | | 312,193 | |
Healthpeak Properties, Inc. | | | 31,480 | | | | 849,016 | |
Host Hotels & Resorts, Inc. (b) | | | 47,165 | | | | 494,289 | |
Iron Mountain, Inc. (b) | | | 18,838 | | | | 490,918 | |
Kimco Realty Corp. | | | 27,421 | | | | 281,340 | |
Mid-America Apartment Communities, Inc. | | | 7,463 | | | | 870,410 | |
Prologis, Inc. | | | 48,220 | | | | 4,783,424 | |
Public Storage | | | 9,873 | | | | 2,261,608 | |
Realty Income Corp. | | | 22,435 | | | | 1,298,089 | |
Regency Centers Corp. | | | 10,968 | | | | 390,351 | |
SBA Communications Corp. | | | 7,398 | | | | 2,148,157 | |
Simon Property Group, Inc. (b) | | | 20,146 | | | | 1,265,370 | |
SL Green Realty Corp. (b) | | | 5,474 | | | | 234,342 | |
UDR, Inc. | | | 19,051 | | | | 595,153 | |
Ventas, Inc. | | | 24,288 | | | | 958,647 | |
Vornado Realty Trust (b) | | | 10,481 | | | | 322,081 | |
Welltower, Inc. | | | 26,390 | | | | 1,418,990 | |
Weyerhaeuser Co. | | | 48,524 | | | | 1,324,220 | |
TOTAL REAL ESTATE INVESTMENT TRUSTS (Cost $47,230,747) | | | | | | | 45,136,016 | |
| | | | | |
| | | Principal
Amount | | | | | |
SHORT-TERM INVESTMENTS — 0.2% | | | | |
| | | | | | | | | |
Money Market Deposit Accounts, — 0.2% | | | | |
U.S. Bank Money Market Deposit Account 0.025% (d) | | $ | 3,088,702 | | | | 3,088,702 | |
TOTAL SHORT-TERM INVESTMENTS (Cost $3,088,702) | | | | | | | 3,088,702 | |
| | | | | |
The accompanying notes are an integral part of the financial statements.
46
Pacer Trendpilot® US Large Cap ETF
SCHEDULE OF INVESTMENTS
October 31, 2020 (Unaudited) (Continued)
| | | Shares | | | Value | |
INVESTMENTS PURCHASED WITH PROCEEDS FROM SECURITIES LENDING — 2.7% |
Mount Vernon Liquid Assets Portfolio, LLC 0.16% (d) | | | 46,975,267 | | | $ | 46,975,267 | |
TOTAL INVESTMENTS PURCHASED WITH PROCEEDS FROM SECURITIES LENDING (Cost $46,975,267) | | | | | | | 46,975,267 | |
Total Investments (Cost $1,719,797,738) — 102.6% | | | | | | | 1,818,569,338 | |
Liabilities in Excess of Other Assets — (2.6)% | | | | | | | (46,146,577 | ) |
TOTAL NET ASSETS — 100.0% | | | | | | $ | 1,772,422,761 | |
Percentages are stated as a percent of net assets.
| | (a) | Non-income producing security. |
| | (b) | All or a portion of this security is on loan as of October 31, 2020. The total value of securities on loan is $45,796,491 or 2.6% of net assets. |
| | (d) | The rate shown is as of October 31, 2020. |
For Fund compliance purposes, the Fund’s industry classifications refer to any one or more of the industry sub-classifications used by one or more widely recognized market indexes or ratings group indexes, and/or they may be defined by Fund management. This definition does not apply for all purposes of this report, which may combine sub-classifications for reporting ease. Categories are shown as a percentage of net assets.
The accompanying notes are an integral part of the financial statements.
47
Pacer Trendpilot® US Mid Cap ETF
SCHEDULE OF INVESTMENTS
October 31, 2020 (Unaudited)
| �� | | Shares | | | Value | |
COMMON STOCKS — 91.2% | | | | |
| | | | | | | | | |
Aerospace/Defense — 0.4% | | | | |
Hexcel Corp. | | | 19,191 | | | $ | 642,515 | |
Mercury Systems, Inc. (a) | | | 12,822 | | | | 883,179 | |
| | | | | | | | 1,525,694 | |
Agriculture — 0.4% | | | | |
Darling Ingredients, Inc. (a) | | | 37,812 | | | | 1,625,916 | |
| | | | | | | | | |
Airlines — 0.2% | | | | |
JetBlue Airways Corp. (a) | | | 62,082 | | | | 743,122 | |
| | | | | | | | | |
Apparel — 1.1% | | | | |
Carter’s, Inc. | | | 10,052 | | | | 818,736 | |
Columbia Sportswear Co. (b) | | | 6,509 | | | | 485,506 | |
Deckers Outdoor Corp. (a) | | | 6,114 | | | | 1,549,104 | |
Skechers U.S.A, Inc. - Class A (a) | | | 31,299 | | | | 992,491 | |
Urban Outfitters, Inc. (a) | | | 16,168 | | | | 361,193 | |
| | | | | | | | 4,207,030 | |
Auto Parts & Equipment — 1.6% | | | | |
Adient PLC (a) | | | 20,056 | | | | 425,588 | |
BorgWarner, Inc. | | | 8,572 | | | | 299,849 | |
Dana, Inc. | | | 33,198 | | | | 464,440 | |
Fox Factory Holding Corp. (a)(b) | | | 9,018 | | | | 758,233 | |
Gentex Corp. | | | 56,386 | | | | 1,560,201 | |
Goodyear Tire & Rubber Co. | | | 53,617 | | | | 443,949 | |
LEAR Corp. | | | 12,565 | | | | 1,517,978 | |
VISTEON Corp. (a)(b) | | | 6,411 | | | | 574,746 | |
| | | | | | | | 6,044,984 | |
Banks — 5.9% | | | | |
Associated Banc-Corp. | | | 35,354 | | | | 483,996 | |
BancorpSouth Bank | | | 22,418 | | | | 524,805 | |
Bank of Hawaii Corp. | | | 9,181 | | | | 556,736 | |
Bank OZK (b) | | | 27,858 | | | | 690,321 | |
Cathay General Bancorp | | | 17,392 | | | | 409,234 | |
CIT Group, Inc. (b) | | | 22,674 | | | | 667,749 | |
Commerce Bancshares, Inc. (b) | | | 23,089 | | | | 1,437,290 | |
Cullen Frost Bankers, Inc. (b) | | | 13,080 | | | | 919,132 | |
East West Bancorp, Inc. (b) | | | 32,610 | | | | 1,189,613 | |
First Financial Bankshares, Inc. (b) | | | 32,684 | | | | 974,310 | |
First Horizon National Corp. | | | 127,416 | | | | 1,326,401 | |
FNB Corp. | | | 74,350 | | | | 562,086 | |
Fulton Financial Corp. | | | 37,266 | | | | 409,553 | |
Glacier Bancorp, Inc. | | | 20,413 | | | | 730,785 | |
Hancock Whitney Corp. | | | 19,804 | | | | 452,917 | |
Home BancShares, Inc. (b) | | | 35,356 | | | | 586,910 | |
International Bancshares Corp. | | | 12,822 | | | | 354,913 | |
PacWest Bancorp | | | 26,829 | | | | 516,190 | |
Pinnacle Financial Partners, Inc. | | | 16,359 | | | | 749,079 | |
Prosperity Bancshares, Inc. (b) | | | 21,289 | | | | 1,173,237 | |
Signature Bank (b) | | | 12,308 | | | | 993,748 | |
| | | Shares | | | Value | |
Banks — 5.9% (Continued) |
Synovus Financial Corp. | | | 33,912 | | | $ | 881,712 | |
TCF Financial Corp. | | | 35,040 | | | | 953,438 | |
Texas Capital Bancshares, Inc. (a) | | | 11,594 | | | | 521,730 | |
Trustmark Corp. | | | 14,523 | | | | 339,693 | |
UMB Financial Corp. | | | 9,694 | | | | 590,074 | |
Umpqua Holdings Corp. | | | 50,689 | | | | 636,654 | |
United Bankshares, Inc. | | | 29,240 | | | | 766,965 | |
Valley National Bancorp | | | 90,147 | | | | 688,723 | |
Webster Financial Corp. | | | 20,775 | | | | 669,163 | |
Wintrust Financial Corp. | | | 13,236 | | | | 651,608 | |
| | | | | | | | 22,408,765 | |
Beverages — 0.5% | | | | |
The Boston Beer Co., Inc. - Class A (a)(b) | | | 1,987 | | | | 2,064,851 | |
| | | | | | | | | |
Biotechnology — 1.6% | | | | |
Arrowhead Pharmaceuticals, Inc. (a)(b) | | | 23,445 | | | | 1,343,399 | |
Emergent BioSolutions, Inc. (a) | | | 9,866 | | | | 887,644 | |
Exelixis, Inc. (a) | | | 70,649 | | | | 1,446,892 | |
Ligand Pharmaceuticals, Inc. (a)(b) | | | 3,641 | | | | 300,200 | |
Nektar Therapeutics (a)(b) | | | 40,993 | | | | 649,329 | |
United Therapeutics Corp. (a) | | | 10,139 | | | | 1,360,958 | |
| | | | | | | | 5,988,422 | |
Building Materials — 2.3% | | | | |
Builders FirstSource, Inc. (a) | | | 25,501 | | | | 772,681 | |
Eagle Materials, Inc. | | | 9,537 | | | | 813,029 | |
Lennox International, Inc. (b) | | | 7,570 | | | | 2,056,466 | |
Louisiana-Pacific Corp. | | | 25,759 | | | | 736,192 | |
MDU Resources Group, Inc. | | | 46,178 | | | | 1,097,189 | |
Owens Corning | | | 24,830 | | | | 1,625,620 | |
Trex Co, Inc. (a)(b) | | | 26,658 | | | | 1,853,798 | |
| | | | | | | | 8,954,975 | |
Chemicals — 2.1% | | | | |
Ashland Global Holdings, Inc. (b) | | | 11,853 | | | | 826,984 | |
Cabot Corp. | | | 12,979 | | | | 493,332 | |
Ingevity Corp. (a) | | | 9,438 | | | | 517,958 | |
Minerals Technologies, Inc. | | | 7,796 | | | | 426,363 | |
NewMarket Corp. | | | 1,644 | | | | 588,042 | |
OLIN Corp. | | | 31,004 | | | | 513,116 | |
RPM International, Inc. | | | 29,856 | | | | 2,527,908 | |
Sensient Technologies Corp. | | | 9,695 | | | | 634,344 | |
The Chemours Co. (b) | | | 37,810 | | | | 761,493 | |
Valvoline, Inc. | | | 42,636 | | | | 838,650 | |
| | | | | | | | 8,128,190 | |
Commercial Services — 4.1% | | | | |
Adtalem Global Education, Inc. (a) | | | 11,951 | | | | 280,131 | |
ASGN, Inc. (a) | | | 12,050 | | | | 803,494 | |
Avis Budget Group, Inc. (a)(b) | | | 12,309 | | | | 414,444 | |
CoreLogic, Inc. | | | 18,262 | | | | 1,404,896 | |
The accompanying notes are an integral part of the financial statements.
48
Pacer Trendpilot® US Mid Cap ETF
SCHEDULE OF INVESTMENTS
October 31, 2020 (Unaudited) (Continued)
| | | Shares | | | Value | |
COMMON STOCKS — 91.2% (Continued) |
| | | | | | | | | |
Commercial Services — 4.1% (Continued) |
FTI Consulting, Inc. (a) | | | 8,496 | | | $ | 836,516 | |
Graham Holdings Co. - Class B | | | 971 | | | | 369,310 | |
Grand Canyon Education, Inc. (a)(b) | | | 10,923 | | | | 856,036 | |
H&R Block, Inc. | | | 42,197 | | | | 728,320 | |
HealthEquity, Inc. (a)(b) | | | 17,490 | | | | 900,560 | |
Insperity, Inc. | | | 8,410 | | | | 644,038 | |
John Wiley & Sons, Inc. - Class A | | | 10,052 | | | | 311,210 | |
LiveRamp Holdings, Inc. (a) | | | 15,070 | | | | 995,976 | |
ManpowerGroup, Inc. | | | 13,336 | | | | 905,114 | |
Paylocity Holding Corp. (a) | | | 8,221 | | | | 1,525,160 | |
Sabre Corp. (b) | | | 68,101 | | | | 444,019 | |
Service Corp. International | | | 38,522 | | | | 1,783,954 | |
Strategic Education, Inc. (b) | | | 5,124 | | | | 425,599 | |
The Brink’s Co. (b) | | | 11,594 | | | | 496,571 | |
WEX, Inc. (a) | | | 9,654 | | | | 1,221,714 | |
WW International, Inc. (a) | | | 10,723 | | | | 226,899 | |
| | | | | | | | 15,573,961 | |
Computers — 1.7% | | | | |
CACI International, Inc. - Class A (a) | | | 5,517 | | | | 1,150,460 | |
Lumentum Holdings, Inc. (a)(b) | | | 17,234 | | | | 1,425,079 | |
Maximus, Inc. | | | 14,107 | | | | 953,351 | |
NCR Corp. (a) | | | 29,399 | | | | 597,388 | |
NetScout Systems, Inc. (a) | | | 14,614 | | | | 299,879 | |
Perspecta, Inc. | | | 31,399 | | | | 562,984 | |
Qualys, Inc. (a)(b) | | | 7,696 | | | | 676,094 | |
Science Applications International Corp. | | | 12,760 | | | | 974,481 | |
| | | | | | | | 6,639,716 | |
Cosmetics/Personal Care — 0.1% | | | | |
Coty, Inc. - Class A (b) | | | 61,815 | | | | 179,264 | |
Edgewell Personal Care Co. (a) | | | 12,465 | | | | 326,832 | |
| | | | | | | | 506,096 | |
Distribution/Wholesale — 2.1% | | | | |
Avient Corp. | | | 21,032 | | | | 653,464 | |
IAA, Inc. (a) | | | 29,305 | | | | 1,658,370 | |
KAR Auction Services, Inc. | | | 29,757 | | | | 433,262 | |
Pool Corp. | | | 8,784 | | | | 3,072,907 | |
Univar Solutions, Inc. (a) | | | 36,936 | | | | 612,768 | |
Watsco, Inc. (b) | | | 7,539 | | | | 1,689,792 | |
| | | | | | | | 8,120,563 | |
Diversified Financial Services — 3.0% | | | | |
Aaron’s Holdings Co, Inc. | | | 15,592 | | | | 814,838 | |
Affiliated Managers Group, Inc. (b) | | | 10,823 | | | | 815,729 | |
Alliance Data Systems Corp. | | | 10,448 | | | | 538,490 | |
Eaton Vance Corp. | | | 26,215 | | | | 1,567,395 | |
Evercore, Inc. - Class A | | | 9,338 | | | | 742,745 | |
Federated Hermes, Inc. | | | 22,061 | | | | 527,258 | |
Interactive Brokers Group, Inc. - Class A | | | 17,646 | | | | 839,420 | |
| | | Shares | | | Value | |
Diversified Financial Services — 3.0% (Continued) | | | | |
Janus Henderson Group PLC (b) | | | 35,299 | | | $ | 857,766 | |
Jefferies Financial Group, Inc. | | | 47,221 | | | | 921,282 | |
LendingTree, Inc. (a)(b) | | | 1,731 | | | | 560,134 | |
Navient Corp. | | | 39,233 | | | | 314,256 | |
SEI Investments Co. | | | 26,543 | | | | 1,304,588 | |
SLM Corp. (b) | | | 86,358 | | | | 793,630 | |
Stifel Financial Corp. (b) | | | 15,749 | | | | 920,687 | |
| | | | | | | | 11,518,218 | |
Electric — 1.6% | | | | |
ALLETE, Inc. | | | 11,851 | | | | 611,275 | |
Black Hills Corp. | | | 14,464 | | | | 819,530 | |
Hawaiian Electric Industries, Inc. | | | 25,087 | | | | 828,874 | |
IDACORP, Inc. (b) | | | 11,594 | | | | 1,017,142 | |
NorthWestern Corp. | | | 11,594 | | | | 604,395 | |
OGE Energy Corp. | | | 46,078 | | | | 1,417,820 | |
PNM Resources, Inc. (b) | | | 18,359 | | | | 917,950 | |
| | | | | | | | 6,216,986 | |
Electrical Components & Equipment — 2.2% | | | | |
Acuity Brands, Inc. (b) | | | 9,081 | | | | 809,480 | |
Belden, Inc. (b) | | | 8,761 | | | | 270,540 | |
Energizer Holdings, Inc. (b) | | | 12,724 | | | | 500,689 | |
EnerSys | | | 9,795 | | | | 701,322 | |
Generac Holdings, Inc. (a) | | | 14,464 | | | | 3,039,609 | |
Littelfuse, Inc. | | | 5,540 | | | | 1,096,588 | |
Universal Display Corp. (b) | | | 9,386 | | | | 1,861,338 | |
| | | | | | | | 8,279,566 | |
Electronics — 3.5% | | | | |
Arrow Electronics, Inc. (a) | | | 16,959 | | | | 1,320,936 | |
AVNET, Inc. | | | 22,743 | | | | 561,070 | |
Coherent, Inc. (a) | | | 5,540 | | | | 693,276 | |
Hubbell, Inc. | | | 12,465 | | | | 1,813,782 | |
II-VI, Inc. (a)(b) | | | 22,212 | | | | 1,009,980 | |
Jabil, Inc. | | | 31,557 | | | | 1,045,799 | |
National Instruments Corp. | | | 28,691 | | | | 897,454 | |
nVent Electric PLC | | | 35,957 | | | | 649,024 | |
SYNNEX Corp. | | | 9,438 | | | | 1,242,418 | |
Trimble, Inc. (a) | | | 57,514 | | | | 2,768,149 | |
Vishay Intertechnology, Inc. (b) | | | 30,528 | | | | 495,164 | |
Woodward, Inc. | | | 13,078 | | | | 1,040,355 | |
| | | | | | | | 13,537,407 | |
Energy-Alternate Sources — 2.3% | | | | |
Enphase Energy, Inc. (a)(b) | | | 27,491 | | | | 2,696,592 | |
First Solar, Inc. (a) | | | 17,549 | | | | 1,527,553 | |
SolarEdge Technologies, Inc. (a) | | | 11,436 | | | | 2,946,943 | |
Sunrun, Inc. (a)(b) | | | 27,681 | | | | 1,439,965 | |
| | | | | | | | 8,611,053 | |
Engineering & Construction — 1.5% | | | | |
AECOM (a) | | | 36,839 | | | | 1,651,861 | |
Dycom Industries, Inc. (a)(b) | | | 7,282 | | | | 472,893 | |
EMCOR Group, Inc. | | | 12,622 | | | | 860,694 | |
The accompanying notes are an integral part of the financial statements.
49
Pacer Trendpilot® US Mid Cap ETF
SCHEDULE OF INVESTMENTS
October 31, 2020 (Unaudited) (Continued)
| | | Shares | | | Value | |
COMMON STOCKS — 91.2% (Continued) |
| | | | | | | | | |
Engineering & Construction — 1.5% (Continued) |
Fluor Corp. | | | 32,282 | | | $ | 366,401 | |
KBR, Inc. | | | 32,784 | | | | 730,756 | |
MasTec, Inc. (a)(b) | | | 13,427 | | | | 666,516 | |
TopBuild Corp. (a) | | | 7,639 | | | | 1,170,371 | |
| | | | | | | | 5,919,492 | |
Entertainment — 1.6% | | | | |
Caesars Entertainment, Inc. (a) | | | 33,419 | | | | 1,497,839 | |
Churchill Downs, Inc. | | | 8,053 | | | | 1,201,105 | |
Cinemark Holdings, Inc. (b) | | | 24,661 | | | | 201,974 | |
Marriott Vacations Worldwide Corp. | | | 8,978 | | | | 867,275 | |
Penn National Gaming, Inc. (a)(b) | | | 29,755 | | | | 1,606,175 | |
Scientific Games Corp. (a)(b) | | | 12,622 | | | | 402,389 | |
Six Flags Entertainment Corp. | | | 18,090 | | | | 391,106 | |
| | | | | | | | 6,167,863 | |
Environmental Control — 0.8% | | | | |
Clean Harbors, Inc. (a) | | | 11,782 | | | | 624,092 | |
Stericycle, Inc. (a) | | | 21,032 | | | | 1,310,294 | |
Tetra Tech, Inc. | | | 12,365 | | | | 1,247,752 | |
| | | | | | | | 3,182,138 | |
Food — 1.9% | | | | |
Flowers Foods, Inc. | | | 44,375 | | | | 1,046,362 | |
Grocery Outlet Holding Corp. (a)(b) | | | 18,223 | | | | 802,176 | |
Hain Celestial Group, Inc. (a) | | | 18,084 | | | | 556,083 | |
Ingredion, Inc. (b) | | | 15,392 | | | | 1,091,139 | |
Lancaster Colony Corp. (b) | | | 4,512 | | | | 749,624 | |
Pilgrim’s Pride Corp. (a) | | | 11,954 | | | | 200,110 | |
Post Holdings, Inc. (a) | | | 14,722 | | | | 1,264,620 | |
Sanderson Farms, Inc. (b) | | | 4,512 | | | | 577,401 | |
Sprouts Farmers Market, Inc. (a)(b) | | | 27,086 | | | | 515,988 | |
Tootsie Roll Industries, Inc. (b) | | | 3,812 | | | | 113,903 | |
TreeHouse Foods, Inc. (a)(b) | | | 12,979 | | | | 504,104 | |
| | | | | | | | 7,421,510 | |
Food Service — 0.1% | | | | |
Healthcare Services Group, Inc. (b) | | | 17,134 | | | | 392,026 | |
| | | | | | | | | |
Forest Products & Paper — 0.1% | | | | |
DOMTAR Corp. | | | 12,722 | | | | 303,801 | |
| | | | | | | | | |
Gas — 1.4% | | | | |
National Fuel Gas Co. | | | 20,775 | | | | 830,169 | |
New Jersey Resources Corp. (b) | | | 22,060 | | | | 643,711 | |
ONE Gas, Inc. | | | 12,108 | | | | 835,936 | |
Southwest Gas Holdings, Inc. | | | 12,622 | | | | 829,518 | |
Spire, Inc. | | | 11,783 | | | | 660,319 | |
UGI Corp. | | | 47,919 | | | | 1,549,701 | |
| | | | | | | | 5,349,354 | |
Hand/Machine Tools — 1.2% | | | | |
Colfax Corp. (a) | | | 21,936 | | | | 596,440 | |
| | | Shares | | | Value | |
Hand/Machine Tools — 1.2% (Continued) |
Kennametal, Inc. (b) | | | 19,033 | | | $ | 590,023 | |
Lincoln Electric Holdings, Inc. | | | 13,693 | | | | 1,394,221 | |
MSA Safety, Inc. (b) | | | 8,220 | | | | 1,084,382 | |
Regal Beloit Corp. | | | 9,280 | | | | 915,472 | |
| | | | | | | | 4,580,538 | |
Healthcare-Products — 4.7% | | | | |
Avanos Medical, Inc. (a) | | | 10,980 | | | | 388,143 | |
Bio-Techne Corp. | | | 8,469 | | | | 2,137,660 | |
Cantel Medical Corp. (b) | | | 8,495 | | | | 406,401 | |
Globus Medical, Inc. - Class A (a) | | | 17,391 | | | | 906,419 | |
Haemonetics Corp. (a) | | | 11,594 | | | | 1,172,037 | |
Hill-Rom Holdings, Inc. | | | 15,335 | | | | 1,396,558 | |
ICU Medical, Inc. (a) | | | 4,412 | | | | 784,410 | |
Integra LifeSciences Holdings Corp. (a) | | | 16,166 | | | | 712,921 | |
LivaNova PLC (a)(b) | | | 11,180 | | | | 562,801 | |
Masimo Corp. (a) | | | 11,028 | | | | 2,468,287 | |
NuVasive, Inc. (a) | | | 11,783 | | | | 523,519 | |
Patterson Cos., Inc. (b) | | | 19,804 | | | | 492,625 | |
Penumbra, Inc. (a)(b) | | | 7,638 | | | | 1,993,747 | |
Quidel Corp. (a)(b) | | | 8,766 | | | | 2,351,830 | |
Repligen Corp. (a) | | | 10,821 | | | | 1,802,454 | |
| | | | | | | | 18,099,812 | |
Healthcare-Services — 3.8% | | | | |
Acadia Healthcare Co., Inc. (a) | | | 20,418 | | | | 727,902 | |
Amedisys, Inc. (a) | | | 7,439 | | | | 1,926,701 | |
Charles River Laboratories International, Inc. (a) | | | 10,854 | | | | 2,471,456 | |
Chemed Corp. | | | 3,455 | | | | 1,652,595 | |
Encompass Health Corp. | | | 22,831 | | | | 1,399,769 | |
LHC Group, Inc. (a) | | | 6,949 | | | | 1,504,806 | |
MEDNAX, Inc. (a)(b) | | | 19,647 | | | | 250,499 | |
Medpace Holdings, Inc. (a) | | | 5,983 | | | | 663,754 | |
Molina Healthcare, Inc. (a) | | | 12,910 | | | | 2,407,328 | |
Syneos Health, Inc. (a) | | | 14,364 | | | | 762,441 | |
Tenet Healthcare Corp. (a) | | | 24,117 | | | | 591,831 | |
| | | | | | | | 14,359,082 | |
Home Builders — 1.0% | | | | |
KB Home | | | 20,002 | | | | 645,064 | |
Taylor Morrison Home Corp. (a) | | | 29,856 | | | | 644,890 | |
Thor Industries, Inc. (b) | | | 12,722 | | | | 1,076,027 | |
Toll Brothers, Inc. | | | 26,573 | | | | 1,123,506 | |
TRI Pointe Group, Inc. (a) | | | 30,014 | | | | 493,130 | |
| | | | | | | | 3,982,617 | |
Home Furnishings — 0.2% | | | | |
Tempur Sealy International, Inc. (a) | | | 10,520 | | | | 936,280 | |
| | | | | | | | | |
Household Products/Wares — 0.3% | | | | |
Helen of Troy Ltd. (a)(b) | | | 5,797 | | | | 1,099,111 | |
| | | | | | | | | |
The accompanying notes are an integral part of the financial statements.
50
Pacer Trendpilot® US Mid Cap ETF
SCHEDULE OF INVESTMENTS
October 31, 2020 (Unaudited) (Continued)
| | | Shares | | | Value | |
COMMON STOCKS — 91.2% (Continued) |
| | | | | | | | | |
Housewares — 0.9% | | | | |
Scotts Miracle-Gro Co. | | | 9,080 | | | $ | 1,362,454 | |
Toro Co. | | | 24,661 | | | | 2,024,668 | |
| | | | | | | | 3,387,122 | |
Insurance — 4.7% | | | | |
Alleghany Corp. | | | 3,289 | | | | 1,798,853 | |
American Financial Group, Inc. | | | 15,706 | | | | 1,177,008 | |
Brighthouse Financial, Inc. (a) | | | 21,646 | | | | 716,483 | |
Brown & Brown, Inc. | | | 51,271 | | | | 2,230,801 | |
CNO Financial Group, Inc. | | | 33,042 | | | | 586,495 | |
Essent Group Ltd. | | | 25,443 | | | | 1,013,903 | |
First American Financial Corp. | | | 25,601 | | | | 1,141,549 | |
Genworth Financial, Inc. - Class A (a) | | | 116,724 | | | | 458,725 | |
Hanover Insurance Group, Inc. | | | 8,767 | | | | 838,651 | |
Kemper Corp. | | | 14,107 | | | | 869,838 | |
Mercury General Corp. | | | 6,254 | | | | 254,600 | |
Old Republic International Corp. | | | 65,785 | | | | 1,070,980 | |
Primerica, Inc. | | | 8,681 | | | | 956,993 | |
Reinsurance Group of America, Inc. | | | 15,592 | | | | 1,575,104 | |
RenaissanceRe Holdings Ltd. (b) | | | 11,594 | | | | 1,874,982 | |
RLI Corp. (b) | | | 9,181 | | | | 795,993 | |
Selective Insurance Group, Inc. | | | 13,750 | | | | 715,825 | |
| | | | | | | | 18,076,783 | |
Internet — 0.6% | | | | |
GrubHub, Inc. (a)(b) | | | 21,189 | | | | 1,567,139 | |
TripAdvisor, Inc. | | | 23,192 | | | | 443,199 | |
YELP, Inc. (a)(b) | | | 15,072 | | | | 296,466 | |
| | | | | | | | 2,306,804 | |
Iron/Steel — 1.1% | | | | |
Commercial Metals Co. | | | 27,401 | | | | 565,831 | |
Reliance Steel & Aluminum Co. | | | 14,621 | | | | 1,593,543 | |
Steel Dynamics, Inc. | | | 43,680 | | | | 1,375,046 | |
United States Steel Corp. (b) | | | 50,689 | | | | 489,656 | |
| | | | | | | | 4,024,076 | |
Leisure Time — 0.9% | | | | |
Brunswick Corp. (b) | | | 18,162 | | | | 1,157,101 | |
Harley-Davidson, Inc. (b) | | | 35,297 | | | | 1,160,565 | |
Polaris Industries, Inc. | | | 13,236 | | | | 1,202,623 | |
| | | | | | | | 3,520,289 | |
Lodging — 0.7% | | | | |
Boyd Gaming Corp. | | | 18,419 | | | | 584,251 | |
Choice Hotels International, Inc. (b) | | | 6,326 | | | | 552,576 | |
Wyndham Destinations, Inc. | | | 19,547 | | | | 637,818 | |
Wyndham Hotels & Resorts, Inc. | | | 21,447 | | | | 997,500 | |
| | | | | | | | 2,772,145 | |
Machinery-Construction & Mining — 0.4% | | | | |
Oshkosh Corp. | | | 15,649 | | | | 1,054,117 | |
Terex Corp. | | | 14,616 | | | | 360,869 | |
| | | | | | | | 1,414,986 | |
| | | Shares | | | Value | |
Machinery-Diversified — 2.9% | | | | |
AGCO Corp. (b) | | | 14,265 | | | $ | 1,098,833 | |
Cognex Corp. | | | 39,508 | | | | 2,603,577 | |
CRANE Co. | | | 11,337 | | | | 575,353 | |
Curtiss-Wright Corp. | | | 9,538 | | | | 804,626 | |
Graco, Inc. | | | 38,324 | | | | 2,372,255 | |
Middleby Corp. (a)(b) | | | 12,822 | | | | 1,276,302 | |
Nordson Corp. | | | 12,141 | | | | 2,348,434 | |
| | | | | | | | 11,079,380 | |
Media — 1.9% | | | | |
AMC Networks, Inc. - Class A (a)(b) | | | 9,338 | | | | 198,433 | |
Cable One, Inc. | | | 1,228 | | | | 2,126,724 | |
FactSet Research Systems, Inc. | | | 8,280 | | | | 2,537,820 | |
TEGNA, Inc. | | | 50,332 | | | | 605,494 | |
The New York Times Co. - Class A (b) | | | 33,198 | | | | 1,316,633 | |
World Wrestling Entertainment, Inc. - Class A (b) | | | 10,665 | | | | 387,779 | |
| | | | | | | | 7,172,883 | |
Metal Fabricate/Hardware — 0.5% | | | | |
The Timken Co. | | | 15,592 | | | | 930,842 | |
Valmont Industries, Inc. | | | 4,868 | | | | 691,013 | |
Worthington Industries, Inc. | | | 8,410 | | | | 413,856 | |
| | | | | | | | 2,035,711 | |
Mining — 0.6% | | | | |
Compass Minerals International, Inc. | | | 7,796 | | | | 470,722 | |
Royal Gold, Inc. | | | 15,071 | | | | 1,790,586 | |
| | | | | | | | 2,261,308 | |
Miscellaneous Manufacturing — 2.0% | | | | |
AptarGroup, Inc. | | | 14,804 | | | | 1,688,988 | |
Axon Enterprise, Inc. (a)(b) | | | 14,463 | | | | 1,430,391 | |
Carlisle Cos., Inc. | | | 12,623 | | | | 1,563,611 | |
Donaldson Co., Inc. | | | 29,045 | | | | 1,379,637 | |
ITT, Inc. | | | 19,804 | | | | 1,198,340 | |
Trinity Industries, Inc. (b) | | | 21,708 | | | | 408,979 | |
| | | | | | | | 7,669,946 | |
Office Furnishings — 0.2% | | | | |
Herman Miller, Inc. | | | 13,493 | | | | 411,132 | |
HNI Corp. | | | 9,795 | | | | 318,827 | |
| | | | | | | | 729,959 | |
Oil & Gas — 0.9% | | | | |
Cimarex Energy Co. | | | 23,545 | | | | 597,337 | |
CNX Resources Corp. (a) | | | 43,050 | | | | 417,585 | |
EQT Corp. | | | 58,800 | | | | 890,232 | |
Murphy Oil Corp. (b) | | | 33,656 | | | | 259,824 | |
Murphy USA, Inc. (a) | | | 6,312 | | | | 771,894 | |
WPX Energy, Inc. (a) | | | 94,059 | | | | 433,612 | |
| | | | | | | | 3,370,484 | |
Oil & Gas Services — 0.1% | | | | |
ChampionX Corp. (a) | | | 42,736 | | | | 373,085 | |
| | | | | | | | | |
The accompanying notes are an integral part of the financial statements.
51
Pacer Trendpilot® US Mid Cap ETF
SCHEDULE OF INVESTMENTS
October 31, 2020 (Unaudited) (Continued)
| | | Shares | | | Value | |
COMMON STOCKS — 91.2% (Continued) |
| | | | | | | | | |
Packaging & Containers — 0.6% | | | | |
Greif, Inc. - Class A | | | 6,054 | | | $ | 245,732 | |
O-I Glass, Inc. | | | 36,068 | | | | 340,121 | |
Silgan Holdings, Inc. | | | 17,810 | | | | 613,555 | |
Sonoco Products Co. | | | 23,089 | | | | 1,128,821 | |
| | | | | | | | 2,328,229 | |
Pharmaceuticals — 0.9% | | | | |
Jazz Pharmaceuticals PLC (a) | | | 12,138 | | | | 1,749,086 | |
PRA Health Sciences, Inc. (a) | | | 14,621 | | | | 1,424,670 | |
Prestige Brands Holdings, Inc. (a)(b) | | | 11,510 | | | | 380,175 | |
| | | | | | | | 3,553,931 | |
Pipelines — 0.3% | | | | |
Antero Midstream Corp. (b) | | | 64,751 | | | | 371,023 | |
Equitrans Midstream Corp. | | | 93,540 | | | | 679,101 | |
| | | | | | | | 1,050,124 | |
Real Estate — 0.4% | | | | |
Jones Lang LaSalle, Inc. | | | 11,851 | | | | 1,337,504 | |
| | | | | | | | | |
Retail — 5.7% | | | | |
American Eagle Outfitters, Inc. (b) | | | 35,816 | | | | 491,037 | |
AutoNation, Inc. (a)(b) | | | 13,236 | | | | 750,878 | |
BJ’s Wholesale Club Holdings, Inc. (a)(b) | | | 30,161 | | | | 1,154,865 | |
Casey’s General Stores, Inc. | | | 8,495 | | | | 1,432,002 | |
Cracker Barrel Old Country Store, Inc. | | | 5,481 | | | | 623,847 | |
Dick’s Sporting Goods, Inc. (b) | | | 14,978 | | | | 848,504 | |
Dunkin’ Brands Group, Inc. (b) | | | 18,876 | | | | 1,882,126 | |
FirstCash, Inc. | | | 9,538 | | | | 496,358 | |
Five Below, Inc. (a)(b) | | | 12,822 | | | | 1,709,685 | |
Foot Locker, Inc. | | | 23,959 | | | | 883,608 | |
Jack in the Box, Inc. (b) | | | 5,208 | | | | 416,952 | |
Kohl’s Corp. (b) | | | 34,519 | | | | 734,910 | |
Lithia Motors, Inc. - Class B (b) | | | 4,933 | | | | 1,132,469 | |
MSC Industrial Direct Co., Inc. - Class A | | | 10,466 | | | | 729,062 | |
Nordstrom, Inc. (b) | | | 24,930 | | | | 301,653 | |
Nu Skin Enterprises, Inc. - Class A | | | 11,951 | | | | 589,782 | |
Ollie’s Bargain Outlet Holdings, Inc. (a)(b) | | | 12,979 | | | | 1,130,341 | |
Papa John’s International, Inc. (b) | | | 7,205 | | | | 551,903 | |
RH (a)(b) | | | 3,355 | | | | 1,124,697 | |
Sally Beauty Holdings, Inc. (a)(b) | | | 25,958 | | | | 217,268 | |
Texas Roadhouse, Inc. (b) | | | 14,978 | | | | 1,048,909 | |
The Wendy’s Co. | | | 40,993 | | | | 895,697 | |
Williams-Sonoma, Inc. (b) | | | 17,905 | | | | 1,633,115 | |
Wingstop, Inc. (b) | | | 6,453 | | | | 750,678 | |
World Fuel Services Corp. | | | 14,523 | | | | 305,709 | |
| | | | | | | | 21,836,055 | |
| | | Shares | | | Value | |
Savings & Loans — 0.5% | | | | |
New York Community Bancorp, Inc. (b) | | | 106,863 | | | $ | 888,032 | |
Sterling Bancorp | | | 44,793 | | | | 599,330 | |
Washington Federal, Inc. | | | 17,391 | | | | 370,254 | |
| | | | | | | | 1,857,616 | |
Semiconductors — 2.7% | | | | |
Cirrus Logic, Inc. (a) | | | 13,426 | | | | 924,649 | |
CMC Materials, Inc. | | | 6,668 | | | | 948,123 | |
CREE, Inc. (a)(b) | | | 24,929 | | | | 1,585,484 | |
MKS Instruments, Inc. (b) | | | 12,622 | | | | 1,368,099 | |
Monolithic Power Systems, Inc. | | | 9,240 | | | | 2,953,104 | |
Semtech Corp. (a) | | | 14,978 | | | | 822,142 | |
Silicon Laboratories, Inc. (a) | | | 10,052 | | | | 1,029,928 | |
Synaptics, Inc. (a)(b) | | | 7,796 | | | | 597,719 | |
| | | | | | | | 10,229,248 | |
Software — 3.2% | | | | |
ACI Worldwide, Inc. (a) | | | 26,629 | | | | 776,768 | |
Blackbaud, Inc. (b) | | | 11,437 | | | | 564,302 | |
CDK Global, Inc. (b) | | | 27,950 | | | | 1,204,645 | |
Ceridian HCM Holding, Inc. (a)(b) | | | 28,370 | | | | 2,446,061 | |
CommVault Systems, Inc. (a) | | | 9,792 | | | | 387,665 | |
Fair Isaac Corp. (a) | | | 6,379 | | | | 2,497,060 | |
J2 Global, Inc. (a)(b) | | | 10,409 | | | | 706,563 | |
Manhattan Associates, Inc. (a) | | | 14,621 | | | | 1,250,095 | |
PTC, Inc. (a) | | | 23,959 | | | | 2,009,681 | |
Teradata Corp. (a)(b) | | | 24,988 | | | | 459,030 | |
| | | | | | | | 12,301,870 | |
Telecommunications — 0.7% | | | | |
CIENA Corp. (a) | | | 35,354 | | | | 1,392,594 | |
InterDigital, Inc. | | | 7,024 | | | | 393,204 | |
Telephone and Data Systems, Inc. | | | 22,473 | | | | 382,041 | |
ViaSat, Inc. (a)(b) | | | 13,428 | | | | 455,209 | |
| | | | | | | | 2,623,048 | |
Toys/Games/Hobbies — 0.3% | | | | |
Mattel, Inc. (a)(b) | | | 79,890 | | | | 1,100,085 | |
| | | | | | | | | |
Transportation — 1.5% | | | | |
Kirby Corp. (a) | | | 13,750 | | | | 529,237 | |
Knight-Swift Transportation Holdings, Inc. | | | 28,111 | | | | 1,067,937 | |
Landstar System, Inc. | | | 8,824 | | | | 1,100,353 | |
Ryder System, Inc. | | | 12,365 | | | | 609,100 | |
Werner Enterprises, Inc. | | | 13,152 | | | | 500,039 | |
XPO Logistics, Inc. (a) | | | 20,932 | | | | 1,883,880 | |
| | | | | | | | 5,690,546 | |
Trucking & Leasing — 0.1% | | | | |
GATX Corp. (b) | | | 7,953 | | | | 543,031 | |
| | | | | | | | | |
The accompanying notes are an integral part of the financial statements.
52
Pacer Trendpilot® US Mid Cap ETF
SCHEDULE OF INVESTMENTS
October 31, 2020 (Unaudited) (Continued)
| | | Shares | | | Value | |
COMMON STOCKS — 91.2% (Continued) | | | | |
| | | | | | | | | |
Water — 0.6% | | | | |
Essential Utilities, Inc. | | | 51,361 | | | $ | 2,116,073 | |
TOTAL COMMON STOCKS (Cost $339,768,205) | | | | | | | 349,251,460 | |
| | | | | | | | | |
REAL ESTATE INVESTMENT TRUSTS — 8.6% | | | | |
American Campus Communities, Inc. (b) | | | 31,656 | | | | 1,185,834 | |
Brixmor Property Group, Inc. | | | 68,226 | | | | 747,757 | |
Camden Property Trust (b) | | | 22,417 | | | | 2,067,744 | |
CoreSite Realty Corp. | | | 9,279 | | | | 1,107,541 | |
Corporate Office Properties Trust | | | 25,759 | | | | 577,774 | |
Cousins Properties, Inc. (b) | | | 34,169 | | | | 870,626 | |
CyrusOne, Inc. (b) | | | 25,580 | | | | 1,817,459 | |
Douglas Emmett, Inc. | | | 37,967 | | | | 896,021 | |
EastGroup Properties, Inc. | | | 9,023 | | | | 1,200,781 | |
EPR Properties (b) | | | 17,813 | | | | 424,662 | |
First Industrial Realty Trust, Inc. | | | 29,242 | | | | 1,164,124 | |
Healthcare Realty Trust, Inc. | | | 31,041 | | | | 862,940 | |
Highwoods Properties, Inc. | | | 23,860 | | | | 710,312 | |
Hudson Pacific Properties, Inc. | | | 35,297 | | | | 679,820 | |
JBG SMITH Properties | | | 24,517 | | | | 572,472 | |
Kilroy Realty Corp. | | | 24,388 | | | | 1,148,187 | |
Lamar Advertising Co. - Class A | | | 19,904 | | | | 1,233,252 | |
Life Storage, Inc. | | | 10,823 | | | | 1,235,445 | |
Macerich Co. (b) | | | 26,733 | | | | 186,062 | |
Medical Properties Trust, Inc. | | | 121,655 | | | | 2,167,892 | |
National Retail Properties, Inc. (b) | | | 39,608 | | | | 1,267,852 | |
Omega Healthcare Investors, Inc. (b) | | | 52,232 | | | | 1,504,804 | |
Park Hotels & Resorts, Inc. (b) | | | 54,230 | | | | 538,504 | |
Pebblebrook Hotel Trust (b) | | | 30,113 | | | | 360,754 | |
Physicians Realty Trust (b) | | | 46,587 | | | | 785,457 | |
PotlatchDeltic Corp. | | | 15,393 | | | | 639,579 | |
PS Business Parks, Inc. | | | 4,611 | | | | 525,792 | |
Rayonier, Inc. | | | 31,815 | | | | 807,465 | |
Rexford Industrial Realty, Inc. (b) | | | 27,025 | | | | 1,255,582 | |
Sabra Health Care REIT, Inc. (b) | | | 47,305 | | | | 622,534 | |
Service Properties Trust | | | 37,867 | | | | 273,021 | |
Spirit Realty Capital, Inc. | | | 23,702 | | | | 712,245 | |
STORE Capital Corp. (b) | | | 51,199 | | | | 1,315,814 | |
Taubman Centers, Inc. | | | 14,207 | | | | 474,798 | |
The GEO Group, Inc. (b) | | | 27,950 | | | | 247,637 | |
Urban Edge Properties | | | 25,445 | | | | 239,183 | |
Weingarten Realty Investors | | | 27,675 | | | | 438,925 | |
TOTAL REAL ESTATE INVESTMENT TRUSTS (Cost $35,032,468) | | | | | | | 32,866,651 | |
| | | | | |
| | Principal
Amount | Value |
SHORT-TERM INVESTMENTS — 0.2% | |
| | | |
Money Market Deposit Accounts, — 0.2% | |
U.S. Bank Money Market Deposit Account 0.025% (c) | $ 585,077 | $ 585,077 |
TOTAL SHORT-TERM INVESTMENTS (Cost $585,077) | | 585,077 |
| | |
| | Shares | |
INVESTMENTS PURCHASED WITH PROCEEDS FROM SECURITIES LENDING — 22.8% | |
Mount Vernon Liquid Assets Portfolio, LLC 0.16% (c) | 87,061,332 | 87,061,332 |
TOTAL INVESTMENTS PURCHASED WITH PROCEEDS FROM SECURITIES LENDING (Cost $87,061,332) | | 87,061,332 |
Total Investments (Cost $462,447,082) — 122.8% | | 469,764,520 |
Liabilities in Excess of Other Assets — (22.8)% | | (87,095,780) |
TOTAL NET ASSETS — 100.0% | | $ 382,668,740 |
Percentages are stated as a percent of net assets.
| | (a) | Non-income producing security. |
| | (b) | All or a portion of this security is on loan as of October 31, 2020. The total value of securities on loan is $83,870,350 or 21.9% of net assets. |
| | (c) | The rate shown is as of October 31, 2020. |
For Fund compliance purposes, the Fund’s industry classifications refer to any one or more of the industry sub-classifications used by one or more widely recognized market indexes or ratings group indexes, and/or they may be defined by Fund management. This definition does not apply for all purposes of this report, which may combine sub-classifications for reporting ease. Categories are shown as a percentage of net assets.
The accompanying notes are an integral part of the financial statements.
53
Pacer Trendpilot® 100 ETF
SCHEDULE OF INVESTMENTS
October 31, 2020 (Unaudited)
| | | Shares | | | Value | |
COMMON STOCKS — 48.3% | | | | |
| | | | | | | | | |
Auto Manufacturers — 1.7% | | | | |
PACCAR, Inc. | | | 11,672 | | | $ | 996,555 | |
Tesla Motors, Inc. (a) | | | 31,423 | | | | 12,193,381 | |
| | | | | | | | 13,189,936 | |
Beverages — 1.0% | | | | |
Monster Beverage Corp. (a) | | | 17,788 | | | | 1,362,027 | |
PepsiCo, Inc. | | | 46,690 | | | | 6,223,310 | |
| | | | | | | | 7,585,337 | |
Biotechnology — 2.2% | | | | |
Alexion Pharmaceuticals, Inc. (a) | | | 7,395 | | | | 851,460 | |
Amgen, Inc. | | | 19,749 | | | | 4,284,348 | |
Biogen, Inc. (a) | | | 5,348 | | | | 1,348,070 | |
BioMarin Pharmaceutical, Inc. (a) | | | 6,120 | | | | 455,512 | |
Gilead Sciences, Inc. | | | 42,275 | | | | 2,458,291 | |
Illumina, Inc. (a) | | | 4,924 | | | | 1,441,255 | |
Incyte Corp. (a) | | | 7,383 | | | | 639,663 | |
Moderna, Inc. (a)(b) | | | 13,304 | | | | 897,621 | |
Regeneron Pharmaceuticals, Inc. (a) | | | 3,532 | | | | 1,919,854 | |
Seagen, Inc. (a)(b) | | | 5,873 | | | | 979,616 | |
Vertex Pharmaceuticals, Inc. (a) | | | 8,788 | | | | 1,831,068 | |
| | | | | | | | 17,106,758 | |
Commercial Services — 1.5% | | | | |
Automatic Data Processing, Inc. | | | 14,504 | | | | 2,291,052 | |
Cintas Corp. | | | 3,493 | | | | 1,098,723 | |
PayPal Holdings, Inc. (a) | | | 39,557 | | | | 7,362,744 | |
Verisk Analytics, Inc. | | | 5,481 | | | | 975,454 | |
| | | | | | | | 11,727,973 | |
Computers — 6.6% | | | | |
Apple, Inc. | | | 452,022 | | | | 49,207,115 | |
Check Point Software Technologies Ltd. (a) | | | 4,729 | | | | 537,025 | |
Cognizant Technology Solutions Corp. - Class A | | | 18,289 | | | | 1,306,200 | |
Western Digital Corp. | | | 10,209 | | | | 385,186 | |
| | | | | | | | 51,435,526 | |
Distribution/Wholesale — 0.2% | | | | |
Copart, Inc. (a) | | | 7,918 | | | | 873,830 | |
Fastenal Co. | | | 19,343 | | | | 836,198 | |
| | | | | | | | 1,710,028 | |
Electric — 0.3% | | | | |
Exelon Corp. | | | 32,864 | | | | 1,310,945 | |
Xcel Energy, Inc. | | | 17,717 | | | | 1,240,722 | |
| | | | | | | | 2,551,667 | |
Food — 0.5% | | | | |
Mondelez International, Inc. - Class A | | | 48,161 | | | | 2,558,312 | |
The Kraft Heinz Co. | | | 41,225 | | | | 1,261,073 | |
| | | | | | | | 3,819,385 | |
| | | Shares | | | Value | |
Healthcare-Products — 0.6% | | | | |
Align Technology, Inc. (a) | | | 2,661 | | | $ | 1,133,799 | |
IDEXX Laboratories, Inc. (a) | | | 2,870 | | | | 1,219,234 | |
Intuitive Surgical, Inc. (a) | | | 3,954 | | | | 2,637,634 | |
| | | | | | | | 4,990,667 | |
Internet — 13.5% | | | | |
Alphabet, Inc. - Class A (a) | | | 9,120 | | | | 14,738,923 | |
Alphabet, Inc. - Class C (a) | | | 8,824 | | | | 14,303,792 | |
Amazon.com, Inc. (a) | | | 13,247 | | | | 40,219,879 | |
BAIDU, Inc. - ADR (a) | | | 9,488 | | | | 1,262,379 | |
Booking Holdings, Inc. (a) | | | 1,388 | | | | 2,252,030 | |
CDW Corp. | | | 4,818 | | | | 590,687 | |
eBay, Inc. | | | 23,599 | | | | 1,124,020 | |
Expedia Group, Inc. | | | 4,583 | | | | 431,490 | |
Facebook, Inc. - Class A (a) | | | 63,554 | | | | 16,721,693 | |
JD.com, Inc. - ADR (a) | | | 30,950 | | | | 2,523,044 | |
MercadoLibre, Inc. (a)(b) | | | 1,684 | | | | 2,044,460 | |
Netflix, Inc. (a) | | | 14,878 | | | | 7,078,060 | |
Pinduoduo, Inc. - ADR (a)(b) | | | 9,733 | | | | 875,775 | |
Trip.com Group Ltd. - ADR (a) | | | 17,633 | | | | 507,125 | |
VeriSign, Inc. (a) | | | 3,879 | | | | 739,725 | |
| | | | | | | | 105,413,082 | |
Lodging — 0.1% | | | | |
Marriott International, Inc. - Class A | | | 10,944 | | | | 1,016,479 | |
| | | | | | | | | |
Media — 1.6% | | | | |
Charter Communications, Inc. - Class A (a) | | | 6,912 | | | | 4,173,604 | |
Comcast Corp. - Class A | | | 153,694 | | | | 6,492,035 | |
FOX Corp. - Class A (b) | | | 11,589 | | | | 307,340 | |
FOX Corp. - Class B | | | 8,809 | | | | 230,267 | |
Liberty Global PLC - Class A (a)(b) | | | 6,153 | | | | 116,784 | |
Liberty Global PLC - Class C (a)(b) | | | 13,447 | | | | 250,921 | |
Sirius XM Holdings, Inc. (b) | | | 146,332 | | | | 838,482 | |
| | | | | | | | 12,409,433 | |
Pharmaceuticals — 0.1% | | | | |
DexCom, Inc. (a) | | | 3,239 | | | | 1,035,120 | |
| | | | | | | | | |
Retail — 1.8% | | | | |
Costco Wholesale Corp. | | | 14,889 | | | | 5,324,604 | |
Dollar Tree, Inc. (a) | | | 8,009 | | | | 723,373 | |
Lululemon Athletica, Inc. (a) | | | 4,202 | | | | 1,341,657 | |
O’Reilly Automotive, Inc. (a) | | | 2,502 | | | | 1,092,373 | |
Ross Stores, Inc. | | | 12,001 | | | | 1,022,125 | |
Starbucks Corp. | | | 39,414 | | | | 3,427,441 | |
Ulta Salon Cosmetics & Fragrance, Inc. (a) | | | 1,906 | | | | 394,104 | |
Walgreens Boots Alliance, Inc. | | | 29,215 | | | | 994,479 | |
| | | | | | | | 14,320,156 | |
Semiconductors — 6.0% | | | | |
Advanced Micro Devices, Inc. (a) | | | 39,585 | | | | 2,980,355 | |
The accompanying notes are an integral part of the financial statements.
54
Pacer Trendpilot® 100 ETF
SCHEDULE OF INVESTMENTS
October 31, 2020 (Unaudited) (Continued)
| | | Shares | | | Value | |
COMMON STOCKS — 48.3% (Continued) |
| | | | | | | | | |
Semiconductors — 6.0% (Continued) |
Analog Devices, Inc. | | | 12,451 | | | $ | 1,475,817 | |
Applied Materials, Inc. | | | 30,797 | | | | 1,824,106 | |
ASML Holding NV - ADR (b) | | | 2,584 | | | | 933,367 | |
Broadcom, Inc. | | | 13,483 | | | | 4,714,061 | |
Intel Corp. | | | 143,397 | | | | 6,349,619 | |
KLA Corp. | | | 5,245 | | | | 1,034,209 | |
Lam Research Corp. | | | 4,913 | | | | 1,680,639 | |
Maxim Integrated Products, Inc. | | | 9,003 | | | | 627,059 | |
Microchip Technology, Inc. | | | 8,518 | | | | 895,071 | |
Micron Technology, Inc. (a) | | | 37,464 | | | | 1,885,938 | |
NVIDIA Corp. | | | 20,810 | | | | 10,433,302 | |
NXP Semiconductors NV | | | 9,414 | | | | 1,272,020 | |
QUALCOMM, Inc. | | | 38,043 | | | | 4,692,984 | |
Skyworks Solutions, Inc. | | | 5,638 | | | | 796,593 | |
Texas Instruments, Inc. | | | 30,890 | | | | 4,466,385 | |
Xilinx, Inc. | | | 8,243 | | | | 978,362 | |
| | | | | | | | 47,039,887 | |
Software — 9.1% | | | | |
Activision Blizzard, Inc. | | | 26,033 | | | | 1,971,479 | |
Adobe Systems, Inc. (a) | | | 16,182 | | | | 7,234,972 | |
ANSYS, Inc. (a) | | | 2,901 | | | | 882,977 | |
Autodesk, Inc. (a) | | | 7,397 | | | | 1,742,289 | |
Cadence Design System, Inc. (a) | | | 9,405 | | | | 1,028,625 | |
Cerner Corp. | | | 10,307 | | | | 722,418 | |
Citrix Systems, Inc. | | | 4,174 | | | | 472,789 | |
DocuSign, Inc. (a) | | | 6,245 | | | | 1,263,051 | |
Electronic Arts, Inc. (a) | | | 9,740 | | | | 1,167,144 | |
Fiserv, Inc. (a) | | | 22,588 | | | | 2,156,476 | |
Intuit, Inc. | | | 8,834 | | | | 2,779,883 | |
Microsoft Corp. | | | 200,021 | | | | 40,498,252 | |
NetEase, Inc. - ADR | | | 12,101 | | | | 1,050,246 | |
Paychex, Inc. | | | 12,099 | | | | 995,143 | |
Splunk, Inc. (a) | | | 5,361 | | | | 1,061,693 | |
Synopsys, Inc. (a) | | | 5,125 | | | | 1,096,033 | |
Take-Two Interactive Software, Inc. (a) | | | 3,867 | | | | 599,076 | |
Workday, Inc. - Class A (a) | | | 5,974 | | | | 1,255,257 | |
Zoom Video Communications, Inc. - Class A (a) | | | 6,151 | | | | 2,835,057 | |
| | | | | | | | 70,812,860 | |
Telecommunications — 1.2% | | | | |
Cisco Systems, Inc. | | | 142,356 | | | | 5,110,580 | |
T-Mobile US, Inc. (a) | | | 41,740 | | | | 4,573,452 | |
| | | | | | | | 9,684,032 | |
Transportation — 0.3% | | | | |
CSX Corp. | | | 25,797 | | | | 2,036,415 | |
TOTAL COMMON STOCKS (Cost $295,168,237) | | | | | | | 377,884,741 | |
| | Principal
Amount | Value |
SHORT-TERM INVESTMENTS — 51.9% | |
| | | |
Money Market Deposit Accounts, — 0.7% | |
U.S. Bank Money Market Deposit Account 0.025% (c) | $ 5,243,030 | $ 5,243,030 |
| | |
U.S. Treasury Bills — 51.2% | |
0.00% 01/14/2021 (a)(c) | 400,000,000 | 399,939,976 |
TOTAL SHORT-TERM INVESTMENTS (Cost $405,157,030) | | 405,183,006 |
| | |
| | Shares | |
INVESTMENTS PURCHASED WITH PROCEEDS FROM SECURITIES LENDING — 0.6% | |
Mount Vernon Liquid Assets Portfolio, LLC 0.16% (c) | 4,601,812 | 4,601,812 |
TOTAL INVESTMENTS PURCHASED WITH PROCEEDS FROM SECURITIES LENDING (Cost $4,601,812) | | 4,601,812 |
Total Investments (Cost $704,939,079) — 100.8% | | 787,669,559 |
Liabilities in Excess of Other Assets — (0.8)% | | (6,257,206) |
TOTAL NET ASSETS — 100.0% | | $ 781,412,353 |
Percentages are stated as a percent of net assets.
ADR | American Depositary Receipt |
| | (a) | Non-income producing security. |
| | (b) | All or a portion of this security is on loan as of October 31, 2020. The total value of securities on loan is $4,279,661 or 0.5% of net assets. |
| | (c) | The rate shown is as of October 31, 2020. |
For Fund compliance purposes, the Fund’s industry classifications refer to any one or more of the industry sub-classifications used by one or more widely recognized market indexes or ratings group indexes, and/or they may be defined by Fund management. This definition does not apply for all purposes of this report, which may combine sub-classifications for reporting ease. Categories are shown as a percentage of net assets.
The accompanying notes are an integral part of the financial statements.
55
Pacer Trendpilot® European Index ETF
SCHEDULE OF INVESTMENTS
October 31, 2020 (Unaudited)
| | | Shares | | | Value | |
COMMON STOCKS — 97.1% | | | | |
| | | | | | | | | |
Austria — 0.5% | | | | |
Andritz AG | | | 949 | | | $ | 31,964 | |
Erste Group Bank AG | | | 3,887 | | | | 79,584 | |
OMV AG | | | 1,895 | | | | 43,478 | |
Raiffeisen Bank International AG (a) | | | 1,801 | | | | 25,884 | |
Telekom Austria AG | | | 1,895 | | | | 12,756 | |
Verbund AG | | | 949 | | | | 54,577 | |
Vienna Insurance Group AG Wiener Versicherung Gruppe | | | 570 | | | | 11,564 | |
Voestalpine AG | | | 1,613 | | | | 44,804 | |
| | | | | | | | 304,611 | |
Belgium — 2.9% | | | | |
Ackermans & van Haaren NV (a) | | | 285 | | | | 35,051 | |
Ageas | | | 2,465 | | | | 99,188 | |
Anheuser-Busch InBev SA/NV - ADR (b) | | | 10,800 | | | | 560,628 | |
Colruyt SA | | | 664 | | | | 39,300 | |
Elia Group SA/NV | | | 476 | | | | 46,068 | |
Galapagos NV - ADR (a) | | | 597 | | | | 69,538 | |
Groupe Bruxelles Lambert SA | | | 1,422 | | | | 116,393 | |
KBC Groep NV | | | 3,790 | | | | 186,845 | |
Proximus SADP | | | 1,895 | | | | 36,846 | |
Sofina SA | | | 191 | | | | 49,606 | |
Solvay SA - Class A | | | 949 | | | | 77,036 | |
Telenet Group Holding NV | | | 664 | | | | 25,520 | |
UCB SA | | | 1,613 | | | | 159,115 | |
Umicore SA | | | 2,750 | | | | 105,820 | |
| | | | | | | | 1,606,954 | |
Cyprus — 0.0% | | | | |
Cairo Mezz PLC (a) | | | 3,180 | | | | 384 | |
| | | | | | | | | |
Finland — 4.6% | | | | |
Elisa OYJ | | | 1,992 | | | | 97,996 | |
Fortum OYJ | | | 5,876 | | | | 110,522 | |
Huhtamaki OYJ | | | 1,234 | | | | 60,246 | |
Kesko OYJ - Class B | | | 3,696 | | | | 94,958 | |
Kojamo Oyj | | | 2,653 | | | | 54,690 | |
Kone OYJ - Class B | | | 5,306 | | | | 422,315 | |
Metso Outotec Oyj | | | 8,244 | | | | 58,040 | |
Neles Oyj | | | 1,422 | | | | 19,037 | |
Neste OYJ | | | 5,685 | | | | 295,827 | |
Nokia OYJ - ADR (a) (b) | | | 72,816 | | | | 245,390 | |
Nokian Renkaat OYJ | | | 1,895 | | | | 58,243 | |
Nordea Bank Abp (a) | | | 44,055 | | | | 331,453 | |
Orion OYJ - Class B | | | 1,422 | | | | 60,863 | |
Sampo OYJ - Class A | | | 7,300 | | | | 275,462 | |
Stora Enso OYJ - Class R | | | 7,865 | | | | 114,728 | |
UPM-Kymmene OYJ | | | 7,295 | | | | 206,115 | |
| | | Shares | | | Value | |
Finland — 4.6% (Continued) |
Wartsila OYJ Abp | | | 6,634 | | | $ | 52,708 | |
| | | | | | | | 2,558,593 | |
France — 29.4% | | | | |
Accor SA (a) | | | 2,267 | | | | 57,716 | |
Aeroports de Paris | | | 332 | | | | 32,441 | |
Air Liquide SA | | | 6,074 | | | | 887,794 | |
ALD SA (c) | | | 684 | | | | 7,369 | |
Alstom SA (a) | | | 2,361 | | | | 105,810 | |
Amundi SA (a) (c) | | | 694 | | | | 45,505 | |
Arkema SA | | | 845 | | | | 82,745 | |
Atos SE (a) | | | 1,194 | | | | 81,488 | |
AXA SA | | | 25,041 | | | | 402,462 | |
BioMerieux | | | 540 | | | | 80,375 | |
BNP Paribas SA (a) | | | 14,107 | | | | 490,507 | |
Bollore SA | | | 11,937 | | | | 42,764 | |
Bouygues SA | | | 2,683 | | | | 87,962 | |
Bureau Veritas SA (a) | | | 3,458 | | | | 75,915 | |
Capgemini SE | | | 2,039 | | | | 235,429 | |
Carrefour SA | | | 7,372 | | | | 114,706 | |
Casino Guichard Perrachon SA (a) | | | 560 | | | | 12,604 | |
Cie de Saint-Gobain (a) | | | 6,282 | | | | 245,096 | |
Cie Generale des Etablissements Michelin | | | 2,267 | | | | 244,593 | |
CNP Assurances (a) | | | 1,650 | | | | 18,582 | |
Credit Agricole SA (a) | | | 14,704 | | | | 116,141 | |
Danone SA | | | 7,808 | | | | 431,035 | |
Dassault Aviation SA (a) | | | 30 | | | | 25,017 | |
Dassault Systemes SE | | | 1,707 | | | | 291,349 | |
Edenred | | | 3,156 | | | | 147,172 | |
Eiffage SA (a) | | | 959 | | | | 69,605 | |
Electricite de France SA | | | 6,396 | | | | 74,252 | |
Engie SA (a) | | | 21,459 | | | | 259,543 | |
EssilorLuxottica SA (a) | | | 3,837 | | | | 474,581 | |
Eurazeo SE (a) | | | 570 | | | | 25,917 | |
Faurecia (a) | | | 872 | | | | 33,047 | |
Getlink SE (a) | | | 5,695 | | | | 76,541 | |
Hermes International | | | 399 | | | | 371,290 | |
Iliad SA | | | 191 | | | | 36,926 | |
Imerys SA | | | 399 | | | | 11,915 | |
Ingenico Group SA (a) | | | 798 | | | | 114,779 | |
Ipsen SA | | | 409 | | | | 37,226 | |
JCDecaux SA (a) | | | 949 | | | | 14,644 | |
Kering | | | 969 | | | | 585,149 | |
La Francaise des Jeux SAEM (c) | | | 1,043 | | | | 39,090 | |
Legrand SA | | | 3,458 | | | | 255,656 | |
L’Oreal SA | | | 3,136 | | | | 1,014,252 | |
LVMH Moet Hennessy Louis Vuitton SE - ADR | | | 16,391 | | | | 1,542,885 | |
Natixis SA (a) | | | 9,351 | | | | 21,738 | |
Orange SA | | | 24,746 | | | | 277,540 | |
The accompanying notes are an integral part of the financial statements.
56
Pacer Trendpilot® European Index ETF
SCHEDULE OF INVESTMENTS
October 31, 2020 (Unaudited) (Continued)
| | | Shares | | | Value | |
COMMON STOCKS — 97.1% (Continued) |
| | | | | | | | | |
France — 29.4% (Continued) |
Orpea (a) | | | 607 | | | $ | 60,613 | |
Pernod Ricard SA | | | 2,700 | | | | 435,205 | |
Peugeot SA (a) | | | 6,926 | | | | 124,464 | |
Plastic Omnium SA | | | 590 | | | | 13,434 | |
Publicis Groupe SA | | | 2,710 | | | | 94,054 | |
Remy Cointreau SA | | | 295 | | | | 49,818 | |
Renault SA (a) | | | 2,267 | | | | 56,119 | |
Rexel SA (a) | | | 3,669 | | | | 38,577 | |
Rubis SCA | | | 1,130 | | | | 37,086 | |
Safran SA (a) | | | 4,189 | | | | 441,620 | |
Sanofi - ADR | | | 28,509 | | | | 1,291,458 | |
Sartorius Stedim Biotech | | | 305 | | | | 115,659 | |
Schneider Electric SE | | | 6,869 | | | | 833,595 | |
SCOR SE (a) | | | 1,925 | | | | 46,767 | |
SEB SA | | | 332 | | | | 53,978 | |
Societe Generale SA (a) | | | 9,884 | | | | 133,992 | |
Sodexo SA | | | 1,090 | | | | 69,947 | |
Suez SA | | | 4,662 | | | | 85,353 | |
Teleperformance | | | 751 | | | | 225,397 | |
Thales SA | | | 1,261 | | | | 82,066 | |
TOTAL SA - ADR (b) | | | 31,692 | | | | 961,218 | |
Ubisoft Entertainment SA (a) | | | 1,187 | | | | 104,706 | |
Valeo SA | | | 3,015 | | | | 91,191 | |
Veolia Environnement SA | | | 6,416 | | | | 119,483 | |
Vinci SA | | | 6,054 | | | | 478,183 | |
Vivendi SA | | | 10,374 | | | | 299,514 | |
Wendel SA | | | 315 | | | | 27,295 | |
Worldline SA/France (a) (c) | | | 1,878 | | | | 139,194 | |
| | | | | | | | 16,209,139 | |
Germany — 26.4% | | | | |
1&1 Drillisch AG | | | 446 | | | | 9,397 | |
adidas AG (a) | | | 2,512 | | | | 746,026 | |
Allianz SE | | | 5,440 | | | | 957,067 | |
BASF SE | | | 11,957 | | | | 655,481 | |
Bayer AG - ADR | | | 51,387 | | | | 602,769 | |
Bayerische Motoren Werke AG | | | 4,159 | | | | 284,232 | |
Bechtle AG | | | 342 | | | | 58,671 | |
Beiersdorf AG | | | 1,281 | | | | 134,123 | |
Brenntag AG | | | 1,972 | | | | 126,042 | |
Carl Zeiss Meditec AG | | | 476 | | | | 61,480 | |
Commerzbank AG (a) | | | 12,913 | | | | 60,833 | |
Continental AG | | | 1,385 | | | | 147,238 | |
Covestro AG (c) | | | 2,160 | | | | 103,066 | |
CTS Eventim AG & Co KGaA (a) | | | 758 | | | | 33,582 | |
Daimler AG | | | 10,508 | | | | 543,372 | |
Delivery Hero SE (a) (c) | | | 1,831 | | | | 210,645 | |
Deutsche Bank AG (a) | | | 26,413 | | | | 243,049 | |
Deutsche Boerse AG | | | 2,388 | | | | 351,401 | |
| | | Shares | | | Value | |
Germany — 26.4% (Continued) |
Deutsche Lufthansa AG (a) | | | 3,498 | | | $ | 30,033 | |
Deutsche Post AG | | | 12,745 | | | | 564,643 | |
Deutsche Telekom AG | | | 42,160 | | | | 641,756 | |
Deutsche Wohnen SE | | | 4,474 | | | | 225,776 | |
DWS Group GmbH & Co KGaA (c) | | | 352 | | | | 11,952 | |
E.ON SE | | | 28,080 | | | | 292,760 | |
Evonik Industries AG | | | 2,371 | | | | 57,078 | |
Fielmann AG (a) | | | 275 | | | | 20,850 | |
Fraport AG Frankfurt Airport Services Worldwide (a) | | | 372 | | | | 13,439 | |
Fresenius Medical Care AG & Co KGaA - ADR (b) | | | 5,232 | | | | 200,019 | |
Fresenius SE & Co. KGaA | | | 5,212 | | | | 193,273 | |
FUCHS PETROLUB SE | | | 342 | | | | 13,104 | |
GEA Group AG | | | 2,066 | | | | 68,744 | |
GRENKE AG | | | 258 | | | | 10,072 | |
Hannover Rueck SE | | | 758 | | | | 110,085 | |
HeidelbergCement AG | | | 1,895 | | | | 108,408 | |
Hella GmbH & Co. KGaA (a) | | | 570 | | | | 24,881 | |
HelloFresh SE (a) | | | 1,774 | | | | 94,874 | |
Henkel AG & Co. KGaA | | | 1,291 | | | | 116,751 | |
HOCHTIEF AG | | | 211 | | | | 15,531 | |
Infineon Technologies AG | | | 16,958 | | | | 472,027 | |
KION Group AG | | | 882 | | | | 68,659 | |
Knorr-Bremse AG | | | 835 | | | | 96,694 | |
LANXESS AG | | | 1,033 | | | | 52,358 | |
LEG Immobilien AG | | | 882 | | | | 119,178 | |
Merck KGaA | | | 1,670 | | | | 247,302 | |
METRO AG | | | 1,821 | | | | 17,857 | |
MTU Aero Engines AG | | | 674 | | | | 115,038 | |
Muenchener Rueckversicherungs-Gesellschaft AG - Class R | | | 1,831 | | | | 428,199 | |
Nemetschek SE | | | 664 | | | | 48,023 | |
OSRAM Licht AG (a) | | | 379 | | | | 22,247 | |
ProSiebenSat.1 Media SE (a) | | | 1,754 | | | | 19,570 | |
Puma SE (a) | | | 1,033 | | | | 90,279 | |
Rational AG | | | 40 | | | | 29,978 | |
Rheinmetall AG | | | 523 | | | | 38,191 | |
RWE AG | | | 8,177 | | | | 302,746 | |
SAP SE - ADR (b) | | | 14,751 | | | | 1,575,849 | |
Scout24 AG (c) | | | 1,308 | | | | 105,340 | |
Siemens AG - ADR (b) | | | 18,266 | | | | 1,175,052 | |
Siemens Energy AG (a) | | | 4,860 | | | | 106,411 | |
Siemens Healthineers AG (c) | | | 1,754 | | | | 75,287 | |
Suedzucker AG | | | 788 | | | | 11,343 | |
Symrise AG | | | 1,630 | | | | 200,943 | |
Talanx AG | | | 580 | | | | 17,077 | |
TeamViewer AG (a) (c) | | | 1,526 | | | | 67,180 | |
Telefonica Deutschland Holding AG | | | 7,325 | | | | 18,487 | |
The accompanying notes are an integral part of the financial statements.
57
Pacer Trendpilot® European Index ETF
SCHEDULE OF INVESTMENTS
October 31, 2020 (Unaudited) (Continued)
| | | Shares | | | Value | |
COMMON STOCKS — 97.1% (Continued) |
| | | | | | | | | |
Germany — 26.4% (Continued) |
ThyssenKrupp AG (a) | | | 5,296 | | | $ | 25,258 | |
Traton SE | | | 466 | | | | 9,045 | |
Uniper SE | | | 1,348 | | | | 40,285 | |
United Internet AG | | | 1,318 | | | | 46,204 | |
Varta AG (a) | | | 154 | | | | 19,299 | |
Volkswagen AG | | | 399 | | | | 62,083 | |
Vonovia SE | | | 7,382 | | | | 471,310 | |
Wacker Chemie AG | | | 191 | | | | 18,423 | |
Zalando SE (a) (c) | | | 2,066 | | | | 192,926 | |
| | | | | | | | 14,548,651 | |
Greece — 0.3% | | | | |
Alpha Bank AE (a) | | | 18,759 | | | | 9,460 | |
Eurobank Ergasias SA (a) | | | 34,771 | | | | 11,529 | |
FF Group (a) (d) | | | 1,259 | | | | 7,038 | |
Hellenic Petroleum SA | | | 758 | | | | 3,708 | |
Hellenic Telecommunications Organization SA | | | 3,223 | | | | 42,867 | |
JUMBO SA | | | 1,422 | | | | 19,874 | |
Motor Oil Hellas Corinth Refineries SA | | | 758 | | | | 7,062 | |
Mytilineos SA | | | 1,422 | | | | 15,535 | |
National Bank of Greece SA (a) | | | 7,486 | | | | 7,817 | |
OPAP SA | | | 2,750 | | | | 22,179 | |
| | | | | | | | 147,069 | |
Ireland — 0.8% | | | | |
AIB Group PLC (a) | | | 10,706 | | | | 12,026 | |
Glanbia PLC | | | 2,653 | | | | 25,213 | |
Kerry Group PLC - Class A | | | 2,086 | | | | 249,505 | |
Kingspan Group PLC (a) | | | 2,086 | | | | 181,844 | |
| | | | | | | | 468,588 | |
Italy — 5.9% | | | | |
A2A SpA | | | 21,033 | | | | 26,737 | |
Amplifon SpA (a) | | | 1,707 | | | | 62,047 | |
Assicurazioni Generali SpA | | | 17,243 | | | | 231,144 | |
Atlantia SpA (a) | | | 6,728 | | | | 103,079 | |
Banca Mediolanum SpA | | | 3,508 | | | | 23,942 | |
Buzzi Unicem SpA | | | 949 | | | | 20,530 | |
Buzzi Unicem SpA - Savings Shares | | | 570 | | | | 8,086 | |
DiaSorin SpA | | | 285 | | | | 62,568 | |
Enel SpA | | | 106,011 | | | | 843,762 | |
Eni SpA | | | 33,255 | | | | 232,808 | |
FinecoBank Banca Fineco SpA (a) | | | 8,338 | | | | 114,102 | |
Hera SpA | | | 9,569 | | | | 30,090 | |
Infrastrutture Wireless Italiane SpA (c) | | | 4,454 | | | | 48,138 | |
Intesa Sanpaolo SpA (a) | | | 211,737 | | | | 350,071 | |
Italgas SpA | | | 6,634 | | | | 38,338 | |
Leonardo SpA | | | 5,400 | | | | 25,710 | |
| | | Shares | | | Value | |
Italy — 5.9% (Continued) |
Mediobanca Banca di Credito Finanziario SpA | | | 10,518 | | | $ | 74,576 | |
Moncler SpA (a) | | | 2,653 | | | | 106,166 | |
Nexi SpA (a) (c) | | | 3,981 | | | | 61,155 | |
Pirelli & C SpA (a) (c) | | | 5,306 | | | | 22,123 | |
Poste Italiane SpA (c) | | | 6,255 | | | | 50,994 | |
Prysmian SpA | | | 3,223 | | | | 87,610 | |
Recordati SpA | | | 1,328 | | | | 68,810 | |
Snam SpA | | | 29,750 | | | | 145,176 | |
Telecom Italia SpA | | | 145,139 | | | | 49,257 | |
Telecom Italia SpA - Savings Shares | | | 82,328 | | | | 29,944 | |
Terna Rete Elettrica Nazionale SpA | | | 18,950 | | | | 128,095 | |
UniCredit SpA (a) | | | 29,180 | | | | 217,534 | |
UnipolSai Assicurazioni SpA | | | 6,822 | | | | 15,843 | |
| | | | | | | | 3,278,435 | |
Luxembourg — 0.7% | | | | |
ArcelorMittal (a) | | | 9,569 | | | | 129,856 | |
Aroundtown SA (a) | | | 14,969 | | | | 71,774 | |
Eurofins Scientific SE (a) | | | 154 | | | | 122,643 | |
RTL Group SA (a) | | | 409 | | | | 15,538 | |
Tenaris SA - ADR | | | 2,673 | | | | 25,554 | |
| | | | | | | | 365,365 | |
Netherlands — 16.6% | | | | |
Aalberts Industries NV | | | 1,328 | | | | 44,605 | |
ABN AMRO Group NV - ADR (a) (c) | | | 5,685 | | | | 46,652 | |
Adyen NV (a) (c) | | | 372 | | | | 627,127 | |
Aegon NV | | | 23,971 | | | | 64,630 | |
Airbus SE - ADR (a) | | | 28,972 | | | | 529,318 | |
Akzo Nobel NV | | | 2,653 | | | | 255,527 | |
Altice Europe NV (a) | | | 379 | | | | 1,878 | |
Altice NV - Class A (a) | | | 7,392 | | | | 36,408 | |
Argenx SE - ADR (a) | | | 607 | | | | 150,615 | |
ASM International NV | | | 664 | | | | 94,964 | |
ASML Holding NV - ADR (b) | | | 5,202 | | | | 1,879,014 | |
ASR Nederland NV | | | 1,895 | | | | 57,603 | |
Davide Campari-Milano NV | | | 7,580 | | | | 79,134 | |
Euronext NV (c) | | | 768 | | | | 80,098 | |
EXOR NV | | | 1,422 | | | | 73,863 | |
Ferrari NV | | | 1,660 | | | | 296,087 | |
GrandVision NV (a) (c) | | | 664 | | | | 18,444 | |
Heineken Holding NV | | | 1,422 | | | | 109,884 | |
Heineken NV | | | 3,223 | | | | 286,028 | |
IMCD NV | | | 758 | | | | 87,803 | |
ING Groep NV - ADR (a) (b) | | | 50,988 | | | | 347,738 | |
JDE Peet’s BV (a) | | | 855 | | | | 30,471 | |
Koninklijke Ahold Delhaize NV | | | 14,687 | | | | 403,511 | |
Koninklijke DSM NV | | | 2,371 | | | | 379,551 | |
Koninklijke KPN NV | | | 45,095 | | | | 121,846 | |
Koninklijke Philips NV (a) | | | 12,413 | | | | 576,463 | |
The accompanying notes are an integral part of the financial statements.
58
Pacer Trendpilot® European Index ETF
SCHEDULE OF INVESTMENTS
October 31, 2020 (Unaudited) (Continued)
| | | Shares | | | Value | |
COMMON STOCKS — 97.1% (Continued) |
| | | | | | | | | |
Netherlands — 16.6% (Continued) |
Koninklijke Vopak NV | | | 949 | | | $ | 49,327 | |
NN Group NV | | | 4,266 | | | | 148,753 | |
Prosus NV | | | 5,876 | | | | 587,032 | |
QIAGEN NV (a) | | | 2,824 | | | | 134,091 | |
Randstad Holding NV (a) | | | 1,516 | | | | 75,762 | |
Signify NV (a) (c) | | | 1,707 | | | | 60,815 | |
Unilever NV | | | 19,802 | | | | 1,119,676 | |
Wolters Kluwer NV | | | 3,602 | | | | 291,892 | |
| | | | | | | | 9,146,610 | |
Portugal — 0.5% | | | | |
EDP - Energias de Portugal SA | | | 38,370 | | | | 189,117 | |
Galp Energia SGPS SA | | | 7,013 | | | | 56,798 | |
Jeronimo Martins SGPS SA | | | 3,317 | | | | 52,693 | |
| | | | | | | | 298,608 | |
Spain — 7.4% | | | | |
Acciona SA | | | 285 | | | | 28,778 | |
ACS Actividades de Construccion y Servicios SA | | | 3,129 | | | | 74,341 | |
Aena SME SA (a) (c) | | | 949 | | | | 127,767 | |
Amadeus IT Holding SA | | | 5,779 | | | | 275,883 | |
Banco Bilbao Vizcaya Argentaria SA - ADR | | | 86,383 | | | | 249,647 | |
Banco Santander SA - ADR (b) | | | 213,075 | | | | 428,281 | |
Bankia SA | | | 16,391 | | | | 20,082 | |
Bankinter SA | | | 9,381 | | | | 35,148 | |
CaixaBank SA | | | 48,979 | | | | 89,102 | |
Cellnex Telecom SA (c) | | | 4,645 | | | | 298,187 | |
EDP Renovaveis SA | | | 2,086 | | | | 39,649 | |
Enagas SA | | | 3,411 | | | | 73,612 | |
Endesa SA | | | 4,360 | | | | 116,842 | |
Ferrovial SA | | | 6,537 | | | | 141,417 | |
Grifols SA | | | 4,548 | | | | 122,833 | |
Iberdrola SA | | | 81,000 | | | | 955,155 | |
Industria de Diseno Textil SA | | | 14,308 | | | | 353,105 | |
Mapfre SA | | | 13,453 | | | | 20,274 | |
Naturgy Energy Group SA | | | 4,075 | | | | 75,698 | |
Red Electrica Corp. SA | | | 5,876 | | | | 103,507 | |
Repsol SA | | | 19,329 | | | | 120,211 | |
Siemens Gamesa Renewable Energy SA (a) | | | 3,032 | | | | 85,914 | |
Telefonica SA | | | 64,327 | | | | 210,220 | |
Zardoya Otis SA | | | 2,465 | | | | 15,043 | |
| | | | | | | | 4,060,696 | |
Switzerland — 0.5% | | | | |
STMicroelectronics NV | | | 8,197 | | | | 249,644 | |
| | | | | | | | | |
United Kingdom — 0.6% | | | | |
CNH Industrial NV (a) | | | 13,453 | | | | 104,349 | |
Fiat Chrysler Automobiles NV (a) | | | 15,066 | | | | 184,976 | |
| | | Shares | | | Value | |
United Kingdom — 0.6% (Continued) |
TechnipFMC PLC | | | 5,440 | | | $ | 29,784 | |
| | | | | | | | 319,109 | |
TOTAL COMMON STOCKS (Cost $59,050,329) | | | | | | | 53,562,456 | |
| | | | | | | | | |
PREFERRED STOCKS — 1.7% | | | | |
| | | | | | | | | |
Germany — 1.7% | | | | |
Bayerische Motoren Werke AG | | | 684 | | | $ | 35,370 | |
FUCHS PETROLUB SE | | | 835 | | | | 42,964 | |
Henkel AG & Co. KGaA | | | 2,257 | | | | 219,541 | |
Porsche Automobil Holding SE | | | 1,945 | | | | 104,201 | |
Sartorius AG | | | 436 | | | | 184,529 | |
Volkswagen AG | | | 2,378 | | | | 346,468 | |
| | | | | | | | 933,073 | |
TOTAL PREFERRED STOCKS (Cost $1,023,437) | | | | | | | 933,073 | |
| | | | | |
REAL ESTATE INVESTMENT TRUSTS — 0.5% | | | | |
| | | | | | | | | |
France — 0.4% | | | | |
Covivio | | | 597 | | | | 35,529 | |
Gecina SA | | | 654 | | | | 81,195 | |
ICADE | | | 352 | | | | 17,792 | |
Klepierre | | | 2,180 | | | | 27,611 | |
Unibail-Rodamco-Westfield (b) | | | 1,801 | | | | 73,204 | |
| | | | | | | | 235,331 | |
Spain — 0.1% | | | | |
Inmobiliaria Colonial Socimi SA | | | 4,454 | | | | 31,669 | |
Merlin Properties Socimi SA | | | 4,548 | | | | 30,589 | |
| | | | | | | | 62,258 | |
TOTAL REAL ESTATE INVESTMENT TRUSTS (Cost $331,534) | | | | | | | 297,589 | |
| | | Principal
Amount | | | | | |
SHORT-TERM INVESTMENTS — 0.2% | | | | |
Money Market Deposit Accounts — 0.2% | | | | |
U.S. Bank Money Market Deposit Account, 0.025% (e) | | $ | 108,392 | | | | 108,392 | |
TOTAL SHORT-TERM INVESTMENTS (Cost $108,392) | | | | | | | 108,392 | |
The accompanying notes are an integral part of the financial statements.
59
Pacer Trendpilot® European Index ETF
SCHEDULE OF INVESTMENTS
October 31, 2020 (Unaudited) (Continued)
| | | Shares | | | Value | |
INVESTMENTS PURCHASED WITH PROCEEDS FROM SECURITIES LENDING — 12.7% | | | | |
Mount Vernon Liquid Assets Portfolio, LLC, 0.16% (e) | | | 7,021,988 | | | $ | 7,021,988 | |
TOTAL INVESTMENTS PURCHASED WITH PROCEEDS FROM SECURITIES LENDING (Cost $7,021,988) | | | | | | | 7,021,988 | |
| | | | | |
Total Investments (Cost $67,535,680) — 112.2% | | | | | | | 61,923,498 | |
Liabilities in Excess of Other Assets — (12.2)% | | | | | | | (6,755,350 | ) |
TOTAL NET ASSETS — 100.0% | | | | | | $ | 55,168,148 | |
Percentages are stated as a percent of net assets.
ADR | American Depositary Receipt |
| | (a) | Non-income producing security. |
| | (b) | All or a portion of this security is on loan as of October 31, 2020. The total value of securities on loan is $6,802,792 or 12.3% of net assets. |
| | (c) | Security exempt from registration under Rule 144(a) of the Securities Act of 1933. Such securities are treated as liquid securities according to the Fund’s liquidity guidelines. The value of these securities total $2,439,054 or 4.42% of net assets. |
| | (d) | As of October 31, 2020, the Fund has fair valued this security. This security is deemed illiquid according to the Fund’s liquidity guidelines. Value determined using significant unobservable inputs. |
| | (e) | The rate shown is as of October 31, 2020. |
The accompanying notes are an integral part of the financial statements.
60
Pacer Global Cash Cows Dividend ETF
SCHEDULE OF INVESTMENTS
October 31, 2020 (Unaudited)
| | | Shares | | | Value | |
COMMON STOCKS — 93.3% | | | | |
| | | | | | | | | |
Australia — 8.1% | | | | |
AGL Energy Ltd. | | | 37,268 | | | $ | 326,921 | |
Alumina Ltd. | | | 196,205 | | | | 197,904 | |
Aurizon Holdings Ltd. | | | 98,812 | | | | 261,845 | |
BHP Billiton Ltd. - ADR (a) | | | 48,355 | | | | 2,326,359 | |
Coca-Cola Amatil Ltd. | | | 35,714 | | | | 312,034 | |
Fortescue Metals Group Ltd. | | | 245,400 | | | | 2,996,175 | |
Origin Energy Ltd. | | | 78,416 | | | | 220,474 | |
Sydney Airport | | | 125,695 | | | | 481,512 | |
Telstra Corp. Ltd. | | | 545,957 | | | | 1,028,457 | |
Woodside Petroleum Ltd. | | | 50,764 | | | | 625,148 | |
Worley Ltd. | | | 20,739 | | | | 137,174 | |
| | | | | | | | 8,914,003 | |
Austria — 0.4% | | | | |
OMV AG | | | 17,455 | | | | 400,479 | |
| | | | | | | | | |
Bermuda — 1.0% | | | | |
CK Infrastructure Holdings Ltd. | | | 134,976 | | | | 635,488 | |
Dairy Farm International Holdings Ltd. | | | 55,565 | | | | 209,480 | |
Pacific Century Premium Developments Ltd. (b) | | | 56,744 | | | | 6,002 | |
Yue Yue Industrial Holdings Ltd. | | | 134,746 | | | | 219,348 | |
| | | | | | | | 1,070,318 | |
Canada — 2.6% | | | | |
BCE, Inc. (a) | | | 45,570 | | | | 1,832,826 | |
Nutrien Ltd. (a) | | | 24,612 | | | | 1,001,216 | |
| | | | | | | | 2,834,042 | |
Cayman Islands — 2.1% | | | | |
Chow Tai Fook Jewellery Group Ltd. | | | 888,740 | | | | 1,134,927 | |
NagaCorp Ltd. | | | 250,169 | | | | 258,156 | |
Uni-President China Holdings Ltd. | | | 176,776 | | | | 152,776 | |
Want Want China Holdings Ltd. | | | 460,819 | | | | 304,340 | |
WH Group Ltd. (c) | | | 631,285 | | | | 495,908 | |
| | | | | | | | 2,346,107 | |
Finland — 0.9% | | | | |
Fortum OYJ | | | 50,500 | | | | 949,856 | |
| | | | | | | | | |
France — 1.9% | | | | |
Sodexo SA | | | 5,488 | | | | 352,176 | |
TOTAL SA - ADR (a) | | | 57,195 | | | | 1,734,724 | |
| | | | | | | | 2,086,900 | |
Germany — 2.0% | | | | |
Deutsche Telekom AG | | | 144,789 | | | | 2,203,967 | |
| | | | | | | | | |
Hong Kong — 3.6% | | | | |
CK Hutchison Holdings Ltd. | | | 209,585 | | | | 1,262,511 | |
CLP Holdings Ltd. | | | 91,326 | | | | 839,928 | |
Jardine Matheson Holdings Ltd. | | | 10,990 | | | | 487,846 | |
| | | Shares | | | Value | |
Hong Kong — 3.6% (Continued) |
Lenovo Group Ltd. | | | 723,922 | | | $ | 452,889 | |
PCCW Ltd. | | | 525,849 | | | | 316,086 | |
Power Assets Holdings Ltd. | | | 123,132 | | | | 632,933 | |
| | | | | | | | 3,992,193 | |
Israel — 0.2% | | | | |
ICL Group Ltd. | | | 57,617 | | | | 209,728 | |
| | | | | | | | | |
Italy — 1.5% | | | | |
Eni SpA - ADR (a) | | | 116,107 | | | | 1,623,176 | |
| | | | | | | | | |
Japan — 17.2% | | | | |
Bridgestone Corp. | | | 26,762 | | | | 866,547 | |
Canon, Inc. - ADR (a) | | | 65,761 | | | | 1,147,529 | |
ENEOS Holdings, Inc. | | | 158,924 | | | | 532,201 | |
Idemitsu Kosan Co Ltd. | | | 15,073 | | | | 303,058 | |
Inpex Corp. | | | 96,534 | | | | 453,649 | |
ITOCHU Corp. | | | 57,094 | | | | 1,363,341 | |
Japan Tobacco, Inc. | | | 117,633 | | | | 2,213,449 | |
Marubeni Corp. | | | 101,230 | | | | 525,222 | |
Mitsubishi Chemical Holdings Corp. | | | 79,656 | | | | 446,004 | |
Mitsubishi Corp. | | | 70,303 | | | | 1,561,580 | |
Nippon Telegraph & Telephone Corp. | | | 108,896 | | | | 2,284,117 | |
NTT DOCOMO, Inc. | | | 93,705 | | | | 3,478,975 | |
SoftBank Corp. | | | 199,865 | | | | 2,314,689 | |
Subaru Corp. | | | 39,892 | | | | 726,054 | |
Sumitomo Corp. | | | 72,677 | | | | 794,487 | |
| | | | | | | | 19,010,902 | |
Jersey — 0.7% | | | | |
WPP PLC - ADR (a) | | | 19,879 | | | | 794,166 | |
| | | | | | | | | |
Netherlands Antilles — 1.5% | | | | |
Schlumberger Ltd. | | | 112,743 | | | | 1,684,380 | |
| | | | | | | | | |
New Zealand — 0.3% | | | | |
Meridian Energy Ltd. | | | 92,628 | | | | 324,602 | |
| | | | | | | | | |
Norway — 2.9% | | | | |
Equinor ASA - ADR | | | 150,907 | | | | 1,936,137 | |
Telenor ASA | | | 79,804 | | | | 1,230,499 | |
| | | | | | | | 3,166,636 | |
Portugal — 0.3% | | | | |
Galp Energia SGPS SA | | | 44,523 | | | | 360,590 | |
| | | | | | | | | |
Republic of Korea — 0.7% | | | | |
GS Holdings Corp. | | | 4,806 | | | | 139,771 | |
POSCO - ADR | | | 13,760 | | | | 637,226 | |
| | | | | | | | 776,997 | |
South Korea — 0.4% | | | | |
KT&G Corp. | | | 6,783 | | | | 484,201 | |
The accompanying notes are an integral part of the financial statements.
61
Pacer Global Cash Cows Dividend ETF
SCHEDULE OF INVESTMENTS
October 31, 2020 (Unaudited)(Continued)
| | | Shares | | | Value | |
COMMON STOCKS — 93.3% (Continued) |
| | | | | | | | | |
Spain — 2.2% | | | | |
Endesa SA | | | 51,405 | | | $ | 1,377,577 | |
Naturgy Energy Group SA | | | 56,900 | | | | 1,056,981 | |
Repsol SA | | | 4,580 | | | | 28,484 | |
| | | | | | | | 2,463,042 | |
Sweden — 0.7% | | | | |
Telia Co. AB (a) | | | 195,115 | | | | 748,148 | |
| | | | | | | | | |
Switzerland — 2.9% | | | | |
Glencore PLC (b) | | | 550,947 | | | | 1,112,743 | |
LafargeHolcim Ltd. | | | 25,307 | | | | 1,086,025 | |
Swisscom AG | | | 2,046 | | | | 1,040,460 | |
| | | | | | | | 3,239,228 | |
United Kingdom — 13.8% | | | | |
Anglo American PLC | | | 54,270 | | | | 1,273,401 | |
BAE Systems PLC | | | 134,536 | | | | 691,939 | |
BP PLC - ADR | | | 90,017 | | | | 1,393,463 | |
British American Tobacco PLC - ADR (a) | | | 61,364 | | | | 1,956,284 | |
GlaxoSmithKline PLC - ADR | | | 59,470 | | | | 1,987,488 | |
Imperial Brands PLC | | | 121,518 | | | | 1,926,908 | |
Rio Tinto PLC - ADR (a) | | | 43,000 | | | | 2,441,110 | |
Royal Dutch Shell PLC - ADR | | | 68,361 | | | | 1,650,918 | |
Vodafone Group PLC - ADR | | | 138,498 | | | | 1,871,108 | |
| | | | | | | | 15,192,619 | |
United States — 25.4% | | | | |
AbbVie, Inc. | | | 26,453 | | | | 2,251,150 | |
Altria Group, Inc. | | | 59,172 | | | | 2,134,926 | |
AT&T, Inc. | | | 75,642 | | | | 2,043,847 | |
Chevron Corp. | | | 24,597 | | | | 1,709,492 | |
Dow, Inc. | | | 43,702 | | | | 1,988,004 | |
HP, Inc. | | | 51,080 | | | | 917,397 | |
International Business Machines Corp. | | | 18,775 | | | | 2,096,417 | |
Kinder Morgan, Inc. | | | 125,043 | | | | 1,488,012 | |
LyondellBasell Industries NV - Class A | | | 17,372 | | | | 1,189,113 | |
Pfizer, Inc. | | | 68,938 | | | | 2,445,920 | |
Philip Morris International, Inc. | | | 32,320 | | | | 2,295,366 | |
Southern Copper Corp. (a) | | | 29,323 | | | | 1,534,766 | |
The Kraft Heinz Co. | | | 55,529 | | | | 1,698,632 | |
Valero Energy Corp. | | | 18,648 | | | | 719,999 | |
Verizon Communications, Inc. | | | 43,026 | | | | 2,452,052 | |
Walgreens Boots Alliance, Inc. | | | 33,077 | | | | 1,125,941 | |
| | | | | | | | 28,091,034 | |
TOTAL COMMON STOCKS (Cost $131,652,230) | | | | | | | 102,967,314 | |
| | | | | |
| | | Shares | | | Value | |
REAL ESTATE INVESTMENT TRUSTS — 5.8% | | | | |
| | | | | | | | | |
Australia — 2.0% | | | | |
Dexus | | | 52,475 | | | $ | 317,576 | |
GPT Group | | | 112,228 | | | | 317,906 | |
Mirvac Group | | | 181,062 | | | | 268,536 | |
Scentre Group | | | 435,426 | | | | 642,727 | |
STOCKLAND | | | 153,661 | | | | 415,831 | |
Vicinity Centres | | | 312,480 | | | | 265,767 | |
| | | | | | | | 2,228,343 | |
France — 0.7% | | | | |
Unibail-Rodamco-Westfield (a) | | | 19,432 | | | | 789,836 | |
| | | | | | | | | |
Hong Kong — 0.2% | | | | |
Champion REIT | | | 369,311 | | | | 178,641 | |
| | | | | | | | | |
Singapore — 0.1% | | | | |
CapitaLand Commercial Trust (d) | | | 184,539 | | | | 203,271 | |
| | | | | | | | | |
United States — 2.8% | | | | |
Public Storage | | | 6,280 | | | | 1,438,559 | |
Simon Property Group, Inc. (a) | | | 26,705 | | | | 1,677,341 | |
| | | | | | | | 3,115,900 | |
TOTAL REAL ESTATE INVESTMENT TRUSTS (Cost $6,240,968) | | | | | | | 6,515,991 | |
| | | | | |
| | | Principal
Amount | | | | | |
SHORT-TERM INVESTMENTS — 0.2% | | | | |
| | | | | | | | | |
Money Market Deposit Accounts — 0.2% | | | | |
U.S. Bank Money Market Deposit Account, 0.025% (d) | | $ | 191,879 | | | | 191,879 | |
TOTAL SHORT-TERM INVESTMENTS (Cost $191,879) | | | | | | | 191,879 | |
| | | | | |
The accompanying notes are an integral part of the financial statements.
62
Pacer Global Cash Cows Dividend ETF
SCHEDULE OF INVESTMENTS
October 31, 2020 (Unaudited)(Continued)
| | | Shares | | | Value | |
INVESTMENTS PURCHASED WITH PROCEEDS FROM SECURITIES LENDING — 16.5% | | | | |
Mount Vernon Liquid Assets Portfolio, LLC, 0.16% (e) | | | 18,210,715 | | | $ | 18,210,715 | |
TOTAL INVESTMENTS PURCHASED WITH PROCEEDS FROM SECURITIES LENDING (Cost $18,210,715) | | | | | | | 18,210,715 | |
Total Investments (Cost $156,295,792) — 115.8% | | | | | | | 127,885,899 | |
Liabilities in Excess of Other Assets — (15.8)% | | | | | | | (17,492,908 | ) |
TOTAL NET ASSETS — 100.0% | | | | | | $ | 110,392,991 | |
Percentages are stated as a percent of net assets.
ADR | American Depositary Receipt |
| | (a) | All or a portion of this security is on loan as of October 31, 2020. The total value of securities on loan is $17,715,254 or 16.0% of net assets. |
| | (b) | Non-income producing security. |
| | (c) | Security exempt from registration under Rule 144(a) of the Securities Act of 1933. Such securities are treated as liquid securities according to the Fund’s liquidity guidelines. The value of these securities total $495,908 or 0.45% of net assets. |
| | (d) | As of October 31, 2020, the Fund has fair valued this security. This security is deemed illiquid according to the Fund’s liquidity guidelines. Value determined using significant unobservable inputs. |
| | (e) | The rate shown is as of October 31, 2020. |
The accompanying notes are an integral part of the financial statements.
63
Pacer US Cash Cows 100 ETF
SCHEDULE OF INVESTMENTS
October 31, 2020 (Unaudited)
| | | Shares | | | Value | |
COMMON STOCKS — 96.9% | | | | |
| | | | | | | | | |
Advertising — 1.0% | | | | |
Omnicom Group, Inc. | | | 41,551 | | | $ | 1,961,207 | |
| | | | | | | | | |
Agriculture — 1.7% | | | | |
Altria Group, Inc. | | | 93,268 | | | | 3,365,109 | |
| | | | | | | | | |
Apparel — 2.1% | | | | |
Capri Holdings Ltd. (a)(b) | | | 53,393 | | | | 1,132,999 | |
Carter’s, Inc. | | | 9,295 | | | | 757,078 | |
Hanesbrands, Inc. (a) | | | 78,509 | | | | 1,261,640 | |
PVH Corp. | | | 15,846 | | | | 923,663 | |
| | | | | | | | 4,075,380 | |
Auto Parts & Equipment — 0.4% | | | | |
Allison Transmission Holdings, Inc. | | | 21,178 | | | | 765,585 | |
| | | | | | | | | |
Beverages — 1.1% | | | | |
Molson Coors Brewing Co. - Class B (a) | | | 62,873 | | | | 2,216,902 | |
| | | | | | | | | |
Biotechnology — 6.3% | | | | |
Alexion Pharmaceuticals, Inc. (b) | | | 33,506 | | | | 3,857,881 | |
Biogen, Inc. (b) | | | 14,890 | | | | 3,753,322 | |
Gilead Sciences, Inc. | | | 62,256 | | | | 3,620,187 | |
United Therapeutics Corp. (b) | | | 9,100 | | | | 1,221,493 | |
| | | | | | | | 12,452,883 | |
Chemicals — 4.0% | | | | |
Cabot Corp. | | | 10,172 | | | | 386,638 | |
CF Industries Holdings, Inc. | | | 56,175 | | | | 1,550,992 | |
Dow, Inc. | | | 83,620 | | | | 3,803,874 | |
Eastman Chemical Co. | | | 25,855 | | | | 2,090,118 | |
| | | | | | | | 7,831,622 | |
Commercial Services — 4.5% | | | | |
Euronet Worldwide, Inc. (b) | | | 8,418 | | | | 747,855 | |
Graham Holdings Co. - Class B | | | 853 | | | | 324,430 | |
Grand Canyon Education, Inc. (b) | | | 5,577 | | | | 437,070 | |
H&R Block, Inc. | | | 52,715 | | | | 909,861 | |
ManpowerGroup, Inc. | | | 23,776 | | | | 1,613,677 | |
Quanta Services, Inc. | | | 37,245 | | | | 2,325,205 | |
Robert Half International, Inc. | | | 19,451 | | | | 985,971 | |
WEX, Inc. (a)(b) | | | 12,221 | | | | 1,546,568 | |
| | | | | | | | 8,890,637 | |
Computers — 9.6% | | | | |
Cognizant Technology Solutions Corp. - Class A | | | 61,509 | | | | 4,392,973 | |
DXC Technology Co. | | | 183,763 | | | | 3,384,914 | |
HP, Inc. | | | 197,837 | | | | 3,553,153 | |
International Business Machines Corp. | | | 33,136 | | | | 3,699,966 | |
Lumentum Holdings, Inc. (b) | | | 9,380 | | | | 775,632 | |
| | | Shares | | | Value | |
Computers — 9.6% (Continued) |
NCR Corp. (b) | | | 40,328 | | | $ | 819,465 | |
NetApp, Inc. | | | 29,890 | | | | 1,311,872 | |
Science Applications International Corp. | | | 12,240 | | | | 934,769 | |
| | | | | | | | 18,872,744 | |
Distribution/Wholesale — 1.3% | | | | |
LKQ Corp. (b) | | | 55,372 | | | | 1,771,350 | |
Univar Solutions, Inc. (b) | | | 46,190 | | | | 766,292 | |
| | | | | | | | 2,537,642 | |
Electric — 2.5% | | | | |
NRG Energy, Inc. | | | 71,076 | | | | 2,247,423 | |
Vistra Corp. | | | 159,202 | | | | 2,765,339 | |
| | | | | | | | 5,012,762 | |
Electrical Components & Equipment — 0.3% | | | | |
Acuity Brands, Inc. | | | 7,556 | | | | 673,542 | |
| | | | | | | | | |
Electronics — 4.1% | | | | |
Arrow Electronics, Inc. (b) | | | 31,675 | | | | 2,467,166 | |
AVNET, Inc. | | | 37,425 | | | | 923,275 | |
Jabil, Inc. | | | 38,335 | | | | 1,270,422 | |
nVent Electric PLC | | | 27,965 | | | | 504,768 | |
SYNNEX Corp. | | | 21,316 | | | | 2,806,038 | |
| | | | | | | | 7,971,669 | |
Food — 4.7% | | | | |
Kroger Co. | | | 115,855 | | | | 3,731,690 | |
Sprouts Farmers Market, Inc. (a)(b) | | | 31,538 | | | | 600,799 | |
Tyson Foods, Inc. - Class A | | | 64,163 | | | | 3,672,048 | |
US Foods Holding Corp. (b) | | | 56,595 | | | | 1,182,835 | |
| | | | | | | | 9,187,372 | |
Hand/Machine Tools — 0.9% | | | | |
Regal Beloit Corp. | | | 6,654 | | | | 656,417 | |
Snap-On, Inc. (a) | | | 7,586 | | | | 1,195,023 | |
| | | | | | | | 1,851,440 | |
Healthcare-Services — 4.4% | | | | |
DaVita, Inc. (a)(b) | | | 30,459 | | | | 2,627,089 | |
HCA Healthcare, Inc. | | | 29,608 | | | | 3,669,615 | |
Universal Health Services, Inc. - Class B | | | 22,460 | | | | 2,460,493 | |
| | | | | | | | 8,757,197 | |
Home Builders — 3.2% | | | | |
Lennar Corp. - Class A | | | 55,821 | | | | 3,920,309 | |
PulteGroup, Inc. | | | 56,263 | | | | 2,293,280 | |
| | | | | | | | 6,213,589 | |
Household Products/Wares — 0.3% | | | | |
Spectrum Brands Holdings, Inc. | | | 11,017 | | | | 626,537 | |
| | | | | | | | | |
Housewares — 0.8% | | | | |
Newell Brands, Inc. | | | 92,863 | | | | 1,639,961 | |
| | | | | | | | | |
The accompanying notes are an integral part of the financial statements.
64
Pacer US Cash Cows 100 ETF
SCHEDULE OF INVESTMENTS
October 31, 2020 (Unaudited) (Continued)
| | | Shares | | | Value | |
COMMON STOCKS — 96.9% (Continued) |
| | | | | | | | | |
Internet — 2.5% | | | | |
eBay, Inc. | | | 78,221 | | | $ | 3,725,666 | |
F5 Networks, Inc. (b) | | | 8,351 | | | | 1,110,182 | |
| | | | | | | | 4,835,848 | |
Iron/Steel — 2.2% | | | | |
Nucor Corp. | | | 46,784 | | | | 2,234,404 | |
Reliance Steel & Aluminum Co. | | | 18,885 | | | | 2,058,276 | |
| | | | | | | | 4,292,680 | |
Leisure Time — 1.2% | | | | |
Harley-Davidson, Inc. (a) | | | 47,437 | | | | 1,559,729 | |
Polaris Industries, Inc. | | | 9,604 | | | | 872,619 | |
| | | | | | | | 2,432,348 | |
Machinery-Diversified — 0.8% | | | | |
CRANE Co. | | | 10,438 | | | | 529,728 | |
GrafTech International Ltd. (a) | | | 164,098 | | | | 1,107,662 | |
| | | | | | | | 1,637,390 | |
Media — 3.4% | | | | |
Discovery, Inc. - Class A (a)(b) | | | 180,162 | | | | 3,646,479 | |
FOX Corp. - Class A (a) | | | 116,416 | | | | 3,087,352 | |
| | | | | | | | 6,733,831 | |
Metal Fabricate/Hardware — 0.7% | | | | |
The Timken Co. | | | 14,140 | | | | 844,158 | |
Valmont Industries, Inc. | | | 3,160 | | | | 448,562 | |
| | | | | | | | 1,292,720 | |
Miscellaneous Manufacturing — 0.8% | | | | |
Carlisle Cos., Inc. | | | 8,004 | | | | 991,455 | |
ITT, Inc. | | | 9,690 | | | | 586,342 | |
| | | | | | | | 1,577,797 | |
Office/Business Equipment — 0.7% | | | | |
Xerox Holdings Corp. | | | 79,621 | | | | 1,383,813 | |
| | | | | | | | | |
Oil & Gas Services — 2.7% | | | | |
Halliburton Co. (a) | | | 182,810 | | | | 2,204,689 | |
Schlumberger Ltd. | | | 212,810 | | | | 3,179,381 | |
| | | | | | | | 5,384,070 | |
Pharmaceuticals — 8.7% | | | | |
Bristol-Myers Squibb Co. | | | 66,924 | | | | 3,911,708 | |
Cardinal Health, Inc. | | | 51,179 | | | | 2,343,486 | |
CVS Health Corp. | | | 67,470 | | | | 3,784,392 | |
Herbalife Ltd. (b) | | | 20,295 | | | | 916,116 | |
McKesson Corp. | | | 26,682 | | | | 3,935,328 | |
Mylan NV (a)(b) | | | 152,449 | | | | 2,216,609 | |
| | | | | | | | 17,107,639 | |
Retail — 13.4% | | | | |
AutoNation, Inc. (a)(b) | | | 50,632 | | | | 2,872,353 | |
Best Buy Co., Inc. | | | 38,657 | | | | 4,312,188 | |
Dick’s Sporting Goods, Inc. (a) | | | 32,386 | | | | 1,834,667 | |
Genuine Parts Co. | | | 21,040 | | | | 1,902,647 | |
Lowe’s Cos., Inc. | | | 25,686 | | | | 4,060,957 | |
| | | Shares | | | Value | |
Retail — 13.4% (Continued) |
MSC Industrial Direct Co., Inc. | | | 7,662 | | | $ | 533,735 | |
Nu Skin Enterprises, Inc. - Class A | | | 6,905 | | | | 340,762 | |
Penske Automotive Group, Inc. (a) | | | 39,740 | | | | 2,033,098 | |
Qurate Retail Group, Inc. QVC Group - Class A | | | 441,643 | | | | 2,989,923 | |
Target Corp. | | | 27,631 | | | | 4,205,991 | |
Williams-Sonoma, Inc. (a) | | | 15,108 | | | | 1,378,001 | |
| | | | | | | | 26,464,322 | |
Semiconductors — 1.8% | | | | |
Intel Corp. | | | 80,094 | | | | 3,546,562 | |
| | | | | | | | | |
Shipbuilding — 0.6% | | | | |
Huntington Ingalls Industries, Inc. | | | 8,561 | | | | 1,262,576 | |
| | | | | | | | | |
Telecommunications — 2.9% | | | | |
Cisco Systems, Inc. | | | 100,672 | | | | 3,614,125 | |
CommScope Holding Co., Inc. (b) | | | 142,491 | | | | 1,268,170 | |
Juniper Networks, Inc. | | | 38,155 | | | | 752,416 | |
| | | | | | | | 5,634,711 | |
Textiles — 0.8% | | | | |
Mohawk Industries, Inc. (b) | | | 15,167 | | | | 1,565,083 | |
| | | | | | | | | |
Transportation — 0.5% | | | | |
Kirby Corp. (b) | | | 13,653 | | | | 525,504 | |
Schneider National, Inc. - Class B | | | 20,000 | | | | 441,200 | |
| | | | | | | | 966,704 | |
TOTAL COMMON STOCKS (Cost $189,804,532) | | | | | | | 191,021,874 | |
| | | | | |
PREFERRED STOCKS — 0.3% | | | | |
| | | | | | | | | |
Retail — 0.3% | | | | |
Qurate Retail, Inc. (b) | | | 6,596 | | | | 645,242 | |
TOTAL PREFERRED STOCKS (Cost $475,917) | | | | | | | 645,242 | |
| | | | | |
REAL ESTATE INVESTMENT TRUSTS — 2.4% | | | | |
Corporate Office Properties Trust | | | 26,541 | | | | 595,315 | |
Equity Commonwealth | | | 3,599 | | | | 95,085 | |
New Residential Investment Corp. | | | 536,996 | | | | 4,027,470 | |
TOTAL REAL ESTATE INVESTMENT TRUSTS (Cost $4,947,214) | | | | | | | 4,717,870 | |
The accompanying notes are an integral part of the financial statements.
65
Pacer US Cash Cows 100 ETF
SCHEDULE OF INVESTMENTS
October 31, 2020 (Unaudited) (Continued)
| | | Principal
Amount | | | Value | |
| SHORT-TERM INVESTMENTS — 0.3% | | | |
| | | | | | | |
| Money Market Deposit Accounts — 0.3% | | | | | | | | |
| U.S. Bank Money Market Deposit Account, 0.025% (c) | | $ | 553,012 | | | $ | 553,012 | |
| TOTAL SHORT-TERM INVESTMENTS (Cost $553,012) | | | | | | | 553,012 | |
| | | | | | | | | |
| | | | Shares | | | | | |
| INVESTMENTS PURCHASED WITH PROCEEDS FROM SECURITIES LENDING — 10.3% | | | | | | | | |
| Mount Vernon Liquid Assets Portfolio, LLC, 0.16% (c) | | | 20,197,179 | | | | 20,197,179 | |
| TOTAL INVESTMENTS PURCHASED WITH PROCEEDS FROM SECURITIES LENDING (Cost $20,197,179) | | | | | | | 20,197,179 | |
| Total Investments (Cost $215,977,854) — 110.2% | | | | | | | 217,135,177 | |
| Liabilities in Excess of Other Assets — (10.2)% | | | | | | | (20,145,987 | ) |
| TOTAL NET ASSETS — 100.0% | | | | | | $ | 196,989,190 | |
Percentages are stated as a percent of net assets.
| | (a) | All or a portion of this security is on loan as of October 31, 2020. The total value of securities on loan is $19,954,099 or 10.1% of net assets. |
| | (b) | Non-income producing security. |
| | (c) | The rate shown is as of October 31, 2020. |
For Fund compliance purposes, the Fund’s industry classifications refer to any one or more of the industry sub-classifications used by one or more widely recognized market indexes or ratings group indexes, and/or they may be defined by Fund management. This definition does not apply for all purposes of this report, which may combine sub-classifications for reporting ease. Categories are shown as a percentage of net assets.
The accompanying notes are an integral part of the financial statements.
66
Pacer US Small Cap Cash Cows 100 ETF
SCHEDULE OF INVESTMENTS
October 31, 2020 (Unaudited)
| | | Shares | | | Value | |
COMMON STOCKS — 98.4% | | | | |
| | | | | | | | | |
Aerospace/Defense — 1.3% | | | | |
Aerojet Rocketdyne Holdings, Inc. (a) | | | 14,616 | | | $ | 473,851 | |
| | | | | | | | | |
Agriculture — 4.4% | | | | |
The Andersons, Inc. | | | 41,908 | | | | 908,985 | |
Vector Group Ltd. | | | 69,795 | | | | 641,416 | |
| | | | | | | | 1,550,401 | |
Airlines — 1.7% | | | | |
SkyWest, Inc. | | | 20,462 | | | | 594,012 | |
| | | | | | | | | |
Apparel — 1.6% | | | | |
Steven Madden Ltd. | | | 20,845 | | | | 500,489 | |
Unifi, Inc. (a) | | | 5,190 | | | | 77,798 | |
| | | | | | | | 578,287 | |
Auto Parts & Equipment — 3.0% | | | | |
Cooper Tire & Rubber Co. | | | 13,089 | | | | 450,131 | |
Dorman Products, Inc. (a) | | | 5,803 | | | | 518,034 | |
Motorcar Parts of America, Inc. (a) | | | 5,784 | | | | 85,198 | |
| | | | | | | | 1,053,363 | |
Biotechnology — 1.4% | | | | |
Innoviva, Inc. (a)(b) | | | 46,600 | | | | 503,746 | |
| | | | | | | | | |
Building Materials — 4.4% | | | | |
Apogee Enterprises, Inc. | | | 10,454 | | | | 249,746 | |
Boise Cascade Co. | | | 10,410 | | | | 399,536 | |
UFP Industries, Inc. | | | 11,661 | | | | 582,000 | |
US Concrete, Inc. (a) | | | 9,955 | | | | 338,072 | |
| | | | | | | | 1,569,354 | |
Coal — 1.0% | | | | |
SunCoke Energy, Inc. | | | 57,745 | | | | 201,530 | |
Warrior Met Coal, Inc. | | | 11,195 | | | | 167,925 | |
| | | | | | | | 369,455 | |
Commercial Services — 7.6% | | | | |
ABM Industries, Inc. | | | 19,186 | | | | 666,138 | |
American Public Education, Inc. (a) | | | 2,775 | | | | 78,449 | |
Deluxe Corp. | | | 16,949 | | | | 363,387 | |
Heidrick & Struggles International, Inc. | | | 6,072 | | | | 138,745 | |
Kelly Services, Inc. - Class A | | | 23,900 | | | | 415,382 | |
Korn/Ferry International | | | 14,399 | | | | 434,706 | |
Perdoceo Education Corp. (a) | | | 19,592 | | | | 221,194 | |
Resources Connection, Inc. | | | 8,050 | | | | 86,457 | |
TrueBlue, Inc. (a) | | | 17,549 | | | | 272,360 | |
| | | | | | | | 2,676,818 | |
Computers — 1.9% | | | | |
Insight Enterprises, Inc. (a) | | | 12,350 | | | | 658,872 | |
| | | | | | | | | |
Distribution/Wholesale — 4.3% | | | | |
Core-Mark Holding Co, Inc. | | | 14,987 | | | | 409,894 | |
| | | Shares | | | Value | |
Distribution/Wholesale — 4.3% (Continued) |
G-III Apparel Group Ltd. (a) | | | 48,594 | | | $ | 655,047 | |
ScanSource, Inc. (a) | | | 22,727 | | | | 456,813 | |
| | | | | | | | 1,521,754 | |
Electrical Components & Equipment — 1.3% | | | | |
Encore Wire Corp. | | | 3,362 | | | | 155,358 | |
Insteel Industries, Inc. | | | 8,021 | | | | 174,537 | |
Powell Industries, Inc. | | | 6,193 | | | | 146,341 | |
| | | | | | | | 476,236 | |
Electronics — 3.7% | | | | |
Bel Fuse, Inc. - Class B | | | 4,546 | | | | 53,233 | |
Comtech Telecommunications Corp. | | | 6,196 | | | | 89,222 | |
Sanmina Corp. (a) | | | 23,250 | | | | 568,230 | |
SMART Global Holdings, Inc. (a) | | | 6,771 | | | | 178,687 | |
TTM Technologies, Inc. (a) | | | 35,102 | | | | 416,661 | |
| | | | | | | | 1,306,033 | |
Energy-Alternate Sources — 3.3% | | | | |
FutureFuel Corp. | | | 16,985 | | | | 201,952 | |
Renewable Energy Group, Inc. (a) | | | 16,971 | | | | 957,164 | |
| | | | | | | | 1,159,116 | |
Engineering & Construction — 3.9% | | | | |
Aegion Corp. (a) | | | 13,339 | | | | 188,213 | |
Arcosa, Inc. | | | 10,737 | | | | 495,727 | |
Comfort Systems USA, Inc. | | | 9,480 | | | | 434,184 | |
MYR Group, Inc. (a) | | | 5,897 | | | | 252,097 | |
| | | | | | | | 1,370,221 | |
Food — 3.5% | | | | |
Seneca Foods Corp. (a) - Class A | | | 5,693 | | | | 209,787 | |
SpartanNash Co. | | | 22,561 | | | | 415,348 | |
United Natural Foods, Inc. (a) | | | 41,771 | | | | 608,604 | |
| | | | | | | | 1,233,739 | |
Forest Products & Paper — 0.5% | | | | |
Glatfelter Corp. | | | 12,834 | | | | 183,141 | |
| | | | | | | | | |
Healthcare-Services — 4.5% | | | | |
The Providence Service Corp. (a) | | | 3,882 | | | | 456,329 | |
RadNet, Inc. (a) | | | 27,462 | | | | 398,474 | |
Select Medical Holdings Corp. (a) | | | 35,721 | | | | 749,426 | |
| | | | | | | | 1,604,229 | |
Home Builders — 1.7% | | | | |
Meritage Homes Corp. (a) | | | 7,015 | | | | 610,936 | |
| | | | | | | | | |
Home Furnishings — 0.6% | | | | |
Daktronics, Inc. | | | 9,879 | | | | 38,528 | |
Ethan Allen Interiors, Inc. | | | 9,832 | | | | 157,804 | |
| | | | | | | | 196,332 | |
Household Products/Wares — 0.5% | | | | |
Quanex Building Products Corp. | | | 9,366 | | | | 170,461 | |
| | | | | | | | | |
The accompanying notes are an integral part of the financial statements.
67
Pacer US Small Cap Cash Cows 100 ETF
SCHEDULE OF INVESTMENTS
October 31, 2020 (Unaudited) (Continued)
| | | Shares | | | Value | |
COMMON STOCKS — 98.4% (Continued) |
| | | | | | | | | |
Leisure Time — 1.0% | | | | |
Vista Outdoor, Inc. (a) | | | 16,989 | | | $ | 335,873 | |
| | | | | |
Machinery-Construction & Mining — 0.7% | | | | |
Astec Industries, Inc. | | | 5,001 | | | | 254,051 | |
| | | | | | | | | |
Machinery-Diversified — 0.4% | | | | |
DXP Enterprises Inc/TX (a)(b) | | | 9,919 | | | | 155,133 | |
| | | | | | | | | |
Metal Fabricate/Hardware — 2.3% | | | | |
AZZ, Inc. | | | 6,401 | | | | 215,009 | |
Mueller Industries, Inc. | | | 16,101 | | | | 465,802 | |
Olympic Steel, Inc. | | | 11,624 | | | | 132,630 | |
| | | | | | | | 813,441 | |
Mining — 1.2% | | | | |
Kaiser Aluminum Corp. | | | 6,556 | | | | 412,569 | |
| | | | | | | | | |
Miscellaneous Manufacturing — 1.0% | | | | |
Lydall, Inc. (a) | | | 6,632 | | | | 131,247 | |
Sturm Ruger & Co, Inc. | | | 3,400 | | | | 227,324 | |
| | | | | | | | 358,571 | |
Oil & Gas Services — 0.1% | | | | |
Matrix Service Co. (a) | | | 6,543 | | | | 49,727 | |
| | | | | | | | | |
Pharmaceuticals — 5.6% | | | | |
Coherus Biosciences, Inc. (a) | | | 15,132 | | | | 252,250 | |
Corcept Therapeutics, Inc. (a) | | | 19,005 | | | | 318,904 | |
Owens & Minor, Inc. | | | 29,991 | | | | 753,374 | |
Supernus Pharmaceuticals, Inc. (a) | | | 15,994 | | | | 293,650 | |
USANA Health Sciences, Inc. (a) | | | 3,714 | | | | 280,964 | |
Vanda Pharmaceuticals, Inc. (a) | | | 7,506 | | | | 80,239 | |
| | | | | | | | 1,979,381 | |
Retail — 23.5% | | | | |
Asbury Automotive Group, Inc. (a) | | | 6,668 | | | | 686,671 | |
Big Lots, Inc. | | | 14,762 | | | | 702,671 | |
Conn’s, Inc. (a) | | | 55,604 | | | | 521,010 | |
Foundation Building Materials, Inc. (a) | | | 26,771 | | | | 389,786 | |
Genesco, Inc. (a) | | | 15,469 | | | | 274,111 | |
GMS, Inc. (a) | | | 22,704 | | | | 513,110 | |
Group 1 Automotive, Inc. | | | 7,877 | | | | 835,592 | |
Guess?, Inc. | | | 37,036 | | | | 436,284 | |
Haverty Furniture Cos, Inc. | | | 5,237 | | | | 131,030 | |
Hibbett Sports, Inc. (a) | | | 8,788 | | | | 332,274 | |
La-Z-Boy, Inc. | | | 16,235 | | | | 555,724 | |
Lumber Liquidators Holdings, Inc. (a) | | | 8,801 | | | | 194,678 | |
MarineMax, Inc. (a) | | | 14,170 | | | | 424,817 | |
Michaels Cos., Inc. (a) | | | 67,913 | | | | 550,774 | |
Movado Group, Inc. | | | 7,731 | | | | 84,345 | |
| | | Shares | | | Value | |
Retail — 23.5% (Continued) | | | | | | | | |
PC Connection, Inc. | | | 5,082 | | | $ | 231,485 | |
Shoe Carnival, Inc. (b) | | | 5,843 | | | | 181,016 | |
Sonic Automotive, Inc. - Class A | | | 17,468 | | | | 629,896 | |
The Buckle, Inc. | | | 12,782 | | | | 306,257 | |
Zumiez, Inc. (a) | | | 11,527 | | | | 322,756 | |
| | | | | | | | 8,304,287 | |
Semiconductors — 1.6% | | | | |
Axcelis Technologies, Inc. (a) | | | 5,366 | | | | 118,428 | |
Photronics, Inc. (a) | | | 14,715 | | | | 143,471 | |
Rambus, Inc. (a) | | | 22,687 | | | | 312,854 | |
| | | | | | | | 574,753 | |
Software — 0.3% | | | | |
Computer Programs & Systems, Inc. | | | 3,178 | | | | 88,634 | |
| | | | | | | | | |
Telecommunications — 0.6% | | | | |
NETGEAR, Inc. (a) | | | 6,710 | | | | 206,802 | |
| | | | | | | | | |
Transportation — 4.0% | | | | |
ArcBest Corp. | | | 5,595 | | | | 170,760 | |
Atlas Air Worldwide Holdings, Inc. (a) | | | 12,196 | | | | 721,515 | |
Dorian LPG Ltd. (a) | | | 41,721 | | | | 342,112 | |
SEACOR Holdings, Inc. (a) | | | 5,395 | | | | 165,249 | |
| | | | | | | | 1,399,636 | |
TOTAL COMMON STOCKS (Cost $33,335,924) | | | | | | | 34,793,215 | |
| | | | | |
REAL ESTATE INVESTMENT TRUSTS — 1.4% | | | | |
CoreCivic, Inc. (b) | | | 74,042 | | | | 474,610 | |
TOTAL REAL ESTATE INVESTMENT TRUSTS (Cost $627,843) | | | | | | | 474,610 | |
| | | Principal
Amount | | | | | |
SHORT-TERM INVESTMENTS — 0.2% | | | | |
| | | | | | | | | |
Money Market Deposit Accounts — 0.2% | | | | |
U.S. Bank Money Market Deposit Account, 0.025% (c) | | $ | 70,885 | | | | 70,885 | |
TOTAL SHORT-TERM INVESTMENTS (Cost $70,885) | | | | | | | 70,885 | |
The accompanying notes are an integral part of the financial statements.
68
Pacer US Small Cap Cash Cows 100 ETF
SCHEDULE OF INVESTMENTS
October 31, 2020 (Unaudited) (Continued)
| | | Shares | | | Value | |
INVESTMENTS PURCHASED WITH PROCEEDS FROM SECURITIES LENDING — 3.5% | | | | |
Mount Vernon Liquid Assets Portfolio, LLC, 0.16% (c) | | | 1,235,495 | | | $ | 1,235,495 | |
TOTAL INVESTMENTS PURCHASED WITH PROCEEDS FROM SECURITIES LENDING (Cost $1,235,495) | | | | | | | 1,235,495 | |
Total Investments (Cost $35,270,147) — 103.5% | | | | | | | 36,574,205 | |
Liabilities in Excess of Other Assets — (3.5)% | | | | | | | (1,224,768 | ) |
TOTAL NET ASSETS — 100.0% | | | | | | $ | 35,349,437 | |
Percentages are stated as a percent of net assets.
| | (a) | Non-income producing security. |
| | (b) | All or a portion of this security is on loan as of October 31, 2020. The total value of securities on loan is $1,206,780 or 3.4% of net assets. |
| | (c) | The rate shown is as of October 31, 2020. |
For Fund compliance purposes, the Fund’s industry classifications refer to any one or more of the industry sub-classifications used by one or more widely recognized market indexes or ratings group indexes, and/or they may be defined by Fund management. This definition does not apply for all purposes of this report, which may combine sub-classifications for reporting ease. Categories are shown as a percentage of net assets.
The accompanying notes are an integral part of the financial statements.
69
Pacer Developed Markets International Cash Cows 100 ETF
SCHEDULE OF INVESTMENTS
October 31, 2020 (Unaudited)
| | | Shares | | | Value | |
COMMON STOCKS — 96.7% | | | | |
| | | | | | | | | |
Australia — 6.7% | | | | |
AGL Energy Ltd. | | | 4,472 | | | $ | 39,229 | |
Ampol Ltd. | | | 1,387 | | | | 25,289 | |
BHP Billiton Ltd. - ADR (a) | | | 5,034 | | | | 242,186 | |
Fortescue Metals Group Ltd. | | | 25,576 | | | | 312,266 | |
Santos Ltd. | | | 20,402 | | | | 67,831 | |
South32 Ltd. | | | 30,282 | | | | 43,209 | |
Woodside Petroleum Ltd. | | | 8,812 | | | | 108,518 | |
| | | | | | | | 838,528 | |
Austria — 0.8% | | | | |
OMV AG | | | 4,161 | | | | 95,468 | |
| | | | | | | | | |
Canada — 2.8% | | | | |
Loblaw Cos Ltd. | | | 3,409 | | | | 169,695 | |
Magna International, Inc. (a) | | | 3,610 | | | | 184,507 | |
| | | | | | | | 354,202 | |
Denmark — 3.4% | | | | |
AP Moller - Maersk A/S - Class B | | | 216 | | | | 345,019 | |
Pandora A/S | | | 1,019 | | | | 80,697 | |
| | | | | | | | 425,716 | |
Finland — 1.7% | | | | |
Fortum OYJ | | | 6,644 | | | | 124,967 | |
Stora Enso OYJ - Class R | | | 5,683 | | | | 82,899 | |
| | | | | | | | 207,866 | |
France — 11.1% | | | | |
Atos SE (b) | | | 949 | | | | 64,768 | |
Bouygues SA | | | 3,360 | | | | 110,157 | |
Capgemini SE | | | 1,136 | | | | 131,166 | |
Cie de Saint-Gobain (b) | | | 4,109 | | | | 160,315 | |
Cie Generale des Etablissements Michelin | | | 1,033 | | | | 111,453 | |
Edenred | | | 1,112 | | | | 51,855 | |
Eiffage SA (b) | | | 1,117 | | | | 81,073 | |
Peugeot SA (b) | | | 14,575 | | | | 261,920 | |
Publicis Groupe SA | | | 4,492 | | | | 155,901 | |
Thales SA | | | 1,154 | | | | 75,103 | |
TOTAL SA - ADR (a) | | | 5,952 | | | | 180,524 | |
| | | | | | | | 1,384,235 | |
Germany — 2.0% | | | | |
Continental AG | | | 1,311 | | | | 139,371 | |
HeidelbergCement AG | | | 1,862 | | | | 106,520 | |
| | | | | | | | 245,891 | |
Hong Kong — 1.1% | | | | |
Galaxy Entertainment Group Ltd. | | | 20,827 | | | | 137,279 | |
| | | | | | | | | |
Ireland — 1.4% | | | | |
CRH PLC - ADR | | | 4,855 | | | | 170,653 | |
| | | | | | | | | |
| | | Shares | | | Value | |
Italy — 3.2% | | | | |
Eni SpA - ADR (a) | | | 12,093 | | | $ | 169,060 | |
Prysmian SpA | | | 1,762 | | | | 47,896 | |
Telecom Italia SpA | | | 542,519 | | | | 184,119 | |
| | | | | | | | 401,075 | |
Japan — 22.2% | | | | |
Asahi Group Holdings Ltd. | | | 3,142 | | | | 96,725 | |
Bridgestone Corp. | | | 3,530 | | | | 114,301 | |
ENEOS Holdings, Inc. | | | 68,404 | | | | 229,070 | |
FamilyMart UNY Holdings Co Ltd. | | | 4,003 | | | | 87,481 | |
Fujitsu Ltd. | | | 1,048 | | | | 122,373 | |
ITOCHU Corp. | | | 12,037 | | | | 287,430 | |
KDDI Corp. | | | 8,908 | | | | 237,601 | |
Marubeni Corp. | | | 30,241 | | | | 156,902 | |
Mitsubishi Chemical Holdings Corp. | | | 25,911 | | | | 145,079 | |
Nexon Co. Ltd. | | | 3,642 | | | | 101,543 | |
Nitto Denko Corp. | | | 583 | | | | 40,706 | |
NTT DOCOMO, Inc. | | | 9,766 | | | | 362,581 | |
Renesas Electronics Corp. (b) | | | 16,925 | | | | 139,189 | |
Seven & i Holdings Co. Ltd. | | | 4,346 | | | | 131,964 | |
Shionogi & Co. Ltd. | | | 1,503 | | | | 70,689 | |
Showa Denko KK | | | 1,014 | | | | 17,114 | |
Skylark Holdings Co Ltd. | | | 1,392 | | | | 19,771 | |
Sony Corp. - ADR (a) | | | 3,934 | | | | 329,118 | |
Welcia Holdings Co Ltd. | | | 868 | | | | 33,992 | |
Yamato Holdings Co. Ltd. | | | 2,017 | | | | 53,057 | |
| | | | | | | | 2,776,686 | |
Jersey — 0.9% | | | | |
WPP PLC - ADR (a) | | | 2,907 | | | | 116,135 | |
| | | | | | | | | |
Luxembourg — 1.4% | | | | |
ArcelorMittal (b) | | | 12,683 | | | | 172,114 | |
| | | | | | | | | |
Netherlands — 3.1% | | | | |
ASM International NV | | | 234 | | | | 33,467 | |
Koninklijke Ahold Delhaize NV | | | 9,758 | | | | 268,091 | |
Randstad Holding NV (b) | | | 1,754 | | | | 87,656 | |
| | | | | | | | 389,214 | |
Republic of Korea — 7.4% | | | | |
Hyundai Engineering & Construction Co Ltd. | | | 2,767 | | | | 74,741 | |
Hyundai Mobis Co. Ltd. | | | 565 | | | | 112,283 | |
Kia Motors Corp. | | | 4,651 | | | | 206,994 | |
POSCO - ADR | | | 4,369 | | | | 202,328 | |
Samsung Electronics Co. Ltd. | | | 5,648 | | | | 281,728 | |
Samsung SDS Co Ltd. | | | 271 | | | | 40,243 | |
| | | | | | | | 918,317 | |
Spain — 5.2% | | | | |
ACS Actividades de Construccion y Servicios SA | | | 3,236 | | | | 76,883 | |
Enagas SA | | | 2,164 | | | | 46,701 | |
The accompanying notes are an integral part of the financial statements.
70
Pacer Developed Markets International Cash Cows 100 ETF
SCHEDULE OF INVESTMENTS
October 31, 2020 (Unaudited) (Continued)
| | | Shares | | | Value | |
COMMON STOCKS — 96.7% (Continued) |
| | | | | | | | | |
Spain — 5.2% (Continued) |
Industria de Diseno Textil SA | | | 8,332 | | | $ | 205,624 | |
Naturgy Energy Group SA | | | 8,437 | | | | 156,727 | |
Telefonica SA - ADR (a) | | | 49,321 | | | | 163,746 | |
| | | | | | | | 649,681 | |
Sweden — 3.2% | | | | |
Hennes & Mauritz AB - Class B | | | 9,841 | | | | 159,917 | |
ICA Gruppen AB | | | 1,131 | | | | 53,548 | |
Lundin Energy AB | | | 1,725 | | | | 32,926 | |
Skanska AB - Class B | | | 2,245 | | | | 42,209 | |
SKF AB | | | 2,573 | | | | 52,684 | |
Tele2 AB | | | 4,670 | | | | 55,394 | |
| | | | | | | | 396,678 | |
Switzerland — 6.4% | | | | |
Adecco Group AG | | | 894 | | | | 43,874 | |
Glencore PLC (b) | | | 112,748 | | | | 227,716 | |
Kuehne + Nagel International AG - Class R | | | 584 | | | | 116,615 | |
LafargeHolcim Ltd. | | | 4,903 | | | | 210,407 | |
The Swatch Group AG | | | 251 | | | | 53,091 | |
Swisscom AG | | | 305 | | | | 155,103 | |
| | | | | | | | 806,806 | |
United Kingdom — 12.7% | | | | |
Anglo American PLC | | | 8,088 | | | | 189,778 | |
Antofagasta PLC | | | 6,673 | | | | 88,999 | |
Barratt Developments PLC (b) | | | 5,766 | | | | 36,042 | |
Berkeley Group Holdings PLC | | | 648 | | | | 34,058 | |
Bunzl Plc | | | 2,054 | | | | 63,863 | |
Imperial Brands PLC | | | 13,545 | | | | 214,783 | |
J Sainsbury PLC | | | 37,452 | | | | 97,815 | |
Kingfisher PLC (b) | | | 15,376 | | | | 57,190 | |
Meggitt Plc (b) | | | 4,242 | | | | 15,019 | |
Next PLC | | | 881 | | | | 66,654 | |
Persimmon PLC | | | 1,635 | | | | 49,480 | |
Rio Tinto PLC - ADR (a) | | | 4,514 | | | | 256,260 | |
Rolls-Royce Holdings PLC (b) | | | 14,141 | | | | 13,066 | |
Royal Dutch Shell PLC - ADR (a) | | | 7,110 | | | | 171,707 | |
Taylor Wimpey PLC (b) | | | 22,048 | | | | 30,220 | |
Vodafone Group PLC - ADR | | | 14,587 | | | | 197,070 | |
| | | | | | | | 1,582,004 | |
TOTAL COMMON STOCKS (Cost $13,451,439) | | | | | | | 12,068,548 | |
| | | | | |
CONTINGENT VALUE RIGHTS — 0.2% | | | | |
Rolls-Royce Holdings PLC - NIL | | | 47,137 | | | | 23,816 | |
TOTAL CONTINGENT VALUE RIGHTS (Cost $0) | | | | | | | 23,816 | |
| | | | | |
| | | Shares | | | Value | |
PREFERRED STOCKS — 1.5% | | | | |
| | | | | | | | | |
Germany — 1.5% | | | | |
Henkel AG & Co. KGaA | | | 1,899 | | | $ | 184,718 | |
TOTAL PREFERRED STOCKS (Cost $194,541) | | | | | | | 184,718 | |
| | | | | |
REAL ESTATE INVESTMENT TRUSTS — 0.7% | | | | |
| | | | | | | | | |
Australia — 0.3% | | | | |
STOCKLAND | | | 14,673 | | | | 39,708 | |
| | | | | | | | | |
United Kingdom — 0.4% | | | | |
The British Land Co. PLC | | | 9,950 | | | | 44,936 | |
TOTAL REAL ESTATE INVESTMENT TRUSTS (Cost $76,002) | | | | | | | 84,644 | |
| | | Principal
Amount | | | | | |
SHORT-TERM INVESTMENTS — 0.1% | | | | |
| | | | | | | | | |
Money Market Depost Accounts — 0.1% | | | | |
U.S. Bank Money Market Deposit Account, 0.025% (c) | | $ | 11,581 | | | | 11,581 | |
TOTAL SHORT-TERM INVESTMENTS (Cost $11,581) | | | | | | | 11,581 | |
| | | Shares | | | | | |
INVESTMENTS PURCHASED WITH PROCEEDS FROM SECURITIES LENDING — 13.4% | | | | |
Mount Vernon Liquid Assets Portfolio, LLC, 0.16% (c) | | | 1,678,843 | | | | 1,678,843 | |
TOTAL INVESTMENTS PURCHASED WITH PROCEEDS FROM SECURITIES LENDING (Cost $1,678,843) | | | | | | | 1,678,843 | |
Total Investments (Cost $15,412,406) — 112.6% | | | | | | | 14,052,150 | |
Liabilities in Excess of Other Assets — (12.6)% | | | | | | | (1,577,718 | ) |
TOTAL NET ASSETS — 100.0% | | | | | | $ | 12,474,432 | |
Percentages are stated as a percent of net assets.
ADR | American Depositary Receipt |
| | (a) | All or a portion of this security is on loan as of October 31, 2020. The total value of securities on loan is $1,646,597 or 13.2% of net assets. |
| | (b) | Non-income producing security. |
| | (c) | The rate shown is as of October 31, 2020. |
The accompanying notes are an integral part of the financial statements.
71
Pacer WealthShield ETF
SCHEDULE OF INVESTMENTS
October 31, 2020 (Unaudited)
| | | Shares | | | Value | |
COMMON STOCKS — 99.5% | | | | |
| | | | | | | | | |
Apparel — 1.3% | | | | |
Hanesbrands, Inc. (a) | | | 1,330 | | | $ | 21,373 | |
NIKE, Inc. - Class B | | | 3,818 | | | | 458,465 | |
PVH Corp. | | | 272 | | | | 15,855 | |
Ralph Lauren Corp. (a) | | | 183 | | | | 12,234 | |
Tapestry, Inc. (a) | | | 1,055 | | | | 23,453 | |
Under Armour, Inc. - Class A (b) | | | 721 | | | | 9,979 | |
Under Armour, Inc. - Class C (a)(b) | | | 750 | | | | 9,172 | |
VF Corp. | | | 982 | | | | 65,990 | |
| | | | | | | | 616,521 | |
Auto Manufacturers — 0.5% | | | | |
Ford Motor Co. | | | 11,973 | | | | 92,551 | |
General Motors Co. | | | 3,856 | | | | 133,148 | |
| | | | | | | | 225,699 | |
Auto Parts & Equipment — 0.2% | | | | |
Aptiv PLC (a) | | | 827 | | | | 79,797 | |
BorgWarner, Inc. | | | 635 | | | | 22,213 | |
| | | | | | | | 102,010 | |
Banks — 0.3% | | | | |
Morgan Stanley | | | 2,942 | | | | 141,657 | |
| | | | | | | | | |
Biotechnology — 15.9% | | | | |
ACADIA Pharmaceuticals, Inc. (a)(b) | | | 2,516 | | | | 116,868 | |
Acceleron Pharma, Inc. (a)(b) | | | 1,018 | | | | 106,462 | |
Adverum Biotechnologies, Inc. (b) | | | 7,449 | | | | 81,269 | |
Agenus, Inc. (b) | | | 7,373 | | | | 27,206 | |
Alexion Pharmaceuticals, Inc. (b) | | | 876 | | | | 100,863 | |
Allakos, Inc. (a)(b) | | | 978 | | | | 93,037 | |
Allogene Therapeutics, Inc. (a)(b) | | | 2,849 | | | | 96,638 | |
Alnylam Pharmaceuticals, Inc. (b) | | | 749 | | | | 92,105 | |
Amgen, Inc. (a) | | | 377 | | | | 81,786 | |
Amicus Therapeutics, Inc. (b) | | | 7,155 | | | | 127,574 | |
AnaptysBio, Inc. (b) | | | 1,367 | | | | 40,272 | |
Apellis Pharmaceuticals, Inc. (a)(b) | | | 3,307 | | | | 105,493 | |
Arcturus Therapeutics Holdings, Inc. (b) | | | 2,389 | | | | 129,197 | |
Arcus Biosciences, Inc. (b) | | | 3,268 | | | | 71,242 | |
Ardelyx, Inc. (b) | | | 3,276 | | | | 16,740 | |
Arena Pharmaceuticals, Inc. (b) | | | 1,457 | | | | 124,894 | |
Arrowhead Pharmaceuticals, Inc. (a)(b) | | | 2,778 | | | | 159,179 | |
Assembly Biosciences, Inc. (b) | | | 808 | | | | 11,910 | |
Atara Biotherapeutics, Inc. (b) | | | 3,319 | | | | 42,848 | |
Athersys, Inc. (a)(b) | | | 16,110 | | | | 28,193 | |
Avrobio, Inc. (b) | | | 1,015 | | | | 14,494 | |
BioCryst Pharmaceuticals, Inc. (a)(b) | | | 23,891 | | | | 91,264 | |
Biogen, Inc. (b) | | | 345 | | | | 86,964 | |
Biohaven Pharmaceutical Holding Co Ltd. (b) | | | 1,552 | | | | 120,218 | |
| | | Shares | | | Value | |
Biotechnology — 15.9% (Continued) |
BioMarin Pharmaceutical, Inc. (b) | | | 1,281 | | | $ | 95,345 | |
Bluebird Bio, Inc. (a)(b) | | | 1,738 | | | | 89,872 | |
Blueprint Medicines Corp. (b) | | | 1,387 | | | | 141,862 | |
Bridgebio Pharma, Inc. (a)(b) | | | 2,053 | | | | 78,794 | |
CEL-SCI Corp. (a)(b) | | | 2,167 | | | | 26,069 | |
ChemoCentryx, Inc. (b) | | | 1,916 | | | | 91,968 | |
Constellation Pharmaceuticals, Inc. (b) | | | 3,023 | | | | 59,311 | |
Corteva, Inc. | | | 10,140 | | | | 334,417 | |
Cue Biopharma, Inc. (b) | | | 1,555 | | | | 17,323 | |
CytomX Therapeutics, Inc. (b) | | | 2,379 | | | | 15,749 | |
Deciphera Pharmaceuticals, Inc. (a)(b) | | | 1,890 | | | | 109,752 | |
Denali Therapeutics, Inc. (a)(b) | | | 1,824 | | | | 78,031 | |
Dicerna Pharmaceuticals, Inc. (a)(b) | | | 3,448 | | | | 72,374 | |
Dynavax Technologies Corp. (a)(b) | | | 18,398 | | | | 68,625 | |
Editas Medicine, Inc. (a)(b) | | | 3,076 | | | | 95,171 | |
Emergent BioSolutions, Inc. (b) | | | 944 | | | | 84,932 | |
Epizyme, Inc. (b) | | | 5,187 | | | | 64,111 | |
Esperion Therapeutics, Inc. (a)(b) | | | 2,356 | | | | 70,609 | |
Exact Sciences Corp. (a)(b) | | | 1,199 | | | | 148,472 | |
Exelixis, Inc. (b) | | | 4,247 | | | | 86,979 | |
Fate Therapeutics, Inc. (a)(b) | | | 2,748 | | | | 122,011 | |
FibroGen, Inc. (a)(b) | | | 2,186 | | | | 83,899 | |
Geron Corp. (b) | | | 12,617 | | | | 21,954 | |
Gilead Sciences, Inc. | | | 1,406 | | | | 81,759 | |
Gossamer Bio, Inc. (b) | | | 2,222 | | | | 18,443 | |
Halozyme Therapeutics, Inc. (a)(b) | | | 3,409 | | | | 95,452 | |
IGM Biosciences, Inc. (b) | | | 347 | | | | 18,318 | |
ImmunoGen, Inc. (b) | | | 10,860 | | | | 61,250 | |
Immunovant, Inc. (b) | | | 1,005 | | | | 43,838 | |
Incyte Corp. (b) | | | 1,047 | | | | 90,712 | |
Inovio Pharmaceuticals, Inc. (a)(b) | | | 9,149 | | | | 90,118 | |
Insmed, Inc. (a)(b) | | | 3,234 | | | | 106,528 | |
Intercept Pharmaceuticals, Inc. (a)(b) | | | 2,211 | | | | 61,444 | |
Ionis Pharmaceuticals, Inc. (b) | | | 1,756 | | | | 82,444 | |
Iovance Biotherapeutics, Inc. (b) | | | 2,907 | | | | 103,722 | |
Karuna Therapeutics, Inc. (b) | | | 909 | | | | 73,802 | |
Karyopharm Therapeutics, Inc. (a)(b) | | | 6,496 | | | | 96,271 | |
Kodiak Sciences, Inc. (b) | | | 1,265 | | | | 114,875 | |
Krystal Biotech, Inc. (b) | | | 603 | | | | 25,923 | |
Ligand Pharmaceuticals, Inc. (a)(b) | | | 942 | | | | 77,668 | |
MacroGenics, Inc. (b) | | | 2,431 | | | | 47,186 | |
Mersana Therapeutics, Inc. (b) | | | 3,596 | | | | 64,800 | |
Mirati Therapeutics, Inc. (b) | | | 695 | | | | 150,912 | |
Moderna, Inc. (a)(b) | | | 1,554 | | | | 104,848 | |
Myriad Genetics, Inc. (b) | | | 3,741 | | | | 46,501 | |
Novavax, Inc. (a)(b) | | | 968 | | | | 78,127 | |
PDL BioPharma, Inc. (b) | | | 5,410 | | | | 11,632 | |
Precigen, Inc. (a)(b) | | | 4,524 | | | | 19,408 | |
The accompanying notes are an integral part of the financial statements.
72
Pacer WealthShield ETF
SCHEDULE OF INVESTMENTS
October 31, 2020 (Unaudited) (Continued)
| | | Shares | | | Value | |
COMMON STOCKS — 99.5% (Continued) |
| | | | | | | | | |
Biotechnology — 15.9% (Continued) |
Prothena Corp PLC (b) | | | 1,234 | | | $ | 13,463 | |
PTC Therapeutics, Inc. (a)(b) | | | 2,080 | | | | 108,555 | |
Puma Biotechnology, Inc. (b) | | | 4,163 | | | | 34,844 | |
Radius Health, Inc. (b) | | | 3,122 | | | | 41,866 | |
Regeneron Pharmaceuticals, Inc. (b) | | | 166 | | | | 90,231 | |
REGENXBIO, Inc. (b) | | | 2,288 | | | | 65,803 | |
Retrophin, Inc. (b) | | | 1,850 | | | | 37,444 | |
REVOLUTION Medicines, Inc. (b) | | | 858 | | | | 25,903 | |
Rigel Pharmaceuticals, Inc. (b) | | | 12,578 | | | | 31,193 | |
Rocket Pharmaceuticals, Inc. (b) | | | 1,593 | | | | 44,508 | |
Sage Therapeutics, Inc. (b) | | | 1,659 | | | | 121,737 | |
Sangamo Therapeutics, Inc. (a)(b) | | | 8,766 | | | | 90,640 | |
Seagen, Inc. (a)(b) | | | 620 | | | | 103,416 | |
Sorrento Therapeutics, Inc. (a)(b) | | | 14,592 | | | | 101,268 | |
SpringWorks Therapeutics, Inc. (b) | | | 780 | | | | 45,232 | |
Syndax Pharmaceuticals, Inc. (a)(b) | | | 1,229 | | | | 21,397 | |
Translate Bio, Inc. (b) | | | 7,093 | | | | 91,003 | |
Turning Point Therapeutics, Inc. (b) | | | 1,171 | | | | 107,954 | |
Twist Bioscience Corp. (b) | | | 1,479 | | | | 113,351 | |
Ultragenyx Pharmaceutical, Inc. (a)(b) | | | 1,251 | | | | 125,726 | |
United Therapeutics Corp. (b) | | | 886 | | | | 118,928 | |
VBI Vaccines, Inc. (a)(b) | | | 29,553 | | | | 69,450 | |
Veracyte, Inc. (b) | | | 2,087 | | | | 72,335 | |
Vericel Corp. (b) | | | 1,956 | | | | 36,245 | |
Vertex Pharmaceuticals, Inc. (b) | | | 360 | | | | 75,010 | |
Viela Bio, Inc. (b) | | | 1,562 | | | | 49,843 | |
Viking Therapeutics, Inc. (b) | | | 7,094 | | | | 39,939 | |
Xencor, Inc. (b) | | | 1,258 | | | | 48,282 | |
Y-mAbs Therapeutics, Inc. (b) | | | 932 | | | | 39,834 | |
ZIOPHARM Oncology, Inc. (b) | | | 9,517 | | | | 19,891 | |
| | | | | | | | 7,775,618 | |
Building Materials — 1.0% | | | | |
Martin Marietta Materials, Inc. | | | 849 | | | | 226,131 | |
Vulcan Materials Co. | | | 1,794 | | | | 259,843 | |
| | | | | | | | 485,974 | |
Chemicals — 13.2% | | | | |
Air Products & Chemicals, Inc. | | | 3,006 | | | | 830,377 | |
Albemarle Corp. (a) | | | 1,443 | | | | 134,502 | |
Celanese Corp. | | | 1,599 | | | | 181,502 | |
CF Industries Holdings, Inc. | | | 2,896 | | | | 79,959 | |
Dow, Inc. | | | 10,043 | | | | 456,856 | |
DuPont de Nemours, Inc. (a) | | | 9,936 | | | | 565,160 | |
Eastman Chemical Co. | | | 1,833 | | | | 148,180 | |
Ecolab, Inc. | | | 3,377 | | | | 619,983 | |
FMC Corp. | | | 1,755 | | | | 180,309 | |
International Flavors & Fragrances, Inc. (a) | | | 1,453 | | | | 149,165 | |
Linde PLC | | | 7,140 | | | | 1,573,228 | |
| | | Shares | | | Value | |
Chemicals — 13.2% (Continued) |
LyondellBasell Industries NV - Class A | | | 3,481 | | | $ | 238,274 | |
Mosaic Co. | | | 4,671 | | | | 86,413 | |
PPG Industries, Inc. | | | 3,198 | | | | 414,845 | |
Sherwin-Williams Co. | | | 1,113 | | | | 765,722 | |
| | | | | | | | 6,424,475 | |
Commercial Services — 2.1% | | | | |
2U, Inc. (a)(b) | | | 2,170 | | | | 79,965 | |
Automatic Data Processing, Inc. | | | 549 | | | | 86,720 | |
FleetCor Technologies, Inc. (b) | | | 124 | | | | 27,393 | |
Gartner, Inc. (b) | | | 135 | | | | 16,213 | |
Global Payments, Inc. | | | 383 | | | | 60,414 | |
PayPal Holdings, Inc. (b) | | | 4,131 | | | | 768,903 | |
| | | | | | | | 1,039,608 | |
Computers — 5.5% | | | | |
Accenture PLC - Class A | | | 803 | | | | 174,179 | |
Apple, Inc. | | | 20,355 | | | | 2,215,845 | |
Cognizant Technology Solutions Corp. - Class A | | | 688 | | | | 49,137 | |
DXC Technology Co. | | | 382 | | | | 7,036 | |
Fortinet, Inc. (b) | | | 201 | | | | 22,184 | |
Hewlett Packard Enterprise Co. | | | 1,936 | | | | 16,727 | |
HP, Inc. | | | 1,736 | | | | 31,179 | |
International Business Machines Corp. | | | 1,131 | | | | 126,288 | |
Leidos Holdings, Inc. | | | 200 | | | | 16,600 | |
NetApp, Inc. | | | 333 | | | | 14,615 | |
Seagate Technology PLC (a) | | | 339 | | | | 16,211 | |
Western Digital Corp. | | | 452 | | | | 17,054 | |
| | | | | | | | 2,707,055 | |
Distribution/Wholesale — 0.1% | | | | |
LKQ Corp. (b) | | | 855 | | | | 27,351 | |
Pool Corp. | | | 120 | | | | 41,980 | |
| | | | | | | | 69,331 | |
Diversified Financial Services — 1.8% | | | | |
Charles Schwab Corp. | | | 4,232 | | | | 173,977 | |
MasterCard, Inc. - Class A | | | 1,122 | | | | 323,854 | |
Visa, Inc. - Class A (a) | | | 2,132 | | | | 387,406 | |
Western Union Co. | | | 618 | | | | 12,014 | |
| | | | | | | | 897,251 | |
Electronics — 0.4% | | | | |
Amphenol Corp. - Class A | | | 381 | | | | 42,992 | |
Flir Systems, Inc. | | | 196 | | | | 6,799 | |
Garmin Ltd. | | | 457 | | | | 47,537 | |
Keysight Technologies, Inc. (b) | | | 281 | | | | 29,469 | |
LENSAR, Inc. (b) | | | 411 | | | | 4,011 | |
TE Connectivity Ltd. | | | 420 | | | | 40,690 | |
| | | | | | | | 171,498 | |
Forest Products & Paper — 0.5% | | | | |
International Paper Co. (a) | | | 5,324 | | | | 232,925 | |
The accompanying notes are an integral part of the financial statements.
73
Pacer WealthShield ETF
SCHEDULE OF INVESTMENTS
October 31, 2020 (Unaudited) (Continued)
| | | Shares | | | Value | |
COMMON STOCKS — 99.5% (Continued) |
| | | | | | | | | |
Healthcare-Products — 0.4% | | | | |
CareDx, Inc. (b) | | | 2,296 | | | $ | 112,619 | |
Natera, Inc. (b) | | | 1,549 | | | | 104,186 | |
| | | | | | | | 216,805 | |
Healthcare-Services — 0.8% | | | | |
Invitae Corp. (a)(b) | | | 2,836 | | | | 111,200 | |
OPKO Health, Inc. (a)(b) | | | 30,838 | | | | 108,550 | |
Teladoc Health, Inc. (a)(b) | | | 870 | | | | 170,920 | |
| | | | | | | | 390,670 | |
Home Builders — 0.4% | | | | |
DR Horton, Inc. | | | 1,017 | | | | 67,946 | |
Lennar Corp. - Class A | | | 843 | | | | 59,204 | |
NVR, Inc. (b) | | | 13 | | | | 51,390 | |
PulteGroup, Inc. | | | 818 | | | | 33,341 | |
| | | | | | | | 211,881 | |
Home Furnishings — 0.1% | | | | |
Leggett & Platt, Inc. | | | 506 | | | | 21,115 | |
Whirlpool Corp. | | | 189 | | | | 34,958 | |
| | | | | | | | 56,073 | |
Household Products/Wares — 0.3% | | | | |
Avery Dennison Corp. | | | 1,131 | | | | 156,519 | |
| | | | | | | | | |
Housewares — 0.0% (c) | | | | |
Newell Brands, Inc. | | | 1,157 | | | | 20,433 | |
| | | | | | | | | |
Internet — 19.8% | | | | |
Alphabet, Inc. - Class A (b) | | | 266 | | | | 429,885 | |
Alphabet, Inc. - Class C (b) | | | 269 | | | | 436,052 | |
Amazon.com, Inc. (b) | | | 1,606 | | | | 4,876,057 | |
Booking Holdings, Inc. (b) | | | 124 | | | | 201,190 | |
CDW Corp. | | | 213 | | | | 26,114 | |
eBay, Inc. | | | 6,634 | | | | 315,977 | |
Etsy, Inc. (b) | | | 1,777 | | | | 216,065 | |
Expedia Group, Inc. | | | 2,021 | | | | 190,277 | |
F5 Networks, Inc. (b) | | | 92 | | | | 12,231 | |
Facebook, Inc. - Class A (b) | | | 2,695 | | | | 709,081 | |
GoDaddy, Inc. - Class A (b) | | | 2,026 | | | | 143,319 | |
GrubHub, Inc. (a)(b) | | | 1,665 | | | | 123,143 | |
Match Group, Inc. (b) | | | 2,077 | | | | 242,552 | |
Netflix, Inc. (b) | | | 978 | | | | 465,274 | |
NortonLifeLock, Inc. | | | 817 | | | | 16,806 | |
Okta, Inc. (b) | | | 1,018 | | | | 213,607 | |
Pinterest, Inc. - Class A (b) | | | 4,903 | | | | 289,032 | |
Snap, Inc. - Class A (b) | | | 8,251 | | | | 325,007 | |
Twitter, Inc. (b) | | | 5,871 | | | | 242,825 | |
VeriSign, Inc. (b) | | | 1,079 | | | | 205,765 | |
| | | | | | | | 9,680,259 | |
Iron/Steel — 0.4% | | | | |
Nucor Corp. | | | 4,086 | | | | 195,147 | |
| | | | | | | | | |
| | | Shares | | | Value | |
Leisure Time — 0.1% | | | | |
Carnival Corp. (a) | | | 1,812 | | | $ | 24,843 | |
Norwegian Cruise Line Holdings Ltd. (a)(b) | | | 978 | | | | 16,264 | |
Royal Caribbean Cruises Ltd. (a) | | | 548 | | | | 30,918 | |
| | | | | | | | 72,025 | |
Lodging — 0.5% | | | | |
Hilton Worldwide Holdings, Inc. (a) | | | 853 | | | | 74,902 | |
Las Vegas Sands Corp. | | | 1,002 | | | | 48,156 | |
Marriott International, Inc. - Class A | | | 814 | | | | 75,604 | |
MGM Resorts International | | | 1,257 | | | | 25,857 | |
Wynn Resorts Ltd. | | | 293 | | | | 21,222 | |
| | | | | | | | 245,741 | |
Mining — 2.1% | | | | |
Freeport-McMoRan, Inc. | | | 19,666 | | | | 341,009 | |
Newmont Goldcorp Corp. | | | 10,911 | | | | 685,647 | |
| | | | | | | | 1,026,656 | |
Office/Business Equipment — 0.1% | | | | |
Xerox Holdings Corp. | | | 276 | | | | 4,797 | |
Zebra Technologies Corp. - Class A (b) | | | 78 | | | | 22,124 | |
| | | | | | | | 26,921 | |
Packaging & Containers — 2.0% | | | | |
Amcor PLC | | | 21,246 | | | | 221,596 | |
Ball Corp. | | | 4,427 | | | | 394,003 | |
Packaging Corp. of America | | | 1,287 | | | | 147,349 | |
Sealed Air Corp. | | | 2,106 | | | | 83,376 | |
WestRock Co. | | | 3,520 | | | | 132,176 | |
| | | | | | | | 978,500 | |
Pharmaceuticals — 3.7% | | | | |
AbbVie, Inc. | | | 1,026 | | | | 87,313 | |
Agios Pharmaceuticals, Inc. (a)(b) | | | 2,496 | | | | 100,015 | |
Akebia Therapeutics, Inc. (b) | | | 23,896 | | | | 53,049 | |
Alector, Inc. (b) | | | 5,117 | | | | 48,151 | |
Alkermes PLC (b) | | | 5,299 | | | | 86,109 | |
Anika Therapeutics, Inc. (b) | | | 514 | | | | 16,767 | |
Athenex, Inc. (a)(b) | | | 2,158 | | | | 24,601 | |
Bioxcel Therapeutics, Inc. (b) | | | 2,052 | | | | 93,756 | |
Catalyst Pharmaceuticals, Inc. (b) | | | 10,838 | | | | 32,189 | |
Clovis Oncology, Inc. (a)(b) | | | 15,163 | | | | 74,754 | |
Coherus Biosciences, Inc. (a)(b) | | | 4,693 | | | | 78,232 | |
Corbus Pharmaceuticals Holdings, Inc. (a)(b) | | | 28,987 | | | | 27,239 | |
Cytokinetics, Inc. (b) | | | 3,303 | | | | 50,767 | |
Eagle Pharmaceuticals, Inc. (a)(b) | | | 862 | | | | 40,100 | |
Enanta Pharmaceuticals, Inc. (b) | | | 685 | | | | 29,886 | |
Flexion Therapeutics, Inc. (b) | | | 3,209 | | | | 38,476 | |
G1 Therapeutics, Inc. (b) | | | 3,189 | | | | 35,047 | |
Global Blood Therapeutics, Inc. (a)(b) | | | 1,752 | | | | 92,646 | |
Heron Therapeutics, Inc. (b) | | | 5,067 | | | | 82,643 | |
The accompanying notes are an integral part of the financial statements.
74
Pacer WealthShield ETF
SCHEDULE OF INVESTMENTS
October 31, 2020 (Unaudited) (Continued)
| | | Shares | | | Value | |
COMMON STOCKS — 99.5% (Continued) |
| | | | | | | | | |
Pharmaceuticals — 3.7% (Continued) |
Intellia Therapeutics, Inc. (a)(b) | | | 3,792 | | | $ | 90,780 | |
Ironwood Pharmaceuticals, Inc. (b) | | | 9,484 | | | | 93,702 | |
Kadmon Holdings, Inc. (b) | | | 10,334 | | | | 35,136 | |
Kura Oncology, Inc. (b) | | | 1,338 | | | | 41,812 | |
Madrigal Pharmaceuticals, Inc. (a)(b) | | | 492 | | | | 62,607 | |
Neurocrine Biosciences, Inc. (a)(b) | | | 891 | | | | 87,915 | |
Protagonist Therapeutics, Inc. (b) | | | 1,297 | | | | 24,578 | |
Rhythm Pharmaceuticals, Inc. (b) | | | 499 | | | | 10,564 | |
Sarepta Therapeutics, Inc. (a)(b) | | | 703 | | | | 95,545 | |
Spectrum Pharmaceuticals, Inc. (a)(b) | | | 5,956 | | | | 20,429 | |
Syros Pharmaceuticals, Inc. (a)(b) | | | 1,619 | | | | 10,799 | |
TG Therapeutics, Inc. (b) | | | 3,705 | | | | 93,625 | |
Vanda Pharmaceuticals, Inc. (b) | | | 2,905 | | | | 31,054 | |
| | | | | | | | 1,790,286 | |
Retail — 7.4% | | | | |
Advance Auto Parts, Inc. | | | 213 | | | | 31,371 | |
AutoZone, Inc. (b) | | | 71 | | | | 80,158 | |
Best Buy Co., Inc. (a) | | | 705 | | | | 78,643 | |
CarMax, Inc. (b) | | | 504 | | | | 43,566 | |
Chipotle Mexican Grill, Inc. (b) | | | 88 | | | | 105,730 | |
Darden Restaurants, Inc. | | | 399 | | | | 36,676 | |
Dollar General Corp. (a) | | | 765 | | | | 159,663 | |
Dollar Tree, Inc. (b) | | | 732 | | | | 66,114 | |
Domino’s Pizza, Inc. (a) | | | 119 | | | | 45,020 | |
Gap, Inc. | | | 815 | | | | 15,852 | |
Genuine Parts Co. | | | 444 | | | | 40,151 | |
Home Depot, Inc. | | | 3,295 | | | | 878,809 | |
L Brands, Inc. | | | 715 | | | | 22,887 | |
Lowe’s Cos., Inc. | | | 2,314 | | | | 365,843 | |
McDonald’s Corp. | | | 2,280 | | | | 485,640 | |
O’Reilly Automotive, Inc. (b) | | | 227 | | | | 99,108 | |
Ross Stores, Inc. | | | 1,087 | | | | 92,580 | |
Starbucks Corp. | | | 3,584 | | | | 311,665 | |
Target Corp. | | | 1,529 | | | | 232,744 | |
Tiffany & Co. | | | 330 | | | | 43,177 | |
TJX Cos., Inc. | | | 3,674 | | | | 186,639 | |
Tractor Supply Co. | | | 352 | | | | 46,890 | |
Ulta Salon Cosmetics & Fragrance, Inc. (b) | | | 175 | | | | 36,185 | |
Yum! Brands, Inc. | | | 926 | | | | 86,424 | |
| | | | | | | | 3,591,535 | |
Semiconductors — 3.6% | | | | |
Advanced Micro Devices, Inc. (b) | | | 1,491 | | | | 112,257 | |
Analog Devices, Inc. | | | 467 | | | | 55,353 | |
Applied Materials, Inc. | | | 1,155 | | | | 68,411 | |
Broadcom, Inc. | | | 512 | | | | 179,010 | |
Intel Corp. | | | 5,386 | | | | 238,492 | |
IPG Photonics Corp. (b) | | | 53 | | | | 9,856 | |
| | | Shares | | | Value | |
Semiconductors — 3.6% (Continued) |
KLA Corp. | | | 195 | | | $ | 38,450 | |
Lam Research Corp. | | | 188 | | | | 64,311 | |
Maxim Integrated Products, Inc. | | | 404 | | | | 28,139 | |
Microchip Technology, Inc. (a) | | | 321 | | | | 33,731 | |
Micron Technology, Inc. (b) | | | 1,403 | | | | 70,627 | |
NVIDIA Corp. | | | 785 | | | | 393,568 | |
Qorvo, Inc. (b) | | | 171 | | | | 21,779 | |
QUALCOMM, Inc. | | | 1,433 | | | | 176,775 | |
Skyworks Solutions, Inc. | | | 211 | | | | 29,812 | |
Teradyne, Inc. | | | 215 | | | | 18,888 | |
Texas Instruments, Inc. | | | 1,165 | | | | 168,447 | |
Xilinx, Inc. | | | 308 | | | | 36,556 | |
| | | | | | | | 1,744,462 | |
Software — 12.4% | | | | |
8x8, Inc. (a)(b) | | | 4,264 | | | | 73,682 | |
Adobe Systems, Inc. (b) | | | 605 | | | | 270,496 | |
Akamai Technologies, Inc. (a)(b) | | | 1,859 | | | | 176,828 | |
ANSYS, Inc. (b) | | | 108 | | | | 32,872 | |
Autodesk, Inc. (b) | | | 281 | | | | 66,187 | |
Box, Inc. - Class A (b) | | | 4,348 | | | | 67,394 | |
Broadridge Financial Solutions, Inc. | | | 171 | | | | 23,530 | |
Cadence Design System, Inc. (a)(b) | | | 351 | | | | 38,389 | |
Citrix Systems, Inc. | | | 1,422 | | | | 161,070 | |
Cloudera, Inc. (a)(b) | | | 6,703 | | | | 65,153 | |
Coupa Software, Inc. (b) | | | 683 | | | | 182,839 | |
DocuSign, Inc. (b) | | | 1,213 | | | | 245,329 | |
Dropbox, Inc. - Class A (b) | | | 5,511 | | | | 100,631 | |
Fidelity National Information Services, Inc. | | | 783 | | | | 97,554 | |
Fiserv, Inc. (b) | | | 700 | | | | 66,829 | |
HubSpot, Inc. (b) | | | 532 | | | | 154,317 | |
Intuit, Inc. | | | 333 | | | | 104,788 | |
Jack Henry & Associates, Inc. | | | 115 | | | | 17,049 | |
Microsoft Corp. | | | 9,587 | | | | 1,941,080 | |
Oracle Corp. | | | 2,446 | | | | 137,245 | |
Paychex, Inc. | | | 411 | | | | 33,805 | |
Paycom Software, Inc. (b) | | | 72 | | | | 26,214 | |
Salesforce.com, Inc. (b) | | | 3,140 | | | | 729,328 | |
ServiceNow, Inc. (b) | | | 248 | | | | 123,397 | |
Smartsheet, Inc. - Class A (b) | | | 2,224 | | | | 110,866 | |
Synopsys, Inc. (b) | | | 189 | | | | 40,420 | |
Tyler Technologies, Inc. (a)(b) | | | 59 | | | | 22,678 | |
Veeva Systems, Inc. - Class A (b) | | | 924 | | | | 249,526 | |
Workday, Inc. - Class A (b) | | | 1,182 | | | | 248,362 | |
Zoom Video Communications, Inc. - Class A (b) | | | 945 | | | | 435,560 | |
| | | | | | | | 6,043,418 | |
Telecommunications — 2.4% | | | | |
Arista Networks, Inc. (a)(b) | | | 774 | | | | 161,689 | |
CIENA Corp. (b) | | | 2,770 | | | | 109,110 | |
The accompanying notes are an integral part of the financial statements.
75
Pacer WealthShield ETF
SCHEDULE OF INVESTMENTS
October 31, 2020 (Unaudited) (Continued)
| | | Shares | | | Value | |
COMMON STOCKS — 99.5% (Continued) |
| | | | | | | | | |
Telecommunications — 2.4% (Continued) |
Cisco Systems, Inc. | | | 16,265 | | | $ | 583,913 | |
CommScope Holding Co., Inc. (b) | | | 7,308 | | | | 65,041 | |
Corning, Inc. (a) | | | 968 | | | | 30,947 | |
Juniper Networks, Inc. | | | 5,824 | | | | 114,849 | |
Motorola Solutions, Inc. | | | 216 | | | | 34,141 | |
Vonage Holdings Corp. (b) | | | 7,520 | | | | 79,562 | |
| | | | | | | | 1,179,252 | |
Textiles — 0.1% | | | | |
Mohawk Industries, Inc. (b) | | | 228 | | | | 23,527 | |
| | | | | | | | | |
Toys/Games/Hobbies — 0.1% | | | | |
Hasbro, Inc. | | | 388 | | | | 32,094 | |
TOTAL COMMON STOCKS (Cost $46,576,746) | | | | | | | 48,571,826 | |
| | | | | |
CONTINGENT VALUE RIGHTS — 0.0% (c) | | | | |
| | | | | | | | | |
Biotechnology — 0.0% (c) | | | | |
Achillion Pharmaceuticals (b)(d) | | | 6,273 | | | | 2,886 | |
TOTAL CONTINGENT VALUE RIGHTS (Cost $2,886) | | | | | | | 2,886 | |
| | | | | |
| | | Principal
Amount | | | Value | |
SHORT-TERM INVESTMENTS — 0.5% | | | | |
| | | | | | | | | |
Money Market Deposit Accounts — 0.5% | | | | |
U.S. Bank Money Market Deposit Account, 0.025% (e) | | $ | 237,768 | | | | 237,768 | |
TOTAL SHORT-TERM INVESTMENTS (Cost $237,768) | | | | | | | 237,768 | |
| | | Shares | | | Value | |
| INVESTMENTS PURCHASED WITH PROCEEDS FROM SECURITIES LENDING — 13.6% | | | | | | | | |
| Mount Vernon Liquid Assets Portfolio, LLC , 0.16% (e) | | | 6,631,208 | | | $ | 6,631,208 | |
| TOTAL INVESTMENTS PURCHASED WITH PROCEEDS FROM SECURITIES LENDING (Cost $6,631,208) | | | | | | | 6,631,208 | |
| Total Investments (Cost $53,448,608) — 113.6% | | | | | | | 55,443,688 | |
| Liabilities in Excess of Other Assets — (13.6)% | | | | | | | (6,642,848 | ) |
| TOTAL NET ASSETS — 100.0% | | | | | | $ | 48,800,840 | |
Percentages are stated as a percent of net assets.
| | (a) | All or a portion of this security is on loan as of October 31, 2020. The total value of securities on loan is $6,302,318 or 12.9% of net assets. |
| | (b) | Non-income producing security. |
| | (d) | As of October 31, 2020, the Fund has fair valued this security. This security is deemed illiquid according to the Fund’s liquidity guidelines. Value determined using significant unobservable inputs. |
| | (e) | The rate shown is as of October 31, 2020. |
For Fund compliance purposes, the Fund’s industry classifications refer to any one or more of the industry sub-classifications used by one or more widely recognized market indexes or ratings group indexes, and/or they may be defined by Fund management. This definition does not apply for all purposes of this report, which may combine sub-classifications for reporting ease. Categories are shown as a percentage of net assets.
The accompanying notes are an integral part of the financial statements.
76
Pacer Military Times Best Employers ETF
SCHEDULE OF INVESTMENTS
October 31, 2020 (Unaudited)
| | | Shares | | | Value | |
COMMON STOCKS — 99.3% | | | | |
| | | | | | | | | |
Aerospace/Defense — 6.6% | | | | |
Boeing Co. | | | 162 | | | $ | 23,391 | |
General Dynamics Corp. | | | 186 | | | | 24,428 | |
Lockheed Martin Corp. | | | 71 | | | | 24,859 | |
Northrop Grumman Corp. | | | 79 | | | | 22,896 | |
| | | | | | | | 95,574 | |
Airlines — 2.0% | | | | |
Southwest Airlines Co. | | | 740 | | | | 29,252 | |
| | | | | | | | | |
Auto Manufacturers — 2.2% | | | | |
General Motors Co. | | | 939 | | | | 32,424 | |
| | | | | | | | | |
Banks — 9.2% | | | | |
Associated Banc-Corp. | | | 2,070 | | | | 28,338 | |
Bank of America Corp. | | | 1,081 | | | | 25,620 | |
Citigroup, Inc. | | | 544 | | | | 22,532 | |
JPMorgan Chase & Co. | | | 278 | | | | 27,255 | |
US Bancorp | | | 764 | | | | 29,758 | |
| | | | | | | | 133,503 | |
Beverages — 1.8% | | | | |
Brown-Forman Corp. - Class B | | | 380 | | | | 26,490 | |
| | | | | | | | | |
Commercial Services — 5.4% | | | | |
Booz Allen Hamilton Holding Corp. | | | 316 | | | | 24,806 | |
United Rentals, Inc. (a) | | | 157 | | | | 27,992 | |
Vectrus, Inc. (a) | | | 641 | | | | 25,332 | |
| | | | | | | | 78,130 | |
Computers — 5.2% | | | | |
Accenture PLC - Class A | | | 116 | | | | 25,162 | |
CACI International, Inc. - Class A (a) | | | 119 | | | | 24,815 | |
Leidos Holdings, Inc. | | | 308 | | | | 25,564 | |
| | | | | | | | 75,541 | |
Diversified Financial Services — 4.2% | | | | |
Capital One Financial Corp. | | | 403 | | | | 29,451 | |
Charles Schwab Corp. | | | 783 | | | | 32,189 | |
| | | | | | | | 61,640 | |
Electric — 8.1% | | | | |
Dominion Energy, Inc. | | | 355 | | | | 28,521 | |
Exelon Corp. | | | 754 | | | | 30,077 | |
Southern Co. | | | 533 | | | | 30,621 | |
Xcel Energy, Inc. | | | 401 | | | | 28,082 | |
| | | | | | | | 117,301 | |
Engineering & Construction — 2.1% | | | | |
AECOM (a) | | | 685 | | | | 30,715 | |
| | | | | | | | | |
Environmental Control — 1.8% | | | | |
Waste Management, Inc. | | | 244 | | | | 26,330 | |
| | | | | | | | | |
| | | Shares | | | Value | |
Food — 3.5% | | | | |
Hormel Foods Corp. | | | 546 | | | $ | 26,585 | |
Kellogg Co. | | | 392 | | | | 24,653 | |
| | | | | | | | 51,238 | |
Healthcare-Services — 3.7% | | | | |
DaVita, Inc. (a) | | | 321 | | | | 27,686 | |
Humana, Inc. | | | 67 | | | | 26,752 | |
| | | | | | | | 54,438 | |
Insurance — 9.2% | | | | |
Allstate Corp. | | | 291 | | | | 25,826 | |
Marsh & McLennan Cos., Inc. | | | 242 | | | | 25,037 | |
Progressive Corp. | | | 293 | | | | 26,927 | |
Prudential Financial, Inc. | | | 411 | | | | 26,312 | |
Travelers Cos., Inc. | | | 240 | | | | 28,971 | |
| | | | | | | | 133,073 | |
Internet — 3.7% | | | | |
Amazon.com, Inc. (a) | | | 8 | | | | 24,289 | |
CDW Corp. | | | 245 | | | | 30,037 | |
| | | | | | | | 54,326 | |
Lodging — 1.9% | | | | |
Hilton Worldwide Holdings, Inc. | | | 308 | | | | 27,045 | |
| | | | | | | | | |
Machinery-Construction & Mining — 1.7% | | | | |
Oshkosh Corp. | | | 361 | | | | 24,317 | |
| | | | | | | | | |
Media — 1.8% | | | | |
Comcast Corp. - Class A | | | 621 | | | | 26,231 | |
| | | | | | | | | |
Miscellaneous Manufacturing — 4.2% | | | | |
Eaton Corp. PLC | | | 273 | | | | 28,335 | |
General Electric Co. | | | 4,389 | | | | 32,566 | |
| | | | | | | | 60,901 | |
Packaging & Containers — 1.8% | | | | |
Sonoco Products Co. | | | 525 | | | | 25,667 | |
| | | | | | | | | |
Pharmaceuticals — 3.4% | | | | |
CVS Health Corp. | | | 448 | | | | 25,128 | |
Merck & Co., Inc. | | | 326 | | | | 24,519 | |
| | | | | | | | 49,647 | |
Retail — 3.7% | | | | |
Home Depot, Inc. | | | 98 | | | | 26,138 | |
Walmart, Inc. | | | 200 | | | | 27,750 | |
| | | | | | | | 53,888 | |
Software — 3.5% | | | | |
Fiserv, Inc. (a) | | | 279 | | | | 26,636 | |
ManTech International Corp. VA - Class A | | | 372 | | | | 24,135 | |
| | | | | | | | 50,771 | |
The accompanying notes are an integral part of the financial statements.
77
Pacer Military Times Best Employers ETF
SCHEDULE OF INVESTMENTS
October 31, 2020 (Unaudited) (Continued)
| | | Shares | | | Value | |
COMMON STOCKS — 99.3% (Continued) |
| | | | | | | | | |
Telecommunications — 3.6% | | | | |
AT&T, Inc. | | | 933 | | | $ | 25,210 | |
Verizon Communications, Inc. | | | 469 | | | | 26,728 | |
| | | | | | | | 51,938 | |
Transportation — 5.0% | | | | |
JB Hunt Trasport Services, Inc. | | | 198 | | | | 24,104 | |
Union Pacific Corp. | | | 145 | | | | 25,693 | |
Werner Enterprises, Inc. | | | 605 | | | | 23,002 | |
| | | | | | | | 72,799 | |
TOTAL COMMON STOCKS (Cost $1,476,942) | | | | | | | 1,443,179 | |
| | | | | |
| | | Principal
Amount | | | | | |
SHORT-TERM INVESTMENTS 0.6% | | | | |
| | | | | | | | | |
Money Market Deposit Accounts, — 0.6% | | | | |
U.S. Bank Money Market Deposit Account 0.025% (b) | | $ | 8,034 | | | | 8,034 | |
TOTAL SHORT-TERM INVESTMENTS (Cost $8,034) | | | | | | | 8,034 | |
Total Investments (Cost $1,484,976) — 99.9% | | | | | | | 1,451,213 | |
Other Assets in Excess of Liabilities — 0.1% | | | | | | | 1,312 | |
TOTAL NET ASSETS — 100.0% | | | | | | $ | 1,452,525 | |
Percentages are stated as a percent of net assets.
| | (a) | Non-income producing security. |
| | (b) | The rate shown is as of October 31, 2020. |
For Fund compliance purposes, the Fund’s industry classifications refer to any one or more of the industry sub-classifications used by one or more widely recognized market indexes or ratings group indexes, and/or they may be defined by Fund management. This definition does not apply for all purposes of this report, which may combine sub-classifications for reporting ease. Categories are shown as a percentage of net assets.
The accompanying notes are an integral part of the financial statements.
78
Pacer Benchmark Industrial Real Estate SCTRSM ETF
SCHEDULE OF INVESTMENTS
October 31, 2020 (Unaudited)
| | | Shares | | | Value | |
COMMON STOCKS — 1.9% | | | | |
| | | | | | | | | |
Real Estate and Rental and Leasing — 1.9% | | | | |
Griffin Industrial Realty, Inc. | | | 40,083 | | | $ | 2,126,403 | |
TOTAL COMMON STOCKS (Cost $2,146,952) | | | | | | | 2,126,403 | |
| | | | | |
REAL ESTATE INVESTMENT TRUSTS — 97.9% | | | | |
| | | | | | | | | |
Diversified — 26.7% | | | | |
One Liberty Properties, Inc. | | | 212,131 | | | | 3,273,175 | |
Lexington Realty Trust (a) | | | 470,311 | | | | 4,670,188 | |
Duke Realty Corp. | | | 463,382 | | | | 17,603,882 | |
PS Business Parks, Inc. | | | 42,417 | | | | 4,836,810 | |
| | | | | | | | 30,384,055 | |
Storage — 5.1% | | | | |
Life Storage, Inc. | | | 50,711 | | | | 5,788,662 | |
| | | | | | | | | |
Warehouse/Industrial — 66.1% | | | | |
Americold Realty Trust (a) | | | 375,286 | | | | 13,596,612 | |
EastGroup Properties, Inc. | | | 40,152 | | | | 5,343,428 | |
First Industrial Realty Trust, Inc. | | | 125,920 | | | | 5,012,875 | |
Industrial Logistics Properties Trust | | | 247,905 | | | | 4,754,818 | |
Innovative Industrial Properties, Inc. (a) | | | 43,434 | | | | 5,065,707 | |
Monmouth Real Estate Investment Corp. (a) | | | 368,531 | | | | 5,104,154 | |
Plymouth Industrial REIT, Inc. | | | 286,887 | | | | 3,646,334 | |
Prologis, Inc. | | | 175,334 | | | | 17,393,133 | |
Rexford Industrial Realty, Inc. (a) | | | 111,452 | | | | 5,178,060 | |
STAG Industrial, Inc. | | | 165,550 | | | | 5,151,916 | |
Terreno Realty Corp. | | | 89,656 | | | | 5,045,840 | |
| | | | | | | | 75,292,877 | |
TOTAL REAL ESTATE INVESTMENT TRUSTS (Cost $109,193,017) | | | | | | | 111,465,594 | |
| | | Principal
Amount | | | | | |
SHORT-TERM INVESTMENTS — 0.2% | | | | |
| | | | | | | | | |
Money Market Deposit Accounts, — 0.2% | | | | |
U.S. Bank Money Market Deposit Account 0.025% (b) | | $ | 321,213 | | | | 321,213 | |
TOTAL SHORT-TERM INVESTMENTS (Cost $321.213) | | | | | | | 321,213 | |
| | | | | |
| | | Shares | | | Value | |
INVESTMENTS PURCHASED WITH PROCEEDS FROM SECURITIES LENDING — 18.1% | | | | |
Mount Vernon Liquid Assets Portfolio, LLC, 0.16% (b) | | | 20,663,664 | | | $ | 20,663,664 | |
TOTAL INVESTMENTS PURCHASED WITH PROCEEDS FROM SECURITIES LENDING (Cost $20,663,664) | | | | | | | 20,663,664 | |
Total Investments (Cost $132,324,846) — 118.1% | | | | | | | 134,576,874 | |
Liabilities in Excess of Other Assets — (18.1)% | | | | | | | (20,612,551 | ) |
TOTAL NET ASSETS — 100.0% | | | | | | $ | 113,964,323 | |
Percentages are stated as a percent of net assets.
| | (a) | All or a portion of this security is on loan as of October 31, 2020. The total value of securities on loan is $20,046,355 or 17.6% of net assets. |
| | (b) | The rate shown is as of October 31, 2020. |
For Fund compliance purposes, the Fund’s industry classifications refer to any one or more of the industry sub-classifications used by one or more widely recognized market indexes or ratings group indexes, and/or they may be defined by Fund management. This definition does not apply for all purposes of this report, which may combine sub-classifications for reporting ease. Categories are shown as a percentage of net assets.
The accompanying notes are an integral part of the financial statements.
79
Pacer Benchmark Data & Infrastructure Real Estate SCTRSM ETF
SCHEDULE OF INVESTMENTS
October 31, 2020 (Unaudited)
| | | Shares | | | Value | |
COMMON STOCKS — 22.0% | | | | |
| | | | | | | | | |
Advertising Sales — 0.3% | | | | |
Clear Channel Outdoor Holdings, Inc. (a) | | | 3,686,424 | | | $ | 3,295,663 | |
| | | | | | | | | |
Building-Heavy Construction — 5.4% | | | | |
Cellnex Telecom SA (b) | | | 787,821 | | | | 50,583,232 | |
Helios Towers PLC (a) | | | 2,781,153 | | | | 5,796,766 | |
| | | | | | | | 56,379,998 | |
Engineering & Construction — 3.9% | | | | |
Infrastrutture Wireless Italiane SpA (b) | | | 3,762,533 | | | | 40,672,242 | |
| | | | | | | | | |
Internet — 1.7% | | | | |
Cogent Communications Holdings, Inc. | | | 323,755 | | | | 18,065,529 | |
| | | | | | | | | |
Internet Connective Services — 1.4% | | | | |
21Vianet Group, Inc. - ADR (a) | | | 626,911 | | | | 14,393,876 | |
| | | | | | | | | |
Telecom Services — 6.1% | | | | |
GDS Holdings Ltd. - ADR (a)(c) | | | 625,552 | | | | 52,571,390 | |
Switch, Inc. - Class A (c) | | | 850,864 | | | | 11,963,148 | |
| | | | | | | | 64,534,538 | |
Telecommunication Services — 3.2% | | | | |
NEXTDC Ltd. (a) | | | 3,763,066 | | | | 33,666,993 | |
TOTAL COMMON STOCKS (Cost $220,053,179) | | | | | | | 231,008,839 | |
| | | | | |
REAL ESTATE INVESTMENT TRUSTS — 77.8% | | | | |
| | | | | | | | | |
Diversified — 66.6% | | | | |
American Tower Corp. | | | 677,385 | | | | 155,561,465 | |
CoreSite Realty Corp. | | | 340,312 | | | | 40,619,640 | |
Crown Castle International Corp. | | | 1,033,789 | | | | 161,477,842 | |
Digital Realty Trust, Inc. | | | 325,403 | | | | 46,955,653 | |
Equinix, Inc. | | | 213,799 | | | | 156,338,381 | |
Keppel DC REIT | | | 10,892,515 | | | | 23,133,133 | |
Lamar Advertising Co. - Class A | | | 698,595 | | | | 43,284,946 | |
Outfront Media, Inc. | | | 1,178,745 | | | | 15,453,347 | |
SBA Communications Corp. | | | 165,652 | | | | 48,100,371 | |
Uniti Group, Inc. | | | 1,246,709 | | | | 10,995,974 | |
| | | | | | | | 701,920,752 | |
Storage — 4.2% | | | | |
Iron Mountain, Inc. (c) | | | 1,682,594 | | | | 43,848,400 | |
| | | | | | | | | |
| | | Shares | | | Value | |
Warehouse/Industrial — 7.0% | | | | |
CyrusOne, Inc. (c) | | | 606,196 | | | $ | 43,070,226 | |
QTS Realty Trust, Inc. - Class A (c) | | | 495,683 | | | | 30,489,461 | |
| | | | | | | | 73,559,687 | |
TOTAL REAL ESTATE INVESTMENT TRUSTS (Cost $813,584,571) | | | | | | | 819,328,839 | |
| | | | | |
| | | Principal
Amount | | | | | |
SHORT-TERM INVESTMENTS — 0.3% | | | | |
| | | | | | | | | |
Money Market Deposit Accounts, — 0.3% | | | | |
U.S. Bank Money Market Deposit Account, 0.025% (d) | | $ | 3,319,926 | | | | 3,319,926 | |
TOTAL SHORT-TERM INVESTMENTS (Cost $3,319,926) | | | | | | | 3,319,926 | |
| | | | | |
| | | Shares | | | | | |
INVESTMENTS PURCHASED WITH PROCEEDS FROM SECURITIES LENDING — 10.3% | | | | |
Mount Vernon Liquid Assets Portfolio, LLC 0.16% (d) | | | 108,852,982 | | | $ | 108,852,982 | |
TOTAL INVESTMENTS PURCHASED WITH PROCEEDS FROM SECURITIES LENDING (Cost $108,852,982) | | | | | | | 108,852,982 | |
Total Investments (Cost $1,145,810,658) — 110.4% | | | | | | | 1,162,510,586 | |
Liabilities in Excess of Other Assets — (10.4)% | | | | | | | (109,345,007 | ) |
TOTAL NET ASSETS — 100.0% | | | | | | $ | 1,053,165,579 | |
Percentages are stated as a percent of net assets.
ADR | American Depositary Receipt |
| | (a) | Non-income producing security. |
| | (b) | Security exempt from registration under Rule 144(a) and Regulation S of the Securities Act of 1933. Such securities are treated as liquid securities according to the Fund’s liquidity guidelines. The value of those securities total $91,255,474 or 8.7% of net assets. |
| | (c) | All or a portion of this security is on loan as of October 31, 2020. The total value of securities on loan is $105,527,709 or 10.0% of net assets. |
| | (d) | The rate shown is as of October 31, 2020. |
For Fund compliance purposes, the Fund’s industry classifications refer to any one or more of the industry sub-classifications used by one or more widely recognized market indexes or ratings group indexes, and/or they may be defined by Fund management. This definition does not apply for all purposes of this report, which may combine sub-classifications for reporting ease. Categories are shown as a percentage of net assets.
The accompanying notes are an integral part of the financial statements.
80
Pacer US Export Leaders ETF
SCHEDULE OF INVESTMENTS
October 31, 2020 (Unaudited)
| | | Shares | | | Value | |
COMMON STOCKS — 98.8% | | | | |
| | | | | | | | | |
Aerospace/Defense — 0.9% | | | | |
Hexcel Corp. | | | 383 | | | $ | 12,823 | |
| | | | | | | | | |
Auto Parts & Equipment — 0.8% | | | | |
BorgWarner, Inc. | | | 349 | | | | 12,208 | |
| | | | | | | | | |
Biotechnology — 2.0% | | | | |
Bio-Rad Laboratories, Inc. - Class A (a) | | | 29 | | | | 17,006 | |
Illumina, Inc. (a) | | | 42 | | | | 12,294 | |
| | | | | | | | 29,300 | |
Building Materials — 1.0% | | | | |
Johnson Controls International PLC | | | 355 | | | | 14,985 | |
| | | | | | | | | |
Chemicals — 7.8% | | | | |
Ashland Global Holdings, Inc. | | | 203 | | | | 14,163 | |
Celanese Corp. | | | 139 | | | | 15,778 | |
FMC Corp. | | | 136 | | | | 13,973 | |
Ingevity Corp. (a) | | | 260 | | | | 14,269 | |
Linde PLC | | | 59 | | | | 13,000 | |
PPG Industries, Inc. | | | 116 | | | | 15,047 | |
Sensient Technologies Corp. | | | 260 | | | | 17,012 | |
The Chemours Co. | | | 696 | | | | 14,017 | |
| | | | | | | | 117,259 | |
Commercial Services — 2.9% | | | | |
ManpowerGroup, Inc. | | | 218 | | | | 14,796 | |
PayPal Holdings, Inc. (a) | | | 80 | | | | 14,890 | |
The Brink’s Co. | | | 327 | | | | 14,005 | |
| | | | | | | | 43,691 | |
Computers — 3.9% | | | | |
Accenture PLC - Class A | | | 63 | | | | 13,665 | |
DXC Technology Co. | | | 757 | | | | 13,944 | |
Fortinet, Inc. (a) | | | 128 | | | | 14,128 | |
Lumentum Holdings, Inc. (a) | | | 210 | | | | 17,365 | |
| | | | | | | | 59,102 | |
Distribution/Wholesale — 1.0% | | | | |
LKQ Corp. (a) | | | 460 | | | | 14,715 | |
| | | | | | | | | |
Electric — 1.1% | | | | |
AES Corp. | | | 831 | | | | 16,205 | |
| | | | | | | | | |
Electrical Components & Equipment — 2.1% | | | | |
AMETEK, Inc. | | | 148 | | | | 14,534 | |
Littelfuse, Inc. | | | 84 | | | | 16,627 | |
| | | | | | | | 31,161 | |
Electronics — 12.3% | | | | |
Agilent Technologies, Inc. | | | 150 | | | | 15,314 | |
Allegion PLC | | | 151 | | | | 14,874 | |
Amphenol Corp. - Class A | | | 142 | | | | 16,023 | |
| | | Shares | | | Value | |
Electronics — 12.3% (Continued) |
Arrow Electronics, Inc. (a) | | | 187 | | | $ | 14,565 | |
AVNET, Inc. | | | 540 | | | | 13,322 | |
Coherent, Inc. (a) | | | 137 | | | | 17,144 | |
Garmin Ltd. | | | 148 | | | | 15,395 | |
Jabil, Inc. | | | 482 | | | | 15,974 | |
Keysight Technologies, Inc. (a) | | | 160 | | | | 16,779 | |
Mettler-Toledo International, Inc. (a) | | | 15 | | | | 14,969 | |
National Instruments Corp. | | | 412 | | | | 12,887 | |
PerkinElmer, Inc. | | | 126 | | | | 16,323 | |
| | | | | | | | 183,569 | |
Energy-Alternate Sources — 1.4% | | | | |
SolarEdge Technologies, Inc. (a) | | | 80 | | | | 20,615 | |
| | | | | | | | | |
Engineering & Construction — 0.9% | | | | |
KBR, Inc. | | | 605 | | | | 13,485 | |
| | | | | | | | | |
Food — 0.9% | | | | |
Mondelez International, Inc. - Class A | | | 257 | | | | 13,652 | |
| | | | | | | | | |
Healthcare-Products — 6.4% | | | | |
Abbott Laboratories | | | 141 | | | | 14,821 | |
Align Technology, Inc. (a) | | | 47 | | | | 20,026 | |
Baxter International, Inc. | | | 178 | | | | 13,807 | |
Repligen Corp. (a) | | | 102 | | | | 16,990 | |
Thermo Fisher Scientific, Inc. | | | 34 | | | | 16,086 | |
West Pharmaceutical Services, Inc. | | | 54 | | | | 14,692 | |
| | | | | | | | 96,422 | |
Healthcare-Services — 1.0% | | | | |
IQVIA Holdings, Inc. (a) | | | 93 | | | | 14,321 | |
| | | | | | | | | |
Household Products/Wares — 0.9% | | | | |
Kimberly-Clark Corp. | | | 100 | | | | 13,259 | |
| | | | | | | | | |
Internet — 2.0% | | | | |
Alphabet, Inc. - Class A (a) | | | 10 | | | | 16,161 | |
Facebook, Inc. - Class A (a) | | | 55 | | | | 14,471 | |
| | | | | | | | 30,632 | |
Machinery-Diversified — 6.8% | | | | |
Cognex Corp. | | | 238 | | | | 15,684 | |
Deere & Co. | | | 68 | | | | 15,362 | |
IDEX Corp. | | | 82 | | | | 13,972 | |
Ingersoll Rand, Inc. (a) | | | 411 | | | | 14,360 | |
Nordson Corp. | | | 77 | | | | 14,894 | |
Wabtec Corp. | | | 219 | | | | 12,987 | |
Xylem, Inc. | | | 175 | | | | 15,250 | |
| | | | | | | | 102,509 | |
Metal Fabricate/Hardware — 1.1% | | | | |
The Timken Co. | | | 263 | | | | 15,701 | |
| | | | | | | | | |
The accompanying notes are an integral part of the financial statements.
81
Pacer US Export Leaders ETF
SCHEDULE OF INVESTMENTS
October 31, 2020 (Unaudited) (Continued)
| | | Shares | | | Value | |
COMMON STOCKS — 98.8% (Continued) |
| | | | | | | | | |
Mining — 1.8% | | | | |
Newmont Goldcorp Corp. | | | 223 | | | $ | 14,013 | |
Royal Gold, Inc. | | | 113 | | | | 13,426 | |
| | | | | | | | 27,439 | |
Miscellaneous Manufacturing — 2.9% | | | | |
Donaldson Co., Inc. | | | 306 | | | | 14,535 | |
Illinois Tool Works, Inc. | | | 76 | | | | 14,887 | |
ITT, Inc. | | | 236 | | | | 14,280 | |
| | | | | | | | 43,702 | |
Office/Business Equipment — 1.1% | | | | |
Zebra Technologies Corp. - Class A (a) | | | 59 | | | | 16,735 | |
| | | | | | | | | |
Oil & Gas — 0.9% | | | | |
Chevron Corp. | | | 190 | | | | 13,205 | |
| | | | | | | | | |
Oil & Gas Services — 0.8% | | | | |
Halliburton Co. | | | 1,037 | | | | 12,506 | |
| | | | | | | | | |
Packaging & Containers — 1.8% | | | | |
Amcor PLC | | | 1,337 | | | | 13,945 | |
O-I Glass, Inc. | | | 1,329 | | | | 12,532 | |
| | | | | | | | 26,477 | |
Pharmaceuticals — 1.9% | | | | |
Mylan NV (a) | | | 965 | | | | 14,031 | |
Zoetis, Inc. | | | 93 | | | | 14,745 | |
| | | | | | | | 28,776 | |
Retail — 1.8% | | | | |
Domino’s Pizza, Inc. | | | 37 | | | | 13,998 | |
World Fuel Services Corp. | | | 630 | | | | 13,261 | |
| | | | | | | | 27,259 | |
Semiconductors — 19.0% | | | | |
Advanced Micro Devices, Inc. (a) | | | 194 | | | | 14,606 | |
Analog Devices, Inc. | | | 130 | | | | 15,409 | |
Applied Materials, Inc. | | | 269 | | | | 15,933 | |
Broadcom, Inc. | | | 41 | | | | 14,335 | |
Cirrus Logic, Inc. (a) | | | 255 | | | | 17,562 | |
CMC Materials, Inc. | | | 104 | | | | 14,788 | |
Intel Corp. | | | 300 | | | | 13,284 | |
IPG Photonics Corp. (a) | | | 93 | | | | 17,294 | |
KLA Corp. | | | 86 | | | | 16,957 | |
Lam Research Corp. | | | 50 | | | | 17,104 | |
Microchip Technology, Inc. | | | 147 | | | | 15,447 | |
MKS Instruments, Inc. | | | 143 | | | | 15,500 | |
Monolithic Power Systems, Inc. | | | 62 | | | | 19,815 | |
NVIDIA Corp. | | | 30 | | | | 15,041 | |
Qorvo, Inc. (a) | | | 120 | | | | 15,283 | |
Semtech Corp. (a) | | | 264 | | | | 14,491 | |
Silicon Laboratories, Inc. (a) | | | 156 | | | | 15,984 | |
| | | Shares | | | Value | |
Semiconductors — 19.0% (Continued) |
Texas Instruments, Inc. | | | 108 | | | $ | 15,615 | |
| | | | | | | | 284,448 | |
Software — 8.7% | | | | |
Activision Blizzard, Inc. | | | 190 | | | $ | 14,389 | |
Adobe Systems, Inc. (a) | | | 31 | | | | 13,860 | |
ANSYS, Inc. (a) | | | 47 | | | | 14,305 | |
Autodesk, Inc. (a) | | | 65 | | | | 15,310 | |
Cadence Design System, Inc. (a) | | | 146 | | | | 15,968 | |
Citrix Systems, Inc. | | | 112 | | | | 12,686 | |
Electronic Arts, Inc. (a) | | | 117 | | | | 14,020 | |
Microsoft Corp. | | | 72 | | | | 14,578 | |
Synopsys, Inc. (a) | | | 74 | | | | 15,826 | |
| | | | | | | | 130,942 | |
Transportation — 0.9% | | | | |
Kansas City Southern | | | 79 | | | | 13,915 | |
TOTAL COMMON STOCKS (Cost $1,488,237) | | | | | | | 1,481,018 | |
| | | | | |
REAL ESTATE INVESTMENT TRUSTS — 0.9% | | | | |
Rayonier, Inc. | | | 541 | | | | 13,731 | |
TOTAL REAL ESTATE INVESTMENT TRUSTS (Cost $14,769) | | | | | | | 13,731 | |
| | | | | |
| | | Principal
Amount | | | | | |
SHORT-TERM INVESTMENTS — 0.3% | | | | |
| | | | | | | | | |
Money Market Deposit Accounts, — 0.3% | | | | |
U.S. Bank Money Market Deposit Account, 0.025% (b) | | $ | 4,431 | | | | 4,431 | |
TOTAL SHORT-TERM INVESTMENTS (Cost $4,431) | | | | | | | 4,431 | |
Total Investments (Cost $1,507,437) — 100.0% | | | | | | | 1,499,180 | |
Liabilities in Excess of Other Assets — 0.0% (c) | | | | | | | (9 | ) |
TOTAL NET ASSETS — 100.0% | | | | | | $ | 1,499,171 | |
Percentages are stated as a percent of net assets.
| | (a) | Non-income producing security. |
| | (b) | The rate shown is as of October 31, 2020. |
For Fund compliance purposes, the Fund’s industry classifications refer to any one or more of the industry sub-classifications used by one or more widely recognized market indexes or ratings group indexes, and/or they may be defined by Fund management. This definition does not apply for all purposes of this report, which may combine sub-classifications for reporting ease. Categories are shown as a percentage of net assets.
The accompanying notes are an integral part of the financial statements.
82
Pacer CFRA-Stovall Equal Weight Seasonal Rotation ETF
SCHEDULE OF INVESTMENTS
October 31, 2020 (Unaudited)
| | | Shares | | | Value | |
COMMON STOCKS — 99.6% | | | | |
| | | | | | | | | |
Aerospace/Defense — 2.9% | | | | |
Boeing Co. | | | 1,100 | | | $ | 158,829 | |
General Dynamics Corp. | | | 1,210 | | | | 158,909 | |
Howmet Aerospace, Inc. | | | 9,900 | | | | 170,775 | |
L3Harris Technologies, Inc. | | | 970 | | | | 156,277 | |
Lockheed Martin Corp. | | | 450 | | | | 157,559 | |
Northrop Grumman Corp. | | | 520 | | | | 150,706 | |
Raytheon Technologies Corp. | | | 2,910 | | | | 158,071 | |
Teledyne Technologies, Inc. (a) | | | 560 | | | | 173,124 | |
TransDigm Group, Inc. | | | 350 | | | | 167,094 | |
| | | | | | | | 1,451,344 | |
Airlines — 1.6% | | | | |
Alaska Air Group, Inc. | | | 4,370 | | | | 165,579 | |
American Airlines Group, Inc. | | | 13,610 | | | | 153,521 | |
Delta Air Lines, Inc. | | | 5,560 | | | | 170,359 | |
Southwest Airlines Co. | | | 4,530 | | | | 179,071 | |
United Airlines Holdings, Inc. (a) | | | 4,890 | | | | 165,575 | |
| | | | | | | | 834,105 | |
Apparel — 3.1% | | | | |
Hanesbrands, Inc. | | | 13,770 | | | | 221,284 | |
NIKE, Inc. - Class B | | | 1,800 | | | | 216,144 | |
PVH Corp. | | | 3,160 | | | | 184,196 | |
Ralph Lauren Corp. | | | 2,780 | | | | 185,843 | |
Tapestry, Inc. | | | 13,120 | | | | 291,658 | |
Under Armour, Inc. - Class A (a) | | | 9,790 | | | | 135,494 | |
Under Armour, Inc. - Class C (a) | | | 10,210 | | | | 124,868 | |
VF Corp. | | | 3,030 | | | | 203,616 | |
| | | | | | | | 1,563,103 | |
Auto Manufacturers — 1.7% | | | | |
Cummins, Inc. | | | 850 | | | | 186,906 | |
Ford Motor Co. | | | 30,270 | | | | 233,987 | |
General Motors Co. | | | 6,960 | | | | 240,329 | |
PACCAR, Inc. | | | 2,100 | | | | 179,298 | |
| | | | | | | | 840,520 | |
Auto Parts & Equipment — 0.8% | | | | |
Aptiv PLC | | | 2,510 | | | | 242,190 | |
BorgWarner, Inc. | | | 5,000 | | | | 174,900 | |
| | | | | | | | 417,090 | |
Biotechnology — 1.0% | | | | |
Corteva, Inc. | | | 14,810 | | | | 488,434 | |
| | | | | | | | | |
Building Materials — 3.5% | | | | |
Carrier Global Corp. | | | 6,030 | | | | 201,342 | |
Fortune Brands Home & Security, Inc. | | | 2,130 | | | | 172,253 | |
Johnson Controls International PLC | | | 4,230 | | | | 178,548 | |
Martin Marietta Materials, Inc. | | | 2,060 | | | | 548,681 | |
Masco Corp. | | | 3,010 | | | | 161,336 | |
| | | Shares | | | Value | |
Building Materials — 3.5% (Continued) |
Vulcan Materials Co. | | | 3,410 | | | $ | 493,904 | |
| | | | | | | | 1,756,064 | |
Chemicals — 12.6% | | | | |
Air Products & Chemicals, Inc. | | | 1,500 | | | | 414,360 | |
Albemarle Corp. | | | 4,760 | | | | 443,680 | |
Celanese Corp. | | | 4,240 | | | | 481,282 | |
CF Industries Holdings, Inc. | | | 13,540 | | | | 373,840 | |
Dow, Inc. | | | 9,060 | | | | 412,139 | |
DuPont de Nemours, Inc. | | | 7,710 | | | | 438,545 | |
Eastman Chemical Co. | | | 5,650 | | | | 456,746 | |
Ecolab, Inc. | | | 2,220 | | | | 407,570 | |
FMC Corp. | | | 4,160 | | | | 427,398 | |
International Flavors & Fragrances, Inc. | | | 3,730 | | | | 382,922 | |
Linde PLC | | | 1,810 | | | | 398,815 | |
LyondellBasell Industries NV - Class A | | | 6,080 | | | | 416,176 | |
Mosaic Co. | | | 24,680 | | | | 456,580 | |
PPG Industries, Inc. | | | 3,560 | | | | 461,803 | |
Sherwin-Williams Co. | | | 640 | | | | 440,307 | |
| | | | | | | | 6,412,163 | |
Commercial Services — 4.8% | | | | |
Automatic Data Processing, Inc. | | | 1,270 | | | | 200,609 | |
Cintas Corp. | | | 550 | | | | 173,002 | |
Equifax, Inc. | | | 1,080 | | | | 147,528 | |
FleetCor Technologies, Inc. (a) | | | 730 | | | | 161,264 | |
Gartner, Inc. (a) | | | 1,340 | | | | 160,934 | |
Global Payments, Inc. | | | 1,020 | | | | 160,895 | |
IHS Markit Ltd. | | | 2,280 | | | | 184,384 | |
Nielsen Holdings PLC | | | 12,170 | | | | 164,417 | |
PayPal Holdings, Inc. (a) | | | 920 | | | | 171,239 | |
Quanta Services, Inc. | | | 3,420 | | | | 213,511 | |
Robert Half International, Inc. | | | 3,410 | | | | 172,853 | |
Rollins, Inc. | | | 3,260 | | | | 188,591 | |
United Rentals, Inc. (a) | | | 1,010 | | | | 180,073 | |
Verisk Analytics, Inc. | | | 970 | | | | 172,631 | |
| | | | | | | | 2,451,931 | |
Computers — 3.9% | | | | |
Accenture PLC - Class A | | | 720 | | | | 156,175 | |
Apple, Inc. | | | 1,510 | | | | 164,379 | |
Cognizant Technology Solutions Corp. - Class A | | | 2,490 | | | | 177,836 | |
DXC Technology Co. | | | 8,670 | | | | 159,701 | |
Fortinet, Inc. (a) | | | 1,470 | | | | 162,244 | |
Hewlett Packard Enterprise Co. | | | 18,350 | | | | 158,544 | |
HP, Inc. | | | 8,790 | | | | 157,868 | |
International Business Machines Corp. | | | 1,400 | | | | 156,324 | |
Leidos Holdings, Inc. | | | 1,950 | | | | 161,850 | |
NetApp, Inc. | | | 3,850 | | | | 168,977 | |
The accompanying notes are an integral part of the financial statements.
83
Pacer CFRA-Stovall Equal Weight Seasonal Rotation ETF
SCHEDULE OF INVESTMENTS
October 31, 2020 (Unaudited) (Continued)
| | | Shares | | | Value | |
COMMON STOCKS — 99.6% (Continued) |
| | | | | | | | | |
Computers — 3.9% (Continued) |
Seagate Technology PLC | | | 3,640 | | | $ | 174,065 | |
Western Digital Corp. | | | 4,540 | | | | 171,294 | |
| | | | | | | | 1,969,257 | |
Distribution/Wholesale — 1.9% | | | | |
Copart, Inc. (a) | | | 1,730 | | | | 190,923 | |
Fastenal Co. | | | 4,000 | | | | 172,920 | |
LKQ Corp. (a) | | | 6,590 | | | | 210,814 | |
Pool Corp. | | | 620 | | | | 216,894 | |
W.W. Grainger, Inc. | | | 500 | | | | 175,010 | |
| | | | | | | | 966,561 | |
Diversified Financial Services — 0.9% | | | | |
MasterCard, Inc. - Class A | | | 510 | | | | 147,206 | |
Visa, Inc. - Class A | | | 850 | | | | 154,454 | |
Western Union Co. | | | 7,670 | | | | 149,105 | |
| | | | | | | | 450,765 | |
Electrical Components & Equipment — 0.7% | | | | |
AMETEK, Inc. | | | 1,760 | | | | 172,832 | |
Emerson Electric Co. | | | 2,600 | | | | 168,454 | |
| | | | | | | | 341,286 | |
Electronics — 3.5% | | | | |
Allegion PLC | | | 1,800 | | | | 177,300 | |
Amphenol Corp. - Class A | | | 1,630 | | | | 183,929 | |
Flir Systems, Inc. | | | 4,960 | | | | 172,063 | |
Fortive Corp. | | | 2,650 | | | | 163,240 | |
Garmin Ltd. | | | 2,120 | | | | 220,522 | |
Honeywell International, Inc. | | | 1,060 | | | | 174,847 | |
Keysight Technologies, Inc. (a) | | | 1,840 | | | | 192,961 | |
Roper Technologies, Inc. | | | 440 | | | | 163,390 | |
TE Connectivity Ltd. | | | 1,730 | | | | 167,602 | |
Vontier Corp. (a) | | | 5,800 | | | | 166,692 | |
| | | | | | | | 1,782,546 | |
Engineering & Construction — 0.4% | | | | |
Jacobs Engineering Group, Inc. | | | 1,900 | | | | 180,500 | |
| | | | | | | | | |
Environmental Control — 1.0% | | | | |
Pentair PLC | | | 4,030 | | | | 200,533 | |
Republic Services, Inc. | | | 1,840 | | | | 162,233 | |
Waste Management, Inc. | | | 1,560 | | | | 168,339 | |
| | | | | | | | 531,105 | |
Forest Products & Paper — 1.0% | | | | |
International Paper Co. | | | 11,610 | | | | 507,938 | |
| | | | | | | | | |
Hand/Machine Tools — 0.7% | | | | |
Snap-On, Inc. | | | 1,190 | | | | 187,461 | |
Stanley Black & Decker, Inc. | | | 1,110 | | | | 184,482 | |
| | | | | | | | 371,943 | |
Home Builders — 1.5% | | | | |
DR Horton, Inc. | | | 2,970 | | | | 198,426 | |
| | | Shares | | | Value | |
Home Builders — 1.5% (Continued) |
Lennar Corp. - Class A | | | 2,730 | | | $ | 191,728 | |
NVR, Inc. (a) | | | 50 | | | | 197,654 | |
PulteGroup, Inc. | | | 4,680 | | | | 190,757 | |
| | | | | | | | 778,565 | |
Home Furnishings — 0.8% | | | | |
Leggett & Platt, Inc. | | | 4,760 | | | | 198,635 | |
Whirlpool Corp. | | | 1,230 | | | | 227,501 | |
| | | | | | | | 426,136 | |
Household Products/Wares — 1.0% | | | | |
Avery Dennison Corp. | | | 3,590 | | | | 496,820 | |
| | | | | | | | | |
Housewares — 0.4% | | | | |
Newell Brands, Inc. | | | 12,140 | | | | 214,392 | |
| | | | | | | | | |
Internet — 3.4% | | | | |
Amazon.com, Inc. (a) | | | 70 | | | | 212,530 | |
Booking Holdings, Inc. (a) | | | 120 | | | | 194,700 | |
CDW Corp. | | | 1,520 | | | | 186,352 | |
eBay, Inc. | | | 4,020 | | | | 191,473 | |
Etsy, Inc. (a) | | | 1,910 | | | | 232,237 | |
Expedia Group, Inc. | | | 2,240 | | | | 210,896 | |
F5 Networks, Inc. (a) | | | 1,410 | | | | 187,445 | |
NortonLifeLock, Inc. | | | 8,030 | | | | 165,177 | |
VeriSign, Inc. (a) | | | 860 | | | | 164,002 | |
| | | | | | | | 1,744,812 | |
Iron/Steel — 0.9% | | | | |
Nucor Corp. | | | 9,840 | | | | 469,958 | |
| | | | | | | | | |
Leisure Time — 1.1% | | | | |
Carnival Corp. | | | 11,980 | | | | 164,246 | |
Norwegian Cruise Line Holdings Ltd. (a) | | | 12,100 | | | | 201,223 | |
Royal Caribbean Cruises Ltd. | | | 3,060 | | | | 172,645 | |
| | | | | | | | 538,114 | |
Lodging — 1.9% | | | | |
Hilton Worldwide Holdings, Inc. | | | 2,430 | | | | 213,378 | |
Las Vegas Sands Corp. | | | 4,080 | | | | 196,085 | |
Marriott International, Inc. - Class A | | | 2,130 | | | | 197,834 | |
MGM Resorts International | | | 9,320 | | | | 191,713 | |
Wynn Resorts Ltd. | | | 2,580 | | | | 186,869 | |
| | | | | | | | 985,879 | |
Machinery-Construction & Mining — 0.4% | | | | |
Caterpillar, Inc. | | | 1,150 | | | | 180,607 | |
| | | | | | | | | |
Machinery-Diversified — 3.1% | | | | |
Deere & Co. | | | 820 | | | | 185,246 | |
Dover Corp. | | | 1,560 | | | | 172,708 | |
Flowserve Corp. | | | 6,260 | | | | 182,291 | |
IDEX Corp. | | | 970 | | | | 165,278 | |
Ingersoll Rand, Inc. (a) | | | 4,900 | | | | 171,206 | |
The accompanying notes are an integral part of the financial statements.
84
Pacer CFRA-Stovall Equal Weight Seasonal Rotation ETF
SCHEDULE OF INVESTMENTS
October 31, 2020 (Unaudited) (Continued)
| | | Shares | | | Value | |
COMMON STOCKS — 99.6% (Continued) |
| | | | | | | | | |
Machinery-Diversified — 3.1% (Continued) |
Otis Worldwide Corp. | | | 2,930 | | | $ | 179,551 | |
Rockwell Automation, Inc. | | | 790 | | | | 187,325 | |
Wabtec Corp. | | | 2,610 | | | | 154,773 | |
Xylem, Inc. | | | 2,080 | | | | 181,251 | |
| | | | | | | | 1,579,629 | |
Mining — 1.8% | | | | |
Freeport-McMoRan, Inc. | | | 27,770 | | | | 481,532 | |
Newmont Goldcorp Corp. | | | 6,820 | | | | 428,569 | |
| | | | | | | | 910,101 | |
Miscellaneous Manufacturing — 2.9% | | | | |
3M Co. | | | 1,060 | | | | 169,558 | |
AO Smith Corp. | | | 3,610 | | | | 186,601 | |
Eaton Corp. PLC | | | 1,720 | | | | 178,519 | |
General Electric Co. | | | 29,630 | | | | 219,855 | |
Illinois Tool Works, Inc. | | | 900 | | | | 176,292 | |
Parker-Hannifin Corp. | | | 840 | | | | 175,022 | |
Textron, Inc. | | | 4,550 | | | | 162,890 | |
Trane Technologies PLC | | | 1,510 | | | | 200,452 | |
| | | | | | | | 1,469,189 | |
Office/Business Equipment — 0.7% | | | | |
Xerox Holdings Corp. | | | 8,880 | | | | 154,335 | |
Zebra Technologies Corp. - Class A (a) | | | 680 | | | | 192,875 | |
| | | | | | | | 347,210 | |
Packaging & Containers — 4.7% | | | | |
Amcor PLC | | | 40,850 | | | | 426,065 | |
Ball Corp. | | | 5,530 | | | | 492,170 | |
Packaging Corp. of America | | | 4,320 | | | | 494,597 | |
Sealed Air Corp. | | | 11,520 | | | | 456,077 | |
WestRock Co. | | | 13,240 | | | | 497,162 | |
| | | | | | | | 2,366,071 | |
Retail — 9.9% | | | | |
Advance Auto Parts, Inc. | | | 1,370 | | | | 201,774 | |
AutoZone, Inc. (a) | | | 170 | | | | 191,927 | |
Best Buy Co., Inc. | | | 1,980 | | | | 220,869 | |
CarMax, Inc. (a) | | | 2,080 | | | | 179,795 | |
Chipotle Mexican Grill, Inc. (a) | | | 160 | | | | 192,237 | |
Darden Restaurants, Inc. | | | 2,440 | | | | 224,285 | |
Dollar General Corp. | | | 1,060 | | | | 221,233 | |
Dollar Tree, Inc. (a) | | | 2,350 | | | | 212,252 | |
Domino’s Pizza, Inc. | | | 540 | | | | 204,293 | |
Gap, Inc. | | | 12,730 | | | | 247,598 | |
Genuine Parts Co. | | | 2,110 | | | | 190,807 | |
Home Depot, Inc. | | | 770 | | | | 205,367 | |
L Brands, Inc. | | | 7,570 | | | | 242,316 | |
Lowe’s Cos., Inc. | | | 1,310 | | | | 207,111 | |
McDonald’s Corp. | | | 970 | | | | 206,610 | |
O’Reilly Automotive, Inc. (a) | | | 450 | | | | 196,470 | |
| | | Shares | | | Value | |
Retail — 9.9% (Continued) |
Ross Stores, Inc. | | | 2,350 | | | $ | 200,149 | |
Starbucks Corp. | | | 2,480 | | | | 215,661 | |
Target Corp. | | | 1,440 | | | | 219,197 | |
Tiffany & Co. | | | 1,860 | | | | 243,362 | |
TJX Cos., Inc. | | | 3,910 | | | | 198,628 | |
Tractor Supply Co. | | | 1,540 | | | | 205,143 | |
Ulta Salon Cosmetics & Fragrance, Inc. (a) | | | 930 | | | | 192,296 | |
Yum! Brands, Inc. | | | 2,300 | | | | 214,659 | |
| | | | | | | | 5,034,039 | |
Semiconductors — 6.4% | | | | |
Advanced Micro Devices, Inc. (a) | | | 2,220 | | | | 167,144 | |
Analog Devices, Inc. | | | 1,490 | | | | 176,610 | |
Applied Materials, Inc. | | | 3,080 | | | | 182,428 | |
Broadcom, Inc. | | | 470 | | | | 164,326 | |
Intel Corp. | | | 3,440 | | | | 152,323 | |
IPG Photonics Corp. (a) | | | 1,070 | | | | 198,977 | |
KLA Corp. | | | 990 | | | | 195,208 | |
Lam Research Corp. | | | 580 | | | | 198,406 | |
Maxim Integrated Products, Inc. | | | 2,570 | | | | 179,001 | |
Microchip Technology, Inc. | | | 1,680 | | | | 176,534 | |
Micron Technology, Inc. (a) | | | 3,680 | | | | 185,251 | |
NVIDIA Corp. | | | 350 | | | | 175,476 | |
Qorvo, Inc. (a) | | | 1,380 | | | | 175,757 | |
QUALCOMM, Inc. | | | 1,500 | | | | 185,040 | |
Skyworks Solutions, Inc. | | | 1,250 | | | | 176,613 | |
Teradyne, Inc. | | | 2,260 | | | | 198,541 | |
Texas Instruments, Inc. | | | 1,240 | | | | 179,292 | |
Xilinx, Inc. | | | 1,720 | | | | 204,147 | |
| | | | | | | | 3,271,074 | |
Shipbuilding — 0.4% | | | | |
Huntington Ingalls Industries, Inc. | | | 1,200 | | | | 176,976 | |
| | | | | | | | | |
Software — 6.5% | | | | |
Adobe Systems, Inc. (a) | | | 360 | | | | 160,956 | |
Akamai Technologies, Inc. (a) | | | 1,590 | | | | 151,241 | |
ANSYS, Inc. (a) | | | 540 | | | | 164,360 | |
Autodesk, Inc. (a) | | | 750 | | | | 176,655 | |
Broadridge Financial Solutions, Inc. | | | 1,260 | | | | 173,376 | |
Cadence Design System, Inc. (a) | | | 1,670 | | | | 182,648 | |
Citrix Systems, Inc. | | | 1,280 | | | | 144,985 | |
Fidelity National Information Services, Inc. | | | 1,180 | | | | 147,016 | |
Fiserv, Inc. (a) | | | 1,820 | | | | 173,755 | |
Intuit, Inc. | | | 540 | | | | 169,927 | |
Jack Henry & Associates, Inc. | | | 1,090 | | | | 161,592 | |
Microsoft Corp. | | | 830 | | | | 168,050 | |
Oracle Corp. | | | 2,980 | | | | 167,208 | |
Paychex, Inc. | | | 2,260 | | | | 185,885 | |
Paycom Software, Inc. (a) | | | 640 | | | | 233,018 | |
The accompanying notes are an integral part of the financial statements.
85
Pacer CFRA-Stovall Equal Weight Seasonal Rotation ETF
SCHEDULE OF INVESTMENTS
October 31, 2020 (Unaudited) (Continued)
| | | Shares | | | Value | |
COMMON STOCKS — 99.6% (Continued) |
| | | | | | | | | |
Software — 6.5% (Continued) |
Salesforce.com, Inc. (a) | | | 700 | | | $ | 162,589 | |
ServiceNow, Inc. (a) | | | 380 | | | | 189,077 | |
Synopsys, Inc. (a) | | | 850 | | | | 181,781 | |
Tyler Technologies, Inc. (a) | | | 520 | | | | 199,878 | |
| | | | | | | | 3,293,997 | |
Telecommunications — 1.6% | | | | |
Arista Networks, Inc. (a) | | | 830 | | | | 173,387 | |
Cisco Systems, Inc. | | | 4,250 | | | | 152,575 | |
Corning, Inc. | | | 5,310 | | | | 169,760 | |
Juniper Networks, Inc. | | | 7,340 | | | | 144,745 | |
Motorola Solutions, Inc. | | | 1,100 | | | | 173,866 | |
| | | | | | | | 814,333 | |
Textiles — 0.4% | | | | |
Mohawk Industries, Inc. (a) | | | 2,190 | | | | 225,986 | |
| | | | | | | | | |
Toys/Games/Hobbies — 0.4% | | | | |
Hasbro, Inc. | | | 2,690 | | | | 222,517 | |
| | | | | | | | | |
Transportation — 3.4% | | | | |
CH Robinson Worldwide, Inc. | | | 1,790 | | | | 158,290 | |
CSX Corp. | | | 2,280 | | | | 179,983 | |
Expeditors International of Washington, Inc. | | | 1,950 | | | | 172,322 | |
FedEx Corp. | | | 760 | | | | 197,197 | |
JB Hunt Trasport Services, Inc. | | | 1,300 | | | | 158,262 | |
Kansas City Southern | | | 950 | | | | 167,333 | |
Norfolk Southern Corp. | | | 810 | | | | 169,387 | |
Old Dominion Freight Line, Inc. | | | 900 | | | | 171,333 | |
Union Pacific Corp. | | | 900 | | | | 159,471 | |
United Parcel Service, Inc. - Class B | | | 1,110 | | | | 174,392 | |
| | | | | | | | 1,707,970 | |
TOTAL COMMON STOCKS (Cost $50,579,953) | | | | | | | 50,571,030 | |
| | | Principal
Amount | | | Value | |
| SHORT-TERM INVESTMENTS — 0.1% | | | |
| | | | | | | |
| Money Market Deposit Accounts, — 0.1% | | | | | | | | |
| U.S. Bank Money Market Deposit Account, 0.025% (b) | | $ | 67,716 | | | $ | 67,716 | |
| TOTAL SHORT-TERM INVESTMENTS (Cost $67,716) | | | | | | | 67,716 | |
| Total Investments (Cost $50,647,669) — 99.7% | | | | | | | 50,638,746 | |
| Other Assets in Excess of Liabilities — 0.3% | | | | | | | 154,430 | |
| TOTAL NET ASSETS — 100.0% | | | | | | $ | 50,793,176 | |
Percentages are stated as a percent of net assets.
| | (a) | Non-income producing security. |
| | (b) | The rate shown is as of October 31, 2020. |
For Fund compliance purposes, the Fund’s industry classifications refer to any one or more of the industry sub-classifications used by one or more widely recognized market indexes or ratings group indexes, and/or they may be defined by Fund management. This definition does not apply for all purposes of this report, which may combine sub-classifications for reporting ease.
The accompanying notes are an integral part of the financial statements.
86
Pacer US Cash Cows Growth ETF
SCHEDULE OF INVESTMENTS
October 31, 2020 (Unaudited)
| | | Shares | | | Value | |
COMMON STOCKS — 99.5% | | | | |
| | | | | | | | | |
Aerospace/Defense — 9.3% | | | | |
Hexcel Corp. | | | 221 | | | $ | 7,399 | |
Lockheed Martin Corp. | | | 174 | | | | 60,923 | |
Northrop Grumman Corp. | | | 200 | | | | 57,964 | |
| | | | | | | | 126,286 | |
Apparel — 1.4% | | | | |
Deckers Outdoor Corp. (a) | | | 74 | | | | 18,749 | |
| | | | | | | | | |
Auto Parts & Equipment — 1.3% | | | | |
Gentex Corp. | | | 649 | | | | 17,958 | |
| | | | | | | | | |
Biotechnology — 1.2% | | | | |
Exelixis, Inc. (a) | | | 816 | | | | 16,712 | |
| | | | | | | | | |
Building Materials — 0.7% | | | | |
Eagle Materials, Inc. | | | 110 | | | | 9,378 | |
| | | | | | | | | |
Chemicals — 7.2% | | | | |
Celanese Corp. | | | 312 | | | | 35,415 | |
Dow, Inc. | | | 1,363 | | | | 62,003 | |
| | | | | | | | 97,418 | |
Commercial Services — 5.4% | | | | |
FleetCor Technologies, Inc. (a) | | | 222 | | | | 49,042 | |
FTI Consulting, Inc. (a) | | | 97 | | | | 9,550 | |
WEX, Inc. (a) | | | 116 | | | | 14,680 | |
| | | | | | | | 73,272 | |
Computers — 2.8% | | | | |
CACI International, Inc. - Class A (a) | | | 66 | | | | 13,763 | |
Lumentum Holdings, Inc. (a) | | | 199 | | | | 16,456 | |
Perspecta, Inc. | | | 425 | | | | 7,620 | |
| | | | | | | | 37,839 | |
Electric — 1.5% | | | | |
NRG Energy, Inc. | | | 645 | | | | 20,395 | |
| | | | | | | | | |
Electronics — 4.0% | | | | |
Coherent, Inc. (a) | | | 64 | | | | 8,009 | |
Hubbell, Inc. | | | 143 | | | | 20,808 | |
Jabil, Inc. | | | 398 | | | | 13,189 | |
Woodward, Inc. | | | 165 | | | | 13,126 | |
| | | | | | | | 55,132 | |
Engineering & Construction — 2.3% | | | | |
KBR, Inc. | | | 376 | | | | 8,381 | |
MasTec, Inc. (a) | | | 195 | | | | 9,680 | |
TopBuild Corp. (a) | | | 87 | | | | 13,329 | |
| | | | | | | | 31,390 | |
Environmental Control — 1.6% | | | | |
Clean Harbors, Inc. (a) | | | 147 | | | | 7,787 | |
Tetra Tech, Inc. | | | 142 | | | | 14,329 | |
| | | | | | | | 22,116 | |
| | | Shares | | | Value | |
Hand/Machine Tools — 1.2% | | | | |
Lincoln Electric Holdings, Inc. | | | 157 | | | $ | 15,986 | |
| | | | | | | | | |
Healthcare-Services — 2.7% | | | | |
Chemed Corp. | | | 41 | | | | 19,611 | |
LHC Group, Inc. (a) | | | 80 | | | | 17,324 | |
| | | | | | | | 36,935 | |
Home Builders — 5.0% | | | | |
NVR, Inc. (a) | | | 10 | | | | 39,531 | |
PulteGroup, Inc. | | | 708 | | | | 28,858 | |
| | | | | | | | 68,389 | |
Home Furnishings — 0.9% | | | | |
Tempur Sealy International, Inc. (a) | | | 136 | | | | 12,104 | |
| | | | | | | | | |
Internet — 4.5% | | | | |
eBay, Inc. | | | 1,287 | | | | 61,300 | |
| | | | | | | | | |
Iron/Steel — 1.3% | | | | |
Reliance Steel & Aluminum Co. | | | 168 | | | | 18,310 | |
| | | | | | | | | |
Leisure Time — 1.1% | | | | |
Polaris Industries, Inc. | | | 162 | | | | 14,719 | |
| | | | | | | | | |
Metal Fabricate/Hardware — 0.9% | | | | |
The Timken Co. | | | 198 | | | | 11,821 | |
| | | | | | | | | |
Miscellaneous Manufacturing — 1.3% | | | | |
Carlisle Cos., Inc. | | | 144 | | | | 17,837 | |
| | | | | | | | | |
Office Furnishings — 0.3% | | | | |
Herman Miller, Inc. | | | 156 | | | | 4,753 | |
| | | | | | | | | |
Office/Business Equipment — 3.7% | | | | |
Xerox Holdings Corp. | | | 563 | | | | 9,785 | |
Zebra Technologies Corp. - Class A (a) | | | 141 | | | | 39,993 | |
| | | | | | | | 49,778 | |
Oil & Gas — 0.7% | | | | |
Murphy USA, Inc. (a) | | | 77 | | | | 9,416 | |
| | | | | | | | | |
Retail — 6.2% | | | | |
Dollar General Corp. | | | 339 | | | | 70,753 | |
Lithia Motors, Inc. - Class B | | | 60 | | | | 13,774 | |
| | | | | | | | 84,527 | |
Semiconductors — 18.8% | | | | |
Applied Materials, Inc. | | | 1,235 | | | | 73,149 | |
Broadcom, Inc. | | | 189 | | | | 66,080 | |
KLA Corp. | | | 395 | | | | 77,886 | |
Qorvo, Inc. (a) | | | 302 | | | | 38,463 | |
| | | | | | | | 255,578 | |
The accompanying notes are an integral part of the financial statements.
87
Pacer US Cash Cows Growth ETF
SCHEDULE OF INVESTMENTS
October 31, 2020 (Unaudited) (Continued)
| | | Shares | | | Value | |
COMMON STOCKS — 99.5% (Continued) |
| | | | | | | | | |
Software — 4.0% | | | | |
J2 Global, Inc. (a) | | | 126 | | | $ | 8,553 | |
Take-Two Interactive Software, Inc. (a) | | | 298 | | | | 46,166 | |
| | | | | | | | 54,719 | |
Telecommunications — 8.2% | | | | |
Arista Networks, Inc. (a) | | | 201 | | | | 41,989 | |
Motorola Solutions, Inc. | | | 438 | | | | 69,230 | |
| | | | | | | | 111,219 | |
TOTAL COMMON STOCKS (Cost $1,392,526) | | | | | | | 1,354,036 | |
| | | | | |
| | | Principal
Amount | | | | | |
SHORT-TERM INVESTMENTS — 0.5% | | | | |
| | | | | | | | | |
Money Market Deposit Accounts, — 0.5% | | | | |
U.S. Bank Money Market Deposit Account, 0.025% (b) | | $ | 7,123 | | | | 7,123 | |
TOTAL SHORT-TERM INVESTMENTS (Cost $7,123) | | | | | | | 7,123 | |
Total Investments (Cost $1,399,649) — 100.0% | | | | | | | 1,361,159 | |
Liabilities in Excess of Other Assets — 0.0% (c) | | | | | | | (341 | ) |
TOTAL NET ASSETS — 100.0% | | | | | | $ | 1,360,818 | |
Percentages are stated as a percent of net assets.
| | (a) | Non-income producing security. |
| | (b) | The rate shown is as of October 31, 2020. |
For Fund compliance purposes, the Fund’s industry classifications refer to any one or more of the industry sub-classifications used by one or more widely recognized market indexes or ratings group indexes, and/or they may be defined by Fund management. This definition does not apply for all purposes of this report, which may combine sub-classifications for reporting ease. Categories are shown as a percentage of net assets.
The accompanying notes are an integral part of the financial statements.
88
Pacer Trendpilot International ETF
SCHEDULE OF INVESTMENTS
October 31, 2020 (Unaudited)
| | | Shares | | | Value | |
COMMON STOCKS — 93.1% | | | | |
| | | | | | | | | |
Australia — 5.7% | | | | |
Afterpay Ltd. (a) | | | 1,790 | | | $ | 121,654 | |
AGL Energy Ltd. | | | 5,197 | | | | 45,589 | |
APA Group | | | 9,180 | | | | 67,688 | |
Aristocrat Leisure Ltd. | | | 5,292 | | | | 106,496 | |
ASX Ltd. | | | 1,615 | | | | 90,395 | |
Australia & New Zealand Banking Group Ltd. | | | 23,527 | | | | 311,063 | |
BHP Billiton Ltd. - ADR | | | 11,276 | | | | 542,488 | |
Brambles Ltd. | | | 12,573 | | | | 84,752 | |
Cochlear Ltd. | | | 516 | | | | 76,957 | |
Coles Group Ltd. | | | 9,963 | | | | 124,303 | |
Commonwealth Bank of Australia | | | 14,690 | | | | 712,672 | |
CSL Ltd. | | | 3,530 | | | | 713,503 | |
Fortescue Metals Group Ltd. | | | 14,039 | | | | 171,407 | |
Insurance Australia Group Ltd. | | | 19,164 | | | | 64,254 | |
Macquarie Group Ltd. | | | 2,756 | | | | 245,539 | |
National Australia Bank Ltd. | | | 26,495 | | | | 346,393 | |
Newcrest Mining Ltd. | | | 6,708 | | | | 137,868 | |
Origin Energy Ltd. | | | 14,605 | | | | 41,063 | |
QBE Insurance Group Ltd. | | | 12,182 | | | | 70,642 | |
Ramsay Health Care Ltd. | | | 1,509 | | | | 66,133 | |
REA Group Ltd. | | | 394 | | | | 32,754 | |
Rio Tinto Ltd. | | | 3,087 | | | | 200,559 | |
Santos Ltd. | | | 14,694 | | | | 48,853 | |
Scentre Group | | | 43,022 | | | | 63,504 | |
Sonic Healthcare Ltd. | | | 3,716 | | | | 90,949 | |
South32 Ltd. | | | 40,184 | | | | 57,338 | |
Suncorp Group Ltd. | | | 10,467 | | | | 60,403 | |
Sydney Airport | | | 10,981 | | | | 42,066 | |
Telstra Corp. Ltd. | | | 34,496 | | | | 64,983 | |
TPG Telecom Ltd. (a) | | | 2,902 | | | | 14,646 | |
Transurban Group | | | 22,674 | | | | 214,519 | |
Wesfarmers Ltd. | | | 9,421 | | | | 304,348 | |
Westpac Banking Corp. | | | 29,942 | | | | 376,937 | |
Woodside Petroleum Ltd. | | | 7,928 | | | | 97,632 | |
Woolworths Group Ltd. | | | 10,490 | | | | 281,369 | |
| | | | | | | | 6,091,719 | |
Austria — 0.3% | | | | |
ams AG (a) | | | 2,279 | | | | 48,838 | |
Andritz AG | | | 597 | | | | 20,108 | |
BAWAG Group AG (a)(b) | | | 601 | | | | 21,979 | |
CA Immobilien Anlagen AG | | | 611 | | | | 16,758 | |
Erste Group Bank AG | | | 2,506 | | | | 51,309 | |
Mayr Melnhof Karton AG | | | 86 | | | | 14,042 | |
OMV AG | | | 1,198 | | | | 27,486 | |
Raiffeisen Bank International AG (a) | | | 1,129 | | | | 16,226 | |
Strabag SE | | | 115 | | | | 3,335 | |
Telekom Austria AG | | | 1,179 | | | | 7,937 | |
| | | Shares | | | Value | |
Austria — 0.3% (Continued) |
Verbund AG | | | 586 | | | $ | 33,701 | |
Voestalpine AG | | | 927 | | | | 25,749 | |
| | | | | | | | 287,468 | |
Belgium — 0.9% | | | | |
Ageas | | | 1,549 | | | | 62,330 | |
Anheuser-Busch InBev SA/NV - ADR | | | 7,046 | | | | 365,758 | |
Galapagos NV - ADR (a) | | | 392 | | | | 45,660 | |
Groupe Bruxelles Lambert SA | | | 981 | | | | 80,296 | |
KBC Groep NV | | | 2,843 | | | | 140,158 | |
Sofina SA | | | 129 | | | | 33,503 | |
Solvay SA - Class A | | | 610 | | | | 49,517 | |
UCB SA | | | 1,067 | | | | 105,255 | |
Umicore SA | | | 1,573 | | | | 60,529 | |
| | | | | | | | 943,006 | |
Bermuda — 0.1% | | | | |
Alibaba Health Information Technology Ltd. (a) | | | 32,404 | | | | 84,641 | |
| | | | | | | | | |
Canada — 8.3% | | | | |
Agnico Eagle Mines Ltd. | | | 2,011 | | | | 159,452 | |
Alimentation Couche-Tard, Inc. - Class B (a) | | | 7,135 | | | | 219,732 | |
Bank of Montreal | | | 5,296 | | | | 314,953 | |
Barrick Gold Corp. | | | 14,761 | | | | 394,562 | |
BCE, Inc. | | | 2,477 | | | | 99,625 | |
Canadian Imperial Bank of Commerce | | | 3,698 | | | | 275,945 | |
Canadian National Railway Co. | | | 5,895 | | | | 586,258 | |
Canadian Natural Resources Ltd. | | | 9,800 | | | | 156,310 | |
Canadian Pacific Railway Ltd. | | | 1,136 | | | | 339,812 | |
CGI, Inc. (a) | | | 1,918 | | | | 119,242 | |
Constellation Software Inc./Canada (a) | | | 182 | | | | 191,056 | |
Enbridge, Inc. | | | 16,761 | | | | 461,933 | |
Fortis, Inc. | | | 3,843 | | | | 151,798 | |
Franco-Nevada Corp. | | | 1,577 | | | | 215,339 | |
Great-West Lifeco, Inc. | | | 2,250 | | | | 45,851 | |
Hydro One Ltd. (a)(b) | | | 2,547 | | | | 55,650 | |
Imperial Oil Ltd. | | | 1,898 | | | | 25,300 | |
Intact Financial Corp. (a) | | | 1,188 | | | | 122,715 | |
Loblaw Cos Ltd. (a) | | | 1,438 | | | | 71,582 | |
Magna International, Inc. | | | 2,353 | | | | 120,262 | |
Manulife Financial Corp. | | | 16,067 | | | | 218,190 | |
National Bank of Canada (a) | | | 2,795 | | | | 134,138 | |
Nutrien Ltd. | | | 4,720 | | | | 192,010 | |
Pembina Pipeline Corp. | | | 4,329 | | | | 90,606 | |
Restaurant Brands International, Inc. | | | 2,495 | | | | 129,740 | |
Rogers Communications, Inc. - Class B | | | 2,921 | | | | 118,622 | |
Royal Bank of Canada | | | 11,785 | | | | 824,832 | |
The accompanying notes are an integral part of the financial statements.
89
Pacer Trendpilot International ETF
SCHEDULE OF INVESTMENTS
October 31, 2020 (Unaudited) (Continued)
| | | Shares | | | Value | |
COMMON STOCKS — 93.1% (Continued) |
| | | | | | | | | |
Canada — 8.3% (Continued) |
Shopify, Inc. - Class A (a) | | | 893 | | | $ | 826,409 | |
Sun Life Financial, Inc. | | | 4,851 | | | | 193,167 | |
Suncor Energy, Inc. | | | 12,661 | | | | 142,943 | |
TC Energy Corp. | | | 7,794 | | | | 307,551 | |
TELUS Corp. | | | 3,488 | | | | 59,680 | |
The Bank of Nova Scotia | | | 10,049 | | | | 417,636 | |
The Toronto-Dominion Bank | | | 14,936 | | | | 660,619 | |
Thomson Reuters Corp. | | | 1,401 | | | | 109,068 | |
TOPICUS.COM, Inc. (a)(c) | | | 338 | | | | 2,105 | |
Waste Connections, Inc. | | | 2,181 | | | | 216,617 | |
Wheaton Precious Metals Corp. | | | 3,510 | | | | 161,846 | |
| | | | | | | | 8,933,156 | |
Cayman Islands — 0.1% | | | | |
CK Asset Holdings Ltd. | | | 21,133 | | | | 97,862 | |
| | | | | | | | | |
Denmark — 2.2% | | | | |
AP Moller - Maersk A/S - Class B | | | 70 | | | | 111,812 | |
AP Moller - Maersk A/S - Class A | | | 34 | | | | 50,160 | |
Carlsberg A/S - Class B | | | 861 | | | | 108,972 | |
Coloplast A/S - Class B | | | 993 | | | | 144,911 | |
DSV A/S | | | 1,668 | | | | 270,084 | |
Genmab A/S - ADR (a) | | | 5,374 | | | | 180,889 | |
Novo Nordisk A/S - ADR | | | 13,452 | | | | 859,448 | |
Novozymes A/S - Class B | | | 1,742 | | | | 104,678 | |
Orsted A/S (b) | | | 1,388 | | | | 220,295 | |
Vestas Wind Systems A/S | | | 1,671 | | | | 285,210 | |
| | | | | | | | 2,336,459 | |
Finland — 1.1% | | | | |
Fortum OYJ | | | 3,630 | | | | 68,277 | |
Kone OYJ - Class B | | | 3,355 | | | | 267,031 | |
Neste OYJ | | | 3,582 | | | | 186,394 | |
Nokia OYJ - ADR (a) | | | 46,536 | | | | 156,826 | |
Nordea Bank Abp (a) | | | 26,770 | | | | 200,600 | |
Sampo OYJ - Class A | | | 4,309 | | | | 162,598 | |
Stora Enso OYJ - Class R | | | 5,097 | | | | 74,351 | |
UPM-Kymmene OYJ | | | 4,410 | | | | 124,602 | |
| | | | | | | | 1,240,679 | |
France — 7.2% | | | | |
Air Liquide SA | | | 3,927 | | | | 573,982 | |
AXA SA | | | 16,091 | | | | 258,616 | |
BNP Paribas SA (a) | | | 9,511 | | | | 330,702 | |
Christian Dior SE | | | 58 | | | | 24,683 | |
Credit Agricole SA (a) | | | 10,528 | | | | 83,157 | |
Danone SA | | | 5,349 | | | | 295,287 | |
Dassault Systemes SE | | | 1,149 | | | | 196,110 | |
Electricite de France SA | | | 3,868 | | | | 44,904 | |
Engie SA (a) | | | 13,800 | | | | 166,909 | |
EssilorLuxottica SA (a) | | | 2,451 | | | | 303,153 | |
| | | Shares | | | Value | |
France — 7.2% (Continued) |
Hermes International | | | 299 | | | $ | 278,235 | |
Kering | | | 625 | | | | 377,418 | |
L’Oreal SA | | | 1,887 | | | | 610,298 | |
LVMH Moet Hennessy Louis Vuitton SE - ADR | | | 10,428 | | | | 981,588 | |
Orange SA | | | 15,811 | | | | 177,329 | |
Pernod Ricard SA | | | 1,570 | | | | 253,064 | |
Safran SA (a) | | | 2,744 | | | | 289,283 | |
Sanofi - ADR | | | 17,837 | | | | 808,016 | |
Schneider Electric SE | | | 4,215 | | | | 511,516 | |
TOTAL SA - ADR | | | 20,633 | | | | 625,799 | |
Vinci SA | | | 4,219 | | | | 333,243 | |
Vivendi SA | | | 6,673 | | | | 192,660 | |
| | | | | | | | 7,715,952 | |
Germany — 6.3% | | | | |
adidas AG (a) | | | 1,545 | | | | 458,841 | |
Allianz SE - ADR | | | 1 | | | | 18 | |
Allianz SE | | | 3,249 | | | | 571,601 | |
BASF SE | | | 7,630 | | | | 418,276 | |
Bayer AG - ADR | | | 32,653 | | | | 383,020 | |
Bayerische Motoren Werke AG | | | 2,649 | | | | 181,036 | |
Beiersdorf AG | | | 823 | | | | 86,169 | |
Daimler AG | | | 6,513 | | | | 336,789 | |
Deutsche Boerse AG | | | 1,576 | | | | 231,913 | |
Deutsche Post AG | | | 8,051 | | | | 356,684 | |
Deutsche Telekom AG | | | 26,854 | | | | 408,770 | |
E.ON SE | | | 18,178 | | | | 189,522 | |
Fresenius Medical Care AG & Co KGaA - ADR | | | 3,529 | | | | 134,914 | |
Fresenius SE & Co. KGaA | | | 3,412 | | | | 126,525 | |
Henkel AG & Co. KGaA | | | 856 | | | | 77,412 | |
Infineon Technologies AG | | | 10,834 | | | | 301,565 | |
Merck KGaA | | | 1,081 | | | | 160,080 | |
Muenchener Rueckversicherungs-Gesellschaft AG - Class R | | | 1,185 | | | | 277,125 | |
SAP SE - ADR | | | 8,821 | | | | 942,347 | |
Sartorius AG | | | 7 | | | | 2,650 | |
Siemens AG - ADR | | | 12,554 | | | | 807,599 | |
Siemens Healthineers AG (b) | | | 1,262 | | | | 54,169 | |
Volkswagen AG | | | 290 | | | | 45,123 | |
Vonovia SE | | | 4,518 | | | | 288,456 | |
| | | | | | | | 6,840,604 | |
Hong Kong — 2.9% | | | | |
AIA Group Ltd. - ADR | | | 23,295 | | | | 886,841 | |
BOC Hong Kong Holdings Ltd. | | | 29,795 | | | | 82,630 | |
Budweiser Brewing Co APAC Ltd. (b) | | | 10,981 | | | | 32,295 | |
China Evergrande New Energy Vehicle Group Ltd. (a) | | | 16,785 | | | | 46,442 | |
CK Hutchison Holdings Ltd. | | | 22,377 | | | | 134,796 | |
The accompanying notes are an integral part of the financial statements.
90
Pacer Trendpilot International ETF
SCHEDULE OF INVESTMENTS
October 31, 2020 (Unaudited) (Continued)
| | | Shares | | | Value | |
COMMON STOCKS — 93.1% (Continued) |
| | | | | | | | | |
Hong Kong — 2.9% (Continued) |
CLP Holdings Ltd. | | | 12,590 | | | $ | 115,791 | |
Galaxy Entertainment Group Ltd. | | | 16,512 | | | | 108,837 | |
Hang Seng Bank Ltd. | | | 6,033 | | | | 92,761 | |
Henderson Land Development Co Ltd. | | | 13,647 | | | | 48,321 | |
Hong Kong & China Gas Co. Ltd. | | | 85,435 | | | | 122,766 | |
Hong Kong Exchanges & Clearing Ltd. | | | 9,898 | | | | 472,653 | |
Jardine Matheson Holdings Ltd. | | | 2,109 | | | | 93,618 | |
Jardine Strategic Holdings Ltd. | | | 1,475 | | | | 31,993 | |
MTR Corp Ltd. | | | 12,767 | | | | 63,156 | |
Sands China Ltd. | | | 20,116 | | | | 70,448 | |
Sea Ltd. - ADR (a) | | | 2,341 | | | | 369,176 | |
Sun Hung Kai Properties Ltd. | | | 12,252 | | | | 156,696 | |
Techtronic Industries Co Ltd. | | | 13,387 | | | | 178,551 | |
| | | | | | | | 3,107,771 | |
Ireland — 0.8% | | | | |
CRH PLC - ADR | | | 6,590 | | | | 231,639 | |
Flutter Entertainment PLC (a) | | | 1,188 | | | | 205,618 | |
James Hardie Industries PLC | | | 3,446 | | | | 83,759 | |
Kerry Group PLC - Class A | | | 1,275 | | | | 152,502 | |
Kingspan Group PLC (a) | | | 1,289 | | | | 112,367 | |
Ryanair Holdings PLC - ADR (a) | | | 785 | | | | 63,271 | |
| | | | | | | | 849,156 | |
Israel — 0.7% | | | | |
Azrieli Group Ltd. | | | 304 | | | | 14,336 | |
Bank Hapoalim BM (a) | | | 9,277 | | | | 54,351 | |
Bank Leumi Le-Israel BM | | | 12,156 | | | | 57,537 | |
Check Point Software Technologies Ltd. (a) | | | 941 | | | | 106,860 | |
CyberArk Software Ltd. (a) | | | 329 | | | | 32,620 | |
Elbit Systems Ltd. | | | 208 | | | | 23,537 | |
Fiverr International Ltd. (a) | | | 140 | | | | 20,499 | |
ICL Group Ltd. | | | 5,713 | | | | 20,795 | |
Isracard Ltd. | | | 0 | | | | 1 | |
Israel Discount Bank Ltd. | | | 9,658 | | | | 27,179 | |
Kornit Digital Ltd. (a) | | | 325 | | | | 21,879 | |
Mizrahi Tefahot Bank Ltd. | | | 1,091 | | | | 21,302 | |
Nice Ltd. - ADR (a) | | | 520 | | | | 118,695 | |
Plus500 Ltd. | | | 843 | | | | 16,114 | |
Taro Pharmaceutical Industries Ltd. (a) | | | 98 | | | | 5,746 | |
Teva Pharmaceutical Industries Ltd. - ADR (a) | | | 9,031 | | | | 78,750 | |
Wix.com Ltd. (a) | | | 394 | | | | 97,444 | |
| | | | | | | | 717,645 | |
Italy — 1.4% | | | | |
Assicurazioni Generali SpA | | | 10,192 | | | | 136,625 | |
Atlantia SpA (a) | | | 3,919 | | | | 60,043 | |
| | | Shares | | | Value | |
Italy — 1.4% (Continued) |
Enel SpA | | | 63,989 | | | $ | 509,301 | |
Eni SpA | | | 21,085 | | | | 147,609 | |
Intesa Sanpaolo SpA (a) | | | 145,090 | | | | 239,882 | |
Poste Italiane SpA (b) | | | 3,807 | | | | 31,037 | |
Recordati SpA | | | 788 | | | | 40,830 | |
Snam SpA | | | 18,026 | | | | 87,964 | |
Terna Rete Elettrica Nazionale SpA | | | 11,619 | | | | 78,540 | |
UniCredit SpA (a) | | | 17,528 | | | | 130,669 | |
| | | | | | | | 1,462,500 | |
Japan — 25.0% | | | | |
Acom Co. Ltd. | | | 3,840 | | | | 17,129 | |
Advantest Corp. | | | 1,678 | | | | 96,646 | |
Aeon Co Ltd. | | | 7,246 | | | | 184,342 | |
Aisin Seiki Co. Ltd. | | | 1,527 | | | | 45,871 | |
Ajinomoto Co, Inc. | | | 4,563 | | | | 91,417 | |
ANA Holdings, Inc. (a) | | | 973 | | | | 21,097 | |
Asahi Glass Co. Ltd. | | | 1,891 | | | | 58,611 | |
Asahi Group Holdings Ltd. | | | 3,831 | | | | 117,936 | |
Asahi Kasei Corp. | | | 11,576 | | | | 99,556 | |
Astellas Pharma, Inc. | | | 14,673 | | | | 201,115 | |
Bandai Namco Holdings, Inc. | | | 1,861 | | | | 138,222 | |
Bridgestone Corp. | | | 5,160 | | | | 167,080 | |
Canon, Inc. - ADR (a) | | | 9,011 | | | | 157,242 | |
Central Japan Railway Co. | | | 1,719 | | | | 206,635 | |
Chubu Electric Power Co, Inc. | | | 5,993 | | | | 67,060 | |
Chugai Pharmaceutical Co Ltd. | | | 5,292 | | | | 203,249 | |
Dai Nippon Printing Co Ltd. | | | 2,513 | | | | 46,542 | |
Daifuku Co Ltd. | | | 985 | | | | 100,951 | |
Dai-ichi Life Holdings, Inc. | | | 9,941 | | | | 146,843 | |
Daiichi Sankyo Co Ltd. | | | 15,185 | | | | 398,571 | |
Daikin Industries Ltd. | | | 2,451 | | | | 456,044 | |
Daiwa House Industry Co Ltd. | | | 5,531 | | | | 144,516 | |
Daiwa Securities Group, Inc. | | | 12,962 | | | | 52,123 | |
Denso Corp. | | | 4,315 | | | | 199,398 | |
Dentsu, Inc. | | | 2,061 | | | | 58,880 | |
Disco Corp. | | | 239 | | | | 63,987 | |
East Japan Railway Co. | | | 3,137 | | | | 163,509 | |
Eisai Co Ltd. | | | 2,460 | | | | 190,066 | |
ENEOS Holdings, Inc. | | | 26,774 | | | | 89,660 | |
FANUC Corp. | | | 1,617 | | | | 340,559 | |
Fast Retailing Co Ltd. | | | 549 | | | | 381,277 | |
FUJIFILM Holdings Corp. | | | 3,435 | | | | 174,481 | |
Fujitsu Ltd. | | | 1,581 | | | | 184,610 | |
GMO Payment Gateway, Inc. | | | 339 | | | | 41,349 | |
Hankyu Hanshin Holdings, Inc. | | | 2,121 | | | | 64,423 | |
Hikari Tsushin, Inc. | | | 190 | | | | 44,299 | |
Hitachi Ltd. | | | 8,038 | | | | 268,867 | |
Honda Motor Co. Ltd. - ADR (a) | | | 13,309 | | | | 314,359 | |
Hoya Corp. | | | 3,137 | | | | 353,566 | |
Hulic Co Ltd. | | | 4,137 | | | | 38,171 | |
The accompanying notes are an integral part of the financial statements.
91
Pacer Trendpilot International ETF
SCHEDULE OF INVESTMENTS
October 31, 2020 (Unaudited) (Continued)
| | | Shares | | | Value | |
COMMON STOCKS — 93.1% (Continued) |
| | | | | | | | | |
Japan — 25.0% (Continued) |
Idemitsu Kosan Co Ltd. | | | 2,058 | | | $ | 41,378 | |
Inpex Corp. | | | 8,982 | | | | 42,210 | |
Isuzu Motors Ltd. | | | 5,143 | | | | 41,411 | |
ITOCHU Corp. | | | 11,513 | | | | 274,918 | |
Itochu Techno-Solutions Corp. | | | 763 | | | | 25,908 | |
Japan Airlines Co. Ltd. (a) | | | 933 | | | | 16,192 | |
Japan Exchange Group, Inc. | | | 4,455 | | | | 108,189 | |
Japan Post Bank Co. Ltd. | | | 3,363 | | | | 26,693 | |
Japan Post Holdings Co. Ltd. | | | 12,322 | | | | 84,140 | |
Japan Post Insurance Co. Ltd. | | | 244 | | | | 3,845 | |
Japan Tobacco, Inc. | | | 9,301 | | | | 175,013 | |
KAJIMA Corp. | | | 4,175 | | | | 44,344 | |
Kansai Paint Co. Ltd. | | | 2,156 | | | | 55,375 | |
Kao Corp. | | | 4,016 | | | | 284,624 | |
KDDI Corp. | | | 12,998 | | | | 346,692 | |
Keio Corp. | | | 1,021 | | | | 59,000 | |
Keyence Corp. | | | 1,575 | | | | 710,815 | |
Kikkoman Corp. | | | 1,618 | | | | 80,054 | |
Kintetsu Group Holdings Co. Ltd. | | | 1,583 | | | | 62,900 | |
Kirin Holdings Co. Ltd. | | | 7,582 | | | | 136,077 | |
Kobe Bussan Co Ltd. | | | 978 | | | | 27,510 | |
Koito Manufacturing Co. Ltd. | | | 1,091 | | | | 52,312 | |
Komatsu Ltd. | | | 8,067 | | | | 180,380 | |
Kose Corp. | | | 306 | | | | 38,814 | |
Kubota Corp. | | | 9,611 | | | | 166,204 | |
Kyocera Corp. | | | 2,930 | | | | 160,388 | |
Kyowa Kirin Co. Ltd. | | | 2,116 | | | | 52,347 | |
Lasertec Corp. | | | 604 | | | | 52,153 | |
LINE Corp. (a) | | | 480 | | | | 24,620 | |
M3, Inc. | | | 3,547 | | | | 238,070 | |
Makita Corp. | | | 2,340 | | | | 102,813 | |
Marubeni Corp. | | | 14,407 | | | | 74,749 | |
MEIJI Holdings Co Ltd. | | | 1,209 | | | | 87,302 | |
MINEBEA MITSUMI, Inc. | | | 3,542 | | | | 63,400 | |
MISUMI Group, Inc. | | | 2,354 | | | | 69,477 | |
Mitsubishi Chemical Holdings Corp. | | | 11,754 | | | | 65,812 | |
Mitsubishi Corp. | | | 10,994 | | | | 244,200 | |
Mitsubishi Electric Corp. | | | 17,810 | | | | 227,952 | |
Mitsubishi Estate Co. Ltd. | | | 11,547 | | | | 171,393 | |
Mitsubishi Heavy Industries Ltd. | | | 2,811 | | | | 59,995 | |
Mitsubishi UFJ Financial Group, Inc. | | | 106,930 | | | | 418,957 | |
Mitsui & Co. Ltd. | | | 12,679 | | | | 197,400 | |
Mitsui Fudosan Co Ltd. | | | 8,138 | | | | 137,933 | |
Mizuho Financial Group, Inc. | | | 21,063 | | | | 257,818 | |
MonotaRO Co Ltd. | | | 975 | | | | 54,014 | |
MS&AD Insurance Group Holdings, Inc. | | | 4,099 | | | | 111,367 | |
Murata Manufacturing Co. Ltd. | | | 5,329 | | | | 369,892 | |
| | | Shares | | | Value | |
Japan — 25.0% (Continued) |
NEC Corp. | | | 2,159 | | | $ | 108,264 | |
Nexon Co. Ltd. | | | 3,828 | | | | 106,728 | |
Nidec Corp. | | | 4,557 | | | | 457,028 | |
Nihon M&A Center, Inc. | | | 1,153 | | | | 67,289 | |
Nintendo Co. Ltd. - ADR (a) | | | 7,845 | | | | 531,342 | |
Nippon Paint Holdings Co. Ltd. | | | 1,667 | | | | 149,512 | |
Nippon Steel Corp. (a) | | | 7,885 | | | | 75,804 | |
Nippon Telegraph & Telephone Corp. | | | 10,691 | | | | 224,246 | |
Nissan Motor Co. Ltd. (a) | | | 19,949 | | | | 69,739 | |
Nissin Foods Holdings Co. Ltd. | | | 705 | | | | 60,874 | |
Nitori Holdings Co. Ltd. | | | 706 | | | | 145,320 | |
Nitto Denko Corp. | | | 1,328 | | | | 92,723 | |
Nomura Holdings, Inc. | | | 23,620 | | | | 104,795 | |
Nomura Research Institute Ltd. | | | 3,236 | | | | 95,663 | |
NTT Data Corp. | | | 5,362 | | | | 60,178 | |
NTT DOCOMO, Inc. | | | 8,332 | | | | 309,341 | |
Obayashi Corp. | | | 5,980 | | | | 49,693 | |
Obic Co Ltd. | | | 571 | | | | 101,171 | |
Odakyu Electric Railway Co. Ltd. | | | 2,828 | | | | 67,881 | |
Olympus Corp. | | | 10,796 | | | | 205,103 | |
Omron Corp. | | | 1,721 | | | | 123,287 | |
Ono Pharmaceutical Co. Ltd. | | | 4,172 | | | | 118,431 | |
Oracle Corp Japan | | | 299 | | | | 29,873 | |
Oriental Land Co. Ltd. | | | 1,871 | | | | 260,648 | |
ORIX Corp. | | | 10,978 | | | | 127,454 | |
Osaka Gas Co. Ltd. | | | 3,460 | | | | 65,502 | |
Otsuka Corp. | | | 877 | | | | 40,376 | |
Otsuka Holdings Co. Ltd. | | | 4,628 | | | | 170,409 | |
Pan Pacific International Holdings Corp. | | | 5,000 | | | | 106,118 | |
Panasonic Corp. | | | 19,317 | | | | 177,256 | |
Rakuten, Inc. | | | 6,780 | | | | 65,731 | |
Recruit Holdings Co. Ltd. | | | 13,236 | | | | 501,905 | |
Renesas Electronics Corp. (a) | | | 8,663 | | | | 71,244 | |
Resona Holdings, Inc. | | | 18,317 | | | | 59,922 | |
Rohm Co. Ltd. | | | 784 | | | | 59,907 | |
Santen Pharmaceutical Co. Ltd. | | | 3,338 | | | | 59,207 | |
Secom Co. Ltd. | | | 1,783 | | | | 149,783 | |
Sekisui Chemical Co. Ltd. | | | 3,789 | | | | 58,629 | |
Sekisui House Ltd. | | | 5,345 | | | | 88,143 | |
Seven & i Holdings Co. Ltd. | | | 6,624 | | | | 201,134 | |
SG Holdings Co. Ltd. | | | 4,066 | | | | 97,674 | |
Sharp Corp. | | | 1,736 | | | | 19,898 | |
Shimadzu Corp. | | | 2,290 | | | | 64,985 | |
Shimano, Inc. | | | 713 | | | | 161,846 | |
Shimizu Corp. | | | 6,021 | | | | 41,637 | |
Shin-Etsu Chemical Co. Ltd. | | | 3,188 | | | | 422,955 | |
Shionogi & Co. Ltd. | | | 2,382 | | | | 112,030 | |
Shiseido Co. Ltd. | | | 3,338 | | | | 205,646 | |
The accompanying notes are an integral part of the financial statements.
92
Pacer Trendpilot International ETF
SCHEDULE OF INVESTMENTS
October 31, 2020 (Unaudited) (Continued)
| | | Shares | | | Value | |
COMMON STOCKS — 93.1% (Continued) |
| | | | | | | | | |
Japan — 25.0% (Continued) |
SMC Corp. | | | 490 | | | $ | 258,818 | |
SoftBank Corp. | | | 13,506 | | | | 156,416 | |
SoftBank Group Corp. - ADR (a) | | | 27,248 | | | | 886,922 | |
Sompo Holdings, Inc. | | | 3,110 | | | | 115,583 | |
Sony Corp. - ADR (a) | | | 10,438 | | | | 873,243 | |
Subaru Corp. | | | 5,296 | | | | 96,390 | |
Sumitomo Corp. | | | 10,389 | | | | 113,570 | |
Sumitomo Electric Industries Ltd. | | | 6,583 | | | | 72,027 | |
Sumitomo Metal Mining Co. Ltd. | | | 2,269 | | | | 69,850 | |
Sumitomo Mitsui Financial Group, Inc. - ADR (a) | | | 57,193 | | | | 316,849 | |
Sumitomo Mitsui Trust Holdings, Inc. | | | 3,131 | | | | 83,243 | |
Sumitomo Realty & Development Co. Ltd. | | | 3,953 | | | | 105,230 | |
Suntory Beverage & Food Ltd. | | | 1,070 | | | | 36,793 | |
Suzuki Motor Corp. | | | 3,826 | | | | 162,878 | |
Sysmex Corp. | | | 1,375 | | | | 128,707 | |
T&D Holdings, Inc. | | | 4,940 | | | | 48,931 | |
Taisei Corp. | | | 1,866 | | | | 57,836 | |
Taiyo Nippon Sanso Corp. | | | 1,769 | | | | 25,801 | |
Takeda Pharmaceutical Co. Ltd. - ADR (a) | | | 26,046 | | | | 400,848 | |
TDK Corp. | | | 1,079 | | | | 125,838 | |
Terumo Corp. | | | 5,793 | | | | 212,309 | |
The Kansai Electric Power Co., Inc. | | | 6,870 | | | | 62,397 | |
Tobu Railway Co. Ltd. | | | 1,760 | | | | 49,676 | |
Toho Co Ltd./Tokyo | | | 1,182 | | | | 46,627 | |
Tokio Marine Holdings, Inc. | | | 5,828 | | | | 259,350 | |
Tokyo Electron Ltd. | | | 1,311 | | | | 349,366 | |
Tokyo Gas Co. Ltd. | | | 3,236 | | | | 73,115 | |
Tokyu Corp. | | | 4,715 | | | | 55,619 | |
Toray Industries, Inc. | | | 13,525 | | | | 60,769 | |
Toshiba Corp. | | | 3,549 | | | | 89,119 | |
TOTO Ltd. | | | 1,333 | | | | 60,414 | |
Toyota Industries Corp. | | | 1,711 | | | | 109,823 | |
Toyota Motor Corp. - ADR (a) | | | 9,865 | | | | 1,295,176 | |
Toyota Tsusho Corp. | | | 1,968 | | | | 54,494 | |
Trend Micro, Inc. | | | 1,023 | | | | 57,162 | |
Unicharm Corp. | | | 3,661 | | | | 169,246 | |
Welcia Holdings Co Ltd. | | | 802 | | | | 31,407 | |
West Japan Railway Co. | | | 1,591 | | | | 67,776 | |
Yakult Honsha Co Ltd. | | | 1,349 | | | | 65,198 | |
Yamaha Corp. | | | 1,404 | | | | 65,979 | |
Yamato Holdings Co. Ltd. | | | 2,799 | | | | 73,628 | |
Yaskawa Electric Corp. | | | 2,226 | | | | 85,791 | |
Z Holdings Corp. | | | 23,091 | | | | 159,924 | |
ZOZO, Inc. | | | 796 | | | | 20,156 | |
| | | | | | | | 26,971,927 | |
| | | Shares | | | Value | |
Jersey — 0.5% | | | | |
Experian PLC | | | 7,548 | | | $ | 275,459 | |
Ferguson PLC | | | 1,940 | | | | 194,075 | |
WPP PLC - ADR | | | 2,048 | | | | 81,818 | |
| | | | | | | | 551,352 | |
Luxembourg — 0.3% | | | | |
ArcelorMittal (a) | | | 5,915 | | | | 80,269 | |
Ardagh Group SA | | | 158 | | | | 2,604 | |
Globant SA (a) | | | 307 | | | | 55,447 | |
RTL Group SA (a) | | | 328 | | | | 12,461 | |
SES SA | | | 3,190 | | | | 25,464 | |
Spotify Technology SA (a) | | | 846 | | | | 202,947 | |
| | | | | | | | 379,192 | |
Netherlands — 4.0% | | | | |
Adyen NV (a)(b) | | | 204 | | | | 343,908 | |
Airbus SE - ADR (a) | | | 20,407 | | | | 372,836 | |
ASML Holding NV - ADR | | | 3,467 | | | | 1,252,315 | |
CNH Industrial NV (a) | | | 8,235 | | | | 63,986 | |
Davide Campari-Milano NV | | | 3,252 | | | | 33,951 | |
EXOR NV | | | 803 | | | | 41,710 | |
Ferrari NV | | | 1,084 | | | | 193,348 | |
Heineken NV | | | 1,962 | | | | 174,120 | |
ING Groep NV - ADR (a) | | | 32,564 | | | | 222,086 | |
Koninklijke Ahold Delhaize NV | | | 9,124 | | | | 250,673 | |
Koninklijke Philips NV (a) | | | 7,593 | | | | 352,621 | |
Prosus NV | | | 3,521 | | | | 351,760 | |
Unilever NV | | | 11,344 | | | | 641,430 | |
| | | | | | | | 4,294,744 | |
New Zealand — 0.4% | | | | |
A2 Milk Co. Ltd. (a) | | | 6,147 | | | | 59,503 | |
Auckland International Airport Ltd. (a) | | | 9,909 | | | | 45,863 | |
Contact Energy Ltd. | | | 5,971 | | | | 29,136 | |
Fisher & Paykel Healthcare Corp. Ltd. | | | 4,779 | | | | 110,596 | |
Mercury NZ Ltd. | | | 5,199 | | | | 18,391 | |
Meridian Energy Ltd. | | | 10,412 | | | | 36,487 | |
Ryman Healthcare Ltd. | | | 3,442 | | | | 31,862 | |
Spark New Zealand Ltd. | | | 15,233 | | | | 45,224 | |
Xero Ltd. (a) | | | 912 | | | | 70,611 | |
| | | | | | | | 447,673 | |
Norway — 0.7% | | | | |
Adevinta ASA (a) | | | 1,876 | | | | 28,985 | |
Aker ASA | | | 205 | | | | 8,173 | |
Aker BP ASA | | | 899 | | | | 13,965 | |
DNB ASA (a) | | | 7,470 | | | | 100,704 | |
Equinor ASA - ADR | | | 9,205 | | | | 118,100 | |
Gjensidige Forsikring ASA | | | 1,576 | | | | 29,930 | |
Leroy Seafood Group ASA | | | 2,339 | | | | 10,986 | |
Mowi ASA | | | 3,726 | | | | 58,798 | |
NEL ASA (a) | | | 6,102 | | | | 11,556 | |
The accompanying notes are an integral part of the financial statements.
93
Pacer Trendpilot International ETF
SCHEDULE OF INVESTMENTS
October 31, 2020 (Unaudited) (Continued)
| | | Shares | | | Value | |
COMMON STOCKS — 93.1% (Continued) |
| | | | | | | | | |
Norway — 0.7% (Continued) |
Norsk Hydro ASA (a) | | | 11,330 | | | $ | 31,723 | |
Orkla ASA | | | 6,739 | | | | 63,588 | |
Salmar ASA (a) | | | 467 | | | | 23,603 | |
Schibsted ASA - Class A (a) | | | 684 | | | | 27,886 | |
Schibsted ASA - Class B (a) | | | 862 | | | | 30,935 | |
Telenor ASA | | | 5,404 | | | | 83,324 | |
TOMRA Systems ASA | | | 916 | | | | 36,912 | |
Yara International ASA | | | 1,484 | | | | 51,686 | |
| | | | | | | | 730,854 | |
Portugal — 0.1% | | | | |
EDP - Energias de Portugal SA | | | 23,039 | | | | 113,554 | |
Jeronimo Martins SGPS SA | | | 2,055 | | | | 32,646 | |
| | | | | | | | 146,200 | |
Republic of Korea — 0.2% | | | | |
KB Financial Group, Inc. - ADR (a) | | | 3,211 | | | | 114,729 | |
POSCO - ADR (a) | | | 2,362 | | | | 109,384 | |
SK Telecom Co. Ltd. - ADR (a) | | | 2,479 | | | | 52,208 | |
| | | | | | | | 276,321 | |
Singapore — 0.9% | | | | |
CapitaLand Ltd. | | | 20,879 | | | | 39,283 | |
City Developments Ltd. | | | 5,115 | | | | 23,741 | |
DBS Group Holdings Ltd. | | | 14,852 | | | | 221,266 | |
Genting Singapore Ltd. | | | 46,968 | | | | 22,178 | |
Keppel Corp. Ltd. | | | 12,033 | | | | 38,673 | |
Oversea-Chinese Banking Corp. Ltd. | | | 32,487 | | | | 200,257 | |
Singapore Airlines Ltd. | | | 10,810 | | | | 26,828 | |
Singapore Exchange Ltd. | | | 6,848 | | | | 43,416 | |
Singapore Technologies Engineering Ltd. | | | 12,941 | | | | 33,064 | |
Singapore Telecommunications Ltd. | | | 53,286 | | | | 79,191 | |
United Overseas Bank Ltd. | | | 11,604 | | | | 161,323 | |
Wilmar International Ltd. | | | 25,190 | | | | 74,503 | |
| | | | | | | | 963,723 | |
Spain — 1.7% | | | | |
Aena SME SA (a)(b) | | | 615 | | | | 82,799 | |
Amadeus IT Holding SA | | | 3,736 | | | | 178,352 | |
Banco Bilbao Vizcaya Argentaria SA - ADR | | | 55,578 | | | | 160,621 | |
Banco Santander SA - ADR | | | 139,899 | | | | 281,197 | |
Cellnex Telecom SA (b) | | | 2,161 | | | | 138,726 | |
EDP Renovaveis SA | | | 1,173 | | | | 22,295 | |
Endesa SA | | | 2,656 | | | | 71,177 | |
Iberdrola SA | | | 44,912 | | | | 529,604 | |
Industria de Diseno Textil SA | | | 8,798 | | | | 217,125 | |
Naturgy Energy Group SA | | | 2,781 | | | | 51,660 | |
Telefonica SA | | | 37,875 | | | | 123,775 | |
| | | | | | | | 1,857,331 | |
Sweden — 3.1% | | | | |
Alfa Laval AB (a) | | | 2,493 | | | | 50,569 | |
| | | Shares | | | Value | |
Sweden — 3.1% (Continued) |
Assa Abloy AB - Class B | | | 8,243 | | | $ | 176,932 | |
Atlas Copco AB - Class B | | | 3,234 | | | | 124,041 | |
Atlas Copco AB - Class A | | | 5,375 | | | | 237,328 | |
Boliden AB | | | 2,270 | | | | 62,041 | |
Epiroc AB - Class B | | | 3,234 | | | | 46,374 | |
Epiroc AB - Class A | | | 5,199 | | | | 77,707 | |
EQT AB | | | 1,609 | | | | 30,658 | |
Essity AB - Class B | | | 5,026 | | | | 145,667 | |
Evolution Gaming Group AB (b) | | | 1,044 | | | | 77,551 | |
Hennes & Mauritz AB - Class B | | | 6,428 | | | | 104,456 | |
Hexagon AB - Class B | | | 2,340 | | | | 171,035 | |
ICA Gruppen AB | | | 790 | | | | 37,403 | |
Industrivarden AB (a)- Class A | | | 1,353 | | | | 36,401 | |
Industrivarden AB (a)- Class C | | | 1,388 | | | | 35,502 | |
Investment AB Latour - Class B | | | 1,043 | | | | 24,357 | |
Investor AB - Class A | | | 1,027 | | | | 61,516 | |
Investor AB - Class B | | | 3,789 | | | | 227,551 | |
Kinnevik AB - Class B | | | 2,018 | | | | 82,809 | |
L E Lundbergforetagen AB - Class B (a) | | | 540 | | | | 24,310 | |
Lundin Energy AB | | | 1,569 | | | | 29,949 | |
Nibe Industrier AB - Class B (a) | | | 2,771 | | | | 66,827 | |
Sandvik AB (a) | | | 9,167 | | | | 163,284 | |
Skandinaviska Enskilda Banken AB - Class A (a) | | | 13,330 | | | | 114,299 | |
Skandinaviska Enskilda Banken AB - Class C (a) | | | 124 | | | | 1,140 | |
Skanska AB - Class B | | | 2,996 | | | | 56,328 | |
SKF AB - Class B | | | 3,118 | | | | 63,843 | |
Svenska Cellulosa AB SCA - Class B (a) | | | 5,026 | | | | 68,202 | |
Svenska Handelsbanken AB - Class A (a) | | | 12,574 | | | | 101,910 | |
Svenska Handelsbanken AB - Class B (a) | | | 298 | | | | 2,877 | |
Swedbank AB (a) | | | 7,706 | | | | 120,807 | |
Swedish Match AB | | | 1,364 | | | | 102,794 | |
Tele2 AB | | | 4,144 | | | | 49,155 | |
Telefonaktiebolaget LM Ericsson - ADR | | | 21,776 | | | | 244,109 | |
Telia Co. AB | | | 21,024 | | | | 80,614 | |
Volvo AB - Class B (a) | | | 12,280 | | | | 238,951 | |
| | | | | | | | 3,339,297 | |
Switzerland — 7.9% | | | | |
ABB Ltd. - ADR | | | 14,867 | | | | 361,119 | |
Alcon, Inc. (a) | | | 4,059 | | | | 230,628 | |
Cie Financiere Richemont SA | | | 4,330 | | | | 271,525 | |
Givaudan SA | | | 64 | | | | 260,760 | |
Glencore PLC (a) | | | 90,660 | | | | 183,105 | |
Lonza Group AG | | | 490 | | | | 296,688 | |
Nestle SA - ADR | | | 22,444 | | | | 2,519,788 | |
The accompanying notes are an integral part of the financial statements.
94
Pacer Trendpilot International ETF
SCHEDULE OF INVESTMENTS
October 31, 2020 (Unaudited) (Continued)
| | | Shares | | | Value | |
COMMON STOCKS — 93.1% (Continued) |
| | | | | | | | | |
Switzerland — 7.9% (Continued) |
Novartis AG - ADR | | | 20,158 | | | $ | 1,573,937 | |
Roche Holding AG - ADR | | | 45,334 | | | | 1,812,907 | |
STMicroelectronics NV | | | 5,443 | | | | 165,769 | |
UBS Group AG | | | 31,756 | | | | 368,660 | |
Zurich Insurance Group AG | | | 1,268 | | | | 420,385 | |
| | | | | | | | 8,465,271 | |
United Kingdom — 10.3% | | | | |
Anglo American PLC | | | 11,304 | | | | 265,239 | |
Ashtead Group PLC | | | 3,528 | | | | 127,975 | |
Associated British Foods PLC | | | 2,956 | | | | 65,006 | |
AstraZeneca PLC - ADR | | | 21,672 | | | | 1,087,068 | |
Atlassian Corp PLC - Class A (a) | | | 1,060 | | | | 203,117 | |
Aviva PLC | | | 32,646 | | | | 108,905 | |
BAE Systems PLC | | | 26,469 | | | | 136,134 | |
Barclays PLC - ADR (a) | | | 34,068 | | | | 188,396 | |
BHP Group PLC - ADR | | | 8,755 | | | | 340,307 | |
BP PLC - ADR | | | 27,878 | | | | 431,551 | |
British American Tobacco PLC - ADR | | | 18,833 | | | | 600,396 | |
BT Group PLC | | | 72,715 | | | | 95,521 | |
Coca-Cola European Partners PLC | | | 1,761 | | | | 62,885 | |
Compass Group PLC | | | 14,801 | | | | 202,294 | |
Diageo PLC - ADR | | | 4,561 | | | | 593,751 | |
Fiat Chrysler Automobiles NV (a) | | | 9,119 | | | | 111,960 | |
GlaxoSmithKline PLC - ADR | | | 20,511 | | | | 685,478 | |
HSBC Holdings PLC - ADR (a) | | | 34,215 | | | | 717,831 | |
Imperial Brands PLC | | | 7,876 | | | | 124,890 | |
Legal & General Group PLC | | | 48,973 | | | | 117,246 | |
Lloyds Banking Group PLC - ADR (a) | | | 153,643 | | | | 216,637 | |
London Stock Exchange Group PLC | | | 2,631 | | | | 282,153 | |
National Grid PLC - ADR | | | 6,280 | | | | 373,346 | |
Natwest Group PLC (a) | | | 38,091 | | | | 61,289 | |
Ocado Group PLC (a) | | | 4,707 | | | | 138,789 | |
Prudential PLC - ADR | | | 10,742 | | | | 262,427 | |
Reckitt Benckiser Group PLC | | | 6,112 | | | | 538,432 | |
RELX PLC - ADR | | | 16,423 | | | | 324,026 | |
Rio Tinto PLC - ADR | | | 8,394 | | | | 476,527 | |
Royal Dutch Shell PLC - ADR | | | 30,885 | | | | 745,873 | |
Smith & Nephew PLC - ADR | | | 3,726 | | | | 130,671 | |
SSE PLC | | | 8,685 | | | | 141,206 | |
Standard Chartered PLC (a) | | | 21,976 | | | | 100,157 | |
Tesco PLC | | | 80,504 | | | | 214,323 | |
Unilever PLC - ADR | | | 9,670 | | | | 549,546 | |
Vodafone Group PLC - ADR | | | 22,161 | | | | 299,395 | |
| | | | | | | | 11,120,747 | |
TOTAL COMMON STOCKS (Cost $107,580,766) | | | | | | | 100,253,250 | |
| | | | | |
| | | Shares | | | Value | |
EXCHANGE TRADED FUNDS — 5.1% | | | | |
iShares MSCI South Korea ETF | | | 84,564 | | | $ | 5,488,204 | |
TOTAL EXCHANGE TRADED FUNDS (Cost $5,460,932) | | | | | | | 5,488,204 | |
| | | | | |
PREFERRED STOCKS — 0.4% | | | | |
| | | | | | | | | |
Germany — 0.4% | | | | |
Bayerische Motoren Werke AG | | | 494 | | | | 25,545 | |
Henkel AG & Co. KGaA | | | 1,478 | | | | 143,767 | |
Volkswagen AG | | | 1,535 | | | | 223,645 | |
| | | | | | | | 392,957 | |
TOTAL PREFERRED STOCKS (Cost $434,838) | | | | | | | 392,957 | |
| | | | | |
REAL ESTATE INVESTMENT TRUSTS — 1.1% | | | | |
| | | | | | | | | |
Australia — 0.2% | | | | |
Dexus | | | 9,051 | | | | 54,776 | |
Goodman Group | | | 13,502 | | | | 174,626 | |
| | | | | | | | 229,402 | |
Britian — 0.1% | | | | |
Segro PLC | | | 9,262 | | | | 108,231 | |
| | | | | | | | | |
Hong Kong — 0.1% | | | | |
Link REIT | | | 17,054 | | | | 129,899 | |
| | | | | | | | | |
Japan — 0.3% | | | | |
Japan Real Estate Investment Corp. | | | 15 | | | | 73,356 | |
Nippon Building Fund, Inc. | | | 15 | | | | 75,648 | |
Nippon Prologis REIT, Inc. | | | 25 | | | | 82,143 | |
Nomura Real Estate Master Fund, Inc. | | | 50 | | | | 59,506 | |
| | | | | | | | 290,653 | |
Singapore — 0.1% | | | | |
Ascendas Real Estate Investment Trust | | | 24,848 | | | | 52,390 | |
| | | | | | | | | |
United States — 0.3% | | | | |
Brookfield Asset Management, Inc. - Class A | | | 11,608 | | | | 345,686 | |
Brookfield Property REIT, Inc. | | | 484 | | | | 7,140 | |
| | | | | | | | 352,826 | |
TOTAL REAL ESTATE INVESTMENT TRUSTS (Cost $1,259,467) | | | | | | | 1,163,401 | |
The accompanying notes are an integral part of the financial statements.
95
Pacer Trendpilot International ETF
SCHEDULE OF INVESTMENTS
October 31, 2020 (Unaudited) (Continued)
| | | Principal
Amount | | | Value | |
| SHORT-TERM INVESTMENTS — 0.0% (d) | | | |
| | | | |
| Money Market Deposit Accounts — 0.0% (d) | | | | | | | | |
| U.S. Bank Money Market Deposit Account, 0.025% (e) | | $ | 23,348 | | | $ | 23,348 | |
| TOTAL SHORT-TERM INVESTMENTS (Cost $23,348) | | | | | | | 23,348 | |
| Total Investments (Cost $114,759,351) — 99.7% | | | | | | | 107,321,160 | |
| Other Assets in Excess of Liabilities — 0.3% | | | | | | | 362,028 | |
| TOTAL NET ASSETS — 100.0% | | | | | | $ | 107,683,188 | |
Percentages are stated as a percent of net assets.
ADR | American Depositary Receipt |
| | (a) | Non-income producing security. |
| | (b) | Security exempt from registration under Rule 144(a) of the Securities Act of 1933. Such securities are treated as liquid securities according to the Fund’s liquidity guidelines. The value of these securities total $1,058,409 or 0.98% of net assets. |
| | (c) | As of October 31, 2020, the Fund has fair valued this security. This security is deemed illiquid according to the Fund’s liquidity guidelines. Value determined using significant unobservable inputs. |
| | (e) | The rate shown is as of October 31, 2020. |
For Fund compliance purposes, the Fund’s industry classifications refer to any one or more of the industry sub-classifications used by one or more widely recognized market indexes or ratings group indexes, and/or they may be defined by Fund management. This definition does not apply for all purposes of this report, which may combine sub-classifications for reporting ease. Categories are shown as a percentage of net assets.
The accompanying notes are an integral part of the financial statements.
96
Pacer Emerging Markets Cash Cows 100 ETF
SCHEDULE OF INVESTMENTS
October 31, 2020 (Unaudited)
| | | Shares | | | Value | |
COMMON STOCKS — 93.1% | | | | |
| | | | | | | | | |
Bermuda — 1.2% | | | | |
Nine Dragons Paper Holdings Ltd. | | | 17,844 | | | $ | 23,708 | |
| | | | | | | | | |
Brazil — 9.5% | | | | |
Ambev SA - ADR | | | 13,992 | | | | 29,943 | |
BRF SA - ADR (a) | | | 3,840 | | | | 11,366 | |
CCR SA | | | 5,304 | | | | 10,288 | |
Cosan SA | | | 772 | | | | 8,700 | |
CPFL Energia SA | | | 3,590 | | | | 17,387 | |
Engie Brasil Energia SA | | | 2,220 | | | | 15,395 | |
JBS SA | | | 9,876 | | | | 33,322 | |
Petrobras Distribuidora SA | | | 3,122 | | | | 10,398 | |
TIM SA/Brazil - ADR | | | 920 | | | | 9,476 | |
Vale SA - ADR | | | 3,576 | | | | 37,798 | |
| | | | | | | | 184,073 | |
Cayman Islands — 4.8% | | | | |
SINA Corp. (a) | | | 404 | | | | 17,311 | |
Tongcheng-Elong Holdings Ltd. (a)(b) | | | 3,224 | | | | 5,348 | |
Xiaomi Corp. - Class B (a)(b) | | | 24,786 | | | | 70,338 | |
| | | | | | | | 92,997 | |
Chile — 0.6% | | | | |
Cencosud SA | | | 8,820 | | | | 12,261 | |
| | | | | | | | | |
China — 15.0% | | | | |
Air China Ltd. - Class H | | | 59,648 | | | | 38,470 | |
Anhui Conch Cement Co. Ltd. - Class H | | | 5,820 | | | | 36,298 | |
Beijing Capital International Airport Co Ltd. - Class H | | | 11,972 | | | | 7,304 | |
China Communications Services Corp Ltd. - Class H | | | 16,414 | | | | 9,528 | |
China Eastern Airlines Corp Ltd. - Class H | | | 104,774 | | | | 41,626 | |
China Shenhua Energy Co Ltd. - Class H | | | 24,634 | | | | 42,579 | |
China Telecom Corp Ltd. - Class H | | | 131,714 | | | | 41,455 | |
Great Wall Motor Co. Ltd. - Class H | | | 40,152 | | | | 64,948 | |
Sinopec Shanghai Petrochemical Co Ltd. - Class H | | | 52,426 | | | | 9,670 | |
| | | | | | | | 291,878 | |
Colombia — 1.4% | | | | |
Ecopetrol SA - ADR | | | 3,044 | | | | 28,157 | |
| | | | | | | | | |
Greece — 0.9% | | | | |
Hellenic Telecommunications Organization SA | | | 966 | | | | 12,848 | |
OPAP SA | | | 566 | | | | 4,565 | |
| | | | | | | | 17,413 | |
| | | Shares | | | Value | |
Hong Kong — 8.4% | | | | |
China Medical System Holdings Ltd. | | | 5,600 | | | $ | 5,865 | |
China Mobile Ltd. - ADR | | | 1,152 | | | | 35,401 | |
China Resources Cement Holdings Ltd. | | | 19,836 | | | | 25,894 | |
China Unicom Hong Kong Ltd. | | | 69,848 | | | | 42,886 | |
CNOOC Ltd. - ADR | | | 338 | | | | 31,137 | |
Sinotruk Hong Kong Ltd. | | | 8,948 | | | | 22,807 | |
| | | | | | | | 163,990 | |
Indonesia — 2.0% | | | | |
Hanjaya Mandala Sampoerna Tbk PT | | | 160,744 | | | | 15,552 | |
Indofood CBP Sukses Makmur Tbk PT | | | 14,220 | | | | 9,383 | |
Indofood Sukses Makmur Tbk PT | | | 28,506 | | | | 13,644 | |
| | | | | | | | 38,579 | |
Malaysia — 1.1% | | | | |
Malaysia Airports Holdings Bhd | | | 5,160 | | | | 5,191 | |
MISC Bhd | | | 9,698 | | | | 15,381 | |
| | | | | | | | 20,572 | |
Mexico — 3.5% | | | | |
Fomento Economico Mexicano SAB de CV - ADR | | | 512 | | | | 27,530 | |
Gruma SAB de CV - Class B | | | 654 | | | | 6,980 | |
Grupo Aeroportuario del Pacifico SAB de CV - ADR | | | 94 | | | | 7,819 | |
Grupo Bimbo SAB de CV | | | 9,598 | | | | 18,552 | |
Kimberly-Clark de Mexico SAB de CV - Class A | | | 4,760 | | | | 7,109 | |
| | | | | | | | 67,990 | |
Russian Federation — 11.9% | | | | |
Alrosa PJSC | | | 14,966 | | | | 13,454 | |
Federal Grid Co Unified Energy System PJSC | | | 3,957,206 | | | | 9,459 | |
Inter RAO UES PJSC | | | 396,234 | | | | 25,357 | |
LUKOIL PJSC - ADR | | | 516 | | | | 26,347 | |
Magnitogorsk Iron & Steel Works PJSC | | | 24,110 | | | | 11,429 | |
MMC Norilsk Nickel PJSC - ADR | | | 1,390 | | | | 33,138 | |
Mobile TeleSystems PJSC - ADR | | | 1,908 | | | | 14,921 | |
Novolipetsk Steel PJSC | | | 11,502 | | | | 26,929 | |
ROSSETI PJSC | | | 815,932 | | | | 14,933 | |
Surgutneftegas PJSC | | | 70,564 | | | | 29,267 | |
Tatneft PJSC - ADR | | | 830 | | | | 25,830 | |
| | | | | | | | 231,064 | |
Singapore — 0.2% | | | | |
Yangzijiang Shipbuilding Holdings Ltd. | | | 5,254 | | | | 3,539 | |
| | | | | | | | | |
South Africa — 6.1% | | | | |
African Rainbow Minerals Ltd. | | | 658 | | | | 9,201 | |
Anglo American Platinum Ltd. | | | 422 | | | | 27,627 | |
Impala Platinum Holdings Ltd. | | | 1,416 | | | | 12,423 | |
The accompanying notes are an integral part of the financial statements.
97
Pacer Emerging Markets Cash Cows 100 ETF
SCHEDULE OF INVESTMENTS
October 31, 2020 (Unaudited) (Continued)
| | | Shares | | | Value | |
COMMON STOCKS — 93.1% (Continued) |
| | | | | | | | | |
South Africa — 6.1% (Continued) |
Kumba Iron Ore Ltd. | | | 1,048 | | | $ | 30,931 | |
Mr Price Group Ltd. | | | 690 | | | | 5,210 | |
MultiChoice Group | | | 1,248 | | | | 10,274 | |
Vodacom Group Ltd. | | | 2,966 | | | | 22,332 | |
| | | | | | | | 117,998 | |
Taiwan — 16.7% | | | | |
Asia Cement Corp. | | | 10,042 | | | | 14,447 | |
Asustek Computer, Inc. | | | 1,986 | | | | 16,837 | |
Catcher Technology Co. Ltd. | | | 2,710 | | | | 17,101 | |
Chicony Electronics Co. Ltd. | | | 2,324 | | | | 6,996 | |
Compal Electronics, Inc. | | | 12,020 | | | | 7,816 | |
Foxconn Technology Co. Ltd. | | | 4,946 | | | | 8,663 | |
Hon Hai Precision Industry Co. Ltd. | | | 15,810 | | | | 42,837 | |
Inventec Corp. | | | 14,866 | | | | 11,746 | |
Lite-On Technology Corp. | | | 5,626 | | | | 9,156 | |
Nanya Technology Corp. | | | 3,446 | | | | 6,963 | |
Pou Chen Corp. | | | 10,898 | | | | 9,601 | |
President Chain Store Corp. | | | 1,488 | | | | 13,422 | |
Quanta Computer, Inc. | | | 17,238 | | | | 43,391 | |
Realtek Semiconductor Corp. | | | 558 | | | | 6,935 | |
Synnex Technology International Corp. | | | 5,664 | | | | 8,406 | |
Uni-President Enterprises Corp. | | | 11,664 | | | | 24,997 | |
United Microelectronics Corp. | | | 53,726 | | | | 57,664 | |
Wistron Corp. | | | 18,134 | | | | 18,068 | |
| | | | | | | | 325,046 | |
Thailand — 3.6% | | | | |
Advanced Info Service PCL | | | 5,084 | | | | 28,138 | |
Electricity Generating PCL | | | 1,548 | | | | 8,244 | |
PTT Exploration & Production PCL | | | 13,268 | | | | 33,524 | |
| | | | | | | | 69,906 | |
Turkey — 4.1% | | | | |
BIM Birlesik Magazalar AS | | | 1,218 | | | | 9,710 | |
Eregli Demir ve Celik Fabrikalari TAS | | | 15,348 | | | | 17,455 | |
KOC Holding AS | | | 13,484 | | | | 22,786 | |
Tupras Turkiye Petrol Rafinerileri AS (a) | | | 504 | | | | 4,496 | |
Turk Telekomunikasyon AS | | | 14,586 | | | | 11,192 | |
Turkcell Iletisim Hizmetleri AS | | | 8,354 | | | | 14,556 | |
| | | | | | | | 80,195 | |
United Arab Emirates — 2.1% | | | | |
Emirates Telecommunications Group Co PJSC | | | 9,158 | | | | 42,086 | |
TOTAL COMMON STOCKS (Cost $1,947,743) | | | | | | | 1,811,452 | |
| | | | | |
| | | Shares | | | Value | |
PREFERRED STOCKS — 5.0% | | | | |
| | | | | | | | | |
Brazil — 3.5% | | | | |
Cia de Transmissao de Energia Eletrica Paulista - ADR | | | 1,350 | | | $ | 5,524 | |
Cia Energetica de Minas Gerais | | | 3,462 | | | | 6,336 | |
Cia Paranaense de Energia | | | 936 | | | | 10,032 | |
Gerdau SA - ADR | | | 4,094 | | | | 15,598 | |
Telefonica Brasil SA - ADR | | | 4,114 | | | | 30,279 | |
| | | | | | | | 67,769 | |
Russian Federation — 1.5% | | | | |
Transneft PJSC | | | 18 | | | | 29,931 | |
TOTAL PREFERRED STOCKS (Cost $120,960) | | | | | | | 97,700 | |
| | | | | |
EXCHANGE TRADED FUNDS — 1.4% | | | | |
iShares MSCI Saudi Arabia ETF | | | 960 | | | | 27,187 | |
TOTAL EXCHANGE TRADED FUNDS (Cost $28,424) | | | | | | | 27,187 | |
| | | | | |
| | | Principal
Amount | | | | | |
SHORT-TERM INVESTMENTS 0.2% | | | | |
| | | | | | | | | |
Money Market Deposit Accounts, — 0.2% | | | | |
U.S. Bank Money Market Deposit Account 0.025% (c) | | $ | 3,820 | | | | 3,820 | |
TOTAL SHORT-TERM INVESTMENTS (Cost $3,820) | | | | | | | 3,820 | |
Total Investments (Cost $2,100,947) — 99.7% | | | | | | | 1,940,159 | |
Other Assets in Excess of Liabilities — 0.3% | | | | | | | 5,355 | |
TOTAL NET ASSETS — 100.0% | | | | | | $ | 1,945,514 | |
Percentages are stated as a percent of net assets.
ADR | American Depositary Receipt |
| | (a) | Non-income producing security. |
| | (b) | Security exempt from registration under Rule 144(a) and Regulation S of the Securities Act of 1933. Such securities are treated as liquid securities according to the Fund’s liquidity guidelines. The value of those securities total $75,686 or 3.9% of net assets. |
| | (c) | The rate shown is as of October 31, 2020. |
The accompanying notes are an integral part of the financial statements.
98
Pacer Cash Cows Fund of Funds ETF
SCHEDULE OF INVESTMENTS
October 31, 2020 (Unaudited)
| | | Shares | | | Value | |
AFFILIATED EXCHANGE TRADED FUNDS — 100.0% |
Pacer Developed Markets International Cash Cows 100 ETF | | | 10,179 | | | $ | 229,740 | |
Pacer Global Cash Cows Dividend ETF | | | 9,613 | | | | 227,540 | |
Pacer US Cash Cows 100 ETF | | | 8,389 | | | | 231,117 | |
Pacer US Cash Cows Growth ETF | | | 8,487 | | | | 230,206 | |
Pacer US Small Cap Cash Cows 100 ETF | | | 9,277 | | | | 233,651 | |
TOTAL AFFILIATED EXCHANGE TRADED FUNDS (Cost $1,262,055) | | | | | | | 1,152,254 | |
| | | | | |
| | | Principal
Amount | | | | | |
SHORT-TERM INVESTMENTS — 0.0% (a) | | | | |
| | | | | |
Money Market Deposit Accounts, — 0.0% (a) | | | | |
U.S. Bank Money Market Deposit Account, 0.025% (b) | | $ | 329 | | | | 329 | |
TOTAL SHORT-TERM INVESTMENTS (Cost $329) | | | | | | | 329 | |
Total Investments (Cost $1,262,384) — 100.0% | | | | | | | 1,152,583 | |
Liabilities in Excess of Other Assets — 0.0% (a) | | | | | | | (155 | ) |
TOTAL NET ASSETS — 100.0% | | | | | | $ | 1,152,428 | |
Percentages are stated as a percent of net assets.
| | (b) | The rate shown is as of October 31, 2020. |
The accompanying notes are an integral part of the financial statements.
99
Pacer Trendpilot Fund of Funds ETF
SCHEDULE OF INVESTMENTS
October 31, 2020 (Unaudited)
| | | Shares | | | Value | |
AFFILIATED EXCHANGE TRADED FUNDS — 99.9% |
Pacer Trendpilot 100 ETF | | | 134,576 | | | $ | 6,495,984 | |
Pacer Trendpilot International ETF | | | 291,804 | | | | 6,428,442 | |
Pacer Trendpilot US Bond ETF | | | 254,400 | | | | 6,690,720 | |
Pacer Trendpilot US Large Cap ETF | | | 220,287 | | | | 6,335,454 | |
Pacer Trendpilot US Mid Cap ETF | | | 229,227 | | | | 6,402,310 | |
TOTAL AFFILIATED EXCHANGE TRADED FUNDS (Cost $31,810,675) | | | | | | | 32,352,910 | |
| | | | | |
| | | Principal
Amount | | | | | |
SHORT-TERM INVESTMENTS — 0.1% | | | | |
| | | | | | | | | |
Money Market Deposit Accounts, — 0.1% | | | | |
U.S. Bank Money Market Deposit Account, 0.025% (a) | | $ | 24,202 | | | | 24,202 | |
TOTAL SHORT-TERM INVESTMENTS (Cost $24,202) | | | | | | | 24,202 | |
Total Investments (Cost $31,834,877) — 100.0% | | | | | | | 32,377,112 | |
Liabilities in Excess of Other Assets — 0.0% (b) | | | | | | | (4,186 | ) |
TOTAL NET ASSETS — 100.0% | | | | | | $ | 32,372,926 | |
Percentages are stated as a percent of net assets.
| | (a) | The rate shown is as of October 31, 2020. |
The accompanying notes are an integral part of the financial statements.
100
Pacer Trendpilot US Bond ETF
SCHEDULE OF INVESTMENTS
October 31, 2020 (Unaudited)
| | | Principal
Amount | | | Value | |
CORPORATE BONDS — 98.4% | | | | |
| | | | | | | | | |
Advertising — 1.0% | | | | |
Outfront Media Capital LLC / Outfront Media Capital Corp. | | | | |
5.000%, 08/15/2027 (a) | | | 3,265,000 | | | $ | 3,099,138 | |
| | | | | | | | | |
Aerospace/Defense — 0.9% | | | | |
TransDigm, Inc. | | | | |
6.250%, 03/15/2026 (a) | | | 2,620,000 | | | | 2,734,612 | |
| | | | | | | | | |
Agriculture — 0.7% | | | | |
Vector Group Ltd. | | | | |
6.125%, 02/01/2025 (a) | | | 2,130,000 | | | | 2,128,669 | |
| | | | | | | | | |
Airlines — 1.1% | | | | |
American Airlines, Inc. | | | | |
11.750%, 07/15/2025 (a) | | | 3,500,000 | | | | 3,409,000 | |
| | | | | | | | | |
Apparel — 0.9% | | | | |
Under Armour, Inc. | | | | |
3.250%, 06/15/2026 | | | 3,050,000 | | | | 2,952,446 | |
| | | | | | | | | |
Auto Manufacturers — 2.8% | | | | |
Allison Transmission, Inc. | | | | |
5.875%, 06/01/2029 (a) | | | 720,000 | | | | 788,483 | |
Ford Motor Co. | | | | |
9.625%, 04/22/2030 | | | 3,070,000 | | | | 4,126,402 | |
Navistar International Corp. | | | | |
9.500%, 05/01/2025 (a) | | | 3,510,000 | | | | 3,896,100 | |
| | | | | | | | 8,810,985 | |
Auto Parts & Equipment — 2.0% | | | | |
Adient US LLC | | | | |
9.000%, 04/15/2025 (a) | | | 3,350,000 | | | | 3,688,182 | |
Goodyear Tire & Rubber Co/The | | | | |
5.000%, 05/31/2026 | | | 2,550,000 | | | | 2,517,360 | |
| | | | | | | | 6,205,542 | |
Beverages — 0.8% | | | | |
Primo Water Holdings, Inc. | | | | |
5.500%, 04/01/2025 (a) | | | 2,415,000 | | | | 2,496,506 | |
| | | | | | | | | |
Building Materials — 1.1% | | | | |
Builders FirstSource, Inc. | | | | |
6.750%, 06/01/2027 (a) | | | 3,210,000 | | | | 3,446,737 | |
| | | | | | | | | |
Chemicals — 3.4% | | | | |
Chemours Co. | | | | |
7.000%, 05/15/2025 | | | 3,500,000 | | | | 3,529,750 | |
Olin Corp. | | | | |
5.625%, 08/01/2029 | | | 3,550,000 | | | | 3,674,232 | |
| | | Principal
Amount | | | Value | |
Chemicals — 3.4% (Continued) |
Tronox, Inc. | | | | |
6.500%, 04/15/2026 (a) | | $ | 3,410,000 | | | $ | 3,462,889 | |
| | | | | | | | 10,666,871 | |
Commercial Services — 5.6% | | | | |
ADT Security Corp/The | | | | |
4.875%, 07/15/2032 (a) | | | 3,160,000 | | | | 3,257,802 | |
Allied Universal Holdco LLC / Allied Universal Finance Corp. | | | | |
6.625%, 07/15/2026 (a) | | | 3,525,000 | | | | 3,696,967 | |
APX Group, Inc. | | | | |
6.750%, 02/15/2027 (a) | | | 2,920,000 | | | | 3,047,750 | |
Sabre GLBL, Inc. | | | | |
5.250%, 11/15/2023 (a) | | | 3,470,000 | | | | 3,409,275 | |
Service Corp International/US | | | | |
5.125%, 06/01/2029 | | | 1,050,000 | | | | 1,149,246 | |
United Rentals North America, Inc. | | | | |
4.000%, 07/15/2030 | | | 2,830,000 | | | | 2,890,421 | |
| | | | | | | | 17,451,461 | |
Computers — 0.3% | | | | |
NCR Corp. | | | | |
5.750%, 09/01/2027 (a) | | | 970,000 | | | | 1,001,525 | |
| | | | | | | | | |
Cosmetics/Personal Care — 0.3% | | | | |
Edgewell Personal Care Co. | | | | |
5.500%, 06/01/2028 (a) | | | 760,000 | | | | 799,797 | |
| | | | | | | | | |
Distribution/Wholesale — 1.8% | | | | |
H&E Equipment Services, Inc. | | | | |
5.625%, 09/01/2025 | | | 700,000 | | | | 727,125 | |
HD Supply, Inc. | | | | |
5.375%, 10/15/2026 (a) | | | 2,270,000 | | | | 2,378,767 | |
Performance Food Group, Inc. | | | | |
5.500%, 10/15/2027 (a) | | | 2,450,000 | | | | 2,515,734 | |
| | | | | | | | 5,621,626 | |
Diversified Financial Services — 2.3% | | | | |
Navient Corp. | | | | |
5.000%, 03/15/2027 | | | 2,970,000 | | | | 2,777,603 | |
5.625%, 08/01/2033 | | | 3,400,000 | | | | 2,920,991 | |
OneMain Finance Corp. | | | | |
5.375%, 11/15/2029 | | | 1,420,000 | | | | 1,462,657 | |
| | | | | | | | 7,161,251 | |
Electric — 3.1% | | | | |
AES Corp | | | | |
5.125%, 09/01/2027 | | | 1,830,000 | | | | 1,967,067 | |
NRG Energy, Inc. | | | | |
5.250%, 06/15/2029 (a) | | | 2,500,000 | | | | 2,715,162 | |
Talen Energy Supply LLC | | | | |
7.250%, 05/15/2027 (a) | | | 3,505,000 | | | | 3,518,144 | |
The accompanying notes are an integral part of the financial statements.
101
Pacer Trendpilot US Bond ETF
SCHEDULE OF INVESTMENTS
October 31, 2020 (Unaudited) (Continued)
| | | Principal
Amount | | | Value | |
CORPORATE BONDS — 98.4% (Continued) |
| | | | | | | | | |
Electric — 3.1% (Continued) |
Vistra Operations Co LLC | | | | |
5.000%, 07/31/2027 (a) | | $ | 1,350,000 | | | $ | 1,412,100 | |
| | | | | | | | 9,612,473 | |
Entertainment — 5.9% | | | | |
Cedar Fair LP / Canada’s Wonderland Co. / Magnum Management Corp. / Millennium Op | | | | |
5.500%, 05/01/2025 (a) | | | 2,350,000 | | | | 2,382,312 | |
Churchill Downs, Inc. | | | | |
5.500%, 04/01/2027 (a) | | | 2,700,000 | | | | 2,802,438 | |
Live Nation Entertainment, Inc. | | | | |
4.875%, 11/01/2024 (a) | | | 3,100,000 | | | | 2,989,578 | |
Scientific Games International, Inc. | | | | |
5.000%, 10/15/2025 (a) | | | 2,800,000 | | | | 2,814,000 | |
Six Flags Theme Parks, Inc. | | | | |
7.000%, 07/01/2025 (a) | | | 2,150,000 | | | | 2,280,344 | |
Vail Resorts, Inc. | | | | |
6.250%, 05/15/2025 (a) | | | 2,600,000 | | | | 2,733,250 | |
Wynn Resorts Finance LLC / Wynn Resorts Capital Corp. | | | | |
5.125%, 10/01/2029 (a) | | | 2,725,000 | | | | 2,612,594 | |
| | | | | | | | 18,614,516 | |
Environmental Control — 1.0% | | | | |
Harsco Corp. | | | | |
5.750%, 07/31/2027 (a) | | | 3,110,000 | | | | 3,185,806 | |
| | | | | | | | | |
Food — 2.9% | | | | |
B&G Foods, Inc. | | | | |
5.250%, 04/01/2025 | | | 1,300,000 | | | | 1,340,300 | |
Post Holdings, Inc. | | | | |
5.500%, 12/15/2029 (a) | | | 1,780,000 | | | | 1,926,894 | |
Simmons Foods, Inc. | | | | |
5.750%, 11/01/2024 (a) | | | 3,450,000 | | | | 3,419,813 | |
US Foods, Inc. | | | | |
6.250%, 04/15/2025 (a) | | | 2,270,000 | | | | 2,375,180 | |
| | | | | | | | 9,062,187 | |
Food Service — 1.1% | | | | |
Aramark Services, Inc. | | | | |
5.000%, 02/01/2028 (a) | | | 3,405,000 | | | | 3,439,425 | |
| | | | | | | | | |
Forest Products & Paper — 1.2% | | | | |
Mercer International, Inc. | | | | |
7.375%, 01/15/2025 | | | 3,700,000 | | | | 3,769,394 | |
| | | | | | | | | |
Healthcare-Services — 1.5% | | | | |
Catalent Pharma Solutions, Inc. | | | | |
5.000%, 07/15/2027 (a) | | | 800,000 | | | | 835,352 | |
MEDNAX, Inc. | | | | |
6.250%, 01/15/2027 (a) | | | 1,300,000 | | | | 1,343,511 | |
| | | Principal
Amount | | | Value | |
Healthcare-Services — 1.5% (Continued) |
Select Medical Corp. | | | | |
6.250%, 08/15/2026 (a) | | $ | 2,470,000 | | | $ | 2,609,654 | |
| | | | | | | | 4,788,517 | |
Home Builders — 1.4% | | | | |
MDC Holdings, Inc. | | | | |
6.000%, 01/15/2043 | | | 3,635,000 | | | | 4,552,201 | |
| | | | | | | | | |
Insurance — 0.3% | | | | |
Radian Group, Inc. | | | | |
6.625%, 03/15/2025 | | | 1,000,000 | | | | 1,084,375 | |
| | | | | | | | | |
Internet — 0.3% | | | | |
GrubHub Holdings, Inc. | | | | |
5.500%, 07/01/2027 (a) | | | 970,000 | | | | 1,010,013 | |
| | | | | | | | | |
Investment Companies — 1.0% | | | | |
Icahn Enterprises LP / Icahn Enterprises Finance Corp. | | | | |
4.750%, 09/15/2024 | | | 3,030,000 | | | | 3,087,767 | |
| | | | | | | | | |
Iron/Steel — 1.2% | | | | |
Cleveland-Cliffs, Inc. | | | | |
9.875%, 10/17/2025 (a) | | | 3,420,000 | | | | 3,915,900 | |
| | | | | | | | | |
Lodging — 1.2% | | | | |
Marriott Ownership Resorts, Inc. / ILG LLC | | | | |
6.500%, 09/15/2026 | | | 2,950,000 | | | | 3,043,574 | |
Wyndham Hotels & Resorts, Inc. | | | | |
5.375%, 04/15/2026 (a) | | | 750,000 | | | | 760,781 | |
| | | | | | | | 3,804,355 | |
Machinery-Construction & Mining — 1.0% | | | | |
Terex Corp. | | | | |
5.625%, 02/01/2025 (a) | | | 3,180,000 | | | | 3,233,663 | |
| | | | | | | | | |
Media — 9.7% | | | | |
AMC Networks, Inc. | | | | |
4.750%, 08/01/2025 | | | 2,550,000 | | | | 2,547,463 | |
Cumulus Media New Holdings, Inc. | | | | |
6.750%, 07/01/2026 (a) | | | 3,650,000 | | | | 3,400,760 | |
DISH DBS Corp. | | | | |
5.875%, 11/15/2024 | | | 2,475,000 | | | | 2,493,562 | |
Gray Television, Inc. | | | | |
7.000%, 05/15/2027 (a) | | | 3,400,000 | | | | 3,672,000 | |
iHeartCommunications, Inc. | | | | |
4.750%, 01/15/2028 (a) | | | 3,300,000 | | | | 3,157,077 | |
Liberty Interactive LLC | | | | |
8.250%, 02/01/2030 | | | 2,970,000 | | | | 3,220,594 | |
Nexstar Broadcasting, Inc. | | | | |
5.625%, 07/15/2027 (a) | | | 1,700,000 | | | | 1,774,910 | |
The accompanying notes are an integral part of the financial statements.
102
Pacer Trendpilot US Bond ETF
SCHEDULE OF INVESTMENTS
October 31, 2020 (Unaudited) (Continued)
| | | Principal
Amount | | | Value | |
CORPORATE BONDS — 98.4% (Continued) |
| | | | | | | | | |
Media — 9.7% (Continued) |
Sinclair Television Group, Inc. | | | | |
5.500%, 03/01/2030 (a) | | $ | 3,530,000 | | | $ | 3,324,519 | |
Sirius XM Radio, Inc. | | | | |
5.500%, 07/01/2029 (a) | | | 720,000 | | | | 785,034 | |
TEGNA, Inc. | | | | |
4.625%, 03/15/2028 (a) | | | 3,000,000 | | | | 2,965,740 | |
Univision Communications, Inc. | | | | |
5.125%, 02/15/2025 (a) | | | 3,250,000 | | | | 3,199,219 | |
| | | | | | | | 30,540,878 | |
Mining — 2.6% | | | | |
Arconic Corp. | | | | |
6.000%, 05/15/2025 (a) | | | 1,100,000 | | | | 1,166,688 | |
Compass Minerals International, Inc. | | | | |
6.750%, 12/01/2027 (a) | | | 2,800,000 | | | | 3,041,948 | |
Freeport-McMoRan, Inc. | | | | |
5.450%, 03/15/2043 | | | 3,470,000 | | | | 3,953,579 | |
| | | | | | | | 8,162,215 | |
Miscellaneous Manufacturing — 0.7% | | | | |
Koppers, Inc. | | | | |
6.000%, 02/15/2025 (a) | | | 2,300,000 | | | | 2,356,063 | |
| | | | | | | | | |
Oil & Gas — 5.9% | | | | |
Apache Corp. | | | | |
4.375%, 10/15/2028 | | | 920,000 | | | | 842,720 | |
Continental Resources Inc/OK | | | | |
4.500%, 04/15/2023 | | | 910,000 | | | | 866,793 | |
CVR Energy, Inc. | | | | |
5.250%, 02/15/2025 (a) | | | 2,200,000 | | | | 1,604,625 | |
EQT Corp. | | | | |
7.875%, 02/01/2025 | | | 1,000,000 | | | | 1,113,895 | |
Hilcorp Energy I LP / Hilcorp Finance Co. | | | | |
6.250%, 11/01/2028 (a) | | | 3,200,000 | | | | 2,942,464 | |
Murphy Oil Corp. | | | | |
5.875%, 12/01/2027 | | | 2,700,000 | | | | 2,133,054 | |
Occidental Petroleum Corp. | | | | |
2.900%, 08/15/2024 | | | 1,810,000 | | | | 1,509,178 | |
PDC Energy, Inc. | | | | |
5.750%, 05/15/2026 | | | 1,400,000 | | | | 1,322,125 | |
Southwestern Energy Co. | | | | |
7.500%, 04/01/2026 | | | 2,920,000 | | | | 2,976,356 | |
Sunoco LP / Sunoco Finance Corp. | | | | |
4.875%, 01/15/2023 | | | 850,000 | | | | 859,473 | |
WPX Energy, Inc. | | | | |
4.500%, 01/15/2030 | | | 2,470,000 | | | | 2,374,905 | |
| | | | | | | | 18,545,588 | |
| | | Principal
Amount | | | Value | |
Oil & Gas Services — 0.3% | | | | |
Archrock Partners LP / Archrock Partners Finance Corp. | | | | |
6.250%, 04/01/2028 (a) | | $ | 1,120,000 | | | $ | 1,083,600 | |
| | | | | | | | | |
Packaging & Containers — 3.3% | | | | |
Ball Corp. | | | | |
5.000%, 03/15/2022 | | | 1,115,000 | | | | 1,163,809 | |
Berry Global, Inc. | | | | |
4.500%, 02/15/2026 (a) | | | 1,090,000 | | | | 1,106,606 | |
Crown Americas LLC / Crown Americas Capital Corp. VI | | | | |
4.750%, 02/01/2026 | | | 1,000,000 | | | | 1,041,060 | |
LABL Escrow Issuer LLC | | | | |
6.750%, 07/15/2026 (a) | | | 3,720,000 | | | | 3,906,744 | |
Mauser Packaging Solutions Holding Co. | | | | |
5.500%, 04/15/2024 (a) | | | 3,110,000 | | | | 3,115,723 | |
| | | | | | | | 10,333,942 | |
Pharmaceuticals — 2.4% | | | | |
Bausch Health Americas, Inc. | | | | |
8.500%, 01/31/2027 (a) | | | 3,370,000 | | | | 3,689,594 | |
Par Pharmaceutical, Inc. | | | | |
7.500%, 04/01/2027 (a) | | | 3,620,000 | | | | 3,841,942 | |
| | | | | | | | 7,531,536 | |
Pipelines — 5.1% | | | | |
EnLink Midstream Partners LP | | | | |
4.150%, 06/01/2025 | | | 3,050,000 | | | | 2,631,265 | |
EQM Midstream Partners LP | | | | |
5.500%, 07/15/2028 | | | 720,000 | | | | 730,714 | |
Genesis Energy LP / Genesis Energy Finance Corp. | | | | |
7.750%, 02/01/2028 | | | 3,220,000 | | | | 2,675,627 | |
NuStar Logistics LP | | | | |
5.625%, 04/28/2027 | | | 2,370,000 | | | | 2,328,087 | |
Rockies Express Pipeline LLC | | | | |
4.950%, 07/15/2029 (a) | | | 2,230,000 | | | | 2,176,201 | |
Tallgrass Energy Partners LP / Tallgrass Energy Finance Corp. | | | | |
5.500%, 09/15/2024 (a) | | | 1,500,000 | | | | 1,445,220 | |
Targa Resources Partners LP / Targa Resources Partners Finance Corp. | | | | |
6.500%, 07/15/2027 | | | 2,120,000 | | | | 2,226,000 | |
Western Midstream Operating LP | | | | |
6.000%, 02/01/2050 | | | 1,945,000 | | | | 1,790,061 | |
| | | | | | | | 16,003,175 | |
Real Estate — 1.5% | | | | |
Cushman & Wakefield US Borrower LLC | | | | |
6.750%, 05/15/2028 (a) | | | 2,500,000 | | | | 2,667,187 | |
Howard Hughes Corp. | | | | |
5.375%, 03/15/2025 (a) | | | 1,900,000 | | | | 1,907,125 | |
| | | | | | | | 4,574,312 | |
The accompanying notes are an integral part of the financial statements.
103
Pacer Trendpilot US Bond ETF
SCHEDULE OF INVESTMENTS
October 31, 2020 (Unaudited) (Continued)
| | | Principal
Amount | | | Value | |
REITS — 5.5% | | | | |
Brookfield Property REIT, Inc. / BPR Cumulus LLC / BPR Nimbus LLC / GGSI Sellco LLC | | | | |
5.750%, 05/15/2026 (a) | | $ | 3,700,000 | | | $ | 3,077,937 | |
Diversified Healthcare Trust | | | | |
4.750%, 02/15/2028 | | | 3,100,000 | | | | 2,759,000 | |
ESH Hospitality, Inc. | | | | |
5.250%, 05/01/2025 (a) | | | 2,455,000 | | | | 2,458,621 | |
Iron Mountain, Inc. | | | | |
5.625%, 07/15/2032 (a) | | | 1,700,000 | | | | 1,759,500 | |
Ladder Capital Finance Holdings LLLP / Ladder Capital Finance Corp. | | | | |
4.250%, 02/01/2027 (a) | | | 3,130,000 | | | | 2,711,363 | |
Park Intermediate Holdings LLC / PK Domestic Property LLC / PK Finance Co-Issuer | | | | |
7.500%, 06/01/2025 (a) | | | 3,400,000 | | | | 3,559,375 | |
Service Properties Trust | | | | |
5.000%, 08/15/2022 | | | 900,000 | | | | 891,000 | |
| | | | | | | | 17,216,796 | |
Retail — 3.4% | | | | |
Gap, Inc. | | | | |
8.375%, 05/15/2023 (a) | | | 1,250,000 | | | | 1,397,000 | |
L Brands, Inc. | | | | |
6.750%, 07/01/2036 | | | 3,285,000 | | | | 3,324,666 | |
Suburban Propane Partners LP/Suburban Energy Finance Corp. | | | | |
5.500%, 06/01/2024 | | | 3,063,000 | | | | 3,106,081 | |
Yum! Brands, Inc. | | | | |
4.750%, 01/15/2030 (a) | | | 2,650,000 | | | | 2,852,725 | |
| | | | | | | | 10,680,472 | |
Semiconductors — 0.9% | | | | |
Amkor Technology, Inc. | | | | |
6.625%, 09/15/2027 (a) | | | 2,535,000 | | | | 2,715,619 | |
| | | | | | | | | |
Software — 1.1% | | | | |
SS&C Technologies, Inc. | | | | |
5.500%, 09/30/2027 (a) | | | 1,560,000 | | | | 1,659,965 | |
The Dun & Bradstreet Corp. | | | | |
6.875%, 08/15/2026 (a) | | | 1,648,000 | | | | 1,766,450 | |
| | | | | | | | 3,426,415 | |
Telecommunications — 6.9% | | | | |
CommScope Technologies LLC | | | | |
5.000%, 03/15/2027 (a) | | | 2,905,000 | | | | 2,716,233 | |
Embarq Corp. | | | | |
7.995%, 06/01/2036 | | | 3,570,000 | | | | 4,192,519 | |
Plantronics, Inc. | | | | |
5.500%, 05/31/2023 (a) | | | 2,950,000 | | | | 2,848,564 | |
T-Mobile USA, Inc. | | | | |
4.750%, 02/01/2028 | | | 3,600,000 | | | | 3,861,529 | |
| | | Principal
Amount | | | Value | |
Telecommunications — 6.9% (Continued) | | | | |
United States Cellular Corp. | | | | |
6.700%, 12/15/2033 | | $ | 2,931,000 | | | $ | 3,868,920 | |
ViaSat, Inc. | | | | |
5.625%, 04/15/2027 (a) | | | 1,355,000 | | | | 1,421,903 | |
Windstream Escrow LLC / Windstream Escrow Finance Corp. | | | | |
7.750%, 08/15/2028 (a) | | | 2,990,000 | | | | 2,892,825 | |
| | | | | | | | 21,802,493 | |
Toys/Games/Hobbies — 0.3% | | | | |
Mattel, Inc. | | | | |
5.875%, 12/15/2027 (a) | | | 745,000 | | | | 810,988 | |
| | | | | | | | | |
Transportation — 0.7% | | | | |
XPO Logistics, Inc. | | | | |
6.250%, 05/01/2025 (a) | | | 2,105,000 | | | | 2,241,182 | |
TOTAL CORPORATE BONDS (Cost $306,943,608) | | | | | | | 309,172,032 | |
| | | | | |
SHORT-TERM INVESTMENTS — 0.0% (b) | | | | |
| | | | | |
Money Market Deposit Accounts — 0.0% (b) | | | | |
U.S. Bank Money Market Deposit Account, 0.025% (c) | | | 68,880 | | | | 68,880 | |
TOTAL SHORT-TERM INVESTMENTS (Cost $68,880) | | | | | | | 68,880 | |
Total Investments (Cost $307,012,488) — 98.4% | | | | | | | 309,240,912 | |
Other Assets in Excess of Liabilities — 1.6% | | | | | | | 4,928,797 | |
TOTAL NET ASSETS — 100.0% | | | | | | $ | 314,169,709 | |
Percentages are stated as a percent of net assets.
| | (a) | Restriced security as defined in Rule 144(a) under the Securities Act of 1933. Resale to the public may require registration or may extend only to qualified institutional buyers. At October 31, 2020, the market value of these securities total $198,795,087, which represents 63.28% of total net assets. |
| | (c) | The rate shown is as of October 31, 2020. |
For Fund compliance purposes, the Fund’s industry classifications refer to any one or more of the industry sub-classifications used by one or more widely recognized market indexes or ratings group indexes, and/or they may be defined by Fund management. This definition does not apply for all purposes of this report, which may combine sub-classifications for reporting ease. Categories are shown as a percentage of net assets.
The accompanying notes are an integral part of the financial statements.
104
Pacer CSOP FTSE China A50 ETF
SCHEDULE OF INVESTMENTS
October 31, 2020 (Unaudited)
| | | Shares | | | Value | |
COMMON STOCKS — 99.5% | | | | |
| | | | | | | | | |
Agriculture — 1.0% | | | | |
Muyuan Foodstuff Co Ltd. - Class A | | | 9,030 | | | $ | 95,526 | |
| | | | | | | | | |
Auto Manufacturers — 0.9% | | | | |
SAIC Motor Corp Ltd. - Class A | | | 24,600 | | | | 84,996 | |
| | | | | | | | | |
Banks — 24.1% | | | | |
Agricultural Bank of China Ltd. - Class H | | | 346,900 | | | | 163,090 | |
Bank of China Ltd. - Class H | | | 193,900 | | | | 92,027 | |
Bank of Communications Co. Ltd. - Class A | | | 181,300 | | | | 122,577 | |
China CITIC Bank Corp. Ltd. - Class H | | | 24,700 | | | | 18,617 | |
China Construction Bank Corp. - Class H | | | 81,500 | | | | 76,510 | |
China Everbright Bank Co. Ltd. - Class H | | | 126,400 | | | | 73,951 | |
China Merchants Bank Co. Ltd. - Class A | | | 106,500 | | | | 632,782 | |
China Minsheng Banking Corp. Ltd. - Class A | | | 250,400 | | | | 197,324 | |
Industrial & Commercial Bank of China Ltd. - Class A | | | 195,300 | | | | 143,410 | |
Industrial Bank Co. Ltd. - Class A | | | 125,500 | | | | 333,408 | |
Ping An Bank Co. Ltd. - Class A | | | 73,800 | | | | 195,509 | |
Shanghai Pudong Development Bank Co. Ltd. - Class A | | | 130,200 | | | | 179,943 | |
| | | | | | | | 2,229,148 | |
Beverages — 18.2% | | | | |
Jiangsu Yanghe Brewery Joint-Stock Co. Ltd. - Class A | | | 4,000 | | | | 100,332 | |
Kweichow Moutai Co. Ltd. - Class A | | | 4,000 | | | | 996,997 | |
Wuliangye Yibin Co. Ltd. - Class A | | | 15,900 | | | | 579,858 | |
| | | | | | | | 1,677,187 | |
Building Materials — 1.3% | | | | |
Anhui Conch Cement Co. Ltd. - Class H | | | 15,600 | | | | 118,370 | |
| | | | | | | | | |
Chemicals — 1.6% | | | | |
Wanhua Chemical Group Co. Ltd. - Class A | | | 12,900 | | | | 151,118 | |
| | | | | | | | | |
Coal — 0.5% | | | | |
China Shenhua Energy Co. Ltd. - Class H | | | 17,900 | | | | 44,482 | |
| | | | | | | | | |
Commercial Services — 0.4% | | | | |
Offcn Education Technology Co. Ltd. - Class A | | | 5,600 | | | | 33,031 | |
| | | | | | | | | |
| | | Shares | | | Value | |
Diversified Financial Services — 5.3% | | | | |
CITIC Securities Co. Ltd. - Class A | | | 76,200 | | | $ | 325,603 | |
CSC Financial Co. Ltd. - Class H | | | 3,600 | | | | 22,991 | |
East Money Information Co. Ltd. - Class A | | | 40,900 | | | | 142,719 | |
| | | | | | | | 491,313 | |
Electric — 1.1% | | | | |
China Yangtze Power Co. Ltd. - Class A | | | 35,900 | | | | 101,589 | |
| | | | | | | | | |
Electrical Components & Equipment — 0.8% | | | | |
Contemporary Amperex Technology Co. Ltd. - Class A | | | 2,100 | | | | 77,469 | |
| | | | | | | | | |
Electronics — 4.2% | | | | |
Foxconn Industrial Internet Co. Ltd. - Class A | | | 10,200 | | | | 20,780 | |
Hangzhou Hikvision Digital Technology Co. Ltd. - Class A | | | 25,600 | | | | 171,553 | |
Luxshare Precision Industry Co. Ltd. - Class A | | | 23,629 | | | | 193,470 | |
| | | | | | | | 385,803 | |
Energy-Alternate Sources — 2.1% | | | | |
LONGi Green Energy Technology Co. Ltd. - Class A | | | 17,200 | | | | 195,073 | |
| | | | | | | | | |
Engineering & Construction — 1.3% | | | | |
China State Construction Engineering Corp. Ltd. - Class A | | | 152,000 | | | | 115,925 | |
| | | | | | | | | |
Food — 3.6% | | | | |
Foshan Haitian Flavouring & Food Co. Ltd. - Class A | | | 2,900 | | | | 69,338 | |
Inner Mongolia Yili Industrial Group Co. Ltd. - Class A | | | 45,000 | | | | 266,836 | |
| | | | | | | | 336,174 | |
Healthcare-Products — 1.4% | | | | |
Shenzhen Mindray Bio-Medical Electronics Co. Ltd. - Class A | | | 2,300 | | | | 132,778 | |
| | | | | | | | | |
Healthcare-Services — 0.4% | | | | |
WuXi AppTec Co. Ltd. - Class H | | | 1,890 | | | | 31,796 | |
| | | | | | | | | |
Home Furnishings — 5.6% | | | | |
Gree Electric Appliances Inc of Zhuhai - Class A | | | 38,500 | | | | 335,744 | |
Midea Group Co. Ltd. - Class A | | | 15,810 | | | | 183,745 | |
| | | | | | | | 519,489 | |
Insurance — 12.7% | | | | |
China Life Insurance Co. Ltd. - Class H | | | 13,200 | | | | 90,782 | |
China Pacific Insurance Group Co. Ltd. - Class A | | | 24,800 | | | | 118,111 | |
The accompanying notes are an integral part of the financial statements.
105
Pacer CSOP FTSE China A50 ETF
SCHEDULE OF INVESTMENTS
October 31, 2020 (Unaudited) (Continued)
| | | Shares | | | Value | |
COMMON STOCKS — 99.5% (Continued) | | | | |
| | | | | | | | | |
Insurance — 12.7% (Continued) |
Ping An Insurance Group Co. of China Ltd. - Class A | | | 83,400 | | | $ | 968,780 | |
| | | | | | | | 1,177,673 | |
Oil & Gas — 0.9% | | | | |
China Petroleum & Chemical Corp. - Class H | | | 86,700 | | | | 50,465 | |
PetroChina Co. Ltd. - Class H | | | 53,700 | | | | 32,620 | |
| | | | | | | | 83,085 | |
Pharmaceuticals — 4.0% | | | | |
Chongqing Zhifei Biological Products Co. Ltd. - Class A | | | 3,200 | | | | 76,501 | |
Jiangsu Hengrui Medicine Co.Ltd. - Class A | | | 22,100 | | | | 293,031 | |
| | | | | | | | 369,532 | |
Real Estate — 4.2% | | | | |
China Vanke Co. Ltd. - Class H | | | 58,600 | | | | 240,952 | |
Poly Developments and Holdings Group Co. Ltd. - Class A | | | 62,300 | | | | 142,821 | |
| | | | | | | | 383,773 | |
Retail — 2.3% | | | | |
China Tourism Group Duty Free Corp. Ltd. - Class A | | | 7,100 | | | | 211,298 | |
| | | | | | | | | |
Telecommunications — 0.5% | | | | |
China United Network Communications Ltd. - Class A | | | 68,900 | | | | 49,051 | |
| | | | | | | | | |
Transportation — 1.1% | | | | |
Beijing-Shanghai High Speed Railway Co. Ltd. - Class A | | | 23,940 | | | | 19,937 | |
SF Holding Co. Ltd. - Class A | | | 6,500 | | | | 80,326 | |
| | | | | | | | 100,263 | |
TOTAL COMMON STOCKS (Cost $8,006,974) | | | | | | | 9,195,942 | |
| | | Principal
Amount | | | Value | |
| SHORT-TERM INVESTMENTS — 0.5% | | | |
| | | | | | | |
| Money Market Deposit Accounts, — 0.5% | | | | | | | | |
| U.S. Bank Money Market Deposit Account, 0.025% (a) | | $ | 45,616 | | | $ | 45,616 | |
| TOTAL SHORT-TERM INVESTMENTS (Cost $45,616) | | | | | | | 45,616 | |
| Total Investments (Cost $8,052,590) — 100.0% | | | | | | | 9,241,558 | |
Other Assets in Excess of Liabilities — 0.0% (b) | | | | | | | 855 | |
| TOTAL NET ASSETS — 100.0% | | | | | | $ | 9,242,413 | |
Percentages are stated as a percent of net assets.
| | (a) | The rate shown is as of October 31, 2020. |
For Fund compliance purposes, the Fund’s industry classifications refer to any one or more of the industry sub-classifications used by one or more widely recognized market indexes or ratings group indexes, and/or they may be defined by Fund management. This definition does not apply for all purposes of this report, which may combine sub-classifications for reporting ease.
The accompanying notes are an integral part of the financial statements.
106
Pacer BioThreat Strategy ETF
SCHEDULE OF INVESTMENTS
October 31, 2020 (Unaudited)
| | | Shares | | | Value | |
COMMON STOCKS — 99.9% | | | | |
| | | | | | | | | |
Biotechnology — 7.8% | | | | |
Emergent BioSolutions, Inc. (a) | | | 104 | | | $ | 9,357 | |
Gilead Sciences, Inc. | | | 2,624 | | | | 152,585 | |
Illumina, Inc. (a) | | | 304 | | | | 88,981 | |
Moderna, Inc. (a) | | | 620 | | | | 41,831 | |
Regeneron Pharmaceuticals, Inc. (a) | | | 216 | | | | 117,409 | |
Vir Biotechnology, Inc. (a) | | | 172 | | | | 5,408 | |
| | | | | | | | 415,571 | |
Chemicals — 2.0% | | | | |
Ecolab, Inc. | | | 560 | | | | 102,811 | |
Stepan Co. | | | 44 | | | | 5,123 | |
| | | | | | | | 107,934 | |
Electrical Components & Equipment — 0.1% | | | | |
Energizer Holdings, Inc. | | | 136 | | | | 5,352 | |
| | | | | | | | | |
Electronics — 3.3% | | | | |
Agilent Technologies, Inc. | | | 604 | | | | 61,662 | |
Flir Systems, Inc. | | | 264 | | | | 9,158 | |
Mettler-Toledo International, Inc. (a) | | | 48 | | | | 47,900 | |
PerkinElmer, Inc. | | | 220 | | | | 28,501 | |
Waters Corp. (a) | | | 124 | | | | 27,630 | |
| | | | | | | | 174,851 | |
Environmental Control — 0.2% | | | | |
Stericycle, Inc. (a) | | | 176 | | | | 10,965 | |
| | | | | | | | | |
Food — 2.5% | | | | |
Campbell Soup Co. | | | 604 | | | | 28,189 | |
Hormel Foods Corp. | | | 1,040 | | | | 50,637 | |
Kroger Co. | | | 1,620 | | | | 52,180 | |
| | | | | | | | 131,006 | |
Healthcare-Products — 16.8% | | | | |
Abbott Laboratories | | | 2,484 | | | | 261,093 | |
Danaher Corp. | | | 1,356 | | | | 311,256 | |
QIAGEN NV (a) | | | 440 | | | | 20,874 | |
Thermo Fisher Scientific, Inc. | | | 650 | | | | 307,528 | |
| | | | | | | | 900,751 | |
Healthcare-Services — 1.8% | | | | |
Laboratory Corp. of American Holdings (a) | | | 196 | | | | 39,155 | |
Quest Diagnostics, Inc. | | | 268 | | | | 32,733 | |
Teladoc Health, Inc. (a) | | | 128 | | | | 25,147 | |
| | | | | | | | 97,035 | |
Household Products/Wares — 3.4% | | | | |
Church & Dwight Co., Inc. | | | 480 | | | | 42,427 | |
Clorox Co. | | | 244 | | | | 50,569 | |
Kimberly-Clark Corp. | | | 668 | | | | 88,570 | |
| | | | | | | | 181,566 | |
| | | Shares | | | Value | |
Internet — 12.3% | | | | |
Amazon.com, Inc. (a) | | | 116 | | | $ | 352,193 | |
Netflix, Inc. (a) | | | 648 | | | | 308,280 | |
| | | | | | | | 660,473 | |
Machinery-Diversified — 0.6% | | | | |
Xylem, Inc. | | | 348 | | | | 30,325 | |
| | | | | | | | | |
Miscellaneous Manufacturing — 3.4% | | | | |
3M Co. | | | 1,148 | | | | 183,634 | |
| | | | | | | | | |
Pharmaceuticals — 16.3% | | | | |
CVS Health Corp. | | | 2,480 | | | | 139,103 | |
GlaxoSmithKline PLC - ADR | | | 4,612 | | | | 154,133 | |
Johnson & Johnson | | | 1,480 | | | | 202,923 | |
Merck & Co., Inc. | | | 2,428 | | | | 182,610 | |
Sanofi - ADR | | | 4,312 | | | | 195,334 | |
| | | | | | | | 874,103 | |
Retail — 15.4% | | | | |
Home Depot, Inc. | | | 952 | | | | 253,908 | |
Lowe’s Cos., Inc. | | | 1,524 | | | | 240,944 | |
Walgreens Boots Alliance, Inc. | | | 1,772 | | | | 60,319 | |
Walmart, Inc. | | | 1,920 | | | | 266,400 | |
| | | | | | | | 821,571 | |
Semiconductors — 8.3% | | | | |
NVIDIA Corp. | | | 884 | | | | 443,202 | |
| | | | | | | | | |
Software — 5.7% | | | | |
Akamai Technologies, Inc. (a) | | | 320 | | | | 30,438 | |
Citrix Systems, Inc. | | | 252 | | | | 28,544 | |
Zoom Video Communications, Inc. (a) | | | 536 | | | | 247,048 | |
| | | | | | | | 306,030 | |
TOTAL COMMON STOCKS (Cost $5,117,174) | | | | | | | 5,344,369 | |
| | | | | |
The accompanying notes are an integral part of the financial statements.
107
Pacer BioThreat Strategy ETF
SCHEDULE OF INVESTMENTS
October 31, 2020 (Unaudited) (Continued)
| | | Principal
Amount | | | Value | |
| SHORT-TERM INVESTMENTS — 0.1% | | | |
| | | | | | | |
| Money Market Deposit Accounts, — 0.1% | | | | | | | | |
| U.S. Bank Money Market Deposit Account 0.025% (b) | | $ | 4,339 | | | $ | 4,339 | |
| TOTAL SHORT-TERM INVESTMENTS (Cost $4,339) | | | | | | | 4,339 | |
| Total Investments (Cost $5,121,513) — 100.0% | | | | | | | 5,348,708 | |
| Other Assets in Excess of Liabilities — 0.0% | | | | | | | 164 | |
| TOTAL NET ASSETS — 100.0% | | | | | | $ | 5,348,872 | |
Percentages are stated as a percent of net assets.
ADR | American Depositary Receipt |
| | (a) | Non-income produc ing security. |
| | (b) | The rate shown is as of October 31, 2020. |
For Fund compliance purposes, the Fund’s industry classifications refer to any one or more of the industry sub-classifications used by one or more widely recognized market indexes or ratings group indexes, and/or they may be defined by Fund management. This definition does not apply for all purposes of this report, which may combine sub-classifications for reporting ease.
The accompanying notes are an integral part of the financial statements.
108
Pacer Lunt Large Cap Alternator ETF
SCHEDULE OF INVESTMENTS
October 31, 2020 (Unaudited)
| | | Shares | | | Value | |
COMMON STOCKS — 96.6% | | | | |
| | | | | | | | | |
Aerospace/Defense — 1.6% | | | | |
General Dynamics Corp. | | | 3,397 | | | $ | 446,128 | |
Northrop Grumman Corp. | | | 1,530 | | | | 443,425 | |
| | | | | | | | 889,553 | |
Agriculture — 1.8% | | | | |
Altria Group, Inc. | | | 13,415 | | | | 484,013 | |
Archer-Daniels-Midland Co. | | | 11,677 | | | | 539,945 | |
| | | | | | | | 1,023,958 | |
Auto Manufacturers — 1.0% | | | | |
PACCAR, Inc. | | | 6,330 | | | | 540,455 | |
| | | | | | | | | |
Beverages — 4.0% | | | | |
Brown-Forman Corp. - Class B | | | 7,474 | | | | 521,012 | |
Coca-Cola Co. | | | 12,919 | | | | 620,887 | |
Monster Beverage Corp. (a) | | | 6,954 | | | | 532,468 | |
PepsiCo, Inc. | | | 4,123 | | | | 549,555 | |
| | | | | | | | 2,223,922 | |
Biotechnology — 3.7% | | | | |
Amgen, Inc. | | | 2,327 | | | | 504,819 | |
Bio-Rad Laboratories, Inc. - Class A (a) | | | 1,034 | | | | 606,358 | |
Gilead Sciences, Inc. | | | 7,948 | | | | 462,176 | |
Incyte Corp. (a) | | | 5,507 | | | | 477,127 | |
| | | | | | | | 2,050,480 | |
Chemicals — 0.9% | | | | |
Linde PLC | | | 2,217 | | | | 488,494 | |
| | | | | | | | | |
Commercial Services — 2.8% | | | | |
Equifax, Inc. | | | 3,145 | | | | 429,607 | |
Rollins, Inc. | | | 10,753 | | | | 622,061 | |
Verisk Analytics, Inc. | | | 2,882 | | | | 512,910 | |
| | | | | | | | 1,564,578 | |
Cosmetics/Personal Care — 2.3% | | | | |
Colgate-Palmolive Co. | | | 8,336 | | | | 657,627 | |
Procter & Gamble Co. | | | 4,527 | | | | 620,652 | |
| | | | | | | | 1,278,279 | |
Diversified Financial Services — 0.9% | | | | |
Intercontinental Exchange, Inc. | | | 5,338 | | | | 503,907 | |
| | | | | | | | | |
Electric — 6.0% | | | | |
Alliant Energy Corp. | | | 10,310 | | | | 569,937 | |
American Electric Power Co., Inc. | | | 6,633 | | | | 596,506 | |
CMS Energy Corp. | | | 8,936 | | | | 565,917 | |
Consolidated Edison, Inc. | | | 7,078 | | | | 555,552 | |
Public Service Enterprise Group, Inc. | | | 9,623 | | | | 559,577 | |
Xcel Energy, Inc. | | | 7,608 | | | | 532,788 | |
| | | | | | | | 3,380,277 | |
Electronics — 3.9% | | | | |
Agilent Technologies, Inc. | | | 5,616 | | | | 573,337 | |
| | | Shares | | | Value | |
Electronics — 3.9% (Continued) |
Garmin Ltd. | | | 5,296 | | | $ | 550,890 | |
PerkinElmer, Inc. | | | 4,979 | | | | 645,029 | |
Roper Technologies, Inc. | | | 1,134 | | | | 421,100 | |
| | | | | | | | 2,190,356 | |
Environmental Control — 2.1% | | | | |
Republic Services, Inc. | | | 6,578 | | | | 579,982 | |
Waste Management, Inc. | | | 5,362 | | | | 578,614 | |
| | | | | | | | 1,158,596 | |
Food — 10.2% | | | | |
Campbell Soup Co. | | | 12,887 | | | | 601,436 | |
ConAgra Foods, Inc. | | | 13,932 | | | | 488,874 | |
General Mills, Inc. | | | 10,811 | | | | 639,146 | |
Hershey Co. | | | 3,754 | | | | 516,025 | |
Hormel Foods Corp. | | | 13,172 | | | | 641,345 | |
JM Smucker Co. | | | 5,543 | | | | 621,925 | |
Kellogg Co. | | | 9,549 | | | | 600,537 | |
Kroger Co. | | | 16,858 | | | | 542,996 | |
McCormick & Co., Inc. | | | 2,701 | | | | 487,557 | |
Mondelez International, Inc. - Class A | | | 10,789 | | | | 573,112 | |
| | | | | | | | 5,712,953 | |
Gas — 0.8% | | | | |
Atmos Energy Corp. | | | 4,983 | | | | 456,792 | |
| | | | | | | | | |
Healthcare-Products — 8.4% | | | | |
Abbott Laboratories | | | 5,456 | | | | 573,480 | |
Baxter International, Inc. | | | 6,525 | | | | 506,144 | |
Danaher Corp. | | | 3,030 | | | | 695,506 | |
Medtronic PLC | | | 5,254 | | | | 528,395 | |
STERIS Plc | | | 3,394 | | | | 601,383 | |
The Cooper Cos., Inc. | | | 1,756 | | | | 560,252 | |
Thermo Fisher Scientific, Inc. | | | 1,384 | | | | 654,798 | |
West Pharmaceutical Services, Inc. | | | 2,030 | | | | 552,302 | |
| | | | | | | | 4,672,260 | |
Healthcare-Services — 1.0% | | | | |
Quest Diagnostics, Inc. | | | 4,398 | | | | 537,172 | |
| | | | | | | | | |
Household Products/Wares — 3.2% | | | | |
Church & Dwight Co., Inc. | | | 6,724 | | | | 594,334 | |
Clorox Co. | | | 3,168 | | | | 656,568 | |
Kimberly-Clark Corp. | | | 4,094 | | | | 542,824 | |
| | | | | | | | 1,793,726 | |
Insurance — 4.7% | | | | |
Aon Plc | | | 2,697 | | | | 496,275 | |
Berkshire Hathaway, Inc. - Class B (a) | | | 2,884 | | | | 582,279 | |
Marsh & McLennan Cos., Inc. | | | 4,886 | | | | 505,505 | |
Progressive Corp. | | | 6,214 | | | | 571,067 | |
Willis Towers Watson PLC | | | 2,595 | | | | 473,536 | |
| | | | | | | | 2,628,662 | |
The accompanying notes are an integral part of the financial statements.
109
Pacer Lunt Large Cap Alternator ETF
SCHEDULE OF INVESTMENTS
October 31, 2020 (Unaudited) (Continued)
| | | Shares | | | Value | |
COMMON STOCKS — 96.6% (Continued) |
| | | | | | | | | |
Internet — 3.9% | | | | |
Alphabet, Inc. - Class C (a) | | | 371 | | | $ | 601,395 | |
Amazon.com, Inc. (a) | | | 192 | | | | 582,941 | |
eBay, Inc. | | | 10,569 | | | | 503,401 | |
VeriSign, Inc. (a) | | | 2,461 | | | | 469,313 | |
| | | | | | | | 2,157,050 | |
Machinery-Diversified — 0.9% | | | | |
IDEX Corp. | | | 3,129 | | | | 533,150 | |
| | | | | | | | | |
Media — 2.1% | | | | |
Charter Communications, Inc. - Class A (a) | | | 1,033 | | | | 623,746 | |
Comcast Corp. - Class A | | | 12,677 | | | | 535,476 | |
| | | | | | | | 1,159,222 | |
Miscellaneous Manufacturing — 1.9% | | | | |
3M Co. | | | 3,238 | | | | 517,951 | |
AO Smith Corp. | | | 11,006 | | | | 568,900 | |
| | | | | | | | 1,086,851 | |
Pharmaceuticals — 8.9% | | | | |
AbbVie, Inc. | | | 6,488 | | | | 552,129 | |
Becton Dickinson and Co. | | | 2,219 | | | | 512,878 | |
Bristol-Myers Squibb Co. | | | 11,652 | | | | 681,059 | |
CVS Health Corp. | | | 8,221 | | | | 461,116 | |
Eli Lilly & Co. | | | 3,518 | | | | 458,958 | |
Johnson & Johnson | | | 4,543 | | | | 622,891 | |
Merck & Co., Inc. | | | 7,722 | | | | 580,772 | |
Pfizer, Inc. | | | 16,203 | | | | 574,882 | |
Zoetis, Inc. | | | 3,333 | | | | 528,447 | |
| | | | | | | | 4,973,132 | |
Retail — 4.7% | | | | |
Costco Wholesale Corp. | | | 2,137 | | | | 764,234 | |
Dollar General Corp. | | | 3,285 | | | | 685,612 | |
Tractor Supply Co. | | | 3,615 | | | | 481,554 | |
Walmart, Inc. | | | 5,117 | | | | 709,984 | |
| | | | | | | | 2,641,384 | |
Software — 7.7% | | | | |
Activision Blizzard, Inc. | | | 6,456 | | | | 488,913 | |
Akamai Technologies, Inc. (a) | | | 5,208 | | | | 495,385 | |
Broadridge Financial Solutions, Inc. | | | 4,105 | | | | 564,848 | |
Cerner Corp. | | | 9,158 | | | | 641,884 | |
Citrix Systems, Inc. | | | 3,988 | | | | 451,721 | |
Electronic Arts, Inc. (a) | | | 4,243 | | | | 508,439 | |
Jack Henry & Associates, Inc. | | | 2,982 | | | | 442,081 | |
Tyler Technologies, Inc. (a) | | | 1,818 | | | | 698,803 | |
| | | | | | | | 4,292,074 | |
Telecommunications — 4.1% | | | | |
AT&T, Inc. | | | 19,320 | | | | 522,026 | |
Juniper Networks, Inc. | | | 23,114 | | | | 455,808 | |
T-Mobile US, Inc. (a) | | | 4,547 | | | | 498,215 | |
| | | Shares | | | Value | |
Telecommunications — 4.1% (Continued) |
Verizon Communications, Inc. | | | 14,199 | | | $ | 809,201 | |
| | | | | | | | 2,285,250 | |
Transportation — 3.1% | | | | |
CH Robinson Worldwide, Inc. | | | 6,268 | | | | 554,279 | |
Expeditors International of Washington, Inc. | | | 7,206 | | | | 636,794 | |
United Parcel Service, Inc. - Class B | | | 3,288 | | | | 516,578 | |
| | | | | | | | 1,707,651 | |
TOTAL COMMON STOCKS (Cost $55,422,131) | | | | | | | 53,930,184 | |
| | | | | |
REAL ESTATE INVESTMENT TRUSTS — 3.1% | | | | |
Equinix, Inc. | | | 669 | | | | 489,200 | |
Extra Space Storage, Inc. | | | 5,097 | | | | 590,997 | |
Public Storage | | | 2,928 | | | | 670,716 | |
TOTAL REAL ESTATE INVESTMENT TRUSTS (Cost $1,633,777) | | | | | | | 1,750,913 | |
| | | | | |
| | | Principal
Amount | | | | | |
SHORT-TERM INVESTMENTS — 0.1% | | | | |
| | | | | | | | | |
Money Market Deposit Accounts, — 0.1% | | | | |
U.S. Bank Money Market Deposit Account, 0.025% (b) | | $ | 71,665 | | | | 71,665 | |
TOTAL SHORT-TERM INVESTMENTS (Cost $71,665) | | | | | | | 71,665 | |
Total Investments (Cost $57,127,573) — 99.8% | | | | | | | 55,752,762 | |
Other Assets in Excess of Liabilities — 0.2% | | | | | | | 96,426 | |
TOTAL NET ASSETS — 100.0% | | | | | | $ | 55,849,188 | |
Percentages are stated as a percent of net assets.
| | (a) | Non-income producing security. |
| | (b) | The rate shown is as of October 31, 2020. |
For Fund compliance purposes, the Fund’s industry classifications refer to any one or more of the industry sub-classifications used by one or more widely recognized market indexes or ratings group indexes, and/or they may be defined by Fund management. This definition does not apply for all purposes of this report, which may combine sub-classifications for reporting ease.
The accompanying notes are an integral part of the financial statements.
110
Pacer Lunt Midcap Multi-Factor Alternator ETF
SCHEDULE OF INVESTMENTS
October 31, 2020 (Unaudited)
| | | Shares | | | Value | |
COMMON STOCKS — 95.0% | | | | |
| | | | | | | | | |
Agriculture — 0.6% | | | | |
Darling Ingredients, Inc. (a) | | | 1,984 | | | $ | 85,312.00 | |
| | | | | | | | | |
Apparel — 0.5% | | | | |
Deckers Outdoor Corp. (a) | | | 319 | | | | 80,825 | |
| | | | | | | | | |
Banks — 0.6% | | | | |
PacWest Bancorp | | | 1,747 | | | | 33,613 | |
Umpqua Holdings Corp. | | | 4,604 | | | | 57,826 | |
| | | | | | | | 91,439 | |
Beverages — 2.6% | | | | |
The Boston Beer Co., Inc. - Class A (a) | | | 371 | | | | 385,536 | |
| | | | | | | | | |
Biotechnology — 2.9% | | | | |
Arrowhead Pharmaceuticals, Inc. (a) | | | 2,728 | | | | 156,314 | |
Emergent BioSolutions, Inc. (a) | | | 1,080 | | | | 97,168 | |
Ligand Pharmaceuticals, Inc. (a) | | | 393 | | | | 32,403 | |
Nektar Therapeutics (a) | | | 3,418 | | | | 54,141 | |
United Therapeutics Corp. (a) | | | 683 | | | | 91,679 | |
| | | | | | | | 431,705 | |
Building Materials — 2.5% | | | | |
Builders FirstSource, Inc. (a) | | | 1,224 | | | | 37,087 | |
Lennox International, Inc. | | | 516 | | | | 140,177 | |
Trex Co, Inc. (a) | | | 2,839 | | | | 197,424 | |
| | | | | | | | 374,688 | |
Chemicals — 0.8% | | | | |
RPM International, Inc. | | | 1,401 | | | | 118,623 | |
| | | | | | | | | |
Commercial Services — 3.4% | | | | |
CoreLogic, Inc. | | | 1,101 | | | | 84,700 | |
FTI Consulting, Inc. (a) | | | 330 | | | | 32,492 | |
HealthEquity, Inc. (a) | | | 1,112 | | | | 57,257 | |
LiveRamp Holdings, Inc. (a) | | | 1,267 | | | | 83,736 | |
Paylocity Holding Corp. (a) | | | 984 | | | | 182,551 | |
WEX, Inc. (a) | | | 564 | | | | 71,374 | |
| | | | | | | | 512,110 | |
Computers — 1.3% | | | | |
Lumentum Holdings, Inc. (a) | | | 1,219 | | | | 100,799 | |
Perspecta, Inc. | | | 2,419 | | | | 43,373 | |
Qualys, Inc. (a) | | | 556 | | | | 48,844 | |
| | | | | | | | 193,016 | |
Cosmetics/Personal Care — 0.2% | | | | |
Edgewell Personal Care Co. (a) | | | 921 | | | | 24,149 | |
| | | | | | | | | |
Distribution/Wholesale — 4.4% | | | | |
Pool Corp. | | | 1,482 | | | | 518,448 | |
Watsco, Inc. | | | 621 | | | | 139,191 | |
| | | | | | | | 657,639 | |
| | | Shares | | | Value | |
Diversified Financial Services — 0.2% | | | | |
LendingTree, Inc. (a) | | | 109 | | | $ | 35,271 | |
| | | | | | | | | |
Electrical Components & Equipment — 3.2% | | | | |
Belden, Inc. | | | 689 | | | | 21,276 | |
Energizer Holdings, Inc. | | | 893 | | | | 35,139 | |
Generac Holdings, Inc. (a) | | | 1,457 | | | | 306,189 | |
Universal Display Corp. | | | 610 | | | | 120,969 | |
| | | | | | | | 483,573 | |
Electronics — 0.7% | | | | |
II-VI, Inc. (a) | | | 1,028 | | | | 46,743 | |
SYNNEX Corp. | | | 420 | | | | 55,289 | |
| | | | | | | | 102,032 | |
Energy-Alternate Sources — 6.3% | | | | |
Enphase Energy, Inc. (a) | | | 3,533 | | | | 346,552 | |
SolarEdge Technologies, Inc. (a) | | | 1,894 | | | | 488,065 | |
Sunrun, Inc. (a) | | | 2,033 | | | | 105,756 | |
| | | | | | | | 940,373 | |
Engineering & Construction — 0.5% | | | | |
TopBuild Corp. (a) | | | 471 | | | | 72,162 | |
| | | | | | | | | |
Entertainment — 2.1% | | | | |
Churchill Downs, Inc. | | | 519 | | | | 77,409 | |
Penn National Gaming, Inc. (a) | | | 3,794 | | | | 204,800 | |
Scientific Games Corp. (a) | | | 933 | | | | 29,744 | |
| | | | | | | | 311,953 | |
Environmental Control — 1.3% | | | | |
Stericycle, Inc. (a) | | | 2,303 | | | | 143,477 | |
Tetra Tech, Inc. | | | 459 | | | | 46,318 | |
| | | | | | | | 189,795 | |
Food — 0.9% | | | | |
Hain Celestial Group, Inc. (a) | | | 1,479 | | | | 45,479 | |
Lancaster Colony Corp. | | | 272 | | | | 45,190 | |
Sprouts Farmers Market, Inc. (a) | | | 1,980 | | | | 37,719 | |
| | | | | | | | 128,388 | |
Hand/Machine Tools — 0.7% | | | | |
MSA Safety, Inc. | | | 843 | | | | 111,209 | |
| | | | | | | | | |
Healthcare-Products — 11.1% | | | | |
Bio-Techne Corp. | | | 1,161 | | | | 293,048 | |
Haemonetics Corp. (a) | | | 936 | | | | 94,620 | |
Integra LifeSciences Holdings Corp. (a) | | | 1,102 | | | | 48,598 | |
LivaNova PLC (a) | | | 707 | | | | 35,590 | |
Masimo Corp. (a) | | | 1,670 | | | | 373,779 | |
NuVasive, Inc. (a) | | | 734 | | | | 32,612 | |
Patterson Cos., Inc. | | | 1,115 | | | | 27,736 | |
Penumbra, Inc. (a) | | | 956 | | | | 249,545 | |
Quidel Corp. (a) | | | 848 | | | | 227,510 | |
Repligen Corp. (a) | | | 1,691 | | | | 281,670 | |
| | | | | | | | 1,664,708 | |
The accompanying notes are an integral part of the financial statements.
111
Pacer Lunt Midcap Multi-Factor Alternator ETF
SCHEDULE OF INVESTMENTS
October 31, 2020 (Unaudited) (Continued)
| | | Shares | | | Value | |
COMMON STOCKS — 95.0% (Continued) |
| | | | | | | | | |
Healthcare-Services — 7.9% | | | | |
Amedisys, Inc. (a) | | | 1,154 | | | $ | 298,886 | |
Catalent, Inc. (a) | | | 2,525 | | | | 221,620 | |
Charles River Laboratories International, Inc. (a) | | | 718 | | | | 163,489 | |
Chemed Corp. | | | 438 | | | | 209,504 | |
LHC Group, Inc. (a) | | | 504 | | | | 109,141 | |
MEDNAX, Inc. (a) | | | 1,095 | | | | 13,961 | |
Molina Healthcare, Inc. (a) | | | 728 | | | | 135,750 | |
Syneos Health, Inc. (a) | | | 578 | | | | 30,680 | |
| | | | | | | | 1,183,031 | |
Home Builders — 0.8% | | | | |
KB Home | | | 806 | | | | 25,994 | |
Thor Industries, Inc. | | | 972 | | | | 82,212 | |
TRI Pointe Group, Inc. (a) | | | 1,136 | | | | 18,664 | |
| | | | | | | | 126,870 | |
Housewares — 1.8% | | | | |
Helen of Troy Ltd. (a) | | | 281 | | | | 53,278 | |
Scotts Miracle-Gro Co. | | | 564 | | | | 84,628 | |
Toro Co. | | | 1,566 | | | | 128,569 | |
| | | | | | | | 266,475 | |
Insurance — 0.9% | | | | |
Brown & Brown, Inc. | | | 2,973 | | | | 129,355 | |
| | | | | | | | | |
Internet — 2.3% | | | | |
Etsy, Inc. (a) | | | 2,053 | | | | 249,624 | |
GrubHub, Inc. (a) | | | 1,376 | | | | 101,769 | |
| | | | | | | | 351,393 | |
Leisure Time — 0.4% | | | | |
Brunswick Corp. | | | 891 | | | | 56,766 | |
| | | | | | | | | |
Lodging — 0.3% | | | | |
Choice Hotels International, Inc. | | | 449 | | | | 39,220 | |
| | | | | | | | | |
Machinery-Diversified — 5.1% | | | | |
Cognex Corp. | | | 5,155 | | | | 339,715 | |
Graco, Inc. | | | 2,306 | | | | 142,741 | |
Nordson Corp. | | | 1,444 | | | | 279,313 | |
| | | | | | | | 761,769 | |
Media — 5.4% | | | | |
Cable One, Inc. | | | 176 | | | | 304,807 | |
FactSet Research Systems, Inc. | | | 1,042 | | | | 319,373 | |
The New York Times Co. - Class A | | | 3,892 | | | | 154,357 | |
World Wrestling Entertainment, Inc. - Class A | | | 733 | | | | 26,652 | |
| | | | | | | | 805,189 | |
Mining — 1.3% | | | | |
Royal Gold, Inc. | | | 1,687 | | | | 200,432 | |
| | | | | | | | | |
| | | Shares | | | Value | |
Miscellaneous Manufacturing — 0.8% | | | | |
Axon Enterprise, Inc. (a) | | | 1,266 | | | $ | 125,207 | |
| | | | | |
Oil & Gas — 0.6% | | | | |
Cimarex Energy Co. | | | 1,825 | | | | 46,300 | |
Murphy USA, Inc. (a) | | | 403 | | | | 49,283 | |
| | | | | | | | 95,583 | |
Oil & Gas Services — 0.1% | | | | |
ChampionX Corp. (a) | | | 1,332 | | | | 11,628 | |
| | | | | | | | | |
Packaging & Containers — 0.3% | | | | |
Silgan Holdings, Inc. | | | 1,201 | | | | 41,374 | |
| | | | | | | | | |
Pharmaceuticals — 0.6% | | | | |
PRA Health Sciences, Inc. (a) | | | 911 | | | | 88,768 | |
| | | | | | | | | |
Pipelines — 0.3% | | | | |
Antero Midstream Corp. | | | 5,104 | | | | 29,246 | |
Equitrans Midstream Corp. | | | 3,232 | | | | 23,464 | |
| | | | | | | | 52,710 | |
Retail — 5.0% | | | | |
BJ’s Wholesale Club Holdings, Inc. (a) | | | 2,513 | | | | 96,223 | |
Dunkin’ Brands Group, Inc. | | | 1,259 | | | | 125,535 | |
Five Below, Inc. (a) | | | 775 | | | | 103,338 | |
Jack in the Box, Inc. | | | 348 | | | | 27,861 | |
Lithia Motors, Inc. - Class B | | | 365 | | | | 83,793 | |
Papa John’s International, Inc. | | | 1,101 | | | | 84,336 | |
RH (a) | | | 282 | | | | 94,535 | |
The Wendy’s Co. | | | 2,754 | | | | 60,175 | |
Williams-Sonoma, Inc. | | | 846 | | | | 77,164 | |
| | | | | | | | 752,960 | |
Semiconductors — 5.7% | | | | |
Cirrus Logic, Inc. (a) | | | 693 | | | | 47,727 | |
CREE, Inc. (a) | | | 1,591 | | | | 101,188 | |
MKS Instruments, Inc. | | | 739 | | | | 80,100 | |
Monolithic Power Systems, Inc. | | | 1,366 | | | | 436,574 | |
Semtech Corp. (a) | | | 1,028 | | | | 56,427 | |
Silicon Laboratories, Inc. (a) | | | 616 | | | | 63,115 | |
Synaptics, Inc. (a) | | | 794 | | | | 60,876 | |
| | | | | | | | 846,007 | |
Software — 7.0% | | | | |
Blackbaud, Inc. | | | 783 | | | | 38,633 | |
CDK Global, Inc. | | | 1,841 | | | | 79,347 | |
Ceridian HCM Holding, Inc. (a) | | | 3,171 | | | | 273,404 | |
CommVault Systems, Inc. (a) | | | 667 | | | | 26,407 | |
Fair Isaac Corp. (a) | | | 752 | | | | 294,370 | |
Manhattan Associates, Inc. (a) | | | 1,096 | | | | 93,708 | |
PTC, Inc. (a) | | | 2,799 | | | | 234,780 | |
| | | | | | | | 1,040,649 | |
The accompanying notes are an integral part of the financial statements.
112
Pacer Lunt Midcap Multi-Factor Alternator ETF
SCHEDULE OF INVESTMENTS
October 31, 2020 (Unaudited) (Continued)
| | | Shares | | | Value | |
COMMON STOCKS — 95.0% (Continued) |
| | | | | | | | | |
Telecommunications — 0.5% | | | | |
CIENA Corp. (a) | | | 1,845 | | | $ | 72,675 | |
| |
Toys/Games/Hobbies — 0.5% | | | | |
Mattel, Inc. (a) | | | 5,283 | | | | 72,747 | |
| | | | | | | | | |
Transportation — 0.6% | | | | |
Knight-Swift Transportation Holdings, Inc. | | | 1,376 | | | | 52,274 | |
Werner Enterprises, Inc. | | | 814 | | | | 30,948 | |
| | | | | | | | 83,222 | |
TOTAL COMMON STOCKS (Cost $13,002,157) | | | | | | | 14,198,536 | |
| | | | | |
REAL ESTATE INVESTMENT TRUSTS — 4.7% | | | | |
CoreSite Realty Corp. | | | 1,255 | | | | 149,797 | |
CyrusOne, Inc. | | | 3,599 | | | | 255,709 | |
EastGroup Properties, Inc. | | | 875 | | | | 116,445 | |
First Industrial Realty Trust, Inc. | | | 1,241 | | | | 49,404 | |
Mack-Cali Realty Corp. | | | 1,346 | | | | 14,792 | |
Medical Properties Trust, Inc. | | | 5,063 | | | | 90,223 | |
PS Business Parks, Inc. | | | 288 | | | | 32,842 | |
TOTAL REAL ESTATE INVESTMENT TRUSTS (Cost $753,139) | | | | | | | 709,212 | |
| | | | | |
| | | Principal
Amount | | | | | |
SHORT-TERM INVESTMENTS — 0.3% | | | | |
| | | | | | | | | |
Money Market Deposit Accounts, — 0.3% | | | | |
U.S. Bank Money Market Deposit Account, 0.025% (b) | | $ | 45,714 | | | | 45,714 | |
TOTAL SHORT-TERM INVESTMENTS (Cost $45,714) | | | | | | | 45,714 | |
Total Investments (Cost $13,801,010) — 100.0% | | | | | | | 14,953,462 | |
Liabilities in Excess of Other Assets — 0.0% (c) | | | | | | | (5,057 | ) |
TOTAL NET ASSETS — 100.0% | | | | | | $ | 14,948,405 | |
Percentages are stated as a percent of net assets.
| | (a) | Non-income producing security. |
| | (b) | The rate shown is as of October 31, 2020. |
For Fund compliance purposes, the Fund’s industry classifications refer to any one or more of the industry sub-classifications used by one or more widely recognized market indexes or ratings group
indexes, and/or they may be defined by Fund management. This definition does not apply for all purposes of this report, which may combine sub-classifications for reporting ease.
The accompanying notes are an integral part of the financial statements.
113
Pacer Lunt Large Cap Multi-Factor Alternator ETF
SCHEDULE OF INVESTMENTS
October 31, 2020 (Unaudited)
| | | Shares | | | Value | |
COMMON STOCKS — 95.6% | | | | |
| | | | | | | | | |
Aerospace/Defense — 0.6% | | | | |
Boeing Co. | | | 395 | | | $ | 57,034 | |
TransDigm Group, Inc. | | | 51 | | | | 24,348 | |
| | | | | | | | 81,382 | |
Agriculture — 0.5% | | | | |
Altria Group, Inc. | | | 1,829 | | | | 65,990 | |
| | | | | | | | | |
Apparel — 1.3% | | | | |
NIKE, Inc. - Class B | | | 1,382 | | | | 165,950 | |
Under Armour, Inc. - Class A (a) | | | 384 | | | | 5,315 | |
| | | | | | | | 171,265 | |
Auto Manufacturers — 0.1% | | | | |
PACCAR, Inc. | | | 195 | | | | 16,649 | |
| | | | | | | | | |
Beverages — 0.4% | | | | |
Brown-Forman Corp. - Class B | | | 294 | | | | 20,495 | |
Monster Beverage Corp. (a) | | | 442 | | | | 33,844 | |
| | | | | | | | 54,339 | |
Biotechnology — 2.5% | | | | |
Amgen, Inc. | | | 385 | | | | 83,522 | |
Bio-Rad Laboratories, Inc. - Class A (a) | | | 20 | | | | 11,728 | |
Illumina, Inc. (a) | | | 162 | | | | 47,417 | |
Incyte Corp. (a) | | | 195 | | | | 16,895 | |
Regeneron Pharmaceuticals, Inc. (a) | | | 125 | | | | 67,945 | |
Vertex Pharmaceuticals, Inc. (a) | | | 533 | | | | 111,056 | |
| | | | | | | | 338,563 | |
Building Materials — 0.1% | | | | |
Fortune Brands Home & Security, Inc. | | | 78 | | | | 6,308 | |
Masco Corp. | | | 180 | | | | 9,648 | |
| | | | | | | | 15,956 | |
Chemicals — 1.7% | | | | |
Air Products & Chemicals, Inc. | | | 117 | | | | 32,320 | |
Ecolab, Inc. | | | 278 | | | | 51,038 | |
Linde PLC | | | 315 | | | | 69,407 | |
Sherwin-Williams Co. | | | 101 | | | | 69,486 | |
| | | | | | | | 222,251 | |
Commercial Services — 6.1% | | | | |
Automatic Data Processing, Inc. | | | 395 | | | | 62,394 | |
Equifax, Inc. | | | 119 | | | | 16,255 | |
FleetCor Technologies, Inc. (a) | | | 76 | | | | 16,789 | |
Gartner, Inc. (a) | | | 81 | | | | 9,728 | |
IHS Markit Ltd. | | | 187 | | | | 15,123 | |
MarketAxess Holdings, Inc. | | | 69 | | | | 37,181 | |
Moody’s Corp. | | | 254 | | | | 66,777 | |
PayPal Holdings, Inc. (a) | | | 2,107 | | | | 392,176 | |
Rollins, Inc. | | | 289 | | | | 16,719 | |
S&P Global, Inc. | | | 418 | | | | 134,901 | |
| | | Shares | | | Value | |
Commercial Services — 6.1% (Continued) |
Verisk Analytics, Inc. | | | 264 | | | $ | 46,984 | |
| | | | | | | | 815,027 | |
Computers — 7.1% | | | | |
Apple, Inc. | | | 8,526 | | | | 928,140 | |
Fortinet, Inc. (a) | | | 234 | | | | 25,827 | |
| | | | | | | | 953,967 | |
Cosmetics/Personal Care — 3.9% | | | | |
Colgate-Palmolive Co. | | | 961 | | | | 75,813 | |
Estee Lauder Cos., Inc. - Class A | | | 243 | | | | 53,378 | |
Procter & Gamble Co. | | | 2,831 | | | | 388,130 | |
| | | | | | | | 517,321 | |
Distribution/Wholesale — 0.3% | | | | |
Copart, Inc. (a) | | | 232 | | | | 25,604 | |
Fastenal Co. | | | 475 | | | | 20,534 | |
| | | | | | | | 46,138 | |
Diversified Financial Services — 3.7% | | | | |
MasterCard, Inc. - Class A | | | 745 | | | | 215,037 | |
Nasdaq, Inc. | | | 75 | | | | 9,074 | |
Visa, Inc. - Class A | | | 1,499 | | | | 272,383 | |
| | | | | | | | 496,494 | |
Electric — 0.7% | | | | |
NextEra Energy, Inc. | | | 1,288 | | | | 94,294 | |
| | | | | | | | | |
Electronics — 0.8% | | | | |
Agilent Technologies, Inc. | | | 220 | | | | 22,460 | |
Garmin Ltd. | | | 85 | | | | 8,842 | |
Keysight Technologies, Inc. (a) | | | 193 | | | | 20,240 | |
Mettler-Toledo International, Inc. (a) | | | 26 | | | | 25,945 | |
PerkinElmer, Inc. | | | 80 | | | | 10,364 | |
Waters Corp. (a) | | | 74 | | | | 16,489 | |
| | | | | | | | 104,340 | |
Food — 0.6% | | | | |
Campbell Soup Co. | | | 103 | | | | 4,807 | |
ConAgra Foods, Inc. | | | 295 | | | | 10,351 | |
General Mills, Inc. | | | 355 | | | | 20,987 | |
Hormel Foods Corp. | | | 175 | | | | 8,521 | |
Kellogg Co. | | | 140 | | | | 8,805 | |
Kroger Co. | | | 865 | | | | 27,862 | |
| | | | | | | | 81,333 | |
Healthcare-Products — 6.8% | | | | |
Abbott Laboratories | | | 2,134 | | | | 224,305 | |
ABIOMED, Inc. (a) | | | 48 | | | | 12,090 | |
Danaher Corp. | | | 545 | | | | 125,099 | |
Edwards Lifesciences Corp. (a) | | | 702 | | | | 50,327 | |
Hologic, Inc. (a) | | | 160 | | | | 11,011 | |
IDEXX Laboratories, Inc. (a) | | | 143 | | | | 60,749 | |
Intuitive Surgical, Inc. (a) | | | 192 | | | | 128,079 | |
ResMed, Inc. | | | 266 | | | | 51,056 | |
Teleflex, Inc. | | | 57 | | | | 18,139 | |
Thermo Fisher Scientific, Inc. | | | 340 | | | | 160,861 | |
The accompanying notes are an integral part of the financial statements.
114
Pacer Lunt Large Cap Multi-Factor Alternator ETF
SCHEDULE OF INVESTMENTS
October 31, 2020 (Unaudited) (Continued)
| | | Shares | | | Value | |
COMMON STOCKS — 95.6% (Continued) |
| | | | | | | | | |
Healthcare-Products — 6.8% (Continued) |
Varian Medical Systems, Inc. (a) | | | 108 | | | $ | 18,663 | |
West Pharmaceutical Services, Inc. | | | 171 | | | | 46,524 | |
| | | | | | | | 906,903 | |
Healthcare-Services — 0.4% | | | | |
DaVita, Inc. (a) | | | 72 | | | | 6,210 | |
IQVIA Holdings, Inc. (a) | | | 218 | | | | 33,570 | |
Quest Diagnostics, Inc. | | | 75 | | | | 9,160 | |
| | | | | | | | 48,940 | |
Home Builders — 0.2% | | | | |
DR Horton, Inc. | | | 198 | | | | 13,228 | |
Lennar Corp. - Class A | | | 165 | | | | 11,588 | |
PulteGroup, Inc. | | | 139 | | | | 5,666 | |
| | | | | | | | 30,482 | |
Household Products/Wares — 0.5% | | | | |
Church & Dwight Co., Inc. | | | 155 | | | | 13,700 | |
Clorox Co. | | | 268 | | | | 55,543 | |
| | | | | | | | 69,243 | |
Insurance — 0.4% | | | | |
Aon PLC - Class A | | | 281 | | | | 51,707 | |
| | | | | | | | | |
Internet — 15.7% | | | | |
Amazon.com, Inc. (a) | | | 302 | | | | 916,917 | |
eBay, Inc. | | | 465 | | | | 22,148 | |
Expedia Group, Inc. | | | 149 | | | | 14,028 | |
Facebook, Inc. - Class A (a) | | | 2,827 | | | | 743,812 | |
Netflix, Inc. (a) | | | 792 | | | | 376,786 | |
NortonLifeLock, Inc. | | | 676 | | | | 13,905 | |
VeriSign, Inc. (a) | | | 88 | | | | 16,782 | |
| | | | | | | | 2,104,378 | |
Lodging — 0.4% | | | | |
Hilton Worldwide Holdings, Inc. | | | 291 | | | | 25,553 | |
Marriott International, Inc. - Class A | | | 257 | | | | 23,870 | |
Wynn Resorts Ltd. | | | 88 | | | | 6,374 | |
| | | | | | | | 55,797 | |
Machinery-Diversified — 0.4% | | | | |
Rockwell Automation, Inc. | | | 197 | | | | 46,713 | |
| | | | | | | | | |
Media — 0.6% | | | | |
Charter Communications, Inc. - Class A (a) | | | 139 | | | | 83,931 | |
| | | | | | | | | |
Mining — 0.4% | | | | |
Newmont Goldcorp Corp. | | | 952 | | | | 59,824 | |
| | | | | | | | | |
Oil & Gas — 0.2% | | | | |
Apache Corp. | | | 276 | | | | 2,291 | |
Chevron Corp. | | | 55 | | | | 3,823 | |
Concho Resources, Inc. | | | 168 | | | | 6,974 | |
| | | Shares | | | Value | |
Oil & Gas — 0.2% (Continued) |
Devon Energy Corp. | | | 408 | | | $ | 3,643 | |
HESS Corp. | | | 188 | | | | 6,997 | |
| | | | | | | | 23,728 | |
Oil & Gas Services — 0.1% | | | | |
Schlumberger Ltd. | | | 1,072 | | | | 16,016 | |
| | | | | | | | | |
Pharmaceuticals — 6.0% | | | | |
AbbVie, Inc. | | | 3,604 | | | | 306,700 | |
Bristol-Myers Squibb Co. | | | 1,825 | | | | 106,671 | |
DexCom, Inc. (a) | | | 203 | | | | 64,875 | |
Eli Lilly & Co. | | | 1,566 | | | | 204,300 | |
Zoetis, Inc. | | | 801 | | | | 126,999 | |
| | | | | | | | 809,545 | |
Retail — 6.0% | | | | |
Chipotle Mexican Grill, Inc. (a) | | | 43 | | | | 51,664 | |
Costco Wholesale Corp. | | | 238 | | | | 85,114 | |
Dollar General Corp. | | | 210 | | | | 43,829 | |
Domino’s Pizza, Inc. | | | 73 | | | | 27,617 | |
Home Depot, Inc. | | | 556 | | | | 148,291 | |
Lowe’s Cos., Inc. | | | 515 | | | | 81,421 | |
McDonald’s Corp. | | | 781 | | | | 166,353 | |
Starbucks Corp. | | | 1,293 | | | | 112,439 | |
Target Corp. | | | 369 | | | | 56,169 | |
Tractor Supply Co. | | | 70 | | | | 9,325 | |
Yum! Brands, Inc. | | | 317 | | | | 29,586 | |
| | | | | | | | 811,808 | |
Semiconductors — 10.4% | | | | |
Advanced Micro Devices, Inc. (a) | | | 2,327 | | | | 175,200 | |
Broadcom, Inc. | | | 355 | | | | 124,119 | |
KLA Corp. | | | 231 | | | | 45,549 | |
Lam Research Corp. | | | 121 | | | | 41,392 | |
NVIDIA Corp. | | | 1,233 | | | | 618,177 | |
Qorvo, Inc. (a) | | | 96 | | | | 12,226 | |
QUALCOMM, Inc. | | | 1,731 | | | | 213,536 | |
Skyworks Solutions, Inc. | | | 140 | | | | 19,781 | |
Texas Instruments, Inc. | | | 804 | | | | 116,250 | |
Xilinx, Inc. | | | 228 | | | | 27,061 | |
| | | | | | | | 1,393,291 | |
Software — 15.9% | | | | |
Activision Blizzard, Inc. | | | 802 | | | | 60,735 | |
Adobe Systems, Inc. (a) | | | 743 | | | | 332,195 | |
Akamai Technologies, Inc. (a) | | | 93 | | | | 8,846 | |
ANSYS, Inc. (a) | | | 141 | | | | 42,916 | |
Autodesk, Inc. (a) | | | 312 | | | | 73,488 | |
Broadridge Financial Solutions, Inc. | | | 108 | | | | 14,861 | |
Cadence Design System, Inc. (a) | | | 454 | | | | 49,654 | |
Citrix Systems, Inc. | | | 217 | | | | 24,580 | |
Electronic Arts, Inc. (a) | | | 265 | | | | 31,755 | |
Intuit, Inc. | | | 221 | | | | 69,544 | |
Jack Henry & Associates, Inc. | | | 114 | | | | 16,901 | |
The accompanying notes are an integral part of the financial statements.
115
Pacer Lunt Large Cap Multi-Factor Alternator ETF
SCHEDULE OF INVESTMENTS
October 31, 2020 (Unaudited) (Continued)
| | | Shares | | | Value | |
COMMON STOCKS — 95.6% (Continued) |
| | | | | | | | | |
Software — 15.9% (Continued) |
Microsoft Corp. | | | 4,392 | | | $ | 889,248 | |
MSCI, Inc. | | | 155 | | | | 54,225 | |
Paychex, Inc. | | | 293 | | | | 24,099 | |
Paycom Software, Inc. (a) | | | 39 | | | | 14,200 | |
Salesforce.com, Inc. (a) | | | 766 | | | | 177,919 | |
ServiceNow, Inc. (a) | | | 296 | | | | 147,281 | |
Synopsys, Inc. (a) | | | 252 | | | | 53,893 | |
Take-Two Interactive Software, Inc. (a) | | | 202 | | | | 31,294 | |
Tyler Technologies, Inc. (a) | | | 40 | | | | 15,375 | |
| | | | | | | | 2,133,009 | |
Telecommunications — 0.5% | | | | |
Motorola Solutions, Inc. | | | 145 | | | | 22,919 | |
T-Mobile US, Inc. (a) | | | 364 | | | | 39,883 | |
| | | | | | | | 62,802 | |
Transportation — 0.2% | | | | |
JB Hunt Trasport Services, Inc. | | | 45 | | | | 5,478 | |
Kansas City Southern | | | 54 | | | | 9,512 | |
Old Dominion Freight Line, Inc. | | | 84 | | | | 15,991 | |
| | | | | | | | 30,981 | |
Water — 0.1% | | | | |
American Water Works Co., Inc. | | | 101 | | | | 15,201 | |
TOTAL COMMON STOCKS (Cost $12,220,826) | | | | | | | 12,829,608 | |
| | | | | |
REAL ESTATE INVESTMENT TRUSTS — 4.3% | | | | |
American Tower Corp. | | | 670 | | | | 153,865 | |
Crown Castle International Corp. | | | 675 | | | | 105,435 | |
Digital Realty Trust, Inc. | | | 195 | | | | 28,139 | |
Equinix, Inc. | | | 175 | | | | 127,967 | |
Extra Space Storage, Inc. | | | 149 | | | | 17,277 | |
Prologis, Inc. | | | 426 | | | | 42,259 | |
Public Storage | | | 173 | | | | 39,629 | |
SBA Communications Corp. | | | 172 | | | | 49,944 | |
UDR, Inc. | | | 326 | | | | 10,184 | |
TOTAL REAL ESTATE INVESTMENT TRUSTS (Cost $579,380) | | | | | | | 574,699 | |
| | | | | |
| | | Principal
Amount | | | Value | |
| SHORT-TERM INVESTMENTS — 0.1% | | | |
| | | | | | | |
| Money Market Deposit Accounts, — 0.1% | | | | | | | | |
| U.S. Bank Money Market Deposit Account 0.025% (b) | | $ | 19,122 | | | $ | 19,122 | |
| TOTAL SHORT-TERM INVESTMENTS (Cost $19,122) | | | | | | | 19,122 | |
| Total Investments (Cost $12,819,328) — 100.0% | | | | | | | 13,423,429 | |
| Other Assets in Excess of Liabilities — 0.0% (c) | | | | | | | 3,356 | |
| TOTAL NET ASSETS — 100.0% | | | | | | $ | 13,426,785 | |
Percentages are stated as a percent of net assets.
| | (a) | Non-income producing security. |
| | (b) | The rate shown is as of October 31, 2020. |
For Fund compliance purposes, the Fund’s industry classifications refer to any one or more of the industry sub-classifications used by one or more widely recognized market indexes or ratings group indexes, and/or they may be defined by Fund management. This definition does not apply for all purposes of this report, which may combine sub-classifications for reporting ease.
The accompanying notes are an integral part of the financial statements.
116
Pacer Funds
STATEMENTS OF ASSETS & LIABILITIES
October 31, 2020 (Unaudited)
| | | Pacer
Trendpilot®
US Large
Cap ETF | | | Pacer
Trendpilot®
US Mid
Cap ETF | | | Pacer
Trendpilot®
100 ETF | | | Pacer
Trendpilot®
European
Index ETF | | | Pacer
Global
Cash Cows
Dividend ETF | |
ASSETS | | | | | | | | | | | | | | | | | | | | |
Investments in Securities, at Value*^ | | $ | 1,818,569,338 | | | $ | 469,764,520 | | | $ | 787,669,559 | | | $ | 61,923,498 | | | $ | 127,885,899 | |
Interest and Dividends Receivable | | | 1,806,691 | | | | 166,038 | | | | 54,485 | | | | 374,520 | | | | 774,326 | |
Receivable for Investment Securities Sold | | | 10,121,922 | | | | — | | | | 1,183,634 | | | | 2,999,859 | | | | — | |
Securities Lending Income Receivable | | | 3,130 | | | | 6,141 | | | | 673 | | | | 607 | | | | 3,723 | |
Total Assets | | | 1,830,501,080 | | | | 469,936,699 | | | | 788,908,351 | | | | 65,298,484 | | | | 128,663,948 | |
| | | | | | | | | | | | | | | | | | | | | |
LIABILITIES | | | | | | | | | | | | | | | | | | | | |
Management Fees Payable | | | 970,663 | | | | 206,627 | | | | 450,896 | | | | 35,178 | | | | 60,242 | |
Payable for Fund Shares Redeemed | | | 10,132,390 | | | | — | | | | 2,443,290 | | | | 3,073,170 | | | | — | |
Collateral Received for Securities Loaned (See Note 5) | | | 46,975,267 | | | | 87,061,332 | | | | 4,601,812 | | | | 7,021,988 | | | | 18,210,715 | |
Total Liabilities | | | 58,078,319 | | | | 87,267,959 | | | | 7,495,998 | | | | 10,130,336 | | | | 18,270,957 | |
| | | | | | | | | | | | | | | | | | | | | |
NET ASSETS | | $ | 1,772,422,761 | | | $ | 382,668,740 | | | $ | 781,412,353 | | | $ | 55,168,148 | | | $ | 110,392,991 | |
| | | | | | | | | | | | | | | | | | | | | |
NET ASSETS CONSIST OF: | | | | | | | | | | | | | | | | | | | | |
Paid-in Capital | | $ | 2,095,433,577 | | | $ | 503,594,644 | | | $ | 563,999,868 | | | $ | 112,501,623 | | | $ | 169,594,806 | |
Total Distributable Earnings (Accumulated Deficit) | | | (323,010,816 | ) | | | (120,925,904 | ) | | | 217,412,485 | | | | (57,333,475 | ) | | | (59,201,815 | ) |
Net Assets | | $ | 1,772,422,761 | | | $ | 382,668,740 | | | $ | 781,412,353 | | | $ | 55,168,148 | | | $ | 110,392,991 | |
* Identified Cost: | | | | | | | | | | | | | | | | | | | | |
Investments in Securities | | $ | 1,719,797,738 | | | $ | 462,447,082 | | | $ | 704,939,079 | | | $ | 67,535,680 | | | $ | 156,295,792 | |
^ Includes Loaned securities with a value of | | | 45,796,491 | | | $ | 83,870,350 | | | $ | 4,279,661 | | | | 6,802,792 | | | | 17,715,254 | |
| | | | | | | | | | | | | | | | | | | | | |
Net Asset Value: | | | | | | | | | | | | | | | | | | | | |
Net Assets | | $ | 1,772,422,761 | | | $ | 382,668,740 | | | $ | 781,412,353 | | | $ | 55,168,148 | | | $ | 110,392,991 | |
Shares Outstanding (No Par Value) | | | 61,650,000 | | | | 13,700,000 | | | | 16,200,000 | | | | 2,700,000 | | | | 4,650,000 | |
Net Asset Value, Offering and Redemption Price per Share | | $ | 28.75 | | | $ | 27.93 | | | $ | 48.24 | | | $ | 20.43 | | | $ | 23.74 | |
The accompanying notes are an integral part of the financial statements.
117
Pacer Funds
STATEMENTS OF ASSETS & LIABILITIES
October 31, 2020 (Unaudited)
| | | Pacer
US
Cash Cows
100 ETF | | | Pacer
US Small
Cap Cash
Cows
100 ETF | | | Pacer
Developed
Markets
International
Cash Cows
100 ETF | | | Pacer
WealthShield
ETF | | | Pacer
Military Times
Best Employers
ETF | |
ASSETS | | | | | | | | | | | | | | | | | | | | |
Investments in Securities, at Value*^ | | $ | 217,135,179 | | | $ | 36,574,205 | | | $ | 14,052,150 | | | $ | 55,443,688 | | | $ | 1,451,213 | |
Foreign Currency at Value* | | | — | | | | — | | | | 21 | | | | — | | | | — | |
Interest and Dividends Receivable | | | 138,512 | | | | 28,892 | | | | 108,097 | | | | 7,609 | | | | 2,078 | |
Securities Lending Income Receivable | | | 1,088 | | | | 131 | | | | 211 | | | | 7,043 | | | | — | |
Total Assets | | | 217,274,779 | | | | 36,603,228 | | | | 14,160,479 | | | | 55,458,340 | | | | 1,453,291 | |
| | | | | | | | | | | | | | | | | | | | | |
LIABILITIES | | | | | | | | | | | | | | | | | | | | |
Management Fees Payable | | | 88,410 | | | | 18,296 | | | | 7,204 | | | | 26,292 | | | | 766 | |
Collateral Received for Securities Loaned (See Note 5) | | | 20,197,179 | | | | 1,235,495 | | | | 1,678,843 | | | | 6,631,208 | | | | — | |
Total Liabilities | | | 20,285,589 | | | | 1,253,791 | | | | 1,686,047 | | | | 6,657,500 | | | | 766 | |
| | | | | | | | | | | | | | | | | | | | | |
NET ASSETS | | $ | 196,989,190 | | | $ | 35,349,437 | | | $ | 12,474,432 | | | $ | 48,800,840 | | | $ | 1,452,525 | |
| | | | | | | | | | | | | | | | | | | | | |
NET ASSETS CONSIST OF: | | | | | | | | | | | | | | | | | | | | |
Paid-in Capital | | $ | 239,327,863 | | | $ | 48,920,689 | | | $ | 22,742,460 | | | $ | 66,065,263 | | | $ | 1,555,517 | |
Total Distributable Earnings (Accumulated Deficit) | | | (42,338,673 | ) | | | (13,571,252 | ) | | | (10,268,028 | ) | | | (17,264,423 | ) | | | (102,992 | ) |
Net Assets | | $ | 196,989,190 | | | $ | 35,349,437 | | | $ | 12,474,432 | | | $ | 48,800,840 | | | $ | 1,452,525 | |
* Identified Cost: | | | | | | | | | | | | | | | | | | | | |
Investments in Securities | | $ | 215,977,854 | | | $ | 35,270,147 | | | $ | 15,412,406 | | | $ | 53,448,608 | | | $ | 1,484,976 | |
Foreign Currencies | | | — | | | | — | | | | 21 | | | | — | | | | — | |
^ Includes loaned securities with a value of | | | 19,954,099 | | | | 1,206,780 | | | | 1,646,597 | | | | 6,302,318 | | | | — | |
| | | | | | | | | | | | | | | | | | | | | |
Net Asset Value: | | | | | | | | | | | | | | | | | | | | |
Net Assets | | $ | 196,989,190 | | | $ | 35,349,437 | | | $ | 12,474,432 | | | $ | 48,800,840 | | | $ | 1,452,525 | |
Shares Outstanding (No Par Value) | | | 7,150,000 | | | | 1,400,000 | | | | 550,000 | | | | 1,950,000 | | | | 50,000 | |
Net Asset Value, Offering and Redemption Price per Share | | $ | 27.55 | | | $ | 25.25 | | | $ | 22.68 | | | $ | 25.03 | | | $ | 29.05 | |
The accompanying notes are an integral part of the financial statements.
118
Pacer Funds
STATEMENTS OF ASSETS & LIABILITIES
October 31, 2020 (Unaudited)
| | | Pacer
Benchmark
Industrial
Real Estate
SCTRSM ETF | | | Pacer
Benchmark
Data &
Infrastructure
Real Estate
SCTRSM ETF | | | Pacer
US Export
Leaders ETF | | | Pacer
CFRA-Stovall
Equal Weight
Seasonal
Rotation ETF | | | Pacer
US
Cash Cows
Growth ETF | |
ASSETS | | | | | | | | | | | | | | | | | | | | |
Investments in Securities, at Value*^ | | $ | 134,576,874 | | | $ | 1,162,510,586 | | | $ | 1,499,180 | | | $ | 50,638,746 | | | $ | 1,361,159 | |
Foreign Currency at Value* | | | — | | | | 2 | | | | — | | | | — | | | | — | |
Interest and Dividends Receivable | | | 98,982 | | | | 79 | | | | 782 | | | | 54,639 | | | | 388 | |
Receivable for Investment Securities Sold | | | — | | | | — | | | | — | | | | 67,950,069 | | | | — | |
Receivable for Fund Shares Sold | | | 1,675,955 | | | | — | | | | — | | | | 17,412,265 | | | | — | |
Securities Lending Income Receivable | | | 829 | | | | 6,818 | | | | — | | | | — | | | | — | |
Total Assets | | | 136,352,640 | | | | 1,162,517,485 | | | | 1,499,962 | | | | 136,055,719 | | | | 1,361,547 | |
| | | | | | | | | | | | | | | | | | | | | |
LIABILITIES | | | | | | | | | | | | | | | | | | | | |
Management Fees Payable | | | 54,958 | | | | 498,924 | | | | 791 | | | | 29,132 | | | | 729 | |
Payable for Investment Securities Purchased | | | 1,669,695 | | | | — | | | | — | | | | 67,850,851 | | | | — | |
Payable for Fund Shares Redeemed | | | — | | | | — | | | | — | | | | 17,382,560 | | | | — | |
Collateral Received for Securities Loaned (See Note 5) | | | 20,663,664 | | | | 108,852,982 | | | | — | | | | — | | | | — | |
Total Liabilities | | | 22,388,317 | | | | 109,351,906 | | | | 791 | | | | 85,262,543 | | | | 729 | |
| | | | | | | | | | | | | | | | | | | | | |
NET ASSETS | | $ | 113,964,323 | | | $ | 1,053,165,579 | | | $ | 1,499,171 | | | $ | 50,793,176 | | | $ | 1,360,818 | |
| | | | | | | | | | | | | | | | | | | | | |
NET ASSETS CONSIST OF: | | | | | | | | | | | | | | | | | | | | |
Paid-in Capital | | $ | 113,482,681 | | | $ | 1,034,039,054 | | | $ | 1,595,241 | | | $ | 62,042,318 | | | $ | 1,446,891 | |
Total Distributable Earnings (Accumulated Deficit) | | | 481,642 | | | | 19,126,525 | | | | (96,070 | ) | | | (11,249,142 | ) | | | (86,073 | ) |
Net Assets | | $ | 113,964,323 | | | $ | 1,053,165,579 | | | $ | 1,499,171 | | | $ | 50,793,176 | | | $ | 1,360,818 | |
* Identified Cost: | | | | | | | | | | | | | | | | | | | | |
Investments in Securities | | $ | 132,324,846 | | | $ | 1,145,810,658 | | | $ | 1,507,437 | | | $ | 50,647,669 | | | $ | 1,399,649 | |
Foreign Currencies | | | — | | | | 2 | | | | — | | | | — | | | | — | |
^ Includes loaned securities with a value of | | | 20,046,355 | | | | 105,527,709 | | | | — | | | | — | | | | — | |
| | | | | | | | | | | | | | | | | | | | | |
Net Asset Value: | | | | | | | | | | | | | | | | | | | | |
Net Assets | | $ | 113,964,323 | | | $ | 1,053,165,579 | | | $ | 1,499,170 | | | $ | 50,793,176 | | | $ | 1,360,818 | |
Shares Outstanding (No Par Value) | | | 3,400,000 | | | | 30,950,000 | | | | 50,000 | | | | 1,900,000 | | | | 50,000 | |
Net Asset Value, Offering and Redemption Price per Share | | $ | 33.52 | | | $ | 34.03 | | | $ | 29.98 | | | $ | 26.73 | | | $ | 27.22 | |
The accompanying notes are an integral part of the financial statements.
119
Pacer Funds
STATEMENTS OF ASSETS & LIABILITIES
October 31, 2020 (Unaudited)
| | | Pacer
Trendpilot
International
ETF | | | Pacer
Emerging
Markets
Cash Cows
100 ETF | | | Pacer
Cash Cows
Fund of Funds
ETF | | | Pacer
Trendpilot
Fund of Funds
ETF | | | Pacer
Trendpilot
US Bond
ETF | |
ASSETS | | | | | | | | | | | | | | | | | | | | |
Investments in Unaffiliated Securities, at Value* | | $ | 107,321,160 | | | $ | 1,940,159 | | | $ | 329 | | | $ | 24,202 | | | $ | 309,240,912 | |
Investments in Affiliated Securities, at Value* | | | — | | | | — | | | | 1,152,254 | | | | 32,352,910 | | | | — | |
Foreign Currency at Value* | | | 121,641 | | | | 1,690 | | | | — | | | | — | | | | — | |
Interest and Dividends Receivable | | | 307,826 | | | | 4,866 | | | | — | | | | — | | | | 5,072,315 | |
Return of Capital Receivable | | | 617 | | | | — | | | | — | | | | — | | | | — | |
Receivable for Investment Securities Sold | | | 5,167 | | | | — | | | | — | | | | — | | | | — | |
Total Assets | | | 107,756,411 | | | | 1,946,715 | | | | 1,152,583 | | | | 32,377,112 | | | | 314,313,227 | |
| | | | | | | | | | | | | | | | | | | | | |
LIABILITIES | | | | | | | | | | | | | | | | | | | | |
Management Fees Payable | | | 73,223 | | | | 1,201 | | | | 155 | | | | 4,186 | | | | 143,518 | |
Total Liabilities | | | 73,223 | | | | 1,201 | | | | 155 | | | | 4,186 | | | | 143,518 | |
| | | | | | | | | | | | | | | | | | | | | |
NET ASSETS | | $ | 107,683,188 | | | $ | 1,945,514 | | | $ | 1,152,428 | | | $ | 32,372,926 | | | $ | 314,169,709 | |
| | | | | | | | | | | | | | | | | | | | | |
NET ASSETS CONSIST OF: | | | | | | | | | | | | | | | | | | | | |
Paid-in Capital | | $ | 127,491,619 | | | $ | 2,219,627 | | | $ | 1,175,779 | | | $ | 32,400,825 | | | $ | 310,148,944 | |
Total Distributable Earnings (Accumulated Deficit) | | | (19,808,431 | ) | | | (274,113 | ) | | | (23,351 | ) | | | (27,899 | ) | | | 4,020,765 | |
Net Assets | | $ | 107,683,188 | | | $ | 1,945,514 | | | $ | 1,152,428 | | | $ | 32,372,926 | | | $ | 314,169,709 | |
* Identified Cost: | | | | | | | | | | | | | | | | | | | | |
Investments in Unaffiliated Securities | | $ | 114,759,351 | | | $ | 2,100,947 | | | $ | 329 | | | $ | 24,202 | | | $ | 307,012,488 | |
Investments in Affiliated Securities | | | — | | | | — | | | | 1,262,055 | | | | 31,810,675 | | | | — | |
Foreign Currencies | | | 121,863 | | | | 1,805 | | | | — | | | | — | | | | — | |
| | | | | | | | | | | | | | | | | | | | | |
Net Asset Value: | | | | | | | | | | | | | | | | | | | | |
Net Assets | | $ | 107,683,188 | | | $ | 1,945,514 | | | $ | 1,152,428 | | | $ | 32,372,926 | | | $ | 314,169,709 | |
Shares Outstanding (No Par Value) | | | 4,900,000 | | | | 100,000 | | | | 50,000 | | | | 1,300,000 | | | | 12,000,000 | |
Net Asset Value, Offering and Redemption Price per Share | | $ | 21.98 | | | $ | 19.46 | | | $ | 23.05 | | | $ | 24.90 | | | $ | 26.18 | |
The accompanying notes are an integral part of the financial statements.
120
Pacer Funds
STATEMENTS OF ASSETS & LIABILITIES
October 31, 2020 (Unaudited)
| | | Pacer
CSOP FTSE
China A50
ETF | | | Pacer
BioThreat
Strategy
ETF | | | Pacer
Lunt Large Cap
Alternator
ETF | | | Pacer
Lunt Midcap
Multi-Factor
Alternator
ETF | | | Pacer
Lunt Large Cap
Multi-Factor
Alternator
ETF | |
ASSETS | | | | | | | | | | | | | | | | | | | | |
Investments in Securities, at Value* | | $ | 9,241,558 | | | $ | 5,348,708 | | | $ | 55,752,762 | | | $ | 14,953,462 | | | $ | 13,423,429 | |
Cash | | | — | | | | — | | | | — | | | | — | | | | — | |
Foreign Currency at Value* | | | 6,299 | | | | — | | | | — | | | | — | | | | — | |
Interest and Dividends Receivable | | | 1 | | | | 3,517 | | | | 70,108 | | | | 2,820 | | | | 10,586 | |
Receivable for Investment Securities Sold | | | — | | | | — | | | | 1,203,555 | | | | — | | | | — | |
Receivable for Fund Shares Sold | | | — | | | | — | | | | 7,284,690 | | | | — | | | | — | |
Total Assets | | | 9,247,858 | | | | 5,352,225 | | | | 64,311,115 | | | | 14,956,282 | | | | 13,434,015 | |
| | | | | | | | | | | | | | | | | | | | | |
LIABILITIES | | | | | | | | | | | | | | | | | | | | |
Due to Custodian | | | — | | | | — | | | | — | | | | — | | | | — | |
Foreign Currency, at Value* | | | — | | | | — | | | | — | | | | — | | | | — | |
Management Fees Payable | | | 5,445 | | | | 3,353 | | | | 26,486 | | | | 7,877 | | | | 7,230 | |
Payable for Investment Securities Purchased | | | — | | | | — | | | | 7,221,326 | | | | — | | | | — | |
Payable for Fund Shares Redeemed | | | — | | | | — | | | | 1,214,115 | | | | — | | | | — | |
Collateral Received for Securities Loaned (See Note 5) | | | — | | | | — | | | | — | | | | — | | | | — | |
Total Liabilities | | | 5,445 | | | | 3,353 | | | | 8,461,927 | | | | 7,877 | | | | 7,230 | |
| | | | | | | | | | | | | | | | | | | | | |
NET ASSETS | | $ | 9,242,413 | | | $ | 5,348,872 | | | $ | 55,849,188 | | | $ | 14,948,405 | | | $ | 13,426,785 | |
| | | | | | | | | | | | | | | | | | | | | |
NET ASSETS CONSIST OF: | | | | | | | | | | | | | | | | | | | | |
Paid-in Capital | | $ | 9,028,096 | | | $ | 5,122,385 | | | $ | 54,249,605 | | | $ | 13,058,675 | | | $ | 12,438,230 | |
Total Distributable Earnings (Accumulated Deficit) | | | 214,317 | | | | 226,487 | | | | 1,599,583 | | | | 1,889,730 | | | | 988,555 | |
Foreign Currencies | | | | | | | | | | | — | | | | — | | | | — | |
Net Assets | | $ | 9,242,413 | | | $ | 5,348,872 | | | $ | 55,849,188 | | | $ | 14,948,405 | | | $ | 13,426,785 | |
* Identified Cost: | | | | | | | | | | | | | | | | | | | | |
Investments in Securities | | $ | 8,052,590 | | | $ | 5,121,513 | | | $ | 57,127,573 | | | $ | 13,801,010 | | | $ | 12,819,328 | |
Foreign Currencies | | | 6,249 | | | | — | | | | — | | | | — | | | | — | |
| | | | | | | | | | | | | | | | | | | | | |
Net Asset Value: | | | | | | | | | | | | | | | | | | | | |
Net Assets | | $ | 9,242,413 | | | $ | 5,348,872 | | | $ | 55,849,188 | | | $ | 14,948,405 | | | $ | 13,426,785 | |
Shares Outstanding (No Par Value) | | | 455,882 | | | | 200,000 | | | | 2,300,000 | | | | 550,000 | | | | 500,000 | |
Net Asset Value, Offering and Redemption Price per Share | | $ | 20.27 | | | $ | 26.74 | | | $ | 24.28 | | | $ | 27.18 | | | $ | 26.85 | |
The accompanying notes are an integral part of the financial statements.
121
Pacer Funds
STATEMENTS OF OPERATIONS
For the Period Ended October 31, 2020 (Unaudited)
| | Pacer
Trendpilot ®
US Large
Cap ETF | | | Pacer
Trendpilot®
US Mid
Cap ETF | | | Pacer
Trendpilot®
100 ETF | | | Pacer
Trendpilot®
European
Index ETF | | | Pacer
Global
Cash Cows
Dividend ETF | |
INVESTMENT INCOME | | | | | | | | | | | | | | | | | | | | |
Income: | | | | | | | | | | | | | | | | | | | | |
Dividends* | | $ | 13,651,684 | | | $ | 2,043,130 | | | $ | 3,420,560 | | | $ | 112,055 | | | $ | 3,386,600 | |
Interest | | | 478,137 | | | | 364,757 | | | | 12,199 | | | | 52,463 | | | | 173 | |
Securities Lending Income | | | 141,762 | | | | 48,338 | | | | 30,853 | | | | 11,060 | | | | 21,799 | |
Total Investment Income | | | 14,271,583 | | | | 2,456,225 | | | | 3,463,612 | | | | 175,578 | | | | 3,408,572 | |
| | | | | | | | | | | | | | | | | | | | | |
Expenses: | | | | | | | | | | | | | | | | | | | | |
Management Fees | | | 6,441,284 | | | | 1,353,082 | | | | 2,664,188 | | | | 248,667 | | | | 393,174 | |
Total Expenses | | | 6,441,284 | | | | 1,353,082 | | | | 2,664,188 | | | | 248,667 | | | | 393,174 | |
Net Investment Income (Loss) | | | 7,830,299 | | | | 1,103,143 | | | | 799,424 | | | | (73,089 | ) | | | 3,015,398 | |
| | | | | | | | | | | | | | | | | | | | | |
REALIZED & UNREALIZED GAIN (LOSS) ON INVESTMENTS | | | | | | | | | | | | | | | | | | | | |
Net Realized Gain (Loss) on: | | | | | | | | | | | | | | | | | | | | |
Investment Securities | | | 283,528 | | | | (16,943,665 | ) | | | (2,697,726 | ) | | | (3,455,721 | ) | | | (11,802,806 | ) |
In-Kind Redemptions | | | 41,300,010 | | | | 1,026,054 | | | | 207,540,096 | | | | (263,230 | ) | | | (1,596,328 | ) |
Foreign Currencies | | | — | | | | — | | | | — | | | | (359,679 | ) | | | (80,563 | ) |
Total | | | 41,583,538 | | | | (15,917,611 | ) | | | 204,842,370 | | | | (4,078,630 | ) | | | (13,479,697 | ) |
Net Change in Unrealized Appreciation (Depreciation) of: | | | | | | | | | | | | | | | | | | | | |
Investments Securities | | | 98,414,640 | | | | 7,053,248 | | | | (11,788,495 | ) | | | (5,623,805 | ) | | | 10,363,049 | |
Foreign Currencies | | | — | | | | — | | | | — | | | | 23,244 | | | | 10,458 | |
Total | | | 98,414,640 | | | | 7,053,248 | | | | (11,788,495 | ) | | | (5,600,561 | ) | | | 10,373,507 | |
Net Realized and Unrealized Gain (Loss) on Investments | | | 139,998,178 | | | | (8,864,363 | ) | | | 193,053,875 | | | | (9,679,191 | ) | | | (3,106,190 | ) |
NET INCREASE (DECREASE) IN NET ASSETS RESULTING FROM OPERATIONS | | $ | 147,828,477 | | | $ | (7,761,220 | ) | | $ | 193,853,299 | | | $ | (9,752,280 | ) | | $ | (90,792 | ) |
| | | | | | | | | | | | | | | | | | | | | |
* Net of fees and foreign witholding tax of | | $ | — | | | $ | — | | | $ | 2,392 | | | $ | 19,728 | | | $ | 190,165 | |
| | | | | | | | | | | | | | | | | | | | | |
The accompanying notes are an integral part of the financial statements.
122
Pacer Funds
STATEMENTS OF OPERATIONS
For the Period Ended October 31, 2020 (Unaudited)
| | | Pacer
US
Cash Cows
100 ETF | | | Pacer
US Small Cap
Cash Cows
100 ETF | | | Pacer
Developed
Markets
International
Cash Cows
100 ETF | | | Pacer
WealthShield
ETF | | | Pacer
Military Times
Best Employers
ETF | |
INVESTMENT INCOME | | | | | | | | | | | | | | | | | | | | |
Income: | | | | | | | | | | | | | | | | | | | | |
Dividends* | | $ | 2,923,469 | | | $ | 121,355 | | | $ | 212,193 | | | $ | 122,490 | | | $ | 17,495 | |
Interest | | | 143 | | | | 11 | | | | 10 | | | | 125,400 | | | | 1 | |
Securities Lending Income | | | 17,554 | | | | 7,023 | | | | 2,181 | | | | 21,775 | | | | — | |
Total Investment Income | | | 2,941,166 | | | | 128,389 | | | | 214,384 | | | | 269,665 | | | | 17,496 | |
| | | | | | | | | | | | | | | | | | | | | |
Expenses: | | | | | | | | | | | | | | | | | | | | |
Management Fees | | | 510,132 | | | | 76,165 | | | | 43,247 | | | | 154,006 | | | | 4,885 | |
Total Expenses | | | 510,132 | | | | 76,165 | | | | 43,247 | | | | 154,006 | | | | 4,885 | |
Net Investment Income | | | 2,431,034 | | | | 52,224 | | | | 171,137 | | | | 115,659 | | | | 12,611 | |
| | | | | | | | | | | | | | | | | | | | | |
REALIZED & UNREALIZED GAIN (LOSS) ON INVESTMENTS | | | | | | | | | | | | | | | | | | | | |
Net Realized Gain (Loss) on: | | | | | | | | | | | | | | | | | | | | |
Investment Securities | | | (20,201,759 | ) | | | (3,095,237 | ) | | | (1,407,929 | ) | | | 2,832,786 | | | | (121,626 | ) |
In-Kind Redemptions | | | 19,888,021 | | | | 2,534,227 | | | | (2,804,440 | ) | | | 1,463,965 | | | | 114,484 | |
Foreign Currencies | | | — | | | | — | | | | 6,174 | | | | — | | | | — | |
Total | | | (313,738 | ) | | | (561,010 | ) | | | (4,206,195 | ) | | | 4,296,751 | | | | (7,142 | ) |
Net Change in Unrealized Appreciation (Depreciation) of: | | | | | | | | | | | | | | | | | | | | |
Investments Securities | | | 17,557,054 | | | | 3,885,592 | | | | 5,023,217 | | | | (1,746,897 | ) | | | 47,765 | |
Foreign Currencies | | | — | | | | — | | | | 2,324 | | | | — | | | | — | |
Total | | | 17,557,054 | | | | 3,885,592 | | | | 5,025,541 | | | | (1,746,897 | ) | | | 47,765 | |
Net Realized and Unrealized Gain (Loss) on Investments | | | 17,243,316 | | | | 3,324,582 | | | | 819,346 | | | | 2,549,854 | | | | 40,623 | |
NET INCREASE (DECREASE) IN NET ASSETS RESULTING FROM OPERATIONS | | $ | 19,674,350 | | | $ | 3,376,806 | | | $ | 990,483 | | | $ | 2,665,513 | | | $ | 53,234 | |
| | | | | | | | | | | | | | | | | | | | | |
* Net of fees and foreign witholding tax of | | $ | — | | | $ | — | | | $ | 25,580 | | | $ | — | | | $ | — | |
| | | | | | | | | | | | | | | | | | | | | |
The accompanying notes are an integral part of the financial statements.
123
Pacer Funds
STATEMENTS OF OPERATIONS
For the Period Ended October 31, 2020 (Unaudited)
| | | Pacer
Benchmark
Industrial Real
Estate SCTR ETF | | | Pacer
Benchmark
Data &
Infrastructure
Real Estate
SCTR ETF | | | Pacer US
Export Leaders
ETF | | | Pacer
CFRA-Stovall
Equal Weight
Seasonal
Rotation ETF | | | Pacer
US
Cash Cows
Growth ETF | |
INVESTMENT INCOME | | | | | | | | | | | | | | | | | | | | |
Income: | | | | | | | | | | | | | | | | | | | | |
Dividends | | $ | 1,342,731 | | | $ | 9,301,238 | | | $ | 8,296 | | | $ | 504,549 | | | $ | 11,330 | |
Interest | | | 89 | | | | 330 | | | | 1 | | | | 30 | | | | 1 | |
Securities Lending Income | | | 3,417 | | | | 77,942 | | | | — | | | | — | | | | — | |
Total Investment Income | | | 1,346,237 | | | | 9,379,510 | | | | 8,297 | | | | 504,579 | | | | 11,331 | |
| | | | | | | | | | | | | | | | | | | | | |
Expenses: | | | | | | | | | | | | | | | | | | | | |
Management Fees | | | 237,056 | | | | 2,404,238 | | | | 4,399 | | | | 180,321 | | | | 4,081 | |
Total Expenses | | | 237,056 | | | | 2,404,238 | | | | 4,399 | | | | 180,321 | | | | 4,081 | |
Net Investment Income | | | 1,109,181 | | | | 6,975,272 | | | | 3,898 | | | | 324,258 | | | | 7,250 | |
| | | | | | | | | | | | | | | | | | | | | |
REALIZED & UNREALIZED GAIN (LOSS) ON INVESTMENTS | | | | | | | | | | | | | | | | | | | | |
Net Realized Gain (Loss) on: | | | | | | | | | | | | | | | | | | | | |
Investment Securities | | | (544,131 | ) | | | (24,636,550 | ) | | | (151,638 | ) | | | (941,738 | ) | | | (109,464 | ) |
In-Kind Redemptions | | | 1,086,736 | | | | 34,665,994 | | | | 331,313 | | | | 4,675,026 | | | | 273,293 | |
Foreign Currencies | | | — | | | | 294,925 | | | | — | | | | — | | | | — | |
Total | | | 542,605 | | | | 10,324,369 | | | | 179,675 | | | | 3,733,288 | | | | 163,829 | |
Net Change in Unrealized Appreciation (Depreciation) of: | | | | | | | | | | | | | | | | | | | | |
Investments Securities | | | 3,840,119 | | | | (19,478,037 | ) | | | 41,110 | | | | (1,934 | ) | | | 30,141 | |
Total | | | 3,840,119 | | | | (19,478,037 | ) | | | 41,110 | | | | (1,934 | ) | | | 30,141 | |
Net Realized and Unrealized Gain (Loss) on Investments | | | 4,382,724 | | | | (9,153,668 | ) | | | 220,785 | | | | 3,731,354 | | | | 193,970 | |
NET INCREASE (DECREASE) IN NET ASSETS RESULTING FROM OPERATIONS | | $ | 5,491,905 | | | $ | (2,178,396 | ) | | $ | 224,683 | | | $ | 4,055,612 | | | $ | 201,220 | |
The accompanying notes are an integral part of the financial statements.
124
Pacer Funds
STATEMENTS OF OPERATIONS
For the Period Ended October 31, 2020 (Unaudited)
| | | Pacer
Trendpilot
International
ETF | | | Pacer
Emerging
Markets
Cash Cows
100 ETF | | | Pacer
Cash Cows
Fund of Funds
ETF | | | Pacer
Trendpilot
Fund of Funds
ETF | | | Pacer
Trendpilot
US Bond
ETF | |
INVESTMENT INCOME | | | | | | | | | | | | | | | | | | | | |
Income: | | | | | | | | | | | | | | | | | | | | |
Dividends from Unaffiliated Investments* | | $ | 627,083 | | | $ | 32,687 | | | $ | — | | | $ | — | | | $ | — | |
Dividends from Affiliated Investments | | | — | | | | — | | | | 28,873 | | | | — | | | | — | |
Interest | | | 69,578 | | | | (1 | ) | | | (5 | ) | | | 5 | | | | 4,844,159 | |
Total Investment Income | | | 696,661 | | | | 32,686 | | | | 28,868 | | | | 5 | | | | 4,844,159 | |
| | | | | | | | | | | | | | | | | | | | | |
Expenses: | | | | | | | | | | | | | | | | | | | | |
Management Fees | | | 469,562 | | | | 4,324 | | | | 1,456 | | | | 22,454 | | | | 635,683 | |
Total Expenses | | | 469,562 | | | | 4,324 | | | | 1,456 | | | | 22,454 | | | | 635,683 | |
Net Investment Income (Loss) | | | 227,099 | | | | 28,362 | | | | 27,412 | | | | (22,449 | ) | | | 4,208,476 | |
| | | | | | | | | | | | | | | | | | | | | |
REALIZED & UNREALIZED GAIN (LOSS) ON INVESTMENTS | | | | | | | | | | | | | | | | | | | | |
Net Realized Gain (Loss) on: | | | | | | | | | | | | | | | | | | | | |
Investment in Unaffiliated Securities | | | (69,385 | ) | | | (65,119 | ) | | | (1 | ) | | | (456,984 | ) | | | (145,694 | ) |
Investment in Affiliated Securities | | | — | | | | — | | | | (1,796 | ) | | | (323,486 | ) | | | 1,410,114 | |
In-Kind Redemptions | | | (450,960 | ) | | | — | | | | 93,215 | | | | 292,175 | | | | — | |
Foreign Currencies | | | 311,298 | | | | (2,839 | ) | | | — | | | | — | | | | — | |
Total | | | (209,047 | ) | | | (67,958 | ) | | | 91,418 | | | | (488,295 | ) | | | 1,264,420 | |
Net Change in Unrealized Appreciation (Depreciation) of: | | | | | | | | | | | | | | | | | | | | |
Investments in Unaffiliated Securities | | | (7,471,127 | ) | | | 68,017 | | | | — | | | | — | | | | (871,409 | ) |
Investments in Affiliated Securities | | | — | | | | — | | | | 110,896 | | | | 1,624,655 | | | | — | |
Foreign Currencies | | | 1,922 | | | | 875 | | | | — | | | | — | | | | — | |
Total | | | (7,469,205 | ) | | | 68,892 | | | | 110,896 | | | | 1,624,655 | | | | (871,409 | ) |
Net Realized and Unrealized Gain (Loss) on Investments | | | (7,678,252 | ) | | | 934 | | | | 202,314 | | | | 1,136,360 | | | | 393,011 | |
NET INCREASE (DECREASE) IN NET ASSETS RESULTING FROM OPERATIONS | | $ | (7,451,153 | ) | | $ | 29,296 | | | $ | 229,726 | | | $ | 1,113,911 | | | $ | 4,601,487 | |
| | | | | | | | | | | | | | | | | | | | | |
* Net of fees and foreign witholding tax of | | $ | 66,432 | | | $ | 4,228 | | | $ | — | | | $ | — | | | $ | — | |
The accompanying notes are an integral part of the financial statements.
125
Pacer Funds
STATEMENTS OF OPERATIONS
For the Period Ended October 31, 2020 (Unaudited)
| | | Pacer
CSOP FTSE
China A50
ETF | | | Pacer
BioThreat
Strategy
ETF (a) | | | Pacer
Lunt Large
Cap Alternator
ETF (a) | | | Pacer
Lunt Midcap
Multi-Factor
Alternator ETF (a) | | | Pacer
Lunt Large Cap
Multi-Factor
Alternator ETF (a) | |
INVESTMENT INCOME | | | | | | | | | | | | | | | | | | | | |
Income: | | | | | | | | | | | | | | | | | | | | |
Dividends* | | $ | 209,652 | | | $ | 20,641 | | | $ | 344,338 | | | $ | 38,642 | | | $ | 47,139 | |
Interest | | | 37 | | | | 1 | | | | 8 | | | | 1 | | | | 18 | |
Total Investment Income | | | 209,689 | | | | 20,642 | | | | 344,346 | | | | 38,643 | | | | 47,157 | |
| | | | | | | | | | | | | | | | | | | | | |
Expenses: | | | | | | | | | | | | | | | | | | | | |
Management Fees | | | 30,924 | | | | 11,666 | | | | 105,062 | | | | 29,309 | | | | 25,434 | |
Total Expenses | | | 30,924 | | | | 11,666 | | | | 105,062 | | | | 29,309 | | | | 25,434 | |
Net Investment Income | | | 178,765 | | | | 8,976 | | | | 239,284 | | | | 9,334 | | | | 21,723 | |
| | | | | | | | | | | | | | | | | | | | | |
REALIZED & UNREALIZED GAIN (LOSS) ON INVESTMENTS | | | | | | | | | | | | | | | | | | | | |
Net Realized Gain (Loss) on: | | | | | | | | | | | | | | | | | | | | |
Investment Securities | | | 33,858 | | | | 6 | | | | (631,483 | ) | | | (250,220 | ) | | | 33,097 | |
In-Kind Redemptions | | | — | | | | — | | | | 3,551,668 | | | | 987,830 | | | | 347,574 | |
Foreign Currencies | | | 4,519 | | | | — | | | | — | | | | — | | | | — | |
Total | | | 38,377 | | | | 6 | | | | 2,920,185 | | | | 737,610 | | | | 380,671 | |
Net Change in Unrealized Appreciation (Depreciation) of: | | | | | | | | | | | | | | | | | | | | |
Investments Securities | | | 1,804,729 | | | | 227,195 | | | | (1,374,811 | ) | | | 1,152,452 | | | | 604,101 | |
Foreign Currencies | | | (32 | ) | | | — | | | | — | | | | — | | | | — | |
Total | | | 1,804,697 | | | | 227,195 | | | | (1,374,811 | ) | | | 1,152,452 | | | | 604,101 | |
Net Realized and Unrealized Gain (Loss) on Investments | | | 1,843,074 | | | | 227,201 | | | | 1,545,374 | | | | 1,890,062 | | | | 984,772 | |
NET INCREASE (DECREASE) IN NET ASSETS RESULTING FROM OPERATIONS | | $ | 2,021,839 | | | $ | 236,177 | | | $ | 1,784,658 | | | $ | 1,899,396 | | | $ | 1,006,495 | |
| | | | | | | | | | | | | | | | | | | | | |
* Net of fees and foreign witholding tax of | | $ | 23,364 | | | $ | — | | | $ | — | | | $ | — | | | $ | — | |
(a) | Fund commenced operations on June 24, 2020. The information presented is from June 24, 2020 to October 31, 2020. |
The accompanying notes are an integral part of the financial statements.
126
Pacer Funds
STATEMENTS OF CHANGES IN NET ASSETS
| | Pacer Trendpilot ®
US Large Cap ETF | | | Pacer Trendpilot ®
US Mid Cap ETF | |
| | | For the
Period Ended
October 31,
2020
(Unaudited) | | | For the
Year Ended
April 30,
2020 | | | For the
Period Ended
October 31,
2020
(Unaudited) | | | For the
Year Ended
April 30,
2020 | |
OPERATIONS | | | | | | | | | | | | | | | | |
Net Investment Income (Loss) | | $ | 7,830,299 | | | $ | 33,672,399 | | | $ | 1,103,143 | | | $ | 6,105,748 | |
Net Realized Gain (Loss) on Investments and Foreign Currency Transactions | | | 41,583,538 | | | | (292,924,566 | ) | | | (15,917,611 | ) | | | (39,781,273 | ) |
Change in Unrealized Appreciation (Depreciation) of Investments and Foreign Currency Transactions | | | 98,414,640 | | | | (112,490,262 | ) | | | 7,053,248 | | | | (13,366,245 | ) |
Net Increase (Decrease) in Net Assets Resulting from Operations | | | 147,828,477 | | | | (371,742,429 | ) | | | (7,761,220 | ) | | | (47,041,770 | ) |
| | | | | | | | | | | | | | | | | |
DISTRIBUTIONS TO SHAREHOLDERS | | | | | | | | | | | | | | | | |
Dividends and Distributions | | | — | | | | (33,554,677 | ) | | | — | | | | (8,738,254 | ) |
Total Distributions to Shareholders | | | — | | | | (33,554,677 | ) | | | — | | | | (8,738,254 | ) |
| | | | | | | | | | | | | | | | | |
CAPITAL SHARE TRANSACTIONS | | | | | | | | | | | | | | | | |
Proceeds from Shares Sold | | | 41,328,085 | | | | 1,910,014,995 | | | | 15,388,870 | | | | 166,856,260 | |
Payments for Shares Redeemed | | | (820,573,095 | ) | | | (1,264,868,215 | ) | | | (165,009,430 | ) | | | (332,331,150 | ) |
Net Increase (Decrease) in Net Assets Derived from Capital Share Transactions (a) | | | (779,245,010 | ) | | | 645,146,780 | | | | (149,620,560 | ) | | | (165,474,890 | ) |
Net Increase (Decrease) in Net Assets | | $ | (631,416,533 | ) | | $ | 239,849,674 | | | $ | (157,381,780 | ) | | $ | (221,254,914 | ) |
| | | | | | | | | | | | | | | | | |
NET ASSETS | | | | | | | | | | | | | | | | |
Beginning of Period | | $ | 2,403,839,294 | | | $ | 2,163,989,620 | | | $ | 540,050,520 | | | $ | 761,305,434 | |
End of Period | | $ | 1,772,422,761 | | | $ | 2,403,839,294 | | | $ | 382,668,740 | | | $ | 540,050,520 | |
(a) | Summary of capital share transactions is as follows: |
| | | Shares | | | Shares | | | Shares | | | Shares | |
Subscriptions | | | 1,450,000 | | | | 65,400,000 | | | | 550,000 | | | | 6,000,000 | |
Redemptions | | | (28,850,000 | ) | | | (47,150,000 | ) | | | (5,900,000 | ) | | | (11,550,000 | ) |
Net Increase (Decrease) | | | (27,400,000 | ) | | | 18,250,000 | | | | (5,350,000 | ) | | | (5,550,000 | ) |
The accompanying notes are an integral part of the financial statements.
127
Pacer Funds
STATEMENTS OF CHANGES IN NET ASSETS
| | | Pacer Trendpilot ® 100 ETF | | | Pacer Trendpilot ®
European Index ETF | |
| | | For the
Period Ended
October 31,
2020
(Unaudited) | | | For the
Year Ended
April 30,
2020 | | | For the
Period Ended
October 31,
2020
(Unaudited) | | | For the
Year Ended
April 30,
2020 | |
OPERATIONS | | | | | | | | | | | | | | | | |
Net Investment Income (Loss) | | $ | 799,424 | | | $ | 2,474,219 | | | $ | (73,089 | ) | | $ | 2,567,627 | |
Net Realized Gain (Loss) on Investments and Foreign Currency Transactions | | | 204,842,370 | | | | (32,800,388 | ) | | | (4,078,630 | ) | | | (4,699,814 | ) |
Change in Unrealized Appreciation (Depreciation) of Investments and Foreign Currency Transactions | | | (11,788,495 | ) | | | 52,334,741 | | | | (5,600,561 | ) | | | (9,778,661 | ) |
Net Increase (Decrease) in Net Assets Resulting from Operations | | | 193,853,299 | | | | 22,008,572 | | | | (9,752,280 | ) | | | (11,910,848 | ) |
| | | | | | | | | | | | | | | | | |
DISTRIBUTIONS TO SHAREHOLDERS | | | | | | | | | | | | | | | | |
Dividends and Distributions | | | — | | | | (3,044,420 | ) | | | — | | | | (4,195,663 | ) |
Total Distributions to Shareholders | | | — | | | | (3,044,420 | ) | | | — | | | | (4,195,663 | ) |
| | | | | | | | | | | | | | | | | |
CAPITAL SHARE TRANSACTIONS | | | | | | | | | | | | | | | | |
Proceeds from Shares Sold | | | 331,498,475 | | | | 313,516,410 | | | | — | | | | 42,658,960 | |
Payments for Shares Redeemed | | | (483,197,205 | ) | | | (95,395,915 | ) | | | (26,567,245 | ) | | | (118,444,135 | ) |
Net Increase (Decrease) in Net Assets Derived from Capital Share Transactions (a) | | | (151,698,730 | ) | | | 218,120,495 | | | | (26,567,245 | ) | | | (75,785,175 | ) |
Net Increase (Decrease) in Net Assets | | $ | 42,154,569 | | | $ | 237,084,647 | | | $ | (36,319,525 | ) | | $ | (91,891,686 | ) |
| | | | | | | | | | | | | | | | | |
NET ASSETS | | | | | | | | | | | | | | | | |
Beginning of Period | | $ | 739,257,784 | | | $ | 502,173,137 | | | $ | 91,487,673 | | | $ | 183,379,359 | |
End of Period | | $ | 781,412,353 | | | $ | 739,257,784 | | | $ | 55,168,148 | | | $ | 91,487,673 | |
(a) | Summary of capital share transactions is as follows: |
| | | Shares | | | Shares | | | Shares | | | Shares | |
Subscriptions | | | 6,700,000 | | | | 8,300,000 | | | | — | | | | 1,700,000 | |
Redemptions | | | (10,000,000 | ) | | | (2,750,000 | ) | | | (1,150,000 | ) | | | (4,700,000 | ) |
Net Increase (Decrease) | | | (3,300,000 | ) | | | 5,550,000 | | | | (1,150,000 | ) | | | (3,000,000 | ) |
The accompanying notes are an integral part of the financial statements.
128
Pacer Funds
STATEMENTS OF CHANGES IN NET ASSETS
| | | Pacer Global Cash
Cows Dividend ETF | | | Pacer US Cash Cows 100 ETF | |
| | | For the
Period Ended
October 31,
2020
(Unaudited) | | | For the
Year Ended
April 30,
2020 | | | For the
Period Ended
October 31,
2020
(Unaudited) | | | For the
Year Ended
April 30,
2020 | |
OPERATIONS | | | | | | | | | | | | | | | | |
Net Investment Income (Loss) | | $ | 3,015,398 | | | $ | 8,948,034 | | | $ | 2,431,034 | | | $ | 6,384,748 | |
Net Realized Gain (Loss) on Investments and Foreign Currency Transactions | | | (13,479,697 | ) | | | (2,144,916 | ) | | | (313,738 | ) | | | (9,174,531 | ) |
Change in Unrealized Appreciation (Depreciation) of Investments and Foreign Currency Transactions | | | 10,373,507 | | | | (43,293,755 | ) | | | 17,557,054 | | | | (25,628,588 | ) |
Net Increase (Decrease) in Net Assets Resulting from Operations | | | (90,792 | ) | | | (36,490,637 | ) | | | 19,674,350 | | | | (28,418,371 | ) |
| | | | | | | | | | | | | | | | | |
DISTRIBUTIONS TO SHAREHOLDERS | | | | | | | | | | | | | | | | |
Dividends and Distributions | | | (3,355,878 | ) | | | (8,770,455 | ) | | | (2,447,236 | ) | | | (6,190,930 | ) |
Total Distributions to Shareholders | | | (3,355,878 | ) | | | (8,770,455 | ) | | | (2,447,236 | ) | | | (6,190,930 | ) |
| | | | | | | | | | | | | | | | | |
CAPITAL SHARE TRANSACTIONS | | | | | | | | | | | | | | | | |
Proceeds from Shares Sold | | | — | | | | 82,306,360 | | | | 68,435,140 | | | | 105,467,960 | |
Payments for Shares Redeemed | | | (21,639,985 | ) | | | (112,070,715 | ) | | | (78,699,905 | ) | | | (146,849,935 | ) |
Transaction Fees (See Note 1) | | | — | | | | 232 | | | | — | | | | — | |
Net Increase (Decrease) in Net Assets Derived from Capital Share Transactions (a) | | | (21,639,985 | ) | | | (29,764,123 | ) | | | (10,264,765 | ) | | | (41,381,975 | ) |
Net Increase (Decrease) in Net Assets | | $ | (25,086,655 | ) | | $ | (75,025,215 | ) | | $ | 6,962,349 | | | $ | (75,991,276 | ) |
| | | | | | | | | | | | | | | | | |
NET ASSETS | | | | | | | | | | | | | | | | |
Beginning of Period | | $ | 135,479,646 | | | $ | 210,504,861 | | | $ | 190,026,841 | | | $ | 266,018,117 | |
End of Period | | $ | 110,392,991 | | | $ | 135,479,646 | | | $ | 196,989,190 | | | $ | 190,026,841 | |
(a) | Summary of capital share transactions is as follows: |
| | | Shares | | | Shares | | | Shares | | | Shares | |
Subscriptions | | | — | | | | 2,650,000 | | | | 2,400,000 | | | | 3,700,000 | |
Redemptions | | | (850,000 | ) | | | (3,900,000 | ) | | | (2,800,000 | ) | | | (5,100,000 | ) |
Net Increase (Decrease) | | | (850,000 | ) | | | (1,250,000 | ) | | | (400,000 | ) | | | (1,400,000 | ) |
The accompanying notes are an integral part of the financial statements.
129
Pacer Funds
STATEMENTS OF CHANGES IN NET ASSETS
| | | Pacer US Small Cap
Cash Cows 100 ETF | | | Pacer Developed Markets
International Cash Cows 100 ETF | |
| | | For the
Period Ended
October 31,
2020
(Unaudited) | | | For the
Year Ended
April 30,
2020 | | | For the
Period Ended
October 31,
2020
(Unaudited) | | | For the
Year Ended
April 30,
2020 | |
OPERATIONS | | | | | | | | | | | | | | | | |
Net Investment Income (Loss) | | $ | 52,224 | | | $ | 440,904 | | | $ | 171,137 | | | $ | 934,227 | |
Net Realized Gain (Loss) on Investments and Foreign Currency Transactions | | | (561,010 | ) | | | (8,077,625 | ) | | | (4,206,195 | ) | | | (1,137,710 | ) |
Change in Unrealized Appreciation (Depreciation) of Investments and Foreign Currency Transactions | | | 3,885,592 | | | | (4,564,010 | ) | | | 5,025,541 | | | | (6,002,034 | ) |
Net Increase (Decrease) in Net Assets Resulting from Operations | | | 3,376,806 | | | | (12,200,731 | ) | | | 990,483 | | | | (6,205,517 | ) |
| | | | | | | | | | | | | | | | | |
DISTRIBUTIONS TO SHAREHOLDERS | | | | | | | | | | | | | | | | |
Dividends and Distributions | | | (61,953 | ) | | | (419,742 | ) | | | (228,419 | ) | | | (1,009,491 | ) |
Total Distributions to Shareholders | | | (61,953 | ) | | | (419,742 | ) | | | (228,419 | ) | | | (1,009,491 | ) |
| | | | | | | | | | | | | | | | | |
CAPITAL SHARE TRANSACTIONS | | | | | | | | | | | | | | | | |
Proceeds from Shares Sold | | | 28,455,225 | | | | 20,281,980 | | | | — | | | | 12,100,810 | |
Payments for Shares Redeemed | | | (10,954,585 | ) | | | (43,601,320 | ) | | | (9,279,055 | ) | | | (17,740,240 | ) |
Transaction Fees (See Note 1) | | | — | | | | — | | | | 109 | | | | 1,376 | |
Net Increase (Decrease) in Net Assets Derived from Capital Share Transactions (a) | | | 17,500,640 | | | | (23,319,340 | ) | | | (9,278,946 | ) | | | (5,638,054 | ) |
Net Increase (Decrease) in Net Assets | | $ | 20,815,493 | | | $ | (35,939,813 | ) | | $ | (8,516,882 | ) | | $ | (12,853,062 | ) |
| | | | | | | | | | | | | | | | | |
NET ASSETS | | | | | | | | | | | | | | | | |
Beginning of Period | | $ | 14,533,944 | | | $ | 50,473,757 | | | $ | 20,991,314 | | | $ | 33,844,376 | |
End of Period | | $ | 35,349,437 | | | $ | 14,533,944 | | | $ | 12,474,432 | | | $ | 20,991,314 | |
(a) | Summary of capital share transactions is as follows: |
| | | Shares | | | Shares | | | Shares | | | Shares | |
Subscriptions | | | 1,150,000 | | | | 800,000 | | | | — | | | | 450,000 | |
Redemptions | | | (450,000 | ) | | | (2,050,000 | ) | | | (450,000 | ) | | | (700,000 | ) |
Net Increase (Decrease) | | | 700,000 | | | | (1,250,000 | ) | | | (450,000 | ) | | | (250,000 | ) |
The accompanying notes are an integral part of the financial statements.
130
Pacer Funds
STATEMENTS OF CHANGES IN NET ASSETS
| | | Pacer WealthShield ETF | | | Pacer Military Times
Best Employers ETF | |
| | | For the
Period Ended
October 31,
2020
(Unaudited) | | | For the
Year Ended
April 30,
2020 | | | For the
Period Ended
October 31,
2020
(Unaudited) | | | For the
Year Ended
April 30,
2020 | |
OPERATIONS | | | | | | | | | | | | | | | | |
Net Investment Income (Loss) | | $ | 115,659 | | | $ | 1,127,632 | | | $ | 12,611 | | | $ | 51,053 | |
Net Realized Gain (Loss) on Investments | | | 4,296,751 | | | | (5,576,677 | ) | | | (7,142 | ) | | | 282,219 | |
Change in Unrealized Appreciation (Depreciation) of Investments | | | (1,746,897 | ) | | | (1,499,370 | ) | | | 47,765 | | | | (395,605 | ) |
Net Increase (Decrease) in Net Assets Resulting from Operations | | | 2,665,513 | | | | (5,948,415 | ) | | | 53,234 | | | | (62,333 | ) |
| | | | | | | | | | | | | | | | | |
DISTRIBUTIONS TO SHAREHOLDERS | | | | | | | | | | | | | | | | |
Dividends and Distributions | | | (171,898 | ) | | | (1,151,877 | ) | | | (12,671 | ) | | | (52,852 | ) |
Total Distributions to Shareholders | | | (171,898 | ) | | | (1,151,877 | ) | | | (12,671 | ) | | | (52,852 | ) |
| | | | | | | | | | | | | | | | | |
CAPITAL SHARE TRANSACTIONS | | | | | | | | | | | | | | | | |
Proceeds from Shares Sold | | | 8,701,715 | | | | 28,716,405 | | | | 1,454,095 | | | | 1,499,390 | |
Payments for Shares Redeemed | | | (13,822,395 | ) | | | (80,267,410 | ) | | | (2,815,070 | ) | | | (1,483,825 | ) |
Transaction Fees (See Note 1) | | | — | | | | 1,088 | | | | — | | | | — | |
Net Increase (Decrease) in Net Assets Derived from Capital Share Transactions (a) | | | (5,120,680 | ) | | | (51,549,917 | ) | | | (1,360,975 | ) | | | 15,565 | |
Net Increase (Decrease) in Net Assets | | $ | (2,627,065 | ) | | $ | (58,650,209 | ) | | $ | (1,320,412 | ) | | $ | (99,620 | ) |
| | | | | | | | | | | | | | | | | |
NET ASSETS | | | | | | | | | | | | | | | | |
Beginning of Period | | $ | 51,427,905 | | | $ | 110,078,114 | | | $ | 2,772,937 | | | $ | 2,872,557 | |
End of Period | | $ | 48,800,840 | | | $ | 51,427,905 | | | $ | 1,452,525 | | | $ | 2,772,937 | |
(a) | Summary of capital share transactions is as follows: |
| | | Shares | | | Shares | | | Shares | | | Shares | |
Subscriptions | | | 350,000 | | | | 1,200,000 | | | | 50,000 | | | | 50,000 | |
Redemptions | | | (550,000 | ) | | | (3,450,000 | ) | | | (100,000 | ) | | | (50,000 | ) |
Net Increase (Decrease) | | | (200,000 | ) | | | (2,250,000 | ) | | | (50,000 | ) | | | — | |
The accompanying notes are an integral part of the financial statements.
131
Pacer Funds
STATEMENTS OF CHANGES IN NET ASSETS
| | | Pacer Benchmark
Industrial Real Estate SCTRSM ETF | | | Pacer Benchmark
Data and Infrastructure Real
Estate SCTRSM ETF | |
| | | For the
Period Ended
October 31,
2020
(Unaudited) | | | For the
Year Ended
April 30,
2020 | | | For the
Period Ended
October 31,
2020
(Unaudited) | | | For the
Year Ended
April 30,
2020 | |
OPERATIONS | | | | | | | | | | | | | | | | |
Net Investment Income (Loss) | | $ | 1,109,181 | | | $ | 684,334 | | | $ | 6,975,272 | | | $ | 2,874,627 | |
Net Realized Gain (Loss) on Investments and Foreign Currency Transactions | | | 542,605 | | | | (2,546,332 | ) | | | 10,324,369 | | | | (5,462,685 | ) |
Change in Unrealized Appreciation (Depreciation) of Investments and Foreign Currency Transactions | | | 3,840,119 | | | | (1,898,576 | ) | | | (19,478,037 | ) | | | 34,852,455 | |
Net Increase (Decrease) in Net Assets Resulting from Operations | | | 5,491,905 | | | | (3,760,574 | ) | | | (2,178,396 | ) | | | 32,264,397 | |
| | | | | | | | | | | | | | | | | |
DISTRIBUTIONS TO SHAREHOLDERS | | | | | | | | | | | | | | | | |
Net Investment Income | | | (666,033 | ) | | | (656,033 | ) | | | (6,151,753 | ) | | | (2,911,078 | ) |
Long-Term Capital Gain | | | — | | | | (6,106 | ) | | | — | | | | — | |
Return of Capital | | | — | | | | — | | | | — | | | | (340,803 | ) |
Total Distributions to Shareholders | | | (666,033 | ) | | | (662,139 | ) | | | (6,151,753 | ) | | | (3,251,881 | ) |
| | | | | | | | | | | | | | | | | |
CAPITAL SHARE TRANSACTIONS | | | | | | | | | | | | | | | | |
Proceeds from Shares Sold | | | 65,726,235 | | | | 50,782,050 | | | | 645,271,685 | | | | 513,245,545 | |
Payments for Shares Redeemed | | | (4,735,275 | ) | | | (5,567,595 | ) | | | (135,990,385 | ) | | | (12,735,020 | ) |
Transaction Fees (Note 1) | | | 43 | | | | — | | | | — | | | | — | |
Net Increase (Decrease) in Net Assets Derived from Capital Share Transactions (c) | | | 60,991,003 | | | | 45,214,455 | | | | 509,281,300 | | | | 500,510,525 | |
Net Increase (Decrease) in Net Assets | | $ | 65,816,875 | | | $ | 40,791,742 | | | $ | 500,951,151 | | | $ | 529,523,041 | |
| | | | | | | | | | | | | | | | | |
NET ASSETS | | | | | | | | | | | | | | | | |
Beginning of Period | | $ | 48,147,448 | | | $ | 7,355,706 | | | $ | 552,214,428 | | | $ | 22,691,387 | |
End of Period | | $ | 113,964,323 | | | $ | 48,147,448 | | | $ | 1,053,165,579 | | | $ | 552,214,428 | |
(a) | Summary of capital share transactions is as follows: |
| | | Shares | | | Shares | | | Shares | | | Shares | |
Subscriptions | | | 1,950,000 | | | | 1,550,000 | | | | 18,150,000 | | | | 16,200,000 | |
Redemptions | | | (150,000 | ) | | | (200,000 | ) | | | (3,800,000 | ) | | | (400,000 | ) |
Net Increase (Decrease) | | | 1,800,000 | | | | 1,350,000 | | | | 14,350,000 | | | | 15,800,000 | |
The accompanying notes are an integral part of the financial statements.
132
Pacer Funds
STATEMENTS OF CHANGES IN NET ASSETS
| | | Pacer US Export Leaders ETF | | | Pacer CFRA-Stovall Equal
Weight Seasonal Rotation ETF | |
| | | For the
Period Ended
October 31,
2020
(Unaudited) | | | For the
Year Ended
April 30,
2020 | | | For the
Period Ended
October 31,
2020
(Unaudited) | | | For the
Year Ended
April 30,
2020 | |
OPERATIONS | | | | | | | | | | | | | | | | |
Net Investment Income (Loss) | | $ | 3,898 | | | $ | 7,964 | | | $ | 324,258 | | | $ | 917,220 | |
Net Realized Gain (Loss) on Investments and Foreign Currency Transactions | | | 179,675 | | | | 56,801 | | | | 3,733,288 | | | | (18,336,835 | ) |
Change in Unrealized Appreciation (Depreciation) of Investments and Foreign Currency Transactions | | | 41,110 | | | | (99,287 | ) | | | (1,934 | ) | | | (5,007 | ) |
Net Increase (Decrease) in Net Assets Resulting from Operations | | | 224,683 | | | | (34,522 | ) | | | 4,055,612 | | | | (17,424,622 | ) |
| | | | | | | | | | | | | | | | | |
DISTRIBUTIONS TO SHAREHOLDERS | | | | | | | | | | | | | | | | |
Dividends and Distributions | | | (4,150 | ) | | | (7,790 | ) | | | — | | | | (898,227 | ) |
Total Distributions to Shareholders | | | (4,150 | ) | | | (7,790 | ) | | | (291,564 | ) | | | (898,227 | ) |
| | | | | | | | | | | | | | | | | |
CAPITAL SHARE TRANSACTIONS | | | | | | | | | | | | | | | | |
Proceeds from Shares Sold | | | 2,874,230 | | | | 2,760,720 | | | | 20,066,295 | | | | 123,166,500 | |
Payments for Shares Redeemed | | | (2,852,995 | ) | | | (2,759,395 | ) | | | (33,591,545 | ) | | | (51,328,850 | ) |
Net Increase (Decrease) in Net Assets Derived from Capital Share Transactions (c) | | | 21,235 | | | | 1,325 | | | | (13,525,250 | ) | | | 71,837,650 | |
Net Increase (Decrease) in Net Assets | | $ | 241,768 | | | $ | (40,987 | ) | | $ | (9,761,202 | ) | | $ | 53,514,801 | |
| | | | | | | | | | | | | | | | | |
NET ASSETS | | | | | | | | | | | | | | | | |
Beginning of Period | | $ | 1,257,403 | | | $ | 1,298,390 | | | $ | 60,554,378 | | | $ | 7,039,577 | |
End of Period | | $ | 1,499,171 | | | $ | 1,257,403 | | | $ | 50,793,176 | | | $ | 60,554,378 | |
(a) | Summary of capital share transactions is as follows: |
| | | Shares | | | Shares | | | Shares | | | Shares | |
Subscriptions | | | 100,000 | | | | 100,000 | | | | 750,000 | | | | 4,100,000 | |
Redemptions | | | (100,000 | ) | | | (100,000 | ) | | | (1,250,000 | ) | | | (1,950,000 | ) |
Net Increase | | | — | | | | — | | | | (500,000 | ) | | | 2,150,000 | |
The accompanying notes are an integral part of the financial statements.
133
Pacer Funds
STATEMENTS OF CHANGES IN NET ASSETS
| | | Pacer US Cash Cows Growth ETF | | | Pacer Trendpilot International ETF | |
| | | For the
Period Ended
October 31,
2020
(Unaudited) | | | For the
Period Ended
April 30,
2020(a) | | | For the
Period Ended
October 31,
2020
(Unaudited) | | | For the
Year Ended
April 30,
2020 (a) | |
OPERATIONS | | | | | | | | | | | | | | | | |
Net Investment Income (Loss) | | $ | 7,250 | | | $ | 24,483 | | | $ | 227,099 | | | $ | 1,135,638 | |
Net Realized Gain (Loss) on Investments and Foreign Currency Transactions | | | 163,829 | | | | 35,274 | | | | (209,047 | ) | | | (9,580,885 | ) |
Change in Unrealized Appreciation (Depreciation) of Investments and Foreign Currency Transactions | | | 30,141 | | | | (68,631 | ) | | | (7,469,205 | ) | | | 32,620 | |
Net Increase (Decrease) in Net Assets Resulting from Operations | | | 201,220 | | | | (8,874 | ) | | | (7,451,153 | ) | | | (8,412,627 | ) |
| | | | | | | | | | | | | | | | | |
DISTRIBUTIONS TO SHAREHOLDERS | | | | | | | | | | | | | | | | |
Dividends and Distributions | | | (7,149 | ) | | | (24,159 | ) | | | — | | | | (1,060,524 | ) |
Total Distributions to Shareholders | | | (7,149 | ) | | | (24,159 | ) | | | — | | | | (1,060,524 | ) |
| | | | | | | | | | | | | | | | | |
CAPITAL SHARE TRANSACTIONS | | | | | | | | | | | | | | | | |
Proceeds from Shares Sold | | | 2,698,270 | | | | 6,249,605 | | | | 15,252,350 | | | | 175,364,155 | |
Payments for Shares Redeemed | | | (2,675,855 | ) | | | (5,072,240 | ) | | | (51,156,480 | ) | | | (14,856,015 | ) |
Transaction Fees (See Note 1) | | | — | | | | — | | | | — | | | | 3,482 | |
Net Increase (Decrease) in Net Assets Derived from Capital Share Transactions (b) | | | 22,415 | | | | 1,177,365 | | | | (35,904,130 | ) | | | 160,511,622 | |
Net Increase (Decrease) in Net Assets | | $ | 216,486 | | | $ | 1,144,332 | | | $ | (43,355,283 | ) | | $ | 151,038,471 | |
| | | | | | | | | | | | | | | | | |
NET ASSETS | | | | | | | | | | | | | | | | |
Beginning of Period | | $ | 1,144,332 | | | $ | — | | | $ | 151,038,471 | | | $ | — | |
End of Period | | $ | 1,360,818 | | | $ | 1,144,332 | | | $ | 107,683,188 | | | $ | 151,038,471 | |
(a) | Fund commenced operations on May 2, 2019. The information presented is from May 2, 2019 to April 30, 2020. |
(b) | Summary of capital share transactions is as follows: |
| | | Shares | | | Shares | | | Shares | | | Shares | |
Subscriptions | | | 100,000 | | | | 250,000 | | | | 650,000 | | | | 7,050,000 | |
Redemptions | | | (100,000 | ) | | | (200,000 | ) | | | (2,200,000 | ) | | | (600,000 | ) |
Net Increase | | | — | | | | 50,000 | | | | (1,550,000 | ) | | | 6,450,000 | |
The accompanying notes are an integral part of the financial statements.
134
Pacer Funds
STATEMENTS OF CHANGES IN NET ASSETS
| | | Pacer Emerging Markets
Cash Cows 100 ETF | | | Pacer Cash Cows Fund of Funds ETF | |
| | | For the
Period Ended
October 31,
2020
(Unaudited) | | | For the
Year Ended
April 30,
2020(a) | | | For the
Period Ended
October 31,
2020
(Unaudited) | | | For the
Year Ended
April 30,
2020(a) | |
OPERATIONS | | | | | | | | | | | | | | | | |
Net Investment Income (Loss) | | $ | 28,362 | | | $ | 102,683 | | | $ | 27,412 | | | $ | 42,529 | |
Net Realized Gain (Loss) on Investments and Foreign Currency Transactions | | | (67,958 | ) | | | 143,068 | | | | 91,418 | | | | (8,917 | ) |
Change in Unrealized Appreciation (Depreciation) of Investments and Foreign Currency Transactions | | | 68,892 | | | | (229,909 | ) | | | 110,896 | | | | (220,697 | ) |
Net Increase (Decrease) in Net Assets Resulting from Operations | | | 29,296 | | | | 15,842 | | | | 229,726 | | | | (187,085 | ) |
| | | | | | | | | | | | | | | | | |
DISTRIBUTIONS TO SHAREHOLDERS | | | | | | | | | | | | | | | | |
Dividends and Distributions | | | (37,854 | ) | | | (149,137 | ) | | | (27,663 | ) | | | (42,529 | ) |
Return of Capital | | | | | | | | | | | — | | | | (151 | ) |
Total Distributions to Shareholders | | | (37,854 | ) | | | (149,137 | ) | | | (27,663 | ) | | | (42,680 | ) |
| | | | | | | | | | | | | | | | | |
CAPITAL SHARE TRANSACTIONS | | | | | | | | | | | | | | | | |
Proceeds from Shares Sold | | | 995,690 | | | | 5,831,035 | | | | 1,092,215 | | | | 2,531,000 | |
Payments for Shares Redeemed | | | — | | | | (4,744,030 | ) | | | (1,183,135 | ) | | | (1,259,950 | ) |
Transaction Fees (Note 1) Payments for Shares Redeemed | | | 2,816 | | | | 1,856 | | | | — | | | | — | |
Net Increase (Decrease) in Net Assets Derived from Capital Share Transactions (c) | | | 998,506 | | | | 1,088,861 | | | | (90,920 | ) | | | 1,271,050 | |
Net Increase (Decrease) in Net Assets | | $ | 989,948 | | | $ | 955,566 | | | $ | 111,143 | | | $ | 1,041,285 | |
| | | | | | | | | | | | | | | | | |
NET ASSETS | | | | | | | | | | | | | | | | |
Beginning of Period | | $ | 955,566 | | | $ | — | | | $ | 1,041,285 | | | $ | — | |
End of Period | | $ | 1,945,514 | | | $ | 955,566 | | | $ | 1,152,428 | | | $ | 1,041,285 | |
(a) | Fund commenced operations on May 2, 2019. The information presented is from May 2, 2019 to April 30, 2020. |
(b) | Fund commenced operations on May 3, 2019. The information presented is from May 3, 2019 to April 30, 2020. |
(c) | Summary of capital share transactions is as follows: |
| | | Shares | | | Shares | | | Shares | | | Shares | |
Subscriptions | | | 50,000 | | | | 250,000 | | | | 50,000 | | | | 100,000 | |
Redemptions | | | — | | | | (200,000 | ) | | | (50,000 | ) | | | (50,000 | ) |
Net Increase | | | 50,000 | | | | 50,000 | | | | — | | | | 50,000 | |
The accompanying notes are an integral part of the financial statements.
135
Pacer Funds
STATEMENTS OF CHANGES IN NET ASSETS
| | | Pacer Trendpilot Fund of Funds ETF | | | Pacer Trendpilot US Bond ETF | |
| | | For the
Period Ended
October 31,
2020
(Unaudited) | | | For the
Year Ended
April 30,
2020(a) | | | For the
Period Ended
October 31,
2020
(Unaudited) | | | For the
Year Ended
April 30,
2020(b) | |
OPERATIONS | | | | | | | | | | | | | | | | |
Net Investment Income (Loss) | | $ | (22,449 | ) | | $ | 125,302 | | | $ | 4,208,476 | | | $ | 954,002 | |
Net Realized Gain (Loss) on Investments and Foreign Currency Transactions | | | (488,295 | ) | | | (47,411 | ) | | | 1,264,420 | | | | (920,856 | ) |
Change in Unrealized Appreciation (Depreciation) of Investments and Foreign Currency Transactions | | | 1,624,655 | | | | (1,082,420 | ) | | | (871,409 | ) | | | 3,099,833 | |
Net Increase (Decrease) in Net Assets Resulting from Operations | | | 1,113,911 | | | | (1,004,529 | ) | | | 4,601,487 | | | | 3,132,979 | |
| | | | | | | | | | | | | | | | | |
DISTRIBUTIONS TO SHAREHOLDERS | | | | | | | | | | | | | | | | |
Dividends and Distributions | | | — | | | | (137,281 | ) | | | (2,676,642 | ) | | | (913,550 | ) |
Return of Capital | | | | | | | | | | | — | | | | — | |
Total Distributions to Shareholders | | | — | | | | (137,281 | ) | | | (2,676,642 | ) | | | (913,550 | ) |
| | | | | | | | | | | | | | | | | |
CAPITAL SHARE TRANSACTIONS | | | | | | | | | | | | | | | | |
Proceeds from Shares Sold | | | 8,789,885 | | | | 28,519,960 | | | | 242,426,290 | | | | 152,226,140 | |
Payments for Shares Redeemed | | | (4,909,020 | ) | | | — | | | | (74,527,390 | ) | | | (10,137,840 | ) |
Transaction Fees (Note 1) | | | — | | | | — | | | | 18,911 | | | | 19,324 | |
Net Increase (Decrease) in Net Assets Derived from Capital Share Transactions (b) | | | 3,880,865 | | | | 28,519,960 | | | | 167,917,811 | | | | 142,107,624 | |
Net Increase (Decrease) in Net Assets | | $ | 4,994,776 | | | $ | 27,378,150 | | | $ | 169,842,656 | | | $ | 144,327,053 | |
| | | | | | | | | | | | | | | | | |
NET ASSETS | | | | | | | | | | | | | | | | |
Beginning of Period | | $ | 27,378,150 | | | $ | — | | | $ | 144,327,053 | | | $ | — | |
End of Period | | $ | 32,372,926 | | | $ | 27,378,150 | | | $ | 314,169,709 | | | $ | 144,327,053 | |
(a) Fund commenced operations on May 3, 2019. The information presented is from May 3, 2019 to April 30, 2020.
(b) Fund commenced operations on October 22, 2019. The information presented is from October 22, 2019 to April 30, 2020.
(c) Summary of capital share transactions is as follows:
| | | Shares | | | Shares | | | Shares | | | Shares | |
Subscriptions | | | 350,000 | | | | 1,150,000 | | | | 9,300,000 | | | | 6,000,000 | |
Redemptions | | | (200,000 | ) | | | — | | | | (2,900,000 | ) | | | (400,000 | ) |
Net Increase | | | 150,000 | | | | 1,150,000 | | | | 6,400,000 | | | | 5,600,000 | |
The accompanying notes are an integral part of the financial statements.
136
Pacer Funds
STATEMENTS OF CHANGES IN NET ASSETS
| | | Pacer
CSOP FTSE China A50
ETF | | | Pacer BioThreat
Strategy ETF | |
| | | For the
Period Ended
October 31,
2020
(Unaudited) | | | For the
Year Ended
April 30,
2020(a) | | | For the
Period Ended
October 31,
2020
(Unaudited)(b) | |
OPERATIONS | | | | | | | | | | | | |
Net Investment Income (Loss) | | $ | 178,765 | | | $ | (55,203 | ) | | $ | 8,976 | |
Net Realized Gain (Loss) on Investments and Foreign Currency Transactions | | | 38,377 | | | | 3,741,277 | | | | 6 | |
Change in Unrealized Appreciation (Depreciation) of Investments and Foreign Currency Transactions | | | 1,804,697 | | | | (2,901,864 | ) | | | 227,195 | |
Net Increase (Decrease) in Net Assets Resulting from Operations | | | 2,021,839 | | | | 784,210 | | | | 236,177 | |
| | | | | | | | | | | | | |
DISTRIBUTIONS TO SHAREHOLDERS | | | | | | | | | | | | |
Dividends and Distributions | | | — | | | | (961,121 | ) | | | (9,690 | ) |
Return of Capital | | | — | | | | (58,489 | ) | | | — | |
Total Distributions to Shareholders | | | — | | | | (1,019,610 | ) | | | (9,690 | ) |
| | | | | | | | | | | | | |
CAPITAL SHARE TRANSACTIONS | | | | | | | | | | | | |
Proceeds from Shares Sold | | | — | | | | 14,683,370 | | | | 5,122,385 | |
Payments for Shares Redeemed | | | (1,772,630 | ) | | | (18,254,205 | ) | | | — | |
Transaction Fees (See Note 1) | | | 857 | | | | 58,539 | | | | — | |
Net Increase (Decrease) in Net Assets Derived from Capital Share Transactions(c) | | | (1,771,773 | ) | | | (3,512,296 | ) | | | 5,122,385 | |
Net Increase (Decrease) in Net Assets | | $ | 250,066 | | | $ | (3,747,696 | ) | | $ | 5,348,872 | |
| | | | | | | | | | | | | |
NET ASSETS | | | | | | | | | | | | |
Beginning of Period/Year | | $ | 8,992,347 | | | $ | 12,740,043 | | | $ | — | |
End of Period/Year | | $ | 9,242,413 | | | $ | 8,992,347 | | | $ | 5,348,872 | |
(a) For the period ended October 1, 2019 to April 30, 2020. See Note 1 to the Financial Statements.
(b) Fund commenced operations on June 24, 2020. The information presented is from June 24, 2020 to October 31, 2020.
(c) Summary of capital share transactions is as follows:
| | | Shares | | | Shares(d) | | | Shares | |
Subscriptions | | | — | | | | 850,000 | | | | 200,000 | |
Redemptions | | | (100,000 | ) | | | (1,050,000 | ) | | | — | |
Net Increase | | | (100,000 | ) | | | (200,000 | ) | | | 200,000 | |
(d) | For the period ended October 1, 2019 to April 30, 2020. Shares of the Predecessor CSOP Fund converted Shares at the close of business on January 22, 2020. See Note 1 to the Financial Statements. |
The accompanying notes are an integral part of the financial statements.
137
Pacer Funds
STATEMENTS OF CHANGES IN NET ASSETS
| | | Pacer Lunt
Large Cap
Alternator ETF | | | Pacer Lunt
Midcap
Multi-Factor
Alternator ETF | |
| | | For the
Period Ended
October 31,
2020
(Unaudited) (a) | | | For the
Period Ended
October 31,
2020
(Unaudited)(a) | |
OPERATIONS | | | | | | | | |
Net Investment Income (Loss) | | $ | 239,284 | | | $ | 9,334 | |
Net Realized Gain (Loss) on Investments and Foreign Currency Transactions | | | 2,920,185 | | | | 737,610 | |
Change in Unrealized Appreciation (Depreciation) of Investments and Foreign Currency Transactions | | | (1,374,811 | ) | | | 1,152,452 | |
Net Increase (Decrease) in Net Assets Resulting from Operations | | | 1,784,658 | | | | 1,899,396 | |
| | | | | | | | | |
DISTRIBUTIONS TO SHAREHOLDERS | | | | | | | | |
Dividends and Distributions | | | (185,075 | ) | | | (9,666 | ) |
Total Distributions to Shareholders | | | (185,075 | ) | | | (9,666 | ) |
| | | | | | | | | |
CAPITAL SHARE TRANSACTIONS | | | | | | | | |
Proceeds from Shares Sold | | | 96,604,575 | | | | 19,647,460 | |
Payments for Shares Redeemed | | | (42,354,970 | ) | | | (6,588,785 | ) |
Net Increase in Net Assets Derived from Capital Share Transactions (b) | | | 54,249,605 | | | | 13,058,675 | |
Net Increase in Net Assets | | $ | 55,849,188 | | | $ | 14,948,405 | |
| | | | | | | | | |
NET ASSETS | | | | | | | | |
Beginning of Period | | $ | — | | | $ | — | |
End of Period | | $ | 55,849,188 | | | $ | 14,948,405 | |
(a) Fund commenced operations on June 24, 2020. The information presented is from June 24, 2020 to October 31, 2020.
(b) Summary of capital share transactions is as follows:
| | | Shares | | | Shares | |
Subscriptions | | | 4,000,000 | | | | 800,000 | |
Redemptions | | | (1,700,000 | ) | | | (250,000 | ) |
Net Increase | | | 2,300,000 | | | | 550,000 | |
The accompanying notes are an integral part of the financial statements.
138
Pacer Funds
STATEMENTS OF CHANGES IN NET ASSETS
| | | Pacer Lunt Large
Cap Multi-Factor
Alternator ETF | |
| | | For the
Period Ended
October 31,
2020
(Unaudited)(a) | |
OPERATIONS | | | | |
Net Investment Income (Loss) | | $ | 21,723 | |
Net Realized Gain (Loss) on Investments and Foreign Currency Transactions | | | 380,671 | |
Change in Unrealized Appreciation (Depreciation) of Investments and Foreign Currency Transactions | | | 604,101 | |
Net Increase (Decrease) in Net Assets Resulting from Operations | | | 1,006,495 | |
| | | | | |
DISTRIBUTIONS TO SHAREHOLDERS | | | | |
Dividends and Distributions | | | (17,940 | ) |
Total Distributions to Shareholders | | | (17,940 | ) |
| | | | | |
CAPITAL SHARE TRANSACTIONS | | | | |
Proceeds from Shares Sold | | | 15,253,910 | |
Payments for Shares Redeemed | | | (2,815,680 | ) |
Net Increase in Net Assets Derived from Capital Share Transactions (b) | | | 12,438,230 | |
Net Increase (Decrease) in Net Assets | | $ | 13,426,785 | |
| | | | | |
NET ASSETS | | | | |
Beginning of Period | | $ | — | |
End of Period | | $ | 13,426,785 | |
(a) Fund commenced operations on June 24, 2020. The information presented is from June 24, 2020 to October 31, 2020.
(b) Summary of capital share transactions is as follows:
| | | Shares | |
Subscriptions | | | 600,000 | |
Redemptions | | | (100,000 | ) |
Net Increase | | | 500,000 | |
The accompanying notes are an integral part of the financial statements.
139
Pacer Trendpilot® US Large Cap ETF
FINANCIAL HIGHLIGHTS
For a capital share outstanding throughout the year/period
| | For the
Period Ended
October 31,
2020
(Unaudited) | | | For the
Year Ended
April 30,
2020 | | | For the
Year Ended
April 30,
2019 | | | For the
Year Ended
April 30,
2018 | | | For the
Year Ended
April 30,
2017 | | | For the
Period Ended
April 30,
2016(a) | |
Net Asset Value, Beginning of Period | | $ | 26.99 | | | $ | 30.56 | | | $ | 28.41 | | | $ | 25.48 | | | $ | 21.88 | | | $ | 25.00 | |
| | | | | | | | | | | | | | | | | | | | | | | | | |
INCOME (LOSS) FROM INVESTMENT OPERATIONS: | | | | | | | | | | | | | | | | | | | | | | | | |
Net Investment Income(b) | | | 0.10 | | | | 0.39 | | | | 0.43 | | | | 0.37 | | | | 0.34 | | | | 0.13 | |
Net Realized and Unrealized Gain (Loss) on Investments (f) | | | 1.66 | | | | (3.59 | ) | | | 2.01 | | | | 2.84 | | | | 3.52 | | | | (3.15 | ) |
Total from Investment Operations | | | 1.76 | | | | (3.20 | ) | | | 2.44 | | | | 3.21 | | | | 3.86 | | | | (3.02 | ) |
| | | | | | | | | | | | | | | | | | | | | | | | | |
LESS DISTRIBUTIONS: | | | | | | | | | | | | | | | | | | | | | | | | |
Distributions from Net Investment Income | | | — | | | | (0.37 | ) | | | (0.29 | ) | | | (0.28 | ) | | | (0.26 | ) | | | (0.10 | ) |
Total Distributions | | | — | | | | (0.37 | ) | | | (0.29 | ) | | | (0.28 | ) | | | (0.26 | ) | | | (0.10 | ) |
Net Asset Value, End of Period | | $ | 28.75 | | | $ | 26.99 | | | $ | 30.56 | | | $ | 28.41 | | | $ | 25.48 | | | $ | 21.88 | |
Total Return | | | 6.50 | %(c) | | | -10.71 | % | | | 8.65 | % | | | 12.56 | % | | | 17.72 | % | | | -12.10 | %(c) |
| | | | | | | | | | | | | | | | | | | | | | | | | |
SUPPLEMENTAL DATA: | | | | | | | | | | | | | | | | | | | | | | | | |
Net Assets at End of Period (000’s) | | $ | 1,772,423 | | | $ | 2,403,839 | | | $ | 2,163,990 | | | $ | 921,975 | | | $ | 456,180 | | | $ | 365,448 | |
| | | | | | | | | | | | | | | | | | | | | | | | | |
RATIOS TO AVERAGE NET ASSETS: | | | | | | | | | | | | | | | | | | | | | | | | |
Expenses to Average Net Assets | | | 0.60 | %(d) | | | 0.60 | % | | | 0.60 | % | | | 0.60 | % | | | 0.60 | % | | | 0.60 | %(d) |
Net Investment Income to Average Net Assets | | | 0.73 | %(d) | | | 1.25 | % | | | 1.43 | % | | | 1.32 | % | | | 1.44 | % | | | 0.62 | %(d) |
Portfolio Turnover Rate (e) | | | 1 | %(c) | | | 5 | % | | | 162 | % | | | 12 | % | | | 7 | % | | | 317 | %(c) |
(a) | Commencement of operations on June 11, 2015. |
(b) | Calculated based on average shares outstanding during the period. |
(e) | Excluded impact of in-kind transactions. |
(f) | Realized and unrealized gains and losses per share in this caption are balancing amounts necessary to reconcile to the change in net asset value for the period and may reconcile with the aggregate gains and losses in the statement of operations due to share transactions for the period. |
The accompanying notes are an integral part of the financial statements.
140
Pacer Trendpilot® US Mid Cap ETF
FINANCIAL HIGHLIGHTS
For a capital share outstanding throughout the year/period
| | | For the
Period Ended
October 31,
2020
(Unaudited) | | | For the
Year Ended
April 30,
2020 | | | For the
Year Ended
April 30,
2019 | | | For the
Year Ended
April 30,
2018 | | | For the
Year Ended
April 30,
2017 | | | For the
Period Ended
April 30,
2016(a) | |
Net Asset Value, Beginning of Period | | $ | 28.35 | | | $ | 30.95 | | | $ | 30.72 | | | $ | 28.00 | | | $ | 23.78 | | | $ | 25.00 | |
| | | | | | | | | | | | | | | | | | | | | | | | | |
INCOME (LOSS) FROM INVESTMENT OPERATIONS: | | | | | | | | | | | | | | | | | | | | | | | | |
Net Investment Income (Loss) (b) | | | 0.07 | | | | 0.28 | | | | 0.41 | | | | 0.27 | | | | 0.27 | | | | (0.04 | ) |
Net Realized and Unrealized Gain (Loss) on Investments (f) | | | (0.49 | ) | | | (2.45 | ) | | | 0.10 | | | | 2.66 | | | | 4.13 | | | | (1.16 | ) |
Total from Investment Operations | | | (0.42 | ) | | | (2.17 | ) | | | 0.51 | | | | 2.93 | | | | 4.40 | | | | (1.20 | ) |
| | | | | | | | | | | | | | | | | | | | | | | | | |
LESS DISTRIBUTIONS: | | | | | | | | | | | | | | | | | | | | | | | | |
Distributions from Net Investment Income | | | — | | | | (0.43 | ) | | | (0.28 | ) | | | (0.21 | ) | | | (0.18 | ) | | | — | |
Distributions from Return of Capital | | | — | | | | — | | | | — | | | | — | | | | — | | | | (0.02 | ) |
Total Distributions | | | — | | | | (0.43 | ) | | | (0.28 | ) | | | (0.21 | ) | | | (0.18 | ) | | | (0.02 | ) |
Net Asset Value, End of Period | | $ | 27.93 | | | $ | 28.35 | | | $ | 30.95 | | | $ | 30.72 | | | $ | 28.00 | | | $ | 23.78 | |
Total Return | | | -1.47 | %(c) | | | -7.11 | % | | | 1.66 | % | | | 10.42 | % | | | 18.54 | % | | | -4.82 | %(c) |
| | | | | | | | | | | | | | | | | | | | | | | | | |
SUPPLEMENTAL DATA: | | | | | | | | | | | | | | | | | | | | | | | | |
Net Assets at End of Period (000’s) | | $ | 382,669 | | | $ | 540,051 | | | $ | 761,305 | | | $ | 497,590 | | | $ | 281,430 | | | $ | 149,808 | |
| | | | | | | | | | | | | | | | | | | | | | | | | |
RATIOS TO AVERAGE NET ASSETS: | | | | | | | | | | | | | | | | | | | | | | | | |
Expenses to Average Net Assets | | | 0.60 | %(d) | | | 0.60 | % | | | 0.60 | % | | | 0.60 | % | | | 0.60 | % | | | 0.60 | %(d) |
Net Investment Income to Average Net Assets | | | 0.49 | %(d) | | | 0.96 | % | | | 1.30 | % | | | 0.91 | % | | | 1.02 | % | | | -0.17 | %(d) |
Portfolio Turnover Rate (e) | | | 203 | %(c) | | | 143 | % | | | 405 | % | | | 66 | % | | | 27 | % | | | 379 | %(c) |
(a) | Commencement of operations on June 11, 2015. |
(b) | Calculated based on average shares outstanding during the period. |
(e) | Excluded impact of in-kind transactions. |
(f) | Realized and unrealized gains and losses per share in this caption are balancing amounts necessary to reconcile to the change in net asset value for the period and may reconcile with the aggregate gains and losses in the statement of operations due to share transactions for the period. |
The accompanying notes are an integral part of the financial statements.
141
Pacer Trendpilot® 100 ETF
FINANCIAL HIGHLIGHTS
For a capital share outstanding throughout the year/period
| | | For the
Period Ended
October 31,
2020
(Unaudited) | | | For the
Year Ended
April 30,
2020 | | | For the
Year Ended
April 30,
2019 | | | For the
Year Ended
April 30,
2018 | | | For the
Year Ended
April 30,
2017 | | | For the
Period Ended
April 30,
2016(a) | |
Net Asset Value, Beginning of Period | | $ | 37.91 | | | $ | 36.00 | | | $ | 31.16 | | | $ | 26.32 | | | $ | 21.44 | | | $ | 25.00 | |
| | | | | | | | | | | | | | | | | | | | | | | | | |
INCOME (LOSS) FROM INVESTMENT OPERATIONS: | | | | | | | | | | | | | | | | | | | | | | | | |
Net Investment Income (b) | | | 0.04 | | | | 0.15 | | | | 0.26 | | | | 0.11 | | | | 0.11 | | | | 0.04 | |
Net Realized and Unrealized Gain (Loss) on Investments (f) | | | 10.29 | | | | 1.94 | | | | 4.73 | | | | 4.83 | | | | 4.84 | | | | (3.55 | ) |
Total from Investment Operations | | | 10.33 | | | | 2.09 | | | | 4.99 | | | | 4.94 | | | | 4.95 | | | | (3.51 | ) |
| | | | | | | | | | | | | | | | | | | | | | | | | |
LESS DISTRIBUTIONS: | | | | | | | | | | | | | | | | | | | | | | | | |
Distributions from Net Investment Income | | | — | | | | (0.18 | ) | | | (0.15 | ) | | | (0.10 | ) | | | (0.07 | ) | | | (0.05 | ) |
Total Distributions | | | — | | | | (0.18 | ) | | | (0.15 | ) | | | (0.10 | ) | | | (0.07 | ) | | | (0.05 | ) |
Net Asset Value, End of Period | | $ | 48.24 | | | $ | 37.91 | | | $ | 36.00 | | | $ | 31.16 | | | $ | 26.32 | | | $ | 21.44 | |
Total Return | | | 27.23 | %(c) | | | 5.78 | % | | | 16.04 | % | | | 18.78 | % | | | 23.11 | % | | | -14.04 | %(c) |
| | | | | | | | | | | | | | | | | | | | | | | | | |
SUPPLEMENTAL DATA: | | | | | | | | | | | | | | | | | | | | | | | | |
Net Assets at End of Period (000’s) | | $ | 781,412 | | | $ | 739,258 | | | $ | 502,173 | | | $ | 211,906 | | | $ | 73,696 | | | $ | 69,689 | |
| | | | | | | | | | | | | | | | | | | | | | | | | |
RATIOS TO AVERAGE NET ASSETS: | | | | | | | | | | | | | | | | | | | | | | | | |
Expenses to Average Net Assets | | | 0.65 | %(d) | | | 0.65 | % | | | 0.65 | % | | | 0.65 | % | | | 0.65 | % | | | 0.65 | %(d) |
Net Investment Income to Average Net Assets | | | 0.20 | %(d) | | | 0.40 | % | | | 0.76 | % | | | 0.38 | % | | | 0.46 | % | | | 0.18 | %(d) |
Portfolio Turnover Rate (e) | | | 2 | %(c) | | | 61 | % | | | 107 | % | | | 3 | % | | | 125 | % | | | 295 | %(c) |
(a) | Commencement of operations on June 11, 2015. |
(b) | Calculated based on average shares outstanding during the period. |
(e) | Excluded impact of in-kind transactions. |
(f) | Realized and unrealized gains and losses per share in this caption are balancing amounts necessary to reconcile to the change in net asset value for the period and may reconcile with the aggregate gains and losses in the statement of operations due to share transactions for the period. |
The accompanying notes are an integral part of the financial statements.
142
Pacer Trendpilot® European Index ETF
FINANCIAL HIGHLIGHTS
For a capital share outstanding throughout the year/period
| | | For the
Period Ended
October 31,
2020
(Unaudited) | | | For the
Year Ended
April 30,
2020 | | | For the
Year Ended
April 30,
2019 | | | For the
Year Ended
April 30,
2018 | | | For the
Year Ended
April 30,
2017 | | | For the
Period Ended
April 30,
2016(a) | |
Net Asset Value, Beginning of Period | | $ | 23.76 | | | $ | 26.77 | | | $ | 29.66 | | | $ | 27.03 | | | $ | 24.97 | | | $ | 25.00 | |
| | | | | | | | | | | | | | | | | | | | | | | | | |
INCOME (LOSS) FROM INVESTMENT OPERATIONS: | | | | | | | | | | | | | | | | | | | | | | | | |
Net Investment Gain (Loss) (b) | | | (0.02 | ) | | | 0.54 | | | | 0.74 | | | | 0.51 | | | | 0.18 | | | | (0.04 | ) |
Net Realized and Unrealized Gain (Loss) on Investments (h) | | | (3.31 | ) | | | (2.61 | ) | | | (3.16 | ) | | | 2.31 | | | | 1.88 | (c) | | | 0.01 | |
Total from Investment Operations | | | (3.33 | ) | | | (2.07 | ) | | | (2.42 | ) | | | 2.82 | | | | 2.06 | | | | (0.03 | ) |
| | | | | | | | | | | | | | | | | | | | | | | | | |
LESS DISTRIBUTIONS: | | | | | | | | | | | | | | | | | | | | | | | | |
Distributions from Net Investment Income | | | — | | | | (0.94 | ) | | | (0.47 | ) | | | (0.19 | ) | | | — | | | | — | |
Total Distributions | | | — | | | | (0.94 | ) | | | (0.47 | ) | | | (0.19 | ) | | | — | | | | — | |
Net Asset Value, End of Period | | $ | 20.43 | | | $ | 23.76 | | | $ | 26.77 | | | $ | 29.66 | | | $ | 27.03 | | | $ | 24.97 | |
Total Return | | | -14.01 | %(d) | | | -8.18 | % | | | -8.07 | % | | | 10.43 | % | | | 8.25 | %(e) | | | -0.13 | %(d) |
| | | | | | | | | | | | | | | | | | | | | | | | | |
SUPPLEMENTAL DATA: | | | | | | | | | | | | | | | | | | | | | | | | |
Net Assets at End of Period (000’s) | | $ | 55,168 | | | $ | 91,488 | | | $ | 183,379 | | | $ | 158,703 | | | $ | 31,081 | | | $ | 22,470 | |
| | | | | | | | | | | | | | | | | | | | | | | | | |
RATIOS TO AVERAGE NET ASSETS: | | | | | | | | | | | | | | | | | | | | | | | | |
Expenses to Average Net Assets | | | 0.65 | %(f) | | | 0.65 | % | | | 0.65 | % | | | 0.65 | % | | | 0.65 | % | | | 0.65 | %(f) |
Net Investment Income (Loss) to Average Net Assets | | | -0.19 | %(f) | | | 2.04 | % | | | 2.77 | % | | | 1.69 | % | | | 0.77 | % | | | -0.39 | %(f) |
Portfolio Turnover Rate (g) | | | 513 | %(d) | | | 12 | % | | | 396 | % | | | 228 | % | | | 143 | % | | | 0 | %(d) |
(a) | Commencement of operations on December 14, 2015. |
(b) | Calculated based on average shares outstanding during the period. |
(c) | Includes $0.41 gain derived from contribution from a settlement. See Note 8. |
(e) | Before the contribution from a settlement, the total return for the year would have been 6.60%. See Note 8. |
(g) | Excluded impact of in-kind transactions. |
(h) | Realized and unrealized gains and losses per share in this caption are balancing amounts necessary to reconcile to the change in net asset value for the period and may reconcile with the aggregate gains and losses in the statement of operations due to share transactions for the period. |
The accompanying notes are an integral part of the financial statements.
143
Pacer Global Cash Cows Dividend ETF
FINANCIAL HIGHLIGHTS
For a capital share outstanding throughout the year/period
| | | For the
Period Ended
October 31,
2020
(Unaudited) | | | For the
Year Ended
April 30,
2020 | | | For the
Year Ended
April 30,
2019 | | | For the
Year Ended
April 30,
2018 | | | For the
Year Ended
April 30,
2017 | | | For the
Period Ended
April 30,
2016(a) | |
Net Asset Value, Beginning of Period | | $ | 24.63 | | | $ | 31.19 | | | $ | 30.75 | | | $ | 28.60 | | | $ | 27.16 | | | $ | 25.00 | |
| | | | | | | | | | | | | | | | | | | | | | | | | |
INCOME FROM INVESTMENT OPERATIONS: | | | | | | | | | | | | | | | | | | | | | | | | |
Net Investment Income (b) | | | 0.59 | | | | 1.32 | | | | 1.21 | | | | 1.07 | | | | 0.88 | | | | 0.23 | |
Net Realized and Unrealized Gain (Loss) on Investments (f) | | | (0.81 | ) | | | (6.60 | ) | | | 0.43 | | | | 2.01 | | | | 1.26 | | | | 1.93 | |
Total from Investment Operations | | | (0.22 | ) | | | (5.28 | ) | | | 1.64 | | | | 3.08 | | | | 2.14 | | | | 2.16 | |
| | | | | | | | | | | | | | | | | | | | | | | | | |
LESS DISTRIBUTIONS: | | | | | | | | | | | | | | | | | | | | | | | | |
Distributions from Net Investment Income | | | (0.67 | ) | | | (1.28 | ) | | | (1.20 | ) | | | (0.93 | ) | | | (0.70 | ) | | | — | |
Total Distributions | | | (0.67 | ) | | | (1.28 | ) | | | (1.20 | ) | | | (0.93 | ) | | | (0.70 | ) | | | — | |
Net Asset Value, End of Period | | $ | 23.74 | | | $ | 24.63 | | | $ | 31.19 | | | $ | 30.75 | | | $ | 28.60 | | | $ | 27.16 | |
Total Return | | | -1.00 | %(c) | | | -17.32 | % | | | 5.56 | % | | | 10.86 | % | | | 8.03 | % | | | 8.64 | %(c) |
| | | | | | | | | | | | | | | | | | | | | | | | | |
SUPPLEMENTAL DATA: | | | | | | | | | | | | | | | | | | | | | | | | |
Net Assets at End of Period (000’s) | | $ | 110,393 | | | $ | 135,480 | | | $ | 210,505 | | | $ | 173,710 | | | $ | 70,059 | | | $ | 5,432 | |
| | | | | | | | | | | | | | | | | | | | | | | | | |
RATIOS TO AVERAGE NET ASSETS: | | | | | | | | | | | | | | | | | | | | | | | | |
Expenses to Average Net Assets | | | 0.60 | %(d) | | | 0.60 | % | | | 0.60 | % | | | 0.60 | % | | | 0.60 | % | | | 0.60 | %(d) |
Net Investment Income to Average Net Assets | | | 4.60 | %(d) | | | 4.52 | % | | | 4.00 | % | | | 3.50 | % | | | 3.19 | % | | | 4.63 | %(d) |
Portfolio Turnover Rate (e) | | | 35 | %(c) | | | 91 | % | | | 74 | % | | | 76 | % | | | 44 | % | | | 0 | %(c) |
(a) | Commencement of operations on February 22, 2016. |
(b) | Calculated based on average shares outstanding during the period. |
(e) | Excluded impact of in-kind transactions. |
(f) | Realized and unrealized gains and losses per share in this caption are balancing amounts necessary to reconcile to the change in net asset value for the period and may reconcile with the aggregate gains and losses in the statement of operations due to share transactions for the period. |
The accompanying notes are an integral part of the financial statements.
144
Pacer US Cash Cows 100 ETF
FINANCIAL HIGHLIGHTS
For a capital share outstanding throughout the year/period
| | | For the
Period Ended
October 31,
2020
(Unaudited) | | | For the
Year Ended
April 30,
2020 | | | For the
Year Ended
April 30,
2019 | | | For the
Year Ended
April 30,
2018 | | | For the
Period Ended
April 30,
2017(a) | |
Net Asset Value, Beginning of Period | | $ | 25.17 | | | $ | 29.72 | | | $ | 28.98 | | | $ | 26.13 | | | $ | 25.00 | |
| | | | | | | | | | | | | | | | | | | | | |
INCOME (LOSS) FROM INVESTMENT OPERATIONS: | | | | | | | | | | | | | | | | | | | | |
Net Investment Income (b) | | | 0.32 | | | | 0.77 | | | | 0.53 | | | | 0.61 | | | | 0.13 | |
Net Realized and Unrealized Gain (Loss) on Investments (f) | | | 2.38 | | | | (4.55 | ) | | | 0.67 | | | | 2.84 | | | | 1.09 | |
Total from Investment Operations | | | 2.70 | | | | (3.78 | ) | | | 1.20 | | | | 3.45 | | | | 1.22 | |
| | | | | | | | | | | | | | | | | | | | | |
LESS DISTRIBUTIONS: | | | | | | | | | | | | | | | | | | | | |
Distributions from Net Investment Income | | | (0.32 | ) | | | (0.77 | ) | | | (0.46 | ) | | | (0.60 | ) | | | (0.09 | ) |
Total Distributions | | | (0.32 | ) | | | (0.77 | ) | | | (0.46 | ) | | | (0.60 | ) | | | (0.09 | ) |
Net Asset Value, End of Period | | $ | 27.55 | | | $ | 25.17 | | | $ | 29.72 | | | $ | 28.98 | | | $ | 26.13 | |
Total Return | | | 10.75 | %(c) | | | -12.63 | % | | | 4.28 | % | | | 13.35 | % | | | 4.87 | %(c) |
| | | | | | | | | | | | | | | | | | | | | |
SUPPLEMENTAL DATA: | | | | | | | | | | | | | | | | | | | | |
Net Assets at End of Period (000’s) | | $ | 196,989 | | | $ | 190,027 | | | $ | 266,018 | | | $ | 28,981 | | | $ | 11,759 | |
| | | | | | | | | | | | | | | | | | | | | |
RATIOS TO AVERAGE NET ASSETS: | | | | | | | | | | | | | | | | | | | | |
Expenses to Average Net Assets | | | 0.49 | %(d) | | | 0.49 | % | | | 0.49 | % | | | 0.49 | % | | | 0.49 | %(d) |
Net Investment Income to Average Net Assets | | | 2.34 | %(d) | | | 2.73 | % | | | 1.82 | % | | | 2.16 | % | | | 1.37 | %(d) |
Portfolio Turnover Rate (e) | | | 64 | %(c) | | | 85 | % | | | 122 | % | | | 101 | % | | | 36 | %(c) |
(a) | Commencement of operations on December 16, 2016. |
(b) | Calculated based on average shares outstanding during the period. |
(e) | Excluded impact of in-kind transactions |
(f) | Realized and unrealized gains and losses per share in this caption are balancing amounts necessary to reconcile to the change in net asset value for the period and may reconcile with the aggregate gains and losses in the statement of operations due to share transactions for the period. |
The accompanying notes are an integral part of the financial statements.
145
Pacer US Small Cap Cash Cows 100 ETF
FINANCIAL HIGHLIGHTS
For a capital share outstanding throughout the year/period
| | | For the
Period Ended
October 31,
2020
(Unaudited) | | | For the
Year Ended
April 30,
2020 | | | For the
Year Ended
April 30,
2019 | | | For the
Period Ended
April 30,
2018(a) | |
Net Asset Value, Beginning of Period | | $ | 20.76 | | | $ | 25.88 | | | $ | 26.17 | | | $ | 24.78 | |
| | | | | | | | | | | | | | | | | |
INCOME (LOSS) FROM INVESTMENT OPERATIONS: | | | | | | | | | | | | | | | | |
Net Investment Income (b) | | | 0.05 | | | | 0.27 | | | | 0.32 | | | | 0.28 | |
Net Realized and Unrealized Gain (Loss) on Investments (f) | | | 4.49 | | | | (5.12 | ) | | | (0.29 | ) | | | 1.38 | |
Total from Investment Operations | | | 4.54 | | | | (4.85 | ) | | | 0.03 | | | | 1.66 | |
| | | | | | | | | | | | | | | | | |
LESS DISTRIBUTIONS: | | | | | | | | | | | | | | | | |
Distributions from Net Investment Income | | | (0.05 | ) | | | (0.27 | ) | | | (0.32 | ) | | | (0.27 | ) |
Total Distributions | | | (0.05 | ) | | | (0.27 | ) | | | (0.32 | ) | | | (0.27 | ) |
Net Asset Value, End of Period | | $ | 25.25 | | | $ | 20.76 | | | $ | 25.88 | | | $ | 26.17 | |
Total Return | | | 21.87 | %(c) | | | -18.72% | | | | 0.20 | % | | | 6.69 | %(c) |
| | | | | | | | | | | | | | | | | |
SUPPLEMENTAL DATA: | | | | | | | | | | | | | | | | |
Net Assets at End of Period (000’s) | | $ | 35,349 | | | $ | 14,534 | | | $ | 50,474 | | | $ | 5,233 | |
| | | | | | | | | | | | | | | | | |
RATIOS TO AVERAGE NET ASSETS: | | | | | | | | | | | | | | | | |
Expenses to Average Net Assets | | | 0.59 | %(d) | | | 0.59% | | | | 0.59 | % | | | 0.59 | %(d) |
Net Investment Income to Average Net Assets | | | 0.40 | %(d) | | | 1.11% | | | | 1.21 | % | | | 1.25 | %(d) |
Portfolio Turnover Rate (e) | | | 86 | %(c) | | | 128% | | | | 123 | % | | | 97 | %(c) |
(a) | Commencement of operations on June 16, 2017. |
(b) | Calculated based on average shares outstanding during the period. |
(e) | Excluded impact of in-kind transactions |
(f) | Realized and unrealized gains and losses per share in this caption are balancing amounts necessary to reconcile to the change in net asset value for the period and may reconcile with the aggregate gains and losses in the statement of operations due to share transactions for the period. |
The accompanying notes are an integral part of the financial statements.
146
Pacer Developed Markets International Cash Cows 100 ETF
FINANCIAL HIGHLIGHTS
For a capital share outstanding throughout the year/period
| | | For the
Period Ended
October 31,
2020
(Unaudited) | | | For the
Year Ended
April 30,
2020 | | | For the
Year Ended
April 30,
2019 | | | For the
Period Ended
April 30,
2018(a) | |
Net Asset Value, Beginning of Period | | $ | 20.99 | | | $ | 27.08 | | | $ | 28.91 | | | $ | 25.09 | |
| | | | | | | | | | | | | | | | | |
INCOME (LOSS) FROM INVESTMENT OPERATIONS: | | | | | | | | | | | | | | | | |
Net Investment Income (b) | | | 0.30 | | | | 0.74 | | | | 0.85 | | | | 0.60 | |
Net Realized and Unrealized Gain (Loss) on Investments (f) | | | 1.81 | | | | (6.05 | ) | | | (2.01 | ) | | | 3.53 | |
Total from Investment Operations | | | 2.11 | | | | (5.31 | ) | | | (1.16 | ) | | | 4.13 | |
| | | | | | | | | | | | | | | | | |
LESS DISTRIBUTIONS: | | | | | | | | | | | | | | | | |
Distributions from Net Investment Income | | | (0.42 | ) | | | (0.78 | ) | | | (0.67 | ) | | | (0.31 | ) |
Total Distributions | | | (0.42 | ) | | | (0.78 | ) | | | (0.67 | ) | | | (0.31 | ) |
Net Asset Value, End of Period | | $ | 22.68 | | | $ | 20.99 | | | $ | 27.08 | | | $ | 28.91 | |
Total Return | | | 10.00 | %(c) | | | -20.04 | % | | | -3.92 | % | | | 16.48 | %(c) |
| | | | | | | | | | | | | | | | | |
SUPPLEMENTAL DATA: | | | | | | | | | | | | | | | | |
Net Assets at End of Period (000’s) | | $ | 12,474 | | | $ | 20,991 | | | $ | 33,844 | | | $ | 20,235 | |
| | | | | | | | | | | | | | | | | |
RATIOS TO AVERAGE NET ASSETS: | | | | | | | | | | | | | | | | |
Expenses to Average Net Assets | | | 0.65 | %(d) | | | 0.65 | % | | | 0.65 | % | | | 0.65 | %(d) |
Net Investment Income to Average Net Assets | | | 2.57 | %(d) | | | 2.96 | % | | | 3.18 | % | | | 2.42 | %(d) |
Portfolio Turnover Rate (e) | | | 39 | %(c) | | | 149 | % | | | 80 | % | | | 25 | %(c) |
(a) | Commencement of operations on June 16, 2017. |
(b) | Calculated based on average shares outstanding during the period. |
(e) | Excluded impact of in-kind transactions |
(f) | Realized and unrealized gains and losses per share in this caption are balancing amounts necessary to reconcile to the change in net asset value for the period and may reconcile with the aggregate gains and losses in the statement of operations due to share transactions for the period. |
The accompanying notes are an integral part of the financial statements.
147
Pacer WealthShield ETF
FINANCIAL HIGHLIGHTS
For a capital share outstanding throughout the year/period
| | | For the
Period Ended
October 31,
2020
(Unaudited) | | | For the
Year Ended
April 30,
2020 | | | For the
Year Ended
April 30,
2019 | | | For the
Period Ended
April 30,
2018(a) | |
Net Asset Value, Beginning of Period | | $ | 23.92 | | | $ | 25.02 | | | $ | 25.02 | | | $ | 25.02 | |
| | | | | | | | | | | | | | | | | |
INCOME (LOSS) FROM INVESTMENT OPERATIONS: | | | | | | | | | | | | | | | | |
Net Investment Income (b) | | | 0.06 | | | | 0.33 | | | | 0.38 | | | | 0.10 | |
Net Realized and Unrealized Gain (Loss) on Investments (f) | | | 1.13 | | | | (1.10 | ) | | | (0.01 | ) | | | (0.05 | ) |
Total from Investment Operations | | | 1.19 | | | | (0.77 | ) | | | 0.37 | | | | 0.05 | |
| | | | | | | | | | | | | | | | | |
LESS DISTRIBUTIONS: | | | | | | | | | | | | | | | | |
Distributions from Net Investment Income | | | (0.08 | ) | | | (0.33 | ) | | | (0.37 | ) | | | (0.05 | ) |
Total Distributions | | | (0.08 | ) | | | (0.33 | ) | | | (0.37 | ) | | | (0.05 | ) |
Net Asset Value, End of Period | | $ | 25.03 | | | $ | 23.92 | | | $ | 25.02 | | | $ | 25.02 | |
Total Return | | | 4.99 | %(c) | | | -3.04% | | | | 1.43 | % | | | 0.23 | %(c) |
| | | | | | | | | | | | | | | | | |
SUPPLEMENTAL DATA: | | | | | | | | | | | | | | | | |
Net Assets at End of Period (000’s) | | $ | 48,801 | | | $ | 51,428 | | | $ | 110,078 | | | $ | 62,539 | |
| | | | | | | | | | | | | | | | | |
RATIOS TO AVERAGE NET ASSETS: | | | | | | | | | | | | | | | | |
Expenses to Average Net Assets | | | 0.60 | %(d) | | | 0.60% | | | | 0.60 | % | | | 0.60 | %(d) |
Net Investment Income to Average Net Assets | | | 0.45 | %(d) | | | 1.38% | | | | 1.52 | % | | | 1.04 | %(d) |
Portfolio Turnover Rate (e) | | | 126 | %(c) | | | 676% | | | | 542 | % | | | 131 | %(c) |
(a) | Commencement of operations on December 11, 2017. |
(b) | Calculated based on average shares outstanding during the period. |
(e) | Excluded impact of in-kind transactions |
(f) | Realized and unrealized gains and losses per share in this caption are balancing amounts necessary to reconcile to the change in net asset value for the period and may reconcile with the aggregate gains and losses in the statement of operations due to share transactions for the period. |
The accompanying notes are an integral part of the financial statements.
148
Pacer Military Times Best Employers ETF
FINANCIAL HIGHLIGHTS
For a capital share outstanding throughout the year/period
| | | For the
Period Ended
October 31,
2020
(Unaudited) | | | For the
Year Ended
April 30,
2020 | | | For the
Year Ended
April 30,
2019 | | | For the
Period Ended
April 30,
2018(a) | |
Net Asset Value, Beginning of Period | | $ | 27.73 | | | $ | 28.73 | | | $ | 25.33 | | | $ | 24.89 | |
| | | | | | | | | | | | | | | | | |
INCOME (LOSS) FROM INVESTMENT OPERATIONS: | | | | | | | | | | | | | | | | |
Net Investment Income (b) | | | 0.23 | | | | 0.51 | | | | 0.44 | | | | — | (c) |
Net Realized and Unrealized Gain (Loss) on Investments (g) | | | 1.34 | | | | (0.98 | ) | | | 3.43 | | | | 0.44 | |
Total from Investment Operations | | | 1.57 | | | | (0.47 | ) | | | 3.87 | | | | 0.44 | |
| | | | | | | | | | | | | | | | | |
LESS DISTRIBUTIONS: | | | | | | | | | | | | | | | | |
Distributions from Net Investment Income | | | (0.25 | ) | | | (0.53 | ) | | | (0.47 | ) | | | — | |
Total Distributions | | | (0.25 | ) | | | (0.53 | ) | | | (0.47 | ) | | | — | |
Net Asset Value, End of Period | | $ | 29.05 | | | $ | 27.73 | | | $ | 28.73 | | | $ | 25.33 | |
Total Return | | | 5.69 | %(d) | | | -1.59 | % | | | 15.46 | % | | | 1.79 | %(d) |
| | | | | | | | | | | | | | | | | |
SUPPLEMENTAL DATA: | | | | | | | | | | | | | | | | |
Net Assets at End of Period (000’s) | | $ | 1,453 | | | $ | 2,773 | | | $ | 2,873 | | | $ | 2,533 | |
| | | | | | | | | | | | | | | | | |
RATIOS TO AVERAGE NET ASSETS: | | | | | | | | | | | | | | | | |
Expenses to Average Net Assets | | | 0.60 | %(e) | | | 0.60 | % | | | 0.60 | % | | | 0.60 | %(e) |
Net Investment Income to Average Net Assets | | | 1.55 | %(e) | | | 1.72 | % | | | 1.66 | % | | | 0.25 | %(e) |
Portfolio Turnover Rate (f) | | | 45 | %(d) | | | 19 | % | | | 9 | % | | | 0 | %(d) |
(a) | Commencement of operations on April 9, 2018. |
(b) | Calculated based on average shares outstanding during the period. |
(f) | Excluded impact of in-kind transactions |
(g) | Realized and unrealized gains and losses per share in this caption are balancing amounts necessary to reconcile to the change in net asset value for the period and may reconcile with the aggregate gains and losses in the statement of operations due to share transactions for the period. |
The accompanying notes are an integral part of the financial statements.
149
Pacer Benchmark Industrial Real Estate SCTRSM ETF
FINANCIAL HIGHLIGHTS
For a capital share outstanding throughout the year/period
| | | For the
Period Ended
October 31,
2020
(Unaudited) | | | For the
Year Ended
April 30,
2020 | | | For the
Period Ended
April 30,
2019(a) | |
Net Asset Value, Beginning of Period | | $ | 30.09 | | | $ | 29.42 | | | $ | 24.83 | |
| | | | | | | | | | | | | |
INCOME (LOSS) FROM INVESTMENT OPERATIONS: | | | | | | | | | | | | |
Net Investment Income (Loss) (b) | | | 0.47 | | | | 0.77 | | | | 0.65 | |
Net Realized and Unrealized Gain (Loss) on Investments (f) | | | 3.22 | | | | 0.52 | | | | 4.61 | |
Total from Investment Operations | | | 3.69 | | | | 1.29 | | | | 5.26 | |
| | | | | | | | | | | | | |
LESS DISTRIBUTIONS: | | | | | | | | | | | | |
Distributions from: | | | | | | | | | | | | |
Net Investment Income | | | (0.26 | ) | | | (0.61 | ) | | | (0.67 | ) |
Long-Term Capital Gain | | | — | | | | (0.01 | ) | | | — | |
Total Distributions | | | (0.26 | ) | | | (0.62 | ) | | | (0.67 | ) |
Net Asset Value, End of Period | | $ | 33.52 | | | $ | 30.09 | | | $ | 29.42 | |
Total Return | | | 12.27 | %(c) | | | 4.38 | % | | | 21.62 | %(c) |
| | | | | | | | | | | | | |
SUPPLEMENTAL DATA: | | | | | | | | | | | | |
Net Assets at End of Period (000’s) | | $ | 113,964 | | | $ | 48,147 | | | $ | 7,356 | |
| | | | | | | | | | | | | |
RATIOS TO AVERAGE NET ASSETS: | | | | | | | | | | | | |
Expenses to Average Net Assets | | | 0.60 | %(d) | | | 0.60 | % | | | 0.60 | %(d) |
Net Investment Income (Loss) to Average Net Assets | | | 2.81 | %(d) | | | 2.40 | % | | | 2.60 | %(d) |
Portfolio Turnover Rate (e) | | | 5 | %(c) | | | 29 | % | | | 36 | %(c) |
(a) | Commencement of operations on May 14, 2018. |
(b) | Calculated based on average shares outstanding during the period. |
(e) | Excluded impact of in-kind transactions |
(f) | These amounts are comprised of only net investment income. |
(g) | Realized and unrealized gains and losses per share in this caption are balancing amounts necessary to reconcile to the change in net asset value for the period and may reconcile with the aggregate gains and losses in the statement of operations due to share transactions for the period. |
The accompanying notes are an integral part of the financial statements.
150
Pacer Benchmark Data & Infrastructure Real Estate SCTRSM ETF
FINANCIAL HIGHLIGHTS
For a capital share outstanding throughout the year/period
| | | For the
Period Ended
October 31,
2020
(Unaudited) | | | For the
Year Ended
April 30,
2020 | | | For the
Period Ended
April 30,
2019(a) | |
Net Asset Value, Beginning of Period | | $ | 33.27 | | | $ | 28.36 | | | $ | 24.67 | |
| | | | | | | | | | | | | |
INCOME FROM INVESTMENT OPERATIONS: | | | | | | | | | | | | |
Net Investment Income (b) | | | 0.31 | | | | 0.54 | | | | 0.39 | |
Net Realized and Unrealized Gain on Investments (f) | | | 0.72 | | | | 4.92 | | | | 3.93 | |
Total from Investment Operations | | | 1.03 | | | | 5.46 | | | | 4.32 | |
| | | | | | | | | | | | | |
LESS DISTRIBUTIONS: | | | | | | | | | | | | |
Distributions from: | | | | | | | | | | | | |
Net Investment Income | | | (0.25 | ) | | | (0.49 | ) | | | (0.44 | ) |
Long-Term Capital Gain | | | — | | | | — | | | | (0.01 | ) |
Return of Capital | | | (0.02 | ) | | | (0.06 | ) | | | (0.18 | ) |
Total Distributions | | | (0.27 | ) | | | (0.55 | ) | | | (0.63 | ) |
Net Asset Value, End of Period | | $ | 34.03 | | | $ | 33.27 | | | $ | 28.36 | |
Total Return | | | 3.09 | %(c) | | | 19.50 | % | | | 17.89 | %(c) |
| | | | | | | | | | | | | |
SUPPLEMENTAL DATA: | | | | | | | | | | | | |
Net Assets at End of Period (000’s) | | $ | 1,053,166 | | | $ | 552,214 | | | $ | 22,691 | |
| | | | | | | | | | | | | |
RATIOS TO AVERAGE NET ASSETS: | | | | | | | | | | | | |
Expenses to Average Net Assets | | | 0.60 | %(d) | | | 0.60 | % | | | 0.60 | %(d) |
Net Investment Income to Average Net Assets | | | 1.74 | %(d) | | | 1.70 | % | | | 1.55 | %(d) |
Portfolio Turnover Rate (6) | | | 23 | %(c) | | | 28 | % | | | 27 | %(c) |
(a) | Commencement of operations on May 15, 2018. |
(b) | Calculated based on average shares outstanding during the period. |
(e) | Excluded impact of in-kind transactions |
(f) | Realized and unrealized gains and losses per share in this caption are balancing amounts necessary to reconcile to the change in net asset value for the period and may reconcile with the aggregate gains and losses in the statement of operations due to share transactions for the period. |
The accompanying notes are an integral part of the financial statements.
151
Pacer US Export Leaders ETF
FINANCIAL HIGHLIGHTS
For a capital share outstanding throughout the year/period
| | | For the
Period Ended
October 31,
2020
(Unaudited) | | | For the
Year Ended
April 30,
2020 | | | For the
Period Ended
April 30,
2019(a) | |
Net Asset Value, Beginning of Period | | $ | 25.15 | | | $ | 25.97 | | | $ | 24.98 | |
| | | | | | | | | | | | | |
INCOME (LOSS) FROM INVESTMENT OPERATIONS: | | | | | | | | | | | | |
Net Investment Income (b) | | | 0.08 | | | | 0.16 | | | | 0.09 | |
Net Realized and Unrealized Gain (Loss) on Investments (f) | | | 4.83 | | | | (0.82 | ) | | | 0.98 | |
Total from Investment Operations | | | 4.91 | | | | (0.66 | ) | | | 1.07 | |
| | | | | | | | | | | | | |
LESS DISTRIBUTIONS: | | | | | | | | | | | | |
Distributions from Net Investment Income | | | (0.08 | ) | | | (0.16 | ) | | | (0.08 | ) |
Total Distributions | | | (0.08 | ) | | | (0.16 | ) | | | (0.08 | ) |
Net Asset Value, End of Period | | $ | 29.98 | | | $ | 25.15 | | | $ | 25.97 | |
Total Return | | | 19.58 | %(c) | | | -2.53 | % | | | 4.33 | %(c) |
| | | | | | | | | | | | | |
SUPPLEMENTAL DATA: | | | | | | | | | | | | |
Net Assets at End of Period (000’s) | | $ | 1,499 | | | $ | 1,257 | | | $ | 1,298 | |
| | | | | | | | | | | | | |
RATIOS TO AVERAGE NET ASSETS: | | | | | | | | | | | | |
Expenses to Average Net Assets | | | 0.60 | %(d) | | | 0.60 | % | | | 0.60 | %(d) |
Net Investment Income to Average Net Assets | | | 0.53 | %(d) | | | 0.61 | % | | | 0.50 | %(d) |
Portfolio Turnover Rate (e) | | | 71 | %(c) | | | 79 | % | | | 55 | %(c) |
(a) | Commencement of operations on July 23, 2018. |
(b) | Calculated based on average shares outstanding during the period. |
(e) | Excluded impact of in-kind transactions |
(f) | Realized and unrealized gains and losses per share in this caption are balancing amounts necessary to reconcile to the change in net asset value for the period and may reconcile with the aggregate gains and losses in the statement of operations due to share transactions for the period. |
The accompanying notes are an integral part of the financial statements.
152
Pacer CFRA-Stovall Equal Weight Seasonal Rotation ETF
FINANCIAL HIGHLIGHTS
For a capital share outstanding throughout the year/period
| | | For the
Period Ended
October 31,
2020
(Unaudited) | | | For the
Year Ended
April 30,
2020 | | | For the
Period Ended
April 30,
2019(a) | |
Net Asset Value, Beginning of Period | | $ | 25.23 | | | $ | 28.16 | | | $ | 25.01 | |
| | | | | | | | | | | | | |
INCOME (LOSS) FROM INVESTMENT OPERATIONS: | | | | | | | | | | | | |
Net Investment Income (b) | | | 0.15 | | | | 0.50 | | | | 0.25 | |
Net Realized and Unrealized Gain (Loss) on Investments (g) | | | 1.48 | | | | (3.00 | ) | | | 3.11 | |
Total from Investment Operations | | | 1.63 | | | | (2.50 | ) | | | 3.36 | |
| | | | | | | | | | | | | |
LESS DISTRIBUTIONS: | | | | | | | | | | | | |
Distributions from Net Investment Income | | | (0.13 | ) | | | (0.43 | ) | | | (0.21 | ) |
Total Distributions | | | (0.13 | ) | | | (0.43 | ) | | | (0.21 | ) |
Net Asset Value, End of Period | | $ | 26.73 | | | $ | 25.23 | | | $ | 28.16 | |
Total Return | | | 6.49 | %(c) | | | -8.80 | % | | | 13.67 | %(c) |
| | | | | | | | | | | | | |
SUPPLEMENTAL DATA: | | | | | | | | | | | | |
Net Assets at End of Period (000’s) | | $ | 50,793 | | | $ | 60,554 | | | $ | 7,040 | |
| | | | | | | | | | | | | |
RATIOS TO AVERAGE NET ASSETS: | | | | | | | | | | | | |
Expenses to Average Net Assets | | | 0.60 | %(d) | | | 0.60 | % | | | 0.60 | %(d) |
Net Investment Income to Average Net Assets | | | 1.08 | %(d) | | | 1.75 | % | | | 1.23 | %(d) |
Portfolio Turnover Rate (e) | | | 96 | %(c) | | | 225 | % | | | 262 | %(c) |
(a) | Commencement of operations on July 23, 2018. |
(b) | Calculated based on average shares outstanding during the period. |
(e) | Excluded impact of in-kind transactions |
(f) | Total Return was calculated using the traded NAV due to the rebalancing of the portfolio at April 30, 2019. |
(g) | Realized and unrealized gains and losses per share in this caption are balancing amounts necessary to reconcile to the change in net asset value for the period and may reconcile with the aggregate gains and losses in the statement of operations due to share transactions for the period. |
The accompanying notes are an integral part of the financial statements.
153
Pacer US Cash Cows Growth ETF
FINANCIAL HIGHLIGHTS
For a capital share outstanding throughout the period
| | | For the
Period Ended
October 31,
2020
(Unaudited) | | | For the
Period Ended
April 30,
2020(a) | |
Net Asset Value, Beginning of Period | | $ | 22.89 | | | $ | 24.78 | |
| | | | | | | | | |
INCOME (LOSS) FROM INVESTMENT OPERATIONS: | | | | | | | | |
Net Investment Income (b) | | | 0.14 | | | | 0.28 | |
Net Realized and Unrealized Gain (Loss) on Investments (f) | | | 4.33 | | | | (1.90 | ) |
Total from Investment Operations | | | 4.47 | | | | (1.62 | ) |
| | | | | | | | | |
LESS DISTRIBUTIONS: | | | | | | | | |
Distributions from Net Investment Income | | | (0.14 | ) | | | (0.27 | ) |
Total Distributions | | | (0.14 | ) | | | (0.27 | ) |
Net Asset Value, End of Period | | $ | 27.22 | | | $ | 22.89 | |
Total Return | | | 19.56 | %(c) | | | -6.52 | %(c) |
| | | | | | | | | |
SUPPLEMENTAL DATA: | | | | | | | | |
Net Assets at End of Period (000’s) | | $ | 1,361 | | | $ | 1,144 | |
| | | | | | | | | |
RATIOS TO AVERAGE NET ASSETS: | | | | | | | | |
Expenses to Average Net Assets | | | 0.60 | %(d) | | | 0.60 | %(d) |
Net Investment Income to Average Net Assets | | | 1.07 | %(d) | | | 1.16 | %(d) |
Portfolio Turnover Rate (e) | | | 68 | %(c) | | | 166 | %(c) |
(a) | Commencement of operations on May 2, 2019. |
(b) | Calculated based on average shares outstanding during the period. |
(e) | Excluded impact of in-kind transactions |
(f) | Realized and unrealized gains and losses per share in this caption are balancing amounts necessary to reconcile to the change in net asset value for the period and may reconcile with the aggregate gains and losses in the statement of operations due to share transactions for the period. |
The accompanying notes are an integral part of the financial statements.
154
Pacer Trendpilot International ETF
FINANCIAL HIGHLIGHTS
For a capital share outstanding throughout the period
| | | For the
Period Ended
October 31,
2020
(Unaudited) | | | For the
Period Ended
April 30,
2020(a) | |
Net Asset Value, Beginning of Period | | $ | 23.42 | | | $ | 24.91 | |
| | | | | | | | | |
INCOME (LOSS) FROM INVESTMENT OPERATIONS: | | | | | | | | |
Net Investment Income (b) | | | 0.04 | | | | 0.32 | |
Net Realized and Unrealized Gain (Loss) on Investments (f) | | | (1.48 | ) | | | (1.55 | ) |
Total from Investment Operations | | | (1.44 | ) | | | (1.23 | ) |
| | | | | | | | | |
LESS DISTRIBUTIONS: | | | | | | | | |
Distributions from Net Investment Income | | | — | | | | (0.26 | ) |
Total Distributions | | | — | | | | (0.26 | ) |
Net Asset Value, End of Period | | $ | 21.98 | | | $ | 23.42 | |
Total Return | | | -6.15 | %(c) | | | -5.08 | %(c) |
| | | | | | | | | |
SUPPLEMENTAL DATA: | | | | | | | | |
Net Assets at End of Period (000’s) | | $ | 107,683 | | | $ | 151,038 | |
| | | | | | | | | |
RATIOS TO AVERAGE NET ASSETS: | | | | | | | | |
Expenses to Average Net Assets | | | 0.65 | %(d) | | | 0.65 | %(d) |
Net Investment Income to Average Net Assets | | | 0.31 | %(d) | | | 1.26 | %(d) |
Portfolio Turnover Rate (e) | | | 173 | %(c) | | | 39 | %(c) |
(a) | Commencement of operations on May 2, 2019. |
(b) | Calculated based on average shares outstanding during the period. |
(e) | Excluded impact of in-kind transactions |
(f) | Realized and unrealized gains and losses per share in this caption are balancing amounts necessary to reconcile to the change in net asset value for the period and may reconcile with the aggregate gains and losses in the statement of operations due to share transactions for the period. |
The accompanying notes are an integral part of the financial statements.
155
Pacer Emerging Markets Cash Cows 100 ETF
FINANCIAL HIGHLIGHTS
For a capital share outstanding throughout the period
| | | For the
Period Ended
October 31,
2020
(Unaudited) | | | For the
Period Ended
April 30,
2020(a) | |
Net Asset Value, Beginning of Period | | $ | 19.11 | | | $ | 24.95 | |
| | | | | | | | | |
INCOME (LOSS) FROM INVESTMENT OPERATIONS: | | | | | | | | |
Net Investment Income (b) | | | 0.47 | | | | 1.05 | |
Net Realized and Unrealized Gain (Loss) on Investments (f) | | | 0.64 | | | | (4.81 | ) |
Total from Investment Operations | | | 1.11 | | | | (3.76 | ) |
| | | | | | | | | |
LESS DISTRIBUTIONS: | | | | | | | | |
Distributions from Net Investment Income | | | (0.76 | ) | | | (2.08 | ) |
Total Distributions | | | (0.76 | ) | | | (2.08 | ) |
Net Asset Value, End of Period | | $ | 19.46 | | | $ | 19.11 | |
Total Return | | | 5.50 | %(c) | | | -16.76 | %(c) |
| | | | | | | | | |
SUPPLEMENTAL DATA: | | | | | | | | |
Net Assets at End of Period (000’s) | | $ | 1,946 | | | $ | 956 | |
| | | | | | | | | |
RATIOS TO AVERAGE NET ASSETS: | | | | | | | | |
Expenses to Average Net Assets | | | 0.70 | %(d) | | | 0.70 | %(d) |
Net Investment Income to Average Net Assets | | | 4.59 | %(d) | | | 4.43 | %(d) |
Portfolio Turnover Rate (e) | | | 31 | %(c) | | | 144 | %(c) |
(a) | Commencement of operations on May 2, 2019. |
(b) | Calculated based on average shares outstanding during the period. |
(e) | Excluded impact of in-kind transactions |
(f) | Realized and unrealized gains and losses per share in this caption are balancing amounts necessary to reconcile to the change in net asset value for the period and may reconcile with the aggregate gains and losses in the statement of operations due to share transactions for the period. |
The accompanying notes are an integral part of the financial statements.
156
Pacer Trendpilot Fund of Funds ETF
FINANCIAL HIGHLIGHTS
For a capital share outstanding throughout the period
| | | For the
Period Ended
October 31,
2020
(Unaudited) | | | For the
Period Ended
April 30,
2020(a) | |
Net Asset Value, Beginning of Period | | $ | 23.81 | | | $ | 25.39 | |
| | | | | | | | | |
INCOME (LOSS) FROM INVESTMENT OPERATIONS: | | | | | | | | |
Net Investment Income (Loss) (b)(c) | | | (0.02 | ) | | | 0.26 | |
Net Realized and Unrealized Gain (Loss) on Investments (h) | | | 1.11 | | | | (1.59 | ) |
Total from Investment Operations | | | 1.09 | | | | (1.33 | ) |
| | | | | | | | | |
LESS DISTRIBUTIONS: | | | | | | | | |
Distributions from Net Investment Income | | | — | | | | (0.25 | ) |
Total Distributions | | | — | | | | (0.25 | ) |
Net Asset Value, End of Period | | $ | 24.90 | | | $ | 23.81 | |
Total Return | | | 4.60 | %(d) | | | -5.37 | %(d) |
| | | | | | | | | |
SUPPLEMENTAL DATA: | | | | | | | | |
Net Assets at End of Period (000’s) | | $ | 32,373 | | | $ | 27,378 | |
| | | | | | | | | |
RATIOS TO AVERAGE NET ASSETS: | | | | | | | | |
Expenses to Average Net Assets (f) | | | 0.15 | %(e) | | | 0.15 | %(e) |
Net Investment Income to Average Net Assets (f) | | | -0.15 | %(e) | | | 1.03 | %(e) |
Portfolio Turnover Rate (g) | | | 30 | %(d) | | | 6 | %(d) |
(a) | Commencement of operations on May 3, 2019. |
(b) | Calculated based on average shares outstanding during the period. |
(c) | Recognition of net investment income by the Fund is affected by the timing of the delcaration of dividends by the underlying investment companies in which the Fund invests. The ratio does not include the net investment income of the underlying companies in which the Fund invests. |
(f) | Does not include expenses of the investment companies in which the Fund invests. |
(g) | Excluded impact of in-kind transactions |
(h) | Realized and unrealized gains and losses per share in this caption are balancing amounts necessary to reconcile to the change in net asset value for the period and may reconcile with the aggregate gains and losses in the statement of operations due to share transactions for the period. |
The accompanying notes are an integral part of the financial statements.
157
Pacer Cash Cows Fund of Funds ETF
FINANCIAL HIGHLIGHTS
For a capital share outstanding throughout the period
| | | For the
Period Ended
October 31,
2020
(Unaudited) | | | For the
Period Ended
April 30,
2020(a) | |
Net Asset Value, Beginning of Period | | $ | 20.83 | | | $ | 25.31 | |
| | | | | | | | | |
INCOME (LOSS) FROM INVESTMENT OPERATIONS: | | | | | | | | |
Net Investment Income (Loss) (b)(c) | | | 0.33 | | | | 0.53 | |
Net Realized and Unrealized Gain (Loss) on Investments (h) | | | 2.17 | | | | (4.46 | ) |
Total from Investment Operations | | | 2.50 | | | | (3.93 | ) |
| | | | | | | | | |
LESS DISTRIBUTIONS: | | | | | | | | |
Distributions from: | | | | | | | | |
Net Investment Income | | | (0.28 | ) | | | (0.55 | ) |
Return of Capital | | | — | | | | (0.00 | )(i) |
Total Distributions | | | (0.28 | ) | | | (0.55 | ) |
Net Asset Value, End of Period | | $ | 23.05 | | | $ | 20.83 | |
Total Return | | | 11.99 | %(d) | | | -15.71 | %(d) |
| | | | | | | | | |
SUPPLEMENTAL DATA: | | | | | | | | |
Net Assets at End of Period (000’s) | | $ | 1,152 | | | $ | 1,041 | |
| | | | | | | | | |
RATIOS TO AVERAGE NET ASSETS: | | | | | | | | |
Expenses to Average Net Assets (f) | | | 0.15 | %(e) | | | 0.15 | %(e) |
Net Investment Income (Loss) to Average Net Assets (f) | | | 2.82 | %(e) | | | 2.27 | %(e) |
Portfolio Turnover Rate (g) | | | 5 | %(d) | | | 2 | %(d) |
(a) | Commencement of operations on May 3, 2019. |
(b) | Calculated based on average shares outstanding during the period. |
(c) | Recognition of net investment income by the Fund is affected by the timing of the delcaration of dividends by the underlying investment companies in which the Fund invests. The ratio does not include the net investment income of the underlying companies in which the Fund invests. |
(f) | Does not include expenses of the investment companies in which the Fund invests. |
(g) | Excluded impact of in-kind transactions |
(h) | Realized and unrealized gains and losses per share in this caption are balancing amounts necessary to reconcile to the change in net asset value for the period and may reconcile with the aggregate gains and losses in the statement of operations due to share transactions for the period. |
The accompanying notes are an integral part of the financial statements.
158
Pacer Trendpilot US Bond ETF
FINANCIAL HIGHLIGHTS
For a capital share outstanding throughout the period
| | | For the
Period Ended
October 31,
2020
(Unaudited) | | | For the
Period Ended
April 30,
2020(a) | |
Net Asset Value, Beginning of Period | | $ | 25.77 | | | $ | 25.00 | |
| | | | | | | | | |
INCOME FROM INVESTMENT OPERATIONS: | | | | | | | | |
Net Investment Income (b) | | | 0.52 | | | | 0.33 | |
Net Realized and Unrealized Gain on Investments (f) | | | 0.17 | | | | 0.72 | |
Total from Investment Operations | | | 0.69 | | | | 1.05 | |
| | | | | | | | | |
LESS DISTRIBUTIONS: | | | | | | | | |
Distributions from Net Investment Income | | | (0.28 | ) | | | (0.28 | ) |
Total Distributions | | | (0.28 | ) | | | (0.28 | ) |
Net Asset Value, End of Period | | $ | 26.18 | | | $ | 25.77 | |
Total Return | | | 2.69 | %(c) | | | 4.24 | %(c) |
| | | | | | | | | |
SUPPLEMENTAL DATA: | | | | | | | | |
Net Assets at End of Period (000’s) | | $ | 314,170 | | | $ | 144,327 | |
| | | | | | | | | |
RATIOS TO AVERAGE NET ASSETS: | | | | | | | | |
Expenses to Average Net Assets | | | 0.60 | %(d) | | | 0.60 | %(d) |
Net Investment Income to Average Net Assets | | | 3.97 | %(d) | | | 2.47 | %(d) |
Portfolio Turnover Rate (e) | | | 78 | %(c) | | | 131 | %(c) |
(a) | Commencement of operations on October 22, 2019. |
(b) | Calculated based on average shares outstanding during the period. |
(e) | Excluded impact of in-kind transactions |
(f) | Realized and unrealized gains and losses per share in this caption are balancing amounts necessary to reconcile to the change in net asset value for the period and may reconcile with the aggregate gains and losses in the statement of operations due to share transactions for the period. |
The accompanying notes are an integral part of the financial statements.
159
Pacer CSOP FTSE China A50 ETF
FINANCIAL HIGHLIGHTS
For a capital share outstanding throughout the year/period
| | | For the
Period Ended
October 31,
2020
(Unaudited) | | | For the
Period Ended
April 30,
2020 (a) | | | For the
Year Ended
September 30,
2019 | | | For the
Year Ended
September 30,
2018 | | | For the
Year Ended
September 30,
2017 | | | For the
Year Ended
September 30,
2016 | |
Net Asset Value, Beginning of Period | | $ | 16.18 | | | $ | 16.85 | | | $ | 15.30 | | | $ | 16.74 | | | $ | 13.34 | | | $ | 15.09 | |
| | | | | | | | | | | | | | | | | | | | | | | | | |
INCOME (LOSS) FROM INVESTMENT OPERATIONS: | | | | | | | | | | | | | | | | | | | | | | | | |
Net Investment Income (Loss) (b) | | | 0.37 | | | | (0.07 | ) | | | 0.31 | | | | 0.31 | | | | 0.23 | | | | 0.13 | |
Net Realized and Unrealized Gain (Loss) on Investments (f) | | | 3.72 | | | | 0.15 | | | | 1.48 | | | | (0.59 | ) | | | 3.32 | | | | 0.50 | |
Total from Investment Operations | | | 4.09 | | | | 0.08 | | | | 1.79 | | | | (0.28 | ) | | | 3.55 | | | | 0.63 | |
| | | | | | | | | | | | | | | | | | | | | | | | | |
LESS DISTRIBUTIONS: | | | | | | | | | | | | | | | | | | | | | | | | |
Distributions from: | | | | | | | | | | | | | | | | | | | | | | | | |
Net Investment Income | | | 0.12 | | | | (0.71 | ) | | | (0.24 | ) | | | (1.16 | ) | | | (0.15 | ) | | | (2.38 | ) |
Return of Capital | | | (0.12 | ) | | | (0.04 | ) | | | — | | | | — | | | | — | | | | — | |
Total Distributions | | | — | | | | (0.75 | ) | | | (0.24 | ) | | | (1.16 | ) | | | (0.15 | ) | | | (2.38 | ) |
Net Asset Value, End of Period | | $ | 20.27 | | | $ | 16.18 | | | $ | 16.85 | | | $ | 15.30 | | | $ | 16.74 | | | $ | 13.34 | |
Total Return | | | 25.33 | %(c) | | | 0.14 | %(c) | | | 12.05 | % | | | -2.34 | % | | | 26.94 | % | | | 3.07 | % |
| | | | | | | | | | | | | | | | | | | | | | | | | |
SUPPLEMENTAL DATA: | | | | | | | | | | | | | | | | | | | | | | | | |
Net Assets at End of Period (000’s) | | $ | 9,242 | | | $ | 8,992 | | | $ | 12,740 | | | $ | 9,269 | | | $ | 6,793 | | | $ | 6,082 | |
| | | | | | | | | | | | | | | | | | | | | | | | | |
RATIOS TO AVERAGE NET ASSETS: | | | | | | | | | | | | | | | | | | | | | | | | |
Expenses to Average Net Assets (Before Advisory Fees Waived) | | | 0.70 | %(d) | | | 0.70 | %(d) | | | 0.70 | % | | | 0.70 | % | | | 0.70 | % | | | 0.70 | % |
Expenses to Average Net Assets (After Advisory Fees Waived) | | | 0.70 | %(d) | | | 0.70 | %(d) | | | 0.70 | % | | | 0.70 | % | | | 0.70 | % | | | 0.69 | % |
Net Investment Income (Loss) to Average Net Assets | | | 4.05 | %(d) | | | -0.66 | %(d) | | | 1.97 | % | | | 1.84 | % | | | 1.57 | % | | | 0.95 | % |
Portfolio Turnover Rate (e) | | | 9 | %(c) | | | 193 | %(c) | | | 45 | % | | | 20 | % | | | 34 | % | | | 410 | % |
(a) | For the period October 1, 2019 to April 30, 2020. See Note 1. |
(b) | Calculated based on average shares outstanding during the period. |
(e) | Excluded impact of in-kind transactions |
(f) | Realized and unrealized gains and losses per share in this caption are balancing amounts necessary to reconcile to the change in net asset value for the period and may reconcile with the aggregate gains and losses in the statement of operations due to share transactions for the period. |
The accompanying notes are an integral part of the financial statements.
160
Pacer BioThreat Strategy ETF
FINANCIAL HIGHLIGHTS
For a capital share outstanding throughout the period
| | | For the
Period Ended
October 31,
2020(a)
(Unaudited) | |
Net Asset Value, Beginning of Period | | $ | 25.00 | |
| | | | | |
INCOME FROM INVESTMENT OPERATIONS: | | | | |
Net Investment Income (b) | | | 0.05 | |
Net Realized and Unrealized Gain on Investments (f) | | | 1.74 | |
Total from Investment Operations | | | 1.79 | |
| | | | | |
LESS DISTRIBUTIONS: | | | | |
Distributions from Net Investment Income | | | (0.05 | ) |
Total Distributions | | | (0.05 | ) |
Net Asset Value, End of Period | | $ | 26.74 | |
Total Return | | | 9.31 | %(c) |
| | | | | |
SUPPLEMENTAL DATA: | | | | |
Net Assets at End of Period (000’s) | | $ | 5,349 | |
| | | | | |
RATIOS TO AVERAGE NET ASSETS: | | | | |
Expenses to Average Net Assets | | | 0.70 | %(d) |
Net Investment Income to Average Net Assets | | | 0.54 | %(d) |
Portfolio Turnover Rate (e) | | | 0 | %(c)(g) |
(a) | Commencement of operations on June 24, 2020. |
(b) | Calculated based on average shares outstanding during the period. |
(e) | Excluded impact of in-kind transactions |
(f) | Realized and unrealized gains and losses per share in this caption are balancing amounts necessary to reconcile to the change in net asset value for the period and may reconcile with the aggregate gains and losses in the statement of operations due to share transactions for the period. |
The accompanying notes are an integral part of the financial statements.
161
Pacer Lunt Large Cap Alternator ETF
FINANCIAL HIGHLIGHTS
For a capital share outstanding throughout the year/period
| | | For the
Period Ended
October 31,
2020(a)
(Unaudited) | |
Net Asset Value, Beginning of Period | | $ | 25.00 | |
| | | | | |
INCOME (LOSS) FROM INVESTMENT OPERATIONS: | | | | |
Net Investment Income (b) | | | 0.12 | |
Net Realized and Unrealized Gain (Loss) on Investments (f) | | | (0.75 | ) |
Total from Investment Operations | | | (0.63 | ) |
| | | | | |
LESS DISTRIBUTIONS: | | | | |
Distributions from Net Investment Income | | | (0.09 | ) |
Total Distributions | | | (0.09 | ) |
Net Asset Value, End of Period | | $ | 24.28 | |
Total Return | | | 3.35 | %(c) |
| | | | | |
SUPPLEMENTAL DATA: | | | | |
Net Assets at End of Period (000’s) | | $ | 55,849 | |
| | | | | |
RATIOS TO AVERAGE NET ASSETS: | | | | |
Expenses to Average Net Assets | | | 0.60 | %(d) |
Net Investment Income to Average Net Assets | | | 1.37 | %(d) |
Portfolio Turnover Rate (e) | | | 108 | %(c) |
(a) | Commencement of operations on June 24, 2020. |
(b) | Calculated based on average shares outstanding during the period. |
(e) | Excluded impact of in-kind transactions |
(f) | Realized and unrealized gains and losses per share in this caption are balancing amounts necessary to reconcile to the change in net asset value for the period and may reconcile with the aggregate gains and losses in the statement of operations due to share transactions for the period. |
The accompanying notes are an integral part of the financial statements.
162
Pacer Lunt Midcap Multi-Factor Alternator ETF
FINANCIAL HIGHLIGHTS
For a capital share outstanding throughout the period
| | | For the
Period Ended
October 31,
2020(a)
(Unaudited) | |
Net Asset Value, Beginning of Period | | $ | 25.00 | |
| | | | | |
INCOME FROM INVESTMENT OPERATIONS: | | | | |
Net Investment Income (b) | | | 0.02 | |
Net Realized and Unrealized Gain on Investments (f) | | | 2.18 | |
Total from Investment Operations | | | 2.20 | |
| | | | | |
LESS DISTRIBUTIONS: | | | | |
Distributions from Net Investment Income | | | (0.02 | ) |
Total Distributions | | | (0.02 | ) |
Net Asset Value, End of Period | | $ | 27.18 | |
Total Return | | | 14.08 | %(c) |
| | | | | |
SUPPLEMENTAL DATA: | | | | |
Net Assets at End of Period (000’s) | | $ | 14,948 | |
| | | | | |
RATIOS TO AVERAGE NET ASSETS: | | | | |
Expenses to Average Net Assets | | | 0.60 | %(d) |
Net Investment Income to Average Net Assets | | | 0.19 | %(d) |
Portfolio Turnover Rate (e) | | | 72 | %(c) |
(a) | Commencement of operations on June 24, 2020. |
(b) | Calculated based on average shares outstanding during the period. |
(e) | Excluded impact of in-kind transactions |
(f) | Realized and unrealized gains and losses per share in this caption are balancing amounts necessary to reconcile to the change in net asset value for the period and may reconcile with the aggregate gains and losses in the statement of operations due to share transactions for the period. |
The accompanying notes are an integral part of the financial statements.
163
Pacer Lunt Large Cap Multi-Factor Alternator ETF
FINANCIAL HIGHLIGHTS
For a capital share outstanding throughout the year/period
| | | For the
Period Ended
October 31,
2020(a)
(Unaudited) | |
Net Asset Value, Beginning of Period | | $ | 25.00 | |
| | | | | |
INCOME FROM INVESTMENT OPERATIONS: | | | | |
Net Investment Income (b) | | | 0.05 | |
Net Realized and Unrealized Gain on Investments (f) | | | 1.84 | |
Total from Investment Operations | | | 1.89 | |
| | | | | |
LESS DISTRIBUTIONS: | | | | |
Distributions from Net Investment Income | | | (0.04 | ) |
Total Distributions | | | (0.04 | ) |
Net Asset Value, End of Period | | $ | 26.85 | |
Total Return | | | 10.13 | %(c) |
| | | | | |
SUPPLEMENTAL DATA: | | | | |
Net Assets at End of Period (000’s) | | $ | 13,427 | |
| | | | | |
RATIOS TO AVERAGE NET ASSETS: | | | | |
Expenses to Average Net Assets | | | 0.60 | %(d) |
Net Investment Income to Average Net Assets | | | 0.51 | %(d) |
Portfolio Turnover Rate (e) | | | 21 | %(c) |
(a) | Commencement of operations on June 24, 2020. |
(b) | Calculated based on average shares outstanding during the period. |
(e) | Excluded impact of in-kind transactions |
(f) | Realized and unrealized gains and losses per share in this caption are balancing amounts necessary to reconcile to the change in net asset value for the period and may reconcile with the aggregate gains and losses in the statement of operations due to share transactions for the period. |
The accompanying notes are an integral part of the financial statements.
164
Pacer Funds
NOTES TO FINANCIAL STATEMENTS
October 31, 2020 (Unaudited)
NOTE 1 – ORGANIZATION
Pacer Funds Trust (the “Trust”), a Delaware statutory trust organized on August 12, 2014. USAI, SLT, and LSLT’s fiscal year end is October 31st and as such are not included in these financial statements. The Trust is registered with the Securities and Exchange Commission (the “SEC”) under the Investment Company Act of 1940, as amended (the “1940 Act”), as an open-end management investment company and the offering of the Funds’ shares (“Shares”) is registered under the Securities Act of 1933, as amended (the “Securities Act”). The trust currently consists of multiple operational series, of which are covered in this report, individually the (“Fund”) or collectively the (“Funds”):
Name | | Ticker | | | Commencement of Operations | |
Pacer Trendpilot ® US Large Cap ETF | | | PTLC | | | | June 11, 2015 | |
Pacer Trendpilot ® US Mid Cap ETF | | | PTMC | | | | June 11, 2015 | |
Pacer Trendpilot ® 100 ETF | | | PTNQ | | | | June 11, 2015 | |
Pacer Trendpilot ® European Index ETF | | | PTEU | | | | December 14, 2015 | |
Pacer Global Cash Cows Dividend ETF | | | GCOW | | | | February 22, 2016 | |
Pacer US Cash Cows 100 ETF | | | COWZ | | | | December 16, 2016 | |
Pacer US Small Cap Cash Cows 100 ETF | | | CALF | | | | June 16, 2017 | |
Pacer Developed Markets International Cash Cows 100 ETF | | | ICOW | | | | June 16, 2017 | |
Pacer WealthShield ETF | | | PWS | | | | December 11, 2017 | |
Pacer Military Times Best Employers ETF | | | VETS | | | | April 9, 2018 | |
Pacer Benchmark Industrial Real Estate SCTRSM ETF | | | INDS | | | | May 14, 2018 | |
Pacer Benchmark Data & Infrastructure Real Estate SCTRSM ETF | | | SRVR | | | | May 15, 2018 | |
Pacer US Export Leaders ETF | | | PEXL | | | | July 23, 2018 | |
Pacer CFRA-Stovall Equal Weight Seasonal Rotation Index ETF | | | SZNE | | | | July 23, 2018 | |
Pacer US Cash Cows Growth ETF | | | BUL | | | | May 2, 2019 | |
Pacer Trendpilot ® International ETF | | | PTIN | | | | May 2, 2019 | |
Pacer Emerging Markets Cash Cows 100 ETF | | | ECOW | | | | May 2, 2019 | |
Pacer Trendpilot ® Fund of Funds ETF | | | TRND | | | | May 3, 2019 | |
Pacer Cash Cows Fund of Funds ETF | | | HERD | | | | May 3, 2019 | |
Pacer Trendpilot ® US Bond ETF | | | PTBD | | | | October 22, 2019 | |
Pacer American Energy Independence ETF | | | USAI | | | | December 12, 2017 | |
Pacer CSOP FTSE China A50 ETF | | | AFTY | | | | March 10, 2015 | |
Pacer BioThreat Strategy ETF | | | VIRS | | | | June 24, 2020 | |
Pacer Lunt Large Cap Alternator ETF | | | ALTL | | | | June 24, 2020 | |
Pacer Lunt Midcap Multi-Factor Alternator ETF | | | PAMC | | | | June 24, 2020 | |
Pacer Lunt Large Cap Multi-Factor Alternator ETF | | | PALC | | | | June 24, 2020 | |
Pacer Salt High truBeta US Market ETF | | | SLT | | | | May 15, 2018 | |
Pacer Salt Low truBeta US Market ETF | | | LSLT | | | | March 12, 2019 | |
The investment objectives of the Funds are to seek to track the total return performance, before fees and expenses, of the Pacer Trendpilot® US Large Cap Index, the Pacer Trendpilot® US Mid-Cap Index, the Pacer NASDAQ-100 Trendpilot® Index, the Pacer Trendpilot® European Index, the Pacer Global Cash Cows High Dividends 100 Index, the Pacer US Cash Cows 100 Index, the Pacer US Small Cap Cash Cows Index, the Pacer Developed Markets International Cash Cows 100 Index, the Pacer WealthShield Index, the Military Times Best for VETSSM Index, the Benchmark Retail Real Estate SCTRSM Index, the Benchmark Industrial Real Estate SCTRSM Index, the Benchmark Data & Infrastructure Real Estate SCTRSM Index, the US Export Leaders Index, the Pacer CFRA-Stovall Equal Weight Seasonal Rotation Index, the Pacer US Cash Cows Growth Index, the Pacer Trendpilot® International Index, the Pacer Emerging Markets Cash Cows 100 Index, Pacer Trendpilot® Fund of Funds Index, the Pacer US Cash Cows Growth Index, the Pacer Trendpilot® US Bond Index, FTSE China A50 Net Total Return Index, LifeSci BioThreat Strategy Index, Lunt Capital U.S. Large Cap Equity Rotation Index, Lunt Capital U.S. MidCap Multi-Factor Rotation Index, and the Lunt Capital U.S. Large Cap Multi-Factor Rotation Index, respectively. Each of the Funds are non-diversfied series of the Trust except for PTLC, PTMC, PTEU, GCOW, PEXL, COWZ, CALF and ICOW.
AFTY is the successor in interest to CSOP FTSE China A50 ETF (the “Predecessor Fund”) having the same investment objective that was included as a series of another investment company, CSOP ETF Trust, and advised by AFTY’s investment adviser at the time and current sub-adviser, CSOP Asset Management Limited (“CSOP).On January 21, 2020, the shareholders of the Predecessor Fund approved the tax-free reorganization of the Predecessor Fund with and into Pacer CSOP FTSE China A50 ETF, and effective as of the close of business on
165
Pacer Funds
NOTES TO FINANCIAL STATEMENTS
October 31, 2020 (Unaudited) (Continued)
January 22, 2020, the assets and liabilities of the Predecessor Fund were transferred to the Trust in exchange for shares of Pacer CSOP FTSE China A50 ETF. For financial reporting purposes, assets received, and shares issued by AFTY were recorded at fair value; however, Chinese regulations prohibited free of payment (i.e., in-kind) transfers of China A shares and required that all securities be crossed on an exchange against local currency. These constraints prevented the Predecessor Fund from directly transferring the securities within its portfolio to AFTY. The Predecessor Fund sold all of its assets and transferred the proceeds to AFTY, at which time AFTY used the transferred proceeds to repurchase the same or similar securities to those sold by the Predecessor Fund. The Predecessor Fund recognized taxable gain on the sale of its assets; however, AFTY also expects to use its capital loss carryforwards to offset any gain recognized from the selling of its assets. Accordingly, neither the Predecessor Fund nor AFTY expects to make a capital gain distribution solely because of the reorganization. While the Predecessor Fund may also realize losses on the sale of its assets, to the extent AFTY repurchased (or entered into a contract to or option to repurchase) the same shares of stock or securities within a period of 61 days (beginning 30 days before and ending 30 days after the disposition of such securities) any losses by the Predecessor Fund have been disallowed under the “wash sales” rule. Such losses will be reflected in an adjustment to the basis of the securities acquired by AFTY. Costs incurred by AFTY in connection with the reorganization were paid by the Sub-Adviser. The fiscal year end of the Predecessor Fund was September 30. The reporting period covered by this annual report for AFTY is October 1, 2019 through April 30, 2020.Operations prior to January 22, 2020 were for the Predecessor Fund. The net assets were $13,150,293, including ($3,630,464) of net unrealized depreciation, ($1,198,629) of undistributed (accumulated) net investment income, and ($3,267,672) of undistributed (accumulated) net realized loss and shares outstanding were 755,882, all of which were transferred into the Trust at NAV at the close of business on January 22, 2020.
The primary purpose of the reorganization was to move the existing Fund from its existing trust to another trust, which the Pacer Advisors, Inc.(the “Adviser”) believed would allow the Fund to become part of a series of a stable fund family with a consistent Adviser across all funds in the Trust. Shareholders are expected to benefit accordingly and to enjoy an improvement in the level and quality of services provided to them and the Fund. During the fiscal year ended April 30, 2020, the Fund accepted a cash contribution of $25,686 to reimburse the Fund for securities transactions related to the reorganization.
Shares of the Funds are listed and traded on the Cboe BZX Exchange, Inc. (“Cboe”) with the exceptions of VETS, ECOW, and HERD, which is listed and traded on the Nasdaq Stock Market LLC (“Nasdaq”) and INDS, SRVR, PEXL, SZNE, BUL, PTIN, TRND, PTBD, AFTY, ALTL, PAMC, and PALC which are listed and traded on the NYSE Arca, Inc. (“NYSE”). Market prices for the shares may be different from their net asset value (“NAV”). The Funds issue and redeem shares on a continuous basis at NAV only in large blocks of shares, called “Creation Units,” which generally consist of 50,000 shares except PTBD which generally consist of 100,000 shares. Creation Units are issued and redeemed principally in-kind for securities included in a specified universe. Once created, Shares generally trade in the secondary market at market prices that change throughout the day in amounts less than a Creation Unit. Except when aggregated in Creation Units, Shares are not redeemable securities of a Fund. Shares of a Fund may only be purchased directly from or redeemed directly to a Fund by certain financial institutions (“Authorized Participants”). An Authorized Participant is either (i) a broker-dealer or other participant in the clearing process through the Continuous Net Settlement System of the National Securities Clearing Corporation or (ii) a DTC participant and, in each case, must have executed a Participant Agreement with Pacer Financial, Inc. (the “Distributor”). Prior to January 23, 2020, ALPS Distributors, Inc. acted as the principal underwriter for AFTY. Most retail investors do not qualify as Authorized Participants nor have the resources to buy and sell whole Creation Units. Therefore, they are unable to purchase or redeem the shares directly from a Fund. Rather, most retail investors may purchase Shares in the secondary market with the assistance of a broker and are subject to customary brokerage commissions or fees.
The Funds each currently offer one class of Shares, which have no front end sales loads, no deferred sales charges, and no redemption fees. A purchase (i.e., creation) transaction fee is imposed for the transfer and other transaction costs associated with the purchase of Creation Units. PTLC charges $500, PTMC charges $500, PTNQ charges $250, PTEU charges $2,000, GCOW charges $1,500, COWZ charges $250, CALF charges $250, ICOW charges $1,500, PWS charges $500, VETS charges $250, INDS charges $250, RTL charges $250, SRVR charges $250, PEXL charges $250, SZNE charges $500, BUL charges $250, PTIN charges $8,000, ECOW charges $1,750, HERD charges $250, TRND charges $250, PTBD charges $500, AFTY charges $250, VIRS charges $250, ALTL charges $250, PAMC charges $250, and PALC charges $250 for the standard fixed creation fee, payable to the Custodian. For the PTLC, PTMC, PTNQ, PTEU, and PTIN, the standard fixed creation transaction fee is $200 when the Deposit Securities include only U.S. Treasury bills. For PTBD, the standard fixed creation transaction fee is $250 when the Deposit Securities include only U.S. Treasury bills. The fixed transaction fee may be waived on certain orders if the Fund’s Custodian has determined to waive some or all of the costs associated with the order, or another party, such as the Adviser, has agreed to pay such fee. In addition, a variable fee may be charged on all cash transactions or substitutes for Creation Units of up to a maximum of 2% as a percentage of the value of the Creation Units subject to the transaction for the Funds, except AFTY which may charge up to a maximum of 8% as a percentage of the value of the Creation Units subject to the transaction. Variable fees received by each Fund are displayed in the Capital Share Transaction section of the Statement of Changes in Net Assets. Each Fund may issue an unlimited number of shares of beneficial interest, with no par value. Shares of each Fund have equal rights and privileges with respect to such Fund.
166
Pacer Funds
NOTES TO FINANCIAL STATEMENTS
October 31, 2020 (Unaudited) (Continued)
NOTE 2 – SIGNIFICANT ACCOUNTING POLICIES
The following is a summary of significant accounting policies consistently followed by the Funds in the preparation of the financial statements. The financial statements have been prepared in conformity with accounting principals generally accepted in the United States of America (“GAAP”). The Funds are investment companies that follow the accounting and reporting guidelines of Accounting Standards Codification Topic 946 applicable to investment companies.
Securities listed on a securities exchange, market or automated quotation system for which quotations are readily available, are valued at the last quoted sale price on the primary exchange or market (foreign or domestic) on which they are traded, except for securities listed on Nasdaq Global Market (“Nasdaq”). If, on a particular day, there is no such reported sale, then the most recent quoted bid price will be used. For securities traded on Nasdaq, the Nasdaq Official Closing Price (“NOCP”) will be used. If a Fund holds foreign shares of a security for which there is no reported volume, and there is an actively trading local version of the security, the last quoted sale price of the local security shall be used. Prices denominated in foreign currencies are converted to U.S. dollar equivalents at the current exchange rate.
Investments in other open-end investment companies, including money market funds, are valued at the investment company’s net asset value per share, with the exception of exchange-traded open-end investment companies, which are priced as equity securities described above.
Fixed-income securities are normally valued on the basis of quotes obtained from independent pricing services in accordance with procedures adopted by the Board of Trustees. The independent pricing services may employ methodologies that utilize market transactions (if the security is actively traded), broker-dealer supplied valuations, or matrix pricing. Short-term securities that have maturies of less than 60 days, at the time of purchase, are valued at amortized cost, which, when combined with accrued interest, approximates market value.
Foreign currency forward contracts are valued at the current day’s interpolated foreign exchange rate, as calculated using the current day’s spot rate, and the twenty, sixty, ninety, and one-hundred eighty day forward rates provided by an independent source.
Units of Mount Vernon Liquid Assets Portfolio are not traded on an exchange and are valued at the investment company’s NAV per share as provided by its administrator.
Deposit accounts are valued at acquisition cost, which approximates fair value.
Any securities for which there are no readily available market quotations and other assets will be valued at their fair value as determined in good faith by the Fair Value Pricing Committee using the Fair Value Procedures approved by the Board of Trustees (the “Board”).
As described above, the Funds utilize various methods to measure the fair value of their investments on a recurring basis. GAAP establishes a hierarchy that prioritizes inputs to valuations methods. The three levels of inputs are:
| | Level 1 – | Unadjusted quoted prices in active markets for identical assets or liabilities that the Funds have the ability to access. |
| | Level 2 – | Observable inputs other than quoted prices included in Level 1 that are observable for the asset or liability, either directly or indirectly. These inputs may include quoted prices for the identical instrument on an inactive market, prices for similar instruments, interest rates, prepayment speeds, credit risk, yield curves, default rates and similar data. |
| | Level 3 – | Unobservable inputs for the asset or liability, to the extent relevant observable inputs are not available; representing the Funds’ own assumptions about the assumptions a market participant would use in valuing the asset or liability, and would be based on the best information available. |
The availability of observable inputs can vary from security to security and is affected by a wide variety of factors, including, for example, the type of security, whether the security is new and not yet established in the marketplace, the liquidity of markets, and other characteristics particular to the security. To the extent that valuation is based on models or inputs that are less observable or unobservable in the market, the determination of fair value requires more judgment. Accordingly, the degree of judgment exercised in determining fair value is greatest for instruments categorized in Level 3.
The inputs used to measure fair value may fall into different levels of the fair value hierarchy. In such cases, for disclosure purposes, the level in the fair value hierarchy within which the fair value measurement falls in its entirety, is determined based on the lowest level input that is significant to the fair value measurement in its entirety.
The following is a summary of the inputs used to value the Funds’ investments as of October 31, 2020:
167
Pacer Funds
NOTES TO FINANCIAL STATEMENTS
October 31, 2020 (Unaudited) (Continued)
PTLC
Description^ | | Level 1 | | | Level 2 | | | Level 3 | | | Investments
Measured at
Net Asset Value | | | Total | |
Common Stocks | | $ | 1,723,369,354 | | | $ | — | | | $ | — | | | $ | — | | | $ | 1,723,369,354 | |
Real Estate Investment Trusts | | | 45,136,016 | | | | — | | | | — | | | | — | | | | 45,136,016 | |
Short-Term Investments | | | 3,088,702 | | | | — | | | | — | | | | — | | | | 3,088,702 | |
Investments Purchased with Proceeds from Securities Lending | | | — | | | | — | | | | — | | | | 46,975,266 | | | | 46,975,266 | |
Total Investments in Securities | | $ | 1,771,594,072 | | | $ | — | | | $ | — | | | $ | 46,975,266 | | | $ | 1,818,569,338 | |
^ See Schedule of Investments for industry breakouts.
PTMC
Description^ | | Level 1 | | | Level 2 | | | Level 3 | | | Investments
Measured at
Net Asset Value | | | Total | |
Common Stocks | | $ | 349,251,460 | | | $ | — | | | $ | — | | | $ | — | | | $ | 349,251,460 | |
Real Estate Investment Trusts | | | 32,866,651 | | | | — | | | | — | | | | — | | | | 32,866,651 | |
Short-Term Investments | | | 585,077 | | | | — | | | | — | | | | — | | | | 585,077 | |
Investments Purchased with Proceeds from Securities Lending | | | — | | | | — | | | | — | | | | 87,061,332 | | | | 87,061,332 | |
Total Investments in Securities | | $ | 382,703,188 | | | $ | — | | | $ | — | | | $ | 87,061,332 | | | $ | 469,764,520 | |
^ See Schedule of Investments for industry breakouts.
PTNQ
Description^ | | Level 1 | | | Level 2 | | | Level 3 | | | Investments
Measured at
Net Asset Value | | | Total | |
Common Stocks | | $ | 377,884,741 | | | $ | — | | | $ | — | | | $ | — | | | $ | 377,884,741 | |
Short-Term Investments | | | 5,243,030 | | | | 399,939,976 | | | | — | | | | — | | | | 405,183,006 | |
Investments Purchased with Proceeds from Securities Lending | | | — | | | | — | | | | — | | | | 4,601,812 | | | | 4,601,812 | |
Total Investments in Securities | | $ | 383,127,771 | | | $ | 399,939,976 | | | $ | — | | | $ | 4,601,812 | | | $ | 787,669,559 | |
^ See Schedule of Investments for industry breakouts.
PTEU
Description^ | | Level 1 | | | Level 2 | | | Level 3 | | | Investments
Measured at
Net Asset Value | | | Total | |
Common Stocks | | $ | 53,555,418 | | | $ | — | | | $ | 7,038 | | | $ | — | | | $ | 53,562,456 | |
Preferred Stocks | | | 933,073 | | | | — | | | | — | | | | — | | | | 933,073 | |
Real Estate Investment Trusts | | | 297,589 | | | | — | | | | — | | | | — | | | | 297,589 | |
Short-Term Investments | | | 108,392 | | | | — | | | | — | | | | — | | | | 108,392 | |
Investments Purchased with Proceeds from Securities Lending | | | — | | | | — | | | | — | | | | 7,021,988 | | | | 7,021,988 | |
Total Investments in Securities | | $ | 54,894,472 | | | $ | — | | | $ | 7,038 | | | $ | 7,021,988 | | | $ | 61,923,498 | |
^ See Schedule of Investments for industry breakouts.
168
Pacer Funds
NOTES TO FINANCIAL STATEMENTS
October 31, 2020 (Unaudited) (Continued)
The following is a reconciliation of investments in which significant unobservable inputs (Level 3) were used in determining fair value:
| | Balance
as of
4/30/2020 | Net
Realized
Gain
(Loss) | Change in Net
Unrealized
Appreciation
(Depreciation) | Purchases | Sales | Transfers
Into
Level 3 | Transfers
Out of
Level 3 | Balance as of
10/31/20 |
Common Stocks | $ 6,622 | $ — | $ 416 | $ — | $ — | $ — | $ — | $ 7,038 |
The following is a summary of quantitative information about Level 3 Fair Value Measurements:
| | | Fair Value as
of 10/31/2020 | | | Valuation
Techniques | | | Unobservable
Input | | | Impact to valuation from
an increase to input | |
Common Stocks | | $ | 7,038 | | | | Last Trade Price | | | | Stale Data | | | | 5.26 EUR | |
| | * | Table presents information for one security, which has been valued at 5.26 EUR throughout the period. |
For the period ended October 31, 2020, the Fund did not recognize any transfers to or from Level 3.
GCOW
Description^ | | Level 1 | | | Level 2 | | | Level 3 | | | Investments
Measured at
Net Asset Value | | | Total | |
Common Stocks | | $ | 102,967,314 | | | $ | — | | | $ | — | | | $ | — | | | $ | 102,967,314 | |
Real Estate Investment Trusts | | | 6,515,991 | | | | — | | | | — | | | | — | | | | 6,515,991 | |
Short-Term Investments | | | 191,879 | | | | — | | | | — | | | | — | | | | 191,879 | |
Investments Purchased with Proceeds from Securities Lending | | | — | | | | — | | | | — | | | | 18,210,715 | | | | 18,210,715 | |
Total Investments in Securities | | $ | 109,675,184 | | | $ | — | | | $ | — | | | $ | 18,210,715 | | | $ | 127,885,899 | |
^ See Schedule of Investments for country breakouts.
The following is a reconciliation of investments in which significant unobservable inputs (Level 3) were used in determining fair value:
GCOW(a) | Balance
as of
4/30/2019 | Net
Realized
Gain
(Loss) | Change in Net
Unrealized
Appreciation
(Depreciation) | Purchases | Sales | Transfers
Out of
Level 3 | Transfers
Into Level 3 | Balance as of
10/31/20 |
Real Estate Investment Trusts | $ — | $ (399) | $ (25,462) | $ 247,791 | $ (18,659) | $ — | $ — | $ 203,271 |
The following is a summary of quantitative information about Level 3 Fair Value Measurements:
GCOW | | Fair Value as
of 10/31/2020 | | | Valuation
Techniques | | | Unobservable
Input | | | Impact to valuation from
an increase to input | |
Common Stocks | | $ | 203,271 | | | | Last Trade Price | | | | Stale Data | | | | 1.5046 SGD | |
| | * | Table presents information for one security, which has been valued at 1.5046 SGD throughout the period. |
COWZ
Description^ | | Level 1 | | | Level 2 | | | Level 3 | | | Investments
Measured at
Net Asset Value | | | Total | |
Common Stocks | | $ | 191,021,874 | | | $ | — | | | $ | — | | | $ | — | | | $ | 191,021,874 | |
Preferred Stocks | | | 645,242 | | | | — | | | | — | | | | — | | | | 645,242 | |
Real Estate Investment Trusts | | | 4,717,870 | | | | — | | | | — | | | | — | | | | 4,717,870 | |
Short-Term Investments | | | 553,012 | | | | — | | | | — | | | | — | | | | 553,012 | |
Investments Purchased with Proceeds from Securities Lending | | | — | | | | — | | | | — | | | | 20,197,179 | | | | 20,197,179 | |
Total Investments in Securities | | $ | 196,937,998 | | | $ | — | | | $ | — | | | $ | 20,197,179 | | | $ | 217,135,177 | |
^ See Schedule of Investments for industry breakouts.
169
Pacer Funds
NOTES TO FINANCIAL STATEMENTS
October 31, 2020 (Unaudited) (Continued)
CALF
Description^ | | Level 1 | | | Level 2 | | | Level 3 | | | Investments
Measured at
Net Asset Value | | | Total | |
Common Stocks | | $ | 34,793,215 | | | $ | — | | | $ | — | | | $ | — | | | $ | 34,793,215 | |
Real Estate Investment Trusts | | | 474,610 | | | | — | | | | — | | | | — | | | | 474,610 | |
Short-Term Investments | | | 70,885 | | | | — | | | | — | | | | — | | | | 70,885 | |
Investments Purchased with Proceeds from Securities Lending | | | — | | | | — | | | | — | | | | 1,235,495 | | | | 1,235,495 | |
Total Investments in Securities | | $ | 35,338,710 | | | $ | — | | | $ | — | | | $ | 1,235,495 | | | $ | 36,574,205 | |
^ See Schedule of Investments for industry breakouts.
ICOW
Description^ | | Level 1 | | | Level 2 | | | Level 3 | | | Investments
Measured at
Net Asset Value | | | Total | |
Common Stocks | | $ | 12,068,548 | | | $ | — | | | $ | — | | | $ | — | | | $ | 12,068,548 | |
Contingent Value Rights | | | 23,816 | | | | — | | | | — | | | | — | | | | 23,816 | |
Preferred Stocks | | | 184,718 | | | | — | | | | — | | | | — | | | | 184,718 | |
Real Estate Investment Trusts | | | 84,644 | | | | — | | | | — | | | | — | | | | 84,644 | |
Short-Term Investments | | | 11,581 | | | | — | | | | — | | | | — | | | | 11,581 | |
Investments Purchased with Proceeds from Securities Lending | | | — | | | | — | | | | — | | | | 1,678,843 | | | | 1,678,843 | |
Total Investments in Securities | | $ | 12,373,307 | | | $ | — | | | $ | — | | | $ | 1,678,843 | | | $ | 14,052,150 | |
^ See Schedule of Investments for country breakouts.
PWS
Description^ | | Level 1 | | | Level 2 | | | Level 3 | | | Investments
Measured at
Net Asset Value | | | Total | |
Common Stocks | | $ | 48,571,826 | | | $ | — | | | $ | — | | | $ | — | | | $ | 48,571,826 | |
Contingent Value Rights | | | — | | | | — | | | | 2,886 | | | | — | | | | 2,886 | |
Short-Term Investments | | | 237,768 | | | | — | | | | — | | | | — | | | | 237,768 | |
Investments Purchased with Proceeds from Securities Lending | | | — | | | | — | | | | — | | | | 6,631,208 | | | | 6,631,208 | |
Total Investments in Securities | | $ | 48,809,594 | | | $ | — | | | $ | 2,886 | | | $ | 6,631,208 | | | $ | 55,443,688 | |
^ See Schedule of Investments for industry breakouts.
The following is a reconciliation of investments in which significant unobservable inputs (Level 3) were used in determining fair value:
PWS(a) | Balance
as of
4/30/2020 | Net
Realized
Gain
(Loss) | Change in Net
Unrealized
Appreciation
(Depreciation) | Purchases | Sales | Corporate
Action | Transfers
Out of
Level 3 | Transfers
Into Level 3 | Balance
as of
10/31/20 |
Common Stocks | $ 2,886 | $ — | $ — | $ — | $ — | $ — | $ — | $ — | $ 2,886 |
The following is a summary of quantitative information about Level 3 Fair Value Measurements:
PWS | | Fair Value as
of 10/31/2020 | | | Valuation
Techniques | | | Unobservable
Input | | | Impact to valuation from
an increase to input | |
Common Stocks | | $ | 2,886 | | | | Acquisition Price | | | | Stale Data | | | | $0.46 | |
| | * | Table presents information for one security, which has been valued at $0.46 throughout the period. |
170
Pacer Funds
NOTES TO FINANCIAL STATEMENTS
October 31, 2020 (Unaudited) (Continued)
VETS
Description^ | | Level 1 | | | Level 2 | | | Level 3 | | | Investments
Measured at
Net Asset Value | | | Total | |
Common Stocks | | $ | 1,443,179 | | | $ | — | | | $ | — | | | $ | — | | | $ | 1,443,179 | |
Short-Term Investments | | | 8,034 | | | | — | | | | — | | | | — | | | | 8,034 | |
Total Investments in Securities | | $ | 1,451,213 | | | $ | — | | | $ | — | | | $ | — | | | $ | 1,451,213 | |
^ See Schedule of Investments for industry breakouts.
INDS
Description^ | | Level 1 | | | Level 2 | | | Level 3 | | | Investments
Measured at
Net Asset Value | | | Total | |
Common Stocks | | $ | 2,126,403 | | | $ | — | | | $ | — | | | $ | | | | $ | 2,126,403 | |
Real Estate Investment Trusts | | | 111,465,594 | | | | — | | | | — | | | | — | | | | 111,465,594 | |
Short-Term Investments | | | 321,213 | | | | — | | | | — | | | | — | | | | 321,213 | |
Investments Purchased with Proceeds from Securities Lending | | | — | | | | — | | | | — | | | | 20,663,664 | | | | 20,663,664 | |
Total Investments in Securities | | $ | 113,913,210 | | | $ | — | | | $ | — | | | $ | 20,663,664 | | | $ | 134,576,874 | |
^ See Schedule of Investments for industry breakouts.
SRVR
Description^ | | Level 1 | | | Level 2 | | | Level 3 | | | Investments
Measured at
Net Asset Value | | | Total | |
Common Stocks | | $ | 231,008,839 | | | $ | — | | | $ | — | | | $ | — | | | $ | 231,008,839 | |
Real Estate Investment Trusts | | | 819,328,839 | | | | — | | | | — | | | | — | | | | 819,328,839 | |
Short-Term Investments | | | 3,319,926 | | | | — | | | | — | | | | — | | | | 3,319,926 | |
Investments Purchased with Proceeds from Securities Lending | | | — | | | | — | | | | — | | | | 108,852,982 | | | | 108,852,982 | |
Total Investments in Securities | | $ | 1,053,657,604 | | | $ | — | | | $ | — | | | $ | — | | | $ | 1,162,510,586 | |
^ See Schedule of Investments for industry breakouts.
PEXL
Description^ | | Level 1 | | | Level 2 | | | Level 3 | | | Investments
Measured at
Net Asset Value | | | Total | |
Common Stocks | | $ | 1,481,018 | | | $ | — | | | $ | — | | | $ | — | | | $ | 1,481,018 | |
Real Estate Investment Trusts | | | 13,731 | | | | — | | | | — | | | | — | | | | 13,731 | |
Short-Term Investments | | | 4,431 | | | | — | | | | — | | | | — | | | | 4,431 | |
Total Investments in Securities | | $ | 1,499,180 | | | $ | — | | | $ | — | | | $ | — | | | $ | 1,499,180 | |
^ See Schedule of Investments for industry breakouts.
SZNE
Description^ | | Level 1 | | | Level 2 | | | Level 3 | | | Investments
Measured at
Net Asset Value | | | Total | |
Common Stocks | | $ | 50,571,030 | | | $ | — | | | $ | — | | | $ | — | | | $ | 50,571,030 | |
Short-Term Investments | | | 67,716 | | | | — | | | | — | | | | — | | | | 67,716 | |
Total Investments in Securities | | $ | 50,638,746 | | | $ | — | | | $ | — | | | $ | — | | | $ | 50,638,746 | |
^ See Schedule of Investments for industry breakouts.
171
Pacer Funds
NOTES TO FINANCIAL STATEMENTS
October 31, 2020 (Unaudited) (Continued)
BUL
Description^ | | Level 1 | | | Level 2 | | | Level 3 | | | Investments
Measured at
Net Asset Value | | | Total | |
Common Stocks | | $ | 1,354,036 | | | $ | — | | | $ | — | | | $ | — | | | $ | 1,354,036 | |
Short-Term Investments | | | 7,123 | | | | — | | | | — | | | | — | | | | 7,123 | |
Total Investments in Securities | | $ | 1,361,159 | | | $ | — | | | $ | — | | | $ | — | | | $ | 1,361,159 | |
^ See Schedule of Investments for industry breakouts.
PTIN
Description^ | | Level 1 | | | Level 2 | | | Level 3 | | | Investments
Measured at
Net Asset Value | | | Total | |
Common Stocks | | $ | 100,251,145 | | | $ | — | | | $ | 2,105 | | | $ | — | | | $ | 100,253,250 | |
Exchange Traded Funds | | | 5,488,204 | | | | — | | | | — | | | | — | | | | 5,488,204 | |
Preferred Stocks | | | 392,957 | | | | — | | | | — | | | | — | | | | 392,957 | |
Real Estate Investment Trusts | | | 1,163,401 | | | | — | | | | — | | | | — | | | | 1,163,401 | |
Short-Term Investments | | | 23,348 | | | | — | | | | — | | | | — | | | | 23,348 | |
Total Investments in Securities | | $ | 107,319,055 | | | $ | — | | | $ | 2,105 | | | $ | — | | | $ | 107,321,160 | |
^ See Schedule of Investments for country breakouts.
The following is a reconciliation of investments in which significant unobservable inputs (Level 3) were used in determining fair value:
PTIN(a) | Balance
as of
4/30/2020 | Net
Realized
Gain
(Loss) | Change in Net
Unrealized
Appreciation
(Depreciation) | Purchases | Sales | Corporate
Action | Transfers
Out of
Level 3 | Transfers
Into Level 3 | Balance as of
10/31/20 |
Common Stocks | $ — | $ — | $ — | $ — | $ — | $ 2,105 | $ — | $ — | $ 2,105 |
The following is a summary of quantitative information about Level 3 Fair Value Measurements:
PTIN | | Fair Value as
of 10/31/2020 | | | Valuation
Techniques | | | Unobservable
Input | | | Impact to valuation from
an increase to input | |
Common Stocks | | $ | 2,105 | | | | Corporate
Action Details | | | | Corporate Action Details | | | | 8.29 CAD | |
| | * | Table presents information for one security, which has been valued at 8.29 CAD throughout the period. |
ECOW
Description^ | | Level 1 | | | Level 2 | | | Level 3 | | | Investments
Measured at
Net Asset Value | | | Total | |
Common Stocks | | $ | 1,811,452 | | | $ | — | | | $ | — | | | $ | — | | | $ | 1,811,452 | |
Preferred Stocks | | | 97,700 | | | | — | | | | — | | | | — | | | | 97,700 | |
Exchange Traded Funds | | | 27,187 | | | | — | | | | — | | | | — | | | | 27,187 | |
Short-Term Investments | | | 3,820 | | | | — | | | | — | | | | — | | | | 3,820 | |
Total Investments in Securities | | $ | 1,940,159 | | | $ | — | | | $ | — | | | $ | — | | | $ | 1,940,159 | |
^ See Schedule of Investments for country breakouts.
172
Pacer Funds
NOTES TO FINANCIAL STATEMENTS
October 31, 2020 (Unaudited) (Continued)
HERD
Description | | Level 1 | | | Level 2 | | | Level 3 | | | Investments
Measured at
Net Asset Value | | | Total | |
Affiliated Exchange Traded Funds | | $ | 1,152,254 | | | $ | — | | | $ | — | | | $ | — | | | $ | 1,152,254 | |
Short-Term Investments | | | 329 | | | | — | | | | — | | | | — | | | | 329 | |
Total Investments in Securities | | $ | 1,152,583 | | | $ | — | | | $ | — | | | $ | — | | | $ | 1,152,583 | |
TRND
Description | | Level 1 | | | Level 2 | | | Level 3 | | | Investments
Measured at
Net Asset Value | | | Total | |
Affiliated Exchange Traded Funds | | $ | 32,352,910 | | | $ | — | | | $ | — | | | $ | — | | | $ | 32,352,910 | |
Short-Term Investments | | | 24,202 | | | | — | | | | — | | | | — | | | | 24,202 | |
Total Investments in Securities | | $ | 32,377,112 | | | $ | — | | | $ | — | | | $ | — | | | $ | 32,377,112 | |
PTBD
Description^ | | Level 1 | | | Level 2 | | | Level 3 | | | Investments
Measured at
Net Asset Value | | | Total | |
Corporate Bonds | | $ | — | | | $ | 309,172,032 | | | $ | — | | | $ | — | | | $ | 309,172,032 | |
Short-Term Investments | | | 68,880 | | | | — | | | | — | | | | — | | | | 68,880 | |
Total Investments in Securities | | $ | 68,880 | | | $ | 309,172,032 | | | $ | — | | | $ | — | | | $ | 309,240,912 | |
^ See Schedule of Investments for industry breakouts.
AFTY
Description^ | | Level 1 | | | Level 2 | | | Level 3 | | | Investments
Measured at
Net Asset Value | | | Total | |
Common Stocks | | $ | 9,195,942 | | | $ | — | | | $ | — | | | $ | — | | | $ | 9,195,942 | |
Short-Term Investments | | | 45,616 | | | | — | | | | — | | | | — | | | | 45,616 | |
Total Investments in Securities | | $ | 9,241,558 | | | $ | — | | | $ | — | | | $ | — | | | $ | 9,241,558 | |
^ See Schedule of Investments for industry breakouts.
VIRS
Description^ | | Level 1 | | | Level 2 | | | Level 3 | | | Investments
Measured at
Net Asset Value | | | Total | |
Common Stocks | | $ | 5,344,369 | | | $ | — | | | $ | — | | | $ | — | | | $ | 5,344,369 | |
Short-Term Investments | | | 4,339 | | | | — | | | | — | | | | — | | | | 4,339 | |
Total Investments in Securities | | $ | 5,348,708 | | | $ | — | | | $ | — | | | $ | — | | | $ | 5,348,708 | |
^ See Schedule of Investments for industry breakouts.
173
Pacer Funds
NOTES TO FINANCIAL STATEMENTS
October 31, 2020 (Unaudited) (Continued)
ALTL
Description^ | | Level 1 | | | Level 2 | | | Level 3 | | | Investments
Measured at
Net Asset Value | | | Total | |
Common Stocks | | $ | 53,930,184 | | | $ | — | | | $ | — | | | $ | — | | | $ | 53,930,184 | |
Real Estate Investment Trusts | | | 1,750,913 | | | | — | | | | — | | | | — | | | | 1,750,913 | |
Short-Term Investments | | | 71,665 | | | | — | | | | — | | | | — | | | | 71,665 | |
Total Investments in Securities | | $ | 55,752,762 | | | $ | — | | | $ | — | | | $ | — | | | $ | 55,752,762 | |
^ See Schedule of Investments for industry breakouts.
PAMC
Description^ | | Level 1 | | | Level 2 | | | Level 3 | | | Investments
Measured at
Net Asset Value | | | Total | |
Common Stocks | | $ | 14,198,536 | | | $ | — | | | $ | — | | | $ | — | | | $ | 14,198,536 | |
Real Estate Investment Trusts | | | 709,212 | | | | — | | | | — | | | | — | | | | 709,212 | |
Short-Term Investments | | | 45,714 | | | | — | | | | — | | | | — | | | | 45,714 | |
Total Investments in Securities | | $ | 14,953,462 | | | $ | — | | | $ | — | | | $ | — | | | $ | 14,953,462 | |
^ See Schedule of Investments for industry breakouts.
PALC
Description^ | | Level 1 | | | Level 2 | | | Level 3 | | | Investments
Measured at
Net Asset Value | | | Total | |
Common Stocks | | $ | 12,829,608 | | | $ | — | | | $ | — | | | $ | — | | | $ | 12,829,608 | |
Real Estate Investment Trusts | | | 574,699 | | | | — | | | | — | | | | — | | | | 574,699 | |
Short-Term Investments | | | 19,122 | | | | — | | | | — | | | | — | | | | 19,122 | |
Total Investments in Securities | | $ | 13,423,429 | | | $ | — | | | $ | — | | | $ | — | | | $ | 13,423,429 | |
^ See Schedule of Investments for industry breakouts.
During the period ended October 31, 2020, the Funds did not recognize any transfers to or from Level 3.
B. | Foreign Currency. Investment securities and other assets and liabilities denominated in foreign currencies are translated into U.S. dollar amounts at the date of valuation. Purchases and sales of investment securities and income and expense items denominated in foreign currencies are translated into U.S. dollar amounts on the respective dates of such transactions. The Funds do not isolate that portion of the results of operations resulting from changes in foreign exchange rates on investments from fluctuations arising from changes in market prices of securities held. Such fluctuations are included with the net realized and unrealized gain or loss from investments. The Funds report net realized foreign exchange gains or losses that arise from sales of foreign currencies, currency gains or losses realized between the trade and settlement dates on foreign currency transactions, and the differences between the amounts of dividends, interest and foreign withholding taxes recorded on the Funds’ books and the U.S. dollar equivalent of the amounts actually received or paid. Net unrealized foreign exchange gains and losses arise from changes in the values of assets and liabilities, other than investments in securities at fiscal period end, resulting from changes in exchange rates. |
C. | Federal Income Taxes. The Funds comply with the requirements of Subchapter M of the Internal Revenue Code of 1986, as amended, necessary to qualify as regulated investment companies and distribute substantially all net taxable investment income and net realized gains to shareholders in a manner which results in no tax cost to the Funds. Therefore, no federal income tax provision is required. As of and during the fiscal period/year ended April 30, 2020, the Funds did not have any tax positions that did not meet the “more-likely-than-not” threshold of being sustained by the applicable tax authority. As of and during the fiscal period/year ended April 30, 2020, the Funds did not have liabilities for any unrecognized tax benefits on uncertain tax positions as income tax expense in the Statement of Operations. Management has analyzed each of the Fund’s tax positions and concluded that no liability for unrecognized tax benefits should be recorded related to uncertain tax positions taken on returns filed for open tax years (2017-2019) or expected to be taken in each of the Fund’s 2020 tax returns. During the year/period ended April 30, 2020, the Funds did not incur any interest or penalties. |
174
Pacer Funds
NOTES TO FINANCIAL STATEMENTS
October 31, 2020 (Unaudited) (Continued)
D. | Security Transactions and Investment Income. Investment securities transactions are accounted for on the trade date. Gains and losses realized on sales of securities are computed on the basis of highest amortized cost. Dividend income is recorded on the ex-dividend date. Interest income is recorded on an accrual basis. Discounts and premiums on securities purchased are accreted and amortized over the lives of the respective securities. Withholding taxes on foreign dividends have been provided for in accordance with the Funds’ understanding of the applicable tax rules and regulations. |
Distributions received from the Fund’s investments in Real Estate Investment Trusts (“REIT”) may be characterized as ordinary income, net capital gain, or a return of capital. The proper characterization of REIT distributions is generally not known until after the end of each calendar year. As such, the Funds must use estimates in reporting the character of their income and distributions for financial statement purposes. The actual character of distributions to the Fund’s shareholders will be reflected on the Form 1099 received by shareholders after the end of the calendar year. Due to the nature of REIT investments, a portion of the distributions received by the Fund’s shareholders may represent a return of capital.
E. | Distributions to Shareholders. Distributions to shareholders from net investment income for the PTLC, PTMC, PTNQ, PTEU, PTIN, TRND, and AFTY, are declared and paid on an annual basis. The GCOW, COWZ, CALF, ICOW, PWS, VETS, PEXL, INDS, SRVR, SZNE, BUL, ECOW, HERD, PTBD, VIRS, ALTL, PAMC and PALC are declared and paid on a quarterly basis. The net realized gains on securities normally are declared and paid on an annual basis for all Funds. Distributions are recorded on the ex-dividend date. |
F. | Use of Estimates. The preparation of financial statements in conformity with GAAP requires management to make estimates and assumptions that affect the reported amounts of assets and liabilities and disclosure of contingent assets and liabilities at the date of the financial statements, and the reported amounts of increases and decreases in net assets from operations during the reporting period. Actual results could differ from those estimates. |
G. | Share Valuation. The NAV per share of each Fund is calculated by dividing the sum of the value of the securities held by the Fund, plus cash and other assets, minus all liabilities (including estimated accrued expenses) by the total number of shares outstanding for the Fund, rounded to the nearest cent. The Funds’ shares will not be priced on the days on which the Cboe, Nasdaq and/or New York’s Stock Exchange (“NYSE”) is closed for trading. The offering and redemption price per share for each Fund is equal to the Fund’s net asset value per share. |
H. | Guarantees and Indemnifications. In the normal course of business, the Funds enter into contracts with service providers that contain general indemnification clauses. Each Fund’s maximum exposure under these arrangements is unknown as this would involve future claims that may be against the Funds that have not yet occurred. |
I. | Reclassification of Capital Accounts. Additionally, U.S. GAAP requires that certain components of net assets relating to permanent differences be reclassified between financial and tax reporting. These reclassifications have no effect on net assets or net asset value per share. For the fiscal period/year ended April 30, 2020, the following table shows the reclassifications made: |
| | | Distributable
Earnings
(Accumulated
Deficit) | | | Paid In Capital | |
PTLC | | $ | (146,749,396 | ) | | $ | 146,749,396 | |
PTMC | | | (15,413,212 | ) | | | 15,413,212 | |
PTNQ | | | (18,103,919 | ) | | | 18,103,919 | |
PTEU | | | (7,513,275 | ) | | | 7,513,275 | |
GCOW | | | (4,967,660 | ) | | | 4,967,660 | |
COWZ | | | (16,682,090 | ) | | | 16,682,090 | |
CALF | | | (1,752,977 | ) | | | 1,752,977 | |
ICOW | | | (1,263,971 | ) | | | 1,263,971 | |
PWS | | | (3,271,211 | ) | | | 3,271,211 | |
VETS | | | (327,505 | ) | | | 327,505 | |
INDS | | | (236,208 | ) | | | 236,208 | |
SRVR | | | (3,025,386 | ) | | | 3,025,386 | |
PEXL | | | (239,319 | ) | | | 239,319 | |
SZNE | | | 3,476,053 | | | | (3,476,053 | ) |
BUL | | | (247,111 | ) | | | 247,111 | |
175
Pacer Funds
NOTES TO FINANCIAL STATEMENTS
October 31, 2020 (Unaudited) (Continued)
| | | Distributable
Earnings
(Accumulated
Deficit) | | | Paid In Capital | |
PTIN | | $ | (2,884,127 | ) | | $ | 2,884,127 | |
ECOW | | | (132,260 | ) | | | 132,260 | |
HERD | | | 4,200 | | | | (4,200 | ) |
TRND | | | — | | | | — | |
PTBD | | | (123,509 | ) | | | 123,509 | |
AFTY | | | 28,865 | | | | (28,865 | ) |
During the fiscal year/period ended April 30, 2020, the Funds’ realized the following net capital gains/(losses) resulting from in-kind redemptions, in which shareholders exchanged Fund shares for securities held by the Fund rather than for cash. Because such gains are not taxable to the Fund, and are not distributed to shareholders, they have been reclassified from accumulated net realized losses to paid-in-capital.
PTLC | | $ | 152,994,042 | |
PTMC | | | 32,298,842 | |
PTNQ | | | 19,066,067 | |
PTEU | | | 7,519,816 | |
GCOW | | | 6,216,192 | |
COWZ | | | 20,338,001 | |
CALF | | | 2,844,207 | |
ICOW | | | 1,547,891 | |
PWS | | | 3,274,584 | |
VETS | | | 328,018 | |
INDS | | | 222,076 | |
SRVR | | | 3,031,680 | |
PEXL | | | 287,024 | |
SZNE | | | (3,441,334 | ) |
BUL | | | 286,571 | |
PTIN | | | 2,874,669 | |
ECOW | | | 178,277 | |
HERD | | | (4,200 | ) |
TRND | | | — | |
PTBD | | | 131,641 | |
AFTY | | | — | |
VIRS, ALTL, PAMC AND PALC commenced operations after April 30, 2020.
NOTE 3 – COMMITMENTS AND OTHER RELATED PARTY TRANSACTIONS
Pacer Advisors, Inc. (“the Adviser”) serves as the investment adviser to the Funds. Pursuant to an Investment Advisory Agreement (“Investment Advisory Agreement”) between the Trust, on behalf of the Funds, and the Adviser, the Adviser provides investment advice to the Funds and oversees the day-to-day operations of the Funds, subject to the direction and control of the Board and the officers of the Trust. The Adviser administers the Funds’ business affairs, provides office facilities and equipment and certain clerical, bookkeeping and administrative services. The Adviser bears the costs of all advisory and non-advisory services required to operate the Funds, in exchange for a single unitary management fee. For services provided to the Funds, PTLC pays the Adviser 0.60%, PTMC pays the Adviser 0.60%, PTNQ pays the Adviser 0.65%, PTEU pays the Adviser 0.65%, GCOW pays the Adviser 0.60%, COWZ pays the Adviser 0.49%, CALF pays the Adviser 0.59%, ICOW pays the Adviser 0.65%, PWS pays the Adviser 0.60%, VETS pays the Adviser 0.60%, INDS pays the Adviser 0.60%, RTL pays the Adviser 0.60%, SRVR pays the Adviser 0.60%, PEXL pays the Adviser 0.60%, SZNE pays the Adviser 0.60%, BUL pays the Adviser 0.60%, PTIN pays the Adviser 0.65%, ECOW pays the Adviser 0.70%, HERD pays the Adviser 0.15%, TRND pays the Adviser 0.15%, PTBD pays the Adviser 0.60%, AFTY pays the Adviser 0.70%, VIRS pays the advisor 0.70%, ALTL pays the advisor 0.60%, PAMC pays the advisor 0.60%, and PALC pays the advisor 0.60% at an annual rate based on each Fund’s average daily net assets.
176
Pacer Funds
NOTES TO FINANCIAL STATEMENTS
October 31, 2020 (Unaudited) (Continued)
The Adviser has overall responsibility for overseeing the investment of the Funds’ assets, managing the Funds’ business affairs and providing certain clerical, bookkeeping and other administrative services for the Trust. Vident Investment Advisory, LLC (“Vident”) serves as the sub-adviser to PTBD and CSOP serves as the sub-adviser to AFTY. Each sub-adviser has responsibility for selecting and continuously monitoring the Fund’s investments. Sub-Advisory fees earned by Vident and CSOP are paid by the Adviser.
Pursuant to a Sub-Advisory Agreement between the Adviser and CSOP (the “Sub-Advisory Agreement”), CSOP is responsible for trading portfolio securities on behalf of AFTY, including selecting broker-dealers to execute purchase and sale transactions as instructed by the Adviser or in connection with any rebalancing or reconstitution of AFTY’s respective Index, subject to the supervision of the Adviser and the Board. For the services it provides to AFTY, CSOP is compensated by the Adviser from the management fees paid by AFTY to the Adviser.
Pursuant to a Sub-Advisory Agreement between the Adviser and VIA (the “Sub-Advisory Agreement”), VIA is responsible for trading portfolio securities on behalf of PTBD, including selecting broker-dealers to execute purchase and sale transactions as instructed by the Adviser or in connection with any rebalancing or reconstitution of PTBD’s respective Index, subject to the supervision of the Adviser and the Board. For the services it provides to PTBD, VIA is compensated by the Adviser from the management fees paid by PTBD to the Adviser.
The Distributor acts as the Funds’ principal underwriter in a continuous public offering of the Funds’ shares. The Distributor is an affiliate of the Adviser. The Funds did not pay any fees or commissions to the Distributor during the fiscal period ended October 31, 2020.
Certain officers and a Trustee of the Trust are affiliated with the Adviser and Distributor.
NOTE 4 – SERVICE AND CUSTODY AGREEMENTS
The Funds have entered into Service Agreements with U.S. Bancorp Fund Services, LLC (“Fund Services” or “Administrator”) doing business as U.S. Global Fund Services and a Custody Agreement with U.S. Bank, N.A. (the “Custodian”), an affiliate of Fund Services. Under these agreements, Fund Services and the Custodian provide certain transfer agency, administrative, accounting and custody services. The Custodian acts as securities lending agent (the “Securities Lending Agent”) for the Funds.
Prior to January 23, 2020, Brown Brothers Harriman & Co. (“BBH) served as administrator and custodian for AFTY.
NOTE 5 – SECURITIES LENDING
The Funds may lend up to 33 1/3% of the value of the securities in their portfolios to brokers, dealers and financial institutions (but not individuals) under terms of participation in a securities lending program administered by the Securities Lending Agent. The securities lending agreement requires that loans are collateralized at all times in an amount equal to at least 102% of the value of any domestic loaned securities at the time of the loan, plus accrued interest. The use of loans of foreign securities, which are denominated and payable in U.S. dollars, shall be collateralized in an amount equal to 105% of the value of any loaned securities at the time of the loan plus accrued interest. The Funds receive compensation in the form of fees and earn interest on the cash collateral. Due to timing issues of when a security is recalled from loan, the financial statements may differ in presentation. The amount of fees depends on a number of factors including the type of security and length of the loan. The Funds continue to receive interest payments or dividends on the securities loaned during the borrowing period. Gain or loss in the value of securities loaned that may occur during the term of the loan will be for the account of the Funds. The Funds have the right under the terms of the securities lending agreements to recall the securities from the borrower on demand.
As of October 31, 2020, the Funds had loaned securities and received cash collateral for the loans. The cash collateral is invested in the Mount Vernon Liquid Assets Portfolio, LLC of which the investment objective is to seek to maximize income to the extent consistent with the preservation of capital and liquidity and maintain a stable Net Asset Value (“NAV”) of $1.00. Although risk is mitigated by the collateral, the Funds could experience a delay in recovering their securities and possible loss of income or value if the borrower fails to return the borrowed securities. In addition, the Funds bear the risk of loss associated with the investment of cash collateral received.
During the period ended October 31, 2020, the Funds (excluding VETS, PEXL, SZNE, BUL, PTIN, ECOW, HERD, TRND, PTBD, AFTY, VIRS, ALTL, PAMC, and PALC) had loaned securities that were collateralized by cash. The cash collateral received was invested in securities as listed in each Fund’s Schedule of Investments. Income earned from these investments is allocated to each Fund based on each Fund’s portion of total cash collateral received. Securities lending income is disclosed in each Fund’s Statement of Operations.
177
Pacer Funds
NOTES TO FINANCIAL STATEMENTS
October 31, 2020 (Unaudited) (Continued)
NOTE 6 – SECURED BORROWINGS
The following represents gross obligations for secured borrowings by remaining time to maturity as of October 31, 2020.
Securities Lending Transactions
Overnight and Continuous | | Investments Purchased
with Proceeds from
Securities Lending
Collateral* | |
PTLC | | $ | 46,975,266 | |
PTMC | | | 87,061,332 | |
PTNQ | | | 4,601,812 | |
PTEU | | | 7,021,988 | |
GCOW | | | 18,210,715 | |
COWZ | | | 20,197,179 | |
CALF | | | 1,235,495 | |
ICOW | | | 1,678,843 | |
PWS | | | 6,631,208 | |
INDS | | | 20,663,664 | |
SRVR | | | 108,852,982 | |
* | Proceeds from securities lending (Investments Purchased with Proceeds from Securities Lending Collateral). |
Due to the absence of a master netting agreement related to the Funds’ participation in securities lending, no additional offsetting disclosures have been made on behalf of the Funds for the total borrowings listed above.
NOTE 7 – OFFSETTING ASSETS AND LIABILITIES
The following is a summary of the Assets and Liabilities for each Fund subject to offsets as of October 31, 2020:
Liabilities
| | | | | | | | | | | | | | | Gross Amounts Net Offset in the
Statements of Assets and Liabilities | | | | | |
Description | | Gross Amounts
of Recognized
Liabilities | | | Gross Amounts
Offset in the
Statement of
Assets and
Liabilities | | | Net Amounts
Presented in
the Statements
of Assets and
Liabilities | | | Financial
Instruments | | | Collateral
Pledged
(Received) | | | Net
Amount | |
PTLC | | | | | | | | | | | | | | | | | | | | | | | | |
Securities Lending | | $ | 46,975,266 | | | $ | — | | | $ | 46,975,266 | | | $ | 46,975,266 | | | $ | — | | | $ | — | |
PTMC | | | | | | | | | | | | | | | | | | | | | | | | |
Securities Lending | | | 87,061,332 | | | | — | | | | 87,061,332 | | | | 87,061,332 | | | | — | | | | — | |
PTNQ | | | | | | | | | | | | | | | | | | | | | | | | |
Securities Lending | | | 4,601,812 | | | | — | | | | 4,601,812 | | | | 4,601,812 | | | | — | | | | — | |
PTEU | | | | | | | | | | | | | | | | | | | | | | | | |
Securities Lending | | | 7,021,988 | | | | — | | | | 7,021,988 | | | | 7,021,988 | | | | — | | | | — | |
GCOW | | | | | | | | | | | | | | | | | | | | | | | | |
Securities Lending | | | 18,210,715 | | | | — | | | | 18,210,715 | | | | 18,210,715 | | | | — | | | | — | |
COWZ | | | | | | | | | | | | | | | | | | | | | | | | |
Securities Lending | | | 20,197,179 | | | | — | | | | 20,197,179 | | | | 20,197,179 | | | | — | | | | — | |
CALF | | | | | | | | | | | | | | | | | | | | | | | | |
Securities Lending | | | 1,235,495 | | | | — | | | | 1,235,495 | | | | 1,235,495 | | | | — | | | | — | |
ICOW | | | | | | | | | | | | | | | | | | | | | | | | |
Securities Lending | | | 1,678,843 | | | | — | | | | 1,678,843 | | | | 1,678,843 | | | | — | | | | — | |
178
Pacer Funds
NOTES TO FINANCIAL STATEMENTS
October 31, 2020 (Unaudited) (Continued)
| | | | | | | | | | | | | | | Gross Amounts Net Offset in the
Statements of Assets and Liabilities | | | | | |
Description | | Gross Amounts
of Recognized
Liabilities | | | Gross Amounts
Offset in the
Statement of
Assets and
Liabilities | | | Net Amounts
Presented in
the Statements
of Assets and
Liabilities | | | Financial
Instruments | | | Collateral
Pledged
(Received) | | | Net
Amount | |
PWS | | | | | | | | | | | | | | | | | | | | | | | | |
Securities Lending | | $ | 6,631,208 | | | $ | — | | | $ | 6,631,208 | | | $ | 6,631,208 | | | $ | — | | | $ | — | |
INDS | | | | | | | | | | | | | | | | | | | | | | | | |
Securities Lending | | | 20,663,664 | | | | — | | | | 20,663,664 | | | | 20,663,664 | | | | — | | | | — | |
SRVR | | | | | | | | | | | | | | | | | | | | | | | | |
Securities Lending | | | 108,852,982 | | | | — | | | | 108,852,982 | | | | 108,852,982 | | | | — | | | | — | |
NOTE 8 – INVESTMENT TRANSACTIONS
For the period ended October 31, 2020, the aggregate purchases and sales of securities by the Funds, excluding short-term securities and in-kind transactions, were as follows:
| | Purchases | | | Sales | |
PTLC | | $ | 2,339,433,854 | | | $ | 17,738,728 | |
PTMC | | | 946,043,980 | | | | 472,519,468 | |
PTNQ | | | 18,412,086 | | | | 425,328,914 | |
PTEU | | | 215,280,320 | | | | 145,657,585 | |
GCOW | | | 44,667,703 | | | | 44,726,801 | |
COWZ | | | 133,123,715 | | | | 130,419,506 | |
CALF | | | 22,020,508 | | | | 21,957,404 | |
ICOW | | | 5,371,299 | | | | 5,951,338 | |
PWS | | | 63,914,547 | | | | 64,231,169 | |
VETS | | | 737,099 | | | | 738,249 | |
INDS | | | 5,375,242 | | | | 3,832,303 | |
SRVR | | | 185,820,412 | | | | 184,465,317 | |
PEXL | | | 1,006,238 | | | | 1,068,233 | |
SZNE | | | 56,689,254 | | | | 56,511,157 | |
BUL | | | 898,309 | | | | 930,802 | |
PTIN | | | 289,875,190 | | | | 152,709,289 | |
ECOW | | | 653,908 | | | | 412,196 | |
HERD | | | 83,703 | | | | 85,128 | |
TRND | | | 8,835,411 | | | | 8,864,453 | |
PTBD | | | 212,738,109 | | | | 163,651,644 | |
AFTY | | | 756,371 | | | | 2,358,097 | |
VIRS | | | — | | | | 838 | |
ALTL | | | 61,010,472 | | | | 60,185,941 | |
PAMC | | | 9,545,888 | | | | 9,475,050 | |
PALC | | | 2,622,007 | | | | 2,585,382 | |
179
Pacer Funds
NOTES TO FINANCIAL STATEMENTS
October 31, 2020 (Unaudited) (Continued)
For the period ended October 31, 2020, in-kind transactions associated with creations and redemptions are as follows:
| | | Purchases | | | Sales | |
PTLC | | $ | 31,397,852 | | | $ | 724,610,300 | |
PTMC | | | — | | | | 82,748,075 | |
PTNQ | | | 329,522,084 | | | | 477,112,316 | |
PTEU | | | — | | | | 5,323,002 | |
GCOW | | | — | | | | 21,110,710 | |
COWZ | | | 67,909,410 | | | | 78,600,890 | |
CALF | | | 28,354,684 | | | | 10,971,751 | |
ICOW | | | — | | | | 8,670,794 | |
PWS | | | 7,356,266 | | | | 12,033,815 | |
VETS | | | 1,448,636 | | | | 2,810,198 | |
INDS | | | 64,574,035 | | | | 4,704,393 | |
SRVR | | | 640,667,702 | | | | 134,330,019 | |
PEXL | | | 2,867,752 | | | | 2,787,582 | |
SZNE | | | 19,906,536 | | | | 33,479,050 | |
BUL | | | 2,689,808 | | | | 2,639,392 | |
PTIN | | | 9,210,518 | | | | 31,559,012 | |
ECOW | | | 739,954 | | | | — | |
HERD | | | 1,092,052 | | | | 1,181,680 | |
TRND | | | 8,783,518 | | | | 4,905,867 | |
PTBD | | | 190,957,119 | | | | 74,019,258 | |
AFTY | | | — | | | | — | |
VIRS | | | 5,118,006 | | | | — | |
ALTL | | | 96,350,545 | | | | 43,024,477 | |
PAMC | | | 19,618,008 | | | | 6,663,631 | |
PALC | | | 15,239,394 | | | | 2,794,305 | |
For the period ended October 31, 2020, long-term purchases and sales of U.S. Government Securities were as follows:
| | | Purchases | | | Sales | |
PWS | | $ | 1,341,275 | | | $ | 100,504,787 | |
PTBD | | | 82,431,390 | | | | 410,850,269 | |
During the fiscal year ended April 30, 2017, PTEU accepted a cash contribution in the amount of $409,837 to reimburse the Fund from prior securities transactions.
180
Pacer Funds
NOTES TO FINANCIAL STATEMENTS
October 31, 2020 (Unaudited) (Continued)
NOTE 9 – TRANSACTIONS WITH AFFILIATED SECURITIES
The Pacer Cash Cows Fund of Funds Index uses an objective, rules-based approach to construct a portfolio that, as of each quarterly rebalance, is composed of the ETFs listed in the following table, each advised by the Adviser (collectively, the “Cash Cows ETFs”). Each of the Cash Cows ETFs is an index-based ETF that seeks to track the total return performance, before fees and expenses, of the applicable underlying index listed in the following table (collectively, the “Cash Cows Indexes”). Each Cash Cows Index uses an objective, rules-based methodology to provide exposure to companies with high free cash flow yields (commonly referred to as “cash cows”) selected from the applicable “Equity Universe” as indicated in the following table.
Weight | Cash Cows ETF | Cash Cows Index | Equity Universe |
20% | Pacer US Cash Cows 100 ETF | Pacer US Cash Cows 100 ETF | Russell 1000 Index |
20% | Pacer Global Cash Cows Dividend ETF | Pacer Global Cash Cows Dividend Index | FTSE Developed Large Cap Index |
20% | Pacer US Small Cap Cash Cows 100 ETF | Pacer US Small Cap Cash Cows 100 Index | S&P Small Cap 600® Index |
20% | Pacer US Cash Cows Growth ETF | Pacer US Cash Cows Growth Index | S&P 900® Pure Growth Index |
20% | Pacer Developed Markets International Cash Cows 100 ETF | Pacer Developed Markets International Cash Cows 100 Index | FTSE Developed ex US Index |
HERD had the following transactions during the current fiscal period with affiliates:
| | | Share Activity | |
Security Name | | Balance
May 1, 2020 | | | Purchases | | | Sales | | | Balance
October 31, 2020 | |
BUL | | | 9,353 | | | | 9,353 | | | | 10,219 | | | | 8,487 | |
CALF | | | 10,472 | | | | 10,472 | | | | 11,667 | | | | 9,277 | |
COWZ | | | 8,322 | | | | 8,655 | | | | 8,588 | | | | 8,389 | |
GCOW | | | 8,196 | | | | 10,220 | | | | 8,803 | | | | 9,613 | |
ICOW | | | 9,510 | | | | 10,567 | | | | 9,898 | | | | 10,179 | |
| | | Period Ended October 31, 2020 | |
Security Name | | Value | | | Dividend Income | | | Gain (Loss) Realized
on Sale of Shares | | | Net Change
in Unrealized
Appreciation
(Depreciation)
on Investments
in Affiliate | |
BUL | | $ | 230,206 | | | $ | 2,586 | | | $ | 28,175 | | | $ | 37,368 | |
CALF | | | 233,651 | | | | 1,032 | | | | 36,731 | | | | 46,161 | |
COWZ | | | 231,117 | | | | 5,418 | | | | 15,064 | | | | 19,922 | |
GCOW | | | 227,540 | | | | 11,686 | | | | (3,599 | ) | | | (9,107 | ) |
ICOW | | | 229,740 | | | | 8,150 | | | | 15,047 | | | | 16,551 | |
Total | | $ | 1,152,254 | | | $ | 28,873 | | | $ | 91,418 | | | $ | 110,896 | |
The Pacer Trendpilot Fund of Funds Index uses an objective, rules-based approach to construct a portfolio that, as of each quarterly rebalance, is composed of the ETFs listed in the following table, each advised by the Adviser (collectively, the “Trendpilot ETFs”). Each of the Trendpilot ETFs is an index-based ETF that seeks to track the total return performance, before fees and expenses, of the underlying index listed in the following table (collectively, the “Trendpilot Indexes”). Each Trendpilot Index other than the Pacer Trendpilot US Bond Index (collectively, the “Trendpilot Equity Indexes”) uses an objective, rules-based methodology to implement a systematic trend-following strategy that directs exposure (i) 100% to the “Underlying Component” specified in the table below, (ii) 50% to the applicable Underlying Component and 50% to 3-Month US Treasury bills, or (iii) 100% to 3-Month US Treasury bills, depending on the relative performance of the Underlying Component and its 200-business day historical simple moving average (the “200-day moving average”). The calculation of the 200-day moving average for each Underlying Component is based on the total return version of such Underlying Component and reflects the reinvestment of dividends paid by the securities in such Underlying Component.
181
Pacer Funds
NOTES TO FINANCIAL STATEMENTS
October 31, 2020 (Unaudited) (Continued)
The Pacer Trendpilot US Bond Index (the “Trendpilot Bond Index”) uses an objective, rules-based methodology to implement a systematic trend-following strategy that directs exposure to one of the following positions: (i) 100% to the S&P U.S. High Yield Corporate Bond Index, (ii) 50% to the S&P U.S. High Yield Corporate Bond Index and 50% to the S&P U.S. Treasury Bond 7-10 Year Index or (iii) 100% to S&P U.S. Treasury Bond 7-10 Year Index, depending on the value of the S&P U.S. High Yield Corporate Bond Index divided by the value of the S&P U.S.Treasury Bond 7-10 Year Index (the “Risk Ratio”).
Weight | Trendpilot ETF | Trendpilot Index | Equity Component |
20% | Pacer Trendpilot® US Large Cap ETF | Pacer Trendpilot® US Large Cap Index | S&P 500® Index |
20% | Pacer Trendpilot® US Mid Cap ETF | Pacer Trendpilot® US Mid Cap Index | S&P MidCap 400® Index |
20% | Pacer Trendpilot® 100 ETF | Pacer NASDAQ-100 Trendpilot® Index | NASDAQ-100® Index |
20% | Pacer Trendpilot® International ETF | Pacer Trendpilot® International Index | S&P Developed Ex-US Large Cap Index |
20% | Pacer Trendpilot® US Bond ETF | Pacer Trendpilot® US Bond Index | S&P U.S. High Yield Corporate Bond Index |
TRND had the following transactions during the current fiscal period with affiliates:
| | | Share Activity | |
Security Name | | Balance
May 1, 2020 | | | Purchases | | | Sales | | | Balance
October 31, 2020 | |
PTBD | | | — | | | | 254,400 | | | | — | | | | 254,400 | |
PTIN | | | 457,345 | | | | 191,729 | | | | 357,270 | | | | 291,804 | |
PTLC | | | 198,393 | | | | 72,716 | | | | 50,822 | | | | 220,287 | |
PTMC | | | 188,916 | | | | 84,151 | | | | 43,840 | | | | 229,227 | |
PTNQ | | | 156,725 | | | | 42,089 | | | | 64,238 | | | | 134,576 | |
| | | Period Ended October 31, 2020 | |
Security Name | | Value | | | Dividend Income | | | Gain (Loss) Realized
on Sale of Shares | | | Net Change
in Unrealized
Appreciation
(Depreciation)
on Investments
in Affiliate | |
PTBD | | $ | 6,690,720 | | | $ | — | | | $ | — | | | $ | (88,404 | ) |
PTIN | | | 6,428,442 | | | | — | | | | (700,960 | ) | | | 178,102 | |
PTLC | | | 6,335,454 | | | | — | | | | (36,450 | ) | | | 388,590 | |
PTMC | | | 6,402,310 | | | | — | | | | (9,280 | ) | | | (71,875 | ) |
PTNQ | | | 6,495,984 | | | | — | | | | 258,395 | | | | 1,218,241 | |
Total | | $ | 32,352,910 | | | $ | — | | | $ | (488,295 | ) | | $ | 1,624,655 | |
NOTE 10 – TAX COST BASIS
The components of tax basis cost of investments and net unrealized appreciation for federal income tax purposes at April 30, 2020 were as follows:
| | | PTLC | | | PTMC | | | PTNQ | | | PTEU | | | GCOW | |
Tax cost of investments | | $ | 3,170,570,008 | | | $ | 702,799,261 | | | $ | 798,281,717 | | | $ | 117,923,023 | | | $ | 210,392,185 | |
Gross tax unrealized appreciation | | | 360,259 | | | | 264,190 | | | | 104,735,993 | | | | 29,640 | | | | 3,473,286 | |
Gross tax unrealized depreciation | | | — | | | | (2,037 | ) | | | (64,112,907 | ) | | | (19,792 | ) | | | (44,165,970 | ) |
Net tax unrealized appreciation (depreciation) | | | 360,259 | | | | 262,153 | | | | 40,623,086 | | | | 9,848 | | | | (40,692,684 | ) |
Undistributed ordinary income | | | 8,861,367 | | | | 892,895 | | | | 518,444 | | | | — | | | | 1,003,305 | |
Undistributed long-term gain | | | — | | | | — | | | | — | | | | — | | | | — | |
Total distributable earnings | | | 8,861,367 | | | | 892,895 | | | | 518,444 | | | | — | | | | 1,003,305 | |
Other accumulated (loss) | | | (480,060,919 | ) | | | (114,319,732 | ) | | | (17,582,345 | ) | | | (47,591,043 | ) | | | (16,065,766 | ) |
Total accumulated gain (loss) | | $ | (470,839,293 | ) | | $ | (113,164,684 | ) | | $ | 23,559,185 | | | $ | (47,581,195 | ) | | $ | (55,755,145 | ) |
182
Pacer Funds
NOTES TO FINANCIAL STATEMENTS
October 31, 2020 (Unaudited) (Continued)
| | | COWZ | | | CALF | | | ICOW | | | PWS | | | VETS | |
Tax cost of investments | | $ | 265,194,167 | | | $ | 20,965,531 | | | $ | 31,710,603 | | | $ | 62,185,260 | | | $ | 2,868,687 | |
Gross tax unrealized appreciation | | | 19,007,834 | | | | 1,412,888 | | | | 392,687 | | | | 3,763,162 | | | | 232,427 | |
Gross tax unrealized depreciation | | | (38,546,481 | ) | | | (4,162,523 | ) | | | (7,035,962 | ) | | | (19,021 | ) | | | (329,962 | ) |
Net tax unrealized appreciation (depreciation) | | | (19,538,647 | ) | | | (2,749,635 | ) | | | (6,643,275 | ) | | | 3,744,141 | | | | (97,535 | ) |
Undistributed ordinary income | | | 294,997 | | | | 29,901 | | | | 99,871 | | | | 49,843 | | | | 1,691 | |
Undistributed long-term gain | | | — | | | | — | | | | — | | | | — | | | | — | |
Total distributable earnings | | | 294,997 | | | | 29,901 | | | | 99,871 | | | | 49,843 | | | | 1,691 | |
Other accumulated (loss) | | | (40,322,137 | ) | | | (14,166,371 | ) | | | (4,486,688 | ) | | | (23,552,021 | ) | | | (47,711 | ) |
Total accumulated gain (loss) | | $ | (59,565,787 | ) | | $ | (16,886,105 | ) | | $ | (11,030,092 | ) | | $ | (19,758,037 | ) | | $ | (143,555 | ) |
| | INDS | | | SRVR | | | PEXL | | | SZNE | |
Tax cost of investments | | $ | 52,780,742 | | | $ | 638,180,881 | | | $ | 1,316,565 | | | $ | 60,661,892 | |
Gross tax unrealized appreciation | | | 2,173,457 | | | | 56,195,327 | | | | 123,586 | | | | — | |
Gross tax unrealized depreciation | | | (4,569,744 | ) | | | (28,202,324 | ) | | | (182,761 | ) | | | (6,989 | ) |
Net tax unrealized appreciation (depreciation) | | | (2,396,287 | ) | | | 27,993,003 | | | | (59,175 | ) | | | (6,989 | ) |
Undistributed ordinary income | | | 30,349 | | | | — | | | | 617 | | | | 23,090 | |
Undistributed long-term gain | | | — | | | | — | | | | — | | | | — | |
Total distributable earnings | | | 30,349 | | | | — | | | | 617 | | | | 23,090 | |
Other accumulated (loss) | | | (1,978,292 | ) | | | (536,329 | ) | | | (258,045 | ) | | | (15,029,291 | ) |
Total accumulated gain (loss) | | $ | (4,344,230 | ) | | $ | 27,456,674 | | | $ | (316,603 | ) | | $ | (15,013,190 | ) |
| | BUL | | | PTIN | | | ECOW | | | HERD | | | TRND | |
Tax cost of investments | | $ | 1,219,620 | | | $ | 151,020,429 | | | $ | 1,194,453 | | | $ | 1,262,100 | | | $ | 28,517,104 | |
Gross tax unrealized appreciation | | | 96,071 | | | | 38,733 | | | | 48,677 | | | | 2,904 | | | | 360,438 | |
Gross tax unrealized depreciation | | | (171,163 | ) | | | (11,231 | ) | | | (286,759 | ) | | | (223,601 | ) | | | (1,496,228 | ) |
Net tax unrealized appreciation (depreciation) | | | (75,092 | ) | | | 27,502 | | | | (238,082 | ) | | | (220,697 | ) | | | (1,135,790 | ) |
Undistributed ordinary income | | | 324 | | | | 227,453 | | | | 13,585 | | | | — | | | | — | |
Undistributed long-term gain | | | — | | | | — | | | | — | | | | — | | | | — | |
Total distributable earnings | | | 324 | | | | 227,453 | | | | 13,585 | | | | — | | | | — | |
Other accumulated (loss) | | | (205,376 | ) | | | (12,612,233 | ) | | | (41,058 | ) | | | (4,717 | ) | | | (6,020 | ) |
Total accumulated gain (loss) | | $ | (280,144 | ) | | $ | (12,357,278 | ) | | $ | (265,555 | ) | | $ | (225,414 | ) | | $ | (1,141,810 | ) |
| | PTBD | | | AFTY | |
Tax cost of investments | | $ | 140,301,610 | | | $ | 9,606,950 | |
Gross tax unrealized appreciation | | | 3,109,727 | | | | 256,734 | |
Gross tax unrealized depreciation | | | (54,156 | ) | | | (872,569 | ) |
Net tax unrealized appreciation (depreciation) | | | 3,055,571 | | | | (615,835 | ) |
Undistributed ordinary income | | | 40,452 | | | | — | |
Undistributed long-term gain | | | — | | | | — | |
Total distributable earnings | | | 40,452 | | | | — | |
Other accumulated (loss) | | | (1,000,103 | ) | | | (1,191,687 | ) |
Total accumulated gain (loss) | | $ | 2,095,920 | | | $ | (1,807,522 | ) |
The difference between book and tax-basis cost is attributable to the realization for tax purposes of unrealized gains on investments in Real Estate Investment Trusts, partnerships, passive foreign investment companies and wash sales. Under tax law, certain capital and foreign currency losses realized after April 30 and within the taxable year are deemed to arise on the first business day of the Fund’s next taxable year.
183
Pacer Funds
NOTES TO FINANCIAL STATEMENTS
October 31, 2020 (Unaudited) (Continued)
At April 30, 2020, the Funds had the following capital loss carryforwards:
| | | Short-Term | | | Long-Term | | | Expires | |
PTLC | | $ | 228,446,268 | | | $ | 251,614,651 | | | | Indefinite | |
PTMC | | | 106,713,763 | | | | 7,605,969 | | | | Indefinite | |
PTNQ | | | 16,331,208 | | | | 1,251,137 | | | | Indefinite | |
PTEU | | | 38,573,148 | | | | 8,767,332 | | | | Indefinite | |
GCOW | | | 7,383,320 | | | | 8,684,188 | | | | Indefinite | |
COWZ | | | 26,797,213 | | | | 13,524,924 | | | | Indefinite | |
CALF | | | 10,982,976 | | | | 3,183,395 | | | | Indefinite | |
ICOW | | | 2,707,011 | | | | 1,779,379 | | | | Indefinite | |
PWS | | | 23,552,021 | | | | — | | | | Indefinite | |
VETS | | | 30,831 | | | | 16,880 | | | | Indefinite | |
INDS | | | 1,978,292 | | | | — | | | | Indefinite | |
SRVR | | | 536,329 | | | | — | | | | Indefinite | |
PEXL | | | 230,870 | | | | 27,175 | | | | Indefinite | |
SZNE | | | 15,029,291 | | | | — | | | | Indefinite | |
BUL | | | 205,376 | | | | — | | | | Indefinite | |
PTIN | | | 12,611,917 | | | | — | | | | Indefinite | |
ECOW | | | 39,967 | | | | — | | | | Indefinite | |
HERD | | | 4,717 | | | | — | | | | Indefinite | |
TRND | | | — | | | | — | | | | Indefinite | |
PTBD | | | 1,000,103 | | | | — | | | | Indefinite | |
AFTY | | | 1,166,967 | | | | — | | | | Indefinite | |
AFTY utilized $2,385,684 of capital loss carryforward during the current period ended April 30, 2020.
At April 30, 2020, PTEU, TRND and AFTY deferred on a tax basis, a post-October capital loss of $232,971, $6,020 and $24,720, respectively. None of the Funds deferred on a tax bases late-year ordinary losses.
VIRS, ALTL, PAMC AND PALC commenced operations after April 30, 2020.
NOTE 11 – DISTRIBUTIONS TO SHAREHOLDERS
The tax character of distributions paid by the Funds during the fiscal period ended October 31, 2020 was as follows:
| | | Ordinary Income | | | Capital Gains | | | Return of Capital | |
PTLC | | $ | — | | | $ | — | | | $ | — | |
PTMC | | | — | | | | — | | | | — | |
PTNQ | | | — | | | | — | | | | — | |
PTEU | | | — | | | | — | | | | — | |
GCOW | | | 3,355,878 | | | | — | | | | — | |
COWZ | | | 2,447,236 | | | | — | | | | — | |
CALF | | | 61,953 | | | | — | | | | — | |
ICOW | | | 228,419 | | | | — | | | | — | |
PWS | | | 171,898 | | | | — | | | | — | |
VETS | | | 12,671 | | | | — | | | | — | |
INDS | | | 666,033 | | | | — | | | | — | |
SRVR | | | 6,151,753 | | | | — | | | | — | |
PEXL | | | 4,150 | | | | — | | | | — | |
SZNE | | | 291,564 | | | | — | | | | — | |
BUL | | | 7,149 | | | | — | | | | — | |
PTIN | | | — | | | | — | | | | — | |
184
Pacer Funds
NOTES TO FINANCIAL STATEMENTS
October 31, 2020 (Unaudited) (Continued)
| | | Ordinary Income | | | Capital Gains | | | Return of Capital | |
ECOW | | $ | 37,854 | | | $ | — | | | $ | — | |
HERD | | | 27,663 | | | | — | | | | — | |
TRND | | | — | | | | — | | | | — | |
PTBD | | | 2,676,642 | | | | — | | | | — | |
AFTY | | | — | | | | — | | | | — | |
VIRS | | | 9,690 | | | | — | | | | — | |
ALTL | | | 185,075 | | | | — | | | | — | |
PAMC | | | 9,666 | | | | — | | | | — | |
PALC | | | 17,940 | | | | — | | | | — | |
The tax character of distributions paid by the Funds during the fiscal year/period ended April 30, 2020 was as follows:
| | Ordinary Income | | | Capital Gains | | | Return of Capital | |
PTLC | | $ | 33,554,677 | | | $ | — | | | $ | — | |
PTMC | | | 8,738,254 | | | | — | | | | — | |
PTNQ | | | 3,044,420 | | | | — | | | | — | |
PTEU | | | 4,195,663 | | | | — | | | | — | |
GCOW | | | 8,770,455 | | | | — | | | | — | |
COWZ | | | 6,190,930 | | | | — | | | | — | |
CALF | | | 419,742 | | | | — | | | | — | |
ICOW | | | 1,009,491 | | | | — | | | | — | |
PWS | | | 1,151,877 | | | | — | | | | — | |
VETS | | | 52,852 | | | | — | | | | — | |
INDS | | | 656,033 | | | | 6,106 | | | | — | |
SRVR | | | 3,251,881 | | | | — | | | | 340,803 | |
PEXL | | | 7,790 | | | | — | | | | — | |
SZNE | | | 898,227 | | | | — | | | | — | |
BUL | | | 24,159 | | | | — | | | | — | |
PTIN | | | 1,060,524 | | | | — | | | | — | |
ECOW | | | 149,137 | | | | — | | | | — | |
HERD | | | 42,680 | | | | — | | | | 151 | |
TRND | | | 137,281 | | | | — | | | | — | |
PTBD | | | 913,550 | | | | — | | | | — | |
AFTY | | | 1,019,610 | | | | — | | | | 58,489 | |
185
Pacer Funds
NOTES TO FINANCIAL STATEMENTS
October 31, 2020 (Unaudited) (Continued)
The tax character of distributions paid by the Funds during the fiscal year/period ended April 30, 2019 was as follows:
| | Ordinary Income | | | Capital Gains | | | Return of Capital | |
PTLC | | $ | 14,704,858 | | | $ | — | | | $ | — | |
PTMC | | | 5,930,872 | | | | — | | | | — | |
PTNQ | | | 1,575,175 | | | | — | | | | — | |
PTEU | | | 2,870,463 | | | | — | | | | — | |
GCOW | | | 7,760,389 | | | | — | | | | — | |
COWZ | | | 2,630,630 | | | | — | | | | — | |
CALF | | | 329,410 | | | | — | | | | — | |
ICOW | | | 731,370 | | | | — | | | | — | |
PWS | | | 1,397,954 | | | | — | | | | — | |
VETS | | | 38,615 | | | | — | | | | — | |
RTL | | | 83,796 | | | | 5,909 | | | | 20,617 | |
INDS | | | 67,295 | | | | — | | | | — | |
SRVR | | | 89,513 | | | | 1,372 | | | | 37,487 | |
PEXL | | | 6,972 | | | | — | | | | — | |
SZNE | | | 29,474 | | | | — | | | | — | |
The tax character of distributions paid by AFTY during the fiscal year ended September 30, 2019 was $183,318 of ordinary income.
The tax composition of distributions paid during the year ended September 30, 2019 for AFTY was as follows:
| | Ordinary Income | | | Capital Gains | | | Return of Capital | |
| | | $ | 183,318 | | | $ | — | | | $ | — | |
The tax character of distributions paid by AFTY during the fiscal year ended September 30, 2019 was $183,318 of ordinary income.
VIRS, ALTL, PAMC AND PALC commenced operations after April 30, 2020.
NOTE 12 – NEW ACCOUNTING PRONOUNCEMENTS
In August 2018, FASB issued ASU 2018-13, Fair Value Measurement (Topic 820): Disclosure Framework—Changes to the Disclosure Requirements for Fair Value Measurement (“ASU 2018-13”). The primary focus of ASU 2018-13 is to improve the effectiveness of the disclosure requirements for fair value measurements. The changes affect all companies that are required to include fair value measurement disclosures. In general, the amendments in ASU 2018-13 are effective for all entities for fiscal years and interim periods within those fiscal years, beginning after December 15, 2019. An entity is permitted to early adopt the removed or modified disclosures upon the issuance of ASU 2018-13 and may delay adoption of the additional disclosures, which are required for public companies only, until their effective date. Management has evaluated the ASU 2018-13 and has decided to adopt the disclosure framework.
In March 2020, FASB issued ASU 2020-04, Reference Rate Reform: Facilitation of the Effects of Reference Rate Reform on Financial Reporting. The main objective of the new guidance is to provide relief to companies that will be impacted by the expected change in benchmark interest rates at the end of 2021, when participating banks will no longer be required to submit London Interbank Offered Rate (“LIBOR”) quotes by the UK Financial Conduct Authority. The new guidance allows companies to, provided the only change to existing contracts are a change to an approved benchmark interest rate, account for modifications as a continuance of the existing contract without additional analysis. In addition, derivative contracts that qualified for hedge accounting prior to modification, will be allowed to continue to receive such treatment, even if critical terms change due to a change in the benchmark interest rate. For new and existing contracts, the Funds may elect to apply the amendments as of March 12, 2020 through December 31, 2022. Management is currently assessing the impact of the ASU’s adoption to the Funds’ financial statements and various filings.
NOTE 13 – SUBSEQUENT EVENT
Management of the Funds has evaluated the need for disclosures and/or adjustments resulting from subsequent events through the date these financial statements were issued. The evaluation did not result in any subsequent events that necessitated disclosures and/or adjustments other than below.
186
Pacer Funds
NOTES TO FINANCIAL STATEMENTS
October 31, 2020 (Unaudited) (Continued)
On December 18, 2020, the following Funds declared distributions from ordinary income to shareholders of record as of December 22, 2020, Payable December 28, 2020, as follows:
| | | Ordinary Income | | | Per Share Amount | |
PTLC | | $ | 20,840,884 | | | $ | 0.35233955 | |
PTMC | | $ | 2,277,219 | | | $ | 0.17121949 | |
PTNQ | | $ | 1,304,636 | | | $ | 0.08309784 | |
PTEU | | $ | — | | | $ | — | |
GCOW | | $ | 1,299,760 | | | $ | 0.29208090 | |
COWZ | | $ | 1,802,041 | | | $ | 0.24685493 | |
CALF | | $ | 229,967 | | | $ | 0.12103527 | |
ICOW | | $ | 133,552 | | | $ | 0.24282182 | |
PWS | | $ | 42,762 | | | $ | 0.02375667 | |
VETS | | $ | 5,765 | | | $ | 0.11530000 | |
INDS | | $ | 955,090 | | | $ | 0.25469067 | |
SRVR | | $ | 4,215,854 | | | $ | 0.13845170 | |
PEXL | | $ | 2,698 | | | $ | 0.05396000 | |
SZNE | | $ | 186,305 | | | $ | 0.10070541 | |
BUL | | $ | 2,279 | | | $ | 0.02279000 | |
PTIN | | $ | 994,630 | | | $ | 0.20298572 | |
ECOW | | $ | 1,402 | | | $ | 0.01402000 | |
PTBD | | $ | 4,387,376 | | | $ | 0.28124206 | |
AFTY | | $ | 154,929 | | | $ | 0.33984453 | |
VIRS | | $ | 7,887 | | | $ | 0.03943500 | |
ALTL | | $ | 232,769 | | | $ | 0.15017355 | |
PAMC | | $ | 43,582 | | | $ | 0.07924000 | |
PALC | | $ | 96,794 | | | $ | 0.17598910 | |
On December 21, 2020, the following Funds declared distributions from ordinary income to shareholders of record as of December 23, 2020, Payable December 29, 2020, as follows:
| | | Ordinary Income | | | Per Share Amount | |
HERD | | $ | 8,077 | | | $ | 0.16154000 | |
TRND | | $ | 245,087 | | | $ | 0.16902552 | |
On December 22, 2020 the Adviser launched three new funds in the Pacer Funds Trust: Pacer Swan SOS Conservative (December) ETF, Pacer Swan SOS Flex (December) ETF, and Pacer Swan SOS Moderate (December) ETF.
The global outbreak of COVID-19 (commonly referred to as “coronavirus”) has disrupted economic markets and the prolonged economic impact is uncertain. The ultimate economic fallout from the pandemic, and the long-term impact on economies, markets, industries and individual issuers, are not known. The operational and financial performance of the issuers of securities in which each Funds invests depends on future developments, including the duration and spread of the outbreak, and such uncertainty may in turn adversely affect the value and liquidity of each Fund’s investments, impair the Fund’s ability to satisfy redemption requests, and negatively impact the Fund’s performance.
187
Pacer Funds
ADDITIONAL INFORMATION
(Unaudited)
NOTE 1 – FREQUENCY DISTRIBUTION OF PREMIUMS AND DISCOUNTS
Information regarding how often shares of each other Fund traded on the Exchange at a price above (i.e., at a premium) or below (i.e., at a discount) the NAV of the Fund is available on the Funds’ website at www.PacerETFs.com.
NOTE 2 – FEDERAL TAX INFORMATION
Qualified Dividend Income/Dividends Received Deduction
For the fiscal year/period ended April 30, 2020, certain dividends paid by the Funds may be subject to a maximum tax rate of 23%, as provided for by the Tax Cuts and Jobs Act of 2017.
The percentage of dividends declared from ordinary income designated as qualified dividend income was as follows:
PTLC | 97.51% |
PTMC | 75.77% |
PTNQ | 94.93% |
PTEU | 99.94% |
GCOW | 97.34% |
COWZ | 100.00% |
CALF | 100.00% |
ICOW | 100.00% |
PWS | 64.11% |
VETS | 100.00% |
INDS | 0.07% |
SRVR | 3.15% |
PEXL | 100.00% |
SZNE | 100.00% |
BUL | 100.00% |
PTIN | 100.00% |
ECOW | 45.09% |
HERD | 95.50% |
TRND | 93.23% |
PTBD | 0.00% |
AFTY | 94.27% |
For corporate shareholders, the percent of ordinary income distributions qualifying for the corporate dividends received deduction for the fiscal year/period ended April 30, 2020 was as follows:
PTLC | 96.80% |
PTMC | 75.12% |
PTNQ | 93.34% |
PTEU | 0.00% |
GCOW | 26.86% |
COWZ | 100.00% |
CALF | 100.00% |
ICOW | 0.08% |
PWS | 62.64% |
VETS | 100.00% |
INDS | 0.00% |
SRVR | 1.52% |
PEXL | 100.00% |
SZNE | 100.00% |
BUL | 100.00% |
PTIN | 0.03% |
188
Pacer Funds
ADDITIONAL INFORMATION
(Unaudited) (Continued)
ECOW | 0.00% |
HERD | 0.00% |
TRND | 52.77% |
PTBD | 0.00% |
AFTY | 0.00% |
Short Term Capital Gains
The percentage of taxable ordinary income distributions that are designated as short-term capital gain distributions under Internal Revenue Section 871(k)(2)(C) for each fund were as follows:
PTLC | 0.00% |
PTMC | 0.00% |
PTNQ | 0.00% |
PTEU | 0.00% |
GCOW | 0.00% |
COWZ | 0.00% |
CALF | 0.00% |
ICOW | 0.00% |
PWS | 0.00% |
VETS | 0.00% |
INDS | 0.00% |
SRVR | 0.00% |
PEXL | 0.00% |
SZNE | 0.00% |
BUL | 0.00% |
PTIN | 0.00% |
ECOW | 0.00% |
HERD | 0.00% |
TRND | 4.34% |
PTBD | 0.00% |
AFTY | 0.00% |
Foreign Tax Credit Pass Through
Pursuant to Section 853 of the Internal Revenue code, the Funds designate the following amounts as foreign taxes paid for the year/period ended April 30, 2020. Foreign taxes paid for purposes of Section 853 may be less than actual foreign taxes paid for financial statement purposes.
| | | | | | | | | | | Per Share | |
Fund | | Gross Foreign
Source Income | | | Foreign Taxes
Passthrough | | | Gross Foreign
Source Income | | | Foreign Taxes
Passthrough | |
PTLC | | $ | — | | | $ | — | | | $ | — | | | $ | — | |
PTMC | | | — | | | | — | | | | — | | | | — | |
PTNQ | | | — | | | | — | | | | — | | | | — | |
PTEU | | | 508,255 | | | | 508,255 | | | | 0.13 | | | | 0.13 | |
GCOW | | | 575,395 | | | | 558,448 | | | | 0.10 | | | | 0.10 | |
COWZ | | | — | | | | — | | | | — | | | | — | |
CALF | | | — | | | | — | | | | — | | | | — | |
ICOW | | | 110,070 | | | | 109,411 | | | | 0.10 | | | | 0.10 | |
PWS | | | — | | | | — | | | | — | | | | — | |
189
Pacer Funds
ADDITIONAL INFORMATION
(Unaudited) (Continued)
| | | | | | | | | | | Per Share | |
Fund | | Gross Foreign
Source Income | | | Foreign Taxes
Passthrough | | | Gross Foreign
Source Income | | | Foreign Taxes
Passthrough | |
VETS | | $ | — | | | $ | — | | | $ | — | | | $ | — | |
INDS | | | — | | | | — | | | | — | | | | — | |
SRVR | | | — | | | | — | | | | — | | | | — | |
PEXL | | | — | | | | — | | | | — | | | | — | |
SZNE | | | — | | | | — | | | | — | | | | — | |
BUL | | | — | | | | — | | | | — | | | | — | |
PTIN | | | 149,935 | | | | 149,358 | | | | 0.02 | | | | 0.02 | |
ECOW | | | 18,857 | | | | 18,786 | | | | 0.19 | | | | 0.19 | |
HERD | | | 1,853 | | | | 1,853 | | | | 0.04 | | | | 0.04 | |
TRND | | | 5,580 | | | | 5,580 | | | | 0.01 | | | | 0.01 | |
PTBD | | | — | | | | — | | | | — | | | | — | |
AFTY | | | — | | | | — | | | | — | | | | — | |
Foreign taxes paid or withheld should be included in taxable income with an offsetting deduction from gross income or as a credit for taxes paid to foreign governements.
Above figures may differ from those cited elsewhere in this report due to difference in the calculation of income and gains under GAAP purposes and Internal Revenue Service purposes.
Shareholders are strongly advised to consult their own tax advisers with respect to the tax consequences of their investments in the Funds.
NOTE 3 – DISCLOSURE OF PORTFOLIO HOLDINGS
The Funds file their complete schedule of portfolio holdings for their first and third fiscal quarters with the Securities and Exchange Commission (“SEC”) on Part F of Form N-PORT. The Funds’ Part F of Form N-PORT is available on the website of the SEC at http://www.sec.gov. Each Fund’s portfolio holdings are posted on their website at www.paceretfs.com daily.
NOTE 4 – PROXY VOTING POLICIES AND PROCEDURES
A description of the policies and procedures the Funds use to determine how to vote proxies relating to portfolio securities is provided in the Statement of Additional Information (“SAI”). The SAI is available without charge upon request by calling toll-free at (800) 617-0004, by accessing the SEC’s website at http://www.sec.gov, or by accessing the Funds’ website at www.paceretfs.com. Information on how the Fund voted proxies relating to portfolio securities during the year ended June 30 is available without charge, upon request, by calling (800) 617-0004 or by accessing the website of the SEC.
NOTE 5 – BOARD CONSIDERATIONS IN APPROVING THE INVESTMENT ADVISORY AGREEMENT FOR THE FUNDS
The Board of Trustees (the “Board”) of Pacer Funds Trust (the “Trust”), including the Trustees thereof who are not “interested persons,” as defined by the Investment Company Act of 1940, as amended (the “1940 Act”), of the Trust (the “Independent Trustees”), held a meeting on June 22, 2020 (the “Meeting”), for the purpose of, among other things, the consideration of, and voting on, the proposed approval of the investment advisory agreement (the “Investment Advisory Agreement”) between the Trust and Pacer Advisors, Inc. (the “Advisor”), relating to the Pacer Lunt Large Cap Multi-Factor Alternator ETF (“PALC”), Pacer Lunt Mid Cap Multi-Factor Alternator ETF (“PAMC”), Pacer Lunt Large Cap Alternator ETF (“ALTL”) and the Pacer BioThreat Strategy ETF (“VIRS”), each a “Fund” and, together, the “Funds.
The Board, including a majority of the Trust’s Independent Trustees voting separately, approved the Investment Advisory Agreement for each of the Funds, based on its review of qualitative and quantitative information provided by the Advisor as well as the Trust’s other service providers. Prior to deciding to approve the Investment Advisory Agreement, the Independent Trustees requested and obtained from the Advisor such information as the Independent Trustees deemed reasonably necessary to evaluate the terms of the Investment Advisory Agreement. The Independent Trustees received assistance and advice from, and met separately with, independent counsel. In addition, the Independent Trustees received a memorandum from independent counsel regarding the responsibilities of the Board with respect to the approval of the Investment Advisory Agreement.
190
Pacer Funds
ADDITIONAL INFORMATION
(Unaudited) (Continued)
Prior to approval, the Board obtained and reviewed a variety of information, including certain information regarding each Fund’s proposed expenses relative to the expenses of other comparable funds. At the Meetings, the Board, including the Independent Trustees, evaluated a number of factors and various materials in connection with the approval process, including: (1) a copy of the Investment Advisory Agreement; (2) the Advisor’s responses to questionnaires designed to provide the Board with information reasonably necessary to evaluate the terms of the Investment Advisory Agreement; (3) the Advisor’s Form ADV disclosures; (4) information describing the nature, quality and extent of services that the Advisor is prepared to provide to each Fund, the advisory fee payable by each Fund to the Advisor for the Advisor’s services; (5) certain comparative information regarding the Funds’ expenses relative to the expenses of other funds; (6) a copy of the Trust’s registration statement; and (7) information regarding the ownership and management structure, financial condition and compliance program of the Advisor. Representatives from the Advisor presented additional information and participated in question and answer sessions at the Meetings to help the Board evaluate the Advisor’s services, fees and other aspects of the Investment Advisory Agreement.
In considering the approval of the Investment Advisory Agreement, the Board considered various factors that its members determined were relevant, including: (i) the nature, extent and quality of the services to be provided by the Advisor, including where relevant the performance of the firm with respect to other, comparable funds; (ii) the fee to be paid to the Advisor by each Fund; and (iii) potential economies of scale.
● | Nature, Extent and Quality of Services to be Provided by the Advisor. The Board reviewed the scope of services to be provided by the Advisor under the Investment Advisory Agreement. In this regard, its members reviewed each Fund’s investment goal and proposed investment strategy, and each firm’s ability to implement such investment goal and/or investment strategy, including, but not limited to, trading practices. |
Based on its review, the Board determined that the Advisor was capable of providing all necessary advisory services required by the Funds, as indicated by the firm’s management capabilities, the professional qualifications and experience of its portfolio management personnel and the performance of comparable funds managed by the firm. The Board also considered other services provided to the Funds by the Advisor, such as selecting broker-dealers for executing portfolio transactions, monitoring adherence to each Fund’s investment restrictions, and monitoring compliance with various policies and procedures and with applicable securities regulations.
Based on the factors above, as well as those discussed below, the Board concluded, within the context of its full deliberations, that it was satisfied with the nature, extent and quality of the services provided and to be provided to the Funds by the Advisor.
● | Costs of Advisory Services to be Provided to the Funds. In considering the advisory fees payable by the Trust to the Advisor and each Fund’s expense ratio, the Board reviewed data compiled by the Advisor comparing the expense ratios of each Fund with the expense ratios of the ETFs in each Fund’s projected peer group. The Board compared each Fund’s expense ratio to the expense ratios of ETFs in its peer group, focusing on whether each Fund was charged fees that were within the range of fees charged by those in the peer group. It also noted that the Advisor had contractually agreed to pay all operating expenses of each Fund, including the cost of transfer agency, custody, fund administration, legal, audit and other services, except interest, taxes, brokerage commissions and other expenses in connection with the execution of portfolio transactions, and extraordinary and non-routine expenses. It was noted that this contractual agreement cannot be changed without shareholder approval. The Board also evaluated the compensation and benefits received (or proposed or likely to be received), by the Advisor from its relationship with the Funds, taking into account assessments of the Advisor’s profitability prepared and shared by the Advisor’s management. Based on the factors above, as well as those discussed below, the Board concluded, within the context of its full deliberations, that each Fund’s advisory fee was reasonable in light of the nature and quality of the services rendered and, where relevant, expected to be rendered by the Advisor. |
● | Economies of Scale. The Board also reviewed and considered the extent to which economies of scale would be realized by the Advisor as the assets of the Funds may grow in the future. |
Based on the Board’s deliberations and its evaluation of the information described above, the Board, including the Independent Trustees: (a) concluded that the terms of the Investment Advisory Agreement with respect to each Fund are fair and reasonable; (b) concluded that the Advisor’s fees are reasonable in light of the nature and quality of the services rendered and expected to be rendered by the Advisor to each Fund; and (c) agreed to approve the Investment Advisory Agreement as to each Fund for a term of two years. In its deliberations, the Board did not identify any particular factor (or conclusion with respect thereto) or single piece of information that was all-important, controlling or determinative of its decision, but considered all of the factors together, and each Trustee may have attributed different weights to the various factors (and conclusions with respect thereto) and information.
191
Pacer Funds
ADDITIONAL INFORMATION
(Unaudited) (Continued)
NOTE 6 – REVIEW OF LIQUIDITY RISK MANAGEMENT PROGRAM (UNAUDITED)
Pursuant to Rule 22e-4 under the Investment Company Act of 1940, the Trust has adopted a liquidity risk management program to govern the Trust’s approach to managing liquidity risk. Rule 22e-4 seeks to promote effective liquidity risk management, thereby reducing the risk that a fund will be unable to meet its redemption obligations and mitigating dilution of the interests of fund shareholders. The Trust’s liquidity risk management program is tailored to reflect its particular risks, but not to eliminate all adverse impacts of liquidity risk.
The Investment Adviser to the Trust has adopted and implemented its own written liquidity risk management program (the “Program”) tailored specifically to assess and manage the liquidity risk of the funds it advises.
On June 22, 2020, the Trustees of Pacer Funds Trust reviewed and considered a written report prepared by the program administrator of the Fund’s Liquidity Risk Management Program (the “Program”), which addressed the operation of the Program and assessed the Program’s adequacy and effectiveness of implementation. In considering the report, the Trustees noted that the Program Administrator has determined that several of the funds within the Pacer Funds Trust are deemed “In-Kind” in accordance with Rule 22e-4. They then confirmed with the Program Administrator that no material changes were made to the Program, and reviewed all of the material features of the Program to ensure that they understand how the Program is designed to assess and manage the risk that the funds within the Trust could not meet requests to redeem shares issued by the funds without significant dilution of remaining investors in the funds. Following this review and discussion, the Trustees determined that they believe the disclosures in the report, taken as a whole, provide the information necessary for the Trustees to effectively assess the Program and its implementation, and that they are comfortable with the report’s conclusion that the Program is reasonably designed to assess and manage the Fund’s liquidity risk, and that the Program has operated as intended during the past year.
NOTE 7 – TRUSTEES AND OFFICERS
The business of the Funds is managed under the direction of the Board of Trustees. The Board of Trustees formulates the general policies of the Funds and meets periodically to review the Funds’ performance, monitor investment activities and practices, and discuss other matters affecting the Funds. The Trustees are fiduciaries for the Funds’ shareholders and are governed by the laws of the State of Delaware in this regard. The names and addresses of the Trustees and officers of the Trust are listed below along with a description of their principal occupations over at least the last five years. There are currently four Trustees, three of whom are not “interested persons” of the Trust within the meaning of that term under the 1940 Act (“Independent Trustee”). The Trustees, in turn, elect the officers of the Trust to actively supervise its day-to-day operations. The address of each Trustee and officer of the Trust, unless otherwise indicated below, is c/o Pacer Advisors, Inc., 500 Chesterfield Parkway, Malvern, PA 19335. The Funds’ Statement of Additional Information includes additional information about the Trustees and is available upon request by calling toll free (800) 617-0004.
Name and Year of Birth | Position(s) Held with the Trust | Term of Office and Length of Time Served | Principal Occupation(s) During Past 5 Years | Number of Portfolios in
Fund
Complex Overseen
By Trustee | Other
Directorships
held by
Trustee During Past Five Years |
Interested Trustee | | | | | |
Joe M. Thomson
Born: 1944 | Trustee , Chairman, President and Principal Executive Officer | Indefinite Term; since 2014 | Founder/President, Pacer Advisors, Inc. (since 2005); President and Chief Compliance Officer, Pacer Financial, Inc. (since 2004) | 28 | Director, First Cornerstone Bank (2000-2016) |
192
Pacer Funds
ADDITIONAL INFORMATION
(Unaudited) (Continued)
Name and Year of Birth | Position(s) Held with the Trust | Term of Office and Length of Time Served | Principal Occupation(s) During Past 5 Years | Number of Portfolios in
Fund
Complex Overseen
By Trustee | Other
Directorships
held by
Trustee During Past Five Years |
Independent Trustees | | | | | |
Deborah G. Wolk
Born: 1950 | Lead Independent Trustee | Indefinite Term; since 2015 | Self-employed providing accounting services and computer modeling (since 1997) | 28 | None |
Jonathan H. Newman, Sr.
Born: 1962 | Trustee | Indefinite Term; since 2015 | CEO and Chairman, Newman Wine & Spirits (since 2007) | 28 | None |
Dennis J. Ryan
Born: 1947 | Trustee | Indefinite Term; since 2017 | Principal/Owner, Brendan Abstract Company, Inc. (title insurance) (since 1999) | 28 | None |
Officers who are not Trustees: | | | | | |
Sean E. O’Hara
Born: 1962 | Treasurer and Principal Financial Officer | Indefinite Term; since 2014 | Director, Index Design Group (since 2015); Director, Pacer Financial, Inc. (since 2007); Director, Pacer Advisors, Inc. (since 2007) | N/A | None |
Bruce Kavanaugh
Born: 1964 | Secretary and Portfolio Manager | Indefinite Term; since 2016 | Vice President, Pacer Advisors, Inc. (since 2005), Vice President, Pacer Financial, Inc. (since 2004) | N/A | None |
Perpetua Seidenberg Gateway Corporate Center, Suite 216
223 Wilmington West Chester Pike Chadds Ford, PA 19317 Born: 1990 | Chief Compliance Officer and AML Officer | Indefinite Term; since 2018 | Compliance Director, Vigilant Compliance, LLC (an investment management services company) (since 2014); Auditor, PricewaterhouseCoopers (2012-2014) | N/A | None |
Mr. Thomson is an “Interested Person” by reason of his relationship with the Adviser.
Each Trustee shall serve during the lifetime of the Trust until he or she: (a) dies; (b) resigns; (c) has reached the mandatory retirement age, if any, as set by the Trustees; (d) is declared incompetent by a court of appropriate jurisdiction; or (e) is removed, or, if sooner, until the next meeting of shareholders called for the purpose of electing Trustees and until the election and qualification of his or her successor inaccordance with the Trust’s Declaration of Trust and By-laws. Each officer holds office at the pleasure of the Board and services for a period of one year, or until his or her successor is duly elected and qualified.
The Statement of Additional Information includes additional information, including compensation, about the Funds’ Trustees.
193
Advisor Pacer Advisors, Inc.
500 Chesterfield Parkway
Malvern, PA 19355 |
Index Provider Index Design Group, LLC
500 Chesterfield Parkway
Malvern, PA 19355 Benchmark Investments, LLC
1115 Broadway, 12th Floor
New York, NY 10010 CFRA
One New York Plaza, 34th Floor
New York, NY 10004 LifeSci Index Partners, LLC
250 W 55th St, Suite 16b
New York, NY 10019 Lunt Capital Management, Inc.
215 S State St, Suite 100
Salt Lake City, UT 84111 FTSE International Limited
12th Floor, 10 Upper Bank Street
Canary Wharf, London E14 5NP VETS Indexes, LLC
6 East 39th Street, Suite 1003
New York, NY 10016 |
Sub Adviser Vident Investment Advisory, LLC
1125 Sanctuary Parkway, Suite 515
Alpharetta, GA 30009 CSOP Asset Management Limited
2801-2803, Two Exchange Square, 8 Connaught Place
Central, Hong Kong |
Distributor Pacer Financial, Inc.
500 Chesterfield Parkway
Malvern, PA 19355 |
Custodian U.S. Bank National Association
Custody Operations
1555 North Rivercenter Drive
Milwaukee, WI 53212 |
Transfer Agent U.S. Bancorp Fund Services, LLC
615 East Michigan Street
Milwaukee, WI 53202 |
Independent Registered
Public Accounting Firm Sanville & Company
1514 Old York Rd.
Abington, PA 19001 |
Legal Counsel Practus, LLP
137 Airdale Road
Bryn Mawr, PA 19010 |

Item 2. Code of Ethics.
Not applicable for semi-annual reports.
Item 3. Audit Committee Financial Expert.
Not applicable for semi-annual reports.
Item 4. Principal Accountant Fees and Services.
Not applicable for semi-annual reports.
Item 5. Audit Committee of Listed Registrants.
Not applicable for semi-annual reports.
Item 6. Investments.
(a) Schedule of Investments is included as part of the report to shareholders filed under Item 1 of this Form.
(b) Not Applicable
Item 7. Disclosure of Proxy Voting Policies and Procedures for Closed-End Management Investment Companies.
Not applicable to open-end investment companies.
Item 8. Portfolio Managers of Closed-End Management Investment Companies.
Not applicable to open-end investment companies.
Item 9. Purchases of Equity Securities by Closed-End Management Investment Company and Affiliated Purchasers.
Not applicable to open-end investment companies.
Item 10. Submission of Matters to a Vote of Security Holders.
There have been no material changes to the procedures by which shareholders may recommend nominees to the registrant’s board of trustees.
Item 11. Controls and Procedures.
| (a) | The Registrant’s President/Principal Executive Officer and Treasurer/Principal Financial Officer have reviewed the Registrant's disclosure controls and procedures (as defined in Rule 30a-3(c) under the Investment Company Act of 1940 (the “Act”)) as of a date within 90 days of the filing of this report, as required by Rule��30a-3(b) under the Act and Rules 13a-15(b) or 15d-15(b) under the Securities Exchange Act of 1934. Based on their review, such officers have concluded that the disclosure controls and procedures are effective in ensuring that information required to be disclosed in this report is appropriately recorded, processed, summarized and reported and made known to them by others within the Registrant and by the Registrant’s service provider. |
| (b) | There were no changes in the Registrant's internal control over financial reporting (as defined in Rule 30a-3(d) under the Act) that occurred during the period covered by this report that have materially affected, or are reasonably likely to materially affect, the Registrant's internal control over financial reporting. |
Item 12. Disclosure of Securities Lending Activities for Closed-End Management Investment Companies
Not applicable to open-end investment companies.
Item 13. Exhibits.
| (a) | (1) Any code of ethics or amendment thereto, that is the subject of the disclosure required by Item 2, to the extent that the registrant intends to satisfy Item 2 requirements through filing an exhibit. Not Applicable |
(2) A separate certification for each principal executive officer and principal financial officer pursuant to Section 302 of the Sarbanes-Oxley Act of 2002. Filed herewith.
(3) Any written solicitation to purchase securities under Rule 23c-1 under the Act sent or given during the period covered by the report by or on behalf of the registrant to 10 or more persons. Not applicable to open-end investment companies.
(4) Change in the registrant’s independent public accountant. There was no change in the registrant’s independent public accountant for the period covered by this report.
SIGNATURES
Pursuant to the requirements of the Securities Exchange Act of 1934 and the Investment Company Act of 1940, the registrant has duly caused this report to be signed on its behalf by the undersigned, thereunto duly authorized.
| | (Registrant) | Pacer Funds Trust | |
| | | | |
| | By (Signature and Title) | /s/ Joe Thomson | |
| | | Joe M. Thomson, President (Principal Executive Officer) | |
| | | | |
| | Date | 1-6-2021 | |
Pursuant to the requirements of the Securities Exchange Act of 1934 and the Investment Company Act of 1940, this report has been signed below by the following persons on behalf of the registrant and in the capacities and on the dates indicated.
| | By (Signature and Title) | /s/ Joe Thomson | |
| | | Joe M. Thomson, President (Principal Executive Officer) | |
| | | | |
| | Date | 1-6-2021 | |
| | | | |
| | By (Signature and Title) | /s/ Sean O’Hara | |
| | | Sean E. O’Hara, Treasurer (Principal Financial Officer) | |
| | | | |
| | Date | 1-6-2021 | |
* Print the name and title of each signing officer under his or her signature.