UNITED STATES
SECURITIES AND EXCHANGE COMMISSION
Washington, D.C. 20549
FORM N-CSR
CERTIFIED SHAREHOLDER REPORT OF REGISTERED
MANAGEMENT INVESTMENT COMPANIES
Investment Company Act file number 811-23024
Pacer Funds Trust
(Exact name of registrant as specified in charter)
500 Chesterfield Parkway
Malvern, PA 19355
(Address of principal executive offices) (Zip code)
Joe M. Thomson, President
500 Chesterfield Parkway
Malvern, PA 19355
(Name and address of agent for service)
610-644-8100
Registrant's telephone number, including area code
Date of fiscal year end: October 31
Date of reporting period: November 1, 2023 to October 31, 2024
Item 1. Reports to Stockholders.
| | |
| Pacer American Energy Independence ETF | |
| USAI (Principal U.S. Listing Exchange: NYSE) |
| Annual Shareholder Report | October 31, 2024 |
This annual shareholder report contains important information about the Pacer American Energy Independence ETF for the period of November 1, 2023, to October 31, 2024. You can find additional information about the Fund at https://www.paceretfs.com/. You can also request this information by contacting us at 877-337-0500
WHAT WERE THE FUND COSTS FOR THE PAST YEAR? (based on a hypothetical $10,000 investment)
| | |
Fund Name | Costs of a $10,000 investment | Costs paid as a percentage of a $10,000 investment |
| Pacer American Energy Independence ETF | $90 | 0.75% |
FACTORS INFLUENCING FUND PERFORMANCE
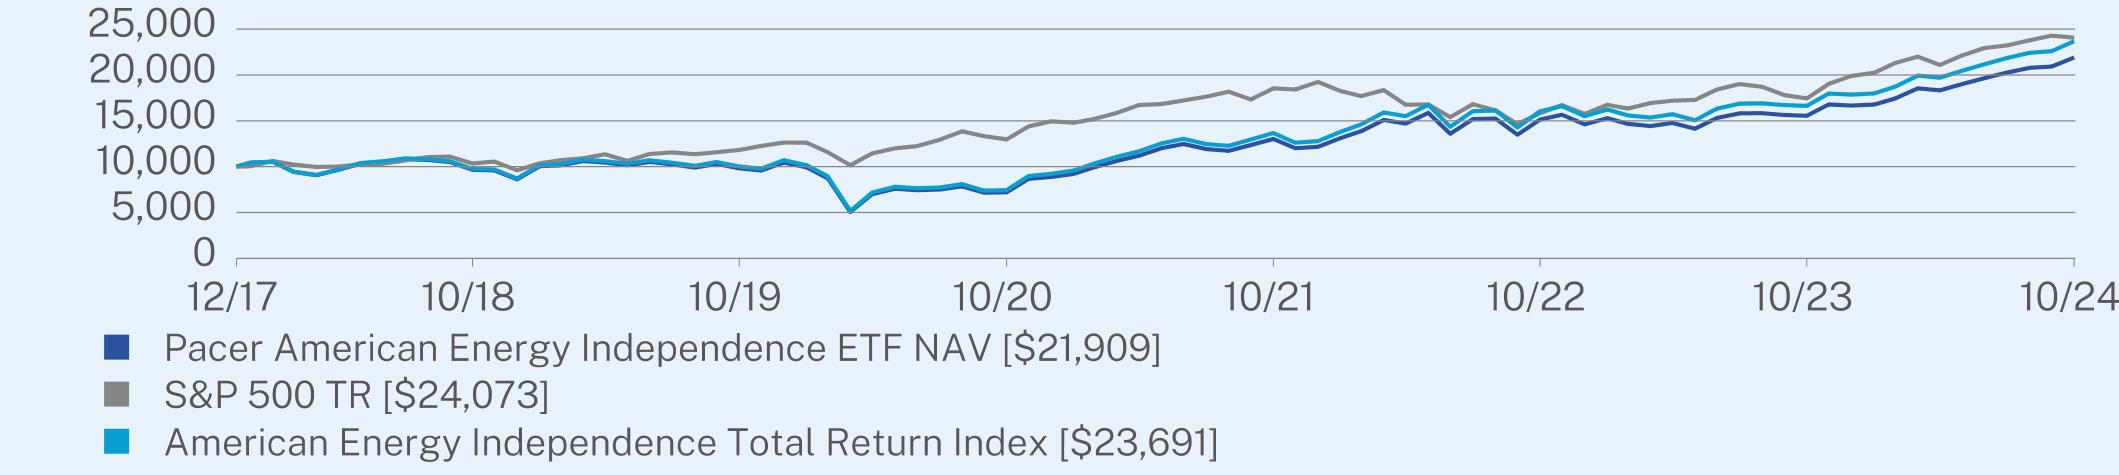
The transportation of oil and gas through pipelines remains critical to the energy infrastructure in the US. This year saw that play out with pipeline companies performing well. Companies plan on increasing the flow as demand continues in the US and the world as the US plans on exporting more oil and gas.
HOW DID THE FUND PERFORM SINCE INCEPTION?*
The $10,000 chart reflects a hypothetical $10,000 investment in the class of shares noted and assumes the maximum sales charge. The chart uses total return NAV performance and assumes reinvestment of dividends and capital gains. Fund expenses, including 12b-1 fees, management fees and other expenses were deducted.
CUMULATIVE PERFORMANCE (Initial Investment of $10,000)
ANNUAL AVERAGE TOTAL RETURN (%)
| | | |
| | 1 Year | 5 Year | Since Inception
(12/12/2017) |
Pacer American Energy Independence ETF NAV | 40.90 | 17.41 | 12.07 |
S&P 500 TR | 38.02 | 15.27 | 13.61 |
American Energy Independence Total Return Index | 42.44 | 18.78 | 13.35 |
Visit https://www.paceretfs.com/ for more recent performance information.
| * | The Fund’s past performance is not a good predictor of how the Fund will perform in the future. The graph and table do not reflect the deduction of taxes that a shareholder would pay on Fund distributions or redemption of Fund shares. |
| Pacer American Energy Independence ETF | PAGE 1 | TSR-AR-69374H634 |
KEY FUND STATISTICS (as of October 31, 2024)
| |
Net Assets | $63,905,674 |
Number of Holdings | 27 |
Net Advisory Fee | $400,222 |
Portfolio Turnover | 22% |
30-Day SEC Yield | 3.43% |
30-Day SEC Yield Unsubsidized | 3.43% |
Visit https://www.paceretfs.com/ for more recent performance information.
WHAT DID THE FUND INVEST IN? (as of October 31, 2024)*
| |
Top Holdings | (%) |
Mount Vernon Liquid Assets Portfolio, LLC | 16.2% |
Williams Cos., Inc. | 8.0% |
Kinder Morgan, Inc. | 7.8% |
TC Energy Corp. | 7.6% |
ONEOK, Inc. | 7.1% |
Energy Transfer LP | 7.0% |
Enbridge, Inc. | 6.9% |
Targa Resources Corp. | 4.4% |
Cheniere Energy, Inc. | 4.3% |
Pembina Pipeline Corp. | 4.2% |
| |
Top Sectors** | (%) |
Energy | 99.6% |
Cash & Other | 0.4% |
| * | Percentages are stated as a percent of net assets. |
| ** | The Global Industry Classification Standard (“GICS®”) was developed by and/or is the exclusive property of MSCI, Inc. (“MSCI”) and Standard & Poor’s Financial Services LLC (“S&P”). GICS® is a service mark of MSCI and S&P and has been licensed for use by U.S. Bank Global Fund Services. |
For additional information about the Fund; including its prospectus, financial information, holdings and proxy information, scan the QR code or visit https://www.paceretfs.com/.
HOUSEHOLDING
To reduce Fund expenses, only one copy of most shareholder documents may be mailed to shareholders with multiple accounts at the same address (Householding). If you would prefer that your Pacer Advisors, Inc. documents not be householded, please contact Pacer Advisors, Inc. at 877-337-0500, or contact your financial intermediary. Your instructions will typically be effective within 30 days of receipt by Pacer Advisors, Inc. or your financial intermediary.
| Pacer American Energy Independence ETF | PAGE 2 | TSR-AR-69374H634 |
9665982172081302615143155492190910346118281297718545158361744224073975910019743613668160451663223691
| | |
| Pacer BlueStar Digital Entertainment ETF | |
ODDS (Principal U.S. Listing Exchange: NasdaqNASDAQ) |
| Annual Shareholder Report | October 31, 2024 |
This annual shareholder report contains important information about the Pacer BlueStar Digital Entertainment ETF for the period of November 1, 2023, to October 31, 2024. You can find additional information about the Fund at https://www.paceretfs.com/. You can also request this information by contacting us at 877-337-0500
WHAT WERE THE FUND COSTS FOR THE PAST YEAR? (based on a hypothetical $10,000 investment)
| | |
Fund Name | Costs of a $10,000 investment | Costs paid as a percentage of a $10,000 investment |
| Pacer BlueStar Digital Entertainment ETF | $72 | 0.60% |
FACTORS INFLUENCING FUND PERFORMANCE
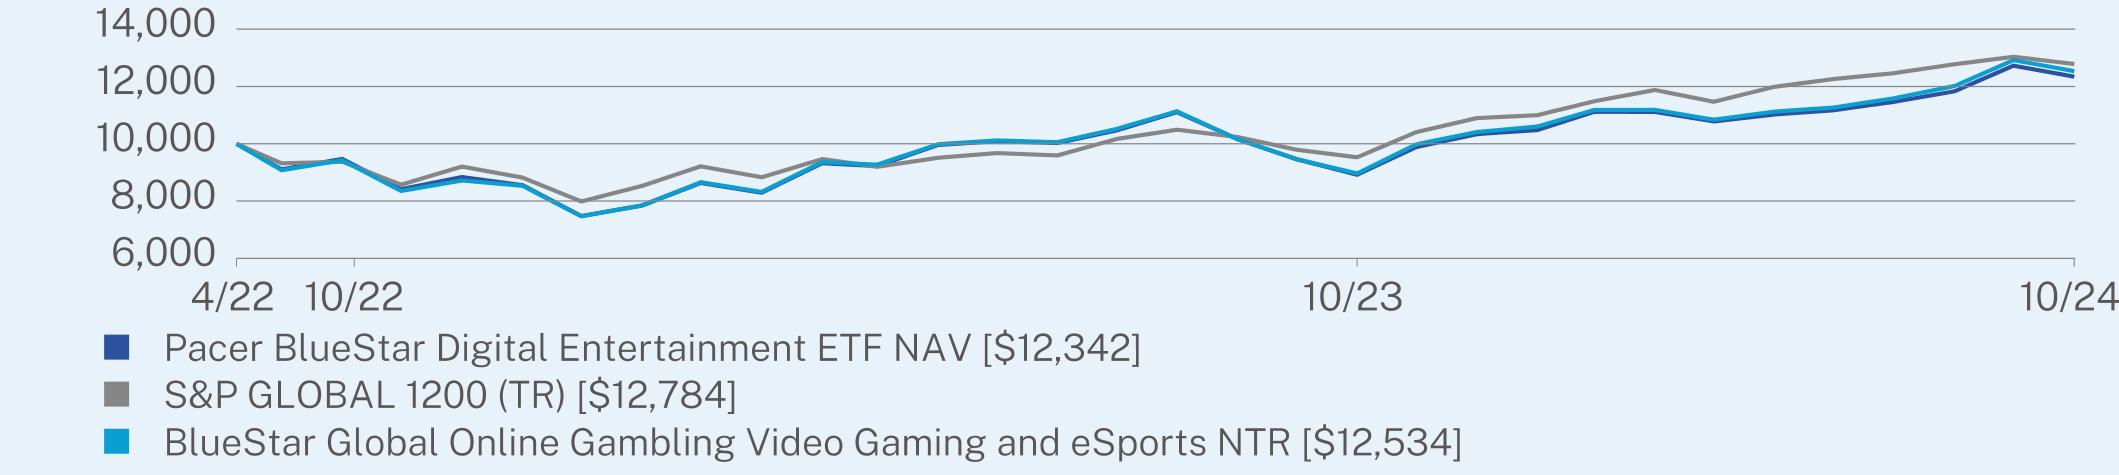
The market for gaming, eSports and gambling continues to expand in the US and around the world and the fund has been able to take advantage of this growing trend.
HOW DID THE FUND PERFORM SINCE INCEPTION?*
The $10,000 chart reflects a hypothetical $10,000 investment in the class of shares noted and assumes the maximum sales charge. The chart uses total return NAV performance and assumes reinvestment of dividends and capital gains. Fund expenses, including 12b-1 fees, management fees and other expenses were deducted.
CUMULATIVE PERFORMANCE (Initial Investment of $10,000)
ANNUAL AVERAGE TOTAL RETURN (%)
| | |
| | 1 Year | Since Inception
(04/07/2022) |
Pacer BlueStar Digital Entertainment ETF NAV | 38.38 | 8.54 |
S&P GLOBAL 1200 (TR) | 34.17 | 10.04 |
BlueStar Global Online Gambling Video Gaming and eSports NTR | 39.84 | 9.20 |
Visit https://www.paceretfs.com/ for more recent performance information.
| * | The Fund’s past performance is not a good predictor of how the Fund will perform in the future. The graph and table do not reflect the deduction of taxes that a shareholder would pay on Fund distributions or redemption of Fund shares. |
| Pacer BlueStar Digital Entertainment ETF | PAGE 1 | TSR-AR-69374H394 |
KEY FUND STATISTICS (as of October 31, 2024)
| |
Net Assets | $959,624 |
Number of Holdings | 44 |
Net Advisory Fee | $5,176 |
Portfolio Turnover | 49% |
30-Day SEC Yield | 0.43% |
30-Day SEC Yield Unsubsidized | 0.43% |
Visit https://www.paceretfs.com/ for more recent performance information.
WHAT DID THE FUND INVEST IN? (as of October 31, 2024)*
| |
Top Holdings | (%) |
Tencent Holdings Ltd. | 8.5% |
Flutter Entertainment PLC | 8.0% |
Evolution AB | 7.6% |
DraftKings, Inc. | 7.2% |
AppLovin Corp. - Class A | 4.2% |
La Francaise des Jeux SAEM | 3.9% |
Entain PLC | 3.1% |
Nintendo Co. Ltd. | 3.0% |
NetEase, Inc. | 2.9% |
Advanced Micro Devices, Inc. | 2.8% |
| |
Top Sectors** | (%) |
Consumer Discretionary | 51.1% |
Communication Services | 37.8% |
Information Technology | 9.8% |
Cash & Other | 1.3% |
| |
Top Ten Countries | (%) |
United States | 29.4% |
China | 12.9% |
Sweden | 10.8% |
Japan | 9.8% |
Ireland | 8.3% |
France | 5.1% |
Australia | 4.2% |
United Kingdom | 3.4% |
IM | 2.6% |
Cash & Other | 13.5% |
| * | Percentages are stated as a percent of net assets. |
| ** | The Global Industry Classification Standard (“GICS®”) was developed by and/or is the exclusive property of MSCI, Inc. (“MSCI”) and Standard & Poor’s Financial Services LLC (“S&P”). GICS® is a service mark of MSCI and S&P and has been licensed for use by U.S. Bank Global Fund Services. |
For additional information about the Fund; including its prospectus, financial information, holdings and proxy information, scan the QR code or visit https://www.paceretfs.com/.
HOUSEHOLDING
To reduce Fund expenses, only one copy of most shareholder documents may be mailed to shareholders with multiple accounts at the same address (Householding). If you would prefer that your Pacer Advisors, Inc. documents not be householded, please contact Pacer Advisors, Inc. at 877-337-0500, or contact your financial intermediary. Your instructions will typically be effective within 30 days of receipt by Pacer Advisors, Inc. or your financial intermediary.
| Pacer BlueStar Digital Entertainment ETF | PAGE 2 | TSR-AR-69374H394 |
784289191234285299529127847848896312534
| | |
| Pacer BlueStar Engineering the Future ETF | |
BULD (Principal U.S. Listing Exchange: NasdaqNASDAQ) |
| Annual Shareholder Report | October 31, 2024 |
This annual shareholder report contains important information about the Pacer BlueStar Engineering the Future ETF for the period of November 1, 2023, to October 31, 2024. You can find additional information about the Fund at https://www.paceretfs.com/. You can also request this information by contacting us at 877-337-0500
WHAT WERE THE FUND COSTS FOR THE PAST YEAR? (based on a hypothetical $10,000 investment)
| | |
Fund Name | Costs of a $10,000 investment | Costs paid as a percentage of a $10,000 investment |
| Pacer BlueStar Engineering the Future ETF | $65 | 0.60% |
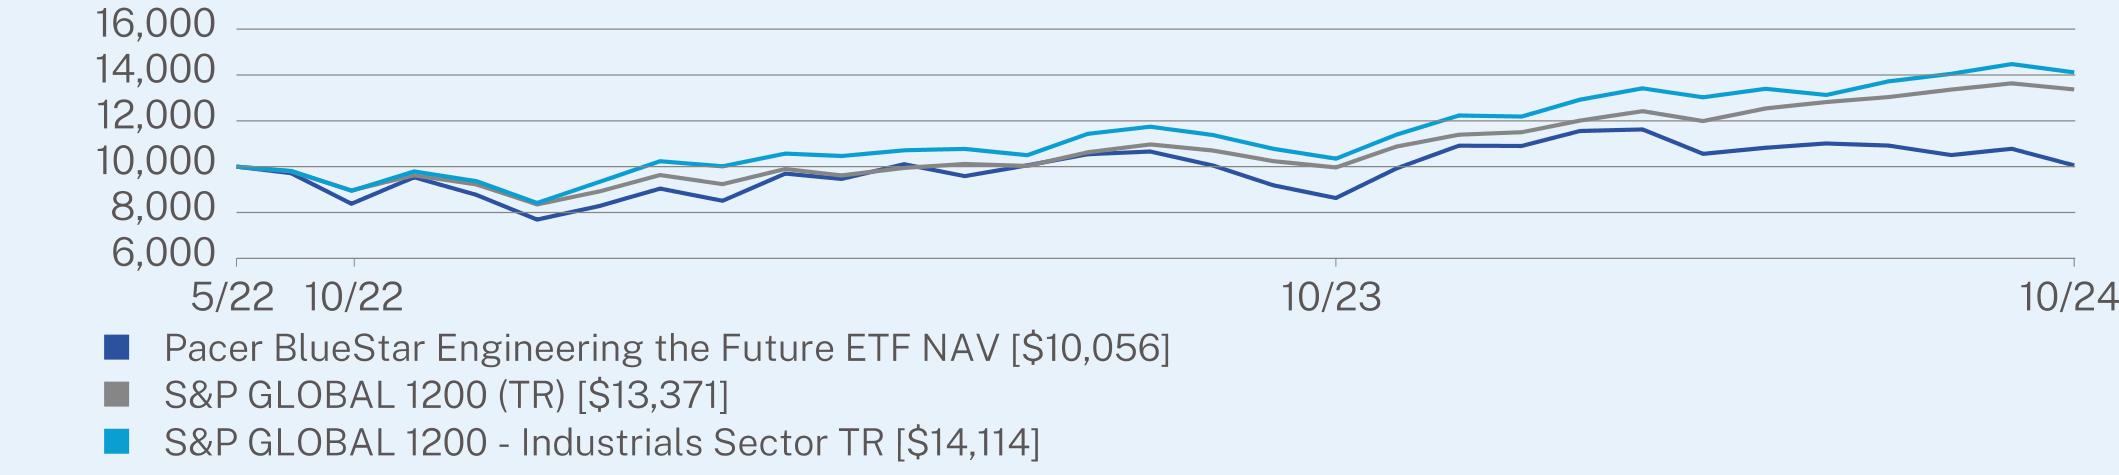
FACTORS INFLUENCING FUND PERFORMANCE
The market for robotics and automation, along with the increased spending on AI continues to expand and receive continued investment dollars in the US and around the world and the fund has been able to take advantage of this trend.
HOW DID THE FUND PERFORM SINCE INCEPTION?*
The $10,000 chart reflects a hypothetical $10,000 investment in the class of shares noted and assumes the maximum sales charge. The chart uses total return NAV performance and assumes reinvestment of dividends and capital gains. Fund expenses, including 12b-1 fees, management fees and other expenses were deducted.
CUMULATIVE PERFORMANCE (Initial Investment of $10,000)
ANNUAL AVERAGE TOTAL RETURN (%)
| | |
| | 1 Year | Since Inception
(05/04/2022) |
Pacer BlueStar Engineering the Future ETF NAV | 16.48 | 0.22 |
S&P GLOBAL 1200 (TR) | 34.17 | 12.36 |
S&P GLOBAL 1200 - Industrials Sector TR | 36.38 | 14.82 |
Visit https://www.paceretfs.com/ for more recent performance information.
| * | The Fund’s past performance is not a good predictor of how the Fund will perform in the future. The graph and table do not reflect the deduction of taxes that a shareholder would pay on Fund distributions or redemption of Fund shares. |
| Pacer BlueStar Engineering the Future ETF | PAGE 1 | TSR-AR-69374H410 |
KEY FUND STATISTICS (as of October 31, 2024)
| |
Net Assets | $821,958 |
Number of Holdings | 53 |
Net Advisory Fee | $5,436 |
Portfolio Turnover | 19% |
30-Day SEC Yield | 0.19% |
30-Day SEC Yield Unsubsidized | 0.19% |
Visit https://www.paceretfs.com/ for more recent performance information.
WHAT DID THE FUND INVEST IN? (as of October 31, 2024)*
| |
Top Holdings | (%) |
Autodesk, Inc. | 11.2% |
Siemens AG | 6.0% |
ASML Holding NV | 5.7% |
Dassault Systemes SE | 5.6% |
Applied Materials, Inc. | 5.0% |
Ansys, Inc. | 4.8% |
Proto Labs, Inc. | 4.3% |
Renishaw PLC | 4.3% |
Stratasys Ltd. | 3.9% |
Keyence Corp. | 3.9% |
| |
Top Sectors** | (%) |
Information Technology | 72.8% |
Industrials | 24.6% |
Consumer Discretionary | 1.5% |
Health Care | 1.0% |
Cash & Other | 0.1% |
| |
Top Ten Countries | (%) |
United States | 55.5% |
Japan | 13.3% |
Germany | 7.4% |
Netherlands | 7.2% |
France | 5.6% |
United Kingdom | 4.3% |
Israel | 3.7% |
Sweden | 1.0% |
Belgium | 0.5% |
Cash & Other | 1.5% |
| * | Percentages are stated as a percent of net assets. |
| ** | The Global Industry Classification Standard (“GICS®”) was developed by and/or is the exclusive property of MSCI, Inc. (“MSCI”) and Standard & Poor’s Financial Services LLC (“S&P”). GICS® is a service mark of MSCI and S&P and has been licensed for use by U.S. Bank Global Fund Services. |
For additional information about the Fund; including its prospectus, financial information, holdings and proxy information, scan the QR code or visit https://www.paceretfs.com/.
HOUSEHOLDING
To reduce Fund expenses, only one copy of most shareholder documents may be mailed to shareholders with multiple accounts at the same address (Householding). If you would prefer that your Pacer Advisors, Inc. documents not be householded, please contact Pacer Advisors, Inc. at 877-337-0500, or contact your financial intermediary. Your instructions will typically be effective within 30 days of receipt by Pacer Advisors, Inc. or your financial intermediary.
| Pacer BlueStar Engineering the Future ETF | PAGE 2 | TSR-AR-69374H410 |
8286863310056892199661337193391034914114
| | |
| Pacer Developed Markets Cash Cows Growth Leaders ETF | |
| EAFG (Principal U.S. Listing Exchange: NYSE) |
| Annual Shareholder Report | October 31, 2024 |
This annual shareholder report contains important information about the Pacer Developed Markets Cash Cows Growth Leaders ETF for the period of November 1, 2023, to October 31, 2024. You can find additional information about the Fund at https://www.paceretfs.com/. You can also request this information by contacting us at 877-337-0500
WHAT WERE THE FUND COSTS FOR THE PAST YEAR? (based on a hypothetical $10,000 investment)*
| | |
Fund Name | Costs of a $10,000 investment | Costs paid as a percentage of a $10,000 investment |
| Pacer Developed Markets Cash Cows Growth Leaders ETF | $40 | 0.65% |
| * | Expense ratio is annualized. Amount shown reflects the expenses of the Fund for the current fiscal period from March 20, 2024 to October 31, 2024. Expenses would be higher if the Fund had been in operations for a full year. |
FACTORS INFLUENCING FUND PERFORMANCE
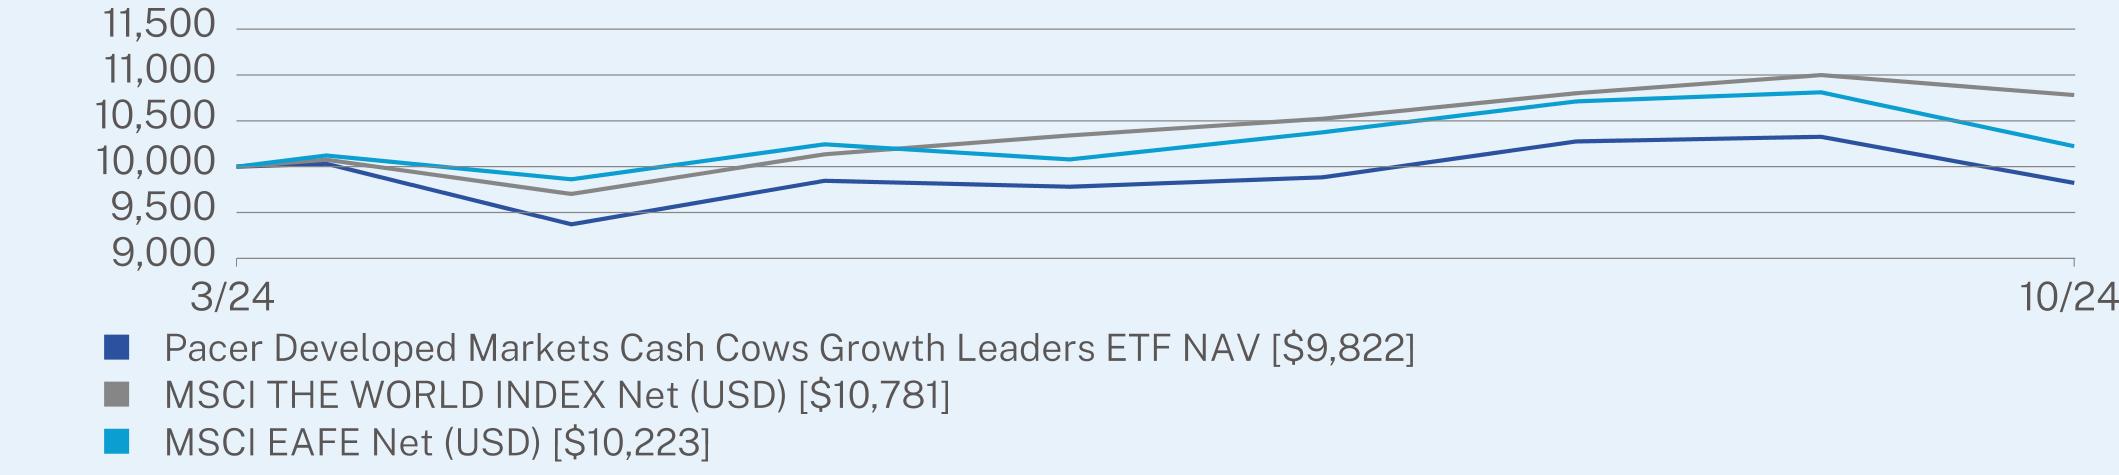
The market for high free cash flow companies and growth companies around the world continues to grow and EAFG is well positioned to maximize returns based on these trends.
HOW DID THE FUND PERFORM SINCE INCEPTION?*
The $10,000 chart reflects a hypothetical $10,000 investment in the class of shares noted and assumes the maximum sales charge. The chart uses total return NAV performance and assumes reinvestment of dividends and capital gains. Fund expenses, including 12b-1 fees, management fees and other expenses were deducted.
CUMULATIVE PERFORMANCE (Initial Investment of $10,000)
ANNUAL AVERAGE TOTAL RETURN (%)
| |
| | Since Inception
(03/20/2024) |
Pacer Developed Markets Cash Cows Growth Leaders ETF NAV | -1.78 |
MSCI THE WORLD INDEX Net (USD) | 7.81 |
MSCI EAFE Net (USD) | 2.23 |
Visit https://www.paceretfs.com/ for more recent performance information.
| * | The Fund’s past performance is not a good predictor of how the Fund will perform in the future. The graph and table do not reflect the deduction of taxes that a shareholder would pay on Fund distributions or redemption of Fund shares. |
| Pacer Developed Markets Cash Cows Growth Leaders ETF | PAGE 1 | TSR-AR-69374H345 |
KEY FUND STATISTICS (as of October 31, 2024)
| |
Net Assets | $488,796 |
Number of Holdings | 100 |
Net Advisory Fee | $2,886 |
Portfolio Turnover | 33% |
30-Day SEC Yield | 1.62% |
30-Day SEC Yield Unsubsidized | 1.62% |
Visit https://www.paceretfs.com/ for more recent performance information.
WHAT DID THE FUND INVEST IN? (as of October 31, 2024)*
| |
Top Holdings | (%) |
Pro Medicus Ltd. | 3.5% |
Recruit Holdings Co. Ltd. | 3.2% |
ZOZO, Inc. | 2.3% |
Singapore Telecommunications Ltd. | 2.1% |
Kansai Electric Power Co., Inc. | 2.1% |
Konami Holdings Corp. | 2.0% |
Prosus NV | 2.0% |
Tele2 AB - Class B | 1.9% |
AstraZeneca PLC | 1.9% |
WiseTech Global Ltd. | 1.8% |
| |
Top Sectors** | (%) |
Communication Services | 20.4% |
Consumer Discretionary | 18.0% |
Information Technology | 17.8% |
Health Care | 16.4% |
Industrials | 14.4% |
Utilities | 5.5% |
Consumer Staples | 3.4% |
Materials | 2.4% |
Energy | 1.3% |
Cash & Other | 0.4% |
| * | Percentages are stated as a percent of net assets. |
| ** | The Global Industry Classification Standard (“GICS®”) was developed by and/or is the exclusive property of MSCI, Inc. (“MSCI”) and Standard & Poor’s Financial Services LLC (“S&P”). GICS® is a service mark of MSCI and S&P and has been licensed for use by U.S. Bank Global Fund Services. |
For additional information about the Fund; including its prospectus, financial information, holdings and proxy information, scan the QR code or visit https://www.paceretfs.com/.
HOUSEHOLDING
To reduce Fund expenses, only one copy of most shareholder documents may be mailed to shareholders with multiple accounts at the same address (Householding). If you would prefer that your Pacer Advisors, Inc. documents not be householded, please contact Pacer Advisors, Inc. at 877-337-0500, or contact your financial intermediary. Your instructions will typically be effective within 30 days of receipt by Pacer Advisors, Inc. or your financial intermediary.
| Pacer Developed Markets Cash Cows Growth Leaders ETF | PAGE 2 | TSR-AR-69374H345 |
98221078110223
| | |
| Pacer Metaurus Nasdaq 100 Dividend Multiplier 600 ETF | |
QSIX (Principal U.S. Listing Exchange: NasdaqNASDAQ) |
| Annual Shareholder Report | October 31, 2024 |
This annual shareholder report contains important information about the Pacer Metaurus Nasdaq 100 Dividend Multiplier 600 ETF for the period of November 1, 2023, to October 31, 2024. You can find additional information about the Fund at https://www.paceretfs.com/. You can also request this information by contacting us at 877-337-0500
WHAT WERE THE FUND COSTS FOR THE PAST YEAR? (based on a hypothetical $10,000 investment)*
| | |
Fund Name | Costs of a $10,000 investment | Costs paid as a percentage of a $10,000 investment |
| Pacer Metaurus Nasdaq 100 Dividend Multiplier 600 ETF | $6 | 0.62% |
| * | Expense ratio is annualized. Amount shown reflects the expenses of the Fund for the current fiscal period from September 23, 2024 to October 31, 2024. Expenses would be higher if the Fund had been in operations for a full year. |
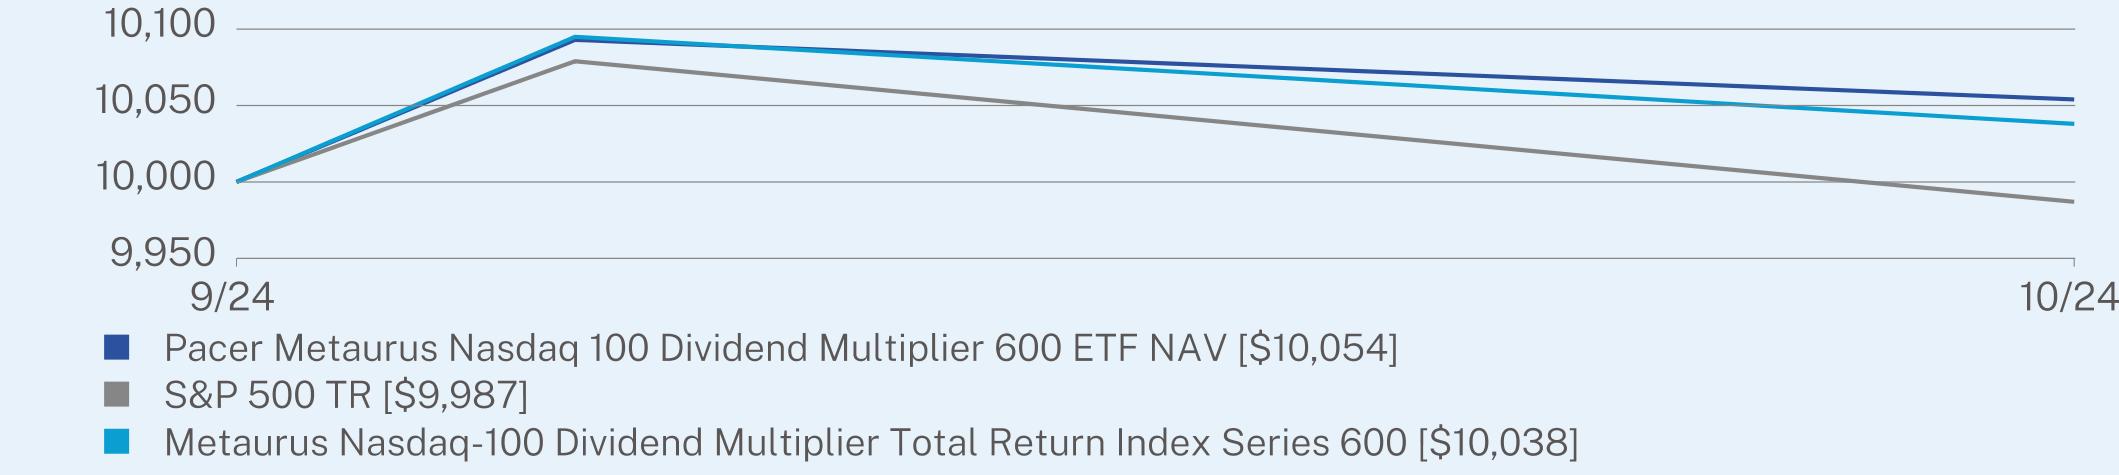
FACTORS INFLUENCING FUND PERFORMANCE
Pacer Metaurus Nasdaq-100 Dividend Multiplier 600 ETF (QSIX) was launched in September 2024. The ETF has performed as expected since its IPO. The fund is still in the seed capital stage. The fund will declare its first quarterly distribution at the end of December 2024. Pacer expects the fund to meet its 6x target rate versus the Nasdaq-100 Index.
HOW DID THE FUND PERFORM SINCE INCEPTION?*
The $10,000 chart reflects a hypothetical $10,000 investment in the class of shares noted and assumes the maximum sales charge. The chart uses total return NAV performance and assumes reinvestment of dividends and capital gains. Fund expenses, including 12b-1 fees, management fees and other expenses were deducted.
CUMULATIVE PERFORMANCE (Initial Investment of $10,000)
ANNUAL AVERAGE TOTAL RETURN (%)
| |
| | Since Inception
(09/23/2024) |
Pacer Metaurus Nasdaq 100 Dividend Multiplier 600 ETF NAV | 0.54 |
S&P 500 TR | -0.13 |
Metaurus Nasdaq-100 Dividend Multiplier Total Return Index Series 600 | 0.38 |
Visit https://www.paceretfs.com/ for more recent performance information.
| * | The Fund’s past performance is not a good predictor of how the Fund will perform in the future. The graph and table do not reflect the deduction of taxes that a shareholder would pay on Fund distributions or redemption of Fund shares. |
| Pacer Metaurus Nasdaq 100 Dividend Multiplier 600 ETF | PAGE 1 | TSR-AR-69374H287 |
KEY FUND STATISTICS (as of October 31, 2024)
| |
Net Assets | $6,392,122 |
Number of Holdings | 103 |
Net Advisory Fee | $3,918 |
Portfolio Turnover | 0% |
30-Day SEC Yield | 0.29% |
30-Day SEC Yield Unsubsidized | 0.29% |
Visit https://www.paceretfs.com/ for more recent performance information.
WHAT DID THE FUND INVEST IN? (as of October 31, 2024)*
| |
Top Holdings | (%) |
Apple, Inc. | 7.9% |
Nvidia Corp. | 7.5% |
Microsoft Corp. | 7.0% |
Broadcom, Inc. | 4.7% |
Meta Platforms, Inc. - Class A | 4.5% |
Amazon.com, Inc. | 4.5% |
Tesla Motors, Inc. | 2.8% |
Alphabet, Inc. - Class A | 2.3% |
Costco Wholesale Corp. | 2.3% |
Alphabet, Inc. - Class C | 2.2% |
| |
Top Sectors** | (%) |
Information Technology | 44.8% |
Communication Services | 14.7% |
Consumer Discretionary | 12.1% |
Consumer Staples | 5.3% |
Health Care | 5.2% |
Industrials | 4.1% |
Materials | 1.3% |
Utilities | 1.3% |
Financials | 0.5% |
Cash & Other | 10.7% |
| |
Top Ten Countries | (%) |
United States | 87.5% |
Netherlands | 0.8% |
Uruguay | 0.6% |
Ireland | 0.5% |
United Kingdom | 0.3% |
BRITAIN | 0.2% |
Canada | 0.2% |
Australia | 0.2% |
Cash & Other | 9.7% |
| * | Percentages are stated as a percent of net assets. |
| ** | The Global Industry Classification Standard (“GICS®”) was developed by and/or is the exclusive property of MSCI, Inc. (“MSCI”) and Standard & Poor’s Financial Services LLC (“S&P”). GICS® is a service mark of MSCI and S&P and has been licensed for use by U.S. Bank Global Fund Services. |
For additional information about the Fund; including its prospectus, financial information, holdings and proxy information, scan the QR code or visit https://www.paceretfs.com/.
HOUSEHOLDING
To reduce Fund expenses, only one copy of most shareholder documents may be mailed to shareholders with multiple accounts at the same address (Householding). If you would prefer that your Pacer Advisors, Inc. documents not be householded, please contact Pacer Advisors, Inc. at 877-337-0500, or contact your financial intermediary. Your instructions will typically be effective within 30 days of receipt by Pacer Advisors, Inc. or your financial intermediary.
| Pacer Metaurus Nasdaq 100 Dividend Multiplier 600 ETF | PAGE 2 | TSR-AR-69374H287 |
10054998710038
| | |
| Pacer Metaurus US Large Cap Dividend Multiplier 400 ETF | |
| QDPL (Principal U.S. Listing Exchange: NYSE) |
| Annual Shareholder Report | October 31, 2024 |
This annual shareholder report contains important information about the Pacer Metaurus US Large Cap Dividend Multiplier 400 ETF for the period of November 1, 2023, to October 31, 2024. You can find additional information about the Fund at https://www.paceretfs.com/. You can also request this information by contacting us at 877-337-0500
This report describes changes to the Fund that occurred during the reporting period.
WHAT WERE THE FUND COSTS FOR THE PAST YEAR? (based on a hypothetical $10,000 investment)
| | |
Fund Name | Costs of a $10,000 investment | Costs paid as a percentage of a $10,000 investment |
| Pacer Metaurus US Large Cap Dividend Multiplier 400 ETF | $74 | 0.63% |
FUND DESCRIPTION AND INVESTMENT STRATEGY
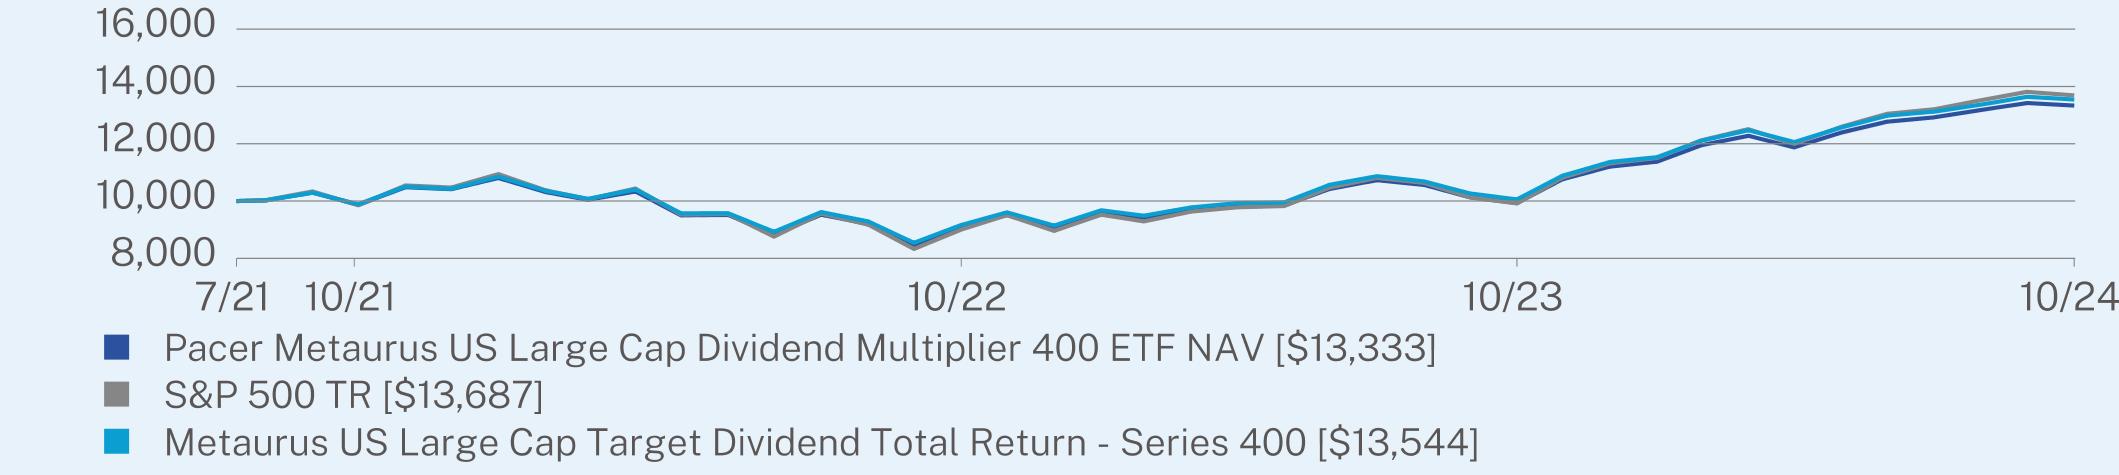
The fund experienced no noteworthy issues during the year and the key factor driving performance was the overall strong growth in the S&P 500 Index. From a total return perspective, QDPL captured over 90% of the S&P 500 total return, while doing so with lower overall volatility. We expect the 2024 distributions to maintain tax efficiency comparable to FY2023.
HOW DID THE FUND PERFORM SINCE INCEPTION?*
The $10,000 chart reflects a hypothetical $10,000 investment in the class of shares noted and assumes the maximum sales charge. The chart uses total return NAV performance and assumes reinvestment of dividends and capital gains. Fund expenses, including 12b-1 fees, management fees and other expenses were deducted.
CUMULATIVE PERFORMANCE (Initial Investment of $10,000)
ANNUAL AVERAGE TOTAL RETURN (%)
| | |
| | 1 Year | Since Inception
(07/12/2021) |
Pacer Metaurus US Large Cap Dividend Multiplier 400 ETF NAV | 34.25 | 9.10 |
S&P 500 TR | 38.02 | 9.96 |
Metaurus US Large Cap Target Dividend Total Return - Series 400 | 34.68 | 9.62 |
Visit https://www.paceretfs.com/ for more recent performance information.
| * | The Fund’s past performance is not a good predictor of how the Fund will perform in the future. The graph and table do not reflect the deduction of taxes that a shareholder would pay on Fund distributions or redemption of Fund shares. |
| Pacer Metaurus US Large Cap Dividend Multiplier 400 ETF | PAGE 1 | TSR-AR-69374H436 |
KEY FUND STATISTICS (as of October 31, 2024)
| |
Net Assets | $594,106,177 |
Number of Holdings | 515 |
Net Advisory Fee | $2,202,966 |
Portfolio Turnover | 7% |
30-Day SEC Yield | 0.95% |
30-Day SEC Yield Unsubsidized | 0.95% |
Visit https://www.paceretfs.com/ for more recent performance information.
WHAT DID THE FUND INVEST IN? (as of October 31, 2024)*
| |
Top Holdings | (%) |
Apple, Inc. | 6.4% |
Nvidia Corp. | 6.1% |
Microsoft Corp. | 5.6% |
Amazon.com, Inc. | 3.2% |
Meta Platforms, Inc. - Class A | 2.3% |
Alphabet, Inc. - Class A | 1.9% |
Alphabet, Inc. - Class C | 1.5% |
Berkshire Hathaway, Inc. - Class B | 1.5% |
Broadcom, Inc. | 1.5% |
United States Treasury Note/Bond | 1.4% |
| |
Top Sectors** | (%) |
Information Technology | 28.4% |
Financials | 12.0% |
Health Care | 10.0% |
Consumer Discretionary | 9.0% |
Government | 8.3% |
Communication Services | 8.2% |
Industrials | 7.6% |
Consumer Staples | 5.2% |
Energy | 3.0% |
Cash & Other | 8.3% |
| * | Percentages are stated as a percent of net assets. |
| ** | The Global Industry Classification Standard (“GICS®”) was developed by and/or is the exclusive property of MSCI, Inc. (“MSCI”) and Standard & Poor’s Financial Services LLC (“S&P”). GICS® is a service mark of MSCI and S&P and has been licensed for use by U.S. Bank Global Fund Services. |
The Fund’s Investment Advisory Fee has been reduced from 0.79% to 0.60%, effective February 1, 2024. This is a summary of certain changes to the Fund since the beginning of the fiscal period. For more complete information, you may review the Fund’s next prospectus, which we expect to be available by February 28, 2025 at https://www.paceretfs.com/. You can also request this information by contacting us at 877-337-0500.
For additional information about the Fund; including its prospectus, financial information, holdings and proxy information, scan the QR code or visit https://www.paceretfs.com/.
HOUSEHOLDING
To reduce Fund expenses, only one copy of most shareholder documents may be mailed to shareholders with multiple accounts at the same address (Householding). If you would prefer that your Pacer Advisors, Inc. documents not be householded, please contact Pacer Advisors, Inc. at 877-337-0500, or contact your financial intermediary. Your instructions will typically be effective within 30 days of receipt by Pacer Advisors, Inc. or your financial intermediary.
| Pacer Metaurus US Large Cap Dividend Multiplier 400 ETF | PAGE 2 | TSR-AR-69374H436 |
1048490679931133331054490049917136871050591641005713544
| | |
| Pacer Swan SOS Conservative (April) ETF | |
| PSCW (Principal U.S. Listing Exchange: CBOE) |
| Annual Shareholder Report | October 31, 2024 |
This annual shareholder report contains important information about the Pacer Swan SOS Conservative (April) ETF for the period of November 1, 2023, to October 31, 2024. You can find additional information about the Fund at https://www.paceretfs.com/. You can also request this information by contacting us at 877-337-0500
This report describes changes to the Fund that occurred during the reporting period.
WHAT WERE THE FUND COSTS FOR THE PAST YEAR? (based on a hypothetical $10,000 investment)
| | |
Fund Name | Costs of a $10,000 investment | Costs paid as a percentage of a $10,000 investment |
| Pacer Swan SOS Conservative (April) ETF | $69 | 0.63% |
FACTORS INFLUENCING FUND PERFORMANCE
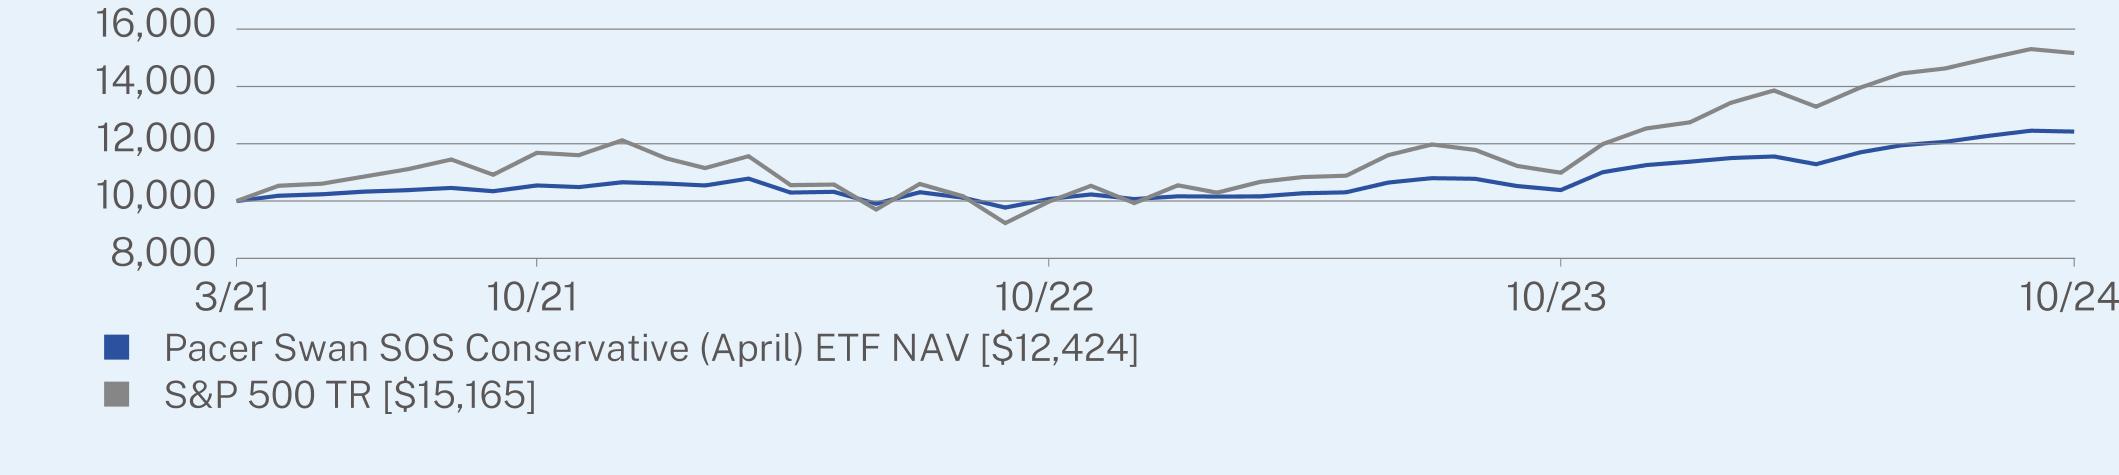
The Pacer Swan SOS fund performed as expected and intended in 2024. With the S&P 500 setting record high after record high throughout the course of the year, the fund maxed out its upside cap. Due to the ongoing bull market and a reduction in volatility, the upside caps available were less generous than they were a few years ago.
HOW DID THE FUND PERFORM SINCE INCEPTION?*
The $10,000 chart reflects a hypothetical $10,000 investment in the class of shares noted and assumes the maximum sales charge. The chart uses total return NAV performance and assumes reinvestment of dividends and capital gains. Fund expenses, including 12b-1 fees, management fees and other expenses were deducted.
CUMULATIVE PERFORMANCE (Initial Investment of $10,000)
ANNUAL AVERAGE TOTAL RETURN (%)
| | |
| | 1 Year | Since Inception
(03/31/2021) |
Pacer Swan SOS Conservative (April) ETF NAV | 19.66 | 6.24 |
S&P 500 TR | 38.02 | 12.31 |
Visit https://www.paceretfs.com/ for more recent performance information.
| * | The Fund’s past performance is not a good predictor of how the Fund will perform in the future. The graph and table do not reflect the deduction of taxes that a shareholder would pay on Fund distributions or redemption of Fund shares. |
| Pacer Swan SOS Conservative (April) ETF | PAGE 1 | TSR-AR-69374H543 |
KEY FUND STATISTICS (as of October 31, 2024)
| |
Net Assets | $37,769,434 |
Number of Holdings | 4 |
Net Advisory Fee | $156,892 |
Portfolio Turnover | 10% |
30-Day SEC Yield | (0.56)% |
30-Day SEC Yield Unsubsidized | (0.56)% |
Visit https://www.paceretfs.com/ for more recent performance information.
WHAT DID THE FUND INVEST IN? (as of October 31, 2024)*
| |
Security Type | (%) |
Purchased Options | 100.7% |
Written Options | -1.8% |
Cash & Other | 1.1% |
| |
Top 10 Securities | (%) |
SPDR S&P 500 ETF, Expiration: 03/31/2025; Exercise Price: $5.75 | 99.5% |
SPDR S&P 500 ETF, Expiration: 03/31/2025; Exercise Price: $496.92 | 1.2% |
SPDR S&P 500 ETF, Expiration: 03/31/2025; Exercise Price: $366.15 | -0.3% |
SPDR S&P 500 ETF, Expiration: 03/31/2025; Exercise Price: $608.28 | -1.5% |
| * | Percentages are stated as a percent of net assets. |
The Fund’s Investment Advisory Fee has been reduced from 0.75% to 0.60%, effective March 1, 2024. This is a summary of certain changes to the Fund since the beginning of the fiscal period. For more complete information, you may review the Fund’s next prospectus, which we expect to be available by February 28, 2025 at https://www.paceretfs.com/. You can also request this information by contacting us at 877-337-0500.
For additional information about the Fund; including its prospectus, financial information, holdings and proxy information, scan the QR code or visit https://www.paceretfs.com/.
HOUSEHOLDING
To reduce Fund expenses, only one copy of most shareholder documents may be mailed to shareholders with multiple accounts at the same address (Householding). If you would prefer that your Pacer Advisors, Inc. documents not be householded, please contact Pacer Advisors, Inc. at 877-337-0500, or contact your financial intermediary. Your instructions will typically be effective within 30 days of receipt by Pacer Advisors, Inc. or your financial intermediary.
| Pacer Swan SOS Conservative (April) ETF | PAGE 2 | TSR-AR-69374H543 |
105451006810383124241168399761098815165
| | |
| Pacer Swan SOS Conservative (January) ETF | |
| PSCX (Principal U.S. Listing Exchange: CBOE) |
| Annual Shareholder Report | October 31, 2024 |
This annual shareholder report contains important information about the Pacer Swan SOS Conservative (January) ETF for the period of November 1, 2023, to October 31, 2024. You can find additional information about the Fund at https://www.paceretfs.com/. You can also request this information by contacting us at 877-337-0500
This report describes changes to the Fund that occurred during the reporting period.
WHAT WERE THE FUND COSTS FOR THE PAST YEAR? (based on a hypothetical $10,000 investment)
| | |
Fund Name | Costs of a $10,000 investment | Costs paid as a percentage of a $10,000 investment |
| Pacer Swan SOS Conservative (January) ETF | $70 | 0.64% |
FACTORS INFLUENCING FUND PERFORMANCE
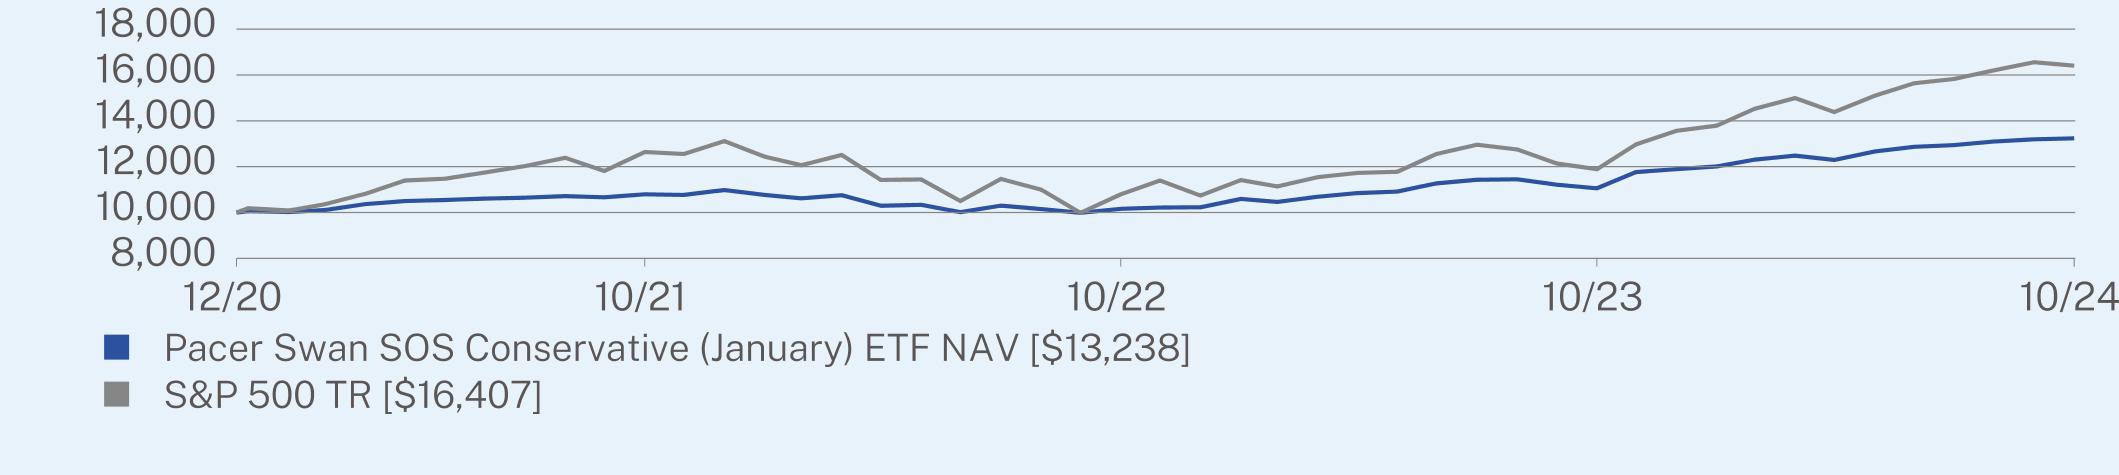
The Pacer Swan SOS fund performed as expected and intended in 2024. With the S&P 500 setting record high after record high throughout the course of the year, the fund maxed out its upside cap. Due to the ongoing bull market and a reduction in volatility, the upside caps available were less generous than they were a few years ago.
HOW DID THE FUND PERFORM SINCE INCEPTION?*
The $10,000 chart reflects a hypothetical $10,000 investment in the class of shares noted and assumes the maximum sales charge. The chart uses total return NAV performance and assumes reinvestment of dividends and capital gains. Fund expenses, including 12b-1 fees, management fees and other expenses were deducted.
CUMULATIVE PERFORMANCE (Initial Investment of $10,000)
ANNUAL AVERAGE TOTAL RETURN (%)
| | |
| | 1 Year | Since Inception
(12/22/2020) |
Pacer Swan SOS Conservative (January) ETF NAV | 19.74 | 7.54 |
S&P 500 TR | 38.02 | 13.70 |
Visit https://www.paceretfs.com/ for more recent performance information.
| * | The Fund’s past performance is not a good predictor of how the Fund will perform in the future. The graph and table do not reflect the deduction of taxes that a shareholder would pay on Fund distributions or redemption of Fund shares. |
| Pacer Swan SOS Conservative (January) ETF | PAGE 1 | TSR-AR-69374H584 |
KEY FUND STATISTICS (as of October 31, 2024)
| |
Net Assets | $19,732,854 |
Number of Holdings | 4 |
Net Advisory Fee | $112,991 |
Portfolio Turnover | 2% |
30-Day SEC Yield | (0.55)% |
30-Day SEC Yield Unsubsidized | (0.55)% |
Visit https://www.paceretfs.com/ for more recent performance information.
WHAT DID THE FUND INVEST IN? (as of October 31, 2024)*
| |
Security Type | (%) |
Purchased Options | 106.1% |
Written Options | -7.1% |
Cash & Other | 1.0% |
| |
Top 10 Securities | (%) |
SPDR S&P 500 ETF, Expiration: 12/31/2024; Exercise Price: $5.23 | 105.8% |
SPDR S&P 500 ETF, Expiration: 12/31/2024; Exercise Price: $451.54 | 0.3% |
SPDR S&P 500 ETF, Expiration: 12/31/2024; Exercise Price: $332.72 | -0.1% |
SPDR S&P 500 ETF, Expiration: 12/31/2024; Exercise Price: $542.80 | -7.0% |
| * | Percentages are stated as a percent of net assets. |
The Fund’s Investment Advisory Fee has been reduced from 0.75% to 0.60%, effective March 1, 2024. This is a summary of certain changes to the Fund since the beginning of the fiscal period. For more complete information, you may review the Fund’s next prospectus, which we expect to be available by February 28, 2025 at https://www.paceretfs.com/. You can also request this information by contacting us at 877-337-0500.
For additional information about the Fund; including its prospectus, financial information, holdings and proxy information, scan the QR code or visit https://www.paceretfs.com/.
HOUSEHOLDING
To reduce Fund expenses, only one copy of most shareholder documents may be mailed to shareholders with multiple accounts at the same address (Householding). If you would prefer that your Pacer Advisors, Inc. documents not be householded, please contact Pacer Advisors, Inc. at 877-337-0500, or contact your financial intermediary. Your instructions will typically be effective within 30 days of receipt by Pacer Advisors, Inc. or your financial intermediary.
| Pacer Swan SOS Conservative (January) ETF | PAGE 2 | TSR-AR-69374H584 |
1079410162110551323812640107931188816407
| | |
| Pacer Swan SOS Conservative (July) ETF | |
| PSCJ (Principal U.S. Listing Exchange: CBOE) |
| Annual Shareholder Report | October 31, 2024 |
This annual shareholder report contains important information about the Pacer Swan SOS Conservative (July) ETF for the period of November 1, 2023, to October 31, 2024. You can find additional information about the Fund at https://www.paceretfs.com/. You can also request this information by contacting us at 877-337-0500
This report describes changes to the Fund that occurred during the reporting period.
WHAT WERE THE FUND COSTS FOR THE PAST YEAR? (based on a hypothetical $10,000 investment)
| | |
Fund Name | Costs of a $10,000 investment | Costs paid as a percentage of a $10,000 investment |
| Pacer Swan SOS Conservative (July) ETF | $71 | 0.64% |
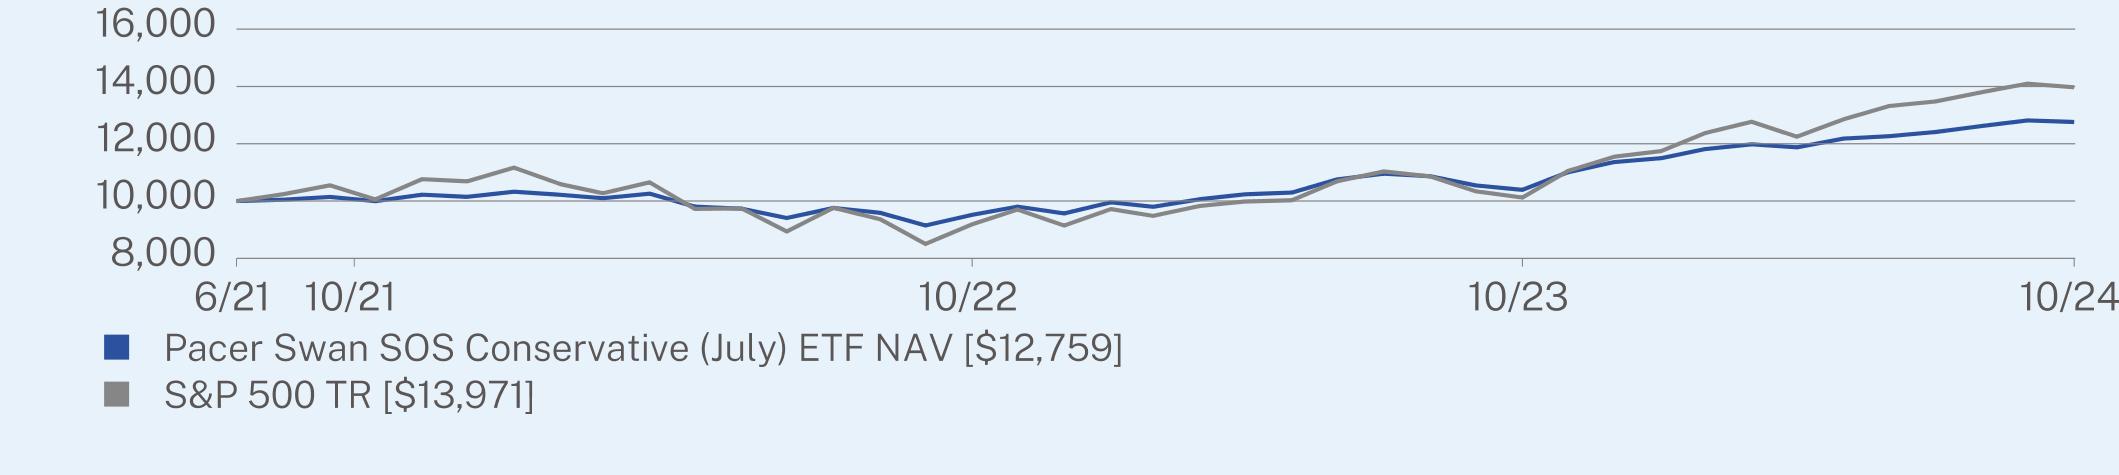
FACTORS INFLUENCING FUND PERFORMANCE
The Pacer Swan SOS fund performed as expected and intended in 2024. With the S&P 500 setting record high after record high throughout the course of the year, the fund maxed out its upside cap. Due to the ongoing bull market and a reduction in volatility, the upside caps available were less generous than they were a few years ago.
HOW DID THE FUND PERFORM SINCE INCEPTION?*
The $10,000 chart reflects a hypothetical $10,000 investment in the class of shares noted and assumes the maximum sales charge. The chart uses total return NAV performance and assumes reinvestment of dividends and capital gains. Fund expenses, including 12b-1 fees, management fees and other expenses were deducted.
CUMULATIVE PERFORMANCE (Initial Investment of $10,000)
ANNUAL AVERAGE TOTAL RETURN (%)
| | |
| | 1 Year | Since Inception
(06/30/2021) |
Pacer Swan SOS Conservative (July) ETF NAV | 22.80 | 7.58 |
S&P 500 TR | 38.02 | 10.54 |
Visit https://www.paceretfs.com/ for more recent performance information.
| * | The Fund’s past performance is not a good predictor of how the Fund will perform in the future. The graph and table do not reflect the deduction of taxes that a shareholder would pay on Fund distributions or redemption of Fund shares. |
| Pacer Swan SOS Conservative (July) ETF | PAGE 1 | TSR-AR-69374H535 |
KEY FUND STATISTICS (as of October 31, 2024)
| |
Net Assets | $37,236,832 |
Number of Holdings | 4 |
Net Advisory Fee | $115,227 |
Portfolio Turnover | 0% |
30-Day SEC Yield | (0.56)% |
30-Day SEC Yield Unsubsidized | (0.56)% |
Visit https://www.paceretfs.com/ for more recent performance information.
WHAT DID THE FUND INVEST IN? (as of October 31, 2024)*
| |
Security Type | (%) |
Purchased Options | 101.2% |
Written Options | -2.1% |
Cash & Other | 0.9% |
| |
Top 10 Securities | (%) |
SPDR S&P 500 ETF, Expiration: 06/30/2025; Exercise Price: $5.99 | 98.9% |
SPDR S&P 500 ETF, Expiration: 06/30/2025; Exercise Price: $517.01 | 2.3% |
SPDR S&P 500 ETF, Expiration: 06/30/2025; Exercise Price: $380.95 | -0.5% |
SPDR S&P 500 ETF, Expiration: 06/30/2025; Exercise Price: $627.00 | -1.6% |
| * | Percentages are stated as a percent of net assets. |
The Fund’s Investment Advisory Fee has been reduced from 0.75% to 0.60%, effective March 1, 2024. This is a summary of certain changes to the Fund since the beginning of the fiscal period. For more complete information, you may review the Fund’s next prospectus, which we expect to be available by February 28, 2025 at https://www.paceretfs.com/. You can also request this information by contacting us at 877-337-0500.
For additional information about the Fund; including its prospectus, financial information, holdings and proxy information, scan the QR code or visit https://www.paceretfs.com/.
HOUSEHOLDING
To reduce Fund expenses, only one copy of most shareholder documents may be mailed to shareholders with multiple accounts at the same address (Householding). If you would prefer that your Pacer Advisors, Inc. documents not be householded, please contact Pacer Advisors, Inc. at 877-337-0500, or contact your financial intermediary. Your instructions will typically be effective within 30 days of receipt by Pacer Advisors, Inc. or your financial intermediary.
| Pacer Swan SOS Conservative (July) ETF | PAGE 2 | TSR-AR-69374H535 |
10222951910391127591076391901012213971
| | |
| Pacer Swan SOS Conservative (October) ETF | |
| PSCQ (Principal U.S. Listing Exchange: CBOE) |
| Annual Shareholder Report | October 31, 2024 |
This annual shareholder report contains important information about the Pacer Swan SOS Conservative (October) ETF for the period of November 1, 2023, to October 31, 2024. You can find additional information about the Fund at https://www.paceretfs.com/. You can also request this information by contacting us at 877-337-0500
This report describes changes to the Fund that occurred during the reporting period.
WHAT WERE THE FUND COSTS FOR THE PAST YEAR? (based on a hypothetical $10,000 investment)
| | |
Fund Name | Costs of a $10,000 investment | Costs paid as a percentage of a $10,000 investment |
| Pacer Swan SOS Conservative (October) ETF | $70 | 0.65% |
FACTORS INFLUENCING FUND PERFORMANCE
The Pacer Swan SOS fund performed as expected and intended in 2024. With the S&P 500 setting record high after record high throughout the course of the year, the fund maxed out its upside cap. Due to the ongoing bull market and a reduction in volatility, the upside caps available were less generous than they were a few years ago.
HOW DID THE FUND PERFORM SINCE INCEPTION?*
The $10,000 chart reflects a hypothetical $10,000 investment in the class of shares noted and assumes the maximum sales charge. The chart uses total return NAV performance and assumes reinvestment of dividends and capital gains. Fund expenses, including 12b-1 fees, management fees and other expenses were deducted.
CUMULATIVE PERFORMANCE (Initial Investment of $10,000)
ANNUAL AVERAGE TOTAL RETURN (%)
| | |
| | 1 Year | Since Inception
(09/30/2021) |
Pacer Swan SOS Conservative (October) ETF NAV | 16.24 | 8.01 |
S&P 500 TR | 38.02 | 11.24 |
Visit https://www.paceretfs.com/ for more recent performance information.
| * | The Fund’s past performance is not a good predictor of how the Fund will perform in the future. The graph and table do not reflect the deduction of taxes that a shareholder would pay on Fund distributions or redemption of Fund shares. |
| Pacer Swan SOS Conservative (October) ETF | PAGE 1 | TSR-AR-69374H527 |
KEY FUND STATISTICS (as of October 31, 2024)
| |
Net Assets | $14,957,932 |
Number of Holdings | 4 |
Net Advisory Fee | $56,838 |
Portfolio Turnover | 0% |
30-Day SEC Yield | (0.54)% |
30-Day SEC Yield Unsubsidized | (0.54)% |
Visit https://www.paceretfs.com/ for more recent performance information.
WHAT DID THE FUND INVEST IN? (as of October 31, 2024)*
| |
Security Type | (%) |
Purchased Options | 101.8% |
Written Options | -2.7% |
Cash & Other | 0.9% |
| |
Top 10 Securities | (%) |
SPDR S&P 500 ETF, Expiration: 09/30/2025; Exercise Price: $6.31 | 98.0% |
SPDR S&P 500 ETF, Expiration: 09/30/2025; Exercise Price: $545.07 | 3.8% |
SPDR S&P 500 ETF, Expiration: 09/30/2025; Exercise Price: $401.63 | -0.9% |
SPDR S&P 500 ETF, Expiration: 09/30/2025; Exercise Price: $641.18 | -1.9% |
| * | Percentages are stated as a percent of net assets. |
The Fund’s Investment Advisory Fee has been reduced from 0.75% to 0.60%, effective March 1, 2024. This is a summary of certain changes to the Fund since the beginning of the fiscal period. For more complete information, you may review the Fund’s next prospectus, which we expect to be available by February 28, 2025 at https://www.paceretfs.com/. You can also request this information by contacting us at 877-337-0500.
For additional information about the Fund; including its prospectus, financial information, holdings and proxy information, scan the QR code or visit https://www.paceretfs.com/.
HOUSEHOLDING
To reduce Fund expenses, only one copy of most shareholder documents may be mailed to shareholders with multiple accounts at the same address (Householding). If you would prefer that your Pacer Advisors, Inc. documents not be householded, please contact Pacer Advisors, Inc. at 877-337-0500, or contact your financial intermediary. Your instructions will typically be effective within 30 days of receipt by Pacer Advisors, Inc. or your financial intermediary.
| Pacer Swan SOS Conservative (October) ETF | PAGE 2 | TSR-AR-69374H527 |
10171969610912126831070191371006413890
| | |
| Pacer Swan SOS Flex (April) ETF | |
| PSFM (Principal U.S. Listing Exchange: CBOE) |
| Annual Shareholder Report | October 31, 2024 |
This annual shareholder report contains important information about the Pacer Swan SOS Flex (April) ETF for the period of November 1, 2023, to October 31, 2024. You can find additional information about the Fund at https://www.paceretfs.com/. You can also request this information by contacting us at 877-337-0500
This report describes changes to the Fund that occurred during the reporting period.
WHAT WERE THE FUND COSTS FOR THE PAST YEAR? (based on a hypothetical $10,000 investment)
| | |
Fund Name | Costs of a $10,000 investment | Costs paid as a percentage of a $10,000 investment |
| Pacer Swan SOS Flex (April) ETF | $72 | 0.65% |
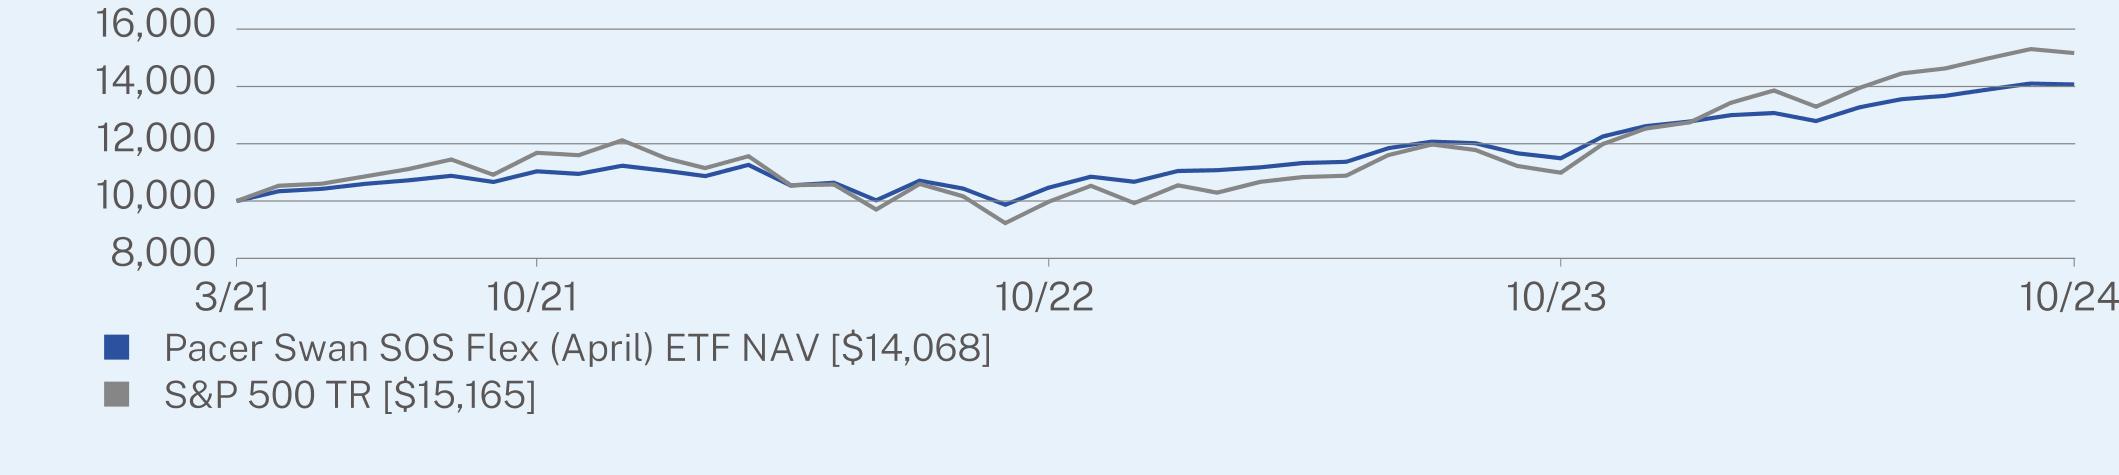
FACTORS INFLUENCING FUND PERFORMANCE
The Pacer Swan SOS fund performed as expected and intended in 2024. With the S&P 500 setting record high after record high throughout the course of the year, the fund maxed out its upside cap. Due to the ongoing bull market and a reduction in volatility, the upside caps available were less generous than they were a few years ago.
HOW DID THE FUND PERFORM SINCE INCEPTION?*
The $10,000 chart reflects a hypothetical $10,000 investment in the class of shares noted and assumes the maximum sales charge. The chart uses total return NAV performance and assumes reinvestment of dividends and capital gains. Fund expenses, including 12b-1 fees, management fees and other expenses were deducted.
CUMULATIVE PERFORMANCE (Initial Investment of $10,000)
ANNUAL AVERAGE TOTAL RETURN (%)
| | |
| | 1 Year | Since Inception
(03/31/2021) |
Pacer Swan SOS Flex (April) ETF NAV | 22.39 | 9.98 |
S&P 500 TR | 38.02 | 12.31 |
Visit https://www.paceretfs.com/ for more recent performance information.
| * | The Fund’s past performance is not a good predictor of how the Fund will perform in the future. The graph and table do not reflect the deduction of taxes that a shareholder would pay on Fund distributions or redemption of Fund shares. |
| Pacer Swan SOS Flex (April) ETF | PAGE 1 | TSR-AR-69374H477 |
KEY FUND STATISTICS (as of October 31, 2024)
| |
Net Assets | $24,645,018 |
Number of Holdings | 5 |
Net Advisory Fee | $144,162 |
Portfolio Turnover | 4% |
30-Day SEC Yield | (0.57)% |
30-Day SEC Yield Unsubsidized | (0.57)% |
Visit https://www.paceretfs.com/ for more recent performance information.
WHAT DID THE FUND INVEST IN? (as of October 31, 2024)*
| |
Security Type | (%) |
Purchased Options | 101.8% |
Written Options | -2.4% |
Cash & Other | 0.6% |
| |
Top 10 Securities | (%) |
SPDR S&P 500 ETF, Expiration: 03/31/2025; Exercise Price: $5.86 | 99.8% |
SPDR S&P 500 ETF, Expiration: 03/31/2025; Exercise Price: $523.07 | 1.8% |
SPDR S&P 500 ETF, Expiration: 03/31/2025; Exercise Price: $313.84 | 0.2% |
SPDR S&P 500 ETF, Expiration: 03/31/2025; Exercise Price: $418.46 | -1.0% |
SPDR S&P 500 ETF, Expiration: 03/31/2025; Exercise Price: $609.53 | -1.5% |
| * | Percentages are stated as a percent of net assets. |
The Fund’s Investment Advisory Fee has been reduced from 0.75% to 0.60%, effective March 1, 2024. This is a summary of certain changes to the Fund since the beginning of the fiscal period. For more complete information, you may review the Fund’s next prospectus, which we expect to be available by February 28, 2025 at https://www.paceretfs.com/. You can also request this information by contacting us at 877-337-0500.
For additional information about the Fund; including its prospectus, financial information, holdings and proxy information, scan the QR code or visit https://www.paceretfs.com/.
HOUSEHOLDING
To reduce Fund expenses, only one copy of most shareholder documents may be mailed to shareholders with multiple accounts at the same address (Householding). If you would prefer that your Pacer Advisors, Inc. documents not be householded, please contact Pacer Advisors, Inc. at 877-337-0500, or contact your financial intermediary. Your instructions will typically be effective within 30 days of receipt by Pacer Advisors, Inc. or your financial intermediary.
| Pacer Swan SOS Flex (April) ETF | PAGE 2 | TSR-AR-69374H477 |
110371046911494140681168399761098815165
| | |
| Pacer Swan SOS Flex (January) ETF | |
| PSFD (Principal U.S. Listing Exchange: CBOE) |
| Annual Shareholder Report | October 31, 2024 |
This annual shareholder report contains important information about the Pacer Swan SOS Flex (January) ETF for the period of November 1, 2023, to October 31, 2024. You can find additional information about the Fund at https://www.paceretfs.com/. You can also request this information by contacting us at 877-337-0500
This report describes changes to the Fund that occurred during the reporting period.
WHAT WERE THE FUND COSTS FOR THE PAST YEAR? (based on a hypothetical $10,000 investment)
| | |
Fund Name | Costs of a $10,000 investment | Costs paid as a percentage of a $10,000 investment |
| Pacer Swan SOS Flex (January) ETF | $72 | 0.64% |
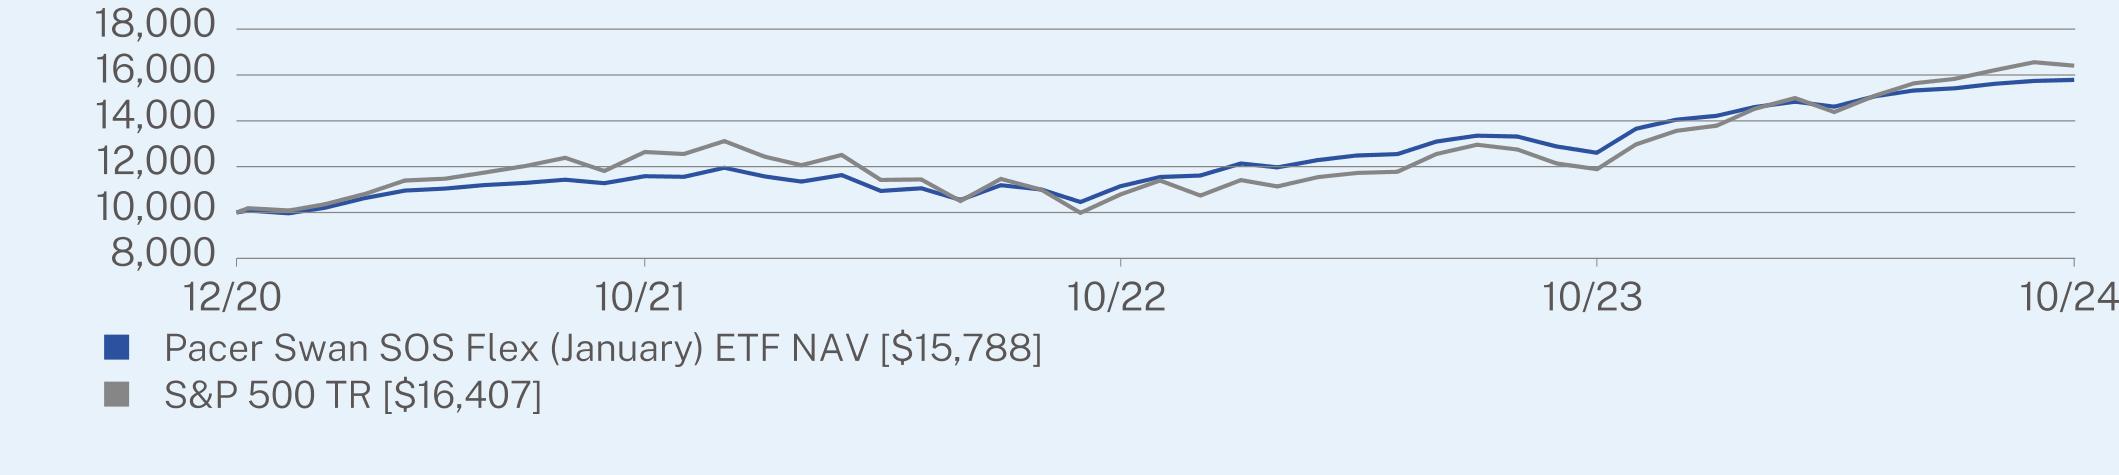
FACTORS INFLUENCING FUND PERFORMANCE
The Pacer Swan SOS fund performed as expected and intended in 2024. With the S&P 500 setting record high after record high throughout the course of the year, the fund maxed out its upside cap. Due to the ongoing bull market and a reduction in volatility, the upside caps available were less generous than they were a few years ago.
HOW DID THE FUND PERFORM SINCE INCEPTION?*
The $10,000 chart reflects a hypothetical $10,000 investment in the class of shares noted and assumes the maximum sales charge. The chart uses total return NAV performance and assumes reinvestment of dividends and capital gains. Fund expenses, including 12b-1 fees, management fees and other expenses were deducted.
CUMULATIVE PERFORMANCE (Initial Investment of $10,000)
ANNUAL AVERAGE TOTAL RETURN (%)
| | |
| | 1 Year | Since Inception
(12/22/2020) |
Pacer Swan SOS Flex (January) ETF NAV | 25.23 | 12.57 |
S&P 500 TR | 38.02 | 13.70 |
Visit https://www.paceretfs.com/ for more recent performance information.
| * | The Fund’s past performance is not a good predictor of how the Fund will perform in the future. The graph and table do not reflect the deduction of taxes that a shareholder would pay on Fund distributions or redemption of Fund shares. |
| Pacer Swan SOS Flex (January) ETF | PAGE 1 | TSR-AR-69374H576 |
KEY FUND STATISTICS (as of October 31, 2024)
| |
Net Assets | $47,066,984 |
Number of Holdings | 5 |
Net Advisory Fee | $246,897 |
Portfolio Turnover | 0% |
30-Day SEC Yield | (0.56)% |
30-Day SEC Yield Unsubsidized | (0.56)% |
Visit https://www.paceretfs.com/ for more recent performance information.
WHAT DID THE FUND INVEST IN? (as of October 31, 2024)*
| |
Security Type | (%) |
Purchased Options | 0.0% |
Written Options | 0.0% |
Cash & Other | 0.6% |
| |
Top 10 Securities | (%) |
SPDR S&P 500 ETF, Expiration: 12/31/2024; Exercise Price: $5.32 | 105.2% |
SPDR S&P 500 ETF, Expiration: 12/31/2024; Exercise Price: $475.31 | 0.4% |
SPDR S&P 500 ETF, Expiration: 12/31/2024; Exercise Price: $285.19 | 0.1% |
SPDR S&P 500 ETF, Expiration: 12/31/2024; Exercise Price: $380.25 | -0.2% |
SPDR S&P 500 ETF, Expiration: 12/31/2024; Exercise Price: $548.65 | -6.1% |
| * | Percentages are stated as a percent of net assets. |
The Fund’s Investment Advisory Fee has been reduced from 0.75% to 0.60%, effective March 1, 2024. This is a summary of certain changes to the Fund since the beginning of the fiscal period. For more complete information, you may review the Fund’s next prospectus, which we expect to be available by February 28, 2025 at https://www.paceretfs.com/. You can also request this information by contacting us at 877-337-0500.
For additional information about the Fund; including its prospectus, financial information, holdings and proxy information, scan the QR code or visit https://www.paceretfs.com/.
HOUSEHOLDING
To reduce Fund expenses, only one copy of most shareholder documents may be mailed to shareholders with multiple accounts at the same address (Householding). If you would prefer that your Pacer Advisors, Inc. documents not be householded, please contact Pacer Advisors, Inc. at 877-337-0500, or contact your financial intermediary. Your instructions will typically be effective within 30 days of receipt by Pacer Advisors, Inc. or your financial intermediary.
| Pacer Swan SOS Flex (January) ETF | PAGE 2 | TSR-AR-69374H576 |
1158511152126071578812640107931188816407
| | |
| Pacer Swan SOS Flex (July) ETF | |
| PSFJ (Principal U.S. Listing Exchange: CBOE) |
| Annual Shareholder Report | October 31, 2024 |
This annual shareholder report contains important information about the Pacer Swan SOS Flex (July) ETFfor the period of November 1, 2023, to October 31, 2024. You can find additional information about the Fund at https://www.paceretfs.com/. You can also request this information by contacting us at 877-337-0500
This report describes changes to the Fund that occurred during the reporting period.
WHAT WERE THE FUND COSTS FOR THE PAST YEAR? (based on a hypothetical $10,000 investment)
| | |
Fund Name | Costs of a $10,000 investment | Costs paid as a percentage of a $10,000 investment |
| Pacer Swan SOS Flex (July) ETF | $74 | 0.66% |
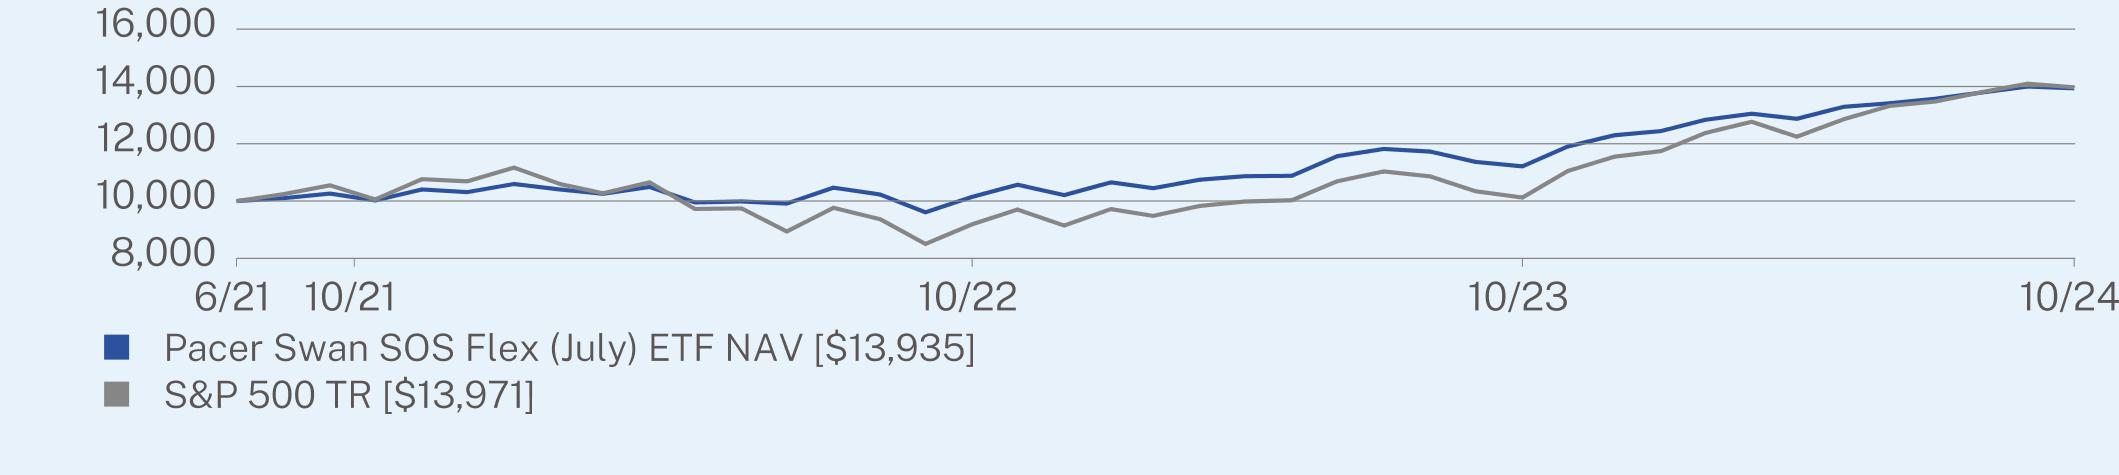
FACTORS INFLUENCING FUND PERFORMANCE
The Pacer Swan SOS fund performed as expected and intended in 2024. With the S&P 500 setting record high after record high throughout the course of the year, the fund maxed out its upside cap. Due to the ongoing bull market and a reduction in volatility, the upside caps available were less generous than they were a few years ago.
HOW DID THE FUND PERFORM SINCE INCEPTION?*
The $10,000 chart reflects a hypothetical $10,000 investment in the class of shares noted and assumes the maximum sales charge. The chart uses total return NAV performance and assumes reinvestment of dividends and capital gains. Fund expenses, including 12b-1 fees, management fees and other expenses were deducted.
CUMULATIVE PERFORMANCE (Initial Investment of $10,000)
ANNUAL AVERAGE TOTAL RETURN (%)
| | |
| | 1 Year | Since Inception
(06/30/2021) |
Pacer Swan SOS Flex (July) ETF NAV | 24.30 | 10.46 |
S&P 500 TR | 38.02 | 10.54 |
Visit https://www.paceretfs.com/ for more recent performance information.
| * | The Fund’s past performance is not a good predictor of how the Fund will perform in the future. The graph and table do not reflect the deduction of taxes that a shareholder would pay on Fund distributions or redemption of Fund shares. |
| Pacer Swan SOS Flex (July) ETF | PAGE 1 | TSR-AR-69374H469 |
KEY FUND STATISTICS (as of October 31, 2024)
| |
Net Assets | $27,112,908 |
Number of Holdings | 5 |
Net Advisory Fee | $169,959 |
Portfolio Turnover | 0% |
30-Day SEC Yield | (0.56)% |
30-Day SEC Yield Unsubsidized | (0.56)% |
Visit https://www.paceretfs.com/ for more recent performance information.
WHAT DID THE FUND INVEST IN? (as of October 31, 2024)*
| |
Security Type | (%) |
Purchased Options | 0.0% |
Written Options | 0.0% |
Cash & Other | 1.0% |
| |
Top 10 Securities | (%) |
SPDR S&P 500 ETF, Expiration: 06/30/2025; Exercise Price: $6.10 | 99.0% |
SPDR S&P 500 ETF, Expiration: 06/30/2025; Exercise Price: $544.22 | 3.2% |
SPDR S&P 500 ETF, Expiration: 06/30/2025; Exercise Price: $326.53 | 0.2% |
SPDR S&P 500 ETF, Expiration: 06/30/2025; Exercise Price: $627.32 | -1.6% |
SPDR S&P 500 ETF, Expiration: 06/30/2025; Exercise Price: $435.38 | -1.8% |
| * | Percentages are stated as a percent of net assets. |
The Fund’s Investment Advisory Fee has been reduced from 0.75% to 0.60%, effective March 1, 2024. This is a summary of certain changes to the Fund since the beginning of the fiscal period. For more complete information, you may review the Fund’s next prospectus, which we expect to be available by February 28, 2025 at https://www.paceretfs.com/. You can also request this information by contacting us at 877-337-0500.
For additional information about the Fund; including its prospectus, financial information, holdings and proxy information, scan the QR code or visit https://www.paceretfs.com/.
HOUSEHOLDING
To reduce Fund expenses, only one copy of most shareholder documents may be mailed to shareholders with multiple accounts at the same address (Householding). If you would prefer that your Pacer Advisors, Inc. documents not be householded, please contact Pacer Advisors, Inc. at 877-337-0500, or contact your financial intermediary. Your instructions will typically be effective within 30 days of receipt by Pacer Advisors, Inc. or your financial intermediary.
| Pacer Swan SOS Flex (July) ETF | PAGE 2 | TSR-AR-69374H469 |
104051014611211139351076391901012213971
| | |
| Pacer Swan SOS Flex (October) ETF | |
| PSFO (Principal U.S. Listing Exchange: CBOE) |
| Annual Shareholder Report | October 31, 2024 |
This annual shareholder report contains important information about the Pacer Swan SOS Flex (October) ETF for the period of November 1, 2023, to October 31, 2024. You can find additional information about the Fund at https://www.paceretfs.com/. You can also request this information by contacting us at 877-337-0500
This report describes changes to the Fund that occurred during the reporting period.
WHAT WERE THE FUND COSTS FOR THE PAST YEAR? (based on a hypothetical $10,000 investment)
| | |
Fund Name | Costs of a $10,000 investment | Costs paid as a percentage of a $10,000 investment |
| Pacer Swan SOS Flex (October) ETF | $71 | 0.65% |
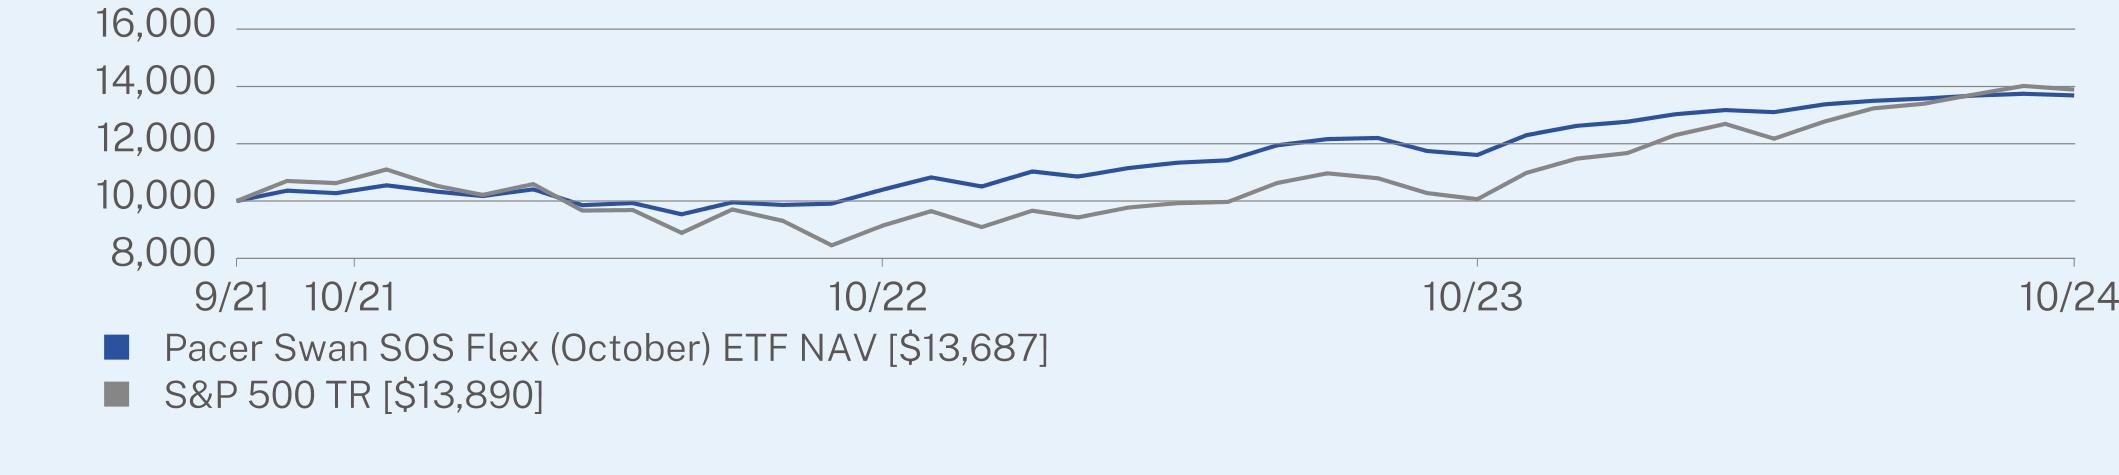
FACTORS INFLUENCING FUND PERFORMANCE
The Pacer Swan SOS fund performed as expected and intended in 2024. With the S&P 500 setting record high after record high throughout the course of the year, the fund maxed out its upside cap. Due to the ongoing bull market and a reduction in volatility, the upside caps available were less generous than they were a few years ago.
HOW DID THE FUND PERFORM SINCE INCEPTION?*
The $10,000 chart reflects a hypothetical $10,000 investment in the class of shares noted and assumes the maximum sales charge. The chart uses total return NAV performance and assumes reinvestment of dividends and capital gains. Fund expenses, including 12b-1 fees, management fees and other expenses were deducted.
CUMULATIVE PERFORMANCE (Initial Investment of $10,000)
ANNUAL AVERAGE TOTAL RETURN (%)
| | |
| | 1 Year | Since Inception
(09/30/2021) |
Pacer Swan SOS Flex (October) ETF NAV | 17.90 | 10.71 |
S&P 500 TR | 38.02 | 11.24 |
Visit https://www.paceretfs.com/ for more recent performance information.
| * | The Fund’s past performance is not a good predictor of how the Fund will perform in the future. The graph and table do not reflect the deduction of taxes that a shareholder would pay on Fund distributions or redemption of Fund shares. |
| Pacer Swan SOS Flex (October) ETF | PAGE 1 | TSR-AR-69374H451 |
KEY FUND STATISTICS (as of October 31, 2024)
| |
Net Assets | $14,738,298 |
Number of Holdings | 5 |
Net Advisory Fee | $96,539 |
Portfolio Turnover | 0% |
30-Day SEC Yield | (0.56)% |
30-Day SEC Yield Unsubsidized | (0.56)% |
Visit https://www.paceretfs.com/ for more recent performance information.
WHAT DID THE FUND INVEST IN? (as of October 31, 2024)*
| |
Security Type | (%) |
Purchased Options | 103.5% |
Written Options | -4.6% |
Cash & Other | 1.1% |
| |
Top 10 Securities | (%) |
SPDR S&P 500 ETF, Expiration: 09/30/2025; Exercise Price: $6.43 | 97.9% |
SPDR S&P 500 ETF, Expiration: 09/30/2025; Exercise Price: $573.76 | 5.1% |
SPDR S&P 500 ETF, Expiration: 09/30/2025; Exercise Price: $344.26 | 0.5% |
SPDR S&P 500 ETF, Expiration: 09/30/2025; Exercise Price: $650.13 | -1.5% |
SPDR S&P 500 ETF, Expiration: 09/30/2025; Exercise Price: $459.01 | -3.1% |
| * | Percentages are stated as a percent of net assets. |
The Fund’s Investment Advisory Fee has been reduced from 0.75% to 0.60%, effective March 1, 2024. This is a summary of certain changes to the Fund since the beginning of the fiscal period. For more complete information, you may review the Fund’s next prospectus, which we expect to be available by February 28, 2025 at https://www.paceretfs.com/. You can also request this information by contacting us at 877-337-0500.
For additional information about the Fund; including its prospectus, financial information, holdings and proxy information, scan the QR code or visit https://www.paceretfs.com/.
HOUSEHOLDING
To reduce Fund expenses, only one copy of most shareholder documents may be mailed to shareholders with multiple accounts at the same address (Householding). If you would prefer that your Pacer Advisors, Inc. documents not be householded, please contact Pacer Advisors, Inc. at 877-337-0500, or contact your financial intermediary. Your instructions will typically be effective within 30 days of receipt by Pacer Advisors, Inc. or your financial intermediary.
| Pacer Swan SOS Flex (October) ETF | PAGE 2 | TSR-AR-69374H451 |
103641039611609136871070191371006413890
| | |
| Pacer Swan SOS Fund of Funds ETF | |
| PSFF (Principal U.S. Listing Exchange: CBOE) |
| Annual Shareholder Report | October 31, 2024 |
This annual shareholder report contains important information about the Pacer Swan SOS Fund of Funds ETFfor the period of November 1, 2023, to October 31, 2024. You can find additional information about the Fund at https://www.paceretfs.com/. You can also request this information by contacting us at 877-337-0500
This report describes changes to the Fund that occurred during the reporting period.
WHAT WERE THE FUND COSTS FOR THE PAST YEAR? (based on a hypothetical $10,000 investment)
| | |
Fund Name | Costs of a $10,000 investment | Costs paid as a percentage of a $10,000 investment |
| Pacer Swan SOS Fund of Funds ETF | $15 | 0.14% |
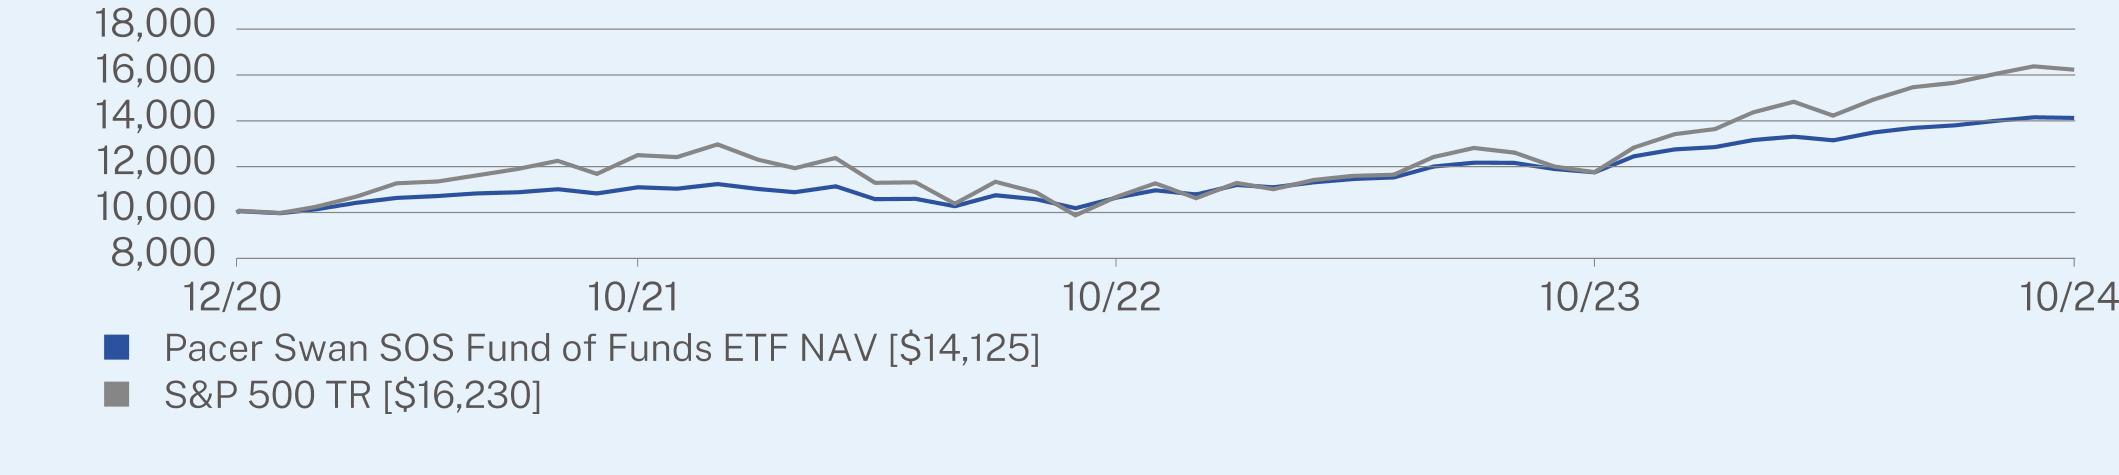
FACTORS INFLUENCING FUND PERFORMANCE
The Pacer Swan SOS Fund of Funds (PSFF) performed as expected and intended in 2024. With the S&P 500 setting record high after record high throughout the course of the year, the Fund rotated its exposure to emphasize those ETFs with favorable risk/return characteristics. Due to the ongoing bull market and a reduction in volatility, the upside caps available were less generous than they were a few years ago. Moreover, the Conservative funds had more attractive upside/downside risk characteristics than the more aggressive Flex series and were therefore favored in PSFF.
HOW DID THE FUND PERFORM SINCE INCEPTION?*
The $10,000 chart reflects a hypothetical $10,000 investment in the class of shares noted and assumes the maximum sales charge. The chart uses total return NAV performance and assumes reinvestment of dividends and capital gains. Fund expenses, including 12b-1 fees, management fees and other expenses were deducted.
CUMULATIVE PERFORMANCE (Initial Investment of $10,000)
ANNUAL AVERAGE TOTAL RETURN (%)
| | |
| | 1 Year | Since Inception
(12/29/2020) |
Pacer Swan SOS Fund of Funds ETF NAV | 20.19 | 9.42 |
S&P 500 TR | 38.02 | 13.45 |
Visit https://www.paceretfs.com/ for more recent performance information.
| * | The Fund’s past performance is not a good predictor of how the Fund will perform in the future. The graph and table do not reflect the deduction of taxes that a shareholder would pay on Fund distributions or redemption of Fund shares. |
| Pacer Swan SOS Fund of Funds ETF | PAGE 1 | TSR-AR-69374H568 |
KEY FUND STATISTICS (as of October 31, 2024)
| |
Net Assets | $377,740,897 |
Number of Holdings | 12 |
Net Advisory Fee | $408,105 |
Portfolio Turnover | 0% |
30-Day SEC Yield | (0.10)% |
30-Day SEC Yield Unsubsidized | (0.10)% |
Visit https://www.paceretfs.com/ for more recent performance information.
WHAT DID THE FUND INVEST IN? (as of October 31, 2024)*
| |
Security Type | (%) |
Affiliated Exchange Traded Funds | 99.5% |
Cash & Other | 0.5% |
| |
Top 10 Securities | (%) |
Pacer Swan SOS Moderate (July) ETF | 16.9% |
Pacer Swan SOS Moderate (January) ETF | 15.6% |
Pacer Swan SOS Moderate (April) ETF | 14.5% |
Pacer Swan SOS Moderate (October) ETF | 9.8% |
Pacer Swan SOS Conservative (April) ETF | 8.9% |
Pacer Swan SOS Conservative (July) ETF | 8.6% |
Pacer Swan SOS Flex (January) ETF | 6.5% |
Pacer Swan SOS Flex (July) ETF | 4.7% |
Pacer Swan SOS Flex (April) ETF | 4.0% |
Pacer Swan SOS Conservative (January) ETF | 3.9% |
| * | Percentages are stated as a percent of net assets. |
The Fund’s Investment Advisory Fee has been reduced from 0.18% to 0.12%, effective March 1, 2024. This is a summary of certain changes to the Fund since the beginning of the fiscal period. For more complete information, you may review the Fund’s next prospectus, which we expect to be available by February 28, 2025 at https://www.paceretfs.com/. You can also request this information by contacting us at 877-337-0500.
For additional information about the Fund; including its prospectus, financial information, holdings and proxy information, scan the QR code or visit https://www.paceretfs.com/.
HOUSEHOLDING
To reduce Fund expenses, only one copy of most shareholder documents may be mailed to shareholders with multiple accounts at the same address (Householding). If you would prefer that your Pacer Advisors, Inc. documents not be householded, please contact Pacer Advisors, Inc. at 877-337-0500, or contact your financial intermediary. Your instructions will typically be effective within 30 days of receipt by Pacer Advisors, Inc. or your financial intermediary.
| Pacer Swan SOS Fund of Funds ETF | PAGE 2 | TSR-AR-69374H568 |
1110110643117531412512503106771175916230
| | |
| Pacer Swan SOS Moderate (April) ETF | |
| PSMR (Principal U.S. Listing Exchange: CBOE) |
| Annual Shareholder Report | October 31, 2024 |
This annual shareholder report contains important information about the Pacer Swan SOS Moderate (April) ETF for the period of November 1, 2023, to October 31, 2024. You can find additional information about the Fund at https://www.paceretfs.com/. You can also request this information by contacting us at 877-337-0500
This report describes changes to the Fund that occurred during the reporting period.
WHAT WERE THE FUND COSTS FOR THE PAST YEAR? (based on a hypothetical $10,000 investment)
| | |
Fund Name | Costs of a $10,000 investment | Costs paid as a percentage of a $10,000 investment |
| Pacer Swan SOS Moderate (April) ETF | $70 | 0.64% |
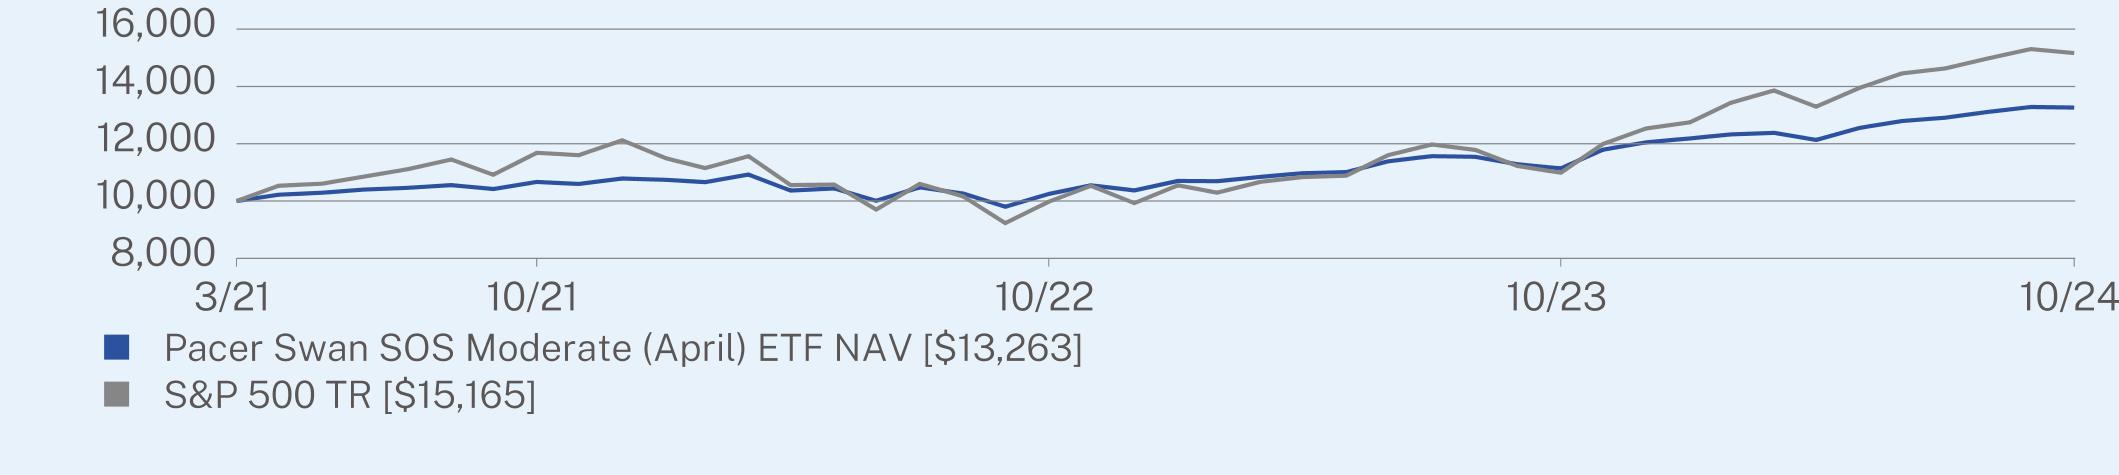
FACTORS INFLUENCING FUND PERFORMANCE
The Pacer Swan SOS fund performed as expected and intended in 2024. With the S&P 500 setting record high after record high throughout the course of the year, the fund maxed out its upside cap. Due to the ongoing bull market and a reduction in volatility, the upside caps available were less generous than they were a few years ago.
HOW DID THE FUND PERFORM SINCE INCEPTION?*
The $10,000 chart reflects a hypothetical $10,000 investment in the class of shares noted and assumes the maximum sales charge. The chart uses total return NAV performance and assumes reinvestment of dividends and capital gains. Fund expenses, including 12b-1 fees, management fees and other expenses were deducted.
CUMULATIVE PERFORMANCE (Initial Investment of $10,000)
ANNUAL AVERAGE TOTAL RETURN (%)
| | |
| | 1 Year | Since Inception
(03/31/2021) |
Pacer Swan SOS Moderate (April) ETF NAV | 19.06 | 8.19 |
S&P 500 TR | 38.02 | 12.31 |
Visit https://www.paceretfs.com/ for more recent performance information.
| * | The Fund’s past performance is not a good predictor of how the Fund will perform in the future. The graph and table do not reflect the deduction of taxes that a shareholder would pay on Fund distributions or redemption of Fund shares. |
| Pacer Swan SOS Moderate (April) ETF | PAGE 1 | TSR-AR-69374H519 |
KEY FUND STATISTICS (as of October 31, 2024)
| |
Net Assets | $71,072,548 |
Number of Holdings | 4 |
Net Advisory Fee | $374,361 |
Portfolio Turnover | 24% |
30-Day SEC Yield | (0.56)% |
30-Day SEC Yield Unsubsidized | (0.56)% |
Visit https://www.paceretfs.com/ for more recent performance information.
WHAT DID THE FUND INVEST IN? (as of October 31, 2024)*
| |
Security Type | (%) |
Purchased Options | 101.9% |
Written Options | -2.7% |
Cash & Other | 0.8% |
| |
Top 10 Securities | (%) |
SPDR S&P 500 ETF, Expiration: 03/31/2025; Exercise Price: $5.81 | 100.0% |
SPDR S&P 500 ETF, Expiration: 03/31/2025; Exercise Price: $523.12 | 1.8% |
SPDR S&P 500 ETF, Expiration: 03/31/2025; Exercise Price: $444.61 | -0.6% |
SPDR S&P 500 ETF, Expiration: 03/31/2025; Exercise Price: $600.38 | -2.1% |
| * | Percentages are stated as a percent of net assets. |
The Fund’s Investment Advisory Fee has been reduced from 0.75% to 0.60%, effective March 1, 2024. This is a summary of certain changes to the Fund since the beginning of the fiscal period. For more complete information, you may review the Fund’s next prospectus, which we expect to be available by February 28, 2025 at https://www.paceretfs.com/. You can also request this information by contacting us at 877-337-0500.
For additional information about the Fund; including its prospectus, financial information, holdings and proxy information, scan the QR code or visit https://www.paceretfs.com/.
HOUSEHOLDING
To reduce Fund expenses, only one copy of most shareholder documents may be mailed to shareholders with multiple accounts at the same address (Householding). If you would prefer that your Pacer Advisors, Inc. documents not be householded, please contact Pacer Advisors, Inc. at 877-337-0500, or contact your financial intermediary. Your instructions will typically be effective within 30 days of receipt by Pacer Advisors, Inc. or your financial intermediary.
| Pacer Swan SOS Moderate (April) ETF | PAGE 2 | TSR-AR-69374H519 |
106671024811140132631168399761098815165
| | |
| Pacer Swan SOS Moderate (January) ETF | |
| PSMD (Principal U.S. Listing Exchange: CBOE) |
| Annual Shareholder Report | October 31, 2024 |
This annual shareholder report contains important information about the Pacer Swan SOS Moderate (January) ETF for the period of November 1, 2023, to October 31, 2024. You can find additional information about the Fund at https://www.paceretfs.com/. You can also request this information by contacting us at 877-337-0500
This report describes changes to the Fund that occurred during the reporting period.
WHAT WERE THE FUND COSTS FOR THE PAST YEAR? (based on a hypothetical $10,000 investment)
| | |
Fund Name | Costs of a $10,000 investment | Costs paid as a percentage of a $10,000 investment |
| Pacer Swan SOS Moderate (January) ETF | $70 | 0.64% |
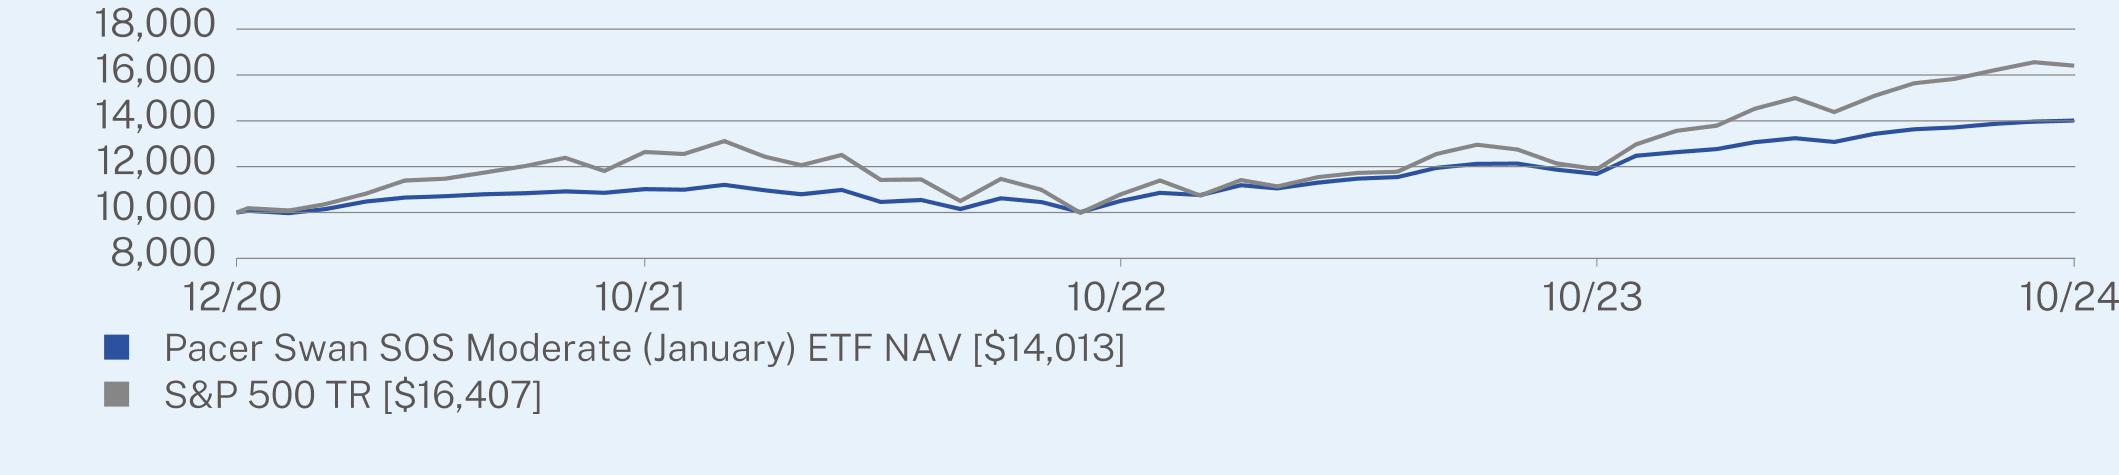
FACTORS INFLUENCING FUND PERFORMANCE
The Pacer Swan SOS fund performed as expected and intended in 2024. With the S&P 500 setting record high after record high throughout the course of the year, the fund maxed out its upside cap. Due to the ongoing bull market and a reduction in volatility, the upside caps available were less generous than they were a few years ago.
HOW DID THE FUND PERFORM SINCE INCEPTION?*
The $10,000 chart reflects a hypothetical $10,000 investment in the class of shares noted and assumes the maximum sales charge. The chart uses total return NAV performance and assumes reinvestment of dividends and capital gains. Fund expenses, including 12b-1 fees, management fees and other expenses were deducted.
CUMULATIVE PERFORMANCE (Initial Investment of $10,000)
ANNUAL AVERAGE TOTAL RETURN (%)
| | |
| | 1 Year | Since Inception
(12/22/2020) |
Pacer Swan SOS Moderate (January) ETF NAV | 19.93 | 9.14 |
S&P 500 TR | 38.02 | 13.70 |
Visit https://www.paceretfs.com/ for more recent performance information.
| * | The Fund’s past performance is not a good predictor of how the Fund will perform in the future. The graph and table do not reflect the deduction of taxes that a shareholder would pay on Fund distributions or redemption of Fund shares. |
| Pacer Swan SOS Moderate (January) ETF | PAGE 1 | TSR-AR-69374H550 |
KEY FUND STATISTICS (as of October 31, 2024)
| |
Net Assets | $68,101,982 |
Number of Holdings | 4 |
Net Advisory Fee | $405,300 |
Portfolio Turnover | 2% |
30-Day SEC Yield | (0.56)% |
30-Day SEC Yield Unsubsidized | (0.56)% |
Visit https://www.paceretfs.com/ for more recent performance information.
WHAT DID THE FUND INVEST IN? (as of October 31, 2024)*
| |
Security Type | (%) |
Purchased Options | 106.6% |
Written Options | -7.6% |
Cash & Other | 1.0% |
| |
Top 10 Securities | (%) |
SPDR S&P 500 ETF, Expiration: 12/31/2024; Exercise Price: $5.28 | 106.2% |
SPDR S&P 500 ETF, Expiration: 12/31/2024; Exercise Price: $475.36 | 0.4% |
SPDR S&P 500 ETF, Expiration: 12/31/2024; Exercise Price: $404.01 | -0.2% |
SPDR S&P 500 ETF, Expiration: 12/31/2024; Exercise Price: $540.19 | -7.4% |
| * | Percentages are stated as a percent of net assets. |
The Fund’s Investment Advisory Fee has been reduced from 0.75% to 0.60%, effective March 1, 2024. This is a summary of certain changes to the Fund since the beginning of the fiscal period. For more complete information, you may review the Fund’s next prospectus, which we expect to be available by February 28, 2025 at https://www.paceretfs.com/. You can also request this information by contacting us at 877-337-0500.
For additional information about the Fund; including its prospectus, financial information, holdings and proxy information, scan the QR code or visit https://www.paceretfs.com/.
HOUSEHOLDING
To reduce Fund expenses, only one copy of most shareholder documents may be mailed to shareholders with multiple accounts at the same address (Householding). If you would prefer that your Pacer Advisors, Inc. documents not be householded, please contact Pacer Advisors, Inc. at 877-337-0500, or contact your financial intermediary. Your instructions will typically be effective within 30 days of receipt by Pacer Advisors, Inc. or your financial intermediary.
| Pacer Swan SOS Moderate (January) ETF | PAGE 2 | TSR-AR-69374H550 |
1102010507116851401312640107931188816407
| | |
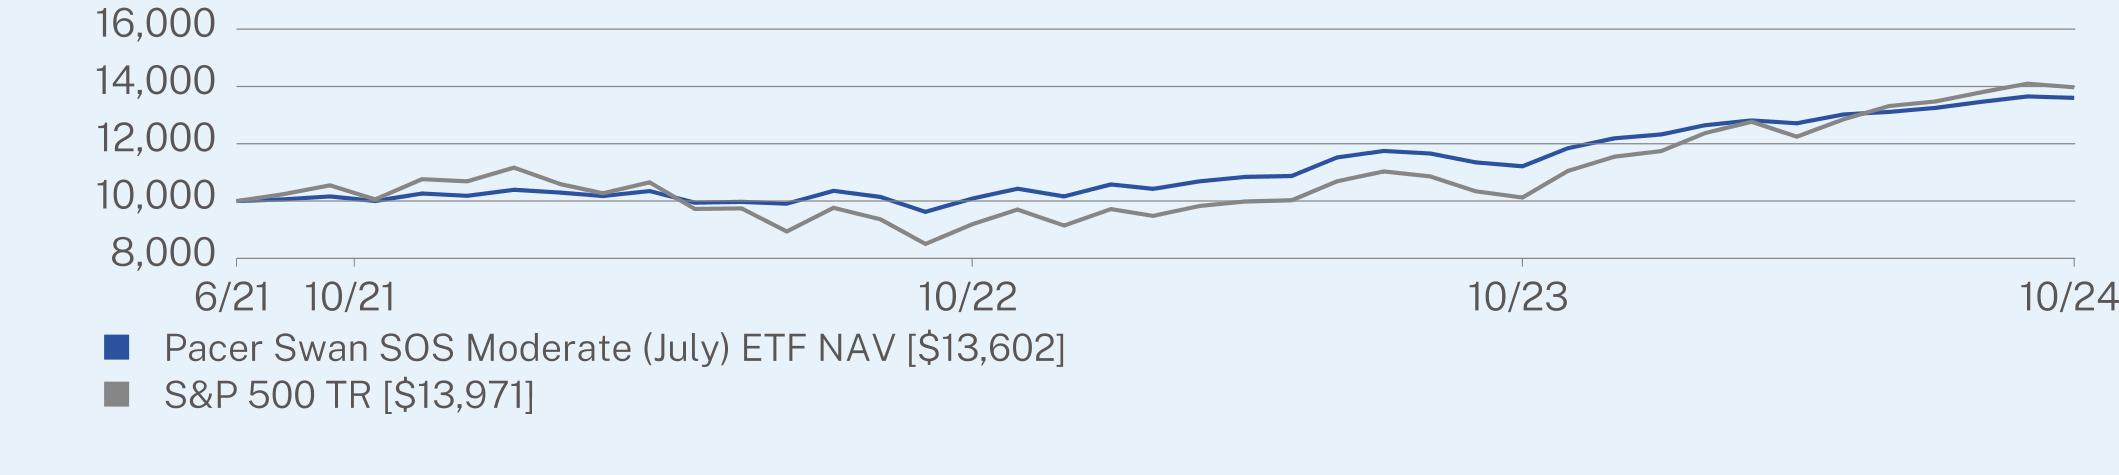
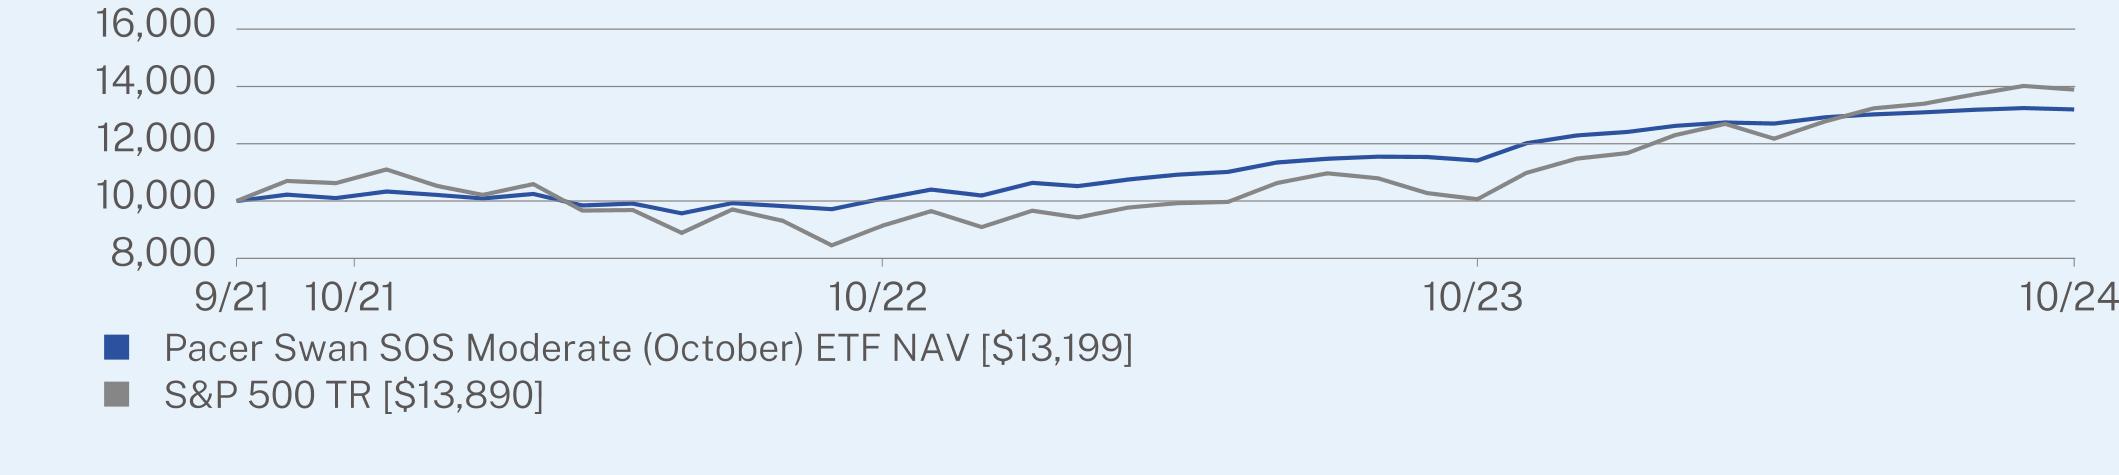
| Pacer Swan SOS Moderate (July) ETF | |
| PSMJ (Principal U.S. Listing Exchange: CBOE) |
| Annual Shareholder Report | October 31, 2024 |
This annual shareholder report contains important information about the Pacer Swan SOS Moderate (July) ETF for the period of November 1, 2023, to October 31, 2024. You can find additional information about the Fund at https://www.paceretfs.com/. You can also request this information by contacting us at 877-337-0500
This report describes changes to the Fund that occurred during the reporting period.
WHAT WERE THE FUND COSTS FOR THE PAST YEAR? (based on a hypothetical $10,000 investment)
| | |
Fund Name | Costs of a $10,000 investment | Costs paid as a percentage of a $10,000 investment |
| Pacer Swan SOS Moderate (July) ETF | $72 | 0.65% |
FACTORS INFLUENCING FUND PERFORMANCE
The Pacer Swan SOS fund performed as expected and intended in 2024. With the S&P 500 setting record high after record high throughout the course of the year, the fund maxed out its upside cap. Due to the ongoing bull market and a reduction in volatility, the upside caps available were less generous than they were a few years ago.
HOW DID THE FUND PERFORM SINCE INCEPTION?*
The $10,000 chart reflects a hypothetical $10,000 investment in the class of shares noted and assumes the maximum sales charge. The chart uses total return NAV performance and assumes reinvestment of dividends and capital gains. Fund expenses, including 12b-1 fees, management fees and other expenses were deducted.
CUMULATIVE PERFORMANCE (Initial Investment of $10,000)
ANNUAL AVERAGE TOTAL RETURN (%)
| | |
| | 1 Year | Since Inception
(06/30/2021) |
Pacer Swan SOS Moderate (July) ETF NAV | 21.30 | 9.66 |
S&P 500 TR | 38.02 | 10.54 |
Visit https://www.paceretfs.com/ for more recent performance information.
| * | The Fund’s past performance is not a good predictor of how the Fund will perform in the future. The graph and table do not reflect the deduction of taxes that a shareholder would pay on Fund distributions or redemption of Fund shares. |
| Pacer Swan SOS Moderate (July) ETF | PAGE 1 | TSR-AR-69374H493 |
KEY FUND STATISTICS (as of October 31, 2024)
| |
Net Assets | $78,679,700 |
Number of Holdings | 4 |
Net Advisory Fee | $405,424 |
Portfolio Turnover | 0% |
30-Day SEC Yield | (0.56)% |
30-Day SEC Yield Unsubsidized | (0.56)% |
Visit https://www.paceretfs.com/ for more recent performance information.
WHAT DID THE FUND INVEST IN? (as of October 31, 2024)*
| |
Security Type | (%) |
Purchased Options | 102.3% |
Written Options | -3.3% |
Cash & Other | 1.0% |
| |
Top 10 Securities | (%) |
SPDR S&P 500 ETF, Expiration: 06/30/2025; Exercise Price: $6.04 | 99.1% |
SPDR S&P 500 ETF, Expiration: 06/30/2025; Exercise Price: $544.27 | 3.2% |
SPDR S&P 500 ETF, Expiration: 06/30/2025; Exercise Price: $462.59 | -1.2% |
SPDR S&P 500 ETF, Expiration: 06/30/2025; Exercise Price: $619.54 | -2.1% |
| * | Percentages are stated as a percent of net assets. |
The Fund’s Investment Advisory Fee has been reduced from 0.75% to 0.60%, effective March 1, 2024. This is a summary of certain changes to the Fund since the beginning of the fiscal period. For more complete information, you may review the Fund’s next prospectus, which we expect to be available by February 28, 2025 at https://www.paceretfs.com/. You can also request this information by contacting us at 877-337-0500.
For additional information about the Fund; including its prospectus, financial information, holdings and proxy information, scan the QR code or visit https://www.paceretfs.com/.
HOUSEHOLDING
To reduce Fund expenses, only one copy of most shareholder documents may be mailed to shareholders with multiple accounts at the same address (Householding). If you would prefer that your Pacer Advisors, Inc. documents not be householded, please contact Pacer Advisors, Inc. at 877-337-0500, or contact your financial intermediary. Your instructions will typically be effective within 30 days of receipt by Pacer Advisors, Inc. or your financial intermediary.
| Pacer Swan SOS Moderate (July) ETF | PAGE 2 | TSR-AR-69374H493 |
102631008511213136021076391901012213971
| | |
| Pacer Swan SOS Moderate (October) ETF | |
| PSMO (Principal U.S. Listing Exchange: CBOE) |
| Annual Shareholder Report | October 31, 2024 |
This annual shareholder report contains important information about the Pacer Swan SOS Moderate (October) ETF for the period of November 1, 2023, to October 31, 2024. You can find additional information about the Fund at https://www.paceretfs.com/. You can also request this information by contacting us at 877-337-0500
This report describes changes to the Fund that occurred during the reporting period.
WHAT WERE THE FUND COSTS FOR THE PAST YEAR? (based on a hypothetical $10,000 investment)
| | |
Fund Name | Costs of a $10,000 investment | Costs paid as a percentage of a $10,000 investment |
| Pacer Swan SOS Moderate (October) ETF | $70 | 0.65% |
FACTORS INFLUENCING FUND PERFORMANCE
The Pacer Swan SOS fund performed as expected and intended in 2024. With the S&P 500 setting record high after record high throughout the course of the year, the fund maxed out its upside cap. Due to the ongoing bull market and a reduction in volatility, the upside caps available were less generous than they were a few years ago.
HOW DID THE FUND PERFORM SINCE INCEPTION?*
The $10,000 chart reflects a hypothetical $10,000 investment in the class of shares noted and assumes the maximum sales charge. The chart uses total return NAV performance and assumes reinvestment of dividends and capital gains. Fund expenses, including 12b-1 fees, management fees and other expenses were deducted.
CUMULATIVE PERFORMANCE (Initial Investment of $10,000)
ANNUAL AVERAGE TOTAL RETURN (%)
| | |
| | 1 Year | Since Inception
(09/30/2021) |
Pacer Swan SOS Moderate (October) ETF NAV | 15.64 | 9.42 |
S&P 500 TR | 38.02 | 11.24 |
Visit https://www.paceretfs.com/ for more recent performance information.
| * | The Fund’s past performance is not a good predictor of how the Fund will perform in the future. The graph and table do not reflect the deduction of taxes that a shareholder would pay on Fund distributions or redemption of Fund shares. |
| Pacer Swan SOS Moderate (October) ETF | PAGE 1 | TSR-AR-69374H485 |
KEY FUND STATISTICS (as of October 31, 2024)
| |
Net Assets | $65,649,108 |
Number of Holdings | 4 |
Net Advisory Fee | $285,159 |
Portfolio Turnover | 0% |
30-Day SEC Yield | (0.55)% |
30-Day SEC Yield Unsubsidized | (0.55)% |
Visit https://www.paceretfs.com/ for more recent performance information.
WHAT DID THE FUND INVEST IN? (as of October 31, 2024)*
| |
Security Type | (%) |
Purchased Options | 103.2% |
Written Options | -4.0% |
Cash & Other | 0.8% |
| |
Top 10 Securities | (%) |
SPDR S&P 500 ETF, Expiration: 09/30/2025; Exercise Price: $6.37 | 98.1% |
SPDR S&P 500 ETF, Expiration: 09/30/2025; Exercise Price: $573.82 | 5.1% |
SPDR S&P 500 ETF, Expiration: 09/30/2025; Exercise Price: $640.55 | -1.9% |
SPDR S&P 500 ETF, Expiration: 09/30/2025; Exercise Price: $487.70 | -2.1% |
| * | Percentages are stated as a percent of net assets. |
The Fund’s Investment Advisory Fee has been reduced from 0.75% to 0.60%, effective March 1, 2024. This is a summary of certain changes to the Fund since the beginning of the fiscal period. For more complete information, you may review the Fund’s next prospectus, which we expect to be available by February 28, 2025 at https://www.paceretfs.com/. You can also request this information by contacting us at 877-337-0500.
For additional information about the Fund; including its prospectus, financial information, holdings and proxy information, scan the QR code or visit https://www.paceretfs.com/.
HOUSEHOLDING
To reduce Fund expenses, only one copy of most shareholder documents may be mailed to shareholders with multiple accounts at the same address (Householding). If you would prefer that your Pacer Advisors, Inc. documents not be householded, please contact Pacer Advisors, Inc. at 877-337-0500, or contact your financial intermediary. Your instructions will typically be effective within 30 days of receipt by Pacer Advisors, Inc. or your financial intermediary.
| Pacer Swan SOS Moderate (October) ETF | PAGE 2 | TSR-AR-69374H485 |
102241008111414131991070191371006413890
Item 2. Code of Ethics.
The registrant has adopted a code of ethics that applies to the registrant’s principal executive officer and principal financial officer. The registrant has not made any substantive amendments to its code of ethics during the period covered by this report. The registrant has not granted any waivers from any provisions of the code of ethics during the period covered by this report.
| (1) | A copy of the registrant’s Code of Ethics is filed herewith. |
Item 3. Audit Committee Financial Expert.
The registrant’s board of trustees has determined that there is at least one audit committee financial expert serving on its audit committee. Deborah Wolk is the “audit committee financial expert” and is considered to be “independent” as each term is defined in Item 3 of Form N-CSR.
Item 4. Principal Accountant Fees and Services.
The registrant has engaged its principal accountant to perform audit services, audit-related services, tax services and other services during the past two fiscal years. “Audit services” refer to performing an audit of the registrant's annual financial statements or services that are normally provided by the accountant in connection with statutory and regulatory filings or engagements for those fiscal years. “Audit-related services” refer to the assurance and related services by the principal accountant that are reasonably related to the performance of the audit. “Tax services” refer to professional services rendered by the principal accountant for tax compliance, tax advice, and tax planning. “Other services” refer to services not covered within the other services. The following table details the aggregate fees billed or expected to be billed for each of the last two fiscal years for audit fees, audit-related fees, tax fees and other fees by the principal accountant.
| | FYE 10/31/2024 | FYE 10/31/2023 |
| (a) Audit Fees | $157,700 | $145,800 |
| (b) Audit-Related Fees | $0 | $0 |
| (c) Tax Fees | $22,800 | $18,000 |
| (d) All Other Fees | $0 | $0 |
(e)(1) The audit committee has adopted pre-approval policies and procedures that require the audit committee to pre-approve all audit and non-audit services of the registrant, including services provided to any entity affiliated with the registrant.
(e)(2) The percentage of fees billed by Sanville & Company applicable to non-audit services pursuant to waiver of pre-approval requirement were as follows:
| | FYE 10/31/2024 | FYE 10/31/2023 |
| Audit-Related Fees | 0% | 0% |
| Tax Fees | 0% | 0% |
| All Other Fees | 0% | 0% |
(f) N/A
(g) The following table indicates the non-audit fees billed or expected to be billed by the registrant’s accountant for services to the registrant and to the registrant’s investment adviser (and any other controlling entity, etc.—not sub-adviser) for the last two years.
| Non-Audit Related Fees | FYE 10/31/2024 | FYE 10/31/2023 |
| Registrant | $0 | $0 |
| Registrant’s Investment Adviser | $0 | $0 |
(h) The audit committee of the board of trustees/directors has considered whether the provision of non-audit services that were rendered to the registrant's investment adviser is compatible with maintaining the principal accountant's independence and has concluded that the provision of such non-audit services by the accountant has not compromised the accountant’s independence.
(i) Not applicable
Item 5. Audit Committee of Listed Registrants.
(a) The registrant is an issuer as defined in Rule 10A-3 under the Securities Exchange Act of 1934, (the “Act”) and has a separately-designated standing audit committee established in accordance with Section 3(a)(58)(A) of the Act. The independent members of the are as follows: Jane Sagendorph, Colin Lake and Deborah Wolk.
(b) Not applicable
Item 6. Investments.
| (a) | Schedule of Investments is included within the financial statements filed under Item 7 of this Form. |
Item 7. Financial Statements and Financial Highlights for Open-End Investment Companies.
Pacer Funds
Pacer American Energy Independence ETF Ticker: USAI
Pacer BlueStar Digital Entertainment ETF Ticker: ODDS
Pacer Bluestar Engineering the Future ETF Ticker: BULD
Pacer Developed Markets Cash Cows Growth Leaders ETF Ticker: EAFG
Pacer Metaurus Nasdaq-100 Dividend Multiplier 600 ETF Ticker: QSIX
Pacer Metaurus US Large Cap Target Dividend Multiplier 400 ETF Ticker: QDPL
Pacer Swan SOS Conservative (April) ETF Ticker: PSCW
Pacer Swan SOS Conservative (January) ETF Ticker: PSCX
Pacer Swan SOS Conservative (July) ETF Ticker: PSCJ
Pacer Swan SOS Conservative (October) ETF Ticker: PSCQ
Pacer Swan SOS Flex (April) ETF Ticker: PSFM
Pacer Swan SOS Flex (January) ETF Ticker: PSFD
Pacer Swan SOS Flex (July) ETF Ticker: PSFJ
Pacer Swan SOS Flex (October) ETF Ticker: PSFO
Pacer Swan SOS Fund of Funds ETF Ticker: PSFF
Pacer Swan SOS Moderate (April) ETF Ticker: PSMR
Pacer Swan SOS Moderate (January) ETF Ticker: PSMD
Pacer Swan SOS Moderate (July) ETF Ticker: PSMJ
Pacer Swan SOS Moderate (October) ETF Ticker: PSMO
Core Financial Statements
October 31, 2024
TABLE OF CONTENTS
Pacer American Energy Independence ETF
Schedule of Investments
October 31, 2024
| | | | | | | |
COMMON STOCKS - 99.6%
| | | | | | |
Energy - 99.6%(a)
| | | | | | |
Antero Midstream Corp. | | | 112,702 | | | $1,619,528 |
Archrock, Inc. | | | 71,792 | | | 1,437,276 |
Cheniere Energy, Inc. | | | 14,344 | | | 2,745,155 |
DT Midstream, Inc.(b) | | | 25,218 | | | 2,273,403 |
Enbridge, Inc. | | | 109,019 | | | 4,403,511 |
Energy Transfer LP | | | 272,663 | | | 4,493,486 |
EnLink Midstream LLC | | | 103,941 | | | 1,542,484 |
Enterprise Products Partners LP | | | 88,348 | | | 2,532,054 |
Excelerate Energy, Inc. - Class A | | | 54,578 | | | 1,303,323 |
Genesis Energy LP | | | 76,808 | | | 868,698 |
Gibson Energy, Inc. | | | 84,914 | | | 1,408,779 |
Hess Midstream LP - Class A | | | 41,240 | | | 1,428,966 |
Keyera Corp. | | | 62,481 | | | 1,918,833 |
Kinder Morgan, Inc.(b) | | | 202,770 | | | 4,969,893 |
Kinetik Holdings, Inc.(b) | | | 28,288 | | | 1,376,777 |
Kodiak Gas Services, Inc.(b) | | | 39,369 | | | 1,255,084 |
MPLX LP | | | 58,075 | | | 2,579,692 |
New Fortress Energy, Inc.(b) | | | 123,052 | | | 1,034,867 |
NextDecade Corp.(b)(c) | | | 248,167 | | | 1,449,295 |
ONEOK, Inc. | | | 47,028 | | | 4,556,073 |
Pembina Pipeline Corp. | | | 63,807 | | | 2,669,413 |
Plains GP Holdings LP - Class A | | | 80,526 | | | 1,385,047 |
Targa Resources Corp. | | | 16,950 | | | 2,829,972 |
TC Energy Corp. | | | 105,040 | | | 4,885,546 |
Western Midstream Partners LP | | | 41,730 | | | 1,574,473 |
Williams Cos., Inc. | | | 97,392 | | | 5,100,419 |
| | | | | | 63,642,047 |
TOTAL COMMON STOCKS
(Cost $43,074,673) | | | | | | 63,642,047 |
| | | Units | | | |
INVESTMENTS PURCHASED WITH PROCEEDS FROM SECURITIES LENDING - 16.2%
| | | | | | |
Mount Vernon Liquid Assets Portfolio, LLC, 5.00%(d) | | | 10,336,726 | | | 10,336,726 |
TOTAL INVESTMENTS PURCHASED WITH SECURITIES LENDING
(Cost $10,336,726) | | | | | | 10,336,726 |
TOTAL INVESTMENTS - 115.8%
(Cost $53,411,399) | | | | | | $73,978,773 |
Liabilities in Excess of Other
Assets - (15.8)% | | | | | | (10,073,099) |
TOTAL NET ASSETS - 100.0% | | | | | | $63,905,674 |
| | | | | | | |
Percentages are stated as a percent of net assets.
The Global Industry Classification Standard (“GICS®”) was developed by and/or is the exclusive property of MSCI, Inc. (“MSCI”) and Standard & Poor’s Financial Services LLC (“S&P”). GICS® is a service mark of MSCI and S&P and has been licensed for use by U.S. Bank Global Fund Services.
(a)
| To the extent that the Fund invests more heavily in a particular industry or sector of the economy, its performance will be especially sensitive to developments that significantly affect those industries or sectors. |
(b)
| All or a portion of this security is on loan as of October 31, 2024. The total market value of these securities was $9,968,392 which represented 15.6% of net assets. |
(c)
| Non-income producing security. |
(d)
| The rate shown represents the 7-day annualized effective yield as of October 31, 2024. |
The accompanying notes are an integral part of these financial statements.
TABLE OF CONTENTS
Pacer BlueStar Digital Entertainment ETF
Schedule of Investments
October 31, 2024
| | | | | | | |
COMMON STOCKS - 98.7%
|
Communication Services - 37.8%(a)
| |
Better Collective AS(b) | | | 610 | | | $7,970 |
Capcom Co. Ltd. | | | 615 | | | 12,362 |
CD Projekt SA | | | 270 | | | 10,828 |
Electronic Arts, Inc. | | | 175 | | | 26,399 |
Embracer Group AB - Class A(b) | | | 4,693 | | | 13,469 |
Kingsoft Corp. Ltd. | | | 4,026 | | | 13,930 |
Konami Group Corp. | | | 142 | | | 13,135 |
Krafton, Inc.(b) | | | 57 | | | 13,672 |
NCSoft Corp. | | | 82 | | | 12,924 |
NetEase, Inc. - ADR | | | 351 | | | 28,259 |
Nexon Co. Ltd. | | | 655 | | | 11,522 |
Nintendo Co. Ltd. | | | 547 | | | 29,249 |
Pearl Abyss Corp.(b) | | | 405 | | | 11,358 |
Roblox Corp. - Class A(b) | | | 517 | | | 26,739 |
Skillz, Inc.(b) | | | 826 | | | 4,766 |
Square Enix Holdings Co. Ltd. | | | 290 | | | 11,370 |
Take-Two Interactive Software, Inc.(b) | | | 131 | | | 21,185 |
Tencent Holdings Ltd. | | | 1,574 | | | 81,915 |
Ubisoft Entertainment SA(b) | | | 782 | | | 11,576 |
| | | | | | 362,628 |
Consumer Discretionary - 51.1%(a)
|
Aristocrat Leisure Ltd. | | | 572 | | | 23,049 |
Bally’s Corp.(b) | | | 599 | | | 10,453 |
Bandai Namco Holdings, Inc. | | | 740 | | | 15,653 |
Betsson AB | | | 1,338 | | | 17,721 |
DraftKings, Inc.(b) | | | 1,944 | | | 68,662 |
Entain PLC | | | 3,121 | | | 29,893 |
Everi Holdings, Inc.(b) | | | 981 | | | 13,077 |
Evoke PLC(b) | | | 11,220 | | | 8,893 |
Evolution AB(c) | | | 772 | | | 72,510 |
Flutter Entertainment PLC(b) | | | 340 | | | 79,288 |
GameStop Corp.(b) | | | 681 | | | 15,105 |
Jumbo Interactive Ltd. | | | 1,258 | | | 10,629 |
Kambi Group PLC(b) | | | 833 | | | 10,525 |
La Francaise des Jeux SAEM(c) | | | 890 | | | 37,837 |
Playtech PLC(b) | | | 2,693 | | | 25,136 |
PointsBet Holdings Ltd. | | | 13,509 | | | 6,990 |
Rank Group PLC | | | 2,836 | | | 3,209 |
Rush Street Interactive, Inc.(b) | | | 1,189 | | | 12,865 |
Sportradar Group AG(b) | | | 1,197 | | | 14,855 |
Super Group SGHC Ltd. | | | 3,410 | | | 13,981 |
| | | | | | 490,331 |
| | | | | | | |
| | | | | | | |
Information Technology - 9.8%
|
Advanced Micro Devices, Inc.(b) | | | 187 | | | $26,941 |
AppLovin Corp. - Class A(b) | | | 236 | | | 39,976 |
Micro-Star International Co. Ltd. | | | 2,267 | | | 12,595 |
Unity Software, Inc.(b) | | | 747 | | | 15,000 |
| | | | | | 94,512 |
TOTAL COMMON STOCKS
(Cost $871,253) | | | | | | 947,471 |
TOTAL INVESTMENTS - 98.7%
(Cost $871,253) | | | | | | $947,471 |
Other Assets in Excess of
Liabilities - 1.3% | | | | | | 12,153 |
TOTAL NET ASSETS - 100.0% | | | | | | $959,624 |
| | | | | | | |
Percentages are stated as a percent of net assets.
The Global Industry Classification Standard (“GICS®”) was developed by and/or is the exclusive property of MSCI, Inc. (“MSCI”) and Standard & Poor’s Financial Services LLC (“S&P”). GICS® is a service mark of MSCI and S&P and has been licensed for use by U.S. Bank Global Fund Services.
AB - Aktiebolag
ADR - American Depositary Receipt
AG - Aktiengesellschaft
AS - Aksjeselskap
PLC - Public Limited Company
SA - Sociedad Anónima
(a)
| To the extent that the Fund invests more heavily in a particular industry or sector of the economy, its performance will be especially sensitive to developments that significantly affect those industries or sectors. |
(b)
| Non-income producing security. |
(c)
| Security is exempt from registration pursuant to Rule 144A under the Securities Act of 1933, as amended. These securities may only be resold in transactions exempt from registration to qualified institutional investors. As of October 31, 2024, the value of these securities total $110,347 or 11.5% of the Fund’s net assets. |
The accompanying notes are an integral part of these financial statements.
TABLE OF CONTENTS
Pacer BlueStar Engineering the Future ETF
Schedule of Investments
October 31, 2024
| | | | | | | |
COMMON STOCKS - 99.9%
| | | | | | |
Consumer Discretionary - 1.5%
| | | | | | |
Denso Corp. | | | 817 | | | $11,891 |
Health Care - 1.0%
|
BICO Group AB (a) | | | 2,258 | | | 8,087 |
Industrials - 24.6%
|
3D Systems Corp.(a) | | | 9,031 | | | 27,093 |
Amada Co. Ltd. | | | 218 | | | 2,171 |
Andritz AG | | | 45 | | | 2,704 |
ATS Corp.(a) | | | 63 | | | 1,888 |
AutoStore Holdings Ltd.(a)(b) | | | 1,268 | | | 1,149 |
Daifuku Co. Ltd. | | | 164 | | | 3,156 |
Emerson Electric Co. | | | 182 | | | 19,705 |
FANUC Corp. | | | 287 | | | 7,757 |
Konecranes Oyj | | | 46 | | | 3,164 |
Lincoln Electric Holdings, Inc. | | | 23 | | | 4,429 |
Proto Labs, Inc.(a) | | | 1,287 | | | 35,264 |
Rockwell Automation, Inc. | | | 37 | | | 9,868 |
Siemens AG | | | 253 | | | 49,001 |
Stratasys Ltd.(a) | | | 4,485 | | | 32,068 |
Yaskawa Electric Corp. | | | 87 | | | 2,544 |
| | | | | | 201,961 |
Information Technology - 72.8%(c)
|
Advantest Corp. | | | 196 | | | 11,771 |
Altair Engineering, Inc. - Class A(a) | | | 57 | | | 5,927 |
Ambarella, Inc.(a) | | | 34 | | | 1,910 |
Ansys, Inc.(a) | | | 123 | | | 39,410 |
Applied Materials, Inc. | | | 228 | | | 41,400 |
ASM International NV | | | 16 | | | 8,897 |
ASML Holding NV | | | 70 | | | 47,079 |
ASMPT Ltd. | | | 179 | | | 1,954 |
Autodesk, Inc.(a) | | | 324 | | | 91,951 |
Axcelis Technologies, Inc.(a) | | | 18 | | | 1,536 |
Azbil Corp. | | | 296 | | | 2,334 |
BE Semiconductor Industries NV | | | 32 | | | 3,403 |
Bentley Systems, Inc. - Class B | | | 319 | | | 15,395 |
Camtek Ltd. | | | 20 | | | 1,591 |
Cognex Corp. | | | 76 | | | 3,058 |
Dassault Systemes SE | | | 1,342 | | | 45,835 |
Disco Corp. | | | 28 | | | 8,174 |
FARO Technologies, Inc.(a) | | | 1,596 | | | 27,994 |
Keyence Corp. | | | 70 | | | 32,067 |
KLA Corp. | | | 41 | | | 27,315 |
Kulicke & Soffa Industries, Inc. | | | 41 | | | 1,839 |
Lam Research Corp. | | | 390 | | | 28,997 |
Lasertec Corp. | | | 27 | | | 4,161 |
Materialise NV - ADR(a) | | | 648 | | | 3,830 |
Nano Dimension Ltd. - ADR(a) | | | 11,957 | | | 25,947 |
Nemetschek SE | | | 104 | | | 11,229 |
Nova Ltd.(a) | | | 12 | | | 2,224 |
Omron Corp. | | | 92 | | | 3,684 |
| | | | | | | |
| | | | | | | |
Onto Innovation, Inc.(a) | | | 18 | | | $3,570 |
PTC, Inc.(a) | | | 155 | | | 28,726 |
Renishaw PLC | | | 863 | | | 34,950 |
SCREEN Holdings Co. Ltd. | | | 38 | | | 2,502 |
Teledyne Technologies, Inc.(a) | | | 14 | | | 6,374 |
Teradyne, Inc. | | | 49 | | | 5,204 |
Tokyo Electron Ltd. | | | 97 | | | 14,901 |
Tokyo Seimitsu Co. Ltd. | | | 27 | | | 1,510 |
| | | | | | 598,649 |
TOTAL COMMON STOCKS
(Cost $836,300) | | | | | | 820,588 |
TOTAL INVESTMENTS - 99.9%
(Cost $836,300) | | | | | | $820,588 |
Other Assets in Excess of
Liabilities - 0.1% | | | | | | 1,370 |
TOTAL NET ASSETS - 100.0% | | | | | | $821,958 |
| | | | | | | |
Percentages are stated as a percent of net assets.
The Global Industry Classification Standard (“GICS®”) was developed by and/or is the exclusive property of MSCI, Inc. (“MSCI”) and Standard & Poor’s Financial Services LLC (“S&P”). GICS® is a service mark of MSCI and S&P and has been licensed for use by U.S. Bank Global Fund Services.
AB - Aktiebolag
ADR - American Depositary Receipt
AG - Aktiengesellschaft
NV - Naamloze Vennootschap
OYJ - Julkinen Asakeyhtio
PLC - Public Limited Company
SE - Societas Europeae
(a)
| Non-income producing security. |
(b)
| Security is exempt from registration pursuant to Rule 144A under the Securities Act of 1933, as amended. These securities may only be resold in transactions exempt from registration to qualified institutional investors. As of October 31, 2024, the value of these securities total $1,149 or 0.1% of the Fund’s net assets. |
(c)
| To the extent that the Fund invests more heavily in a particular industry or sector of the economy, its performance will be especially sensitive to developments that significantly affect those industries or sectors. |
The accompanying notes are an integral part of these financial statements.
TABLE OF CONTENTS
Pacer Developed Markets Cash Cows Growth Leaders ETF
Schedule of Investments
October 31, 2024
| | | | | | | |
COMMON STOCKS - 99.3%
| | | | | | |
Australia - 12.0%
|
Aristocrat Leisure Ltd. | | | 197 | | | $7,976 |
BHP Billiton Ltd. | | | 95 | | | 2,666 |
CAR Group Ltd. | | | 157 | | | 3,903 |
Computershare Ltd. | | | 288 | | | 5,000 |
Fortescue Metals Group Ltd. | | | 126 | | | 1,589 |
Pro Medicus Ltd. | | | 132 | | | 16,925 |
REA Group Ltd. | | | 45 | | | 6,720 |
SEEK Ltd. | | | 138 | | | 2,265 |
Transurban Group | | | 364 | | | 3,045 |
WiseTech Global Ltd. | | | 112 | | | 8,718 |
| | | | | | 58,807 |
Belgium - 0.6%
|
Anheuser-Busch InBev SA/NV | | | 47 | | | 2,811 |
Denmark - 2.3%
|
Genmab A/S(a) | | | 10 | | | 2,237 |
Novo Nordisk AS | | | 46 | | | 5,119 |
Pandora A/S | | | 24 | | | 3,619 |
| | | | | | 10,975 |
Finland - 1.6%
|
Fortum Oyj | | | 542 | | | 7,977 |
France - 2.0%
|
Dassault Systemes SE | | | 45 | | | 1,540 |
Hermes International | | | 1 | | | 2,256 |
Legrand SA | | | 43 | | | 4,846 |
LVMH Moet Hennessy Louis
Vuitton SE | | | 2 | | | 1,326 |
| | | | | | 9,968 |
Germany - 2.8%
|
Deutsche Telekom AG | | | 230 | | | 6,960 |
SAP SE | | | 28 | | | 6,542 |
| | | | | | 13,502 |
Hong Kong - 2.2%
|
CLP Holdings Ltd. | | | 441 | | | 3,747 |
Galaxy Entertainment Group Ltd. | | | 347 | | | 1,542 |
Power Assets Holdings Ltd. | | | 849 | | | 5,652 |
| | | | | | 10,941 |
Ireland - 1.1%
|
Experian PLC | | | 109 | | | 5,309 |
Israel - 5.2%
|
Check Point Software Technologies Ltd.(a) | | | 36 | | | 6,236 |
CyberArk Software Ltd.(a) | | | 16 | | | 4,424 |
Monday.com Ltd.(a) | | | 27 | | | 7,934 |
Wix.com Ltd.(a) | | | 41 | | | 6,852 |
| | | | | | 25,446 |
Italy - 0.4%
|
Moncler SpA | | | 31 | | | 1,718 |
| | | | | | | |
| | | | | | | |
Japan - 30.9%(b)
|
Capcom Co. Ltd. | | | 179 | | | $3,607 |
Chugai Pharmaceutical Co. Ltd. | | | 178 | | | 8,599 |
Daiichi Sankyo Co. Ltd. | | | 205 | | | 6,720 |
Disco Corp. | | | 8 | | | 2,342 |
FANUC Corp. | | | 105 | | | 2,845 |
Fast Retailing Co. Ltd. | | | 15 | | | 4,889 |
Hoya Corp. | | | 31 | | | 4,229 |
Inpex Corp. | | | 335 | | | 4,439 |
Japan Tobacco, Inc. | | | 161 | | | 4,536 |
Kansai Electric Power Co., Inc. | | | 621 | | | 10,034 |
KDDI Corp. | | | 137 | | | 4,308 |
Keyence Corp. | | | 7 | | | 3,215 |
Konami Holdings Corp. | | | 107 | | | 9,923 |
M3, Inc. | | | 123 | | | 1,284 |
Makita Corp. | | | 258 | | | 8,580 |
Murata Manufacturing Co. Ltd. | | | 159 | | | 2,833 |
Nexon Co. Ltd. | | | 366 | | | 6,455 |
Nintendo Co. Ltd. | | | 45 | | | 2,412 |
Obic Co. Ltd. | | | 135 | | | 4,435 |
Ono Pharmaceutical Co. Ltd. | | | 137 | | | 1,724 |
Oriental Land Co. Ltd. | | | 53 | | | 1,292 |
Recruit Holdings Co. Ltd. | | | 247 | | | 15,497 |
Renesas Electronics Corp. | | | 231 | | | 3,208 |
Shimano, Inc. | | | 55 | | | 8,241 |
Shin-Etsu Chemical Co. Ltd. | | | 79 | | | 2,992 |
Shionogi & Co. Ltd. | | | 144 | | | 2,075 |
Sony Group Corp. | | | 275 | | | 4,929 |
Tokyo Electron Ltd. | | | 9 | | | 1,386 |
Z Holdings Corp. | | | 981 | | | 2,708 |
ZOZO, Inc. | | | 345 | | | 11,287 |
| | | | | | 151,024 |
Luxembourg - 0.4%
|
Tenaris SA | | | 114 | | | 1,878 |
Macau - 0.3%
|
Sands China Ltd.(a) | | | 653 | | | 1,665 |
Netherlands - 4.9%
|
ASM International NV | | | 8 | | | 4,457 |
BE Semiconductor Industries NV | | | 11 | | | 1,172 |
Koninklijke KPN NV | | | 1,165 | | | 4,553 |
Prosus NV | | | 231 | | | 9,735 |
Wolters Kluwer NV | | | 24 | | | 4,039 |
| | | | | | 23,956 |
New Zealand - 1.3%
|
Xero Ltd.(a) | | | 63 | | | 6,198 |
Singapore - 2.7%
|
Singapore Airlines Ltd. | | | 577 | | | 2,823 |
Singapore Telecommunications Ltd. | | | 4,425 | | | 10,488 |
| | | | | | 13,311 |
| | | | | | | |
The accompanying notes are an integral part of these financial statements.
TABLE OF CONTENTS
Pacer Developed Markets Cash Cows Growth Leaders ETF
Schedule of Investments
October 31, 2024(Continued)
| | | | | | | |
COMMON STOCKS - (Continued)
|
Spain - 3.7%
|
Aena SME SA(c) | | | 18 | | | $3,975 |
Amadeus IT Holding SA | | | 81 | | | 5,868 |
Industria de Diseno Textil SA | | | 140 | | | 7,964 |
| | | | | | 17,807 |
Sweden - 4.9%
|
Atlas Copco AB - Class A | | | 201 | | | 3,309 |
Evolution AB(c) | | | 16 | | | 1,509 |
Hexagon AB - Class B | | | 193 | | | 1,804 |
Tele2 AB - Class B | | | 888 | | | 9,305 |
Telia Co. AB | | | 2,795 | | | 8,122 |
| | | | | | 24,049 |
Switzerland - 8.8%
|
Cie Financiere Richemont SA | | | 19 | | | 2,758 |
Geberit AG | | | 7 | | | 4,384 |
Givaudan SA | | | 1 | | | 4,744 |
Logitech International SA | | | 36 | | | 2,950 |
Novartis AG | | | 54 | | | 5,865 |
Roche Holding AG | | | 26 | | | 8,066 |
Sonova Holding AG | | | 14 | | | 5,110 |
Swisscom AG | | | 7 | | | 4,264 |
Temenos AG | | | 31 | | | 2,145 |
VAT Group AG(c) | | | 7 | | | 2,914 |
| | | | | | 43,200 |
United Kingdom - 11.2%
|
AstraZeneca PLC | | | 64 | | | 9,112 |
Auto Trader Group PLC(c) | | | 586 | | | 6,341 |
British American Tobacco PLC | | | 208 | | | 7,228 |
GSK PLC | | | 147 | | | 2,640 |
Halma PLC | | | 189 | | | 6,032 |
Informa PLC | | | 349 | | | 3,639 |
Next PLC | | | 63 | | | 7,953 |
Reckitt Benckiser Group PLC | | | 34 | | | 2,054 |
RELX PLC | | | 79 | | | 3,626 |
Sage Group PLC | | | 133 | | | 1,663 |
Vodafone Group PLC | | | 4,877 | | | 4,529 |
| | | | | | 54,817 |
TOTAL COMMON STOCKS
(Cost $481,381) | | | | | | 485,359 |
| | | | | | | |
| | | | | | | |
PREFERRED STOCKS - 0.3%
| | | | | | |
Germany - 0.3%
| | | | | | |
Porsche Automobil Holding SE | | | 39 | | | $1,617 |
TOTAL PREFERRED STOCKS
(Cost $2,077) | | | | | | 1,617 |
TOTAL INVESTMENTS - 99.6%
(Cost $483,458) | | | | | | $486,976 |
Other Assets in Excess of
Liabilities - 0.4% | | | | | | 1,820 |
TOTAL NET ASSETS - 100.0% | | | | | | $488,796 |
| | | | | | | |
Percentages are stated as a percent of net assets.
AG - Aktiengesellschaft
AB - Aktiebolag
NV - Naamloze Vennootschap
PLC - Public Limited Company
SA - Sociedad Anónima
SA/NV - Societe Anonime/Naamloze Vennootschap
(a)
| Non-income producing security. |
(b)
| To the extent that the Fund invests a significant portion of its assets in the securities of companies of a single country or region, it is more likely to be impacted by events or conditions affecting the country or region. |
(c)
| Security is exempt from registration pursuant to Rule 144A under the Securities Act of 1933, as amended. These securities may only be resold in transactions exempt from registration to qualified institutional investors. As of October 31, 2024, the value of these securities total $14,739 or 3.0% of the Fund’s net assets.
|
The accompanying notes are an integral part of these financial statements.
TABLE OF CONTENTS
Pacer Metaurus Nasdaq-100 Dividend Multiplier 600 ETF
Schedule of Investments
October 31, 2024
| | | | | | | |
COMMON STOCKS - 89.9%
| | | | | | |
Communication Services - 14.7%
|
Alphabet, Inc. - Class A | | | 864 | | | $147,839 |
Alphabet, Inc. - Class C | | | 824 | | | 142,297 |
Charter Communications, Inc. - Class A(a) | | | 56 | | | 18,346 |
Comcast Corp. - Class A | | | 1,476 | | | 64,457 |
Electronic Arts, Inc. | | | 100 | | | 15,085 |
Meta Platforms, Inc. - Class A | | | 512 | | | 290,600 |
Netflix, Inc.(a) | | | 164 | | | 123,989 |
Take-Two Interactive Software, Inc.(a) | | | 68 | | | 10,997 |
T-Mobile US, Inc. | | | 444 | | | 99,083 |
Trade Desk, Inc. - Class A(a) | | | 172 | | | 20,676 |
Warner Bros Discovery, Inc.(a) | | | 936 | | | 7,610 |
| | | | | | 940,979 |
Consumer Discretionary - 12.1%
|
Airbnb, Inc. - Class A(a) | | | 168 | | | 22,645 |
Amazon.com, Inc.(a) | | | 1,552 | | | 289,292 |
Booking Holdings, Inc. | | | 12 | | | 56,115 |
DoorDash, Inc. - Class A(a) | | | 148 | | | 23,192 |
Lululemon Athletica, Inc.(a) | | | 44 | | | 13,108 |
Marriott International, Inc. - Class A | | | 108 | | | 28,082 |
MercadoLibre, Inc.(a) | | | 20 | | | 40,744 |
O'Reilly Automotive, Inc.(a) | | | 24 | | | 27,675 |
PDD Holdings, Inc. - ADR(a) | | | 256 | | | 30,871 |
Ross Stores, Inc. | | | 128 | | | 17,884 |
Starbucks Corp. | | | 432 | | | 42,206 |
Tesla Motors, Inc.(a) | | | 716 | | | 178,893 |
| | | | | | 770,707 |
Consumer Staples - 5.3%
|
Coca-Cola Europacific Partners PLC | | | 176 | | | 13,376 |
Costco Wholesale Corp. | | | 168 | | | 146,862 |
Dollar Tree, Inc.(a) | | | 84 | | | 5,430 |
Keurig Dr Pepper, Inc. | | | 516 | | | 17,002 |
Mondelez International, Inc. - Class A | | | 508 | | | 34,788 |
Monster Beverage Corp.(a) | | | 372 | | | 19,597 |
PepsiCo, Inc. | | | 524 | | | 87,026 |
The Kraft Heinz Co. | | | 460 | | | 15,392 |
| | | | | | 339,473 |
Energy - 0.4%
|
Baker Hughes Co. | | | 380 | | | 14,471 |
Diamondback Energy, Inc. | | | 68 | | | 12,020 |
| | | | | | 26,491 |
Financials - 0.5%
|
PayPal Holdings, Inc.(a) | | | 392 | | | 31,086 |
Health Care - 5.2%
|
Amgen, Inc. | | | 204 | | | 65,313 |
AstraZeneca PLC - ADR | | | 224 | | | 15,938 |
Biogen, Inc.(a) | | | 56 | | | 9,744 |
DexCom, Inc.(a) | | | 152 | | | 10,713 |
GE HealthCare Technologies, Inc. | | | 176 | | | 15,374 |
| | | | | | | |
| | | | | | | |
Gilead Sciences, Inc. | | | 476 | | | $42,278 |
Idexx Laboratories, Inc.(a) | | | 32 | | | 13,021 |
Illumina, Inc.(a) | | | 60 | | | 8,648 |
Intuitive Surgical, Inc.(a) | | | 136 | | | 68,523 |
Moderna, Inc.(a) | | | 148 | | | 8,045 |
Regeneron Pharmaceuticals, Inc.(a) | | | 40 | | | 33,528 |
Vertex Pharmaceuticals, Inc.(a) | | | 100 | | | 47,598 |
| | | | | | 338,723 |
Industrials - 4.1%
|
Automatic Data Processing, Inc. | | | 156 | | | 45,121 |
Cintas Corp. | | | 152 | | | 31,283 |
Copart, Inc.(a) | | | 368 | | | 18,941 |
CSX Corp. | | | 740 | | | 24,894 |
Fastenal Co. | | | 220 | | | 17,200 |
Honeywell International, Inc. | | | 248 | | | 51,008 |
Old Dominion Freight Line, Inc. | | | 80 | | | 16,106 |
Paccar, Inc. | | | 200 | | | 20,856 |
Paychex, Inc. | | | 136 | | | 18,949 |
Verisk Analytics, Inc. | | | 56 | | | 15,384 |
| | | | | | 259,742 |
Information Technology - 44.8%(b)
|
Adobe, Inc.(a) | | | 168 | | | 80,317 |
Advanced Micro Devices, Inc.(a) | | | 616 | | | 88,747 |
Analog Devices, Inc. | | | 188 | | | 41,945 |
Ansys, Inc.(a) | | | 32 | | | 10,253 |
Apple, Inc. | | | 2,248 | | | 507,847 |
Applied Materials, Inc. | | | 316 | | | 57,379 |
ARM Holdings PLC - ADR(a) | | | 48 | | | 6,782 |
ASML Holding NV | | | 36 | | | 24,212 |
Atlassian Corp. - Class A(a) | | | 60 | | | 11,312 |
Autodesk, Inc.(a) | | | 84 | | | 23,839 |
Broadcom, Inc. | | | 1,768 | | | 300,153 |
Cadence Design System, Inc.(a) | | | 104 | | | 28,716 |
CDW Corp. | | | 52 | | | 9,788 |
Cisco Systems, Inc. | | | 1,536 | | | 84,127 |
Cognizant Technology Solutions Corp. - Class A | | | 188 | | | 14,023 |
Crowdstrike Holdings, Inc. - Class A(a) | | | 88 | | | 26,125 |
Datadog, Inc. - Class A(a) | | | 120 | | | 15,053 |
Fortinet, Inc.(a) | | | 292 | | | 22,969 |
GLOBALFOUNDRIES, Inc.(a) | | | 212 | | | 7,738 |
Intel Corp. | | | 1,632 | | | 35,121 |
Intuit, Inc. | | | 108 | | | 65,912 |
KLA Corp. | | | 52 | | | 34,644 |
Lam Research Corp. | | | 480 | | | 35,688 |
Marvell Technology, Inc. | | | 332 | | | 26,597 |
Microchip Technology, Inc. | | | 204 | | | 14,967 |
Micron Technology, Inc. | | | 424 | | | 42,252 |
Microsoft Corp. | | | 1,100 | | | 446,985 |
MongoDB, Inc.(a) | | | 28 | | | 7,571 |
NVIDIA Corp. | | | 3,624 | | | 481,122 |
NXP Semiconductors NV | | | 96 | | | 22,512 |
ON Semiconductor Corp.(a) | | | 164 | | | 11,560 |
| | | | | | | |
The accompanying notes are an integral part of these financial statements.
TABLE OF CONTENTS
Pacer Metaurus Nasdaq-100 Dividend Multiplier 600 ETF
Schedule of Investments
October 31, 2024(Continued)
| | | | | | | | |
COMMON STOCKS - (Continued)
| | | | | | | |
Information Technology - (Continued)
| | | | | | | | | |
Palo Alto Networks, Inc.(a) | | | 124 | | | $44,681 | |
QUALCOMM, Inc. | | | 424 | | | 69,014 | |
Roper Technologies, Inc. | | | 40 | | | 21,509 | |
Super Micro Computer, Inc.(a) | | | 240 | | | 6,986 | |
Synopsys, Inc.(a) | | | 60 | | | 30,817 | |
Texas Instruments, Inc. | | | 348 | | | 70,700 | |
Workday, Inc. - Class A(a) | | | 80 | | | 18,708 | |
Zscaler, Inc.(a) | | | 56 | | | 10,124 | |
| | | | | | 2,858,795 | |
Materials - 1.3%
| |
Linde PLC | | | 184 | | | 83,931 | |
Real Estate - 0.2%
| |
CoStar Group, Inc.(a) | | | 156 | | | 11,355 | |
Utilities - 1.3%
| |
American Electric Power Co., Inc. | | | 204 | | | 20,145 | |
Constellation Energy Corp. | | | 120 | | | 31,555 | |
Exelon Corp. | | | 380 | | | 14,934 | |
Xcel Energy, Inc. | | | 212 | | | 14,164 | |
| | | | | | 80,798 | |
TOTAL COMMON STOCKS
(Cost $5,731,183) | | | | | | 5,742,080 | |
TOTAL INVESTMENTS - 89.9% (Cost $5,731,183) | | | | | | $5,742,080 | |
Other Assets in Excess of
Liabilities - 10.1% | | | | | | 650,042 | |
TOTAL NET ASSETS - 100.0% | | | | | | $6,392,122 | |
| | | | | | | | |
Percentages are stated as a percent of net assets.
The Global Industry Classification Standard (“GICS®”) was developed by and/or is the exclusive property of MSCI, Inc. (“MSCI”) and Standard & Poor’s Financial Services LLC (“S&P”). GICS® is a service mark of MSCI and S&P and has been licensed for use by U.S. Bank Global Fund Services.
ADR - American Depositary Receipt
NV - Naamloze Vennootschap
PLC - Public Limited Company
(a)
| Non-income producing security. |
(b)
| To the extent that the Fund invests more heavily in a particular industry or sector of the economy, its performance will be especially sensitive to developments that significantly affect those industries or sectors. |
The accompanying notes are an integral part of these financial statements.
TABLE OF CONTENTS
Pacer Metaurus Nasdaq-100 Dividend Multiplier 600 ETF
Schedule of Futures Contracts
October 31, 2024
| | | | | | | | | | | | | |
NSDQ 100 Annual Dividend Index | | | 50 | | | 12/19/2025 | | | $ 840,000 | | | $ 22,149 |
NSDQ 100 Annual Dividend Index | | | 5 | | | 12/18/2026 | | | 84,500 | | | 1,478 |
Total Unrealized Appreciation (Depreciation) | | | | | | | | | | | | $23,627 |
| | | | | | | | | | | | | |
The accompanying notes are an integral part of these financial statements.
TABLE OF CONTENTS
Pacer Metaurus US Large Cap TARGET DIVIDEND Multiplier 400 ETF
Schedule of Investments
October 31, 2024
| | | | | | | |
COMMON STOCKS - 87.7%
| | | | | | |
Communication Services - 8.2%
| | | | | | |
Alphabet, Inc. - Class A | | | 64,913 | | | $11,107,263 |
Alphabet, Inc. - Class C | | | 53,227 | | | 9,191,771 |
AT&T, Inc. | | | 79,475 | | | 1,791,367 |
Charter Communications, Inc. - Class A(a) | | | 1,073 | | | 351,526 |
Comcast Corp. - Class A | | | 42,793 | | | 1,868,770 |
Electronic Arts, Inc. | | | 2,660 | | | 401,261 |
Fox Corp. - Class A | | | 2,473 | | | 103,866 |
Fox Corp. - Class B | | | 1,449 | | | 56,453 |
Interpublic Group of Cos., Inc. | | | 4,097 | | | 120,452 |
Live Nation Entertainment, Inc.(a) | | | 1,714 | | | 200,778 |
Match Group, Inc.(a) | | | 2,827 | | | 101,857 |
Meta Platforms, Inc. - Class A | | | 24,104 | | | 13,680,948 |
Netflix, Inc.(a) | | | 4,754 | | | 3,594,167 |
News Corp. - Class A | | | 4,166 | | | 113,524 |
News Corp. - Class B | | | 1,236 | | | 35,893 |
Omnicom Group, Inc. | | | 2,160 | | | 218,160 |
Paramount Global - Class B | | | 6,554 | | | 71,701 |
Take-Two Interactive Software, Inc.(a) | | | 1,795 | | | 290,287 |
T-Mobile US, Inc. | | | 5,408 | | | 1,206,849 |
Verizon Communications, Inc. | | | 46,611 | | | 1,963,721 |
Walt Disney Co. | | | 20,088 | | | 1,932,466 |
Warner Bros Discovery, Inc.(a) | | | 24,732 | | | 201,071 |
| | | | | | 48,604,151 |
Consumer Discretionary - 9.0%
|
Airbnb, Inc. - Class A(a) | | | 4,858 | | | 654,810 |
Amazon.com, Inc.(a) | | | 103,060 | | | 19,210,384 |
Aptiv PLC(a) | | | 2,902 | | | 164,921 |
AutoZone, Inc.(a) | | | 186 | | | 559,674 |
Best Buy Co., Inc. | | | 2,166 | | | 195,871 |
Booking Holdings, Inc. | | | 364 | | | 1,702,155 |
BorgWarner, Inc. | | | 2,507 | | | 84,310 |
Caesars Entertainment, Inc.(a) | | | 2,382 | | | 95,399 |
CarMax, Inc.(a) | | | 1,709 | | | 123,697 |
Carnival Corp.(a) | | | 11,177 | | | 245,894 |
Chipotle Mexican Grill, Inc.(a) | | | 15,118 | | | 843,131 |
Darden Restaurants, Inc. | | | 1,303 | | | 208,506 |
Deckers Outdoor Corp.(a) | | | 1,675 | | | 269,491 |
Domino’s Pizza, Inc. | | | 380 | | | 157,217 |
DR Horton, Inc. | | | 3,239 | | | 547,391 |
eBay, Inc. | | | 5,398 | | | 310,439 |
Expedia Group, Inc.(a) | | | 1,370 | | | 214,145 |
Ford Motor Co. | | | 43,260 | | | 445,145 |
Garmin Ltd. | | | 1,687 | | | 334,616 |
General Motors Co. | | | 12,409 | | | 629,881 |
Genuine Parts Co. | | | 1,530 | | | 175,491 |
Hasbro, Inc. | | | 1,440 | | | 94,507 |
Hilton Worldwide Holdings, Inc. | | | 2,718 | | | 638,322 |
Home Depot, Inc. | | | 10,927 | | | 4,302,506 |
Las Vegas Sands Corp. | | | 3,886 | | | 201,489 |
Lennar Corp. - Class A | | | 2,672 | | | 455,042 |
| | | | | | | |
| | | | | | | |
LKQ Corp. | | | 2,878 | | | $ 105,882 |
Lowe’s Cos., Inc. | | | 6,316 | | | 1,653,718 |
Lululemon Athletica, Inc.(a) | | | 1,265 | | | 376,844 |
Marriott International, Inc. - Class A | | | 2,571 | | | 668,511 |
McDonald’s Corp. | | | 7,943 | | | 2,320,230 |
MGM Resorts International(a) | | | 2,540 | | | 93,650 |
Mohawk Industries, Inc.(a) | | | 573 | | | 76,937 |
NIKE, Inc. - Class B | | | 13,295 | | | 1,025,443 |
Norwegian Cruise Line Holdings Ltd.(a) | | | 4,855 | | | 123,026 |
NVR, Inc.(a) | | | 33 | | | 302,043 |
O’Reilly Automotive, Inc.(a) | | | 638 | | | 735,703 |
Pool Corp. | | | 416 | | | 150,442 |
PulteGroup, Inc. | | | 2,273 | | | 294,422 |
Ralph Lauren Corp. | | | 435 | | | 86,100 |
Ross Stores, Inc. | | | 3,696 | | | 516,405 |
Royal Caribbean Cruises Ltd. | | | 2,626 | | | 541,875 |
Starbucks Corp. | | | 12,497 | | | 1,220,957 |
Tapestry, Inc. | | | 2,533 | | | 120,191 |
Tesla Motors, Inc.(a) | | | 30,722 | | | 7,675,892 |
TJX Cos., Inc. | | | 12,468 | | | 1,409,258 |
Tractor Supply Co. | | | 1,188 | | | 315,426 |
Ulta Beauty, Inc.(a) | | | 529 | | | 195,190 |
Wynn Resorts Ltd. | | | 1,024 | | | 98,325 |
Yum! Brands, Inc. | | | 3,095 | | | 405,940 |
| | | | | | 53,376,844 |
Consumer Staples - 5.2%
|
Altria Group, Inc. | | | 18,917 | | | 1,030,220 |
Archer-Daniels-Midland Co. | | | 5,295 | | | 292,337 |
Brown-Forman Corp. - Class B | | | 2,016 | | | 88,764 |
Bunge Global SA | | | 1,555 | | | 130,651 |
Campbell Soup Co. | | | 2,173 | | | 101,370 |
Church & Dwight Co., Inc. | | | 2,702 | | | 269,957 |
Clorox Co. | | | 1,362 | | | 215,945 |
Coca-Cola Co. | | | 42,944 | | | 2,804,673 |
Colgate-Palmolive Co. | | | 9,042 | | | 847,326 |
Conagra Brands, Inc. | | | 5,303 | | | 153,469 |
Constellation Brands, Inc. - Class A | | | 1,715 | | | 398,463 |
Costco Wholesale Corp. | | | 4,889 | | | 4,273,866 |
Dollar General Corp. | | | 2,421 | | | 193,777 |
Dollar Tree, Inc.(a) | | | 2,221 | | | 143,565 |
Estee Lauder Cos., Inc. - Class - | | | 2,564 | | | 176,762 |
General Mills, Inc. | | | 6,117 | | | 416,078 |
Hershey Co. | | | 1,629 | | | 289,278 |
Hormel Foods Corp. | | | 3,212 | | | 98,127 |
J M Smucker Co. | | | 1,162 | | | 131,899 |
Kellanova | | | 2,926 | | | 235,982 |
Kenvue, Inc. | | | 21,204 | | | 486,208 |
Keurig Dr Pepper, Inc. | | | 12,408 | | | 408,844 |
Kimberly-Clark Corp. | | | 3,726 | | | 499,955 |
Kroger Co. | | | 7,361 | | | 410,523 |
Lamb Weston Holdings, Inc. | | | 1,591 | | | 123,605 |
McCormick & Co., Inc. | | | 2,771 | | | 216,803 |
Molson Coors Beverage Co. - Class B | | | 1,933 | | | 105,290 |
| | | | | | | |
The accompanying notes are an integral part of these financial statements.
TABLE OF CONTENTS
Pacer Metaurus US Large Cap TARGET DIVIDEND Multiplier 400 ETF
Schedule of Investments
October 31, 2024(Continued)
| | | | | | | |
COMMON STOCKS - (Continued)
|
Consumer Staples - 5.2% (Continued)
|
Mondelez International, Inc. - Class A | | | 14,797 | | | $1,013,299 |
Monster Beverage Corp.(a) | | | 7,755 | | | 408,533 |
PepsiCo, Inc. | | | 15,230 | | | 2,529,398 |
Philip Morris International, Inc. | | | 17,179 | | | 2,279,653 |
Procter & Gamble Co. | | | 26,051 | | | 4,303,104 |
Sysco Corp. | | | 5,425 | | | 406,604 |
Target Corp. | | | 5,074 | | | 761,303 |
The Kraft Heinz Co. | | | 9,740 | | | 325,900 |
Tyson Foods, Inc. - Class A | | | 3,167 | | | 185,554 |
Walgreens Boots Alliance, Inc. | | | 7,935 | | | 75,065 |
Walmart, Inc. | | | 48,109 | | | 3,942,533 |
| | | | | | 30,774,683 |
Energy - 3.0%
|
APA Corp. | | | 4,042 | | | 95,391 |
Baker Hughes Co. | | | 10,944 | | | 416,747 |
Chevron Corp. | | | 18,793 | | | 2,796,774 |
ConocoPhillips | | | 12,838 | | | 1,406,275 |
Coterra Energy, Inc. | | | 8,153 | | | 195,020 |
Devon Energy Corp. | | | 6,927 | | | 267,936 |
Diamondback Energy, Inc. | | | 2,059 | | | 363,969 |
EOG Resources, Inc. | | | 6,304 | | | 768,836 |
EQT Corp. | | | 6,547 | | | 239,227 |
Exxon Mobil Corp. | | | 49,203 | | | 5,745,926 |
Halliburton Co. | | | 9,742 | | | 270,243 |
Hess Corp. | | | 3,043 | | | 409,223 |
Kinder Morgan, Inc. | | | 21,354 | | | 523,387 |
Marathon Oil Corp. | | | 6,143 | | | 170,161 |
Marathon Petroleum Corp. | | | 3,706 | | | 539,112 |
Occidental Petroleum Corp. | | | 7,450 | | | 373,319 |
ONEOK, Inc. | | | 6,452 | | | 625,070 |
Phillips 66 | | | 4,580 | | | 557,936 |
Schlumberger Ltd. | | | 15,673 | | | 628,017 |
Targa Resources Corp. | | | 2,412 | | | 402,708 |
Valero Energy Corp. | | | 3,497 | | | 453,771 |
Williams Cos., Inc. | | | 13,462 | | | 705,005 |
| | | | | | 17,954,053 |
Financials - 12.0%
|
Aflac, Inc. | | | 5,542 | | | 580,746 |
Allstate Corp. | | | 2,886 | | | 538,297 |
American Express Co. | | | 6,165 | | | 1,665,043 |
American International Group, Inc. | | | 7,097 | | | 538,520 |
Ameriprise Financial, Inc. | | | 1,083 | | | 552,655 |
Aon PLC - Class A | | | 2,392 | | | 877,553 |
Arch Capital Group Ltd.(a) | | | 4,087 | | | 402,815 |
Arthur J Gallagher & Co. | | | 2,412 | | | 678,254 |
Assurant, Inc. | | | 567 | | | 108,694 |
Bank of America Corp. | | | 74,814 | | | 3,128,721 |
Bank of New York Mellon Corp. | | | 8,140 | | | 613,430 |
Berkshire Hathaway, Inc. - Class B(a) | | | 20,262 | | | 9,136,541 |
Blackrock, Inc. | | | 1,529 | | | 1,499,995 |
Blackstone, Inc. | | | 7,969 | | | 1,336,800 |
| | | | | | | |
| | | | | | | |
Brown & Brown, Inc. | | | 2,625 | | | $ 274,680 |
Capital One Financial Corp. | | | 4,229 | | | 688,439 |
Cboe Global Markets, Inc. | | | 1,145 | | | 244,538 |
Charles Schwab Corp. | | | 16,525 | | | 1,170,466 |
Chubb Ltd. | | | 4,097 | | | 1,157,157 |
Cincinnati Financial Corp. | | | 1,711 | | | 240,960 |
Citigroup, Inc. | | | 21,133 | | | 1,356,105 |
Citizens Financial Group, Inc. | | | 4,937 | | | 207,946 |
CME Group, Inc. | | | 3,949 | | | 889,947 |
Corpay, Inc.(a) | | | 762 | | | 251,247 |
Discover Financial Services | | | 2,762 | | | 409,964 |
Erie Indemnity Co. - Class A | | | 271 | | | 121,636 |
Everest Group Ltd. | | | 470 | | | 167,137 |
FactSet Research Systems, Inc. | | | 413 | | | 187,527 |
Fidelity National Information Services, Inc. | | | 6,011 | | | 539,367 |
Fifth Third Bancorp | | | 7,483 | | | 326,857 |
Fiserv, Inc.(a) | | | 6,372 | | | 1,261,019 |
Franklin Resources, Inc. | | | 3,384 | | | 70,286 |
Global Payments, Inc. | | | 2,794 | | | 289,766 |
Globe Life, Inc. | | | 984 | | | 103,910 |
Goldman Sachs Group, Inc. | | | 3,453 | | | 1,787,929 |
Hartford Financial Services Group,
Inc. | | | 3,235 | | | 357,273 |
Huntington Bancshares, Inc. | | | 16,056 | | | 250,313 |
Intercontinental Exchange, Inc. | | | 6,357 | | | 990,866 |
Invesco Ltd. | | | 4,953 | | | 85,885 |
Jack Henry & Associates, Inc. | | | 800 | | | 145,544 |
JPMorgan Chase & Co. | | | 31,542 | | | 6,999,801 |
KeyCorp. | | | 10,247 | | | 176,761 |
KKR & Co., Inc. | | | 7,461 | | | 1,031,409 |
Loews Corp. | | | 2,003 | | | 158,157 |
M&T Bank Corp. | | | 1,838 | | | 357,822 |
MarketAxess Holdings, Inc. | | | 410 | | | 118,662 |
Marsh & McLennan Cos., Inc. | | | 5,425 | | | 1,183,952 |
Mastercard, Inc. - Class A | | | 9,099 | | | 4,545,769 |
MetLife, Inc. | | | 6,492 | | | 509,103 |
Moody’s Corp. | | | 1,714 | | | 778,224 |
Morgan Stanley | | | 13,791 | | | 1,603,204 |
MSCI, Inc. | | | 862 | | | 492,374 |
Nasdaq, Inc. | | | 4,535 | | | 335,227 |
Northern Trust Corp. | | | 2,217 | | | 222,853 |
PayPal Holdings, Inc.(a) | | | 11,293 | | | 895,535 |
PNC Financial Services Group, Inc. | | | 4,379 | | | 824,434 |
Principal Financial Group, Inc. | | | 2,326 | | | 191,662 |
Progressive Corp. | | | 6,467 | | | 1,570,382 |
Prudential Financial, Inc. | | | 3,919 | | | 479,999 |
Raymond James Financial, Inc. | | | 2,038 | | | 302,072 |
Regions Financial Corp. | | | 10,123 | | | 241,636 |
S&P Global, Inc. | | | 3,495 | | | 1,678,858 |
State Street Corp. | | | 3,289 | | | 305,219 |
Synchrony Financial | | | 4,357 | | | 240,245 |
T Rowe Price Group, Inc. | | | 2,450 | | | 269,157 |
Travelers Cos., Inc. | | | 2,508 | | | 616,817 |
| | | | | | | |
The accompanying notes are an integral part of these financial statements.
TABLE OF CONTENTS
Pacer Metaurus US Large Cap TARGET DIVIDEND Multiplier 400 ETF
Schedule of Investments
October 31, 2024(Continued)
| | | | | | | |
COMMON STOCKS - (Continued)
|
Financials - 12.0% (Continued)
|
Truist Financial Corp. | | | 14,828 | | | $638,345 |
US Bancorp | | | 17,233 | | | 832,526 |
Visa, Inc. - Class A | | | 18,502 | | | 5,362,805 |
W R Berkley Corp. | | | 3,308 | | | 189,118 |
Wells Fargo & Co. | | | 37,678 | | | 2,446,056 |
Willis Towers Watson PLC | | | 1,116 | | | 337,244 |
| | | | | | 71,170,256 |
Health Care - 10.0%
|
Abbott Laboratories | | | 19,238 | | | 2,181,012 |
AbbVie, Inc. | | | 19,564 | | | 3,988,513 |
Agilent Technologies, Inc. | | | 3,223 | | | 419,989 |
Align Technology, Inc.(a) | | | 771 | | | 158,078 |
Amgen, Inc. | | | 5,933 | | | 1,899,509 |
Baxter International, Inc. | | | 5,601 | | | 199,956 |
Becton Dickinson & Co. | | | 3,197 | | | 746,787 |
Biogen, Inc.(a) | | | 1,610 | | | 280,140 |
Bio-Techne Corp. | | | 1,723 | | | 127,071 |
Boston Scientific Corp.(a) | | | 16,322 | | | 1,371,374 |
Bristol-Myers Squibb Co. | | | 22,421 | | | 1,250,419 |
Cardinal Health, Inc. | | | 2,693 | | | 292,244 |
Catalent, Inc.(a) | | | 1,990 | | | 116,614 |
Cencora, Inc. | | | 1,919 | | | 437,686 |
Centene Corp.(a) | | | 5,825 | | | 362,665 |
Charles River Laboratories International, Inc.(a) | | | 566 | | | 101,076 |
Cigna Group | | | 3,077 | | | 968,670 |
Cooper Cos., Inc.(a) | | | 2,193 | | | 229,563 |
CVS Health Corp. | | | 13,908 | | | 785,246 |
Danaher Corp. | | | 7,085 | | | 1,740,501 |
DaVita, Inc.(a) | | | 501 | | | 70,045 |
DexCom, Inc.(a) | | | 4,410 | | | 310,817 |
Edwards Lifesciences Corp.(a) | | | 6,627 | | | 444,075 |
Elevance Health, Inc. | | | 2,551 | | | 1,035,094 |
Eli Lilly & Co. | | | 8,699 | | | 7,217,908 |
GE HealthCare Technologies, Inc. | | | 5,025 | | | 438,934 |
Gilead Sciences, Inc. | | | 13,784 | | | 1,224,295 |
HCA Healthcare, Inc. | | | 2,043 | | | 732,906 |
Henry Schein, Inc.(a) | | | 1,393 | | | 97,830 |
Hologic, Inc.(a) | | | 2,555 | | | 206,623 |
Humana, Inc. | | | 1,324 | | | 341,367 |
Idexx Laboratories, Inc.(a) | | | 902 | | | 367,042 |
Incyte Corp.(a) | | | 1,745 | | | 129,339 |
Insulet Corp.(a) | | | 770 | | | 178,278 |
Intuitive Surgical, Inc.(a) | | | 3,897 | | | 1,963,464 |
IQVIA Holdings, Inc.(a) | | | 1,906 | | | 392,293 |
Johnson & Johnson | | | 26,631 | | | 4,257,232 |
Labcorp Holdings, Inc. | | | 920 | | | 210,008 |
McKesson Corp. | | | 1,425 | | | 713,341 |
Medtronic PLC | | | 14,216 | | | 1,268,778 |
Merck & Co., Inc. | | | 28,068 | | | 2,871,918 |
Mettler-Toledo International, Inc.(a) | | | 231 | | | 298,394 |
Moderna, Inc.(a) | | | 3,740 | | | 203,306 |
| | | | | | | |
| | | | | | | |
Molina Healthcare, Inc.(a) | | | 645 | | | $ 207,187 |
Pfizer, Inc. | | | 62,785 | | | 1,776,816 |
Quest Diagnostics, Inc. | | | 1,225 | | | 189,667 |
Regeneron Pharmaceuticals, Inc.(a) | | | 1,159 | | | 971,474 |
ResMed, Inc. | | | 1,622 | | | 393,286 |
Revvity, Inc. | | | 1,356 | | | 160,808 |
Solventum Corp.(a) | | | 1,517 | | | 110,104 |
STERIS PLC | | | 1,087 | | | 241,151 |
Stryker Corp. | | | 3,784 | | | 1,348,164 |
Teleflex, Inc. | | | 525 | | | 105,557 |
Thermo Fisher Scientific, Inc. | | | 4,231 | | | 2,311,480 |
UnitedHealth Group, Inc. | | | 10,203 | | | 5,759,594 |
Universal Health Services, Inc. -
Class B | | | 654 | | | 133,619 |
Vertex Pharmaceuticals, Inc.(a) | | | 2,829 | | | 1,346,547 |
Viatris, Inc. | | | 13,219 | | | 153,340 |
Waters Corp.(a) | | | 653 | | | 210,991 |
West Pharmaceutical Services, Inc. | | | 796 | | | 245,112 |
Zimmer Biomet Holdings, Inc. | | | 2,236 | | | 239,073 |
Zoetis, Inc. | | | 4,982 | | | 890,682 |
| | | | | | 59,425,052 |
Industrials - 7.6%
|
3M Co. | | | 6,048 | | | 776,987 |
A O Smith Corp. | | | 1,319 | | | 99,057 |
Allegion PLC | | | 955 | | | 133,347 |
Amentum Holdings, Inc.(a) | | | 1,376 | | | 40,922 |
AMETEK, Inc. | | | 2,547 | | | 466,967 |
Automatic Data Processing, Inc. | | | 4,477 | | | 1,294,928 |
Axon Enterprise, Inc.(a) | | | 788 | | | 333,718 |
Boeing Co.(a) | | | 8,035 | | | 1,199,706 |
Broadridge Financial Solutions, Inc. | | | 1,284 | | | 270,744 |
Builders FirstSource, Inc.(a) | | | 1,281 | | | 219,563 |
Carrier Global Corp. | | | 9,256 | | | 673,096 |
Caterpillar, Inc. | | | 5,359 | | | 2,016,056 |
CH Robinson Worldwide, Inc. | | | 1,290 | | | 132,922 |
Cintas Corp. | | | 3,782 | | | 778,373 |
Copart, Inc.(a) | | | 9,674 | | | 497,921 |
CSX Corp. | | | 21,429 | | | 720,872 |
Cummins, Inc. | | | 1,505 | | | 495,115 |
Dayforce, Inc.(a) | | | 1,728 | | | 122,602 |
Deere & Co. | | | 2,812 | | | 1,137,988 |
Delta Air Lines, Inc. | | | 7,071 | | | 404,603 |
Dover Corp. | | | 1,509 | | | 285,699 |
Eaton Corp. PLC | | | 4,385 | | | 1,453,978 |
Emerson Electric Co. | | | 6,343 | | | 686,757 |
Equifax, Inc. | | | 1,360 | | | 360,427 |
Expeditors International of Washington, Inc. | | | 1,549 | | | 184,331 |
Fastenal Co. | | | 6,343 | | | 495,896 |
FedEx Corp. | | | 2,480 | | | 679,148 |
Fortive Corp. | | | 3,856 | | | 275,434 |
GE Vernova, Inc.(a) | | | 3,026 | | | 912,823 |
Generac Holdings, Inc.(a) | | | 662 | | | 109,594 |
General Dynamics Corp. | | | 2,827 | | | 824,382 |
| | | | | | | |
The accompanying notes are an integral part of these financial statements.
TABLE OF CONTENTS
Pacer Metaurus US Large Cap TARGET DIVIDEND Multiplier 400 ETF
Schedule of Investments
October 31, 2024(Continued)
| | | | | | | |
COMMON STOCKS - (Continued)
|
Industrials - 7.6% (Continued)
|
General Electric Co. | | | 11,958 | | | $2,054,145 |
Honeywell International, Inc. | | | 7,166 | | | 1,473,903 |
Howmet Aerospace, Inc. | | | 4,480 | | | 446,746 |
Hubbell, Inc. | | | 591 | | | 252,375 |
Huntington Ingalls Industries, Inc. | | | 426 | | | 78,793 |
IDEX Corp. | | | 830 | | | 178,151 |
Illinois Tool Works, Inc. | | | 2,975 | | | 776,862 |
Ingersoll Rand, Inc. | | | 4,436 | | | 425,856 |
Jacobs Solutions, Inc. | | | 1,376 | | | 193,438 |
JB Hunt Trasport Services, Inc. | | | 883 | | | 159,487 |
Johnson Controls International PLC | | | 7,399 | | | 558,994 |
L3Harris Technologies, Inc. | | | 2,103 | | | 520,429 |
Leidos Holdings, Inc. | | | 1,480 | | | 271,077 |
Lockheed Martin Corp. | | | 2,317 | | | 1,265,198 |
Masco Corp. | | | 2,403 | | | 192,024 |
Nordson Corp. | | | 599 | | | 148,486 |
Norfolk Southern Corp. | | | 2,488 | | | 623,070 |
Northrop Grumman Corp. | | | 1,510 | | | 768,620 |
Old Dominion Freight Line, Inc. | | | 2,073 | | | 417,336 |
Otis Worldwide Corp. | | | 4,408 | | | 432,866 |
PACCAR, Inc. | | | 5,808 | | | 605,658 |
Parker-Hannifin Corp. | | | 1,413 | | | 895,941 |
Paychex, Inc. | | | 3,498 | | | 487,376 |
Paycom Software, Inc. | | | 538 | | | 112,458 |
Pentair PLC | | | 1,822 | | | 180,597 |
Quanta Services, Inc. | | | 1,626 | | | 490,450 |
Republic Services, Inc. | | | 2,241 | | | 443,718 |
Rockwell Automation, Inc. | | | 1,249 | | | 333,121 |
Rollins, Inc. | | | 3,092 | | | 145,757 |
RTX Corp. | | | 14,743 | | | 1,783,756 |
Snap-On, Inc. | | | 576 | | | 190,155 |
Southwest Airlines Co. | | | 6,596 | | | 201,706 |
Stanley Black & Decker, Inc. | | | 1,689 | | | 156,976 |
Textron, Inc. | | | 2,060 | | | 165,665 |
Trane Technologies PLC | | | 2,484 | | | 919,477 |
TransDigm Group, Inc. | | | 618 | | | 804,821 |
Uber Technologies, Inc.(a) | | | 23,269 | | | 1,676,531 |
Union Pacific Corp. | | | 6,692 | | | 1,553,012 |
United Airlines Holdings, Inc.(a) | | | 3,621 | | | 283,379 |
United Parcel Service, Inc. - Class B | | | 8,088 | | | 1,084,277 |
United Rentals, Inc. | | | 731 | | | 594,157 |
Veralto Corp. | | | 2,724 | | | 278,366 |
Verisk Analytics, Inc. | | | 1,579 | | | 433,783 |
W.W. Grainger, Inc. | | | 483 | | | 535,758 |
Waste Management, Inc. | | | 3,997 | | | 862,752 |
Westinghouse Air Brake Technologies Corp. | | | 1,927 | | | 362,237 |
Xylem, Inc. | | | 2,684 | | | 326,858 |
| | | | | | 45,230,554 |
Information Technology - 28.4%(b)
|
Accenture PLC - Class A | | | 6,929 | | | 2,389,258 |
Adobe, Inc.(a) | | | 4,890 | | | 2,337,811 |
| | | | | | | |
| | | | | | | |
Advanced Micro Devices, Inc.(a) | | | 17,933 | | | $2,583,607 |
Akamai Technologies, Inc.(a) | | | 1,666 | | | 168,399 |
Amphenol Corp. - Class A | | | 13,322 | | | 892,840 |
Analog Devices, Inc. | | | 5,467 | | | 1,219,742 |
Ansys, Inc.(a) | | | 957 | | | 306,632 |
Apple, Inc. | | | 167,751 | | | 37,896,628 |
Applied Materials, Inc. | | | 9,145 | | | 1,660,549 |
Arista Networks, Inc.(a) | | | 2,824 | | | 1,091,307 |
Autodesk, Inc.(a) | | | 2,373 | | | 673,457 |
Broadcom, Inc. | | | 51,593 | | | 8,758,944 |
Cadence Design System, Inc.(a) | | | 3,015 | | | 832,502 |
CDW Corp. | | | 1,467 | | | 276,133 |
Cisco Systems, Inc. | | | 44,667 | | | 2,446,412 |
Cognizant Technology Solutions Corp. - Class A | | | 5,462 | | | 407,411 |
Corning, Inc. | | | 8,520 | | | 405,467 |
Crowdstrike Holdings, Inc. - Class A(a) | | | 2,540 | | | 754,050 |
Dell Technologies, Inc. - Class C | | | 3,184 | | | 393,638 |
Enphase Energy, Inc.(a) | | | 1,487 | | | 123,481 |
EPAM Systems, Inc.(a) | | | 627 | | | 118,284 |
F5, Inc.(a) | | | 641 | | | 149,917 |
Fair Isaac Corp.(a) | | | 266 | | | 530,167 |
First Solar, Inc.(a) | | | 1,168 | | | 227,153 |
Fortinet, Inc.(a) | | | 7,010 | | | 551,407 |
Gartner, Inc.(a) | | | 845 | | | 424,613 |
Gen Digital, Inc. | | | 5,974 | | | 173,903 |
GoDaddy, Inc. - Class A(a) | | | 1,548 | | | 258,206 |
Hewlett Packard Enterprise Co. | | | 14,379 | | | 280,247 |
HP, Inc. | | | 10,802 | | | 383,687 |
Intel Corp. | | | 47,306 | | | 1,018,025 |
International Business Machines Corp. | | | 10,181 | | | 2,104,616 |
Intuit, Inc. | | | 3,077 | | | 1,877,893 |
Jabil, Inc. | | | 1,249 | | | 153,739 |
Juniper Networks, Inc. | | | 3,624 | | | 140,974 |
Keysight Technologies, Inc.(a) | | | 1,920 | | | 286,099 |
KLA Corp. | | | 1,476 | | | 983,355 |
Lam Research Corp. | | | 14,267 | | | 1,060,751 |
Microchip Technology, Inc. | | | 5,925 | | | 434,717 |
Micron Technology, Inc. | | | 12,265 | | | 1,222,207 |
Microsoft Corp. | | | 82,003 | | | 33,321,919 |
Monolithic Power Systems, Inc. | | | 538 | | | 408,503 |
Motorola Solutions, Inc. | | | 1,837 | | | 825,456 |
NetApp, Inc. | | | 2,254 | | | 259,909 |
Nvidia Corp. | | | 271,414 | | | 36,032,923 |
NXP Semiconductors NV | | | 2,797 | | | 655,897 |
ON Semiconductor Corp.(a) | | | 4,746 | | | 334,546 |
Oracle Corp. | | | 17,668 | | | 2,965,397 |
Palantir Technologies, Inc. - Class A(a) | | | 22,291 | | | 926,414 |
Palo Alto Networks, Inc.(a) | | | 3,566 | | | 1,284,937 |
PTC, Inc.(a) | | | 1,321 | | | 244,821 |
Qorvo, Inc.(a) | | | 1,052 | | | 74,966 |
Qualcomm, Inc. | | | 12,314 | | | 2,004,350 |
Roper Technologies, Inc. | | | 1,169 | | | 628,606 |
salesforce.com, Inc. | | | 10,711 | | | 3,120,864 |
| | | | | | | |
The accompanying notes are an integral part of these financial statements.
TABLE OF CONTENTS
Pacer Metaurus US Large Cap TARGET DIVIDEND Multiplier 400 ETF
Schedule of Investments
October 31, 2024(Continued)
| | | | | | | |
COMMON STOCKS - (Continued)
|
Information Technology - 28.4% (Continued)
|
Seagate Technology Holdings PLC | | | 2,297 | | | $230,550 |
ServiceNow, Inc.(a) | | | 2,259 | | | 2,107,624 |
Skyworks Solutions, Inc. | | | 1,744 | | | 152,740 |
Super Micro Computer, Inc.(a) | | | 5,540 | | | 161,269 |
Synopsys, Inc.(a) | | | 1,682 | | | 863,892 |
TE Connectivity PLC | | | 3,339 | | | 492,235 |
Teledyne Technologies, Inc.(a) | | | 508 | | | 231,303 |
Teradyne, Inc. | | | 1,797 | | | 190,859 |
Texas Instruments, Inc. | | | 10,104 | | | 2,052,729 |
Trimble, Inc.(a) | | | 2,696 | | | 163,108 |
Tyler Technologies, Inc.(a) | | | 464 | | | 280,994 |
VeriSign, Inc.(a) | | | 920 | | | 162,693 |
Western Digital Corp.(a) | | | 3,595 | | | 234,789 |
Zebra Technologies Corp. - Class A - Class A(a) | | | 565 | | | 215,813 |
| | | | | | 168,628,334 |
Materials - 1.9%
|
Air Products & Chemicals, Inc. | | | 2,447 | | | 759,867 |
Albemarle Corp. | | | 1,293 | | | 122,486 |
Amcor PLC | | | 15,988 | | | 177,946 |
Avery Dennison Corp. | | | 883 | | | 182,807 |
Ball Corp. | | | 3,336 | | | 197,658 |
Celanese Corp. | | | 1,203 | | | 151,542 |
CF Industries Holdings, Inc. | | | 1,984 | | | 163,144 |
Corteva, Inc. | | | 7,631 | | | 464,881 |
Dow, Inc. | | | 7,714 | | | 380,917 |
DuPont de Nemours, Inc. | | | 4,570 | | | 379,264 |
Eastman Chemical Co. | | | 1,286 | | | 135,146 |
Ecolab, Inc. | | | 2,783 | | | 683,867 |
FMC Corp. | | | 1,372 | | | 89,166 |
Freeport-McMoRan, Inc. | | | 15,907 | | | 716,133 |
International Flavors & Fragrances, Inc. | | | 2,806 | | | 279,001 |
International Paper Co. | | | 3,827 | | | 212,552 |
Linde PLC | | | 5,319 | | | 2,426,262 |
LyondellBasell Industries NV -
Class A | | | 2,848 | | | 247,349 |
Martin Marietta Materials, Inc. | | | 672 | | | 398,052 |
Mosaic Co. | | | 3,480 | | | 93,125 |
Newmont Goldcorp Corp. | | | 12,706 | | | 577,361 |
Nucor Corp. | | | 2,631 | | | 373,181 |
Packaging Corp. of America | | | 977 | | | 223,674 |
PPG Industries, Inc. | | | 2,567 | | | 319,617 |
Sherwin-Williams Co. | | | 2,553 | | | 915,940 |
Smurfit WestRock PLC | | | 5,440 | | | 280,160 |
Steel Dynamics, Inc. | | | 1,589 | | | 207,365 |
Vulcan Materials Co. | | | 1,451 | | | 397,472 |
| | | | | | 11,555,935 |
Real Estate - 0.1%
|
CBRE Group, Inc. - Class A(a) | | | 3,314 | | | 434,034 |
CoStar Group, Inc.(a) | | | 4,496 | | | 327,264 |
| | | | | | 761,298 |
| | | | | | | |
| | | | | | | |
Utilities - 2.3%
|
AES Corp. | | | 7,882 | | | $129,974 |
Alliant Energy Corp. | | | 2,814 | | | 168,840 |
Ameren Corp. | | | 2,912 | | | 253,664 |
American Electric Power Co., Inc. | | | 5,883 | | | 580,946 |
American Water Works Co., Inc. | | | 2,152 | | | 297,213 |
Atmos Energy Corp. | | | 1,701 | | | 236,065 |
CenterPoint Energy, Inc. | | | 7,171 | | | 211,760 |
CMS Energy Corp. | | | 3,290 | | | 229,017 |
Consolidated Edison, Inc. | | | 3,813 | | | 387,706 |
Constellation Energy Corp. | | | 3,423 | | | 900,112 |
Dominion Energy, Inc. | | | 9,250 | | | 550,653 |
DTE Energy Co. | | | 2,268 | | | 281,731 |
Duke Energy Corp. | | | 8,538 | | | 984,175 |
Edison International | | | 4,271 | | | 351,930 |
Entergy Corp. | | | 2,333 | | | 361,102 |
Evergy, Inc. | | | 2,530 | | | 152,913 |
Eversource Energy | | | 3,923 | | | 258,330 |
Exelon Corp. | | | 11,080 | | | 435,444 |
FirstEnergy Corp. | | | 5,623 | | | 235,210 |
NextEra Energy, Inc. | | | 22,753 | | | 1,803,175 |
NiSource, Inc. | | | 4,939 | | | 173,655 |
NRG Energy, Inc. | | | 2,262 | | | 204,485 |
PG&E Corp. | | | 23,691 | | | 479,032 |
Pinnacle West Capital Corp. | | | 1,250 | | | 109,763 |
PPL Corp. | | | 8,138 | | | 264,973 |
Public Service Enterprise Group, Inc. | | | 5,486 | | | 490,503 |
Sempra | | | 6,993 | | | 583,006 |
Southern Co. | | | 12,118 | | | 1,103,102 |
Vistra Corp. | | | 3,791 | | | 473,723 |
WEC Energy Group, Inc. | | | 3,456 | | | 330,152 |
Xcel Energy, Inc. | | | 6,125 | | | 409,211 |
| | | | | | 13,431,565 |
TOTAL COMMON STOCKS
(Cost $453,116,718) | | | | | | 520,912,725 |
| | | Par | |
U.S. TREASURY SECURITIES - 8.3%
|
United States Treasury Note/Bond
|
4.25%, 12/31/2024 | | | $5,400,000 | | | 5,396,899 |
1.75%, 03/15/2025 | | | 8,500,000 | | | 8,415,319 |
4.63%, 06/30/2025 | | | 6,500,000 | | | 6,509,715 |
3.00%, 09/30/2025 | | | 6,000,000 | | | 5,928,526 |
4.63%, 03/15/2026 | | | 8,000,000 | | | 8,040,625 |
4.63%, 06/30/2026 | | | 3,500,000 | | | 3,523,379 |
3.50%, 09/30/2026 | | | 3,500,000 | | | 3,457,344 |
2.50%, 03/31/2027 | | | 8,500,000 | | | 8,186,894 |
TOTAL U.S. TREASURY SECURITIES
(Cost $49,461,744) | | | | | | 49,458,701 |
| | | | | | | |
The accompanying notes are an integral part of these financial statements.
TABLE OF CONTENTS
Pacer Metaurus US Large Cap TARGET DIVIDEND Multiplier 400 ETF
Schedule of Investments
October 31, 2024(Continued)
| | | | | | | |
REAL ESTATE INVESTMENT TRUSTS - 1.9%
|
Alexandria Real Estate Equities, Inc. | | | 1,705 | | | $190,193 |
American Tower Corp. | | | 5,116 | | | 1,092,471 |
AvalonBay Communities, Inc. | | | 1,575 | | | 349,036 |
BXP, Inc. | | | 1,606 | | | 129,379 |
Camden Property Trust | | | 1,164 | | | 134,780 |
Crown Castle, Inc. | | | 4,806 | | | 516,597 |
Digital Realty Trust, Inc. | | | 3,376 | | | 601,704 |
Equinix, Inc. | | | 1,052 | | | 955,300 |
Equity Residential | | | 3,768 | | | 265,154 |
Essex Property Trust, Inc. | | | 706 | | | 200,405 |
Extra Space Storage, Inc. | | | 2,315 | | | 378,039 |
Federal Realty Investment Trust | | | 825 | | | 91,443 |
Healthpeak Properties, Inc. | | | 7,741 | | | 173,785 |
Host Hotels & Resorts, Inc. | | | 7,728 | | | 133,231 |
Invitation Homes, Inc. | | | 6,315 | | | 198,354 |
Iron Mountain, Inc. | | | 3,238 | | | 400,638 |
Kimco Realty Corp. | | | 7,458 | | | 176,904 |
Mid-America Apartment Communities, Inc. | | | 1,286 | | | 194,623 |
Prologis, Inc. | | | 10,226 | | | 1,154,924 |
Public Storage | | | 1,723 | | | 566,970 |
Realty Income Corp. | | | 9,628 | | | 571,614 |
Regency Centers Corp. | | | 1,799 | | | 128,521 |
SBA Communications Corp. | | | 1,172 | | | 268,939 |
Simon Property Group, Inc. | | | 3,364 | | | 568,920 |
UDR, Inc. | | | 3,303 | | | 139,354 |
Ventas, Inc. | | | 4,528 | | | 296,539 |
VICI Properties, Inc. | | | 11,603 | | | 368,511 |
Welltower, Inc. | | | 6,401 | | | 863,367 |
Weyerhaeuser Co. | | | 8,038 | | | 250,464 |
TOTAL REAL ESTATE INVESTMENT TRUSTS
(Cost $10,569,872) | | | | | | 11,360,159 |
TOTAL INVESTMENTS - 97.9%
(Cost $513,148,334) | | | | | | $581,731,585 |
Other Assets in Excess of
Liabilities - 2.1% | | | | | | 12,374,592 |
TOTAL NET ASSETS - 100.0% | | | | | | $594,106,177 |
| | | | | | | |
Percentages are stated as a percent of net assets.
The Global Industry Classification Standard (“GICS®”) was developed by and/or is the exclusive property of MSCI, Inc. (“MSCI”) and Standard & Poor’s Financial Services LLC (“S&P”). GICS® is a service mark of MSCI and S&P and has been licensed for use by U.S. Bank Global Fund Services.
NV - Naamloze Vennootschap
PLC - Public Limited Company
SA - Sociedad Anónima
(a)
| Non-income producing security. |
(b)
| To the extent that the Fund invests more heavily in a particular industry or sector of the economy, its performance will be especially sensitive to developments that significantly affect those industries or sectors. |
The accompanying notes are an integral part of these financial statements.
TABLE OF CONTENTS
Pacer Metaurus US Large Cap TARGET DIVIDEND Multiplier 400 ETF
Schedule of Futures Contracts
October 31, 2024
| | | | | | | | | | | | | |
S&P 500 Annual Dividend Index | | | 1,228 | | | 12/20/2024 | | | $ 23,101,750 | | | $ 1,372,772 |
S&P 500 Annual Dividend Index | | | 1,290 | | | 12/19/2025 | | | 24,703,500 | | | 1,790,194 |
S&P 500 Annual Dividend Index | | | 1,290 | | | 12/18/2026 | | | 24,800,250 | | | 1,053,748 |
S&P 500 Annual Dividend Index | | | 232 | | | 12/17/2027 | | | 4,451,500 | | | 23,348 |
Net Unrealized Appreciation (Depreciation) | | | | | | | | | | | | $ 4,240,062 |
| | | | | | | | | | | | | |
The accompanying notes are an integral part of these financial statements.
TABLE OF CONTENTS
Pacer Swan SOS Conservative April ETF
Schedule of Investments
October 31, 2024
| | | | | | | | | | |
PURCHASED OPTIONS - 100.7%
|
Call Options - 99.5%
| | | | | | | |
SPDR S&P 500 ETF, Expiration: 03/31/2025; Exercise Price:
$5.75(a)(b) | | | $ 38,042,016 | | | 669 | | | $ 37,574,124 |
Put Options - 1.2%
| | | | | | | |
SPDR S&P 500 ETF, Expiration: 03/31/2025; Exercise Price: $496.92(a)(b) | | | 38,042,016 | | | 669 | | | 469,564 |
TOTAL PURCHASED OPTIONS
(Cost $34,708,469) | | | | | | | | | $38,043,688 |
TOTAL INVESTMENTS - 100.7%
(Cost $34,708,469) | | | | | | | | | 38,043,688 |
Liabilities in Excess of Other Assets - (0.7)% | | | | | | | | | (274,254) |
TOTAL NET
ASSETS - 100.0% | | | | | | | | | $ 37,769,434 |
| | | | | | | | | | |
Percentages are stated as a percent of net assets.
(b)
| 100 shares per contract. |
The accompanying notes are an integral part of these financial statements.
TABLE OF CONTENTS
Pacer Swan SOS Conservative April ETF
Schedule of Written Options
October 31, 2024
| | | | | | | | | | |
WRITTEN OPTIONS - (1.8)%
|
Call Options - (1.5)%
|
SPDR S&P 500 ETF, Expiration: 03/31/2025; Exercise Price: $608.28(a)(b) | | | $ 38,042,016 | | | 669 | | | $(581,416) |
Put Options - (0.3)%
|
SPDR S&P 500 ETF, Expiration: 03/31/2025; Exercise Price: $366.15(a)(b) | | | 38,042,016 | | | 669 | | | (107,266) |
TOTAL WRITTEN OPTIONS
(Premiums received $635,181) | | | | | | | | | $(688,682) |
| | | | | | | | | | |
Percentages are stated as a percent of net assets.
(b)
| 100 shares per contract. |
The accompanying notes are an integral part of these financial statements.
TABLE OF CONTENTS
Pacer Swan SOS Conservative January ETF
Schedule of Investments
October 31, 2024
| | | | | | | | | | |
PURCHASED OPTIONS - 106.1%
|
Call Options - 105.8%
| | | | | | | |
SPDR S&P 500 ETF, Expiration: 12/31/2024; Exercise Price:
$5.23(a)(b) | | | $ 21,096,544 | | | 371 | | | $ 20,874,397 |
Put Options - 0.3%
| | | | | | | |
SPDR S&P 500 ETF, Expiration: 12/31/2024; Exercise Price: $451.54(a)(b) | | | 21,096,544 | | | 371 | | | 53,461 |
TOTAL PURCHASED OPTIONS
(Cost $18,101,265) | | | | | | | | | 20,927,858 |
TOTAL INVESTMENTS - 106.1%
(Cost $18,101,265) | | | | | | | | | $20,927,858 |
Liabilities in Excess of Other Assets - (6.1)% | | | | | | | | | (1,195,004) |
TOTAL NET
ASSETS - 100.0% | | | | | | | | | $ 19,732,854 |
| | | | | | | | | | |
Percentages are stated as a percent of net assets.
(b)
| 100 shares per contract. |
The accompanying notes are an integral part of these financial statements.
TABLE OF CONTENTS
Pacer Swan SOS Conservative January ETF
Schedule of Written Options
October 31, 2024
| | | | | | | | | | |
WRITTEN OPTIONS - (7.1)%
|
Call Options - (7.0)%
|
SPDR S&P 500 ETF, Expiration: 12/31/2024; Exercise Price: $542.80(a)(b) | | | $ 21,096,544 | | | 371 | | | $ (1,377,853) |
Put Options - (0.1)%
|
SPDR S&P 500 ETF, Expiration: 12/31/2024; Exercise Price: $332.72(a)(b) | | | 21,096,544 | | | 371 | | | (17,215) |
TOTAL WRITTEN OPTIONS
(Premiums received $798,989) | | | | | | | | | $ (1,395,068) |
| | | | | | | | | | |
Percentages are stated as a percent of net assets.
(b)
| 100 shares per contract. |
The accompanying notes are an integral part of these financial statements.
TABLE OF CONTENTS
Pacer Swan SOS Conservative July ETF
Schedule of Investments
October 31, 2024
| | | | | | | | | | |
PURCHASED OPTIONS - 101.2%
|
Call Options - 98.9%
| | | | | | | |
SPDR S&P 500 ETF, Expiration: 06/30/2025;
Exercise Price: $5.99(a)(b) | | | $ 37,359,648 | | | 657 | | | $ 36,812,584 |
Put Options - 2.3%
| | | | | | | |
SPDR S&P 500 ETF, Expiration: 06/30/2025;
Exercise Price:
$517.01(a)(b) | | | 37,359,648 | | | 657 | | | 858,903 |
TOTAL PURCHASED OPTIONS
(Cost $36,211,627) | | | | | | | | | 37,671,487 |
TOTAL INVESTMENTS - 101.2%
(Cost $36,211,627) | | | | | | | | | 37,671,487 |
Liabilities in Excess of Other Assets - (1.2)% | | | | | | | | | (434,655) |
TOTAL NET
ASSETS - 100.0% | | | | | | | | | $ 37,236,832 |
| | | | | | | | | | |
Percentages are stated as a percent of net assets.
(b)
| 100 shares per contract. |
The accompanying notes are an integral part of these financial statements.
TABLE OF CONTENTS
Pacer Swan SOS Conservative July ETF
Schedule of Written Options
October 31, 2024
| | | | | | | | | | |
WRITTEN OPTIONS - (2.1)%
|
Call Options - (1.6)%
|
SPDR S&P 500 ETF, Expiration: 06/30/2025; Exercise Price: $627.00(a)(b) | | | $ 37,359,648 | | | 657 | | | $ (606,720) |
Put Options - (0.5)%
|
SPDR S&P 500 ETF, Expiration: 06/30/2025; Exercise Price: $380.95(a)(b) | | | 37,359,648 | | | 657 | | | (191,220) |
TOTAL WRITTEN OPTIONS
(Premiums received $705,223) | | | | | | | | | $ (797,940) |
| | | | | | | | | | |
Percentages are stated as a percent of net assets.
(b)
| 100 shares per contract. |
The accompanying notes are an integral part of these financial statements.
TABLE OF CONTENTS
Pacer Swan SOS Conservative October ETF
Schedule of Investments
October 31, 2024
| | | | | | | | | | |
PURCHASED OPTIONS - 101.8%
|
Call Options - 98.0%
| | | | | | | |
SPDR S&P 500 ETF, Expiration: 09/30/2025;
Exercise Price:
$6.31(a)(b) | | | $ 14,898,368 | | | 262 | | | $ 14,657,373 |
Put Options - 3.8%
| | | | | | | |
SPDR S&P 500 ETF, Expiration: 09/30/2025;
Exercise Price:
$545.07(a)(b) | | | 14,898,368 | | | 262 | | | 573,921 |
TOTAL PURCHASED OPTIONS
(Cost $15,348,571) | | | | | | | | | 15,231,294 |
TOTAL INVESTMENTS - 101.8%
(Cost $15,348,571) | | | | | | | | | $15,231,294 |
Liabilities in Excess of Other Assets - (1.8)% | | | | | | | | | (273,362) |
TOTAL NET
ASSETS - 100.0% | | | | | | | | | $ 14,957,932 |
| | | | | | | | | | |
Percentages are stated as a percent of net assets.
(b)
| 100 shares per contract. |
The accompanying notes are an integral part of these financial statements.
TABLE OF CONTENTS
Pacer Swan SOS Conservative October ETF
Schedule of Written Options
October 31, 2024
| | | | | | | | | | |
WRITTEN OPTIONS - (2.7)%
|
Call Options - (1.9)%
|
SPDR S&P 500 ETF, Expiration: 09/30/2025; Exercise Price: $641.18(a)(b) | | | $ 14,898,368 | | | 262 | | | $ (279,276) |
Put Options - (0.8)%
|
SPDR S&P 500 ETF, Expiration: 09/30/2025; Exercise Price: $401.63(a)(b) | | | 14,898,368 | | | 262 | | | (129,517) |
TOTAL WRITTEN OPTIONS
(Premiums received $457,745) | | | | | | | | | $ (408,793) |
| | | | | | | | | | |
Percentages are stated as a percent of net assets.
(b)
| 100 shares per contract. |
The accompanying notes are an integral part of these financial statements.
TABLE OF CONTENTS
Pacer Swan SOS Flex April ETF
Schedule of Investments
October 31, 2024
| | | | | | | | | | |
PURCHASED OPTIONS - 101.8%
|
Call Options - 99.8%
| | | | | | | |
SPDR S&P 500 ETF,
Expiration: 03/31/2025; Exercise Price: $5.86(a)(b) | | | $ 24,906,432 | | | 438 | | | $ 24,595,378 |
Put Options - 2.0%
| | | | | | | |
SPDR S&P 500 ETF(a)(b)
| | | | | | | | | |
Expiration: 03/31/2025; Exercise Price: $523.07 | | | 24,906,432 | | | 438 | | | 439,279 |
Expiration: 03/31/2025; Exercise Price: $313.84 | | | 24,906,432 | | | 438 | | | 43,804 |
TOTAL PURCHASED OPTIONS
(Cost $23,484,199) | | | | | | | | | 25,078,461 |
TOTAL INVESTMENTS - 101.8%
(Cost $23,484,199) | | | | | | | | | $25,078,461 |
Liabilities in Excess of Other Assets - (1.8)% | | | | | | | | | (433,443) |
TOTAL NET
ASSETS - 100.0% | | | | | | | | | $ 24,645,018 |
| | | | | | | | | | |
Percentages are stated as a percent of net assets.
(b)
| 100 shares per contract. |
The accompanying notes are an integral part of these financial statements.
TABLE OF CONTENTS
Pacer Swan SOS Flex April ETF
Schedule of Written Options
October 31, 2024
| | | | | | | | | | |
WRITTEN OPTIONS - (2.4)%
|
Call Options - (1.5)%
|
SPDR S&P 500 ETF, Expiration: 03/31/2025; Exercise Price: $609.53(a)(b) | | | $ 24,906,432 | | | 438 | | | $(362,660) |
Put Options - (0.9)%
|
SPDR S&P 500 ETF, Expiration: 03/31/2025; Exercise Price: $418.46(a)(b) | | | 49,812,864 | | | 876 | | | (238,044) |
TOTAL WRITTEN OPTIONS
(Premiums received $859,756) | | | | | | | | | $(600,704) |
| | | | | | | | | | |
Percentages are stated as a percent of net assets.
(b)
| 100 shares per contract. |
The accompanying notes are an integral part of these financial statements.
TABLE OF CONTENTS
Pacer Swan SOS Flex January ETF
Schedule of Investments
October 31, 2024
| | | | | | | | | | |
PURCHASED OPTIONS - 105.7%
|
Call Options - 105.2%
| | | | | | | |
SPDR S&P 500 ETF, Expiration: 12/31/2024; Exercise Price:
$5.32(a)(b) | | | $50,040,320 | | | 880 | | | $49,505,579 |
Put Options - 0.5%
| | | | | | | |
SPDR S&P 500 ETF(a)(b)
| | | | | | | |
Expiration: 12/31/2024; Exercise Price: $475.31 | | | 50,040,320 | | | 880 | | | 177,778 |
Expiration: 12/31/2024; Exercise Price:
$285.19 | | | 50,040,320 | | | 880 | | | 29,999 |
TOTAL PURCHASED OPTIONS
(Cost $43,841,702) | | | | | | | | | 49,713,356 |
TOTAL INVESTMENTS - 105.7%
|
(Cost $43,841,702) | | | | | | | | | $49,713,356 |
Liabilities in Excess of Other Assets - (5.7)% | | | | | | | | | (2,646,372) |
TOTAL NET
ASSETS - 100.0% | | | | | | | | | $47,066,984 |
| | | | | | | | | | |
Percentages are stated as a percent of net assets.
(b)
| 100 shares per contract. |
The accompanying notes are an integral part of these financial statements.
TABLE OF CONTENTS
Pacer Swan SOS Flex January ETF
Schedule of Written Options
October 31, 2024
| | | | | | | | | | |
WRITTEN OPTIONS - (6.3)%
|
Call Options - (6.1)%
|
SPDR S&P 500 ETF, Expiration: 12/31/2024; Exercise Price: $548.65(a)(b) | | | $50,040,320 | | | 880 | | | $(2,855,459) |
Put Options - (0.2)%
| | | | | | | | | |
SPDR S&P 500 ETF, Expiration: 12/31/2024; Exercise Price: $380.25(a)(b) | | | 100,080,640 | | | 1,760 | | | (119,064) |
TOTAL WRITTEN OPTIONS
(Premiums received $2,423,371) | | | | | | | | | $(2,974,523) |
| | | | | | | | | | |
Percentages are stated as a percent of net assets.
(b)
| 100 shares per contract. |
The accompanying notes are an integral part of these financial statements.
TABLE OF CONTENTS
Pacer Swan SOS Flex July ETF
Schedule of Investments
October 31, 2024
| | | | | | | | | | |
PURCHASED OPTIONS - 102.4%
| | | | | | |
Call Options - 99.0%
| | | | | | | | | |
SPDR S&P 500 ETF, Expiration: 06/30/2025; Exercise Price:
$6.10(a)(b) | | | $27,237,856 | | | 479 | | | $26,833,901 |
Put Options - 3.4%
| | | | | | | | | |
SPDR S&P 500 ETF(a)(b)
| | | | | | | | | |
Expiration: 06/30/2025; Exercise Price: $544.22 | | | 27,237,856 | | | 479 | | | 857,784 |
Expiration: 06/30/2025; Exercise Price: $326.53 | | | 27,237,856 | | | 479 | | | 81,080 |
TOTAL PURCHASED OPTIONS
(Cost $26,743,190) | | | | | | | | | 27,772,765 |
TOTAL INVESTMENTS - 102.4%
|
(Cost $26,743,190) | | | | | | | | | $27,772,765 |
Liabilities in Excess of Other Assets - (2.4)% | | | | | | | | | (659,857) |
TOTAL NET
ASSETS - 100.0% | | | | | | | | | $27,112,908 |
| | | | | | | | | | |
Percentages are stated as a percent of net assets.
(b)
| 100 shares per contract. |
The accompanying notes are an integral part of these financial statements.
TABLE OF CONTENTS
Pacer Swan SOS Flex July ETF
Schedule of Written Options
October 31, 2024
| | | | | | | | | | |
WRITTEN OPTIONS - (3.4)%
| | | | | | | | | |
Call Options - (1.6)%
|
SPDR S&P 500 ETF, Expiration: 06/30/2025; Exercise Price: $627.32(a)(b) | | | $27,237,856 | | | 479 | | | $(437,902) |
Put Options - (1.8)%
|
SPDR S&P 500 ETF, Expiration: 06/30/2025; Exercise Price: $435.38(a)(b) | | | 54,475,712 | | | 958 | | | (487,449) |
TOTAL WRITTEN OPTIONS
(Premiums received $910,296) | | | | | | | | | $(925,351) |
| | | | | | | | | | |
Percentages are stated as a percent of net assets.
(b)
| 100 shares per contract. |
The accompanying notes are an integral part of these financial statements.
TABLE OF CONTENTS
Pacer Swan SOS Flex October ETF
Schedule of Investments
October 31, 2024
| | | | | | | | | | |
PURCHASED OPTIONS - 103.5%
|
Call Options - 97.9%
| | | | | | | |
SPDR S&P 500 ETF, Expiration: 09/30/2025; Exercise Price:
$6.43(a)(b) | | | $ 14,670,912 | | | 258 | | | $ 14,430,634 |
Put Options - 5.6%
| | | | | | | |
SPDR S&P 500 ETF (a)(b)
| | | | | | | | | |
Expiration: 09/30/2025; Exercise Price: $573.76 | | | 14,670,912 | | | 258 | | | 754,500 |
Expiration: 09/30/2025; Exercise Price: $344.26 | | | 14,670,912 | | | 258 | | | 73,084 |
TOTAL PURCHASED OPTIONS
(Cost $15,337,182) | | | | | | | | | 15,258,218 |
TOTAL INVESTMENTS - 103.5%
|
(Cost $15,337,182) | | | | | | | | | $15,258,218 |
Liabilities in Excess of Other Assets - (3.5)% | | | | | | | | | (519,920) |
TOTAL NET
ASSETS - 100.0% | | | | | | | | | $ 14,738,298 |
| | | | | | | | | | |
Percentages are stated as a percent of net assets.
(b)
| 100 shares per contract. |
The accompanying notes are an integral part of these financial statements.
TABLE OF CONTENTS
Pacer Swan SOS Flex October ETF
Schedule of Written Options
October 31, 2024
| | | | | | | | | | |
WRITTEN OPTIONS - (4.6)%
|
Call Options - (1.5)%
|
SPDR S&P 500 ETF, Expiration: 09/30/2025; Exercise Price: $650.13(a)(b) | | | $ 14,670,912 | | | 258 | | | $(215,053) |
Put Options - (3.1)%
| | | | | | | | | |
SPDR S&P 500 ETF, Expiration: 09/30/2025; Exercise Price: $459.01(a)(b) | | | 29,341,824 | | | 516 | | | (461,547) |
TOTAL WRITTEN OPTIONS
(Premiums received $706,013) | | | | | | | | | $(676,600) |
| | | | | | | | | | |
Percentages are stated as a percent of net assets.
(b)
| 100 shares per contract. |
The accompanying notes are an integral part of these financial statements.
TABLE OF CONTENTS
Pacer Swan SOS Fund of Funds ETF
Schedule of Investments
October 31, 2024
| | | | | | | |
AFFILIATED EXCHANGE TRADED FUNDS - 99.5%
|
Pacer Swan SOS Conservative (April) ETF(a)(b) | | | 1,312,698 | | | $33,614,520 |
Pacer Swan SOS Conservative (January) ETF(a)(b) | | | 539,983 | | | 14,695,151 |
Pacer Swan SOS Conservative (July) ETF(a)(b) | | | 1,240,907 | | | 32,371,045 |
Pacer Swan SOS Conservative (October) ETF(a)(b) | | | 438,477 | | | 11,413,556 |
Pacer Swan SOS Flex (April)
ETF(a)(b) | | | 514,875 | | | 14,929,264 |
Pacer Swan SOS Flex (January)
ETF(a)(b) | | | 761,833 | | | 24,723,385 |
Pacer Swan SOS Flex (July)
ETF(a)(b) | | | 619,348 | | | 17,675,263 |
Pacer Swan SOS Flex (October)
ETF(a)(b) | | | 418,350 | | | 11,764,044 |
Pacer Swan SOS Moderate (April)
ETF(a)(b) | | | 2,001,636 | | | 54,720,925 |
Pacer Swan SOS Moderate (January) ETF(a)(b) | | | 2,058,558 | | | 59,024,416 |
Pacer Swan SOS Moderate (July)
ETF(a)(b) | | | 2,299,512 | | | 63,933,562 |
Pacer Swan SOS Moderate (October) ETF(a)(b) | | | 1,363,536 | | | 36,842,744 |
TOTAL AFFILIATED EXCHANGE TRADED FUNDS
(Cost $333,136,265) | | | | | | 375,707,875 |
TOTAL INVESTMENTS - 99.5% (Cost $333,136,265) | | | | | | $375,707,875 |
Other Assets in Excess of
Liabilities - 0.5% | | | | | | 2,033,022 |
TOTAL NET ASSETS - 100.0% | | | | | | $ 377,740,897 |
| | | | | | | |
Percentages are stated as a percent of net assets.
(a)
| Non-income producing security.
|
(b)
| Affiliated company as defined by the Investment Company Act of 1940. |
The accompanying notes are an integral part of these financial statements.
TABLE OF CONTENTS
Pacer Swan SOS Moderate April ETF
Schedule of Investments
October 31, 2024
| | | | | | | | | | |
PURCHASED OPTIONS - 101.9%
| | | | | | |
Call Options - 100.1%
| | | | | | | |
SPDR S&P 500 ETF, Expiration: 03/31/2025; Exercise Price:
$5.81(a)(b) | | | $ 71,989,824 | | | 1,266 | | | $ 71,096,952 |
Put Options - 1.8%
| | | | | | | | | |
SPDR S&P 500 ETF, Expiration: 03/31/2025; Exercise Price: $523.12(a)(b) | | | 71,989,824 | | | 1,266 | | | 1,270,583 |
TOTAL PURCHASED OPTIONS
(Cost $66,845,216) | | | | | | | | | 72,367,535 |
TOTAL INVESTMENTS - 101.9%
| | | | | | |
(Cost $66,845,216) | | | | | | | | | $72,367,535 |
Liabilities in Excess of Other Assets - (1.9)% | | | | | | | | | (1,294,987) |
TOTAL NET
ASSETS - 100.0% | | | | | | | | | $ 71,072,548 |
| | | | | | | | | | |
Percentages are stated as a percent of net assets.
(b)
| 100 shares per contract. |
The accompanying notes are an integral part of these financial statements.
TABLE OF CONTENTS
Pacer Swan SOS Moderate April ETF
Schedule of Written Options
October 31, 2024
| | | | | | | | | | |
WRITTEN OPTIONS - (2.7)%
| | | | | | | | | |
Call Options - (2.1)%
| |
SPDR S&P 500 ETF, Expiration: 03/31/2025; Exercise Price: $600.38(a)(b) | | | $ 71,989,824 | | | 1,266 | | | $ (1,474,827) |
Put Options - (0.6)%
| |
SPDR S&P 500 ETF, Expiration: 03/31/2025; Exercise Price: $444.61(a)(b) | | | 71,989,824 | | | 1,266 | | | (461,330) |
TOTAL WRITTEN OPTIONS
(Premiums received $2,276,516) | | | | | | | | | $ (1,936,157) |
| | | | | | | | | | |
Percentages are stated as a percent of net assets.
(b)
| 100 shares per contract. |
The accompanying notes are an integral part of these financial statements.
TABLE OF CONTENTS
Pacer Swan SOS Moderate January ETF
Schedule of Investments
October 31, 2024
| | | | | | | | | | |
PURCHASED OPTIONS - 106.6%
|
Call Options - 106.2%
| | | | | | | | | |
SPDR S&P 500 ETF, Expiration: 12/31/2024; Exercise Price:
$5.28(a)(b) | | | $ 73,127,104 | | | 1,286 | | | $ 72,350,720 |
Put Options - 0.4%
| | | | | | | | | |
SPDR S&P 500 ETF, Expiration: 12/31/2024; Exercise Price:
$475.36(a)(b) | | | 73,127,104 | | | 1,286 | | | 260,004 |
TOTAL PURCHASED OPTIONS
(Cost $62,584,636) | | | | | | | | | 72,610,724 |
TOTAL INVESTMENTS - 106.6%
|
(Cost $62,584,636) | | | | | | | | | $72,610,724 |
Liabilities in Excess of Other Assets - (6.6)% | | | | | | | | | (4,508,742) |
TOTAL NET
ASSETS - 100.0% | | | | | | | | | $ 68,101,982 |
| | | | | | | | | | |
Percentages are stated as a percent of net assets.
(b)
| 100 shares per contract. |
The accompanying notes are an integral part of these financial statements.
TABLE OF CONTENTS
Pacer Swan SOS Moderate January ETF
Schedule of Written Options
October 31, 2024
| | | | | | | | | | |
WRITTEN OPTIONS - (7.6)%
| | | | | | | | | |
Call Options - (7.4)%
|
SPDR S&P 500 ETF, Expiration: 12/31/2024; Exercise Price: $540.19(a)(b) | | | $ 73,127,104 | | | 1,286 | | | $ (5,051,768) |
Put Options - (0.2)%
|
SPDR S&P 500 ETF, Expiration: 12/31/2024; Exercise Price: $404.01(a)(b) | | | 73,127,104 | | | 1,286 | | | (108,487) |
TOTAL WRITTEN OPTIONS
(Premiums received $3,155,973) | | | | | | | | | $(5,160,255) |
| | | | | | | | | | |
Percentages are stated as a percent of net assets.
(b)
| 100 shares per contract. |
The accompanying notes are an integral part of these financial statements.
TABLE OF CONTENTS
Pacer Swan SOS Moderate July ETF
Schedule of Investments
October 31, 2024
| | | | | | | | | | |
PURCHASED OPTIONS - 102.3%
| | | | | | |
Call Options - 99.1%
| | | | | | | | | |
SPDR S&P 500 ETF, Expiration: 06/30/2025; Exercise Price:
$6.04(a)(b) | | | $ 79,154,688 | | | 1,392 | | | $ 77,988,860 |
Put Options - 3.2%
| | | | | | | | | |
SPDR S&P 500 ETF, Expiration: 06/30/2025; Exercise Price: $544.27(a)(b) | | | 79,154,688 | | | 1,392 | | | 2,494,214 |
TOTAL PURCHASED OPTIONS
(Cost $77,141,454) | | | | | | | | | 80,483,074 |
TOTAL INVESTMENTS - 102.3%
| | | | | | |
(Cost $77,141,454) | | | | | | | | | $80,483,074 |
Liabilities in Excess of Other Assets - (2.3)% | | | | | | | | | (1,803,374) |
TOTAL NET
ASSETS - 100.0% | | | | | | | | | $ 78,679,700 |
| | | | | | | | | | |
Percentages are stated as a percent of net assets.
(b)
| 100 shares per contract. |
The accompanying notes are an integral part of these financial statements.
TABLE OF CONTENTS
Pacer Swan SOS Moderate July ETF
Schedule of Written Options
October 31, 2024
| | | | | | | | | | |
WRITTEN OPTIONS - (3.3)%
| | | | | | | | | |
Call Options - (2.1)%
| |
SPDR S&P 500 ETF, Expiration: 06/30/2025; Exercise Price: $619.54(a)(b) | | | $ 79,154,688 | | | 1,392 | | | $ (1,616,042) |
Put Options - (1.2)%
| |
SPDR S&P 500 ETF, Expiration: 06/30/2025; Exercise Price: $462.59(a)(b) | | | 79,154,688 | | | 1,392 | | | (960,021) |
TOTAL WRITTEN OPTIONS
(Premiums received $2,520,964) | | | | | | | | | $ (2,576,063) |
| | | | | | | | | | |
Percentages are stated as a percent of net assets.
(b)
| 100 shares per contract. |
The accompanying notes are an integral part of these financial statements.
TABLE OF CONTENTS
Pacer Swan SOS Moderate October ETF
Schedule of Investments
October 31, 2024
| | | | | | | | | | |
PURCHASED OPTIONS - 103.2%
|
Call Options - 98.1%
| | | | | | | | | |
SPDR S&P 500 ETF, Expiration: 09/30/2025; Exercise Price:
$6.37(a)(b) | | | $ 65,450,464 | | | 1,151 | | | $ 64,385,133 |
Put Options - 5.1%
| | | | | | | | | |
SPDR S&P 500 ETF, Expiration: 09/30/2025; Exercise Price: $573.82(a)(b) | | | 65,450,464 | | | 1,151 | | | 3,368,056 |
TOTAL PURCHASED OPTIONS
(Cost $68,010,657) | | | | | | | | | 67,753,189 |
TOTAL INVESTMENTS - 103.2%
|
(Cost $68,010,657) | | | | | | | | | $67,753,189 |
Liabilities in Excess of Other Assets - (3.2)% | | | | | | | | | (2,104,081) |
TOTAL NET
ASSETS - 100.0% | | | | | | | | | $65,649,108 |
| | | | | | | | | | |
Percentages are stated as a percent of net assets.
(b)
| 100 shares per contract. |
The accompanying notes are an integral part of these financial statements.
TABLE OF CONTENTS
Pacer Swan SOS Moderate October ETF
Schedule of Written Options
October 31, 2024
| | | | | | | | | | |
WRITTEN OPTIONS - (4.0)%
| | | | | | | | | |
Call Options - (1.9)%
| | | | | | | | | |
SPDR S&P 500 ETF, Expiration: 09/30/2025; Exercise Price: $640.55(a)(b) | | | $ 65,450,464 | | | 1,151 | | | $(1,247,753) |
Put Options - (2.1)%
| |
SPDR S&P 500 ETF, Expiration: 09/30/2025; Exercise Price: $487.70(a)(b) | | | 65,450,464 | | | 1,151 | | | (1,396,462) |
TOTAL WRITTEN OPTIONS
(Premiums received $2,782,954) | | | | | | | | | $(2,644,215) |
| | | | | | | | | | |
Percentages are stated as a percent of net assets.
(b)
| 100 shares per contract. |
The accompanying notes are an integral part of these financial statements.
TABLE OF CONTENTS
PACER FUNDS
Statements of Assets and Liabilities
October 31, 2024
| | | | | | | | | | | | | | | | |
ASSETS:
| | | | | | | | | | | | | | | |
Investments, at value | | | $ 73,978,773 | | | $ 947,471 | | | $ 820,588 | | | $ 486,976 | | | $ 5,742,080 |
Dividends receivable | | | 249,839 | | | 348 | | | 1,368 | | | 1,009 | | | 615 |
Cash - interest bearing deposit account | | | 42,319 | | | 13,262 | | | 392 | | | 848 | | | 328,031 |
Dividend tax reclaims receivable | | | 6,408 | | | 23 | | | 40 | | | 237 | | | — |
Security lending income receivable | | | 4,212 | | | — | | | — | | | — | | | — |
Interest receivable | | | 363 | | | 6 | | | 2 | | | 2 | | | 1,038 |
Receivable for investments sold | | | — | | | 10,865 | | | — | | | — | | | — |
Foreign currency, at value | | | — | | | 107 | | | — | | | — | | | — |
Deposit at broker for other investments | | | — | | | — | | | — | | | — | | | 323,628 |
Prepaid expenses and other assets | | | — | | | — | | | — | | | — | | | 17 |
Total assets | | | 74,281,914 | | | 972,082 | | | 822,390 | | | 489,072 | | | 6,395,409 |
LIABILITIES:
| | | | | | | | | | | | | | | |
Payable upon return of securities loaned | | | 10,336,726 | | | — | | | — | | | — | | | — |
Payable to adviser | | | 39,435 | | | 491 | | | 432 | | | 276 | | | 3,287 |
Payable to custodian foreign currency, at value | | | 79 | | | — | | | — | | | — | | | — |
Payable for investments purchased | | | — | | | 11,967 | | | — | | | — | | | — |
Total liabilities | | | 10,376,240 | | | 12,458 | | | 432 | | | 276 | | | 3,287 |
NET ASSETS | | | $63,905,674 | | | $ 959,624 | | | $ 821,958 | | | $ 488,796 | | | $ 6,392,122 |
NET ASSETS CONSISTS OF:
| | | | | | | | | | | | | | | |
Paid-in capital | | | 44,531,573 | | | $ 986,504 | | | $ 861,509 | | | $ 500,250 | | | $ 6,358,000 |
Total distributable earnings/
(accumulated losses) | | | 19,374,101 | | | (26,880) | | | (39,551) | | | (11,454) | | | 34,122 |
Total net assets | | | $ 63,905,674 | | | $ 959,624 | | | $ 821,958 | | | $ 488,796 | | | $ 6,392,122 |
Net assets | | | $ 63,905,674 | | | $ 959,624 | | | $ 821,958 | | | $ 488,796 | | | $ 6,392,122 |
Shares issued and outstanding | | | 1,750,000 | | | 40,000 | | | 40,000 | | | 25,000 | | | 200,000 |
Net asset value per share | | | $36.52 | | | $23.99 | | | $20.55 | | | $19.55 | | | $31.96 |
COST:
| | | | | | | | | | | | | | | |
Investments, at cost | | | $53,411,399 | | | $ 871,253 | | | $ 836,300 | | | $ 483,458 | | | $ 5,731,183 |
Foreign currency, at cost | | | $— | | | $192 | | | $— | | | $— | | | $— |
LOANED SECURITIES:
| |
at value (included in investments) | | | $9,968,392 | | | $— | | | $— | | | $— | | | $— |
| | | | | | | | | | | | | | | | |
The accompanying notes are an integral part of these financial statements.
TABLE OF CONTENTS
PACER FUNDS
Statements of Assets and Liabilities
October 31, 2024(Continued)
| | | | | | | | | | | | | | | | |
ASSETS:
| | | | | | | | | | | | | | | |
Investments, at value | | | $581,731,585 | | | $38,043,688 | | | $20,927,858 | | | $37,671,487 | | | $15,231,294 |
Receivable for fund shares sold | | | 9,053,064 | | | — | | | — | | | — | | | — |
Deposit at broker for other investments | | | 6,295,149 | | | 10,247 | | | 12,703 | | | 12,433 | | | 10,536 |
Cash - interest bearing deposit account | | | 5,843,256 | | | 422,635 | | | 196,974 | | | 369,202 | | | 130,291 |
Receivable for investments sold | | | 659,975 | | | — | | | — | | | — | | | — |
Interest receivable | | | 365,843 | | | 1,263 | | | 627 | | | 1,108 | | | 332 |
Dividends receivable | | | 262,803 | | | — | | | — | | | — | | | — |
Dividend tax reclaims receivable | | | 2,352 | | | — | | | — | | | — | | | — |
Prepaid expenses and other assets | | | 328 | | | — | | | 10 | | | 18 | | | 5 |
Total assets | | | 604,214,355 | | | 38,477,833 | | | 21,138,172 | | | 38,054,248 | | | 15,372,458 |
LIABILITIES:
| | | | | | | | | | | | | | | |
Written option contracts, at value | | | — | | | 688,682 | | | 1,395,068 | | | 797,940 | | | 408,793 |
Payable for investments purchased | | | 9,822,028 | | | — | | | — | | | — | | | — |
Payable to adviser | | | 286,150 | | | 19,717 | | | 10,250 | | | 19,476 | | | 5,733 |
Total liabilities | | | 10,108,178 | | | 708,399 | | | 1,405,318 | | | 817,416 | | | 414,526 |
NET ASSETS | | | $594,106,177 | | | $37,769,434 | | | $19,732,854 | | | $37,236,832 | | | $14,957,932 |
NET ASSETS CONSISTS OF:
| | | | | | | | | | | | | | | |
Paid-in capital | | | $529,202,892 | | | $ 37,176,727 | | | $ 19,178,919 | | | $ 37,339,601 | | | $ 16,670,907 |
Total distributable earnings/(accumulated losses) | | | 64,903,285 | | | 592,707 | | | 553,935 | | | (102,769) | | | (1,712,975) |
Total net assets | | | $ 594,106,177 | | | $ 37,769,434 | | | $ 19,732,854 | | | $ 37,236,832 | | | $ 14,957,932 |
Net assets | | | $ 594,106,177 | | | $ 37,769,434 | | | $ 19,732,854 | | | $ 37,236,832 | | | $ 14,957,932 |
Shares issued and outstanding | | | 15,750,000 | | | 1,475,000 | | | 725,000 | | | 1,425,000 | | | 575,000 |
Net asset value per share | | | $37.72 | | | $25.61 | | | $27.22 | | | $26.13 | | | $26.01 |
COST:
| | | | | | | | | | | | | | | |
Investments, at cost | | | $ 513,148,334 | | | $ 34,708,469 | | | $ 18,101,265 | | | $36,211,627 | | | $ 15,348,571 |
PROCEEDS:
| | | | | | | | | | | | | | | |
Written options premium | | | $— | | | $635,181 | | | $798,989 | | | $705,223 | | | $457,745 |
| | | | | | | | | | | | | | | | |
The accompanying notes are an integral part of these financial statements.
TABLE OF CONTENTS
PACER FUNDS
Statements of Assets and Liabilities
October 31, 2024(Continued)
| | | | | | | | | | | | | | | | |
ASSETS:
| | | | | | | | | | | | | | | |
Investments in unaffiliates, at value | | | $25,078,461 | | | $49,713,356 | | | $27,772,765 | | | $15,258,218 | | | $— |
Investments in affiliates, at fair value | | | — | | | — | | | — | | | — | | | 375,707,875 |
Cash - interest bearing deposit account | | | 172,132 | | | 342,632 | | | 269,087 | | | 156,981 | | | 2,065,006 |
Deposit at broker for other investments | | | 7,169 | | | 8,681 | | | 9,624 | | | 6,992 | | | — |
Interest receivable | | | 554 | | | 1,023 | | | 801 | | | 454 | | | 6,572 |
Prepaid expenses and other assets | | | 9 | | | 17 | | | 13 | | | 7 | | | 108 |
Total assets | | | 25,258,325 | | | 50,065,709 | | | 28,052,290 | | | 15,422,652 | | | 377,779,561 |
LIABILITIES:
| | | | | | | | | | | | | | | |
Written option contracts, at value | | | 600,704 | | | 2,974,523 | | | 925,351 | | | 676,600 | | | — |
Payable to adviser | | | 12,603 | | | 24,202 | | | 14,031 | | | 7,754 | | | 38,664 |
Total liabilities | | | 613,307 | | | 2,998,725 | | | 939,382 | | | 684,354 | | | 38,664 |
NET ASSETS | | | $24,645,018 | | | $47,066,984 | | | $27,112,908 | | | $14,738,298 | | | $377,740,897 |
Net Assets Consists of:
| | | | | | | | | | | | | | | |
Paid-in capital | | | $27,118,520 | | | $ 44,435,618 | | | $29,089,433 | | | $ 17,477,763 | | | $ 335,639,948 |
Total distributable earnings/(accumulated losses) | | | (2,473,502) | | | 2,631,366 | | | (1,976,525) | | | (2,739,465) | | | 42,100,949 |
Total net assets | | | $24,645,018 | | | $47,066,984 | | | $27,112,908 | | | $14,738,298 | | | $377,740,897 |
Net assets | | | $24,645,018 | | | $47,066,984 | | | $27,112,908 | | | $14,738,298 | | | $377,740,897 |
Shares issued and outstanding | | | 850,000 | | | 1,450,000 | | | 950,000 | | | 525,000 | | | 13,200,000 |
Net asset value per share | | | $28.99 | | | $32.46 | | | $28.54 | | | $28.07 | | | $28.62 |
Cost:
| | | | | | | | | | | | | | | |
Investments in unaffiliates, at cost | | | $23,484,199 | | | $43,841,702 | | | $26,743,190 | | | $15,337,182 | | | $— |
Investments in affiliates, at cost | | | $— | | | $— | | | $— | | | $— | | | $333,136,265 |
Proceeds:
| | | | | | | | | | | | | | | |
Written options premium | | | $859,756 | | | $2,423,371 | | | $910,296 | | | $706,013 | | | $— |
| | | | | | | | | | | | | | | | |
The accompanying notes are an integral part of these financial statements.
TABLE OF CONTENTS
PACER FUNDS
Statements of Assets and Liabilities
October 31, 2024(Continued)
| | | | | | | | | | | | | |
ASSETS:
| | | | | | | | | | | | |
Investments, at value | | | $ 72,367,535 | | | $ 72,610,724 | | | $ 80,483,074 | | | $ 67,753,189 |
Cash - interest bearing deposit account | | | 669,966 | | | 670,366 | | | 799,729 | | | 563,474 |
Deposit at broker for other investments | | | 6,027 | | | 14,477 | | | 11,621 | | | 5,942 |
Interest receivable | | | 2,146 | | | 1,733 | | | 2,589 | | | 1,549 |
Prepaid expenses and other assets | | | — | | | — | | | 42 | | | 25 |
Total assets | | | 73,045,674 | | | 73,297,300 | | | 81,297,055 | | | 68,324,179 |
LIABILITIES:
| | | | | | | | | | | | |
Written option contracts, at value | | | 1,936,157 | | | 5,160,255 | | | 2,576,063 | | | 2,644,215 |
Payable to adviser | | | 36,969 | | | 35,062 | | | 41,292 | | | 30,856 |
Interest payable | | | — | | | 1 | | | — | | | — |
Total liabilities | | | 1,973,126 | | | 5,195,318 | | | 2,617,355 | | | 2,675,071 |
NET ASSETS | | | $71,072,548 | | | $ 68,101,982 | | | $ 78,679,700 | | | $ 65,649,108 |
NET ASSETS CONSISTS OF:
| | | | | | | | | | | | |
Paid-in capital | | | $ 72,559,300 | | | $ 63,613,898 | | | $ 80,824,827 | | | $74,182,536 |
Total distributable earnings/(accumulated losses) | | | (1,486,752) | | | 4,488,084 | | | (2,145,127) | | | (8,533,428) |
Total net assets | | | $ 71,072,548 | | | $ 68,101,982 | | | $ 78,679,700 | | | $ 65,649,108 |
Net assets | | | $ 71,072,548 | | | $ 68,101,982 | | | $ 78,679,700 | | | $ 65,649,108 |
Shares issued and outstanding | | | 2,600,000 | | | 2,375,000 | | | 2,825,000 | | | 2,425,000 |
Net asset value per share | | | $27.34 | | | $28.67 | | | $27.85 | | | $27.07 |
COST:
| | | | | | | | | | | | |
Investments, at cost | | | $ 66,845,216 | | | $ 62,584,636 | | | $ 77,141,454 | | | $ 68,010,657 |
Proceeds:
| | | | | | | | | | | | |
Written options premium | | | $2,276,516 | | | $3,155,973 | | | $2,520,964 | | | $2,782,954 |
| | | | | | | | | | | | | |
The accompanying notes are an integral part of these financial statements.
TABLE OF CONTENTS
PACER FUNDS
Statements of Operations
For the Period Ended October 31, 2024
| | | | | | | | | | | | | | | | |
INVESTMENT INCOME:
| | | | | | | | | | | | | | | |
Dividend income | | | $1,700,341 | | | $9,498 | | | $8,179 | | | $14,590 | | | $2,264 |
Less: Dividend withholding taxes | | | (126,159) | | | (909) | | | (970) | | | (2,179) | | | (9) |
Less: Issuance fees | | | — | | | (2) | | | (242) | | | — | | | — |
Interest income | | | 4,553 | | | 68 | | | 35 | | | 27 | | | 1,260 |
Securities lending income | | | 30,269 | | | — | | | — | | | — | | | — |
Other income | | | 17 | | | — | | | — | | | — | | | — |
Total investment income | | | 1,609,021 | | | 8,655 | | | 7,002 | | | 12,438 | | | 3,515 |
EXPENSES:
| | | | | | | | | | | | | | | |
Investment advisory fee | | | 400,222 | | | 5,176 | | | 5,436 | | | 2,886 | | | 3,918 |
Total expenses | | | 400,222 | | | 5,176 | | | 5,436 | | | 2,886 | | | 3,918 |
Net investment income/(loss) | | | 1,208,799 | | | 3,479 | | | 1,566 | | | 9,552 | | | (403) |
REALIZED AND UNREALIZED GAIN/(LOSS)
| | | | | | | | | | | | | | | |
Net realized gain/(loss) from:
| | | | | | | | | | | | | | | |
Investments | | | 3,142,737 | | | 91,181 | | | 91,368 | | | (32,595) | | | — |
Distributions received from other investment companies | | | — | | | 781 | | | — | | | — | | | — |
Foreign currency translation | | | (6,753) | | | 1,839 | | | (51) | | | (625) | | | — |
Net realized gain/(loss) | | | 3,135,984 | | | 93,801 | | | 91,317 | | | (33,220) | | | — |
Net change in unrealized
appreciation on:
| | | | | | | | | | | | | | | |
Investments | | | 13,850,252 | | | 166,088 | | | 109,643 | | | 3,518 | | | 10,898 |
Future contracts | | | — | | | — | | | — | | | — | | | 23,627 |
Foreign currency translation | | | 232 | | | (112) | | | (37) | | | (41) | | | — |
Net change in unrealized
appreciation | | | 13,850,484 | | | 165,976 | | | 109,606 | | | 3,477 | | | 34,525 |
Net realized and unrealized gain/(loss) | | | 16,986,468 | | | 259,777 | | | 200,923 | | | (29,743) | | | 34,525 |
NET INCREASE/(DECREASE) IN NET ASSETS RESULTING FROM OPERATIONS | | | $ 18,195,267 | | | $ 263,256 | | | $ 202,489 | | | $ (20,191) | | | $ 34,122 |
| | | | | | | | | | | | | | | | |
(a)
| Inception date of the Fund was March 20, 2024 |
(b)
| Inception date of the Fund was September 23, 2024 |
The accompanying notes are an integral part of these financial statements.
TABLE OF CONTENTS
PACER FUNDS
Statements of Operations
For the Year Ended October 31, 2024(Continued)
| | | | | | | | | | | | | | | | |
INVESTMENT INCOME:
| | | | | | | | | | | | | | | |
Dividend income | | | $4,242,608 | | | $— | | | $— | | | $— | | | $— |
Less: Dividend withholding taxes | | | (1,077) | | | — | | | — | | | — | | | — |
Less: Issuance fees | | | (9) | | | — | | | — | | | — | | | — |
Interest income | | | 2,019,985 | | | 8,863 | | | 5,594 | | | 6,152 | | | 2,811 |
Total investment income | | | 6,261,507 | | | 8,863 | | | 5,594 | | | 6,152 | | | 2,811 |
EXPENSES:
| | | | | | | | | | | | | | | |
Investment advisory fee | | | 2,202,966 | | | 156,892 | | | 112,991 | | | 115,227 | | | 56,838 |
Interest expense | | | — | | | 1,793 | | | 1,243 | | | 1,126 | | | 467 |
Total expenses | | | 2,202,966 | | | 158,685 | | | 114,234 | | | 116,353 | | | 57,305 |
Net investment income/(loss) | | | 4,058,541 | | | (149,822) | | | (108,640) | | | (110,201) | | | (54,494) |
REALIZED AND UNREALIZED GAIN
| | | | | | | | | | | | |
Net realized gain from:
| | | | | | | | | | | | | | | |
Investments | | | 3,873,048 | | | 2,548,230 | | | 2,030,641 | | | 2,305,469 | | | 2,496,685 |
Written option contracts | | | — | | | (1,135,928) | | | (604,099) | | | (638,381) | | | (1,289,599) |
Futures contracts | | | 723,267 | | | — | | | — | | | — | | | — |
Net realized gain | | | 4,596,315 | | | 1,412,302 | | | 1,426,542 | | | 1,667,088 | | | 1,207,086 |
Net change in unrealized
appreciation on:
| | | | | | | | | | | | | | | |
Investments | | | 70,008,791 | | | 3,334,542 | | | 2,454,284 | | | 2,047,482 | | | 10,273 |
Written option contracts | | | — | | | (327,108) | | | (989,097) | | | (387,071) | | | (1,152) |
Future contracts | | | 3,256,075 | | | — | | | — | | | — | | | — |
Net change in unrealized
appreciation | | | 73,264,866 | | | 3,007,434 | | | 1,465,187 | | | 1,660,411 | | | 9,121 |
Net realized and unrealized gain | | | 77,861,181 | | | 4,419,736 | | | 2,891,729 | | | 3,327,499 | | | 1,216,207 |
NET INCREASE IN NET ASSETS RESULTING FROM OPERATIONS | | | $ 81,919,722 | | | $4,269,914 | | | $ 2,783,089 | | | $ 3,217,298 | | | $1,161,713 |
| | | | | | | | | | | | | | | | |
The accompanying notes are an integral part of these financial statements.
TABLE OF CONTENTS
PACER FUNDS
Statements of Operations
For the Year Ended October 31, 2024(Continued)
| | | | | | | | | | | | | | | | |
INVESTMENT INCOME:
| | | | | | | | | | | | | | | |
Interest income | | | $8,163 | | | $11,877 | | | $9,122 | | | $4,658 | | | $83,911 |
Total investment income | | | 8,163 | | | 11,877 | | | 9,122 | | | 4,658 | | | 83,911 |
EXPENSES:
| | | | | | | | | | | | | | | |
Investment advisory fee | | | 144,162 | | | 246,897 | | | 169,959 | | | 96,539 | | | 408,105 |
Interest expense | | | 2,223 | | | 3,127 | | | 2,648 | | | 1,110 | | | 10 |
Total expenses | | | 146,385 | | | 250,024 | | | 172,607 | | | 97,649 | | | 408,115 |
Net investment loss | | | (138,222) | | | (238,147) | | | (163,485) | | | (92,991) | | | (324,204) |
REALIZED AND UNREALIZED GAIN
| | | | | | | | | | | | |
Net realized gain from:
| | | | | | | | | | | | | | | |
Investments - unaffiliates | | | 4,057,766 | | | 3,212,365 | | | 3,932,025 | | | 3,989,146 | | | — |
Investments in affiliates | | | — | | | — | | | — | | | — | | | 12,173,994 |
Written option contracts | | | (954,240) | | | 77,399 | | | 331,416 | | | (1,708,266) | | | — |
Net realized gain | | | 3,103,526 | | | 3,289,764 | | | 4,263,441 | | | 2,280,880 | | | 12,173,994 |
Net change in unrealized
appreciation on:
| | | | | | | | | | | | | | | |
Investments - unaffiliates | | | 1,667,844 | | | 5,604,289 | | | 2,559,335 | | | 106,931 | | | — |
Investments in affiliates | | | — | | | — | | | — | | | — | | | 35,921,245 |
Written option contracts | | | (405,976) | | | (1,403,293) | | | (1,151,543) | | | (27,181) | | | — |
Net change in unrealized
appreciation | | | 1,261,868 | | | 4,200,996 | | | 1,407,792 | | | 79,750 | | | 35,921,245 |
Net realized and unrealized gain | | | 4,365,394 | | | 7,490,760 | | | 5,671,233 | | | 2,360,630 | | | 48,095,239 |
NET INCREASE IN NET ASSETS RESULTING FROM OPERATIONS | | | $ 4,227,172 | | | $7,252,613 | | | $5,507,748 | | | $2,267,639 | | | $ 47,771,035 |
| | | | | | | | | | | | | | | | |
The accompanying notes are an integral part of these financial statements.
TABLE OF CONTENTS
PACER FUNDS
Statements of Operations
For the Year Ended October 31, 2024(Continued)
| | | | | | | | | | | | | |
INVESTMENT INCOME:
| | | | | | | | | | | | |
Interest income | | | $19,505 | | | $22,325 | | | $23,700 | | | $14,431 |
Total investment income | | | 19,505 | | | 22,325 | | | 23,700 | | | 14,431 |
EXPENSES:
| | | | | | | | | | | | |
Investment advisory fee | | | 374,361 | | | 405,300 | | | 405,424 | | | 285,159 |
Interest expense | | | 3,916 | | | 4,237 | | | 3,917 | | | 1,874 |
Total expenses | | | 378,277 | | | 409,537 | | | 409,341 | | | 287,033 |
Net investment loss | | | (358,772) | | | (387,212) | | | (385,641) | | | (272,602) |
REALIZED AND UNREALIZED GAIN
| | | | | | | | | | | | |
Net realized gain from:
| | | | | | | | | | | | |
Investments | | | 7,781,754 | | | 6,266,539 | | | 9,850,813 | | | 11,877,729 |
Written option contracts | | | (3,145,341) | | | (1,954,166) | | | (2,676,117) | | | (5,929,062) |
Net realized gain | | | 4,636,413 | | | 4,312,373 | | | 7,174,696 | | | 5,948,667 |
Net change in unrealized appreciation on:
| | | | | | | | | | | | |
Investments | | | 5,897,477 | | | 9,284,311 | | | 5,256,794 | | | 377,700 |
Written option contracts | | | (672,838) | | | (3,365,458) | | | (942,083) | | | (110,680) |
Net change in unrealized appreciation | | | 5,224,639 | | | 5,918,853 | | | 4,314,711 | | | 267,020 |
Net realized and unrealized gain | | | 9,861,052 | | | 10,231,226 | | | 11,489,407 | | | 6,215,687 |
NET INCREASE IN NET ASSETS RESULTING FROM OPERATIONS | | | $9,502,280 | | | $9,844,014 | | | $ 11,103,766 | | | $5,943,085 |
| | | | | | | | | | | | | |
The accompanying notes are an integral part of these financial statements.
TABLE OF CONTENTS
Pacer Funds
Statements of Changes in Net Assets
| | | | | | | |
OPERATIONS:
| | | | | | | | | | | | |
Net investment income | | | $ 1,208,799 | | | $ 1,086,307 | | | $ 3,479 | | | $ 5,902 |
Net realized gain/(loss) | | | 3,135,984 | | | 2,610,511 | | | 93,801 | | | (8,100) |
Net change in unrealized appreciation/(depreciation) | | | 13,850,484 | | | (2,676,795) | | | 165,976 | | | 87,562 |
Net increase in net assets from operations | | | 18,195,267 | | | 1,020,023 | | | 263,256 | | | 85,364 |
DISTRIBUTIONS TO SHAREHOLDERS:
| | | | | | | | | |
Distributions to shareholders | | | (1,396,764) | | | (572,644) | | | (3,735) | | | (6,600) |
Return of capital | | | (1,033,236) | | | (1,917,356) | | | — | | | — |
Total distributions to shareholders | | | (2,430,000) | | | (2,490,000) | | | (3,735) | | | (6,600) |
CAPITAL TRANSACTIONS:
| | | | | | | | | | | | |
Subscriptions | | | 8,137,985 | | | 4,192,825 | | | 435,384 | | | — |
Redemptions | | | (3,386,030) | | | (6,710,965) | | | (431,758) | | | — |
ETF transaction fees (See Note 1) | | | — | | | — | | | 1 | | | — |
Net increase (decrease) in net assets from capital transactions | | | 4,751,955 | | | (2,518,140) | | | 3,627 | | | — |
Net increase (decrease) in net assets | | | 20,517,222 | | | (3,988,117) | | | 263,148 | | | 78,764 |
NET ASSETS:
| | | | | | | | | | | | |
Beginning of the year | | | 43,388,452 | | | 47,376,569 | | | 696,476 | | | 617,712 |
End of the year | | | $63,905,674 | | | $ 43,388,452 | | | $ 959,624 | | | $ 696,476 |
SHARES TRANSACTIONS
| | | | | | | | | | | | |
Subscriptions | | | 250,000 | | | 150,000 | | | 20,000 | | | — |
Redemptions | | | (100,000) | | | (250,000) | | | (20,000) | | | — |
Total increase/(decrease) in shares outstanding | | | 150,000 | | | (100,000) | | | — | | | — |
| | | | | | | | | | | | | |
The accompanying notes are an integral part of these financial statements.
TABLE OF CONTENTS
Pacer Funds
Statements of Changes in Net Assets
| | | | | | | | | | |
OPERATIONS:
| | | | | | | | | | | | |
Net investment income/(loss) | | | $ 1,566 | | | $ 2,986 | | | $ 9,552 | | | $ (403) |
Net realized gain/(loss) | | | 91,317 | | | (12,531) | | | (33,220) | | | — |
Net change in unrealized appreciation | | | 109,606 | | | 66,955 | | | 3,477 | | | 34,525 |
Net increase/(decrease) in net assets from operations | | | 202,489 | | | 57,410 | | | (20,191) | | | 34,122 |
DISTRIBUTIONS TO SHAREHOLDERS:
| | | | | | | | | | | | |
Distributions to shareholders | | | (1,389) | | | (3,412) | | | (8,278) | | | — |
Return of capital | | | — | | | (723) | | | — | | | — |
Total distributions to shareholders | | | (1,389) | | | (4,135) | | | (8,278) | | | — |
CAPITAL TRANSACTIONS:
| | | | | | | | | | | | |
Subscriptions | | | — | | | — | | | 1,005,000 | | | 6,358,000 |
Redemptions | | | (792,712) | | | — | | | (487,735) | | | — |
Net increase (decrease) in net assets from capital transactions | | | (792,712) | | | — | | | 517,265 | | | 6,358,000 |
Net increase (decrease) in net assets | | | (591,612) | | | 53,275 | | | 488,796 | | | 6,392,122 |
NET ASSETS:
| | | | | | | | | | | | |
Beginning of the period | | | 1,413,570 | | | 1,360,295 | | | — | | | — |
End of the period | | | $821,958 | | | $ 1,413,570 | | | $ 488,796 | | | $ 6,392,122 |
SHARES TRANSACTIONS
| | | | | | | | | | | | |
Subscriptions | | | — | | | — | | | 50,000 | | | 200,000 |
Redemptions | | | (40,000) | | | — | | | (25,000) | | | — |
Total increase/(decrease) in shares outstanding | | | (40,000) | | | — | | | 25,000 | | | 200,000 |
| | | | | | | | | | | | | |
(a)
| Inception date of the Fund was March 20, 2024. |
(b)
| Inception date of the Fund was September 23, 2024. |
The accompanying notes are an integral part of these financial statements.
TABLE OF CONTENTS
Pacer Funds
Statements of Changes in Net Assets
| | | | | | | |
OPERATIONS:
| | | | | | | | | | | | | | | |
Net investment income/(loss) | | | $ 4,058,541 | | | $ 810,583 | | | $821,750 | | | $ (149,822) | | | $ (107,370) |
Net realized gain/(loss) | | | 4,596,315 | | | (662,605) | | | (750,663) | | | 1,412,302 | | | (682,641) |
Net change in unrealized appreciation/(depreciation) | | | 73,264,866 | | | (695,885) | | | 4,665,415 | | | 3,007,434 | | | 1,468,250 |
Net increase/(decrease) in net assets from operations | | | 81,919,722 | | | (547,907) | | | 4,736,502 | | | 4,269,914 | | | 678,239 |
DISTRIBUTIONS TO SHAREHOLDERS:
| | | | | | | | | | | | | |
Distributions to shareholders | | | (7,672,502) | | | (983,273) | | | (1,700,952) | | | — | | | — |
Return of capital | | | (13,454,992) | | | (3,763,619) | | | (3,972,774) | | | — | | | — |
Total distributions to shareholders | | | (21,127,494) | | | (4,746,892) | | | (5,673,726) | | | — | | | — |
CAPITAL TRANSACTIONS:
| | | | | | | | | | | | | |
Subscriptions | | | 390,260,988 | | | 57,600,453 | | | 62,340,960 | | | 44,449,320 | | | 1,592,030 |
Redemptions | | | (17,723,919) | | | (916,410) | | | (7,071,537) | | | (21,118,528) | | | (8,187,940) |
ETF transaction fees
(See Note 1) | | | — | | | — | | | — | | | 4,058 | | | 978 |
Net increase (decrease) in net assets from capital transactions | | | 372,537,069 | | | 56,684,043 | | | 55,269,423 | | | 23,334,850 | | | (6,594,932) |
Net increase (decrease) in net assets | | | 433,329,297 | | | 51,389,244 | | | 54,332,199 | | | 27,604,764 | | | (5,916,693) |
NET ASSETS:
| | | | | | | | | | | | | |
Beginning of the year | | | 160,776,880 | | | 109,387,636 | | | 55,055,437 | | | 10,164,670 | | | 16,081,363 |
End of the year | | | $ 594,106,177 | | | $ 160,776,880 | | | $ 109,387,636 | | | $ 37,769,434 | | | $ 10,164,670 |
SHARES TRANSACTIONS
| | | | | | | | | | | | | | | |
Subscriptions | | | 10,830,000 | | | 1,830,000 | | | 2,100,000 | | | 1,875,000 | | | 75,000 |
Redemptions | | | (480,000) | | | (30,000) | | | (240,000) | | | (875,000) | | | (375,000) |
Total increase/(decrease) in shares outstanding | | | 10,350,000 | | | 1,800,000 | | | 1,860,000 | | | 1,000,000 | | | (300,000) |
| | | | | | | | | | | | | | | | |
(a)
| For the period May 1, 2023 through October 31, 2023. |
The accompanying notes are an integral part of these financial statements.
TABLE OF CONTENTS
Pacer Funds
Statements of Changes in Net Assets
| | | | | | | |
OPERATIONS:
| | | | | | | | | | | | |
Net investment loss | | | $ (108,640) | | | $ (77,283) | | | $ (110,201) | | | $ (51,966) |
Net realized gain/(loss) | | | 1,426,542 | | | (103,517) | | | 1,667,088 | | | 922,219 |
Net change in unrealized appreciation/
(depreciation) | | | 1,465,187 | | | 989,919 | | | 1,660,411 | | | (372,179) |
Net increase in net assets from operations | | | 2,783,089 | | | 809,119 | | | 3,217,298 | | | 498,074 |
CAPITAL TRANSACTIONS:
| | | | | | | | | | | | |
Subscriptions | | | 22,886,263 | | | 1,107,260 | | | 41,936,132 | | | 10,841,250 |
Redemptions | | | (16,167,300) | | | (7,358,450) | | | (16,964,972) | | | (8,630,518) |
ETF transaction fees (See Note 1) | | | 1,593 | | | 846 | | | 3,136 | | | 533 |
Net increase (decrease) in net assets from capital transactions | | | 6,720,556 | | | (6,250,344) | | | 24,974,296 | | | 2,211,265 |
Net increase (decrease) in net assets | | | 9,503,645 | | | (5,441,225) | | | 28,191,594 | | | 2,709,339 |
NET ASSETS:
| | | | | | | | | | | | |
Beginning of the year | | | 10,229,209 | | | 15,670,434 | | | 9,045,238 | | | 6,335,899 |
End of the year | | | $ 19,732,854 | | | $ 10,229,209 | | | $ 37,236,832 | | | $ 9,045,238 |
SHARES TRANSACTIONS
| | | | | | | | | | | | |
Subscriptions | | | 925,000 | | | 50,000 | | | 1,675,000 | | | 500,000 |
Redemptions | | | (650,000) | | | (350,000) | | | (675,000) | | | (400,000) |
Total increase/(decrease) in shares outstanding | | | 275,000 | | | (300,000) | | | 1,000,000 | | | 100,000 |
| | | | | | | | | | | | | |
The accompanying notes are an integral part of these financial statements.
TABLE OF CONTENTS
Pacer Funds
Statements of Changes in Net Assets
| | | | | | | |
OPERATIONS:
| | | | | | | | | | | | |
Net investment loss | | | $ (54,494) | | | $ (39,606) | | | $ (138,222) | | | $ (107,066) |
Net realized gain/(loss) | | | 1,207,086 | | | 864,915 | | | 3,103,526 | | | (1,214,487) |
Net change in unrealized appreciation/
(depreciation) | | | 9,121 | | | (228,454) | | | 1,261,868 | | | 2,558,788 |
Net increase in net assets from operations | | | 1,161,713 | | | 596,855 | | | 4,227,172 | | | 1,237,235 |
CAPITAL TRANSACTIONS:
| | | | | | | | | | | | |
Subscriptions | | | 17,419,863 | | | 9,897,415 | | | 28,784,565 | | | 8,776,413 |
Redemptions | | | (10,337,700) | | | (8,753,333) | | | (24,949,467) | | | (5,839,780) |
ETF transaction fees (See Note 1) | | | 1,084 | | | 623 | | | 1,064 | | | 1,462 |
Net increase in net assets from capital transactions | | | 7,083,247 | | | 1,144,705 | | | 3,836,162 | | | 2,938,095 |
Net increase in net assets | | | 8,244,960 | | | 1,741,560 | | | 8,063,334 | | | 4,175,330 |
NET ASSETS:
| | | | | | | | | | | | |
Beginning of the year | | | 6,712,972 | | | 4,971,412 | | | 16,581,684 | | | 12,406,354 |
End of the year | | | $ 14,957,932 | | | $ 6,712,972 | | | $ 24,645,018 | | | $ 16,581,684 |
SHARES TRANSACTIONS
| | | | | | | | | | | | |
Subscriptions | | | 675,000 | | | 450,000 | | | 1,075,000 | | | 375,000 |
Redemptions | | | (400,000) | | | (400,000) | | | (925,000) | | | (250,000) |
Total increase in shares outstanding | | | 275,000 | | | 50,000 | | | 150,000 | | | 125,000 |
| | | | | | | | | | | | | |
The accompanying notes are an integral part of these financial statements.
TABLE OF CONTENTS
Pacer Funds
Statements of Changes in Net Assets
| | | | | | | |
OPERATIONS:
| | | | | | | | | | | | |
Net investment loss | | | $ (238,147) | | | $ (110,228) | | | $ (163,485) | | | $ (101,507) |
Net realized gain | | | 3,289,764 | | | 1,841,514 | | | 4,263,441 | | | 1,624,146 |
Net change in unrealized appreciation/
(depreciation) | | | 4,200,996 | | | (69,986) | | | 1,407,792 | | | (709,222) |
Net increase in net assets from operations | | | 7,252,613 | | | 1,661,300 | | | 5,507,748 | | | 813,417 |
CAPITAL TRANSACTIONS:
| | | | | | | | | | | | |
Subscriptions | | | 50,810,650 | | | 8,286,335 | | | 37,180,479 | | | 31,118,538 |
Redemptions | | | (29,146,917) | | | (8,998,310) | | | (38,537,555) | | | (21,442,255) |
ETF transaction fees (See Note 1) | | | 3,422 | | | 1,728 | | | 1,998 | | | 2,939 |
Net increase (decrease) in net assets from capital transactions | | | 21,667,155 | | | (710,247) | | | (1,355,078) | | | 9,679,222 |
Net increase in net assets | | | 28,919,768 | | | 951,053 | | | 4,152,670 | | | 10,492,639 |
NET ASSETS:
| | | | | | | | | | | | |
Beginning of the year | | | 18,147,216 | | | 17,196,163 | | | 22,960,238 | | | 12,467,599 |
End of the year | | | $ 47,066,984 | | | $ 18,147,216 | | | $ 27,112,908 | | | $ 22,960,238 |
SHARES TRANSACTIONS
| | | | | | | | | | | | |
Subscriptions | | | 1,750,000 | | | 325,000 | | | 1,375,000 | | | 1,325,000 |
Redemptions | | | (1,000,000) | | | (375,000) | | | (1,425,000) | | | (925,000) |
Total increase/(decrease) in shares
outstanding | | | 750,000 | | | (50,000) | | | (50,000) | | | 400,000 |
| | | | | | | | | | | | | |
The accompanying notes are an integral part of these financial statements.
TABLE OF CONTENTS
Pacer Funds
Statements of Changes in Net Assets
| | | | | | | |
OPERATIONS:
| | | | | | | | | | | | |
Net investment loss | | | $ (92,991) | | | $ (76,363) | | | $ (324,204) | | | $ (203,061) |
Net realized gain | | | 2,280,880 | | | 1,707,383 | | | 12,173,994 | | | 1,462,001 |
Net change in unrealized appreciation/
(depreciation) | | | 79,750 | | | (588,105) | | | 35,921,245 | | | 9,749,815 |
Net increase in net assets from operations | | | 2,267,639 | | | 1,042,915 | | | 47,771,035 | | | 11,008,755 |
DISTRIBUTIONS TO SHAREHOLDERS:
| | | | | | | | | | | | |
Return of capital | | | — | | | — | | | — | | | (6,428) |
Total distributions to shareholders | | | — | | | — | | | — | | | (6,428) |
CAPITAL TRANSACTIONS:
| | | | | | | | | | | | |
Subscriptions | | | 21,974,547 | | | 18,912,313 | | | 223,157,394 | | | 83,011,103 |
Redemptions | | | (20,219,830) | | | (19,903,785) | | | (66,801,481) | | | (38,958,543) |
ETF transaction fees (See Note 1) | | | 1,268 | | | 1,714 | | | 375,124 | | | 123,786 |
Net increase (decrease) in net assets from capital transactions | | | 1,755,985 | | | (989,758) | | | 156,731,037 | | | 44,176,346 |
Net increase in net assets | | | 4,023,624 | | | 53,157 | | | 204,502,072 | | | 55,178,673 |
NET ASSETS:
| | | | | | | | | | | | |
Beginning of the year | | | 10,714,674 | | | 10,661,517 | | | 173,238,825 | | | 118,060,152 |
End of the year | | | $14,738,298 | | | $ 10,714,674 | | | $ 377,740,897 | | | $ 173,238,825 |
SHARES TRANSACTIONS
| | | | | | | | | | | | |
Subscriptions | | | 800,000 | | | 800,000 | | | 8,375,000 | | | 3,525,000 |
Redemptions | | | (725,000) | | | (850,000) | | | (2,450,000) | | | (1,725,000) |
Total increase/(decrease) in shares outstanding | | | 75,000 | | | (50,000) | | | 5,925,000 | | | 1,800,000 |
| | | | | | | | | | | | | |
The accompanying notes are an integral part of these financial statements.
TABLE OF CONTENTS
Pacer Funds
Statements of Changes in Net Assets
| | | | | | | |
OPERATIONS:
| | | | | | | | | | | | |
Net investment loss | | | $ (358,772) | | | $ (162,215) | | | $ (387,212) | | | $ (191,323) |
Net realized gain/(loss) | | | 4,636,413 | | | (1,675,677) | | | 4,312,373 | | | 256,883 |
Net change in unrealized appreciation | | | 5,224,639 | | | 3,232,777 | | | 5,918,853 | | | 2,287,844 |
Net increase in net assets from operations | | | 9,502,280 | | | 1,394,885 | | | 9,844,014 | | | 2,353,404 |
CAPITAL TRANSACTIONS:
| | | | | | | | | | | | |
Subscriptions | | | 99,784,487 | | | 16,533,515 | | | 92,195,350 | | | 16,395,415 |
Redemptions | | | (68,071,712) | | | (6,035,740) | | | (68,014,698) | | | (5,106,713) |
ETF transaction fees (See Note 1) | | | 8,750 | | | 2,257 | | | 8,040 | | | 2,151 |
Net increase in net assets from capital transactions | | | 31,721,525 | | | 10,500,032 | | | 24,188,692 | | | 11,290,853 |
Net increase in net assets
| | | 41,223,805 | | | 11,894,917 | | | 34,032,706 | | | 13,644,257 |
NET ASSETS:
| | | | | | | | | | | | |
Beginning of the year | | | 29,848,743 | | | 17,953,826 | | | 34,069,276 | | | 20,425,019 |
End of the year | | | $71,072,548 | | | $ 29,848,743 | | | $ 68,101,982 | | | $ 34,069,276 |
SHARES TRANSACTIONS
| | | | | | | | | | | | |
Subscriptions | | | 3,925,000 | | | 725,000 | | | 3,525,000 | | | 700,000 |
Redemptions | | | (2,625,000) | | | (275,000) | | | (2,575,000) | | | (225,000) |
Total increase in shares outstanding | | | 1,300,000 | | | 450,000 | | | 950,000 | | | 475,000 |
| | | | | | | | | | | | | |
The accompanying notes are an integral part of these financial statements.
TABLE OF CONTENTS
Pacer Funds
Statements of Changes in Net Assets
| | | | | | | |
OPERATIONS:
| | | | | | | | | | | | |
Net investment loss | | | $ (385,641) | | | $ (273,675) | | | $ (272,602) | | | $ (195,650) |
Net realized gain | | | 7,174,696 | | | 5,506,696 | | | 5,948,667 | | | 4,585,195 |
Net change in unrealized appreciation/
(depreciation) | | | 4,314,711 | | | (1,856,102) | | | 267,020 | | | (1,197,846) |
Net increase in net assets from operations | | | 11,103,766 | | | 3,376,919 | | | 5,943,085 | | | 3,191,699 |
CAPITAL TRANSACTIONS:
| | | | | | | | | | | | |
Subscriptions | | | 104,661,249 | | | 56,101,605 | | | 80,435,795 | | | 47,715,283 |
Redemptions | | | (78,995,868) | | | (51,134,675) | | | (57,598,727) | | | (37,306,550) |
ETF transaction fees (See Note 1) | | | 6,725 | | | 3,916 | | | 5,372 | | | 2,365 |
Net increase in net assets from capital transactions | | | 25,672,106 | | | 4,970,846 | | | 22,842,440 | | | 10,411,098 |
Net increase in net assets | | | 36,775,872 | | | 8,347,765 | | | 28,785,525 | | | 13,602,797 |
NET ASSETS:
| | | | | | | | | | | | |
Beginning of the year | | | 41,903,828 | | | 33,556,063 | | | 36,863,583 | | | 23,260,786 |
End of the year | | | $78,679,700 | | | $ 41,903,828 | | | $ 65,649,108 | | | $ 36,863,583 |
SHARES TRANSACTIONS
| | | | | | | | | | | | |
Subscriptions | | | 3,950,000 | | | 2,425,000 | | | 3,000,000 | | | 2,050,000 |
Redemptions | | | (2,950,000) | | | (2,225,000) | | | (2,150,000) | | | (1,600,000) |
Total increase in shares outstanding | | | 1,000,000 | | | 200,000 | | | 850,000 | | | 450,000 |
| | | | | | | | | | | | | |
The accompanying notes are an integral part of these financial statements.
TABLE OF CONTENTS
Pacer American Energy Independence ETF
Financial Highlights
| | | | | | | | | | |
PER SHARE DATA:
| | | | | | | | | | | | | | | | | | |
Net asset value, beginning of year | | | $27.12 | | | $27.87 | | | $25.31 | | | $14.96 | | | $21.79 | | | $23.21 |
INVESTMENT OPERATIONS:
| | | | | | | | | | | | | | | | | | |
Net investment income(a) | | | 0.72 | | | 0.63 | | | 0.41 | | | 0.40 | | | 0.28 | | | 0.37 |
Net realized and unrealized gain (loss) on investments(b) | | | 10.12 | | | 0.06 | | | 3.59 | | | 11.39 | | | (5.55) | | | (0.34) |
Total from investment operations | | | 10.84 | | | 0.69 | | | 4.00 | | | 11.79 | | | (5.27) | | | 0.03 |
LESS DISTRIBUTIONS FROM:
| | | | | | | | | | | | | | | | | | |
Net investment income | | | (0.82) | | | (0.33) | | | (0.26) | | | (0.50) | | | (0.52) | | | (0.22) |
Return of capital | | | (0.62) | | | (1.11) | | | (1.18) | | | (0.94) | | | (1.04) | | | (1.23) |
Total distributions | | | (1.44) | | | (1.44) | | | (1.44) | | | (1.44) | | | (1.56) | | | (1.45) |
ETF transaction fees per share | | | 0.00(c) | | | — | | | — | | | — | | | — | | | 0.00(c) |
Net asset value, end of year | | | $36.52 | | | $27.12 | | | $27.87 | | | $25.31 | | | $14.96 | | | $21.79 |
Total return | | | 40.90% | | | 2.68% | | | 16.26% | | | 80.71% | | | −24.76% | | | −0.13% |
SUPPLEMENTAL DATA AND RATIOS:
|
Net assets, end of year (in thousands) | | | $63,906 | | | $43,388 | | | $47,377 | | | $25,309 | | | $11,966 | | | $10,897 |
Ratio of expenses to average net assets | | | 0.75% | | | 0.75% | | | 0.75% | | | 0.75% | | | 0.75% | | | 0.75% |
Ratio of net investment income to average net assets | | | 2.27% | | | 2.32% | | | 1.53% | | | 1.82% | | | 1.81% | | | 1.58% |
Portfolio turnover rate(d) | | | 22% | | | 27% | | | 25% | | | 22% | | | 41% | | | 26% |
| | | | | | | | | | | | | | | | | | | |
(a)
| Net investment income per share has been calculated based on average shares outstanding during the year. |
(b)
| Realized and unrealized gains and losses per share in the caption are balancing amounts necessary to reconcile the change in net asset value per share for the years, and may not reconcile with the aggregate gains and losses in the Statement of Operations due to share transactions for the year. |
(c)
| Amount represents less than $0.005 per share. |
(d)
| Portfolio turnover rate excludes in-kind transactions. |
(e)
| Shares of the Predecessor USAI Fund converted Shares at the close of business on December 13, 2019. See Note 1 in the Financial Statements. For the period ended December 13, 2019 to October 31, 2020. |
The accompanying notes are an integral part of these financial statements.
TABLE OF CONTENTS
Pacer BlueStar Digital Entertainment ETF
Financial Highlights
| | | | | | | |
PER SHARE DATA:
| | | | | | | | | |
Net asset value, beginning of period | | | $17.41 | | | $15.44 | | | $19.74 |
INVESTMENT OPERATIONS:
| | | | | | | | | |
Net investment income(b) | | | 0.09 | | | 0.15 | | | 0.05 |
Net realized and unrealized gain (loss) on investments(c) | | | 6.58 | | | 1.99 | | | (4.32) |
Total from investment operations | | | 6.67 | | | 2.14 | | | (4.27) |
LESS DISTRIBUTIONS FROM:
| | | | | | | | | |
Net investment income | | | (0.09) | | | (0.17) | | | (0.04) |
Total distributions | | | (0.09) | | | (0.17) | | | (0.04) |
ETF transaction fees per share | | | 0.00(d) | | | — | | | 0.01 |
Net asset value, end of period | | | $23.99 | | | $17.41 | | | $15.44 |
Total return | | | 38.38% | | | 13.74% | | | −21.58% |
SUPPLEMENTAL DATA AND RATIOS:
| | | | | | | | | |
Net assets, end of period (in thousands) | | | $960 | | | $696 | | | $618 |
Ratio of expenses to average net assets(e) | | | 0.60% | | | 0.60% | | | 0.60% |
Ratio of net investment income to average net assets(e) | | | 0.40% | | | 0.78% | | | 0.53% |
Portfolio turnover rate(f) | | | 49% | | | 40% | | | 33% |
| | | | | | | | | | |
(a)
| Inception date of the Fund was April 7, 2022. |
(b)
| Net investment income per share has been calculated based on average shares outstanding during the year. |
(c)
| Realized and unrealized gains and losses per share in the caption are balancing amounts necessary to reconcile the change in net asset value per share for the years, and may not reconcile with the aggregate gains and losses in the Statement of Operations due to share transactions for the year. |
(d)
| Amount represents less than $0.005 per share. |
(e)
| Annualized for periods less than one year. |
(f)
| Portfolio turnover rate excludes in-kind transactions. |
The accompanying notes are an integral part of these financial statements.
TABLE OF CONTENTS
Pacer BlueStar Engineering the Future ETF
Financial Highlights
| | | | | | | |
PER SHARE DATA:
| | | | | | | | | |
Net asset value, beginning of period | | | $17.67 | | | $17.00 | | | $20.52 |
INVESTMENT OPERATIONS:
| | | | | | | | | |
Net investment income(b) | | | 0.04 | | | 0.04 | | | 0.01 |
Net realized and unrealized gain on investments(c) | | | 2.87 | | | 0.68 | | | (3.53) |
Total from investment operations | | | 2.91 | | | 0.72 | | | (3.52) |
LESS DISTRIBUTIONS FROM:
| | | | | | | | | |
Net investment income | | | (0.03) | | | (0.04) | | | — |
Return of capital | | | — | | | (0.01) | | | — |
Total distributions | | | (0.03) | | | (0.05) | | | — |
Net asset value, end of period | | | $20.55 | | | $17.67 | | | $17.00 |
Total return | | | 16.48% | | | 4.18% | | | −17.14% |
SUPPLEMENTAL DATA AND RATIOS:
| | | | | | | | | |
Net assets, end of period (in thousands) | | | $822 | | | $1,414 | | | $1,360 |
Ratio of expenses to average net assets(d) | | | 0.60% | | | 0.60% | | | 0.60% |
Ratio of net investment income to average net assets(d) | | | 0.17% | | | 0.19% | | | 0.07% |
Portfolio turnover rate(e) | | | 19% | | | 15% | | | 0% |
| | | | | | | | | | |
(a)
| Inception date of the Fund was May 4, 2022. The information presented is from May 4, 2022 to October 31, 2022 |
(b)
| Net investment income per share has been calculated based on average shares outstanding during the year. |
(c)
| Realized and unrealized gains and losses per share in the caption are balancing amounts necessary to reconcile the change in net asset value per share for the years, and may not reconcile with the aggregate gains and losses in the Statement of Operations due to share transactions for the year. |
(d)
| Annualized for periods less than one year. |
(e)
| Portfolio turnover rate excludes in-kind transactions. |
The accompanying notes are an integral part of these financial statements.
TABLE OF CONTENTS
Pacer Developed Markets Cash Cows Growth Leaders ETF
Financial Highlights
| | | | |
PER SHARE DATA:
| | | |
Net asset value, beginning of period | | | $20.10 |
INVESTMENT OPERATIONS:
| | | |
Net investment income(b) | | | 0.26 |
Net realized and unrealized loss on investments(c) | | | (0.62) |
Total from investment operations | | | (0.36) |
LESS DISTRIBUTIONS FROM:
| | | |
Net investment income | | | (0.19) |
Total distributions | | | (0.19) |
Net asset value, end of period | | | $19.55 |
Total return(d) | | | −1.78% |
SUPPLEMENTAL DATA AND RATIOS:
| | | |
Net assets, end of period (in thousands) | | | $489 |
Ratio of expenses to average net assets(e) | | | 0.65% |
Ratio of net investment income to average net assets(e) | | | 2.16% |
Portfolio turnover rate(d)(f) | | | 33% |
| | | | |
(a)
| Inception date of the Fund was March 20, 2024. |
(b)
| Net investment income per share has been calculated based on average shares outstanding during the period. |
(c)
| Realized and unrealized gains and losses per share in the caption are balancing amounts necessary to reconcile the change in net asset value per share for the years, and may not reconcile with the aggregate gains and losses in the Statement of Operations due to share transactions for the year. |
(d)
| Not annualized for periods less than one year. |
(e)
| Annualized for periods less than one year. |
(f)
| Portfolio turnover rate excludes in-kind transactions. |
The accompanying notes are an integral part of these financial statements.
TABLE OF CONTENTS
Pacer Metaurus Nasdaq 100 Dividend Multiplier 600 ETF
Financial Highlights
| | | | |
PER SHARE DATA:
| | | |
Net asset value, beginning of period | | | $31.79 |
INVESTMENT OPERATIONS:
| | | |
Net investment income(b) | | | (0.00)(c) |
Net realized and unrealized gain on investments(d) | | | 0.17 |
Total from investment operations | | | 0.17 |
Net asset value, end of period | | | $31.96 |
Total return(e) | | | 0.54% |
SUPPLEMENTAL DATA AND RATIOS:
| | | |
Net assets, end of period (in thousands) | | | $6,392 |
Ratio of expenses to average net assets(f) | | | 0.60% |
Ratio of net investment loss to average net assets(f) | | | (0.06)% |
Portfolio turnover rate(e)(g) | | | 0% |
| | | | |
(a)
| Inception date of the Fund was September 23, 2024. |
(b)
| Net investment income per share has been calculated based on average shares outstanding during the period. |
(c)
| Amount represents less than $0.005 per share. |
(d)
| Realized and unrealized gains and losses per share in the caption are balancing amounts necessary to reconcile the change in net asset value per share for the years, and may not reconcile with the aggregate gains and losses in the Statement of Operations due to share transactions for the year. |
(e)
| Not annualized for periods less than one year. |
(f)
| Annualized for periods less than one year. |
(g)
| Portfolio turnover rate excludes in-kind transactions. |
The accompanying notes are an integral part of these financial statements.
TABLE OF CONTENTS
Pacer Metaurus US Large Cap Div Multiplier 400 ETF
Financial Highlights
| | | | | | | | | | | | | |
PER SHARE DATA:
| | | | | | | | | | | | |
Net asset value, beginning of period | | | $29.77 | | | $30.39 | | | $31.64 | | | $34.65 |
INVESTMENT OPERATIONS:
| | | | | | | | | | | | |
Net investment income(b) | | | 0.42 | | | 0.18 | | | 0.32 | | | 0.12 |
Net realized and unrealized gain (loss) on investments(c) | | | 9.62 | | | 0.22 | | | 0.53 | | | (1.73) |
Total from investment operations | | | 10.04 | | | 0.40 | | | 0.85 | | | (1.61) |
LESS DISTRIBUTIONS FROM:
| | | | | | | | | | | | |
Net investment income | | | (0.56) | | | (0.16) | | | (0.30) | | | (0.10) |
Net realized gains | | | (0.20) | | | (0.04) | | | (0.33) | | | — |
Return of capital | | | (1.33) | | | (0.82) | | | (1.47) | | | (1.30) |
Total distributions | | | (2.09) | | | (1.02) | | | (2.10) | | | (1.40) |
Net asset value, end of period | | | $37.72 | | | $29.77 | | | $30.39 | | | $31.64 |
Total return | | | 34.25% | | | 1.25% | | | 3.25% | | | −5.00% |
SUPPLEMENTAL DATA AND RATIOS:
| | | | | | | | | | | | |
Net assets, end of period (in thousands) | | | $594,106 | | | $160,777 | | | $109,388 | | | $55,055 |
Ratio of expenses to average net assets(d)(g) | | | 0.63% | | | 0.79% | | | 0.79% | | | 0.79% |
Ratio of net investment income to average net assets(d) | | | 1.16% | | | 1.15% | | | 1.07% | | | 0.42% |
Portfolio turnover rate(e) | | | 7% | | | 4% | | | 9% | | | 7% |
| | | | | | | | | | | | | |
(a)
| Inception date of the Fund was July 12, 2021. |
(b)
| Net investment income per share has been calculated based on average shares outstanding during the year. |
(c)
| Realized and unrealized gains and losses per share in the caption are balancing amounts necessary to reconcile the change in net asset value per share for the years, and may not reconcile with the aggregate gains and losses in the Statement of Operations due to share transactions for the year. |
(d)
| Annualized for periods less than one year. |
(e)
| Portfolio turnover rate excludes in-kind transactions. |
(f)
| For the period May 1, 2023 to October 31, 2023. |
(g)
| Effective February 1, 2024 the investment advisory fee changed from 0.79% to 0.60%. |
The accompanying notes are an integral part of these financial statements.
TABLE OF CONTENTS
Pacer Swan SOS Conservative April ETF
Financial Highlights
| | | | | | | |
PER SHARE DATA:
| | | | | | | | | | | | |
Net asset value, beginning of period | | | $21.40 | | | $20.75 | | | $21.73 | | | $20.61 |
INVESTMENT OPERATIONS:
| | | | | | | | | | | | |
Net investment loss(b) | | | (0.15) | | | (0.15) | | | (0.16) | | | (0.09) |
Net realized and unrealized gain (loss) on investments(c) | | | 4.36 | | | 0.80 | | | (0.82) | | | 1.21 |
Total from investment operations | | | 4.21 | | | 0.65 | | | (0.98) | | | 1.12 |
ETF transaction fees per share | | | 0.00(d) | | | 0.00(d) | | | 0.00(d) | | | — |
Net asset value, end of period | | | $25.61 | | | $21.40 | | | $20.75 | | | $21.73 |
Total return | | | 19.66% | | | 3.13% | | | −4.52% | | | 5.45% |
SUPPLEMENTAL DATA AND RATIOS:
| | | | | | | | | | | | |
Net assets, end of period (in thousands) | | | $37,769 | | | $10,165 | | | $16,081 | | | $2,717 |
Ratio of expenses to average net assets(e)(g) | | | 0.63% | | | 0.76% | | | 0.76% | | | 0.75% |
Ratio of dividends, interest and borrowing expense on securities sold short to average net assets(e) | | | 0.01% | | | 0.01% | | | —% | | | —% |
Ratio of operational expenses to average net assets excluding dividends, interest, and borrowing expense on securities sold short(e)(g) | | | 0.62% | | | 0.75% | | | 0.76% | | | 0.75% |
Ratio of net investment loss to average net assets(e) | | | (0.60)% | | | (0.73)% | | | (0.75)% | | | (0.75)% |
Portfolio turnover rate(f) | | | 13% | | | 0% | | | 0% | | | 0% |
| | | | | | | | | | | | | |
(a)
| Inception date of the Fund was March 31, 2021. |
(b)
| Net investment loss per share has been calculated based on average shares outstanding during the year. |
(c)
| Realized and unrealized gains and losses per share in the caption are balancing amounts necessary to reconcile the change in net asset value per share for the years, and may not reconcile with the aggregate gains and losses in the Statement of Operations due to share transactions for the year. |
(d)
| Amount represents less than $0.005 per share. |
(e)
| Annualized for periods less than one year. |
(f)
| Portfolio turnover rate excludes in-kind transactions. |
(g)
| Effective March 1, 2024 the investment advisory fee changed from 0.75% to 0.60%. |
The accompanying notes are an integral part of these financial statements.
TABLE OF CONTENTS
Pacer Swan SOS Conservative January ETF
Financial Highlights
| | | | | | | |
PER SHARE DATA:
| | | | | | | | | | | | |
Net asset value, beginning of period | | | $22.73 | | | $20.89 | | | $22.19 | | | $20.56 |
INVESTMENT OPERATIONS:
| | | | | | | | | | | | |
Net investment loss(b) | | | (0.16) | | | (0.16) | | | (0.16) | | | (0.14) |
Net realized and unrealized gain (loss) on investments(c) | | | 4.65 | | | 2.00 | | | (1.14) | | | 1.77 |
Total from investment operations | | | 4.49 | | | 1.84 | | | (1.30) | | | 1.63 |
ETF transaction fees per share | | | 0.00(d) | | | 0.00(d) | | | 0.00(d) | | | — |
Net asset value, end of period | | | $27.22 | | | $22.73 | | | $20.89 | | | $22.19 |
Total return | | | 19.74% | | | 8.79% | | | −5.85% | | | 7.94% |
SUPPLEMENTAL DATA AND RATIOS:
| | | | | | | | | | | | |
Net assets, end of period (in thousands) | | | $19,733 | | | $10,229 | | | $15,670 | | | $2,774 |
Ratio of expenses to average net assets(e)(g) | | | 0.64% | | | 0.77% | | | 0.76% | | | 0.75% |
Ratio of dividends, interest and borrowing expense on securities sold short to average net assets(e) | | | 0.01% | | | 0.02% | | | —% | | | —% |
Ratio of operational expenses to average net assets excluding dividends, interest, and borrowing expense on securities sold short(e)(g) | | | 0.63% | | | 0.75% | | | 0.76% | | | 0.75% |
Ratio of net investment loss to average net assets(e) | | | (0.61)% | | | (0.74)% | | | (0.75)% | | | (0.75)% |
Portfolio turnover rate(f) | | | 4% | | | 0% | | | 19% | | | 0% |
| | | | | | | | | | | | | |
(a)
| Inception date of the Fund was December 22, 2020. |
(b)
| Net investment loss per share has been calculated based on average shares outstanding during the year. |
(c)
| Realized and unrealized gains and losses per share in the caption are balancing amounts necessary to reconcile the change in net asset value per share for the years, and may not reconcile with the aggregate gains and losses in the Statement of Operations due to share transactions for the year. |
(d)
| Amount represents less than $0.005 per share. |
(e)
| Annualized for periods less than one year. |
(f)
| Portfolio turnover rate excludes in-kind transactions. |
(g)
| Effective March 1, 2024 the investment advisory fee changed from 0.75% to 0.60%. |
The accompanying notes are an integral part of these financial statements.
TABLE OF CONTENTS
Pacer Swan SOS Conservative July ETF
Financial Highlights
| | | | | | | |
PER SHARE DATA:
| | | | | | | | | | | | |
Net asset value, beginning of period | | | $21.28 | | | $19.50 | | | $20.94 | | | $20.48 |
INVESTMENT OPERATIONS:
| | | | | | | | | | | | |
Net investment loss(b) | | | (0.15) | | | (0.15) | | | (0.15) | | | (0.05) |
Net realized and unrealized gain (loss) on investments(c) | | | 5.00 | | | 1.93 | | | (1.29) | | | 0.51 |
Total from investment operations | | | 4.85 | | | 1.78 | | | (1.44) | | | 0.46 |
ETF transaction fees per share | | | 0.00(d) | | | 0.00(d) | | | 0.00(d) | | | — |
Net asset value, end of period | | | $26.13 | | | $21.28 | | | $19.50 | | | $20.94 |
Total return | | | 22.80% | | | 9.16% | | | −6.88% | | | 2.22% |
SUPPLEMENTAL DATA AND RATIOS:
| | | | | | | | | | | | |
Net assets, end of period (in thousands) | | | $37,237 | | | $9,045 | | | $6,336 | | | $3,664 |
Ratio of expenses to average net assets(e)(g) | | | 0.64% | | | 0.76% | | | 0.76% | | | 0.76% |
Ratio of dividends, interest and borrowing expense on securities sold short to average net assets(e) | | | 0.01% | | | 0.01% | | | —% | | | —% |
Ratio of operational expenses to average net assets excluding dividends, interest, and borrowing expense on securities sold short(e)(g) | | | 0.63% | | | 0.75% | | | —% | | | —% |
Ratio of net investment loss to average net assets(e) | | | (0.60)% | | | (0.72)% | | | (0.75)% | | | (0.76)% |
Portfolio turnover rate(f) | | | 2% | | | 0% | | | 0% | | | 0% |
| | | | | | | | | | | | | |
(a)
| Inception date of the Fund was June 30, 2021. |
(b)
| Net investment loss per share has been calculated based on average shares outstanding during the year. |
(c)
| Realized and unrealized gains and losses per share in the caption are balancing amounts necessary to reconcile the change in net asset value per share for the years, and may not reconcile with the aggregate gains and losses in the Statement of Operations due to share transactions for the year. |
(d)
| Amount represents less than $0.005 per share. |
(e)
| Annualized for periods less than one year. |
(f)
| Portfolio turnover rate excludes in-kind transactions. |
(g)
| Effective March 1, 2024 the investment advisory fee changed from 0.75% to 0.60%. |
The accompanying notes are an integral part of these financial statements.
TABLE OF CONTENTS
Pacer Swan SOS Conservative October ETF
Financial Highlights
| | | | | | | |
PER SHARE DATA:
| | | | | | | | | | | | |
Net asset value, beginning of period | | | $22.38 | | | $19.89 | | | $20.86 | | | $20.51 |
INVESTMENT OPERATIONS:
| | | | | | | | | | | | |
Net investment loss(b) | | | (0.16) | | | (0.16) | | | (0.15) | | | (0.01) |
Net realized and unrealized gain (loss) on investments(c) | | | 3.79 | | | 2.65 | | | (0.82) | | | 0.36 |
Total from investment operations | | | 3.63 | | | 2.49 | | | (0.97) | | | 0.35 |
ETF transaction fees per share | | | 0.00(d) | | | 0.00(d) | | | 0.00(d) | | | — |
Net asset value, end of period | | | $26.01 | | | $22.38 | | | $19.89 | | | $20.86 |
Total return | | | 16.24% | | | 12.54% | | | −4.67% | | | 1.71% |
SUPPLEMENTAL DATA AND RATIOS:
| | | | | | | | | | | | |
Net assets, end of period (in thousands) | | | $14,958 | | | $6,713 | | | $4,971 | | | $2,607 |
Ratio of expenses to average net assets(e)(g) | | | 0.65% | | | 0.77% | | | 0.76% | | | 0.75% |
Ratio of dividends, interest and borrowing expense on securities sold short to average net assets(e) | | | 0.01% | | | 0.02% | | | —% | | | —% |
Ratio of operational expenses to average net assets excluding dividends, interest, and borrowing expense on securities sold short(e)(g) | | | 0.64% | | | 0.75% | | | 0.76% | | | 0.75% |
Ratio of net investment loss to average net assets(e) | | | (0.62)% | | | (0.74)% | | | (0.75)% | | | (0.75)% |
Portfolio turnover rate(f) | | | 0% | | | 0% | | | 0% | | | 0% |
| | | | | | | | | | | | | |
(a)
| Inception date of the Fund was September 30, 2021. |
(b)
| Net investment loss per share has been calculated based on average shares outstanding during the year. |
(c)
| Realized and unrealized gains and losses per share in the caption are balancing amounts necessary to reconcile the change in net asset value per share for the years, and may not reconcile with the aggregate gains and losses in the Statement of Operations due to share transactions for the year. |
(d)
| Amount represents less than $0.005 per share. |
(e)
| Annualized for periods less than one year. |
(f)
| Portfolio turnover rate excludes in-kind transactions. |
(g)
| Effective March 1, 2024 the investment advisory fee changed from 0.75% to 0.60%. |
The accompanying notes are an integral part of these financial statements.
TABLE OF CONTENTS
Pacer Swan SOS Flex April ETF
Financial Highlights
| | | | | | | |
PER SHARE DATA:
| | | | | | | | | | | | |
Net asset value, beginning of period | | | $23.69 | | | $21.58 | | | $22.75 | | | $20.61 |
INVESTMENT OPERATIONS:
| | | | | | | | | | | | |
Net investment loss(b) | | | (0.17) | | | (0.17) | | | (0.17) | | | (0.10) |
Net realized and unrealized gain (loss) on investments(c) | | | 5.47 | | | 2.28 | | | (1.00) | | | 2.24 |
Total from investment operations | | | 5.30 | | | 2.11 | | | (1.17) | | | 2.14 |
ETF transaction fees per share | | | 0.00(d) | | | 0.00(d) | | | 0.00(d) | | | — |
Net asset value, end of period | | | $28.99 | | | $23.69 | | | $21.58 | | | $22.75 |
Total return | | | 22.39% | | | 9.80% | | | −5.15% | | | 10.37% |
SUPPLEMENTAL DATA AND RATIOS:
| | | | | | | | | | | | |
Net assets, end of period (in thousands) | | | $24,645 | | | $16,582 | | | $12,406 | | | $7,962 |
Ratio of expenses to average net assets(e)(g) | | | 0.65% | | | 0.76% | | | 0.77% | | | 0.75% |
Ratio of dividends, interest and borrowing expense on securities sold short to average net assets(e) | | | 0.01% | | | 0.01% | | | —% | | | —% |
Ratio of operational expenses to average net assets excluding dividends, interest, and borrowing expense on securities sold short(e)(g) | | | 0.64% | | | 0.75% | | | 0.77% | | | 0.75% |
Ratio of net investment loss to average net assets(e) | | | (0.62)% | | | (0.73)% | | | (0.76)% | | | (0.75)% |
Portfolio turnover rate(f) | | | 7% | | | 0% | | | 0% | | | 0% |
| | | | | | | | | | | | | |
(a)
| Inception date of the Fund was March 31, 2021. |
(b)
| Net investment loss per share has been calculated based on average shares outstanding during the year. |
(c)
| Realized and unrealized gains and losses per share in the caption are balancing amounts necessary to reconcile the change in net asset value per share for the years, and may not reconcile with the aggregate gains and losses in the Statement of Operations due to share transactions for the year. |
(d)
| Amount represents less than $0.005 per share. |
(e)
| Annualized for periods less than one year. |
(f)
| Portfolio turnover rate excludes in-kind transactions. |
(g)
| Effective March 1, 2024 the investment advisory fee changed from 0.75% to 0.60%. |
The accompanying notes are an integral part of these financial statements.
TABLE OF CONTENTS
Pacer Swan SOS Flex January ETF
Financial Highlights
| | | | | | | |
PER SHARE DATA:
| | | | | | | | | | | | |
Net asset value, beginning of period | | | $25.92 | | | $22.93 | | | $23.82 | | | $20.56 |
INVESTMENT OPERATIONS:
| | | | | | | | | | | | |
Net investment loss(b) | | | (0.19) | | | (0.19) | | | (0.17) | | | (0.15) |
Net realized and unrealized gain (loss) on investments(c) | | | 6.73 | | | 3.18 | | | (0.73) | | | 3.41 |
Total from investment operations | | | 6.54 | | | 2.99 | | | (0.90) | | | 3.26 |
ETF transaction fees per share | | | 0.00(d) | | | 0.00(d) | | | 0.01 | | | — |
Net asset value, end of period | | | $32.46 | | | $25.92 | | | $22.93 | | | $23.82 |
Total return | | | 25.23% | | | 13.05% | | | −3.74% | | | 15.85% |
SUPPLEMENTAL DATA AND RATIOS:
| | | | | | | | | | | | |
Net assets, end of period (in thousands) | | | $47,067 | | | $18,147 | | | $17,196 | | | $3,573 |
Ratio of expenses to average net assets(e)(g) | | | 0.64% | | | 0.77% | | | 0.76% | | | 0.75% |
Ratio of dividends, interest and borrowing expense on securities sold short to average net assets(e) | | | 0.01% | | | 0.02% | | | —% | | | —% |
Ratio of operational expenses to average net assets excluding dividends, interest, and borrowing expense on securities sold short(e)(g) | | | 0.63% | | | 0.75% | | | 0.76% | | | 0.75% |
Ratio of net investment loss to average net assets(e) | | | (0.61)% | | | (0.73)% | | | (0.76)% | | | (0.75)% |
Portfolio turnover rate(f) | | | 6% | | | 0% | | | 226% | | | 0% |
| | | | | | | | | | | | | |
(a)
| Inception date of the Fund was December 22, 2020. |
(b)
| Net investment loss per share has been calculated based on average shares outstanding during the year. |
(c)
| Realized and unrealized gains and losses per share in the caption are balancing amounts necessary to reconcile the change in net asset value per share for the years, and may not reconcile with the aggregate gains and losses in the Statement of Operations due to share transactions for the year. |
(d)
| Amount represents less than $0.005 per share. |
(e)
| Annualized for periods less than one year. |
(f)
| Portfolio turnover rate excludes in-kind transactions. |
(f)
| Effective March 1, 2024 the investment advisory fee changed from 0.75% to 0.60%. |
The accompanying notes are an integral part of these financial statements.
TABLE OF CONTENTS
Pacer Swan SOS Flex July ETF
Financial Highlights
| | | | | | | |
PER SHARE DATA:
| | | | | | | | | | | | |
Net asset value, beginning of period | | | $22.96 | | | $20.78 | | | $21.31 | | | $20.48 |
INVESTMENT OPERATIONS:
| | | | | | | | | | | | |
Net investment loss(b) | | | (0.17) | | | (0.16) | | | (0.16) | | | (0.05) |
Net realized and unrealized gain (loss) on investments(c) | | | 5.75 | | | 2.34 | | | (0.37) | | | 0.88 |
Total from investment operations | | | 5.58 | | | 2.18 | | | (0.53) | | | 0.83 |
ETF transaction fees per share | | | 0.00(d) | | | 0.00(d) | | | 0.00(d) | | | — |
Net asset value, end of period | | | $28.54 | | | $22.96 | | | $20.78 | | | $21.31 |
Total return | | | 24.30% | | | 10.49% | | | −2.49% | | | 4.05% |
SUPPLEMENTAL DATA AND RATIOS:
| | | | | | | | | | | | |
Net assets, end of period (in thousands) | | | $27,113 | | | $22,960 | | | $12,468 | | | $5,327 |
Ratio of expenses to average net assets(e)(g) | | | 0.66% | | | 0.77% | | | 0.76% | | | 0.76% |
Ratio of dividends, interest and borrowing expense on securities sold short to average net assets(e) | | | 0.01% | | | 0.02% | | | —% | | | —% |
Ratio of operational expenses to average net assets excluding dividends, interest, and borrowing expense on securities sold short(e)(g) | | | 0.65% | | | 0.75% | | | 0.76% | | | 0.76% |
Ratio of net investment loss to average net assets(e) | | | (0.62)% | | | (0.69)% | | | (0.75)% | | | (0.76)% |
Portfolio turnover rate(f) | | | 12% | | | 0% | | | 0% | | | 0% |
| | | | | | | | | | | | | |
(a)
| Inception date of the Fund was June 30, 2021. |
(b)
| Net investment loss per share has been calculated based on average shares outstanding during the year. |
(c)
| Realized and unrealized gains and losses per share in the caption are balancing amounts necessary to reconcile the change in net asset value per share for the years, and may not reconcile with the aggregate gains and losses in the Statement of Operations due to share transactions for the year. |
(d)
| Amount represents less than $0.005 per share. |
(e)
| Annualized for periods less than one year. |
(f)
| Portfolio turnover rate excludes in-kind transactions. |
(g)
| Effective March 1, 2024 the investment advisory fee changed from 0.75% to 0.60%. |
The accompanying notes are an integral part of these financial statements.
TABLE OF CONTENTS
Pacer Swan SOS Flex October ETF
Financial Highlights
| | | | | | | |
PER SHARE DATA:
| | | | | | | | | | | | |
Net asset value, beginning of period | | | $23.81 | | | $21.32 | | | $21.26 | | | $20.51 |
INVESTMENT OPERATIONS:
| | | | | | | | | | | | |
Net investment loss(b) | | | (0.17) | | | (0.17) | | | (0.16) | | | (0.01) |
Net realized and unrealized gain on investments(c) | | | 4.43 | | | 2.66 | | | 0.22 | | | 0.76 |
Total from investment operations | | | 4.26 | | | 2.49 | | | 0.06 | | | 0.75 |
ETF transaction fees per share | | | 0.00(d) | | | 0.00(d) | | | 0.00(d) | | | — |
Net asset value, end of period | | | $28.07 | | | $23.81 | | | $21.32 | | | $21.26 |
Total return | | | 17.90% | | | 11.66% | | | 0.31% | | | 3.64% |
SUPPLEMENTAL DATA AND RATIOS:
| | | | | | | | | | | | |
Net assets, end of period (in thousands) | | | $14,738 | | | $10,715 | | | $10,662 | | | $3,720 |
Ratio of expenses to average net assets(e)(g) | | | 0.66% | | | 0.77% | | | 0.76% | | | 0.75% |
Ratio of dividends, interest and borrowing expense on securities sold short to average net assets(e) | | | 0.01% | | | 0.02% | | | —% | | | —% |
Ratio of operational expenses to average net assets excluding dividends, interest, and borrowing expense on securities sold short(e)(g) | | | 0.65% | | | 0.75% | | | 0.76% | | | 0.75% |
Ratio of net investment loss to average net assets(e) | | | (0.62)% | | | (0.74)% | | | (0.75)% | | | (0.75)% |
Portfolio turnover rate(f) | | | 0% | | | 12% | | | 0% | | | 0% |
| | | | | | | | | | | | | |
(a)
| Inception date of the Fund was September 30, 2021. |
(b)
| Net investment loss per share has been calculated based on average shares outstanding during the year. |
(c)
| Realized and unrealized gains and losses per share in the caption are balancing amounts necessary to reconcile the change in net asset value per share for the years, and may not reconcile with the aggregate gains and losses in the Statement of Operations due to share transactions for the year. |
(d)
| Amount represents less than $0.005 per share. |
(e)
| Annualized for periods less than one year. |
(f)
| Portfolio turnover rate excludes in-kind transactions. |
(g)
| Effective March 1, 2024 the investment advisory fee changed from 0.75% to 0.60%. |
The accompanying notes are an integral part of these financial statements.
TABLE OF CONTENTS
Pacer Swan SOS Fund of Funds ETF
Financial Highlights
| | | | | | | |
PER SHARE DATA:
| | | | | | | | | | | | |
Net asset value, beginning of period | | | $23.81 | | | $21.56 | | | $22.49 | | | $20.26 |
INVESTMENT OPERATIONS:
| | | | | | | | | | | | |
Net investment loss(b) | | | (0.03) | | | (0.04) | | | (0.03) | | | (0.03) |
Net realized and unrealized gain (loss) on
investments(c) | | | 4.81 | | | 2.27 | | | (0.96) | | | 2.26 |
Total from investment operations | | | 4.78 | | | 2.23 | | | (0.99) | | | 2.23 |
ETF transaction fees per share | | | 0.03 | | | 0.02 | | | 0.06 | | | — |
Net asset value, end of period | | | $28.62 | | | $23.81 | | | $21.56 | | | $22.49 |
Total return | | | 20.19% | | | 10.42% | | | −4.12% | | | 11.01% |
SUPPLEMENTAL DATA AND RATIOS:
| | | | | | | | | | | | |
Net assets, end of period (in thousands) | | | $377,741 | | | $173,239 | | | $118,060 | | | $38,234 |
Ratio of expenses to average net assets(d)(g) | | | 0.14% | | | 0.18% | | | 0.18% | | | 0.18% |
Ratio of dividends, interest and borrowing expense on securities sold short to average net assets(d) | | | 0.00%(e) | | | —% | | | —% | | | —% |
Ratio of net investment loss to average net assets(d) | | | (0.11)% | | | (0.15)% | | | (0.13)% | | | (0.18)% |
Portfolio turnover rate(f) | | | 0% | | | 6% | | | 11% | | | 69% |
| | | | | | | | | | | | | |
(a)
| Inception date of the Fund was December 29, 2020. |
(b)
| Net investment loss per share has been calculated based on average shares outstanding during the year. |
(c)
| Realized and unrealized gains and losses per share in the caption are balancing amounts necessary to reconcile the change in net asset value per share for the years, and may not reconcile with the aggregate gains and losses in the Statement of Operations due to share transactions for the year. |
(d)
| Annualized for periods less than one year. |
(e)
| Amount represents less than 0.005%. |
(f)
| Portfolio turnover rate excludes in-kind transactions. |
(g)
| Effective March 1, 2024 the investment advisory fee changed from 0.18% to 0.12%. |
The accompanying notes are an integral part of these financial statements.
TABLE OF CONTENTS
Pacer Swan SOS Moderate April ETF
Financial Highlights
| | | | | | | |
PER SHARE DATA:
| | | | | | | | | | | | |
Net asset value, beginning of period | | | $22.96 | | | $21.12 | | | $21.98 | | | $20.61 |
INVESTMENT OPERATIONS:
| | | | | | | | | | | | |
Net investment loss(b) | | | (0.16) | | | (0.17) | | | (0.16) | | | (0.10) |
Net realized and unrealized gain (loss) on investments(c) | | | 4.54 | | | 2.01 | | | (0.70) | | | 1.47 |
Total from investment operations | | | 4.38 | | | 1.84 | | | (0.86) | | | 1.37 |
ETF transaction fees per share | | | 0.00(d) | | | 0.00(d) | | | 0.00(d) | | | — |
Net asset value, end of period | | | $27.34 | | | $22.96 | | | $21.12 | | | $21.98 |
Total return | | | 19.06% | | | 8.70% | | | −3.92% | | | 6.67% |
SUPPLEMENTAL DATA AND RATIOS:
| | | | | | | | | | | | |
Net assets, end of period (in thousands) | | | $71,073 | | | $29,849 | | | $17,954 | | | $5,496 |
Ratio of expenses to average net assets(e)(g) | | | 0.64% | | | 0.76% | | | 0.76% | | | 0.75% |
Ratio of dividends, interest and borrowing expense on securities sold short to average net assets(e) | | | 0.01% | | | 0.01% | | | —% | | | —% |
Ratio of operational expenses to average net assets excluding dividends, interest, and borrowing expense on securities sold short(e)(g) | | | 0.63% | | | 0.75% | | | 0.76% | | | 0.75% |
Ratio of net investment loss to average net assets(e) | | | (0.60)% | | | (0.73)% | | | (0.75)% | | | (0.75)% |
Portfolio turnover rate(f) | | | 27% | | | 0% | | | 0% | | | 0% |
| | | | | | | | | | | | | |
(a)
| Inception date of the Fund was March 31, 2021. |
(b)
| Net investment loss per share has been calculated based on average shares outstanding during the year. |
(c)
| Realized and unrealized gains and losses per share in the caption are balancing amounts necessary to reconcile the change in net asset value per share for the years, and may not reconcile with the aggregate gains and losses in the Statement of Operations due to share transactions for the year. |
(d)
| Amount represents less than $0.005 per share. |
(e)
| Annualized for periods less than one year. |
(f)
| Portfolio turnover rate excludes in-kind transactions. |
(g)
| Effective March 1, 2024 the investment advisory fee changed from 0.75% to 0.60%. |
The accompanying notes are an integral part of these financial statements.
TABLE OF CONTENTS
Pacer Swan SOS Moderate January ETF
Financial Highlights
| | | | | | | |
PER SHARE DATA:
| | | | | | | | | | | | |
Net asset value, beginning of period | | | $23.91 | | | $21.50 | | | $22.66 | | | $20.56 |
INVESTMENT OPERATIONS:
| | | | | | | | | | | | |
Net investment loss(b) | | | (0.17) | | | (0.17) | | | (0.16) | | | (0.14) |
Net realized and unrealized gain (loss) on investments(c) | | | 4.93 | | | 2.58 | | | (0.89) | | | 2.24 |
Total from investment operations | | | 4.76 | | | 2.41 | | | (1.05) | | | 2.10 |
LESS DITSRIBUTIONS FROM:
| | | | | | | | | | | | |
Net investment income | | | — | | | — | | | (0.11) | | | — |
Total distributions | | | — | | | — | | | (0.11) | | | — |
ETF transaction fees per share | | | 0.00(d) | | | 0.00(d) | | | 0.00(d) | | | — |
Net asset value, end of period | | | $28.67 | | | $23.91 | | | $21.50 | | | $22.66 |
Total return | | | 19.93% | | | 11.21% | | | −4.65% | | | 10.20% |
SUPPLEMENTAL DATA AND RATIOS:
| | | | | | | | | | | | |
Net assets, end of period (in thousands) | | | $68,102 | | | $34,069 | | | $20,425 | | | $2,832 |
Ratio of expenses to average net assets(e)(g) | | | 0.64% | | | 0.76% | | | 0.75% | | | 0.75% |
Ratio of dividends, interest and borrowing expense on securities sold short to average net assets(e) | | | 0.01% | | | 0.01% | | | —% | | | —% |
Ratio of operational expenses to average net assets excluding dividends, interest, and borrowing expense on securities sold short(e)(g) | | | 0.63% | | | 0.75% | | | 0.75% | | | 0.75% |
Ratio of net investment loss to average net assets(e) | | | (0.61)% | | | (0.73)% | | | (0.75)% | | | (0.75)% |
Portfolio turnover rate(f) | | | 4% | | | 0% | | | 48% | | | 0% |
| | | | | | | | | | | | | |
(a)
| Inception date of the Fund was December 22, 2020.
|
(b)
| Net investment loss per share has been calculated based on average shares outstanding during the year.
|
(c)
| Realized and unrealized gains and losses per share in the caption are balancing amounts necessary to reconcile the change in net asset value per share for the years, and may not reconcile with the aggregate gains and losses in the Statement of Operations due to share transactions for the year.
|
(d)
| Amount represents less than $0.005 per share.
|
(e)
| Annualized for periods less than one year.
|
(f)
| Portfolio turnover rate excludes in-kind transactions. |
(g)
| Effective March 1, 2024 the investment advisory fee changed from 0.75% to 0.60%. |
The accompanying notes are an integral part of these financial statements.
TABLE OF CONTENTS
Pacer Swan SOS Moderate July ETF
Financial Highlights
| | | | | | | |
PER SHARE DATA:
| | | | | | | | | | | | |
Net asset value, beginning of period | | | $22.96 | | | $20.65 | | | $21.02 | | | $20.48 |
INVESTMENT OPERATIONS:
| | | | | | | | | | | | |
Net investment loss(b) | | | (0.16) | | | (0.16) | | | (0.15) | | | (0.05) |
Net realized and unrealized gain (loss) on
investments(c) | | | 5.05 | | | 2.47 | | | (0.22) | | | 0.59 |
Total from investment operations | | | 4.89 | | | 2.31 | | | (0.37) | | | 0.54 |
LESS DITSRIBUTIONS FROM:
| | | | | | | | | | | | |
Net investment income | | | — | | | — | | | (0.00)(d) | | | — |
Total distributions | | | — | | | — | | | (0.00)(d) | | | — |
ETF transaction fees per share | | | 0.00(d) | | | 0.00(d) | | | 0.00(d) | | | 0.00(d) |
Net asset value, end of period | | | $27.85 | | | $22.96 | | | $20.65 | | | $21.02 |
Total return | | | 21.30% | | | 11.19% | | | −1.74% | | | 2.63% |
SUPPLEMENTAL DATA AND RATIOS:
| | | | | | | | | | | | |
Net assets, end of period (in thousands) | | | $78,680 | | | $41,904 | | | $33,556 | | | $17,866 |
Ratio of expenses to average net assets(e)(g) | | | 0.65% | | | 0.76% | | | 0.76% | | | 0.75% |
Ratio of dividends, interest and borrowing expense on securities sold short to average net assets(e) | | | 0.01% | | | 0.01% | | | —% | | | —% |
Ratio of operational expenses to average net assets excluding dividends, interest, and borrowing expense on securities sold short(e)(g) | | | 0.64% | | | 0.75% | | | 0.76% | | | 0.75% |
Ratio of net investment loss to average net assets(e) | | | (0.61)% | | | (0.73)% | | | (0.75)% | | | (0.75)% |
Portfolio turnover rate(f) | | | 3% | | | 0% | | | 0% | | | 0% |
| | | | | | | | | | | | | |
(a)
| Inception date of the Fund was June 30, 2021. |
(b)
| Net investment loss per share has been calculated based on average shares outstanding during the year. |
(c)
| Realized and unrealized gains and losses per share in the caption are balancing amounts necessary to reconcile the change in net asset value per share for the years, and may not reconcile with the aggregate gains and losses in the Statement of Operations due to share transactions for the year. |
(d)
| Amount represents less than $0.005 per share. |
(e)
| Annualized for periods less than one year. |
(f)
| Portfolio turnover rate excludes in-kind transactions. |
(g)
| Effective March 1, 2024 the investment advisory fee changed from 0.75% to 0.60%. |
The accompanying notes are an integral part of these financial statements.
TABLE OF CONTENTS
Pacer Swan SOS Moderate October ETF
Financial Highlights
| | | | | | | |
PER SHARE DATA:
| | | | | | | | | | | | |
Net asset value, beginning of period | | | $23.41 | | | $20.68 | | | $20.97 | | | $20.51 |
INVESTMENT OPERATIONS:
| | | | | | | | | | | | |
Net investment loss(b) | | | (0.16) | | | (0.16) | | | (0.15) | | | (0.01) |
Net realized and unrealized gain (loss) on
investments(c) | | | 3.82 | | | 2.89 | | | (0.14) | | | 0.47 |
Total from investment operations | | | 3.66 | | | 2.73 | | | (0.29) | | | 0.46 |
ETF transaction fees per share | | | 0.00(d) | | | 0.00(d) | | | 0.00(d) | | | — |
Net asset value, end of period | | | $27.07 | | | $23.41 | | | $20.68 | | | $20.97 |
Total return | | | 15.64% | | | 13.22% | | | −1.40% | | | 2.24% |
SUPPLEMENTAL DATA AND RATIOS:
| | | | | | | | | | | | |
Net assets, end of period (in thousands) | | | $65,649 | | | $36,864 | | | $23,261 | | | $8,912 |
Ratio of expenses to average net assets(e)(g) | | | 0.65% | | | 0.76% | | | 0.75% | | | 0.75% |
Ratio of dividends, interest and borrowing expense on securities sold short to average net assets(e) | | | 0.00%(f) | | | 0.01% | | | —% | | | —% |
Ratio of operational expenses to average net assets excluding dividends, interest, and borrowing expense on securities sold short(e)(g) | | | 0.65% | | | 0.75% | | | 0.75% | | | 0.75% |
Ratio of net investment loss to average net assets(e) | | | (0.62)% | | | (0.72)% | | | (0.74)% | | | (0.75)% |
Portfolio turnover rate(g) | | | 0% | | | 0% | | | 0% | | | 0% |
| | | | | | | | | | | | | |
(a)
| Inception date of the Fund was September 30, 2021. |
(b)
| Net investment loss per share has been calculated based on average shares outstanding during the year. |
(c)
| Realized and unrealized gains and losses per share in the caption are balancing amounts necessary to reconcile the change in net asset value per share for the years, and may not reconcile with the aggregate gains and losses in the Statement of Operations due to share transactions for the year. |
(d)
| Amount represents less than $0.005 per share. |
(e)
| Annualized for periods less than one year. |
(f)
| Amount represents less than 0.005%. |
(g)
| Effective March 1, 2024 the investment advisory fee changed from 0.75% to 0.60%. |
The accompanying notes are an integral part of these financial statements.
TABLE OF CONTENTS
Pacer Funds
NOTES TO FINANCIAL STATEMENTS
October 31, 2024
NOTE 1 – ORGANIZATION
Pacer Funds Trust (the “Trust”) is a Delaware statutory trust organized on August 12, 2014. PTLC, PTMC, PTNQ, PTEU, PTIN, PTBD, TRND, COWZ, CALF, GCOW, ICOW, ECOW, COWG, CAFG, BUL, HERD, PWS, INDS, SRVR, SZNE, ALTL, PAMC, PALC, PEXL, FLRT, SHPP, TRFK, QQQG, GLBL and PATN’s fiscal year ends are April 30th and as such are not included in these financial statements. The Trust is registered with the Securities and Exchange Commission (the “SEC”) under the Investment Company Act of 1940, as amended (the “1940 Act”), as an open-end management investment company and the offering of the Funds’ shares (“Shares”) is registered under the Securities Act of 1933, as amended (the “Securities Act”). The Trust currently consists of multiple operational series, of which are covered in this report, individually the (“Fund”) or collectively the (“Funds”).
| | | | | | | | | | | | | |
Pacer American Energy Independence ETF | | | USAI | | | December 12, 2017 | | | NYSE | | | $300 |
Pacer Bluestar Engineering the Future ETF | | | BULD | | | May 4, 2022 | | | Nasdaq | | | 500 |
Pacer BlueStar Digital Entertainment ETF | | | ODDS | | | April 7, 2022 | | | Nasdaq | | | 500 |
Pacer Developed Markets Cash Cows Growth Leaders ETF | | | EAFG | | | March 20, 2024 | | | NYSE | | | 750 |
Pacer Metaurus Nasdaq-100 Dividend Multiplier 600 ETF | | | QSIX | | | September 23, 2024 | | | Nasdaq | | | 300 |
Pacer Metaurus US Large Cap Target Dividend Multiplier 400 ETF | | | QDPL | | | July 12, 2021 | | | NYSE | | | 300 |
Pacer Swan SOS Conservative (April) ETF | | | PSCW | | | March 31, 2021 | | | Cboe | | | 300 |
Pacer Swan SOS Conservative (January) ETF | | | PSCX | | | December 22, 2020 | | | Cboe | | | 300 |
Pacer Swan SOS Conservative (July) ETF | | | PSCJ | | | June 30, 2021 | | | Cboe | | | 300 |
Pacer Swan SOS Conservative (October) ETF | | | PSCQ | | | September 30, 2021 | | | Cboe | | | 300 |
Pacer Swan SOS Flex (April) ETF | | | PSFM | | | March 31, 2021 | | | Cboe | | | 300 |
Pacer Swan SOS Flex (January) ETF | | | PSFD | | | December 22, 2020 | | | Cboe | | | 300 |
Pacer Swan SOS Flex (July) ETF | | | PSFJ | | | June 30, 2021 | | | Cboe | | | 300 |
Pacer Swan SOS Flex (October) ETF | | | PSFO | | | September 30, 2021 | | | Cboe | | | 300 |
Pacer Swan SOS Fund of Funds ETF | | | PSFF | | | December 29, 2020 | | | Cboe | | | 300 |
Pacer Swan SOS Moderate (April) ETF | | | PSMR | | | March 31, 2021 | | | Cboe | | | 300 |
Pacer Swan SOS Moderate (January) ETF | | | PSMD | | | December 22, 2020 | | | Cboe | | | 300 |
Pacer Swan SOS Moderate (July) ETF | | | PSMJ | | | June 30, 2021 | | | Cboe | | | 300 |
Pacer Swan SOS Moderate (October) ETF | | | PSMO | | | September 30, 2021 | | | Cboe | | | 300 |
| | | | | | | | | | | | | |
Each Fund (other than QDPL) is classified as a non-diversified series of the Trust.
The investment objective of the following Funds is to track the performance, before fees and expenses, of the
| | | | |
USAI | | | American Energy Independence Index |
BULD | | | BlueStar Robotics and 3D Printing Index |
ODDS | | | BlueStar Global Online Gambling, Video Gaming, and eSports Index |
QDPL | | | Metaurus US Large Cap Dividend Multiplier Index – Series 400 |
EAFG | | | Pacer Developed Markets Cash Cows Growth Leaders Index |
QSIX | | | Metaurus Nasdaq-100® Dividend Multiplier Total Return Series Index - Series 600 |
| | | | |
TABLE OF CONTENTS
Pacer Funds
NOTES TO FINANCIAL STATEMENTS
October 31, 2024(Continued)
The investment objective of the following Funds is to seek
| | | | |
PSFF | | | capital appreciation with downside protection. |
PSCX | | | to provide investors with returns that, before fees and expenses of the Fund, match those of the SPDR® S&P 500® ETF Trust (the “Underlying ETF”) up to a predetermined upside cap of 14.20% (before fees and expenses of the Fund) and 13.45% (after fees and expenses of the Fund), while providing a buffer against Underlying ETF losses between 5% and 30% over the period from January 2, 2024 to December 31, 2024. |
PSMD | | | to provide investors with returns that, before fees and expenses of the Fund, match those of the SPDR® S&P 500® ETF Trust (“the Underlying ETF”) up to a predetermined upside cap of 13.65% (before fees and expenses of the Fund) and 12.90% (after fees and expenses of the Fund), while providing a buffer against the first 15% of Underlying ETF losses, over the period from January 2, 2024 to December 31, 2024. |
PSFD | | | to provide investors with returns that match those of the SPDR® S&P 500® ETF Trust (the “Underlying ETF”) up to a predetermined upside cap of 15.43% (before fees and expenses of the Fund) and 14.68% (after fees and expenses of the Fund), while providing a buffer against the first 20% of Underlying ETF losses with the benefits of such buffer declining from 20% to 0% for Underlying ETF losses between 20% and 40%, over the period from January 2, 2024 to December 31, 2024. |
PSCW | | | to provide investors with returns that, before fees and expenses of the Fund, match those of the SPDR® S&P 500® ETF Trust (the “Underlying ETF”) up to a predetermined upside cap of 16.29% (before fees and expenses of the Fund) and 15.69% (after fees and expenses of the Fund), while providing a buffer against Underlying ETF losses between 5% and 30% over the period from April 1, 2024 to March 31, 2025. |
PSMR | | | to provide investors with returns that, before fees and expenses of the Fund, match those of the SPDR® S&P 500® ETF Trust (“the Underlying ETF”) up to a predetermined upside cap of 14.78% (before fees and expenses of the Fund) and 14.18% (after fees and expenses of the Fund), while providing a buffer against the first 15% of Underlying ETF losses, over the period from April 1, 2024 to March 31, 2025. |
PSFM | | | to provide investors with returns that match those of the SPDR® S&P 500® ETF Trust (the “Underlying ETF”) up to a predetermined upside cap of 16.53% (before fees and expenses of the Fund) and 15.93% (after fees and expenses of the Fund), while providing a buffer against the first 20% of Underlying ETF losses with the benefits of such buffer declining from 20% to 0% for Underlying ETF losses between 20% and 40%, over the period from April 1, 2024 to March 31, 2025. |
PSCJ | | | to provide investors with returns that, before fees and expenses of the Fund, match those of the SPDR® S&P 500® ETF Trust (the “Underlying ETF”) up to a predetermined upside cap of 15.21%(before fees and expenses of the Fund) and 14.61% (after fees and expenses of the Fund), while providing a buffer against Underlying ETF losses between 5% and 30% over the period from July 1, 2024 to June 30, 2025. |
PSMJ | | | to provide investors with returns that, before fees and expenses of the Fund, match those of the SPDR® S&P 500® ETF Trust (“the Underlying ETF”) up to a predetermined upside cap of 13.84%% (before fees and expenses of the Fund) and 13.24% (after fees and expenses of the Fund), while providing a buffer against the first 15% of Underlying ETF losses, over the period from July 1, 2024 to June 30, 2025 |
PSFJ | | | to provide investors with returns that match those of the SPDR® S&P 500® ETF Trust (the “Underlying ETF”) up to a predetermined upside cap of 15.27% (before fees and expenses of the Fund) and 14.67% (after fees and expenses of the Fund), while providing a buffer against the first 20% of Underlying ETF losses with the benefits of such buffer declining from 20% to 0% for Underlying ETF losses between 20% and 40%, over the period from July 1, 2024 to June 30, 2025 |
PSCQ | | | to provide investors with returns that, before fees and expenses of the Fund, match those of the SPDR® S&P 500® ETF Trust (the “Underlying ETF”) up to a predetermined upside cap of 11.75% (before fees and expenses of the Fund) and 11.15% (after fees and expenses of the Fund), while providing a buffer against Underlying ETF losses between 5% and 30% over the period from October 1, 2024 to September 30, 2025 |
| | | | |
TABLE OF CONTENTS
Pacer Funds
NOTES TO FINANCIAL STATEMENTS
October 31, 2024(Continued)
| | | | |
PSMO | | | to provide investors with returns that, before fees and expenses of the Fund, match those of the SPDR® S&P 500® ETF Trust (“the Underlying ETF”) up to a predetermined upside cap of 11.64% (before fees and expenses of the Fund) and 11.04% (after fees and expenses of the Fund), while providing a buffer against the first 15% of Underlying ETF losses, over the period from October 1, 2024 to September 30, 2025 |
PSFO | | | to provide investors with returns that match those of the SPDR® S&P 500® ETF Trust (the “Underlying ETF”) up to a predetermined upside cap of 13.31% (before fees and expenses of the Fund) and 12.71% (after fees and expenses of the Fund), while providing a buffer against the first 20% of Underlying ETF losses with the benefits of such buffer declining from 20% to 0% for Underlying ETF losses between 20% and 40%, over the period from October 1, 2024 to September 30, 2025 |
| | | | |
Market prices for the shares may be different from their net asset value (“NAV”). The Funds issue and redeem shares on a continuous basis at NAV only in large blocks of shares, called “Creation Units,” which generally consist of 25,000 shares except USAI and QSIX which generally consist of 50,000 shares, QDPL which consists of 30,000 shares, along with ODDS and BULD which generally consist of 20,000 shares. Creation Units are issued and redeemed principally in-kind for securities included in a specified universe. Once created, Shares generally trade in the secondary market at market prices that change throughout the day in amounts less than a Creation Unit. Except when aggregated in Creation Units, Shares are not redeemable securities of a Fund. Shares of a Fund may only be purchased directly from or redeemed directly to a Fund by certain financial institutions (“Authorized Participants”). An Authorized Participant is either (i) a broker-dealer or other participant in the clearing process through the Continuous Net Settlement System of the National Securities Clearing Corporation or (ii) a DTC participant and, in each case, must have executed a Participant Agreement with Pacer Financial, Inc. (the “Distributor”). Most retail investors do not qualify as Authorized Participants nor have the resources to buy and sell whole Creation Units. Therefore, they are unable to purchase or redeem the shares directly from a Fund. Rather, most retail investors may purchase Shares in the secondary market with the assistance of a broker and are subject to customary brokerage commissions or fees. The Funds currently offer one class of Shares, which have no front-end sales load, no deferred sales charge, and no redemption fee. A purchase (i.e., creation) transaction fee is imposed for the transfer and other transaction costs associated with the purchase of Creation Units. Each Fund charges $300 for the standard fixed creation fee, payable to the Custodian except ODDS and BULD which charges $500 and EAFG which charges $750. The fixed transaction fee may be waived on certain orders if the Funds’ Custodian has determined to waive some or all of the costs associated with the order, or another party, such as the Adviser, has agreed to pay such fee. In regards to USAI, a variable fee, payable to the Fund, may be charged on all cash transactions or substitutes for Creation Units of up to a maximum of 2% as a percentage of the value of the Creation Units subject to the transaction. In regards to BULD, ODDS, PSFF, PSCX, PSMD, PSFD, PSCW, PSMR, PSFM, PSCJ, PSMJ, PSFJ, PSCQ, PSMO, PSFO, QSXI and QDPL a variable fee, payable to a Fund, of up to a maximum of 2% of the value of the Creation Units subject to the transaction may be imposed for cash purchases, non-standard orders, or partial cash purchases of Creation Units. The variable charge is primarily designed to cover additional costs (e.g., brokerage, taxes) involved with buying the securities with cash. For orders comprised entirely of cash, a variable fee of 0.01% of the value of the order will be charged by a Fund. For orders partially comprised of cash in lieu of certain Deposit Securities, a variable fee of 0.01% of the value of such cash in lieu of Deposit Securities will be charged by PSCX, PSMD, PSFD, PSCW, PSMR, PSFM, PSCJ, PSMJ, PSFJ, PSCQ, PSMO and PSFO. A Fund may determine to not charge a variable fee on certain orders when the Adviser has determined that doing so is in the best interests of Fund shareholders (e.g., for creation orders that facilitate changes to the Fund’s portfolio in a more tax efficient manner than could be achieved without such order). Investors who use the services of a broker or other such intermediary may be charged a fee for such services. Investors are responsible for the fixed costs of transferring the Fund Securities from the Fund to their account or on their order. Variable fees received by the Funds, if any, are displayed in the Capital Shares Transactions section of the Statements of Changes in Net Assets. Each Fund may issue an unlimited number of shares of beneficial interest, with no par value. Shares of each Fund have equal rights and privileges to such Fund.
NOTE 2 – SIGNIFICANT ACCOUNTING POLICIES
The following is a summary of significant accounting policies consistently followed by the Funds in the preparation of the financial statements. The financial statements have been prepared in conformity with accounting
TABLE OF CONTENTS
Pacer Funds
NOTES TO FINANCIAL STATEMENTS
October 31, 2024(Continued)
principles generally accepted in the United States of America (“GAAP”). The Funds are investment companies that follow the accounting and reporting guidelines of Accounting Standards Codification Topic 946 applicable to investment companies.
Securities, including master limited partnerships (“MLPs”), listed on a securities exchange, market or automated quotation system for which quotations are readily available, are valued at the last quoted sale price on the primary exchange or market (foreign or domestic) on which they are traded, except for securities listed on Nasdaq Global Market (“Nasdaq”). If, on a particular day, there is no such reported sale, then the most recent quoted bid price will be used. For securities traded on Nasdaq, the Nasdaq Official Closing Price (“NOCP”) will be used. If a Fund holds foreign shares of a security for which there is no reported volume, and there is an actively trading local version of the security, the last quoted sale price of the local security shall be used. Prices denominated in foreign currencies are converted to U.S. dollar equivalents at the current exchange rate.
Investments in other open-end investment companies, including money market funds, are valued at the investment company’s net asset value per share, with the exception of exchange-traded open-end investment companies, which are priced as equity securities described above.
Fixed-income securities are normally valued on the basis of quotes obtained from independent pricing services in accordance with procedures adopted by the Board of Trustees. The independent pricing services may employ methodologies that utilize market transactions (if the security is actively traded), broker-dealer supplied valuations, or matrix pricing. Short-term securities that have maturities of less than 60 days, at the time of purchase, are valued at amortized cost, which, when combined with accrued interest, approximates market value.
Options on securities that are listed on an exchange shall be valued at the sale price on such exchange (or any other exchange on which such options are listed) having the trade closest to the close of the New York Stock Exchange (“NYSE”) on the day of valuation or, if there was no sale on any of the applicable options exchanges on such day, at the mean between the highest bid and lowest ask price on any of such exchanges on such day closest to the close of the NYSE on such day. On the last trading day prior to expiration, expiring options may be priced at intrinsic value.
Foreign currency forward contracts are valued at the current day’s interpolated foreign exchange rate, as calculated using the current day’s spot rate, and the twenty, sixty, ninety, and one-hundred eighty day forward rates provided by an independent source.
Futures contracts are valued at the settlement price on the exchange on which they are principally traded.
Units of Mount Vernon Liquid Assets Portfolio are not traded on an exchange and are valued at the investment company’s NAV per share as provided by its administrator.
The Trust’s Valuation Procedures provide for the designation of the Adviser as “Valuation Designee”. If no quotation is available from either a pricing service, or one or more brokers or there is reason to question the reliability or accuracy of a quotation supplied, securities are valued at fair value as determined in good faith, by the Valuation Designee pursuant to procedures established by the Funds’ Board of Trustees (the “Board”).As described above, the Funds utilize various methods to measure the fair value of their investments on a recurring basis. GAAP establishes a hierarchy that prioritizes inputs to valuations methods. The three levels of inputs are:
Level 1 –
| Unadjusted quoted prices in active markets for identical assets or liabilities that the Funds have the ability to access. |
Level 2 –
| Observable inputs other than quoted prices included in Level 1 that are observable for the asset or liability, either directly or indirectly. These inputs may include quoted prices for the identical instrument on an inactive market, prices for similar instruments, interest rates, prepayment speeds, credit risk, yield curves, default rates and similar data. |
Level 3 –
| Unobservable inputs for the asset or liability, to the extent relevant observable inputs are not available; representing the Funds’ own assumptions about the assumptions a market participant would use in valuing the asset or liability, and would be based on the best information available. |
TABLE OF CONTENTS
Pacer Funds
NOTES TO FINANCIAL STATEMENTS
October 31, 2024(Continued)
The availability of observable inputs can vary from security to security and is affected by a wide variety of factors, including, for example, the type of security, whether the security is new and not yet established in the marketplace, the liquidity of markets, and other characteristics particular to the security. To the extent that valuation is based on models or inputs that are less observable or unobservable in the market, the determination of fair value requires more judgment. Accordingly, the degree of judgment exercised in determining fair value is greatest for instruments categorized in Level 3.
The inputs used to measure fair value may fall into different levels of the fair value hierarchy. In such cases, for disclosure purposes, the level in the fair value hierarchy within which the fair value measurement falls in its entirety, is determined based on the lowest level input that is significant to the fair value measurement in its entirety.
USAI
| | | | | | | | | | | | | | | | |
Common Stocks | | | $63,642,047 | | | $— | | | $— | | | $— | | | $63,642,047 |
Investments Purchased with Proceeds from Securities Lending | | | — | | | — | | | — | | | 10,336,726 | | | 10,336,726 |
Total Investments in Securities | | | $63,642,047 | | | $— | | | $— | | | $10,336,726 | | | $73,978,773 |
| | | | | | | | | | | | | | | | |
^
| See Schedules of Investments for industry breakouts. |
BULD
| | | | | | | | | | | | | | | | |
Common Stocks | | | $820,588 | | | $— | | | $— | | | $— | | | $820,588 |
Total Investments in Securities | | | $820,588 | | | $— | | | $— | | | $— | | | $820,588 |
| | | | | | | | | | | | | | | | |
^
| See Schedules of Investments for industry breakouts. |
ODDS
| | | | | | | | | | | | | | | | |
Common Stocks | | | $947,471 | | | $— | | | $— | | | $— | | | $947,471 |
Total Investments in Securities | | | $947,471 | | | $— | | | $— | | | $— | | | $947,471 |
| | | | | | | | | | | | | | | | |
^
| See Schedules of Investments for industry breakouts. |
EAFG
| | | | | | | | | | | | | | | | |
Common Stocks | | | $485,359 | | | $— | | | $— | | | $— | | | $485,359 |
Preferred Stocks | | | 1,617 | | | — | | | — | | | — | | | 1,617 |
Total Investments in Securities | | | $486,976 | | | $— | | | $— | | | $— | | | $486,976 |
| | | | | | | | | | | | | | | | |
^
| See Schedule of Investments for sector breakouts. |
TABLE OF CONTENTS
Pacer Funds
NOTES TO FINANCIAL STATEMENTS
October 31, 2024(Continued)
QSIX
| | | | | | | | | | | | | | | | |
Common Stocks | | | $5,742,080 | | | $— | | | $— | | | $— | | | $5,742,080 |
Preferred Stocks | | | — | | | — | | | — | | | — | | | — |
Investments Purchased with Proceeds from Securities Lending | | | — | | | — | | | — | | | — | | | — |
Total Investments in Securities | | | $5,742,080 | | | $— | | | $— | | | $— | | | $5,742,080 |
Other Financial Instruments(a)
| | | | | | | | | | | | | | | |
Futures Contracts | | | $23,627 | | | $— | | | $— | | | $— | | | $23,627 |
| | | | | | | | | | | | | | | | |
^
| See Schedule of Investments for sector breakouts. |
(a)
| Other Financial Instruments are derivative instruments not reflected in the Schedule of Investments, such as futures contracts which are reflected at the unrealized appreciation on the instrument. |
QDPL
| | | | | | | | | | | | | | | | |
Common Stocks | | | $520,912,725 | | | $— | | | $— | | | $— | | | $520,912,725 |
Real Estate Investment Trusts | | | 11,360,159 | | | — | | | — | | | — | | | 11,360,159 |
US Government Notes/Bonds/
Bills | | | — | | | 49,458,701 | | | — | | | — | | | 49,458,701 |
Total Investments in Securities | | | $532,272,884 | | | $49,458,701 | | | $— | | | $— | | | $581,731,585 |
Other Financial Instruments(a)
| | | | | | | | | | | | | | | |
Futures Contracts | | | $4,240,062 | | | $— | | | $— | | | $— | | | $4,240,062 |
| | | | | | | | | | | | | | | | |
^
| See Schedule of Investments for sector breakouts. |
(a)
| Other Financial Instruments are derivative instruments not reflected in the Schedule of Investments, such as futures contracts which are reflected at the unrealized appreciation on the instrument. |
PSCW
| | | | | | | | | | | | | | | | |
Assets
| | | | | | | | | | | | | | | |
Purchased Options | | | $— | | | $38,043,688 | | | $— | | | $— | | | $38,043,688 |
Total Investments in Securities | | | $— | | | $38,043,688 | | | $— | | | $— | | | $38,043,688 |
Liabilities
| | | | | | | | | | | | | | | |
Options Written | | | $— | | | $688,682 | | | $— | | | $— | | | $688,682 |
Total Investments in Securities | | | $— | | | $688,682 | | | $— | | | $— | | | $688,682 |
| | | | | | | | | | | | | | | | |
^
| See the Schedules of Investments for further disaggregation of investment categories. |
TABLE OF CONTENTS
Pacer Funds
NOTES TO FINANCIAL STATEMENTS
October 31, 2024(Continued)
PSCX
| | | | | | | | | | | | | | | | |
Assets
| | | | | | | | | | | | | | | |
Purchased Options | | | $— | | | $20,927,858 | | | $— | | | $— | | | $20,927,858 |
Total Investments in Securities | | | $— | | | $20,927,858 | | | $— | | | $— | | | $20,927,858 |
Liabilities
| | | | | | | | | | | | | | | |
Options Written | | | $— | | | $1,395,068 | | | $— | | | $— | | | $1,395,068 |
Total Investments in Securities | | | $— | | | $1,395,068 | | | $— | | | $— | | | $1,395,068 |
| | | | | | | | | | | | | | | | |
^
| See the Schedules of Investments for further disaggregation of investment categories. |
PSCJ
| | | | | | | | | | | | | | | | |
Assets
| | | | | | | | | | | | | | | |
Purchased Options | | | $— | | | $37,671,487 | | | $— | | | $— | | | $37,671,487 |
Total Investments in Securities | | | $— | | | $37,671,487 | | | $— | | | $— | | | $37,671,487 |
Liabilities
| | | | | | | | | | | | | | | |
Options Written | | | $— | | | $797,940 | | | $— | | | $— | | | $797,940 |
Total Investments in Securities | | | $— | | | $797,940 | | | $— | | | $— | | | $797,940 |
| | | | | | | | | | | | | | | | |
^
| See the Schedules of Investments for further disaggregation of investment categories. |
PSCQ
| | | | | | | | | | | | | | | | |
Assets
| | | | | | | | | | | | | | | |
Purchased Options | | | $— | | | $15,231,294 | | | $— | | | $— | | | $15,231,294 |
Total Investments in Securities | | | $— | | | $15,231,294 | | | $— | | | $— | | | $15,231,294 |
Liabilities
| | | | | | | | | | | | | | | |
Options Written | | | $— | | | $408,793 | | | $— | | | $— | | | $408,793 |
Total Investments in Securities | | | $— | | | $408,793 | | | $— | | | $— | | | $408,793 |
| | | | | | | | | | | | | | | | |
^
| See the Schedules of Investments for further disaggregation of investment categories. |
TABLE OF CONTENTS
Pacer Funds
NOTES TO FINANCIAL STATEMENTS
October 31, 2024(Continued)
PSFM
| | | | | | | | | | | | | | | | |
Assets
| | | | | | | | | | | | | | | |
Purchased Options | | | $— | | | $25,078,461 | | | $— | | | $— | | | $25,078,461 |
Total Investments in Securities | | | $— | | | $25,078,461 | | | $— | | | $— | | | $25,078,461 |
Liabilities
| | | | | | | | | | | | | | | |
Options Written | | | $— | | | $600,704 | | | $— | | | $— | | | $600,704 |
Total Investments in Securities | | | $— | | | $600,704 | | | $— | | | $— | | | $600,704 |
| | | | | | | | | | | | | | | | |
^
| See the Schedules of Investments for further disaggregation of investment categories. |
PSFD
| | | | | | | | | | | | | | | | |
Assets
| | | | | | | | | | | | | | | |
Purchased Options | | | $— | | | $49,713,356 | | | $— | | | $— | | | $49,713,356 |
Total Investments in Securities | | | $— | | | $49,713,356 | | | $— | | | $— | | | $49,713,356 |
Liabilities
| | | | | | | | | | | | | | | |
Options Written | | | $— | | | $2,974,523 | | | $— | | | $— | | | $2,974,523 |
Total Investments in Securities | | | $— | | | $2,974,523 | | | $— | | | $— | | | $2,974,523 |
| | | | | | | | | | | | | | | | |
^
| See the Schedules of Investments for further disaggregation of investment categories. |
PSFJ
| | | | | | | | | | | | | | | | |
Assets
| | | | | | | | | | | | | | | |
Purchased Options | | | $— | | | $27,772,765 | | | $— | | | $— | | | $27,772,765 |
Total Investments in Securities | | | $— | | | $27,772,765 | | | $— | | | $— | | | $27,772,765 |
Liabilities
| | | | | | | | | | | | | | | |
Options Written | | | $— | | | $925,351 | | | $— | | | $— | | | $925,351 |
Total Investments in Securities | | | $— | | | $925,351 | | | $— | | | $— | | | $925,351 |
| | | | | | | | | | | | | | | | |
^
| See the Schedules of Investments for further disaggregation of investment categories. |
TABLE OF CONTENTS
Pacer Funds
NOTES TO FINANCIAL STATEMENTS
October 31, 2024(Continued)
PSFO
| | | | | | | | | | | | | | | | |
Assets
| | | | | | | | | | | | | | | |
Purchased Options | | | $— | | | $15,258,218 | | | $— | | | $— | | | $15,258,218 |
Total Investments in Securities | | | $— | | | $15,258,218 | | | $— | | | $— | | | $15,258,218 |
Liabilities
| | | | | | | | | | | | | | | |
Options Written | | | $— | | | $676,600 | | | $— | | | $— | | | $676,600 |
Total Investments in Securities | | | $— | | | $676,600 | | | $— | | | $— | | | $676,600 |
| | | | | | | | | | | | | | | | |
^
| See the Schedules of Investments for further disaggregation of investment categories. |
PSFF
| | | | | | | | | | | | | | | | |
Affiliated Exchange Traded
Funds | | | $375,707,875 | | | $— | | | $— | | | $— | | | $375,707,875 |
Total Investments in Securities | | | $375,707,875 | | | $— | | | $— | | | $— | | | $375,707,875 |
| | | | | | | | | | | | | | | | |
PSMR
| | | | | | | | | | | | | | | | |
Assets
| | | | | | | | | | | | | | | |
Purchased Options | | | $— | | | $72,367,535 | | | $— | | | $— | | | $72,367,535 |
Total Investments in Securities | | | $— | | | $72,367,535 | | | $— | | | $— | | | $72,367,535 |
Liabilities
| | | | | | | | | | | | | | | |
Options Written | | | $— | | | $1,936,157 | | | $— | | | $— | | | $1,936,157 |
Total Investments in Securities | | | $— | | | $1,936,157 | | | $— | | | $— | | | $1,936,157 |
| | | | | | | | | | | | | | | | |
^
| See the Schedules of Investments for further disaggregation of investment categories. |
PSMD
| | | | | | | | | | | | | | | | |
Assets
| | | | | | | | | | | | | | | |
Purchased Options | | | $— | | | $72,610,724 | | | $— | | | $— | | | $72,610,724 |
Total Investments in Securities | | | $— | | | $72,610,724 | | | $— | | | $— | | | $72,610,724 |
Liabilities
| | | | | | | | | | | | | | | |
Options Written | | | $— | | | $5,160,255 | | | $— | | | $— | | | $5,160,255 |
Total Investments in Securities | | | $— | | | $5,160,255 | | | $— | | | $— | | | $5,160,255 |
| | | | | | | | | | | | | | | | |
^
| See the Schedules of Investments for further disaggregation of investment categories. |
TABLE OF CONTENTS
Pacer Funds
NOTES TO FINANCIAL STATEMENTS
October 31, 2024(Continued)
PSMJ
| | | | | | | | | | | | | | | | |
Assets
| | | | | | | | | | | | | | | |
Purchased Options | | | $— | | | $80,483,074 | | | $— | | | $— | | | $80,483,074 |
Total Investments in Securities | | | $— | | | $80,483,074 | | | $— | | | $— | | | $80,483,074 |
Liabilities
| | | | | | | | | | | | | | | |
Options Written | | | $— | | | $2,576,063 | | | $— | | | $— | | | $2,576,063 |
Total Investments in Securities | | | $— | | | $2,576,063 | | | $— | | | $— | | | $2,576,063 |
| | | | | | | | | | | | | | | | |
^
| See the Schedules of Investments for further disaggregation of investment categories. |
PSMO
| | | | | | | | | | | | | | | | |
Assets
| | | | | | | | | | | | | | | |
Purchased Options | | | $— | | | $67,753,189 | | | $— | | | $— | | | $67,753,189 |
Total Investments in Securities | | | $— | | | $67,753,189 | | | $— | | | $— | | | $67,753,189 |
Liabilities
| | | | | | | | | | | | | | | |
Options Written | | | $— | | | $2,644,215 | | | $— | | | $— | | | $2,644,215 |
Total Investments in Securities | | | $— | | | $2,644,215 | | | $— | | | $— | | | $2,644,215 |
| | | | | | | | | | | | | | | | |
^
| See the Schedules of Investments for further disaggregation of investment categories. |
(a)
| Other Financial Instruments are derivative instruments not reflected in the Schedule of Investments, such as futures contracts which are reflected at the unrealized appreciation on the instrument. |
OPTIONS CONTRACTS – In general, an option contract is an agreement between a buyer and seller that gives the purchaser of the option the right to buy or sell a particular asset at a specified future date at an agreed upon price (commonly known as the “strike price”). PSCX, PSMD, PSFD, PSCW, PSMR, PSFM, PSCJ, PSMJ, PSFJ, PSCQ, PSMO and PSFO portfolios include several types of FLEX Options, including both purchased and written put and call options (as further described below). The FLEX Options are all European style options, which means that they are exercisable at the strike price only on the FLEX Option expiration date. FLEX Options are customized option contracts available through national securities exchanges that are guaranteed for settlement by the Options Clearing Corporation (“OCC”), a market clearinghouse. FLEX Options provide investors with the ability to customize terms of an option, including exercise prices, exercise styles (European style versus American style options which are exercisable any time prior to the expiration date) and expiration dates, while achieving price discovery in competitive, transparent auctions markets and avoiding the counterparty exposure of the over-the-counter option positions.
Each FLEX Option contract entitles the holder thereof (i.e., the purchaser of the FLEX Option) the option to purchase (for the call options) or sell (for the put options) the cash value of the reference asset as of the close of the market on the FLEX Option expiration date at the strike price. The Fund intends to be structured so that any amount owed by the Fund on the written FLEX Options will be covered by payouts at expiration from the purchased FLEX Options. As a result, the FLEX Options will be fully covered, and no additional collateral will be necessary during the life of the Fund. The Fund receives premiums in exchange for the written FLEX Options and pays premiums in exchange for the purchased FLEX Options. The OCC and securities exchange that the FLEX Options are listed on do not charge ongoing fees to writers or purchasers of the FLEX Options during their life for continuing to hold the option contracts. In general, put options give the holder (i.e., the buyer) the right to sell an asset (or deliver the cash value of the index, in case of an index put option) and the seller (i.e., the writer) of the put has the obligation to buy the asset (or
TABLE OF CONTENTS
Pacer Funds
NOTES TO FINANCIAL STATEMENTS
October 31, 2024(Continued)
receive cash value of the index, in case of an index put option) at a certain defined price. Call options give the holder (i.e., the buyer) the right to buy an asset (or receive cash value of the index, in case of an index call option) and the seller (i.e., the writer) the obligation to sell the asset (or deliver cash value of the index, in case of an index call option) at a certain defined price.
When the Funds purchase an option, an amount equal to the premium paid by the Funds are recorded as an investment and is subsequently adjusted to the current value of the option purchased. If an option expires on the stipulated expiration date or if the Funds enter into a closing sale transaction, a gain or loss is realized. If a call option is exercised, the cost of the security acquired is increased by the premium paid for the call. If a put option is exercised, a gain or loss is realized from the sale of the underlying security, and the proceeds from such sale are decreased by the premium originally paid. Purchased options are non-income producing securities. When the Funds write an option, an amount equal to the premium received by the Funds are recorded as a liability and is subsequently adjusted to the current value of the option written. Premiums received from writing options that expire unexercised are treated by the Funds on the expiration date as realized gain from written options. The difference between the premium and the amount paid on effecting a closing purchase transaction, including brokerage commissions, is also treated as a realized gain, or if the premium is less than the amount paid for the closing purchase transaction, as a realized loss. If a call option is exercised, the premium is added to the proceeds from the sale of the underlying security in determining whether the Funds have realized a gain or loss. If a put option is exercised, the premium reduces the cost basis of the securities purchased by the Funds. The Funds, as writers of an option, bear the market risk of an unfavorable change in the price of the security underlying the written option.
The OCC guarantees performance by each of the counterparties to FLEX Options, becoming the “buyer for every seller and the seller for every buyer,” protecting clearing members and options traders from counterparty risk. Subject to determination by the Securities Committee of the OCC, adjustments may be made to the FLEX Options for certain events (collectively, “Corporate Actions”) specified in the OCC’s by-laws and rules: certain stock dividends or distributions, stock splits, reverse stock splits, rights offerings, distributions, reorganizations, recapitalizations, or reclassifications with respect to an underlying security, or a merger, consolidation, dissolution or liquidation of the issuer of the underlying security. According to the OCC’s by-laws, the nature and extent of any such adjustment is to be determined by the OCC’s Securities Committee, in light of the circumstances known to it at the time such determination is made, based on its judgment as to what is appropriate for the protection of investors and the public interest, taking into account such factors as fairness to holders and writers (or purchasers and sellers) of the affected options, the maintenance of a fair and orderly market in the affected options, consistency of interpretation and practice, efficiency of exercise settlement procedures, and the coordination with other clearing agencies of the clearance and settlement of transactions in the underlying interest.
The value of derivative instruments on the Statements of Assets and Liabilities for the Funds as of October 31, 2024, is as follows:
| | | | |
PSCX | | | $20,927,858 | | | $1,395,068 |
PSMD | | | 72,610,724 | | | 5,160,255 |
PSFD | | | 49,713,356 | | | 2,974,523 |
PSCW | | | 38,043,688 | | | 688,682 |
PSMR | | | 72,367,535 | | | 1,936,157 |
PSFM | | | 25,078,461 | | | 600,704 |
PSCJ | | | 37,671,487 | | | 797,940 |
PSMJ | | | 80,483,074 | | | 2,576,063 |
PSFJ | | | 27,772,765 | | | 925,351 |
PSCQ | | | 15,231,294 | | | 408,793 |
PSMO | | | 67,753,189 | | | 2,644,215 |
PSFO | | | 15,258,218 | | | 676,600 |
| | | | | | | |
TABLE OF CONTENTS
Pacer Funds
NOTES TO FINANCIAL STATEMENTS
October 31, 2024(Continued)
The effect of derivative instruments on the Statement of Operations for the period ended October 31, 2024 is as follows:
| | | | |
PSCX | | | $2,030,641 | | | $(604,099) | | | $2,454,284 | | | $(989,097) |
PSMD | | | 6,266,539 | | | (1,954,166) | | | 9,284,311 | | | (3,365,458) |
PSFD | | | 3,212,365 | | | 77,399 | | | 5,604,289 | | | (1,403,293) |
PSCW | | | 2,548,230 | | | (1,135,928) | | | 3,334,542 | | | (327,108) |
PSMR | | | 7,781,754 | | | (3,145,341) | | | 5,897,477 | | | (672,838) |
PSFM | | | 4,057,766 | | | (954,240) | | | 1,667,844 | | | (405,976) |
PSCJ | | | 2,305,469 | | | (638,382) | | | 2,047,482 | | | (387,071) |
PSMJ | | | 9,850,813 | | | (2,676,117) | | | 5,256,794 | | | (942,083) |
PSFJ | | | 3,932,025 | | | 331,416 | | | 2,559,335 | | | (1,151,543) |
PSCQ | | | 2,496,685 | | | (1,289,599) | | | 10,273 | | | (1,152) |
PSMO | | | 11,877,729 | | | (5,929,062) | | | 377,700 | | | (110,680) |
PSFO | | | 3,989,146 | | | (1,708,266) | | | 106,931 | | | (27,181) |
| | | | | | | | | | | | | |
The effect of derivative instruments on the Statement of Operations for the period ended October 31, 2024 is as follows:
| | | | |
PSCX | | | $18,961,378 | | | $(940,994) |
PSMD | | | 68,448,364 | | | (3,694,291) |
PSFD | | | 41,821,721 | | | (2,033,301) |
PSCW | | | 26,915,896 | | | (596,307) |
PSMR | | | 63,005,405 | | | (1,929,605) |
PSFM | | | 23,138,431 | | | (642,940) |
PSCJ | | | 19,958,582 | | | (476,021) |
PSMJ | | | 66,508,287 | | | (2,050,629) |
PSFJ | | | 26,878,438 | | | (713,091) |
PSCQ | | | 9,665,213 | | | (655,244) |
PSMO | | | 47,431,208 | | | (3,480,205) |
PSFO | | | 15,843,786 | | | (1,056,643) |
| | | | | | | |
A.
| Foreign Currency. Investment securities and other assets and liabilities denominated in foreign currencies are translated into U.S. dollar amounts at the date of valuation. Purchases and sales of investment securities and income and expense items denominated in foreign currencies are translated into U.S. dollar amounts on the respective dates of such transactions. The Funds do not isolate that portion of the result of operations resulting from changes in foreign exchange rates on investments from fluctuations arising from changes in market prices of securities held. Such fluctuations are included with the net realized and unrealized gain or loss from investments. The Funds report net realized foreign exchange gains or losses that arise from sales of foreign currencies, currency gains or losses realized between the trade and settlement dates on foreign currency transactions, and the differences between the amounts of dividends, interest and foreign withholding taxes recorded on the Funds’ books and the U.S. dollar equivalent of the amounts actually received or paid. Net unrealized foreign exchange gains and losses arise from changes in the values of assets and liabilities, other than investments in securities at fiscal period end, resulting from changes in exchange rates. |
TABLE OF CONTENTS
Pacer Funds
NOTES TO FINANCIAL STATEMENTS
October 31, 2024(Continued)
B.
| Federal Income Taxes.The Funds have complied and intend to continue to comply with the requirements of Subchapter M of the Internal Revenue Code of 1986, as amended, necessary to qualify as regulated investment companies and distribute substantially all net taxable investment income and net realized gains to shareholders in a manner which results in no tax cost to the Funds. Therefore, no federal income tax provision is required. As of and during the fiscal year or period ended October 31, 2024, the Funds did not have any tax positions that did not meet the “more-likely-than-not” threshold of being sustained by the applicable tax authority. As of and during the fiscal year or period ended October 31, 2024, the Funds did not have liabilities for any unrecognized tax benefits on uncertain tax positions as income tax expense in the Statement of Operations. Management has analyzed each of the Fund’s tax positions and concluded that no liability for unrecognized tax benefits should be recorded related to uncertain tax positions taken on returns filed for open tax years (2021-2023) for the applicable funds, or expected to be taken in each of the Fund’s 2024 tax returns. During the year or period ended October 31, 2024, the Funds did not incur any interest or penalties. |
C.
| Security Transactions and Investment Income. Investment securities transactions are accounted for on the trade date. Gains and losses realized on sales of securities are computed on the basis of highest amortized cost. Dividend income is recorded on the ex-dividend date. Interest income is recorded on an accrual basis. Discounts and premiums on securities purchased are accreted and amortized over the lives of the respective securities. Withholding taxes on foreign dividends have been provided for in accordance with the Funds’ understanding of the applicable tax rules and regulations. |
Distributions received from a Funds’ investments in REITs and MLPs may be characterized as ordinary income, net capital gain, or return of capital. The proper characterization of such distributions is generally not known until after the end of each calendar year. As such, the Funds must use estimates in reporting the character of their income and distributions for financial statement purposes. Such estimates are based on historical information available from each MLP and other industry sources. The actual character of distributions to each Fund’s shareholders will be reflected on the Form 1099 received by shareholders after the end of the calendar year. Due to the nature of such investments, a portion of the distributions received by each Fund’s shareholders may represent a return of capital.
D.
| Distributions to Shareholders. Distributions to shareholders from net investment income for USAI is declared and paid on a monthly basis, distributions to shareholders from net investment income for BULD are declared and paid on a semi-annual basis, distributions to shareholders from net investment income for ODDS,QDPL, EAFG and QSIX are declared and paid on a quarterly basis, and distributions to shareholders from net investment income for PSCX, PSMD, PSFD, PSFF, PSCW, PSMR, PSFM, PSCJ, PSMJ, PSFJ, PSCQ, PSMO and PSFO are declared and paid at least annually. Distributions for all Funds from net realized gains on securities, if any, normally are declared and paid on an annual basis. Distributions are recorded on the ex-dividend date. |
E.
| Use of Estimates. The preparation of financial statements in conformity with GAAP requires management to make estimates and assumptions that affect the reported amounts of assets and liabilities and disclosure of contingent assets and liabilities at the date of the financial statements, and the reported amounts of increases and decreases in net assets from operations during the reporting period. Actual results could differ from those estimates. |
F.
| Share Valuation. The NAV per share of each Fund is calculated by dividing the sum of the value of the securities held by the Fund, plus cash and other assets, minus all liabilities (including estimated accrued expenses) by the total number of shares outstanding for the Fund, rounded to the nearest cent. The Funds’ shares will not be priced on the days on which the NYSE are closed for trading. The offering and redemption price per share of the Fund is equal to each Fund’s NAV per share. |
G.
| Guarantees and Indemnifications. In the normal course of business, the Funds enters into contracts with service providers that contain general indemnification clauses. Each Fund’s maximum exposure under these arrangements is unknown as this would involve future claims that may be against the Funds that have not yet occurred. |
TABLE OF CONTENTS
Pacer Funds
NOTES TO FINANCIAL STATEMENTS
October 31, 2024(Continued)
H.
| Cash and cash equivalents.Cash and cash equivalents are held with a financial institution. Cash and cash equivalents of the Funds may be placed in deposit accounts at U.S. banks and such deposits generally exceed Federal Deposit Insurance Corporation (“FDIC”) insurance limits. The FDIC insures deposit accounts up to $250,000 for each account holder. The counter party is generally a single bank rather than a group of financial institutions; thus there may be a greater counter party credit risk. The Funds place deposits only with those counter parties which are believed to be creditworthy and there has been no history of loss. |
I.
| Reclassification of Capital Accounts. Additionally, U.S. GAAP requires that certain components of net assets relating to permanent differences be reclassified between financial and tax reporting. These reclassifications have no effect on net assets or net asset value per share. For the fiscal year ended October 31, 2024, the following table shows the reclassifications made: |
| | | | | | | |
USAI | | | $(2,171,786) | | | $ 2,171,786 |
BULD | | | (95,746) | | | 95,746 |
ODDS | | | (148,337) | | | 148,337 |
EAFG | | | 17,015 | | | (17,015) |
QSIX | | | — | | | — |
QDPL | | | (5,336,016) | | | 5,336,016 |
PSCW | | | (2,946,585) | | | 2,946,585 |
PSCX | | | (2,140,485) | | | 2,140,485 |
PSCJ | | | (2,500,498) | | | 2,500,498 |
PSCQ | | | (2,256,229) | | | 2,256,229 |
PSFM | | | (5,358,262) | | | 5,358,262 |
PSFD | | | (4,021,847) | | | 4,021,847 |
PSFJ | | | (6,093,666) | | | 6,093,666 |
PSFO | | | (4,109,260) | | | 4,109,260 |
PSFF | | | (11,922,236) | | | 11,922,236 |
PSMR | | | (9,156,337) | | | 9,156,337 |
PSMD | | | (6,150,641) | | | 6,150,641 |
PSMJ | | | (10,836,205) | | | 10,836,205 |
PSMO | | | (11,557,527) | | | 11,557,527 |
| | | | | | | |
During the fiscal year ended October 31, 2024, the Fund realized the following in net capital gains/(losses) resulting from in-kind redemptions, in which shareholders exchanged Fund shares for securities held by the Fund rather than for cash. Because such gains are not taxable to the Fund, and are not distributed to shareholders, they have been reclassified from net realized losses to paid-in capital.
| | | | |
USAI | | | $ 1,978,990 |
BULD | | | 97,131 |
ODDS | | | 150,137 |
EAFG | | | (15,184) |
QSIX | | | — |
QDPL | | | 5,902,624 |
PSCW | | | 3,016,335 |
PSCX | | | 2,200,534 |
PSCJ | | | 2,568,793 |
PSCQ | | | 2,284,286 |
PSFM | | | 5,462,041 |
PSFD | | | 4,155,387 |
| | | | |
TABLE OF CONTENTS
Pacer Funds
NOTES TO FINANCIAL STATEMENTS
October 31, 2024(Continued)
| | | | |
PSFJ | | | $6,295,176 |
PSFO | | | 4,169,642 |
PSFF | | | 12,173,994 |
PSMR | | | 9,300,073 |
PSMD | | | 6,386,205 |
PSMJ | | | 11,206,604 |
PSMO | | | 11,432,106 |
| | | | |
NOTE 3 – COMMITMENTS AND OTHER RELATED PARTY TRANSACTIONS
Pursuant to an Investment Advisory Agreement (“Investment Advisory Agreement”) between the Trust, on behalf of the Funds, and the Adviser, the Adviser provides investment advice to the Funds and oversees the day-to-day operations of the Funds, subject to the direction and control of the Board and the officers of the Trust. The Adviser administers the Funds’ business affairs, provides office facilities and equipment and certain clerical, bookkeeping and administrative services. The Adviser bears the costs of all advisory and non-advisory services required to operate the Funds, in exchange for a single unitary management fee. For services provided to the Funds, the Funds pay the Adviser an advisory fee at an annual rate based on the Fund’s average daily net assets:
| | | | | | | |
USAI | | | 0.75% | | | 0.75% |
ODDS | | | 0.60% | | | 0.60% |
BULD | | | 0.60% | | | 0.60% |
EAFG | | | 0.65% | | | 0.65% |
QSIX | | | 0.60% | | | 0.60% |
QDPL | | | 0.60%1 | | | 0.79% |
PSCW | | | 0.60%2 | | | 0.75% |
PSCX | | | 0.60%2 | | | 0.75% |
PSCJ | | | 0.60%2 | | | 0.75% |
PSCQ | | | 0.60%2 | | | 0.75% |
PSFM | | | 0.60%2 | | | 0.75% |
PSFD | | | 0.60%2 | | | 0.75% |
PSFJ | | | 0.60%2 | | | 0.75% |
PSFO | | | 0.60%2 | | | 0.75% |
PSFF | | | 0.12%2 | | | 0.18% |
PSMR | | | 0.60%2 | | | 0.75% |
PSMD | | | 0.60%2 | | | 0.75% |
PSMJ | | | 0.60%2 | | | 0.75% |
PSMO | | | 0.60%2 | | | 0.75% |
| | | | | | | |
1
| The new advisory fee took effect on February 1, 2024 |
2
| The new advisory fee took effect on March 1, 2024 |
Swan Global Management, LLC (“Swan”) serves as the sub-adviser to PSFF, PSCX, PSMD, PSFD, PSCW, PSMR, PSFM, PSCJ, PSMJ, PSFJ, PSCQ, PSMO and PSFO. The sub-adviser has responsibility for selecting and continuously monitoring the Funds’ investments. Sub-Advisory fees earned by Swan are paid by the Adviser.
Pursuant to a Sub-Advisory Agreement between the Adviser and Metaurus (the “Sub-Advisory Agreement”), Metaurus is responsible for the day-to-day management of QDPL and QSIX, including the trading of portfolio securities for the Funds. Metaurus is responsible for selecting broker-dealers to execute purchase and sale transactions or in connection with any rebalancing of reconstitutions of Indices, subject to the supervision of the Adviser and the Board. For the services it provides to QDPL and QSIX, Metaurus is compensated by the Adviser from the management fees paid by QDPL and QSIX to the Adviser.
TABLE OF CONTENTS
Pacer Funds
NOTES TO FINANCIAL STATEMENTS
October 31, 2024(Continued)
The Distributor acts as the Funds’ principal underwriter in a continuous public offering of the Funds’ shares. The Distributor is an affiliate of the Adviser. The Funds did not pay any fees or commissions to the Distributor during the fiscal year ended October 31, 2024.
Certain officers and a Trustee of the Trust are affiliated with the Adviser and Distributor.
NOTE 4 – SERVICE AND CUSTODY AGREEMENTS
The Funds have entered into Service Agreements with U.S. Bancorp Fund Services, LLC (“Fund Services” or “Administrator”) doing business as U.S. Global Fund Services and a Custody Agreement with U.S. Bank, N.A. (the “Custodian”), an affiliate of Fund Services. Under these agreements, Fund Services and the Custodian provide certain transfer agency, administrative, accounting and custody services. The Custodian acts as securities lending agent (the “Securities Lending Agent”) for the Funds.
NOTE 5 – SECURITIES LENDING
The Funds may lend up to 33 1/3% of the value of the securities in their portfolios to brokers, dealers and financial institutions (but not individuals) under terms of participation in a securities lending program administered by the Securities Lending Agent. The securities lending agreement requires that loans are collateralized at all times in an amount equal to at least 102% of the value of any domestic loaned securities at the time of the loan, plus accrued interest. The use of loans of foreign securities, which are denominated and payable in U.S. dollars, shall be collateralized in an amount equal to 105% of the value of any loaned securities at the time of the loan plus accrued interest. The Funds receive compensation in the form of fees and earn interest on the cash collateral. Due to timing issues of when a security is recalled from loan, the financial statements may differ in presentation. The amount of fees depends on a number of factors including the type of security and length of the loan. The Funds continue to receive interest payments or dividends on the securities loaned during the borrowing period. Gain or loss in the value of securities loaned that may occur during the term of the loan will be for the account of the Funds. The Funds have the right under the terms of the securities lending agreements to recall the securities from the borrower on demand.
As of October 31, 2024, USAI had loaned securities and received cash collateral for the loans. The cash collateral is invested in the Mount Vernon Liquid Assets Portfolio, LLC of which the investment objective is to seek to maximize income to the extent consistent with the preservation of capital and liquidity and maintain a stable NAV of $1.00. Although risk is mitigated by the collateral, the Fund could experience a delay in recovering their securities and possible loss of income or value if the borrower fails to return the borrowed securities. In addition, the Fund bears the risk of loss associated with the investment of cash collateral received.
During the year ended October 31, 2024, USAI had loaned securities that were collateralized by cash. The cash collateral received was invested in securities as listed in the Fund’s Schedule of Investments. Income earned from these investments is allocated to the Fund based on the Fund’s portion of total cash collateral received. Securities lending income is disclosed in the Fund’s Statement of Operations.
NOTE 6 – SECURED BORROWINGS
The following represents gross obligations for secured borrowings by remaining time to maturity as of October 31, 2024.
Securities Lending Transactions
*
| Proceeds from securities lending (Investments Purchased with Proceeds from Securities Lending Collateral). |
Due to the absence of a master netting agreement related to the Funds’ participation in securities lending, no additional offsetting disclosures have been made on behalf of the Funds for the total borrowings listed above.
TABLE OF CONTENTS
Pacer Funds
NOTES TO FINANCIAL STATEMENTS
October 31, 2024(Continued)
NOTE 7 – DERIVATIVES TRANSACTIONS
The Funds may enter into futures contracts to hedge various investments for risk management as well as speculative purposes. Initial margin deposits are made upon entering into futures contracts and can be either cash or securities. Secondary margin limits are required to be maintained while futures are held, as defined by each contract.
During the period a futures contract is open, changes in the value of the contract are recognized as unrealized gains or losses by “marking- to-market” on a daily basis to reflect the fair value of the contract at the end of each day’s trading. Variation margin receivables or payables represent the difference between the change in unrealized appreciation and depreciation on the open contracts and the cash deposits made on the margin accounts. When the contract is closed, the Funds record a realized gain or loss equal to the difference between the proceeds from the closing transaction and the Funds’ cost of entering into a contract. The use of futures contracts involves the risk of illiquid markets or imperfect correlation between the value of the instruments and the underlying securities, or that the counterparty will fail to perform its obligations.
The following tables represent a summary of the value of derivative instruments as of October 31, 2024 and the effect of derivative instruments on the Statement of Assets and Liabilities as of October 31, 2024:
QDPL
Statement of Assets and Liabilities - Values of Derivative Instruments as of October 31, 2024
| | | | |
Equity Contracts - Futures | | | Deposit at Broker for Futures | | | $4,240,062 |
| | | | | | | |
The effect of Derivative Instruments on the Statement of Operations for the period ended October 31, 2024 is as follows:
| | | | | | | | | | |
Equity Contracts - Futures | | | $723,267 | | | Equity Contracts - Futures | | | $3,256,075 |
| | | | | | | | | | |
The average monthly value of long futures during the period ended October 31, 2024 in QDPL was $48,292,828.
QSIX
Statement of Assets and Liabilities - Values of Derivative Instruments as of October 31, 2024
| | | | |
Equity Contracts - Futures | | | Deposit at Broker for Futures | | | $23,627 |
| | | | | | | |
The effect of Derivative Instruments on the Statement of Operations for the period ended October 31, 2024 is as follows:
| | | | | | | | | | |
Equity Contracts - Futures | | | $0 | | | Equity Contracts - Futures | | | $23,627 |
| | | | | | | | | | |
The average monthly value of long futures during the period ended October 31, 2024 in QSIX was $871,000.
TABLE OF CONTENTS
Pacer Funds
NOTES TO FINANCIAL STATEMENTS
October 31, 2024(Continued)
NOTE 8 – OFFSETTING ASSETS AND LIABILITIES
The following is a summary of the Assets and Liabilities for each Fund subject to offsets as of October 31, 2024:
Assets
| | | | | | | | | | | | | | | | |
QDPL
| | | | | | | | | | | | | | | | | | |
Futures Contracts | | | $6,295,149 | | | $ — | | | $ 6,295,149 | | | $6,295,149 | | | $ — | | | $ — |
QSIX
| | | | | | | | | | | | | | | | | | |
Futures Contracts | | | $323,628 | | | $— | | | $323,628 | | | $323,628 | | | $— | | | $— |
| | | | | | | | | | | | | | | | | | | |
Liabilities
| | | | | | | | | | | | | | | | |
USAI
| | | | | | | | | | | | | | | | | | |
Securities Lending | | | $10,336,726 | | | $ — | | | $10,336,726 | | | $10,336,726 | | | $ — | | | $ — |
| | | | | | | | | | | | | | | | | | | |
NOTE 9 – INVESTMENT TRANSACTIONS
For the year ended October 31, 2024, the aggregate purchases and sales of securities by the Funds, excluding short-term securities and in-kind transactions were as follows:
| | | | | | | |
USAI | | | $12,337,408 | | | $11,974,198 |
BULD | | | 175,946 | | | 183,600 |
ODDS | | | 417,220 | | | 427,036 |
EAFG | | | 244,556 | | | 247,213 |
QSIX | | | 5,731,183 | | | — |
QDPL | | | 78,159,221 | | | 23,687,606 |
PSCW | | | 12,632,119 | | | 1,482,354 |
PSCX | | | 12,595,323 | | | 562,752 |
PSCJ | | | 13,827,506 | | | 263,319 |
PSCQ | | | 1,056,992 | | | 4,920 |
PSFM | | | 22,142,250 | | | 1,567,514 |
PSFD | | | 25,100,280 | | | 1,510,406 |
PSFJ | | | 25,953,885 | | | 2,908,528 |
PSFO | | | 1,418,940 | | | 32,925 |
PSFF | | | 165,322,970 | | | — |
PSMR | | | 41,102,510 | | | 10,641,526 |
PSMD | | | 45,522,157 | | | 2,004,174 |
PSMJ | | | 59,923,984 | | | 1,886,736 |
PSMO | | | 5,411,465 | | | 15,101 |
| | | | | | | |
TABLE OF CONTENTS
Pacer Funds
NOTES TO FINANCIAL STATEMENTS
October 31, 2024(Continued)
For the year ended October 31, 2024, in-kind transactions associated with creations and redemptions, excluding short-term securities are as follows:
| | | | | | | |
USAI | | | $7,656,793 | | | $3,249,787 |
BULD | | | — | | | 785,941 |
ODDS | | | 434,439 | | | 430,531 |
EAFG | | | 1,003,882 | | | 485,100 |
QSIX | | | — | | | — |
QDPL | | | 305,908,115 | | | 14,852,363 |
PSCW | | | — | | | — |
PSCX | | | — | | | — |
PSCJ | | | — | | | — |
PSCQ | | | 174 | | | 8,001,919 |
PSFM | | | — | | | — |
PSFD | | | — | | | — |
PSFJ | | | — | | | — |
PSFO | | | 1,241 | | | 12,359,574 |
PSFF | | | 56,560,062 | | | 66,408,338 |
PSMR | | | — | | | — |
PSMD | | | — | | | — |
PSMJ | | | — | | | — |
PSMO | | | 2,876 | | | 39,731,221 |
| | | | | | | |
For the year ended October 31, 2024, U.S. Government transactions associated with creations and redemptions, excluding short-term securities are as follows:
| | | | | | | |
USAI | | | $— | | | $— |
BULD | | | — | | | — |
ODDS | | | — | | | — |
EAFG | | | — | | | — |
QSIX | | | — | | | — |
QDPL | | | 36,371,361 | | | 8,500,000 |
PSCW | | | — | | | — |
PSCX | | | — | | | — |
PSCJ | | | — | | | — |
PSCQ | | | — | | | — |
PSFM | | | — | | | — |
PSFD | | | — | | | — |
PSFJ | | | — | | | — |
PSFO | | | — | | | — |
PSFF | | | — | | | — |
PSMR | | | — | | | — |
PSMD | | | — | | | — |
PSMJ | | | — | | | — |
PSMO | | | — | | | — |
| | | | | | | |
TABLE OF CONTENTS
Pacer Funds
NOTES TO FINANCIAL STATEMENTS
October 31, 2024(Continued)
NOTE 10 – TRANSACTIONS WITH AFFILIATED SECURITIES
PSFF seeks capital appreciation with downside protection. The Fund is an actively-managed exchange-traded fund that seeks to achieve its investment objective by investing in a portfolio of other ETFs also managed by the Fund’s Adviser, that seek exposure to U.S. equity securities, while limiting downside risk (the “Underlying Buffer ETFs”). Certain Underlying ETFs may also be sub-advised by Swan. Underlying ETFs generally invest in equity securities or options on equity securities (including other ETFs) to obtain their long exposure to the U.S. equity market. Additionally, the Underlying ETFs may invest in cash, short-term U.S. Treasury securities, or high yield corporate bonds or utilize options on equity securities (including other ETFs) to hedge their exposure to U.S. equities. The Fund may also invest directly in equity securities, options on equity securities (including other ETFs) or indices, cash, or cash equivalents. While the Fund is not limited in the types of strategies the Underlying ETFs may utilize, the Fund is expected to primarily utilize “trend-following strategy” and “structured outcome strategy” styles of Underlying ETFs.
PSFF had the following transactions during the current fiscal year with affiliates:
| | | | |
PSCW | | | 327,442 | | | 1,196,218 | | | (210,962) | | | 1,312,698 |
PSCX | | | 308,978 | | | 342,793 | | | (111,788) | | | 539,983 |
PSCJ | | | 313,311 | | | 1,067,557 | | | (139,961) | | | 1,240,907 |
PSCQ | | | 214,178 | | | 281,796 | | | (57,497) | | | 438,477 |
PSFM | | | 472,770 | | | 160,791 | | | (118,686) | | | 514,875 |
PSFD | | | 437,034 | | | 482,632 | | | (157,833) | | | 761,833 |
PSFJ | | | 483,971 | | | 277,006 | | | (141,629) | | | 619,348 |
PSFO | | | 380,730 | | | 134,055 | | | (96,435) | | | 418,350 |
PSMR | | | 1,013,302 | | | 1,364,396 | | | (376,062) | | | 2,001,636 |
PSMD | | | 1,183,273 | | | 1,301,950 | | | (426,665) | | | 2,058,558 |
PSMJ | | | 1,185,133 | | | 1,505,674 | | | (391,295) | | | 2,299,512 |
PSMO | | | 1,070,760 | | | 565,315 | | | (272,539) | | | 1,363,536 |
| | | | | | | | | | | | | |
| | | | |
PSCW | | | $33,614,520 | | | $ — | | | $619,904 | | | $2,843,156 |
PSCX | | | 14,695,151 | | | — | | | 398,095 | | | 1,607,968 |
PSCJ | | | 32,371,045 | | | — | | | 641,128 | | | 1,888,682 |
PSCQ | | | 11,413,556 | | | — | | | 274,623 | | | 603,472 |
PSFM | | | 14,929,264 | | | — | | | 567,286 | | | 2,263,086 |
PSFD | | | 24,723,385 | | | — | | | 1,032,526 | | | 2,943,626 |
PSFJ | | | 17,675,263 | | | — | | | 839,378 | | | 2,625,707 |
PSFO | | | 11,764,044 | | | — | | | 600,261 | | | 1,281,999 |
PSMR | | | 54,720,925 | | | — | | | 1,495,890 | | | 5,277,793 |
PSMD | | | 59,024,416 | | | — | | | 1,986,958 | | | 6,058,365 |
PSMJ | | | 63,933,562 | | | — | | | 2,232,499 | | | 5,652,049 |
PSMO | | | 36,842,744 | | | — | | | 1,485,446 | | | 2,875,342 |
Total | | | $375,707,875 | | | $— | | | $12,173,994 | | | $35,921,245 |
| | | | | | | | | | | | | |
TABLE OF CONTENTS
Pacer Funds
NOTES TO FINANCIAL STATEMENTS
October 31, 2024(Continued)
NOTE 11 – TAX COST BASIS
The components of tax basis cost of investments and net unrealized appreciation for federal income tax purposes at October 31, 2024, were as follows:
| | | | | | | | | | | | | | | | |
Tax cost of investments | | | $53,921,805 | | | $837,007 | | | $929,702 | | | $483,458 | | | $5,731,183 |
Gross tax unrealized appreciation | | | 22,421,810 | | | 142,959 | | | 149,726 | | | 24,229 | | | 180,658 |
Gross tax unrealized depreciation | | | (2,364,842) | | | (159,378) | | | (131,958) | | | (20,752) | | | (169,761) |
Net tax unrealized appreciation (depreciation) | | | 20,056,968 | | | (16,419) | | | 17,768 | | | 3,477 | | | 10,897 |
Undistributed ordinary income | | | — | | | 521 | | | 1,881 | | | 3,981 | | | 9,048 |
Undistributed long-term gain | | | — | | | — | | | — | | | — | | | 14,177 |
Total distributable earnings | | | — | | | 521 | | | 1,881 | | | 3,981 | | | 23,225 |
Other accumulated (loss) | | | (682,867) | | | (23,653) | | | (46,529) | | | (18,912) | | | — |
Total accumulated gain (loss) | | | $19,374,101 | | | $(39,551) | | | $(26,880) | | | $(11,454) | | | $34,122 |
| | | | | | | | | | | | | | | | |
| | | | | | | | | | | | | | | | |
Tax cost of investments | | | $516,828,300 | | | $34,183,078 | | | $17,416,053 | | | $35,587,813 | | | $14,890,826 |
Gross tax unrealized appreciation | | | 81,495,855 | | | 4,058,183 | | | 3,564,908 | | | 1,718,783 | | | 80,898 |
Gross tax unrealized depreciation | | | (16,592,570) | | | (886,255) | | | (1,448,171) | | | (433,049) | | | (149,223) |
Net tax unrealized appreciation (depreciation) | | | 64,903,285 | | | 3,171,928 | | | 2,116,737 | | | 1,285,734 | | | (68,325) |
Undistributed ordinary income | | | — | | | — | | | — | | | — | | | — |
Undistributed long-term gain | | | — | | | — | | | — | | | — | | | — |
Total distributable earnings | | | — | | | — | | | — | | | — | | | — |
Other accumulated (loss) | | | — | | | (2,579,221) | | | (1,562,802) | | | (1,388,503) | | | (1,644,650) |
Total accumulated gain (loss) | | | $64,903,285 | | | $592,707 | | | $553,935 | | | $(102,769) | | | $(1,712,975) |
| | | | | | | | | | | | | | | | |
| | | | | | | | | | | | | | | | |
Tax cost of investments | | | $22,643,019 | | | $41,705,379 | | | $25,944,903 | | | $14,644,365 | | | $333,192,583 |
Gross tax unrealized appreciation | | | 2,473,261 | | | 8,851,406 | | | 1,303,085 | | | 52,208 | | | 42,665,954 |
Gross tax unrealized depreciation | | | (638,523) | | | (3,817,952) | | | (400,574) | | | (114,955) | | | (150,662) |
Net tax unrealized appreciation (depreciation) | | | 1,834,738 | | | 5,033,454 | | | 902,511 | | | (62,747) | | | 42,515,292 |
Undistributed ordinary income | | | — | | | — | | | — | | | — | | | — |
Undistributed long-term gain | | | — | | | — | | | — | | | — | | | — |
Total distributable earnings | | | — | | | — | | | — | | | — | | | — |
Other accumulated (loss) | | | (4,308,240) | | | (2,402,088) | | | (2,879,036) | | | (2,676,718) | | | (414,343) |
Total accumulated gain (loss) | | | $(2,473,502) | | | $2,631,366 | | | $(1,976,525) | | | $(2,739,465) | | | $42,100,949 |
| | | | | | | | | | | | | | | | |
TABLE OF CONTENTS
Pacer Funds
NOTES TO FINANCIAL STATEMENTS
October 31, 2024(Continued)
| | | | | | | | | | | | | |
Tax cost of investments | | | $64,876,259 | | | $60,336,187 | | | $74,768,275 | | | $65,253,496 |
Gross tax unrealized appreciation | | | 7,654,179 | | | 12,859,713 | | | 4,142,962 | | | 269,037 |
Gross tax unrealized depreciation | | | (2,099,060) | | | (5,745,431) | | | (1,004,226) | | | (413,559) |
Net tax unrealized appreciation (depreciation) | | | 5,555,119 | | | 7,114,282 | | | 3,138,736 | | | (144,522) |
Undistributed ordinary income | | | — | | | — | | | — | | | — |
Undistributed long-term gain | | | — | | | — | | | — | | | — |
Total distributable earnings | | | — | | | — | | | — | | | — |
Other accumulated (loss) | | | (7,041,871) | | | (2,626,198) | | | (5,283,863) | | | (8,388,907) |
Total accumulated gain (loss) | | | $(1,486,752) | | | $4,488,084 | | | $(2,145,127) | | | $(8,533,429) |
| | | | | | | | | | | | | |
The difference between book and tax-basis cost is attributable to the realization for tax purposes of unrealized gains on investments in Real Estate Investment Trusts (REITs), partnerships, passive foreign investment companies and wash sales. Under tax law, certain capital and foreign currency losses realized after October 31 and within the taxable year are deemed to arise on the first business day of a Fund’s next taxable year. At October 31, 2024, the Funds, on a tax basis, did not defer any post-October.
At October 31, 2024, the following Funds deferred, on a tax basis, ordinary late year loses:
| | | | |
USAI | | | $— |
BULD | | | — |
ODDS | | | — |
EAFG | | | — |
QSIX | | | — |
QDPL | | | — |
PSCW | | | 149,872 |
PSCX | | | 108,640 |
PSCJ | | | 110,921 |
PSCQ | | | 58,567 |
PSFM | | | 129,576 |
PSFD | | | 224,290 |
PSFJ | | | 146,545 |
PSFO | | | 90,938 |
PSFF | | | 283,870 |
PSMR | | | 332,497 |
PSMD | | | 354,022 |
PSMJ | | | 342,507 |
PSMO | | | 236,686 |
| | | | |
TABLE OF CONTENTS
Pacer Funds
NOTES TO FINANCIAL STATEMENTS
October 31, 2024(Continued)
At October 31, 2024, the Funds had the following capital loss carryforwards:
| | | | | | | | | | |
USAI | | | $(579,395) | | | $(103,256) | | | Indefinite |
BULD | | | (17,775) | | | (5,827) | | | Indefinite |
ODDS | | | (31,139) | | | (15,359) | | | Indefinite |
EAFG | | | (18,912) | | | — | | | Indefinite |
QSIX | | | — | | | — | | | Indefinite |
QDPL | | | — | | | — | | | Indefinite |
PSCW | | | (2,273,932) | | | (155,417) | | | Indefinite |
PSCX | | | (993,410) | | | (460,752) | | | Indefinite |
PSCJ | | | (1,169,445) | | | (108,137) | | | Indefinite |
PSCQ | | | (1,280,738) | | | (305,345) | | | Indefinite |
PSFM | | | (3,997,099) | | | (181,565) | | | Indefinite |
PSFD | | | (1,953,225) | | | (224,573) | | | Indefinite |
PSFJ | | | (2,096,487) | | | (636,003) | | | Indefinite |
PSFO | | | (1,924,649) | | | (660,680) | | | Indefinite |
PSFF | | | (130,264) | | | (209) | | | Indefinite |
PSMR | | | (6,534,036) | | | (175,338) | | | Indefinite |
PSMD | | | (1,523,169) | | | (749,007) | | | Indefinite |
PSMJ | | | (4,475,229) | | | (426,279) | | | Indefinite |
PSMO | | | (6,607,114) | | | (1,545,106) | | | Indefinite |
| | | | | | | | | | |
NOTE 12 – DISTRIBUTIONS TO SHAREHOLDERS
The tax character of distributions paid by the Funds during the fiscal year ended October 31, 2024, was as follows:
| | | | | | | | | | |
USAI | | | $1,396,764 | | | $— | | | $1,033,236 |
BULD | | | 1,389 | | | — | | | — |
ODDS | | | 3,734 | | | — | | | — |
EAFG | | | 8,278 | | | — | | | — |
QSIX | | | — | | | — | | | — |
QDPL | | | 5,620,734 | | | 2,051,768 | | | 13,454,992 |
PSCW | | | — | | | — | | | — |
PSCX | | | — | | | — | | | — |
PSCJ | | | — | | | — | | | — |
PSCQ | | | — | | | — | | | — |
PSFM | | | — | | | — | | | — |
PSFD | | | — | | | — | | | — |
PSFJ | | | — | | | — | | | — |
PSFO | | | — | | | — | | | — |
PSFF | | | — | | | — | | | — |
PSMR | | | — | | | — | | | — |
PSMD | | | — | | | — | | | — |
PSMJ | | | — | | | — | | | — |
PSMO | | | — | | | — | | | — |
| | | | | | | | | | |
TABLE OF CONTENTS
Pacer Funds
NOTES TO FINANCIAL STATEMENTS
October 31, 2024(Continued)
The tax character of distributions paid by the Funds during the fiscal year ended October 31, 2023, was as follows:
| | | | | | | | | | |
USAI | | | $572,644 | | | $— | | | $1,917,356 |
BULD | | | 3,412 | | | — | | | 723 |
ODDS | | | 6,600 | | | — | | | — |
EAFG | | | 8,278 | | | — | | | — |
QSIX | | | — | | | — | | | — |
QDPL | | | 897,292 | | | 85,981 | | | 3,763,619 |
PSCW | | | — | | | — | | | — |
PSCX | | | — | | | — | | | — |
PSCJ | | | — | | | — | | | — |
PSCQ | | | — | | | — | | | — |
PSFM | | | — | | | — | | | — |
PSFD | | | — | | | — | | | — |
PSFJ | | | — | | | — | | | — |
PSFO | | | — | | | — | | | — |
PSFF | | | — | | | — | | | 6,428 |
PSMR | | | — | | | — | | | — |
PSMD | | | — | | | — | | | — |
PSMJ | | | — | | | — | | | — |
PSMO | | | — | | | — | | | — |
| | | | | | | | | | |
NOTE 13 – RISKS
On February 24, 2022, Russia commenced a military attack on Ukraine. The outbreak of hostilities between the two countries could result in more widespread conflict and could have a severe adverse effect on the region and the markets. In addition, sanctions imposed on Russia by the United States and other countries, and any sanctions imposed in the future could have a significant adverse impact on the Russian economy and related markets. The price and liquidity of investments may fluctuate widely as a result of the conflict and related events. How long such conflict and related events will last and whether it will escalate further cannot be predicted, nor its effect on the Funds.
NOTE 14 – SUBSEQUENT EVENTS
On November 20, 2024, the following Funds declared a distribution from ordinary income to shareholders of record as of November 21, 2024, Payable November 27, 2024, as follows:
| | | | | | | |
USAI | | | $216,000 | | | $0.12000000 |
| | | | | | | |
TABLE OF CONTENTS
Pacer Funds
NOTES TO FINANCIAL STATEMENTS
October 31, 2024(Continued)
On December 26, 2024, the following Funds declared a distribution from ordinary income to shareholders of record as of December 27, 2024, Payable January 2, 2025, as follows:
| | | | | | | |
USAI | | | $234,000 | | | $ 0.12000000 |
BULD | | | 521 | | | 0.01302500 |
ODDS | | | 1,980 | | | 0.04950000 |
EAFG | | | 4,536 | | | 0.18144000 |
PSCW | | | — | | | — |
PSCX | | | — | | | — |
PSCJ | | | — | | | — |
PSCQ | | | — | | | — |
PSFM | | | — | | | — |
PSFD | | | — | | | — |
PSFJ | | | — | | | — |
PSFO | | | — | | | — |
PSMR | | | — | | | — |
PSMD | | | — | | | — |
PSMJ | | | — | | | — |
PSMO | | | — | | | — |
| | | | | | | |
On December 27, 2024, the following Funds declared a distribution from ordinary income to shareholders of record as of December 30, 2024, Payable January 3, 2025, as follows:
On December 30, 2024, the following Funds declared a distribution from ordinary income to shareholders of record as of December 31, 2024, Payable January 2, 2025, as follows:
| | | | | | | |
QSIX | | | $70,960 | | | $0.35480000 |
QDPL | | | $10,020,360 | | | $0.52850000 |
| | | | | | | |
TABLE OF CONTENTS
PACER FUNDS
REPORT OF INDEPENDENT REGISTERED PUBLIC ACCOUNTING FIRM
To the Board of Trustees of Pacer Funds Trust and the Shareholders of Pacer American Energy Independence ETF, Pacer BlueStar Digital Entertainment ETF, Pacer BlueStar Engineering the Future ETF, Pacer Developed Markets Cash Cows Growth Leaders ETF, Pacer Metaurus Nasdaq 100 Dividend Multiplier 600 ETF, Pacer Metaurus US Large Cap Dividend Multiplier 400 ETF, Pacer Swan SOS Conservative (April) ETF, Pacer Swan SOS Conservative (January) ETF, Pacer Swan SOS Conservative (July) ETF, Pacer Swan SOS Conservative (October) ETF, Pacer Swan SOS Flex (April) ETF, Pacer Swan SOS Flex (January) ETF, Pacer Swan SOS Flex (July) ETF, Pacer Swan SOS Flex (October) ETF, Pacer Swan SOS Fund of Funds ETF, Pacer Swan SOS Moderate (April) ETF, Pacer Swan SOS Moderate (January) ETF, Pacer Swan SOS Moderate (July) ETF and Pacer Swan SOS Moderate (October) ETF
Opinion on the Financial Statements
We have audited the accompanying statements of assets and liabilities of the Pacer American Energy Independence ETF (“USAI”), Pacer BlueStar Digital Entertainment ETF (“ODDS”), Pacer BlueStar Engineering the Future ETF (“BULD”), Pacer Developed Markets Cash Cows Growth Leaders ETF (“EAFG”), Pacer Metaurus Nasdaq 100 Dividend Multiplier 600 ETF (“QSIX”), Pacer Metaurus US Large Cap Dividend Multiplier 400 ETF (“QDPL”), Pacer Swan SOS Conservative (April) ETF (“PSCW”), Pacer Swan SOS Conservative (January) ETF (“PSCX”), Pacer Swan SOS Conservative (July) ETF (“PSCJ”), Pacer Swan SOS Conservative (October) ETF (“PSCQ”), Pacer Swan SOS Flex (April) ETF (“PSFM”), Pacer Swan SOS Flex (January) ETF (“PSFD”), Pacer Swan SOS Flex (July) ETF (“PSFJ”), Pacer Swan SOS Flex (October) ETF (“PSFO”), Pacer Swan SOS Fund of Funds ETF (“PSFF”), Pacer Swan SOS Moderate (April) ETF (“PSMR”), Pacer Swan SOS Moderate (January) ETF (“PSMD”), Pacer Swan SOS Moderate (July) ETF (“PSMJ”) and Pacer Swan SOS Moderate (October) ETF (“PSMO”) and (collectively the “Funds”), each a series of the Pacer Funds Trust (the “Trust”) including the schedules of investments, schedules of written options and schedules of futures contracts, as of October 31, 2024, the related statements of operations, the statements of changes in net assets, the related notes and the financial highlights for the periods indicated in the table below (collectively, referred to as the “financial statements”).
The financial highlights for the year ended November 30, 2019 for the USAI Fund were audited by other auditors whose opinion dated January 28, 2020, expressed an unqualified opinion on those financial statements.
In our opinion, the financial statements and financial highlights present fairly, in all material respects, the financial positions of the Funds, as of October 31, 2024, the results of their operations, the changes in their net assets, and the financial highlights for each of the periods indicated below, in conformity with accounting principles generally accepted in the United States of America.
| | | | | | | | | | |
Pacer American Energy Independence ETF | | | For the year ended October 31, 2024 | | | For the years ended October 31, 2024 and 2023 | | | For the years ended October 31, 2024, 2023, 2022, 2021 and for the period December 1, 2019 to October 31, 2020 |
Pacer BlueStar Digital Entertainment ETF | | | For the year ended October 31, 2024 | | | For the years ended October 31, 2024 and 2023 | | | For the years ended October 31, 2024 and 2023 and for the period April 7, 2022 to October 31, 2022 |
Pacer Blue Star Engineering the Future ETF | | | For the year ended October 31, 2024 | | | For the years ended October 31, 2024 and 2023 | | | For the years ended October 31, 2024 and 2023 and for the period May 4, 2022 to October 31, 2022 |
Pacer Developed Markets Cash Cows Growth Leaders ETF | | | For the period March 20, 2024 through October 31, 2024 | | | For the period March 20, 2024 through October 31, 2024 | | | For the period March 20, 2024 through October 31, 2024 |
Pacer Metaurus Nasdaq 100 Dividend Multiplier 600 ETF | | | For the period September 23, 2024 through October 31, 2024 | | | For the period September 23, 2024 through October 31, 2024 | | | For the period September 23, 2024 through October 31, 2024 |
Pacer Metaurus US Large Cap Dividend Multiplier 400 ETF | | | For the year ended October 31, 2024 | | | For the year ended October 31, 2024, for the period May 1, 2023 through October 31, 2023, and the year ended April 30, 2023 | | | For the year ended October 31, 2024, for the period May 1, 2023 through October 31, 2023, for the year ended April 30, 2023 and the period July 12, 2021 through April 30, 2022 |
| | | | | | | | | | |
TABLE OF CONTENTS
PACER FUNDS
REPORT OF INDEPENDENT REGISTERED PUBLIC ACCOUNTING FIRM(Continued)
| | | | | | | | | | |
Pacer Swan SOS Conservative (April) ETF | | | For the year ended October 31, 2024 | | | For the years ended October 31, 2024 and 2023 | | | For the years ended October 31, 2024, 2023, 2022 and for the period March 31, 2021 to October 31, 2021 |
Pacer Swan SOS Conservative (January) ETF | | | For the year ended October 31, 2024 | | | For the years ended October 31, 2024 and 2023 | | | For the years ended October 31, 2024, 2023, 2022 and for the period December 22, 2020 to October 31, 2021 |
Pacer Swan SOS Conservative (July) ETF | | | For the year ended October 31, 2024 | | | For the years ended October 31, 2024 and 2023 | | | For the years ended October 31, 2024, 2023, 2022 and for the period June 30, 2021 to October 31, 2021 |
Pacer Swan SOS Conservative (October) ETF | | | For the year ended October 31, 2024 | | | For the years ended October 31, 2024 and 2023 | | | For the years ended October 31, 2024, 2023, 2022 and for the period September 30, 2021 to October 31, 2021 |
Pacer Swan SOS Flex (April) ETF | | | For the year ended October 31, 2024 | | | For the years ended October 31, 2024 and 2023 | | | For the years ended October 31, 2024, 2023, 2022 and for the period March 31, 2021 to October 31, 2021 |
Pacer Swan SOS Flex (January) ETF | | | For the year ended October 31, 2024 | | | For the years ended October 31, 2024 and 2023 | | | For the years ended October 31, 2024, 2023, 2022 and for the period December 22, 2020 to October 31, 2021 |
Pacer Swan SOS Flex (July) ETF | | | For the year ended October 31, 2024 | | | For the years ended October 31, 2024 and 2023 | | | For the years ended October 31, 2024, 2023, 2022 and for the period June 30, 2021 to October 31, 2021 |
Pacer Swan SOS Flex (October) ETF | | | For the year ended October 31, 2024 | | | For the years ended October 31, 2024 and 2023 | | | For the years ended October 31, 2024, 2023, 2022 and for the period September 30, 2021 to October 31, 2021 |
Pacer Swan SOS Fund of Funds ETF | | | For the year ended October 31, 2024 | | | For the years ended October 31, 2024 and 2023 | | | For the years ended October 31, 2024, 2023, 2022 and for the period December 29, 2020 to October 31, 2021 |
Pacer Swan SOS Moderate (April) ETF | | | For the year ended October 31, 2024 | | | For the years ended October 31, 2024 and 2023 | | | For the years ended October 31, 2024, 2023, 2022 and for the period March 31, 2021 to October 31, 2021 |
Pacer Swan SOS Moderate (January) ETF | | | For the year ended October 31, 2024 | | | For the years ended October 31, 2024 and 2023 | | | For the years ended October 31, 2024, 2023, 2022 and for the period December 22, 2020 to October 31, 2021 |
Pacer Swan SOS Moderate (July) ETF | | | For the year ended October 31, 2024 | | | For the years ended October 31, 2024 and 2023 | | | For the years ended October 31, 2024, 2023, 2022 and for the period June 30, 2021 to October 31, 2021 |
Pacer Swan SOS Moderate (October) ETF | | | For the year ended October 31, 2024 | | | For the years ended October 31, 2024 and 2023 | | | For the years ended October 31, 2024, 2023, 2022 and for the period September 30, 2021 to October 31, 2021 |
| | | | | | | | | | |
TABLE OF CONTENTS
PACER FUNDS
REPORT OF INDEPENDENT REGISTERED PUBLIC ACCOUNTING FIRM(Continued)
Basis for Opinion
These financial statements and financial highlights are the responsibility of the Funds’ management. Our responsibility is to express an opinion on these financial statements and financial highlights based on our audits. We are a public accounting firm registered with the Public Company Accounting Oversight Board (United States) (“PCAOB”) and are required to be independent with respect to the Funds in accordance with the U.S. federal securities laws and the applicable rules and regulations of the Securities and Exchange Commission and the PCAOB.
We conducted our audits in accordance with the standards of the PCAOB. Those standards require that we plan and perform the audit to obtain reasonable assurance about whether the financial statements and financial highlights are free of material misstatement, whether due to error or fraud. The Funds are not required to have, nor were we engaged to perform, an audit of their internal control over financial reporting. As part of our audits, we are required to obtain an understanding of internal control over financial reporting but not for the purpose of expressing an opinion on the effectiveness of the Funds’ internal control over financial reporting. Accordingly, we express no such opinion.
Our audits included performing procedures to assess the risk of material misstatement of the financial statements and financial highlights, whether due to error or fraud, and performing procedures that respond to those risks. Such procedures included examining, on a test basis, evidence regarding the amounts and disclosures in the financial statements and financial highlights. Our procedures included confirmation of securities and cash owned as of October 31, 2024, by correspondence with the custodian and brokers; when replies were not received from brokers, we performed other auditing procedures. Our audits also included evaluating the accounting principles used and significant estimates made by management, as well as evaluating the overall presentation of the financial statements and financial highlights. We believe that our audits provide a reasonable basis for our opinion.
We have served as the auditor for the Pacer Funds Trust since 2015
Huntingdon Valley, Pennsylvania
December 30, 2024
TABLE OF CONTENTS
Pacer Funds
Additional Information
NOTE 1 – FREQUENCY DISTRIBUTION OF PREMIUMS AND DISCOUNTS
Information regarding how often shares of the Funds trade on the Exchange at a price above (i.e., at a premium) or below (i.e., at a discount) the NAV of the Funds is available on the Funds’ website at www.PacerETFs.com.
NOTE 2 – FEDERAL TAX INFORMATION
Qualified Dividend Income/Dividends Received Deduction
For the fiscal year ended October 31, 2024, certain dividends paid by the Funds may be subject to a maximum tax rate of 23%, as provided for by the Tax Cuts and Jobs Act of 2017.
The percentage of dividends declared from ordinary income designated as qualified dividend income (QDI) was as follows:
| | | | |
USAI | | | 100% |
BULD | | | 100% |
ODDS | | | 95.22% |
EAFG | | | 97.73% |
QSIX | | | 0% |
QDPL | | | 75.95% |
PSCW | | | 0% |
PSCX | | | 0% |
PSCJ | | | 0% |
PSCQ | | | 0% |
PSFM | | | 0% |
PSFD | | | 0% |
PSFJ | | | 0% |
PSFO | | | 0% |
PSFF | | | 0% |
PSMR | | | 0% |
PSMD | | | 0% |
PSMJ | | | 0% |
PSMO | | | 0% |
| | | | |
For corporate shareholders, the percent of ordinary income distributions qualifying for the corporate dividends received deduction (DRD) for the fiscal year ended October 31, 2024 was as follows:
| | | | |
USAI | | | 72.05% |
BULD | | | 100% |
ODDS | | | 1.82% |
EAFG | | | 0% |
QSIX | | | 0% |
QDPL | | | 73.12% |
PSCW | | | 0% |
PSCX | | | 0% |
PSCJ | | | 0% |
PSCQ | | | 0% |
PSFM | | | 0% |
PSFD | | | 0% |
PSFJ | | | 0% |
PSFO | | | 0% |
| | | | |
TABLE OF CONTENTS
Pacer Funds
Additional Information(Continued)
| | | | |
PSFF | | | 0% |
PSMR | | | 0% |
PSMD | | | 0% |
PSMJ | | | 0% |
PSMO | | | 0% |
| | | | |
The Percentage of taxable ordinary income distributions that are designated as short-term capital gain (STCG) distributions under Internal Revenue Section 871(k)(2)(C) for each Fund were as follows.
| | | | |
USAI | | | 0% |
BULD | | | 0% |
ODDS | | | 0% |
EAFG | | | 0% |
QSIX | | | 0% |
QDPL | | | 27.83% |
PSCW | | | 0% |
PSCX | | | 0% |
PSCJ | | | 0% |
PSCQ | | | 0% |
PSFM | | | 0% |
PSFD | | | 0% |
PSFJ | | | 0% |
PSFO | | | 0% |
PSFF | | | 0% |
PSMR | | | 0% |
PSMD | | | 0% |
PSMJ | | | 0% |
PSMO | | | 0% |
| | | | |
Foreign Tax Credit Pass Through
Pursuant to Section 853 of the Internal Revenue Code, the following Funds designate the following amounts as foreign taxes paid for the year ended October 31, 2024. Foreign taxes paid for purposes of Section 853 may be less than actual foreign taxes paid for financial statement purposes.
| | | | | | | | | | |
USAI | | | $ — | | | $ — | | | $ — | | | $ — |
BULD | | | 8,423 | | | 909 | | | 0.21 | | | 0.02 |
ODDS | | | — | | | — | | | — | | | — |
EAFG | | | 14,550 | | | 2,179 | | | 0.58 | | | 0.09 |
QSIX | | | — | | | — | | | — | | | — |
QDPL | | | — | | | — | | | — | | | — |
PSCW | | | — | | | — | | | — | | | — |
PSCX | | | — | | | — | | | — | | | — |
PSCJ | | | — | | | — | | | — | | | — |
PSCQ | | | — | | | — | | | — | | | — |
PSFM | | | — | | | — | | | — | | | — |
PSFD | | | — | | | — | | | — | | | — |
| | | | | | | | | | | | | |
TABLE OF CONTENTS
Pacer Funds
Additional Information(Continued)
| | | | | | | | | | |
PSFJ | | | $— | | | $— | | | $— | | | $— |
PSFO | | | — | | | — | | | — | | | — |
PSFF | | | — | | | — | | | — | | | — |
PSMR | | | — | | | — | | | — | | | — |
PSMD | | | — | | | — | | | — | | | — |
PSMJ | | | — | | | — | | | — | | | — |
PSMO | | | — | | | — | | | — | | | — |
| | | | | | | | | | | | | |
Foreign taxes paid or withheld should be included in taxable income with an offsetting deduction from gross income or as a credit for taxes paid to foreign governments.
Above figures may differ from those cited elsewhere in this report due to difference in the calculation of income and gains under GAAP purposes and Internal Revenue Service purposes.
Shareholders are strongly advised to consult their own tax advisers with respect to the tax consequences of their investments in the Funds.
NOTE 3 – DISCLOSURE OF PORTFOLIO HOLDINGS
The Funds files their complete schedule of portfolio holdings for their first and third fiscal quarters with the Securities and Exchange Commission (“SEC”) on Part F of Form N-PORT. The Funds’ Part F of Form N-PORT is available on the website of the SEC at www.sec.gov. Each Fund’s portfolio holdings are posted daily on its website at www.PacerETFs.com.
NOTE 4 – PROXY VOTING POLICIES AND PROCEDURES
A description of the policies and procedures the Funds use to determine how to vote proxies relating to portfolio securities is provided in the Statement of Additional Information (“SAI”). The SAI is available without charge upon request by calling toll-free at (800) 617-0004, by accessing the SEC’s website at www.sec.gov, or by accessing the Funds’ website at www.paceretfs.com. Information how the Funds voted proxies relating to portfolio securities during the year ended June 30 is available without charge, upon request, by calling (800) 617-0004 or by accessing the website of the SEC.
NOTE 5 – BOARD CONSIDERATIONS IN APPROVING THE INVESTMENT ADVISORY AGREEMENT FOR THE FUNDS
USAI, GCOW, COWZ, PTEU, PWS and COWG
The Board of Trustees (the “Board”) of Pacer Funds Trust (the “Trust”), including the Trustees thereof who are not “interested persons,” as defined by the Investment Company Act of 1940, as amended (the “1940 Act”), of the Trust (the “Independent Trustees”), held a meeting on September 20, 2024 (the “Meeting”) for the purpose of, among other things, the consideration of, and voting on, the proposed renewal of the investment advisory agreement (the “Investment Advisory Agreement”) between the Trust and Pacer Advisors, Inc. (the “Adviser”), relating to the Pacer American Energy Independence ETF, Pacer Global Cash Cows Dividend ETF, Pacer US Cash Cows 100 ETF, Pacer Trendpilot European ETF, Pacer Wealthshield ETF, and Pacer US Large Cap Cash Cows Growth Leaders ETF (each, a “Fund” and together, the “Funds”).
The Board, including a majority of the Trust’s Independent Trustees voting separately, approved the renewal of the Investment Advisory Agreement as it relates to each Fund at the Meeting, based on its review of qualitative and quantitative information provided by the Adviser as well as the Trust’s other service providers. Prior to deciding to approve the renewal of the Investment Advisory Agreement at the Meeting, the Independent Trustees requested and obtained from the Adviser such information as the Independent Trustees deemed reasonably necessary to evaluate the terms of the Investment Advisory Agreement. The Independent Trustees received assistance and advice from, and met separately with, independent counsel. In addition, the Independent Trustees received a memorandum from independent counsel regarding the responsibilities of the Board with respect to the renewal of the Investment Advisory Agreement.
TABLE OF CONTENTS
Pacer Funds
Additional Information(Continued)
The Independent Trustees carefully evaluated information provided by the Adviser, including: a copy of the Investment Advisory Agreement; the Adviser’s responses to a questionnaire designed to provide the Board with information reasonably necessary to evaluate the terms of the Investment Advisory Agreement; the Adviser’s Form ADV; information describing the nature, quality and extent of services that the Adviser has and is prepared in the future to provide to the Funds, and the advisory fees payable to the Adviser for its services; certain comparative information prepared by Broadridge Financial Solutions (“Broadridge”) regarding each Fund’s fees and expenses relative to the fees and expenses of other funds with similar investment objectives and strategies; a copy of the Trust’s registration statement that included the Funds; information regarding compliance; marketing and distribution related initiatives; changes (if any) in personnel serving the Funds; and information regarding the financial condition of the Adviser.
Representatives from the Adviser, along with other Trust service providers, presented additional information and participated in question-and-answer sessions at the Meeting to help the Board evaluate the Adviser’s services, fees and other aspects of the Investment Advisory Agreement. Independent Trustee Counsel reviewed the factors the Trustees should consider in approving the Advisory Agreement, including the following to the extent applicable: (1) the nature, quality and extent of the services to be provided by the Adviser; (2) the cost of the services provided and the profits realized by the Adviser from services rendered to the Trust; (3) comparative fee and expense data for the Trust’s series and other investment companies with similar investment objectives; (4) the extent to which economies of scale would be realized as the Trust’s assets grew and whether the advisory fee payable to the Adviser reflects these economies of scale; and (5) other incidental and “fall-out” benefits to the Adviser and its affiliates resulting from services rendered to the Trust.
The Board, including the Independent Trustees evaluated these factors and various materials in connection with the approval process, including: (1) a copy of the each Fund’s Advisory Agreement; (2) the Adviser’s responses to questionnaires designed to provide the Board with information reasonably necessary to evaluate the terms of the Fund’s Advisory Agreement; (3) the Adviser’s Form ADV disclosures; (4) information describing the nature, quality and extent of services that the Adviser is prepared to provide to the Funds; (5) the advisory fee payable by each Fund to the Adviser for its services; (6) certain comparative information prepared by Broadridge regarding each Fund’s fees and expenses and performance relative to the fees and expenses of other comparable funds and each Fund’s underlying index; (7) a copy of the Trust’s registration statement and prospectuses; and (8) information regarding the ownership and management structure, financial condition, and compliance program of the Adviser.
Nature, Extent and Quality of Services to be Provided by the Adviser. The Board reviewed the scope of services to be provided by the Adviser under the Investment Advisory Agreement. In this regard, the Trustees reviewed each Fund’s investment goal and investment strategy, and the Adviser’s ability to implement such investment goal and/or investment strategy, including, but not limited to, trading practices. In addition, the Trustees reviewed the management team at the Adviser that would be responsible for managing each Fund, including staffing, skills and compensation program, and considered various other Funds advised by the Adviser and any potential conflicts.
Based on its review, the Board determined that the Adviser is capable of providing all necessary advisoryservices required by each Fund, as indicated by the Adviser’s management capabilities, the professional qualifications and experience of its portfolio management personnel and the performance of the Funds relative to their respective underlying indexes. The Board reviewed, a comparison of each September Renewal Fund’s performance for the one-year, three-year, five-year and since inception periods (as applicable), to that of its underlying index and that, during the year, the Board received periodic reports on each Fund’s short- and longer-term performance in comparison with its underlying index. The Board noted that each of the September Renewal Fund’s generally performed in line with its underlying index over the relevant periods. The Board also considered other services provided to the Funds by the Adviser, where relevant, such as selecting broker-dealers for executing portfolio transactions, monitoring adherence to each Fund’s investment restrictions, and monitoring compliance with various policies and procedures and with applicable securities regulations.
Based on the factors above, as well as those discussed below, the Board concluded, within the context of itsfull deliberations, that it was satisfied with the nature, extent and quality of the services provided and to be provided to the Funds by the Adviser.
TABLE OF CONTENTS
Pacer Funds
Additional Information(Continued)
Costs and Benefits of Advisory Services to be Provided to the Funds. In considering the advisory fees payable by the Trust to the Adviser and each Fund’s expense ratio, the Board reviewed statistical information prepared by Broadridge regarding the expense ratio components, including gross and net total expenses of the Fund in comparison with the same information for other ETFs, objectively selected by Broadridge as comprising the Fund’s applicable expense peer group (“Peer Group”) pursuant to Broadridge’s proprietary ETF methodology. The Board was provided with a detailed description of the proprietary ETF methodology used by Broadridge to determine the Fund’s peer group. The Board noted that, due to the limitations in providing comparable funds in the peer group, the statistical information provided in Broadridge’s report may or may not provide meaningful direct comparisons to the Fund in all instances. The Board compared each Fund’s expense ratio to the expense ratios of funds in its Peer Group, focusing on whether each Fund was charged fees that were within the range of fees charged by those in the Peer Group. It also noted that the Adviser had contractually agreed to pay the operating expenses of each Fund, including the cost of transfer agency, custody, fund administration, legal, audit and other services, except interest, taxes, brokerage commissions and other expenses in connection with the execution of portfolio transactions, and extraordinary and non-routine expenses. It was noted that this contractual agreement cannot be changed without shareholder approval. The Board also evaluated the compensation and incidental or “fall-out” benefits received (or proposed or likely to be received) by the Adviser from its relationship with the Funds, taking into account assessments of the Adviser’s profitability prepared and shared by the Adviser’s management.
Based on the factors above, as well as those discussed below, the Board concluded, within the context of itsfull deliberations, that each Fund’s advisory fee was reasonable in light of the nature and quality of the services expected to be rendered by the Adviser.
Economies of Scale. The Board also reviewed and considered the extent to which economies of scale would be realized by the Adviser as the assets of the Funds may grow in the future. In considering the extent to which economies of scale would be realized as the Funds grow and whether advisory fee levels reflect those economies of scale for the benefit of the Funds’ investors, the Trustees considered that each Fund’s fee arrangement with the Adviser involved a contractual commitment by the Adviser to pay the operating expenses of each Fund. For each Fund the Trustees considered that, while the investment advisory fee would remain the same at all asset levels, the Funds’ shareholders benefited from the Adviser’s commitment to pay each Fund’s operating expenses out of its investment advisory fee. The Trustees noted that the advisory fee structure of the Funds would not directly result in economies of scale for shareholders.
Based on its deliberations and its evaluation of the information described above, at the Meeting, the Board, including the Independent Trustees: (a) concluded that the terms of the Investment Advisory Agreement with respect to each Fund are fair and reasonable; (b) concluded that the Adviser’s fees are reasonable in light of the nature and quality of the services expected to be rendered by the Adviser to each Fund; and (c) agreed to approve the renewal of the Investment Advisory Agreement as to each Fund for an additional annual period. In its deliberations at the Meeting, the Board did not identify any particular factor (or conclusion with respect thereto) or single piece of information that was all-important, controlling or determinative of its decision, but considered all of the factors together, and each Trustee may have attributed different weights to the various factors (and conclusions with respect thereto) and information.
PACER SWAN SOS FUNDS
The Board of Trustees (the “Board”) of Pacer Funds Trust (the “Trust”), including the Trustees thereof who are not “interested persons,” as defined by the Investment Company Act of 1940, as amended (the “1940 Act”), of the Trust (the “Independent Trustees”), held a meeting on September 20, 2024 (the “Meeting”) for the purpose of, among other things, the consideration of, and voting on, the proposed renewal of the investment advisory agreement (the “SOS ETFs Advisory Agreement”) between the Trust and Pacer Advisors, Inc. (the “Advisor”), relating to the Pacer Swan SOS Fund of Funds ETF, Pacer Swan SOS Conservative ETF, Pacer Swan SOS Moderate ETF, and Pacer Swan SOS Flex ETF (each, a “Fund” together, the “Funds”). The Board also considered the continuation of the investment sub-advisory agreement (the “Swan Sub-Advisory Agreement”) between the Advisor and Swan Global Management (referred to as “Swan” or the “Sub-Advisor”) with respect to each Fund.
The Board, including a majority of the Trust’s Independent Trustees voting separately, approved the renewal of the SOS ETFs Advisory Agreement and the Swan Sub-Advisory Agreement as it relates to each Fund at the Meeting, based on its review of qualitative and quantitative information provided by the Advisor, Sub-Advisor as well as the Trust’s
TABLE OF CONTENTS
Pacer Funds
Additional Information(Continued)
other service providers. Prior to deciding to approve the renewal of the SOS ETFs Advisory Agreement and Swan Sub-Advisory Agreement at the Meeting, the Independent Trustees requested and obtained from the Advisor and the Sub-Advisor such information as the Independent Trustees deemed reasonably necessary to evaluate the terms of the respective agreements. The Independent Trustees received assistance and advice from, and met separately with, independent counsel. In addition, the Independent Trustees received a memorandum from independent counsel regarding the responsibilities of the Board with respect to the renewal of the SOS ETFs Advisory Agreement and the Swan Sub-Advisory Agreement.
Representatives from the Adviser and Swan presented additional information and participated in question-and-answer sessions at the Meeting to help the Board evaluate the Adviser’s and Swan’s services, fees and other aspects of the SOS ETFs Advisory Agreement and Swan Sub-Advisory Agreement. Independent Trustee Counsel reviewed the factors the Trustees should consider in approving the SOS ETFs Advisory Agreement and Swan Sub-Advisory Agreement including the following to the extent applicable: (1) the nature, quality and extent of the services to be provided by the Adviser; (2) the cost of the services provided and the profits realized by the Adviser from services rendered to the Trust; (3) comparative fee and expense data for the Trust’s series and other investment companies with similar investment objectives; (4) the extent to which economies of scale would be realized as the Trust’s assets grew and whether the advisory fee payable to the Adviser reflects these economies of scale; and (5) other incidental and “fall-out” benefits to the Adviser and its affiliates resulting from services rendered to the Trust.
The Board, including the Independent Trustees evaluated these factors and various materials in connection with the approval process, including: (1) a copy of the SOS ETFs Advisory Agreement and the Swan Sub-Advisory Agreement; (2) the Adviser’s and Swan’s responses to questionnaires designed to provide the Board with information reasonably necessary to evaluate the terms of the SOS ETFs Advisory Agreement and the Swan Sub-Advisory Agreement; (3) the Adviser’s and Swan’s Form ADV disclosures; (4) information describing the nature, quality and extent of services that the Adviser and Swan is prepared to provide to the SOS ETFs; (5) the advisory fee payable by each SOS ETF to the Adviser for its services and the sub-advisory fee payable to Swan by the Adviser under the Swan Sub-Advisory Agreement; (6) certain comparative information prepared by Broadridge Financial Solutions (“Broadridge”) regarding each Fund’s fees and expenses and performance relative to the fees and expenses of other comparable funds and each Fund’s underlying index; (7) a copy of the Trust’s registration statement and prospectuses; and (8) information regarding the ownership and management structure, financial condition, and compliance program of the Adviser and Swan.
In considering the approval of the SOS ETFs Advisory Agreement and the Swan Sub-Advisory Agreement, respectively, the Board considered various factors that the Trustees determined were relevant, including: (i) the nature, extent and quality of the services to be provided by the Adviser and Swan, including the performance of the Adviser and Swan with respect to the SOS ETFs; (ii) the costs and benefits, including the fee to be paid to the Adviser by the SOS ETFs, of the advisory services to be provided to the SOS ETFs; (iii) the fee paid to Swan by the Adviser; and (iv) potential economies of scale.
| • | Nature, Extent and Quality of Services to be Provided by the Adviser and Swan. The Board reviewed the scope of services provided by the Adviser under the SOS ETFs Advisory Agreement and Swan under the Swan Sub-Advisory Agreement. In this regard, the Trustees reviewed SOS ETFs’ investment goal and investment strategy, and each of the Adviser’s and Swan’s ability to implement such investment goal and/or investment strategy, including, but not limited to, trading practices. With respect to sub-advisory services to be provided by Swan, the Board noted that the Sub-Advisor has assets allocated to it by the Adviser and considered Swan’s ability to ensure compliance with SOS ETF’s strategies, policies, and limitations. The Board reviewed, a comparison of each SOS ETF’s performance for the one-year and since inception periods ended June 30, 2024, to that of the S&P 500 Price Return Index and that, during the year, the Board received periodic reports on each Fund’s short- and longer-term performance in comparison with the S&P 500 Price Return Index. The Board noted that each of the SOS ETF’s generally performed in line with its investment objective over the relevant periods. The Trustees also considered the successful performance of Swan in managing each SOS ETF. In addition, the Trustees reviewed the management team at the Adviser and Swan that is responsible for managing each SOS ETF, including staffing, skills and compensation program, and considered various other portfolios advised by the Adviser and Swan and any potential conflicts. They discussed the personnel changes at Swan and considered the quality of the professionals brought in to replace such personnel. |
TABLE OF CONTENTS
Pacer Funds
Additional Information(Continued)
Based on its review, the Board determined that each of the Adviser and Swan is capable of providing allnecessary advisory and sub-advisory services required by each SOS ETF, as indicated by the Adviser’s and Swan’s management capabilities, the professional qualifications and experience of its portfolio management personnel and the performance of each SOS ETF relative to the S&P 500 Price Return Index and other products managed by the Adviser and Swan with similar investment objectives and strategies as each SOS ETF, as applicable. The Board also considered other services provided to each SOS ETF by the Adviser and Swan, where relevant, such as selecting broker-dealers for executing portfolio transactions, monitoring adherence to each SOS ETF’s investment restrictions, and monitoring compliance with various policies and procedures and with applicable securities regulations.
Based on the factors above, as well as those discussed below, the Board concluded, within the context ofits full deliberations, that it was satisfied with the nature, extent and quality of the services provided and to be provided to each SOS ETF by the Adviser and Swan, respectively.
| • | Costs and Benefits of Advisory Services to be Provided to each SOS ETF. In considering the advisory fees payable by the Trust to the Adviser and each SOS ETF’s expense ratio, the Board reviewed statistical information prepared by Broadridge regarding the expense ratio components, including gross and net total expenses of the Fund in comparison with the same information for other ETFs, objectively selected by Broadridge as comprising the Fund’s applicable expense peer group (“Peer Group”) pursuant to Broadridge’s proprietary ETF methodology. The Board was provided with a detailed description of the proprietary ETF methodology used by Broadridge to determine the Fund’s peer group. The Board noted that, due to the limitations in providing comparable funds in the peer group, the statistical information provided in Broadridge’s report may or may not provide meaningful direct comparisons to the Fund in all instances. The Board compared each SOS ETF’s expense ratio to the expense ratios of funds in its Peer Group, focusing on whether each SOS ETF was charged fees that were within the range of fees charged by those in the Peer Group. It also noted that the Adviser had contractually agreed to pay the operating expenses of each SOS ETF, including the cost of transfer agency, custody, fund administration, legal, audit and other services, except interest, taxes, brokerage commissions and other expenses in connection with the execution of portfolio transactions, and extraordinary and non-routine expenses. It was further noted that this contractual agreement cannot be changed without shareholder approval. The Board also evaluated the compensation and incidental or “fall-out” benefits received by the Adviser from its relationship with each SOS ETF, considering the Adviser’s profitability analysis prepared and shared by the Adviser’s management. |
Based on the factors above, as well as those discussed below, the Board concluded, within the context ofits full deliberations, that each SOS ETF’s advisory fee was reasonable in light of the nature and quality of the services expected to be rendered by the Adviser.
| • | Costs and Benefits of Swan’s Sub-Advisory Advisory Services to be Provided to each SOS ETF. The Board noted that the sub-advisory fees paid to Swan are paid by the Adviser and would not be additional fees to be borne by each SOS ETF. The Board also noted that the sub-advisory fees were the product of arms-length negotiations between the Adviser and Swan. In considering the sub-advisory fees payable by the Adviser to Swan, the Board evaluated the compensation and benefits received or likely to be received by Swan from the Adviser relating to the services provided to each SOS ETF. Based on the factors above, as well as those discussed below, the Board concluded, within the context of its full deliberations, that the sub-advisory fees payable to Swan under the Swan Sub-Advisory Agreement with the Adviser were reasonable in light of the nature and quality of the services rendered and, where relevant, expected to be rendered by the Sub-Advisor. |
| • | Economies of Scale. The Board also reviewed and considered the extent to which economies of scale would be realized by the Adviser and the Sub-Advisor as the assets of the SOS ETFs may grow in the future. In considering the extent to which economies of scale would be realized as the SOS ETFs grow and whether advisory fee levels reflect those economies of scale for the benefit of the Funds’ investors, the Trustees considered that each SOS ETF’s fee arrangement with the Adviser involved a contractual commitment by the Adviser to pay the operating expenses of each Fund. For each SOS ETF, the Trustees considered that, while |
TABLE OF CONTENTS
Pacer Funds
Additional Information(Continued)
the investment advisory fee would remain the same at all asset levels, the Funds’ shareholders benefited from the Adviser’s commitment to pay each Fund’s operating expenses out of its investment advisory fee. The Trustees noted that the advisory fee structure of the Funds would not directly result in economies of scale for shareholders.
Based on its deliberations and its evaluation of the information described above, at the Meeting, the Board, including the Independent Trustees: (a) concluded that the terms of the SOS ETFs Advisory Agreement and the Swan Sub-Advisory Agreement with respect to each Fund are fair and reasonable; (b) concluded that the Advisor’s fees and the Sub-Advisor’s fees are reasonable in light of the nature and quality of the services expected to be rendered by the Advisor and the Sub-Advisor, respectively, to each Fund; and (c) agreed to approve the renewal of the SOS ETFs Advisory Agreement and the Swan Sub-Advisory Agreement as to each Fund for an additional annual period. In its deliberations at the Meeting, the Board did not identify any particular factor (or conclusion with respect thereto) or single piece of information that was all-important, controlling or determinative of its decision, but considered all of the factors together, and each Trustee may have attributed different weights to the various factors (and conclusions with respect thereto) and information.
TABLE OF CONTENTS
Advisor
Pacer Advisors, Inc.
500 Chesterfield Parkway
Malvern, PA 19355
Index Provider
SL Advisors, LLC
220 Lenox Avenue, Suite 303
Westfield, New Jersey 07090
MV Index Solutions
Kreuznacher Str. 30,
60486 Frankfurt am
Main, Germany
Custodian
U.S. Bank National Association
Custody Operations
1555 North Rivercenter Drive
Milwaukee, WI 53212
Sub Adviser
Swan Global Management, LLC
20 Ridge Top Palmas Del Mar
Humacao, PR 00791
Metaurus Advisors LLC
22 Hudson Place, Third Floor
Hoboken, New Jersey 07030
Distributor
Pacer Financial, Inc.
500 Chesterfield Parkway
Malvern, PA 19355
Transfer Agent
U.S. Bancorp Fund Services, LLC
615 East Michigan Street
Milwaukee, WI 53202
Independent Registered
Public Accounting Firm
Sanville & Company
2617 Huntingdon Pike
Huntingdon Valley, PA 19006
Legal Counsel
Practus, LLP
11300 Tomahawk Creek Parkway, Suite 310
Leawood, Kansas 66211
| (b) | Financial Highlights are included within the financial statements filed under Item 7 of this Form. |
Item 8. Changes in and Disagreements with Accountants for Open-End Investment Companies.
There were no changes in or disagreements with accountants during the period covered by this report.
Item 9. Proxy Disclosure for Open-End Investment Companies.
There were no matters submitted to a vote of shareholders during the period covered by this report.
Item 10. Remuneration Paid to Directors, Officers, and Others of Open-End Investment Companies.
All fund expenses, including Trustee compensation, are paid by the Investment Adviser pursuant to the Investment Advisory Agreement. Additional information related to those fees is available in the Fund’s Statement of Additional Information.
Item 11. Statement Regarding Basis for Approval of Investment Advisory Contract.
See Item 7(a).
Item 12. Disclosure of Proxy Voting Policies and Procedures for Closed-End Management Investment Companies.
Not applicable to open-end investment companies.
Item 13. Portfolio Managers of Closed-End Management Investment Companies.
Not applicable to open-end investment companies.
Item 14. Purchases of Equity Securities by Closed-End Management Investment Company and Affiliated Purchasers.
Not applicable to open-end investment companies.
Item 15. Submission of Matters to a Vote of Security Holders.
There have been no material changes to the procedures by which shareholders may recommend nominees to the registrant’s board of Trustees.
Item 16. Controls and Procedures.
| (a) | The Registrant’s President/Principal Executive Officer and Treasurer/Principal Financial Officer have reviewed the Registrant's disclosure controls and procedures (as defined in Rule 30a-3(c) under the Investment Company Act of 1940 (the “Act”)) as of a date within 90 days of the filing of this report, as required by Rule 30a-3(b) under the Act and Rules 13a-15(b) or 15d-15(b) under the Securities Exchange Act of 1934. Based on their review, such officers have concluded that the disclosure controls and procedures are effective in ensuring that information required to be disclosed in this report is appropriately recorded, processed, summarized and reported and made known to them by others within the Registrant and by the Registrant’s service provider. |
| (b) | There were no changes in the Registrant's internal control over financial reporting (as defined in Rule 30a-3(d) under the Act) that occurred during the period covered by this report that have materially affected, or are reasonably likely to materially affect, the Registrant's internal control over financial reporting. |
Item 17. Disclosure of Securities Lending Activities for Closed-End Management Investment Companies
Not applicable to open-end investment companies.
Item 18. Recovery of Erroneously Awarded Compensation.
Not applicable
Item 19. Exhibits.
(2) Not Applicable
(3) A separate certification for each principal executive officer and principal financial officer of the registrant as required by Rule 30a-2(a) under the Investment Company Act of 1940 (17 CFR 270.30a-2(a)). Filed herewith.
(4) Any written solicitation to purchase securities under Rule 23c-1 under the Act sent or given during the period covered by the report by or on behalf of the registrant to 10 or more persons. Not applicable to open-end investment companies.
| (5) | Change in the registrant’s independent public accountant. Not applicable to open-end investment companies and ETFs. |
SIGNATURES
Pursuant to the requirements of the Securities Exchange Act of 1934 and the Investment Company Act of 1940, the registrant has duly caused this report to be signed on its behalf by the undersigned, thereunto duly authorized.
| | (Registrant) | Pacer Funds Trust | |
| | By (Signature and Title) * | /s/ Joe M. Thomson | |
| | | Joe M. Thomson, President/Principal Executive Officer | |
Pursuant to the requirements of the Securities Exchange Act of 1934 and the Investment Company Act of 1940, this report has been signed below by the following persons on behalf of the registrant and in the capacities and on the dates indicated.
| | By (Signature and Title) * | /s/ Joe M. Thomson | |
| | | Joe M. Thomson, President/Principal Executive Officer | |
| | By (Signature and Title) * | /s/ Sean E. O’Hara | |
| | | Sean E. O’Hara, Treasurer/Principal Financial Officer | |
* Print the name and title of each signing officer under his or her signature.