As filed with the U.S. Securities and Exchange Commission on July 9, 2024
UNITED STATES
SECURITIES AND EXCHANGE COMMISSION
Washington, D.C. 20549
FORM N-CSR
CERTIFIED SHAREHOLDER REPORT OF REGISTERED
MANAGEMENT INVESTMENT COMPANIES
Investment Company Act file number 811-23024
Pacer Funds Trust
(Exact name of registrant as specified in charter)
500 Chesterfield Parkway
Malvern, PA 19355
(Address of principal executive offices) (Zip code)
Joe M. Thomson, President
500 Chesterfield Parkway
Malvern, PA 19355
(Name and address of agent for service)
610-644-8100
Registrant's telephone number, including area code
Date of fiscal year end: April 30
Date of reporting period: May 1, 2023 to April 30, 2024
Item 1. Reports to Stockholders.
Pacer Funds
TABLE OF CONTENTS
| | Page |
Letter to Shareholders | 1 |
Portfolio Allocation | 22 |
Performance Summary | 36 |
Expense Example | 68 |
Schedules of Investments | 71 |
Statements of Assets & Liabilities | 168 |
Statements of Operations | 174 |
Statements of Changes in Net Assets | 180 |
Financial Highlights | 197 |
Notes to Financial Statements | 226 |
Report of Independent Registered Public Accounting Firm | 253 |
Additional Information | 257 |
Pacer Funds
Dear Shareholder,
We celebrate our accomplishments over the last year and anticipate the promising ventures that lie ahead for Pacer as our network grows. We seek to continuously provide a broad and diverse line up of funds that allows investors to achieve their financial goals by offering unique, innovative, and disruptive investment solutions.
Pacer has experienced tremendous growth this year in assets under management, surpassing $43 billion, as of April 30th, 2024. The Pacer Cash Cows ETF™ Series was a lead contributor, with over $36 billion, an 80.8% increase in AUM since April 30th of last year.
By building out the growth side of the Cash Cows series, we hope to replicate the success we have with our Cash Cows value series which focuses on free cash flow yield. The launch of the Pacer Developed Markets Cash Cows Growth Leaders ETF (EAFG) coincides with a new partnership between Pacer and MSCI, as EAFG is the first of Pacer’s funds to screen equity names using an MSCI Index. EAFG’s strategy tracks the Pacer Developed Markets Cash Cows Growth Leaders Index, pulling the top 100 international large- and mid-cap securities in developed markets with above-average free cash flow margin from the MSCI EAFE Index. EAFG joins COWG (large-cap U.S.) and CAFG (small-cap U.S.) in the Cash Cows growth series.
As technology increasingly permeates every aspect of our daily lives, the Pacer Data and Digital Revolution ETF (ticker: TRFK) provides exposure to the companies driving the ongoing digital and technological revolution; also, having been our strongest performing fund in 2023.
We deeply value the strong relationships we have built and the trust our partners, financial advisors, and investors have placed in us. Pacer remains committed to delivering long-term value to help investors reach their goals.

Joe M. Thomson,
Chairman, Pacer Funds Trust
1
Pacer Funds
From 5/1/2023 to 4/30/2024, the S&P 500 gained 22.66%, the Nasdaq-100 gained 32.77%, and the Dow Jones Industrial Average gained 13.41%.
From 5/1/2023 to the end of the year, the market was positive, with the S&P 500 gaining 15.72%, the Nasdaq-100 gaining 27.92%, and the Dow Jones Industrial Average gaining 13.38%.
While inflation decreased, ending 2023 with a Consumer Price Index (CPI) of 3.4%, it remained above the Federal Reserve’s (the “Fed”) 2.0% target, prompting two additional 25 basis point rate hikes in the second half of 2023, one in May and one in June. However, the progress in moderating price pressures allowed the Fed to refrain from further interest rate hikes since July. Raising interest rates helped drive down inflation but also cooled the housing market. Rising interest rates pushed mortgage rates higher, peaking at about 8.0% in October, more than double the rate during the pandemic and well above pre-pandemic levels. Higher mortgage rates led to fewer buyers, but home prices climbed year over year due to diminishing inventory. Fortunately, mortgage rates fell by more than a full point over the last few months of the year, settling at about 6.61% at the end of December 2023.
While the number of new jobs trended lower during the second half of the year, job growth averaged 225,000 through December. There were 6.3 million unemployed in December 2023, compared to 6.0 million a year earlier. The unemployment rate was 3.7% and remained within a range of 3.5%-3.8% for most of the year. Average hourly earnings increased by 4.0% in 2023. The number of job openings decreased during the year but remained solid at 8.7 million.
One of the primary factors in the drop in overall inflation was a decline in energy prices. According to the Consumer Price Index, energy prices fell 6.4% over the 12 months ended in December. Gasoline prices dropped 10.9% over the same period. Food prices, on the other hand, rose 5.8%, while prices for shelter increased 7.9%.
Inflation fell in most major countries during the last quarter of the year. Declining prices for food, energy, and goods, coupled with tightened monetary policies, helped reduce inflation. Several countries saw consumer prices, as measured by the Consumer Price Index, trend lower in December, including Canada, the Eurozone, the United Kingdom, and Japan. For 2023, the STOXX Europe 600 Index rose 12.7%; the United Kingdom’s FTSE advanced 3.8%; Japan’s Nikkei 225 Index gained 28.2%; and China’s Shanghai Composite Index lost 3.7%.
At the start of 2024, investors entered the first quarter optimistic that a soft landing was in store for the economy, expecting a recession to be avoided, inflation to continue improving, and the Fed to start cutting interest rates in March. The economy not only avoided recession but also performed stronger than expected. However, inflation turned sticky again, with April inflation at 3.4%. Consequently, Fed rate cuts have been pushed out to at least June. Investors had previously priced in five cuts for 2024, but expectations now center on two cuts later on the year.
The bull market continued into early 2024. Even the threat of higher interest rates for a longer period didn’t hinder its strong performance. Stocks staged impressive returns in the first quarter, gaining over 10%, bringing total returns to just shy of 30% over the last 12 months.
Stock prices rose in the first quarter despite diminished expectations for Federal Reserve rate cuts in 2024. Gains were led by technology stocks, particularly those expected to benefit from the artificial intelligence boom. Value stocks also joined in the rally. Meanwhile, the bond market’s performance was dented by the prospect of the Fed delaying rate cuts until the middle of the year.
2
Pacer Funds
The Pacer Trendpilot™ Series
The Pacer Trendpilot series is based on a trend following strategy that alternates exposure between a Benchmark Index and 3-Month US T-Bills using three indicators. It is designed to participate in the market when it is trending up, maintain some exposure during short term market declines and exit the market when it is trending down. The period referenced in this section for all Trendpilot Funds is for the fiscal year end of April 30, 2024.
Pacer Trendpilot® US Large Cap ETF
The Pacer Trendpilot® US Large Cap ETF (the “Fund”) is an exchange traded fund that seeks to track the total return performance, before fees and expenses, of the Pacer Trendpilot® US Large Cap Index (the “Index”).
The Index uses an objective, rules-based methodology to implement a systematic trend-following strategy that directs exposure (i) 100% to the S&P 500 Index, (ii) 50% to the S&P 500 Index and 50% to 3-Month US Treasury bills, or (iii) 100% to 3-Month US Treasury bills, depending on the relative performance of the S&P 500 Total Return Index and its 200-business day historical simple moving average.
The S&P 500 Total Return Index is a total return version of the S&P 500 Index and reflects the reinvestment of dividends paid by the securities in the S&P 500 Index. The S&P 500 Index consists of approximately 500 leading U.S.-listed companies representing approximately 80% of the U.S. equity market capitalization.
The Fund
The Fund had a NAV total return of 19.96%. The Index had a total return of 20.68%. The S&P 500 Index had a total return of 22.66%.
Since the end of the previous fiscal year, the Fund switched from Equities to 50/50 in November 1, 2023. From there the Fund switched to equities a week later in November 8, 2023. During this time (11/1/2023 – 11/8/2023), the U.S. Treasury 3-Month Yield was relatively unchanged, from 5.4511% to 5.4223%, due to Fed’s rate policy.
PTLC EXPOSURE CHANGES |
Dates | Resulting Exposure | U.S. Treasury 3-Month Yield |
November 1, 2023 | 50/50 | 5.4511% |
November 8, 2023 | Equities | 5.4223 |
Pacer Trendpilot® US Mid Cap ETF
The Pacer Trendpilot® US Mid Cap ETF (the “Fund”) is an exchange traded fund that seeks to track the total return performance, before fees and expenses, of the Pacer Trendpilot US Mid Cap Trendpilot Index (the “Index”).
The Index uses an objective, rules-based methodology to implement a systematic trend-following strategy that directs exposure (i) 100% to the S&P MidCap 400 Index, (ii) 50% to the S&P MidCap 400 Index and 50% to 3-Month US Treasury bills, or (iii) 100% to 3-Month US Treasury bills, depending on the relative performance of the S&P MidCap 400 Total Return Index and its 200-business day historical simple moving average.
The S&P MidCap 400 Total Return Index is a total return version of the S&P MidCap 400 Index and reflects the reinvestment of dividends paid by the securities in the S&P MidCap 400 Index. The S&P Midcap 400 measures the performance of mid-capitalization stocks in the United States.
The Fund
The Fund had a NAV total return of 7.02%. The Index had a total return of 7.77% The S&P MidCap 400 Index had a total return of 16.82%.
3
Pacer Funds
The Fund had the following exposure changes during the fiscal year. Summary details of these changes are presented in the following table.
PTMC EXPOSURE CHANGES |
Dates | Resulting Exposure | U.S. Treasury 3-Month Yield |
5/9/2023 | 50/50 | 5.1819% |
5/19/2023 | T-Bills | 5.2172 |
6/9/2023 | Equities | 5.2354 |
9/28/2023 | 50/50 | 5.4616 |
10/25/2023 | T-Bills | 5.4596 |
11/27/2023 | Equities | 5.3979 |
Pacer Trendpilot® 100 ETF
The Pacer Trendpilot® 100 ETF (the “Fund”) seeks to track the total return performance, before fees and expenses, of the Pacer NASDAQ-100 Trendpilot™ Index (the “Index”).
The Index uses an objective, rules-based methodology to implement a systematic trend-following strategy that directs exposure (i) 100% to the Nasdaq-100 Index, (ii) 50% to the Nasdaq-100 Index and 50% to 3-Month US Treasury bills, or (iii) 100% to 3-Month US Treasury bills, depending on the relative performance of the Nasdaq-100 Total Return Index and its 200-business day historical simple moving average.
The Nasdaq-100 Total Return Index is a total return version of the Nasdaq-100 Index and reflects the reinvestment of dividends paid by the securities in the Nasdaq-100 Index. The Nasdaq-100 Index includes approximately 100 of the largest non-financial securities listed on The Nasdaq Stock Market based on market capitalization. The Nasdaq-100 Index comprises securities of companies across major industry groups, including computer, biotechnology, healthcare, telecommunications and transportation. However, it does not contain securities of financial companies, including investment companies. The Nasdaq-100 Index was developed by Nasdaq OMX. There is no minimum market capitalization requirement for inclusion in the Nasdaq-100 Index. Inclusion is determined based on the top 100 largest issuers based on market capitalization meeting all other eligibility requirements.
The Fund
The Fund had a NAV total return of 23.36%. The Index had a total return of 24.13%. The NASDAQ-100 Index had a total return of 32.77%.
The Fund had the following exposure changes during the fiscal year. Summary details of these changes are presented in the following table.
PTNQ EXPOSURE CHANGES |
Dates | Resulting Exposure | U.S. Treasury 3-Month Yield |
6/5/2023 | 50/50 | 5.2828% |
Pacer Trendpilot® European Index ETF
The Pacer Trendpilot® European Index ETF (the “Fund”) seeks to track the total return performance, before fees and expenses, of the Pacer Trendpilot European Index (the “Index”).
The Index uses an objective, rules-based methodology to implement a systematic trend-following strategy that directs exposure (i) 100% to the FTSE Eurozone Index, (ii) 50% to the FTSE Eurozone Index and 50% to 3-Month US Treasury bills, or (iii) 100% to 3-Month US Treasury bills, depending on the relative performance of the FTSE Eurozone Total Return Index and its 200-business day historical simple moving average.
The FTSE Eurozone Index is a rules-based, float-adjusted, market capitalization weighted index comprised of large- and mid-capitalization stocks providing coverage of the developed markets in the euro zone, including primarily France, Germany, Spain, the Netherlands and Italy. The FTSE Eurozone Index is a subset of the FTSE Global Equity Index Series, which covers 98% of the world’s investable market capitalization. The FTSE Eurozone Total Return Index is a total return version of the FTSE Eurozone Index and reflects the reinvestment of dividend paid by the securities in the FTSE Eurozone Index.
4
Pacer Funds
The Fund
The Fund had a NAV total return of -0.02%. The Index had a total return of 1.40%. The FTSE Eurozone Index (USD) had a total return of 10.33%.
The Fund had the following exposure changes during the fiscal year. Summary details of these changes are presented in the following table.
PTEU EXPOSURE CHANGES |
Dates | Resulting Exposure | U.S. Treasury 3-Month Yield |
10/2/2023 | 50/50 | 5.4555% |
10/31/2023 | T-Bills | 5.4623 |
11/21/2023 | Equities | 5.3849 |
Pacer Trendpilot® International ETF
The Pacer Trendpilot® International ETF is an exchange traded fund (“ETF”) that seeks to track the total return performance, before fees and expenses, of the Pacer Trendpilot International Index (the “Index”).
The Index uses an objective, rules-based methodology to implement a systematic trend-following strategy that directs exposure (i) 100% to the S&P Developed Ex-U.S. LargeCap Index, (ii) 50% to the S&P Developed Ex-U.S. LargeCap Index and 50% to 3-Month US Treasury bills, or (iii) 100% to 3-Month US Treasury bills, depending on the relative performance of the S&P Developed Ex-U.S. LargeCap Index and its 200-business day historical simple moving average (the “200-day moving average”). The calculation of the 200-day moving average for the S&P Developed Ex-U.S. LargeCap Index is based on the total return version of the S&P Developed Ex-U.S. LargeCap Local Currency Index and reflects the reinvestment of dividends paid by the securities in the S&P Developed Ex-U.S. LargeCap Index. The Index is expected to be predominantly invested in the components of the S&P Developed Ex-U.S. LargeCap Index over most short- and long-term periods and is only expected to invest in 3-Month US Treasury bills from time to time in response to adverse market conditions as defined by the “50/50 Indicator” and “T-Bill Indicator” below.
The S&P Developed Ex-U.S. LargeCap Index is a rules-based, float-adjusted, market capitalization-weighted index comprised of large-capitalization stocks providing coverage of the developed markets excluding the United States. The S&P Developed Ex-U.S. LargeCap Index is a subset of the S&P Global BMI, a comprehensive, rules-based index measuring global stock market performance.
The Fund
The Fund had a NAV total return of 6.85%. The Index had a total return of 7.91%. The S&P Developed Ex-US Large Cap Index had a total return of 10.97%.
The Fund had the following exposure changes during the fiscal year. Summary details of these changes are presented in the following table.
PTIN EXPOSURE CHANGES |
Dates | Resulting Exposure | U.S. Treasury 3-Month Yield |
10/26/2023 | 50/50 | 5.4484% |
11/9/2023 | Equities | 5.4241% |
Pacer Trendpilot® US Bond ETF
The Pacer Trendpilot US Bond ETF (the “Fund”) is an exchange traded fund (“ETF”) that seeks to track the total return performance, before fees and expenses, of the Pacer Trendpilot US Bond Index (the “Index”).
The Index uses an objective, rules-based methodology to implement a systematic trend-following strategy that directs exposure to one of the following positions: (i) 100% to the iBoxx® USD Liquid High Yield Index, (ii) 50% to the iBoxx USD Liquid High Yield Index and 50% to the iBoxx® USD Treasuries 7-10 Year Index or (iii) 100% to iBoxx USD Treasuries 7-10 Year Index, depending on the “Risk Ratio,” described below.
The iBoxx USD Liquid High Yield Index is designed to track the performance of U.S. dollar-denominated, high-yield corporate bonds issued in the U.S. The iBoxx USD Treasuries 7-10 Year Index is designed to measure the performance of U.S. Treasury bonds maturing in 7 to 10 years. The Index uses a “Risk Ratio” to signal a change in the position of the Index. The Risk Ratio is calculated by dividing the value of the iBoxx USD Liquid High Yield Index by the value of the iBoxx USD Treasuries 7-10 Year Index.
5
Pacer Funds
The Index, and consequently the Fund, may stay in any of its three possible positions for an extended period of time. As described below, the Index will change its position based on the following indicators, and each change will become effective by the close of business on the sixth business day after the indicator for the change is triggered. The Index will be in a new position effective on the seventh business day.
The Fund
The Fund had a NAV total return of 6.30%. The Index had a total return of 7.16%. The iBoxx USD Liquid High Yield Index had a total return of 8.32%.
PTBD had one exposure change initiated on May 30, 2023. This was to switch from T-Bills to Equities, the rate at the time was 5.252.
The Fund had the following exposure changes during the fiscal year. Summary details of these changes are presented in the following table.
PTBD EXPOSURE CHANGES |
Dates | Resulting Exposure | U.S. Treasury 10-Year Yield |
May 30, 2023 | Equities | 5.252% |
Pacer Trendpilot® Fund of Funds ETF
The Pacer Trendpilot Fund of Funds ETF is an exchange traded fund (“ETF”) that seeks to track the total return performance, before fees and expenses, of the Pacer Trendpilot Fund of Funds Index (the “Index” or the “Fund of Funds Index”).
The Fund of Funds Index uses an objective, rules-based approach to construct a portfolio that, as of each quarterly rebalance, is composed of the ETFs listed in the following table, each advised by the Adviser (collectively, the “Trendpilot ETFs”). Each of the Trendpilot ETFs is an index-based ETF that seeks to track the total return performance, before fees and expenses, of the underlying index listed in the following table (collectively, the “Trendpilot Indexes”). Each Trendpilot Index uses an objective, rules-based methodology to implement a systematic trend-following strategy that directs exposure (i) 100% to the “Equity Component” specified in the table below, (ii) 50% to the applicable Equity Component and 50% to 3-Month US Treasury bills, or (iii) 100% to 3-Month US Treasury bills, depending on the relative performance of the Equity Component and its 200- business day historical simple moving average (the “200-day moving average”). The calculation of the 200-day moving average for each Equity Component is based on the total return version of such Equity Component and reflects the reinvestment of dividends paid by the securities in such Equity Component.
Weight | Trendpilot ETF | Trendpilot Index | Equity Universe |
20% | Pacer Trendpilot® US Large Cap ETF | Pacer Trendpilot US Large Cap Index S | S&P 500® Index |
20% | Pacer Trendpilot® US Mid Cap ETF | Pacer Trendpilot US Mid Cap Index | S&P MidCap 400® Index |
20% | Pacer Trendpilot® 100 ETF | Pacer NASDAQ-100 Trendpilot Index | NASDAQ-100® Index |
20% | Pacer Trendpilot® International ETF | Pacer Trendpilot International Index | S&P Developed Ex-U.S. LargeCap Index |
20% | Pacer Trendpilot® US Bond ETF | Pacer Trendpilot US Bond Index | iBoxx USD Liquid High Yield Index |
The Fund
The Fund had a NAV total return of 12.39%. The Index had a return of 13.30%. The S&P 1200 Index had a total return of 18.45%.
The Pacer Cash Cows Index® ETF Series
The Pacer Cash Cows ETFs aim to provide capital appreciation over time by screening broad based indexes to identify quality companies with high free cash flow yield. The period referenced in this section for all Cash Cows Funds is for the fiscal year end of April 30, 2024.
Pacer US Cash Cows 100 ETF
The Pacer US Cash Cows 100 ETF (the “Fund”) seeks to track the total return performance, before fees and expenses, of the Pacer US Cash Cows 100 Index (the “Index”).
The Index uses an objective, rules-based methodology to provide exposure to large and mid-capitalization U.S. companies with high free cash flow yields. The initial index universe is derived from the component companies of the Russell 1000 Index. The initial universe of companies is screened based on their average projected free cash flows and earnings over each of the next two fiscal years. Companies with no forward year estimates available for free cash flows or earnings will remain in the Index universe. Companies with negative average projected free cash
6
Pacer Funds
flows or earnings are removed from the Index universe. Additionally, financial companies, other than real estate investment trusts, are excluded from the Index universe. The remaining companies are ranked by their free cash flow yield for the trailing twelve-month period. The equity securities of the 100 companies with the highest free cash flow yield are included in the Index.
The Russell 1000 Index is a market-capitalization weighted index representing the top 1,000 large-cap stocks in the Russell 3000 Index. The Russell 1000 Total Return Index is a total return version of the Russell 1000 Index that reflects the reinvestment of dividends paid by the securities in the Russell 1000 Index.
The Fund
The Fund had a NAV total return of 19.70%. The Index had a total return of 20.34%. The Russell 1000 Value Index had a total return of 13.37%. The Russell 1000 Index had a total return of 22.82%.
During the fiscal year, the top three sectors for contribution to performance were Consumer Discretionary 6.62%, Energy at 6.58%, and Industrials at 2.99%. The three sectors with the lowest contribution to performance were Consumer Staples at -0.46%, Health Care at -0.01%, and Communication Services at 0.27%. These return numbers reflect the contribution to the total return of the fund.
Pacer US Small Cap Cash Cows 100 ETF
The Pacer US Small Cap Cash Cows 100 ETF (the “Fund”) seeks to track the total performance, before fees and expenses, of the Pacer US Small Cap Cash Cows 100 Index (the “Index”).
The Index uses an objective, rules-based methodology to provide exposure to small-capitalization U.S. companies with high free cash flow yields. The initial index universe is derived from the component companies of the S&P Small Cap 600 Index. The initial universe of companies is screened based on their average projected free cash flows and earnings over each of the next two fiscal years. Companies with no forward year estimates available for free cash flows or earnings will remain in the Index universe. Companies with negative average projected free cash flows or earnings are removed from the Index universe. Additionally, financial companies, other than real estate investment trusts, are excluded from the Index universe. The remaining companies are ranked by their free cash flow yield for the trailing twelve-month period. The equity securities of the 100 companies with the highest free cash flow yield are included in the Index.
The S&P SmallCap 600 Index measures the performance of 600 small sized companies in the US equity market, with market capitalization ranging from $450 million to $2.1 billion USD. The Index does not overlap holdings with the S&P 500 or S&P MidCap 400.
The Fund
The Fund had a NAV total return of 25.18%. The Index had a total return of 25.37%. The S&P Small Cap 600 Value Index had a total return of 6.95%. The S&P Small Cap 600 Index had a total return of 12.55%.
During the fiscal year, the top three sectors for contribution to performance were Consumer Discretionary 11.48%, Industrials at 8.34%, and Energy at 6.37%. The three sectors with the lowest contribution to performance were Health Care at -0.62%, Consumer Staples at -0.36%, and Real Estate at -0.05%. These return numbers reflect the contribution to the total return of the Fund.
Pacer Global Cash Cows Dividend ETF
The Pacer Global Cash Cows Dividend ETF (the “Fund”) seeks to track the total return performance, before fees and expenses, of the Pacer Global Cash Cows Dividend Index (the “Index”).
The Index uses an objective, rules-based methodology to provide exposure to global companies with high dividend yield backed by a high free cash flow yield. The initial index universe is derived from the component companies of the FTSE Developed Large Cap Index. The initial universe of companies is screened based on their average projected free cash flows and earnings over each of the next two fiscal years. Companies with negative average projected free cash flows or earnings are removed from the Index universe. Additionally, financial companies, other than real estate investment trusts, are excluded from the Index universe. The remaining companies are ranked by their free cash flow yield for the trailing twelve-month period. The 300 companies with the highest free cash flow yield are then ranked by their dividend yield. The equity securities of the 100 companies with the highest dividend yield are included in the Index.
The FTSE Developed Large-Cap Index is a market-capitalization weighted index representing the performance of large-cap stocks in developed markets. The FTSE Developed Large-Cap Total Return Index is a total return version of the FTSE Developed Large-Cap Index and reflects the reinvestment of dividends paid by the securities in the FTSE Developed Large-Cap Index.
7
Pacer Funds
The Fund
The Fund had a NAV total return of 6.17%. The Index had a total return of 7.19%. The MSCI World Value Index had a total return of 12.54%. The FTSE Developed Large-Cap Index had a total return of 20.05%.
During the fiscal year, the top three sectors for contribution to performance were Energy 3.48%, Consumer Discretionary at 2.25%, and Materials at 1.76%. The three sectors with the lowest contribution to performance were Utilities at -0.18%, Consumer Staples at 0.09%, and Communication Services at 0.11%. These return numbers reflect the contribution to the total return of the Fund.
During the fiscal year, the top three countries for contribution to performance were the United States at 3.51%, Japan at 2.21%, and Italy at 0.99%. The three countries with the lowest contribution to performance were Denmark at -0.27%, Hong Kong at -0.27%, and Switzerland at -0.26%. These return numbers reflect the contribution to the total return of the Fund.
Pacer Developed Markets International Cash Cows 100 ETF
The Pacer Developed Markets International Cash Cows 100 ETF (the “Fund”) seeks to track the total performance, before fees and expenses, of the Pacer Developed Markets International Cash Cows 100 Index (the “Index”).
The Index uses an objective, rules-based methodology to provide exposure to large and mid-capitalization non-U.S. companies in developed markets with high free cash flow yields. The initial index universe is derived from the component companies of the FTSE Developed ex US Index. The initial universe of companies is screened based on their average projected free cash flows and earnings over each of the next two fiscal years. Companies with no forward year estimates available for free cash flows or earnings will remain in the Index universe. Companies with negative average projected free cash flows or earnings are removed from the Index universe. Additionally, financial companies, other than real estate investment trusts and companies with a market capitalization of less than $3 billion are excluded from the Index universe. The remaining companies are ranked by their average daily trading value (“ADTV”) for the prior three months. The 500 companies with the highest ADTV are then ranked by their free cash flow yield for the trailing twelve-month period. The equity securities of the 100 companies with the highest free cash flow yield are included in the Index.
The FTSE Developed ex-US Index is comprised of Large (85%) and Mid (15%) cap stocks providing coverage of Developed markets (24 countries) excluding the US. The index is derived from the FTSE Global Equity Index Series, which covers over 99% of the world’s investable market capitalization.
The Fund
The Fund had a NAV total return of 10.00%. The Index had a total return of 11.26%. The MSCI EAFE Value Index had a total return of 12.44%. The FTSE Developed ex-US Index had a total return of 9.31%.
During the fiscal year, the top three sectors for contribution to performance were Energy 3.92%, Consumer Discretionary at 3.47%, and Industrials at 3.17%. The three sectors with the lowest contribution to performance were Health Care at -0.26%, Utilities at -0.20%, and Consumer Staples at -0.03%. These return numbers reflect the contribution to the total return of the Fund.
During the fiscal year, the top three countries for contribution to performance were Japan at 6.28%, Italy at 1.32%, and South Korea at 0.98%. The three countries with the lowest contribution to performance were Denmark at -0.47%, Netherlands at -0.32%, and Singapore at -0.19%. These return numbers reflect the contribution to the total return of the Fund.
Pacer Emerging Markets Cash Cows 100 ETF
The Pacer Emerging Markets Cash Cows 100 ETF is an exchange traded fund (“ETF”) that seeks to track the total return performance, before fees and expenses, of the Pacer Emerging Markets Cash Cows 100 Index (the “Index”).
The Index uses an objective, rules-based methodology to provide exposure to large and mid-capitalization companies in emerging markets with high free cash flow yields. Companies with high free cash flow yields are commonly referred to as “cash cows”. The initial index universe is derived from the component companies of the FTSE Emerging Markets Index. The Fund defines emerging markets countries as those countries included in the FTSE Emerging Markets Index. The initial universe of companies is screened based on their average projected free cash flows and earnings (if available) over each of the next two fiscal years. Companies with no forward year estimates available for free cash flows or earnings will remain in the Index universe. Companies with negative average projected free cash flows or earnings are removed from the Index universe. Additionally, financial companies, other than real estate investment trusts (“REITs”), companies with a market capitalization of less than $2 billion, and companies whose average daily trading value (“ADTV”) for the prior 90 days does not exceed $5 million are excluded from the Index universe. The remaining companies are ranked by their free cash flow yield for the trailing twelve-month
8
Pacer Funds
period. The equity securities of the 100 companies with the highest free cash flow yield (the “Top 100 Companies”) are included in the Index, subject to the exceptions described below. At the time of each rebalance of the Index, the companies included in the Index are weighted in proportion to their trailing twelve-month free cash flow, and weightings are capped at 2% of the weight of the Index for any individual company. Additionally, the Index is limited to a maximum of twenty companies from any individual country and any sector. If the Top 100 Companies include more than 20 companies from an individual country or sector (the “Exposure Limit”), the Index will exclude the companies with the lowest free cash flow yield from each country and/or sector needed to meet the Exposure Limit and will include companies outside the Top 100 Companies based on their free cash flow yield until the Index includes 100 companies and satisfies the Exposure Limit. The Index is reconstituted and rebalanced semi-annually as of the close of business on the 3rd Friday of June and December based on data as of the 1st Friday of the applicable rebalance month.
The Fund
The Fund had a NAV total return of 11.79%. The Index had a total return of 14.50%. The MSCI Emerging Markets Value Index had a total return of 11.60%. The FTSE Emerging Market Index had a total return of 10.80%.
During the fiscal year, the top three sectors for contribution to performance were Information Technology 7.54%, Energy at 4.83%, and Industrials at 4.10%. The three sectors with the lowest contribution to performance were Communication Services at -1.07%, Health Care at -0.58%, and Consumer Discretionary at 0.50%. These return numbers reflect the contribution to the total return of the Fund.
During the fiscal year, the top three countries for contribution to performance were Taiwan at 8.70%, Turkey at 4.38%, and Brazil at 2.61%. The three countries with the lowest contribution to performance were South Africa at -1.96%, Indonesia at -1.54%, and Thailand at -0.46%. These return numbers reflect the contribution to the total return of the Fund.
Pacer US Large Cap Cash Cows Growth Leaders ETF
The Pacer US Large Cap Cash Cows Growth Leaders ETF (the “Fund”) is an exchange traded fund (“ETF”) that seeks to track the performance, before fees and expenses, of the Pacer US Large Cap Cash Cows Growth Leaders Index (the “Index”).
The Index uses a rules-based methodology that seeks to provide exposure to large capitalization U.S. companies with above average free cash flow margins. Companies with above average free cash flow margins are commonly referred to as “cash cows.” The initial Index universe is typically derived from the component companies of the Russell 1000 Index®. The initial universe of companies is typically screened based on their average projected free cash flows and earnings (if available) over each of the next two fiscal years. Companies for which information on their projected free cash flows or earnings is not available will typically remain in the Index universe. A company’s projected free cash flows and earnings are typically determined by the Index Provider. Companies with negative average projected free cash flows or earnings are typically removed from the Index universe. Additionally, companies in the financial or real estate sectors are typically excluded from the Index universe.
The Fund
The Fund had a NAV total return of 22.96%. The Index had a total return of 23.49%. The Russell 1000 Growth Index had a total return of 31.80%. The Russell 1000 Index had a total return of 22.82%.
During the fiscal year, the top three sectors for contribution to performance were Information Technology 21.92%, Energy at 1.39%, and Industrials at 1.09%. The three sectors with the lowest contribution to performance were Health Care at -1.46%, Consumer Staples at -0.31%, and Utilities at -0.02%. These return numbers reflect the contribution to the total return of the Fund.
Pacer US Small Cap Cash Cows Growth Leaders ETF
The Pacer US Small Cap Cash Cows Growth Leaders ETF (the “Fund”) is an exchange traded fund (“ETF”) that seeks to track the performance, before fees and expenses, of the Pacer US Small Cap Cash Cows Growth Leaders Index (the “Index”).
The Index uses a rules-based methodology that seeks to provide exposure to small-capitalization U.S. companies with above average free cash flow margins. Companies with above average free cash flow margins are commonly referred to as “cash cows.” The Fund considers a company to be a small-capitalization at the time of purchase if it was included in the S&P SmallCap 600® Index (the “S&P SmallCap 600”) at any time within the prior six months. The initial Index universe is derived from the component companies of the S&P SmallCap 600. The initial universe of companies is screened based on their average projected free cash flows and earnings (if available) over each of the next two fiscal years. Companies for which information on their projected free cash flows or earnings is not available will remain in the Index universe. A
9
Pacer Funds
company’s projected free cash flows and earnings are determined by the Index Provider. Companies with negative average projected free cash flows or earnings are removed from the Index universe. Additionally, companies in the financial or real estate sectors are excluded from the Index universe.
The Fund
The Fund’s inception occurred during the fiscal year on 5/1/2023. Since inception, it had a NAV total return of 14.26%. The Index had a total return of 15.08%. The S&P SmallCap 600 Index had a total return of 12.55%.
During the fiscal year, the top three sectors for contribution to performance were Information Technology 5.79%, Consumer Discretionary at 5.56%, and Industrials at 5.55%. The three sectors with the lowest contribution to performance were Health Care at -2.57%, Communication Services at -1.04%, and Utilities at 0.01%. These return numbers reflect the contribution to the total return of the Fund.
Pacer US Cash Cows Growth ETF
The Pacer US Cash Cows Growth ETF is an exchange traded fund (“ETF”) that seeks to track the total return performance, before fees and expenses, of the Pacer US Cash Cows Growth Index (the “Index”).
The Fund employs a “passive management” (or indexing) investment approach designed to track the total return performance, before fees and expenses, of the Index. The Index is based on a proprietary methodology developed and maintained by Index Design Group, an affiliate of Pacer Advisors, Inc., the Fund’s investment adviser (the “Adviser”). The Index uses an objective, rules-based methodology to provide exposure to mid- and large-capitalization U.S. companies with high free cash flow yields. Companies with high free cash flow yields are commonly referred to as “cash cows”. The initial Index universe is derived from the component companies of the S&P 900® Pure Growth Index. The initial universe of companies is screened based on their average projected free cash flows and earnings (if available) over each of the next two fiscal years. Companies for which information on their projected free cash flows or earnings is not available will remain in the Index universe. Companies with negative average projected free cash flows or earnings are removed from the Index universe. Additionally, financial companies, other than real estate investment trusts (“REITs”), are excluded from the Index universe. The remaining companies are ranked by their free cash flow yield for the trailing twelve month period. The equity securities of the 50 companies with the highest free cash flow yield are included in the Index. At the time of each rebalance of the Index, the companies included in the Index are weighted in proportion to their current market capitalization, and weightings are capped at 5% of the weight of the Index for any individual company. Weight above the 5% limitation is redistributed among the other Index constituents in proportion to their weights. The Index is reconstituted and rebalanced quarterly as of the close of business on the 3nd Friday of March, June, September, and December based on data as of the 2nd Friday of the applicable rebalance month.
The Fund
The Fund had a NAV total return of 17.34%. The Index had a total return of 17.31%. The S&P 900 Pure Growth Index had a total return of 22.79%.
During the fiscal year, the top three sectors for contribution to performance were Industrials 4.75%, Information Technology at 4.05%, and Energy at 4.01%. The three sectors with the lowest contribution to performance were Health Care at -2.95%, Consumer Staples at -0.03%, and Utilities at 1.58%. These return numbers reflect the contribution to the total return of the Fund.
Pacer Cash Cows Fund of Funds ETF
The Pacer Cash Cows Fund of Funds ETF is an exchange traded fund (“ETF”) that seeks to track the total return performance, before fees and expenses, of the Pacer Cash Cows Fund of Funds Index (the “Index” or the “Fund of Funds Index”).
The Fund employs a “passive management” (or indexing) investment approach designed to track the total return performance, before fees and expenses, of the Index. The Index is based on a proprietary methodology developed and maintained by Index Design Group, an affiliate of Pacer Advisors, Inc., the Fund’s investment adviser (the “Adviser”). The Fund of Funds Index uses an objective, rules-based approach to construct a portfolio that, as of each quarterly rebalance, is composed of the ETFs listed in the following table, each advised by the Adviser (collectively, the “Cash Cows ETFs”). Each of the Cash Cows ETFs is an index-based ETF that seeks to track the total return performance,
10
Pacer Funds
before fees and expenses, of the applicable underlying index listed in the following table (collectively, the “Cash Cows Indexes”). Each Cash Cows Index uses an objective, rules-based methodology to provide exposure to companies with high free cash flow yields (commonly referred to as “cash cows”) selected from the applicable “Equity Universe” as indicated in the following table.
Weight | Cash Cows ETF | Cash Cows Index | Equity Universe |
20% | Pacer US Cash Cows 100 ETF | Pacer US Cash Cows 100 Index | Russell 1000 Index |
20% | Pacer Global Cash Cows Dividend ETF | Pacer Global Cash Cows Dividend Index | FTSE Developed Large Cap Index |
20% | Pacer US Small Cap Cash Cows 100 ETF | Pacer US Small Cap Cash Cows Index | S&P Small Cap 600® Index |
20% | Pacer US Cash Cows Growth ETF | Pacer US Cash Cows Growth Index | S&P 900® Pure Growth Index |
20% | Pacer Developed Markets International Cash Cows 100 ETF | Pacer Developed Markets International Cash Cows 100 Index | FTSE Developed ex US Index |
The Fund
The Fund had a NAV total return of 15.38%. The Index had a total return of 16.25%. The FTSE All-World Developed Index had a total return of 17.95%.
The Fund’s top contributor to its return was Pacer US Small Cap Cash Cows ETF at 5.41%. The Fund’s bottom contributor to its return was Pacer Global Cash Cows Dividend ETF at 1.07%. These return numbers reflect the contribution to the total return of the Fund.
The Pacer Custom ETF Series
The Pacer Custom ETFs are strategy-driven, rules-based and are each designed to offer a specific investment focus. The period referenced in this section for all custom funds is for the fiscal year end of April 30, 2024.
Pacer WealthShield ETF
The Pacer WealthShield ETF (the “Fund”) seeks to track the total performance, before fees and expenses, of the Pacer WealthShield Index (the “Index”).
The Index uses an objective, rules-based methodology to implement a trend-following strategy that directs some or all of the Index’s exposure to (i) U.S. equity securities or (ii) U.S. Treasury securities depending on the strength of the high yield corporate (“junk”) bond market relative to U.S. Treasury bonds and the momentum of certain U.S. equity sectors or industries and of long-term U.S. Treasury bonds.
The Fund
The Fund had a NAV total return of 4.06%. The Index had a total return of 4.65%. The S&P 500 Index had a total return of 22.66%.
The fund was “risk on” for the entire fiscal year 2024.
Pacer Industrial Real Estate ETF
The Pacer Industrial Real Estate ETF (the “Fund”) is an exchange traded fund (“ETF”) that seeks to track the total return performance, before fees and expenses, of the Solactive GPR Industrial Real Estate Index (the “Index”).
The Index is generally composed of the equity securities of developed markets companies that derive at least 85% of their earnings or revenues from real estate operations in the industrial real estate sector (“Industrial Companies”), including companies that derive at least 85% of their earnings or revenues from self-storage real estate operations (“Self-Storage Companies”). At the time of each reconstitution of the Index, Industrial Companies with a market capitalization of more than $200 million and average daily traded volume of at least 10,000 shares that are part of the GPR 250 Index are included in the Index (the “Index Constituents”). A significant portion of the Index is expected to be composed of real estate investment trusts (“REITs”). The real estate companies included in the Index may utilize leverage, and some may be highly leveraged. Additionally, such companies may include significant business operations outside of the United States.
The Fund
The Fund had a NAV total return of -9.31%. The Solactive GPR Industrial Real Estate Index had a total return of -8.72%.
11
Pacer Funds
The Fund’s top three contributors to its return were SEGRO plc at 4.67% total return and a contribution of 0.37%, AB Sagax Class B at 4.85% total return and a contribution of 0.35%, and STAG Industrial at 5.77% total return and a contribution of 0.28%. The Fund’s bottom three contributors to its return were Prologis, Inc. at -16.21% total return and a contribution of -2.41%, Public storage at -8.17% total return and a contribution of -1.46%, and Rexford Industries Reality at -20.90% total return and a contribution of -0.98%.
Pacer Data & Infrastructure Real Estate ETF
The Pacer Data & Infrastructure Real Estate ETF (the “Fund”) is an exchange traded fund (“ETF”) that seeks to track the total return performance, before fees and expenses, of the Solactive GPR Data & Infrastructure Real Estate Index (the “Index”).
The Index is generally composed of equity securities of developed markets companies that derive at least 85% of their earnings or revenues from real estate operations in the data and infrastructure real estate sectors (“Eligible Companies”). At the time of each reconstitution of the Index, Eligible Companies with a market capitalization of more than $500 million and average daily traded volume of at least 10,000 shares that are part of the GPR 250 Index and the GPR Pure Infrastructure Index are included in the Index (the “Index Constituents”). A significant portion of the Index is expected to be composed of real estate investment trusts (“REITs”). The real estate companies included in the Index may utilize leverage, and some may be highly leveraged. Additionally, such companies may include significant business operations outside of the United States.
The Fund
The Fund had a NAV total return of -7.74%. The Solactive GPR Data & Infrastructure Real Estate Index had a total return of -6.85%.
The Fund’s top three contributors to its return Uniti Group Inc at 88.43% total return and a contribution of 2.25%, Digital Reality Trust at 45.48% total return and a contribution of 2.12%, and Iron Mountain at 45.87% total return with a contribution of 1.70%. The Fund’s bottom three contributors to its return were Crown Castle at -19.30% total return and a contribution of -3.10%, American Tower Corporation at -13.07% total return and a contribution of -2.15, and Eutelsat Communications SA at -39.14% total return and a contribution of -1.37%.
Pacer CFRA-Stovall Equal Weight Seasonal Rotation ETF
The Pacer CFRA-Stovall Equal Weight Seasonal Rotation ETF (the “Fund”) is an exchange traded fund (“ETF”) that seeks to track the total return performance, before fees and expenses, of the Pacer CFRA-Stovall Equal Weight Seasonal Rotation Index (the “Index”).
The Index uses an objective, rules-based methodology to track the performance of a semi-annual rotation of certain sectors within the S&P 500 Equal Weight Index (“EWI”). The S&P 500 EWI is an equal-weighted version of the S&P 500®, which measures the performance of the large-cap segment of the U.S. equity market. The S&P 500 EWI includes stocks covering all 11 Global Industry Classification Standard (“GICS®”) sectors, six of which are eligible for inclusion in the Index.
The Fund
The Fund had a NAV total return of 3.13%. The Index had a total return of 3.83%. The S&P 500 Index had a total return of 22.66%.
Between 5/1/2024 and 4/30/2024, the fund’s returns were influenced by Information Technology which contributed 6.29%, Industrials which contributed 6.22%, and Consumer Discretionary which contributed 5.61%.
Conversely, the bottom three contributors to the Fund’s return were Real Estate which did not contribute to the performance of the fund, Health Care which contributed -8.97%, and Consumer Staples which contributed -10.04% to the fund’s performance.
These return numbers reflect the contribution to the total return of the Fund.
Pacer CSOP FTSE China A50 ETF
The Pacer CSOP FTSE China A50 ETF (the “Fund”) is an exchange traded fund (“ETF”) that seeks to provide investment results that, before fees and expenses, track the performance for the FTSE China A50 Net Total Return Index (the “Index.”)
The Fund employs a “passive management” (or indexing) investment approach designed to track the total return performance, before fees and expenses, of the Index. The Index is comprised of A-Shares issued by the 50 largest companies in the China A-Shares market. The Index is a net total return index, which means that the performance of the Index assumes that dividends paid by the Index constituents, net of any withholding taxes, are reinvested in additional shares of such Index constituents. The Index is a free float-adjusted market capitalization-weighted index compiled and published by FTSE International Limited (“FTSE” or the “Index Provider”), which is not affiliated with the Fund, Pacer Advisors, Inc. (the “Adviser”), CSOP Asset Management Limited (the “Sub-Adviser”), or the Fund’s distributor. The Index is
12
Pacer Funds
a real-time, tradable index comprising the largest 50 China A-Share companies by full market capitalization of the FTSE China AAll Cap Free Index. The Index is a subset of the FTSE China AAll Cap Free Index, FTSE’s most comprehensive benchmark for the Chinese A-Share market. It is denominated and quoted in Chinese Yuan (“CNY”) and comprised of stocks listed on the Shanghai Stock and Shenzhen Stock Exchange main markets, the Shenzhen SME Board and/or the Shenzhen ChiNext Board. The Index Provider determines the composition of the Index and relative weightings of the Index constituents based on the Index’s methodology and publishes information regarding the market value of the Index.
The Fund
The Fund had a NAV total return of -7.50%. The FTSE China A50 Index had a total return of -6.95%.
During the fiscal year, the top three sectors for contribution to performance were Energy, which contributed 1.15%, Utilities which contributed 0.72%, and Material which contributed 0.66% to the performance of the fund.
Conversely, the bottom three contributors to the Fund’s return were Consumer staples which contributed -3.47%, Industrial which contributed -2.09%, and Consumer Discretionary which contributed -1.43% to the performance of the fund.
These return numbers reflect the contribution to the total return of the Fund.
The Pacer Factor ETF Series
The Pacer Factor ETFs invest in equities based on certain shared characteristics (factors) and seeks to outperform the market over time. Three of these funds, the Pacer Lunt funds, have the ability to rotate their factor exposures on a monthly basis based on certain signals in an effort to realize greater returns than the overall market. The period referenced in this section for all factor funds is for the fiscal year end of April 30, 2024.
Pacer BioThreat Strategy ETF
The Pacer BioThreat Strategy ETF employs a “passive management” (or indexing) investment approach designed to track the total return performance, before fees and expenses, of the Index.
The Index is based on a proprietary methodology developed by LifeSci Index Partners, LLC, the Fund’s Index Provider (the “Index Provider”), which is not affiliated with the Fund, its distributor, or Pacer Advisors, Inc., the Fund’s investment adviser (the “Adviser”). The Index is generally composed of U.S.-listed stocks of companies whose products or services help protect against, endure, or recover from biological threats to human health. Companies helping to protect against such threats include those that conduct research to identify or anticipate such threats and those developing or producing the tools necessary to detect them. Companies helping to endure biological threats include those offering goods or services to help individuals, organizations, businesses, and governments adapt to requirements for social distancing or remote connectivity. Such companies may reflect a variety of industries, ranging from the provision of consumer staples that may be stockpiled in an emergency to critical healthcare supplies to basic energy resources. Companies helping to recover from a biological threat include those that support the treatment of diseases or responses to chemical or biological attacks. The Index selects companies based on a proprietary, multi-step research process. First, the Index Provider conducts fundamental research to identify the most important current and emerging biological threats to human health. Such threats may include pandemic diseases, biological warfare, food and water safety, environmental safety, and natural disasters. Next, the Index Provider utilizes publicly available information such as financial reports and screens, corporate websites, news reports, and interviews with key opinion leaders to identify publicly traded companies which protect against and prepare for recovering from these threats. These companies have products, technologies, and services that seek to: ● research or combat pandemic diseases such as the novel coronavirus (COVID-19), Zika, H1N1, Ebola, avian flu, and MERS; ● combat agents of biological or chemical warfare such as anthrax, sarin gas, variola virus, and brucellosis; ● detect the presence of biological or chemical threats; ● enable social distancing and increased productivity for working and shopping at home; ● secure national borders and ports and strengthen homeland security; ● aid in stockpiling of products in times of natural disasters and disease outbreaks, such as canned foods, power sources, consumer first aid kits, anti-microbial agents, gas masks, and sterilization supplies and services; and ● test and improve food and water safety and purity. Finally, the Index Provider only includes those companies with a minimum market capitalization of $1 billion and a minimum average daily value traded for the last six months of at least $2 million. Index components are weighted based on their market capitalization, subject to a maximum weight of 4.9% at the time of rebalance. The Index is reconstituted (i.e., components are added or removed and weights are reset based on the Index methodology) on the third Friday of each January and rebalanced (i.e., weights are reset based on the Index methodology, but no components are added or removed) semi-annually as of the close of business on the third Friday of each January and July. The weights are fixed as of closing prices on the second Friday in each January and July. As of April 30, 2024, the Index was made up of 50 companies and included significant allocations to companies in the health care and industrial sectors.
13
Pacer Funds
The Fund
The Fund had a NAV total return of 18.52%. The Index had a total return of 19.38%. The S&P 500 Index had a total return of 22.66%.
During the fiscal year (5/1/2024 – 4/30/2024) the top three sectors for contribution to performance were Information Technology, which contributed 11.09%, Consumer Discretionary which contributed 4.58%, and Communication Services which contributed 3.35% to the total return of the funds performance.
Conversely, the bottom three contributors to the Fund’s return were Health Care, which contributed -1.15%, Consumer Staples which contributed 0.25%, and Material which contributed 0.70% to the total return of the fund’s performance.
These return numbers reflect the contribution to the total return of the Fund.
Pacer Lunt Large Cap Alternator ETF
The Pacer Lunt Large Cap Alternator ETF employs a “passive management” (or indexing) investment approach designed to track the total return performance, before fees and expenses, of the Index.
The Index is based on a proprietary methodology developed by Lunt Capital Management, Inc. (“Lunt Capital” or the “Index Provider”). The Index uses an objective, rules-based methodology to provide exposure to large-capitalization U.S. companies. The Index uses Lunt Capital’s proprietary relative strength methodology to rotate between the holdings of one of two sub-indices, the S&P 500 Low Volatility Index and the S&P 500 High Beta Index (each, a “Sub-Index,” and together, the “Sub-Indices”), that seek to identify the 100 components of the S&P 500 Index that most strongly exhibit a particular trait (e.g., low volatility or high beta). Each Sub-Index is composed of the 100 securities comprising the S&P 500 Index that most strongly exhibit the characteristic screened for by the Sub-Index. The S&P 500 is a free-float weighted index that measures the performance of the large-cap segment of the U.S. equity market. The S&P500 includes approximately 500 leading companies and captures approximately 80% of the U.S. market capitalization. Accordingly, each Sub-Index is composed of large-capitalization equity 4 securities. S&P Opco LLC (a subsidiary of S&P Dow Jones Indices, LLC) compiles, maintains, and calculates the S&P 500 Index and the Sub-Indices. The S&P 500 Low Volatility Index is composed of the 100 securities comprising the S&P 500 Index that have exhibited the lowest realized volatility over the prior 12 months. Each stock comprising the S&P 500 Low Volatility Index is weighted by the inverse of its volatility with the least volatile stocks receiving the highest weights. Volatility is a statistical measurement of the magnitude of price fluctuations in a stock’s price over time. The S&P 500 High Beta Index is composed of the 100 securities comprising the S&P 500 Index that have exhibited the highest sensitivity to market movements, or “beta,” over the prior 12 months. The weight of each stock in the S&P 500 High Beta Index is proportionate to its beta, rather than to its market capitalization. Beta is a measure of relative risk and is the rate of change of a security’s price. The Index utilizes Lunt Capital’s proprietary relative strength analysis in its attempt to determine which Sub-Index is likely to exhibit better price performance than the other Sub-Index. Pursuant to this methodology, the Index Provider calculates the “Risk Adjusted Score” for each Sub-Index. Each Sub-Index’s “Risk-Adjusted Score” is calculated using the Sub-Index’s standard deviation of returns over the prior 12 months. On the final trading day of each month, the Index Provider computes the relative strength of each Sub-Index by comparing each Sub-Index’s Risk-Adjusted Score. The Index Provider considers the Sub-Index with the higher Risk-Adjusted Score to have the higher relative strength. The Index is composed of the securities comprising the Sub-Index demonstrating the greater relative strength. The Index is reconstituted and rebalanced monthly, except when the Index methodology would not result in a change in the Sub-Index comprising the Index at such time.
The Fund
The Fund had a NAV total return of -5.65%. The Index had a total return of -4.91%. The S&P 500 Index had a total return of 22.66%.
During the fiscal year, the top three sectors for contribution to performance were Consumer Staples which contributed 1.52%, Industrials which contributed 1.07%, and Energy which contributed 0.53% to the fund’s total performance.
Conversely, the bottom three contributors to the Fund’s return were Consumer Discretionary which contributed -2.17%, Health Care which contributed -0.96%, and Financial which contributed -0.73% to the fund’s total performance.
These return numbers reflect the contribution to the total return of the fund.
Pacer Lunt Midcap Multi-Factor Alternator ETF
The Pacer Lunt Midcap Multi-Factor Alternator ETF employs a “passive management” (or indexing) investment approach designed to track the total return performance, before fees and expenses, of the Index.
14
Pacer Funds
The Index is based on a proprietary methodology developed by Lunt Capital Management, Inc. (“Lunt Capital” or the “Index Provider”). The Index uses an objective, rules-based methodology to provide exposure to mid-capitalization U.S. companies. The Index uses Lunt Capital’s proprietary relative strength methodology to rotate between the holdings of the highest and lowest quintile components of four factor-based indices of the S&P MidCap 400 Index (each, a “Sub-Index,” and together, the “Sub-Indices”), that seek to identify the components of the S&P MidCap 400 Index that most strongly exhibit a particular factor. The four factor groups are Momentum, Quality, Value, and Volatility. 9 The Index will include holdings for two of the following eight Sub-Indices: Momentum Quality Value Volatility Highest Quintile S&P MidCap 400 Momentum Index S&P MidCap 400 Quality Index S&P MidCap 400 Enhanced Value Index S&P MidCap 400 Volatility - Highest Quintile Index Lowest Quintile S&P MidCap 400 Momentum - Lowest Quintile Index S&P MidCap 400 Quality - Lowest Quintile Index S&P MidCap 400 Enhanced Value - Lowest Quintile Index S&P MidCap 400 Low Volatility Index Each Sub-Index is composed of the 80 securities (a quintile) comprising the S&P MidCap 400 Index that most strongly exhibit the characteristic screened for by the Sub-Index. The S&P MidCap 400 Index is a market-weighted index and measures the performance of mid-capitalization stocks in the United States. S&P Opco LLC (a subsidiary of S&P Dow Jones Indices, LLC) compiles, maintains, and calculates the S&P MidCap 400 Index and the Sub-Indices. The Index utilizes Lunt Capital’s proprietary relative strength analysis in its attempt to determine which two Sub-Indices are likely to exhibit better price performance than the other Sub-Indices. Pursuant to this methodology, the Index Provider calculates the “Risk Adjusted Score” for each Sub-Index. On the final trading day of each month, the Index Provider computes the relative strength of each Sub-Index by comparing each Sub-Index’s Risk-Adjusted Score. The Index Provider considers a higher Risk-Adjusted Score to indicate greater relative strength. The Index is composed of the securities comprising the two Sub-Indices demonstrating the greatest relative strength unless such Sub-Indices include both the highest and lowest quintile from the same factor group, in which case only the Sub-Indices with the highest and third-highest Risk-Adjusted Score would be selected. The Index is reconstituted and rebalanced monthly, except when the Index methodology would not result in a change in the Sub-Indices comprising the Index at such time.
The Fund
The Fund had a NAV total return of 30.16%. The Index had a total return of 31.19%. The S&P MidCap 400 Index had a total return of 16.82%.
During the fiscal year, the top three sectors for contribution to performance were Information Technology which contributed 8.81%, Industrials which contributed 7.63%, and Consumer Discretionary which contributed 6.97% to the total performance of the fund.
Conversely, the bottom three contributors to the Fund’s return were Health Care which contributed -0.38%, Communication Service which contributed -0.17%, and Utilities which contributed 0.04% to the total returns of the fund’s performance.
These return numbers reflect the contribution to the total return of the fund.
Pacer Lunt Large Cap Multi-Factor Alternator ETF
The Pacer Lunt Large Cap Multi-Factor Alternator ETF employs a “passive management” (or indexing) investment approach designed to track the total return performance, before fees and expenses, of the Index. The Index is based on a proprietary methodology developed by Lunt Capital Management, Inc. (“Lunt Capital” or the “Index Provider”). The Index uses an objective, rules-based methodology to provide exposure to large-capitalization U.S. companies. The Index uses Lunt Capital’s proprietary relative strength methodology to rotate between the holdings of the highest and lowest quintile components of four factor-based indices of the S&P 500 Index (each, a “Sub-Index,” and together, the “Sub-Indices”), that seek to identify the components of the S&P 500 Index that most strongly exhibit a particular factor. The four factor groups are Momentum, Quality, Value, and Volatility. 14 The Index will include holdings for two of the following eight Sub-Indices: Momentum Quality Value Volatility Highest Quintile S&P 500 Momentum Index S&P 500 Quality Index S&P 500 Enhanced Value Index S&P 500 Volatility - Highest Quintile Index Lowest Quintile S&P 500 Momentum - Lowest Quintile Index S&P 500 Quality - Lowest Quintile Index S&P 500 Enhanced Value - Lowest Quintile Index S&P 500 Low Volatility Index Each Sub-Index is composed of the 100 securities (a quintile) comprising the S&P 500 Index that most strongly exhibit the characteristic screened for by the Sub-Index. The S&P 500 is a free-float weighted index that measures the performance of the large-cap segment of the U.S. equity market. The S&P 500 includes approximately 500 leading companies and captures approximately 80% of the U.S. market capitalization. S&P Opco LLC (a subsidiary of S&P Dow Jones Indices, LLC) compiles, maintains, and calculates the S&P 500 Index and the Sub-Indices. The Index utilizes Lunt Capital’s proprietary relative strength analysis in its attempt to determine which two Sub-Indices are likely to exhibit better price performance than the other Sub-Indices. Pursuant to this methodology, the Index Provider calculates the “Risk Adjusted Score” for each Sub-Index. On the final trading day of each month, the Index Provider computes the relative strength of each Sub-Index by comparing each Sub-Index’s Risk-Adjusted Score. The Index Provider considers a higher Risk-Adjusted Score to indicate greater relative strength. The Index is composed of the securities comprising the two Sub-Indices demonstrating the greatest relative strength unless such Sub-Indices include both the highest and lowest quintile from the same factor group, in which case only the Sub-Indices with the highest and third-highest Risk-Adjusted Score
15
Pacer Funds
would be selected. The Index is reconstituted and rebalanced monthly, except when the Index methodology would not result in a change in the Sub-Indices comprising the Index at such time. The Fund’s Investment Strategy Under normal circumstances, at least 80% of the Fund’s total assets (exclusive of collateral held from securities lending) will be invested in the component securities of the Fund’s underlying Index or in one or more ETFs that track the performance of all or a portion of such component securities in the same approximate proportion as in the Fund’s underlying Index. The Fund’s investment adviser expects that, over time, the correlation between the Fund’s performance and that of the Index, before fees and expenses, will be 95% or better. The Fund will generally use a “replication” strategy to achieve its investment objective, meaning it will invest in all of the component securities of the Index. The Fund is considered to be non-diversified, which means that it may invest more of its assets in the securities of a single issuer or a smaller number of issuers than if it were a diversified fund.
The Fund
The Fund had a NAV total return of 27.83%. The Index had a total return of 28.83%. The S&P 500 Index had a total return of 22.66%
During the fiscal year, the top three sectors for contribution to performance were Consumer Staples which contributed 1.52%, Industrials which contributed 1.07%, and Energy which contributed 0.53% to the total return performance of the fund.
Conversely, the bottom three contributors to the Fund’s return were Consumer Discretionary which contributed -2.17%, Health Care which contributed -0.96%, and Financial which contributed -0.73% to the total return performance of the fund.
These return numbers reflect the contribution to the total return of the fund.
The Pacer Leaders ETF Series
The Pacer Leaders ETFs are strategy-driven, rules-based and are each designed to offer exposure to leaders in specific themes. The period referenced in this section for all custom funds is for the fiscal year end of April 30, 2024.
Pacer US Export Leaders ETF
The Pacer US Export Leaders ETF (the “Fund”) is an exchange traded fund that seeks to track the total return performance, before fees and expenses, of the Pacer US Export Leaders Index (the “Index”).
The Index uses an objective, rules-based methodology to measure the performance of an equal weight portfolio of approximately 100 large- and mid-capitalization U.S. companies with a high percentage of foreign sales and high free cash flow growth. Free cash flow is a company’s cash flow from operations minus its capital expenditures. Construction of the Index begins with an initial universe of the 200 companies across the S&P 900® Index (which is comprised of the S&P 500® Index (“S&P 500”) and S&P MidCap 400® Index (“S&P MidCap 400”)) that have the highest annual foreign sales as a percentage of total sales. The 200 companies are then narrowed to the 100 companies with the highest change in free cash flow growth over the past five years, and those 100 companies are equally weighted to create the Index. The Index is reconstituted and rebalanced to equal-weight quarterly. From time to time, the Index may include more or less than 100 companies as a result of events such as acquisitions, spin-offs and other corporate actions. The S&P 500 consists of approximately 500 leading U.S.-listed companies representing approximately 80% of the U.S. equity market capitalization. The S&P MidCap 400 measures the performance of mid-capitalization stocks in the United States.
The Fund
The Fund had a NAV total return of 18.40%. The Index had a total return of 19.11%. The S&P 900 Index had a total return of 22.32%.
During the fiscal year, the top three sectors for contribution to performance were Information Technology which contributed 13.17%, Industrial which contributed 4.51%, and Communication Services which contributed 1.10% to the total return of the fun’s performance.
Conversely, the bottom three contributors to the Fund’s return were Health Care which contributed -1.33%, Consumer Staples which contributed -0.45%, and Real Estate which contributed 0.07% to the fund’s total return performance.
These return numbers reflect the contribution to the total return of the fund.
Pacer Pacific Asset Floating Rate High Income ETF
Aristotle Pacific Capital, LLC (the “Sub-Adviser”) seeks to achieve the Fund’s investment objective by selecting a focused portfolio comprised primarily of income-producing adjustable rate securities. Under normal circumstances, the Fund will invest at least 80% of its net assets (plus any borrowings for investment purposes) in senior secured floating rate loans and other adjustable rate securities. Other adjustable rate securities will typically include collateralized loan obligations (“CLOs”), asset-backed securities (“ABS”), and commercial mortgage
16
Pacer Funds
backed securities (“CMBS”) (collectively, “Adjustable Rate Securities”). The Fund is expected to invest primarily in loans and Adjustable Rate Securities that are rated below investment grade (i.e., high yield securities, sometimes called “junk bonds” or non-investment grade securities) or, if unrated, of comparable quality as determined by the Sub-Adviser. The Fund may invest in U.S.-dollar denominated senior floating rate loans and Adjustable Rate Securities of domestic and foreign issuers. Senior floating rate loans are debt instruments that may have a right to payment that is senior to most other debts of borrowers. Borrowers may include corporations, partnerships and other entities that operate in a variety of industries and geographic regions, which may from time to time prepay their loan obligations in response, for example, to changes in interest rates. Senior loans in which the Fund may invest include secured and unsecured loans. Generally, secured floating rate loans are secured by specific assets of the borrower. An adjustable rate security includes any fixed income security that requires periodic changes in its interest rate based upon changes in a recognized index interest rate or another method of determining prevailing interest rates. The Fund invests in various types of ABS, such as auto loan and student loan ABS. The Fund is actively managed. The Fund may invest up to 20% of its assets in certain other types of debt instruments or securities, including corporate bonds (including floating rate investment grade bonds) and secured or unsecured second lien floating rate loans. Second lien loans generally are second in line behind senior loans in terms of prepayment priority with respect to pledged collateral and therefore have a lower credit quality as compared to senior loans but may produce a higher yield to compensate for the additional risk. The secondary market on which high yield securities are traded may be less liquid than the market for investment-grade securities. Less liquidity in the secondary trading market could adversely affect the ability of the Fund to sell a high yield security or the price at which the Fund could sell a high yield security, and could adversely affect the daily NAV of Fund shares. When secondary markets for high yield securities are less liquid than the market for investment-grade securities, it may be more difficult to value the securities because such valuation may require more research, and elements of judgment may play a greater role in the valuation because there is less reliable, objective data available. The Fund may invest up to an aggregate amount of 15% of its net assets in illiquid investments, as such term is defined by Rule 22e-4 under the Investment Company Act of 1940, as amended (the “1940 Act”). When the Sub-Adviser believes that current market, economic, political or other conditions are unsuitable and would impair the pursuit of the Fund’s investment objectives, the Fund may invest some or all of its assets in cash or cash equivalents, including but not limited to obligations of the U.S. government, money market fund shares, commercial paper, certificates of deposit and/or bankers acceptances, as well as other interest bearing or discount obligations or debt instruments that carry an investment grade rating by a national rating agency. When the Fund takes a temporary defensive position, the Fund may not achieve its investment objectives. The Fund may invest from time to time more heavily in one or more sectors of the economy than in other sectors.
The Fund
The Fund had a NAV total return of 13.25%. The S&P/LSTA Leveraged Loan Total Return Index had a total return of 11.47%.
The Fund’s top three performers in the fund were Neuberger Berman Loan Advisers CLO 48 Ltd with a total return of 14.08% and a contribution to the return of the fund of 0.14%. Harbor Park CLO 18-1 Ltd with a total return of 18.56% and a contribution of 0.14% to the return of the fund. And Goldentree Loan Management US CLO 1 Ltd with a total return of 20.03% which was a contribution to the return of the fund of 0.11%.
The Fund’s bottom three contributors to its return were Altice France Societe Anonyme Term Loan 15-aug-2028 with a total return of -15.63% and a contribution of -0.06%, ROCKLAND OK CLO 2021 with a total return of -1.06% and a contribution of -0.01%, and ELMWOOD CLO LTD 2021-12 with a total return of -2.00% and a contribution of -0.01% to the total return of the fund.
Pacer Data and Digital Revolution ETF
The Pacer Data and Digital Revolution ETF (the “Fund”) employs a “passive management” (or indexing) investment approach designed to track the total return performance, before fees and expenses, of the Pacer Data Transmission and Communication Revolution Index (the “Index”).
The Index is based on a proprietary methodology developed and maintained by Index Design Group, an affiliate of Pacer Advisors, Inc., the Fund’s investment adviser (the “Adviser”). The Index is a rules-based index that consists of globally-listed stocks and depositary receipts of companies that, at the time of being added to the Index, derive at least 50% of their revenues from one of the following activities related to the use, manipulation, transmission, or storage of data (i.e., information that is stored in a digital or electronic format) and the ancillary services that enable these processes (i.e., services that enable companies to use, manipulate, transmit, or store data): electrical equipment and component manufacturing; automatic environmental control or heating and cooling equipment; computer storage device manufacturing; computer systems design services; computer equipment or telephone 3 equipment manufacturing; custom computer programming or record reproducing services; data processing and hosting services; software publishing; semiconductor manufacturing; wireless communications equipment manufacturing; communication and energy wire or wiring device manufacturing or producers of raw materials; cybersecurity systems and data protection services; power and distribution transformer manufacturing; satellite and digital telecommunications; electrical
17
Pacer Funds
equipment component manufacturing; industrial value manufacturing; commercial machinery manufacturing; instruments used for measuring, displaying, and controlling industrial process variables (e.g., instruments used for testing electricity and glass thermometers for non-medical uses); computer facilities management services; or electrical equipment or wiring supplies wholesalers (collectively, “Data and Digital Revolution”), as determined by the Index Provider.
The Fund
The Fund had a NAV total return of 58.06%. The index had a total return of 59.18%. The S&P Global 1200 Index had a total return of 18.44%.
The Fund’s top three contributors to its return were NVIDIA Corporation at 211.47% total return and a contribution 15.60%, Advanced Micro Devices, Inc. at 77.22% total return and a contribution of 4.40%, and Broadcom Inc. at 111.66% total return and a contribution of 9.43% to the total return of the fund.
The Fund’s bottom three contributors to its return were Nokia Oyj at a total return of -10.66% and a contribution of -0.28%, Hexatronic Group AB at a total return of -62.73% and a contribution of -0.11%, and Calix, Inc at a total return of -39.32% and a contribution of -0.08%.
Pacer Industrials and Logistics ETF
The Pacer Industrials and Logistics ETF (the “Fund”) employs a “passive management” (or indexing) investment approach designed to track the total return performance, before fees and expenses, of the Pacer Global Supply Chain Infrastructure Index (the “Index”).
The Index is based on a proprietary methodology developed and maintained by Index Design Group, an affiliate of Pacer Advisors, Inc., the Fund’s investment adviser (the “Adviser”). The Index consists of globally-listed stocks and depositary receipts of industrials and logistics companies, as described below. Companies eligible to be added to the Index are those that derive at least 50% of their revenue from the following activities: (i) transportation, including air, ocean, and rail freight, long and short haul trucking, and other courier services that contribute to the movement of products within global supply chains; (ii) software, including transportation management services, logistics software, and other software services that enable companies to draw insights and maximize supply chain efficiency; (iii) hardware, including robotics, forklifts, and other equipment that is instrumental in the logistics process such as conveyor belt technology in warehouses; or (iv) consulting companies responsible for increasing the efficiency of companies with operations in supply chain and logistics management (collectively, “Industrials and Logistics”), as determined by the Index Provider. “Industrials” companies are those companies that are engaged in the research, development, manufacture, distribution, supply, or sale of industrial products, services, or equipment (e.g., capital goods, construction services, machinery, and transportation). “Logistics” companies are those companies involved in the supply chain movements required to move raw materials, intermediate goods, and finished products around the world (e.g., the provision of logistics support, logistics software, rail and air freight, trucking, and marine shipping).
The Fund
The Fund had a NAV total return of 7.54%. The S&P Global 1200 Index had a total return of 18.44%.
The Fund’s top three contributors to its return were SAP SE with a total return of 36.04% and a contribution of 3.43%, Union Pacific Corporation with a total return of 24.03% and a contribution of 2.02%, and Toyota Industries with a total return of 68.55% and a contribution of 0.98% to the total return of the fund’s performance.
The Fund’s bottom three contributors to its return were United Parcel Service at a total return of -14.52% and a contribution of -1.44%, Hapag-Lloyd AG with a total return of -21.29% and a contribution of -0.84%, and DSV A/S at a total return of -23.48% and a contribution of -0.70% to the total return of the fund.
Before investing you should carefully consider a Fund’s investment objectives, risks, charges and expenses. This and other information is in the prospectus. A copy may be obtained by visiting www.paceretfs.com or calling 1-877-337-0500. Please read the prospectus carefully before investing.
The performance data quoted is historical. Past performance is no guarantee of future results. You cannot invest directly in an index.
An investment in the Funds is subject to investment risk, including the possible loss of principal. Pacer ETF shares may be bought and sold on an exchange through a brokerage account. Brokerage commissions and ETF expenses will reduce investment returns. There can be no assurance that an active trading market for ETF shares will be developed or maintained. The risks associated with these funds are detailed in the prospectus and could include factors such as alternator strategy risk, cash redemption risk, high yield risk, management risk,
18
Pacer Funds
calculation methodology risk, concentration risk, currency exchange rate risk, emerging markets risk, equity market risk, ETF risks, European investments risk, fixed income risk, foreign sales risk, foreign securities risk, geographic concentration risk, government obligations risk, high portfolio turnover risk, index criteria risk, international operations risk, large and mid-capitalization investing risk, monthly exposure risk, new fund risk, non-diversification risk, other investment companies risk, passive investment risk, real estate companies risk, REIT investment risk, models and data risk, sector risk, sector rotation risk, smaller-capitalization companies risk, style risk, tax risk, tracking risk, trend lag risk, energy infrastructure industry risk, MLP risk, risk of investing in China, risk of investments in A-Shares, A-Shares tax risk, risk of investing through Shanghai-Hong Kong Stock Connect, risk of investing in Issuers listed on the ChiNext Board, authorized participant concentration risk, concentration risk, costs of buying or selling fund shares, emerging markets risk, equity securities risk, financial sector risk, index tracking error risk, international closed market trading risk, large-capitalization securities risk, market risk, non-U.S. currency risk, non-U.S. securities risk, passive investment risk, risk of cash transactions, secondary market trading risk, shares of the fund may trade at prices other than NAV, cybersecurity risk and/or special risks of exchange traded funds.
The Pacer Trendpilot® US Large Cap Index, Pacer Trendpilot® US Mid Cap Index, Pacer US Small Cap Cash Cows Index, Pacer US Export Leaders Index, Pacer WealthShield Index, Pacer Trendpilot® International Index, Pacer US Cash Cows Growth Index, Pacer Trendpilot® US Bond Index, and Pacer Trendpilot® Fund of Funds Index (the “Indices”) are the property of Index Design Group, LLC which has contracted with S&P Opco, LLC (a subsidiary of S&P Dow Jones Indices LLC) to calculate and maintain the Indices. The Indices are not sponsored by S&P Dow Jones Indices or its affiliates or its third party licensors (collectively, “S&P Dow Jones Indices”). S&P Dow Jones Indices will not be liable for any errors or omissions in calculating the Indices. “Calculated by S&P Dow Jones Indices” and the related stylized mark(s) are service marks of S&P Dow Jones Indices and have been licensed for use by Index Design Group, LLC. S&P® is a registered trademark of Standard & Poor’s Financial Services LLC (“SPFS”), and Dow Jones® is a registered trademark of Dow Jones Trademark Holdings LLC (“Dow Jones”).
The Pacer NASDAQ-100 Trendpilot® Index is co-owned by Index Design Group, LLC. and Nasdaq, Inc. (which with its affiliates is referred to as the “Corporations”). The NASDAQ-100 is a registered trademark of the Corporations and is licensed for use by Index Design Group, LLC. The Product(s) are not issued, endorsed, sold, or promoted by the Corporations. The Corporations make no warranties and bear no liability with respect to the product(s).
“FTSE®” is a trade mark of the London Stock Exchange Group companies and is used by FTSE International Limited under license. All rights in the FTSE indices and / or FTSE ratings vest in FTSE and/or its licensors. Neither FTSE nor its licensors accept any liability for any errors or omissions in the FTSE indices and / or FTSE ratings or underlying data and no party may rely on any FTSE indices, ratings and / or data underlying data contained in this communication. No further distribution of FTSE Data is permitted without FTSE’s express written consent. FTSE does not promote, sponsor or endorse the content of this communication.
Frank Russell Company (“Russell”) is the source and owner of the trademarks, service marks and copyrights related to the Russell Indexes. Russell® is a trademark of Frank Russell Company. Neither Russell nor its licensors accept any liability for any errors or omissions in the Russell Indexes and / or Russell ratings or underlying data and no party may rely on any Russell Indexes and / or Russell ratings and / or underlying data contained in this communication. No further distribution of Russell Data is permitted without Russell’s express written consent. Russell does not promote, sponsor or endorse the content of this communication.
The Russell 1000 Index (the “Index”) is a trademark of Frank Russell Company (“Russell”) and has been licensed for use by Index Design Group, LLC (“IDG”). The Pacer US Cash Cows 100 Index is not in any way sponsored, endorsed, sold or promoted by Russell or the London Stock Exchange Group companies (“LSEG”) (together the “Licensor Parties”) and none of the Licensor Parties make any claim, prediction, warranty or representation whatsoever, expressly or impliedly, either as to (i) the results to be obtained from the use of the Index (upon which the Pacer US Cash Cows 100 Index is based), (ii) the figure at which the Index is said to stand at any particular time on any particular day or otherwise, or (iii) the suitability of the Index for the purpose to which it is being put in connection with the Pacer US Cash Cows 100 Index. None of the Licensor Parties have provided or will provide any financial or investment advice or recommendation in relation to the Index to IDG or to its clients. The Index is calculated by Russell or its agent. None of the Licensor Parties shall be (a) liable (whether in negligence or otherwise) to any person for any error in the Index or (b) under any obligation to advise any person of any error therein.
Solactive AG (“Solactive”) is the licensor of the Solactive GPR Data & Infrastructure Real Estate Index (the “Index”). The financial instruments that are based on the Index are not sponsored, endorsed, promoted or sold by Solactive in any way and Solactive makes no express or implied representation, guarantee or assurance with regard to: (a) the advisability in investing in the financial instruments; (b) the quality, accuracy and/or completeness of the Index; and/or (c) the results obtained or to be obtained by any person or entity from the use of the Index. Solactive reserves the right to change the methods of calculation or publication with respect to the Index. Solactive shall not be liable for any damages suffered or incurred as a result of the use (or inability to use) of the Index.
19
Pacer Funds
Solactive AG (“Solactive”) is the licensor of the Solactive GPR Industrial Real Estate Index (the “Index”). The financial instruments that are based on the Index are not sponsored, endorsed, promoted or sold by Solactive in any way and Solactive makes no express or implied representation, guarantee or assurance with regard to: (a) the advisability in investing in the financial instruments; (b) the quality, accuracy and/or completeness of the Index; and/or (c) the results obtained or to be obtained by any person or entity from the use of the Index. Solactive reserves the right to change the methods of calculation or publication with respect to the Index. Solactive shall not be liable for any damages suffered or incurred as a result of the use (or inability to use) of the Index.
Pacer Cash Cows Fund of Funds ETF is not sponsored, promoted, sold or supported in any other manner by Solactive AG nor does Solactive AG offer any express or implicit guarantee or assurance either with regard to the results of using the Index and/or Index trade mark or the Index Price at any time or in any other respect. The Index is calculated and published by Solactive AG. Solactive AG uses its best efforts to ensure that the Indexes are calculated correctly. Irrespective of its obligations towards the Issuer, Solactive AG has no obligation to point out errors in the Indexes to third parties including but not limited to investors and/or financial intermediaries of the financial instrument. Neither publication of the Index by Solactive AG nor the licensing of the Indexes or Indexes trade mark for the purpose of use in connection with the financial instrument constitutes a recommendation by Solactive AG to invest capital in said financial instrument nor does it in any way represent an assurance or opinion of Solactive AG with regard to any investment in this financial instrument.
The Lunt Capital U.S. Large Cap Equity Rotation Index, Lunt Capital U.S. MidCap Multi-Factor Rotation Index, and Lunt Capital U.S. Large Cap Multi-Factor Rotation Index (the “Indices”) are a service mark of Lunt Capital Management, Inc. and have been licensed for use by Pacer Advisors, Inc. The Products are not sponsored, endorsed, sold, or promoted by Lunt Capital Management, Inc. and Lunt Capital Management, Inc. makes no representation regarding the advisability of investing in the Products. The Index is the property of Lunt Capital Management, Inc., which has contracted with S&P Opco, LLC (a subsidiary of S&P Dow Jones Indices LLC) to calculate and maintain the Indices. The Indices are not sponsored by S&P Dow Jones Indices or its affiliates or its third party licensors (collectively, “S&P Dow Jones Indices”). S&P Dow Jones Indices will not be liable for any errors or omissions in calculating the Indices. “Calculated by S&P Dow Jones Indices” and the related stylized mark(s) are service marks of S&P Dow Jones Indices and have been licensed for use by Lunt Capital Management, Inc. S&P® is a registered trademark of Standard & Poor’s Financial Services LLC (“SPFS”), and Dow Jones® is a registered trademark of Dow Jones Trademark Holdings LLC (“Dow Jones”).
CFRA makes no representation or warranty, express or implied, to the owners of the Product or any member of the public regarding the advisability of investing in securities generally, or in the Product particularly, or the ability of CFRA’s Index to track general market performance. CFRA is not responsible for and has not participated in the determination of the prices and amount of the Product or the timing of the issuance or sale of the Product or in the determination or calculation of the equation by which the product may be converted into cash or other redemption mechanics. CFRA has no obligation or liability in connection with the administration, marketing or trading of the Product. CFRA is not an investment advisor. Inclusion of a security within a CFRA Index is not a recommendation by CFRA to buy, sell, or hold any security, nor is it investment advice. CFRA does not guarantee the adequacy, accuracy, timeliness and/or the completeness of the CFRA Index or any data related thereto or any communication with respect thereto, including oral, written, or electronic communications. CFRA shall not be subject to any damages or liability for any errors, omissions, or delays therein. CFRA makes no express or implied warranties, and expressly disclaims all warranties, of merchantability or fitness for a particular purpose or use or as to results to be obtained by users, owners of the product, or any other person or entity from the use of the CFRA Index or with respect to any data related thereto.
The LifeSci BioThreat Strategy Index is a trademark of LifeSci Index Partners, LLC (“LSIP”) and has been licensed for use by Pacer Advisors, Inc. The Pacer BioThreat Strategy ETF (CBOE: VIRS) is not sponsored, endorsed, sold or promoted by LifeSci Index Partners, LLC and LSIP makes no representation or warranty regarding the advisability of investing in the Pacer BioThreat ETF.
Pacer Advisors, Inc. is the fund advisor. Aristotle Pacific Capital, LLC serves as investment sub-advisor to the Fund. The Fund is the successor to the Pacific Global Senior Loan ETF, a series of Pacific Global ETF Trust, and its investment performance as a result of the reorganization of the Predecessor Fund into the Fund at the close of business on October 22, 2021. In addition, the Pacific Global Senior Loan ETF was the successor to the investment performance of AdvisorShares Pacific Asset Enhanced Floating Rate ETF, a series of AdvisorShares Trust, as a result of the reorganization of the series of AdvisorShares Trust into a series of Pacific Global ETF that occurred on December 27, 2019 (together, the “Predecessor Fund”).
From the Predecessor Fund’s inception to October 22, 2021, the Predecessor Fund invested at least 80% of its net assets (plus any borrowings for investment purposes) in senior secured floating rate loans. After the reorganization, the Fund invests at least 80% of its net assets (plus any borrowings for investment purposes) in senior secured floating rate loans and other adjustable rate securities. Other than each Fund’s respective 80% policy and the associated risks with investing in adjustable rate securities, the Funds had similar investment objectives, strategies, and policies.
20
Pacer Funds
The Value Indices listed below are being included to provide a performance comparison of a value index, which the Adviser believes is a more suitable comparison for the Cash Cows Series based on the investment strategy of the Fund.
Russell 1000 Value Index
S&P SmallCap 600 Value Index
MSCI EAFE Value Index
MSCI World Value Index
MSCI Emerging Markets Value Index
Investment products offered are: Not FDIC Insured ● No Bank Guarantee ● May Lose Value
Trendpilot®, Cash Cows Index® and Strategy Driven ETFs™ are trademarks of Index Design Group, LLC.
Distributor: Pacer Financial, Inc, member FINRA, SIPC, an affiliate of Pacer Advisors, Inc.
21
Pacer Funds
PORTFOLIO ALLOCATION (Unaudited)
As of April 30, 2024
Pacer Trendpilot® US Large Cap ETF
Industry(a) | Percentage of
Net Assets |
Automobiles & Components | 1.5% |
Banks | 3.4% |
Capital Goods | 5.8% |
Commercial & Professional Services | 1.3% |
Consumer Discretionary Distribution & Retail | 5.9% |
Consumer Durables & Apparel | 0.8% |
Consumer Services | 2.1% |
Consumer Staples Distribution & Retail | 1.9% |
Energy | 4.1% |
Equity Real Estate Investment Trusts (REITs) | 2.0% |
Financial Services | 7.6% |
Food Beverage & Tobacco | 2.7% |
Health Care Equipment & Services | 5.2% |
Household & Personal Products | 1.5% |
Insurance | 2.1% |
Materials | 2.4% |
Media & Entertainment | 8.3% |
Pharmaceuticals Biotechnology & Life Sciences | 7.1% |
Real Estate Management & Development | 0.2% |
Semiconductors & Semiconductor Equipment | 10.1% |
Software & Services | 11.4% |
Technology Hardware & Equipment | 7.5% |
Telecommunication Services | 0.9% |
Transportation | 1.7% |
Utilities | 2.3% |
Investments Purchased with Proceeds from Securities Lending | 3.7% |
Liabilities in Excess of Other Assets | -3.5% |
Total | 100.0% |
(a) | The Fund may classify a company in a different category than the Pacer Trendpilot® US Large Cap Index. |
Pacer Trendpilot® US Mid Cap ETF
Industry(a) | Percentage of
Net Assets |
Automobiles & Components | 1.7% |
Banks | 5.2% |
Capital Goods | 15.5% |
Commercial & Professional Services | 4.3% |
Consumer Discretionary Distribution & Retail | 4.3% |
Consumer Durables & Apparel | 4.2% |
Consumer Services | 4.9% |
Consumer Staples Distribution & Retail | 2.1% |
Energy | 5.6% |
Equity Real Estate Investment Trusts (REITs) | 6.7% |
Financial Services | 6.2% |
Food Beverage & Tobacco | 1.8% |
Health Care Equipment & Services | 4.7% |
Household & Personal Products | 0.8% |
Insurance | 4.6% |
Materials | 6.9% |
22
Pacer Funds
PORTFOLIO ALLOCATION (Unaudited) (Continued)
As of April 30, 2024
Pacer Trendpilot® US Mid Cap ETF (Continued) | |
Industry(a) | Percentage of
Net Assets |
Media & Entertainment | 1.1% |
Pharmaceuticals Biotechnology & Life Sciences | 3.5% |
Real Estate Management & Development | 0.3% |
Semiconductors & Semiconductor Equipment | 2.7% |
Software & Services | 3.2% |
Technology Hardware & Equipment | 3.4% |
Telecommunication Services | 0.3% |
Transportation | 2.3% |
Utilities | 3.6% |
Investments Purchased with Proceeds from Securities Lending | 22.5% |
Liabilities in Excess of Other Assets | -22.4% |
Total | 100.0% |
(a) | The Fund may classify a company in a different category than the Pacer Trendpilot® US Mid Cap Index. |
Pacer Trendpilot® 100 ETF
Industry(a) | Percentage of
Net Assets |
Automobiles & Components | 1.3% |
Capital Goods | 0.9% |
Commercial & Professional Services | 1.2% |
Consumer Discretionary Distribution & Retail | 3.9% |
Consumer Durables & Apparel | 0.2% |
Consumer Services | 1.6% |
Consumer Staples Distribution & Retail | 1.5% |
Energy | 0.3% |
Financial Services | 0.3% |
Food Beverage & Tobacco | 2.1% |
Health Care Equipment & Services | 1.0% |
Materials | 0.9% |
Media & Entertainment | 7.5% |
Pharmaceuticals Biotechnology & Life Sciences | 2.3% |
Real Estate Management & Development | 0.2% |
Semiconductors & Semiconductor Equipment | 12.4% |
Software & Services | 8.9% |
Technology Hardware & Equipment | 5.0% |
Telecommunication Services | 0.8% |
Transportation | 0.4% |
Utilities | 0.7% |
U.S. Treasury Bills | 45.0% |
Investments Purchased with Proceeds from Securities Lending | 30.9% |
Liabilities in Excess of Other Assets | -29.3% |
Total | 100.0% |
(a) | The Fund may classify a company in a different category than the Pacer Nasdaq-100 Trendpilot® Index. |
23
Pacer Funds
PORTFOLIO ALLOCATION (Unaudited) (Continued)
As of April 30, 2024
Pacer Trendpilot® European Index ETF
Country(a) | Percentage of
Net Assets |
Automobiles & Components | 4.9% |
Banks | 11.0% |
Capital Goods | 14.8% |
Commercial & Professional Services | 1.0% |
Consumer Discretionary Distribution & Retail | 2.0% |
Consumer Durables & Apparel | 6.6% |
Consumer Services | 1.0% |
Consumer Staples Distribution & Retail | 0.8% |
Energy | 4.2% |
Equity Real Estate Investment Trusts (REITs) | 0.5% |
Financial Services | 3.0% |
Food Beverage & Tobacco | 3.6% |
Health Care Equipment & Services | 2.4% |
Household & Personal Products | 2.5% |
Insurance | 6.2% |
Materials | 5.2% |
Media & Entertainment | 1.3% |
Pharmaceuticals Biotechnology & Life Sciences | 4.3% |
Real Estate Management & Development | 0.5% |
Semiconductors & Semiconductor Equipment | 8.0% |
Software & Services | 4.7% |
Technology Hardware & Equipment | 0.3% |
Telecommunication Services | 2.9% |
Transportation | 1.4% |
Utilities | 5.6% |
Investments Purchased with Proceeds from Securities Lending | 14.4% |
Liabilities in Excess of Other Assets | -13.1% |
Total | 100.0% |
(a) | The Fund may classify a company in a different category than the Pacer Trendpilot European Index. |
Pacer Trendpilot® International ETF
Industry(a) | Percentage of
Net Assets |
Automobiles & Components | 4.3% |
Banks | 12.3% |
Capital Goods | 10.1% |
Commercial & Professional Services | 2.0% |
Consumer Discretionary Distribution & Retail | 1.6% |
Consumer Durables & Apparel | 3.9% |
Consumer Services | 1.3% |
Consumer Staples Distribution & Retail | 1.2% |
Energy | 6.0% |
Equity Real Estate Investment Trusts (REITs) | 0.4% |
Financial Services | 3.1% |
Food Beverage & Tobacco | 4.6% |
Health Care Equipment & Services | 1.6% |
Household & Personal Products | 2.4% |
Insurance | 4.7% |
24
Pacer Funds
PORTFOLIO ALLOCATION (Unaudited) (Continued)
As of April 30, 2024
Pacer Trendpilot® International ETF (Continued) | |
Industry(a) | Percentage of
Net Assets |
Materials | 7.1% |
Media & Entertainment | 1.1% |
Pharmaceuticals Biotechnology & Life Sciences | 10.2% |
Real Estate Management & Development | 0.8% |
Semiconductors & Semiconductor Equipment | 3.9% |
Software & Services | 3.3% |
Technology Hardware & Equipment | 1.8% |
Telecommunication Services | 2.2% |
Transportation | 2.4% |
Utilities | 2.6% |
Exchange Traded Funds | 4.4% |
Investments Purchased with Proceeds from Securities Lending | 22.0% |
Liabilities in Excess of Other Assets | -21.3% |
Total | 100.0% |
(a) | The Fund may classify a company in a different category than the Pacer Trendpilot® International Index. |
Pacer Trendpilot® US Bond ETF
Industry(a) | Percentage of
Net Assets |
Corporate Bonds | 98.7% |
Investments Purchased with Proceeds from Securities Lending | 11.6% |
Liabilities in Excess of Other Assets | -10.3% |
Total | 100.0% |
(a) | The Fund may classify a company in a different category than the Pacer Trendpilot® US Bond Index. |
Pacer Trendpilot® Fund of Funds ETF
Industry(a) | Percentage of
Net Assets |
Affiliated Exchange Traded Funds | 99.9% |
Other Assets in Excess of Liabilities | 0.1% |
Total | 100.0% |
(a) | The Fund may classify a company in a different category than the Pacer Trendpilot® Fund of Funds Index. |
25
Pacer Funds
PORTFOLIO ALLOCATION (Unaudited) (Continued)
As of April 30, 2024
Pacer US Cash Cows 100 ETF
Industry(a) | Percentage of
Net Assets |
Automobiles & Components | 0.4% |
Capital Goods | 10.9% |
Commercial & Professional Services | 0.3% |
Consumer Discretionary Distribution & Retail | 5.4% |
Consumer Durables & Apparel | 9.9% |
Consumer Services | 1.6% |
Energy | 23.9% |
Food Beverage & Tobacco | 5.1% |
Health Care Equipment & Services | 7.2% |
Household & Personal Products | 2.2% |
Materials | 9.8% |
Media & Entertainment | 2.2% |
Pharmaceuticals Biotechnology & Life Sciences | 6.1% |
Semiconductors & Semiconductor Equipment | 1.1% |
Software & Services | 3.2% |
Technology Hardware & Equipment | 5.0% |
Telecommunication Services | 2.0% |
Transportation | 1.0% |
Utilities | 2.5% |
Investments Purchased with Proceeds from Securities Lending | 4.8% |
Liabilities in Excess of Other Assets | -4.6% |
Total | 100.0% |
(a) | The Fund may classify a company in a different category than the Pacer US Cash Cows 100 Index. |
Pacer US Small Cap Cash Cows 100 ETF
Industry(a) | Percentage of
Net Assets |
Automobiles & Components | 4.1% |
Capital Goods | 17.5% |
Commercial & Professional Services | 2.0% |
Consumer Discretionary Distribution & Retail | 8.5% |
Consumer Durables & Apparel | 15.8% |
Consumer Services | 0.9% |
Consumer Staples Distribution & Retail | 2.1% |
Energy | 13.9% |
Food Beverage & Tobacco | 2.1% |
Health Care Equipment & Services | 4.3% |
Household & Personal Products | 1.9% |
Materials | 5.4% |
Media & Entertainment | 2.3% |
Pharmaceuticals Biotechnology & Life Sciences | 5.1% |
Semiconductors & Semiconductor Equipment | 1.2% |
Software & Services | 2.5% |
Technology Hardware & Equipment | 7.0% |
Transportation | 3.4% |
Investments Purchased with Proceeds from Securities Lending | 10.4% |
Liabilities in Excess of Other Assets | -10.4% |
Total | 100.0% |
(a) | The Fund may classify a company in a different category than the Pacer US Small Cap Cash Cows 100 Index. |
26
Pacer Funds
PORTFOLIO ALLOCATION (Unaudited) (Continued)
As of April 30, 2024
Pacer Global Cash Cows Dividend ETF
Industry(a) | Percentage of
Net Assets |
Automobiles & Components | 9.3% |
Capital Goods | 3.5% |
Commercial & Professional Services | 0.2% |
Consumer Discretionary Distribution & Retail | 1.6% |
Consumer Services | 0.1% |
Consumer Staples Distribution & Retail | 1.0% |
Energy | 23.2% |
Food Beverage & Tobacco | 8.8% |
Health Care Equipment & Services | 1.5% |
Household & Personal Products | 2.5% |
Materials | 10.4% |
Media & Entertainment | 0.1% |
Pharmaceuticals Biotechnology & Life Sciences | 13.5% |
Software & Services | 2.0% |
Telecommunication Services | 8.6% |
Transportation | 8.4% |
Utilities | 4.4% |
Investments Purchased with Proceeds from Securities Lending | 12.1% |
Liabilities in Excess of Other Assets | -11.2% |
Total | 100.0% |
(a) | The Fund may classify a company in a different category than the Pacer Global Cash Cows Dividend 100 Index. |
Pacer Developed Markets International Cash Cows 100 ETF
Industry(a) | Percentage of
Net Assets |
Automobiles & Components | 8.4% |
Capital Goods | 13.6% |
Commercial & Professional Services | 0.9% |
Consumer Discretionary Distribution & Retail | 1.4% |
Consumer Durables & Apparel | 0.7% |
Consumer Services | 0.2% |
Consumer Staples Distribution & Retail | 6.1% |
Energy | 25.4% |
Food Beverage & Tobacco | 1.8% |
Health Care Equipment & Services | 2.3% |
Household & Personal Products | 0.3% |
Materials | 12.3% |
Media & Entertainment | 2.0% |
Pharmaceuticals Biotechnology & Life Sciences | 0.7% |
Semiconductors & Semiconductor Equipment | 0.3% |
Telecommunication Services | 4.1% |
Transportation | 15.5% |
Utilities | 3.2% |
Investments Purchased with Proceeds from Securities Lending | 8.6% |
Liabilities in Excess of Other Assets | -7.8% |
Total | 100.0% |
(a) | The Fund may classify a company in a different category than the Pacer Developed Markets International Cash Cows 100 Index. |
27
Pacer Funds
PORTFOLIO ALLOCATION (Unaudited) (Continued)
As of April 30, 2024
Pacer Emerging Markets Cash Cows 100 ETF
Industry(a) | Percentage of
Net Assets |
Automobiles & Components | 2.9% |
Capital Goods | 10.1% |
Consumer Discretionary Distribution & Retail | 7.0% |
Consumer Durables & Apparel | 1.7% |
Consumer Services | 1.7% |
Consumer Staples Distribution & Retail | 3.0% |
Energy | 17.2% |
Food Beverage & Tobacco | 3.8% |
Household & Personal Products | 0.3% |
Materials | 12.6% |
Media & Entertainment | 0.3% |
Pharmaceuticals Biotechnology & Life Sciences | 0.2% |
Semiconductors & Semiconductor Equipment | 0.9% |
Technology Hardware & Equipment | 13.7% |
Telecommunication Services | 7.4% |
Transportation | 6.8% |
Utilities | 9.6% |
Investments Purchased with Proceeds from Securities Lending | 0.0%* |
Other Assets in Excess of Liabilities | 0.8% |
Total | 100.0% |
(a) | The Fund may classify a company in a different category than the Pacer Emerging Markets Cash Cows 100 Index. |
Pacer US Large Cap Cash Cows Growth Leaders ETF
Industry(a) | Percentage of
Net Assets |
Capital Goods | 4.9% |
Commercial & Professional Services | 1.1% |
Consumer Discretionary Distribution & Retail | 0.5% |
Consumer Durables & Apparel | 4.3% |
Consumer Services | 3.3% |
Energy | 6.4% |
Food Beverage & Tobacco | 1.0% |
Health Care Equipment & Services | 3.1% |
Household & Personal Products | 0.2% |
Materials | 1.4% |
Media & Entertainment | 5.7% |
Pharmaceuticals Biotechnology & Life Sciences | 6.8% |
Semiconductors & Semiconductor Equipment | 15.6% |
Software & Services | 39.2% |
Technology Hardware & Equipment | 4.5% |
Telecommunication Services | 0.3% |
Transportation | 1.2% |
Utilities | 0.4% |
Other Assets in Excess of Liabilities | 0.1% |
Total | 100.0% |
(a) | The Fund generally classifies a company in a different category than the Pacer US Large Cap Cash Cows Growth Leaders Index. |
28
Pacer Funds
PORTFOLIO ALLOCATION (Unaudited) (Continued)
As of April 30, 2024
Pacer US Small Cap Cash Cows Growth Leaders ETF
Industry(a) | Percentage of
Net Assets |
Automobiles & Components | 0.6% |
Capital Goods | 21.3% |
Commercial & Professional Services | 3.1% |
Consumer Discretionary Distribution & Retail | 7.8% |
Consumer Durables & Apparel | 10.3% |
Consumer Services | 3.1% |
Energy | 5.1% |
Food Beverage & Tobacco | 3.2% |
Health Care Equipment & Services | 5.7% |
Household & Personal Products | 1.9% |
Materials | 7.3% |
Media & Entertainment | 3.3% |
Pharmaceuticals Biotechnology & Life Sciences | 10.0% |
Semiconductors & Semiconductor Equipment | 2.2% |
Software & Services | 8.5% |
Technology Hardware & Equipment | 3.5% |
Telecommunication Services | 0.3% |
Transportation | 2.2% |
Utilities | 0.5% |
Other Assets in Excess of Liabilities | 0.1% |
Total | 100.0% |
(a) | The Fund generally classifies a company in a different category than the Pacer US Small Cap Cash Cows Growth Leaders Index. |
Pacer US Cash Cows Growth ETF
Industry(a) | Percentage of
Net Assets |
Capital Goods | 15.2% |
Commercial & Professional Services | 0.5% |
Consumer Discretionary Distribution & Retail | 7.7% |
Consumer Durables & Apparel | 18.3% |
Consumer Services | 8.3% |
Energy | 10.3% |
Food Beverage & Tobacco | 0.9% |
Health Care Equipment & Services | 0.9% |
Materials | 8.0% |
Media & Entertainment | 6.0% |
Pharmaceuticals Biotechnology & Life Sciences | 1.5% |
Semiconductors & Semiconductor Equipment | 9.5% |
Software & Services | 3.9% |
Technology Hardware & Equipment | 5.7% |
Utilities | 3.2% |
Investments Purchased with Proceeds from Securities Lending | 15.1% |
Liabilities in Excess of Other Assets | -15.0% |
Total | 100.0% |
(a) | The Fund may classify a company in a different category than the Pacer US Cash Cows Growth Index. |
29
Pacer Funds
PORTFOLIO ALLOCATION (Unaudited) (Continued)
As of April 30, 2024
Pacer Cash Cows Fund of Funds ETF
Industry(a) | Percentage of
Net Assets |
Affiliated Exchange Traded Funds | 100.0% |
Other Assets in Excess of Liabilities | 0.0%* |
Total | 100.0% |
(a) | The Fund may classify a company in a different category than the Pacer Cash Cows Fund of Funds Index. |
Pacer WealthShield ETF
Industry(a) | Percentage of
Net Assets |
Banks | 5.3% |
Capital Goods | 13.8% |
Commercial & Professional Services | 2.9% |
Consumer Discretionary Distribution & Retail | 2.7% |
Consumer Services | 1.5% |
Financial Services | 12.6% |
Health Care Equipment & Services | 0.5% |
Insurance | 3.4% |
Media & Entertainment | 6.4% |
Semiconductors & Semiconductor Equipment | 7.0% |
Software & Services | 14.0% |
Technology Hardware & Equipment | 7.2% |
Transportation | 3.9% |
U.S. Treasury Bills | 17.8% |
Investments Purchased with Proceeds from Securities Lending | 21.0% |
Liabilities in Excess of Other Assets | -20.0% |
Total | 100.0% |
(a) | The Fund may classify a company in a different category than the Pacer WealthShield Index. |
Pacer Industrial Real Estate ETF
Industry(a) | Percentage of
Net Assets |
Equity Real Estate Investment Trusts | 94.9% |
Common Stock | 4.7% |
Investments Purchased with Proceeds from Securities Lending | 7.5% |
Liabilities in Excess of Other Assets | -7.1% |
Total | 100.0% |
(a) | The Fund may classify a company in a different category than the Pacer Industrial Real Estate Index. |
30
Pacer Funds
PORTFOLIO ALLOCATION (Unaudited) (Continued)
As of April 30, 2024
Pacer Data & Infrastructure Real Estate ETF
Industry(a) | Percentage of
Net Assets |
Equity Real Estate Investment Trusts (REITs) | 61.0% |
Media & Entertainment | 3.6% |
Real Estate Management & Development | 4.0% |
Software & Services | 6.3% |
Telecommunication Services | 24.9% |
Investments Purchased with Proceeds from Securities Lending | 6.3% |
Liabilities in Excess of Other Assets | -6.1% |
Total | 100.0% |
(a) | The Fund may classify a company in a different category than the Pacer Data & Infrastructure Real Estate Index. |
Pacer CFRA-Stovall Equal Weight Seasonal Rotation ETF
Industry(a) | Percentage of
Net Assets |
Consumer Staples Distribution & Retail | 9.8% |
Food Beverage & Tobacco | 31.1% |
Health Care Equipment & Services | 28.7% |
Household & Personal Products | 9.4% |
Pharmaceuticals Biotechnology & Life Sciences | 21.7% |
Investments Purchased with Proceeds from Securities Lending | 18.8% |
Liabilities in Excess of Other Assets | -19.5% |
Total | 100.0% |
(a) | The Fund may classify a company in a different category than the Pacer CFRA-Stovall Equal Weight Seasonal Rotation Index. |
Pacer CSOP FTSE China A50 ETF
Industry(a) | Percentage of
Net Assets |
Automobiles & Components | 3.2% |
Banks | 21.6% |
Capital Goods | 8.9% |
Consumer Discretionary Distribution & Retail | 1.0% |
Consumer Durables & Apparel | 2.4% |
Energy | 6.7% |
Financial Services | 3.7% |
Food Beverage & Tobacco | 26.8% |
Health Care Equipment & Services | 2.5% |
Insurance | 4.6% |
Materials | 4.3% |
Pharmaceuticals Biotechnology & Life Sciences | 2.0% |
Semiconductors & Semiconductor Equipment | 1.3% |
Technology Hardware & Equipment | 3.5% |
Transportation | 2.2% |
Utilities | 4.5% |
Other Assets in Excess of Liabilities | 0.8% |
Total | 100.0% |
(a) | The Fund may classify a company in a different category than the FTSE China A50 Net Total Return Index. |
31
Pacer Funds
PORTFOLIO ALLOCATION (Unaudited) (Continued)
As of April 30, 2024
Pacer BioThreat Strategy ETF
Industry(a) | Percentage of
Net Assets |
Capital Goods | 3.0% |
Commercial & Professional Services | 1.6% |
Consumer Discretionary Distribution & Retail | 14.1% |
Consumer Staples Distribution & Retail | 7.1% |
Food Beverage & Tobacco | 1.2% |
Health Care Equipment & Services | 9.1% |
Household & Personal Products | 4.6% |
Materials | 2.3% |
Media & Entertainment | 5.3% |
Pharmaceuticals Biotechnology & Life Sciences | 40.1% |
Semiconductors & Semiconductor Equipment | 7.9% |
Software & Services | 2.9% |
Technology Hardware & Equipment | 0.6% |
Investments Purchased with Proceeds from Securities Lending | 13.9% |
Liabilities in Excess of Other Assets | -13.7% |
Total | 100.0% |
(a) | The Fund may classify a company in a different category than the BioShares BioThreat Index. |
Pacer Lunt Large Cap Alternator ETF
Industry(a) | Percentage of
Net Assets |
Banks | 1.0% |
Capital Goods | 6.9% |
Commercial & Professional Services | 6.2% |
Consumer Discretionary Distribution & Retail | 2.7% |
Consumer Services | 3.4% |
Consumer Staples Distribution & Retail | 4.3% |
Energy | 2.2% |
Equity Real Estate Investment Trusts (REITs) | 1.8% |
Financial Services | 8.1% |
Food Beverage & Tobacco | 14.2% |
Health Care Equipment & Services | 7.5% |
Household & Personal Products | 4.9% |
Insurance | 7.3% |
Materials | 2.0% |
Media & Entertainment | 0.8% |
Pharmaceuticals Biotechnology & Life Sciences | 3.7% |
Software & Services | 3.6% |
Technology Hardware & Equipment | 3.7% |
Telecommunication Services | 1.0% |
Transportation | 0.8% |
Utilities | 13.7% |
Investments Purchased with Proceeds from Securities Lending | 5.2% |
Liabilities in Excess of Other Assets | -5.0% |
Total | 100.0% |
(a) | The Fund may classify a company in a different category than the Lunt Capital U.S. Large Cap Equity Rotation Index. |
32
Pacer Funds
PORTFOLIO ALLOCATION (Unaudited) (Continued)
As of April 30, 2024
Pacer Lunt Midcap Multi-Factor Alternator ETF
Industry(a) | Percentage of
Net Assets |
Automobiles & Components | 0.5% |
Banks | 0.2% |
Capital Goods | 28.7% |
Commercial & Professional Services | 4.3% |
Consumer Discretionary Distribution & Retail | 4.5% |
Consumer Durables & Apparel | 6.2% |
Consumer Services | 3.9% |
Consumer Staples Distribution & Retail | 1.7% |
Energy | 6.0% |
Equity Real Estate Investment Trusts (REITs) | 0.5% |
Financial Services | 4.7% |
Food Beverage & Tobacco | 2.8% |
Health Care Equipment & Services | 2.5% |
Household & Personal Products | 1.9% |
Insurance | 5.4% |
Materials | 5.7% |
Media & Entertainment | 0.5% |
Pharmaceuticals Biotechnology & Life Sciences | 1.9% |
Semiconductors & Semiconductor Equipment | 2.5% |
Software & Services | 7.5% |
Technology Hardware & Equipment | 2.2% |
Transportation | 2.9% |
Utilities | 2.9% |
Investments Purchased with Proceeds from Securities Lending | 22.5% |
Liabilities in Excess of Other Assets | -22.4% |
Total | 100.0% |
(a) | The Fund may classify a company in a different category than the Lunt Capital U.S. MidCap Multi-Factor Rotation Index. |
Pacer Lunt Large Cap Multi-Factor Alternator ETF
Industry(a) | Percentage of
Net Assets |
Automobiles & Components | 2.3% |
Banks | 13.0% |
Capital Goods | 3.8% |
Commercial & Professional Services | 0.9% |
Consumer Discretionary Distribution & Retail | 5.1% |
Consumer Durables & Apparel | 1.6% |
Consumer Services | 1.1% |
Consumer Staples Distribution & Retail | 2.2% |
Energy | 9.1% |
Equity Real Estate Investment Trusts (REITs) | 0.1% |
Financial Services | 7.8% |
Food Beverage & Tobacco | 1.5% |
Health Care Equipment & Services | 5.9% |
Insurance | 2.1% |
Materials | 3.2% |
Media & Entertainment | 5.3% |
Pharmaceuticals Biotechnology & Life Sciences | 3.9% |
Semiconductors & Semiconductor Equipment | 10.7% |
33
Pacer Funds
PORTFOLIO ALLOCATION (Unaudited) (Continued)
As of April 30, 2024
Pacer Lunt Large Cap Multi-Factor Alternator ETF (Continued) | |
Industry(a) | Percentage of
Net Assets |
Software & Services | 9.9% |
Technology Hardware & Equipment | 5.8% |
Telecommunication Services | 1.7% |
Transportation | 2.0% |
Utilities | 0.8% |
Investments Purchased with Proceeds from Securities Lending | 3.1% |
Liabilities in Excess of Other Assets | -2.9% |
Total | 100.0% |
(a) | The Fund may classify a company in a different category than the Lunt Capital U.S. Large Cap Multi-Factor Rotation Index. |
Pacer US Export Leaders ETF
Industry(a) | Percentage of
Net Assets |
Automobiles & Components | 4.0% |
Capital Goods | 12.6% |
Commercial & Professional Services | 3.9% |
Consumer Discretionary Distribution & Retail | 0.9% |
Consumer Durables & Apparel | 4.2% |
Consumer Services | 3.1% |
Energy | 5.5% |
Equity Real Estate Investment Trusts (REITs) | 0.8% |
Food Beverage & Tobacco | 4.3% |
Health Care Equipment & Services | 0.9% |
Household & Personal Products | 0.9% |
Materials | 12.3% |
Media & Entertainment | 5.0% |
Pharmaceuticals Biotechnology & Life Sciences | 7.7% |
Semiconductors & Semiconductor Equipment | 14.5% |
Software & Services | 7.5% |
Technology Hardware & Equipment | 8.9% |
Transportation | 2.9% |
Investments Purchased with Proceeds from Securities Lending | 11.4% |
Liabilities in Excess of Other Assets | -11.3% |
Total | 100.0% |
(a) | The Fund may classify a company in a different category than the Pacer US Export Leaders Index. |
Pacer Pacific Asset Floating Rate High Income ETF
Industry(a) | Percentage of
Net Assets |
Bank Loans | 53.4% |
Collateralized Loan Obligations | 33.0% |
Corporate Bonds | 8.9% |
Exchange Traded Funds | 0.5% |
Closed End Funds | 0.0%* |
Other Assets in Excess of Liabilities | 4.2% |
Total | 100.0% |
(a) | The Fund may classify a company in a different category than the S&P LSTA U.S. Leverage Loan 100 Index. |
34
Pacer Funds
PORTFOLIO ALLOCATION (Unaudited) (Continued)
As of April 30, 2024
Pacer Data and Digital Revolution ETF
Industry(a) | Percentage of
Net Assets |
Capital Goods | 7.4% |
Semiconductors & Semiconductor Equipment | 36.9% |
Software & Services | 29.2% |
Technology Hardware & Equipment | 26.5% |
Other Assets in Excess of Liabilities | 0.0%* |
Total | 100.0% |
(a) | The Fund may classify a company in a different category than the Pacer Data Transmission and Communication Revolution Index. |
Pacer Industrials and Logistics ETF
Industry(a) | Percentage of
Net Assets |
Capital Goods | 8.0% |
Energy | 0.1% |
Pharmaceuticals Biotechnology & Life Sciences | 0.1% |
Software & Services | 10.4% |
Technology Hardware & Equipment | 1.9% |
Transportation | 76.9% |
Exchange Traded Funds | 2.3% |
Other Assets in Excess of Liabilities | 0.3% |
Total | 100.0% |
(a) | The Fund may classify a company in a different category than the Pacer Global Supply Chain Infrastructure Index. |
35
Pacer Trendpilot® US Large Cap ETF
PERFORMANCE SUMMARY
(Unaudited)
Growth of $10,000
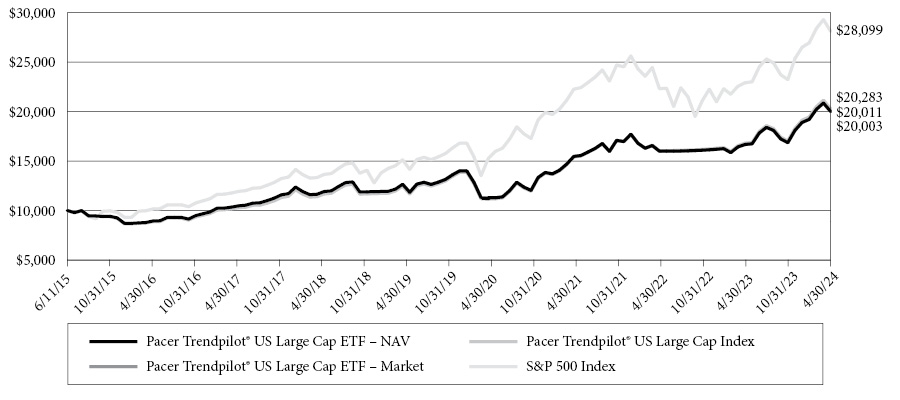
This chart illustrates the performance of a hypothetical $10,000 investment made on June 11, 2015, and is not intended to imply any future performance. The returns shown do not reflect the deduction of taxes that a shareholder would pay on fund distributions or the redemption of fund shares. The chart assumes reinvestment of capital gains and dividends.
The Pacer Trendpilot® US Large Cap Index uses an objective, rules-based methodology to implement a systematic trend-following strategy that directs exposure (i) 100% to the S&P 500 Total Return Index, (ii) 50% to the S&P 500 Total Return Index and 50% to 3-Month US Treasury bills, or (iii) 100% to 3-Month US Treasury bills, depending on the relative performance of the S&P 500 Total Return Index and its 200-business day historical simple moving average.
The S&P 500 Index consists of approximately 500 leading U.S.-listed companies.
Annualized Returns(1)
(For the Periods Ended April 30, 2024)
| | One Year | Three Year | Five Year | Since Inception(2) |
Pacer Trendpilot® US Large Cap ETF - NAV | 19.96% | 8.96% | 9.59% | 8.11% |
Pacer Trendpilot® US Large Cap ETF - Market | 20.09% | 8.98% | 9.59% | 8.12% |
Pacer Trendpilot® US Large Cap Index(3) | 20.68% | 9.61% | 10.23% | 8.76% |
S&P 500® Index(3) | 22.66% | 8.06% | 13.19% | 12.33% |
(1) | The performance data quoted is historical. Past performance is no guarantee of future results. Current performance may be higher or lower than the performance data quoted. The principal value and investment return of an investment will fluctuate so that investor’s shares, when redeemed, may be worth more or less than the original cost. The returns shown do not reflect the deduction of taxes that a shareholder would pay on Fund distributions or on redemptions of Fund shares. The total annual operating expenses as stated in the fee table to the Fund’s prospectus dated August 31, 2023, is 0.60%. For performance information current to the most recent month-end, please call 1-877-337-0500. |
(2) | Inception date is June 11, 2015. |
(3) | Indexes are unmanaged statistical composites and their returns do not include fees an investor would pay to purchase the securities they represent. Such costs would lower performance. It is not possible to invest directly in an index. |
36
Pacer Trendpilot® US Mid Cap ETF
PERFORMANCE SUMMARY
(Unaudited)
Growth of $10,000
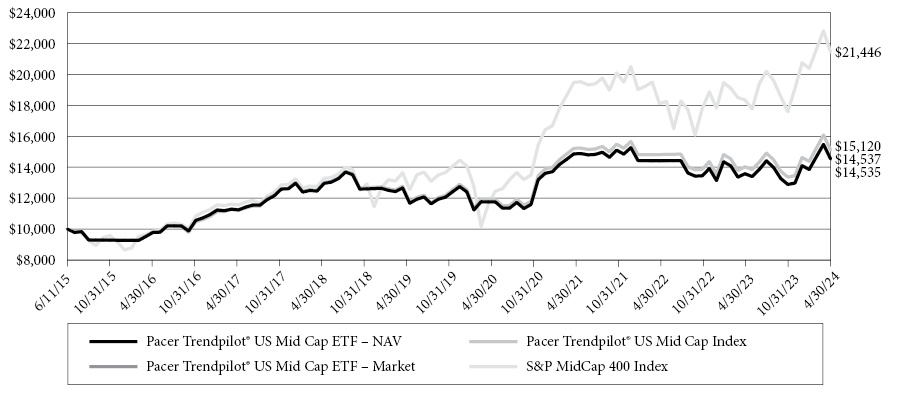
This chart illustrates the performance of a hypothetical $10,000 investment made on June 11, 2015, and is not intended to imply any future performance. The returns shown do not reflect the deduction of taxes that a shareholder would pay on fund distributions or the redemption of fund shares. The chart assumes reinvestment of capital gains and dividends.
The Pacer Trendpilot® US Mid Cap Index uses an objective, rules-based methodology to implement a systematic trend-following strategy that directs exposure (i) 100% to the S&P MidCap 400 Index, (ii) 50% to the S&P MidCap 400 Index and 50% to 3-Month US Treasury bills, or (iii) 100% to 3-Month US Treasury bills, depending on the relative performance of the S&P MidCap 400 Total Return Index and its 200-business day historical simple moving average.
The S&P Midcap 400 Index measures the performance of mid-capitalization stocks in the United States.
Annualized Returns(1)
(For the Periods Ended April 30, 2024)
| | One Year | Three Year | Five Year | Since Inception(2) |
Pacer Trendpilot® US Mid Cap ETF - NAV | 7.02% | -0.74% | 2.79% | 4.30% |
Pacer Trendpilot® US Mid Cap ETF - Market | 7.10% | -0.75% | 2.79% | 4.30% |
Pacer Trendpilot® US Mid Cap Index(3) | 7.77% | -0.22% | 3.43% | 4.94% |
S&P MidCap 400 Index(3) | 16.82% | 3.25% | 9.47% | 8.96% |
(1) | The performance data quoted is historical. Past performance is no guarantee of future results. Current performance may be higher or lower than the performance data quoted. The principal value and investment return of an investment will fluctuate so that investor’s shares, when redeemed, may be worth more or less than the original cost. The returns shown do not reflect the deduction of taxes that a shareholder would pay on Fund distributions or on redemptions of Fund shares. The total annual operating expenses as stated in the fee table to the Fund’s prospectus dated August 31, 2023, is 0.60%. For performance information current to the most recent month-end, please call 1-877-337-0500. |
(2) | Inception date is June 11, 2015. |
(3) | Indexes are unmanaged statistical composites and their returns do not include fees an investor would pay to purchase the securities they represent. Such costs would lower performance. It is not possible to invest directly in an index. |
37
Pacer Trendpilot® 100 ETF
PERFORMANCE SUMMARY
(Unaudited)
Growth of $10,000
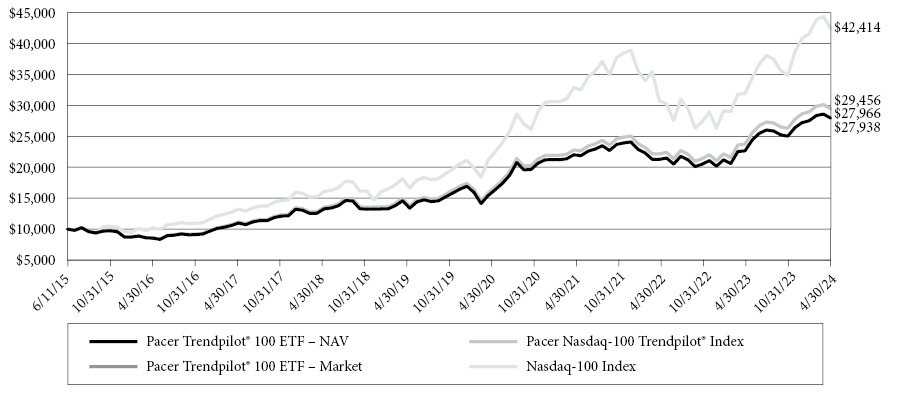
This chart illustrates the performance of a hypothetical $10,000 investment made on June 11, 2015, and is not intended to imply any future performance. The returns shown do not reflect the deduction of taxes that a shareholder would pay on fund distributions or the redemption of fund shares. The chart assumes reinvestment of capital gains and dividends.
Pacer NASDAQ-100 Trendpilot® Index uses an objective, rules-based methodology to implement a systematic trend-following strategy that directs exposure (i) 100% to the NASDAQ-100 Index, (ii) 50% to the NASDAQ-100 Index and 50% to 3-Month US Treasury bills, or (iii) 100% to 3-Month US Treasury bills, depending on the relative performance of the NASDAQ-100 Index and its 200-business day historical simple moving average.
The NASDAQ-100 Index includes approximately 100 of the largest non-financial securities listed on The NASDAQ Stock Market based on market capitalization. The NASDAQ-100 Index comprises securities of companies across major industry groups, including computer, biotechnology, healthcare, telecommunications and transportation. The NASDAQ-100 Index was developed by NASDAQ OMX. There is no minimum market capitalization requirement for inclusion in the NASDAQ-100 Index. Inclusion is determined based on the top 100 largest issuers based on market capitalization meeting all other eligibility requirements.
Annualized Returns(1)
(For the Periods Ended April 30, 2024)
| | One Year | Three Year | Five Year | Since Inception(2) |
Pacer Trendpilot® 100 ETF - NAV | 23.36% | 8.26% | 13.88% | 12.25% |
Pacer Trendpilot® 100 ETF - Market | 23.72% | 8.28% | 13.89% | 12.27% |
Pacer NASDAQ-100 Trendpilot® Index(3) | 24.13% | 8.93% | 14.53% | 12.92% |
NASDAQ-100 Index(3) | 32.77% | 8.84% | 18.53% | 17.65% |
(1) | The performance data quoted is historical. Past performance is no guarantee of future results. Current performance may be higher or lower than the performance data quoted. The principal value and investment return of an investment will fluctuate so that investor’s shares, when redeemed, may be worth more or less than the original cost. The returns shown do not reflect the deduction of taxes that a shareholder would pay on Fund distributions or on redemptions of Fund shares. The total annual operating expenses as stated in the fee table to the Fund’s prospectus August 31, 2023, is 0.65%. For performance information current to the most recent month-end, please call 1-877-337-0500. |
(2) | Inception date is June 11, 2015. |
(3) | Indexes are unmanaged statistical composites and their returns do not include fees an investor would pay to purchase the securities they represent. Such costs would lower performance. It is not possible to invest directly in an index. |
38
Pacer Trendpilot® European Index ETF
PERFORMANCE SUMMARY
(Unaudited)
Growth of $10,000
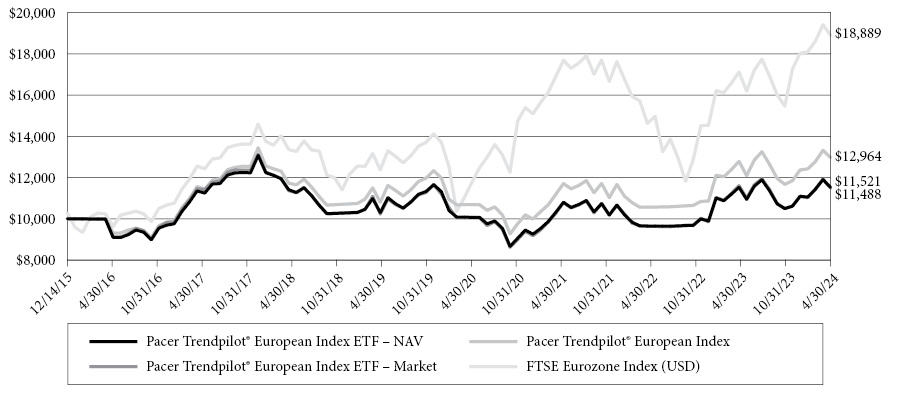
This chart illustrates the performance of a hypothetical $10,000 investment made on December 14, 2015, and is not intended to imply any future performance. The returns shown do not reflect the deduction of taxes that a shareholder would pay on fund distributions or the redemption of fund shares. The chart assumes reinvestment of capital gains and dividends.
The Pacer Trendpilot® European Index uses an objective, rules-based methodology to implement a systematic trend-following strategy that directs exposure (i) 100% to the FTSE Eurozone Index, (ii) 50% to the FTSE Eurozone Index and 50% to 3-Month US Treasury bills, or (iii) 100% to 3-Month US Treasury bills, depending on the relative performance of the FTSE Eurozone Total Return Index and its 200-business day historical simple moving average.
The FTSE Eurozone Index is a rules-based, float-adjusted, market capitalization-weighted index comprised of large- and mid-capitalization stocks providing coverage of the developed markets in the euro zone, including primarily France, Germany, Spain, the Netherlands, and Italy. The FTSE Eurozone Index is a subset of the FTSE Global Equity Index Series, which covers 99% of the investable market capitalization globally.
Annualized Returns(1)
(For the Periods Ended April 30, 2024)
| | One Year | Three Year | Five Year | Since Inception(2) |
Pacer Trendpilot® European Index ETF - NAV | -0.02% | 3.75% | 0.98% | 1.70% |
Pacer Trendpilot® European Index ETF - Market | -1.01% | 3.80% | 0.72% | 1.67% |
Pacer Trendpilot® European Index(3) | 1.40% | 5.03% | 2.43% | 3.15% |
FTSE Eurozone Index(3) | 10.33% | 3.76% | 7.48% | 7.88% |
(1) | The performance data quoted is historical. Past performance is no guarantee of future results. Current performance may be higher or lower than the performance data quoted. The principal value and investment return of an investment will fluctuate so that investor’s shares, when redeemed, may be worth more or less than the original cost. The returns shown do not reflect the deduction of taxes that a shareholder would pay on Fund distributions or on redemptions of Fund shares. The total annual operating expenses as stated in the fee table to the Fund’s prospectus dated August 31, 2023, is 0.65%. For performance information current to the most recent month-end, please call 1-877-337-0500. |
(2) | Inception date is December 14, 2015. |
(3) | Indexes are unmanaged statistical composites and their returns do not include fees an investor would pay to purchase the securities they represent. Such costs would lower performance. It is not possible to invest directly in an index. |
39
Pacer Trendpilot® International ETF
PERFORMANCE SUMMARY
(Unaudited)
Growth of $10,000
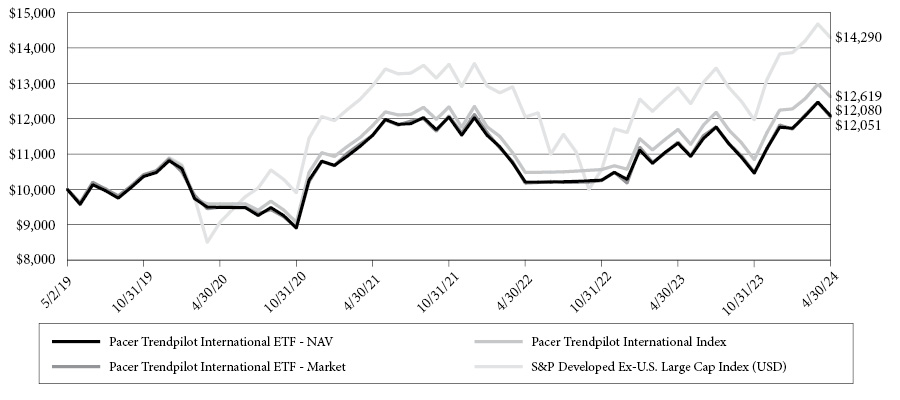
This chart illustrates the performance of a hypothetical $10,000 investment made on May 2, 2019, and is not intended to imply any future performance. The returns shown do not reflect the deduction of taxes that a shareholder would pay on fund distributions or the redemption of fund shares. The chart assumes reinvestment of capital gains and dividends.
The Pacer Trendpilot International Index uses an objective, rules-based methodology to implement a systematic trend-following strategy that directs exposure (i) 100% to the S&P Developed Ex-U.S. LargeCap Index, (ii) 50% to the S&P Developed Ex-U.S. LargeCap Index and 50% to 3-Month US Treasury bills, or (iii) 100% to 3-Month US Treasury bills, depending on the relative performance of the S&P Developed Ex-U.S. LargeCap Index and its 200-business day historical simple moving average (the “200-day moving average”).
The S&P Developed Ex-US LargeCap Index is a rules-based, float-adjusted, market capitalization-weighted index comprised of large-capitalization stocks providing coverage of the developed markets excluding the United States.
Annualized Returns(1)
(For the Periods Ended April 30, 2024)
| | One Year | Three Year | Since Inception(2) |
Pacer Trendpilot International ETF - NAV | 6.85% | 1.57% | 3.85% |
Pacer Trendpilot International ETF - Market | 6.31% | 1.49% | 3.80% |
Pacer Trendpilot International Index | 7.91% | 2.25% | 4.76% |
S&P Developed Ex-US Large Cap Index(3) | 10.97% | 3.39% | 7.40% |
(1) | The performance data quoted is historical. Past performance is no guarantee of future results. Current performance may be higher or lower than the performance data quoted. The principal value and investment return of an investment will fluctuate so that investor’s shares, when redeemed, may be worth more or less than the original cost. The returns shown do not reflect the deduction of taxes that a shareholder would pay on Fund distributions or on redemptions of Fund shares. The total annual operating expenses as stated in the fee table to the Fund’s prospectus dated August 31, 2023, is 0.66%. For performance information current to the most recent month-end, please call 1-877-337-0500. |
(2) | Inception date is May 2, 2019. |
(3) | Indexes are unmanaged statistical composites and their returns do not include fees an investor would pay to purchase the securities they represent. Such costs would lower performance. It is not possible to invest directly in an index. |
40
Pacer Trendpilot® US Bond ETF
PERFORMANCE SUMMARY
(Unaudited)
Growth of $10,000
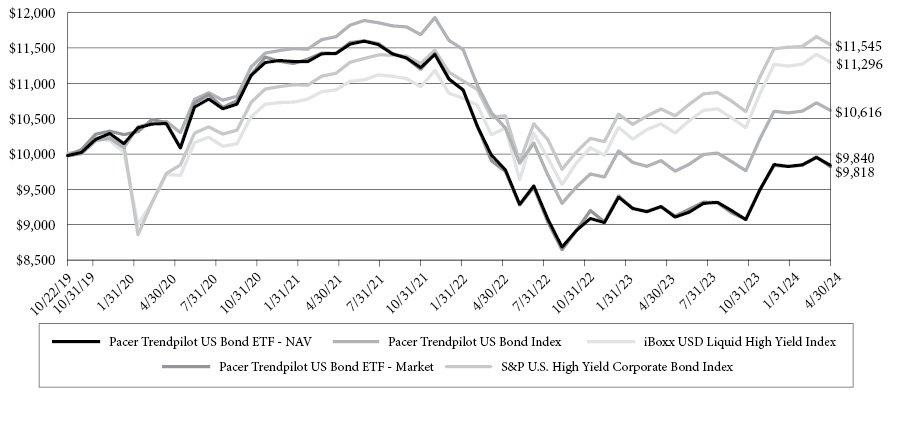
This chart illustrates the performance of a hypothetical $10,000 investment made on October 22, 2019, and is not intended to imply any future performance. The returns shown do not reflect the deduction of taxes that a shareholder would pay on fund distributions or the redemption of fund shares. The chart assumes reinvestment of capital gains and dividends.
The Pacer Trendpilot US Bond Index uses an objective, rules-based methodology to implement a systematic trend-following strategy that directs exposure to one of the following positions: (i) 100% to the iBoxx® USD Liquid High Yield Index, (ii) 50% to the iBoxx USD Liquid High Yield Index and 50% to the iBoxx® USD Treasuries 7-10 Year Index or (iii) 100% to iBoxx USD Treasuries 7-10 Year Index
The iBoxx USD Liquid High Yield Index is designed to track the performance of liquid U.S. dollar-denominated high yield bonds, selected to provide a balanced representation of the U.S. dollar high yield corporate bond universe. The iBoxx USD Treasuries 7-10 Year Index is designed to measure the performance of U.S. Treasury bonds maturing in 7 to 10 years.
Annualized Returns(1)
(For the Periods Ended April 30, 2024)
| | One Year | Three Year | Since Inception(2) |
Pacer Trendpilot US Bond ETF - NAV | 6.30% | -4.84% | -0.36% |
Pacer Trendpilot US Bond ETF - Market | 6.07% | -4.94% | -0.41% |
Pacer Trendpilot US Bond Index(3) | 7.16% | -2.96% | 1.33% |
iBoxx USD Liquid High Yield Index(3) | 8.32% | 1.25% | 2.73% |
S&P U.S. High Yield Corporate Bond IndexTM(3) | 8.51% | 1.32% | 3.23% |
(1) | The performance data quoted is historical. Past performance is no guarantee of future results. Current performance may be higher or lower than the performance data quoted. The principal value and investment return of an investment will fluctuate so that investor’s shares, when redeemed, may be worth more or less than the original cost. The returns shown do not reflect the deduction of taxes that a shareholder would pay on Fund distributions or on redemptions of Fund shares. The total annual operating expenses as stated in the fee table to the Fund’s prospectus dated August 31, 2023, is 0.60%. For performance information current to the most recent month-end, please call 1-877-337-0500. |
(2) | Inception date is October 22, 2019. |
(3) | Indexes are unmanaged statistical composites and their returns do not include fees an investor would pay to purchase the securities they represent. Such costs would lower performance. It is not possible to invest directly in an index. |
41
Pacer Trendpilot® Fund of Funds ETF
PERFORMANCE SUMMARY
(Unaudited)
Growth of $10,000
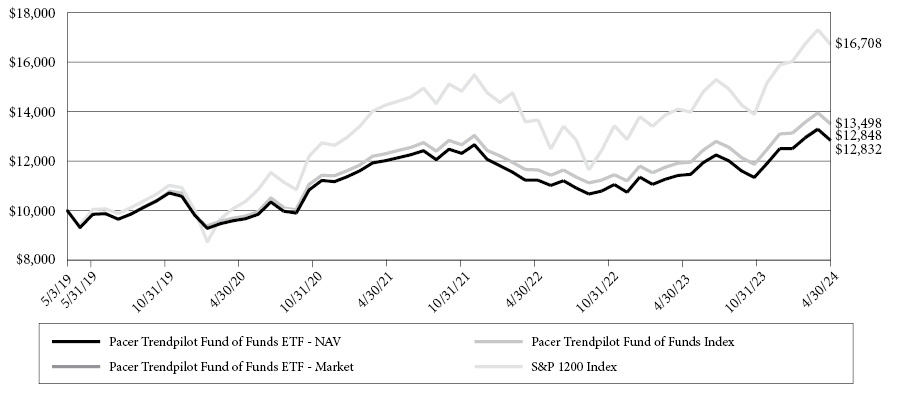
This chart illustrates the performance of a hypothetical $10,000 investment made on May 3, 2019, and is not intended to imply any future performance. The returns shown do not reflect the deduction of taxes that a shareholder would pay on fund distributions or the redemption of fund shares. The chart assumes reinvestment of capital gains and dividends.
The Pacer Trendpilot Fund of Funds Index uses an objective, rules-based approach to construct a portfolio that, as of each quarterly rebalance, is composed of the ETFs listed in the following table, each advised by Pacer Advisors, Inc. (collectively, the “Trendpilot ETFs”). Each of the Trendpilot ETFs is an index-based ETF that seeks to track the total return performance, before fees and expenses, of the underlying index listed in the following table (collectively, the “Trendpilot Indexes”). Each Trendpilot Index other than the Pacer Trendpilot US Bond Index (collectively, the “Trendpilot Equity Indexes”) uses an objective, rules-based methodology to implement a systematic trend-following strategy that directs exposure (i) 100% to the “Underlying Component” specified in the table below, (ii) 50% to the applicable Underlying Component and 50% to 3-Month US Treasury bills, or (iii) 100% to 3-Month US Treasury bills, depending on the relative performance of the Underlying Component and its 200 business day historical simple moving average (the “200-day moving average”). The calculation of the 200-day moving average for each Underlying Component is based on the total return version of such Underlying Component and reflects the reinvestment of dividends paid by the securities in such Underlying Component. The Pacer Trendpilot US Bond Index (the “Trendpilot Bond Index”) uses an objective, rules-based methodology to implement a systematic trend-following strategy that directs exposure to one of the following positions: (i) 100% to the iBoxx® USD Liquid High Yield Index, (ii) 50% to the iBoxx USD Liquid High Yield Index and 50% to the iBoxx USD Treasuries 7-10 Year Index or (iii) 100% to iBoxx® USD Treasuries 7-10 Year Index, depending on the value of the iBoxx USD Liquid High Yield Index divided by the value of the iBoxx USD Treasuries 7-10 Year Index (the “Risk Ratio”).
Weight | Trendpilot ETF | Trendpilot Index | Equity Component |
20% | Pacer Trendpilot® US Large Cap ETF | Pacer Trendpilot® US Large Cap Index | S&P 500® Index |
20% | Pacer Trendpilot® US Mid Cap ETF | Pacer Trendpilot® US Mid Cap Index | S&P MidCap 400® Index |
20% | Pacer Trendpilot® 100 ETF | Pacer NASDAQ-100 Trendpilot® Index | NASDAQ-100® Index |
20% | Pacer Trendpilot® International ETF | Pacer Trendpilot® International Index | S&P Developed Ex-US Large Cap Index |
20% | Pacer Trendpilot® US Bond ETF | Pacer Trendpilot® US Bond Index | iBoxx USD Liquid High Yield Index |
The S&P 1200 Index captures approximately 70% of global market capitalization.
42
Pacer Trendpilot® Fund of Funds ETF
PERFORMANCE SUMMARY (Continued)
(Unaudited)
Annualized Returns(1)
(For the Periods Ended April 30, 2024)
| | One Year | Three Year | Since Inception(2) |
Pacer Trendpilot Fund of Funds ETF - NAV | 12.39% | 2.47% | 5.12% |
Pacer Trendpilot Fund of Funds ETF - Market | 12.53% | 2.51% | 5.15% |
Pacer Trendpilot Fund of Funds Index(3) | 13.30% | 3.44% | 6.19% |
S&P 1200 Index(3) | 18.45% | 6.03% | 10.82% |
(1) | The performance data quoted is historical. Past performance is no guarantee of future results. Current performance may be higher or lower than the performance data quoted. The principal value and investment return of an investment will fluctuate so that investor’s shares, when redeemed, may be worth more or less than the original cost. The returns shown do not reflect the deduction of taxes that a shareholder would pay on Fund distributions or on redemptions of Fund shares. The total annual operating expenses as stated in the fee table to the Fund’s prospectus dated August 31, 2023, is 0.77%. For performance information current to the most recent month-end, please call 1-877-337-0500. |
(2) | Inception date is May 3, 2019. |
(3) | Indexes are unmanaged statistical composites and their returns do not include fees an investor would pay to purchase the securities they represent. Such costs would lower performance. It is not possible to invest directly in an index. |
43
Pacer US Cash Cows 100 ETF
PERFORMANCE SUMMARY
(Unaudited)
Growth of $10,000
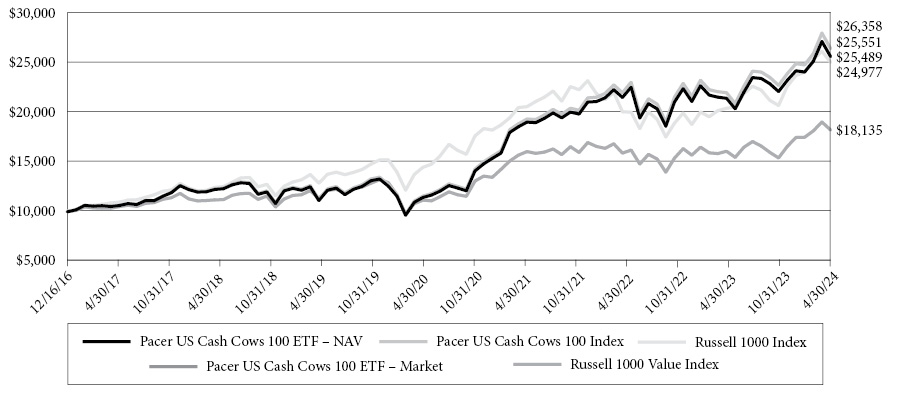
This chart illustrates the performance of a hypothetical $10,000 investment made on December 16, 2016, and is not intended to imply any future performance. The returns shown do not reflect the deduction of taxes that a shareholder would pay on fund distributions or the redemption of fund shares. The chart assumes reinvestment of capital gains and dividends.
The Pacer US Cash Cows 100 Index uses an objective, rules-based methodology to provide exposure to large and mid-capitalization U.S. companies with high free cash flow yields. Companies with high free cash flow yields are commonly referred to as “cash cows.” The initial index universe is derived from the component companies of the Russell 1000® Index. The initial universe of companies is screened based on their average projected free cash flows and earnings (if available) over each of the next two fiscal years. Companies with no forward year estimates available for free cash flows or earnings will remain in the Index universe. Companies with negative average projected free cash flows or earnings are removed from the Index universe. Additionally, financial companies, other than real estate investment trusts, are excluded from the Index universe. The remaining companies are ranked by their free cash flow yield for the trailing twelve month period. The equity securities of the 100 companies with the highest free cash flow yield are included in the Index.
The Russell 1000 Index is a market-capitalization weighted index representing the top 1,000 large-cap stocks in the Russell 3000 Index.
Annualized Returns(1)
(For the Periods Ended April 30, 2024)
| | One Year | Three Year | Five Year | Since Inception(2) |
Pacer US Cash Cows 100 ETF - NAV | 19.70% | 11.45% | 15.56% | 13.57% |
Pacer US Cash Cows 100 ETF - Market | 19.68% | 11.41% | 15.47% | 13.54% |
Pacer US Cash Cows 100 Index(3) | 20.34% | 12.01% | 16.04% | 14.05% |
Russell 1000® Index(3) | 22.82% | 6.98% | 12.87% | 13.22% |
Russell 1000® Value Index(3) | 13.37% | 5.16% | 8.58% | 8.41% |
(1) | The performance data quoted is historical. Past performance is no guarantee of future results. Current performance may be higher or lower than the performance data quoted. The principal value and investment return of an investment will fluctuate so that investor’s shares, when redeemed, may be worth more or less than the original cost. The returns shown do not reflect the deduction of taxes that a shareholder would pay on Fund distributions or on redemptions of Fund shares. The total annual operating expenses as stated in the fee table to the Fund’s prospectus dated August 31, 2023, is 0.49%. For performance information current to the most recent month-end, please call 1-877-337-0500. |
(2) | Inception date is December 16, 2016. |
(3) | Indexes are unmanaged statistical composites and their returns do not include fees an investor would pay to purchase the securities they represent. Such costs would lower performance. It is not possible to invest directly in an index. |
44
Pacer US Small Cap Cash Cows 100 ETF
PERFORMANCE SUMMARY
(Unaudited)
Growth of $10,000
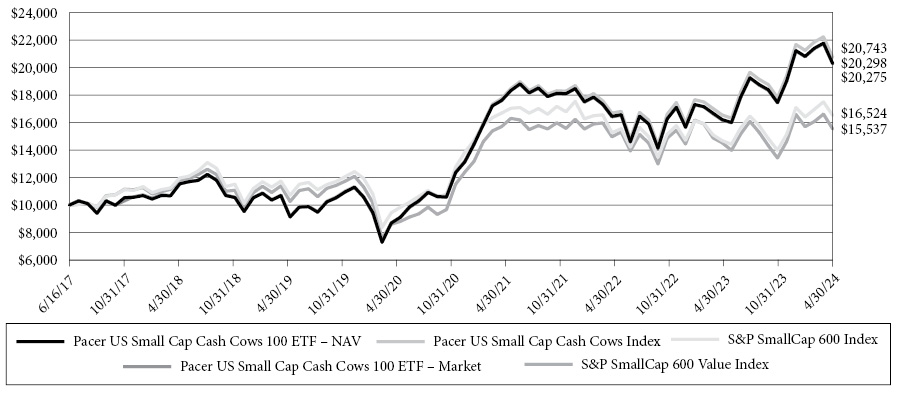
This chart illustrates the performance of a hypothetical $10,000 investment made on June 16, 2017, and is not intended to imply any future performance. The returns shown do not reflect the deduction of taxes that a shareholder would pay on fund distributions or the redemption of fund shares. The chart assumes reinvestment of capital gains and dividends.
The Pacer US Small Cap Cash Cows Index uses an objective, rules-based methodology to provide exposure to small-capitalization U.S. companies with high free cash flow yields. Companies with high free cash flow yields are commonly referred to as “cash cows.” The initial Index universe is derived from the component companies of the S&P Small Cap 600® Index. The initial universe of companies is screened based on their average projected free cash flows and earnings (if available) over each of the next two fiscal years. Companies for which information on their projected free cash flows or earnings is not available will remain in the Index universe. Companies with negative average projected free cash flows or earnings are removed from the Index universe. Additionally, financial companies, other than real estate investment trusts, are excluded from the Index universe. The remaining companies are ranked by their free cash flow yield for the trailing twelve month period. The equity securities of the 100 companies with the highest free cash flow yield are included in the Index.
The S&P SmallCap 600® Index seeks to measure the small-cap segment of the U.S. equity market.
Annualized Returns(1)
(For the Periods Ended April 30, 2024)
| | One Year | Three Year | Five Year | Since Inception(2) |
Pacer US Small Cap Cash Cows 100 ETF - NAV | 25.18% | 4.84% | 13.68% | 10.85% |
Pacer US Small Cap Cash Cows 100 ETF - Market | 25.36% | 4.86% | 13.65% | 10.83% |
Pacer US Small Cap Cash Cows Index(3) | 25.37% | 5.35% | 14.09% | 11.20% |
S&P SmallCap 600® Index(3) | 12.55% | -0.34% | 7.08% | 7.58% |
S&P SmallCap 600® Value Index(3) | 6.95% | -0.36% | 6.40% | 6.62% |
(1) | The performance data quoted is historical. Past performance is no guarantee of future results. Current performance may be higher or lower than the performance data quoted. The principal value and investment return of an investment will fluctuate so that investor’s shares, when redeemed, may be worth more or less than the original cost. The returns shown do not reflect the deduction of taxes that a shareholder would pay on Fund distributions or on redemptions of Fund shares. The total annual operating expenses as stated in the fee table to the Fund’s prospectus dated August 31, 2023, is 0.59%. For performance information current to the most recent month-end, please call 1-877-337-0500. |
(2) | Inception date is June 16, 2017. |
(3) | Indexes are unmanaged statistical composites and their returns do not include fees an investor would pay to purchase the securities they represent. Such costs would lower performance. It is not possible to invest directly in an index. |
45
Pacer Global Cash Cows Dividend ETF
PERFORMANCE SUMMARY
(Unaudited)
Growth of $10,000
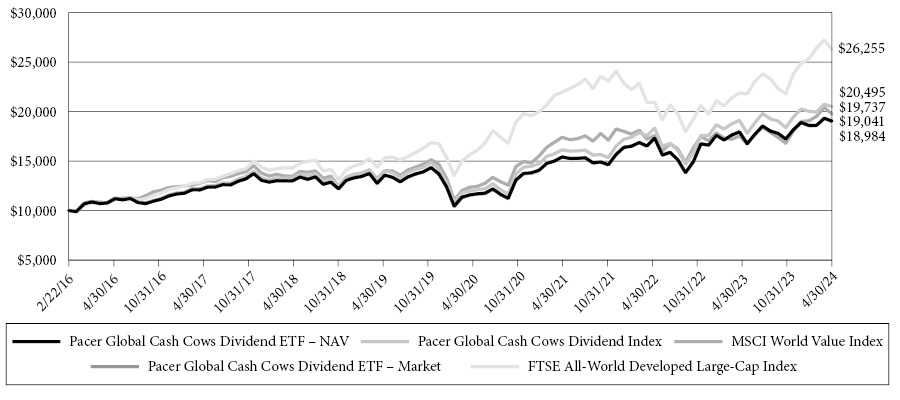
This chart illustrates the performance of a hypothetical $10,000 investment made on February 22, 2016, and is not intended to imply any future performance. The returns shown do not reflect the deduction of taxes that a shareholder would pay on fund distributions or the redemption of fund shares. The chart assumes reinvestment of capital gains and dividends.
The Pacer Global Cash Cows Dividend Index uses an objective, rules-based methodology to provide exposure to global companies with high dividend yield backed by a high free cash flow yield. The initial index universe is derived from the component companies of the FTSE All-World Developed Large Cap Index. The initial universe of companies is screened based on their average projected free cash flows and earnings (if available) over each of the next two fiscal years. Companies with negative average projected free cash flows or earnings are removed from the Index universe. Additionally, financial companies, other than real estate investment trusts, are excluded from the Index universe. The remaining companies are ranked by their free cash flow yield for the trailing twelve month period. The 300 companies with the highest free cash flow yield are then ranked by their dividend yield. The equity securities of the 100 companies with the highest dividend yield are included in the Index.
The FTSE All-World Developed Large-Cap Index is a market-capitalization weighted index representing the performance of large-cap stocks in developed markets.
Annualized Returns(1)
(For the Periods Ended April 30, 2024)
| | One Year | Three Year | Five Year | Since Inception(2) |
Pacer Global Cash Cows Dividend ETF - NAV | 6.17% | 8.29% | 6.75% | 8.18% |
Pacer Global Cash Cows Dividend ETF - Market | 5.56% | 8.19% | 6.65% | 8.15% |
Pacer Global Cash Cows Dividend Index(3) | 7.19% | 9.22% | 7.74% | 9.16% |
FTSE All-World Developed Large-Cap Index(3) | 20.05% | 6.66% | 11.48% | 12.51% |
MSCI World Value Index(3) | 12.54% | 5.30% | 6.97% | 8.65% |
(1) | The performance data quoted is historical. Past performance is no guarantee of future results. Current performance may be higher or lower than the performance data quoted. The principal value and investment return of an investment will fluctuate so that investor’s shares, when redeemed, may be worth more or less than the original cost. The returns shown do not reflect the deduction of taxes that a shareholder would pay on Fund distributions or on redemptions of Fund shares. The total annual operating expenses as stated in the fee table to the Fund’s prospectus dated August 31, 2023, is 0.60%. For performance information current to the most recent month-end, please call 1-877-337-0500. |
(2) | Inception date is February 22, 2016. |
(3) | Indexes are unmanaged statistical composites and their returns do not include fees an investor would pay to purchase the securities they represent. Such costs would lower performance. It is not possible to invest directly in an index. |
46
Pacer Developed Markets International Cash Cows 100 ETF
PERFORMANCE SUMMARY
(Unaudited)
Growth of $10,000
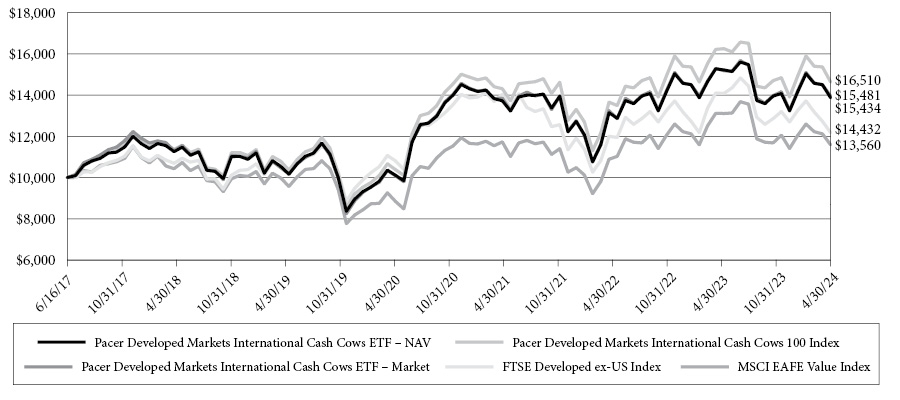
This chart illustrates the performance of a hypothetical $10,000 investment made on June 16, 2017, and is not intended to imply any future performance. The returns shown do not reflect the deduction of taxes that a shareholder would pay on fund distributions or the redemption of fund shares. The chart assumes reinvestment of capital gains and dividends.
The Pacer Developed Markets International Cash Cows 100 Index uses an objective, rules-based methodology to provide exposure to large and mid-capitalization non-U.S. companies in developed markets with high free cash flow yields. Companies with high free cash flow yields are commonly referred to as “cash cows”. The initial index universe is derived from the component companies of the FTSE Developed ex US Index. The initial universe of companies is screened based on their average projected free cash flows and earnings over each of the next two fiscal years (if available). Companies with no forward year estimates available for free cash flows or earnings will remain in the Index universe. Companies with negative average projected free cash flows or earnings are removed from the Index universe. Additionally, financial companies, other than real estate investment trusts, and companies with a market capitalization of less than $3 billion are excluded from the Index universe. The remaining companies are ranked by their average daily trading value (“ADTV”) for the prior three months. The 500 companies with the highest ADTV are then ranked by their free cash flow yield for the trailing twelve month period. The equity securities of the 100 companies with the highest free cash flow yield are included in the Index.
The FTSE Developed ex-US Index is comprised of Large (85%) and Mid (15%) cap stocks providing coverage of Developed markets (24 countries) excluding the US.
Annualized Returns(1)
(For the Periods Ended April 30, 2024)
| | One Year | Three Year | Five Year | Since Inception(2) |
Pacer Developed Markets International Cash Cows 100 ETF - NAV | 10.00% | 3.42% | 6.70% | 6.57% |
Pacer Developed Markets International Cash Cows 100 ETF - Market | 9.03% | 3.22% | 6.49% | 6.52% |
Pacer Developed Markets International Cash Cows 100 Index(3) | 11.26% | 4.32% | 7.77% | 7.57% |
FTSE Developed ex-US Index(3) | 9.31% | 2.15% | 6.23% | 5.48% |
MSCI EAFE Value Index(3) | 12.44% | 5.55% | 5.67% | 4.53% |
(1) | The performance data quoted is historical. Past performance is no guarantee of future results. Current performance may be higher or lower than the performance data quoted. The principal value and investment return of an investment will fluctuate so that investor’s shares, when redeemed, may be worth more or less than the original cost. The returns shown do not reflect the deduction of taxes that a shareholder would pay on Fund distributions or on redemptions of Fund shares. The total annual operating expenses as stated in the fee table to the Fund’s prospectus dated August 31, 2023, is 0.65%. For performance information current to the most recent month-end, please call 1-877-337-0500. |
(2) | Inception date is June 16, 2017. |
(3) | Indexes are unmanaged statistical composites and their returns do not include fees an investor would pay to purchase the securities they represent. Such costs would lower performance. It is not possible to invest directly in an index. |
47
Pacer Emerging Markets Cash Cows 100 ETF
PERFORMANCE SUMMARY
(Unaudited)
Growth of $10,000
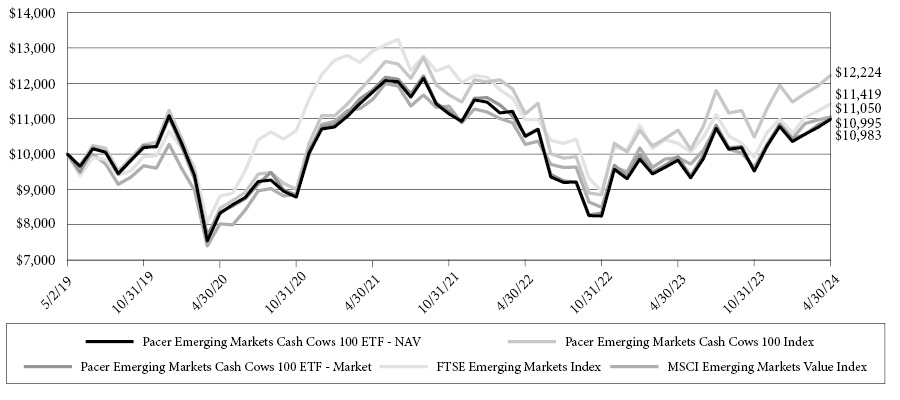
This chart illustrates the performance of a hypothetical $10,000 investment made on May 2, 2019, and is not intended to imply any future performance. The returns shown do not reflect the deduction of taxes that a shareholder would pay on fund distributions or the redemption of fund shares. The chart assumes reinvestment of capital gains and dividends.
The Pacer Emerging Markets Cash Cows 100 Index uses an objective, rules-based methodology to provide exposure to large and mid-capitalization companies in emerging markets with high free cash flow yields. Companies with high free cash flow yields are commonly referred to as “cash cows.” The initial index universe is derived from the component companies of the FTSE Emerging Markets Index. The Fund defines emerging markets countries as those countries included in the FTSE Emerging Markets Index. The initial universe of companies is screened based on their average projected free cash flows and earnings (if available) over each of the next two fiscal years. Companies with no forward year estimates available for free cash flows or earnings will remain in the Index universe. Companies with negative average projected free cash flows or earnings are removed from the Index universe. Additionally, financial companies, other than real estate investment trusts (“REITs”), companies with a market capitalization of less than $2 billion, and companies whose average daily trading value (“ADTV”) for the prior 90 days does not exceed $5 million are excluded from the Index universe. The remaining companies are ranked by their free cash flow yield for the trailing twelve-month period. The equity securities of the 100 companies with the highest free cash flow yield (the “Top 100 Companies”) are included in the Index.
The FTSE Emerging Markets Index is comprised of all the countries that make up the advanced emerging markets and secondary emerging markets within the FTSE Global Equity Index Series.
Annualized Returns(1)
(For the Periods Ended April 30, 2024)
| | One Year | Three Year | Since Inception(2) |
Pacer Emerging Markets Cash Cows 100 ETF - NAV | 11.79% | -2.23% | 1.89% |
Pacer Emerging Markets Cash Cows 100 ETF - Market | 10.80% | -2.35% | 1.92% |
Pacer Emerging Markets Cash Cows 100 Index(3) | 14.50% | 0.08% | 4.10% |
FTSE Emerging Markets Index(3) | 10.80% | -4.01% | 2.69% |
MSCI Emerging Markets Value Index(3) | 11.60% | -1.44% | 2.02% |
(1) | The performance data quoted is historical. Past performance is no guarantee of future results. Current performance may be higher or lower than the performance data quoted. The principal value and investment return of an investment will fluctuate so that investor’s shares, when redeemed, may be worth more or less than the original cost. The returns shown do not reflect the deduction of taxes that a shareholder would pay on Fund distributions or on redemptions of Fund shares. The total annual operating expenses as stated in the fee table to the Fund’s prospectus dated August 31, 2023, is 0.70%. For performance information current to the most recent month-end, please call 1-877-337-0500. |
(2) | Inception date is May 2, 2019. |
(3) | Indexes are unmanaged statistical composites and their returns do not include fees an investor would pay to purchase the securities they represent. Such costs would lower performance. It is not possible to invest directly in an index. |
48
Pacer US Large Cap Cash Cows Growth Leaders ETF
PERFORMANCE SUMMARY
(Unaudited)
Growth of $10,000
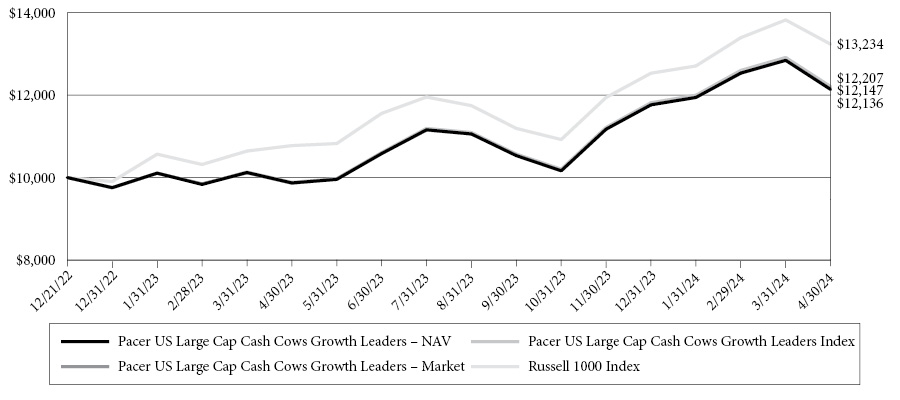
This chart illustrates the performance of a hypothetical $10,000 investment made on December 21, 2022, and is not intended to imply any future performance. The returns shown do not reflect the deduction of taxes that a shareholder would pay on fund distributions or the redemption of fund shares. The chart assumes reinvestment of capital gains and dividends.
The Pacer US Large Cap Cash Cows Growth Leaders Index is a rules-based methodology that seeks to provide exposure to large capitalization U.S. companies with above average free cash flow margins. Companies with above average free cash flow margins are commonly referred to as “cash cows.” The initial Index universe is typically derived from the component companies of the Russell 1000 Index®. The initial universe of companies is typically screened based on their average projected free cash flows and earnings (if available) over each of the next two fiscal years. Companies for which information on their projected free cash flows or earnings is not available will typically remain in the Index universe. A company’s projected free cash flows and earnings are typically determined by the Index Provider. Companies with negative average projected free cash flows or earnings are typically removed from the Index universe. Additionally, companies in the financial or real estate sectors are typically excluded from the Index universe. The remaining companies are typically ranked by their free cash flow margin (defined as a company’s free cash flow divided by sales) for the trailing twelve month period. The equity securities of the 100 companies with the highest free cash flow margin are typically included in the Index.
The Russell 1000 Index is a market-capitalization weighted index representing the top 1,000 large-cap stocks in the Russell 3000 Index.
Annualized Returns(1)
(For the Periods Ended April 30, 2024)
| | One Year | Since Inception(2) |
Pacer US Large Cap Cash Cows Growth Leaders - NAV | 22.96% | 15.35% |
Pacer US Large Cap Cash Cows Growth Leaders - Market | 23.14% | 15.42% |
Pacer US Large Cap Cash Cows Growth Leaders Index(3) | 23.49% | 15.84% |
Russell 1000 Index | 22.82% | 22.95% |
(1) | The performance data quoted is historical. Past performance is no guarantee of future results. Current performance may be higher or lower than the performance data quoted. The principal value and investment return of an investment will fluctuate so that investor’s shares, when redeemed, may be worth more or less than the original cost. The returns shown do not reflect the deduction of taxes that a shareholder would pay on Fund distributions or on redemptions of Fund shares. The total annual operating expenses as stated in the fee table to the Fund’s prospectus dated August 31, 2023 is 0.49%. For performance information current to the most recent month-end, please call 1-877-337-0500. |
(2) | Inception date is December 21, 2022. |
(3) | Indexes are unmanaged statistical composites and their returns do not include fees an investor would pay to purchase the securities they represent. Such costs would lower
performance. It is not possible to invest directly in an index. |
49
Pacer US Small Cap Cash Cows Growth Leaders ETF
PERFORMANCE SUMMARY
(Unaudited)
Growth of $10,000
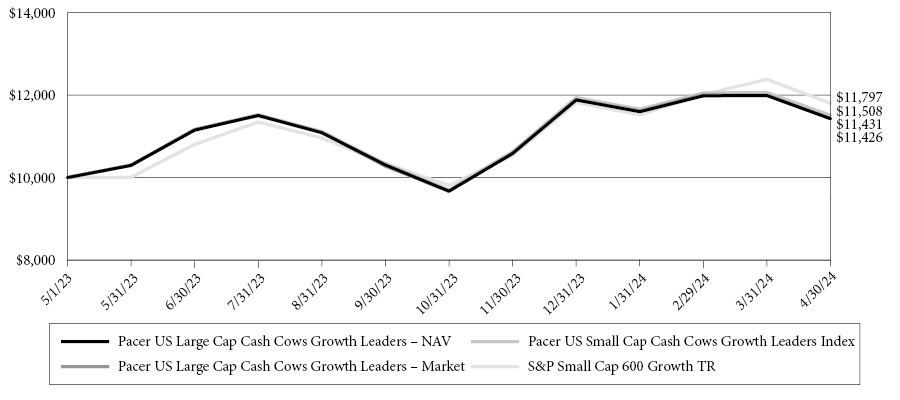
This chart illustrates the performance of a hypothetical $10,000 investment made on May 1, 2023, and is not intended to imply any future performance. The returns shown do not reflect the deduction of taxes that a shareholder would pay on fund distributions or the redemption of fund shares. The chart assumes reinvestment of capital gains and dividends.
The Pacer US Small Cap Cash Cows Growth Leaders Index is a rules-based methodology that seeks to provide exposure to small-capitalization U.S. companies with above average free cash flow margins. Companies with above average free cash flow margins are commonly referred to as “cash cows.” The Fund considers a company to be a small-capitalization at the time of purchase if it was included in the S&P SmallCap 600®Index (the “S&P SmallCap 600”) at any time within the prior six months. The initial Index universe is derived from the component companies of the S&P SmallCap 600. The initial universe of companies is screened based on their average projected free cash flows and earnings (if available) over each of the next two fiscal years. Companies for which information on their projected free cash flows or earnings is not available will remain in the Index universe. A company’s projected free cash flows and earnings are determined by the Index Provider. Companies with negative average projected free cash flows or earnings are removed from the Index universe. Additionally, companies in the financial or real estate sectors are excluded from the Index universe. The remaining companies are ranked by their free cash flow margin (defined as a company’s free cash flow divided by sales)
for the trailing twelve month period. The equity securities of the 100 companies with the highest free cash flow margin are included in the Index.
The S&P SmallCap 600® Index seeks to measure the small-cap segment of the U.S. equity market.
Cumulative Returns(1)
(For the Periods Ended April 30, 2024)
| | Since Inception(2) |
Pacer US Small Cap Cash Cows Growth Leaders - NAV | 14.26% |
Pacer US Small Cap Cash Cows Growth Leaders - Market | 14.31% |
Pacer US Small Cap Cash Cows Growth Leaders Total Return Index(3) | 15.08% |
S&P SmallCap 600 Growth TR | 17.97% |
(1) | The performance data quoted is historical. Past performance is no guarantee of future results. Current performance may be higher or lower than the performance data quoted. The principal value and investment return of an investment will fluctuate so that investor’s shares, when redeemed, may be worth more or less than the original cost. The returns shown do not reflect the deduction of taxes that a shareholder would pay on Fund distributions or on redemptions of Fund shares. The total annual operating expenses as stated in the fee table to the Fund’s prospectus dated April 4, 2023 is 0.59%. For performance information current to the most recent month-end, please call 1-877-337-0500. |
(2) | Inception date is May 1, 2023. |
(3) | Indexes are unmanaged statistical composites and their returns do not include fees an investor would pay to purchase the securities they represent. Such costs would lower
performance. It is not possible to invest directly in an index. |
50
Pacer US Cash Cows Growth ETF
PERFORMANCE SUMMARY
(Unaudited)
Growth of $10,000
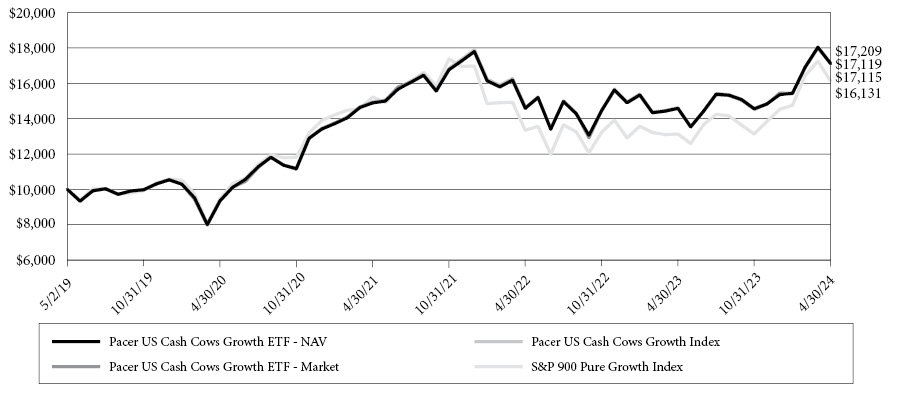
This chart illustrates the performance of a hypothetical $10,000 investment made on May 2, 2019, and is not intended to imply any future performance. The returns shown do not reflect the deduction of taxes that a shareholder would pay on fund distributions or the redemption of fund shares. The chart assumes reinvestment of capital gains and dividends.
The Pacer US Cash Cows Growth Index uses an objective, rules-based methodology to provide exposure to mid- and large-capitalization U.S. companies with high free cash flow yields. Companies with high free cash flow yields are commonly referred to as “cash cows”. The initial Index universe is derived from the component companies of the S&P 900® Pure Growth Index. The initial universe of companies is screened based on their average projected free cash flows and earnings (if available) over each of the next two fiscal years. Companies for which information on their projected free cash flows or earnings is not available will remain in the Index universe. Companies with negative average projected free cash flows or earnings are removed from the Index universe. Additionally, financial companies, other than real estate investment trusts, are excluded from the Index universe. The remaining companies are ranked by their free cash flow yield for the trailing twelve month period. The equity securities of the 50 companies with the highest free cash flow yield are included in the Index.
The S&P 900 Pure Growth Index is composed of companies found in the S&P 400 and S&P 500 Indices, including mid- and large-cap stocks based on growth potential with respect to sales, earnings relative to price, and momentum.
Annualized Returns(1)
(For the Periods Ended April 30, 2024)
| | One Year | Three Year | Since Inception(2) |
Pacer US Cash Cows Growth ETF - NAV | 17.34% | 4.75% | 11.35% |
Pacer US Cash Cows Growth ETF - Market | 17.44% | 4.72% | 11.36% |
Pacer US Cash Cows Growth Index(3) | 17.31% | 4.80% | 11.47% |
S&P 900 Pure Growth Index(3) | 22.79% | 1.93% | 10.04% |
(1) | The performance data quoted is historical. Past performance is no guarantee of future results. Current performance may be higher or lower than the performance data quoted. The principal value and investment return of an investment will fluctuate so that investor’s shares, when redeemed, may be worth more or less than the original cost. The returns shown do not reflect the deduction of taxes that a shareholder would pay on Fund distributions or on redemptions of Fund shares. The total annual operating expenses as stated in the fee table to the Fund’s prospectus dated August 31, 2023, is 0.60%. For performance information current to the most recent month-end, please call 1-877-337-0500. |
(2) | Inception date is May 2, 2019. |
(3) | Indexes are unmanaged statistical composites and their returns do not include fees an investor would pay to purchase the securities they represent. Such costs would lower performance. It is not possible to invest directly in an index. |
51
Pacer Cash Cows Fund of Funds ETF
PERFORMANCE SUMMARY
(Unaudited)
Growth of $10,000
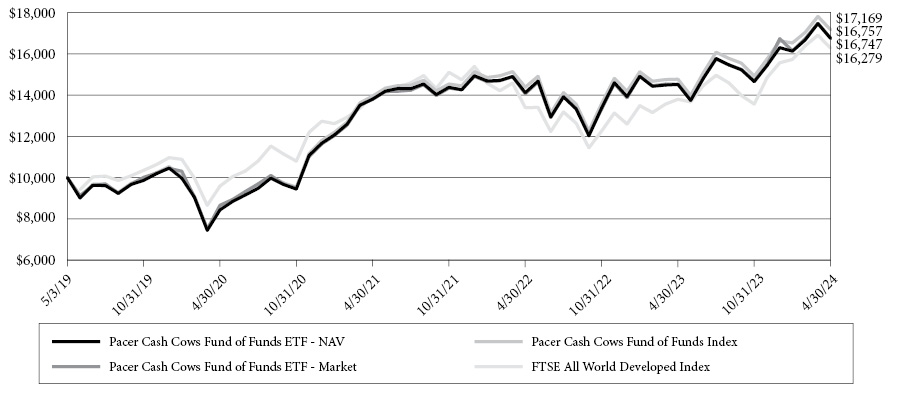
This chart illustrates the performance of a hypothetical $10,000 investment made on May 3, 2019, and is not intended to imply any future performance. The returns shown do not reflect the deduction of taxes that a shareholder would pay on fund distributions or the redemption of fund shares. The chart assumes reinvestment of capital gains and dividends.
The Pacer Cash Cows Fund of Funds Index uses an objective, rules-based approach to construct a portfolio that, as of each quarterly rebalance, is composed of the ETFs listed in the following table, each advised by the Pacer Advisors, Inc. (collectively, the “Cash Cows ETFs”). Each of the Cash Cows ETFs is an index-based ETF that seeks to track the total return performance, before fees and expenses, of the applicable underlying index listed in the following table (collectively, the “Cash Cows Indexes”). Each Cash Cows Index uses an objective, rules-based methodology to provide exposure to companies with high free cash flow yields (commonly referred to as “cash cows”) selected from the applicable “Equity Universe” as indicated in the following table.
Weight | Cash Cows ETF | Cash Cows Index | Equity Universe |
20% | Pacer US Cash Cows 100 ETF | Pacer US Cash Cows 100 ETF | Russell 1000 Index |
20% | Pacer Global Cash Cows Dividend ETF | Pacer Global Cash Cows Dividend Index | FTSE Developed Large Cap Index |
20% | Pacer US Small Cap Cash Cows 100 ETF | Pacer US Small Cap Cash Cows 100 Index | S&P Small Cap 600® Index |
20% | Pacer US Cash Cows Growth ETF | Pacer US Cash Cows Growth Index | S&P 900® Pure Growth Index |
20% | Pacer Developed Markets International Cash Cows 100 ETF | Pacer Developed Markets International Cash Cows 100 Index | FTSE Developed ex US Index |
The FTSE All World Developed Index is a market-capitalization weighted index representing the performance of large- and mid-cap stocks from the FTSE Global Equity Index Series.
52
Pacer Cash Cows Fund of Funds ETF
PERFORMANCE SUMMARY (Continued)
(Unaudited)
Annualized Returns(1)
(For the Periods Ended April 30, 2024)
| | One Year | Three Year | Since Inception(2) |
Pacer Cash Cows Fund of Funds ETF - NAV | 15.38% | 6.66% | 10.88% |
Pacer Cash Cows Fund of Funds ETF - Market | 15.38% | 6.70% | 10.89% |
Pacer Cash Cows Fund of Funds Index(3) | 16.25% | 7.18% | 11.43% |
FTSE All World Developed Index(3) | 17.95% | 5.23% | 10.24% |
(1) | The performance data quoted is historical. Past performance is no guarantee of future results. Current performance may be higher or lower than the performance data quoted. The principal value and investment return of an investment will fluctuate so that investor’s shares, when redeemed, may be worth more or less than the original cost. The returns shown do not reflect the deduction of taxes that a shareholder would pay on Fund distributions or on redemptions of Fund shares. The total annual operating expenses as stated in the fee table to the Fund’s prospectus dated August 31, 2023, is 0.74%. For performance information current to the most recent month-end, please call 1-877-337-0500. |
(2) | Inception date is May 3, 2019. |
(3) | Indexes are unmanaged statistical composites and their returns do not include fees an investor would pay to purchase the securities they represent. Such costs would lower performance. It is not possible to invest directly in an index. |
53
Pacer WealthShield ETF
PERFORMANCE SUMMARY
(Unaudited)
Growth of $10,000
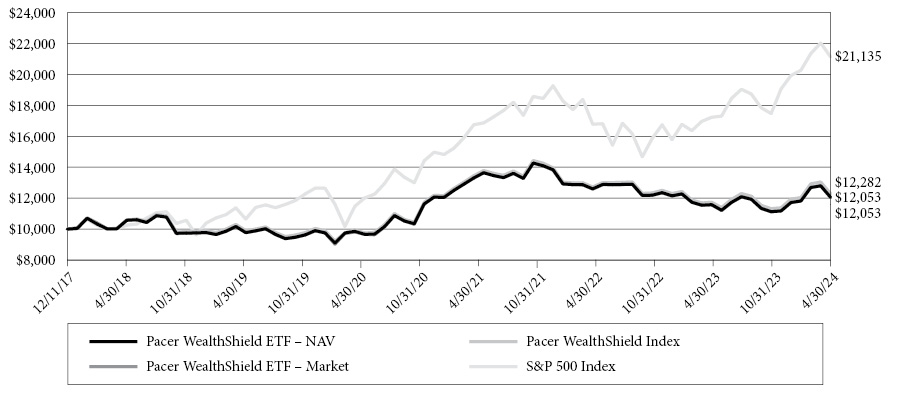
This chart illustrates the performance of a hypothetical $10,000 investment made on December 11, 2017, and is not intended to imply any future performance. The returns shown do not reflect the deduction of taxes that a shareholder would pay on fund distributions or the redemption of fund shares. The chart assumes reinvestment of capital gains and dividends.
The Pacer WealthShield Index uses an objective, rules-based methodology to implement a trend-following strategy that directs some or all of the Index’s exposure to (i) U.S. equity securities or (ii) U.S. Treasury securities depending on the strength of the high-yield corporate (“junk”) bond market relative to U.S. Treasury bonds and the momentum of certain U.S. equity sectors or industries and of long-term U.S. Treasury bonds.
The S&P 500 Index consists of approximately 500 leading U.S.-listed companies.
Annualized Returns(1)
(For the Periods Ended April 30, 2024)
| | One Year | Three Year | Five Year | Since Inception(2) |
Pacer WealthShield ETF - NAV | 4.06% | -3.25% | 3.46% | 2.97% |
Pacer WealthShield ETF - Market | 4.22% | -3.23% | 3.46% | 2.97% |
Pacer WealthShield Index(3) | 4.65% | -2.98% | 3.57% | 3.27% |
S&P 500® Index (3) | -13.78% | -11.65% | -4.28% | -3.27% |
S&P U.S. Treasury Bond 20+ Year Total Return Index(3) | 22.66% | 8.06% | 13.19% | 12.44% |
(1) | The performance data quoted is historical. Past performance is no guarantee of future results. Current performance may be higher or lower than the performance data quoted. The principal value and investment return of an investment will fluctuate so that investor’s shares, when redeemed, may be worth more or less than the original cost. The returns shown do not reflect the deduction of taxes that a shareholder would pay on Fund distributions or on redemptions of Fund shares. The total annual operating expenses as stated in the fee table to the Fund’s prospectus dated August 31, 2023, is 0.60%. For performance information current to the most recent month-end, please call 1-877-337-0500. |
(2) | Inception date is December 11, 2017. |
(3) | Indexes are unmanaged statistical composites and their returns do not include fees an investor would pay to purchase the securities they represent. Such costs would lower performance. It is not possible to invest directly in an index. |
54
Pacer Industrial Real Estate ETF
PERFORMANCE SUMMARY
(Unaudited)
Growth of $10,000
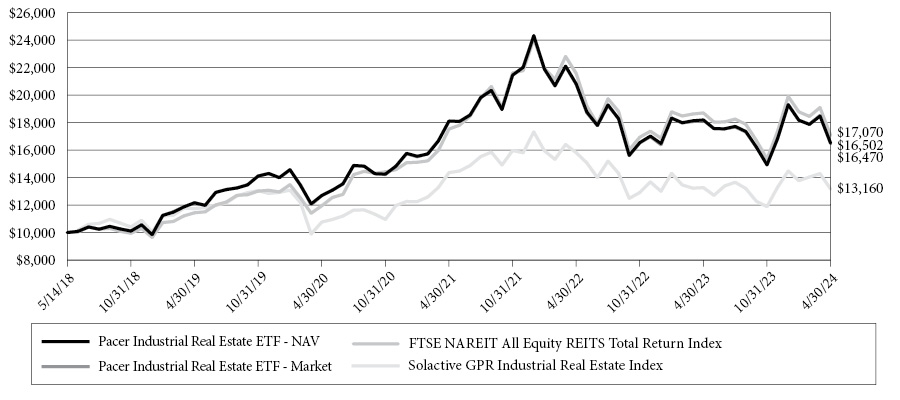
This chart illustrates the performance of a hypothetical $10,000 investment made on May 14, 2018, and is not intended to imply any future performance. The returns shown do not reflect the deduction of taxes that a shareholder would pay on fund distributions or the redemption of fund shares. The chart assumes reinvestment of capital gains and dividends.
The Solactive GPR Industrial Real Estate Index is generally composed of the equity securities of developed markets companies that derive at least 85% of their earnings or revenues from real estate operations in the industrial real estate sector (“Industrial Companies”), including companies that derive at least 85% of their earnings or revenues from self-storage real estate operations (“SelfStorage Companies”).
The FTSE Nareit All Equity REITs Index is a free-float adjusted, market capitalization-weighted index of U.S. equity REITs. Constituents of the index include all tax-qualified REITs with more than 50% of total assets in qualifying real estate assets other than mortgages secured by real property.
Annualized Returns(1)
(For the Periods Ended April 30, 2024)
| | One Year | Three Year | Five Year | Since Inception(2) |
Pacer Industrial Real Estate ETF - NAV | -9.31% | -3.06% | 6.29% | 8.77% |
Pacer Industrial Real Estate ETF - Market | -9.32% | -3.08% | 6.22% | 8.73% |
Kelly Industrial Real Estate Index / Solactive GPR Industrial Real Estate Index (3)(4) | -8.72% | 2.40% | 7.15% | 9.58% |
Solactive GPR Industrial Real Estate Index | -8.72% | -0.88% | 8.33% | 9.38% |
FTSE NAREIT All Equity REITS Total Return Index(3) | -0.82% | -2.87% | 2.30% | 4.71% |
(1) | The performance data quoted is historical. Past performance is no guarantee of future results. Current performance may be higher or lower than the performance data quoted. The principal value and investment return of an investment will fluctuate so that investor’s shares, when redeemed, may be worth more or less than the original cost. The returns shown do not reflect the deduction of taxes that a shareholder would pay on Fund distributions or on redemptions of Fund shares. The total annual operating expenses after Fee Waiver as stated in the fee table to the Fund’s prospectus dated August 31, 2023 supplemented November 1, 2023 is 0.55%. The Fund’s investment adviser has agreed to waive 5 basis points (0.05%) of its management fee for the Fund until October 31, 2024. The fee waiver agreement may only be terminated prior to October 31, 2024 with the consent of the Adviser and the Fund’s Board of Trustees, and may be renewed by the Adviser in its sole discretion. For performance information current to the most recent month-end, please call 1-877-337-0500. |
(2) | Inception date is May 14, 2018. |
(3) | Indexes are unmanaged statistical composites and their returns do not include fees an investor would pay to purchase the securities they represent. Such costs would lower performance. It is not possible to invest directly in an index. |
(4) | Effective November 1, 2022, the Fund’s investment objective was to track the price and total return performance, before fees and expenses, of the Solactive GPR Industrial Real Estate Index. Prior to November 1, 2022, the Fund’s investment objective was to track the price and total return performance, before fees and expenses, of the Kelly Industrial Real Estate Index. Performance shown for periods beginning November 1, 2022 is that of the Solactive GPR Industrial Real Estate Index, and performance shown for periods prior to November 1, 2022 is that of the Kelly Industrial Real Estate Index. |
55
Pacer Data & Infrastructure Real Estate ETF
PERFORMANCE SUMMARY
(Unaudited)
Growth of $10,000
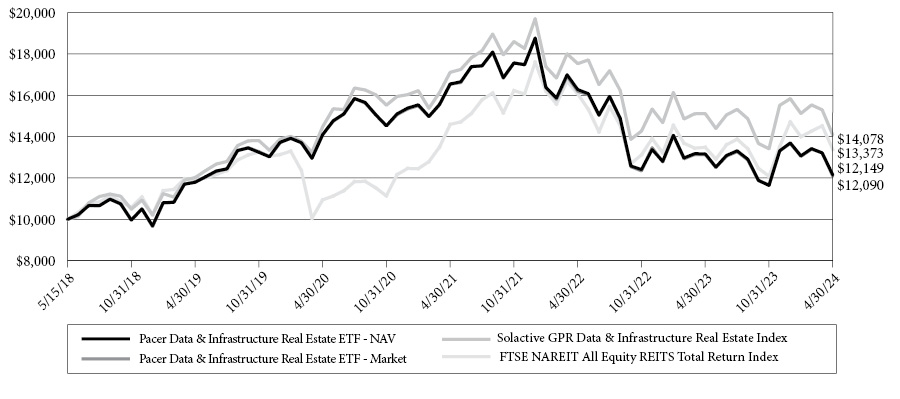
This chart illustrates the performance of a hypothetical $10,000 investment made on May 15, 2018, and is not intended to imply any future performance. The returns shown do not reflect the deduction of taxes that a shareholder would pay on fund distributions or the redemption of fund shares. The chart assumes reinvestment of capital gains and dividends.
The Solactive GPR Data & Infrastructure Real Estate ETF is generally composed of equity securities of developed markets companies that derive at least 85% of their earnings or revenues from real estate operations in the data and infrastructure real estate sectors (“Eligible Companies”). At the time of each reconstitution of the Index, Eligible Companies with a market capitalization of more than $500 million and average daily traded volume of at least 10,000 shares are included in the Index (the “Index Constituents”). A significant portion of the Index is expected to be composed of real estate investment trusts (“REITs”). The real estate companies included in the Index may utilize leverage, and some may be highly leveraged. Additionally, such companies may include significant business operations outside of the United States.
The FTSE NAREIT All Equity REITs Index is a free-float adjusted, market capitalization-weighted index of U.S. equity REITs. Constituents of the index include all tax-qualified REITs with more than 50% of total assets in qualifying real estate assets other than mortgages secured by real property.
Annualized Returns(1)
(For the Periods Ended April 30, 2024)
| | One Year | Three Year | Five Year | Since Inception(2) |
Pacer Data & Infrastructure Real Estate ETF - NAV | -7.74% | -9.79% | 0.60% | 3.32% |
Pacer Data & Infrastructure Real Estate ETF - Market | -7.97% | -9.92% | 0.47% | 3.24% |
Kelly Data Center & Tech Infrastructure Real Estate Index / Solactive GPR Data & Infrastructure Real Estate Index (3)(4) | -6.85% | -9.34% | 1.13% | 3.98% |
Solactive GPR Data & Infrastructure Real Estate Index | -6.85% | -6.30% | 3.21% | 5.91% |
FTSE NAREIT All Equity REITS Total Return Index(3) | -0.82% | -2.87% | 2.31% | 4.99% |
(1) | The performance data quoted is historical. Past performance is no guarantee of future results. Current performance may be higher or lower than the performance data quoted. The principal value and investment return of an investment will fluctuate so that investor’s shares, when redeemed, may be worth more or less than the original cost. The returns shown do not reflect the deduction of taxes that a shareholder would pay on Fund distributions or on redemptions of Fund shares. The total annual operating expenses as stated in the fee table to the Fund’s prospectus dated August 31, 2023 supplemented November 1, 2023 is 0.55%. The Fund’s investment adviser has agreed to waive 5 basis points (0.05%) of its management fee for the Fund until October 31, 2024. The fee waiver agreement may only be terminated prior to October 31, 2024 with the consent of the Adviser and the Fund’s Board of Trustees, and may be renewed by the Adviser in its sole discretion. For performance information current to the most recent month-end, please call 1-877-337-0500. |
56
Pacer Data & Infrastructure Real Estate ETF
PERFORMANCE SUMMARY (Continued)
(Unaudited)
(2) | Inception date is May 15, 2018. |
(3) | Indexes are unmanaged statistical composites and their returns do not include fees an investor would pay to purchase the securities they represent. Such costs would lower performance. It is not possible to invest directly in an index. |
(4) | Effective November 1, 2022, the Fund’s investment objective was to track the price and total return performance, before fees and expenses, of the Solactive GPR Data & Infrastructure Real Estate Index. Prior to November 1, 2022, the Fund’s investment objective was to track the price and total return performance, before fees and expenses, of the Kelly Data Center & Tech Infrastructure Real Estate Index. Performance shown for periods beginning November 1, 2022 is that of the Solactive GPR Data & Infrastructure Real Estate Index, and performance shown for periods prior to November 1, 2022 is that of the Kelly Data Center & Tech Infrastructure Real Estate Index.` |
57
Pacer CFRA-Stovall Equal Weight Seasonal Rotation ETF
PERFORMANCE SUMMARY
(Unaudited)
Growth of $10,000
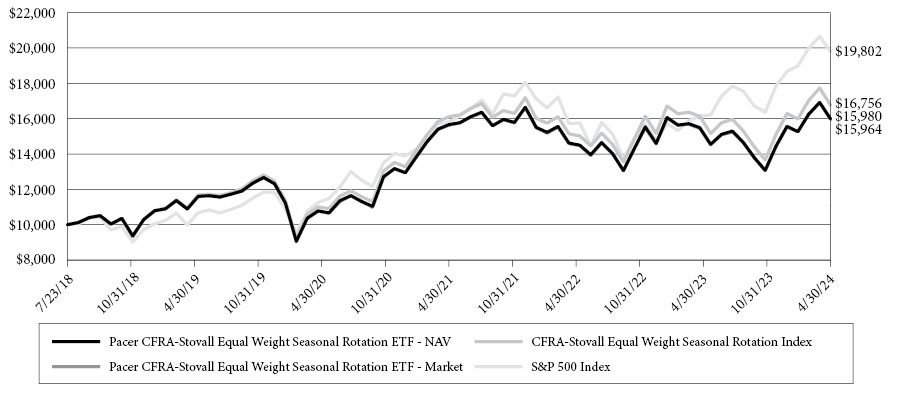
This chart illustrates the performance of a hypothetical $10,000 investment made on July 23, 2018, and is not intended to imply any future performance. The returns shown do not reflect the deduction of taxes that a shareholder would pay on fund distributions or the redemption of fund shares. The chart assumes reinvestment of capital gains and dividends.
The CFRA-Stovall Equal Weight Seasonal Rotation Index (formerly known as Pacer CFRA-Stovall Equal Weight Seasonal Rotation Index) uses an objective, rules-based methodology to track the performance of a semi-annual rotation of certain sectors within the S&P 500 Equal Weight Index (“EWI”). The S&P 500 EWI is an equal-weighted version of the S&P 500®, which measures the performance of the large-cap segment of the U.S. equity market.
The S&P 500 Index consists of approximately 500 leading U.S.-listed companies.
Annualized Returns(1)
(For the Periods Ended April 30, 2024)
| | One Year | Three Year | Five Year | Since Inception(2) |
Pacer CFRA-Stovall Equal Weight Seasonal Rotation ETF - NAV | 3.13% | 1.21% | 7.05% | 8.46% |
Pacer CFRA-Stovall Equal Weight Seasonal Rotation ETF - Market | 3.31% | 1.23% | 7.02% | 8.44% |
Pacer CFRA-Stovall Equal Weight Seasonal Rotation Index(3) | 3.83% | 1.91% | 7.99% | 9.36% |
S&P 500® Index(3) | 22.66% | 8.06% | 13.19% | 12.57% |
(1) | The performance data quoted is historical. Past performance is no guarantee of future results. Current performance may be higher or lower than the performance data quoted. The principal value and investment return of an investment will fluctuate so that investor’s shares, when redeemed, may be worth more or less than the original cost. The returns shown do not reflect the deduction of taxes that a shareholder would pay on Fund distributions or on redemptions of Fund shares. The total annual operating expenses as stated in the fee table to the Fund’s prospectus dated August 31, 2023, is 0.60%. For performance information current to the most recent month-end, please call 1-877-337-0500. |
(2) | Inception date is July 23, 2018. |
(3) | Indexes are unmanaged statistical composites and their returns do not include fees an investor would pay to purchase the securities they represent. Such costs would lower performance. It is not possible to invest directly in an index. |
58
Pacer CSOP FTSE China A50 ETF
PERFORMANCE SUMMARY
(Unaudited)
Growth of $10,000
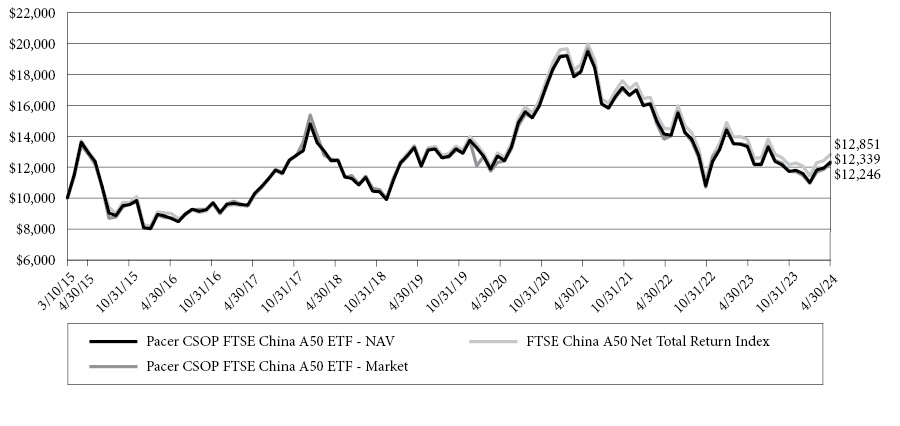
This chart illustrates the performance of a hypothetical $10,000 investment made on March 10, 2015, and is not intended to imply any future performance. The returns shown do not reflect the deduction of taxes that a shareholder would pay on fund distributions or the redemption of fund shares. The chart assumes reinvestment of capital gains and dividends.
The FTSE China A50 Net Total Return Index® is comprised of the A-Shares issued by the 50 largest companies in the China A-Shares market. The Index is a free float-adjusted market capitalization-weighted index compiled and published by FTSE International Limited, which is not affiliated with the Fund, Pacer Advisors, Inc, CSOP Asset Management Limited (“CSOP” or “CSOP Sub-Adviser”) or the Fund’s distributor. The Index is a real-time, tradable index comprising of the largest 50 China A-Share companies by full market capitalization of the FTSE China A All Cap Free Index.
Annualized Returns(1)
(For the Periods Ended April 30, 2024)
| | One Year | Three Year | Five Year | Since Inception(2) |
Pacer CSOP FTSE China A50 ETF - NAV | -7.50% | -12.10% | -1.44% | 2.33% |
Pacer CSOP FTSE China A50 ETF - Market | -8.79% | -12.37% | -1.70% | 2.24% |
FTSE China A50 Net Total Return Index®(3) | -6.95% | -11.65% | -0.83% | 2.78% |
(1) | The performance data quoted is historical. Past performance is no guarantee of future results. Current performance may be higher or lower than the performance data quoted. The principal value and investment return of an investment will fluctuate so that investor’s shares, when redeemed, may be worth more or less than the original cost. The returns shown do not reflect the deduction of taxes that a shareholder would pay on Fund distributions or on redemptions of Fund shares. The total annual operating expenses as stated in the fee table to the Fund’s prospectus dated August 31, 2023, is 0.70%. For performance information current to the most recent month-end, please call 1-877-337-0500. |
(2) | Inception date is March 10, 2015. The Fund is the successor to the investment performance of the CSOP FTSE China A50 ETF (the “Predecessor CSOP”) as a result of the reorganization of the Predecessor CSOP Fund into the Fund on January 23, 2020. Accordingly, the performance information shown in the chart and table above for periods prior to January 23, 2020 is that of the Predecessor CSOP Fund’s Shares for the Fund. The Predecessor CSOP Fund was managed by the same portfolio managers as the Fund and had substantially the same investment objectives, policies, and strategies as the Fund. |
(3) | Indexes are unmanaged statistical composites and their returns do not include fees an investor would pay to purchase the securities they represent. Such costs would lower performance. It is not possible to invest directly in an index. |
59
Pacer BioThreat Strategy ETF
PERFORMANCE SUMMARY
(Unaudited)
Growth of $10,000
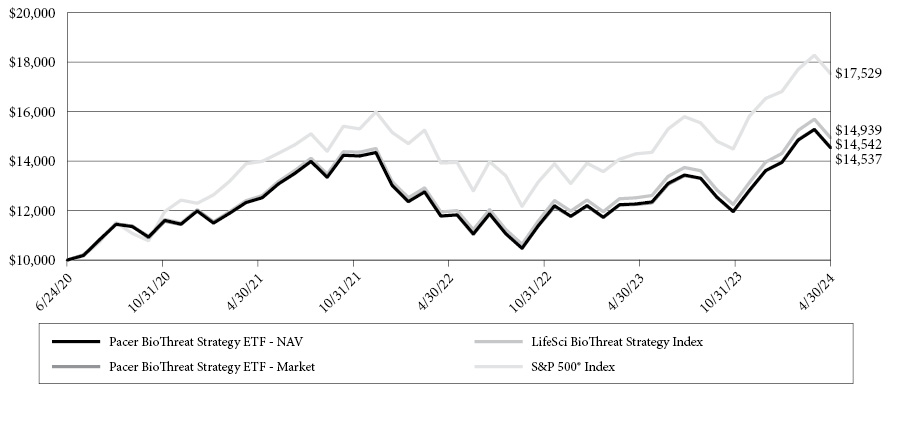
This chart illustrates the performance of a hypothetical $10,000 investment made on June 24, 2020, and is not intended to imply any future performance. The returns shown do not reflect the deduction of taxes that a shareholder would pay on fund distributions or the redemption of fund shares. The chart assumes reinvestment of capital gains and dividends.
The LifeSci BioThreat Strategy Index is generally composed of U.S.-listed stocks of companies whose products or services help protect against, endure, or recover from biological threats to human health. Companies helping to protect against such threats include those that conduct research to identify or anticipate such threats and those developing or producing the tools necessary to detect them. Companies helping to endure biological threats include those offering goods or services to help individuals, organizations, businesses, and governments adapt to requirements for social distancing or remote 2 connectivity. The Index Provider only includes those companies with a minimum market capitalization of $1 billion and a minimum average daily value traded for the last six moths of at least $2 million.
The S&P 500 Index consists of approximately 500 leading U.S.-listed companies.
Annualized Returns(1)
(For the Periods Ended April 30, 2024)
| | One Year | Three Year | Since Inception(2) |
Pacer BioThreat Strategy ETF - NAV | 18.52% | 5.66% | 10.21% |
Pacer BioThreat Strategy ETF - Market | 18.75% | 5.68% | 10.22% |
LifeSci BioThreat Strategy Index(3) | 19.38% | 6.41% | 10.99% |
S&P 500® Index(3) | 22.66% | 8.06% | 15.70% |
(1) | The performance data quoted is historical. Past performance is no guarantee of future results. Current performance may be higher or lower than the performance data quoted. The principal value and investment return of an investment will fluctuate so that investor’s shares, when redeemed, may be worth more or less than the original cost. The returns shown do not reflect the deduction of taxes that a shareholder would pay on Fund distributions or on redemptions of Fund shares. The total annual operating expenses as stated in the fee table to the Fund’s prospectus dated August 31, 2023, is 0.70%. For performance information current to the most recent month-end, please call 1-877-337-0500. |
(2) | Inception date is June 24, 2020. |
(3) | Indexes are unmanaged statistical composites and their returns do not include fees an investor would pay to purchase the securities they represent. Such costs would lower performance. It is not possible to invest directly in an index. |
60
Pacer Lunt Large Cap Alternator ETF
PERFORMANCE SUMMARY
(Unaudited)
Growth of $10,000
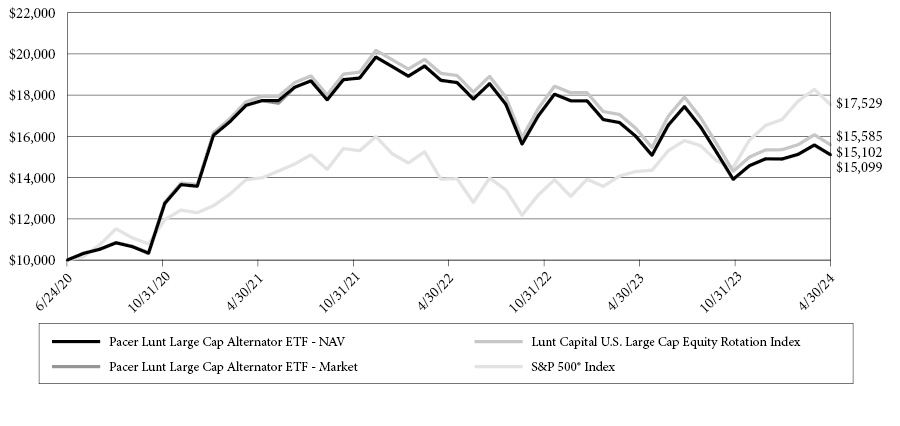
This chart illustrates the performance of a hypothetical $10,000 investment made on June 24, 2020, and is not intended to imply any future performance. The returns shown do not reflect the deduction of taxes that a shareholder would pay on fund distributions or the redemption of fund shares. The chart assumes reinvestment of capital gains and dividends.
The Lunt Capital U.S. Large Cap Equity Rotation Index uses an objective, rules-based methodology to provide exposure to large-capitalization U.S. companies. The Index uses Lunt Capital’s proprietary relative strength methodology to rotate between the holdings of one of two sub-indices, the S&P 500 Low Volatility Index and the S&P 500 High Beta Index (each, a “Sub-Index,” and together, the “Sub-Indices”), that seek to identify the 100 components of the S&P 500 Index that most strongly exhibit a particular trait (e.g., low volatility or high beta). Each Sub-Index is composed of the 100 securities comprising the S&P 500 Index that most strongly exhibit the characteristic screened for by the Sub-Index.
The S&P 500 Index consists of approximately 500 leading U.S.-listed companies.
Annualized Returns(1)
(For the Periods Ended April 30, 2024)
| | One Year | Three Year | Since Inception(2) |
Pacer Lunt Large Cap Alternator ETF - NAV | -5.65% | -4.79% | 11.30% |
Pacer Lunt Large Cap Alternator ETF - Market | -5.61% | -4.82% | 11.30% |
Lunt Capital U.S. Large Cap Equity Rotation Index(3) | -4.91% | -4.11% | 12.22% |
S&P 500® Index(3) | 22.66% | 8.06% | 15.70% |
(1) | The performance data quoted is historical. Past performance is no guarantee of future results. Current performance may be higher or lower than the performance data quoted. The principal value and investment return of an investment will fluctuate so that investor’s shares, when redeemed, may be worth more or less than the original cost. The returns shown do not reflect the deduction of taxes that a shareholder would pay on Fund distributions or on redemptions of Fund shares. The total annual operating expenses as stated in the fee table to the Fund’s prospectus dated August 31, 2023, is 0.60%. For performance information current to the most recent month-end, please call 1-877-337-0500. |
(2) | Inception date is June 24, 2020. |
(3) | Indexes are unmanaged statistical composites and their returns do not include fees an investor would pay to purchase the securities they represent. Such costs would lower performance. It is not possible to invest directly in an index. |
61
Pacer Lunt Midcap Multi-Factor Alternator ETF
PERFORMANCE SUMMARY
(Unaudited)
Growth of $10,000
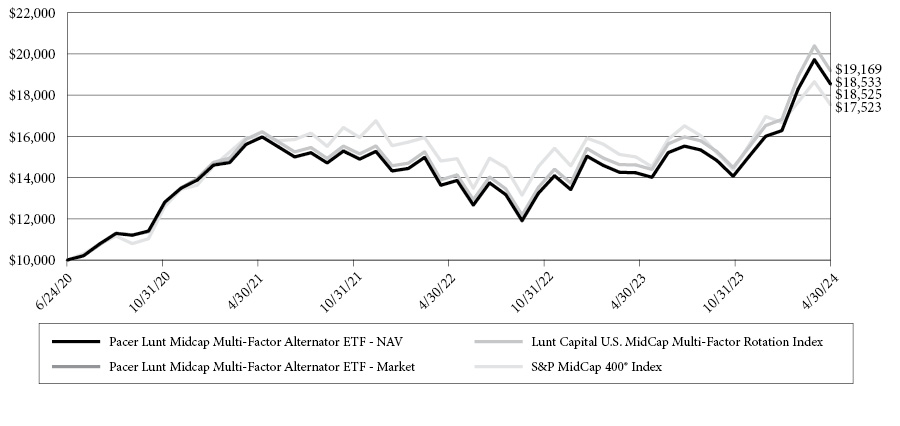
This chart illustrates the performance of a hypothetical $10,000 investment made on June 24, 2020, and is not intended to imply any future performance. The returns shown do not reflect the deduction of taxes that a shareholder would pay on fund distributions or the redemption of fund shares. The chart assumes reinvestment of capital gains and dividends.
The Lunt Capital U.S. MidCap Multi-Factor Rotation Index uses an objective, rules-based methodology to provide exposure to mid-capitalization U.S. companies. The Index uses Lunt Capital’s proprietary relative strength methodology to rotate between the holdings of the highest and lowest quintile components of four factor-based indices of the S&P MidCap 400 Index (each, a “Sub-Index,” and together, the “Sub-Indices”), that seek to identify the components of the S&P MidCap 400 Index that most strongly exhibit a particular factor. The four factor groups are Momentum, Quality, Value, and Volatility.
The S&P MidCap 400 Index is comprised of 400 companies that broadly represent companies with midrange market capitalization between $3.6 billion and $13.1 billion.
Annualized Returns(1)
(For the Periods Ended April 30, 2024)
| | One Year | Three Year | Since Inception(2) |
Pacer Lunt Midcap Multi-Factor Alternator ETF - NAV | 30.16% | 5.89% | 17.37% |
Pacer Lunt Midcap Multi-Factor Alternator ETF - Market | 30.25% | 5.88% | 17.38% |
Lunt Capital U.S. MidCap Multi-Factor Rotation Index(3) | 31.19% | 6.54% | 18.42% |
S&P MidCap 400® Index(3) | 16.82% | 3.25% | 15.69% |
(1) | The performance data quoted is historical. Past performance is no guarantee of future results. Current performance may be higher or lower than the performance data quoted. The principal value and investment return of an investment will fluctuate so that investor’s shares, when redeemed, may be worth more or less than the original cost. The returns shown do not reflect the deduction of taxes that a shareholder would pay on Fund distributions or on redemptions of Fund shares. The total annual operating expenses as stated in the fee table to the Fund’s prospectus dated August 31, 2023, is 0.60%. For performance information current to the most recent month-end, please call 1-877-337-0500. |
(2) | Inception date is June 24, 2020. |
(3) | Indexes are unmanaged statistical composites and their returns do not include fees an investor would pay to purchase the securities they represent. Such costs would lower performance. It is not possible to invest directly in an index. |
62
Pacer Lunt Large Cap Multi-Factor Alternator ETF
PERFORMANCE SUMMARY
(Unaudited)
Growth of $10,000
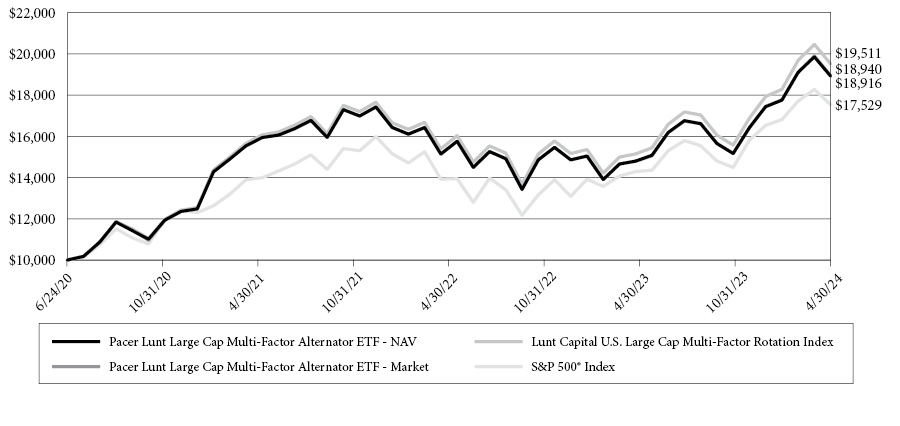
This chart illustrates the performance of a hypothetical $10,000 investment made on June 24, 2020, and is not intended to imply any future performance. The returns shown do not reflect the deduction of taxes that a shareholder would pay on fund distributions or the redemption of fund shares. The chart assumes reinvestment of capital gains and dividends.
The Lunt Capital U.S. Large Cap Multi-Factor Rotation Index uses an objective, rules-based methodology to provide exposure to large-capitalization U.S. companies. The Index uses Lunt Capital’s proprietary relative strength methodology to rotate between the holdings of the highest and lowest quintile components of four factor-based indices of the S&P 500 Index (each, a “Sub-Index,” and together, the “Sub-Indices”), that seek to identify the components of the S&P 500 Index that most strongly exhibit a particular factor. The four factor groups are Momentum, Quality, Value, and Volatility.
The S&P 500 Index consists of approximately 500 leading U.S.-listed companies.
Annualized Returns(1)
(For the Periods Ended April 30, 2024)
| | One Year | Three Year | Since Inception(2) |
Pacer Lunt Large Cap Multi-Factor Alternator ETF - NAV | 27.83% | 6.77% | 18.01% |
Pacer Lunt Large Cap Multi-Factor Alternator ETF - Market | 28.05% | 6.84% | 18.05% |
Lunt Capital U.S. Large Cap Multi-Factor Rotation Index(3) | 28.83% | 7.61% | 18.96% |
S&P 500® Index(3) | 22.66% | 8.06% | 15.70% |
(1) | The performance data quoted is historical. Past performance is no guarantee of future results. Current performance may be higher or lower than the performance data quoted. The principal value and investment return of an investment will fluctuate so that investor’s shares, when redeemed, may be worth more or less than the original cost. The returns shown do not reflect the deduction of taxes that a shareholder would pay on Fund distributions or on redemptions of Fund shares. The total annual operating expenses as stated in the fee table to the Fund’s prospectus dated August 31, 2023, is 0.60%. For performance information current to the most recent month-end, please call 1-877-337-0500. |
(2) | Inception date is June 24, 2020. |
(3) | Indexes are unmanaged statistical composites and their returns do not include fees an investor would pay to purchase the securities they represent. Such costs would lower performance. It is not possible to invest directly in an index. |
63
Pacer US Export Leaders ETF
PERFORMANCE SUMMARY
(Unaudited)
Growth of $10,000
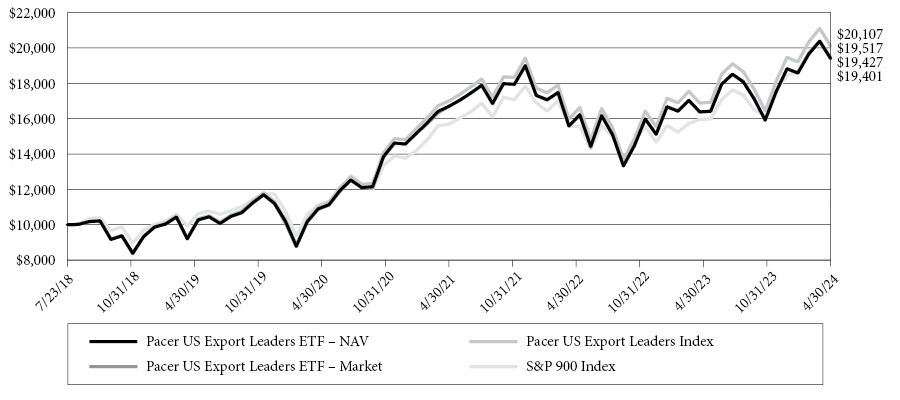
This chart illustrates the performance of a hypothetical $10,000 investment made on July 23, 2018, and is not intended to imply any future performance. The returns shown do not reflect the deduction of taxes that a shareholder would pay on fund distributions or the redemption of fund shares. The chart assumes reinvestment of capital gains and dividends.
The Pacer US Export Leaders Index uses an objective, rules-based methodology to measure the performance of an equal weight portfolio of approximately 100 large- and mid-capitalization U.S. companies with a high percentage of foreign sales and high free cash flow growth. Free cash flow is a company’s cash flow from operations minus its capital expenditures. Construction of the Index begins with an initial universe of the 200 companies across the S&P 900® Index (which is comprised of the S&P 500® Index (“S&P 500”) and S&P MidCap 400® Index (“S&P MidCap 400”)) that have the highest annual foreign sales as a percentage of total sales. The 200 companies are then narrowed to the 100 companies with the highest change in free cash flow growth over the past five years, and those 100 companies are equally weighted to create the Index. The Index is reconstituted and rebalanced to equal-weight quarterly.
The S&P 900® combines the S&P 500® and the S&P MidCap 400® to form an investable benchmark for the mid- to large-cap segment of the U.S. equity market.
Annualized Returns(1)
(For the Periods Ended April 30, 2024)
| | One Year | Three Year | Five Year | Since Inception(2) |
Pacer US Export Leaders ETF - NAV | 18.40% | 5.72% | 13.21% | 12.17% |
Pacer US Export Leaders ETF - Market | 18.69% | 5.94% | 13.25% | 12.20% |
Pacer US Export Leaders Index(3) | 19.11% | 6.31% | 13.90% | 12.87% |
S&P 900 IndexTM(3) | 22.32% | 7.77% | 12.96% | 12.29% |
(1) | The performance data quoted is historical. Past performance is no guarantee of future results. Current performance may be higher or lower than the performance data quoted. The principal value and investment return of an investment will fluctuate so that investor’s shares, when redeemed, may be worth more or less than the original cost. The returns shown do not reflect the deduction of taxes that a shareholder would pay on Fund distributions or on redemptions of Fund shares. The total annual operating expenses as stated in the fee table to the Fund’s prospectus dated August 31, 2023, is 0.60%. For performance information current to the most recent month-end, please call 1-877-337-0500. |
(2) | Inception date is July 23, 2018. |
(3) | Indexes are unmanaged statistical composites and their returns do not include fees an investor would pay to purchase the securities they represent. Such costs would lower performance. It is not possible to invest directly in an index. |
64
Pacer Pacific Asset Floating Rate High Income ETF
PERFORMANCE SUMMARY
(Unaudited)
Growth of $10,000
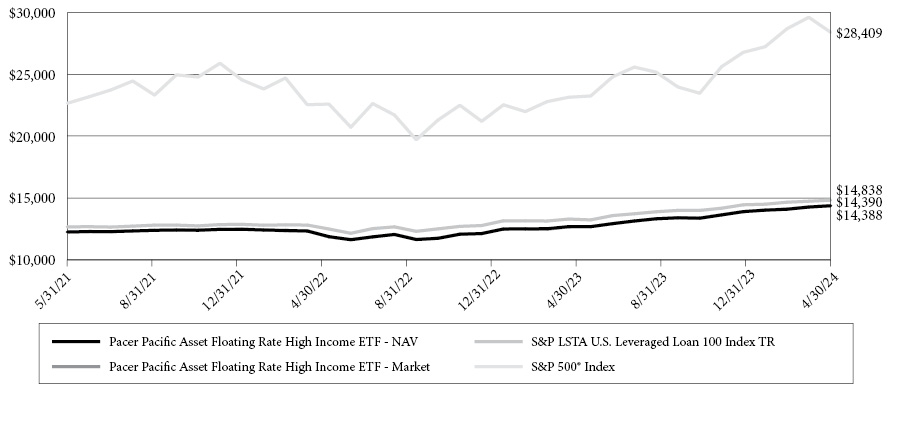
This chart illustrates the performance of a hypothetical $10,000 investment made on February 18, 2015, and is not intended to imply any future performance. The returns shown do not reflect the deduction of taxes that a shareholder would pay on fund distributions or the redemption of fund shares. The chart assumes reinvestment of capital gains and dividends.
The S&P/LSTA U.S. Leveraged Loan 100 Index is an index designed to reflect the performance of the largest facilities in the leveraged loan market.
The S&P 500 Index consists of approximately 500 leading U.S.-listed companies.
Annualized Returns(1)
(For the Periods Ended April 30, 2024)
| | One Year | Three Year | Five Year | Since Inception(2) |
Pacer Pacific Asset Floating Rate High Income ETF - NAV | 13.25% | 5.59% | 4.75% | 4.04% |
Pacer Pacific Asset Floating Rate High Income ETF - Market | 13.40% | 5.53% | 4.75% | 4.04% |
S&P 500® Index(3) | 22.66% | 5.57% | 4.83% | 4.39% |
S&P/LSTA U.S. Leveraged Loan 100 Index(3) | 11.47% | 8.06% | 13.19% | 12.03% |
(1) | The performance data quoted is historical. Past performance is no guarantee of future results. Current performance may be higher or lower than the performance data quoted. The principal value and investment return of an investment will fluctuate so that investor’s shares, when redeemed, may be worth more or less than the original cost. The returns shown do not reflect the deduction of taxes that a shareholder would pay on Fund distributions or on redemptions of Fund shares. The total annual operating expenses as stated in the fee table to the Fund’s prospectus dated August 31, 2023, is 0.61%. For performance information current to the most recent month-end, please call 1-877-337-0500. |
(2) | Inception date is February 18, 2015. The Fund is the successor to the investment performance of the Pacific Global Senior Loan ETF (the “Predecessor Fund”) as a result of the reorganization of the Predecessor Fund into the Fund on October 22, 2021. Accordingly, the performance information shown in the chart and table above for periods prior to October 22, 2021 is that of the Predecessor Fund’s Shares for the Fund. The Predecessor Fund was managed by the same portfolio managers as the Fund and had substantially the same investment objectives, policies, and strategies as the Fund. |
(3) | Indexes are unmanaged statistical composites and their returns do not include fees an investor would pay to purchase the securities they represent. Such costs would lower performance. It is not possible to invest directly in an index. |
65
Pacer Data and Digital Revolution ETF
PERFORMANCE SUMMARY
(Unaudited)
Growth of $10,000
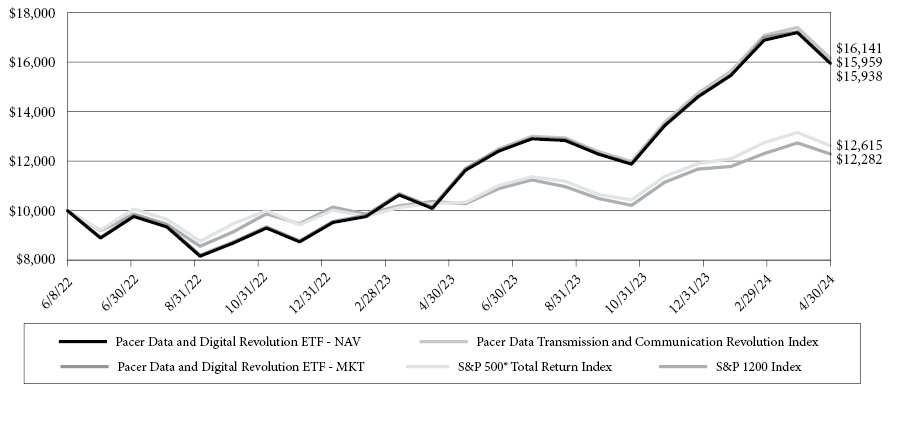
This chart illustrates the performance of a hypothetical $10,000 investment made on June 8, 2022, and is not intended to imply any future performance. The returns shown do not reflect the deduction of taxes that a shareholder would pay on fund distributions or the redemption of fund shares. The chart assumes reinvestment of capital gains and dividends.
The Pacer Data Transmission and Communication Revolution TR Index will generally use a “replication” strategy to achieve its investment objective, meaning it will invest in all of the component securities of the applicable Index in the same approximate proportion as in such Index, but may, when the Adviser believes it is in the best interests of such Fund, use a “representative sampling” strategy, meaning it may invest in a sample of the securities in the applicable Index whose risk, return, and other characteristics closely resemble the risk, return, and other characteristics of the applicable Index as a whole (e.g., when replicating the Index involves practical difficulties or substantial costs, an Index constituent becomes temporarily illiquid, unavailable or less liquid, or as a result of legal restrictions or limitations that apply to a Fund but not to its Index).
The S&P 500 Index consists of approximately 500 leading U.S.-listed companies.
Annualized Returns(1)
(For the Periods Ended April 30, 2024)
| | One Year | Since Inception(2) |
Pacer Data and Digital Revolution ETF - NAV | 58.06% | 27.92% |
Pacer Data and Digital Revolution ETF - Market | 57.73% | 28.01% |
Pacer Data Transmission and Communication Revolution Index(3) | 59.18% | 28.77% |
S&P 500® Index(3) | 22.66% | 13.05% |
S&P 1200® Index(3) | 18.44% | 11.45% |
(1) | The performance data quoted is historical. Past performance is no guarantee of future results. Current performance may be higher or lower than the performance data quoted. The principal value and investment return of an investment will fluctuate so that investor’s shares, when redeemed, may be worth more or less than the original cost. The returns shown do not reflect the deduction of taxes that a shareholder would pay on Fund distributions or on redemptions of Fund shares. The total annual operating expenses as stated in the fee table to the Fund’s prospectus dated August 31, 2023 is 0.60%. For performance information current to the most recent month-end, please call 1-877-337-0500. |
(2) | Inception date is June 8, 2022. |
(3) | Indexes are unmanaged statistical composites and their returns do not include fees an investor would pay to purchase the securities they represent. Such costs would lower performance. It is not possible to invest directly in an index. |
66
Pacer Industrials and Logistics ETF
PERFORMANCE SUMMARY
(Unaudited)
Growth of $10,000
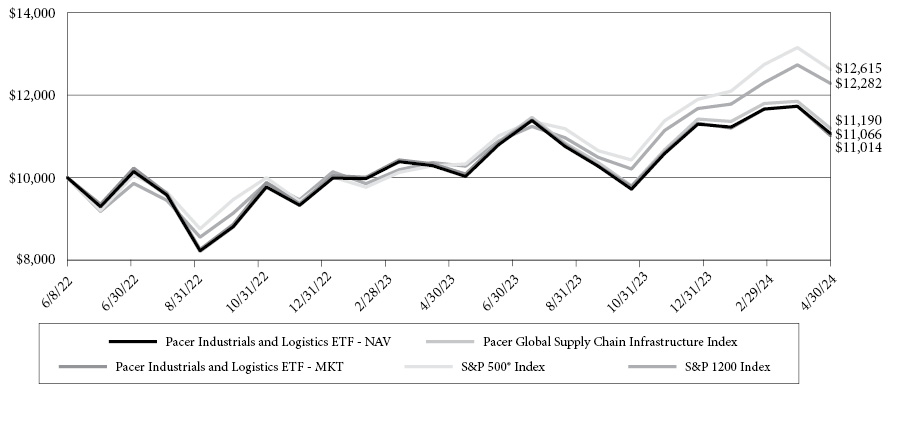
This chart illustrates the performance of a hypothetical $10,000 investment made on June 8, 2022, and is not intended to imply any future performance. The returns shown do not reflect the deduction of taxes that a shareholder would pay on fund distributions or the redemption of fund shares. The chart assumes reinvestment of capital gains and dividends.
The Pacer Global Supply Chain Infrastructure Total Return Index will generally use a “replication” strategy to achieve its investment objective, meaning it will invest in all of the component securities of the applicable Index in the same approximate proportion as in such Index, but may, when the Adviser believes it is in the best interests of such Fund, use a “representative sampling” strategy, meaning it may invest in a sample of the securities in the applicable Index whose risk, return, and other characteristics closely resemble the risk, return, and other characteristics of the applicable Index as a whole (e.g., when replicating the Index involves practical difficulties or substantial costs, an Index constituent becomes temporarily illiquid, unavailable or less liquid, or as a result of legal restrictions or limitations that apply to a Fund but not to its Index).
The S&P 500 Index consists of approximately 500 leading U.S.-listed companies.
Annualized Returns(1)
(For the Periods Ended April 30, 2024)
| | One Year | Since Inception(2) |
Pacer Industrials and Logistics ETF - NAV | 7.54% | 5.49% |
Pacer Industrials and Logistics ETF - Market | 6.57% | 5.24% |
Pacer Global Supply Chain Infrastructure Index(3) | 8.45% | 6.12% |
S&P 500® Index(3) | 22.66% | 13.05% |
S&P 1200® Index(3) | 18.44% | 11.45% |
(1) | The performance data quoted is historical. Past performance is no guarantee of future results. Current performance may be higher or lower than the performance data quoted. The principal value and investment return of an investment will fluctuate so that investor’s shares, when redeemed, may be worth more or less than the original cost. The returns shown do not reflect the deduction of taxes that a shareholder would pay on Fund distributions or on redemptions of Fund shares. The total annual operating expenses as stated in the fee table to the Fund’s prospectus dated August 31, 2023 is 0.60%. For performance information current to the most recent month-end, please call 1-877-337-0500. |
(2) | Inception date is June 8, 2022. |
(3) | Indexes are unmanaged statistical composites and their returns do not include fees an investor would pay to purchase the securities they represent. Such costs would lower performance. It is not possible to invest directly in an index. |
67
Pacer Funds
EXPENSE EXAMPLE
For the Six-Months Ended April 30, 2024
As a shareholder of a Fund, you pay ongoing expenses, such as advisory fees, and other fund expenses. The following examples are intended to help you understand the ongoing cost (in dollars) of investing in a Fund and to compare these costs with the ongoing costs of investing in other funds. Please note, the expenses shown in the tables are meant to highlight ongoing costs only and do not reflect any transactional costs. You may pay brokerage commissions on your purchase and sale of Fund shares, which are not reflected in the following examples. Each example is based on an investment of $1,000 invested at the beginning of the period and held for the entire period as indicated below.
Actual Expenses
The columns under the heading entitled “Actual” help you estimate the actual expenses you paid over the period. The “Actual Ending Account Value” shown is derived from a Fund’s actual return and the “Actual Expenses Paid During Period” show the dollar amount that would have been paid by an investor who started with $1,000 in a Fund. To estimate the expenses you paid on your account during this period, simply divide your account value by $1,000 (for example, an $8,600 account value divided by $1,000=8.6), then multiply the result by the number in the column under the heading untitled “Actual Expenses Paid During Period”.
Hypothetical Example for Comparison Purposes
The columns under the heading entitled “Hypothetical” provide information about hypothetical account value and hypothetical expenses based on a Fund’s actual expense ratio and an assumed rate of return of 5% per year before expenses, which is not the Fund’s return. The hypothetical account values and expenses may not be used to estimate the actual ending account balance or expenses you paid for the period. You may use this information to compare the ongoing costs of investing in a Fund and other funds. To do so, compare this 5% hypothetical example with the 5% hypothetical examples that appear in the shareholder reports of other funds.
Please note that the expenses shown in the table are meant to highlight your ongoing costs only and do not reflect any transactional costs which may be applicable to your account. Therefore, the last column of the table (Hypothetical Expenses Paid During Period) is useful in comparing ongoing costs only and will not help you determine the relative total costs of owning different funds. In addition, if these transactional costs were included, your costs would have been higher.
| | Fund’s Annual
Expense Ratio | Beginning Account
Value 11/01/23 | Ending Account
Value 04/30/24 | Expenses Paid
During Period(a) |
Pacer Trendpilot® US Large Cap ETF | | | | |
Actual | 0.60% | $1,000.00 | $ 1,186.30 | $ 3.26 |
Hypothetical(b) | 0.60% | $1,000.00 | $ 1,021.88 | $ 3.02 |
Pacer Trendpilot® US Mid Cap ETF | | | | |
Actual | 0.60% | $1,000.00 | $ 1,127.80 | $ 3.17 |
Hypothetical(b) | 0.60% | $1,000.00 | $ 1,021.88 | $ 3.02 |
Pacer TrendpilotTM 100 ETF | | | | |
Actual | 0.65% | $1,000.00 | $ 1,116.40 | $ 3.42 |
Hypothetical(b) | 0.65% | $1,000.00 | $ 1,021.63 | $ 3.27 |
Pacer Trendpilot® European Index ETF | | | | |
Actual | 0.65% | $1,000.00 | $ 1,098.00 | $ 3.39 |
Hypothetical(b) | 0.65% | $1,000.00 | $ 1,021.63 | $ 3.27 |
Pacer Trendpilot International ETF | | | | |
Actual | 0.65% | $1,000.00 | $ 1,154.90 | $ 3.48 |
Hypothetical(b) | 0.65% | $1,000.00 | $ 1,021.63 | $ 3.27 |
Pacer Trendpilot US Bond ETF | | | | |
Actual | 0.60% | $1,000.00 | $ 1,084.60 | $ 3.11 |
Hypothetical(b) | 0.60% | $1,000.00 | $ 1,021.88 | $ 3.02 |
Pacer Trendpilot Fund of Funds ETF | | | | |
Actual | 0.15% | $1,000.00 | $ 1,131.80 | $ 0.80 |
Hypothetical(b) | 0.15% | $1,000.00 | $ 1,024.12 | $ 0.75 |
Pacer U.S. Cash Cows 100 ETF | | | | |
Actual | 0.49% | $1,000.00 | $ 1,160.30 | $ 2.63 |
Hypothetical(b) | 0.49% | $1,000.00 | $ 1,022.43 | $ 2.46 |
68
Pacer Funds
EXPENSE EXAMPLE
For the Six-Months Ended April 30, 2024 (Continued)
| | Fund’s Annual
Expense Ratio | Beginning Account
Value 11/01/23 | Ending Account
Value 04/30/24 | Expenses Paid
During Period(a) |
Pacer U.S. Small Cap Cash Cows 100 ETF | | | | |
Actual | 0.59% | $1,000.00 | $ 1,162.70 | $ 3.17 |
Hypothetical(b) | 0.59% | $1,000.00 | $ 1,021.93 | $ 2.97 |
Pacer Global Cash Cows Dividend ETF | | | | |
Actual | 0.60% | $1,000.00 | $ 1,105.60 | $ 3.14 |
Hypothetical(b) | 0.60% | $1,000.00 | $ 1,021.88 | $ 3.02 |
Pacer Developed Markets International Cash Cows 100 ETF | | | | |
Actual | 0.65% | $1,000.00 | $ 1,116.70 | $ 3.42 |
Hypothetical(b) | 0.65% | $1,000.00 | $ 1,021.63 | $ 3.27 |
Pacer Emerging Markets Cash Cows 100 ETF | | | | |
Actual | 0.70% | $1,000.00 | $ 1,153.70 | $ 3.75 |
Hypothetical(b) | 0.70% | $1,000.00 | $ 1,021.38 | $ 3.52 |
Pacer US Large Cap Cash Cows Growth Leaders ETF | | | | |
Actual | 0.49% | $1,000.00 | $ 1,194.10 | $ 2.67 |
Hypothetical(b) | 0.49% | $1,000.00 | $ 1,022.43 | $ 2.46 |
Pacer U.S. Small Cap Cash Cows Growth Leaders ETF | | | | |
Actual | 0.59% | $1,000.00 | $ 1,181.60 | $ 3.20 |
Hypothetical(b) | 0.59% | $1,000.00 | $ 1,021.93 | $ 2.97 |
Pacer US Cash Cows Growth ETF | | | | |
Actual | 0.60% | $1,000.00 | $ 1,175.60 | $ 3.25 |
Hypothetical(b) | 0.60% | $1,000.00 | $ 1,021.88 | $ 3.02 |
Pacer Cash Cows Fund of Funds ETF | | | | |
Actual | 0.15% | $1,000.00 | $ 1,143.20 | $ 0.80 |
Hypothetical(b) | 0.15% | $1,000.00 | $ 1,024.12 | $ 0.75 |
Pacer WealthShield ETF | | | | |
Actual | 0.60% | $1,000.00 | $ 1,083.10 | $ 3.11 |
Hypothetical(b) | 0.60% | $1,000.00 | $ 1,021.88 | $ 3.02 |
Pacer Industrial Real Estate ETF | | | | |
Actual | 0.55% | $1,000.00 | $ 1,106.00 | $ 2.88 |
Hypothetical(b) | 0.55% | $1,000.00 | $ 1,022.13 | $ 2.77 |
Pacer Data & Infrastructure Real Estate ETF | | | |
Actual | 0.55% | $1,000.00 | $ 1,043.80 | $ 2.79 |
Hypothetical(b) | 0.55% | $1,000.00 | $ 1,022.13 | $ 2.77 |
Pacer CFRA-Stovall Equal Weight Seasonal Rotation ETF | | | | |
Actual | 0.60% | $1,000.00 | $ 1,221.50 | $ 3.31 |
Hypothetical(b) | 0.60% | $1,000.00 | $ 1,021.88 | $ 3.02 |
Pacer CSOP FTSE China A50 ETF | | | | |
Actual | 0.70% | $1,000.00 | $ 1,051.60 | $ 3.57 |
Hypothetical(b) | 0.70% | $1,000.00 | $ 1,021.38 | $ 3.52 |
Pacer BioThreat Strategy ETF | | | | |
Actual | 0.70% | $1,000.00 | $ 1,215.40 | $ 3.86 |
Hypothetical(b) | 0.70% | $1,000.00 | $ 1,021.38 | $ 3.52 |
Pacer Lunt Large Cap Alternator ETF | | | | |
Actual | 0.60% | $1,000.00 | $ 1,085.10 | $ 3.11 |
Hypothetical(b) | 0.60% | $1,000.00 | $ 1,021.88 | $ 3.02 |
Pacer Lunt Midcap Multi-Factor Alternator ETF | | | | |
Actual | 0.60% | $1,000.00 | $ 1,317.50 | $ 3.46 |
Hypothetical(b) | 0.60% | $1,000.00 | $ 1,021.88 | $ 3.02 |
69
Pacer Funds
EXPENSE EXAMPLE
For the Six-Months Ended April 30, 2024 (Continued)
| | Fund’s Annual
Expense Ratio | Beginning Account
Value 11/01/23 | Ending Account
Value 04/30/24 | Expenses Paid
During Period(a) |
Pacer Lunt Large Cap Multi-Factor Alternator ETF | | | | |
Actual | 0.60% | $1,000.00 | $ 1,247.50 | $ 3.35 |
Hypothetical(b) | 0.60% | $1,000.00 | $ 1,021.88 | $ 3.02 |
Pacer US Export Leaders ETF | | | | |
Actual | 0.60% | $1,000.00 | $ 1,218.90 | $ 3.31 |
Hypothetical(b) | 0.60% | $1,000.00 | $ 1,021.88 | $ 3.02 |
Pacer Pacific Asset Floating Rate High Income ETF | | | |
Actual | 0.60% | $1,000.00 | $ 1,075.40 | $ 3.10 |
Hypothetical(b) | 0.60% | $1,000.00 | $ 1,021.88 | $ 3.02 |
Pacer Industrials and Logistics ETF | | | |
Actual | 0.60% | $1,000.00 | $ 1,138.90 | $ 3.19 |
Hypothetical(b) | 0.60% | $1,000.00 | $ 1,021.88 | $ 3.02 |
Pacer Data and Digital Revolution ETF | | | | |
Actual | 0.60% | $1,000.00 | $ 1,342.50 | $ 3.49 |
Hypothetical(b) | 0.60% | $1,000.00 | $ 1,021.88 | $ 3.02 |
(a) | The dollar amounts shown as expenses paid during the period are equal to the annualized six-month expense ratio multiplied by the average account value during the period, multiplied by the number of days (182) in the most recent six-month period and divided by the number of days in the most recent twelve-month period (366). |
(b) | Assumes 5% return before expenses. |
70
Pacer Trendpilot® US Large Cap ETF
SCHEDULE OF INVESTMENTS
April 30, 2024
| | | Shares | | | Value | |
COMMON STOCKS — 97.8% |
| |
Communication Services — 9.1% |
Alphabet, Inc. - Class A(a) | | | 366,209 | | | $ | 59,611,500 | |
Alphabet, Inc. - Class C(a) | | | 305,634 | | | | 50,319,582 | |
AT&T, Inc. | | | 444,687 | | | | 7,510,763 | |
Charter Communications, Inc. - Class A(a)(b) | | | 6,353 | | | | 1,625,987 | |
Comcast Corp. - Class A | | | 245,996 | | | | 9,374,908 | |
Electronic Arts, Inc. | | | 15,362 | | | | 1,948,209 | |
Fox Corp. - Class A(b) | | | 15,817 | | | | 490,485 | |
Fox Corp. - Class B | | | 8,206 | | | | 235,348 | |
Interpublic Group of Cos., Inc.(b) | | | 23,993 | | | | 730,347 | |
Live Nation Entertainment, Inc.(a)(b) | | | 8,840 | | | | 785,964 | |
Match Group, Inc.(a) | | | 17,338 | | | | 534,357 | |
Meta Platforms, Inc. - Class A | | | 136,288 | | | | 58,627,009 | |
Netflix, Inc.(a) | | | 26,840 | | | | 14,779,178 | |
News Corp. - Class A | | | 23,691 | | | | 563,846 | |
News Corp. - Class B(b) | | | 7,155 | | | | 175,584 | |
Omnicom Group, Inc. | | | 12,267 | | | | 1,138,868 | |
Paramount Global - Class B(b) | | | 30,022 | | | | 341,951 | |
Take-Two Interactive Software, Inc.(a) | | | 9,880 | | | | 1,410,963 | |
T-Mobile US, Inc.(b) | | | 32,378 | | | | 5,315,496 | |
Verizon Communications, Inc. | | | 257,331 | | | | 10,162,001 | |
Walt Disney Co. | | | 113,662 | | | | 12,627,848 | |
Warner Bros Discovery, Inc.(a)(b) | | | 137,952 | | | | 1,015,327 | |
| | | | | | | 239,325,521 | |
| |
Consumer Discretionary — 10.3% |
Airbnb, Inc. - Class A(a) | | | 26,493 | | | | 4,200,995 | |
Amazon.com, Inc.(a) | | | 566,191 | | | | 99,083,424 | |
Aptiv PLC(a) | | | 17,539 | | | | 1,245,269 | |
AutoZone, Inc.(a) | | | 1,079 | | | | 3,189,956 | |
Bath & Body Works, Inc. | | | 14,219 | | | | 645,827 | |
Best Buy Co., Inc. | | | 12,065 | | | | 888,467 | |
Booking Holdings, Inc. | | | 2,135 | | | | 7,370,084 | |
BorgWarner, Inc. | | | 14,651 | | | | 480,113 | |
Caesars Entertainment, Inc.(a)(b) | | | 13,410 | | | | 480,346 | |
CarMax, Inc.(a)(b) | | | 9,880 | | | | 671,544 | |
Carnival Corp.(a)(b) | | | 62,637 | | | | 928,280 | |
Chipotle Mexican Grill, Inc.(a) | | | 1,672 | | | | 5,282,851 | |
Darden Restaurants, Inc.(b) | | | 7,495 | | | | 1,149,808 | |
Deckers Outdoor Corp.(a) | | | 1,614 | | | | 1,321,011 | |
Domino’s Pizza, Inc. | | | 2,185 | | | | 1,156,455 | |
DR Horton, Inc. | | | 18,920 | | | | 2,695,911 | |
eBay, Inc. | | | 33,140 | | | | 1,708,036 | |
Etsy, Inc.(a) | | | 7,695 | | | | 528,416 | |
Expedia Group, Inc.(a) | | | 7,746 | | | | 1,042,844 | |
Ford Motor Co. | | | 244,510 | | | | 2,970,797 | |
Garmin Ltd. | | | 9,541 | | | | 1,378,388 | |
| | | Shares | | | Value | |
Consumer Discretionary — 10.3% (Continued) |
General Motors Co. | | | 71,534 | | | $ | 3,185,409 | |
Genuine Parts Co. | | | 8,738 | | | | 1,373,701 | |
Hasbro, Inc.(b) | | | 8,098 | | | | 496,407 | |
Hilton Worldwide Holdings, Inc. | | | 15,290 | | | | 3,016,411 | |
Home Depot, Inc. | | | 61,707 | | | | 20,623,713 | |
Las Vegas Sands Corp. | | | 22,999 | | | | 1,020,236 | |
Lennar Corp. - Class A | | | 15,693 | | | | 2,379,373 | |
LKQ Corp. | | | 16,627 | | | | 717,123 | |
Lowe’s Cos., Inc. | | | 35,289 | | | | 8,045,539 | |
Lululemon Athletica, Inc.(a) | | | 6,951 | | | | 2,506,531 | |
Marriott International, Inc. - Class A | | | 14,884 | | | | 3,514,559 | |
McDonald’s Corp. | | | 44,486 | | | | 12,146,457 | |
MGM Resorts International(a) | | | 17,463 | | | | 688,741 | |
Mohawk Industries, Inc.(a) | | | 3,327 | | | | 383,670 | |
NIKE, Inc. - Class B | | | 74,805 | | | | 6,901,509 | |
Norwegian Cruise Line Holdings Ltd.(a)(b) | | | 26,479 | | | | 500,983 | |
NVR, Inc.(a) | | | 200 | | | | 1,487,770 | |
O’Reilly Automotive, Inc.(a) | | | 3,568 | | | | 3,615,312 | |
Pool Corp.(b) | | | 2,385 | | | | 864,634 | |
PulteGroup, Inc. | | | 13,616 | | | | 1,517,095 | |
Ralph Lauren Corp. | | | 2,485 | | | | 406,645 | |
Ross Stores, Inc. | | | 21,205 | | | | 2,747,108 | |
Royal Caribbean Cruises Ltd.(a)(b) | | | 14,650 | | | | 2,045,580 | |
Starbucks Corp. | | | 69,702 | | | | 6,167,930 | |
Tapestry, Inc. | | | 14,450 | | | | 576,844 | |
Tesla Motors, Inc.(a) | | | 171,866 | | | | 31,499,599 | |
TJX Cos., Inc. | | | 69,772 | | | | 6,564,847 | |
Tractor Supply Co.(b) | | | 6,755 | | | | 1,844,655 | |
Ulta Beauty, Inc.(a) | | | 3,125 | | | | 1,265,125 | |
Wynn Resorts Ltd. | | | 6,021 | | | | 551,825 | |
Yum! Brands, Inc.(b) | | | 17,447 | | | | 2,464,389 | |
| | | | | | | 269,538,542 | |
| |
Consumer Staples — 6.1% |
Altria Group, Inc. | | | 110,437 | | | | 4,838,245 | |
Archer-Daniels-Midland Co. | | | 33,342 | | | | 1,955,842 | |
Brown-Forman Corp. - Class B(b) | | | 11,425 | | | | 546,686 | |
Bunge Global SA | | | 9,372 | | | | 953,695 | |
Campbell Soup Co. | | | 12,267 | | | | 560,725 | |
Church & Dwight Co., Inc.(b) | | | 15,254 | | | | 1,645,754 | |
Clorox Co. | | | 7,697 | | | | 1,138,155 | |
Coca-Cola Co. | | | 241,976 | | | | 14,946,857 | |
Colgate-Palmolive Co. | | | 51,420 | | | | 4,726,526 | |
Conagra Brands, Inc. | | | 29,706 | | | | 914,351 | |
Constellation Brands, Inc. - Class A | | | 10,082 | | | | 2,555,384 | |
Costco Wholesale Corp. | | | 27,470 | | | | 19,858,062 | |
Dollar General Corp. | | | 13,610 | | | | 1,894,376 | |
Dollar Tree, Inc.(a) | | | 12,977 | | | | 1,534,530 | |
Estee Lauder Cos., Inc. | | | 14,450 | | | | 2,119,960 | |
The accompanying notes are an integral part of the financial statements.
71
Pacer Trendpilot® US Large Cap ETF
SCHEDULE OF INVESTMENTS
April 30, 2024 (Continued)
| | | Shares | | | Value | |
COMMON STOCKS — 97.8% (Continued) |
| | | | | | | | | |
Consumer Staples — 6.1% (Continued) |
General Mills, Inc. | | | 36,367 | | | $ | 2,562,419 | |
Hershey Co. | | | 9,340 | | | | 1,811,213 | |
Hormel Foods Corp. | | | 17,980 | | | | 639,369 | |
J M Smucker Co. | | | 6,655 | | | | 764,327 | |
Kellanova | | | 16,396 | | | | 948,673 | |
Kenvue, Inc. | | | 107,184 | | | | 2,017,203 | |
Keurig Dr Pepper, Inc. | | | 62,592 | | | | 2,109,350 | |
Kimberly-Clark Corp. | | | 20,974 | | | | 2,863,580 | |
Kroger Co. | | | 41,031 | | | | 2,272,297 | |
Lamb Weston Holdings, Inc.(b) | | | 9,040 | | | | 753,394 | |
McCormick & Co., Inc. | | | 15,593 | | | | 1,186,004 | |
Molson Coors Beverage Co. - Class B(b) | | | 11,525 | | | | 659,922 | |
Mondelez International, Inc. - Class A | | | 84,654 | | | | 6,090,009 | |
Monster Beverage Corp.(a) | | | 46,218 | | | | 2,470,352 | |
PepsiCo, Inc. | | | 84,366 | | | | 14,840,822 | |
Philip Morris International, Inc. | | | 94,955 | | | | 9,015,028 | |
Procter & Gamble Co. | | | 145,385 | | | | 23,726,831 | |
Sysco Corp. | | | 31,357 | | | | 2,330,452 | |
Target Corp. | | | 28,664 | | | | 4,614,331 | |
The Kraft Heinz Co. | | | 49,637 | | | | 1,916,485 | |
Tyson Foods, Inc. - Class A | | | 17,778 | | | | 1,078,236 | |
Walgreens Boots Alliance, Inc. | | | 44,579 | | | | 790,386 | |
Walmart, Inc. | | | 265,465 | | | | 15,755,347 | |
| | | | | | | 161,405,178 | |
| |
Energy — 4.1% |
APA Corp.(b) | | | 19,129 | | | | 601,416 | |
Baker Hughes Co. | | | 62,837 | | | | 2,049,743 | |
Chevron Corp. | | | 109,104 | | | | 17,595,202 | |
ConocoPhillips | | | 72,791 | | | | 9,144,005 | |
Coterra Energy, Inc. | | | 47,151 | | | | 1,290,051 | |
Devon Energy Corp. | | | 39,897 | | | | 2,041,928 | |
Diamondback Energy, Inc. | | | 11,125 | | | | 2,237,571 | |
EOG Resources, Inc.(b) | | | 36,258 | | | | 4,790,770 | |
EQT Corp.(b) | | | 22,554 | | | | 904,190 | |
Exxon Mobil Corp. | | | 247,220 | | | | 29,238,710 | |
Halliburton Co. | | | 55,890 | | | | 2,094,198 | |
Hess Corp. | | | 17,238 | | | | 2,714,813 | |
Kinder Morgan, Inc. | | | 120,599 | | | | 2,204,550 | |
Marathon Oil Corp. | | | 37,718 | | | | 1,012,728 | |
Marathon Petroleum Corp. | | | 23,688 | | | | 4,304,583 | |
Occidental Petroleum Corp. | | | 41,258 | | | | 2,728,804 | |
ONEOK, Inc. | | | 36,286 | | | | 2,870,948 | |
Phillips 66 | | | 26,588 | | | | 3,807,667 | |
Pioneer Natural Resources Co. | | | 14,556 | | | | 3,920,222 | |
Schlumberger Ltd. | | | 88,423 | | | | 4,198,324 | |
| | | Shares | | | Value | |
Energy — 4.1% (Continued) | | | | | | | | |
Targa Resources Corp. | | | 13,910 | | | $ | 1,586,575 | |
Valero Energy Corp. | | | 20,364 | | | | 3,255,593 | |
Williams Cos., Inc. | | | 75,616 | | | | 2,900,630 | |
| | | | | | | 107,493,221 | |
| |
Financials — 13.2% |
Aflac, Inc. | | | 31,896 | | | | 2,668,100 | |
Allstate Corp. | | | 16,304 | | | | 2,772,658 | |
American Express Co. | | | 35,152 | | | | 8,226,623 | |
American International Group, Inc.(b) | | | 42,199 | | | | 3,178,007 | |
Ameriprise Financial, Inc. | | | 6,353 | | | | 2,616,102 | |
Aon PLC - Class A | | | 12,068 | | | | 3,403,297 | |
Arch Capital Group Ltd.(a) | | | 23,151 | | | | 2,165,545 | |
Arthur J Gallagher & Co. | | | 13,410 | | | | 3,147,193 | |
Assurant, Inc. | | | 3,327 | | | | 580,229 | |
Bank of America Corp. | | | 428,031 | | | | 15,841,427 | |
Bank of New York Mellon Corp. | | | 48,442 | | | | 2,736,489 | |
Berkshire Hathaway, Inc. - Class B(a) | | | 112,859 | | | | 44,774,550 | |
BlackRock, Inc. | | | 8,526 | | | | 6,434,061 | |
Blackstone, Inc. | | | 44,202 | | | | 5,154,395 | |
Brown & Brown, Inc. | | | 14,653 | | | | 1,194,806 | |
Capital One Financial Corp.(b) | | | 23,691 | | | | 3,398,000 | |
Cboe Global Markets, Inc. | | | 6,555 | | | | 1,187,438 | |
Charles Schwab Corp. | | | 92,467 | | | | 6,837,935 | |
Chubb Ltd. | | | 24,834 | | | | 6,174,725 | |
Cincinnati Financial Corp. | | | 9,780 | | | | 1,131,448 | |
Citigroup, Inc. | | | 116,612 | | | | 7,151,814 | |
Citizens Financial Group, Inc. | | | 29,411 | | | | 1,003,209 | |
CME Group, Inc. | | | 22,348 | | | | 4,685,035 | |
Comerica, Inc. | | | 8,198 | | | | 411,294 | |
Corpay, Inc.(a)(b) | | | 4,570 | | | | 1,380,780 | |
Discover Financial Services | | | 15,601 | | | | 1,977,115 | |
Everest Group Ltd. | | | 2,685 | | | | 983,811 | |
FactSet Research Systems, Inc. | | | 2,385 | | | | 994,283 | |
Fidelity National Information Services, Inc. | | | 36,869 | | | | 2,504,142 | |
Fifth Third Bancorp | | | 42,382 | | | | 1,545,248 | |
Fiserv, Inc.(a) | | | 36,469 | | | | 5,567,722 | |
Franklin Resources, Inc.(b) | | | 17,649 | | | | 403,103 | |
Global Payments, Inc. | | | 16,203 | | | | 1,989,242 | |
Globe Life, Inc. | | | 5,410 | | | | 412,080 | |
Goldman Sachs Group, Inc. | | | 19,960 | | | | 8,517,132 | |
Hartford Financial Services Group, Inc. | | | 19,032 | | | | 1,844,010 | |
Huntington Bancshares, Inc. | | | 90,048 | | | | 1,212,947 | |
Intercontinental Exchange, Inc. | | | 35,554 | | | | 4,577,933 | |
Invesco Ltd. | | | 27,929 | | | | 395,754 | |
Jack Henry & Associates, Inc. | | | 4,570 | | | | 743,493 | |
JPMorgan Chase & Co. | | | 179,337 | | | | 34,386,075 | |
The accompanying notes are an integral part of the financial statements.
72
Pacer Trendpilot® US Large Cap ETF
SCHEDULE OF INVESTMENTS
April 30, 2024 (Continued)
| | | Shares | | | Value | |
COMMON STOCKS — 97.8% (Continued) |
| | | | | | | | | |
Financials — 13.2% (Continued) | | | | | | | | |
KeyCorp. | | | 58,260 | | | $ | 844,187 | |
Loews Corp. | | | 11,533 | | | | 866,705 | |
M&T Bank Corp. | | | 10,300 | | | | 1,487,217 | |
MarketAxess Holdings, Inc. | | | 2,385 | | | | 477,215 | |
Marsh & McLennan Cos., Inc. | | | 30,748 | | | | 6,132,074 | |
Mastercard, Inc. - Class A | | | 51,105 | | | | 23,058,576 | |
MetLife, Inc. | | | 39,261 | | | | 2,790,672 | |
Moody’s Corp. | | | 9,780 | | | | 3,621,827 | |
Morgan Stanley | | | 77,185 | | | | 7,011,485 | |
MSCI, Inc. | | | 4,870 | | | | 2,268,397 | |
Nasdaq, Inc. | | | 23,601 | | | | 1,412,520 | |
Northern Trust Corp. | | | 12,868 | | | | 1,060,195 | |
PayPal Holdings, Inc.(a) | | | 65,263 | | | | 4,432,663 | |
PNC Financial Services Group, Inc. | | | 24,733 | | | | 3,790,580 | |
Principal Financial Group, Inc. | | | 13,818 | | | | 1,093,557 | |
Progressive Corp. | | | 36,461 | | | | 7,593,003 | |
Prudential Financial, Inc. | | | 22,548 | | | | 2,491,103 | |
Raymond James Financial, Inc. | | | 11,733 | | | | 1,431,426 | |
Regions Financial Corp. | | | 58,358 | | | | 1,124,559 | |
S&P Global, Inc. | | | 19,849 | | | | 8,253,810 | |
State Street Corp. | | | 18,084 | | | | 1,310,909 | |
Synchrony Financial | | | 25,992 | | | | 1,143,128 | |
T Rowe Price Group, Inc. | | | 13,910 | | | | 1,524,119 | |
Travelers Cos., Inc. | | | 14,219 | | | | 3,016,703 | |
Truist Financial Corp. | | | 82,871 | | | | 3,111,806 | |
US Bancorp | | | 96,857 | | | | 3,935,300 | |
Visa, Inc. - Class A(b) | | | 98,389 | | | | 26,428,269 | |
W R Berkley Corp. | | | 12,668 | | | | 975,056 | |
Wells Fargo & Co. | | | 223,117 | | | | 13,235,300 | |
Willis Towers Watson PLC | | | 6,553 | | | | 1,645,720 | |
| | | | | | | 343,877,331 | |
| |
Health Care — 12.2% |
Abbott Laboratories | | | 106,356 | | | | 11,270,545 | |
AbbVie, Inc. | | | 108,786 | | | | 17,692,955 | |
Agilent Technologies, Inc. | | | 18,344 | | | | 2,513,862 | |
Align Technology, Inc.(a) | | | 4,470 | | | | 1,262,239 | |
Amgen, Inc. | | | 32,754 | | | | 8,972,631 | |
Baxter International, Inc. | | | 31,488 | | | | 1,271,171 | |
Becton Dickinson & Co. | | | 18,080 | | | | 4,241,568 | |
Biogen, Inc.(a) | | | 9,040 | | | | 1,941,973 | |
Bio-Rad Laboratories, Inc. - Class A(a) | | | 1,339 | | | | 361,195 | |
Bio-Techne Corp.(b) | | | 9,780 | | | | 618,194 | |
Boston Scientific Corp.(a) | | | 91,132 | | | | 6,549,657 | |
Bristol-Myers Squibb Co. | | | 124,054 | | | | 5,450,933 | |
Cardinal Health, Inc. | | | 15,793 | | | | 1,627,311 | |
Catalent, Inc.(a)(b) | | | 11,225 | | | | 626,916 | |
| | | Shares | | | Value | |
Health Care — 12.2% (Continued) | | | | | | | | |
Cencora, Inc. | | | 10,383 | | | $ | 2,482,056 | |
Centene Corp.(a) | | | 33,650 | | | | 2,458,469 | |
Charles River Laboratories International, Inc.(a) | | | 3,227 | | | | 738,983 | |
Cigna Corp. | | | 17,853 | | | | 6,374,235 | |
Cooper Cos., Inc. | | | 12,488 | | | | 1,112,181 | |
CVS Health Corp. | | | 79,943 | | | | 5,412,941 | |
Danaher Corp. | | | 40,241 | | | | 9,924,235 | |
DaVita, Inc.(a) | | | 3,327 | | | | 462,486 | |
DexCom, Inc.(a) | | | 24,094 | | | | 3,069,335 | |
Edwards Lifesciences Corp.(a) | | | 37,812 | | | | 3,201,542 | |
Elevance Health, Inc. | | | 14,343 | | | | 7,581,423 | |
Eli Lilly & Co. | | | 49,419 | | | | 38,601,180 | |
GE HealthCare Technologies, Inc. | | | 26,232 | | | | 1,999,928 | |
Gilead Sciences, Inc. | | | 77,498 | | | | 5,052,870 | |
HCA Healthcare, Inc.(b) | | | 11,927 | | | | 3,695,223 | |
Henry Schein, Inc.(a) | | | 8,098 | | | | 561,029 | |
Hologic, Inc.(a) | | | 15,262 | | | | 1,156,402 | |
Humana, Inc. | | | 7,695 | | | | 2,324,583 | |
IDEXX Laboratories, Inc.(a) | | | 5,210 | | | | 2,567,280 | |
Illumina, Inc.(a) | | | 9,880 | | | | 1,215,734 | |
Incyte Corp.(a) | | | 11,525 | | | | 599,876 | |
Insulet Corp.(a) | | | 4,386 | | | | 754,129 | |
Intuitive Surgical, Inc.(a) | | | 21,809 | | | | 8,082,852 | |
IQVIA Holdings, Inc.(a) | | | 11,425 | | | | 2,647,972 | |
Johnson & Johnson | | | 148,539 | | | | 21,477,254 | |
Laboratory Corp. of America Holdings | | | 4,898 | | | | 986,310 | |
McKesson Corp. | | | 8,006 | | | | 4,300,903 | |
Medtronic PLC | | | 82,811 | | | | 6,644,755 | |
Merck & Co., Inc. | | | 156,114 | | | | 20,173,051 | |
Mettler-Toledo International, Inc.(a) | | | 1,339 | | | | 1,646,568 | |
Moderna, Inc.(a)(b) | | | 20,565 | | | | 2,268,525 | |
Molina Healthcare, Inc.(a) | | | 3,628 | | | | 1,241,139 | |
Pfizer, Inc. | | | 346,365 | | | | 8,873,871 | |
Quest Diagnostics, Inc. | | | 6,955 | | | | 961,042 | |
Regeneron Pharmaceuticals, Inc.(a) | | | 6,655 | | | | 5,927,342 | |
ResMed, Inc.(b) | | | 9,140 | | | | 1,955,869 | |
Revvity, Inc.(b) | | | 7,697 | | | | 788,712 | |
Solventum Corp.(a) | | | 8,597 | | | | 558,891 | |
STERIS PLC | | | 6,113 | | | | 1,250,475 | |
Stryker Corp. | | | 20,974 | | | | 7,057,751 | |
Teleflex, Inc. | | | 2,925 | | | | 610,594 | |
Thermo Fisher Scientific, Inc. | | | 23,996 | | | | 13,647,005 | |
UnitedHealth Group, Inc. | | | 57,167 | | | | 27,651,677 | |
Universal Health Services, Inc. - Class B | | | 3,845 | | | | 655,303 | |
Vertex Pharmaceuticals, Inc.(a) | | | 15,715 | | | | 6,173,009 | |
Viatris, Inc. | | | 74,581 | | | | 862,902 | |
The accompanying notes are an integral part of the financial statements.
73
Pacer Trendpilot® US Large Cap ETF
SCHEDULE OF INVESTMENTS
April 30, 2024 (Continued)
| | | Shares | | | Value | |
COMMON STOCKS — 97.8% (Continued) |
| | | | | | | | | |
Health Care — 12.2% (Continued) | | | | | | | | |
Waters Corp.(a) | | | 3,628 | | | $ | 1,121,197 | |
West Pharmaceutical Services, Inc. | | | 4,570 | | | | 1,633,684 | |
Zimmer Biomet Holdings, Inc. | | | 12,977 | | | | 1,560,874 | |
Zoetis, Inc.(b) | | | 27,930 | | | | 4,447,573 | |
| | | | | | | 320,954,370 | |
| |
Industrials — 8.8% |
3M Co. | | | 34,367 | | | | 3,316,759 | |
A O Smith Corp.(b) | | | 7,797 | | | | 645,903 | |
Allegion PLC | | | 5,512 | | | | 670,039 | |
American Airlines Group, Inc.(a) | | | 40,696 | | | | 549,803 | |
AMETEK, Inc. | | | 14,350 | | | | 2,506,371 | |
Automatic Data Processing, Inc. | | | 25,054 | | | | 6,060,312 | |
Axon Enterprise, Inc.(a) | | | 4,350 | | | | 1,364,421 | |
Boeing Co.(a) | | | 35,299 | | | | 5,924,584 | |
Broadridge Financial Solutions, Inc. | | | 7,356 | | | | 1,422,724 | |
Builders FirstSource, Inc.(a) | | | 7,719 | | | | 1,411,188 | |
Carrier Global Corp.(b) | | | 52,154 | | | | 3,206,949 | |
Caterpillar, Inc. | | | 31,696 | | | | 10,604,531 | |
CH Robinson Worldwide, Inc.(b) | | | 7,255 | | | | 515,105 | |
Cintas Corp. | | | 5,412 | | | | 3,562,936 | |
Copart, Inc.(a) | | | 54,064 | | | | 2,936,216 | |
CSX Corp. | | | 119,555 | | | | 3,971,617 | |
Cummins, Inc. | | | 8,840 | | | | 2,497,212 | |
Dayforce Inc.(a)(b) | | | 9,641 | | | | 591,668 | |
Deere & Co. | | | 16,322 | | | | 6,388,594 | |
Delta Air Lines, Inc. | | | 39,989 | | | | 2,002,249 | |
Dover Corp.(b) | | | 8,738 | | | | 1,566,723 | |
Eaton Corp. PLC | | | 24,833 | | | | 7,903,351 | |
Emerson Electric Co. | | | 35,587 | | | | 3,835,567 | |
Equifax, Inc.(b) | | | 7,597 | | | | 1,672,783 | |
Expeditors International of Washington, Inc. | | | 9,248 | | | | 1,029,395 | |
Fastenal Co. | | | 35,531 | | | | 2,413,976 | |
FedEx Corp. | | | 14,450 | | | | 3,782,721 | |
Fortive Corp. | | | 21,900 | | | | 1,648,413 | |
GE Vernova, Inc.(a) | | | 16,639 | | | | 2,557,581 | |
Generac Holdings, Inc.(a) | | | 3,828 | | | | 520,455 | |
General Dynamics Corp. | | | 14,111 | | | | 4,051,127 | |
General Electric Co. | | | 66,545 | | | | 10,768,313 | |
Honeywell International, Inc. | | | 40,325 | | | | 7,771,837 | |
Howmet Aerospace, Inc. | | | 24,386 | | | | 1,627,766 | |
Hubbell, Inc.(b) | | | 3,315 | | | | 1,228,274 | |
Huntington Ingalls Industries, Inc. | | | 2,485 | | | | 688,171 | |
IDEX Corp. | | | 4,670 | | | | 1,029,548 | |
Illinois Tool Works, Inc. | | | 16,618 | | | | 4,056,620 | |
Ingersoll Rand, Inc. | | | 25,135 | | | | 2,345,598 | |
Jacobs Solutions, Inc. | | | 7,797 | | | | 1,119,103 | |
| | | Shares | | | Value | |
Industrials — 8.8% (Continued) | | | | | | | | |
JB Hunt Trasport Services, Inc. | | | 5,079 | | | $ | 825,693 | |
Johnson Controls International PLC | | | 42,282 | | | | 2,751,290 | |
L3Harris Technologies, Inc. | | | 11,726 | | | | 2,509,950 | |
Leidos Holdings, Inc. | | | 8,507 | | | | 1,192,852 | |
Lockheed Martin Corp. | | | 13,418 | | | | 6,238,431 | |
Masco Corp. | | | 14,010 | | | | 958,985 | |
Nordson Corp. | | | 3,327 | | | | 858,998 | |
Norfolk Southern Corp. | | | 14,119 | | | | 3,251,888 | |
Northrop Grumman Corp. | | | 8,838 | | | | 4,286,695 | |
Old Dominion Freight Line, Inc. | | | 11,224 | | | | 2,039,513 | |
Otis Worldwide Corp. | | | 25,644 | | | | 2,338,733 | |
PACCAR, Inc. | | | 32,556 | | | | 3,454,517 | |
Parker-Hannifin Corp. | | | 7,998 | | | | 4,358,190 | |
Paychex, Inc. | | | 19,932 | | | | 2,368,121 | |
Paycom Software, Inc. | | | 3,025 | | | | 568,640 | |
Pentair PLC | | | 10,283 | | | | 813,282 | |
Quanta Services, Inc. | | | 9,040 | | | | 2,337,382 | |
Republic Services, Inc. | | | 12,768 | | | | 2,447,626 | |
Robert Half, Inc. | | | 6,653 | | | | 459,988 | |
Rockwell Automation, Inc. | | | 7,155 | | | | 1,938,719 | |
Rollins, Inc. | | | 17,459 | | | | 777,973 | |
RTX Corp. | | | 82,174 | | | | 8,342,304 | |
Snap-On, Inc. | | | 3,327 | | | | 891,503 | |
Southwest Airlines Co. | | | 37,070 | | | | 961,596 | |
Stanley Black & Decker, Inc. | | | 9,541 | | | | 872,047 | |
Textron, Inc. | | | 12,365 | | | | 1,045,955 | |
Trane Technologies PLC | | | 14,219 | | | | 4,512,257 | |
TransDigm Group, Inc. | | | 3,428 | | | | 4,278,247 | |
Uber Technologies, Inc.(a) | | | 125,738 | | | | 8,332,657 | |
Union Pacific Corp. | | | 37,302 | | | | 8,846,542 | |
United Airlines Holdings, Inc.(a) | | | 20,365 | | | | 1,047,983 | |
United Parcel Service, Inc. - Class B | | | 44,967 | | | | 6,631,733 | |
United Rentals, Inc. | | | 4,268 | | | | 2,850,981 | |
Veralto Corp. | | | 13,614 | | | | 1,275,360 | |
Verisk Analytics, Inc. | | | 9,003 | | | | 1,962,294 | |
W.W. Grainger, Inc. | | | 2,785 | | | | 2,565,960 | |
Waste Management, Inc. | | | 22,958 | | | | 4,775,723 | |
Westinghouse Air Brake Technologies Corp. | | | 11,125 | | | | 1,792,015 | |
Xylem, Inc. | | | 14,964 | | | | 1,955,795 | |
| | | | | | | 231,484,921 | |
| |
Information Technology — 29.1%(c) |
Accenture PLC - Class A | | | 38,506 | | | | 11,586,840 | |
Adobe, Inc.(a) | | | 28,263 | | | | 13,080,964 | |
Advanced Micro Devices, Inc.(a) | | | 100,143 | | | | 15,860,648 | |
Akamai Technologies, Inc.(a) | | | 9,448 | | | | 953,587 | |
Amphenol Corp. - Class A | | | 37,070 | | | | 4,476,944 | |
Analog Devices, Inc. | | | 30,367 | | | | 6,091,924 | |
ANSYS, Inc.(a) | | | 5,412 | | | | 1,758,251 | |
The accompanying notes are an integral part of the financial statements.
74
Pacer Trendpilot® US Large Cap ETF
SCHEDULE OF INVESTMENTS
April 30, 2024 (Continued)
| | | Shares | | | Value | |
COMMON STOCKS — 97.8% (Continued) |
| | | | | | | | | |
Information Technology — 29.1%(c) (Continued) |
Apple, Inc. | | | 900,219 | | | $ | 153,334,303 | |
Applied Materials, Inc. | | | 51,151 | | | | 10,161,146 | |
Arista Networks, Inc.(a) | | | 15,595 | | | | 4,001,053 | |
Autodesk, Inc.(a) | | | 13,308 | | | | 2,832,608 | |
Broadcom, Inc. | | | 27,308 | | | | 35,507,773 | |
Cadence Design System, Inc.(a) | | | 16,938 | | | | 4,668,621 | |
CDW Corp. | | | 8,298 | | | | 2,006,954 | |
Cisco Systems, Inc. | | | 251,992 | | | | 11,838,584 | |
Cognizant Technology Solutions Corp. - Class A | | | 31,357 | | | | 2,059,528 | |
Corning, Inc. | | | 47,784 | | | | 1,595,030 | |
Enphase Energy, Inc.(a) | | | 8,499 | | | | 924,351 | |
EPAM Systems, Inc.(a) | | | 3,628 | | | | 853,523 | |
F5, Inc.(a) | | | 3,728 | | | | 616,276 | |
Fair Isaac Corp.(a) | | | 1,568 | | | | 1,777,061 | |
First Solar, Inc.(a) | | | 6,647 | | | | 1,171,866 | |
Fortinet, Inc.(a) | | | 38,061 | | | | 2,404,694 | |
Gartner, Inc.(a) | | | 4,870 | | | | 2,009,313 | |
Gen Digital, Inc. | | | 35,024 | | | | 705,383 | |
Hewlett Packard Enterprise Co. | | | 80,286 | | | | 1,364,862 | |
HP, Inc. | | | 53,915 | | | | 1,514,472 | |
Intel Corp. | | | 259,094 | | | | 7,894,594 | |
International Business Machines Corp. | | | 56,669 | | | | 9,418,388 | |
Intuit, Inc. | | | 17,167 | | | | 10,740,019 | |
Jabil, Inc. | | | 8,019 | | | | 941,110 | |
Juniper Networks, Inc. | | | 19,932 | | | | 694,032 | |
Keysight Technologies, Inc.(a) | | | 11,123 | | | | 1,645,537 | |
KLA Corp. | | | 8,257 | | | | 5,691,468 | |
Lam Research Corp. | | | 8,015 | | | | 7,168,696 | |
Microchip Technology, Inc. | | | 33,873 | | | | 3,115,639 | |
Micron Technology, Inc. | | | 68,191 | | | | 7,702,855 | |
Microsoft Corp. | | | 460,846 | | | | 179,421,174 | |
Monolithic Power Systems, Inc. | | | 3,022 | | | | 2,022,715 | |
Motorola Solutions, Inc. | | | 10,383 | | | | 3,521,394 | |
NetApp, Inc. | | | 13,077 | | | | 1,336,600 | |
NVIDIA Corp. | | | 153,208 | | | | 132,374,777 | |
NXP Semiconductors NV | | | 15,995 | | | | 4,097,759 | |
ON Semiconductor Corp.(a) | | | 26,787 | | | | 1,879,376 | |
Oracle Corp. | | | 98,835 | | | | 11,242,481 | |
Palo Alto Networks, Inc.(a) | | | 19,055 | | | | 5,542,909 | |
PTC, Inc.(a)(b) | | | 7,391 | | | | 1,311,459 | |
Qorvo, Inc.(a) | | | 6,121 | | | | 715,178 | |
QUALCOMM, Inc. | | | 69,257 | | | | 11,486,273 | |
Roper Technologies, Inc. | | | 6,655 | | | | 3,403,766 | |
salesforce.com, Inc. | | | 59,925 | | | | 16,116,230 | |
Seagate Technology Holdings PLC | | | 11,934 | | | | 1,025,250 | |
ServiceNow, Inc.(a) | | | 12,568 | | | | 8,713,771 | |
| | | Shares | | | Value | |
Information Technology — 29.1%(c) (Continued) |
Skyworks Solutions, Inc. | | | 9,882 | | | $ | 1,053,322 | |
Super Micro Computer, Inc.(a)(b) | | | 3,040 | | | | 2,610,752 | |
Synopsys, Inc.(a) | | | 9,440 | | | | 5,008,770 | |
TE Connectivity Ltd. | | | 19,531 | | | | 2,763,246 | |
Teledyne Technologies, Inc.(a) | | | 2,925 | | | | 1,115,829 | |
Teradyne, Inc.(b) | | | 9,549 | | | | 1,110,740 | |
Texas Instruments, Inc. | | | 55,586 | | | | 9,806,482 | |
Trimble, Inc.(a) | | | 15,493 | | | | 930,665 | |
Tyler Technologies, Inc.(a) | | | 2,585 | | | | 1,193,107 | |
VeriSign, Inc.(a) | | | 5,612 | | | | 951,122 | |
Western Digital Corp.(a) | | | 19,915 | | | | 1,410,579 | |
Zebra Technologies Corp. - Class A(a)(b) | | | 3,227 | | | | 1,015,085 | |
| | | | | | | 763,349,708 | |
| |
Materials — 2.4% |
Air Products & Chemicals, Inc. | | | 13,810 | | | | 3,263,855 | |
Albemarle Corp.(b) | | | 7,256 | | | | 872,969 | |
Amcor PLC | | | 91,515 | | | | 818,144 | |
Avery Dennison Corp. | | | 4,970 | | | | 1,079,882 | |
Ball Corp. | | | 19,623 | | | | 1,365,172 | |
Celanese Corp.(b) | | | 6,214 | | | | 954,533 | |
CF Industries Holdings, Inc. | | | 12,065 | | | | 952,773 | |
Corteva, Inc. | | | 44,156 | | | | 2,390,164 | |
Dow, Inc. | | | 43,725 | | | | 2,487,953 | |
DuPont de Nemours, Inc. | | | 26,771 | | | | 1,940,898 | |
Eastman Chemical Co. | | | 7,364 | | | | 695,456 | |
Ecolab, Inc. | | | 15,795 | | | | 3,572,039 | |
FMC Corp. | | | 7,797 | | | | 460,101 | |
Freeport-McMoRan, Inc. | | | 89,226 | | | | 4,455,946 | |
International Flavors & Fragrances, Inc. | | | 15,895 | | | | 1,345,512 | |
International Paper Co. | | | 21,516 | | | | 751,769 | |
Linde PLC | | | 30,031 | | | | 13,242,470 | |
LyondellBasell Industries NV - Class A | | | 15,895 | | | | 1,589,023 | |
Martin Marietta Materials, Inc. | | | 3,828 | | | | 2,247,304 | |
Mosaic Co. | | | 20,673 | | | | 648,925 | |
Newmont Goldcorp Corp.(b) | | | 71,695 | | | | 2,913,685 | |
Nucor Corp. | | | 15,493 | | | | 2,611,035 | |
Packaging Corp. of America | | | 5,612 | | | | 970,764 | |
PPG Industries, Inc. | | | 14,653 | | | | 1,890,237 | |
Sherwin-Williams Co. | | | 14,281 | | | | 4,278,730 | |
Steel Dynamics, Inc. | | | 9,649 | | | | 1,255,528 | |
Vulcan Materials Co. | | | 8,298 | | | | 2,137,814 | |
Westrock Co. | | | 15,895 | | | | 762,324 | |
| | | | | | | 61,955,005 | |
| |
The accompanying notes are an integral part of the financial statements.
75
Pacer Trendpilot® US Large Cap ETF
SCHEDULE OF INVESTMENTS
April 30, 2024 (Continued)
| | | Shares | | | Value | |
COMMON STOCKS — 97.8% (Continued) |
| |
Real Estate — 0.2% |
CBRE Group, Inc. - Class A(a)(b) | | | 19,321 | | | $ | 1,678,802 | |
CoStar Group, Inc.(a)(b) | | | 25,436 | | | | 2,328,157 | |
| | | | | | | 4,006,959 | |
| |
Utilities — 2.3% |
AES Corp. | | | 41,640 | | | | 745,356 | |
Alliant Energy Corp. | | | 15,695 | | | | 781,611 | |
Ameren Corp. | | | 16,296 | | | | 1,203,786 | |
American Electric Power Co., Inc. | | | 32,091 | | | | 2,760,789 | |
American Water Works Co., Inc. | | | 12,094 | | | | 1,479,338 | |
Atmos Energy Corp. | | | 9,240 | | | | 1,089,396 | |
CenterPoint Energy, Inc. | | | 39,255 | | | | 1,143,891 | |
CMS Energy Corp. | | | 18,180 | | | | 1,101,890 | |
Consolidated Edison, Inc. | | | 21,416 | | | | 2,021,670 | |
Constellation Energy Corp. | | | 20,063 | | | | 3,730,514 | |
Dominion Energy, Inc. | | | 52,022 | | | | 2,652,082 | |
DTE Energy Co. | | | 12,813 | | | | 1,413,530 | |
Duke Energy Corp. | | | 47,977 | | | | 4,714,220 | |
Edison International | | | 23,893 | | | | 1,697,837 | |
Entergy Corp. | | | 13,200 | | | | 1,408,044 | |
Evergy, Inc.(b) | | | 14,350 | | | | 752,658 | |
Eversource Energy | | | 21,708 | | | | 1,315,939 | |
Exelon Corp. | | | 61,905 | | | | 2,326,390 | |
FirstEnergy Corp. | | | 32,107 | | | | 1,230,982 | |
NextEra Energy, Inc. | | | 125,334 | | | | 8,393,617 | |
NiSource, Inc. | | | 25,767 | | | | 717,869 | |
NRG Energy, Inc.(b) | | | 14,219 | | | | 1,033,295 | |
PG&E Corp. | | | 130,095 | | | | 2,225,925 | |
Pinnacle West Capital Corp.(b) | | | 7,055 | | | | 519,601 | |
PPL Corp. | | | 45,869 | | | | 1,259,563 | |
Public Service Enterprise Group, Inc. | | | 31,040 | | | | 2,144,243 | |
Sempra | | | 39,093 | | | | 2,800,232 | |
Southern Co. | | | 67,818 | | | | 4,984,622 | |
WEC Energy Group, Inc. | | | 19,624 | | | | 1,621,727 | |
Xcel Energy, Inc. | | | 34,276 | | | | 1,841,649 | |
| | | | | | | 61,112,266 | |
TOTAL COMMON STOCKS (Cost $2,152,003,959) | | | | | | | 2,564,503,022 | |
| |
| | | Shares | | | Value | |
REAL ESTATE INVESTMENT TRUSTS — 2.0% |
Alexandria Real Estate Equities, Inc.(b) | | | 9,694 | | | $ | 1,123,244 | |
American Tower Corp. | | | 28,972 | | | | 4,970,436 | |
AvalonBay Communities, Inc. | | | 8,840 | | | | 1,675,799 | |
Boston Properties, Inc.(b) | | | 8,940 | | | | 553,297 | |
Camden Property Trust(b) | | | 6,655 | | | | 663,370 | |
Crown Castle, Inc. | | | 27,018 | | | | 2,533,748 | |
Digital Realty Trust, Inc. | | | 18,816 | | | | 2,611,284 | |
Equinix, Inc. | | | 5,813 | | | | 4,133,682 | |
Equity Residential | | | 21,508 | | | | 1,385,115 | |
Essex Property Trust, Inc. | | | 3,937 | | | | 969,486 | |
Extra Space Storage, Inc. | | | 13,084 | | | | 1,756,920 | |
Federal Realty Investment Trust | | | 4,570 | | | | 476,057 | |
Healthpeak Properties, Inc. | | | 43,879 | | | | 816,588 | |
Host Hotels & Resorts, Inc.(b) | | | 44,257 | | | | 835,130 | |
Invitation Homes, Inc. | | | 35,727 | | | | 1,221,863 | |
Iron Mountain, Inc. | | | 18,180 | | | | 1,409,314 | |
Kimco Realty Corp. | | | 38,549 | | | | 718,168 | |
Mid-America Apartment Communities, Inc. | | | 7,255 | | | | 943,150 | |
Prologis, Inc. | | | 57,435 | | | | 5,861,242 | |
Public Storage | | | 9,880 | | | | 2,563,366 | |
Realty Income Corp. | | | 51,469 | | | | 2,755,650 | |
Regency Centers Corp. | | | 10,175 | | | | 602,564 | |
SBA Communications Corp. | | | 6,755 | | | | 1,257,241 | |
Simon Property Group, Inc. | | | 20,365 | | | | 2,861,893 | |
UDR, Inc. | | | 18,920 | | | | 720,474 | |
Ventas, Inc. | | | 25,035 | | | | 1,108,550 | |
VICI Properties, Inc. | | | 63,023 | | | | 1,799,307 | |
Welltower, Inc.(b) | | | 34,512 | | | | 3,288,303 | |
Weyerhaeuser Co. | | | 45,467 | | | | 1,371,739 | |
TOTAL REAL ESTATE INVESTMENT TRUSTS (Cost $54,994,447) | | | | | | | 52,986,980 | |
| |
The accompanying notes are an integral part of the financial statements.
76
Pacer Trendpilot® US Large Cap ETF
SCHEDULE OF INVESTMENTS
April 30, 2024 (Continued)
| | | Units | | | Value | |
INVESTMENTS PURCHASED WITH PROCEEDS FROM SECURITIES LENDING — 3.7% |
Mount Vernon Liquid Assets Portfolio, LLC – 5.51%(d) | | | 95,811,917 | | | $ | 95,811,917 | |
TOTAL INVESTMENTS PURCHASED WITH PROCEEDS FROM SECURITIES LENDING (Cost $95,811,917) | | | | | | | 95,811,917 | |
| |
TOTAL INVESTMENTS — 103.5% (Cost $2,302,810,323) | | | | | | | 2,713,301,919 | |
Liabilities in Excess of Other Assets — (3.5)% | | | | | | | (93,520,175 | ) |
TOTAL NET ASSETS — 100.0% | | | | | | $ | 2,619,781,744 | |
Percentages are stated as a percent of net assets.
NV - Naamloze Vennootschap
PLC - Public Limited Company
SA - Sociedad Anónima
| | (a) | Non-income producing security. |
| | (b) | All or a portion of this security is on loan as of April 30, 2024. The total market value of these securities was $92,102,045 which represented 3.5% of net assets. |
| | (c) | To the extent that the Fund invests more heavily in a particular industry or sector of the economy, its performance will be especially sensitive to developments that significantly affect those industries or sectors. |
| | (d) | The rate shown represents the 7-day effective yield as of April 30, 2024. |
The Global Industry Classification Standard (GICS®) was developed by and/or is the exclusive property of MSCI, Inc. and Standard & Poor’s Financial Services LLC (“S&P”). GICS is a service mark of MSCI, Inc. and S&P and has been licensed for use by U.S. Bank Global Fund Services.
The accompanying notes are an integral part of the financial statements.
77
Pacer Trendpilot® US Mid Cap ETF
SCHEDULE OF INVESTMENTS
April 30, 2024
| | | Shares | | | Value | |
COMMON STOCKS — 92.6% |
| |
Communication Services — 1.4% |
Frontier Communications Parent, Inc.(a)(b) | | | 32,813 | | | $ | 759,293 | |
Iridium Communications, Inc. | | | 18,374 | | | | 565,735 | |
New York Times Co. - Class A | | | 24,590 | | | | 1,058,108 | |
Nexstar Media Group, Inc. | | | 4,782 | | | | 765,407 | |
TEGNA, Inc. | | | 29,221 | | | | 398,574 | |
TKO Group Holdings, Inc.(b) | | | 8,903 | | | | 842,847 | |
Ziff Davis, Inc.(a) | | | 6,817 | | | | 341,600 | |
ZoomInfo Technologies, Inc.(a) | | | 43,956 | | | | 697,142 | |
| | | | | | | 5,428,706 | |
| |
Consumer Discretionary — 15.2% |
Adient PLC(a) | | | 13,893 | | | | 414,984 | |
Aramark | | | 39,455 | | | | 1,243,227 | |
Autoliv, Inc. | | | 10,978 | | | | 1,315,055 | |
AutoNation, Inc.(a)(b) | | | 3,841 | | | | 618,977 | |
Boyd Gaming Corp. | | | 10,305 | | | | 551,421 | |
Brunswick Corp. (b) | | | 10,290 | | | | 829,786 | |
Burlington Stores, Inc.(a) | | | 9,556 | | | | 1,719,507 | |
Capri Holdings Ltd.(a)(b) | | | 17,434 | | | | 618,558 | |
Carter’s, Inc.(b) | | | 5,464 | | | | 373,792 | |
Choice Hotels International, Inc.(b) | | | 3,691 | | | | 436,498 | |
Churchill Downs, Inc. | | | 10,154 | | | | 1,309,866 | |
Columbia Sportswear Co.(b) | | | 5,115 | | | | 407,307 | |
Crocs, Inc.(a) | | | 9,052 | | | | 1,125,797 | |
Dick’s Sporting Goods, Inc. | | | 8,718 | | | | 1,751,795 | |
Duolingo, Inc.(a) | | | 5,350 | | | | 1,207,763 | |
Five Below, Inc.(a) | | | 8,270 | | | | 1,210,232 | |
Floor & Decor Holdings, Inc.(a)(b) | | | 15,880 | | | | 1,752,040 | |
GameStop Corp.(a)(b) | | | 39,856 | | | | 442,003 | |
Gap, Inc. | | | 32,162 | | | | 659,964 | |
Gentex Corp. | | | 35,085 | | | | 1,203,416 | |
Goodyear Tire & Rubber Co.(a) | | | 42,076 | | | | 503,229 | |
Graham Holdings Co. - Class B(b) | | | 528 | | | | 370,323 | |
Grand Canyon Education, Inc.(a) | | | 4,383 | | | | 569,878 | |
H&R Block, Inc. | | | 20,756 | | | | 980,306 | |
Harley-Davidson, Inc. | | | 18,800 | | | | 646,532 | |
Helen of Troy Ltd.(a) | | | 3,517 | | | | 326,061 | |
Hilton Grand Vacations, Inc.(a) | | | 10,571 | | | | 440,176 | |
Hyatt Hotels Corp. - Class A(b) | | | 6,608 | | | | 983,204 | |
KB Home | | | 11,057 | | | | 716,051 | |
Lear Corp.(b) | | | 8,541 | | | | 1,075,056 | |
Leggett & Platt, Inc. | | | 19,776 | | | | 357,352 | |
Light & Wonder, Inc.(a) | | | 13,497 | | | | 1,204,742 | |
Lithia Motors, Inc.(b) | | | 4,116 | | | | 1,047,028 | |
Macy’s, Inc. | | | 40,981 | | | | 755,280 | |
Marriott Vacations Worldwide Corp.(b) | | | 4,891 | | | | 470,074 | |
| | | Shares | | | Value | |
Consumer Discretionary — 15.2% (Continued) |
Mattel, Inc.(a) | | | 52,823 | | | $ | 967,717 | |
Murphy USA, Inc. | | | 2,835 | | | | 1,173,180 | |
Nordstrom, Inc.(b) | | | 14,390 | | | | 273,554 | |
Ollie’s Bargain Outlet Holdings, Inc.(a)(b) | | | 9,149 | | | | 669,158 | |
Penn Entertainment, Inc.(a)(b) | | | 22,514 | | | | 372,382 | |
Penske Automotive Group, Inc.(b) | | | 2,887 | | | | 441,451 | |
Planet Fitness, Inc. - Class A(a) | | | 12,668 | | | | 758,053 | |
Polaris, Inc.(b) | | | 7,875 | | | | 670,635 | |
PVH Corp. | | | 8,918 | | | | 970,278 | |
RH(a)(b) | | | 2,290 | | | | 565,745 | |
Service Corp. International (b) | | | 22,186 | | | | 1,590,958 | |
Skechers USA, Inc. - Class A(a) | | | 20,084 | | | | 1,326,548 | |
Taylor Morrison Home Corp.(a) | | | 15,945 | | | | 893,079 | |
Tempur Sealy International, Inc. | | | 25,865 | | | | 1,294,802 | |
Texas Roadhouse, Inc. | | | 9,990 | | | | 1,606,192 | |
Thor Industries, Inc.(b) | | | 7,905 | | | | 785,915 | |
Toll Brothers, Inc. | | | 15,595 | | | | 1,857,520 | |
TopBuild Corp.(a)(b) | | | 4,728 | | | | 1,913,280 | |
Travel + Leisure Co. | | | 10,743 | | | | 467,750 | |
Under Armour, Inc. - Class A(a) | | | 28,009 | | | | 188,501 | |
Under Armour, Inc. - Class C(a)(b) | | | 28,530 | | | | 186,016 | |
Vail Resorts, Inc. | | | 5,682 | | | | 1,076,000 | |
Valvoline, Inc.(a) | | | 19,473 | | | | 827,992 | |
Visteon Corp.(a) | | | 4,120 | | | | 455,796 | |
Wendy’s Co.(b) | | | 24,790 | | | | 495,552 | |
Whirlpool Corp.(b) | | | 8,264 | | | | 783,923 | |
Williams-Sonoma, Inc.(b) | | | 9,563 | | | | 2,742,476 | |
Wingstop, Inc. | | | 4,413 | | | | 1,698,078 | |
Wyndham Hotels & Resorts, Inc. | | | 12,452 | | | | 915,347 | |
YETI Holdings, Inc.(a)(b) | | | 12,880 | | | | 460,074 | |
| | | | | | | 58,065,232 | |
| |
Consumer Staples — 4.7% |
BellRing Brands, Inc.(a) | | | 19,658 | | | | 1,084,532 | |
BJ’s Wholesale Club Holdings, Inc.(a)(b) | | | 20,014 | | | | 1,494,646 | |
Boston Beer Co., Inc. - Class A(a) | | | 1,394 | | | | 388,104 | |
Casey’s General Stores, Inc. | | | 5,533 | | | | 1,768,235 | |
Celsius Holdings, Inc.(a) | | | 22,170 | | | | 1,580,056 | |
Coca-Cola Consolidated, Inc. | | | 692 | | | | 571,592 | |
Coty, Inc. - Class A(a)(b) | | | 55,559 | | | | 635,595 | |
Darling Ingredients, Inc.(a) | | | 23,965 | | | | 1,015,397 | |
elf Beauty, Inc.(a)(b) | | | 8,329 | | | | 1,353,712 | |
Flowers Foods, Inc. | | | 28,507 | | | | 710,965 | |
Grocery Outlet Holding Corp.(a) | | | 14,722 | | | | 382,330 | |
Ingredion, Inc. | | | 9,754 | | | | 1,117,711 | |
Lancaster Colony Corp. | | | 3,021 | | | | 576,437 | |
Performance Food Group Co.(a) | | | 23,339 | | | | 1,584,251 | |
The accompanying notes are an integral part of the financial statements.
78
Pacer Trendpilot® US Mid Cap ETF
SCHEDULE OF INVESTMENTS
April 30, 2024 (Continued)
| | | Shares | | | Value | |
COMMON STOCKS — 92.6% (Continued) |
| | | | | | | | | |
Consumer Staples — 4.7% (Continued) |
Pilgrim’s Pride Corp.(a) | | | 6,091 | | | $ | 219,398 | |
Post Holdings, Inc.(a)(b) | | | 7,539 | | | | 800,265 | |
Sprouts Farmers Market, Inc.(a)(b) | | | 15,188 | | | | 1,002,864 | |
US Foods Holding Corp.(a) | | | 33,700 | | | | 1,693,425 | |
| | | | | | | 17,979,515 | |
| |
Energy — 5.6% |
Antero Midstream Corp. | | | 50,533 | | | | 699,377 | |
Antero Resources Corp.(a) | | | 42,463 | | | | 1,444,167 | |
ChampionX Corp. | | | 28,571 | | | | 959,128 | |
Chesapeake Energy Corp.(b) | | | 16,562 | | | | 1,488,593 | |
Chord Energy Corp.(b) | | | 6,170 | | | | 1,091,967 | |
Civitas Resources, Inc. | | | 12,834 | | | | 923,535 | |
CNX Resources Corp.(a)(b) | | | 22,695 | | | | 533,786 | |
DT Midstream, Inc. | | | 14,371 | | | | 893,876 | |
Equitrans Midstream Corp. | | | 64,289 | | | | 869,830 | |
HF Sinclair Corp. | | | 23,230 | | | | 1,260,228 | |
Matador Resources Co.(b) | | | 16,564 | | | | 1,031,937 | |
Murphy Oil Corp. | | | 21,765 | | | | 971,590 | |
NOV, Inc. | | | 59,155 | | | | 1,093,776 | |
Ovintiv, Inc. | | | 37,779 | | | | 1,938,817 | |
PBF Energy, Inc. - Class A | | | 16,139 | | | | 859,725 | |
Permian Resources Corp.(b) | | | 68,832 | | | | 1,152,936 | |
Range Resources Corp. | | | 36,254 | | | | 1,301,881 | |
Southwestern Energy Co.(a) | | | 165,482 | | | | 1,239,460 | |
Valaris Ltd.(a) | | | 9,296 | | | | 604,798 | |
Weatherford International PLC(a) | | | 10,866 | | | | 1,343,255 | |
| | | | | | | 21,702,662 | |
| |
Financials — 15.4% |
Affiliated Managers Group, Inc. | | | 5,016 | | | | 782,998 | |
Ally Financial, Inc.(b) | | | 40,444 | | | | 1,551,027 | |
American Financial Group, Inc./OH | | | 9,774 | | | | 1,248,629 | |
Associated Banc-Corp. | | | 22,052 | | | | 464,636 | |
Bank OZK | | | 15,610 | | | | 696,987 | |
Brighthouse Financial, Inc.(a) | | | 9,520 | | | | 459,340 | |
Cadence Bank | | | 27,103 | | | | 749,940 | |
Carlyle Group, Inc.(b) | | | 32,247 | | | | 1,444,666 | |
CNO Financial Group, Inc. | | | 16,638 | | | | 438,079 | |
Columbia Banking System, Inc.(b) | | | 30,951 | | | | 582,188 | |
Commerce Bancshares, Inc.(b) | | | 17,615 | | | | 963,188 | |
Cullen Frost Bankers, Inc.(b) | | | 9,549 | | | | 996,343 | |
East West Bancorp, Inc.(b) | | | 20,993 | | | | 1,563,769 | |
Equitable Holdings, Inc. | | | 46,921 | | | | 1,731,854 | |
Erie Indemnity Co. - Class A(b) | | | 3,745 | | | | 1,433,062 | |
Essent Group Ltd. | | | 15,834 | | | | 838,727 | |
Euronet Worldwide, Inc.(a) | | | 6,495 | | | | 666,907 | |
Evercore, Inc. | | | 5,184 | | | | 940,896 | |
| | | Shares | | | Value | |
Financials — 15.4% (Continued) | | | | | | | | |
Federated Hermes, Inc. | | | 12,219 | | | $ | 401,394 | |
Fidelity National Financial, Inc.(b) | | | 38,529 | | | | 1,907,185 | |
First American Financial Corp. | | | 15,306 | | | | 819,942 | |
First Financial Bankshares, Inc.(b) | | | 19,050 | | | | 563,118 | |
First Horizon Corp. | | | 83,936 | | | | 1,252,325 | |
FirstCash Holdings, Inc. | | | 5,483 | | | | 619,469 | |
FNB Corp. | | | 53,241 | | | | 710,235 | |
Glacier Bancorp, Inc.(b) | | | 16,444 | | | | 594,944 | |
Hancock Whitney Corp. | | | 12,783 | | | | 580,220 | |
Hanover Insurance Group, Inc. | | | 5,299 | | | | 687,916 | |
Home BancShares, Inc./AR | | | 27,843 | | | | 659,322 | |
Houlihan Lokey, Inc.(b) | | | 7,848 | | | | 1,000,542 | |
Interactive Brokers Group, Inc. | | | 15,943 | | | | 1,835,358 | |
International Bancshares Corp. | | | 7,915 | | | | 440,470 | |
Janus Henderson Group PLC | | | 19,662 | | | | 613,848 | |
Jefferies Financial Group, Inc. | | | 25,456 | | | | 1,096,135 | |
Kemper Corp. | | | 8,935 | | | | 521,000 | |
Kinsale Capital Group, Inc. | | | 3,293 | | | | 1,196,182 | |
MGIC Investment Corp.(b) | | | 41,141 | | | | 834,339 | |
Morningstar, Inc. | | | 3,897 | | | | 1,101,487 | |
New York Community Bancorp, Inc.(b) | | | 105,895 | | | | 280,622 | |
Old National Bancorp | | | 46,870 | | | | 775,230 | |
Old Republic International Corp. | | | 39,229 | | | | 1,171,378 | |
Pinnacle Financial Partners, Inc. | | | 11,369 | | | | 872,002 | |
Primerica, Inc. | | | 5,234 | | | | 1,108,875 | |
Prosperity Bancshares, Inc. | | | 13,903 | | | | 861,569 | |
Reinsurance Group of America, Inc. | | | 9,873 | | | | 1,846,151 | |
RenaissanceRe Holdings Ltd. | | | 7,906 | | | | 1,733,390 | |
RLI Corp. | | | 6,010 | | | | 849,514 | |
SEI Investments Co. | | | 14,945 | | | | 985,623 | |
Selective Insurance Group, Inc. | | | 9,064 | | | | 921,356 | |
SLM Corp. | | | 32,944 | | | | 698,083 | |
SouthState Corp.(b) | | | 11,284 | | | | 854,199 | |
Stifel Financial Corp.(b) | | | 15,348 | | | | 1,226,612 | |
Synovus Financial Corp. | | | 21,698 | | | | 776,571 | |
Texas Capital Bancshares, Inc.(a) | | | 7,121 | | | | 408,745 | |
UMB Financial Corp. | | | 6,481 | | | | 516,276 | |
United Bankshares, Inc. | | | 20,020 | | | | 649,849 | |
Unum Group | | | 27,291 | | | | 1,383,654 | |
Valley National Bancorp(b) | | | 63,278 | | | | 443,579 | |
Voya Financial, Inc.(b) | | | 15,399 | | | | 1,049,596 | |
Webster Financial Corp. | | | 25,832 | | | | 1,132,217 | |
Western Union Co. | | | 52,414 | | | | 704,444 | |
WEX, Inc.(a) | | | 6,386 | | | | 1,349,106 | |
Wintrust Financial Corp. | | | 9,168 | | | | 885,996 | |
Zions Bancorp | | | 22,302 | | | | 909,476 | |
| | | | | | | 59,382,780 | |
| |
The accompanying notes are an integral part of the financial statements.
79
Pacer Trendpilot® US Mid Cap ETF
SCHEDULE OF INVESTMENTS
April 30, 2024 (Continued)
| | | Shares | | | Value | |
COMMON STOCKS — 92.6% (Continued) |
| |
Health Care — 8.2% |
Acadia Healthcare Co., Inc.(a) | | | 13,820 | | | $ | 1,021,851 | |
Amedisys, Inc.(a) | | | 4,841 | | | | 445,614 | |
Arrowhead Pharmaceuticals, Inc.(a) | | | 18,598 | | | | 420,687 | |
Azenta, Inc.(a)(b) | | | 8,427 | | | | 442,080 | |
Bruker Corp. | | | 13,800 | | | | 1,076,538 | |
Chemed Corp. | | | 2,249 | | | | 1,277,432 | |
Cytokinetics, Inc.(a)(b) | | | 14,736 | | | | 903,612 | |
DENTSPLY SIRONA, Inc. | | | 31,680 | | | | 950,717 | |
Doximity, Inc. - Class A(a)(b) | | | 18,323 | | | | 445,066 | |
Encompass Health Corp. | | | 14,918 | | | | 1,243,863 | |
Enovis Corp.(a) | | | 7,367 | | | | 406,879 | |
Envista Holdings Corp.(a) | | | 25,434 | | | | 500,541 | |
Exelixis, Inc.(a) | | | 45,562 | | | | 1,068,885 | |
Globus Medical, Inc. - Class A(a)(b) | | | 17,114 | | | | 852,106 | |
Haemonetics Corp.(a) | | | 7,529 | | | | 692,292 | |
Halozyme Therapeutics, Inc.(a) | | | 19,602 | | | | 746,836 | |
HealthEquity, Inc.(a) | | | 12,834 | | | | 1,012,731 | |
Integra LifeSciences Holdings Corp.(a) | | | 10,091 | | | | 294,354 | |
Jazz Pharmaceuticals PLC(a) | | | 9,432 | | | | 1,044,594 | |
Lantheus Holdings, Inc.(a) | | | 10,154 | | | | 675,647 | |
LivaNova PLC(a)(b) | | | 7,997 | | | | 445,833 | |
Masimo Corp.(a)(b) | | | 6,585 | | | | 885,090 | |
Medpace Holdings, Inc.(a) | | | 3,490 | | | | 1,355,342 | |
Neogen Corp.(a)(b) | | | 29,209 | | | | 360,147 | |
Neurocrine Biosciences, Inc.(a) | | | 14,836 | | | | 2,040,544 | |
Option Care Health, Inc.(a) | | | 26,273 | | | | 785,300 | |
Penumbra, Inc.(a) | | | 5,767 | | | | 1,133,042 | |
Perrigo Co. PLC | | | 20,100 | | | | 656,466 | |
Progyny, Inc.(a)(b) | | | 12,365 | | | | 396,422 | |
QuidelOrtho Corp.(a) | | | 7,335 | | | | 297,434 | |
R1 RCM, Inc.(a) | | | 29,219 | | | | 359,102 | |
Repligen Corp.(a)(b) | | | 7,797 | | | | 1,280,267 | |
Roivant Sciences Ltd.(a)(b) | | | 50,490 | | | | 550,341 | |
Shockwave Medical, Inc.(a) | | | 5,506 | | | | 1,818,026 | |
Sotera Health Co.(a) | | | 18,654 | | | | 208,925 | |
Tenet Healthcare Corp.(a) | | | 15,122 | | | | 1,698,049 | |
United Therapeutics Corp.(a) | | | 7,028 | | | | 1,646,871 | |
| | | | | | | 31,439,526 | |
| |
Industrials — 21.9% |
Acuity Brands, Inc. | | | 4,587 | | | | 1,138,952 | |
Advanced Drainage Systems, Inc. | | | 10,237 | | | | 1,607,209 | |
AECOM | | | 20,378 | | | | 1,882,112 | |
AGCO Corp. | | | 9,308 | | | | 1,062,881 | |
Applied Industrial Technologies, Inc. | | | 5,775 | | | | 1,058,269 | |
ASGN, Inc.(a) | | | 6,997 | | | | 674,861 | |
Avis Budget Group, Inc. | | | 2,736 | | | | 261,151 | |
| | | Shares | | | Value | |
Industrials — 21.9% (Continued) | | | | | | | | |
Brink’s Co. | | | 6,681 | | | $ | 584,320 | |
BWX Technologies, Inc. | | | 13,681 | | | | 1,310,229 | |
CACI International, Inc. - Class A(a) | | | 3,313 | | | | 1,332,588 | |
Carlisle Cos., Inc. | | | 7,261 | | | | 2,819,084 | |
Chart Industries, Inc.(a)(b) | | | 6,274 | | | | 903,832 | |
Clean Harbors, Inc.(a) | | | 7,526 | | | | 1,425,801 | |
Comfort Systems USA, Inc. | | | 5,337 | | | | 1,651,321 | |
Concentrix Corp.(b) | | | 7,013 | | | | 383,401 | |
Core & Main, Inc. - Class A(a) | | | 25,405 | | | | 1,434,620 | |
Crane Co. | | | 7,301 | | | | 1,022,213 | |
Curtiss-Wright Corp. | | | 5,704 | | | | 1,445,508 | |
Donaldson Co., Inc. | | | 17,888 | | | | 1,291,514 | |
EMCOR Group, Inc. | | | 7,038 | | | | 2,513,762 | |
EnerSys | | | 5,991 | | | | 541,886 | |
Esab Corp. | | | 8,405 | | | | 889,921 | |
ExlService Holdings, Inc.(a) | | | 24,463 | | | | 709,427 | |
Exponent, Inc.(b) | | | 7,509 | | | | 690,152 | |
Flowserve Corp. | | | 19,468 | | | | 918,111 | |
Fluor Corp.(a) | | | 25,647 | | | | 1,034,344 | |
Fortune Brands Innovations, Inc. | | | 18,904 | | | | 1,381,882 | |
FTI Consulting, Inc.(a) | | | 5,203 | | | | 1,112,557 | |
GATX Corp.(b) | | | 5,261 | | | | 643,736 | |
Genpact Ltd. | | | 24,764 | | | | 761,245 | |
Graco, Inc. | | | 25,235 | | | | 2,023,847 | |
GXO Logistics, Inc.(a) | | | 17,926 | | | | 890,205 | |
Hertz Global Holdings, Inc.(a)(b) | | | 19,642 | | | | 89,371 | |
Hexcel Corp. | | | 12,619 | | | | 810,266 | |
Insperity, Inc.(b) | | | 5,249 | | | | 540,280 | |
ITT, Inc. | | | 12,315 | | | | 1,592,822 | |
KBR, Inc. | | | 20,280 | | | | 1,316,983 | |
Kirby Corp.(a)(b) | | | 8,761 | | | | 956,088 | |
Knight-Swift Transportation Holdings, Inc. | | | 24,258 | | | | 1,121,447 | |
Landstar System, Inc. | | | 5,378 | | | | 937,977 | |
Lennox International, Inc.(b) | | | 4,774 | | | | 2,212,367 | |
Lincoln Electric Holdings, Inc.(b) | | | 8,528 | | | | 1,872,152 | |
ManpowerGroup, Inc. | | | 7,241 | | | | 546,333 | |
MasTec, Inc.(a)(b) | | | 8,965 | | | | 795,106 | |
Maximus, Inc. | | | 9,123 | | | | 732,394 | |
MDU Resources Group, Inc. | | | 30,220 | | | | 746,434 | |
Middleby Corp.(a) | | | 8,058 | | | | 1,119,820 | |
MSA Safety, Inc. | | | 5,506 | | | | 993,282 | |
MSC Industrial Direct Co., Inc. - Class A(b) | | | 6,877 | | | | 627,457 | |
nVent Electric PLC | | | 24,891 | | | | 1,793,895 | |
Oshkosh Corp. | | | 9,786 | | | | 1,098,674 | |
Owens Corning | | | 13,244 | | | | 2,227,773 | |
Paylocity Holding Corp.(a)(b) | | | 6,450 | | | | 1,000,782 | |
RBC Bearings, Inc.(a)(b) | | | 4,317 | | | | 1,055,722 | |
The accompanying notes are an integral part of the financial statements.
80
Pacer Trendpilot® US Mid Cap ETF
SCHEDULE OF INVESTMENTS
April 30, 2024 (Continued)
| | | Shares | | | Value | |
COMMON STOCKS — 92.6% (Continued) |
| | | | | | | | | |
Industrials — 21.9% (Continued) | | | | | | | | |
Regal Rexnord Corp.(b) | | | 9,932 | | | $ | 1,602,727 | |
Ryder System, Inc. | | | 6,569 | | | | 800,433 | |
Saia, Inc.(a) | | | 3,965 | | | | 1,573,431 | |
Science Applications International Corp. | | | 7,753 | | | | 997,811 | |
Sensata Technologies Holding PLC | | | 22,457 | | | | 860,328 | |
Simpson Manufacturing Co., Inc. | | | 6,376 | | | | 1,108,723 | |
Stericycle, Inc.(a) | | | 13,728 | | | | 614,053 | |
Terex Corp.(b) | | | 9,978 | | | | 559,267 | |
Tetra Tech, Inc. | | | 8,004 | | | | 1,558,539 | |
Timken Co. | | | 9,625 | | | | 858,743 | |
Toro Co.(b) | | | 15,541 | | | | 1,361,236 | |
Trex Co., Inc.(a) | | | 16,177 | | | | 1,432,473 | |
UFP Industries, Inc. | | | 9,260 | | | | 1,043,602 | |
Valmont Industries, Inc. | | | 3,097 | | | | 634,266 | |
Watsco, Inc.(b) | | | 4,681 | | | | 2,095,777 | |
Watts Water Technologies, Inc. - Class A | | | 4,057 | | | | 805,152 | |
Werner Enterprises, Inc.(b) | | | 9,403 | | | | 321,583 | |
WESCO International, Inc. | | | 6,570 | | | | 1,003,568 | |
Woodward, Inc. | | | 9,055 | | | | 1,470,170 | |
XPO Logistics, Inc.(a)(b) | | | 17,365 | | | | 1,866,043 | |
| | | | | | | 84,156,291 | |
| |
Information Technology — 9.4% |
Allegro MicroSystems, Inc.(a)(b) | | | 10,563 | | | | 313,615 | |
Amkor Technology, Inc. | | | 15,316 | | | | 495,473 | |
Appfolio, Inc. - Class A(a) | | | 3,060 | | | | 693,947 | |
Arrow Electronics, Inc.(a) | | | 8,035 | | | | 1,025,828 | |
Aspen Technology, Inc.(a)(b) | | | 4,159 | | | | 818,782 | |
Avnet, Inc. | | | 13,421 | | | | 655,884 | |
Belden, Inc. | | | 6,185 | | | | 502,655 | |
Blackbaud, Inc.(a) | | | 6,389 | | | | 497,831 | |
Ciena Corp.(a) | | | 21,670 | | | | 1,001,804 | |
Cirrus Logic, Inc.(a) | | | 7,997 | | | | 708,294 | |
Cognex Corp. | | | 25,914 | | | | 1,076,468 | |
Coherent Corp.(a) | | | 19,894 | | | | 1,086,809 | |
CommVault Systems, Inc.(a) | | | 6,491 | | | | 665,133 | |
Crane NXT Co.(b) | | | 7,163 | | | | 435,582 | |
Dolby Laboratories, Inc. - Class A | | | 8,830 | | | | 685,738 | |
Dropbox, Inc. - Class A(a) | | | 38,461 | | | | 890,757 | |
Dynatrace, Inc.(a) | | | 35,725 | | | | 1,618,700 | |
GoDaddy, Inc. - Class A(a) | | | 21,060 | | | | 2,577,323 | |
IPG Photonics Corp.(a) | | | 4,383 | | | | 368,084 | |
Kyndryl Holdings, Inc.(a) | | | 34,405 | | | | 676,402 | |
Lattice Semiconductor Corp.(a)(b) | | | 20,558 | | | | 1,410,279 | |
Littelfuse, Inc. | | | 3,721 | | | | 858,211 | |
Lumentum Holdings, Inc.(a)(b) | | | 9,936 | | | | 434,799 | |
| | | Shares | | | Value | |
Information Technology — 9.4% (Continued) |
MACOM Technology Solutions Holdings, Inc.(a)(b) | | | 8,185 | | | $ | 834,461 | |
Manhattan Associates, Inc.(a) | | | 9,178 | | | | 1,891,219 | |
MKS Instruments, Inc. | | | 9,412 | | | | 1,119,840 | |
Novanta, Inc.(a) | | | 5,358 | | | | 838,527 | |
Onto Innovation, Inc.(a)(b) | | | 7,306 | | | | 1,355,190 | |
Power Integrations, Inc.(b) | | | 8,435 | | | | 562,783 | |
Pure Storage, Inc.(a) | | | 44,418 | | | | 2,238,667 | |
Qualys, Inc.(a)(b) | | | 5,487 | | | | 899,374 | |
Rambus, Inc.(a) | | | 16,160 | | | | 885,891 | |
Silicon Laboratories, Inc.(a)(b) | | | 4,709 | | | | 572,096 | |
Synaptics, Inc.(a) | | | 5,807 | | | | 522,398 | |
TD SYNNEX Corp. | | | 11,605 | | | | 1,367,533 | |
Teradata Corp.(a) | | | 14,506 | | | | 538,173 | |
Universal Display Corp. | | | 6,510 | | | | 1,028,450 | |
Vishay Intertechnology, Inc. | | | 18,726 | | | | 433,320 | |
Vontier Corp. | | | 23,073 | | | | 937,456 | |
Wolfspeed, Inc.(a)(b) | | | 18,590 | | | | 502,488 | |
| | | | | | | 36,026,264 | |
| |
Materials — 6.9% |
Alcoa Corp. | | | 26,481 | | | | 930,542 | |
AptarGroup, Inc. | | | 9,833 | | | | 1,419,689 | |
Arcadium Lithium PLC(a)(b) | | | 154,180 | | | | 678,392 | |
Ashland, Inc.(b) | | | 7,441 | | | | 709,351 | |
Avient Corp. | | | 13,524 | | | | 573,688 | |
Axalta Coating Systems Ltd.(a) | | | 33,044 | | | | 1,038,903 | |
Berry Global Group, Inc. | | | 17,318 | | | | 980,892 | |
Cabot Corp. | | | 8,290 | | | | 756,297 | |
Chemours Co.(b) | | | 22,026 | | | | 589,196 | |
Cleveland-Cliffs, Inc.(a) | | | 74,513 | | | | 1,259,270 | |
Commercial Metals Co.(b) | | | 17,342 | | | | 931,959 | |
Crown Holdings, Inc. | | | 17,829 | | | | 1,463,225 | |
Eagle Materials, Inc. | | | 5,167 | | | | 1,295,419 | |
Graphic Packaging Holding Co. | | | 45,963 | | | | 1,188,144 | |
Greif, Inc. - Class A | | | 3,771 | | | | 231,087 | |
Knife River Corp.(a) | | | 8,390 | | | | 656,014 | |
Louisiana-Pacific Corp. | | | 9,520 | | | | 696,769 | |
MP Materials Corp.(a)(b) | | | 21,374 | | | | 341,984 | |
NewMarket Corp. | | | 1,023 | | | | 539,039 | |
Olin Corp. | | | 17,946 | | | | 938,217 | |
Reliance, Inc. | | | 8,598 | | | | 2,448,022 | |
Royal Gold, Inc.(b) | | | 9,833 | | | | 1,181,238 | |
RPM International, Inc. | | | 19,322 | | | | 2,065,714 | |
Scotts Miracle-Gro Co. | | | 6,165 | | | | 422,549 | |
Silgan Holdings, Inc. | | | 12,002 | | | | 560,013 | |
Sonoco Products Co. | | | 14,535 | | | | 814,687 | |
United States Steel Corp.(b) | | | 33,634 | | | | 1,227,641 | |
Westlake Chemical Corp. | | | 4,749 | | | | 699,813 | |
| | | | | | | 26,637,754 | |
| |
The accompanying notes are an integral part of the financial statements.
81
Pacer Trendpilot® US Mid Cap ETF
SCHEDULE OF INVESTMENTS
April 30, 2024 (Continued)
| | | Shares | | | Value | |
COMMON STOCKS — 92.6% (Continued) |
| |
Real Estate — 0.3% |
Jones Lang LaSalle, Inc.(a) | | | 7,153 | | | $ | 1,292,547 | |
| |
Utilities — 3.6% |
ALLETE, Inc. | | | 8,527 | | | | 504,969 | |
Black Hills Corp. | | | 10,083 | | | | 553,557 | |
Essential Utilities, Inc. | | | 37,763 | | | | 1,381,371 | |
IDACORP, Inc.(b) | | | 7,509 | | | | 711,703 | |
National Fuel Gas Co. | | | 13,771 | | | | 731,240 | |
New Jersey Resources Corp. | | | 14,704 | | | | 642,418 | |
Northwestern Energy Group, Inc. | | | 9,089 | | | | 458,449 | |
OGE Energy Corp. | | | 30,126 | | | | 1,043,866 | |
ONE Gas, Inc.(b) | | | 8,221 | | | | 530,419 | |
Ormat Technologies, Inc. | | | 7,967 | | | | 508,534 | |
PNM Resources, Inc. | | | 12,733 | | | | 471,885 | |
Portland General Electric Co. | | | 15,003 | | | | 648,580 | |
Southwest Gas Holdings, Inc.(b) | | | 8,915 | | | | 665,237 | |
Spire, Inc. | | | 8,303 | | | | 513,042 | |
UGI Corp.(b) | | | 31,081 | | | | 794,430 | |
Vistra Corp. | | | 50,255 | | | | 3,811,339 | |
| | | | | | | 13,971,039 | |
TOTAL COMMON STOCKS (Cost $323,710,288) | | | | | | | 356,082,316 | |
| |
REAL ESTATE INVESTMENT TRUSTS — 7.3% |
Agree Realty Corp.(b) | | | 14,912 | | | | 853,265 | |
American Homes 4 Rent - Class A | | | 47,390 | | | | 1,696,562 | |
Annaly Capital Management, Inc.(b) | | | 75,140 | | | | 1,408,124 | |
Apartment Income REIT Corp. | | | 21,808 | | | | 836,991 | |
Brixmor Property Group, Inc. | | | 45,133 | | | | 997,439 | |
COPT Defense Properties | | | 16,698 | | | | 400,251 | |
Cousins Properties, Inc. | | | 22,524 | | | | 516,701 | |
CubeSmart | | | 33,743 | | | | 1,364,567 | |
EastGroup Properties, Inc. | | | 7,099 | | | | 1,102,901 | |
EPR Properties | | | 11,175 | | | | 453,593 | |
Equity LifeStyle Properties, Inc. | | | 27,968 | | | | 1,686,191 | |
First Industrial Realty Trust, Inc. | | | 19,882 | | | | 903,040 | |
Gaming and Leisure Properties, Inc. | | | 39,788 | | | | 1,700,141 | |
Healthcare Realty Trust, Inc.(b) | | | 56,507 | | | | 804,095 | |
Independence Realty Trust, Inc.(b) | | | 33,341 | | | | 525,788 | |
Kilroy Realty Corp. | | | 15,824 | | | | 534,851 | |
Kite Realty Group Trust | | | 32,549 | | | | 709,568 | |
Lamar Advertising Co. - Class A | | | 13,113 | | | | 1,519,141 | |
National Storage Affiliates Trust(b) | | | 11,461 | | | | 401,593 | |
NNN REIT, Inc.(b) | | | 27,435 | | | | 1,111,941 | |
Omega Healthcare Investors, Inc.(b) | | | 36,899 | | | | 1,122,099 | |
Park Hotels & Resorts, Inc. | | | 31,155 | | | | 502,530 | |
PotlatchDeltic Corp. | | | 11,770 | | | | 470,918 | |
| | | Shares | | | Value | |
REAL ESTATE INVESTMENT TRUSTS — 7.3% (Continued) |
Rayonier, Inc. | | | 20,244 | | | $ | 600,437 | |
Rexford Industrial Realty, Inc. | | | 31,380 | | | | 1,343,378 | |
Sabra Health Care REIT, Inc. | | | 34,313 | | | | 477,637 | |
STAG Industrial, Inc.(b) | | | 27,300 | | | | 938,847 | |
Starwood Property Trust, Inc.(b) | | | 44,152 | | | | 837,563 | |
Vornado Realty Trust(b) | | | 23,714 | | | | 617,275 | |
WP Carey, Inc. | | | 32,586 | | | | 1,787,015 | |
TOTAL REAL ESTATE INVESTMENT TRUSTS (Cost $28,651,701) | | | | | | | 28,224,442 | |
| |
| | | Units | | | | | |
INVESTMENTS PURCHASED WITH PROCEEDS FROM SECURITIES LENDING — 22.5% |
Mount Vernon Liquid Assets Portfolio, LLC – 5.51%(c) | | | 86,595,764 | | | | 86,595,764 | |
TOTAL INVESTMENTS PURCHASED WITH PROCEEDS FROM SECURITIES LENDING (Cost $86,595,764) | | | | | | | 86,595,764 | |
| |
TOTAL INVESTMENTS — 122.4% (Cost $438,957,753) | | | | | | | 470,902,522 | |
Liabilities in Excess of Other Assets — (22.4)% | | | | | | | (86,433,619 | ) |
TOTAL NET ASSETS — 100.0% | | | | | | $ | 384,468,903 | |
Percentages are stated as a percent of net assets.
| | PLC - Public Limited Company | |
| | (a) | Non-income producing security. |
| | (b) | All or a portion of this security is on loan as of April 30, 2024. The total market value of these securities was $82,949,350 which represented 21.6% of net assets. |
| | (c) | The rate shown represents the 7-day effective yield as of April 30, 2024. |
The Global Industry Classification Standard (GICS®) was developed by and/or is the exclusive property of MSCI, Inc. and Standard & Poor’s Financial Services LLC (“S&P”). GICS is a service mark of MSCI, Inc. and S&P and has been licensed for use by U.S. Bank Global Fund Services.
The accompanying notes are an integral part of the financial statements.
82
Pacer Trendpilot® 100 ETF
SCHEDULE OF INVESTMENTS
April 30, 2024
| | | Shares | | | Value | |
COMMON STOCKS — 53.4% |
| |
Communication Services — 8.3% |
Alphabet, Inc. - Class A(a) | | | 109,176 | | | $ | 17,771,669 | |
Alphabet, Inc. - Class C(a) | | | 105,066 | | | | 17,298,066 | |
Charter Communications, Inc. - Class A(a)(b) | | | 6,949 | | | | 1,778,527 | |
Comcast Corp. - Class A | | | 189,606 | | | | 7,225,885 | |
Electronic Arts, Inc. | | | 12,794 | | | | 1,622,535 | |
Meta Platforms, Inc. - Class A | | | 64,841 | | | | 27,892,653 | |
Netflix, Inc.(a) | | | 20,702 | | | | 11,399,349 | |
Sirius XM Holdings, Inc.(b) | | | 183,873 | | | | 540,587 | |
Take-Two Interactive Software, Inc.(a) | | | 8,226 | | | | 1,174,755 | |
T-Mobile US, Inc.(b) | | | 56,797 | | | | 9,324,363 | |
Trade Desk, Inc. - Class A(a) | | | 21,295 | | | | 1,764,291 | |
Warner Bros Discovery, Inc.(a)(b) | | | 116,747 | | | | 859,258 | |
| | | | | | | 98,651,938 | |
| |
Consumer Discretionary — 7.1% |
Airbnb, Inc. - Class A(a) | | | 20,965 | | | | 3,324,420 | |
Amazon.com, Inc.(a) | | | 192,447 | | | | 33,678,225 | |
Booking Holdings, Inc. | | | 1,635 | | | | 5,644,069 | |
DoorDash, Inc. - Class A(a)(b) | | | 18,023 | | | | 2,329,653 | |
Lululemon Athletica, Inc.(a) | | | 5,794 | | | | 2,089,316 | |
Marriott International, Inc. | | | 13,852 | | | | 3,270,873 | |
MercadoLibre, Inc.(a) | | | 2,416 | | | | 3,524,219 | |
O’Reilly Automotive, Inc.(a) | | | 2,820 | | | | 2,857,393 | |
PDD Holdings, Inc. - ADR(a) | | | 31,960 | | | | 4,000,753 | |
Ross Stores, Inc. | | | 16,107 | | | | 2,086,662 | |
Starbucks Corp. | | | 54,171 | | | | 4,793,592 | |
Tesla Motors, Inc.(a) | | | 89,314 | | | | 16,369,470 | |
| | | | | | | 83,968,645 | |
| |
Consumer Staples — 3.5% |
Coca-Cola Europacific Partners PLC(b) | | | 21,853 | | | | 1,573,853 | |
Costco Wholesale Corp. | | | 21,229 | | | | 15,346,445 | |
Dollar Tree, Inc.(a) | | | 10,421 | | | | 1,232,283 | |
Keurig Dr Pepper, Inc. | | | 66,397 | | | | 2,237,579 | |
Mondelez International, Inc. | | | 64,429 | | | | 4,635,022 | |
Monster Beverage Corp.(a) | | | 49,798 | | | | 2,661,703 | |
PepsiCo, Inc. | | | 65,765 | | | | 11,568,721 | |
The Kraft Heinz Co. | | | 58,049 | | | | 2,241,272 | |
Walgreens Boots Alliance, Inc. | | | 41,262 | | | | 731,575 | |
| | | | | | | 42,228,453 | |
| |
Energy — 0.3% |
Baker Hughes Co. | | | 47,893 | | | | 1,562,270 | |
Diamondback Energy, Inc. | | | 8,539 | | | | 1,717,449 | |
| | | | | | | 3,279,719 | |
| |
| | | Shares | | | Value | |
Financials — 0.3% |
PayPal Holdings, Inc.(a) | | | 51,284 | | | $ | 3,483,209 | |
| |
Health Care — 3.3% |
Amgen, Inc. | | | 25,636 | | | | 7,022,725 | |
AstraZeneca PLC - ADR | | | 27,864 | | | | 2,114,320 | |
Biogen, Inc.(a) | | | 6,952 | | | | 1,493,429 | |
DexCom, Inc.(a) | | | 18,449 | | | | 2,350,218 | |
GE HealthCare Technologies, Inc. | | | 21,787 | | | | 1,661,041 | |
Gilead Sciences, Inc. | | | 59,613 | | | | 3,886,768 | |
IDEXX Laboratories, Inc.(a)(b) | | | 3,976 | | | | 1,959,214 | |
Illumina, Inc.(a) | | | 7,603 | | | | 935,549 | |
Intuitive Surgical, Inc.(a) | | | 16,853 | | | | 6,246,059 | |
Moderna, Inc.(a)(b) | | | 18,280 | | | | 2,016,467 | |
Regeneron Pharmaceuticals, Inc.(a) | | | 5,160 | | | | 4,595,806 | |
Vertex Pharmaceuticals, Inc.(a) | | | 12,356 | | | | 4,853,560 | |
| | | | | | | 39,135,156 | |
| |
Industrials — 2.5% |
Automatic Data Processing, Inc. | | | 19,653 | | | | 4,753,864 | |
Cintas Corp. | | | 4,846 | | | | 3,190,316 | |
Copart, Inc.(a) | | | 46,003 | | | | 2,498,423 | |
CSX Corp. | | | 93,752 | | | | 3,114,441 | |
Fastenal Co. | | | 27,380 | | | | 1,860,197 | |
Honeywell International, Inc. | | | 31,204 | | | | 6,013,947 | |
Old Dominion Freight Line, Inc. | | | 10,404 | | | | 1,890,511 | |
PACCAR, Inc. | | | 25,066 | | | | 2,659,753 | |
Paychex, Inc. | | | 17,288 | | | | 2,053,987 | |
Verisk Analytics, Inc. | | | 6,857 | | | | 1,494,552 | |
| | | | | | | 29,529,991 | |
| |
Information Technology — 26.3%(c) |
Adobe, Inc.(a) | | | 21,628 | | | | 10,010,087 | |
Advanced Micro Devices, Inc.(a) | | | 77,317 | | | | 12,245,466 | |
Analog Devices, Inc. | | | 23,723 | | | | 4,759,071 | |
ANSYS, Inc.(a) | | | 4,163 | | | | 1,352,476 | |
Apple, Inc. | | | 286,091 | | | | 48,729,881 | |
Applied Materials, Inc. | | | 39,756 | | | | 7,897,529 | |
ASML Holding NV | | | 4,126 | | | | 3,599,811 | |
Atlassian Corp. - Class A(a) | | | 7,566 | | | | 1,303,622 | |
Autodesk, Inc.(a) | | | 10,240 | | | | 2,179,584 | |
Broadcom, Inc. | | | 22,166 | | | | 28,821,785 | |
Cadence Design System, Inc.(a) | | | 13,025 | | | | 3,590,081 | |
CDW Corp. | | | 6,424 | | | | 1,553,709 | |
Cisco Systems, Inc. | | | 193,764 | | | | 9,103,033 | |
Cognizant Technology Solutions Corp. - Class A | | | 23,818 | | | | 1,564,366 | |
Crowdstrike Holdings, Inc. - Class A(a) | | | 10,884 | | | | 3,184,005 | |
Datadog, Inc. - Class A(a) | | | 14,634 | | | | 1,836,567 | |
Fortinet, Inc.(a) | | | 36,506 | | | | 2,306,449 | |
GLOBALFOUNDRIES, Inc.(a)(b) | | | 26,211 | | | | 1,281,194 | |
The accompanying notes are an integral part of the financial statements.
83
Pacer Trendpilot® 100 ETF
SCHEDULE OF INVESTMENTS
April 30, 2024 (Continued)
| | | Shares | | | Value | |
COMMON STOCKS — 53.4% (Continued) |
| | | | | | | | | |
Information Technology — 26.3%(c) (Continued) |
Intel Corp. | | | 202,322 | | | $ | 6,164,751 | |
Intuit, Inc. | | | 13,395 | | | | 8,380,180 | |
KLA Corp. | | | 6,473 | | | | 4,461,774 | |
Lam Research Corp. | | | 6,265 | | | | 5,603,479 | |
Marvell Technology, Inc. | | | 41,361 | | | | 2,726,104 | |
Microchip Technology, Inc. | | | 25,852 | | | | 2,377,867 | |
Micron Technology, Inc. | | | 52,820 | | | | 5,966,547 | |
Microsoft Corp. | | | 137,662 | | | | 53,595,947 | |
MongoDB, Inc.(a)(b) | | | 3,467 | | | | 1,266,079 | |
NVIDIA Corp. | | | 46,313 | | | | 40,015,359 | |
NXP Semiconductors NV | | | 12,269 | | | | 3,143,195 | |
ON Semiconductor Corp.(a)(b) | | | 20,445 | | | | 1,434,421 | |
Palo Alto Networks, Inc.(a) | | | 15,453 | | | | 4,495,123 | |
QUALCOMM, Inc. | | | 53,396 | | | | 8,855,727 | |
Roper Technologies, Inc. | | | 5,122 | | | | 2,619,698 | |
Synopsys, Inc.(a) | | | 7,294 | | | | 3,870,123 | |
Texas Instruments, Inc. | | | 43,504 | | | | 7,674,976 | |
Workday, Inc. - Class A(a) | | | 9,995 | | | | 2,446,076 | |
Zscaler, Inc.(a) | | | 7,093 | | | | 1,226,663 | |
| | | | | | | 311,642,804 | |
| |
Materials — 0.9% |
Linde PLC | | | 23,040 | | | | 10,159,719 | |
| |
Real Estate — 0.2% |
CoStar Group, Inc.(a)(b) | | | 19,545 | | | | 1,788,954 | |
| |
Utilities — 0.7% |
American Electric Power Co., Inc. | | | 25,175 | | | | 2,165,805 | |
Constellation Energy Corp. | | | 15,150 | | | | 2,816,991 | |
Exelon Corp. | | | 47,827 | | | | 1,797,339 | |
Xcel Energy, Inc. | | | 26,562 | | | | 1,427,176 | |
| | | | | | | 8,207,311 | |
TOTAL COMMON STOCKS (Cost $482,588,357) | | | | | | | 632,075,899 | |
| |
| | | Units | | | | | |
INVESTMENTS PURCHASED WITH PROCEEDS FROM SECURITIES LENDING — 30.9% |
Mount Vernon Liquid Assets Portfolio, LLC – 5.51%(d) | | | 364,781,969 | | | | 364,781,969 | |
TOTAL INVESTMENTS PURCHASED WITH PROCEEDS FROM SECURITIES LENDING (Cost $364,781,969) | | | | | | | 364,781,969 | |
| |
| | | Par | | | Value | |
U.S. TREASURY BILLS - 45.0% | | | | | | | | |
5.29%, 05/16/2024(e) | | | 40,000,000 | | | $ | 39,912,333 | |
5.30%, 05/23/2024(b)(e) | | | 473,000,000 | | | | 471,475,232 | |
5.27%, 07/05/2024(e) | | | 20,000,000 | | | | 19,810,056 | |
U.S. Treasury Bills Total (Cost $531,213,280) | | | | | | | 531,197,621 | |
TOTAL SHORT-TERM INVESTMENTS (Cost $895,995,249) | | | | | | | 895,979,590 | |
| |
TOTAL INVESTMENTS — 129.3% (Cost $1,378,583,606) | | | | | | | 1,528,055,489 | |
Liabilities in Excess of Other Assets — (29.3)% | | | | | | | (346,586,024 | ) |
TOTAL NET ASSETS — 100.0% | | | | | | $ | 1,181,469,465 | |
Percentages are stated as a percent of net assets.
| | ADR - American Depositary Receipt | |
| | NV - Naamloze Vennootschap | |
| | PLC - Public Limited Company | |
| | (a) | Non-income producing security. |
| | (b) | All or a portion of this security is on loan as of April 30, 2024. The total market value of these securities was $357,002,972 which represented 30.2% of net assets. |
| | (c) | To the extent that the Fund invests more heavily in a particular industry or sector of the economy, its performance will be especially sensitive to developments that significantly affect those industries or sectors. |
| | (d) | The rate shown represents the 7-day effective yield as of April 30, 2024. |
| | (e) | The rate shown is the effective yield as of April 30, 2024. |
The Global Industry Classification Standard (GICS®) was developed by and/or is the exclusive property of MSCI, Inc. and Standard & Poor’s Financial Services LLC (“S&P”). GICS is a service mark of MSCI, Inc. and S&P and has been licensed for use by U.S. Bank Global Fund Services.
The accompanying notes are an integral part of the financial statements.
84
Pacer Trendpilot® European Index ETF
SCHEDULE OF INVESTMENTS
April 30, 2024
| | | Shares | | | Value | |
COMMON STOCKS — 97.2% |
| |
Austria — 0.6% |
ANDRITZ AG | | | 498 | | | $ | 27,318 | |
Erste Group Bank AG | | | 2,180 | | | | 102,065 | |
OMV AG | | | 1,016 | | | | 48,445 | |
Raiffeisen Bank International AG | | | 922 | | | | 17,101 | |
Telekom Austria AG | | | 978 | | | | 8,402 | |
Verbund AG | | | 470 | | | | 35,913 | |
voestalpine AG | | | 790 | | | | 21,178 | |
| | | | | | | 260,422 | |
| |
Belgium — 2.5% |
Ackermans & van Haaren NV | | | 160 | | | | 27,577 | |
Ageas SA/NV | | | 1,176 | | | | 54,142 | |
Anheuser-Busch InBev SA/NV - ADR(a) | | | 7,027 | | | | 419,231 | |
Cenergy Holdings SA | | | 254 | | | | 2,152 | |
D’ieteren Group | | | 160 | | | | 34,697 | |
Elia Group SA/NV | | | 274 | | | | 26,420 | |
Groupe Bruxelles Lambert NV | | | 599 | | | | 44,652 | |
KBC Groep NV | | | 1,748 | | | | 130,395 | |
Lotus Bakeries NV | | | 3 | | | | 30,191 | |
Sofina SA | | | 124 | | | | 29,219 | |
Solvay SA | | | 498 | | | | 16,162 | |
Syensqo SA(b) | | | 498 | | | | 46,340 | |
Titan Cement International SA | | | 282 | | | | 8,953 | |
UCB SA | | | 866 | | | | 115,109 | |
Umicore SA | | | 1,457 | | | | 32,435 | |
Viohalco SA | | | 302 | | | | 1,869 | |
| | | | | | | 1,019,544 | |
| |
Finland — 2.9% |
Elisa Oyj | | | 1,016 | | | | 45,887 | |
Fortum Oyj | | | 3,100 | | | | 40,957 | |
Kesko Oyj - Class B | | | 1,926 | | | | 32,949 | |
Kone Oyj - Class B | | | 2,250 | | | | 109,974 | |
Metso Oyj | | | 4,548 | | | | 51,813 | |
Neste Oyj | | | 2,960 | | | | 67,411 | |
Nokia Oyj - ADR(a) | | | 37,829 | | | | 138,076 | |
Nordea Bank Abp | | | 23,392 | | | | 274,730 | |
Orion Oyj - Class B | | | 744 | | | | 28,417 | |
Sampo Oyj - Class A | | | 3,140 | | | | 127,070 | |
Stora Enso Oyj - Class R | | | 4,088 | | | | 54,752 | |
UPM-Kymmene Oyj | | | 3,691 | | | | 129,673 | |
Valmet Oyj | | | 1,176 | | | | 29,443 | |
Wartsila OYJ Abp | | | 3,448 | | | | 63,880 | |
| | | | | | | 1,195,032 | |
| |
France — 32.8%(c) |
Accor SA | | | 1,306 | | | | 57,576 | |
Aeroports de Paris SA | | | 226 | | | | 28,822 | |
| | | Shares | | | Value | |
France — 32.8%(c) (Continued) | | | | | | | | |
Air Liquide SA | | | 3,600 | | | $ | 706,453 | |
Airbus SE - ADR(a) | | | 16,560 | | | | 679,622 | |
ALD SA(d) | | | 1,392 | | | | 9,218 | |
Alstom SA | | | 2,030 | | | | 32,225 | |
Amundi SA(d) | | | 404 | | | | 28,348 | |
Arkema SA | | | 414 | | | | 42,879 | |
AXA SA(a) | | | 12,511 | | | | 433,132 | |
BioMerieux | | | 310 | | | | 33,083 | |
BNP Paribas SA - ADR | | | 14,498 | | | | 521,928 | |
Bollore SE | | | 6,200 | | | | 40,362 | |
Bouygues SA | | | 1,274 | | | | 47,056 | |
Bureau Veritas SA | | | 2,030 | | | | 59,403 | |
Capgemini SE | | | 1,118 | | | | 236,121 | |
Carrefour SA | | | 3,776 | | | | 63,630 | |
Cie de Saint-Gobain SA | | | 3,229 | | | | 257,278 | |
Cie Generale des Etablissements Michelin SCA | | | 4,856 | | | | 187,497 | |
Credit Agricole SA | | | 7,066 | | | | 109,719 | |
Danone SA | | | 4,385 | | | | 274,510 | |
Dassault Aviation SA | | | 160 | | | | 34,355 | |
Dassault Systemes SE | | | 4,706 | | | | 185,974 | |
Edenred SE | | | 1,724 | | | | 81,800 | |
Eiffage SA | | | 518 | | | | 55,447 | |
Engie SA(a) | | | 12,332 | | | | 214,125 | |
EssilorLuxottica SA | | | 2,145 | | | | 459,661 | |
Eurazeo SE | | | 340 | | | | 30,770 | |
Getlink SE | | | 2,510 | | | | 42,859 | |
Hermes International SCA | | | 246 | | | | 590,958 | |
Ipsen SA | | | 246 | | | | 29,955 | |
JCDecaux SE(b) | | | 518 | | | | 10,846 | |
Kering | | | 498 | | | | 175,384 | |
La Francaise des Jeux SAEM(d) | | | 714 | | | | 27,020 | |
Legrand SA | | | 1,813 | | | | 187,408 | |
L’Oreal SA | | | 1,625 | | | | 762,443 | |
LVMH Moet Hennessy Louis Vuitton SE - ADR | | | 8,710 | | | | 1,429,747 | |
Neoen SA(d) | | | 490 | | | | 15,039 | |
Orange SA | | | 13,276 | | | | 147,703 | |
Pernod Ricard SA | | | 1,427 | | | | 216,251 | |
Pluxee NV(b) | | | 620 | | | | 19,116 | |
Publicis Groupe SA | | | 1,583 | | | | 175,442 | |
Remy Cointreau SA | | | 160 | | | | 15,265 | |
Renault SA | | | 1,364 | | | | 68,038 | |
Rexel SA | | | 1,692 | | | | 44,113 | |
Safran SA | | | 2,398 | | | | 522,578 | |
Sanofi SA - ADR | | | 15,399 | | | | 758,093 | |
Sartorius Stedim Biotech | | | 170 | | | | 36,829 | |
Schneider Electric SE | | | 3,740 | | | | 858,536 | |
SCOR SE | | | 1,072 | | | | 35,053 | |
The accompanying notes are an integral part of the financial statements.
85
Pacer Trendpilot® European Index ETF
SCHEDULE OF INVESTMENTS
April 30, 2024 (Continued)
| | | Shares | | | Value | |
COMMON STOCKS — 97.2% (Continued) |
| | | | | | | | | |
France — 32.8%(c) (Continued) | | | | | | | | |
SEB SA | | | 160 | | | $ | 18,988 | |
Societe Generale SA | | | 5,036 | | | | 136,457 | |
Sodexo SA | | | 620 | | | | 54,091 | |
SOITEC(b) | | | 180 | | | | 17,788 | |
Teleperformance SE | | | 414 | | | | 37,767 | |
Thales SA | | | 686 | | | | 115,635 | |
TotalEnergies SE - ADR(a) | | | 14,503 | | | | 1,051,032 | |
Valeo SE | | | 1,486 | | | | 18,935 | |
Veolia Environnement SA | | | 4,404 | | | | 137,192 | |
Vinci SA | | | 3,449 | | | | 405,806 | |
Vivendi SE | | | 4,368 | | | | 44,592 | |
Wendel SA | | | 198 | | | | 20,296 | |
Worldline SA/France(b)(d) | | | 1,738 | | | | 18,184 | |
| | | | | | | 13,156,433 | |
| |
Germany — 23.8% |
adidas AG - ADR(a) | | | 2,321 | | | | 278,822 | |
Allianz SE | | | 2,742 | | | | 780,143 | |
BASF SE | | | 6,194 | | | | 324,927 | |
Bayer AG - ADR | | | 27,696 | | | | 202,181 | |
Bayerische Motoren Werke AG | | | 2,149 | | | | 234,961 | |
Bechtle AG | | | 584 | | | | 28,233 | |
Beiersdorf AG | | | 688 | | | | 103,197 | |
Brenntag SE | | | 935 | | | | 74,698 | |
Carl Zeiss Meditec AG | | | 264 | | | | 27,921 | |
Commerzbank AG | | | 7,123 | | | | 106,119 | |
Continental AG | | | 772 | | | | 50,125 | |
Covestro AG(b)(d) | | | 1,354 | | | | 67,886 | |
CTS Eventim AG & Co. KGaA | | | 424 | | | | 37,647 | |
Daimler Truck Holding AG | | | 3,709 | | | | 167,474 | |
Delivery Hero SE(b)(d) | | | 1,344 | | | | 37,866 | |
Deutsche Bank AG | | | 14,267 | | | | 228,539 | |
Deutsche Boerse AG | | | 1,277 | | | | 246,874 | |
Deutsche Lufthansa AG(b) | | | 4,256 | | | | 30,495 | |
Deutsche Post AG | | | 6,961 | | | | 291,653 | |
Deutsche Telekom AG | | | 22,657 | | | | 519,619 | |
Deutsche Wohnen SE | | | 348 | | | | 6,588 | |
DWS Group GmbH & Co. KGaA(d) | | | 246 | | | | 10,407 | |
E.ON SE | | | 15,590 | | | | 206,308 | |
Evonik Industries AG | | | 1,457 | | | | 30,391 | |
Fielmann Group AG | | | 180 | | | | 8,423 | |
Fraport AG Frankfurt Airport Services Worldwide(b) | | | 254 | | | | 12,762 | |
Fresenius Medical Care AG - ADR(a) | | | 2,982 | | | | 62,741 | |
Fresenius SE & Co. KGaA | | | 2,816 | | | | 84,057 | |
FUCHS SE | | | 236 | | | | 8,651 | |
GEA Group AG | | | 1,147 | | | | 46,393 | |
Hannover Rueck SE | | | 423 | | | | 104,911 | |
| | | Shares | | | Value | |
Germany — 23.8% (Continued) | | | | | | | | |
Heidelberg Materials AG | | | 958 | | | $ | 96,758 | |
Henkel AG & Co. KGaA | | | 714 | | | | 51,167 | |
HOCHTIEF AG | | | 152 | | | | 16,011 | |
Infineon Technologies AG | | | 9,075 | | | | 316,888 | |
KION Group AG | | | 508 | | | | 23,518 | |
Knorr-Bremse AG | | | 470 | | | | 34,885 | |
LEG Immobilien SE(b) | | | 527 | | | | 44,948 | |
Mercedez-Benz Group AG | | | 6,024 | | | | 456,060 | |
Merck KGaA | | | 896 | | | | 142,427 | |
MTU Aero Engines AG | | | 367 | | | | 88,751 | |
Muenchener Rueckversicherungs-Gesellschaft AG | | | 949 | | | | 417,466 | |
Nemetschek SE | | | 386 | | | | 34,418 | |
Puma SE | | | 714 | | | | 33,177 | |
Rational AG | | | 31 | | | | 26,599 | |
Rheinmetall AG | | | 304 | | | | 167,794 | |
RWE AG | | | 5,014 | | | | 174,601 | |
SAP SE - ADR(a) | | | 7,717 | | | | 1,398,398 | |
Sartorius AG | | | 20 | | | | 4,696 | |
Scout24 SE(d) | | | 527 | | | | 38,863 | |
Siemens AG - ADR | | | 10,527 | | | | 985,011 | |
Siemens Energy AG(b) | | | 3,799 | | | | 78,248 | |
Siemens Healthineers AG(d) | | | 1,912 | | | | 106,309 | |
Sixt SE | | | 94 | | | | 9,029 | |
Symrise AG | | | 898 | | | | 96,506 | |
Talanx AG | | | 376 | | | | 28,370 | |
ThyssenKrupp AG | | | 3,504 | | | | 17,605 | |
Traton SE | | | 358 | | | | 12,742 | |
Volkswagen AG | | | 208 | | | | 29,479 | |
Vonovia SE | | | 4,828 | | | | 140,044 | |
Wacker Chemie AG | | | 104 | | | | 11,165 | |
Zalando SE(b)(d) | | | 1,550 | | | | 40,792 | |
| | | | | | | 9,543,737 | |
| |
Greece — 0.8% |
Aegean Airlines SA(b) | | | 264 | | | | 3,550 | |
Alpha Services and Holdings SA(b) | | | 15,220 | | | | 25,867 | |
Athens Water Supply & Sewage Co. SA | | | 292 | | | | 1,782 | |
Autohellas Tourist and Trading SA | | | 142 | | | | 1,952 | |
Ellaktor SA(b) | | | 592 | | | | 1,655 | |
Eurobank Ergasias SA(b) | | | 18,132 | | | | 38,894 | |
FF Group(b)(e) | | | 1,259 | | | | 6,449 | |
GEK TERNA SA | | | 396 | | | | 7,091 | |
Hellenic Telecommunications Organization SA | | | 1,222 | | | | 18,623 | |
HELLENiQ ENERGY Holdings SA | | | 414 | | | | 3,725 | |
Holding Co. ADMIE IPTO SA | | | 808 | | | | 1,927 | |
JUMBO SA | | | 780 | | | | 24,290 | |
The accompanying notes are an integral part of the financial statements.
86
Pacer Trendpilot® European Index ETF
SCHEDULE OF INVESTMENTS
April 30, 2024 (Continued)
| | | Shares | | | Value | |
COMMON STOCKS — 97.2% (Continued) |
| | | | | | | | | |
Greece — 0.8% (Continued) | | | | | | | | |
LAMDA Development SA(b) | | | 574 | | | $ | 4,221 | |
Motor Oil Hellas Corinth Refineries SA | | | 404 | | | | 11,710 | |
Mytilineos SA | | | 714 | | | | 29,108 | |
National Bank of Greece SA(b) | | | 5,256 | | | | 42,405 | |
OPAP SA | | | 1,334 | | | | 22,223 | |
Piraeus Financial Holdings SA(b) | | | 7,138 | | | | 28,757 | |
Piraeus Port Authority SA | | | 58 | | | | 1,535 | |
Public Power Corp. SA(b) | | | 1,522 | | | | 18,258 | |
Quest Holdings SA | | | 188 | | | | 1,164 | |
Sarantis SA | | | 226 | | | | 2,870 | |
Terna Energy SA | | | 368 | | | | 7,163 | |
| | | | | | | 305,219 | |
| |
Ireland — 0.9% |
AIB Group PLC | | | 10,882 | | | | 56,510 | |
Bank of Ireland Group PLC | | | 7,534 | | | | 80,765 | |
Glanbia PLC | | | 1,260 | | | | 23,989 | |
Kerry Group PLC - Class A | | | 1,100 | | | | 94,853 | |
Kingspan Group PLC | | | 1,046 | | | | 93,601 | |
| | | | | | | 349,718 | |
| |
Italy — 7.7% |
A2A SpA | | | 10,926 | | | | 21,636 | |
Amplifon SpA | | | 922 | | | | 30,926 | |
Assicurazioni Generali SpA | | | 8,750 | | | | 213,841 | |
Banca Mediolanum SpA | | | 1,720 | | | | 18,686 | |
Banco BPM SpA | | | 9,742 | | | | 64,293 | |
Brunello Cucinelli SpA | | | 240 | | | | 24,614 | |
Buzzi SpA | | | 612 | | | | 22,115 | |
Davide Campari-Milano NV | | | 3,534 | | | | 35,527 | |
DiaSorin SpA | | | 152 | | | | 15,401 | |
Enel SpA | | | 54,097 | | | | 356,843 | |
Eni SpA - ADR(a) | | | 7,502 | | | | 240,289 | |
Ferrari NV | | | 827 | | | | 341,733 | |
FinecoBank Banca Fineco SpA | | | 4,350 | | | | 67,035 | |
Hera SpA | | | 5,487 | | | | 19,851 | |
Infrastrutture Wireless Italiane SpA(d) | | | 2,528 | | | | 27,194 | |
Interpump Group SpA | | | 564 | | | | 24,726 | |
Intesa Sanpaolo SpA | | | 113,211 | | | | 426,008 | |
Italgas SpA | | | 3,486 | | | | 19,345 | |
Leonardo SpA | | | 2,848 | | | | 65,742 | |
Mediobanca Banca di Credito Finanziario SpA | | | 4,586 | | | | 65,337 | |
Moncler SpA | | | 1,457 | | | | 99,701 | |
Nexi SpA(b)(d) | | | 5,816 | | | | 34,001 | |
Pirelli & C SpA(d) | | | 3,486 | | | | 22,203 | |
Poste Italiane SpA(d) | | | 3,232 | | | | 41,114 | |
Prysmian SpA | | | 1,880 | | | | 102,685 | |
| | | Shares | | | Value | |
Italy — 7.7% (Continued) | | | | | | | | |
Recordati Industria Chimica e Farmaceutica SpA | | | 696 | | | $ | 37,175 | |
Reply SpA | | | 160 | | | | 21,003 | |
Snam SpA | | | 16,178 | | | | 74,275 | |
Telecom Italia SpA(b) | | | 76,336 | | | | 18,159 | |
Telecom Italia SpA - Savings Shares(b) | | | 42,912 | | | | 10,593 | |
Terna Rete Elettrica Nazionale SpA | | | 10,014 | | | | 80,409 | |
UniCredit SpA | | | 11,641 | | | | 429,599 | |
UnipolSai Assicurazioni SpA | | | 2,978 | | | | 8,536 | |
| | | | | | | 3,080,595 | |
| |
Luxembourg — 0.5% |
ArcelorMittal | | | 3,534 | | | | 88,970 | |
Eurofins Scientific SE | | | 874 | | | | 53,725 | |
RTL Group SA | | | 274 | | | | 8,465 | |
Tenaris SA - ADR | | | 1,678 | | | | 55,357 | |
| | | | | | | 206,517 | |
| |
Netherlands — 15.5% |
Aalberts Industries NV | | | 686 | | | | 32,886 | |
ABN AMRO Group NV(d) | | | 3,076 | | | | 49,536 | |
Adyen NV - ADR(b) | | | 20,932 | | | | 249,928 | |
Aegon Ltd. | | | 12,054 | | | | 75,332 | |
Akzo Nobel NV | | | 1,212 | | | | 80,375 | |
Argenx SE - ADR(a)(b) | | | 424 | | | | 159,212 | |
ASM International NV | | | 330 | | | | 209,615 | |
ASML Holding NV | | | 2,775 | | | | 2,421,104 | |
ASR Nederland NV | | | 1,034 | | | | 51,831 | |
BE Semiconductor Industries NV | | | 536 | | | | 71,789 | |
CTP NV(d) | | | 734 | | | | 12,502 | |
DSM BV(e) | | | 1,312 | | | | 147,998 | |
Euronext NV(d) | | | 584 | | | | 52,758 | |
EXOR NV | | | 688 | | | | 75,406 | |
Heineken Holding NV | | | 930 | | | | 74,983 | |
Heineken NV | | | 1,973 | | | | 192,240 | |
IMCD NV | | | 404 | | | | 61,331 | |
ING Groep NV - ADR | | | 23,940 | | | | 378,252 | |
JDE Peet’s NV | | | 856 | | | | 19,020 | |
Koninklijke Ahold Delhaize NV | | | 6,638 | | | | 201,471 | |
Koninklijke KPN NV | | | 22,630 | | | | 82,306 | |
Koninklijke Philips NV(b) | | | 5,502 | | | | 148,262 | |
Koninklijke Vopak NV | | | 462 | | | | 18,401 | |
NN Group NV | | | 1,914 | | | | 88,547 | |
OCI NV | | | 686 | | | | 18,522 | |
Prosus NV | | | 10,539 | | | | 354,400 | |
QIAGEN NV | | | 1,520 | | | | 63,393 | |
Randstad Holding NV | | | 780 | | | | 39,290 | |
Signify NV(d) | | | 894 | | | | 24,577 | |
Stellantis NV | | | 14,857 | | | | 331,061 | |
The accompanying notes are an integral part of the financial statements.
87
Pacer Trendpilot® European Index ETF
SCHEDULE OF INVESTMENTS
April 30, 2024 (Continued)
| | | Shares | | | Value | |
COMMON STOCKS — 97.2% (Continued) |
| | | | | | | | | |
Netherlands — 15.5% (Continued) | | | | | | | | |
Universal Music Group NV | | | 5,186 | | | $ | 153,306 | |
Wolters Kluwer NV | | | 1,729 | | | | 259,711 | |
| | | | | | | 6,199,345 | |
| |
Poland — 0.1% |
InPost SA(b) | | | 1,448 | | | | 23,381 | |
| |
Portugal — 0.5% |
EDP - Energias de Portugal SA | | | 21,410 | | | | 80,565 | |
Galp Energia SGPS SA | | | 3,052 | | | | 65,793 | |
Jeronimo Martins SGPS SA | | | 1,954 | | | | 40,351 | |
| | | | | | | 186,709 | |
| |
Spain — 8.1% |
Acciona SA | | | 160 | | | | 18,561 | |
ACS Actividades de Construccion y Servicios SA | | | 1,689 | | | | 67,738 | |
Aena SME SA(d) | | | 498 | | | | 91,200 | |
Amadeus IT Holding SA | | | 3,165 | | | | 201,851 | |
Banco Bilbao Vizcaya Argentaria SA - ADR(a) | | | 41,466 | | | | 444,101 | |
Banco de Sabadell SA | | | 37,342 | | | | 71,573 | |
Banco Santander SA - ADR(a) | | | 114,206 | | | | 548,189 | |
Bankinter SA | | | 4,867 | | | | 38,540 | |
CaixaBank SA | | | 26,100 | | | | 137,933 | |
Cellnex Telecom SA(d) | | | 3,876 | | | | 128,438 | |
Corp. ACCIONA Energias Renovables SA | | | 404 | | | | 8,218 | |
EDP Renovaveis SA | | | 2,096 | | | | 28,788 | |
Enagas SA | | | 1,767 | | | | 25,948 | |
Endesa SA | | | 2,256 | | | | 41,170 | |
Ferrovial SE | | | 3,635 | | | | 131,119 | |
Grifols SA(b) | | | 2,330 | | | | 21,499 | |
Iberdrola SA | | | 41,132 | | | | 505,244 | |
Industria de Diseno Textil SA | | | 7,304 | | | | 334,009 | |
Mapfre SA | | | 7,046 | | | | 17,009 | |
Naturgy Energy Group SA | | | 978 | | | | 24,757 | |
Redeia Corp. SA | | | 3,072 | | | | 51,308 | |
Repsol SA | | | 8,534 | | | | 134,108 | |
Telefonica SA | | | 35,694 | | | | 160,218 | |
| | | | | | | 3,231,519 | |
| |
| | | Shares | | | Value | |
Switzerland — 0.5% |
STMicroelectronics NV | | | 4,584 | | | $ | 184,161 | |
| |
United Kingdom — 0.0%(f) |
Allfunds Group PLC | | | 2,396 | | | | 15,189 | |
TOTAL COMMON STOCKS (Cost $36,035,076) | | | | | | | 38,957,521 | |
| |
PREFERRED STOCKS — 1.0% |
| |
Germany — 1.0% |
Bayerische Motoren Werke AG, 0.00%, | | | 404 | | | | 41,606 | |
FUCHS SE, 0.00%, | | | 490 | | | | 22,915 | |
Henkel AG & Co. KGaA, 0.00%, | | | 1,147 | | | | 91,145 | |
Sartorius AG, 0.00%, | | | 170 | | | | 51,216 | |
Sixt SE, 0.00%, | | | 124 | | | | 8,602 | |
Volkswagen AG, 0.00%, | | | 1,390 | | | | 170,814 | |
| | | | | | | 386,298 | |
| |
Spain — 0.0%(f) |
Grifols SA, Class B, 0.00%, | | | 1,824 | | | | 11,689 | |
TOTAL PREFERRED STOCKS (Cost $389,570) | | | | | | | 397,987 | |
| |
REAL ESTATE INVESTMENT TRUSTS — 0.5% |
| |
Belgium — 0.1% |
Warehouses De Pauw CVA | | | 1,128 | | | | 30,023 | |
| |
France — 0.3% |
Covivio SA | | | 376 | | | | 18,803 | |
Gecina SA | | | 368 | | | | 37,702 | |
Klepierre | | | 1,466 | | | | 39,520 | |
Unibail-Rodamco-Westfield(b) | | | 734 | | | | 61,476 | |
| | | | | | | 157,501 | |
| |
Spain — 0.1% |
Merlin Properties Socimi SA | | | 2,378 | | | | 26,926 | |
TOTAL REAL ESTATE INVESTMENT TRUSTS (Cost $192,447) | | | | | | | 214,450 | |
| |
The accompanying notes are an integral part of the financial statements.
88
Pacer Trendpilot® European Index ETF
SCHEDULE OF INVESTMENTS
April 30, 2024 (Continued)
| | | Units | | | Value | |
INVESTMENTS PURCHASED WITH PROCEEDS FROM SECURITIES LENDING — 14.4% |
Mount Vernon Liquid Assets Portfolio, LLC – 5.51%(g) | | | 5,787,866 | | | $ | 5,787,866 | |
TOTAL INVESTMENTS PURCHASED WITH PROCEEDS FROM SECURITIES LENDING (Cost $5,787,866) | | | | | | | 5,787,866 | |
| |
TOTAL INVESTMENTS — 113.1% (Cost $42,404,959) | | | | | | | 45,357,824 | |
Liabilities in Excess of Other Assets — (13.1)% | | | | | | | (5,267,252 | ) |
TOTAL NET ASSETS — 100.0% | | | | | | $ | 40,090,572 | |
Percentages are stated as a percent of net assets.
ADR - American Depositary Receipt
AG - Aktiengesellschaft
NV - Naamloze Vennootschap
PLC - Public Limited Company
SA - Sociedad Anónima
SA/NV - Societe Anonime/Naamloze Vennootschap
| | (a) | All or a portion of this security is on loan as of April 30, 2024. The total market value of these securities was $5,470,347 which represented 13.6% of net assets. |
| | (b) | Non-income producing security. |
| | (c) | To the extent that the Fund invests a significant portion of its assets in the securities of companies of a single country or region, it is more likely to be impacted by events or conditions affecting the country or region. |
| | (d) | Security is exempt from registration pursuant to Rule 144A under the Securities Act of 1933, as amended. These securities may only be resold in transactions exempt from registration to qualified institutional investors. As of April 30, 2024, the value of these securities total $883,455 or 2.2% of the Fund’s net assets. |
| | (e) | Fair value determined using significant unobservable inputs in accordance with procedures established by and under the supervision of the Adviser, acting as Valuation Designee. These securities represented $154,447 or 0.4% of net assets as of April 30, 2024. |
| | (f) | Represents less than 0.05% of net assets. |
| | (g) | The rate shown represents the 7-day effective yield as of April 30, 2024. |
The Global Industry Classification Standard (GICS®) was developed by and/or is the exclusive property of MSCI, Inc. and Standard & Poor’s Financial Services LLC (“S&P”). GICS is a service mark of MSCI, Inc. and S&P and has been licensed for use by U.S. Bank Global Fund Services.
The accompanying notes are an integral part of the financial statements.
89
Pacer Trendpilot® International ETF
SCHEDULE OF INVESTMENTS
April 30, 2024
| | | Shares | | | Value | |
COMMON STOCKS — 94.2% |
| |
Australia — 5.6% |
ANZ Group Holdings Ltd. | | | 26,518 | | | $ | 483,741 | |
Aristocrat Leisure Ltd. | | | 5,904 | | | | 152,678 | |
ASX Ltd. | | | 1,766 | | | | 72,771 | |
BHP Group Ltd. - ADR(a) | | | 22,837 | | | | 1,259,689 | |
Brambles Ltd. | | | 12,638 | | | | 119,692 | |
Cochlear Ltd. | | | 604 | | | | 127,202 | |
Coles Group Ltd. | | | 12,172 | | | | 127,895 | |
Commonwealth Bank of Australia | | | 14,902 | | | | 1,105,712 | |
Computershare Ltd. | | | 5,219 | | | | 92,061 | |
CSL Ltd. | | | 4,284 | | | | 768,055 | |
EBOS Group Ltd. | | | 1,426 | | | | 29,460 | |
Fortescue Ltd. | | | 15,397 | | | | 259,827 | |
Macquarie Group Ltd. | | | 3,162 | | | | 384,002 | |
National Australia Bank Ltd. | | | 27,676 | | | | 605,982 | |
QBE Insurance Group Ltd. | | | 13,576 | | | | 155,927 | |
Ramsay Health Care Ltd. | | | 1,694 | | | | 57,338 | |
REA Group Ltd. | | | 468 | | | | 54,461 | |
Rio Tinto Ltd. | | | 3,375 | | | | 285,292 | |
Santos Ltd. | | | 29,532 | | | | 147,307 | |
Sonic Healthcare Ltd. | | | 4,294 | | | | 74,465 | |
South32 Ltd. | | | 41,332 | | | | 96,122 | |
Suncorp Group Ltd. | | | 11,520 | | | | 124,029 | |
Telstra Group Ltd. | | | 36,776 | | | | 87,432 | |
Transurban Group | | | 28,018 | | | | 227,601 | |
Wesfarmers Ltd. | | | 9,976 | | | | 431,626 | |
Westpac Banking Corp. | | | 30,974 | | | | 520,885 | |
WiseTech Global Ltd. | | | 1,658 | | | | 99,661 | |
Woodside Energy Group Ltd. - ADR(a) | | | 17,120 | | | | 304,907 | |
Woolworths Group Ltd. | | | 11,082 | | | | 229,007 | |
| | | | | | | 8,484,827 | |
| |
Austria — 0.3% |
ANDRITZ AG | | | 652 | | | | 35,765 | |
Erste Group Bank AG | | | 3,238 | | | | 151,597 | |
EVN AG | | | 328 | | | | 10,099 | |
OMV AG | | | 1,284 | | | | 61,224 | |
Raiffeisen Bank International AG | | | 1,226 | | | | 22,740 | |
Strabag SE | | | 112 | | | | 4,769 | |
Telekom Austria AG | | | 1,267 | | | | 10,885 | |
Verbund AG | | | 762 | | | | 58,225 | |
voestalpine AG | | | 956 | | | | 25,629 | |
| | | | | | | 380,933 | |
| |
| | | Shares | | | Value | |
Belgium — 0.6% |
Anheuser-Busch InBev SA/NV - ADR(a) | | | 8,068 | | | $ | 481,337 | |
Groupe Bruxelles Lambert NV | | | 876 | | | | 65,301 | |
KBC Groep NV | | | 3,074 | | | | 229,312 | |
UCB SA | | | 1,098 | | | | 145,946 | |
| | | | | | | 921,896 | |
| |
Canada — 9.4% |
Agnico Eagle Mines Ltd. | | | 4,528 | | | | 286,849 | |
Alimentation Couche-Tard, Inc. | | | 6,610 | | | | 366,355 | |
Bank of Montreal | | | 6,576 | | | | 587,368 | |
Barrick Gold Corp.(a) | | | 16,038 | | | | 266,872 | |
BCE, Inc.(a) | | | 2,744 | | | | 90,140 | |
Brookfield Corp.(a) | | | 12,972 | | | | 520,437 | |
Canadian Imperial Bank of Commerce(a) | | | 8,394 | | | | 391,916 | |
Canadian National Railway Co.(a) | | | 5,171 | | | | 627,966 | |
Canadian Natural Resources Ltd. | | | 9,719 | | | | 736,894 | |
Canadian Pacific Kansas City Ltd.(a) | | | 8,442 | | | | 662,107 | |
Cenovus Energy, Inc. | | | 12,232 | | | | 251,490 | |
CGI, Inc.(b) | | | 1,900 | | | | 192,318 | |
Constellation Software, Inc. | | | 174 | | | | 447,975 | |
Enbridge, Inc.(a) | | | 19,264 | | | | 684,643 | |
Fortis, Inc.(a) | | | 4,426 | | | | 173,898 | |
Franco-Nevada Corp. | | | 1,718 | | | | 206,847 | |
Great-West Lifeco, Inc. | | | 2,456 | | | | 72,628 | |
Imperial Oil Ltd.(a) | | | 1,588 | | | | 109,493 | |
Intact Financial Corp. | | | 1,594 | | | | 261,994 | |
Loblaw Cos. Ltd. | | | 1,356 | | | | 148,696 | |
Manulife Financial Corp. | | | 16,410 | | | | 382,681 | |
National Bank of Canada | | | 3,074 | | | | 246,831 | |
Nutrien Ltd.(a) | | | 4,514 | | | | 238,204 | |
Pembina Pipeline Corp. | | | 5,004 | | | | 176,141 | |
Power Corp. of Canada | | | 5,064 | | | | 134,927 | |
Restaurant Brands International, Inc.(a) | | | 2,842 | | | | 215,566 | |
Rogers Communications, Inc. - Class B | | | 3,378 | | | | 126,574 | |
Royal Bank of Canada | | | 12,730 | | | | 1,232,645 | |
Shopify, Inc. - Class A(b) | | | 10,876 | | | | 763,495 | |
Sun Life Financial, Inc. | | | 5,340 | | | | 272,554 | |
Suncor Energy, Inc.(a) | | | 11,717 | | | | 447,472 | |
TC Energy Corp. | | | 9,426 | | | | 337,922 | |
Teck Resources Ltd. - Class B(a) | | | 4,164 | | | | 204,827 | |
TELUS Corp.(a) | | | 4,347 | | | | 69,856 | |
The Bank of Nova Scotia(a) | | | 10,924 | | | | 501,412 | |
The Toronto-Dominion Bank | | | 16,069 | | | | 953,213 | |
Thomson Reuters Corp. | | | 1,352 | | | | 204,287 | |
Tourmaline Oil Corp. | | | 2,896 | | | | 141,534 | |
The accompanying notes are an integral part of the financial statements.
90
Pacer Trendpilot® International ETF
SCHEDULE OF INVESTMENTS
April 30, 2024 (Continued)
| | | Shares | | | Value | |
COMMON STOCKS — 94.2% (Continued) |
| | | | | | | | | |
Canada — 9.4% (Continued) |
Wheaton Precious Metals Corp.(a) | | | 4,090 | | | $ | 213,253 | |
| | | | | | | 13,950,280 | |
| |
Denmark — 3.0% |
AP Moller - Maersk AS - Class A | | | 20 | | | | 28,502 | |
AP Moller - Maersk AS - Class B | | | 40 | | | | 58,321 | |
Coloplast AS - Class B | | | 1,132 | | | | 137,092 | |
DSV AS | | | 1,628 | | | | 232,428 | |
Novo Nordisk AS - ADR(a) | | | 29,256 | | | | 3,753,837 | |
Orsted AS(b)(c) | | | 1,720 | | | | 94,923 | |
Svitzer AS(b) | | | 120 | | | | 4,032 | |
Vestas Wind Systems AS(b) | | | 9,192 | | | | 247,790 | |
| | | | | | | 4,556,925 | |
| |
Finland — 0.7% |
Kone Oyj - Class B | | | 3,668 | | | | 179,284 | |
Neste Oyj | | | 3,922 | | | | 89,320 | |
Nokia Oyj - ADR | | | 48,016 | | | | 175,258 | |
Nordea Bank Abp | | | 31,230 | | | | 364,431 | |
Sampo Oyj - Class A | | | 4,240 | | | | 171,586 | |
UPM-Kymmene Oyj | | | 4,860 | | | | 170,743 | |
| | | | | | | 1,150,622 | |
| |
France — 9.1% |
Air Liquide SA | | | 4,718 | | | | 925,846 | |
Airbus SE - ADR | | | 22,296 | | | | 915,028 | |
AXA SA(a) | | | 15,742 | | | | 544,988 | |
BNP Paribas SA | | | 9,188 | | | | 662,947 | |
Capgemini SE | | | 1,416 | | | | 299,058 | |
Christian Dior SE | | | 30 | | | | 23,388 | |
Credit Agricole SA | | | 10,184 | | | | 158,135 | |
Danone SA | | | 5,536 | | | | 346,565 | |
Dassault Systemes SE | | | 6,094 | | | | 240,826 | |
Engie SA(a) | | | 15,942 | | | | 276,807 | |
EssilorLuxottica SA | | | 2,528 | | | | 541,735 | |
Hermes International SCA | | | 303 | | | | 727,888 | |
Kering | | | 634 | | | | 223,280 | |
L’Oreal SA | | | 2,048 | | | | 960,912 | |
LVMH Moet Hennessy Louis Vuitton SE - ADR | | | 11,798 | | | | 1,936,642 | |
Pernod Ricard SA | | | 1,811 | | | | 274,444 | |
Safran SA | | | 3,056 | | | | 665,971 | |
Sanofi SA - ADR | | | 20,392 | | | | 1,003,898 | |
Schneider Electric SE | | | 4,783 | | | | 1,097,962 | |
TotalEnergies SE - ADR(a) | | | 20,241 | | | | 1,466,865 | |
Vinci SA | | | 4,638 | | | | 545,702 | |
| | | | | | | 13,838,887 | |
| |
| | | Shares | | | Value | |
Germany — 6.3% |
adidas AG | | | 1,508 | | | $ | 364,355 | |
Allianz SE | | | 3,578 | | | | 1,017,998 | |
BASF SE | | | 7,868 | | | | 412,742 | |
Bayer AG | | | 8,932 | | | | 260,706 | |
Bayerische Motoren Werke AG | | | 2,636 | | | | 288,207 | |
Beiersdorf AG | | | 896 | | | | 134,395 | |
BioNTech SE - ADR(b) | | | 816 | | | | 72,477 | |
Daimler Truck Holding AG | | | 4,716 | | | | 212,943 | |
Deutsche Boerse AG | | | 1,724 | | | | 333,290 | |
Deutsche Post AG | | | 8,294 | | | | 347,504 | |
Deutsche Telekom AG | | | 30,950 | | | | 709,812 | |
E.ON SE | | | 20,419 | | | | 270,211 | |
Hapag-Lloyd AG(c) | | | 72 | | | | 13,255 | |
Henkel AG & Co. KGaA | | | 896 | | | | 64,210 | |
Infineon Technologies AG | | | 11,526 | | | | 402,475 | |
Mercedez-Benz Group AG | | | 7,082 | | | | 536,158 | |
Merck KGaA | | | 1,176 | | | | 186,937 | |
Muenchener Rueckversicherungs-Gesellschaft AG | | | 1,204 | | | | 529,640 | |
RWE AG | | | 6,158 | | | | 214,439 | |
SAP SE - ADR(a) | | | 9,252 | | | | 1,676,555 | |
Sartorius AG | | | 20 | | | | 4,696 | |
Siemens AG - ADR | | | 13,584 | | | | 1,271,055 | |
Siemens Healthineers AG(c) | | | 2,568 | | | | 142,784 | |
Uniper SE(b) | | | 34 | | | | 1,904 | |
Volkswagen AG | | | 264 | | | | 37,415 | |
| | | | | | | 9,506,163 | |
| |
Hong Kong — 1.6% |
AIA Group Ltd. - ADR | | | 25,548 | | | | 747,023 | |
BOC Hong Kong Holdings Ltd. | | | 32,687 | | | | 100,910 | |
Budweiser Brewing Co. APAC Ltd.(c) | | | 15,663 | | | | 22,025 | |
Chow Tai Fook Jewellery Group Ltd. | | | 20,919 | | | | 28,774 | |
CK Asset Holdings Ltd. | | | 17,311 | | | | 74,465 | |
CK Hutchison Holdings Ltd. | | | 24,389 | | | | 119,253 | |
CK Infrastructure Holdings Ltd. | | | 5,506 | | | | 31,181 | |
CLP Holdings Ltd. | | | 15,170 | | | | 119,650 | |
Galaxy Entertainment Group Ltd. | | | 18,283 | | | | 82,853 | |
Hang Seng Bank Ltd. | | | 6,610 | | | | 87,793 | |
Henderson Land Development Co. Ltd. | | | 11,886 | | | | 36,162 | |
Hong Kong & China Gas Co. Ltd. | | | 98,425 | | | | 75,114 | |
Hong Kong Exchanges & Clearing Ltd. | | | 10,845 | | | | 348,805 | |
MTR Corp. Ltd. | | | 14,129 | | | | 46,689 | |
Prudential PLC - ADR | | | 12,328 | | | | 216,480 | |
Sun Hung Kai Properties Ltd. | | | 13,697 | | | | 127,380 | |
Techtronic Industries Co. Ltd. | | | 12,016 | | | | 168,043 | |
The accompanying notes are an integral part of the financial statements.
91
Pacer Trendpilot® International ETF
SCHEDULE OF INVESTMENTS
April 30, 2024 (Continued)
| | | Shares | | | Value | |
COMMON STOCKS — 94.2% (Continued) |
| | | | | | | | | |
Hong Kong — 1.6% (Continued) | | | | | | | | |
Wharf Real Estate Investment Co. Ltd. | | | 14,082 | | | $ | 44,014 | |
| | | | | | | 2,476,614 | |
| |
Ireland — 1.2% |
CRH PLC | | | 6,578 | | | | 509,269 | |
Experian PLC | | | 8,388 | | | | 340,010 | |
Flutter Entertainment PLC(b) | | | 1,610 | | | | 300,257 | |
ICON PLC(b) | | | 750 | | | | 223,410 | |
James Hardie Industries PLC(b) | | | 4,004 | | | | 140,609 | |
Kerry Group PLC - Class A | | | 1,421 | | | | 122,533 | |
Ryanair Holdings PLC - ADR(a) | | | 830 | | | | 113,046 | |
| | | | | | | 1,749,134 | |
| |
Israel — 0.9% |
Airport City Ltd.(b) | | | 590 | | | | 9,120 | |
Amot Investments Ltd. | | | 1,966 | | | | 8,281 | |
Azrieli Group Ltd. | | | 336 | | | | 21,740 | |
Bank Hapoalim BM | | | 11,438 | | | | 103,508 | |
Bank Leumi Le-Israel BM | | | 13,938 | | | | 109,144 | |
Bezeq The Israeli Telecommunication Corp. Ltd. | | | 18,368 | | | | 22,817 | |
Big Shopping Centers Ltd.(b) | | | 107 | | | | 11,056 | |
Check Point Software Technologies Ltd.(b) | | | 848 | | | | 126,708 | |
CyberArk Software Ltd.(a)(b) | | | 380 | | | | 90,915 | |
Delek Group Ltd. | | | 92 | | | | 10,893 | |
Elbit Systems Ltd. | | | 230 | | | | 46,963 | |
First International Bank Of Israel Ltd. | | | 478 | | | | 19,048 | |
Global-e Online Ltd.(a)(b) | | | 866 | | | | 29,037 | |
ICL Group Ltd. | | | 6,566 | | | | 30,921 | |
Inmode Ltd.(b) | | | 650 | | | | 11,174 | |
Isracard Ltd. | | | 1 | | | | 3 | |
Israel Corp. Ltd. | | | 40 | | | | 9,574 | |
Israel Discount Bank Ltd. - Class A | | | 11,249 | | | | 57,964 | |
JFrog Ltd.(b) | | | 720 | | | | 28,714 | |
Melisron Ltd. | | | 232 | | | | 15,948 | |
Mivne Real Estate KD Ltd. | | | 5,422 | | | | 13,078 | |
Mizrahi Tefahot Bank Ltd. | | | 1,358 | | | | 49,614 | |
Monday.com Ltd.(b) | | | 228 | | | | 43,167 | |
Nice Ltd. - ADR(a)(b) | | | 582 | | | | 130,083 | |
Nova Ltd.(b) | | | 264 | | | | 44,854 | |
Phoenix Holdings Ltd. | | | 1,548 | | | | 14,857 | |
Shapir Engineering and Industry Ltd. | | | 1,302 | | | | 7,127 | |
Strauss Group Ltd. | | | 458 | | | | 8,422 | |
Teva Pharmaceutical Industries Ltd. - ADR(b) | | | 10,196 | | | | 143,253 | |
Tower Semiconductor Ltd.(b) | | | 998 | | | | 32,804 | |
| | | Shares | | | Value | |
Israel — 0.9% (Continued) | | | | | | | | |
Wix.com Ltd.(b) | | | 520 | | | $ | 61,812 | |
| | | | | | | 1,312,599 | |
| |
Italy — 1.9% |
Assicurazioni Generali SpA | | | 10,068 | | | | 246,051 | |
Davide Campari-Milano NV | | | 4,862 | | | | 48,878 | |
Enel SpA | | | 68,244 | | | | 450,163 | |
Eni SpA - ADR(a) | | | 10,804 | | | | 346,052 | |
Ferrari NV | | | 1,146 | | | | 473,551 | |
Intesa Sanpaolo SpA | | | 141,709 | | | | 533,244 | |
PRADA SpA | | | 4,650 | | | | 38,221 | |
Snam SpA | | | 18,642 | | | | 85,587 | |
Terna - Rete Elettrica Nazionale | | | 12,794 | | | | 102,731 | |
UniCredit SpA | | | 15,358 | | | | 566,770 | |
| | | | | | | 2,891,248 | |
| |
Japan — 22.5% |
Advantest Corp. | | | 6,970 | | | | 220,791 | |
Aeon Co. Ltd. | | | 7,926 | | | | 165,943 | |
AGC, Inc. | | | 2,063 | | | | 76,299 | |
Aisin Corp. | | | 1,664 | | | | 63,230 | |
Ajinomoto Co., Inc. | | | 4,816 | | | | 179,400 | |
ANA Holdings, Inc. | | | 1,460 | | | | 27,772 | |
Asahi Group Holdings Ltd. | | | 4,614 | | | | 158,125 | |
Asahi Kasei Corp. | | | 12,678 | | | | 88,464 | |
Astellas Pharma, Inc. | | | 16,454 | | | | 157,952 | |
Bandai Namco Holdings, Inc. | | | 6,062 | | | | 113,849 | |
Bridgestone Corp. | | | 5,322 | | | | 235,502 | |
Canon, Inc. | | | 9,224 | | | | 250,317 | |
Capcom Co. Ltd. | | | 3,048 | | | | 50,663 | |
Central Japan Railway Co. | | | 9,368 | | | | 214,844 | |
Chubu Electric Power Co., Inc. | | | 6,892 | | | | 88,491 | |
Chugai Pharmaceutical Co. Ltd. | | | 5,800 | | | | 185,715 | |
Daifuku Co. Ltd. | | | 3,454 | | | | 71,439 | |
Dai-ichi Life Holdings, Inc. | | | 9,000 | | | | 208,230 | |
Daiichi Sankyo Co. Ltd. | | | 17,168 | | | | 583,897 | |
Daikin Industries Ltd. | | | 2,580 | | | | 355,718 | |
Daiwa House Industry Co. Ltd. | | | 6,052 | | | | 170,376 | |
Denso Corp. | | | 19,500 | | | | 332,779 | |
Dentsu Group, Inc. | | | 2,090 | | | | 56,572 | |
Disco Corp. | | | 810 | | | | 235,222 | |
East Japan Railway Co. | | | 10,320 | | | | 189,302 | |
Eisai Co. Ltd. | | | 2,692 | | | | 110,981 | |
ENEOS Holdings, Inc. | | | 27,580 | | | | 127,814 | |
FANUC Corp. | | | 8,572 | | | | 251,483 | |
Fast Retailing Co. Ltd. | | | 1,764 | | | | 464,727 | |
FUJIFILM Holdings Corp. | | | 11,298 | | | | 241,913 | |
Fujitsu Ltd. | | | 15,820 | | | | 244,299 | |
Hamamatsu Photonics KK | | | 1,344 | | | | 49,520 | |
Hankyu Hanshin Holdings, Inc. | | | 2,314 | | | | 60,654 | |
The accompanying notes are an integral part of the financial statements.
92
Pacer Trendpilot® International ETF
SCHEDULE OF INVESTMENTS
April 30, 2024 (Continued)
| | | Shares | | | Value | |
COMMON STOCKS — 94.2% (Continued) |
| | | | | | | | | |
Japan — 22.5% (Continued) | | | | | | | | |
Hitachi Ltd. | | | 8,364 | | | $ | 775,332 | |
Honda Motor Co. Ltd. - ADR(a) | | | 15,168 | | | | 515,560 | |
Hoya Corp. | | | 3,083 | | | | 361,050 | |
Inpex Corp. | | | 9,336 | | | | 141,625 | |
Isuzu Motors Ltd. | | | 5,656 | | | | 71,706 | |
ITOCHU Corp. | | | 13,130 | | | | 594,082 | |
Japan Airlines Co. Ltd. | | | 1,314 | | | | 23,324 | |
Japan Exchange Group, Inc. | | | 4,812 | | | | 113,103 | |
Japan Post Bank Co. Ltd. | | | 12,832 | | | | 130,464 | |
Japan Post Holdings Co. Ltd. | | | 18,256 | | | | 174,903 | |
Japan Tobacco, Inc. | | | 10,008 | | | | 269,372 | |
JFE Holdings, Inc. | | | 5,314 | | | | 79,551 | |
Kansai Electric Power Co., Inc. | | | 7,512 | | | | 112,335 | |
Kao Corp. | | | 4,242 | | | | 175,500 | |
KDDI Corp. | | | 13,178 | | | | 367,645 | |
Keyence Corp. | | | 1,798 | | | | 801,442 | |
Kikkoman Corp. | | | 8,830 | | | | 105,676 | |
Kirin Holdings Co. Ltd. | | | 7,400 | | | | 107,940 | |
Kobe Bussan Co. Ltd. | | | 1,322 | | | | 28,709 | |
Komatsu Ltd. | | | 8,852 | | | | 266,882 | |
Konami Group Corp. | | | 940 | | | | 56,943 | |
Kubota Corp. | | | 9,669 | | | | 156,056 | |
Kyocera Corp. | | | 12,636 | | | | 154,830 | |
Kyowa Kirin Co. Ltd. | | | 2,306 | | | | 38,732 | |
Lasertec Corp. | | | 726 | | | | 159,272 | |
LY Corp. | | | 24,296 | | | | 59,017 | |
M3, Inc. | | | 3,894 | | | | 41,763 | |
Marubeni Corp. | | | 15,446 | | | | 276,572 | |
MEIJI Holdings Co. Ltd. | | | 2,508 | | | | 56,055 | |
MINEBEA MITSUMI, Inc. | | | 3,884 | | | | 73,425 | |
Mitsubishi Chemical Group Corp. | | | 13,018 | | | | 76,062 | |
Mitsubishi Corp. | | | 38,128 | | | | 875,143 | |
Mitsubishi Electric Corp. | | | 19,528 | | | | 343,348 | |
Mitsubishi Estate Co. Ltd. | | | 12,040 | | | | 221,997 | |
Mitsubishi HC Capital, Inc. | | | 8,804 | | | | 57,134 | |
Mitsubishi Heavy Industries Ltd. | | | 30,740 | | | | 276,283 | |
Mitsubishi UFJ Financial Group, Inc. - ADR(a) | | | 112,282 | | | | 1,117,206 | |
Mitsui & Co. Ltd. | | | 13,740 | | | | 665,503 | |
Mitsui Fudosan Co. Ltd. | | | 25,572 | | | | 261,534 | |
Mitsui OSK Lines Ltd. | | | 3,294 | | | | 104,220 | |
Mizuho Financial Group, Inc. | | | 22,316 | | | | 431,845 | |
MS&AD Insurance Group Holdings, Inc. | | | 12,144 | | | | 219,180 | |
Murata Manufacturing Co. Ltd. | | | 17,154 | | | | 315,801 | |
NEC Corp. | | | 2,478 | | | | 180,687 | |
Nexon Co. Ltd. | | | 4,122 | | | | 64,595 | |
| | | Shares | | | Value | |
Japan — 22.5% (Continued) | | | | | | | | |
NIDEC CORP | | | 4,776 | | | $ | 223,273 | |
Nintendo Co. Ltd. - ADR | | | 42,072 | | | | 512,437 | |
Nippon Paint Holdings Co. Ltd. | | | 9,702 | | | | 62,470 | |
Nippon Steel Corp. | | | 8,638 | | | | 193,939 | |
Nippon Telegraph & Telephone Corp. | | | 271,734 | | | | 294,279 | |
Nippon Yusen KK | | | 4,638 | | | | 131,334 | |
Nissan Motor Co. Ltd. | | | 21,498 | | | | 79,291 | |
Nissin Foods Holdings Co. Ltd. | | | 2,286 | | | | 60,949 | |
Nitori Holdings Co. Ltd. | | | 794 | | | | 106,956 | |
Nitto Denko Corp. | | | 1,362 | | | | 112,870 | |
Nomura Holdings, Inc. - ADR | | | 26,424 | | | | 150,881 | |
Nomura Research Institute Ltd. | | | 4,214 | | | | 102,468 | |
NTT Data Group Corp. | | | 5,358 | | | | 84,048 | |
Obic Co. Ltd. | | | 604 | | | | 77,973 | |
Olympus Corp. | | | 11,516 | | | | 160,676 | |
Omron Corp. | | | 1,878 | | | | 65,015 | |
Ono Pharmaceutical Co. Ltd. | | | 4,424 | | | | 63,843 | |
Oracle Corp. Japan | | | 306 | | | | 23,079 | |
Oriental Land Co. Ltd./Japan | | | 10,232 | | | | 282,991 | |
ORIX Corp. | | | 10,672 | | | | 219,307 | |
Osaka Gas Co. Ltd. | | | 3,792 | | | | 84,152 | |
Otsuka Holdings Co. Ltd. | | | 5,074 | | | | 216,903 | |
Pan Pacific International Holdings Corp. | | | 4,852 | | | | 114,628 | |
Panasonic Holdings Corp. | | | 22,316 | | | | 195,547 | |
Rakuten Group, Inc.(b) | | | 13,420 | | | | 64,966 | |
Recruit Holdings Co. Ltd. | | | 15,006 | | | | 656,700 | |
Renesas Electronics Corp. | | | 12,996 | | | | 216,593 | |
Resona Holdings, Inc. | | | 21,484 | | | | 136,357 | |
Rohm Co. Ltd. | | | 3,182 | | | | 46,293 | |
Secom Co. Ltd. | | | 1,916 | | | | 133,390 | |
Sekisui House Ltd. | | | 6,026 | | | | 138,543 | |
Seven & i Holdings Co. Ltd. | | | 21,774 | | | | 281,640 | |
SG Holdings Co. Ltd. | | | 4,424 | | | | 51,739 | |
Shimadzu Corp. | | | 2,505 | | | | 68,472 | |
Shimano, Inc. | | | 749 | | | | 122,597 | |
Shin-Etsu Chemical Co. Ltd. | | | 17,936 | | | | 704,520 | |
Shionogi & Co. Ltd. | | | 2,548 | | | | 119,132 | |
Shiseido Co. Ltd. | | | 3,638 | | | | 97,227 | |
SMC Corp. | | | 550 | | | | 291,260 | |
SoftBank Corp. | | | 25,698 | | | | 311,377 | |
SoftBank Group Corp. | | | 9,183 | | | | 460,853 | |
Sompo Holdings, Inc. | | | 9,507 | | | | 188,072 | |
Sony Group Corp. - ADR(a) | | | 11,428 | | | | 943,610 | |
Subaru Corp. | | | 5,596 | | | | 125,321 | |
Sumitomo Corp. | | | 11,128 | | | | 293,167 | |
Sumitomo Electric Industries Ltd. | | | 7,218 | | | | 111,715 | |
Sumitomo Metal Mining Co. Ltd. | | | 2,484 | | | | 83,695 | |
The accompanying notes are an integral part of the financial statements.
93
Pacer Trendpilot® International ETF
SCHEDULE OF INVESTMENTS
April 30, 2024 (Continued)
| | | Shares | | | Value | |
COMMON STOCKS — 94.2% (Continued) |
| | | | | | | | | |
Japan — 22.5% (Continued) | | | | | | | | |
Sumitomo Mitsui Financial Group, Inc. - ADR(a) | | | 60,360 | | | $ | 683,275 | |
Sumitomo Mitsui Trust Holdings, Inc. | | | 6,624 | | | | 139,355 | |
Sumitomo Realty & Development Co. Ltd. | | | 4,332 | | | | 150,850 | |
Suntory Beverage & Food Ltd. | | | 1,152 | | | | 37,442 | |
Suzuki Motor Corp. | | | 17,864 | | | | 208,526 | |
Sysmex Corp. | | | 4,350 | | | | 69,877 | |
Taiyo Nippon Sanso Corp. | | | 1,934 | | | | 57,696 | |
Takeda Pharmaceutical Co. Ltd. - ADR(a) | | | 28,482 | | | | 372,545 | |
TDK Corp. | | | 3,532 | | | | 158,645 | |
Terumo Corp. | | | 13,592 | | | | 232,128 | |
Toho Co. Ltd. | | | 1,142 | | | | 38,275 | |
Tokio Marine Holdings, Inc. | | | 17,640 | | | | 558,230 | |
Tokyo Electron Ltd. | | | 4,230 | | | | 941,937 | |
Tokyo Gas Co. Ltd. | | | 3,682 | | | | 82,621 | |
Tokyu Corp. | | | 5,680 | | | | 67,293 | |
Toray Industries, Inc. | | | 14,840 | | | | 67,955 | |
Toyota Industries Corp. | | | 1,722 | | | | 164,104 | |
Toyota Motor Corp. - ADR(a) | | | 11,258 | | | | 2,559,056 | |
Toyota Tsusho Corp. | | | 2,160 | | | | 138,052 | |
Unicharm Corp. | | | 4,014 | | | | 119,543 | |
West Japan Railway Co. | | | 4,448 | | | | 84,439 | |
Yakult Honsha Co. Ltd. | | | 2,774 | | | | 54,279 | |
Yamaha Motor Co. Ltd. | | | 9,538 | | | | 89,263 | |
Yaskawa Electric Corp. | | | 2,428 | | | | 101,298 | |
| | | | | | | 33,974,919 | |
| |
Luxembourg — 0.1% |
ArcelorMittal | | | 4,188 | | | | 105,434 | |
Tenaris SA - ADR | | | 2,102 | | | | 69,345 | |
| | | | | | | | 174,779 | |
| |
Macao — 0.0%(e) |
Sands China Ltd.(b) | | | 22,086 | | | | 52,740 | |
| |
Netherlands — 5.6% |
Adyen NV - ADR(b) | | | 28,210 | | | | 336,827 | |
Argenx SE - ADR(a)(b) | | | 542 | | | | 203,521 | |
ASML Holding NV | | | 3,644 | | | | 3,179,281 | |
DSM BV(f) | | | 1,378 | | | | 155,443 | |
Heineken NV | | | 2,306 | | | | 224,686 | |
ING Groep NV - ADR | | | 31,792 | | | | 502,314 | |
Koninklijke Ahold Delhaize NV | | | 8,872 | | | | 269,276 | |
Prosus NV | | | 13,336 | | | | 448,457 | |
Shell PLC - ADR(a) | | | 29,034 | | | | 2,080,576 | |
Stellantis NV | | | 19,518 | | | | 434,923 | |
Universal Music Group NV | | | 6,956 | | | | 205,630 | |
| | | Shares | | | Value | |
Netherlands — 5.6% (Continued) | | | | | | | | |
Wolters Kluwer NV | | | 2,264 | | | $ | 340,072 | |
| | | | | | | 8,381,006 | |
| |
New Zealand — 0.3% |
Auckland International Airport Ltd. | | | 11,926 | | | | 55,165 | |
Fisher & Paykel Healthcare Corp. Ltd. | | | 5,292 | | | | 88,778 | |
Infratil Ltd. | | | 7,570 | | | | 48,710 | |
Mercury NZ Ltd. | | | 6,054 | | | | 22,760 | |
Meridian Energy Ltd. | | | 11,280 | | | | 39,880 | |
Spark New Zealand Ltd. | | | 16,772 | | | | 47,142 | |
Xero Ltd.(b) | | | 1,284 | | | | 101,543 | |
| | | | | | | 403,978 | |
| |
Norway — 0.7% |
Adevinta ASA(b) | | | 2,866 | | | | 29,257 | |
Aker BP ASA | | | 2,820 | | | | 69,050 | |
AutoStore Holdings Ltd.(b)(c) | | | 8,106 | | | | 11,675 | |
DNB Bank ASA | | | 8,136 | | | | 142,160 | |
Equinor ASA - ADR(a) | | | 8,988 | | | | 238,991 | |
Gjensidige Forsikring ASA | | | 1,730 | | | | 27,830 | |
Kongsberg Gruppen ASA | | | 802 | | | | 56,747 | |
Mowi ASA | | | 4,046 | | | | 71,370 | |
Norsk Hydro ASA | | | 12,250 | | | | 75,980 | |
Orkla ASA | | | 6,828 | | | | 46,592 | |
Salmar ASA | | | 642 | | | | 40,542 | |
Telenor ASA | | | 5,728 | | | | 65,951 | |
Var Energi ASA | | | 4,996 | | | | 16,362 | |
Yara International ASA | | | 1,488 | | | | 42,530 | |
| | | | | | | 935,037 | |
| |
Portugal — 0.1% |
EDP - Energias de Portugal SA | | | 27,016 | | | | 101,660 | |
| |
Singapore — 1.2% |
CapitaLand Investment Ltd. | | | 21,770 | | | | 42,422 | |
DBS Group Holdings Ltd. | | | 17,778 | | | | 454,532 | |
Grab Holdings Ltd. - Class A(b) | | | 18,930 | | | | 66,255 | |
Jardine Cycle & Carriage Ltd. | | | 828 | | | | 16,074 | |
Keppel Ltd. | | | 12,588 | | | | 63,445 | |
Oversea-Chinese Banking Corp. Ltd. | | | 35,310 | | | | 368,607 | |
Sea Ltd. - ADR(b) | | | 3,124 | | | | 197,406 | |
Singapore Airlines Ltd. | | | 12,192 | | | | 58,412 | |
Singapore Technologies Engineering Ltd. | | | 13,912 | | | | 41,072 | |
Singapore Telecommunications Ltd. | | | 64,576 | | | | 112,590 | |
United Overseas Bank Ltd. | | | 13,946 | | | | 310,581 | |
Wilmar International Ltd. | | | 27,368 | | | | 64,759 | |
| | | | | | | 1,796,155 | |
| |
The accompanying notes are an integral part of the financial statements.
94
Pacer Trendpilot® International ETF
SCHEDULE OF INVESTMENTS
April 30, 2024 (Continued)
| | | Shares | | | Value | |
COMMON STOCKS — 94.2% (Continued) |
| |
South Korea — 0.5% |
Coupang, Inc.(b) | | | 10,388 | | | $ | 233,730 | |
KB Financial Group, Inc. - ADR | | | 3,416 | | | | 184,362 | |
POSCO Holdings, Inc. - ADR(a) | | | 2,726 | | | | 195,045 | |
| | | | | | | 613,137 | |
| |
Spain — 2.0% |
Amadeus IT Holding SA | | | 4,096 | | | | 261,226 | |
Banco Bilbao Vizcaya Argentaria SA - ADR(a) | | | 53,717 | | | | 575,309 | |
Banco Santander SA - ADR(a) | | | 146,487 | | | | 703,138 | |
CaixaBank SA | | | 36,844 | | | | 194,713 | |
Cellnex Telecom SA(c) | | | 5,338 | | | | 176,883 | |
EDP Renovaveis SA | | | 2,701 | | | | 37,098 | |
Iberdrola SA | | | 52,111 | | | | 640,105 | |
Industria de Diseno Textil SA | | | 9,884 | | | | 451,991 | |
Naturgy Energy Group SA | | | 1,674 | | | | 42,376 | |
| | | | | | | 3,082,839 | |
| |
Sweden — 2.8% |
Alfa Laval AB | | | 2,630 | | | | 113,024 | |
Assa Abloy AB - Class B | | | 9,016 | | | | 241,345 | |
Atlas Copco AB - Class A | | | 22,750 | | | | 403,478 | |
Atlas Copco AB - Class B | | | 14,196 | | | | 215,766 | |
Epiroc AB | | | 5,700 | | | | 106,962 | |
Epiroc AB - Class B | | | 3,544 | | | | 59,365 | |
EQT AB | | | 3,128 | | | | 85,804 | |
Essity AB - Class B | | | 5,486 | | | | 136,697 | |
Evolution AB(c) | | | 1,744 | | | | 194,966 | |
H & M Hennes & Mauritz AB - Class B(a) | | | 5,612 | | | | 90,007 | |
Hexagon AB - Class B | | | 19,122 | | | | 202,578 | |
Industrivarden AB - Class A | | | 1,416 | | | | 45,896 | |
Industrivarden AB - Class C | | | 1,368 | | | | 44,303 | |
Investment AB Latour - Class B | | | 1,246 | | | | 30,470 | |
Investor AB | | | 16,024 | | | | 396,006 | |
L E Lundbergforetagen AB - Class B | | | 662 | | | | 32,919 | |
Nibe Industrier AB - Class B(b) | | | 13,942 | | | | 65,280 | |
Sandvik AB | | | 9,810 | | | | 198,240 | |
Skandinaviska Enskilda Banken AB - Class A | | | 15,204 | | | | 200,459 | |
Skandinaviska Enskilda Banken AB - Class C | | | 186 | | | | 2,478 | |
Spotify Technology SA(b) | | | 1,296 | | | | 363,450 | |
Svenska Cellulosa AB SCA - Class B | | | 5,452 | | | | 80,169 | |
Svenska Handelsbanken AB - Class A | | | 14,324 | | | | 125,012 | |
Svenska Handelsbanken AB - Class B | | | 318 | | | | 3,428 | |
Swedbank AB - Class A | | | 8,346 | | | | 160,855 | |
Telefonaktiebolaget LM Ericsson - ADR(a) | | | 28,338 | | | | 142,257 | |
| | | Shares | | | Value | |
Sweden — 2.8% (Continued) | | | | | | | | |
Telia Co. AB | | | 21,098 | | | $ | 48,359 | |
Volvo AB - Class A | | | 1,740 | | | | 46,230 | |
Volvo AB - Class B | | | 13,960 | | | | 358,995 | |
Volvo Car AB(b) | | | 4,882 | | | | 15,474 | |
Volvo Car AB(b) | | | 4,882 | | | | 997 | |
| | | | | | | 4,211,269 | |
| |
Switzerland — 7.5% |
ABB Ltd. - ADR | | | 14,712 | | | | 716,474 | |
Alcon, Inc. | | | 4,544 | | | | 351,459 | |
Cie Financiere Richemont SA | | | 4,824 | | | | 671,188 | |
DSM-Firmenich AG | | | 72 | | | | 8,122 | |
Givaudan SA | | | 72 | | | | 309,069 | |
Glencore PLC | | | 100,657 | | | | 588,253 | |
Holcim AG | | | 4,688 | | | | 393,603 | |
Kuehne + Nagel International AG | | | 510 | | | | 135,205 | |
Lonza Group AG | | | 672 | | | | 373,118 | |
Nestle SA - ADR | | | 24,136 | | | | 2,428,082 | |
Novartis AG - ADR | | | 18,888 | | | | 1,834,592 | |
Roche Holding AG - ADR(a) | | | 52,816 | | | | 1,574,973 | |
Sika AG | | | 1,452 | | | | 415,895 | |
STMicroelectronics NV | | | 5,964 | | | | 239,603 | |
UBS Group AG | | | 27,043 | | | | 713,988 | |
Zurich Insurance Group AG | | | 1,322 | | | | 638,817 | |
| | | | | | | 11,392,441 | |
| |
United Kingdom — 10.0% |
3i Group PLC | | | 8,848 | | | | 317,970 | |
Anglo American PLC | | | 12,166 | | | | 400,420 | |
ARM Holdings PLC - ADR(b) | | | 838 | | | | 84,814 | |
Ashtead Group PLC | | | 4,106 | | | | 299,732 | |
Associated British Foods PLC | | | 3,078 | | | | 102,153 | |
AstraZeneca PLC - ADR | | | 27,918 | | | | 2,118,417 | |
BAE Systems PLC | | | 26,804 | | | | 446,460 | |
Barclays PLC - ADR(a) | | | 32,004 | | | | 327,721 | |
BP PLC - ADR | | | 25,305 | | | | 981,075 | |
British American Tobacco PLC - ADR | | | 19,888 | | | | 585,105 | |
BT Group PLC | | | 51,672 | | | | 66,245 | |
Coca-Cola Europacific Partners PLC | | | 1,880 | | | | 135,398 | |
Compass Group PLC | | | 15,734 | | | | 438,820 | |
Diageo PLC - ADR | | | 5,000 | | | | 690,800 | |
GSK PLC - ADR(a) | | | 18,772 | | | | 777,912 | |
Haleon PLC - ADR(a) | | | 27,882 | | | | 237,833 | |
HSBC Holdings PLC - ADR(a) | | | 34,456 | | | | 1,501,592 | |
Imperial Brands PLC | | | 8,322 | | | | 190,141 | |
Legal & General Group PLC | | | 54,358 | | | | 160,298 | |
Lloyds Banking Group PLC - ADR | | | 146,373 | | | | 374,715 | |
London Stock Exchange Group PLC | | | 3,440 | | | | 380,241 | |
National Grid PLC - ADR(a) | | | 6,684 | | | | 445,489 | |
The accompanying notes are an integral part of the financial statements.
95
Pacer Trendpilot® International ETF
SCHEDULE OF INVESTMENTS
April 30, 2024 (Continued)
| | | Shares | | | Value | |
COMMON STOCKS — 94.2% (Continued) |
| | | | | | | | | |
United Kingdom — 10.0% (Continued) |
NatWest Group PLC | | | 50,722 | | | $ | 192,357 | |
Reckitt Benckiser Group PLC | | | 6,496 | | | | 362,669 | |
RELX PLC - ADR(a) | | | 17,252 | | | | 710,610 | |
Rio Tinto PLC - ADR | | | 10,114 | | | | 686,033 | |
SSE PLC | | | 9,952 | | | | 207,237 | |
Standard Chartered PLC | | | 19,962 | | | | 172,060 | |
Tesco PLC | | | 64,864 | | | | 240,153 | |
Unilever PLC - ADR(a) | | | 22,676 | | | | 1,175,750 | |
Vodafone Group PLC - ADR | | | 20,322 | | | | 170,908 | |
| | | | | | | 14,981,128 | |
| |
United States — 0.3% |
Flex Ltd.(b) | | | 4,060 | | | | 116,319 | |
Waste Connections, Inc. | | | 2,344 | | | | 379,939 | |
| | | | | | | 496,258 | |
TOTAL COMMON STOCKS (Cost $123,901,816) | | | | | | | 141,817,474 | |
| |
EXCHANGE TRADED FUNDS — 4.4% |
| |
iShares MSCI South Korea ETF(a) | | | 105,482 | | | | 6,650,640 | |
TOTAL EXCHANGE TRADED FUNDS (Cost $6,374,321) | | | | | | | 6,650,640 | |
| |
REAL ESTATE INVESTMENT TRUSTS — 0.4% |
| |
Australia — 0.2% |
Goodman Group | | | 15,594 | | | | 320,125 | |
Scentre Group | | | 47,202 | | | | 97,236 | |
| | | | | | | 417,361 | |
| |
Hong Kong — 0.1% |
Link REIT | | | 23,305 | | | | 100,844 | |
| |
Japan — 0.1% |
Nippon Building Fund, Inc. | | | 20 | | | | 76,467 | |
| |
Singapore — 0.0%(e) |
CapitaLand Integrated Commercial Trust | | | 45,988 | | | | 66,032 | |
TOTAL REAL ESTATE INVESTMENT TRUSTS (Cost $563,354) | | | | | | | 660,704 | |
| |
| | | Shares | | | Value | |
PREFERRED STOCKS — 0.3% |
| |
Germany — 0.3% |
Bayerische Motoren Werke AG, 0.00%, | | | 535 | | | $ | 55,097 | |
Dr Ing hc F Porsche AG, 0.00%, (c) | | | 828 | | | | 73,961 | |
Henkel AG & Co. KGaA, 0.00%, | | | 1,478 | | | | 117,448 | |
Sartorius AG, 0.00%, | | | 244 | | | | 73,510 | |
Volkswagen AG, 0.00%, | | | 1,668 | | | | 204,977 | |
| | | | | | | 524,993 | |
TOTAL PREFERRED STOCKS (Cost $531,228) | | | | | | | 524,993 | |
| |
| | | Contracts | | | | | |
WARRANTS — 0.0%(d) |
| |
Canada — 0.0%(d) |
Constellation Software, Inc., Expires 03/31/2040, Exercise Price $0.00(b)(e) | | | 162 | | | | 0 | |
TOTAL WARRANTS (Cost $0) | | | | | | | 0 | |
| |
| | | Units | | | | | |
INVESTMENTS PURCHASED WITH PROCEEDS FROM SECURITIES LENDING — 22.0% |
Mount Vernon Liquid Assets Portfolio, LLC – 5.51%(f) | | | 33,098,496 | | | | 33,098,496 | |
TOTAL INVESTMENTS PURCHASED WITH PROCEEDS FROM SECURITIES LENDING (Cost $33,098,496) | | | | | | | 33,098,496 | |
| |
TOTAL INVESTMENTS — 121.3% (Cost $164,469,215) | | | | | | | 182,752,307 | |
Liabilities in Excess of Other Assets — (21.3)% | | | | | | | (32,080,720 | ) |
TOTAL NET ASSETS — 100.0% | | | | | | $ | 150,671,587 | |
Percentages are stated as a percent of net assets.
ADR - American Depositary Receipt
AG - Aktiengesellschaft
ARM Adjustable Rate Mortgage
ASA - Advanced Subscription Agreement
NV - Naamloze Vennootschap
PLC - Public Limited Company
SA - Sociedad Anónima
SA/NV - Societe Anonime/Naamloze Vennootschap
| | (a) | All or a portion of this security is on loan as of April 30, 2024. The total market value of these securities was $31,864,146 which represented 21.1% of net assets. |
| | (b) | Non-income producing security. |
The accompanying notes are an integral part of the financial statements.
96
Pacer Trendpilot® International ETF
SCHEDULE OF INVESTMENTS
April 30, 2024 (Continued)
| | (c) | Security is exempt from registration pursuant to Rule 144A under the Securities Act of 1933, as amended. These securities may only be resold in transactions exempt from registration to qualified institutional investors. As of April 30, 2024, the value of these securities total $730,472 or 0.5% of the Fund’s net assets. |
| | (d) | Represents less than 0.05% of net assets. |
| | (e) | Fair value determined using significant unobservable inputs in accordance with procedures established by and under the supervision of the Adviser, acting as Valuation Designee. These securities represented $155,443 or 0.1% of net assets as of April 30, 2024. |
| | (f) | The rate shown represents the 7-day effective yield as of April 30, 2024. |
The Global Industry Classification Standard (GICS®) was developed by and/or is the exclusive property of MSCI, Inc. and Standard & Poor’s Financial Services LLC (“S&P”). GICS is a service mark of MSCI, Inc. and S&P and has been licensed for use by U.S. Bank Global Fund Services.
The accompanying notes are an integral part of the financial statements.
97
Pacer Trendpilot® US Bond ETF
SCHEDULE OF INVESTMENTS
April 30, 2024
| | | Par | | | Value | |
CORPORATE BONDS — 98.7% |
| |
Communications — 15.7% |
Altice Financing SA |
5.00%, 01/15/2028 (a)(b) | | $ | 241,000 | | | $ | 189,788 | |
5.75%, 08/15/2029 (a)(b) | | | 395,000 | | | | 292,793 | |
Altice France Holding SA |
10.50%, 05/15/2027 (a) | | | 281,000 | | | | 99,053 | |
8.13%, 02/01/2027 (a)(b) | | | 345,000 | | | | 258,060 | |
6.00%, 02/15/2028 (a) | | | 222,000 | | | | 63,461 | |
5.50%, 01/15/2028 (a) | | | 177,000 | | | | 119,546 | |
5.13%, 01/15/2029 (a) | | | 111,000 | | | | 72,428 | |
5.13%, 07/15/2029 (a) | | | 501,000 | | | | 325,650 | |
5.50%, 10/15/2029 (a)(b) | | | 339,000 | | | | 221,621 | |
AMC Entertainment Holdings, Inc., 7.50%, 02/15/2029 (a) | | | 172,000 | | | | 118,042 | |
AMC Networks, Inc. | | | | | | | | |
10.25%, 01/15/2029 (a) | | | 145,000 | | | | 145,000 | |
4.25%, 02/15/2029 | | | 179,000 | | | | 122,168 | |
Arches Buyer, Inc. |
4.25%, 06/01/2028 (a) | | | 164,000 | | | | 140,414 | |
6.13%, 12/01/2028 (a) | | | 117,000 | | | | 95,063 | |
British Telecommunications PLC |
4.25% to 02/23/2027 then 5 yr. CMT Rate + 2.99%, 11/23/2081 (a) | | | 92,000 | | | | 86,579 | |
4.88% to 11/23/2031 then 5 yr. CMT Rate + 3.49%, 11/23/2081 (a)(b) | | | 117,000 | | | | 104,296 | |
C&W Senior Finance Ltd., 6.88%, 09/15/2027 (a) | | | 231,000 | | | | 218,106 | |
CCO Holdings LLC / CCO Holdings Capital Corp. |
5.50%, 05/01/2026 (a) | | | 145,000 | | | | 142,100 | |
5.13%, 05/01/2027 (a) | | | 597,000 | | | | 559,919 | |
5.00%, 02/01/2028 (a) | | | 486,000 | | | | 442,564 | |
5.38%, 06/01/2029 (a) | | | 296,000 | | | | 260,850 | |
6.38%, 09/01/2029 (a)(b) | | | 286,000 | | | | 262,179 | |
4.75%, 03/01/2030 (a) | | | 470,000 | | | | 390,520 | |
4.50%, 08/15/2030 (a)(b) | | | 504,000 | | | | 408,302 | |
4.25%, 02/01/2031 (a) | | | 553,000 | | | | 432,425 | |
7.38%, 03/01/2031 (a)(b) | | | 227,000 | | | | 214,698 | |
4.75%, 02/01/2032 (a) | | | 241,000 | | | | 189,383 | |
4.50%, 05/01/2032 (b) | | | 550,000 | | | | 421,690 | |
4.50%, 06/01/2033 (a) | | | 320,000 | | | | 240,800 | |
4.25%, 01/15/2034 (a) | | | 364,000 | | | | 263,900 | |
Clear Channel Outdoor Holdings, Inc. |
5.13%, 08/15/2027 (a) | | | 238,000 | | | | 220,399 | |
7.75%, 04/15/2028 (a)(b) | | | 204,000 | | | | 172,890 | |
9.00%, 09/15/2028 (a) | | | 140,000 | | | | 143,943 | |
7.50%, 06/01/2029 (a) | | | 211,000 | | | | 168,920 | |
| | | Par | | | Value | |
Communications — 15.7% (Continued) |
7.88%, 04/01/2030 (a) | | $ | 150,000 | | | $ | 146,991 | |
CMG Media Corp., 8.88%, 12/15/2027 (a) | | | 193,000 | | | | 106,440 | |
Connect Finco SARL / Connect US Finco LLC, 6.75%, 10/01/2026 (a) | | | 386,000 | | | | 374,218 | |
Consolidated Communications, Inc. | | | | | | | | |
5.00%, 10/01/2028 (a) | | | 93,000 | | | | 76,711 | |
6.50%, 10/01/2028 (a) | | | 135,000 | | | | 117,113 | |
CSC Holdings LLC |
5.50%, 04/15/2027 (a) | | | 207,000 | | | | 169,337 | |
5.38%, 02/01/2028 (a) | | | 199,000 | | | | 152,612 | |
7.50%, 04/01/2028 (a) | | | 205,000 | | | | 110,188 | |
11.25%, 05/15/2028 (a) | | | 124,000 | | | | 109,740 | |
11.75%, 01/31/2029 (a) | | | 380,000 | | | | 336,775 | |
6.50%, 02/01/2029 (a) | | | 350,000 | | | | 259,875 | |
5.75%, 01/15/2030 (a) | | | 417,000 | | | | 182,438 | |
4.13%, 12/01/2030 (a) | | | 252,000 | | | | 160,020 | |
4.63%, 12/01/2030 (a)(b) | | | 395,000 | | | | 170,344 | |
3.38%, 02/15/2031 (a) | | | 199,000 | | | | 122,634 | |
4.50%, 11/15/2031 (a) | | | 281,000 | | | | 177,981 | |
5.00%, 11/15/2031 (a) | | | 117,000 | | | | 49,093 | |
Directv Financing LLC, 8.88%, 02/01/2030 (a) | | | 130,000 | | | | 126,272 | |
Directv Financing LLC / Directv Financing Co.-Obligor, Inc., 5.88%, 08/15/2027 (a) | | | 682,000 | | | | 636,817 | |
DISH DBS Corp. |
7.75%, 07/01/2026 (b) | | | 404,000 | | | | 252,904 | |
5.25%, 12/01/2026 (a)(b) | | | 554,000 | | | | 435,069 | |
7.38%, 07/01/2028 | | | 204,000 | | | | 90,780 | |
5.75%, 12/01/2028 (a) | | | 441,000 | | | | 297,675 | |
5.13%, 06/01/2029 | | | 306,000 | | | | 122,018 | |
DISH Network Corp., 11.75%, 11/15/2027 (a) | | | 510,000 | | | | 513,350 | |
Frontier Communications Holdings LLC |
5.88%, 10/15/2027 (a) | | | 154,000 | | | | 147,648 | |
5.00%, 05/01/2028 (a) | | | 298,000 | | | | 273,096 | |
6.75%, 05/01/2029 (a) | | | 199,000 | | | | 175,120 | |
5.88%, 11/01/2029 | | | 135,000 | | | | 112,513 | |
6.00%, 01/15/2030 (a) | | | 194,000 | | | | 161,020 | |
8.75%, 05/15/2030 (a) | | | 256,000 | | | | 260,181 | |
8.63%, 03/15/2031 (a) | | | 135,000 | | | | 136,350 | |
Go Daddy Operating Co. LLC / GD Finance Co., Inc. |
5.25%, 12/01/2027 (a) | | | 120,000 | | | | 115,795 | |
3.50%, 03/01/2029 (a) | | | 62,000 | | | | 54,974 | |
Gray Television, Inc. | | | | | | | | |
5.88%, 07/15/2026 (a) | | | 124,000 | | | | 119,645 | |
The accompanying notes are an integral part of the financial statements.
98
Pacer Trendpilot® US Bond ETF
SCHEDULE OF INVESTMENTS
April 30, 2024 (Continued)
| | | Par | | | Value | |
CORPORATE BONDS - 98.7% (Continued) |
| | | | | | | | | |
Communications — 15.7% (Continued) |
7.00%, 05/15/2027 (a)(b) | | $ | 135,000 | | | $ | 123,019 | |
4.75%, 10/15/2030 (a) | | | 135,000 | | | | 81,506 | |
5.38%, 11/15/2031 (a) | | | 254,000 | | | | 152,331 | |
Hughes Satellite Systems Corp. |
5.25%, 08/01/2026 | | | 150,000 | | | | 124,125 | |
6.63%, 08/01/2026 | | | 145,000 | | | | 83,375 | |
iHeartCommunications, Inc. |
6.38%, 05/01/2026 | | | 157,000 | | | | 132,456 | |
8.38%, 05/01/2027 | | | 188,000 | | | | 100,674 | |
5.25%, 08/15/2027 (a) | | | 135,000 | | | | 98,904 | |
4.75%, 01/15/2028 (a) | | | 117,000 | | | | 83,714 | |
Iliad Holding SASU |
6.50%, 10/15/2026 (a) | | | 211,000 | | | | 209,870 | |
7.00%, 10/15/2028 (a)(b) | | | 186,000 | | | | 181,583 | |
Intelsat Jackson Holdings SA, 6.50%, 03/15/2030 (a) | | | 603,000 | | | | 577,372 | |
Lamar Media Corp. | | | | | | | | |
3.75%, 02/15/2028 | | | 100,000 | | | | 92,156 | |
4.88%, 01/15/2029 | | | 68,000 | | | | 64,178 | |
4.00%, 02/15/2030 | | | 103,000 | | | | 91,764 | |
3.63%, 01/15/2031 | | | 103,000 | | | | 87,861 | |
LCPR Senior Secured Financing DAC | | | | | | | | |
6.75%, 10/15/2027 (a) | | | 232,000 | | | | 214,607 | |
5.13%, 07/15/2029 (a) | | | 152,000 | | | | 126,850 | |
Level 3 Financing, Inc. |
4.25%, 07/01/2028 (a) | | | 211,000 | | | | 81,235 | |
3.75%, 07/15/2029 (a) | | | 171,000 | | | | 58,354 | |
11.00%, 11/15/2029 (a) | | | 300,000 | | | | 306,510 | |
10.50%, 05/15/2030 (a)(b) | | | 151,000 | | | | 151,000 | |
Live Nation Entertainment, Inc. | | | | | | | | |
6.50%, 05/15/2027 (a) | | | 256,000 | | | | 256,188 | |
4.75%, 10/15/2027 (a) | | | 197,000 | | | | 185,372 | |
3.75%, 01/15/2028 (a) | | | 117,000 | | | | 106,142 | |
Match Group Holdings II LLC |
5.00%, 12/15/2027 (a) | | | 105,000 | | | | 99,385 | |
4.63%, 06/01/2028 (a) | | | 87,000 | | | | 80,333 | |
4.13%, 08/01/2030 (a) | | | 117,000 | | | | 101,161 | |
3.63%, 10/01/2031 (a)(b) | | | 117,000 | | | | 96,379 | |
McGraw-Hill Education, Inc. |
5.75%, 08/01/2028 (a) | | | 151,000 | | | | 139,968 | |
8.00%, 08/01/2029 (a) | | | 130,000 | | | | 119,504 | |
Nexstar Media, Inc. |
5.63%, 07/15/2027 (a)(b) | | | 313,000 | | | | 293,490 | |
4.75%, 11/01/2028 (a)(b) | | | 209,000 | | | | 185,339 | |
News Corp. | | | | | | | | |
3.88%, 05/15/2029 (a) | | | 204,000 | | | | 183,855 | |
5.13%, 02/15/2032 (a) | | | 117,000 | | | | 107,203 | |
| | | Par | | | Value | |
Communications — 15.7% (Continued) |
Outfront Media Capital LLC / Outfront Media Capital Corp. |
5.00%, 08/15/2027 (a) | | $ | 127,000 | | | $ | 120,790 | |
4.25%, 01/15/2029 (a) | | | 92,000 | | | | 81,845 | |
4.63%, 03/15/2030 (a) | | | 117,000 | | | | 102,989 | |
7.38%, 02/15/2031 (a) | | | 90,000 | | | | 92,391 | |
Paramount Global | | | | | | | | |
6.25% to 02/28/2027 then 3 mo. LIBOR US + 3.90%, 02/28/2057 (c) | | | 137,000 | | | | 119,875 | |
6.38% to 03/30/2027 then 5 yr. CMT Rate + 4.00%, 03/30/2062 (b) | | | 194,000 | | | | 179,314 | |
Radiate Holdco LLC / Radiate Finance, Inc. |
4.50%, 09/15/2026 (a) | | | 191,000 | | | | 145,876 | |
6.50%, 09/15/2028 (a) | | | 184,000 | | | | 76,518 | |
ROBLOX Corp., 3.88%, 05/01/2030 (a) | | | 154,000 | | | | 132,906 | |
Rogers Communications, Inc., 5.25% to 03/15/2027 then 5 yr. CMT Rate + 3.59%, 03/15/2082 (a) | | | 135,000 | | | | 127,913 | |
Scripps Escrow II, Inc., 3.88%, 01/15/2029 (a) | | | 122,000 | | | | 90,073 | |
Scripps Escrow, Inc., 5.88%, 07/15/2027 (a) | | | 103,000 | | | | 80,770 | |
Sinclair Television Group, Inc. |
5.50%, 03/01/2030 (a) | | | 117,000 | | | | 81,023 | |
4.13%, 12/01/2030 (a) | | | 135,000 | | | | 92,813 | |
Sirius XM Radio, Inc. |
3.13%, 09/01/2026 (a) | | | 179,000 | | | | 166,680 | |
5.00%, 08/01/2027 (a) | | | 286,000 | | | | 269,913 | |
4.00%, 07/15/2028 (a) | | | 374,000 | | | | 333,902 | |
5.50%, 07/01/2029 (a) | | | 268,000 | | | | 248,614 | |
4.13%, 07/01/2030 (a) | | | 286,000 | | | | 241,936 | |
3.88%, 09/01/2031 (a)(b) | | | 286,000 | | | | 229,856 | |
Stagwell Global LLC, 5.63%, 08/15/2029 (a)(b) | | | 227,000 | | | | 202,920 | |
Sunrise FinCo I BV, 4.88%, 07/15/2031 (a) | | | 228,000 | | | | 198,794 | |
Sunrise HoldCo IV BV, 5.50%, 01/15/2028 (a) | | | 56,000 | | | | 52,835 | |
TEGNA, Inc. | | | | | | | | |
4.75%, 03/15/2026 (a) | | | 98,000 | | | | 94,613 | |
4.63%, 03/15/2028 (b) | | | 204,000 | | | | 185,242 | |
5.00%, 09/15/2029 | | | 227,000 | | | | 200,098 | |
Telenet Finance Luxembourg Notes Sarl, 5.50%, 03/01/2028 (a) | | | 200,000 | | | | 185,650 | |
Univision Communications, Inc. |
6.63%, 06/01/2027 (a) | | | 286,000 | | | | 276,253 | |
8.00%, 08/15/2028 (a) | | | 250,000 | | | | 250,000 | |
The accompanying notes are an integral part of the financial statements.
99
Pacer Trendpilot® US Bond ETF
SCHEDULE OF INVESTMENTS
April 30, 2024 (Continued)
| | | Par | | | Value | |
CORPORATE BONDS - 98.7% (Continued) |
| | | | | | | | | |
Communications — 15.7% (Continued) |
4.50%, 05/01/2029 (a) | | $ | 216,000 | | | $ | 187,504 | |
7.38%, 06/30/2030 (a)(b) | | | 186,000 | | | | 177,722 | |
Videotron Ltd. |
5.13%, 04/15/2027 (a) | | | 115,000 | | | | 111,011 | |
3.63%, 06/15/2029 (a)(b) | | | 47,000 | | | | 41,713 | |
Virgin Media Finance PLC, 5.00%, 07/15/2030 (a)(b) | | | 176,000 | | | | 143,660 | |
Virgin Media Secured Finance PLC |
5.50%, 05/15/2029 (a)(b) | | | 279,000 | | | | 253,175 | |
4.50%, 08/15/2030 (a) | | | 174,000 | | | | 146,109 | |
Vmed O2 UK Financing I PLC |
4.25%, 01/31/2031 (a) | | | 291,000 | | | | 238,620 | |
4.75%, 07/15/2031 (a) | | | 263,000 | | | | 219,013 | |
7.75%, 04/15/2032 (a) | | | 125,000 | | | | 122,981 | |
Vodafone Group PLC | | | | | | | | |
7.00% to 04/04/2029 then 5 Yr. Swap Rate USD + 4.87%, 04/04/2079 | | | 394,000 | | | | 399,417 | |
4.13% to 06/04/2031 then 5 yr. CMT Rate + 2.77%, 06/04/2081 | | | 199,000 | | | | 165,966 | |
3.25% to 09/04/2026 then 5 yr. CMT Rate + 2.45%, 06/04/2081 | | | 92,000 | | | | 85,296 | |
VZ Secured Financing BV, 5.00%, 01/15/2032 (a) | | | 287,000 | | | | 242,156 | |
Windstream Escrow LLC / Windstream Escrow Finance Corp., 7.75%, 08/15/2028 (a) | | | 203,000 | | | | 194,880 | |
WMG Acquisition Corp. |
3.75%, 12/01/2029 (a) | | | 66,000 | | | | 58,080 | |
3.88%, 07/15/2030 (a) | | | 95,000 | | | | 82,820 | |
3.00%, 02/15/2031 (a) | | | 157,000 | | | | 130,215 | |
Zayo Group Holdings, Inc. | | | | | | | | |
4.00%, 03/01/2027 (a)(b) | | | 286,000 | | | | 228,064 | |
6.13%, 03/01/2028 (a)(b) | | | 218,000 | | | | 145,243 | |
Ziggo Bond Co. BV |
6.00%, 01/15/2027 (a) | | | 111,000 | | | | 108,938 | |
5.13%, 02/28/2030 (a) | | | 67,000 | | | | 55,515 | |
Ziggo BV, 4.88%, 01/15/2030 (a) | | | 172,000 | | | | 150,571 | |
| | | | | | | 27,990,121 | |
| |
Consumer Discretionary — 19.4% |
1011778 BC ULC / New Red Finance, Inc. |
3.88%, 01/15/2028 (a) | | | 268,000 | | | | 246,840 | |
4.38%, 01/15/2028 (a) | | | 135,000 | | | | 125,381 | |
3.50%, 02/15/2029 (a)(b) | | | 145,000 | | | | 129,471 | |
4.00%, 10/15/2030 (a) | | | 570,000 | | | | 492,337 | |
Adient Global Holdings Ltd. |
4.88%, 08/15/2026 (a) | | | 146,000 | | | | 140,412 | |
| | | Par | | | Value | |
Consumer Discretionary — 19.4% (Continued) |
7.00%, 04/15/2028 (a) | | $ | 92,000 | | | $ | 92,855 | |
8.25%, 04/15/2031 (a)(b) | | | 117,000 | | | | 121,316 | |
Allied Universal Holdco LLC, 7.88%, 02/15/2031 (a) | | | 180,000 | | | | 180,066 | |
Allied Universal Holdco LLC / Allied Universal Finance Corp. |
6.63%, 07/15/2026 (a) | | | 176,000 | | | | 175,331 | |
9.75%, 07/15/2027 (a) | | | 196,000 | | | | 195,128 | |
6.00%, 06/01/2029 (a) | | | 200,000 | | | | 169,598 | |
Allied Universal Holdco LLC/Allied Universal Finance Corp./Atlas Luxco 4 Sarl |
4.63%, 06/01/2028 (a) | | | 242,000 | | | | 217,092 | |
4.63%, 06/01/2028 (a) | | | 141,000 | | | | 126,164 | |
American Airlines, Inc. |
7.25%, 02/15/2028 (a)(b) | | | 130,000 | | | | 130,936 | |
8.50%, 05/15/2029 (a) | | | 220,000 | | | | 229,128 | |
American Airlines, Inc./AAdvantage Loyalty IP Ltd. |
5.50%, 04/20/2026 (a) | | | 283,333 | | | | 280,146 | |
5.75%, 04/20/2029 (a) | | | 578,000 | | | | 557,769 | |
American Axle & Manufacturing, Inc. | | | | | | | | |
6.50%, 04/01/2027 | | | 91,000 | | | | 89,808 | |
6.88%, 07/01/2028 | | | 93,000 | | | | 92,267 | |
5.00%, 10/01/2029 (b) | | | 140,000 | | | | 126,274 | |
American Builders & Contractors Supply Co., Inc. |
4.00%, 01/15/2028 (a) | | | 124,000 | | | | 114,125 | |
3.88%, 11/15/2029 (a) | | | 93,000 | | | | 81,387 | |
APX Group, Inc., 5.75%, 07/15/2029 (a) | | | 152,000 | | | | 141,399 | |
Aramark Services, Inc., 5.00%, 02/01/2028 (a) | | | 194,000 | | | | 184,543 | |
Asbury Automotive Group, Inc. |
4.50%, 03/01/2028 | | | 94,000 | | | | 87,937 | |
4.63%, 11/15/2029 (a) | | | 112,000 | | | | 101,202 | |
4.75%, 03/01/2030 | | | 104,000 | | | | 94,257 | |
5.00%, 02/15/2032 (a) | | | 140,000 | | | | 124,108 | |
Ashton Woods USA LLC / Ashton Woods Finance Co., 4.63%, 04/01/2030 (a) | | | 93,000 | | | | 82,943 | |
Avis Budget Car Rental LLC / Avis Budget Finance, Inc. |
5.75%, 07/15/2027 (a) | | | 93,000 | | | | 88,350 | |
4.75%, 04/01/2028 (a) | | | 87,000 | | | | 76,898 | |
5.38%, 03/01/2029 (a)(b) | | | 140,000 | | | | 124,084 | |
8.00%, 02/15/2031 (a)(b) | | | 100,000 | | | | 95,750 | |
Bath & Body Works, Inc. |
5.25%, 02/01/2028 | | | 117,000 | | | | 112,240 | |
7.50%, 06/15/2029 (b) | | | 117,000 | | | | 120,205 | |
6.63%, 10/01/2030 (a) | | | 184,000 | | | | 183,884 | |
Boyd Gaming Corp. |
4.75%, 12/01/2027 (b) | | | 164,000 | | | | 155,536 | |
4.75%, 06/15/2031 (a) | | | 181,000 | | | | 160,411 | |
The accompanying notes are an integral part of the financial statements.
100
Pacer Trendpilot® US Bond ETF
SCHEDULE OF INVESTMENTS
April 30, 2024 (Continued)
| | | Par | | | Value | |
CORPORATE BONDS - 98.7% (Continued) |
| |
Consumer Discretionary — 19.4% (Continued) |
Brookfield Residential Properties, Inc. / Brookfield Residential US LLC |
6.25%, 09/15/2027 (a) | | $ | 115,000 | | | $ | 110,596 | |
4.88%, 02/15/2030 (a) | | | 117,000 | | | | 101,233 | |
Caesars Entertainment, Inc. |
8.13%, 07/01/2027 (a) | | | 332,000 | | | | 336,150 | |
4.63%, 10/15/2029 (a)(b) | | | 236,000 | | | | 210,636 | |
7.00%, 02/15/2030 (a) | | | 399,000 | | | | 401,493 | |
6.50%, 02/15/2032 (a) | | | 240,000 | | | | 236,256 | |
Camelot Return Merger Sub, Inc., 8.75%, 08/01/2028 (a) | | | 141,000 | | | | 138,552 | |
Carnival Holdings Bermuda Ltd., 10.38%, 05/01/2028 (a) | | | 371,000 | | | | 402,053 | |
Carvana Co. |
12.00% (12.00% PIK), 12/01/2028 (a) | | | 0 | | | | 0 | |
13.00% (13.00% PIK), 06/01/2030 (a) | | | 250,000 | | | | 248,125 | |
Cedar Fair LP, 5.25%, 07/15/2029 | | | 92,000 | | | | 85,612 | |
Cedar Fair LP / Canada’s Wonderland Co. / Magnum Management Corp. / Millennium Op |
5.50%, 05/01/2025 (a) | | | 204,000 | | | | 203,725 | |
5.38%, 04/15/2027 | | | 117,000 | | | | 113,299 | |
Century Communities, Inc. |
6.75%, 06/01/2027 | | | 117,000 | | | | 117,004 | |
3.88%, 08/15/2029 (a) | | | 117,000 | | | | 102,177 | |
Churchill Downs, Inc. |
5.50%, 04/01/2027 (a)(b) | | | 140,000 | | | | 136,219 | |
4.75%, 01/15/2028 (a) | | | 99,000 | | | | 93,369 | |
5.75%, 04/01/2030 (a) | | | 231,000 | | | | 219,196 | |
6.75%, 05/01/2031 (a) | | | 140,000 | | | | 138,874 | |
Cinemark USA, Inc. |
5.88%, 03/15/2026 (a) | | | 94,000 | | | | 92,776 | |
5.25%, 07/15/2028 (a) | | | 139,000 | | | | 128,509 | |
Clarios Global LP, 6.75%, 05/15/2025 (a) | | | 80,000 | | | | 80,100 | |
Clarios Global LP / Clarios US Finance Co. |
6.25%, 05/15/2026 (a) | | | 181,000 | | | | 180,489 | |
8.50%, 05/15/2027 (a)(b) | | | 357,000 | | | | 357,241 | |
6.75%, 05/15/2028 (a) | | | 145,000 | | | | 145,367 | |
Dana, Inc. |
5.38%, 11/15/2027 | | | 93,000 | | | | 89,861 | |
5.63%, 06/15/2028 | | | 93,000 | | | | 89,750 | |
4.25%, 09/01/2030 | | | 93,000 | | | | 80,611 | |
Fertitta Entertainment LLC / Fertitta Entertainment Finance Co., Inc. |
4.63%, 01/15/2029 (a) | | | 194,000 | | | | 174,851 | |
6.75%, 01/15/2030 (a)(b) | | | 228,000 | | | | 198,485 | |
| | | Par | | | Value | |
Consumer Discretionary — 19.4% (Continued) |
Gap, Inc. |
3.63%, 10/01/2029 (a) | | $ | 135,000 | | | $ | 114,263 | |
3.88%, 10/01/2031 (a) | | | 175,000 | | | | 142,727 | |
Garda World Security Corp. |
4.63%, 02/15/2027 (a) | | | 108,000 | | | | 102,490 | |
9.50%, 11/01/2027 (a) | | | 141,000 | | | | 140,295 | |
7.75%, 02/15/2028 (a) | | | 93,000 | | | | 93,698 | |
6.00%, 06/01/2029 (a)(b) | | | 117,000 | | | | 103,253 | |
Global Auto Holdings Ltd./AAG FH UK Ltd. |
8.38%, 01/15/2029 (a) | | | 120,000 | | | | 114,067 | |
8.75%, 01/15/2032 (a) | | | 80,000 | | | | 75,420 | |
Goodyear Tire & Rubber Co. |
9.50%, 05/31/2025 | | | 157,000 | | | | 157,589 | |
5.00%, 05/31/2026 | | | 181,000 | | | | 174,901 | |
4.88%, 03/15/2027 | | | 94,000 | | | | 89,911 | |
5.00%, 07/15/2029 (b) | | | 159,000 | | | | 144,154 | |
5.25%, 04/30/2031 (b) | | | 128,000 | | | | 114,567 | |
5.25%, 07/15/2031 | | | 60,000 | | | | 52,800 | |
5.63%, 04/30/2033 | | | 105,000 | | | | 91,775 | |
Hanesbrands, Inc. |
4.88%, 05/15/2026 (a) | | | 136,000 | | | | 131,629 | |
9.00%, 02/15/2031 (a)(b) | | | 140,000 | | | | 138,976 | |
Hawaiian Brand Intellectual Property Ltd. / HawaiianMiles Loyalty Ltd., 5.75%, 01/20/2026 (a)(b) | | | 251,000 | | | | 235,356 | |
Hertz Corp. |
4.63%, 12/01/2026 (a) | | | 92,000 | | | | 71,300 | |
5.00%, 12/01/2029 (a)(b) | | | 184,000 | | | | 126,270 | |
Hilton Domestic Operating Co., Inc. | | | | | | | | |
5.38%, 05/01/2025 (a)(b) | | | 117,000 | | | | 116,314 | |
5.75%, 05/01/2028 (a) | | | 117,000 | | | | 115,560 | |
5.88%, 04/01/2029 (a) | | | 100,000 | | | | 98,692 | |
3.75%, 05/01/2029 (a) | | | 157,000 | | | | 141,104 | |
4.88%, 01/15/2030 | | | 199,000 | | | | 187,020 | |
4.00%, 05/01/2031 (a) | | | 177,000 | | | | 154,783 | |
3.63%, 02/15/2032 (a) | | | 296,000 | | | | 248,538 | |
6.13%, 04/01/2032 (a) | | | 100,000 | | | | 98,414 | |
Hilton Grand Vacations Borrower Escrow LLC / Hilton Grand Vacations Borrower Esc |
5.00%, 06/01/2029 (a) | | | 139,000 | | | | 126,198 | |
4.88%, 07/01/2031 (a) | | | 117,000 | | | | 101,776 | |
6.63%, 01/15/2032 (a) | | | 160,000 | | | | 157,600 | |
IHO Verwaltungs GmbH, 6.00% (6.75% PIK), 05/15/2027 (a) | | | 80,000 | | | | 78,506 | |
International Game Technology PLC |
4.13%, 04/15/2026 (a) | | | 135,000 | | | | 130,106 | |
6.25%, 01/15/2027 (a) | | | 175,000 | | | | 174,638 | |
5.25%, 01/15/2029 (a) | | | 135,000 | | | | 127,573 | |
The accompanying notes are an integral part of the financial statements.
101
Pacer Trendpilot® US Bond ETF
SCHEDULE OF INVESTMENTS
April 30, 2024 (Continued)
| | | Par | | | Value | |
CORPORATE BONDS - 98.7% (Continued) |
| | | | | | | | | |
Consumer Discretionary — 19.4% (Continued) |
Jaguar Land Rover Automotive PLC |
7.75%, 10/15/2025 (a) | | $ | 129,000 | | | $ | 129,420 | |
4.50%, 10/01/2027 (a) | | | 117,000 | | | | 108,613 | |
5.88%, 01/15/2028 (a) | | | 107,000 | | | | 103,571 | |
5.50%, 07/15/2029 (a) | | | 77,000 | | | | 72,143 | |
KFC Holding Co./Pizza Hut Holdings LLC/Taco Bell of America LLC, 4.75%, 06/01/2027 (a) | | | 110,000 | | | | 105,832 | |
Kohl’s Corp., 4.63%, 05/01/2031 (b) | | | 57,000 | | | | 47,096 | |
LBM Acquisition LLC, 6.25%, 01/15/2029 (a)(b) | | | 152,000 | | | | 139,004 | |
LCM Investments Holdings II LLC |
4.88%, 05/01/2029 (a) | | | 214,000 | | | | 195,361 | |
8.25%, 08/01/2031 (a) | | | 100,000 | | | | 103,908 | |
Life Time, Inc. |
5.75%, 01/15/2026 (a) | | | 171,000 | | | | 168,920 | |
8.00%, 04/15/2026 (a) | | | 111,000 | | | | 111,186 | |
Light & Wonder International, Inc. |
7.00%, 05/15/2028 (a) | | | 124,000 | | | | 124,550 | |
7.25%, 11/15/2029 (a) | | | 117,000 | | | | 118,428 | |
7.50%, 09/01/2031 (a) | | | 100,000 | | | | 101,519 | |
Lithia Motors, Inc. |
4.63%, 12/15/2027 (a) | | | 63,000 | | | | 59,170 | |
3.88%, 06/01/2029 (a) | | | 157,000 | | | | 138,703 | |
4.38%, 01/15/2031 (a)(b) | | | 128,000 | | | | 112,160 | |
Macy’s Retail Holdings LLC |
5.88%, 04/01/2029 (a) | | | 92,000 | | | | 88,698 | |
5.88%, 03/15/2030 (a) | | | 99,000 | | | | 94,298 | |
6.13%, 03/15/2032 (a) | | | 99,000 | | | | 93,633 | |
Mattamy Group Corp. |
5.25%, 12/15/2027 (a) | | | 92,000 | | | | 87,975 | |
4.63%, 03/01/2030 (a) | | | 110,000 | | | | 98,278 | |
Melco Resorts Finance Ltd. |
4.88%, 06/06/2025 (a)(b) | | | 164,000 | | | | 159,593 | |
5.25%, 04/26/2026 (a) | | | 117,000 | | | | 112,320 | |
5.63%, 07/17/2027 (a) | | | 140,000 | | | | 132,175 | |
5.75%, 07/21/2028 (a) | | | 159,000 | | | | 147,633 | |
5.38%, 12/04/2029 (a) | | | 244,000 | | | | 217,853 | |
7.63%, 04/17/2032 (a) | | | 125,000 | | | | 122,359 | |
Merlin Entertainments Group US Holdings, Inc., 7.38%, 02/15/2031 (a) | | | 80,000 | | | | 80,268 | |
MGM China Holdings Ltd. |
5.25%, 06/18/2025 (a) | | | 92,000 | | | | 90,484 | |
5.88%, 05/15/2026 (a)(b) | | | 135,000 | | | | 132,549 | |
4.75%, 02/01/2027 (a) | | | 135,000 | | | | 127,358 | |
| | | Par | | | Value | |
Consumer Discretionary — 19.4% (Continued) |
MGM Resorts International |
6.75%, 05/01/2025 | | $ | 135,000 | | | $ | 134,968 | |
5.75%, 06/15/2025 | | | 158,000 | | | | 157,212 | |
4.63%, 09/01/2026 | | | 93,000 | | | | 89,513 | |
5.50%, 04/15/2027 | | | 118,000 | | | | 115,050 | |
4.75%, 10/15/2028 (b) | | | 135,000 | | | | 125,805 | |
6.50%, 04/15/2032 | | | 125,000 | | | | 121,279 | |
Michaels Cos., Inc. |
5.25%, 05/01/2028 (a) | | | 159,000 | | | | 134,753 | |
7.88%, 05/01/2029 (a) | | | 249,000 | | | | 182,704 | |
Miter Brands Acquisition Holdco, Inc. / MIWD Borrower LLC, 6.75%, 04/01/2032 (a) | | | 120,000 | | | | 118,982 | |
Mohegan Tribal Gaming Authority |
8.00%, 02/01/2026 (a) | | | 230,000 | | | | 218,507 | |
13.25%, 12/15/2027 (a) | | | 92,000 | | | | 101,200 | |
NCL Corp. Ltd. |
5.88%, 03/15/2026 (a)(b) | | | 279,000 | | | | 273,074 | |
5.88%, 02/15/2027 (a) | | | 189,000 | | | | 185,173 | |
8.38%, 02/01/2028 (a)(b) | | | 140,000 | | | | 145,899 | |
8.13%, 01/15/2029 (a) | | | 125,000 | | | | 130,201 | |
7.75%, 02/15/2029 (a)(b) | | | 110,000 | | | | 112,518 | |
NCL Finance Ltd., 6.13%, 03/15/2028 (a) | | | 93,000 | | | | 90,704 | |
Newell Brands, Inc. |
4.88%, 06/01/2025 | | | 117,000 | | | | 115,247 | |
5.70%, 04/01/2026 | | | 414,000 | | | | 406,606 | |
6.38%, 09/15/2027 (b) | | | 117,000 | | | | 114,602 | |
6.63%, 09/15/2029 | | | 42,000 | | | | 40,610 | |
NMG Holding Co., Inc. / Neiman Marcus Group LLC, 7.13%, 04/01/2026 (a) | | | 202,000 | | | | 200,634 | |
Nordstrom, Inc. |
4.38%, 04/01/2030 | | | 92,000 | | | | 82,097 | |
4.25%, 08/01/2031 (b) | | | 99,000 | | | | 85,388 | |
Odeon Finco PLC, 12.75%, 11/01/2027 (a) | | | 93,000 | | | | 95,622 | |
Penske Automotive Group, Inc. |
3.50%, 09/01/2025 | | | 128,000 | | | | 123,521 | |
3.75%, 06/15/2029 | | | 117,000 | | | | 102,322 | |
PetSmart, Inc. / PetSmart Finance Corp. |
4.75%, 02/15/2028 (a) | | | 256,000 | | | | 236,275 | |
7.75%, 02/15/2029 (a)(b) | | | 239,000 | | | | 226,687 | |
Premier Entertainment Sub LLC / Premier Entertainment Finance Corp. |
5.63%, 09/01/2029 (a) | | | 155,000 | | | | 115,584 | |
5.88%, 09/01/2031 (a) | | | 175,000 | | | | 125,296 | |
The accompanying notes are an integral part of the financial statements.
102
Pacer Trendpilot® US Bond ETF
SCHEDULE OF INVESTMENTS
April 30, 2024 (Continued)
| | | Par | | | Value | |
CORPORATE BONDS - 98.7% (Continued) |
| | | | | | | | | |
Consumer Discretionary — 19.4% (Continued) |
Prime Security Services Borrower LLC / Prime Finance, Inc. |
5.75%, 04/15/2026 (a) | | $ | 291,000 | | | $ | 287,363 | |
3.38%, 08/31/2027 (a) | | | 169,000 | | | | 153,812 | |
6.25%, 01/15/2028 (a)(b) | | | 234,000 | | | | 228,426 | |
QVC, Inc. |
4.75%, 02/15/2027 | | | 109,000 | | | | 94,887 | |
4.38%, 09/01/2028 | | | 117,000 | | | | 90,033 | |
Rakuten Group, Inc. |
5.13% to 04/22/2026 then 5 yr. CMT Rate + 4.58%, Perpetual (a) | | | 90,000 | | | | 74,942 | |
11.25%, 02/15/2027 (a) | | | 330,000 | | | | 343,053 | |
9.75%, 04/15/2029 (a) | | | 350,000 | | | | 345,555 | |
6.25% to 04/22/2031 then 5 yr. CMT Rate + 4.96%, Perpetual (a) | | | 199,000 | | | | 143,710 | |
Resorts World Las Vegas LLC / RWLV Capital, Inc., 4.63%, 04/16/2029 (a) | | | 194,000 | | | | 171,991 | |
Service Corp. International/US |
4.63%, 12/15/2027 | | | 128,000 | | | | 121,938 | |
5.13%, 06/01/2029 | | | 135,000 | | | | 129,121 | |
3.38%, 08/15/2030 (b) | | | 169,000 | | | | 143,228 | |
4.00%, 05/15/2031 | | | 147,000 | | | | 126,839 | |
Six Flags Entertainment Corp. |
5.50%, 04/15/2027 (a) | | | 117,000 | | | | 112,682 | |
7.25%, 05/15/2031 (a) | | | 147,000 | | | | 146,697 | |
Sonic Automotive, Inc. |
4.63%, 11/15/2029 (a) | | | 112,000 | | | | 100,240 | |
4.88%, 11/15/2031 (a) | | | 117,000 | | | | 102,050 | |
Sotheby’s, 7.38%, 10/15/2027 (a) | | | 149,000 | | | | 138,534 | |
Spirit Loyalty Cayman Ltd. / Spirit IP Cayman Ltd. |
8.00%, 09/20/2025 (a) | | | 119,000 | | | | 93,016 | |
8.00%, 09/20/2025 (a) | | | 115,000 | | | | 89,889 | |
SRS Distribution, Inc. |
4.63%, 07/01/2028 (a) | | | 112,000 | | | | 111,580 | |
6.13%, 07/01/2029 (a) | | | 105,000 | | | | 106,706 | |
6.00%, 12/01/2029 (a) | | | 149,000 | | | | 150,741 | |
Staples, Inc. |
7.50%, 04/15/2026 (a) | | | 394,000 | | | | 378,997 | |
10.75%, 04/15/2027 (a)(b) | | | 189,000 | | | | 172,411 | |
Station Casinos LLC |
4.50%, 02/15/2028 (a) | | | 160,000 | | | | 148,326 | |
4.63%, 12/01/2031 (a) | | | 77,000 | | | | 67,569 | |
6.63%, 03/15/2032 (a) | | | 100,000 | | | | 97,973 | |
Stena International SA |
7.25%, 01/15/2031 (a) | | | 120,000 | | | | 120,000 | |
7.63%, 02/15/2031 (a) | | | 90,000 | | | | 90,884 | |
| | | Par | | | Value | |
Consumer Discretionary — 19.4% (Continued) |
Studio City Finance Ltd. |
6.50%, 01/15/2028 (a) | | $ | 117,000 | | | $ | 109,328 | |
5.00%, 01/15/2029 (a) | | | 207,000 | | | | 177,233 | |
Taylor Morrison Communities, Inc. |
5.88%, 06/15/2027 (a) | | | 2,000 | | | | 1,970 | |
5.75%, 01/15/2028 (a) | | | 105,000 | | | | 102,375 | |
5.13%, 08/01/2030 (a) | | | 117,000 | | | | 108,415 | |
Tempur Sealy International, Inc. |
4.00%, 04/15/2029 (a) | | | 147,000 | | | | 130,311 | |
3.88%, 10/15/2031 (a) | | | 162,000 | | | | 133,138 | |
Tenneco, Inc., 8.00%, 11/17/2028 (a) | | | 375,000 | | | | 349,542 | |
TKC Holdings, Inc. |
6.88%, 05/15/2028 (a) | | | 99,000 | | | | 93,070 | |
10.50%, 05/15/2029 (a) | | | 118,000 | | | | 112,918 | |
Travel + Leisure Co. |
6.63%, 07/31/2026 (a) | | | 152,000 | | | | 152,202 | |
6.00%, 04/01/2027 | | | 93,000 | | | | 91,851 | |
4.50%, 12/01/2029 (a) | | | 152,000 | | | | 136,988 | |
United Airlines, Inc. |
4.38%, 04/15/2026 (a) | | | 409,000 | | | | 393,355 | |
4.63%, 04/15/2029 (a) | | | 389,000 | | | | 358,824 | |
Viking Cruises Ltd. |
5.88%, 09/15/2027 (a) | | | 163,000 | | | | 157,906 | |
7.00%, 02/15/2029 (a) | | | 92,000 | | | | 91,595 | |
9.13%, 07/15/2031 (a) | | | 100,000 | | | | 107,171 | |
VistaJet Malta Finance PLC / Vista Management Holding, Inc. |
7.88%, 05/01/2027 (a)(b) | | | 117,000 | | | | 103,762 | |
9.50%, 06/01/2028 (a)(b) | | | 117,000 | | | | 104,540 | |
6.38%, 02/01/2030 (a)(b) | | | 184,000 | | | | 142,600 | |
VOC Escrow Ltd., 5.00%, 02/15/2028 (a) | | | 88,000 | | | | 83,948 | |
Wand NewCo 3, Inc., 7.63%, 01/30/2032 (a) | | | 225,000 | | | | 228,909 | |
Williams Scotsman, Inc. |
6.13%, 06/15/2025 (a) | | | 93,000 | | | | 92,651 | |
4.63%, 08/15/2028 (a) | | | 117,000 | | | | 108,083 | |
7.38%, 10/01/2031 (a) | | | 100,000 | | | | 102,197 | |
Wynn Macau Ltd. |
5.50%, 01/15/2026 (a) | | | 179,000 | | | | 173,643 | |
5.50%, 10/01/2027 (a) | | | 175,000 | | | | 164,547 | |
5.63%, 08/26/2028 (a) | | | 291,000 | | | | 268,375 | |
5.13%, 12/15/2029 (a)(b) | | | 184,000 | | | | 161,830 | |
Wynn Resorts Finance LLC / Wynn Resorts Capital Corp. |
5.13%, 10/01/2029 (a) | | | 95,000 | | | | 88,037 | |
7.13%, 02/15/2031 (a) | | | 140,000 | | | | 141,858 | |
Yum! Brands, Inc. |
4.75%, 01/15/2030 (a) | | | 147,000 | | | | 137,165 | |
3.63%, 03/15/2031 | | | 181,000 | | | | 156,444 | |
The accompanying notes are an integral part of the financial statements.
103
Pacer Trendpilot® US Bond ETF
SCHEDULE OF INVESTMENTS
April 30, 2024 (Continued)
| | | Par | | | Value | |
CORPORATE BONDS - 98.7% (Continued) |
| | | | | | | | | |
Consumer Discretionary — 19.4% (Continued) |
4.63%, 01/31/2032 | | $ | 227,000 | | | $ | 204,250 | |
5.38%, 04/01/2032 | | | 204,000 | | | | 192,500 | |
ZF North America Capital, Inc. |
6.88%, 04/14/2028 (a) | | | 115,000 | | | | 115,863 | |
7.13%, 04/14/2030 (a) | | | 115,000 | | | | 117,444 | |
6.75%, 04/23/2030 (a) | | | 130,000 | | | | 130,224 | |
6.88%, 04/23/2032 (a) | | | 115,000 | | | | 116,087 | |
| | | | | | | 34,391,883 | |
| |
Consumer Staples — 3.4% |
Albertsons Cos., Inc. / Safeway, Inc. / New Albertsons LP / Albertsons LLC |
3.25%, 03/15/2026 (a) | | | 135,000 | | | | 128,214 | |
7.50%, 03/15/2026 (a) | | | 115,000 | | | | 116,539 | |
4.63%, 01/15/2027 (a) | | | 291,000 | | | | 278,591 | |
5.88%, 02/15/2028 (a) | | | 175,000 | | | | 171,063 | |
6.50%, 02/15/2028 (a) | | | 175,000 | | | | 175,000 | |
3.50%, 03/15/2029 (a) | | | 291,000 | | | | 256,626 | |
4.88%, 02/15/2030 (a) | | | 109,000 | | | | 101,489 | |
B&G Foods, Inc. |
5.25%, 09/15/2027 (b) | | | 106,000 | | | | 97,858 | |
8.00%, 09/15/2028 (a) | | | 105,000 | | | | 108,601 | |
Central Garden & Pet Co. |
4.13%, 10/15/2030 (b) | | | 92,000 | | | | 80,270 | |
4.13%, 04/30/2031 (a) | | | 93,000 | | | | 80,276 | |
Coty, Inc., 5.00%, 04/15/2026 (a) | | | 75,000 | | | | 73,610 | |
Coty, Inc./HFC Prestige Products, Inc./HFC Prestige International US LLC |
4.75%, 01/15/2029 (a) | | | 117,000 | | | | 109,007 | |
6.63%, 07/15/2030 (a) | | | 150,000 | | | | 149,913 | |
Darling Ingredients, Inc. |
5.25%, 04/15/2027 (a) | | | 110,000 | | | | 106,710 | |
6.00%, 06/15/2030 (a) | | | 119,000 | | | | 115,582 | |
Edgewell Personal Care Co. |
5.50%, 06/01/2028 (a) | | | 120,000 | | | | 115,816 | |
4.13%, 04/01/2029 (a) | | | 92,000 | | | | 83,236 | |
Energizer Holdings, Inc. |
4.75%, 06/15/2028 (a) | | | 115,000 | | | | 104,363 | |
4.38%, 03/31/2029 (a) | | | 162,000 | | | | 142,231 | |
HLF Financing Sarl LLC / Herbalife International, Inc. |
12.25%, 04/15/2029 (a) | | | 130,000 | | | | 124,066 | |
4.88%, 06/01/2029 (a)(b) | | | 140,000 | | | | 81,940 | |
Kronos Acquisition Holdings, Inc. / KIK Custom Products, Inc. |
5.00%, 12/31/2026 (a) | | | 86,000 | | | | 82,990 | |
7.00%, 12/31/2027 (a) | | | 98,000 | | | | 94,737 | |
Lamb Weston Holdings, Inc. |
4.88%, 05/15/2028 (a) | | | 92,000 | | | | 87,584 | |
4.13%, 01/31/2030 (a) | | | 102,000 | | | | 90,792 | |
4.38%, 01/31/2032 (a) | | | 89,000 | | | | 77,139 | |
| | | Par | | | Value | |
Consumer Staples — 3.4% (Continued) |
Performance Food Group, Inc. |
5.50%, 10/15/2027 (a) | | $ | 188,000 | | | $ | 181,975 | |
4.25%, 08/01/2029 (a) | | | 209,000 | | | | 187,055 | |
Pilgrim’s Pride Corp. |
4.25%, 04/15/2031 | | | 109,000 | | | | 96,068 | |
3.50%, 03/01/2032 | | | 181,000 | | | | 149,317 | |
6.25%, 07/01/2033 | | | 139,000 | | | | 137,850 | |
6.88%, 05/15/2034 | | | 100,000 | | | | 103,502 | |
Post Holdings, Inc. |
5.63%, 01/15/2028 (a) | | | 170,000 | | | | 165,292 | |
5.50%, 12/15/2029 (a) | | | 238,000 | | | | 225,620 | |
4.63%, 04/15/2030 (a) | | | 284,000 | | | | 256,103 | |
4.50%, 09/15/2031 (a) | | | 209,000 | | | | 183,528 | |
6.25%, 02/15/2032 (a) | | | 180,000 | | | | 178,040 | |
US Foods, Inc. |
6.88%, 09/15/2028 (a) | | | 80,000 | | | | 80,859 | |
4.75%, 02/15/2029 (a) | | | 181,000 | | | | 168,538 | |
4.63%, 06/01/2030 (a) | | | 117,000 | | | | 106,137 | |
7.25%, 01/15/2032 (a) | | | 90,000 | | | | 91,733 | |
Vector Group Ltd. |
10.50%, 11/01/2026 (a) | | | 95,000 | | | | 95,627 | |
5.75%, 02/01/2029 (a) | | | 175,000 | | | | 159,194 | |
Walgreens Boots Alliance, Inc. |
3.45%, 06/01/2026 | | | 250,000 | | | | 236,420 | |
3.20%, 04/15/2030 | | | 75,000 | | | | 64,219 | |
| | | | | | | 6,101,320 | |
| |
Energy — 11.9% |
Antero Midstream Partners LP / Antero Midstream Finance Corp. |
7.88%, 05/15/2026 (a) | | | 98,000 | | | | 99,621 | |
5.75%, 03/01/2027 (a) | | | 112,000 | | | | 109,789 | |
5.75%, 01/15/2028 (a) | | | 112,000 | | | | 109,296 | |
5.38%, 06/15/2029 (a) | | | 135,000 | | | | 128,351 | |
6.63%, 02/01/2032 (a) | | | 100,000 | | | | 99,347 | |
Antero Resources Corp. |
7.63%, 02/01/2029 (a) | | | 97,000 | | | | 99,061 | |
5.38%, 03/01/2030 (a) | | | 140,000 | | | | 132,841 | |
Archrock Partners LP / Archrock Partners Finance Corp. |
6.88%, 04/01/2027 (a) | | | 92,000 | | | | 91,747 | |
6.25%, 04/01/2028 (a) | | | 147,000 | | | | 143,868 | |
Ascent Resources Utica Holdings LLC / ARU Finance Corp. |
7.00%, 11/01/2026 (a) | | | 110,000 | | | | 109,863 | |
8.25%, 12/31/2028 (a) | | | 120,000 | | | | 122,068 | |
5.88%, 06/30/2029 (a) | | | 93,000 | | | | 88,338 | |
Baytex Energy Corp., 8.50%, 04/30/2030 (a) | | | 147,000 | | | | 153,170 | |
Buckeye Partners LP |
3.95%, 12/01/2026 | | | 115,000 | | | | 108,244 | |
4.13%, 12/01/2027 | | | 68,000 | | | | 63,100 | |
4.50%, 03/01/2028 (a) | | | 92,000 | | | | 85,714 | |
The accompanying notes are an integral part of the financial statements.
104
Pacer Trendpilot® US Bond ETF
SCHEDULE OF INVESTMENTS
April 30, 2024 (Continued)
| | | Par | | | Value | |
CORPORATE BONDS - 98.7% (Continued) |
| |
Energy — 11.9% (Continued) |
Chesapeake Energy Corp. |
5.50%, 02/01/2026 (a) | | $ | 117,000 | | | $ | 115,391 | |
5.88%, 02/01/2029 (a) | | | 117,000 | | | | 114,804 | |
6.75%, 04/15/2029 (a) | | | 197,000 | | | | 196,700 | |
CITGO Petroleum Corp. |
7.00%, 06/15/2025 (a) | | | 133,000 | | | | 132,752 | |
6.38%, 06/15/2026 (a) | | | 122,000 | | | | 121,768 | |
8.38%, 01/15/2029 (a) | | | 200,000 | | | | 207,000 | |
Civitas Resources, Inc. |
8.38%, 07/01/2028 (a) | | | 250,000 | | | | 260,468 | |
8.63%, 11/01/2030 (a) | | | 170,000 | | | | 180,784 | |
8.75%, 07/01/2031 (a) | | | 250,000 | | | | 264,945 | |
CNX Resources Corp. |
6.00%, 01/15/2029 (a) | | | 117,000 | | | | 113,292 | |
7.38%, 01/15/2031 (a) | | | 117,000 | | | | 118,316 | |
7.25%, 03/01/2032 (a) | | | 90,000 | | | | 90,338 | |
Comstock Resources, Inc. |
6.75%, 03/01/2029 (a)(b) | | | 242,000 | | | | 230,698 | |
6.75%, 03/01/2029 (a) | | | 65,000 | | | | 61,100 | |
5.88%, 01/15/2030 (a)(b) | | | 196,000 | | | | 177,856 | |
CQP Holdco LP / BIP-V Chinook Holdco LLC |
5.50%, 06/15/2031 (a) | | | 213,000 | | | | 195,428 | |
7.50%, 12/15/2033 (a) | | | 100,000 | | | | 100,542 | |
Crescent Energy Finance LLC |
9.25%, 02/15/2028 (a) | | | 193,000 | | | | 203,084 | |
7.63%, 04/01/2032 (a) | | | 120,000 | | | | 120,083 | |
CrownRock LP / CrownRock Finance, Inc. |
5.63%, 10/15/2025 (a) | | | 182,000 | | | | 180,899 | |
5.00%, 05/01/2029 (a) | | | 93,000 | | | | 91,615 | |
CVR Energy, Inc. |
5.75%, 02/15/2028 (a) | | | 93,000 | | | | 86,549 | |
8.50%, 01/15/2029 (a) | | | 125,000 | | | | 124,531 | |
Delek Logistics Partners LP / Delek Logistics Finance Corp., 8.63%, 03/15/2029 (a) | | | 100,000 | | | | 101,092 | |
DT Midstream, Inc. |
4.13%, 06/15/2029 (a) | | | 212,000 | | | | 192,121 | |
4.38%, 06/15/2031 (a) | | | 204,000 | | | | 180,675 | |
eG Global Finance PLC, 12.00%, 11/30/2028 (a) | | | 215,000 | | | | 221,719 | |
Encino Acquisition Partners Holdings LLC, 8.75%, 05/01/2031 (a) | | | 90,000 | | | | 91,584 | |
Energean Israel Finance Ltd. |
4.88%, 03/30/2026 (a) | | | 111,000 | | | | 104,440 | |
5.38%, 03/30/2028 (a) | | | 111,000 | | | | 98,425 | |
5.88%, 03/30/2031 (a) | | | 111,000 | | | | 94,691 | |
8.50%, 09/30/2033 (a) | | | 165,000 | | | | 159,455 | |
| | | Par | | | Value | |
Energy — 11.9% (Continued) |
Energy Transfer LP, 8.00% to 05/15/2029 then 5 yr. CMT Rate + 4.02%, 05/15/2054 (b) | | $ | 140,000 | | | $ | 144,077 | |
EQM Midstream Partners LP |
4.13%, 12/01/2026 | | | 92,000 | | | | 87,745 | |
7.50%, 06/01/2027 (a) | | | 92,000 | | | | 93,704 | |
6.50%, 07/01/2027 (a) | | | 181,000 | | | | 181,226 | |
5.50%, 07/15/2028 | | | 164,000 | | | | 159,593 | |
4.50%, 01/15/2029 (a) | | | 147,000 | | | | 135,975 | |
6.38%, 04/01/2029 (a) | | | 100,000 | | | | 99,065 | |
7.50%, 06/01/2030 (a) | | | 117,000 | | | | 122,704 | |
4.75%, 01/15/2031 (a)(b) | | | 197,000 | | | | 180,034 | |
Genesis Energy LP / Genesis Energy Finance Corp. |
8.00%, 01/15/2027 | | | 189,000 | | | | 191,363 | |
7.75%, 02/01/2028 | | | 137,000 | | | | 136,862 | |
8.25%, 01/15/2029 | | | 90,000 | | | | 91,330 | |
8.88%, 04/15/2030 | | | 117,000 | | | | 120,854 | |
Global Partners LP / GLP Finance Corp., 8.25%, 01/15/2032 (a) | | | 80,000 | | | | 82,019 | |
Hess Midstream Operations LP |
5.63%, 02/15/2026 (a) | | | 146,000 | | | | 144,251 | |
5.13%, 06/15/2028 (a) | | | 103,000 | | | | 98,623 | |
4.25%, 02/15/2030 (a) | | | 150,000 | | | | 135,000 | |
5.50%, 10/15/2030 (a) | | | 93,000 | | | | 88,522 | |
Hilcorp Energy I LP / Hilcorp Finance Co. |
6.25%, 11/01/2028 (a) | | | 115,000 | | | | 113,372 | |
5.75%, 02/01/2029 (a) | | | 110,000 | | | | 105,600 | |
6.00%, 04/15/2030 (a) | | | 82,000 | | | | 78,243 | |
6.00%, 02/01/2031 (a) | | | 140,000 | | | | 133,739 | |
6.25%, 04/15/2032 (a) | | | 67,000 | | | | 64,429 | |
8.38%, 11/01/2033 (a) | | | 130,000 | | | | 139,357 | |
ITT Holdings LLC, 6.50%, 08/01/2029 (a) | | | 201,000 | | | | 181,448 | |
Kinetik Holdings LP |
6.63%, 12/15/2028 (a) | | | 145,000 | | | | 145,511 | |
5.88%, 06/15/2030 (a) | | | 169,000 | | | | 163,153 | |
Leviathan Bond Ltd. |
6.13%, 06/30/2025 (a) | | | 115,000 | | | | 112,092 | |
6.50%, 06/30/2027 (a) | | | 105,000 | | | | 98,481 | |
6.75%, 06/30/2030 (a) | | | 98,000 | | | | 87,588 | |
Matador Resources Co. |
6.88%, 04/15/2028 (a) | | | 92,000 | | | | 92,649 | |
6.50%, 04/15/2032 (a) | | | 150,000 | | | | 148,881 | |
Moss Creek Resources Holdings, Inc. |
7.50%, 01/15/2026 (a) | | | 164,000 | | | | 163,590 | |
10.50%, 05/15/2027 (a) | | | 92,000 | | | | 94,056 | |
Murphy Oil Corp., 5.88%, 12/01/2027 | | | 82,000 | | | | 81,128 | |
The accompanying notes are an integral part of the financial statements.
105
Pacer Trendpilot® US Bond ETF
SCHEDULE OF INVESTMENTS
April 30, 2024 (Continued)
| | | Par | | | Value | |
CORPORATE BONDS - 98.7% (Continued) |
| | | | | | | | | |
Energy — 11.9% (Continued) | | | | | | | | |
Murphy Oil USA, Inc. |
4.75%, 09/15/2029 | | $ | 87,000 | | | $ | 80,774 | |
3.75%, 02/15/2031 (a) | | | 117,000 | | | | 100,673 | |
Nabors Industries Ltd., 7.25%, 01/15/2026 (a)(b) | | | 131,000 | | | | 130,107 | |
Nabors Industries, Inc. |
7.38%, 05/15/2027 (a) | | | 164,000 | | | | 161,900 | |
9.13%, 01/31/2030 (a) | | | 140,000 | | | | 143,980 | |
New Fortress Energy, Inc. |
6.75%, 09/15/2025 (a) | | | 153,000 | | | | 151,005 | |
6.50%, 09/30/2026 (a)(b) | | | 276,000 | | | | 263,790 | |
8.75%, 03/15/2029 (a) | | | 120,000 | | | | 117,113 | |
NGL Energy Operating LLC / NGL Energy Finance Corp. |
8.13%, 02/15/2029 (a) | | | 100,000 | | | | 101,398 | |
8.38%, 02/15/2032 (a) | | | 240,000 | | | | 243,299 | |
Northern Oil & Gas, Inc. |
8.13%, 03/01/2028 (a) | | | 165,000 | | | | 167,296 | |
8.75%, 06/15/2031 (a) | | | 117,000 | | | | 123,143 | |
NuStar Logistics LP |
5.75%, 10/01/2025 | | | 100,000 | | | | 99,125 | |
6.00%, 06/01/2026 | | | 92,000 | | | | 91,183 | |
5.63%, 04/28/2027 | | | 98,000 | | | | 95,796 | |
6.38%, 10/01/2030 (b) | | | 110,000 | | | | 108,586 | |
Parkland Corp. |
5.88%, 07/15/2027 (a) | | | 117,000 | | | | 114,157 | |
4.50%, 10/01/2029 (a) | | | 147,000 | | | | 132,885 | |
4.63%, 05/01/2030 (a) | | | 147,000 | | | | 132,594 | |
PBF Holding Co. LLC / PBF Finance Corp. |
6.00%, 02/15/2028 | | | 147,000 | | | | 143,187 | |
7.88%, 09/15/2030 (a) | | | 100,000 | | | | 102,712 | |
Permian Resources Operating LLC |
8.00%, 04/15/2027 (a) | | | 100,000 | | | | 102,664 | |
5.88%, 07/01/2029 (a) | | | 100,000 | | | | 97,020 | |
9.88%, 07/15/2031 (a) | | | 100,000 | | | | 110,594 | |
7.00%, 01/15/2032 (a) | | | 202,000 | | | | 205,693 | |
Range Resources Corp. |
4.88%, 05/15/2025 | | | 90,000 | | | | 89,105 | |
8.25%, 01/15/2029 | | | 140,000 | | | | 145,661 | |
4.75%, 02/15/2030 (a) | | | 117,000 | | | | 107,494 | |
Rockies Express Pipeline LLC |
3.60%, 05/15/2025 (a) | | | 93,000 | | | | 90,233 | |
4.95%, 07/15/2029 (a) | | | 128,000 | | | | 117,963 | |
SM Energy Co. |
6.75%, 09/15/2026 | | | 73,000 | | | | 72,821 | |
6.63%, 01/15/2027 | | | 97,000 | | | | 96,632 | |
6.50%, 07/15/2028 | | | 93,000 | | | | 92,083 | |
| | | Par | | | Value | |
Energy — 11.9% (Continued) | | | | | | | | |
Southwestern Energy Co. |
5.38%, 02/01/2029 | | $ | 123,000 | | | $ | 117,522 | |
5.38%, 03/15/2030 | | | 211,000 | | | | 200,326 | |
4.75%, 02/01/2032 (b) | | | 179,000 | | | | 160,570 | |
Sunoco LP |
7.00%, 05/01/2029 (a) | | | 125,000 | | | | 126,954 | |
7.25%, 05/01/2032 (a) | | | 125,000 | | | | 126,941 | |
Sunoco LP / Sunoco Finance Corp. |
6.00%, 04/15/2027 | | | 115,000 | | | | 113,546 | |
5.88%, 03/15/2028 | | | 93,000 | | | | 90,760 | |
7.00%, 09/15/2028 (a) | | | 100,000 | | | | 101,153 | |
4.50%, 05/15/2029 | | | 147,000 | | | | 134,138 | |
4.50%, 04/30/2030 | | | 147,000 | | | | 132,116 | |
Tallgrass Energy Partners LP / Tallgrass Energy Finance Corp. |
6.00%, 03/01/2027 (a) | | | 75,000 | | | | 73,054 | |
5.50%, 01/15/2028 (a) | | | 135,000 | | | | 128,081 | |
7.38%, 02/15/2029 (a) | | | 140,000 | | | | 139,978 | |
6.00%, 12/31/2030 (a) | | | 105,000 | | | | 98,660 | |
6.00%, 09/01/2031 (a) | | | 117,000 | | | | 108,466 | |
Talos Production, Inc. |
9.00%, 02/01/2029 (a) | | | 100,000 | | | | 105,592 | |
9.38%, 02/01/2031 (a) | | | 140,000 | | | | 148,784 | |
Transocean, Inc. |
8.00%, 02/01/2027 (a) | | | 87,000 | | | | 86,957 | |
8.25%, 05/15/2029 (a) | | | 150,000 | | | | 149,250 | |
8.75%, 02/15/2030 (a) | | | 189,000 | | | | 196,946 | |
8.50%, 05/15/2031 (a) | | | 150,000 | | | | 148,875 | |
USA Compression Partners LP / USA Compression Finance Corp. |
6.88%, 09/01/2027 | | | 140,000 | | | | 139,733 | |
7.13%, 03/15/2029 (a) | | | 170,000 | | | | 168,764 | |
Valaris Ltd., 8.38%, 04/30/2030 (a) | | | 200,000 | | | | 204,812 | |
Venture Global Calcasieu Pass LLC |
3.88%, 08/15/2029 (a) | | | 223,000 | | | | 197,043 | |
6.25%, 01/15/2030 (a) | | | 179,000 | | | | 176,986 | |
4.13%, 08/15/2031 (a) | | | 243,000 | | | | 211,234 | |
3.88%, 11/01/2033 (a) | | | 253,000 | | | | 207,665 | |
Venture Global LNG, Inc. |
8.13%, 06/01/2028 (a) | | | 427,000 | | | | 435,672 | |
9.50%, 02/01/2029 (a) | | | 600,000 | | | | 643,932 | |
8.38%, 06/01/2031 (a) | | | 417,000 | | | | 427,945 | |
9.88%, 02/01/2032 (a) | | | 250,000 | | | | 266,175 | |
Vital Energy, Inc. |
9.75%, 10/15/2030 | | | 100,000 | | | | 108,917 | |
7.88%, 04/15/2032 (a) | | | 140,000 | | | | 142,107 | |
Weatherford International Ltd., 8.63%, 04/30/2030 (a)(b) | | | 325,000 | | | | 336,496 | |
| | | | | | | 21,262,643 | |
| |
The accompanying notes are an integral part of the financial statements.
106
Pacer Trendpilot® US Bond ETF
SCHEDULE OF INVESTMENTS
April 30, 2024 (Continued)
| | | Par | | | Value | |
CORPORATE BONDS - 98.7% (Continued) |
| | | | | | | | | |
Financials — 12.0% |
Acrisure LLC / Acrisure Finance, Inc. |
10.13%, 08/01/2026 (a) | | $ | 68,000 | | | $ | 70,237 | |
8.25%, 02/01/2029 (a) | | | 160,000 | | | | 158,642 | |
4.25%, 02/15/2029 (a) | | | 134,000 | | | | 119,954 | |
6.00%, 08/01/2029 (a) | | | 117,000 | | | | 105,519 | |
AerCap Global Aviation Trust, 6.50% to 06/15/2025 then 3 mo. Term SOFR + 4.56%, 06/15/2045 (a) | | | 42,000 | | | | 41,742 | |
AG Issuer LLC, 6.25%, 03/01/2028 (a) | | | 117,000 | | | | 113,100 | |
AG TTMT Escrow Issuer LLC, 8.63%, 09/30/2027 (a) | | | 97,000 | | | | 99,923 | |
Alliant Holdings Intermediate LLC / Alliant Holdings Co.-Issuer |
4.25%, 10/15/2027 (a) | | | 150,000 | | | | 139,754 | |
6.75%, 10/15/2027 (a) | | | 269,000 | | | | 264,293 | |
6.75%, 04/15/2028 (a) | | | 268,000 | | | | 266,945 | |
5.88%, 11/01/2029 (a) | | | 105,000 | | | | 96,258 | |
7.00%, 01/15/2031 (a) | | | 260,000 | | | | 260,487 | |
Ally Financial, Inc. |
5.75%, 11/20/2025 | | | 216,000 | | | | 214,173 | |
6.70%, 02/14/2033 (b) | | | 117,000 | | | | 114,608 | |
AmWINS Group, Inc. |
6.38%, 02/15/2029 (a) | | | 100,000 | | | | 98,690 | |
4.88%, 06/30/2029 (a) | | | 100,000 | | | | 90,671 | |
Anywhere Real Estate Group LLC / Anywhere Co.-Issuer Corp., 7.00%, 04/15/2030 (a) | | | 125,000 | | | | 109,300 | |
Ardonagh Finco Ltd., 7.75%, 02/15/2031 (a) | | | 140,000 | | | | 137,813 | |
Ardonagh Group Finance Ltd., 8.88%, 02/15/2032 (a) | | | 180,000 | | | | 175,275 | |
Aretec Group, Inc., 10.00%, 08/15/2030 (a) | | | 130,000 | | | | 140,607 | |
AssuredPartners, Inc. |
5.63%, 01/15/2029 (a) | | | 98,000 | | | | 89,303 | |
7.50%, 02/15/2032 (a) | | | 80,000 | | | | 77,638 | |
Block, Inc. |
2.75%, 06/01/2026 | | | 184,000 | | | | 172,276 | |
3.50%, 06/01/2031 | | | 179,000 | | | | 151,479 | |
Boost Newco Borrower LLC, 7.50%, 01/15/2031 (a) | | | 400,000 | | | | 411,174 | |
Brandywine Operating Partnership LP, 8.88%, 04/12/2029 | | | 65,000 | | | | 66,478 | |
Bread Financial Holdings, Inc., 9.75%, 03/15/2029 (a) | | | 165,000 | | | | 171,298 | |
Brookfield Property REIT, Inc. / BPR Cumulus LLC / BPR Nimbus LLC / GGSI Sellco LL |
5.75%, 05/15/2026 (a) | | | 181,000 | | | | 175,132 | |
| | | Par | | | Value | |
Financials — 12.0% (Continued) | | | | | | | | |
4.50%, 04/01/2027 (a) | | $ | 135,000 | | | $ | 119,715 | |
Burford Capital Global Finance LLC, 6.25%, 04/15/2028 (a) | | | 100,000 | | | | 96,279 | |
Coinbase Global, Inc. |
3.38%, 10/01/2028 (a) | | | 194,000 | | | | 162,039 | |
3.63%, 10/01/2031 (a) | | | 144,000 | | | | 112,129 | |
Compass Group Diversified Holdings LLC, 5.25%, 04/15/2029 (a) | | | 169,000 | | | | 157,964 | |
Credit Acceptance Corp., 9.25%, 12/15/2028 (a) | | | 100,000 | | | | 105,923 | |
Cushman & Wakefield US Borrower LLC |
6.75%, 05/15/2028 (a) | | | 100,000 | | | | 98,602 | |
8.88%, 09/01/2031 (a) | | | 100,000 | | | | 103,911 | |
FirstCash, Inc. |
4.63%, 09/01/2028 (a) | | | 95,000 | | | | 87,756 | |
5.63%, 01/01/2030 (a) | | | 128,000 | | | | 120,599 | |
6.88%, 03/01/2032 (a) | | | 80,000 | | | | 78,889 | |
Freedom Mortgage Corp. |
7.63%, 05/01/2026 (a) | | | 90,000 | | | | 89,465 | |
6.63%, 01/15/2027 (a) | | | 27,000 | | | | 25,982 | |
12.00%, 10/01/2028 (a) | | | 140,000 | | | | 149,651 | |
12.25%, 10/01/2030 (a) | | | 100,000 | | | | 108,500 | |
Freedom Mortgage Holdings LLC, 9.25%, 02/01/2029 (a) | | | 80,000 | | | | 80,661 | |
GGAM Finance Ltd. |
8.00%, 02/15/2027 (a) | | | 150,000 | | | | 153,533 | |
8.00%, 06/15/2028 (a) | | | 100,000 | | | | 102,935 | |
6.88%, 04/15/2029 (a) | | | 65,000 | | | | 65,000 | |
Global Atlantic Fin Co., 4.70% to 10/15/2026 then 5 yr. CMT Rate + 3.80%, 10/15/2051 (a) | | | 135,000 | | | | 119,207 | |
Goeasy Ltd. |
9.25%, 12/01/2028 (a) | | | 100,000 | | | | 105,569 | |
7.63%, 07/01/2029 (a) | | | 90,000 | | | | 89,735 | |
GTCR AP Finance, Inc., 8.00%, 05/15/2027 (a) | | | 111,000 | | | | 111,026 | |
HAT Holdings I LLC / HAT Holdings II LLC |
3.38%, 06/15/2026 (a)(b) | | | 189,000 | | | | 175,298 | |
8.00%, 06/15/2027 (a)(b) | | | 160,000 | | | | 164,040 | |
Howden UK Refinance PLC / Howden UK Refinance 2 PLC / Howden US Refinance LLC |
7.25%, 02/15/2031 (a) | | | 180,000 | | | | 177,525 | |
8.13%, 02/15/2032 (a) | | | 80,000 | | | | 78,809 | |
HUB International Ltd. |
5.63%, 12/01/2029 (a) | | | 128,000 | | | | 117,426 | |
7.25%, 06/15/2030 (a) | | | 606,000 | | | | 614,070 | |
7.38%, 01/31/2032 (a) | | | 350,000 | | | | 346,254 | |
The accompanying notes are an integral part of the financial statements.
107
Pacer Trendpilot® US Bond ETF
SCHEDULE OF INVESTMENTS
April 30, 2024 (Continued)
| | | Par | | | Value | |
CORPORATE BONDS - 98.7% (Continued) |
| |
Financials — 12.0% (Continued) |
Hudson Pacific Properties LP |
3.95%, 11/01/2027 | | $ | 75,000 | | | $ | 66,150 | |
4.65%, 04/01/2029 | | | 90,000 | | | | 75,825 | |
3.25%, 01/15/2030 | | | 75,000 | | | | 56,625 | |
Icahn Enterprises LP / Icahn Enterprises Finance Corp. |
6.38%, 12/15/2025 | | | 175,000 | | | | 171,938 | |
6.25%, 05/15/2026 | | | 237,000 | | | | 230,490 | |
5.25%, 05/15/2027 | | | 270,000 | | | | 248,177 | |
9.75%, 01/15/2029 (a) | | | 95,000 | | | | 97,965 | |
4.38%, 02/01/2029 | | | 135,000 | | | | 113,523 | |
Intesa Sanpaolo SpA |
5.71%, 01/15/2026 (a) | | | 301,000 | | | | 296,549 | |
4.20% to 06/01/2031 then 1 yr. CMT Rate + 2.60%, 06/01/2032 (a) | | | 135,000 | | | | 110,579 | |
Iron Mountain Information Management Services, Inc., 5.00%, 07/15/2032 (a) | | | 135,000 | | | | 119,696 | |
Jane Street Group / JSG Finance, Inc., 7.13%, 04/30/2031 (a) | | | 250,000 | | | | 251,445 | |
Jefferies Finance LLC / JFIN Co.-Issuer Corp., 5.00%, 08/15/2028 (a) | | | 194,000 | | | | 174,583 | |
Jones Deslauriers Insurance Management, Inc., 8.50%, 03/15/2030 (a) | | | 125,000 | | | | 128,220 | |
Kennedy-Wilson, Inc. |
4.75%, 03/01/2029 | | | 110,000 | | | | 90,038 | |
4.75%, 02/01/2030 (b) | | | 110,000 | | | | 87,104 | |
5.00%, 03/01/2031 | | | 110,000 | | | | 85,621 | |
Ladder Capital Finance Holdings LLLP / Ladder Capital Finance Corp. |
4.25%, 02/01/2027 (a) | | | 127,000 | | | | 117,498 | |
4.75%, 06/15/2029 (a) | | | 127,000 | | | | 113,395 | |
LD Holdings Group LLC |
6.50%, 11/01/2025 (a) | | | 117,000 | | | | 110,952 | |
6.13%, 04/01/2028 (a) | | | 117,000 | | | | 88,189 | |
Liberty Mutual Group, Inc. |
4.13% to 12/15/2026 then 5 yr. CMT Rate + 3.32%, 12/15/2051 (a) | | | 92,000 | | | | 83,689 | |
4.30%, 02/01/2061 (a) | | | 147,000 | | | | 90,392 | |
Macquarie Airfinance Holdings Ltd. |
8.38%, 05/01/2028 (a) | | | 100,000 | | | | 104,962 | |
6.40%, 03/26/2029 (a) | | | 80,000 | | | | 79,817 | |
8.13%, 03/30/2029 (a) | | | 100,000 | | | | 104,555 | |
6.50%, 03/26/2031 (a) | | | 80,000 | | | | 80,100 | |
| | | Par | | | Value | |
Financials — 12.0% (Continued) | | | | | | | | |
Midcap Financial Issuer Trust |
6.50%, 05/01/2028 (a) | | $ | 189,000 | | | $ | 170,971 | |
5.63%, 01/15/2030 (a) | | | 93,000 | | | | 78,018 | |
MPT Operating Partnership LP / MPT Finance Corp. |
5.25%, 08/01/2026 (b) | | | 117,000 | | | | 106,412 | |
5.00%, 10/15/2027 (b) | | | 288,000 | | | | 236,160 | |
4.63%, 08/01/2029 (b) | | | 171,000 | | | | 127,079 | |
3.50%, 03/15/2031 | | | 249,000 | | | | 165,592 | |
Nationstar Mortgage Holdings, Inc. |
5.00%, 02/01/2026 (a) | | | 80,000 | | | | 77,809 | |
6.00%, 01/15/2027 (a) | | | 140,000 | | | | 137,170 | |
5.50%, 08/15/2028 (a) | | | 199,000 | | | | 187,558 | |
5.13%, 12/15/2030 (a) | | | 122,000 | | | | 109,563 | |
5.75%, 11/15/2031 (a) | | | 140,000 | | | | 126,875 | |
7.13%, 02/01/2032 (a) | | | 160,000 | | | | 157,124 | |
Navient Corp. |
6.75%, 06/25/2025 | | | 92,000 | | | | 91,885 | |
6.75%, 06/15/2026 | | | 92,000 | | | | 91,726 | |
5.00%, 03/15/2027 | | | 124,000 | | | | 116,861 | |
4.88%, 03/15/2028 | | | 92,000 | | | | 82,881 | |
5.50%, 03/15/2029 | | | 135,000 | | | | 120,676 | |
9.38%, 07/25/2030 | | | 92,000 | | | | 94,588 | |
11.50%, 03/15/2031 | | | 105,000 | | | | 114,389 | |
NCR Atleos Corp., 9.50%, 04/01/2029 (a) | | | 270,000 | | | | 286,663 | |
OneMain Finance Corp. |
7.13%, 03/15/2026 | | | 290,000 | | | | 292,615 | |
3.50%, 01/15/2027 | | | 135,000 | | | | 124,144 | |
6.63%, 01/15/2028 | | | 157,000 | | | | 156,428 | |
3.88%, 09/15/2028 | | | 110,000 | | | | 96,733 | |
9.00%, 01/15/2029 | | | 170,000 | | | | 178,288 | |
5.38%, 11/15/2029 (b) | | | 135,000 | | | | 124,875 | |
7.88%, 03/15/2030 | | | 135,000 | | | | 137,462 | |
4.00%, 09/15/2030 | | | 159,000 | | | | 133,595 | |
Panther Escrow Issuer LLC, 7.13%, 06/01/2031 (a) | | | 530,000 | | | | 532,734 | |
Park Intermediate Holdings LLC / PK Domestic Property LLC / PK Finance Co.-Issuer |
7.50%, 06/01/2025 (a) | | | 127,000 | | | | 126,949 | |
5.88%, 10/01/2028 (a)(b) | | | 140,000 | | | | 134,820 | |
4.88%, 05/15/2029 (a) | | | 145,000 | | | | 132,737 | |
PennyMac Financial Services, Inc. |
5.38%, 10/15/2025 (a) | | | 152,000 | | | | 149,756 | |
4.25%, 02/15/2029 (a) | | | 152,000 | | | | 134,991 | |
7.88%, 12/15/2029 (a) | | | 115,000 | | | | 117,512 | |
5.75%, 09/15/2031 (a) | | | 117,000 | | | | 106,119 | |
PRA Group, Inc., 8.38%, 02/01/2028 (a) | | | 68,000 | | | | 66,290 | |
The accompanying notes are an integral part of the financial statements.
108
Pacer Trendpilot® US Bond ETF
SCHEDULE OF INVESTMENTS
April 30, 2024 (Continued)
| | | Par | | | Value | |
CORPORATE BONDS - 98.7% (Continued) |
| | | | | | | | | |
Financials — 12.0% (Continued) | | | | | | | | |
Realogy Group LLC / Realogy Co.-Issuer Corp. |
5.75%, 01/15/2029 (a) | | $ | 121,000 | | | $ | 84,277 | |
5.25%, 04/15/2030 (a) | | | 100,000 | | | | 66,750 | |
RHP Hotel Properties LP / RHP Finance Corp. |
4.75%, 10/15/2027 | | | 164,000 | | | | 155,237 | |
4.50%, 02/15/2029 (a) | | | 140,000 | | | | 128,648 | |
6.50%, 04/01/2032 (a) | | | 160,000 | | | | 156,765 | |
Rithm Capital Corp., 8.00%, 04/01/2029 (a) | | | 130,000 | | | | 127,114 | |
RLJ Lodging Trust LP, 4.00%, 09/15/2029 (a) | | | 117,000 | | | | 100,808 | |
Rocket Mortgage LLC / Rocket Mortgage Co.-Issuer, Inc. |
2.88%, 10/15/2026 (a) | | | 209,000 | | | | 191,777 | |
3.63%, 03/01/2029 (a) | | | 175,000 | | | | 153,825 | |
3.88%, 03/01/2031 (a)(b) | | | 223,000 | | | | 189,029 | |
4.00%, 10/15/2033 (a)(b) | | | 144,000 | | | | 116,961 | |
SLM Corp. |
4.20%, 10/29/2025 | | | 117,000 | | | | 112,862 | |
3.13%, 11/02/2026 | | | 117,000 | | | | 108,303 | |
Starwood Property Trust, Inc. |
3.63%, 07/15/2026 (a) | | | 93,000 | | | | 86,108 | |
4.38%, 01/15/2027 (a)(b) | | | 117,000 | | | | 108,278 | |
7.25%, 04/01/2029 (a) | | | 100,000 | | | | 98,659 | |
Synchrony Financial, 7.25%, 02/02/2033 | | | 135,000 | | | | 132,073 | |
UniCredit SpA |
5.86% to 06/19/2027 then 5 Year Mid Swap Rate USD + 3.70%, 06/19/2032 (a) | | | 209,000 | | | | 201,417 | |
7.30% to 04/02/2029 then 5 Year Mid Swap Rate USD + 4.91%, 04/02/2034 (a) | | | 248,000 | | | | 250,313 | |
5.46% to 06/30/2030 then 5 yr. CMT Rate + 4.75%, 06/30/2035 (a) | | | 321,000 | | | | 294,922 | |
United Wholesale Mortgage LLC |
5.50%, 11/15/2025 (a) | | | 147,000 | | | | 144,742 | |
5.75%, 06/15/2027 (a) | | | 117,000 | | | | 112,040 | |
5.50%, 04/15/2029 (a) | | | 144,000 | | | | 133,560 | |
Uniti Group LP / Uniti Fiber Holdings, Inc. / CSL Capital LLC, 6.00%, 01/15/2030 (a) | | | 64,000 | | | | 49,920 | |
Uniti Group LP / Uniti Group Finance, Inc. / CSL Capital LLC | | | | | | | | |
10.50%, 02/15/2028 (a) | | | 499,000 | | | | 517,181 | |
4.75%, 04/15/2028 (a) | | | 108,000 | | | | 94,826 | |
6.50%, 02/15/2029 (a) | | | 220,000 | | | | 176,550 | |
USI, Inc./NY, 7.50%, 01/15/2032 (a) | | | 110,000 | | | | 109,409 | |
| | | Par | | | Value | |
Financials — 12.0% (Continued) |
XHR LP |
6.38%, 08/15/2025 (a) | | $ | 117,000 | | | $ | 116,835 | |
4.88%, 06/01/2029 (a) | | | 117,000 | | | | 106,248 | |
| | | | | | | 21,480,823 | |
| |
Health Care — 8.7% |
AdaptHealth LLC |
4.63%, 08/01/2029 (a) | | | 117,000 | | | | 98,719 | |
5.13%, 03/01/2030 (a)(b) | | | 100,000 | | | | 85,133 | |
Avantor Funding, Inc. |
4.63%, 07/15/2028 (a) | | | 298,000 | | | | 278,258 | |
3.88%, 11/01/2029 (a) | | | 162,000 | | | | 143,775 | |
Bausch + Lomb Corp., 8.38%, 10/01/2028 (a)(b) | | | 280,000 | | | | 288,907 | |
Bausch Health Americas, Inc. |
9.25%, 04/01/2026 (a)(b) | | | 118,000 | | | | 109,740 | |
8.50%, 01/31/2027 (a) | | | 150,000 | | | | 97,875 | |
Bausch Health Cos., Inc. |
5.50%, 11/01/2025 (a) | | | 328,000 | | | | 307,197 | |
9.00%, 12/15/2025 (a)(b) | | | 114,000 | | | | 107,490 | |
6.13%, 02/01/2027 (a) | | | 114,000 | | | | 83,576 | |
5.75%, 08/15/2027 (a) | | | 117,000 | | | | 80,751 | |
5.00%, 01/30/2028 (a) | | | 101,000 | | | | 45,504 | |
4.88%, 06/01/2028 (a) | | | 315,000 | | | | 203,963 | |
11.00%, 09/30/2028 (a) | | | 356,000 | | | | 277,283 | |
5.00%, 02/15/2029 (a) | | | 106,000 | | | | 46,269 | |
6.25%, 02/15/2029 (a) | | | 152,000 | | | | 66,310 | |
5.25%, 01/30/2030 (a) | | | 142,000 | | | | 60,776 | |
5.25%, 02/15/2031 (a) | | | 108,000 | | | | 45,201 | |
Catalent Pharma Solutions, Inc. |
5.00%, 07/15/2027 (a) | | | 87,000 | | | | 85,275 | |
3.13%, 02/15/2029 (a) | | | 98,000 | | | | 93,390 | |
3.50%, 04/01/2030 (a) | | | 102,000 | | | | 97,061 | |
Charles River Laboratories International, Inc. |
4.25%, 05/01/2028 (a) | | | 100,000 | | | | 93,125 | |
3.75%, 03/15/2029 (a) | | | 82,000 | | | | 73,510 | |
4.00%, 03/15/2031 (a) | | | 117,000 | | | | 101,849 | |
CHS/Community Health Systems, Inc. |
8.00%, 03/15/2026 (a) | | | 207,000 | | | | 206,120 | |
5.63%, 03/15/2027 (a) | | | 365,000 | | | | 334,431 | |
8.00%, 12/15/2027 (a) | | | 124,000 | | | | 121,356 | |
6.88%, 04/01/2028 (a) | | | 137,000 | | | | 93,735 | |
6.00%, 01/15/2029 (a) | | | 151,000 | | | | 131,389 | |
6.88%, 04/15/2029 (a) | | | 265,000 | | | | 196,113 | |
6.13%, 04/01/2030 (a) | | | 223,000 | | | | 156,487 | |
5.25%, 05/15/2030 (a) | | | 324,000 | | | | 264,870 | |
4.75%, 02/15/2031 (a) | | | 163,000 | | | | 127,333 | |
10.88%, 01/15/2032 (a)(b) | | | 200,000 | | | | 204,724 | |
The accompanying notes are an integral part of the financial statements.
109
Pacer Trendpilot® US Bond ETF
SCHEDULE OF INVESTMENTS
April 30, 2024 (Continued)
| | | Par | | | Value | |
CORPORATE BONDS - 98.7% (Continued) |
| | | | | | | | | |
Health Care — 8.7% (Continued) | | | | | | | | |
DaVita, Inc. |
4.63%, 06/01/2030 (a) | | $ | 494,000 | | | $ | 432,560 | |
3.75%, 02/15/2031 (a) | | | 286,000 | | | | 235,186 | |
Encompass Health Corp. |
4.50%, 02/01/2028 | | | 147,000 | | | | 138,105 | |
4.75%, 02/01/2030 | | | 147,000 | | | | 134,758 | |
4.63%, 04/01/2031 | | | 93,000 | | | | 83,313 | |
Endo Finance Holdings, Inc., 8.50%, 04/15/2031 (a) | | | 170,000 | | | | 172,635 | |
Heartland Dental LLC / Heartland Dental Finance Corp., 10.50%, 04/30/2028 (a) | | | 120,000 | | | | 126,693 | |
Hologic, Inc. |
4.63%, 02/01/2028 (a) | | | 93,000 | | | | 88,307 | |
3.25%, 02/15/2029 (a) | | | 182,000 | | | | 159,660 | |
IQVIA, Inc. |
5.00%, 10/15/2026 (a) | | | 121,000 | | | | 118,307 | |
5.00%, 05/15/2027 (a) | | | 232,000 | | | | 223,952 | |
6.50%, 05/15/2030 (a) | | | 82,000 | | | | 82,277 | |
Jazz Securities DAC, 4.38%, 01/15/2029 (a) | | | 241,000 | | | | 219,113 | |
Legacy LifePoint Health LLC, 4.38%, 02/15/2027 (a) | | | 90,000 | | | | 84,254 | |
LifePoint Health, Inc. |
5.38%, 01/15/2029 (a) | | | 117,000 | | | | 93,532 | |
9.88%, 08/15/2030 (a) | | | 150,000 | | | | 156,057 | |
11.00%, 10/15/2030 (a) | | | 200,000 | | | | 213,000 | |
Medline Borrower LP |
3.88%, 04/01/2029 (a)(b) | | | 860,000 | | | | 769,475 | |
5.25%, 10/01/2029 (a)(b) | | | 461,000 | | | | 427,548 | |
Medline Borrower LP/Medline Co.-Issuer, Inc., 6.25%, 04/01/2029 (a) | | | 170,000 | | | | 168,887 | |
ModivCare Escrow Issuer, Inc., 5.00%, 10/01/2029 (a) | | | 67,000 | | | | 46,409 | |
ModivCare, Inc., 5.88%, 11/15/2025 (a) | | | 117,000 | | | | 114,108 | |
Molina Healthcare, Inc. |
4.38%, 06/15/2028 (a) | | | 157,000 | | | | 145,618 | |
3.88%, 11/15/2030 (a)(b) | | | 107,000 | | | | 92,827 | |
3.88%, 05/15/2032 (a) | | | 135,000 | | | | 112,894 | |
Organon & Co. / Organon Foreign Debt Co.-Issuer BV |
4.13%, 04/30/2028 (a) | | | 412,000 | | | | 375,435 | |
5.13%, 04/30/2031 (a)(b) | | | 359,000 | | | | 310,535 | |
Owens & Minor, Inc. |
4.50%, 03/31/2029 (a) | | | 117,000 | | | | 104,426 | |
6.63%, 04/01/2030 (a)(b) | | | 95,000 | | | | 91,913 | |
| | | Par | | | Value | |
Health Care — 8.7% (Continued) | | | | | | | | |
Perrigo Finance Unlimited Co. |
4.38%, 03/15/2026 | | $ | 119,000 | | | $ | 114,741 | |
4.65%, 06/15/2030 | | | 145,000 | | | | 132,534 | |
Prestige Brands, Inc. |
5.13%, 01/15/2028 (a) | | | 68,000 | | | | 65,339 | |
3.75%, 04/01/2031 (a) | | | 140,000 | | | | 118,626 | |
Radiology Partners, Inc., 9.25%, 02/01/2028 (a)(b) | | | 166,000 | | | | 123,608 | |
RegionalCare Hospital Partners Holdings, Inc. / LifePoint Health, Inc., 9.75%, 12/01/2026 (a)(b) | | | 269,000 | | | | 267,830 | |
Select Medical Corp., 6.25%, 08/15/2026 (a) | | | 222,000 | | | | 222,087 | |
Star Parent, Inc., 9.00%, 10/01/2030 (a) | | | 200,000 | | | | 209,337 | |
Teleflex, Inc. |
4.63%, 11/15/2027 | | | 92,000 | | | | 87,364 | |
4.25%, 06/01/2028 (a) | | | 117,000 | | | | 108,007 | |
Tenet Healthcare Corp. |
6.25%, 02/01/2027 | | | 286,000 | | | | 285,022 | |
5.13%, 11/01/2027 (b) | | | 286,000 | | | | 276,808 | |
4.63%, 06/15/2028 | | | 115,000 | | | | 108,000 | |
6.13%, 10/01/2028 (b) | | | 431,000 | | | | 425,198 | |
4.25%, 06/01/2029 | | | 263,000 | | | | 240,424 | |
4.38%, 01/15/2030 | | | 275,000 | | | | 249,777 | |
6.13%, 06/15/2030 (b) | | | 384,000 | | | | 378,240 | |
6.75%, 05/15/2031 (a)(b) | | | 261,000 | | | | 261,412 | |
Teva Pharmaceutical Finance Netherlands III BV |
3.15%, 10/01/2026 | | | 622,000 | | | | 576,406 | |
4.75%, 05/09/2027 (b) | | | 194,000 | | | | 185,533 | |
6.75%, 03/01/2028 (b) | | | 167,000 | | | | 169,408 | |
5.13%, 05/09/2029 | | | 194,000 | | | | 184,116 | |
7.88%, 09/15/2029 | | | 140,000 | | | | 147,317 | |
8.13%, 09/15/2031 | | | 117,000 | | | | 126,073 | |
| | | | | | | 15,392,486 | |
| |
Industrials — 8.7% |
ADT Security Corp., 4.13%, 08/01/2029 (a) | | | 209,000 | | | | 188,361 | |
Air Canada, 3.88%, 08/15/2026 (a)(b) | | | 156,000 | | | | 147,877 | |
Albion Financing 1 SARL / Aggreko Holdings, Inc., 6.13%, 10/15/2026 (a) | | | 32,000 | | | | 31,374 | |
Albion Financing 2 Sarl, 8.75%, 04/15/2027 (a) | | | 105,000 | | | | 105,508 | |
Allison Transmission, Inc. |
4.75%, 10/01/2027 (a) | | | 93,000 | | | | 88,622 | |
5.88%, 06/01/2029 (a) | | | 117,000 | | | | 113,961 | |
3.75%, 01/30/2031 (a) | | | 109,000 | | | | 93,028 | |
The accompanying notes are an integral part of the financial statements.
110
Pacer Trendpilot® US Bond ETF
SCHEDULE OF INVESTMENTS
April 30, 2024 (Continued)
| | | Par | | | Value | |
CORPORATE BONDS - 98.7% (Continued) |
| | | | | | | | | |
Industrials — 8.7% (Continued) | | | | | | | | |
Beacon Roofing Supply, Inc., 6.50%, 08/01/2030 (a) | | $ | 125,000 | | | $ | 124,270 | |
Bombardier, Inc. |
7.13%, 06/15/2026 (a) | | | 81,000 | | | | 81,735 | |
7.88%, 04/15/2027 (a) | | | 264,000 | | | | 262,022 | |
6.00%, 02/15/2028 (a) | | | 135,000 | | | | 131,550 | |
7.50%, 02/01/2029 (a)(b) | | | 135,000 | | | | 137,783 | |
8.75%, 11/15/2030 (a) | | | 170,000 | | | | 180,300 | |
7.25%, 07/01/2031 (a) | | | 125,000 | | | | 125,304 | |
Brand Industrial Services, Inc., 10.38%, 08/01/2030 (a) | | | 250,000 | | | | 268,743 | |
Brink’s Co. |
5.50%, 07/15/2025 (a) | | | 93,000 | | | | 92,449 | |
4.63%, 10/15/2027 (a) | | | 140,000 | | | | 131,352 | |
Builders FirstSource, Inc. |
5.00%, 03/01/2030 (a) | | | 128,000 | | | | 119,747 | |
4.25%, 02/01/2032 (a) | | | 240,000 | | | | 208,992 | |
6.38%, 06/15/2032 (a) | | | 119,000 | | | | 117,797 | |
6.38%, 03/01/2034 (a) | | | 160,000 | | | | 156,882 | |
Chart Industries, Inc. |
7.50%, 01/01/2030 (a) | | | 277,000 | | | | 283,269 | |
9.50%, 01/01/2031 (a) | | | 119,000 | | | | 127,363 | |
Clean Harbors, Inc. |
4.88%, 07/15/2027 (a) | | | 102,000 | | | | 98,290 | |
6.38%, 02/01/2031 (a) | | | 92,000 | | | | 90,940 | |
Covanta Holding Corp. |
4.88%, 12/01/2029 (a) | | | 139,000 | | | | 121,865 | |
5.00%, 09/01/2030 | | | 93,000 | | | | 80,329 | |
Delta Air Lines, Inc. |
7.38%, 01/15/2026 (b) | | | 171,000 | | | | 174,779 | |
4.38%, 04/19/2028 | | | 92,000 | | | | 87,952 | |
3.75%, 10/28/2029 | | | 115,000 | | | | 103,356 | |
EMRLD Borrower LP / Emerald Co.-Issuer, Inc., 6.63%, 12/15/2030 (a) | | | 518,000 | | | | 514,762 | |
Fortress Transportation and Infrastructure Investors LLC |
9.75%, 08/01/2027 (a) | | | 68,000 | | | | 70,208 | |
5.50%, 05/01/2028 (a)(b) | | | 194,000 | | | | 186,240 | |
7.88%, 12/01/2030 (a) | | | 105,000 | | | | 108,778 | |
FXI Holdings, Inc. |
12.25%, 11/15/2026 (a) | | | 141,000 | | | | 139,912 | |
12.25%, 11/15/2026 (a)(b) | | | 117,000 | | | | 116,124 | |
GEO Group, Inc. |
8.63%, 04/15/2029 (a) | | | 105,000 | | | | 106,706 | |
10.25%, 04/15/2031 (a) | | | 100,000 | | | | 103,051 | |
| | | Par | | | Value | |
Industrials — 8.7% (Continued) | | | | | | | | |
GFL Environmental, Inc. |
4.25%, 06/01/2025 (a) | | $ | 87,000 | | | $ | 85,672 | |
3.75%, 08/01/2025 (a) | | | 150,000 | | | | 145,755 | |
5.13%, 12/15/2026 (a) | | | 87,000 | | | | 84,638 | |
4.00%, 08/01/2028 (a) | | | 135,000 | | | | 122,054 | |
3.50%, 09/01/2028 (a) | | | 135,000 | | | | 121,236 | |
4.75%, 06/15/2029 (a) | | | 135,000 | | | | 124,248 | |
4.38%, 08/15/2029 (a) | | | 128,000 | | | | 115,360 | |
6.75%, 01/15/2031 (a) | | | 200,000 | | | | 201,499 | |
H&E Equipment Services, Inc., 3.88%, 12/15/2028 (a) | | | 253,000 | | | | 223,905 | |
Herc Holdings, Inc., 5.50%, 07/15/2027 (a) | | | 256,000 | | | | 248,732 | |
Hillenbrand, Inc. |
5.75%, 06/15/2025 | | | 93,000 | | | | 92,302 | |
6.25%, 02/15/2029 | | | 100,000 | | | | 99,237 | |
Husky Injection Molding Systems Ltd. / Titan Co.-Borrower LLC, 9.00%, 02/15/2029 (a) | | | 200,000 | | | | 205,089 | |
Madison IAQ LLC |
4.13%, 06/30/2028 (a) | | | 124,000 | | | | 115,010 | |
5.88%, 06/30/2029 (a) | | | 217,000 | | | | 199,928 | |
Pike Corp., 8.63%, 01/31/2031 (a) | | | 70,000 | | | | 73,308 | |
Ritchie Bros Holdings, Inc. |
6.75%, 03/15/2028 (a) | | | 128,000 | | | | 129,252 | |
7.75%, 03/15/2031 (a) | | | 147,000 | | | | 152,475 | |
Sensata Technologies BV |
5.00%, 10/01/2025 (a) | | | 124,000 | | | | 122,140 | |
4.00%, 04/15/2029 (a) | | | 179,000 | | | | 160,098 | |
5.88%, 09/01/2030 (a) | | | 117,000 | | | | 112,373 | |
Sensata Technologies, Inc. |
4.38%, 02/15/2030 (a) | | | 105,000 | | | | 93,726 | |
3.75%, 02/15/2031 (a) | | | 135,000 | | | | 114,075 | |
Spirit AeroSystems, Inc. |
4.60%, 06/15/2028 | | | 124,000 | | | | 114,179 | |
9.38%, 11/30/2029 (a) | | | 186,000 | | | | 200,869 | |
9.75%, 11/15/2030 (a) | | | 270,000 | | | | 298,739 | |
TK Elevator Holdco GmbH, 7.63%, 07/15/2028 (a) | | | 93,000 | | | | 91,140 | |
TK Elevator US Newco, Inc., 5.25%, 07/15/2027 (a) | | | 285,000 | | | | 272,622 | |
TransDigm, Inc. |
5.50%, 11/15/2027 | | | 526,000 | | | | 510,877 | |
6.75%, 08/15/2028 (a) | | | 402,000 | | | | 403,619 | |
4.63%, 01/15/2029 (b) | | | 231,000 | | | | 211,654 | |
6.38%, 03/01/2029 (a) | | | 400,000 | | | | 396,695 | |
4.88%, 05/01/2029 | | | 135,000 | | | | 124,178 | |
6.88%, 12/15/2030 (a) | | | 275,000 | | | | 276,537 | |
7.13%, 12/01/2031 (a) | | | 200,000 | | | | 203,312 | |
The accompanying notes are an integral part of the financial statements.
111
Pacer Trendpilot® US Bond ETF
SCHEDULE OF INVESTMENTS
April 30, 2024 (Continued)
| | | Par | | | Value | |
CORPORATE BONDS - 98.7% (Continued) |
| | | | | | | | | |
Industrials — 8.7% (Continued) | | | | | | | | |
6.63%, 03/01/2032 (a) | | $ | 400,000 | | | $ | 399,580 | |
Triumph Group, Inc., 9.00%, 03/15/2028 (a) | | | 226,000 | | | | 233,967 | |
Uber Technologies, Inc. |
8.00%, 11/01/2026 (a) | | | 286,000 | | | | 287,828 | |
7.50%, 09/15/2027 (a) | | | 256,000 | | | | 260,840 | |
6.25%, 01/15/2028 (a) | | | 117,000 | | | | 116,892 | |
4.50%, 08/15/2029 (a) | | | 281,000 | | | | 262,033 | |
United Rentals North America, Inc. |
5.50%, 05/15/2027 | | | 117,000 | | | | 115,260 | |
3.88%, 11/15/2027 | | | 135,000 | | | | 125,809 | |
4.88%, 01/15/2028 (b) | | | 321,000 | | | | 307,602 | |
5.25%, 01/15/2030 | | | 135,000 | | | | 129,481 | |
4.00%, 07/15/2030 | | | 135,000 | | | | 120,132 | |
3.88%, 02/15/2031 (b) | | | 227,000 | | | | 198,909 | |
3.75%, 01/15/2032 | | | 135,000 | | | | 114,692 | |
6.13%, 03/15/2034 (a) | | | 180,000 | | | | 175,725 | |
WESCO Distribution, Inc. |
7.13%, 06/15/2025 (a) | | | 256,000 | | | | 256,077 | |
7.25%, 06/15/2028 (a) | | | 280,000 | | | | 284,550 | |
6.38%, 03/15/2029 (a) | | | 150,000 | | | | 149,063 | |
6.63%, 03/15/2032 (a) | | | 140,000 | | | | 139,230 | |
XPO, Inc. |
7.13%, 06/01/2031 (a) | | | 105,000 | | | | 105,525 | |
7.13%, 02/01/2032 (a) | | | 110,000 | | | | 110,376 | |
| | | | | | | 15,561,685 | |
| |
Information Technology — 6.1% |
AthenaHealth Group, Inc., 6.50%, 02/15/2030 (a)(b) | | | 430,000 | | | | 386,138 | |
Central Parent LLC / CDK Global II LLC / CDK Financing Co., Inc., 8.00%, 06/15/2029 (a) | | | 140,000 | | | | 143,587 | |
Central Parent, Inc. / CDK Global, Inc., 7.25%, 06/15/2029 (a) | | | 140,000 | | | | 141,455 | |
Clarivate Science Holdings Corp. | | | | | | | | |
3.88%, 07/01/2028 (a) | | | 176,000 | | | | 160,155 | |
4.88%, 07/01/2029 (a) | | | 186,000 | | | | 169,655 | |
Cloud Software Group, Inc. | | | | | | | | |
6.50%, 03/31/2029 (a) | | | 783,000 | | | | 742,871 | |
9.00%, 09/30/2029 (a) | | | 579,000 | | | | 557,790 | |
CommScope Technologies LLC | | | | | | | | |
6.00%, 06/15/2025 (a)(b) | | | 273,000 | | | | 215,670 | |
5.00%, 03/15/2027 (a) | | | 120,000 | | | | 41,114 | |
6.00%, 03/01/2026 (a)(b) | | | 291,000 | | | | 257,713 | |
8.25%, 03/01/2027 (a) | | | 188,000 | | | | 72,144 | |
7.13%, 07/01/2028 (a) | | | 133,000 | | | | 44,282 | |
| | | Par | | | Value | |
Information Technology — 6.1% (Continued) |
4.75%, 09/01/2029 (a) | | $ | 258,000 | | | $ | 180,230 | |
Entegris, Inc. | | | | | | | | |
4.38%, 04/15/2028 (a) | | | 68,000 | | | | 63,430 | |
4.75%, 04/15/2029 (a) | | | 305,000 | | | | 287,923 | |
3.63%, 05/01/2029 (a) | | | 93,000 | | | | 82,129 | |
5.95%, 06/15/2030 (a) | | | 184,000 | | | | 179,076 | |
EquipmentShare.com, Inc., 9.00%, 05/15/2028 (a) | | | 200,000 | | | | 205,635 | |
Fair Isaac Corp. | | | | | | | | |
5.25%, 05/15/2026 (a) | | | 68,000 | | | | 66,842 | |
4.00%, 06/15/2028 (a) | | | 181,000 | | | | 166,301 | |
Gen Digital, Inc. |
6.75%, 09/30/2027 (a) | | | 141,000 | | | | 141,367 | |
7.13%, 09/30/2030 (a)(b) | | | 140,000 | | | | 141,094 | |
Imola Merger Corp., 4.75%, 05/15/2029 (a) | | | 384,000 | | | | 353,651 | |
McAfee Corp., 7.38% 02/15/2030 (a) | | | 393,000 | | | | 362,599 | |
MPH Acquisition Holdings LLC | | | | | | | | |
5.50%, 09/01/2028 (a) | | | 206,000 | | | | 167,482 | |
5.75%, 11/01/2028 (a) | | | 175,000 | | | | 127,953 | |
NCR Voyix Corp. | | | | | | | | |
5.00%, 10/01/2028 (a) | | | 152,000 | | | | 139,930 | |
5.13%, 04/15/2029 (a) | | | 221,000 | | | | 202,933 | |
5.25%, 10/01/2030 (a) | | | 105,000 | | | | 93,347 | |
Neptune Bidco US, Inc., 9.29%, 04/15/2029 (a) | | | 522,000 | | | | 493,290 | |
Newfold Digital Holdings Group, Inc. |
11.75%, 10/15/2028 (a) | | | 100,000 | | | | 106,925 | |
6.00%, 02/15/2029 (a) | | | 120,000 | | | | 90,036 | |
Open Text Corp. |
3.88%, 02/15/2028 (a) | | | 216,000 | | | | 197,249 | |
3.88%, 12/01/2029 (a) | | | 174,000 | | | | 152,026 | |
Open Text Holdings, Inc. | | | | | | | | |
4.13%, 02/15/2030 (a) | | | 171,000 | | | | 150,238 | |
4.13%, 12/01/2031 (a)(b) | | | 112,000 | | | | 95,760 | |
Presidio Holdings, Inc., 4.88%, 02/01/2027 (a) | | | 98,000 | | | | 98,043 | |
Sabre GLBL, Inc. | | | | | | | | |
8.63%, 06/01/2027 (a) | | | 74,000 | | | | 65,253 | |
11.25%, 12/15/2027 (a) | | | 130,000 | | | | 120,965 | |
Seagate HDD Cayman | | | | | | | | |
4.88%, 06/01/2027 | | | 93,000 | | | | 89,804 | |
4.09%, 06/01/2029 | | | 117,000 | | | | 106,470 | |
8.25%, 12/15/2029 (a) | | | 93,000 | | | | 98,394 | |
8.50%, 07/15/2031 (a) | | | 93,000 | | | | 99,112 | |
9.63%, 12/01/2032 | | | 130,000 | | | | 145,947 | |
SS&C Technologies, Inc., 5.50%, 09/30/2027 (a) | | | 409,000 | | | | 397,468 | |
Twilio, Inc. | | | | | | | | |
3.63%, 03/15/2029 | | | 92,000 | | | | 81,502 | |
The accompanying notes are an integral part of the financial statements.
112
Pacer Trendpilot® US Bond ETF
SCHEDULE OF INVESTMENTS
April 30, 2024 (Continued)
| | | Par | | | Value | |
CORPORATE BONDS - 98.7% (Continued) |
| | | | | | | | | |
Information Technology — 6.1% (Continued) |
3.88%, 03/15/2031 | | $ | 87,000 | | | $ | 75,317 | |
UKG, Inc., 6.88%, 02/01/2031 (a) | | | 450,000 | | | | 449,528 | |
Vericast Corp. | | | | | | | | |
11.00%, 09/15/2026 (a) | | | 224,000 | | | | 240,800 | |
13.00%, 10/15/2027 (a) | | | 78,000 | | | | 89,076 | |
Veritas US, Inc. / Veritas Bermuda Ltd., 7.50%, 09/01/2025 (a) | | | 345,000 | | | | 313,466 | |
Verscend Escrow Corp., 9.75%, 08/15/2026 (a) | | | 192,000 | | | | 192,421 | |
Viasat, Inc. | | | | | | | | |
5.63%, 09/15/2025 (a) | | | 119,000 | | | | 114,314 | |
5.63%, 04/15/2027 (a) | | | 110,000 | | | | 100,683 | |
6.50%, 07/15/2028 (a) | | | 63,000 | | | | 48,313 | |
7.50%, 05/30/2031 (a)(b) | | | 145,000 | | | | 102,596 | |
Western Digital Corp., 4.75%, 02/15/2026 | | | 444,000 | | | | 431,502 | |
Xerox Holdings Corp. |
5.50%, 08/15/2028 (a) | | | 135,000 | | | | 116,603 | |
8.88%, 11/30/2029 (a) | | | 100,000 | | | | 95,250 | |
| | | | | | | 10,852,847 | |
| |
Materials — 7.6% |
Alcoa Nederland Holding BV |
5.50%, 12/15/2027 (a) | | | 140,000 | | | | 149,450 | |
7.13%, 03/15/2031 (a) | | | 140,000 | | | | 141,696 | |
Ardagh Metal Packaging Finance USA LLC / Ardagh Metal Packaging Finance PLC | | | | | | | | |
3.25%, 09/01/2028 (a)(b) | | | 140,000 | | | | 120,976 | |
4.00%, 09/01/2029 (a) | | | 191,000 | | | | 157,037 | |
Ardagh Packaging Finance PLC / Ardagh Holdings USA, Inc. |
5.25%, 04/30/2025 (a) | | | 124,000 | | | | 122,760 | |
4.13%, 08/15/2026 (a) | | | 249,000 | | | | 207,713 | |
5.25%, 08/15/2027 (a) | | | 189,000 | | | | 96,366 | |
5.25%, 08/15/2027 (a) | | | 157,000 | | | | 80,050 | |
Arsenal AIC Parent LLC, 8.00%, 10/01/2030 (a) | | | 125,000 | | | | 130,000 | |
ASP Unifrax Holdings, Inc. |
5.25%, 09/30/2028 (a) | | | 147,000 | | | | 87,759 | |
7.50%, 09/30/2029 (a) | | | 68,000 | | | | 34,711 | |
ATI, Inc., 7.25%, 08/15/2030 | | | 90,000 | | | | 92,039 | |
Avient Corp. |
5.75%, 05/15/2025 (a) | | | 152,000 | | | | 151,240 | |
7.13%, 08/01/2030 (a) | | | 130,000 | | | | 131,293 | |
Axalta Coating Systems Dutch Holding B BV, 7.25%, 02/15/2031 (a) | | | 100,000 | | | | 101,822 | |
Axalta Coating Systems LLC, 3.38%, 02/15/2029 (a) | | | 124,000 | | | | 108,191 | |
| | | Par | | | Value | |
Materials — 7.6% (Continued) | | | | | | | | |
Axalta Coating Systems LLC / Axalta Coating Systems Dutch Holding B BV, 4.75%, 06/15/2027 (a) | | $ | 12,000 | | | $ | 11,488 | |
Ball Corp. |
6.88%, 03/15/2028 | | | 135,000 | | | | 137,229 | |
6.00%, 06/15/2029 (b) | | | 204,000 | | | | 202,831 | |
2.88%, 08/15/2030 | | | 239,000 | | | | 199,826 | |
3.13%, 09/15/2031 | | | 174,000 | | | | 144,281 | |
Chemours Co. |
5.38%, 05/15/2027 | | | 116,000 | | | | 109,971 | |
5.75%, 11/15/2028 (a) | | | 143,000 | | | | 131,086 | |
4.63%, 11/15/2029 (a) | | | 145,000 | | | | 124,639 | |
Cleveland-Cliffs, Inc. |
5.88%, 06/01/2027 | | | 100,000 | | | | 98,807 | |
6.75%, 04/15/2030 (a) | | | 135,000 | | | | 131,541 | |
7.00%, 03/15/2032 (a) | | | 140,000 | | | | 136,717 | |
Clydesdale Acquisition Holdings, Inc. |
6.63%, 04/15/2029 (a) | | | 117,000 | | | | 116,708 | |
8.75%, 04/15/2030 (a) | | | 205,000 | | | | 198,167 | |
Constellium SE, 3.75%, 04/15/2029 (a) | | | 117,000 | | | | 103,758 | |
Crown Americas LLC, 5.25%, 04/01/2030 | | | 117,000 | | | | 111,370 | |
Crown Americas LLC / Crown Americas Capital Corp. V, 4.25%, 09/30/2026 | | | 93,000 | | | | 89,280 | |
Crown Americas LLC / Crown Americas Capital Corp. VI, 4.75%, 02/01/2026 | | | 175,000 | | | | 171,159 | |
FMG Resources August 2006 Pty Ltd. |
4.50%, 09/15/2027 (a) | | | 115,000 | | | | 108,448 | |
5.88%, 04/15/2030 (a) | | | 134,000 | | | | 128,590 | |
4.38%, 04/01/2031 (a) | | | 271,000 | | | | 238,066 | |
6.13%, 04/15/2032 (a) | | | 157,000 | | | | 152,285 | |
Graphic Packaging International LLC |
3.50%, 03/15/2028 (a) | | | 105,000 | | | | 95,415 | |
3.75%, 02/01/2030 (a) | | | 93,000 | | | | 81,004 | |
INEOS Finance PLC |
6.75%, 05/15/2028 (a) | | | 90,000 | | | | 88,425 | |
7.50%, 04/15/2029 (a) | | | 100,000 | | | | 100,439 | |
Kaiser Aluminum Corp. |
4.63%, 03/01/2028 (a) | | | 117,000 | | | | 108,859 | |
4.50%, 06/01/2031 (a) | | | 88,000 | | | | 77,110 | |
LABL, Inc. |
6.75%, 07/15/2026 (a) | | | 124,000 | | | | 122,046 | |
10.50%, 07/15/2027 (a) | | | 121,000 | | | | 118,847 | |
5.88%, 11/01/2028 (a) | | | 117,000 | | | | 104,276 | |
8.25%, 11/01/2029 (a) | | | 107,000 | | | | 90,482 | |
The accompanying notes are an integral part of the financial statements.
113
Pacer Trendpilot® US Bond ETF
SCHEDULE OF INVESTMENTS
April 30, 2024 (Continued)
| | | Par | | | Value | |
CORPORATE BONDS - 98.7% (Continued) |
| | | | | | | | | |
Materials — 7.6% (Continued) | | | | | | | | |
Mauser Packaging Solutions Holding Co. |
7.88%, 04/15/2027 (a) | | $ | 534,000 | | | $ | 543,479 | |
9.25%, 04/15/2027 (a) | | | 266,000 | | | | 260,800 | |
Mercer International, Inc., 5.13%, 02/01/2029 | | | 165,000 | | | | 144,375 | |
Methanex Corp. |
5.13%, 10/15/2027 | | | 124,000 | | | | 118,899 | |
5.25%, 12/15/2029 | | | 124,000 | | | | 117,608 | |
Mineral Resources Ltd. |
8.13%, 05/01/2027 (a) | | | 124,000 | | | | 125,395 | |
8.00%, 11/01/2027 (a) | | | 146,000 | | | | 147,643 | |
9.25%, 10/01/2028 (a) | | | 200,000 | | | | 210,000 | |
8.50%, 05/01/2030 (a) | | | 146,000 | | | | 149,475 | |
NOVA Chemicals Corp. |
5.00%, 05/01/2025 (a) | | | 87,000 | | | | 85,465 | |
5.25%, 06/01/2027 (a) | | | 186,000 | | | | 174,608 | |
8.50%, 11/15/2028 (a) | | | 80,000 | | | | 83,988 | |
4.25%, 05/15/2029 (a)(b) | | | 134,000 | | | | 112,256 | |
9.00%, 02/15/2030 (a) | | | 90,000 | | | | 92,453 | |
Novelis Corp. |
3.25%, 11/15/2026 (a) | | | 145,000 | | | | 135,575 | |
4.75%, 01/30/2030 (a) | | | 335,000 | | | | 305,165 | |
3.88%, 08/15/2031 (a) | | | 135,000 | | | | 114,269 | |
OI European Group BV, 4.75%, 02/15/2030 (a) | | | 93,000 | | | | 84,607 | |
Olin Corp. |
5.13%, 09/15/2027 | | | 92,000 | | | | 88,674 | |
5.63%, 08/01/2029 | | | 131,000 | | | | 126,193 | |
5.00%, 02/01/2030 | | | 96,000 | | | | 89,640 | |
Olympus Water US Holding Corp. |
4.25%, 10/01/2028 (a) | | | 151,000 | | | | 135,667 | |
9.75%, 11/15/2028 (a) | | | 300,000 | | | | 318,290 | |
6.25%, 10/01/2029 (a) | | | 93,000 | | | | 83,628 | |
Owens-Brockway Glass Container, Inc. |
6.63%, 05/13/2027 (a) | | | 143,000 | | | | 142,914 | |
7.25%, 05/15/2031 (a) | | | 121,000 | | | | 120,979 | |
Pactiv Evergreen Group Issuer LLC / Pactiv Evergreen Group Issuer, Inc. 4.38%, 10/15/2028 (a) | | | 32,000 | | | | 29,343 | |
4.00%, 10/15/2027 (a) | | | 204,000 | | | | 188,374 | |
SCIH Salt Holdings, Inc. |
4.88%, 05/01/2028 (a) | | | 187,000 | | | | 173,910 | |
6.63%, 05/01/2029 (a) | | | 124,000 | | | | 113,615 | |
Scotts Miracle-Gro Co. |
4.50%, 10/15/2029 (b) | | | 96,000 | | | | 85,689 | |
4.00%, 04/01/2031 | | | 111,000 | | | | 93,509 | |
4.38%, 02/01/2032 | | | 93,000 | | | | 78,385 | |
| | | Par | | | Value | |
Materials — 7.6% (Continued) | | | | | | | | |
Sealed Air Corp. |
5.50%, 09/15/2025 (a) | | $ | 93,000 | | | $ | 92,137 | |
4.00%, 12/01/2027 (a) | | | 99,000 | | | | 91,430 | |
5.00%, 04/15/2029 (a) | | | 99,000 | | | | 93,017 | |
6.13%, 02/01/2028 (a) | | | 146,000 | | | | 144,079 | |
7.25%, 02/15/2031 (a) | | | 90,000 | | | | 91,543 | |
Smyrna Ready Mix Concrete LLC |
6.00%, 11/01/2028 (a) | | | 222,000 | | | | 214,785 | |
8.88%, 11/15/2031 (a) | | | 220,000 | | | | 231,838 | |
Standard Industries, Inc. |
5.00%, 02/15/2027 (a) | | | 164,000 | | | | 157,877 | |
4.75%, 01/15/2028 (a) | | | 204,000 | | | | 191,964 | |
4.38%, 07/15/2030 (a) | | | 325,000 | | | | 287,778 | |
3.38%, 01/15/2031 (a) | | | 212,000 | | | | 174,900 | |
Summit Materials LLC / Summit Materials Finance Corp. |
5.25%, 01/15/2029 (a) | | | 124,000 | | | | 119,192 | |
7.25%, 01/15/2031 (a) | | | 130,000 | | | | 133,477 | |
Trivium Packaging Finance BV |
5.50%, 08/15/2026 (a) | | | 221,000 | | | | 216,909 | |
8.50%, 08/15/2027 (a) | | | 124,000 | | | | 122,714 | |
Tronox, Inc., 4.63%, 03/15/2029 (a) | | | 207,000 | | | | 184,079 | |
WR Grace Holdings LLC |
4.88%, 06/15/2027 (a) | | | 134,000 | | | | 126,599 | |
5.63%, 08/15/2029 (a) | | | 215,000 | | | | 192,406 | |
| | | | | | | 13,487,847 | |
| |
Real Estate — 1.9% |
Diversified Healthcare Trust |
9.75%, 06/15/2025 | | | 117,000 | | | | 117,234 | |
4.75%, 02/15/2028 | | | 117,000 | | | | 92,078 | |
4.38%, 03/01/2031 | | | 117,000 | | | | 84,536 | |
Howard Hughes Corp. |
5.38%, 08/01/2028 (a) | | | 175,000 | | | | 164,719 | |
4.13%, 02/01/2029 (a) | | | 152,000 | | | | 134,106 | |
4.38%, 02/01/2031 (a) | | | 112,000 | | | | 94,959 | |
Iron Mountain, Inc. |
4.88%, 09/15/2027 (a) | | | 174,000 | | | | 165,844 | |
5.25%, 03/15/2028 (a) | | | 153,000 | | | | 146,450 | |
5.00%, 07/15/2028 (a) | | | 87,000 | | | | 81,872 | |
7.00%, 02/15/2029 (a) | | | 174,000 | | | | 175,088 | |
4.88%, 09/15/2029 (a) | | | 184,000 | | | | 169,464 | |
5.25%, 07/15/2030 (a) | | | 249,000 | | | | 230,919 | |
4.50%, 02/15/2031 (a)(b) | | | 177,000 | | | | 156,203 | |
5.63%, 07/15/2032 (a) | | | 140,000 | | | | 129,563 | |
Office Properties Income Trust, 3.45%, 10/15/2031 | | | 93,000 | | | | 39,160 | |
SBA Communications Corp. |
3.88%, 02/15/2027 (b) | | | 286,000 | | | | 268,386 | |
3.13%, 02/01/2029 (b) | | | 286,000 | | | | 249,177 | |
The accompanying notes are an integral part of the financial statements.
114
Pacer Trendpilot® US Bond ETF
SCHEDULE OF INVESTMENTS
April 30, 2024 (Continued)
| | | Par | | | Value | |
CORPORATE BONDS - 98.7% (Continued) |
| |
Real Estate — 1.9% (Continued) |
Service Properties Trust |
7.50%, 09/15/2025 | | $ | 147,000 | | | $ | 148,092 | |
4.75%, 10/01/2026 | | | 105,000 | | | | 97,428 | |
4.95%, 02/15/2027 | | | 93,000 | | | | 85,713 | |
5.50%, 12/15/2027 | | | 80,000 | | | | 75,278 | |
3.95%, 01/15/2028 | | | 93,000 | | | | 79,199 | |
4.95%, 10/01/2029 (b) | | | 99,000 | | | | 81,002 | |
4.38%, 02/15/2030 (b) | | | 68,000 | | | | 51,816 | |
8.63%, 11/15/2031 (a) | | | 195,000 | | | | 204,376 | |
| | | | | | | 3,322,662 | |
Utilities — 3.3% |
AmeriGas Partners LP / AmeriGas Finance Corp. |
5.50%, 05/20/2025 | | | 124,000 | | | | 123,223 | |
5.88%, 08/20/2026 | | | 118,000 | | | | 116,109 | |
5.75%, 05/20/2027 | | | 123,000 | | | | 119,026 | |
Calpine Corp. |
5.25%, 06/01/2026 (a) | | | 73,000 | | | | 71,842 | |
4.50%, 02/15/2028 (a) | | | 228,000 | | | | 212,294 | |
5.13%, 03/15/2028 (a)(b) | | | 253,000 | | | | 239,753 | |
4.63%, 02/01/2029 (a) | | | 127,000 | | | | 116,543 | |
5.00%, 02/01/2031 (a) | | | 159,000 | | | | 143,838 | |
3.75%, 03/01/2031 (a) | | | 171,000 | | | | 147,789 | |
Clearway Energy Operating LLC |
4.75%, 03/15/2028 (a) | | | 159,000 | | | | 150,001 | |
3.75%, 02/15/2031 (a) | | | 186,000 | | | | 156,950 | |
DPL, Inc. |
4.13%, 07/01/2025 | | | 72,000 | | | | 70,169 | |
4.35%, 04/15/2029 | | | 93,000 | | | | 83,577 | |
Edison International |
8.13% to 06/15/2028 then 5 yr. CMT Rate + 3.86%, 06/15/2053 | | | 92,000 | | | | 93,610 | |
7.88% to 06/15/2029 then 5 yr. CMT Rate + 3.66%, 06/15/2054 | | | 85,000 | | | | 86,332 | |
Electricite de France SA, 9.13% to 06/15/2033 then 5 yr. CMT Rate + 5.41%, Perpetual (a) | | | 275,000 | | | | 298,903 | |
Emera, Inc., 6.75% to 06/15/2026 then 3 mo. LIBOR US + 5.44%, 06/15/2076 (c) | | | 221,000 | | | | 218,417 | |
Ferrellgas LP / Ferrellgas Finance Corp. |
5.38%, 04/01/2026 (a) | | | 92,000 | | | | 90,086 | |
5.88%, 04/01/2029 (a) | | | 163,000 | | | | 154,329 | |
NextEra Energy Operating Partners LP |
3.88%, 10/15/2026 (a) | | | 92,000 | | | | 85,789 | |
4.50%, 09/15/2027 (a) | | | 98,000 | | | | 91,263 | |
7.25%, 01/15/2029 (a)(b) | | | 120,000 | | | | 121,211 | |
| | | Par | | | Value | |
Utilities — 3.3% (Continued) | | | | | | | | |
NRG Energy, Inc. |
5.75%, 01/15/2028 | | $ | 161,000 | | | $ | 158,005 | |
3.38%, 02/15/2029 (a) | | | 100,000 | | | | 87,603 | |
5.25%, 06/15/2029 (a) | | | 136,000 | | | | 128,350 | |
3.63%, 02/15/2031 (a)(b) | | | 206,000 | | | | 173,858 | |
3.88%, 02/15/2032 (a) | | | 71,000 | | | | 59,743 | |
PG&E Corp. |
5.00%, 07/01/2028 | | | 199,000 | | | | 189,425 | |
5.25%, 07/01/2030 | | | 179,000 | | | | 167,755 | |
Suburban Propane Partners LP/Suburban Energy Finance Corp., 5.00%, 06/01/2031 (a) | | | 112,000 | | | | 99,379 | |
Talen Energy Supply LLC, 8.63%, 06/01/2030 (a) | | | 231,000 | | | | 244,401 | |
TerraForm Power Operating LLC |
5.00%, 01/31/2028 (a) | | | 124,000 | | | | 115,692 | |
4.75%, 01/15/2030 (a) | | | 124,000 | | | | 110,456 | |
Vistra Operations Co. LLC |
5.50%, 09/01/2026 (a) | | | 179,000 | | | | 174,657 | |
5.63%, 02/15/2027 (a) | | | 254,000 | | | | 247,184 | |
5.00%, 07/31/2027 (a) | | | 239,000 | | | | 227,950 | |
4.38%, 05/01/2029 (a) | | | 228,000 | | | | 207,338 | |
7.75%, 10/15/2031 (a) | | | 275,000 | | | | 282,267 | |
6.88%, 04/15/2032 (a) | | | 170,000 | | | | 169,227 | |
| | | | | | | 5,834,344 | |
TOTAL CORPORATE BONDS (Cost $174,757,214) | | | | | | | 175,678,661 | |
| |
The accompanying notes are an integral part of the financial statements.
115
Pacer Trendpilot® US Bond ETF
SCHEDULE OF INVESTMENTS
April 30, 2024 (Continued)
| | | Units | | | Value | |
INVESTMENTS PURCHASED WITH PROCEEDS FROM SECURITIES LENDING — 11.6% |
Mount Vernon Liquid Assets Portfolio, LLC – 5.51%(d) | | | 20,705,300 | | | $ | 20,705,300 | |
TOTAL INVESTMENTS PURCHASED WITH PROCEEDS FROM SECURITIES LENDING (Cost $20,705,300) | | | | | | | 20,705,300 | |
| |
TOTAL INVESTMENTS — 110.3% (Cost $195,462,514) | | | | | | | 196,383,961 | |
Liabilities in Excess of Other Assets — (10.3)% | | | | | | | (18,362,991 | ) |
TOTAL NET ASSETS — 100.0% | | | | | | $ | 178,020,970 | |
Percentages are stated as a percent of net assets.
AG - Aktiengesellschaft
CMT - Constant Maturity Treasury Rate
LIBOR - London Interbank Offered Rate
PIK - Payment in Kind
PLC - Public Limited Company
SA - Sociedad Anónima
SOFR - Secured Overnight Financing Rate
| | (a) | Security is exempt from registration pursuant to Rule 144A under the Securities Act of 1933, as amended. These securities may only be resold in transactions exempt from registration to qualified institutional investors. As of April 30, 2024, the value of these securities total $144,378,337 or 81.1% of the Fund’s net assets. |
| | (b) | All or a portion of this security is on loan as of April 30, 2024. The total market value of these securities was $20,158,891 which represented 11.3% of net assets. |
| | (c) | Securities referencing LIBOR are expected to transition to an alternative reference rate by the security’s next scheduled coupon reset date. |
| | (d) | The rate shown represents the 7-day effective yield as of April 30, 2024. |
The Global Industry Classification Standard (GICS®) was developed by and/or is the exclusive property of MSCI, Inc. and Standard & Poor’s Financial Services LLC (“S&P”). GICS is a service mark of MSCI, Inc. and S&P and has been licensed for use by U.S. Bank Global Fund Services.
The accompanying notes are an integral part of the financial statements.
116
Pacer Trendpilot® Fund of Funds ETF
SCHEDULE OF INVESTMENTS
April 30, 2024
| | | Shares | | | Value | |
AFFILIATED EXCHANGE TRADED FUNDS — 99.9% |
| |
Pacer Trendpilot 100 ETF(a) | | | 150,803 | | | $ | 10,130,946 | |
Pacer Trendpilot International ETF(a) | | | 356,544 | | | | 10,020,099 | |
Pacer Trendpilot US Bond ETF(a) | | | 508,593 | | | | 10,151,516 | |
Pacer Trendpilot US Large Cap ETF(a) | | | 218,565 | | | | 10,014,648 | |
Pacer Trendpilot US Mid Cap ETF(a) | | | 292,679 | | | | 9,907,184 | |
TOTAL AFFILIATED EXCHANGE TRADED FUNDS (Cost $48,454,535) | | | | | | | 50,224,393 | |
| |
TOTAL INVESTMENTS — 99.9% (Cost $48,454,535) | | | | | | | 50,224,393 | |
Other Assets in Excess of Liabilities — 0.1% | | | | | | | 69,594 | |
TOTAL NET ASSETS — 100.0% | | | | | | $ | 50,293,987 | |
Percentages are stated as a percent of net assets.
| | (a) | Affiliated company as defined by the Investment Company Act of 1940. |
The Global Industry Classification Standard (GICS®) was developed by and/or is the exclusive property of MSCI, Inc. and Standard & Poor’s Financial Services LLC (“S&P”). GICS is a service mark of MSCI, Inc. and S&P and has been licensed for use by U.S. Bank Global Fund Services.
The accompanying notes are an integral part of the financial statements.
117
Pacer US Cash Cows 100 ETF
SCHEDULE OF INVESTMENTS
April 30, 2024
| | | Shares | | | Value | |
COMMON STOCKS — 99.8% |
| |
Communication Services — 4.2% |
AT&T, Inc. | | | 26,355,990 | | | $ | 445,152,671 | |
Match Group, Inc.(a)(b) | | | 3,498,610 | | | | 107,827,160 | |
Nexstar Media Group, Inc.(b) | | | 786,536 | | | | 125,892,952 | |
Omnicom Group, Inc.(b) | | | 2,303,682 | | | | 213,873,837 | |
Playtika Holding Corp.(b) | | | 8,362,574 | | | | 60,628,662 | |
| | | | | | | | 953,375,282 | |
| |
Consumer Discretionary — 17.2% |
Best Buy Co., Inc.(b) | | | 2,678,371 | | | | 197,235,240 | |
Carter’s, Inc.(b) | | | 884,251 | | | | 60,491,611 | |
Columbia Sportswear Co.(b) | | | 1,085,052 | | | | 86,402,691 | |
Crocs, Inc.(a) | | | 989,780 | | | | 123,098,939 | |
Dick’s Sporting Goods, Inc.(b) | | | 963,495 | | | | 193,604,685 | |
eBay, Inc. | | | 6,218,237 | | | | 320,487,935 | |
Etsy, Inc.(a)(b) | | | 1,443,980 | | | | 99,158,107 | |
Expedia Group, Inc.(a) | | | 2,043,727 | | | | 275,146,966 | |
Gap, Inc.(b) | | | 9,191,041 | | | | 188,600,161 | |
H&R Block, Inc.(b) | | | 1,885,628 | | | | 89,058,210 | |
Leggett & Platt, Inc.(b) | | | 2,815,024 | | | | 50,867,484 | |
Lennar Corp. - Class A | | | 2,779,707 | | | | 421,459,175 | |
Mohawk Industries, Inc.(a) | | | 886,657 | | | | 102,249,285 | |
Newell Brands, Inc. | | | 12,962,372 | | | | 102,921,234 | |
NVR, Inc.(a)(b) | | | 29,138 | | | | 216,753,211 | |
Polaris, Inc.(b) | | | 891,330 | | | | 75,905,663 | |
PulteGroup, Inc. | | | 2,874,770 | | | | 320,306,873 | |
Skechers USA, Inc. - Class A(a) | | | 2,205,549 | | | | 145,676,512 | |
Tapestry, Inc. | | | 4,161,006 | | | | 166,107,360 | |
Thor Industries, Inc.(b) | | | 888,164 | | | | 88,301,265 | |
Toll Brothers, Inc. | | | 1,621,959 | | | | 193,191,537 | |
VF Corp.(b) | | | 9,775,752 | | | | 121,805,870 | |
Williams-Sonoma, Inc.(b) | | | 778,703 | | | | 223,316,446 | |
YETI Holdings, Inc.(a)(b) | | | 774,752 | | | | 27,674,141 | |
| | | | | | | 3,889,820,601 | |
| |
Consumer Staples — 7.3% |
Altria Group, Inc. | | | 10,984,374 | | | | 481,225,425 | |
Bunge Global SA(b) | | | 3,523,320 | | | | 358,533,043 | |
Ingredion, Inc. | | | 958,402 | | | | 109,823,285 | |
Kenvue, Inc. | | | 21,752,107 | | | | 409,374,654 | |
Molson Coors Beverage Co. - Class B(b) | | | 3,435,660 | | | | 196,725,892 | |
Olaplex Holdings, Inc.(a)(b) | | | 14,542,859 | | | | 20,214,574 | |
Reynolds Consumer Products, Inc. | | | 2,782,060 | | | | 79,650,378 | |
| | | | | | | 1,655,547,251 | |
| |
Energy — 23.9% |
Cheniere Energy, Inc. | | | 2,873,749 | | | | 453,535,067 | |
Chevron Corp.(b) | | | 2,936,917 | | | | 473,636,605 | |
Coterra Energy, Inc. | | | 9,108,525 | | | | 249,209,244 | |
| | | Shares | | | Value | |
Energy — 23.9% (Continued) | | | | | | | | |
Devon Energy Corp. | | | 9,008,376 | | | $ | 461,048,684 | |
Diamondback Energy, Inc.(b) | | | 2,423,328 | | | | 487,403,961 | |
EOG Resources, Inc.(b) | | | 3,856,202 | | | | 509,519,970 | |
Exxon Mobil Corp.(b) | | | 4,230,331 | | | | 500,321,247 | |
HF Sinclair Corp. | | | 5,207,115 | | | | 282,485,989 | |
Marathon Oil Corp. | | | 12,510,045 | | | | 335,894,708 | |
Marathon Petroleum Corp. | | | 2,584,513 | | | | 469,657,702 | |
Occidental Petroleum Corp.(b) | | | 7,296,879 | | | | 482,615,577 | |
Ovintiv, Inc. | | | 4,243,412 | | | | 217,771,904 | |
Valero Energy Corp. | | | 3,124,666 | | | | 499,540,353 | |
| | | | | | | 5,422,641,011 | |
| |
Health Care — 13.3% |
Bristol-Myers Squibb Co. | | | 8,793,780 | | | | 386,398,693 | |
Cardinal Health, Inc. | | | 3,959,300 | | | | 407,966,272 | |
Cencora, Inc. | | | 1,893,479 | | | | 452,636,155 | |
CVS Health Corp. | | | 6,060,437 | | | | 410,352,189 | |
DaVita, Inc.(a) | | | 1,787,544 | | | | 248,486,492 | |
Gilead Sciences, Inc. | | | 6,188,957 | | | | 403,519,996 | |
Jazz Pharmaceuticals PLC(a) | | | 1,363,045 | | | | 150,957,234 | |
Premier, Inc. | | | 1,382,728 | | | | 28,871,361 | |
Solventum Corp.(a)(b) | | | 1,216,395 | | | | 79,077,839 | |
United Therapeutics Corp.(a) | | | 488,323 | | | | 114,428,729 | |
Viatris, Inc.(b) | | | 28,011,534 | | | | 324,093,448 | |
| | | | | | | 3,006,788,408 | |
| |
Industrials — 12.2% |
3M Co. | | | 4,886,025 | | | | 471,550,273 | |
Acuity Brands, Inc. | | | 311,634 | | | | 77,378,722 | |
AGCO Corp. | | | 802,257 | | | | 91,609,727 | |
Allison Transmission Holdings, Inc. | | | 1,323,922 | | | | 97,374,463 | |
Builders FirstSource, Inc.(a) | | | 1,388,314 | | | | 253,811,566 | |
Carlisle Cos., Inc. | | | 534,237 | | | | 207,417,515 | |
CH Robinson Worldwide, Inc.(b) | | | 1,327,993 | | | | 94,287,503 | |
Core & Main, Inc. - Class A(a) | | | 3,230,483 | | | | 182,425,375 | |
Cummins, Inc. | | | 1,549,431 | | | | 437,698,763 | |
Expeditors International of Washington, Inc.(b) | | | 1,273,149 | | | | 141,714,215 | |
Fortune Brands Innovations, Inc. | | | 1,460,035 | | | | 106,728,559 | |
Gates Industrial Corp. PLC(a) | | | 4,183,926 | | | | 73,720,776 | |
MSC Industrial Direct Co., Inc. - Class A(b) | | | 936,099 | | | | 85,409,673 | |
Owens Corning | | | 1,192,885 | | | | 200,655,186 | |
Robert Half, Inc. | | | 1,108,496 | | | | 76,641,413 | |
Snap-On, Inc. | | | 579,302 | | | | 155,229,764 | |
| | | | | | | 2,753,653,493 | |
| |
Information Technology — 9.4% |
Amdocs Ltd. | | | 1,308,080 | | | | 109,865,639 | |
Cisco Systems, Inc. | | | 9,246,336 | | | | 434,392,865 | |
Crane NXT Co.(b) | | | 612,318 | | | | 37,235,058 | |
The accompanying notes are an integral part of the financial statements.
118
Pacer US Cash Cows 100 ETF
SCHEDULE OF INVESTMENTS
April 30, 2024 (Continued)
| | | Shares | | | Value | |
COMMON STOCKS — 99.8% (Continued) |
| | | | | | | | | |
Information Technology — 9.4%(Continued) |
DocuSign, Inc.(a) | | | 2,085,782 | | | $ | 118,055,261 | |
Dropbox, Inc. - Class A(a) | | | 4,763,529 | | | | 110,323,332 | |
DXC Technology Co.(a)(b) | | | 6,076,301 | | | | 118,427,106 | |
HP, Inc. | | | 15,216,839 | | | | 427,441,007 | |
IPG Photonics Corp.(a) | | | 321,402 | | | | 26,991,340 | |
RingCentral, Inc. - Class A(a)(b) | | | 1,541,680 | | | | 45,664,562 | |
Skyworks Solutions, Inc.(b) | | | 2,369,837 | | | | 252,600,926 | |
TD SYNNEX Corp. | | | 1,810,358 | | | | 213,332,587 | |
Teradata Corp.(a) | | | 1,398,530 | | | | 51,885,463 | |
Zoom Video Communications, Inc. - Class A(a) | | | 2,827,267 | | | | 172,746,014 | |
| | | | | | | 2,118,961,160 | |
| |
Materials — 9.8% |
Berry Global Group, Inc. | | | 2,545,982 | | | | 144,204,420 | |
Cleveland-Cliffs, Inc.(a)(b) | | | 11,418,814 | | | | 192,977,957 | |
LyondellBasell Industries NV - Class A | | | 4,513,079 | | | | 451,172,508 | |
Mosaic Co. | | | 4,818,200 | | | | 151,243,298 | |
NewMarket Corp. | | | 124,341 | | | | 65,517,760 | |
Nucor Corp.(b) | | | 2,347,830 | | | | 395,679,790 | |
Olin Corp. | | | 1,867,182 | | | | 97,616,275 | |
Reliance, Inc.(b) | | | 569,248 | | | | 162,076,290 | |
Scotts Miracle-Gro Co.(b) | | | 1,168,558 | | | | 80,092,965 | |
Steel Dynamics, Inc.(b) | | | 2,111,932 | | | | 274,804,592 | |
Westlake Chemical Corp. | | | 1,437,446 | | | | 211,822,042 | |
| | | | | | | 2,227,207,897 | |
| |
Utilities — 2.5% |
Vistra Corp. | | | 7,534,223 | | | | 571,395,472 | |
TOTAL COMMON STOCKS (Cost $20,687,549,848) | | | | | | | 22,599,390,575 | |
| |
| | | Units | | | Value | |
INVESTMENTS PURCHASED WITH PROCEEDS FROM SECURITIES LENDING — 4.8% |
Mount Vernon Liquid Assets Portfolio, LLC – 5.51%(c) | | | 1,079,037,899 | | | $ | 1,079,037,899 | |
TOTAL INVESTMENTS PURCHASED WITH PROCEEDS FROM SECURITIES LENDING (Cost $1,079,037,899) | | | | | | | 1,079,037,899 | |
| |
TOTAL INVESTMENTS — 104.6% (Cost $21,766,587,747) | | | | | | | 23,678,428,474 | |
Liabilities in Excess of Other Assets — (4.6)% | | | | | | | (1,036,542,747 | ) |
TOTAL NET ASSETS — 100.0% | | | | | | $ | 22,641,885,727 | |
Percentages are stated as a percent of net assets.
NV - Naamloze Vennootschap
PLC - Public Limited Company
SA - Sociedad Anónima
| | (a) | Non-income producing security. |
| | (b) | All or a portion of this security is on loan as of April 30, 2024. The total market value of these securities was $1,034,824,542 which represented 4.6% of net assets. |
| | (c) | The rate shown represents the 7-day effective yield as of April 30, 2024. |
The Global Industry Classification Standard (GICS®) was developed by and/or is the exclusive property of MSCI, Inc. and Standard & Poor’s Financial Services LLC (“S&P”). GICS is a service mark of MSCI, Inc. and S&P and has been licensed for use by U.S. Bank Global Fund Services.
The accompanying notes are an integral part of the financial statements.
119
Pacer US Small Cap Cash Cows 100 ETF
SCHEDULE OF INVESTMENTS
April 30, 2024
| | | Shares | | | Value | |
COMMON STOCKS — 100.0% |
| |
Communication Services — 2.2% |
Marcus Corp.(b) | | | 1,639,170 | | | $ | 21,374,777 | |
Scholastic Corp. | | | 1,005,605 | | | | 35,819,650 | |
Thryv Holdings, Inc.(a)(b) | | | 1,973,419 | | | | 45,408,371 | |
YELP, Inc.(a) | | | 2,734,692 | | | | 110,044,006 | |
| | | | | | | 212,646,804 | |
| |
Consumer Discretionary — 29.3%(c) |
American Eagle Outfitters, Inc.(b) | | | 8,949,221 | | | | 217,108,101 | |
Buckle, Inc.(b) | | | 2,126,075 | | | | 79,493,944 | |
Caleres, Inc.(b) | | | 1,813,036 | | | | 66,774,116 | |
Cavco Industries, Inc.(a)(b) | | | 221,343 | | | | 80,615,334 | |
Designer Brands, Inc. - Class A(b) | | | 11,605,860 | | | | 107,818,439 | |
Ethan Allen Interiors, Inc.(b) | | | 898,914 | | | | 25,385,331 | |
G-III Apparel Group Ltd.(a) | | | 6,519,751 | | | | 183,530,991 | |
Green Brick Partners, Inc.(a) | | | 1,462,498 | | | | 79,165,017 | |
Hanesbrands, Inc.(a)(b) | | | 34,704,365 | | | | 158,251,904 | |
Kontoor Brands, Inc.(b) | | | 1,948,011 | | | | 120,893,563 | |
La-Z-Boy, Inc.(b) | | | 1,373,685 | | | | 45,111,815 | |
LCI Industries(b) | | | 1,508,310 | | | | 156,834,074 | |
M/I Homes, Inc.(a) | | | 1,573,022 | | | | 182,816,617 | |
Monarch Casino & Resort, Inc. | | | 669,350 | | | | 45,361,850 | |
Monro, Inc.(b) | | | 1,673,370 | | | | 45,599,333 | |
Movado Group, Inc. | | | 1,011,705 | | | | 25,768,126 | |
Newell Brands, Inc. | | | 25,379,293 | | | | 201,511,586 | |
ODP Corp.(a) | | | 1,645,098 | | | | 83,751,939 | |
Patrick Industries, Inc.(b) | | | 1,168,196 | | | | 122,064,800 | |
Perdoceo Education Corp.(b) | | | 2,254,552 | | | | 41,258,302 | |
Signet Jewelers Ltd.(b) | | | 2,056,824 | | | | 201,630,457 | |
Sonos, Inc.(a) | | | 2,985,218 | | | | 50,450,184 | |
Standard Motor Products, Inc. | | | 1,423,278 | | | | 45,687,224 | |
Vista Outdoor, Inc.(a) | | | 4,535,254 | | | | 159,142,063 | |
Winnebago Industries, Inc.(b) | | | 1,025,082 | | | | 63,124,550 | |
Worthington Enterprises, Inc. | | | 2,988,330 | | | | 170,812,943 | |
| | | | | | | 2,759,962,603 | |
| |
Consumer Staples — 6.1% |
Andersons, Inc.(b) | | | 3,636,448 | | | | 199,786,453 | |
Cal-Maine Foods, Inc.(b) | | | 2,920,381 | | | | 161,584,681 | |
Central Garden & Pet Co.(a)(b) | | | 2,987,023 | | | | 122,318,592 | |
John B Sanfilippo & Son, Inc. | | | 344,006 | | | | 34,297,398 | |
Medifast, Inc.(b) | | | 1,334,278 | | | | 36,732,673 | |
USANA Health Sciences, Inc.(a) | | | 423,690 | | | | 17,591,609 | |
| | | | | | | 572,311,406 | |
| |
Energy — 13.9% |
California Resources Corp.(b) | | | 3,565,806 | | | | 188,488,505 | |
CONSOL Energy, Inc. | | | 2,166,569 | | | | 179,305,251 | |
CVR Energy, Inc.(b) | | | 6,027,990 | | | | 183,130,336 | |
| | | Shares | | | Value | |
Energy — 13.9% (Continued) |
Dorian LPG Ltd.(b) | | | 2,646,241 | | | $ | 109,342,678 | |
Helmerich & Payne, Inc.(b) | | | 3,703,667 | | | | 145,665,223 | |
Liberty Energy, Inc.(b) | | | 7,158,562 | | | | 157,488,364 | |
RPC, Inc.(b) | | | 10,608,987 | | | | 70,974,123 | |
SM Energy Co.(b) | | | 3,949,328 | | | | 191,502,915 | |
US Silica Holdings, Inc.(a)(b) | | | 4,994,953 | | | | 77,072,125 | |
| | | | | | | 1,302,969,520 | |
| |
Health Care — 9.4% |
Alkermes PLC(a) | | | 4,526,127 | | | | 111,071,157 | |
Collegium Pharmaceutical, Inc.(a)(b) | | | 2,733,742 | | | | 100,957,092 | |
Cross Country Healthcare, Inc.(a)(b) | | | 4,642,995 | | | | 81,716,712 | |
Dynavax Technologies Corp.(a)(b) | | | 2,750,855 | | | | 31,277,221 | |
Harmony Biosciences Holdings, Inc.(a)(b) | | | 2,640,573 | | | | 81,620,112 | |
Innoviva, Inc.(a)(b) | | | 3,551,693 | | | | 53,666,081 | |
Ironwood Pharmaceuticals, Inc.(a) | | | 7,617,134 | | | | 59,032,789 | |
Omnicell, Inc.(a) | | | 1,655,126 | | | | 44,373,928 | |
Owens & Minor, Inc.(a) | | | 7,780,219 | | | | 192,482,618 | |
Pacira BioSciences, Inc.(a) | | | 1,664,509 | | | | 43,693,361 | |
Pediatrix Medical Group, Inc.(a) | | | 5,536,452 | | | | 49,108,329 | |
Varex Imaging Corp.(a) | | | 2,063,032 | | | | 33,524,270 | |
| | | | | | | 882,523,670 | |
| |
Industrials — 23.0% |
American Woodmark Corp.(a) | | | 755,759 | | | | 69,590,289 | |
Apogee Enterprises, Inc. | | | 841,384 | | | | 51,980,704 | |
Boise Cascade Co.(b) | | | 1,369,433 | | | | 181,134,903 | |
DNOW, Inc.(a) | | | 4,349,775 | | | | 61,375,325 | |
Encore Wire Corp. | | | 487,494 | | | | 136,186,324 | |
Forward Air Corp.(b) | | | 2,254,619 | | | | 49,646,710 | |
Gibraltar Industries, Inc.(a) | | | 1,000,969 | | | | 71,529,245 | |
GMS, Inc.(a) | | | 1,554,493 | | | | 143,821,692 | |
Griffon Corp. | | | 2,321,877 | | | | 152,129,381 | |
Hub Group, Inc. - Class A | | | 2,486,356 | | | | 100,001,238 | |
Insteel Industries, Inc. | | | 1,011,760 | | | | 32,477,496 | |
Interface, Inc. | | | 2,806,013 | | | | 42,903,939 | |
Kelly Services, Inc. - Class A | | | 908,954 | | | | 20,851,405 | |
Lindsay Corp. | | | 374,646 | | | | 43,515,133 | |
Liquidity Services, Inc.(a) | | | 884,775 | | | | 15,271,217 | |
Masterbrand, Inc.(a) | | | 7,243,355 | | | | 120,746,728 | |
MillerKnoll Inc.(b) | | | 3,688,376 | | | | 93,795,402 | |
Mueller Industries, Inc. | | | 3,853,733 | | | | 215,115,376 | |
National Presto Industries, Inc. | | | 186,897 | | | | 15,323,685 | |
Powell Industries, Inc.(b) | | | 647,478 | | | | 92,589,354 | |
Quanex Building Products Corp. | | | 1,197,563 | | | | 39,783,043 | |
Resideo Technologies, Inc.(a) | | | 5,629,233 | | | | 109,938,920 | |
Resources Connection, Inc. | | | 1,422,724 | | | | 15,721,100 | |
SkyWest, Inc.(a) | | | 2,328,843 | | | | 170,075,404 | |
Titan International, Inc.(a)(b) | | | 3,500,474 | | | | 38,575,223 | |
The accompanying notes are an integral part of the financial statements.
120
Pacer US Small Cap Cash Cows 100 ETF
SCHEDULE OF INVESTMENTS
April 30, 2024 (Continued)
| | | Shares | | | Value | |
COMMON STOCKS — 100.0% (Continued) |
| | | | | | | | | |
Industrials — 23.0% (Continued) |
Wabash National Corp.(b) | | | 2,898,885 | | | $ | 66,993,232 | |
| | | | | | | 2,151,072,468 | |
| |
Information Technology — 10.7% |
Adeia, Inc. | | | 4,808,447 | | | | 47,315,119 | |
DXC Technology Co.(a) | | | 9,563,034 | | | | 186,383,533 | |
ePlus, Inc.(a) | | | 1,231,910 | | | | 94,709,241 | |
Extreme Networks, Inc.(a) | | | 6,997,090 | | | | 78,367,408 | |
Insight Enterprises, Inc.(a)(b) | | | 1,070,686 | | | | 195,475,143 | |
PC Connection, Inc. | | | 1,077,423 | | | | 66,767,903 | |
Photronics, Inc.(a) | | | 2,240,039 | | | | 61,399,469 | |
ScanSource, Inc.(a) | | | 1,592,641 | | | | 66,285,718 | |
SMART Global Holdings, Inc.(a)(b) | | | 2,872,215 | | | | 52,475,368 | |
Xerox Holdings Corp.(b) | | | 11,944,605 | | | | 158,743,800 | |
| | | | | | | 1,007,922,702 | |
| |
Materials — 5.4% |
Alpha Metallurgical Resources, Inc.(b) | | | 530,374 | | | | 173,495,943 | |
Arch Resources, Inc.(b) | | | 933,338 | | | | 148,195,408 | |
Clearwater Paper Corp.(a) | | | 1,090,930 | | | | 49,135,487 | |
Metallus Inc.(a)(b) | | | 1,362,943 | | | | 28,022,108 | |
Olympic Steel, Inc.(b) | | | 892,113 | | | | 56,711,623 | |
SunCoke Energy, Inc. | | | 4,837,606 | | | | 49,875,718 | |
| | | | | | | 505,436,287 | |
TOTAL COMMON STOCKS (Cost $9,108,655,587) | | | | | | | 9,394,845,460 | |
| |
| | | Units | | | Value | |
INVESTMENTS PURCHASED WITH PROCEEDS FROM SECURITIES LENDING — 10.4% |
Mount Vernon Liquid Assets Portfolio, LLC – 5.51%(d) | | | 975,050,215 | | | $ | 975,050,215 | |
TOTAL INVESTMENTS PURCHASED WITH PROCEEDS FROM SECURITIES LENDING (Cost $975,050,215) | | | | | | | 975,050,215 | |
| |
TOTAL INVESTMENTS — 110.4% (Cost $10,083,705,802) | | | | | | | 10,369,895,675 | |
Liabilities in Excess of Other Assets — (10.4)% | | | | | | | (970,204,483 | ) |
TOTAL NET ASSETS — 100.0% | | | | | | $ | 9,399,691,192 | |
Percentages are stated as a percent of net assets.
| | PLC - Public Limited Company | |
| | (a) | Non-income producing security. |
| | (b) | All or a portion of this security is on loan as of April 30, 2024. The total market value of these securities was $918,208,256 which represented 9.8% of net assets. |
| | (c) | To the extent that the Fund invests more heavily in a particular industry or sector of the economy, its performance will be especially sensitive to developments that significantly affect those industries or sectors. |
| | (d) | The rate shown represents the 7-day effective yield as of April 30, 2024. |
The Global Industry Classification Standard (GICS®) was developed by and/or is the exclusive property of MSCI, Inc. and Standard & Poor’s Financial Services LLC (“S&P”). GICS is a service mark of MSCI, Inc. and S&P and has been licensed for use by U.S. Bank Global Fund Services.
The accompanying notes are an integral part of the financial statements.
121
Pacer Global Cash Cows Dividend ETF
SCHEDULE OF INVESTMENTS
April 30, 2024
| | | Shares | | | Value | |
COMMON STOCKS — 99.1% |
| |
Australia — 6.7% |
Ampol Ltd. | | | 100,535 | | | $ | 2,397,303 | |
Atlas Arteria Ltd. | | | 724,579 | | | | 2,436,088 | |
BHP Group Ltd. - ADR(a) | | | 599,562 | | | | 33,071,840 | |
Coles Group Ltd. | | | 423,172 | | | | 4,446,391 | |
Fortescue Ltd. | | | 1,554,687 | | | | 26,235,576 | |
IGO Ltd. | | | 383,663 | | | | 1,965,922 | |
Santos Ltd. | | | 1,224,561 | | | | 6,108,169 | |
Sonic Healthcare Ltd. | | | 122,611 | | | | 2,126,267 | |
Telstra Group Ltd. | | | 3,772,210 | | | | 8,968,129 | |
Wesfarmers Ltd. | | | 302,117 | | | | 13,071,533 | |
Woodside Energy Group Ltd. - ADR(a) | | | 1,526,511 | | | | 27,187,161 | |
| | | | | | | 128,014,379 | |
| |
Canada — 3.2% |
Canadian Natural Resources Ltd. | | | 305,269 | | | | 23,145,496 | |
Enbridge, Inc.(a) | | | 1,050,687 | | | | 37,341,416 | |
| | | | | | | 60,486,912 | |
| |
Denmark — 1.8% |
AP Moller - Maersk AS - Class B | | | 23,186 | | | | 33,805,798 | |
Svitzer AS(b) | | | 46,372 | | | | 1,558,251 | |
| | | | | | | 35,364,049 | |
| |
France — 6.7% |
Cie Generale des Etablissements Michelin SCA | | | 200,622 | | | | 7,746,288 | |
Engie SA(a) | | | 1,480,978 | | | | 25,714,771 | |
Orange SA | | | 1,140,798 | | | | 12,692,037 | |
Sanofi SA - ADR | | | 739,026 | | | | 36,382,250 | |
TotalEnergies SE - ADR(a) | | | 550,402 | | | | 39,887,633 | |
Veolia Environnement SA | | | 189,811 | | | | 5,912,919 | |
| | | | | | | 128,335,898 | |
| |
Germany — 6.4% |
BASF SE | | | 492,065 | | | | 25,812,893 | |
Bayerische Motoren Werke AG | | | 353,794 | | | | 38,682,001 | |
Daimler AG | | | 566,675 | | | | 42,901,427 | |
Deutsche Post AG | | | 351,342 | | | | 14,720,646 | |
| | | | | | | 122,116,967 | |
| |
Hong Kong — 4.1% |
Chow Tai Fook Jewellery Group Ltd. | | | 8,069,876 | | | | 11,099,987 | |
CK Hutchison Holdings Ltd. | | | 1,968,221 | | | | 9,623,845 | |
CK Infrastructure Holdings Ltd. | | | 1,217,192 | | | | 6,892,966 | |
Orient Overseas International Ltd. | | | 2,136,898 | | | | 31,222,908 | |
Power Assets Holdings Ltd. | | | 1,062,911 | | | | 6,121,178 | |
SITC International Holdings Co. Ltd. | | | 3,648,926 | | | | 7,948,368 | |
WH Group Ltd.(c) | | | 5,569,566 | | | | 4,072,497 | |
| | | Shares | | | Value | |
Hong Kong — 4.1% (Continued) | | | | | | | | |
Xinyi Glass Holdings Ltd. | | | 1,567,805 | | | $ | 1,687,514 | |
| | | | | | | 78,669,263 | |
| |
Italy — 2.7% |
Enel SpA | | | 4,611,557 | | | | 30,419,553 | |
Eni SpA - ADR(a) | | | 677,118 | | | | 21,688,090 | |
| | | | | | | 52,107,643 | |
| |
Japan — 5.5% |
Astellas Pharma, Inc. | | | 493,173 | | | | 4,734,261 | |
Dentsu Group, Inc. | | | 83,836 | | | | 2,269,257 | |
ENEOS Holdings, Inc. | | | 864,180 | | | | 4,004,877 | |
Isuzu Motors Ltd. | | | 263,348 | | | | 3,338,708 | |
Japan Tobacco, Inc. | | | 727,961 | | | | 19,593,535 | |
JFE Holdings, Inc. | | | 177,416 | | | | 2,655,925 | |
Komatsu Ltd. | | | 280,862 | | | | 8,467,798 | |
Marubeni Corp. | | | 444,353 | | | | 7,956,459 | |
Mitsui OSK Lines Ltd. | | | 250,141 | | | | 7,914,298 | |
Nippon Steel Corp. | | | 333,085 | | | | 7,478,388 | |
Nippon Yusen KK | | | 216,365 | | | | 6,126,786 | |
SoftBank Corp. | | | 1,721,043 | | | | 20,853,522 | |
Sumitomo Corp. | | | 353,520 | | | | 9,313,481 | |
| | | | | | | 104,707,295 | |
| |
Netherlands — 4.2% |
Koninklijke Ahold Delhaize NV | | | 275,037 | | | | 8,347,707 | |
Shell PLC - ADR | | | 565,467 | | | | 40,521,365 | |
Stellantis NV | | | 1,454,013 | | | | 32,400,021 | |
| | | | | | | 81,269,093 | |
| |
Singapore — 1.4% |
Genting Singapore Ltd. | | | 3,238,178 | | | | 2,170,568 | |
Jardine Cycle & Carriage Ltd. | | | 143,354 | | | | 2,782,961 | |
Singapore Airlines Ltd. | | | 1,255,630 | | | | 6,015,765 | |
Singapore Telecommunications Ltd. | | | 6,624,641 | | | | 11,550,233 | |
Wilmar International Ltd. | | | 2,072,787 | | | | 4,904,657 | |
| | | | | | | 27,424,184 | |
| |
South Korea — 1.1% |
HMM Co. Ltd. | | | 268,924 | | | | 3,084,035 | |
Kia Corp. | | | 116,950 | | | | 9,984,878 | |
KT&G Corp. | | | 55,827 | | | | 3,611,124 | |
LG Corp. | | | 41,600 | | | | 2,389,871 | |
S-Oil Corp. | | | 38,705 | | | | 2,035,926 | |
| | | | | | | 21,105,834 | |
| |
Spain — 1.4% |
Endesa SA | | | 490,516 | | | | 8,951,499 | |
Repsol SA | | | 387,537 | | | | 6,089,968 | |
Telefonica SA | | | 2,441,767 | | | | 10,960,238 | |
| | | | | | | 26,001,705 | |
| |
The accompanying notes are an integral part of the financial statements.
122
Pacer Global Cash Cows Dividend ETF
SCHEDULE OF INVESTMENTS
April 30, 2024 (Continued)
| | | Shares | | | Value | |
COMMON STOCKS — 99.1% (Continued) |
| |
Sweden — 0.4% |
H & M Hennes & Mauritz AB - Class B(a) | | | 462,538 | | | $ | 7,418,387 | |
| |
Switzerland — 6.8% |
Glencore PLC | | | 6,376,644 | | | | 37,265,946 | |
Kuehne + Nagel International AG | | | 42,214 | | | | 11,191,245 | |
Novartis AG - ADR | | | 379,438 | | | | 36,854,813 | |
Roche Holding AG - ADR(a) | | | 1,078,118 | | | | 32,149,479 | |
SGS SA | | | 52,034 | | | | 4,588,388 | |
Swisscom AG | | | 14,645 | | | | 8,021,493 | |
| | | | | | | 130,071,364 | |
| |
United Kingdom — 10.4% |
BP PLC - ADR | | | 936,605 | | | | 36,312,176 | |
British American Tobacco PLC - ADR | | | 1,162,075 | | | | 34,188,246 | |
GSK PLC - ADR(a) | | | 558,359 | | | | 23,138,397 | |
Imperial Brands PLC | | | 481,392 | | | | 10,998,829 | |
Rio Tinto PLC - ADR | | | 520,835 | | | | 35,328,238 | |
Tesco PLC | | | 1,904,924 | | | | 7,052,806 | |
Unilever PLC - ADR | | | 688,435 | | | | 35,695,355 | |
Vodafone Group PLC - ADR(a) | | | 2,067,382 | | | | 17,386,682 | |
| | | | | | | 200,100,729 | |
| |
United States — 36.3%(d) |
3M Co. | | | 239,585 | | | | 23,122,348 | |
AbbVie, Inc. | | | 257,140 | | | | 41,821,250 | |
Altria Group, Inc. | | | 865,560 | | | | 37,920,184 | |
AT&T, Inc. | | | 2,199,958 | | | | 37,157,291 | |
Bristol-Myers Squibb Co. | | | 668,362 | | | | 29,367,826 | |
Chevron Corp. | | | 254,631 | | | | 41,064,341 | |
ConocoPhillips | | | 320,477 | | | | 40,258,321 | |
CVS Health Corp. | | | 328,860 | | | | 22,267,111 | |
EOG Resources, Inc. | | | 197,810 | | | | 26,136,635 | |
Exxon Mobil Corp. | | | 358,561 | | | | 42,407,009 | |
Ford Motor Co. | | | 3,418,934 | | | | 41,540,048 | |
Gilead Sciences, Inc. | | | 345,961 | | | | 22,556,657 | |
International Business Machines Corp. | | | 230,006 | | | | 38,226,997 | |
Kimberly-Clark Corp. | | | 92,590 | | | | 12,641,313 | |
Pfizer, Inc. | | | 1,275,321 | | | | 32,673,724 | |
Philip Morris International, Inc. | | | 392,069 | | | | 37,223,031 | |
Pioneer Natural Resources Co. | | | 119,636 | | | | 32,220,368 | |
Solventum Corp.(b) | | | 59,471 | | | | 3,866,210 | |
Southern Copper Corp.(a) | | | 254,856 | | | | 29,734,050 | |
The Kraft Heinz Co. | | | 399,550 | | | | 15,426,625 | |
United Parcel Service, Inc. - Class B | | | 238,025 | | | | 35,103,927 | |
Verizon Communications, Inc. | | | 957,158 | | | | 37,798,169 | |
| | | Shares | | | Value | |
United States — 36.3%(d) (Continued) |
Williams Cos., Inc. | | | 417,505 | | | $ | 16,015,492 | |
| | | | | | | 696,548,927 | |
TOTAL COMMON STOCKS (Cost $1,837,359,909) | | | | | | | 1,899,742,629 | |
| |
| | | Units | | | | | |
INVESTMENTS PURCHASED WITH PROCEEDS FROM SECURITIES LENDING — 12.1% |
Mount Vernon Liquid Assets Portfolio, LLC - 5.51%(e) | | | 232,196,500 | | | | 232,196,500 | |
TOTAL INVESTMENTS PURCHASED WITH PROCEEDS FROM SECURITIES LENDING (Cost $232,196,500) | | | | | | | 232,196,500 | |
| |
TOTAL INVESTMENTS — 111.2% (Cost $2,069,556,409) | | | | | | | 2,131,939,129 | |
Liabilities in Excess of Other Assets — (11.2)% | | | | | | | (215,255,652 | ) |
TOTAL NET ASSETS — 100.0% | | | | | | $ | 1,916,683,477 | |
Percentages are stated as a percent of net assets.
ADR - American Depositary Receipt
AG - Aktiengesellschaft
NV - Naamloze Vennootschap
PLC - Public Limited Company
SA - Sociedad Anónima
| | (a) | All or a portion of this security is on loan as of April 30, 2024. The total market value of these securities was $221,424,115 which represented 11.6% of net assets. |
| | (b) | Non-income producing security. |
| | (c) | Security is exempt from registration pursuant to Rule 144A under the Securities Act of 1933, as amended. These securities may only be resold in transactions exempt from registration to qualified institutional investors. As of April 30, 2024, the value of these securities total $4,072,497 or 0.2% of the Fund’s net assets. |
| | (d) | To the extent that the Fund invests a significant portion of its assets in the securities of companies of a single country or region, it is more likely to be impacted by events or conditions affecting the country or region. |
| | (e) | The rate shown represents the 7-day effective yield as of April 30, 2024. |
The Global Industry Classification Standard (GICS®) was developed by and/or is the exclusive property of MSCI, Inc. and Standard & Poor’s Financial Services LLC (“S&P”). GICS is a service mark of MSCI, Inc. and S&P and has been licensed for use by U.S. Bank Global Fund Services.
The accompanying notes are an integral part of the financial statements.
123
Pacer Developed Markets International Cash Cows 100 ETF
SCHEDULE OF INVESTMENTS
April 30, 2024
| | | Shares | | | Value | |
COMMON STOCKS — 99.2% |
| |
Australia — 7.1% |
BlueScope Steel Ltd. | | | 406,190 | | | $ | 6,023,029 | |
Fortescue Ltd. | | | 1,613,030 | | | | 27,220,123 | |
IGO Ltd. | | | 804,100 | | | | 4,120,277 | |
Qantas Airways Ltd.(a) | | | 2,978,063 | | | | 11,382,189 | |
Santos Ltd. | | | 2,428,412 | | | | 12,113,036 | |
Whitehaven Coal Ltd. | | | 2,943,358 | | | | 14,719,745 | |
Woodside Energy Group Ltd. - ADR(b) | | | 1,337,908 | | | | 23,828,142 | |
| | | | | | | 99,406,541 | |
| |
Belgium — 0.4% |
Solvay SA | | | 164,684 | | | | 5,344,589 | |
| |
Canada — 4.5% |
Imperial Oil Ltd.(b) | | | 282,058 | | | | 19,447,899 | |
Suncor Energy, Inc. | | | 818,610 | | | | 31,262,716 | |
Tourmaline Oil Corp. | | | 240,310 | | | | 11,744,493 | |
| | | | | | | 62,455,108 | |
| |
Denmark — 1.8% |
AP Moller - Maersk AS - Class B | | | 16,988 | | | | 24,768,951 | |
Svitzer AS(a) | | | 33,976 | | | | 1,141,705 | |
| | | | | | | 25,910,656 | |
| |
Finland — 1.7% |
Fortum Oyj | | | 772,920 | | | | 10,211,786 | |
UPM-Kymmene Oyj | | | 397,468 | | | | 13,963,957 | |
| | | | | | | 24,175,743 | |
| |
France — 6.4% |
Carrefour SA | | | 936,118 | | | | 15,774,632 | |
Cie de Saint-Gobain SA | | | 389,081 | | | | 31,000,915 | |
Eiffage SA | | | 143,568 | | | | 15,367,566 | |
Getlink SE | | | 376,156 | | | | 6,422,949 | |
Publicis Groupe SA | | | 157,903 | | | | 17,500,215 | |
Teleperformance SE | | | 44,695 | | | | 4,077,275 | |
| | | | | | | 90,143,552 | |
| |
Germany — 4.8% |
Brenntag SE | | | 101,494 | | | | 8,108,428 | |
Deutsche Post AG | | | 565,812 | | | | 23,706,583 | |
Fresenius Medical Care AG - ADR(b) | | | 599,754 | | | | 12,618,824 | |
Fresenius SE & Co. KGaA | | | 635,610 | | | | 18,972,724 | |
Zalando SE(a)(c) | | | 134,996 | | | | 3,552,716 | |
| | | | | | | 66,959,275 | |
| |
Italy — 1.9% |
Eni SpA - ADR(b) | | | 818,957 | | | | 26,231,193 | |
| |
| | | Shares | | | Value | |
Japan — 26.8%(d) |
Aisin Corp. | | | 280,298 | | | $ | 10,651,022 | |
ANA Holdings, Inc. | | | 755,733 | | | | 14,375,291 | |
ENEOS Holdings, Inc. | | | 4,750,975 | | | | 22,017,485 | |
Inpex Corp. | | | 1,913,361 | | | | 29,025,243 | |
Japan Airlines Co. Ltd. | | | 562,806 | | | | 9,990,016 | |
JFE Holdings, Inc. | | | 899,236 | | | | 13,461,600 | |
Kawasaki Kisen Kaisha Ltd. | | | 1,519,076 | | | | 21,295,863 | |
Koito Manufacturing Co. Ltd. | | | 118,808 | | | | 1,601,533 | |
Lawson, Inc. | | | 226,505 | | | | 14,828,419 | |
Makita Corp. | | | 248,841 | | | | 7,262,563 | |
Mazda Motor Corp. | | | 842,998 | | | | 9,642,510 | |
Mitsubishi Motors Corp. | | | 1,351,595 | | | | 4,271,217 | |
Mitsui & Co. Ltd. | | | 732,494 | | | | 35,478,690 | |
Mitsui OSK Lines Ltd. | | | 480,879 | | | | 15,214,699 | |
NGK Insulators Ltd. | | | 210,376 | | | | 2,870,552 | |
NIPPON EXPRESS HOLDINGS INC | | | 212,306 | | | | 10,857,941 | |
Nippon Steel Corp. | | | 944,813 | | | | 21,212,839 | |
Nippon Yusen KK | | | 997,754 | | | | 28,253,301 | |
Niterra Co. Ltd. | | | 136,763 | | | | 4,484,914 | |
Nitto Denko Corp. | | | 66,384 | | | | 5,501,309 | |
Obayashi Corp. | | | 725,468 | | | | 8,104,965 | |
Ono Pharmaceutical Co. Ltd. | | | 243,985 | | | | 3,520,970 | |
Persol Holdings Co. Ltd. | | | 1,118,964 | | | | 1,555,191 | |
SCREEN Holdings Co. Ltd. | | | 59,273 | | | | 6,234,911 | |
Sega Sammy Holdings, Inc. | | | 119,296 | | | | 1,569,535 | |
SG Holdings Co. Ltd. | | | 443,306 | | | | 5,184,528 | |
Shimamura Co. Ltd. | | | 33,250 | | | | 1,644,633 | |
Shionogi & Co. Ltd. | | | 141,035 | | | | 6,594,123 | |
Sojitz Corp. | | | 278,690 | | | | 7,172,448 | |
Subaru Corp. | | | 813,973 | | | | 18,228,784 | |
Tokyo Gas Co. Ltd. | | | 601,190 | | | | 13,490,229 | |
Toyota Tsusho Corp. | | | 307,476 | | | | 19,651,638 | |
Welcia Holdings Co. Ltd. | | | 110,416 | | | | 1,625,628 | |
| | | | | | | 376,874,590 | |
| |
Luxembourg — 3.4% |
ArcelorMittal | | | 1,060,444 | | | | 26,696,983 | |
Tenaris SA - ADR | | | 650,746 | | | | 21,468,111 | |
| | | | | | | 48,165,094 | |
| |
Netherlands — 6.6% |
Koninklijke Ahold Delhaize NV | | | 939,942 | | | | 28,528,383 | |
Randstad Holding NV | | | 129,668 | | | | 6,531,626 | |
Shell PLC - ADR | | | 413,889 | | | | 29,659,286 | |
Stellantis NV | | | 1,238,213 | | | | 27,591,312 | |
| | | | | | | 92,310,607 | |
| |
The accompanying notes are an integral part of the financial statements.
124
Pacer Developed Markets International Cash Cows 100 ETF
SCHEDULE OF INVESTMENTS
April 30, 2024 (Continued)
| | | Shares | | | Value | |
COMMON STOCKS — 99.2% (Continued) |
| |
Norway — 2.9% |
Aker BP ASA | | | 368,680 | | | $ | 9,027,408 | |
Equinor ASA - ADR(b) | | | 844,460 | | | | 22,454,191 | |
Norsk Hydro ASA | | | 1,442,036 | | | | 8,944,167 | |
| | | | | | | 40,425,766 | |
| |
Poland — 1.5% |
ORLEN SA | | | 1,290,914 | | | | 21,143,952 | |
| |
Portugal — 1.3% |
Galp Energia SGPS SA | | | 863,436 | | | | 18,613,499 | |
| |
Singapore — 2.1% |
Genting Singapore Ltd. | | | 4,809,308 | | | | 3,223,704 | |
Singapore Airlines Ltd. | | | 5,573,066 | | | | 26,700,744 | |
| | | | | | | 29,924,448 | |
| |
South Korea — 4.5% |
Hanwha Aerospace Co. Ltd. | | | 79,918 | | | | 12,229,692 | |
Hyundai Mobis Co. Ltd. | | | 42,064 | | | | 6,954,362 | |
Kia Corp. | | | 410,519 | | | | 35,049,014 | |
LG H&H Co. Ltd. | | | 12,908 | | | | 3,922,553 | |
Posco International Corp. | | | 159,548 | | | | 5,344,817 | |
| | | | | | | 63,500,438 | |
| |
Spain — 3.0% |
Repsol SA | | | 908,460 | | | | 14,276,036 | |
Telefonica SA | | | 6,214,289 | | | | 27,893,770 | |
| | | | | | | 42,169,806 | |
| |
Sweden — 1.2% |
SKF AB - Class B | | | 244,324 | | | | 5,099,136 | |
SSAB AB - Class B(b) | | | 1,321,762 | | | | 7,472,122 | |
Tele2 AB - Class B | | | 510,348 | | | | 4,774,498 | |
| | | | | | | 17,345,756 | |
| |
Switzerland — 1.9% |
Glencore PLC | | | 4,665,115 | | | | 27,263,546 | |
| |
United Kingdom — 15.4% |
B&M European Value Retail SA | | | 637,840 | | | | 4,136,488 | |
BAE Systems PLC - ADR(b) | | | 405,142 | | | | 27,294,417 | |
Barratt Developments PLC | | | 576,307 | | | | 3,274,398 | |
BP PLC - ADR | | | 746,218 | | | | 28,930,872 | |
British American Tobacco PLC - ADR | | | 848,669 | | | | 24,967,842 | |
Bunzl PLC | | | 181,760 | | | | 6,981,597 | |
Burberry Group PLC | | | 201,296 | | | | 2,893,839 | |
Centrica PLC | | | 13,532,551 | | | | 21,635,781 | |
International Consolidated Airlines Group SA(a) | | | 8,744,972 | | | | 19,133,621 | |
JD Sports Fashion PLC | | | 3,389,505 | | | | 4,896,060 | |
| | | Shares | | | Value | |
United Kingdom — 15.4% (Continued) |
Kingfisher PLC | | | 1,740,420 | | | $ | 5,395,522 | |
Mondi PLC | | | 252,501 | | | | 4,792,625 | |
Taylor Wimpey PLC | | | 1,580,221 | | | | 2,604,445 | |
Tesco PLC | | | 6,642,311 | | | | 24,592,545 | |
Vodafone Group PLC - ADR | | | 2,983,774 | | | | 25,093,539 | |
WPP PLC - ADR(b) | | | 197,747 | | | | 9,956,561 | |
| | | | | | | 216,580,152 | |
TOTAL COMMON STOCKS (Cost $1,332,466,067) | | | | | | | 1,394,944,311 | |
| |
| | | Units | | | | | |
INVESTMENTS PURCHASED WITH PROCEEDS FROM SECURITIES LENDING — 8.6% |
Mount Vernon Liquid Assets Portfolio, LLC – 5.51%(e) | | | 120,207,214 | | | | 120,207,214 | |
TOTAL INVESTMENTS PURCHASED WITH PROCEEDS FROM SECURITIES LENDING (Cost $120,207,214) | | | | | | | 120,207,214 | |
| |
TOTAL INVESTMENTS — 107.8% (Cost $1,452,673,281) | | | | | | | 1,515,151,525 | |
Liabilities in Excess of Other Assets — (7.8)% | | | | | | | (109,953,086 | ) |
TOTAL NET ASSETS — 100.0% | | | | | | $ | 1,405,198,439 | |
Percentages are stated as a percent of net assets.
ADR - American Depositary Receipt
AG - Aktiengesellschaft
ASA - Advanced Subscription Agreement
NV - Naamloze Vennootschap
PLC - Public Limited Company
SA - Sociedad Anónima
| | (a) | Non-income producing security. |
| | (b) | All or a portion of this security is on loan as of April 30, 2024. The total market value of these securities was $114,713,940 which represented 8.2% of net assets. |
| | (c) | Security is exempt from registration pursuant to Rule 144A under the Securities Act of 1933, as amended. These securities may only be resold in transactions exempt from registration to qualified institutional investors. As of April 30, 2024, the value of these securities total $3,552,716 or 0.3% of the Fund’s net assets. |
| | (d) | To the extent that the Fund invests a significant portion of its assets in the securities of companies of a single country or region, it is more likely to be impacted by events or conditions affecting the country or region. |
| | (e) | The rate shown represents the 7-day effective yield as of April 30, 2024. |
The accompanying notes are an integral part of the financial statements.
125
Pacer Emerging Markets Cash Cows 100 ETF
SCHEDULE OF INVESTMENTS
April 30, 2024
| | | Shares | | | Value | |
COMMON STOCKS — 93.6% |
| |
Brazil — 8.4% |
Ambev SA - ADR (a) | | | 635,415 | | | $ | 1,474,163 | |
Auren Energia SA | | | 168,046 | | | | 374,759 | |
CPFL Energia SA | | | 169,054 | | | | 1,044,094 | |
CSN Mineracao SA | | | 605,810 | | | | 576,340 | |
Lojas Renner SA | | | 70,504 | | | | 207,876 | |
M Dias Branco SA | | | 30,932 | | | | 202,357 | |
Telefonica Brasil SA - ADR | | | 152,690 | | | | 1,410,856 | |
TIM SA - ADR | | | 54,986 | | | | 936,411 | |
Vale SA - ADR | | | 118,336 | | | | 1,440,149 | |
Vibra Energia SA | | | 112,335 | | | | 507,742 | |
| | | | | | | 8,174,747 | |
| |
Chile — 2.2% |
Cencosud SA | | | 587,627 | | | | 1,006,932 | |
Falabella SA(b) | | | 422,300 | | | | 1,130,474 | |
| | | | | | | 2,137,406 | |
| |
China — 25.0% |
Alibaba Group Holding Ltd. - ADR | | | 24,440 | | | | 1,829,334 | |
Anhui Conch Cement Co. Ltd. - Class H | | | 402,538 | | | | 939,617 | |
China Coal Energy Co. Ltd. - Class H | | | 2,106,426 | | | | 2,127,241 | |
China Feihe Ltd.(c) | | | 860,212 | | | | 472,843 | |
China Shenhua Energy Co. Ltd. - Class H | | | 565,513 | | | | 2,363,925 | |
COSCO SHIPPING Holdings Co. Ltd. - Class H | | | 1,963,202 | | | | 2,549,776 | |
Ganfeng Lithium Group Co. Ltd. - Class H(c) | | | 379,236 | | | | 1,124,711 | |
Haidilao International Holding Ltd.(c) | | | 480,944 | | | | 1,099,272 | |
JD Logistics, Inc.(b)(c) | | | 620,074 | | | | 677,724 | |
JD.com, Inc. - ADR | | | 67,442 | | | | 1,948,399 | |
Kingsoft Corp. Ltd. | | | 84,004 | | | | 276,516 | |
PetroChina Co. Ltd. - Class H | | | 2,777,161 | | | | 2,619,997 | |
Sinotruk Hong Kong Ltd. | | | 669,032 | | | | 1,672,858 | |
Tianqi Lithium Corp. - Class H | | | 383,568 | | | | 1,490,594 | |
Weichai Power Co. Ltd. - Class H | | | 893,760 | | | | 1,839,459 | |
Yadea Group Holdings Ltd.(c) | | | 329,464 | | | | 635,958 | |
Yangzijiang Shipbuilding Holdings Ltd. | | | 438,428 | | | | 565,278 | |
| | | | | | | 24,233,502 | |
| |
Czech Republic — 1.6% |
CEZ AS | | | 41,420 | | | | 1,528,919 | |
| |
| | | Shares | | | Value | |
Greece — 1.1% |
Hellenic Telecommunications Organization SA | | | 35,265 | | | $ | 537,426 | |
OPAP SA | | | 31,009 | | | | 516,579 | |
| | | | | | | 1,054,005 | |
| |
Hong Kong — 1.7% |
Bosideng International Holdings Ltd. | | | 743,956 | | | | 430,813 | |
China Medical System Holdings Ltd. | | | 184,104 | | | | 164,977 | |
Kunlun Energy Co. Ltd. | | | 1,125,562 | | | | 1,097,836 | |
| | | | | | | 1,693,626 | |
| |
Indonesia — 3.9% |
Adaro Energy Tbk PT | | | 5,744,559 | | | | 957,427 | |
Astra International Tbk PT | | | 2,937,744 | | | | 930,466 | |
Telkom Indonesia Persero Tbk PT - ADR | | | 57,418 | | | | 1,116,780 | |
United Tractors Tbk PT | | | 547,729 | | | | 836,247 | |
| | | | | | | 3,840,920 | |
| |
Kuwait — 0.5% |
Mobile Telecommunications Co. KSCP | | | 308,074 | | | | 487,642 | |
| |
Malaysia — 3.2% |
Tenaga Nasional Bhd | | | 840,300 | | | | 2,105,812 | |
YTL Corp. Bhd | | | 1,558,786 | | | | 1,012,517 | |
| | | | | | | 3,118,329 | |
| |
Mexico — 4.8% |
Coca-Cola Femsa SAB de CV - ADR | | | 11,767 | | | | 1,166,698 | |
Grupo Aeroportuario del Sureste SAB de CV - ADR | | | 2,000 | | | | 689,000 | |
Grupo Mexico SAB de CV - Class B | | | 393,667 | | | | 2,432,678 | |
Kimberly-Clark de Mexico SAB de CV - Class A | | | 168,509 | | | | 351,758 | |
| | | | | | | 4,640,134 | |
| |
Qatar — 1.3% |
Industries Qatar QSC | | | 367,156 | | | | 1,235,282 | |
| |
Russia — 0.0% (b)(d) |
Alrosa PJSC(b)(e) | | | 91,900 | | | | 0 | |
Inter RAO UES PJSC(b)(e) | | | 1,901,988 | | | | 0 | |
LUKOIL PJSC - ADR - ADR(b)(e) | | | 2,652 | | | | 0 | |
Magnit PJSC(b)(e) | | | 1,958 | | | | 0 | |
Magnitogorsk Iron & Steel Works PJSC(b)(e) | | | 106,418 | | | | 0 | |
Magnitogorsk Iron & Steel Works PJSC - GDR(b)(e) | | | 2,458 | | | | 0 | |
Severstal PAO - GDR(b)(e) | | | 2,129 | | | | 0 | |
Severstal PAO(b)(e) | | | 9,320 | | | | 0 | |
Surgutneftegas PJSC(b)(e) | | | 477,461 | | | | 0 | |
TATNEFT PJSC ADS (b)(e) | | | 3,600 | | | | 0 | |
| | | | | | | 0 | |
| |
The accompanying notes are an integral part of the financial statements.
126
Pacer Emerging Markets Cash Cows 100 ETF
SCHEDULE OF INVESTMENTS
April 30, 2024 (Continued)
| | | Shares | | | Value | |
COMMON STOCKS — 93.6% (Continued) |
| |
South Africa — 5.8% |
African Rainbow Minerals Ltd. | | | 44,320 | | | $ | 462,103 | |
Clicks Group Ltd. | | | 10,988 | | | | 170,198 | |
Exxaro Resources Ltd. | | | 65,849 | | | | 633,291 | |
Impala Platinum Holdings Ltd. | | | 157,156 | | | | 707,572 | |
Kumba Iron Ore Ltd. | | | 18,295 | | | | 450,560 | |
Mr Price Group Ltd. | | | 33,180 | | | | 308,331 | |
MTN Group Ltd. | | | 237,180 | | | | 1,141,463 | |
Northam Platinum Holdings Ltd. | | | 48,677 | | | | 323,621 | |
Sasol Ltd. | | | 75,026 | | | | 531,206 | |
Vodacom Group Ltd. | | | 189,736 | | | | 911,822 | |
| | | | | | | 5,640,167 | |
| |
Taiwan — 19.8% |
Acer, Inc. | | | 662,829 | | | | 919,070 | |
Asustek Computer, Inc. | | | 133,959 | | | | 1,769,006 | |
Catcher Technology Co. Ltd. | | | 58,570 | | | | 392,121 | |
Cheng Shin Rubber Industry Co. Ltd. | | | 274,186 | | | | 397,023 | |
Chicony Electronics Co. Ltd. | | | 83,017 | | | | 516,275 | |
China Airlines Ltd. | | | 1,228,370 | | | | 790,318 | |
Compal Electronics, Inc. | | | 1,060,641 | | | | 1,166,112 | |
Eva Airways Corp. | | | 1,705,253 | | | | 1,861,733 | |
Foxconn Technology Co. Ltd. | | | 163,146 | | | | 308,636 | |
Giant Manufacturing Co. Ltd. | | | 32,238 | | | | 216,326 | |
Gigabyte Technology Co. Ltd. | | | 49,428 | | | | 453,872 | |
Hon Hai Precision Industry Co. Ltd. | | | 568,424 | | | | 2,723,240 | |
Inventec Corp. | | | 394,798 | | | | 643,811 | |
Lite-On Technology Corp. | | | 165,801 | | | | 509,186 | |
Novatek Microelectronics Corp. | | | 44,337 | | | | 841,480 | |
Pegatron Corp. | | | 320,896 | | | | 962,826 | |
Pou Chen Corp. | | | 908,468 | | | | 1,008,572 | |
President Chain Store Corp. | | | 89,132 | | | | 750,020 | |
Quanta Computer, Inc. | | | 281,867 | | | | 2,250,642 | |
Synnex Technology International Corp. | | | 294,910 | | | | 722,739 | |
| | | | | | | 19,203,008 | |
| |
Thailand — 4.3% |
PTT Exploration & Production PCL | | | 343,849 | | | | 1,452,034 | |
PTT Oil & Retail Business PCL(c) | | | 1,748,620 | | | | 882,331 | |
PTT PCL | | | 1,790,290 | | | | 1,630,391 | |
SCG Packaging PCL | | | 243,700 | | | | 213,714 | |
| | | | | | | 4,178,470 | |
| |
| | | Shares | | | Value | |
Turkey — 9.6% |
Anadolu Efes Biracilik Ve Malt Sanayii AS | | | 87,868 | | | $ | 495,146 | |
BIM Birlesik Magazalar AS | | | 44,291 | | | | 529,256 | |
Borusan Birlesik Boru Fabrikalari Sanayi ve Ticaret AS(b) | | | 7,460 | | | | 138,552 | |
Enka Insaat ve Sanayi AS | | | 231,160 | | | | 274,084 | |
Ford Otomotiv Sanayi AS | | | 34,638 | | | | 1,191,454 | |
KOC Holding AS | | | 368,034 | | | | 2,569,377 | |
Migros Ticaret AS | | | 31,050 | | | | 423,763 | |
Oyak Cimento Fabrikalari AS(b) | | | 53,820 | | | | 100,706 | |
Tofas Turk Otomobil Fabrikasi AS | | | 70,920 | | | | 602,747 | |
Turk Traktor ve Ziraat Makineleri AS | | | 10,760 | | | | 305,495 | |
Turkcell Iletisim Hizmetleri AS | | | 270,198 | | | | 674,113 | |
Turkiye Petrol Rafinerileri AS | | | 340,625 | | | | 2,059,342 | |
| | | | | | | 9,364,035 | |
| |
United Arab Emirates — 0.4% |
National Marine Dredging Co. | | | 55,717 | | | | 404,426 | |
TOTAL COMMON STOCKS (Cost $85,540,081) | | | | | | | 90,934,618 | |
| |
PREFERRED STOCKS — 5.6% |
| |
Brazil — 5.6% |
Centrais Eletricas Brasileiras SA, 0.00%, | | | 121,544 | | | | 972,801 | |
Cia Energetica de Minas Gerais - ADR, 0.00%, | | | 341,274 | | | | 819,058 | |
Companhia Paranaense de Energia, 0.00%, | | | 201,532 | | | | 352,019 | |
Gerdau SA - ADR, Series 0, 0.00%, | | | 181,757 | | | | 632,515 | |
Metalurgica Gerdau SA, 0.00%, | | | 314,744 | | | | 636,447 | |
Petroleo Brasileiro SA - ADR, 0.00%, | | | 124,775 | | | | 2,011,373 | |
| | | | | | | 5,424,213 | |
TOTAL PREFERRED STOCKS (Cost $5,047,326) | | | | | | | 5,424,213 | |
| |
The accompanying notes are an integral part of the financial statements.
127
Pacer Emerging Markets Cash Cows 100 ETF
SCHEDULE OF INVESTMENTS
April 30, 2024 (Continued)
| | | Units | | | Value | |
INVESTMENTS PURCHASED WITH PROCEEDS FROM SECURITIES LENDING — 0.0%(d) |
Mount Vernon Liquid Assets Portfolio, LLC – 5.51%(f) | | | 4,543 | | | $ | 4,543 | |
TOTAL INVESTMENTS PURCHASED WITH PROCEEDS FROM SECURITIES LENDING (Cost $4,543) | | | | | | | 4,543 | |
| |
TOTAL INVESTMENTS — 99.2% (Cost $90,591,950) | | | | | | | 96,363,374 | |
Other Assets in Excess of Liabilities — 0.8% | | | | | | | 723,006 | |
TOTAL NET ASSETS — 100.0% | | | | | | $ | 97,086,380 | |
Percentages are stated as a percent of net assets.
ADR - American Depositary Receipt
GDR - Global Depositary Receipt
PJSC - Public Joint Stock Company
SA - Sociedad Anónima
SAB de CV - Sociedad Anónima Bursátil de Capital Variable
| | (a) | All or a portion of this security is on loan as of April 30, 2024. The total market value of these securities was $4,215 which represented 0.0% of net assets. |
| | (b) | Non-income producing security. |
| | (c) | Security is exempt from registration pursuant to Rule 144A under the Securities Act of 1933, as amended. These securities may only be resold in transactions exempt from registration to qualified institutional investors. As of April 30, 2024, the value of these securities total $4,892,839 or 5.0% of the Fund’s net assets. |
| | (d) | Represents less than 0.05% of net assets. |
| | (e) | Fair value determined using significant unobservable inputs in accordance with procedures established by and under the supervision of the Adviser, acting as Valuation Designee. These securities represented $0 or 0.0% of net assets as of April 30, 2024. |
| | (f) | The rate shown represents the 7-day effective yield as of April 30, 2024. |
The Global Industry Classification Standard (GICS®) was developed by and/or is the exclusive property of MSCI, Inc. and Standard & Poor’s Financial Services LLC (“S&P”). GICS is a service mark of MSCI, Inc. and S&P and has been licensed for use by U.S. Bank Global Fund Services.
The accompanying notes are an integral part of the financial statements.
128
Pacer US Large Cap Cash Cows Growth Leaders ETF
SCHEDULE OF INVESTMENTS
April 30, 2024
| | | Shares | | | Value | |
COMMON STOCKS — 99.9% |
| |
Communication Services — 5.9% |
Alphabet, Inc. - Class A(a) | | | 5,364 | | | $ | 873,152 | |
Electronic Arts, Inc. | | | 9,141 | | | | 1,159,262 | |
Iridium Communications, Inc. | | | 10,322 | | | | 317,814 | |
Match Group, Inc.(a) | | | 11,296 | | | | 348,143 | |
Meta Platforms, Inc. - Class A | | | 6,793 | | | | 2,922,145 | |
Trade Desk, Inc. - Class A(a) | | | 10,529 | | | | 872,328 | |
ZoomInfo Technologies, Inc.(a) | | | 34,015 | | | | 539,478 | |
| | | | | | | 7,032,322 | |
| |
Consumer Discretionary — 8.1% |
Airbnb, Inc. - Class A(a) | | | 8,983 | | | | 1,424,434 | |
Booking Holdings, Inc. | | | 308 | | | | 1,063,225 | |
Deckers Outdoor Corp.(a) | | | 3,951 | | | | 3,233,775 | |
Etsy, Inc.(a) | | | 9,265 | | | | 636,228 | |
Garmin Ltd. | | | 13,529 | | | | 1,954,535 | |
McDonald’s Corp. | | | 2,749 | | | | 750,587 | |
Wyndham Hotels & Resorts, Inc. | | | 9,661 | | | | 710,180 | |
| | | | | | | 9,772,964 | |
| |
Consumer Staples — 1.2% |
Altria Group, Inc. | | | 13,854 | | | | 606,944 | |
Olaplex Holdings, Inc.(a) | | | 194,238 | | | | 269,991 | |
Philip Morris International, Inc. | | | 6,497 | | | | 616,825 | |
| | | | | | | 1,493,760 | |
| |
Energy — 6.4% |
Antero Midstream Corp. | | | 77,247 | | | | 1,069,098 | |
Cheniere Energy, Inc. | | | 3,864 | | | | 609,816 | |
Coterra Energy, Inc. | | | 21,251 | | | | 581,427 | |
Diamondback Energy, Inc. | | | 7,890 | | | | 1,586,916 | |
EOG Resources, Inc. | | | 4,521 | | | | 597,360 | |
EQT Corp. | | | 13,141 | | | | 526,823 | |
Kinder Morgan, Inc. | | | 41,302 | | | | 755,001 | |
Marathon Oil Corp. | | | 22,763 | | | | 611,186 | |
Texas Pacific Land Corp. | | | 890 | | | | 512,907 | |
Williams Cos., Inc. | | | 22,005 | | | | 844,112 | |
| | | | | | | 7,694,646 | |
| |
Health Care — 9.9% |
AbbVie, Inc. | | | 8,059 | | | | 1,310,716 | |
Amgen, Inc. | | | 3,163 | | | | 866,472 | |
Bristol-Myers Squibb Co. | | | 8,856 | | | | 389,133 | |
Doximity, Inc. - Class A(a) | | | 49,290 | | | | 1,197,254 | |
Gilead Sciences, Inc. | | | 8,182 | | | | 533,466 | |
Jazz Pharmaceuticals PLC(a) | | | 3,820 | | | | 423,065 | |
Mettler-Toledo International, Inc.(a) | | | 606 | | | | 745,198 | |
Regeneron Pharmaceuticals, Inc.(a) | | | 1,334 | | | | 1,188,141 | |
Royalty Pharma PLC - Class A | | | 24,705 | | | | 684,329 | |
Shockwave Medical, Inc.(a) | | | 5,223 | | | | 1,724,582 | |
| | | Shares | | | Value | |
Health Care — 9.9% (Continued) | | | | | | | | |
United Therapeutics Corp.(a) | | | 3,086 | | | $ | 723,142 | |
Veeva Systems, Inc. - Class A(a) | | | 4,210 | | | | 835,938 | |
Vertex Pharmaceuticals, Inc.(a) | | | 3,419 | | | | 1,343,017 | |
| | | | | | | 11,964,453 | |
| |
Industrials — 7.2% |
Allison Transmission Holdings, Inc. | | | 21,878 | | | | 1,609,127 | |
AMETEK, Inc. | | | 6,318 | | | | 1,103,502 | |
Carlisle Cos., Inc. | | | 5,801 | | | | 2,252,238 | |
CSX Corp. | | | 44,326 | | | | 1,472,510 | |
Nordson Corp. | | | 3,625 | | | | 935,939 | |
Paychex, Inc. | | | 5,760 | | | | 684,345 | |
Verisk Analytics, Inc. | | | 2,898 | | | | 631,648 | |
| | | | | | | 8,689,309 | |
| |
Information Technology — 59.3%(b) |
Adobe, Inc.(a) | | | 1,239 | | | | 573,446 | |
Analog Devices, Inc. | | | 4,323 | | | | 867,237 | |
ANSYS, Inc.(a) | | | 2,412 | | | | 783,611 | |
Apple, Inc. | | | 3,463 | | | | 589,853 | |
Applied Materials, Inc. | | | 9,363 | | | | 1,859,960 | |
AppLovin Corp. - Class A(a) | | | 35,833 | | | | 2,528,735 | |
Arista Networks, Inc.(a) | | | 8,345 | | | | 2,140,993 | |
Aspen Technology, Inc.(a) | | | 3,473 | | | | 683,729 | |
Atlassian Corp. - Class A(a) | | | 3,549 | | | | 611,493 | |
Autodesk, Inc.(a) | | | 4,859 | | | | 1,034,238 | |
Bentley Systems, Inc. - Class B | | | 15,021 | | | | 789,053 | |
Broadcom, Inc. | | | 1,678 | | | | 2,181,853 | |
Cadence Design System, Inc.(a) | | | 5,506 | | | | 1,517,619 | |
CCC Intelligent Solutions Holdings, Inc.(a) | | | 84,968 | | | | 953,341 | |
Cisco Systems, Inc. | | | 9,696 | | | | 455,518 | |
Crowdstrike Holdings, Inc. - Class A(a) | | | 15,401 | | | | 4,505,408 | |
Datadog, Inc. - Class A(a) | | | 16,531 | | | | 2,074,640 | |
DocuSign, Inc.(a) | | | 15,700 | | | | 888,620 | |
Dolby Laboratories, Inc. - Class A | | | 7,513 | | | | 583,460 | |
Dropbox, Inc. - Class A(a) | | | 20,232 | | | | 468,573 | |
Dynatrace, Inc.(a) | | | 15,599 | | | | 706,791 | |
Enphase Energy, Inc.(a) | | | 5,435 | | | | 591,111 | |
F5, Inc.(a) | | | 6,354 | | | | 1,050,380 | |
Fair Isaac Corp.(a) | | | 1,798 | | | | 2,037,727 | |
Fortinet, Inc.(a) | | | 17,385 | | | | 1,098,384 | |
Gen Digital, Inc. | | | 39,593 | | | | 797,403 | |
GoDaddy, Inc. - Class A (a) | | | 26,922 | | | | 3,294,714 | |
Intuit, Inc. | | | 2,312 | | | | 1,446,433 | |
Keysight Technologies, Inc.(a) | | | 8,068 | | | | 1,193,580 | |
KLA Corp. | | | 2,982 | | | | 2,055,463 | |
Lam Research Corp. | | | 2,065 | | | | 1,846,957 | |
Lattice Semiconductor Corp.(a) | | | 5,370 | | | | 368,382 | |
The accompanying notes are an integral part of the financial statements.
129
Pacer US Large Cap Cash Cows Growth Leaders ETF
SCHEDULE OF INVESTMENTS
April 30, 2024 (Continued)
| | | Shares | | | Value | |
COMMON STOCKS — 99.9% (Continued) |
| | | | | | | | | |
Information Technology — 59.3%(b) (Continued) |
Manhattan Associates, Inc.(a) | | | 6,495 | | | $ | 1,338,360 | |
Microchip Technology, Inc. | | | 8,778 | | | | 807,400 | |
Microsoft Corp. | | | 4,136 | | | | 1,610,269 | |
Monolithic Power Systems, Inc. | | | 3,002 | | | | 2,009,329 | |
NVIDIA Corp. | | | 3,863 | | | | 3,337,709 | |
Palantir Technologies, Inc. - Class A(a) | | | 140,092 | | | | 3,077,821 | |
Palo Alto Networks, Inc.(a) | | | 5,881 | | | | 1,710,724 | |
PTC, Inc.(a) | | | 8,718 | | | | 1,546,922 | |
QUALCOMM, Inc. | | | 13,577 | | | | 2,251,745 | |
Roper Technologies, Inc. | | | 1,790 | | | | 915,513 | |
salesforce.com, Inc. | | | 7,220 | | | | 1,941,747 | |
ServiceNow, Inc.(a) | | | 2,476 | | | | 1,716,685 | |
Skyworks Solutions, Inc. | | | 5,913 | | | | 630,267 | |
Snowflake, Inc. - Class A(a) | | | 7,764 | | | | 1,204,973 | |
VeriSign, Inc.(a) | | | 3,004 | | | | 509,118 | |
Workday, Inc. - Class A(a) | | | 5,029 | | | | 1,230,747 | |
Zoom Video Communications, Inc. - Class A(a) | | | 9,716 | | | | 593,648 | |
Zscaler, Inc.(a) | | | 13,490 | | | | 2,332,961 | |
| | | | | | | 71,344,643 | |
| |
Materials — 1.4% |
Royal Gold, Inc. | | | 5,219 | | | | 626,959 | |
Southern Copper Corp. | | | 8,723 | | | | 1,017,712 | |
| | | | | | | 1,644,671 | |
| |
Utilities — 0.5% |
Clearway Energy, Inc. - Class C | | | 23,096 | | | | 539,984 | |
TOTAL COMMON STOCKS (Cost $117,436,409) | | | | | | | 120,176,752 | |
| |
TOTAL INVESTMENTS — 99.9% (Cost $117,436,409) | | | | | | | 120,176,752 | |
Other Assets in Excess of Liabilities — 0.1% | | | | | | | 165,343 | |
TOTAL NET ASSETS — 100.0% | | | | | | $ | 120,342,095 | |
Percentages are stated as a percent of net assets.
| | PLC - Public Limited Company | |
| | (a) | Non-income producing security. |
| | (b) | To the extent that the Fund invests more heavily in a particular industry or sector of the economy, its performance will be especially sensitive to developments that significantly affect those industries or sectors. |
The Global Industry Classification Standard (GICS®) was developed by and/or is the exclusive property of MSCI, Inc. and Standard & Poor’s Financial Services LLC (“S&P”). GICS is a service mark of MSCI, Inc. and S&P and has been licensed for use by U.S. Bank Global Fund Services.
The accompanying notes are an integral part of the financial statements.
130
Pacer US Small Cap Cash Cows Growth Leaders ETF
SCHEDULE OF INVESTMENTS
April 30, 2024
| | | Shares | | | Value | |
COMMON STOCKS — 99.9% |
| |
Communication Services — 3.8% |
Cars.com, Inc.(a) | | | 2,987 | | | $ | 49,913 | |
Gogo, Inc.(a) | | | 3,486 | | | | 31,583 | |
Madison Square Garden Sports Corp.(a) | | | 396 | | | | 73,624 | |
TechTarget, Inc.(a) | | | 2,779 | | | | 76,422 | |
Thryv Holdings, Inc.(a) | | | 2,999 | | | | 69,007 | |
YELP, Inc.(a) | | | 1,166 | | | | 46,920 | |
| | | | | | | 347,469 | |
| |
Consumer Discretionary — 21.7% |
Abercrombie & Fitch Co. - Class A(a) | | | 3,102 | | | | 376,955 | |
Adtalem Global Education, Inc.(a) | | | 1,888 | | | | 93,682 | |
American Eagle Outfitters, Inc. | | | 7,894 | | | | 191,508 | |
Buckle, Inc. | | | 2,413 | | | | 90,222 | |
Cavco Industries, Inc.(a) | | | 432 | | | | 157,339 | |
Dine Brands Global, Inc. | | | 860 | | | | 37,926 | |
Ethan Allen Interiors, Inc. | | | 2,290 | | | | 64,670 | |
G-III Apparel Group Ltd.(a) | | | 8,736 | | | | 245,918 | |
Green Brick Partners, Inc.(a) | | | 2,113 | | | | 114,377 | |
Kontoor Brands, Inc. | | | 2,329 | | | | 144,538 | |
LCI Industries | | | 529 | | | | 55,005 | |
M/I Homes, Inc.(a) | | | 1,136 | | | | 132,026 | |
Monarch Casino & Resort, Inc. | | | 1,006 | | | | 68,177 | |
Monro, Inc. | | | 2,000 | | | | 54,500 | |
Perdoceo Education Corp. | | | 4,476 | | | | 81,911 | |
Vista Outdoor, Inc.(a) | | | 2,387 | | | | 83,760 | |
| | | | | | | 1,992,514 | |
| |
Consumer Staples — 5.1% |
Cal-Maine Foods, Inc. | | | 2,024 | | | | 111,988 | |
Energizer Holdings, Inc. | | | 1,335 | | | | 38,341 | |
Medifast, Inc. | | | 540 | | | | 14,866 | |
National Beverage Corp.(a) | | | 1,307 | | | | 58,162 | |
Simply Good Foods Co.(a) | | | 1,686 | | | | 61,455 | |
Vector Group Ltd. | | | 6,206 | | | | 64,232 | |
WD-40 Co. | | | 517 | | | | 116,909 | |
| | | | | | | 465,953 | |
| |
Energy — 5.1% |
California Resources Corp. | | | 1,015 | | | | 53,653 | |
CONSOL Energy, Inc. | | | 640 | | | | 52,966 | |
Dorian LPG Ltd. | | | 4,690 | | | | 193,791 | |
Helmerich & Payne, Inc. | | | 1,342 | | | | 52,781 | |
RPC, Inc. | | | 6,318 | | | | 42,267 | |
SM Energy Co. | | | 1,493 | | | | 72,396 | |
| | | | | | | 467,854 | |
| |
| | | Shares | | | Value | |
Health Care — 15.7% |
Alkermes PLC(a) | | | 2,888 | | | $ | 70,872 | |
Amphastar Pharmaceuticals, Inc.(a) | | | 924 | | | | 38,115 | |
ANI Pharmaceuticals, Inc.(a) | | | 1,061 | | | | 70,026 | |
Certara, Inc.(a) | | | 3,608 | | | | 61,733 | |
Collegium Pharmaceutical, Inc.(a) | | | 6,010 | | | | 221,949 | |
Corcept Therapeutics, Inc.(a) | | | 1,307 | | | | 30,479 | |
Cross Country Healthcare, Inc.(a) | | | 1,609 | | | | 28,318 | |
Dynavax Technologies Corp.(a) | | | 3,270 | | | | 37,180 | |
Harmony Biosciences Holdings, Inc.(a) | | | 1,388 | | | | 42,903 | |
HealthStream, Inc. | | | 5,478 | | | | 141,168 | |
Innoviva, Inc.(a) | | | 7,782 | | | | 117,586 | |
Ironwood Pharmaceuticals, Inc.(a) | | | 8,617 | | | | 66,782 | |
LeMaitre Vascular, Inc. | | | 1,776 | | | | 115,085 | |
Mesa Laboratories, Inc. | | | 298 | | | | 31,612 | |
Pacira BioSciences, Inc.(a) | | | 1,248 | | | | 32,760 | |
Premier, Inc. | | | 2,533 | | | | 52,889 | |
Prestige Brands Holdings, Inc.(a) | | | 1,541 | | | | 110,582 | |
Simulations Plus, Inc. | | | 1,109 | | | | 50,293 | |
Supernus Pharmaceuticals, Inc.(a) | | | 1,568 | | | | 47,197 | |
US Physical Therapy, Inc. | | | 691 | | | | 70,143 | |
| | | | | | | 1,437,672 | |
| |
Industrials — 26.6%(b) |
Armstrong World Industries, Inc. | | | 1,869 | | | | 214,711 | |
Brady Corp. - Class A | | | 1,793 | | | | 105,787 | |
Encore Wire Corp. | | | 871 | | | | 243,322 | |
EnPro Industries, Inc. | | | 611 | | | | 91,729 | |
Franklin Electric Co., Inc. | | | 776 | | | | 74,705 | |
Gibraltar Industries, Inc.(a) | | | 867 | | | | 61,956 | |
Griffon Corp. | | | 3,855 | | | | 252,580 | |
Hayward Holdings, Inc.(a) | | | 4,155 | | | | 56,425 | |
Insteel Industries, Inc. | | | 1,982 | | | | 63,622 | |
Lindsay Corp. | | | 462 | | | | 53,661 | |
Liquidity Services, Inc.(a) | | | 3,172 | | | | 54,749 | |
Masterbrand, Inc.(a) | | | 8,945 | | | | 149,113 | |
Mueller Industries, Inc. | | | 3,001 | | | | 167,516 | |
Powell Industries, Inc. | | | 2,440 | | | | 348,920 | |
SkyWest, Inc.(a) | | | 2,710 | | | | 197,911 | |
Tennant Co. | | | 1,522 | | | | 177,283 | |
Verra Mobility Corp.(a) | | | 5,328 | | | | 125,634 | |
| | | | | | | 2,439,624 | |
| |
Information Technology — 14.2% |
A10 Networks, Inc. | | | 3,263 | | | | 42,615 | |
Adeia, Inc. | | | 8,264 | | | | 81,318 | |
Alarm.com Holdings, Inc.(a) | | | 1,913 | | | | 127,215 | |
Axcelis Technologies, Inc.(a) | | | 225 | | | | 23,292 | |
Badger Meter, Inc. | | | 323 | | | | 59,083 | |
BlackLine, Inc.(a) | | | 748 | | | | 43,421 | |
The accompanying notes are an integral part of the financial statements.
131
Pacer US Small Cap Cash Cows Growth Leaders ETF
SCHEDULE OF INVESTMENTS
April 30, 2024 (Continued)
| | | Shares | | | Value | |
COMMON STOCKS — 99.9% (Continued) |
| | | | | | | | | |
Information Technology — 14.2% (Continued) |
Box, Inc. - Class A(a) | | | 1,849 | | | $ | 48,111 | |
Cohu, Inc.(a) | | | 1,269 | | | | 38,476 | |
CTS Corp. | | | 1,324 | | | | 60,573 | |
DoubleVerify Holdings, Inc.(a) | | | 1,450 | | | | 42,485 | |
ePlus, Inc.(a) | | | 1,604 | | | | 123,316 | |
Extreme Networks, Inc.(a) | | | 1,781 | | | | 19,947 | |
InterDigital, Inc. | | | 1,200 | | | | 118,476 | |
Knowles Corp.(a) | | | 3,855 | | | | 61,025 | |
LiveRamp Holdings, Inc.(a) | | | 2,312 | | | | 74,238 | |
N-able, Inc.(a) | | | 4,622 | | | | 56,666 | |
Perficient, Inc.(a) | | | 988 | | | | 46,693 | |
Photronics, Inc.(a) | | | 4,143 | | | | 113,560 | |
Progress Software Corp. | | | 787 | | | | 39,208 | |
SMART Global Holdings, Inc.(a) | | | 1,574 | | | | 28,757 | |
SPS Commerce, Inc.(a) | | | 321 | | | | 55,812 | |
| | | | | | | 1,304,287 | |
| |
Materials — 7.2% |
Alpha Metallurgical Resources, Inc. | | | 834 | | | | 272,818 | |
Arch Resources, Inc. | | | 735 | | | | 116,703 | |
Balchem Corp. | | | 587 | | | | 82,990 | |
Hawkins, Inc. | | | 1,366 | | | | 103,502 | |
Quaker Chemical Corp. | | | 478 | | | | 89,162 | |
| | | | | | | 665,175 | |
| |
Utilities — 0.5% |
Clearway Energy, Inc. - Class C | | | 1,892 | | | | 44,235 | |
TOTAL COMMON STOCKS (Cost $9,132,777) | | | | | | | 9,164,783 | |
| |
TOTAL INVESTMENTS - 99.9% (Cost $9,132,777) | | | | | | | 9,164,783 | |
Other Assets in Excess of Liabilities - 0.1% | | | | | | | 5,476 | |
TOTAL NET ASSETS — 100.0% | | | | | | $ | 9,170,259 | |
Percentages are stated as a percent of net assets.
| | PLC - Public Limited Company | |
| | (a) | Non-income producing security. |
| | (b) | To the extent that the Fund invests more heavily in a particular industry or sector of the economy, its performance will be especially sensitive to developments that significantly affect those industries or sectors. |
The Global Industry Classification Standard (GICS®) was developed by and/or is the exclusive property of MSCI, Inc. and Standard & Poor’s Financial Services LLC (“S&P”). GICS is a service mark of MSCI, Inc. and S&P and has been licensed for use by U.S. Bank Global Fund Services.
The accompanying notes are an integral part of the financial statements.
132
Pacer US Cash Cows Growth ETF
SCHEDULE OF INVESTMENTS
April 30, 2024
| | | Shares | | | Value | |
COMMON STOCKS — 99.9% |
| |
Communication Services — 6.0% |
Alphabet, Inc. - Class A(a) | | | 17,095 | | | $ | 2,782,724 | |
| |
Consumer Discretionary — 34.3%(b) |
Booking Holdings, Inc. | | | 664 | | | | 2,292,148 | |
Boyd Gaming Corp. | | | 5,459 | | | | 292,111 | |
Crocs, Inc.(a) | | | 3,441 | | | | 427,957 | |
Deckers Outdoor Corp.(a) | | | 1,460 | | | | 1,194,966 | |
DR Horton, Inc. | | | 15,073 | | | | 2,147,752 | |
Expedia Group, Inc.(a) | | | 7,751 | | | | 1,043,517 | |
Grand Canyon Education, Inc.(a) | | | 1,706 | | | | 221,814 | |
Murphy USA, Inc. | | | 1,183 | | | | 489,549 | |
NVR, Inc.(a) | | | 181 | | | | 1,346,432 | |
PulteGroup, Inc. | | | 12,064 | | | | 1,344,171 | |
Ross Stores, Inc. | | | 15,883 | | | | 2,057,643 | |
Skechers U.S.A., Inc. - Class A(a) | | | 8,717 | | | | 575,758 | |
Toll Brothers, Inc. | | | 5,925 | | | | 705,727 | |
TopBuild Corp.(a) | | | 1,807 | | | | 731,239 | |
Williams-Sonoma, Inc.(c) | | | 3,648 | | | | 1,046,173 | |
| | | | | | | 15,916,957 | |
| |
Consumer Staples — 0.9% |
Coca-Cola Consolidated, Inc. | | | 533 | | | | 440,258 | |
| |
Energy — 10.3% |
APA Corp.(c) | | | 17,151 | | | | 539,227 | |
Chord Energy Corp.(c) | | | 2,357 | | | | 417,142 | |
Diamondback Energy, Inc.(c) | | | 10,149 | | | | 2,041,268 | |
Ovintiv, Inc. | | | 15,328 | | | | 786,633 | |
Range Resources Corp. | | | 13,770 | | | | 494,481 | |
Weatherford International PLC(a) | | | 4,113 | | | | 508,449 | |
| | | | | | | 4,787,200 | |
| |
Health Care — 2.4% |
Exelixis, Inc.(a) | | | 17,244 | | | | 404,544 | |
Halozyme Therapeutics, Inc.(a) | | | 7,208 | | | | 274,625 | |
Lantheus Holdings, Inc.(a)(c) | | | 3,895 | | | | 259,173 | |
Progyny, Inc.(a) | | | 5,485 | | | | 175,849 | |
| | | | | | | 1,114,191 | |
| |
| | | Shares | | | Value | |
Industrials — 15.7% |
Advanced Drainage Systems, Inc.(c) | | | 4,414 | | | $ | 692,998 | |
Applied Industrial Technologies, Inc. | | | 2,199 | | | | 402,967 | |
Brink’s Co. | | | 2,524 | | | | 220,749 | |
Builders FirstSource, Inc.(a)(c) | | | 6,935 | | | | 1,267,857 | |
Comfort Systems USA, Inc.(c) | | | 2,030 | | | | 628,102 | |
EMCOR Group, Inc. | | | 2,677 | | | | 956,144 | |
Esab Corp. | | | 3,432 | | | | 363,380 | |
Fortive Corp. | | | 19,984 | | | | 1,504,196 | |
Owens Corning | | | 4,948 | | | | 832,303 | |
UFP Industries, Inc. | | | 3,503 | | | | 394,788 | |
| | | | | | | 7,263,484 | |
| |
Information Technology — 19.1% |
Apple, Inc. | | | 13,558 | | | | 2,309,334 | |
Applied Materials, Inc. | | | 11,261 | | | | 2,236,998 | |
Dropbox, Inc. - Class A(a) | | | 19,564 | | | | 453,102 | |
GoDaddy, Inc. - Class A(a) | | | 8,103 | | | | 991,645 | |
Lam Research Corp. | | | 2,420 | | | | 2,164,472 | |
Qualys, Inc.(a) | | | 2,102 | | | | 344,539 | |
Vontier Corp. | | | 8,747 | | | | 355,391 | |
| | | | | | | 8,855,481 | |
| |
Materials — 8.0% |
Celanese Corp. | | | 6,194 | | | | 951,460 | |
Eagle Materials, Inc.(c) | | | 1,959 | | | | 491,141 | |
NewMarket Corp. | | | 545 | | | | 287,171 | |
Reliance, Inc.(c) | | | 3,266 | | | | 929,896 | |
Westlake Chemical Corp. | | | 7,292 | | | | 1,074,549 | |
| | | | | | | 3,734,217 | |
| |
Utilities — 3.2% |
Vistra Corp. | | | 19,786 | | | | 1,500,570 | |
TOTAL COMMON STOCKS (Cost $41,805,464) | | | | | | | 46,395,082 | |
| |
The accompanying notes are an integral part of the financial statements.
133
Pacer US Cash Cows Growth ETF
SCHEDULE OF INVESTMENTS
April 30, 2024 (Continued)
| | | Units | | | Value | |
INVESTMENTS PURCHASED WITH PROCEEDS FROM SECURITIES LENDING — 15.1% |
Mount Vernon Liquid Assets Portfolio, LLC – 5.51%(d) | | | 7,010,900 | | | $ | 7,010,900 | |
TOTAL INVESTMENTS PURCHASED WITH PROCEEDS FROM SECURITIES LENDING (Cost $7,010,900) | | | | | | | 7,010,900 | |
| |
TOTAL INVESTMENTS — 115.0% (Cost $48,816,364) | | | | | | | 53,405,982 | |
Liabilities in Excess of Other Assets — (15.0)% | | | | | | | (6,994,352 | ) |
TOTAL NET ASSETS — 100.0% | | | | | | $ | 46,411,630 | |
Percentages are stated as a percent of net assets.
PLC - Public Limited Company
| | (a) | Non-income producing security. |
| | (b) | To the extent that the Fund invests more heavily in a particular industry or sector of the economy, its performance will be especially sensitive to developments that significantly affect those industries or sectors. |
| | (c) | All or a portion of this security is on loan as of April 30, 2024. The total market value of these securities was $6,709,378 which represented 14.5% of net assets. |
| | (d) | The rate shown represents the 7-day effective yield as of April 30, 2024. |
The Global Industry Classification Standard (GICS®) was developed by and/or is the exclusive property of MSCI, Inc. and Standard & Poor’s Financial Services LLC (“S&P”). GICS is a service mark of MSCI, Inc. and S&P and has been licensed for use by U.S. Bank Global Fund Services.
The accompanying notes are an integral part of the financial statements.
134
Pacer Cash Cows Fund of Funds ETF
SCHEDULE OF INVESTMENTS
April 30, 2024
| | | Shares | | | Value | |
AFFILIATED EXCHANGE TRADED FUNDS — 100.0% |
| |
Pacer Developed Markets International Cash Cows 100 ETF(a) | | | 609,263 | | | $ | 19,173,506 | |
Pacer Global Cash Cows Dividend ETF(a) | | | 563,787 | | | | 19,225,137 | |
Pacer US Cash Cows 100 ETF(a) | | | 339,100 | | | | 18,596,244 | |
Pacer US Cash Cows Growth ETF(a) | | | 460,089 | | | | 18,583,225 | |
Pacer US Small Cap Cash Cows 100 ETF(a) | | | 402,486 | | | | 18,458,008 | |
TOTAL AFFILIATED EXCHANGE TRADED FUNDS (Cost $86,738,838) | | | | | | | 94,036,120 | |
| | | | | | | | | |
TOTAL INVESTMENTS — 100.0% (Cost $86,738,838) | | | | | | | 94,036,120 | |
Other Assets in Excess of Liabilities — 0.0%(b) | | | | | | | 1,302 | |
TOTAL NET ASSETS — 100.0% | | | | | | $ | 94,037,422 | |
Percentages are stated as a percent of net assets.
| | (a) | Affiliated company as defined by the Investment Company Act of 1940. |
| | (b) | Represents less than 0.05% of net assets. |
The Global Industry Classification Standard (GICS®) was developed by and/or is the exclusive property of MSCI, Inc. and Standard & Poor’s Financial Services LLC (“S&P”). GICS is a service mark of MSCI, Inc. and S&P and has been licensed for use by U.S. Bank Global Fund Services.
The accompanying notes are an integral part of the financial statements.
135
Pacer WealthShield ETF
SCHEDULE OF INVESTMENTS
April 30, 2024
| | | Shares | | | Value | |
COMMON STOCKS — 81.3% |
| |
Communication Services — 6.4% |
Alphabet, Inc. - Class A(a) | | | 1,558 | | | $ | 253,611 | |
Alphabet, Inc. - Class C(a) | | | 1,304 | | | | 214,691 | |
Match Group, Inc.(a)(b) | | | 1,484 | | | | 45,737 | |
Meta Platforms, Inc. - Class A | | | 675 | | | | 290,365 | |
Netflix, Inc.(a) | | | 342 | | | | 188,319 | |
Pinterest, Inc. - Class A(a)(b) | | | 2,104 | | | | 70,379 | |
ROBLOX Corp. - Class A(a)(b) | | | 1,789 | | | | 63,617 | |
Snap, Inc. - Class A(a)(b) | | | 4,929 | | | | 74,181 | |
ZoomInfo Technologies, Inc.(a) | | | 2,305 | | | | 36,557 | |
| | | | | | | 1,237,457 | |
| |
Consumer Discretionary — 4.2% |
Airbnb, Inc. - Class A(a)(b) | | | 768 | | | | 121,782 | |
Amazon.com, Inc.(a) | | | 2,285 | | | | 399,875 | |
Carvana Co.(a)(b) | | | 607 | | | | 50,332 | |
DoorDash, Inc. - Class A(a)(b) | | | 735 | | | | 95,006 | |
DraftKings, Inc.(a) | | | 1,666 | | | | 69,239 | |
eBay, Inc.(b) | | | 1,574 | | | | 81,124 | |
| | | | | | | 817,358 | |
| |
Financials — 21.4% |
Aflac, Inc.(b) | | | 391 | | | | 32,707 | |
Allstate Corp. | | | 193 | | | | 32,822 | |
American Express Co. | | | 409 | | | | 95,718 | |
American International Group, Inc.(b) | | | 516 | | | | 38,860 | |
Ameriprise Financial, Inc. | | | 72 | | | | 29,649 | |
Aon PLC(b) | | | 144 | | | | 40,609 | |
Arch Capital Group Ltd.(a)(b) | | | 274 | | | | 25,630 | |
Arthur J Gallagher & Co. | | | 159 | | | | 37,316 | |
Assurant, Inc. | | | 40 | | | | 6,976 | |
Bank of America Corp. | | | 4,961 | | | | 183,607 | |
Bank of New York Mellon Corp. | | | 564 | | | | 31,860 | |
Berkshire Hathaway, Inc. - Class B(a) | | | 1,311 | | | | 520,112 | |
BlackRock, Inc.(b) | | | 100 | | | | 75,464 | |
Blackstone, Inc. | | | 516 | | | | 60,171 | |
Brown & Brown, Inc. | | | 174 | | | | 14,188 | |
Capital One Financial Corp.(b) | | | 280 | | | | 40,160 | |
Cboe Global Markets, Inc. | | | 78 | | | | 14,130 | |
Charles Schwab Corp. | | | 1,065 | | | | 78,757 | |
Chubb Ltd. | | | 291 | | | | 72,354 | |
Cincinnati Financial Corp. | | | 116 | | | | 13,420 | |
Citigroup, Inc. | | | 1,362 | | | | 83,531 | |
Citizens Financial Group, Inc.(b) | | | 343 | | | | 11,700 | |
CME Group, Inc. | | | 259 | | | | 54,297 | |
Comerica, Inc.(b) | | | 98 | | | | 4,917 | |
Corpay, Inc.(a)(b) | | | 54 | | | | 16,316 | |
Discover Financial Services | | | 184 | | | | 23,318 | |
| | | Shares | | | Value | |
Financials — 21.4% (Continued) | | | | | | | | |
Everest Group Ltd. | | | 33 | | | $ | 12,092 | |
FactSet Research Systems, Inc. | | | 28 | | | | 11,673 | |
Fidelity National Information Services, Inc. | | | 434 | | | | 29,477 | |
Fifth Third Bancorp(b) | | | 500 | | | | 18,230 | |
Fiserv, Inc.(a) | | | 432 | | | | 65,953 | |
Franklin Resources, Inc.(b) | | | 224 | | | | 5,116 | |
Global Payments, Inc. | | | 192 | | | | 23,572 | |
Globe Life, Inc.(b) | | | 64 | | | | 4,875 | |
Goldman Sachs Group, Inc. | | | 234 | | | | 99,850 | |
Hartford Financial Services Group, Inc. | | | 222 | | | | 21,510 | |
Huntington Bancshares, Inc. | | | 1,071 | | | | 14,426 | |
Intercontinental Exchange, Inc. | | | 420 | | | | 54,079 | |
Invesco Ltd. | | | 330 | | | | 4,676 | |
Jack Henry & Associates, Inc. | | | 55 | | | | 8,948 | |
JPMorgan Chase & Co.(b) | | | 2,083 | | | | 399,393 | |
KeyCorp.(b) | | | 696 | | | | 10,085 | |
Loews Corp. | | | 135 | | | | 10,145 | |
M&T Bank Corp. | | | 123 | | | | 17,760 | |
MarketAxess Holdings, Inc. | | | 28 | | | | 5,603 | |
Marsh & McLennan Cos., Inc. | | | 352 | | | | 70,199 | |
Mastercard, Inc. - Class A | | | 594 | | | | 268,013 | |
MetLife, Inc. | | | 456 | | | | 32,412 | |
Moody’s Corp.(b) | | | 116 | | | | 42,958 | |
Morgan Stanley(b) | | | 897 | | | | 81,483 | |
MSCI, Inc. | | | 58 | | | | 27,016 | |
Nasdaq, Inc. | | | 274 | | | | 16,399 | |
Northern Trust Corp. | | | 153 | | | | 12,606 | |
PayPal Holdings, Inc.(a) | | | 2,817 | | | | 191,331 | |
PNC Financial Services Group, Inc. | | | 287 | | | | 43,986 | |
Principal Financial Group, Inc.(b) | | | 162 | | | | 12,821 | |
Progressive Corp. | | | 420 | | | | 87,465 | |
Prudential Financial, Inc.(b) | | | 266 | | | | 29,388 | |
Raymond James Financial, Inc. | | | 139 | | | | 16,958 | |
Regions Financial Corp.(b) | | | 683 | | | | 13,161 | |
S&P Global, Inc. | | | 230 | | | | 95,641 | |
State Street Corp. | | | 227 | | | | 16,455 | |
Synchrony Financial | | | 304 | | | | 13,370 | |
T Rowe Price Group, Inc. | | | 165 | | | | 18,079 | |
Travelers Cos., Inc. | | | 168 | | | | 35,643 | |
Truist Financial Corp.(b) | | | 961 | | | | 36,086 | |
US Bancorp(b) | | | 1,122 | | | | 45,587 | |
Visa, Inc. - Class A(b) | | | 1,140 | | | | 306,215 | |
W R Berkley Corp. | | | 150 | | | | 11,546 | |
Wells Fargo & Co. | | | 2,593 | | | | 153,817 | |
Willis Towers Watson PLC | | | 77 | | | | 19,338 | |
| | | | | | | 4,154,025 | |
The accompanying notes are an integral part of the financial statements.
136
Pacer WealthShield ETF
SCHEDULE OF INVESTMENTS
April 30, 2024 (Continued)
| | | Shares | | | Value | |
COMMON STOCKS — 81.3% (Continued) |
| | | | | | | | | |
Health Care — 0.5% |
Teladoc Health, Inc.(a)(b) | | | 1,910 | | | $ | 24,353 | |
Veeva Systems, Inc. - Class A(a) | | | 394 | | | | 78,232 | |
| | | | | | | 102,585 | |
| |
Industrials — 20.6% |
3M Co. | | | 591 | | | | 57,037 | |
A O Smith Corp.(b) | | | 132 | | | | 10,935 | |
Allegion PLC(b) | | | 94 | | | | 11,427 | |
American Airlines Group, Inc.(a) | | | 700 | | | | 9,457 | |
AMETEK, Inc. | | | 247 | | | | 43,141 | |
Automatic Data Processing, Inc. | | | 439 | | | | 106,190 | |
Axon Enterprise, Inc.(a) | | | 76 | | | | 23,838 | |
Boeing Co.(a)(b) | | | 613 | | | | 102,886 | |
Broadridge Financial Solutions, Inc. | | | 126 | | | | 24,370 | |
Builders FirstSource, Inc.(a)(b) | | | 132 | | | | 24,132 | |
Carrier Global Corp.(b) | | | 893 | | | | 54,911 | |
Caterpillar, Inc. | | | 549 | | | | 183,678 | |
CH Robinson Worldwide, Inc.(b) | | | 126 | | | | 8,946 | |
Cintas Corp. | | | 93 | | | | 61,226 | |
Copart, Inc.(a) | | | 934 | | | | 50,726 | |
CSX Corp. | | | 2,112 | | | | 70,161 | |
Cummins, Inc. | | | 146 | | | | 41,244 | |
Dayforce Inc.(a)(b) | | | 168 | | | | 10,310 | |
Deere & Co.(b) | | | 279 | | | | 109,203 | |
Delta Air Lines, Inc.(b) | | | 685 | | | | 34,298 | |
Dover Corp.(b) | | | 150 | | | | 26,895 | |
Eaton Corp. PLC | | | 431 | | | | 137,170 | |
Emerson Electric Co. | | | 611 | | | | 65,854 | |
Equifax, Inc. | | | 132 | | | | 29,065 | |
Expeditors International of Washington, Inc.(b) | | | 155 | | | | 17,253 | |
Fastenal Co.(b) | | | 612 | | | | 41,579 | |
FedEx Corp. | | | 246 | | | | 64,398 | |
Fortive Corp. | | | 375 | | | | 28,226 | |
GE Vernova, Inc.(a) | | | 293 | | | | 45,037 | |
Generac Holdings, Inc.(a) | | | 66 | | | | 8,973 | |
General Dynamics Corp. | | | 243 | | | | 69,763 | |
General Electric Co.(b) | | | 1,174 | | | | 189,976 | |
Honeywell International, Inc. | | | 711 | | | | 137,030 | |
Howmet Aerospace, Inc.(b) | | | 419 | | | | 27,968 | |
Hubbell, Inc.(b) | | | 57 | | | | 21,120 | |
Huntington Ingalls Industries, Inc. | | | 42 | | | | 11,631 | |
IDEX Corp. | | | 82 | | | | 18,078 | |
Illinois Tool Works, Inc. | | | 291 | | | | 71,036 | |
Ingersoll Rand, Inc. | | | 433 | | | | 40,408 | |
Jacobs Solutions, Inc. | | | 135 | | | | 19,377 | |
JB Hunt Trasport Services, Inc. | | | 87 | | | | 14,144 | |
| | | Shares | | | Value | |
Industrials — 20.6% (Continued) | | | | | | | | |
Johnson Controls International PLC | | | 728 | | | $ | 47,371 | |
L3Harris Technologies, Inc. | | | 203 | | | | 43,452 | |
Leidos Holdings, Inc. | | | 147 | | | | 20,612 | |
Lockheed Martin Corp. | | | 230 | | | | 106,934 | |
Masco Corp. | | | 236 | | | | 16,154 | |
Nordson Corp. | | | 58 | | | | 14,975 | |
Norfolk Southern Corp. | | | 242 | | | | 55,737 | |
Northrop Grumman Corp.(b) | | | 151 | | | | 73,240 | |
Old Dominion Freight Line, Inc. | | | 192 | | | | 34,888 | |
Otis Worldwide Corp. | | | 434 | | | | 39,581 | |
PACCAR, Inc. | | | 560 | | | | 59,422 | |
Parker-Hannifin Corp. | | | 138 | | | | 75,198 | |
Paychex, Inc. | | | 343 | | | | 40,752 | |
Paycom Software, Inc. | | | 52 | | | | 9,775 | |
Pentair PLC | | | 177 | | | | 13,999 | |
Quanta Services, Inc. | | | 155 | | | | 40,077 | |
Republic Services, Inc. | | | 219 | | | | 41,982 | |
Robert Half, Inc. | | | 112 | | | | 7,744 | |
Rockwell Automation, Inc.(b) | | | 123 | | | | 33,328 | |
Rollins, Inc. | | | 300 | | | | 13,368 | |
RTX Corp. | | | 1,431 | | | | 145,275 | |
Snap-On, Inc.(b) | | | 56 | | | | 15,006 | |
Southwest Airlines Co.(b) | | | 638 | | | | 16,550 | |
Stanley Black & Decker, Inc. | | | 164 | | | | 14,990 | |
Textron, Inc. | | | 210 | | | | 17,764 | |
Trane Technologies PLC | | | 243 | | | | 77,114 | |
TransDigm Group, Inc.(b) | | | 60 | | | | 74,882 | |
Uber Technologies, Inc.(a)(b) | | | 2,219 | | | | 147,053 | |
Union Pacific Corp. | | | 658 | | | | 156,050 | |
United Airlines Holdings, Inc.(a) | | | 350 | | | | 18,011 | |
United Parcel Service, Inc. - Class B | | | 780 | | | | 115,034 | |
United Rentals, Inc.(b) | | | 72 | | | | 48,095 | |
Veralto Corp. | | | 235 | | | | 22,015 | |
Verisk Analytics, Inc. | | | 155 | | | | 33,784 | |
W.W. Grainger, Inc. | | | 48 | | | | 44,225 | |
Waste Management, Inc. | | | 392 | | | | 81,544 | |
Westinghouse Air Brake Technologies Corp. | | | 192 | | | | 30,927 | |
Xylem, Inc. | | | 258 | | | | 33,721 | |
| | | | | | | 4,003,726 | |
| |
Information Technology — 28.2%(d) |
Accenture PLC - Class A | | | 196 | | | | 58,979 | |
Adobe, Inc.(a) | | | 142 | | | | 65,722 | |
Advanced Micro Devices, Inc.(a) | | | 506 | | | | 80,140 | |
Akamai Technologies, Inc.(a)(b) | | | 637 | | | | 64,292 | |
Amphenol Corp. | | | 189 | | | | 22,826 | |
Analog Devices, Inc. | | | 155 | | | | 31,095 | |
The accompanying notes are an integral part of the financial statements.
137
Pacer WealthShield ETF
SCHEDULE OF INVESTMENTS
April 30, 2024 (Continued)
| | | Shares | | | Value | |
COMMON STOCKS — 81.3% (Continued) |
| | | | | | | | | |
Information Technology — 28.2%(d) (Continued) |
ANSYS, Inc.(a) | | | 29 | | | $ | 9,422 | |
Apple, Inc. | | | 4,573 | | | | 778,918 | |
Applied Materials, Inc.(b) | | | 261 | | | | 51,848 | |
Arista Networks, Inc.(a) | | | 522 | | | | 133,924 | |
Atlassian Corp. - Class A(a)(b) | | | 435 | | | | 74,951 | |
Autodesk, Inc.(a)(b) | | | 71 | | | | 15,112 | |
Box, Inc.(a)(b) | | | 1,191 | | | | 30,990 | |
Broadcom, Inc. | | | 139 | | | | 180,738 | |
Cadence Design System, Inc.(a) | | | 86 | | | | 23,704 | |
CDW Corp. | | | 45 | | | | 10,884 | |
Ciena Corp.(a) | | | 803 | | | | 37,123 | |
Cisco Systems, Inc. | | | 5,001 | | | | 234,947 | |
Cloudflare, Inc. - Class A(a)(b) | | | 856 | | | | 74,814 | |
Cognizant Technology Solutions Corp. | | | 166 | | | | 10,903 | |
CommScope Holding Co., Inc.(a) | | | 12,546 | | | | 11,216 | |
Confluent, Inc. - Class A(a)(b) | | | 1,343 | | | | 37,765 | |
Corning, Inc. | | | 256 | | | | 8,545 | |
Datadog, Inc. - Class A(a)(b) | | | 756 | | | | 94,878 | |
DocuSign, Inc.(a) | | | 1,026 | | | | 58,072 | |
Dropbox, Inc. - Class A(a) | | | 1,751 | | | | 40,553 | |
Enphase Energy, Inc.(a)(b) | | | 46 | | | | 5,003 | |
EPAM Systems, Inc.(a) | | | 20 | | | | 4,705 | |
F5, Inc.(a) | | | 21 | | | | 3,472 | |
Fair Isaac Corp.(a) | | | 8 | | | | 9,067 | |
Fastly, Inc.(a) | | | 1,765 | | | | 22,327 | |
First Solar, Inc.(a) | | | 36 | | | | 6,347 | |
Fortinet, Inc.(a) | | | 210 | | | | 13,268 | |
Gartner, Inc.(a) | | | 25 | | | | 10,315 | |
Gen Digital, Inc. | | | 188 | | | | 3,786 | |
GoDaddy, Inc. - Class A(a) | | | 569 | | | | 69,634 | |
Hewlett Packard Enterprise Co. | | | 430 | | | | 7,310 | |
HP, Inc. | | | 289 | | | | 8,118 | |
Intel Corp. | | | 1,323 | | | | 40,312 | |
International Business Machines Corp. | | | 287 | | | | 47,699 | |
Intuit, Inc. | | | 88 | | | | 55,055 | |
Jabil, Inc. | | | 42 | | | | 4,929 | |
Juniper Networks, Inc.(b) | | | 1,602 | | | | 55,782 | |
Keysight Technologies, Inc.(a) | | | 60 | | | | 8,876 | |
KLA Corp. | | | 43 | | | | 29,639 | |
Lam Research Corp. | | | 42 | | | | 37,565 | |
Marathon Digital Holdings, Inc.(a) | | | 1,683 | | | | 27,029 | |
Microchip Technology, Inc. | | | 179 | | | | 16,464 | |
Micron Technology, Inc.(b) | | | 346 | | | | 39,084 | |
Microsoft Corp. | | | 2,341 | | | | 911,421 | |
Monolithic Power Systems, Inc.(b) | | | 16 | | | | 10,709 | |
Motorola Solutions, Inc. | | | 52 | | | | 17,636 | |
| | | Shares | | | Value | |
Information Technology — 28.2%(d) (Continued) |
NetApp, Inc.(b) | | | 70 | | | $ | 7,155 | |
Nutanix, Inc.(a) | | | 990 | | | | 60,093 | |
NVIDIA Corp. | | | 778 | | | | 672,207 | |
NXP Semiconductors NV | | | 81 | | | | 20,751 | |
Okta, Inc.(a) | | | 616 | | | | 57,276 | |
ON Semiconductor Corp.(a)(b) | | | 144 | | | | 10,103 | |
Oracle Corp. | | | 499 | | | | 56,761 | |
Palo Alto Networks, Inc.(a)(b) | | | 99 | | | | 28,798 | |
PTC, Inc.(a)(b) | | | 41 | | | | 7,275 | |
Qorvo, Inc.(a) | | | 34 | | | | 3,973 | |
QUALCOMM, Inc. | | | 350 | | | | 58,048 | |
Roper Technologies, Inc. | | | 34 | | | | 17,390 | |
salesforce.com, Inc. | | | 1,022 | | | | 274,857 | |
Seagate Technology Holdings PLC | | | 64 | | | | 5,498 | |
ServiceNow, Inc.(a) | | | 65 | | | | 45,066 | |
Skyworks Solutions, Inc.(b) | | | 54 | | | | 5,756 | |
Smartsheet, Inc.(a)(b) | | | 970 | | | | 36,695 | |
Snowflake, Inc.(a) | | | 672 | | | | 104,294 | |
Super Micro Computer, Inc.(a)(b) | | | 16 | | | | 13,741 | |
Synopsys, Inc.(a) | | | 48 | | | | 25,468 | |
TE Connectivity Ltd. | | | 103 | | | | 14,572 | |
Teledyne Technologies, Inc.(a) | | | 16 | | | | 6,104 | |
Teradyne, Inc.(b) | | | 52 | | | | 6,049 | |
Texas Instruments, Inc.(b) | | | 285 | | | | 50,280 | |
Trimble, Inc.(a) | | | 84 | | | | 5,046 | |
Tyler Technologies, Inc.(a)(b) | | | 14 | | | | 6,462 | |
VeriSign, Inc.(a) | | | 30 | | | | 5,084 | |
Western Digital Corp.(a)(b) | | | 107 | | | | 7,579 | |
Workday, Inc. - Class A(a) | | | 420 | | | | 102,787 | |
Zebra Technologies Corp.(a)(b) | | | 18 | | | | 5,662 | |
Zoom Video Communications, Inc. - Class A(a) | | | 992 | | | | 60,611 | |
| | | | | | | 5,489,354 | |
TOTAL COMMON STOCKS (Cost $14,752,566) | | | | | | | 15,804,505 | |
| |
| | | Units | | | | | |
INVESTMENTS PURCHASED WITH PROCEEDS FROM SECURITIES LENDING — 21.0% |
Mount Vernon Liquid Assets Portfolio, LLC – 5.51%(f) | | | 4,078,068 | | | | 4,078,068 | |
TOTAL INVESTMENTS PURCHASED WITH PROCEEDS FROM SECURITIES LENDING (Cost $4,078,068) | | | | | | | 4,078,068 | |
| |
The accompanying notes are an integral part of the financial statements.
138
Pacer WealthShield ETF
SCHEDULE OF INVESTMENTS
April 30, 2024 (Continued)
| | | Contracts | | | Value | |
RIGHTS — 0.0%(e) |
| |
Health Care — 0.0%(e) |
Abiomed, Inc.(a)(c) | | | 64 | | | $ | 0 | |
Bristol-Myers Squibb Co., Expires 01/24/2025, Exercise Price $12.00(a)(c) | | | 868 | | | | 0 | |
TOTAL RIGHTS (Cost $0) | | | | | | | 0 | |
| |
| | | Par | | | | | |
U.S. TREASURY BILLS – 17.8% | | | | | | | | |
0.00%, 08/01/2024(g) | | $ | 3,500,000 | | | | 3,453,075 | |
TOTAL U.S. TREASURY BILLS (Cost $3,453,618) | | | | | | | 3,453,075 | |
| |
TOTAL INVESTMENTS — 120.0% (Cost $22,284,252) | | | | | | | 23,335,648 | |
Liabilities in Excess of Other Assets — (20.0)% | | | | | | | (3,889,152 | ) |
TOTAL NET ASSETS — 100.0% | | | | | | $ | 19,446,496 | |
Percentages are stated as a percent of net assets.
NV - Naamloze Vennootschap
PLC - Public Limited Company
| | (a) | Non-income producing security. |
| | (b) | All or a portion of this security is on loan as of April 30, 2024. The total market value of these securities was $3,914,706 which represented 20.10% of net assets. |
| | (c) | Fair value determined using significant unobservable inputs in accordance with procedures established by and under the supervision of the Adviser, acting as Valuation Designee. These securities represented $0 or 0.0% of net assets as of April 30, 2024. |
| | (d) | To the extent that the Fund invests more heavily in a particular industry or sector of the economy, its performance will be especially sensitive to developments that significantly affect those industries or sectors. |
| | (e) | Represents less than 0.05% of net assets. |
| | (f) | The rate shown represents the 7-day effective yield as of April 30, 2024. |
| | (g) | Zero coupon bonds make no periodic interest payments but are issued at a discount from par value. |
The Global Industry Classification Standard (GICS®) was developed by and/or is the exclusive property of MSCI, Inc. and Standard & Poor’s Financial Services LLC (“S&P”). GICS is a service mark of MSCI, Inc. and S&P and has been licensed for use by U.S. Bank Global Fund Services.
The accompanying notes are an integral part of the financial statements.
139
Pacer Industrial Real Estate ETF
SCHEDULE OF INVESTMENTS
April 30, 2024
| | | Shares | | | Value | |
REAL ESTATE INVESTMENT TRUSTS — 94.9% |
| |
Big Yellow Group PLC | | | 245,075 | | | $ | 3,307,314 | |
Centuria Industrial REIT | | | 705,055 | | | | 1,456,980 | |
CubeSmart(a) | | | 217,020 | | | | 8,776,289 | |
Dream Industrial Real Estate Investment Trust | | | 349,591 | | | | 3,151,436 | |
EastGroup Properties, Inc. | | | 54,515 | | | | 8,469,450 | |
Extra Space Storage, Inc.(a) | | | 65,539 | | | | 8,800,577 | |
First Industrial Realty Trust, Inc. | | | 174,566 | | | | 7,928,788 | |
GLP J-Reit | | | 6,299 | | | | 5,132,178 | |
Granite Real Estate Investment Trust | | | 84,120 | | | | 4,158,185 | |
LondonMetric Property PLC | | | 2,660,464 | | | | 6,535,721 | |
LXP Industrial Trust | | | 387,228 | | | | 3,233,354 | |
Mapletree Industrial Trust | | | 2,721,755 | | | | 4,526,123 | |
Mapletree Logistics Trust | | | 4,430,232 | | | | 4,381,388 | |
National Storage Affiliates Trust(a) | | | 93,858 | | | | 3,288,784 | |
National Storage REIT | | | 1,666,032 | | | | 2,331,186 | |
Prologis, Inc. | | | 243,529 | | | | 24,852,134 | |
Public Storage | | | 112,239 | | | | 29,120,409 | |
Rexford Industrial Realty, Inc.(a) | | | 185,820 | | | | 7,954,954 | |
Safestore Holdings PLC | | | 282,600 | | | | 2,731,399 | |
Segro PLC | | | 856,534 | | | | 9,075,970 | |
STAG Industrial, Inc.(a) | | | 241,499 | | | | 8,305,151 | |
Terreno Realty Corp. | | | 114,213 | | | | 6,207,477 | |
Tritax Big Box REIT PLC | | | 2,506,196 | | | | 4,747,520 | |
Urban Logistics REIT PLC | | | 615,981 | | | | 891,309 | |
Warehouses De Pauw CVA | | | 230,601 | | | | 6,137,679 | |
WP Carey, Inc. | | | 171,530 | | | | 9,406,705 | |
TOTAL REAL ESTATE INVESTMENT TRUSTS (Cost $205,779,042) | | | | | | | 184,908,460 | |
| |
COMMON STOCKS — 4.7% |
| |
Real Estate — 4.7% |
Sagax AB - Class B | | | 282,270 | | | | 7,125,650 | |
VGP NV | | | 17,686 | | | | 1,932,752 | |
| | | | | | | 9,058,402 | |
TOTAL COMMON STOCKS (Cost $7,362,758) | | | | | | | 9,058,402 | |
| |
| | | Units | | | Value | |
INVESTMENTS PURCHASED WITH PROCEEDS FROM SECURITIES LENDING — 7.5% |
Mount Vernon Liquid Assets Portfolio, LLC - 5.51%(b) | | | 14,624,834 | | | $ | 14,624,834 | |
TOTAL INVESTMENTS PURCHASED WITH PROCEEDS FROM SECURITIES LENDING (Cost $14,624,834) | | | | | | | 14,624,834 | |
| |
TOTAL INVESTMENTS — 107.1% (Cost $227,766,634) | | | | | | | 208,591,696 | |
Liabilities in Excess of Other Assets — (7.1)% | | | | | | | (13,823,079 | ) |
TOTAL NET ASSETS — 100.0% | | | | | | $ | 194,768,617 | |
Percentages are stated as a percent of net assets.
| | NV - Naamloze Vennootschap | |
| | PLC - Public Limited Company | |
| | (a) | All or a portion of this security is on loan as of April 30, 2024. The total market value of these securities was $14,135,307 which represented 7.3% of net assets. |
| | (b) | The rate shown represents the 7-day effective yield as of April 30, 2024. |
The Global Industry Classification Standard (GICS®) was developed by and/or is the exclusive property of MSCI, Inc. and Standard & Poor’s Financial Services LLC (“S&P”). GICS is a service mark of MSCI, Inc. and S&P and has been licensed for use by U.S. Bank Global Fund Services.
The accompanying notes are an integral part of the financial statements.
140
Pacer Data & Infrastructure Real Estate ETF
SCHEDULE OF INVESTMENTS
April 30, 2024
| | | Shares | | | Value | |
REAL ESTATE INVESTMENT TRUSTS — 61.1% |
| |
American Tower Corp. | | | 348,119 | | | $ | 59,723,296 | |
Crown Castle, Inc. | | | 639,159 | | | | 59,940,332 | |
Digital Core REIT Management Pte Ltd. | | | 5,356,787 | | | | 3,267,640 | |
Digital Realty Trust, Inc.(a) | | | 145,027 | | | | 20,126,847 | |
Equinix, Inc. | | | 79,303 | | | | 56,393,156 | |
Iron Mountain, Inc. | | | 266,459 | | | | 20,655,902 | |
Keppel DC REIT | | | 8,499,555 | | | | 10,657,554 | |
SBA Communications Corp. | | | 96,906 | | | | 18,036,145 | |
Uniti Group, Inc.(a) | | | 1,502,172 | | | | 8,637,489 | |
TOTAL REAL ESTATE INVESTMENT TRUSTS (Cost $322,957,524) | | | | | | | 257,438,361 | |
| |
COMMON STOCKS — 38.6% |
| |
Communication Services — 28.4%(b) |
Cellnex Telecom SA(c) | | | 572,537 | | | | 19,008,451 | |
China Tower Corp. Ltd. - Class H(c) | | | 177,466,220 | | | | 20,875,176 | |
Chorus Ltd. | | | 2,569,821 | | | | 10,996,831 | |
Eutelsat Communications SACA(a)(d) | | | 847,166 | | | | 3,429,499 | |
HKBN Ltd. | | | 5,504,291 | | | | 1,660,887 | |
Infrastrutture Wireless Italiane SpA(c) | | | 1,898,872 | | | | 20,466,227 | |
Iridium Communications, Inc.(a) | | | 704,462 | | | | 21,690,385 | |
PT Tower Bersama Infrastructure Tbk | | | 34,898,909 | | | | 4,238,951 | |
Sarana Menara Nusantara Tbk PT | | | 121,190,240 | | | | 5,999,886 | |
SES SA | | | 2,315,422 | | | | 11,294,500 | |
| | | | | | | 119,660,793 | |
| |
Information Technology — 6.2% |
GDS Holdings Ltd. - ADR(a)(d) | | | 717,084 | | | | 5,851,405 | |
NEXTDC Ltd.(d) | | | 1,873,168 | | | | 20,300,762 | |
| | | | | | | 26,152,167 | |
| |
Real Estate — 4.0% |
DigitalBridge Group, Inc.(a) | | | 1,036,826 | | | | 17,045,419 | |
TOTAL COMMON STOCKS (Cost $190,385,010) | | | | | | | 162,858,379 | |
| |
| | | Contracts | | | | | |
RIGHTS — 0.1% | | | | | | | | |
| | | | | | | | | |
Information Technology — 0.1% | | | | | | | | |
NEXTDC Ltd., Expires 05/03/2024, Exercise Price $15.40(d)(e) | 317,065 | | | 264,780 | |
TOTAL RIGHTS (Cost $191,671) | | | | | | | 264,780 | |
| | | | | | | | | |
| | | Units | | | Value | |
INVESTMENTS PURCHASED WITH PROCEEDS FROM SECURITIES LENDING — 6.3% |
Mount Vernon Liquid Assets Portfolio, LLC – 5.51%(f) | | | 26,363,358 | | | $ | 26,363,358 | |
TOTAL INVESTMENTS PURCHASED WITH PROCEEDS FROM SECURITIES LENDING (Cost $26,363,358) | | | | | | | 26,363,358 | |
| |
TOTAL INVESTMENTS — 106.1% (Cost $539,897,563) | | | | | | | 446,924,878 | |
Liabilities in Excess of Other Assets — (6.1)% | | | | | | | (25,763,370 | ) |
TOTAL NET ASSETS — 100.0% | | | | | | $ | 421,161,508 | |
Percentages are stated as a percent of net assets.
ADR - American Depositary Receipt
SA - Sociedad Anónima
| | (a) | All or a portion of this security is on loan as of April 30, 2024. The total market value of these securities was $24,975,033 which represented 5.9% of net assets. |
| | (b) | To the extent that the Fund invests more heavily in a particular industry or sector of the economy, its performance will be especially sensitive to developments that significantly affect those industries or sectors. |
| | (c) | Security is exempt from registration pursuant to Rule 144A under the Securities Act of 1933, as amended. These securities may only be resold in transactions exempt from registration to qualified institutional investors. As of April 30, 2024, the value of these securities total $60,349,854 or 14.3% of the Fund’s net assets. |
| | (d) | Non-income producing security. |
| | (e) | Fair value determined using significant unobservable inputs in accordance with procedures established by and under the supervision of the Adviser, acting as Valuation Designee. These securities represented $264,780 or 0.1% of net assets as of April 30, 2024. |
| | (f) | The rate shown represents the 7-day effective yield as of April 30, 2024. |
The Global Industry Classification Standard (GICS®) was developed by and/or is the exclusive property of MSCI, Inc. and Standard & Poor’s Financial Services LLC (“S&P”). GICS is a service mark of MSCI, Inc. and S&P and has been licensed for use by U.S. Bank Global Fund Services.
The accompanying notes are an integral part of the financial statements.
141
Pacer CFRA-Stovall Equal Weight Seasonal Rotation ETF
SCHEDULE OF INVESTMENTS
April 30, 2024
| | | Shares | | | Value | |
COMMON STOCKS — 100.7% |
| |
Consumer Staples — 50.2%(a) |
Altria Group, Inc. | | | 12,390 | | | $ | 542,806 | |
Archer-Daniels-Midland Co. | | | 9,460 | | | | 554,924 | |
Brown-Forman Corp. - Class B | | | 9,530 | | | | 456,011 | |
Bunge Global SA | | | 5,430 | | | | 552,557 | |
Campbell Soup Co. | | | 12,280 | | | | 561,319 | |
Church & Dwight Co., Inc. | | | 4,980 | | | | 537,292 | |
Clorox Co. | | | 3,330 | | | | 492,407 | |
Coca-Cola Co. | | | 8,720 | | | | 538,634 | |
Colgate-Palmolive Co. | | | 5,890 | | | | 541,409 | |
Conagra Brands, Inc. | | | 18,440 | | | | 567,582 | |
Constellation Brands, Inc. - Class A | | | 2,010 | | | | 509,455 | |
Costco Wholesale Corp. | | | 720 | | | | 520,488 | |
Dollar General Corp. | | | 3,300 | | | | 459,327 | |
Dollar Tree, Inc.(b) | | | 3,510 | | | | 415,058 | |
Estee Lauder Cos., Inc | | | 3,470 | | | | 509,084 | |
General Mills, Inc. | | | 7,950 | | | | 560,157 | |
Hershey Co. | | | 2,670 | | | | 517,766 | |
Hormel Foods Corp. | | | 15,210 | | | | 540,868 | |
J M Smucker Co. | | | 4,340 | | | | 498,449 | |
Kellanova | | | 9,570 | | | | 553,720 | |
Kenvue, Inc. | | | 25,910 | | | | 487,626 | |
Keurig Dr Pepper, Inc. | | | 17,210 | | | | 579,976 | |
Kimberly-Clark Corp. | | | 4,130 | | | | 563,868 | |
Kroger Co. | | | 9,270 | | | | 513,373 | |
Lamb Weston Holdings, Inc. | | | 5,130 | | | | 427,534 | |
McCormick & Co., Inc. | | | 7,300 | | | | 555,238 | |
Molson Coors Beverage Co. - Class B | | | 8,030 | | | | 459,798 | |
Mondelez International, Inc. - Class A | | | 7,220 | | | | 519,407 | |
Monster Beverage Corp.(b) | | | 8,770 | | | | 468,757 | |
PepsiCo, Inc. | | | 3,180 | | | | 559,394 | |
Philip Morris International, Inc. | | | 5,600 | | | | 531,664 | |
Procter & Gamble Co. | | | 3,240 | | | | 528,768 | |
Sysco Corp. | | | 6,440 | | | | 478,621 | |
Target Corp. | | | 3,060 | | | | 492,599 | |
The Kraft Heinz Co. | | | 14,370 | | | | 554,826 | |
Tyson Foods, Inc. - Class A | | | 9,260 | | | | 561,618 | |
Walgreens Boots Alliance, Inc. | | | 24,510 | | | | 434,562 | |
Walmart, Inc. | | | 8,630 | | | | 512,191 | |
| | | | | | | 19,659,133 | |
| |
Health Care — 50.5%(a) |
Abbott Laboratories | | | 2,720 | | | | 288,238 | |
AbbVie, Inc. | | | 1,840 | | | | 299,258 | |
Agilent Technologies, Inc. | | | 2,220 | | | | 304,229 | |
Align Technology, Inc.(b) | | | 1,050 | | | | 296,499 | |
Amgen, Inc. | | | 1,200 | | | | 328,728 | |
Baxter International, Inc. | | | 7,510 | | | | 303,179 | |
| | | Shares | | | Value | |
Health Care — 50.5%(a) (Continued) |
Becton Dickinson & Co. | | | 1,370 | | | $ | 321,402 | |
Biogen, Inc.(b) | | | 1,470 | | | | 315,785 | |
Bio-Rad Laboratories, Inc. - Class A(b) | | | 960 | | | | 258,960 | |
Bio-Techne Corp. | | | 4,260 | | | | 269,275 | |
Boston Scientific Corp.(b) | | | 4,860 | | | | 349,288 | |
Bristol-Myers Squibb Co. | | | 6,110 | | | | 268,473 | |
Cardinal Health, Inc. | | | 2,850 | | | | 293,664 | |
Catalent, Inc.(b) | | | 5,810 | | | | 324,489 | |
Cencora, Inc. | | | 1,380 | | | | 329,889 | |
Centene Corp.(b) | | | 4,210 | | | | 307,583 | |
Charles River Laboratories International, Inc.(b) | | | 1,230 | | | | 281,670 | |
Cigna Corp. | | | 960 | | | | 342,758 | |
Cooper Cos., Inc. | | | 3,240 | | | | 288,554 | |
CVS Health Corp. | | | 4,380 | | | | 296,570 | |
Danaher Corp. | | | 1,300 | | | | 320,606 | |
DaVita, Inc.(b) | | | 2,430 | | | | 337,794 | |
DexCom, Inc.(b) | | | 2,430 | | | | 309,558 | |
Edwards Lifesciences Corp.(b) | | | 3,570 | | | | 302,272 | |
Elevance Health, Inc. | | | 650 | | | | 343,577 | |
Eli Lilly & Co. | | | 430 | | | | 335,873 | |
GE HealthCare Technologies, Inc. | | | 3,500 | | | | 266,840 | |
Gilead Sciences, Inc. | | | 4,370 | | | | 284,924 | |
HCA Healthcare, Inc. | | | 1,010 | | | | 312,918 | |
Henry Schein, Inc.(b) | | | 4,400 | | | | 304,832 | |
Hologic, Inc.(b) | | | 4,260 | | | | 322,780 | |
Humana, Inc. | | | 970 | | | | 293,027 | |
IDEXX Laboratories, Inc.(b) | | | 590 | | | | 290,728 | |
Illumina, Inc.(b) | | | 2,430 | | | | 299,012 | |
Incyte Corp.(b) | | | 5,470 | | | | 284,714 | |
Insulet Corp.(b) | | | 1,830 | | | | 314,650 | |
Intuitive Surgical, Inc.(b) | | | 840 | | | | 311,321 | |
IQVIA Holdings, Inc.(b) | | | 1,280 | | | | 296,666 | |
Johnson & Johnson | | | 2,060 | | | | 297,855 | |
Laboratory Corp. of America Holdings | | | 1,510 | | | | 304,069 | |
McKesson Corp. | | | 620 | | | | 333,070 | |
Medtronic PLC | | | 3,860 | | | | 309,726 | |
Merck & Co., Inc. | | | 2,660 | | | | 343,725 | |
Mettler-Toledo International, Inc.(b) | | | 250 | | | | 307,425 | |
Moderna, Inc.(b) | | | 3,190 | | | | 351,889 | |
Molina Healthcare, Inc.(b) | | | 840 | | | | 287,364 | |
Pfizer, Inc. | | | 12,070 | | | | 309,233 | |
Quest Diagnostics, Inc. | | | 2,580 | | | | 356,504 | |
Regeneron Pharmaceuticals, Inc.(b) | | | 340 | | | | 302,824 | |
ResMed, Inc. | | | 1,740 | | | | 372,342 | |
Revvity, Inc. | | | 3,010 | | | | 308,435 | |
Solventum Corp.(b) | | | 4,360 | | | | 283,444 | |
The accompanying notes are an integral part of the financial statements.
142
Pacer CFRA-Stovall Equal Weight Seasonal Rotation ETF
SCHEDULE OF INVESTMENTS
April 30, 2024 (Continued)
| | | Shares | | | Value | |
COMMON STOCKS — 100.7% (Continued) |
| | | | | | | | | |
Health Care — 50.5%(a) (Continued) |
STERIS PLC | | | 1,410 | | | $ | 288,430 | |
Stryker Corp. | | | 920 | | | | 309,580 | |
Teleflex, Inc. | | | 1,460 | | | | 304,775 | |
Thermo Fisher Scientific, Inc. | | | 550 | | | | 312,796 | |
UnitedHealth Group, Inc. | | | 690 | | | | 333,753 | |
Universal Health Services, Inc. - Class B | | | 1,870 | | | | 318,704 | |
Vertex Pharmaceuticals, Inc.(b) | | | 790 | | | | 310,320 | |
Viatris, Inc. | | | 26,800 | | | | 310,076 | |
Waters Corp.(b) | | | 920 | | | | 284,317 | |
West Pharmaceutical Services, Inc. | | | 920 | | | | 328,882 | |
Zimmer Biomet Holdings, Inc. | | | 2,590 | | | | 311,525 | |
Zoetis, Inc. | | | 1,800 | | | | 286,633 | |
| | | | | | | 19,768,279 | |
TOTAL COMMON STOCKS (Cost $39,435,809) | | | | | | | 39,427,412 | |
| |
| | | Units | | | | | |
INVESTMENTS PURCHASED WITH PROCEEDS FROM SECURITIES LENDING — 18.8% |
Mount Vernon Liquid Assets Portfolio, LLC – 5.51%(c)(d) | | | 7,355,777 | | | | 7,355,777 | |
TOTAL INVESTMENTS PURCHASED WITH PROCEEDS FROM SECURITIES LENDING (Cost $7,355,777) | | | | | | | 7,355,777 | |
| |
TOTAL INVESTMENTS — 119.5% (Cost $46,791,586) | | | | | | | 46,783,189 | |
Liabilities in Excess of Other Assets — (19.5)% | | | | | | | (7,642,864 | ) |
TOTAL NET ASSETS — 100.0% | | | | | | $ | 39,140,325 | |
Percentages are stated as a percent of net assets.
| | PLC - Public Limited Company | |
| | (a) | To the extent that the Fund invests more heavily in a particular industry or sector of the economy, its performance will be especially sensitive to developments that significantly affect those industries or sectors. |
| | (b) | Non-income producing security. |
| | (c) | The rate shown represents the 7-day effective yield as of April 30, 2024. |
| | (d) | Due to settlement of open trades, there are no positions in the portfolio on loan as of April 30, 2024. The total value of securities on loan is $7,028,954 or 18.0% of total net assets. |
The Global Industry Classification Standard (GICS®) was developed by and/or is the exclusive property of MSCI, Inc. and Standard & Poor’s Financial Services LLC (“S&P”). GICS is a service mark of MSCI, Inc. and S&P and has been licensed for use by U.S. Bank Global Fund Services.
The accompanying notes are an integral part of the financial statements.
143
Pacer CSOP FTSE China A50 ETF
SCHEDULE OF INVESTMENTS
April 30, 2024
| | | Shares | | | Value | |
COMMON STOCKS — 99.2% |
| |
Consumer Discretionary — 6.6% |
BYD Co. Ltd. - Class A | | | 3,945 | | | $ | 119,034 | |
China Tourism Group Duty Free Corp. Ltd. - Class A | | | 4,300 | | | | 44,476 | |
Great Wall Motor Co. Ltd. - Class A | | | 6,000 | | | | 21,708 | |
Gree Electric Appliances, Inc. of Zhuhai | | | 8,800 | | | | 51,185 | |
Haier Smart Home Co. Ltd. - Class A | | | 13,700 | | | | 57,248 | |
| | | | | | | 293,651 | |
| |
Consumer Staples — 26.8%(a) |
Foshan Haitian Flavouring & Food Co. Ltd. | | | 10,712 | | | | 58,075 | |
Inner Mongolia Yili Industrial Group Co. Ltd. | | | 13,900 | | | | 54,917 | |
Kweichow Moutai Co. Ltd. | | | 2,700 | | | | 635,710 | |
Luzhou Laojiao Co. Ltd. | | | 3,245 | | | | 83,394 | |
Muyuan Foods Co. Ltd. | | | 11,862 | | | | 71,452 | |
Shanxi Xinghuacun Fen Wine Factory Co. Ltd. | | | 2,683 | | | | 97,187 | |
Wuliangye Yibin Co. Ltd. | | | 8,400 | | | | 174,496 | |
Yihai Kerry Arawana Holdings Co. Ltd. | | | 4,200 | | | | 18,212 | |
| | | | | | | 1,193,443 | |
| |
Energy — 6.7% |
China Petroleum & Chemical Corp. - Class A | | | 73,900 | | | | 64,802 | |
China Shenhua Energy Co. Ltd. - Class A | | | 15,400 | | | | 84,704 | |
PetroChina Co. Ltd. - Class A | | | 54,200 | | | | 76,867 | |
Shaanxi Coal Industry Co. Ltd. - Class A | | | 21,100 | | | | 71,475 | |
| | | | | | | 297,848 | |
| |
Financials — 29.9%(a) |
Agricultural Bank of China Ltd. - Class A | | | 206,000 | | | | 125,167 | |
Bank of China Ltd. - Class A | | | 97,600 | | | | 61,863 | |
Bank of Communications Co. Ltd. - Class A | | | 85,400 | | | | 81,137 | |
China CITIC Bank Corp. Ltd. - Class A | | | 21,200 | | | | 20,142 | |
China Construction Bank Corp. - Class A | | | 20,900 | | | | 20,549 | |
China Everbright Bank Co. Ltd. - Class A | | | 101,000 | | | | 43,934 | |
China Merchants Bank Co. Ltd. - Class A | | | 44,900 | | | | 212,735 | |
China Pacific Insurance Group Co. Ltd. - Class A | | | 14,900 | | | | 53,086 | |
CITIC Securities Co. Ltd. - Class A | | | 26,570 | | | | 69,750 | |
CSC Financial Co. Ltd. - Class A | | | 11,100 | | | | 34,228 | |
| | | Shares | | | Value | |
Financials — 29.9%(a) (Continued) | | | | | | | | |
East Money Information Co. Ltd. | | | 34,492 | | | $ | 62,158 | |
Industrial & Commercial Bank of China Ltd. - Class A | | | 167,700 | | | | 125,749 | |
Industrial Bank Co. Ltd. | | | 45,200 | | | | 105,174 | |
People’s Insurance Co. Group of China Ltd. - Class A | | | 23,200 | | | | 16,820 | |
Ping An Bank Co. Ltd. | | | 42,200 | | | | 62,879 | |
Ping An Insurance Group Co. of China Ltd. - Class A | | | 23,600 | | | | 134,792 | |
Postal Savings Bank of China Co. Ltd. - Class A | | | 50,100 | | | | 33,209 | |
Shanghai Pudong Development Bank Co. Ltd. | | | 63,900 | | | | 67,946 | |
| | | | | | | 1,331,318 | |
| |
Health Care — 4.5% |
Jiangsu Hengrui Pharmaceuticals Co. Ltd. | | | 13,900 | | | | 88,604 | |
Shenzhen Mindray Bio-Medical Electronics Co. Ltd. | | | 2,600 | | | | 109,360 | |
| | | | | | | 197,964 | |
| |
Industrials — 11.1% |
Beijing-Shanghai High Speed Railway Co. Ltd. | | | 62,100 | | | | 43,650 | |
China State Construction Engineering Corp. Ltd. | | | 91,300 | | | | 67,578 | |
Contemporary Amperex Technology Co. Ltd. | | | 9,640 | | | | 269,704 | |
NARI Technology Co. Ltd. | | | 17,500 | | | | 56,887 | |
SF Holding Co. Ltd. | | | 10,700 | | | | 53,563 | |
| | | | | | | 491,382 | |
| |
Information Technology — 4.8% |
Foxconn Industrial Internet Co. Ltd. | | | 27,200 | | | | 92,025 | |
Hygon Information Technology Co. Ltd. - Class A | | | 1,600 | | | | 17,510 | |
LONGi Green Energy Technology Co. Ltd. | | | 16,520 | | | | 41,520 | |
Luxshare Precision Industry Co. Ltd. | | | 15,529 | | | | 62,618 | |
| | | | | | | 213,673 | |
| |
Materials — 4.3% |
Wanhua Chemical Group Co. Ltd. | | | 6,812 | | | | 83,815 | |
Zijin Mining Group Co. Ltd. - Class A | | | 44,800 | | | | 108,946 | |
| | | | | | | 192,761 | |
| |
The accompanying notes are an integral part of the financial statements.
144
Pacer CSOP FTSE China A50 ETF
SCHEDULE OF INVESTMENTS
April 30, 2024 (Continued)
| | | Shares | | | Value | |
COMMON STOCKS — 99.2% (Continued) |
| |
Utilities — 4.5% |
CGN Power Co. Ltd. - Class A | | | 15,900 | | | $ | 9,024 | |
China Yangtze Power Co. Ltd. | | | 53,300 | | | | 189,824 | |
| | | | | | | 198,848 | |
TOTAL COMMON STOCKS (Cost $4,417,579) | | | | | | | 4,410,888 | |
| |
TOTAL INVESTMENTS — 99.2% (Cost $4,417,579) | | | | | | | 4,410,888 | |
Other Assets in Excess of Liabilities — 0.8% | | | | | | | 32,662 | |
TOTAL NET ASSETS — 100.0% | | | | | | $ | 4,443,550 | |
Percentages are stated as a percent of net assets.
| | (a) | To the extent that the Fund invests more heavily in a particular industry or sector of the economy, its performance will be especially sensitive to developments that significantly affect those industries or sectors. |
The Global Industry Classification Standard (GICS®) was developed by and/or is the exclusive property of MSCI, Inc. and Standard & Poor’s Financial Services LLC (“S&P”). GICS is a service mark of MSCI, Inc. and S&P and has been licensed for use by U.S. Bank Global Fund Services.
The accompanying notes are an integral part of the financial statements.
145
Pacer BioThreat Strategy ETF
SCHEDULE OF INVESTMENTS
April 30, 2024
| | | Shares | | | Value | |
COMMON STOCKS — 99.8% |
| |
Communication Services — 5.3% |
Netflix, Inc.(a) | | | 331 | | | $ | 182,262 | |
| |
Consumer Discretionary — 14.2% |
Amazon.com, Inc.(a) | | | 1,019 | | | | 178,325 | |
Home Depot, Inc. | | | 460 | | | | 153,741 | |
Lowe’s Cos., Inc. | | | 694 | | | | 158,225 | |
| | | | | | | 490,291 | |
| |
Consumer Staples — 12.9% |
Campbell Soup Co.(b) | | | 360 | | | | 16,456 | |
Church & Dwight Co., Inc. | | | 297 | | | | 32,043 | |
Clorox Co. | | | 150 | | | | 22,181 | |
Energizer Holdings, Inc. | | | 85 | | | | 2,441 | |
Haleon PLC - ADR | | | 5,563 | | | | 47,452 | |
Hormel Foods Corp. | | | 660 | | | | 23,470 | |
Kimberly-Clark Corp. | | | 408 | | | | 55,704 | |
Kroger Co. | | | 866 | | | | 47,959 | |
Walgreens Boots Alliance, Inc. | | | 1,043 | | | | 18,492 | |
Walmart, Inc. | | | 2,989 | | | | 177,397 | |
| | | | | | | 443,595 | |
| |
Health Care — 49.1%(c) |
Abbott Laboratories | | | 1,438 | | | | 152,385 | |
Agilent Technologies, Inc. | | | 353 | | | | 48,375 | |
BioNTech SE – ADR (a) | | | 287 | | | | 25,491 | |
CVS Health Corp.(b) | | | 1,553 | | | | 105,154 | |
Danaher Corp. | | | 691 | | | | 170,414 | |
Emergent BioSolutions, Inc.(a) | | | 60 | | | | 113 | |
Fortrea Holdings, Inc.(a) | | | 105 | | | | 3,842 | |
Gilead Sciences, Inc.(b) | | | 1,504 | | | | 98,061 | |
GSK PLC - ADR(b) | | | 2,479 | | | | 102,730 | |
Illumina, Inc.(a) | | | 192 | | | | 23,626 | |
Johnson & Johnson | | | 973 | | | | 140,686 | |
Laboratory Corp. of America Holdings | | | 102 | | | | 20,540 | |
Merck & Co., Inc. | | | 1,449 | | | | 187,240 | |
Mettler-Toledo International, Inc.(a) | | | 26 | | | | 31,972 | |
Moderna, Inc.(a)(b) | | | 459 | | | | 50,632 | |
Neogen Corp.(a) | | | 256 | | | | 3,156 | |
Organon & Co. | | | 302 | | | | 5,620 | |
QIAGEN NV SHS | | | 266 | | | | 11,260 | |
Quest Diagnostics, Inc. | | | 136 | | | | 18,792 | |
| | | Shares | | | Value | |
Health Care — 49.1%(c) (Continued) |
Regeneron Pharmaceuticals, Inc.(a)(b) | | | 132 | | | $ | 117,567 | |
Revvity, Inc. | | | 148 | | | | 15,166 | |
Sanofi SA - ADR | | | 3,040 | | | | 149,659 | |
Solventum Corp.(a) | | | 166 | | | | 10,792 | |
Teladoc Health, Inc.(a) | | | 194 | | | | 2,474 | |
Thermo Fisher Scientific, Inc. | | | 307 | | | | 174,597 | |
Vir Biotechnology, Inc.(a) | | | 159 | | | | 1,345 | |
Waters Corp.(a) | | | 71 | | | | 21,942 | |
| | | | | | | 1,693,631 | |
| |
Industrials — 4.6% |
3M Co.(b) | | | 665 | | | | 64,179 | |
Booz Allen Hamilton Holding Corp. | | | 157 | | | | 23,184 | |
Stericycle, Inc.(a) | | | 110 | | | | 4,920 | |
Veralto Corp. | | | 297 | | | | 27,823 | |
Xylem, Inc. | | | 291 | | | | 38,034 | |
| | | | | | | 158,140 | |
| |
Information Technology — 11.4% |
Akamai Technologies, Inc.(a)(b) | | | 182 | | | | 18,369 | |
NVIDIA Corp. | | | 316 | | | | 273,031 | |
Palantir Technologies, Inc. - Class A(a) | | | 2,621 | | | | 57,583 | |
Teledyne Technologies, Inc.(a) | | | 57 | | | | 21,744 | |
Zoom Video Communications, Inc. - Class A(a) | | | 368 | | | | 22,485 | |
| | | | | | | 393,212 | |
| |
Materials — 2.3% |
Ecolab, Inc. | | | 344 | | | | 77,795 | |
Stepan Co. | | | 27 | | | | 2,242 | |
| | | | | | | 80,037 | |
TOTAL COMMON STOCKS (Cost $3,753,761) | | | | | | | 3,441,168 | |
| |
The accompanying notes are an integral part of the financial statements.
146
Pacer BioThreat Strategy ETF
SCHEDULE OF INVESTMENTS
April 30, 2024 (Continued)
| | | Units | | | Value | |
INVESTMENTS PURCHASED WITH PROCEEDS FROM SECURITIES LENDING — 13.9% |
Mount Vernon Liquid Assets Portfolio, LLC – 5.51%(d) | | | 477,840 | | | $ | 477,840 | |
TOTAL INVESTMENTS PURCHASED WITH PROCEEDS FROM SECURITIES LENDING (Cost $477,840) | | | | | | | 477,840 | |
| |
TOTAL INVESTMENTS — 113.7% (Cost $4,231,601) | | | | | | | 3,919,008 | |
Liabilities in Excess of Other Assets — (13.7)% | | | | | | | (473,888 | ) |
TOTAL NET ASSETS — 100.0% | | | | | | $ | 3,445,120 | |
Percentages are stated as a percent of net assets.
ADR - American Depositary Receipt
NV - Naamloze Vennootschap
PLC - Public Limited Company
SA - Sociedad Anónima
| | (a) | Non-income producing security. |
| | (b) | All or a portion of this security is on loan as of April 30, 2024. The total market value of these securities was $468,102 which represented 13.6% of net assets. |
| | (c) | To the extent that the Fund invests more heavily in a particular industry or sector of the economy, its performance will be especially sensitive to developments that significantly affect those industries or sectors. |
| | (d) | The rate shown represents the 7-day effective yield as of April 30, 2024. |
The Global Industry Classification Standard (GICS®) was developed by and/or is the exclusive property of MSCI, Inc. and Standard & Poor’s Financial Services LLC (“S&P”). GICS is a service mark of MSCI, Inc. and S&P and has been licensed for use by U.S. Bank Global Fund Services.
The accompanying notes are an integral part of the financial statements.
147
Pacer Lunt Large Cap Alternator ETF
SCHEDULE OF INVESTMENTS
April 30, 2024
| | | Shares | | | Value | |
COMMON STOCKS — 98.0% |
| |
Communication Services — 1.8% |
Electronic Arts, Inc. | | | 16,462 | | | $ | 2,087,711 | |
T-Mobile US, Inc.(a) | | | 15,586 | | | | 2,558,753 | |
| | | | | | | 4,646,464 | |
| |
Consumer Discretionary — 6.1% |
Darden Restaurants, Inc.(a) | | | 15,548 | | | | 2,385,219 | |
LKQ Corp. | | | 47,006 | | | | 2,027,369 | |
McDonald’s Corp. | | | 11,883 | | | | 3,244,533 | |
O’Reilly Automotive, Inc.(b) | | | 2,137 | | | | 2,165,337 | |
TJX Cos., Inc. | | | 29,838 | | | | 2,807,457 | |
Yum! Brands, Inc.(a) | | | 22,082 | | | | 3,119,083 | |
| | | | | | | 15,748,998 | |
| |
Consumer Staples — 23.4% |
Altria Group, Inc. | | | 61,882 | | | | 2,711,050 | |
Church & Dwight Co., Inc.(a) | | | 25,001 | | | | 2,697,358 | |
Coca-Cola Co. | | | 59,372 | | | | 3,667,408 | |
Colgate-Palmolive Co. | | | 36,211 | | | | 3,328,515 | |
Conagra Brands, Inc. | | | 86,625 | | | | 2,666,318 | |
Constellation Brands, Inc. - Class A | | | 10,451 | | | | 2,648,910 | |
Costco Wholesale Corp. | | | 3,652 | | | | 2,640,031 | |
General Mills, Inc. | | | 39,714 | | | | 2,798,248 | |
Hershey Co. | | | 13,526 | | | | 2,622,962 | |
J M Smucker Co. | | | 17,588 | | | | 2,019,982 | |
Kellanova | | | 48,734 | | | | 2,819,749 | |
Keurig Dr Pepper, Inc. | | | 81,238 | | | | 2,737,721 | |
Kimberly-Clark Corp. | | | 24,314 | | | | 3,319,590 | |
Kroger Co. | | | 54,553 | | | | 3,021,145 | |
Mondelez International, Inc. - Class A | | | 35,437 | | | | 2,549,338 | |
PepsiCo, Inc. | | | 18,123 | | | | 3,188,017 | |
Philip Morris International, Inc. | | | 29,883 | | | | 2,837,092 | |
Procter & Gamble Co. | | | 19,080 | | | | 3,113,856 | |
Sysco Corp. | | | 30,473 | | | | 2,264,753 | |
The Kraft Heinz Co. | | | 76,234 | | | | 2,943,395 | |
Walmart, Inc. | | | 53,152 | | | | 3,154,571 | |
| | | | | | | 59,750,009 | |
| |
Energy — 2.2% |
Kinder Morgan, Inc. | | | 158,139 | | | | 2,890,781 | |
Williams Cos., Inc. | | | 68,586 | | | | 2,630,959 | |
| | | | | | | 5,521,740 | |
| |
Financials — 16.4% |
Aflac, Inc. | | | 29,340 | | | | 2,454,291 | |
Aon PLC - Class A | | | 7,676 | | | | 2,164,709 | |
Arthur J Gallagher & Co. | | | 10,269 | | | | 2,410,032 | |
Berkshire Hathaway, Inc. - Class B(b) | | | 8,472 | | | | 3,361,097 | |
Brown & Brown, Inc. | | | 28,760 | | | | 2,345,090 | |
| | | Shares | | | Value | |
Financials — 16.4% (Continued) | | | | | | | | |
Cboe Global Markets, Inc. | | | 13,659 | | | $ | 2,474,328 | |
Chubb Ltd. | | | 9,369 | | | | 2,329,508 | |
CME Group, Inc. | | | 12,106 | | | | 2,537,902 | |
FactSet Research Systems, Inc. | | | 4,758 | | | | 1,983,563 | |
Globe Life, Inc.(a) | | | 20,276 | | | | 1,544,423 | |
Intercontinental Exchange, Inc. | | | 19,913 | | | | 2,563,998 | |
JPMorgan Chase & Co. | | | 12,762 | | | | 2,446,986 | |
Loews Corp. | | | 35,787 | | | | 2,689,393 | |
Marsh & McLennan Cos., Inc. | | | 14,298 | | | | 2,851,450 | |
MasterCard, Inc. - Class A | | | 6,167 | | | | 2,782,550 | |
Moody’s Corp. | | | 5,686 | | | | 2,105,696 | |
Visa, Inc. - Class A(a) | | | 11,000 | | | | 2,954,710 | |
| | | | | | | 41,999,726 | |
| |
Health Care — 11.2% |
Abbott Laboratories | | | 20,409 | | | | 2,162,742 | |
AbbVie, Inc. | | | 13,499 | | | | 2,195,477 | |
Becton Dickinson & Co. | | | 9,703 | | | | 2,276,324 | |
Boston Scientific Corp.(b) | | | 35,233 | | | | 2,532,196 | |
Bristol-Myers Squibb Co. | | | 49,075 | | | | 2,156,356 | |
Cencora, Inc. | | | 11,231 | | | | 2,684,771 | |
Hologic, Inc.(b) | | | 32,026 | | | | 2,426,610 | |
Johnson & Johnson | | | 18,266 | | | | 2,641,081 | |
Laboratory Corp. of America Holdings | | | 10,777 | | | | 2,170,164 | |
McKesson Corp. | | | 4,462 | | | | 2,397,031 | |
Merck & Co., Inc. | | | 19,311 | | | | 2,495,367 | |
Quest Diagnostics, Inc. | | | 19,534 | | | | 2,699,208 | |
| | | | | | | 28,837,327 | |
| |
Industrials — 13.9% |
AMETEK, Inc. | | | 15,573 | | | | 2,719,980 | |
Automatic Data Processing, Inc. | | | 9,288 | | | | 2,246,674 | |
Broadridge Financial Solutions, Inc. | | | 12,120 | | | | 2,344,129 | |
Cintas Corp. | | | 4,006 | | | | 2,637,310 | |
CSX Corp. | | | 62,363 | | | | 2,071,699 | |
General Dynamics Corp. | | | 9,362 | | | | 2,687,737 | |
Honeywell International, Inc. | | | 13,457 | | | | 2,593,568 | |
IDEX Corp. | | | 10,168 | | | | 2,241,637 | |
Illinois Tool Works, Inc. | | | 9,061 | | | | 2,211,881 | |
Lockheed Martin Corp. | | | 5,859 | | | | 2,724,025 | |
Otis Worldwide Corp. | | | 26,938 | | | | 2,456,746 | |
Republic Services, Inc. | | | 17,940 | | | | 3,439,097 | |
Verisk Analytics, Inc. | | | 9,456 | | | | 2,061,030 | |
Waste Management, Inc. | | | 15,739 | | | | 3,274,027 | |
| | | | | | | 35,709,540 | |
| |
Information Technology — 7.3% |
Amphenol Corp. - Class A | | | 23,595 | | | | 2,849,569 | |
Apple, Inc. | | | 11,972 | | | | 2,039,191 | |
The accompanying notes are an integral part of the financial statements.
148
Pacer Lunt Large Cap Alternator ETF
SCHEDULE OF INVESTMENTS
April 30, 2024 (Continued)
| | | Shares | | | Value | |
COMMON STOCKS — 98.0% (Continued) |
| | | | | | | | | |
Information Technology — 7.3% (Continued) |
Cisco Systems, Inc. | | | 45,027 | | | $ | 2,115,368 | |
International Business Machines Corp. | | | 13,536 | | | | 2,249,683 | |
Motorola Solutions, Inc. | | | 7,503 | | | | 2,544,642 | |
PTC, Inc.(a)(b) | | | 12,506 | | | | 2,219,065 | |
Roper Technologies, Inc. | | | 5,411 | | | | 2,767,510 | |
VeriSign, Inc.(b) | | | 12,207 | | | | 2,068,842 | |
| | | | | | | 18,853,870 | |
| |
Materials — 2.0% |
Ecolab, Inc. | | | 11,430 | | | | 2,584,895 | |
Linde PLC | | | 5,889 | | | | 2,596,813 | |
| | | | | | | 5,181,708 | |
| |
Utilities — 13.7% |
Alliant Energy Corp. | | | 47,823 | | | | 2,381,585 | |
Atmos Energy Corp. | | | 22,197 | | | | 2,617,026 | |
CenterPoint Energy, Inc.(a) | | | 85,097 | | | | 2,479,727 | |
CMS Energy Corp. | | | 40,843 | | | | 2,475,494 | |
Consolidated Edison, Inc. | | | 28,394 | | | | 2,680,394 | |
DTE Energy Co. | | | 22,518 | | | | 2,484,186 | |
Duke Energy Corp. | | | 26,332 | | | | 2,587,382 | |
FirstEnergy Corp. | | | 63,032 | | | | 2,416,647 | |
PPL Corp. | | | 95,202 | | | | 2,614,247 | |
Public Service Enterprise Group, Inc. | | | 40,374 | | | | 2,789,037 | |
Sempra | | | 33,624 | | | | 2,408,487 | |
Southern Co. | | | 37,128 | | | | 2,728,908 | |
WEC Energy Group, Inc. | | | 29,166 | | | | 2,410,278 | |
Xcel Energy, Inc. | | | 40,339 | | | | 2,167,414 | |
| | | | | | | 35,240,812 | |
TOTAL COMMON STOCKS (Cost $250,704,358) | | | | | | | 251,490,194 | |
| |
| | | Shares | | | Value | |
REAL ESTATE INVESTMENT TRUSTS — 1.8% |
| |
Realty Income Corp. | | | 43,660 | | | $ | 2,337,557 | |
VICI Properties, Inc. | | | 80,119 | | | | 2,287,397 | |
TOTAL REAL ESTATE INVESTMENT TRUSTS (Cost $4,899,788) | | | | | | | 4,624,954 | |
| |
| | | Units | | | | | |
INVESTMENTS PURCHASED WITH PROCEEDS FROM SECURITIES LENDING — 5.2% |
Mount Vernon Liquid Assets Portfolio, LLC – 5.51%(c) | | | 13,275,747 | | | | 13,275,747 | |
TOTAL INVESTMENTS PURCHASED WITH PROCEEDS FROM SECURITIES LENDING (Cost $13,275,747) | | | | | | | 13,275,747 | |
| |
TOTAL INVESTMENTS — 105.0% (Cost $268,879,893) | | | | | | | 269,390,895 | |
Liabilities in Excess of Other Assets — (5.0)% | | | | | | | (12,761,264 | ) |
TOTAL NET ASSETS — 100.0% | | | | | | $ | 256,629,631 | |
Percentages are stated as a percent of net assets.
| | PLC - Public Limited Company | |
| | (a) | All or a portion of this security is on loan as of April 30, 2024. The total market value of these securities was $12,912,764 which represented 5.0% of net assets. |
| | (b) | Non-income producing security. |
| | (c) | The rate shown represents the 7-day effective yield as of April 30, 2024. |
The Global Industry Classification Standard (GICS®) was developed by and/or is the exclusive property of MSCI, Inc. and Standard & Poor’s Financial Services LLC (“S&P”). GICS is a service mark of MSCI, Inc. and S&P and has been licensed for use by U.S. Bank Global Fund Services.
The accompanying notes are an integral part of the financial statements.
149
Pacer Lunt MidCap Multi-Factor Alternator ETF
SCHEDULE OF INVESTMENTS
April 30, 2024
| | | Shares | | | Value | |
COMMON STOCKS — 99.4% |
| |
Communication Services — 0.5% |
New York Times Co. - Class A | | | 6,486 | | | $ | 279,093 | |
| |
Consumer Discretionary — 15.1% |
Boyd Gaming Corp. | | | 2,966 | | | | 158,711 | |
Gentex Corp. | | | 8,439 | | | | 289,458 | |
Grand Canyon Education, Inc.(a) | | | 1,289 | | | | 167,596 | |
H&R Block, Inc.(b) | | | 4,074 | | | | 192,415 | |
KB Home | | | 3,172 | | | | 205,419 | |
Murphy USA, Inc.(b) | | | 1,774 | | | | 734,117 | |
Ollie’s Bargain Outlet Holdings, Inc.(a) | | | 1,772 | | | | 129,604 | |
Polaris, Inc. | | | 2,244 | | | | 191,099 | |
Skechers USA, Inc. - Class A(a) | | | 4,050 | | | | 267,503 | |
Taylor Morrison Home Corp.(a) | | | 8,196 | | | | 459,058 | |
Texas Roadhouse, Inc. | | | 5,125 | | | | 823,998 | |
Toll Brothers, Inc. | | | 9,573 | | | | 1,140,239 | |
TopBuild Corp.(a) | | | 2,939 | | | | 1,189,324 | |
Williams-Sonoma, Inc.(b) | | | 5,775 | | | | 1,656,154 | |
Wingstop, Inc.(b) | | | 1,604 | | | | 617,203 | |
Wyndham Hotels & Resorts, Inc. | | | 3,261 | | | | 239,716 | |
| | | | | | | 8,461,614 | |
| |
Consumer Staples — 6.4% |
BellRing Brands, Inc.(a) | | | 8,401 | | | | 463,483 | |
Boston Beer Co., Inc. - Class A(a) | | | 362 | | | | 100,784 | |
Casey’s General Stores, Inc. | | | 936 | | | | 299,127 | |
Celsius Holdings, Inc.(a) | | | 13,387 | | | | 954,092 | |
Coca-Cola Consolidated, Inc. | | | 448 | | | | 370,048 | |
elf Beauty, Inc.(a)(b) | | | 3,575 | | | | 581,045 | |
Lancaster Colony Corp. | | | 803 | | | | 153,220 | |
Sprouts Farmers Market, Inc.(a)(b) | | | 4,773 | | | | 315,161 | |
US Foods Holding Corp.(a) | | | 6,455 | | | | 324,364 | |
| | | | | | | 3,561,324 | |
| |
Energy — 6.1% |
Antero Midstream Corp. | | | 10,232 | | | | 141,611 | |
ChampionX Corp. | | | 8,676 | | | | 291,253 | |
CNX Resources Corp.(a)(b) | | | 11,522 | | | | 270,997 | |
Equitrans Midstream Corp. | | | 13,448 | | | | 181,951 | |
Matador Resources Co.(b) | | | 4,387 | | | | 273,310 | |
PBF Energy, Inc. - Class A | | | 7,131 | | | | 379,868 | |
Range Resources Corp.(b) | | | 14,483 | | | | 520,086 | |
Southwestern Energy Co.(a) | | | 74,303 | | | | 556,530 | |
Weatherford International PLC(a) | | | 6,096 | | | | 753,588 | |
| | | | | | | 3,369,194 | |
| |
Financials – 10.2% |
Affiliated Managers Group, Inc. | | | 1,652 | | | | 257,877 | |
American Financial Group, Inc. | | | 2,715 | | | | 346,841 | |
| | | Shares | | | Value | |
Financials – 10.2% (Continued) | | | | | | | | |
Erie Indemnity Co. - Class A | | | 2,210 | | | $ | 845,679 | |
Essent Group Ltd. | | | 7,639 | | | | 404,638 | |
Evercore, Inc. | | | 2,503 | | | | 454,295 | |
Federated Hermes, Inc. | | | 3,788 | | | | 124,436 | |
FirstCash Holdings, Inc. | | | 1,178 | | | | 133,090 | |
Houlihan Lokey, Inc. | | | 1,580 | | | | 201,434 | |
International Bancshares Corp. | | | 1,936 | | | | 107,738 | |
Kinsale Capital Group, Inc. | | | 1,947 | | | | 707,249 | |
MGIC Investment Corp. | | | 24,001 | | | | 486,740 | |
Primerica, Inc. | | | 1,656 | | | | 350,840 | |
RenaissanceRe Holdings Ltd.(b) | | | 2,395 | | | | 525,103 | |
RLI Corp. | | | 1,832 | | | | 258,953 | |
SEI Investments Co. | | | 4,479 | | | | 295,390 | |
Western Union Co. | | | 18,186 | | | | 244,420 | |
| | | | | | | 5,744,723 | |
| |
Health Care — 4.4% |
Chemed Corp. | | | 1,067 | | | | 606,056 | |
Encompass Health Corp. | | | 4,069 | | | | 339,273 | |
Medpace Holdings, Inc.(a) | | | 1,604 | | | | 622,913 | |
Neurocrine Biosciences, Inc.(a) | | | 3,164 | | | | 435,177 | |
Tenet Healthcare Corp.(a) | | | 3,838 | | | | 430,969 | |
| | | | | | | 2,434,388 | |
| |
Industrials — 35.8%(c) |
Acuity Brands, Inc. | | | 2,085 | | | | 517,706 | |
Advanced Drainage Systems, Inc.(b) | | | 3,520 | | | | 552,640 | |
AGCO Corp. | | | 2,552 | | | | 291,413 | |
BWX Technologies, Inc. | | | 3,934 | | | | 376,759 | |
Carlisle Cos., Inc. | | | 3,438 | | | | 1,334,804 | |
Clean Harbors, Inc.(a) | | | 1,632 | | | | 309,182 | |
Comfort Systems USA, Inc. | | | 1,888 | | | | 584,166 | |
Core & Main, Inc. - Class A(a) | | | 10,694 | | | | 603,890 | |
Crane Co. | | | 4,436 | | | | 621,084 | |
Curtiss-Wright Corp. | | | 1,676 | | | | 424,732 | |
Donaldson Co., Inc. | | | 4,794 | | | | 346,127 | |
EMCOR Group, Inc.(b) | | | 4,391 | | | | 1,568,332 | |
Esab Corp. | | | 2,427 | | | | 256,971 | |
ExlService Holdings, Inc.(a) | | | 6,385 | | | | 185,165 | |
Exponent, Inc. | | | 2,143 | | | | 196,963 | |
Fortune Brands Innovations, Inc. | | | 5,008 | | | | 366,085 | |
Genpact Ltd. | | | 6,747 | | | | 207,403 | |
Graco, Inc. | | | 11,426 | | | | 916,365 | |
Insperity, Inc. | | | 1,430 | | | | 147,190 | |
ITT, Inc. | | | 3,003 | | | | 388,408 | |
Landstar System, Inc. | | | 1,858 | | | | 324,054 | |
Lennox International, Inc.(b) | | | 1,753 | | | | 812,375 | |
Lincoln Electric Holdings, Inc. | | | 2,199 | | | | 482,746 | |
MSA Safety, Inc. | | | 1,050 | | | | 189,420 | |
The accompanying notes are an integral part of the financial statements.
150
Pacer Lunt MidCap Multi-Factor Alternator ETF
SCHEDULE OF INVESTMENTS
April 30, 2024 (Continued)
| | | Shares | | | Value | |
COMMON STOCKS — 99.4% (Continued) |
| | | | | | | | | |
Industrials — 35.8%(c) (Continued) | | | | | | | | |
MSC Industrial Direct Co., Inc. - Class A | | | 3,854 | | | $ | 351,639 | |
nVent Electric PLC | | | 7,254 | | | | 522,796 | |
Owens Corning | | | 7,970 | | | | 1,340,634 | |
Paylocity Holding Corp.(a) | | | 1,731 | | | | 268,582 | |
Ryder System, Inc. | | | 1,288 | | | | 156,943 | |
Saia, Inc.(a)(b) | | | 1,097 | | | | 435,323 | |
Science Applications International Corp. | | | 3,671 | | | | 472,458 | |
Simpson Manufacturing Co., Inc. | | | 2,241 | | | | 389,687 | |
Terex Corp.(b) | | | 2,993 | | | | 167,758 | |
Tetra Tech, Inc. | | | 2,106 | | | | 410,080 | |
Trex Co., Inc.(a) | | | 8,243 | | | | 729,918 | |
UFP Industries, Inc. | | | 2,172 | | | | 244,784 | |
Watsco, Inc.(b) | | | 2,503 | | | | 1,120,643 | |
Watts Water Technologies, Inc. - Class A | | | 1,813 | | | | 359,808 | |
Woodward, Inc. | | | 2,100 | | | | 340,956 | |
XPO Inc.(a)(b) | | | 6,563 | | | | 705,260 | |
| | | | | | | 20,021,249 | |
| |
Information Technology — 12.3% |
Belden, Inc. | | | 1,650 | | | | 134,096 | |
Blackbaud, Inc.(a) | | | 1,382 | | | | 107,685 | |
CommVault Systems, Inc.(a) | | | 2,170 | | | | 222,360 | |
Crane NXT Co. | | | 4,049 | | | | 246,220 | |
Dropbox, Inc. - Class A(a) | | | 9,572 | | | | 221,688 | |
Dynatrace, Inc.(a) | | | 8,913 | | | | 403,848 | |
GoDaddy, Inc. - Class A (a) | | | 4,721 | | | | 577,756 | |
IPG Photonics Corp.(a) | | | 1,137 | | | | 95,485 | |
Kyndryl Holdings, Inc.(a) | | | 7,300 | | | | 143,518 | |
Lattice Semiconductor Corp.(a) | | | 6,919 | | | | 474,643 | |
Manhattan Associates, Inc.(a) | | | 8,316 | | | | 1,713,594 | |
Onto Innovation, Inc.(a)(b) | | | 2,812 | | | | 521,598 | |
Power Integrations, Inc. | | | 2,393 | | | | 159,661 | |
Pure Storage, Inc. - Class A (a) | | | 8,402 | | | | 423,461 | |
Qualys, Inc.(a) | | | 4,374 | | | | 716,942 | |
Rambus, Inc.(a) | | | 4,050 | | | | 222,021 | |
Teradata Corp.(a) | | | 2,839 | | | | 105,327 | |
Vontier Corp. | | | 7,608 | | | | 309,113 | |
| | | | | | | 6,799,016 | |
| |
Materials — 5.7% |
Ashland, Inc.(b) | | | 1,908 | | | | 181,890 | |
Cabot Corp. | | | 2,056 | | | | 187,569 | |
Eagle Materials, Inc.(b) | | | 3,325 | | | | 833,611 | |
Greif, Inc. - Class A | | | 944 | | | | 57,848 | |
NewMarket Corp. | | | 834 | | | | 439,451 | |
Olin Corp. | | | 4,839 | | | | 252,983 | |
| | | Shares | | | Value | |
Materials — 5.7% (Continued) | | | | | | | | |
Reliance, Inc.(b) | | | 4,320 | | | $ | 1,229,990 | |
| | | | | | | 3,183,342 | |
| |
Utilities — 2.9% |
Vistra Corp.(b) | | | 21,584 | | | | 1,636,931 | |
TOTAL COMMON STOCKS (Cost $52,642,216) | | | | | | | 55,490,874 | |
| |
REAL ESTATE INVESTMENT TRUSTS — 0.5% |
Apartment Income REIT Corp. | | | 7,391 | | | | 283,667 | |
TOTAL REAL ESTATE INVESTMENT TRUSTS (Cost $238,189) | | | | | | | 283,667 | |
| |
| | | Units | | | | | |
INVESTMENTS PURCHASED WITH PROCEEDS FROM SECURITIES LENDING — 22.5% |
Mount Vernon Liquid Assets Portfolio, LLC -5.51%(d) | | | 12,553,301 | | | | 12,553,301 | |
TOTAL INVESTMENTS PURCHASED WITH PROCEEDS FROM SECURITIES LENDING (Cost $12,553,301) | | | | | | | 12,553,301 | |
| |
TOTAL INVESTMENTS — 122.4% (Cost $65,433,706) | | | | | | | 68,327,842 | |
Liabilities in Excess of Other Assets — (22.4)% | | | | | | | (12,519,203 | ) |
TOTAL NET ASSETS — 100.0% | | | | | | $ | 55,808,639 | |
Percentages are stated as a percent of net assets.
| | PLC - Public Limited Company | |
| | (a) | Non-income producing security. |
| | (b) | All or a portion of this security is on loan as of April 30, 2024. The total market value of these securities was $12,025,500 which represented 21.5% of net assets. |
| | (c) | To the extent that the Fund invests more heavily in a particular industry or sector of the economy, its performance will be especially sensitive to developments that significantly affect those industries or sectors. |
| | (d) | The rate shown represents the 7-day effective yield as of April 30, 2024. |
The Global Industry Classification Standard (GICS®) was developed by and/or is the exclusive property of MSCI, Inc. and Standard & Poor’s Financial Services LLC (“S&P”). GICS is a service mark of MSCI, Inc. and S&P and has been licensed for use by U.S. Bank Global Fund Services.
The accompanying notes are an integral part of the financial statements.
151
Pacer Lunt Large Cap Multi-Factor Alternator ETF
SCHEDULE OF INVESTMENTS
April 30, 2024
| | | Shares | | | Value | |
COMMON STOCKS — 99.7% |
| |
Communication Services — 7.0% |
Fox Corp. - Class A(a) | | | 6,790 | | | $ | 210,558 | |
Meta Platforms, Inc. - Class A | | | 30,844 | | | | 13,268,163 | |
Netflix, Inc.(b) | | | 3,492 | | | | 1,922,835 | |
Paramount Global - Class B(a) | | | 14,518 | | | | 165,360 | |
Take-Two Interactive Software, Inc.(b) | | | 1,296 | | | | 185,082 | |
Verizon Communications, Inc. | | | 127,380 | | | | 5,030,236 | |
| | | | | | | | 20,782,234 | |
| |
Consumer Discretionary — 10.1% |
Amazon.com, Inc.(b) | | | 73,852 | | | | 12,924,101 | |
Aptiv PLC(a)(b) | | | 7,082 | | | | 502,822 | |
Best Buy Co., Inc. | | | 5,944 | | | | 437,716 | |
Booking Holdings, Inc. | | | 311 | | | | 1,073,581 | |
BorgWarner, Inc. | | | 9,218 | | | | 302,074 | |
Caesars Entertainment, Inc.(a)(b) | | | 5,430 | | | | 194,503 | |
CarMax, Inc.(a)(b) | | | 5,390 | | | | 366,358 | |
Carnival Corp.(a)(b) | | | 7,121 | | | | 105,533 | |
Chipotle Mexican Grill, Inc.(b) | | | 244 | | | | 770,942 | |
DR Horton, Inc. | | | 9,933 | | | | 1,415,353 | |
Ford Motor Co. | | | 218,883 | | | | 2,659,429 | |
General Motors Co. | | | 77,318 | | | | 3,442,972 | |
Hilton Worldwide Holdings, Inc. | | | 1,936 | | | | 381,934 | |
Lennar Corp. - Class A | | | 9,242 | | | | 1,401,272 | |
LKQ Corp. | | | 6,576 | | | | 283,623 | |
Lululemon Athletica, Inc.(b) | | | 894 | | | | 322,376 | |
Marriott International, Inc. | | | 2,040 | | | | 481,705 | |
Mohawk Industries, Inc.(b) | | | 1,138 | | | | 131,234 | |
NVR, Inc.(b) | | | 24 | | | | 178,532 | |
O’Reilly Automotive, Inc.(b) | | | 438 | | | | 443,808 | |
PulteGroup, Inc. | | | 9,069 | | | | 1,010,468 | |
Royal Caribbean Cruises Ltd.(a)(b) | | | 2,846 | | | | 397,387 | |
Tapestry, Inc. | | | 5,769 | | | | 230,298 | |
TJX Cos., Inc. | | | 7,215 | | | | 678,859 | |
| | | | | | | 30,136,880 | |
| |
Consumer Staples — 3.9% |
Archer-Daniels-Midland Co. | | | 20,956 | | | | 1,229,279 | |
Bunge Global SA | | | 7,475 | | | | 760,656 | |
Conagra Brands, Inc. | | | 11,989 | | | | 369,021 | |
Costco Wholesale Corp. | | | 4,784 | | | | 3,458,354 | |
Kroger Co. | | | 22,538 | | | | 1,248,154 | |
Molson Coors Beverage Co. - Class B | | | 4,574 | | | | 261,907 | |
Mondelez International, Inc. | | | 8,023 | | | | 577,175 | |
The Kraft Heinz Co. | | | 23,364 | | | | 902,084 | |
Tyson Foods, Inc. - Class A | | | 9,793 | | | | 593,945 | |
Walgreens Boots Alliance, Inc. | | | 21,309 | | | | 377,809 | |
| | | Shares | | | Value | |
Consumer Staples — 3.9% (Continued) |
Walmart, Inc. | | | 26,874 | | | $ | 1,594,972 | |
| | | | | | | 11,373,356 | |
| |
Energy — 9.1% |
APA Corp.(a) | | | 7,085 | | | | 222,752 | |
Chevron Corp. | | | 41,354 | | | | 6,669,160 | |
Coterra Energy, Inc. | | | 20,124 | | | | 550,593 | |
Devon Energy Corp. | | | 16,402 | | | | 839,454 | |
Diamondback Energy, Inc. | | | 4,553 | | | | 915,745 | |
EQT Corp.(a) | | | 13,220 | | | | 529,990 | |
Exxon Mobil Corp. | | | 59,474 | | | | 7,033,990 | |
Marathon Oil Corp. | | | 17,671 | | | | 474,466 | |
Marathon Petroleum Corp. | | | 19,462 | | | | 3,536,635 | |
Phillips 66 | | | 23,002 | | | | 3,294,116 | |
Valero Energy Corp. | | | 17,936 | | | | 2,867,428 | |
| | | | | | | 26,934,329 | |
| |
Financials — 22.8% |
American International Group, Inc.(a) | | | 22,185 | | | | 1,670,752 | |
Arch Capital Group Ltd.(b) | | | 2,296 | | | | 214,768 | |
Arthur J Gallagher & Co. | | | 1,309 | | | | 307,209 | |
Assurant, Inc. | | | 1,219 | | | | 212,594 | |
Bank of America Corp. | | | 193,050 | | | | 7,144,782 | |
Bank of New York Mellon Corp. | | | 22,910 | | | | 1,294,186 | |
Berkshire Hathaway, Inc. - Class B(b) | | | 32,265 | | | | 12,800,494 | |
Brown & Brown, Inc. | | | 1,956 | | | | 159,492 | |
Capital One Financial Corp.(a) | | | 13,349 | | | | 1,914,647 | |
Cboe Global Markets, Inc. | | | 1,340 | | | | 242,741 | |
Cincinnati Financial Corp. | | | 4,201 | | | | 486,014 | |
Citigroup, Inc. | | | 72,853 | | | | 4,468,074 | |
Citizens Financial Group, Inc. | | | 17,329 | | | | 591,092 | |
Comerica, Inc. | | | 4,191 | | | | 210,262 | |
Corpay, Inc.(a)(b) | | | 546 | | | | 164,968 | |
Discover Financial Services | | | 6,558 | | | | 831,095 | |
Everest Group Ltd. | | | 1,410 | | | | 516,637 | |
Fifth Third Bancorp | | | 18,467 | | | | 673,307 | |
Fiserv, Inc.(b) | | | 4,790 | | | | 731,289 | |
Franklin Resources, Inc.(a) | | | 7,647 | | | | 174,657 | |
Goldman Sachs Group, Inc. | | | 7,999 | | | | 3,413,253 | |
Hartford Financial Services Group, Inc. | | | 8,110 | | | | 785,778 | |
Huntington Bancshares, Inc. | | | 47,726 | | | | 642,869 | |
Invesco Ltd. | | | 14,709 | | | | 208,427 | |
JPMorgan Chase & Co. | | | 58,833 | | | | 11,280,640 | |
KeyCorp | | | 27,051 | | | | 391,969 | |
Loews Corp. | | | 6,065 | | | | 455,785 | |
M&T Bank Corp. | | | 5,873 | | | | 848,002 | |
PNC Financial Services Group, Inc. | | | 10,568 | | | | 1,619,652 | |
Principal Financial Group, Inc. | | | 5,440 | | | | 430,522 | |
The accompanying notes are an integral part of the financial statements.
152
Pacer Lunt Large Cap Multi-Factor Alternator ETF
SCHEDULE OF INVESTMENTS
April 30, 2024 (Continued)
| | | Shares | | | Value | |
COMMON STOCKS — 99.7% (Continued) |
| | | | | | | | | |
Financials — 22.8% (Continued) | | | | | | | | |
Prudential Financial, Inc. | | | 9,551 | | | $ | 1,055,194 | |
Regions Financial Corp. | | | 31,646 | | | | 609,818 | |
State Street Corp. | | | 9,702 | | | | 703,298 | |
Synchrony Financial | | | 14,397 | | | | 633,180 | |
Truist Financial Corp. | | | 45,882 | | | | 1,722,869 | |
US Bancorp | | | 38,739 | | | | 1,573,966 | |
Wells Fargo & Co. | | | 114,494 | | | | 6,791,785 | |
| | | | | | | 67,976,067 | |
| |
Health Care — 9.9% |
Amgen, Inc. | | | 3,896 | | | | 1,067,270 | |
Baxter International, Inc. | | | 14,699 | | | | 593,399 | |
Boston Scientific Corp.(b) | | | 13,136 | | | | 944,084 | |
Cardinal Health, Inc. | | | 2,437 | | | | 251,108 | |
Cencora, Inc. | | | 6,455 | | | | 1,543,068 | |
Centene Corp.(a)(b) | | | 21,821 | | | | 1,594,242 | |
Cigna Corp. | | | 10,589 | | | | 3,780,697 | |
CVS Health Corp. | | | 57,656 | | | | 3,903,888 | |
Eli Lilly & Co. | | | 10,953 | | | | 8,555,388 | |
Intuitive Surgical, Inc.(b) | | | 3,126 | | | | 1,158,558 | |
McKesson Corp. | | | 5,045 | | | | 2,710,224 | |
Regeneron Pharmaceuticals, Inc.(b) | | | 642 | | | | 571,804 | |
Stryker Corp. | | | 2,503 | | | | 842,260 | |
Universal Health Services, Inc. - Class B | | | 1,813 | | | | 308,990 | |
Vertex Pharmaceuticals, Inc.(b) | | | 1,856 | | | | 729,055 | |
Viatris, Inc. | | | 50,850 | | | | 588,335 | |
West Pharmaceutical Services, Inc. | | | 546 | | | | 195,184 | |
| | | | | | | | 29,337,554 | |
| |
Industrials — 6.7% |
American Airlines Group, Inc.(b) | | | 23,112 | | | | 312,243 | |
Broadridge Financial Solutions, Inc. | | | 1,122 | | | | 217,006 | |
Builders FirstSource, Inc.(b) | | | 1,524 | | | | 278,618 | |
Cintas Corp. | | | 833 | | | | 548,397 | |
Copart, Inc.(b) | | | 8,513 | | | | 462,341 | |
Cummins, Inc. | | | 3,103 | | | | 876,566 | |
Delta Air Lines, Inc. | | | 24,351 | | | | 1,219,255 | |
Eaton Corp. PLC | | | 3,954 | | | | 1,258,400 | |
Emerson Electric Co. | | | 14,495 | | | | 1,562,271 | |
Fastenal Co. | | | 5,180 | | | | 351,929 | |
FedEx Corp. | | | 5,229 | | | | 1,368,848 | |
General Electric Co. | | | 13,967 | | | | 2,260,139 | |
Howmet Aerospace, Inc. | | | 3,332 | | | | 222,411 | |
Hubbell, Inc.(a) | | | 456 | | | | 168,957 | |
Huntington Ingalls Industries, Inc. | | | 806 | | | | 223,206 | |
Ingersoll Rand, Inc. | | | 3,537 | | | | 330,073 | |
PACCAR, Inc. | | | 5,042 | | | | 535,007 | |
| | | Shares | | | Value | |
Industrials — 6.7% (Continued) | | | | | | | | |
Parker-Hannifin Corp. | | | 1,064 | | | $ | 579,784 | |
Pentair PLC | | | 1,299 | | | | 102,738 | |
Quanta Services, Inc. | | | 857 | | | | 221,586 | |
Republic Services, Inc. | | | 2,442 | | | | 468,131 | |
Southwest Airlines Co. | | | 14,951 | | | | 387,829 | |
Trane Technologies PLC | | | 1,876 | | | | 595,330 | |
TransDigm Group, Inc. | | | 660 | | | | 823,700 | |
Uber Technologies, Inc.(b) | | | 28,040 | | | | 1,858,211 | |
United Airlines Holdings, Inc.(b) | | | 16,200 | | | | 833,652 | |
United Rentals, Inc. | | | 427 | | | | 285,232 | |
Verisk Analytics, Inc. | | | 1,250 | | | | 272,450 | |
W.W. Grainger, Inc. | | | 439 | | | | 404,473 | |
Waste Management, Inc. | | | 2,730 | | | | 567,895 | |
Westinghouse Air Brake Technologies Corp. | | | 1,265 | | | | 203,766 | |
| | | | | | | 19,800,444 | |
| |
Information Technology — 26.3%(c) |
Accenture PLC - Class A | | | 4,934 | | | | 1,484,690 | |
Adobe, Inc.(b) | | | 4,541 | | | | 2,101,711 | |
Advanced Micro Devices, Inc.(b) | | | 19,072 | | | | 3,020,623 | |
Akamai Technologies, Inc.(b) | | | 1,226 | | | | 123,740 | |
Amphenol Corp. - Class A | | | 4,636 | | | | 559,890 | |
Apple, Inc. | | | 83,653 | | | | 14,248,616 | |
Applied Materials, Inc. | | | 6,241 | | | | 1,239,775 | |
Arista Networks, Inc.(b) | | | 2,690 | | | | 690,146 | |
Broadcom, Inc. | | | 6,277 | | | | 8,161,795 | |
Cadence Design System, Inc.(b) | | | 2,669 | | | | 735,656 | |
Fair Isaac Corp.(b) | | | 333 | | | | 377,399 | |
Gartner, Inc.(b) | | | 562 | | | | 231,876 | |
Hewlett Packard Enterprise Co. | | | 42,497 | | | | 722,449 | |
HP, Inc. | | | 18,538 | | | | 520,732 | |
Intel Corp. | | | 31,118 | | | | 948,165 | |
International Business Machines Corp. | | | 10,127 | | | | 1,683,107 | |
Intuit, Inc. | | | 2,472 | | | | 1,546,533 | |
Jabil, Inc. | | | 1,058 | | | | 124,167 | |
KLA Corp. | | | 1,067 | | | | 735,472 | |
Lam Research Corp. | | | 1,214 | | | | 1,085,814 | |
Microsoft Corp. | | | 36,555 | | | | 14,231,958 | |
Motorola Solutions, Inc. | | | 1,216 | | | | 412,406 | |
NVIDIA Corp. | | | 19,105 | | | | 16,507,103 | |
Palo Alto Networks, Inc.(b) | | | 4,093 | | | | 1,190,613 | |
PTC, Inc.(a)(b) | | | 988 | | | | 175,311 | |
Roper Technologies, Inc. | | | 904 | | | | 462,360 | |
salesforce.com, Inc. | | | 10,613 | | | | 2,854,260 | |
ServiceNow, Inc.(b) | | | 2,194 | | | | 1,521,166 | |
Synopsys, Inc.(b) | | | 1,326 | | | | 703,562 | |
| | | | | | | 78,401,095 | |
| |
The accompanying notes are an integral part of the financial statements.
153
Pacer Lunt Large Cap Multi-Factor Alternator ETF
SCHEDULE OF INVESTMENTS
April 30, 2024 (Continued)
| | | Shares | | | Value | |
COMMON STOCKS — 99.7% (Continued) |
| |
Materials — 3.1% |
Albemarle Corp.(a) | | | 3,949 | | | $ | 475,104 | |
Celanese Corp.(a) | | | 2,639 | | | | 405,377 | |
CF Industries Holdings, Inc.(a) | | | 5,080 | | | | 401,168 | |
Dow, Inc. | | | 15,455 | | | | 879,390 | |
DuPont de Nemours, Inc. | | | 14,532 | | | | 1,053,570 | |
Eastman Chemical Co. | | | 2,607 | | | | 246,205 | |
Ecolab, Inc. | | | 1,956 | | | | 442,349 | |
International Paper Co. | | | 8,523 | | | | 297,794 | |
Linde PLC | | | 3,408 | | | | 1,502,792 | |
LyondellBasell Industries NV - Class A | | | 6,488 | | | | 648,605 | |
Martin Marietta Materials, Inc. | | | 517 | | | | 303,515 | |
Mosaic Co. | | | 12,976 | | | | 407,317 | |
Nucor Corp. | | | 6,972 | | | | 1,174,990 | |
Sherwin-Williams Co. | | | 1,731 | | | | 518,625 | |
Steel Dynamics, Inc. | | | 4,695 | | | | 610,913 | |
Vulcan Materials Co. | | | 809 | | | | 208,423 | |
| | | | | | | 9,576,137 | |
| |
Utilities — 0.8% |
Consolidated Edison, Inc. | | | 7,727 | | | | 729,428 | |
Constellation Energy Corp. | | | 2,676 | | | | 497,575 | |
Evergy, Inc.(a) | | | 5,289 | | | | 277,408 | |
Eversource Energy | | | 7,798 | | | | 472,715 | |
NRG Energy, Inc. | | | 2,368 | | | | 172,083 | |
Pinnacle West Capital Corp.(a) | | | 2,498 | | | | 183,978 | |
| | | | | | | 2,333,187 | |
TOTAL COMMON STOCKS (Cost $281,811,425) | | | | | | | 296,651,283 | |
| |
REAL ESTATE INVESTMENT TRUSTS — 0.1% |
Iron Mountain, Inc. | | | 2,059 | | | | 159,614 | |
TOTAL REAL ESTATE INVESTMENT TRUSTS (Cost $121,605) | | | | | | | 159,614 | |
| |
| | | Units | | | Value | |
INVESTMENTS PURCHASED WITH PROCEEDS FROM SECURITIES LENDING — 3.1% |
Mount Vernon Liquid Assets Portfolio, LLC – 5.51%(d) | | | 9,103,620 | | | $ | 9,103,620 | |
TOTAL INVESTMENTS PURCHASED WITH PROCEEDS FROM SECURITIES LENDING (Cost $9,103,620) | | | | | | | 9,103,620 | |
| |
TOTAL INVESTMENTS — 102.9% (Cost $291,036,650) | | | | | | | 305,914,517 | |
Liabilities in Excess of Other Assets — (2.9)% | | | | | | | (8,836,103 | ) |
TOTAL NET ASSETS — 100.0% | | | | | | $ | 297,078,414 | |
Percentages are stated as a percent of net assets.
NV - Naamloze Vennootschap
PLC - Public Limited Company
SA - Sociedad Anónima
| | (a) | All or a portion of this security is on loan as of April 30, 2024. The total market value of these securities was $8,720,282 which represented 2.9% of net assets. |
| | (b) | Non-income producing security. |
| | (c) | To the extent that the Fund invests more heavily in a particular industry or sector of the economy, its performance will be especially sensitive to developments that significantly affect those industries or sectors. |
| | (d) | The rate shown represents the 7-day effective yield as of April 30, 2024. |
The Global Industry Classification Standard (GICS®) was developed by and/or is the exclusive property of MSCI, Inc. and Standard & Poor’s Financial Services LLC (“S&P”). GICS is a service mark of MSCI, Inc. and S&P and has been licensed for use by U.S. Bank Global Fund Services.
The accompanying notes are an integral part of the financial statements.
154
Pacer US Export Leaders ETF
SCHEDULE OF INVESTMENTS
April 30, 2024
| | | Shares | | | Value | |
COMMON STOCKS — 99.1% |
| |
Communication Services — 5.0% |
Alphabet, Inc. - Class A(a) | | | 4,677 | | | $ | 761,322 | |
Electronic Arts, Inc.(b) | | | 4,664 | | | | 591,488 | |
Meta Platforms, Inc. - Class A | | | 1,246 | | | | 535,992 | |
Netflix, Inc.(a) | | | 1,047 | | | | 576,520 | |
News Corp. - Class A | | | 24,047 | | | | 572,319 | |
| | | | | | | 3,037,641 | |
| |
Consumer Discretionary — 12.0% |
Adient PLC(a) | | | 17,888 | | | | 534,315 | |
Airbnb, Inc. - Class A(a) | | | 3,841 | | | | 609,067 | |
Autoliv, Inc. | | | 5,383 | | | | 644,830 | |
Crocs, Inc.(a) | | | 5,065 | | | | 629,934 | |
Garmin Ltd.(b) | | | 4,462 | | | | 644,625 | |
LKQ Corp. | | | 12,259 | | | | 528,731 | |
McDonald’s Corp. | | | 2,155 | | | | 588,401 | |
Ralph Lauren Corp. - Class A | | | 3,581 | | | | 585,995 | |
Royal Caribbean Cruises Ltd.(a) | | | 4,968 | | | | 693,682 | |
Skechers USA, Inc. - Class A(a) | | | 10,497 | | | | 693,327 | |
Tesla Motors, Inc.(a) | | | 3,595 | | | | 658,892 | |
Visteon Corp.(a) | | | 5,388 | | | | 596,074 | |
| | | | | | | 7,407,873 | |
| |
Consumer Staples — 5.2% |
Archer-Daniels-Midland Co. | | | 11,553 | | | | 677,699 | |
Bunge Global SA | | | 6,868 | | | | 698,888 | |
Coca-Cola Co. | | | 10,591 | | | | 654,206 | |
Coty, Inc. - Class A(a) | | | 49,518 | | | | 566,486 | |
Ingredion, Inc. | | | 5,392 | | | | 617,869 | |
| | | | | | | 3,215,148 | |
| |
Energy — 5.6% |
APA Corp.(b) | | | 20,553 | | | | 646,186 | |
Baker Hughes Co. | | | 20,696 | | | | 675,104 | |
Exxon Mobil Corp.(b) | | | 5,843 | | | | 691,052 | |
Halliburton Co. | | | 17,488 | | | | 655,275 | |
Weatherford International PLC(a)(b) | | | 5,851 | | | | 723,301 | |
| | | | | | | 3,390,918 | |
| |
Health Care — 8.6% |
Agilent Technologies, Inc. | | | 4,264 | | | | 584,339 | |
Align Technology, Inc.(a)(b) | | | 2,028 | | | | 572,667 | |
Danaher Corp. | | | 2,485 | | | | 612,850 | |
IQVIA Holdings, Inc.(a) | | | 2,463 | | | | 570,850 | |
Mettler-Toledo International, Inc.(a) | | | 480 | | | | 590,256 | |
Regeneron Pharmaceuticals, Inc.(a) | | | 654 | | | | 582,492 | |
Repligen Corp.(a)(b) | | | 3,241 | | | | 532,172 | |
Thermo Fisher Scientific, Inc. | | | 1,055 | | | | 600,000 | |
West Pharmaceutical Services, Inc. | | | 1,764 | | | | 630,594 | |
| | | | | | | 5,276,220 | |
| |
| | | Shares | | | Value | |
Industrials — 17.4% |
AGCO Corp. | | | 5,619 | | | $ | 641,634 | |
Brink’s Co. | | | 7,522 | | | | 657,874 | |
Caterpillar, Inc. | | | 1,867 | | | | 624,642 | |
Concentrix Corp. | | | 9,578 | | | | 523,629 | |
Donaldson Co., Inc. | | | 8,732 | | | | 630,450 | |
Expeditors International of Washington, Inc. | | | 5,198 | | | | 578,589 | |
Flowserve Corp. | | | 14,599 | | | | 688,489 | |
General Electric Co.(b) | | | 3,753 | | | | 607,310 | |
Genpact Ltd. | | | 18,340 | | | | 563,772 | |
GXO Logistics, Inc.(a) | | | 12,872 | | | | 639,224 | |
Howmet Aerospace, Inc.(b) | | | 9,306 | | | | 621,176 | |
IDEX Corp. | | | 2,642 | | | | 582,455 | |
Ingersoll Rand, Inc. | | | 7,008 | | | | 653,987 | |
ITT, Inc. | | | 4,984 | | | | 644,631 | |
Nordson Corp. | | | 2,381 | | | | 614,750 | |
Timken Co. | | | 7,339 | | | | 654,786 | |
Westinghouse Air Brake Technologies Corp. | | | 4,444 | | | | 715,839 | |
| | | | | | | 10,643,237 | |
| |
Information Technology – 33.0%(c) |
Accenture PLC - Class A | | | 1,667 | | | | 501,617 | |
Advanced Micro Devices, Inc.(a) | | | 3,055 | | | | 483,851 | |
Amphenol Corp. | | | 5,736 | | | | 692,736 | |
Analog Devices, Inc. | | | 3,232 | | | | 648,372 | |
ANSYS, Inc.(a) | | | 1,890 | | | | 614,023 | |
Apple, Inc. | | | 3,692 | | | | 628,858 | |
Applied Materials, Inc. | | | 3,068 | | | | 609,458 | |
Arrow Electronics, Inc.(a) | | | 5,276 | | | | 673,587 | |
Autodesk, Inc.(a)(b) | | | 2,503 | | | | 532,764 | |
Broadcom, Inc. | | | 482 | | | | 626,730 | |
Cadence Design System, Inc.(a) | | | 2,043 | | | | 563,112 | |
Coherent Corp.(a) | | | 9,871 | | | | 539,253 | |
Fortinet, Inc.(a) | | | 8,835 | | | | 558,195 | |
Hewlett Packard Enterprise Co. | | | 35,039 | | | | 595,663 | |
Jabil, Inc.(b) | | | 4,188 | | | | 491,504 | |
KBR, Inc. | | | 10,271 | | | | 666,999 | |
Keysight Technologies, Inc.(a) | | | 4,104 | | | | 607,146 | |
KLA Corp. | | | 902 | | | | 621,740 | |
Lam Research Corp. | | | 660 | | | | 590,311 | |
Lattice Semiconductor Corp.(a)(b) | | | 7,874 | | | | 540,156 | |
MACOM Technology Solutions Holdings, Inc.(a)(b) | | | 6,775 | | | | 690,711 | |
Microchip Technology, Inc. | | | 7,095 | | | | 652,598 | |
Microsoft Corp. | | | 1,552 | | | | 604,240 | |
Monolithic Power Systems, Inc.(b) | | | 862 | | | | 576,962 | |
NVIDIA Corp. | | | 722 | | | | 623,822 | |
Onto Innovation, Inc.(a) | | | 3,404 | | | | 631,408 | |
PTC, Inc.(a)(b) | | | 3,416 | | | | 606,135 | |
The accompanying notes are an integral part of the financial statements.
155
Pacer US Export Leaders ETF
SCHEDULE OF INVESTMENTS
April 30, 2024 (Continued)
| | | Shares | | | Value | |
COMMON STOCKS — 99.1% (Continued) |
| | | | | | | | | |
Information Technology – 33.0%(c) (Continued) |
QUALCOMM, Inc. | | | 3,696 | | | $ | 612,982 | |
Rambus, Inc.(a) | | | 9,886 | | | | 541,951 | |
Synaptics, Inc.(a) | | | 5,893 | | | | 530,134 | |
Synopsys, Inc.(a) | | | 1,109 | | | | 588,424 | |
TE Connectivity Ltd. | | | 4,486 | | | | 634,679 | |
Teledyne Technologies, Inc.(a) | | | 1,480 | | | | 564,590 | |
Uber Technologies, Inc.(a) | | | 8,048 | | | | 533,341 | |
| | | | | | | 20,178,052 | |
| |
Materials — 12.3% |
AptarGroup, Inc. | | | 4,426 | | | | 639,026 | |
Ashland Global Holdings, Inc.(b) | | | 6,600 | | | | 629,178 | |
Avery Dennison Corp. | | | 2,922 | | | | 634,892 | |
Cabot Corp. | | | 7,270 | | | | 663,242 | |
Corteva, Inc. | | | 11,582 | | | | 626,934 | |
Crown Holdings, Inc. | | | 8,084 | | | | 663,454 | |
DuPont de Nemours, Inc.(b) | | | 8,870 | | | | 643,075 | |
International Flavors & Fragrances, Inc. | | | 8,042 | | | | 680,755 | |
Linde PLC | | | 1,363 | | | | 601,028 | |
Mosaic Co. | | | 20,049 | | | | 629,338 | |
NewMarket Corp. | | | 1,025 | | | | 540,093 | |
PPG Industries, Inc. | | | 4,500 | | | | 580,500 | |
| | | | | | | 7,531,515 | |
TOTAL COMMON STOCKS (Cost $55,541,658) | | | | | | | 60,680,604 | |
| |
REAL ESTATE INVESTMENT TRUSTS — 0.8% |
Equinix, Inc. | | | 693 | | | | 492,799 | |
TOTAL REAL ESTATE INVESTMENT TRUSTS (Cost $512,425) | | | | | | | 492,799 | |
| |
| | | Units | | | Value | |
INVESTMENTS PURCHASED WITH PROCEEDS FROM SECURITIES LENDING — 11.4% |
Mount Vernon Liquid Assets Portfolio, LLC – 5.51%(d) | | | 6,978,588 | | | $ | 6,978,588 | |
TOTAL INVESTMENTS PURCHASED WITH PROCEEDS FROM SECURITIES LENDING (Cost $6,978,588) | | | | | | | 6,978,588 | |
| |
TOTAL INVESTMENTS — 111.3% (Cost $63,032,671) | | | | | | | 68,151,991 | |
Liabilities in Excess of Other Assets — (11.3)% | | | | | | | (6,957,782 | ) |
TOTAL NET ASSETS — 100.0% | | | | | | $ | 61,194,209 | |
Percentages are stated as a percent of net assets.
| | PLC - Public Limited Company | |
| | (a) | Non-income producing security. |
| | (b) | All or a portion of this security is on loan as of April 30, 2024. The total market value of these securities was $6,619,824 which represented 10.8% of net assets. |
| | (c) | To the extent that the Fund invests more heavily in a particular industry or sector of the economy, its performance will be especially sensitive to developments that significantly affect those industries or sectors. |
| | (d) | The rate shown represents the 7-day effective yield as of April 30, 2024. |
The Global Industry Classification Standard (GICS®) was developed by and/or is the exclusive property of MSCI, Inc. and Standard & Poor’s Financial Services LLC (“S&P”). GICS is a service mark of MSCI, Inc. and S&P and has been licensed for use by U.S. Bank Global Fund Services.
The accompanying notes are an integral part of the financial statements.
156
Pacer Pacific Asset Floating Rate High Income ETF
SCHEDULE OF INVESTMENTS
April 30, 2024
| | | Par | | | Value | |
BANK LOANS - 53.4% |
| |
Communication Services — 1.5% |
Altice France SA, Senior Secured First Lien, 10.83% (3 mo. SOFR US + 5.50%), 08/15/2028 | | $ | 990,000 | | | $ | 746,523 | |
SBA Senior Finance II LLC, Senior Secured First Lien, 7.32% (1 mo. SOFR US + 2.00%), 01/19/2031 | | | 2,955,238 | | | | 2,968,167 | |
| | | | | | | 3,714,690 | |
| |
Consumer Discretionary — 13.9% |
1011778 BC ULC, Senior Secured First Lien, 7.57% (1 mo. SOFR US + 2.25%), 09/20/2030 | | | 2,308,912 | | | | 2,315,296 | |
AAdvantage Loyalty IP Ltd., Senior Secured First Lien, 10.34% (3 mo. SOFR US + 4.75%), 04/20/2028 | | | 800,000 | | | | 833,084 | |
Allied Universal Holdco LLC, Senior Secured First Lien, 9.17% (1 mo. SOFR US + 3.75%), 05/12/2028 | | | 1,974,734 | | | | 1,978,437 | |
Bombardier Recreational Products, Inc., Senior Secured First Lien, 7.42% (1 mo. SOFR US + 2.00%), 05/24/2027 | | | 212,534 | | | | 212,934 | |
Carnival Corp., Senior Secured First Lien, 8.69% (1 mo. SOFR US + 3.25%), 10/18/2028 | | | 1,148,779 | | | | 1,154,885 | |
Cedar Fair LP, 7.83% (1 mo. Term SOFR + 2.00%), 04/18/2031 | | | 4,000,000 | | | | 4,004,999 | |
ClubCorp Holdings, Inc., Senior Secured First Lien | | | | | | | | |
10.56% (3 mo. SOFR US + 5.00%), 09/18/2026 | | | 2,126,027 | | | | 2,133,469 | |
10.56% (3 mo. SOFR US + 5.00%), 09/18/2026 | | | 34,758 | | | | 34,880 | |
Fertitta Entertainment LLC/NV, Senior Secured First Lien, 9.07% (1 mo. SOFR US + 3.75%), 01/29/2029 | | | 2,979,804 | | | | 2,990,055 | |
Great Outdoors Group LLC, Senior Secured First Lien, 9.18% (1 mo. SOFR US + 3.75%), 03/06/2028 | | | 2,268,908 | | | | 2,272,754 | |
IRB Holding Corp., Senior Secured First Lien, 8.17% (1 mo. SOFR US + 2.75%), 12/15/2027 | | | 2,741,770 | | | | 2,749,008 | |
| | | Par | | | Value | |
Consumer Discretionary — 13.9%(Continued) |
MajorDrive Holdings IV LLC, Senior Secured First Lien, 9.57% (3 mo. SOFR US + 4.00%), 06/01/2028 | | $ | 2,485,956 | | | $ | 2,501,755 | |
Mileage Plus Holdings LLC, Senior Secured First Lien, 10.73% (3 mo. SOFR US + 5.25%), 06/21/2027 | | | 325,000 | | | | 334,072 | |
SeaWorld Parks & Entertainment, Inc., Senior Secured First Lien, 7.82% (1 mo. SOFR US + 2.50%), 08/25/2028 | | | 2,209,403 | | | | 2,211,247 | |
SRS Distribution, Inc., Senior Secured First Lien, 8.93% (1 mo. SOFR US + 3.50%), 06/02/2028 | | | 1,963,541 | | | | 1,979,926 | |
United Airlines, Inc., Senior Secured First Lien, 8.08% (3 mo. SOFR US + 2.75%), 02/24/2031 | | | 1,800,000 | | | | 1,809,846 | |
Wand NewCo 3, Inc., Senior Secured First Lien, 9.07% (1 mo. SOFR US + 3.75%), 01/30/2031 | | | 2,000,000 | | | | 2,015,390 | |
Whatabrands LLC, Senior Secured First Lien, 8.68% (1 mo. SOFR US + 3.25%), 08/03/2028 | | | 2,984,823 | | | | 3,000,060 | |
| | | | | | | 34,532,097 | |
| |
Consumer Staples — 0.4% |
Naked Juice LLC, Senior Secured First Lien | | | | | | | | |
8.66% (3 mo. SOFR US + 3.25%), 01/24/2029 | | | 992,405 | | | | 961,779 | |
8.66% (3 mo. SOFR US + 3.25%), 01/24/2029 | | | 2,532 | | | | 2,454 | |
| | | | | | | 964,233 | |
| |
Energy — 1.5% |
CQP Holdco LP, Senior Secured First Lien, 8.30% (3 mo. SOFR US + 3.00%), 12/31/2030 | | | 2,161,702 | | | | 2,170,436 | |
Traverse Midstream Partners LLC, Senior Secured First Lien, 8.83% (3 mo. SOFR US + 3.50%), 02/16/2028 | | | 1,621,722 | | | | 1,628,566 | |
| | | | | | | 3,799,002 | |
| |
The accompanying notes are an integral part of the financial statements.
157
Pacer Pacific Asset Floating Rate High Income ETF
SCHEDULE OF INVESTMENTS
April 30, 2024 (Continued)
| | | Par | | | Value | |
BANK LOANS - 53.4% (Continued) |
| |
Financials — 6.7% |
Acrisure LLC, Senior Secured First Lien, 8.93% (CME Term SOFR 1 Month + 3.50%), 2/16/2027 | | $ | 1,987,093 | | | $ | 1,988,534 | |
Avolon TLB Borrower 1 US LLC, Senior Secured First Lien, 7.32% (1 mo. SOFR US + 2.00%), 06/22/2028 | | | 2,164,947 | | | | 2,172,048 | |
Boost Newco Borrower LLC, Senior Secured First Lien, 8.31% (3 mo. SOFR US + 3.00%), 01/31/2031 | | | 2,500,000 | | | | 2,511,725 | |
Deerfield Dakota Holding LLC, Senior Secured First Lien, 9.06% (3 mo. SOFR US + 3.75%), 04/09/2027 | | | 2,468,430 | | | | 2,469,516 | |
HUB International Ltd., Senior Secured First Lien | | | | | | | | |
8.57% (1 mo. SOFR US + 3.25%), 06/20/2030 | | | 4,994 | | | | 5,025 | |
8.57% (3 mo. SOFR US + 3.25%), 06/20/2030 | | | 1,992,506 | | | | 2,004,830 | |
USI, Inc./NY, Senior Secured First Lien, 8.30% (3 mo. SOFR US + 3.00%), 11/22/2029 | | | 2,366,813 | | | | 2,375,191 | |
Wec US Holdings Ltd., Senior Secured First Lien, 8.07% (1 mo. SOFR US + 2.75%), 01/27/2031 | | | 3,000,000 | | | | 3,005,519 | |
| | | | | | | 16,532,388 | |
| |
Health Care — 4.0% |
Bausch + Lomb Corp., Senior Secured First Lien, 9.32% (1 mo. SOFR US + 4.00%), 09/29/2028 | | | 1,492,500 | | | | 1,499,970 | |
Gainwell Acquisition Corp., Senior Secured First Lien, 9.41% (3 mo. SOFR US + 4.00%), 10/01/2027 | | | 487,406 | | | | 466,235 | |
ICON Luxembourg Sarl, Senior Secured First Lien | | | | | | | | |
7.31% (1 mo. SOFR US + 2.00%), 07/03/2028 | | | 1,766,983 | | | | 1,776,419 | |
7.31% (1 mo. SOFR US + 2.00%), 07/03/2028 | | | 440,245 | | | | 442,596 | |
Medline Borrower LP, Senior Secured First Lien, 8.07% (1 mo. SOFR US + 2.75%), 10/23/2028 | | | 2,803,372 | | | | 2,813,941 | |
Phoenix Newco, Inc., Senior Secured First Lien, 8.68% (1 mo. SOFR US + 3.25%), 11/15/2028 | | | 490,000 | | | | 492,114 | |
| | | Par | | | Value | |
Health Care — 4.0% (Continued) | | | | | | | | |
Star Parent, Inc., Senior Secured First Lien, 9.31% (3 mo. SOFR US + 4.00%), 09/27/2030 | | $ | 2,500,000 | | | $ | 2,502,350 | |
| | | | | | | 9,993,625 | |
| |
Industrials — 15.1% |
Apple Bidco LLC First Lien, 8.83% (1 mo. Term SOFR + 4.00%), 09/22/2028 | | | 3,000,000 | | | | 3,011,999 | |
Chart Industries, Inc., Senior Secured First Lien, 8.67% (1 mo. SOFR US + 3.25%), 03/17/2030 | | | 2,366,799 | | | | 2,377,900 | |
Core & Main LP, Senior Secured First Lien, 7.57% (3 mo. SOFR US + 2.25%), 02/05/2031 | | | 2,992,500 | | | | 3,007,462 | |
CoreLogic, Inc., Senior Secured First Lien, 8.93% (1 mo. SOFR US + 3.50%), 06/02/2028 | | | 1,989,809 | | | | 1,930,115 | |
Crosby US Acquisition Corp. First Lien, 9.33% (1 mo. Term SOFR + 4.00%), 08/12/2029 | | | 1,500,000 | | | | 1,512,495 | |
Dun & Bradstreet Corp., Senior Secured First Lien, 8.07% (1 mo. SOFR US + 2.75%), 01/18/2029 | | | 1,492,091 | | | | 1,497,381 | |
Dynasty Acquisition Co., Inc. First Lien, 8.83% (1 mo. Term SOFR + 3.50%), 08/24/2028 | | | 1,804,306 | | | | 1,814,969 | |
Emrld Borrower LP, Senior Secured First Lien, 7.82% (1 mo. SOFR US + 2.50%), 05/31/2030 | | | 2,831,728 | | | | 2,843,749 | |
Engineered Machinery Holdings, Inc., Senior Secured First Lien, 9.32% (3 mo. SOFR US + 3.75%), 05/22/2028 | | | 1,994,898 | | | | 1,997,661 | |
Engineered Machinery Holdings, Inc., Senior Secured Second Lien, 11.57% (3 mo. SOFR US + 6.00%), 05/21/2029 | | | 600,000 | | | | 599,439 | |
GFL Environmental, Inc., Senior Secured First Lien, 7.83% (3 mo. SOFR US + 2.50%), 05/31/2027 | | | 2,553,347 | | | | 2,568,501 | |
Madison IAQ LLC, Senior Secured First Lien, 8.68% (1 mo. SOFR US + 3.25%), 06/21/2028 | | | 2,964,726 | | | | 2,969,707 | |
The accompanying notes are an integral part of the financial statements.
158
Pacer Pacific Asset Floating Rate High Income ETF
SCHEDULE OF INVESTMENTS
April 30, 2024 (Continued)
| | | Par | | | Value | |
BANK LOANS - 53.4% (Continued) | | | | | | | | |
| | | | | | | | | |
Industrials — 15.1% (Continued) | | | | | | | | |
Roper Industrial Products Investment Co., Senior Secured First Lien, 9.30% (3 mo. SOFR US + 4.00%), 11/22/2029 | | $ | 1,490,013 | | | $ | 1,503,423 | |
SPX FLOW, Inc., Senior Secured First Lien, 9.92% (1 mo. SOFR US + 4.50%), 04/05/2029 | | | 2,839,266 | | | | 2,859,127 | |
Standard Aero Ltd. First Lien, 8.83% (1 mo. Term SOFR + 3.50%), 08/24/2028 | | | 695,694 | | | | 699,806 | |
Titan Acquisition Ltd./Canada, Senior Secured First Lien, 10.34% (1 mo. SOFR US + 5.00%), 02/01/2029 | | | 1,851,268 | | | | 1,863,033 | |
TK Elevator US Newco, Inc. First Lien, 8.79% (3 mo. Term SOFR), 04/30/2030 | | | 1,500,000 | | | | 1,507,965 | |
TransDigm, Inc. First Lien, 8.56% (3 mo. Term SOFR + 3.25%), 02/28/2031 | | | 3,000,000 | | | | 3,020,984 | |
| | | | | | | 37,585,716 | |
| |
Information Technology — 6.8% |
UKG, Inc., Senior Secured First Lien, 8.81% (3 mo. SOFR US + 3.50%), 02/10/2031 | | | 2,484,848 | | | | 2,499,099 | |
Applied Systems, Inc. First Lien, 8.82% (1 mo. Term SOFR + 3.50%), 02/24/2031 | | | 2,500,000 | | | | 2,521,563 | |
AthenaHealth Group, Inc., Senior Secured First Lien, 8.57% (1 mo. SOFR US + 3.25%), 02/15/2029 | | | 2,316,931 | | | | 2,316,213 | |
Central Parent, Inc., Senior Secured First Lien, 9.31% (3 mo. SOFR US + 4.00%), 07/06/2029 | | | 997,487 | | | | 1,002,704 | |
Epicor Software Corp., Senior Secured First Lien, 8.68% (1 mo. SOFR US + 3.25%), 07/30/2027 | | | 2,469,712 | | | | 2,483,493 | |
Peraton Corp., Senior Secured First Lien, 9.17% (1 mo. SOFR US + 3.75%), 02/01/2028 | | | 1,971,428 | | | | 1,974,593 | |
Polaris Newco LLC, Senior Secured First Lien, 9.59% (1 mo. SOFR US + 4.00%), 06/02/2028 | | | 2,224,874 | | | | 2,214,540 | |
| | | Par | | | Value | |
Information Technology — 6.8% (Continued) |
Tempo Acquisition LLC, Senior Secured First Lien, 8.07% (1 mo. SOFR US + 2.75%), 08/31/2028 | | $ | 1,911,857 | | | $ | 1,919,475 | |
| | | | | | | 16,931,680 | |
| |
Materials — 3.5% |
Graham Packaging Co., Inc., Senior Secured First Lien, 8.43% (1 mo. SOFR US + 3.00%), 08/04/2027 | | | 1,954,728 | | | | 1,961,453 | |
Nouryon USA LLC, Senior Secured First Lien | | | | | | | | |
9.42% (3 mo. SOFR US + 4.00%), 04/03/2028 | | | 959,783 | | | | 963,536 | |
9.42% (3 mo. SOFR US + 4.00%), 04/03/2028 | | | 249,137 | | | | 250,111 | |
Pregis TopCo LLC, Senior Secured First Lien, 9.07% (1 mo. SOFR US + 3.75%), 07/31/2026 | | | 1,478,391 | | | | 1,485,206 | |
Proampac PG Borrower LLC, Senior Secured First Lien | | | | | | | | |
9.32% (1 mo. SOFR US + 4.00%), 09/15/2028 | | | 582,296 | | | | 586,905 | |
9.33% (3 mo. SOFR US + 4.00%), 09/15/2028 | | | 875,721 | | | | 882,653 | |
Quikrete Holdings, Inc., Senior Secured First Lien, 7.82% (1 mo. SOFR US + 2.50%), 04/14/2031 | | | 2,450,240 | | | | 2,454,614 | |
| | | | | | | 8,584,478 | |
TOTAL BANK LOANS (Cost $131,830,244) | | | | | | | 132,637,909 | |
| |
COLLATERALIZED LOAN OBLIGATIONS — 33.0% |
Aimco CDO | | | | | | | | |
Series 2015-AA, Class ER2, 12.18% (3 mo. Term SOFR + 6.86%), 10/17/2034 (a) | | | 1,000,000 | | | | 1,003,449 | |
Series 2019-10A, Class ER, 11.54% (3 mo. Term SOFR + 6.21%), 07/22/2032 (a) | | | 1,100,000 | | | | 1,103,506 | |
Series 2021-15A, Class E, 11.53% (3 mo. Term SOFR + 6.21%), 10/17/2034 (a) | | | 1,250,000 | | | | 1,263,566 | |
AIMCO CLO Series 2018-B, Series 2018-BA, Class ER, 11.63% (3 mo. Term SOFR + 6.30%), 04/16/2037 (a) | | | 2,000,000 | | | | 2,013,956 | |
ALM Ltd./KY, Series 2020-12A, Class DR2, 12.31% (3 mo. Term SOFR + 6.98%), 01/15/2036 (a) | | | 1,080,000 | | | | 1,102,337 | |
The accompanying notes are an integral part of the financial statements.
159
Pacer Pacific Asset Floating Rate High Income ETF
SCHEDULE OF INVESTMENTS
April 30, 2024 (Continued)
| | | Par | | | Value | |
COLLATERALIZED LOAN OBLIGATIONS — 33.0% (Continued) |
Beechwood Park CLO Ltd., Series 2019-1A, Class ER, 11.82% (3 mo. Term SOFR + 6.50%), 01/17/2035 (a) | | $ | 1,000,000 | | | $ | 1,010,842 | |
Benefit Street Partners CLO Ltd., Series 2022-28A, Class E, 12.91% (3 mo. Term SOFR + 7.59%), 10/20/2035 (a) | | | 1,000,000 | | | | 1,038,246 | |
CarVal CLO, Series 2019-2A, Class E, 12.03% (3 mo. Term SOFR + 6.70%), 07/20/2032 (a) | | | 1,000,000 | | | | 983,100 | |
CIFC Funding Ltd. |
Series 2018-5A, Class D, 11.74% (3 mo. Term SOFR + 6.41%), 01/15/2032 (a) | | | 1,000,000 | | | | 1,009,531 | |
Series 2019-1A, Class E, 12.42% (3 mo. Term SOFR + 7.09%), 04/20/2032 (a) | | | 1,000,000 | | | | 1,004,956 | |
Series 2019-FAL, Class E, 13.00% (3 mo. Term SOFR + 7.67%), 01/20/2033 (a) | | | 1,000,000 | | | | 1,008,677 | |
Clover CLO |
Series 2018-1A, Class ERR, 11.72% (3 mo. Term SOFR + 6.40%), 04/20/2037 (a) | | | 1,650,000 | | | | 1,659,111 | |
Series 2021-2A, Class E, 12.09% (3 mo. Term SOFR + 6.76%), 07/20/2034 (a) | | | 1,000,000 | | | | 1,009,007 | |
Series 2021-3A, Class E, 12.05% (3 mo. Term SOFR + 6.72%), 01/25/2035 (a) | | | 1,000,000 | | | | 1,003,460 | |
Dryden Senior Loan Fund |
Series 2017-50A, Class E, 11.85% (3 mo. Term SOFR + 6.52%), 07/15/2030 (a) | | | 1,000,000 | | | | 965,914 | |
Series 2018-64A, Class A, 6.56% (3 mo. Term SOFR + 1.23%), 04/18/2031 (a) | | | 2,985,886 | | | | 2,987,929 | |
Series 2019-76A, Class A1R, 6.74% (3 mo. Term SOFR + 1.41%), 10/20/2034 (a) | | | 1,000,000 | | | | 1,000,194 | |
Eaton Vance Management, Series 2020-1A, Class ER, 11.84% (3 mo. Term SOFR + 6.51%), 10/15/2034 (a) | | | 1,000,000 | | | | 1,003,305 | |
Flatiron CLO Ltd. |
Series 2020-1A, Class ER, 11.73% (3 mo. Term SOFR + 6.45%), 05/20/2036 (a) | | | 1,500,000 | | | | 1,491,191 | |
Series 2021-1A, Class E, 11.59% (3 mo. Term SOFR + 6.26%), 07/19/2034 (a) | | | 2,000,000 | | | | 2,019,651 | |
| | | Par | | | Value | |
GoldenTree Loan Management US CLO, Series 2017-1A, Class FR2, 13.09% (3 mo. Term SOFR + 7.76%), 04/20/2034 (a) | | $ | 1,000,000 | | | $ | 985,724 | |
Goldentree Loan Opportunities Ltd. |
Series 2019-6A, Class ER, 12.02% (3 mo. Term SOFR + 6.70%), 04/20/2035 (a) | | | 1,000,000 | | | | 1,011,690 | |
Series 2023-17A, Class E, 11.82% (3 mo. Term SOFR + 6.50%), 07/20/2036 (a) | | | 1,000,000 | | | | 1,019,992 | |
Harbor Park CLO Ltd., Series 2018-1A, Class E, 11.19% (3 mo. Term SOFR + 5.86%), 01/20/2031 (a) | | | 1,000,000 | | | | 991,137 | |
Magnetite CLO Ltd. |
Series 2016-17A, Class DR2, 8.82% (3 mo. Term SOFR + 3.50%), 04/20/2037 (a) | | | 3,000,000 | | | | 3,012,835 | |
Series 2019-22A, Class ER, 11.94% (3 mo. Term SOFR + 6.61%), 04/15/2031 (a) | | | 2,000,000 | | | | 2,008,967 | |
Series 2020-28A, Class ER, 11.74% (3 mo. Term SOFR + 6.41%), 01/20/2035 (a) | | | 1,750,000 | | | | 1,769,365 | |
Series 2021-30A, Class E, 11.79% (3 mo. Term SOFR + 6.46%), 10/25/2034 (a) | | | 1,500,000 | | | | 1,516,457 | |
Series 2021-31A, Class E, 11.59% (3 mo. Term SOFR + 6.26%), 07/15/2034 (a) | | | 500,000 | | | | 504,997 | |
Series 2023-37A, Class D, 9.32% (3 mo. Term SOFR + 4.00%), 10/20/2036 (a) | | | 2,000,000 | | | | 2,024,093 | |
Magnetite Xxix Ltd. |
Series 2021-29A, Class A, 6.58% (3 mo. Term SOFR + 1.25%), 01/15/2034 (a) | | | 1,919,446 | | | | 1,919,591 | |
Series 2021-29A, Class E, 11.34% (3 mo. Term SOFR + 6.01%), 01/15/2034 (a) | | | 2,110,000 | | | | 2,119,672 | |
Morgan Stanley Eaton Vance CLO Ltd., Series 2021-1A, Class A, 6.75% (3 mo. Term SOFR + 1.42%), 10/20/2034 (a) | | | 2,000,000 | | | | 2,004,745 | |
Neuberger Berman CLO Ltd. |
Series 2017-26A, Class E, 11.49% (3 mo. Term SOFR + 6.16%), 10/18/2030 (a) | | | 1,000,000 | | | | 994,294 | |
Series 2019-35A, Class E, 12.59% (3 mo. Term SOFR + 7.26%), 01/19/2033 (a) | | | 1,000,000 | | | | 1,019,854 | |
Series 2021-41A, Class E, 12.09% (3 mo. Term SOFR + 6.76%), 04/15/2034 (a) | | | 1,000,000 | | | | 1,007,184 | |
The accompanying notes are an integral part of the financial statements.
160
Pacer Pacific Asset Floating Rate High Income ETF
SCHEDULE OF INVESTMENTS
April 30, 2024 (Continued)
| | | Par | | | Value | |
COLLATERALIZED LOAN OBLIGATIONS — 33.0% (Continued) |
Series 2022-48A, Class E, 11.82% (3 mo. Term SOFR + 6.50%), 04/25/2036 (a) | | $ | 1,500,000 | | | $ | 1,525,855 | |
Niagara Park CLO, Series 2019-1A, Class AR, 6.58% (3 mo. Term SOFR + 1.26%), 07/17/2032 (a) | | | 2,000,000 | | | | 1,999,788 | |
Oak Hill Credit Partners |
Series 2014-10RA, Class ER, 11.84% (3 mo. Term SOFR + 6.51%), 04/20/2034 (a) | | | 1,000,000 | | | | 1,009,910 | |
Series 2021-16A, Class E, 11.69% (3 mo. Term SOFR + 6.36%), 10/18/2034 (a) | | | 1,000,000 | | | | 1,008,239 | |
OCP CLO Ltd. |
Series 2017-14A, Class D, 11.38% (3 mo. Term SOFR + 6.06%), 11/20/2030 (a) | | | 1,000,000 | | | | 1,001,000 | |
Series 2018-15A, Class D, 11.44% (3 mo. Term SOFR + 6.11%), 07/20/2031 (a) | | | 1,000,000 | | | | 1,003,262 | |
Series 2020-19A, Class ER, 12.09% (3 mo. Term SOFR + 6.76%), 10/20/2034 (a) | | | 250,000 | | | | 249,384 | |
Series 2021-21A, Class E, 11.87% (3 mo. Term SOFR + 6.54%), 07/20/2034 (a) | | | 1,000,000 | | | | 1,004,195 | |
Octagon Investment Partners Ltd., Series 2021-1A, Class A1, 6.71% (3 mo. Term SOFR + 1.38%), 07/15/2034 (a) | | | 1,000,000 | | | | 999,235 | |
OHA Credit Funding |
Series 2018-1A, Class ER, 11.81% (3 mo. Term SOFR + 6.50%), 04/20/2037 (a) | | | 1,000,000 | | | | 994,727 | |
Series 2019-2A, Class ER, 11.95% (3 mo. Term SOFR + 6.62%), 04/21/2034 (a) | | | 810,000 | | | | 817,203 | |
OHA Loan Funding Ltd., Series 2016-1A, Class ER, 11.94% (3 mo. Term SOFR + 6.61%), 01/20/2033 (a) | | | 500,000 | | | | 505,159 | |
Palmer Square Loan Funding Ltd., Series 2022-4A, Class D, 12.61% (3 mo. Term SOFR + 7.29%), 07/24/2031 (a) | | | 1,000,000 | | | | 1,000,895 | |
Parallel CLO Ltd., Series 2021-2A, Class D, 12.79% (3 mo. Term SOFR + 7.46%), 10/20/2034 (a) | | | 1,000,000 | | | | 944,469 | |
Point Au Roche Park CLO, Series 2021-1A, Class E, 11.69% (3 mo. Term SOFR + 6.36%), 07/20/2034 (a) | | | 370,000 | | | | 373,047 | |
| | | Par | | | Value | |
Rad CLO, Series 2021-12A, Class E, 11.94% (3 mo. Term SOFR + 6.61%), 10/30/2034 (a) | | $ | 500,000 | | | $ | 477,302 | |
RR Ltd./Cayman Islands |
Series 2020-8A, Class D, 11.99% (3 mo. Term SOFR + 6.66%), 04/15/2033 (a) | | | 1,000,000 | | | | 1,009,138 | |
Series 2021-19A, Class D, 12.09% (3 mo. Term SOFR + 6.76%), 10/15/2035 (a) | | | 1,000,000 | | | | 1,019,430 | |
Series 2023-26A, Class A1, 7.11% (3 mo. Term SOFR + 1.78%), 04/15/2038 (a) | | | 2,000,000 | | | | 2,006,297 | |
Sixth Street CLO, Series 2021-19A, Class E, 11.49% (3 mo. Term SOFR + 6.16%), 07/20/2034 (a) | | | 500,000 | | | | 496,372 | |
Symphony CLO Ltd. |
Series 2020-22A, Class A1A, 6.88% (3 mo. Term SOFR + 1.55%), 04/18/2033 (a) | | | 2,000,000 | | | | 2,003,304 | |
Series 2020-24A, Class E, 12.59% (3 mo. Term SOFR + 7.26%), 01/23/2032 (a) | | | 1,000,000 | | | | 1,003,443 | |
Series 2021-26A, Class AR, 6.67% (3 mo. Term SOFR + 1.34%), 04/20/2033 (a) | | | 3,000,000 | | | | 2,999,472 | |
Series 2021-29A, Class E, 11.84% (3 mo. Term SOFR + 6.51%), 01/15/2034 (a) | | | 1,500,000 | | | | 1,489,698 | |
Series 2022-37A, Class DR, 10.22% (3 mo. Term SOFR + 4.90%), 01/20/2037 (a) | | | 1,250,000 | | | | 1,267,603 | |
Trimaran CAVU LLC |
Series 2021-1A, Class E, 12.09% (3 mo. Term SOFR + 6.76%), 04/23/2032 (a) | | | 1,250,000 | | | | 1,245,484 | |
Series 2021-3A, Class E, 12.96% (3 mo. Term SOFR + 7.63%), 01/18/2035 (a) | | | 1,925,000 | | | | 1,944,354 | |
Wellington Management Clo 2 Ltd., Series 2024-2A, Class E, 12.21% (3 mo. Term SOFR + 6.90%), 04/20/2037 (a) | | | 1,000,000 | | | | 1,009,000 | |
TOTAL COLLATERALIZED LOAN OBLIGATIONS (Cost $80,306,220) | | | | | | | 81,999,790 | |
| |
The accompanying notes are an integral part of the financial statements.
161
Pacer Pacific Asset Floating Rate High Income ETF
SCHEDULE OF INVESTMENTS
April 30, 2024 (Continued)
| | | Par | | | Value | |
CORPORATE BONDS — 8.9% |
| |
Communication Services — 0.8% |
DISH Network Corp., 11.75%, 11/15/2027 (a) | | $ | 1,500,000 | | | $ | 1,516,394 | |
CCO Holdings LLC / CCO Holdings Capital Corp., 4.75%, 03/01/2030 (a) | | | 500,000 | | | | 416,623 | |
| | | | | | | 1,933,017 | |
| |
Consumer Discretionary — 2.4% |
1011778 BC ULC / New Red Finance, Inc., 4.00%, 10/15/2030 (a) | | | 1,000,000 | | | | 864,232 | |
Allied Universal Holdco LLC / Allied Universal Finance Corp., 9.75%, 07/15/2027 (a) | | | 1,000,000 | | | | 996,998 | |
American Airlines, Inc./AAdvantage Loyalty IP Ltd., 5.50%, 04/20/2026 (a) | | | 333,333 | | | | 329,720 | |
Cedar Fair LP / Canada’s Wonderland Co. / Magnum Management Corp. / Millennium Op, 5.50%, 05/01/2025 (a) | | | 500,000 | | | | 500,000 | |
Ford Motor Credit Co. LLC, 5.11%, 05/03/2029 | | | 1,000,000 | | | | 953,186 | |
Las Vegas Sands Corp., 3.90%, 08/08/2029 | | | 1,000,000 | | | | 893,495 | |
MajorDrive Holdings IV LLC, 6.38%, 06/01/2029 (a) | | | 1,500,000 | | | | 1,408,922 | |
| | | | | | | 5,946,553 | |
| |
Consumer Staples — 0.2% |
US Foods, Inc., 4.63%, 06/01/2030 (a) | | | 500,000 | | | | 455,065 | |
| |
Energy — 1.0% |
Antero Midstream Partners LP / Antero Midstream Finance Corp., 5.38%, 06/15/2029 (a) | | | 1,500,000 | | | | 1,428,953 | |
Venture Global LNG, Inc., 8.13%, 06/01/2028 (a) | | | 1,000,000 | | | | 1,023,338 | |
| | | | | | | 2,452,291 | |
| |
| | | Par | | | Value | |
Financials — 0.4% |
Boost Newco Borrower LLC, 7.50%, 01/15/2031 (a) | | $ | 1,000,000 | | | $ | 1,032,876 | |
| |
Health Care — 0.5% |
Medline Borrower LP, 3.88%, 04/01/2029 (a) | | | 1,500,000 | | | | 1,347,738 | |
| |
Industrials — 1.7% |
Madison IAQ LLC, 4.13%, 06/30/2028 (a) | | | 1,500,000 | | | | 1,392,315 | |
OT Merger Corp., 7.88%, 10/15/2029 (a) | | | 500,000 | | | | 327,100 | |
SPX FLOW, Inc., 8.75%, 04/01/2030 (a) | | | 1,000,000 | | | | 1,028,559 | |
TK Elevator Holdco GmbH, 7.63%, 07/15/2028 (a) | | | 1,500,000 | | | | 1,471,619 | |
| | | | | | | 4,219,593 | |
| |
Information Technology — 0.6% |
UKG, Inc., 6.88%, 02/01/2031 (a) | | | 1,500,000 | | | | 1,506,673 | |
| |
Materials — 0.2% |
Standard Industries, Inc./NJ, 4.75%, 01/15/2028 (a) | | | 500,000 | | | | 472,054 | |
| |
Real Estate — 0.2% |
Howard Hughes Corp., 5.38%, 08/01/2028 (a) | | | 500,000 | | | | 471,373 | |
| |
Utilities — 0.9% |
Calpine Corp., 5.13%, 03/15/2028 (a) | | | 1,500,000 | | | | 1,424,111 | |
NRG Energy, Inc., 3.63%, 02/15/2031 (a) | | | 1,000,000 | | | | 847,955 | |
| | | | | | | 2,272,066 | |
TOTAL CORPORATE BONDS (Cost $21,919,576) | | | | | | | 22,109,299 | |
| |
The accompanying notes are an integral part of the financial statements.
162
Pacer Pacific Asset Floating Rate High Income ETF
SCHEDULE OF INVESTMENTS
April 30, 2024 (Continued)
| | | Shares | | | Value | |
EXCHANGE TRADED FUNDS — 0.5% |
iShares iBoxx $ High Yield Corporate Bond ETF | | | 8,065 | | | $ | 615,279 | |
SPDR Bloomberg High Yield Bond ETF | | | 6,533 | | | | 610,378 | |
TOTAL EXCHANGE TRADED FUNDS (Cost $1,201,405) | | | | | | | 1,225,657 | |
| |
CLOSED END FUNDS — 0.0%(b) |
Eagle Point Credit Co., Inc. | | | 1,905 | | | | 19,145 | |
TOTAL CLOSED END FUNDS (Cost $33,494) | | | | | | | 19,145 | |
| |
TOTAL INVESTMENTS — 95.8% (Cost $235,286,700) | | | | | | | 237,991,800 | |
Other Assets in Excess of Liabilities — 4.2% | | | | | | | 10,429,807 | |
TOTAL NET ASSETS — 100.0% | | | | | | $ | 248,421,607 | |
Percentages are stated as a percent of net assets.
NV - Naamloze Vennootschap
SA - Sociedad Anónima
SOFR - Secured Overnight Financing Rate
| | (a) | Security is exempt from registration pursuant to Rule 144A under the Securities Act of 1933, as amended. These securities may only be resold in transactions exempt from registration to qualified institutional investors. As of April 30, 2024, the value of these securities total $102,262,408 or 41.2% of the Fund’s net assets. |
| | (b) | Represents less than 0.05% of net assets. |
The Global Industry Classification Standard (GICS®) was developed by and/or is the exclusive property of MSCI, Inc. and Standard & Poor’s Financial Services LLC (“S&P”). GICS is a service mark of MSCI, Inc. and S&P and has been licensed for use by U.S. Bank Global Fund Services.
The accompanying notes are an integral part of the financial statements.
163
Pacer Data and Digital Revolution ETF
SCHEDULE OF INVESTMENTS
April 30, 2024
| | | Shares | | | Value | |
COMMON STOCKS — 100.0% |
| |
Industrials – 7.5% |
AAON, Inc. | | | 1,333 | | | $ | 125,422 | |
Atkore, Inc. | | | 603 | | | | 105,706 | |
Encore Wire Corp. | | | 260 | | | | 72,634 | |
Hexatronic Group AB | | | 3,258 | | | | 10,226 | |
Johnson Controls International PLC | | | 11,185 | | | | 727,808 | |
Legrand SA | | | 4,320 | | | | 447,414 | |
Lennox International, Inc. | | | 582 | | | | 269,710 | |
Nexans SA | | | 713 | | | | 76,543 | |
nVent Electric PLC | | | 2,723 | | | | 196,247 | |
SPX Technologies, Inc.(a) | | | 749 | | | | 91,236 | |
| | | | | | | 2,122,946 | |
| |
Information Technology — 92.5%(b) |
A10 Networks, Inc. | | | 1,190 | | | | 15,541 | |
Advanced Micro Devices, Inc.(a) | | | 15,385 | | | | 2,436,676 | |
Akamai Technologies, Inc.(a) | | | 2,472 | | | | 249,499 | |
Ambarella, Inc.(a) | | | 669 | | | | 30,754 | |
Arista Networks, Inc.(a) | | | 4,871 | | | | 1,249,704 | |
Belden, Inc. | | | 679 | | | | 55,182 | |
BlackBerry Ltd.(a) | | | 9,397 | | | | 26,334 | |
Broadcom, Inc. | | | 2,404 | | | | 3,125,849 | |
Calix, Inc.(a) | | | 1,094 | | | | 30,337 | |
Check Point Software Technologies Ltd.(a) | | | 1,982 | | | | 296,150 | |
Ciena Corp.(a) | | | 2,370 | | | | 109,565 | |
Cisco Systems, Inc. | | | 38,692 | | | | 1,817,750 | |
CommScope Holding Co., Inc.(a) | | | 3,400 | | | | 3,040 | |
CommVault Systems, Inc.(a) | | | 712 | | | | 72,959 | |
Computacenter PLC | | | 1,839 | | | | 59,456 | |
Confluent, Inc. - Class A(a) | | | 3,587 | | | | 100,866 | |
Credo Technology Group Holding Ltd.(a) | | | 2,641 | | | | 47,195 | |
Crowdstrike Holdings, Inc. - Class A(a) | | | 3,736 | | | | 1,092,929 | |
CyberArk Software Ltd.(a) | | | 674 | | | | 161,255 | |
Datadog, Inc. - Class A(a) | | | 4,957 | | | | 622,104 | |
Digi International, Inc.(a) | | | 585 | | | | 17,936 | |
Dropbox, Inc. - Class A(a) | | | 4,336 | | | | 100,422 | |
DXC Technology Co.(a) | | | 3,020 | | | | 58,860 | |
Dynatrace, Inc.(a) | | | 4,858 | | | | 220,116 | |
Elastic NV(a) | | | 1,635 | | | | 167,130 | |
| | | Shares | | | Value | |
Information Technology — 92.5%(b) (Continued) |
Extreme Networks, Inc.(a) | | | 2,113 | | | $ | 23,666 | |
F5, Inc.(a) | | | 964 | | | | 159,359 | |
Fastly, Inc.(a) | | | 2,147 | | | | 27,160 | |
Fortinet, Inc.(a) | | | 12,604 | | | | 796,321 | |
Hewlett Packard Enterprise Co. | | | 21,310 | | | | 362,270 | |
Infinera Corp.(a) | | | 3,641 | | | | 17,550 | |
Informatica, Inc. - Class A(a) | | | 4,042 | | | | 125,181 | |
Intel Corp. | | | 40,259 | | | | 1,226,692 | |
InterDigital, Inc. | | | 426 | | | | 42,059 | |
Juniper Networks, Inc. | | | 5,284 | | | | 183,989 | |
Kingsoft Cloud Holdings Ltd.(a) | | | 61,219 | | | | 13,072 | |
MaxLinear, Inc.(a) | | | 1,345 | | | | 27,963 | |
MicroStrategy, Inc.(a) | | | 245 | | | | 260,932 | |
MongoDB, Inc.(a) | | | 1,184 | | | | 432,373 | |
Motorola Solutions, Inc. | | | 2,724 | | | | 923,845 | |
NEC Networks & System Integration Corp. | | | 2,397 | | | | 39,923 | |
NET One Systems Co. Ltd. | | | 1,339 | | | | 22,493 | |
NetApp, Inc. | | | 3,382 | | | | 345,674 | |
NetScout Systems, Inc.(a) | | | 1,166 | | | | 22,457 | |
Nokia OYJ | | | 91,852 | | | | 335,054 | |
Nutanix, Inc.(a) | | | 3,983 | | | | 241,768 | |
NVIDIA Corp. | | | 4,277 | | | | 3,695,413 | |
Okta, Inc.(a) | | | 2,591 | | | | 240,911 | |
Oracle Corp. Japan | | | 2,098 | | | | 158,585 | |
Palo Alto Networks, Inc.(a) | | | 3,147 | | | | 915,431 | |
Pure Storage, Inc.(a) | | | 5,186 | | | | 261,374 | |
Qualys, Inc.(a) | | | 606 | | | | 99,329 | |
Rapid7, Inc.(a) | | | 1,017 | | | | 45,562 | |
Seagate Technology Holdings PLC | | | 3,439 | | | | 295,443 | |
Semtech Corp.(a) | | | 1,055 | | | | 39,689 | |
SentinelOne, Inc. - Class A(a) | | | 4,070 | | | | 85,999 | |
Snowflake, Inc.(a) | | | 5,405 | | | | 838,856 | |
SolarWinds Corp. | | | 2,722 | | | | 29,996 | |
Super Micro Computer, Inc.(a) | | | 918 | | | | 788,378 | |
Telefonaktiebolaget LM Ericsson - Class B | | | 50,437 | | | | 258,345 | |
Tenable Holdings, Inc.(a) | | | 1,926 | | | | 86,612 | |
Teradata Corp.(a) | | | 1,615 | | | | 59,917 | |
Trend Micro, Inc. | | | 2,304 | | | | 114,347 | |
Varonis Systems, Inc.(a) | | | 1,784 | | | | 78,050 | |
Western Digital Corp.(a) | | | 5,322 | | | | 376,957 | |
The accompanying notes are an integral part of the financial statements.
164
Pacer Data and Digital Revolution ETF
SCHEDULE OF INVESTMENTS
April 30, 2024 (Continued)
| | | Shares | | | Value | |
COMMON STOCKS — 100.0% (Continued) |
| | | | | | | | | |
Information Technology — 92.5%(b) (Continued) |
Zscaler, Inc.(a) | | | 2,434 | | | $ | 420,936 | |
| | | | | | | 26,687,540 | |
TOTAL COMMON STOCKS (Cost $27,219,596) | | | | | | | 28,810,486 | |
| |
TOTAL INVESTMENTS — 100.0% (Cost $27,219,596) | | | | | | | 28,810,486 | |
Other Assets in Excess of Assets — 0.0%(c) | | | | | | | 1,551 | |
TOTAL NET ASSETS — 100.0% | | | | | | $ | 28,812,037 | |
Percentages are stated as a percent of net assets.
| | NV - Naamloze Vennootschap | |
| | PLC - Public Limited Company | |
| | (a) | Non-income producing security. |
| | (b) | To the extent that the Fund invests more heavily in a particular industry or sector of the economy, its performance will be especially sensitive to developments that significantly affect those industries or sectors. |
| | (c) | Represents less than 0.05% of net assets. |
The Global Industry Classification Standard (GICS®) was developed by and/or is the exclusive property of MSCI, Inc. and Standard & Poor’s Financial Services LLC (“S&P”). GICS is a service mark of MSCI, Inc. and S&P and has been licensed for use by U.S. Bank Global Fund Services.
The accompanying notes are an integral part of the financial statements.
165
Pacer Industrials and Logistics ETF
SCHEDULE OF INVESTMENTS
April 30, 2024
| | | Shares | | | Value | |
COMMON STOCKS — 97.4% |
| |
Energy — 0.1% |
SFL Corp. Ltd. | | | 100 | | | $ | 1,333 | |
| |
Health Care — 0.1% |
CryoPort, Inc.(a) | | | 36 | | | | 583 | |
| |
Industrials — 84.9%(b) |
Air Transport Services Group, Inc.(a) | | | 49 | | | | 628 | |
AP Moller - Maersk AS - Class B | | | 5 | | | | 7,304 | |
ArcBest Corp. | | | 17 | | | | 1,885 | |
ATS Corp.(a) | | | 72 | | | | 2,374 | |
AutoStore Holdings Ltd.(a)(c) | | | 2,501 | | | | 3,613 | |
AZ-COM MARUWA Holdings, Inc. | | | 104 | | | | 802 | |
Canadian National Railway Co. | | | 518 | | | | 63,000 | |
Canadian Pacific Kansas City Ltd. | | | 751 | | | | 59,037 | |
Cargojet, Inc. | | | 13 | | | | 1,164 | |
Cargotec Oyj - Class B(a) | | | 40 | | | | 3,165 | |
CH Robinson Worldwide, Inc. | | | 85 | | | | 6,035 | |
China Merchants Port Holdings Co. Ltd. | | | 3,062 | | | | 4,056 | |
Cia de Distribucion Integral Logista Holdings SA | | | 97 | | | | 2,651 | |
Clarkson PLC | | | 22 | | | | 1,070 | |
COSCO SHIPPING Holdings Co. Ltd. - Class H | | | 2,417 | | | | 3,140 | |
COSCO SHIPPING Ports Ltd. | | | 2,599 | | | | 1,602 | |
Costamare, Inc. | | | 91 | | | | 1,090 | |
CSX Corp. | | | 1,594 | | | | 52,953 | |
D/S Norden AS | | | 25 | | | | 1,059 | |
Daifuku Co. Ltd. | | | 277 | | | | 5,742 | |
Danaos Corp. | | | 15 | | | | 1,148 | |
Deutsche Post AG | | | 904 | | | | 37,949 | |
Dfds AS | | | 43 | | | | 1,320 | |
DSV AS | | | 160 | | | | 22,887 | |
Expeditors International of Washington, Inc. | | | 108 | | | | 12,021 | |
FedEx Corp. | | | 183 | | | | 47,906 | |
Forward Air Corp. | | | 20 | | | | 440 | |
Full Truck Alliance Co. Ltd. - ADR | | | 696 | | | | 5,993 | |
Golden Ocean Group Ltd. | | | 146 | | | | 2,057 | |
GXO Logistics, Inc.(a) | | | 87 | | | | 4,320 | |
Hapag-Lloyd AG(c) | | | 128 | | | | 23,609 | |
Heartland Express, Inc. | | | 60 | | | | 596 | |
Hoegh Autoliners ASA | | | 139 | | | | 1,471 | |
International Container Terminal Services, Inc. | | | 1,482 | | | | 8,492 | |
International Distributions Services PLC(a) | | | 697 | | | | 2,362 | |
Interroll Holding AG | | | 1 | | | | 3,238 | |
JB Hunt Trasport Services, Inc. | | | 76 | | | | 12,355 | |
| | | Shares | | | Value | |
Industrials — 84.9%(b) (Continued) |
JD Logistics, Inc.(a)(c) | | | 4,828 | | | $ | 5,278 | |
Kamigumi Co. Ltd. | | | 82 | | | | 1,775 | |
Kardex Holding AG | | | 6 | | | | 1,596 | |
Kawasaki Kisen Kaisha Ltd. | | | 549 | | | | 7,714 | |
KION Group AG | | | 96 | | | | 4,453 | |
Kirby Corp.(a) | | | 43 | | | | 4,693 | |
Knight-Swift Transportation Holdings, Inc. | | | 118 | | | | 5,455 | |
Kuehne + Nagel International AG | | | 88 | | | | 23,383 | |
Landstar System, Inc. | | | 27 | | | | 4,709 | |
Mainfreight Ltd. | | | 73 | | | | 2,937 | |
Marten Transport Ltd. | | | 59 | | | | 998 | |
Matson, Inc. | | | 27 | | | | 2,910 | |
Mitsubishi Logistics Corp. | | | 60 | | | | 1,998 | |
Mitsui OSK Lines Ltd. | | | 264 | | | | 8,371 | |
Mullen Group Ltd. | | | 69 | | | | 642 | |
NEXTracker, Inc. - Class A(a) | | | 100 | | | | 4,279 | |
Nippon Yusen KK | | | 372 | | | | 10,557 | |
Nishi-Nippon Railroad Co. Ltd. | | | 58 | | | | 906 | |
Norfolk Southern Corp. | | | 166 | | | | 38,233 | |
NTG Nordic Transport Group AS(a) | | | 17 | | | | 691 | |
Old Dominion Freight Line, Inc. | | | 160 | | | | 29,074 | |
Orient Overseas International Ltd. | | | 482 | | | | 7,044 | |
Pacific Basin Shipping Ltd. | | | 3,839 | | | | 1,335 | |
Rockwell Automation, Inc. | | | 84 | | | | 22,761 | |
RXO, Inc.(a) | | | 85 | | | | 1,607 | |
Ryder System, Inc. | | | 33 | | | | 4,021 | |
Saia, Inc.(a) | | | 20 | | | | 7,937 | |
Sankyu, Inc. | | | 45 | | | | 1,564 | |
Schneider National, Inc. - Class B | | | 68 | | | | 1,406 | |
Seino Holdings Co. Ltd. | | | 137 | | | | 1,841 | |
SG Holdings Co. Ltd. | | | 467 | | | | 5,474 | |
SITC International Holdings Co. Ltd. | | | 1,957 | | | | 4,264 | |
Star Bulk Carriers Corp. | | | 68 | | | | 1,654 | |
Sumitomo Warehouse Co. Ltd. | | | 58 | | | | 963 | |
Svitzer AS(a) | | | 10 | | | | 337 | |
Symbotic, Inc.(a) | | | 68 | | | | 2,623 | |
TFI International, Inc. | | | 63 | | | | 8,221 | |
Toyota Industries Corp. | | | 238 | | | | 22,731 | |
Transcoal Pacific Tbk PT | | | 3,647 | | | | 1,906 | |
Union Pacific Corp. | | | 441 | | | | 104,589 | |
United Parcel Service, Inc. - Class B | | | 583 | | | | 85,981 | |
Wallenius Wilhelmsen ASA | | | 309 | | | | 3,142 | |
Werner Enterprises, Inc. | | | 46 | | | | 1,573 | |
XPO Inc.(a) | | | 85 | | | | 9,134 | |
Yamato Holdings Co. Ltd. | | | 277 | | | | 3,674 | |
Yaskawa Electric Corp. | | | 195 | | | | 8,154 | |
The accompanying notes are an integral part of the financial statements.
166
Pacer Industrials and Logistics ETF
SCHEDULE OF INVESTMENTS
April 30, 2024 (Continued)
| | | Shares | | | Value | |
COMMON STOCKS — 97.4% (Continued) |
| | | | | | | | | |
Industrials — 84.9%(b) (Continued) |
ZIM Integrated Shipping Services Ltd. | | | 91 | | | $ | 1,206 | |
ZTO Express Cayman, Inc. | | | 443 | | | | 9,448 | |
| | | | | | | 895,776 | |
| |
Information Technology – 12.3% |
Celestica, Inc.(a) | | | 87 | | | | 3,775 | |
Cognex Corp. | | | 126 | | | | 5,235 | |
Flex Ltd.(a) | | | 307 | | | | 8,796 | |
Sanmina Corp.(a) | | | 41 | | | | 2,487 | |
SAP SE | | | 605 | | | | 109,779 | |
| | | | | | | 130,072 | |
TOTAL COMMON STOCKS (Cost $962,997) | | | | | | | 1,027,764 | |
| |
EXCHANGE TRADED FUNDS — 2.3% |
iShares MSCI Brazil ETF | | | 238 | | | | 7,385 | |
iShares MSCI South Korea ETF | | | 182 | | | | 11,475 | |
iShares MSCI UAE ETF | | | 390 | | | | 5,589 | |
TOTAL EXCHANGE TRADED FUNDS (Cost $25,056) | | | | | | | 24,449 | |
| |
TOTAL INVESTMENTS — 99.7% (Cost $988,053) | | | | | | | 1,052,213 | |
Other Assets in Excess of Liabilities — 0.3% | | | | | | | 3,151 | |
TOTAL NET ASSETS — 100.0% | | | | | | $ | 1,055,364 | |
Percentages are stated as a percent of net assets.
ADR - American Depositary Receipt
AG - Aktiengesellschaft
ASA - Advanced Subscription Agreement
PLC - Public Limited Company
SA - Sociedad Anónima
| | (a) | Non-income producing security. |
| | (b) | To the extent that the Fund invests more heavily in a particular industry or sector of the economy, its performance will be especially sensitive to developments that significantly affect those industries or sectors. |
| | (c) | Security is exempt from registration pursuant to Rule 144A under the Securities Act of 1933, as amended. These securities may only be resold in transactions exempt from registration to qualified institutional investors. As of April 30, 2024, the value of these securities total $32,500 or 3.1% of the Fund’s net assets. |
The Global Industry Classification Standard (GICS®) was developed by and/or is the exclusive property of MSCI, Inc. and Standard & Poor’s Financial Services LLC (“S&P”). GICS is a service mark of MSCI, Inc. and S&P and has been licensed for use by U.S. Bank Global Fund Services.
The accompanying notes are an integral part of the financial statements.
167
Pacer Funds
STATEMENTS OF ASSETS & LIABILITIES
April 30, 2024
| | | Pacer
Trendpilot®
US Large
Cap ETF | | | Pacer
Trendpilot®
US Mid
Cap ETF | | | Pacer
Trendpilot®
100 ETF | | | Pacer
Trendpilot®
European
Index ETF | | | Pacer
Trendpilot®
International
ETF | |
ASSETS | | | | | | | | | | | | | | | | | | | | |
Investments in Securities, at Value* ^ | | $ | 2,713,301,919 | | | $ | 470,902,522 | | | $ | 1,528,055,489 | | | $ | 45,357,824 | | | $ | 182,752,307 | |
Cash | | | 2,001,186 | | | | 213,810 | | | | 18,709,528 | | | | 20,213 | | | | 146,110 | |
Interest and Dividends Receivable | | | 1,574,571 | | | | 133,142 | | | | 102,668 | | | | 516,858 | | | | 943,138 | |
Receivable for Fund Shares Sold | | | 4,653,140 | | | | — | | | | — | | | | — | | | | — | |
Securities Lending Income Receivable | | | 6,661 | | | | 8,301 | | | | 15,534 | | | | 5,331 | | | | 10,171 | |
Total Assets | | | 2,721,537,477 | | | | 471,257,775 | | | | 1,546,883,219 | | | | 45,900,226 | | | | 183,851,726 | |
| | | | | | | | | | | | | | | | | | | | | |
LIABILITIES | | | | | | | | | | | | | | | | | | | | |
Management Fees Payable | | | 1,302,830 | | | | 193,108 | | | | 631,785 | | | | 21,603 | | | | 80,940 | |
Payable to Custodian | | | — | | | | — | | | | — | | | | 185 | | | | 703 | |
Payable for Investment Securities Purchased | | | 4,640,986 | | | | — | | | | — | | | | — | | | | — | |
Collateral Received For Securities Loaned (See Note 5) | | | 95,811,917 | | | | 86,595,764 | | | | 364,781,969 | | | | 5,787,866 | | | | 33,098,496 | |
Total Liabilities | | | 101,755,733 | | | | 86,788,872 | | | | 365,413,754 | | | | 5,809,654 | | | | 33,180,139 | |
| | | | | | | | | | | | | | | | | | | | | |
NET ASSETS | | $ | 2,619,781,744 | | | $ | 384,468,903 | | | $ | 1,181,469,465 | | | $ | 40,090,572 | | | $ | 150,671,587 | |
| | | | | | | | | | | | | | | | | | | | | |
NET ASSETS CONSIST OF: | | | | | | | | | | | | | | | | | | | | |
Paid-in Capital | | $ | 2,519,886,791 | | | $ | 483,462,277 | | | $ | 1,055,768,405 | | | $ | 86,306,186 | | | $ | 157,911,871 | |
Total Distributable Earnings (Accumulated Deficit) | | | 99,894,953 | | | | (98,993,374 | ) | | | 125,701,060 | | | | (46,215,614 | ) | | | (7,240,284 | ) |
Net Assets | | $ | 2,619,781,744 | | | $ | 384,468,903 | | | $ | 1,181,469,465 | | | $ | 40,090,572 | | | $ | 150,671,587 | |
* Identified Cost: | | | | | | | | | | | | | | | | | | | | |
Investments in Securities | | $ | 2,302,810,323 | | | $ | 438,957,753 | | | $ | 1,378,583,606 | | | $ | 42,404,959 | | | $ | 164,469,215 | |
^ Includes Loaned Securities with a value of | | | 92,102,045 | | | | 82,949,350 | | | | 357,002,972 | | | | 5,470,347 | | | | 31,864,146 | |
| | | | | | | | | | | | | | | | | | | | | |
Net Asset Value: | | | | | | | | | | | | | | | | | | | | |
Net Assets | | $ | 2,619,781,744 | | | $ | 384,468,903 | | | $ | 1,181,469,465 | | | $ | 40,090,572 | | | $ | 150,671,587 | |
Shares Outstanding (No Par Value) | | | 57,200,000 | | | | 11,350,000 | | | | 17,600,000 | | | | 1,550,000 | | | | 5,350,000 | |
Net Asset Value, Offering and Redemption Price per Share | | $ | 45.80 | | | $ | 33.87 | | | $ | 67.13 | | | $ | 25.86 | | | $ | 28.16 | |
The accompanying notes are an integral part of the financial statements.
168
Pacer Funds
STATEMENTS OF ASSETS & LIABILITIES
April 30, 2024
| | | Pacer
Trendpilot®
US Bond ETF | | | Pacer
Trendpilot®
Fund of Funds
ETF | | | Pacer
US
Cash Cows
100 ETF | | | Pacer
US Small
Cap Cash
Cows
100 ETF | | | Pacer
Global
Cash Cows
Dividend ETF | |
ASSETS | | | | | | | | | | | | | | | | | | | | |
Investments in Unaffiliated Securities, at Value* | | $ | 196,383,961 | | | $ | — | | | $ | 23,678,428,474 | | | $ | 10,369,895,675 | | | $ | 2,131,939,129 | |
Investments in Affiliated Securities, at Value* | | | — | | | | 50,224,393 | | | | — | | | | — | | | | — | |
Interest and Dividends Receivable | | | 2,952,636 | | | | 72,902 | | | | 21,062,976 | | | | 4,480,890 | | | | 14,106,753 | |
Receivable for Fund Shares Sold | | | — | | | | — | | | | 86,093,450 | | | | 65,666,840 | | | | — | |
Receivable for Investment Securities Sold | | | 2,864,044 | | | | — | | | | — | | | | — | | | | — | |
Cash | | | 2,433,694 | | | | 2,951 | | | | 30,055,129 | | | | 4,692,146 | | | | 3,763,438 | |
Securities Lending Income Receivable | | | 9,887 | | | | — | | | | 94,450 | | | | 96,212 | | | | 35,570 | |
Total Assets | | | 204,644,222 | | | | 50,300,246 | | | | 23,815,734,479 | | | | 10,444,831,763 | | | | 2,149,844,890 | |
| | | | | | | | | | | | | | | | | | | | | |
LIABILITIES | | | | | | | | | | | | | | | | | | | | |
Management Fees Payable | | | 88,156 | | | | 6,259 | | | | 9,134,157 | | | | 4,600,949 | | | | 947,922 | |
Payable for Investment Securities Purchased | | | 4,554,391 | | | | — | | | | 85,676,696 | | | | 65,487,893 | | | | — | |
Other Payable | | | — | | | | — | | | | — | | | | — | | | | — | |
Payable for Fund Shares Redeemed | | | — | | | | — | | | | — | | | | — | | | | — | |
Payable for Distributions to Shareholders | | | 1,275,405 | | | | — | | | | — | | | | — | | | | — | |
Collateral Received For Securities Loaned (See Note 5) | | | 20,705,300 | | | | — | | | | 1,079,037,899 | | | | 975,050,215 | | | | 232,196,500 | |
Payable to Custodian | | | — | | | | — | | | | — | | | | 1,514 | | | | 16,991 | |
Total Liabilities | | | 26,623,252 | | | | 6,259 | | | | 1,173,848,752 | | | | 1,045,140,571 | | | | 233,161,413 | |
| | | | | | | | | | | | | | | | | | | | | |
NET ASSETS | | $ | 178,020,970 | | | $ | 50,293,987 | | | $ | 22,641,885,727 | | | $ | 9,399,691,192 | | | $ | 1,916,683,477 | |
| | | | | | | | | | | | | | | | | | | | | |
NET ASSETS CONSIST OF: | | | | | | | | | | | | | | | | | | | | |
Paid-in Capital | | $ | 438,292,660 | | | $ | 49,324,166 | | | $ | 21,449,730,556 | | | $ | 9,182,729,451 | | | $ | 1,898,648,062 | |
Total Distributable Earnings (Accumulated Deficit) | | | (260,271,690 | ) | | | 969,821 | | | | 1,192,155,171 | | | | 216,961,741 | | | | 18,035,415 | |
Net Assets | | $ | 178,020,970 | | | $ | 50,293,987 | | | $ | 22,641,885,727 | | | $ | 9,399,691,192 | | | $ | 1,916,683,477 | |
* Identified Cost: | | | | | | | | | | | | | | | | | | | | |
Investments in Unaffiliated Securities | | $ | 195,462,514 | | | $ | — | | | $ | 21,766,587,747 | | | $ | 10,083,705,802 | | | $ | 2,069,556,409 | |
Investments in Affiliated Securities | | | — | | | | 48,454,535 | | | | — | | | | — | | | | — | |
Foreign Currencies | | | — | | | | — | | | | — | | | | — | | | | — | |
^ Includes Loaned Securities with a value of | | | 20,158,891 | | | | — | | | | 1,034,824,542 | | | | 918,208,256 | | | | 221,424,115 | |
| | | | | | | | | | | | | | | | | | | | | |
Net Asset Value: | | | | | | | | | | | | | | | | | | | | |
Net Assets | | $ | 178,020,970 | | | $ | 50,293,987 | | | $ | 22,641,885,727 | | | $ | 9,399,691,192 | | | $ | 1,916,683,477 | |
Shares Outstanding (No Par Value) | | | 8,900,000 | | | | 1,650,000 | | | | 413,000,000 | | | | 205,100,000 | | | | 56,100,000 | |
Net Asset Value, Offering and Redemption Price per Share | | $ | 20.00 | | | $ | 30.48 | | | $ | 54.82 | | | $ | 45.83 | | | $ | 34.17 | |
The accompanying notes are an integral part of the financial statements.
169
Pacer Funds
STATEMENTS OF ASSETS & LIABILITIES
April 30, 2024
| | | Pacer
Developed
Markets
International
Cash Cows
100 ETF | | | Pacer
Emerging
Markets
Cash Cows
100 ETF | | | Pacer
US Large
Cap Cash
Cows Growth
Leaders ETF | | | Pacer
US Small
Cap Cash
Cows Growth
Leaders ETF | | | Pacer US
Cash Cows
Growth ETF | |
ASSETS | | | | | | | | | | | | | | | | | | | | |
Investments in Securities, at Value* ^ | | $ | 1,515,151,525 | | | $ | 96,363,374 | | | $ | 120,176,752 | | | $ | 9,164,783 | | | $ | 53,405,982 | |
Interest and Dividends Receivable | | | 9,483,926 | | | | 430,747 | | | | 46,321 | | | | 2,418 | | | | 13,097 | |
Cash | | | 1,419,505 | | | | 349,640 | | | | 128,404 | | | | 7,251 | | | | 26,017 | |
Receivable for Fund Shares Sold | | | — | | | | — | | | | 1,855,708 | | | | — | | | | — | |
Securities Lending Income Receivable | | | 82,278 | | | | 164 | | | | — | | | | — | | | | 545 | |
Total Assets | | | 1,526,137,234 | | | | 97,143,925 | | | | 122,207,185 | | | | 9,174,452 | | | | 53,445,641 | |
| | | | | | | | | | | | | | | | | | | | | |
LIABILITIES | | | | | | | | | | | | | | | | | | | | |
Management Fees Payable | | | 726,909 | | | | 53,001 | | | | 48,159 | | | | 4,193 | | | | 23,110 | |
Payable to Custodian | | | 4,672 | | | | 1 | | | | — | | | | — | | | | 1 | |
Payable for Investment Securities Purchased | | | — | | | | — | | | | 1,816,931 | | | | — | | | | — | |
Collateral Received For Securities Loaned (See Note 5) | | | 120,207,214 | | | | 4,543 | | | | — | | | | — | | | | 7,010,900 | |
Total Liabilities | | | 120,938,795 | | | | 57,545 | | | | 1,865,090 | | | | 4,193 | | | | 7,034,011 | |
| | | | | | | | | | | | | | | | | | | | | |
NET ASSETS | | $ | 1,405,198,439 | | | $ | 97,086,380 | | | $ | 120,342,095 | | | $ | 9,170,259 | | | $ | 46,411,630 | |
| | | | | | | | | | | | | | | | | | | | | |
NET ASSETS CONSIST OF: | | | | | | | | | | | | | | | | | | | | |
Paid-in Capital | | $ | 1,346,578,654 | | | $ | 94,449,939 | | | $ | 119,604,198 | | | $ | 9,306,316 | | | $ | 46,665,067 | |
Total Distributable Earnings (Accumulated Deficit) | | | 58,619,785 | | | | 2,636,441 | | | | 737,897 | | | | (136,057 | ) | | | (253,437 | ) |
Net Assets | | $ | 1,405,198,439 | | | $ | 97,086,380 | | | $ | 120,342,095 | | | $ | 9,170,259 | | | $ | 46,411,630 | |
* Identified Cost: | | | | | | | | | | | | | | | | | | | | |
Investments in Securities | | $ | 1,452,673,281 | | | $ | 90,591,950 | | | $ | 117,436,409 | | | $ | 9,132,777 | | | $ | 48,816,364 | |
^ Includes Loaned Securities with a value of | | | 114,713,940 | | | | 4,215 | | | | — | | | | — | | | | 6,709,378 | |
| | | | | | | | | | | | | | | | | | | | | |
Net Asset Value: | | | | | | | | | | | | | | | | | | | | |
Net Assets | | $ | 1,405,198,439 | | | $ | 97,086,380 | | | $ | 120,342,095 | | | $ | 9,170,259 | | | $ | 46,411,630 | |
Shares Outstanding (No Par Value) | | | 44,500,000 | | | | 4,750,000 | | | | 4,900,000 | | | | 400,000 | | | | 1,150,000 | |
Net Asset Value, Offering and Redemption Price per Share | | $ | 31.58 | | | $ | 20.44 | | | $ | 24.56 | | | $ | 22.93 | | | $ | 40.36 | |
The accompanying notes are an integral part of the financial statements.
170
Pacer Funds
STATEMENTS OF ASSETS & LIABILITIES
April 30, 2024
| | | Pacer
Cash Cows
Fund of Funds
ETF | | | Pacer
WealthShield
ETF | | | Pacer
Industrial
Real Estate ETF | | | Pacer Data &
Infrastructure
Real Estate ETF | | | Pacer
CFRA-Stovall
Equal Weight
Seasonal Rotation
Index ETF | |
ASSETS | | | | | | | | | | | | | | | | | | | | |
Investments in Unaffiliated Securities, at Value* ^ | | $ | — | | | $ | 23,335,648 | | | $ | 208,591,696 | | | $ | 446,924,878 | | | $ | 46,783,189 | |
Investments in Affiliated Securities, at Value* | | | 94,036,120 | | | | — | | | | — | | | | — | | | | — | |
Receivable for Fund Shares Sold | | | — | | | | — | | | | — | | | | — | | | | 28,483,050 | |
Cash | | | 12,886 | | | | 15,917 | | | | 230,623 | | | | 853,511 | | | | 4,419 | |
Interest and Dividends Receivable | | | 55 | | | | 5,112 | | | | 661,809 | | | | 2,827 | | | | 17,560 | |
Receivable for Investment Securities Sold | | | — | | | | 3,705,048 | | | | — | | | | 1,247,130 | | | | 66,751,022 | |
Securities Lending Income Receivable | | | — | | | | 1,513 | | | | 2,224 | | | | 10,583 | | | | 731 | |
Total Assets | | | 94,049,061 | | | | 27,063,238 | | | | 209,486,352 | | | | 449,038,929 | | | | 142,039,971 | |
| | | | | | | | | | | | | | | | | | | | | |
LIABILITIES | | | | | | | | | | | | | | | | | | | | |
Management Fees Payable, net of waiver, if any | | | 11,639 | | | | 9,877 | | | | 92,901 | | | | 197,933 | | | | 21,055 | |
Payable to Custodian | | | — | | | | — | | | | — | | | | — | | | | — | |
Payable for Investment Securities Purchased | | | — | | | | 3,528,797 | | | | — | | | | — | | | | 67,552,989 | |
Payable for Fund Shares Redeemed | | | — | | | | — | | | | — | | | | 1,316,130 | | | | 27,969,825 | |
Collateral Received For Securities Loaned (See Note 5) | | | — | | | | 4,078,068 | | | | 14,624,834 | | | | 26,363,358 | | | | 7,355,777 | |
Total Liabilities | | | 11,639 | | | | 7,616,742 | | | | 14,717,735 | | | | 27,877,421 | | | | 102,899,646 | |
| | | | | | | | | | | | | | | | | | | | | |
NET ASSETS | | $ | 94,037,422 | | | $ | 19,446,496 | | | $ | 194,768,617 | | | $ | 421,161,508 | | | $ | 39,140,325 | |
| | | | | | | | | | | | | | | | | | | | | |
NET ASSETS CONSIST OF: | | | | | | | | | | | | | | | | | | | | |
Paid-in Capital | | $ | 86,958,279 | | | $ | 46,369,917 | | | $ | 276,632,899 | | | $ | 785,645,701 | | | $ | 66,552,412 | |
Total Distributable Earnings (Accumulated Deficit) | | | 7,079,143 | | | | (26,923,421 | ) | | | (81,864,282 | ) | | | (364,484,193 | ) | | | (27,412,087 | ) |
Net Assets | | $ | 94,037,422 | | | $ | 19,446,496 | | | $ | 194,768,617 | | | $ | 421,161,508 | | | $ | 39,140,325 | |
* Identified Cost: | | | | | | | | | | | | | | | | | | | | |
Investments in Unaffiliated Securities | | $ | — | | | $ | 22,284,252 | | | $ | 227,766,634 | | | $ | 539,897,563 | | | $ | 46,791,586 | |
Investments in Affiliated Securities | | | 86,738,838 | | | | — | | | | — | | | | — | | | | — | |
Foreign Currencies | | | — | | | | — | | | | — | | | | — | | | | — | |
^ Includes Loaned Securities with a value of | | | — | | | | 3,914,706 | | | | 14,135,307 | | | | 24,975,033 | | | | 7,028,954 | |
| | | | | | | | | | | | | | | | | | | | | |
Net Asset Value: | | | | | | | | | | | | | | | | | | | | |
Net Assets | | $ | 94,037,422 | | | $ | 19,446,496 | | | $ | 194,768,617 | | | $ | 421,161,508 | | | $ | 39,140,325 | |
Shares Outstanding (No Par Value) | | | 2,500,000 | | | | 700,000 | | | | 5,500,000 | | | | 16,000,000 | | | | 1,050,000 | |
Net Asset Value, Offering and Redemption Price per Share | | $ | 37.61 | | | $ | 27.78 | | | $ | 35.41 | | | $ | 26.32 | | | $ | 37.28 | |
The accompanying notes are an integral part of the financial statements.
171
Pacer Funds
STATEMENTS OF ASSETS & LIABILITIES
April 30, 2024
| | | Pacer
CSOP FTSE
China A50
ETF | | | Pacer
BioThreat
Strategy
ETF | | | Pacer
Lunt Large Cap
Alternator
ETF | | | Pacer
Lunt Midcap
Multi-Factor
Alternator
ETF | | | Pacer
Lunt Large Cap
Multi-Factor
Alternator
ETF | |
ASSETS | | | | | | | | | | | | | | | | | | | | |
Investments in Securities, at Value* ^ | | $ | 4,410,888 | | | $ | 3,919,008 | | | $ | 269,390,895 | | | $ | 68,327,842 | | | $ | 305,914,517 | |
Cash | | | 29,242 | | | | 2,047 | | | | 352,388 | | | | 46,180 | | | | 202,454 | |
Foreign Currency at Value* | | | 5,830 | | | | — | | | | — | | | | — | | | | — | |
Interest and Dividends Receivable | | | 78 | | | | 3,827 | | | | 301,903 | | | | 14,097 | | | | 186,056 | |
Receivable for Fund Shares Sold | | | — | | | | — | | | | — | | | | — | | | | 2,254,540 | |
Receivable for Investment Securities Sold | | | — | | | | — | | | | 1,688,649 | | | | — | | | | — | |
Securities Lending Income Receivable | | | — | | | | 74 | | | | 1,256 | | | | 1,105 | | | | 714 | |
Total Assets | | | 4,446,038 | | | | 3,924,956 | | | | 271,735,091 | | | | 68,389,224 | | | | 308,558,281 | |
| | | | | | | | | | | | | | | | | | | | | |
LIABILITIES | | | | | | | | | | | | | | | | | | | | |
Management Fees Payable | | | 2,488 | | | | 1,996 | | | | 130,178 | | | | 27,284 | | | | 148,821 | |
Payable for Fund Shares Redeemed | | | — | | | | — | | | | 1,699,535 | | | | — | | | | — | |
Payable for Investment Securities Purchased | | | — | | | | — | | | | — | | | | — | | | | 2,227,426 | |
Collateral Received For Securities Loaned (See Note 5) | | | — | | | | 477,840 | | | | 13,275,747 | | | | 12,553,301 | | | | 9,103,620 | |
Total Liabilities | | | 2,488 | | | | 479,836 | | | | 15,105,460 | | | | 12,580,585 | | | | 11,479,867 | |
| | | | | | | | | | | | | | | | | | | | | |
NET ASSETS | | $ | 4,443,550 | | | $ | 3,445,120 | | | $ | 256,629,631 | | | $ | 55,808,639 | | | $ | 297,078,414 | |
| | | | | | | | | | | | | | | | | | | | | |
NET ASSETS CONSIST OF: | | | | | | | | | | | | | | | | | | | | |
Paid-in Capital | | $ | 6,806,415 | | | $ | 3,839,043 | | | $ | 521,003,247 | | | $ | 61,485,121 | | | $ | 331,796,535 | |
Total Distributable Earnings (Accumulated Deficit) | | | (2,362,865 | ) | | | (393,923 | ) | | | (264,373,616 | ) | | | (5,676,482 | ) | | | (34,718,121 | ) |
Net Assets | | $ | 4,443,550 | | | $ | 3,445,120 | | | $ | 256,629,631 | | | $ | 55,808,639 | | | $ | 297,078,414 | |
* Identified Cost: | | | | | | | | | | | | | | | | | | | | |
Investments in Securities | | $ | 4,417,579 | | | $ | 4,231,601 | | | $ | 268,879,893 | | | $ | 65,433,706 | | | $ | 291,036,650 | |
Foreign Cash | | | 5,781 | | | | — | | | | — | | | | — | | | | — | |
^ Includes Loaned Securities with a value of | | | — | | | | 468,102 | | | | 12,912,764 | | | | 12,025,500 | | | | 8,720,282 | |
| | | | | | | | | | | | | | | | | | | | | |
Net Asset Value: | | | | | | | | | | | | | | | | | | | | |
Net Assets | | $ | 4,443,550 | | | $ | 3,445,120 | | | $ | 256,629,631 | | | $ | 55,808,639 | | | $ | 297,078,414 | |
Shares Outstanding (No Par Value) | | | 305,882 | | | | 100,000 | | | | 7,550,000 | | | | 1,300,000 | | | | 6,700,000 | |
Net Asset Value, Offering and Redemption Price per Share | | $ | 14.53 | | | $ | 34.45 | | | $ | 33.99 | | | $ | 42.93 | | | $ | 44.34 | |
The accompanying notes are an integral part of the financial statements.
172
Pacer Funds
STATEMENTS OF ASSETS & LIABILITIES
April 30, 2024
| | | Pacer
US Export
Leaders
ETF | | | Pacer Pacific
Asset Floating
Rate High
Income ETF | | | Pacer Industrials
and Logistics
ETF | | | Pacer Data
and Digital
Revolution ETF | |
ASSETS | | | | | | | | | | | | | | | | |
Investments in Securities, at Value* ^ | | $ | 68,151,991 | | | $ | 237,991,800 | | | $ | 1,052,213 | | | $ | 28,810,486 | |
Cash | | | 35,808 | | | | 35,714,429 | | | | 1,107 | | | | 10,126 | |
Interest and Dividends Receivable | | | 14,422 | | | | 1,367,747 | | | | 2,577 | | | | 6,002 | |
Receivable for Investment Securities Sold | | | — | | | | 2,489,819 | | | | — | | | | — | |
Securities Lending Income Receivable | | | 678 | | | | — | | | | — | | | | — | |
Total Assets | | | 68,202,899 | | | | 277,563,795 | | | | 1,055,897 | | | | 28,826,614 | |
| | | | | | | | | | | | | | | | | |
LIABILITIES | | | | | | | | | | | | | | | | |
Management Fees Payable | | | 30,102 | | | | 114,839 | | | | 533 | | | | 14,577 | |
Payable for Investment Securities Purchased | | | — | | | | 27,096,875 | | | | — | | | | — | |
Payable for Distributions to Shareholders | | | — | | | | 1,930,416 | | | | — | | | | — | |
Other Payables | | | — | | | | 58 | | | | — | | | | — | |
Collateral Received For Securities Loaned (See Note 5) | | | 6,978,588 | | | | — | | | | — | | | | — | |
Total Liabilities | | | 7,008,690 | | | | 29,142,188 | | | | 533 | | | | 14,577 | |
| | | | | | | | | | | | | | | | | |
NET ASSETS | | $ | 61,194,209 | | | $ | 248,421,607 | | | $ | 1,055,364 | | | $ | 28,812,037 | |
| | | | | | | | | | | | | | | | | |
NET ASSETS CONSIST OF: | | | | | | | | | | | | | | | | |
Paid-in Capital | | $ | 57,369,845 | | | $ | 248,807,504 | | | $ | 994,800 | | | $ | 27,164,006 | |
Total Distributable Earnings (Accumulated Deficit) | | | 3,824,364 | | | | (385,897 | ) | | | 60,564 | | | | 1,648,031 | |
Net Assets | | $ | 61,194,209 | | | $ | 248,421,607 | | | $ | 1,055,364 | | | $ | 28,812,037 | |
* Identified Cost: | | | | | | | | | | | | | | | | |
Investments in Securities | | $ | 63,032,671 | | | $ | 235,286,700 | | | $ | 988,053 | | | $ | 27,219,596 | |
^ Includes Loaned Securities with a value of | | | 6,619,824 | | | | — | | | | — | | | | — | |
| | | | | | | | | | | | | | | | | |
Net Asset Value: | | | | | | | | | | | | | | | | |
Net Assets | | $ | 61,194,209 | | | $ | 248,421,607 | | | $ | 1,055,364 | | | $ | 28,812,037 | |
Shares Outstanding (No Par Value) | | | 1,300,000 | | | | 5,230,000 | | | | 40,000 | | | | 720,000 | |
Net Asset Value, Offering and Redemption Price per Share | | $ | 47.07 | | | $ | 47.50 | | | $ | 26.38 | | | $ | 40.02 | |
The accompanying notes are an integral part of the financial statements.
173
Pacer Funds
STATEMENTS OF OPERATIONS
For the Year Ended April 30, 2024
| | | Pacer
Trendpilot®
US Large
Cap ETF | | | Pacer
Trendpilot®
US Mid
Cap ETF | | | Pacer
Trendpilot®
100 ETF | | | Pacer
Trendpilot®
European
Index ETF | | | Pacer
Trendpilot®
International
ETF | |
INVESTMENT INCOME | | | | | | | | | | | | | | | | | | | | |
Income: | | | | | | | | | | | | | | | | | | | | |
Dividends* | | $ | 35,528,227 | | | $ | 4,902,960 | | | $ | 5,255,183 | | | $ | 1,138,566 | | | $ | 3,999,724 | |
Interest | | | 1,241,498 | | | | 3,919,489 | | | | 23,776,882 | | | | 209,552 | | | | 141,724 | |
Securities Lending Income | | | 147,090 | | | | 118,924 | | | | 298,406 | | | | 33,897 | | | | 106,607 | |
Total Investment Income | | | 36,916,815 | | | | 8,941,373 | | | | 29,330,471 | | | | 1,382,015 | | | | 4,248,055 | |
| | | | | | | | | | | | | | | | | | | | | |
Expenses: | | | | | | | | | | | | | | | | | | | | |
Management fees | | | 13,982,346 | | | | 2,305,346 | | | | 6,590,916 | | | | 269,191 | | | | 909,940 | |
Total Expenses | | | 13,982,346 | | | | 2,305,346 | | | | 6,590,916 | | | | 269,191 | | | | 909,940 | |
Net Investment Income (Loss) | | | 22,934,469 | | | | 6,636,027 | | | | 22,739,555 | | | | 1,112,824 | | | | 3,338,115 | |
| | | | | | | | | | | | | | | | | | | | | |
REALIZED & UNREALIZED GAIN (LOSS) ON INVESTMENTS | | | | | | | | | | | | | | | | | | | | |
Net Realized Gain (Loss) on: | | | | | | | | | | | | | | | | | | | | |
Net Realized Gain (Loss) on Investments | | | 24,698,299 | | | | (10,274,454 | ) | | | 16,081,009 | | | | 2,373,843 | | | | (2,765,729 | ) |
Net Realized Gain (Loss) on In-Kind Redemptions | | | 15,477,025 | | | | 2,724,049 | | | | 44,843,094 | | | | (230,162 | ) | | | 1,017,901 | |
Net Realized Gain (Loss) on Foreign Currency | | | — | | | | — | | | | — | | | | (30,814 | ) | | | (292,267 | ) |
Total | | | 40,175,324 | | | | (7,550,405 | ) | | | 60,924,103 | | | | 2,112,867 | | | | (2,040,095 | ) |
Net Change in Unrealized Appreciation (Depreciation) of: | | | | | | | | | | | | | | | | | | | | |
Change in Unrealized Appreciation (Depreciation) on Investments | | | 361,242,587 | | | | 25,933,702 | | | | 110,295,271 | | | | (3,351,995 | ) | | | 8,680,833 | |
Change in Unrealized Appreciation (Depreciation) on Foreign Currency | | | — | | | | — | | | | — | | | | (5,987 | ) | | | (3,797 | ) |
Total | | | 361,242,587 | | | | 25,933,702 | | | | 110,295,271 | | | | (3,357,982 | ) | | | 8,677,036 | |
Net Realized and Unrealized Gain (Loss) on Investments | | | 401,417,911 | | | | 18,383,297 | | | | 171,219,374 | | | | (1,245,115 | ) | | | 6,636,941 | |
NET INCREASE (DECREASE) IN NET ASSETS RESULTING FROM OPERATIONS | | $ | 424,352,380 | | | $ | 25,019,324 | | | $ | 193,958,929 | | | $ | (132,291 | ) | | $ | 9,975,056 | |
| | | | | | | | | | | | | | | | | | | | | |
* Net of fees and foreign witholding tax of | | $ | 9,407 | | | $ | — | | | $ | 11,501 | | | $ | 207,551 | | | $ | 463,429 | |
The accompanying notes are an integral part of the financial statements.
174
Pacer Funds
STATEMENTS OF OPERATIONS
For the Year Ended April 30, 2024
| | | Pacer
Trendpilot®
US Bond ETF | | | Pacer
Trendpilot®
Fund of Funds
ETF | | | Pacer
US
Cash Cows
100 ETF | | | Pacer
US Small
Cap Cash
Cows
100 ETF | | | Pacer
Global
Cash Cows
Dividend ETF | |
INVESTMENT INCOME | | | | | | | | | | | | | | | | | | | | |
Income: | | | | | | | | | | | | | | | | | | | | |
Dividends from Unaffiliated Investments* | | $ | — | | | $ | — | | | $ | 433,946,484 | | | $ | 90,466,399 | | | $ | 101,020,626 | |
Dividends from Affiliated Investments | | | — | | | | 1,412,825 | | | | — | | | | — | | | | — | |
Interest | | | 14,526,835 | | | | 2,194 | | | | 1,078,375 | | | | 400,884 | | | | 249,939 | |
Securities Lending Income | | | 110,429 | | | | — | | | | 6,569,512 | | | | 1,061,102 | | | | 540,462 | |
Total Investment Income | | | 14,637,264 | | | | 1,415,019 | | | | 441,594,371 | | | | 91,928,385 | | | | 101,811,027 | |
| | | | | | | | | | | | | | | | | | | | | |
Expenses: | | | | | | | | | | | | | | | | | | | | |
Management fees | | | 1,148,708 | | | | 76,582 | | | | 81,733,134 | | | | 30,298,102 | | | | 10,482,068 | |
Total Expenses | | | 1,148,708 | | | | 76,582 | | | | 81,733,134 | | | | 30,298,102 | | | | 10,482,068 | |
Net Investment Income (Loss) | | | 13,488,556 | | | | 1,338,437 | | | | 359,861,237 | | | | 61,630,283 | | | | 91,328,959 | |
| | | | | | | | | | | | | | | | | | | | | |
REALIZED & UNREALIZED GAIN (LOSS) ON INVESTMENTS | | | | | | | | | | | | | | | | | | | | |
Net Realized Gain (Loss) on: | | | | | | | | | | | | | | | | | | | | |
Net Realized Gain (Loss) on Investments in Unaffiliated Securities | | | (3,367,547 | ) | | | — | | | | 105,510,823 | | | | 143,876,508 | | | | 5,787,205 | |
Net Realized Gain (Loss) on Investments in Affiliated Securities | | | — | | | | 67,918 | | | | — | | | | — | | | | — | |
Net Realized Gain (Loss) on In-Kind Redemptions | | | 444,405 | | | | 1,420,611 | | | | 902,699,272 | | | | 220,578,371 | | | | 10,477,781 | |
Net Realized Gain (Loss) on Foreign Currency | | | (1,014 | ) | | | — | | | | — | | | | — | | | | 21,816 | |
Total | | | (2,924,156 | ) | | | 1,488,529 | | | | 1,008,210,095 | | | | 364,454,879 | | | | 16,286,802 | |
Net Change in Unrealized Appreciation (Depreciation) of: | | | | | | | | | | | | | | | | | | | | |
Change in Unrealized Appreciation (Depreciation) on Investments in Unaffiliated Securities | | | 53,799 | | | | — | | | | 1,597,970,731 | | | | 263,449,038 | | | | 2,827,232 | |
Change in Unrealized Appreciation (Depreciation) on Investments in Affiliated Securities | | | — | | | | 3,174,313 | | | | — | | | | — | | | | — | |
Change in Unrealized Appreciation (Depreciation) on Foreign Currency | | | — | | | | — | | | | — | | | | — | | | | (111,871 | ) |
Total | | | 53,799 | | | | 3,174,313 | | | | 1,597,970,731 | | | | 263,449,038 | | | | 2,715,361 | |
Net Realized and Unrealized Gain (Loss) on Investments | | | (2,870,357 | ) | | | 4,662,842 | | | | 2,606,180,826 | | | | 627,903,917 | | | | 19,002,163 | |
NET INCREASE (DECREASE) IN NET ASSETS RESULTING FROM OPERATIONS | | $ | 10,618,199 | | | $ | 6,001,279 | | | $ | 2,966,042,063 | | | $ | 689,534,200 | | | $ | 110,331,122 | |
| | | | | | | | | | | | | | | | | | | | | |
* Net of fees and foreign witholding tax of | | $ | — | | | $ | — | | | $ | — | | | $ | — | | | $ | 6,397,673 | |
The accompanying notes are an integral part of the financial statements.
175
Pacer Funds
STATEMENTS OF OPERATIONS
For the Year Ended April 30, 2024
| | | Pacer
Developed
Markets
International
Cash Cows
100 ETF | | | Pacer
Emerging
Markets
Cash Cows
100 ETF | | | Pacer
US Large Cap
Cash Cows
Growth Leaders
ETF | | | Pacer
US Small Cap
Cash Cows
Growth Leaders
ETF | | | Pacer US
Cash Cows
Growth ETF | |
INVESTMENT INCOME | | | | | | | | | | | | | | | | | | | | |
Income: | | | | | | | | | | | | | | | | | | | | |
Dividends* | | $ | 41,967,871 | | | $ | 4,223,621 | | | $ | 520,017 | | | $ | 46,613 | | | $ | 837,163 | |
Interest | | | 103,851 | | | | 10,370 | | | | 3,971 | | | | 279 | | | | 2,661 | |
Securities Lending Income | | | 601,699 | | | | 7,377 | | | | — | | | | — | | | | 9,947 | |
Total Investment Income | | | 42,673,421 | | | | 4,241,368 | | | | 523,988 | | | | 46,892 | | | | 849,771 | |
| | | | | | | | | | | | | | | | | | | | | |
Expenses: | | | | | | | | | | | | | | | | | | | | |
Management fees | | | 6,099,594 | | | | 495,512 | | | | 251,991 | | | | 23,329 | | | | 239,650 | |
Total Expenses | | | 6,099,594 | | | | 495,512 | | | | 251,991 | | | | 23,329 | | | | 239,650 | |
Net Investment Income (Loss) | | | 36,573,827 | | | | 3,745,856 | | | | 271,997 | | | | 23,563 | | | | 610,121 | |
| | | | | | | | | | | | | | | | | | | | | |
REALIZED & UNREALIZED GAIN (LOSS) ON INVESTMENTS | | | | | | | | | | | | | | | | | | | | |
Net Realized Gain (Loss) on: | | | | | | | | | | | | | | | | | | | | |
Net Realized Gain (Loss) on Investments | | | 7,489,128 | | | | (1,399,125 | ) | | | (1,980,209 | ) | | | (185,190 | ) | | | (1,761,637 | ) |
Net Realized Gain (Loss) on In-Kind Redemptions | | | 22,708,144 | | | | — | | | | 4,356,668 | | | | 508,608 | | | | 2,435,139 | |
Net Realized Gain (Loss) on Foreign Currency | | | (1,626,967 | ) | | | (66,421 | ) | | | — | | | | — | | | | — | |
Total | | | 28,570,305 | | | | (1,465,546 | ) | | | 2,376,459 | | | | 323,418 | | | | 673,502 | |
Net Change in Unrealized Appreciation (Depreciation) of: | | | | | | | | | | | | | | | | | | | | |
Change in Unrealized Appreciation (Depreciation) on Investments | | | 33,759,840 | | | | 5,996,909 | | | | 2,806,401 | | | | 32,006 | | | | 5,645,580 | |
Change in Unrealized Appreciation (Depreciation) on Foreign Currency | | | (196,597 | ) | | | (6,454 | ) | | | — | | | | — | | | | — | |
Total | | | 33,563,243 | | | | 5,990,455 | | | | 2,806,401 | | | | 32,006 | | | | 5,645,580 | |
Net Realized and Unrealized Gain (Loss) on Investments | | | 62,133,548 | | | | 4,524,909 | | | | 5,182,860 | | | | 355,424 | | | | 6,319,082 | |
NET INCREASE (DECREASE) IN NET ASSETS RESULTING FROM OPERATIONS | | $ | 98,707,375 | | | $ | 8,270,765 | | | $ | 5,454,857 | | | $ | 378,987 | | | $ | 6,929,203 | |
| | | | | | | | | | | | | | | | | | | | | |
* Net of fees and foreign witholding tax of | | $ | 4,686,757 | | | $ | 545,107 | | | $ | — | | | $ | — | | | $ | — | |
The accompanying notes are an integral part of the financial statements.
176
Pacer Funds
STATEMENTS OF OPERATIONS
For the Year Ended April 30, 2024
| | | Pacer
Cash Cows
Fund of Funds
ETF | | | Pacer
WealthShield
ETF | | | Pacer
Industrial
Real Estate ETF | | | Pacer Data &
Infrastructure
Real Estate ETF | | | Pacer
CFRA-Stovall
Equal Weight
Seasonal Rotation
Index ETF | |
INVESTMENT INCOME | | | | | | | | | | | | | | | | | | | | |
Income: | | | | | | | | | | | | | | | | | | | | |
Dividends from Unaffiliated Investments* | | $ | — | | | $ | 133,517 | | | $ | 7,467,377 | | | $ | 16,182,070 | | | $ | 895,039 | |
Dividends from Affiliated Investments | | | 2,029,260 | | | | — | | | | — | | | | — | | | | — | |
Interest | | | 2,392 | | | | 362,057 | | | | 18,864 | | | | 64,188 | | | | 1,701 | |
Securities Lending Income | | | — | | | | 8,558 | | | | 34,488 | | | | 221,287 | | | | 12,489 | |
Total Investment Income | | | 2,031,652 | | | | 504,132 | | | | 7,520,729 | | | | 16,467,545 | | | | 909,229 | |
| | | | | | | | | | | | | | | | | | | | | |
Expenses: | | | | | | | | | | | | | | | | | | | | |
Management fees | | | 108,853 | | | | 149,652 | | | | 1,244,890 | | | | 3,208,645 | | | | 309,308 | |
Total Expenses | | | 108,853 | | | | 149,652 | | | | 1,244,890 | | | | 3,208,645 | | | | 309,308 | |
Fees waived by adviser | | | — | | | | — | | | | (103,741 | ) | | | (267,387 | ) | | | — | |
Net Expenses | | | 108,853 | | | | 149,652 | | | | 1,141,149 | | | | 2,941,258 | | | | 309,308 | |
Net Investment Income (Loss) | | | 1,922,799 | | | | 354,480 | | | | 6,379,580 | | | | 13,526,287 | | | | 599,921 | |
| | | | | | | | | | | | | | | | | | | | | |
REALIZED & UNREALIZED GAIN (LOSS) ON INVESTMENTS | | | | | | | | | | | | | | | | | | | | |
Net Realized Gain (Loss) on: | | | | | | | | | | | | | | | | | | | | |
Net Realized Gain (Loss) on Investments in Unaffiliated Securities | | | — | | | | (990,005 | ) | | | (5,489,100 | ) | | | (74,215,912 | ) | | | (8,977,617 | ) |
Net Realized Gain (Loss) on Investments in Affiliated Securities | | | (84,756 | ) | | | — | | | | — | | | | — | | | | — | |
Net Realized Gain (Loss) on In-Kind Redemptions | | | 2,561,250 | | | | 506,058 | | | | 637,413 | | | | (8,036,393 | ) | | | 7,698,818 | |
Net Realized Gain (Loss) on Foreign Currency | | | — | | | | — | | | | (5,512 | ) | | | 34,308 | | | | — | |
Capital Gain Distributions from Underlying Holdings | | | — | | | | — | | | | 2,224 | | | | — | | | | — | |
Total | | | 2,476,494 | | | | (483,947 | ) | | | (4,854,975 | ) | | | (82,217,997 | ) | | | (1,278,799 | ) |
Net Change in Unrealized Appreciation (Depreciation) of: | | | | | | | | | | | | | | | | | | | | |
Change in Unrealized Appreciation (Depreciation) on Investments in Unaffiliated Securities | | | — | | | | 1,055,852 | | | | (22,857,946 | ) | | | 19,546,736 | | | | (1,964 | ) |
Change in Unrealized Appreciation (Depreciation) on Investments in Affiliated Securities | | | 6,775,878 | | | | — | | | | — | | | | — | | | | — | |
Change in Unrealized Appreciation (Depreciation) on Foreign Currency | | | — | | | | — | | | | (19,196 | ) | | | (4,772 | ) | | | — | |
Total | | | 6,775,878 | | | | 1,055,852 | | | | (22,877,142 | ) | | | 19,541,964 | | | | (1,964 | ) |
Net Realized and Unrealized Gain (Loss) on Investments | | | 9,252,372 | | | | 571,905 | | | | (27,732,117 | ) | | | (62,676,033 | ) | | | (1,280,763 | ) |
NET INCREASE (DECREASE) IN NET ASSETS RESULTING FROM OPERATIONS | | $ | 11,175,171 | | | $ | 926,385 | | | $ | (21,352,537 | ) | | $ | (49,149,746 | ) | | $ | (680,842 | ) |
| | | | | | | | | | | | | | | | | | | | | |
* Net of fees and foreign witholding tax of | | $ | — | | | $ | 74 | | | $ | 321,798 | | | $ | 801,634 | | | $ | 236 | |
The accompanying notes are an integral part of the financial statements.
177
Pacer Funds
STATEMENTS OF OPERATIONS
For the Year Ended April 30, 2024
| | | Pacer
CSOP FTSE
China A50
ETF | | | Pacer
Biothreat
Strategy
ETF | | | Pacer
Lunt Large Cap
Alternator
ETF | | | Pacer
Lunt Midcap
Multi Factor
Alternator
ETF | | | Pacer
Lunt Large Cap
Multi Factor
Alternator
ETF | |
INVESTMENT INCOME | | | | | | | | | | | | | | | | | | | | |
Income: | | | | | | | | | | | | | | | | | | | | |
Dividends* | | $ | 133,277 | | | $ | 61,114 | | | $ | 8,837,242 | | | $ | 493,616 | | | $ | 3,683,963 | |
Interest | | | 1,009 | | | | 223 | | | | 29,718 | | | | 2,094 | | | | 13,942 | |
Securities Lending Income | | | — | | | | 1,389 | | | | 67,428 | | | | 16,383 | | | | 22,343 | |
Total Investment Income | | | 134,286 | | | | 62,726 | | | | 8,934,388 | | | | 512,093 | | | | 3,720,248 | |
| | | | | | | | | | | | | | | | | | | | | |
Expenses: | | | | | | | | | | | | | | | | | | | | |
Management fees | | | 30,882 | | | | 25,886 | | | | 2,981,059 | | | | 242,632 | | | | 1,544,517 | |
Tax Expense | | | 188 | | | | — | | | | — | | | | — | | | | — | |
Total Expenses | | | 31,070 | | | | 25,886 | | | | 2,981,059 | | | | 242,632 | | | | 1,544,517 | |
Net Investment Income (Loss) | | | 103,216 | | | | 36,840 | | | | 5,953,329 | | | | 269,461 | | | | 2,175,731 | |
| | | | | | | | | | | | | | | | | | | | | |
REALIZED & UNREALIZED GAIN (LOSS) ON INVESTMENTS | | | | | | | | | | | | | | | | | | | | |
Net Realized Gain (Loss) on: | | | | | | | | | | | | | | | | | | | | |
Net Realized Gain (Loss) on Investments | | | (266,361 | ) | | | (112,225 | ) | | | (127,277,099 | ) | | | 2,443,017 | | | | 5,188,639 | |
Net Realized Gain (Loss) on In-Kind Redemptions | | | — | | | | 370,838 | | | | 14,731,884 | | | | 5,144,555 | | | | 48,417,971 | |
Net Realized Gain (Loss) on Foreign Currency | | | (678 | ) | | | — | | | | — | | | | — | | | | — | |
Total | | | (267,039 | ) | | | 258,613 | | | | (112,545,215 | ) | | | 7,587,572 | | | | 53,606,610 | |
Net Change in Unrealized Appreciation (Depreciation) of: | | | | | | | | | | | | | | | | | | | | |
Change in Unrealized Appreciation (Depreciation) on Investments | | | (213,954 | ) | | | 314,969 | | | | 67,003,760 | | | | 2,268,321 | | | | 5,460,211 | |
Change in Unrealized Appreciation (Depreciation) on Foreign Currency | | | 36 | | | | — | | | | — | | | | — | | | | — | |
Total | | | (213,918 | ) | | | 314,969 | | | | 67,003,760 | | | | 2,268,321 | | | | 5,460,211 | |
Net Realized and Unrealized Gain (Loss) on Investments | | | (480,957 | ) | | | 573,582 | | | | (45,541,455 | ) | | | 9,855,893 | | | | 59,066,821 | |
NET INCREASE (DECREASE) IN NET ASSETS RESULTING FROM OPERATIONS | | $ | (377,741 | ) | | $ | 610,422 | | | $ | (39,588,126 | ) | | $ | 10,125,354 | | | $ | 61,242,552 | |
| | | | | | | | | | | | | | | | | | | | | |
* Net of fees and foreign witholding tax of | | $ | 14,837 | | | $ | 788 | | | $ | 10,528 | | | $ | — | | | $ | — | |
The accompanying notes are an integral part of the financial statements.
178
Pacer Funds
STATEMENTS OF OPERATIONS
For the Year Ended April 30, 2024
| | | Pacer US Export
Leaders ETF | | | Pacer Pacific
Asset Floating
Rate High
Income ETF | | | Pacer
Industrials and
Logistics ETF | | | Pacer
Data and Digital
Revolution
ETF | |
INVESTMENT INCOME | | | | | | | | | | | | | | | | |
Income: | | | | | | | | | | | | | | | | |
Dividends* | | $ | 440,431 | | | $ | 80,299 | | | $ | 29,767 | | | $ | 86,916 | |
Interest | | | 2,061 | | | | 14,815,443 | | | | 77 | | | | 819 | |
Securities Lending Income | | | 8,899 | | | | — | | | | — | | | | — | |
Total Investment Income | | | 451,391 | | | | 14,895,742 | | | | 29,844 | | | | 87,735 | |
| | | | | | | | | | | | | | | | | |
Expenses: | | | | | | | | | | | | | | | | |
Management fees | | | 251,922 | | | | 927,275 | | | | 6,257 | | | | 60,137 | |
Tax Expense | | | — | | | | — | | | | — | | | | 100 | |
Total Expenses | | | 251,922 | | | | 927,275 | | | | 6,257 | | | | 60,237 | |
Net Investment Income (Loss) | | | 199,469 | | | | 13,968,467 | | | | 23,587 | | | | 27,498 | |
| | | | | | | | | | | | | | | | | |
REALIZED & UNREALIZED GAIN (LOSS) ON INVESTMENTS | | | | | | | | | | | | | | | | |
Net Realized Gain (Loss) on: | | | | | | | | | | | | | | | | |
Net Realized Gain (Loss) on Investments | | | (1,014,526 | ) | | | 608,118 | | | | (638,994 | ) | | | 36,073 | |
Net Realized Gain (Loss) on In-Kind Redemptions | | | 3,259,712 | | | | — | | | | 637,413 | | | | 115,344 | |
Net Realized Gain (Loss) on Foreign Currency | | | — | | | | — | | | | (272 | ) | | | (216 | ) |
Total | | | 2,245,186 | | | | 608,118 | | | | (1,853 | ) | | | 151,201 | |
Net Change in Unrealized Appreciation (Depreciation) of: | | | | | | | | | | | | | | | | |
Change in Unrealized Appreciation (Depreciation) on Investments | | | 4,469,723 | | | | 4,276,383 | | | | 53,500 | | | | 1,590,745 | |
Change in Unrealized Appreciation (Depreciation) on Foreign Currency | | | — | | | | — | | | | (43 | ) | | | (68 | ) |
Total | | | 4,469,723 | | | | 4,276,383 | | | | 53,457 | | | | 1,590,677 | |
Net Realized and Unrealized Gain (Loss) on Investments | | | 6,714,909 | | | | 4,884,501 | | | | 51,604 | | | | 1,741,878 | |
NET INCREASE (DECREASE) IN NET ASSETS RESULTING FROM OPERATIONS | | $ | 6,914,378 | | | $ | 18,852,968 | | | $ | 75,191 | | | $ | 1,769,376 | |
| | | | | | | | | | | | | | | | | |
* Net of fees and foreign witholding tax of | | $ | 239 | | | $ | — | | | $ | 3,632 | | | $ | — | |
The accompanying notes are an integral part of the financial statements.
179
Pacer Funds
STATEMENTS OF CHANGES IN NET ASSETS
| | | Pacer Trendpilot®
US Large Cap ETF | | | Pacer Trendpilot®
US Mid Cap ETF | |
| | | For the
Year Ended
April 30,
2024 | | | For the
Year Ended
April 30,
2023 | | | For the
Year Ended
April 30,
2024 | | | For the
Year Ended
April 30,
2023 | |
OPERATIONS | | | | | | | | | | | | | | | | |
Net Investment Income (Loss) | | $ | 22,934,469 | | | $ | 35,149,499 | | | $ | 6,636,027 | | | $ | 5,157,936 | |
Net Realized Gain (Loss) on Investments and Foreign Currency Transactions | | | 40,175,324 | | | | (2,146,942 | ) | | | (7,550,405 | ) | | | (38,006,691 | ) |
Change in Unrealized Appreciation (Depreciation) of Investments and Foreign Currency Transactions | | | 361,242,587 | | | | 49,274,263 | | | | 25,933,702 | | | | 5,998,134 | |
Net Increase (Decrease) in Net Assets Resulting from Operations | | | 424,352,380 | | | | 82,276,820 | | | | 25,019,324 | | | | (26,850,621 | ) |
| | | | | | | | | | | | | | | | | |
DISTRIBUTIONS TO SHAREHOLDERS | | | | | | | | | | | | | | | | |
Dividends and Distributions | | | (28,840,382 | ) | | | (26,415,381 | ) | | | (7,000,000 | ) | | | (3,237,926 | ) |
Total Distributions to Shareholders | | | (28,840,382 | ) | | | (26,415,381 | ) | | | (7,000,000 | ) | | | (3,237,926 | ) |
| | | | | | | | | | | | | | | | | |
CAPITAL SHARE TRANSACTION | | | | | | | | | | | | | | | | |
Proceeds from Shares Sold | | | 269,651,410 | | | | 521,811,485 | | | | 31,186,025 | | | | 170,960,965 | |
Payments for Shares Redeemed | | | (84,990,400 | ) | | | (379,307,265 | ) | | | (54,988,860 | ) | | | (192,513,530 | ) |
Net Increase (Decrease) in Net Assets Derived from Capital Share Transactions (a) | | | 184,661,010 | | | | 142,504,220 | | | | (23,802,835 | ) | | | (21,552,565 | ) |
Net Increase (Decrease) in Net Assets | | $ | 580,173,008 | | | | 198,365,659 | | | $ | (5,783,511 | ) | | $ | (51,641,112 | ) |
| | | | | | | | | | | | | | | | | |
NET ASSETS | | | | | | | | | | | | | | | | |
Beginning of Year | | $ | 2,039,608,736 | | | $ | 1,841,243,077 | | | $ | 390,252,414 | | | $ | 441,893,526 | |
End of Year | | $ | 2,619,781,744 | | | $ | 2,039,608,736 | | | $ | 384,468,903 | | | $ | 390,252,414 | |
(a) | Summary of capital share transactions is as follows: |
| | | Shares | | | Shares | | | Shares | | | Shares | |
Subscriptions | | | 6,400,000 | | | | 13,850,000 | | | | 950,000 | | | | 5,200,000 | |
Redemptions | | | (2,000,000 | ) | | | (10,100,000 | ) | | | (1,700,000 | ) | | | (5,900,000 | ) |
Net Increase (Decrease) | | | 4,400,000 | | | | 3,750,000 | | | | (750,000 | ) | | | (700,000 | ) |
The accompanying notes are an integral part of the financial statements.
180
Pacer Funds
STATEMENTS OF CHANGES IN NET ASSETS
| | | Pacer Trendpilot® 100 ETF | | | Pacer Trendpilot®
European Index ETF | |
| | | For the
Year Ended
April 30,
2024 | | | For the
Year Ended
April 30,
2023 | | | For the
Year Ended
April 30,
2024 | | | For the
Year Ended
April 30,
2023 | |
OPERATIONS | | | | | | | | | | | | | | | | |
Net Investment Income (Loss) | | $ | 22,739,555 | | | $ | 6,417,380 | | | $ | 1,112,824 | | | $ | 659,133 | |
Net Realized Gain (Loss) on Investments and Foreign Currency Transactions | | | 60,924,103 | | | | (933,181 | ) | | | 2,112,867 | | | | 390,928 | |
Change in Unrealized Appreciation (Depreciation) of Investments and Foreign Currency Transactions | | | 110,295,271 | | | | 39,195,084 | | | | (3,357,982 | ) | | | 6,339,180 | |
Net Increase (Decrease) in Net Assets Resulting from Operations | | | 193,958,929 | | | | 44,679,283 | | | | (132,291 | ) | | | 7,389,241 | |
| | | | | | | | | | | | | | | | | |
DISTRIBUTIONS TO SHAREHOLDERS | | | | | | | | | | | | | | | | |
Dividends and Distributions | | | (15,996,062 | ) | | | (4,142,394 | ) | | | (1,192,866 | ) | | | (273,384 | ) |
Total Distributions to Shareholders | | | (15,996,062 | ) | | | (4,142,394 | ) | | | (1,192,866 | ) | | | (273,384 | ) |
| | | | | | | | | | | | | | | | | |
CAPITAL SHARE TRANSACTIONS | | | | | | | | | | | | | | | | |
Proceeds from Shares Sold | | | 409,358,020 | | | | 64,757,685 | | | | 7,865,625 | | | | 12,499,820 | |
Payments for Shares Redeemed | | | (156,776,250 | ) | | | (43,185,630 | ) | | | (10,293,245 | ) | | | (21,697,145 | ) |
Net Increase (Decrease) in Net Assets Derived from Capital Share Transactions (a) | | | 252,581,770 | | | | 21,572,055 | | | | (2,427,620 | ) | | | (9,197,325 | ) |
Net Increase (Decrease) in Net Assets | | $ | 430,544,637 | | | $ | 62,108,944 | | | $ | (3,752,777 | ) | | $ | (2,081,468 | ) |
| | | | | | | | | | | | | | | | | |
NET ASSETS | | | | | | | | | | | | | | | | |
Beginning of Year | | $ | 750,924,828 | | | $ | 688,815,884 | | | $ | 43,843,349 | | | $ | 45,924,817 | |
End of Year | | $ | 1,181,469,465 | | | $ | 750,924,828 | | | $ | 40,090,572 | | | $ | 43,843,349 | |
(a) | Summary of capital share transactions is as follows: |
| | | Shares | | | Shares | | | Shares | | | Shares | |
Subscriptions | | | 6,550,000 | | | | 1,250,000 | | | | 300,000 | | | | 550,000 | |
Redemptions | | | (2,550,000 | ) | | | (850,000 | ) | | | (400,000 | ) | | | (950,000 | ) |
Net Increase (Decrease) | | | 4,000,000 | | | | 400,000 | | | | (100,000 | ) | | | (400,000 | ) |
The accompanying notes are an integral part of the financial statements.
181
Pacer Funds
STATEMENTS OF CHANGES IN NET ASSETS
| | | Pacer Trendpilot®
International ETF | |
| | | For the
Year Ended
April 30,
2024 | | | For the
Year Ended
April 30,
2023 | |
OPERATIONS | | | | | | | | |
Net Investment Income (Loss) | | $ | 3,338,115 | | | $ | 2,167,755 | |
Net Realized Gain (Loss) on Investments and Foreign Currency Transactions | | | (2,040,095 | ) | | | 90,195 | |
Change in Unrealized Appreciation (Depreciation) of Investments and Foreign Currency Transactions | | | 8,677,036 | | | | 9,646,729 | |
Net Increase (Decrease) in Net Assets Resulting from Operations | | | 9,975,056 | | | | 11,904,679 | |
| | | | | | | | | |
DISTRIBUTIONS TO SHAREHOLDERS | | | | | | | | |
Dividends and Distributions | | | (3,142,461 | ) | | | (444,569 | ) |
Total Distributions to Shareholders | | | (3,142,461 | ) | | | (444,569 | ) |
| | | | | | | | | |
CAPITAL SHARE TRANSACTIONS | | | | | | | | |
Proceeds from Shares Sold | | | 24,192,740 | | | | 9,090,440 | |
Payments for Shares Redeemed | | | (5,496,020 | ) | | | (25,936,275 | ) |
Transaction Fees (See Note 1) | | | 1,061 | | | | 70 | |
Net Increase (Decrease) in Net Assets Derived from Capital Share Transactions (a) | | | 18,697,781 | | | | (16,845,765 | ) |
Net Increase (Decrease) in Net Assets | | $ | 25,530,376 | | | $ | (5,385,655 | ) |
| | | | | | | | | |
NET ASSETS | | | | | | | | |
Beginning of Year | | $ | 125,141,211 | | | $ | 130,526,866 | |
End of Year | | $ | 150,671,587 | | | $ | 125,141,211 | |
(a) | Summary of capital share transactions is as follows: |
| | | Shares | | | Shares | |
Subscriptions | | | 900,000 | | | | 350,000 | |
Redemptions | | | (200,000 | ) | | | (1,050,000 | ) |
Net Increase (Decrease) | | | 700,000 | | | | (700,000 | ) |
The accompanying notes are an integral part of the financial statements.
182
Pacer Funds
STATEMENTS OF CHANGES IN NET ASSETS
| | | Pacer Trendpilot®
US Bond ETF | | | Pacer Trendpilot®
Fund of Funds ETF | |
| | | For the
Year Ended
April 30,
2024 | | | For the
Year Ended
April 30,
2023 | | | For the
Year Ended
April 30,
2024 | | | For the
Year Ended
April 30,
2023 | |
OPERATIONS | | | | | | | | | | | | | | | | |
Net Investment Income (Loss) | | $ | 13,488,556 | | | $ | 22,093,968 | | | $ | 1,338,437 | | | $ | 1,024,679 | |
Net Realized Gain (Loss) on Investments and Foreign Currency Transactions | | | (2,924,156 | ) | | | (123,726,526 | ) | | | 1,488,529 | | | | 1,039,553 | |
Change in Unrealized Appreciation (Depreciation) of Investments and Foreign Currency Transactions | | | 53,799 | | | | 39,291,335 | | | | 3,174,313 | | | | (1,480,620 | ) |
Net Increase (Decrease) in Net Assets Resulting from Operations | | | 10,618,199 | | | | (62,341,223 | ) | | | 6,001,279 | | | | 583,612 | |
| | | | | | | | | | | | | | | | | |
DISTRIBUTIONS TO SHAREHOLDERS | | | | | | | | | | | | | | | | |
Dividends and Distributions | | | (13,319,148 | ) | | | (26,684,806 | ) | | | (1,304,500 | ) | | | (942,758 | ) |
Total Distributions to Shareholders | | | (13,319,148 | ) | | | (26,684,806 | ) | | | (1,304,500 | ) | | | (942,758 | ) |
| | | | | | | | | | | | | | | | | |
CAPITAL SHARE TRANSACTIONS | | | | | | | | | | | | | | | | |
Proceeds from Shares Sold | | | 6,142,640 | | | | — | | | | 1,458,985 | | | | 1,364,660 | |
Payments for Shares Redeemed | | | (57,768,460 | ) | | | (628,183,340 | ) | | | (8,680,450 | ) | | | (12,154,420 | ) |
Transaction Fees (See Note 1) | | | 7,524 | | | | — | | | | — | | | | — | |
Net Increase (Decrease) in Net Assets Derived from Capital Share Transactions (a) | | | (51,618,296 | ) | | | (628,183,340 | ) | | | (7,221,465 | ) | | | (10,789,760 | ) |
Net Increase (Decrease) in Net Assets | | $ | (54,319,245 | ) | | $ | (717,209,369 | ) | | $ | (2,524,686 | ) | | $ | (11,148,906 | ) |
| | | | | | | | | | | | | | | | | |
NET ASSETS | | | | | | | | | | | | | | | | |
Beginning of Year | | $ | 232,340,215 | | | $ | 949,549,584 | | | $ | 52,818,673 | | | $ | 63,967,579 | |
End of Year | | $ | 178,020,970 | | | $ | 232,340,215 | | | $ | 50,293,987 | | | $ | 52,818,673 | |
(a) | Summary of capital share transactions is as follows: |
| | | Shares | | | Shares | | | Shares | | | Shares | |
Subscriptions | | | 300,000 | | | | — | | | | 50,000 | | | | 50,000 | |
Redemptions | | | (2,900,000 | ) | | | (29,200,000 | ) | | | (300,000 | ) | | | (450,000 | ) |
Net Increase (Decrease) | | | (2,600,000 | ) | | | (29,200,000 | ) | | | (250,000 | ) | | | (400,000 | ) |
The accompanying notes are an integral part of the financial statements.
183
Pacer Funds
STATEMENTS OF CHANGES IN NET ASSETS
| | | Pacer US Cash Cows 100 ETF | | | Pacer US Small Cap
Cash Cows 100 ETF | |
| | | For the
Year Ended
April 30,
2024 | | | For the
Year Ended
April 30,
2023 | | | For the
Year Ended
April 30,
2024 | | | For the
Year Ended
April 30,
2023 | |
OPERATIONS | | | | | | | | | | | | | | | | |
Net Investment Income (Loss) | | $ | 359,861,237 | | | $ | 207,988,150 | | | $ | 61,630,283 | | | $ | 17,791,694 | |
Net Realized Gain (Loss) on Investments and Foreign Currency Transactions | | | 1,008,210,095 | | | | (591,025,700 | ) | | | 364,454,879 | | | | (139,420,421 | ) |
Change in Unrealized Appreciation (Depreciation) of Investments and Foreign Currency Transactions | | | 1,597,970,731 | | | | 321,930,563 | | | | 263,449,038 | | | | 87,241,929 | |
Net Increase (Decrease) in Net Assets Resulting from Operations | | | 2,966,042,063 | | | | (61,106,987 | ) | | | 689,534,200 | | | | (34,386,798 | ) |
| | | | | | | | | | | | | | | | | |
DISTRIBUTIONS TO SHAREHOLDERS | | | | | | | | | | | | | | | | |
Dividends and Distributions | | | (341,685,265 | ) | | | (193,788,560 | ) | | | (58,323,606 | ) | | | (16,000,780 | ) |
Total Distributions to Shareholders | | | (341,685,265 | ) | | | (193,788,560 | ) | | | (58,323,606 | ) | | | (16,000,780 | ) |
| | | | | | | | | | | | | | | | | |
CAPITAL SHARE TRANSACTIONS | | | | | | | | | | | | | | | | |
Proceeds from Shares Sold | | | 11,017,493,590 | | | | 10,511,453,425 | | | | 7,367,718,520 | | | | 1,451,823,265 | |
Payments for Shares Redeemed | | | (4,219,840,280 | ) | | | (1,591,432,405 | ) | | | (635,002,345 | ) | | | (197,346,245 | ) |
Net Increase (Decrease) in Net Assets Derived from Capital Share Transactions (a) | | | 6,797,653,310 | | | | 8,920,021,020 | | | | 6,732,716,175 | | | | 1,254,477,020 | |
Net Increase (Decrease) in Net Assets | | $ | 9,422,010,108 | | | $ | 8,665,125,473 | | | $ | 7,363,926,769 | | | $ | 1,204,089,442 | |
| | | | | | | | | | | | | | | | | |
NET ASSETS | | | | | | | | | | | | | | | | |
Beginning of Year | | $ | 13,219,875,619 | | | $ | 4,554,750,146 | | | $ | 2,035,764,423 | | | $ | 831,674,981 | |
End of Year | | $ | 22,641,885,727 | | | $ | 13,219,875,619 | | | $ | 9,399,691,192 | | | $ | 2,035,764,423 | |
(a) | Summary of capital share transactions is as follows: |
| | | Shares | | | Shares | | | Shares | | | Shares | |
Subscriptions | | | 207,250,000 | | | | 222,700,000 | | | | 163,750,000 | | | | 38,500,000 | |
Redemptions | | | (77,150,000 | ) | | | (34,800,000 | ) | | | (13,600,000 | ) | | | (5,400,000 | ) |
Net Increase (Decrease) | | | 130,100,000 | | | | 187,900,000 | | | | 150,150,000 | | | | 33,100,000 | |
The accompanying notes are an integral part of the financial statements.
184
Pacer Funds
STATEMENTS OF CHANGES IN NET ASSETS
| | | Pacer Global Cash
Cows Dividend ETF | |
| | | For the
Year Ended
April 30,
2024 | | | For the
Year Ended
April 30,
2023 | |
OPERATIONS | | | | | | | | |
Net Investment Income (Loss) | | $ | 91,328,959 | | | $ | 52,787,500 | |
Net Realized Gain (Loss) on Investments and Foreign Currency Transactions | | | 16,286,802 | | | | (6,077,033 | ) |
Change in Unrealized Appreciation (Depreciation) of Investments and Foreign Currency Transactions | | | 2,715,361 | | | | 56,617,021 | |
Net Increase (Decrease) in Net Assets Resulting from Operations | | | 110,331,122 | | | | 103,327,488 | |
| | | | | | | | | |
DISTRIBUTIONS TO SHAREHOLDERS | | | | | | | | |
Dividends and Distributions | | | (103,433,974 | ) | | | (33,617,374 | ) |
Total Distributions to Shareholders | | | (103,433,974 | ) | | | (33,617,374 | ) |
| | | | | | | | | |
CAPITAL SHARE TRANSACTIONS | | | | | | | | |
Proceeds from Shares Sold | | | 372,460,780 | | | | 1,227,571,200 | |
Payments for Shares Redeemed | | | (42,288,465 | ) | | | (69,174,060 | ) |
Transaction Fees (See Note 1) | | | 53,609 | | | | 150,678 | |
Net Increase (Decrease) in Net Assets Derived from Capital Share Transactions (a) | | | 330,225,924 | | | | 1,158,547,818 | |
Net Increase (Decrease) in Net Assets | | $ | 337,123,072 | | | $ | 1,228,257,932 | |
| | | | | | | | | |
NET ASSETS | | | | | | | | |
Beginning of Year | | $ | 1,579,560,405 | | | $ | 351,302,473 | |
End of Year | | $ | 1,916,683,477 | | | $ | 1,579,560,405 | |
(a) | Summary of capital share transactions is as follows: |
| | | Shares | | | Shares | |
Subscriptions | | | 11,100,000 | | | | 37,750,000 | |
Redemptions | | | (1,250,000 | ) | | | (2,200,000 | ) |
Net Increase (Decrease) | | | 9,850,000 | | | | 35,550,000 | |
The accompanying notes are an integral part of the financial statements.
185
Pacer Funds
STATEMENTS OF CHANGES IN NET ASSETS
| | | Pacer Developed Markets
International Cash Cows 100 ETF | | | Pacer Emerging Markets
Cash Cows 100 ETF | |
| | | For the
Year Ended
April 30,
2024 | | | For the
Year Ended
April 30,
2023 | | | For the
Year Ended
April 30,
2024 | | | For the
Year Ended
April 30,
2023 | |
OPERATIONS | | | | | | | | | | | | | | | | |
Net Investment Income (Loss) | | $ | 36,573,827 | | | $ | 12,211,358 | | | $ | 3,745,856 | | | $ | 1,385,535 | |
Net Realized Gain (Loss) on Investments and Foreign Currency Transactions | | | 28,570,305 | | | | (13,922,605 | ) | | | (1,465,546 | ) | | | (2,008,425 | ) |
Change in Unrealized Appreciation (Depreciation) of Investments and Foreign Currency Transactions | | | 33,563,243 | | | | 33,122,204 | | | | 5,990,455 | | | | 1,455,641 | |
Net Increase (Decrease) in Net Assets Resulting from Operations | | | 98,707,375 | | | | 31,410,957 | | | | 8,270,765 | | | | 832,751 | |
| | | | | | | | | | | | | | | | | |
DISTRIBUTIONS TO SHAREHOLDERS | | | | | | | | | | | | | | | | |
Dividends and Distributions | | | (31,659,355 | ) | | | (7,687,068 | ) | | | (3,557,922 | ) | | | (973,073 | ) |
Total Distributions to Shareholders | | | (31,659,355 | ) | | | (7,687,068 | ) | | | (3,557,922 | ) | | | (973,073 | ) |
| | | | | | | | | | | | | | | | | |
CAPITAL SHARE TRANSACTIONS | | | | | | | | | | | | | | | | |
Proceeds from Shares Sold | | | 847,601,895 | | | | 419,380,945 | | | | 37,279,240 | | | | 44,046,650 | |
Payments for Shares Redeemed | | | (64,189,830 | ) | | | — | | | | — | | | | — | |
Transaction Fees (See Note 1) | | | 154,544 | | | | 133,089 | | | | 43,514 | | | | 74,713 | |
Net Increase (Decrease) in Net Assets Derived from Capital Share Transactions (a) | | | 783,566,609 | | | | 419,514,034 | | | | 37,322,754 | | | | 44,121,363 | |
Net Increase (Decrease) in Net Assets | | $ | 850,614,629 | | | $ | 443,237,923 | | | $ | 42,035,597 | | | $ | 43,981,041 | |
| | | | | | | | | | | | | | | | | |
NET ASSETS | | | | | | | | | | | | | | | | |
Beginning of Year | | $ | 554,583,810 | | | $ | 111,345,887 | | | $ | 55,050,783 | | | $ | 11,069,742 | |
End of Year | | $ | 1,405,198,439 | | | $ | 554,583,810 | | | $ | 97,086,380 | | | $ | 55,050,783 | |
(a) | Summary of capital share transactions is as follows: |
| | | Shares | | | Shares | | | Shares | | | Shares | |
Subscriptions | | | 28,000,000 | | | | 14,850,000 | | | | 1,900,000 | | | | 2,350,000 | |
Redemptions | | | (2,100,000 | ) | | | — | | | | — | | | | — | |
Net Increase (Decrease) | | | 25,900,000 | | | | 14,850,000 | | | | 1,900,000 | | | | 2,350,000 | |
The accompanying notes are an integral part of the financial statements.
186
Pacer Funds
STATEMENTS OF CHANGES IN NET ASSETS
| | | Pacer US Large Cap Cash
Cows Growth Leaders ETF | | | Pacer US Small
Cap Cash
Cows Growth
Leaders ETF | |
| | | For the
Year Ended
April 30,
2024 | | | For the
Year Ended
April 30,
2023 (a) | | | For the
Year Ended
April 30,
2024 (b) | |
OPERATIONS | | | | | | | | | | | | |
Net Investment Income (Loss) | | $ | 271,997 | | | $ | 10,993 | | | $ | 23,563 | |
Net Realized Gain (Loss) on Investments and Foreign Currency Transactions | | | 2,376,459 | | | | (218,546 | ) | | | 323,418 | |
Change in Unrealized Appreciation (Depreciation) of Investments and Foreign Currency Transactions | | | 2,806,401 | | | | (66,058 | ) | | | 32,006 | |
Net Increase (Decrease) in Net Assets Resulting from Operations | | | 5,454,857 | | | | (273,611 | ) | | | 378,987 | |
| | | | | | | | | | | | | |
DISTRIBUTIONS TO SHAREHOLDERS | | | | | | | | | | | | |
Dividends and Distributions | | | (265,559 | ) | | | (9,399 | ) | | | (23,563 | ) |
Return of Capital | | | — | | | | — | | | | (93 | ) |
Total Distributions to Shareholders | | | (265,559 | ) | | | (9,399 | ) | | | (23,656 | ) |
| | | | | | | | | | | | | |
CAPITAL SHARE TRANSACTIONS | | | | | | | | | | | | |
Proceeds from Shares Sold | | | 119,220,635 | | | | 19,853,740 | | | | 12,786,183 | |
Payments for Shares Redeemed | | | (23,638,568 | ) | | | — | | | | (3,971,255 | ) |
Net Increase (Decrease) in Net Assets Derived from Capital Share Transactions (c) | | | 95,582,067 | | | | 19,853,740 | | | | 8,814,928 | |
Net Increase (Decrease) in Net Assets | | $ | 100,771,365 | | | $ | 19,570,730 | | | $ | 9,170,259 | |
| | | | | | | | | | | | | |
NET ASSETS | | | | | | | | | | | | |
Beginning of Period/Year | | | 19,570,730 | | | | — | | | $ | — | |
End of Period/Year | | $ | 120,342,095 | | | $ | 19,570,730 | | | $ | 9,170,259 | |
(a) | The Fund commenced operations on December 21, 2022. The information presented is for the period from December 21, 2022 to April 30, 2023. |
(b) | The Fund commenced operations on May 1, 2023. |
(c) | Summary of capital share transactions is as follows: |
| | | Shares | | | Shares | | | Shares | |
Subscriptions | | | 4,950,000 | | | | 975,000 | | | | 575,000 | |
Redemptions | | | (1,025,000 | ) | | | — | | | | (175,000 | ) |
Net Increase (Decrease) | | | 3,925,000 | | | | 975,000 | | | | 400,000 | |
The accompanying notes are an integral part of the financial statements.
187
Pacer Funds
STATEMENTS OF CHANGES IN NET ASSETS
| | | Pacer US Cash Cows Growth ETF | | | Pacer Cash Cows Fund of Funds ETF | |
| | | For the
Year Ended
April 30,
2024 | | | For the
Year Ended
April 30,
2023 | | | For the
Year Ended
April 30,
2024 | | | For the
Year Ended
April 30,
2023 | |
OPERATIONS | | | | | | | | | | | | | | | | |
Net Investment Income (Loss) | | $ | 610,121 | | | $ | 430,081 | | | $ | 1,922,799 | | | $ | 578,642 | |
Net Realized Gain (Loss) on Investments and Foreign Currency Transactions | | | 673,502 | | | | (1,986,956 | ) | | | 2,476,494 | | | | 38,918 | |
Change in Unrealized Appreciation (Depreciation) of Investments and Foreign Currency Transactions | | | 5,645,580 | | | | 589,864 | | | | 6,775,878 | | | | 1,025,743 | |
Net Increase (Decrease) in Net Assets Resulting from Operations | | | 6,929,203 | | | | (967,011 | ) | | | 11,175,171 | | | | 1,643,303 | |
| | | | | | | | | | | | | | | | | |
DISTRIBUTIONS TO SHAREHOLDERS | | | | | | | | | | | | | | | | |
Net Investment Income | | | (657,918 | ) | | | (382,192 | ) | | | (1,930,353 | ) | | | (584,387 | ) |
Capital Gains | | | — | | | | — | | | | (262 | ) | | | (117 | ) |
Return of Capital | | | (16,317 | ) | | | — | | | | (3,388 | ) | | | (1,841 | ) |
Total Distributions to Shareholders | | | (674,235 | ) | | | (382,192 | ) | | | (1,934,003 | ) | | | (586,345 | ) |
| | | | | | | | | | | | | | | | | |
CAPITAL SHARE TRANSACTIONS | | | | | | | | | | | | | | | | |
Proceeds from Shares Sold | | | 19,194,280 | | | | 68,710,005 | | | | 55,741,170 | | | | 45,528,065 | |
Payments for Shares Redeemed | | | (17,537,245 | ) | | | (37,720,425 | ) | | | (19,563,140 | ) | | | (6,327,395 | ) |
Net Increase (Decrease) in Net Assets Derived from Capital Share Transactions (a) | | | 1,657,035 | | | | 30,989,580 | | | | 36,178,030 | | | | 39,200,670 | |
Net Increase (Decrease) in Net Assets | | $ | 7,912,003 | | | $ | 29,640,377 | | | $ | 45,419,198 | | | $ | 40,257,628 | |
| | | | | | | | | | | | | | | | | |
NET ASSETS | | | | | | | | | | | | | | | | |
Beginning of Year | | $ | 38,499,627 | | | $ | 8,859,250 | | | $ | 48,618,224 | | | $ | 8,360,596 | |
End of Year | | $ | 46,411,630 | | | $ | 38,499,627 | | | $ | 94,037,422 | | | $ | 48,618,224 | |
(a) | Summary of capital share transactions is as follows: |
| | | Shares | | | Shares | | | Shares | | | Shares | |
Subscriptions | | | 500,000 | | | | 1,900,000 | | | | 1,600,000 | | | | 1,400,000 | |
Redemptions | | | (450,000 | ) | | | (1,050,000 | ) | | | (550,000 | ) | | | (200,000 | ) |
Net Increase (Decrease) | | | 50,000 | | | | 850,000 | | | | 1,050,000 | | | | 1,200,000 | |
The accompanying notes are an integral part of the financial statements.
188
Pacer Funds
STATEMENTS OF CHANGES IN NET ASSETS
| | | Pacer WealthShield ETF | | | Pacer Industrial Real Estate ETF | |
| | | For the
Year Ended
April 30,
2024 | | | For the
Year Ended
April 30,
2023 | | | For the
Year Ended
April 30,
2024 | | | For the
Year Ended
April 30,
2023 | |
OPERATIONS | | | | | | | | | | | | | | | | |
Net Investment Income (Loss) | | $ | 354,480 | | | $ | 698,677 | | | $ | 6,379,580 | | | $ | 5,579,107 | |
Net Realized Gain (Loss) on Investments and Foreign Currency Transactions | | | (483,947 | ) | | | (4,406,726 | ) | | | (4,854,975 | ) | | | (44,167,991 | ) |
Change in Unrealized Appreciation (Depreciation) of Investments and Foreign Currency Transactions | | | 1,055,852 | | | | 717,354 | | | | (22,877,142 | ) | | | (14,357,291 | ) |
Net Increase (Decrease) in Net Assets Resulting from Operations | | | 926,385 | | | | (2,990,695 | ) | | | (21,352,537 | ) | | | (52,946,175 | ) |
| | | | | | | | | | | | | | | | | |
DISTRIBUTIONS TO SHAREHOLDERS | | | | | | | | | | | | | | | | |
Dividends and Distributions | | | (453,354 | ) | | | (597,772 | ) | | | (8,470,476 | ) | | | (6,149,407 | ) |
Total Distributions to Shareholders | | | (453,354 | ) | | | (597,772 | ) | | | (8,470,476 | ) | | | (6,149,407 | ) |
| | | | | | | | | | | | | | | | | |
CAPITAL SHARE TRANSACTIONS | | | | | | | | | | | | | | | | |
Proceeds from Shares Sold | | | 6,713,655 | | | | 10,773,195 | | | | 19,804,965 | | | | 44,461,180 | |
Payments for Shares Redeemed | | | (12,186,680 | ) | | | (15,910,675 | ) | | | (15,145,245 | ) | | | (150,423,405 | ) |
Net Increase (Decrease) in Net Assets Derived from Capital Share Transactions (a) | | | (5,473,025 | ) | | | (5,137,480 | ) | | | 4,659,720 | | | | (105,962,225 | ) |
Net Increase (Decrease) in Net Assets | | $ | (4,999,994 | ) | | $ | (8,725,947 | ) | | $ | (25,163,293 | ) | | $ | (165,057,807 | ) |
| | | | | | | | | | | | | | | | | |
NET ASSETS | | | | | | | | | | | | | | | | |
Beginning of Year | | $ | 24,446,490 | | | $ | 33,172,437 | | | $ | 219,931,910 | | | $ | 384,989,717 | |
End of Year | | $ | 19,446,496 | | | $ | 24,446,490 | | | $ | 194,768,617 | | | $ | 219,931,910 | |
(a) | Summary of capital share transactions is as follows: |
| | | Shares | | | Shares | | | Shares | | | Shares | |
Subscriptions | | | 250,000 | | | | 350,000 | | | | 500,000 | | | | 1,100,000 | |
Redemptions | | | (450,000 | ) | | | (550,000 | ) | | | (400,000 | ) | | | (3,750,000 | ) |
Net Increase (Decrease) | | | (200,000 | ) | | | (200,000 | ) | | | 100,000 | | | | (2,650,000 | ) |
The accompanying notes are an integral part of the financial statements.
189
Pacer Funds
STATEMENTS OF CHANGES IN NET ASSETS
| | | Pacer Data & Infrastructure
Real Estate ETF | | | Pacer CFRA-Stovall Equal
Weight Seasonal Rotation ETF | |
| | | For the
Year Ended
April 30,
2024 | | | For the
Year Ended
April 30,
2023 | | | For the
Year Ended
April 30,
2024 | | | For the
Year Ended
April 30,
2023 | |
OPERATIONS | | | | | | | | | | | | | | | | |
Net Investment Income (Loss) | | $ | 13,526,287 | | | $ | 23,775,260 | | | $ | 599,921 | | | $ | 845,660 | |
Net Realized Gain (Loss) on Investments and Foreign Currency Transactions | | | (82,217,997 | ) | | | (181,810,261 | ) | | | (1,278,799 | ) | | | 2,499,877 | |
Change in Unrealized Appreciation (Depreciation) of Investments and Foreign Currency Transactions | | | 19,541,964 | | | | (81,614,201 | ) | | | (1,964 | ) | | | 22 | |
Net Increase (Decrease) in Net Assets Resulting from Operations | | | (49,149,746 | ) | | | (239,649,202 | ) | | | (680,842 | ) | | | 3,345,559 | |
| | | | | | | | | | | | | | | | | |
DISTRIBUTIONS TO SHAREHOLDERS | | | | | | | | | | | | | | | | |
Net Investment Income | | | (21,236,193 | ) | | | (18,743,593 | ) | | | (614,377 | ) | | | (826,693 | ) |
Capital Gains | | | — | | | | (1,717,631 | ) | | | — | | | | — | |
Total Distributions to Shareholders | | | (21,236,193 | ) | | | (20,461,224 | ) | | | (614,377 | ) | | | (826,693 | ) |
| | | | | | | | | | | | | | | | | |
CAPITAL SHARE TRANSACTIONS | | | | | | | | | | | | | | | | |
Proceeds from Shares Sold | | | 27,266,075 | | | | 96,006,885 | | | | 28,483,050 | | | | 16,851,465 | |
Payments for Shares Redeemed | | | (236,283,570 | ) | | | (434,676,185 | ) | | | (66,727,240 | ) | | | (21,079,065 | ) |
Transaction Fees (See Note 1) | | | 17,332 | | | | 6,781 | | | | — | | | | — | |
Net Increase (Decrease) in Net Assets Derived from Capital Share Transactions (a) | | | (209,000,163 | ) | | | (338,662,519 | ) | | | (38,244,190 | ) | | | (4,227,600 | ) |
Net Increase (Decrease) in Net Assets | | $ | (279,386,102 | ) | | $ | (598,772,945 | ) | | $ | (39,539,409 | ) | | $ | (1,708,734 | ) |
| | | | | | | | | | | | | | | | | |
NET ASSETS | | | | | | | | | | | | | | | | |
Beginning of Year | | $ | 700,547,610 | | | $ | 1,299,320,555 | | | $ | 78,679,734 | | | $ | 80,388,468 | |
End of Year | | $ | 421,161,508 | | | $ | 700,547,610 | | | $ | 39,140,325 | | | $ | 78,679,734 | |
(a) | Summary of capital share transactions is as follows: |
| | | Shares | | | Shares | | | Shares | | | Shares | |
Subscriptions | | | 950,000 | | | | 2,950,000 | | | | 750,000 | | | | 450,000 | |
Redemptions | | | (8,550,000 | ) | | | (14,000,000 | ) | | | (1,850,000 | ) | | | (600,000 | ) |
Net Increase (Decrease) | | | (7,600,000 | ) | | | (11,050,000 | ) | | | (1,100,000 | ) | | | (150,000 | ) |
The accompanying notes are an integral part of the financial statements.
190
Pacer Funds
STATEMENTS OF CHANGES IN NET ASSETS
| | | Pacer CSOP FTSE China A50 ETF | |
| | | For the
Year Ended
April 30,
2024 | | | For the
Year Ended
April 30,
2023 | |
OPERATIONS | | | | | | | | |
Net Investment Income (Loss) | | $ | 103,216 | | | $ | 111,199 | |
Net Realized Gain (Loss) on Investments and Foreign Currency Transactions | | | (267,039 | ) | | | (452,535 | ) |
Change in Unrealized Appreciation (Depreciation) of Investments and Foreign Currency Transactions | | | (213,918 | ) | | | (114,924 | ) |
Net Increase (Decrease) in Net Assets Resulting from Operations | | | (377,741 | ) | | | (456,260 | ) |
| | | | | | | | | |
DISTRIBUTIONS TO SHAREHOLDERS | | | | | | | | |
Net Investment Income | | | (92,239 | ) | | | (100,794 | ) |
Total Distributions to Shareholders | | | (92,239 | ) | | | (100,794 | ) |
| | | | | | | | | |
CAPITAL SHARE TRANSACTIONS | | | | | | | | |
Proceeds from Shares Sold | | | — | | | | — | |
Payments for Shares Redeemed | | | — | | | | (717,525 | ) |
Transaction Fees (See Note 1) | | | — | | | | 1 | |
Net Increase (Decrease) in Net Assets Derived from Capital Share Transactions (a) | | | — | | | | (717,524 | ) |
Net Increase (Decrease) in Net Assets | | $ | (469,980 | ) | | $ | (1,274,578 | ) |
| | | | | | | | | |
NET ASSETS | | | | | | | | |
Beginning of Year | | $ | 4,913,530 | | | $ | 6,188,108 | |
End of Year | | $ | 4,443,550 | | | $ | 4,913,530 | |
(a) | Summary of capital share transactions is as follows: |
| | | Shares | | | Shares | |
Subscriptions | | | — | | | | — | |
Redemptions | | | — | | | | (50,000 | ) |
Net Increase (Decrease) | | | — | | | | (50,000 | ) |
The accompanying notes are an integral part of the financial statements.
191
Pacer Funds
STATEMENTS OF CHANGES IN NET ASSETS
| | | Pacer Biothreat Strategy ETF | | | Pacer Lunt Large Cap Alternator ETF | |
| | | For the
Year Ended
April 30,
2024 | | | For the
Year Ended
April 30,
2023 | | | For the
Year Ended
April 30,
2024 | | | For the
Year Ended
April 30,
2023 | |
OPERATIONS | | | | | | | | | | | | | | | | |
Net Investment Income (Loss) | | $ | 36,840 | | | $ | 47,043 | | | $ | 5,953,329 | | | $ | 9,373,354 | |
Net Realized Gain (Loss) on Investments and Foreign Currency Transactions | | | 258,613 | | | | (152,098 | ) | | | (112,545,215 | ) | | | (107,696,482 | ) |
Change in Unrealized Appreciation (Depreciation) of Investments and Foreign Currency Transactions | | | 314,969 | | | | 207,677 | | | | 67,003,760 | | | | (45,887,725 | ) |
Net Increase (Decrease) in Net Assets Resulting from Operations | | | 610,422 | | | | 102,622 | | | | (39,588,126 | ) | | | (144,210,853 | ) |
| | | | | | | | | | | | | | | | | |
DISTRIBUTIONS TO SHAREHOLDERS | | | | | | | | | | | | | | | | |
Net Investment Income | | | (37,062 | ) | | | (46,298 | ) | | | (5,527,814 | ) | | | (9,575,595 | ) |
Return of Capital | | | — | | | | — | | | | — | | | | (488,359 | ) |
Total Distributions to Shareholders | | | (37,062 | ) | | | (46,298 | ) | | | (5,527,814 | ) | | | (10,063,954 | ) |
| | | | | | | | | | | | | | | | | |
CAPITAL SHARE TRANSACTIONS | | | | | | | | | | | | | | | | |
Proceeds from Shares Sold | | | 1,598,128 | | | | — | | | | 10,274,100 | | | | 624,040,115 | |
Payments for Shares Redeemed | | | (2,397,053 | ) | | | (2,087,637 | ) | | | (485,208,345 | ) | | | (247,539,040 | ) |
Net Increase (Decrease) in Net Assets Derived from Capital Share Transactions (a) | | | (798,925 | ) | | | (2,087,637 | ) | | | (474,934,245 | ) | | | 376,501,075 | |
Net Increase (Decrease) in Net Assets | | $ | (225,565 | ) | | $ | (2,031,313 | ) | | $ | (520,050,185 | ) | | $ | 222,226,268 | |
| | | | | | | | | | | | | | | | | |
NET ASSETS | | | | | | | | | | | | | | | | |
Beginning of Year | | $ | 3,670,685 | | | $ | 5,701,998 | | | $ | 776,679,816 | | | $ | 554,453,548 | |
End of Year | | $ | 3,445,120 | | | $ | 3,670,685 | | | $ | 256,629,631 | | | $ | 776,679,816 | |
(a) | Summary of capital share transactions is as follows: |
| | | Shares | | | Shares | | | Shares | | | Shares | |
Subscriptions | | | 50,000 | | | | — | | | | 300,000 | | | | 15,050,000 | |
Redemptions | | | (75,000 | ) | | | (75,000 | ) | | | (14,050,000 | ) | | | (6,600,000 | ) |
Net Increase (Decrease) | | | (25,000 | ) | | | (75,000 | ) | | | (13,750,000 | ) | | | 8,450,000 | |
The accompanying notes are an integral part of the financial statements.
192
Pacer Funds
STATEMENTS OF CHANGES IN NET ASSETS
| | | Pacer Lunt Midcap Multi
Factor Alternator ETF | | | Pacer Lunt Large Cap Multi
Factor Alternator ETF | |
| | | For the
Year Ended
April 30,
2024 | | | For the
Year Ended
April 30,
2023 | | | For the
Year Ended
April 30,
2024 | | | For the
Year Ended
April 30,
2023 | |
OPERATIONS | | | | | | | | | | | | | | | | |
Net Investment Income (Loss) | | $ | 269,461 | | | $ | 410,202 | | | $ | 2,175,731 | | | $ | 3,419,925 | |
Net Realized Gain (Loss) on Investments and Foreign Currency Transactions | | | 7,587,572 | | | | (1,636,618 | ) | | | 53,606,610 | | | | (40,943,498 | ) |
Change in Unrealized Appreciation (Depreciation) of Investments and Foreign Currency Transactions | | | 2,268,321 | | | | 3,320,047 | | | | 5,460,211 | | | | 30,690,624 | |
Net Increase (Decrease) in Net Assets Resulting from Operations | | | 10,125,354 | | | | 2,093,631 | | | | 61,242,552 | | | | (6,832,949 | ) |
| | | | | | | | | | | | | | | | | |
DISTRIBUTIONS TO SHAREHOLDERS | | | | | | | | | | | | | | | | |
Net Investment Income | | | (258,009 | ) | | | (410,052 | ) | | | (2,027,944 | ) | | | (3,553,899 | ) |
Return of Capital | | | — | | | | (20,581 | ) | | | — | | | | — | |
Total Distributions to Shareholders | | | (258,009 | ) | | | (430,633 | ) | | | (2,027,944 | ) | | | (3,553,899 | ) |
| | | | | | | | | | | | | | | | | |
CAPITAL SHARE TRANSACTIONS | | | | | | | | | | | | | | | | |
Proceeds from Shares Sold | | | 29,383,790 | | | | 21,010,460 | | | | 224,182,620 | | | | 51,694,570 | |
Payments for Shares Redeemed | | | (18,294,535 | ) | | | (23,227,120 | ) | | | (192,509,665 | ) | | | (102,211,650 | ) |
Net Increase (Decrease) in Net Assets Derived from Capital Share Transactions (a) | | | 11,089,255 | | | | (2,216,660 | ) | | | 31,672,955 | | | | (50,517,080 | ) |
Net Increase (Decrease) in Net Assets | | $ | 20,956,600 | | | $ | (553,662 | ) | | $ | 90,887,563 | | | $ | (60,903,928 | ) |
| | | | | | | | | | | | | | | | | |
NET ASSETS | | | | | | | | | | | | | | | | |
Beginning of Year | | $ | 34,852,039 | | | $ | 35,405,701 | | | $ | 206,190,851 | | | $ | 267,094,779 | |
End of Year | | $ | 55,808,639 | | | $ | 34,852,039 | | | $ | 297,078,414 | | | $ | 206,190,851 | |
(a) | Summary of capital share transactions is as follows: |
| | | Shares | | | Shares | | | Shares | | | Shares | |
Subscriptions | | | 700,000 | | | | 650,000 | | | | 5,350,000 | | | | 1,450,000 | |
Redemptions | | | (450,000 | ) | | | (700,000 | ) | | | (4,550,000 | ) | | | (2,900,000 | ) |
Net Increase (Decrease) | | | 250,000 | | | | (50,000 | ) | | | 800,000 | | | | (1,450,000 | ) |
The accompanying notes are an integral part of the financial statements.
193
Pacer Funds
STATEMENTS OF CHANGES IN NET ASSETS
| | | Pacer US Export Leaders ETF | |
| | | For the
Year Ended
April 30,
2024 | | | For the
Year Ended
April 30,
2023 | |
OPERATIONS | | | | | | | | |
Net Investment Income (Loss) | | $ | 199,469 | | | $ | 62,495 | |
Net Realized Gain (Loss) on Investments and Foreign Currency Transactions | | | 2,245,186 | | | | (279,343 | ) |
Change in Unrealized Appreciation (Depreciation) of Investments and Foreign Currency Transactions | | | 4,469,723 | | | | 1,019,862 | |
Net Increase (Decrease) in Net Assets Resulting from Operations | | | 6,914,378 | | | | 803,014 | |
| | | | | | | | | |
DISTRIBUTIONS TO SHAREHOLDERS | | | | | | | | |
Net Investment Income | | | (199,688 | ) | | | (62,859 | ) |
Return of Capital | | | (7,444 | ) | | | — | |
Total Distributions to Shareholders | | | (207,132 | ) | | | (62,859 | ) |
| | | | | | | | | |
CAPITAL SHARE TRANSACTIONS | | | | | | | | |
Proceeds from Shares Sold | | | 48,424,215 | | | | 15,408,145 | |
Payments for Shares Redeemed | | | (13,912,915 | ) | | | — | |
Net Increase (Decrease) in Net Assets Derived from Capital Share Transactions (a) | | | 34,511,300 | | | | 15,408,145 | |
Net Increase (Decrease) in Net Assets | | $ | 41,218,546 | | | $ | 16,148,300 | |
| | | | | | | | | |
NET ASSETS | | | | | | | | |
Beginning of Year | | $ | 19,975,663 | | | $ | 3,827,363 | |
End of Year | | $ | 61,194,209 | | | $ | 19,975,663 | |
(a) | Summary of capital share transactions is as follows: |
| | | Shares | | | Shares | |
Subscriptions | | | 1,100,000 | | | | 400,000 | |
Redemptions | | | (300,000 | ) | | | — | |
Net Increase (Decrease) | | | 800,000 | | | | 400,000 | |
The accompanying notes are an integral part of the financial statements.
194
Pacer Funds
STATEMENTS OF CHANGES IN NET ASSETS
| | | Pacer Pacific Asset Floating
Rate High Income ETF | |
| | | For the
Year Ended
April 30,
2024 | | | For the
Year Ended
April 30,
2023 | |
OPERATIONS | | | | | | | | |
Net Investment Income (Loss) | | $ | 13,968,467 | | | $ | 5,818,699 | |
Net Realized Gain (Loss) on Investments and Foreign Currency Transactions | | | 608,118 | | | | (3,432,998 | ) |
Change in Unrealized Appreciation (Depreciation) of Investments and Foreign Currency Transactions | | | 4,276,383 | | | | 41,729 | |
Net Increase (Decrease) in Net Assets Resulting from Operations | | | 18,852,968 | | | | 2,427,430 | |
| | | | | | | | | |
DISTRIBUTIONS TO SHAREHOLDERS | | | | | | | | |
Dividends and Distributions | | | (13,662,425 | ) | | | (5,819,045 | ) |
Total Distributions to Shareholders | | | (13,662,425 | ) | | | (5,819,045 | ) |
| | | | | | | | | |
CAPITAL SHARE TRANSACTIONS | | | | | | | | |
Proceeds from Shares Sold | | | 189,807,930 | | | | 87,368,338 | |
Payments for Shares Redeemed | | | (46,671,646 | ) | | | (65,544,726 | ) |
Net Increase (Decrease) in Net Assets Derived from Capital Share Transactions (a) | | | 143,136,284 | | | | 21,823,612 | |
Net Increase (Decrease) in Net Assets | | $ | 148,326,827 | | | $ | 18,431,997 | |
| | | | | | | | | |
NET ASSETS | | | | | | | | |
Beginning of Period/Year | | $ | 100,094,780 | | | $ | 81,662,783 | |
End of Period/Year | | $ | 248,421,607 | | | $ | 100,094,780 | |
(a) | Summary of capital share transactions is as follows: |
| | | Shares | | | Shares | |
Subscriptions | | | 4,040,000 | | | | 1,920,000 | |
Redemptions | | | (1,000,000 | ) | | | (1,440,000 | ) |
Net Increase (Decrease) | | | 3,040,000 | | | | 480,000 | |
The accompanying notes are an integral part of the financial statements.
195
Pacer Funds
STATEMENTS OF CHANGES IN NET ASSETS
| | | Pacer Industrials and Logistics ETF | | | Pacer Data and Digital
Revolution ETF | |
| | | For the
Year Ended
April 30,
2024 | | | For the
Period Ended
April 30,
2023 (a) | | | For the
Year Ended
April 30,
2024 | | | For the
Period Ended
April 30,
2023 (a) | |
OPERATIONS | | | | | | | | | | | | | | | | |
Net Investment Income (Loss) | | $ | 23,587 | | | $ | 16,988 | | | $ | 27,498 | | | $ | 6,083 | |
Net Realized Gain (Loss) on Investments and Foreign Currency Transactions | | | (1,853 | ) | | | (523 | ) | | | 151,201 | | | | 1,392 | |
Change in Unrealized Appreciation (Depreciation) of Investments and Foreign Currency Transactions | | | 53,457 | | | | 10,629 | | | | 1,590,677 | | | | 147 | |
Net Increase (Decrease) in Net Assets Resulting from Operations | | | 75,191 | | | | 27,094 | | | | 1,769,376 | | | | 7,622 | |
| | | | | | | | | | | | | | | | | |
DISTRIBUTIONS TO SHAREHOLDERS | | | | | | | | | | | | | | | | |
Distributions and Dividends | | | (29,550 | ) | | | (12,171 | ) | | | (8,801 | ) | | | (5,555 | ) |
Total Distributions to Shareholders | | | (29,550 | ) | | | (12,171 | ) | | | (8,801 | ) | | | (5,555 | ) |
| | | | | | | | | | | | | | | | | |
CAPITAL SHARE TRANSACTIONS | | | | | | | | | | | | | | | | |
Proceeds from Shares Sold | | | — | | | | 994,800 | | | | 26,583,430 | | | | 1,012,400 | |
Payments for Shares Redeemed | | | — | | | | — | | | | (546,454 | ) | | | — | |
Transaction Fees (See Note 1) | | | — | | | | — | | | | 19 | | | | — | |
Net Increase (Decrease) in Net Assets Derived from Capital Share Transactions (b) | | | — | | | | 994,800 | | | | 26,036,995 | | | | 1,012,400 | |
Net Increase (Decrease) in Net Assets | | $ | 45,641 | | | $ | 1,009,723 | | | $ | 27,797,570 | | | $ | 1,014,467 | |
| | | | | | | | | | | | | | | | | |
NET ASSETS | | | | | | | | | | | | | | | | |
Beginning of Period | | $ | 1,009,723 | | | | — | | | $ | 1,014,467 | | | | — | |
End of Period | | $ | 1,055,364 | | | $ | 1,009,723 | | | $ | 28,812,037 | | | $ | 1,014,467 | |
(a) | Fund commenced operations on June 8, 2022. The information presented is from June 8, 2022 to April 30, 2023. |
(b) | Summary of capital share transactions is as follows: |
| | | Shares | | | Shares | | | Shares | | | Shares | |
Subscriptions | | | — | | | | 40,000 | | | | 700,000 | | | | 40,000 | |
Redemptions | | | — | | | | — | | | | (20,000 | ) | | | — | |
Net Increase (Decrease) | | | — | | | | 40,000 | | | | 680,000 | | | | 40,000 | |
The accompanying notes are an integral part of the financial statements.
196
Pacer Trendpilot® US Large Cap ETF
FINANCIAL HIGHLIGHTS
For a capital share outstanding throughout the year
| | For the
Year Ended
April 30,
2024 | | | For the
Year Ended
April 30,
2023 | | | For the
Year Ended
April 30,
2022 | | | For the
Year Ended
April 30,
2021 | | | For the
Year Ended
April 30,
2020 | |
Net Asset Value, Beginning of Period | | $ | 38.63 | | | $ | 37.54 | | | $ | 36.54 | | | $ | 26.99 | | | $ | 30.56 | |
| | | | | | | | | | | | | | | | | | | | | |
INCOME (LOSS) FROM INVESTMENT OPERATIONS: | | | | | | | | | | | | | | | | | | | | |
Net Investment Income (Loss)(a) | | | 0.42 | | | | 0.66 | | | | 0.28 | | | | 0.25 | | | | 0.39 | |
Net Realized and Unrealized Gain (Loss) on Investments(c) | | | 7.26 | | | | 0.90 | | | | 1.03 | | | | 9.65 | | | | (3.59 | ) |
Total from Investment Operations | | | 7.68 | | | | 1.56 | | | | 1.31 | | | | 9.90 | | | | (3.20 | ) |
| | | | | | | | | | | | | | | | | | | | | |
LESS DISTRIBUTIONS: | | | | | | | | | | | | | | | | | | | | |
Distributions from Net Investment Income | | | (0.51 | ) | | | (0.47 | ) | | | (0.31 | ) | | | (0.35 | ) | | | (0.37 | ) |
Total Distributions | | | (0.51 | ) | | | (0.47 | ) | | | (0.31 | ) | | | (0.35 | ) | | | (0.37 | ) |
Net Asset Value, End of Period | | $ | 45.80 | | | $ | 38.63 | | | $ | 37.54 | | | $ | 36.54 | | | $ | 26.99 | |
Total Return | | | 19.96 | % | | | 4.20 | % | | | 3.48 | % | | | 36.86 | % | | | -10.71 | % |
| | | | | | | | | | | | | | | | | | | | | |
SUPPLEMENTAL DATA: | | | | | | | | | | | | | | | | | | | | |
Net Assets at End of Period (000’s) | | $ | 2,619,782 | | | $ | 2,039,609 | | | $ | 1,841,243 | | | $ | 1,894,772 | | | $ | 2,403,839 | |
| | | | | | | | | | | | | | | | | | | | | |
RATIOS TO AVERAGE NET ASSETS: | | | | | | | | | | | | | | | | | | | | |
Expenses to Average Net Assets | | | 0.60 | % | | | 0.60 | % | | | 0.60 | % | | | 0.60 | % | | | 0.60 | % |
Net Investment Income (Loss) to Average Net Assets | | | 0.98 | % | | | 1.75 | % | | | 0.71 | % | | | 0.83 | % | | | 1.25 | % |
Portfolio Turnover Rate(b) | | | 51 | % | | | 1 | % | | | 58 | % | | | 6 | % | | | 5 | % |
(a) | Calculated based on average shares outstanding during the period. |
(b) | Excludes the impact of in-kind transactions. |
(c) | Realized and unrealized gain (loss) per share in this caption are balancing amounts necessary to reconcile the change in net asset value per share for the period, and may not reconcile with the aggregate gain (loss) in the Statement of Operations due to share transactions for the period. |
The accompanying notes are an integral part of the financial statements.
197
Pacer Trendpilot® US Mid Cap ETF
FINANCIAL HIGHLIGHTS
For a capital share outstanding throughout the year
| | | For the
Year Ended
April 30,
2024 | | | For the
Year Ended
April 30,
2023 | | | For the
Year Ended
April 30,
2022 | | | For the
Year Ended
April 30,
2021 | | | For the
Year Ended
April 30,
2020 | |
Net Asset Value, Beginning of Period | | $ | 32.25 | | | $ | 34.52 | | | $ | 35.63 | | | $ | 28.35 | | | $ | 30.95 | |
| | | | | | | | | | | | | | | | | | | | | |
INCOME (LOSS) FROM INVESTMENT OPERATIONS: | | | | | | | | | | | | | | | | | | | | |
Net Investment Income (Loss)(a) | | | 0.56 | | | | 0.39 | | | | 0.00 | (d) | | | 0.09 | | | | 0.28 | |
Net Realized and Unrealized Gain (Loss) on Investments(c) | | | 1.69 | | | | (2.41 | ) | | | (1.07 | ) | | | 7.36 | | | | (2.45 | ) |
Total from Investment Operations | | | 2.25 | | | | (2.02 | ) | | | (1.07 | ) | | | 7.45 | | | | (2.17 | ) |
| | | | | | | | | | | | | | | | | | | | | |
LESS DISTRIBUTIONS: | | | | | | | | | | | | | | | | | | | | |
Distributions from Net Investment Income | | | (0.63 | ) | | | (0.25 | ) | | | (0.04 | ) | | | (0.17 | ) | | | (0.43 | ) |
Total Distributions | | | (0.63 | ) | | | (0.25 | ) | | | (0.04 | ) | | | (0.17 | ) | | | (0.43 | ) |
Net Asset Value, End of Period | | $ | 33.87 | | | $ | 32.25 | | | $ | 34.52 | | | $ | 35.63 | | | $ | 28.35 | |
Total Return | | | 7.02 | % | | | -5.81 | % | | | -2.98 | % | | | 26.34 | % | | | -7.11 | % |
| | | | | | | | | | | | | | | | | | | | | |
SUPPLEMENTAL DATA: | | | | | | | | | | | | | | | | | | | | |
Net Assets at End of Period (000’s) | | $ | 384,469 | | | $ | 390,252 | | | $ | 441,894 | | | $ | 452,474 | | | $ | 540,051 | |
| | | | | | | | | | | | | | | | | | | | | |
RATIOS TO AVERAGE NET ASSETS: | | | | | | | | | | | | | | | | | | | | |
Expenses to Average Net Assets | | | 0.60 | % | | | 0.60 | % | | | 0.60 | % | | | 0.60 | % | | | 0.60 | % |
Net Investment Income (Loss) to Average Net Assets | | | 1.72 | % | | | 1.19 | % | | | 0.01 | % | | | 0.30 | % | | | 0.96 | % |
Portfolio Turnover Rate(b) | | | 262 | % | | | 441 | % | | | 16 | % | | | 304 | % | | | 143 | % |
(a) | Calculated based on average shares outstanding during the period. |
(b) | Excludes the impact of in-kind transactions. |
(c) | Realized and unrealized gain (loss) per share in this caption are balancing amounts necessary to reconcile the change in net asset value per share for the period, and may not reconcile with the aggregate gain (loss) in the Statement of Operations due to share transactions for the period. |
(d) | Represents less the $0.005. |
The accompanying notes are an integral part of the financial statements.
198
Pacer Trendpilot® 100 ETF
FINANCIAL HIGHLIGHTS
For a capital share outstanding throughout the year
| | | For the
Year Ended
April 30,
2024 | | | For the
Year Ended
April 30,
2023 | | | For the
Year Ended
April 30,
2022 | | | For the
Year Ended
April 30,
2021 | | | For the
Year Ended
April 30,
2020 | |
Net Asset Value, Beginning of Period | | $ | 55.22 | | | $ | 52.18 | | | $ | 54.01 | | | $ | 37.91 | | | $ | 36.00 | |
| | | | | | | | | | | | | | | | | | | | | |
INCOME (LOSS) FROM INVESTMENT OPERATIONS: | | | | | | | | | | | | | | | | | | | | |
Net Investment Income (Loss)(a) | | | 1.43 | | | | 0.48 | | | | (0.13 | ) | | | 0.01 | | | | 0.15 | |
Net Realized and Unrealized Gain (Loss) on Investments(c) | | | 11.44 | | | | 2.87 | | | | (1.70 | ) | | | 16.17 | | | | 1.94 | |
Total from Investment Operations | | | 12.87 | | | | 3.35 | | | | (1.83 | ) | | | 16.18 | | | | 2.09 | |
| | | | | | | | | | | | | | | | | | | | | |
LESS DISTRIBUTIONS: | | | | | | | | | | | | | | | | | | | | |
Distributions from Net Investment Income | | | (0.96 | ) | | | (0.31 | ) | | | — | | | | (0.08 | ) | | | (0.18 | ) |
Total Distributions | | | (0.96 | ) | | | (0.31 | ) | | | — | | | | (0.08 | ) | | | (0.18 | ) |
| | | | | | | | | | | | | | | | | | | | | |
CAPITAL SHARE TRANSACTIONS | | | | | | | | | | | | | | | | | | | | |
Transaction Fees (see Note 1) | | | — | | | | — | | | | — | | | | 0.00 | (d) | | | — | |
Net Asset Value, End of Period | | $ | 67.13 | | | $ | 55.22 | | | $ | 52.18 | | | $ | 54.01 | | | $ | 37.91 | |
Total Return | | | 23.36 | % | | | 6.47 | % | | | -3.38 | % | | | 42.69 | % | | | 5.78 | % |
| | | | | | | | | | | | | | | | | | | | | |
SUPPLEMENTAL DATA: | | | | | | | | | | | | | | | | | | | | |
Net Assets at End of Period (000’s) | | $ | 1,181,469 | | | $ | 750,925 | | | $ | 688,816 | | | $ | 783,124 | | | $ | 739,258 | |
| | | | | | | | | | | | | | | | | | | | | |
RATIOS TO AVERAGE NET ASSETS: | | | | | | | | | | | | | | | | | | | | |
Expenses to Average Net Assets | | | 0.65 | % | | | 0.65 | % | | | 0.65 | % | | | 0.65 | % | | | 0.65 | % |
Net Investment Income (Loss) to Average Net Assets | | | 2.24 | % | | | 0.93 | % | | | -0.22 | % | | | 0.01 | % | | | 0.40 | % |
Portfolio Turnover Rate(b) | | | 20 | % | | | 6 | % | | | 7 | % | | | 6 | % | | | 61 | % |
(a) | Calculated based on average shares outstanding during the period. |
(b) | Excludes the impact of in-kind transactions. |
(c) | Realized and unrealized gain (loss) per share in this caption are balancing amounts necessary to reconcile the change in net asset value per share for the period, and may not reconcile with the aggregate gain (loss) in the Statement of Operations due to share transactions for the period. |
(d) | Represents less the $0.005. |
The accompanying notes are an integral part of the financial statements.
199
Pacer Trendpilot® European Index ETF
FINANCIAL HIGHLIGHTS
For a capital share outstanding throughout the year
| | | For the
Year Ended
April 30,
2024 | | | For the
Year Ended
April 30,
2023 | | | For the
Year Ended
April 30,
2022 | | | For the
Year Ended
April 30,
2021 | | | For the
Year Ended
April 30,
2020 | |
Net Asset Value, Beginning of Period | | $ | 26.57 | | | $ | 22.40 | | | $ | 24.33 | | | $ | 23.76 | | | $ | 26.77 | |
| | | | | | | | | | | | | | | | | | | | | |
INCOME (LOSS) FROM INVESTMENT OPERATIONS: | | | | | | | | | | | | | | | | | | | | |
Net Investment Income (Loss)(a) | | | 0.68 | | | | 0.34 | | | | 0.34 | | | | 0.10 | | | | 0.54 | |
Net Realized and Unrealized Gain (Loss) on Investments(c) | | | (0.71 | ) | | | 3.99 | | | | (1.89 | ) | | | 0.47 | | | | (2.61 | ) |
Total from Investment Operations | | | (0.03 | ) | | | 4.33 | | | | (1.55 | ) | | | 0.57 | | | | (2.07 | ) |
| | | | | | | | | | | | | | | | | | | | | |
LESS DISTRIBUTIONS: | | | | | | | | | | | | | | | | | | | | |
Distributions from Net Investment Income | | | (0.68 | ) | | | (0.16 | ) | | | (0.38 | ) | | | — | | | | (0.94 | ) |
Total Distributions | | | (0.68 | ) | | | (0.16 | ) | | | (0.38 | ) | | | — | | | | (0.94 | ) |
| | | | | | | | | | | | | | | | | | | | | |
CAPITAL SHARE TRANSACTIONS | | | | | | | | | | | | | | | | | | | | |
Transaction Fees (see Note 1) | | | — | | | | — | | | | 0.00 | (d) | | | — | | | | — | |
Net Asset Value, End of Period | | $ | 25.86 | | | $ | 26.57 | | | $ | 22.40 | | | $ | 24.33 | | | $ | 23.76 | |
Total Return | | | -0.02 | % | | | 19.43 | % | | | -6.47 | % | | | 2.38 | % | | | -8.18 | % |
| | | | | | | | | | | | | | | | | | | | | |
SUPPLEMENTAL DATA: | | | | | | | | | | | | | | | | | | | | |
Net Assets at End of Period (000’s) | | $ | 40,091 | | | $ | 43,843 | | | $ | 45,925 | | | $ | 54,741 | | | $ | 91,488 | |
| | | | | | | | | | | | | | | | | | | | | |
RATIOS TO AVERAGE NET ASSETS: | | | | | | | | | | | | | | | | | | | | |
Expenses to Average Net Assets | | | 0.65 | % | | | 0.65 | % | | | 0.66 | % | | | 0.65 | % | | | 0.65 | % |
Net Investment Income (Loss) to Average Net Assets | | | 2.68 | % | | | 1.48 | % | | | 1.39 | % | | | 0.43 | % | | | 2.04 | % |
Portfolio Turnover Rate(b) | | | 111 | % | | | 5 | % | | | 7 | % | | | 506 | % | | | 12 | % |
(a) | Calculated based on average shares outstanding during the period. |
(b) | Excludes the impact of in-kind transactions. |
(c) | Realized and unrealized gain (loss) per share in this caption are balancing amounts necessary to reconcile the change in net asset value per share for the period, and may not reconcile with the aggregate gain (loss) in the Statement of Operations due to share transactions for the period. |
(d) | Represents less the $0.005. |
The accompanying notes are an integral part of the financial statements.
200
Pacer Trendpilot® International ETF
FINANCIAL HIGHLIGHTS
For a capital share outstanding throughout the year/period
| | | For the
Year Ended
April 30,
2024 | | | For the
Year Ended
April 30,
2023 | | | For the
Year Ended
April 30,
2022 | | | For the
Year Ended
April 30,
2021 | | | For the
Period Ended
April 30,
2020 (a)(f) | |
Net Asset Value, Beginning of Period | | $ | 26.91 | | | $ | 24.40 | | | $ | 28.22 | | | $ | 23.42 | | | $ | 24.91 | |
| | | | | | | | | | | | | | | | | | | | | |
INCOME (LOSS) FROM INVESTMENT OPERATIONS: | | | | | | | | | | | | | | | | | | | | |
Net Investment Income (Loss)(b) | | | 0.65 | | | | 0.45 | | | | 0.44 | | | | 0.28 | | | | 0.32 | |
Net Realized and Unrealized Gain (Loss) on Investments(d) | | | 1.18 | | | | 2.16 | | | | (3.57 | ) | | | 4.72 | | | | (1.55 | ) |
Total from Investment Operations | | | 1.83 | | | | 2.61 | | | | (3.13 | ) | | | 5.00 | | | | (1.23 | ) |
| | | | | | | | | | | | | | | | | | | | | |
LESS DISTRIBUTIONS: | | | | | | | | | | | | | | | | | | | | |
Distributions from Net Investment Income | | | (0.58 | ) | | | (0.10 | ) | | | (0.69 | ) | | | (0.20 | ) | | | (0.26 | ) |
Total Distributions | | | (0.58 | ) | | | (0.10 | ) | | | (0.69 | ) | | | (0.20 | ) | | | (0.26 | ) |
| | | | | | | | | | | | | | | | | | | | | |
CAPITAL SHARE TRANSACTIONS | | | | | | | | | | | | | | | | | | | | |
Transaction Fees (see Note 1) | | | 0.00 | (e) | | | 0.00 | (e) | | | 0.00 | (e) | | | — | | | | — | |
Net Asset Value, End of Period | | $ | 28.16 | | | $ | 26.91 | | | $ | 24.40 | | | $ | 28.22 | | | $ | 23.42 | |
Total Return | | | 6.85 | % | | | 10.75 | % | | | -11.46 | % | | | 21.46 | % | | | -5.08 | % |
| | | | | | | | | | | | | | | | | | | | | |
SUPPLEMENTAL DATA: | | | | | | | | | | | | | | | | | | | | |
Net Assets at End of Period (000’s) | | $ | 150,672 | | | $ | 125,141 | | | $ | 130,527 | | | $ | 131,228 | | | $ | 151,038 | |
| | | | | | | | | | | | | | | | | | | | | |
RATIOS TO AVERAGE NET ASSETS: | | | | | | | | | | | | | | | | | | | | |
Expenses to Average Net Assets | | | 0.65 | % | | | 0.65 | % | | | 0.65 | % | | | 0.65 | % | | | 0.65 | % |
Net Investment Income (Loss) to Average Net Assets | | | 2.38 | % | | | 1.82 | % | | | 1.56 | % | | | 1.15 | % | | | 1.26 | % |
Portfolio Turnover Rate(c) | | | 58 | % | | | 3 | % | | | 202 | % | | | 161 | % | | | 39 | % |
(a) | Commencement of operations on May 02, 2019. |
(b) | Calculated based on average shares outstanding during the period. |
(c) | Excludes the impact of in-kind transactions. |
(d) | Realized and unrealized gain (loss) per share in this caption are balancing amounts necessary to reconcile the change in net asset value per share for the period, and may not reconcile with the aggregate gain (loss) in the Statement of Operations due to share transactions for the period. |
(e) | Represents less the $0.005. |
(f) | Ratios have been annualized and total return and portfolio turnover have not been annualized. |
The accompanying notes are an integral part of the financial statements.
201
Pacer Trendpilot® US Bond ETF
FINANCIAL HIGHLIGHTS
For a capital share outstanding throughout the year/period
| | | For the
Year Ended
April 30,
2024 | | | For the
Year Ended
April 30,
2023 | | | For the
Year Ended
April 30,
2022 | | | For the
Year Ended
April 30,
2021 | | | For the
Period Ended
April 30,
2020(a)(f) | |
Net Asset Value, Beginning of Period | | $ | 20.20 | | | $ | 23.33 | | | $ | 27.45 | | | $ | 25.77 | | | $ | 25.00 | |
| | | | | | | | | | | | | | | | | | | | | |
INCOME (LOSS) FROM INVESTMENT OPERATIONS: | | | | | | | | | | | | | | | | | | | | |
Net Investment Income (Loss)(b) | | | 1.41 | | | | 1.11 | | | | 0.80 | | | | 1.09 | | | | 0.33 | |
Net Realized and Unrealized Gain (Loss) on Investments(d) | | | (0.19 | ) | | | (2.83 | ) | | | (4.17 | ) | | | 1.34 | | | | 0.72 | |
Total from Investment Operations | | | 1.22 | | | | (1.72 | ) | | | (3.37 | ) | | | 2.43 | | | | 1.05 | |
| | | | | | | | | | | | | | | | | | | | | |
LESS DISTRIBUTIONS: | | | | | | | | | | | | | | | | | | | | |
Distributions from Net Investment Income | | | (1.42 | ) | | | (1.41 | ) | | | (0.75 | ) | | | (0.75 | ) | | | (0.28 | ) |
Total Distributions | | | (1.42 | ) | | | (1.41 | ) | | | (0.75 | ) | | | (0.75 | ) | | | (0.28 | ) |
| | | | | | | | | | | | | | | | | | | | | |
CAPITAL SHARE TRANSACTIONS | | | | | | | | | | | | | | | | | | | | |
Transaction Fees (see Note 1) | | | 0.00 | (e) | | | — | | | | — | | | | 0.00 | (e) | | | — | |
Net Asset Value, End of Period | | $ | 20.00 | | | $ | 20.20 | | | $ | 23.33 | | | $ | 27.45 | | | $ | 25.77 | |
Total Return | | | 6.30 | % | | | -7.30 | % | | | -12.54 | % | | | 9.53 | % | | | 4.24 | % |
| | | | | | | | | | | | | | | | | | | | | |
SUPPLEMENTAL DATA: | | | | | | | | | | | | | | | | | | | | |
Net Assets at End of Period (000’s) | | $ | 178,021 | | | $ | 232,340 | | | $ | 949,550 | | | $ | 839,970 | | | $ | 144,327 | |
| | | | | | | | | | | | | | | | | | | | | |
RATIOS TO AVERAGE NET ASSETS: | | | | | | | | | | | | | | | | | | | | |
Expenses to Average Net Assets | | | 0.60 | % | | | 0.60 | % | | | 0.60 | % | | | 0.60 | % | | | 0.60 | % |
Net Investment Income (Loss) to Average Net Assets | | | 7.03 | % | | | 5.26 | % | | | 3.01 | % | | | 4.04 | % | | | 2.47 | % |
Portfolio Turnover Rate(c) | | | 131 | % | | | 711 | % | | | 652 | % | | | 55 | % | | | 131 | % |
(a) | Commencement of operations on October 22, 2019. |
(b) | Calculated based on average shares outstanding during the period. |
(c) | Excludes the impact of in-kind transactions. |
(d) | Realized and unrealized gain (loss) per share in this caption are balancing amounts necessary to reconcile the change in net asset value per share for the period, and may not reconcile with the aggregate gain (loss) in the Statement of Operations due to share transactions for the period. |
(e) | Represents less the $0.005. |
(f) | Ratios have been annualized and total return and portfolio turnover have not been annualized. |
The accompanying notes are an integral part of the financial statements.
202
Pacer Trendpilot® Fund of Funds ETF
FINANCIAL HIGHLIGHTS
For a capital share outstanding throughout the year/period
| | | For the
Year Ended
April 30,
2024 | | | For the
Year Ended
April 30,
2023 | | | For the
Year Ended
April 30,
2022 | | | For the
Year Ended
April 30,
2021 | | | For the
Period Ended
April 30,
2020(a)(d) | |
Net Asset Value, Beginning of Period | | $ | 27.80 | | | $ | 27.81 | | | $ | 29.82 | | | $ | 23.81 | | | $ | 25.39 | |
| | | | | | | | | | | | | | | | | | | | | |
INCOME (LOSS) FROM INVESTMENT OPERATIONS: | | | | | | | | | | | | | | | | | | | | |
Net Investment Income (Loss)(b)(c) | | | 0.77 | | | | 0.48 | | | | 0.35 | | | | 0.22 | | | | 0.26 | |
Net Realized and Unrealized Gain (Loss) on Investments(g) | | | 2.66 | | | | (0.03 | ) | | | (2.07 | ) | | | 5.96 | | | | (1.59 | ) |
Total from Investment Operations | | | 3.43 | | | | 0.45 | | | | (1.72 | ) | | | 6.18 | | | | (1.33 | ) |
| | | | | | | | | | | | | | | | | | | | | |
LESS DISTRIBUTIONS: | | | | | | | | | | | | | | | | | | | | |
Distributions from Net Investment Income | | | (0.75 | ) | | | (0.46 | ) | | | (0.29 | ) | | | (0.17 | ) | | | (0.25 | ) |
Total Distributions | | | (0.75 | ) | | | (0.46 | ) | | | (0.29 | ) | | | (0.17 | ) | | | (0.25 | ) |
Net Asset Value, End of Period | | $ | 30.48 | | | $ | 27.80 | | | $ | 27.81 | | | $ | 29.82 | | | $ | 23.81 | |
Total Return | | | 12.39 | % | | | 1.71 | % | | | -5.87 | % | | | 26.02 | % | | | -5.37 | % |
| | | | | | | | | | | | | | | | | | | | | |
SUPPLEMENTAL DATA: | | | | | | | | | | | | | | | | | | | | |
Net Assets at End of Period (000’s) | | $ | 50,294 | | | $ | 52,819 | | | $ | 63,968 | | | $ | 44,728 | | | $ | 27,378 | |
| | | | | | | | | | | | | | | | | | | | | |
RATIOS TO AVERAGE NET ASSETS: | | | | | | | | | | | | | | | | | | | | |
Expenses to Average Net Assets(e) | | | 0.15 | % | | | 0.15 | % | | | 0.15 | % | | | 0.15 | % | | | 0.15 | % |
Net Investment Income (Loss) to Average Net Assets(e) | | | 2.61 | % | | | 1.77 | % | | | 1.16 | % | | | 0.82 | % | | | 1.03 | % |
Portfolio Turnover Rate(f) | | | 6 | % | | | 6 | % | | | 5 | % | | | 29 | % | | | 6 | % |
(a) | Commencement of operations on May 3, 2019. |
(b) | Calculated based on average shares outstanding during the period. |
(c) | Recognition of net investment income by the Fund is affected by the timing of the delcaration of dividends by the underlying investment companies in which the Fund
invests. The ratio does not include the net investment income of the underlying companies in which the Fund invests. |
(d) | Ratios have been annualized and total return and portfolio turnover have not been annualized. |
(e) | Does not include expenses of the investment companies in which the Fund invests. |
(f) | Excludes the impact of in-kind transactions. |
(g) | Realized and unrealized gain (loss) per share in this caption are balancing amounts necessary to reconcile the change in net asset value per share for the period, and may not reconcile with the aggregate gain (loss) in the Statement of Operations due to share transactions for the period. |
The accompanying notes are an integral part of the financial statements.
203
Pacer US Cash Cows 100 ETF
FINANCIAL HIGHLIGHTS
For a capital share outstanding throughout the year
| | | For the
Year Ended
April 30,
2024 | | | For the
Year Ended
April 30,
2023 | | | For the
Year Ended
April 30,
2022 | | | For the
Year Ended
April 30,
2021 | | | For the
Year Ended
April 30,
2020 | |
Net Asset Value, Beginning of Period | | $ | 46.73 | | | $ | 47.94 | | | $ | 41.95 | | | $ | 25.17 | | | $ | 29.72 | |
| | | | | | | | | | | | | | | | | | | | | |
INCOME (LOSS) FROM INVESTMENT OPERATIONS: | | | | | | | | | | | | | | | | | | | | |
Net Investment Income (Loss)(a) | | | 1.10 | | | | 1.08 | | | | 0.84 | | | | 0.71 | | | | 0.77 | |
Net Realized and Unrealized Gain (Loss) on Investments(c) | | | 8.02 | | | | (1.32 | ) | | | 5.87 | | | | 16.76 | | | | (4.55 | ) |
Total from Investment Operations | | | 9.12 | | | | (0.24 | ) | | | 6.71 | | | | 17.47 | | | | (3.78 | ) |
| | | | | | | | | | | | | | | | | | | | | |
LESS DISTRIBUTIONS: | | | | | | | | | | | | | | | | | | | | |
Distributions from Net Investment Income | | | (1.03 | ) | | | (0.97 | ) | | | (0.72 | ) | | | (0.69 | ) | | | (0.77 | ) |
Total Distributions | | | (1.03 | ) | | | (0.97 | ) | | | (0.72 | ) | | | (0.69 | ) | | | (0.77 | ) |
Net Asset Value, End of Period | | $ | 54.82 | | | $ | 46.73 | | | $ | 47.94 | | | $ | 41.95 | | | $ | 25.17 | |
Total Return | | | 19.70 | % | | | -0.38 | % | | | 16.08 | % | | | 70.43 | % | | | -12.63 | % |
| | | | | | | | | | | | | | | | | | | | | |
SUPPLEMENTAL DATA: | | | | | | | | | | | | | | | | | | | | |
Net Assets at End of Period (000’s) | | $ | 22,641,886 | | | $ | 13,219,876 | | | $ | 4,554,750 | | | $ | 432,113 | | | $ | 190,027 | |
| | | | | | | | | | | | | | | | | | | | | |
RATIOS TO AVERAGE NET ASSETS: | | | | | | | | | | | | | | | | | | | | |
Expenses to Average Net Assets | | | 0.49 | % | | | 0.49 | % | | | 0.49 | % | | | 0.49 | % | | | 0.49 | % |
Net Investment Income (Loss) to Average Net Assets | | | 2.15 | % | | | 2.30 | % | | | 1.78 | % | | | 2.23 | % | | | 2.73 | % |
Portfolio Turnover Rate(b) | | | 77 | % | | | 90 | % | | | 114 | % | | | 104 | % | | | 85 | % |
(a) | Calculated based on average shares outstanding during the period. |
(b) | Excludes the impact of in-kind transactions. |
(c) | Realized and unrealized gain (loss) per share in this caption are balancing amounts necessary to reconcile the change in net asset value per share for the period, and may not reconcile with the aggregate gain (loss) in the Statement of Operations due to share transactions for the period. |
The accompanying notes are an integral part of the financial statements.
204
Pacer US Small Cap Cash Cows 100 ETF
FINANCIAL HIGHLIGHTS
For a capital share outstanding throughout the year
| | | For the
Year Ended
April 30,
2024 | | | For the
Year Ended
April 30,
2023 | | | For the
Year Ended
April 30,
2022 | | | For the
Year Ended
April 30,
2021 | | | For the
Year Ended
April 30,
2020 | |
Net Asset Value, Beginning of Period | | $ | 37.05 | | | $ | 38.06 | | | $ | 41.82 | | | $ | 20.76 | | | $ | 25.88 | |
| | | | | | | | | | | | | | | | | | | | | |
INCOME (LOSS) FROM INVESTMENT OPERATIONS: | | | | | | | | | | | | | | | | | | | | |
Net Investment Income (Loss)(a) | | | 0.54 | | | | 0.51 | | | | 0.72 | | | | 0.11 | | | | 0.27 | |
Net Realized and Unrealized Gain (Loss) on Investments(c) | | | 8.76 | | | | (1.09 | ) | | | (3.37 | ) | | | 21.13 | | | | (5.12 | ) |
Total from Investment Operations | | | 9.30 | | | | (0.58 | ) | | | (2.65 | ) | | | 21.24 | | | | (4.85 | ) |
| | | | | | | | | | | | | | | | | | | | | |
LESS DISTRIBUTIONS: | | | | | | | | | | | | | | | | | | | | |
Distributions from Net Investment Income | | | (0.52 | ) | | | (0.43 | ) | | | (0.67 | ) | | | (0.14 | ) | | | (0.27 | ) |
Distributions from Return of Capital | | | — | | | | — | | | | (0.44 | ) | | | (0.04 | ) | | | — | |
Total Distributions | | | (0.52 | ) | | | (0.43 | ) | | | (1.11 | ) | | | (0.18 | ) | | | (0.27 | ) |
Net Asset Value, End of Period | | $ | 45.83 | | | $ | 37.05 | | | $ | 38.06 | | | $ | 41.82 | | | $ | 20.76 | |
Total Return | | | 25.18 | % | | | -1.46 | % | | | -6.57 | % | | | 102.70 | % | | | -18.72 | % |
| | | | | | | | | | | | | | | | | | | | | |
SUPPLEMENTAL DATA: | | | | | | | | | | | | | | | | | | | | |
Net Assets at End of Period (000’s) | | $ | 9,399,691 | | | $ | 2,035,764 | | | $ | 831,675 | | | $ | 271,840 | | | $ | 14,534 | |
| | | | | | | | | | | | | | | | | | | | | |
RATIOS TO AVERAGE NET ASSETS: | | | | | | | | | | | | | | | | | | | | |
Expenses to Average Net Assets | | | 0.59 | % | | | 0.59 | % | | | 0.60 | % | | | 0.59 | % | | | 0.59 | % |
Net Investment Income (Loss) to Average Net Assets | | | 1.20 | % | | | 1.36 | % | | | 1.70 | % | | | 0.33 | % | | | 1.11 | % |
Portfolio Turnover Rate(b) | | | 108 | % | | | 101 | % | | | 133 | % | | | 123 | % | | | 128 | % |
(a) | Calculated based on average shares outstanding during the period. |
(b) | Excludes the impact of in-kind transactions. |
(c) | Realized and unrealized gain (loss) per share in this caption are balancing amounts necessary to reconcile the change in net asset value per share for the period, and may not reconcile with the aggregate gain (loss) in the Statement of Operations due to share transactions for the period. |
The accompanying notes are an integral part of the financial statements.
205
Pacer Global Cash Cows Dividend ETF
FINANCIAL HIGHLIGHTS
For a capital share outstanding throughout the year
| | | For the
Year Ended
April 30,
2024 | | | For the
Year Ended
April 30,
2023 | | | For the
Year Ended
April 30,
2022 | | | For the
Year Ended
April 30,
2021 | | | For the
Year Ended
April 30,
2020 | |
Net Asset Value, Beginning of Period | | $ | 34.15 | | | $ | 32.83 | | | $ | 31.10 | | | $ | 24.63 | | | $ | 31.19 | |
| | | | | | | | | | | | | | | | | | | | | |
INCOME (LOSS) FROM INVESTMENT OPERATIONS: | | | | | | | | | | | | | | | | | | | | |
Net Investment Income (Loss)(a) | | | 1.75 | | | | 1.94 | | | | 1.39 | | | | 1.17 | | | | 1.32 | |
Net Realized and Unrealized Gain (Loss) on Investments(c) | | | 0.27 | | | | 0.65 | | | | 1.69 | | | | 6.51 | | | | (6.60 | ) |
Total from Investment Operations | | | 2.02 | | | | 2.59 | | | | 3.08 | | | | 7.68 | | | | (5.28 | ) |
| | | | | | | | | | | | | | | | | | | | | |
LESS DISTRIBUTIONS: | | | | | | | | | | | | | | | | | | | | |
Distributions from Net Investment Income | | | (2.00 | ) | | | (1.28 | ) | | | (1.35 | ) | | | (1.21 | ) | | | (1.28 | ) |
Total Distributions | | | (2.00 | ) | | | (1.28 | ) | | | (1.35 | ) | | | (1.21 | ) | | | (1.28 | ) |
| | | | | | | | | | | | | | | | | | | | | |
CAPITAL SHARE TRANSACTIONS | | | | | | | | | | | | | | | | | | | | |
Transaction Fees (see Note 1) | | | 0.00 | (d) | | | 0.01 | | | | 0.00 | (d) | | | — | | | | — | |
Net Asset Value, End of Period | | $ | 34.17 | | | $ | 34.15 | | | $ | 32.83 | | | $ | 31.10 | | | $ | 24.63 | |
Total Return | | | 6.17 | % | | | 8.50 | % | | | 10.22 | % | | | 32.05 | % | | | -17.32 | % |
| | | | | | | | | | | | | | | | | | | | | |
SUPPLEMENTAL DATA: | | | | | | | | | | | | | | | | | | | | |
Net Assets at End of Period (000’s) | | $ | 1,916,683 | | | $ | 1,579,560 | | | $ | 351,302 | | | $ | 135,269 | | | $ | 135,480 | |
| | | | | | | | | | | | | | | | | | | | | |
RATIOS TO AVERAGE NET ASSETS: | | | | | | | | | | | | | | | | | | | | |
Expenses to Average Net Assets | | | 0.60 | % | | | 0.60 | % | | | 0.60 | % | | | 0.60 | % | | | 0.60 | % |
Net Investment Income (Loss) to Average Net Assets | | | 5.21 | % | | | 6.07 | % | | | 4.32 | % | | | 4.32 | % | | | 4.52 | % |
Portfolio Turnover Rate(b) | | | 65 | % | | | 47 | % | | | 39 | % | | | 76 | % | | | 91 | % |
(a) | Calculated based on average shares outstanding during the period. |
(b) | Excludes the impact of in-kind transactions. |
(c) | Realized and unrealized gain (loss) per share in this caption are balancing amounts necessary to reconcile the change in net asset value per share for the period, and may not reconcile with the aggregate gain (loss) in the Statement of Operations due to share transactions for the period. |
(d) | Represents less the $0.005. |
The accompanying notes are an integral part of the financial statements.
206
Pacer Developed Markets International Cash Cows 100 ETF
FINANCIAL HIGHLIGHTS
For a capital share outstanding throughout the year
| | | For the
Year Ended
April 30,
2024 | | | For the
Year Ended
April 30,
2023 | | | For the
Year Ended
April 30,
2022 | | | For the
Year Ended
April 30,
2021 | | | For the
Year Ended
April 30,
2020 | |
Net Asset Value, Beginning of Period | | $ | 29.82 | | | $ | 29.69 | | | $ | 31.95 | | | $ | 20.99 | | | $ | 27.08 | |
| | | | | | | | | | | | | | | | | | | | | |
INCOME (LOSS) FROM INVESTMENT OPERATIONS: | | | | | | | | | | | | | | | | | | | | |
Net Investment Income (Loss)(a) | | | 1.19 | | | | 1.52 | | | | 1.03 | | | | 0.66 | | | | 0.74 | |
Net Realized and Unrealized Gain (Loss) on Investments(c) | | | 1.72 | | | | (0.18 | ) | | | (2.43 | ) | | | 10.98 | | | | (6.05 | ) |
Total from Investment Operations | | | 2.91 | | | | 1.34 | | | | (1.40 | ) | | | 11.64 | | | | (5.31 | ) |
| | | | | | | | | | | | | | | | | | | | | |
LESS DISTRIBUTIONS: | | | | | | | | | | | | | | | | | | | | |
Distributions from Net Investment Income | | | (1.16 | ) | | | (1.23 | ) | | | (0.87 | ) | | | (0.68 | ) | | | (0.78 | ) |
Total Distributions | | | (1.16 | ) | | | (1.23 | ) | | | (0.87 | ) | | | (0.68 | ) | | | (0.78 | ) |
| | | | | | | | | | | | | | | | | | | | | |
CAPITAL SHARE TRANSACTIONS | | | | | | | | | | | | | | | | | | | | |
Transaction Fees (see Note 1) | | | 0.01 | | | | 0.02 | | | | 0.01 | | | | 0.00 | (d) | | | — | |
Net Asset Value, End of Period | | $ | 31.58 | | | $ | 29.82 | | | $ | 29.69 | | | $ | 31.95 | | | $ | 20.99 | |
Total Return | | | 10.00 | % | | | 5.26 | % | | | -4.48 | % | | | 56.41 | % | | | -20.04 | % |
| | | | | | | | | | | | | | | | | | | | | |
SUPPLEMENTAL DATA: | | | | | | | | | | | | | | | | | | | | |
Net Assets at End of Period (000’s) | | $ | 1,405,198 | | | $ | 554,584 | | | $ | 111,346 | | | $ | 20,769 | | | $ | 20,991 | |
| | | | | | | | | | | | | | | | | | | | | |
RATIOS TO AVERAGE NET ASSETS: | | | | | | | | | | | | | | | | | | | | |
Expenses to Average Net Assets | | | 0.65 | % | | | 0.65 | % | | | 0.65 | % | | | 0.65 | % | | | 0.65 | % |
Net Investment Income (Loss) to Average Net Assets | | | 3.89 | % | | | 5.43 | % | | | 3.28 | % | | | 2.52 | % | | | 2.96 | % |
Portfolio Turnover Rate(b) | | | 67 | % | | | 59 | % | | | 71 | % | | | 83 | % | | | 149 | % |
(a) | Calculated based on average shares outstanding during the period. |
(b) | Excludes the impact of in-kind transactions. |
(c) | Realized and unrealized gain (loss) per share in this caption are balancing amounts necessary to reconcile the change in net asset value per share for the period, and may not reconcile with the aggregate gain (loss) in the Statement of Operations due to share transactions for the period. |
(d) | Represents less the $0.005. |
The accompanying notes are an integral part of the financial statements.
207
Pacer Emerging Markets Cash Cows 100 ETF
FINANCIAL HIGHLIGHTS
For a capital share outstanding throughout the year/period
| | | For the
Year Ended
April 30,
2024 | | | For the
Year Ended
April 30,
2023 | | | For the
Year Ended
April 30,
2022 | | | For the
Year Ended
April 30,
2021 | | | For the
Period Ended
April 30,
2020(a)(c) | |
Net Asset Value, Beginning of Period | | $ | 19.32 | | | $ | 22.14 | | | $ | 25.94 | | | $ | 19.11 | | | $ | 24.95 | |
| | | | | | | | | | | | | | | | | | | | | |
INCOME (LOSS) FROM INVESTMENT OPERATIONS: | | | | | | | | | | | | | | | | | | | | |
Net Investment Income (Loss)(b) | | | 1.03 | | | | 1.12 | | | | 1.36 | | | | 0.72 | | | | 1.05 | |
Net Realized and Unrealized Gain (Loss) on Investments(e) | | | 1.15 | | | | (2.70 | ) | | | (4.03 | ) | | | 6.91 | | | | (4.81 | ) |
Total from Investment Operations | | | 2.18 | | | | (1.58 | ) | | | (2.67 | ) | | | 7.63 | | | | (3.76 | ) |
| | | | | | | | | | | | | | | | | | | | | |
LESS DISTRIBUTIONS: | | | | | | | | | | | | | | | | | | | | |
Distributions from Net Investment Income | | | (1.07 | ) | | | (1.30 | ) | | | (1.14 | ) | | | (0.85 | ) | | | (2.08 | ) |
Total Distributions | | | (1.07 | ) | | | (1.30 | ) | | | (1.14 | ) | | | (0.85 | ) | | | (2.08 | ) |
| | | | | | | | | | | | | | | | | | | | | |
CAPITAL SHARE TRANSACTIONS | | | | | | | | | | | | | | | | | | | | |
Transaction Fees (see Note 1) | | | 0.01 | | | | 0.06 | | | | 0.01 | | | | 0.05 | | | | 0.00 | (f) |
Net Asset Value, End of Period | | $ | 20.44 | | | $ | 19.32 | | | $ | 22.14 | | | $ | 25.94 | | | $ | 19.11 | |
Total Return | | | 11.79 | % | | | -6.43 | % | | | -10.67 | % | | | 41.19 | % | | | -16.76 | % |
| | | | | | | | | | | | | | | | | | | | | |
SUPPLEMENTAL DATA: | | | | | | | | | | | | | | | | | | | | |
Net Assets at End of Period (000’s) | | $ | 97,086 | | | $ | 55,051 | | | $ | 11,070 | | | $ | 3,891 | | | $ | 956 | |
| | | | | | | | | | | | | | | | | | | | | |
RATIOS TO AVERAGE NET ASSETS: | | | | | | | | | | | | | | | | | | | | |
Expenses to Average Net Assets | | | 0.70 | % | | | 0.70 | % | | | 0.71 | % | | | 0.70 | % | | | 0.70 | % |
Net Investment Income (Loss) to Average Net Assets | | | 5.28 | % | | | 5.93 | % | | | 5.50 | % | | | 3.12 | % | | | 4.43 | % |
Portfolio Turnover Rate(d) | | | 73 | % | | | 66 | % | | | 97 | % | | | 109 | % | | | 144 | % |
(a) | Commencement of operations on May 02, 2019. |
(b) | Calculated based on average shares outstanding during the period. |
(c) | Ratios have been annualized and total return and portfolio turnover have not been annualized. |
(d) | Excludes the impact of in-kind transactions. |
(e) | Realized and unrealized gain (loss) per share in this caption are balancing amounts necessary to reconcile the change in net asset value per share for the period, and may not reconcile with the aggregate gain (loss) in the Statement of Operations due to share transactions for the period. |
(f) | Represents less the $0.005. |
The accompanying notes are an integral part of the financial statements.
208
Pacer US Large Cap Cash Cows Growth Leaders ETF
FINANCIAL HIGHLIGHTS
For a capital share outstanding throughout the year/period
| | | For the
Year Ended
April 30,
2024 | | | For the
Period Ended
April 30,
2023(a)(c) | |
Net Asset Value, Beginning of Period | | $ | 20.07 | | | $ | 20.36 | |
| | | | | | | | | |
INCOME (LOSS) FROM INVESTMENT OPERATIONS: | | | | | | | | |
Net Investment Income (Loss) (b) | | | 0.12 | | | | 0.03 | |
Net Realized and Unrealized Gain (Loss) on Investments (e) | | | 4.48 | | | | (0.30 | ) |
Total from Investment Operations | | | 4.60 | | | | (0.27 | ) |
| | | | | | | | | |
LESS DISTRIBUTIONS: | | | | | | | | |
Distributions from Net Investment Income | | | (0.11 | ) | | | (0.02 | ) |
Total Distributions | | | (0.11 | ) | | | (0.02 | ) |
Net Asset Value, End of Period | | $ | 24.56 | | | $ | 20.07 | |
Total Return | | | 22.96 | % | | | -1.30 | % |
| | | | | | | | | |
SUPPLEMENTAL DATA: | | | | | | | | |
Net Assets at End of Period (000’s) | | $ | 120,342 | | | $ | 19,571 | |
| | | | | | | | | |
RATIOS TO AVERAGE NET ASSETS: | | | | | | | | |
Expenses to Average Net Assets | | | 0.49 | % | | | 0.49 | % |
Net Investment Income (Loss) to Average Net Assets | | | 0.53 | % | | | 0.44 | % |
Portfolio Turnover Rate (d) | | | 111 | % | | | 30 | % |
(a) | Commencement of operations on December 21, 2022. |
(b) | Calculated based on average shares outstanding during the period. |
(c) | Ratios have been annualized and total return and portfolio turnover have not been annualized. |
(d) | Excludes the impact of in-kind transactions. |
(e) | Net realized and unrealized gain (loss) per share in this caption are balancing amounts necessary to reconcile the change in net asset value per share for the period, and may not reconcile with the aggregate gain (loss) in the Statement of Operations due to share transactions for the period. |
The accompanying notes are an integral part of the financial statements.
209
Pacer US Small Cap Cash Cows Growth Leaders ETF
FINANCIAL HIGHLIGHTS
For a capital share outstanding throughout the year/period
| | | For the
Year Ended
April 30,
2024 (a)(c) | |
Net Asset Value, Beginning of Period | | $ | 20.18 | |
| | | | | |
INCOME (LOSS) FROM INVESTMENT OPERATIONS: | | | | |
Net Investment Income (Loss) (b) | | | 0.13 | |
Net Realized and Unrealized Gain (Loss) on Investments (e) | | | 2.75 | |
Total from Investment Operations | | | 2.88 | |
| | | | | |
LESS DISTRIBUTIONS: | | | | |
Distributions from Net Investment Income | | | (0.13 | ) |
Distributions from Return of capital (f) | | | 0.00 | |
Total Distributions | | | (0.13 | ) |
| | | | | |
CAPITAL SHARE TRANSACTIONS: | | | | |
Transaction Fees (see Note 1) | | | — | |
Net Asset Value, End of Period | | $ | 22.93 | |
Total Return | | | 14.26 | % |
| | | | | |
SUPPLEMENTAL DATA: | | | | |
Net Assets at End of Period (000’s) | | $ | 9,170 | |
| | | | | |
RATIOS TO AVERAGE NET ASSETS: | | | | |
Expenses to Average Net Assets | | | 0.59 | % |
Net Investment Income (Loss) to Average Net Assets | | | 0.59 | % |
Portfolio Turnover Rate (d) | | | 152 | % |
(a) | Commencement of operations on May 1, 2023 |
(b) | Calculated based on average shares outstanding during the period. |
(c) | Ratios have been annualized and total return and portfolio turnover have not been annualized. |
(d) | Excludes the impact of in-kind transactions. |
(e) | Net realized and unrealized gain (loss) per share in this caption are balancing amounts necessary to reconcile the change in net asset value per share for the period, and may not reconcile with the aggregate gain (loss) in the Statement of Operations due to share transactions for the period. |
The accompanying notes are an integral part of the financial statements.
210
Pacer US Cash Cows Growth ETF
FINANCIAL HIGHLIGHTS
For a capital share outstanding throughout the year/period
| | | For the
Year Ended
April 30,
2024 | | | For the
Year Ended
April 30,
2023 | | | For the
Year Ended
April 30,
2022 | | | For the
Year Ended
April 30,
2021 | | | For the
Period Ended
April 30,
2020(a)(c) | |
Net Asset Value, Beginning of Period | | $ | 35.00 | | | $ | 35.44 | | | $ | 36.21 | | | $ | 22.89 | | | $ | 24.78 | |
| | | | | | | | | | | | | | | | | | | | | |
INCOME (LOSS) FROM INVESTMENT OPERATIONS: | | | | | | | | | | | | | | | | | | | | |
Net Investment Income (Loss) (b) | | | 0.56 | | | | 0.60 | | | | 0.04 | | | | 0.14 | | | | 0.28 | |
Net Realized and Unrealized Gain (Loss) on Investments (e) | | | 5.43 | | | | (0.65 | ) | | | (0.75 | ) | | | 13.37 | | | | (1.90 | ) |
Total from Investment Operations | | | 5.99 | | | | (0.05 | ) | | | (0.71 | ) | | | 13.51 | | | | (1.62 | ) |
| | | | | | | | | | | | | | | | | | | | | |
LESS DISTRIBUTIONS: | | | | | | | | | | | | | | | | | | | | |
Distributions from Net Investment Income | | | (0.62 | ) | | | (0.39 | ) | | | (0.04 | ) | | | (0.19 | ) | | | (0.27 | ) |
Distributions from Return of Capital | | | (0.01 | ) | | | — | | | | (0.02 | ) | | | — | | | | — | |
Total Distributions | | | (0.63 | ) | | | (0.39 | ) | | | (0.06 | ) | | | (0.19 | ) | | | (0.27 | ) |
Net Asset Value, End of Period | | $ | 40.36 | | | $ | 35.00 | | | $ | 35.44 | | | $ | 36.21 | | | $ | 22.89 | |
Total Return | | | 17.34 | % | | | -0.07 | % | | | -1.98 | % | | | 59.29 | % | | | -6.52 | % |
| | | | | | | | | | | | | | | | | | | | | |
SUPPLEMENTAL DATA: | | | | | | | | | | | | | | | | | | | | |
Net Assets at End of Period (000’s) | | $ | 46,412 | | | $ | 38,500 | | | $ | 8,859 | | | $ | 3,621 | | | $ | 1,144 | |
| | | | | | | | | | | | | | | | | | | | | |
RATIOS TO AVERAGE NET ASSETS: | | | | | | | | | | | | | | | | | | | | |
Expenses to Average Net Assets | | | 0.60 | % | | | 0.60 | % | | | 0.60 | % | | | 0.60 | % | | | 0.60 | % |
Net Investment Income (Loss) to Average Net Assets | | | 1.52 | % | | | 1.69 | % | | | 0.10 | % | | | 0.43 | % | | | 1.16 | % |
Portfolio Turnover Rate (d) | | | 123 | % | | | 182 | % | | | 76 | % | | | 170 | % | | | 166 | % |
(a) | Commencement of operations on May 02, 2019. |
(b) | Calculated based on average shares outstanding during the period. |
(c) | Ratios have been annualized and total return and portfolio turnover have not been annualized. |
(d) | Excludes the impact of in-kind transactions. |
(e) | Realized and unrealized gain (loss) per share in this caption are balancing amounts necessary to reconcile the change in net asset value per share for the period, and may not reconcile with the aggregate gain (loss) in the Statement of Operations due to share transactions for the period. |
The accompanying notes are an integral part of the financial statements.
211
Pacer Cash Cows Fund of Funds ETF
FINANCIAL HIGHLIGHTS
For a capital share outstanding throughout the year/period
| | | For the
Year Ended
April 30,
2024 | | | For the
Year Ended
April 30,
2023 | | | For the
Year Ended
April 30,
2022 | | | For the
Year Ended
April 30,
2021 | | | For the
Period Ended
April 30,
2020(a)(d) | |
Net Asset Value, Beginning of Period | | $ | 33.53 | | | $ | 33.44 | | | $ | 33.44 | | | $ | 20.83 | | | $ | 25.31 | |
| | | | | | | | | | | | | | | | | | | | | |
INCOME (LOSS) FROM INVESTMENT OPERATIONS: | | | | | | | | | | | | | | | | | | | | |
Net Investment Income (Loss) (b)(c) | | | 0.94 | | | | 0.76 | | | | 0.79 | | | | 0.55 | | | | 0.53 | |
Net Realized and Unrealized Gain (Loss) on Investments (g) | | | 4.13 | | | | 0.11 | | | | — | | | | 12.56 | | | | (4.46 | ) |
Total from Investment Operations | | | 5.07 | | | | 0.87 | | | | 0.79 | | | | 13.11 | | | | (3.93 | ) |
| | | | | | | | | | | | | | | | | | | | | |
LESS DISTRIBUTIONS: | | | | | | | | | | | | | | | | | | | | |
Distributions from Net Investment Income | | | (0.99 | ) | | | (0.78 | ) | | | (0.79 | ) | | | (0.50 | ) | | | (0.55 | ) |
Distributions from Capital Gains | | | (0.00 | )(h) | | | (0.00 | )(h) | | | — | | | | — | | | | — | |
Distributions from Return of Capital | | | (0.00 | )(h) | | | (0.00 | )(h) | | | — | | | | — | | | | (0.00 | )(h) |
Total Distributions | | | (0.99 | ) | | | (0.78 | ) | | | (0.79 | ) | | | (0.50 | ) | | | (0.55 | ) |
Net Asset Value, End of Period | | $ | 37.61 | | | $ | 33.53 | | | $ | 33.44 | | | $ | 33.44 | | | $ | 20.83 | |
Total Return | | | 15.38 | % | | | 2.81 | % | | | 2.29 | % | | | 63.73 | % | | | -15.71 | % |
| | | | | | | | | | | | | | | | | | | | | |
SUPPLEMENTAL DATA: | | | | | | | | | | | | | | | | | | | | |
Net Assets at End of Period (000’s) | | $ | 94,037 | | | $ | 48,618 | | | $ | 8,361 | | | $ | 1,672 | | | $ | 1,041 | |
| | | | | | | | | | | | | | | | | | | | | |
RATIOS TO AVERAGE NET ASSETS: | | | | | | | | | | | | | | | | | | | | |
Expenses to Average Net Assets (e) | | | 0.15 | % | | | 0.15 | % | | | 0.16 | % | | | 0.15 | % | | | 0.15 | % |
Net Investment Income (Loss) to Average Net Assets (e) | | | 2.64 | % | | | 2.33 | % | | | 2.27 | % | | | 2.09 | % | | | 2.27 | % |
Portfolio Turnover Rate (f) | | | 4 | % | | | 8 | % | | | 26 | % | | | 9 | % | | | 2 | % |
(a) | Commencement of operations on May 03, 2019. |
(b) | Calculated based on average shares outstanding during the period. |
(c) | Recognition of net investment income by the Fund is affected by the timing of the delcaration of dividends by the underlying investment companies in which the Fund
invests. The ratio does not include the net investment income of the underlying companies in which the Fund invests. |
(d) | Ratios have been annualized and total return and portfolio turnover have not been annualized. |
(e) | Does not include expenses of the investment companies in which the Fund invests. |
(f) | Excludes the impact of in-kind transactions. |
(g) | Realized and unrealized gain (loss) per share in this caption are balancing amounts necessary to reconcile the change in net asset value per share for the period, and may not reconcile with the aggregate gain (loss) in the Statement of Operations due to share transactions for the period. |
The accompanying notes are an integral part of the financial statements.
212
Pacer WealthShield ETF
FINANCIAL HIGHLIGHTS
For a capital share outstanding throughout the year
| | | For the
Year Ended
April 30,
2024 | | | For the
Year Ended
April 30,
2023 | | | For the
Year Ended
April 30,
2022 | | | For the
Year Ended
April 30,
2021 | | | For the
Year Ended
April 30,
2020 | |
Net Asset Value, Beginning of Period | | $ | 27.16 | | | $ | 30.16 | | | $ | 32.10 | | | $ | 23.92 | | | $ | 25.02 | |
| | | | | | | | | | | | | | | | | | | | | |
INCOME (LOSS) FROM INVESTMENT OPERATIONS: | | | | | | | | | | | | | | | | | | | | |
Net Investment Income (Loss) (a) | | | 0.39 | | | | 0.64 | | | | 0.26 | | | | 0.14 | | | | 0.33 | |
Net Realized and Unrealized Gain (Loss) on Investments (c) | | | 0.71 | | | | (3.07 | ) | | | (1.94 | ) | | | 8.20 | | | | (1.10 | ) |
Total from Investment Operations | | | 1.10 | | | | (2.43 | ) | | | (1.68 | ) | | | 8.34 | | | | (0.77 | ) |
| | | | | | | | | | | | | | | | | | | | | |
LESS DISTRIBUTIONS: | | | | | | | | | | | | | | | | | | | | |
Distributions from Net Investment Income | | | (0.48 | ) | | | (0.57 | ) | | | (0.26 | ) | | | (0.16 | ) | | | (0.33 | ) |
Total Distributions | | | (0.48 | ) | | | (0.57 | ) | | | (0.26 | ) | | | (0.16 | ) | | | (0.33 | ) |
| | | | | | | | | | | | | | | | | | | | | |
CAPITAL SHARE TRANSACTIONS | | | | | | | | | | | | | | | | | | | | |
Transaction Fees (see Note 1) | | | — | | | | — | | | | 0.00 | (d) | | | — | | | | — | |
Net Asset Value, End of Period | | $ | 27.78 | | | $ | 27.16 | | | $ | 30.16 | | | $ | 32.10 | | | $ | 23.92 | |
Total Return | | | 4.06 | % | | | -8.09 | % | | | -5.30 | % | | | 35.00 | % | | | -3.04 | % |
| | | | | | | | | | | | | | | | | | | | | |
SUPPLEMENTAL DATA: | | | | | | | | | | | | | | | | | | | | |
Net Assets at End of Period (000’s) | | $ | 19,446 | | | $ | 24,446 | | | $ | 33,172 | | | $ | 48,143 | | | $ | 51,428 | |
| | | | | | | | | | | | | | | | | | | | | |
RATIOS TO AVERAGE NET ASSETS: | | | | | | | | | | | | | | | | | | | | |
Expenses to Average Net Assets | | | 0.60 | % | | | 0.60 | % | | | 0.61 | % | | | 0.60 | % | | | 0.60 | % |
Net Investment Income (Loss) to Average Net Assets | | | 1.42 | % | | | 2.19 | % | | | 0.79 | % | | | 0.53 | % | | | 1.38 | % |
Portfolio Turnover Rate (b) | | | 315 | % | | | 669 | % | | | 448 | % | | | 227 | % | | | 676 | % |
(a) | Calculated based on average shares outstanding during the period. |
(b) | Excludes the impact of in-kind transactions. |
(c) | Realized and unrealized gain (loss) per share in this caption are balancing amounts necessary to reconcile the change in net asset value per share for the period, and may not reconcile with the aggregate gain (loss) in the Statement of Operations due to share transactions for the period. |
(d) | Represents less than $0.005. |
The accompanying notes are an integral part of the financial statements.
213
Pacer Industrial Real Estate ETF
FINANCIAL HIGHLIGHTS
For a capital share outstanding throughout the year
| | | For the
Year Ended
April 30,
2024 | | | For the
Year Ended
April 30,
2023 | | | For the
Year Ended
April 30,
2022 | | | For the
Year Ended
April 30,
2021 | | | For the
Year Ended
April 30,
2020 | |
Net Asset Value, Beginning of Period | | $ | 40.73 | | | $ | 47.82 | | | $ | 42.12 | | | $ | 30.09 | | | $ | 29.42 | |
| | | | | | | | | | | | | | | | | | | | | |
INCOME (LOSS) FROM INVESTMENT OPERATIONS: | | | | | | | | | | | | | | | | | | | | |
Net Investment Income (Loss) (a) | | | 1.18 | | | | 0.90 | | | | 0.78 | | | | 0.63 | | | | 0.77 | |
Net Realized and Unrealized Gain (Loss) on Investments (c) | | | (4.94 | ) | | | (6.99 | ) | | | 5.48 | | | | 12.08 | | | | 0.52 | |
Total from Investment Operations | | | (3.76 | ) | | | (6.09 | ) | | | 6.26 | | | | 12.71 | | | | 1.29 | |
| | | | | | | | | | | | | | | | | | | | | |
LESS DISTRIBUTIONS: | | | | | | | | | | | | | | | | | | | | |
Distributions from Net Investment Income | | | (1.56 | ) | | | (1.00 | ) | | | (0.57 | ) | | | (0.58 | ) | | | (0.61 | ) |
Distributions from Capital Gains | | | — | | | | — | | | | — | | | | — | | | | (0.00 | )(d) |
Distributions from Return of Capital | | | — | | | | — | | | | — | | | | (0.10 | ) | | | — | |
Total Distributions | | | (1.56 | ) | | | (1.00 | ) | | | (0.57 | ) | | | (0.68 | ) | | | (0.61 | ) |
| | | | | | | | | | | | | | | | | | | | | |
CAPITAL SHARE TRANSACTIONS | | | | | | | | | | | | | | | | | | | | |
Transaction Fees (see Note 1) | | | — | | | | — | | | | 0.01 | | | | 0.00 | (d) | | | — | |
Net Asset Value, End of Period | | $ | 35.41 | | | $ | 40.73 | | | $ | 47.82 | | | $ | 42.12 | | | $ | 30.09 | |
Total Return | | | -9.31 | % | | | -12.56 | % | | | 14.88 | % | | | 42.70 | % | | | 4.38 | % |
| | | | | | | | | | | | | | | | | | | | | |
SUPPLEMENTAL DATA: | | | | | | | | | | | | | | | | | | | | |
Net Assets at End of Period (000’s) | | $ | 194,769 | | | $ | 219,932 | | | $ | 384,990 | | | $ | 200,086 | | | $ | 48,147 | |
| | | | | | | | | | | | | | | | | | | | | |
RATIOS TO AVERAGE NET ASSETS: | | | | | | | | | | | | | | | | | | | | |
Expenses to Average Net Assets | | | 0.60 | % | | | 0.60 | % | | | 0.61 | % | | | 0.60 | % | | | 0.60 | % |
Expenses to Average Net Assets (Waived) (see Note 3) | | | 0.55 | % | | | 0.58 | % | | | N/A | | | | N/A | | | | N/A | |
Net Investment Income (Loss) to Average Net Assets | | | 3.07 | % | | | 2.25 | % | | | 1.60 | % | | | 1.75 | % | | | 2.40 | % |
Net Investment Income (Loss) to Average Net Assets (Waived) (see Note 3) | | | 3.12 | % | | | 2.23 | % | | | N/A | | | | N/A | | | | N/A | |
Portfolio Turnover Rate (b) | | | 19 | % | | | 92 | % | | | 43 | % | | | 13 | % | | | 29 | % |
(a) | Calculated based on average shares outstanding during the period. |
(b) | Excludes the impact of in-kind transactions. |
(c) | Realized and unrealized gain (loss) per share in this caption are balancing amounts necessary to reconcile the change in net asset value per share for the period, and may not reconcile with the aggregate gain (loss) in the Statement of Operations due to share transactions for the period. |
(d) | Represents less than $0.005. |
The accompanying notes are an integral part of the financial statements.
214
Pacer Data & Infrastructure Real Estate ETF
FINANCIAL HIGHLIGHTS
For a capital share outstanding throughout the year
| | | For the
Year Ended
April 30,
2024 | | | For the
Year Ended
April 30,
2023 | | | For the
Year Ended
April 30,
2022 | | | For the
Year Ended
April 30,
2021 | | | For the
Year Ended
April 30,
2020 | |
Net Asset Value, Beginning of Year/Period | | $ | 29.68 | | | $ | 37.50 | | | $ | 38.48 | | | $ | 33.27 | | | $ | 28.36 | |
| | | | | | | | | | | | | | | | | | | | | |
INCOME (LOSS) FROM INVESTMENT OPERATIONS: | | | | | | | | | | | | | | | | | | | | |
Net Investment Income (Loss) (a) | | | 0.71 | | | | 0.77 | | | | 0.32 | | | | 0.36 | | | | 0.54 | |
Net Realized and Unrealized Gain (Loss) on Investments (c) | | | (2.98 | ) | | | (7.92 | ) | | | (0.91 | ) | | | 5.39 | | | | 4.92 | |
Total from Investment Operations | | | (2.27 | ) | | | (7.15 | ) | | | (0.59 | ) | | | 5.75 | | | | 5.46 | |
| | | | | | | | | | | | | | | | | | | | | |
LESS DISTRIBUTIONS: | | | | | | | | | | | | | | | | | | | | |
Distributions from Net Investment Income | | | (1.09 | ) | | | (0.61 | ) | | | (0.33 | ) | | | (0.37 | ) | | | (0.49 | ) |
Distributions from Capital Gains | | | — | | | | (0.06 | ) | | | (0.06 | ) | | | — | | | | — | |
Distributions from Return of Capital | | | — | | | | — | | | | — | | | | (0.17 | ) | | | (0.06 | ) |
Total Distributions | | | (1.09 | ) | | | (0.67 | ) | | | (0.39 | ) | | | (0.54 | ) | | | (0.55 | ) |
| | | | | | | | | | | | | | | | | | | | | |
CAPITAL SHARE TRANSACTIONS | | | | | | | | | | | | | | | | | | | | |
Transaction Fees (see Note 1) | | | 0.00 | (d) | | | 0.00 | (d) | | | — | | | | — | | | | — | |
Net Asset Value, End of Period | | $ | 26.32 | | | $ | 29.68 | | | $ | 37.50 | | | $ | 38.48 | | | $ | 33.27 | |
Total Return | | | -7.74 | % | | | -19.11 | % | | | -1.63 | % | | | 17.46 | % | | | 19.50 | % |
| | | | | | | | | | | | | | | | | | | | | |
SUPPLEMENTAL DATA: | | | | | | | | | | | | | | | | | | | | |
Net Assets at End of Period (000’s) | | $ | 421,162 | | | $ | 700,548 | | | $ | 1,299,321 | | | $ | 1,119,810 | | | $ | 552,214 | |
| | | | | | | | | | | | | | | | | | | | | |
RATIOS TO AVERAGE NET ASSETS: | | | | | | | | | | | | | | | | | | | | |
Expenses to Average Net Assets | | | 0.60 | % | | | 0.60 | % | | | 0.62 | % | | | 0.60 | % | | | 0.60 | % |
Expenses to Average Net Assets After Advisory Fees (Waived) (see Note 3) | | | 0.55 | % | | | 0.58 | % | | | N/A | | | | N/A | | | | N/A | |
Net Investment Income (Loss) to Average Net Assets | | | 2.52 | % | | | 2.43 | % | | | 0.81 | % | | | 1.02 | % | | | 1.70 | % |
Net Investment Income (Loss) to Average Net Assets After Advisory Fees (Waived) (see Note 3) | | | 2.57 | % | | | 2.41 | % | | | N/A | | | | N/A | | | | N/A | |
Portfolio Turnover Rate (b) | | | 68 | % | | | 51 | % | | | 23 | % | | | 30 | % | | | 28 | % |
(a) | Calculated based on average shares outstanding during the period. |
(b) | Excludes the impact of in-kind transactions. |
(c) | Realized and unrealized gain (loss) per share in this caption are balancing amounts necessary to reconcile the change in net asset value per share for the period, and may not reconcile with the aggregate gain (loss) in the Statement of Operations due to share transactions for the period. |
(d) | Represents less the $0.005. |
The accompanying notes are an integral part of the financial statements.
215
Pacer CFRA-Stovall Equal Weight Seasonal Rotation ETF
FINANCIAL HIGHLIGHTS
For a capital share outstanding throughout the year
| | | For the
Year Ended
April 30,
2024 | | | For the
Year Ended
April 30,
2023 | | | For the
Year Ended
April 30,
2022 | | | For the
Year Ended
April 30,
2021 | | | For the
Year Ended
April 30,
2020 | |
Net Asset Value, Beginning of Period | | $ | 36.60 | | | $ | 34.95 | | | $ | 37.16 | | | $ | 25.23 | | | $ | 28.16 | |
| | | | | | | | | | | | | | | | | | | | | |
INCOME (LOSS) FROM INVESTMENT OPERATIONS: | | | | | | | | | | | | | | | | | | | | |
Net Investment Income (Loss) (a) | | | 0.41 | | | | 0.40 | | | | 0.34 | | | | 0.26 | | | | 0.50 | |
Net Realized and Unrealized Gain (Loss) on Investments (d) | | | 0.70 | | | | 1.65 | | | | (2.21 | ) | | | 11.95 | | | | (3.00 | ) |
Total from Investment Operations | | | 1.11 | | | | 2.05 | | | | (1.87 | ) | | | 12.21 | | | | (2.50 | ) |
| | | | | | | | | | | | | | | | | | | | | |
LESS DISTRIBUTIONS: | | | | | | | | | | | | | | | | | | | | |
Distributions from Net Investment Income | | | (0.43 | ) | | | (0.40 | ) | | | (0.34 | ) | | | (0.28 | ) | | | (0.43 | ) |
Total Distributions | | | (0.43 | ) | | | (0.40 | ) | | | (0.34 | ) | | | (0.28 | ) | | | (0.43 | ) |
Net Asset Value, End of Period | | $ | 37.28 | | | $ | 36.60 | | | $ | 34.95 | | | $ | 37.16 | | | $ | 25.23 | |
Total Return (c) | | | 3.13 | % | | | 5.95 | % | | | -5.11 | % | | | 48.66 | % | | | -8.80 | % |
| | | | | | | | | | | | | | | | | | | | | |
SUPPLEMENTAL DATA: | | | | | | | | | | | | | | | | | | | | |
Net Assets at End of Period (000’s) | | $ | 39,140 | | | $ | 78,680 | | | $ | 80,388 | | | $ | 66,883 | | | $ | 60,554 | |
| | | | | | | | | | | | | | | | | | | | | |
RATIOS TO AVERAGE NET ASSETS: | | | | | | | | | | | | | | | | | | | | |
Expenses to Average Net Assets | | | 0.60 | % | | | 0.60 | % | | | 0.60 | % | | | 0.60 | % | | | 0.60 | % |
Net Investment Income (Loss) to Average Net Assets | | | 1.16 | % | | | 1.16 | % | | | 0.89 | % | | | 0.89 | % | | | 1.75 | % |
Portfolio Turnover Rate (b) | | | 185 | % | | | 227 | % | | | 225 | % | | | 217 | % | | | 225 | % |
(a) | Calculated based on average shares outstanding during the period. |
(b) | Excludes the impact of in-kind transactions. |
(c) | Total Return was calculated using the traded NAV due to the rebalancing of the portfolio at April 30, 2022. |
(d) | Realized and unrealized gains and losses per share in this caption are balancing amounts necessary to reconcile the change in net asset value per share for the period, and may not reconcile with the aggregate gains and losses in the Statement of Operations due to share transactions for the period. |
The accompanying notes are an integral part of the financial statements.
216
Pacer CSOP FTSE China A50 ETF
FINANCIAL HIGHLIGHTS
For a capital share outstanding throughout the year
| | | For the
Year Ended
April 30,
2024 | | | For the
Year Ended
April 30,
2023 | | | For the
Year Ended
April 30,
2022 | | | For the
Year Ended
April 30,
2021 | | | For the
Period Ended
April 30,
2020 (a)(c) | | | For the
Year Ended
September 30,
2019 | |
Net Asset Value, Beginning of Period | | $ | 16.06 | | | $ | 17.39 | | | $ | 22.74 | | | $ | 16.18 | | | $ | 16.85 | | | $ | 15.30 | |
| | | | | | | | | | | | | | | | | | | | | | | | | |
INCOME (LOSS) FROM INVESTMENT OPERATIONS: | | | | | | | | | | | | | | | | | | | | | | | | |
Net Investment Income (Loss) (b) | | | 0.34 | | | | 0.33 | | | | 0.31 | | | | 0.36 | | | | (0.07 | ) | | | 0.31 | |
Net Realized and Unrealized Gain (Loss) on Investments (e) | | | (1.57 | ) | | | (1.33 | ) | | | (5.33 | ) | | | 6.54 | | | | 0.15 | | | | 1.48 | |
Total from Investment Operations | | | (1.23 | ) | | | (1.00 | ) | | | (5.02 | ) | | | 6.90 | | | | 0.08 | | | | 1.79 | |
| | | | | | | | | | | | | | | | | | | | | | | | | |
LESS DISTRIBUTIONS: | | | | | | | | | | | | | | | | | | | | | | | | |
Distributions from Net Investment Income | | | (0.30 | ) | | | (0.33 | ) | | | (0.37 | ) | | | (0.33 | ) | | | (0.71 | ) | | | (0.24 | ) |
Distributions from Return of Capital | | | — | | | | — | | | | (0.01 | ) | | | (0.01 | ) | | | (0.04 | ) | | | — | |
Total Distributions | | | (0.30 | ) | | | (0.33 | ) | | | (0.38 | ) | | | (0.34 | ) | | | (0.75 | ) | | | (0.24 | ) |
| | | | | | | | | | | | | | | | | | | | | | | | | |
CAPITAL SHARE TRANSACTIONS | | | | | | | | | | | | | | | | | | | | | | | | |
Transaction Fees (see Note 1) | | | — | | | | 0.00 | (f) | | | 0.05 | | | | 0.00 | (f) | | | — | | | | — | |
Net Asset Value, End of Period | | $ | 14.53 | | | $ | 16.06 | | | $ | 17.39 | | | $ | 22.74 | | | $ | 16.18 | | | $ | 16.85 | |
Total Return | | | -7.50 | % | | | -5.68 | % | | | -22.15 | % | | | 42.73 | % | | | 0.14 | % | | | 12.05 | % |
| | | | | | | | | | | | | | | | | | | | | | | | | |
SUPPLEMENTAL DATA: | | | | | | | | | | | | | | | | | | | | | | | | |
Net Assets at End of Period (000’s) | | $ | 4,444 | | | $ | 4,914 | | | $ | 6,188 | | | $ | 10,367 | | | $ | 8,992 | | | $ | 12,740 | |
| | | | | | | | | | | | | | | | | | | | | | | | | |
RATIOS TO AVERAGE NET ASSETS: | | | | | | | | | | | | | | | | | | | | | | | | |
Expenses to Average Net Assets | | | 0.70 | % | | | 0.70 | % | | | 0.71 | % | | | 0.70 | % | | | 0.70 | % | | | 0.70 | % |
Net Investment Income (Loss) to Average Net Assets | | | 2.33 | % | | | 2.03 | % | | | 1.49 | % | | | 1.73 | % | | | -0.66 | % | | | 1.97 | % |
Portfolio Turnover Rate (d) | | | 12 | % | | | 13 | % | | | 59 | % | | | 32 | % | | | 193 | % | | | 45 | % |
(a) | For the period October 1, 2019 to April 30, 2020. |
(b) | Calculated based on average shares outstanding during the period. |
(c) | Ratios have been annualized and total return and portfolio turnover have not been annualized. |
(d) | Excludes the impact of in-kind transactions. |
(e) | Realized and unrealized gain (loss) per share in this caption are balancing amounts necessary to reconcile the change in net asset value per share for the period, and may not reconcile with the aggregate gain (loss) in the Statement of Operations due to share transactions for the period. |
(f) | Represents less the $0.005. |
The accompanying notes are an integral part of the financial statements.
217
Pacer BioThreat Strategy ETF
FINANCIAL HIGHLIGHTS
For a capital share outstanding throughout the year/period
| | | For the
Year Ended
April 30,
2024 | | | For the
Year Ended
April 30,
2023 | | | For the
Year Ended
April 30,
2022 | | | For the
Period Ended
April 30,
2021(a)(c) | |
Net Asset Value, Beginning of Period | | $ | 29.37 | | | $ | 28.51 | | | $ | 30.05 | | | $ | 24.51 | |
| | | | | | | | | | | | | | | | | |
INCOME (LOSS) FROM INVESTMENT OPERATIONS: | | | | | | | | | | | | | | | | |
Net Investment Income (Loss) (b) | | | 0.32 | | | | 0.30 | | | | 0.22 | | | | 0.16 | |
Net Realized and Unrealized Gain (Loss) on Investments (e) | | | 5.09 | | | | 0.86 | | | | (1.52 | ) | | | 5.53 | |
Total from Investment Operations | | | 5.41 | | | | 1.16 | | | | (1.30 | ) | | | 5.69 | |
| | | | | | | | | | | | | | | | | |
LESS DISTRIBUTIONS: | | | | | | | | | | | | | | | | |
Distributions from Net Investment Income | | | (0.33 | ) | | | (0.30 | ) | | | (0.24 | ) | | | (0.15 | ) |
Distributions from Return of Capital | | | — | | | | — | | | | — | | | | (0.00 | )(f) |
Total Distributions | | | (0.33 | ) | | | (0.30 | ) | | | (0.24 | ) | | | (0.15 | ) |
Net Asset Value, End of Period | | $ | 34.45 | | | $ | 29.37 | | | $ | 28.51 | | | $ | 30.05 | |
Total Return | | | 18.52 | % | | | 4.13 | % | | | -4.41 | % | | | 23.23 | % |
| | | | | | | | | | | | | | | | | |
SUPPLEMENTAL DATA: | | | | | | | | | | | | | | | | |
Net Assets at End of Period (000’s) | | $ | 3,445 | | | $ | 3,671 | | | $ | 5,702 | | | $ | 4,507 | |
| | | | | | | | | | | | | | | | | |
RATIOS TO AVERAGE NET ASSETS: | | | | | | | | | | | | | | | | |
Expenses to Average Net Assets | | | 0.70 | % | | | 0.70 | % | | | 0.71 | % | | | 0.70 | % |
Net Investment Income (Loss) to Average Net Assets | | | 0.99 | % | | | 1.07 | % | | | 0.69 | % | | | 0.65 | % |
Portfolio Turnover Rate (d) | | | 13 | % | | | 10 | % | | | 17 | % | | | 5 | % |
(a) | Commencement of operations on June 24, 2020. |
(b) | Calculated based on average shares outstanding during the period. |
(c) | Ratios have been annualized and total return and portfolio turnover have not been annualized. |
(d) | Excludes the impact of in-kind transactions. |
(e) | Realized and unrealized gain (loss) per share in this caption are balancing amounts necessary to reconcile the change in net asset value per share for the period, and may not reconcile with the aggregate gain (loss) in the Statement of Operations due to share transactions for the period. |
The accompanying notes are an integral part of the financial statements.
218
Pacer Lunt Large Cap Alternator ETF
FINANCIAL HIGHLIGHTS
For a capital share outstanding throughout the year/period
| | | For the
Year Ended
April 30,
2024 | | | For the
Year Ended
April 30,
2023 | | | For the
Year Ended
April 30,
2022 | | | For the
Period Ended
April 30,
2021(a)(c) | |
Net Asset Value, Beginning of Period | | $ | 36.46 | | | $ | 43.15 | | | $ | 40.74 | | | $ | 23.58 | |
| | | | | | | | | | | | | | | | | |
INCOME (LOSS) FROM INVESTMENT OPERATIONS: | | | | | | | | | | | | | | | | |
Net Investment Income (Loss) (b) | | | 0.42 | | | | 0.44 | | | | 0.48 | | | | 0.41 | |
Net Realized and Unrealized Gain (Loss) on Investments (e) | | | (2.47 | ) | | | (6.67 | ) | | | 2.36 | | | | 17.16 | |
Total from Investment Operations | | | (2.05 | ) | | | (6.23 | ) | | | 2.84 | | | | 17.57 | |
| | | | | | | | | | | | | | | | | |
LESS DISTRIBUTIONS: | | | | | | | | | | | | | | | | |
Distributions from Net Investment Income | | | (0.42 | ) | | | (0.44 | ) | | | (0.43 | ) | | | (0.41 | ) |
Distributions from Return of Capital | | | — | | | | (0.02 | ) | | | — | | | | — | |
Total Distributions | | | (0.42 | ) | | | (0.46 | ) | | | (0.43 | ) | | | (0.41 | ) |
Net Asset Value, End of Period | | $ | 33.99 | | | $ | 36.46 | | | $ | 43.15 | | | $ | 40.74 | |
Total Return | | | -5.65 | % | | | -14.49 | % | | | 6.97 | % | | | 74.99 | % |
| | | | | | | | | | | | | | | | | |
SUPPLEMENTAL DATA: | | | | | | | | | | | | | | | | |
Net Assets at End of Period (000’s) | | $ | 256,630 | | | $ | 776,680 | | | $ | 554,454 | | | $ | 130,353 | |
| | | | | | | | | | | | | | | | | |
RATIOS TO AVERAGE NET ASSETS: | | | | | | | | | | | | | | | | |
Expenses to Average Net Assets | | | 0.60 | % | | | 0.60 | % | | | 0.60 | % | | | 0.60 | % |
Net Investment Income (Loss) to Average Net Assets | | | 1.19 | % | | | 1.11 | % | | | 1.09 | % | | | 1.59 | % |
Portfolio Turnover Rate (d) | | | 597 | % | | | 384 | % | | | 722 | % | | | 193 | % |
(a) | Commencement of operations on June 24, 2020. |
(b) | Calculated based on average shares outstanding during the period. |
(c) | Ratios have been annualized and total return and portfolio turnover have not been annualized. |
(d) | Excludes the impact of in-kind transactions. |
(e) | Realized and unrealized gain (loss) per share in this caption are balancing amounts necessary to reconcile the change in net asset value per share for the period, and may not reconcile with the aggregate gain (loss) in the Statement of Operations due to share transactions for the period. |
The accompanying notes are an integral part of the financial statements.
219
Pacer Lunt Midcap Multi-Factor Alternator ETF
FINANCIAL HIGHLIGHTS
For a capital share outstanding throughout the year/period
| | | For the
Year Ended
April 30,
2024 | | | For the
Year Ended
April 30,
2023 | | | For the
Year Ended
April 30,
2022 | | | For the
Period Ended
April 30,
2021(a)(c) | |
Net Asset Value, Beginning of Period | | $ | 33.19 | | | $ | 32.19 | | | $ | 37.07 | | | $ | 23.84 | |
| | | | | | | | | | | | | | | | | |
INCOME (LOSS) FROM INVESTMENT OPERATIONS: | | | | | | | | | | | | | | | | |
Net Investment Income (Loss) (b) | | | 0.25 | | | | 0.37 | | | | 0.20 | | | | 0.07 | |
Net Realized and Unrealized Gain (Loss) on Investments (e) | | | 9.73 | | | | 1.01 | | | | (4.87 | ) | | | 13.26 | |
Total from Investment Operations | | | 9.98 | | | | 1.38 | | | | (4.67 | ) | | | 13.33 | |
| | | | | | | | | | | | | | | | | |
LESS DISTRIBUTIONS: | | | | | | | | | | | | | | | | |
Distributions from Net Investment Income | | | (0.24 | ) | | | (0.36 | ) | | | (0.19 | ) | | | (0.07 | ) |
Distributions from Return of Capital | | | — | | | | (0.02 | ) | | | (0.02 | ) | | | (0.03 | ) |
Total Distributions | | | (0.24 | ) | | | (0.38 | ) | | | (0.21 | ) | | | (0.10 | ) |
Net Asset Value, End of Period | | $ | 42.93 | | | $ | 33.19 | | | $ | 32.19 | | | $ | 37.07 | |
Total Return | | | 30.16 | % | | | 4.43 | % | | | -12.66 | % | | | 56.04 | % |
| | | | | | | | | | | | | | | | | |
SUPPLEMENTAL DATA: | | | | | | | | | | | | | | | | |
Net Assets at End of Period (000’s) | | $ | 55,809 | | | $ | 34,852 | | | $ | 35,406 | | | $ | 35,219 | |
| | | | | | | | | | | | | | | | | |
RATIOS TO AVERAGE NET ASSETS: | | | | | | | | | | | | | | | | |
Expenses to Average Net Assets | | | 0.60 | % | | | 0.60 | % | | | 0.61 | % | | | 0.60 | % |
Net Investment Income (Loss) to Average Net Assets | | | 0.66 | % | | | 1.14 | % | | | 0.55 | % | | | 0.27 | % |
Portfolio Turnover Rate (d) | | | 367 | % | | | 569 | % | | | 529 | % | | | 322 | % |
(a) | Commencement of operations on June 24, 2020. |
(b) | Calculated based on average shares outstanding during the period. |
(c) | Ratios have been annualized and total return and portfolio turnover have not been annualized. |
(d) | Excludes the impact of in-kind transactions. |
(e) | Realized and unrealized gain (loss) per share in this caption are balancing amounts necessary to reconcile the change in net asset value per share for the period, and may not reconcile with the aggregate gain (loss) in the Statement of Operations due to share transactions for the period. |
The accompanying notes are an integral part of the financial statements.
220
Pacer Lunt Large Cap Multi-Factor Alternator ETF
FINANCIAL HIGHLIGHTS
For a capital share outstanding throughout the year/period
| | | For the
Year Ended
April 30,
2024 | | | For the
Year Ended
April 30,
2023 | | | For the
Year Ended
April 30,
2022 | | | For the
Period Ended
April 30,
2021(a)(c) | |
Net Asset Value, Beginning of Period | | $ | 34.95 | | | $ | 36.34 | | | $ | 37.61 | | | $ | 24.42 | |
| | | | | | | | | | | | | | | | | |
INCOME (LOSS) FROM INVESTMENT OPERATIONS: | | | | | | | | | | | | | | | | |
Net Investment Income (Loss) (b) | | | 0.34 | | | | 0.54 | | | | 0.39 | | | | 0.32 | |
Net Realized and Unrealized Gain (Loss) on Investments (e) | | | 9.36 | | | | (1.38 | ) | | | (1.33 | ) | | | 13.14 | |
Total from Investment Operations | | | 9.70 | | | | (0.84 | ) | | | (0.94 | ) | | | 13.46 | |
| | | | | | | | | | | | | | | | | |
LESS DISTRIBUTIONS: | | | | | | | | | | | | | | | | |
Distributions from Net Investment Income | | | (0.31 | ) | | | (0.55 | ) | | | (0.33 | ) | | | (0.27 | ) |
Total Distributions | | | (0.31 | ) | | | (0.55 | ) | | | (0.33 | ) | | | (0.27 | ) |
Net Asset Value, End of Period | | $ | 44.34 | | | $ | 34.95 | | | $ | 36.34 | | | $ | 37.61 | |
Total Return | | | 27.83 | % | | | -2.26 | % | | | -2.58 | % | | | 55.41 | % |
| | | | | | | | | | | | | | | | | |
SUPPLEMENTAL DATA: | | | | | | | | | | | | | | | | |
Net Assets at End of Period (000’s) | | $ | 297,078 | | | $ | 206,191 | | | $ | 267,095 | | | $ | 43,253 | |
| | | | | | | | | | | | | | | | | |
RATIOS TO AVERAGE NET ASSETS: | | | | | | | | | | | | | | | | |
Expenses to Average Net Assets | | | 0.60 | % | | | 0.60 | % | | | 0.60 | % | | | 0.60 | % |
Net Investment Income (Loss) to Average Net Assets | | | 0.84 | % | | | 1.54 | % | | | 0.98 | % | | | 1.19 | % |
Portfolio Turnover Rate (d) | | | 417 | % | | | 629 | % | | | 434 | % | | | 304 | % |
(a) | Commencement of operations on June 24, 2020. |
(b) | Calculated based on average shares outstanding during the period. |
(c) | Ratios have been annualized and total return and portfolio turnover have not been annualized. |
(d) | Excludes the impact of in-kind transactions. |
(e) | Realized and unrealized gain (loss) per share in this caption are balancing amounts necessary to reconcile the change in net asset value per share for the period, and may not reconcile with the aggregate gain (loss) in the Statement of Operations due to share transactions for the period. |
The accompanying notes are an integral part of the financial statements.
221
Pacer US Export Leaders ETF
FINANCIAL HIGHLIGHTS
For a capital share outstanding throughout the year
| | | For the
Year Ended
April 30,
2024 | | | For the
Year Ended
April 30,
2023 | | | For the
Year Ended
April 30,
2022 | | | For the
Year Ended
April 30,
2021 | | | For the
Year Ended
April 30,
2020 | |
Net Asset Value, Beginning of Period | | $ | 39.95 | | | $ | 38.27 | | | $ | 40.41 | | | $ | 25.15 | | | $ | 25.97 | |
| | | | | | | | | | | | | | | | | | | | | |
INCOME (LOSS) FROM INVESTMENT OPERATIONS: | | | | | | | | | | | | | | | | | | | | |
Net Investment Income (Loss) (a) | | | 0.21 | | | | 0.25 | | | | 0.12 | | | | 0.14 | | | | 0.16 | |
Net Realized and Unrealized Gain (Loss) on Investments (c) | | | 7.12 | | | | 1.67 | | | | (2.13 | ) | | | 15.27 | | | | (0.82 | ) |
Total from Investment Operations | | | 7.33 | | | | 1.92 | | | | (2.01 | ) | | | 15.41 | | | | (0.66 | ) |
| | | | | | | | | | | | | | | | | | | | | |
LESS DISTRIBUTIONS: | | | | | | | | | | | | | | | | | | | | |
Distributions from Net Investment Income | | | (0.21 | ) | | | (0.24 | ) | | | (0.12 | ) | | | (0.15 | ) | | | (0.16 | ) |
Distribution from Return of Capital | | | — | | | | — | | | | (0.01 | ) | | | — | | | | — | |
Total Distributions | | | (0.21 | ) | | | (0.24 | ) | | | (0.13 | ) | | | (0.15 | ) | | | (0.16 | ) |
Net Asset Value, End of Period | | $ | 47.07 | | | $ | 39.95 | | | $ | 38.27 | | | $ | 40.41 | | | $ | 25.15 | |
Total Return | | | 18.40 | % | | | 5.06 | % | | | -5.00 | % | | | 61.47 | % | | | -2.53 | % |
| | | | | | | | | | | | | | | | | | | | | |
SUPPLEMENTAL DATA: | | | | | | | | | | | | | | | | | | | | |
Net Assets at End of Period (000’s) | | $ | 61,194 | | | $ | 19,976 | | | $ | 3,827 | | | $ | 2,021 | | | $ | 1,257 | |
| | | | | | | | | | | | | | | | | | | | | |
RATIOS TO AVERAGE NET ASSETS: | | | | | | | | | | | | | | | | | | | | |
Expenses to Average Net Assets | | | 0.60 | % | | | 0.60 | % | | | 0.61 | % | | | 0.60 | % | | | 0.60 | % |
Net Investment Income (Loss) to Average Net Assets | | | 0.47 | % | | | 0.64 | % | | | 0.29 | % | | | 0.43 | % | | | 0.61 | % |
Portfolio Turnover Rate (b) | | | 75 | % | | | 74 | % | | | 79 | % | | | 111 | % | | | 79 | % |
(a) | Calculated based on average shares outstanding during the period. |
(b) | Excludes the impact of in-kind transactions. |
(c) | Realized and unrealized gain (loss) per share in this caption are balancing amounts necessary to reconcile the change in net asset value per share for the period, and may not reconcile with the aggregate gain (loss) in the Statement of Operations due to share transactions for the period. |
The accompanying notes are an integral part of the financial statements.
222
Pacer Pacific Asset Floating Rate High Income ETF
FINANCIAL HIGHLIGHTS
For a capital share outstanding throughout the year
| | | For the
Year Ended
April 30,
2024 | | | For the
Year Ended
April 30,
2023 | | | For the
Period Ended
April 30,
2022 (a)(c) | | | For the
Year Ended
June 30,
2021 | | | For the
Year Ended
June 30,
2020 | |
Net Asset Value, Beginning of Period | | $ | 45.71 | | | $ | 47.76 | | | $ | 48.90 | | | $ | 46.52 | | | $ | 48.73 | |
| | | | | | | | | | | | | | | | | | | | | |
INCOME (LOSS) FROM INVESTMENT OPERATIONS: | | | | | | | | | | | | | | | | | | | | |
Net Investment Income (Loss) (b) | | | 4.23 | | | | 3.34 | | | | 1.47 | | | | 1.47 | | | | 1.90 | |
Net Realized and Unrealized Gain (Loss) on Investments (e) | | | 1.58 | | | | (2.10 | ) | | | (1.29 | ) | | | 2.47 | | | | (2.20 | ) |
Total from Investment Operations | | | 5.81 | | | | 1.24 | | | | 0.18 | | | | 3.94 | | | | (0.30 | ) |
| | | | | | | | | | | | | | | | | | | | | |
LESS DISTRIBUTIONS: | | | | | | | | | | | | | | | | | | | | |
Distributions from Net Investment Income | | | (4.02 | ) | | | (3.29 | ) | | | (1.32 | ) | | | (1.56 | ) | | | (1.91 | ) |
Total Distributions | | | (4.02 | ) | | | (3.29 | ) | | | (1.32 | ) | | | (1.56 | ) | | | (1.91 | ) |
Net Asset Value, End of Period | | $ | 47.50 | | | $ | 45.71 | | | $ | 47.76 | | | $ | 48.90 | | | $ | 46.52 | |
Total Return | | | 13.25 | % | | | 2.91 | % | | | 0.34 | % | | | 8.63 | % | | | -0.70 | % |
| | | | | | | | | | | | | | | | | | | | | |
SUPPLEMENTAL DATA: | | | | | | | | | | | | | | | | | | | | |
Net Assets at End of Period (000’s) | | $ | 248,422 | | | $ | 100,095 | | | $ | 81,663 | | | $ | 31,788 | | | $ | 27,911 | |
| | | | | | | | | | | | | | | | | | | | | |
RATIOS TO AVERAGE NET ASSETS: | | | | | | | | | | | | | | | | | | | | |
Expenses to Average Net Assets | | | 0.60 | % | | | 0.60 | % | | | 0.62 | % | | | 0.68 | % | | | 1.06 | % |
Expenses to Average Net Assets After Advisory Fees (Waived) and Other Fees (Reimbursed)/Recouped | | | N/A | | | | N/A | | | | N/A | | | | 0.86 | % | | | 1.10 | % |
Net Investment Income (Loss) to Average Net Assets | | | 9.01 | % | | | 7.36 | % | | | 3.63 | % | | | 3.04 | % | | | 3.98 | % |
Portfolio Turnover Rate (d) | | | 43 | % | | | 79 | % | | | 37 | % | | | 35 | % | | | 48 | % |
(a) | For the period ended July 1, 2021 to April 30, 2022. |
(b) | Calculated based on average shares outstanding during the period. |
(c) | Ratios have been annualized and total return and portfolio turnover have not been annualized. |
(d) | Excludes the impact of in-kind transactions. |
(e) | Realized and unrealized gains and losses per share in this caption are balancing amounts necessary to reconcile the change in net asset value per share for the period, and may not reconcile with the aggregate gains and losses in the Statement of Operations due to share transactions for the period. |
The accompanying notes are an integral part of the financial statements.
223
Pacer Industrials and Logistics ETF
FINANCIAL HIGHLIGHTS
For a capital share outstanding throughout the year/period
| | | For the
Year Ended
April 30,
2024 | | | For the
Period Ended
April 30,
2023(a)(e) | |
Net Asset Value, Beginning of Period | | $ | 25.24 | | | $ | 24.87 | |
| | | | | | | | | |
INCOME (LOSS) FROM INVESTMENT OPERATIONS: | | | | | | | | |
Net Investment Income (Loss) (b) | | | 0.59 | | | | 0.43 | |
Net Realized and Unrealized Gain (Loss) on Investments (c) | | | 1.29 | | | | 0.24 | |
Total from Investment Operations | | | 1.88 | | | | 0.67 | |
| | | | | | | | | |
LESS DISTRIBUTIONS: | | | | | | | | |
Distributions from Net Investment Income | | | (0.74 | ) | | | (0.30 | ) |
Total Distributions | | | (0.74 | ) | | | (0.30 | ) |
Net Asset Value, End of Period | | $ | 26.38 | | | $ | 25.24 | |
Total Return | | | 7.54 | % | | | 2.90 | % |
| | | | | | | | | |
SUPPLEMENTAL DATA: | | | | | | | | |
Net Assets at End of Period (000’s) | | $ | 1,055 | | | $ | 1,010 | |
| | | | | | | | | |
RATIOS TO AVERAGE NET ASSETS: | | | | | | | | |
Expenses to Average Net Assets | | | 0.60 | % | | | 0.60 | % |
Net Investment Income (Loss) to Average Net Assets | | | 2.26 | % | | | 2.01 | % |
Portfolio Turnover Rate (d) | | | 26 | % | | | 10 | % |
(a) | Commencement of operations on June 8, 2022. |
(b) | Calculated based on average shares outstanding during the period. |
(c) | Realized and unrealized gain (loss) per share in this caption are balancing amounts necessary to reconcile the change in net asset value per share for the period, and may not reconcile with the aggregate gain (loss) in the Statement of Operations due to share transactions for the period. |
(d) | Excludes the impact of in-kind transactions. |
(e) | Ratios have been annualized and total return and portfolio turnover have not been annualized. |
The accompanying notes are an integral part of the financial statements.
224
Pacer Data and Digital Revolution ETF
FINANCIAL HIGHLIGHTS
For a capital share outstanding throughout the year/period
| | | For the
Year Ended
April 30,
2024 | | | For the
Period Ended
April 30,
2023(a)(e) | |
Net Asset Value, Beginning of Period | | $ | 25.36 | | | $ | 25.31 | |
| | | | | | | | | |
INCOME (LOSS) FROM INVESTMENT OPERATIONS: | | | | | | | | |
Net Investment Income (Loss) (b) | | | 0.10 | | | | 0.15 | |
Net Realized and Unrealized Gain (Loss) on Investments (c) | | | 14.62 | | | | 0.04 | |
Total from Investment Operations | | | 14.72 | | | | 0.19 | |
| | | | | | | | | |
LESS DISTRIBUTIONS: | | | | | | | | |
Distributions from Net Investment Income | | | (0.06 | ) | | | (0.14 | ) |
Total Distributions | | | (0.06 | ) | | | (0.14 | ) |
| | | | | | | | | |
CAPITAL SHARE TRANSACTIONS | | | | | | | | |
Transaction Fees (see Note 1) | | | 0.00 | (f) | | | — | |
Net Asset Value, End of Period | | $ | 40.02 | | | $ | 25.36 | |
Total Return | | | 58.06 | % | | | 0.84 | % |
| | | | | | | | | |
SUPPLEMENTAL DATA: | | | | | | | | |
Net Assets at End of Period (000’s) | | $ | 28,812 | | | $ | 1,014 | |
| | | | | | | | | |
RATIOS TO AVERAGE NET ASSETS: | | | | | | | | |
Expenses to Average Net Assets | | | 0.60 | % | | | 0.60 | % |
Net Investment Income (Loss) to Average Net Assets | | | 0.27 | % | | | 0.73 | % |
Portfolio Turnover Rate (d) | | | 27 | % | | | 9 | % |
(a) | Commencement of operations on June 8, 2022. |
(b) | Calculated based on average shares outstanding during the period. |
(c) | Realized and unrealized gain (loss) per share in this caption are balancing amounts necessary to reconcile the change in net asset value per share for the period, and may not reconcile with the aggregate gain (loss) in the Statement of Operations due to share transactions for the period. |
(d) | Excludes the impact of in-kind transactions. |
(e) | Ratios have been annualized and total return and portfolio turnover have not been annualized. |
(f) | Represents less than $0.005. |
The accompanying notes are an integral part of the financial statements.
225
Pacer Funds
NOTES TO FINANCIAL STATEMENTS
April 30, 2024
NOTE 1 – ORGANIZATION
Pacer Funds Trust (the “Trust”), a Delaware statutory trust organized on August 12, 2014. USAI, BULD, ODDS, PSFF, PSCX, PSMD, PSFD, PSCW, PSMR, PSFM, PSCJ, PSMJ, PSFJ, PSCQ, PSMO, PSFO, QDPL and EAFG fiscal year end is October 31st and as such are not included in these financial statements. The Trust is registered with the Securities and Exchange Commission (the “SEC”) under the Investment Company Act of 1940, as amended (the “1940 Act”), as an open-end management investment company and the offering of the Funds’ shares (“Shares”) is registered under the Securities Act of 1933, as amended (the “Securities Act”). The Trust currently consists of multiple operational series, of which are covered in this report, individually the (“Fund”) or collectively the (“Funds”).
Shares of the Funds are listed and traded on the Cboe BZX Exchange, Inc. (“Cboe”), Nasdaq Stock Market LLC (“Nasdaq”), or the NYSE Arca, Inc. (“NYSE”). Market prices for the shares may be different from their net asset value (“NAV”). The Funds issue and redeem shares on a continuous basis at NAV only in large blocks of shares, called “Creation Units,” which generally consist of 50,000 shares except PTBD which generally consist of 100,000 shares, COWG and CAFG which generally consist of 25,000 shares, and FLRT, SHPP and TRFK which generally consist of 20,000 shares. Creation Units are issued and redeemed principally in-kind for securities included in a specified universe. Once created, Shares generally trade in the secondary market at market prices that change throughout the day in amounts less than a Creation Unit. Except when aggregated in Creation Units, Shares are not redeemable securities of a Fund. Shares of a Fund may only be purchased directly from or redeemed directly to a Fund by certain financial institutions (“Authorized Participants”). An Authorized Participant is either (i) a broker-dealer or other participant in the clearing process through the Continuous Net Settlement System of the National Securities Clearing Corporation or (ii) a DTC participant and, in each case, must have executed a Participant Agreement with Pacer Financial, Inc. (the “Distributor”). Most retail investors do not qualify as Authorized Participants nor have the resources to buy and sell whole Creation Units. Therefore, they are unable to purchase or redeem the shares directly from a Fund. Rather, most retail investors may purchase Shares in the secondary market with the assistance of a broker and are subject to customary brokerage commissions or fees.
The Funds each currently offer one class of Shares, which have no front-end sales loads, no deferred sales charges, and no redemption fees. A purchase (i.e., creation) transaction fee is imposed for the transfer and other transaction costs associated with the purchase of Creation Units. Below are the charges for the standard fixed creation fee, payable to the Custodian. The fixed transaction fee may be waived on certain orders if the Fund’s Custodian has determined to waive some or all of the costs associated with the order, or another party, such as the Adviser, has agreed to pay such fee. In addition, a variable fee may be charged on all cash transactions or substitutes for Creation Units of up to a maximum of 2% as a percentage of the value of the Creation Units subject to the transaction for the Funds, except AFTY which may charge up to a maximum of 8% as a percentage of the value of the Creation Units subject to the transaction. Variable fees received by each Fund are displayed in the Capital Share Transaction section of the Statement of Changes in Net Assets. Each Fund may issue an unlimited number of shares of beneficial interest, with no par value. Shares of each Fund have equal rights and privileges with respect to such Fund.
Fund Name | | Ticker | | | Commencement
of Operations | | | Exchange | | | Transaction Fees | |
Pacer Trendpilot® US Large Cap ETF | | | PTLC | | | | June 11, 2015 | | | | Cboe | | | $ | 500 | * |
Pacer Trendpilot® US Mid Cap ETF | | | PTMC | | | | June 11, 2015 | | | | Cboe | | | | 300 | * |
Pacer Trendpilot® 100 ETF | | | PTNQ | | | | June 11, 2015 | | | | Nasdaq | | | | 300 | * |
Pacer Trendpilot® European Index ETF | | | PTEU | | | | December 14, 2015 | | | | Cboe | | | | 2,000 | * |
Pacer Trendpilot® International ETF | | | PTIN | | | | May 2, 2019 | | | | NYSE | | | | 8,000 | * |
Pacer Trendpilot® US Bond ETF | | | PTBD | | | | October 22, 2019 | | | | NYSE | | | | 500 | * |
Pacer Trendpilot® Fund of Funds ETF | | | TRND | | | | May 3, 2019 | | | | NYSE | | | | 300 | |
Pacer US Cash Cows 100 ETF | | | COWZ | | | | December 16, 2016 | | | | Cboe | | | | 300 | |
Pacer US Small Cap Cash Cows 100 ETF | | | CALF | | | | June 16, 2017 | | | | Cboe | | | | 300 | |
Pacer Global Cash Cows Dividend ETF | | | GCOW | | | | February 22, 2016 | | | | Cboe | | | | 1,500 | |
Pacer Developed Markets International Cash Cows 100 ETF | | | ICOW | | | | June 16, 2017 | | | | Cboe | | | | 1,500 | |
Pacer Emerging Markets Cash Cows 100 ETF | | | ECOW | | | | May 2, 2019 | | | | Nasdaq | | | | 1,750 | |
Pacer US Large Cap Cash Cows Growth Leaders ETF | | | COWG | | | | December 21, 2022 | | | | Nasdaq | | | | 300 | |
Pacer US Small Cap Cash Cows Growth Leaders ETF | | | CAFG | | | | May 1, 2023 | | | | Nasdaq | | | | 300 | |
Pacer US Cash Cows Growth ETF | | | BUL | | | | May 2, 2019 | | | | NYSE | | | | 300 | |
Pacer Cash Cows Fund of Funds ETF | | | HERD | | | | May 3, 2019 | | | | Nasdaq | | | | 300 | |
Pacer WealthShield ETF | | | PWS | | | | December 11, 2017 | | | | Cboe | | | | 500 | |
Pacer Industrial Real Estate ETF | | | INDS | | | | May 14, 2018 | | | | NYSE | | | | 300 | |
Pacer Data & Infrastructure Real Estate ETF | | | SRVR | | | | May 15, 2018 | | | | NYSE | | | | 300 | |
Pacer CFRA-Stovall Equal Weight Seasonal Rotation Index ETF | | | SZNE | | | | July 23, 2018 | | | | NYSE | | | | 500 | |
226
Pacer Funds
NOTES TO FINANCIAL STATEMENTS
April 30, 2024 (Continued)
Fund Name | | Ticker | | | Commencement
of Operations | | | Exchange | | | Transaction Fees | |
Pacer CSOP FTSE China A50 ETF | | | AFTY | | | | March 10, 2015 | | | | NYSE | | | $ | 300 | |
Pacer BioThreat Strategy ETF | | | VIRS | | | | June 24, 2020 | | | | Cboe | | | | 300 | |
Pacer Lunt Large Cap Alternator ETF | | | ALTL | | | | June 24, 2020 | | | | NYSE | | | | 300 | |
Pacer Lunt Midcap Multi-Factor Alternator ETF | | | PAMC | | | | June 24, 2020 | | | | NYSE | | | | 300 | |
Pacer Lunt Large Cap Multi-Factor Alternator ETF | | | PALC | | | | June 24, 2020 | | | | NYSE | | | | 300 | |
Pacer US Export Leaders ETF | | | PEXL | | | | July 23, 2018 | | | | NYSE | | | | 300 | |
Pacer Pacific Asset Floating Rate High Income ETF | | | FLRT | | | | February 18, 2015 | | | | NYSE | | | | 300 | |
Pacer Data and Digital Revolution ETF | | | TRFK | | | | June 8, 2022 | | | | NYSE | | | | 750 | |
Pacer Industrials and Logistics ETF | | | SHPP | | | | June 8, 2022 | | | | NYSE | | | | 2,000 | |
* | For the PTLC, PTMC, PTNQ, PTEU, and PTIN, the standard fixed creation transaction fee is $300 when the Deposit Securities include only U.S. Treasury bills. For PTBD, the standard fixed creation transaction fee is $300 when the Deposit Securities include only U.S. Treasury bills. |
The investment objectives of the Funds are to seek to track the total return performance, before fees and expenses, of the following indexes, respectively.
Ticker | Index | Diversification |
PTLC | Pacer Trendpilot® US Large Cap Index | Diversified |
PTMC | Pacer Trendpilot® US Mid-Cap Index | Diversified |
PTNQ | Pacer NASDAQ-100 Trendpilot® Index | Non-Diversified |
PTEU | Pacer Trendpilot® European Index | Diversified |
PTIN | Pacer Trendpilot® International Index | Diversified |
PTBD | Pacer Trendpilot® US Bond Index | Diversified |
TRND | Pacer Trendpilot Fund of Funds Index | Diversified |
COWZ | Pacer US Cash Cows 100 Index | Diversified |
CALF | Pacer US Small Cap Cash Cows Index | Diversified |
GCOW | Pacer Global Cash Cows High Dividends 100 Index | Diversified |
ICOW | Pacer Developed Markets International Cash Cows 100 Index | Diversified |
ECOW | Pacer Emerging Markets Cash Cows 100 Index | Diversified |
COWG | Pacer US Large Cap Cash Cows Growth Leaders Index | Non-Diversified |
CAFG | Pacer US Small Cap Cash Cows Growth Leaders Index | Non-Diversified |
BUL | Pacer US Cash Cows Growth Index | Non-Diversified |
HERD | Pacer Cash Cows Fund of Funds Index | Diversified |
PWS | Pacer WealthShield Index | Diversified |
INDS | Solactive GPR Industrial Real Estate Index | Non-Diversified |
SRVR | Solactive GPR Data & Infrastructure Real Estate Index | Non-Diversified |
SZNE | Pacer CFRA-Stovall Equal Weight Seasonal Rotation Index | Diversified |
AFTY | FTSE China A50 Net Total Return Index | Diversified |
VIRS | LifeSci BioThreat Strategy Index | Non-Diversified |
ALTL | Lunt Capital U.S. Large Cap Equity Rotation Index | Non-Diversified |
PAMC | Lunt Capital U.S. MidCap Multi-Factor Rotation Index | Non-Diversified |
PALC | Lunt Capital U.S. Large Cap Multi-Factor Rotation Index | Non-Diversified |
PEXL | US Export Leaders Index | Diversified |
FLRT | Pacer Pacific Asset Floating Rate High Income Index | Non-Diversified |
SHPP | Pacer Global Supply Chain Infrastructure Index | Non-Diversified |
TRFK | Pacer Data Transmission and Communication Revolution Index | Non-Diversified |
The investment objective of FLRT is to seek to provide a high level of current income. FLRT is a non-diversified Fund.
227
Pacer Funds
NOTES TO FINANCIAL STATEMENTS
April 30, 2024 (Continued)
NOTE 2 – SIGNIFICANT ACCOUNTING POLICIES
The following is a summary of significant accounting policies consistently followed by the Funds in the preparation of the financial statements. The financial statements have been prepared in conformity with accounting principles generally accepted in the United States of America (“GAAP”). The Funds are investment companies that follow the accounting and reporting guidelines of Accounting Standards Codification Topic 946 applicable to investment companies.
Securities, including master limited partnerships (“MLPs”), listed on a securities exchange, market or automated quotation system for which quotations are readily available, are valued at the last quoted sale price on the primary exchange or market (foreign or domestic) on which they are traded, except for securities listed on Nasdaq Global Market (“Nasdaq”). If, on a particular day, there is no such reported sale, then the most recent quoted bid price will be used. For securities traded on Nasdaq, the Nasdaq Official Closing Price (“NOCP”) will be used. If a Fund holds foreign shares of a security for which there is no reported volume, and there is an actively trading local version of the security, the last quoted sale price of the local security shall be used. Prices denominated in foreign currencies are converted to U.S. dollar equivalents at the current exchange rate.
Investments in other open-end investment companies, including money market funds, are valued at the investment company’s net asset value per share, with the exception of exchange-traded open-end investment companies, which are priced as equity securities described above.
Fixed-income securities are normally valued on the basis of quotes obtained from independent pricing services in accordance with procedures adopted by the Board of Trustees. The independent pricing services may employ methodologies that utilize market transactions (if the security is actively traded), broker-dealer supplied valuations, or matrix pricing. Short-term securities that have maturities of less than 60 days, at the time of purchase, are valued at amortized cost, which, when combined with accrued interest, approximates market value.
Options on securities that are listed on an exchange shall be valued at the sale price on such exchange (or any other exchange on which such options are listed) having the trade closest to the close of the New York Stock Exchange (“NYSE”) on the day of valuation or, if there was no sale on any of the applicable options exchanges on such day, at the mean between the highest bid and lowest ask price on any of such exchanges on such day closest to the close of the NYSE on such day. On the last trading day prior to expiration, expiring options may be priced at intrinsic value.
Foreign currency forward contracts are valued at the current day’s interpolated foreign exchange rate, as calculated using the current day’s spot rate, and the twenty, sixty, ninety, and one-hundred eighty day forward rates provided by an independent source.
Futures contracts are valued at the settlement price on the exchange on which they are principally traded.
Units of Mount Vernon Liquid Assets Portfolio are not traded on an exchange and are valued at the investment company’s NAV per share as provided by its administrator.
Cash and cash equivalents - Cash and cash equivalents are held with a financial institution. Cash and cash equivalents of the Funds may be placed in deposit accounts at U.S. banks and such deposits generally exceed Federal Deposit Insurance Corporation (“FDIC”) insurance limits. The FDIC insures deposit accounts up to $250,000 for each accountholder. The counterparty is generally a single bank rather than a group of financial institutions; thus there may be a greater counterparty credit risk. The Funds place deposits only with those counterparties which are believed to be creditworthy and there has been no history of loss.
The Trust’s Valuation Procedures provide for the designation of the Adviser as “Valuation Designee”. If no quotation is available from either a pricing service, or one or more brokers or there is reason to question the reliability or accuracy of a quotation supplied, securities are valued at fair value as determined in good faith, by the Valuation Designee pursuant to procedures established by the Funds’ Board of Trustees (the “Board”).As described above, the Funds utilize various methods to measure the fair value of their investments on a recurring basis. GAAP establishes a hierarchy that prioritizes inputs to valuations methods. The three levels of inputs are:
| | Level 1 – | Unadjusted quoted prices in active markets for identical assets or liabilities that the Funds have the ability to access. |
| | Level 2 – | Observable inputs other than quoted prices included in Level 1 that are observable for the asset or liability, either directly or indirectly. These inputs may include quoted prices for the identical instrument on an inactive market, prices for similar instruments, interest rates, prepayment speeds, credit risk, yield curves, default rates and similar data. |
| | Level 3 – | Unobservable inputs for the asset or liability, to the extent relevant observable inputs are not available; representing the Funds’ own assumptions about the assumptions a market participant would use in valuing the asset or liability, and would be based on the best information available. |
228
Pacer Funds
NOTES TO FINANCIAL STATEMENTS
April 30, 2024 (Continued)
The availability of observable inputs can vary from security to security and is affected by a wide variety of factors, including, for example, the type of security, whether the security is new and not yet established in the marketplace, the liquidity of markets, and other characteristics particular to the security. To the extent that valuation is based on models or inputs that are less observable or unobservable in the market, the determination of fair value requires more judgment. Accordingly, the degree of judgment exercised in determining fair value is greatest for instruments categorized in Level 3.
The inputs used to measure fair value may fall into different levels of the fair value hierarchy. In such cases, for disclosure purposes, the level in the fair value hierarchy within which the fair value measurement falls in its entirety, is determined based on the lowest level input that is significant to the fair value measurement in its entirety.
The following is a summary of the inputs used to value the Funds’ investments as of April 30, 2024:
PTLC
Description^ | | Level 1 | | | Level 2 | | | Level 3 | | | Investments
Measured at
Net Asset Value | | | Total | |
Common Stocks | | $ | 2,564,503,022 | | | $ | — | | | $ | — | | | $ | — | | | $ | 2,564,503,022 | |
Real Estate Investment Trusts | | | 52,986,980 | | | | — | | | | — | | | | — | | | | 52,986,980 | |
Investments Purchased with Proceeds from Securities Lending | | | — | | | | — | | | | — | | | | 95,811,917 | | | | 95,811,917 | |
Total Investments in Securities | | $ | 2,617,490,002 | | | $ | — | | | $ | — | | | $ | 95,811,917 | | | $ | 2,713,301,919 | |
| | ^ | See Schedule of Investments for sector breakouts. |
PTMC
Description^ | | Level 1 | | | Level 2 | | | Level 3 | | | Investments
Measured at
Net Asset Value | | | Total | |
Common Stocks | | $ | 356,082,316 | | | $ | — | | | $ | — | | | $ | — | | | $ | 356,082,316 | |
Real Estate Investment Trusts | | | 28,224,442 | | | | — | | | | — | | | | — | | | | 28,224,442 | |
Investments Purchased with Proceeds from Securities Lending | | | — | | | | — | | | | — | | | | 86,595,764 | | | | 86,595,764 | |
Total Investments in Securities | | $ | 384,306,758 | | | $ | — | | | $ | — | | | $ | 86,595,764 | | | $ | 470,902,522 | |
| | ^ | See Schedule of Investments for sector breakouts. |
PTNQ
Description^ | | Level 1 | | | Level 2 | | | Level 3 | | | Investments
Measured at
Net Asset Value | | | Total | |
Common Stocks | | $ | 632,075,899 | | | $ | — | | | $ | — | | | $ | — | | | $ | 632,075,899 | |
Short-Term Investments | | | — | | | | 531,197,621 | | | | — | | | | — | | | | 531,197,621 | |
Investments Purchased with Proceeds from Securities Lending | | | — | | | | — | | | | — | | | | 364,781,969 | | | | 364,781,969 | |
Total Investments in Securities | | $ | 632,075,899 | | | $ | 531,197,621 | | | $ | — | | | $ | 364,781,969 | | | $ | 1,528,055,489 | |
| | ^ | See Schedule of Investments for sector breakouts. |
229
Pacer Funds
NOTES TO FINANCIAL STATEMENTS
April 30, 2024 (Continued)
PTEU
Description^ | | Level 1 | | | Level 2 | | | Level 3 | | | Investments
Measured at
Net Asset Value | | | Total | |
Common Stocks | | $ | 38,803,074 | | | $ | — | | | $ | 154,447 | | | $ | — | | | $ | 38,957,521 | |
Preferred Stocks | | | 397,987 | | | | — | | | | — | | | | — | | | | 397,987 | |
Real Estate Investment Trusts | | | 214,450 | | | | — | | | | — | | | | — | | | | 214,450 | |
Investments Purchased with Proceeds from Securities Lending | | | — | | | | — | | | | — | | | | 5,787,866 | | | | 5,787,866 | |
Total Investments in Securities | | $ | 39,415,511 | | | $ | — | | | $ | 154,447 | | | $ | 5,787,866 | | | $ | 45,357,824 | |
| | ^ | See Schedule of Investments for country breakouts. |
The following is a reconciliation of investments in which significant unobservable inputs (Level 3) were used in determining fair value:
PTEU(a) | | Balance
as of
4/30/2023 | | | Net
Realized
Gain
(Loss) | | | Change in Net
Unrealized
Appreciation
(Depreciation) | | | Purchases | | | Sales | | | Transfers
Into
Level 3 | | | Transfers
Out of
Level 3 | | | Balance as of
4/30/2024 | |
Common Stocks | | $ | 190,014 | | | $ | (626 | ) | | $ | (24,310 | ) | | $ | 5,191 | | | $ | (15,822 | ) | | $ | — | | | $ | — | | | $ | 154,447 | |
The following is a summary of quantitative information about Level 3 Fair Value Measurements:
PTEU | | Fair Value as
of 4/30/2024 | | | Valuation
Techniques | | | Unobservable
Input | | | Impact to Valuation From
an Increase to Input | |
Common Stocks | | $ | 6,449 | | | | Last Trade Price | | | | Stale Data | | | | 4.8 EUR | |
Common Stocks | | $ | 147,998 | | | | Last Trade Price | | | | Stale Data | | | | 105.7 EUR | |
| | (a) | Table presents information for two securities: FF Group, which has been valued between 4.8-5.3 EUR and DSM BV, which has been valued between 76.13-118.75 EUR throughout the period. |
PTIN
Description^ | | Level 1 | | | Level 2 | | | Level 3 | | | Investments
Measured at
Net Asset Value | | | Total | |
Common Stocks | | $ | 141,662,031 | | | $ | — | | | $ | 155,443 | | | $ | — | | | $ | 141,817,474 | |
Exchange Traded Funds | | | 6,650,640 | | | | — | | | | — | | | | — | | | | 6,650,640 | |
Preferred Stocks | | | 524,993 | | | | — | | | | — | | | | — | | | | 524,993 | |
Real Estate Investment Trusts | | | 660,704 | | | | — | | | | — | | | | — | | | | 660,704 | |
Warrants | | | — | | | | — | | | | 0 | | | | — | | | | — | |
Investments Purchased with Proceeds from Securities Lending | | | — | | | | — | | | | — | | | | 33,098,496 | | | | 33,098,496 | |
Total Investments in Securities | | $ | 149,498,368 | | | $ | — | | | $ | 155,443 | | | $ | 33,098,496 | | | $ | 182,752,307 | |
| | ^ | See Schedule of Investments for country breakouts. |
The following is a reconciliation of investments in which significant unobservable inputs (Level 3) were used in determining fair value:
PTIN(a) | | Balance
as of
4/30/2023 | | | Net
Realized
Gain
(Loss) | | | Change in Net
Unrealized
Appreciation
(Depreciation) | | | Purchases | | | Sales | | | Transfers
Into
Level 3 | | | Transfers
Out of
Level 3 | | | Balance as of
4/30/2024 | |
Common Stocks | | $ | 176,649 | | | $ | — | | | $ | (24,725 | ) | | $ | 3,519 | | | $ | — | | | $ | — | | | $ | — | | | $ | 155,443 | |
Warrants | | $ | 0 | | | $ | — | | | $ | — | | | $ | — | | | $ | — | | | $ | — | | | $ | — | | | $ | 0 | |
230
Pacer Funds
NOTES TO FINANCIAL STATEMENTS
April 30, 2024 (Continued)
The following is a summary of quantitative information about Level 3 Fair Value Measurements:
PTIN | | Fair Value as
of 4/30/2024 | | | Valuation
Techniques | | | Unobservable
Input | | | Impact to Valuation From
an Increase to Input | |
Common Stocks | | $ | 155,443 | | | | US Line | | | | Delisting | | | | 105.70 EUR | |
Warrants | | $ | — | | | | US Line | | | | Delisting | | | | 0.00 CAD | |
| | (a) | Table presents information for two securities: DSM BV, which has been valued between 76.13-118.75 EUR and Constellation Software, Inc. which has been valued at 0.00 CAD throughout the period. |
PTBD
Description^ | | Level 1 | | | Level 2 | | | Level 3 | | | Investments
Measured at
Net Asset Value | | | Total | |
Corporate Bonds | | $ | — | | | $ | 175,678,661 | | | $ | — | | | $ | — | | | $ | 175,678,661 | |
Investments Purchased with Proceeds from Securities Lending | | | — | | | | — | | | | — | | | | 20,705,300 | | | | 20,705,300 | |
Total Investments in Securities | | $ | — | | | $ | 175,678,661 | | | $ | — | | | $ | 20,705,300 | | | $ | 196,383,961 | |
| | ^ | See Schedule of Investments for sector breakouts. |
TRND
Description^ | | Level 1 | | | Level 2 | | | Level 3 | | | Investments
Measured at
Net Asset Value | | | Total | |
Affiliated Exchange Traded Funds | | $ | 50,224,393 | | | $ | — | | | $ | — | | | $ | — | | | $ | 50,224,393 | |
Total Investments in Securities | | $ | 50,224,393 | | | $ | — | | | $ | — | | | $ | — | | | $ | 50,224,393 | |
COWZ
Description^ | | Level 1 | | | Level 2 | | | Level 3 | | | Investments
Measured at
Net Asset Value | | | Total | |
Common Stocks | | $ | 22,599,390,575 | | | $ | — | | | $ | — | | | $ | — | | | $ | 22,599,390,575 | |
Investments Purchased with Proceeds from Securities Lending | | | — | | | | — | | | | — | | | | 1,079,037,899 | | | | 1,079,037,899 | |
Total Investments in Securities | | $ | 22,599,390,575 | | | $ | — | | | $ | — | | | $ | 1,079,037,899 | | | $ | 23,678,428,474 | |
| | ^ | See Schedule of Investments for sector breakouts. |
CALF
Description^ | | Level 1 | | | Level 2 | | | Level 3 | | | Investments
Measured at
Net Asset Value | | | Total | |
Common Stocks | | $ | 9,394,845,460 | | | $ | — | | | $ | — | | | $ | — | | | $ | 9,394,845,460 | |
Investments Purchased with Proceeds from Securities Lending | | | — | | | | — | | | | — | | | | 975,050,215 | | | | 975,050,215 | |
Total Investments in Securities | | $ | 9,394,845,460 | | | $ | — | | | $ | — | | | $ | 975,050,215 | | | $ | 10,369,895,675 | |
| | ^ | See Schedule of Investments for sector breakouts. |
231
Pacer Funds
NOTES TO FINANCIAL STATEMENTS
April 30, 2024 (Continued)
GCOW
Description^ | | Level 1 | | | Level 2 | | | Level 3 | | | Investments
Measured at
Net Asset Value | | | Total | |
Common Stocks | | $ | 1,899,742,629 | | | $ | — | | | $ | — | | | $ | — | | | $ | 1,899,742,629 | |
Investments Purchased with Proceeds from Securities Lending | | | — | | | | — | | | | — | | | | 232,196,500 | | | | 232,196,500 | |
Total Investments in Securities | | $ | 1,899,742,629 | | | $ | — | | | $ | — | | | $ | 232,196,500 | | | $ | 2,131,939,129 | |
| | ^ | See Schedule of Investments for country breakouts. |
ICOW
Description^ | | Level 1 | | | Level 2 | | | Level 3 | | | Investments
Measured at
Net Asset Value | | | Total | |
Common Stocks | | $ | 1,394,944,311 | | | $ | — | | | $ | — | | | $ | — | | | $ | 1,394,944,311 | |
Investments Purchased with Proceeds from Securities Lending | | | — | | | | — | | | | — | | | | 120,207,214 | | | | 120,207,214 | |
Total Investments in Securities | | $ | 1,394,944,311 | | | $ | — | | | $ | — | | | $ | 120,207,214 | | | $ | 1,515,151,525 | |
| | ^ | See Schedule of Investments for country breakouts. |
ECOW
Description^ | | Level 1 | | | Level 2 | | | Level 3 | | | Investments
Measured at
Net Asset Value | | | Total | |
Common Stocks | | $ | 90,934,618 | | | $ | — | | | $ | 0 | | | $ | — | | | $ | 90,934,618 | |
Preferred Stocks | | | 5,424,213 | | | | — | | | | — | | | | — | | | | 5,424,213 | |
Investments Purchased with Proceeds from Securities Lending | | | — | | | | — | | | | — | | | | 4,543 | | | | 4,543 | |
Total Investments in Securities | | $ | 96,358,831 | | | $ | — | | | $ | 0 | | | $ | 4,543 | | | $ | 96,363,374 | |
| | ^ | See Schedule of Investments for country breakouts. |
The following is a reconciliation of investments in which significant unobservable inputs (Level 3) were used in determining fair value:
ECOW | | Balance
as of
4/30/2023 | | | Net
Realized
Gain
(Loss) | | | Change in Net
Unrealized
Appreciation
(Depreciation) | | | Purchases | | | Sales | | | Transfers
Out of
Level 3 | | | Transfers
Into Level 3 | | | Balance as of
4/30/2024 | |
Common Stocks | | $ | 0 | | | $ | — | | | $ | — | | | $ | — | | | $ | — | | | $ | — | | | $ | — | | | $ | 0 | |
The following is a summary of quantitative information about Level 3 Fair Value Measurements:
ECOW | | Fair Value as
of 4/30/2024 | | | Valuation
Techniques | | | Unobservable Input | | | Impact to Valuation From
an Increase to Input | |
Common Stocks | | $ | 0 | | | | Market comparable companies | | | | Discount for lack of marketability | | | | $0 | |
| | * | Table presents information for ten securities, which due to the Russian foreign exchange restrictions are not actively trading. |
232
Pacer Funds
NOTES TO FINANCIAL STATEMENTS
April 30, 2024 (Continued)
COWG
Description^ | | Level 1 | | | Level 2 | | | Level 3 | | | Investments
Measured at
Net Asset Value | | | Total | |
Common Stocks | | $ | 120,176,752 | | | $ | — | | | $ | — | | | $ | — | | | $ | 120,176,752 | |
Total Investments in Securities | | $ | 120,176,752 | | | $ | — | | | $ | — | | | $ | — | | | $ | 120,176,752 | |
| | ^ | See Schedule of Investments for sector breakouts. |
CAFG
Description^ | | Level 1 | | | Level 2 | | | Level 3 | | | Investments
Measured at
Net Asset Value | | | Total | |
Common Stocks | | $ | 9,164,783 | | | $ | — | | | $ | — | | | $ | — | | | $ | 9,164,783 | |
Total Investments in Securities | | $ | 9,164,783 | | | $ | — | | | $ | — | | | $ | — | | | $ | 9,164,783 | |
| | ^ | See Schedule of Investments for sector breakouts. |
BUL
Description^ | | Level 1 | | | Level 2 | | | Level 3 | | | Investments
Measured at
Net Asset Value | | | Total | |
Common Stocks | | $ | 46,395,082 | | | $ | — | | | $ | — | | | $ | — | | | $ | 46,395,082 | |
Investments Purchased with Proceeds from Securities Lending | | | — | | | | — | | | | — | | | | 7,010,900 | | | | 7,010,900 | |
Total Investments in Securities | | $ | 46,395,082 | | | $ | — | | | $ | — | | | $ | 7,010,900 | | | $ | 53,405,982 | |
| | ^ | See Schedule of Investments for sector breakouts. |
HERD
Description^ | | Level 1 | | | Level 2 | | | Level 3 | | | Investments
Measured at
Net Asset Value | | | Total | |
Affiliated Exchange Traded Funds | | $ | 94,036,120 | | | $ | — | | | $ | — | | | $ | — | | | $ | 94,036,120 | |
Total Investments in Securities | | $ | 94,036,120 | | | $ | — | | | $ | — | | | $ | — | | | $ | 94,036,120 | |
PWS
Description^ | | Level 1 | | | Level 2 | | | Level 3 | | | Investments
Measured at
Net Asset Value | | | Total | |
Common Stocks | | $ | 15,804,505 | | | $ | — | | | $ | — | | | $ | — | | | $ | 15,804,505 | |
Contingent Value Rights | | | — | | | | — | | | | 0 | | | | — | | | | 0 | |
Short-Term Investments | | | — | | | | 3,453,075 | | | | — | | | | — | | | | 3,453,075 | |
Investment Purchased with Proceeds from Securities Lending | | | — | | | | — | | | | — | | | | 4,078,068 | | | | 4,078,068 | |
Total Investments in Securities | | $ | 15,804,505 | | | $ | 3,453,075 | | | $ | 0 | | | $ | 4,078,068 | | | $ | 23,335,648 | |
| | ^ | See Schedule of Investments for sector breakouts. |
233
Pacer Funds
NOTES TO FINANCIAL STATEMENTS
April 30, 2024 (Continued)
The following is a reconciliation of investments in which significant unobservable inputs (Level 3) were used in determining fair value:
PWS(a) | | Balance
as of
4/30/2023 | | | Net
Realized
Gain
(Loss) | | | Change in Net
Unrealized
Appreciation
(Depreciation) | | | Purchases | | | Sales | | | Transfers
Out of
Level 3 | | | Transfers
Into Level 3 | | | Balance as of
4/30/2024 | |
Rights | | $ | 0 | | | $ | — | | | $ | — | | | $ | — | | | $ | — | | | $ | — | | | $ | — | | | $ | 0 | |
The following is a summary of quantitative information about Level 3 Fair Value Measurements:
PWS | | Fair Value as
of 4/30/2024 | | | Valuation
Techniques | | | Unobservable
Input | | | Impact to Valuation From
an Increase to Input | |
Rights | | $ | 0 | | | | Acquisition Price | | | | Stale Data | | | | $0 | |
Rights | | $ | 0 | | | | Acquisition Price | | | | Stale Data | | | | $0 | |
| | (a) | Table presents information for two securities, Abiomed has been valued at $0.00 and Bristol-Myers Squibb Co. has been valued at $0.00 throughout the period. |
INDS
Description^ | | Level 1 | | | Level 2 | | | Level 3 | | | Investments
Measured at
Net Asset Value | | | Total | |
Common Stocks | | $ | 9,058,402 | | | $ | — | | | $ | — | | | $ | — | | | $ | 9,058,402 | |
Real Estate Investment Trusts | | | 184,908,460 | | | | — | | | | — | | | | — | | | | 184,908,460 | |
Investments Purchased with Proceeds from Securities Lending | | | — | | | | — | | | | — | | | | 14,624,834 | | | | 14,624,834 | |
Total Investments in Securities | | $ | 193,966,862 | | | $ | — | | | $ | — | | | $ | 14,624,834 | | | $ | 208,591,696 | |
| | ^ | See Schedule of Investments for sector breakouts. |
SRVR
Description^ | | Level 1 | | | Level 2 | | | Level 3 | | | Investments
Measured at
Net Asset Value | | | Total | |
Common Stocks | | $ | 162,858,379 | | | $ | — | | | $ | — | | | $ | — | | | $ | 162,858,379 | |
Real Estate Investment Trusts | | | 257,438,361 | | | | — | | | | — | | | | — | | | | 257,438,361 | |
Rights | | | — | | | | — | | | | 264,780 | | | | — | | | | 264,780 | |
Investments Purchased with Proceeds from Securities Lending | | | — | | | | — | | | | — | | | | 26,363,358 | | | | 26,363,358 | |
Total Investments in Securities | | $ | 420,296,740 | | | $ | — | | | $ | 264,780 | | | $ | 26,363,358 | | | $ | 446,924,878 | |
| | ^ | See Schedule of Investments for sector breakouts. |
The following is a reconciliation of investments in which significant unobservable inputs (Level 3) were used in determining fair value:
SRVR(a) | | Balance
as of
4/30/2023 | | | Net
Realized
Gain
(Loss) | | | Change in Net
Unrealized
Appreciation
(Depreciation) | | | Purchases | | | Sales | | | Transfers
Out of
Level 3 | | | Transfers
Into Level 3 | | | Balance as of
4/30/2024 | |
Contingent Value Rights | | $ | — | | | $ | — | | | $ | 73,109 | | | $ | 191,671 | | | $ | — | | | $ | — | | | $ | — | | | $ | 264,780 | |
234
Pacer Funds
NOTES TO FINANCIAL STATEMENTS
April 30, 2024 (Continued)
The following is a summary of quantitative information about Level 3 Fair Value Measurements:
SRVR | | Fair Value as
of 4/30/2024 | | | Valuation
Techniques | | | Unobservable
Input | | | Impact to Valuation From
an Increase to Input | |
Contingent Value Rights | | $ | 264,780 | | | | Implied value gain if right immediately exercised. | | | | Underlying public investment price adjusted down by strike price. | | | | 1.29 AUD | |
| | (a) | Table presents information for one security, NEXTOC Ltd has been valued at 0.00 - 17.97 AUD throughout the period. |
SZNE
Description^ | | Level 1 | | | Level 2 | | | Level 3 | | | Investments
Measured at
Net Asset Value | | | Total | |
Common Stocks | | $ | 39,427,412 | | | $ | — | | | $ | — | | | $ | — | | | $ | 39,427,412 | |
Investments Purchased with Proceeds from Securities Lending | | | — | | | | — | | | | — | | | | 7,355,777 | | | | 7,355,777 | |
Total Investments in Securities | | $ | 39,427,412 | | | $ | — | | | $ | — | | | $ | 7,355,777 | | | $ | 46,783,189 | |
| | ^ | See Schedule of Investments for sector breakouts. |
AFTY
Description^ | | Level 1 | | | Level 2 | | | Level 3 | | | Investments
Measured at
Net Asset Value | | | Total | |
Common Stocks | | $ | 4,410,888 | | | $ | — | | | $ | — | | | $ | — | | | $ | 4,410,888 | |
Total Investments in Securities | | $ | 4,410,888 | | | $ | — | | | $ | — | | | $ | — | | | $ | 4,410,888 | |
| | ^ | See Schedule of Investments for sector breakouts. |
VIRS
Description^ | | Level 1 | | | Level 2 | | | Level 3 | | | Investments
Measured at
Net Asset Value | | | Total | |
Common Stocks | | $ | 3,441,168 | | | $ | — | | | $ | — | | | $ | — | | | $ | 3,441,168 | |
Investments Purchased with Proceeds from Securities Lending | | | — | | | | — | | | | — | | | | 477,840 | | | | 477,840 | |
Total Investments in Securities | | $ | 3,441,168 | | | $ | — | | | $ | — | | | $ | 477,840 | | | $ | 3,919,008 | |
| | ^ | See Schedule of Investments for sector breakouts. |
ALTL
Description^ | | Level 1 | | | Level 2 | | | Level 3 | | | Investments
Measured at
Net Asset Value | | | Total | |
Common Stocks | | $ | 251,490,194 | | | $ | — | | | $ | — | | | $ | — | | | $ | 251,490,194 | |
Real Estate Investment Trusts | | | 4,624,954 | | | | — | | | | — | | | | — | | | | 4,624,954 | |
Investments Purchased with Proceeds from Securities Lending | | | — | | | | — | | | | — | | | | 13,275,747 | | | | 13,275,747 | |
Total Investments in Securities | | $ | 256,115,148 | | | $ | — | | | $ | — | | | $ | 13,275,747 | | | $ | 269,390,895 | |
| | ^ | See Schedule of Investments for sector breakouts. |
235
Pacer Funds
NOTES TO FINANCIAL STATEMENTS
April 30, 2024 (Continued)
PAMC
Description^ | | Level 1 | | | Level 2 | | | Level 3 | | | Investments
Measured at
Net Asset Value | | | Total | |
Common Stocks | | $ | 55,490,874 | | | $ | — | | | $ | — | | | $ | — | | | $ | 55,490,874 | |
Real Estate Investment Trusts | | | 283,667 | | | | — | | | | — | | | | — | | | | 283,667 | |
Investments Purchased with Proceeds from Securities Lending | | | — | | | | — | | | | — | | | | 12,553,301 | | | | 12,553,301 | |
Total Investments in Securities | | $ | 55,774,541 | | | $ | — | | | $ | — | | | $ | 12,553,301 | | | $ | 68,327,842 | |
| | ^ | See Schedule of Investments for sector breakouts. |
PALC
Description^ | | Level 1 | | | Level 2 | | | Level 3 | | | Investments
Measured at
Net Asset Value | | | Total | |
Common Stocks | | $ | 296,651,283 | | | $ | — | | | $ | — | | | $ | — | | | $ | 296,651,283 | |
Real Estate Investment Trusts | | | 159,614 | | | | — | | | | — | | | | — | | | | 159,614 | |
Investments Purchased with Proceeds from Securities Lending | | | — | | | | — | | | | — | | | | 9,103,620 | | | | 9,103,620 | |
Total Investments in Securities | | $ | 296,810,897 | | | $ | — | | | $ | — | | | $ | 9,103,620 | | | $ | 305,914,517 | |
| | ^ | See Schedule of Investments for sector breakouts. |
PEXL
Description^ | | Level 1 | | | Level 2 | | | Level 3 | | | Investments
Measured at
Net Asset Value | | | Total | |
Common Stocks | | $ | 60,680,604 | | | $ | — | | | $ | — | | | $ | — | | | $ | 60,680,604 | |
Real Estate Investment Trusts | | | 492,799 | | | | — | | | | — | | | | — | | | | 492,799 | |
Investments Purchased with Proceeds from Securities Lending | | | — | | | | — | | | | — | | | | 6,978,588 | | | | 6,978,588 | |
Total Investments in Securities | | $ | 61,173,403 | | | $ | — | | | $ | — | | | $ | 6,978,588 | | | $ | 68,151,991 | |
| | ^ | See Schedule of Investments for sector breakouts. |
FLRT
Description^ | | Level 1 | | | Level 2 | | | Level 3 | | | Investments
Measured at Net
Asset Value | | | Total | |
Bank Loans | | $ | — | | | $ | 132,637,909 | | | $ | — | | | $ | — | | | $ | 132,637,909 | |
Closed-End Funds | | | 19,145 | | | | | | | | — | | | | — | | | | 19,145 | |
Collateralized Loan Obligations | | | 994,727 | | | | 81,005,063 | | | | | | | | | | | | 81,999,790 | |
Corporate Bonds | | | — | | | | 22,109,299 | | | | — | | | | — | | | | 22,109,299 | |
Exchange Traded Funds | | | 1,225,657 | | | | — | | | | — | | | | — | | | | 1,225,657 | |
Total Investments in Securities | | $ | 2,239,529 | | | $ | 235,752,271 | | | $ | — | | | $ | — | | | $ | 237,991,800 | |
| | ^ | See Schedule of Investments for sector breakouts. |
236
Pacer Funds
NOTES TO FINANCIAL STATEMENTS
April 30, 2024 (Continued)
SHPP
Description^ | | Level 1 | | | Level 2 | | | Level 3 | | | Investments
Measured at Net
Asset Value | | | Total | |
Common Stocks | | $ | 1,027,764 | | | $ | — | | | $ | — | | | $ | — | | | $ | 1,027,764 | |
Exchange Traded Funds | | | 24,449 | | | | — | | | | — | | | | — | | | | 24,449 | |
Total Investments in Securities | | $ | 1,052,213 | | | $ | — | | | $ | — | | | $ | — | | | $ | 1,052,213 | |
^ See Schedule of Investments for sector breakouts.
TRFK
Description^ | | Level 1 | | | Level 2 | | | Level 3 | | | Investments
Measured at Net
Asset Value | | | Total | |
Common Stocks | | $ | 28,810,486 | | | $ | — | | | $ | — | | | $ | — | | | $ | 28,810,486 | |
Total Investments in Securities | | $ | 28,810,486 | | | $ | — | | | $ | — | | | $ | — | | | $ | 28,810,486 | |
^ See Schedule of Investments for sector breakouts.
See Schedule of Investments for sector breakouts.
B. | Foreign Currency. Investment securities and other assets and liabilities denominated in foreign currencies are translated into U.S. dollar amounts at the date of valuation. Purchases and sales of investment securities and income and expense items denominated in foreign currencies are translated into U.S. dollar amounts on the respective dates of such transactions. The Funds do not isolate that portion of the results of operations resulting from changes in foreign exchange rates on investments from fluctuations arising from changes in market prices of securities held. Such fluctuations are included with the net realized and unrealized gain or loss from investments. The Funds report net realized foreign exchange gains or losses that arise from sales of foreign currencies, currency gains or losses realized between the trade and settlement dates on foreign currency transactions, and the differences between the amounts of dividends, interest and foreign withholding taxes recorded on the Funds’ books and the U.S. dollar equivalent of the amounts actually received or paid. Net unrealized foreign exchange gains and losses arise from changes in the values of assets and liabilities, other than investments in securities at fiscal period end, resulting from changes in exchange rates. |
C. | Federal Income Taxes. The Funds have complied and intend to continue to comply with the requirements of Subchapter M of the Internal Revenue Code of 1986, as amended, necessary to qualify as regulated investment companies and distribute substantially all net taxable investment income and net realized gains to shareholders in a manner which results in no tax cost to the Funds. Therefore, no federal income tax provision is required. As of and during the fiscal period/year ended April 30, 2024, the Funds did not have any tax positions that did not meet the “more-likely- than-not” threshold of being sustained by the applicable tax authority. As of and during the fiscal period/year ended April 30, 2024, the Funds did not have liabilities for any unrecognized tax benefits on uncertain tax positions as income tax expense in the Statement of Operations. Management has analyzed each of the Fund’s tax positions and concluded that no liability for unrecognized tax benefits should be recorded related to uncertain tax positions taken on returns filed for open tax years (2021-2023) or expected to be taken in each of the Fund’s 2024 tax returns. During the year/period ended April 30, 2024, the Funds did not incur any interest or penalties. |
D. | Security Transactions and Investment Income. Investment securities transactions are accounted for on the trade date. Gains and losses realized on sales of securities are computed on the basis of highest amortized cost. Dividend income is recorded on the ex-dividend date. Interest income is recorded on an accrual basis. Discounts and premiums on securities purchased are accreted and amortized over the lives of the respective securities. Withholding taxes on foreign dividends have been provided for in accordance with the Funds’ understanding of the applicable tax rules and regulations. |
Distributions received from a Fund’s investments in Real Estate Investment Trusts (“REIT”) may be characterized as ordinary income, net capital gain, or a return of capital. The proper characterization of REIT distributions is generally not known until after the end of each calendar year. As such, the Funds must use estimates in reporting the character of their income and distributions for financial statement purposes. The actual character of distributions to the Fund’s shareholders will be reflected on the Form 1099 received by shareholders after the end of the calendar year. Due to the nature of REIT investments, a portion of the distributions received by the Fund’s shareholders may represent a return of capital.
237
Pacer Funds
NOTES TO FINANCIAL STATEMENTS
April 30, 2024 (Continued)
E. | Distributions to Shareholders. Distributions to shareholders from net investment income for PTLC, PTMC, PTNQ, PTEU, PTIN, TRND, and AFTY, are declared and paid on an annual basis. COWZ, CALF, GCOW, ICOW, ECOW, COWG, CAFG, BUL, HERD, PWS, INDS, SRVR, SZNE, VIRS, ALTL, PAMC, PALC, PEXL,, TRFK, and SHPP, are declared and paid on a quarterly basis. PTBD and FLRT are declared and paid on a monthly basis. The net realized gains on securities normally are declared and paid on an annual basis for all Funds. Distributions are recorded on the ex-dividend date. |
F. | Use of Estimates. The preparation of financial statements in conformity with GAAP requires management to make estimates and assumptions that affect the reported amounts of assets and liabilities and disclosure of contingent assets and liabilities at the date of the financial statements, and the reported amounts of increases and decreases in net assets from operations during the reporting period. Actual results could differ from those estimates. |
G. | Share Valuation. The NAV per share of each Fund is calculated by dividing the sum of the value of the securities held by the Fund, plus cash and other assets, minus all liabilities (including estimated accrued expenses) by the total number of shares outstanding for the Fund, rounded to the nearest cent. Each Fund’s shares will not be priced on the days on which the NYSE is closed for trading. The offering and redemption price per share for each Fund is equal to the Fund’s net asset value per share. |
H. | Guarantees and Indemnifications. In the normal course of business, the Funds enter into contracts with service providers that contain general indemnification clauses. Each Fund’s maximum exposure under these arrangements is unknown as this would involve future claims that may be against the Funds that have not yet occurred. |
I. | Reclassification of Capital Accounts. Additionally, U.S. GAAP requires that certain components of net assets relating to permanent differences be reclassified between financial and tax reporting. These reclassifications have no effect on net assets or net asset value per share. For the fiscal period/year ended April 30, 2024, the following table shows the reclassifications made: |
| | | Distributable
Earnings
(Accumulated
Deficit) | | | Paid-In Capital | |
PTLC | | $ | (12,168,879 | ) | | $ | 12,168,879 | |
PTMC | | | (1,888,737 | ) | | | 1,888,737 | |
PTNQ | | | (44,667,244 | ) | | | 44,667,244 | |
PTEU | | | (737,761 | ) | | | 737,761 | |
PTIN | | | (747,358 | ) | | | 747,358 | |
PTBD | | | (444,405 | ) | | | 444,405 | |
TRND | | | (1,298,824 | ) | | | 1,298,824 | |
COWZ | | | (866,093,044 | ) | | | 866,093,044 | |
CALF | | | (217,443,133 | ) | | | 217,443,133 | |
GCOW | | | (9,848,366 | ) | | | 9,848,366 | |
ICOW | | | (22,307,725 | ) | | | 22,307,725 | |
ECOW | | | — | | | | — | |
COWG | | | (4,168,391 | ) | | | 4,168,391 | |
CAFG | | | (491,388 | ) | | | 491,388 | |
BUL | | | (2,345,464 | ) | | | 2,345,464 | |
HERD | | | (2,475,114 | ) | | | 2,475,114 | |
PWS | | | (428,196 | ) | | | 428,196 | |
INDS | | | (137,585 | ) | | | 137,585 | |
SRVR | | | 21,552,673 | | | | (21,552,673 | ) |
SZNE | | | (7,642,905 | ) | | | 7,642,905 | |
AFTY | | | 188 | | | | (188 | ) |
VIRS | | | (279,832 | ) | | | 279,832 | |
ALTL | | | (14,464,418 | ) | | | 14,464,418 | |
PAMC | | | (5,085,174 | ) | | | 5,085,174 | |
PALC | | | (47,189,312 | ) | | | 47,189,312 | |
PEXL | | | (3,088,487 | ) | | | 3,088,487 | |
FLRT | | | — | | | | — | |
238
Pacer Funds
NOTES TO FINANCIAL STATEMENTS
April 30, 2024 (Continued)
| | | Distributable
Earnings
(Accumulated
Deficit) | | | Paid-In Capital | |
SHPP | | $ | — | | | $ | — | |
TRFK | | | (114,611 | ) | | | 114,611 | |
During the fiscal year/period ended April 30, 2024, the Funds’ realized the following net capital gains/(losses) resulting from in-kind redemptions, in which shareholders exchanged Fund shares for securities held by the Fund rather than for cash. Because such gains are not taxable to the Fund, and are not distributed to shareholders, they have been reclassified from accumulated net realized losses to paid- in-capital.
PTLC | | $ | 15,477,025 | |
PTMC | | | 2,724,049 | |
PTNQ | | | 44,843,094 | |
PTEU | | | (230,162 | ) |
PTIN | | | 1,017,901 | |
PTBD | | | 444,405 | |
TRND | | | 1,420,611 | |
COWZ | | | 902,699,272 | |
CALF | | | 220,578,371 | |
GCOW | | | 10,477,781 | |
ICOW | | | 22,708,144 | |
ECOW | | | — | |
COWG | | | 4,356,668 | |
CAFG | | | 508,608 | |
BUL | | | 2,435,139 | |
HERD | | | 2,561,250 | |
PWS | | | 506,058 | |
INDS | | | 637,413 | |
SRVR | | | (8,036,393 | ) |
SZNE | | | 7,698,818 | |
AFTY | | | — | |
VIRS | | | 370,838 | |
ALTL | | | 14,731,884 | |
PAMC | | | 5,144,555 | |
PALC | | | 48,417,971 | |
PEXL | | | 3,259,712 | |
FLRT | | | — | |
SHPP | | | 637,413 | |
TRFK | | | 115,344 | |
NOTE 3 – COMMITMENTS AND OTHER RELATED PARTY TRANSACTIONS
Pacer Advisors, Inc. (“the Adviser”) serves as the investment adviser to the Funds. Pursuant to an Investment Advisory Agreement (“Investment Advisory Agreement”) between the Trust, on behalf of the Funds, and the Adviser, the Adviser provides investment advice to the Funds and oversees the day-to-day operations of the Funds, subject to the direction and control of the Board and the officers of the Trust. The Adviser administers the Funds’ business affairs, provides office facilities and equipment and certain clerical, bookkeeping and administrative
239
Pacer Funds
NOTES TO FINANCIAL STATEMENTS
April 30, 2024 (Continued)
services. The Adviser bears the costs of all advisory and non-advisory services required to operate the Funds, in exchange for a single unitary management fee. For services provided to the Funds, the Funds pay the Adviser at the following annual rates based on each Fund’s average daily net assets:
| | | Annual Rate of
Average Daily
Net Assets | |
PTLC | | | 0.60 | % |
PTMC | | | 0.60 | % |
PTNQ | | | 0.65 | % |
PTEU | | | 0.65 | % |
PTIN | | | 0.65 | % |
PTBD | | | 0.60 | % |
TRND | | | 0.15 | % |
COWZ | | | 0.49 | % |
CALF | | | 0.59 | % |
GCOW | | | 0.60 | % |
ICOW | | | 0.65 | % |
ECOW | | | 0.70 | % |
COWG | | | 0.49 | % |
CAFG | | | 0.59 | % |
BUL | | | 0.60 | % |
HERD | | | 0.15 | % |
PWS | | | 0.60 | % |
INDS | | | 0.60 | % |
SRVR | | | 0.60 | % |
SZNE | | | 0.60 | % |
AFTY | | | 0.70 | % |
VIRS | | | 0.70 | % |
ALTL | | | 0.60 | % |
PAMC | | | 0.60 | % |
PALC | | | 0.60 | % |
PEXL | | | 0.60 | % |
FLRT | | | 0.60 | % |
SHPP | | | 0.60 | % |
TRFK | | | 0.60 | % |
The Adviser has overall responsibility for overseeing the investment of the Funds’ assets, managing the Funds’ business affairs and providing certain clerical, bookkeeping and other administrative services for the Trust. Vident Asset Management (“Vident”) serves as the sub-adviser to PTBD, CSOP serves as the sub-adviser to AFTY, and Aristotle Pacific Capital, LLC (“Aristotle Pacific”) serves as the sub-adviser to FLRT. Each sub-adviser has responsibility for selecting and continuously monitoring their respective Fund(s) investments. Sub-Advisory fees earned by Vident, CSOP, and Aristotle Pacific are paid by the Adviser.
Effective November 1, 2022, pursuant to a contractual agreement between the Trust on behalf of each INDS and SRVR, the Adviser shall waive a portion of its advisory fee under the Advisory Agreement with respect to each Fund which limits each Fund’s total operating expenses (exclusive of any Rule 12b-1 fees, taxes, interest, brokerage fees, acquired fund fees and expenses, expenses incurred in connection with any merger, reorganization, or proxy solicitation, litigation, and other extraordinary expenses) to not more than 0.55% of the average daily net assets of each Fund. For the year ended April 30, 2024, the Adviser’s management fee was reduced by $103,741 and $267,387 in INDS and SRVR, respectively. This contractual agreement expires on October 31, 2024. The Adviser is not entitled to recoup any fees that have been previously waived.
240
Pacer Funds
NOTES TO FINANCIAL STATEMENTS
April 30, 2024 (Continued)
Pursuant to a Sub-Advisory Agreement between the Adviser and CSOP (the “Sub-Advisory Agreement”), CSOP is responsible for the day-to-day management of the Fund, including the trading of portfolio securities for the Fund. CSOP is responsible for selecting broker-dealers to execute purchase and sale transactions or in connection with any rebalancing or reconstitutions of the Index, subject to the supervision of the Adviser and the Board. For the services it provides to AFTY, CSOP is compensated by the Adviser from the management fees paid by AFTY to the Adviser.
Pursuant to a Sub-Advisory Agreement between the Adviser and Vident (the “Sub-Advisory Agreement”), Vident is responsible for the day-to-day management of the Fund, including the trading of portfolio securities for the Fund. Vident is responsible for selecting broker-dealers to execute purchase and sale transactions or in connection with any rebalancing or reconstitutions of the Index, subject to the supervision of the Adviser and the Board. For the services it provides to PTBD, Vident is compensated by the Adviser from the management fees paid by PTBD to the Adviser.
Effective April 12, 2023 and pursuant to a Sub-Advisory Agreement between the Adviser and the Aristotle Pacific (the “Sub-Advisory Agreement”), Aristotle Pacific is responsible for the day-to-day management of FLRT, including selecting broker-dealers to execute purchase and sale transactions, subject to the supervision of the Adviser and the Board. For the services it provides to FLRT, Aristotle Pacific is compensated by the Adviser from the management fees paid by FLRT to the Adviser. Prior to April 12, 2023, pursuant to a Sub-Advisory Agreement between the Adviser and the Pacific Asset Management LLC (Pacific Asset), Pacific Asset was responsible for trading portfolio securities on behalf of FLRT, including selecting broker-dealers to execute purchase and sale transactions, subject to the supervision of the Adviser and the Board. For the services they provided to FLRT, Pacific Asset was compensated by the Adviser from the management fees paid by FLRT to the Adviser.
The Distributor acts as the Funds’ principal underwriter in a continuous public offering of the Funds’ shares. The Distributor is an affiliate of the Adviser. The Funds did not pay any fees or commissions to the Distributor during the fiscal year/period ended April 30, 2024.
Certain officers and a Trustee of the Trust are affiliated with the Adviser and Distributor.
NOTE 4 – SERVICE AND CUSTODY AGREEMENTS
The Funds have entered into Service Agreements with U.S. Bancorp Fund Services, LLC (“Fund Services” or “Administrator”) doing business as U.S. Global Fund Services and a Custody Agreement with U.S. Bank, N.A. (the “Custodian”), an affiliate of Fund Services. Under these agreements, Fund Services and the Custodian provide certain transfer agency, administrative, accounting and custody services. The Custodian acts as securities lending agent (the “Securities Lending Agent”) for the Funds.
NOTE 5 – SECURITIES LENDING
The Funds may lend up to 33 1/3% of the value of the securities in their portfolios to brokers, dealers and financial institutions (but not individuals) under terms of participation in a securities lending program administered by the Securities Lending Agent. The securities lending agreement requires that loans are collateralized at all times in an amount equal to at least 102% of the value of any domestic loaned securities at the time of the loan, plus accrued interest. The use of loans of foreign securities, which are denominated and payable in U.S. dollars, shall be collateralized in an amount equal to 105% of the value of any loaned securities at the time of the loan plus accrued interest. The Funds receive compensation in the form of fees and earn interest on the cash collateral. Due to timing issues of when a security is recalled from loan, the financial statements may differ in presentation. The amount of fees depends on a number of factors including the type of security and length of the loan. The Funds continue to receive interest payments or dividends on the securities loaned during the borrowing period. Gain or loss in the value of securities loaned that may occur during the term of the loan will be for the account of the Funds. The Funds have the right under the terms of the securities lending agreements to recall the securities from the borrower on demand.
As of April 30, 2024, the Funds in following table had loaned securities and received cash collateral for the loans. The cash collateral is invested in the Mount Vernon Liquid Assets Portfolio, LLC of which the investment objective is to seek to maximize income to the extent consistent with the preservation of capital and liquidity and maintain a stable Net Asset Value (“NAV”) of $1.00. Although risk is mitigated by the collateral, the Funds could experience a delay in recovering their securities and possible loss of income or value if the borrower fails to return the borrowed securities. In addition, the Funds bear the risk of loss associated with the investment of cash collateral received.
During the year/period ended April 30, 2024, the Funds (excluding TRND, COWG, CAFG, HERD, AFTY, FLRT, TRFK, and SHPP) had loaned securities that were collateralized by cash. The cash collateral received was invested in securities as listed in each Fund’s Schedule of Investments. Income earned from these investments is allocated to each Fund based on each Fund’s portion of total cash collateral received. Securities lending income is disclosed in each Fund’s Statement of Operations, as applicable.
241
Pacer Funds
NOTES TO FINANCIAL STATEMENTS
April 30, 2024 (Continued)
NOTE 6 – SECURED BORROWINGS
The following represents gross obligations for secured borrowings by remaining time to maturity as of April 30, 2024.
Securities Lending Transactions
Overnight and Continuous | | Investments Purchased
with Proceeds from
Securities Lending
Collateral* | |
PTLC | | $ | 95,811,917 | |
PTMC | | | 86,595,764 | |
PTNQ | | | 364,781,969 | |
PTEU | | | 5,787,866 | |
PTIN | | | 33,098,496 | |
PTBD | | | 20,705,300 | |
TRND | | | — | |
COWZ | | | 1,079,037,899 | |
CALF | | | 975,050,215 | |
GCOW | | | 232,196,500 | |
ICOW | | | 120,207,214 | |
ECOW | | | 4,543 | |
COWG | | | — | |
CAFG | | | — | |
BUL | | | 7,010,900 | |
HERD | | | — | |
PWS | | | 4,078,068 | |
INDS | | | 14,624,834 | |
SRVR | | | 26,363,358 | |
SZNE | | | 7,355,777 | |
AFTY | | | — | |
VIRS | | | 477,840 | |
ALTL | | | 13,275,747 | |
PAMC | | | 12,553,301 | |
PALC | | | 9,103,620 | |
PEXL | | | 6,978,588 | |
FLRT | | | — | |
SHPP | | | — | |
TRFK | | | — | |
* | Proceeds from securities lending (Investments Purchased with Proceeds from Securities Lending Collateral). |
Due to the absence of a master netting agreement related to the Funds’ participation in securities lending, no additional offsetting disclosures have been made on behalf of the Funds for the total borrowings listed above.
242
Pacer Funds
NOTES TO FINANCIAL STATEMENTS
April 30, 2024 (Continued)
NOTE 7 – OFFSETTING ASSETS AND LIABILITIES
The following is a summary of the Assets and Liabilities for each Fund subject to offsets as of April 30, 2024:
Liabilities
| | | | | | | | | | | | | | | Gross Amounts Not Offset in the
Statements of Assets and Liabilities | | | | | |
Description | | Gross Amounts
of Recognized
Liabilities | | | Gross Amounts
Offset in the
Statements
of Assets and
Liabilities | | | Net Amounts
Presented in
the Statements
of Assets and
Liabilities | | | Financial
Instruments | | | Collateral
Pledged
(Received) | | | Net
Amount | |
PTLC | | | | | | | | | | | | | | | | | | | | | | | | |
Securities Lending | | $ | 95,811,917 | | | $ | — | | | $ | 95,811,917 | | | $ | 95,811,917 | | | $ | — | | | $ | — | |
PTMC | | | | | | | | | | | | | | | | | | | | | | | | |
Securities Lending | | | 86,595,764 | | | | — | | | | 86,595,764 | | | | 86,595,764 | | | | — | | | | — | |
PTNQ | | | | | | | | | | | | | | | | | | | | | | | | |
Securities Lending | | | 364,781,969 | | | | — | | | | 364,781,969 | | | | 364,781,969 | | | | — | | | | — | |
PTEU | | | | | | | | | | | | | | | | | | | | | | | | |
Securities Lending | | | 5,787,866 | | | | — | | | | 5,787,866 | | | | 5,787,866 | | | | — | | | | — | |
PTIN | | | | | | | | | | | | | | | | | | | | | | | | |
Securities Lending | | | 33,098,496 | | | | — | | | | 33,098,496 | | | | 33,098,496 | | | | — | | | | — | |
PTBD | | | | | | | | | | | | | | | | | | | | | | | | |
Securities Lending | | | 20,705,300 | | | | — | | | | 20,705,300 | | | | 20,705,300 | | | | — | | | | — | |
TRND | | | | | | | | | | | | | | | | | | | | | | | | |
Securities Lending | | | — | | | | — | | | | — | | | | — | | | | — | | | | — | |
COWZ | | | | | | | | | | | | | | | | | | | | | | | | |
Securities Lending | | | 1,079,037,899 | | | | — | | | | 1,079,037,899 | | | | 1,079,037,899 | | | | — | | | | — | |
CALF | | | | | | | | | | | | | | | | | | | | | | | | |
Securities Lending | | | 975,050,215 | | | | — | | | | 975,050,215 | | | | 975,050,215 | | | | — | | | | — | |
GCOW | | | | | | | | | | | | | | | | | | | | | | | | |
Securities Lending | | | 232,196,500 | | | | — | | | | 232,196,500 | | | | 232,196,500 | | | | — | | | | — | |
ICOW | | | | | | | | | | | | | | | | | | | | | | | | |
Securities Lending | | | 120,207,214 | | | | — | | | | 120,207,214 | | | | 120,207,214 | | | | — | | | | — | |
ECOW | | | | | | | | | | | | | | | | | | | | | | | | |
Securities Lending | | | 4,543 | | | | — | | | | 4,543 | | | | 4,543 | | | | — | | | | — | |
COWG | | | | | | | | | | | | | | | | | | | | | | | | |
Securities Lending | | | — | | | | — | | | | — | | | | — | | | | — | | | | — | |
CAFG | | | | | | | | | | | | | | | | | | | | | | | | |
Securities Lending | | | — | | | | — | | | | — | | | | — | | | | — | | | | — | |
BUL | | | | | | | | | | | | | | | | | | | | | | | | |
Securities Lending | | | 7,010,900 | | | | — | | | | 7,010,900 | | | | 7,010,900 | | | | — | | | | — | |
HERD | | | | | | | | | | | | | | | | | | | | | | | | |
Securities Lending | | | — | | | | — | | | | — | | | | — | | | | — | | | | — | |
PWS | | | | | | | | | | | | | | | | | | | | | | | | |
Securities Lending | | | 4,078,068 | | | | — | | | | 4,078,068 | | | | 4,078,068 | | | | — | | | | — | |
INDS | | | | | | | | | | | | | | | | | | | | | | | | |
Securities Lending | | | 14,624,834 | | | | — | | | | 14,624,834 | | | | 14,624,834 | | | | — | | | | — | |
SRVR | | | | | | | | | | | | | | | | | | | | | | | | |
Securities Lending | | | 26,363,358 | | | | — | | | | 26,363,358 | | | | 26,363,358 | | | | — | | | | — | |
SZNE | | | | | | | | | | | | | | | | | | | | | | | | |
Securities Lending | | | 7,355,777 | | | | — | | | | 7,355,777 | | | | 7,355,777 | | | | — | | | | — | |
243
Pacer Funds
NOTES TO FINANCIAL STATEMENTS
April 30, 2024 (Continued)
| | | | | | | | | | | | | | | Gross Amounts Not Offset in the
Statements of Assets and Liabilities | | | | | |
Description | | Gross Amounts
of Recognized
Liabilities | | | Gross Amounts
Offset in the
Statements
of Assets and
Liabilities | | | Net Amounts
Presented in
the Statements
of Assets and
Liabilities | | | Financial
Instruments | | | Collateral
Pledged
(Received) | | | Net
Amount | |
AFTY | | | | | | | | | | | | | | | | | | | | | | | | |
Securities Lending | | $ | — | | | $ | — | | | $ | — | | | $ | — | | | $ | — | | | $ | — | |
VIRS | | | | | | | | | | | | | | | | | | | | | | | | |
Securities Lending | | | 477,840 | | | | — | | | | 477,840 | | | | 477,840 | | | | — | | | | — | |
ALTL | | | | | | | | | | | | | | | | | | | | | | | | |
Securities Lending | | | 13,275,747 | | | | — | | | | 13,275,747 | | | | 13,275,747 | | | | — | | | | — | |
PAMC | | | | | | | | | | | | | | | | | | | | | | | | |
Securities Lending | | | 12,553,301 | | | | — | | | | 12,553,301 | | | | 12,553,301 | | | | — | | | | — | |
PALC | | | | | | | | | | | | | | | | | | | | | | | | |
Securities Lending | | | 9,103,620 | | | | — | | | | 9,103,620 | | | | 9,103,620 | | | | — | | | | — | |
PEXL | | | | | | | | | | | | | | | | | | | | | | | | |
Securities Lending | | | 6,978,588 | | | | — | | | | 6,978,588 | | | | 6,978,588 | | | | — | | | | — | |
FLRT | | | | | | | | | | | | | | | | | | | | | | | | |
Securities Lending | | | — | | | | — | | | | — | | | | — | | | | — | | | | — | |
SHPP | | | | | | | | | | | | | | | | | | | | | | | | |
Securities Lending | | | — | | | | — | | | | — | | | | — | | | | — | | | | — | |
TRFK | | | | | | | | | | | | | | | | | | | | | | | | |
Securities Lending | | | — | | | | — | | | | — | | | | — | | | | — | | | | — | |
NOTE 8 – INVESTMENT TRANSACTIONS
For the year/period ended April 30, 2024, the aggregate purchases and sales of securities by the Funds, excluding short-term securities and in-kind transactions, the in-kind transactions associated with creations and redemptions, and the long-term purchases and sales of U.S. Government Securities were as follows:
| | Purchases | | | Sales | | | In-Kind
Purchases | | | In-Kind Sales | | | U.S.
Government
Purchases | | | U.S.
Government
Sales | |
PTLC | | $ | 1,177,333,226 | | | $ | 1,180,114,658 | | | $ | 264,930,949 | | | $ | 81,786,860 | | | $ | — | | | $ | — | |
PTMC | | | 824,463,938 | | | | 830,325,582 | | | | 27,631,723 | | | | 45,138,316 | | | | — | | | | — | |
PTNQ | | | 119,590,379 | | | | 549,315,868 | | | | 281,068,228 | | | | 141,119,683 | | | | — | | | | — | |
PTEU | | | 42,381,447 | | | | 42,404,274 | | | | 7,618,933 | | | | 10,049,354 | | | | — | | | | — | |
PTIN | | | 78,513,317 | | | | 77,988,987 | | | | 23,510,927 | | | | 5,272,507 | | | | — | | | | — | |
PTBD | | | 248,264,276 | | | | 252,983,189 | | | | 5,811,738 | | | | 56,467,639 | | | | — | | | | 226,518,815 | |
TRND | | | 3,107,009 | | | | 3,048,408 | | | | 1,458,894 | | | | 8,675,564 | | | | — | | | | — | |
COWZ | | | 12,934,411,371 | | | | 12,880,403,693 | | | | 10,921,298,541 | | | | 4,205,576,483 | | | | — | | | | — | |
CALF | | | 5,707,108,844 | | | | 5,645,445,893 | | | | 7,299,175,009 | | | | 626,570,735 | | | | — | | | | — | |
GCOW | | | 1,152,304,544 | | | | 1,124,972,674 | | | | 332,032,261 | | | | 42,631,475 | | | | — | | | | — | |
ICOW | | | 699,695,887 | | | | 628,371,573 | | | | 776,646,828 | | | | 66,428,997 | | | | — | | | | — | |
ECOW | | | 72,885,228 | | | | 52,154,166 | | | | 16,809,999 | | | | — | | | | — | | | | — | |
COWG | | | 61,359,016 | | | | 58,926,676 | | | | 116,740,674 | | | | 23,683,708 | | | | — | | | | — | |
CAFG | | | 6,210,195 | | | | 6,160,778 | | | | 12,718,533 | | | | 3,957,352 | | | | — | | | | — | |
BUL | | | 49,394,235 | | | | 49,297,362 | | | | 19,070,831 | | | | 17,510,833 | | | | — | | | | — | |
HERD | | | 3,313,751 | | | | 3,242,640 | | | | 55,692,173 | | | | 19,543,695 | | | | — | | | | — | |
PWS | | | 61,164,222 | | | | 67,888,603 | | | | 4,507,570 | | | | 6,589,715 | | | | 377,724 | | | | 23,582,640 | |
INDS | | | 38,585,869 | | | | 40,318,107 | | | | 19,721,299 | | | | 15,094,459 | | | | — | | | | — | |
244
Pacer Funds
NOTES TO FINANCIAL STATEMENTS
April 30, 2024 (Continued)
| | Purchases | | | Sales | | | In-Kind
Purchases | | | In-Kind Sales | | | U.S.
Government
Purchases | | | U.S.
Government
Sales | |
SRVR | | $ | 361,825,672 | | | $ | 371,568,439 | | | $ | 26,809,414 | | | $ | 231,578,502 | | | $ | — | | | $ | — | |
SZNE | | | 97,001,101 | | | | 96,431,777 | | | | 28,117,180 | | | | 66,246,924 | | | | — | | | | — | |
AFTY | | | 529,685 | | | | 533,893 | | | | — | | | | — | | | | — | | | | — | |
VIRS | | | 477,717 | | | | 474,040 | | | | 1,585,929 | | | | 2,384,735 | | | | — | | | | — | |
ALTL | | | 2,967,012,207 | | | | 2,969,565,903 | | | | 10,105,821 | | | | 481,985,280 | | | | — | | | | — | |
PAMC | | | 148,278,132 | | | | 148,245,800 | | | | 29,221,145 | | | | 18,131,091 | | | | — | | | | — | |
PALC | | | 1,080,090,596 | | | | 1,077,050,603 | | | | 221,385,756 | | | | 192,651,739 | | | | — | | | | — | |
PEXL | | | 32,131,240 | | | | 31,792,345 | | | | 48,106,035 | | | | 13,934,991 | | | | — | | | | — | |
FLRT | | | 203,381,635 | | | | 65,677,614 | | | | — | | | | — | | | | — | | | | — | |
SHPP | | | 271,114 | | | | 277,567 | | | | — | | | | — | | | | — | | | | — | |
TRFK | | | 3,048,834 | | | | 2,828,985 | | | | 26,378,804 | | | | 542,960 | | | | — | | | | — | |
NOTE 9 – TRANSACTIONS WITH AFFILIATED SECURITIES
The Pacer Trendpilot Fund of Funds Index uses an objective, rules-based approach to construct a portfolio that, as of each quarterly rebalance, is composed of the ETFs listed in the following table, each advised by the Adviser (collectively, the “Trendpilot ETFs”). Each of the Trendpilot ETFs is an index-based ETF that seeks to track the total return performance, before fees and expenses, of the underlying index listed in the following table (collectively, the “Trendpilot Indexes”). Each Trendpilot Index other than the Pacer Trendpilot US Bond Index (collectively, the “Trendpilot Equity Indexes”) uses an objective, rules-based methodology to implement a systematic trend-following strategy that directs exposure (i) 100% to the “Underlying Component” specified in the table below, (ii) 50% to the applicable Underlying Component and 50% to 3-Month US Treasury bills, or (iii) 100% to 3-Month US Treasury bills, depending on the relative performance of the Underlying Component and its 200-business day historical simple moving average (the “200-day moving average”). The calculation of the 200-day moving average for each Underlying Component is based on the total return version of such Underlying Component and reflects the reinvestment of dividends paid by the securities in such Underlying Component.
The Pacer Trendpilot US Bond Index (the “Trendpilot Bond Index”) uses an objective, rules-based methodology to implement a systematic trend-following strategy that directs exposure to one of the following positions: (i) 100% to the S&P U.S. High Yield Corporate Bond Index, (ii) 50% to the S&P U.S. High Yield Corporate Bond Index and 50% to the S&P U.S. Treasury Bond 7-10 Year Index or (iii) 100% to S&P U.S. Treasury Bond 7-10 Year Index, depending on the value of the S&P U.S. High Yield Corporate Bond Index divided by the value of the S&P U.S.Treasury Bond 7-10 Year Index (the “Risk Ratio”).
Weight | Trendpilot ETF | Trendpilot Index | Equity Component |
20% | Pacer Trendpilot® US Large Cap ETF | Pacer Trendpilot® US Large Cap Index | S&P 500® Index |
20% | Pacer Trendpilot® US Mid Cap ETF | Pacer Trendpilot® US Mid Cap Index | S&P MidCap 400® Index |
20% | Pacer Trendpilot® 100 ETF | Pacer NASDAQ-100 Trendpilot® Index | NASDAQ-100® Index |
20% | Pacer Trendpilot® International ETF | Pacer Trendpilot® International Index | S&P Developed Ex-US Large Cap Index |
20% | Pacer Trendpilot® US Bond ETF | Pacer Trendpilot® US Bond Index | iBoxx USD Liquid High Yield Index |
TRND had the following transactions during the current fiscal period with affiliates:
| | | Share Activity | |
Security Name | | Balance
May 1, 2023 | | | Purchases | | | Sales | | | Balance
April 30, 2024 | |
PTBD | | | 513,868 | | | | 88,335 | | | | (93,610 | ) | | | 508,593 | |
PTIN | | | 396,769 | | | | 34,226 | | | | (74,451 | ) | | | 356,544 | |
PTLC | | | 275,318 | | | | 11,064 | | | | (67,817 | ) | | | 218,565 | |
PTMC | | | 323,679 | | | | 29,487 | | | | (60,487 | ) | | | 292,679 | |
PTNQ | | | 191,684 | | | | 7,100 | | | | (47,981 | ) | | | 150,803 | |
245
Pacer Funds
NOTES TO FINANCIAL STATEMENTS
April 30, 2024 (Continued)
Security Name | | Value | | | Dividend Income | | | Gain (Loss) Realized
on Sale of Shares | | | Net Change
in Unrealized
Appreciation
(Depreciation)
on Investments
in Affiliate | |
PTBD | | $ | 10,151,516 | | | $ | 713,161 | | | $ | (191,188 | ) | | $ | 57,845 | |
PTIN | | | 10,020,099 | | | | 219,006 | | | | 219,263 | | | | 201,861 | |
PTLC | | | 10,014,648 | | | | 126,165 | | | | 552,541 | | | | 1,237,313 | |
PTMC | | | 9,907,184 | | | | 199,843 | | | | 162,809 | | | | 323,017 | |
PTNQ | | | 10,130,946 | | | | 154,650 | | | | 745,104 | | | | 1,354,277 | |
Total | | | 50,224,393 | | | | 1,412,825 | | | | 1,488,529 | | | | 3,174,313 | |
The Pacer Cash Cows Fund of Funds Index uses an objective, rules-based approach to construct a portfolio that, as of each quarterly rebalance, is composed of the ETFs listed in the following table, each advised by the Adviser (collectively, the “Cash Cows ETFs”). Each of the Cash Cows ETFs is an index-based ETF that seeks to track the total return performance, before fees and expenses, of the applicable underlying index listed in the following table (collectively, the “Cash Cows Indexes”). Each Cash Cows Index uses an objective, rules-based methodology to provide exposure to companies with high free cash flow yields (commonly referred to as “cash cows”) selected from the applicable “Equity Universe” as indicated in the following table.
Weight | Cash Cows ETF | Cash Cows Index | Equity Universe |
20% | Pacer US Cash Cows 100 ETF | Pacer US Cash Cows 100 ETF | Russell 1000 Index |
20% | Pacer Global Cash Cows Dividend ETF | Pacer Global Cash Cows Dividend Index | FTSE Developed Large Cap Index |
20% | Pacer US Small Cap Cash Cows 100 ETF | Pacer US Small Cap Cash Cows 100 Index | S&P Small Cap 600® Index |
20% | Pacer US Cash Cows Growth ETF | Pacer US Cash Cows Growth Index | S&P 900® Pure Growth Index |
20% | Pacer Developed Markets International Cash Cows 100 ETF | Pacer Developed Markets International Cash Cows 100 Index | FTSE Developed ex US Index |
HERD had the following transactions during the current fiscal period with affiliates:
| | | Share Activity | |
Security Name | | Balance
May 1, 2023 | | | Purchases | | | Sales | | | Balance
April 30, 2024 | |
BUL | | | 279,015 | | | | 333,302 | | | | (152,228 | ) | | | 460,089 | |
CALF | | | 254,470 | | | | 279,538 | | | | (131,522 | ) | | | 402,486 | |
COWZ | | | 206,174 | | | | 225,071 | | | | (92,145 | ) | | | 339,100 | |
GCOW | | | 288,041 | | | | 372,126 | | | | (96,380 | ) | | | 563,787 | |
ICOW | | | 328,702 | | | | 385,509 | | | | (104,948 | ) | | | 609,263 | |
Security Name | | Value | | | Dividend Income | | | Gain (Loss) Realized
on Sale of Shares | | | Net Change
in Unrealized
Appreciation
(Depreciation)
on Investments
in Affiliate | |
BUL | | $ | 18,583,225 | | | $ | 244,026 | | | $ | 412,654 | | | $ | 2,212,134 | |
CALF | | | 18,458,008 | | | | 173,603 | | | | 842,132 | | | | 2,140,392 | |
COWZ | | | 18,596,244 | | | | 303,434 | | | | 447,312 | | | | 2,081,051 | |
GCOW | | | 19,225,137 | | | | 804,217 | | | | 351,801 | | | | (150,702 | ) |
ICOW | | | 19,173,506 | | | | 503,980 | | | | 422,595 | | | | 493,003 | |
Total | | | 94,036,120 | | | | 2,029,260 | | | | 2,476,494 | | | | 6,775,878 | |
246
Pacer Funds
NOTES TO FINANCIAL STATEMENTS
April 30, 2024 (Continued)
NOTE 10 – TAX COST BASIS
The components of tax basis cost of investments and net unrealized appreciation for federal income tax purposes at April 30, 2024 were as follows:
| | | PTLC | | | PTMC | | | PTNQ | | | PTEU | | | PTIN | |
Tax cost of Investments | | $ | 2,386,659,462 | | | $ | 439,038,457 | | | $ | 1,381,941,633 | | | $ | 43,061,918 | | | $ | 171,131,414 | |
Unrealized Appreciation | | | 477,115,222 | | | | 42,554,637 | | | | 163,190,260 | | | | 3,844,667 | | | | 22,323,005 | |
Unrealized Depreciation | | | (150,472,765 | ) | | | (10,690,572 | ) | | | (17,076,404 | ) | | | (1,548,761 | ) | | | (10,702,112 | ) |
Net unrealized appreciation (depreciation) | | | 326,642,457 | | | | 31,864,065 | | | | 146,113,856 | | | | 2,295,906 | | | | 11,620,893 | |
Undistributed Ordinary income | | | 6,125,009 | | | | 1,036,862 | | | | 8,554,710 | | | | 265,048 | | | | 1,788,565 | |
Undistributed Long-term capital gain | | | — | | | | — | | | | — | | | | — | | | | — | |
Distributable earnings | | | 6,125,009 | | | | 1,036,862 | | | | 8,554,710 | | | | 265,048 | | | | 1,788,565 | |
Other accumulated gain/(loss) | | | (232,872,513 | ) | | | (131,894,301 | ) | | | (28,967,506 | ) | | | (48,776,568 | ) | | | (20,649,742 | ) |
Total accumulated gain/(loss) | | $ | 99,894,953 | | | $ | (98,993,374 | ) | | $ | 125,701,060 | | | $ | (46,215,614 | ) | | $ | (7,240,284 | ) |
| | | PTBD | | | TRND | | | COWZ | | | CALF | | | GCOW | |
Tax cost of Investments | | $ | 195,470,224 | | | $ | 48,524,276 | | | $ | 21,986,753,752 | | | $ | 10,138,174,414 | | | $ | 2,103,792,967 | |
Unrealized Appreciation | | | 3,600,618 | | | | 5,423,537 | | | | 2,666,911,885 | | | | 883,492,050 | | | | 169,054,460 | |
Unrealized Depreciation | | | (2,686,881 | ) | | | (3,723,420 | ) | | | (975,237,163 | ) | | | (651,770,789 | ) | | | (141,072,794 | ) |
Net unrealized appreciation (depreciation) | | | 913,737 | | | | 1,700,117 | | | | 1,691,674,722 | | | | 231,721,261 | | | | 27,981,666 | |
Undistributed Ordinary income | | | 261,706 | | | | 213,638 | | | | 35,837,423 | | | | 5,109,271 | | | | 19,479,603 | |
Undistributed Long-term capital gain | | | — | | | | — | | | | — | | | | — | | | | — | |
Distributable earnings | | | 261,706 | | | | 213,638 | | | | 35,837,423 | | | | 5,109,271 | | | | 19,479,603 | |
Other accumulated gain/(loss) | | | (261,447,133 | ) | | | (943,934 | ) | | | (535,356,974 | ) | | | (19,868,791 | ) | | | (29,425,854 | ) |
Total accumulated gain/(loss) | | $ | (260,271,690 | ) | | $ | 969,821 | | | $ | 1,192,155,171 | | | $ | 216,961,741 | | | $ | 18,035,415 | |
| | ICOW | | | ECOW | | | COWG | | | CAFG | | | BUL | |
Tax cost of Investments | | $ | 1,482,476,202 | | | $ | 92,409,896 | | | $ | 118,533,125 | | | $ | 9,229,962 | | | $ | 48,953,355 | |
Unrealized Appreciation | | | 125,974,035 | | | | 13,178,422 | | | | 7,986,302 | | | | 455,749 | | | | 5,666,320 | |
Unrealized Depreciation | | | (93,523,270 | ) | | | (9,228,952 | ) | | | (6,342,675 | ) | | | (520,928 | ) | | | (1,213,693 | ) |
Net unrealized appreciation (depreciation) | | | 32,450,765 | | | | 3,949,470 | | | | 1,643,627 | | | | (65,179 | ) | | | 4,452,627 | |
Undistributed Ordinary income | | | 33,029,919 | | | | 2,006,284 | | | | 8,895 | | | | — | | | | — | |
Undistributed Long-term capital gain | | | — | | | | — | | | | — | | | | — | | | | — | |
Distributable earnings | | | 33,029,919 | | | | 2,006,284 | | | | 8,895 | | | | — | | | | — | |
Other accumulated gain/(loss) | | | (6,860,899 | ) | | | (3,319,313 | ) | | | (914,625 | ) | | | (70,878 | ) | | | (4,706,064 | ) |
Total accumulated gain/(loss) | | $ | 58,619,785 | | | $ | 2,636,441 | | | $ | 737,897 | | | $ | (136,057 | ) | | $ | (253,437 | ) |
| | HERD | | | PWS | | | INDS | | | SRVR | | | SZNE | |
Tax cost of Investments | | $ | 86,956,977 | | | $ | 22,598,306 | | | $ | 232,268,767 | | | $ | 548,141,339 | | | $ | 46,790,873 | |
Unrealized Appreciation | | | 7,560,825 | | | | 1,571,440 | | | | 5,985,629 | | | | 24,254,170 | | | | 858 | |
Unrealized Depreciation | | | (481,682 | ) | | | (834,098 | ) | | | (29,675,258 | ) | | | (125,470,631 | ) | | | (8,542 | ) |
Net unrealized appreciation (depreciation) | | | 7,079,143 | | | | 737,342 | | | | (23,689,629 | ) | | | (101,216,461 | ) | | | (7,684 | ) |
Undistributed Ordinary income | | | — | | | | 2,741 | | | | 100,987 | | | | 97,065 | | | | 8,527 | |
Undistributed Long-term capital gain | | | — | | | | — | | | | — | | | | — | | | | — | |
Distributable earnings | | | — | | | | 2,741 | | | | 100,987 | | | | 97,065 | | | | 8,527 | |
Other accumulated gain/(loss) | | | — | | | | (27,663,504 | ) | | | (58,275,640 | ) | | | (263,364,797 | ) | | | (27,412,930 | ) |
Total accumulated gain/(loss) | | $ | 7,079,143 | | | $ | (26,923,421 | ) | | $ | (81,864,282 | ) | | $ | (364,484,193 | ) | | $ | (27,412,087 | ) |
247
Pacer Funds
NOTES TO FINANCIAL STATEMENTS
April 30, 2024 (Continued)
| | AFTY | | | VIRS | | | ALTL | | | PAMC | | | PALC | |
Tax cost of Investments | | $ | 4,573,053 | | | $ | 4,253,512 | | | $ | 269,606,589 | | | $ | 65,567,536 | | | $ | 294,001,679 | |
Unrealized Appreciation | | | 628,854 | | | | 312,765 | | | | 7,801,130 | | | | 4,702,988 | | | | 24,513,555 | |
Unrealized Depreciation | | | (791,019 | ) | | | (647,269 | ) | | | (8,016,824 | ) | | | (1,942,682 | ) | | | (12,600,717 | ) |
Net unrealized appreciation (depreciation) | | | (162,165 | ) | | | (334,504 | ) | | | (215,694 | ) | | | 2,760,306 | | | | 11,912,838 | |
Undistributed Ordinary income | | | 2,022 | | | | 714 | | | | 428,625 | | | | 11,256 | | | | 170,639 | |
Undistributed Long-term capital gain | | | — | | | | — | | | | — | | | | — | | | | — | |
Distributable earnings | | | 2,022 | | | | 714 | | | | 428,625 | | | | 11,256 | | | | 170,639 | |
Other accumulated gain/(loss) | | | (2,202,722 | ) | | | (60,133 | ) | | | (264,586,547 | ) | | | (8,448,044 | ) | | | (46,801,598 | ) |
Total accumulated gain/(loss) | | $ | (2,362,865 | ) | | $ | (393,923 | ) | | $ | (264,373,616 | ) | | $ | (5,676,482 | ) | | $ | (34,718,121 | ) |
| | PEXL | | | FLRT | | | SHPP | | | TRFK | |
Tax cost of Investments | | $ | 63,287,707 | | | $ | 235,327,163 | | | $ | 1,003,838 | | | $ | 27,295,789 | |
Unrealized Appreciation | | | 7,019,663 | | | | 3,200,850 | | | | 144,425 | | | | 3,338,029 | |
Unrealized Depreciation | | | (2,155,379 | ) | | | (536,213 | ) | | | (96,124 | ) | | | (1,823,398 | ) |
Net unrealized appreciation (depreciation) | | | 4,864,284 | | | | 2,664,637 | | | | 48,301 | | | | 1,514,631 | |
Undistributed Ordinary income | | | — | | | | 424,750 | | | | 14,591 | | | | 123,121 | |
Undistributed Long-term capital gain | | | — | | | | — | | | | — | | | | 10,279 | |
Distributable earnings | | | — | | | | 424,750 | | | | 14,591 | | | | 133,400 | |
Other accumulated gain/(loss) | | | (1,039,920 | ) | | | (3,475,284 | ) | | | (2,328 | ) | | | — | |
Total accumulated gain/(loss) | | $ | 3,824,364 | | | $ | (385,897 | ) | | $ | 60,564 | | | $ | 1,648,031 | |
The difference between book and tax-basis cost is attributable to the realization for tax purposes of unrealized gains on investments in Real Estate Investment Trusts, partnerships, passive foreign investment companies and wash sales. Under tax law, certain capital and foreign currency losses realized after April 30, 2024 and within the taxable year are deemed to arise on the first business day of the Fund’s next taxable year.
At April 30, 2024, the Funds had the following capital loss carryforwards:
| | | Short-Term | | | Long-Term | | | Expires | |
PTLC | | $ | (120,467,978 | ) | | $ | (112,404,535 | ) | | | Indefinite | |
PTMC | | | (131,854,933 | ) | | | — | | | | Indefinite | |
PTNQ | | | (12,631,202 | ) | | | (16,336,304 | ) | | | Indefinite | |
PTEU | | | (38,076,088 | ) | | | (10,686,286 | ) | | | Indefinite | |
PTIN | | | (16,458,290 | ) | | | (4,176,064 | ) | | | Indefinite | |
PTBD | | | (261,236,012 | ) | | | (211,121 | ) | | | Indefinite | |
TRND | | | (527,317 | ) | | | (416,617 | ) | | | Indefinite | |
COWZ | | | (283,783,366 | ) | | | (251,573,608 | ) | | | Indefinite | |
CALF | | | — | | | | (19,868,791 | ) | | | Indefinite | |
GCOW | | | (3,760,510 | ) | | | (25,665,344 | ) | | | Indefinite | |
ICOW | | | (3,301,284 | ) | | | (3,559,615 | ) | | | Indefinite | |
ECOW | | | (2,122,928 | ) | | | (1,196,385 | ) | | | Indefinite | |
COWG | | | (888,588 | ) | | | (26,037 | ) | | | Indefinite | |
CAFG | | | (70,878 | ) | | | — | | | | Indefinite | |
BUL | | | (4,444,605 | ) | | | (261,459 | ) | | | Indefinite | |
HERD | | | — | | | | — | | | | Indefinite | |
PWS | | | (27,663,504 | ) | | | — | | | | Indefinite | |
INDS | | | (45,486,103 | ) | | | (12,789,537 | ) | | | Indefinite | |
SRVR | | | (46,157,919 | ) | | | (217,206,878 | ) | | | Indefinite | |
SZNE | | | (27,412,930 | ) | | | — | | | | Indefinite | |
AFTY | | | (1,529,092 | ) | | | (673,630 | ) | | | Indefinite | |
248
Pacer Funds
NOTES TO FINANCIAL STATEMENTS
April 30, 2024 (Continued)
| | | Short-Term | | | Long-Term | | | Expires | |
VIRS | | $ | (13,664 | ) | | $ | (46,469 | ) | | | Indefinite | |
ALTL | | | (264,579,997 | ) | | | (6,550 | ) | | | Indefinite | |
PAMC | | | (8,448,044 | ) | | | — | | | | Indefinite | |
PALC | | | (45,573,218 | ) | | | (1,228,380 | ) | | | Indefinite | |
PEXL | | | (949,045 | ) | | | (90,875 | ) | | | Indefinite | |
FLRT | | | (2,891,434 | ) | | | (583,850 | ) | | | Indefinite | |
SHPP | | | (380 | ) | | | (1,948 | ) | | | Indefinite | |
TRFK | | | — | | | | — | | | | Indefinite | |
NOTE 11 – DISTRIBUTIONS TO SHAREHOLDERS
The tax character of distributions paid by the Funds during the fiscal year/period ended April 30, 2024, was as follows:
| | | Ordinary Income | | | Capital Gains | | | Long Term
Capital Gain | | | Return of Capital | |
PTLC | | $ | 28,840,382 | | | $ | — | | | $ | — | | | $ | — | |
PTMC | | | 7,000,000 | | | | — | | | | — | | | | — | |
PTNQ | | | 15,996,062 | | | | — | | | | — | | | | — | |
PTEU | | | 1,192,866 | | | | — | | | | — | | | | — | |
PTIN | | | 3,142,461 | | | | — | | | | — | | | | — | |
PTBD | | | 13,319,148 | | | | — | | | | — | | | | — | |
TRND | | | 1,304,500 | | | | — | | | | — | | | | — | |
COWZ | | | 341,685,265 | | | | — | | | | — | | | | — | |
CALF | | | 58,323,606 | | | | — | | | | — | | | | — | |
GCOW | | | 103,433,974 | | | | — | | | | — | | | | — | |
ICOW | | | 31,659,355 | | | | — | | | | — | | | | — | |
ECOW | | | 3,557,922 | | | | — | | | | — | | | | — | |
COWG | | | 265,559 | | | | — | | | | — | | | | — | |
CAFG | | | 23,563 | | | | — | | | | — | | | | 93 | |
BUL | | | 657,918 | | | | — | | | | — | | | | 16,317 | |
HERD | | | 1,930,353 | | | | — | | | | 262 | | | | 3,388 | |
PWS | | | 453,354 | | | | — | | | | — | | | | — | |
INDS | | | 8,470,476 | | | | — | | | | — | | | | — | |
SRVR | | | 21,236,193 | | | | — | | | | — | | | | — | |
SZNE | | | 614,377 | | | | — | | | | — | | | | — | |
AFTY | | | 92,239 | | | | — | | | | — | | | | — | |
VIRS | | | 37,062 | | | | — | | | | — | | | | — | |
ALTL | | | 5,527,814 | | | | — | | | | — | | | | — | |
PAMC | | | 258,009 | | | | — | | | | — | | | | — | |
PALC | | | 2,027,944 | | | | — | | | | — | | | | — | |
PEXL | | | 199,688 | | | | — | | | | — | | | | 7,444 | |
FLRT | | | 13,662,425 | | | | — | | | | — | | | | — | |
SHPP | | | 29,550 | | | | — | | | | — | | | | — | |
TRFK | | | 8,801 | | | | — | | | | — | | | | — | |
249
Pacer Funds
NOTES TO FINANCIAL STATEMENTS
April 30, 2024 (Continued)
The tax character of distributions paid by the Funds during the fiscal year/period ended April 30, 2023 was as follows:
| | | Ordinary Income | | | Capital Gains | | | Long Term
Capital Gain | | | Return of Capital | |
PTLC | | $ | 26,415,381 | | | $ | — | | | $ | — | | | $ | — | |
PTMC | | | 3,237,926 | | | | — | | | | — | | | | — | |
PTNQ | | | 4,142,394 | | | | — | | | | — | | | | — | |
PTEU | | | 273,384 | | | | — | | | | — | | | | — | |
PTIN | | | 444,569 | | | | — | | | | — | | | | — | |
PTBD | | | 26,684,806 | | | | — | | | | — | | | | — | |
TRND | | | 942,758 | | | | — | | | | — | | | | — | |
COWZ | | | 193,788,560 | | | | — | | | | — | | | | — | |
CALF | | | 16,000,780 | | | | — | | | | — | | | | — | |
GCOW | | | 33,617,374 | | | | — | | | | — | | | | — | |
ICOW | | | 7,687,068 | | | | — | | | | — | | | | — | |
ECOW | | | 973,073 | | | | — | | | | — | | | | — | |
COWG | | | 9,399 | | | | — | | | | — | | | | — | |
BUL | | | 382,192 | | | | — | | | | — | | | | — | |
HERD | | | 584,387 | | | | — | | | | 117 | | | | 1,841 | |
PWS | | | 597,772 | | | | — | | | | — | | | | — | |
INDS | | | 6,149,407 | | | | — | | | | — | | | | — | |
SRVR | | | 18,743,593 | | | | — | | | | 1,717,631 | | | | — | |
SZNE | | | 826,693 | | | | — | | | | — | | | | — | |
AFTY | | | 100,794 | | | | — | | | | — | | | | — | |
VIRS | | | 46,298 | | | | — | | | | — | | | | — | |
ALTL | | | 9,575,595 | | | | — | | | | — | | | | 488,359 | |
PAMC | | | 410,052 | | | | — | | | | — | | | | 20,581 | |
PALC | | | 3,553,899 | | | | — | | | | — | | | | — | |
PEXL | | | 62,468 | | | | — | | | | — | | | | — | |
FLRT | | | 5,819,045 | | | | — | | | | — | | | | — | |
TRFK | | | 5,555 | | | | — | | | | — | | | | — | |
SHPP | | | 12,171 | | | | — | | | | — | | | | — | |
NOTE 12 – NEW ACCOUNTING PRONOUNCEMENTS
In June 2022, the FASB issued Accounting Standards Update 2022-03, which amends Fair Value Measurement (Topic 820): Fair Value Measurement of Equity Securities Subject to Contractual Sale Restrictions (“ASU 2022-03”). ASU 2022-03 clarifies guidance for fair value measurement of an equity security subject to a contractual sale restriction and establishes new disclosure requirements for such equity securities. ASU 2022-03 is effective for fiscal years beginning after December 15, 2023 and for interim periods within those fiscal years, with early adoption permitted. Management is currently evaluating the impact of these amendments on the financial statements.
NOTE 13 – RISKS
On February 24, 2022, Russia commenced a military attack on Ukraine. The outbreak of hostilities between the two countries could result in more widespread conflict and could have a severe adverse effect on the region and the markets. In addition, sanctions imposed on Russia by the United States and other countries, and any sanctions imposed in the future could have a significant adverse impact on the Russian economy and related markets. The price and liquidity of investments may fluctuate widely as a result of the conflict and related events. How long such conflict and related events will last and whether it will escalate further cannot be predicted, nor its effect on the Funds.
Sector Risk. To the extent a Fund invests more heavily in particular sectors of the economy, its performance will be especially sensitive to developments that significantly affect those sectors.
250
Pacer Funds
NOTES TO FINANCIAL STATEMENTS
April 30, 2024 (Continued)
● Industrials Sector Risk. The SHPP Fund may invest in companies in the industrials sector, and therefore the performance of the Fund could be negatively impacted by events affecting this sector. The industrials sector may be affected by changes in the supply of and demand for products and services, product obsolescence, claims for environmental damage or product liability and general economic conditions, among other factors.
● Information Technology Sector Risk. The TRFK Fund may invest in companies in the information technology sector, and therefore the performance of the Fund could be negatively impacted by events affecting this sector. Market or economic factors impacting information technology companies and companies that rely heavily on technological advances could have a significant effect on the value of the Fund’s investments. The value of stocks of information technology companies and companies that rely heavily on technology is particularly vulnerable to rapid changes in technology product cycles, rapid product obsolescence, government regulation and competition, both domestically and internationally, including competition from foreign competitors with lower production costs. Stocks of information technology companies and companies that rely heavily on technology, especially those of smaller, less-seasoned companies, tend to be more volatile than the overall market. Information technology companies are heavily dependent on patent and intellectual property rights, the loss or impairment of which may adversely affect profitability.
NOTE 14 – SUBSEQUENT EVENT
Management of the Funds has evaluated the need for disclosures and/or adjustments resulting from subsequent events through the date these financial statements were issued. The evaluation did not result in any subsequent events that necessitated disclosures and/or adjustments other than below.
On May 22, 2024, the following Funds declared a distribution from ordinary income to shareholders of record as of May 24, 2024, payable May 29, 2024, as follows:
| | | Ordinary Income | | | Per Share Amount | |
FLRT | | $ | 1,220,042 | | | $ | 0.21071545 | |
PTBD | | | 766,975 | | | | 0.08715628 | |
On June 26, 2024, the following Fund declared distributions from ordinary income to shareholders of record as of June 27, 2024, Payable July 3, 2024, as follows:
| | | Ordinary Income | | | Per Share Amount | |
COWG | | $ | 131,074 | | | $ | 0.02122663 | |
FLRT | | | 2,820,984 | | | | 0.41302837 | |
INDS | | | 1,088,319 | | | | 0.20342415 | |
SRVR | | | 4,266,271 | | | | 0.27001712 | |
PEXL | | | 85,638 | | | | 0.06587516 | |
GCOW | | | 40,244,591 | | | | 0.71737238 | |
PTBD | | | 1,490,405 | | | | 0.17534174 | |
SZNE | | | 100,568 | | | | 0.10056847 | |
CALF | | | 20,888,946 | | | | 0.10098596 | |
COWZ | | | 127,611,532 | | | | 0.30036844 | |
ICOW | | | 43,803,502 | | | | 0.97125282 | |
ECOW | | | 3,092,198 | | | | 0.61843965 | |
PWS | | | 33,041 | | | | 0.04720157 | |
BUL | | | 48,319 | | | | 0.03579188 | |
VIRS | | | 10,420 | | | | 0.10419600 | |
ALTL | | | 1,161,329 | | | | 0.17463591 | |
PAMC | | | 71,871 | | | | 0.05133619 | |
PALC | | | 730,237 | | | | 0.10431954 | |
TRFK | | | 136,721 | | | | 0.17989564 | |
SHPP | | | 22,306 | | | | 0.55764875 | |
CAFG | | | 14,074 | | | | 0.02962966 | |
251
Pacer Funds
NOTES TO FINANCIAL STATEMENTS
April 30, 2024 (Continued)
On June 27, 2024, the following Fund declared distributions from ordinary income to shareholders of record as of June 28, 2024, Payable July 5, 2024, as follows:
| | | Ordinary Income | | | Per Share Amount | |
HERD | | $ | 1,086,808 | | | $ | 0.46247137 | |
252
Pacer Funds
Report of Independent Registered Public Accounting Firm
To the Board of Trustees of Pacer Funds Trust and the Shareholders of
Pacer Trendpilot® US Large Cap ETF, Pacer Trendpilot® US Mid Cap ETF, Pacer Trendpilot® 100 ETF, Pacer Trendpilot® European Index ETF, Pacer Trendpilot® International ETF, Pacer Trendpilot® US Bond ETF, Pacer Trendpilot® Fund of Funds ETF, Pacer US Cash Cows 100 ETF, Pacer US Small Cap Cash Cows 100 ETF, Pacer Global Cash Cows Dividend ETF, Pacer Developed Markets International Cash Cows 100 ETF, Pacer Emerging Markets Cash Cows 100 ETF, Pacer US Large Cap Cash Cows Growth Leaders ETF, Pacer US Small Cap Cash Cows Growth Leaders ETF, Pacer US Cash Cows Growth ETF, Pacer Cash Cows Fund of Funds ETF, Pacer Wealthshield ETF, Pacer Industrial Real Estate ETF, Pacer Data & Infrastructure Real Estate ETF, Pacer CFRA-Stovall Equal Weight Seasonal Rotation ETF, Pacer CSOP FTSE China A50 ETF, Pacer BioThreat Strategy ETF, Pacer Lunt Large Cap Alternator ETF, Pacer Lunt Midcap Multi-Factor Alternator ETF, Pacer Lunt Large Cap Multi-Factor Alternator ETF, Pacer US Export Leaders ETF, Pacer Pacific Asset Floating Rate High Income ETF, Pacer Data and Digital Revolution ETF and Pacer Industrials and Logistics ETF
Opinion on the Financial Statements
We have audited the accompanying statements of assets and liabilities, including the schedules of investments, of the funds listed below (the “Funds”) each a series of the Pacer Funds Trust, as of April 30, 2024, the related statements of operations, the statements of changes in net assets, the related notes, and the financial highlights for the periods indicated below (collectively referred to as the “financial statements”).
The financial highlights for the year ended September 30, 2019, for the Pacer CSOP FTSE China A50 ETF, were audited by other auditors whose opinion dated November 19, 2019, expressed an unqualified opinion on those financial statements. The financial highlights for the two years ended June 30, 2021, for the Pacer Pacific Asset Floating Rate High Income ETF were audited by other auditors whose opinion dated August 16, 2021 expressed an unqualified opinion on those financial statements.
In our opinion, the financial statements present fairly, in all material respects, the financial positions of the Funds as of April 30, 2024, the results of their operations, the changes in their net assets, and the financial highlights for each of the periods indicated below, in conformity with accounting principles generally accepted in the United States of America.
Fund Name | Statements of Operations | Statements of Changes in Net Assets | Financial Highlights |
Pacer Trendpilot® US Large Cap ETF | For the year ended April 30, 2024 | For the years ended April 30, 2024 and 2023 | For the years ended April 30, 2024, 2023, 2022, 2021 and 2020 |
Pacer Trendpilot® US Mid Cap ETF | For the year ended April 30, 2024 | For the years ended April 30, 2024 and 2023 | For the years ended April 30, 2024, 2023, 2022, 2021 and 2020 |
Pacer Trendpilot® 100 ETF | For the year ended April 30, 2024 | For the years ended April 30, 2024 and 2023 | For the years ended April 30, 2024, 2023, 2022, 2021 and 2020 |
Pacer Trendpilot® European Index ETF | For the year ended April 30, 2024 | For the years ended April 30, 2024 and 2023 | For the years ended April 30, 2024, 2023, 2022, 2021 and 2020 |
Pacer Trendpilot® International ETF | For the year ended April 30, 2024 | For the years ended April 30, 2024 and 2023 | For the years ended April 30, 2024, 2023, 2022 and 2021 and period from May 2, 2019 (commencement of operations) through April 30, 2020 |
Pacer Trendpilot® US Bond ETF | For the year ended April 30, 2024 | For the years ended April 30, 2024 and 2023 | For the years ended April 30, 2024, 2023, 2022 and 2021 and period from October 22, 2019 (commencement of operations) through April 30, 2020 |
Pacer Trendpilot® Fund of Funds ETF | For the year ended April 30, 2024 | For the years ended April 30, 2024 and 2023 | For the years ended April 30, 2024, 2023, 2022 and 2021 and period from May 3, 2019 (commencement of operations) through April 30, 2020 |
Pacer US Cash Cows 100 ETF | For the year ended April 30, 2024 | For the years ended April 30, 2024 and 2023 | For the years ended April 30, 2024, 2023, 2022, 2021 and 2020 |
253
Pacer Funds
REPORT OF INDEPENDENT REGISTERED PUBLIC ACCOUNTING FIRM
(Continued)
Fund Name | Statements of Operations | Statements of Changes in Net Assets | Financial Highlights |
Pacer US Small Cap Cash Cows 100 ETF | For the year ended April 30, 2024 | For the years ended April 30, 2024 and 2023 | For the years ended April 30, 2024, 2023, 2022, 2021, 2020 |
Pacer Global Cash Cows Dividend ETF | For the year ended April 30, 2024 | For the years ended April 30, 2024 and 2023 | For the years ended April 30, 2024, 2023, 2022, 2021 and 2020 |
Pacer Developed Markets International Cash Cows 100 ETF | For the year ended April 30, 2024 | For the years ended April 30, 2024 and 2023 | For the years ended April 30, 2024, 2023, 2022, 2021 and 2020 |
Pacer Emerging Markets Cash Cows 100 ETF | For the year ended April 30, 2024 | For the years ended April 30, 2024 and 2023 | For the years ended April 30, 2024, 2023, 2022 and 2021 and period from May 2, 2019 (commencement of operations) through April 30, 2020 |
Pacer US Large Cap Cash Cows Growth Leaders ETF | For the year ended April 30, 2024 | For the year ended April 30, 2024 and for the period December 21, 2022 (commencement of operations) through April 30, 2023 | For the year ended April 30, 2024 and for the period December 21, 2022 (commencement of operations) through April 30, 2023 |
Pacer US Small Cap Cash Cows Growth Leaders ETF | For the year ended April 30, 2024 | For the year ended April 30, 2024 | For the year ended April 30, 2024 |
Pacer US Cash Cows Growth ETF | For the year ended April 30, 2024 | For the years ended April 30, 2024 and 2023 | For the years ended April 30, 2024, 2023, 2022, 2021 and period from May 2, 2019 (commencement of operations) through April 30, 2020 |
Pacer Cash Cows Fund of Funds ETF | For the year ended April 30, 2024 | For the years ended April 30, 2024 and 2023 | For the years ended April 30, 2024, 2023, 2022, 2021 and period from May 3, 2019 (commencement of operations) through April 30, 2020 |
Pacer WealthShield ETF | For the year ended April 30, 2024 | For the years ended April 30, 2024 and 2023 | For the years ended April 30, 2024, 2023, 2022, 2021 and 2020 |
Pacer Industrial Real Estate ETF | For the year ended April 30, 2024 | For the years ended April 30, 2024 and 2023 | For the years ended April 30, 2024, 2023, 2022, 2021 and 2020 |
Pacer Data & Infrastructure Real Estate ETF | For the year ended April 30, 2024 | For the years ended April 30, 2024 and 2023 | For the years ended April 30, 2024, 2023, 2022, 2021 and 2020 |
Pacer CFRA-Stovall Equal Weight Seasonal Rotation ETF | For the year ended April 30, 2024 | For the years ended April 30, 2024 and 2023 | For the years ended April 30, 2024, 2023, 2022, 2021 and 2020 |
Pacer CSOP FTSE China A50 ETF | For the year ended April 30, 2024 | For the years ended April 30, 2024 and 2023 | For the years ended April 30, 2024, 2023, 2022 and 2021 and for the period from October 1, 2019 through April 30, 2020 |
Pacer BioThreat Strategy ETF | For the year ended April 30, 2024 | For the years ended April 30, 2024 and 2023 | For the years ended April 30, 2024, 2023 and 2022 and for the period June 24, 2020 (commencement of operations) through April 30, 2021 |
254
Pacer Funds
REPORT OF INDEPENDENT REGISTERED PUBLIC ACCOUNTING FIRM
(Continued)
Fund Name | Statements of Operations | Statements of Changes in Net Assets | Financial Highlights |
Pacer Lunt Large Cap Alternator ETF | For the year ended April 30, 2024 | For the years ended April 30, 2024 and 2023 | For the years ended April 30, 2024, 2023 and 2022 and for the period June 24, 2020 (commencement of operations) through April 30, 2021 |
Pacer Lunt Midcap Multi-Factor Alternator ETF | For the year ended April 30, 2024 | For the years ended April 30, 2024 and 2023 | For the years ended April 30, 2024, 2023 and 2022 and for the period June 24, 2020 (commencement of operations) through April 30, 2021 |
Pacer Lunt Large Cap Multi-Factor Alternator ETF | For the year ended April 30, 2024 | For the years ended April 30, 2024 and 2023 | For the years ended April 30, 2024, 2023 and 2022 and for the period June 24, 2020 (commencement of operations) through April 30, 2021 |
Pacer US Export Leaders ETF | For the year ended April 30, 2024 | For the years ended April 30, 2024 and 2023 | For the years ended April 30, 2024, 2023, 2022, 2021 and 2020 |
Pacer Pacific Asset Floating Rate High Income ETF | For the year ended April 30, 2024 | For the years ended April 30, 2024 and 2023 | For the years ended April 30, 2024 and 2023 and for the period July 1, 2021 through April 30, 2022 |
Pacer Industrials and Logistics ETF | For the year ended April 30, 2024 | For the year ended April 30, 2024 and for the period June 8, 2022 (commencement of operations) through April 30, 2023 | For the year ended April 30, 2024 and for the period June 8, 2022 (commencement of operations) through April 30, 2023 |
Pacer Data and Digital Revolution ETF | For the year ended April 30, 2024 | For the year ended April 30, 2024 and for the period June 8, 2022 (commencement of operations) through April 30, 2023 | For the year ended April 30, 2024 and for the period June 8, 2022 (commencement of operations) through April 30, 2023 |
Basis for Opinion
These financial statements and financial highlights are the responsibility of the Funds’ management. Our responsibility is to express an opinion on these financial statements and financial highlights based on our audits. We are a public accounting firm registered with the Public Company Accounting Oversight Board (United States) (PCAOB) and are required to be independent with respect to the Funds in accordance with the U.S. federal securities laws and the applicable rules and regulations of the Securities and Exchange Commission and the PCAOB.
We conducted our audits in accordance with the standards of the PCAOB. Those standards require that we plan and perform the audit to obtain reasonable assurance about whether the financial statements and financial highlights are free of material misstatement, whether due to error or fraud. The Funds are not required to have, nor were we engaged to perform, an audit of their internal control over financial reporting. As part of our audits, we are required to obtain an understanding of internal control over financial reporting but not for the purpose of expressing an opinion on the effectiveness of the Funds’ internal control over financial reporting. Accordingly, we express no such opinion.
Our audits included performing procedures to assess the risk of material misstatement of the financial statements and financial highlights, whether due to error or fraud, and performing procedures that respond to those risks. Such procedures included examining, on a test basis, evidence regarding the amounts and disclosures in the financial statements and financial highlights. Our procedures included confirmation of securities and cash owned as of April 30, 2024, by correspondence with the custodian and brokers; when replies were not received from
255
Pacer Funds
REPORT OF INDEPENDENT REGISTERED PUBLIC ACCOUNTING FIRM
(Continued)
brokers, we performed other auditing procedures. Our audits also included evaluating the accounting principles used and significant estimates made by management, as well as evaluating the overall presentation of the financial statements and financial highlights. We believe that our audits provide a reasonable basis for our opinion.

We have served as the auditor for the Pacer Funds Trust since 2015
Huntingdon Valley, Pennsylvania
June 27, 2024
256
Pacer Funds
ADDITIONAL INFORMATION
(Unaudited)
NOTE 1 – FREQUENCY DISTRIBUTION OF PREMIUMS AND DISCOUNTS
Information regarding how often shares of each other Fund traded on the Exchange at a price above (i.e., at a premium) or below (i.e., at a discount) the NAV of the Fund is available on the Funds’ website at www.PacerETFs.com.
NOTE 2 – FEDERAL TAX INFORMATION
Qualified Dividend Income/Dividends Received Deduction/Short Term Capital Gains
For the fiscal year/period ended April 30, 2024, certain dividends paid by the Funds may be subject to a maximum tax rate of 23%, as provided for by the Tax Cuts and Jobs Act of 2017. The following are the percentage of dividends declared from ordinary income designated as qualified dividend income (“QDI”), for corporate shareholders, the percent qualifying for the corporate dividends received deduction (“DRD”), and the percentage of taxable ordinary income distributions that are designated as short-term capital gain (“STCG”) distributions under Internal Revenue Section 871(k)(2)(C) for each fund.
| | QDI | DRD | STCG |
PTLC | 68.15% | 68.04% | 0.00% |
PTMC | 49.35% | 44.25% | 0.00% |
PTNQ | 27.32% | 20.04% | 0.00% |
PTEU | 91.62% | 0.79% | 0.00% |
PTIN | 99.78% | 2.95% | 0.00% |
PTBD | 0.00% | 0.00% | 0.00% |
TRND | 30.54% | 15.12% | 0.00% |
COWZ | 100.00% | 100.00% | 0.00% |
CALF | 100.00% | 100.00% | 0.00% |
GCOW | 88.47% | 24.69% | 0.00% |
ICOW | 72.82% | 0.00% | 0.00% |
ECOW | 63.42% | 0.61% | 0.00% |
COWG | 100.00% | 100.00% | 0.00% |
CAFG | 100.00% | 100.00% | 0.00% |
BUL | 100.00% | 100.00% | 0.00% |
HERD | 87.13% | 44.42% | 0.39% |
PWS | 35.50% | 34.08% | 0.00% |
INDS | 37.55% | 2.32% | 0.00% |
SRVR | 31.96% | 2.06% | 0.00% |
SZNE | 100.00% | 100.00% | 0.00% |
AFTY | 100.00% | 0.00% | 0.00% |
VIRS | 100.00% | 100.00% | 0.00% |
ALTL | 100.00% | 100.00% | 0.00% |
PAMC | 100.00% | 100.00% | 0.00% |
PALC | 100.00% | 100.00% | 0.00% |
PEXL | 100.00% | 100.00% | 0.00% |
FLRT | 0.00% | 0.00% | 0.00% |
TRFK | 79.47% | 63.95% | 26.71% |
SHPP | 72.11% | 23.55% | 0.00% |
257
Pacer Funds
ADDITIONAL INFORMATION
(Unaudited) (Continued)
Foreign Tax Credit Pass Through
Pursuant to Section 853 of the Internal Revenue code, the Funds designate the following amounts as foreign taxes paid for the year/period ended April 30, 2024. Foreign taxes paid for purposes of Section 853 may be less than actual foreign taxes paid for financial statement purposes.
| | | | | | | | | | | Per Share | |
Fund | | Gross Foreign
Source Income | | | Foreign Taxes
Passthrough | | | Gross Foreign
Source Income | | | Foreign Taxes
Passthrough | |
PTLC | | $ | — | | | $ | — | | | $ | — | | | $ | — | |
PTMC | | | — | | | | — | | | | — | | | | — | |
PTNQ | | | — | | | | — | | | | — | | | | — | |
PTEU | | | 1,357,518 | | | | 209,424 | | | | 0.88 | | | | 0.14 | |
PTIN | | | 4,323,287 | | | | 461,253 | | | | 0.81 | | | | 0.09 | |
PTBD | | | — | | | | — | | | | — | | | | — | |
TRND | | | 219,006 | | | | 18,535 | | | | 0.13 | | | | 0.01 | |
COWZ | | | — | | | | — | | | | — | | | | — | |
CALF | | | — | | | | — | | | | — | | | | — | |
GCOW | | | 80,299,989 | | | | 6,392,814 | | | | 1.43 | | | | 0.11 | |
ICOW | | | 46,841,713 | | | | 4,686,257 | | | | 1.05 | | | | 0.11 | |
ECOW | | | 4,787,424 | | | | 545,107 | | | | 1.01 | | | | 0.11 | |
COWG | | | — | | | | — | | | | — | | | | — | |
CAFG | | | — | | | | — | | | | — | | | | — | |
BUL | | | — | | | | — | | | | — | | | | — | |
HERD | | | 1,308,198 | | | | 129,755 | | | | 0.52 | | | | 0.05 | |
PWS | | | — | | | | — | | | | — | | | | — | |
INDS | | | — | | | | — | | | | — | | | | — | |
SRVR | | | — | | | | — | | | | — | | | | — | |
SZNE | | | — | | | | — | | | | — | | | | — | |
AFTY | | | 148,114 | | | | 14,837 | | | | 0.48 | | | | 0.05 | |
VIRS | | | — | | | | — | | | | — | | | | — | |
ALTL | | | — | | | | — | | | | — | | | | — | |
PAMC | | | — | | | | — | | | | — | | | | — | |
PALC | | | — | | | | — | | | | — | | | | — | |
PEXL | | | — | | | | — | | | | — | | | | — | |
FLRT | | | — | | | | — | | | | — | | | | — | |
TRFK | | | — | | | | — | | | | — | | | | — | |
SHPP | | | 22,815 | | | | 3,617 | | | | 0.57 | | | | 0.09 | |
Foreign taxes paid or withheld should be included in taxable income with an offsetting deduction from gross income or as a credit for taxes paid to foreign governments.
Above figures may differ from those cited elsewhere in this report due to difference in the calculation of income and gains under GAAP purposes and Internal Revenue Service purposes.
Shareholders are strongly advised to consult their own tax advisers with respect to the tax consequences of their investments in the Funds.
NOTE 3 – DISCLOSURE OF PORTFOLIO HOLDINGS
The Funds file their complete schedule of portfolio holdings for their first and third fiscal quarters with the Securities and Exchange Commission (“SEC”) on Part F of Form N-PORT. The Funds’ Part F of Form N-PORT is available without charge, upon request, by calling toll-free at (800) 617-0004. Furthermore, you may obtain Part F of Form N-PORT on the SEC’s website at www.sec.gov. Each Fund’s portfolio holdings are posted on their website at www.paceretfs.com daily.
258
Pacer Funds
ADDITIONAL INFORMATION
(Unaudited) (Continued)
NOTE 4 – PROXY VOTING POLICIES AND PROCEDURES
A description of the policies and procedures the Funds use to determine how to vote proxies relating to portfolio securities is provided in the Statement of Additional Information (“SAI”). The SAI is available without charge upon request by calling toll-free at (800) 617-0004, by accessing the SEC’s website at http://www.sec.gov, or by accessing the Funds’ website at www.paceretfs.com. Information on how the Fund voted proxies relating to portfolio securities during the year ended June 30 is available without charge, upon request, by calling (800) 617-0004 or by accessing the website of the SEC.
NOTE 5 – BOARD CONSIDERATIONS IN APPROVING THE INVESTMENT ADVISORY AGREEMENT FOR THE FUNDS
ALTL, BUL, CALF, CAFG, ECOW, HERD, ICOW, INDS, PALC, PAMC, PEXL, PTIN, PTLC, PTMC, PTNQ, SRVR, SZNE, TRND, VIRS, BULD, ODDS, SHPP and TRFK
The Board of Trustees (the “Board”) of Pacer Funds Trust (the “Trust”), including the Trustees thereof who are not “interested persons,” as defined by the Investment Company Act of 1940, as amended (the “1940 Act”), of the Trust (the “Independent Trustees”), held a meeting on March 19, 2024 (the “Meeting”) for the purpose of, among other things, the consideration of, and voting on, the proposed renewal of the investment advisory agreement (the “Investment Advisory Agreement”) between the Trust and Pacer Advisors, Inc. (the “Advisor”), relating to Pacer Lunt Large Cap Alternator ETF (ALTL), Pacer Lunt Large Cap Multi-Factor Alternator ETF (PALC), Pacer Lunt Mid Cap Multi-Factor Alternator ETF (PAMC), Pacer Trendpilot US Large Cap ETF (PTLC), Pacer Trendpilot US Mid Cap ETF (PTMC), Pacer Trendpilot 100 ETF (PTNQ), Pacer US Small Cap Cash Cows 100 ETF (CALF), Pacer Developed Markets International Cash Cows 100 ETF (ICOW), Pacer US Export Leaders ETF (PEXL), Pacer CFRA-Stovall Equal Weight Seasonal Rotation ETF (SZNE), Pacer US Cash Cows Growth ETF (BUL), Pacer Trendpilot International ETF (PTIN), Pacer Emerging Markets Cash Cows 100 ETF (ECOW), Pacer Cash Cows Fund of Funds ETF (HERD), Pacer Trendpilot Fund of Funds ETF (TRND), Pacer Bio Threat Strategy ETF (VIRS), Pacer Industrial Real Estate ETF (INDS) Pacer Data & Infrastructure Real Estate ETF (SRVR), Pacer US Small Cap Cash Cows Growth Leaders ETF (CAFG), Pacer BlueStar Engineering the Future ETF (BULD), Pacer BlueStar Digital Entertainment ETF (ODDS), Pacer Industrials and Logistics ETF (SHPP) and Pacer Data and Digital Revolution ETF (TRFK). Each of the aforenamed funds is referred to as a “Fund” and, together, as the “Funds.”
The Board, including a majority of the Trust’s Independent Trustees voting separately, approved the renewal of the Investment Advisory Agreement at the Meeting, respectively, based on its review of qualitative and quantitative information provided by the Advisor as well as the Trust’s other service providers. Prior to deciding to approve the renewal of the Investment Advisory Agreement at the Meeting, respectively, the Independent Trustees requested and obtained from the Advisor such information as the Independent Trustees deemed reasonably necessary to evaluate the terms of the Investment Advisory Agreement. The Independent Trustees received assistance and advice from, and met separately with, independent counsel. In addition, the Independent Trustees received a memorandum from independent counsel regarding the responsibilities of the Board with respect to the renewal of the Investment Advisory Agreement.
Prior to approval, the Board obtained and reviewed a variety of information, including certain information prepared by Broadridge Financial Solutions (“Broadridge”) regarding each Fund’s fees and expenses relative to the fees and expenses of other funds with similar investment objectives and strategies. At the Meeting, respectively, the Board, including the Independent Trustees, evaluated a number of factors and various materials in connection with the approval process, including: (1) a copy of the Investment Advisory Agreement; (2) the Advisor’s responses to questionnaires designed to provide the Board with information reasonably necessary to evaluate the terms of the Investment Advisory Agreement; (3) the Advisor’s Form ADV disclosures; (4) information describing the nature, quality and extent of services that the Advisor is prepared to provide to each Fund under consideration; (5) the advisory fee payable by a Fund to the Advisor for its services; (6) certain comparative information regarding a Fund’s expenses and performance relative to the expenses and performance of other comparable funds; (7) a copy of the Trust’s registration statement; and (8) information regarding the ownership and management structure, financial condition, and compliance program of the Advisor. Representatives from the Advisor presented additional information and participated in question-and-answer sessions at the Meeting to help the Board evaluate the Advisor’s services and fees, as well as other aspects of the Investment Advisory Agreement.
In considering the renewal of the Investment Advisory Agreement at the Meeting, the Board considered various factors that the Trustees determined were relevant, including: (i) the nature, extent and quality of the services to be provided by the Advisor, including the performance of the Advisor with respect to each Fund; (ii) the costs and benefits, including the fee to be paid to the Advisor by each Fund, of the advisory services to be provided to the Funds; and (iii) potential economies of scale.
259
Pacer Funds
ADDITIONAL INFORMATION
(Unaudited) (Continued)
● | Nature, Extent and Quality of Services to be Provided by the Advisor. The Board reviewed the scope of services to be provided by the Advisor under the Investment Advisory Agreement. In this regard, the Trustees reviewed each Fund’s investment goal and investment strategy, and the Advisor’s ability to implement such investment goal and/or investment strategy, including, but not limited to, trading practices. In addition, the Trustees reviewed the management team at the Advisor that would be responsible for managing each Fund, including staffing, skills and compensation program, and considered various other Funds advised by the Advisor and any potential conflicts. |
Based on its review, the Board determined that the Advisor is capable of providing all necessary advisory services required by each Fund, as indicated by the Advisor’s management capabilities, the professional qualifications and experience of its portfolio management personnel. The Board reviewed, a comparison of each Fund’s performance for the one-year, three-year, five-year and since inception periods ended December 31, 2023 (as applicable), to that of its underlying index and that, during the year, the Board received periodic reports on each Fund’s short- and longer-term performance in comparison with its underlying index. The Board noted that each Fund performed in line with its underlying index over the relevant periods. The Board also considered other services provided to the Funds by the Advisor, where relevant, such as selecting broker-dealers for executing portfolio transactions, monitoring adherence to each Fund’s investment restrictions, and monitoring compliance with various policies and procedures and with applicable securities regulations.
Based on the factors above, as well as those discussed below, the Board concluded, within the context of its full deliberations, that it was satisfied with the nature, extent and quality of the services provided and to be provided to the Funds by the Advisor.
● | Costs and Benefits of Advisory Services to be Provided to the Funds. In considering the advisory fees payable by the Trust to the Advisor and each Fund’s expense ratio, the Board reviewed statistical information prepared by Broadridge regarding the expense ratio components, including gross and net total expenses of each Fund in comparison with the same information for other ETFs, objectively selected by Broadridge as comprising a Fund’s applicable expense peer group (“Peer Group”) pursuant to Broadridge’s proprietary ETF methodology. The Board was provided with a detailed description of the proprietary ETF methodology used by Broadridge to determine a Fund’s peer group. The Board noted that, due to the limitations in providing comparable funds in the peer group, the statistical information provided in Broadridge’s report may or may not provide meaningful direct comparisons to a Fund in all instances. The Board compared each Fund’s expense ratio to the expense ratios of funds in its Peer Group, focusing on whether each Fund was charged fees that were within the range of fees charged by those in the Peer Group. It also noted that the Advisor had contractually agreed to pay the operating expenses of each Fund, including the cost of transfer agency, custody, fund administration, legal, audit and other services, except interest, taxes, brokerage commissions and other expenses in connection with the execution of portfolio transactions, and extraordinary and non-routine expenses. It was noted that this contractual agreement cannot be changed without shareholder approval. The Board also evaluated the compensation and incidental or “fall-out” benefits received (or proposed or likely to be received) by the Advisor from its relationship with the Funds, taking into account assessments of the Advisor’s profitability prepared and shared by the Advisor’s management. |
Based on the factors above, as well as those discussed below, the Board concluded, within the context of its full deliberations, that each Fund’s advisory fee was reasonable in light of the nature and quality of the services expected to be rendered by the Advisor.
● | Economies of Scale. The Board also reviewed and considered the extent to which economies of scale would be realized by the Advisor as the assets of the Funds may grow in the future. In considering the extent to which economies of scale would be realized as the Funds grow and whether advisory fee levels reflect those economies of scale for the benefit of the Funds’ investors, the Trustees considered that each Fund’s fee arrangement with the Advisor involved a contractual commitment by the Advisor to pay the operating expenses of each Fund. The Board reviewed the Adviser’s methodology for calculating estimated profitability of the Fund, noting that profitability may be affected by numerous factors, including, among others, the types of funds managed and expense allocations. The Board acknowledged the difficulty in calculating and comparing profitability at the individual fund level. For each Fund the Trustees considered that, while the investment advisory fee would remain the same at all asset levels, the Funds’ shareholders benefited from the Advisor’s commitment to pay each Fund’s operating expenses out of its investment advisory fee. The Trustees noted that the advisory fee structure of the Funds would not directly result in economies of scale for shareholders. |
Overall Findings and Conclusions of the Board
Based on its deliberations and its evaluation of the information described above, at the Meeting, respectively, the Board, including the Independent Trustees: (a) concluded that the terms of the Investment Advisory Agreement with respect to each Fund are fair and reasonable; (b) concluded that the Advisor’s fees are reasonable in light of the nature and quality of the services expected to be rendered by the Advisor to each Fund; and (c) agreed to approve the renewal of the Investment Advisory Agreement as to each Fund for an additional annual period. In its deliberations at the Meeting, the Board did not identify any particular factor (or conclusion with respect thereto) or single piece of information that was all-important, controlling or determinative of its decision, but considered all of the factors together, and each Trustee may have attributed different weights to the various factors (and conclusions with respect thereto) and information.
260
Pacer Funds
ADDITIONAL INFORMATION
(Unaudited) (Continued)
FLRT
The Board of Trustees (the “Board”) of Pacer Funds Trust (the “Trust”), including the Trustees thereof who are not “interested persons,” as defined by the Investment Company Act of 1940, as amended (the “1940 Act”), of the Trust (the “Independent Trustees”), held a meeting March 19, 2024 (the “Meeting”) for the purpose of, among other things, the consideration of, and voting on, the proposed renewal of the investment advisory agreement (the “Investment Advisory Agreement”) between the Trust and Pacer Advisors, Inc. (the “Advisor”) with respect to Pacer Pacific Asset Floating Rate High Income ETF (“FLRT” or the “Fund”), and the proposed renewal of an investment sub-advisory agreement (the “Sub-Advisory Agreement”) between the Advisor and Aristotle Pacific Capital, LLC (the “Sub-Advisor”) with respect to FLRT.
The Board, including a majority of the Trust’s Independent Trustees voting separately, approved the Investment Advisory Agreement and the Sub-Advisory Agreement on behalf of the Fund at the Meeting, based on its review of qualitative and quantitative information provided by the Advisor and the Sub-Advisor, as well as the Trust’s other service providers. Prior to deciding to approve the Investment Advisory Agreement and the Sub-Advisory Agreement for the Fund at the Meeting, the Independent Trustees requested and obtained from the Advisor and the Sub-Advisor such information as the Independent Trustees deemed reasonably necessary to evaluate the terms of the Investment Advisory Agreement and the Sub-Advisory Agreement. The Independent Trustees received assistance and advice from, and met separately with, independent counsel. In addition, the Independent Trustees received a memorandum from independent counsel regarding the responsibilities of the Board with respect to the approval of the renewal of the Investment Advisory Agreement and the Sub-Advisory Agreement.
Prior to approval, the Board obtained and reviewed a variety of information, including certain information prepared by Broadridge Financial Solutions (“Broadridge”) regarding the Fund’s fees and expenses relative to the fees and expenses of other funds with similar investment objectives and strategies. At the Meeting, the Board, including the Independent Trustees, evaluated a number of factors and various materials in connection with the approval process, including: (1) a copy of the Investment Advisory Agreement and the Sub-Advisory Agreement for the Fund; (2) the Advisor’s and the Sub-Advisor’s responses to questionnaires designed to provide the Board with information reasonably necessary to evaluate the terms of the Investment Advisory Agreement and the Sub-Advisory Agreement on behalf of the Fund; (3) the Advisor’s and the Sub-Advisor’s Form ADV disclosures; (4) information describing the nature, quality and extent of services that the Advisor and the Sub-Advisor are providing and prepared to provide to the Fund; (5) the advisory fee payable by the Fund to the Advisor for its services and the sub-advisory fees payable to the Sub-Advisor by the Advisor under the Sub-Advisory Agreement; (6) certain comparative information regarding the Fund’s expenses and performance relative to the expenses and performance of other funds; (7) a copy of the registration statement; and (8) information regarding the ownership and management structure, financial condition, and compliance program of the Advisor and the Sub-Advisor. Representatives from the Advisor presented additional information and participated in question and answer sessions at the Meeting to help the Board evaluate the Advisor’s, and the Sub-Advisor’s services and fees, as well as other aspects of the Investment Advisory Agreement and the Sub-Advisory Agreement.
In considering the approval of the Investment Advisory Agreement and the Sub-Advisory Agreement at the Meeting, respectively, the Board considered various factors that the Trustees determined were relevant, including: (i) the nature, extent and quality of the services to be provided by the Advisor and the Sub-Advisor, including the performance of the Advisor and Sub-Advisor with respect to the Fund; (ii) the costs and benefits, including the fee to be paid to the Advisor by the Fund, of the advisory services to be provided to the Fund; (iii) the cost and benefits, including the fees paid, to the Sub-Advisor by the Advisor as it relates to the investment advisory services provided to the Fund; and (iv) potential economies of scale. The Board’s findings as it relates to each of the factors for the Fund are set forth below.
● | Nature, Extent and Quality of Services to be Provided by the Adviser and the Sub-Advisor. The Board reviewed the scope of services provided by the Adviser under the Investment Advisory Agreement and the Sub-Advisor under the Sub-Advisory Agreement. In this regard, the Trustees reviewed Fund’s investment goal and investment strategy, and the Adviser’s and the Sub-Advisor’s ability to implement such investment goal and/or investment strategy, including, but not limited to, trading practices. With respect to sub-advisory services to be provided by the Sub-Advisor, the Board noted that Sub-Advisor has assets allocated to it by the Adviser and considered the Sub-Advisor’s ability to ensure compliance with the Fund’s strategies, policies, and limitations. In addition, the Trustees reviewed the management team at the Adviser and the Sub-Advisor that is responsible for managing the Fund, including staffing, skills and compensation program, and considered various other portfolios advised by the Adviser and the Sub-Advisor and any potential conflicts. The Trustees also considered the strong reputation of the Sub-Advisor in the industry and the potential positive impact that might have on investment interest in the Fund. The Board also considered a report from the Trust’s Chief Compliance Officer regarding the Sub-Advisor’s compliance programs as such relates to the operation of the Fund. |
Based on its review, the Board determined that the Adviser and the Sub-Advisor are capable of providing all necessary advisory and sub-advisory services required by the Fund, as indicated by the Adviser’s and the Sub-Advisor’s management capabilities, the professional qualifications and experience of its portfolio management personnel and the performance of the Fund relative to its benchmark index and other products managed by the Adviser and the Sub-Advisor with similar investment objectives and strategies as the Fund (if applicable). The Board reviewed,
261
Pacer Funds
ADDITIONAL INFORMATION
(Unaudited) (Continued)
a comparison of the Fund’s performance for the one-year, three-year, five-year and since inception periods ended December 31, 2023, to that of its benchmark index and that, during the year, the Board received periodic reports on the Fund’s short- and longer-term performance in comparison with its benchmark index. The Board noted that the Fund had periods of outperformance and underperformance relative to its benchmark index over the relevant periods. The Board also considered other services provided to the Fund by the Adviser and the Sub-Advisor, where relevant, such as selecting broker-dealers for executing portfolio transactions, monitoring adherence to the Fund’s investment restrictions, and monitoring compliance with various policies and procedures and with applicable securities regulations.
Based on the factors above, as well as those discussed below, the Board concluded, within the context of its full deliberations, that it was satisfied with the nature, extent and quality of the services provided and to be provided to the Fund by the Adviser and the Sub-Advisor, respectively.
● | Costs and Benefits of Advisory Services to be Provided to the Fund. In considering the advisory fees payable by the Trust to the Adviser and the Fund’s expense ratio, the Board reviewed statistical information prepared by Broadridge regarding the expense ratio components, including gross and net total expenses of the Fund in comparison with the same information for other ETFs, objectively selected by Broadridge as comprising the Fund’s applicable expense peer group (“Peer Group”) pursuant to Broadridge’s proprietary ETF methodology. The Board was provided with a detailed description of the proprietary ETF methodology used by Broadridge to determine the Fund’s peer group. The Board noted that, due to the limitations in providing comparable funds in the peer group, the statistical information provided in Broadridge’s report may or may not provide meaningful direct comparisons to the Fund in all instances. The Board compared Fund’s expense ratio to the expense ratios of funds in its Peer Group, focusing on whether the Fund was charged fees that were within the range of fees charged by those in the Peer Group. It also noted that the Adviser had contractually agreed to pay the operating expenses of the Fund, including the cost of transfer agency, custody, fund administration, legal, audit and other services, except interest, taxes, brokerage commissions and other expenses in connection with the execution of portfolio transactions, and extraordinary and non-routine expenses. It was further noted that this contractual agreement cannot be changed without shareholder approval. The Board also evaluated the compensation and incidental or “fall-out” benefits received by the Adviser from its relationship with the Fund, considering the Adviser’s profitability analysis prepared and shared by the Adviser’s management. |
Based on the factors above, as well as those discussed below, the Board concluded, within the context of its full deliberations, that Fund’s advisory fee was reasonable in light of the nature and quality of the services expected to be rendered by the Adviser.
● | Costs and Benefits of Sub-Advisor’s Services to be Provided to the Fund. The Board noted that the sub-advisory fees paid to the Sub-Advisor are paid by the Adviser and would not be additional fees to be borne by the Fund. The Board also noted that the sub-advisory fees were the product of arms-length negotiations between the Adviser and the Sub-Advisor. In considering the sub-advisory fees payable by the Adviser to Sub-Advisor, the Board evaluated the compensation and benefits received or likely to be received by the Sub-Advisor from the Adviser relating to the services provided to the Fund. Based on the factors above, as well as those discussed below, the Board concluded, within the context of its full deliberations, that the sub-advisory fees payable to Sub-Advisor under the Sub-Advisory Agreement with the Adviser were reasonable in light of the nature and quality of the services rendered and, where relevant, expected to be rendered by the Sub-Advisor. |
● | Economies of Scale. The Board also reviewed and considered the extent to which economies of scale would be realized by the Adviser and the Sub-Advisor as the assets of the Fund may grow in the future. In considering the extent to which economies of scale would be realized as the Fund grows and whether advisory fee levels reflect those economies of scale for the benefit of the Fund’s investors, the Trustees considered that the Fund’s fee arrangement with the Adviser involved a contractual commitment by the Adviser to pay the operating expenses of the Fund. The Board reviewed the Adviser’s methodology for calculating estimated profitability of the Fund, noting that profitability may be affected by numerous factors, including, among others, the types of funds managed and expense allocations. The Board acknowledged the difficulty in calculating and comparing profitability at the individual fund level. For the Fund the Trustees considered that, while the investment advisory fee would remain the same at all asset levels, the Funds’ shareholders benefited from the Adviser’s commitment to pay each Fund’s operating expenses out of its investment advisory fee. |
In its deliberations, the Board did not identify any particular factor (or conclusion with respect thereto) or single piece of information that was all-important, controlling or determinative of its decision, but considered all of the factors together, and each Trustee may have attributed different weights to the various factors (and conclusions with respect thereto) and information. After further discussion, upon a motion duly made, seconded and approved, the following resolutions were unanimously approved (with the Independent Trustees voting separately):
262
Pacer Funds
ADDITIONAL INFORMATION
(Unaudited) (Continued)
Overall Findings and Conclusions of the Board
Based on its deliberations and its evaluation of the information described above as it relates to the Fund, at the Meeting, respectively, the Board, including the Independent Trustees: (a) concluded that the terms of the Investment Advisory Agreement with respect to the Fund are fair and reasonable; (b) concluded that the terms of the Sub-Advisory Agreement with respect to the Fund are fair and reasonable; (c) concluded that the Advisor’s fees are reasonable in light of the nature and quality of the services expected to be rendered by the Advisor to the Fund; (d) concluded that the Sub-Advisor’s fees are reasonable in light of the nature and quality of the services expected to be rendered to the Fund by the Sub- Advisor; (e) agreed to approve the Investment Advisory Agreement as to the Fund; and (f) agreed to approve the Sub-Advisory Agreement for the Fund. In its deliberations at the Meeting, the Board did not identify any particular factor (or conclusion with respect thereto) or single piece of information that was all-important, controlling or determinative of its decision, but considered all of the factors together, and each Trustee may have attributed different weights to the various factors (and conclusions with respect thereto) and information.
QDPL
The Board of Trustees (the “Board”) of Pacer Funds Trust (the “Trust”), including the Trustees thereof who are not “interested persons,” as defined by the Investment Company Act of 1940, as amended (the “1940 Act”), of the Trust (the “Independent Trustees”), held a meeting March 19, 2024 (the “Meeting”) for the purpose of, among other things, the consideration of, and voting on, the proposed renewal of the investment advisory agreement (the “Investment Advisory Agreement”) between the Trust and Pacer Advisors, Inc. (the “Advisor”) with respect to Pacer Metaurus US Large Cap Dividend Multiplier 400 ETF (“QDPL” or the “Fund”), and the proposed renewal of an investment sub-advisory agreement (the “Sub-Advisory Agreement”) between the Advisor and Metaurus Advisors, LLC (the “Sub-Advisor”) with respect to QDPL.
The Board, including a majority of the Trust’s Independent Trustees voting separately, approved the renewal of the Investment Advisory Agreement and the Sub-Advisory Agreement on behalf of the Fund at the Meeting, based on its review of qualitative and quantitative information provided by the Advisor and the Sub-Advisor, as well as the Trust’s other service providers. Prior to deciding to approve the renewal of the Investment Advisory Agreement and the Sub-Advisory Agreement for the Fund at the Meeting, the Independent Trustees requested and obtained from the Advisor and the Sub-Advisor such information as the Independent Trustees deemed reasonably necessary to evaluate the terms of the Investment Advisory Agreement and the Sub-Advisory Agreement. The Independent Trustees received assistance and advice from, and met separately with, independent counsel. In addition, the Independent Trustees received a memorandum from independent counsel regarding the responsibilities of the Board with respect to the approval of the renewal of the Investment Advisory Agreement and the Sub-Advisory Agreement.
Prior to approval, the Board obtained and reviewed a variety of information, including certain information prepared by Broadridge Financial Solutions (“Broadridge”) regarding the Fund’s fees and expenses relative to the fees and expenses of other funds with similar investment objectives and strategies. At the Meeting, the Board, including the Independent Trustees, evaluated a number of factors and various materials in connection with the approval process, including: (1) a copy of the Investment Advisory Agreement and the Sub-Advisory Agreement for the Fund; (2) the Advisor’s and the Sub-Advisor’s responses to questionnaires designed to provide the Board with information reasonably necessary to evaluate the terms of the Investment Advisory Agreement and the Sub-Advisory Agreement on behalf of the Fund; (3) the Advisor’s and the Sub-Advisor’s Form ADV disclosures; (4) information describing the nature, quality and extent of services that the Advisor and the Sub-Advisor are providing and prepared to provide to the Fund; (5) the advisory fee payable by the Fund to the Advisor for its services and the sub-advisory fees payable to the Sub-Advisor by the Advisor under the Sub-Advisory Agreement; (6) certain comparative information regarding the Fund’s expenses and performance relative to the expenses and performance of other funds; (7) a copy of the Trust’s registration statement; and (8) information regarding the ownership and management structure, financial condition, and compliance program of the Advisor and the Sub-Advisor. Representatives from the Advisor presented additional information and participated in question and answer sessions at the Meeting to help the Board evaluate the Advisor’s, and the Sub-Advisor’s services and fees, as well as other aspects of the Investment Advisory Agreement and the Sub-Advisory Agreement.
In considering the approval of the Investment Advisory Agreement and the Sub-Advisory Agreement at the Meeting, respectively, the Board considered various factors that the Trustees determined were relevant, including: (i) the nature, extent and quality of the services to be provided by the Advisor and the Sub-Advisor, including the performance of the Advisor and Sub-Advisor with respect to the Fund; (ii) the costs and benefits, including the fee to be paid to the Advisor by the Fund, of the advisory services to be provided to the Fund; (iii) the cost and benefits, including the fees paid, to the Sub-Advisor by the Advisor as it relates to the investment advisory services provided to the Fund; and (iv) potential economies of scale. The Board’s findings as it relates to each of the factors for the Fund are set forth below.
263
Pacer Funds
ADDITIONAL INFORMATION
(Unaudited) (Continued)
● | Nature, Extent and Quality of Services to be Provided by the Advisor and the Sub-Advisor. The Board reviewed the scope of services provided by the Advisor under the Investment Advisory Agreement and the Sub-Advisor under the Sub-Advisory Agreement. In this regard, the Trustees reviewed the Fund’s investment goal and investment strategy, and the Advisor’s and the Sub-Advisor’s ability to implement such investment goal and/or investment strategy, including, but not limited to, trading practices. With respect to sub-advisory services to be provided by the Sub-Advisor, the Board noted that Sub-Advisor has assets allocated to it by the Advisor and considered the Sub-Advisor’s ability to ensure compliance with the Fund’s strategies, policies, and limitations. In addition, the Trustees reviewed the management team at the Advisor and the Sub-Advisor that is responsible for managing the Fund, including staffing, skills and compensation program, and considered various other portfolios advised by the Advisor and the Sub-Advisor and any potential conflicts. The Trustees also considered the strong reputation of the Sub-Advisor in the industry and the potential positive impact that might have on investment interest in the Fund. The Board also considered a report from the Trust’s Chief Compliance Officer regarding the Sub-Advisor’s compliance programs as such relates to the operation of the Fund. |
Based on its review, the Board determined that the Advisor and the Sub-Advisor are capable of providing all necessary advisory and sub-advisory services required by the Fund, as indicated by the Advisor’s and the Sub-Advisor’s management capabilities, the professional qualifications and experience of its portfolio management personnel and the performance of the Fund relative to its underlying index and other products managed by the Advisor and the Sub-Advisor with similar investment objectives and strategies as the Fund (if applicable). The Board reviewed, a comparison of the Fund’s performance for the one-year and since inception periods ended December 31, 2023, to that of its underlying index and that, during the year, the Board received periodic reports on the Fund’s short- and longer-term performance in comparison with its underlying index. The Board noted that the Fund performed in line with its underlying index over the relevant periods. The Board also considered other services provided to the Fund by the Advisor and the Sub-Advisor, where relevant, such as selecting broker-dealers for executing portfolio transactions, monitoring adherence to the Fund’s investment restrictions, and monitoring compliance with various policies and procedures and with applicable securities regulations.
Based on the factors above, as well as those discussed below, the Board concluded, within the context of its full deliberations, that it was satisfied with the nature, extent and quality of the services provided and to be provided to the Fund by the Advisor and the Sub-Advisor, respectively.
● | Costs and Benefits of Advisory Services to be Provided to the Fund. In considering the advisory fees payable by the Trust to the Adviser and the Fund’s expense ratio, the Board reviewed statistical information prepared by Broadridge regarding the expense ratio components, including gross and net total expenses of the Fund in comparison with the same information for other ETFs, objectively selected by Broadridge as comprising the Fund’s applicable expense peer group (“Peer Group”) pursuant to Broadridge’s proprietary ETF methodology. The Board was provided with a detailed description of the proprietary ETF methodology used by Broadridge to determine the Fund’s peer group. The Board noted that, due to the limitations in providing comparable funds in the peer group, the statistical information provided in Broadridge’s report may or may not provide meaningful direct comparisons to the Fund in all instances. The Board compared the Fund’s expense ratio to the expense ratios of funds in its Peer Group, focusing on whether the Fund was charged fees that were within the range of fees charged by those in the Peer Group. It also noted that the Advisor had contractually agreed to pay the operating expenses of the Fund, including the cost of transfer agency, custody, fund administration, legal, audit and other services, except interest, taxes, brokerage commissions and other expenses in connection with the execution of portfolio transactions, and extraordinary and non-routine expenses. It was further noted that this contractual agreement cannot be changed without shareholder approval. The Board also evaluated the compensation and incidental or “fall-out” benefits received by the Advisor from its relationship with the Fund, considering the Advisor’s profitability analysis prepared and shared by the Advisor’s management. |
Based on the factors above, as well as those discussed below, the Board concluded, within the context of its full deliberations, that the Fund’s advisory fee was reasonable in light of the nature and quality of the services expected to be rendered by the Advisor.
● | Costs and Benefits of Sub-Advisor’s Services to be Provided to the Fund. The Board noted that the sub-advisory fees paid to the Sub-Advisor are paid by the Advisor and would not be additional fees to be borne by the Fund. The Board also noted that the sub-advisory fees were the product of arms-length negotiations between the Advisor and the Sub-Advisor. In considering the sub-advisory fees payable by the Advisor to Sub-Advisor, the Board evaluated the compensation and benefits received or likely to be received by the Sub-Advisor from the Advisor relating to the services provided to the Fund. Based on the factors above, as well as those discussed below, the Board concluded, within the context of its full deliberations, that the sub-advisory fees payable to Sub-Advisor under the Sub-Advisory Agreement with the Advisor were reasonable in light of the nature and quality of the services rendered and, where relevant, expected to be rendered by the Sub-Advisor. |
264
Pacer Funds
ADDITIONAL INFORMATION
(Unaudited) (Continued)
● | Economies of Scale. The Board also reviewed and considered the extent to which economies of scale would be realized by the Advisor and the Sub-Advisor as the assets of the Fund may grow in the future. In considering the extent to which economies of scale would be realized as the Fund grows and whether advisory fee levels reflect those economies of scale for the benefit of the Fund’s investors, the Trustees considered that the Fund’s fee arrangement with the Adviser involved a contractual commitment by the Adviser to pay the operating expenses of the Fund. The Board reviewed the Adviser’s methodology for calculating estimated profitability of the Fund, noting that profitability may be affected by numerous factors, including, among others, the types of funds managed and expense allocations. The Board acknowledged the difficulty in calculating and comparing profitability at the individual fund level. For the Fund the Trustees considered that, while the investment advisory fee would remain the same at all asset levels, the Funds’ shareholders benefited from the Adviser’s commitment to pay each Fund’s operating expenses out of its investment advisory fee. |
Overall Findings and Conclusions of the Board
Based on its deliberations and its evaluation of the information described above as it relates to the Fund, at the Meeting, respectively, the Board, including the Independent Trustees: (a) concluded that the terms of the Investment Advisory Agreement with respect to the Fund are fair and reasonable; (b) concluded that the terms of the Sub-Advisory Agreement with respect to the Fund are fair and reasonable; (c) concluded that the Advisor’s fees are reasonable in light of the nature and quality of the services expected to be rendered by the Advisor to the Fund; (d) concluded that the Sub-Advisor’s fees are reasonable in light of the nature and quality of the services expected to be rendered to the Fund by the Sub- Advisor; (e) agreed to approve the Investment Advisory Agreement as to the Fund; and (f) agreed to approve the Sub-Advisory Agreement for the Fund. In its deliberations at the Meeting, the Board did not identify any particular factor (or conclusion with respect thereto) or single piece of information that was all-important, controlling or determinative of its decision, but considered all of the factors together, and each Trustee may have attributed different weights to the various factors (and conclusions with respect thereto) and information.
NOTE 6 – TRUSTEES AND OFFICERS
The business of the Funds is managed under the direction of the Board of Trustees. The Board of Trustees formulates the general policies of the Funds and meets periodically to review the Funds’ performance, monitor investment activities and practices, and discuss other matters affecting the Funds. The Trustees are fiduciaries for the Funds’ shareholders and are governed by the laws of the State of Delaware in this regard. The names and addresses of the Trustees and officers of the Trust are listed below along with a description of their principal occupations over at least the last five years. There are currently four Trustees, three of whom are not “interested persons” of the Trust within the meaning of that term under the 1940 Act (“Independent Trustee”). The Trustees, in turn, elect the officers of the Trust to actively supervise its day-to-day operations. The address of each Trustee and officer of the Trust, unless otherwise indicated below, is c/o Pacer Advisors, Inc., 500 Chesterfield Parkway, Malvern, PA 19335. The Funds’ Statement of Additional Information includes additional information about the Trustees and is available upon request by calling toll free (800) 617-0004.
Additional information about each Trustee of the Trust is set forth below. The address of each Trustee of the Trust is c/o Pacer Advisors, Inc., 500 Chesterfield Parkway, Malvern, Pennsylvania 19355.
Name and Year of Birth | Position(s)
Held with
the Trust | Term of Office
and Length of
Time Served | Principal Occupation(s)
During Past 5 Years | Number of
Portfolios in
Fund
Complex
Overseen
By Trustee | Other
Directorships
held by
Trustee During
Past Five Years |
Interested Trustee | | | | | |
Joe M. Thomson
Born: 1944 | Trustee, Chairman, President, and Principal Executive Officer | Indefinite Term; since 2014 | Founder/President at Pacer Advisors, Inc. (since 2005) | 52 | Director, First Cornerstone Bank (2000–2016) |
265
Pacer Funds
ADDITIONAL INFORMATION
(Unaudited) (Continued)
Name and Year of Birth | Position(s)
Held with
the Trust | Term of Office
and Length of
Time Served | Principal Occupation(s)
During Past 5 Years | Number of
Portfolios in
Fund
Complex
Overseen
By Trustee | Other
Directorships
held by
Trustee During
Past Five Years |
Independent Trustees | | | | | |
Deborah G. Wolk
Born: 1950 | Lead Independent Trustee | Indefinite Term; since 2015 | Self-employed providing accounting services and computer modeling (since 1997) | 52 | 0 |
Jane K. Sagendorph
Born: 1951 | Trustee | Indefinite Term; since 2021 | Accountant, BluFish Designs (since 2011) | 52 | 0 |
Colin C. Lake
Born: 1971 | Trustee | Indefinite Term; since 2021 | Founder/President, Developing the Next Leaders, Inc. (consulting) (since 2016) | 52 | 0 |
The officers of the Trust conduct and supervise its daily business. The address of each officer of the Trust, unless otherwise indicated below, is c/o Pacer Advisors, Inc., 500 Chesterfield Parkway, Malvern, Pennsylvania 19355.
Name and Year of Birth | Position(s) Held
with Funds | Term of Office
and Length of
Time Served | Principal Occupation(s)
During Past Five Years |
Principal Officers of the Trust | | | |
Joe M. Thomson
Born: 1944 | Trustee, Chairman, President, and Principal Executive Officer | Indefinite Term; since 2014 | Founder/President, Pacer Advisors, Inc. (since 2005); President and Chief Compliance Officer, Pacer Financial, Inc. (since 2004) |
Sean E. O’Hara
Born: 1962 | Treasurer and Principal Financial Officer | Indefinite Term; since 2014 | Director, Index Design Group (since 2015); Director, Pacer Financial, Inc. (since 2007); Director, Pacer Advisors, Inc. (since 2007) |
Bruce Kavanaugh
Born: 1964 | Secretary and Portfolio Manager | Indefinite Term; since 2016 | Vice President, Pacer Advisors, Inc. (since 2005); Vice President, Pacer Financial, Inc. (since 2004) |
Liam Clarke
Gateway Corporate Center
Suite 216
223 Wilmington West Chester Pike
Chadds Ford, PA 19317
Born: 1996 | Chief Compliance Officer and AML Officer | Indefinite Term; since 2023 | Director, Vigilant, (since 2021); Financial Services Assurance Experienced Associate, PricewaterhouseCoopers, (2018-2021) |
Mr. Thomson is an “Interested Person” by reason of his relationship with the Adviser.
Each Trustee shall serve during the lifetime of the Trust until he or she: (a) dies; (b) resigns; (c) has reached the mandatory retirement age, if any, as set by the Trustees; (d) is declared incompetent by a court of appropriate jurisdiction; or (e) is removed, or, if sooner, until the next meeting of shareholders called for the purpose of electing Trustees and until the election and qualification of his or her successor in accordance with the Trust’s Declaration of Trust and By-laws. Each officer holds office at the pleasure of the Board and services for a period of one year, or until his or her successor is duly elected and qualified.
The Statement of Additional Information includes additional information, including compensation, about the Funds’ Trustees.
266
(This Page Intentionally Left Blank.)
(This Page Intentionally Left Blank.)
(This Page Intentionally Left Blank.)
Advisor Pacer Advisors, Inc.
500 Chesterfield Parkway
Malvern, PA 19355 |
Index Provider CFRA
One New York Plaza, 34th Floor
New York, NY 10004
FTSE International Limited
12th Floor, 10 Upper Bank Street
Canary Wharf, London E14 5NP Index Design Group, LLC
500 Chesterfield Parkway
Malvern, PA 19355 LifeSci Index Partners, LLC
250 W 55th St, Suite 16b
New York, NY 10019 Lunt Capital Management, Inc.
215 S State St, Suite 100
Salt Lake City, UT 84111 Solactive AG
Platz der Einheit 1
60327 Frankfurt am Main
Germany S&P Dow Jones Indices LLC
55 Water Street
New York, NY 10041 |
Custodian U.S. Bank National Association
Custody Operations
1555 North Rivercenter Drive
Milwaukee, WI 53212 |
Sub Adviser Vident Investment Advisory, LLC
1125 Sanctuary Parkway, Suite 515
Alpharetta, GA 30009 CSOP Asset Management Limited
2802, Two Exchange Square, 8 Connaught Place Central, Hong Kong Aristotle Pacific Capital, LLC
840 Newport Center Drive, 7th Floor
Newport Beach, CA 92660 |
Distributor Pacer Financial, Inc.
500 Chesterfield Parkway
Malvern, PA 19355 |
Transfer Agent U.S. Bancorp Fund Services, LLC
615 East Michigan Street
Milwaukee, WI 53202 |
Independent Registered
Public Accounting Firm Sanville & Company
2617 Huntingdon Pike
Huntingdon Valley, PA 19006 |
Legal Counsel Practus, LLP
11300 Tomahawk Creek Parkway, Suite 310
Leawood, Kansas 66211 |

Item 2. Code of Ethics.
The registrant has adopted a code of ethics that applies to the registrant’s principal executive officer and principal financial officer. The registrant has not made any substantive amendments to its code of ethics during the period covered by this report. The registrant has not granted any waivers from any provisions of the code of ethics during the period covered by this report.
| (1) | File: A copy of the registrant’s Code of Ethics is filed herewith. |
Item 3. Audit Committee Financial Expert.
The registrant’s board of trustees has determined that there is at least one audit committee financial expert serving on its audit committee. Deborah Wolk is the “audit committee financial expert” and is considered to be “independent” as each term is defined in Item 3 of Form N-CSR.
Item 4. Principal Accountant Fees and Services.
The registrant has engaged its principal accountant to perform audit services, audit-related services, tax services and other services during the past two fiscal years. “Audit services” refer to performing an audit of the registrant's annual financial statements or services that are normally provided by the accountant in connection with statutory and regulatory filings or engagements for those fiscal years. “Audit-related services” refer to the assurance and related services by the principal accountant that are reasonably related to the performance of the audit. “Tax services” refer to professional services rendered by the principal accountant for tax compliance, tax advice, and tax planning. No "other services” were provided by the principal accountant. The following table details the aggregate fees billed or expected to be billed for each of the last two fiscal years for audit fees, audit-related fees, tax fees and other fees by the principal accountant.
| | FYE 04/30/2024 | FYE 04/30/2023 |
| ( a ) Audit Fees | $234,100 | $234,100 |
| ( b ) Audit-Related Fees | $0 | $0 |
| ( c ) Tax Fees | $29,000 | $29,000 |
| ( d ) All Other Fees | $0 | $0 |
The audit committee has adopted pre-approval policies and procedures that require the audit committee to pre-approve all audit and non-audit services of the registrant, including services provided to any entity affiliated with the registrant.
The percentage of fees billed by Sanville & Company applicable to non-audit services pursuant to waiver of pre-approval requirement were as follows:
| | FYE 04/30/2024 | FYE 04/30/2023 |
| Audit-Related Fees | 0% | 0% |
| Tax Fees | 0% | 0% |
| All Other Fees | 0% | 0% |
All of the principal accountant’s hours spent on auditing the registrant’s financial statements were attributed to work performed by full-time permanent employees of the principal accountant.
The following table indicates the non-audit fees billed or expected to be billed by the registrant’s accountant for services to the registrant and to the registrant’s investment adviser (and any other controlling entity, etc.—not sub-adviser) for the last two years.
| Non-Audit Related Fees | FYE 04/30/2024 | FYE 04/30/2023 |
| Registrant | $0 | $0 |
| Registrant’s Investment Adviser | $0 | $0 |
The audit committee of the board of trustees/directors has considered whether the provision of non-audit services that were rendered to the registrant's investment adviser is compatible with maintaining the principal accountant's independence and has concluded that the provision of such non-audit services by the accountant has not compromised the accountant’s independence.
( i ) Not applicable
Item 5. Audit Committee of Listed Registrants.
The registrant is an issuer as defined in Rule 10A-3 under the Securities Exchange Act of 1934, (the “Act”) and has a separately-designated standing audit committee established in accordance with Section 3(a)(58)(A) of the Act. The independent members of the committee, consisting of the entire Board, are as follows: Jane Sagendorph, Colin Lake and Deborah Wolk.
(b) Not applicable.
Item 6. Investments.
Schedule of Investments is included as part of the report to shareholders filed under Item 1 of this Form.
Item 7. Disclosure of Proxy Voting Policies and Procedures for Closed-End Management Investment Companies.
Not applicable to open-end investment companies.
Item 8. Portfolio Managers of Closed-End Management Investment Companies.
Not applicable to open-end investment companies.
Item 9. Purchases of Equity Securities by Closed-End Management Investment Company and Affiliated Purchasers.
Not applicable to open-end investment companies.
Item 10. Submission of Matters to a Vote of Security Holders.
There have been no material changes to the procedures by which shareholders may recommend nominees to the registrant’s board of Trustees.
Item 11. Controls and Procedures.
| (a) | The Registrant’s President/Principal Executive Officer and Treasurer/Principal Financial Officer have reviewed the Registrant's disclosure controls and procedures (as defined in Rule 30a-3(c) under the Investment Company Act of 1940 (the “Act”)) as of a date within 90 days of the filing of this report, as required by Rule 30a-3(b) under the Act and Rules 13a-15(b) or 15d-15(b) under the Securities Exchange Act of 1934. Based on their review, such officers have concluded that the disclosure controls and procedures are effective in ensuring that information required to be disclosed in this report is appropriately recorded, processed, summarized and reported and made known to them by others within the Registrant and by the Registrant’s service provider. |
| (b) | There were no changes in the Registrant's internal control over financial reporting (as defined in Rule 30a-3(d) under the Act) that occurred during the period covered by this report that have materially affected, or are reasonably likely to materially affect, the Registrant's internal control over financial reporting. |
Item 12. Disclosure of Securities Lending Activities for Closed-End Management Investment Companies
Not applicable to open-end investment companies.
Item 13. Exhibits.
| (a) | (1) Any code of ethics or amendment thereto, that is the subject of the disclosure required by Item 2, to the extent that the registrant intends to satisfy Item 2 requirements through filing an exhibit. 1) Filed herewith. |
(2) A separate certification for each principal executive officer and principal financial officer pursuant to Section 302 of the Sarbanes-Oxley Act of 2002. Filed herewith.
(3) Any written solicitation to purchase securities under Rule 23c-1 under the Act sent or given during the period covered by the report by or on behalf of the registrant to 10 or more persons. Not applicable to open-end investment companies.
| (4) | Change in the registrant’s independent public accountant. There was no change in the registrant’s independent public accountant for the period covered by this report. |
| (b) | Certifications pursuant to Section 906 of the Sarbanes-Oxley Act of 2002. Furnished herewith. |
SIGNATURES
Pursuant to the requirements of the Securities Exchange Act of 1934 and the Investment Company Act of 1940, the registrant has duly caused this report to be signed on its behalf by the undersigned, thereunto duly authorized.
| (Registrant) | Pacer Funds Trust | |
| | | |
| By (Signature and Title)* | /s/ Joe M. Thomson | |
| | Joe M. Thomson, President/Principal Executive Officer | |
| | | |
| Date | 7/3/2024 | |
Pursuant to the requirements of the Securities Exchange Act of 1934 and the Investment Company Act of 1940, this report has been signed below by the following persons on behalf of the registrant and in the capacities and on the dates indicated.
| By (Signature and Title)* | /s/ Joe M. Thomson | |
| | Joe M. Thomson, President/Principal Executive Officer | |
| | | |
| Date | 7/3/2024 | |
| By (Signature and Title)* | /s/ Sean E. O’Hara | |
| | Sean E. O’Hara, Treasurer/Principal Financial Officer | |
| | | |
| Date | 7/3/2024 | |
| * | Print the name and title of each signing officer under his or her signature. |