As filed with the U.S. Securities and Exchange Commission on 7/7/2021
UNITED STATES
SECURITIES AND EXCHANGE COMMISSION
Washington, D.C. 20549
FORM N-CSR
CERTIFIED SHAREHOLDER REPORT OF REGISTERED MANAGEMENT INVESTMENT COMPANIES
Investment Company Act file number 811-23024
Pacer Funds Trust
(Exact name of registrant as specified in charter)
500 Chesterfield Parkway
Malvern, PA 19355
(Address of principal executive offices) (Zip code)
Joe M. Thomson, President
500 Chesterfield Parkway
Malvern, PA 19355
(Name and address of agent for service)
610-644-8100
Registrant's telephone number, including area code
Date of fiscal year end: October 31
Date of reporting period: November 01, 2020 through April 30, 2021
Updated May 5, 2021
Item 1. Reports to Stockholders.
(a)
Pacer Funds
TABLE OF CONTENTS
| | Page |
Portfolio Allocation | 1 |
Performance Summary | 4 |
Expense Example | 14 |
Schedules of Investments | 16 |
Statements of Assets & Liabilities | 30 |
Statements of Operations | 32 |
Statements of Changes in Net Assets | 35 |
Financial Highlights | 41 |
Notes to Financial Statements | 51 |
Additional Information | 65 |
Pacer Funds
PORTFOLIO ALLOCATION (Unaudited)
As of April 30, 2021
Pacer American Energy Independence ETF
Sector(a) | | Percentage of
Net Assets | |
Transportation and Warehousing | | | 48.8 | % |
Utilities | | | 33.6 | % |
Mining, Quarrying, and Oil and Gas Extraction | | | 9.6 | % |
Professional Scientific and Technical Services | | | 4.1 | % |
Real Estate and Rental and Leasing | | | 2.0 | % |
Wholesale Trade | | | 0.7 | % |
Retail Trade | | | 0.5 | % |
Short-Term Investments | | | 0.7 | % |
Investments Purchased With Proceeds From Securities Lending | | | 9.5 | % |
Other Assets in Excess of Liabilities | | | -9.5 | % |
Total | | | 100.0 | % |
(a) | The Fund may classify a company in a different category than the American Energy Independence Index. |
Pacer Salt High truBetaTM US Market ETF
Sector(a) | | Percentage of
Net Assets | |
Consumer Cyclical | | | 27.1 | % |
Technology | | | 25.5 | % |
Financial | | | 13.8 | % |
Communications | | | 13.3 | % |
Energy | | | 6.1 | % |
Consumer, Non-cyclical | | | 5.7 | % |
Industrial | | | 5.1 | % |
Basic Materials | | | 3.2 | % |
Short-Term Investments | | | 0.2 | % |
Investments Purchased With Proceeds From Securities Lending | | | 22.5 | % |
Liabilities in Excess of Other Assets | | | -22.5 | % |
| | | | 100.0 | % |
(a) | The Fund may classify a company in a different category than the Salt High truBetaTM US Market Index. |
Pacer Salt Low truBetaTM US Market ETF
Sector(a) | | Percentage of
Net Assets | |
Consumer, Non-cyclical | | | 37.5 | % |
Utilities | | | 18.3 | % |
Financials | | | 17.3 | % |
Consumer Cyclical | | | 7.0 | % |
Communications | | | 6.6 | % |
Industrials | | | 6.1 | % |
Technology | | | 4.8 | % |
Basic Materials | | | 2.0 | % |
Short-Term Investments | | | 0.3 | % |
Investments Purchased With Proceeds From Securities Lending | | | 23.4 | % |
Liabilities in Excess of Other Assets | | | -23.3 | % |
| | | | 100.0 | % |
(a) | The Fund may classify a company in a different category than the Salt Low truBetaTM US Market Index. |
1
Pacer Funds
PORTFOLIO ALLOCATION (Unaudited)
As of April 30, 2021 (Continued)
Pacer Swan SOS Conservative (December) ETF
Sector | | Percentage of
Net Assets | |
Purchases Options | | | 108.0 | % |
Short-Term Investments | | | 0.6 | % |
Liabilities in Excess of Other Assets | | | -8.6 | % |
| | | | 100.0 | % |
Pacer Swan SOS Moderate (December) ETF
Sector | | Percentage of
Net Assets | |
Purchases Options | | | 107.2 | % |
Short-Term Investments | | | 0.6 | % |
Liabilities in Excess of Other Assets | | | -7.8 | % |
| | | | 100.0 | % |
Pacer Swan SOS Flex (December) ETF
Sector | | Percentage of
Net Assets | |
Purchases Options | | | 104.5 | % |
Short-Term Investments | | | 0.5 | % |
Liabilities in Excess of Other Assets | | | -5.0 | % |
| | | | 100.0 | % |
Pacer Swan SOS Fund of Funds ETF
Sector | | Percentage of
Net Assets | |
Affiliated Exchange Traded Funds | | | 99.3 | % |
Short-Term Investments | | | 0.7 | % |
Liabilities in Excess of Other Assets | | | 0.0 | %(a) |
| | | | 100.0 | % |
Pacer Swan SOS Conservative (April) ETF
Sector | | Percentage of
Net Assets | |
Purchases Options | | | 105.0 | % |
Short-Term Investments | | | 0.7 | % |
Liabilities in Excess of Other Assets | | | -5.7 | % |
| | | | 100.0 | % |
2
Pacer Funds
PORTFOLIO ALLOCATION (Unaudited)
As of April 30, 2021 (Continued)
Pacer Swan SOS Moderate (April) ETF
Sector | | Percentage of
Net Assets | |
Purchases Options | | | 105.9 | % |
Short-Term Investments | | | 0.8 | % |
Liabilities in Excess of Other Assets | | | -6.7 | % |
| | | | 100.0 | % |
Pacer Swan SOS Flex (April) ETF
Sector | | Percentage of
Net Assets | |
Purchases Options | | | 105.3 | % |
Short-Term Investments | | | 0.8 | % |
Liabilities in Excess of Other Assets | | | -6.1 | % |
| | | | 100.0 | % |
3
Pacer American Energy Independence ETF
PERFORMANCE SUMMARY
(Unaudited)
Growth of $10,000
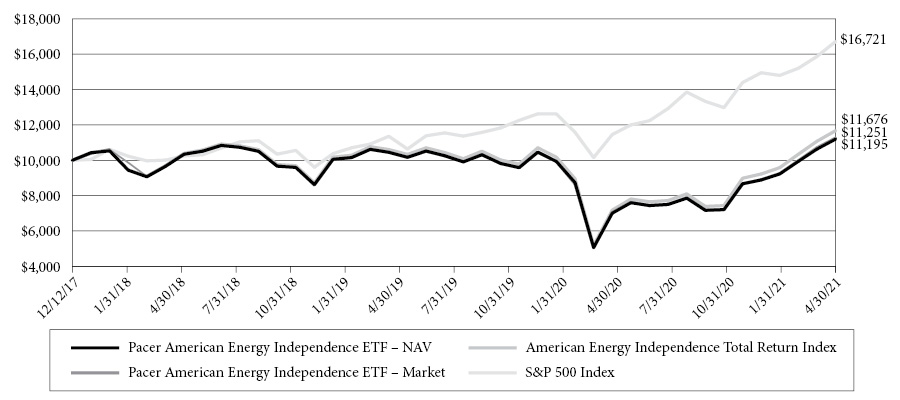
This chart illustrates the performance of a hypothetical $10,000 investment made on December 12, 2017, and is not intended to imply any future performance. The returns shown do not reflect the deduction of taxes that a shareholder would pay on fund distributions or the redemption of fund shares. The chart assumes reinvestment of capital gains and dividends.
The American Energy Independence Total Return Index uses a proprietary, rules based methodology to measure the performance of a portfolio of U.S. and Canadian exchange-listed equity securities of companies that generate a majority of their cash flow from certain qualifying “midstream” energy infrastructure activities. The companies in the Index are expected to benefit from regulatory policies favoring and industry trends toward American energy independence (i.e., a reduced or eliminated need for the United States to import fuels, such as coal, crude oil, or natural gas). Midstream energy infrastructure refers to the processing, storage, transportation, and distribution of crude oil, natural gas, refined products, and their related products as well as the transmission or storage of renewable energy. The following activity segments are considered qualifying midstream energy infrastructure activities: gathering & processing, compression, fractionation, logistics, midstream services, pipeline transportation, storage and terminaling of oil, gas, natural gas liquids, and refined products, as well as liquid natural gas facilities. The following activity segments are not qualifying activities: refining, shipping, exploration, production, retail, distribution, power generation or oil services. The Index may include small-, mid-, and large-capitalization companies.
The S&P 500 Index consists of approximately 500 leasing U.S.-listed companies representing approximately 8% of the U.S. equity market capitalization.
Annualized Returns(1)
(For the period ended April 30, 2021)
| | Six Months | One Year | Since Inception(2) |
Pacer American Energy Independence ETF - NAV | 55.31% | 59.87% | 3.40% |
Pacer American Energy Independence ETF - Market | 56.18% | 59.85% | 3.55% |
American Energy Independence Total Return Index (3) | 57.01% | 62.67% | 4.69% |
S&P 500 Total Return (3) | 28.85% | 45.98% | 16.42% |
(1) | The performance data quoted is historical. Past performance is no guarantee of future results. Current performance may be higher or lower than the performance data quoted. The principal value and investment return of an investment will fluctuate so that investor’s shares, when redeemed, may be worth more or less than the original cost. The returns shown do not reflect the deduction of taxes that a shareholder would pay on Fund distributions or on redemptions of Fund shares. The total annual operating expenses as stated in the fee table to the Fund’s prospectus dated February 28, 2021, is 0.75%. For performance information current to the most recent month-end, please call 1-877-337-0500. |
(2) | Inception date is December 12, 2017. The Fund is the sucessor to the investment performance of the American Energy Independence ETF (the “Predecessor USAI”) as a result of the reorganization of the Predecessor USAI Fund into the Fund on December 16, 2019. Accordingly, the performance information shown in the chart and table above for periods prior to December 16, 2019 is that of the Predecessor USAI Fund’s Shares for the Fund. The Predecessor USAI Fund was advised by SL Advisors, LLC and sub-advised by Penserra Capital Management LLC and had substantially the same investment objectives, policies, and strategies as the Fund. |
(3) | Indexes are unmanaged statistical composites and their returns do not include fees an investor would pay to purchase the securities they represent. Such costs would lower performance. It is not possible to invest directly in an index. |
4
Pacer Salt High truBetaTM US Market ETF
PERFORMANCE SUMMARY
(Unaudited)
Growth of $10,000
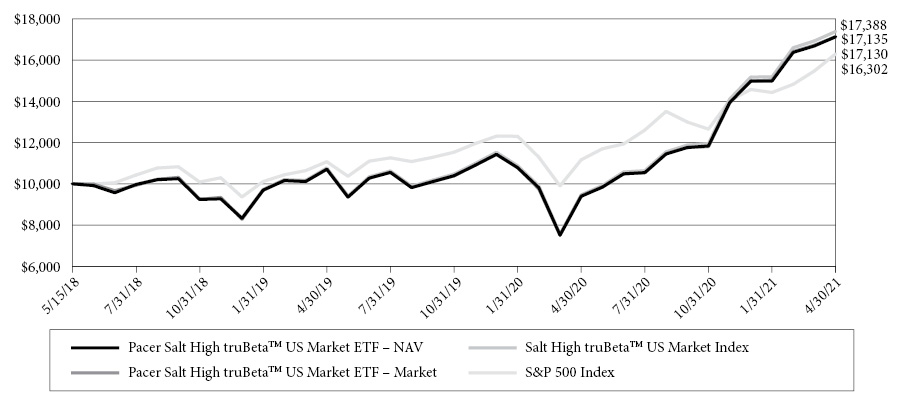
This chart illustrates the performance of a hypothetical $10,000 investment made on May 15, 2018, and is not intended to imply any future performance. The returns shown do not reflect the deduction of taxes that a shareholder would pay on fund distributions or the redemption of fund shares. The chart assumes reinvestment of capital gains and dividends.
The Salt High truBetaTM US Market Index uses an objective, rules-based methodology to measure the performance of an equal-weighted portfolio of approximately 100 large- and mid-capitalization U.S.-listed stocks with the highest forecasted systematic risk relative to the market (known as “beta”). Construction of the Index begins with the constituents of the Solactive US Large & Mid Cap Index (the “Equity Universe”), generally the 1,000 largest U.S.-listed common stocks and real estate investment trusts (“REITs”). Companies in the Equity Universe are then screened to keep only the 500 stocks with the highest average daily traded value over the past 30 days. Those 500 stocks are then analyzed using a proprietary algorithm developed by the Index Provider to calculate each stock’s truBetaTM forecast, i.e., its projected beta for the subsequent quarter, and to eliminate stocks whose performance is weakly correlated with the broader U.S. equity market (the remaining securities are referred to as the “Index Universe”).
The S&P 500 Index consists of approximately 500 leasing U.S.-listed companies representing approximately 8% of the U.S. equity market capitalization.
Annualized Returns(1)
(For the period ended April 30, 2021)
| | Six Months | One Year | Since Inception(2) |
Pacer Salt High truBetaTM US Market ETF - NAV | 44.72% | 82.33% | 19.95% |
Pacer Salt High truBetaTM US Market ETF - Market | 45.18% | 81.75% | 19.96% |
Salt High truBetaTM US Market Index(3) | 45.50% | 83.72% | 20.56% |
S&P 500 Total Return (3) | 28.85% | 45.98% | 17.96% |
(1) | The performance data quoted is historical. Past performance is no guarantee of future results. Current performance may be higher or lower than the performance data quoted. The principal value and investment return of an investment will fluctuate so that investor’s shares, when redeemed, may be worth more or less than the original cost. The returns shown do not reflect the deduction of taxes that a shareholder would pay on Fund distributions or on redemptions of Fund shares. The total annual operating expenses as stated in the fee table to the Fund’s prospectus dated February 28, 2021, is 0.60%. For performance information current to the most recent month-end, please call 1-877-337-0500. |
(2) | Inception date is May 15, 2018. The Fund is the successor to the investment performance of the Salt Low truBetaTM US Market ETF, as a result of the reorganization of the Salt Low truBetaTM US Market ETF into the Fund on October 5, 2020. In addition, the Salt Low truBetaTM US Market ETF was the successor to the investment performance of Salt Low truBetaTM US Market ETF, a series of Salt Funds Trust, as a result of the reorganization of the series of Salt Funds Trust into a series of ETF Series Solutions that occurred on December 16, 2019 (together, the “Predecessor SLT”). Accordingly, any performance information for periods prior to October 5, 2020 is that of the series of ETF Series Solutions; any performance for periods prior to December 16, 2019 is that of the series of Salt Funds Trust. The Predecessor SLT Fund was advised by Salt Financial, LLC and sub-advised by Penserra Capital Management LLC and had substantially the same investment objectives, policies, and strategies as the Fund. |
(3) | Indexes are unmanaged statistical composites and their returns do not include fees an investor would pay to purchase the securities they represent. Such costs would lower performance. It is not possible to invest directly in an index. |
5
Pacer Salt Low truBetaTM US Market ETF
PERFORMANCE SUMMARY
(Unaudited)
Growth of $10,000
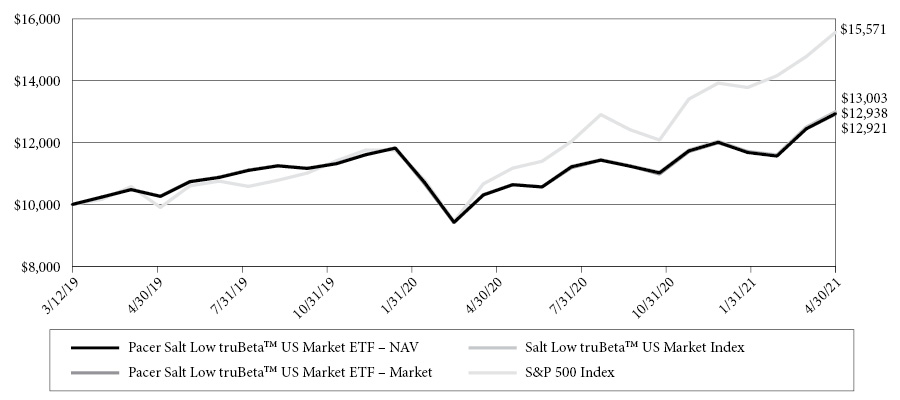
This chart illustrates the performance of a hypothetical $10,000 investment made on March 12, 2019, and is not intended to imply any future performance. The returns shown do not reflect the deduction of taxes that a shareholder would pay on fund distributions or the redemption of fund shares. The chart assumes reinvestment of capital gains and dividends.
The Salt Low truBetaTM US Market Index uses a an objective, rules-based methodology to to measure the performance of an equal-weighted portfolio of approximately 100 large and mid-capitalization U.S.-listed stocks with the lowest levels of variability in their historical beta calculations (“Beta Variability”) and forecasted beta of less than 1.00. “Beta” is a calculation of an investment’s systematic risk relative to the market. Construction of the Index begins with the constituents of the Solactive US Large & Mid Cap Index (the “Equity Universe”), generally the 1,000 largest U.S.-listed common stocks and real estate investment trusts (“REITs”). Companies in the Equity Universe are then screened to keep only the 500 stocks with the highest average daily traded value over the past 30 days. The remaining stocks (the “Index Universe”) are analyzed using a proprietary algorithm developed by the Index Provider to calculate each stock’s truBeta forecast, i.e., its projected beta for the subsequent quarter.
The S&P 500 Index consists of approximately 500 leasing U.S.-listed companies representing approximately 8% of the U.S. equity market capitalization.
Annualized Returns(1)
(For the period ended April 30, 2021)
| | Six Months | One Year | Since Inception(2) |
Pacer Salt Low truBetaTM US Market ETF - NAV | 17.37% | 25.53% | 12.83% |
Pacer Salt Low truBetaTM US Market ETF - Market | 17.63% | 25.26% | 12.76% |
Salt Low truBetaTM US Market Index(3) | 17.76% | 26.18% | 13.09% |
S&P 500 Total Return (3) | 28.85% | 45.98% | 23.06% |
(1) | The performance data quoted is historical. Past performance is no guarantee of future results. Current performance may be higher or lower than the performance data quoted. The principal value and investment return of an investment will fluctuate so that investor’s shares, when redeemed, may be worth more or less than the original cost. The returns shown do not reflect the deduction of taxes that a shareholder would pay on Fund distributions or on redemptions of Fund shares. The total annual operating expenses as stated in the fee table to the Fund’s prospectus dated February 28, 2021, is 0.60%. For performance information current to the most recent month-end, please call 1-877-337-0500. |
(2) | Inception date is March 12, 2019. The Fund is the successor to the Salt Low truBetaTM US Market ETF, a series of ETF Series Solutions, as a result of the reorganization of the Salt Low truBetaTM US Market ETF into the Fund on October 2, 2020. In addition, the Salt Low truBetaTM US Market ETF was the successor to the investment performance of Salt Low truBetaTM US Market ETF, a series of Salt Funds Trust, as a result of the reorganization of the series of Salt Funds Trust into a series of ETF Series Solutions that occurred on December 16, 2019 (together, the “Predecessor LSLT”). The Predecessor LSLT Fund commenced operations on March 12, 2019. Accordingly, any performance information for periods prior to October 2, 2020 is that of the series of ETF Series Solutions; any performance for periods prior to December 16, 2019 is that of the series of Salt Funds Trust. The Predecessor SLT Fund was advised by Salt Financial, LLC and sub-advised by Penserra Capital Management, LLC and had substantially the same investment objectives, policies, and strategies as the Fund. |
(3) | Indexes are unmanaged statistical composites and their returns do not include fees an investor would pay to purchase the securities they represent. Such costs would lower performance. It is not possible to invest directly in an index. |
6
Pacer Swan SOS Conservative (December) ETF
PERFORMANCE SUMMARY
(Unaudited)
Growth of $10,000
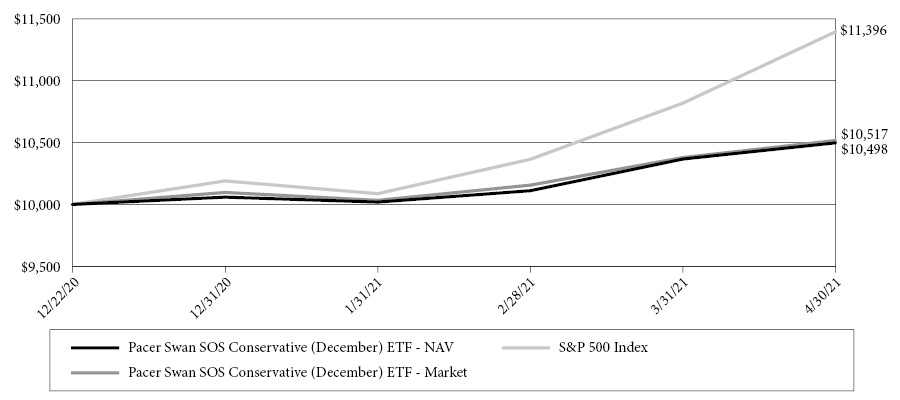
This chart illustrates the performance of a hypothetical $10,000 investment made on December 22, 2020, and is not intended to imply any future performance. The returns shown do not reflect the deduction of taxes that a shareholder would pay on fund distributions or the redemption of fund shares. The chart assumes reinvestment of capital gains and dividends.
The Pacer Swan SOS Conservative (December) ETF (the “Fund”) seeks to provide investors with returns that, before fees and expenses of the Fund, match those of the SPDR® S&P 500® ETF Trust (the “Underlying ETF”) up to a predetermined upside cap of 9.92% (before fees and expenses of the Fund) and 9.17% (after fees and expenses of the Fund), while providing a buffer against Underlying ETF losses between 5% and 30% over the period from December 22, 2020 to December 17, 2021.
The S&P 500 Index consists of approximately 500 leading U.S.-listed companies representing approximately 8% of the U.S. equity market capitalization.
Cumulative Returns (1)
(For the period ended April 30, 2021)
| | Since Inception(2) |
Pacer Swan SOS Conservative (December) ETF - NAV | 4.98% |
Pacer Swan SOS Conservative (December) ETF - Market | 5.17% |
S&P 500 Index (3) | 13.96% |
(1) | The performance data quoted is historical. Past performance is no guarantee of future results. Current performance may be higher or lower than the performance data quoted. The principal value and investment return of an investment will fluctuate so that investor’s shares, when redeemed, may be worth more or less than the original cost. The returns shown do not reflect the deduction of taxes that a shareholder would pay on Fund distributions or on redemptions of Fund shares. The total annual operating expenses as stated in the fee table to the Fund’s prospectus dated December 23, 2020 as supplemented March 17, 2021, is 0.75%. For performance information current to the most recent month-end, please call 1-877-337-0500. |
(2) | Inception date is December 22, 2020. |
(3) | Indexes are unmanaged statistical composites and their returns do not include fees an investor would pay to purchase the securities they represent. Such costs would lower performance. It is not possible to invest directly in an index. |
7
Pacer Swan SOS Moderate (December) ETF
PERFORMANCE SUMMARY
(Unaudited)
Growth of $10,000

This chart illustrates the performance of a hypothetical $10,000 investment made on December 22, 2020, and is not intended to imply any future performance. The returns shown do not reflect the deduction of taxes that a shareholder would pay on fund distributions or the redemption of fund shares. The chart assumes reinvestment of capital gains and dividends.
The Pacer Swan SOS Moderate (December) ETF (the “Fund”) seeks to provide investors with returns that, before fees and expenses of the Fund, match those of the SPDR® S&P 500® ETF Trust (“the Underlying ETF”) up to a predetermined upside cap of 12.25% (before fees and expenses of the Fund) and 11.50% (after fees and expenses of the Fund), while providing a buffer against the first 15% of Underlying ETF losses, over the period from December 22, 2020 to December 17, 2021.
The S&P 500 Index consists of approximately 500 leading U.S.-listed companies representing approximately 8% of the U.S. equity market capitalization.
Cumulative Returns (1)
(For the period ended April 30, 2021)
| | Since Inception(2) |
Pacer Swan SOS Moderate (December) ETF - NAV | 6.50% |
Pacer Swan SOS Moderate (December) ETF - Market | 6.64% |
S&P 500 Index (3) | 13.96% |
(1) | The performance data quoted is historical. Past performance is no guarantee of future results. Current performance may be higher or lower than the performance data quoted. The principal value and investment return of an investment will fluctuate so that investor’s shares, when redeemed, may be worth more or less than the original cost. The returns shown do not reflect the deduction of taxes that a shareholder would pay on Fund distributions or on redemptions of Fund shares. The total annual operating expenses as stated in the fee table to the Fund’s prospectus dated December 23, 2020 as supplemented March 17, 2021, is 0.75%. For performance information current to the most recent month-end, please call 1-877-337-0500. |
(2) | Inception date is December 22, 2020. |
(3) | Indexes are unmanaged statistical composites and their returns do not include fees an investor would pay to purchase the securities they represent. Such costs would lower performance. It is not possible to invest directly in an index. |
8
Pacer Swan SOS Flex (December) ETF
PERFORMANCE SUMMARY
(Unaudited)
Growth of $10,000
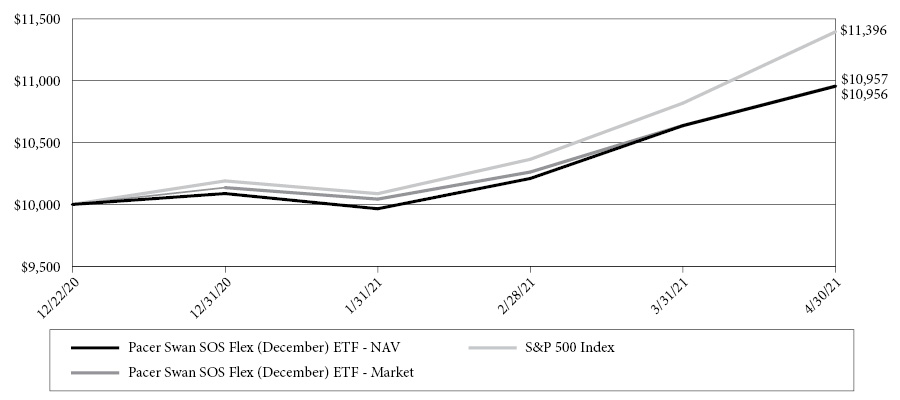
This chart illustrates the performance of a hypothetical $10,000 investment made on December 22, 2020, and is not intended to imply any future performance. The returns shown do not reflect the deduction of taxes that a shareholder would pay on fund distributions or the redemption of fund shares. The chart assumes reinvestment of capital gains and dividends.
The Pacer Swan SOS Flex (December) ETF (the “Fund”) seeks to provide investors with returns that match those of the SPDR® S&P 500® ETF Trust (the “Underlying ETF”) up to a predetermined upside cap of 18.52% (before fees and expenses of the Fund) and 17.17% (after fees and expenses of the Fund), while providing a buffer against the first 20% of Underlying ETF losses with the benefits of such buffer declining from 20% to 0% for Underlying ETF losses between 20% and 40%, over the period from December 22, 2020 to December 17, 2021.
The S&P 500 Index consists of approximately 500 leading U.S.-listed companies representing approximately 8% of the U.S. equity market capitalization.
Cumulative Returns (1)
(For the period ended April 30, 2021)
| | Since Inception(2) |
Pacer Swan SOS Flex (December) ETF - NAV | 9.56% |
Pacer Swan SOS Flex (December) ETF - Market | 9.57% |
S&P 500 Index (3) | 13.96% |
(1) | The performance data quoted is historical. Past performance is no guarantee of future results. Current performance may be higher or lower than the performance data quoted. The principal value and investment return of an investment will fluctuate so that investor’s shares, when redeemed, may be worth more or less than the original cost. The returns shown do not reflect the deduction of taxes that a shareholder would pay on Fund distributions or on redemptions of Fund shares. The total annual operating expenses as stated in the fee table to the Fund’s prospectus dated December 23, 2020 as supplemented March 17, 2021, is 0.75%. For performance information current to the most recent month-end, please call 1-877-337-0500. |
(2) | Inception date is December 22, 2020. |
(3) | Indexes are unmanaged statistical composites and their returns do not include fees an investor would pay to purchase the securities they represent. Such costs would lower performance. It is not possible to invest directly in an index. |
9
Pacer Swan SOS Fund of Funds ETF
PERFORMANCE SUMMARY
(Unaudited)
Growth of $10,000
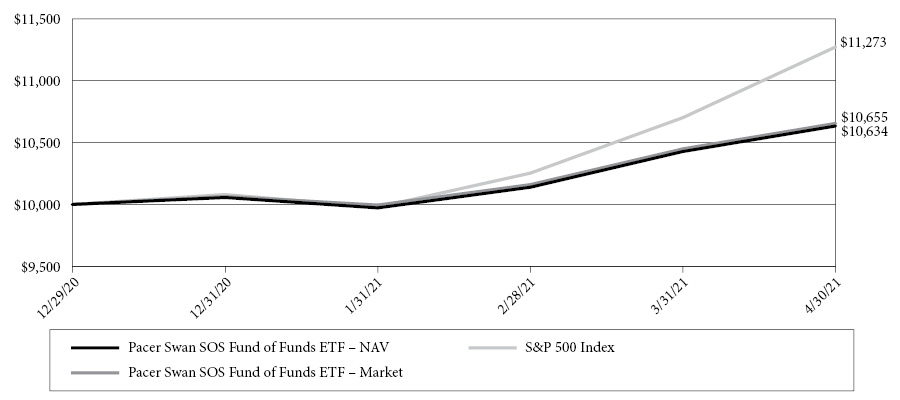
This chart illustrates the performance of a hypothetical $10,000 investment made on December 29, 2020, and is not intended to imply any future performance. The returns shown do not reflect the deduction of taxes that a shareholder would pay on fund distributions or the redemption of fund shares. The chart assumes reinvestment of capital gains and dividends.
The Pacer Swan SOS Fund of Funds ETF (the “Fund”) seeks capital appreciation with downside protection.
The S&P 500 Index consists of approximately 500 leading U.S.-listed companies representing approximately 8% of the U.S. equity market capitalization.
Cumulative Returns (1)
(For the period ended April 30, 2021)
| | Since Inception(2) |
Pacer Swan SOS Fund of Funds ETF - NAV | 6.34% |
Pacer Swan SOS Fund of Funds ETF - Market | 6.55% |
S&P 500 Index (3) | 12.73% |
(1) | The performance data quoted is historical. Past performance is no guarantee of future results. Current performance may be higher or lower than the performance data quoted. The principal value and investment return of an investment will fluctuate so that investor’s shares, when redeemed, may be worth more or less than the original cost. The returns shown do not reflect the deduction of taxes that a shareholder would pay on Fund distributions or on redemptions of Fund shares. The total annual operating expenses as stated in the fee table to the Fund’s prospectus dated December 23, 2020 as supplemented March 17, 2021, is 0.93%. For performance information current to the most recent month-end, please call 1-877-337-0500. |
(2) | Inception date is December 29, 2020. |
(3) | Indexes are unmanaged statistical composites and their returns do not include fees an investor would pay to purchase the securities they represent. Such costs would lower performance. It is not possible to invest directly in an index. |
10
Pacer Swan SOS Conservative (April) ETF
PERFORMANCE SUMMARY
(Unaudited)
Growth of $10,000

This chart illustrates the performance of a hypothetical $10,000 investment made on March 31, 2021, and is not intended to imply any future performance. The returns shown do not reflect the deduction of taxes that a shareholder would pay on fund distributions or the redemption of fund shares. The chart assumes reinvestment of capital gains and dividends.
The Pacer Swan SOS Conservative (April) ETF (the “Fund”) seeks to provide investors with returns that, before fees and expenses of the Fund, match those of the SPDR® S&P 500® ETF Trust (the “Underlying ETF”) up to a predetermined upside cap of 9.10% (before fees and expenses of the Fund) and 8.35% (after fees and expenses of the Fund), while providing a buffer against Underlying ETF losses between 5% and 30% over the period from April 1, 2021 to March 31, 2022.
The S&P 500 Index consists of approximately 500 leading U.S.-listed companies representing approximately 8% of the U.S. equity market capitalization.
Cumulative Returns (1)
(For the period ended April 30, 2021)
| | Since Inception(2) |
Pacer Swan SOS Conservative (April) ETF - NAV | 1.85% |
Pacer Swan SOS Conservative (April) ETF - Market | 1.96% |
S&P 500 Index (3) | 5.34% |
(1) | The performance data quoted is historical. Past performance is no guarantee of future results. Current performance may be higher or lower than the performance data quoted. The principal value and investment return of an investment will fluctuate so that investor’s shares, when redeemed, may be worth more or less than the original cost. The returns shown do not reflect the deduction of taxes that a shareholder would pay on Fund distributions or on redemptions of Fund shares. The total annual operating expenses as stated in the fee table to the Fund’s prospectus dated December 23, 2020 as supplemented April 1, 2021, is 0.75%. For performance information current to the most recent month-end, please call 1-877-337-0500. |
(2) | Inception date is March 31, 2021. |
(3) | Indexes are unmanaged statistical composites and their returns do not include fees an investor would pay to purchase the securities they represent. Such costs would lower performance. It is not possible to invest directly in an index. |
11
Pacer Swan SOS Moderate (April) ETF
PERFORMANCE SUMMARY
(Unaudited)
Growth of $10,000

This chart illustrates the performance of a hypothetical $10,000 investment made on March 31, 2021, and is not intended to imply any future performance. The returns shown do not reflect the deduction of taxes that a shareholder would pay on fund distributions or the redemption of fund shares. The chart assumes reinvestment of capital gains and dividends.
The Pacer Swan SOS Moderate (April) ETF (the “Fund”) seeks to provide investors with returns that, before fees and expenses of the Fund, match those of the SPDR® S&P 500® ETF Trust (“the Underlying ETF”) up to a predetermined upside cap of 10.48% (before fees and expenses of the Fund) and 9.73% (after fees and expenses of the Fund), while providing a buffer against the first 15% of Underlying ETF losses, over the period from April 1, 2021 to March 31, 2022.
The S&P 500 Index consists of approximately 500 leading U.S.-listed companies representing approximately 8% of the U.S. equity market capitalization.
Cumulative Returns (1)
(For the period ended April 30, 2021)
| | Since Inception(2) |
Pacer Swan SOS Moderate (April) ETF - NAV | 2.21% |
Pacer Swan SOS Moderate (April) ETF - Market | 2.19% |
S&P 500 Index (3) | 5.34% |
(1) | The performance data quoted is historical. Past performance is no guarantee of future results. Current performance may be higher or lower than the performance data quoted. The principal value and investment return of an investment will fluctuate so that investor’s shares, when redeemed, may be worth more or less than the original cost. The returns shown do not reflect the deduction of taxes that a shareholder would pay on Fund distributions or on redemptions of Fund shares. The total annual operating expenses as stated in the fee table to the Fund’s prospectus dated December 23, 2020 as supplemented April 1, 2021, is 0.75%. For performance information current to the most recent month-end, please call 1-877-337-0500. |
(2) | Inception date is March 31, 2021. |
(3) | Indexes are unmanaged statistical composites and their returns do not include fees an investor would pay to purchase the securities they represent. Such costs would lower performance. It is not possible to invest directly in an index. |
12
Pacer Swan SOS Flex (April) ETF
PERFORMANCE SUMMARY
(Unaudited)
Growth of $10,000
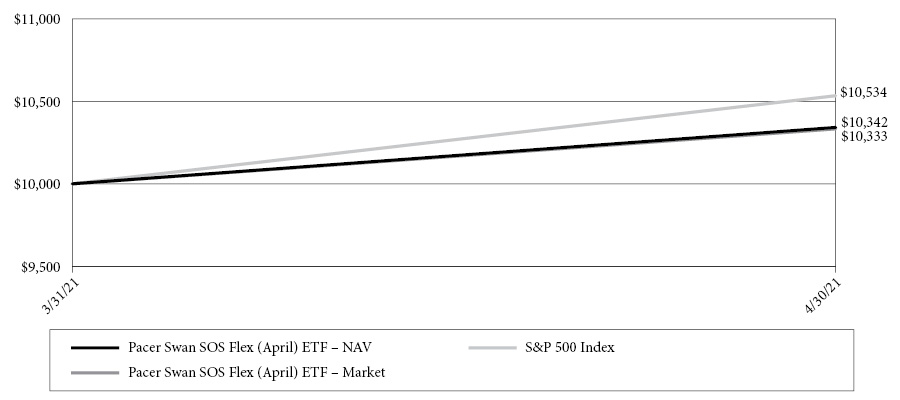
This chart illustrates the performance of a hypothetical $10,000 investment made on March 31, 2021, and is not intended to imply any future performance. The returns shown do not reflect the deduction of taxes that a shareholder would pay on fund distributions or the redemption of fund shares. The chart assumes reinvestment of capital gains and dividends.
The Pacer Swan SOS Flex (April) ETF (the “Fund”) seeks to provide investors with returns that match those of the SPDR® S&P 500® ETF Trust (the “Underlying ETF”) up to a predetermined upside cap of 16.04% (before fees and expenses of the Fund) and 15.29% (after fees and expenses of the Fund), while providing a buffer against the first 20% of Underlying ETF losses with the benefits of such buffer declining from 20% to 0% for Underlying ETF losses between 20% and 40%, over the period from April 1, 2021 to March 31, 2022.
The S&P 500 Index consists of approximately 500 leading U.S.-listed companies representing approximately 8% of the U.S. equity market capitalization.
Cumulative Returns (1)
(For the period ended April 30, 2021)
| | Since Inception(2) |
Pacer Swan SOS Flex (April) ETF - NAV | 3.42% |
Pacer Swan SOS Flex (April) ETF - Market | 3.33% |
S&P 500 Index (3) | 5.34% |
(1) | The performance data quoted is historical. Past performance is no guarantee of future results. Current performance may be higher or lower than the performance data quoted. The principal value and investment return of an investment will fluctuate so that investor’s shares, when redeemed, may be worth more or less than the original cost. The returns shown do not reflect the deduction of taxes that a shareholder would pay on Fund distributions or on redemptions of Fund shares. The total annual operating expenses as stated in the fee table to the Fund’s prospectus dated December 23, 2020 as supplemented April 1, 2021, is 0.75%. For performance information current to the most recent month-end, please call 1-877-337-0500. |
(2) | Inception date is March 31, 2021. |
(3) | Indexes are unmanaged statistical composites and their returns do not include fees an investor would pay to purchase the securities they represent. Such costs would lower performance. It is not possible to invest directly in an index. |
13
Pacer Funds
EXPENSE EXAMPLE
For the Period Ended April 30, 2021 (Unaudited)
As a shareholder of a Fund, you pay ongoing expenses, such as advisory fees, and other Fund expenses. The following examples are intended to help you understand the ongoing cost (in dollars) of investing in a Fund and to compare these costs with the ongoing costs of investing in other funds. Please note, the expenses shown in the tables are meant to highlight ongoing costs only and do not reflect any transactional costs. You may pay brokerage commissions on your purchase and sale of Fund shares, which are not reflected in the following examples. Each example is based on an investment of $1,000 invested at the beginning of the period and held for the entire period as indicated below.
Actual Expenses
The columns under the heading entitled “Actual” help you estimate the actual expenses you paid over the period. The “Actual Ending Account Value” shown is derived from a Fund’s actual return and the “Actual Expenses Paid During Period” show the dollar amount that would have been paid by an investor who started with $1,000 in the Fund. To estimate the expenses you paid on your account during this period, simply divide your account value by $1,000 (for example, an $8,600 account value divided by $1,000=8.6), then multiply the result by the number in the column under the heading untitled “Actual Expenses Paid During Period”.
Hypothetical Example for Comparison Purposes
The columns under the heading entitled “Hypothetical” provide information about hypothetical account value and hypothetical expenses based on a Fund’s actual expense ratio and an assumed rate of return of 5% per year before expenses, which is not the Fund’s return. The hypothetical account value and expenses may not be used to estimate the actual ending account balance or expenses you paid for the period. You may use this information to compare the ongoing costs of investing in a Fund and other funds. To do so, compare this 5% hypothetical example with the 5% hypothetical examples that appear in the shareholder reports of other funds.
Please note that the expenses shown in the table are meant to highlight your ongoing costs only and do not reflect any transactional costs which may be applicable to your account. Therefore, the last column of the table (Hypothetical Expenses Paid During Period) is useful in comparing ongoing costs only and will not help you determine the relative total costs of owning different funds. In addition, if these transactional costs were included, your costs would have been higher.
| | Fund’s Annual
Expense Ratio | Beginning
Account Value
11/01/20 | Ending
Account Value
04/30/21 | Expenses Paid
During Period(a) |
Pacer American Energy Independence ETF | | | | |
Actual | 0.75% | $ 1,000.00 | $ 1,553.10 | $ 4.75 |
Hypothetical(b) | 0.75% | $ 1,000.00 | $ 1,021.08 | $ 3.76 |
Pacer Salt High truBetaTM US Market ETF | | | | |
Actual | 0.60% | $ 1,000.00 | $ 1,447.20 | $ 3.64 |
Hypothetical(b) | 0.60% | $ 1,000.00 | $ 1,021.82 | $ 3.01 |
Pacer Salt Low truBetaTM US Market ETF | | | | |
Actual | 0.60% | $ 1,000.00 | $ 1,173.70 | $ 3.23 |
Hypothetical(b) | 0.60% | $ 1,000.00 | $ 1,021.82 | $ 3.01 |
(a) | The dollar amounts shown as expenses paid during the period are equal to the annualized six-month expense ratio multiplied by the average account value during the period, multiplied by the number of days (181) in the most recent six-month period and divided by the number of days in the most recent twelve-month period (365). |
(b) | Assumes 5% return before expenses. |
14
Pacer Funds
EXPENSE EXAMPLE
For the Period Ended April 30, 2021 (Unaudited) (Continued)
| | Fund’s Annual
Expense Ratio | Beginning
Account Value
12/22/20(a) | Ending
Account Value
04/30/21 | Expenses Paid
During Period(a) |
Pacer Swan SOS Conservative (December) ETF | | | | |
Actual | 0.75% | $ 1,000.00 | $ 1,049.80 | $ 2.72(b) |
Hypothetical(d) | 0.75% | $ 1,000.00 | $ 1,021.08 | $ 3.76(c) |
Pacer Swan SOS Moderate (December) ETF | | | | |
Actual | 0.75% | $ 1,000.00 | $ 1,065.00 | $ 2.74(b) |
Hypothetical(d) | 0.75% | $ 1,000.00 | $ 1,021.08 | $ 3.76(c) |
Pacer Swan SOS Flex (December) ETF | | | | |
Actual | 0.75% | $ 1,000.00 | $ 1,095.60 | $ 2.78(b) |
Hypothetical(d) | 0.75% | $ 1,000.00 | $ 1,021.08 | $ 3.76(c) |
(a) | Inception Date of the Fund. |
(b) | The dollar amounts shown as expenses paid during the period are equal to the annualized six-month expense ratio multiplied by the average account value during the period, multiplied by the number of days (129) in the most recent six-month period and divided by the number of days in the most recent twelve-month period (365). |
(c) | The dollar amounts shown as expenses paid during the period are equal to the annualized six-month expense ratio multiplied by the average account value during the period, multiplied by the number of days (181) in the most recent six-month period and divided by the number of days in the most recent twelve-month period (365). |
(d) | Assumes 5% return before expenses. |
| | Fund’s Annual
Expense Ratio | Beginning
Account Value
12/29/20(a) | Ending
Account Value
04/30/21 | Expenses Paid
During Period(a) |
Pacer Swan SOS Fund of Funds ETF | | | | |
Actual | 0.18% | $ 1,000.00 | $ 1,063.40 | $ 0.62(b) |
Hypothetical(d) | 0.18% | $ 1,000.00 | $ 1,023.9 | $ 0.90(c) |
(a) | Inception Date of the Fund. |
(b) | The dollar amounts shown as expenses paid during the period are equal to the annualized six-month expense ratio multiplied by the average account value during the period, multiplied by the number of days (122) in the most recent six-month period and divided by the number of days in the most recent twelve-month period (365). |
(c) | The dollar amounts shown as expenses paid during the period are equal to the annualized six-month expense ratio multiplied by the average account value during the period, multiplied by the number of days (181) in the most recent six-month period and divided by the number of days in the most recent twelve-month period (365). |
(d) | Assumes 5% return before expenses. |
| | Fund’s Annual
Expense Ratio | Beginning
Account Value
03/31/21(a) | Ending
Account Value
04/30/21 | Expenses Paid
During Period(a) |
Pacer Swan SOS Conservative (April) ETF | | | | |
Actual | 0.75% | $ 1,000.00 | $ 1,018.50 | $ 0.62(b) |
Hypothetical(d) | 0.75% | $ 1,000.00 | $ 1,021.08 | $ 3.76(c) |
Pacer Swan SOS Moderate (April) ETF | | | | |
Actual | 0.75% | $ 1,000.00 | $ 1,022.10 | $ 0.62(b) |
Hypothetical(d) | 0.75% | $ 1,000.00 | $ 1,021.08 | $ 3.76(c) |
Pacer Swan SOS Flex (April) ETF | | | | |
Actual | 0.75% | $ 1,000.00 | $ 1,034.20 | $ 0.63(b) |
Hypothetical(d) | 0.75% | $ 1,000.00 | $ 1,021.08 | $ 3.76(c) |
(a) | Inception Date of the Fund. |
(b) | The dollar amounts shown as expenses paid during the period are equal to the annualized six-month expense ratio multiplied by the average account value during the period, multiplied by the number of days (30) in the most recent six-month period and divided by the number of days in the most recent twelve-month period (365). |
(c) | The dollar amounts shown as expenses paid during the period are equal to the annualized six-month expense ratio multiplied by the average account value during the period, multiplied by the number of days (181) in the most recent six-month period and divided by the number of days in the most recent twelve-month period (365). |
(d) | Assumes 5% return before expenses. |
15
Pacer American Energy Independence ETF
SCHEDULES OF INVESTMENTS
April 30, 2021 (Unaudited)
| | | Shares | | | Value | |
COMMON STOCKS — 74.9% | | | | |
| | | | | | | | | |
Investment Companies — 2.0% | | | | |
Altus Midstream Co. | | | 6,609 | | | $ | 396,540 | |
| | | | | | | | | |
Oil & Gas — 1.7% | | | | |
Tellurian, Inc. (a) | | | 156,537 | | | | 346,729 | |
| | | | | | | | | |
Oil & Gas Services — 2.0% | | | | |
Archrock, Inc. | | | 43,411 | | | | 405,459 | |
| | | | | | | | | |
Pipelines — 69.2% (d) | | | | |
Antero Midstream Corp. | | | 55,618 | | | | 480,539 | |
Cheniere Energy, Inc. (a) | | | 11,130 | | | | 862,797 | |
Enbridge, Inc. | | | 37,499 | | | | 1,446,388 | |
Equitrans Midstream Corp. | | | 66,055 | | | | 539,009 | |
Gibson Energy, Inc. | | | 27,767 | | | | 507,155 | |
Hess Midstream LP | | | 17,364 | | | | 387,738 | |
Inter Pipeline Ltd. | | | 48,328 | | | | 704,583 | |
Keyera Corp. | | | 29,115 | | | | 665,844 | |
Kinder Morgan, Inc. | | | 86,214 | | | | 1,469,949 | |
New Fortress Energy, Inc. | | | 7,779 | | | | 330,763 | |
ONEOK, Inc. (b) | | | 28,520 | | | | 1,492,737 | |
Pembina Pipeline Corp. | | | 27,968 | | | | 863,284 | |
Plains GP Holdings LP | | | 48,707 | | | | 456,872 | |
Targa Resources Corp. (b) | | | 24,051 | | | | 834,329 | |
TC Energy Corp. | | | 29,899 | | | | 1,479,200 | |
Williams Cos., Inc. (b) | | | 58,935 | | | | 1,435,657 | |
| | | | | | | | 13,956,844 | |
TOTAL COMMON STOCKS (Cost $12,529,344) | | | | | | | 15,105,572 | |
| | | | | |
MASTER LIMITED PARTNERSHIPS AND RELATED COMPANIES — 24.4% | | | | |
| | | | | | | | | |
Gas — 1.0% | | | | |
Western Midstream Partners LP | | | 9,903 | | | | 194,495 | |
| | | | | | | | | |
Pipelines — 23.4% | | | | |
Crestwood Equity Partners LP | | | 3,189 | | | | 97,105 | |
Energy Transfer LP | | | 103,490 | | | | 891,049 | |
EnLink Midstream LLC | | | 94,609 | | | | 438,039 | |
Enterprise Products Partners LP | | | 60,610 | | | | 1,394,636 | |
Genesis Energy LP | | | 7,484 | | | | 68,778 | |
Holly Energy Partners LP | | | 3,159 | | | | 64,665 | |
Magellan Midstream Partners LP | | | 11,056 | | | | 517,089 | |
MPLX LP | | | 17,516 | | | | 472,757 | |
NuStar Energy LP | | | 5,773 | | | | 110,611 | |
PBF Logistics LP | | | 2,535 | | | | 39,039 | |
Phillips 66 Partners LP | | | 3,439 | | | | 118,817 | |
Rattler Midstream LP | | | 34,586 | | | | 392,551 | |
| | | Shares | | | Value | |
Pipelines — 23.4% (Continued) | | | | |
Shell Midstream Partners LP | | | 7,249 | | | $ | 111,852 | |
| | | | | | | | 4,716,988 | |
TOTAL MASTER LIMITED PARTNERSHIPS AND RELATED COMPANIES (Cost $4,076,970) | | | | | | | 4,911,483 | |
| | | | | |
| | | Principal
Amount | | | | | |
SHORT-TERM INVESTMENTS — 0.7% | | | | |
| | | | | | | | | |
Money Market Deposit Accounts — 0.7% | | | | |
U.S. Bank Money Market Deposit Account, 0.003% (c) | | $ | 133,573 | | | | 133,573 | |
TOTAL SHORT-TERM INVESTMENTS (Cost $133,573) | | | | | | | 133,573 | |
| | | | | | | | | |
| | | Shares | | | | | |
INVESTMENTS PURCHASED WITH PROCEEDS FROM SECURITIES LENDING — 9.5% | | | | |
Mount Vernon Liquid Assets Portfolio, LLC, 0.110% (c) | | | 1,925,172 | | | | 1,925,172 | |
TOTAL INVESTMENTS PURCHASED WITH PROCEEDS FROM SECURITIES LENDING (Cost $1,925,172) | | | | | | | 1,925,172 | |
| | | | | |
Total Investments (Cost $18,665,059) — 109.5% | | | | | | | 22,075,800 | |
Liabilities in Excess of Other Assets — (9.5)% | | | | | | | (1,907,832 | ) |
TOTAL NET ASSETS — 100.0% | | | | | | $ | 20,167,968 | |
Percentages are stated as a percent of net assets.
| | (a) | Non-income producing security. |
| | (b) | All or a portion of this security is on loan as of April 30, 2021. The total value of securities on loan is $1,856,916 or 9.2% of net assets. |
| | (c) | The rate shown is as of April 30, 2021. |
| | (d) | To the extent that the Fund invests more heavily in particular industry groups
of the economy, its performance will be especially sensitive to developments that
significantly affect those industry groups or strategies. |
For Fund compliance purposes, the Fund’s industry classifications refer to any one or more of the industry sub-classifications used by one or more widely recognized market indexes or ratings group indexes, and/or they may be defined by Fund management. This definition does not apply for all purposes of this report, which may combine sub-classifications for reporting ease. Categories are shown as a percentage of net assets.
The accompanying notes are an integral part of the financial statements.
16
Pacer Salt High truBetaTM US Market ETF
SCHEDULES OF INVESTMENTS
April 30, 2021 (Unaudited)
| | | Shares | | | Value | |
COMMON STOCKS — 97.7% | | | | |
| | | | | | | | | |
Aerospace/Defense — 1.9% | | | | |
Howmet Aerospace, Inc. (a) | | | 3,946 | | | $ | 126,114 | |
The Boeing Co. (a) (b) | | | 460 | | | | 107,783 | |
| | | | | | | | 233,897 | |
Airlines — 3.8% | | | | |
Alaska Air Group, Inc. (a) | | | 1,826 | | | | 126,249 | |
Delta Air Lines, Inc. (a) | | | 2,499 | | | | 117,253 | |
JetBlue Airways Corp. (a) | | | 5,799 | | | | 118,068 | |
United Airlines Holdings, Inc. (a) | | | 2,110 | | | | 114,784 | |
| | | | | | | | 476,354 | |
Apparel — 1.1% | | | | |
Tapestry, Inc. | | | 2,791 | | | | 133,549 | |
| | | | | | | | | |
Auto Manufacturers — 2.0% | | | | |
General Motors Co. | | | 2,101 | | | | 120,219 | |
Tesla Motors, Inc. (a) (b) | | | 183 | | | | 129,828 | |
| | | | | | | | 250,047 | |
Banks — 1.0% | | | | |
First Horizon Corp. | | | 7,054 | | | | 129,018 | |
| | | | | | | | | |
Biotechnology — 0.9% | | | | |
Iovance Biotherapeutics, Inc. (a) | | | 3,589 | | | | 112,838 | |
| | | | | | | | | |
Building Materials — 2.3% | | | | |
Builders FirstSource, Inc. (a) | | | 2,667 | | | | 129,803 | |
Louisiana-Pacific Corp. (b) | | | 2,371 | | | | 156,201 | |
| | | | | | | | 286,004 | |
Chemicals — 2.1% | | | | |
Albemarle Corp. | | | 792 | | | | 133,191 | |
Mosaic Co. | | | 3,750 | | | | 131,925 | |
| | | | | | | | 265,116 | |
Commercial Services — 3.1% | | | | |
Chegg, Inc. (a) | | | 1,396 | | | | 126,101 | |
PayPal Holdings, Inc. (a) | | | 498 | | | | 130,620 | |
Square, Inc. - Class A (a) (b) | | | 513 | | | | 125,593 | |
| | | | | | | | 382,314 | |
Computers — 2.0% | | | | |
Pure Storage, Inc. (a) (b) | | | 5,557 | | | | 112,363 | |
Western Digital Corp. (b) | | | 1,818 | | | | 128,405 | |
| | | | | | | | 240,768 | |
Diversified Financial Services — 4.3% | | | | |
Capital One Financial Corp. | | | 941 | | | | 140,284 | |
Discover Financial Services | | | 1,214 | | | | 138,396 | |
Invesco Ltd. | | | 4,842 | | | | 130,734 | |
Synchrony Financial | | | 2,912 | | | | 127,371 | |
| | | | | | | | 536,785 | |
Electronics — 1.0% | | | | |
II-VI, Inc. (a) (b) | | | 1,742 | | | | 116,958 | |
| | | | | | | | | |
| | | Shares | | | Value | |
Energy-Alternate Sources — 3.1% | | | | |
Enphase Energy, Inc. (a) | | | 716 | | | $ | 99,703 | |
First Solar, Inc. (a) (b) | | | 1,519 | | | | 116,249 | |
Plug Power, Inc. (a) | | | 2,635 | | | | 75,124 | |
Sunrun, Inc. (a) (b) | | | 1,996 | | | | 97,804 | |
| | | | | | | | 388,880 | |
Entertainment — 3.4% | | | | |
Caesars Entertainment, Inc. (a) (b) | | | 1,241 | | | | 121,419 | |
DraftKings, Inc. - Class A (a) (b) | | | 1,736 | | | | 98,362 | |
Live Nation Entertainment, Inc. (a) | | | 1,420 | | | | 116,269 | |
Penn National Gaming, Inc. (a) | | | 955 | | | | 85,110 | |
| | | | | | | | 421,160 | |
Healthcare-Services — 1.7% | | | | |
Invitae Corp. (a) (b) | | | 2,916 | | | | 101,768 | |
Teladoc Health, Inc. (a) | | | 629 | | | | 108,408 | |
| | | | | | | | 210,176 | |
Home Builders — 4.8% | | | | |
DR Horton, Inc. | | | 1,547 | | | | 152,055 | |
Lennar Corp. - Class A (b) | | | 1,416 | | | | 146,697 | |
PulteGroup, Inc. | | | 2,597 | | | | 153,535 | |
Toll Brothers, Inc. (b) | | | 2,243 | | | | 140,636 | |
| | | | | | | | 592,923 | |
Home Furnishings — 1.0% | | | | |
Tempur Sealy International, Inc. | | | 3,279 | | | | 125,061 | |
| | | | | | | | | |
Insurance — 5.4% | | | | |
Athene Holding Ltd. (a) | | | 2,483 | | | | 148,160 | |
Lincoln National Corp. | | | 1,982 | | | | 127,106 | |
MGIC Investment Corp. | | | 9,475 | | | | 144,399 | |
Radian Group, Inc. | | | 5,380 | | | | 132,563 | |
Unum Group | | | 4,284 | | | | 121,066 | |
| | | | | | | | 673,294 | |
Internet — 11.2% | | | | |
Anaplan, Inc. (a) | | | 2,101 | | | | 125,325 | |
Chewy, Inc. - Class A (a) (b) | | | 1,454 | | | | 115,913 | |
Etsy, Inc. (a) | | | 558 | | | | 110,925 | |
Expedia Group, Inc. | | | 713 | | | | 125,652 | |
Lyft, Inc. - Class A (a) | | | 1,876 | | | | 104,418 | |
Match Group, Inc. (a) | | | 812 | | | | 126,371 | |
Pinterest, Inc. - Class A (a) (b) | | | 1,735 | | | | 115,152 | |
Roku, Inc. (a) | | | 346 | | | | 118,668 | |
Snap, Inc. - Class A (a) (b) | | | 1,986 | | | | 122,774 | |
Twitter, Inc. (a) | | | 1,828 | | | | 100,942 | |
Wayfair, Inc. - Class A (a) (b) | | | 394 | | | | 116,455 | |
Zillow Group, Inc. - Class C (a) | | | 826 | | | | 107,479 | |
| | | | | | | | 1,390,074 | |
Leisure Time — 3.8% | | | | |
Carnival Corp. (a) (b) | | | 4,374 | | | | 122,297 | |
Norwegian Cruise Line Holdings Ltd. (a) (b) | | | 4,051 | | | | 125,784 | |
The accompanying notes are an integral part of the financial statements.
17
Pacer Salt High truBetaTM US Market ETF
SCHEDULES OF INVESTMENTS
April 30, 2021 (Unaudited) (Continued)
| | | Shares | | | Value | |
COMMON STOCKS — 97.7% (Continued) | | | | |
| | | | | | | | | |
Leisure Time — 3.8% (Continued) | | | | |
Peloton Interactive, Inc. - Class A (a) | | | 1,116 | | | $ | 109,759 | |
Royal Caribbean Cruises Ltd. | | | 1,312 | | | | 114,078 | |
| | | | | | | | 471,918 | |
Lodging — 3.0% | | | | |
Marriott International, Inc. (a) | | | 829 | | | | 123,123 | |
MGM Resorts International | | | 3,191 | | | | 129,937 | |
Wynn Resorts Ltd. (a) | | | 907 | | | | 116,459 | |
| | | | | | | | 369,519 | |
Media — 1.2% | | | | |
DISH Network Corp. - Class A (a) | | | 3,340 | | | | 149,599 | |
| | | | | | | | | |
Mining — 1.0% | | | | |
Freeport-McMoRan, Inc. | | | 3,324 | | | | 125,348 | |
| | | | | | | | | |
Oil & Gas — 1.0% | | | | |
Marathon Petroleum Corp. | | | 2,156 | | | | 119,981 | |
| | | | | | | | | |
Oil & Gas Services — 0.9% | | | | |
Schlumberger Ltd. | | | 4,292 | | | | 116,099 | |
| | | | | | | | | |
Pipelines — 1.0% | | | | |
ONEOK, Inc. | | | 2,413 | | | | 126,296 | |
| | | | | | | | | |
Real Estate — 1.0% | | | | |
Redfin Corp. (a) | | | 1,669 | | | | 118,132 | |
| | | | | | | | | |
Retail — 4.2% | | | | |
Carvana Co. (a) (b) | | | 434 | | | | 123,803 | |
Dick’s Sporting Goods, Inc. (b) | | | 1,646 | | | | 135,927 | |
L Brands, Inc. (a) | | | 2,046 | | | | 134,831 | |
The Gap, Inc. | | | 3,845 | | | | 127,269 | |
| | | | | | | | 521,830 | |
Semiconductors — 13.8% | | | | |
Advanced Micro Devices, Inc. (a) | | | 1,531 | | | | 124,960 | |
Applied Materials, Inc. | | | 1,088 | | | | 144,388 | |
Cree, Inc. (a) (b) | | | 1,131 | | | | 112,444 | |
KLA Corp. | | | 423 | | | | 133,393 | |
Lam Research Corp. | | | 237 | | | | 147,047 | |
Microchip Technology, Inc. | | | 840 | | | | 126,244 | |
Micron Technology, Inc. (a) | | | 1,418 | | | | 122,047 | |
| | | Shares | | | Value | |
Semiconductors — 13.8% (Continued) | | | | |
NVIDIA Corp. | | | 238 | | | $ | 142,890 | |
ON Semiconductor Corp. (a) | | | 3,236 | | | | 126,204 | |
Qorvo, Inc. (a) | | | 721 | | | | 135,671 | |
Skyworks Solutions, Inc. | | | 720 | | | | 130,558 | |
Teradyne, Inc. | | | 1,098 | | | | 137,338 | |
Xilinx, Inc. | | | 992 | | | | 126,936 | |
| | | | | | | | 1,710,120 | |
Software — 9.8% | | | | |
Alteryx, Inc. - Class A (a) | | | 1,455 | | | | 118,947 | |
Bill.com Holdings, Inc. (a) | | | 773 | | | | 119,529 | |
Ceridian HCM Holding, Inc. (a) | | | 1,429 | | | | 135,012 | |
Dynatrace, Inc. (a) | | | 2,361 | | | | 122,866 | |
Elastic NV (a) | | | 1,071 | | | | 129,184 | |
Fastly, Inc. - Class A (a) (b) | | | 1,656 | | | | 105,769 | |
Nutanix, Inc. - Class A (a) | | | 4,545 | | | | 122,897 | |
Snowflake, Inc. (a) | | | 541 | | | | 125,290 | |
Twilio, Inc. - Class A (a) (b) | | | 337 | | | | 123,949 | |
Zoom Video Communications, Inc. - Class A (a) | | | 359 | | | | 114,726 | |
| | | | | | | | 1,218,169 | |
Telecommunications — 0.9% | | | | |
Iridium Communications, Inc. (a) | | | 3,003 | | | | 114,084 | |
TOTAL COMMON STOCKS (Cost $11,004,357) | | | | | | | 12,126,311 | |
| | | | | |
REAL ESTATE INVESTMENT TRUSTS — 2.1% | | | | |
New Residential Investment Corp. | | | 11,390 | | | | 122,101 | |
Weyerhaeuser Co. | | | 3,469 | | | | 134,493 | |
TOTAL REAL ESTATE INVESTMENT TRUSTS (Cost $215,917) | | | | | | | 256,594 | |
| | | | | |
| | | Principal
Amount | | | | | |
SHORT-TERM INVESTMENTS — 0.2% | | | | |
| | | | | | | | | |
Money Market Deposit Accounts — 0.2% | | | | |
U.S. Bank Money Market Deposit Account, 0.003% (c) | | $ | 27,128 | | | | 27,128 | |
TOTAL SHORT-TERM INVESTMENTS (Cost $27,128) | | | | | | | 27,128 | |
| | | | | |
The accompanying notes are an integral part of the financial statements.
18
Pacer Salt High truBetaTM US Market ETF
SCHEDULES OF INVESTMENTS
April 30, 2021 (Unaudited) (Continued)
| | | Shares | | | Value | |
INVESTMENTS PURCHASED WITH PROCEEDS FROM SECURITIES LENDING — 22.5% | | | | |
Mount Vernon Liquid Assets Portfolio, LLC, 0.110% (c) | | | 2,796,987 | | | $ | 2,796,987 | |
TOTAL INVESTMENTS PURCHASED WITH PROCEEDS FROM SECURITIES LENDING (Cost $2,796,987) | | | | | | | 2,796,987 | |
| | | | | |
Total Investments (Cost $14,044,389) — 122.5% | | | | | | | 15,207,020 | |
Liabilities in Excess of Other Assets — (22.5)% | | | | | | | (2,797,448 | ) |
TOTAL NET ASSETS — 100.0% | | | | | | $ | 12,409,572 | |
Percentages are stated as a percent of net assets.
| | (a) | Non-income producing security. |
| | (b) | All or a portion of this security is on loan as of April 30, 2021. The total value of securities on loan is $2,687,980 or 21.7% of net assets. |
| | (c) | The rate shown is as of April 30, 2021. |
For Fund compliance purposes, the Fund’s industry classifications refer to any one or more of the industry sub-classifications used by one or more widely recognized market indexes or ratings group indexes, and/or they may be defined by Fund management. This definition does not apply for all purposes of this report, which may combine sub-classifications for reporting ease. Categories are shown as a percentage of net assets.
The accompanying notes are an integral part of the financial statements.
19
Pacer Salt Low truBetaTM US Market ETF
SCHEDULES OF INVESTMENTS
April 30, 2021 (Unaudited)
| | | Shares | | | Value | |
COMMON STOCKS — 90.3% | | | | |
| | | | | | | | | |
Aerospace/Defense — 1.0% | | | | |
General Dynamics Corp. | | | 326 | | | $ | 62,015 | |
| | | | | | | | | |
Agriculture — 2.9% | | | | |
Altria Group, Inc. | | | 1,180 | | | | 56,345 | |
Archer-Daniels-Midland Co. | | | 982 | | | | 61,994 | |
Philip Morris International, Inc. | | | 652 | | | | 61,940 | |
| | | | | | | | 180,279 | |
Apparel — 0.9% | | | | |
NIKE, Inc. - Class B | | | 406 | | | | 53,844 | |
| | | | | | | | | |
Auto Parts & Equipment — 0.9% | | | | |
Gentex Corp. | | | 1,554 | | | | 54,670 | |
| | | | | | | | | |
Banks — 1.0% | | | | |
The Bank of New York Mellon Corp. (a) | | | 1,228 | | | | 61,252 | |
| | | | | | | | | |
Beverages — 5.1% | | | | |
Brown-Forman Corp. - Class B | | | 804 | | | | 61,329 | |
Keurig Dr Pepper, Inc. | | | 1,724 | | | | 61,805 | |
Molson Coors Brewing Co. - Class B | | | 1,230 | | | | 67,589 | |
PepsiCo, Inc. | | | 432 | | | | 62,277 | |
The Coca-Cola Co. | | | 1,144 | | | | 61,753 | |
| | | | | | | | 314,753 | |
Biotechnology — 1.0% | | | | |
Amgen, Inc. (a) | | | 250 | | | | 59,910 | |
| | | | | | | | | |
Chemicals — 2.0% | | | | |
Air Products & Chemicals, Inc. | | | 210 | | | | 60,581 | |
Ecolab, Inc. | | | 268 | | | | 60,064 | |
| | | | | | | | 120,645 | |
Commercial Services — 2.1% | | | | |
Rollins, Inc. (a) | | | 1,736 | | | | 64,718 | |
Service Corp. International | | | 1,192 | | | | 63,700 | |
| | | | | | | | 128,418 | |
Cosmetics/Personal Care — 3.0% | | | | |
Colgate-Palmolive Co. | | | 772 | | | | 62,300 | |
Estee Lauder Cos., Inc. | | | 202 | | | | 63,388 | |
The Procter & Gamble Co. | | | 452 | | | | 60,306 | |
| | | | | | | | 185,994 | |
Distribution/Wholesale — 1.1% | | | | |
Copart, Inc. (b) | | | 524 | | | | 65,243 | |
| | | | | | | | | |
Diversified Finan Serv — 2.8% | | | | |
CME Group, Inc. | | | 278 | | | | 56,153 | |
Intercontinental Exchange, Inc. | | | 496 | | | | 58,384 | |
The Western Union Co. | | | 2,352 | | | | 60,588 | |
| | | | | | | | 175,125 | |
| | | Shares | | | Value | |
Electric — 18.3% | | | | |
Alliant Energy Corp. | | | 1,122 | | | $ | 63,023 | |
Ameren Corp. | | | 742 | | | | 62,951 | |
American Electric Power Co., Inc. (a) | | | 708 | | | | 62,807 | |
CMS Energy Corp. | | | 996 | | | | 64,132 | |
Consolidated Edison, Inc. | | | 806 | | | | 62,392 | |
Dominion Energy, Inc. (a) | | | 780 | | | | 62,322 | |
Duke Energy Corp. | | | 624 | | | | 62,830 | |
Edison International | | | 986 | | | | 58,618 | |
Evergy, Inc. | | | 994 | | | | 63,586 | |
Eversource Energy | | | 704 | | | | 60,699 | |
Exelon Corp. | | | 1,346 | | | | 60,489 | |
FirstEnergy Corp. | | | 1,650 | | | | 62,568 | |
Pinnacle West Capital Corp. (a) | | | 738 | | | | 62,472 | |
PPL Corp. | | | 2,072 | | | | 60,357 | |
Public Service Enterprise Group, Inc. (a) | | | 998 | | | | 63,034 | |
Southern Co. | | | 964 | | | | 63,788 | |
WEC Energy Group, Inc. (a) | | | 646 | | | | 62,772 | |
Xcel Energy, Inc. (a) | | | 922 | | | | 65,739 | |
| | | | | | | | 1,124,579 | |
Environmental Control — 2.1% | | | | |
Republic Services, Inc. | | | 600 | | | | 63,780 | |
Waste Management, Inc. | | | 476 | | | | 65,674 | |
| | | | | | | | 129,454 | |
Food — 7.6% | | | | |
Campbell Soup Co. | | | 1,200 | | | | 57,300 | |
Conagra Brands, Inc. | | | 1,548 | | | | 57,415 | |
General Mills, Inc. (a) | | | 974 | | | | 59,278 | |
Hormel Foods Corp. | | | 1,182 | | | | 54,608 | |
Kellogg Co. (a) | | | 948 | | | | 59,174 | |
Mondelez International, Inc. | | | 1,012 | | | | 61,540 | |
The Hershey Co. | | | 379 | | | | 62,270 | |
The Kroger Co. | | | 1,618 | | | | 59,122 | |
| | | | | | | | 470,707 | |
Healthcare-Products — 5.2% | | | | |
Baxter International, Inc. | | | 734 | | | | 62,896 | |
Danaher Corp. (a) | | | 272 | | | | 69,072 | |
Edwards Lifesciences Corp. (b) | | | 696 | | | | 66,482 | |
Medtronic PLC | | | 488 | | | | 63,889 | |
ResMed, Inc. | | | 310 | | | | 58,271 | |
| | | | | | | | 320,610 | |
Healthcare-Services — 1.0% | | | | |
UnitedHealth Group, Inc. (a) | | | 160 | | | | 63,808 | |
| | | | | | | | | |
Household Products/Wares — 2.8% | | | | |
Church & Dwight Co., Inc. (a) | | | 694 | | | | 59,504 | |
Kimberly-Clark Corp. | | | 432 | | | | 57,594 | |
The Clorox Co. (a) | | | 302 | | | | 55,115 | |
| | | | | | | | 172,213 | |
The accompanying notes are an integral part of the financial statements.
20
Pacer Salt Low truBetaTM US Market ETF
SCHEDULES OF INVESTMENTS
April 30, 2021 (Unaudited) (Continued)
| | | Shares | | | Value | |
COMMON STOCKS — 90.3% (Continued) | | | | |
| | | | | | | | | |
Insurance — 4.2% | | | | |
Brown & Brown, Inc. | | | 1,232 | | | $ | 65,518 | |
Marsh & McLennan Cos., Inc. | | | 488 | | | | 66,222 | |
The Allstate Corp. | | | 492 | | | | 62,385 | |
The Progressive Corp. (a) | | | 614 | | | | 61,854 | |
| | | | | | | | 255,979 | |
Media — 1.8% | | | | |
Comcast Corp. - Class A | | | 1,008 | | | | 56,599 | |
The New York Times Co. - Class A | | | 1,136 | | | | 51,586 | |
| | | | | | | | 108,185 | |
Pharmaceuticals — 6.7% | | | | |
Bristol-Myers Squibb Co. | | | 946 | | | | 59,049 | |
CVS Health Corp. | | | 782 | | | | 59,745 | |
Eli Lilly & Co. (a) | | | 274 | | | | 50,079 | |
Johnson & Johnson | | | 358 | | | | 58,257 | |
Merck & Co., Inc. | | | 768 | | | | 57,216 | |
Pfizer, Inc. | | | 1,664 | | | | 64,314 | |
Zoetis, Inc. | | | 372 | | | | 64,367 | |
| | | | | | | | 413,027 | |
Retail — 4.2% | | | | |
Costco Wholesale Corp. | | | 174 | | | | 64,744 | |
Dollar General Corp. | | | 302 | | | | 64,854 | |
McDonald’s Corp. | | | 274 | | | | 64,686 | |
Yum! Brands, Inc. (a) | | | 548 | | | | 65,497 | |
| | | | | | | | 259,781 | |
Software — 4.8% | | | | |
Akamai Technologies, Inc. (a) (b) | | | 590 | | | | 64,133 | |
Black Knight, Inc. (b) | | | 756 | | | | 54,749 | |
Citrix Systems, Inc. | | | 434 | | | | 53,751 | |
Fidelity National Information Services, Inc. | | | 394 | | | | 60,243 | |
Oracle Corp. | | | 856 | | | | 64,876 | |
| | | | | | | | 297,752 | |
Telecommunications — 4.9% | | | | |
AT&T, Inc. | | | 1,928 | | | | 60,559 | |
Cisco Systems, Inc. (a) | | | 1,174 | | | | 59,768 | |
Motorola Solutions, Inc. | | | 322 | | | | 60,633 | |
| | | Shares | | | Value | |
Telecommunications — 4.9% (Continued) | | | | |
T-Mobile US, Inc. (a) (b) | | | 457 | | | $ | 60,383 | |
Verizon Communications, Inc. | | | 1,038 | | | | 59,986 | |
| | | | | | | | 301,329 | |
Transportation — 2.9% | | | | |
Expeditors International of Washington, Inc. | | | 569 | | | | 62,511 | |
Knight-Swift Transportation Holdings, Inc. | | | 1,250 | | | | 58,900 | |
Union Pacific Corp. | | | 270 | | | | 59,964 | |
| | | | | | | | 181,375 | |
TOTAL COMMON STOCKS (Cost $4,864,580) | | | | | | | 5,560,947 | |
| | | | | |
REAL ESTATE INVESTMENT TRUSTS — 9.3% | | | | |
AGNC Investment Corp. (a) | | | 3,494 | | | | 62,647 | |
American Campus Communities, Inc. | | | 1,312 | | | | 59,315 | |
American Homes 4 Rent - Class A | | | 1,788 | | | | 66,228 | |
Crown Castle International Corp. (a) | | | 360 | | | | 68,062 | |
CubeSmart | | | 1,510 | | | | 63,933 | |
Digital Realty Trust, Inc. | | | 426 | | | | 65,736 | |
Duke Realty Corp. | | | 1,412 | | | | 65,686 | |
Equity Residential (a) | | | 778 | | | | 57,751 | |
Lexington Realty Trust | | | 5,020 | | | | 61,445 | |
TOTAL REAL ESTATE INVESTMENT TRUSTS (Cost $451,313) | | | | | | | 570,803 | |
| | | | | |
| | | Principal
Amount | | | | | |
SHORT-TERM INVESTMENTS — 0.3% | | | | |
| | | | | | | | | |
Money Market Deposit Account — 0.3% | | | | |
U.S. Bank Money Market Deposit Account, 0.003% (c) | | $ | 17,243 | | | | 17,243 | |
TOTAL SHORT-TERM INVESTMENTS (Cost $17,243) | | | | | | | 17,243 | |
| | | | | |
The accompanying notes are an integral part of the financial statements.
21
Pacer Salt Low truBetaTM US Market ETF
SCHEDULES OF INVESTMENTS
April 30, 2021 (Unaudited) (Continued)
| | | Shares | | | Value | |
INVESTMENTS PURCHASED WITH PROCEEDS FROM SECURITIES LENDING — 23.4% | | | | |
Mount Vernon Liquid Assets Portfolio, LLC, 0.110% (c) | | | 1,438,035 | | | $ | 1,438,035 | |
TOTAL INVESTMENTS PURCHASED WITH PROCEEDS FROM SECURITIES LENDING (Cost $1,438,035) | | | | | | | 1,438,035 | |
| | | | | |
Total Investments (Cost $6,771,171) — 123.3% | | | | | | | 7,587,028 | |
Liabilities in Excess of Other Assets — (23.3)% | | | | | | | (1,432,726 | ) |
TOTAL NET ASSETS — 100.0% | | | | | | $ | 6,154,302 | |
Percentages are stated as a percent of net assets.
| | (a) | All or a portion of this security is on loan as of April 30, 2021. The total value of securities on loan is $1,406,129 or 22.8% of net assets. |
| | (b) | Non-income producing security. |
| | (c) | The rate shown is as of April 30, 2021. |
For Fund compliance purposes, the Fund’s industry classifications refer to any one or more of the industry sub-classifications used by one or more widely recognized market indexes or ratings group indexes, and/or they may be defined by Fund management. This definition does not apply for all purposes of this report, which may combine sub-classifications for reporting ease. Categories are shown as a percentage of net assets.
The accompanying notes are an integral part of the financial statements.
22
Pacer Swan SOS Conservative (December) ETF
SCHEDULES OF INVESTMENTS
April 30, 2021 (Unaudited)
| | | Contracts | | | Notional Amount | | | Value | |
PURCHASED OPTIONS — 108.0% (a)(b) | | | | |
| | | | | | | | | | | | | |
CALL OPTIONS — 105.6% | | | | | | | | |
SPDR S&P 500 ETF Trust, Expires 12/17/2021, Strike Price $5.51 | | | 56 | | | $ | 2,336,880 | | | $ | 2,280,091 | |
| | | | | | | | | | | | 2,280,091 | |
PUT OPTIONS — 2.4% | | | | | | | | | | | | |
SPDR S&P 500 ETF Trust, Expires 12/17/2021, Strike Price $348.88 | | | 56 | | | | 2,336,880 | | | | 50,599 | |
| | | | | | | | | | | | 50,599 | |
TOTAL PURCHASED OPTIONS (Cost $2,194,392) | | | | | | | | | | | 2,330,690 | |
| | | | | | | | | |
| | | Principal
Amount | | | | | | | | | |
SHORT-TERM INVESTMENTS — 0.6% | | | | | | | | | | | | |
| | | | | | | | | | | | | |
Money Market Deposit Accounts — 0.6% | | | | | | | | | | | | |
U.S. Bank Money Market Deposit Account, 0.003% (c) | | $ | 12,517 | | | | | | | | 12,517 | |
TOTAL SHORT-TERM INVESTMENTS (Cost $12,517) | | | | | | | | | | | 12,517 | |
| | | | | | | | | | | | | |
Total Investments (Cost $2,206,909) — 108.6% | | | | | | | | | | | 2,343,207 | |
Liabilities in Excess of Other Assets — (8.6)% | | | | | | | | | | | (184,742 | ) |
TOTAL NET ASSETS — 100.0% | | | | | | | | | | $ | 2,158,465 | |
Percentages are stated as a percent of net assets.
| | (b) | Purchased option contracts are held in connection with corresponding option contracts written short. |
| | (c) | The rate shown is as of April 30, 2021. |
SCHEDULES OF OPTIONS WRITTEN — (8.7%) (a)
Description | | Contracts | | | Notional Amount | | | Value | |
Call Options Written — (8.1%) | | | | | | | | |
SPDR S&P 500 ETF Trust, Expires 12/17/2021, Strike Price $403.67 | | | 56 | | | $ | (2,336,880 | ) | | $ | (175,023 | ) |
| | | | | | | | | | | | (175,023 | ) |
Put Options Written — (0.6%) | | | | | | | | | | | | |
SPDR S&P 500 ETF Trust, Expires 12/17/2021, Strike Price $257.07 | | | 56 | | | | (2,336,880 | ) | | | (11,838 | ) |
Total Options Written (Premiums Received $131,019) | | | | | | | | | | | (11,838 | ) |
| | | | | | | $ | (186,861 | ) |
The accompanying notes are an integral part of the financial statements.
23
Pacer Swan SOS Moderate (December) ETF
SCHEDULES OF INVESTMENTS
April 30, 2021 (Unaudited)
| | | Contracts | | | Notional Amount | | | Value | |
PURCHASED OPTIONS — 107.2% (a)(b) | | | | |
| | | | | | | | | | | | | |
CALL OPTIONS — 104.1% | | | | | | | | |
SPDR S&P 500 ETF Trust, Expires 12/17/2021, Strike Price $5.55 | | | 112 | | | $ | 4,673,760 | | | $ | 4,559,737 | |
| | | | | | | | | | | | 4,559,737 | |
PUT OPTIONS — 3.1% | | | | | | | | | | | | |
SPDR S&P 500 ETF Trust, Expires 12/17/2021, Strike Price $367.28 | | | 112 | | | | 4,673,760 | | | | 133,415 | |
| | | | | | | | | | | | 133,415 | |
TOTAL PURCHASED OPTIONS (Cost $4,446,453) | | | | | | | | | | | 4,693,152 | |
| | | | | | | | | |
| | | Principal
Amount | | | | | | | | | |
SHORT-TERM INVESTMENTS — 0.6% | | | | | | | | | | | | |
| | | | | | | | | | | | | |
Money Market Deposit Accounts — 0.6% | | | | | | | | | | | | |
U.S. Bank Money Market Deposit Account, 0.003% (c) | | $ | 27,579 | | | | | | | | 27,579 | |
TOTAL SHORT-TERM INVESTMENTS (Cost $27,579) | | | | | | | | | | | 27,579 | |
| | | | | | | | | | | | | |
Total Investments (Cost $4,474,032) — 107.8% | | | | | | | | | | | 4,720,731 | |
Liabilities in Excess of Other Assets — (7.8)% | | | | | | | | | | | (341,534 | ) |
TOTAL NET ASSETS — 100.0% | | | | | | | | | | $ | 4,379,197 | |
Percentages are stated as a percent of net assets.
| | (b) | Purchased option contracts are held in connection with corresponding option contracts written short. |
| | (c) | The rate shown is as of April 30, 2021. |
SCHEDULES OF OPTIONS WRITTEN — (7.8%) (a)
Description | | Contracts | | | Notional Amount | | | Value | |
Call Options Written — (6.5%) | | | | | | | | |
SPDR S&P 500 ETF Trust, Expires 12/17/2021, Strike Price $412.23 | | | 112 | | | $ | (4,673,760 | ) | | $ | (286,169 | ) |
| | | | | | | | | | | | (286,169 | ) |
Put Options Written — (1.3%) | | | | | | | | | | | | |
SPDR S&P 500 ETF Trust, Expires 12/17/2021, Strike Price $312.15 | | | 112 | | | | (4,673,760 | ) | | | (57,150 | ) |
Total Options Written (Premiums Received $290,148) | | | | | | | | | | | (57,150 | ) |
| | | | | | | $ | (343,319 | ) |
The accompanying notes are an integral part of the financial statements.
24
Pacer Swan SOS Flex (December) ETF
SCHEDULES OF INVESTMENTS
April 30, 2021 (Unaudited)
| | | Contracts | | | Notional Amount | | | Value | |
PURCHASED OPTIONS — 104.5% (a)(b) | | | | |
| | | | | | | | | | | | | |
CALL OPTIONS — 101.2% | | | | | | | | |
SPDR S&P 500 ETF Trust, Expires 12/17/2021, Strike Price $5.58 | | | 42 | | | $ | 1,752,660 | | | $ | 1,709,776 | |
| | | | | | | | | | | | 1,709,776 | |
PUT OPTIONS — 3.3% | | | | | | | | | | | | |
SPDR S&P 500 ETF Trust, Expires 12/17/2021, Strike Price $220.34 | | | 42 | | | | 1,752,660 | | | | 4,941 | |
SPDR S&P 500 ETF Trust, Expires 12/17/2021, Strike Price $367.24 | | | 42 | | | | 1,752,660 | | | | 50,001 | |
| | | | | | | | | | | | 54,942 | |
TOTAL PURCHASED OPTIONS (Cost $1,662,904) | | | | | | | | | | | 1,764,718 | |
| | | | | | | | | |
| | | Principal
Amount | | | | | | | | | |
SHORT-TERM INVESTMENTS — 0.5% | | | | | | | | | | | | |
| | | | | | | | | | | | | |
Money Market Deposit Accounts — 0.5% | | | | | | | | | | | | |
U.S. Bank Money Market Deposit Account, 0.003% (b) | | $ | 9,028 | | | | | | | | 9,028 | |
TOTAL SHORT-TERM INVESTMENTS (Cost $9,028) | | | | | | | | | | | 9,028 | |
| | | | | | | | | | | | | |
Total Investments (Cost $1,671,932) — 105.0% | | | | | | | | | | | 1,773,746 | |
Liabilities in Excess of Other Assets — (5.0)% | | | | | | | | | | | (84,391 | ) |
TOTAL NET ASSETS — 100.0% | | | | | | | | | | $ | 1,689,355 | |
Percentages are stated as a percent of net assets.
| | (b) | Purchased option contracts are held in connection with corresponding option contracts written short. |
| | (c) | The rate shown is as of April 30, 2021. |
SCHEDULES OF OPTIONS WRITTEN — (5.1%) (a)
Description | | Contracts | | | Notional Amount | | | Value | |
Call Options Written — (3.2%) | | | | | | | | |
SPDR S&P 500 ETF Trust, Expires 12/17/2021, Strike Price $435.25 | | | 42 | | | $ | (1,752,660 | ) | | $ | (54,226 | ) |
| | | | | | | | | | | | (54,226 | ) |
Put Options Written — (1.9%) | | | | | | | | | | | | |
SPDR S&P 500 ETF Trust, Expires 12/17/2021, Strike Price $293.79 | | | 84 | | | | (3,505,320 | ) | | | (31,971 | ) |
Total Options Written (Premiums Received $118,090) | | | | | | | | | | | (31,971 | ) |
| | | | | | | $ | (86,197 | ) |
The accompanying notes are an integral part of the financial statements.
25
Pacer Swan SOS Fund of Funds ETF
SCHEDULES OF INVESTMENTS
April 30, 2021 (Unaudited)
| | | Shares | | | Value | |
AFFILIATED EXCHANGE TRADED FUNDS — 99.3% | | | | |
Pacer Swan SOS Conservative (April) ETF | | | 20,418 | | | $ | 429,055 | |
Pacer Swan SOS Conservative (December) ETF | | | 32,995 | | | | 713,451 | |
Pacer Swan SOS Flex (April) ETF | | | 35,256 | | | | 750,812 | |
Pacer Swan SOS Flex (December) ETF | | | 48,546 | | | | 1,093,630 | |
Pacer Swan SOS Moderate (April) ETF | | | 71,284 | | | | 1,501,291 | |
Pacer Swan SOS Moderate (December) ETF | | | 112,468 | | | | 2,465,883 | |
TOTAL AFFILIATED EXCHANGE TRADED FUNDS (Cost $6,770,636) | | | | | | | 6,954,122 | |
| | | | | |
| | | Principal
Amount | | | | | |
SHORT-TERM INVESTMENTS — 0.7% | | | | |
| | | | | | | | | |
Money Market Deposit Accounts — 0.7% | | | | |
U.S. Bank Money Market Deposit Account, 0.003% (a) | | $ | 48,675 | | | | 48,675 | |
TOTAL SHORT-TERM INVESTMENTS (Cost $48,675) | | | | | | | 48,675 | |
| | | | | |
Total Investments (Cost $6,819,311) — 100.0% | | | | | | | 7,002,797 | |
Liabilities in Excess of Other Assets — 0.0% (b) | | | | | | | (753 | ) |
TOTAL NET ASSETS — 100.0% | | | | | | $ | 7,002,044 | |
Percentages are stated as a percent of net assets.
| | (a) | The rate shown is as of April 30, 2021. |
The accompanying notes are an integral part of the financial statements.
26
Pacer Swan SOS Conservative (April) ETF
SCHEDULES OF INVESTMENTS
April 30, 2021 (Unaudited)
| | | Shares | | | Notional Amount | | | Value | |
PURCHASED OPTIONS — 105.0% (a)(b) | | | | |
| | | | | | | | | | | | | |
CALL OPTIONS — 100.4% | | | | | | | | |
SPDR S&P 500 ETF Trust, Expires 3/31/2022, Strike Price $5.94 | | | 39 | | | $ | 1,627,470 | | | $ | 1,580,599 | |
| | | | | | | | | | | | 1,580,599 | |
PUT OPTIONS — 4.6% | | | | | | | | | | | | |
SPDR S&P 500 ETF Trust, Expires 3/31/2022, Strike Price $376.51 | | | 39 | | | | 1,627,470 | | | | 72,246 | |
| | | | | | | | | | | | 72,246 | |
TOTAL PURCHASED OPTIONS (Cost $1,614,422) | | | | | | | | | | | 1,652,845 | |
| | | | | | | | | |
| | | Principal
Amount | | | | | | | | | |
SHORT-TERM INVESTMENTS — 0.7% | | | | | | | | | | | | |
| | | | | | | | | | | | | |
Money Market Deposit Accounts — 0.7% | | | | | | | | | | | | |
U.S. Bank Money Market Deposit Account, 0.003% (c) | | $ | 11,578 | | | | | | | | 11,578 | |
TOTAL SHORT-TERM INVESTMENTS (Cost $11,578) | | | | | | | | | | | 11,578 | |
| | | | | | | | | | | | | |
Total Investments (Cost $1,626,000) — 105.7% | | | | | | | | | | | 1,664,423 | |
Liabilities in Excess of Other Assets — (5.7)% | | | | | | | | | | | (90,113 | ) |
TOTAL NET ASSETS — 100.0% | | | | | | | | | | $ | 1,574,310 | |
Percentages are stated as a percent of net assets.
| | (b) | Purchased option contracts are held in connection with corresponding option contracts written short. |
| | (c) | The rate shown is as of April 30, 2021. |
SCHEDULES OF OPTIONS WRITTEN — (5.9%) (a)
Description | | Contracts | | | Notional Amount | | | Value | |
Call Options Written — (4.8%) | | | | | | | | |
SPDR S&P 500 ETF Trust, Expires 3/31/2022, Strike Price $432.40 | | | 39 | | | $ | (1,627,470 | ) | | $ | (74,830 | ) |
| | | | | | | | | | | | (74,830 | ) |
Put Options Written — (1.1%) | | | | | | | | | | | | |
SPDR S&P 500 ETF Trust, Expires 3/31/2022, Strike Price $277.43 | | | 39 | | | | (1,627,470 | ) | | | (18,478 | ) |
Total Options Written (Premiums Received $73,187) | | | | | | | | | | | (18,478 | ) |
| | | | | | | $ | (93,308 | ) |
The accompanying notes are an integral part of the financial statements.
27
Pacer Swan SOS Moderate (April) ETF
SCHEDULES OF INVESTMENTS
April 30, 2021 (Unaudited)
| | | Shares | | | Notional Amount | | | Value | |
PURCHASED OPTIONS — 105.9% (a)(b) | | | | |
| | | | | | | | | | | | | |
CALL OPTIONS — 100.0% | | | | | | | | |
SPDR S&P 500 ETF Trust, Expires 3/31/2022, Strike Price $5.98 | | | 65 | | | $ | 2,712,450 | | | $ | 2,634,072 | |
| | | | | | | | | | | | 2,634,072 | |
PUT OPTIONS — 5.9% | | | | | | | | | | | | |
SPDR S&P 500 ETF Trust, Expires 3/31/2022, Strike Price $396.37 | | | 65 | | | | 2,712,450 | | | | 154,098 | |
| | | | | | | | | | | | 154,098 | |
TOTAL PURCHASED OPTIONS (Cost $2,747,892) | | | | | | | | | | | 2,788,170 | |
| | | | | | | | | |
| | | Principal
Amount | | | | | | | | | |
SHORT-TERM INVESTMENTS — 0.8% | | | | | | | | | | | | |
| | | | | | | | | | | | | |
Money Market Deposit Accounts — 0.8% | | | | | | | | | | | | |
U.S. Bank Money Market Deposit Account, 0.003% (c) | | $ | 22,208 | | | | | | | | 22,208 | |
TOTAL SHORT-TERM INVESTMENTS (Cost $22,208) | | | | | | | | | | | 22,208 | |
| | | | | | | | | | | | | |
Total Investments (Cost $2,770,100) — 106.7% | | | | | | | | | | | 2,810,378 | |
Liabilities in Excess of Other Assets — (6.7)% | | | | | | | | | | | (177,253 | ) |
TOTAL NET ASSETS — 100.0% | | | | | | | | | | $ | 2,633,125 | |
Percentages are stated as a percent of net assets.
| | (b) | Purchased option contracts are held in connection with corresponding option contracts written short. |
| | (c) | The rate shown is as of April 30, 2021. |
SCHEDULES OF OPTIONS WRITTEN — (6.8%) (a)
Description | | Contracts | | | Notional Amount | | | Value | |
Call Options Written — (4.1%) | | | | | | | | |
SPDR S&P 500 ETF Trust, Expires 3/31/2022, Strike Price $437.87 | | | 65 | | | $ | (2,712,450 | ) | | $ | (107,767 | ) |
| | | | | | | | | | | | (107,767 | ) |
Put Options Written — (2.7%) | | | | | | | | | | | | |
SPDR S&P 500 ETF Trust, Expires 3/31/2022, Strike Price $336.88 | | | 65 | | | | (2,712,450 | ) | | | (71,961 | ) |
Total Options Written (Premiums Received $165,133) | | | | | | | | | | | (71,961 | ) |
| | | | | | | $ | (179,728 | ) |
The accompanying notes are an integral part of the financial statements.
28
Pacer Swan SOS Flex (April) ETF
SCHEDULES OF INVESTMENTS
April 30, 2021 (Unaudited)
| | | Shares | | | Notional Amount | | | Value | |
PURCHASED OPTIONS — 105.3% (a)(b) | | | | |
| | | | | | | | | | | | | |
CALL OPTIONS — 98.9% | | | | | | | | |
SPDR S&P 500 ETF Trust, Expires 3/31/2022, Strike Price $6.02 | | | 130 | | | $ | 5,424,900 | | | $ | 5,267,627 | |
| | | | | | | | | | | | 5,267,627 | |
PUT OPTIONS — 6.4% | | | | | | | | | | | | |
SPDR S&P 500 ETF Trust, Expires 3/31/2022, Strike Price $237.80 | | | 130 | | | | 5,424,900 | | | | 33,553 | |
SPDR S&P 500 ETF Trust, Expires 3/31/2022, Strike Price $396.33 | | | 130 | | | | 5,424,900 | | | | 308,046 | |
| | | | | | | | | | | | 341,599 | |
TOTAL PURCHASED OPTIONS (Cost $5,562,130) | | | | | | | | | | | 5,609,226 | |
| | | | | | | | | |
| | | Principal
Amount | | | | | | | | | |
SHORT-TERM INVESTMENTS — 0.8% | | | | | | | | | | | | |
| | | | | | | | | | | | | |
Money Market Deposit Accounts — 0.8% | | | | | | | | | | | | |
U.S. Bank Money Market Deposit Account, 0.003% (c) | | $ | 42,040 | | | | | | | | 42,040 | |
TOTAL SHORT-TERM INVESTMENTS (Cost $42,040) | | | | | | | | | | | 42,040 | |
| | | | | | | | | | | | | |
Total Investments (Cost $5,604,170) — 106.1% | | | | | | | | | | | 5,651,266 | |
Liabilities in Excess of Other Assets — (6.1)% | | | | | | | | | | | (322,565 | ) |
TOTAL NET ASSETS — 100.0% | | | | | | | | | | $ | 5,328,701 | |
Percentages are stated as a percent of net assets.
| | (b) | Purchased option contracts are held in connection with corresponding option contracts written short. |
| | (c) | The rate shown is as of April 30, 2021. |
SCHEDULES OF OPTIONS WRITTEN — (6.2%) (a)
Description | | Contracts | | | Notional Amount | | | Value | |
Call Options Written — (2.1%) | | | | | | | | |
SPDR S&P 500 ETF Trust, Expires 3/31/2022, Strike Price $459.90 | | | 130 | | | $ | (5,424,900 | ) | | $ | (110,737 | ) |
| | | | | | | | | | | | (110,737 | ) |
Put Options Written — (4.1%) | | | | | | | | | | | | |
SPDR S&P 500 ETF Trust, Expires 3/31/2022, Strike Price $317.06 | | | 260 | | | | (10,849,800 | ) | | | (218,878 | ) |
Total Options Written (Premiums Received $333,368) | | | | | | | | | | | (218,878 | ) |
| | | | | | | $ | (329,615 | ) |
For Fund compliance purposes, the Fund’s industry classifications refer to any one or more of the industry sub-classifications used by one or more widely recognized market indexes or ratings group indexes, and/or they may be defined by Fund management. This definition does not apply for all purposes of this report, which may combine sub-classifications for reporting ease.
The accompanying notes are an integral part of the financial statements.
29
Pacer Funds
STATEMENTS OF ASSETS & LIABILITIES
April 30, 2021 (Unaudited)
| | Pacer
American Energy
Independence
ETF | | | Pacer
Salt High
truBetaTM US
Market ETF | | | Pacer
Salt Low
truBetaTM US
Market ETF | | | Pacer
Swan SOS
Conservative
(December) ETF | | | Pacer
Swan SOS
Moderate
(December) ETF | |
ASSETS | | | | | | | | | | | | | | | | | | | | |
Investments in Securities, at Value* | | $ | 22,075,800 | | | $ | 15,207,020 | | | $ | 7,587,028 | | | $ | 2,343,207 | | | $ | 4,720,731 | |
Foreign Currency at Value* | | | 1,847 | | | | — | | | | — | | | | — | | | | — | |
Interest and Dividends Receivable | | | 135,103 | | | | 5,554 | | | | 8,265 | | | | — | | | | — | |
Deposits with Broker for Options | | | — | | | | — | | | | — | | | | 3,280 | | | | 4,339 | |
Securities Lending Income Receivable | | | 31 | | | | 132 | | | | 30 | | | | — | | | | — | |
Total Assets | | | 22,212,781 | | | | 15,212,706 | | | | 7,595,323 | | | | 2,346,487 | | | | 4,725,070 | |
| | | | | | | | | | | | | | | | | | | | | |
LIABILITIES | | | | | | | | | | | | | | | | | | | | |
Options Written, at Value (Premiums Received ($0, $0, $0, $131,019, $290,148) | | | — | | | | — | | | | — | | | | 186,861 | | | | 343,319 | |
Management Fees Payable | | | 11,641 | | | | 6,147 | | | | 2,986 | | | | 1,161 | | | | 2,554 | |
Payable for distributions to shareholders | | | 108,000 | | | | — | | | | — | | | | — | | | | — | |
Collateral Received for Securities Loaned | | | 1,925,172 | | | | 2,796,987 | | | | 1,438,035 | | | | — | | | | — | |
Total Liabilities | | | 2,044,813 | | | | 2,803,134 | | | | 1,441,021 | | | | 188,022 | | | | 345,873 | |
| | | | | | | | | | | | | | | | | | | | | |
NET ASSETS | | $ | 20,167,968 | | | $ | 12,409,572 | | | $ | 6,154,302 | | | $ | 2,158,465 | | | $ | 4,379,197 | |
| | | | | | | | | | | | | | | | | | | | | |
NET ASSETS CONSIST OF: | | | | | | | | | | | | | | | | | | | | |
Paid-in Capital | | $ | 19,844,792 | | | $ | 11,969,456 | | | $ | 5,734,859 | | | $ | 2,081,898 | | | $ | 4,193,762 | |
Total Distributable Earnings (Accumulated Deficit) | | | 323,176 | | | | 440,116 | | | | 419,443 | | | | 76,567 | | | | 185,435 | |
Net Assets | | $ | 20,167,968 | | | $ | 12,409,572 | | | $ | 6,154,302 | | | $ | 2,158,465 | | | $ | 4,379,197 | |
* Identified Cost: | | | | | | | | | | | | | | | | | | | | |
Investments in Securities | | $ | 18,665,059 | | | $ | 14,044,389 | | | $ | 67,711,711 | | | $ | 2,206,909 | | | $ | 4,474,032 | |
Foreign Currencies | | | 1,850 | | | | — | | | | — | | | | — | | | | — | |
^ Includes Loaned Securities with a value of | | | 1,856,916 | | | | 2,687,980 | | | | 1,406,129 | | | | — | | | | — | |
| | | | | | | | | | | | | | | | | | | | | |
Net Asset Value: | | | | | | | | | | | | | | | | | | | | |
Net Assets | | $ | 20,167,968 | | | $ | 12,409,572 | | | $ | 6,154,302 | | | $ | 2,158,465 | | | $ | 4,379,197 | |
Shares Outstanding (No Par Value) | | | 900,000 | | | | 300,000 | | | | 200,000 | | | | 100,000 | | | | 200,000 | |
Net Asset Value, Offering and Redemption Price per Share | | $ | 22.41 | | | $ | 41.37 | | | $ | 30.77 | | | $ | 21.58 | | | $ | 21.90 | |
The accompanying notes are an integral part of the financial statements.
30
Pacer Funds
STATEMENTS OF ASSETS & LIABILITIES
April 30, 2021 (Unaudited)
| | | Pacer
Swan SOS Flex
(December) ETF | | | Pacer
Swan SOS Fund
of Funds ETF | | | Pacer
Swan SOS
Conservative
(April) ETF | | | Pacer
Swan SOS
Moderate
(April) ETF | | | Pacer
Swan SOS Flex
(April) ETF | |
ASSETS | | | | | | | | | | | | | | | | | | | | |
Investments in Unaffiliated Securities, at Value* | | $ | 1,773,746 | | | $ | 48,675 | | | $ | 1,664,423 | | | $ | 2,810,378 | | | $ | 5,651,266 | |
Investments in Affiliated Securities, at Value* | | $ | — | | | $ | 6,954,122 | | | $ | — | | | $ | — | | | $ | — | |
Deposits with Broker for Options | | | 2,838 | | | | — | | | | 3,765 | | | | 3,241 | | | | 8,238 | |
Total Assets | | | 1,776,584 | | | | 7,002,797 | | | | 1,668,188 | | | | 2,813,619 | | | | 5,659,504 | |
| | | | | | | | | | | | | | | | | | | | | |
LIABILITIES | | | | | | | | | | | | | | | | | | | | |
Options Written, at Value (Premiums Received ($118,090, $0, $73,187, $165,133, $333,368) | | | 86,197 | | | | — | | | | 93,308 | | | | 179,728 | | | | 329,615 | |
Management Fees Payable | | | 1,032 | | | | 753 | | | | 570 | | | | 766 | | | | 1,188 | |
Total Liabilities | | | 87,229 | | | | 753 | | | | 93,878 | | | | 180,494 | | | | 330,803 | |
| | | | | | | | | | | | | | | | | | | | | |
NET ASSETS | | $ | 1,689,355 | | | $ | 7,002,044 | | | $ | 1,574,310 | | | $ | 2,633,125 | | | $ | 5,328,701 | |
| | | | | | | | | | | | | | | | | | | | | |
NET ASSETS CONSIST OF: | | | | | | | | | | | | | | | | | | | | |
Paid-in Capital | | $ | 1,559,533 | | | $ | 6,794,821 | | | $ | 1,556,578 | | | $ | 2,608,208 | | | $ | 5,279,040 | |
Total Distributable Earnings (Accumulated Deficit) | | | 129,822 | | | | 207,223 | | | | 17,732 | | | | 24,917 | | | | 49,661 | |
Net Assets | | $ | 1,689,355 | | | $ | 7,002,044 | | | $ | 1,574,310 | | | $ | 2,633,125 | | | $ | 5,328,701 | |
* Identified Cost: | | | | | | | | | | | | | | | | | | | | |
Investments in Unaffiliated Securities | | $ | 1,671,932 | | | $ | 48,675 | | | $ | 1,626,000 | | | $ | 2,770,100 | | | $ | 5,604,170 | |
Investments in Affiliated Securities | | $ | — | | | $ | 6,770,636 | | | $ | — | | | $ | — | | | $ | — | |
| | | | | | | | | | | | | | | | | | | | | |
Net Asset Value: | | | | | | | | | | | | | | | | | | | | |
Net Assets | | $ | 1,689,355 | | | $ | 7,002,044 | | | $ | 1,574,310 | | | $ | 2,633,125 | | | $ | 5,328,701 | |
Shares Outstanding (No Par Value) | | | 75,000 | | | | 325,000 | | | | 75,000 | | | | 125,000 | | | | 250,000 | |
Net Asset Value, Offering and Redemption Price per Share | | $ | 22.52 | | | $ | 21.54 | | | $ | 20.99 | | | $ | 21.06 | | | $ | 21.31 | |
The accompanying notes are an integral part of the financial statements.
31
Pacer Funds
STATEMENTS OF OPERATIONS
For the Period Ended April 30, 2021 (Unaudited)
| | Pacer American
Energy
Independence
ETF | | | Pacer Salt High
truBetaTM US
Market ETF | | | Pacer Salt Low
truBetaTM US
Market ETF | |
INVESTMENT INCOME | | | | | | | | | | | | |
Income: | | | | | | | | | | | | |
Dividends* | | $ | 229,488 | | | $ | 47,741 | | | $ | 97,585 | |
Securities Lending Income, Net | | | 40 | | | | 160 | | | | 35 | |
Interest | | | 4 | | | | 3 | | | | — | |
Total Investment Income | | | 229,532 | | | | 47,904 | | | | 97,620 | |
| | | | | | | | | | | | | |
Expenses | | | | | | | | | | | | |
Management fees | | | 59,600 | | | | 32,648 | | | | 22,038 | |
Total Expenses | | | 59,600 | | | | 32,648 | | | | 22,038 | |
Net Investment Income | | | 169,932 | | | | 15,256 | | | | 75,582 | |
| | | | | | | | | | | | | |
REALIZED & UNREALIZED GAIN (LOSS) ON INVESTMENTS | | | | | | | | | | | | |
Net Realized Gain (Loss) on: | | | | | | | | | | | | |
Net Realized Gain (Loss) on Investments | | | (288,050 | ) | | | 759,965 | | | | 57,544 | |
Net Realized Gain (Loss) on In-Kind Redemptions | | | 898,520 | | | | 2,260,061 | | | | 387,344 | |
Net realized Gain (Loss) on Foreign Currency | | | 958 | | | | — | | | | — | |
Total | | | 611,428 | | | | 3,020,026 | | | | 444,888 | |
Net Change in Unrealized Appreciation (Depreciation) of: | | | | | | | | | | | | |
Change in Unrealized Appreciation (Depreciation) on Investments | | | 5,787,113 | | | | 636,916 | | | | 612,978 | |
Change in Unrealized Appreciation (Depreciation) on Foreign Currency | | | 338 | | | | — | | | | — | |
Total | | | 5,787,451 | | | | 636,916 | | | | 612,978 | |
Net Realized and Unrealized Gain (Loss) on Investments | | | 6,398,879 | | | | 3,656,942 | | | | 1,057,866 | |
NET INCREASE (DECREASE) IN NET ASSETS RESULTING FROM OPERATIONS | | $ | 6,568,811 | | | $ | 3,672,198 | | | $ | 1,133,448 | |
| | | | | | | | | | | | | |
* Net of fees and foreign withholding tax of | | $ | (22,261 | ) | | $ | — | | | $ | — | |
The accompanying notes are an integral part of the financial statements.
32
Pacer Funds
STATEMENTS OF OPERATIONS
For the Period Ended April 30, 2021 (Unaudited)
| | | Pacer Swan SOS
Conservative
(December)
ETF (a) | | | Pacer Swan
SOS Moderate
(December)
ETF (a) | | | Pacer Swan SOS
Flex (December)
ETF (a) | | | Pacer Swan
SOS Fund of
Funds ETF (b) | |
INVESTMENT INCOME | | | | | | | | | | | | | | | | |
Income: | | | | | | | | | | | | | | | | |
Interest | | $ | — | | | $ | 7 | | | $ | — | | | $ | 1 | |
Total Investment Income | | | — | | | | 7 | | | | — | | | | 1 | |
| | | | | | | | | | | | | | | | | |
Expenses | | | | | | | | | | | | | | | | |
Management fees | | | 3,884 | | | | 8,081 | | | | 3,880 | | | | 2,101 | |
Broker interest | | | 5 | | | | 19 | | | | 5 | | | | — | |
Total Expenses | | | 3,889 | | | | 8,100 | | | | 3,885 | | | | 2,101 | |
Net Investment Income | | | (3,889 | ) | | | (8,093 | ) | | | (3,885 | ) | | | (2,100 | ) |
| | | | | | | | | | | | | | | | | |
REALIZED & UNREALIZED GAIN (LOSS) ON INVESTMENTS | | | | | | | | | | | | | | | | |
Net Realized Gain (Loss) on: | | | | | | | | | | | | | | | | |
Net Realized Gain (Loss) on Investments in Unaffiliated Securities | | | — | | | | — | | | | — | | | | — | |
Net Realized Gain (Loss) on Investments in Affiliated Securities | | | — | | | | — | | | | — | | | | 25,837 | |
Net Realized Gain (Loss) on Options Written | | | — | | | | — | | | | — | | | | — | |
Total | | | — | | | | — | | | | — | | | | 25,837 | |
Net Change in Unrealized Appreciation (Depreciation) of: | | | | | | | | | | | | | | | | |
Change in Unrealized Appreciation (Depreciation) on Investments in Unaffiliated Securities | | | 136,298 | | | | 246,699 | | | | 101,814 | | | | — | |
Change in Unrealized Appreciation (Depreciation) on Investments in Affiliated Securities | | | — | | | | — | | | | — | | | | 183,486 | |
Change in Unrealized Appreciation (Depreciation) on Options Written | | | (55,842 | ) | | | (53,171 | ) | | | 31,893 | | | | — | |
Total | | | 80,456 | | | | 193,528 | | | | 133,707 | | | | 183,486 | |
Net Realized and Unrealized Gain (Loss) on Investments | | | 80,456 | | | | 193,528 | | | | 133,707 | | | | 209,323 | |
NET INCREASE (DECREASE) IN NET ASSETS RESULTING FROM OPERATIONS | | $ | 76,567 | | | $ | 185,435 | | | $ | 129,822 | | | $ | 207,223 | |
(a) | The Fund commenced operations on December 22, 2020. The information presented is for the period from December 22, 2020 to April 30, 2021. |
(b) | The Fund commenced operations on December 29, 2020. The information presented is for the period from December 29, 2020 to April 30, 2021. |
The accompanying notes are an integral part of the financial statements.
33
Pacer Funds
STATEMENTS OF OPERATIONS
For the Period Ended April 30, 2021 (Unaudited)
| | | Pacer Swan SOS
Conservative
(April) ETF (c) | | | Pacer Swan
SOS Moderate
(April) ETF (c) | | | Pacer Swan
SOS Flex
(April) ETF (c) | |
INVESTMENT INCOME | | | | | | | | | | | | |
| | | | | | | | | | | | | |
Expenses | | | | | | | | | | | | |
Management fees | | | 570 | | | | 766 | | | | 1,188 | |
Total Expenses | | | 570 | | | | 766 | | | | 1,188 | |
Net Investment Income | | | (570 | ) | | | (766 | ) | | | (1,188 | ) |
| | | | | | | | | | | | | |
REALIZED & UNREALIZED GAIN (LOSS) ON INVESTMENTS | | | | | | | | | | | | |
Net Change in Unrealized Appreciation (Depreciation) of: | | | | | | | | | | | | |
Change in Unrealized Appreciation (Depreciation) on Investments in Securities | | | 38,423 | | | | 40,277 | | | | 47,096 | |
Change in Unrealized Appreciation (Depreciation) on Options Written | | | (20,121 | ) | | | (14,594 | ) | | | 3,753 | |
Total | | | 18,302 | | | | 25,683 | | | | 50,849 | |
Net Realized and Unrealized Gain (Loss) on Investments | | | 18,302 | | | | 25,683 | | | | 50,849 | |
NET INCREASE (DECREASE) IN NET ASSETS RESULTING FROM OPERATIONS | | $ | 17,732 | | | $ | 24,917 | | | $ | 49,661 | |
(c) | The Fund commenced operations on March 31, 2021. The information presented is for the period from March 31, 2021 to April 30, 2021. |
The accompanying notes are an integral part of the financial statements.
34
Pacer Funds
STATEMENTS OF CHANGES IN NET ASSETS
| | Pacer American Energy Independence ETF (a) | |
| | | For the
Period Ended
April 30,
2021
(Unaudited) | | | For the
Period Ended
October 31,
2020 (b) | | | For the
Year Ended
November 30,
2019 | |
OPERATIONS | | | | | | | | | | | | |
Net Investment Income | | $ | 169,932 | | | $ | 191,447 | | | $ | 181,818 | |
Net Realized Gain (Loss) on Investments and Foreign Currency Transactions | | | 611,428 | | | | (1,896,546 | ) | | | 616,147 | |
Change in Unrealized Appreciation (Depreciation) of Investments and Foreign Currency Transactions | | | 5,787,451 | | | | (1,115,064 | ) | | | (500,453 | ) |
Net Increase (Decrease) in Net Assets Resulting from Operations | | | 6,568,811 | | | | (2,820,163 | ) | | | 297,512 | |
| | | | | | | | | | | | | |
DISTRIBUTIONS TO SHAREHOLDERS | | | | | | | | | | | | |
Net Investment Income | | | (588,000 | ) | | | (245,568 | ) | | | (112,296 | ) |
Return of Capital | | | — | | | | (709,985 | ) | | | (626,154 | ) |
Total Distributions to Shareholders | | | (588,000 | ) | | | (955,553 | ) | | | (738,450 | ) |
| | | | | | | | | | | | | |
CAPITAL SHARE TRANSACTIONS | | | | | | | | | | | | |
Proceeds from Shares Sold | | | 5,121,720 | | | | 9,066,280 | | | | 17,042,250 | |
Payments for Shares Redeemed | | | (2,900,605 | ) | | | (4,221,315 | ) | | | (14,988,310 | ) |
Transaction Fees (see Note 1) | | | — | | | | — | | | | 147 | |
Net Increase (Decrease) in Net Assets Derived from Capital Share Transactions (c) | | | 2,221,115 | | | | 4,844,965 | | | | 2,054,087 | |
Net Increase (Decrease) in Net Assets | | $ | 8,201,926 | | | $ | 1,069,249 | | | $ | 1,613,149 | |
| | | | | | | | | | | | | |
NET ASSETS | | | | | | | | | | | | |
Beginning of Period | | $ | 11,966,042 | | | $ | 10,896,793 | | | $ | 9,283,644 | |
End of Period | | $ | 20,167,968 | | | $ | 11,966,042 | | | $ | 10,896,793 | |
(a) | Shares of the Predecessor USAI Fund converted Shares at the close of business on December 13, 2019. See Note 1 to the Financial Statements. |
(b) | For the period ended December 1, 2019 to October 31, 2020. |
(c) | A summary of capital share transactions is as follows: |
| | | Shares | | | Shares (d) | | | Shares (d) | |
Subscriptions | | | 250,000 | | | | 550,000 | | | | 700,000 | |
Redemptions | | | (150,000 | ) | | | (250,000 | ) | | | (600,000 | ) |
Net Increase (Decrease) | | | 100,000 | | | | 300,000 | | | | 100,000 | |
(d) | Shares of Predecessor Fund converted into Fund Shares at the close of business on December 13, 2019. See Note 1 to the Financial Statements. |
The accompanying notes are an integral part of the financial statements.
35
Pacer Funds
STATEMENTS OF CHANGES IN NET ASSETS
| | | Pacer Salt High truBetaTM US Market ETF (a) | |
| | | For the
Period Ended
April 30,
2021
(Unaudited) | | | For the
Period Ended
October 31,
2020 (b) | | | For the
Year Ended
December 31,
2019 | |
OPERATIONS | | | | | | | | | | | | |
Net Investment Income (Loss) | | $ | 15,256 | | | $ | 169,489 | | | $ | 155,088 | |
Net Realized Gain (Loss) on Investments | | | 3,020,026 | | | | 792,296 | | | | 1,995,803 | |
Change in Unrealized Appreciation (Depreciation) of Investments | | | 636,916 | | | | (552,103 | ) | | | 1,458,045 | |
Net Increase (Decrease) in Net Assets Resulting from Operations | | | 3,672,198 | | | | 409,682 | | | | 3,608,936 | |
| | | | | | | | | | | | | |
DISTRIBUTIONS TO SHAREHOLDERS | | | | | | | | | | | | |
Dividends and Distributions | | | (185,907 | ) | | | — | | | | (155,507 | ) |
Total Distributions to Shareholders | | | (185,907 | ) | | | — | | | | (155,507 | ) |
| | | | | | | | | | | | | |
CAPITAL SHARE TRANSACTIONS | | | | | | | | | | | | |
Proceeds from Shares Sold | | | 10,794,045 | | | | 4,923,967 | | | | 11,643,208 | |
Payments for Shares Redeemed | | | (9,876,827 | ) | | | (12,790,613 | ) | | | (7,909,050 | ) |
Net Increase (Decrease) in Net Assets Derived from Capital Share Transactions (c) | | | 917,218 | | | | (7,866,646 | ) | | | 3,734,158 | |
Net Increase (Decrease) in Net Assets | | $ | 4,403,509 | | | $ | (7,456,964 | ) | | $ | 7,187,587 | |
| | | | | | | | | | | | | |
NET ASSETS | | | | | | | | | | | | |
Beginning of Period/Year | | $ | 8,006,063 | | | $ | 15,463,027 | | | $ | 8,275,440 | |
End of Period/Year | | $ | 12,409,572 | | | $ | 8,006,063 | | | $ | 15,463,027 | |
(a) | Shares of the Predecessor SLT Fund and the Predecessor LSLT Fund each converted Shares at the close of business on October 2, 2020. See Note 1 to the Financial Statements. |
(b) | For the period ended January 1, 2020 to October 31, 2020. |
(c) | Summary of capital share transactions is as follows: |
| | | Shares | | | Shares (d) | | | Shares (d) | |
Subscriptions | | | 275,000 | | | | 200,000 | | | | 450,000 | |
Redemptions | | | (250,000 | ) | | | (475,000 | ) | | | (300,000 | ) |
Net Increase (Decrease) | | | 25,000 | | | | (275,000 | ) | | | 150,000 | |
(d) | Shares of each Predecessor Fund converted into separate Fund Shares at the close of business on October 2, 2020. See Note 1 to the Financial Statements. |
The accompanying notes are an integral part of the financial statements.
36
Pacer Funds
STATEMENTS OF CHANGES IN NET ASSETS
| | | Pacer Salt Low truBetaTM US Market ETF (a) | |
| | | For the
Period Ended
April 30,
2021
(Unaudited) | | | For the
Period Ended
October 31,
2020 (b) | | | For the
Period Ended
December 31,
2019 (c) | |
OPERATIONS | | | | | | | | | | | | |
Net Investment Income (Loss) | | $ | 75,582 | | | $ | 184,347 | | | $ | 136,318 | |
Net Realized Gain (Loss) on Investments | | | 444,888 | | | | (451,039 | ) | | | 21,452 | |
Change in Unrealized Appreciation (Depreciation) of Investments | | | 612,978 | | | | (460,175 | ) | | | 663,054 | |
Net Increase (Decrease) in Net Assets Resulting from Operations | | | 1,133,448 | | | | (726,867 | ) | | | 820,824 | |
| | | | | | | | | | | | | |
DISTRIBUTIONS TO SHAREHOLDERS | | | | | | | | | | | | |
Dividends and Distributions | | | (93,206 | ) | | | (179,737 | ) | | | (138,282 | ) |
Total Distributions to Shareholders | | | (93,206 | ) | | | (179,737 | ) | | | (138,282 | ) |
| | | | | | | | | | | | | |
CAPITAL SHARE TRANSACTIONS | | | | | | | | | | | | |
Proceeds from Shares Sold | | | — | | | | 2,801,520 | | | | 8,610,788 | |
Payments for Shares Redeemed | | | (2,862,033 | ) | | | (3,212,153 | ) | | | — | |
Net Increase (Decrease) in Net Assets Derived from Capital Share Transactions (d) | | | (2,862,033 | ) | | | (410,633 | ) | | | 8,610,788 | |
Net Increase (Decrease) in Net Assets | | $ | (1,821,791 | ) | | $ | (1,317,237 | ) | | $ | 9,293,330 | |
| | | | | | | | | | | | | |
NET ASSETS | | | | | | | | | | | | |
Beginning of Period/Year | | $ | 7,976,093 | | | $ | 9,293,330 | | | $ | — | |
End of Period/Year | | $ | 6,154,302 | | | $ | 7,976,093 | | | $ | 9,293,330 | |
(a) | Shares of the Predecessor SLT Fund and the Predecessor LSLT Fund each converted Shares at the close of business on October 2, 2020. See Note 1 to the Financial Statements. |
(b) | For the period ended January 1, 2020 to October 31, 2020. |
(c) | The Fund commenced operations on March 12, 2019. The information presented is for the period from March 12, 2019 to December 31, 2019. Shares of the Predecessor Fund converted to shares of the Fund at the close of business December 13, 2019. |
(d) | Summary of capital share transactions is as follows: |
| | | Shares | | | Shares (e) | | | Shares (c) | |
Subscriptions | | | — | | | | 100,000 | | | | 325,000 | |
Redemptions | | | (100,000 | ) | | | (125,000 | ) | | | — | |
Net Increase (Decrease) | | | (100,000 | ) | | | (25,000 | ) | | | 325,000 | |
(e) | Shares of each Predecessor Fund converted into separate Fund Shares at the close of business on October 2, 2020. See Note 1 to the Financial Statements. |
The accompanying notes are an integral part of the financial statements.
37
Pacer Funds
STATEMENTS OF CHANGES IN NET ASSETS
| | | Pacer Swan SOS
Conservative
(December) ETF | | | Pacer Swan
SOS Moderate
(December) ETF | | | Pacer Swan
SOS Flex
(December) ETF | |
| | | For the
Period Ended
April 30,
2021
(Unaudited) (a) | | | For the
Period Ended
April 30,
2021
(Unaudited) (a) | | | For the
Period Ended
April 30,
2021
(Unaudited) (a) | |
OPERATIONS | | | | | | | | | | | | |
Net Investment Income (Loss) | | $ | (3,889 | ) | | $ | (8,093 | ) | | $ | (3,885 | ) |
Change in Unrealized Appreciation (Depreciation) of Investments | | | 80,456 | | | | 193,528 | | | | 133,707 | |
Net Increase (Decrease) in Net Assets Resulting from Operations | | | 76,567 | | | | 185,435 | | | | 129,822 | |
| | | | | | | | | | | | | |
CAPITAL SHARE TRANSACTIONS | | | | | | | | | | | | |
Proceeds from Shares Sold | | | 2,081,690 | | | | 4,193,343 | | | | 1,559,378 | |
Transaction Fees (See Note 1) | | | 208 | | | | 419 | | | | 155 | |
Net Increase (Decrease) in Net Assets Derived from Capital Share Transactions | | | 2,081,898 | | | | 4,193,762 | | | | 1,559,533 | |
Net Increase (Decrease) in Net Assets | | $ | 2,158,465 | | | $ | 4,379,197 | | | $ | 1,689,355 | |
| | | | | | | | | | | | | |
NET ASSETS | | | | | | | | | | | | |
Beginning of Period | | $ | — | | | $ | — | | | $ | — | |
End of Period | | $ | 2,158,465 | | | $ | 4,379,197 | | | $ | 1,689,355 | |
(a) | Fund commenced operations on December 22, 2020. The information presented is from December 22, 2020 to April 30, 2021. |
(b) | Summary of capital share transactions is as follows: |
| | | Shares | | | Shares | | | Shares | |
Subscriptions | | | 100,000 | | | | 200,000 | | | | 75,000 | |
Net Increase (Decrease) | | | 100,000 | | | | 200,000 | | | | 75,000 | |
The accompanying notes are an integral part of the financial statements.
38
Pacer Funds
STATEMENTS OF CHANGES IN NET ASSETS
| | | Pacer Swan
SOS Fund of
Funds ETF | |
| | | For the
Period Ended
April 30,
2021
(Unaudited) (a) | |
OPERATIONS | | | | |
Net Investment Income (Loss) | | $ | (2,100 | ) |
Net Realized Gain (Loss) on investments | | | 25,837 | |
Change in Unrealized Appreciation (Depreciation) of Investments | | | 183,486 | |
Net Increase (Decrease) in Net Assets Resulting from Operations | | | 207,223 | |
| | | | | |
CAPITAL SHARE TRANSACTIONS | | | | |
Proceeds from Shares Sold | | | 7,825,018 | |
Payments for Shares Redeemed | | | (1,038,595 | ) |
Transaction Fees (See Note 1) | | | 8,398 | |
Net Increase (Decrease) in Net Assets Derived from Capital Share Transactions | | | 6,794,821 | |
Net Increase (Decrease) in Net Assets | | $ | 7,002,044 | |
| | | | | |
NET ASSETS | | | | |
Beginning of Period | | $ | — | |
End of Period | | $ | 7,002,044 | |
(a) | Fund commenced operations on December 29, 2021. The information presented is from December 29, 2020 to April 30, 2021. |
(b) | Summary of capital share transactions is as follows: |
| | | Shares | |
Subscriptions | | | 325,000 | |
Net Increase (Decrease) | | | 325,000 | |
The accompanying notes are an integral part of the financial statements.
39
Pacer Funds
STATEMENTS OF CHANGES IN NET ASSETS
| | | Pacer Swan SOS
Conservative
(April) ETF | | | Pacer Swan
SOS Moderate
(April) ETF | | | Pacer Swan SOS
Flex (April) ETF | |
| | | For the
Period Ended
April 30,
2021
(Unaudited) (a) | | | For the
Period Ended
April 30,
2021
(Unaudited) (a) | | | For the
Period Ended
April 30,
2021
(Unaudited) (a) | |
OPERATIONS | | | | | | | | | | | | |
Net Investment Income (Loss) | | $ | (570 | ) | | $ | (766 | ) | | $ | (1,188 | ) |
Change in Unrealized Appreciation (Depreciation) of Investments | | | 18,302 | | | | 25,683 | | | | 50,849 | |
Net Increase (Decrease) in Net Assets Resulting from Operations | | | 17,732 | | | | 24,917 | | | | 49,661 | |
| | | | | | | | | | | | | |
CAPITAL SHARE TRANSACTIONS | | | | | | | | | | | | |
Proceeds from Shares Sold | | | 1,556,423 | | | | 2,607,948 | | | | 5,278,513 | |
Transaction Fees (See Note 1) | | | 155 | | | | 260 | | | | 527 | |
Net Increase (Decrease) in Net Assets Derived from Capital Share Transactions | | | 1,556,578 | | | | 2,608,208 | | | | 5,279,040 | |
Net Increase (Decrease) in Net Assets | | $ | 1,574,310 | | | $ | 2,633,125 | | | $ | 5,328,701 | |
| | | | | | | | | | | | | |
NET ASSETS | | | | | | | | | | | | |
Beginning of Period | | $ | — | | | $ | — | | | $ | — | |
End of Period | | $ | 1,574,310 | | | $ | 2,633,125 | | | $ | 5,328,701 | |
(a) | Fund commenced operations on March 31, 2021. The information presented is from March 31, 2021 to April 30, 2021. |
(b) | Summary of capital share transactions is as follows: |
| | | Shares | | | Shares | | | Shares | |
Subscriptions | | | 75,000 | | | | 125,000 | | | | 250,000 | |
Net Increase (Decrease) | | | 75,000 | | | | 125,000 | | | | 250,000 | |
The accompanying notes are an integral part of the financial statements.
40
Pacer American Energy Independence ETF
FINANCIAL HIGHLIGHTS
For a capital share outstanding throughout the year/period
| | For the
Period Ended
April 30,
2021
(Unaudited) | | | For the
Period Ended
October 31,
2020(a) | | | For the
Year Ended
November 30,
2019 | | | For the
Period Ended
November 30,
2018(b) | |
Net Asset Value, Beginning of Period | | $ | 14.96 | | | $ | 21.79 | | | $ | 23.21 | | | $ | 25.00 | |
| | | | | | | | | | | | | | | | | |
INCOME (LOSS) FROM INVESTMENT OPERATIONS: | | | | | | | | | | | | | | | | |
Net Investment Income (c) | | | 0.21 | | | | 0.28 | | | | 0.37 | | | | 0.55 | |
Net Realized and Unrealized Gain (Loss) on Investments (d) | | | 7.96 | | | | (5.55 | ) | | | (0.34 | ) | | | (1.51 | ) |
Total from Investment Operations | | | 8.17 | | | | (5.27 | ) | | | 0.03 | | | | (0.96 | ) |
| | | | | | | | | | | | | | | | | |
LESS DISTRIBUTIONS: | | | | | | | | | | | | | | | | |
Distributions From: | | | | | | | | | | | | | | | | |
Net Investment Income | | | (0.72 | ) | | | (0.52 | ) | | | (0.22 | ) | | | (0.50 | ) |
Return of Capital | | | — | | | | (1.04 | ) | | | (1.23 | ) | | | (0.33 | ) |
Total Distributions | | | (0.72 | ) | | | (1.56 | ) | | | (1.45 | ) | | | (0.83 | ) |
| | | | | | | | | | | | | | | | | |
CAPITAL SHARE TRANSACTIONS: | | | | | | | | | | | | | | | | |
Transaction Fees (See Note 1) | | | — | | | | — | | | | 0.00 | (e) | | | — | |
| | | | | | | | | | | | | | | | | |
Net Asset Value, End of Period | | $ | 22.41 | | | $ | 14.96 | | | $ | 21.79 | | | $ | 23.21 | |
Total return | | | 55.31 | %(f) | | | -24.76 | %(f) | | | -0.13 | % | | | -4.06 | %(f) |
| | | | | | | | | | | | | | | | | |
SUPPLEMENTAL DATA: | | | | | | | | | | | | | | | | |
Net Assets at End of Period (000’s) | | $ | 20,168 | | | $ | 11,966 | | | $ | 10,897 | | | $ | 9,284 | |
| | | | | | | | | | | | | | | | | |
RATIOS TO AVERAGE NET ASSETS: | | | | | | | | | | | | | | | | |
Expenses to Average Net Assets | | | 0.75 | %(g) | | | 0.75 | %(g) | | | 0.75 | % | | | 0.75 | %(g) |
Net Investment Income (Loss) to Average Net Assets | | | 2.13 | %(g) | | | 1.81 | %(g) | | | 1.58 | % | | | 2.25 | %(g) |
Portfolio Turnover Rate (h) | | | 13 | %(f) | | | 41 | %(f) | | | 26 | % | | | 61 | %(f) |
(a) | Shares of the Predecessor USAI Fund converted Shares at the close of business on December 13, 2019. See Note 1 in the Financial Statements. For the period ended December 1, 2019 to October 31, 2020. |
(b) | Commencement of operations on December 12, 2017. |
(c) | Calculated based on average shares outstanding during the period. |
(d) | Realized and unrealized gains and losses per share are balancing amounts necessary to reconcile to the change in net asset value for the period and may reconcile with aggregate gains and losses in the statement of operations due to share transactions for the period. |
(e) | Represents less than $0.005. |
(h) | Excludes the impact of in-kind transactions. |
The accompanying notes are an integral part of the financial statements.
41
Pacer Salt High truBetaTM US Market ETF
FINANCIAL HIGHLIGHTS
For a capital share outstanding throughout the period
| | | For the
Period Ended
April 30,
2021
(Unaudited) | | | For the
Period Ended
October 31,
2020(a) | | | For the
Year Ended
December 31,
2019 | | | For the
Period Ended
December 31,
2018(b) | |
Net Asset Value, Beginning of Period | | $ | 29.11 | | | $ | 28.11 | | | $ | 20.69 | | | $ | 25.00 | |
| | | | | | | | | | | | | | | | | |
INCOME (LOSS) FROM INVESTMENT OPERATIONS: | | | | | | | | | | | | | | | | |
Net Investment Income (Loss) (c) | | | 0.05 | | | | 0.37 | | | | 0.32 | | | | 0.14 | |
Net Realized and Unrealized Gain (Loss) on Investments (g) | | | 12.88 | | | | 0.63 | | | | 7.40 | | | | (4.32 | ) |
Total from Investment Operations | | | 12.93 | | | | 1.00 | | | | 7.72 | | | | (4.18 | ) |
| | | | | | | | | | | | | | | | | |
LESS DISTRIBUTIONS: | | | | | | | | | | | | | | | | |
Distributions From: | | | | | | | | | | | | | | | | |
Net Investment Income | | | (0.67 | ) | | | — | | | | (0.30 | ) | | | (0.07 | ) |
Realized Gains | | | — | | | | — | | | | — | | | | (0.06 | ) |
Total Distributions | | | (0.67 | ) | | | — | | | | (0.30 | ) | | | (0.13 | ) |
| | | | | | | | | | | | | | | | | |
CAPITAL SHARE TRANSACTIONS: | | | | | | | | | | | | | | | | |
Transaction Fees (See Note 1) | | | — | | | | — | | | | — | | | | (0.00 | )(h) |
| | | | | | | | | | | | | | | | | |
Net Asset Value, End of Period | | $ | 41.37 | | | $ | 29.11 | | | $ | 28.11 | | | $ | 20.69 | |
Total Return | | | 44.72 | %(d) | | | 3.55 | % | | | 37.32 | % | | | -16.76 | %(d) |
| | | | | | | | | | | | | | | | | |
SUPPLEMENTAL DATA: | | | | | | | | | | | | | | | | |
Net Assets at End of Period (000’s) | | $ | 12,410 | | | $ | 8,006 | | | $ | 15,463 | | | $ | 8,275 | |
| | | | | | | | | | | | | | | | | |
RATIOS TO AVERAGE NET ASSETS: | | | | | | | | | | | | | | | | |
Expenses to Average Net Assets | | | 0.60 | %(e) | | | 0.31 | %(e) | | | 0.30 | %(i) | | | 0.50 | %(e) |
Net Investment Income (Loss) to Average Net Assets | | | 0.28 | %(e) | | | 1.79 | %(e) | | | 1.28 | % | | | 0.97 | %(e) |
Portfolio Turnover Rate (f) | | | 128 | %(d) | | | 157 | %(d) | | | 202 | % | | | 145 | %(d) |
(a) | Shares of the Predecessor SLT Fund converted Shares at the close of business on October 2, 2020. See Note 1 in the Financial Statements. For the period ended January 1, 2020 to October 31, 2020. |
(b) | The Fund commenced operations on May 15, 2018. The information presented is for the period from May 15, 2018 to December 31, 2018. |
(c) | Calculated based on average shares outstanding during the period. |
(f) | Excludes the impact of in-kind transactions. |
(g) | Realized and unrealized gains and losses per share in this caption are balancing amounts necessary to reconcile to the change in net asset value for the period and may reconcile with the aggregate gains and losses in the statement of operations due to share transactions for the period. |
(h) | Represents less than $0.005. |
(i) | Effective January 14, 2019, the Predessor SLT Fund’s adviser reduced its management fee from 0.50% to 0.29%. See Note 3 to the Financial Statements. |
The accompanying notes are an integral part of the financial statements.
42
Pacer Salt Low truBetaTM US Market ETF
FINANCIAL HIGHLIGHTS
For a capital share outstanding throughout the period
| | | For the
Period Ended
April 30,
2021
(Unaudited) | | | For the
Period Ended
October 31,
2020(a) | | | For the
Period Ended
December 31,
2019(b) | |
Net Asset Value, Beginning of Period | | $ | 26.59 | | | $ | 28.59 | | | $ | 25.00 | |
| | | | | | | | | | | | | |
INCOME (LOSS) FROM INVESTMENT OPERATIONS: | | | | | | | | | | | | |
Net Investment Income (Loss) (c) | | | 0.29 | | | | 0.53 | | | | 0.62 | |
Net Realized and Unrealized Gain (Loss) on Investments (g) | | | 4.29 | | | | (2.01 | ) | | | 3.40 | |
Total from Investment Operations | | | 4.58 | | | | (1.48 | ) | | | 4.02 | |
| | | | | | | | | | | | | |
LESS DISTRIBUTIONS: | | | | | | | | | | | | |
Distributions From: | | | | | | | | | | | | |
Net Investment Income | | | (0.40 | ) | | | (0.45 | ) | | | (0.43 | ) |
Realized Gains | | | — | | | | (0.07 | ) | | | — | |
Total Distributions | | | (0.40 | ) | | | (0.52 | ) | | | (0.43 | ) |
| | | | | | | | | | | | | |
Net Asset Value, End of Period | | $ | 30.77 | | | $ | 26.59 | | | $ | 28.59 | |
Total Return | | | 17.37 | %(d) | | | -5.04 | %(d) | | | 16.09 | %(d)(i) |
| | | | | | | | | | | | | |
SUPPLEMENTAL DATA: | | | | | | | | | | | | |
Net Assets at End of Period (000’s) | | $ | 6,154 | | | $ | 7,976 | | | $ | 9,293 | |
| | | | | | | | | | | | | |
RATIOS TO AVERAGE NET ASSETS: | | | | | | | | | | | | |
Expenses to Average Net Assets before Fees Waived | | | 0.60 | %(e) | | | 0.31 | %(e) | | | 0.29 | %(e) |
Expenses to Average Net Assets after Fees Waived | | | 0.60 | %(e) | | | 0.13 | %(e) | | | 0.03 | %(h)(e) |
Net Investment Income (Loss) to Average Net Assets before Fees Waived | | | 2.06 | %(e) | | | 2.21 | %(e) | | | 2.54 | %(e) |
Net Investment Income (Loss) to Average Net Assets after Fees Waived | | | 2.06 | %(e) | | | 2.39 | %(e) | | | 2.79 | %(e) |
Portfolio Turnover Rate (f) | | | 8 | %(d) | | | 39 | %(d) | | | 31 | %(d) |
(a) | Shares of the Predecessor LSLT Fund converted Shares at the close of business on October 2, 2020. See Note 1 in the Financial Statements. For the period ended January 1, 2020 to October 31, 2020. |
(b) | The Fund commenced operations on March 12, 2019. The information presented is for the period from March 12, 2019 to December 31, 2019. Shares of the Predecessor Fund converted to shares of the Fund at the close of business December 13, 2019. |
(c) | Calculated based on average shares outstanding during the period. |
(f) | Excludes the impact of in-kind transactions. |
(g) | Realized and unrealized gains and losses per share in this caption are balancing amounts necessary to reconcile to the change in net asset value for the period and may reconcile with the aggregate gains and losses in the statement of operations due to share transactions for the period. |
(h) | Effective May 13, 2019, the Predecessor Fund’s adviser agreed to waive the Fund’s full unitary management fee of 0.29% on the first $100 million in net assets. See Note 3 to the Financial Statements. |
(i) | Net increase from contributions contributed 0.04% to this return. See Note 3 to the Financial Statements. |
The accompanying notes are an integral part of the financial statements.
43
Pacer Swan SOS Conservative (December) ETF
FINANCIAL HIGHLIGHTS
For a capital share outstanding throughout the period
| | | For the
Period Ended
April 30,
2021
(Unaudited) (a) | |
Net Asset Value, Beginning of Year/Period | | $ | 20.56 | |
| | | | | |
INCOME (LOSS) FROM INVESTMENT OPERATIONS: | | | | |
Net Investment Income (Loss) (b) | | | (0.06 | ) |
Net Realized and Unrealized Gain (Loss) on Investments (c) | | | 1.08 | |
Total from Investment Operations | | | 1.02 | |
| | | | | |
Net Asset Value, End of Period | | $ | 21.58 | |
Total Return | | | 4.98 | %(f) |
| | | | | |
SUPPLEMENTAL DATA: | | | | |
Net Assets at End of Period (000’s) | | $ | 2,158 | |
| | | | | |
RATIOS TO AVERAGE NET ASSETS: | | | | |
Expenses to Average Net Assets | | | 0.75 | %(e) |
Net Investment Income (Loss) to Average Net Assets | | | -0.75 | %(e) |
Portfolio Turnover Rate (d) | | | 0.00 | %(f) |
(a) | Fund commenced operations on December 22, 2020. The information presented is from December 22, 2020 to April 30, 2021. |
(b) | Calculated based on average shares outstanding during the period. |
(c) | Realized and unrealized gains and losses per share in this caption are balancing amounts necessary to reconcile to the change in net asset value for the period and may reconcile with aggregate gains and losses in the statement of operations due to share transactions for the period. |
(d) | Excludes the impact of in-kind transactions. |
The accompanying notes are an integral part of the financial statements.
44
Pacer Swan SOS Moderate (December) ETF
FINANCIAL HIGHLIGHTS
For a capital share outstanding throughout the period
| | | For the
Period Ended
April 30,
2021
(Unaudited) (a) | |
Net Asset Value, Beginning of Year/Period | | $ | 20.56 | |
| | | | | |
INCOME (LOSS) FROM INVESTMENT OPERATIONS: | | | | |
Net Investment Income (Loss) (b) | | | (0.06 | ) |
Net Realized and Unrealized Gain (Loss) on Investments (c) | | | 1.40 | |
Total from Investment Operations | | | 1.34 | |
| | | | | |
Net Asset Value, End of Period | | $ | 21.90 | |
Total Return | | | 6.50 | %(f) |
| | | | | |
SUPPLEMENTAL DATA: | | | | |
Net Assets at End of Period (000’s) | | $ | 4,379 | |
| | | | | |
RATIOS TO AVERAGE NET ASSETS: | | | | |
Expenses to Average Net Assets | | | 0.75 | %(e) |
Net Investment Income (Loss) to Average Net Assets | | | -0.75 | %(e) |
Portfolio Turnover Rate (d) | | | 0.00 | %(f) |
(a) | Fund commenced operations on December 22, 2020. The information presented is from December 22, 2020 to April 30, 2021. |
(b) | Calculated based on average shares outstanding during the period. |
(c) | Realized and unrealized gains and losses per share in this caption are balancing amounts necessary to reconcile to the change in net asset value for the period and may reconcile with aggregate gains and losses in the statement of operations due to share transactions for the period. |
(d) | Excludes the impact of in-kind transactions. |
The accompanying notes are an integral part of the financial statements.
45
Pacer Swan SOS Flex (December) ETF
FINANCIAL HIGHLIGHTS
For a capital share outstanding throughout the period
| | | For the
Period Ended
April 30,
2021
(Unaudited) (a) | |
Net Asset Value, Beginning of Year/Period | | $ | 20.56 | |
| | | | | |
INCOME (LOSS) FROM INVESTMENT OPERATIONS: | | | | |
Net Investment Income (Loss) (b) | | | (0.06 | ) |
Net Realized and Unrealized Gain (Loss) on Investments (c) | | | 2.02 | |
Total from Investment Operations | | | 1.96 | |
| | | | | |
Net Asset Value, End of Period | | $ | 22.52 | |
Total Return | | | 9.56 | %(f) |
| | | | | |
SUPPLEMENTAL DATA: | | | | |
Net Assets at End of Period (000’s) | | $ | 1,689 | |
| | | | | |
RATIOS TO AVERAGE NET ASSETS: | | | | |
Expenses to Average Net Assets | | | 0.75 | %(e) |
Net Investment Income (Loss) to Average Net Assets | | | -0.75 | %(e) |
Portfolio Turnover Rate (d) | | | 0.00 | %(f) |
(a) | Fund commenced operations on December 22, 2020. The information presented is from December 22, 2020 to April 30, 2021. |
(b) | Calculated based on average shares outstanding during the period. |
(c) | Realized and unrealized gains and losses per share in this caption are balancing amounts necessary to reconcile to the change in net asset value for the period and may reconcile with aggregate gains and losses in the statement of operations due to share transactions for the period. |
(d) | Excludes the impact of in-kind transactions. |
The accompanying notes are an integral part of the financial statements.
46
Pacer Swan SOS Fund of Funds ETF
FINANCIAL HIGHLIGHTS
For a capital share outstanding throughout the period
| | | For the
Period Ended
April 30,
2021
(Unaudited) (a) | |
Net Asset Value, Beginning of Year/Period | | $ | 20.26 | |
| | | | | |
INCOME (LOSS) FROM INVESTMENT OPERATIONS: | | | | |
Net Investment Income (Loss) (b) | | | (0.01 | ) |
Net Realized and Unrealized Gain (Loss) on Investments (c) | | | 1.29 | |
Total from Investment Operations | | | 1.28 | |
| | | | | |
Net Asset Value, End of Period | | $ | 21.54 | |
Total Return | | | 6.34 | %(f) |
| | | | | |
SUPPLEMENTAL DATA: | | | | |
Net Assets at End of Period (000’s) | | $ | 7,002 | |
| | | | | |
RATIOS TO AVERAGE NET ASSETS: | | | | |
Expenses to Average Net Assets | | | 0.18 | %(e) |
Net Investment Income (Loss) to Average Net Assets | | | -0.18 | %(e) |
Portfolio Turnover Rate (d) | | | 0.00 | %(f) |
(a) | Fund commenced operations on December 29, 2020. The information presented is from December 29, 2020 to April 30, 2021. |
(b) | Calculated based on average shares outstanding during the period. |
(c) | Realized and unrealized gains and losses per share in this caption are balancing amounts necessary to reconcile to the change in net asset value for the period and may reconcile with aggregate gains and losses in the statement of operations due to share transactions for the period. |
(d) | Excludes the impact of in-kind transactions. |
The accompanying notes are an integral part of the financial statements.
47
Pacer Swan SOS Conservative (April) ETF
FINANCIAL HIGHLIGHTS
For a capital share outstanding throughout the period
| | | For the
Period Ended
April 30,
2021
(Unaudited) (a) | |
Net Asset Value, Beginning of Year/Period | | $ | 20.61 | |
| | | | | |
INCOME (LOSS) FROM INVESTMENT OPERATIONS: | | | | |
Net Investment Income (Loss) (b) | | | (0.01 | ) |
Net Realized and Unrealized Gain (Loss) on Investments (c) | | | 0.39 | |
Total from Investment Operations | | | 0.38 | |
| | | | | |
Net Asset Value, End of Period | | $ | 20.99 | |
Total Return | | | 1.85 | %(f) |
| | | | | |
SUPPLEMENTAL DATA: | | | | |
Net Assets at End of Period (000’s) | | $ | 1,574 | |
| | | | | |
RATIOS TO AVERAGE NET ASSETS: | | | | |
Expenses to Average Net Assets | | | 0.75 | %(e) |
Net Investment Income (Loss) to Average Net Assets | | | -0.75 | %(e) |
Portfolio Turnover Rate (d) | | | 0.00 | %(f) |
(a) | Fund commenced operations on March 31, 2021. The information presented is from March 31, 2021 to April 30, 2021. |
(b) | Calculated based on average shares outstanding during the period. |
(c) | Realized and unrealized gains and losses per share in this caption are balancing amounts necessary to reconcile to the change in net asset value for the period and may reconcile with aggregate gains and losses in the statement of operations due to share transactions for the period. |
(d) | Excludes the impact of in-kind transactions. |
The accompanying notes are an integral part of the financial statements.
48
Pacer Swan SOS Moderate (April) ETF
FINANCIAL HIGHLIGHTS
For a capital share outstanding throughout the period
| | | For the
Period Ended
April 30,
2021
(Unaudited) (a) | |
Net Asset Value, Beginning of Year/Period | | $ | 20.61 | |
| | | | | |
INCOME (LOSS) FROM INVESTMENT OPERATIONS: | | | | |
Net Investment Income (Loss) (b) | | | (0.01 | ) |
Net Realized and Unrealized Gain (Loss) on Investments (c) | | | 0.46 | |
Total from Investment Operations | | | 0.45 | |
| | | | | |
Net Asset Value, End of Period | | $ | 21.06 | |
Total Return | | | 2.21 | %(f) |
| | | | | |
SUPPLEMENTAL DATA: | | | | |
Net Assets at End of Period (000’s) | | $ | 2,633 | |
| | | | | |
RATIOS TO AVERAGE NET ASSETS: | | | | |
Expenses to Average Net Assets | | | 0.75 | %(e) |
Net Investment Income (Loss) to Average Net Assets | | | -0.75 | %(e) |
Portfolio Turnover Rate (d) | | | 0.00 | %(f) |
(a) | Fund commenced operations on March 31, 2021. The information presented is from March 31, 2021 to April 30, 2021. |
(b) | Calculated based on average shares outstanding during the period. |
(c) | Realized and unrealized gains and losses per share in this caption are balancing amounts necessary to reconcile to the change in net asset value for the period and may reconcile with aggregate gains and losses in the statement of operations due to share transactions for the period. |
(d) | Excludes the impact of in-kind transactions. |
The accompanying notes are an integral part of the financial statements.
49
Pacer Swan SOS Flex (April) ETF
FINANCIAL HIGHLIGHTS
For a capital share outstanding throughout the period
| | | For the
Period Ended
April 30,
2021
(Unaudited) (a) | |
Net Asset Value, Beginning of Year/Period | | $ | 20.61 | |
| | | | | |
INCOME (LOSS) FROM INVESTMENT OPERATIONS: | | | | |
Net Investment Income (Loss) (b) | | | (0.01 | ) |
Net Realized and Unrealized Gain (Loss) on Investments (c) | | | 0.71 | |
Total from Investment Operations | | | 0.70 | |
| | | | | |
Net Asset Value, End of Period | | $ | 21.31 | |
Total Return | | | 3.42 | %(f) |
| | | | | |
SUPPLEMENTAL DATA: | | | | |
Net Assets at End of Period (000’s) | | $ | 5,329 | |
| | | | | |
RATIOS TO AVERAGE NET ASSETS: | | | | |
Expenses to Average Net Assets | | | 0.75 | %(e) |
Net Investment Income (Loss) to Average Net Assets | | | -0.75 | %(e) |
Portfolio Turnover Rate (d) | | | 0.00 | %(f) |
(a) | Fund commenced operations on March 31, 2021. The information presented is from March 31, 2021 to April 30, 2021. |
(b) | Calculated based on average shares outstanding during the period. |
(c) | Realized and unrealized gains and losses per share in this caption are balancing amounts necessary to reconcile to the change in net asset value for the period and may reconcile with aggregate gains and losses in the statement of operations due to share transactions for the period. |
(d) | Excludes the impact of in-kind transactions. |
The accompanying notes are an integral part of the financial statements.
50
Pacer Funds
NOTES TO FINANCIAL STATEMENTS
April 30, 2021 (Unaudited)
NOTE 1 – ORGANIZATION
Pacer Funds Trust (the “Trust”) is a Delaware statutory trust organized on August 12, 2014. All Funds in the Trust, except USAI, SLT, LSLT, PSCX, PSMD. PSFD, PSFF, PSCW, PSMR, and PSFM’s fiscal year ends are April 30th and as such are not included in these financial statements. The Trust is registered with the Securities and Exchange Commission (the “SEC”) under the Investment Company Act of 1940, as amended (the “1940 Act”), as an open-end management investment company and the offering of the Funds’ shares (“Shares”) is registered under the Securities Act of 1933, as amended (the “Securities Act”). The Trust currently consists of multiple operational series, of which are covered in this report, individually the (“Fund”) or collectively the (“Funds”);
Fund Name | Ticker | Commencement
of Operations | Exchange | Transaction Fees |
Pacer American Energy ETF | USAI | December 12, 2017 | NYSE | $250 |
Pacer Salt High truBetaTM US Market ETF | SLT | May 15, 2018 | Cboe | 250 |
Pacer Salt Low truBetaTM US Market ETF | LSLT | March 12, 2019 | Cboe | 250 |
Pacer Swan SOS Conservative (December) ETF | PSCX | December 22, 2020 | Cboe | 250 |
Pacer Swan SOS Moderate (December) ETF | PSMD | December 22, 2020 | Cboe | 250 |
Pacer Swan SOS Flex (December) ETF | PSFD | December 22, 2020 | Cboe | 250 |
Pacer Swan SOS Fund of Funds ETF | PSFF | December 29, 2020 | Cboe | 250 |
Pacer Swan SOS Conservative (April) ETF | PSCW | March 31, 2021 | Cboe | 250 |
Pacer Swan SOS Moderate (April) ETF | PSMR | March 31, 2021 | Cboe | 250 |
Pacer Swan SOS Flex (April) ETF | PSFM | March 31, 2021 | Cboe | 250 |
The investment objective of the following Funds is to track the performance, before fees and expenses, of the
Ticker | Index |
USAI | American Energy Independence Index |
SLT | Pacer Salt High truBetaTM US Market Index |
LSLT | Pacer Salt Low truBetaTM US Market Index |
The investment objective of the following Funds is to seek
Ticker | Objective |
PSCX | to provide investors with returns that, before fees and expenses of the Fund, match those of the SPDR® S&P 500® ETF Trust (the “Underlying ETF”) up to a predetermined upside cap of 9.92% (before fees and expenses of the Fund) and 9.17% (after fees and expenses of the Fund), while providing a buffer against Underlying ETF losses between 5% and 30% over the period from December 22, 2020 to December 17, 2021. |
PSMD | to provide investors with returns that, before fees and expenses of the Fund, match those of the SPDR® S&P 500® ETF Trust (“the Underlying ETF”) up to a predetermined upside cap of 12.25% (before fees and expenses of the Fund) and 11.50% (after fees and expenses of the Fund), while providing a buffer against the first 15% of Underlying ETF losses, over the period from December 22, 2020 to December 17, 2021. |
PSFD | to provide investors with returns that match those of the SPDR® S&P 500® ETF Trust (the “Underlying ETF”) up to a predetermined upside cap of 18.52% (before fees and expenses of the Fund) and 17.17% (after fees and expenses of the Fund), while providing a buffer against the first 20% of Underlying ETF losses with the benefits of such buffer declining from 20% to 0% for Underlying ETF losses between 20% and 40%, over the period from December 22, 2020 to December 17, 2021. |
PSFF | capital appreciation with downside protection. |
PSCW | to provide investors with returns that, before fees and expenses of the Fund, match those of the SPDR® S&P 500® ETF Trust (the “Underlying ETF”) up to a predetermined upside cap of 9.10% (before fees and expenses of the Fund) and 8.35% (after fees and expenses of the Fund), while providing a buffer against Underlying ETF losses between 5% and 30% over the period from April 1, 2021 to March 31, 2022. |
PSMR | to provide investors with returns that, before fees and expenses of the Fund, match those of the SPDR® S&P 500® ETF Trust (“the Underlying ETF”) up to a predetermined upside cap of 10.48% (before fees and expenses of the Fund) and 9.73% (after fees and expenses of the Fund), while providing a buffer against the first 15% of Underlying ETF losses, over the period from April 1, 2021 to March 31, 2022. |
PSFM | to provide investors with returns that match those of the SPDR® S&P 500® ETF Trust (the “Underlying ETF”) up to a predetermined upside cap of 16.04% (before fees and expenses of the Fund) and 15.29% (after fees and expenses of the Fund), while providing a buffer against the first 20% of Underlying ETF losses with the benefits of such buffer declining from 20% to 0% for Underlying ETF losses between 20% and 40%, over the period from April 1, 2021 to March 31, 2022. |
51
Pacer Funds
NOTES TO FINANCIAL STATEMENTS
April 30, 2021 (Unaudited) (Continued)
USAI is the successor in interest to American Energy Independence ETF (the “USAI Predecessor Fund”) having the same investment objective that was included as a series of another investment company, ETF Series Solutions that was advised by SL Advisors, LLC and sub-advised by Penserra Capital Management LLC. On December 10, 2019, the shareholders of the USAI Predecessor Fund approved the reorganization of the USAI Predecessor Fund with and into USAI and effective as of the close of business on December 13, 2019, the assets and liabilities of the USAI Predecessor Fund were transferred to USAI in exchange for shares of USAI. For financial reporting purposes, assets received and shares issued by USAI were recorded at fair value; however, the cost basis of the investments received from the USAI Predecessor Fund was carried forward to align ongoing reporting of USAI’s realized and unrealized gains and losses with amounts distributable to shareholders for tax purposes. Costs incurred by USAI in connection with the reorganization were paid by the Pacer Advisors, Inc. (the “Adviser”). The fiscal year end of the USAI Predecessor Fund was November 30. Operations prior to December 16, 2019 were for the USAI Predecessor Fund. The net assets were $11,300,062, including ($873,236) of net unrealized depreciation, ($556,632) of undistributed (accumulated) net investment income, and $479,349 of undistributed (accumulated) net realized gain and shares outstanding were 500,000, all of which were transferred into the Trust at NAV at the close of business on December 13, 2019.
SLT is the successor in interest to Salt High truBetaTM US Market ETF (the “SLT Predecessor Fund”) having the same investment objective that was included as a series of another investment company, ETF Series Solutions that was advised by Salt Financial LLC and sub-advised by Penserra Capital Management LLC. On September 29, 2020, the shareholders of the SLT Predecessor Fund approved the reorganization of the SLT Predecessor Fund with and into SLT, and effective as of the close of business on October 2, 2020, the assets and liabilities of the SLT Predecessor Fund were transferred to SLT in exchange for shares of SLT. For financial reporting purposes, assets received and shares issued bySLT were recorded at fair value; however, the cost basis of the investments received from the SLT Predecessor Fund was carried forward to align ongoing reporting of SLT’s realized and unrealized gains and losses with amounts distributable to shareholders for tax purposes. Costs incurred by SLT in connection with the reorganization were paid by the Pacer Advisors, Inc. (the “Adviser”). The fiscal year end of the SLT Predecessor Fund was December 31. Operations prior to October 5, 2020 were for the SLT Predecessor Fund. The net assets were $8,245,397, including $768,257 of net unrealized appreciation, ($425) of undistributed (accumulated) net investment income, and ($1,203,643) of undistributed (accumulated) net realized loss and shares outstanding were 275,000, all of which were transferred into the Trust at NAV at the close of business on October 2, 2020.
LSLT is the successor in interest to Salt Low truBetaTM US Market ETF (the “LSLT Predecessor Fund”) having the same investment objective that was included as a series of another investment company, ETF Series Solutions that was advised by Salt Financial LLC and sub-advised by Penserra Capital Management LLC. On September 29, 2020, the shareholders of the LSLT Predecessor Fund approved the reorganization of the LSLT Predecessor Fund with and into LSLT, and effective as of the close of business on October 2, 2020, the assets and liabilities of the LSLT Predecessor Fund were transferred to LSLT in exchange for shares of LSLT. For financial reporting purposes, assets received and shares issued by LSLT were recorded at fair value; however, the cost basis of the investments received from the LSLT Predecessor Fund was carried forward to align ongoing reporting of LSLT’s realized and unrealized gains and losses with amounts distributable to shareholders for tax purposes. Costs incurred by LSLT in connection with the reorganization were paid by the Pacer Advisors, Inc. (the “Adviser”). The fiscal year end of the LSLT Predecessor Fund was December 31. Operations prior to October 5, 2020 were for the LSLT Predecessor Fund. The net assets were $8,269,463, including $497,549 of net unrealized appreciation, $9,209 of undistributed (accumulated) net investment income, and $14,478 of undistributed (accumulated) net realized gain and shares outstanding were 300,000, all of which were transferred into the Trust at NAV at the close of business on October 2, 2020.
Market prices for the shares may be different from their net asset value (“NAV”). The Funds issue and redeem shares on a continuous basis at NAV only in large blocks of shares, called “Creation Units,” which generally consist of 25,000 shares except USAI which generally consist of 50,000 shares. Creation Units are issued and redeemed principally in-kind for securities included in a specified universe. Once created, Shares generally trade in the secondary market at market prices that change throughout the day in amounts less than a Creation Unit. Except when aggregated in Creation Units, Shares are not redeemable securities of a Fund. Shares of a Fund may only be purchased directly from or redeemed directly to a Fund by certain financial institutions (“Authorized Participants”). An Authorized Participant is either (i) a broker-dealer or other participant in the clearing process through the Continuous Net Settlement System of the National Securities Clearing Corporation or (ii) a DTC participant and, in each case, must have executed a Participant Agreement with Pacer Financial, Inc. (the “Distributor”). Most retail investors do not qualify as Authorized Participants nor have the resources to buy and sell whole Creation Units. Therefore, they are unable to purchase or redeem the shares directly from a Fund. Rather, most retail investors may purchase Shares in the secondary market with the assistance of a broker and are subject to customary brokerage commissions or fees.The Funds currently offer one class of Shares, which have no front end sales load, no deferred sales charge, and no redemption fee. A purchase (i.e., creation) transaction fee is imposed for the transfer and other transaction costs associated with the purchase of Creation Units. Each Fund charges $250 for the standard fixed creation fee, payable to the Custodian. The fixed transaction fee may be waived on certain orders if the Fund’s Custodian has determined to waive some or all of the costs associated with the order, or another party, such as the Adviser, has agreed to pay such fee. In regards to USAI, SLT and LSLT, a variable fee, payable to a Fund, may be charged on all cash transactions or substitutes for Creation Units of up to a maximum of 2% as a
52
Pacer Funds
NOTES TO FINANCIAL STATEMENTS
April 30, 2021 (Unaudited) (Continued)
percentage of the value of the Creation Units subject to the transaction. In regards to PSCX, PSMD. PSFD, PSFF, PSCW, PSMR, and PSFM, a variable fee, payable to a Fund, of up to a maximum of 2% of the value of the Creation Units subject to the transaction may be imposed for cash purchases, non-standard orders, or partial cash purchases of Creation Units. The variable charge is primarily designed to cover additional costs (e.g., brokerage, taxes) involved with buying the securities with cash. For orders comprised entirely of cash, a variable fee of 0.01% of the value of the order will be charged by a Fund. For orders partially comprised of cash in lieu of certain Deposit Securities, a variable fee of 0.01% of the value of such cash in lieu of Deposit Securities will be charged by PSCX, PSMD, PSFD, PSFF, PSCW, PSMR and PSFM. A Fund may determine to not charge a variable fee on certain orders when the Adviser has determined that doing so is in the best interests of Fund shareholders e.g., for creation orders that facilitate changes to the Fund’s portfolio in a more tax efficient manner than could be achieved without such order. Investors who use the services of a broker or other such intermediary may be charged a fee for such services. Investors are responsible for the fixed costs of transferring the Fund Securities from the Fund to their account or on their order. Variable fees received by the Funds, if any, are displayed in the Capital Shares Transactions section of the Statements of Changes in Net Assets. Each Fund may issue an unlimited number of shares of beneficial interest, with no par value. Shares of each Fund have equal rights and privileges to such Fund.
NOTE 2 – SIGNIFICANT ACCOUNTING POLICIES
The following is a summary of significant accounting policies consistently followed by the Funds in the preparation of their financial statements. The financial statements have been prepared in conformity with accounting principals generally accepted in the United States of America (“GAAP”). The Funds are investment companies that follow the accounting and reporting guidelines of Accounting Standards Codification Topic 946 applicable to investment companies.
Securities, including master limited partnerships (“MLPs”), listed on a securities exchange, market or automated quotation system for which quotations are readily available, are valued at the last quoted sale price on the primary exchange or market (foreign or domestic) on which they are traded, except for securities listed on Nasdaq Global Market (“Nasdaq”). If, on a particular day, there is no such reported sale, then the most recent quoted bid price will be used. For securities traded on Nasdaq, the Nasdaq Official Closing Price (“NOCP”) will be used. If a Fund holds foreign shares of a security for which there is no reported volume, and there is an actively trading local version of the security, the last quoted sale price of the local security shall be used. Prices denominated in foreign currencies are converted to U.S. dollar equivalents at the current exchange rate.
Investments in other open-end investment companies, including money market funds, are valued at the investment company’s net asset value per share, with the exception of exchange-traded open-end investment companies, which are priced as equity securities described above. Deposit accounts are valued at acquisition cost, which approximates fair value.
Fixed-income securities are normally valued on the basis of quotes obtained from independent pricing services in accordance with procedures adopted by the Board of Trustees. The independent pricing services may employ methodologies that utilize market transactions (if the security is actively traded), broker-dealer supplied valuations, or matrix pricing. Short-term securities that have maturies of less than 60 days, at the time of purchase, are valued at amortized cost, which, when combined with accrued interest, approximates market value.
Options on securities that are listed on an exchange shall be valued at the sale price on such exchange (or any other exchange on which such options are listed) having the trade closest to the close of the New York Stock Exchange (“NYSE”) on the day of valuation or, if there was no sale on any of the applicable options exchanges on such day, at the mean between the highest bid and lowest ask price on any of such exchanges on such day closest to the close of the NYSE on such day. On the last trading day prior to expiration, expiring options may be priced at intrinsic value.
Units of Mount Vernon Liquid Assets Portfolio are not traded on an exchange and are valued at the investment company’s NAV per share as provided by its administrator.
Deposit accounts are valued at acquisition cost, which approximates fair value.
Any securities for which there are no readily available market quotations and other assets will be valued at their fair value as determined in good faith by the Fair Value Pricing Committee using the Fair Value Procedures approved by the Board of Trustees (the “Board”).
As described above, the Funds utilize various methods to measure the fair value of their investments on a recurring basis. GAAP establishes a hierarchy that prioritizes inputs to valuations methods. The three levels of inputs are:
| | Level 1 – | Unadjusted quoted prices in active markets for identical assets or liabilities that the Funds have the ability to access. |
53
Pacer Funds
NOTES TO FINANCIAL STATEMENTS
April 30, 2021 (Unaudited) (Continued)
| | Level 2 – | Observable inputs other than quoted prices included in Level 1 that are observable for the asset or liability, either directly or indirectly. These inputs may include quoted prices for the identical instrument on an inactive market, prices for similar instruments, interest rates, prepayment speeds, credit risk, yield curves, default rates and similar data. |
| | Level 3 – | Unobservable inputs for the asset or liability, to the extent relevant observable inputs are not available; representing the Funds’ own assumptions about the assumptions a market participant would use in valuing the asset or liability, and would be based on the best information available. |
The availability of observable inputs can vary from security to security and is affected by a wide variety of factors, including, for example, the type of security, whether the security is new and not yet established in the marketplace, the liquidity of markets, and other characteristics particular to the security. To the extent that valuation is based on models or inputs that are less observable or unobservable in the market, the determination of fair value requires more judgment. Accordingly, the degree of judgment exercised in determining fair value is greatest for instruments categorized in Level 3.
The inputs used to measure fair value may fall into different levels of the fair value hierarchy. In such cases, for disclosure purposes, the level in the fair value hierarchy within which the fair value measurement falls in its entirety, is determined based on the lowest level input that is significant to the fair value measurement in its entirety.
The following is a summary of the inputs used to value the Fund’s investments as of April 30, 2021:
USAI | | | | | | | | | | | | | | | | | | | | |
Description^ | | Level 1 | | | Level 2 | | | Level 3 | | | Investments
Measured at Net
Asset Value | | | Total | |
Common Stocks | | $ | 15,105,572 | | | $ | — | | | $ | — | | | $ | — | | | $ | 15,105,572 | |
Master Limited Partnerships and Related Companies | | | 4,911,483 | | | | — | | | | — | | | | — | | | | 4,911,483 | |
Short-Term Investments | | | 133,573 | | | | — | | | | — | | | | — | | | | 133,573 | |
Investments Purchased with Proceeds from Securities Lending | | | — | | | | — | | | | — | | | | 1,925,172 | | | | 1,925,172 | |
Total Investments in Securities | | $ | 20,150,628 | | | $ | — | | | $ | — | | | $ | 1,925,172 | | | $ | 22,075,800 | |
^ See Schedule of Investments for industry breakouts.
SLT | | | | | | | | | | | | | | | | | | | | |
Description^ | | Level 1 | | | Level 2 | | | Level 3 | | | Investments
Measured at Net
Asset Value | | | Total | |
Common Stocks | | $ | 12,126,311 | | | $ | — | | | $ | — | | | $ | — | | | $ | 12,126,311 | |
Real Estate Investment Trusts | | | 256,594 | | | | — | | | | — | | | | — | | | | 256,594 | |
Short-Term Investments | | | 27,128 | | | | — | | | | — | | | | — | | | | 27,128 | |
Investments Purchased with Proceeds from Securities Lending | | | — | | | | — | | | | — | | | | 2,796,987 | | | | 2,796,987 | |
Total Investments in Securities | | $ | 12,410,032 | | | $ | — | | | $ | — | | | $ | 2,796,987 | | | $ | 15,207,020 | |
^ See Schedule of Investments for industry breakouts.
LSLT | | | | | | | | | | | | | | | | | | | | |
Description^ | | Level 1 | | | Level 2 | | | Level 3 | | | Investments
Measured at Net
Asset Value | | | Total | |
Common Stocks | | $ | 5,560,947 | | | $ | — | | | $ | — | | | $ | — | | | $ | 5,560,947 | |
Real Estate Investment Trusts | | | 570,803 | | | | — | | | | — | | | | — | | | | 570,803 | |
Short-Term Investments | | | 17,243 | | | | — | | | | — | | | | — | | | | 17,243 | |
Investments Purchased with Proceeds from Securities Lending | | | — | | | | — | | | | — | | | | 1,438,035 | | | | 1,438,035 | |
Total Investments in Securities | | $ | 6,148,993 | | | $ | — | | | $ | — | | | $ | 1,438,035 | | | $ | 7,587,028 | |
^ See Schedule of Investments for industry breakouts.
54
Pacer Funds
NOTES TO FINANCIAL STATEMENTS
April 30, 2021 (Unaudited) (Continued)
PSCX | | | | | | | | | | | | | | | | | | | | |
Description^ | | Level 1 | | | Level 2 | | | Level 3 | | | Investments
Measured at Net
Asset Value | | | Total | |
Assets |
Purchased Options | | $ | — | | | $ | 2,330,690 | | | $ | — | | | $ | — | | | $ | 2,330,690 | |
Short-Term Investments | | | 12,517 | | | | — | | | | — | | | | — | | | | 12,517 | |
Total Investments in Securities | | $ | 12,517 | | | $ | 2,330,690 | | | $ | — | | | $ | — | | | $ | 2,343,207 | |
Liabilities |
Options Written | | $ | — | | | $ | 186,861 | | | $ | — | | | $ | — | | | $ | 186,861 | |
Total Investments in Securities | | $ | — | | | $ | 186,861 | | | $ | — | | | $ | — | | | $ | 186,861 | |
^ See the Schedules of Investments for further disaggregation of investment categories.
PSMD | | | | | | | | | | | | | | | | | | | | |
Description^ | | Level 1 | | | Level 2 | | | Level 3 | | | Investments
Measured at Net
Asset Value | | | Total | |
Assets |
Purchased Options | | $ | — | | | $ | 4,693,152 | | | $ | — | | | $ | — | | | $ | 4,693,152 | |
Short-Term Investments | | | 27,579 | | | | — | | | | — | | | | — | | | | 27,579 | |
Total Investments in Securities | | $ | 27,579 | | | $ | 4,693,152 | | | $ | — | | | $ | — | | | $ | 4,720,731 | |
Liabilities |
Options Written | | $ | — | | | $ | 343,319 | | | $ | — | | | $ | — | | | $ | 343,319 | |
Total Investments in Securities | | $ | — | | | $ | 343,319 | | | $ | — | | | $ | — | | | $ | 343,319 | |
^ See the Schedules of Investments for further disaggregation of investment categories.
PSFD | | | | | | | | | | | | | | | | | | | | |
Description^ | | Level 1 | | | Level 2 | | | Level 3 | | | Investments
Measured at Net
Asset Value | | | Total | |
Assets |
Purchased Options | | $ | — | | | $ | 1,764,718 | | | $ | — | | | $ | — | | | $ | 1,764,718 | |
Short-Term Investments | | | 9,028 | | | | — | | | | — | | | | — | | | | 9,028 | |
Total Investments in Securities | | $ | 9,028 | | | $ | 1,764,718 | | | $ | — | | | $ | — | | | $ | 1,773,746 | |
Liabilities |
Options Written | | $ | — | | | $ | 86,197 | | | $ | — | | | $ | — | | | $ | 86,197 | |
Total Investments in Securities | | $ | — | | | $ | 86,197 | | | $ | — | | | $ | — | | | $ | 86,197 | |
^ See the Schedules of Investments for further disaggregation of investment categories.
PSFF | | | | | | | | | | | | | | | | | | | | |
Description | | Level 1 | | | Level 2 | | | Level 3 | | | Investments
Measured at Net
Asset Value | | | Total | |
Assets |
Affiliated Exchange Traded Funds | | $ | 6,954,122 | | | $ | — | | | $ | — | | | $ | — | | | $ | 6,954,122 | |
Short-Term Investments | | | 48,675 | | | | — | | | | — | | | | — | | | | 48,675 | |
Total Investments in Securities | | $ | 7,002,797 | | | $ | — | | | $ | — | | | $ | — | | | $ | 7,002,797 | |
55
Pacer Funds
NOTES TO FINANCIAL STATEMENTS
April 30, 2021 (Unaudited) (Continued)
PSCW |
Description^ | | Level 1 | | | Level 2 | | | Level 3 | | | Investments
Measured at Net
Asset Value | | | Total | |
Assets |
Purchased Options | | $ | — | | | $ | 1,652,845 | | | $ | — | | | $ | — | | | $ | 1,652,845 | |
Short-Term Investments | | | 11,578 | | | | — | | | | — | | | | — | | | | 11,578 | |
Total Investments in Securities | | $ | 11,578 | | | $ | 1,652,845 | | | $ | — | | | $ | — | | | $ | 1,664,423 | |
Liabilities |
Options Written | | $ | — | | | $ | 93,308 | | | $ | — | | | $ | — | | | $ | 93,308 | |
Total Investments in Securities | | $ | — | | | $ | 93,308 | | | $ | — | | | $ | — | | | $ | 93,308 | |
^ See the Schedules of Investments for further disaggregation of investment categories.
PSMR |
Description^ | | Level 1 | | | Level 2 | | | Level 3 | | | Investments
Measured at Net
Asset Value | | | Total | |
Assets |
Purchased Options | | $ | — | | | $ | 2,788,170 | | | $ | — | | | $ | — | | | $ | 2,788,170 | |
Short-Term Investments | | | 22,208 | | | | — | | | | — | | | | — | | | | 22,208 | |
Total Investments in Securities | | $ | 22,208 | | | $ | 2,788,170 | | | $ | — | | | $ | — | | | $ | 2,810,378 | |
Liabilities |
Options Written | | $ | — | | | $ | 179,728 | | | $ | — | | | $ | — | | | $ | 179,728 | |
Total Investments in Securities | | $ | — | | | $ | 179,728 | | | $ | — | | | $ | — | | | $ | 179,728 | |
^ See the Schedules of Investments for further disaggregation of investment categories.
PSFM | | | | | | | | | | | | | | | | | | | | |
Description^ | | Level 1 | | | Level 2 | | | Level 3 | | | Investments
Measured at Net
Asset Value | | | Total | |
Assets |
Purchased Options | | $ | — | | | $ | 5,609,226 | | | $ | — | | | $ | — | | | $ | 5,609,226 | |
Short-Term Investments | | | 42,040 | | | | — | | | | — | | | | — | | | | 42,040 | |
Total Investments in Securities | | $ | 42,040 | | | $ | 5,609,226 | | | $ | — | | | $ | — | | | $ | 5,651,266 | |
Liabilities |
Options Written | | $ | — | | | $ | 329,615 | | | $ | — | | | $ | — | | | $ | 329,615 | |
Total Investments in Securities | | $ | — | | | $ | 329,615 | | | $ | — | | | $ | — | | | $ | 329,615 | |
^ See the Schedules of Investments for further disaggregation of investment categories.
OPTIONS CONTRACTS
In general, an option contract is an agreement between a buyer and seller that gives the purchaser of the option the right to buy or sell a particular asset at a specified future date at an agreed upon price (commonly known as the “strike price”).
PSCX, PSMD, PSFD, PSCW, PSMR, and PSFM’s portfolios include several types of FLEX Options, including both purchased and written put and call options (as further described below). The FLEX Options are all European style options, which means that they are exercisable at the strike price only on the FLEX Option expiration date. FLEX Options are customized option contracts available through national
56
Pacer Funds
NOTES TO FINANCIAL STATEMENTS
April 30, 2021 (Unaudited) (Continued)
securities exchanges that are guaranteed for settlement by the Options Clearing Corporation(“OCC”), a market clearinghouse. FLEX Options provide investors with the ability to customize terms of an option, including exercise prices, exercise styles (European style versus American style options which are exercisable any time prior to the expiration date) and expiration dates, while achieving price discovery in competitive, transparent auctions markets and avoiding the counterparty exposure of the over-the-counter option positions.
Each FLEX Option contract entitles the holder thereof (i.e., the purchaser of the FLEX Option) the option to purchase (for the call options) or sell (for the put options) the cash value of the reference asset as of the close of the market on the FLEX Option expiration date at the strike price. The Fund intends to be structured so that any amount owed by the Fund on the written FLEX Options will be covered by payouts at expiration from the purchased FLEX Options. As a result, the FLEX Options will be fully covered, and no additional collateral will be necessary during the life of the Fund. The Fund receives premiums in exchange for the written FLEX Options and pays premiums in exchange for the purchased FLEX Options. The OCC and securities exchange that the FLEX Options are listed on do not charge ongoing fees to writers or purchasers of the FLEX Options during their life for continuing to hold the option contracts. In general, put options give the holder (i.e., the buyer) the right to sell an asset (or deliver the cash value of the index, in case of an index put option) and the seller (i.e., the writer) of the put has the obligation to buy the asset (or receive cash value of the index, in case of an index put option) at a certain defined price. Call options give the holder (i.e., the buyer) the right to buy an asset (or receive cash value of the index, in case of an index call option) and the seller (i.e., the writer) the obligation to sell the asset (or deliver cash value of the index, in case of an index call option) at a certain defined price.
When the Funds purchase an option, an amount equal to the premium paid by the Funds are recorded as an investment and is subsequently adjusted to the current value of the option purchased. If an option expires on the stipulated expiration date or if the Funds enter into a closing sale transaction, a gain or loss is realized. If a call option is exercised, the cost of the security acquired is increased by the premium paid for the call. If a put option is exercised, a gain or loss is realized from the sale of the underlying security, and the proceeds from such sale are decreased by the premium originally paid. Purchased options are non-income producing securities. When the Funds write an option, an amount equal to the premium received by the Funds are recorded as a liability and is subsequently adjusted to the current value of the option written. Premiums received from writing options that expire unexercised are treated by the Funds on the expiration date as realized gain from written options. The difference between the premium and the amount paid on effecting a closing purchase transaction, including brokerage commissions, is also treated as a realized gain, or if the premium is less than the amount paid for the closing purchase transaction, as a realized loss. If a call option is exercised, the premium is added to the proceeds from the sale of the underlying security in determining whether the Funds have realized a gain or loss. If a put option is exercised, the premium reduces the cost basis of the securities purchased by the Funds. The Funds, as writers of an option, bear the market risk of an unfavorable change in the price of the security underlying the written option.
The OCC guarantees performance by each of the counterparties to FLEX Options, becoming the “buyer for every seller and the seller for every buyer,” protecting clearing members and options traders from counterparty risk. Subject to determination by the Securities Committee of the OCC, adjustments may be made to the FLEX Options for certain events (collectively, “Corporate Actions”) specified in the OCC’s by-laws and rules: certain stock dividends or distributions, stock splits, reverse stock splits, rights offerings, distributions, reorganizations, recapitalizations, or reclassifications with respect to an underlying security, or a merger, consolidation, dissolution or liquidation of the issuer of the underlying security. According to the OCC’s by-laws, the nature and extent of any such adjustment is to be determined by the OCC’s Securities Committee, in light of the circumstances known to it at the time such determination is made, based on its judgment as to what is appropriate for the protection of investors and the public interest, taking into account such factors as fairness to holders and writers (or purchasers and sellers) of the affected options, the maintenance of a fair and orderly market in the affected options, consistency of interpretation and practice, efficiency of exercise settlement procedures, and the coordination with other clearing agencies of the clearance and settlement of transactions in the underlying interest.
The value of derivative instruments on the Statements of Assets and Liabilities for the Funds as of April 30, 2021, is as follows:
| | | Equity Risk - Call and Put Options not
Accounted for as Hedging Instruments | |
| | | Asset Derivatives | | | Liability Derivatives | |
| | | Investments,
at value | | | Options written,
at value | |
PSCX | | $ | 2,330,690 | | | $ | 186,861 | |
PSMD | | | 4,693,152 | | | | 343,319 | |
PSFD | | | 1,764,718 | | | | 86,197 | |
PSCW | | | 1,652,845 | | | | 93,308 | |
PSMR | | | 2,788,170 | | | | 179,728 | |
PSFM | | | 5,609,226 | | | | 329,615 | |
57
Pacer Funds
NOTES TO FINANCIAL STATEMENTS
April 30, 2021 (Unaudited) (Continued)
There was no effect of derivative instruments on the Statements of Operations for the period ended April 30, 2021.
The average volume of derivative activity during the period ended April 30, 2021, is as follows:
| | | Equity Risk - Call and Put Options not
Accounted for as Hedging Instruments | |
| | | Change in Unrealized Appreciation/
(Depreciation) on Derivatives
Recognized in Income | |
| | | Investments | | | Options written | |
PSCX | | $ | 136,298 | | | $ | (55,842 | ) |
PSMD | | | 246,699 | | | | (53,171 | ) |
PSFD | | | 101,814 | | | | 31,893 | |
PSCW | | | 38,423 | | | | (20,121 | ) |
PSMR | | | 40,277 | | | | (14,594 | ) |
PSFM | | | 47,096 | | | | 3,753 | |
During the period ended April 30, 2021, the Funds did not recognize any transfers to or from Level 3.
B. | Foreign Currency. Investment securities and other assets and liabilities denominated in foreign currencies are translated into U.S. dollar amounts at the date of valuation. Purchases and sales of investment securities and income and expense items denominated in foreign currencies are translated into U.S. dollar amounts on the respective dates of such transactions. The Funds do not isolate that portion of the result of operations resulting from changes in foreign exchange rates on investments from fluctuations arising from changes in market prices of securities held. Such fluctuations are included with the net realized and unrealized gain or loss from investments. The Funds report net realized foreign exchange gains or losses that arise from sales of foreign currencies, currency gains or losses realized between the trade and settlement dates on foreign currency transactions, and the differences between the amounts of dividends, interest and foreign withholding taxes recorded on the Funds’ books and the U.S. dollar equivalent of the amounts actually received or paid. Net unrealized foreign exchange gains and losses arise from changes in the values of assets and liabilities, other than investments in securities at fiscal period end, resulting from changes in exchange rates. |
C. | Federal Income Taxes. The Funds comply with the requirements of Subchapter M of the Internal Revenue Code of 1986, as amended, necessary to qualify as regulated investment companies and distribute substantially all net taxable investment income and net realized gains to shareholders in a manner which results in no tax cost to the Funds. Therefore, no federal income tax provision is required. As of and during the fiscal period ended April 30, 2021, the Funds did not have any tax positions that did not meet the “more-likely-than-not” threshold of being sustained by the applicable tax authority. As of and during the fiscal period ended April 30, 2021, the Funds did not have liabilities for any unrecognized tax benefits on uncertain tax positions as income tax expense in the Statement of Operations. Management has analyzed each of the Fund’s tax positions and concluded that no liability for unrecognized tax benefits should be recorded related to uncertain tax positions taken on returns filed for open tax years (2018-2020) or expected to be taken in each of the Fund’s 2020 tax returns. During the period ended April 30, 2021, the Funds did not incur any interest or penalties. |
D. | Security Transactions and Investment Income. Investment securities transactions are accounted for on the trade date. Gains and losses realized on sales of securities are computed on the basis of highest amortized cost. Dividend income is recorded on the ex-dividend date. Interest income is recorded on an accrual basis. Discounts and premiums on securities purchased are accreted and amortized over the lives of the respective securities. Withholding taxes on foreign dividends have been provided for in accordance with the Funds’ understanding of the applicable tax rules and regulations. |
Distributions received from the Funds’ investments in REITs and MLPs may be characterized as ordinary income net capital gain, or return of capital. The proper characterization of such distributions is generally not known until after the end of each calendar year. As such, the Funds must use estimates in reporting the character of their income and distributions for financial statement purposes. Such estimates are based on historical information available from each MLP and other industry sources. The actual character of distributions to each Fund’s shareholders will be reflected on the Form 1099 received by shareholders after the end of the calendar year. Due to the nature of such investments, a portion of the distributions received by each Fund’s shareholders may represent a return of capital.
E. | Distributions to Shareholders. Distributions to shareholders from net investment income for the USAI Fund is declared and paid on a monthly basis and distributions to shareholders from net investment income for SLT, LSLT, PSCX, PSMD. PSFD, PSFF, PSCW, PSMR, and PSFM are declared and paid at least annually. Distributions from net realized gains on securities normally are declared and paid on an annual basis. Distributions are recorded on the ex-dividend date. |
58
Pacer Funds
NOTES TO FINANCIAL STATEMENTS
April 30, 2021 (Unaudited) (Continued)
F. | Use of Estimates. The preparation of financial statements in conformity with GAAP requires management to make estimates and assumptions that affect the reported amounts of assets and liabilities and disclosure of contingent assets and liabilities at the date of the financial statements, and the reported amounts of increases and decreases in net assets from operations during the reporting period. Actual results could differ from those estimates. |
G. | Share Valuation. The NAV per share of each Fund is calculated by dividing the sum of the value of the securities held by the Fund, plus cash and other assets, minus all liabilities (including estimated accrued expenses) by the total number of shares outstanding for the Fund, rounded to the nearest cent. The Funds’ shares will not be priced on the days on which the NYSE or Cboe are is closed for trading. The offering and redemption price per share of the Fund is equal to each Fund’s NAV per share. |
H. | Guarantees and Indemnifications. In the normal course of business, the Funds enters into contracts with service providers that contain general indemnification clauses. Each Fund’s maximum exposure under these arrangements is unknown as this would involve future claims that may be against the Funds that have not yet occurred. |
I. | Reclassification of Capital Accounts. Additionally, U.S. GAAP requires that certain components of net assets relating to permanent differences be reclassified between financial and tax reporting. These reclassifications have no effect on net assets or net asset value per share. For the fiscal period ended October 31, 2020, the following table shows the reclassifications made: |
| | | Distributable
Earnings
(Accumulated
Deficit) | | | Paid-In Capital | |
USAI | | $ | (168,965 | ) | | $ | 168,965 | |
SLT | | | (3,870,557 | ) | | | 3,870,557 | |
LSLT | | | (396,737 | ) | | | 396,737 | |
During the fiscal period ended October 31, 2020, the Fund realized the following in net capital gains/(losses) resulting from in-kind redemptions, in which shareholders exchanged Fund shares for securities held by the Fund rather than for cash. Because such gains are not taxable to the Fund, and are not distributed to shareholders, they have been reclassified from net realized losses to paid-in capital.
USAI | | $ | 1,208,719 | |
SLT | | | 4,019,141 | |
LSLT | | | 400,084 | |
PSCX, PSMD. PSFD, PSFF, PSCW, PSMR, and PSFM commenced operations after October 31, 2020.
NOTE 3 – COMMITMENTS AND OTHER RELATED PARTY TRANSACTIONS
Pursuant to an Investment Advisory Agreement (“Investment Advisory Agreement”) between the Trust, on behalf of the Funds, and the Adviser, the Adviser provides investment advice to the Funds and oversees the day-to-day operations of the Funds, subject to the direction and control of the Board and the officers of the Trust. The Adviser administers the Funds’ business affairs, provides office facilities and equipment and certain clerical, bookkeeping and administrative services. The Adviser bears the costs of all advisory and non-advisory services required to operate the Funds, in exchange for a single unitary management fee. For services provided to the Funds, the Funds pay the Adviser at an annual rate based on the Fund’s average daily net assets:
Ticker | Adviser Fee |
USAI | 0.75% |
SLT | 0.60% |
LSLT | 0.60% |
PSCX | 0.75% |
PSMD | 0.75% |
PSFD | 0.75% |
PSFF | 0.18% |
PSCW | 0.75% |
PSMR | 0.75% |
PSFM | 0.75% |
59
Pacer Funds
NOTES TO FINANCIAL STATEMENTS
April 30, 2021 (Unaudited) (Continued)
The Distributor acts as the Fund’s principal underwriter in a continuous public offering of the Funds’ shares. The Distributor is an affiliate of the Adviser. The Funds did not pay any fees or commissions to the Distributor during the fiscal period ended April 30, 2021.
Certain officers and a Trustee of the Trust are affiliated with the Adviser and Distributor.
NOTE 4 – SERVICE AND CUSTODY AGREEMENTS
The Funds have entered into Service Agreements with U.S. Bancorp Fund Services, LLC (“Fund Services” or “Administrator”) doing business as U.S. Global Fund Services and a Custody Agreement with U.S. Bank, N.A. (the “Custodian”), an affiliate of Fund Services. Under these agreements, Fund Services and the Custodian provide certain transfer agency, administrative, accounting and custody services. The Custodian acts as securities lending agent (the “Securities Lending Agent”) for the Funds.
NOTE 5 – SECURITIES LENDING
The Funds may lend up to 33 1/3% of the value of the securities in their portfolios to brokers, dealers and financial institutions (but not individuals) under terms of participation in a securities lending program administered by the Securities Lending Agent. The securities lending agreement requires that loans are collateralized at all times in an amount equal to at least 102% of the value of any domestic loaned securities at the time of the loan, plus accrued interest. The use of loans of foreign securities, which are denominated and payable in U.S. dollars, shall be collateralized in an amount equal to 105% of the value of any loaned securities at the time of the loan plus accrued interest. The Funds receive compensation in the form of fees and earn interest on the cash collateral. Due to timing issues of when a security is recalled from loan, the financial statements may differ in presentation. The amount of fees depends on a number of factors including the type of security and length of the loan. The Funds continue to receive interest payments or dividends on the securities loaned during the borrowing period. Gain or loss in the value of securities loaned that may occur during the term of the loan will be for the account of the Funds. The Funds have the right under the terms of the securities lending agreements to recall the securities from the borrower on demand.
As of April 30, 2021, the Funds had loaned securities and received cash collateral for the loans. The cash collateral is invested in the Mount Vernon Liquid Assets Portfolio, LLC of which the investment objective is to seek to maximize income to the extent consistent with the preservation of capital and liquidity and maintain a stable Net Asset Value (“NAV”) of $1.00. Although risk is mitigated by the collateral, the Funds could experience a delay in recovering their securities and possible loss of income or value if the borrower fails to return the borrowed securities. In addition, the Funds bear the risk of loss associated with the investment of cash collateral received.
During the period ended April 30, 2021, the Funds (excluding PSCX, PSMD, PSFD, PSFF, PSCW, PSMR and PSFM) had loaned securities that were collateralized by cash. The cash collateral received was invested in securities as listed in each Fund’s Schedule of Investments. Income earned from these investments is allocated to each Fund based on each Fund’s portion of total cash collateral received. Securities lending income is disclosed in each Fund’s Statement of Operations.
NOTE 6 – SECURED BORROWINGS
The following represents gross obligations for secured borrowings by remaining time to maturity as of April 30, 2021.
Securities Lending Transactions
Overnight and Continuous | | Investments
Purchased with
Proceeds from
Securities Lending
Collateral* | |
USAI | | $ | 1,925,172 | |
SLT | | | 2,796,987 | |
LSLT | | | 1,438,035 | |
* | Proceeds from securities lending (Investments Purchased with Proceeds from Securities Lending Collateral). |
Due to the absence of a master netting agreement related to the Funds’ participation in securities lending, no additional offsetting disclosures
have been made on behalf of the Funds for the total borrowings listed above.
60
Pacer Funds
NOTES TO FINANCIAL STATEMENTS
April 30, 2021 (Unaudited) (Continued)
NOTE 7 – OFFSETTING ASSETS AND LIABILITIES
The following is a summary of the Assets and Liabilities for each Fund subject to offsets as of April 30, 2021:
Liabilities
| | | | | | | | | | | | | | | Gross Amounts Net Offset in the
Statements of Assets and Liabilities | | | | | |
Description | | Gross Amounts
of Recognized
Liabilities | | | Gross Amounts
Offset in the
Statement of
Assets and
Liabilities | | | Net Amounts
Presented in
the Statements
of Assets and
Liabilities | | | Financial
Instruments | | | Collateral
Pledged
(Received) | | | Net
Amount | |
USAI | | | | | | | | | | | | | | | | | | | | | | | | |
Securities Lending | | $ | 1,925,172 | | | $ | — | | | $ | 1,925,172 | | | $ | 1,925,172 | | | $ | — | | | $ | — | |
SLT | | | | | | | | | | | | | | | | | | | | | | | | |
Securities Lending | | | 2,796,987 | | | | — | | | | 2,796,987 | | | | 2,796,987 | | | | — | | | | — | |
LSLT | | | | | | | | | | | | | | | | | | | | | | | | |
Securities Lending | | | 1,438,035 | | | | — | | | | 1,438,035 | | | | 1,438,035 | | | | — | | | | — | |
NOTE 8 – INVESTMENT TRANSACTIONS
For the period ended April 30, 2021, the aggregate purchases and sales of securities by the Funds, excluding short-term securities and in-kind transactions were as follows:
| | | Purchases | | | Sales | |
USAI | | $ | 2,064,970 | | | $ | 2,154,810 | |
SLT | | | 13,603,598 | | | | 13,555,899 | |
LSLT | | | 602,719 | | | | 633,834 | |
PSCX | | | 2,325,412 | | | | — | |
PSMD | | | 4,736,601 | | | | — | |
PSFD | | | 1,780,993 | | | | — | |
PSFF | | | 3,203,210 | | | | — | |
PSCW | | | 1,687,608 | | | | — | |
PSMR | | | 2,913,026 | | | | — | |
PSFM | | | 5,895,498 | | | | — | |
For the period ended April 30, 2021, in-kind transactions associated with creations and redemptions are as follows:
| | | Purchases | | | Sales | |
USAI | | $ | 5,100,314 | | | $ | 2,883,649 | |
SLT | | | 10,688,818 | | | | 9,830,452 | |
LSLT | | | — | | | | 2,837,400 | |
PSCX | | | — | | | | — | |
PSMD | | | — | | | | — | |
PSFD | | | — | | | | — | |
PSFF | | | 4,570,668 | | | | 1,029,079 | |
PSCW | | | — | | | | — | |
PSMR | | | — | | | | — | |
PSFM | | | — | | | | — | |
For the period ended April 30, 2021, there were no long-term purchases or sales of U.S. Government Securities for the Funds.
61
Pacer Funds
NOTES TO FINANCIAL STATEMENTS
April 30, 2021 (Unaudited) (Continued)
NOTE 9 – TRANSACTIONS WITH AFFILIATED SECURITIES
PSFF seeks capital appreciation with downside protection. The Fund is an actively-managed exchange-traded fund (“ETF”) that seeks to achieve its investment objective by investing in a portfolio of other ETFs also managed by the Fund’s Adviser, that seek exposure to U.S. equity securities, while limiting downside risk (the “Underlying ETFs”). Certain Underlying ETFs may also be sub-advised by the Fund’s Sub-Adviser. Underlying ETFs generally invest in equity securities or options on equity securities (including other ETFs) to obtain their long exposure to the U.S. equity market. Additionally, the Underlying ETFs may invest in cash or short-term U.S. Treasury securities or utilize options on equity securities (including other ETFs) to hedge their exposure to U.S. equities. The Fund may also invest directly in equity securities, options on equity securities (including other ETFs) or indices, cash, or cash equivalents. While the Fund is not limited in the types of strategies the Underlying ETFs may utilize, the Fund is expected to primarily utilize “trend-following strategy” and “structured outcome strategy” styles of Underlying ETFs.
PSFF had the following transactions during the current fiscal period with affiliates:
| | | Share Activity | |
Security Name | | Balance
November 1, 2020 | | | Purchases | | | Sales | | | Balance April
30, 2021 | |
PSCX | | | — | | | | 41,243 | | | | (8,248 | ) | | | 32,995 | |
PSMD | | | — | | | | 140,596 | | | | (28,128 | ) | | | 112,468 | |
PSFD | | | — | | | | 60,680 | | | | (12,134 | ) | | | 48,546 | |
PSCW | | | — | | | | 20,418 | | | | — | | | | 20,418 | |
PSMR | | | — | | | | 71,284 | | | | — | | | | 71,284 | |
PSFM | | | — | | | | 35,256 | | | | — | | | | 35,256 | |
| | | Period Ended April 30, 2021 | |
Security Name | | Value | | | Dividend Income | | | Gain Realized on
Sale of Shares | | | Net Change
in Unrealized
Appreciation
(Depreciation)
on Investments
in Affiliate | |
PSCX | | $ | 713,451 | | | $ | — | | | $ | 3,154 | | | $ | 22,408 | |
PSMD | | | 2,465,883 | | | | — | | | | 13,633 | | | | 99,709 | |
PSFD | | | 1,093,630 | | | | — | | | | 9,050 | | | | 64,031 | |
PSCW | | | 429,055 | | | | — | | | | — | | | | (1,765 | ) |
PSMR | | | 1,501,291 | | | | — | | | | — | | | | (913 | ) |
PSFM | | | 750,812 | | | | — | | | | — | | | | 16 | |
Total | | $ | 6,954,122 | | | $ | — | | | $ | 25,837 | | | $ | 183,486 | |
NOTE 10 – TAX COST BASIS
The components of tax basis cost of investments and net unrealized appreciation for federal income tax purposes at October 31, 2020, were as follows:
| | | USAI | | | SLT | | | LSLT | |
Tax cost of investments | | $ | 15,279,221 | | | $ | 7,502,843 | | | $ | 7,834,352 | |
Gross tax unrealized appreciation | | | 621,723 | | | | 824,072 | | | | 640,975 | |
Gross tax unrealized depreciation | | | (4,009,303 | ) | | | (319,223 | ) | | | (507,284 | ) |
Net tax unrealized appreciation (depreciation) | | | (3,387,580 | ) | | | 504,849 | | | | 133,691 | |
Undistributed ordinary income | | | — | | | | 169,488 | | | | 27,628 | |
Undistributed long-term gain | | | — | | | | — | | | | — | |
Total distributable earnings | | | — | | | | 169,488 | | | | 27,628 | |
Other accumulated (loss) | | | (2,270,055 | ) | | | (3,720,512 | ) | | | (782,118 | ) |
Total accumulated gain (loss) | | $ | (5,657,635 | ) | | $ | (3,046,175 | ) | | $ | (620,799 | ) |
62
Pacer Funds
NOTES TO FINANCIAL STATEMENTS
April 30, 2021 (Unaudited) (Continued)
The difference between book and tax-basis cost is attributable to the realization for tax purposes of unrealized gains on investments in Real Estate Investment Trusts, partnerships, passive foreign investment companies and wash sales. Under tax law, certain capital and foreign currency losses realized after October 31 and within the taxable year are deemed to arise on the first business day of the Fund’s next taxable year. At October 31, 2020, the Funds, on a tax basis, did not defer any post-October or late year ordinary losses.
At October 31, 2020, the Fund had the following capital loss carryforwards:
| | | Short-Term | | | Long-Term | | | Expires | |
USAI | | $ | (1,290,365 | ) | | $ | (979,561 | ) | | | Indefinite | |
SLT | | | (3,155,635 | ) | | | (564,877 | ) | | | Indefinite | |
LSLT | | | (598,874 | ) | | | (183,244 | ) | | | Indefinite | |
PSCX, PSMD. PSFD, PSFF, PSCW, PSMR, and PSFM commenced operations after October 31, 2020.
NOTE 11 – DISTRIBUTIONS TO SHAREHOLDERS
The tax character of distributions paid by the Fund during the fiscal period ended October 31, 2020, was as follows:
| | | Ordinary Income | | | Capital Gains | | | Return of Capital | |
USAI | | $ | 245,568 | | | $ | — | | | $ | 709,985 | |
SLT | | | — | | | | — | | | | — | |
LSLT | | | 173,605 | | | | 6,132 | | | | — | |
The tax character of distributions paid by USAI during the fiscal period ended November 30, 2019, was as follows:
| | | Ordinary Income | | | Return of Capital | |
| | | $ | 112,296 | | | $ | 626,154 | |
The tax character of distributions paid by SLT & LSLT during the fiscal period ended December 31, 2019, was as follows:
| | | Ordinary Income | |
SLT | | $ | 155,507 | |
LSLT | | $ | 138,282 | |
PSCX, PSMD. PSFD, PSFF, PSCW, PSMR, and PSFM commenced operations after October 31, 2020.
NOTE 12 – NEW ACCOUNTING PRONOUNCEMENTS
In March 2020, FASB issued ASU 2020-04, Reference Rate Reform: Facilitation of the Effects of Reference Rate Reform on Financial Reporting. The main objective of the new guidance is to provide relief to companies that will be impacted by the expected change in benchmark interest rates at the end of 2021, when participating banks will no longer be required to submit London Interbank Offered Rate (“LIBOR”) quotes by the UK Financial Conduct Authority. The new guidance allows companies to, provided the only change to existing contracts are a change to an approved benchmark interest rate, account for modifications as a continuance of the existing contract without additional analysis. In addition, derivative contracts that qualified for hedge accounting prior to modification, will be allowed to continue to receive such treatment, even if critical terms change due to a change in the benchmark interest rate. For new and existing contracts, the Funds may elect to apply the amendments as of March 12, 2020 through December 31, 2022. Management is currently assessing the impact of the ASU’s adoption to the Funds’ financial statements and various filings.
63
Pacer Funds
NOTES TO FINANCIAL STATEMENTS
April 30, 2021 (Unaudited) (Continued)
NOTE 13 – SUBSEQUENT EVENTS
Management of the Fund has evaluated the need for disclosures and/or adjustments resulting from subsequent events through the date these financial statements were issued. The evaluation did not result in any subsequent events that necessitated disclosures and/or adjustments other than the below:
On June 18, 2021, the following Funds declared distributions from ordinary income to shareholders of record as of June 22, 2021, Payable June 25, 2021, as follows:
| | | Ordinary Income | | | Per Share Amount | |
SLT | | $ | 172,868 | | | $ | 0.62861091 | |
LSLT | | | 37,001 | | | | 0.12333668 | |
On June 28, 2021, the following Fund declared distributions from ordinary income to shareholders of record as of June 30, 2021, Payable July 1, 2021, as follows:
| | | Ordinary Income | | | Per Share Amount | |
USAI | | $ | 120,000 | | | $ | 0.12000000 | |
The global outbreak of COVID-19 (commonly referred to as “coronavirus”) has disrupted economic markets and the prolonged economic impact is uncertain. The ultimate economic fallout from the pandemic, and the long-term impact on economies, markets, industries and individual issuers, are not known. The operational and financial performance of the issuers of securities in which each Funds invests depends on future developments, including the duration and spread of the outbreak, and such uncertainty may in turn adversely affect the value and liquidity of each Fund’s investments, impair each Fund’s ability to satisfy redemption requests, and negatively impact each Fund’s performance.
64
Pacer Funds
ADDITIONAL INFORMATION
(Unaudited)
NOTE 1 – FREQUENCY DISTRIBUTION OF PREMIUMS AND DISCOUNTS
Information regarding how often shares of the Fund trade on the Exchange at a price above (i.e., at a premium) or below (i.e., at a discount) the NAV of the Fund is available on the Fund’s website at www.PacerETFs.com.
NOTE 2 – FEDERAL TAX INFORMATION
Qualified Dividend Income/Dividends Received Deduction
For the fiscal period ended October 31, 2020, certain dividends paid by the Fund may be subject to a maximum tax rate of 20%, as provided for by the Jobs and Growth Tax Relief Reconciliation Act of 2003.
The percentage of dividends declared from ordinary income was as follows:
USAI | 100.00% |
SLT | 0.00% |
LSLT | 88.18% |
For corporate shareholders, the percent of ordinary income distributions qualifying for corporate dividends received deduction for the fiscal period ended October 31, 2020 was as follows:
USAI | 100.00% |
SLT | 0.00% |
LSLT | 87.40% |
Short Term Capital Gains
The percentage of taxable ordinary income distributions that are designated as short-term capital gain distributions under Internal Revenue Section 871(k)(2)(C) for each fund were as follows:
USAI | 0.00% |
SLT | 0.00% |
LSLT | 9.39% |
PSCX, PSMD. PSFD, PSFF, PSCW, PSMR, and PSFM commenced operations after October 31, 2020.
NOTE 3 – DISCLOSURE OF PORTFOLIO HOLDINGS
The Funds files their complete schedule of portfolio holdings for their first and third fiscal quarters with the Securities and Exchange Commission (“SEC”) on Part F of Form N-PORT. The Funds’ Part F of Form N-PORT is available on the website of the SEC at www.sec.gov. Each Fund’s portfolio holdings are posted on its website at www.PacerETFs.com daily.
NOTE 4 – PROXY VOTING POLICIES AND PROCEDURES
A description of the policies and procedures the Funds use to determine how to vote proxies relating to portfolio securities is provided in the Statement of Additional Information (“SAI”). The SAI is available without charge upon request by calling toll-free at (800) 617-0004, by accessing the SEC’s website at www.sec.gov, or by accessing the Funds’ website at www.paceretfs.com. Information how the Funds voted proxies relating to portfolio securities during the year ended June 30 is available without charge, upon request, by calling (800) 617-0004 or by accessing the website of the SEC.
NOTE 5 – BOARD CONSIDERATIONS IN APPROVING THE INVESTMENT ADVISORY AGREEMENT FOR THE FUND
The Board of Trustees (the “Board”) of Pacer Funds Trust (the “Trust”), including the Trustees thereof who are not “interested persons,” as defined by the Investment Company Act of 1940, as amended (the “1940 Act”), of the Trust (the “Independent Trustees”), held a meeting on December 21, 2020 (the “Meeting”) for the purpose of, among other things, the consideration of, and voting on, the proposed approval of the investment advisory agreement (the “Investment Advisory Agreement”) between the Trust and Pacer Advisors, Inc. (the “Advisor”) and the proposed approval of an investment sub-advisory agreement (the “Sub-Advisory Agreement”) between the Advisor and Swan Capital Management, LLC (the “Sub-Advisor”) relating to Pacer Swan SOS Conservative (December) ETF, Pacer Swan SOS Conservative (April) ETF, Pacer Swan SOS Conservative (July) ETF, Pacer Swan SOS Conservative (October) ETF, Pacer Swan SOS Moderate (December) ETF,
65
Pacer Funds
ADDITIONAL INFORMATION
(Unaudited) (Continued)
Pacer Swan SOS Moderate (April) ETF, Pacer Swan SOS Moderate (July) ETF, Pacer Swan SOS Moderate (October) ETF, Pacer Swan SOS Flex (December) ETF, Pacer Swan SOS Flex (April) ETF, Pacer Swan SOS Flex (July) ETF, Pacer Swan SOS Flex (October) ETF, and Pacer Swan SOS Fund of Funds ETF. Additionally, the Board, including the Independent Trustees, held a meeting on March 30, 2021 for the purpose of, among other things, the consideration of, and voting on, the proposed approval of the Investment Advisory Agreement relating to Pacer American Energy Independence ETF. Each of the aforenamed funds is referred to as a “Fund” and, together, as the “Funds”. Each of the aforementioned meetings is referred to as a “Meeting” and, together, as the “Meetings”.
The Board, including a majority of the Trust’s Independent Trustees voting separately, approved the Investment Advisory Agreement and the Sub-Advisory Agreement at the Meetings, respectively, based on its review of qualitative and quantitative information provided by the Advisor and the Sub-Advisor, as well as the Trust’s other service providers. Prior to deciding to approve the Investment Advisory Agreement and the Sub-Advisory Agreement at the Meetings, respectively, the Independent Trustees requested and obtained from the Advisor and the Sub-Advisor such information as the Independent Trustees deemed reasonably necessary to evaluate the terms of the Investment Advisory Agreement and the Sub-Advisory Agreement. The Independent Trustees received assistance and advice from, and met separately with, independent counsel. In addition, the Independent Trustees received a memorandum from independent counsel regarding the responsibilities of the Board with respect to the approval of the Investment Advisory Agreement and the Sub-Advisory Agreement.
Prior to approval, the Board obtained and reviewed a variety of information, including certain information regarding each Fund’s proposed expenses relative to the expenses of other comparable funds. At the Meetings, respectively, the Board, including the Independent Trustees, evaluated a number of factors and various materials in connection with the approval process, including: (1) a copy of the Investment Advisory Agreement and the Sub-Advisory Agreement; (2) the Advisor’s and the Sub-Advisor’s responses to questionnaires designed to provide the Board with information reasonably necessary to evaluate the terms of the Investment Advisory Agreement and the Sub-Advisory Agreement; (3) the Advisor’s and Sub-Advisor’s Form ADV disclosures; (4) information describing the nature, quality and extent of services that the Advisor and the Sub-Advisor is prepared to provide to each Fund under consideration; (5) the advisory fee payable by each such Fund to the Advisor for its services and the sub-advisory fee payable to the Sub-Advisor by the Advisor under its respective Sub-Advisory Agreement; (6) certain comparative information regarding each such Fund’s expenses and performance relative to the expenses and performance of other funds; (7) a copy of the Trust’s registration statement and prospectuses; and (8) information regarding the ownership and management structure, financial condition, and compliance program of the Advisor and the Sub-Advisor. Representatives from the Advisor and the Sub-Advisor presented additional information and participated in question and answer sessions at the Meetings to help the Board evaluate the Advisor’s and the Sub-Advisor’s services and fees, as well as other aspects of the Investment Advisory Agreement and the Sub-Advisory Agreement.
In considering the approval of the Investment Advisory Agreement and the Sub-Advisory Agreement at the Meetings, respectively, the Board considered various factors that the Trustees determined were relevant, including: (i) the nature, extent and quality of the services to be provided by the Advisor and the Sub-Adviser, including the performance of the Advisor and Sub-Advisor with respect to each relevant Fund; (ii) the costs and benefits, including the fee to be paid to the Advisor by each Fund, of the advisory services to be provided to the Funds; (iii) the fee paid to the Sub-Advisor by the Advisor; and (iv) potential economies of scale.
● | Nature, Extent and Quality of Services to be Provided by the Advisor and the Sub-Advisor. The Board reviewed the scope of services to be provided by the Advisor under the Investment Advisory Agreement and the Sub-Advisor under the Sub-Advisory Agreement. In this regard, the Trustees reviewed each Fund’s investment goal and proposed investment strategy, and each of the Advisor’s and Sub-Advisor’s ability to implement such investment goal and/or investment strategy, including, but not limited to, trading practices. With respect to sub-advisory services to be provided by the Sub-Advisor, the Board noted that the Sub-Advisor would have assets allocated to it by the Advisor and considered the proposed Sub-Advisor’s ability to ensure compliance with each Fund’s strategies, policies, and limitations. The Trustees also considered the successful performance of the Sub-Advisor in managing investment products with investment strategies similar to the investment strategy of each Fund. In addition, the Trustees reviewed the management team at the Advisor and the Sub-Advisor that would be responsible for managing each Fund, including staffing, skills and compensation program, and considered various other portfolios advised by the Advisor and the Sub-Advisor and any potential conflicts. The Board also considered a report from the Trust’s Chief Compliance Officer regarding the Sub-Advisor’s compliance program as such relates to the operation of each Fund. Finally, the Board considered the selection and due diligence process employed by the Advisor in proposing the Sub-Advisor to each Fund, including the due diligence undertaken with respect to the Sub-Advisor’s compliance capabilities. |
Based on its review, the Board determined that each of the Advisor and the Sub-Advisor is capable of providing all necessary advisory and sub-advisory services required by each relevant Fund, as indicated by the Advisor’s and Sub-Advisor’s management capabilities, the professional qualifications and experience of its portfolio management personnel and the performance of the Funds relative to comparable funds managed by other investment advisers (each a “Peer Group”) and other products managed by the Advisor and the Sub-Advisor with similar investment objectives and strategies as each Fund. The Board also considered other services provided to the Funds
66
Pacer Funds
ADDITIONAL INFORMATION
(Unaudited) (Continued)
by the Advisor and the Sub-Advisor, where relevant, such as selecting broker-dealers for executing portfolio transactions, monitoring adherence to each Fund’s investment restrictions, and monitoring compliance with various policies and procedures and with applicable securities regulations.
Based on the factors above, as well as those discussed below, the Board concluded, within the context of its full deliberations, that it was satisfied with the nature, extent and quality of the services provided and to be provided to the Funds by the Advisor and the Sub-Advisor, respectively.
● | Costs and Benefits of Advisory Services to be Provided to the Funds. In considering the advisory fees payable by the Trust to the Advisor and each Fund’s expense ratio, the Board reviewed data compiled by the Advisor comparing the expense ratios of each Fund with the expense ratios of the ETFs and other funds in each Fund’s Peer Group. The Board compared each Fund’s expense ratio to the expense ratios of funds in its Peer Group, focusing on whether each Fund was charged fees that were within the range of fees charged by those in the Peer Group. It also noted that the Advisor had contractually agreed to pay the operating expenses of each Fund, including the cost of transfer agency, custody, fund administration, legal, audit and other services, except interest, taxes, brokerage commissions and other expenses in connection with the execution of portfolio transactions, and extraordinary and non-routine expenses. It was noted that this contractual agreement cannot be changed without shareholder approval. The Board also evaluated the compensation and incidental or “fall-out” benefits received (or proposed or likely to be received) by the Advisor from its relationship with the Funds, taking into account assessments of the Advisor’s profitability prepared and shared by the Advisor’s management. |
Based on the factors above, as well as those discussed below, the Board concluded, within the context of its full deliberations, that each Fund’s advisory fee was reasonable in light of the nature and quality of the services expected to be rendered by the Advisor.
● | Costs and Benefits of Sub-Advisory Advisory Services to be Provided to the Funds. The Board noted that the sub-advisory fees paid to the Sub-Advisor would be paid by the Advisor and would not be additional fees to be borne by each Fund. The Board also noted that the sub-advisory fees were the product of arms-length negotiations between the Advisor and the Sub-Advisor. In considering the sub-advisory fees payable by the Advisor to the Sub-Advisor, the Board evaluated the compensation and benefits proposed or likely to be received by the Sub-Advisor from the Advisor relating to each Fund. Based on the factors above, as well as those discussed below, the Board concluded, within the context of its full deliberations, that the sub-advisory fees payable to the Sub-Advisor under the Sub-Advisory Agreement with the Advisor were reasonable in light of the nature and quality of the services rendered and, where relevant, expected to be rendered by the Sub-Advisor. |
● | Economies of Scale. The Board also reviewed and considered the extent to which economies of scale would be realized by the Advisor and the Sub-Advisor as the assets of the Funds may grow in the future. |
Based on its deliberations and its evaluation of the information described above, at the Meetings, respectively, the Board, including the Independent Trustees: (a) concluded that the terms of the Investment Advisory Agreement with respect to each Fund are fair and reasonable; (b) concluded that the terms of the Sub-Advisory Agreement with respect to each Fund is fair and reasonable; (c) concluded that the Advisor’s fees are reasonable in light of the nature and quality of the services expected to be rendered by the Advisor to each Fund; (d) concluded that the Sub-Advisor’s fees are reasonable in light of the nature and quality of the services expected to be rendered by the Sub- Advisor; (e) agreed to approve the Investment Advisory Agreement as to each Fund for a term of two years; and (f) agreed to approve the Sub-Advisory Agreement as to each Fund for a term of two years. In its deliberations at the Meetings, the Board did not identify any particular factor (or conclusion with respect thereto) or single piece of information that was all-important, controlling or determinative of its decision, but considered all of the factors together, and each Trustee may have attributed different weights to the various factors (and conclusions with respect thereto) and information.
NOTE 6 – TRUSTEES AND OFFICERS
The business of the Funds is managed under the direction of the Board of Trustees. The Board of Trustees formulates the general policies of the Funds and meets periodically to review the Funds’ performance, monitor investment activities and practices, and discuss other matters affecting the Funds. The Trustees are fiduciaries for the Funds’ shareholders and are governed by the laws of the State of Delaware in this regard. The names and addresses of the Trustees and officers of the Trust are listed below along with a description of their principal occupations over at least the last five years. There are currently four Trustees, three of whom are not “interested persons” of the Trust within the meaning of that term under the 1940 Act (“Independent Trustee”).The Trustees, in turn, elect the officers of the Trust to actively supervise its day-to-day operations. The address of each Trustee and officer of the Trust, unless otherwise indicated below, is c/o Pacer Advisors, Inc., 500 Chesterfield Parkway, Malvern, PA 19335.The Funds’ Statement of Additional Information includes additional information about the Trustees and is available upon request by calling toll free (800) 617-0004.
67
Pacer Funds
ADDITIONAL INFORMATION
(Unaudited) (Continued)
Name and Year of Birth | Position(s)
Held with
the Trust | Term of Office
and Length of
Time Served | Principal Occupation(s)
During Past 5 Years | Number of
Portfolios in
Fund
Complex
Overseen
By Trustee | Other
Directorships
held by
Trustee During
Past Five Years |
Interested Trustee | | | | | |
Joe M. Thomson
Born: 1944 | Trustee, Chairman, President and Principal Executive Officer | Indefinite Term; since 2014 | Founder/President, Pacer Advisors, Inc. (since 2005); President and Chief Compliance Officer, Pacer Financial, Inc. (since 2004) | 35 | Director, First Cornerstone Bank (2000-2016) |
Independent Trustees | | | | | |
Deborah G. Wolk
Born: 1950 | Lead Independent Trustee | Indefinite Term; since 2015 | Self-employed providing accounting services and computer modeling (since 1997) | 35 | None |
Jonathan H. Newman, Sr.
Born: 1962 | Trustee | Indefinite Term; since 2015 | CEO and Chairman, Newman Wine & Spirits (since 2007) | 35 | None |
Dennis J. Ryan
Born: 1947 | Trustee | Indefinite Term; since 2017 | Principal/Owner, Brendan Abstract Company, Inc. (title insurance) (since 1999) | 35 | None |
Officers who are not Trustees: | | | | | |
Sean E. O’Hara
Born: 1962 | Treasurer and Principal Financial Officer | Indefinite Term; since 2014 | Director, Index Design Group (since 2015); Director, Pacer Financial, Inc. (since 2007); Director, Pacer Advisors, Inc. (since 2007) | N/A | None |
Bruce Kavanaugh
Born: 1964 | Secretary and Portfolio Manager | Indefinite Term; since 2016 | Vice President, Pacer Advisors, Inc. (since 2005), Vice President, Pacer Financial, Inc. (since 2004) | N/A | None |
Perpetua Seidenberg Gateway Corporate Center, Suite 216
223 Wilmington West Chester Pike Chadds Ford, PA 19317 Born: 1990 | Chief Compliance Officer and AML Officer | Indefinite Term; since 2018 | Compliance Director, Vigilant Compliance, LLC (an investment management services company) (since 2014); Auditor, PricewaterhouseCoopers (2012-2014) | N/A | None |
Mr. Thomson is an “Interested Person” by reason of his relationship with the Adviser.
��
Each Trustee shall serve during the lifetime of the Trust until he or she: (a) dies; (b) resigns; (c) has reached the mandatory retirement age, if any, as set by the Trustees; (d) is declared incompetent by a court of appropriate jurisdiction; or (e) is removed, or, if sooner, until the next meeting of shareholders called for the purpose of electing Trustees and until the election and qualification of his or her successor inaccordance with the Trust’s Declaration of Trust and By-laws. Each officer holds office at the pleasure of the Board and services for a period of one year, or until his or her successor is duly elected and qualified.
The Statement of Additional Information includes additional information, including compensation, about the Funds’ Trustees.
68
(This Page Intentionally Left Blank.)
Advisor Pacer Advisors, Inc.
500 Chesterfield Parkway
Malvern, PA 19355 |
Index Provider SL Advisors, LLC
220 Lenox Avenue, Suite 303
Westfield, New Jersey 07090 Salt Financial Indices LLC
20 West 22nd Street, Suite 511
New York, New York 10010 |
Distributor Pacer Financial, Inc.
500 Chesterfield Parkway
Malvern, PA 19355 |
Custodian U.S. Bank National Association
1555 North Rivercenter Drive
Milwaukee, WI 53212 |
Sub Adviser Swan Global Management, LLC
20 Ridge Top Palmas Del Mar
Humacao, PR 00791 |
Transfer Agent U.S. Bancorp Fund Services, LLC
615 East Michigan Street
Milwaukee, WI 53202 |
Independent Registered
Public Accounting Firm Sanville & Company
1514 Old York Rd.
Abington, PA 19001 |
Legal Counsel Practus, LLP
11300 Tomahawk Creek Parkway, Suite 310
Leawood, Kansas 66211 |


Item 2. Code of Ethics.
Not applicable for semi-annual reports.
Item 3. Audit Committee Financial Expert.
Not applicable for semi-annual reports.
Item 4. Principal Accountant Fees and Services.
Not applicable for semi-annual reports.
Item 5. Audit Committee of Listed Registrants.
Not applicable for semi-annual reports.
Item 6. Investments.
| (a) | Schedule of Investments is included as part of the report to shareholders filed under Item 1 of this Form. |
Item 7. Disclosure of Proxy Voting Policies and Procedures for Closed-End Management Investment Companies.
Not applicable to open-end investment companies.
Item 8. Portfolio Managers of Closed-End Management Investment Companies.
Not applicable to open-end investment companies.
Item 9. Purchases of Equity Securities by Closed-End Management Investment Company and Affiliated Purchasers.
Not applicable to open-end investment companies.
1
Item 10. Submission of Matters to a Vote of Security Holders.
There have been no material changes to the procedures by which shareholders may recommend nominees to the registrant’s board of trustees.
Item 11. Controls and Procedures.
| (a) | The Registrant’s President/Principal Executive Officer and Treasurer/Principal Financial Officer have reviewed the Registrant's disclosure controls and procedures (as defined in Rule 30a-3(c) under the Investment Company Act of 1940 (the “Act”)) as of a date within 90 days of the filing of this report, as required by Rule 30a-3(b) under the Act and Rules 13a-15(b) or 15d-15(b) under the Securities Exchange Act of 1934. Based on their review, such officers have concluded that the disclosure controls and procedures are effective in ensuring that information required to be disclosed in this report is appropriately recorded, processed, summarized and reported and made known to them by others within the Registrant and by the Registrant’s service provider. |
| (b) | There were no changes in the Registrant's internal control over financial reporting (as defined in Rule 30a-3(d) under the Act) that occurred during the period covered by this report that have materially affected, or are reasonably likely to materially affect, the Registrant's internal control over financial reporting. |
Item 12. Disclosure of Securities Lending Activities for Closed-End Management Investment Companies
Not applicable to open-end investment companies.
Item 13. Exhibits.
| (a) | (1) ) Any code of ethics or amendment thereto, that is the subject of the disclosure required by Item 2, to the extent that the registrant intends to satisfy Item 2 requirements through filing an exhibit. Not Applicable |
(2) A separate certification for each principal executive officer and principal financial officer pursuant to Section 302 of the Sarbanes-Oxley Act of 2002. Filed herewith.
(3) Any written solicitation to purchase securities under Rule 23c-1 under the Act sent or given during the period covered by the report by or on behalf of the registrant to 10 or more persons. Not applicable to open-end investment companies.
(4) Change in the registrant’s independent public accountant. There was no change in the registrant’s independent public accountant for the period covered by this report.
2
SIGNATURES
Pursuant to the requirements of the Securities Exchange Act of 1934 and the Investment Company Act of 1940, the registrant has duly caused this report to be signed on its behalf by the undersigned, thereunto duly authorized.
| (Registrant) | Pacer Funds Trust | |
| | | |
| By (Signature and Title) | /s/ Joe M. Thomson | |
| | Joe M. Thomson, President (Principal Executive Officer) | |
| | | |
| Date | 6/29/21 | |
Pursuant to the requirements of the Securities Exchange Act of 1934 and the Investment Company Act of 1940, this report has been signed below by the following persons on behalf of the registrant and in the capacities and on the dates indicated.
| By (Signature and Title) | /s/ Joe M. Thomson | |
| | Joe M. Thomson, President (Principal Executive Officer) | |
| | | |
| Date | 6/29/21 | |
| | | |
| By (Signature and Title) | /s/ Sean E. O’Hara | |
| | Sean E. O’Hara, Treasurer (Principal Financial Officer) | |
| | | |
| Date | 6/29/21 | |
| | * | Print the name and title of each signing officer under his or her signature. |
3