UNITED STATES
SECURITIES AND EXCHANGE COMMISSION
Washington, D.C. 20549
FORM N-CSR
CERTIFIED SHAREHOLDER REPORT OF REGISTERED
MANAGEMENT INVESTMENT COMPANIES
Investment Company Act file number 811-23024
Pacer Funds Trust
(Exact name of registrant as specified in charter)
500 Chesterfield Parkway
Malvern, PA 19355
(Address of principal executive offices) (Zip code)
Joe M. Thomson, President
500 Chesterfield Parkway
Malvern, PA 19355
(Name and address of agent for service)
610-644-8100
Registrant's telephone number, including area code
Date of fiscal year end: April 30
Date of reporting period: October 31, 2021
Item 1. Reports to Stockholders.
Pacer Funds
TABLE OF CONTENTS
| | Page |
Portfolio Allocation | 1 |
Performance Summary | 11 |
Expense Example | 40 |
Schedules of Investments | 43 |
Statements of Assets & Liabilities | 140 |
Statements of Operations | 146 |
Statements of Changes in Net Assets | 152 |
Financial Highlights | 166 |
Notes to Financial Statements | 193 |
Additional Information | 219 |
Pacer Funds
PORTFOLIO ALLOCATION (Unaudited)
As of October 31, 2021
Pacer Trendpilot® US Large Cap ETF
Sector(a) | Percentage of
Net Assets |
Technology | 24.2% |
Consumer, Non-Cyclical | 19.5% |
Communications | 15.7% |
Financial | 15.1% |
Consumer, Cyclical | 10.3% |
Industrial | 7.8% |
Energy | 2.9% |
Utilities | 2.4% |
Basic Materials | 2.0% |
Short-Term Investments | 0.1% |
Investments Purchased with Proceeds from Securities Lending | 3.3% |
Liabilities in excess of other assets | -3.3% |
Total | 100.0% |
(a) | The Fund may classify a company in a different category than the Pacer Trendpilot® US Large Cap Index. |
Pacer Trendpilot® US Mid Cap ETF
Sector(a) | Percentage of
Net Assets |
Financial | 13.6% |
Industrial | 11.4% |
Consumer, Non-Cyclical | 9.5% |
Consumer, Cyclical | 9.2% |
Technology | 4.9% |
Basic Materials | 2.4% |
Energy | 2.2% |
Communications | 1.7% |
Utilities | 1.5% |
Short-Term Investments | 43.6% |
Investments Purchased with Proceeds from Securities Lending | 14.3% |
Liabilities in excess of other assets | -14.3% |
Total | 100.0% |
(a) | The Fund may classify a company in a different category than the Pacer Trendpilot® US Mid Cap Index. |
Pacer Trendpilot® 100 ETF
Sector(a) | Percentage of
Net Assets |
Technology | 26.0% |
Communications | 16.8% |
Consumer, Non-Cyclical | 6.9% |
Consumer, Cyclical | 6.1% |
Industrial | 0.9% |
Utilities | 0.5% |
Short-Term Investments | 43.0% |
Investments Purchased with Proceeds from Securities Lending | 1.3% |
Liabilities in excess of other assets | -1.5% |
Total | 100.0% |
(a) | The Fund may classify a company in a different category than the Pacer Nasdaq-100 Trendpilot® Index. |
1
Pacer Funds
PORTFOLIO ALLOCATION (Unaudited) (Continued)
As of October 31, 2021
Pacer Trendpilot® European Index ETF
Sector(a) | Percentage of
Net Assets |
Consumer, Non-Cyclical | 18.3% |
Financial | 17.4% |
Consumer, Cyclical | 14.6% |
Industrial | 14.5% |
Technology | 12.2% |
Communications | 6.1% |
Basic Materials | 6.1% |
Utilities | 6.0% |
Energy | 3.8% |
Short-Term Investments | 0.2% |
Investments Purchased with Proceeds from Securities Lending | 12.6% |
Liabilities in excess of other assets | -11.8% |
Total | 100.0% |
(a) | The Fund generally classifies a company based on its country of incorporation, but may designate a different country in certain circumstances. |
Pacer Trendpilot® International ETF
Sector(a) | Percentage of
Net Assets |
Consumer, Non-Cyclical | 23.2% |
Financial | 20.4% |
Industrial | 12.5% |
Consumer, Cyclical | 12.4% |
Technology | 6.3% |
Communications | 6.0% |
Basic Materials | 6.0% |
Investment Companies | 5.1% |
Energy | 4.8% |
Utilities | 2.7% |
Diversified | 0.2% |
Short-Term Investments | 0.1% |
Investments Purchased with Proceeds from Securities Lending | 4.7% |
Liabilities in excess of other assets | -4.4% |
Total | 100.0% |
(a) | The Fund may classify a company in a different category than the Pacer Trendpilot® International Index. |
2
Pacer Funds
PORTFOLIO ALLOCATION (Unaudited) (Continued)
As of October 31, 2021
Pacer Trendpilot® US Bond ETF
Sector(a) | Percentage of
Net Assets |
Consumer, Cyclical | 20.8% |
Communications | 15.9% |
Financial | 15.5% |
Consumer, Non-Cyclical | 12.6% |
Industrial | 12.1% |
Energy | 11.7% |
Basic Materials | 7.5% |
Technology | 1.9% |
Utilities | 0.4% |
Short-Term Investments | 0.4% |
Investments Purchased with Proceeds from Securities Lending | 26.2% |
Liabilities in excess of other assets | -25.0% |
Total | 100.0% |
(a) | The Fund may classify a company in a different category than the Pacer Trendpilot® US Bond Index. |
Pacer Trendpilot® Fund of Funds ETF
Sector(a) | Percentage of
Net Assets |
Affiliated Exchange Traded Funds | 99.9% |
Short-Term Investments | 0.1% |
Liabilities in excess of other assets | 0.0%* |
Total | 100.0% |
(a) | The Fund may classify a company in a different category than the Pacer Trendpilot® Fund of Funds Index. |
Pacer Global Cash Cows Dividend ETF
Sector(a) | Percentage of
Net Assets |
Consumer, Non-Cyclical | 39.1% |
Communications | 20.0% |
Energy | 9.4% |
Consumer, Cyclical | 8.5% |
Basic Materials | 7.6% |
Industrial | 5.5% |
Technology | 4.9% |
Utilities | 3.3% |
Diversified | 1.1% |
Short-Term Investments | 0.1% |
Investments Purchased with Proceeds from Securities Lending | 13.8% |
Liabilities in excess of other assets | -13.3% |
Total | 100.0% |
(a) | The Fund may classify a company in a different category than the Pacer Global Cash Cows Dividend 100 Index. |
3
Pacer Funds
PORTFOLIO ALLOCATION (Unaudited) (Continued)
As of October 31, 2021
Pacer US Cash Cows 100 ETF
Sector(a) | Percentage of
Net Assets |
Consumer, Cyclical | 31.3% |
Consumer, Non-Cyclical | 20.3% |
Technology | 12.3% |
Communications | 11.5% |
Basic Materials | 7.5% |
Industrial | 7.2% |
Energy | 6.4% |
Financial | 2.5% |
Utilities | 0.7% |
Short-Term Investments | 0.2% |
Investments Purchased with Proceeds from Securities Lending | 15.3% |
Liabilities in excess of other assets | -15.2% |
Total | 100.0% |
(a) | The Fund may classify a company in a different category than the Pacer US Cash Cows 100 Index. |
Pacer US Small Cap Cash Cows 100 ETF
Sector(a) | Percentage of
Net Assets |
Consumer, Cyclical | 51.4% |
Consumer, Non-Cyclical | 16.5% |
Industrial | 12.7% |
Energy | 6.2% |
Communications | 5.3% |
Basic Materials | 2.7% |
Financial | 2.7% |
Technology | 2.5% |
Short-Term Investments | 0.0%* |
Investments Purchased with Proceeds from Securities Lending | 30.2% |
Liabilities in excess of other assets | -30.2% |
Total | 100.0% |
(a) | The Fund may classify a company in a different category than the Pacer US Small Cap Cash Cows 100 Index. |
Pacer Developed Markets International Cash Cows 100 ETF
Sector(a) | Percentage of
Net Assets |
Consumer, Cyclical | 22.8% |
Communications | 19.2% |
Consumer, Non-Cyclical | 18.0% |
Industrial | 16.2% |
Basic Materials | 10.0% |
Energy | 7.1% |
Technology | 4.2% |
Diversified | 1.9% |
Short-Term Investments | 0.5% |
Investments Purchased with Proceeds from Securities Lending | 2.2% |
Liabilities in excess of other assets | -2.1% |
Total | 100.0% |
(a) | The Fund may classify a company in a different category than the Pacer Developed Markets International Cash Cows 100 Index. |
4
Pacer Funds
PORTFOLIO ALLOCATION (Unaudited) (Continued)
As of October 31, 2021
Pacer US Cash Cows Growth ETF
Sector(a) | Percentage of
Net Assets |
Technology | 34.9% |
Consumer, Non-cyclical | 24.5% |
Communications | 18.3% |
Consumer, Cyclical | 12.7% |
Industrial | 6.6% |
Basic Materials | 1.7% |
Energy | 1.2% |
Short-Term Investments | 0.1% |
Investments Purchased with Proceeds from Securities Lending | 19.9% |
Liabilities in excess of other assets | -19.9% |
Total | 100.0% |
(a) | The Fund may classify a company in a different category than the Pacer US Cash Cows Growth Index. |
Pacer Emerging Markets Cash Cows 100 ETF
Sector(a) | Percentage of
Net Assets |
Basic Materials | 17.2% |
Consumer, Cyclical | 15.8% |
Industrial | 14.8% |
Energy | 12.9% |
Consumer, Non-Cyclical | 12.6% |
Communications | 12.5% |
Utilities | 5.9% |
Technology | 3.1% |
Diversified | 3.0% |
Financial | 1.6% |
Short-Term Investments | 0.3% |
Other assets in excess of liabilities | 0.3% |
Total | 100.0% |
(a) | The Fund generally classifies a company based on its country of incorporation, but may designate a different country in certain circumstances. |
Pacer Cash Cows Fund of Funds ETF
Sector(a) | Percentage of
Net Assets |
Affiliated Exchange Traded Funds | 99.9% |
Short-Term Investments | 0.1% |
Liabilities in excess of other assets | 0.0%* |
Total | 100.0% |
(a) | The Fund may classify a company in a different category than the Pacer Cash Cows Fund of Funds Index. |
5
Pacer Funds
PORTFOLIO ALLOCATION (Unaudited) (Continued)
As of October 31, 2021
Pacer WealthShield ETF
Sector(a) | Percentage of
Net Assets |
Financial | 40.0% |
Technology | 22.9% |
Communications | 20.0% |
Consumer, Cyclical | 13.6% |
Consumer, Non-cyclical | 2.9% |
Industrial | 0.4% |
Energy | 0.1% |
Short-Term Investments | 0.1% |
Investments Purchased with Proceeds from Securities Lending | 14.5% |
Liabilities in excess of other assets | -14.5% |
Total | 100.0% |
(a) | The Fund may classify a company in a different category than the Pacer WealthShield Index. |
Pacer Benchmark Industrial Real Estate SCTRSM ETF
Sector(a) | Percentage of
Net Assets |
Financial | 99.8% |
Short-Term Investments | 0.2% |
Investments Purchased with Proceeds from Securities Lending | 6.6% |
Liabilities in excess of other assets | -6.6% |
Total | 100.0% |
(a) | The Fund may classify a company in a different category than the Benchmark Industrial Real Estate SCTRSM Index. |
Pacer Benchmark Data & Infrastructure Real Estate SCTRSM ETF
Sector(a) | Percentage of
Net Assets |
Financial | 79.1% |
Communications | 13.0% |
Industrial | 7.8% |
Short-Term Investments | 0.1% |
Investments Purchased with Proceeds from Securities Lending | 11.3% |
Liabilities in excess of other assets | -11.3% |
Total | 100.0% |
(a) | The Fund may classify a company in a different category than the Benchmark Data & Infrastructure Real Estate SCTRSM Index. |
6
Pacer Funds
PORTFOLIO ALLOCATION (Unaudited) (Continued)
As of October 31, 2021
Pacer CFRA-Stovall Equal Weight Seasonal Rotation ETF
Sector(a) | Percentage of
Net Assets |
Consumer, Cyclical | 26.0% |
Industrial | 25.8% |
Technology | 18.2% |
Basic Materials | 17.0% |
Consumer, Non-Cyclical | 6.4% |
Communications | 5.0% |
Financial | 0.9% |
Energy | 0.5% |
Short-Term Investments | 0.2% |
Investments Purchased with Proceeds from Securities Lending | 21.3% |
Liabilities in excess of other assets | -21.3% |
Total | 100.0% |
(a) | The Fund may classify a company in a different category than the Pacer CFRA-Stovall Equal Weight Seasonal Rotation Index. |
Pacer CSOP FTSE China A50 ETF
Sector(a) | Percentage of
Net Assets |
Financial | 36.1% |
Consumer, Non-Cyclical | 33.2% |
Consumer, Cyclical | 9.7% |
Industrial | 7.5% |
Energy | 5.5% |
Basic Materials | 3.9% |
Communications | 2.7% |
Utilities | 1.3% |
Short-Term Investments | 0.1% |
Other assets in excess of liabilities | 0.0%* |
Total | 100.0% |
(a) | The Fund may classify a company in a different category than the FTSE China A50 Net Total Return Index. |
Pacer BioThreat Strategy ETF
Sector(a) | Percentage of
Net Assets |
Consumer, Non-Cyclical | 54.4% |
Consumer, Cyclical | 15.4% |
Communications | 10.6% |
Technology | 10.5% |
Industrial | 7.1% |
Basic Materials | 1.8% |
Short-Term Investments | 0.2% |
Investments Purchased with Proceeds from Securities Lending | 16.4% |
Liabilities in excess of other assets | -16.4% |
Total | 100.0% |
(a) | The Fund may classify a company in a different category than the BioShares BioThreat Index. |
7
Pacer Funds
PORTFOLIO ALLOCATION (Unaudited) (Continued)
As of October 31, 2021
Pacer Lunt Large Cap Alternator ETF
Sector(a) | Percentage of
Net Assets |
Technology | 34.7% |
Consumer, Cyclical | 18.3% |
Energy | 16.6% |
Financial | 9.7% |
Communications | 8.0% |
Consumer, Non-cyclical | 5.8% |
Industrial | 4.5% |
Basic Materials | 2.1% |
Short-Term Investments | 0.1% |
Investments Purchased with Proceeds from Securities Lending | 8.1% |
Liabilities in excess of other assets | -7.9% |
Total | 100.0% |
(a) | The Fund may classify a company in a different category than the Lunt Capital U.S. Large Cap Equity Rotation Index. |
Pacer Lunt Midcap Multi-Factor Alternator ETF
Sector(a) | Percentage of
Net Assets |
Financial | 29.9% |
Consumer, Cyclical | 22.9% |
Consumer, Non-Cyclical | 12.5% |
Industrial | 12.0% |
Energy | 9.7% |
Technology | 6.4% |
Basic Materials | 3.6% |
Communications | 2.1% |
Utilities | 0.9% |
Short-Term Investments | 0.1% |
Investments Purchased with Proceeds from Securities Lending | 28.3% |
Liabilities in excess of other assets | -28.4% |
Total | 100.0% |
(a) | The Fund may classify a company in a different category than the Lunt Capital U.S. MidCap Multi-Factor Rotation Index. |
Pacer Lunt Large Cap Multi-Factor Alternator ETF
Sector(a) | Percentage of
Net Assets |
Technology | 19.5% |
Financial | 19.2% |
Communications | 17.0% |
Consumer, Cyclical | 17.0% |
Consumer, Non-Cyclical | 13.8% |
Industrial | 10.1% |
Basic Materials | 1.8% |
Energy | 1.5% |
Short-Term Investments | 0.1% |
Investments Purchased with Proceeds from Securities Lending | 10.2% |
Liabilities in excess of other assets | -10.2% |
Total | 100.0% |
* Less than 0.05%.
(a) | The Fund may classify a company in a different category than the Lunt Capital U.S. Large Cap Multi-Factor Rotation Index. |
8
Pacer Funds
PORTFOLIO ALLOCATION (Unaudited) (Continued)
As of October 31, 2021
Pacer US Export Leaders ETF
Sector(a) | Percentage of
Net Assets |
Technology | 34.3% |
Industrial | 20.0% |
Consumer, Non-cyclical | 17.9% |
Consumer, Cyclical | 8.8% |
Basic Materials | 8.7% |
Communications | 5.2% |
Energy | 5.0% |
Short-Term Investments | 0.1% |
Investments Purchased with Proceeds from Securities Lending | 17.7% |
Liabilities in excess of other assets | -17.7% |
Total | 100.0% |
(a) | The Fund may classify a company in a different category than the Pacer US Export Leaders Index. |
Pacer Metaurus US Large Cap Dividend Multiplier 300 ETF
Sector(a) | Percentage of
Net Assets |
Technology | 22.5% |
Consumer, Non-Cyclical | 18.1% |
Communications | 14.7% |
Financial | 14.0% |
Consumer, Cyclical | 9.5% |
Industrial | 7.2% |
Energy | 2.7% |
Utilities | 2.2% |
Basic Materials | 1.9% |
Short-Term Investments | 2.3% |
Other assets in excess of liabilities | 4.9% |
Total | 100.0% |
(a) | The Fund may classify a company in a different category than the Metaurus US Large Cap Dividend Multiplier Total Return - Series 300. |
Pacer Metaurus US Large Cap Dividend Multiplier 400 ETF
Sector(a) | Percentage of
Net Assets |
Technology | 21.7% |
Consumer, Non-Cyclical | 17.5% |
Communications | 14.1% |
Financial | 13.4% |
Consumer, Cyclical | 9.3% |
Industrial | 7.0% |
Energy | 2.6% |
Utilities | 2.1% |
Basic Materials | 1.8% |
Short-Term Investments | 8.5% |
Other assets in excess of liabilities | 2.0% |
Total | 100.0% |
(a) | The Fund may classify a company in a different category than the Metaurus US Large Cap Dividend Multiplier Total Return - Series 400. |
9
Pacer Funds
PORTFOLIO ALLOCATION (Unaudited) (Continued)
As of October 31, 2021
Pacer Pacific Asset Floating Rate High Income ETF
Sector(a) | Percentage of
Net Assets |
Consumer, Cyclical | 24.4% |
Industrial | 18.7% |
Consumer, Non-cyclical | 15.3% |
Communications | 14.5% |
Technology | 13.3% |
Financial | 6.9% |
Energy | 2.8% |
Basic Materials | 2.4% |
Other assets in excess of liabilities | 1.7% |
Total | 100.0% |
(a) | The Fund may classify a company in a different category than the S&P LSTA U.S. Leverage Loan 100 Index. |
10
Pacer Trendpilot® US Large Cap ETF
PERFORMANCE SUMMARY
(Unaudited)
Growth of $10,000
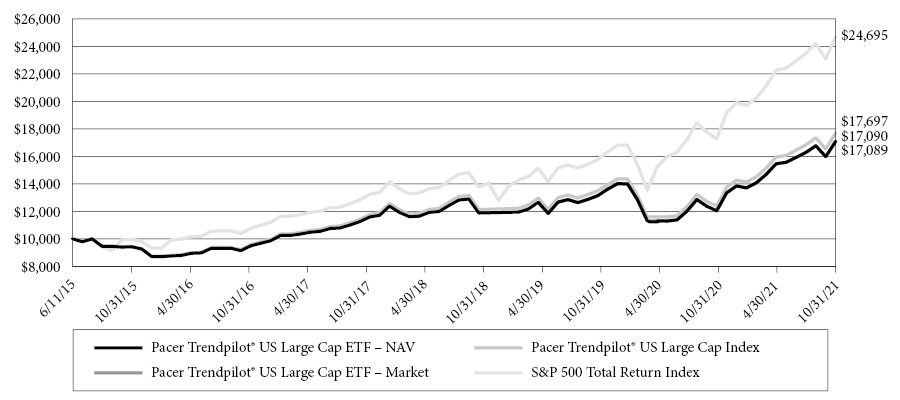
This chart illustrates the performance of a hypothetical $10,000 investment made on June 11, 2015, and is not intended to imply any future performance. The returns shown do not reflect the deduction of taxes that a shareholder would pay on fund distributions or the redemption of fund shares. The chart assumes reinvestment of capital gains and dividends.
The Pacer Trendpilot® US Large Cap Index uses an objective, rules-based methodology to implement a systematic trend-following strategy that directs exposure (i) 100% to the S&P 500 Total Return Index, (ii) 50% to the S&P 500 Total Return Index and 50% to 3-Month US Treasury bills, or (iii) 100% to 3-Month US Treasury bills, depending on the relative performance of the S&P 500 Total Return Index and its 200-business day historical simple moving average.
The S&P 500 Total Return Index consists of approximately 500 leading U.S.-listed companies representing approximately 8% of the U.S. equity market capitalization.
Annualized Returns(1)
(For the period ended October 31, 2021)
| | One Year | Three Year | Five Year | Since Inception(2) |
Pacer Trendpilot® US Large Cap ETF - NAV | 42.00% | 12.90% | 13.33% | 8.75% |
Pacer Trendpilot® US Large Cap ETF - Market | 41.96% | 12.87% | 13.34% | 8.75% |
Pacer Trendpilot® US Large Cap Index(3) | 42.91% | 13.58% | 14.03% | 9.41% |
S&P 500® Index(3) | 42.91% | 21.48% | 18.93% | 15.20% |
(1) | The performance data quoted is historical. Past performance is no guarantee of future results. Current performance may be higher or lower than the performance data quoted. The principal value and investment return of an investment will fluctuate so that investor’s shares, when redeemed, may be worth more or less than the original cost. The returns shown do not reflect the deduction of taxes that a shareholder would pay on Fund distributions or on redemptions of Fund shares. The total annual operating expenses as stated in the fee table to the Fund’s prospectus dated August 31, 2020, as supplemented October 15, 2020, is 0.60%. For performance information current to the most recent month-end, please call 1-877-337-0500. |
(2) | Inception date is June 11, 2015. |
(3) | Indexes are unmanaged statistical composites and their returns do not include fees an investor would pay to purchase the securities they represent. Such costs would lower performance. It is not possible to invest directly in an index. |
11
Pacer Trendpilot® US Mid Cap ETF
PERFORMANCE SUMMARY
(Unaudited)
Growth of $10,000
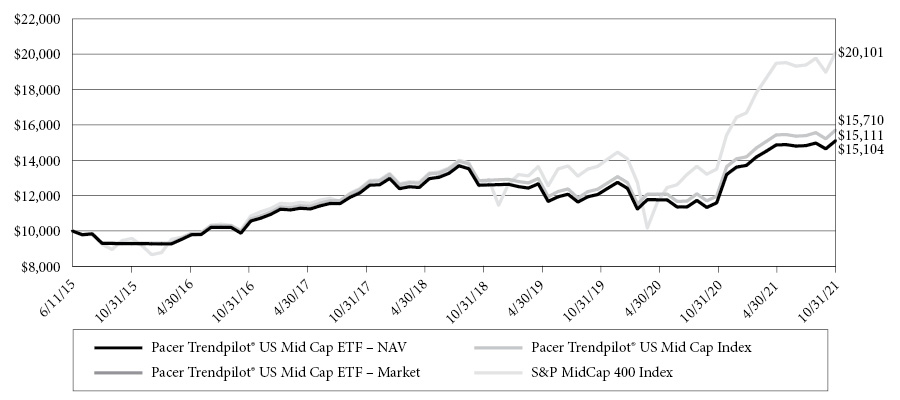
This chart illustrates the performance of a hypothetical $10,000 investment made on June 11, 2015, and is not intended to imply any future performance. The returns shown do not reflect the deduction of taxes that a shareholder would pay on fund distributions or the redemption of fund shares. The chart assumes reinvestment of capital gains and dividends.
The Pacer Trendpilot® US Mid Cap Index uses an objective, rules-based methodology to implement a systematic trend-following strategy that directs exposure (i) 100% to the S&P MidCap 400 Index, (ii) 50% to the S&P MidCap 400 Index and 50% to 3-Month US Treasury bills, or (iii) 100% to 3-Month US Treasury bills, depending on the relative performance of the S&P MidCap 400 Total Return Index and its 200-business day historical simple moving average.
The S&P MidCap 400 Index is a total return version of the S&P MidCap 400 Index and reflects the reinvestment of dividends paid by the securities in the S&P MidCap 400 Index. The S&P Midcap 400 measures the performance of mid-capitalization stocks in the United States.
Annualized Returns(1)
(For the period ended October 31, 2021)
| | One Year | Three Year | Five Year | Since Inception(2) |
Pacer Trendpilot® US Mid Cap ETF - NAV | 30.29% | 6.27% | 8.87% | 6.67% |
Pacer Trendpilot® US Mid Cap ETF - Market | 30.36% | 6.26% | 8.85% | 6.67% |
Pacer Trendpilot® US Mid Cap Index(3) | 31.35% | 6.97% | 9.53% | 7.34% |
S&P MidCap 400 Index(3) | 48.90% | 17.07% | 14.89% | 11.55% |
(1) | The performance data quoted is historical. Past performance is no guarantee of future results. Current performance may be higher or lower than the performance data quoted. The principal value and investment return of an investment will fluctuate so that investor’s shares, when redeemed, may be worth more or less than the original cost. The returns shown do not reflect the deduction of taxes that a shareholder would pay on Fund distributions or on redemptions of Fund shares. The total annual operating expenses as stated in the fee table to the Fund’s prospectus dated August 31, 2020, as supplemented October 15, 2020, is 0.60%. For performance information current to the most recent month-end, please call 1-877-337-0500. |
(2) | Inception date is June 11, 2015. |
(3) | Indexes are unmanaged statistical composites and their returns do not include fees an investor would pay to purchase the securities they represent. Such costs would lower performance. It is not possible to invest directly in an index. |
12
Pacer Trendpilot® 100 ETF
PERFORMANCE SUMMARY
(Unaudited)
Growth of $10,000
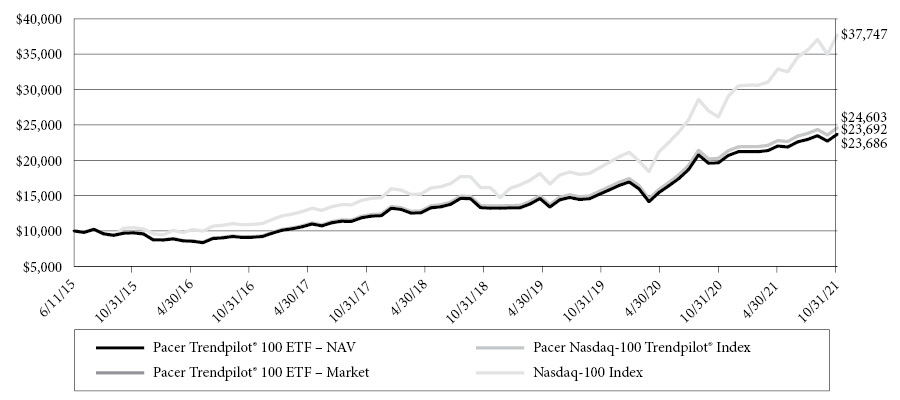
This chart illustrates the performance of a hypothetical $10,000 investment made on June 11, 2015, and is not intended to imply any future performance. The returns shown do not reflect the deduction of taxes that a shareholder would pay on fund distributions or the redemption of fund shares. The chart assumes reinvestment of capital gains and dividends.
Pacer NASDAQ-100 Trendpilot® Index uses an objective, rules-based methodology to implement a systematic trend-following strategy that directs exposure (i) 100% to the NASDAQ-100 Index, (ii) 50% to the NASDAQ-100 Index and 50% to 3-Month US Treasury bills, or (iii) 100% to 3-Month US Treasury bills, depending on the relative performance of the NASDAQ-100 Index and its 200-business day historical simple moving average.
The NASDAQ-100 Index includes approximately 100 of the largest non-financial securities listed on The NASDAQ Stock Market based on market capitalization. The NASDAQ-100 Index comprises securities of companies across major industry groups, including computer, biotechnology, healthcare, telecommunications and transportation. However, it does not contain securities of financial companies, including investment companies. The NASDAQ-100 Index was developed by NASDAQ OMX. There is no minimum market capitalization requirement for inclusion in the NASDAQ-100 Index. Inclusion is determined based on the top 100 largest issuers based on market capitalization meeting all other eligibility requirements.
Annualized Returns(1)
(For the period ended October 31, 2021)
| | One Year | Three Year | Five Year | Since Inception(2) |
Pacer Trendpilot® 100 ETF - NAV | 20.66% | 21.33% | 21.15% | 14.45% |
Pacer Trendpilot® 100 ETF - Market | 20.60% | 21.14% | 21.10% | 14.45% |
Pacer NASDAQ-100 Trendpilot® Index(3) | 21.43% | 21.86% | 21.84% | 15.13% |
NASDAQ-100 Index(3) | 44.43% | 32.74% | 28.25% | 23.11% |
(1) | The performance data quoted is historical. Past performance is no guarantee of future results. Current performance may be higher or lower than the performance data quoted. The principal value and investment return of an investment will fluctuate so that investor’s shares, when redeemed, may be worth more or less than the original cost. The returns shown do not reflect the deduction of taxes that a shareholder would pay on Fund distributions or on redemptions of Fund shares. The total annual operating expenses as stated in the fee table to the Fund’s prospectus dated August 31, 2020, as supplemented October 15, 2020, is 0.65%. For performance information current to the most recent month-end, please call 1-877-337-0500. |
(2) | Inception date is June 11, 2015. |
(3) | Indexes are unmanaged statistical composites and their returns do not include fees an investor would pay to purchase the securities they represent. Such costs would lower performance. It is not possible to invest directly in an index. |
13
Pacer Trendpilot® European Index ETF
PERFORMANCE SUMMARY
(Unaudited)
Growth of $10,000
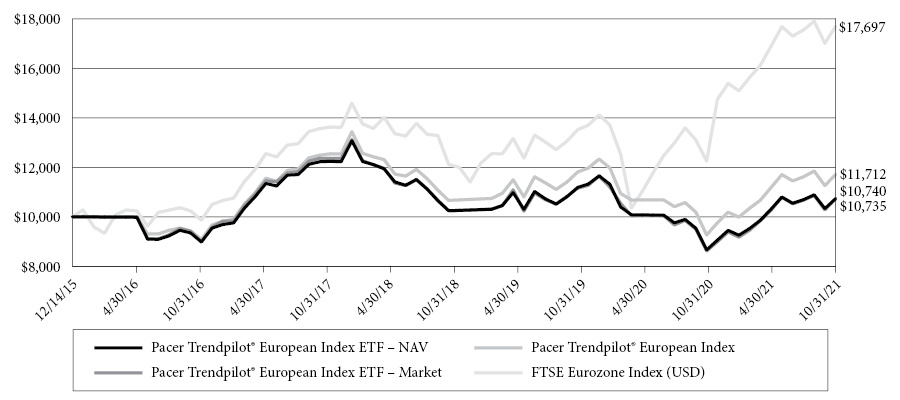
This chart illustrates the performance of a hypothetical $10,000 investment made on December 14, 2015, and is not intended to imply any future performance. The returns shown do not reflect the deduction of taxes that a shareholder would pay on fund distributions or the redemption of fund shares. The chart assumes reinvestment of capital gains and dividends.
The Pacer Trendpilot® European Index uses an objective, rules-based methodology to implement a systematic trend-following strategy that directs exposure (i) 100% to the FTSE Eurozone Index, (ii) 50% to the FTSE Eurozone Index and 50% to 3-Month US Treasury bills, or (iii) 100% to 3-Month US Treasury bills, depending on the relative performance of the FTSE Eurozone Total Return Index and its 200-business day historical simple moving average.
The FTSE Eurozone Index is a rules-based, float-adjusted, market capitalization-weighted index comprised of large- and mid-capitalization stocks providing coverage of the developed markets in the euro zone, including primarily France, Germany, Spain, the Netherlands, and Italy. The FTSE Eurozone Index is a subset of the FTSE Global Equity Index Series, which covers 98% of the world’s investable market capitalization.
Annualized Returns(1)
(For the period ended October 31, 2021)
| | One Year | Three Year | Five Year | Since Inception(2) |
Pacer Trendpilot® European Index ETF - NAV | 23.90% | 1.57% | 2.81% | 1.21% |
Pacer Trendpilot® European Index ETF - Market | 24.58% | 1.59% | 2.66% | 1.22% |
Pacer Trendpilot® European Index(3) | 26.39% | 3.18% | 4.37% | 2.72% |
FTSE Eurozone Index (USD)(3) | 44.44% | 13.44% | 11.56% | 10.19% |
(1) | The performance data quoted is historical. Past performance is no guarantee of future results. Current performance may be higher or lower than the performance data quoted. The principal value and investment return of an investment will fluctuate so that investor’s shares, when redeemed, may be worth more or less than the original cost. The returns shown do not reflect the deduction of taxes that a shareholder would pay on Fund distributions or on redemptions of Fund shares. The total annual operating expenses as stated in the fee table to the Fund’s prospectus dated August 31, 2020, as supplemented October 15, 2020, is 0.65%. For performance information current to the most recent month-end, please call 1-877-337-0500. |
(2) | Inception date is December 14, 2015. |
(3) | Indexes are unmanaged statistical composites and their returns do not include fees an investor would pay to purchase the securities they represent. Such costs would lower performance. It is not possible to invest directly in an index. |
14
Pacer Trendpilot International ETF
PERFORMANCE SUMMARY
(Unaudited)
Growth of $10,000

This chart illustrates the performance of a hypothetical $10,000 investment made on May 2, 2019, and is not intended to imply any future performance. The returns shown do not reflect the deduction of taxes that a shareholder would pay on fund distributions or the redemption of fund shares. The chart assumes reinvestment of capital gains and dividends.
The Pacer Trendpilot International Index uses an objective, rules-based methodology to implement a systematic trend-following strategy that directs exposure (i) 100% to the S&P Developed Ex-U.S. LargeCap Index, (ii) 50% to the S&P Developed Ex-U.S. LargeCap Index and 50% to 3-Month US Treasury bills, or (iii) 100% to 3-Month US Treasury bills, depending on the relative performance of the S&P Developed Ex-U.S. LargeCap Index and its 200-business day historical simple moving average (the “200-day moving average”). The calculation of the 200-day moving average for the S&P Developed Ex-U.S. LargeCap Index is based on the total return version of the S&P Developed Ex-U.S. LargeCap Local Currency Index and reflects the reinvestment of dividends paid by the securities in the S&P Developed Ex-U.S. LargeCap Index. The Index is expected to be predominantly invested in the components of the S&P Developed Ex-U.S. LargeCap Index over most short- and long-term periods and is only expected to invest in 3-Month US Treasury bills from time to time in response to adverse market conditions as defined by the “50/50 Indicator” and “T-Bill Indicator” below.
The S&P Developed Ex-US LargeCap Index is a rules-based, float-adjusted, market capitalization-weighted index comprised of large-capitalization stocks providing coverage of the developed markets excluding the United States.
Annualized Returns(1)
(For the period ended October 31, 2021)
| | One Year | Since Inception(2) |
Pacer Trendpilot International ETF - NAV | 35.20% | 7.72% |
Pacer Trendpilot International ETF - Market | 35.22% | 7.83% |
Pacer Trendpilot International Index | 36.02% | 8.76% |
S&P Developed Ex-US Large Cap Index (USD)(3) | 39.75% | 12.87% |
(1) | The performance data quoted is historical. Past performance is no guarantee of future results. Current performance may be higher or lower than the performance data quoted. The principal value and investment return of an investment will fluctuate so that investor’s shares, when redeemed, may be worth more or less than the original cost. The returns shown do not reflect the deduction of taxes that a shareholder would pay on Fund distributions or on redemptions of Fund shares. The total annual operating expenses as stated in the fee table to the Fund’s prospectus dated August 31, 2020, as supplemented October 29, 2020, is 0.65%. For performance information current to the most recent month-end, please call 1-877-337-0500. |
(2) | Inception date is May 2, 2019. |
(3) | Indexes are unmanaged statistical composites and their returns do not include fees an investor would pay to purchase the securities they represent. Such costs would lower performance. It is not possible to invest directly in an index. |
15
Pacer Trendpilot US Bond ETF
PERFORMANCE SUMMARY
(Unaudited)
Growth of $10,000
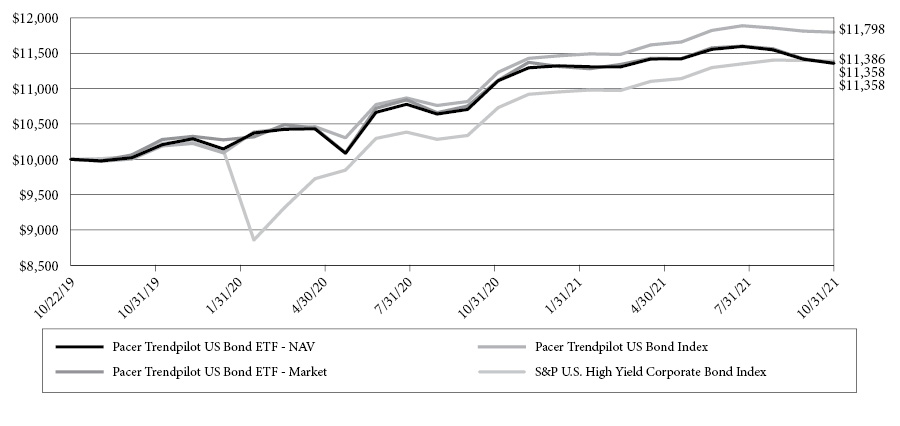
This chart illustrates the performance of a hypothetical $10,000 investment made on October 22, 2019, and is not intended to imply any future performance. The returns shown do not reflect the deduction of taxes that a shareholder would pay on fund distributions or the redemption of fund shares. The chart assumes reinvestment of capital gains and dividends.
The Pacer Trendpilot US Bond Index uses an objective, rules-based methodology to implement a systematic trend-following strategy that directs exposure to one of the following positions: (i) 100% to the S&P U.S. High Yield Corporate Bond Index, (ii) 50% to the S&P U.S. High Yield Corporate Bond Index and 50% to the S&P U.S. Treasury Bond 7-10 Year Index or (iii) 100% to S&P U.S. Treasury Bond 7-10 Year Index.
The S&P U.S. High Yield Corporate Bond Index is designed to track the performance of U.S. dollar-denominated, high-yield corporate bonds issued in the U.S. The S&P U.S. Treasury Bond 7-10 Year Index is designed to measure the performance of U.S. Treasury bonds maturing in 7 to 10 years. The Index uses a “Risk Ratio” to signal a change in the position of the Index. The Risk Ratio is calculated by dividing the value of the S&P U.S. High Yield Corporate Bond Index by the value of the S&P U.S. Treasury Bond 7-10 Year Index.
Annualized Returns(1)
(For the period ended October 31, 2021)
| | One Year | Since Inception(2) |
Pacer Trendpilot US Bond ETF - NAV | 6.10% | 6.49% |
Pacer Trendpilot US Bond ETF - Market | 5.62% | 6.49% |
Pacer Trendpilot US Bond Index(3) | 9.07% | 8.51% |
S&P U.S. High Yield Corporate Bond IndexTM(3) | 10.16% | 6.61% |
(1) | The performance data quoted is historical. Past performance is no guarantee of future results. Current performance may be higher or lower than the performance data quoted. The principal value and investment return of an investment will fluctuate so that investor’s shares, when redeemed, may be worth more or less than the original cost. The returns shown do not reflect the deduction of taxes that a shareholder would pay on Fund distributions or on redemptions of Fund shares. The total annual operating expenses as stated in the fee table to the Fund’s prospectus dated August 31, 2020, is 0.60%. For performance information current to the most recent month-end, please call 1-877-337-0500. |
(2) | Inception date is October 22, 2019. |
(3) | Indexes are unmanaged statistical composites and their returns do not include fees an investor would pay to purchase the securities they represent. Such costs would lower performance. It is not possible to invest directly in an index. |
16
Pacer Trendpilot Fund of Funds ETF
PERFORMANCE SUMMARY
(Unaudited)
Growth of $10,000
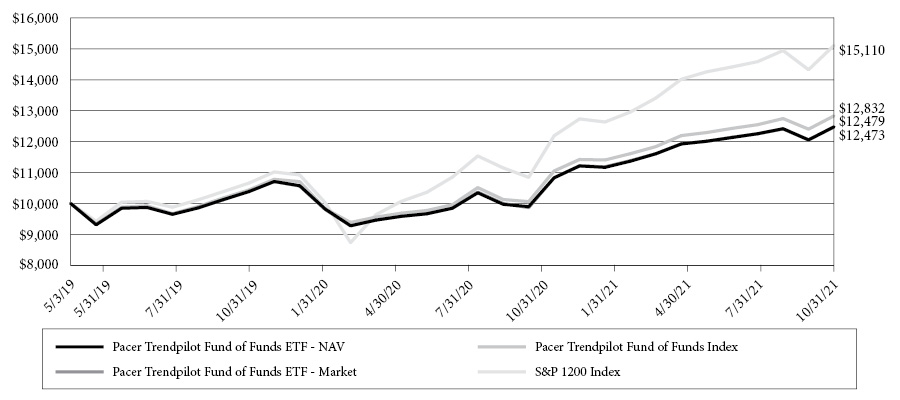
This chart illustrates the performance of a hypothetical $10,000 investment made on May 3, 2019, and is not intended to imply any future performance. The returns shown do not reflect the deduction of taxes that a shareholder would pay on fund distributions or the redemption of fund shares. The chart assumes reinvestment of capital gains and dividends.
The Pacer Trendpilot Fund of Funds Index uses an objective, rules-based approach to construct a portfolio that, as of each quarterly rebalance, is composed of the ETFs listed in the following table, each advised by the Adviser (collectively, the “Trendpilot ETFs”). Each of the Trendpilot ETFs is an index-based ETF that seeks to track the total return performance, before fees and expenses, of the underlying index listed in the following table (collectively, the “Trendpilot Indexes”). Each Trendpilot Index other than the Pacer Trendpilot US Bond Index (collectively, the “Trendpilot Equity Indexes”) uses an objective, rules-based methodology to implement a systematic trend-following strategy that directs exposure (i) 100% to the “Underlying Component” specified in the table below, (ii) 50% to the applicable Underlying Component and 50% to 3-Month US Treasury bills, or (iii) 100% to 3-Month US Treasury bills, depending on the relative performance of the Underlying Component and its 200 business day historical simple moving average (the “200-day moving average”). The calculation of the 200-day moving average for each Underlying Component is based on the total return version of such Underlying Component and reflects the reinvestment of dividends paid by the securities in such Underlying Component. The Pacer Trendpilot US Bond Index (the “Trendpilot Bond Index”) uses an objective, rules-based methodology to implement a systematic trend-following strategy that directs exposure to one of the following positions: (i) 100% to the S&P U.S. High Yield Corporate Bond Index, (ii) 50% to the S&P U.S. High Yield Corporate Bond Index and 50% to the S&P U.S. Treasury Bond 7-10 Year Index or (iii) 100% to S&P U.S. Treasury Bond 7-10 Year Index, depending on the value of the S&P U.S. High Yield Corporate Bond Index divided by the value of the S&P U.S. Treasury Bond 7-10 Year Index (the “Risk Ratio”).
Weight | Trendpilot ETF | Trendpilot Index | Equity Component |
20% | Pacer Trendpilot® US Large Cap ETF | Pacer Trendpilot® US Large Cap Index | S&P 500® Index |
20% | Pacer Trendpilot® US Mid Cap ETF | Pacer Trendpilot® US Mid Cap Index | S&P MidCap 400® Index |
20% | Pacer Trendpilot® 100 ETF | Pacer NASDAQ-100 Trendpilot® Index | NASDAQ-100® Index |
20% | Pacer Trendpilot® International ETF | Pacer Trendpilot® International Index | S&P Developed Ex-US Large Cap Index |
20% | Pacer Trendpilot® US Bond ETF | Pacer Trendpilot® US Bond Index | S&P U.S. High Yield Corporate Bond Index |
The S&P 1200 Index captures approximately 70% of global market capitalization.
17
Pacer Trendpilot Fund of Funds ETF
PERFORMANCE SUMMARY (Continued)
(Unaudited)
Annualized Returns(1)
(For the period ended October 31, 2021)
| | One Year | Since Inception(2) |
Pacer Trendpilot Fund of Funds ETF - NAV | 26.07% | 9.28% |
Pacer Trendpilot Fund of Funds ETF - Market | 26.41% | 9.26% |
Pacer Trendpilot Fund of Funds Index(3) | 27.56% | 10.51% |
S&P 1200 Index(3) | 39.32% | 17.96% |
(1) | The performance data quoted is historical. Past performance is no guarantee of future results. Current performance may be higher or lower than the performance data quoted. The principal value and investment return of an investment will fluctuate so that investor’s shares, when redeemed, may be worth more or less than the original cost. The returns shown do not reflect the deduction of taxes that a shareholder would pay on Fund distributions or on redemptions of Fund shares. The total annual operating expenses as stated in the fee table to the Fund’s prospectus dated August 31, 2020, as supplemented October 15, 2020, is 0.15%. For performance information current to the most recent month-end, please call 1-877-337-0500. |
(2) | Inception date is May 3, 2019. |
(3) | Indexes are unmanaged statistical composites and their returns do not include fees an investor would pay to purchase the securities they represent. Such costs would lower performance. It is not possible to invest directly in an index. |
18
Pacer Global Cash Cows Dividend ETF
PERFORMANCE SUMMARY
(Unaudited)
Growth of $10,000
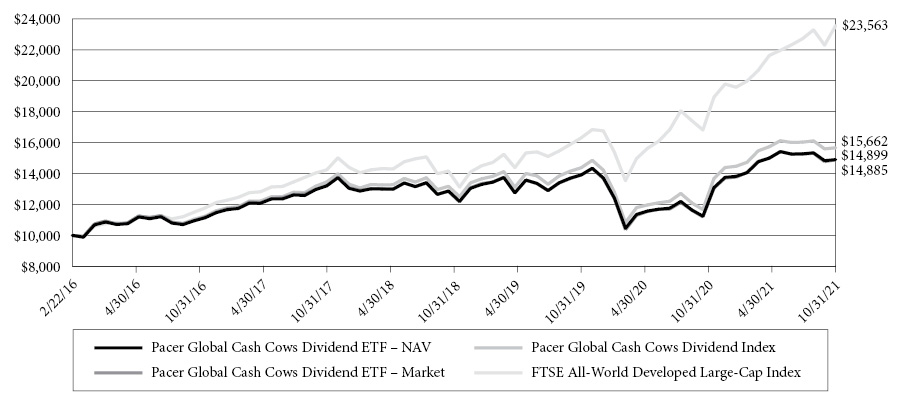
This chart illustrates the performance of a hypothetical $10,000 investment made on February 22, 2016, and is not intended to imply any future performance. The returns shown do not reflect the deduction of taxes that a shareholder would pay on fund distributions or the redemption of fund shares. The chart assumes reinvestment of capital gains and dividends.
The Pacer Global Cash Cows Dividend Index uses an objective, rules-based methodology to provide exposure to global companies with high dividend yield backed by a high free cash flow yield. The initial index universe is derived from the component companies of the FTSE All-World Developed Large Cap Index. The initial universe of companies is screened based on their average projected free cash flows and earnings over each of the next two fiscal years. Companies with negative average projected free cash flows or earnings are removed from the Index universe. Additionally, financial companies, other than real estate investment trusts, are excluded from the Index universe. The remaining companies are ranked by their free cash flow yield for the trailing twelve month period. The 300 companies with the highest free cash flow yield are then ranked by their dividend yield. The equity securities of the 100 companies with the highest dividend yield are included in the Index.
The FTSE All-World Developed Large-Cap Index is a market-capitalization weighted index representing the performance of large-cap stocks in developed markets.
Annualized Returns(1)
(For the period ended October 31, 2021)
| | One Year | Three Year | Five Year | Since Inception(2) |
Pacer Global Cash Cows Dividend ETF - NAV | 32.52% | 5.62% | 6.66% | 7.26% |
Pacer Global Cash Cows Dividend ETF - Market | 32.95% | 5.53% | 6.57% | 7.24% |
Pacer Global Cash Cows Dividend Index(3) | 34.21% | 6.51% | 7.60% | 8.20% |
FTSE All-World Developed Large-Cap Index(3) | 32.64% | 18.97% | 16.31% | 16.25% |
(1) | The performance data quoted is historical. Past performance is no guarantee of future results. Current performance may be higher or lower than the performance data quoted. The principal value and investment return of an investment will fluctuate so that investor’s shares, when redeemed, may be worth more or less than the original cost. The returns shown do not reflect the deduction of taxes that a shareholder would pay on Fund distributions or on redemptions of Fund shares. The total annual operating expenses as stated in the fee table to the Fund’s prospectus dated August 31, 2020, is 0.60%. For performance information current to the most recent month-end, please call 1-877-337-0500. |
(2) | Inception date is February 22, 2016. |
(3) | Indexes are unmanaged statistical composites and their returns do not include fees an investor would pay to purchase the securities they represent. Such costs would lower performance. It is not possible to invest directly in an index. |
19
Pacer US Cash Cows 100 ETF
PERFORMANCE SUMMARY
(Unaudited)
Growth of $10,000

This chart illustrates the performance of a hypothetical $10,000 investment made on December 16, 2016, and is not intended to imply any future performance. The returns shown do not reflect the deduction of taxes that a shareholder would pay on fund distributions or the redemption of fund shares. The chart assumes reinvestment of capital gains and dividends.
The Pacer US Cash Cows 100 Index uses an objective, rules-based methodology to provide exposure to large and mid-capitalization U.S. companies with high free cash flow yields. Companies with high free cash flow yields are commonly referred to as “cash cows.” The initial index universe is derived from the component companies of the Russell 1000® Index. The initial universe of companies is screened based on their average projected free cash flows and earnings over each of the next two fiscal years. Companies with no forward year estimates available for free cash flows or earnings will remain in the Index universe. Companies with negative average projected free cash flows or earnings are removed from the Index universe. Additionally, financial companies, other than real estate investment trusts, are excluded from the Index universe. The remaining companies are ranked by their free cash flow yield for the trailing twelve month period. The equity securities of the 100 companies with the highest free cash flow yield are included in the Index.
The Russell 1000 Index is a market-capitalization weighted index representing the top 1,000 large-cap stocks in the Russell 3000 Index.
Annualized Returns(1)
(For the period ended October 31, 2021)
| | One Year | Three Year | Since Inception(2) |
Pacer US Cash Cows 100 ETF - NAV | 66.29% | 19.67% | 15.22% |
Pacer US Cash Cows 100 ETF - Market | 66.30% | 19.52% | 15.17% |
Pacer US Cash Cows 100 Index(3) | 67.23% | 20.13% | 15.67% |
Russell 1000® Index(3) | 43.51% | 22.01% | 18.12% |
(1) | The performance data quoted is historical. Past performance is no guarantee of future results. Current performance may be higher or lower than the performance data quoted. The principal value and investment return of an investment will fluctuate so that investor’s shares, when redeemed, may be worth more or less than the original cost. The returns shown do not reflect the deduction of taxes that a shareholder would pay on Fund distributions or on redemptions of Fund shares. The total annual operating expenses as stated in the fee table to the Fund’s prospectus dated August 31, 2020, is 0.49%. For performance information current to the most recent month-end, please call 1-877-337-0500. |
(2) | Inception date is December 16, 2016. |
(3) | Indexes are unmanaged statistical composites and their returns do not include fees an investor would pay to purchase the securities they represent. Such costs would lower performance. It is not possible to invest directly in an index. |
20
Pacer US Small Cap Cash Cows 100 ETF
PERFORMANCE SUMMARY
(Unaudited)
Growth of $10,000
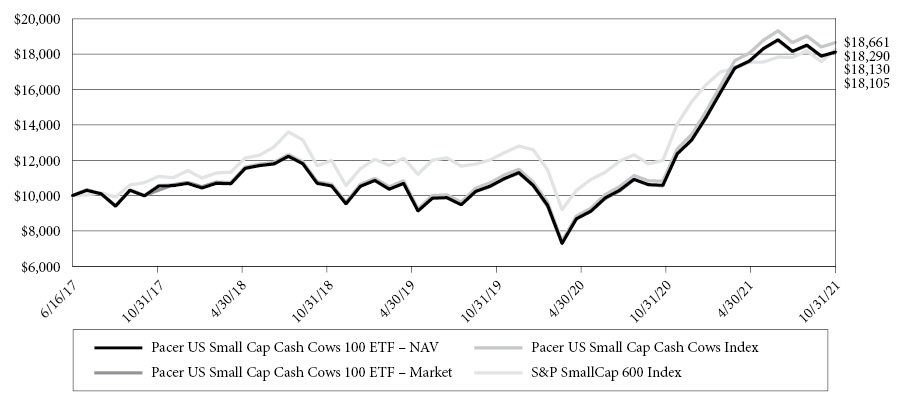
This chart illustrates the performance of a hypothetical $10,000 investment made on June 16, 2017, and is not intended to imply any future performance. The returns shown do not reflect the deduction of taxes that a shareholder would pay on fund distributions or the redemption of fund shares. The chart assumes reinvestment of capital gains and dividends.
The Pacer US Small Cap Cash Cows Index uses an objective, rules-based methodology to provide exposure to small-capitalization U.S. companies with high free cash flow yields. Companies with high free cash flow yields are commonly referred to as “cash cows.” The initial Index universe is derived from the component companies of the S&P Small Cap 600® Index. The initial universe of companies is screened based on their average projected free cash flows and earnings over each of the next two fiscal years. Companies with no forward year estimates available for free cash flows or earnings will remain in the Index universe. Companies with negative average projected free cash flows or earnings are removed from the Index universe. Additionally, financial companies, other than real estate investment trusts, are excluded from the Index universe. The remaining companies are ranked by their free cash flow yield for the trailing twelve month period. The equity securities of the 100 companies with the highest free cash flow yield are included in the Index.
The S&P SmallCap 600® Index measures the performance of 600 small sized companies in the US equity market, with market capitalization ranging from $450 million to $2.1 billion USD. The Index does not overlap holdings with the S&P 500 or S&P MidCap 400.
Annualized Returns(1)
(For the period ended October 31, 2021)
| | One Year | Three Year | Since Inception(2) |
Pacer US Small Cap Cash Cows 100 ETF - NAV | 71.21% | 19.26% | 14.57% |
Pacer US Small Cap Cash Cows 100 ETF - Market | 71.60% | 19.01% | 14.53% |
Pacer US Small Cap Cash Cows Index(3) | 72.14% | 19.60% | 14.83% |
S&P SmallCap 600® Index(3) | 58.94% | 14.83% | 13.17% |
(1) | The performance data quoted is historical. Past performance is no guarantee of future results. Current performance may be higher or lower than the performance data quoted. The principal value and investment return of an investment will fluctuate so that investor’s shares, when redeemed, may be worth more or less than the original cost. The returns shown do not reflect the deduction of taxes that a shareholder would pay on Fund distributions or on redemptions of Fund shares. The total annual operating expenses as stated in the fee table to the Fund’s prospectus dated August 31, 2020, is 0.59%. For performance information current to the most recent month-end, please call 1-877-337-0500. |
(2) | Inception date is June 16, 2017. |
(3) | Indexes are unmanaged statistical composites and their returns do not include fees an investor would pay to purchase the securities they represent. Such costs would lower performance. It is not possible to invest directly in an index. |
21
Pacer Developed Markets International Cash Cows 100 ETF
PERFORMANCE SUMMARY
(Unaudited)
Growth of $10,000
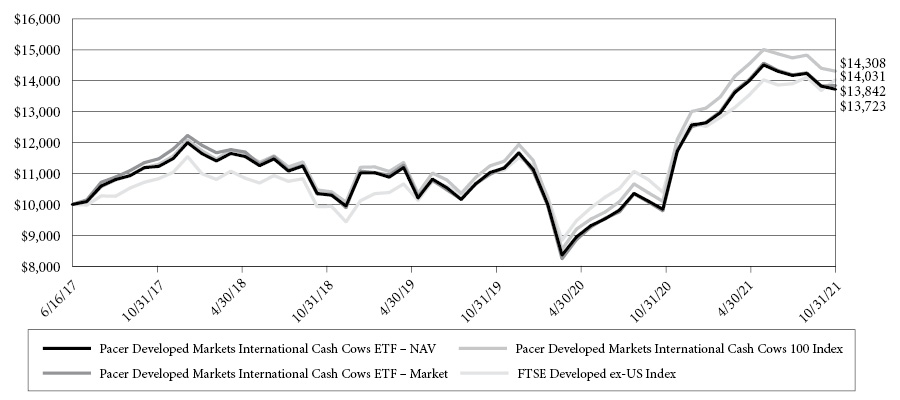
This chart illustrates the performance of a hypothetical $10,000 investment made on June 16, 2017, and is not intended to imply any future performance. The returns shown do not reflect the deduction of taxes that a shareholder would pay on fund distributions or the redemption of fund shares. The chart assumes reinvestment of capital gains and dividends.
The Pacer Developed Markets International Cash Cows 100 Index uses an objective, rules-based methodology to provide exposure to large and mid-capitalization non-U.S. companies in developed markets with high free cash flow yields. The initial index universe is derived from the component companies of the FTSE Developed ex US Index. The initial universe of companies is screened based on their average projected free cash flows and earnings over each of the next two fiscal years. Companies with no forward year estimates available for free cash flows or earnings will remain in the Index universe. Companies with negative average projected free cash flows or earnings are removed from the Index universe. Additionally, financial companies, other than real estate investment trusts, and companies with a market capitalization of less than $3 billion are excluded from the Index universe. The remaining companies are ranked by their average daily trading value (“ADTV”) for the prior three months. The 500 companies with the highest ADTV are then ranked by their free cash flow yield for the trailing twelve month period. The equity securities of the 100 companies with the highest free cash flow yield are included in the Index.
The FTSE Developed ex-US Index is comprised of Large (85%) and Mid (15%) cap stocks providing coverage of Developed markets (24 countries) excluding the US. The index is derived from the FTSE Global Equity Index Series, which covers 98% of the world’s investable market capitalization.
Annualized Returns(1)
(For the period ended October 31, 2021)
| | One Year | Three Year | Since Inception(2) |
Pacer Developed Markets International Cash Cows 100 ETF - NAV | 39.40% | 9.84% | 7.50% |
Pacer Developed Markets International Cash Cows 100 ETF - Market | 41.33% | 10.23% | 7.71% |
Pacer Developed Markets International Cash Cows 100 Index(3) | 41.66% | 10.97% | 8.53% |
FTSE Developed ex-US Index(3) | 34.98% | 14.03% | 8.04% |
(1) | The performance data quoted is historical. Past performance is no guarantee of future results. Current performance may be higher or lower than the performance data quoted. The principal value and investment return of an investment will fluctuate so that investor’s shares, when redeemed, may be worth more or less than the original cost. The returns shown do not reflect the deduction of taxes that a shareholder would pay on Fund distributions or on redemptions of Fund shares. The total annual operating expenses as stated in the fee table to the Fund’s prospectus dated August 31, 2020, is 0.65%. For performance information current to the most recent month-end, please call 1-877-337-0500. |
(2) | Inception date is June 16, 2017. |
(3) | Indexes are unmanaged statistical composites and their returns do not include fees an investor would pay to purchase the securities they represent. Such costs would lower performance. It is not possible to invest directly in an index. |
22
Pacer US Cash Cows Growth ETF
PERFORMANCE SUMMARY
(Unaudited)
Growth of $10,000
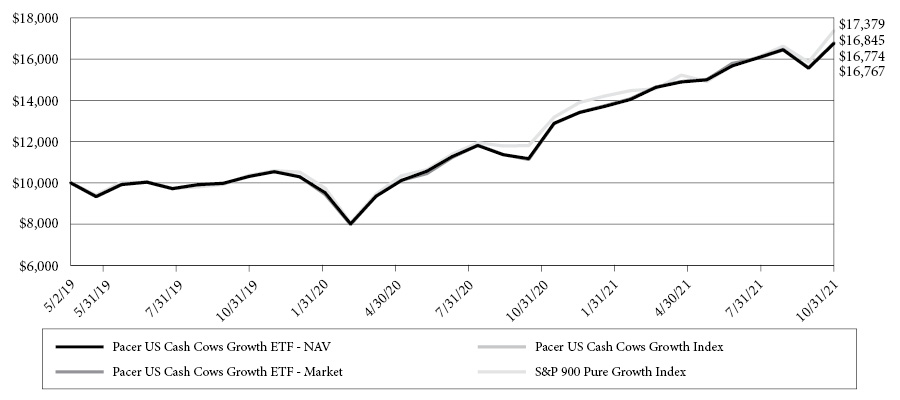
This chart illustrates the performance of a hypothetical $10,000 investment made on May 2, 2019, and is not intended to imply any future performance. The returns shown do not reflect the deduction of taxes that a shareholder would pay on fund distributions or the redemption of fund shares. The chart assumes reinvestment of capital gains and dividends.
The Pacer US Cash Cows Growth Index uses an objective, rules-based methodology to provide exposure to mid- and large-capitalization U.S. companies with high free cash flow yields. Companies with high free cash flow yields are commonly referred to as “cash cows”.
The S&P 900 Pure Growth Index cis made up of approximately 150 companies that exhibit strong growth characteristics from the S&P 500 and S&P MidCap 400.
Annualized Returns(1)
(For the period ended October 31, 2021)
| | One Year | Since Inception(2) |
Pacer US Cash Cows Growth ETF - NAV | 50.01% | 22.98% |
Pacer US Cash Cows Growth ETF - Market | 50.65% | 23.00% |
Pacer US Cash Cows Growth Index(3) | 50.52% | 23.21% |
S&P 900 Pure Growth Index(3) | 47.08% | 24.73% |
(1) | The performance data quoted is historical. Past performance is no guarantee of future results. Current performance may be higher or lower than the performance data quoted. The principal value and investment return of an investment will fluctuate so that investor’s shares, when redeemed, may be worth more or less than the original cost. The returns shown do not reflect the deduction of taxes that a shareholder would pay on Fund distributions or on redemptions of Fund shares. The total annual operating expenses as stated in the fee table to the Fund’s prospectus dated August 31, 2020, is 0.60%. For performance information current to the most recent month-end, please call 1-877-337-0500. |
(2) | Inception date is May 2, 2019. |
(3) | Indexes are unmanaged statistical composites and their returns do not include fees an investor would pay to purchase the securities they represent. Such costs would lower performance. It is not possible to invest directly in an index. |
23
Pacer Emerging Markets Cash Cows 100 ETF
PERFORMANCE SUMMARY
(Unaudited)
Growth of $10,000

This chart illustrates the performance of a hypothetical $10,000 investment made on May 2, 2019, and is not intended to imply any future performance. The returns shown do not reflect the deduction of taxes that a shareholder would pay on fund distributions or the redemption of fund shares. The chart assumes reinvestment of capital gains and dividends.
The Pacer Emerging Markets Cash Cows 100 Index uses an objective, rules-based methodology to provide exposure to large and mid-capitalization companies in emerging markets with high free cash flow yields.
The FTSE Emerging Markets Index is comprised of all the countries that make up the advanced emerging markets and secondary emerging markets within the FTSE Global Equity Index Series.
Annualized Returns(1)
(For the period ended October 31, 2021)
| | One Year | Since Inception(2) |
Pacer Emerging Markets Cash Cows 100 ETF - NAV | 26.81% | 4.40% |
Pacer Emerging Markets Cash Cows 100 ETF - Market | 26.63% | 4.70% |
Pacer Emerging Markets Cash Cows 100 Index(3) | 29.73% | 6.40% |
FTSE Emerging Markets Index(3) | 17.05% | 9.29% |
(1) | The performance data quoted is historical. Past performance is no guarantee of future results. Current performance may be higher or lower than the performance data quoted. The principal value and investment return of an investment will fluctuate so that investor’s shares, when redeemed, may be worth more or less than the original cost. The returns shown do not reflect the deduction of taxes that a shareholder would pay on Fund distributions or on redemptions of Fund shares. The total annual operating expenses as stated in the fee table to the Fund’s prospectus dated August 31, 2020, is 0.70%. For performance information current to the most recent month-end, please call 1-877-337-0500. |
(2) | Inception date is May 2, 2019. |
(3) | Indexes are unmanaged statistical composites and their returns do not include fees an investor would pay to purchase the securities they represent. Such costs would lower performance. It is not possible to invest directly in an index. |
24
Pacer Cash Cows Fund of Funds ETF
PERFORMANCE SUMMARY
(Unaudited)
Growth of $10,000
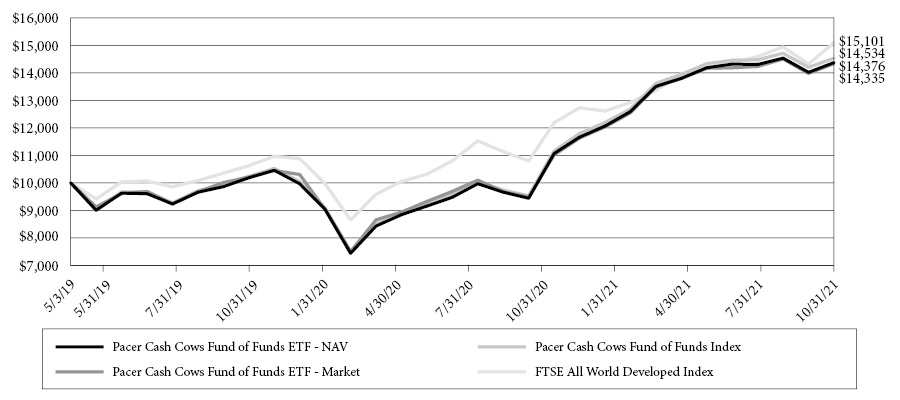
This chart illustrates the performance of a hypothetical $10,000 investment made on May 3, 2019, and is not intended to imply any future performance. The returns shown do not reflect the deduction of taxes that a shareholder would pay on fund distributions or the redemption of fund shares. The chart assumes reinvestment of capital gains and dividends.
The Pacer Cash Cows Fund of Funds Index uses an objective, rules-based approach to construct a portfolio that, as of each quarterly rebalance, is composed of the ETFs listed in the following table, each advised by the Adviser (collectively, the “Cash Cows ETFs”). Each of the Cash Cows ETFs is an index-based ETF that seeks to track the total return performance, before fees and expenses, of the applicable underlying index listed in the following table (collectively, the “Cash Cows Indexes”). Each Cash Cows Index uses an objective, rules-based methodology to provide exposure to companies with high free cash flow yields (commonly referred to as “cash cows”) selected from the applicable “Equity Universe” as indicated in the following table.
Weight | Cash Cows ETF | Cash Cows Index | Equity Universe |
20% | Pacer US Cash Cows 100 ETF | Pacer US Cash Cows 100 ETF | Russell 1000 Index |
20% | Pacer Global Cash Cows Dividend ETF | Pacer Global Cash Cows Dividend Index | FTSE Developed Large Cap Index |
20% | Pacer US Small Cap Cash Cows 100 ETF | Pacer US Small Cap Cash Cows 100 Index | S&P Small Cap 600® Index |
20% | Pacer US Cash Cows Growth ETF | Pacer US Cash Cows Growth Index | S&P 900® Pure Growth Index |
20% | Pacer Developed Markets International Cash Cows 100 ETF | Pacer Developed Markets International Cash Cows 100 Index | FTSE Developed ex US Index |
The FTSE All World Developed Index is a market-capitalization weighted index representing the performance of large and mid cap companies in Developed and Emerging Markets, excluding the USA. The index is derived from the FTSE Global Equity Index Series (GEIS), which covers 98% of the world’s investable market capitalization.
25
Pacer Cash Cows Fund of Funds ETF
PERFORMANCE SUMMARY (Continued)
(Unaudited)
Annualized Returns(1)
(For the period ended October 31, 2021)
| | One Year | Since Inception(2) |
Pacer Cash Cows Fund of Funds ETF - NAV | 52.28% | 15.65% |
Pacer Cash Cows Fund of Funds ETF - Market | 52.28% | 15.52% |
Pacer Cash Cows Fund of Funds Index(3) | 52.46% | 16.16% |
FTSE All World Developed Index(3) | 39.90% | 17.93% |
(1) | The performance data quoted is historical. Past performance is no guarantee of future results. Current performance may be higher or lower than the performance data quoted. The principal value and investment return of an investment will fluctuate so that investor’s shares, when redeemed, may be worth more or less than the original cost. The returns shown do not reflect the deduction of taxes that a shareholder would pay on Fund distributions or on redemptions of Fund shares. The total annual operating expenses as stated in the fee table to the Fund’s prospectus dated August 31, 2020, is 0.15%. For performance information current to the most recent month-end, please call 1-877-337-0500. |
(2) | Inception date is May 3, 2019. |
(3) | Indexes are unmanaged statistical composites and their returns do not include fees an investor would pay to purchase the securities they represent. Such costs would lower performance. It is not possible to invest directly in an index. |
26
Pacer WealthShield ETF
PERFORMANCE SUMMARY
(Unaudited)
Growth of $10,000
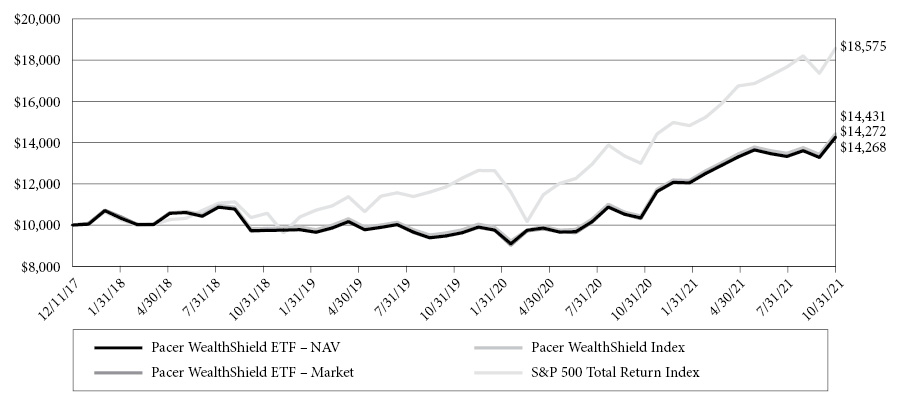
This chart illustrates the performance of a hypothetical $10,000 investment made on December 11, 2017, and is not intended to imply any future performance. The returns shown do not reflect the deduction of taxes that a shareholder would pay on fund distributions or the redemption of fund shares. The chart assumes reinvestment of capital gains and dividends.
The Pacer WealthShield Index uses an objective, rules-based methodology to implement a trend-following strategy that directs some or all of the Index’s exposure to (i) U.S. equity securities or (ii) U.S. Treasury securities depending on the strength of the high-yield corporate (“junk”) bond market relative to U.S. Treasury bonds and the momentum of certain U.S. equity sectors or industries and of long-term U.S. Treasury bonds.
The S&P 500 Index consists of approximately 500 leading U.S.-listed companies representing approximately 8% of the U.S. equity market capitalization.
Annualized Returns(1)
(For the period ended October 31, 2021)
| | One Year | Three Year | Since Inception(2) |
Pacer WealthShield ETF - NAV | 37.87% | 13.61% | 9.57% |
Pacer WealthShield ETF - Market | 38.44% | 13.72% | 9.58% |
Pacer WealthShield Index(3) | 38.18% | 13.70% | 9.89% |
S&P 500® Index(3) | 42.91% | 21.48% | 17.27% |
(1) | The performance data quoted is historical. Past performance is no guarantee of future results. Current performance may be higher or lower than the performance data quoted. The principal value and investment return of an investment will fluctuate so that investor’s shares, when redeemed, may be worth more or less than the original cost. The returns shown do not reflect the deduction of taxes that a shareholder would pay on Fund distributions or on redemptions of Fund shares. The total annual operating expenses as stated in the fee table to the Fund’s prospectus dated August 31, 2020, is 0.60%. For performance information current to the most recent month-end, please call 1-877-337-0500. |
(2) | Inception date is December 11, 2017. |
(3) | Indexes are unmanaged statistical composites and their returns do not include fees an investor would pay to purchase the securities they represent. Such costs would lower performance. It is not possible to invest directly in an index. |
27
Pacer Benchmark Industrial Real Estate SCTRSM ETF
PERFORMANCE SUMMARY
(Unaudited)
Growth of $10,000
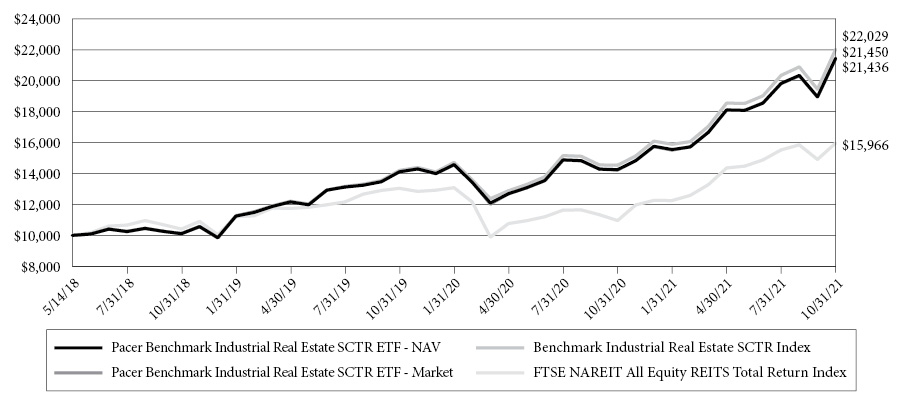
This chart illustrates the performance of a hypothetical $10,000 investment made on May 14, 2018, and is not intended to imply any future performance. The returns shown do not reflect the deduction of taxes that a shareholder would pay on fund distributions or the redemption of fund shares. The chart assumes reinvestment of capital gains and dividends.
The Kelly Industrial Real Estate Index (formerly known as the Benchmark Industrial Real Estate SCTRSM Index) is generally composed of the U.S.-listed equity securities of companies that derive at least 85% of their earnings or revenues from real estate operations in the industrial real estate sector (“Industrial Companies”), including companies that derivate at least 85% of their earnings or revenues from self-storage real estate operations (“Self-Storage Companies”). At the time of each reconstitution of the Index, Industrial Companies with a market capitalization of more than $200 million and average daily traded volume of at least 10,000 shares are included in the Index (the “Index Constituents”). A significant portion of the Index is expected to be composed of real estate investment trusts (“REITs”).
The FTSE Nareit All Equity REITs Index is a free-float adjusted, market capitalization-weighted index of U.S. equity REITs. Constituents of the index include all tax-qualified REITs with more than 50% of total assets in qualifying real estate assets other than mortgages secured by real property.
Annualized Returns(1)
(For the period ended October 31, 2021)
| | One Year | Three Year | Since Inception(2) |
Pacer Benchmark Industrial Real Estate SCTRSM ETF - NAV | 50.50% | 28.52% | 24.63% |
Pacer Benchmark Industrial Real Estate SCTRSM ETF - Market | 50.74% | 28.40% | 24.61% |
Kelly Industrial Real Estate Index(3) | 51.56% | 29.59% | 25.59% |
FTSE NAREIT All Equity REITS Total Return Index | 45.66% | 15.30% | 14.44% |
(1) | The performance data quoted is historical. Past performance is no guarantee of future results. Current performance may be higher or lower than the performance data quoted. The principal value and investment return of an investment will fluctuate so that investor’s shares, when redeemed, may be worth more or less than the original cost. The returns shown do not reflect the deduction of taxes that a shareholder would pay on Fund distributions or on redemptions of Fund shares. The total annual operating expenses as stated in the fee table to the Fund’s prospectus dated August 31, 2020, is 0.60%. For performance information current to the most recent month-end, please call 1-877-337-0500. |
(2) | Inception date is May 14, 2018. |
(3) | Indexes are unmanaged statistical composites and their returns do not include fees an investor would pay to purchase the securities they represent. Such costs would lower performance. It is not possible to invest directly in an index. |
28
Pacer Benchmark Data & Infrastructure Real Estate SCTRSM ETF
PERFORMANCE SUMMARY
(Unaudited)
Growth of $10,000
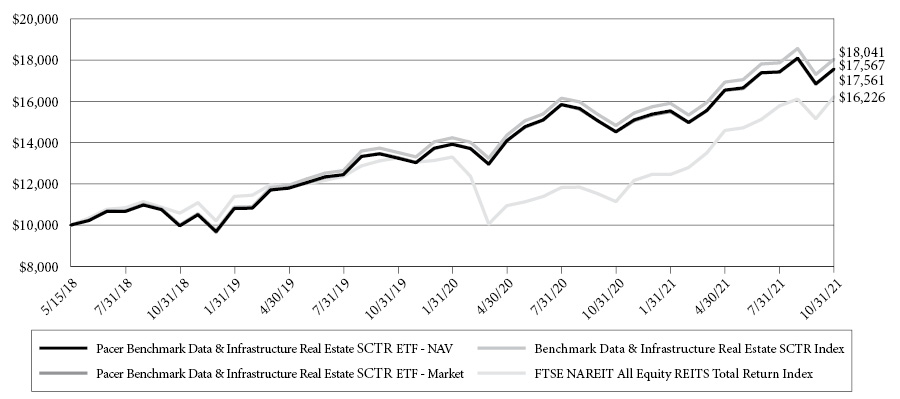
This chart illustrates the performance of a hypothetical $10,000 investment made on May 15, 2018, and is not intended to imply any future performance. The returns shown do not reflect the deduction of taxes that a shareholder would pay on fund distributions or the redemption of fund shares. The chart assumes reinvestment of capital gains and dividends.
The Kelly Data Center & Tech Infrastructure Index (formerly known as the Benchmark Data & Infrastructure Real Estate SCTRSM Index)is generally composed of the U.S.-listed equity securities of companies that derive at least 85% of their earnings or revenues from real estate operations in the data and infrastructure real estate sectors (“Eligible Companies”). At the time of each reconstitution of the Index, Eligible Companies with a market capitalization of more than $200 million and average daily traded volume of at least 10,000 shares are included in the Index (the “Index Constituents”). A significant portion of the Index is expected to be composed of real estate investment trusts (“REITs”).
The FTSE Nareit All Equity REITs Index is a free-float adjusted, market capitalization-weighted index of U.S. equity REITs. Constituents of the index include all tax-qualified REITs with more than 50% of total assets in qualifying real estate assets other than mortgages secured by real property.
Annualized Returns(1)
(For the period ended October 31, 2021)
| | One Year | Three Year | Since Inception(2) |
Pacer Benchmark Data & Infrastructure Real Estate SCTRSM ETF - NAV | 20.92% | 20.80% | 17.66% |
Pacer Benchmark Data & Infrastructure Real Estate SCTRSM ETF - Market | 20.98% | 20.75% | 17.67% |
Kelly Data Center & Tech Infrastructure Index(3) | 21.65% | 21.71% | 18.58% |
FTSE NAREIT All Equity REITS Total Return Index(3) | 45.66% | 15.30% | 14.99% |
(1) | The performance data quoted is historical. Past performance is no guarantee of future results. Current performance may be higher or lower than the performance data quoted. The principal value and investment return of an investment will fluctuate so that investor’s shares, when redeemed, may be worth more or less than the original cost. The returns shown do not reflect the deduction of taxes that a shareholder would pay on Fund distributions or on redemptions of Fund shares. The total annual operating expenses as stated in the fee table to the Fund’s prospectus dated August 31, 2020, as supplemented September 16, 2020, is 0.60%. For performance information current to the most recent month-end, please call 1-877-337-0500. |
(2) | Inception date is May 15, 2018. |
(3) | Indexes are unmanaged statistical composites and their returns do not include fees an investor would pay to purchase the securities they represent. Such costs would lower performance. It is not possible to invest directly in an index. |
29
Pacer CFRA-Stovall Equal Weight Seasonal Rotation ETF
PERFORMANCE SUMMARY
(Unaudited)
Growth of $10,000
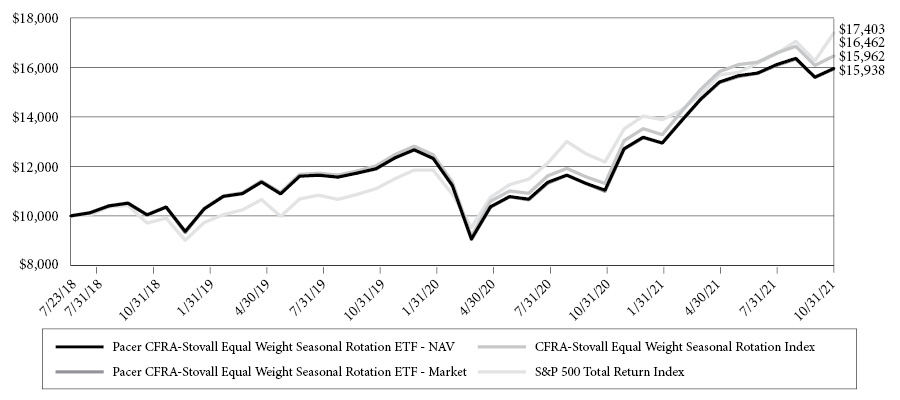
This chart illustrates the performance of a hypothetical $10,000 investment made on July 23, 2018, and is not intended to imply any future performance. The returns shown do not reflect the deduction of taxes that a shareholder would pay on fund distributions or the redemption of fund shares. The chart assumes reinvestment of capital gains and dividends.
The Pacer CFRA-Stovall Equal Weight Seasonal Rotation Index uses an objective, rules-based methodology to track the performance of a semi-annual rotation of certain sectors within the S&P 500 Equal Weight Index (“EWI”). The S&P 500 EWI is an equal-weighted version of the S&P 500®, which measures the performance of the large-cap segment of the U.S. equity market.
The S&P 500 Index consists of approximately 500 leading U.S.-listed companies representing approximately 8% of the U.S. equity market capitalization.
Annualized Returns(1)
(For the period ended October 31, 2021)
| | One Year | Three Year | Since Inception(2) |
Pacer CFRA-Stovall Equal Weight Seasonal Rotation ETF - NAV | 44.58% | 16.72% | 15.35% |
Pacer CFRA-Stovall Equal Weight Seasonal Rotation ETF - Market | 44.99% | 16.63% | 15.30% |
Pacer CFRA-Stovall Equal Weight Seasonal Rotation Index(3) | 45.58% | 17.93% | 16.44% |
S&P 500® Index(3) | 42.91% | 21.48% | 18.44% |
(1) | The performance data quoted is historical. Past performance is no guarantee of future results. Current performance may be higher or lower than the performance data quoted. The principal value and investment return of an investment will fluctuate so that investor’s shares, when redeemed, may be worth more or less than the original cost. The returns shown do not reflect the deduction of taxes that a shareholder would pay on Fund distributions or on redemptions of Fund shares. The total annual operating expenses as stated in the fee table to the Fund’s prospectus dated August 31, 2020, is 0.60%. For performance information current to the most recent month-end, please call 1-877-337-0500. |
(2) | Inception date is July 23, 2018. |
(3) | Indexes are unmanaged statistical composites and their returns do not include fees an investor would pay to purchase the securities they represent. Such costs would lower performance. It is not possible to invest directly in an index. |
30
Pacer CSOP FTSE China A50 ETF
PERFORMANCE SUMMARY
(Unaudited)
Growth of $10,000
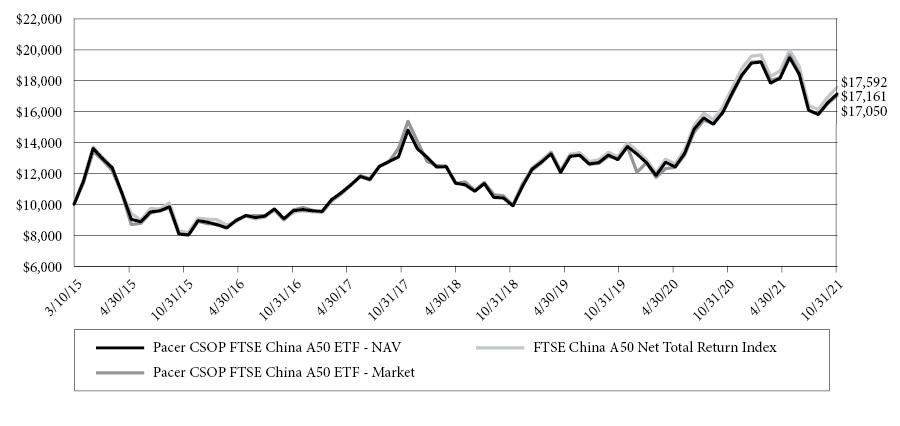
This chart illustrates the performance of a hypothetical $10,000 investment made on March 10, 2015, and is not intended to imply any future performance. The returns shown do not reflect the deduction of taxes that a shareholder would pay on fund distributions or the redemption of fund shares. The chart assumes reinvestment of capital gains and dividends.
The FTSE China A50 Net Total Return Index® is comprised of the A-Shares issued by the 50 largest companies in the China A-Shares market. The Index is a free float-adjusted market capitalization-weighted index compiled and published by FTSE International Limited, which is not affiliated with the Fund, Pacer Advisors, Inc, CSOP Asset Management Limited (“CSOP” or “CSOP Sub-Adviser”) or the Fund’s distributor. The Index is a real-time, tradable index comprising of the largest 50 China A-Share companies by full market capitalization of the FTSE China A All Cap Free Index.
Annualized Returns(1)
(For the period ended October 31, 2021)
| | One Year | Three Year | Five Year | Since Inception(2) |
Pacer CSOP FTSE China A50 ETF - NAV | 7.59% | 17.97% | 13.17% | 8.47% |
Pacer CSOP FTSE China A50 ETF - Market | 6.84% | 17.07% | 12.95% | 8.36% |
FTSE China A50 Net Total Return Index®(3) | 7.91% | 18.76% | 13.92% | 8.87% |
(1) | The performance data quoted is historical. Past performance is no guarantee of future results. Current performance may be higher or lower than the performance data quoted. The principal value and investment return of an investment will fluctuate so that investor’s shares, when redeemed, may be worth more or less than the original cost. The returns shown do not reflect the deduction of taxes that a shareholder would pay on Fund distributions or on redemptions of Fund shares. The total annual operating expenses as stated in the fee table to the Fund’s prospectus dated August 31, 2020, is 0.70%. For performance information current to the most recent month-end, please call 1-877-337-0500. |
(2) | Inception date is March 10, 2015. The Fund is the successor to the investment performance of the CSOP FTSE China A50 ETF (the “Predecessor CSOP”) as a result of the reorganization of the Predecessor CSOP Fund into the Fund on January 23, 2020. Accordingly, the performance information shown in the chart and table above for periods prior to January 23, 2020 is that of the Predecessor CSOP Fund’s Shares for the Fund. The Predecessor CSOP Fund was managed by the same portfolio managers as the Fund and had substantially the same investment objectives, policies, and strategies as the Fund. |
(3) | Indexes are unmanaged statistical composites and their returns do not include fees an investor would pay to purchase the securities they represent. Such costs would lower performance. It is not possible to invest directly in an index. |
31
Pacer BioThreat Strategy ETF
PERFORMANCE SUMMARY
(Unaudited)
Growth of $10,000
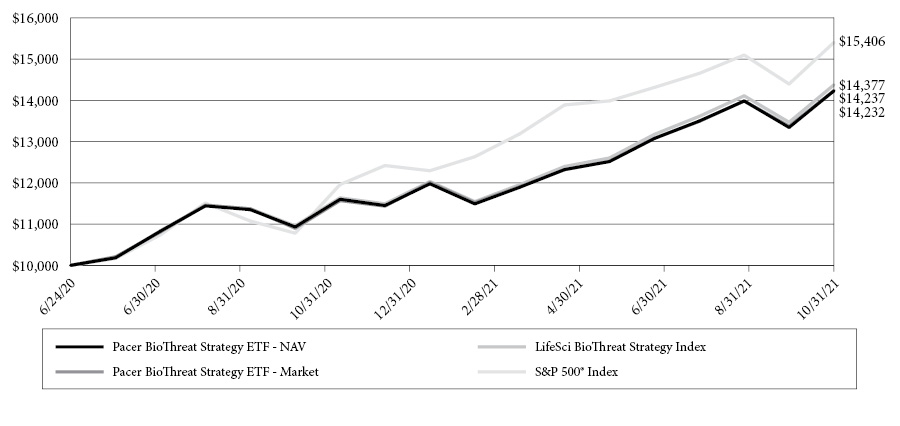
This chart illustrates the performance of a hypothetical $10,000 investment made on June 24, 2020, and is not intended to imply any future performance. The returns shown do not reflect the deduction of taxes that a shareholder would pay on fund distributions or the redemption of fund shares. The chart assumes reinvestment of capital gains and dividends.
The LifeSci BioThreat Strategy Index is generally composed of U.S.-listed stocks of companies whose products or services help protect against, endure, or recover from biological threats to human health. Companies helping to protect against such threats include those that conduct research to identify or anticipate such threats and those developing or producing the tools necessary to detect them. Companies helping to endure biological threats include those offering goods or services to help individuals, organizations, businesses, and governments adapt to requirements for social distancing or remote 2 connectivity. The Index Provider only includes those companies with a minimum market capitalization of $1 billion and a minimum average daily value traded for the last six moths of at least $2 million.
Cumulative Returns(1)
(For the period ended October 31, 2021)
| | One Year | Since Inception(2) |
Pacer BioThreat Strategy ETF - NAV | 30.20% | 29.79% |
Pacer BioThreat Strategy ETF - Market | 30.63% | 29.83% |
LifeSci BioThreat Strategy Index(3) | 31.20% | 30.77% |
S&P 500® Index(3) | 42.91% | 37.62% |
(1) | The performance data quoted is historical. Past performance is no guarantee of future results. Current performance may be higher or lower than the performance data quoted. The principal value and investment return of an investment will fluctuate so that investor’s shares, when redeemed, may be worth more or less than the original cost. The returns shown do not reflect the deduction of taxes that a shareholder would pay on Fund distributions or on redemptions of Fund shares. The total annual operating expenses as stated in the fee table to the Fund’s prospectus dated June 23, 2020, is 0.70%. For performance information current to the most recent month-end, please call 1-877-337-0500. |
(2) | Inception date is June 24, 2020. |
(3) | Indexes are unmanaged statistical composites and their returns do not include fees an investor would pay to purchase the securities they represent. Such costs would lower performance. It is not possible to invest directly in an index. |
32
Pacer Lunt Large Cap Alternator ETF
PERFORMANCE SUMMARY
(Unaudited)
Growth of $10,000
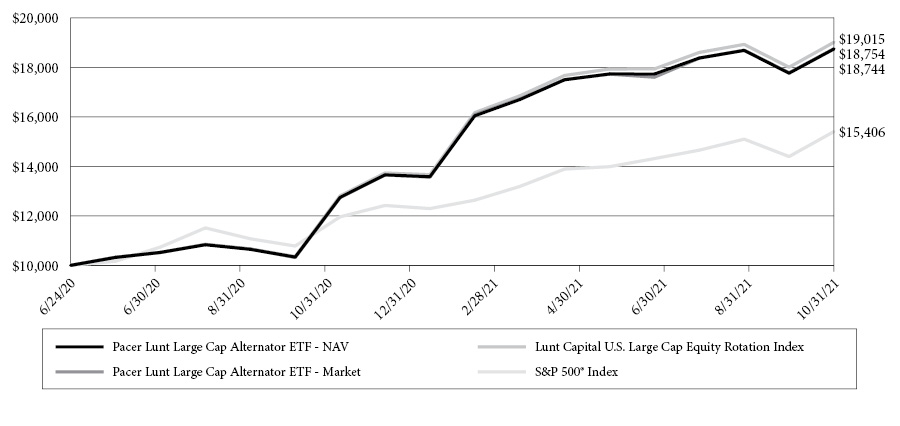
This chart illustrates the performance of a hypothetical $10,000 investment made on June 24, 2020, and is not intended to imply any future performance. The returns shown do not reflect the deduction of taxes that a shareholder would pay on fund distributions or the redemption of fund shares. The chart assumes reinvestment of capital gains and dividends.
The Lunt Capital U.S. Large Cap Equity Rotation Index uses an objective, rules-based methodology to provide exposure to large-capitalization U.S. companies. The Index uses Lunt Capital’s proprietary relative strength methodology to rotate between the holdings of one of two sub-indices, the S&P 500 Low Volatility Index and the S&P 500 High Beta Index (each, a “Sub-Index,” and together, the “Sub-Indices”), that seek to identify the 100 components of the S&P 500 Index that most strongly exhibit a particular trait (e.g., low volatility or high beta). Each Sub-Index is composed of the 100 securities comprising the S&P 500 Index that most strongly exhibit the characteristic screened for by the Sub-Index.
Cumulative Returns(1)
(For the period ended October 31, 2021)
| | One Year | Since Inception(2) |
Pacer Lunt Large Cap Alternator ETF - NAV | 81.37% | 59.08% |
Pacer Lunt Large Cap Alternator ETF - Market | 81.81% | 59.14% |
Lunt Capital U.S. Large Cap Equity Rotation Index(3) | 83.58% | 60.78% |
S&P 500® Index(3) | 42.91% | 37.62% |
(1) | The performance data quoted is historical. Past performance is no guarantee of future results. Current performance may be higher or lower than the performance data quoted. The principal value and investment return of an investment will fluctuate so that investor’s shares, when redeemed, may be worth more or less than the original cost. The returns shown do not reflect the deduction of taxes that a shareholder would pay on Fund distributions or on redemptions of Fund shares. The total annual operating expenses as stated in the fee table to the Fund’s prospectus dated June 23, 2020, is 0.60%. For performance information current to the most recent month-end, please call 1-877-337-0500. |
(2) | Inception date is June 24, 2020. |
(3) | Indexes are unmanaged statistical composites and their returns do not include fees an investor would pay to purchase the securities they represent. Such costs would lower performance. It is not possible to invest directly in an index. |
33
Pacer Lunt Midcap Multi-Factor Alternator ETF
PERFORMANCE SUMMARY
(Unaudited)
Growth of $10,000

This chart illustrates the performance of a hypothetical $10,000 investment made on June 24, 2020, and is not intended to imply any future performance. The returns shown do not reflect the deduction of taxes that a shareholder would pay on fund distributions or the redemption of fund shares. The chart assumes reinvestment of capital gains and dividends.
The Lunt Capital U.S. MidCap Multi-Factor Rotation Index uses an objective, rules-based methodology to provide exposure to mid-capitalization U.S. companies. The Index uses Lunt Capital’s proprietary relative strength methodology to rotate between the holdings of the highest and lowest quintile components of four factor-based indices of the S&P MidCap 400 Index (each, a “Sub-Index,” and together, the “Sub-Indices”), that seek to identify the components of the S&P MidCap 400 Index that most strongly exhibit a particular factor. The four factor groups are Momentum, Quality, Value, and Volatility.
Cumulative Returns(1)
(For the period ended October 31, 2021)
| | One Year | Since Inception(2) |
Pacer Lunt Midcap Multi-Factor Alternator ETF - NAV | 33.91% | 36.77% |
Pacer Lunt Midcap Multi-Factor Alternator ETF - Market | 34.57% | 36.97% |
Lunt Capital U.S. MidCap Multi-Factor Rotation Index(3) | 36.17% | 38.41% |
S&P MidCap 400® Index(3) | 48.90% | 44.29% |
(1) | The performance data quoted is historical. Past performance is no guarantee of future results. Current performance may be higher or lower than the performance data quoted. The principal value and investment return of an investment will fluctuate so that investor’s shares, when redeemed, may be worth more or less than the original cost. The returns shown do not reflect the deduction of taxes that a shareholder would pay on Fund distributions or on redemptions of Fund shares. The total annual operating expenses as stated in the fee table to the Fund’s prospectus dated June 23, 2020, is 0.60%. For performance information current to the most recent month-end, please call 1-877-337-0500. |
(2) | Inception date is June 24, 2020. |
(3) | Indexes are unmanaged statistical composites and their returns do not include fees an investor would pay to purchase the securities they represent. Such costs would lower performance. It is not possible to invest directly in an index. |
34
Pacer Lunt Large Cap Multi-Factor Alternator ETF
PERFORMANCE SUMMARY
(Unaudited)
Growth of $10,000
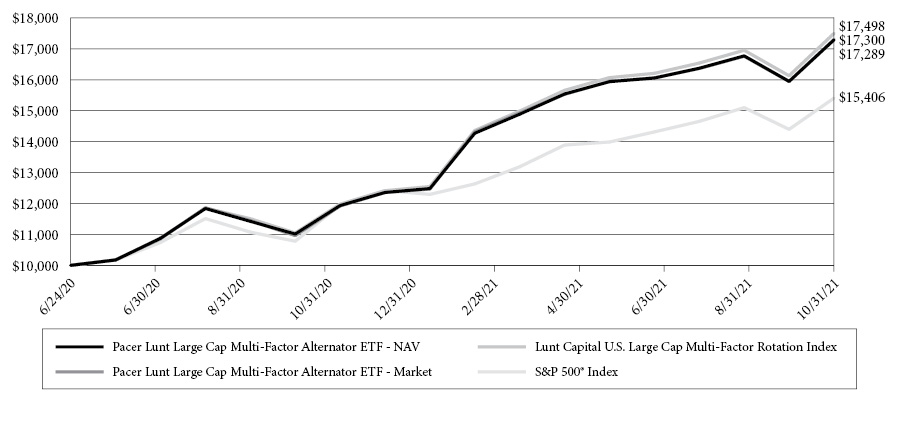
This chart illustrates the performance of a hypothetical $10,000 investment made on June 24, 2020, and is not intended to imply any future performance. The returns shown do not reflect the deduction of taxes that a shareholder would pay on fund distributions or the redemption of fund shares. The chart assumes reinvestment of capital gains and dividends.
The Lunt Capital U.S. Large Cap Multi-Factor Rotation Index uses an objective, rules-based methodology to provide exposure to large-capitalization U.S. companies. The Index uses Lunt Capital’s proprietary relative strength methodology to rotate between the holdings of the highest and lowest quintile components of four factor-based indices of the S&P 500 Index (each, a “Sub-Index,” and together, the “Sub-Indices”), that seek to identify the components of the S&P 500 Index that most strongly exhibit a particular factor. The four factor groups are Momentum, Quality, Value, and Volatility.
Cumulative Returns(1)
(For the period ended October 31, 2021)
| | One Year | Since Inception(2) |
Pacer Lunt Large Cap Multi-Factor Alternator ETF - NAV | 56.99% | 49.86% |
Pacer Lunt Large Cap Multi-Factor Alternator ETF - Market | 57.82% | 49.93% |
Lunt Capital U.S. Large Cap Multi-Factor Rotation Index(3) | 58.40% | 51.20% |
S&P 500® Index(3) | 42.91% | 37.62% |
(1) | The performance data quoted is historical. Past performance is no guarantee of future results. Current performance may be higher or lower than the performance data quoted. The principal value and investment return of an investment will fluctuate so that investor’s shares, when redeemed, may be worth more or less than the original cost. The returns shown do not reflect the deduction of taxes that a shareholder would pay on Fund distributions or on redemptions of Fund shares. The total annual operating expenses as stated in the fee table to the Fund’s prospectus dated June 23, 2020, is 0.60%. For performance information current to the most recent month-end, please call 1-877-337-0500. |
(2) | Inception date is June 24, 2020. |
(3) | Indexes are unmanaged statistical composites and their returns do not include fees an investor would pay to purchase the securities they represent. Such costs would lower performance. It is not possible to invest directly in an index. |
35
Pacer US Export Leaders ETF
PERFORMANCE SUMMARY
(Unaudited)
Growth of $10,000
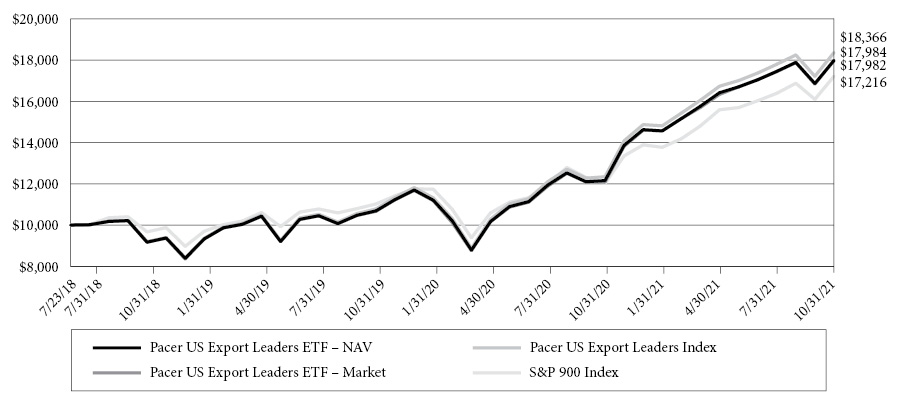
This chart illustrates the performance of a hypothetical $10,000 investment made on July 23, 2018, and is not intended to imply any future performance. The returns shown do not reflect the deduction of taxes that a shareholder would pay on fund distributions or the redemption of fund shares. The chart assumes reinvestment of capital gains and dividends.
The Pacer US Export Leaders Index uses an objective, rules-based methodology to measure the performance of an equal weight portfolio of approximately 100 large- and mid-capitalization U.S. companies with a high percentage of foreign sales and high free cash flow growth. Free cash flow is a company’s cash flow from operations minus its capital expenditures. Construction of the Index begins with an initial universe of the 200 companies across the S&P 900® Index (which is comprised of the S&P 500® Index (“S&P 500”) and S&P MidCap 400® Index (“S&P MidCap 400”)) that have the highest annual foreign sales as a percentage of total sales. The 200 companies are then narrowed to the 100 companies with the highest change in free cash flow growth over the past five years, and those 100 companies are equally weighted to create the Index. The Index is reconstituted and rebalanced to equal-weight quarterly.
The S&P 900® combines the S&P 500® and the S&P MidCap 400® to form an investable benchmark for the mid- to large-cap segment of the U.S. equity market.
Annualized Returns(1)
(For the period ended October 31, 2021)
| | One Year | Three Year | Since Inception(2) |
Pacer US Export Leaders ETF - NAV | 47.89% | 25.18% | 19.63% |
Pacer US Export Leaders ETF - Market | 48.81% | 25.12% | 19.63% |
Pacer US Export Leaders Index(3) | 48.81% | 25.94% | 20.40% |
S&P 900 IndexTM(3) | 43.29% | 21.20% | 18.05% |
(1) | The performance data quoted is historical. Past performance is no guarantee of future results. Current performance may be higher or lower than the performance data quoted. The principal value and investment return of an investment will fluctuate so that investor’s shares, when redeemed, may be worth more or less than the original cost. The returns shown do not reflect the deduction of taxes that a shareholder would pay on Fund distributions or on redemptions of Fund shares. The total annual operating expenses as stated in the fee table to the Fund’s prospectus dated August 31, 2020, is 0.60%. For performance information current to the most recent month-end, please call 1-877-337-0500. |
(2) | Inception date is July 23, 2018. |
(3) | Indexes are unmanaged statistical composites and their returns do not include fees an investor would pay to purchase the securities they represent. Such costs would lower performance. It is not possible to invest directly in an index. |
36
Pacer Metaurus US Large Cap Dividend Multiplier 300 ETF
PERFORMANCE SUMMARY
(Unaudited)
Growth of $10,000
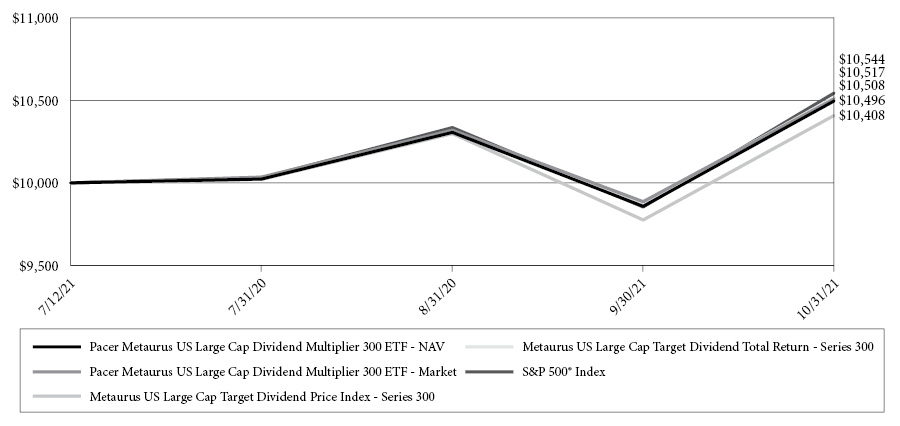
This chart illustrates the performance of a hypothetical $10,000 investment made on July 12, 2021, and is not intended to imply any future performance. The returns shown do not reflect the deduction of taxes that a shareholder would pay on fund distributions or the redemption of fund shares. The chart assumes reinvestment of capital gains and dividends.
The Metaurus US Large Cap Dividend Multiplier Index - Series 300 has two components: (i) an S&P 500 Index component (the “S&P 500 Component”) and (ii) a dividend component (the “Dividend Component”) consisting of long positions in annual futures contracts that provide exposure to ordinary dividends paid on the common stocks of companies included in the S&P 500. The Dividend Component is designed to give the Fund exposure to approximately 300% of the ordinary dividends the Fund would otherwise have expected to receive from its investment in the S&P 500 Component. The Dividend Component consists of annual futures contracts whose value represents the market’s expectation of the amount of ordinary dividends to be paid by S&P 500 companies during the term of the futures contract.
The S&P 500 Total Return Index consists of approximately 500 leading U.S.-listed companies representing approximately 80% of the U.S. equity market capitalization.
Cumulative Returns(1)
(For the period ended October 31, 2021)
| | Since Inception(2) |
Pacer Metaurus US Large Cap Dividend Multiplier 300 ETF - NAV | 4.96% |
Pacer Metaurus US Large Cap Dividend Multiplier 300 ETF - Market | 5.08% |
Metaurus US Large Cap Dividend Multiplier Return Index – Series 300 (3) | 5.17% |
S&P 500® Index (3) | 5.44% |
(1) | The performance data quoted is historical. Past performance is no guarantee of future results. Current performance may be higher or lower than the performance data quoted. The principal value and investment return of an investment will fluctuate so that investor’s shares, when redeemed, may be worth more or less than the original cost. The returns shown do not reflect the deduction of taxes that a shareholder would pay on Fund distributions or on redemptions of Fund shares. The total annual operating expenses as stated in the fee table to the Fund’s prospectus dated July 12, 2021, is 0.79%. For performance information current to the most recent month-end, please call 1-877-337-0500. |
(2) | Inception date is July 12, 2021. |
(3) | Indexes are unmanaged statistical composites and their returns do not include fees an investor would pay to purchase the securities they represent. Such costs would lower performance. It is not possible to invest directly in an index. |
37
Pacer Metaurus US Large Cap Dividend Multiplier 400 ETF
PERFORMANCE SUMMARY
(Unaudited)
Growth of $10,000
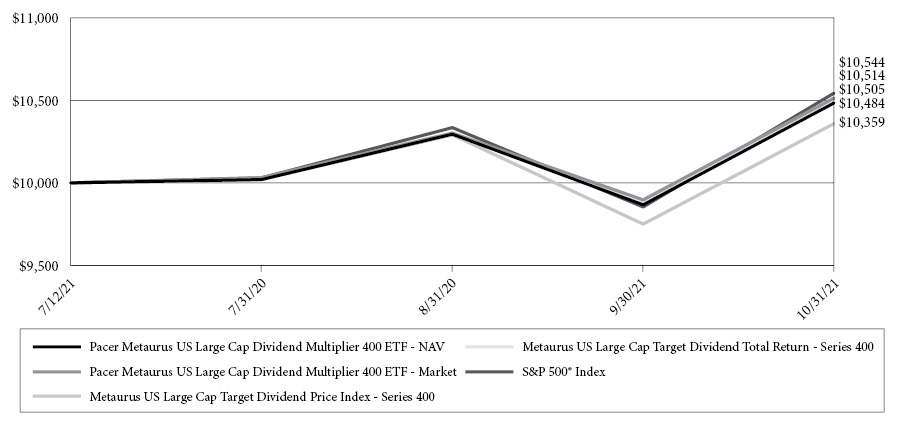
This chart illustrates the performance of a hypothetical $10,000 investment made on July 12, 2021, and is not intended to imply any future performance. The returns shown do not reflect the deduction of taxes that a shareholder would pay on fund distributions or the redemption of fund shares. The chart assumes reinvestment of capital gains and dividends.
The Metaurus US Large Cap Dividend Multiplier Index - Series 400 has two components: (i) an S&P 500 Index component (the “S&P 500 Component”) and (ii) a dividend component (the “Dividend Component”) consisting of long positions in annual futures contracts that provide exposure to ordinary dividends paid on the common stocks of companies included in the S&P 500. The Dividend Component is designed to give the Fund exposure to approximately 400% of the ordinary dividends the Fund would otherwise have expected to receive from its investment in the S&P 500 Component. The Dividend Component consists of annual futures contracts whose value represents the market’s expectation of the amount of ordinary dividends to be paid by S&P 500 companies during the term of the futures contract.
The S&P 500 Total Return Index consists of approximately 500 leading U.S.-listed companies representing approximately 80% of the U.S. equity market capitalization.
Cumulative Returns(1)
(For the period ended October 31, 2021)
| | Since Inception(2) |
Pacer Metaurus US Large Cap Dividend Multiplier 400 ETF - NAV | 4.84% |
Pacer Metaurus US Large Cap Dividend Multiplier 400 ETF - Market | 5.14% |
Metaurus US Large Cap Dividend Multiplier Return Index – Series 400 (3) | 5.05% |
S&P 500® Index (3) | 5.44% |
(1) | The performance data quoted is historical. Past performance is no guarantee of future results. Current performance may be higher or lower than the performance data quoted. The principal value and investment return of an investment will fluctuate so that investor’s shares, when redeemed, may be worth more or less than the original cost. The returns shown do not reflect the deduction of taxes that a shareholder would pay on Fund distributions or on redemptions of Fund shares. The total annual operating expenses as stated in the fee table to the Fund’s prospectus dated July 12, 2021, is 0.79%. For performance information current to the most recent month-end, please call 1-877-337-0500. |
(2) | Inception date is July 12, 2021. |
(3) | Indexes are unmanaged statistical composites and their returns do not include fees an investor would pay to purchase the securities they represent. Such costs would lower performance. It is not possible to invest directly in an index. |
38
Pacer Pacific Asset Floating Rate High Income ETF
PERFORMANCE SUMMARY
(Unaudited)
Growth of $10,000
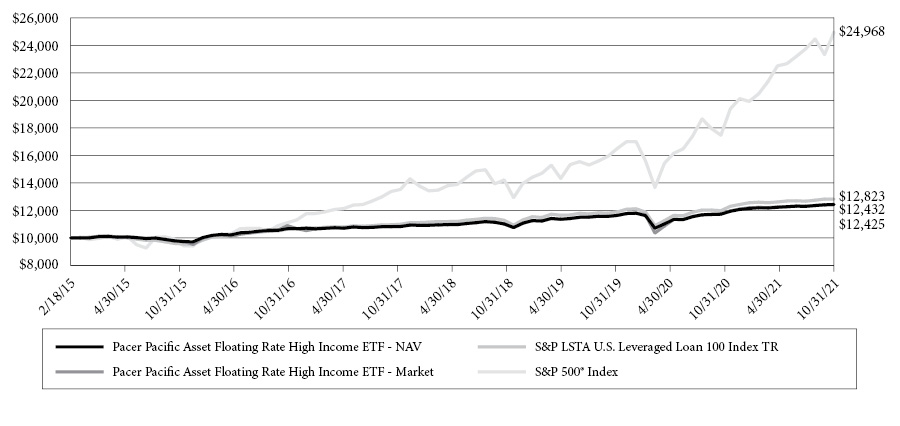
This chart illustrates the performance of a hypothetical $10,000 investment made on February 18, 2015, and is not intended to imply any future performance. The returns shown do not reflect the deduction of taxes that a shareholder would pay on fund distributions or the redemption of fund shares. The chart assumes reinvestment of capital gains and dividends.
The S&P/LSTA U.S. Leveraged Loan 100 Index is an index designed to reflect the performance of the largest facilities in the leveraged loan market.
The S&P 500 Total Return Index consists of approximately 500 leading U.S.-listed companies representing approximately 80% of the U.S. equity market capitalization.
Annualized Returns(1)
(For the period ended October 31, 2021)
| | One Year | Three Year | Five Year | Since Inception(2) |
Pacer Pacific Asset Floating Rate High Income ETF - NAV | 6.02% | 3.75% | 3.37% | 3.29% |
Pacer Pacific Asset Floating Rate High Income ETF - Market | 5.88% | 3.68% | 3.25% | 3.30% |
S&P/LSTA U.S. Leveraged Loan 100 Index (3) | 7.08% | 3.99% | 4.11% | 3.78% |
S&P 500® Index (3) | 42.91% | 21.48% | 18.93% | 14.64% |
(1) | The performance data quoted is historical. Past performance is no guarantee of future results. Current performance may be higher or lower than the performance data quoted. The principal value and investment return of an investment will fluctuate so that investor’s shares, when redeemed, may be worth more or less than the original cost. The returns shown do not reflect the deduction of taxes that a shareholder would pay on Fund distributions or on redemptions of Fund shares. The total annual operating expenses as stated in the fee table to the Fund’s prospectus dated October 25, 2021, is 0.60%. For performance information current to the most recent month-end, please call 1-877-337-0500. |
(2) | Inception date is February 18, 2015. |
(3) | Indexes are unmanaged statistical composites and their returns do not include fees an investor would pay to purchase the securities they represent. Such costs would lower performance. It is not possible to invest directly in an index. |
39
Pacer Funds
EXPENSE EXAMPLE
For the Period Ended October 31, 2021 (Unaudited)
As a shareholder of a Fund, you pay ongoing expenses, such as advisory fees, and other fund expenses. The following examples are intended to help you understand the ongoing cost (in dollars) of investing in a Fund and to compare these costs with the ongoing costs of investing in other funds. Please note, the expenses shown in the tables are meant to highlight ongoing costs only and do not reflect any transactional costs. You may pay brokerage commissions on your purchase and sale of Fund shares, which are not reflected in the following examples. Each example is based on an investment of $1,000 invested at the beginning of the period and held for the entire period as indicated below.
Actual Expenses
The columns under the heading entitled “Actual” help you estimate the actual expenses you paid over the period. The “Actual Ending Account Value” shown is derived from a Fund’s actual return and the “Actual Expenses Paid During Period” show the dollar amount that would have been paid by an investor who started with $1,000 in a Fund. To estimate the expenses you paid on your account during this period, simply divide your account value by $1,000 (for example, an $8,600 account value divided by $1,000=8.6), then multiply the result by the number in the column under the heading untitled “Actual Expenses Paid During Period”.
Hypothetical Example for Comparison Purposes
The columns under the heading entitled “Hypothetical” provide information about hypothetical account value and hypothetical expenses based on a Fund’s actual expense ratio and an assumed rate of return of 5% per year before expenses, which is not the Fund’s return. The hypothetical account values and expenses may not be used to estimate the actual ending account balance or expenses you paid for the period. You may use this information to compare the ongoing costs of investing in a Fund and other funds. To do so, compare this 5% hypothetical example with the 5% hypothetical examples that appear in the shareholder reports of other funds.
Please note that the expenses shown in the table are meant to highlight your ongoing costs only and do not reflect any transactional costs which may be applicable to your account. Therefore, the last column of the table (Hypothetical Expenses Paid During Period) is useful in comparing ongoing costs only and will not help you determine the relative total costs of owning different funds. In addition, if these transactional costs were included, your costs would have been higher.
| | Fund’s Annual
Expense Ratio | Beginning Account
Value 05/01/21 | Ending Account
Value 10/31/21 | Expenses Paid
During Period(a) |
Pacer Trendpilot® US Large Cap ETF | | | | |
Actual | 0.60% | $1,000.00 | $ 1,105.10 | $ 3.18 |
Hypothetical(b) | 0.60% | $1,000.00 | $ 1,022.18 | $ 3.06 |
Pacer Trendpilot® US Mid Cap ETF | | | | |
Actual | 0.60% | $1,000.00 | $ 1,016.10 | $ 3.05 |
Hypothetical(b) | 0.60% | $1,000.00 | $ 1,022.18 | $ 3.06 |
Pacer TrendpilotTM 100 ETF | | | | |
Actual | 0.65% | $1,000.00 | $ 1,075.90 | $ 3.40 |
Hypothetical(b) | 0.65% | $1,000.00 | $ 1,021.93 | $ 3.31 |
Pacer Trendpilot® European Index ETF | | | | |
Actual | 0.65% | $1,000.00 | $ 1,040.60 | $ 3.34 |
Hypothetical(b) | 0.65% | $1,000.00 | $ 1,021.93 | $ 3.31 |
Pacer Trendpilot International ETF | | | | |
Actual | 0.65% | $1,000.00 | $ 1,044.60 | $ 3.35 |
Hypothetical(b) | 0.65% | $1,000.00 | $ 1,021.93 | $ 3.31 |
Pacer Trendpilot US Bond ETF | | | | |
Actual | 0.60% | $1,000.00 | $ 994.70 | $ 3.02 |
Hypothetical(b) | 0.60% | $1,000.00 | $ 1,022.18 | $ 3.06 |
Pacer Trendpilot Fund of Funds ETF | | | | |
Actual | 0.15% | $1,000.00 | $ 1,046.50 | $ 0.77 |
Hypothetical(b) | 0.15% | $1,000.00 | $ 1,024.45 | $ 0.77 |
Pacer Global Cash Cows Dividend ETF | | | | |
Actual | 0.60% | $1,000.00 | $ 993.50 | $ 3.01 |
Hypothetical(b) | 0.60% | $1,000.00 | $ 1,022.18 | $ 3.06 |
40
Pacer Funds
EXPENSE EXAMPLE
For the Period Ended October 31, 2021 (Unaudited) (Continued)
| | Fund’s Annual
Expense Ratio | Beginning Account
Value 05/01/21 | Ending Account
Value 10/31/21 | Expenses Paid
During Period(a) |
Pacer U.S. Cash Cows 100 ETF | | | | |
Actual | 0.49% | $1,000.00 | $ 1,080.50 | $ 2.57 |
Hypothetical(b) | 0.49% | $1,000.00 | $ 1,022.74 | $ 2.50 |
Pacer U.S. Small Cap Cash Cows 100 ETF | | | | |
Actual | 0.59% | $1,000.00 | $ 1,029.40 | $ 3.02 |
Hypothetical(b) | 0.59% | $1,000.00 | $ 1,022.23 | $ 3.01 |
Pacer Developed Markets International Cash Cows 100 ETF | | | | |
Actual | 0.65% | $1,000.00 | $ 980.40 | $ 3.24 |
Hypothetical(b) | 0.65% | $1,000.00 | $ 1,021.93 | $ 3.31 |
Pacer US Cash Cows Growth ETF | | | | |
Actual | 0.60% | $1,000.00 | $ 1,125.90 | $ 3.22 |
Hypothetical(b) | 0.60% | $1,000.00 | $ 1,022.18 | $ 3.06 |
Pacer Emerging Markets Cash Cows 100 ETF | | | | |
Actual | 0.70% | $1,000.00 | $ 947.50 | $ 3.44 |
Hypothetical(b) | 0.70% | $1,000.00 | $ 1,021.68 | $ 3.57 |
Pacer Cash Cows Fund of Funds ETF | | | | |
Actual | 0.15% | $1,000.00 | $ 1,041.60 | $ 0.77 |
Hypothetical(b) | 0.15% | $1,000.00 | $ 1,024.45 | $ 0.77 |
Pacer WealthShield ETF | | | | |
Actual | 0.60% | $1,000.00 | $ 1,072.20 | $ 3.13 |
Hypothetical(b) | 0.60% | $1,000.00 | $ 1,022.18 | $ 3.06 |
Pacer Benchmark Industrial Real Estate SCTRSM ETF | | | | |
Actual | 0.60% | $1,000.00 | $ 1,184.10 | $ 3.30 |
Hypothetical(b) | 0.60% | $1,000.00 | $ 1,022.18 | $ 3.06 |
Pacer Benchmark Data & Infrastructure Real Estate SCTRSM ETF | | | |
Actual | 0.60% | $1,000.00 | $ 1,061.30 | $ 3.12 |
Hypothetical(b) | 0.60% | $1,000.00 | $ 1,022.18 | $ 3.06 |
Pacer CFRA-Stovall Equal Weight Seasonal Rotation ETF | | | | |
Actual | 0.60% | $1,000.00 | $ 1,035.70 | $ 3.08 |
Hypothetical(b) | 0.60% | $1,000.00 | $ 1,022.18 | $ 3.06 |
Pacer CSOP FTSE China A50 ETF | | | | |
Actual | 0.70% | $1,000.00 | $ 944.70 | $ 3.43 |
Hypothetical(b) | 0.70% | $1,000.00 | $ 1,021.68 | $ 3.57 |
Pacer BioThreat Strategy ETF | | | | |
Actual | 0.70% | $1,000.00 | $ 1,155.00 | $ 3.80 |
Hypothetical(b) | 0.70% | $1,000.00 | $ 1,021.68 | $ 3.57 |
Pacer Lunt Large Cap Alternator ETF | | | | |
Actual | 0.60% | $1,000.00 | $ 1,071.10 | $ 3.13 |
Hypothetical(b) | 0.60% | $1,000.00 | $ 1,022.18 | $ 3.06 |
Pacer Lunt Midcap Multi-Factor Alternator ETF | | | | |
Actual | 0.60% | $1,000.00 | $ 979.10 | $ 2.99 |
Hypothetical(b) | 0.60% | $1,000.00 | $ 1,022.18 | $ 3.06 |
Pacer Lunt Large Cap Multi-Factor Alternator ETF | | | | |
Actual | 0.60% | $1,000.00 | $ 1,112.50 | $ 3.19 |
Hypothetical(b) | 0.60% | $1,000.00 | $ 1,022.18 | $ 3.06 |
Pacer US Export Leaders ETF | | | | |
Actual | 0.60% | $1,000.00 | $ 1,095.20 | $ 3.17 |
Hypothetical(b) | 0.60% | $1,000.00 | $ 1,022.18 | $ 3.06 |
41
Pacer Funds
EXPENSE EXAMPLE
For the Period Ended October 31, 2021 (Unaudited) (Continued)
| | Fund’s Annual
Expense Ratio | Beginning Account
Value 05/01/21 | Ending Account
Value 10/31/21 | Expenses Paid
During Period(a) |
Pacer Pacific Asset Floating Rate High Income ETF | | | |
Actual | 0.68% | $1,000.00 | $ 1,016.70 | $ 3.46 |
Hypothetical(b) | 0.68% | $1,000.00 | $ 1,021.78 | $ 3.47 |
| | Fund’s Annual
Expense Ratio | Beginning Account
Value 07/12/21(c) | Ending Account
Value 10/31/21 | Expenses Paid
During Period |
Pacer Metaurus US Large Cap Dividend Multiplier 300 ETF | | | |
Actual | 0.79% | $1,000.00 | $ 1,049.60 | $ 2.46(d) |
Hypothetical(b) | 0.79% | $1,000.00 | $ 1,012.80 | $ 2.42(a) |
Pacer Metaurus US Large Cap Dividend Multiplier 400 ETF | | | | |
Actual | 0.79% | $1,000.00 | $ 1,048.60 | $ 2.46(d) |
Hypothetical(b) | 0.79% | $1,000.00 | $ 1,012.80 | $ 2.42(a) |
(a) | The dollar amounts shown as expenses paid during the period are equal to the annualized six-month expense ratio multiplied by the average account value during the period, multiplied by the number of days (184) in the most recent six-month period and divided by the number of days in the most recent twelve-month period (365). |
(b) | Assumes 5% return before expenses. |
(c) | Inception date of the Fund. |
(d) | The dollar amounts shown as expenses paid during the period are equal to the annualized six-month expense ratio multiplied by the average account value during the period, multiplied by the number of days (111) in the most recent six-month period and divided by the number of days in the most recent twelve-month period (365). |
42
Pacer Trendpilot® US Large Cap ETF
SCHEDULE OF INVESTMENTS
October 31, 2021 (Unaudited)
| | | Shares | | | Value | |
COMMON STOCKS — 97.4% | | | | |
Advertising — 0.1% | | | | |
Omnicom Group, Inc. | | | 11,577 | | | $ | 788,162 | |
The Interpublic Group of Cos., Inc. | | | 20,479 | | | | 748,917 | |
| | | | | | | | 1,537,079 | |
Aerospace/Defense — 1.4% | | | | |
General Dynamics Corp. | | | 11,934 | | | | 2,419,618 | |
Howmet Aerospace, Inc. | | | 20,530 | | | | 609,536 | |
L3Harris Technologies, Inc. | | | 10,554 | | | | 2,433,119 | |
Lockheed Martin Corp. | | | 12,669 | | | | 4,210,162 | |
Northrop Grumman Corp. | | | 7,982 | | | | 2,851,330 | |
Raytheon Technologies Corp. | | | 78,252 | | | | 6,953,473 | |
Teledyne Technologies, Inc. (a) | | | 2,436 | | | | 1,094,300 | |
The Boeing Co. (a) | | | 28,426 | | | | 5,885,035 | |
TransDigm Group, Inc. (a) | | | 2,803 | | | | 1,748,567 | |
| | | | | | | | 28,205,140 | |
Agriculture — 0.7% | | | | |
Altria Group, Inc. | | | 95,679 | | | | 4,220,401 | |
Archer-Daniels-Midland Co. | | | 29,471 | | | | 1,893,217 | |
Philip Morris International, Inc. | | | 80,197 | | | | 7,581,824 | |
| | | | | | | | 13,695,442 | |
Airlines — 0.2% | | | | |
Alaska Air Group, Inc. (a) | | | 6,570 | | | | 346,896 | |
American Airlines Group, Inc. (a)(b) | | | 32,931 | | | | 632,275 | |
Delta Air Lines, Inc. (a) | | | 32,847 | | | | 1,285,303 | |
Southwest Airlines Co. (a) | | | 30,443 | | | | 1,439,345 | |
United Airlines Holdings, Inc. (a) | | | 16,426 | | | | 757,896 | |
| | | | | | | | 4,461,715 | |
Apparel — 0.7% | | | | |
Hanesbrands, Inc. (b) | | | 19,481 | | | | 331,956 | |
NIKE, Inc. - Class B | | | 65,435 | | | | 10,946,621 | |
PVH Corp. (a) | | | 3,958 | | | | 432,728 | |
Ralph Lauren Corp. (b) | | | 2,497 | | | | 317,544 | |
Tapestry, Inc. | | | 14,485 | | | | 564,625 | |
Under Armour, Inc. - Class A (a)(b) | | | 9,993 | | | | 219,446 | |
Under Armour, Inc. - Class C (a) | | | 10,489 | | | | 198,032 | |
VF Corp. | | | 16,505 | | | | 1,202,885 | |
| | | | | | | | 14,213,837 | |
Auto Manufacturers — 2.8% | | | | |
Cummins, Inc. | | | 7,593 | | | | 1,821,105 | |
Ford Motor Co. (a) | | | 201,219 | | | | 3,436,820 | |
General Motors Co. (a) | | | 74,292 | | | | 4,043,714 | |
PACCAR, Inc. | | | 17,853 | | | | 1,599,986 | |
Tesla Motors, Inc. (a) | | | 41,340 | | | | 46,052,760 | |
| | | | | | | | 56,954,385 | |
Auto Parts & Equipment — 0.1% | | | | |
Aptiv PLC (a) | | | 13,896 | | | | 2,402,480 | |
BorgWarner, Inc. | | | 12,329 | | | | 555,668 | |
| | | | | | | | 2,958,148 | |
| | | Shares | | | Value | |
Banks — 5.4% | | | | |
Bank of America Corp. | | | 378,954 | | | $ | 18,106,422 | |
Citigroup, Inc. | | | 107,434 | | | | 7,430,135 | |
Citizens Financial Group, Inc. | | | 21,880 | | | | 1,036,674 | |
Comerica, Inc. | | | 7,762 | | | | 660,469 | |
Fifth Third Bancorp | | | 37,463 | | | | 1,630,764 | |
First Republic Bank | | | 8,946 | | | | 1,935,288 | |
Huntington Bancshares, Inc. | | | 76,231 | | | | 1,199,876 | |
JPMorgan Chase & Co. | | | 152,914 | | | | 25,978,559 | |
KeyCorp. | | | 49,874 | | | | 1,160,568 | |
M&T Bank Corp. (b) | | | 6,596 | | | | 970,404 | |
Morgan Stanley | | | 77,285 | | | | 7,943,352 | |
Northern Trust Corp. | | | 10,706 | | | | 1,317,266 | |
Regions Financial Corp. | | | 51,061 | | | | 1,209,124 | |
State Street Corp. | | | 18,121 | | | | 1,785,825 | |
SVB Financial Group (a) | | | 2,624 | | | | 1,882,458 | |
The Bank of New York Mellon Corp. | | | 42,457 | | | | 2,513,454 | |
The Goldman Sachs Group, Inc. | | | 17,695 | | | | 7,314,228 | |
The PNC Financial Services Group, Inc. (b) | | | 21,820 | | | | 4,604,675 | |
Truist Financial Corp. | | | 69,391 | | | | 4,404,247 | |
US Bancorp | | | 70,405 | | | | 4,250,350 | |
Wells Fargo & Co. | | | 212,847 | | | | 10,889,253 | |
Zions Bancorp | | | 9,035 | | | | 569,115 | |
| | | | | | | | 108,792,506 | |
Beverages — 1.4% | | | | |
Brown-Forman Corp. - Class B | | | 9,491 | | | | 644,344 | |
Constellation Brands, Inc. - Class A | | | 8,853 | | | | 1,919,419 | |
Molson Coors Brewing Co. - Class B (b) | | | 9,985 | | | | 440,239 | |
Monster Beverage Corp. (a) | | | 19,037 | | | | 1,618,145 | |
PepsiCo, Inc. | | | 71,036 | | | | 11,479,418 | |
The Coca-Cola Co. | | | 199,669 | | | | 11,255,341 | |
| | | | | | | | 27,356,906 | |
Biotechnology — 1.5% | | | | |
Amgen, Inc. | | | 29,719 | | | | 6,150,941 | |
Biogen, Inc. (a) | | | 7,832 | | | | 2,088,638 | |
Bio-Rad Laboratories, Inc. - Class A (a) | | | 1,117 | | | | 887,658 | |
Corteva, Inc. | | | 38,333 | | | | 1,654,069 | |
Gilead Sciences, Inc. | | | 64,678 | | | | 4,196,309 | |
Illumina, Inc. (a) | | | 7,493 | | | | 3,110,045 | |
Incyte Corp. (a) | | | 9,475 | | | | 634,635 | |
Moderna, Inc. (a) | | | 17,193 | | | | 5,935,195 | |
Regeneron Pharmaceuticals, Inc. (a) | | | 5,495 | | | | 3,516,470 | |
Vertex Pharmaceuticals, Inc. (a) | | | 13,487 | | | | 2,494,151 | |
| | | | | | | | 30,668,111 | |
Building Materials — 0.4% | | | | |
Carrier Global Corp. | | | 42,959 | | | | 2,243,749 | |
Fortune Brands Home & Security, Inc. | | | 7,493 | | | | 759,790 | |
The accompanying notes are an integral part of the financial statements.
43
Pacer Trendpilot® US Large Cap ETF
SCHEDULE OF INVESTMENTS
October 31, 2021 (Unaudited) (Continued)
| | | Shares | | | Value | |
COMMON STOCKS — 97.4% (Continued) |
Building Materials — 0.4% (Continued) |
Johnson Controls International PLC | | | 34,292 | | | $ | 2,516,004 | |
Martin Marietta Materials, Inc. (b) | | | 3,222 | | | | 1,265,731 | |
Masco Corp. | | | 13,257 | | | | 868,996 | |
Vulcan Materials Co. | | | 7,003 | | | | 1,331,410 | |
| | | | | | | | 8,985,680 | |
Chemicals — 1.6% | | | | |
Air Products & Chemicals, Inc. | | | 11,513 | | | | 3,451,712 | |
Albemarle Corp. | | | 6,006 | | | | 1,504,323 | |
Celanese Corp. | | | 5,870 | | | | 948,064 | |
CF Industries Holdings, Inc. | | | 11,550 | | | | 656,040 | |
Dow, Inc. | | | 38,397 | | | | 2,149,080 | |
DuPont de Nemours, Inc. | | | 27,751 | | | | 1,931,470 | |
Eastman Chemical Co. | | | 7,333 | | | | 762,852 | |
Ecolab, Inc. | | | 12,790 | | | | 2,842,194 | |
FMC Corp. | | | 6,846 | | | | 623,054 | |
International Flavors & Fragrances, Inc. | | | 12,811 | | | | 1,888,982 | |
Linde PLC | | | 26,914 | | | | 8,590,949 | |
LyondellBasell Industries NV | | | 13,487 | | | | 1,251,863 | |
Mosaic Co. | | | 18,540 | | | | 770,708 | |
PPG Industries, Inc. | | | 12,214 | | | | 1,961,202 | |
The Sherwin-Williams Co. | | | 12,487 | | | | 3,953,509 | |
| | | | | | | | 33,286,002 | |
Commercial Services — 2.3% | | | | |
Automatic Data Processing, Inc. | | | 22,036 | | | | 4,946,862 | |
Cintas Corp. | | | 4,495 | | | | 1,946,784 | |
Equifax, Inc. | | | 6,493 | | | | 1,801,353 | |
FleetCor Technologies, Inc. (a) | | | 4,316 | | | | 1,067,822 | |
Gartner, Inc. (a) | | | 4,631 | | | | 1,537,075 | |
Global Payments, Inc. | | | 15,216 | | | | 2,175,736 | |
IHS Markit Ltd | | | 19,209 | | | | 2,511,000 | |
MarketAxess Holdings, Inc. | | | 2,011 | | | | 821,835 | |
Moody’s Corp. | | | 8,305 | | | | 3,356,466 | |
Nielsen Holdings PLC (b) | | | 18,792 | | | | 380,538 | |
PayPal Holdings, Inc. (a) | | | 60,323 | | | | 14,030,527 | |
Quanta Services, Inc. | | | 7,593 | | | | 920,879 | |
Robert Half International, Inc. | | | 6,377 | | | | 721,047 | |
Rollins, Inc. | | | 11,386 | | | | 401,129 | |
S&P Global, Inc. (b) | | | 12,422 | | | | 5,890,015 | |
United Rentals, Inc. (a) | | | 3,697 | | | | 1,401,570 | |
Verisk Analytics, Inc. | | | 8,529 | | | | 1,793,393 | |
| | | | | | | | 45,704,031 | |
Computers — 7.4% | | | | |
Accenture PLC - Class A | | | 32,631 | | | | 11,707,676 | |
Apple, Inc. | | | 810,074 | | | | 121,349,085 | |
Cognizant Technology Solutions Corp. | | | 27,343 | | | | 2,135,215 | |
DXC Technology Co. (a) | | | 13,619 | | | | 443,571 | |
| | | Shares | | | Value | |
Computers — 7.4% (Continued) |
Fortinet, Inc. (a) | | | 6,972 | | | $ | 2,344,962 | |
Hewlett Packard Enterprise Co. | | | 68,475 | | | | 1,003,159 | |
HP, Inc. | | | 64,454 | | | | 1,954,890 | |
International Business Machines Corp. | | | 46,010 | | | | 5,755,851 | |
Leidos Holdings, Inc. | | | 7,068 | | | | 706,659 | |
NetApp, Inc. | | | 11,489 | | | | 1,025,968 | |
Seagate Technology Holdings PLC | | | 10,367 | | | | 923,389 | |
Western Digital Corp. (a) | | | 15,633 | | | | 817,449 | |
| | | | | | | | 150,167,874 | |
Cosmetics/Personal Care — 1.3% | | | | |
Colgate-Palmolive Co. | | | 43,669 | | | | 3,327,141 | |
The Estee Lauder Cos., Inc. | | | 11,702 | | | | 3,795,310 | |
The Procter & Gamble Co. | | | 126,773 | | | | 18,127,271 | |
| | | | | | | | 25,249,722 | |
Distribution/Wholesale — 0.3% | | | | |
Copart, Inc. (a) | | | 10,785 | | | | 1,674,803 | |
Fastenal Co. | | | 29,541 | | | | 1,686,200 | |
LKQ Corp. (a) | | | 14,394 | | | | 792,821 | |
Pool Corp. | | | 2,110 | | | | 1,086,988 | |
W.W. Grainger, Inc. | | | 2,284 | | | | 1,057,743 | |
| | | | | | | | 6,298,555 | |
Diversified Financial Services — 3.8% | | | | |
American Express Co. | | | 33,653 | | | | 5,848,218 | |
Ameriprise Financial, Inc. | | | 6,012 | | | | 1,816,406 | |
BlackRock, Inc. | | | 7,331 | | | | 6,916,505 | |
Capital One Financial Corp. | | | 23,620 | | | | 3,567,329 | |
Cboe Global Markets, Inc. | | | 5,863 | | | | 773,564 | |
CME Group, Inc. | | | 18,481 | | | | 4,075,985 | |
Discover Financial Services | | | 15,776 | | | | 1,787,736 | |
Franklin Resources, Inc. (b) | | | 14,680 | | | | 462,273 | |
Intercontinental Exchange, Inc. | | | 28,916 | | | | 4,003,709 | |
Invesco Ltd. | | | 19,562 | | | | 497,071 | |
MasterCard, Inc. - Class A | | | 45,154 | | | | 15,150,070 | |
Nasdaq, Inc. | | | 6,121 | | | | 1,284,614 | |
Raymond James Financial, Inc. | | | 9,900 | | | | 976,041 | |
Synchrony Financial | | | 27,962 | | | | 1,298,835 | |
T Rowe Price Group, Inc. | | | 11,718 | | | | 2,541,400 | |
The Charles Schwab Corp. | | | 77,058 | | | | 6,321,068 | |
The Western Union Co. (b) | | | 22,315 | | | | 406,579 | |
Visa, Inc. - Class A (b) | | | 87,350 | | | | 18,498,110 | |
| | | | | | | | 76,225,513 | |
Electric — 2.3% | | | | |
Alliant Energy Corp. | | | 12,602 | | | | 712,895 | |
Ameren Corp. | | | 13,027 | | | | 1,098,046 | |
American Electric Power Co., Inc. | | | 25,538 | | | | 2,163,324 | |
CenterPoint Energy, Inc. (b) | | | 28,429 | | | | 740,291 | |
CMS Energy Corp. | | | 15,027 | | | | 906,879 | |
Consolidated Edison, Inc. | | | 17,483 | | | | 1,318,218 | |
The accompanying notes are an integral part of the financial statements.
44
Pacer Trendpilot® US Large Cap ETF
SCHEDULE OF INVESTMENTS
October 31, 2021 (Unaudited) (Continued)
| | | Shares | | | Value | |
COMMON STOCKS — 97.4% (Continued) |
Electric — 2.3% (Continued) |
Dominion Energy, Inc. | | | 41,459 | | | $ | 3,147,982 | |
DTE Energy Co. | | | 10,280 | | | | 1,165,238 | |
Duke Energy Corp. | | | 39,547 | | | | 4,034,190 | |
Edison International | | | 19,495 | | | | 1,226,820 | |
Entergy Corp. | | | 10,489 | | | | 1,080,577 | |
Evergy, Inc. | | | 12,097 | | | | 771,184 | |
Eversource Energy | | | 17,636 | | | | 1,497,296 | |
Exelon Corp. | | | 50,289 | | | | 2,674,872 | |
FirstEnergy Corp. | | | 28,471 | | | | 1,096,988 | |
NextEra Energy, Inc. | | | 100,904 | | | | 8,610,138 | |
NRG Energy, Inc. | | | 13,487 | | | | 537,996 | |
Pinnacle West Capital Corp. | | | 6,000 | | | | 386,940 | |
PPL Corp. | | | 40,459 | | | | 1,165,219 | |
Public Service Enterprise Group, Inc. (b) | | | 26,675 | | | | 1,701,865 | |
Sempra Energy | | | 15,550 | | | | 1,984,647 | |
Southern Co. | | | 54,432 | | | | 3,392,202 | |
The AES Corp. | | | 35,213 | | | | 884,903 | |
WEC Energy Group, Inc. | | | 16,560 | | | | 1,491,394 | |
Xcel Energy, Inc. | | | 27,649 | | | | 1,785,849 | |
| | | | | | | | 45,575,953 | |
Electrical Components & Equipment — 0.3% | | | | |
AMETEK, Inc. | | | 12,160 | | | | 1,609,984 | |
Emerson Electric Co. | | | 30,887 | | | | 2,996,348 | |
Generac Holdings, Inc. (a) | | | 3,255 | | | | 1,622,813 | |
| | | | | | | | 6,229,145 | |
Electronics — 1.2% | | | | |
Agilent Technologies, Inc. | | | 15,666 | | | | 2,467,238 | |
Allegion PLC | | | 4,947 | | | | 634,700 | |
Amphenol Corp. | | | 31,181 | | | | 2,393,765 | |
Fortive Corp. | | | 17,436 | | | | 1,320,080 | |
Garmin Ltd. | | | 7,493 | | | | 1,075,995 | |
Honeywell International, Inc. | | | 35,796 | | | | 7,825,722 | |
Keysight Technologies, Inc. (a) | | | 9,551 | | | | 1,719,371 | |
Mettler-Toledo International, Inc. (a) | | | 1,220 | | | | 1,806,674 | |
TE Connectivity Ltd. | | | 17,040 | | | | 2,487,840 | |
Trimble, Inc. (a) | | | 10,609 | | | | 926,908 | |
Waters Corp. (a) | | | 3,216 | | | | 1,182,041 | |
| | | | | | | | 23,840,334 | |
Energy-Alternate Sources — 0.1% | | | | |
Enphase Energy, Inc. (a) | | | 6,635 | | | | 1,536,865 | |
| | | | | |
Engineering & Construction — 0.0% (c) | | | | |
Jacobs Engineering Group, Inc. | | | 6,676 | | | | 937,444 | |
| | | | | |
Entertainment — 0.1% | | | | |
Caesars Entertainment, Inc. (a)(b) | | | 10,792 | | | | 1,181,292 | |
| | | Shares | | | Value | |
Entertainment — 0.1% (Continued) |
Live Nation Entertainment, Inc. (a)(b) | | | 7,476 | | | $ | 756,198 | |
Penn National Gaming, Inc. (a)(b) | | | 6,198 | | | | 443,777 | |
| | | | | | | | 2,381,267 | |
Environmental Control — 0.3% | | | | |
Pentair PLC | | | 8,907 | | | | 658,851 | |
Republic Services, Inc. | | | 11,246 | | | | 1,513,711 | |
Waste Management, Inc. | | | 20,048 | | | | 3,212,291 | |
| | | | | | | | 5,384,853 | |
Food — 0.9% | | | | |
Campbell Soup Co. (b) | | | 10,483 | | | | 418,796 | |
Conagra Brands, Inc. (b) | | | 25,659 | | | | 826,220 | |
General Mills, Inc. | | | 31,971 | | | | 1,975,808 | |
Hormel Foods Corp. (b) | | | 14,597 | | | | 617,745 | |
Kellogg Co. (b) | | | 13,297 | | | | 815,106 | |
Lamb Weston Holdings, Inc. | | | 7,622 | | | | 430,262 | |
McCormick & Co., Inc. | | | 12,985 | | | | 1,041,786 | |
Mondelez International, Inc. | | | 72,686 | | | | 4,414,948 | |
Sysco Corp. | | | 26,300 | | | | 2,022,470 | |
The Hershey Co. | | | 7,513 | | | | 1,317,404 | |
The JM Smucker Co. (b) | | | 5,617 | | | | 690,105 | |
The Kraft Heinz Co. | | | 32,967 | | | | 1,183,186 | |
The Kroger Co. | | | 39,215 | | | | 1,569,384 | |
Tyson Foods, Inc. - Class A | | | 15,485 | | | | 1,238,335 | |
| | | | | | | | 18,561,555 | |
Forest Products & Paper — 0.1% | | | | |
International Paper Co. | | | 20,655 | | | | 1,025,934 | |
Sylvamo Corp. (a) | | | 1,877 | | | | 52,869 | |
| | | | | | | | 1,078,803 | |
Gas — 0.1% | | | | |
Atmos Energy Corp. (b) | | | 6,493 | | | | 598,135 | |
NiSource, Inc. (b) | | | 19,681 | | | | 485,530 | |
| | | | | | | | 1,083,665 | |
Hand/Machine Tools — 0.1% | | | | |
Snap-On, Inc. (b) | | | 2,922 | | | | 593,838 | |
Stanley Black & Decker, Inc. | | | 8,305 | | | | 1,492,658 | |
| | | | | | | | 2,086,496 | |
Healthcare-Products — 4.0% | | | | |
Abbott Laboratories | | | 91,228 | | | | 11,758,377 | |
ABIOMED, Inc. (a) | | | 2,353 | | | | 781,290 | |
Align Technology, Inc. (a) | | | 3,738 | | | | 2,333,895 | |
Baxter International, Inc. | | | 26,007 | | | | 2,053,513 | |
Bio-Techne Corp. | | | 1,290 | | | | 675,508 | |
Boston Scientific Corp. (a) | | | 73,325 | | | | 3,162,507 | |
Danaher Corp. | | | 32,610 | | | | 10,166,820 | |
DENTSPLY SIRONA, Inc. (b) | | | 11,696 | | | | 669,128 | |
Edwards Lifesciences Corp. (a) | | | 32,167 | | | | 3,854,250 | |
Henry Schein, Inc. (a) | | | 7,690 | | | | 587,131 | |
Hologic, Inc. (a) | | | 13,286 | | | | 973,997 | |
The accompanying notes are an integral part of the financial statements.
45
Pacer Trendpilot® US Large Cap ETF
SCHEDULE OF INVESTMENTS
October 31, 2021 (Unaudited) (Continued)
| | | Shares | | | Value | |
COMMON STOCKS — 97.4% (Continued) |
Healthcare-Products — 4.0% (Continued) |
IDEXX Laboratories, Inc. (a) | | | 4,427 | | | $ | 2,949,002 | |
Intuitive Surgical, Inc. (a) | | | 18,195 | | | | 6,570,760 | |
Medtronic PLC | | | 69,431 | | | | 8,322,000 | |
PerkinElmer, Inc. | | | 5,881 | | | | 1,040,290 | |
ResMed, Inc. | | | 7,493 | | | | 1,969,985 | |
STERIS PLC | | | 4,538 | | | | 1,060,712 | |
Stryker Corp. | | | 16,841 | | | | 4,480,885 | |
Teleflex, Inc. | | | 2,497 | | | | 891,279 | |
The Cooper Cos., Inc. | | | 2,497 | | | | 1,041,049 | |
Thermo Fisher Scientific, Inc. | | | 20,296 | | | | 12,848,789 | |
West Pharmaceutical Services, Inc. | | | 3,945 | | | | 1,695,877 | |
Zimmer Biomet Holdings, Inc. | | | 10,888 | | | | 1,558,290 | |
| | | | | | | | 81,445,334 | |
Healthcare-Services — 2.2% | | | | |
Anthem, Inc. | | | 12,582 | | | | 5,474,806 | |
Catalent, Inc. (a) | | | 8,696 | | | | 1,198,831 | |
Centene Corp. (a) | | | 29,941 | | | | 2,132,997 | |
Charles River Laboratories International, Inc. (a) | | | 2,549 | | | | 1,143,685 | |
DaVita, Inc. (a) | | | 3,697 | | | | 381,678 | |
HCA Healthcare, Inc. | | | 13,626 | | | | 3,412,768 | |
Humana, Inc. | | | 6,609 | | | | 3,061,024 | |
IQVIA Holdings, Inc. (a) | | | 9,616 | | | | 2,513,815 | |
Laboratory Corp. of American Holdings (a) | | | 5,027 | | | | 1,442,850 | |
Quest Diagnostics, Inc. | | | 7,216 | | | | 1,059,164 | |
UnitedHealth Group, Inc. | | | 48,649 | | | | 22,401,405 | |
Universal Health Services, Inc. - Class B | | | 4,008 | | | | 497,393 | |
| | | | | | | | 44,720,416 | |
Home Builders — 0.2% | | | | |
DR Horton, Inc. | | | 17,044 | | | | 1,521,518 | |
Lennar Corp. - Class A | | | 14,143 | | | | 1,413,310 | |
NVR, Inc. (a) | | | 191 | | | | 934,907 | |
PulteGroup, Inc. | | | 13,496 | | | | 648,887 | |
| | | | | | | | 4,518,622 | |
Home Furnishings — 0.0% (c) | | | | |
Leggett & Platt, Inc. (b) | | | 6,998 | | | | 327,856 | |
Whirlpool Corp. (b) | | | 3,249 | | | | 684,987 | |
| | | | | | | | 1,012,843 | |
Household Products/Wares — 0.3% | | | | |
Avery Dennison Corp. | | | 4,495 | | | | 978,651 | |
Church & Dwight Co., Inc. (b) | | | 12,992 | | | | 1,134,981 | |
Kimberly-Clark Corp. | | | 17,432 | | | | 2,257,270 | |
The Clorox Co. (b) | | | 6,493 | | | | 1,058,424 | |
| | | | | | | | 5,429,326 | |
| | | Shares | | | Value | |
Housewares — 0.0% (c) | | | | |
Newell Brands, Inc. | | | 20,278 | | | $ | 464,163 | |
| | | | | |
Insurance — 3.3% | | | | |
Aflac, Inc. | | | 32,970 | | | | 1,769,500 | |
American International Group, Inc. | | | 44,492 | | | | 2,629,032 | |
Aon PLC | | | 11,609 | | | | 3,713,951 | |
Arthur J Gallagher & Co. | | | 9,864 | | | | 1,653,897 | |
Assurant, Inc. | | | 2,980 | | | | 480,704 | |
Berkshire Hathaway, Inc. - Class B (a) | | | 94,857 | | | | 27,224,908 | |
Brown & Brown, Inc. | | | 11,961 | | | | 754,859 | |
Chubb Ltd. | | | 23,194 | | | | 4,531,644 | |
Cincinnati Financial Corp. | | | 8,065 | | | | 979,414 | |
Everest Re Group Ltd. | | | 2,063 | | | | 539,474 | |
Globe Life, Inc. | | | 4,885 | | | | 434,863 | |
Lincoln National Corp. | | | 9,311 | | | | 671,789 | |
Loews Corp. | | | 11,665 | | | | 654,057 | |
Marsh & McLennan Cos., Inc. | | | 26,178 | | | | 4,366,490 | |
MetLife, Inc. | | | 38,684 | | | | 2,429,355 | |
Principal Financial Group, Inc. | | | 13,515 | | | | 906,721 | |
Prudential Financial, Inc. | | | 20,473 | | | | 2,253,054 | |
The Allstate Corp. | | | 15,565 | | | | 1,924,923 | |
The Hartford Financial Services Group, Inc. | | | 18,437 | | | | 1,344,610 | |
The Progressive Corp. | | | 30,171 | | | | 2,862,624 | |
The Travelers Cos., Inc. | | | 12,985 | | | | 2,089,027 | |
W R Berkley Corp. | | | 7,230 | | | | 575,508 | |
Willis Towers Watson PLC | | | 6,751 | | | | 1,635,632 | |
| | | | | | | | 66,426,036 | |
Internet — 11.8% | | | | |
Alphabet, Inc. - Class A (a) | | | 15,485 | | | | 45,849,846 | |
Alphabet, Inc. - Class C (a) | | | 14,424 | | | | 42,773,074 | |
Amazon.com, Inc. (a) | | | 22,309 | | | | 75,235,541 | |
Booking Holdings, Inc. (a) | | | 2,117 | | | | 5,124,791 | |
CDW Corp. | | | 7,493 | | | | 1,398,568 | |
eBay, Inc. (b) | | | 33,304 | | | | 2,555,083 | |
Etsy, Inc. (a) | | | 6,492 | | | | 1,627,480 | |
Expedia Group, Inc. (a) | | | 7,132 | | | | 1,172,572 | |
F5 Networks, Inc. (a)(b) | | | 3,372 | | | | 711,998 | |
Match Group, Inc. (a)(b) | | | 11,696 | | | | 1,763,523 | |
Meta Platforms, Inc. - Class A (a) | | | 121,990 | | | | 39,472,304 | |
Netflix, Inc. (a) | | | 22,790 | | | | 15,732,165 | |
NortonLifeLock, Inc. | | | 30,576 | | | | 778,159 | |
Twitter, Inc. (a) | | | 40,813 | | | | 2,185,128 | |
VeriSign, Inc. (a) | | | 5,133 | | | | 1,142,965 | |
| | | | | | | | 237,523,197 | |
Iron/Steel — 0.1% | | | | |
Nucor Corp. | | | 15,371 | | | | 1,716,172 | |
| | | | | |
The accompanying notes are an integral part of the financial statements.
46
Pacer Trendpilot® US Large Cap ETF
SCHEDULE OF INVESTMENTS
October 31, 2021 (Unaudited) (Continued)
| | | Shares | | | Value | |
COMMON STOCKS — 97.4% (Continued) |
Leisure Time — 0.1% | | | | |
Carnival Corp. (a) | | | 35,126 | | | $ | 778,392 | |
Norwegian Cruise Line Holdings Ltd. (a)(b) | | | 18,680 | | | | 480,450 | |
Royal Caribbean Cruises Ltd. (a) | | | 11,291 | | | | 953,299 | |
| | | | | | | | 2,212,141 | |
Lodging — 0.3% | | | | |
Hilton Worldwide Holdings, Inc. (a) | | | 14,315 | | | | 2,060,644 | |
Las Vegas Sands Corp. (a)(b) | | | 16,905 | | | | 656,083 | |
Marriott International, Inc. (a) | | | 13,675 | | | | 2,188,273 | |
MGM Resorts International | | | 21,530 | | | | 1,015,355 | |
Wynn Resorts Ltd. (a)(b) | | | 5,192 | | | | 466,242 | |
| | | | | | | | 6,386,597 | |
Machinery-Construction & Mining — 0.3% | | | | |
Caterpillar, Inc. | | | 28,082 | | | | 5,729,009 | |
| | | | | |
Machinery-Diversified — 0.7% | | | | |
Deere & Co. | | | 14,522 | | | | 4,971,026 | |
Dover Corp. | | | 7,556 | | | | 1,277,568 | |
IDEX Corp. | | | 4,041 | | | | 899,405 | |
Ingersoll Rand, Inc. (a) | | | 18,481 | | | | 993,539 | |
Otis Worldwide Corp. | | | 21,467 | | | | 1,724,015 | |
Rockwell Automation, Inc. | | | 5,979 | | | | 1,909,693 | |
Westinghouse Air Brake Technologies Corp. | | | 9,491 | | | | 861,118 | |
Xylem, Inc. | | | 9,491 | | | | 1,239,430 | |
| | | | | | | | 13,875,794 | |
Media — 1.8% | | | | |
Charter Communications, Inc. - Class A (a)(b) | | | 6,493 | | | | 4,382,061 | |
Comcast Corp. - Class A | | | 235,318 | | | | 12,102,405 | |
Discovery, Inc. - Class A (a)(b) | | | 8,491 | | | | 199,029 | |
Discovery, Inc. - Class C (a)(b) | | | 14,909 | | | | 336,347 | |
DISH Network Corp. - Class A (a) | | | 13,487 | | | | 553,911 | |
Fox Corp. - Class A (b) | | | 17,231 | | | | 684,760 | |
Fox Corp. - Class B | | | 8,699 | | | | 321,515 | |
News Corp. - Class A | | | 20,479 | | | | 468,969 | |
News Corp. - Class B | | | 6,493 | | | | 146,482 | |
The Walt Disney Co. (a) | | | 93,550 | | | | 15,816,499 | |
ViacomCBS, Inc. - Class B | | | 29,238 | | | | 1,059,000 | |
| | | | | | | | 36,070,978 | |
Mining — 0.3% | | | | |
Freeport-McMoRan, Inc. | | | 75,101 | | | | 2,832,810 | |
Newmont Goldcorp Corp. | | | 41,222 | | | | 2,225,988 | |
| | | | | | | | 5,058,798 | |
Miscellaneous Manufacturing — 1.2% | | | | |
3M Co. | | | 29,804 | | | | 5,325,379 | |
A O Smith Corp. | | | 7,432 | | | | 543,056 | |
Eaton Corp. PLC | | | 20,636 | | | | 3,399,987 | |
| | | Shares | | | Value | |
Miscellaneous Manufacturing — 1.2% (Continued) |
General Electric Co. | | | 56,430 | | | $ | 5,917,814 | |
Illinois Tool Works, Inc. | | | 14,825 | | | | 3,378,173 | |
Parker-Hannifin Corp. | | | 6,741 | | | | 1,999,313 | |
Textron, Inc. | | | 12,130 | | | | 895,800 | |
Trane Technologies PLC | | | 12,296 | | | | 2,224,715 | |
| | | | | | | | 23,684,237 | |
Office/Business Equipment — 0.1% | | | | |
Zebra Technologies Corp. (a) | | | 2,735 | | | | 1,460,353 | |
| | | | | |
Oil & Gas — 2.4% | | | | |
APA Corp. | | | 19,912 | | | | 521,894 | |
Chevron Corp. | | | 99,764 | | | | 11,421,980 | |
ConocoPhillips | | | 69,735 | | | | 5,194,560 | |
Coterra Energy, Inc. | | | 21,684 | | | | 462,303 | |
Devon Energy Corp. | | | 30,469 | | | | 1,221,198 | |
Diamondback Energy, Inc. | | | 8,584 | | | | 920,119 | |
EOG Resources, Inc. | | | 30,050 | | | | 2,778,423 | |
Exxon Mobil Corp. | | | 218,655 | | | | 14,096,688 | |
Hess Corp. | | | 13,576 | | | | 1,120,970 | |
Marathon Oil Corp. | | | 42,457 | | | | 692,898 | |
Marathon Petroleum Corp. | | | 33,499 | | | | 2,208,589 | |
Occidental Petroleum Corp. | | | 43,180 | | | | 1,447,825 | |
Phillips 66 | | | 22,477 | | | | 1,680,830 | |
Pioneer Natural Resources Co. | | | 11,947 | | | | 2,233,850 | |
Valero Energy Corp. | | | 21,039 | | | | 1,626,946 | |
| | | | | | | | 47,629,073 | |
Oil & Gas Services — 0.2% | | | | |
Baker Hughes Co. (b) | | | 37,499 | | | | 940,475 | |
Halliburton Co. | | | 46,429 | | | | 1,160,261 | |
Schlumberger Ltd. | | | 73,088 | | | | 2,357,819 | |
| | | | | | | | 4,458,555 | |
Packaging & Containers — 0.2% | | | | |
Amcor PLC (b) | | | 80,419 | | | | 970,657 | |
Ball Corp. | | | 16,876 | | | | 1,543,816 | |
Packaging Corp. of America | | | 5,013 | | | | 688,636 | |
Sealed Air Corp. | | | 8,300 | | | | 492,356 | |
Westrock Co. | | | 13,487 | | | | 648,725 | |
| | | | | | | | 4,344,190 | |
Pharmaceuticals — 5.0% | | | | |
AbbVie, Inc. | | | 90,916 | | | | 10,425,338 | |
AmerisourceBergen Corp. | | | 7,559 | | | | 922,349 | |
Becton Dickinson and Co. | | | 14,958 | | | | 3,583,787 | |
Bristol-Myers Squibb Co. | | | 115,380 | | | | 6,738,192 | |
Cardinal Health, Inc. | | | 15,497 | | | | 740,912 | |
Cigna Corp. | | | 18,124 | | | | 3,871,468 | |
CVS Health Corp. | | | 67,485 | | | | 6,025,061 | |
DexCom, Inc. (a) | | | 4,949 | | | | 3,084,266 | |
Eli Lilly & Co. | | | 40,956 | | | | 10,433,951 | |
Johnson & Johnson | | | 135,365 | | | | 22,048,251 | |
The accompanying notes are an integral part of the financial statements.
47
Pacer Trendpilot® US Large Cap ETF
SCHEDULE OF INVESTMENTS
October 31, 2021 (Unaudited) (Continued)
| | | Shares | | | Value | |
COMMON STOCKS — 97.4% (Continued) |
Pharmaceuticals — 5.0% (Continued) |
McKesson Corp. | | | 8,200 | | | $ | 1,704,616 | |
Merck & Co., Inc. | | | 130,298 | | | | 11,472,739 | |
Organon & Co. | | | 13,029 | | | | 478,816 | |
Pfizer, Inc. | | | 287,191 | | | | 12,561,734 | |
Viatris, Inc. | | | 63,647 | | | | 849,687 | |
Zoetis, Inc. | | | 24,475 | | | | 5,291,495 | |
| | | | | | | | 100,232,662 | |
Pipelines — 0.2% | | | | |
Kinder Morgan, Inc. (b) | | | 100,258 | | | | 1,679,322 | |
ONEOK, Inc. (b) | | | 22,905 | | | | 1,457,216 | |
Williams Cos., Inc. | | | 64,213 | | | | 1,803,743 | |
| | | | | | | | 4,940,281 | |
Real Estate — 0.1% | | | | |
CBRE Group, Inc. (a) | | | 17,598 | | | | 1,831,600 | |
| | | | | |
Retail — 5.2% | | | | |
Advance Auto Parts, Inc. | | | 3,520 | | | | 793,830 | |
AutoZone, Inc. (a) | | | 1,152 | | | | 2,056,136 | |
Bath & Body Works, Inc. (a) | | | 12,487 | | | | 862,727 | |
Best Buy Co., Inc. | | | 12,081 | | | | 1,476,781 | |
CarMax, Inc. (a) | | | 8,578 | | | | 1,174,500 | |
Chipotle Mexican Grill, Inc. (a) | | | 1,481 | | | | 2,634,743 | |
Costco Wholesale Corp. | | | 22,776 | | | | 11,195,315 | |
Darden Restaurants, Inc. | | | 6,920 | | | | 997,449 | |
Dollar General Corp. | | | 12,587 | | | | 2,788,272 | |
Dollar Tree, Inc. (a) | | | 12,487 | | | | 1,345,599 | |
Domino’s Pizza, Inc. | | | 2,078 | | | | 1,016,080 | |
Genuine Parts Co. | | | 7,558 | | | | 990,929 | |
Lowe’s Cos., Inc. | | | 36,529 | | | | 8,541,211 | |
McDonald’s Corp. | | | 38,416 | | | | 9,433,049 | |
O’Reilly Automotive, Inc. (a) | | | 3,587 | | | | 2,232,262 | |
Ross Stores, Inc. | | | 18,354 | | | | 2,077,673 | |
Starbucks Corp. | | | 60,589 | | | | 6,426,675 | |
Target Corp. | | | 25,774 | | | | 6,691,446 | |
The Gap, Inc. (b) | | | 11,442 | | | | 259,619 | |
The Home Depot, Inc. | | | 55,445 | | | | 20,611,124 | |
The TJX Cos., Inc. | | | 61,805 | | | | 4,047,610 | |
Tractor Supply Co. | | | 5,987 | | | | 1,300,197 | |
Ulta Beauty, Inc. (a) | | | 2,894 | | | | 1,063,140 | |
Walgreens Boots Alliance, Inc. | | | 36,920 | | | | 1,735,978 | |
Walmart, Inc. | | | 73,136 | | | | 10,927,981 | |
Yum! Brands, Inc. | | | 15,482 | | | | 1,934,321 | |
| | | | | | | | 104,614,647 | |
Savings & Loans — 0.0% (c) | | | | |
People’s United Financial, Inc. | | | 23,543 | | | | 403,527 | |
| | | | | |
Semiconductors — 5.6% | | | | |
Advanced Micro Devices, Inc. (a) | | | 61,876 | | | | 7,439,351 | |
| | | Shares | | | Value | |
Semiconductors — 5.6% (Continued) |
Analog Devices, Inc. | | | 27,677 | | | $ | 4,801,683 | |
Applied Materials, Inc. | | | 47,267 | | | | 6,459,036 | |
Broadcom, Inc. | | | 20,990 | | | | 11,159,753 | |
Intel Corp. | | | 209,207 | | | | 10,251,143 | |
IPG Photonics Corp. (a)(b) | | | 1,887 | | | | 300,052 | |
KLA Corp. | | | 7,928 | | | | 2,955,241 | |
Lam Research Corp. | | | 7,384 | | | | 4,161,401 | |
Microchip Technology, Inc. | | | 27,708 | | | | 2,052,886 | |
Micron Technology, Inc. | | | 57,569 | | | | 3,978,018 | |
Monolithic Power Systems, Inc. | | | 2,284 | | | | 1,200,151 | |
NVIDIA Corp. | | | 128,857 | | | | 32,944,869 | |
NXP Semiconductors NV | | | 14,299 | | | | 2,872,097 | |
Qorvo, Inc. (a) | | | 5,820 | | | | 979,099 | |
QUALCOMM, Inc. | | | 58,454 | | | | 7,776,720 | |
Skyworks Solutions, Inc. | | | 8,491 | | | | 1,419,101 | |
Teradyne, Inc. | | | 8,826 | | | | 1,220,106 | |
Texas Instruments, Inc. | | | 47,409 | | | | 8,888,239 | |
Xilinx, Inc. | | | 12,629 | | | | 2,273,220 | |
| | | | | | | | 113,132,166 | |
Shipbuilding — 0.0% (c) | | | | |
Huntington Ingalls Industries, Inc. | | | 2,282 | | | | 462,630 | |
| | | | | |
Software — 11.1% | | | | |
Activision Blizzard, Inc. | | | 39,883 | | | | 3,118,452 | |
Adobe, Inc. (a) | | | 24,657 | | | | 16,035,927 | |
Akamai Technologies, Inc. (a) | | | 8,491 | | | | 895,461 | |
ANSYS, Inc. (a) | | | 4,495 | | | | 1,706,212 | |
Autodesk, Inc. (a) | | | 11,345 | | | | 3,603,285 | |
Broadridge Financial Solutions, Inc. | | | 6,112 | | | | 1,090,442 | |
Cadence Design System, Inc. (a) | | | 14,390 | | | | 2,491,053 | |
Ceridian HCM Holding, Inc. (a) | | | 6,902 | | | | 864,475 | |
Cerner Corp. | | | 15,754 | | | | 1,170,365 | |
Citrix Systems, Inc. | | | 6,143 | | | | 581,926 | |
Electronic Arts, Inc. | | | 14,796 | | | | 2,075,139 | |
Fidelity National Information Services, Inc. | | | 31,979 | | | | 3,541,354 | |
Fiserv, Inc. (a) | | | 30,733 | | | | 3,026,893 | |
Intuit, Inc. | | | 14,107 | | | | 8,830,841 | |
Jack Henry & Associates, Inc. (b) | | | 4,121 | | | | 686,064 | |
Microsoft Corp. | | | 388,387 | | | | 128,796,897 | |
MSCI, Inc. | | | 4,270 | | | | 2,839,038 | |
Oracle Corp. | | | 84,299 | | | | 8,087,646 | |
Paychex, Inc. | | | 16,839 | | | | 2,075,912 | |
Paycom Software, Inc. (a) | | | 2,497 | | | | 1,367,981 | |
PTC, Inc. (a) | | | 5,410 | | | | 688,964 | |
Roper Technologies, Inc. | | | 5,495 | | | | 2,680,846 | |
salesforce.com, Inc. (a) | | | 49,719 | | | | 14,900,287 | |
ServiceNow, Inc. (a) | | | 10,104 | | | | 7,050,167 | |
Synopsys, Inc. (a) | | | 7,998 | | | | 2,664,774 | |
The accompanying notes are an integral part of the financial statements.
48
Pacer Trendpilot® US Large Cap ETF
SCHEDULE OF INVESTMENTS
October 31, 2021 (Unaudited) (Continued)
| | | Shares | | | Value | |
COMMON STOCKS — 97.4% (Continued) |
Software — 11.1% (Continued) |
Take-Two Interactive Software, Inc. (a) | | | 5,994 | | | $ | 1,084,914 | |
Tyler Technologies, Inc. (a) | | | 2,156 | | | | 1,171,182 | |
| | | | | | | | 223,126,497 | |
Telecommunications — 2.1% | | | | |
Arista Networks, Inc. (a) | | | 2,868 | | | | 1,174,991 | |
AT&T, Inc. | | | 367,144 | | | | 9,274,058 | |
Cisco Systems, Inc. | | | 217,327 | | | | 12,163,792 | |
Corning, Inc. | | | 39,530 | | | | 1,406,082 | |
Juniper Networks, Inc. | | | 17,593 | | | | 519,345 | |
Lumen Technologies, Inc. (b) | | | 51,938 | | | | 615,985 | |
Motorola Solutions, Inc. (b) | | | 8,682 | | | | 2,158,258 | |
T-Mobile US, Inc. (a) | | | 30,081 | | | | 3,460,218 | |
Verizon Communications, Inc. | | | 213,066 | | | | 11,290,367 | |
| | | | | | | | 42,063,096 | |
Textiles — 0.0% (c) | | | | |
Mohawk Industries, Inc. (a) | | | 3,249 | | | | 575,755 | |
| | | | | |
Toys/Games/Hobbies — 0.0% (c) | | | | |
Hasbro, Inc. | | | 6,631 | | | | 634,985 | |
| | | | | |
Transportation — 1.6% | | | | |
CH Robinson Worldwide, Inc. (b) | | | 7,267 | | | | 704,826 | |
CSX Corp. | | | 117,823 | | | | 4,261,658 | |
Expeditors International of Washington, Inc. | | | 9,016 | | | | 1,111,312 | |
FedEx Corp. | | | 12,573 | | | | 2,961,319 | |
JB Hunt Trasport Services, Inc. | | | 4,321 | | | | 852,058 | |
Kansas City Southern | | | 4,654 | | | | 1,443,904 | |
Norfolk Southern Corp. | | | 12,968 | | | | 3,800,272 | |
Old Dominion Freight Line, Inc. | | | 5,116 | | | | 1,746,347 | |
Union Pacific Corp. | | | 34,465 | | | | 8,319,851 | |
United Parcel Service, Inc. - Class B | | | 37,120 | | | | 7,924,006 | |
| | | | | | | | 33,125,553 | |
Water — 0.1% | | | | |
American Water Works Co., Inc. | | | 9,491 | | | | 1,653,142 | |
TOTAL COMMON STOCKS (Cost $1,329,502,079) | | | | | | | 1,964,419,401 | |
| | | | | |
REAL ESTATE INVESTMENT TRUSTS — 2.5% | | | | |
Alexandria Real Estate Equities, Inc. | | | 6,493 | | | | 1,325,481 | |
American Tower Corp. | | | 22,872 | | | | 6,449,218 | |
AvalonBay Communities, Inc. | | | 7,197 | | | | 1,703,386 | |
Boston Properties, Inc. | | | 7,493 | | | | 851,504 | |
Crown Castle International Corp. | | | 21,990 | | | | 3,964,797 | |
Digital Realty Trust, Inc. (b) | | | 14,485 | | | | 2,285,878 | |
Duke Realty Corp. | | | 19,442 | | | | 1,093,418 | |
Equinix, Inc. | | | 4,515 | | | | 3,779,371 | |
| | | Shares | | | Value | |
REAL ESTATE INVESTMENT TRUSTS — 2.5% (Continued) |
Equity Residential | | | 17,628 | | | $ | 1,523,059 | |
Essex Property Trust, Inc. | | | 3,371 | | | | 1,145,904 | |
Extra Space Storage, Inc. | | | 6,836 | | | | 1,349,221 | |
Federal Realty Investment Trust (b) | | | 3,603 | | | | 433,621 | |
Healthpeak Properties, Inc. | | | 27,717 | | | | 984,231 | |
Host Hotels & Resorts, Inc. (a) | | | 38,283 | | | | 644,303 | |
Iron Mountain, Inc. (b) | | | 15,328 | | | | 699,570 | |
Kimco Realty Corp. | | | 22,271 | | | | 503,325 | |
Mid-America Apartment Communities, Inc. | | | 6,059 | | | | 1,237,308 | |
Prologis, Inc. | | | 38,081 | | | | 5,520,222 | |
Public Storage | | | 8,001 | | | | 2,657,772 | |
Realty Income Corp. (b) | | | 19,241 | | | | 1,374,385 | |
Regency Centers Corp. | | | 8,868 | | | | 624,396 | |
SBA Communications Corp. | | | 5,602 | | | | 1,934,539 | |
Simon Property Group, Inc. | | | 16,908 | | | | 2,478,375 | |
UDR, Inc. | | | 15,485 | | | | 859,882 | |
Ventas, Inc. | | | 19,612 | | | | 1,046,692 | |
Vornado Realty Trust | | | 8,491 | | | | 361,971 | |
Welltower, Inc. | | | 21,474 | | | | 1,726,510 | |
Weyerhaeuser Co. | | | 39,398 | | | | 1,407,296 | |
TOTAL REAL ESTATE INVESTMENT TRUSTS (Cost $37,531,900) | | | | | | | 49,965,635 | |
| | | | | |
| | | Principal
Amount | | | | | |
SHORT-TERM INVESTMENTS — 0.1% | | | | |
Money Market Deposit Accounts — 0.1% | | | | |
U.S. Bank Money Market Deposit Account, 0.003% (d) | | $ | 2,238,592 | | | | 2,238,592 | |
TOTAL SHORT-TERM INVESTMENTS (Cost $2,238,592) | | | | | | | 2,238,592 | |
| | | | | |
The accompanying notes are an integral part of the financial statements.
49
Pacer Trendpilot® US Large Cap ETF
SCHEDULE OF INVESTMENTS
October 31, 2021 (Unaudited) (Continued)
| | | Shares | | | Value | |
| INVESTMENTS PURCHASED WITH PROCEEDS FROM SECURITIES LENDING — 3.3% |
| Mount Vernon Liquid Assets Portfolio, LLC, 0.10% (d) | | | 66,236,144 | | | $ | 66,236,144 | |
| TOTAL INVESTMENTS PURCHASED WITH PROCEEDS FROM SECURITIES LENDING (Cost $66,236,144) | | | | | | | 66,236,144 | |
| | | | | | | | | |
| Total Investments (Cost $1,435,508,715) — 103.3% | | | | | | | 2,082,859,772 | |
| Liabilities in Excess of Other Assets — (3.3)% | | | | | | | (65,703,362 | ) |
| TOTAL NET ASSETS — 100.0% | | | | | | $ | 2,017,156,410 | |
Percentages are stated as a percent of net assets.
| | (a) | Non-income producing security. |
| | (b) | All or a portion of this security is on loan as of October 31, 2021. The total value of securities on loan is $64,610,813 or 3.2% of net assets. |
| | (d) | The rate shown is as of October 31, 2021. |
For Fund compliance purposes, the Fund’s industry classifications refer to any one or more of the industry sub-classifications used by one or more widely recognized market indexes or ratings group indexes, and/or they may be defined by Fund management. This definition does not apply for all purposes of this report, which may combine sub-classifications for reporting ease. Categories are shown as a percentage of net assets.
The accompanying notes are an integral part of the financial statements.
50
Pacer Trendpilot® US Mid Cap ETF
SCHEDULE OF INVESTMENTS
October 31, 2021 (Unaudited)
| | | Shares | | | Value | |
COMMON STOCKS — 51.1% | | | | |
Aerospace/Defense — 0.2% | | | | |
Hexcel Corp. (a) (b) | | | 9,196 | | | $ | 521,781 | |
Mercury Systems, Inc. (a) | | | 6,169 | | | | 317,950 | |
| | | | | | | | 839,731 | |
Agriculture — 0.3% | | | | |
Darling Ingredients, Inc. (a) | | | 17,885 | | | | 1,511,640 | |
| | | | | |
Airlines — 0.1% | | | | |
JetBlue Airways Corp. (a) | | | 34,760 | | | | 487,683 | |
| | | | | |
Apparel — 1.0% | | | | |
Capri Holdings Ltd. -(a) | | | 16,615 | | | | 884,583 | |
Carter’s, Inc. (b) | | | 4,844 | | | | 477,231 | |
Columbia Sportswear Co. | | | 3,354 | | | | 348,279 | |
Crocs, Inc. (a) | | | 6,780 | | | | 1,094,631 | |
Deckers Outdoor Corp. (a) | | | 2,994 | | | | 1,183,558 | |
Skechers U.S.A, Inc. - Class A (a) | | | 15,042 | | | | 695,091 | |
Urban Outfitters, Inc. (a) (b) | | | 7,540 | | | | 240,752 | |
| | | | | | | | 4,924,125 | |
Auto Parts & Equipment — 1.0% | | | | |
Adient PLC (a) | | | 10,338 | | | | 430,267 | |
Dana, Inc. | | | 15,914 | | | | 353,132 | |
Fox Factory Holding Corp. (a) (b) | | | 4,591 | | | | 738,921 | |
Gentex Corp. | | | 26,800 | | | | 948,452 | |
Lear Corp. | | | 6,316 | | | | 1,085,405 | |
The Goodyear Tire & Rubber Co. (a) | | | 30,573 | | | | 584,556 | |
Visteon Corp. (a) | | | 3,071 | | | | 347,576 | |
| | | | | | | | 4,488,309 | |
Banks — 3.8% | | | | |
Associated Banc-Corp. | | | 16,811 | | | | 374,549 | |
BancorpSouth Bank (b) | | | — | | | | — | |
Bank of Hawaii Corp. | | | 4,423 | | | | 373,744 | |
Bank OZK (b) | | | 13,294 | | | | 593,843 | |
Cadence Bank | | | 10,599 | | | | 307,583 | |
Cathay General Bancorp (b) | | | 8,222 | | | | 346,886 | |
CIT Group, Inc. (b) | | | 10,853 | | | | 537,549 | |
Commerce Bancshares, Inc. (b) | | | 11,585 | | | | 816,858 | |
Cullen Frost Bankers, Inc. (b) | | | 6,178 | | | | 800,051 | |
East West Bancorp, Inc. | | | 15,568 | | | | 1,237,345 | |
First Financial Bankshares, Inc. (b) | | | 13,555 | | | | 687,510 | |
First Horizon Corp. (b) | | | 61,104 | | | | 1,036,935 | |
FNB Corp. | | | 35,369 | | | | 412,049 | |
Fulton Financial Corp. | | | 17,852 | | | | 287,417 | |
Glacier Bancorp, Inc. (b) | | | 11,780 | | | | 651,316 | |
Hancock Whitney Corp. | | | 9,538 | | | | 471,940 | |
Home BancShares, Inc. | | | 16,711 | | | | 397,053 | |
International Bancshares Corp. | | | 6,129 | | | | 259,870 | |
PacWest Bancorp | | | 12,843 | | | | 609,657 | |
Pinnacle Financial Partners, Inc. | | | 8,358 | | | | 807,132 | |
| | | Shares | | | Value | |
Banks — 3.8% (Continued) |
Prosperity Bancshares, Inc. | | | 10,217 | | | $ | 769,442 | |
Signature Bank (b) | | | 6,406 | | | | 1,907,835 | |
Synovus Financial Corp. | | | 16,347 | | | | 761,607 | |
Texas Capital Bancshares, Inc. (a) | | | 5,553 | | | | 336,512 | |
UMB Financial Corp. | | | 4,773 | | | | 471,668 | |
Umpqua Holdings Corp. | | | 24,242 | | | | 495,749 | |
United Bankshares, Inc. | | | 14,184 | | | | 524,666 | |
Valley National Bancorp (b) | | | 44,621 | | | | 591,674 | |
Webster Financial Corp. (b) | | | 9,934 | | | | 555,907 | |
Wintrust Financial Corp. | | | 6,262 | | | | 554,187 | |
| | | | | | | | 17,978,534 | |
Beverages — 0.1% | | | | |
The Boston Beer Co., Inc. - Class A (a) | | | 1,011 | | | | 497,897 | |
| | | | | |
Biotechnology — 0.7% | | | | |
Arrowhead Pharmaceuticals, Inc. (a) | | | 11,409 | | | | 728,123 | |
Emergent BioSolutions, Inc. (a) | | | 4,987 | | | | 237,730 | |
Exelixis, Inc. (a) | | | 34,322 | | | | 738,266 | |
Halozyme Therapeutics, Inc. (a) (b) | | | 15,052 | | | | 573,030 | |
Nektar Therapeutics (a) (b) | | | 20,045 | | | | 303,882 | |
United Therapeutics Corp. (a) | | | 4,896 | | | | 933,961 | |
| | | | | | | | 3,514,992 | |
Building Materials — 1.6% | | | | |
Builders FirstSource, Inc. (a) | | | 22,711 | | | | 1,323,370 | |
Eagle Materials, Inc. | | | 4,612 | | | | 684,236 | |
Lennox International, Inc. | | | 3,777 | | | | 1,130,381 | |
Louisiana-Pacific Corp. | | | 10,063 | | | | 593,013 | |
MDU Resources Group, Inc. | | | 22,054 | | | | 677,719 | |
Owens Corning | | | 11,540 | | | | 1,077,951 | |
Simpson Manufacturing Co., Inc. | | | 4,763 | | | | 505,307 | |
Trex Co., Inc. (a) (b) | | | 12,742 | | | | 1,355,749 | |
| | | | | | | | 7,347,726 | |
Chemicals — 1.2% | | | | |
Ashland Global Holdings, Inc. (b) | | | 6,001 | | | | 576,156 | |
Cabot Corp. | | | 6,244 | | | | 333,118 | |
Ingevity Corp. (a) | | | 4,726 | | | | 368,203 | |
Minerals Technologies, Inc. (b) | | | 3,722 | | | | 264,039 | |
NewMarket Corp. | | | 801 | | | | 272,348 | |
Olin Corp. | | | 15,707 | | | | 894,985 | |
RPM International, Inc. | | | 14,317 | | | | 1,248,442 | |
Sensient Technologies Corp. | | | 4,659 | | | | 445,400 | |
The Chemours Co. | | | 18,162 | | | | 508,899 | |
Valvoline, Inc. | | | 19,955 | | | | 677,672 | |
| | | | | | | | 5,589,262 | |
Commercial Services — 2.4% | | | | |
ASGN, Inc. (a) | | | 5,831 | | | | 697,737 | |
Avis Budget Group, Inc. (a) (b) | | | 4,998 | | | | 866,203 | |
FTI Consulting, Inc. (a) (b) | | | 3,765 | | | | 541,859 | |
The accompanying notes are an integral part of the financial statements.
51
Pacer Trendpilot® US Mid Cap ETF
SCHEDULE OF INVESTMENTS
October 31, 2021 (Unaudited) (Continued)
| | | Shares | | | Value | |
COMMON STOCKS — 51.1% (Continued) |
Commercial Services — 2.4% (Continued) |
Graham Holdings Co. - Class B | | | 441 | | | $ | 258,360 | |
Grand Canyon Education, Inc. (a) | | | 5,155 | | | | 410,854 | |
GXO Logistics, Inc. (a) | | | 10,430 | | | | 926,184 | |
H&R Block, Inc. | | | 20,172 | | | | 465,368 | |
HealthEquity, Inc. (a) (b) | | | 9,120 | | | | 603,562 | |
Insperity, Inc. | | | 3,905 | | | | 488,125 | |
John Wiley & Sons, Inc. - Class A (b) | | | 4,784 | | | | 259,149 | |
LiveRamp Holdings, Inc. (a) | | | 7,361 | | | | 393,887 | |
ManpowerGroup, Inc. | | | 6,047 | | | | 584,443 | |
Paylocity Holding Corp. (a) | | | 4,123 | | | | 1,258,092 | |
PROG Holdings, Inc. (b) | | | 7,444 | | | | 301,110 | |
Progyny, Inc. (a) (b) | | | 7,286 | | | | 447,579 | |
Sabre Corp. (a) (b) | | | 34,905 | | | | 362,314 | |
Service Corp. International | | | 18,637 | | | | 1,276,448 | |
The Brink’s Co. (b) | | | 5,438 | | | | 374,569 | |
WEX, Inc. (a) | | | 4,853 | | | | 726,494 | |
| | | | | | | | 11,242,337 | |
Computers — 1.2% | | | | |
CACI International, Inc. (a) | | | 2,559 | | | | 736,071 | |
Genpact Ltd. | | | 19,103 | | | | 942,733 | |
KBR, Inc. (b) | | | 15,496 | | | | 657,650 | |
Lumentum Holdings, Inc. (a) (b) | | | 8,328 | | | | 687,726 | |
Maximus, Inc. | | | 6,761 | | | | 571,778 | |
NCR Corp. (a) | | | 14,307 | | | | 565,699 | |
NetScout Systems, Inc. (a) | | | 8,076 | | | | 218,536 | |
Qualys, Inc. (a) (b) | | | 3,712 | | | | 462,070 | |
Science Applications International Corp. | | | 6,404 | | | | 574,951 | |
| | | | | | | | 5,417,214 | |
Cosmetics/Personal Care — 0.1% | | | | |
Coty, Inc. (a) | | | 31,208 | | | | 264,644 | |
| | | | | |
Distribution/Wholesale — 0.7% | | | | |
Avient Corp. | | | 10,044 | | | | 541,171 | |
IAA, Inc. (a) (b) | | | 14,798 | | | | 882,701 | |
KAR Auction Services, Inc. (a) | | | 14,263 | | | | 209,238 | |
Univar Solutions, Inc. (a) | | | 18,631 | | | | 476,581 | |
Watsco, Inc. | | | 3,607 | | | | 1,044,515 | |
| | | | | | | | 3,154,206 | |
Diversified Financial Services — 1.5% | | | | |
Affiliated Managers Group, Inc. | | | 4,475 | | | | 751,263 | |
Alliance Data Systems Corp. | | | 5,469 | | | | 466,232 | |
Evercore, Inc. | | | 4,304 | | | | 653,519 | |
Federated Hermes, Inc. | | | 10,312 | | | | 343,493 | |
Interactive Brokers Group, Inc. | | | 8,886 | | | | 629,573 | |
Janus Henderson Group PLC | | | 18,772 | | | | 872,898 | |
Jefferies Financial Group, Inc. | | | 22,272 | | | | 957,696 | |
Navient Corp. | | | 18,292 | | | | 360,353 | |
| | | Shares | | | Value | |
Diversified Financial Services — 1.5% (Continued) |
SEI Investments Co. | | | 11,332 | | | $ | 714,369 | |
SLM Corp. | | | 33,283 | | | | 610,743 | |
Stifel Financial Corp. (b) | | | 11,542 | | | | 841,066 | |
| | | | | | | | 7,201,205 | |
Electric — 0.7% | | | | |
ALLETE, Inc. | | | 5,721 | | | | 352,070 | |
Black Hills Corp. | | | 6,908 | | | | 458,553 | |
Hawaiian Electric Industries, Inc. | | | 12,008 | | | | 487,045 | |
IDACORP, Inc. | | | 5,553 | | | | 579,289 | |
NorthWestern Corp. | | | 5,563 | | | | 316,312 | |
OGE Energy Corp. | | | 22,004 | | | | 749,676 | |
PNM Resources, Inc. | | | 9,442 | | | | 469,740 | |
| | | | | | | | 3,412,685 | |
Electrical Components & Equipment — 0.7% | | | | |
Acuity Brands, Inc. (b) | | | 3,963 | | | | 814,119 | |
Belden, Inc. | | | 4,909 | | | | 295,571 | |
Energizer Holdings, Inc. (b) | | | 6,386 | | | | 232,897 | |
EnerSys | | | 4,694 | | | | 375,708 | |
Littelfuse, Inc. | | | 2,700 | | | | 795,285 | |
Universal Display Corp. | | | 4,711 | | | | 863,055 | |
| | | | | | | | 3,376,635 | |
Electronics — 1.8% | | | | |
Arrow Electronics, Inc. (a) | | | 7,767 | | | | 899,030 | |
Avnet, Inc. | | | 10,942 | | | | 417,000 | |
Coherent, Inc. (a) | | | 2,690 | | | | 684,336 | |
Hubbell, Inc. | | | 5,981 | | | | 1,192,432 | |
II-VI, Inc. (a) (b) | | | 11,525 | | | | 697,378 | |
Jabil, Inc. | | | 15,428 | | | | 925,063 | |
National Instruments Corp. | | | 14,474 | | | | 614,711 | |
nVent Electric PLC | | | 18,496 | | | | 655,683 | |
SYNNEX Corp. | | | 4,541 | | | | 476,805 | |
Vishay Intertechnology, Inc. | | | 14,589 | | | | 280,400 | |
Vontier Corp. | | | 18,535 | | | | 627,039 | |
Woodward, Inc. | | | 6,718 | | | | 758,798 | |
| | | | | | | | 8,228,675 | |
Energy-Alternate Sources — 1.0% | | | | |
First Solar, Inc. (a) | | | 10,455 | | | | 1,250,313 | |
SolarEdge Technologies, Inc. (a) (b) | | | 5,673 | | | | 2,012,100 | |
SunPower Corp. (a) | | | 8,978 | | | | 302,200 | |
Sunrun, Inc. (a) (b) | | | 21,777 | | | | 1,256,097 | |
| | | | | | | | 4,820,710 | |
Engineering & Construction — 0.9% | | | | |
AECOM (a) | | | 15,712 | | | | 1,074,229 | |
Dycom Industries, Inc. (a) (b) | | | 3,381 | | | | 268,519 | |
EMCOR Group, Inc. | | | 6,029 | | | | 732,463 | |
Fluor Corp. (a) (b) | | | 13,784 | | | | 267,961 | |
MasTec, Inc. (a) | | | 6,204 | | | | 552,963 | |
Southwest Gas Holdings, Inc. (b) | | | 6,294 | | | | 435,859 | |
The accompanying notes are an integral part of the financial statements.
52
Pacer Trendpilot® US Mid Cap ETF
SCHEDULE OF INVESTMENTS
October 31, 2021 (Unaudited) (Continued)
| | | Shares | | | Value | |
COMMON STOCKS — 51.1% (Continued) |
Engineering & Construction — 0.9% (Continued) |
TopBuild Corp. (a) | | | 3,642 | | | $ | 935,885 | |
| | | | | | | | 4,267,879 | |
Entertainment — 0.6% | | | | |
Churchill Downs, Inc. | | | 3,810 | | | | 876,300 | |
Marriott Vacations Worldwide Corp. (b) | | | 4,531 | | | | 712,364 | |
Scientific Games Corp. (a) (b) | | | 10,191 | | | | 815,789 | |
Six Flags Entertainment Corp. (a) (b) | | | 8,338 | | | | 342,942 | |
| | | | | | | | 2,747,395 | |
Environmental Control — 0.5% | | | | |
Clean Harbors, Inc. (a) | | | 5,546 | | | | 624,147 | |
Stericycle, Inc. (a) | | | 10,074 | | | | 674,152 | |
Tetra Tech, Inc. (b) | | | 5,981 | | | | 1,050,622 | |
| | | | | | | | 2,348,921 | |
Food — 1.0% | | | | |
Flowers Foods, Inc. | | | 21,661 | | | | 536,110 | |
Grocery Outlet Holding Corp. (a) (b) | | | 9,535 | | | | 211,582 | |
Ingredion, Inc. | | | 7,384 | | | | 703,178 | |
Lancaster Colony Corp. (b) | | | 2,154 | | | | 366,180 | |
Performance Food Group Co. (a) | | | 16,713 | | | | 755,929 | |
Pilgrim’s Pride Corp. (a) | | | 5,357 | | | | 150,853 | |
Post Holdings, Inc. (b) | | | 6,585 | | | | 668,246 | |
Sanderson Farms, Inc. | | | 2,184 | | | | 413,759 | |
Sprouts Farmers Market, Inc. (a) (b) | | | 12,967 | | | | 287,089 | |
The Hain Celestial Group, Inc. (a) (b) | | | 9,006 | | | | 404,099 | |
Tootsie Roll Industries, Inc. (b) | | | 1,956 | | | | 61,907 | |
| | | | | | | | 4,558,932 | |
Gas — 0.6% | | | | |
National Fuel Gas Co. | | | 10,024 | | | | 575,678 | |
New Jersey Resources Corp. | | | 10,580 | | | | 400,030 | |
ONE Gas, Inc. | | | 5,856 | | | | 394,109 | |
Spire, Inc. | | | 5,677 | | | | 356,289 | |
UGI Corp. | | | 22,937 | | | | 995,695 | |
| | | | | | | | 2,721,801 | |
Hand/Machine Tools — 0.6% | | | | |
Kennametal, Inc. (b) | | | 9,185 | | | | 365,104 | |
Lincoln Electric Holdings, Inc. (b) | | | 6,561 | | | | 934,286 | |
MSA Safety, Inc. | | | 4,001 | | | | 612,273 | |
Regal Beloit Corp. | | | 7,357 | | | | 1,120,692 | |
| | | | | | | | 3,032,355 | |
Healthcare-Products — 2.5% | | | | |
Envista Holdings Corp. (a) (b) | | | 17,637 | | | | 689,607 | |
Globus Medical, Inc. (a) | | | 8,496 | | | | 655,636 | |
Haemonetics Corp. (a) | | | 5,593 | | | | 384,295 | |
Hill-Rom Holdings, Inc. | | | 7,300 | | | | 1,130,770 | |
ICU Medical, Inc. (a) | | | 2,164 | | | | 506,657 | |
Integra LifeSciences Holdings Corp. (a) | | | 7,801 | | | | 518,454 | |
| | | Shares | | | Value | |
Healthcare-Products — 2.5% (Continued) |
LivaNova PLC (a) (b) | | | 5,350 | | | $ | 410,452 | |
Masimo Corp. (a) | | | 5,590 | | | | 1,584,989 | |
Neogen Corp. (a) | | | 11,726 | | | | 496,127 | |
NuVasive, Inc. (a) (b) | | | 5,647 | | | | 301,324 | |
Patterson Cos., Inc. (b) | | | 9,568 | | | | 299,096 | |
Penumbra, Inc. (a) (b) | | | 3,731 | | | | 1,031,808 | |
Quidel Corp. (a) | | | 4,231 | | | | 561,750 | |
Repligen Corp. (a) | | | 5,603 | | | | 1,627,672 | |
STAAR Surgical Co. (a) (b) | | | 5,115 | | | | 605,923 | |
Tandem Diabetes Care, Inc. (a) (b) | | | 6,883 | | | | 938,359 | |
| | | | | | | | 11,742,919 | |
Healthcare-Services — 1.7% | | | | |
Acadia Healthcare Co., Inc. (a) | | | 9,791 | | | | 607,042 | |
Amedisys, Inc. (a) | | | 3,607 | | | | 610,809 | |
Chemed Corp. | | | 1,755 | | | | 846,349 | |
Encompass Health Corp. | | | 10,921 | | | | 694,139 | |
LHC Group, Inc. (a) | | | 3,471 | | | | 467,162 | |
Medpace Holdings, Inc. (a) (b) | | | 3,025 | | | | 685,314 | |
Molina Healthcare, Inc. (a) | | | 6,377 | | | | 1,885,806 | |
R1 RCM, Inc. (a) | | | 15,138 | | | | 328,495 | |
Syneos Health, Inc. (a) | | | 11,073 | | | | 1,033,554 | |
Tenet Healthcare Corp. (a) (b) | | | 11,673 | | | | 836,487 | |
| | | | | | | | 7,995,157 | |
Home Builders — 0.5% | | | | |
KB Home (b) | | | 9,782 | | | | 392,747 | |
Taylor Morrison Home Corp. (a) (b) | | | 14,172 | | | | 432,671 | |
Thor Industries, Inc. (b) | | | 6,089 | | | | 620,835 | |
Toll Brothers, Inc. | | | 12,320 | | | | 741,294 | |
Tri Pointe Homes, Inc. (a) | | | 13,111 | | | | 317,155 | |
| | | | | | | | 2,504,702 | |
Home Furnishings — 0.3% | | | | |
Herman Miller, Inc. (b) | | | 7,962 | | | | 309,881 | |
Tempur Sealy International, Inc. | | | 21,000 | | | | 933,870 | |
| | | | | | | | 1,243,751 | |
Household Products/Wares — 0.1% | | | | |
Helen of Troy Ltd. (a) (b) | | | 2,678 | | | | 602,416 | |
| | | | | |
Housewares — 0.1% | | | | |
The Scotts Miracle-Gro Co. | | | 4,470 | | | | 663,616 | |
| | | | | |
Insurance — 2.4% | | | | |
Alleghany Corp. (a) | | | 1,536 | | | | 1,000,520 | |
American Financial Group, Inc. | | | 6,975 | | | | 948,879 | |
Brighthouse Financial, Inc. (a) | | | 9,623 | | | | 483,363 | |
CNO Financial Group, Inc. | | | 14,820 | | | | 357,755 | |
Essent Group Ltd. - | | | 12,414 | | | | 595,872 | |
First American Financial Corp. | | | 12,086 | | | | 883,970 | |
Kemper Corp. | | | 6,768 | | | | 429,633 | |
Kinsale Capital Group, Inc. (b) | | | 2,355 | | | | 440,738 | |
The accompanying notes are an integral part of the financial statements.
53
Pacer Trendpilot® US Mid Cap ETF
SCHEDULE OF INVESTMENTS
October 31, 2021 (Unaudited) (Continued)
| | | Shares | | | Value | |
COMMON STOCKS — 51.1% (Continued) |
Insurance — 2.4% (Continued) |
Mercury General Corp. | | | 2,923 | | | $ | 159,274 | |
MGIC Investment Corp. (b) | | | 37,248 | | | | 601,928 | |
Old Republic International Corp. | | | 31,118 | | | | 803,778 | |
Primerica, Inc. | | | 4,324 | | | | 727,470 | |
Reinsurance Group of America, Inc. | | | 7,474 | | | | 882,530 | |
RenaissanceRe Holdings Ltd. - | | | 4,979 | | | | 706,022 | |
RLI Corp. (b) | | | 4,366 | | | | 472,882 | |
Selective Insurance Group, Inc. | | | 6,585 | | | | 516,066 | |
The Hanover Insurance Group, Inc. | | | 3,997 | | | | 503,622 | |
Unum Group | | | 21,626 | | | | 550,814 | |
| | | | | | | | 11,065,116 | |
Internet — 0.2% | | | | |
Mimecast Ltd. (a) | | | 6,455 | | | | 486,965 | |
TripAdvisor, Inc. (a) | | | 10,598 | | | | 349,416 | |
Yelp, Inc. (a) (b) | | | 7,748 | | | | 299,306 | |
| | | | | | | | 1,135,687 | |
Iron/Steel — 1.0% | | | | |
Cleveland-Cliffs, Inc. (a) (b) | | | 50,490 | | | | 1,217,314 | |
Commercial Metals Co. | | | 13,201 | | | | 424,808 | |
Reliance Steel & Aluminum Co. | | | 6,996 | | | | 1,022,535 | |
Steel Dynamics, Inc. | | | 20,499 | | | | 1,354,574 | |
United States Steel Corp. (b) | | | 28,872 | | | | 761,932 | |
| | | | | | | | 4,781,163 | |
Leisure Time — 0.7% | | | | |
Brunswick Corp. | | | 8,554 | | | | 796,292 | |
Callaway Golf Co. (a) | | | 12,740 | | | | 344,617 | |
Harley-Davidson, Inc. | | | 16,863 | | | | 615,331 | |
Polaris, Inc. (b) | | | 6,402 | | | | 735,910 | |
YETI Holdings, Inc. (a) | | | 9,243 | | | | 908,864 | |
| | | | | | | | 3,401,014 | |
Lodging — 0.5% | | | | |
Boyd Gaming Corp. (a) (b) | | | 8,862 | | | | 565,218 | |
Choice Hotels International, Inc. (b) | | | 3,470 | | | | 487,952 | |
Travel + Leisure Co. | | | 9,448 | | | | 513,404 | |
Wyndham Hotels & Resorts, Inc. | | | 10,248 | | | | 865,649 | |
| | | | | | | | 2,432,223 | |
Machinery-Construction & Mining — 0.2% | | | | |
Oshkosh Corp. | | | 7,522 | | | | 804,854 | |
Terex Corp. | | | 7,628 | | | | 341,734 | |
| | | | | | | | 1,146,588 | |
Machinery-Diversified — 2.1% | | | | |
AGCO Corp. | | | 6,789 | | | | 829,684 | |
Cognex Corp. | | | 19,366 | | | | 1,696,268 | |
Colfax Corp. (a) (b) | | | 13,696 | | | | 706,987 | |
Crane Co. | | | 5,438 | | | | 561,637 | |
Curtiss-Wright Corp. | | | 4,501 | | | | 574,688 | |
Flowserve Corp. (b) | | | 14,335 | | | | 481,943 | |
Graco, Inc. | | | 18,566 | | | | 1,395,792 | |
| | | Shares | | | Value | |
Machinery-Diversified — 2.1% (Continued) |
Nordson Corp. | | | 5,943 | | | $ | 1,510,770 | |
The Middleby Corp. | | | 6,119 | | | | 1,116,350 | |
The Toro Co. | | | 11,832 | | | | 1,129,601 | |
| | | | | | | | 10,003,720 | |
Media — 1.0% | | | | |
Cable One, Inc. (b) | | | 526 | | | | 900,096 | |
FactSet Research Systems, Inc. | | | 4,177 | | | | 1,854,129 | |
TEGNA, Inc. | | | 24,157 | | | | 474,927 | |
The New York Times Co. - Class A | | | 17,683 | | | | 965,315 | |
World Wrestling Entertainment, Inc. - Class A (b) | | | 5,138 | | | | 313,880 | |
| | | | | | | | 4,508,347 | |
Metal Fabricate/Hardware — 0.3% | | | | |
The Timken Co. | | | 7,494 | | | | 531,699 | |
Valmont Industries, Inc. | | | 2,341 | | | | 559,406 | |
Worthington Industries, Inc. (b) | | | 3,790 | | | | 205,873 | |
| | | | | | | | 1,296,978 | |
Mining — 0.2% | | | | |
Compass Minerals International, Inc. (b) | | | 3,732 | | | | 244,819 | |
Royal Gold, Inc. (b) | | | 7,217 | | | | 714,628 | |
| | | | | | | | 959,447 | |
Miscellaneous Manufacturing — 1.0% | | | | |
Axon Enterprise, Inc. (a) | | | 7,020 | | | | 1,263,319 | |
Carlisle Cos., Inc. | | | 5,641 | | | | 1,257,492 | |
Donaldson Co., Inc. | | | 13,872 | | | | 832,459 | |
ITT, Inc. | | | 9,508 | | | | 894,418 | |
Trinity Industries, Inc. (b) | | | 9,030 | | | | 253,291 | |
| | | | | | | | 4,500,979 | |
Office/Business Equipment — 0.1% | | | | |
Xerox Holdings Corp. | | | 14,525 | | | | 258,545 | |
| | | | | |
Oil & Gas — 0.4% | | | | |
CNX Resources Corp. (a) (b) | | | 24,181 | | | | 353,284 | |
EQT Corp. (a) (b) | | | 30,681 | | | | 610,859 | |
HollyFrontier Corp. | | | 16,393 | | | | 554,083 | |
Murphy Oil Corp. (b) | | | 15,885 | | | | 442,080 | |
| | | | | | | | 1,960,306 | |
Oil & Gas Services — 0.2% | | | | |
ChampionX Corp. (a) | | | 20,501 | | | | 537,741 | |
NOV, Inc. (a) (b) | | | 41,345 | | | | 579,657 | |
| | | | | | | | 1,117,398 | |
Packaging & Containers — 0.4% | | | | |
AptarGroup, Inc. | | | 7,165 | | | | 865,389 | |
Greif, Inc. - Class A | | | 2,913 | | | | 188,413 | |
Silgan Holdings, Inc. | | | 8,592 | | | | 345,398 | |
Sonoco Products Co. | | | 11,047 | | | | 640,174 | |
| | | | | | | | 2,039,374 | |
The accompanying notes are an integral part of the financial statements.
54
Pacer Trendpilot® US Mid Cap ETF
SCHEDULE OF INVESTMENTS
October 31, 2021 (Unaudited) (Continued)
| | | Shares | | | Value | |
COMMON STOCKS — 51.1% (Continued) |
Pharmaceuticals — 0.6% | | | | |
Jazz Pharmaceuticals PLC (a) | | | 6,610 | | | $ | 879,394 | |
Neurocrine Biosciences, Inc. (a) | | | 10,329 | | | | 1,088,780 | |
Option Care Health, Inc. (a) (b) | | | 13,693 | | | | 374,230 | |
Perrigo Co. PLC | | | 14,143 | | | | 638,556 | |
| | | | | | | | 2,980,960 | |
Pipelines — 0.6% | | | | |
Antero Midstream Corp. | | | 31,480 | | | | 334,947 | |
DT Midstream, Inc. | | | 10,243 | | | | 491,254 | |
Equitrans Midstream Corp. | | | 44,869 | | | | 462,599 | |
Targa Resources Corp. | | | 25,056 | | | | 1,369,812 | |
| | | | | | | | 2,658,612 | |
Real Estate — 0.3% | | | | |
Jones Lang LaSalle, Inc. (a) | | | 5,621 | | | | 1,451,511 | |
| | | | | |
Retail — 3.5% | | | | |
American Eagle Outfitters, Inc. (b) | | | 16,449 | | | | 390,499 | |
AutoNation, Inc. (a) | | | 4,605 | | | | 557,758 | |
BJ’s Wholesale Club Holdings, Inc. (a) (b) | | | 15,097 | | | | 882,269 | |
Casey’s General Stores, Inc. | | | 4,057 | | | | 777,078 | |
Cracker Barrel Old Country Store, Inc. (b) | | | 2,611 | | | | 347,707 | |
Dick’s Sporting Goods, Inc. (b) | | | 7,231 | | | | 898,162 | |
FirstCash, Inc. | | | 4,511 | | | | 399,088 | |
Five Below, Inc. (a) | | | 6,139 | | | | 1,211,225 | |
Foot Locker, Inc. | | | 9,526 | | | | 454,104 | |
GameStop Corp. (a) (b) | | | 6,771 | | | | 1,242,546 | |
Jack in the Box, Inc. (b) | | | 2,508 | | | | 248,167 | |
Kohl’s Corp. (b) | | | 17,338 | | | | 841,413 | |
Lithia Motors, Inc. (b) | | | 3,242 | | | | 1,034,911 | |
MSC Industrial Direct Co., Inc. | | | 5,137 | | | | 431,868 | |
Murphy USA, Inc. (b) | | | 2,570 | | | | 418,781 | |
Nordstrom, Inc. (a) | | | 11,980 | | | | 344,185 | |
Nu Skin Enterprises, Inc. (b) | | | 5,591 | | | | 224,479 | |
Ollie’s Bargain Outlet Holdings, Inc. (a) | | | 6,262 | | | | 423,687 | |
Papa John’s International, Inc. (a) | | | 3,622 | | | | 449,418 | |
RH (a) (b) | | | 1,795 | | | | 1,184,036 | |
Texas Roadhouse, Inc. | | | 7,191 | | | | 638,633 | |
The Wendy’s Co. | | | 19,695 | | | | 439,198 | |
Victoria’s Secret & Co. (a) | | | 7,938 | | | | 400,631 | |
Williams-Sonoma, Inc. (b) | | | 8,210 | | | | 1,524,843 | |
Wingstop, Inc. (b) | | | 3,266 | | | | 563,287 | |
| | | | | | | | 16,327,973 | |
Savings & Loans — 0.3% | | | | |
New York Community Bancorp, Inc. (b) | | | 51,232 | | | | 636,814 | |
Sterling Bancorp (b) | | | 21,281 | | | | 541,601 | |
| | | Shares | | | Value | |
Savings & Loans — 0.3% (Continued) |
Washington Federal, Inc. | | | 7,378 | | | $ | 260,886 | |
| | | | | | | | 1,439,301 | |
Semiconductors — 1.6% | | | | |
Amkor Technology, Inc. | | | 11,775 | | | | 258,108 | |
Brooks Automation, Inc. | | | 8,165 | | | | 950,814 | |
Cirrus Logic, Inc. (a) | | | 6,387 | | | | 516,134 | |
CMC Materials, Inc. (b) | | | 3,206 | | | | 411,554 | |
Lattice Semiconductor Corp. (a) | | | 14,927 | | | | 1,036,531 | |
MKS Instruments, Inc. | | | 6,069 | | | | 910,653 | |
Semtech Corp. (a) | | | 7,151 | | | | 608,050 | |
Silicon Laboratories, Inc. (a) (b) | | | 4,290 | | | | 809,780 | |
Synaptics, Inc. (a) (b) | | | 3,842 | | | | 747,538 | |
Wolfspeed, Inc. (a) (b) | | | 12,221 | | | | 1,467,864 | |
| | | | | | | | 7,717,026 | |
Software — 2.0% | | | | |
ACI Worldwide, Inc. (a) (b) | | | 12,887 | | | | 395,373 | |
Aspen Technology, Inc. (a) | | | 7,408 | | | | 1,160,760 | |
Blackbaud, Inc. (a) (b) | | | 4,447 | | | | 315,781 | |
CDK Global, Inc. (b) | | | 13,391 | | | | 582,776 | |
Cerence, Inc. (a) (b) | | | 4,014 | | | | 421,992 | |
CommVault Systems, Inc. (a) (b) | | | 5,167 | | | | 317,770 | |
Concentrix Corp. | | | 4,571 | | | | 812,175 | |
Consensus Cloud Solutions, Inc. (a) | | | 0 | | | | 21 | |
Digital Turbine, Inc. (a) (b) | | | 9,244 | | | | 795,539 | |
Envestnet, Inc. (a) (b) | | | 5,942 | | | | 496,157 | |
Fair Isaac Corp. (a) | | | 2,993 | | | | 1,191,813 | |
J2 Global, Inc. (b) | | | 5,088 | | | | 652,638 | |
Manhattan Associates, Inc. (a) | | | 7,021 | | | | 1,274,592 | |
Sailpoint Technologies Holdings, Inc. (a) (b) | | | 10,057 | | | | 482,535 | |
Teradata Corp. (a) (b) | | | 11,989 | | | | 678,098 | |
| | | | | | | | 9,578,020 | |
Telecommunications — 0.5% | | | | |
Ciena Corp. (a) | | | 17,066 | | | | 926,513 | |
Iridium Communications, Inc. (a) (b) | | | 13,951 | | | | 565,713 | |
Telephone and Data Systems, Inc. | | | 10,959 | | | | 205,372 | |
Viasat, Inc. (a) (b) | | | 7,152 | | | | 426,903 | |
| | | | | | | | 2,124,501 | |
Toys/Games/Hobbies — 0.2% | | | | |
Mattel, Inc. (a) (b) | | | 38,304 | | | | 835,410 | |
| | | | | |
Transportation — 1.0% | | | | |
Kirby Corp. (a) | | | 6,605 | | | | 346,168 | |
Knight-Swift Transportation Holdings, Inc. | | | 17,554 | | | | 995,136 | |
Landstar System, Inc. | | | 4,218 | | | | 741,566 | |
Ryder System, Inc. | | | 5,904 | | | | 501,545 | |
Saia, Inc. (a) | | | 2,819 | | | | 881,332 | |
Werner Enterprises, Inc. (b) | | | 6,280 | | | | 284,610 | |
The accompanying notes are an integral part of the financial statements.
55
Pacer Trendpilot® US Mid Cap ETF
SCHEDULE OF INVESTMENTS
October 31, 2021 (Unaudited) (Continued)
| | | Shares | | | Value | |
COMMON STOCKS — 51.1% (Continued) |
Transportation — 1.0% (Continued) |
XPO Logistics, Inc. (a) | | | 10,430 | | | $ | 894,894 | |
| | | | | | | | 4,645,251 | |
Trucking & Leasing — 0.1% | | | | |
GATX Corp. (b) | | | 3,860 | | | | 366,121 | |
| | | | | |
Water — 0.2% | | | | |
Essential Utilities, Inc. | | | 24,562 | | | | 1,156,133 | |
TOTAL COMMON STOCKS (Cost $179,026,462) | | | | | | | 240,615,758 | |
| | | | | |
REAL ESTATE INVESTMENT TRUSTS — 5.3% | | | | |
American Campus Communities, Inc. | | | 15,145 | | | | 813,589 | |
Apartment Income REIT Corp. | | | 16,382 | | | | 878,239 | |
Brixmor Property Group, Inc. | | | 32,642 | | | | 765,128 | |
Camden Property Trust | | | 10,733 | | | | 1,750,552 | |
CoreSite Realty Corp. | | | 4,704 | | | | 670,132 | |
Corporate Office Properties Trust (b) | | | 12,342 | | | | 334,715 | |
Cousins Properties, Inc. (b) | | | 16,337 | | | | 647,109 | |
CyrusOne, Inc. | | | 13,262 | | | | 1,087,749 | |
Douglas Emmett, Inc. | | | 18,138 | | | | 592,750 | |
EastGroup Properties, Inc. | | | 4,359 | | | | 862,123 | |
EPR Properties (b) | | | 8,223 | | | | 412,877 | |
First Industrial Realty Trust, Inc. | | | 14,204 | | | | 827,099 | |
Healthcare Realty Trust, Inc. (b) | | | 15,371 | | | | 508,165 | |
Highwoods Properties, Inc. | | | 11,440 | | | | 512,970 | |
Hudson Pacific Properties, Inc. (b) | | | 16,598 | | | | 427,398 | |
JBG SMITH Properties | | | 12,152 | | | | 350,707 | |
Kilroy Realty Corp. | | | 11,647 | | | | 784,775 | |
Kite Realty Group Trust | | | 23,747 | | | | 482,064 | |
Lamar Advertising Co. - Class A | | | 9,508 | | | | 1,076,306 | |
Life Storage, Inc. | | | 8,296 | | | | 1,110,088 | |
Medical Properties Trust, Inc. (b) | | | 63,807 | | | | 1,361,003 | |
National Retail Properties, Inc. | | | 19,276 | | | | 874,359 | |
National Storage Affiliates Trust | | | 8,633 | | | | 539,217 | |
Omega Healthcare Investors, Inc. (b) | | | 25,492 | | | | 748,445 | |
Park Hotels & Resorts, Inc. (a) (b) | | | 26,005 | | | | 481,873 | |
Pebblebrook Hotel Trust (b) | | | 14,441 | | | | 324,345 | |
Physicians Realty Trust (b) | | | 23,164 | | | | 440,348 | |
PotlatchDeltic Corp. | | | 7,365 | | | | 384,968 | |
PS Business Parks, Inc. | | | 2,205 | | | | 391,828 | |
Rayonier, Inc. (b) | | | 15,157 | | | | 565,811 | |
Rexford Industrial Realty, Inc. | | | 14,457 | | | | 971,510 | |
Sabra Health Care REIT, Inc. | | | 23,184 | | | | 328,054 | |
SL Green Realty Corp. (b) | | | 7,625 | | | | 534,284 | |
Spirit Realty Capital, Inc. | | | 12,633 | | | | 618,133 | |
STORE Capital Corp. | | | 26,390 | | | | 905,969 | |
The Macerich Co. (b) | | | 22,532 | | | | 407,604 | |
| | | Shares | | | Value | |
REAL ESTATE INVESTMENT TRUSTS — 5.3% (Continued) |
Urban Edge Properties | | | 12,099 | | | $ | 212,095 | |
TOTAL REAL ESTATE INVESTMENT TRUSTS (Cost $19,343,175) | | | | | | | 24,984,381 | |
| | | | | |
| | | Principal
Amount | | | | | |
SHORT-TERM INVESTMENTS — 43.6% | | | | |
Money Market Deposit Accounts — 10.3% | | | | |
U.S. Bank Money Market Deposit Account, 0.003% (c) | | $ | 48,375,103 | | | | 48,375,103 | |
| | | | | |
U.S. Treasury Bill — 33.3% | | | | |
0.000% 11/18/2021 (a) (b) | | | 156,787,000 | | | | 156,783,470 | |
TOTAL SHORT-TERM INVESTMENTS (Cost $205,158,389) | | | | | | | 205,158,573 | |
| | | | | |
| | | Shares | | | | | |
INVESTMENTS PURCHASED WITH PROCEEDS FROM SECURITIES LENDING — 14.3% |
Mount Vernon Liquid Assets Portfolio, LLC, 0.10% (c) | | | 67,335,599 | | | | 67,335,599 | |
TOTAL INVESTMENTS PURCHASED WITH PROCEEDS FROM SECURITIES LENDING (Cost $67,335,599) | | | | | | | 67,335,599 | |
| | | | | |
Total Investments (Cost $470,863,625) — 114.3% | | | | | | | 538,094,311 | |
Liabilities in Excess of Other Assets — (14.3)% | | | | | | | (67,470,558 | ) |
TOTAL NET ASSETS — 100.0% | | | | | | $ | 470,623,753 | |
Percentages are stated as a percent of net assets.
| | (a) | Non-income producing security. |
| | (b) | All or a portion of this security is on loan as of October 31, 2021. The total value of securities on loan is $65,936,788 or 14.0% of net assets. |
| | (c) | The rate shown is as of October 31, 2021. |
For Fund compliance purposes, the Fund’s industry classifications refer to any one or more of the industry sub-classifications used by one or more widely recognized market indexes or ratings group indexes, and/or they may be defined by Fund management. This definition does not apply for all purposes of this report, which may combine sub-classifications for reporting ease. Categories are shown as a percentage of net assets.
The accompanying notes are an integral part of the financial statements.
56
Pacer Trendpilot® 100 ETF
SCHEDULE OF INVESTMENTS
October 31, 2021 (Unaudited)
| | | Shares | | | Value | |
COMMON STOCKS — 57.2% | | | | |
Auto Manufacturers — 3.5% | | | | |
PACCAR, Inc. | | | 10,851 | | | $ | 972,467 | |
Tesla Motors, Inc. (a) | | | 24,658 | | | | 27,469,012 | |
| | | | | | | | 28,441,479 | |
Beverages — 1.2% | | | | |
Keurig Dr Pepper, Inc. | | | 44,172 | | | | 1,594,167 | |
Monster Beverage Corp. (a) | | | 16,509 | | | | 1,403,265 | |
PepsiCo, Inc. | | | 42,740 | | | | 6,906,784 | |
| | | | | | | | 9,904,216 | |
Biotechnology — 2.3% | | | | |
Amgen, Inc. | | | 17,559 | | | | 3,634,186 | |
Biogen, Inc. (a) | | | 4,770 | | | | 1,272,063 | |
Gilead Sciences, Inc. | | | 39,345 | | | | 2,552,704 | |
Illumina, Inc. (a) | | | 4,837 | | | | 2,007,645 | |
Incyte Corp. (a) | | | 6,601 | | | | 442,135 | |
Moderna, Inc. (a) | | | 12,428 | | | | 4,290,270 | |
Regeneron Pharmaceuticals, Inc. (a) | | | 3,318 | | | | 2,123,321 | |
Seagen, Inc. (a) | | | 5,663 | | | | 998,557 | |
Vertex Pharmaceuticals, Inc. (a) | | | 8,162 | | | | 1,509,399 | |
| | | | | | | | 18,830,280 | |
Commercial Services — 1.7% | | | | |
Automatic Data Processing, Inc. | | | 13,088 | | | | 2,938,125 | |
Cintas Corp. | | | 3,293 | | | | 1,426,198 | |
PayPal Holdings, Inc. (a) | | | 36,604 | | | | 8,513,724 | |
Verisk Analytics, Inc. | | | 4,903 | | | | 1,030,954 | |
| | | | | | | | 13,909,001 | |
Computers — 6.6% | | | | |
Apple, Inc. | | | 335,918 | | | | 50,320,517 | |
Check Point Software Technologies Ltd. (a) | | | 4,219 | | | | 504,592 | |
Cognizant Technology Solutions Corp. (b) | | | 16,317 | | | | 1,274,195 | |
Crowdstrike Holdings, Inc. - Class A (a) (b) | | | 4,638 | | | | 1,306,988 | |
| | | | | | | | 53,406,292 | |
Distribution/Wholesale — 0.3% | | | | |
Copart, Inc. (a) | | | 7,068 | | | | 1,097,590 | |
Fastenal Co. | | | 17,269 | | | | 985,714 | |
| | | | | | | | 2,083,304 | |
Electric — 0.5% | | | | |
American Electric Power Co., Inc. | | | 15,590 | | | | 1,320,629 | |
Exelon Corp. | | | 30,520 | | | | 1,623,359 | |
Xcel Energy, Inc. | | | 16,800 | | | | 1,085,112 | |
| | | | | | | | 4,029,100 | |
Electronics — 0.6% | | | | |
Honeywell International, Inc. | | | 21,569 | | | | 4,715,415 | |
| | | | | |
| | | Shares | | | Value | |
Food — 0.5% | | | | |
Mondelez International, Inc. | | | 44,130 | | | $ | 2,680,456 | |
The Kraft Heinz Co. (b) | | | 38,225 | | | | 1,371,895 | |
| | | | | | | | 4,052,351 | |
Healthcare-Products — 0.9% | | | | |
Align Technology, Inc. (a) | | | 2,486 | | | | 1,552,184 | |
IDEXX Laboratories, Inc. (a) | | | 2,678 | | | | 1,783,923 | |
Intuitive Surgical, Inc. (a) | | | 11,076 | | | | 3,999,876 | |
| | | | | | | | 7,335,983 | |
Internet — 13.9% | | | | |
Alphabet, Inc. - Class A (a) | | | 6,119 | | | | 18,117,869 | |
Alphabet, Inc. - Class C (a) | | | 6,511 | | | | 19,307,785 | |
Amazon.com, Inc. (a) | | | 10,294 | | | | 34,715,794 | |
Baidu, Inc. - ADR (a) | | | 7,817 | | | | 1,268,230 | |
Booking Holdings, Inc. (a) | | | 1,272 | | | | 3,079,232 | |
CDW Corp. | | | 4,308 | | | | 804,088 | |
eBay, Inc. (b) | | | 20,101 | | | | 1,542,149 | |
JD.com, Inc. - ADR (a) | | | 24,410 | | | | 1,910,815 | |
Match Group, Inc. (a) (b) | | | 8,374 | | | | 1,262,632 | |
MercadoLibre, Inc. (a) | | | 1,534 | | | | 2,271,885 | |
Meta Platforms, Inc. - Class A (a) | | | 48,445 | | | | 15,675,349 | |
Netflix, Inc. (a) | | | 13,685 | | | | 9,446,892 | |
Okta, Inc. (a) | | | 4,442 | | | | 1,097,974 | |
Pinduoduo, Inc. - ADR (a) | | | 11,843 | | | | 1,053,080 | |
Trip.com Group Ltd. - ADR (a) | | | 15,729 | | | | 449,220 | |
VeriSign, Inc. (a) | | | 3,480 | | | | 774,892 | |
| | | | | | | | 112,777,886 | |
Leisure Time — 0.1% | | | | |
Peloton Interactive, Inc. - Class A (a) (b) | | | 8,038 | | | | 734,995 | |
| | | | | |
Lodging — 0.2% | | | | |
Marriott International Inc/MD (a) | | | 10,139 | | | | 1,622,443 | |
| | | | | |
Media — 1.5% | | | | |
Charter Communications, Inc. - Class A (a) (b) | | | 5,686 | | | | 3,837,425 | |
Comcast Corp. - Class A | | | 141,638 | | | | 7,284,442 | |
Fox Corp. - Class A (b) | | | 10,360 | | | | 411,706 | |
Fox Corp. - Class B | | | 7,857 | | | | 290,395 | |
Sirius XM Holdings, Inc. (b) | | | 130,488 | | | | 794,672 | |
| | | | | | | | 12,618,640 | |
Pharmaceuticals — 0.2% | | | | |
DexCom, Inc. (a) | | | 3,017 | | | | 1,880,224 | |
| | | | | |
Retail — 2.1% | | | | |
Costco Wholesale Corp. | | | 13,676 | | | | 6,722,301 | |
Dollar Tree, Inc. (a) | | | 7,159 | | | | 771,454 | |
Lululemon Athletica, Inc. (a) | | | 3,920 | | | | 1,826,759 | |
O’Reilly Automotive, Inc. (a) | | | 2,240 | | | | 1,393,997 | |
The accompanying notes are an integral part of the financial statements.
57
Pacer Trendpilot® 100 ETF
SCHEDULE OF INVESTMENTS
October 31, 2021 (Unaudited) (Continued)
| | | Shares | | | Value | |
COMMON STOCKS — 57.2% (Continued) |
Retail — 2.1% (Continued) |
Ross Stores, Inc. | | | 11,150 | | | $ | 1,262,180 | |
Starbucks Corp. | | | 36,840 | | | | 3,907,619 | |
Walgreens Boots Alliance, Inc. | | | 27,003 | | | | 1,269,681 | |
| | | | | | | | 17,153,991 | |
Semiconductors — 8.6% | | | | |
Advanced Micro Devices, Inc. (a) | | | 37,759 | | | | 4,539,765 | |
Analog Devices, Inc. | | | 16,678 | | | | 2,893,466 | |
Applied Materials, Inc. | | | 27,928 | | | | 3,816,361 | |
ASML Holding NV (b) | | | 2,520 | | | | 2,048,458 | |
Broadcom, Inc. | | | 12,703 | | | | 6,753,804 | |
Intel Corp. | | | 125,457 | | | | 6,147,393 | |
KLA Corp. | | | 4,817 | | | | 1,795,585 | |
Lam Research Corp. | | | 4,392 | | | | 2,475,199 | |
Marvell Technology, Inc. | | | 25,640 | | | | 1,756,340 | |
Microchip Technology, Inc. | | | 16,828 | | | | 1,246,787 | |
Micron Technology, Inc. | | | 34,948 | | | | 2,414,907 | |
NVIDIA Corp. | | | 77,305 | | | | 19,764,569 | |
NXP Semiconductors NV | | | 8,203 | | | | 1,647,655 | |
QUALCOMM, Inc. | | | 34,885 | | | | 4,641,100 | |
Skyworks Solutions, Inc. | | | 5,040 | | | | 842,335 | |
Texas Instruments, Inc. | | | 28,832 | | | | 5,405,423 | |
Xilinx, Inc. | | | 7,669 | | | | 1,380,420 | |
| | | | | | | | 69,569,567 | |
Software — 10.8% | | | | |
Activision Blizzard, Inc. | | | 24,269 | | | | 1,897,593 | |
Adobe, Inc. (a) | | | 14,736 | | | | 9,583,705 | |
ANSYS, Inc. (a) | | | 2,721 | | | | 1,032,837 | |
Atlassian Corp. PLC - Class A (a) | | | 4,174 | | | | 1,912,235 | |
Autodesk, Inc. (a) | | | 6,901 | | | | 2,191,827 | |
Cadence Design System, Inc. (a) | | | 8,718 | | | | 1,509,173 | |
Cerner Corp. | | | 9,219 | | | | 684,880 | |
DocuSign, Inc. (a) | | | 5,842 | | | | 1,625,770 | |
Electronic Arts, Inc. | | | 8,988 | | | | 1,260,567 | |
Fiserv, Inc. (a) | | | 21,038 | | | | 2,072,033 | |
Intuit, Inc. (b) | | | 8,565 | | | | 5,361,604 | |
Microsoft Corp. | | | 152,715 | | | | 50,643,348 | |
NetEase, Inc. - ADR | | | 9,629 | | | | 939,694 | |
Paychex, Inc. | | | 11,272 | | | | 1,389,612 | |
Splunk, Inc. (a) | | | 5,054 | | | | 833,000 | |
Synopsys, Inc. (a) | | | 4,761 | | | | 1,586,270 | |
Workday, Inc. - Class A (a) | | | 5,911 | | | | 1,714,072 | |
Zoom Video Communications, Inc. - Class A (a) | | | 7,392 | | | | 2,030,213 | |
| | | | | | | | 88,268,433 | |
Telecommunications — 1.4% | | | | |
Cisco Systems, Inc. | | | 130,318 | | | | 7,293,899 | |
T-Mobile US, Inc. (a) | | | 38,944 | | | | 4,479,728 | |
| | | | | | | | 11,773,627 | |
| | | Shares | | | Value | |
Transportation — 0.3% | | | | |
CSX Corp. | | | 69,718 | | | $ | 2,521,700 | |
TOTAL COMMON STOCKS (Cost $271,636,534) | | | | | | | 465,628,927 | |
| | | | | |
| | | Principal
Amount | | | | | |
SHORT-TERM INVESTMENTS — 43.0% | | | | |
Money Market Deposit Accounts — 6.3% | | | | |
U.S. Bank Money Market Deposit Account, 0.003% (c) | | $ | 50,795,176 | | | | 50,795,176 | |
| | | | | |
U.S. Treasury Bill — 36.7% | | | | |
0.00%, 01/13/2022 (a) | | | 298,932,000 | | | | 298,898,558 | |
TOTAL SHORT-TERM INVESTMENTS (Cost $349,701,413) | | | | | | | 349,693,734 | |
| | | | | |
| | | Shares | | | | | |
INVESTMENTS PURCHASED WITH PROCEEDS FROM SECURITIES LENDING — 1.3% |
Mount Vernon Liquid Assets Portfolio, LLC, 0.10% (c) | | | 10,310,192 | | | | 10,310,192 | |
TOTAL INVESTMENTS PURCHASED WITH PROCEEDS FROM SECURITIES LENDING (Cost $10,310,192) | | | | | | | 10,310,192 | |
| | | | | |
Total Investments (Cost $631,648,139) — 101.5% | | | | | | | 825,632,853 | |
Liabilities in Excess of Other Assets — (1.5)% | | | | | | | (12,147,952 | ) |
TOTAL NET ASSETS — 100.0% | | | | | | $ | 813,484,901 | |
Percentages are stated as a percent of net assets.
ADR American Depositary Receipt
| | (a) | Non-income producing security. |
| | (b) | All or a portion of this security is on loan as of October 31, 2021. The total value of securities on loan is $10,138,298 or 1.2% of net assets. |
| | (c) | The rate shown is as of October 31, 2021. |
For Fund compliance purposes, the Fund’s industry classifications refer to any one or more of the industry sub-classifications used by one or more widely recognized market indexes or ratings group indexes, and/or they may be defined by Fund management. This definition does not apply for all purposes of this report, which may combine sub-classifications for reporting ease. Categories are shown as a percentage of net assets.
The accompanying notes are an integral part of the financial statements.
58
Pacer Trendpilot® European Index ETF
SCHEDULE OF INVESTMENTS
October 31, 2021 (Unaudited)
| | | Shares | | | Value | |
COMMON STOCKS — 96.7% | | | | |
Austria — 0.7% | | | | |
ANDRITZ AG | | | 630 | | | $ | 35,671 | |
Erste Group Bank AG | | | 2,550 | | | | 109,363 | |
OMV AG | | | 1,270 | | | | 76,930 | |
Raiffeisen Bank International AG | | | 1,163 | | | | 34,014 | |
Telekom Austria AG | | | 1,221 | | | | 10,558 | |
Verbund AG | | | 588 | | | | 61,244 | |
voestalpine AG | | | 1,026 | | | | 38,950 | |
| | | | | | | | 366,730 | |
Belgium — 2.7% | | | | |
Ackermans & van Haaren NV | | | 206 | | | | 35,411 | |
Ageas SA/NV | | | 1,593 | | | | 77,528 | |
Anheuser-Busch InBev SA/NV - ADR (a) | | | 7,334 | | | | 448,987 | |
D’ieteren Group | | | 202 | | | | 34,770 | |
Elia Group SA/NV | | | 323 | | | | 37,675 | |
Etablissements Franz Colruyt SA | | | 464 | | | | 22,764 | |
Galapagos NV - ADR (b) | | | 420 | | | | 22,256 | |
Groupe Bruxelles Lambert SA | | | 966 | | | | 111,949 | |
KBC Groep NV | | | 2,452 | | | | 228,349 | |
Proximus SADP | | | 1,261 | | | | 23,739 | |
Sofina SA | | | 137 | | | | 60,562 | |
Solvay SA | | | 626 | | | | 74,392 | |
Telenet Group Holding NV | | | 421 | | | | 15,116 | |
UCB SA | | | 1,085 | | | | 129,314 | |
Umicore SA | | | 1,837 | | | | 105,287 | |
| | | | | | | | 1,428,099 | |
Britain — 0.3% | | | | |
CNH Industrial NV | | | 8,781 | | | | 151,552 | |
TechnipFMC PLC (b) | | | 4,093 | | | | 30,623 | |
| | | | | | | | 182,175 | |
Finland — 4.1% | | | | |
Elisa OYJ | | | 1,280 | | | | 77,210 | |
Fortum Oyj | | | 3,859 | | | | 114,648 | |
Huhtamaki OYJ | | | 841 | | | | 36,613 | |
Kesko OYJ - Class B | | | 2,403 | | | | 78,030 | |
Kojamo Oyj | | | 1,749 | | | | 39,082 | |
Kone Oyj - Class B | | | 3,507 | | | | 239,030 | |
Metso Outotec Oyj | | | 5,412 | | | | 54,305 | |
Neste Oyj | | | 3,712 | | | | 206,787 | |
Nokia Oyj - ADR (b) | | | 50,106 | | | | 284,602 | |
Nokian Renkaat OYJ | | | 1,219 | | | | 45,657 | |
Nordea Bank Abp | | | 31,362 | | | | 383,356 | |
Orion OYJ - Class B | | | 926 | | | | 40,067 | |
Sampo OYJ | | | 4,513 | | | | 239,984 | |
Stora Enso Oyj - Class R | | | 5,126 | | | | 85,211 | |
UPM-Kymmene Oyj | | | 4,757 | | | | 167,833 | |
Valmet Oyj | | | 1,173 | | | | 47,595 | |
| | | Shares | | | Value | |
Finland — 4.1% (Continued) |
Wartsila OYJ Abp | | | 4,357 | | | $ | 60,415 | |
| | | | | | | | 2,200,425 | |
France — 30.6% | | | | |
Accor SA (b) | | | 1,639 | | | | 58,565 | |
Aeroports de Paris (b) | | | 254 | | | | 33,737 | |
Air Liquide SA | | | 4,099 | | | | 683,475 | |
Airbus SE (b) | | | 4,908 | | | | 627,507 | |
ALD SA (c) | | | 723 | | | | 10,748 | |
Alstom SA | | | 2,604 | | | | 92,655 | |
Amundi SA (c) | | | 508 | | | | 45,248 | |
Arkema SA | | | 596 | | | | 81,437 | |
Atos SE | | | 840 | | | | 43,677 | |
AXA SA | | | 17,320 | | | | 503,753 | |
BioMerieux | | | 381 | | | | 48,470 | |
BNP Paribas SA | | | 9,564 | | | | 640,143 | |
Bollore SA | | | 8,801 | | | | 50,972 | |
Bouygues SA | | | 1,895 | | | | 76,672 | |
Bureau Veritas SA | | | 2,472 | | | | 78,471 | |
Capgemini SE | | | 1,407 | | | | 327,414 | |
Carrefour SA | | | 5,567 | | | | 100,747 | |
Cie de Saint-Gobain | | | 4,187 | | | | 288,281 | |
Cie Generale des Etablissements Michelin | | | 1,563 | | | | 245,187 | |
Cie Plastic Omnium SA | | | 506 | | | | 14,015 | |
CNP Assurances | | | 1,339 | | | | 33,527 | |
Credit Agricole SA | | | 10,925 | | | | 164,686 | |
Danone SA | | | 5,353 | | | | 348,698 | |
Dassault Aviation SA | | | 200 | | | | 20,866 | |
Dassault Systemes SE | | | 5,885 | | | | 342,739 | |
Edenred | | | 2,198 | | | | 118,838 | |
Eiffage SA | | | 684 | | | | 70,341 | |
Electricite de France SA | | | 4,579 | | | | 67,384 | |
Engie SA | | | 14,779 | | | | 210,072 | |
EssilorLuxottica SA | | | 2,638 | | | | 545,562 | |
Eurazeo SE | | | 391 | | | | 36,634 | |
Faurecia | �� | | 1,045 | | | | 54,421 | |
Getlink SE | | | 4,064 | | | | 62,413 | |
Hermes International | | | 274 | | | | 434,099 | |
Imerys SA | | | 352 | | | | 15,251 | |
Ipsen SA | | | 313 | | | | 32,347 | |
JCDecaux SA (b) | | | 655 | | | | 17,082 | |
Kering | | | 652 | | | | 488,557 | |
La Francaise des Jeux SAEM (c) | | | 782 | | | | 40,589 | |
Legrand SA | | | 2,384 | | | | 259,717 | |
L’Oreal SA | | | 2,124 | | | | 969,740 | |
LVMH Moet Hennessy Louis Vuitton SE - ADR | | | 10,968 | | | | 1,725,924 | |
Neoen SA (b) (c) | | | 194 | | | | 8,926 | |
Orange SA | | | 17,052 | | | | 185,984 | |
The accompanying notes are an integral part of the financial statements.
59
Pacer Trendpilot® European Index ETF
SCHEDULE OF INVESTMENTS
October 31, 2021 (Unaudited) (Continued)
| | | Shares | | | Value | |
COMMON STOCKS — 96.7% (Continued) |
France — 30.6% (Continued) |
Orpea SA | | | 440 | | | $ | 45,879 | |
Pernod Ricard SA | | | 1,856 | | | | 426,319 | |
Publicis Groupe SA | | | 1,999 | | | | 133,891 | |
Remy Cointreau SA | | | 215 | | | | 43,395 | |
Renault SA (b) | | | 1,641 | | | | 58,921 | |
Rexel SA | | | 2,706 | | | | 53,679 | |
Rubis SCA | | | 840 | | | | 26,888 | |
Safran SA | | | 3,072 | | | | 412,086 | |
Sanofi - ADR (a) | | | 19,147 | | | | 965,583 | |
Sartorius Stedim Biotech | | | 215 | | | | 118,355 | |
Schneider Electric SE | | | 4,736 | | | | 815,202 | |
SCOR SE | | | 1,407 | | | | 47,331 | |
SEB SA | | | 279 | | | | 43,638 | |
Societe Generale SA | | | 6,906 | | | | 230,200 | |
Sodexo SA (b) | | | 782 | | | | 75,936 | |
SOITEC (b) | | | 190 | | | | 50,473 | |
Suez SA | | | 3,319 | | | | 75,527 | |
Teleperformance | | | 518 | | | | 216,230 | |
Thales SA | | | 899 | | | | 82,786 | |
TotalEnergies SE - ADR | | | 21,280 | | | | 1,066,341 | |
Ubisoft Entertainment SA (b) | | | 841 | | | | 43,973 | |
Valeo | | | 2,140 | | | | 62,662 | |
Veolia Environnement SA | | | 5,174 | | | | 168,848 | |
Vinci SA | | | 4,428 | | | | 472,822 | |
Vivendi SE | | | 6,589 | | | | 84,814 | |
Wendel SA | | | 252 | | | | 33,530 | |
Worldline SA/France (b) (c) | | | 2,185 | | | | 127,253 | |
| | | | | | | | 16,288,133 | |
Germany — 24.9% | | | | |
1&1 AG | | | 421 | | | | 12,254 | |
adidas AG | | | 1,694 | | | | 554,777 | |
Allianz SE | | | 3,625 | | | | 842,921 | |
Auto1 Group SE (b) (c) | | | 813 | | | | 31,954 | |
BASF SE | | | 8,080 | | | | 581,726 | |
Bayer AG | | | 8,856 | | | | 498,262 | |
Bayerische Motoren Werke AG | | | 2,872 | | | | 289,640 | |
Bechtle AG | | | 756 | | | | 56,631 | |
Beiersdorf AG | | | 889 | | | | 94,444 | |
Brenntag SE | | | 1,386 | | | | 131,766 | |
Carl Zeiss Meditec AG | | | 333 | | | | 66,962 | |
Commerzbank AG (b) | | | 9,284 | | | | 67,785 | |
Continental AG (b) | | | 967 | | | | 113,485 | |
Covestro AG (c) | | | 1,612 | | | | 103,237 | |
CTS Eventim AG & Co. KGaA (b) | | | 528 | | | | 38,368 | |
Daimler AG | | | 7,424 | | | | 735,835 | |
Delivery Hero SE (b) (c) | | | 1,667 | | | | 207,255 | |
Deutsche Bank AG (b) | | | 18,246 | | | | 235,096 | |
Deutsche Boerse AG | | | 1,641 | | | | 272,409 | |
| | | Shares | | | Value | |
Germany — 24.9% (Continued) |
Deutsche Lufthansa AG (b) | | | 4,077 | | | $ | 26,921 | |
Deutsche Post AG | | | 8,723 | | | | 539,685 | |
Deutsche Telekom AG | | | 28,514 | | | | 529,967 | |
Deutsche Wohnen SE | | | 1,137 | | | | 58,214 | |
DWS Group GmbH & Co. KGaA (c) | | | 313 | | | | 13,540 | |
E.ON SE | | | 19,320 | | | | 244,914 | |
Evonik Industries AG | | | 1,710 | | | | 55,389 | |
Evotec SE (b) | | | 1,310 | | | | 63,376 | |
Fielmann AG | | | 215 | | | | 14,167 | |
Fraport AG Frankfurt Airport Services Worldwide (b) | | | 323 | | | | 23,038 | |
Fresenius Medical Care AG & Co. KGaA | | | 1,753 | | | | 116,441 | |
Fresenius SE & Co. KGaA | | | 3,605 | | | | 163,633 | |
FUCHS PETROLUB SE | | | 303 | | | | 11,146 | |
GEA Group AG | | | 1,485 | | | | 73,113 | |
Hannover Rueck SE | | | 546 | | | | 99,726 | |
HeidelbergCement AG | | | 1,329 | | | | 100,076 | |
Hella GmbH & Co. KGaA | | | 401 | | | | 27,813 | |
HelloFresh SE (b) | | | 1,445 | | | | 116,930 | |
Henkel AG & Co. KGaA | | | 909 | | | | 75,763 | |
HOCHTIEF AG | | | 176 | | | | 13,571 | |
Infineon Technologies AG | | | 11,718 | | | | 547,192 | |
KION Group AG | | | 707 | | | | 77,153 | |
Knorr-Bremse AG | | | 596 | | | | 62,793 | |
LANXESS AG | | | 753 | | | | 50,714 | |
LEG Immobilien SE | | | 626 | | | | 93,099 | |
Merck KGaA | | | 1,163 | | | | 274,533 | |
METRO AG | | | 1,176 | | | | 14,859 | |
MTU Aero Engines AG | | | 479 | | | | 106,509 | |
Muenchener Rueckversicherungs-Gesellschaft AG | | | 1,261 | | | | 373,468 | |
Nemetschek SE | | | 489 | | | | 56,076 | |
ProSiebenSat.1 Media SE | | | 1,397 | | | | 23,392 | |
Puma SE | | | 881 | | | | 109,278 | |
Rational AG | | | 30 | | | | 29,811 | |
Rheinmetall AG | | | 391 | | | | 37,895 | |
RWE AG | | | 5,627 | | | | 216,416 | |
SAP SE - ADR (a) | | | 9,788 | | | | 1,417,107 | |
Sartorius AG | | | 20 | | | | 12,277 | |
Scout24 SE (c) | | | 736 | | | | 51,219 | |
Siemens AG - ADR (a) | | | 13,224 | | | | 1,080,269 | |
Siemens Energy AG (b) | | | 3,789 | | | | 108,714 | |
Siemens Healthineers AG (c) | | | 2,454 | | | | 163,004 | |
Symrise AG | | | 1,134 | | | | 156,719 | |
Talanx AG | | | 479 | | | | 23,035 | |
TeamViewer AG (b) (c) | | | 1,421 | | | | 21,191 | |
Telefonica Deutschland Holding AG | | | 5,966 | | | | 15,538 | |
The accompanying notes are an integral part of the financial statements.
60
Pacer Trendpilot® European Index ETF
SCHEDULE OF INVESTMENTS
October 31, 2021 (Unaudited) (Continued)
| | | Shares | | | Value | |
COMMON STOCKS — 96.7% (Continued) |
Germany — 24.9% (Continued) |
thyssenkrupp AG (b) | | | 4,159 | | | $ | 43,232 | |
Traton SE | | | 450 | | | | 11,600 | |
Uniper SE | | | 777 | | | | 34,321 | |
United Internet AG | | | 967 | | | | 35,637 | |
Vantage Towers AG | | | 609 | | | | 20,937 | |
Varta AG | | | 127 | | | | 19,526 | |
Vitesco Technologies Group AG (b) | | | 243 | | | | 13,933 | |
Volkswagen AG | | | 294 | | | | 95,434 | |
Vonovia SE | | | 5,060 | | | | 306,858 | |
Wacker Chemie AG | | | 137 | | | | 24,698 | |
Zalando SE (b) (c) | | | 1,926 | | | | 181,635 | |
| | | | | | | | 13,212,302 | |
Greece — 0.4% | | | | |
Alpha Services and Holdings SA (b) | | | 18,488 | | | | 23,477 | |
Eurobank Ergasias Services and Holdings SA (b) | | | 22,720 | | | | 23,727 | |
FF Group (b) (d) | | | 1,259 | | | | 6,986 | |
Hellenic Petroleum SA | | | 528 | | | | 3,638 | |
Hellenic Telecommunications Organization SA | | | 2,081 | | | | 36,806 | |
JUMBO SA | | | 938 | | | | 13,923 | |
Motor Oil Hellas Corinth Refineries SA (b) | | | 506 | | | | 8,587 | |
Mytilineos SA | | | 948 | | | | 17,282 | |
National Bank of Greece SA (b) | | | 4,872 | | | | 15,319 | |
OPAP SA | | | 1,817 | | | | 28,251 | |
Piraeus Financial Holdings SA (b) | | | 5,113 | | | | 8,689 | |
Public Power Corp SA (b) | | | 1,023 | | | | 11,087 | |
Terna Energy SA | | | 391 | | | | 5,289 | |
| | | | | | | | 203,061 | |
Ireland — 0.7% | | | | |
AIB Group PLC (b) | | | 7,004 | | | | 18,979 | |
Glanbia PLC | | | 1,766 | | | | 28,846 | |
Kerry Group PLC | | | 1,378 | | | | 184,944 | |
Kingspan Group PLC | | | 1,348 | | | | 155,268 | |
| | | | | | | | 388,037 | |
Italy — 6.6% | | | | |
A2A SpA | | | 13,777 | | | | 28,954 | |
Amplifon SpA | | | 1,092 | | | | 55,480 | |
Assicurazioni Generali SpA | | | 11,282 | | | | 245,842 | |
Atlantia SpA (b) | | | 4,396 | | | | 84,891 | |
Banca Mediolanum SpA | | | 2,296 | | | | 23,107 | |
Buzzi Unicem SpA | | | 879 | | | | 20,495 | |
Davide Campari-Milano NV | | | 4,505 | | | | 63,952 | |
De’ Longhi SpA | | | 570 | | | | 22,272 | |
DiaSorin SpA | | | 206 | | | | 46,520 | |
Enel SpA | | | 68,644 | | | | 574,196 | |
Eni SpA | | | 22,302 | | | | 319,790 | |
| | | Shares | | | Value | |
Italy — 6.6% (Continued) |
Ferrari NV | | | 1,092 | | | $ | 258,783 | |
FinecoBank Banca Fineco SpA (b) | | | 5,441 | | | | 103,876 | |
Hera SpA | | | 6,259 | | | | 25,592 | |
Infrastrutture Wireless Italiane SpA (c) | | | 2,892 | | | | 31,947 | |
Interpump Group SpA | | | 709 | | | | 52,250 | |
Intesa Sanpaolo SpA | | | 146,633 | | | | 416,566 | |
Italgas SpA | | | 4,368 | | | | 27,721 | |
Leonardo SpA (b) | | | 3,527 | | | | 25,841 | |
Mediobanca Banca di Credito Finanziario SpA (b) | | | 6,121 | | | | 72,988 | |
Moncler SpA | | | 1,900 | | | | 136,441 | |
Nexi SpA (b) (c) | | | 5,209 | | | | 90,475 | |
Pirelli & C SpA (c) | | | 4,677 | | | | 28,720 | |
Poste Italiane SpA (c) | | | 4,075 | | | | 58,130 | |
Prysmian SpA | | | 2,278 | | | | 86,111 | |
Recordati Industria Chimica e Farmaceutica SpA | | | 870 | | | | 54,430 | |
Reply SpA | | | 199 | | | | 38,578 | |
Snam SpA | | | 19,487 | | | | 110,315 | |
Telecom Italia SpA | | | 94,960 | | | | 33,821 | |
Telecom Italia SpA - Savings Shares | | | 53,819 | | | | 20,438 | |
Terna Rete Elettrica Nazionale SpA | | | 12,415 | | | | 92,454 | |
UniCredit SpA | | | 19,068 | | | | 251,815 | |
UnipolSai Assicurazioni SpA | | | 4,445 | | | | 12,867 | |
| | | | | | | | 3,515,658 | |
Luxembourg — 0.9% | | | | |
ArcelorMittal | | | 5,611 | | | | 190,212 | |
Aroundtown SA | | | 10,676 | | | | 74,172 | |
Eurofins Scientifi (b) | | | 1,114 | | | | 131,277 | |
RTL Group SA | | | 342 | | | | 19,720 | |
Tenaris SA - ADR (a) | | | 2,048 | | | | 45,630 | |
| | | | | | | | 461,011 | |
Netherlands — 16.5% | | | | |
Aalberts Industries NV | | | 860 | | | | 47,571 | |
ABN AMRO Group NV (c) | | | 3,697 | | | | 54,388 | |
Adyen NV (b) (c) | | | 255 | | | | 769,525 | |
Aegon NV | | | 15,707 | | | | 79,620 | |
Akzo Nobel NV | | | 1,710 | | | | 196,530 | |
Argenx SE - ADR (b) | | | 450 | | | | 135,882 | |
ASM International NV | | | 420 | | | | 190,033 | |
ASML Holding NV (a) | | | 3,497 | | | | 2,842,641 | |
ASR Nederland NV | | | 1,241 | | | | 58,044 | |
BE Semiconductor Industries NV | | | 630 | | | | 57,505 | |
CTP NV (c) | | | 539 | | | | 11,465 | |
Euronext NV (c) | | | 727 | | | | 81,856 | |
EXOR NV | | | 928 | | | | 87,431 | |
GrandVision NV (b) (c) | | | 440 | | | | 14,445 | |
Heineken Holding NV | | | 948 | | | | 87,890 | |
The accompanying notes are an integral part of the financial statements.
61
Pacer Trendpilot® European Index ETF
SCHEDULE OF INVESTMENTS
October 31, 2021 (Unaudited) (Continued)
| | | Shares | | | Value | |
COMMON STOCKS — 96.7% (Continued) |
Netherlands — 16.5% (Continued) |
Heineken NV | | | 2,130 | | | $ | 235,936 | |
IMCD NV | | | 508 | | | | 112,781 | |
ING Groep NV - ADR (a) | | | 34,283 | | | | 518,702 | |
JDE Peet’s NV | | | 745 | | | | 21,694 | |
Just Eat Takeaway.com NV - ADR (b) | | | 7,932 | | | | 113,348 | |
Koninklijke Ahold Delhaize NV | | | 8,607 | | | | 279,885 | |
Koninklijke DSM NV | | | 1,464 | | | | 319,946 | |
Koninklijke KPN NV | | | 29,526 | | | | 88,232 | |
Koninklijke Philips NV | | | 8,001 | | | | 376,673 | |
Koninklijke Vopak NV | | | 596 | | | | 23,701 | |
NN Group NV | | | 2,784 | | | | 149,072 | |
Prosus NV | | | 7,786 | | | | 685,938 | |
QIAGEN NV (b) | | | 1,974 | | | | 108,598 | |
Randstad Holding NV | | | 987 | | | | 70,969 | |
Signify NV (c) | | | 1,134 | | | | 54,861 | |
Stellantis NV | | | 8,470 | | | | 168,783 | |
Stellantis NV | | | 9,828 | | | | 195,981 | |
Universal Music Group NV | | | 10,589 | | | | 307,431 | |
Wolters Kluwer NV | | | 2,314 | | | | 242,461 | |
| | | | | | | | 8,789,818 | |
Poland — 0.1% | | | | |
InPost SA (b) | | | 1,817 | | | | 25,911 | |
| | | | | | | | | |
Portugal — 0.5% | | | | |
EDP - Energias de Portugal SA | | | 25,103 | | | | 141,730 | |
Galp Energia SGPS SA | | | 4,591 | | | | 47,722 | |
Jeronimo Martins SGPS SA | | | 2,179 | | | | 49,371 | |
| | | | | | | | 238,823 | |
Spain — 7.2% | | | | |
Acciona SA | | | 186 | | | | 35,650 | |
ACS Actividades de Construccion y Servicios SA | | | 1,996 | | | | 52,216 | |
Aena SME SA (b) (c) | | | 630 | | | | 103,161 | |
Amadeus IT Holding SA (b) | | | 3,800 | | | | 254,080 | |
Banco Bilbao Vizcaya Argentaria SA - ADR | | | 58,445 | | | | 407,362 | |
Banco Santander SA - ADR | | | 149,462 | | | | 566,461 | |
Bankinter SA | | | 6,115 | | | | 33,662 | |
CaixaBank SA | | | 39,361 | | | | 113,071 | |
Cellnex Telecom SA (c) | | | 5,368 | | | | 330,004 | |
EDP Renovaveis SA | | | 2,161 | | | | 60,205 | |
Enagas SA | | | 2,226 | | | | 49,934 | |
Endesa SA | | | 2,833 | | | | 65,319 | |
Ferrovial SA | | | 4,365 | | | | 137,553 | |
Fluidra SA | | | 899 | | | | 34,347 | |
Grifols SA | | | 2,950 | | | | 67,505 | |
Iberdrola SA | | | 52,108 | | | | 615,321 | |
Industria de Diseno Textil SA | | | 9,377 | | | | 338,636 | |
| | | Shares | | | Value | |
Spain — 7.2% (Continued) |
Linea Directa Aseguradora SA Cia de Seguros y Reaseguros | | | 6,115 | | | $ | 12,300 | |
Mapfre SA | | | 8,811 | | | | 18,645 | |
Naturgy Energy Group SA | | | 2,687 | | | | 70,603 | |
Red Electrica Corp. SA | | | 3,849 | | | | 80,135 | |
Repsol SA | | | 11,473 | | | | 146,634 | |
Siemens Gamesa Renewable Energy SA (b) | | | 2,003 | | | | 54,251 | |
Telefonica SA | | | 43,780 | | | | 190,521 | |
| | | | | | | | 3,837,576 | |
Switzerland — 0.5% | | | | |
STMicroelectronics NV | | | 5,646 | | | | 267,044 | |
TOTAL COMMON STOCKS (Cost $43,105,971) | | | | | | | 51,404,803 | |
| | | | | |
PREFERRED STOCKS — 1.6% | | | | |
Germany — 1.6% | | | | |
Bayerische Motoren Werke AG | | | 508 | | | | 43,222 | |
FUCHS PETROLUB SE | | | 626 | | | | 29,988 | |
Henkel AG & Co. KGaA | | | 1,563 | | | | 139,813 | |
Porsche Automobil Holding SE | | | 1,378 | | | | 143,081 | |
Sartorius AG | | | 213 | | | | 137,986 | |
Volkswagen AG | | | 1,639 | | | | 367,228 | |
| | | | | | | | 861,318 | |
TOTAL PREFERRED STOCKS (Cost $707,074) | | | | | | | 861,318 | |
| | | | | |
REAL ESTATE INVESTMENT TRUSTS — 0.7% | | | | |
Belgium — 0.1% | | | | |
Warehouses De Pauw CVA | | | 1,256 | | | | 57,206 | |
| | | | | |
France — 0.5% | | | | |
Covivio | | | 450 | | | | 38,911 | |
Gecina SA | | | 464 | | | | 64,929 | |
ICADE | | | 294 | | | | 23,043 | |
Klepierre | | | 1,681 | | | | 39,953 | |
Unibail-Rodamco-Westfield (b) | | | 1,212 | | | | 86,601 | |
| | | | | | | | 253,437 | |
Spain — 0.1% | | | | |
Inmobiliaria Colonial Socimi SA | | | 2,901 | | | | 28,204 | |
Merlin Properties Socimi SA | | | 2,960 | | | | 32,055 | |
| | | | | | | | 60,259 | |
TOTAL REAL ESTATE INVESTMENT TRUSTS (Cost $319,640) | | | | | | | 370,902 | |
The accompanying notes are an integral part of the financial statements.
62
Pacer Trendpilot® European Index ETF
SCHEDULE OF INVESTMENTS
October 31, 2021 (Unaudited) (Continued)
| | | Principal
Amount | | | Value | |
| SHORT-TERM INVESTMENTS- 0.2% | | | | | | | | |
| Money Market Deposit Accounts — 0.2% | | | | | | | | |
| U.S. Bank Money Market Deposit Account, 0.003% (e) | | $ | 119,290 | | | $ | 119,290 | |
| TOTAL SHORT-TERM INVESTMENTS (Cost $119,290) | | | | | | | 119,290 | |
| | | | | | | | | |
| | | | Shares | | | | | |
| INVESTMENTS PURCHASED WITH PROCEEDS FROM SECURITIES LENDING — 12.6% |
| Mount Vernon Liquid Assets Portfolio, LLC, 0.10% (e) | | | 6,679,123 | | | | 6,679,123 | |
| TOTAL INVESTMENTS PURCHASED WITH PROCEEDS FROM SECURITIES LENDING (Cost $6,679,123) | | | | | | | 6,679,123 | |
| | | | | | | | | |
Total Investments (Cost $50,931,098) — 111.8% | | | | | | | 59,435,436 | |
Liabilities in Excess of Other Assets — (11.8)% | | | | | | | (6,272,527 | ) |
TOTAL NET ASSETS — 100.0% | | | | | | $ | 53,162,909 | |
Percentages are stated as a percent of net assets.
ADR American Depositary Receipt
| | (a) | All or a portion of this security is on loan as of October 31, 2021. The total value of securities on loan is $6,499,003 or 12.1% of net assets. |
| | (b) | Non-income producing security. |
| | (c) | Security exempt from registration under Rule 144(a) and Regulation S of the Securities Act of 1933. Such securities are treated as liquid securities according to the Fund’s liquidity guidelines. The value of those securities total $2,634,776 or 5.0% of net assets. |
| | (d) | Value determined using significant unobservable inputs. |
| | (e) | The rate shown is as of October 31, 2021. |
For Fund compliance purposes, the Fund’s industry classifications refer to any one or more of the industry sub-classifications used by one or more widely recognized market indexes or ratings group indexes, and/or they may be defined by Fund management. This definition does not apply for all purposes of this report, which may combine sub-classifications for reporting ease.
The accompanying notes are an integral part of the financial statements.
63
Pacer Trendpilot International ETF
SCHEDULE OF INVESTMENTS
October 31, 2021 (Unaudited)
| | | Shares | | | Value | |
COMMON STOCKS — 93.5% | | | | |
Australia — 6.2% | | | | |
Afterpay Ltd. (a) | | | 1,754 | | | | 162,674 | |
APA Group | | | 8,994 | | | | 55,479 | |
Aristocrat Leisure Ltd. | | | 5,184 | | | | 182,036 | |
ASX Ltd. | | | 1,583 | | | | 98,861 | |
Atlassian Corp. PLC - Class A (a) | | | 1,090 | | | | 499,362 | |
Australia & New Zealand Banking Group Ltd. | | | 22,254 | | | | 471,078 | |
BHP Group Ltd. - ADR (b) | | | 12,105 | | | | 663,838 | |
BHP Group PLC - ADR (b) | | | 8,189 | | | | 433,853 | |
Brambles Ltd. | | | 12,317 | | | | 93,025 | |
Cochlear Ltd. | | | 506 | | | | 83,908 | |
Coles Group Ltd. | | | 9,761 | | | | 125,854 | |
Commonwealth Bank of Australia | | | 13,906 | | | | 1,095,031 | |
CSL Ltd. | | | 3,658 | | | | 826,865 | |
Fortescue Metals Group Ltd. | | | 13,753 | | | | 144,115 | |
Insurance Australia Group Ltd. | | | 18,774 | | | | 67,789 | |
Macquarie Group Ltd. | | | 2,700 | | | | 401,806 | |
National Australia Bank Ltd. | | | 25,955 | | | | 560,551 | |
Newcrest Mining Ltd. | | | 6,572 | | | | 123,050 | |
QBE Insurance Group Ltd. | | | 11,934 | | | | 106,202 | |
Ramsay Health Care Ltd. | | | 1,479 | | | | 78,347 | |
REA Group Ltd. | | | 386 | | | | 46,499 | |
Reece Ltd. | | | 1,079 | | | | 16,144 | |
Rio Tinto Ltd. | | | 3,025 | | | | 205,459 | |
Santos Ltd. | | | 14,403 | | | | 75,626 | |
Sonic Healthcare Ltd. | | | 3,649 | | | | 109,880 | |
South32 Ltd. | | | 39,364 | | | | 105,713 | |
Suncorp Group Ltd. | | | 10,255 | | | | 90,412 | |
Sydney Airport (a) | | | 10,757 | | | | 66,273 | |
Telstra Corp. Ltd. | | | 33,792 | | | | 97,104 | |
TPG Telecom Ltd. | | | 2,844 | | | | 14,441 | |
Transurban Group | | | 22,212 | | | | 224,568 | |
Wesfarmers Ltd. | | | 8,861 | | | | 381,609 | |
Westpac Banking Corp. | | | 29,332 | | | | 566,406 | |
Woodside Petroleum Ltd. | | | 7,768 | | | | 135,919 | |
Woolworths Group Ltd. | | | 10,276 | | | | 294,362 | |
| | | | | | | | 8,704,139 | |
Austria — 0.3% | | | | |
ams AG (a) | | | 2,233 | | | | 44,119 | |
ANDRITZ AG | | | 585 | | | | 33,123 | |
BAWAG Group AG (c) | | | 589 | | | | 37,074 | |
Erste Group Bank AG | | | 2,456 | | | | 105,332 | |
OMV AG | | | 1,174 | | | | 71,115 | |
Raiffeisen Bank International AG | | | 1,107 | | | | 32,376 | |
Telekom Austria AG | | | 1,155 | | | | 9,987 | |
Verbund AG | | | 583 | | | | 60,723 | |
voestalpine AG | | | 909 | | | | 34,508 | |
| | | | | | | | 428,357 | |
| | | Shares | | | Value | |
Belgium — 0.8% | | | | |
Anheuser-Busch InBev SA/NV - ADR (b) | | | 6,888 | | | $ | 421,683 | |
Groupe Bruxelles Lambert SA | | | 961 | | | | 111,370 | |
KBC Groep NV | | | 2,785 | | | | 259,360 | |
Sofina SA | | | 127 | | | | 56,141 | |
Solvay SA | | | 598 | | | | 71,064 | |
UCB SA | | | 1,047 | | | | 124,785 | |
Umicore SA | | | 1,541 | | | | 88,322 | |
| | | | | | | | 1,132,725 | |
Canada — 9.1% | | | | |
Agnico Eagle Mines Ltd. | | | 1,971 | | | | 104,562 | |
Alimentation Couche-Tard, Inc. - Class B | | | 6,603 | | | | 247,666 | |
Bank of Montreal | | | 5,188 | | | | 562,950 | |
Barrick Gold Corp. | | | 14,461 | | | | 265,649 | |
BCE, Inc. | | | 2,427 | | | | 124,918 | |
Brookfield Asset Management, Inc. - Class A | | | 11,425 | | | | 689,956 | |
Canadian Imperial Bank of Commerce | | | 3,624 | | | | 439,446 | |
Canadian National Railway Co. | | | 4,780 | | | | 635,310 | |
Canadian Natural Resources Ltd. | | | 9,600 | | | | 408,096 | |
Canadian Pacific Railway Ltd. (b) | | | 5,232 | | | | 404,957 | |
CGI, Inc. (a) | | | 1,716 | | | | 153,393 | |
Constellation Software, Inc./Canada | | | 150 | | | | 263,614 | |
Enbridge, Inc. | | | 15,889 | | | | 665,113 | |
Fortis, Inc./Canada | | | 3,765 | | | | 167,580 | |
Franco-Nevada Corp. | | | 1,545 | | | | 220,672 | |
Great-West Lifeco, Inc. | | | 2,213 | | | | 65,106 | |
Hydro One Ltd. (c) | | | 2,504 | | | | 59,828 | |
Imperial Oil Ltd. (b) | | | 1,860 | | | | 63,017 | |
Intact Financial Corp. | | | 1,164 | | | | 156,043 | |
Loblaw Cos. Ltd. | | | 1,410 | | | | 106,046 | |
Magna International, Inc. | | | 2,141 | | | | 174,063 | |
Manulife Financial Corp. | | | 15,748 | | | | 306,928 | |
National Bank of Canada | | | 2,739 | | | | 226,760 | |
NUTRIEN Ltd. (a) | | | 4,624 | | | | 323,264 | |
Pembina Pipeline Corp. | | | 4,241 | | | | 140,335 | |
Power Corp of Canada | | | 3,994 | | | | 133,026 | |
Restaurant Brands International, Inc. | | | 2,445 | | | | 138,485 | |
Rogers Communications, Inc. - Class B | | | 2,863 | | | | 133,358 | |
Royal Bank of Canada | | | 11,167 | | | | 1,161,480 | |
Shopify, Inc. - Class A (a) | | | 885 | | | | 1,298,056 | |
Sun Life Financial, Inc. | | | 4,753 | | | | 270,778 | |
Suncor Energy, Inc. | | | 12,403 | | | | 326,199 | |
TC Energy Corp. | | | 7,846 | | | | 424,469 | |
TELUS Corp. | | | 3,418 | | | | 78,443 | |
The Bank of Nova Scotia | | | 9,528 | | | | 624,656 | |
The Toronto-Dominion Bank | | | 14,276 | | | | 1,035,153 | |
The accompanying notes are an integral part of the financial statements.
64
Pacer Trendpilot International ETF
SCHEDULE OF INVESTMENTS
October 31, 2021 (Unaudited) (Continued)
| | | Shares | | | Value | |
COMMON STOCKS — 93.5% (Continued) |
Canada — 9.1% (Continued) |
Thomson Reuters Corp. | | | 1,373 | | | $ | 165,213 | |
Wheaton Precious Metals Corp. (b) | | | 3,440 | | | | 139,010 | |
| | | | | | | | 12,903,598 | |
Chile — 0.0% (d) | | | | |
Antofagasta PLC | | | 1,849 | | | | 36,071 | |
| | | | | |
China — 0.1% | | | | |
China Evergrande New Energy Vehicle Group Ltd. (a) | | | 16,443 | | | | 7,904 | |
ENN Energy Holdings Ltd. | | | 4,992 | | | | 86,424 | |
| | | | | | | | 94,328 | |
Denmark — 2.2% | | | | |
AP Moller - Maersk A/S - Class A | | | 24 | | | | 65,716 | |
AP Moller - Maersk A/S - Class B | | | 50 | | | | 144,483 | |
Carlsberg A/S - Class B | | | 845 | | | | 139,389 | |
Coloplast A/S - Class B | | | 973 | | | | 158,613 | |
DSV A/S | | | 1,634 | | | | 379,743 | |
Genmab A/S - ADR (a) | | | 5,266 | | | | 235,074 | |
Novo Nordisk A/S - ADR | | | 13,075 | | | | 1,439,950 | |
Orsted AS (c) | | | 1,360 | | | | 191,900 | |
Vestas Wind Systems A/S | | | 7,745 | | | | 334,955 | |
| | | | | | | | 3,089,823 | |
Finland — 1.1% | | | | |
Fortum Oyj | | | 3,556 | | | | 105,646 | |
Kone Oyj - Class B | | | 3,287 | | | | 224,035 | |
Neste Oyj | | | 3,510 | | | | 195,534 | |
Nokia Oyj - ADR (a) | | | 45,588 | | | | 258,940 | |
Nordea Bank Abp | | | 28,224 | | | | 345,274 | |
Sampo Oyj - Class A | | | 3,939 | | | | 209,461 | |
Stora Enso Oyj - Class R | | | 4,993 | | | | 83,000 | |
UPM-Kymmene Oyj | | | 4,320 | | | | 152,415 | |
| | | | | | | | 1,574,305 | |
France — 8.2% | | | | |
Air Liquide SA | | | 3,691 | | | | 615,444 | |
Airbus SE - ADR (a) | | | 19,795 | | | | 633,440 | |
AXA SA | | | 16,793 | | | | 488,425 | |
BNP Paribas SA | | | 8,989 | | | | 601,657 | |
Christian Dior SE | | | 28 | | | | 21,929 | |
Cie de Saint-Gobain | | | 3,940 | | | | 271,275 | |
Credit Agricole SA | | | 10,314 | | | | 155,476 | |
Danone SA | | | 5,241 | | | | 341,403 | |
Dassault Systemes SE | | | 5,644 | | | | 328,703 | |
Electricite de France SA | | | 3,790 | | | | 55,773 | |
Engie SA | | | 13,520 | | | | 192,176 | |
EssilorLuxottica SA | | | 2,401 | | | | 496,548 | |
Hermes International | | | 275 | | | | 435,683 | |
Kering | | | 583 | | | | 436,854 | |
L’Oreal SA | | | 1,922 | | | | 877,514 | |
| | | Shares | | | Value | |
France — 8.2% (Continued) |
LVMH Moet Hennessy Louis Vuitton SE - ADR | | | 10,434 | | | $ | 1,641,894 | |
Pernod Ricard SA | | | 1,538 | | | | 353,275 | |
Safran SA | | | 2,736 | | | | 367,014 | |
Sanofi - ADR | | | 18,400 | | | | 927,912 | |
Sartorius Stedim Biotech | | | 161 | | | | 88,629 | |
Schneider Electric SE | | | 4,535 | | | | 780,604 | |
TotalEnergies SE - ADR | | | 19,225 | | | | 963,365 | |
Vinci SA | | | 4,142 | | | | 442,283 | |
Vivendi SE | | | 6,537 | | | | 84,145 | |
| | | | | | | | 11,601,421 | |
Germany — 6.5% | | | | |
adidas AG | | | 1,444 | | | | 472,904 | |
Allianz SE | | | 3,306 | | | | 768,744 | |
Allianz SE - ADR | | | 1 | | | | 23 | |
BASF SE | | | 7,152 | | | | 514,914 | |
Bayer AG - ADR (b) | | | 31,591 | | | | 447,960 | |
Bayerische Motoren Werke AG | | | 2,595 | | | | 261,705 | |
Beiersdorf AG | | | 807 | | | | 85,733 | |
BioNTech SE - ADR (a) | | | 589 | | | | 164,172 | |
Daimler AG | | | 6,690 | | | | 663,084 | |
Delivery Hero SE (a) (c) | | | 1,369 | | | | 170,205 | |
Deutsche Boerse AG | | | 1,544 | | | | 256,307 | |
Deutsche Post AG | | | 7,887 | | | | 487,963 | |
Deutsche Telekom AG | | | 25,319 | | | | 470,584 | |
E.ON SE | | | 17,808 | | | | 225,747 | |
Fresenius Medical Care AG & Co. KGaA | | | 1,492 | | | | 99,104 | |
Fresenius SE & Co. KGaA | | | 3,344 | | | | 151,786 | |
Henkel AG & Co. KGaA | | | 840 | | | | 70,012 | |
Infineon Technologies AG | | | 10,216 | | | | 477,054 | |
Merck KGaA | | | 1,059 | | | | 249,983 | |
Muenchener Rueckversicherungs-Gesellschaft AG | | | 1,093 | | | | 323,711 | |
SAP SE - ADR (b) | | | 8,527 | | | | 1,234,539 | |
Siemens AG - ADR (b) | | | 12,476 | | | | 1,019,164 | |
Siemens Healthineers AG (c) | | | 2,236 | | | | 148,524 | |
Volkswagen AG | | | 226 | | | | 73,361 | |
Vonovia SE | | | 4,426 | | | | 268,410 | |
Zalando SE (a) (c) | | | 380 | | | | 35,837 | |
| | | | | | | | 9,141,530 | |
Hong Kong — 2.3% | | | | |
AIA Group Ltd. - ADR | | | 23,637 | | | | 1,069,338 | |
Alibaba Health Information Technology Ltd. (a) | | | 31,744 | | | | 40,106 | |
BOC Hong Kong Holdings Ltd. | | | 29,187 | | | | 92,657 | |
Budweiser Brewing Co. APAC Ltd. (c) | | | 10,757 | | | | 29,656 | |
CK Asset Holdings Ltd. | | | 15,853 | | | | 97,903 | |
The accompanying notes are an integral part of the financial statements.
65
Pacer Trendpilot International ETF
SCHEDULE OF INVESTMENTS
October 31, 2021 (Unaudited) (Continued)
| | | Shares | | | Value | |
COMMON STOCKS — 93.5% (Continued) |
Hong Kong — 2.3% (Continued) |
CK Hutchison Holdings Ltd. | | | 21,921 | | | $ | 147,492 | |
CLP Holdings Ltd. | | | 12,334 | | | | 120,716 | |
Galaxy Entertainment Group Ltd. (a) | | | 16,176 | | | | 87,528 | |
Hang Seng Bank Ltd. | | | 5,911 | | | | 112,439 | |
Henderson Land Development Co. Ltd. | | | 10,566 | | | | 44,271 | |
Hong Kong & China Gas Co. Ltd. | | | 87,879 | | | | 136,667 | |
Hong Kong Exchanges & Clearing Ltd. | | | 9,318 | | | | 563,835 | |
Jardine Matheson Holdings Ltd. | | | 2,067 | | | | 119,741 | |
MTR Corp Ltd. | | | 12,507 | | | | 68,157 | |
Sands China Ltd. (a) | | | 19,706 | | | | 45,032 | |
Sun Hung Kai Properties Ltd. | | | 12,002 | | | | 159,657 | |
Techtronic Industries Co. Ltd. | | | 13,115 | | | | 269,868 | |
| | | | | | | | 3,205,063 | |
Ireland — 0.8% | | | | |
CRH PLC - ADR | | | 6,456 | | | | 309,501 | |
Experian PLC | | | 7,394 | | | | 338,685 | |
James Hardie Industries PLC | | | 3,376 | | | | 131,170 | |
Kerry Group PLC | | | 1,249 | | | | 167,631 | |
Kingspan Group PLC | | | 1,263 | | | | 145,477 | |
Ryanair Holdings PLC - ADR (a) | | | 769 | | | | 87,289 | |
| | | | | | | | 1,179,753 | |
Israel — 0.8% | | | | |
Azrieli Group Ltd. | | | 298 | | | | 27,819 | |
Bank Hapoalim BM | | | 9,089 | | | | 89,329 | |
Bank Leumi Le-Israel BM | | | 11,908 | | | | 113,535 | |
Bezeq The Israeli Telecommunication Corp. Ltd. (a) | | | 3,749 | | | | 4,693 | |
Check Point Software Technologies Ltd. (a) | | | 923 | | | | 110,391 | |
CyberArk Software Ltd. (a) | | | 323 | | | | 58,176 | |
Elbit Systems Ltd. | | | 204 | | | | 32,105 | |
Fiverr International Ltd. (a) | | | 238 | | | | 40,543 | |
ICL Group Ltd. | | | 5,597 | | | | 47,845 | |
Inmode Ltd. (a) | | | 348 | | | | 32,970 | |
Isracard Ltd. | | | 1 | | | | 3 | |
Israel Discount Bank Ltd. (a) | | | 9,462 | | | | 57,053 | |
JFrog Ltd. (a) | | | 87 | | | | 2,844 | |
Kornit Digital Ltd. (a) | | | 319 | | | | 53,362 | |
Mizrahi Tefahot Bank Ltd. | | | 1,069 | | | | 38,816 | |
Nice Ltd. - ADR (a) (b) | | | 510 | | | | 144,340 | |
Nova Ltd. (a) | | | 52 | | | | 5,648 | |
Plus500 Ltd. | | | 827 | | | | 14,900 | |
Shapir Engineering and Industry Ltd. | | | 1,105 | | | | 9,030 | |
Strauss Group Ltd. | | | 388 | | | | 11,395 | |
Taro Pharmaceutical Industries Ltd. (a) | | | 96 | | | | 5,335 | |
| | | Shares | | | Value | |
Israel — 0.8% (Continued) |
Teva Pharmaceutical Industries Ltd. - ADR (a) | | | 8,847 | | | $ | 77,323 | |
The First International Bank Of Israel Ltd | | | 407 | | | | 16,283 | |
Wix.com Ltd. (a) | | | 438 | | | | 81,451 | |
ZIM Integrated Shipping Services Ltd. | | | 565 | | | | 28,939 | |
| | | | | | | | 1,104,128 | |
Italy — 1.6% | | | | |
Assicurazioni Generali SpA | | | 9,984 | | | | 217,558 | |
Atlantia SpA (a) | | | 3,848 | | | | 74,309 | |
Davide Campari-Milano NV | | | 3,186 | | | | 45,228 | |
Enel SpA | | | 60,195 | | | | 503,521 | |
Eni SpA - ADR | | | 10,037 | | | | 288,965 | |
Ferrari NV | | | 995 | | | | 235,796 | |
Intesa Sanpaolo SpA | | | 136,778 | | | | 388,569 | |
Moncler SpA | | | 1,374 | | | | 98,668 | |
Poste Italiane SpA (c) | | | 3,731 | | | | 53,223 | |
PRADA SpA | | | 938 | | | | 5,883 | |
Snam SpA | | | 17,667 | | | | 100,012 | |
Terna - Rete Elettrica Nazionale | | | 11,383 | | | | 84,769 | |
UniCredit SpA | | | 17,172 | | | | 226,776 | |
| | | | | | | | 2,323,277 | |
Japan — 21.5% | | | | |
Advantest Corp. | | | 1,644 | | | | 134,578 | |
Aeon Co. Ltd. | | | 7,107 | | | | 163,247 | |
AGC, Inc. | | | 1,853 | | | | 92,183 | |
Aisin Corp. | | | 1,497 | | | | 54,705 | |
Ajinomoto Co., Inc. | | | 4,471 | | | | 133,610 | |
ANA Holdings, Inc. (a) | | | 962 | | | | 22,393 | |
Asahi Group Holdings Ltd. | | | 3,753 | | | | 169,811 | |
Asahi Kasei Corp. | | | 11,340 | | | | 119,046 | |
Astellas Pharma, Inc. | | | 14,375 | | | | 241,780 | |
Bandai Namco Holdings, Inc. | | | 1,832 | | | | 139,632 | |
Bridgestone Corp. | | | 5,056 | | | | 222,646 | |
Canon, Inc. - ADR | | | 8,381 | | | | 187,483 | |
Central Japan Railway Co. | | | 1,685 | | | | 249,849 | |
Chubu Electric Power Co., Inc. | | | 5,871 | | | | 60,732 | |
Chugai Pharmaceutical Co. Ltd. | | | 5,184 | | | | 193,169 | |
Dai Nippon Printing Co. Ltd. | | | 2,463 | | | | 60,724 | |
Daifuku Co. Ltd. | | | 965 | | | | 88,478 | |
Dai-ichi Life Holdings, Inc. | | | 8,877 | | | | 187,042 | |
Daiichi Sankyo Co. Ltd. | | | 14,312 | | | | 360,013 | |
Daikin Industries Ltd. | | | 2,285 | | | | 499,001 | |
Daiwa House Industry Co. Ltd. | | | 5,419 | | | | 178,343 | |
Daiwa Securities Group, Inc. | | | 12,698 | | | | 71,158 | |
Denso Corp. | | | 4,227 | | | | 304,967 | |
Dentsu Group, Inc. | | | 2,019 | | | | 73,869 | |
Disco Corp. | | | 235 | | | | 63,093 | |
The accompanying notes are an integral part of the financial statements.
66
Pacer Trendpilot International ETF
SCHEDULE OF INVESTMENTS
October 31, 2021 (Unaudited) (Continued)
| | | Shares | | | Value | |
COMMON STOCKS — 93.5% (Continued) |
Japan — 21.5% (Continued) |
East Japan Railway Co. | | | 3,073 | | | $ | 191,107 | |
Eisai Co. Ltd. | | | 2,410 | | | | 169,731 | |
ENEOS Holdings, Inc. | | | 26,228 | | | | 105,763 | |
FANUC Corp. | | | 1,477 | | | | 289,115 | |
Fast Retailing Co. Ltd. | | | 509 | | | | 337,219 | |
FUJIFILM Holdings Corp. | | | 3,134 | | | | 242,003 | |
Fujitsu Ltd. | | | 1,452 | | | | 250,015 | |
GMO Payment Gateway, Inc. | | | 333 | | | | 42,189 | |
Hankyu Hanshin Holdings, Inc. | | | 2,079 | | | | 64,299 | |
Hikari Tsushin, Inc. | | | 195 | | | | 30,026 | |
Hitachi Ltd. | | | 7,566 | | | | 435,074 | |
Honda Motor Co. Ltd. - ADR (a) | | | 13,969 | | | | 413,203 | |
Hoya Corp. | | | 2,927 | | | | 429,516 | |
Hulic Co. Ltd. | | | 4,053 | | | | 38,868 | |
Inpex Corp. | | | 8,800 | | | | 73,504 | |
Isuzu Motors Ltd. | | | 5,039 | | | | 67,599 | |
ITOCHU Corp. | | | 11,151 | | | | 317,188 | |
Itochu Techno-Solutions Corp. | | | 749 | | | | 23,592 | |
Japan Airlines Co. Ltd. (a) | | | 915 | | | | 19,677 | |
Japan Exchange Group, Inc. | | | 4,365 | | | | 103,155 | |
Japan Post Bank Co. Ltd. | | | 3,295 | | | | 25,701 | |
Japan Post Holdings Co. Ltd. | | | 9,452 | | | | 72,564 | |
Japan Post Insurance Co. Ltd. | | | 964 | | | | 15,647 | |
Japan Tobacco, Inc. | | | 9,120 | | | | 178,879 | |
JFE Holdings, Inc. | | | 3,539 | | | | 54,121 | |
Kao Corp. | | | 3,943 | | | | 222,482 | |
KDDI Corp. | | | 12,734 | | | | 394,170 | |
Keio Corp. | | | 1,001 | | | | 50,412 | |
Keyence Corp. | | | 1,508 | | | | 906,454 | |
Kikkoman Corp. | | | 1,586 | | | | 129,691 | |
Kirin Holdings Co. Ltd. | | | 6,762 | | | | 117,530 | |
Kobe Bussan Co. Ltd. | | | 967 | | | | 33,216 | |
Koito Manufacturing Co. Ltd. | | | 1,069 | | | | 60,402 | |
Komatsu Ltd. | | | 7,903 | | | | 205,696 | |
Kose Corp. | | | 300 | | | | 34,718 | |
Kubota Corp. | | | 9,415 | | | | 200,113 | |
Kyocera Corp. | | | 2,872 | | | | 167,696 | |
Kyowa Kirin Co. Ltd. | | | 2,074 | | | | 68,057 | |
Lasertec Corp. | | | 592 | | | | 130,009 | |
M3, Inc. | | | 3,475 | | | | 204,521 | |
Makita Corp. | | | 2,294 | | | | 105,930 | |
Marubeni Corp. | | | 14,113 | | | | 119,021 | |
MEIJI Holdings Co. Ltd. | | | 1,185 | | | | 74,755 | |
MINEBEA MITSUMI, Inc. | | | 3,470 | | | | 87,530 | |
MISUMI Group, Inc. | | | 2,306 | | | | 96,307 | |
Mitsubishi Chemical Holdings Corp. | | | 11,523 | | | | 95,308 | |
Mitsubishi Corp. | | | 11,770 | | | | 373,005 | |
Mitsubishi Electric Corp. | | | 17,448 | | | | 233,456 | |
| | | Shares | | | Value | |
Japan — 21.5% (Continued) |
Mitsubishi Estate Co. Ltd. | | | 11,313 | | | $ | 171,519 | |
Mitsubishi Heavy Industries Ltd. | | | 2,755 | | | | 70,316 | |
Mitsubishi UFJ Financial Group, Inc. | | | 100,928 | | | | 551,241 | |
Mitsui & Co. Ltd. | | | 12,421 | | | | 282,476 | |
Mitsui Fudosan Co. Ltd. | | | 7,972 | | | | 181,753 | |
Mizuho Financial Group, Inc. | | | 20,642 | | | | 272,570 | |
MonotaRO Co. Ltd. | | | 1,928 | | | | 43,643 | |
MS&AD Insurance Group Holdings, Inc. | | | 4,017 | | | | 129,912 | |
Murata Manufacturing Co. Ltd. | | | 5,017 | | | | 380,891 | |
NEC Corp. | | | 2,115 | | | | 108,000 | |
Nexon Co. Ltd. | | | 3,750 | | | | 63,534 | |
Nidec Corp. | | | 4,279 | | | | 471,920 | |
Nihon M&A Center Holdings, Inc. | | | 2,265 | | | | 69,257 | |
Nintendo Co. Ltd. - ADR | | | 7,579 | | | | 418,740 | |
Nippon Paint Holdings Co. Ltd. | | | 11,281 | | | | 120,654 | |
Nippon Steel Corp. | | | 7,725 | | | | 135,488 | |
Nippon Telegraph & Telephone Corp. | | | 10,473 | | | | 292,941 | |
Nippon Yusen KK | | | 1,148 | | | | 82,392 | |
Nissan Motor Co. Ltd. (a) | | | 19,543 | | | | 99,005 | |
Nissin Foods Holdings Co. Ltd. | | | 691 | | | | 52,806 | |
Nitori Holdings Co. Ltd. | | | 692 | | | | 126,621 | |
Nitto Denko Corp. | | | 1,302 | | | | 101,441 | |
Nomura Holdings, Inc. | | | 23,138 | | | | 111,655 | |
Nomura Research Institute Ltd. | | | 3,170 | | | | 126,272 | |
NTT Data Corp. | | | 5,254 | | | | 105,241 | |
Obic Co. Ltd. | | | 561 | | | | 103,316 | |
Odakyu Electric Railway Co. Ltd. | | | 2,772 | | | | 59,903 | |
Olympus Corp. | | | 10,576 | | | | 228,315 | |
Omron Corp. | | | 1,687 | | | | 160,892 | |
Ono Pharmaceutical Co. Ltd. | | | 4,088 | | | | 85,562 | |
Oracle Corp Japan | | | 293 | | | | 27,635 | |
Oriental Land Co. Ltd./Japan | | | 1,833 | | | | 288,520 | |
ORIX Corp. | | | 10,048 | | | | 198,800 | |
Osaka Gas Co. Ltd. | | | 3,390 | | | | 54,609 | |
Otsuka Corp. | | | 868 | | | | 42,648 | |
Otsuka Holdings Co. Ltd. | | | 4,534 | | | | 178,774 | |
Pan Pacific International Holdings Corp. | | | 4,898 | | | | 102,537 | |
Panasonic Corp. | | | 18,923 | | | | 231,194 | |
Rakuten Group, Inc. | | | 6,642 | | | | 72,845 | |
Recruit Holdings Co. Ltd. | | | 13,267 | | | | 881,401 | |
Renesas Electronics Corp. (a) | | | 10,987 | | | | 135,150 | |
Resona Holdings, Inc. | | | 17,952 | | | | 67,414 | |
Rohm Co. Ltd. | | | 768 | | | | 69,944 | |
Secom Co. Ltd. | | | 1,747 | | | | 118,623 | |
Sekisui Chemical Co. Ltd. | | | 3,713 | | | | 60,757 | |
Sekisui House Ltd. | | | 5,237 | | | | 108,508 | |
The accompanying notes are an integral part of the financial statements.
67
Pacer Trendpilot International ETF
SCHEDULE OF INVESTMENTS
October 31, 2021 (Unaudited) (Continued)
| | | Shares | | | Value | |
COMMON STOCKS — 93.5% (Continued) |
Japan — 21.5% (Continued) |
Seven & i Holdings Co. Ltd. | | | 6,490 | | | $ | 272,298 | |
SG Holdings Co. Ltd. | | | 3,984 | | | | 99,622 | |
Sharp Corp./Japan | | | 1,702 | | | | 20,025 | |
Shimadzu Corp. | | | 2,244 | | | | 90,863 | |
Shimano, Inc. | | | 699 | | | | 193,678 | |
Shin-Etsu Chemical Co. Ltd. | | | 3,124 | | | | 555,180 | |
Shionogi & Co. Ltd. | | | 2,334 | | | | 151,682 | |
Shiseido Co. Ltd. | | | 3,270 | | | | 217,331 | |
SMC Corp. | | | 480 | | | | 286,126 | |
SoftBank Corp. | | | 20,599 | | | | 280,949 | |
SoftBank Group Corp. - ADR | | | 20,068 | | | | 541,635 | |
Sompo Holdings, Inc. | | | 3,048 | | | | 132,323 | |
Sony Group Corp. - ADR | | | 9,848 | | | | 1,140,300 | |
Subaru Corp. | | | 5,188 | | | | 101,416 | |
Sumitomo Corp. | | | 9,287 | | | | 131,758 | |
Sumitomo Electric Industries Ltd. | | | 6,449 | | | | 85,242 | |
Sumitomo Metal Mining Co. Ltd. | | | 2,223 | | | | 86,267 | |
Sumitomo Mitsui Financial Group, Inc. | | | 10,742 | | | | 350,700 | |
Sumitomo Mitsui Trust Holdings, Inc. | | | 3,076 | | | | 101,314 | |
Sumitomo Realty & Development Co. Ltd. | | | 3,873 | | | | 139,662 | |
Suntory Beverage & Food Ltd. | | | 1,057 | | | | 40,945 | |
Suzuki Motor Corp. | | | 3,748 | | | | 166,888 | |
Sysmex Corp. | | | 1,347 | | | | 166,285 | |
T&D Holdings, Inc. | | | 4,840 | | | | 62,085 | |
Taisei Corp. | | | 1,828 | | | | 57,258 | |
Taiyo Nippon Sanso Corp. | | | 1,733 | | | | 40,826 | |
Takeda Pharmaceutical Co. Ltd. - ADR (b) | | | 24,838 | | | | 348,229 | |
TDK Corp. | | | 3,171 | | | | 114,904 | |
Terumo Corp. | | | 5,675 | | | | 249,854 | |
The Kansai Electric Power Co., Inc. | | | 6,730 | | | | 61,882 | |
Toho Co. Ltd./Tokyo | | | 1,158 | | | | 54,357 | |
Tokio Marine Holdings, Inc. | | | 5,710 | | | | 300,492 | |
Tokyo Electron Ltd. | | | 1,227 | | | | 568,958 | |
Tokyo Gas Co. Ltd. | | | 3,170 | | | | 55,042 | |
Tokyu Corp. | | | 4,619 | | | | 64,923 | |
Toray Industries, Inc. | | | 13,249 | | | | 82,406 | |
Toshiba Corp. | | | 3,477 | | | | 149,788 | |
TOTO Ltd. | | | 1,307 | | | | 63,071 | |
Toyota Industries Corp. | | | 1,677 | | | | 142,135 | |
Toyota Motor Corp. - ADR | | | 10,071 | | | | 1,778,236 | |
Toyota Tsusho Corp. | | | 1,928 | | | | 83,396 | |
Trend Micro, Inc. | | | 1,003 | | | | 56,585 | |
Unicharm Corp. | | | 3,587 | | | | 144,519 | |
Welcia Holdings Co. Ltd. | | | 786 | | | | 29,344 | |
| | | Shares | | | Value | |
Japan — 21.5% (Continued) |
West Japan Railway Co. | | | 1,559 | | | $ | 73,357 | |
Yakult Honsha Co. Ltd. | | | 1,323 | | | | 66,629 | |
Yamaha Corp. | | | 1,376 | | | | 86,683 | |
Yamato Holdings Co. Ltd. | | | 2,743 | | | | 67,315 | |
Yaskawa Electric Corp. | | | 2,182 | | | | 94,191 | |
Z Holdings Corp. | | | 20,753 | | | | 128,551 | |
ZOZO, Inc. | | | 780 | | | | 24,945 | |
| | | | | | | | 30,421,871 | |
Luxembourg — 0.1% | | | | |
ArcelorMittal | | | 5,795 | | | | 196,449 | |
| | | | | |
Netherlands — 5.5% | | | | |
Adyen NV - ADR (a) | | | 23,674 | | | | 718,979 | |
ASML Holding NV | | | 3,363 | | | | 2,733,715 | |
EXOR NV | | | 787 | | | | 74,147 | |
Heineken NV | | | 1,922 | | | | 212,896 | |
ING Groep NV - ADR (b) | | | 31,164 | | | | 471,511 | |
Koninklijke Ahold Delhaize NV | | | 8,420 | | | | 273,804 | |
Koninklijke DSM NV | | | 1,293 | | | | 282,575 | |
Koninklijke Philips NV | | | 7,128 | | | | 335,574 | |
Prosus NV | | | 6,624 | | | | 583,568 | |
Royal Dutch Shell PLC - ADR | | | 30,523 | | | | 1,399,174 | |
Stellantis NV | | | 17,319 | | | | 345,359 | |
Universal Music Group NV | | | 12,937 | | | | 375,600 | |
| | | | | | | | 7,806,902 | |
New Zealand — 0.3% | | | | |
Auckland International Airport Ltd. (a) | | | 9,707 | | | | 55,579 | |
Contact Energy Ltd. | | | 5,858 | | | | 34,338 | |
Fisher & Paykel Healthcare Corp. Ltd. | | | 4,683 | | | | 104,736 | |
Mercury NZ Ltd. | | | 5,093 | | | | 22,390 | |
Meridian Energy Ltd. | | | 10,200 | | | | 36,473 | |
Ryman Healthcare Ltd. | | | 3,372 | | | | 34,917 | |
Spark New Zealand Ltd. | | | 14,923 | | | | 48,817 | |
Xero Ltd. (a) | | | 894 | | | | 100,547 | |
| | | | | | | | 437,797 | |
Norway — 0.8% | | | | |
Adevinta ASA (a) | | | 1,838 | | | | 30,253 | |
Aker BP ASA | | | 881 | | | | 33,778 | |
DNB Bank ASA | | | 7,318 | | | | 173,943 | |
Equinor ASA - ADR (b) | | | 9,026 | | | | 229,531 | |
Gjensidige Forsikring ASA | | | 1,544 | | | | 38,399 | |
Mowi ASA | | | 3,650 | | | | 105,682 | |
Norsk Hydro ASA | | | 11,100 | | | | 81,306 | |
Orkla ASA | | | 6,603 | | | | 64,218 | |
Salmar ASA | | | 459 | | | | 34,936 | |
Schibsted ASA - Class A | | | 679 | | | | 35,019 | |
Schibsted ASA - Class B | | | 846 | | | | 38,195 | |
The accompanying notes are an integral part of the financial statements.
68
Pacer Trendpilot International ETF
SCHEDULE OF INVESTMENTS
October 31, 2021 (Unaudited) (Continued)
| | | Shares | | | Value | |
COMMON STOCKS — 93.5% (Continued) |
Norway — 0.8% (Continued) |
Telenor ASA | | | 5,294 | | | $ | 83,566 | |
TOMRA Systems ASA | | | 898 | | | | 57,954 | |
Yara International ASA | | | 1,454 | | | | 75,868 | |
| | | | | | | | 1,082,648 | |
Poland — 0.0% (d) | | | | |
Allegro.eu SA (a) (c) | | | 1,153 | | | | 13,040 | |
| | | | | |
Portugal — 0.1% | | | | |
EDP - Energias de Portugal SA | | | 22,569 | | | | 127,423 | |
| | | | | |
Singapore — 1.5% | | | | |
Capitaland Investment Ltd/Singapore (a) | | | 20,453 | | | | 52,175 | |
DBS Group Holdings Ltd. | | | 14,550 | | | | 340,201 | |
Oversea-Chinese Banking Corp. Ltd. | | | 31,825 | | | | 278,484 | |
Sea Ltd. - ADR (a) | | | 2,589 | | | | 889,503 | |
Singapore Airlines Ltd. (a) | | | 10,590 | | | | 40,837 | |
Singapore Technologies Engineering Ltd. | | | 12,677 | | | | 36,005 | |
Singapore Telecommunications Ltd. | | | 52,200 | | | | 96,774 | |
United Overseas Bank Ltd. | | | 11,368 | | | | 225,505 | |
Wilmar International Ltd. | | | 24,676 | | | | 79,051 | |
| | | | | | | | 2,038,535 | |
South Korea — 0.1% | | | | |
Coupang, Inc. (a) | | | 964 | | | | 28,689 | |
POSCO - ADR | | | 2,416 | | | | 152,836 | |
| | | | | | | | 181,525 | |
Spain — 1.9% | | | | |
Aena SME SA (a) (c) | | | 603 | | | | 98,740 | |
Amadeus IT Holding SA (a) | | | 3,660 | | | | 244,719 | |
Banco Bilbao Vizcaya Argentaria SA - ADR | | | 54,444 | | | | 379,475 | |
Banco Santander SA - ADR | | | 137,124 | | | | 519,700 | |
Cellnex Telecom SA (c) | | | 4,381 | | | | 269,327 | |
EDP Renovaveis SA | | | 2,188 | | | | 60,957 | |
Endesa SA | | | 2,602 | | | | 59,993 | |
Iberdrola SA | | | 45,412 | | | | 536,251 | |
Industria de Diseno Textil SA | | | 8,620 | | | | 311,298 | |
Naturgy Energy Group SA | | | 2,725 | | | | 71,602 | |
Telefonica SA - ADR | | | 41,856 | | | | 182,074 | |
| | | | | | | | 2,734,136 | |
Sweden — 3.5% | | | | |
Alfa Laval AB | | | 2,443 | | | | 104,598 | |
Assa Abloy AB - Class B | | | 8,075 | | | | 236,477 | |
Atlas Copco AB - Class A | | | 5,267 | | | | 338,418 | |
Atlas Copco AB - Class B | | | 3,168 | | | | 171,348 | |
EPIROC AB (a) | | | 3,168 | | | | 67,322 | |
EPIROC AB (a) | | | 5,093 | | | | 126,732 | |
| | | Shares | | | Value | |
Sweden — 3.5% (Continued) |
EQT AB | | | 2,177 | | | $ | 114,731 | |
Essity AB - Class B | | | 4,924 | | | | 159,279 | |
Evolution AB (c) | | | 1,465 | | | | 236,979 | |
Fastighets AB Balder - Class B (a) | | | 571 | | | | 41,369 | |
H & M Hennes & Mauritz AB - Class B (b) | | | 6,298 | | | | 118,084 | |
HEXAGON AB | | | 16,076 | | | | 258,324 | |
Industrivarden AB - Class A | | | 1,521 | | | | 50,157 | |
Industrivarden AB - Class C | | | 1,360 | | | | 44,167 | |
Investment AB Latour - Class B | | | 1,023 | | | | 37,070 | |
INVESTOR AB | | | 4,034 | | | | 93,250 | |
INVESTOR AB | | | 14,858 | | | | 342,384 | |
Kinnevik AB - Class A (a) | | | 66 | | | | 2,661 | |
Kinnevik AB - Class B (a) | | | 1,978 | | | | 77,538 | |
L E Lundbergforetagen AB - Class B | | | 530 | | | | 30,524 | |
NIBE INDUSTRIER AB | | | 10,863 | | | | 161,718 | |
Sagax AB - Class B | | | 853 | | | | 33,373 | |
Sagax AB - Class D | | | 871 | | | | 3,321 | |
Sandvik AB | | | 8,526 | | | | 215,930 | |
SINCH AB | | | 3,632 | | | | 68,872 | |
Skandinaviska Enskilda Banken AB - Class A | | | 13,058 | | | | 204,126 | |
Skandinaviska Enskilda Banken AB - Class C | | | 122 | | | | 1,955 | |
Skanska AB - Class B | | | 2,936 | | | | 74,528 | |
SKF AB - Class B | | | 3,056 | | | | 70,813 | |
Spotify Technology SA (a) | | | 1,071 | | | | 309,947 | |
Svenska Cellulosa AB SCA - Class B | | | 4,924 | | | | 76,773 | |
Svenska Handelsbanken AB - Class A | | | 12,318 | | | | 141,052 | |
Svenska Handelsbanken AB - Class B | | | 292 | | | | 3,689 | |
Swedbank AB (b) | | | 7,550 | | | | 163,730 | |
SWEDISH MATCH | | | 13,450 | | | | 118,369 | |
Telefonaktiebolaget LM Ericsson - ADR | | | 22,932 | | | | 249,271 | |
Telia Co. AB (b) | | | 20,596 | | | | 81,048 | |
Volvo AB - Class A | | | 751 | | | | 17,734 | |
Volvo AB - Class B | | | 12,030 | | | | 280,046 | |
| | | | | | | | 4,927,707 | |
Switzerland — 8.0% | | | | |
ABB Ltd. - ADR (b) | | | 13,917 | | | | 459,818 | |
Alcon, Inc. | | | 3,977 | | | | 328,637 | |
Cie Financiere Richemont SA | | | 4,078 | | | | 503,737 | |
Givaudan SA | | | 64 | | | | 301,197 | |
Glencore PLC | | | 88,810 | | | | 443,928 | |
Kuehne + Nagel International AG | | | 354 | | | | 111,466 | |
Lonza Group AG | | | 560 | | | | 459,083 | |
Nestle SA - ADR | | | 22,260 | | | | 2,934,313 | |
Novartis AG - ADR | | | 18,996 | | | | 1,572,109 | |
Partners Group Holding AG | | | 168 | | | | 293,119 | |
Roche Holding AG - ADR | | | 46,308 | | | | 2,238,066 | |
The accompanying notes are an integral part of the financial statements.
69
Pacer Trendpilot International ETF
SCHEDULE OF INVESTMENTS
October 31, 2021 (Unaudited) (Continued)
| | | Shares | | | Value | |
COMMON STOCKS — 93.5% (Continued) |
Switzerland — 8.0% (Continued) |
Sika AG | | | 1,063 | | | $ | 359,906 | |
STMicroelectronics NV | | | 5,333 | | | | 252,239 | |
UBS Group AG | | | 30,178 | | | | 548,616 | |
Zurich Insurance Group AG | | | 1,174 | | | | 520,453 | |
| | | | | | | | 11,326,687 | |
United Kingdom — 10.0% | | | | |
3i Group PLC | | | 6,679 | | | | 124,677 | |
Anglo American PLC | | | 10,666 | | | | 406,160 | |
Ashtead Group PLC | | | 3,456 | | | | 289,648 | |
Associated British Foods PLC | | | 2,896 | | | | 70,864 | |
AstraZeneca PLC - ADR | | | 24,489 | | | | 1,527,624 | |
Aviva PLC | | | 31,980 | | | | 172,745 | |
BAE Systems PLC | | | 25,929 | | | | 195,807 | |
Barclays PLC - ADR (b) | | | 32,135 | | | | 359,591 | |
BP PLC - ADR | | | 26,977 | | | | 776,668 | |
British American Tobacco PLC - ADR | | | 17,766 | | | | 620,389 | |
BT Group PLC (a) | | | 71,240 | | | | 135,421 | |
CNH Industrial NV | | | 8,067 | | | | 138,026 | |
Coca-Cola European Partners PLC | | | 1,608 | | | | 84,661 | |
Compass Group PLC (a) | | | 14,499 | | | | 307,561 | |
Croda International PLC | | | 983 | | | | 127,237 | |
Diageo PLC - ADR | | | 4,669 | | | | 932,259 | |
Entain PLC (a) | | | 3,954 | | | | 110,822 | |
Ferguson PLC | | | 1,902 | | | | 286,198 | |
GlaxoSmithKline PLC - ADR | | | 19,314 | | | | 817,562 | |
HSBC Holdings PLC - ADR | | | 32,462 | | | | 976,132 | |
Imperial Brands PLC | | | 7,716 | | | | 162,831 | |
Legal & General Group PLC | | | 47,975 | | | | 189,681 | |
Lloyds Banking Group PLC - ADR | | | 141,281 | | | | 384,284 | |
London Stock Exchange Group PLC | | | 2,432 | | | | 236,310 | |
National Grid PLC - ADR | | | 6,152 | | | | 394,220 | |
Natwest Group PLC | | | 37,315 | | | | 112,910 | |
Ocado Group PLC (a) | | | 4,611 | | | | 113,776 | |
Prudential PLC - ADR | | | 10,604 | | | | 437,945 | |
Reckitt Benckiser Group PLC | | | 5,744 | | | | 465,762 | |
RELX PLC - ADR | | | 16,089 | | | | 501,816 | |
Rio Tinto PLC - ADR (b) | | | 8,240 | | | | 521,345 | |
Smith & Nephew PLC - ADR | | | 3,650 | | | | 126,838 | |
SSE PLC | | | 8,509 | | | | 191,386 | |
Standard Chartered PLC | | | 21,528 | | | | 145,808 | |
Tesco PLC | | | 62,258 | | | | 229,964 | |
Unilever PLC - ADR | | | 20,564 | | | | 1,101,819 | |
Vodafone Group PLC - ADR | | | 21,328 | | | | 318,854 | |
WPP PLC | | | 8,473 | | | | 122,451 | |
| | | | | | | | 14,218,052 | |
| | | Shares | | | Value | |
United States — 0.2% | | | | |
Jackson Financial, Inc. - Class A (a) | | | 490 | | | $ | 13,264 | |
Waste Connections, Inc. | | | 2,137 | | | | 290,654 | |
| | | | | | | | 303,918 | |
TOTAL COMMON STOCKS (Cost $108,895,582) | | | | | | | 132,335,208 | |
| | | | | |
PREFERRED STOCKS — 0.5% | | | | |
Canada — 0.0% (d) | | | | |
Brookfield Property Preferred LP (a) | | | 31 | | | | 770 | |
| | | | | |
Germany — 0.5% | | | | |
Bayerische Motoren Werke AG | | | 484 | | | | 41,180 | |
Henkel AG & Co. KGaA | | | 1,448 | | | | 129,526 | |
Porsche Automobil Holding SE | | | 1,031 | | | | 107,051 | |
Sartorius AG | | | 168 | | | | 108,834 | |
Volkswagen AG | | | 1,428 | | | | 319,952 | |
| | | | | | | | 706,543 | |
TOTAL PREFERRED STOCKS (Cost $637,941) | | | | | | | 707,313 | |
| | | | | |
REAL ESTATE INVESTMENT TRUSTS — 0.8% | | | | |
Australia — 0.3% | | | | |
Dexus | | | 8,867 | | | | 72,505 | |
Goodman Group | | | 13,228 | | | | 217,921 | |
Scentre Group | | | 42,144 | | | | 95,742 | |
| | | | | | | | 386,168 | |
Hong Kong — 0.1% | | | | |
Link REIT | | | 16,706 | | | | 148,154 | |
| | | | | |
Japan — 0.2% | | | | |
Japan Real Estate Investment Corp. | | | 5 | | | | 30,620 | |
Nippon Building Fund, Inc. | | | 15 | | | | 97,390 | |
Nippon Prologis REIT, Inc. | | | 15 | | | | 50,077 | |
Nomura Real Estate Master Fund, Inc. | | | 40 | | | | 59,908 | |
| | | | | | | | 237,995 | |
Singapore — 0.1% | | | | |
Ascendas Real Estate Investment Trust | | | 24,342 | | | | 55,778 | |
CapitaLand Integrated Commercial Trust | | | 27,823 | | | | 44,360 | |
| | | | | | | | 100,138 | |
United Kingdom — 0.1% | | | | |
Segro PLC | | | 9,074 | | | | 160,506 | |
TOTAL REAL ESTATE INVESTMENT TRUSTS (Cost $862,712) | | | | | | | 1,032,961 | |
| | | | | |
The accompanying notes are an integral part of the financial statements.
70
Pacer Trendpilot International ETF
SCHEDULE OF INVESTMENTS
October 31, 2021 (Unaudited) (Continued)
| | | Shares | | | Value | |
EXCHANGE TRADED FUNDS — 4.8% | | | | |
iShares MSCI South Korea ETF | | | 86,266 | | | $ | 6,857,285 | |
TOTAL EXCHANGE TRADED FUNDS (Cost $5,793,993) | | | | | | | 6,857,285 | |
| | | | | |
| | | Principal
Amount | | | | | |
SHORT-TERM INVESTMENTS- 0.1% | | | | |
MONEY MARKET FUNDS — 0.1% | | | | |
U.S. Bank Money Market Deposit Account, 0.003% (e) | | $ | 204,400 | | | | 204,400 | |
TOTAL SHORT-TERM INVESTMENTS (Cost $204,400) | | | | | | | 204,400 | |
| | | | | |
| | | Shares | | | | | |
INVESTMENTS PURCHASED WITH PROCEEDS FROM SECURITIES LENDING — 4.7% |
Mount Vernon Liquid Assets Portfolio, LLC, 0.10% (e) | | | 6,653,842 | | | $ | 6,653,842 | |
TOTAL INVESTMENTS PURCHASED WITH PROCEEDS FROM SECURITIES LENDING (Cost $6,653,842) | | | | | | | 6,653,842 | |
Total Investments (Cost $123,048,470) — 104.4% | | | | | | | 147,791,009 | |
Liabilities in Excess of Other Assets — (4.4)% | | | | | | | (6,289,739 | ) |
TOTAL NET ASSETS — 100.0% | | | | | | $ | 141,501,272 | |
Percentages are stated as a percent of net assets.
| | (a) | Non-income producing security. |
| | (b) | All or a portion of this security is on loan as of October 31, 2021. The total value of securities on loan is $6,397,493 or 4.5% of net assets. |
| | (c) | Security exempt from registration under Rule 144(a) and Regulation S of the Securities Act of 1933. Such securities are treated as liquid securities according to the Fund’s liquidity guidelines. The value of those securities total $1,344,333 or 1.0% of net assets. |
| | (e) | The rate shown is as of October 31, 2021. |
For Fund compliance purposes, the Fund’s industry classifications refer to any one or more of the industry sub-classifications used by one or more widely recognized market indexes or ratings group indexes, and/or they may be defined by Fund management. This definition does not apply for all purposes of this report, which may combine sub-classifications for reporting ease.
The accompanying notes are an integral part of the financial statements.
71
Pacer Trendpilot US Bond ETF
SCHEDULE OF INVESTMENTS
October 31, 2021 (Unaudited)
| | | Shares | | | Value | |
CORPORATE BONDS — 98.4% | | | | |
Aerospace/Defense — 4.3% | | | | |
Howmet Aerospace, Inc. | | | | |
5.125%, 10/01/2024 (a) (b) | | | 5,795,000 | | | $ | 6,396,231 | |
3.000%, 01/15/2029 (a) | | | 6,260,000 | | | | 6,173,925 | |
Moog, Inc. | | | | |
4.250%, 12/15/2027 (a) (c) | | | 4,875,000 | | | | 5,024,565 | |
Spirit AeroSystems, Inc. | | | | |
5.500%, 01/15/2025 (a) (c) | | | 11,935,000 | | | | 12,442,237 | |
TransDigm, Inc. | | | | |
5.500%, 11/15/2027 (a) (b) | | | 14,215,000 | | | | 14,570,375 | |
Triumph Group, Inc. | | | | |
8.875%, 06/01/2024 (a) (b) (c) | | | 10,802,000 | | | | 11,912,014 | |
| | | | | | | | 56,519,347 | |
Agriculture — 0.8% | | | | |
Vector Group Ltd. | | | | |
5.750%, 02/01/2029 (a) (c) | | | 10,825,000 | | | | 10,784,406 | |
| | | | | |
Airlines — 1.7% | | | | |
American Airlines, Inc. | | | | |
11.750%, 07/15/2025 (a) (c) | | | 10,840,000 | | | | 13,441,600 | |
United Airlines, Inc. | | | | |
4.625%, 04/15/2029 (a) (b) (c) | | | 8,395,000 | | | | 8,665,571 | |
| | | | | | | | 22,107,171 | |
Apparel — 1.2% | | | | |
Levi Strauss & Co. | | | | |
3.500%, 03/01/2031 (a) (b) (c) | | | 6,205,000 | | | | 6,243,782 | |
Under Armour, Inc. | | | | |
3.250%, 06/15/2026 (a) (b) | | | 4,825,000 | | | | 4,951,656 | |
Wolverine World Wide, Inc. | | | | |
4.000%, 08/15/2029 (a) (c) | | | 4,975,000 | | | | 4,918,086 | |
| | | | | | | | 16,113,524 | |
Auto Manufacturers — 1.0% | | | | |
Allison Transmission, Inc. | | | | |
3.750%, 01/30/2031 (a) (b) (c) | | | 5,550,000 | | | | 5,342,125 | |
Ford Motor Co. | | | | |
4.750%, 01/15/2043 (a) (b) | | | 7,290,000 | | | | 7,963,450 | |
| | | | | | | | 13,305,575 | |
Auto Parts & Equipment — 2.7% | | | | |
American Axle & Manufacturing, Inc. | | | | |
5.000%, 10/01/2029 (a) (b) | | | 11,145,000 | | | | 10,670,145 | |
Tenneco, Inc. | | | | |
5.125%, 04/15/2029 (a) (c) | | | 11,725,000 | | | | 11,637,063 | |
The Goodyear Tire & Rubber Co. | | | | |
4.875%, 03/15/2027 (a) (b) | | | 12,095,000 | | | | 12,878,151 | |
| | | | | | | | 35,185,359 | |
Banks — 0.7% | | | | |
CIT Group, Inc. | | | | |
4.750%, 02/16/2024 (a) | | | 9,215,000 | | | | 9,802,456 | |
| | | Shares | | | Value | |
Beverages — 0.5% | | | | |
Primo Water Holdings, Inc. | | | | |
4.375%, 04/30/2029 (a) (c) | | | 5,535,000 | | | $ | 5,492,502 | |
Triton Water Holdings, Inc. | | | | |
6.250%, 04/01/2029 (a) (c) | | | 1,470,000 | | | | 1,467,030 | |
| | | | | | | | 6,959,532 | |
Building Materials — 0.8% | | | | |
Builders FirstSource, Inc. | | | | |
5.000%, 03/01/2030 (a) (c) | | | 5,525,000 | | | | 5,842,771 | |
Summit Materials LLC / Summit Materials Finance Corp. | | | | |
5.250%, 01/15/2029 (a) (c) | | | 4,715,000 | | | | 4,944,856 | |
| | | | | | | | 10,787,627 | |
Chemicals — 4.1% | | | | |
CVR Partners LP / CVR Nitrogen Finance Corp. | | | | |
6.125%, 06/15/2028 (a) (c) | | | 10,635,000 | | | | 11,020,519 | |
Element Solutions, Inc. | | | | |
3.875%, 09/01/2028 (a) (c) | | | 4,940,000 | | | | 4,941,630 | |
Ingevity Corp. | | | | |
3.875%, 11/01/2028 (a) (c) | | | 9,305,000 | | | | 9,153,329 | |
Olin Corp. | | | | |
5.625%, 08/01/2029 (a) (b) | | | 5,065,000 | | | | 5,538,476 | |
Rayonier AM Products, Inc. | | | | |
7.625%, 01/15/2026 (a) (c) | | | 10,828,000 | | | | 11,211,257 | |
The Chemours Co. | | | | |
5.375%, 05/15/2027 (a) (b) | | | 11,305,000 | | | | 11,940,906 | |
| | | | | | | | 53,806,117 | |
Commercial Services — 3.6% | | | | |
Avis Budget Car Rental LLC / Avis Budget Finance, Inc. | | | | |
4.750%, 04/01/2028 (a) (b) (c) | | | 12,085,000 | | | | 12,553,354 | |
Service Corp. International | | | | |
5.125%, 06/01/2029 (a) (b) | | | 4,605,000 | | | | 4,978,005 | |
Square, Inc. | | | | |
3.500%, 06/01/2031 (a) (b) (c) | | | 8,185,000 | | | | 8,399,857 | |
The ADT Security Corp | | | | |
4.125%, 06/15/2023 (a) (b) | | | 10,070,000 | | | | 10,495,256 | |
WW International, Inc. | | | | |
4.500%, 04/15/2029 (a) (b) (c) | | | 11,020,000 | | | | 10,565,425 | |
| | | | | | | | 46,991,897 | |
Computers — 1.3% | | | | |
Booz Allen Hamilton, Inc. | | | | |
3.875%, 09/01/2028 (a) (b) (c) | | | 4,905,000 | | | | 4,981,518 | |
NCR Corp. | | | | |
5.125%, 04/15/2029 (a) (b) (c) | | | 11,980,000 | | | | 12,265,483 | |
| | | | | | | | 17,247,001 | |
Cosmetics/Personal Care — 1.1% | | | | |
Coty, Inc. | | | | |
5.000%, 04/15/2026 (a) (c) | | | 13,965,000 | | | | 14,331,581 | |
| | | | | |
The accompanying notes are an integral part of the financial statements.
72
Pacer Trendpilot US Bond ETF
SCHEDULE OF INVESTMENTS
October 31, 2021 (Unaudited) (Continued)
| | | Shares | | | Value | |
CORPORATE BONDS — 98.4% (Continued) |
Distribution/Wholesale — 0.4% | | | | |
H&E Equipment Services, Inc. | | | | |
3.875%, 12/15/2028 (a) (b) (c) | | | 5,000,000 | | | $ | 4,987,500 | |
| | | | | |
Diversified Financial Services — 3.2% | | | | |
Ally Financial, Inc. | | | | |
5.750%, 11/20/2025 (a) (b) | | | 6,460,000 | | | | 7,337,080 | |
LD Holdings Group LLC | | | | |
6.500%, 11/01/2025 (a) (b) (c) | | | 11,730,000 | | | | 11,516,338 | |
LPL Holdings, Inc. | | | | |
4.000%, 03/15/2029 (a) (b) (c) | | | 4,880,000 | | | | 4,983,700 | |
Navient Corp. | | | | |
5.625%, 08/01/2033 (a) | | | 9,795,000 | | | | 9,323,909 | |
Rocket Mortgage LLC / Rocket Mortgage Co-Issuer, Inc. | | | | |
3.625%, 03/01/2029 (a) (b) (c) | | | 4,905,000 | | | | 4,874,344 | |
SLM Corp. | | | | |
4.200%, 10/29/2025 (a) | | | 4,615,000 | | | | 4,884,170 | |
| | | | | | | | 42,919,541 | |
Electric — 0.4% | | | | |
NextEra Energy Operating Partners LP | | | | |
4.250%, 07/15/2024 (a) (b) (c) | | | 4,785,000 | | | | 5,071,861 | |
| | | | | |
Electrical Components & Equipment — 2.0% | | | | |
Energizer Holdings, Inc. | | | | |
4.375%, 03/31/2029 (a) (b) (c) | | | 12,220,000 | | | | 11,725,090 | |
WESCO Distribution, Inc. | | | | |
7.250%, 06/15/2028 (a) (c) | | | 13,320,000 | | | | 14,707,411 | |
| | | | | | | | 26,432,501 | |
Electronics — 0.9% | | | | |
Sensata Technologies, Inc. | | | | |
3.750%, 02/15/2031 (a) (b) (c) | | | 6,305,000 | | | | 6,226,313 | |
TTM Technologies, Inc. | | | | |
4.000%, 03/01/2029 (a) (b) (c) | | | 5,740,000 | | | | 5,703,580 | |
| | | | | | | | 11,929,893 | |
Engineering & Construction — 1.4% | | | | |
AECOM | | | | |
5.125%, 03/15/2027 (a) | | | 5,750,000 | | | | 6,353,750 | |
Dycom Industries, Inc. | | | | |
4.500%, 04/15/2029 (a) (c) | | | 12,150,000 | | | | 12,347,437 | |
| | | | | | | | 18,701,187 | |
Entertainment — 1.1% | | | | |
Allen Media LLC / Allen Media Co-Issuer, Inc. | | | | |
10.500%, 02/15/2028 (a) (c) | | | 2,850,000 | | | | 3,058,022 | |
Lions Gate Capital Holdings LLC | | | | |
5.500%, 04/15/2029 (a) (c) | | | 1,710,000 | | | | 1,750,613 | |
Live Nation Entertainment, Inc. | | | | |
3.750%, 01/15/2028 (a) (c) | | | 5,045,000 | | | | 5,000,856 | |
| | | Shares | | | Value | |
Entertainment — 1.1% (Continued) |
WMG Acquisition Corp. | | | | |
3.875%, 07/15/2030 (a) (b) (c) | | | 4,785,000 | | | $ | 4,964,772 | |
| | | | | | | | 14,774,263 | |
Environmental Control — 0.4% | | | | |
Stericycle, Inc. | | | | |
3.875%, 01/15/2029 (a) (c) | | | 4,935,000 | | | | 4,867,144 | |
| | | | | |
Food — 3.7% | | | | |
Albertsons Cos Inc / Safeway Inc / New Albertsons LP / Albertsons LLC | | | | |
3.500%, 03/15/2029 (a) (b) (c) | | | 4,940,000 | | | | 4,875,459 | |
B&G Foods, Inc. | | | | |
5.250%, 09/15/2027 (a) (b) | | | 14,005,000 | | | | 14,380,155 | |
Performance Food Group, Inc. | | | | |
4.250%, 08/01/2029 (a) (b) (c) | | | 5,015,000 | | | | 5,021,269 | |
Pilgrim’s Pride Corp. | | | | |
3.500%, 03/01/2032 (a) (b) (c) | | | 7,970,000 | | | | 7,999,888 | |
Post Holdings, Inc. | | | | |
4.625%, 04/15/2030 (a) (b) (c) | | | 4,885,000 | | | | 4,915,531 | |
TreeHouse Foods, Inc. | | | | |
4.000%, 09/01/2028 (a) (b) | | | 12,815,000 | | | | 12,255,603 | |
| | | | | | | | 49,447,905 | |
Forest Products & Paper — 0.9% | | | | |
Mercer International, Inc. | | | | |
5.125%, 02/01/2029 (a) (b) | | | 12,335,000 | | | | 12,279,122 | |
| | | | | |
Healthcare-Services — 1.4% | | | | |
CHS/Community Health Systems, Inc. | | | | |
6.000%, 01/15/2029 (a) (b) (c) | | | 11,620,000 | | | | 12,259,100 | |
LifePoint Health, Inc. | | | | |
5.375%, 01/15/2029 (a) (c) | | | 1,440,000 | | | | 1,413,000 | |
Tenet Healthcare Corp. | | | | |
4.625%, 06/15/2028 (a) (b) (c) | | | 4,825,000 | | | | 5,030,062 | |
| | | | | | | | 18,702,162 | |
Home Builders — 0.8% | | | | |
Taylor Morrison Communities, Inc. | | | | |
5.875%, 06/15/2027 (a) (b) (c) | | | 4,365,000 | | | | 4,889,062 | |
Williams Scotsman International, Inc. | | | | |
4.625%, 08/15/2028 (a) (c) | | | 4,875,000 | | | | 5,045,625 | |
| | | | | | | | 9,934,687 | |
Home Furnishings — 0.4% | | | | |
Tempur Sealy International, Inc. | | | | |
4.000%, 04/15/2029 (a) (c) | | | 4,800,000 | | | | 4,882,656 | |
| | | | | |
Household Products/Wares — 0.7% | | | | |
Central Garden & Pet Co. | | | | |
4.125%, 10/15/2030 (a) | | | 4,875,000 | | | | 4,917,535 | |
The accompanying notes are an integral part of the financial statements.
73
Pacer Trendpilot US Bond ETF
SCHEDULE OF INVESTMENTS
October 31, 2021 (Unaudited) (Continued)
| | | Shares | | | Value | |
CORPORATE BONDS — 98.4% (Continued) |
Household Products/Wares — 0.7% (Continued) |
Spectrum Brands, Inc. | | | | |
3.875%, 03/15/2031 (a) (b) (c) | | | 5,040,000 | | | $ | 4,946,029 | |
| | | | | | | | 9,863,564 | |
Housewares — 0.8% | | | | |
Newell Brands, Inc. | | | | |
4.875%, 06/01/2025 (a) (b) | | | 5,805,000 | | | | 6,365,705 | |
The Scotts Miracle-Gro Co. | | | | |
4.000%, 04/01/2031 (a) (b) (c) | | | 4,920,000 | | | | 4,886,495 | |
| | | | | | | | 11,252,200 | |
Insurance — 0.4% | | | | |
Radian Group, Inc. | | | | |
6.625%, 03/15/2025 (a) | | | 4,355,000 | | | | 4,861,269 | |
| | | | | |
Internet — 1.6% | | | | |
Endure Digital, Inc. | | | | |
6.000%, 02/15/2029 (a) (c) | | | 550,000 | | | | 506,940 | |
Netflix, Inc. | | | | |
5.375%, 11/15/2029 (a) (b) (c) | | | 6,430,000 | | | | 7,764,000 | |
Uber Technologies, Inc. | | | | |
4.500%, 08/15/2029 (a) (b) (c) | | | 12,805,000 | | | | 12,911,282 | |
| | | | | | | | 21,182,222 | |
Investment Companies — 2.1% | | | | |
Compass Group Diversified Holdings LLC | | | | |
5.250%, 04/15/2029 (a) (b) (c) | | | 12,165,000 | | | | 12,666,806 | |
Icahn Enterprises LP / Icahn Enterprises Finance Corp. | | | | |
4.750%, 09/15/2024 (a) | | | 14,050,000 | | | | 14,579,615 | |
| | | | | | | | 27,246,421 | |
Iron/Steel — 1.3% | | | | |
Cleveland-Cliffs, Inc. | | | | |
4.625%, 03/01/2029 (a) (b) (c) | | | 4,800,000 | | | | 4,962,000 | |
United States Steel Corp. | | | | |
6.875%, 03/01/2029 (a) (b) | | | 11,895,000 | | | | 12,742,519 | |
| | | | | | | | 17,704,519 | |
Lodging — 3.5% | | | | |
Hilton Domestic Operating Co, Inc. | | | | |
3.750%, 05/01/2029 (a) (b) (c) | | | 4,905,000 | | | | 4,911,131 | |
Marriott Ownership Resorts, Inc. | | | | |
4.500%, 06/15/2029 (a) (b) (c) | | | 4,950,000 | | | | 4,956,188 | |
MGM Resorts International | | | | |
5.500%, 04/15/2027 (a) (b) | | | 8,815,000 | | | | 9,498,162 | |
Travel + Leisure Co. | | | | |
6.625%, 07/31/2026 (a) (c) | | | 10,910,000 | | | | 12,197,380 | |
Wyndham Hotels & Resorts, Inc. | | | | |
4.375%, 08/15/2028 (a) (c) | | | 4,895,000 | | | | 5,062,899 | |
Wynn Las Vegas LLC / Wynn Las Vegas Capital Corp. | | | | |
5.250%, 05/15/2027 (a) (b) (c) | | | 9,225,000 | | | | 9,351,844 | |
| | | | | | | | 45,977,604 | |
| | | Shares | | | Value | |
Machinery-Construction & Mining — 0.9% | | | | |
Terex Corp. | | | | |
5.000%, 05/15/2029 (a) (c) | | | 11,770,000 | | | $ | 12,020,113 | |
| | | | | |
Media — 7.7% | | | | |
Cable One, Inc. | | | | |
4.000%, 11/15/2030 (a) (b) (c) | | | 4,955,000 | | | | 4,873,911 | |
CCO Holdings LLC / CCO Holdings Capital Corp. | | | | |
4.500%, 08/15/2030 (a) (c) | | | 6,120,000 | | | | 6,234,750 | |
Clear Channel Worldwide Holdings, Inc. | | | | |
5.125%, 08/15/2027 (a) (b) (c) | | | 12,220,000 | | | | 12,555,439 | |
CSC Holdings LLC | | | | |
5.250%, 06/01/2024 (a) (b) | | | 13,670,000 | | | | 14,404,763 | |
DISH DBS Corp. | | | | |
5.875%, 11/15/2024 (a) | | | 12,000,000 | | | | 12,795,000 | |
iHeartCommunications, Inc. | | | | |
4.750%, 01/15/2028 (a) (c) | | | 12,165,000 | | | | 12,257,211 | |
Mav Acquisition Corp. | | | | |
8.000%, 08/01/2029 (a) (c) | | | 1,110,000 | | | | 1,081,406 | |
News Corp. | | | | |
3.875%, 05/15/2029 (a) (c) | | | 4,865,000 | | | | 4,944,056 | |
Nexstar Media, Inc. | | | | |
4.750%, 11/01/2028 (a) (b) (c) | | | 12,780,000 | | | | 13,072,662 | |
Sirius XM Radio, Inc. | | | | |
3.125%, 09/01/2026 (a) (c) | | | 6,270,000 | | | | 6,285,675 | |
TEGNA, Inc. | | | | |
5.000%, 09/15/2029 (a) | | | 12,530,000 | | | | 12,701,348 | |
| | | | | | | | 101,206,221 | |
Mining — 1.1% | | | | |
Freeport-McMoRan, Inc. | | | | |
4.550%, 11/14/2024 (a) (b) | | | 4,620,000 | | | | 5,001,242 | |
Kaiser Aluminum Corp. | | | | |
4.500%, 06/01/2031 (a) (c) | | | 4,795,000 | | | | 4,705,573 | |
Novelis Corp. | | | | |
3.875%, 08/15/2031 (a) (b) (c) | | | 5,490,000 | | | | 5,366,750 | |
| | | | | | | | 15,073,565 | |
Oil & Gas — 6.6% | | | | |
Apache Corp. | | | | |
4.375%, 10/15/2028 (a) | | | 5,090,000 | | | | 5,467,271 | |
California Resources Corp. | | | | |
7.125%, 02/01/2026 (a) (b) (c) | | | 11,765,000 | | | | 12,426,369 | |
Chesapeake Energy Corp. | | | | |
5.875%, 02/01/2029 (a) (b) (c) | | | 4,725,000 | | | | 5,026,219 | |
CNX Resources Corp. | | | | |
6.000%, 01/15/2029 (a) (b) (c) | | | 4,780,000 | | | | 5,048,875 | |
Continental Resources Inc/OK | | | | |
4.900%, 06/01/2044 (a) (b) | | | 4,420,000 | | | | 5,021,451 | |
EQT Corp. | | | | |
6.625%, 02/01/2025 (a) (b) | | | 4,390,000 | | | | 4,944,237 | |
The accompanying notes are an integral part of the financial statements.
74
Pacer Trendpilot US Bond ETF
SCHEDULE OF INVESTMENTS
October 31, 2021 (Unaudited) (Continued)
| | | Shares | | | Value | |
CORPORATE BONDS — 98.4% (Continued) |
Oil & Gas — 6.6% (Continued) |
Hilcorp Energy I LP / Hilcorp Finance Co. | | | | |
5.750%, 02/01/2029 (a) (b) (c) | | | 6,335,000 | | | $ | 6,437,944 | |
Matador Resources Co. | | | | |
5.875%, 09/15/2026 (a) (b) | | | 12,135,000 | | | | 12,545,891 | |
Occidental Petroleum Corp. | | | | |
5.875%, 09/01/2025 (a) (b) | | | 4,495,000 | | | | 4,995,069 | |
Range Resources Corp. | | | | |
4.875%, 05/15/2025 (a) | | | 11,730,000 | | | | 12,243,188 | |
Southwestern Energy Co. | | | | |
6.200%, 01/23/2025 (a) | | | 12,010,000 | | | | 13,105,913 | |
| | | | | | | | 87,262,427 | |
Oil & Gas Services — 1.0% | | | | |
Oceaneering International, Inc. | | | | |
4.650%, 11/15/2024 (a) (b) | | | 12,830,000 | | | | 13,343,200 | |
| | | | | |
Packaging & Containers — 0.5% | | | | |
Ball Corp. | | | | |
5.250%, 07/01/2025 (a) (b) | | | 5,755,000 | | | | 6,423,040 | |
| | | | | |
Pharmaceuticals — 0.7% | | | | |
Owens & Minor, Inc. | | | | |
4.500%, 03/31/2029 (a) (b) (c) | | | 4,825,000 | | | | 4,849,125 | |
Prestige Brands, Inc. | | | | |
3.750%, 04/01/2031 (a) (b) (c) | | | 5,060,000 | | | | 4,895,550 | |
| | | | | | | | 9,744,675 | |
Pipelines — 4.1% | | | | |
Cheniere Energy, Inc. | | | | |
4.625%, 10/15/2028 (a) | | | 5,240,000 | | | | 5,501,738 | |
DCP Midstream Operating LP | | | | |
5.375%, 07/15/2025 (a) (b) | | | 4,555,000 | | | | 5,038,969 | |
EQM Midstream Partners LP | | | | |
6.000%, 07/01/2025 (a) (c) | | | 11,490,000 | | | | 12,481,012 | |
ITT Holdings LLC | | | | |
6.500%, 08/01/2029 (a) (c) | | | 14,360,000 | | | | 14,452,694 | |
New Fortress Energy, Inc. | | | | |
6.500%, 09/30/2026 (a) (b) (c) | | | 11,685,000 | | | | 11,374,413 | |
Western Midstream Operating LP | | | | |
5.300%, 02/01/2030 (a) | | | 5,005,000 | | | | 5,492,987 | |
| | | | | | | | 54,341,813 | |
Real Estate — 0.8% | | | | |
Kennedy-Wilson, Inc. | | | | |
4.750%, 03/01/2029 (a) (b) | | | 5,665,000 | | | | 5,785,381 | |
The Howard Hughes Corp. | | | | |
4.125%, 02/01/2029 (a) (b) (c) | | | 5,000,000 | | | | 5,011,600 | |
| | | | | | | | 10,796,981 | |
| | | Shares | | | Value | |
REITS — 8.3% | | | | |
Brookfield Property REIT, Inc. / BPR Cumulus LLC / BPR Nimbus LLC / GGSI Sellco LL | | | | |
5.750%, 05/15/2026 (a) (b) (c) | | | 12,045,000 | | | $ | 12,475,609 | |
Diversified Healthcare Trust | | | | |
4.375%, 03/01/2031 (a) (b) | | | 8,225,000 | | | | 7,958,798 | |
Iron Mountain, Inc. | | | | |
4.875%, 09/15/2029 (a) (b) (c) | | | 11,710,000 | | | | 12,134,956 | |
iStar, Inc. | | | | |
4.750%, 10/01/2024 (a) (b) | | | 4,680,000 | | | | 4,950,270 | |
Ladder Capital Finance Holdings LLLP / Ladder Capital Finance Corp. | | | | |
4.250%, 02/01/2027 (a) (c) | | | 12,240,000 | | | | 12,318,336 | |
Park Intermediate Holdings LLC / PK Domestic Property LLC / PK Finance Co-Issuer | | | | |
5.875%, 10/01/2028 (a) (b) (c) | | | 11,630,000 | | | | 12,167,887 | |
RHP Hotel Properties LP / RHP Finance Corp. | | | | |
4.750%, 10/15/2027 (a) | | | 7,660,000 | | | | 7,822,775 | |
RLJ Lodging Trust LP | | | | |
3.750%, 07/01/2026 (a) (c) | | | 12,500,000 | | | | 12,641,063 | |
SBA Communications Corp. | | | | |
3.125%, 02/01/2029 (a) (c) | | | 6,460,000 | | | | 6,209,675 | |
Service Properties Trust | | | | |
4.350%, 10/01/2024 (a) (b) | | | 14,180,000 | | | | 14,307,620 | |
Uniti Group LP / Uniti Group Finance Inc / CSL Capital LLC | | | | |
6.500%, 02/15/2029 (a) (c) | | | 1,140,000 | | | | 1,155,002 | |
VICI Properties LP / VICI Note Co, Inc. | | | | |
4.625%, 12/01/2029 (a) (b) (c) | | | 4,610,000 | | | | 4,924,056 | |
| | | | | | | | 109,066,047 | |
Retail — 6.8% | | | | |
Ambience Merger Sub, Inc. | | | | |
7.125%, 07/15/2029 (a) (c) | | | 1,800,000 | | | | 1,737,369 | |
Carvana Co. | | | | |
4.875%, 09/01/2029 (a) (c) | | | 1,890,000 | | | | 1,830,937 | |
Lithia Motors, Inc. | | | | |
3.875%, 06/01/2029 (a) (c) | | | 4,790,000 | | | | 4,969,673 | |
Macy’s Retail Holdings LLC | | | | |
5.875%, 04/01/2029 (a) (b) (c) | | | 10,980,000 | | | | 11,715,280 | |
Murphy Oil USA, Inc. | | | | |
3.750%, 02/15/2031 (a) (c) | | | 5,005,000 | | | | 4,929,925 | |
Nordstrom, Inc. | | | | |
5.000%, 01/15/2044 (a) (b) | | | 5,215,000 | | | | 5,166,109 | |
Party City Holdings, Inc. | | | | |
8.750%, 02/15/2026 (a) (c) | | | 870,000 | | | | 890,954 | |
QVC, Inc. | | | | |
4.375%, 09/01/2028 (a) (b) | | | 9,905,000 | | | | 10,140,442 | |
Staples, Inc. | | | | |
7.500%, 04/15/2026 (a) (b) (c) | | | 13,925,000 | | | | 14,084,859 | |
The accompanying notes are an integral part of the financial statements.
75
Pacer Trendpilot US Bond ETF
SCHEDULE OF INVESTMENTS
October 31, 2021 (Unaudited) (Continued)
| | | Shares | | | Value | |
CORPORATE BONDS — 98.4% (Continued) |
Retail — 6.8% (Continued) |
Suburban Propane Partners LP/Suburban Energy Finance Corp. | | | | |
5.000%, 06/01/2031 (a) (c) | | | 9,160,000 | | | $ | 9,400,450 | |
The Michaels Cos., Inc. | | | | |
5.250%, 05/01/2028 (a) (b) (c) | | | 12,705,000 | | | | 12,848,567 | |
Yum! Brands, Inc. | | | | |
3.625%, 03/15/2031 (a) (b) | | | 11,855,000 | | | | 11,731,708 | |
| | | | | | | | 89,446,273 | |
Software — 0.6% | | | | |
Clarivate Science Holdings Corp. | | | | |
4.875%, 07/01/2029 (a) (c) | | | 1,560,000 | | | | 1,555,242 | |
MSCI, Inc. | | | | |
3.250%, 08/15/2033 (a) (b) (c) | | | 7,005,000 | | | | 7,040,866 | |
| | | | | | | | 8,596,108 | |
Telecommunications — 6.7% | | | | |
Avaya, Inc. | | | | |
6.125%, 09/15/2028 (a) (b) (c) | | | 11,895,000 | | | | 12,389,237 | |
CommScope, Inc. | | | | |
4.750%, 09/01/2029 (a) (b) (c) | | | 12,005,000 | | | | 11,794,312 | |
Consolidated Communications, Inc. | | | | |
6.500%, 10/01/2028 (a) (b) (c) | | | 11,135,000 | | | | 11,871,469 | |
Level 3 Financing, Inc. | | | | |
4.250%, 07/01/2028 (a) (b) (c) | | | 12,385,000 | | | | 12,262,079 | |
Lumen Technologies, Inc. | | | | |
5.625%, 04/01/2025 (a) (b) | | | 11,445,000 | | | | 12,303,375 | |
Plantronics, Inc. | | | | |
4.750%, 03/01/2029 (a) (b) (c) | | | 10,605,000 | | | | 9,748,911 | |
T-Mobile USA, Inc. | | | | |
2.625%, 04/15/2026 (a) (b) | | | 10,155,000 | | | | 10,321,339 | |
United States Cellular Corp. | | | | |
6.700%, 12/15/2033 (a) (b) | | | 5,870,000 | | | | 7,313,891 | |
| | | | | | | | 88,004,613 | |
Toys/Games/Hobbies — 0.5% | | | | |
Mattel, Inc. | | | | |
3.750%, 04/01/2029 (a) (b) (c) | | | 6,065,000 | | | | 6,307,903 | |
| | | | | |
Transportation — 0.9% | | | | |
Cargo Aircraft Management, Inc. | | | | |
4.750%, 02/01/2028 (a) (b) (c) | | | 12,155,000 | | | | 12,444,654 | |
TOTAL CORPORATE BONDS (Cost $1,326,206,521) | | | | | | | 1,301,037,447 | |
| | | | | |
| | | Principal
Amount | | | Value | |
SHORT-TERM INVESTMENTS — 0.4% | | | | |
Money Market Deposit Accounts — 0.4% | | | | |
U.S. Bank Money Market Deposit Account, 0.003% (d) | | $ | 4,937,966 | | | $ | 4,937,966 | |
TOTAL SHORT-TERM INVESTMENTS (Cost $4,937,966) | | | | | | | 4,937,966 | |
| | | | | |
| | | Shares | | | | | |
INVESTMENTS PURCHASED WITH PROCEEDS FROM SECURITIES LENDING — 26.2% |
Mount Vernon Liquid Assets Portfolio, LLC, 0.10% (d) | | | 345,897,645 | | | | 345,897,645 | |
TOTAL INVESTMENTS PURCHASED WITH PROCEEDS FROM SECURITIES LENDING (Cost $345,897,645) | | | | | | | 345,897,645 | |
Total Investments (Cost $1,677,042,132) — 125.0% | | | | | | | 1,651,873,058 | |
Liabilities in Excess of Other Assets — (25.0)% | | | | | | | (330,688,396 | ) |
TOTAL NET ASSETS — 100.0% | | | | | | $ | 1,321,184,662 | |
Percentages are stated as a percent of net assets.
| | (a) | Non-income producing security. |
| | (b) | All or a portion of this security is on loan as of October 31, 2021. The total value of securities on loan is $338,595,751 or 25.6% of net assets. |
| | (c) | Security exempt from registration under Rule 144(a) of the Securities Act of 1933. Such securities are treated as liquid securities according to the Fund’s liquidity guidelines. The value of those securities total $838,072,806 or 63.4% of net assets. |
| | (d) | The rate shown is as of October 31, 2021. |
For Fund compliance purposes, the Fund’s industry classifications refer to any one or more of the industry sub-classifications used by one or more widely recognized market indexes or ratings group indexes, and/or they may be defined by Fund management. This definition does not apply for all purposes of this report, which may combine sub-classifications for reporting ease. Categories are shown as a percentage of net assets.
The accompanying notes are an integral part of the financial statements.
76
Pacer Trendpilot Fund of Funds ETF
SCHEDULE OF INVESTMENTS
October 31, 2021 (Unaudited)
| | | Shares | | | Value | |
AFFILIATED EXCHANGE TRADED FUNDS — 99.9% |
Pacer Trendpilot 100 ETF | | | 227,897 | | | $ | 13,245,260 | |
Pacer Trendpilot International ETF | | | 442,607 | | | | 13,083,463 | |
Pacer Trendpilot US Bond ETF | | | 469,707 | | | | 12,667,998 | |
Pacer Trendpilot US Large Cap ETF | | | 333,765 | | | | 13,480,768 | |
Pacer Trendpilot US Mid Cap ETF | | | 359,191 | | | | 13,009,898 | |
TOTAL EXCHANGE TRADED FUNDS (Cost $57,533,027) | | | | | | | 65,487,387 | |
| | | | | |
| | | Principal
Amount | | | | | |
SHORT-TERM INVESTMENTS — 0.1% | | | | |
Money Market Deposit Accounts — 0.1% | | | | |
U.S. Bank Money Market Deposit Account, 0.003% (a) | | $ | 49,439 | | | | 49,439 | |
TOTAL SHORT-TERM INVESTMENTS (Cost $49,439) | | | | | | | 49,439 | |
| | | | | |
Total Investments (Cost $57,582,466) — 100.0% | | | | | | | 65,536,826 | |
Liabilities in Excess of Other Assets — 0.0% (b) | | | | | | | (7,987 | ) |
TOTAL NET ASSETS — 100.0% | | | | | | $ | 65,528,839 | |
Percentages are stated as a percent of net assets.
| | (a) | The rate shown is as of October 31, 2021. |
The accompanying notes are an integral part of the financial statements.
77
Pacer Global Cash Cows Dividend ETF
SCHEDULE OF INVESTMENTS
October 31, 2021 (Unaudited)
| | | Shares | | | Value | |
COMMON STOCKS — 99.4% | | | | |
Australia — 5.4% | | | | |
AGL Energy Ltd. | | | 43,720 | | | $ | 188,121 | |
Aurizon Holdings Ltd. | | | 109,432 | | | | 277,418 | |
BHP Group Ltd. - ADR (a) | | | 37,750 | | | | 2,070,210 | |
Coles Group Ltd. | | | 36,808 | | | | 474,585 | |
Evolution Mining Ltd. | | | 41,113 | | | | 112,266 | |
Fortescue Metals Group Ltd. | | | 160,875 | | | | 1,685,778 | |
Origin Energy Ltd. | | | 63,364 | | | | 240,710 | |
Telstra Corp. Ltd. | | | 400,918 | | | | 1,152,072 | |
Wesfarmers Ltd. | | | 25,565 | | | | 1,100,986 | |
| | | | | | | | 7,302,146 | |
Britain — 12.1% | | | | |
BP PLC - ADR | | | 104,581 | | | | 3,010,887 | |
British American Tobacco PLC - ADR | | | 72,848 | | | | 2,543,852 | |
GlaxoSmithKline PLC - ADR (a) | | | 73,346 | | | | 3,104,736 | |
Imperial Brands PLC | | | 63,950 | | | | 1,349,540 | |
Rio Tinto PLC - ADR (a) | | | 32,109 | | | | 2,031,537 | |
Unilever PLC - ADR | | | 46,761 | | | | 2,505,454 | |
Vodafone Group PLC - ADR | | | 126,028 | | | | 1,884,119 | |
| | | | | | | | 16,430,125 | |
Cambodia — 0.2% | | | | |
NagaCorp Ltd. | | | 193,879 | | | | 178,168 | |
| | | | | | | | �� | |
Canada — 1.5% | | | | |
BCE, Inc. - | | | 38,578 | | | | 1,985,610 | |
| | | | | | | | | |
China — 1.0% | | | | |
Lenovo Group Ltd. | | | 313,652 | | | | 341,044 | |
Tingyi Cayman Islands Holding Corp. | | | 277,778 | | | | 519,819 | |
Uni-President China Holdings Ltd. | | | 195,776 | | | | 167,078 | |
Want Want China Holdings Ltd. | | | 420,199 | | | | 325,660 | |
| | | | | | | | 1,353,601 | |
France — 7.2% | | | | |
Bouygues SA | | | 15,405 | | | | 623,288 | |
Carrefour SA | | | 17,797 | | | | 322,076 | |
Danone SA | | | 17,020 | | | | 1,108,696 | |
Orange SA - ADR (a) | | | 187,574 | | | | 2,046,432 | |
Sanofi - ADR (a) | | | 54,224 | | | | 2,734,516 | |
TotalEnergies SE - ADR | | | 58,966 | | | | 2,954,786 | |
| | | | | | | | 9,789,794 | |
Germany — 1.8% | | | | |
BASF SE | | | 34,280 | | | | 2,468,017 | |
| | | | | | | | | |
Hong Kong — 3.3% | | | | |
ASM Pacific Technology Ltd. | | | 9,450 | | | | 102,085 | |
CK Hutchison Holdings Ltd. | | | 125,927 | | | | 847,282 | |
CK Infrastructure Holdings Ltd. | | | 110,083 | | | | 663,568 | |
CLP Holdings Ltd. | | | 84,888 | | | | 830,823 | |
| | | Shares | | | Value | |
Hong Kong — 3.3% (Continued) |
Dairy Farm International Holdings Ltd. | | | 42,925 | | | $ | 153,242 | |
Jardine Matheson Holdings Ltd. | | | 6,852 | | | | 396,936 | |
PCCW Ltd. | | | 502,807 | | | | 259,142 | |
Power Assets Holdings Ltd. | | | 106,863 | | | | 651,713 | |
Sun Art Retail Group Ltd. | | | 205,385 | | | | 120,900 | |
Swire Pacific Ltd. - Class A | | | 37,394 | | | | 235,260 | |
WH Group Ltd. (b) | | | 315,812 | | | | 221,623 | |
| | | | | | | | 4,482,574 | |
Japan — 14.8% | | | | |
Asahi Kasei Corp. | | | 31,301 | | | | 328,595 | |
Canon, Inc. | | | 28,386 | | | | 637,082 | |
ENEOS Holdings, Inc. | | | 129,487 | | | | 522,152 | |
Inpex Corp. | | | 37,888 | | | | 316,467 | |
ITOCHU Corp. | | | 33,660 | | | | 957,453 | |
Japan Tobacco, Inc. | | | 108,513 | | | | 2,128,369 | |
KDDI Corp. | | | 64,435 | | | | 1,994,531 | |
Kirin Holdings Co. Ltd. | | | 21,145 | | | | 367,521 | |
Marubeni Corp. | | | 42,437 | | | | 357,889 | |
Mitsubishi Chemical Holdings Corp. | | | 32,337 | | | | 267,463 | |
Mitsubishi Corp. | | | 56,354 | | | | 1,785,924 | |
Mitsui & Co. Ltd. | | | 45,504 | | | | 1,034,844 | |
Nippon Telegraph & Telephone Corp. | | | 105,490 | | | | 2,950,666 | |
SoftBank Corp. | | | 219,431 | | | | 2,992,810 | |
Subaru Corp. | | | 16,741 | | | | 327,255 | |
Sumitomo Corp. | | | 48,465 | | | | 687,589 | |
Taisei Corp. | | | 6,103 | | | | 191,162 | |
Takeda Pharmaceutical Co. Ltd. - ADR (a) | | | 131,629 | | | | 1,845,439 | |
Tokyo Gas Co. Ltd. | | | 10,924 | | | | 189,678 | |
Trend Micro, Inc. | | | 3,428 | | | | 193,394 | |
| | | | | | | | 20,076,283 | |
Netherlands — 3.3% | | | | |
Koninklijke Ahold Delhaize NV | | | 31,080 | | | | 1,010,670 | |
Royal Dutch Shell PLC - ADR | | | 75,247 | | | | 3,449,323 | |
| | | | | | | | 4,459,993 | |
New Zealand — 0.2% | | | | |
Spark New Zealand Ltd. | | | 89,390 | | | | 292,419 | |
| | | | | | | | | |
Norway — 0.8% | | | | |
Telenor ASA | | | 65,512 | | | | 1,034,106 | |
| | | | | | | | | |
Singapore — 1.3% | | | | |
Jardine Cycle & Carriage Ltd. | | | 8,434 | | | | 140,723 | |
Singapore Technologies Engineering Ltd. | | | 98,839 | | | | 280,722 | |
Singapore Telecommunications Ltd. | | | 694,067 | | | | 1,286,739 | |
| | | | | | | | 1,708,184 | |
The accompanying notes are an integral part of the financial statements.
78
Pacer Global Cash Cows Dividend ETF
SCHEDULE OF INVESTMENTS
October 31, 2021 (Unaudited) (Continued)
| | | Shares | | | Value | |
COMMON STOCKS — 99.4% (Continued) |
South Korea — 0.6% | | | | |
KT&G Corp. | | | 5,713 | | | $ | 396,495 | |
SK Telecom Co. Ltd. - ADR (c) | | | 15,363 | | | | 445,527 | |
| | | | | | | | 842,022 | |
Spain — 3.3% | | | | |
Endesa SA | | | 62,987 | | | | 1,452,258 | |
Naturgy Energy Group SA | | | 33,313 | | | | 875,330 | |
Repsol SA | | | 50,735 | | | | 648,432 | |
Telefonica SA - ADR | | | 352,770 | | | | 1,534,550 | |
| | | | | | | | 4,510,570 | |
Sweden — 0.5% | | | | |
Telia Co. AB (a) | | | 171,733 | | | | 675,794 | |
| | | | | | | | | |
Switzerland — 6.0% | | | | |
Holcim Ltd. | | | 18,239 | | | | 910,556 | |
Novartis AG - ADR | | | 31,453 | | | | 2,603,050 | |
Roche Holding AG - ADR | | | 63,894 | | | | 3,087,997 | |
SGS SA | | | 175 | | | | 517,584 | |
Swisscom AG | | | 1,800 | | | | 979,816 | |
| | | | | | | | 8,099,003 | |
United States — 36.1% | | | | |
3M Co. | | | 13,782 | | | | 2,462,568 | |
AbbVie, Inc. | | | 25,303 | | | | 2,901,495 | |
Altria Group, Inc. | | | 57,065 | | | | 2,517,137 | |
Amgen, Inc. | | | 12,004 | | | | 2,484,468 | |
AT&T, Inc. | | | 97,340 | | | | 2,458,808 | |
Bristol-Myers Squibb Co. | | | 43,733 | | | | 2,554,007 | |
Broadcom, Inc. | | | 6,035 | | | | 3,208,628 | |
Cisco Systems, Inc. | | | 52,567 | | | | 2,942,175 | |
Costco Wholesale Corp. (a) | | | 7,382 | | | | 3,628,548 | |
Dow, Inc. | | | 24,767 | | | | 1,386,209 | |
General Mills, Inc. (a) | | | 15,861 | | | | 980,210 | |
Gilead Sciences, Inc. | | | 42,143 | | | | 2,734,238 | |
International Business Machines Corp. (a) | | | 19,327 | | | | 2,417,808 | |
Kimberly-Clark Corp. (a) | | | 9,359 | | | | 1,211,897 | |
Kinder Morgan, Inc. (a) | | | 107,034 | | | | 1,792,820 | |
Lockheed Martin Corp. | | | 5,991 | | | | 1,990,929 | |
Pfizer, Inc. | | | 72,608 | | | | 3,175,874 | |
Philip Morris International, Inc. | | | 29,119 | | | | 2,752,910 | |
The Coca-Cola Co. | | | 50,543 | | | | 2,849,109 | |
The Kraft Heinz Co. (a) | | | 37,075 | | | | 1,330,622 | |
Walgreens Boots Alliance, Inc. | | | 24,650 | | | | 1,159,043 | |
| | | | | | | | 48,939,503 | |
TOTAL COMMON STOCKS (Cost $134,216,375) | | | | | | | 134,627,912 | |
| | | | | |
| | | Principal
Amount | | | Value | |
| SHORT-TERM INVESTMENTS- 0.1% | | | | | | | | |
| Money Market Deposit Accounts — 0.1% | | | | | | | | |
| U.S. Bank Money Market Deposit Account, 0.003% (d) | | $ | 115,504 | | | $ | 115,504 | |
| TOTAL SHORT-TERM INVESTMENTS (Cost $115,504) | | | | | | | 115,504 | |
| | | | | | | | | |
| | | | Shares | | | | | |
| INVESTMENTS PURCHASED WITH PROCEEDS FROM SECURITIES LENDING — 13.8% |
| Mount Vernon Liquid Assets Portfolio, LLC, 0.10% (d) | | | 18,658,940 | | | | 18,658,940 | |
| TOTAL INVESTMENTS PURCHASED WITH PROCEEDS FROM SECURITIES LENDING (Cost $18,658,940) | | | | | | | 18,658,940 | |
| | | | | | | | | |
Total Investments (Cost $152,990,819) — 113.3% | | | | | | | 153,402,356 | |
Liabilities in Excess of Other Assets — (13.3)% | | | | | | | (17,948,315 | ) |
TOTAL NET ASSETS — 100.0% | | | | | | $ | 135,454,041 | |
Percentages are stated as a percent of net assets.
ADR American Depositary Receipt
| | (a) | All or a portion of this security is on loan as of October 31, 2021. The total value of securities on loan is $18,044,636 or 13.3% of net assets. |
| | (b) | Restricted security as defined in Rule 144 under the Securities Act of 1933. Resale to the public may require registration or may extend only to qualified institutional buyers. At October 31, 2021, the market value of these securities total $221,623, which represents 0.2% of total net assets. |
| | (c) | Non-income producing security. |
| | (d) | The rate shown is as of October 31, 2021. |
For Fund compliance purposes, the Fund’s industry classifications refer to any one or more of the industry sub-classifications used by one or more widely recognized market indexes or ratings group indexes, and/or they may be defined by Fund management. This definition does not apply for all purposes of this report, which may combine sub-classifications for reporting ease.
The accompanying notes are an integral part of the financial statements.
79
Pacer US Cash Cows 100 ETF
SCHEDULE OF INVESTMENTS
October 31, 2021 (Unaudited)
| | | Shares | | | Value | |
COMMON STOCKS — 98.0% | | | | |
Advertising — 2.6% | | | | |
Omnicom Group, Inc. (a) | | | 175,773 | | | $ | 11,966,626 | |
The Interpublic Group of Cos., Inc. | | | 349,418 | | | | 12,778,216 | |
| | | | | | | | 24,744,842 | |
Apparel — 1.3% | | | | |
Carter’s, Inc. (a) | | | 20,577 | | | | 2,027,246 | |
Ralph Lauren Corp. (a) | | | 29,004 | | | | 3,688,439 | |
Tapestry, Inc. | | | 170,355 | | | | 6,640,438 | |
| | | | | | | | 12,356,123 | |
Auto Manufacturers — 4.3% | | | | |
Cummins, Inc. | | | 65,078 | | | | 15,608,308 | |
Ford Motor Co. (b) | | | 1,481,801 | | | | 25,309,161 | |
| | | | | | | | 40,917,469 | |
Auto Parts & Equipment — 1.2% | | | | |
Allison Transmission Holdings, Inc. | | | 67,134 | | | | 2,239,590 | |
Gentex Corp. | | | 86,582 | | | | 3,064,137 | |
Lear Corp. | | | 34,507 | | | | 5,930,028 | |
| | | | | | | | 11,233,755 | |
Biotechnology — 2.1% | | | | |
Gilead Sciences, Inc. | | | 265,748 | | | | 17,241,730 | |
United Therapeutics Corp. (b) | | | 15,234 | | | | 2,906,038 | |
| | | | | | | | 20,147,768 | |
Building Materials — 1.8% | | | | |
Eagle Materials, Inc. (a) | | | 22,984 | | | | 3,409,906 | |
Louisiana-Pacific Corp. | | | 107,734 | | | | 6,348,765 | |
Owens Corning | | | 75,996 | | | | 7,098,786 | |
| | | | | | | | 16,857,457 | |
Chemicals — 1.7% | | | | |
Olin Corp. | | | 100,453 | | | | 5,723,812 | |
The Chemours Co. | | | 123,490 | | | | 3,460,190 | |
Westlake Chemical Corp. | | | 76,696 | | | | 7,465,588 | |
| | | | | | | | 16,649,590 | |
Commercial Services — 0.6% | | | | |
H&R Block, Inc. | | | 139,068 | | | | 3,208,299 | |
ManpowerGroup, Inc. | | | 22,477 | | | | 2,172,402 | |
| | | | | | | | 5,380,701 | |
Computers — 7.7% | | | | |
Amdocs Ltd - | | | 53,298 | | | | 4,148,716 | |
CACI International, Inc. (b) | | | 13,225 | | | | 3,804,039 | |
Dell Technologies, Inc. - Class C (b) | | | 197,148 | | | | 21,684,309 | |
HP, Inc. | | | 641,186 | | | | 19,447,171 | |
International Business Machines Corp. | | | 137,180 | | | | 17,161,218 | |
Lumentum Holdings, Inc. (a) (b) | | | 42,022 | | | | 3,470,177 | |
Science Applications International Corp. | | | 34,504 | | | | 3,097,769 | |
| | | | | | | | 72,813,399 | |
Distribution/Wholesale — 0.8% | | | | |
LKQ Corp. (b) | | | 144,469 | | | | 7,957,353 | |
| | | | | |
| | | Shares | | | Value | |
Diversified Financial Serviced — 0.8% | | | | |
Alliance Data Systems Corp. (a) | | | 90,792 | | | $ | 7,740,018 | |
| | | | | |
Electric — 0.7% | | | | |
NRG Energy, Inc. (a) | | | 158,755 | | | | 6,332,737 | |
| | | | | |
Electronics — 0.8% | | | | |
SYNNEX Corp. | | | 35,483 | | | | 3,725,715 | |
Vontier Corp. | | | 101,999 | | | | 3,450,626 | |
| | | | | | | | 7,176,341 | |
Engineering & Construction — 0.9% | | | | |
AECOM (b) | | | 77,872 | | | | 5,324,109 | |
MasTec, Inc. (a) (b) | | | 38,095 | | | | 3,395,407 | |
| | | | | | | | 8,719,516 | |
Food — 1.6% | | | | |
Tyson Foods, Inc. - Class A | | | 195,845 | | | | 15,661,725 | |
| | | | | |
Forest Products & Paper — 1.2% | | | | |
International Paper Co. | | | 226,534 | | | | 11,251,944 | |
Sylvamo Corp. (a) (b) | | | 20,552 | | | | 578,739 | |
| | | | | | | | 11,830,683 | |
Hand/Machine Tools — 0.5% | | | | |
Snap-On, Inc. (a) | | | 25,884 | | | | 5,260,405 | |
| | | | | |
Healthcare-Products — 1.6% | | | | |
Hologic, Inc. (b) | | | 152,055 | | | | 11,147,152 | |
Quidel Corp. (a) (b) | | | 28,769 | | | | 3,819,660 | |
| | | | | | | | 14,966,812 | |
Healthcare-Services — 2.8% | | | | |
Laboratory Corp. of American Holdings (b) | | | 53,528 | | | | 15,363,606 | |
Quest Diagnostics, Inc. | | | 79,887 | | | | 11,725,814 | |
| | | | | | | | 27,089,420 | |
Home Builders — 3.3% | | | | |
Lennar Corp. - Class A | | | 179,808 | | | | 17,968,213 | |
PulteGroup, Inc. | | | 149,696 | | | | 7,197,384 | |
Toll Brothers, Inc. (a) | | | 111,001 | | | | 6,678,930 | |
| | | | | | | | 31,844,527 | |
Home Furnishings — 1.4% | | | | |
Whirlpool Corp. (a) | | | 62,234 | | | | 13,120,794 | |
| | | | | |
Housewares — 0.6% | | | | |
Newell Brands, Inc. | | | 245,224 | | | | 5,613,177 | |
| | | | | |
Internet — 2.0% | | | | |
Expedia Group, Inc. (b) | | | 114,210 | | | | 18,777,266 | |
| | | | | |
Iron/Steel — 0.6% | | | | |
United States Steel Corp. (a) | | | 228,953 | | | | 6,042,070 | |
| | | | | |
The accompanying notes are an integral part of the financial statements.
80
Pacer US Cash Cows 100 ETF
SCHEDULE OF INVESTMENTS
October 31, 2021 (Unaudited) (Continued)
| | | Shares | | | Value | |
COMMON STOCKS — 98.0% (Continued) |
Leisure Time — 1.5% | | | | |
Brunswick Corp. | | | 42,272 | | | $ | 3,935,100 | |
Harley-Davidson, Inc. (a) | | | 162,624 | | | | 5,934,150 | |
Polaris, Inc. (a) | | | 36,324 | | | | 4,175,444 | |
| | | | | | | | 14,044,694 | |
Lodging — 0.4% | | | | |
Boyd Gaming Corp. (b) | | | 65,089 | | | | 4,151,376 | |
| | | | | |
Machinery-Construction & Mining — 0.6% | | | | |
Oshkosh Corp. | | | 50,479 | | | | 5,401,253 | |
| | | | | |
Machinery-Diversified — 0.3% | | | | |
Crane Co. | | | 23,844 | | | | 2,462,608 | |
| | | | | |
Media — 3.1% | | | | |
Discovery, Inc. - Class A (a) (b) | | | 443,659 | | | | 10,399,367 | |
Fox Corp. - Class A (a) | | | 338,216 | | | | 13,440,704 | |
Nexstar Media Group, Inc. | | | 36,304 | | | | 5,443,059 | |
| | | | | | | | 29,283,130 | |
Mining — 3.9% | | | | |
Freeport-McMoRan, Inc. | | | 528,824 | | | | 19,947,241 | |
Newmont Goldcorp Corp. | | | 320,847 | | | | 17,325,738 | |
| | | | | | | | 37,272,979 | |
Miscellaneous Manufacturing — 0.8% | | | | |
Textron, Inc. | | | 105,984 | | | | 7,826,918 | |
| | | | | |
Office/Business Equipment — 0.3% | | | | |
Xerox Holdings Corp. | | | 154,257 | | | | 2,745,775 | |
| | | | | |
Oil & Gas — 4.7% | | | | |
APA Corp. | | | 423,528 | | | | 11,100,669 | |
Coterra Energy, Inc. | | | 25 | | | | 533 | |
Marathon Oil Corp. | | | 570,849 | | | | 9,316,256 | |
Occidental Petroleum Corp. | | | 732,532 | | | | 24,561,798 | |
| | | | | | | | 44,979,256 | |
Packaging & Containers — 0.9% | | | | |
Westrock Co. | | | 186,563 | | | | 8,973,680 | |
| | | | | |
Pharmaceuticals — 11.6% | | | | |
AbbVie, Inc. | | | 171,344 | | | | 19,648,016 | |
AmerisourceBergen Corp. | | | 118,552 | | | | 14,465,715 | |
Bristol-Myers Squibb Co. | | | 289,382 | | | | 16,899,909 | |
Cardinal Health, Inc. | | | 216,969 | | | | 10,373,288 | |
McKesson Corp. | | | 92,768 | | | | 19,284,612 | |
Organon & Co. | | | 306,802 | | | | 11,274,973 | |
Pfizer, Inc. | | | 408,384 | | | | 17,862,716 | |
| | | | | | | | 109,809,229 | |
Pipelines — 1.7% | | | | |
Antero Midstream Corp. (a) | | | 342,597 | | | | 3,645,232 | |
| | | Shares | | | Value | |
Pipelines — 1.7% (Continued) |
Targa Resources Corp. (a) | | | 225,492 | | | $ | 12,327,648 | |
| | | | | | | | 15,972,880 | |
Retail — 15.2% | | | | |
Advance Auto Parts, Inc. | | | 29,868 | | | | 6,735,831 | |
AutoNation, Inc. (b) | | | 101,754 | | | | 12,324,444 | |
AutoZone, Inc. (b) | | | 11,502 | | | | 20,529,230 | |
Bath & Body Works, Inc. (b) | | | 178,697 | | | | 12,346,176 | |
Dick’s Sporting Goods, Inc. (a) | | | 58,546 | | | | 7,271,999 | |
Foot Locker, Inc. | | | 142,246 | | | | 6,780,867 | |
Genuine Parts Co. | | | 75,216 | | | | 9,861,570 | |
Kohl’s Corp. (a) | | | 260,846 | | | | 12,658,856 | |
Nordstrom, Inc. (a) (b) | | | 148,764 | | | | 4,273,990 | |
Penske Automotive Group, Inc. (a) | | | 109,819 | | | | 11,646,305 | |
Qurate Retail Group, Inc. - Class A (a) | | | 907,932 | | | | 9,478,810 | |
Ross Stores, Inc. | | | 165,768 | | | | 18,764,938 | |
Victoria’s Secret & Co. (a) (b) | | | 46,767 | | | | 2,360,330 | |
Williams-Sonoma, Inc. (a) | | | 48,318 | | | | 8,974,102 | |
| | | | | | | | 144,007,448 | |
Semiconductors — 2.0% | | | | |
Cirrus Logic, Inc. (b) | | | 19,965 | | | | 1,613,372 | |
Intel Corp. | | | 356,816 | | | | 17,483,984 | |
| | | | | | | | 19,097,356 | |
Shipbuilding — 0.4% | | | | |
Huntington Ingalls Industries, Inc. | | | 17,920 | | | | 3,632,922 | |
| | | | | |
Software — 2.4% | | | | |
Teradata Corp. (a) (b) | | | 42,891 | | | | 2,425,915 | |
VMware, Inc. - Class A (a) (b) | | | 131,895 | | | | 20,008,471 | |
| | | | | | | | 22,434,386 | |
Telecommunications — 3.8% | | | | |
AT&T, Inc. | | | 693,651 | | | | 17,521,624 | |
Lumen Technologies, Inc. (a) | | | 1,573,955 | | | | 18,667,107 | |
| | | | | | | | 36,188,731 | |
Textiles — 0.6% | | | | |
Mohawk Industries, Inc. (b) | | | 33,896 | | | | 6,006,710 | |
| | | | | |
Toys/Games/Hobbies — 0.7% | | | | |
Hasbro, Inc. | | | 67,322 | | | | 6,446,755 | |
| | | | | |
Transportation — 0.2% | | | | |
Kirby Corp. (b) | | | 34,056 | | | | 1,784,875 | |
TOTAL COMMON STOCKS (Cost $883,848,307) | | | | | | | 931,756,909 | |
| | | | | |
REAL ESTATE INVESTMENT TRUSTS — 1.7% | | | | |
Weyerhaeuser Co. | | | 443,797 | | | | 15,852,429 | |
TOTAL REAL ESTATE INVESTMENT TRUSTS (Cost $16,093,923) | | | | | | | 15,852,429 | |
The accompanying notes are an integral part of the financial statements.
81
Pacer US Cash Cows 100 ETF
SCHEDULE OF INVESTMENTS
October 31, 2021 (Unaudited) (Continued)
| | | Principal
Amount | | | Value | |
| SHORT-TERM INVESTMENTS — 0.2% | | | | | | | | |
| Money Market Deposit Accounts — 0.2% | | | | | | | | |
| U.S. Bank Money Market Deposit Account, 0.003% (c) | | $ | 1,729,280 | | | | 1,729,280 | |
| TOTAL SHORT-TERM INVESTMENTS (Cost $1,729,280) | | | | | | | 1,729,280 | |
| | | | | | | | | |
| | | | Shares | | | | | |
| INVESTMENTS PURCHASED WITH PROCEEDS FROM SECURITIES LENDING — 15.3% |
| Mount Vernon Liquid Assets Portfolio, LLC, 0.10% (c) | | | 145,394,629 | | | | 145,394,629 | |
| TOTAL INVESTMENTS PURCHASED WITH PROCEEDS FROM SECURITIES LENDING (Cost $145,394,629) | | | | | | | 145,394,629 | |
| | | | | | | | | |
Total Investments (Cost $1,047,066,139) — 115.2% | | | | | | | 1,094,733,247 | |
Liabilities in Excess of Other Assets — (15.2)% | | | | | | | (144,598,801 | ) |
TOTAL NET ASSETS — 100.0% | | | | | | $ | 950,134,446 | |
Percentages are stated as a percent of net assets.
| | (a) | All or a portion of this security is on loan as of October 31, 2021. The total value of securities on loan is $141,885,301 or 14.9% of net assets. |
| | (b) | Non-income producing security. |
| | (c) | The rate shown is as of October 31, 2021. |
For Fund compliance purposes, the Fund’s industry classifications refer to any one or more of the industry sub-classifications used by one or more widely recognized market indexes or ratings group indexes, and/or they may be defined by Fund management. This definition does not apply for all purposes of this report, which may combine sub-classifications for reporting ease. Categories are shown as a percentage of net assets.
The accompanying notes are an integral part of the financial statements.
82
Pacer US Small Cap Cash Cows 100 ETF
SCHEDULE OF INVESTMENTS
October 31, 2021 (Unaudited)
| | | Shares | | | Value | |
COMMON STOCKS — 97.3% | | | | |
Apparel — 4.6% | | | | |
Fossil Group, Inc. (a) (b) | | | 379,315 | | | $ | 4,483,503 | |
Kontoor Brands, Inc. | | | 137,599 | | | | 7,292,747 | |
Oxford Industries, Inc. | | | 46,909 | | | | 4,349,403 | |
Wolverine World Wide, Inc. | | | 217,122 | | | | 7,201,937 | |
| | | | | | | | 23,327,590 | |
Auto Parts & Equipment — 3.3% | | | | |
American Axle & Manufacturing Holdings, Inc. (b) | | | 1,215,558 | | | | 11,037,267 | |
Methode Electronics, Inc. | | | 78,977 | | | | 3,322,562 | |
Standard Motor Products, Inc. | | | 56,407 | | | | 2,701,895 | |
| | | | | | | | 17,061,724 | |
Biotechnology — 1.7% | | | | |
Innoviva, Inc. (a) (b) | | | 498,334 | | | | 8,695,928 | |
| | | | | |
Building Materials — 2.4% | | | | |
Apogee Enterprises, Inc. (a) | | | 66,231 | | | | 2,777,066 | |
Boise Cascade Co. | | | 163,599 | | | | 9,262,975 | |
| | | | | | | | 12,040,041 | |
Chemicals — 2.0% | | | | |
AdvanSix, Inc. (b) | | | 85,214 | | | | 4,141,401 | |
American Vanguard Corp. | | | 77,750 | | | | 1,211,345 | |
Rayonier Advanced Materials, Inc. (b) | | | 645,317 | | | | 4,633,376 | |
| | | | | | | | 9,986,122 | |
Coal — 1.4% | | | | |
CONSOL Energy, Inc. (b) | | | 128,654 | | | | 3,539,272 | |
SunCoke Energy, Inc. | | | 480,482 | | | | 3,469,080 | |
| | | | | | | | 7,008,352 | |
Commercial Services — 6.2% | | | | |
ABM Industries, Inc. | | | 216,330 | | | | 9,520,683 | |
Adtalem Global Education, Inc. (a) (b) | | | 110,455 | | | | 4,079,103 | |
American Public Education, Inc. (b) | | | 15,209 | | | | 380,073 | |
Forrester Research, Inc. (b) | | | 46,731 | | | | 2,488,426 | |
Heidrick & Struggles International, Inc. | | | 51,193 | | | | 2,399,928 | |
Kelly Services, Inc. - Class A | | | 79,193 | | | | 1,427,850 | |
Perdoceo Education Corp. (a) (b) | | | 321,891 | | | | 3,418,482 | |
The Aaron’s Co., Inc. (a) | | | 258,399 | | | | 6,043,953 | |
TrueBlue, Inc. (b) | | | 65,626 | | | | 1,827,684 | |
| | | | | | | | 31,586,182 | |
Distribution/Wholesale — 1.8% | | | | |
G-III Apparel Group Ltd. (a) (b) | | | 214,383 | | | | 6,144,217 | |
ScanSource, Inc. (b) | | | 92,574 | | | | 3,312,298 | |
| | | | | | | | 9,456,515 | |
Electrical Components & Equipment — 0.3% | | | | |
Insteel Industries, Inc. | | | 40,339 | | | | 1,640,587 | |
| | | | | |
Electronics — 2.5% | | | | |
Benchmark Electronics, Inc. | | | 90,685 | | | | 2,113,867 | |
| | | Shares | | | Value | |
Electronics (Continued) |
Plexus Corp. (b) | | | 54,031 | | | $ | 4,717,987 | |
Sanmina Corp. (a) (b) | | | 163,889 | | | | 6,186,810 | |
| | | | | | | | 13,018,664 | |
Food Service — 0.5% | | | | |
Healthcare Services Group, Inc. (a) | | | 132,048 | | | | 2,534,001 | |
| | | | | |
Forest Products & Paper — 0.7% | | | | |
Clearwater Paper Corp. (b) | | | 91,421 | | | | 3,824,140 | |
| | | | | |
Healthcare-Products — 0.3% | | | | |
Natus Medical, Inc. (b) | | | 62,509 | | | | 1,565,850 | |
| | | | | |
Healthcare-Services — 3.2% | | | | |
Fulgent Genetics, Inc. (a) (b) | | | 101,848 | | | | 8,445,236 | |
ModivCare, Inc. (b) | | | 47,846 | | | | 7,787,894 | |
| | | | | | | | 16,233,130 | |
Home Builders — 3.4% | | | | |
Century Communities, Inc. | | | 101,952 | | | | 6,836,901 | |
M/I Homes, Inc. (b) | | | 95,023 | | | | 5,441,017 | |
Winnebago Industries, Inc. (a) | | | 76,275 | | | | 5,163,055 | |
| | | | | | | | 17,440,973 | |
Home Furnishings — 3.3% | | | | |
Daktronics, Inc. (b) | | | 215,631 | | | | 1,196,752 | |
Ethan Allen Interiors, Inc. (a) | | | 150,233 | | | | 3,486,908 | |
iRobot Corp. (a) (b) | | | 47,902 | | | | 3,995,985 | |
Sleep Number Corp. (a) (b) | | | 78,808 | | | | 6,961,899 | |
Universal Electronics, Inc. (b) | | | 29,895 | | | | 1,231,076 | |
| | | | | | | | 16,872,620 | |
Household Products/Wares — 2.0% | | | | |
Central Garden & Pet Co. (b) | | | 164,327 | | | | 8,475,987 | |
Quanex Building Products Corp. (a) | | | 87,835 | | | | 1,819,941 | |
| | | | | | | | 10,295,928 | |
Leisure Time — 1.2% | | | | |
Vista Outdoor, Inc. (b) | | | 150,693 | | | | 6,304,995 | |
| | | | | |
Machinery-Diversified — 0.6% | | | | |
DXP Enterprises, Inc./TX (b) | | | 99,057 | | | | 3,264,919 | |
| | | | | |
Media — 4.3% | | | | |
AMC Networks, Inc. - Class A (b) | | | 211,475 | | | | 8,414,590 | |
Meredith Corp. (a) (b) | | | 232,486 | | | | 13,539,985 | |
| | | | | | | | 21,954,575 | |
Metal Fabricate/Hardware — 0.9% | | | | |
TimkenSteel Corp. (b) | | | 239,379 | | | | 3,339,337 | |
Tredegar Corp. (a) | | | 106,489 | | | | 1,284,257 | |
| | | | | | | | 4,623,594 | |
Miscellaneous Manufacturing — 2.3% | | | | |
Haynes International, Inc. | | | 31,493 | | | | 1,263,814 | |
The accompanying notes are an integral part of the financial statements.
83
Pacer US Small Cap Cash Cows 100 ETF
SCHEDULE OF INVESTMENTS
October 31, 2021 (Unaudited) (Continued)
| | | Shares | | | Value | |
COMMON STOCKS — 97.3% (Continued) |
Miscellaneous Manufacturing (Continued) |
Hillenbrand, Inc. | | | 234,992 | | | $ | 10,682,736 | |
| | | | | | | | 11,946,550 | |
Office Furnishings — 0.8% | | | | |
HNI Corp. (a) | | | 112,695 | | | | 4,214,793 | |
| | | | | |
Oil & Gas — 2.4% | | | | |
PDC Energy, Inc. (a) | | | 238,545 | | | | 12,478,289 | |
| | | | | |
Oil & Gas Services — 2.5% | | | | |
Archrock, Inc. (a) | | | 730,104 | | | | 5,979,552 | |
Bristow Group, Inc. (a) (b) | | | 86,432 | | | | 2,990,547 | |
Oceaneering International, Inc. (b) | | | 267,222 | | | | 3,634,219 | |
| | | | | | | | 12,604,318 | |
Pharmaceuticals — 3.2% | | | | |
Collegium Pharmaceutical, Inc. (a) (b) | | | 122,175 | | | | 2,398,295 | |
Supernus Pharmaceuticals, Inc. (a) (b) | | | 104,382 | | | | 3,115,803 | |
uniQure NV (a) (b) | | | 191,953 | | | | 5,848,808 | |
USANA Health Sciences, Inc. (a) (b) | | | 35,780 | | | | 3,472,807 | |
Vanda Pharmaceuticals, Inc. (a) (b) | | | 81,121 | | | | 1,388,791 | |
| | | | | | | | 16,224,504 | |
Retail — 32.4% | | | | |
Abercrombie & Fitch Co. (a) (b) | | | 235,052 | | | | 9,293,956 | |
Asbury Automotive Group, Inc. (b) | | | 58,367 | | | | 11,423,006 | |
Bed Bath & Beyond, Inc. (a) (b) | | | 398,128 | | | | 5,589,717 | |
Bloomin’ Brands, Inc. (b) | | | 362,856 | | | | 7,844,947 | |
Caleres, Inc. (a) | | | 179,090 | | | | 4,129,815 | |
Chico’s FAS, Inc. (a) (b) | | | 1,457,834 | | | | 7,959,774 | |
Conn’s, Inc. (a) (b) | | | 346,350 | | | | 7,713,215 | |
Genesco, Inc. (a) (b) | | | 81,656 | | | | 4,947,537 | |
Group 1 Automotive, Inc. | | | 63,113 | | | | 11,347,717 | |
Guess?, Inc. (a) | | | 194,139 | | | | 4,020,619 | |
Haverty Furniture Cos., Inc. (a) | | | 98,106 | | | | 2,815,642 | |
La-Z-Boy, Inc. | | | 173,074 | | | | 5,752,980 | |
Lumber Liquidators Holdings, Inc. (a) (b) | | | 115,873 | | | | 2,094,984 | |
Macy’s, Inc. (a) | | | 477,559 | | | | 12,640,987 | |
MarineMax, Inc. (a) (b) | | | 188,738 | | | | 9,774,741 | |
Movado Group, Inc. (a) | | | 73,650 | | | | 2,452,545 | |
PetMed Express, Inc. (a) | | | 40,058 | | | | 1,138,849 | |
Sally Beauty Holdings, Inc. (a) (b) | | | 439,109 | | | | 6,700,803 | |
Shoe Carnival, Inc. (a) | | | 96,433 | | | | 3,266,186 | |
Signet Jewelers Ltd. (a) | | | 129,886 | | | | 11,583,233 | |
The Buckle, Inc. (a) | | | 182,055 | | | | 7,577,129 | |
The Cato Corp. - Class A | | | 138,899 | | | | 2,448,789 | |
The ODP Corp. (b) | | | 178,161 | | | | 7,714,371 | |
Vera Bradley, Inc. (b) | | | 138,953 | | | | 1,363,129 | |
World Fuel Services Corp. | | | 271,324 | | | | 8,283,522 | |
| | | Shares | | | Value | |
Retail — 32.4% (Continued) |
Zumiez, Inc. (a) (b) | | | 156,907 | | | $ | 6,386,115 | |
| | | | | | | | 166,264,308 | |
Semiconductors — 0.4% | | | | |
CTS Corp. | | | 60,366 | | | | 2,150,237 | |
| | | | | |
Software — 2.1% | | | | |
Computer Programs & Systems, Inc. (b) | | | 32,661 | | | | 1,179,062 | |
Digi International, Inc. (a) (b) | | | 60,088 | | | | 1,294,896 | |
Xperi Holding Corp. | | | 454,728 | | | | 8,148,726 | |
| | | | | | | | 10,622,684 | |
Telecommunications — 1.0% | | | | |
Extreme Networks, Inc. (b) | | | 344,803 | | | | 3,389,414 | |
NETGEAR, Inc. (a) (b) | | | 62,280 | | | | 1,795,532 | |
| | | | | | | | 5,184,946 | |
Transportation — 3.6% | | | | |
ArcBest Corp. | | | 69,945 | | | | 6,284,558 | |
Atlas Air Worldwide Holdings, Inc. (a) (b) | | | 110,053 | | | | 8,927,499 | |
Dorian LPG Ltd. | | | 278,957 | | | | 3,380,959 | |
| | | | | | | | 18,593,016 | |
TOTAL COMMON STOCKS (Cost $486,636,272) | | | | | | | 499,020,075 | |
| | | | | |
REAL ESTATE INVESTMENT TRUSTS — 2.7% | | | | |
Tanger Factory Outlet Centers, Inc. (a) | | | 368,159 | | | | 6,185,071 | |
The GEO Group, Inc. (a) | | | 920,580 | | | | 7,530,344 | |
TOTAL REAL ESTATE INVESTMENT TRUSTS (Cost $13,181,676) | | | | | | | 13,715,415 | |
| | | | | |
| | | Principal
Amount | | | | | |
SHORT-TERM INVESTMENTS — 0.0% | | | | |
Money Market Deposit Accounts — 0.0% (c) | | | | |
U.S. Bank Money Market Deposit Account, 0.003% (d) | | $ | 273,979 | | | | 273,979 | |
TOTAL SHORT-TERM INVESTMENTS (Cost $273,979) | | | | | | | 273,979 | |
| | | | | |
The accompanying notes are an integral part of the financial statements.
84
Pacer US Small Cap Cash Cows 100 ETF
SCHEDULE OF INVESTMENTS
October 31, 2021 (Unaudited) (Continued)
| | | Shares | | | Value | |
INVESTMENTS PURCHASED WITH PROCEEDS FROM SECURITIES LENDING — 30.2% |
Mount Vernon Liquid Assets Portfolio, LLC, 0.10% (d) | | | 154,675,918 | | | $ | 154,675,918 | |
TOTAL INVESTMENTS PURCHASED WITH PROCEEDS FROM SECURITIES LENDING (Cost $154,675,918) | | | | | | | 154,675,918 | |
| | | | | |
Total Investments (Cost $654,767,845) — 130.2% | | | | | | | 667,685,387 | |
Liabilities in Excess of Other Assets — (30.2)% | | | | | | | (154,749,738 | ) |
TOTAL NET ASSETS — 100.0% | | | | | | $ | 512,935,649 | |
Percentages are stated as a percent of net assets.
| | (a) | All or a portion of this security is on loan as of October 31, 2021. The total value of securities on loan is $150,546,918 or 29.4% of net assets. |
| | (b) | Non-income producing security. |
| | (d) | The rate shown is as of October 31, 2021. |
For Fund compliance purposes, the Fund’s industry classifications refer to any one or more of the industry sub-classifications used by one or more widely recognized market indexes or ratings group indexes, and/or they may be defined by Fund management. This definition does not apply for all purposes of this report, which may combine sub-classifications for reporting ease. Categories are shown as a percentage of net assets.
The accompanying notes are an integral part of the financial statements.
85
Pacer Developed Markets International Cash Cows 100 ETF
SCHEDULE OF INVESTMENTS
October 31, 2021 (Unaudited)
| | | Shares | | | Value | |
COMMON STOCKS — 99.4% | | | | |
Australia — 2.0% | | | | |
Coles Group Ltd. | | | 20,455 | | | $ | 263,737 | |
Fortescue Metals Group Ltd. | | | 43,025 | | | | 450,851 | |
| | | | | | | | 714,588 | |
Britain — 10.5% | | | | |
Barratt Developments PLC | | | 14,753 | | | | 133,861 | |
British American Tobacco PLC - ADR | | | 19,534 | | | | 682,127 | |
Bunzl PLC | | | 5,098 | | | | 188,515 | |
Imperial Brands PLC | | | 32,577 | | | | 687,474 | |
Kingfisher PLC | | | 62,504 | | | | 286,559 | |
Persimmon PLC | | | 3,832 | | | | 142,697 | |
Rio Tinto PLC - ADR (a) | | | 8,652 | | | | 547,412 | |
Vodafone Group PLC - ADR | | | 41,573 | | | | 621,516 | |
WPP PLC | | | 28,939 | | | | 418,224 | |
| | | | | | | | 3,708,385 | |
Canada — 4.3% | | | | |
Barrick Gold Corp. | | | 29,931 | | | | 549,832 | |
Canadian Tire Corp. Ltd. - Class A | | | 1,453 | | | | 206,374 | |
Loblaw Cos. Ltd. | | | 5,920 | | | | 445,244 | |
Magna International, Inc. | | | 3,818 | | | | 310,403 | |
| | | | | | | | 1,511,853 | |
China — 1.2% | | | | |
Lenovo Group Ltd. | | | 396,382 | | | | 431,000 | |
| | | | | |
Denmark — 2.1% | | | | |
AP Moller - Maersk A/S - Class B | | | 260 | | | | 751,313 | |
| | | | | |
Finland — 2.4% | | | | |
Kesko OYJ - Class B | | | 5,758 | | | | 186,974 | |
Nokia OYJ - ADR (b) | | | 94,109 | | | | 534,539 | |
Wartsila OYJ Abp | | | 9,601 | | | | 133,130 | |
| | | | | | | | 854,643 | |
France — 7.8% | | | | |
Atos SE | | | 2,719 | | | | 141,380 | |
Bouygues SA | | | 7,532 | | | | 304,745 | |
Carrefour SA | | | 19,441 | | | | 351,828 | |
Cie de Saint-Gobain | | | 9,997 | | | | 688,309 | |
Cie Generale des Etablissements Michelin | | | 2,558 | | | | 401,272 | |
Eiffage SA | | | 3,255 | | | | 334,738 | |
Publicis Groupe SA | | | 8,082 | | | | 541,322 | |
| | | | | | | | 2,763,594 | |
Germany — 11.3% | | | | |
Bayerische Motoren Werke AG | | | 6,743 | | | | 680,029 | |
Brenntag SE | | | 1,993 | | | | 189,474 | |
Covestro AG (c) | | | 3,083 | | | | 197,443 | |
Daimler AG | | | 7,958 | | | | 788,762 | |
Deutsche Post AG | | | 11,094 | | | | 686,378 | |
| | | Shares | | | Value | |
Germany — 11.3% (Continued) |
Fresenius Medical Care AG & Co KGaA - ADR (a) | | | 14,699 | | | $ | 488,448 | |
Fresenius SE & Co. KGaA | | | 14,016 | | | | 636,192 | |
HeidelbergCement AG | | | 4,556 | | | | 343,076 | |
| | | | | | | | 4,009,802 | |
Hong Kong — 2.6% | | | | |
CK Hutchison Holdings Ltd. | | | 99,626 | | | | 670,320 | |
WH Group Ltd. (c) | | | 359,199 | | | | 252,069 | |
| | | | | | | | 922,389 | |
Ireland — 1.6% | | | | |
CRH PLC - ADR | | | 9,998 | | | | 479,304 | |
DCC PLC | | | 1,258 | | | | 105,123 | |
| | | | | | | | 584,427 | |
Japan — 30.8% | | | | |
Amada Co Ltd. | | | 3,922 | | | | 38,609 | |
Bridgestone Corp. | | | 13,048 | | | | 574,581 | |
Canon, Inc. | | | 17,121 | | | | 384,256 | |
Dentsu Group, Inc. | | | 4,454 | | | | 162,958 | |
Ebara Corp. | | | 1,202 | | | | 65,386 | |
ENEOS Holdings, Inc. | | | 175,249 | | | | 706,685 | |
FUJIFILM Holdings Corp. | | | 6,426 | | | | 496,207 | |
Inpex Corp. | | | 36,342 | | | | 303,554 | |
ITOCHU Corp. | | | 25,303 | | | | 719,740 | |
Japan Tobacco, Inc. | | | 36,322 | | | | 712,418 | |
KDDI Corp. | | | 22,778 | | | | 705,074 | |
Mitsubishi Electric Corp. | | | 28,759 | | | | 384,799 | |
NEC Corp. | | | 5,814 | | | | 296,885 | |
Nexon Co. Ltd. | | | 9,236 | | | | 156,479 | |
Nitori Holdings Co. Ltd. | | | 1,321 | | | | 241,715 | |
Nitto Denko Corp. | | | 1,476 | | | | 114,998 | |
Otsuka Holdings Co. Ltd. | | | 5,977 | | | | 235,671 | |
Renesas Electronics Corp. (b) | | | 29,081 | | | | 357,724 | |
SCREEN Holdings Co. Ltd. | | | 667 | | | | 61,857 | |
Secom Co. Ltd. | | | 2,256 | | | | 153,184 | |
Seiko Epson Corp. | | | 6,176 | | | | 109,784 | |
Shionogi & Co. Ltd. | | | 3,829 | | | | 248,839 | |
SoftBank Corp. | | | 58,831 | | | | 802,393 | |
Sony Group Corp. - ADR | | | 7,621 | | | | 882,436 | |
Subaru Corp. | | | 6,190 | | | | 121,003 | |
Sumitomo Chemical Co. Ltd. | | | 58,374 | | | | 286,812 | |
Sumitomo Corp. | | | 46,587 | | | | 660,945 | |
Trend Micro, Inc. | | | 1,546 | | | | 87,219 | |
Yamaha Motor Co. Ltd. | | | 9,323 | | | | 258,893 | |
Z Holdings Corp. | | | 92,291 | | | | 571,682 | |
| | | | | | | | 10,902,786 | |
Luxembourg — 0.4% | | | | |
Tenaris SA - ADR | | | 6,941 | | | | 154,645 | |
| | | | | |
The accompanying notes are an integral part of the financial statements.
86
Pacer Developed Markets International Cash Cows 100 ETF
SCHEDULE OF INVESTMENTS
October 31, 2021 (Unaudited) (Continued)
| | | Shares | | | Value | |
COMMON STOCKS — 99.4% (Continued) |
Netherlands — 3.4% | | | | |
Koninklijke Ahold Delhaize NV | | | 24,878 | | | $ | 808,992 | |
Randstad Holding NV | | | 3,482 | | | | 250,368 | |
Signify NV (c) | | | 2,679 | | | | 129,607 | |
| | | | | | | | 1,188,967 | |
Norway — 2.0% | | | | |
Telenor ASA | | | 27,240 | | | | 429,983 | |
Yara International ASA | | | 5,524 | | | | 288,235 | |
| | | | | | | | 718,218 | |
South Korea — 9.6% | | | | |
Daewoo Engineering & Construction Co Ltd. (b) | | | 17,881 | | | | 95,637 | |
E-MART, Inc. | | | 1,238 | | | | 177,985 | |
Fila Holdings Corp. | | | 1,464 | | | | 46,480 | |
GS Engineering & Construction Corp. | | | 2,675 | | | | 94,657 | |
Hyundai Doosan Infracore Co Ltd. (b) | | | 3,484 | | | | 31,305 | |
Hyundai Engineering & Construction Co. Ltd. | | | 3,205 | | | | 137,959 | |
Hyundai Mobis Co. Ltd. | | | 905 | | | | 195,165 | |
Kia Corp. | | | 8,229 | | | | 599,279 | |
KT&G Corp. | | | 1,898 | | | | 131,725 | |
Kumho Petrochemical Co. Ltd. | | | 644 | | | | 94,791 | |
LG Electronics, Inc. | | | 3,194 | | | | 329,363 | |
Lotte Chemical Corp. | | | 539 | | | | 103,552 | |
POSCO - AD | | | 9,020 | | | | 570,605 | |
Samsung Engineering Co Ltd. (b) | | | 5,028 | | | | 106,709 | |
SK Telecom Co. Ltd. - ADR (b) | | | 11,266 | | | | 326,714 | |
S-Oil Corp. | | | 4,041 | | | | 354,458 | |
| | | | | | | | 3,396,384 | |
Spain — 2.0% | | | | |
Telefonica SA - ADR | | | 163,011 | | | | 709,098 | |
| | | | | |
Sweden — 1.9% | | | | |
Boliden AB | | | 3,834 | | | | 135,226 | |
Electrolux AB - Class B | | | 6,536 | | | | 148,331 | |
Getinge AB - Class B | | | 4,095 | | | | 183,245 | |
Skanska AB - Class B | | | 8,101 | | | | 205,638 | |
| | | | | | | | 672,440 | |
Switzerland — 3.5% | | | | |
Adecco Group AG | | | 1,878 | | | | 94,495 | |
Holcim Ltd. | | | 10,425 | | | | 520,453 | |
Logitech International SA | | | 1,872 | | | | 155,837 | |
Swisscom AG | | | 836 | | | | 455,070 | |
| | | | | | | | 1,225,855 | |
TOTAL COMMON STOCKS (Cost $34,457,463) | | | | | | | 35,220,387 | |
| | | | | |
| | | Principal
Amount | | | Value | |
| SHORT-TERM INVESTMENTS — 0.5% | | | | | | | | |
| Money Market Deposit Accounts — 0.5% | | | | | | | | |
| U.S. Bank Money Market Deposit Account, 0.003% (d) | | $ | 177,147 | | | $ | 177,147 | |
| TOTAL SHORT-TERM INVESTMENTS (Cost $177,147) | | | | | | | 177,147 | |
| | | | | | | | | |
| | | | Shares | | | | | |
| INVESTMENTS PURCHASED WITH PROCEEDS FROM SECURITIES LENDING — 2.2% |
| Mount Vernon Liquid Assets Portfolio, LLC, 0.10% (d) | | | 801,934 | | | | 801,934 | |
| TOTAL INVESTMENTS PURCHASED WITH PROCEEDS FROM SECURITIES LENDING (Cost $801,934) | | | | | | | 801,934 | |
| | | | | | | | | |
Total Investments (Cost $35,436,544) — 102.1% | | | | | | | 36,199,468 | |
Liabilities in Excess of Other Assets — (2.1)% | | | | | | | (755,556 | ) |
TOTAL NET ASSETS — 100.0% | | | | | | $ | 35,443,912 | |
Percentages are stated as a percent of net assets.
ADR American Depositary Receipt
| | (a) | All or a portion of this security is on loan as of October 31, 2021. The total value of securities on loan is $760,467 or 2.1% of net assets. |
| | (b) | Non-income producing security. |
| | (c) | Security exempt from registration under Rule 144(a) and Regulation S of the Securities Act of 1933. Such securities are treated as liquid securities according to the Fund’s liquidity guidelines. The value of those securities total $579,119 or 1.6% of net assets. |
| | (d) | The rate shown is as of October 31, 2021. |
For Fund compliance purposes, the Fund’s industry classifications refer to any one or more of the industry sub-classifications used by one or more widely recognized market indexes or ratings group indexes, and/or they may be defined by Fund management. This definition does not apply for all purposes of this report, which may combine sub-classifications for reporting ease.
The accompanying notes are an integral part of the financial statements.
87
Pacer US Cash Cows Growth ETF
SCHEDULE OF INVESTMENTS
October 31, 2021 (Unaudited)
| | | Shares | | | Value | |
COMMON STOCKS — 99.9% | | | | |
Apparel — 3.1% | | | | |
Crocs, Inc. (a) (b) | | | 547 | | | $ | 88,313 | |
Deckers Outdoor Corp. (a) | | | 260 | | | | 102,781 | |
| | | | | | | | 191,094 | |
Biotechnology — 6.1% | | | | |
Emergent BioSolutions, Inc. (a) (b) | | | 471 | | | | 22,452 | |
Exelixis, Inc. (a) | | | 2,758 | | | | 59,325 | |
Vertex Pharmaceuticals, Inc. (a) | | | 1,570 | | | | 290,340 | |
| | | | | | | | 372,117 | |
Building Materials — 0.7% | | | | |
Simpson Manufacturing Co., Inc. | | | 381 | | | | 40,420 | |
| | | | | |
Chemicals — 1.7% | | | | |
FMC Corp. | | | 1,127 | | | | 102,568 | |
| | | | | |
Commercial Services — 2.3% | | | | |
ASGN, Inc. (a) | | | 464 | | | | 55,522 | |
FTI Consulting, Inc. (a) (b) | | | 301 | | | | 43,320 | |
Insperity, Inc. | | | 339 | | | | 42,375 | |
| | | | | | | | 141,217 | |
Computers — 5.6% | | | | |
Apple, Inc. | | | 1,987 | | | | 297,653 | |
Qualys, Inc. (a) | | | 342 | | | | 42,572 | |
| | | | | | | | 340,225 | |
Engineering & Construction — 1.2% | | | | |
TopBuild Corp. (a) | | | 289 | | | | 74,264 | |
| | | | | |
Environmental Control — 1.4% | | | | |
Tetra Tech, Inc. | | | 474 | | | | 83,263 | |
| | | | | |
Hand/Machine Tools — 1.2% | | | | |
Lincoln Electric Holdings, Inc. | | | 521 | | | | 74,190 | |
| | | | | |
Healthcare-Products — 9.0% | | | | |
PerkinElmer, Inc. | | | 983 | | | | 173,883 | |
Quidel Corp. (a) (b) | | | 365 | | | | 48,461 | |
Thermo Fisher Scientific, Inc. | | | 518 | | | | 327,930 | |
| | | | | | | | 550,274 | |
Healthcare-Services — 6.0% | | | | |
Amedisys, Inc. (a) | | | 286 | | | | 48,431 | |
Chemed Corp. | | | 138 | | | | 66,550 | |
DaVita, Inc. (a) | | | 919 | | | | 94,878 | |
Medpace Holdings, Inc. (a) | | | 314 | | | | 71,137 | |
Syneos Health, Inc. (a) | | | 908 | | | | 84,753 | |
| | | | | | | | 365,749 | |
Home Furnishings — 1.2% | | | | |
Tempur Sealy International, Inc. | | | 1,724 | | | | 76,666 | |
| | | | | |
| | | Shares | | | Value | |
Internet — 10.1% | | | | |
Alphabet, Inc. - Class A (a) | | | 104 | | | $ | 307,936 | |
eBay, Inc. (b) | | | 4,079 | | | | 312,941 | |
| | | | | | | | 620,877 | |
Media — 3.7% | | | | |
FactSet Research Systems, Inc. | | | 329 | | | | 146,040 | |
The New York Times Co. - Class A | | | 1,466 | | | | 80,029 | |
| | | | | | | | 226,069 | |
Metal Fabricate/Hardware — 0.8% | | | | |
The Timken Co. | | | 669 | | | | 47,466 | |
| | | | | |
Oil & Gas — 0.4% | | | | |
CNX Resources Corp. (a) | | | 1,911 | | | | 27,920 | |
| | | | | |
Pharmaceuticals — 1.2% | | | | |
Jazz Pharmaceuticals PLC (a) | | | 538 | | | | 71,575 | |
| | | | | |
Pipelines — 0.7% | | | | |
Antero Midstream Corp. (b) | | | 4,188 | | | | 44,560 | |
| | | | | |
Retail — 7.2% | | | | |
Jack in the Box, Inc. | | | 196 | | | | 19,394 | |
Lithia Motors, Inc. (b) | | | 265 | | | | 84,593 | |
Ollie’s Bargain Outlet Holdings, Inc. (a) | | | 571 | | | | 38,634 | |
RH (a) (b) | | | 184 | | | | 121,372 | |
Texas Roadhouse, Inc. | | | 611 | | | | 54,263 | |
Williams-Sonoma, Inc. (b) | | | 652 | | | | 121,096 | |
| | | | | | | | 439,352 | |
Semiconductors — 27.8% | | | | |
Applied Materials, Inc. | | | 2,151 | | | | 293,934 | |
CMC Materials, Inc. (b) | | | 256 | | | | 32,863 | |
KLA Corp. | | | 844 | | | | 314,610 | |
Lam Research Corp. | | | 492 | | | | 277,276 | |
MKS Instruments, Inc. | | | 486 | | | | 72,924 | |
Qorvo, Inc. (a) | | | 975 | | | | 164,024 | |
Teradyne, Inc. (b) | | | 1,444 | | | | 199,619 | |
Xilinx, Inc. | | | 1,899 | | | | 341,820 | |
| | | | | | | | 1,697,070 | |
Software — 1.6% | | | | |
Fair Isaac Corp. (a) | | | 250 | | | | 99,550 | |
| | | | | |
Telecommunications — 4.5% | | | | |
Arista Networks, Inc. (a) (b) | | | 669 | | | | 274,083 | |
| | | | | |
Toys/Games/Hobbies — 1.1% | | | | |
Mattel, Inc. (a) (b) | | | 3,055 | | | | 66,629 | |
| | | | | |
The accompanying notes are an integral part of the financial statements.
88
Pacer US Cash Cows Growth ETF
SCHEDULE OF INVESTMENTS
October 31, 2021 (Unaudited) (Continued)
| | | Shares | | | Value | |
COMMON STOCKS — 99.9% (Continued) |
Transportation — 1.3% | | | | |
Knight-Swift Transportation Holdings, Inc. | | | 1,456 | | | $ | 82,541 | |
TOTAL COMMON STOCKS (Cost $5,689,514) | | | | | | | 6,109,739 | |
| | | | | |
| | | Principal
Amount | | | | | |
SHORT-TERM INVESTMENTS — 0.1% | | | | |
Money Market Deposit Accounts — 0.1% | | | | |
U.S. Bank Money Market Deposit Account, 0.003% (c) | | $ | 5,440 | | | | 5,440 | |
TOTAL SHORT-TERM INVESTMENTS (Cost $5,440) | | | | | | | 5,440 | |
| | | | | |
| | | Shares | | | | | |
INVESTMENTS PURCHASED WITH PROCEEDS FROM SECURITIES LENDING — 19.9% |
Mount Vernon Liquid Assets Portfolio, LLC, 0.10% (c) | | | 1,217,976 | | | | 1,217,976 | |
TOTAL INVESTMENTS PURCHASED WITH PROCEEDS FROM SECURITIES LENDING (Cost $1,217,976) | | | | | | | 1,217,976 | |
| | | | | |
Total Investments (Cost $6,912,930) — 119.9% | | | | | | | 7,333,155 | |
Liabilities in Excess of Other Assets — (19.9)% | | | | | | | (1,219,321 | ) |
TOTAL NET ASSETS — 100.0% | | | | | | $ | 6,113,834 | |
Percentages are stated as a percent of net assets.
| | (a) | Non-income producing security. |
| | (b) | All or a portion of this security is on loan as of October 31, 2021. The total value of securities on loan is $1,216,204 or 19.9% of net assets. |
| | (c) | The rate shown is as of October 31, 2021. |
For Fund compliance purposes, the Fund’s industry classifications refer to any one or more of the industry sub-classifications used by one or more widely recognized market indexes or ratings group indexes, and/or they may be defined by Fund management. This definition does not apply for all purposes of this report, which may combine sub-classifications for reporting ease. Categories are shown as a percentage of net assets.
The accompanying notes are an integral part of the financial statements.
89
Pacer Emerging Markets Cash Cows 100 ETF
SCHEDULE OF INVESTMENTS
October 31, 2021 (Unaudited)
| | | Shares | | | Value | |
COMMON STOCKS — 94.0% | | | | |
Brazil — 8.8% | | | | |
Cia Siderurgica Nacional SA - ADR | | | 17,902 | | | $ | 73,040 | |
Cielo SA | | | 32,467 | | | | 12,483 | |
CPFL Energia SA | | | 15,575 | | | | 72,524 | |
Equatorial Energia SA | | | 10,684 | | | | 43,237 | |
JBS SA | | | 31,678 | | | | 219,857 | |
Telefonica Brasil SA - ADR | | | 18,601 | | | | 149,366 | |
TIM SA/Brazil | | | 29,327 | | | | 58,095 | |
Vale SA - ADR | | | 8,405 | | | | 106,996 | |
| | | | | | | | 735,598 | |
Chile — 1.9% | | | | |
CAP SA | | | 3,685 | | | | 36,474 | |
Cia Cervecerias Unidas SA | | | 2,353 | | | | 19,714 | |
Falabella SA | | | 38,345 | | | | 106,037 | |
| | | | | | | | 162,225 | |
China — 20.8% | | | | |
Angang Steel Co. Ltd. - Class H | | | 227,125 | | | | 122,313 | |
Anhui Conch Cement Co. Ltd. - Class H | | | 33,171 | | | | 164,992 | |
BAIC Motor Corp Ltd. - Class H (b) | | | 507,611 | | | | 168,323 | |
China Petroleum & Chemical Corp. - Class H | | | 337,751 | | | | 165,826 | |
China Shenhua Energy Co. Ltd. - Class H | | | 83,126 | | | | 179,062 | |
COSCO SHIPPING Holdings Co. Ltd. - Class H (a) | | | 117,163 | | | | 181,907 | |
Haier Smart Home Co. Ltd. - Class H | | | 45,224 | | | | 169,143 | |
Hengan International Group Co. Ltd. | | | 7,834 | | | | 40,929 | |
Shandong Chenming Paper Holdings Ltd. - Class H | | | 209,261 | | | | 100,858 | |
Sinotruk Hong Kong Ltd. | | | 83,867 | | | | 115,768 | |
Topsports International Holdings Ltd. (b) | | | 39,799 | | | | 48,390 | |
Weichai Power Co. Ltd. - Class H | | | 84,469 | | | | 151,774 | |
Yadea Group Holdings Ltd. (b) | | | 19,312 | | | | 33,260 | |
Yangzijiang Shipbuilding Holdings Ltd. | | | 92,821 | | | | 97,742 | |
| | | | | | | | 1,740,287 | |
Greece — 0.8% | | | | |
Hellenic Telecommunications Organization SA | | | 3,140 | | | | 55,537 | |
JUMBO SA | | | 796 | | | | 11,815 | |
| | | | | | | | 67,352 | |
Hong Kong — 3.4% | | | | |
Bosideng International Holdings Ltd. | | | 57,584 | | | | 44,703 | |
China Resources Cement Holdings Ltd. | | | 56,461 | | | | 47,604 | |
Kingboard Holdings Ltd. | | | 18,085 | | | | 79,146 | |
| | | Shares | | | Value | |
Hong Kong — 3.4% (Continued) |
Kunlun Energy Co. Ltd. | | | 126,619 | | | $ | 115,870 | |
| | | | | | | | 287,323 | |
Indonesia — 6.9% | | | | |
Adaro Energy Tbk PT | | | 523,988 | | | | 62,135 | |
Astra International Tbk PT | | | 514,393 | | | | 218,756 | |
Telekom Indonesia Persero Tbk PT | | | 752,422 | | | | 201,814 | |
United Tractors Tbk PT | | | 53,875 | | | | 89,554 | |
| | | | | | | | 572,259 | |
Malaysia — 3.6% | | | | |
Hartalega Holdings Bhd | | | 18,670 | | | | 26,420 | |
Supermax Corp Bhd | | | 84,185 | | | | 39,033 | |
Tenaga Nasional Bhd | | | 67,006 | | | | 156,309 | |
Top Glove Corp Bhd | | | 123,377 | | | | 81,040 | |
| | | | | | | | 302,802 | |
Mexico — 10.1% | | | | |
Alfa SAB de CV | | | 74,963 | | | | 54,143 | |
America Movil SAB de CV - ADR | | | 12,193 | | | | 216,792 | |
Arca Continental SAB de CV | | | 13,658 | | | | 83,130 | |
Cemex SAB de CV - ADR (a) | | | 16,686 | | | | 107,291 | |
Coca-Cola Femsa SAB de CV - ADR | | | 1,514 | | | | 81,378 | |
Gruma SAB de CV | | | 2,761 | | | | 32,323 | |
Grupo Bimbo SAB de CV | | | 45,285 | | | | 134,614 | |
Grupo Elektra SAB DE CV | | | 1,691 | | | | 129,774 | |
| | | | | | | | 839,445 | |
Russia — 11.0% | | | | |
Alrosa PJSC | | | 70,548 | | | | 124,304 | |
Inter RAO UES PJSC | | | 1,200,844 | | | | 81,377 | |
LUKOIL PJSC - ADR | | | 2,077 | | | | 211,854 | |
Magnit PJSC | | | 1,766 | | | | 161,088 | |
MMC Norilsk Nickel PJSC - ADR | | | 5,122 | | | | 160,267 | |
Surgutneftegas PJSC | | | 129,623 | | | | 62,364 | |
Tatneft PJSC ADS | | | 2,570 | | | | 117,578 | |
| | | | | | | | 918,832 | |
South Africa — 9.4% | | | | |
African Rainbow Minerals Ltd. | | | 1,501 | | | | 20,000 | |
AngloGold Ashanti Ltd. - ADR | | | 2,981 | | | | 55,089 | |
Impala Platinum Holdings Ltd. | | | 7,848 | | | | 101,723 | |
Kumba Iron Ore Ltd. | | | 2,589 | | | | 78,678 | |
MTN Group Ltd. (a) | | | 18,030 | | | | 161,686 | |
MultiChoice Group | | | 3,457 | | | | 27,491 | |
Pepkor Holdings Ltd. (a) (b) | | | 25,558 | | | | 40,207 | |
Shoprite Holdings Ltd. | | | 5,703 | | | | 67,760 | |
Sibanye Stillwater Ltd. - ADR | | | 4,945 | | | | 70,219 | |
The Foschini Group Ltd. (a) | | | 3,259 | | | | 27,672 | |
Vodacom Group Ltd. | | | 11,850 | | | | 105,180 | |
Woolworths Holdings Ltd. | | | 9,270 | | | | 32,717 | |
| | | | | | | | 788,422 | |
Taiwan — 9.7% | | | | |
Acer, Inc. | | | 47,796 | | | | 44,688 | |
The accompanying notes are an integral part of the financial statements.
90
Pacer Emerging Markets Cash Cows 100 ETF
SCHEDULE OF INVESTMENTS
October 31, 2021 (Unaudited) (Continued)
| | | Shares | | | Value | |
COMMON STOCKS — 94.0% (Continued) |
Taiwan — 9.7% (Continued) |
Asustek Computer, Inc. | | | 7,728 | | | $ | 98,099 | |
AU Optronics Corp. | | | 116,555 | | | | 80,474 | |
Catcher Technology Co. Ltd. | | | 5,062 | | | | 29,307 | |
Cheng Shin Rubber Industry Co. Ltd. | | | 23,858 | | | | 29,256 | |
Chicony Electronics Co. Ltd. | | | 4,683 | | | | 13,371 | |
Evergreen Marine Corp Taiwan Ltd. | | | 43,166 | | | | 154,450 | |
Foxconn Technology Co. Ltd. | | | 11,061 | | | | 27,366 | |
Innolux Corp. | | | 88,770 | | | | 53,309 | |
Largan Precision Co. Ltd. | | | 700 | | | | 52,106 | |
Lite-On Technology Corp. | | | 17,383 | | | | 38,318 | |
Micro-Star International Co. Ltd. | | | 5,673 | | | | 28,560 | |
Nanya Technology Corp. | | | 16,094 | | | | 38,486 | |
Teco Electric and Machinery Co Ltd. | | | 13,088 | | | | 14,190 | |
Uni-President Enterprises Corp. | | | 43,812 | | | | 104,928 | |
| | | | | | | | 806,908 | |
Thailand — 1.1% | | | | |
Electricity Generating PCL | | | 7,629 | | | | 41,039 | |
Ratch Group PCL | | | 12,838 | | | | 17,603 | |
Sri Trang Gloves Thailand PCL | | | 32,859 | | | | 30,203 | |
| | | | | | | | 88,845 | |
Turkey — 6.5% | | | | |
BIM Birlesik Magazalar AS | | | 3,785 | | | | 24,468 | |
Coca-Cola Icecek AS | | | 2,585 | | | | 22,882 | |
Enka Insaat ve Sanayi AS | | | 52,379 | | | | 59,930 | |
Eregli Demir ve Celik Fabrikalari TAS | | | 27,193 | | | | 55,693 | |
Ford Otomotiv Sanayi AS | | | 3,936 | | | | 75,985 | |
KOC Holding AS | | | 78,253 | | | | 191,929 | |
Koza Altin Isletmeleri AS (a) | | | 1,523 | | | | 16,998 | |
Turk Telekomunikasyon AS | | | 48,712 | | | | 38,153 | |
Turkcell Iletisim Hizmetleri AS | | | 35,473 | | | | 56,416 | |
| | | | | | | | 542,454 | |
TOTAL COMMON STOCKS (Cost $8,633,832) | | | | | | | 7,852,752 | |
| | | | | |
PREFERRED STOCKS — 5.4% | | | | |
Brazil — 5.2% | | | | |
Cia Energetica de Minas Gerais - ADR | | | 37,048 | | | | 83,358 | |
Companhia Paranaense de Energia-Copel (ELP) | | | 8,380 | | | | 42,822 | |
Gerdau SA - ADR | | | 12,999 | | | | 61,485 | |
Metalurgica Gerdau SA | | | 27,817 | | | | 61,856 | |
Petroleo Brasileiro SA - ADR | | | 16,655 | | | | 160,055 | |
Usinas Siderurgicas de Minas Gerais SA Usiminas - Class A | | | 9,039 | | | | 21,221 | |
| | | | | | | | 430,797 | |
| | | Shares | | | Value | |
PREFERRED STOCKS — 5.4% (Continued) |
Chile — 0.2% | | | | |
Embotelladora Andina SA - Class B | | | 8,716 | | | $ | 18,000 | |
TOTAL PREFERRED STOCKS (Cost $529,240) | | | | | | | 448,797 | |
| | | | | |
| | | Principal
Amount | | | | | |
SHORT-TERM INVESTMENTS- 0.3% | | | | |
Money Market Deposit Accounts — 0.3% | | | | |
U.S. Bank Money Market Deposit Account, 0.003% (c) | | $ | 29,113 | | | | 29,113 | |
TOTAL SHORT-TERM INVESTMENTS (Cost $29,113) | | | | | | | 29,113 | |
| | | | | |
Total Investments (Cost $9,192,185) — 99.7% | | | | | | | 8,330,662 | |
Other Assets in Excess of Liabilities — 0.3% | | | | | | | 24,652 | |
TOTAL NET ASSETS — 100.0% | | | | | | $ | 8,355,314 | |
Percentages are stated as a percent of net assets.
ADR American Depositary Receipt
| | (a) | Non-income producing security. |
| | (b) | Security exempt from registration under Rule 144(a) and Regulation S of the Securities Act of 1933. Such securities are treated as liquid securities according to the Fund’s liquidity guidelines. The value of those securities total $290,180 or 3.5% of net assets. |
| | (c) | The rate shown is as of October 31, 2021. |
For Fund compliance purposes, the Fund’s industry classifications refer to any one or more of the industry sub-classifications used by one or more widely recognized market indexes or ratings group indexes, and/or they may be defined by Fund management. This definition does not apply for all purposes of this report, which may combine sub-classifications for reporting ease.
The accompanying notes are an integral part of the financial statements.
91
Pacer Cash Cows Fund of Funds ETF
SCHEDULE OF INVESTMENTS
October 31, 2021 (Unaudited)
| | | Shares | | | Value | |
AFFILIATED EXCHANGE TRADED FUNDS — 99.9% |
Pacer Developed Markets International Cash Cows 100 ETF | | | 21,799 | | | $ | 677,949 | |
Pacer Global Cash Cows Dividend ETF | | | 22,695 | | | | 683,347 | |
Pacer US Cash Cows 100 ETF | | | 15,308 | | | | 689,472 | |
Pacer US Cash Cows Growth ETF | | | 17,734 | | | | 723,483 | |
Pacer US Small Cap Cash Cows 100 ETF | | | 15,536 | | | | 666,805 | |
TOTAL EXCHANGE TRADED FUNDS (Cost $3,447,353) | | | | | | | 3,441,056 | |
| | | | | |
| | | Principal
Amount | | | | | |
SHORT-TERM INVESTMENTS — 0.1% | | | | |
Money Market Deposit Accounts — 0.1% (a) | | | | |
U.S. Bank Money Market Deposit Account, 0.003% (a) | | $ | 3,967 | | | | 3,967 | |
TOTAL SHORT-TERM INVESTMENTS (Cost $3,967) | | | | | | | 3,967 | |
| | | | | |
Total Investments (Cost $3,451,320) — 100.0% | | | | | | | 3,445,023 | |
Liabilities in Excess of Other Assets — 0.0% (b) | | | | | | | (456 | ) |
TOTAL NET ASSETS — 100.0% | | | | | | $ | 3,444,567 | |
Percentages are stated as a percent of net assets.
| | (a) | The rate shown is as of October 31, 2021. |
The accompanying notes are an integral part of the financial statements.
92
Pacer WealthShield ETF
SCHEDULE OF INVESTMENTS
October 31, 2021 (Unaudited)
| | | Shares | | | Value | |
COMMON STOCKS — 80.5% | | | | |
Aerospace/Defense — 0.0% (a) | | | | |
Teledyne Technologies, Inc. (b) | | | 50 | | | $ | 22,461 | |
| | | | | |
Apparel — 1.1% | | | | |
Hanesbrands, Inc. (c) | | | 810 | | | | 13,802 | |
NIKE, Inc. - Class B | | | 2,965 | | | | 496,015 | |
PVH Corp. (b) (c) | | | 165 | | | | 18,039 | |
Ralph Lauren Corp. (c) | | | 115 | | | | 14,625 | |
Tapestry, Inc. | | | 645 | | | | 25,142 | |
Under Armour, Inc. - Class A (b) | | | 435 | | | | 9,553 | |
Under Armour, Inc. - Class C (b) | | | 485 | | | | 9,157 | |
VF Corp. (c) | | | 755 | | | | 55,024 | |
| | | | | | | | 641,357 | |
Auto Manufacturers — 4.3% | | | | |
Ford Motor Co. (b) | | | 9,095 | | | | 155,343 | |
General Motors Co. (b) | | | 3,365 | | | | 183,157 | |
Tesla Motors, Inc. (b) | | | 1,880 | | | | 2,094,320 | |
| | | | | | | | 2,432,820 | |
Auto Parts & Equipment — 0.2% | | | | |
Aptiv PLC (b) | | | 625 | | | | 108,056 | |
BorgWarner, Inc. | | | 555 | | | | 25,014 | |
| | | | | | | | 133,070 | |
Banks — 9.4% | | | | |
Bank of America Corp. | | | 18,598 | | | | 888,612 | |
Citigroup, Inc. (c) | | | 5,092 | | | | 352,163 | |
Citizens Financial Group, Inc. (c) | | | 1,069 | | | | 50,649 | |
Comerica, Inc. | | | 337 | | | | 28,675 | |
Fifth Third Bancorp | | | 1,734 | | | | 75,481 | |
First Republic Bank | | | 441 | | | | 95,402 | |
Huntington Bancshares, Inc. (c) | | | 3,708 | | | | 58,364 | |
JPMorgan Chase & Co. | | | 7,506 | | | | 1,275,194 | |
KeyCorp. | | | 2,401 | | | | 55,871 | |
M&T Bank Corp. (c) | | | 322 | | | | 47,373 | |
Morgan Stanley (c) | | | 3,664 | | | | 376,586 | |
Northern Trust Corp. | | | 525 | | | | 64,596 | |
Regions Financial Corp. (c) | | | 2,398 | | | | 56,785 | |
State Street Corp. | | | 920 | | | | 90,666 | |
SVB Financial Group (b) | | | 148 | | | | 106,175 | |
The Bank of New York Mellon Corp. | | | 1,994 | | | | 118,045 | |
The Goldman Sachs Group, Inc. | | | 849 | | | | 350,934 | |
The PNC Financial Services Group, Inc. (c) | | | 1,068 | | | | 225,380 | |
Truist Financial Corp. | | | 3,352 | | | | 212,751 | |
US Bancorp | | | 3,386 | | | | 204,413 | |
Wells Fargo & Co. | | | 10,312 | | | | 527,562 | |
Zions Bancorp | | | 409 | | | | 25,763 | |
| | | | | | | | 5,287,440 | |
| | | Shares | | | Value | |
Commercial Services — 2.5% | | | | |
Automatic Data Processing, Inc. | | | 440 | | | $ | 98,776 | |
FleetCor Technologies, Inc. (b) | | | 85 | | | | 21,030 | |
Gartner, Inc. (b) | | | 85 | | | | 28,212 | |
Global Payments, Inc. | | | 305 | | | | 43,612 | |
MarketAxess Holdings, Inc. | | | 97 | | | | 39,641 | |
Moody’s Corp. | | | 408 | | | | 164,893 | |
PayPal Holdings, Inc. (b) | | | 3,242 | | | | 754,057 | |
S&P Global, Inc. (c) | | | 607 | | | | 287,815 | |
| | | | | | | | 1,438,036 | |
Computers — 5.4% | | | | |
Accenture PLC - Class A | | | 660 | | | | 236,801 | |
Apple, Inc. | | | 16,395 | | | | 2,455,971 | |
Cognizant Technology Solutions Corp. (c) | | | 550 | | | | 42,949 | |
DXC Technology Co. (b) | | | 265 | | | | 8,631 | |
Fortinet, Inc. (b) | | | 140 | | | | 47,088 | |
Hewlett Packard Enterprise Co. | | | 1,365 | | | | 19,997 | |
HP, Inc. | | | 1,255 | | | | 38,064 | |
International Business Machines Corp. (c) | | | 935 | | | | 116,969 | |
NetApp, Inc. | | | 235 | | | | 20,986 | |
Seagate Technology Holdings PLC | | | 220 | | | | 19,595 | |
Western Digital Corp. (b) | | | 320 | | | | 16,733 | |
| | | | | | | | 3,023,784 | |
Distribution/Wholesale — 0.1% | | | | |
LKQ Corp. (b) (c) | | | 625 | | | | 34,425 | |
Pool Corp. | | | 95 | | | | 48,940 | |
| | | | | | | | 83,365 | |
Diversified Financial Services — 4.8% | | | | |
American Express Co. | | | 1,615 | | | | 280,655 | |
Ameriprise Financial, Inc. (c) | | | 288 | | | | 87,013 | |
BlackRock, Inc. | | | 359 | | | | 338,702 | |
Capital One Financial Corp. | | | 1,119 | | | | 169,003 | |
Cboe Global Markets, Inc. | | | 269 | | | | 35,492 | |
CME Group, Inc. | | | 902 | | | | 198,936 | |
Discover Financial Services | | | 750 | | | | 84,990 | |
Franklin Resources, Inc. (c) | | | 709 | | | | 22,326 | |
Intercontinental Exchange, Inc. | | | 1,412 | | | | 195,506 | |
Invesco Ltd. | | | 856 | | | | 21,751 | |
MasterCard, Inc. - Class A | | | 910 | | | | 305,323 | |
Nasdaq, Inc. | | | 293 | | | | 61,492 | |
Raymond James Financial, Inc. | | | 467 | | | | 46,042 | |
Synchrony Financial | | | 1,432 | | | | 66,516 | |
T Rowe Price Group, Inc. | | | 571 | | | | 123,839 | |
The Charles Schwab Corp. | | | 3,770 | | | | 309,253 | |
The Western Union Co. (c) | | | 425 | | | | 7,744 | |
Visa, Inc. - Class A (c) | | | 1,760 | | | | 372,715 | |
| | | | | | | | 2,727,298 | |
The accompanying notes are an integral part of the financial statements.
93
Pacer WealthShield ETF
SCHEDULE OF INVESTMENTS
October 31, 2021 (Unaudited) (Continued)
| | | Shares | | | Value | |
COMMON STOCKS — 80.5% (Continued) |
Electronics — 0.4% | | | | |
Amphenol Corp. | | | 625 | | | $ | 47,981 | |
Garmin Ltd. | | | 350 | | | | 50,260 | |
Keysight Technologies, Inc. (b) | | | 190 | | | | 34,204 | |
TE Connectivity Ltd. | | | 340 | | | | 49,640 | |
Trimble, Inc. (b) | | | 265 | | | | 23,153 | |
| | | | | | | | 205,238 | |
Energy-Alternate Sources — 0.1% | | | | |
Enphase Energy, Inc. (b) | | | 140 | | | | 32,428 | |
| | | | | |
Entertainment — 0.1% | | | | |
Caesars Entertainment, Inc. (b) (c) | | | 495 | | | | 54,183 | |
Penn National Gaming, Inc. (b) (c) | | | 365 | | | | 26,134 | |
| | | | | | | | 80,317 | |
Healthcare-Services — 0.3% | | | | |
Teladoc Health, Inc. (b) (c) | | | 1,272 | | | | 190,278 | |
| | | | | |
Home Builders — 0.4% | | | | |
DR Horton, Inc. (c) | | | 755 | | | | 67,399 | |
Lennar Corp. - Class A | | | 635 | | | | 63,456 | |
NVR, Inc. (b) (c) | | | 8 | | | | 39,158 | |
PulteGroup, Inc. | | | 600 | | | | 28,848 | |
| | | | | | | | 198,861 | |
Home Furnishings — 0.1% | | | | |
Leggett & Platt, Inc. (c) | | | 310 | | | | 14,524 | |
Whirlpool Corp. (c) | | | 145 | | | | 30,570 | |
| | | | | | | | 45,094 | |
Housewares — 0.0% (a) | | | | |
Newell Brands, Inc. (c) | | | 880 | | | | 20,143 | |
| | | | | |
Insurance — 5.7% | | | | |
Aflac, Inc. | | | 1,551 | | | | 83,242 | |
American International Group, Inc. | | | 2,149 | | | | 126,984 | |
Aon PLC | | | 569 | | | | 182,034 | |
Arthur J Gallagher & Co. | | | 518 | | | | 86,853 | |
Assurant, Inc. | | | 149 | | | | 24,035 | |
Berkshire Hathaway, Inc. - Class B (b) | | | 4,657 | | | | 1,336,606 | |
Brown & Brown, Inc. | | | 587 | | | | 37,046 | |
Chubb Ltd. | | | 1,101 | | | | 215,113 | |
Cincinnati Financial Corp. | | | 375 | | | | 45,540 | |
Everest Re Group Ltd. | | | 99 | | | | 25,888 | |
Globe Life, Inc. | | | 233 | | | | 20,742 | |
Lincoln National Corp. | | | 443 | | | | 31,962 | |
Loews Corp. | | | 509 | | | | 28,540 | |
Marsh & McLennan Cos., Inc. | | | 1,270 | | | | 211,836 | |
MetLife, Inc. | | | 1,831 | | | | 114,987 | |
Principal Financial Group, Inc. | | | 629 | | | | 42,200 | |
Prudential Financial, Inc. | | | 972 | | | | 106,969 | |
The Allstate Corp. (c) | | | 741 | | | | 91,639 | |
| | | Shares | | | Value | |
Insurance — 5.7% (Continued) |
The Hartford Financial Services Group, Inc. | | | 874 | | | $ | 63,741 | |
The Progressive Corp. | | | 1,470 | | | | 139,474 | |
The Travelers Cos., Inc. (c) | | | 625 | | | | 100,550 | |
W R Berkley Corp. | | | 354 | | | | 28,178 | |
Willis Towers Watson PLC | | | 325 | | | | 78,741 | |
| | | | | | | | 3,222,900 | |
Internet — 17.9% | | | | |
Airbnb, Inc. - Class A (b) (c) | | | 1,683 | | | | 287,221 | |
Alphabet, Inc. - Class A (b) | | | 197 | | | | 583,301 | |
Alphabet, Inc. - Class C (b) | | | 185 | | | | 548,601 | |
Amazon.com, Inc. (b) | | | 1,311 | | | | 4,421,256 | |
Booking Holdings, Inc. (b) | | | 95 | | | | 229,974 | |
CDW Corp. | | | 145 | | | | 27,064 | |
eBay, Inc. (c) | | | 4,990 | | | | 382,833 | |
Etsy, Inc. (b) | | | 1,201 | | | | 301,079 | |
Expedia Group, Inc. (b) | | | 1,525 | | | | 250,725 | |
F5 Networks, Inc. (b) (c) | | | 65 | | | | 13,725 | |
GoDaddy, Inc. - Class A (b) | | | 1,809 | | | | 125,129 | |
Match Group, Inc. (b) (c) | | | 1,554 | | | | 234,312 | |
Meta Platforms, Inc. - Class A (b) | | | 2,223 | | | | 719,296 | |
Netflix, Inc. (b) | | | 856 | | | | 590,905 | |
NortonLifeLock, Inc. | | | 605 | | | | 15,397 | |
Okta, Inc. (b) | | | 814 | | | | 201,204 | |
Pinterest, Inc. - Class A (b) (c) | | | 3,781 | | | | 168,784 | |
Snap, Inc. - Class A (b) (c) | | | 4,391 | | | | 230,879 | |
Twitter, Inc. (b) (c) | | | 4,203 | | | | 225,029 | |
VeriSign, Inc. (b) | | | 891 | | | | 198,399 | |
Wayfair, Inc. - Class A (b) (c) | | | 642 | | | | 159,922 | |
Zillow Group, Inc. - Class A (b) | | | 316 | | | | 33,408 | |
Zillow Group, Inc. - Class C (b) (c) | | | 1,445 | | | | 149,745 | |
| | | | | | | | 10,098,188 | |
Leisure Time — 0.2% | | | | |
Carnival Corp. (b) | | | 1,850 | | | | 40,996 | |
Norwegian Cruise Line Holdings Ltd. (b) | | | 860 | | | | 22,119 | |
Royal Caribbean Cruises Ltd. (b) | | | 520 | | | | 43,904 | |
| | | | | | | | 107,019 | |
Lodging — 0.5% | | | | |
Hilton Worldwide Holdings, Inc. (b) | | | 645 | | | | 92,848 | |
Las Vegas Sands Corp. (b) | | | 795 | | | | 30,854 | |
Marriott International, Inc. (b) | | | 635 | | | | 101,612 | |
MGM Resorts International | | | 925 | | | | 43,623 | |
Wynn Resorts Ltd. (b) (c) | | | 245 | | | | 22,001 | |
| | | | | | | | 290,938 | |
Office/Business Equipment — 0.1% | | | | |
Zebra Technologies Corp. (b) | | | 55 | | | | 29,367 | |
| | | | | |
The accompanying notes are an integral part of the financial statements.
94
Pacer WealthShield ETF
SCHEDULE OF INVESTMENTS
October 31, 2021 (Unaudited) (Continued)
| | | Shares | | | Value | |
COMMON STOCKS — 80.5% (Continued) |
Real Estate — 0.7% | | | | |
CBRE Group, Inc. (b) | | | 3,742 | | | $ | 389,467 | |
| | | | | |
Retail — 6.4% | | | | |
Advance Auto Parts, Inc. | | | 150 | | | | 33,828 | |
AutoZone, Inc. (b) | | | 50 | | | | 89,242 | |
Bath & Body Works, Inc. (b) | | | 615 | | | | 42,490 | |
Best Buy Co., Inc. | | | 525 | | | | 64,176 | |
CarMax, Inc. (b) | | | 380 | | | | 52,030 | |
Chipotle Mexican Grill, Inc. (b) | | | 65 | | | | 115,637 | |
Darden Restaurants, Inc. (c) | | | 300 | | | | 43,242 | |
Dollar General Corp. | | | 550 | | | | 121,836 | |
Dollar Tree, Inc. (b) (c) | | | 540 | | | | 58,190 | |
Domino’s Pizza, Inc. | | | 85 | | | | 41,563 | |
Genuine Parts Co. | | | 330 | | | | 43,266 | |
Lowe’s Cos., Inc. | | | 1,640 | | | | 383,465 | |
McDonald’s Corp. | | | 1,730 | | | | 424,802 | |
O’Reilly Automotive, Inc. (b) | | | 160 | | | | 99,571 | |
Ross Stores, Inc. | | | 830 | | | | 93,956 | |
Starbucks Corp. | | | 2,735 | | | | 290,101 | |
Target Corp. | | | 1,145 | | | | 297,265 | |
The Gap, Inc. (c) | | | 500 | | | | 11,345 | |
The Home Depot, Inc. | | | 2,465 | | | | 916,339 | |
The TJX Cos., Inc. | | | 2,795 | | | | 183,045 | |
Tractor Supply Co. | | | 265 | | | | 57,550 | |
Ulta Beauty, Inc. (b) | | | 125 | | | | 45,920 | |
Yum! Brands, Inc. | | | 685 | | | | 85,584 | |
| | | | | | | | 3,594,443 | |
Savings & Loans — 0.0% (a) | | | | |
People’s United Financial, Inc. | | | 1,077 | | | | 18,460 | |
| | | | | |
Semiconductors — 4.1% | | | | |
Advanced Micro Devices, Inc. (b) | | | 1,265 | | | | 152,091 | |
Analog Devices, Inc. | | | 560 | | | | 97,154 | |
Applied Materials, Inc. | | | 955 | | | | 130,501 | |
Broadcom, Inc. | | | 430 | | | | 228,618 | |
Intel Corp. | | | 4,235 | | | | 207,515 | |
IPG Photonics Corp. (b) (c) | | | 35 | | | | 5,565 | |
KLA Corp. | | | 160 | | | | 59,642 | |
Lam Research Corp. | | | 150 | | | | 84,535 | |
Microchip Technology, Inc. | | | 570 | | | | 42,231 | |
Micron Technology, Inc. | | | 1,175 | | | | 81,193 | |
Monolithic Power Systems, Inc. | | | 45 | | | | 23,646 | |
NVIDIA Corp. | | | 2,600 | | | | 664,742 | |
NXP Semiconductors NV | | | 275 | | | | 55,237 | |
Qorvo, Inc. (b) | | | 115 | | | | 19,346 | |
QUALCOMM, Inc. | | | 1,175 | | | | 156,322 | |
Skyworks Solutions, Inc. | | | 170 | | | | 28,412 | |
Teradyne, Inc. (c) | | | 170 | | | | 23,501 | |
| | | Shares | | | Value | |
Semiconductors — 4.1% (Continued) |
Texas Instruments, Inc. | | | 965 | | | $ | 180,918 | |
Xilinx, Inc. | | | 260 | | | | 46,800 | |
| | | | | | | | 2,287,969 | |
Software — 13.5% | | | | |
Adobe, Inc. (b) | | | 495 | | | | 321,928 | |
Akamai Technologies, Inc. (b) (c) | | | 1,596 | | | | 168,314 | |
ANSYS, Inc. (b) | | | 90 | | | | 34,162 | |
Autodesk, Inc. (b) | | | 230 | | | | 73,050 | |
Box, Inc. (b) (c) | | | 3,136 | | | | 81,003 | |
Broadridge Financial Solutions, Inc. | | | 120 | | | | 21,409 | |
Cadence Design System, Inc. (b) | | | 290 | | | | 50,202 | |
Ceridian HCM Holding, Inc. (b) (c) | | | 140 | | | | 17,535 | |
Citrix Systems, Inc. | | | 1,432 | | | | 135,653 | |
Coupa Software, Inc. (b) (c) | | | 642 | | | | 146,183 | |
Datadog, Inc. - Class A (b) | | | 1,551 | | | | 259,095 | |
DocuSign, Inc. (b) | | | 975 | | | | 271,333 | |
Dropbox, Inc. - Class A (b) | | | 3,659 | | | | 111,563 | |
Fastly, Inc. - Class A (b) (c) | | | 1,945 | | | | 98,436 | |
Fidelity National Information Services, Inc. | | | 645 | | | | 71,427 | |
Fiserv, Inc. (b) (c) | | | 620 | | | | 61,064 | |
Intuit, Inc. (c) | | | 285 | | | | 178,407 | |
Jack Henry & Associates, Inc. (c) | | | 80 | | | | 13,318 | |
Microsoft Corp. | | | 7,845 | | | | 2,601,559 | |
MSCI, Inc. | | | 208 | | | | 138,295 | |
Nutanix, Inc. - Class A (b) | | | 2,649 | | | | 90,887 | |
Oracle Corp. | | | 1,720 | | | | 165,017 | |
Paychex, Inc. | | | 335 | | | | 41,299 | |
Paycom Software, Inc. (b) | | | 50 | | | | 27,393 | |
PTC, Inc. (b) | | | 110 | | | | 14,009 | |
salesforce.com, Inc. (b) | | | 2,935 | | | | 879,590 | |
ServiceNow, Inc. (b) | | | 205 | | | | 143,041 | |
Snowflake, Inc. (b) (c) | | | 992 | | | | 351,009 | |
Synopsys, Inc. (b) | | | 160 | | | | 53,309 | |
Tyler Technologies, Inc. (b) | | | 45 | | | | 24,445 | |
Veeva Systems, Inc. - Class A (b) | | | 788 | | | | 249,804 | |
Workday, Inc. - Class A (b) | | | 977 | | | | 283,311 | |
Zoom Video Communications, Inc. - Class A (b) | | | 1,006 | | | | 276,298 | |
ZoomInfo Technologies, Inc. (b) | | | 2,046 | | | | 137,532 | |
| | | | | | | | 7,590,880 | |
Telecommunications — 2.1% | | | | |
Arista Networks, Inc. (b) (c) | | | 60 | | | | 24,582 | |
Ciena Corp. (b) | | | 2,014 | | | | 109,340 | |
Cisco Systems, Inc. | | | 12,866 | | | | 720,110 | |
CommScope Holding Co., Inc. (b) | | | 4,716 | | | | 50,508 | |
Corning, Inc. | | | 800 | | | | 28,456 | |
Juniper Networks, Inc. (c) | | | 4,458 | | | | 131,600 | |
Motorola Solutions, Inc. (c) | | | 175 | | | | 43,503 | |
The accompanying notes are an integral part of the financial statements.
95
Pacer WealthShield ETF
SCHEDULE OF INVESTMENTS
October 31, 2021 (Unaudited) (Continued)
| | | Shares | | | Value | |
COMMON STOCKS — 80.5% (Continued) |
Telecommunications — 2.1% (Continued) |
Vonage Holdings Corp. (b) | | | 5,245 | | | $ | 84,550 | |
| | | | | | | | 1,192,649 | |
Textiles — 0.0% (a) | | | | |
Mohawk Industries, Inc. (b) | | | 130 | | | | 23,037 | |
| | | | | |
Toys/Games/Hobbies — 0.1% | | | | |
Hasbro, Inc. | | | 300 | | | | 28,728 | |
TOTAL COMMON STOCKS (Cost $40,443,036) | | | | | | | 45,436,035 | |
| | | | | |
REAL ESTATE INVESTMENT TRUSTS — 19.4% | | | | |
Alexandria Real Estate Equities, Inc. | | | 1,547 | | | | 315,805 | |
American Tower Corp. | | | 5,069 | | | | 1,429,306 | |
AvalonBay Communities, Inc. | | | 1,558 | | | | 368,747 | |
Boston Properties, Inc. (c) | | | 1,585 | | | | 180,119 | |
Crown Castle International Corp. | | | 4,816 | | | | 868,325 | |
Digital Realty Trust, Inc. (c) | | | 3,150 | | | | 497,102 | |
Duke Realty Corp. | | | 4,216 | | | | 237,108 | |
Equinix, Inc. (c) | | | 1,007 | | | | 842,929 | |
Equity Residential | | | 3,795 | | | | 327,888 | |
Essex Property Trust, Inc. | | | 725 | | | | 246,449 | |
Extra Space Storage, Inc. | | | 1,491 | | | | 294,279 | |
Federal Realty Investment Trust (c) | | | 780 | | | | 93,873 | |
Healthpeak Properties, Inc. | | | 6,006 | | | | 213,273 | |
Host Hotels & Resorts, Inc. (b) | | | 7,953 | | | | 133,849 | |
Iron Mountain, Inc. (c) | | | 3,227 | | | | 147,280 | |
Kimco Realty Corp. (c) | | | 6,835 | | | | 154,471 | |
Mid-America Apartment Communities, Inc. | | | 1,295 | | | | 264,452 | |
Prologis, Inc. | | | 8,238 | | | | 1,194,181 | |
Public Storage | | | 1,697 | | | | 563,709 | |
Realty Income Corp. (c) | | | 4,339 | | | | 309,935 | |
Regency Centers Corp. | | | 1,702 | | | | 119,838 | |
SBA Communications Corp. | | | 1,221 | | | | 421,648 | |
Simon Property Group, Inc. | | | 3,661 | | | | 536,629 | |
UDR, Inc. | | | 3,107 | | | | 172,532 | |
Ventas, Inc. | | | 4,383 | | | | 233,921 | |
Vornado Realty Trust | | | 1,770 | | | | 75,455 | |
Welltower, Inc. | | | 4,708 | | | | 378,523 | |
Weyerhaeuser Co. | | | 8,354 | | | | 298,405 | |
TOTAL REAL ESTATE INVESTMENT TRUSTS (Cost $10,205,341) | | | | | | | 10,920,031 | |
| | | Principal
Amount | | | Value | |
CONTINGENT VALUE RIGHTS — 0.0% (a) | | | | |
Pharmaceuticals — 0.0% (a) | | | | |
Achillion Pharmaceuticals, Inc. (d) | | $ | 6,273 | | | $ | 2,886 | |
TOTAL CONTINGENT VALUE RIGHTS (Cost $0) | | | | | | | 2,886 | |
| | | | | |
SHORT-TERM INVESTMENTS — 0.1% | | | | |
Money Market Deposit Accounts — 0.1% | | | | |
U.S. Bank Money Market Deposit Account, 0.003% (e) | | | 79,768 | | | | 79,768 | |
TOTAL SHORT-TERM INVESTMENTS (Cost $79,768) | | | | | | | 79,768 | |
| | | | | |
| | | Shares | | | | | |
INVESTMENTS PURCHASED WITH PROCEEDS FROM SECURITIES LENDING — 14.5% |
Mount Vernon Liquid Assets Portfolio, LLC 0.10% (e) | | | 8,168,584 | | | | 8,168,584 | |
TOTAL INVESTMENTS PURCHASED WITH PROCEEDS FROM SECURITIES LENDING (Cost $8,168,584) | | | | | | | 8,168,584 | |
| | | | | |
Total Investments (Cost $58,896,729) — 114.5% | | | | | | | 64,607,304 | |
Liabilities in Excess of Other Assets — (14.5)% | | | | | | | (8,172,017 | ) |
TOTAL NET ASSETS — 100.0% | | | | | | $ | 56,435,287 | |
Percentages are stated as a percent of net assets.
| | (b) | Non-income producing security. |
| | (c) | All or a portion of this security is on loan as of October 31, 2021. The total value of securities on loan is $7,968,760 or 14.1% of net assets. |
| | (d) | Value determined using significant unobservable inputs. |
| | (e) | The rate shown is as of October 31, 2021. |
For Fund compliance purposes, the Fund’s industry classifications refer to any one or more of the industry sub-classifications used by one or more widely recognized market indexes or ratings group indexes, and/or they may be defined by Fund management. This definition does not apply for all purposes of this report, which may combine sub-classifications for reporting ease. Categories are shown as a percentage of net assets.
The accompanying notes are an integral part of the financial statements.
96
Pacer Benchmark Industrial Real Estate SCTRSM ETF
SCHEDULE OF INVESTMENTS
October 31, 2021 (Unaudited)
| | | Shares | | | Value | |
REAL ESTATE INVESTMENT TRUSTS — 99.8% | | | | |
Diversified — 28.1% | | | | |
Duke Realty Corp. | | | 833,389 | | | $ | 46,869,797 | |
Lexington Realty Trust (a) | | | 970,302 | | | | 14,137,300 | |
One Liberty Properties, Inc. | | | 335,240 | | | | 10,479,602 | |
PS Business Parks, Inc. | | | 83,504 | | | | 14,838,661 | |
| | | | | | | | 86,325,360 | |
Storage — 10.5% | | | | |
Life Storage, Inc. | | | 242,385 | | | | 32,433,537 | |
| | | | | | | | 32,433,537 | |
Warehouse/Industrial — 61.2% | | | | |
Americold Realty Trust (a) | | | 356,312 | | | | 10,500,515 | |
EastGroup Properties, Inc. | | | 72,781 | | | | 14,394,626 | |
First Industrial Realty Trust, Inc. | | | 233,782 | | | | 13,613,126 | |
Indus Realty Trust, Inc. | | | 100,862 | | | | 7,030,081 | |
Industrial Logistics Properties Trust | | | 477,255 | | | | 13,406,093 | |
Innovative Industrial Properties, Inc. (a) | | | 53,198 | | | | 13,995,862 | |
Monmouth Real Estate Investment Corp. | | | 689,699 | | | | 13,000,826 | |
Plymouth Industrial REIT, Inc. | | | 502,438 | | | | 12,842,315 | |
Prologis, Inc. | | | 324,997 | | | | 47,111,565 | |
Rexford Industrial Realty, Inc. | | | 211,336 | | | | 14,201,779 | |
STAG Industrial, Inc. | | | 310,707 | | | | 13,525,076 | |
Terreno Realty Corp. | | | 196,534 | | | | 14,372,532 | |
| | | | | | | | 187,994,396 | |
TOTAL REAL ESTATE INVESTMENT TRUSTS (Cost $242,598,470) | | | | | | | 306,753,293 | |
| | | | | | | | |
| | | Principal
Amount | | | | | |
SHORT-TERM INVESTMENTS — 0.2% | | | | |
Money Market Deposit Accounts — 0.2% | | | | |
U.S. Bank Money Market Deposit Account, 0.003% (b) | | $ | 603,746 | | | | 603,746 | |
TOTAL SHORT-TERM INVESTMENTS (Cost $603,746) | | | | | | | 603,746 | |
| | | | | |
| | | Shares | | | Value | |
INVESTMENTS PURCHASED WITH PROCEEDS FROM SECURITIES LENDING — 6.6% |
Mount Vernon Liquid Assets Portfolio, LLC, 0.10% (b) | | | 20,263,470 | | | $ | 20,263,470 | |
TOTAL INVESTMENTS PURCHASED WITH PROCEEDS FROM SECURITIES LENDING (Cost $20,263,470) | | | | | | | 20,263,470 | |
| | | | | |
Total Investments (Cost $263,465,686) — 106.6% | | | | | | | 327,620,509 | |
Liabilities in Excess of Other Assets — (6.6)% | | | | | | | (20,213,727 | ) |
TOTAL NET ASSETS — 100.0% | | | | | | $ | 307,406,782 | |
Percentages are stated as a percent of net assets.
| | (a) | All or a portion of this security is on loan as of October 31, 2021. The total value of securities on loan is $19,776,460 or 6.4% of net assets. |
| | (b) | The rate shown is as of October 31, 2021. |
For Fund compliance purposes, the Fund’s industry classifications refer to any one or more of the industry sub-classifications used by one or more widely recognized market indexes or ratings group indexes, and/or they may be defined by Fund management. This definition does not apply for all purposes of this report, which may combine sub-classifications for reporting ease.
The accompanying notes are an integral part of the financial statements.
97
Pacer Benchmark Data & Infrastructure Real Estate SCTRSM ETF
SCHEDULE OF INVESTMENTS
October 31, 2021 (Unaudited)
| | | Shares | | | Value | |
COMMON STOCKS — 20.8% | | | | |
Advertising Sales — 0.9% | | | | |
Clear Channel Outdoor Holdings, Inc. (a) (b) | | | 4,747,445 | | | $ | 13,767,591 | |
| | | | | |
Building-Heavy Construct — 1.0% | | | | |
Helios Towers PLC (a) | | | 7,739,397 | | | | 16,379,901 | |
| | | | | |
Engineering & Construction — 6.8% | | | | |
Cellnex Telecom SA (c) | | | 1,096,592 | | | | 67,486,880 | |
Infrastrutture Wireless Italiane SpA (c) | | | 3,786,945 | | | | 41,878,496 | |
| | | | | | | | 109,365,376 | |
Internet Connectiv Svcs — 2.7% | | | | |
Cogent Communications Holdings, Inc. | | | 389,476 | | | | 29,829,967 | |
Vnet Group, Inc. - ADR (a) | | | 919,742 | | | | 14,421,554 | |
| | | | | | | | 44,251,521 | |
Telecommunication Services — 9.4% | | | | |
Chindata Group Holdings Ltd. - ADR (a) | | | 1,141,926 | | | | 11,373,583 | |
Cyxtera Technologies, Inc. (a) (b) | | | 457,960 | | | | 4,552,123 | |
GDS Holdings Ltd. - ADR (a) (b) | | | 1,058,565 | | | | 62,878,761 | |
NEXTDC Ltd. (a) | | | 4,549,824 | | | | 40,119,976 | |
Switch, Inc. - Class A | | | 1,315,958 | | | | 33,267,418 | |
| | | | | | | | 152,191,861 | |
TOTAL COMMON STOCKS (Cost $338,454,450) | | | | | | | 335,956,250 | |
| | | | | |
REAL ESTATE INVESTMENT TRUSTS — 79.1% | | | | |
Diversified — 74.7% | | | | |
American Tower Corp. | | | 857,155 | | | | 241,691,995 | |
CoreSite Realty Corp. (b) | | | 428,372 | | | | 61,025,875 | |
Crown Castle International Corp. | | | 1,286,459 | | | | 231,948,558 | |
CyrusOne, Inc. | | | 973,691 | | | | 79,862,136 | |
Digital Realty Trust, Inc. (b) | | | 457,721 | | | | 72,232,951 | |
DigitalBridge Group, Inc. (a) (b) | | | 4,860,312 | | | | 32,564,091 | |
Equinix, Inc. | | | 296,959 | | | | 248,575,470 | |
Keppel DC REIT | | | 14,139,523 | | | | 25,060,037 | |
Lamar Advertising Co. - Class A | | | 658,446 | | | | 74,536,087 | |
Outfront Media, Inc. (b) | | | 1,449,176 | | | | 36,069,991 | |
SBA Communications Corp. | | | 208,837 | | | | 72,117,681 | |
Uniti Group, Inc. (b) | | | 2,121,468 | | | | 30,358,207 | |
| | | | | | | | 1,206,043,079 | |
Storage — 4.4% | | | | |
Iron Mountain, Inc. (b) | | | 1,571,070 | | | | 71,703,635 | |
TOTAL REAL ESTATE INVESTMENT TRUSTS (Cost $1,120,221,972) | | | | | | | 1,277,746,714 | |
| | | | | |
| | | Principal
Amount | | | Value | |
SHORT-TERM INVESTMENTS — 0.1% | | | | |
Money Market Deposit Accounts — 0.1% | | | | |
U.S. Bank Money Market Deposit Account, 0.003% (d) | | $ | 818,974 | | | $ | 818,974 | |
TOTAL SHORT-TERM INVESTMENTS (Cost $818,974) | | | | | | | 818,974 | |
| | | | | |
| | | Shares | | | | | |
INVESTMENTS PURCHASED WITH PROCEEDS FROM SECURITIES LENDING — 11.3% |
Mount Vernon Liquid Assets Portfolio, LLC, 0.10% (d) | | | 183,211,916 | | | | 183,211,916 | |
TOTAL INVESTMENTS PURCHASED WITH PROCEEDS FROM SECURITIES LENDING (Cost $183,211,916) | | | | | | | 183,211,916 | |
| | | | | |
Total Investments (Cost $1,642,707,312) — 111.3% | | | | | | | 1,797,733,854 | |
Liabilities in Excess of Other Assets — (11.3)% | | | | | | | (183,329,180 | ) |
TOTAL NET ASSETS — 100.0% | | | | | | $ | 1,614,404,674 | |
Percentages are stated as a percent of net assets.
ADR American Depositary Receipt
| | (a) | Non-income producing security. |
| | (b) | All or a portion of this security is on loan as of October 31, 2021. The total value of securities on loan is $176,389,319 or 10.9% of net assets. |
| | (c) | Security exempt from registration under Rule 144(a) and Regulation S of the Securities Act of 1933. Such securities are treated as liquid securities according to the Fund’s liquidity guidelines. The value of these securities total $109,365,376 or 6.8% of net assets. |
| | (d) | The rate shown is as of October 31, 2021. |
For Fund compliance purposes, the Fund’s industry classifications refer to any one or more of the industry sub-classifications used by one or more widely recognized market indexes or ratings group indexes, and/or they may be defined by Fund management. This definition does not apply for all purposes of this report, which may combine sub-classifications for reporting ease.
The accompanying notes are an integral part of the financial statements.
98
Pacer CFRA-Stovall Equal Weight Seasonal Rotation ETF
SCHEDULE OF INVESTMENTS
October 31, 2021 (Unaudited)
| | | Shares | | | Value | |
COMMON STOCKS — 99.8% | | | | |
Aerospace/Defense — 3.0% | | | | |
General Dynamics Corp. | | | 1,374 | | | $ | 278,578 | |
Howmet Aerospace, Inc. | | | 8,870 | | | | 263,350 | |
L3Harris Technologies, Inc. | | | 1,196 | | | | 275,726 | |
Lockheed Martin Corp. | | | 801 | | | | 266,188 | |
Northrop Grumman Corp. | | | 782 | | | | 279,346 | |
Raytheon Technologies Corp. | | | 3,336 | | | | 296,437 | |
Teledyne Technologies, Inc. (a) | | | 627 | | | | 281,661 | |
The Boeing Co. (a) | | | 1,317 | | | | 272,659 | |
TransDigm Group, Inc. (a) | | | 462 | | | | 288,205 | |
| | | | | | | | 2,502,150 | |
Airlines — 1.7% | | | | |
Alaska Air Group, Inc. (a) | | | 4,937 | | | | 260,673 | |
American Airlines Group, Inc. (a) | | | 14,614 | | | | 280,589 | |
Delta Air Lines, Inc. (a) | | | 7,036 | | | | 275,319 | |
Southwest Airlines Co. (a) | | | 5,781 | | | | 273,326 | |
United Airlines Holdings, Inc. (a) | | | 6,246 | | | | 288,190 | |
| | | | | | | | 1,378,097 | |
Apparel — 2.7% | | | | |
Hanesbrands, Inc. | | | 17,036 | | | | 290,294 | |
NIKE, Inc. - Class B | | | 1,950 | | | | 326,216 | |
PVH Corp. (a) | | | 2,922 | | | | 319,462 | |
Ralph Lauren Corp. | | | 2,832 | | | | 360,145 | |
Tapestry, Inc. | | | 7,880 | | | | 307,162 | |
Under Armour, Inc. - Class A (a) | | | 7,366 | | | | 161,757 | |
Under Armour, Inc. - Class C (a) | | | 7,673 | | | | 144,866 | |
VF Corp. | | | 4,495 | | | | 327,596 | |
| | | | | | | | 2,237,498 | |
Auto Manufacturers — 2.2% | | | | |
Cummins, Inc. | | | 1,187 | | | | 284,690 | |
Ford Motor Co. (a) | | | 25,152 | | | | 429,596 | |
General Motors Co. (a) | | | 6,444 | | | | 350,747 | |
PACCAR, Inc. | | | 3,312 | | | | 296,822 | |
Tesla Motors, Inc. (a) | | | 433 | | | | 482,362 | |
| | | | | | | | 1,844,217 | |
Auto Parts & Equipment — 0.9% | | | | |
Aptiv PLC (a) | | | 2,178 | | | | 376,554 | |
BorgWarner, Inc. | | | 7,441 | | | | 335,366 | |
| | | | | | | | 711,920 | |
Biotechnology — 0.9% | | | | |
Corteva, Inc. | | | 16,604 | | | | 716,463 | |
| | | | | |
Building Materials — 3.1% | | | | |
Carrier Global Corp. | | | 4,907 | | | | 256,293 | |
Fortune Brands Home & Security, Inc. | | | 2,894 | | | | 293,451 | |
Johnson Controls International PLC | | | 3,689 | | | | 270,662 | |
Martin Marietta Materials, Inc. | | | 1,847 | | | | 725,575 | |
Masco Corp. | | | 4,651 | | | | 304,873 | |
| | | Shares | | | Value | |
Building Materials — 3.1% (Continued) |
Vulcan Materials Co. | | | 3,840 | | | $ | 730,061 | |
| | | | | | | | 2,580,915 | |
Chemicals — 13.6% | | | | |
Air Products & Chemicals, Inc. | | | 2,553 | | | | 765,415 | |
Albemarle Corp. | | | 2,989 | | | | 748,655 | |
Celanese Corp. | | | 4,705 | | | | 759,905 | |
CF Industries Holdings, Inc. | | | 15,064 | | | | 855,635 | |
Dow, Inc. | | | 11,934 | | | | 667,946 | |
DuPont de Nemours, Inc. | | | 10,227 | | | | 711,799 | |
Eastman Chemical Co. | | | 6,586 | | | | 685,142 | |
Ecolab, Inc. | | | 3,192 | | | | 709,326 | |
FMC Corp. | | | 7,347 | | | | 668,651 | |
International Flavors & Fragrances, Inc. | | | 4,885 | | | | 720,293 | |
Linde PLC | | | 2,322 | | | | 741,182 | |
LyondellBasell Industries NV | | | 7,763 | | | | 720,562 | |
Mosaic Co. | | | 21,690 | | | | 901,653 | |
PPG Industries, Inc. | | | 4,711 | | | | 756,445 | |
The Sherwin-Williams Co. | | | 2,398 | | | | 759,231 | |
| | | | | | | | 11,171,840 | |
Commercial Services — 4.7% | | | | |
Automatic Data Processing, Inc. | | | 1,351 | | | | 303,286 | |
Cintas Corp. | | | 686 | | | | 297,107 | |
Equifax, Inc. | | | 1,015 | | | | 281,591 | |
FleetCor Technologies, Inc. (a) | | | 1,040 | | | | 257,306 | |
Gartner, Inc. (a) | | | 865 | | | | 287,102 | |
Global Payments, Inc. | | | 1,630 | | | | 233,074 | |
IHS Markit Ltd. | | | 2,292 | | | | 299,610 | |
Nielsen Holdings PLC | | | 13,923 | | | | 281,941 | |
PayPal Holdings, Inc. (a) | | | 954 | | | | 221,891 | |
Quanta Services, Inc. | | | 2,391 | | | | 289,981 | |
Robert Half International, Inc. | | | 2,698 | | | | 305,063 | |
Rollins, Inc. | | | 7,110 | | | | 250,485 | |
United Rentals, Inc. (a) | | | 811 | | | | 307,458 | |
Verisk Analytics, Inc. | | | 1,347 | | | | 283,234 | |
| | | | | | | | 3,899,129 | |
Computers — 4.0% | | | | |
Accenture PLC - Class A | | | 793 | | | | 284,521 | |
Apple, Inc. | | | 1,821 | | | | 272,786 | |
Cognizant Technology Solutions Corp. | | | 3,557 | | | | 277,766 | |
DXC Technology Co. (a) | | | 7,892 | | | | 257,043 | |
Fortinet, Inc. (a) | | | 874 | | | | 293,961 | |
Hewlett Packard Enterprise Co. | | | 18,956 | | | | 277,705 | |
HP, Inc. | | | 9,688 | | | | 293,837 | |
International Business Machines Corp. | | | 1,980 | | | | 247,698 | |
Leidos Holdings, Inc. | | | 2,848 | | | | 284,743 | |
The accompanying notes are an integral part of the financial statements.
99
Pacer CFRA-Stovall Equal Weight Seasonal Rotation ETF
SCHEDULE OF INVESTMENTS
October 31, 2021 (Unaudited) (Continued)
| | | Shares | | | Value | |
COMMON STOCKS — 99.8% (Continued) |
Computers — 4.0% (Continued) |
NetApp, Inc. | | | 2,938 | | | $ | 262,363 | |
Seagate Technology Holdings PLC | | | 3,232 | | | | 287,874 | |
Western Digital Corp. (a) | | | 4,679 | | | | 244,665 | |
| | | | | | | | 3,284,962 | |
Distribution/Wholesale — 1.9% | | | | |
Copart, Inc. (a) | | | 1,933 | | | | 300,176 | |
Fastenal Co. | | | 5,168 | | | | 294,990 | |
LKQ Corp. (a) | | | 6,292 | | | | 346,563 | |
Pool Corp. | | | 646 | | | | 332,793 | |
W.W. Grainger, Inc. | | | 667 | | | | 308,894 | |
| | | | | | | | 1,583,416 | |
Diversified Financial Services — 0.9% | | | | |
MasterCard, Inc. - Class A | | | 781 | | | | 262,041 | |
The Western Union Co. | | | 12,862 | | | | 234,346 | |
Visa, Inc. - Class A | | | 1,206 | | | | 255,394 | |
| | | | | | | | 751,781 | |
Electrical Components & Equipment — 1.0% | | | | |
AMETEK, Inc. | | | 2,123 | | | | 281,085 | |
Emerson Electric Co. | | | 2,767 | | | | 268,427 | |
Generac Holdings, Inc. (a) | | | 614 | | | | 306,116 | |
| | | | | | | | 855,628 | |
Electronics — 2.6% | | | | |
Allegion PLC | | | 1,916 | | | | 245,823 | |
Amphenol Corp. | | | 3,600 | | | | 276,372 | |
Fortive Corp. | | | 3,677 | | | | 278,385 | |
Garmin Ltd. | | | 1,848 | | | | 265,373 | |
Honeywell International, Inc. | | | 1,245 | | | | 272,182 | |
Keysight Technologies, Inc. (a) | | | 1,506 | | | | 271,110 | |
TE Connectivity Ltd. | | | 1,866 | | | | 272,436 | |
Trimble, Inc. (a) | | | 2,889 | | | | 252,412 | |
| | | | | | | | 2,134,093 | |
Energy-Alternate Sources — 0.5% | | | | |
Enphase Energy, Inc. (a) | | | 1,714 | | | | 397,014 | |
| | | | | |
Engineering & Construction — 0.4% | | | | |
Jacobs Engineering Group, Inc. | | | 2,077 | | | | 291,652 | |
| | | | | |
Entertainment — 0.8% | | | | |
Caesars Entertainment, Inc. (a) | | | 3,061 | | | | 335,057 | |
Penn National Gaming, Inc. (a) | | | 3,996 | | | | 286,114 | |
| | | | | | | | 621,171 | |
Environmental Control — 1.0% | | | | |
Pentair PLC | | | 3,619 | | | | 267,698 | |
Republic Services, Inc. | | | 2,229 | | | | 300,023 | |
Waste Management, Inc. | | | 1,793 | | | | 287,292 | |
| | | | | | | | 855,013 | |
| | | Shares | | | Value | |
Forest Products & Paper — 0.8% | | | | |
International Paper Co. | | | 13,051 | | | $ | 648,243 | |
| | | | | |
Hand/Machine Tools — 0.6% | | | | |
Snap-On, Inc. | | | 1,267 | | | | 257,492 | |
Stanley Black & Decker, Inc. | | | 1,485 | | | | 266,899 | |
| | | | | | | | 524,391 | |
Home Builders — 1.5% | | | | |
DR Horton, Inc. | | | 3,560 | | | | 317,801 | |
Lennar Corp. - Class A | | | 3,198 | | | | 319,576 | |
NVR, Inc. (a) | | | 62 | | | | 303,478 | |
PulteGroup, Inc. | | | 6,654 | | | | 319,924 | |
| | | | | | | | 1,260,779 | |
Home Furnishings — 0.8% | | | | |
Leggett & Platt, Inc. | | | 6,832 | | | | 320,079 | |
Whirlpool Corp. | | | 1,478 | | | | 311,607 | |
| | | | | | | | 631,686 | |
Household Products/Wares — 0.8% | | | | |
Avery Dennison Corp. | | | 3,213 | | | | 699,534 | |
| | | | | |
Housewares — 0.4% | | | | |
Newell Brands, Inc. | | | 12,813 | | | | 293,289 | |
| | | | | |
Internet — 3.4% | | | | |
Amazon.com, Inc. (a) | | | 92 | | | | 310,264 | |
Booking Holdings, Inc. (a) | | | 138 | | | | 334,068 | |
CDW Corp. | | | 1,370 | | | | 255,710 | |
eBay, Inc. | | | 4,395 | | | | 337,184 | |
Etsy, Inc. (a) | | | 1,470 | | | | 368,514 | |
Expedia Group, Inc. (a) | | | 2,194 | | | | 360,716 | |
F5 Networks, Inc. (a) | | | 1,337 | | | | 282,308 | |
NortonLifeLock, Inc. | | | 9,951 | | | | 253,253 | |
VeriSign, Inc. (a) | | | 1,226 | | | | 272,993 | |
| | | | | | | | 2,775,010 | |
Iron/Steel — 0.9% | | | | |
Nucor Corp. | | | 6,423 | | | | 717,128 | |
| | | | | |
Leisure Time — 1.2% | | | | |
Carnival Corp. (a) | | | 14,019 | | | | 310,661 | |
Norwegian Cruise Line Holdings Ltd. (a) | | | 12,970 | | | | 333,589 | |
Royal Caribbean Cruises Ltd. (a) | | | 3,910 | | | | 330,121 | |
| | | | | | | | 974,371 | |
Lodging — 2.0% | | | | |
Hilton Worldwide Holdings, Inc. (a) | | | 2,503 | | | | 360,307 | |
Las Vegas Sands Corp. (a) | | | 7,622 | | | | 295,810 | |
Marriott International, Inc. (a) | | | 2,351 | | | | 376,207 | |
MGM Resorts International | | | 7,541 | | | | 355,633 | |
The accompanying notes are an integral part of the financial statements.
100
Pacer CFRA-Stovall Equal Weight Seasonal Rotation ETF
SCHEDULE OF INVESTMENTS
October 31, 2021 (Unaudited) (Continued)
| | | Shares | | | Value | |
COMMON STOCKS — 99.8% (Continued) |
Lodging — 2.0% (Continued) |
Wynn Resorts Ltd. (a) | | | 3,141 | | | $ | 282,062 | |
| | | | | | | | 1,670,019 | |
Machinery-Construction & Mining — 0.3% | | | | |
Caterpillar, Inc. | | | 1,351 | | | | 275,617 | |
| | | | | |
Machinery-Diversified — 2.6% | | | | |
Deere & Co. | | | 763 | | | | 261,182 | |
Dover Corp. | | | 1,596 | | | | 269,852 | |
IDEX Corp. | | | 1,275 | | | | 283,777 | |
Ingersoll Rand, Inc. (a) | | | 5,060 | | | | 272,026 | |
Otis Worldwide Corp. | | | 3,058 | | | | 245,588 | |
Rockwell Automation, Inc. | | | 882 | | | | 281,711 | |
Westinghouse Air Brake Technologies Corp. | | | 3,098 | | | | 281,081 | |
Xylem, Inc. | | | 2,061 | | | | 269,146 | |
| | | | | | | | 2,164,363 | |
Mining — 1.8% | | | | |
Freeport-McMoRan, Inc. | | | 20,308 | | | | 766,018 | |
Newmont Goldcorp Corp. | | | 12,650 | | | | 683,100 | |
| | | | | | | | 1,449,118 | |
Miscellaneous Manufacturing — 2.7% | | | | |
3M Co. | | | 1,501 | | | | 268,199 | |
A O Smith Corp. | | | 3,950 | | | | 288,627 | |
Eaton Corp. PLC | | | 1,727 | | | | 284,541 | |
General Electric Co. | | | 2,715 | | | | 284,722 | |
Illinois Tool Works, Inc. | | | 1,266 | | | | 288,483 | |
Parker-Hannifin Corp. | | | 975 | | | | 289,175 | |
Textron, Inc. | | | 3,925 | | | | 289,861 | |
Trane Technologies PLC | | | 1,457 | | | | 263,615 | |
| | | | | | | | 2,257,223 | |
Office/Business Equipment — 0.3% | | | | |
Zebra Technologies Corp. (a) | | | 467 | | | | 249,355 | |
| | | | | |
Packaging & Containers — 4.2% | | | | |
Amcor PLC | | | 58,612 | | | | 707,447 | |
Ball Corp. | | | 7,602 | | | | 695,431 | |
Packaging Corp. of America | | | 4,749 | | | | 652,370 | |
Sealed Air Corp. | | | 12,413 | | | | 736,339 | |
Westrock Co. | | | 13,899 | | | | 668,542 | |
| | | | | | | | 3,460,129 | |
Retail — 9.2% | | | | |
Advance Auto Parts, Inc. | | | 1,594 | | | | 359,479 | |
AutoZone, Inc. (a) | | | 206 | | | | 367,677 | |
Bath & Body Works, Inc. (a) | | | 5,011 | | | | 346,210 | |
Best Buy Co., Inc. | | | 2,864 | | | | 350,095 | |
CarMax, Inc. (a) | | | 2,371 | | | | 324,637 | |
Chipotle Mexican Grill, Inc. (a) | | | 168 | | | | 298,877 | |
Darden Restaurants, Inc. | | | 2,145 | | | | 309,180 | |
| | | Shares | | | Value | |
Retail — 9.2% (Continued) |
Dollar General Corp. | | | 1,463 | | | $ | 324,084 | |
Dollar Tree, Inc. (a) | | | 3,535 | | | | 380,932 | |
Domino’s Pizza, Inc. | | | 624 | | | | 305,117 | |
Genuine Parts Co. | | | 2,694 | | | | 353,210 | |
Lowe’s Cos., Inc. | | | 1,561 | | | | 364,993 | |
McDonald’s Corp. | | | 1,333 | | | | 327,318 | |
O’Reilly Automotive, Inc. (a) | | | 538 | | | | 334,808 | |
Ross Stores, Inc. | | | 2,827 | | | | 320,017 | |
Starbucks Corp. | | | 2,672 | | | | 283,419 | |
Target Corp. | | | 1,304 | | | | 338,545 | |
The Gap, Inc. | | | 13,366 | | | | 303,275 | |
The Home Depot, Inc. | | | 961 | | | | 357,242 | |
The TJX Cos., Inc. | | | 4,631 | | | | 303,284 | |
Tractor Supply Co. | | | 1,557 | | | | 338,134 | |
Ulta Beauty, Inc. (a) | | | 851 | | | | 312,623 | |
Yum! Brands, Inc. | | | 2,455 | | | | 306,728 | |
| | | | | | | | 7,609,884 | |
Semiconductors — 6.3% | | | | |
Advanced Micro Devices, Inc. (a) | | | 2,579 | | | | 310,073 | |
Analog Devices, Inc. | | | 1,596 | | | | 276,890 | |
Applied Materials, Inc. | | | 1,982 | | | | 270,840 | |
Broadcom, Inc. | | | 545 | | | | 289,760 | |
Intel Corp. | | | 5,038 | | | | 246,862 | |
IPG Photonics Corp. (a) | | | 1,573 | | | | 250,123 | |
KLA Corp. | | | 774 | | | | 288,516 | |
Lam Research Corp. | | | 454 | | | | 255,861 | |
Microchip Technology, Inc. | | | 3,445 | | | | 255,240 | |
Micron Technology, Inc. | | | 3,691 | | | | 255,048 | |
Monolithic Power Systems, Inc. | | | 549 | | | | 288,478 | |
NVIDIA Corp. | | | 1,207 | | | | 308,594 | |
NXP Semiconductors NV | | | 1,279 | | | | 256,900 | |
Qorvo, Inc. (a) | | | 1,513 | | | | 254,532 | |
QUALCOMM, Inc. | | | 1,901 | | | | 252,909 | |
Skyworks Solutions, Inc. | | | 1,530 | | | | 255,709 | |
Teradyne, Inc. | | | 2,242 | | | | 309,934 | |
Texas Instruments, Inc. | | | 1,423 | | | | 266,784 | |
Xilinx, Inc. | | | 1,749 | | | | 314,820 | |
| | | | | | | | 5,207,873 | |
Shipbuilding — 0.3% | | | | |
Huntington Ingalls Industries, Inc. | | | 1,397 | | | | 283,214 | |
| | | | | |
Software — 7.6% | | | | |
Adobe, Inc. (a) | | | 412 | | | | 267,948 | |
Akamai Technologies, Inc. (a) | | | 2,423 | | | | 255,530 | |
ANSYS, Inc. (a) | | | 726 | | | | 275,575 | |
Autodesk, Inc. (a) | | | 954 | | | | 303,000 | |
Broadridge Financial Solutions, Inc. | | | 1,596 | | | | 284,742 | |
Cadence Design System, Inc. (a) | | | 1,626 | | | | 281,477 | |
The accompanying notes are an integral part of the financial statements.
101
Pacer CFRA-Stovall Equal Weight Seasonal Rotation ETF
SCHEDULE OF INVESTMENTS
October 31, 2021 (Unaudited) (Continued)
| | | Shares | | | Value | |
COMMON STOCKS — 99.8% (Continued) |
Software — 7.6% (Continued) |
Ceridian HCM Holding, Inc. (a) | | | 2,469 | | | $ | 309,242 | |
Citrix Systems, Inc. | | | 2,522 | | | | 238,909 | |
Fidelity National Information Services, Inc. | | | 2,191 | | | | 242,631 | |
Fiserv, Inc. (a) | | | 2,451 | | | | 241,399 | |
Intuit, Inc. | | | 478 | | | | 299,223 | |
Jack Henry & Associates, Inc. | | | 1,605 | | | | 267,200 | |
Microsoft Corp. | | | 917 | | | | 304,096 | |
Oracle Corp. | | | 3,025 | | | | 290,218 | |
Paychex, Inc. | | | 2,459 | | | | 303,146 | |
Paycom Software, Inc. (a) | | | 570 | | | | 312,275 | |
PTC, Inc. (a) | | | 2,159 | | | | 274,949 | |
Roper Technologies, Inc. | | | 584 | | | | 284,916 | |
salesforce.com, Inc. (a) | | | 1,055 | | | | 316,173 | |
ServiceNow, Inc. (a) | | | 419 | | | | 292,361 | |
Synopsys, Inc. (a) | | | 816 | | | | 271,875 | |
Tyler Technologies, Inc. (a) | | | 575 | | | | 312,352 | |
| | | | | | | | 6,229,237 | |
Telecommunications — 1.7% | | | | |
Arista Networks, Inc. (a) | | | 773 | | | | 316,690 | |
Cisco Systems, Inc. | | | 4,686 | | | | 262,275 | |
Corning, Inc. | | | 6,986 | | | | 248,492 | |
Juniper Networks, Inc. | | | 9,747 | | | | 287,732 | |
Motorola Solutions, Inc. | | | 1,118 | | | | 277,924 | |
| | | | | | | | 1,393,113 | |
Textiles — 0.4% | | | | |
Mohawk Industries, Inc. (a) | | | 1,700 | | | | 301,257 | |
| | | | | |
Toys/Games/Hobbies — 0.4% | | | | |
Hasbro, Inc. | | | 3,254 | | | | 311,603 | |
| | | | | |
Transportation — 3.7% | | | | |
CH Robinson Worldwide, Inc. | | | 3,133 | | | | 303,870 | |
CSX Corp. | | | 8,948 | | | | 323,649 | |
Expeditors International of Washington, Inc. | | | 2,202 | | | | 271,419 | |
FedEx Corp. | | | 1,075 | | | | 253,195 | |
JB Hunt Trasport Services, Inc. | | | 1,594 | | | | 314,321 | |
Kansas City Southern | | | 989 | | | | 306,837 | |
Norfolk Southern Corp. | | | 1,120 | | | | 328,216 | |
Old Dominion Freight Line, Inc. | | | 950 | | | | 324,282 | |
Union Pacific Corp. | | | 1,333 | | | | 321,786 | |
United Parcel Service, Inc. - Class B | | | 1,433 | | | | 305,903 | |
| | | | | | | | 3,053,478 | |
TOTAL COMMON STOCKS (Cost $82,264,012) | | | | | | | 82,256,873 | |
| | | | | |
| | | Principal
Amount | | | Value | |
SHORT-TERM INVESTMENTS — 0.2% | | | | |
Money Market Deposit Accounts — 0.2% | | | | |
U.S. Bank Money Market Deposit Account, 0.003% (b) | | $ | 173,417 | | | $ | 173,417 | |
TOTAL SHORT-TERM INVESTMENTS (Cost $173,417) | | | | | | | 173,417 | |
| | | | | |
Total Investments (Cost $82,437,429) — 100.0% | | | | | | | 82,430,290 | |
Liabilities in Excess of Other Assets — (0.0)% (c) | | | | | | | 46,168 | |
TOTAL NET ASSETS — 100.0% | | | | | | $ | 82,384,122 | |
Percentages are stated as a percent of net assets.
| | (a) | Non-income producing security. |
| | (b) | The rate shown is as of October 31, 2021. |
For Fund compliance purposes, the Fund’s industry classifications refer to any one or more of the industry sub-classifications used by one or more widely recognized market indexes or ratings group indexes, and/or they may be defined by Fund management. This definition does not apply for all purposes of this report, which may combine sub-classifications for reporting ease. Categories are shown as a percentage of net assets.
The accompanying notes are an integral part of the financial statements.
102
Pacer CSOP FTSE China A50 ETF
SCHEDULE OF INVESTMENTS
October 31, 2021 (Unaudited)
| | | Shares | | | Value | |
COMMON STOCKS — 99.9% | | | | |
Agriculture — 1.2% | | | | |
Muyuan Foods Co. Ltd. | | | 11,262 | | | $ | 100,507 | |
| | | | | |
Auto Manufacturers — 5.1% | | | | |
BYD Co. Ltd. - Class A | | | 6,145 | | | | 298,939 | |
Great Wall Motor Co. Ltd. - Class A | | | 7,400 | | | | 78,634 | |
SAIC Motor Corp. Ltd. | | | 21,700 | | | | 68,769 | |
| | | | | | | | 446,342 | |
Banks — 23.0% | | | | |
Agricultural Bank of China Ltd. - Class A | | | 307,200 | | | | 141,135 | |
Bank of China Ltd. - Class A | | | 169,000 | | | | 80,548 | |
Bank of Communications Co. Ltd. - Class A | | | 160,500 | | | | 113,366 | |
China Construction Bank Corp. - Class A | | | 72,200 | | | | 66,905 | |
China Merchants Bank Co. Ltd. - Class A | | | 94,300 | | | | 795,301 | |
Industrial & Commercial Bank of China Ltd. - Class A | | | 172,900 | | | | 126,177 | |
Industrial Bank Co. Ltd. | | | 111,100 | | | | 323,441 | |
Ping An Bank Co. Ltd. | | | 65,400 | | | | 199,287 | |
Shanghai Pudong Development Bank Co. Ltd. | | | 115,300 | | | | 161,077 | |
| | | | | | | | 2,007,237 | |
Beverages — 21.8% | | | | |
Jiangsu Yanghe Brewery Joint-Stock Co. Ltd. | | | 3,500 | | | | 101,828 | |
Kweichow Moutai Co. Ltd. | | | 3,500 | | | | 998,747 | |
Luzhou Laojiao Co. Ltd. | | | 5,345 | | | | 191,230 | |
Shanxi Xinghuacun Fen Wine Factory Co. Ltd. | | | 2,883 | | | | 135,831 | |
Wuliangye Yibin Co. Ltd. | | | 14,100 | | | | 477,051 | |
| | | | | | | | 1,904,687 | |
Building Materials — 1.0% | | | | |
Anhui Conch Cement Co. Ltd. - Class A | | | 13,900 | | | | 82,714 | |
| | | | | |
Chemicals — 2.2% | | | | |
Wanhua Chemical Group Co. Ltd. | | | 11,412 | | | | 188,087 | |
| | | | | |
Coal — 0.6% | | | | |
China Shenhua Energy Co. Ltd. - Class A | | | 15,900 | | | | 49,420 | |
| | | | | |
Commercial Services — 0.2% | | | | |
Beijing-Shanghai High Speed Railway Co. Ltd. | | | 20,880 | | | | 15,009 | |
| | | | | |
| | | Shares | | | Value | |
Diversified Financial Services — 3.1% | | | | |
CITIC Securities Co. Ltd. - Class A | | | 67,500 | | | $ | 272,983 | |
| | | | | |
Electric — 1.3% | | | | |
China Yangtze Power Co. Ltd. | | | 32,800 | | | | 108,918 | |
| | | | | |
Electrical Components & Equipment — 2.2% | | | | |
Contemporary Amperex Technology Co. Ltd. | | | 1,900 | | | | 189,789 | |
| | | | | |
Electronics — 1.6% | | | | |
Foxconn Industrial Internet Co. Ltd. | | | 9,000 | | | | 15,963 | |
Luxshare Precision Industry Co. Ltd. | | | 21,029 | | | | 126,976 | |
| | | | | | | | 142,939 | |
Energy-Alternate Sources — 3.8% | | | | |
LONGi Green Energy Technology Co. Ltd. | | | 21,843 | | | | 333,449 | |
| | | | | |
Food — 4.1% | | | | |
Foshan Haitian Flavouring & Food Co. Ltd. | | | 3,370 | | | | 61,625 | |
Inner Mongolia Yili Industrial Group Co. Ltd. | | | 40,000 | | | | 268,780 | |
Yihai Kerry Arawana Holdings Co. Ltd. | | | 2,900 | | | | 27,589 | |
| | | | | | | | 357,994 | |
Healthcare-Products — 1.4% | | | | |
Shenzhen Mindray Bio-Medical Electronics Co. Ltd. | | | 2,100 | | | | 123,418 | |
| | | | | |
Healthcare-Services — 1.6% | | | | |
Aier Eye Hospital Group Co. Ltd. | | | 12,874 | | | | 97,632 | |
WuXi AppTec Co. Ltd. - Class A | | | 2,096 | | | | 45,203 | |
| | | | | | | | 142,835 | |
Home Furnishings — 1.6% | | | | |
Gree Electric Appliances, Inc. of Zhuhai | | | 13,500 | | | | 77,317 | |
Midea Group Co. Ltd. | | | 5,710 | | | | 61,363 | |
| | | | | | | | 138,680 | |
Insurance — 8.3% | | | | |
China Life Insurance Co. Ltd. - Class A | | | 11,700 | | | | 54,484 | |
China Pacific Insurance Group Co. Ltd. - Class A | | | 22,000 | | | | 94,198 | |
Ping An Insurance Group Co. of China Ltd. - Class A | | | 73,800 | | | | 571,667 | |
| | | | | | | | 720,349 | |
Internet — 2.7% | | | | |
East Money Information Co. Ltd. | | | 46,406 | | | | 238,582 | |
| | | | | |
The accompanying notes are an integral part of the financial statements.
103
Pacer CSOP FTSE China A50 ETF
SCHEDULE OF INVESTMENTS
October 31, 2021 (Unaudited) (Continued)
| | | Shares | | | Value | |
COMMON STOCKS — 99.9% (Continued) | | | | |
Machinery-Construction & Mining — 1.3% | | | | |
Sany Heavy Industry Co. Ltd. | | | 32,000 | | | $ | 114,813 | |
| | | | | |
Mining — 1.7% | | | | |
Zijin Mining Group Co. Ltd. - Class A | | | 89,900 | | | | 146,946 | |
| | | | | |
Oil & Gas — 1.1% | | | | |
China Petroleum & Chemical Corp. - Class A | | | 76,600 | | | | 50,873 | |
PetroChina Co. Ltd. - Class A | | | 55,900 | | | | 47,869 | |
| | | | | | | | 98,742 | |
Pharmaceuticals — 2.8% | | | | |
Chongqing Zhifei Biological Products Co. Ltd. | | | 2,800 | | | | 65,720 | |
Jiangsu Hengrui Medicine Co. Ltd. | | | 23,600 | | | | 181,592 | |
| | | | | | | | 247,312 | |
Real Estate — 1.7% | | | | |
China Vanke Co. Ltd. - Class A | | | 51,800 | | | | 147,403 | |
| | | | | |
Retail — 3.0% | | | | |
China Tourism Group Duty Free Corp. Ltd. | | | 6,300 | | | | 264,294 | |
| | | | | |
Transportation — 1.5% | | | | |
COSCO SHIPPING Holdings Co. Ltd. - Class A (a) | | | 26,100 | | | | 67,420 | |
SF Holding Co. Ltd. | | | 5,900 | | | | 59,587 | |
| | | | | | | | 127,007 | |
TOTAL COMMON STOCKS (Cost $7,188,060) | | | | | | | 8,710,456 | |
| | | | | |
| | | Principal
Amount | | | Value | |
SHORT-TERM INVESTMENTS — 0.1% | | | | |
Money Market Deposit Accounts — 0.1% | | | | |
U.S. Bank Money Market Deposit Account, 0.003% (b) | | $ | 7,601 | | | $ | 7,601 | |
TOTAL SHORT-TERM INVESTMENTS (Cost $7,601) | | | | | | | 7,601 | |
| | | | | |
Total Investments (Cost $7,195,661) — 100.0% | | | | | | | 8,718,057 | |
Other Assets in Excess of Liabilities — 0.0% (c) | | | | | | | 1,465 | |
TOTAL NET ASSETS — 100.0% | | | | | | $ | 8,719,522 | |
Percentages are stated as a percent of net assets.
| | (a) | Non-income producing security. |
| | (b) | The rate shown is as of October 31, 2021. |
For Fund compliance purposes, the Fund’s industry classifications refer to any one or more of the industry sub-classifications used by one or more widely recognized market indexes or ratings group indexes, and/or they may be defined by Fund management. This definition does not apply for all purposes of this report, which may combine sub-classifications for reporting ease. Categories are shown as a percentage of net assets.
The accompanying notes are an integral part of the financial statements.
104
Pacer BioThreat Strategy ETF
SCHEDULE OF INVESTMENTS
October 31, 2021 (Unaudited)
| | | Shares | | | Value | |
COMMON STOCKS — 99.8% | | | | |
Aerospace/Defense — 0.6% | | | | |
Teledyne Technologies, Inc. (a) | | | 86 | | | $ | 38,633 | |
| | | | | |
Biotechnology — 11.4% | | | | |
BioNTech SE - ADR (a) | | | 450 | | | | 125,429 | |
Emergent BioSolutions, Inc. (a) (b) | | | 100 | | | | 4,767 | |
Gilead Sciences, Inc. | | | 2,341 | | | | 151,884 | |
Illumina, Inc. (a) | | | 272 | | | | 112,896 | |
Moderna, Inc. (a) | | | 752 | | | | 259,598 | |
Regeneron Pharmaceuticals, Inc. (a) | | | 198 | | | | 126,708 | |
Vir Biotechnology, Inc. (a) (b) | | | 242 | | | | 9,131 | |
| | | | | | | | 790,413 | |
Chemicals — 1.8% | | | | |
Ecolab, Inc. | | | 533 | | | | 118,443 | |
Stepan Co. | | | 45 | | | | 5,401 | |
| | | | | | | | 123,844 | |
Commercial Services — 0.3% | | | | |
Booz Allen Hamilton Holding Corp. | | | 253 | | | | 21,976 | |
| | | | | |
Electrical Components & Equipment — 0.1% | | | | |
Energizer Holdings, Inc. (b) | | | 128 | | | | 4,668 | |
| | | | | |
Electronics — 2.8% | | | | |
Agilent Technologies, Inc. | | | 566 | | | | 89,139 | |
Mettler-Toledo International, Inc. (a) | | | 44 | | | | 65,159 | |
Waters Corp. (a) (b) | | | 114 | | | | 41,901 | |
| | | | | | | | 196,199 | |
Environmental Control — 0.2% | | | | |
Stericycle, Inc. (a) (b) | | | 172 | | | | 11,510 | |
| | | | | |
Food — 1.8% | | | | |
Campbell Soup Co. (b) | | | 565 | | | | 22,572 | |
Hormel Foods Corp. | | | 1,012 | | | | 42,828 | |
The Kroger Co. (b) | | | 1,413 | | | | 56,548 | |
| | | | | | | | 121,948 | |
Healthcare-Products — 17.6% | | | | |
Abbott Laboratories | | | 2,752 | | | | 354,705 | |
Danaher Corp. | | | 1,225 | | | | 381,918 | |
Neogen Corp. (a) | | | 200 | | | | 8,462 | |
PerkinElmer, Inc. | | | 209 | | | | 36,970 | |
QIAGEN NV (a) | | | 426 | | | | 23,754 | |
Thermo Fisher Scientific, Inc. | | | 650 | | | | 411,496 | |
| | | | | | | | 1,217,305 | |
Healthcare-Services — 1.9% | | | | |
Laboratory Corp. of American Holdings (a) | | | 182 | | | | 52,238 | |
Quest Diagnostics, Inc. | | | 244 | | | | 35,814 | |
Teladoc Health, Inc. (a) (b) | | | 288 | | | | 43,082 | |
| | | | | | | | 131,134 | |
| | | Shares | | | Value | |
Household Products/Wares — 2.3% | | | | |
Church & Dwight Co., Inc. (b) | | | 457 | | | $ | 39,923 | |
Kimberly-Clark Corp. (b) | | | 630 | | | | 81,579 | |
The Clorox Co. | | | 232 | | | | 37,818 | |
| | | | | | | | 159,320 | |
Internet — 10.6% | | | | |
Amazon.com, Inc. (a) | | | 90 | | | | 303,519 | |
Netflix, Inc. (a) | | | 618 | | | | 426,611 | |
| | | | | | | | 730,130 | |
Machinery-Diversified — 0.6% | | | | |
Xylem, Inc. | | | 336 | | | | 43,878 | |
| | | | | |
Miscellaneous Manufactur — 2.8% | | | | |
3M Co. | | | 1,082 | | | | 193,332 | |
| | | | | |
Pharmaceuticals — 19.0% | | | | |
CVS Health Corp. (b) | | | 2,458 | | | | 219,450 | |
GlaxoSmithKline PLC - ADR (b) | | | 4,613 | | | | 195,268 | |
Johnson & Johnson | | | 1,833 | | | | 298,559 | |
Merck & Co., Inc. | | | 3,966 | | | | 349,206 | |
Organon & Co. | | | 460 | | | | 16,905 | |
Sanofi - ADR | | | 4,690 | | | | 236,517 | |
| | | | | | | | 1,315,905 | |
Retail — 15.4% | | | | |
Lowe’s Cos., Inc. | | | 1,322 | | | | 309,110 | |
The Home Depot, Inc. (b) | | | 973 | | | | 361,703 | |
Walgreens Boots Alliance, Inc. | | | 1,614 | | | | 75,890 | |
Walmart, Inc. (b) | | | 2,149 | | | | 321,104 | |
| | | | | | | | 1,067,807 | |
Semiconductors — 6.3% | | | | |
NVIDIA Corp. | | | 1,697 | | | | 433,872 | |
| | | | | |
Software — 4.3% | | | | |
Akamai Technologies, Inc. (a) | | | 304 | | | | 32,060 | |
Citrix Systems, Inc. | | | 232 | | | | 21,977 | |
Palantir Technologies, Inc. - Class A (a) | | | 3,506 | | | | 90,735 | |
Zoom Video Communications, Inc. - Class A (a) | | | 550 | | | | 151,058 | |
| | | | | | | | 295,830 | |
TOTAL COMMON STOCKS (Cost $6,218,543) | | | | | | | 6,897,704 | |
| | | | | |
The accompanying notes are an integral part of the financial statements.
105
Pacer BioThreat Strategy ETF
SCHEDULE OF INVESTMENTS
October 31, 2021 (Unaudited) (Continued)
| | | Principal
Amount | | | Value | |
| SHORT-TERM INVESTMENTS — 0.2% | | | | | | | | |
| MONEY MARKET FUNDS — 0.2% | | | | | | | | |
| U.S. Bank Money Market Deposit Account, 0.003% (c) | | $ | 11,481 | | | $ | 11,481 | |
| TOTAL SHORT-TERM INVESTMENTS (Cost $11,481) | | | | | | | 11,481 | |
| | | | | | | | | |
| | | | Shares | | | | | |
| INVESTMENTS PURCHASED WITH PROCEEDS FROM SECURITIES LENDING — 16.4% |
| Mount Vernon Liquid Assets Portfolio, LLC, 0.10% (c) | | | 1,133,416 | | | | 1,133,416 | |
| TOTAL INVESTMENTS PURCHASED WITH PROCEEDS FROM SECURITIES LENDING (Cost $1,133,416) | | | | | | | 1,133,416 | |
| | | | | | | | | |
Total Investments (Cost $7,363,440) — 116.4% | | | | | | | 8,042,601 | |
Liabilities in Excess of Other Assets — (16.4)% | | | | | | | (1,132,117 | ) |
TOTAL NET ASSETS — 100.0% | | | | | | $ | 6,910,484 | |
Percentages are stated as a percent of net assets.
ADR American Depositary Receipt
| | (a) | Non-income producing security. |
| | (b) | All or a portion of this security is on loan as of October 31, 2021. The total value of securities on loan is $1,114,901 or 16.1% of net assets. |
| | (c) | The rate shown is as of October 31, 2021. |
For Fund compliance purposes, the Fund’s industry classifications refer to any one or more of the industry sub-classifications used by one or more widely recognized market indexes or ratings group indexes, and/or they may be defined by Fund management. This definition does not apply for all purposes of this report, which may combine sub-classifications for reporting ease. Categories are shown as a percentage of net assets.
The accompanying notes are an integral part of the financial statements.
106
Pacer Lunt Large Cap Alternator ETF
SCHEDULE OF INVESTMENTS
October 31, 2021 (Unaudited)
| | | Shares | | | Value | |
COMMON STOCKS — 97.1% | | | | |
Aerospace/Defense — 1.7% | | | | |
Howmet Aerospace, Inc. | | | 76,875 | | | $ | 2,282,419 | |
The Boeing Co. (a) | | | 11,955 | | | | 2,475,043 | |
| | | | | | | | 4,757,462 | |
Airlines — 1.6% | | | | |
Alaska Air Group, Inc. (a) | | | 38,094 | | | | 2,011,363 | |
United Airlines Holdings, Inc. (a) | | | 52,272 | | | | 2,411,830 | |
| | | | | | | | 4,423,193 | |
Apparel — 0.8% | | | | |
PVH Corp. (a) (b) | | | 21,018 | | | | 2,297,898 | |
| | | | | |
Auto Manufacturers — 2.1% | | | | |
Tesla Motors, Inc. (a) | | | 5,316 | | | | 5,922,024 | |
| | | | | |
Auto Parts & Equipment — 0.9% | | | | |
Aptiv PLC (a) | | | 14,362 | | | | 2,483,046 | |
| | | | | |
Banks — 2.8% | | | | |
Regions Financial Corp. (b) | | | 114,124 | | | | 2,702,456 | |
State Street Corp. | | | 24,747 | | | | 2,438,817 | |
SVB Financial Group (a) | | | 3,776 | | | | 2,708,903 | |
| | | | | | | | 7,850,176 | |
Chemicals — 1.0% | | | | |
Albemarle Corp. | | | 11,272 | | | | 2,823,298 | |
| | | | | |
Commercial Services — 2.8% | | | | |
Cintas Corp. | | | 6,095 | | | | 2,639,744 | |
PayPal Holdings, Inc. (a) | | | 9,729 | | | | 2,262,868 | |
United Rentals, Inc. (a) | | | 7,298 | | | | 2,766,745 | |
| | | | | | | | 7,669,357 | |
Computers — 4.4% | | | | |
Apple, Inc. | | | 20,010 | | | | 2,997,498 | |
DXC Technology Co. (a) | | | 66,232 | | | | 2,157,176 | |
Fortinet, Inc. (a) | | | 8,097 | | | | 2,723,345 | |
NetApp, Inc. | | | 27,556 | | | | 2,460,751 | |
Western Digital Corp. (a) | | | 35,132 | | | | 1,837,052 | |
| | | | | | | | 12,175,822 | |
Diversified Financial Services — 3.2% | | | | |
Discover Financial Services | | | 17,860 | | | | 2,023,895 | |
Invesco Ltd. - | | | 97,944 | | | | 2,488,757 | |
MasterCard, Inc. - Class A | | | 7,065 | | | | 2,370,449 | |
Synchrony Financial | | | 45,503 | | | | 2,113,614 | |
| | | | | | | | 8,996,715 | |
Electrical Components & Equipment — 1.0% | | | | |
Generac Holdings, Inc. (a) | | | 5,444 | | | | 2,714,161 | |
| | | | | |
Electronics — 1.0% | | | | |
Trimble, Inc. (a) | | | 30,785 | | | | 2,689,685 | |
| | | | | |
| | | Shares | | | Value | |
Energy-Alternate Sources — 1.5% | | | | |
Enphase Energy, Inc. (a) | | | 18,227 | | | $ | 4,221,920 | |
| | | | | |
Entertainment — 3.7% | | | | |
Caesars Entertainment, Inc. (a) (b) | | | 37,402 | | | | 4,094,023 | |
Live Nation Entertainment, Inc. (a) (b) | | | 27,924 | | | | 2,824,513 | |
Penn National Gaming, Inc. (a) (b) | | | 46,355 | | | | 3,319,018 | |
| | | | | | | | 10,237,554 | |
Healthcare-Products — 1.9% | | | | |
Align Technology, Inc. (a) | | | 4,055 | | | | 2,531,820 | |
Intuitive Surgical, Inc. (a) | | | 7,424 | | | | 2,681,029 | |
| | | | | | | | 5,212,849 | |
Insurance — 1.0% | | | | |
Lincoln National Corp. | | | 38,291 | | | | 2,762,696 | |
| | | | | |
Internet — 6.5% | | | | |
Alphabet, Inc. - Class C (a) | | | 849 | | | | 2,517,633 | |
Amazon.com, Inc. (a) | | | 684 | | | | 2,306,742 | |
Booking Holdings, Inc. (a) | | | 1,180 | | | | 2,856,520 | |
Etsy, Inc. (a) | | | 12,982 | | | | 3,254,458 | |
Expedia Group, Inc. (a) | | | 16,428 | | | | 2,700,927 | |
Meta Platforms, Inc. - Class A (a) | | | 7,250 | | | | 2,345,883 | |
Twitter, Inc. (a) (b) | | | 39,081 | | | | 2,092,397 | |
| | | | | | | | 18,074,560 | |
Leisure Time — 2.7% | | | | |
Carnival Corp. (a) | | | 109,963 | | | | 2,436,780 | |
Norwegian Cruise Line Holdings Ltd. (a) | | | 100,934 | | | | 2,596,022 | |
Royal Caribbean Cruises Ltd. (a) | | | 30,392 | | | | 2,565,997 | |
| | | | | | | | 7,598,799 | |
Lodging — 3.1% | | | | |
Marriott International, Inc. (a) | | | 18,204 | | | | 2,913,004 | |
MGM Resorts International | | | 70,102 | | | | 3,306,010 | |
Wynn Resorts Ltd. (a) (b) | | | 25,655 | | | | 2,303,819 | |
| | | | | | | | 8,522,833 | |
Media — 0.8% | | | | |
DISH Network Corp. - Class A (a) | | | 54,529 | | | | 2,239,506 | |
| | | | | |
Mining — 1.1% | | | | |
Freeport-McMoRan, Inc. | | | 78,161 | | | | 2,948,233 | |
| | | | | |
Miscellaneous Manufacturing — 0.9% | | | | |
Textron, Inc. | | | 32,296 | | | | 2,385,060 | |
| | | | | |
Office/Business Equipment — 0.8% | | | | |
Zebra Technologies Corp. (a) | | | 4,233 | | | | 2,260,210 | |
| | | | | |
Oil & Gas — 12.9% | | | | |
APA Corp. | | | 141,785 | | | | 3,716,185 | |
The accompanying notes are an integral part of the financial statements.
107
Pacer Lunt Large Cap Alternator ETF
SCHEDULE OF INVESTMENTS
October 31, 2021 (Unaudited) (Continued)
| | | Shares | | | Value | |
COMMON STOCKS — 97.1% (Continued) |
Oil & Gas — 12.9% (Continued) |
ConocoPhillips (b) | | | 40,249 | | | $ | 2,998,148 | |
Devon Energy Corp. (b) | | | 101,762 | | | | 4,078,621 | |
Diamondback Energy, Inc. | | | 36,251 | | | | 3,885,745 | |
EOG Resources, Inc. | | | 36,629 | | | | 3,386,717 | |
Hess Corp. | | | 31,637 | | | | 2,612,267 | |
Marathon Oil Corp. | | | 224,592 | | | | 3,665,342 | |
Marathon Petroleum Corp. | | | 42,299 | | | | 2,788,773 | |
Occidental Petroleum Corp. | | | 105,146 | | | | 3,525,545 | |
Phillips 66 | | | 32,045 | | | | 2,396,325 | |
Valero Energy Corp. | | | 36,663 | | | | 2,835,150 | |
| | | | | | | | 35,888,818 | |
Oil & Gas Services — 1.2% | | | | |
Halliburton Co. | | | 130,864 | | | | 3,270,291 | |
| | | | | |
Pharmaceuticals — 1.2% | | | | |
DexCom, Inc. (a) | | | 5,136 | | | | 3,200,807 | |
| | | | | |
Pipelines — 1.0% | | | | |
ONEOK, Inc. (b) | | | 43,450 | | | | 2,764,289 | |
| | | | | |
Retail — 2.6% | | | | |
Bath & Body Works, Inc. (a) | | | 38,838 | | | | 2,683,318 | |
Ross Stores, Inc. | | | 20,352 | | | | 2,303,846 | |
The Gap, Inc. (b) | | | 100,655 | | | | 2,283,862 | |
| | | | | | | | 7,271,026 | |
Semiconductors — 19.1% | | | | |
Advanced Micro Devices, Inc. (a) | | | 24,740 | | | | 2,974,490 | |
Analog Devices, Inc. | | | 14,777 | | | | 2,563,662 | |
Applied Materials, Inc. | | | 26,010 | | | | 3,554,267 | |
Broadcom, Inc. | | | 5,563 | | | | 2,957,680 | |
IPG Photonics Corp. (a) (b) | | | 14,592 | | | | 2,320,274 | |
KLA Corp. | | | 10,072 | | | | 3,754,439 | |
Lam Research Corp. | | | 5,560 | | | | 3,133,449 | |
Microchip Technology, Inc. | | | 43,576 | | | | 3,228,546 | |
Micron Technology, Inc. | | | 36,268 | | | | 2,506,119 | |
Monolithic Power Systems, Inc. | | | 7,048 | | | | 3,703,442 | |
NVIDIA Corp. | | | 16,344 | | | | 4,178,670 | |
NXP Semiconductors NV | | | 14,508 | | | | 2,914,077 | |
Qorvo, Inc. (a) | | | 18,126 | | | | 3,049,337 | |
QUALCOMM, Inc. | | | 20,267 | | | | 2,696,322 | |
Skyworks Solutions, Inc. | | | 18,502 | | | | 3,092,239 | |
Teradyne, Inc. (b) | | | 27,702 | | | | 3,829,524 | |
Texas Instruments, Inc. | | | 13,781 | | | | 2,583,662 | |
| | | | | | | | 53,040,199 | |
| | | Shares | | | Value | |
Software — 10.4% | | | | |
Adobe, Inc. (a) | | | 3,899 | | | $ | 2,535,754 | |
ANSYS, Inc. (a) | | | 7,859 | | | | 2,983,119 | |
Autodesk, Inc. (a) | | | 8,104 | | | | 2,573,912 | |
Cadence Design System, Inc. (a) | | | 17,712 | | | | 3,066,124 | |
Intuit, Inc. (b) | | | 4,876 | | | | 3,052,327 | |
Microsoft Corp. | | | 8,354 | | | | 2,770,354 | |
Paycom Software, Inc. (a) | | | 5,766 | | | | 3,158,903 | |
PTC, Inc. (a) | | | 21,530 | | | | 2,741,846 | |
salesforce.com, Inc. (a) | | | 9,670 | | | | 2,898,002 | |
Synopsys, Inc. (a) | | | 9,358 | | | | 3,117,898 | |
| | | | | | | | 28,898,239 | |
Telecommunications — 0.7% | | | | |
Corning, Inc. | | | 57,497 | | | | 2,045,168 | |
| | | | | |
Textiles — 0.7% | | | | |
Mohawk Industries, Inc. (a) | | | 11,286 | | | | 1,999,992 | |
TOTAL COMMON STOCKS (Cost $260,004,297) | | | | | | | 269,645,886 | |
| | | | | |
REAL ESTATE INVESTMENT TRUSTS — 2.6% | | | | |
Host Hotels & Resorts, Inc. (a) (b) | | | 141,998 | | | | 2,389,827 | |
Simon Property Group, Inc. | | | 17,442 | | | | 2,556,649 | |
Weyerhaeuser Co. | | | 64,650 | | | | 2,309,298 | |
TOTAL REAL ESTATE INVESTMENT TRUSTS (Cost $7,086,628) | | | | | | | 7,255,774 | |
| | | | | |
| | | Principal
Amount | | | | | |
SHORT-TERM INVESTMENTS — 0.1% | | | | |
Money Market Deposit Accounts — 0.1% | | | | |
U.S. Bank Money Market Deposit Account, 0.003% (a) (c) | | $ | 358,188 | | | | 358,188 | |
TOTAL SHORT-TERM INVESTMENTS (Cost $358,188) | | | | | | | 358,188 | |
| | | | | |
The accompanying notes are an integral part of the financial statements.
108
Pacer Lunt Large Cap Alternator ETF
SCHEDULE OF INVESTMENTS
October 31, 2021 (Unaudited) (Continued)
| | | Shares | | | Value | |
INVESTMENTS PURCHASED WITH PROCEEDS FROM SECURITIES LENDING — 8.1% |
Mount Vernon Liquid Assets Portfolio, LLC, 0.10% (c) | | | 22,435,006 | | | $ | 22,435,006 | |
TOTAL INVESTMENTS PURCHASED WITH PROCEEDS FROM SECURITIES LENDING (Cost $22,435,006) | | | | | | | 22,435,006 | |
| | | | | |
Total Investments (Cost $289,884,119) — 107.9% | | | | | | | 299,694,854 | |
Liabilities in Excess of Other Assets — (7.9)% | | | | | | | (21,902,026 | ) |
TOTAL NET ASSETS — 100.0% | | | | | | $ | 277,792,828 | |
Percentages are stated as a percent of net assets.
| | (a) | Non-income producing security. |
| | (b) | All or a portion of this security is on loan as of October 31, 2021. The total value of securities on loan is $21,806,321 or 7.8% of net assets. |
| | (c) | The rate shown is as of October 31, 2021. |
For Fund compliance purposes, the Fund’s industry classifications refer to any one or more of the industry sub-classifications used by one or more widely recognized market indexes or ratings group indexes, and/or they may be defined by Fund management. This definition does not apply for all purposes of this report, which may combine sub-classifications for reporting ease. Categories are shown as a percentage of net assets.
The accompanying notes are an integral part of the financial statements.
109
Pacer Lunt Midcap Multi-Factor Alternator ETF
SCHEDULE OF INVESTMENTS
October 31, 2021 (Unaudited)
| | | Shares | | | Value | |
COMMON STOCKS — 95.8% | | | | |
Aerospace/Defense — 0.5% | | | | |
Hexcel Corp. (a) | | | 3,998 | | | $ | 226,847 | |
| | | | | |
Airlines — 0.5% | | | | |
JetBlue Airways Corp. (a) | | | 15,473 | | | | 217,086 | |
| | | | | |
Apparel — 1.7% | | | | |
Capri Holdings Ltd. (a) | | | 4,200 | | | | 223,608 | |
Crocs, Inc. (a) (b) | | | 1,571 | | | | 253,638 | |
Urban Outfitters, Inc. (a) | | | 6,793 | | | | 216,900 | |
| | | | | | | | 694,146 | |
Auto Parts & Equipment — 4.1% | | | | |
Adient PLC (a) | | | 11,194 | | | | 465,894 | |
Dana, Inc. | | | 16,240 | | | | 360,366 | |
Lear Corp. | | | 2,285 | | | | 392,677 | |
The Goodyear Tire & Rubber Co. (a) | | | 24,942 | | | | 476,891 | |
| | | | | | | | 1,695,828 | |
Banks — 8.5% | | | | |
Associated Banc-Corp. | | | 8,192 | | | | 182,518 | |
Bank OZK | | | 4,586 | | | | 204,857 | |
Cadence Bank | | | 4,264 | | | | 123,741 | |
Cathay General Bancorp | | | 2,783 | | | | 117,415 | |
CIT Group, Inc. | | | 4,513 | | | | 223,529 | |
First Horizon Corp. | | | 24,561 | | | | 416,800 | |
FNB Corp. (b) | | | 16,495 | | | | 192,167 | |
Fulton Financial Corp. | | | 7,095 | | | | 114,229 | |
Hancock Whitney Corp. | | | 5,023 | | | | 248,538 | |
International Bancshares Corp. | | | 1,960 | | | | 83,104 | |
PacWest Bancorp | | | 5,780 | | | | 274,377 | |
Prosperity Bancshares, Inc. | | | 3,826 | | | | 288,136 | |
Signature Bank (b) | | | 917 | | | | 273,101 | |
Umpqua Holdings Corp. | | | 8,940 | | | | 182,823 | |
United Bankshares, Inc. | | | 5,371 | | | | 198,673 | |
Valley National Bancorp | | | 15,393 | | | | 204,111 | |
Wintrust Financial Corp. | | | 2,396 | | | | 212,046 | |
| | | | | | | | 3,540,165 | |
Beverages — 0.5% | | | | |
The Boston Beer Co., Inc. - Class A (a) | | | 389 | | | | 191,575 | |
| | | | | |
Biotechnology — 1.6% | | | | |
Arrowhead Pharmaceuticals, Inc. (a) | | | 5,782 | | | | 369,007 | |
Emergent BioSolutions, Inc. (a) | | | 6,146 | | | | 292,980 | |
| | | | | | | | 661,987 | |
Building Materials — 2.3% | | | | |
Builders FirstSource, Inc. (a) (b) | | | 12,330 | | | | 718,469 | |
MDU Resources Group, Inc. | | | 7,925 | | | | 243,535 | |
| | | | | | | | 962,004 | |
| | | Shares | | | Value | |
Chemicals — 0.7% | | | | |
Olin Corp. | | | 5,205 | | | $ | 296,581 | |
| | | | | |
Commercial Services — 5.4% | | | | |
Avis Budget Group, Inc. (a) (b) | | | 3,545 | | | | 614,384 | |
Graham Holdings Co. - Class B | | | 294 | | | | 172,240 | |
HealthEquity, Inc. (a) | | | 3,181 | | | | 210,519 | |
LiveRamp Holdings, Inc. (a) | | | 5,371 | | | | 287,402 | |
ManpowerGroup, Inc. | | | 2,947 | | | | 284,827 | |
Progyny, Inc. (a) (b) | | | 5,394 | | | | 331,353 | |
Sabre Corp. (a) (b) | | | 31,718 | | | | 329,233 | |
| | | | | | | | 2,229,958 | |
Computers — 0.6% | | | | |
Qualys, Inc. (a) | | | 2,089 | | | | 260,039 | |
| | | | | |
Cosmetics/Personal Care — 0.8% | | | | |
Coty, Inc. (a) (b) | | | 38,722 | | | | 328,363 | |
| | | | | |
Distribution/Wholesale — 0.9% | | | | |
KAR Auction Services, Inc. (a) | | | 11,899 | | | | 174,558 | |
Univar Solutions, Inc. (a) | | | 7,411 | | | | 189,574 | |
| | | | | | | | 364,132 | |
Diversified Financial Services — 3.9% | | | | |
Alliance Data Systems Corp. | | | 2,880 | | | | 245,520 | |
Janus Henderson Group PLC | | | 6,661 | | | | 309,736 | |
Jefferies Financial Group, Inc. | | | 13,603 | | | | 584,929 | |
Navient Corp. (b) | | | 9,487 | | | | 186,894 | |
Stifel Financial Corp. | | | 3,900 | | | | 284,193 | |
| | | | | | | | 1,611,272 | |
Electronics — 4.4% | | | | |
Arrow Electronics, Inc. (a) | | | 5,377 | | | | 622,388 | |
Avnet, Inc. | | | 7,574 | | | | 288,645 | |
II-VI, Inc. (a) (b) | | | 3,648 | | | | 220,741 | |
Jabil, Inc. | | | 7,445 | | | | 446,402 | |
SYNNEX Corp. | | | 2,667 | | | | 280,035 | |
| | | | | | | | 1,858,211 | |
Energy-Alternate Sources — 2.8% | | | | |
First Solar, Inc. (a) (b) | | | 2,664 | | | | 318,588 | |
SolarEdge Technologies, Inc. (a) | | | 1,163 | | | | 412,493 | |
Sunrun, Inc. (a) (b) | | | 7,712 | | | | 444,828 | |
| | | | | | | | 1,175,909 | |
Engineering & Construction — 2.0% | | | | |
Dycom Industries, Inc. (a) (b) | | | 3,596 | | | | 285,594 | |
Fluor Corp. (a) (b) | | | 17,580 | | | | 341,755 | |
Southwest Gas Holdings, Inc. | | | 2,859 | | | | 197,986 | |
| | | | | | | | 825,335 | |
Entertainment — 1.5% | | | | |
Scientific Games Corp. (a) (b) | | | 4,690 | | | | 375,434 | |
Six Flags Entertainment Corp. (a) (b) | | | 6,160 | | | | 253,361 | |
| | | | | | | | 628,795 | |
The accompanying notes are an integral part of the financial statements.
110
Pacer Lunt Midcap Multi-Factor Alternator ETF
SCHEDULE OF INVESTMENTS
October 31, 2021 (Unaudited) (Continued)
| | | Shares | | | Value | |
COMMON STOCKS — 95.8% (Continued) |
Food — 0.5% | | | | |
Pilgrim’s Pride Corp. (a) (b) | | | 2,669 | | | $ | 75,159 | |
Sprouts Farmers Market, Inc. (a) (b) | | | 6,599 | | | | 146,102 | |
| | | | | | | | 221,261 | |
Gas — 0.9% | | | | |
UGI Corp. (b) | | | 8,826 | | | | 383,137 | |
| | | | | |
Healthcare-Products — 2.2% | | | | |
Haemonetics Corp. (a) | | | 4,311 | | | | 296,209 | |
Quidel Corp. (a) (b) | | | 2,785 | | | | 369,764 | |
STAAR Surgical Co. (a) | | | 2,021 | | | | 239,408 | |
| | | | | | | | 905,381 | |
Healthcare-Services — 1.6% | | | | |
Tenet Healthcare Corp. (a) | | | 9,257 | | | | 663,357 | |
| | | | | |
Home Builders — 4.1% | | | | |
KB Home (b) | | | 4,689 | | | | 188,263 | |
Taylor Morrison Home Corp. (a) (b) | | | 17,866 | | | | 545,449 | |
Thor Industries, Inc. (b) | | | 2,596 | | | | 264,688 | |
Toll Brothers, Inc. (b) | | | 5,280 | | | | 317,698 | |
Tri Pointe Homes, Inc. (a) | | | 16,902 | | | | 408,859 | |
| | | | | | | | 1,724,957 | |
Home Furnishings — 0.6% | | | | |
Herman Miller, Inc. (b) | | | 6,073 | | | | 236,361 | |
| | | | | |
Insurance — 10.2% | | | | |
Alleghany Corp. (a) | | | 728 | | | | 474,205 | |
American Financial Group, Inc. | | | 3,585 | | | | 487,703 | |
Brighthouse Financial, Inc. (a) | | | 4,681 | | | | 235,127 | |
CNO Financial Group, Inc. (b) | | | 10,003 | | | | 241,472 | |
First American Financial Corp. | | | 6,032 | | | | 441,180 | |
Kemper Corp. | | | 3,726 | | | | 236,526 | |
Mercury General Corp. | | | 1,545 | | | | 84,187 | |
MGIC Investment Corp. (b) | | | 15,685 | | | | 253,470 | |
Old Republic International Corp. | | | 17,115 | | | | 442,080 | |
Reinsurance Group of America, Inc. | | | 4,998 | | | | 590,164 | |
RenaissanceRe Holdings Ltd. | | | 2,432 | | | | 344,858 | |
Selective Insurance Group, Inc. | | | 2,353 | | | | 184,405 | |
The Hanover Insurance Group, Inc. | | | 1,738 | | | | 218,988 | |
| | | | | | | | 4,234,365 | |
Internet — 1.2% | | | | |
TripAdvisor, Inc. (a) (b) | | | 7,933 | | | | 261,551 | |
YELP, Inc. (a) | | | 6,430 | | | | 248,391 | |
| | | | | | | | 509,942 | |
Iron/Steel — 2.9% | | | | |
Cleveland-Cliffs, Inc. (a) (b) | | | 12,810 | | | | 308,849 | |
Commercial Metals Co. | | | 6,120 | | | | 196,942 | |
Reliance Steel & Aluminum Co. | | | 2,426 | | | | 354,584 | |
| | | Shares | | | Value | |
Iron/Steel — 2.9% (Continued) |
United States Steel Corp. (b) | | | 12,569 | | | $ | 331,696 | |
| | | | | | | | 1,192,071 | |
Leisure Time — 1.0% | | | | |
Harley-Davidson, Inc. (b) | | | 5,610 | | | | 204,709 | |
YETI Holdings, Inc. (a) | | | 2,198 | | | | 216,129 | |
| | | | | | | | 420,838 | |
Machinery-Construction & Mining — 0.5% | | | | |
Terex Corp. | | | 4,425 | | | | 198,240 | |
| | | | | |
Media — 0.5% | | | | |
TEGNA, Inc. | | | 10,813 | | | | 212,583 | |
| | | | | |
Metal Fabricate/Hardware — 0.2% | | | | |
Worthington Industries, Inc. | | | 1,620 | | | | 87,998 | |
| | | | | |
Miscellaneous Manufacturing — 0.5% | | | | |
Axon Enterprise, Inc. (a) | | | 1,197 | | | | 215,412 | |
| | | | | |
Office/Business Equipment — 0.5% | | | | |
Xerox Holdings Corp. | | | 10,568 | | | | 188,110 | |
| | | | | |
Oil & Gas — 3.6% | | | | |
CNX Resources Corp. (a) | | | 30,448 | | | | 444,845 | |
EQT Corp. (a) | | | 13,988 | | | | 278,501 | |
HollyFrontier Corp. (b) | | | 9,400 | | | | 317,720 | |
Murphy Oil Corp. (b) | | | 15,917 | | | | 442,970 | |
| | | | | | | | 1,484,036 | |
Oil & Gas Services — 0.8% | | | | |
ChampionX Corp. (a) | | | 12,754 | | | | 334,537 | |
| | | | | |
Packaging & Containers — 0.2% | | | | |
Greif, Inc. - Class A (b) | | | 1,188 | | | | 76,840 | |
| | | | | |
Pipelines — 2.5% | | | | |
Antero Midstream Corp. | | | 24,813 | | | | 264,010 | |
Equitrans Midstream Corp. | | | 46,018 | | | | 474,446 | |
Targa Resources Corp. | | | 5,259 | | | | 287,509 | |
| | | | | | | | 1,025,965 | |
Real Estate — 1.2% | | | | |
Jones Lang LaSalle, Inc. (a) | | | 1,929 | | | | 498,126 | |
| | | | | |
Retail — 8.5% | | | | |
American Eagle Outfitters, Inc. (b) | | | 6,281 | | | | 149,111 | |
AutoNation, Inc. (a) | | | 3,961 | | | | 479,756 | |
BJ’s Wholesale Club Holdings, Inc. (a) (b) | | | 7,110 | | | | 415,509 | |
Dick’s Sporting Goods, Inc. | | | 2,678 | | | | 332,634 | |
Foot Locker, Inc. | | | 5,512 | | | | 262,757 | |
Kohl’s Corp. | | | 14,719 | | | | 714,313 | |
The accompanying notes are an integral part of the financial statements.
111
Pacer Lunt Midcap Multi-Factor Alternator ETF
SCHEDULE OF INVESTMENTS
October 31, 2021 (Unaudited) (Continued)
| | | Shares | | | Value | |
COMMON STOCKS — 95.8% (Continued) |
Retail — 8.5% (Continued) |
Lithia Motors, Inc. | | | 1,536 | | | $ | 490,322 | |
Murphy USA, Inc. (b) | | | 1,592 | | | | 259,417 | |
Nordstrom, Inc. (a) | | | 8,534 | | | | 245,182 | |
RH (a) (b) | | | 313 | | | | 206,464 | |
| | | | | | | | 3,555,465 | |
Savings & Loans — 2.0% | | | | |
New York Community Bancorp, Inc. (b) | | | 24,213 | | | | 300,968 | |
Sterling Bancorp | | | 17,497 | | | | 445,299 | |
Washington Federal, Inc. | | | 2,821 | | | | 99,750 | |
| | | | | | | | 846,017 | |
Semiconductors — 3.1% | | | | |
Amkor Technology, Inc. (b) | | | 14,023 | | | | 307,384 | |
Brooks Automation, Inc. | | | 3,238 | | | | 377,065 | |
Lattice Semiconductor Corp. (a) (b) | | | 3,865 | | | | 268,386 | |
Wolfspeed, Inc. (a) (b) | | | 2,990 | | | | 359,129 | |
| | | | | | | | 1,311,964 | |
Software — 2.2% | | | | |
Cerence, Inc. (a) (b) | | | 2,750 | | | | 289,107 | |
Sailpoint Technologies Holdings, Inc. (a) (b) | | | 5,009 | | | | 240,332 | |
Teradata Corp. (a) | | | 6,841 | | | | 386,927 | |
| | | | | | | | 916,366 | |
Telecommunications — 0.3% | | | | |
Telephone and Data Systems, Inc. | | | 7,659 | | | | 143,530 | |
| | | | | |
Transportation — 1.3% | | | | |
Knight-Swift Transportation Holdings, Inc. | | | 5,449 | | | | 308,904 | |
Ryder System, Inc. (b) | | | 2,765 | | | | 234,887 | |
| | | | | | | | 543,791 | |
TOTAL COMMON STOCKS (Cost $38,365,472) | | | | | | | 39,898,883 | |
| | | | | |
REAL ESTATE INVESTMENT TRUSTS — 4.2% | | | | |
EPR Properties | | | 6,502 | | | | 326,465 | |
Park Hotels & Resorts, Inc. (a) (b) | | | 16,075 | | | | 297,870 | |
Pebblebrook Hotel Trust | | | 11,614 | | | | 260,851 | |
SL Green Realty Corp. (b) | | | 3,618 | | | | 253,513 | |
The Macerich Co. (b) | | | 20,260 | | | | 366,503 | |
Urban Edge Properties | | | 13,021 | | | | 228,258 | |
TOTAL REAL ESTATE INVESTMENT TRUSTS (Cost $1,770,628) | | | | | | | 1,733,460 | |
| | | | | |
| | | Principal
Amount | | | Value | |
| SHORT-TERM INVESTMENTS — 0.1% | | | | | | | | |
| Money Market Deposit Accounts — 0.1% | | | | | | | | |
| U.S. Bank Money Market Deposit Account, 0.003% (c) | | $ | 22,470 | | | $ | 22,470 | |
| TOTAL SHORT-TERM INVESTMENTS (Cost $22,470) | | | | | | | 22,470 | |
| | | | | | | | | |
| | | | Shares | | | | | |
| INVESTMENTS PURCHASED WITH PROCEEDS FROM SECURITIES LENDING — 28.3% |
| Mount Vernon Liquid Assets Portfolio, LLC, 0.10% (c) | | | 11,806,880 | | | | 11,806,880 | |
| TOTAL INVESTMENTS PURCHASED WITH PROCEEDS FROM SECURITIES LENDING (Cost $11,806,880) | | | | | | | 11,806,880 | |
| | | | | | | | | |
Total Investments (Cost $51,965,450) — 128.4% | | | | | | | 53,461,693 | |
Liabilities in Excess of Other Assets — (28.4)% | | | | | | | (11,809,280 | ) |
TOTAL NET ASSETS — 100.0% | | | | | | $ | 41,652,413 | |
Percentages are stated as a percent of net assets.
| | (a) | Non-income producing security. |
| | (b) | All or a portion of this security is on loan as of October 31, 2021. The total value of securities on loan is $11,556,475 or 27.7% of net assets. |
| | (c) | The rate shown is as of October 31, 2021. |
For Fund compliance purposes, the Fund’s industry classifications refer to any one or more of the industry sub-classifications used by one or more widely recognized market indexes or ratings group indexes, and/or they may be defined by Fund management. This definition does not apply for all purposes of this report, which may combine sub-classifications for reporting ease. Categories are shown as a percentage of net assets.
The accompanying notes are an integral part of the financial statements.
112
Pacer Lunt Large Cap Multi-Factor Alternator ETF
SCHEDULE OF INVESTMENTS
October 31, 2021 (Unaudited)
| | | Shares | | | Value | |
COMMON STOCKS — 96.4% | | | | |
Advertising — 0.1% | | | | |
The Interpublic Group of Cos., Inc. (a) | | | 4,495 | | | $ | 164,382 | |
| | | | | |
Aerospace/Defense — 1.2% | | | | |
Howmet Aerospace, Inc. | | | 4,166 | | | | 123,689 | |
The Boeing Co. (a) | | | 6,309 | | | | 1,306,152 | |
TransDigm Group, Inc. (a) | | | 503 | | | | 313,781 | |
| | | | | | | | 1,743,622 | |
Airlines — 0.7% | | | | |
Alaska Air Group, Inc. (a) | | | 1,480 | | | | 78,144 | |
American Airlines Group, Inc. (a) (b) | | | 7,235 | | | | 138,912 | |
Delta Air Lines, Inc. (a) | | | 8,570 | | | | 335,344 | |
Southwest Airlines Co. (a) (b) | | | 6,349 | | | | 300,181 | |
United Airlines Holdings, Inc. (a) | | | 3,394 | | | | 156,599 | |
| | | | | | | | 1,009,180 | |
Apparel — 2.7% | | | | |
NIKE, Inc. - Class B (a) | | | 22,417 | | | | 3,750,140 | |
Tapestry, Inc. | | | 5,064 | | | | 197,395 | |
| | | | | | | | 3,947,535 | |
Auto Manufacturers — 5.2% | | | | |
Ford Motor Co. (a) | | | 40,926 | | | | 699,016 | |
General Motors Co. (a) | | | 17,683 | | | | 962,486 | |
Tesla Motors, Inc. (a) | | | 5,323 | | | | 5,929,822 | |
| | | | | | | | 7,591,324 | |
Auto Parts & Equipment — 0.4% | | | | |
Aptiv PLC (a) | | | 3,393 | | | | 586,616 | |
| | | | | |
Banks — 5.3% | | | | |
Fifth Third Bancorp (a) | | | 5,763 | | | | 250,863 | |
First Republic Bank (a) | | | 1,764 | | | | 381,606 | |
Morgan Stanley (a) (b) | | | 19,269 | | | | 1,980,468 | |
SVB Financial Group (a) | | | 867 | | | | 621,986 | |
The Goldman Sachs Group, Inc. | | | 4,418 | | | | 1,826,180 | |
The PNC Financial Services Group, Inc. (b) | | | 3,754 | | | | 792,207 | |
Wells Fargo & Co. | | | 37,622 | | | | 1,924,741 | |
| | | | | | | | 7,778,051 | |
Beverages — 0.1% | | | | |
Brown-Forman Corp. - Class B | | | 1,575 | | | | 106,927 | |
| | | | | |
Biotechnology — 1.8% | | | | |
Illumina, Inc. (a) | | | 1,161 | | | | 481,885 | |
Moderna, Inc. (a) | | | 6,382 | | | | 2,203,130 | |
| | | | | | | | 2,685,015 | |
Building Materials — 1.1% | | | | |
Carrier Global Corp. (b) | | | 11,918 | | | | 622,477 | |
Johnson Controls International PLC (a) (b) | | | 10,610 | | | | 778,455 | |
| | | Shares | | | Value | |
Building Materials — 1.1% (Continued) |
Martin Marietta Materials, Inc. | | | 539 | | | $ | 211,741 | |
| | | | | | | | 1,612,673 | |
Chemicals — 0.7% | | | | |
Albemarle Corp. (b) | | | 1,358 | | | | 340,138 | |
Ecolab, Inc. | | | 2,275 | | | | 505,551 | |
Mosaic Co. | | | 3,500 | | | | 145,495 | |
| | | | | | | | 991,184 | |
Commercial Services — 4.3% | | | | |
Automatic Data Processing, Inc. (a) | | | 4,422 | | | | 992,695 | |
Gartner, Inc. (a) | | | 1,826 | | | | 606,068 | |
MarketAxess Holdings, Inc. (b) | | | 351 | | | | 143,443 | |
Moody’s Corp. | | | 1,273 | | | | 514,483 | |
PayPal Holdings, Inc. (a) | | | 9,041 | | | | 2,102,846 | |
Quanta Services, Inc. | | | 2,243 | | | | 272,031 | |
Robert Half International, Inc. | | | 1,137 | | | | 128,561 | |
Rollins, Inc. | | | 1,854 | | | | 65,316 | |
S&P Global, Inc. (a) (b) | | | 1,984 | | | | 940,734 | |
United Rentals, Inc. (a) | | | 721 | | | | 273,338 | |
Verisk Analytics, Inc. (a) | | | 1,282 | | | | 269,566 | |
| | | | | | | | 6,309,081 | |
Computers — 1.1% | | | | |
DXC Technology Co. (a) | | | 2,462 | | | | 80,187 | |
Fortinet, Inc. (a) | | | 2,525 | | | | 849,259 | |
HP, Inc. | | | 10,191 | | | | 309,093 | |
NetApp, Inc. | | | 1,934 | | | | 172,706 | |
Seagate Technology Holdings PLC | | | 2,222 | | | | 197,914 | |
| | | | | | | | 1,609,159 | |
Cosmetics/Personal Care — 0.9% | | | | |
The Estee Lauder Cos., Inc. (a) | | | 4,222 | | | | 1,369,321 | |
| | | | | |
Distribution/Wholesale — 0.5% | | | | |
Copart, Inc. (a) | | | 3,504 | | | | 544,136 | |
LKQ Corp. (a) (b) | | | 2,528 | | | | 139,242 | |
| | | | | | | | 683,378 | |
Diversified Financial Services — 7.0% | | | | |
American Express Co. (a) | | | 5,606 | | | | 974,211 | |
Ameriprise Financial, Inc. (b) | | | 1,022 | | | | 308,777 | |
Capital One Financial Corp. (a) | | | 7,433 | | | | 1,122,606 | |
Discover Financial Services | | | 4,659 | | | | 527,958 | |
Invesco Ltd. - | | | 4,836 | | | | 122,883 | |
MasterCard, Inc. - Class A (a) | | | 7,114 | | | | 2,386,889 | |
Raymond James Financial, Inc. (a) | | | 2,190 | | | | 215,912 | |
Synchrony Financial (b) | | | 6,680 | | | | 310,286 | |
The Charles Schwab Corp. (b) | | | 18,882 | | | | 1,548,890 | |
Visa, Inc. - Class A (b) | | | 12,833 | | | | 2,717,644 | |
| | | | | | | | 10,236,056 | |
Electrical Components & Equipment — 0.8% | | | | |
Emerson Electric Co. | | | 5,419 | | | | 525,697 | |
The accompanying notes are an integral part of the financial statements.
113
Pacer Lunt Large Cap Multi-Factor Alternator ETF
SCHEDULE OF INVESTMENTS
October 31, 2021 (Unaudited) (Continued)
| | | Shares | | | Value | |
COMMON STOCKS — 96.4% (Continued) |
Electrical Components & Equipment — 0.8% (Continued) |
Generac Holdings, Inc. (a) (b) | | | 1,375 | | | $ | 685,520 | |
| | | | | | | | 1,211,217 | |
Electronics — 2.9% | | | | |
Agilent Technologies, Inc. (a) | | | 3,242 | | | | 510,583 | |
Garmin Ltd. - | | | 1,728 | | | | 248,141 | |
Honeywell International, Inc. | | | 6,262 | | | | 1,368,998 | |
Keysight Technologies, Inc. (a) | | | 1,757 | | | | 316,295 | |
Mettler-Toledo International, Inc. (a) | | | 396 | | | | 586,428 | |
TE Connectivity Ltd. - | | | 3,329 | | | | 486,034 | |
Trimble, Inc. (a) | | | 2,742 | | | | 239,569 | |
Waters Corp. (a) (b) | | | 1,298 | | | | 477,080 | |
| | | | | | | | 4,233,128 | |
Energy-Alternate Sources — 0.4% | | | | |
Enphase Energy, Inc. (a) | | | 2,663 | | | | 616,831 | |
| | | | | |
Entertainment — 0.5% | | | | |
Caesars Entertainment, Inc. (a) (b) | | | 5,048 | | | | 552,554 | |
Live Nation Entertainment, Inc. (a) (b) | | | 1,967 | | | | 198,962 | |
| | | | | | | | 751,516 | |
Environmental Control — 0.1% | | | | |
Pentair PLC | | | 1,839 | | | | 136,031 | |
| | | | | |
Forest Products & Paper — 0.1% | | | | |
International Paper Co. | | | 3,578 | | | | 177,719 | |
Sylvamo Corp. (a) (b) | | | 315 | | | | 8,871 | |
| | | | | | | | 186,590 | |
Healthcare-Products — 2.9% | | | | |
ABIOMED, Inc. (a) | | | 356 | | | | 118,206 | |
Align Technology, Inc. (a) | | | 1,337 | | | | 834,783 | |
Edwards Lifesciences Corp. (a) | | | 5,197 | | | | 622,704 | |
IDEXX Laboratories, Inc. (a) | | | 1,448 | | | | 964,571 | |
Intuitive Surgical, Inc. (a) | | | 2,988 | | | | 1,079,056 | |
ResMed, Inc. | | | 1,148 | | | | 301,821 | |
West Pharmaceutical Services, Inc. | | | 637 | | | | 273,834 | |
| | | | | | | | 4,194,975 | |
Healthcare-Services — 1.0% | | | | |
Charles River Laboratories International, Inc. (a) | | | 708 | | | | 317,665 | |
HCA Healthcare, Inc. | | | 2,842 | | | | 711,807 | |
IQVIA Holdings, Inc. (a) | | | 1,580 | | | | 413,044 | |
| | | | | | | | 1,442,516 | |
Household Products/Wares — 0.2% | | | | |
Avery Dennison Corp. | | | 1,029 | | | | 224,034 | |
| | | | | |
Insurance — 3.1% | | | | |
Berkshire Hathaway, Inc. - Class B (a) | | | 15,585 | | | | 4,473,051 | |
| | | | | |
| | | Shares | | | Value | |
Internet — 14.6% | | | | |
Alphabet, Inc. - Class A (a) | | | 2,217 | | | $ | 6,564,360 | |
Alphabet, Inc. - Class C (a) | | | 2,207 | | | | 6,544,660 | |
Amazon.com, Inc. (a) | | | 976 | | | | 3,291,492 | |
Booking Holdings, Inc. (a) | | | 379 | | | | 917,475 | |
Etsy, Inc. (a) | | | 1,025 | | | | 256,957 | |
Expedia Group, Inc. (a) | | | 2,830 | | | | 465,280 | |
Netflix, Inc. (a) | | | 3,799 | | | | 2,622,488 | |
NortonLifeLock, Inc. | | | 4,238 | | | | 107,857 | |
Twitter, Inc. (a) (b) | | | 7,087 | | | | 379,438 | |
VeriSign, Inc. (a) | | | 823 | | | | 183,257 | |
| | | | | | | | 21,333,264 | |
Iron/Steel — 0.4% | | | | |
Nucor Corp. | | | 4,791 | | | | 534,915 | |
| | | | | |
Leisure Time — 0.4% | | | | |
Carnival Corp. (a) | | | 8,264 | | | | 183,130 | |
Norwegian Cruise Line Holdings Ltd. (a) (b) | | | 4,317 | | | | 111,033 | |
Royal Caribbean Cruises Ltd. (a) | | | 2,662 | | | | 224,753 | |
| | | | | | | | 518,916 | |
Lodging — 1.1% | | | | |
Hilton Worldwide Holdings, Inc. (a) | | | 2,972 | | | | 427,819 | |
Las Vegas Sands Corp. (a) | | | 3,682 | | | | 142,899 | |
Marriott International, Inc. (a) | | | 2,605 | | | | 416,852 | |
MGM Resorts International | | | 8,444 | | | | 398,219 | |
Wynn Resorts Ltd. (a) (b) | | | 1,556 | | | | 139,729 | |
| | | | | | | | 1,525,518 | |
Machinery-Diversified — 1.4% | | | | |
Deere & Co. | | | 4,171 | | | | 1,427,775 | |
Dover Corp. | | | 1,593 | | | | 269,344 | |
Xylem, Inc. (a) | | | 2,211 | | | | 288,735 | |
| | | | | | | | 1,985,854 | |
Media — 1.7% | | | | |
News Corp. - Class A | | | 4,510 | | | | 103,279 | |
News Corp. - Class B | | | 1,231 | | | | 27,771 | |
Walt Disney Co. (a) | | | 14,250 | | | | 2,409,248 | |
| | | | | | | | 2,540,298 | |
Mining — 0.6% | | | | |
Freeport-McMoRan, Inc. | | | 22,153 | | | | 835,611 | |
| | | | | |
Miscellaneous Manufacturing — 2.1% | | | | |
Eaton Corp. PLC | | | 4,648 | | | | 765,804 | |
General Electric Co. (a) | | | 11,976 | | | | 1,255,923 | |
Parker-Hannifin Corp. (a) | | | 1,206 | | | | 357,688 | |
Textron, Inc. | | | 2,328 | | | | 171,923 | |
Trane Technologies PLC | | | 3,190 | | | | 577,167 | |
| | | | | | | | 3,128,505 | |
The accompanying notes are an integral part of the financial statements.
114
Pacer Lunt Large Cap Multi-Factor Alternator ETF
SCHEDULE OF INVESTMENTS
October 31, 2021 (Unaudited) (Continued)
| | | Shares | | | Value | |
COMMON STOCKS — 96.4% (Continued) |
Office/Business Equipment — 0.2% | | | | |
Zebra Technologies Corp. (a) | | | 640 | | | $ | 341,728 | |
| | | | | |
Oil & Gas — 0.6% | | | | |
Devon Energy Corp. (b) | | | 6,203 | | | | 248,616 | |
Diamondback Energy, Inc. (a) | | | 1,446 | | | | 154,997 | |
Hess Corp. (a) (b) | | | 2,064 | | | | 170,425 | |
Occidental Petroleum Corp. | | | 7,393 | | | | 247,887 | |
| | | | | | | | 821,925 | |
Oil & Gas Services — 0.3% | | | | |
Halliburton Co. | | | 7,039 | | | | 175,904 | |
Schlumberger Ltd. - | | | 10,022 | | | | 323,310 | |
| | | | | | | | 499,214 | |
Packaging & Containers — 0.1% | | | | |
Sealed Air Corp. | | | 1,210 | | | | 71,777 | |
| | | | | |
Pharmaceuticals — 2.6% | | | | |
Bristol-Myers Squibb Co. | | | 18,855 | | | | 1,101,132 | |
DexCom, Inc. (a) | | | 786 | | | | 489,843 | |
Eli Lilly & Co. | | | 5,415 | | | | 1,379,525 | |
Zoetis, Inc. (a) | | | 3,954 | | | | 854,855 | |
| | | | | | | | 3,825,355 | |
Pipelines — 0.2% | | | | |
ONEOK, Inc. (a) (b) | | | 4,001 | | | | 254,544 | |
| | | | | |
Real Estate — 0.3% | | | | |
CBRE Group, Inc. - Class A (a) | | | 4,284 | | | | 445,879 | |
| | | | | |
Retail — 5.5% | | | | |
Bath & Body Works, Inc. (a) | | | 4,802 | | | | 331,770 | |
Chipotle Mexican Grill, Inc. (a) | | | 245 | | | | 435,862 | |
Darden Restaurants, Inc. (b) | | | 2,212 | | | | 318,838 | |
Domino’s Pizza, Inc. (a) | | | 295 | | | | 144,246 | |
McDonald’s Corp. | | | 6,415 | | | | 1,575,203 | |
Starbucks Corp. | | | 22,402 | | | | 2,376,180 | |
Target Corp. (a) | | | 8,474 | | | | 2,200,020 | |
Yum! Brands, Inc. | | | 4,921 | | | | 614,830 | |
| | | | | | | | 7,996,949 | |
Semiconductors — 7.6% | | | | |
Advanced Micro Devices, Inc. (a) | | | 8,716 | | | | 1,047,925 | |
Applied Materials, Inc. (a) | | | 9,216 | | | | 1,259,366 | |
Broadcom, Inc. | | | 2,972 | | | | 1,580,123 | |
Microchip Technology, Inc. | | | 4,163 | | | | 308,437 | |
Monolithic Power Systems, Inc. | | | 350 | | | | 183,911 | |
NVIDIA Corp. (a) | | | 18,349 | | | | 4,691,289 | |
NXP Semiconductors NV (a) | | | 2,177 | | | | 437,272 | |
Texas Instruments, Inc. | | | 6,735 | | | | 1,262,678 | |
Xilinx, Inc. | | | 1,832 | | | | 329,760 | |
| | | | | | | | 11,100,761 | |
| | | Shares | | | Value | |
Software — 10.6% | | | | |
Adobe, Inc. (a) | | | 3,640 | | | $ | 2,367,310 | |
ANSYS, Inc. (a) | | | 659 | | | | 250,143 | |
Autodesk, Inc. (a) | | | 1,845 | | | | 585,990 | |
Cadence Design System, Inc. (a) | | | 2,177 | | | | 376,861 | |
Citrix Systems, Inc. | | | 852 | | | | 80,710 | |
Intuit, Inc. (b) | | | 4,511 | | | | 2,823,841 | |
Microsoft Corp. (a) | | | 12,539 | | | | 4,158,183 | |
MSCI, Inc. | | | 762 | | | | 506,639 | |
Oracle Corp. | | | 14,911 | | | | 1,430,561 | |
Paychex, Inc. | | | 5,965 | | | | 735,365 | |
Paycom Software, Inc. (a) | | | 430 | | | | 235,576 | |
PTC, Inc. (a) (b) | | | 785 | | | | 99,970 | |
ServiceNow, Inc. (a) | | | 1,738 | | | | 1,212,707 | |
Synopsys, Inc. (a) | | | 1,077 | | | | 358,835 | |
Tyler Technologies, Inc. (a) | | | 296 | | | | 160,793 | |
| | | | | | | | 15,383,484 | |
Telecommunications — 0.5% | | | | |
Motorola Solutions, Inc. (b) | | | 2,988 | | | | 742,787 | |
| | | | | |
Textiles — 0.1% | | | | |
Mohawk Industries, Inc. (a) | | | 790 | | | | 139,996 | |
| | | | | |
Transportation — 0.4% | | | | |
Expeditors International of Washington, Inc. (a) | | | 1,616 | | | | 199,188 | |
FedEx Corp. | | | 1,908 | | | | 449,391 | |
| | | | | | | | 648,579 | |
TOTAL COMMON STOCKS (Cost $131,090,630) | | | | | | | 140,569,252 | |
| | | | | |
REAL ESTATE INVESTMENT TRUSTS — 3.5% | | | | |
American Tower Corp. | | | 3,743 | | | | 1,055,414 | |
Crown Castle International Corp. | | | 3,452 | | | | 622,396 | |
Equinix, Inc. (b) | | | 650 | | | | 544,095 | |
Extra Space Storage, Inc. | | | 1,562 | | | | 308,292 | |
Host Hotels & Resorts, Inc. (a) | | | 5,902 | | | | 99,331 | |
Mid-America Apartment Communities, Inc. | | | 1,407 | | | | 287,323 | |
Public Storage | | | 2,887 | | | | 959,004 | |
SBA Communications Corp. (a) | | | 995 | | | | 343,603 | |
Simon Property Group, Inc. (b) | | | 5,197 | | | | 761,776 | |
UDR, Inc. | | | 2,217 | | | | 123,110 | |
TOTAL REAL ESTATE INVESTMENT TRUSTS (Cost $4,880,444) | | | | | | | 5,104,344 | |
| | | | | |
The accompanying notes are an integral part of the financial statements.
115
Pacer Lunt Large Cap Multi-Factor Alternator ETF
SCHEDULE OF INVESTMENTS
October 31, 2021 (Unaudited) (Continued)
| | | Principal
Amount | | | Value | |
SHORT-TERM INVESTMENTS — 0.1% | | | | |
Money Market Deposit Accounts — 0.1% | | | | |
U.S. Bank Money Market Deposit Account, 0.003% (c) | | $ | 180,569 | | | $ | 180,569 | |
TOTAL SHORT-TERM INVESTMENTS (Cost $180,569) | | | | | | | 180,569 | |
| | | | | |
| | | Shares | | | | | |
INVESTMENTS PURCHASED WITH PROCEEDS FROM SECURITIES LENDING — 10.2% |
Mount Vernon Liquid Assets Portfolio, LLC, 0.10% (c) | | | 14,937,333 | | | | 14,937,333 | |
TOTAL INVESTMENTS PURCHASED WITH PROCEEDS FROM SECURITIES LENDING (Cost $14,937,333) | | | | | | | 14,937,333 | |
| | | | | |
Total Investments (Cost $151,088,976) — 110.2% | | | | | | | 160,791,498 | |
Liabilities in Excess of Other Assets — (10.2)% | | | | | | | (14,949,197 | ) |
TOTAL NET ASSETS — 100.0% | | | | | | $ | 145,842,301 | |
Percentages are stated as a percent of net assets.
| | (a) | Non-income producing security. |
| | (b) | All or a portion of this security is on loan as of October 31, 2021. The total value of securities on loan is $14,646,070 or 10.0% of net assets. |
| | (c) | The rate shown is as of October 31, 2021. |
For Fund compliance purposes, the Fund’s industry classifications refer to any one or more of the industry sub-classifications used by one or more widely recognized market indexes or ratings group indexes, and/or they may be defined by Fund management. This definition does not apply for all purposes of this report, which may combine sub-classifications for reporting ease. Categories are shown as a percentage of net assets.
The accompanying notes are an integral part of the financial statements.
116
Pacer US Export Leaders ETF
SCHEDULE OF INVESTMENTS
October 31, 2021 (Unaudited)
| | | Shares | | | Value | |
COMMON STOCKS — 99.9% | | | | |
Agriculture — 1.2% | | | | |
Darling Ingredients, Inc. (a) | | | 308 | | | $ | 26,032 | |
| | | | | |
Apparel — 1.0% | | | | |
NIKE, Inc. - Class B | | | 134 | | | | 22,417 | |
| | | | | |
Auto Manufacturers — 1.5% | | | | |
Tesla Motors, Inc. (a) | | | 30 | | | | 33,420 | |
| | | | | |
Auto Parts & Equipment — 3.3% | | | | |
Adient PLC (a) | | | 579 | | | | 24,098 | |
BorgWarner, Inc. | | | 508 | | | | 22,895 | |
Visteon Corp. (a) | | | 222 | | | | 25,126 | |
| | | | | | | | 72,119 | |
Biotechnology — 2.8% | | | | |
Bio-Rad Laboratories, Inc. - Class A (a) | | | 27 | | | | 21,456 | |
Halozyme Therapeutics, Inc. (a) (b) | | | 528 | | | | 20,101 | |
Illumina, Inc. (a) | | | 47 | | | | 19,508 | |
| | | | | | | | 61,065 | |
Building Materials — 1.0% | | | | |
Johnson Controls International PLC | | | 290 | | | | 21,277 | |
| | | | | |
Chemicals — 5.9% | | | | |
FMC Corp. | | | 222 | | | | 20,204 | |
Ingevity Corp. (a) | | | 295 | | | | 22,984 | |
International Flavors & Fragrances, Inc. | | | 147 | | | | 21,675 | |
Linde PLC | | | 70 | | | | 22,344 | |
Sensient Technologies Corp. | | | 239 | | | | 22,848 | |
The Chemours Co. | | | 698 | | | | 19,558 | |
| | | | | | | | 129,613 | |
Commercial Services — 1.7% | | | | |
PayPal Holdings, Inc. (a) | | | 76 | | | | 17,677 | |
The Brink’s Co. (b) | | | 296 | | | | 20,388 | |
| | | | | | | | 38,065 | |
Computers — 6.0% | | | | |
Accenture PLC - Class A | | | 64 | | | | 22,963 | |
Apple, Inc. | | | 148 | | | | 22,170 | |
Fortinet, Inc. (a) (b) | | | 70 | | | | 23,544 | |
Genpact Ltd. (b) | | | 435 | | | | 21,467 | |
Hewlett Packard Enterprise Co. | | | 1,521 | | | | 22,283 | |
Lumentum Holdings, Inc. (a) | | | 256 | | | | 21,141 | |
| | | | | | | | 133,568 | |
Cosmetics/Personal Care — 0.9% | | | | |
The Estee Lauder Cos., Inc. | | | 65 | | | | 21,081 | |
| | | | | |
| | | Shares | | | Value | |
Distribution/Wholesale — 1.1% | | | | |
LKQ Corp. (a) (b) | | | 429 | | | $ | 23,629 | |
| | | | | |
Electrical Components & Equipment — 2.0% | | | | |
Littelfuse, Inc. (b) | | | 80 | | | | 23,564 | |
Universal Display Corp. | | | 109 | | | | 19,969 | |
| | | | | | | | 43,533 | |
Electronics — 6.3% | | | | |
Agilent Technologies, Inc. | | | 123 | | | | 19,371 | |
Allegion PLC | | | 149 | | | | 19,117 | |
Garmin Ltd. | | | 126 | | | | 18,094 | |
Jabil, Inc. | | | 346 | | | | 20,746 | |
Keysight Technologies, Inc. (a) | | | 121 | | | | 21,782 | |
Mettler-Toledo International, Inc. (a) | | | 14 | | | | 20,732 | |
Vishay Intertechnology, Inc. (b) | | | 1,044 | | | | 20,066 | |
| | | | | | | | 139,908 | |
Healthcare-Products — 9.3% | | | | |
Abbott Laboratories | | | 169 | | | | 21,783 | |
Align Technology, Inc. (a) | | | 30 | | | | 18,731 | |
Danaher Corp. | | | 67 | | | | 20,889 | |
LivaNova PLC (a) | | | 263 | | | | 20,177 | |
PerkinElmer, Inc. | | | 116 | | | | 20,519 | |
Repligen Corp. (a) | | | 74 | | | | 21,497 | |
STAAR Surgical Co. (a) (b) | | | 148 | | | | 17,532 | |
The Cooper Cos., Inc. | | | 48 | | | | 20,012 | |
Thermo Fisher Scientific, Inc. | | | 38 | | | | 24,057 | |
West Pharmaceutical Services, Inc. (b) | | | 47 | | | | 20,204 | |
| | | | | | | | 205,401 | |
Healthcare-Services — 1.0% | | | | |
IQVIA Holdings, Inc. (a) | | | 84 | | | | 21,959 | |
| | | | | |
Household Products/Wares — 0.9% | | | | |
Avery Dennison Corp. | | | 97 | | | | 21,119 | |
| | | | | |
Internet — 4.1% | | | | |
Alphabet, Inc. - Class A (a) | | | 8 | | | | 23,687 | |
Meta Platforms, Inc. - Class A (a) | | | 57 | | | | 18,444 | |
Mimecast Ltd. (a) | | | 311 | | | | 23,462 | |
Netflix, Inc. (a) | | | 36 | | | | 24,851 | |
| | | | | | | | 90,444 | |
Machinery-Construction & Mining — 1.0% | | | | |
Caterpillar, Inc. | | | 107 | | | | 21,829 | |
| | | | | |
Machinery-Diversified — 5.9% | | | | |
AGCO Corp. | | | 170 | | | | 20,776 | |
Cognex Corp. | | | 249 | | | | 21,810 | |
Ingersoll Rand, Inc. (a) | | | 398 | | | | 21,397 | |
Nordson Corp. | | | 90 | | | | 22,879 | |
Westinghouse Air Brake Technologies Corp. | | | 243 | | | | 22,047 | |
The accompanying notes are an integral part of the financial statements.
117
Pacer US Export Leaders ETF
SCHEDULE OF INVESTMENTS
October 31, 2021 (Unaudited) (Continued)
| | | Shares | | | Value | |
COMMON STOCKS — 99.9% (Continued) |
Machinery-Diversified — 5.9% (Continued) |
Xylem, Inc. | | | 164 | | | $ | 21,417 | |
| | | | | | | | 130,326 | |
Mining — 2.9% | | | | |
Freeport-McMoRan, Inc. | | | 613 | | | | 23,122 | |
Newmont Goldcorp Corp. | | | 382 | | | | 20,628 | |
Royal Gold, Inc. (b) | | | 200 | | | | 19,804 | |
| | | | | | | | 63,554 | |
Miscellaneous Manufacturing — 2.9% | | | | |
Donaldson Co., Inc. | | | 365 | | | | 21,904 | |
General Electric Co. | | | 216 | | | | 22,652 | |
Trane Technologies PLC | | | 114 | | | | 20,626 | |
| | | | | | | | 65,182 | |
Office/Business Equipment — 0.9% | | | | |
Zebra Technologies Corp. (a) (b) | | | 37 | | | | 19,756 | |
| | | | | |
Oil & Gas — 3.7% | | | | |
APA Corp. | | | 1,164 | | | | 30,508 | |
Chevron Corp. | | | 226 | | | | 25,875 | |
Exxon Mobil Corp. | | | 395 | | | | 25,466 | |
| | | | | | | | 81,849 | |
Oil & Gas Services — 1.3% | | | | |
Halliburton Co. (b) | | | 1,115 | | | | 27,864 | |
| | | | | |
Packaging & Containers — 0.9% | | | | |
AptarGroup, Inc. | | | 173 | | | | 20,895 | |
| | | | | |
Retail — 0.9% | | | | |
Domino’s Pizza, Inc. (b) | | | 43 | | | | 21,026 | |
| | | | | |
Semiconductors — 19.1% | | | | |
Advanced Micro Devices, Inc. (a) | | | 207 | | | | 24,888 | |
Amkor Technology, Inc. (b) | | | 784 | | | | 17,185 | |
Analog Devices, Inc. | | | 128 | | | | 22,207 | |
Applied Materials, Inc. | | | 159 | | | | 21,727 | |
Broadcom, Inc. | | | 44 | | | | 23,393 | |
Brooks Automation, Inc. | | | 237 | | | | 27,599 | |
Cirrus Logic, Inc. (a) | | | 251 | | | | 20,283 | |
CMC Materials, Inc. (b) | | | 166 | | | | 21,309 | |
KLA Corp. | | | 62 | | | | 23,111 | |
Lam Research Corp. | | | 36 | | | | 20,289 | |
Lattice Semiconductor Corp. (a) (b) | | | 347 | | | | 24,096 | |
Microchip Technology, Inc. | | | 276 | | | | 20,449 | |
Micron Technology, Inc. | | | 288 | | | | 19,901 | |
MKS Instruments, Inc. | | | 147 | | | | 22,057 | |
Monolithic Power Systems, Inc. (b) | | | 44 | | | | 23,120 | |
NVIDIA Corp. | | | 97 | | | | 24,800 | |
NXP Semiconductors NV | | | 103 | | | | 20,689 | |
Qorvo, Inc. (a) | | | 121 | | | | 20,356 | |
| | | Shares | | | Value | |
Semiconductors — 19.1% (Continued) |
Teradyne, Inc. (b) | | | 180 | | | $ | 24,883 | |
| | | | | | | | 422,342 | |
Software — 8.3% | | | | |
Aspen Technology, Inc. (a) | | | 169 | | | | 26,481 | |
Autodesk, Inc. (a) | | | 77 | | | | 24,456 | |
Cadence Design System, Inc. (a) | | | 130 | | | | 22,504 | |
Fair Isaac Corp. (a) | | | 48 | | | | 19,114 | |
Microsoft Corp. | | | 74 | | | | 24,540 | |
MSCI, Inc. | | | 33 | | | | 21,941 | |
PTC, Inc. (a) | | | 173 | | | | 22,031 | |
Synopsys, Inc. (a) | | | 65 | | | | 21,657 | |
| | | | | | | | 182,724 | |
Telecommunications — 1.1% | | | | |
Arista Networks, Inc. (a) (b) | | | 62 | | | | 25,401 | |
| | | | | |
Toys/Games/Hobbies — 1.0% | | | | |
Hasbro, Inc. | | | 222 | | | | 21,259 | |
TOTAL COMMON STOCKS (Cost $2,045,501) | | | | | | | 2,208,657 | |
| | | | | |
| | | Principal
Amount | | | | | |
SHORT-TERM INVESTMENTS — 0.1% | | | | |
Money Market Deposit Accounts — 0.1% | | | | |
U.S. Bank Money Market Deposit Account, 0.003% (c) | | $ | 1,319 | | | | 1,319 | |
TOTAL SHORT-TERM INVESTMENTS (Cost $1,319) | | | | | | | 1,319 | |
| | | | | |
The accompanying notes are an integral part of the financial statements.
118
Pacer US Export Leaders ETF
SCHEDULE OF INVESTMENTS
October 31, 2021 (Unaudited) (Continued)
| | | Shares | | | Value | |
INVESTMENTS PURCHASED WITH PROCEEDS FROM SECURITIES LENDING — 17.7% |
Mount Vernon Liquid Assets Portfolio, LLC, 0.10% (c) | | | 390,955 | | | $ | 390,955 | |
TOTAL INVESTMENTS PURCHASED WITH PROCEEDS FROM SECURITIES LENDING (Cost $390,955) | | | | | | | 390,955 | |
| | | | | |
Total Investments (Cost $2,437,775) — 117.7% | | | | | | | 2,600,931 | |
Liabilities in Excess of Other Assets — (17.7)% | | | | | | | (391,256 | ) |
TOTAL NET ASSETS — 100.0% | | | | | | $ | 2,209,675 | |
Percentages are stated as a percent of net assets.
| | (a) | Non-income producing security. |
| | (b) | All or a portion of this security is on loan as of October 31, 2021. The total value of securities on loan is $382,041 or 17.3% of net assets. |
| | (c) | The rate shown is as of October 31, 2021. |
For Fund compliance purposes, the Fund’s industry classifications refer to any one or more of the industry sub-classifications used by one or more widely recognized market indexes or ratings group indexes, and/or they may be defined by Fund management. This definition does not apply for all purposes of this report, which may combine sub-classifications for reporting ease. Categories are shown as a percentage of net assets.
The accompanying notes are an integral part of the financial statements.
119
Pacer Metaurus US Large Cap Dividend Multiplier 300 ETF
SCHEDULE OF INVESTMENTS
October 31, 2021 (Unaudited)
| | | Shares | | | Value | |
COMMON STOCKS — 90.4% | | | | |
Advertising — 0.1% | | | | |
Omnicom Group, Inc. | | | 11 | | | $ | 749 | |
The Interpublic Group of Cos., Inc. | | | 20 | | | | 731 | |
| | | | | | | | 1,480 | |
Aerospace/Defense — 1.3% | | | | |
General Dynamics Corp. | | | 12 | | | | 2,433 | |
Howmet Aerospace, Inc. | | | 19 | | | | 564 | |
L3Harris Technologies, Inc. | | | 10 | | | | 2,305 | |
Lockheed Martin Corp. | | | 12 | | | | 3,988 | |
Northrop Grumman Corp. | | | 8 | | | | 2,858 | |
Raytheon Technologies Corp. | | | 76 | | | | 6,753 | |
Teledyne Technologies, Inc. (a) | | | 2 | | | | 898 | |
The Boeing Co. (a) | | | 28 | | | | 5,797 | |
TransDigm Group, Inc. (a) | | | 3 | | | | 1,872 | |
| | | | | | | | 27,468 | |
Agriculture — 0.6% | | | | |
Altria Group, Inc. | | | 93 | | | | 4,102 | |
Archer-Daniels-Midland Co. | | | 28 | | | | 1,799 | |
Philip Morris International, Inc. | | | 78 | | | | 7,374 | |
| | | | | | | | 13,275 | |
Airlines — 0.2% | | | | |
Alaska Air Group, Inc. (a) | | | 6 | | | | 317 | |
American Airlines Group, Inc. (a) | | | 32 | | | | 615 | |
Delta Air Lines, Inc. (a) | | | 32 | | | | 1,252 | |
Southwest Airlines Co. (a) | | | 30 | | | | 1,418 | |
United Airlines Holdings, Inc. (a) | | | 16 | | | | 738 | |
| | | | | | | | 4,340 | |
Apparel — 0.7% | | | | |
Hanesbrands, Inc. | | | 18 | | | | 307 | |
NIKE, Inc. - Class B | | | 64 | | | | 10,706 | |
PVH Corp. (a) | | | 4 | | | | 437 | |
Ralph Lauren Corp. | | | 2 | | | | 254 | |
Tapestry, Inc. | | | 14 | | | | 546 | |
Under Armour, Inc. - Class A (a) | | | 9 | | | | 198 | |
Under Armour, Inc. - Class C (a) | | | 10 | | | | 189 | |
VF Corp. | | | 16 | | | | 1,166 | |
| | | | | | | | 13,803 | |
Auto Manufacturers — 2.7% | | | | |
Cummins, Inc. | | | 7 | | | | 1,679 | |
Ford Motor Co. (a) | | | 197 | | | | 3,365 | |
General Motors Co. (a) | | | 73 | | | | 3,973 | |
PACCAR, Inc. | | | 17 | | | | 1,524 | |
Tesla Motors, Inc. (a) | | | 41 | | | | 45,674 | |
| | | | | | | | 56,215 | |
Auto Parts & Equipment — 0.1% | | | | |
Aptiv PLC (a) | | | 14 | | | | 2,420 | |
BorgWarner, Inc. | | | 12 | | | | 541 | |
| | | | | | | | 2,961 | |
| | | Shares | | | Value | |
Banks — 5.0% | | | | |
Bank of America Corp. | | | 371 | | | $ | 17,726 | |
Citigroup, Inc. | | | 102 | | | | 7,054 | |
Citizens Financial Group, Inc. | | | 21 | | | | 995 | |
Comerica, Inc. | | | 7 | | | | 596 | |
Fifth Third Bancorp | | | 35 | | | | 1,524 | |
First Republic Bank | | | 9 | | | | 1,947 | |
Huntington Bancshares, Inc. | | | 74 | | | | 1,165 | |
JPMorgan Chase & Co. | | | 150 | | | | 25,483 | |
KeyCorp. | | | 48 | | | | 1,117 | |
M&T Bank Corp. | | | 6 | | | | 883 | |
Morgan Stanley | | | 73 | | | | 7,503 | |
Northern Trust Corp. | | | 10 | | | | 1,230 | |
Regions Financial Corp. | | | 48 | | | | 1,137 | |
State Street Corp. | | | 17 | | | | 1,675 | |
SVB Financial Group (a) | | | 3 | | | | 2,152 | |
The Bank of New York Mellon Corp. | | | 40 | | | | 2,368 | |
The Goldman Sachs Group, Inc. | | | 17 | | | | 7,027 | |
The PNC Financial Services Group, Inc. | | | 21 | | | | 4,432 | |
Truist Financial Corp. | | | 67 | | | | 4,252 | |
US Bancorp | | | 68 | | | | 4,105 | |
Wells Fargo & Co. | | | 206 | | | | 10,539 | |
Zions Bancorp | | | 8 | | | | 504 | |
| | | | | | | | 105,414 | |
Beverages — 1.3% | | | | |
Brown-Forman Corp. - Class B | | | 9 | | | | 611 | |
Constellation Brands, Inc. - Class A | | | 8 | | | | 1,735 | |
Molson Coors Brewing Co. - Class B | | | 9 | | | | 397 | |
Monster Beverage Corp. (a) | | | 19 | | | | 1,615 | |
PepsiCo, Inc. | | | 69 | | | | 11,150 | |
The Coca-Cola Co. | | | 195 | | | | 10,992 | |
| | | | | | | | 26,500 | |
Biotechnology — 1.4% | | | | |
Amgen, Inc. | | | 28 | | | | 5,795 | |
Biogen, Inc. (a) | | | 7 | | | | 1,867 | |
Bio-Rad Laboratories, Inc. - Class A (a) | | | 1 | | | | 795 | |
Corteva, Inc. | | | 37 | | | | 1,596 | |
Gilead Sciences, Inc. | | | 63 | | | | 4,087 | |
Illumina, Inc. (a) | | | 7 | | | | 2,905 | |
Incyte Corp. (a) | | | 9 | | | | 603 | |
Moderna, Inc. (a) | | | 18 | | | | 6,214 | |
Regeneron Pharmaceuticals, Inc. (a) | | | 5 | | | | 3,200 | |
Vertex Pharmaceuticals, Inc. (a) | | | 13 | | | | 2,404 | |
| | | | | | | | 29,466 | |
Building Materials — 0.4% | | | | |
Carrier Global Corp. | | | 44 | | | | 2,298 | |
Fortune Brands Home & Security, Inc. | | | 7 | | | | 710 | |
The accompanying notes are an integral part of the financial statements.
120
Pacer Metaurus US Large Cap Dividend Multiplier 300 ETF
SCHEDULE OF INVESTMENTS
October 31, 2021 (Unaudited) (Continued)
| | | Shares | | | Value | |
COMMON STOCKS — 90.4% (Continued) |
Building Materials — 0.4% (Continued) |
Johnson Controls International PLC | | | 36 | | | $ | 2,641 | |
Martin Marietta Materials, Inc. | | | 3 | | | | 1,178 | |
Masco Corp. | | | 12 | | | | 787 | |
Vulcan Materials Co. | | | 7 | | | | 1,331 | |
| | | | | | | | 8,945 | |
Chemicals — 1.5% | | | | |
Air Products & Chemicals, Inc. | | | 11 | | | | 3,298 | |
Albemarle Corp. | | | 6 | | | | 1,503 | |
Celanese Corp. | | | 6 | | | | 969 | |
CF Industries Holdings, Inc. | | | 11 | | | | 625 | |
Dow, Inc. | | | 37 | | | | 2,071 | |
DuPont de Nemours, Inc. | | | 26 | | | | 1,809 | |
Eastman Chemical Co. | | | 7 | | | | 728 | |
Ecolab, Inc. | | | 12 | | | | 2,667 | |
FMC Corp. | | | 6 | | | | 546 | |
International Flavors & Fragrances, Inc. | | | 12 | | | | 1,769 | |
Linde PLC | | | 26 | | | | 8,299 | |
LyondellBasell Industries NV | | | 13 | | | | 1,207 | |
Mosaic Co. | | | 17 | | | | 707 | |
PPG Industries, Inc. | | | 12 | | | | 1,927 | |
The Sherwin-Williams Co. | | | 12 | | | | 3,799 | |
| | | | | | | | 31,924 | |
Commercial Services — 2.1% | | | | |
Automatic Data Processing, Inc. | | | 21 | | | | 4,714 | |
Cintas Corp. | | | 4 | | | | 1,732 | |
Equifax, Inc. | | | 6 | | | | 1,665 | |
FleetCor Technologies, Inc. (a) | | | 4 | | | | 990 | |
Gartner, Inc. (a) | | | 4 | | | | 1,328 | |
Global Payments, Inc. | | | 15 | | | | 2,145 | |
IHS Markit Ltd. | | | 20 | | | | 2,614 | |
MarketAxess Holdings, Inc. | | | 2 | | | | 817 | |
Moody’s Corp. | | | 8 | | | | 3,233 | |
Nielsen Holdings PLC | | | 18 | | | | 365 | |
PayPal Holdings, Inc. (a) | | | 59 | | | | 13,723 | |
Quanta Services, Inc. | | | 7 | | | | 849 | |
Robert Half International, Inc. | | | 6 | | | | 678 | |
Rollins, Inc. | | | 11 | | | | 388 | |
S&P Global, Inc. | | | 12 | | | | 5,690 | |
United Rentals, Inc. (a) | | | 4 | | | | 1,516 | |
Verisk Analytics, Inc. | | | 8 | | | | 1,682 | |
| | | | | | | | 44,129 | |
Computers — 6.9% | | | | |
Accenture PLC - Class A | | | 32 | | | | 11,481 | |
Apple, Inc. | | | 788 | | | | 118,042 | |
Cognizant Technology Solutions Corp. | | | 26 | | | | 2,030 | |
DXC Technology Co. (a) | | | 13 | | | | 424 | |
| | | Shares | | | Value | |
Computers — 6.9% (Continued) |
Fortinet, Inc. (a) | | | 7 | | | $ | 2,354 | |
Hewlett Packard Enterprise Co. | | | 66 | | | | 967 | |
HP, Inc. | | | 60 | | | | 1,820 | |
International Business Machines Corp. | | | 45 | | | | 5,630 | |
Leidos Holdings, Inc. | | | 7 | | | | 700 | |
NetApp, Inc. | | | 11 | | | | 982 | |
Seagate Technology Holdings PLC | | | 11 | | | | 980 | |
Western Digital Corp. (a) | | | 15 | | | | 784 | |
| | | | | | | | 146,194 | |
Cosmetics/Personal Care — 1.2% | | | | |
Colgate-Palmolive Co. | | | 42 | | | | 3,200 | |
The Estee Lauder Cos., Inc. | | | 12 | | | | 3,892 | |
The Procter & Gamble Co. | | | 122 | | | | 17,445 | |
| | | | | | | | 24,537 | |
Distribution/Wholesale — 0.3% | | | | |
Copart, Inc. (a) | | | 11 | | | | 1,708 | |
Fastenal Co. | | | 29 | | | | 1,656 | |
LKQ Corp. (a) | | | 14 | | | | 771 | |
Pool Corp. | | | 2 | | | | 1,030 | |
W.W. Grainger, Inc. | | | 2 | | | | 926 | |
| | | | | | | | 6,091 | |
Diversified Financial Services — 3.5% | | | | |
American Express Co. | | | 32 | | | | 5,561 | |
Ameriprise Financial, Inc. | | | 6 | | | | 1,813 | |
BlackRock, Inc. | | | 7 | | | | 6,604 | |
Capital One Financial Corp. | | | 22 | | | | 3,323 | |
Cboe Global Markets, Inc. | | | 5 | | | | 660 | |
CME Group, Inc. | | | 18 | | | | 3,970 | |
Discover Financial Services | | | 15 | | | | 1,700 | |
Franklin Resources, Inc. | | | 14 | | | | 441 | |
Intercontinental Exchange, Inc. | | | 28 | | | | 3,877 | |
Invesco Ltd. | | | 17 | | | | 432 | |
MasterCard, Inc. - Class A | | | 44 | | | | 14,763 | |
Nasdaq, Inc. | | | 6 | | | | 1,259 | |
Raymond James Financial, Inc. | | | 9 | | | | 887 | |
Synchrony Financial | | | 29 | | | | 1,347 | |
T Rowe Price Group, Inc. | | | 11 | | | | 2,386 | |
The Charles Schwab Corp. | | | 75 | | | | 6,152 | |
The Western Union Co. | | | 20 | | | | 364 | |
Visa, Inc. - Class A | | | 85 | | | | 18,000 | |
| | | | | | | | 73,539 | |
Electric — 2.1% | | | | |
Alliant Energy Corp. | | | 13 | | | | 736 | |
Ameren Corp. | | | 13 | | | | 1,096 | |
American Electric Power Co., Inc. | | | 25 | | | | 2,118 | |
CenterPoint Energy, Inc. | | | 30 | | | | 781 | |
CMS Energy Corp. | | | 15 | | | | 905 | |
Consolidated Edison, Inc. | | | 18 | | | | 1,357 | |
The accompanying notes are an integral part of the financial statements.
121
Pacer Metaurus US Large Cap Dividend Multiplier 300 ETF
SCHEDULE OF INVESTMENTS
October 31, 2021 (Unaudited) (Continued)
| | | Shares | | | Value | |
COMMON STOCKS — 90.4% (Continued) |
Electric — 2.1% (Continued) |
Dominion Energy, Inc. | | | 41 | | | $ | 3,113 | |
DTE Energy Co. | | | 10 | | | | 1,134 | |
Duke Energy Corp. | | | 39 | | | | 3,979 | |
Edison International | | | 19 | | | | 1,196 | |
Entergy Corp. | | | 10 | | | | 1,030 | |
Evergy, Inc. | | | 12 | | | | 765 | |
Eversource Energy | | | 17 | | | | 1,443 | |
Exelon Corp. | | | 49 | | | | 2,606 | |
FirstEnergy Corp. | | | 27 | | | | 1,040 | |
NextEra Energy, Inc. | | | 98 | | | | 8,362 | |
NRG Energy, Inc. | | | 12 | | | | 479 | |
Pinnacle West Capital Corp. | | | 6 | | | | 387 | |
PPL Corp. | | | 39 | | | | 1,123 | |
Public Service Enterprise Group, Inc. | | | 25 | | | | 1,595 | |
Sempra Energy | | | 16 | | | | 2,042 | |
Southern Co. | | | 53 | | | | 3,303 | |
The AES Corp. | | | 33 | | | | 829 | |
WEC Energy Group, Inc. | | | 16 | | | | 1,441 | |
Xcel Energy, Inc. | | | 27 | | | | 1,744 | |
| | | | | | | | 44,604 | |
Electrical Components & Equipment — 0.3% | | | | |
AMETEK, Inc. | | | 12 | | | | 1,589 | |
Emerson Electric Co. | | | 30 | | | | 2,910 | |
Generac Holdings, Inc. (a) | | | 3 | | | | 1,496 | |
| | | | | | | | 5,995 | |
Electronics — 1.1% | | | | |
Agilent Technologies, Inc. | | | 15 | | | | 2,362 | |
Allegion PLC | | | 4 | | | | 513 | |
Amphenol Corp. | | | 30 | | | | 2,303 | |
Fortive Corp. | | | 18 | | | | 1,363 | |
Garmin Ltd. | | | 8 | | | | 1,149 | |
Honeywell International, Inc. | | | 35 | | | | 7,652 | |
Keysight Technologies, Inc. (a) | | | 9 | | | | 1,620 | |
Mettler-Toledo International, Inc. (a) | | | 1 | | | | 1,481 | |
TE Connectivity Ltd. | | | 16 | | | | 2,336 | |
Trimble, Inc. (a) | | | 13 | | | | 1,136 | |
Waters Corp. (a) | | | 3 | | | | 1,102 | |
| | | | | | | | 23,017 | |
Energy-Alternate Sources — 0.1% | | | | |
Enphase Energy, Inc. (a) | | | 7 | | | | 1,621 | |
| | | | | |
Engineering & Construction — 0.1% | | | | |
Jacobs Engineering Group, Inc. | | | 7 | | | | 983 | |
| | | | | |
Entertainment — 0.1% | | | | |
Caesars Entertainment, Inc. (a) | | | 11 | | | | 1,204 | |
Live Nation Entertainment, Inc. (a) | | | 7 | | | | 708 | |
| | | Shares | | | Value | |
Entertainment — 0.1% (Continued) |
Penn National Gaming, Inc. (a) | | | 8 | | | $ | 573 | |
| | | | | | | | 2,485 | |
Environmental Control — 0.2% | | | | |
Pentair PLC | | | 8 | | | | 592 | |
Republic Services, Inc. | | | 11 | | | | 1,481 | |
Waste Management, Inc. | | | 19 | | | | 3,044 | |
| | | | | | | | 5,117 | |
Food — 0.8% | | | | |
Campbell Soup Co. | | | 10 | | | | 400 | |
Conagra Brands, Inc. | | | 24 | | | | 773 | |
General Mills, Inc. | | | 30 | | | | 1,854 | |
Hormel Foods Corp. | | | 14 | | | | 592 | |
Kellogg Co. | | | 13 | | | | 797 | |
Lamb Weston Holdings, Inc. | | | 7 | | | | 395 | |
McCormick & Co., Inc. | | | 13 | | | | 1,043 | |
Mondelez International, Inc. | | | 70 | | | | 4,252 | |
Sysco Corp. | | | 26 | | | | 1,999 | |
The Hershey Co. | | | 7 | | | | 1,227 | |
The JM Smucker Co. | | | 5 | | | | 614 | |
The Kraft Heinz Co. | | | 34 | | | | 1,220 | |
The Kroger Co. | | | 34 | | | | 1,361 | |
Tyson Foods, Inc. - Class A | | | 15 | | | | 1,200 | |
| | | | | | | | 17,727 | |
Forest Products & Paper — 0.1% | | | | |
International Paper Co. | | | 20 | | | | 993 | |
Sylvamo Corp. (a) | | | 1 | | | | 23 | |
| | | | | | | | 1,016 | |
Gas — 0.1% | | | | |
Atmos Energy Corp. | | | 7 | | | | 645 | |
NiSource, Inc. | | | 20 | | | | 493 | |
| | | | | | | | 1,138 | |
Hand/Machine Tools — 0.1% | | | | |
Snap-On, Inc. | | | 3 | | | | 610 | |
Stanley Black & Decker, Inc. | | | 8 | | | | 1,438 | |
| | | | | | | | 2,048 | |
Healthcare-Products — 3.8% | | | | |
Abbott Laboratories | | | 89 | | | | 11,471 | |
ABIOMED, Inc. (a) | | | 2 | | | | 664 | |
Align Technology, Inc. (a) | | | 4 | | | | 2,498 | |
Baxter International, Inc. | | | 25 | | | | 1,974 | |
Bio-Techne Corp. | | | 2 | | | | 1,047 | |
Boston Scientific Corp. (a) | | | 71 | | | | 3,062 | |
Danaher Corp. | | | 32 | | | | 9,977 | |
DENTSPLY SIRONA, Inc. | | | 11 | | | | 629 | |
Edwards Lifesciences Corp. (a) | | | 31 | | | | 3,714 | |
Henry Schein, Inc. (a) | | | 7 | | | | 535 | |
Hologic, Inc. (a) | | | 13 | | | | 953 | |
IDEXX Laboratories, Inc. (a) | | | 4 | | | | 2,665 | |
Intuitive Surgical, Inc. (a) | | | 18 | | | | 6,500 | |
The accompanying notes are an integral part of the financial statements.
122
Pacer Metaurus US Large Cap Dividend Multiplier 300 ETF
SCHEDULE OF INVESTMENTS
October 31, 2021 (Unaudited) (Continued)
| | | Shares | | | Value | |
COMMON STOCKS — 90.4% (Continued) |
Healthcare-Products — 3.8% (Continued) |
Medtronic PLC | | | 67 | | | $ | 8,031 | |
PerkinElmer, Inc. | | | 6 | | | | 1,061 | |
ResMed, Inc. | | | 7 | | | | 1,840 | |
STERIS PLC | | | 5 | | | | 1,169 | |
Stryker Corp. | | | 17 | | | | 4,523 | |
Teleflex, Inc. | | | 2 | | | | 714 | |
The Cooper Cos., Inc. | | | 2 | | | | 834 | |
Thermo Fisher Scientific, Inc. | | | 20 | | | | 12,661 | |
West Pharmaceutical Services, Inc. | | | 4 | | | | 1,720 | |
Zimmer Biomet Holdings, Inc. | | | 10 | | | | 1,431 | |
| | | | | | | | 79,673 | |
Healthcare-Services — 2.0% | | | | |
Anthem, Inc. | | | 12 | | | | 5,222 | |
Catalent, Inc. (a) | | | 9 | | | | 1,241 | |
Centene Corp. (a) | | | 29 | | | | 2,066 | |
Charles River Laboratories International, Inc. (a) | | | 3 | | | | 1,346 | |
DaVita, Inc. (a) | | | 3 | | | | 310 | |
HCA Healthcare, Inc. | | | 12 | | | | 3,005 | |
Humana, Inc. | | | 6 | | | | 2,779 | |
IQVIA Holdings, Inc. (a) | | | 10 | | | | 2,614 | |
Laboratory Corp. of American Holdings (a) | | | 5 | | | | 1,435 | |
Quest Diagnostics, Inc. | | | 6 | | | | 881 | |
UnitedHealth Group, Inc. | | | 47 | | | | 21,642 | |
Universal Health Services, Inc. - Class B | | | 4 | | | | 496 | |
| | | | | | | | 43,037 | |
Home Builders — 0.2% | | | | |
DR Horton, Inc. | | | 16 | | | | 1,428 | |
Lennar Corp. - Class A | | | 14 | | | | 1,399 | |
PulteGroup, Inc. | | | 13 | | | | 625 | |
| | | | | | | | 3,452 | |
Home Furnishings — 0.1% | | | | |
Leggett & Platt, Inc. | | | 7 | | | | 328 | |
Whirlpool Corp. | | | 3 | | | | 633 | |
| | | | | | | | 961 | |
Household Products/Wares — 0.2% | | | | |
Avery Dennison Corp. | | | 4 | | | | 871 | |
Church & Dwight Co., Inc. | | | 12 | | | | 1,048 | |
Kimberly-Clark Corp. | | | 17 | | | | 2,202 | |
The Clorox Co. | | | 6 | | | | 978 | |
| | | | | | | | 5,099 | |
Housewares — 0.0% (b) | | | | |
Newell Brands, Inc. | | | 19 | | | | 435 | |
| | | | | |
Insurance — 3.0% | | | | |
Aflac, Inc. | | | 31 | | | | 1,664 | |
| | | Shares | | | Value | |
Insurance — 3.0% (Continued) |
American International Group, Inc. | | | 43 | | | $ | 2,541 | |
Aon PLC | | | 11 | | | | 3,519 | |
Arthur J Gallagher & Co. | | | 10 | | | | 1,677 | |
Assurant, Inc. | | | 3 | | | | 484 | |
Berkshire Hathaway, Inc. - Class B (a) | | | 93 | | | | 26,692 | |
Brown & Brown, Inc. | | | 12 | | | | 757 | |
Chubb Ltd. | | | 22 | | | | 4,298 | |
Cincinnati Financial Corp. | | | 8 | | | | 971 | |
Everest Re Group Ltd. | | | 2 | | | | 523 | |
Globe Life, Inc. | | | 5 | | | | 445 | |
Lincoln National Corp. | | | 9 | | | | 649 | |
Loews Corp. | | | 10 | | | | 561 | |
Marsh & McLennan Cos., Inc. | | | 25 | | | | 4,170 | |
MetLife, Inc. | | | 37 | | | | 2,324 | |
Principal Financial Group, Inc. | | | 13 | | | | 872 | |
Prudential Financial, Inc. | | | 19 | | | | 2,091 | |
The Allstate Corp. | | | 15 | | | | 1,855 | |
The Hartford Financial Services Group, Inc. | | | 17 | | | | 1,240 | |
The Progressive Corp. | | | 29 | | | | 2,752 | |
The Travelers Cos., Inc. | | | 13 | | | | 2,091 | |
W R Berkley Corp. | | | 7 | | | | 557 | |
Willis Towers Watson PLC | | | 6 | | | | 1,454 | |
| | | | | | | | 64,187 | |
Internet — 11.0% | | | | |
Alphabet, Inc. - Class A (a) | | | 15 | | | | 44,414 | |
Alphabet, Inc. - Class C (a) | | | 14 | | | | 41,516 | |
Amazon.com, Inc. (a) | | | 22 | | | | 74,193 | |
Booking Holdings, Inc. (a) | | | 2 | | | | 4,842 | |
CDW Corp. | | | 7 | | | | 1,307 | |
eBay, Inc. | | | 33 | | | | 2,532 | |
Etsy, Inc. (a) | | | 6 | | | | 1,504 | |
Expedia Group, Inc. (a) | | | 7 | | | | 1,151 | |
F5 Networks, Inc. (a) | | | 3 | | | | 633 | |
Match Group, Inc. (a) | | | 14 | | | | 2,111 | |
Meta Platforms, Inc. - Class A (a) | | | 120 | | | | 38,828 | |
Netflix, Inc. (a) | | | 22 | | | | 15,187 | |
NortonLifeLock, Inc. | | | 29 | | | | 738 | |
Twitter, Inc. (a) | | | 40 | | | | 2,142 | |
VeriSign, Inc. (a) | | | 5 | | | | 1,113 | |
| | | | | | | | 232,211 | |
Iron/Steel — 0.1% | | | | |
Nucor Corp. | | | 15 | | | | 1,675 | |
| | | | | |
Leisure Time — 0.1% | | | | |
Carnival Corp. (a) | | | 40 | | | | 886 | |
Norwegian Cruise Line Holdings Ltd. (a) | | | 19 | | | | 489 | |
The accompanying notes are an integral part of the financial statements.
123
Pacer Metaurus US Large Cap Dividend Multiplier 300 ETF
SCHEDULE OF INVESTMENTS
October 31, 2021 (Unaudited) (Continued)
| | | Shares | | | Value | |
COMMON STOCKS — 90.4% (Continued) |
Leisure Time — 0.1% (Continued) |
Royal Caribbean Cruises Ltd. (a) | | | 11 | | | $ | 929 | |
| | | | | | | | 2,304 | |
Lodging — 0.3% | | | | |
Hilton Worldwide Holdings, Inc. (a) | | | 14 | | | | 2,016 | |
Las Vegas Sands Corp. (a) | | | 17 | | | | 660 | |
Marriott International, Inc. (a) | | | 14 | | | | 2,240 | |
MGM Resorts International | | | 20 | | | | 943 | |
Wynn Resorts Ltd. (a) | | | 5 | | | | 449 | |
| | | | | | | | 6,308 | |
Machinery-Construction & Mining — 0.3% | | | | |
Caterpillar, Inc. | | | 27 | | | | 5,508 | |
| | | | | |
Machinery-Diversified — 0.6% | | | | |
Deere & Co. | | | 14 | | | | 4,792 | |
Dover Corp. | | | 7 | | | | 1,184 | |
IDEX Corp. | | | 4 | | | | 890 | |
Ingersoll Rand, Inc. (a) | | | 20 | | | | 1,075 | |
Otis Worldwide Corp. | | | 21 | | | | 1,687 | |
Rockwell Automation, Inc. | | | 6 | | | | 1,916 | |
Westinghouse Air Brake Technologies Corp. | | | 9 | | | | 817 | |
Xylem, Inc. | | | 9 | | | | 1,175 | |
| | | | | | | | 13,536 | |
Media — 1.7% | | | | |
Charter Communications, Inc. - Class A (a) | | | 6 | | | | 4,049 | |
Comcast Corp. - Class A | | | 230 | | | | 11,829 | |
Discovery, Inc. - Class A (a) | | | 8 | | | | 188 | |
Discovery, Inc. - Class C (a) | | | 15 | | | | 338 | |
DISH Network Corp. - Class A (a) | | | 12 | | | | 493 | |
Fox Corp. - Class A | | | 16 | | | | 636 | |
Fox Corp. - Class B | | | 7 | | | | 259 | |
News Corp. - Class A | | | 20 | | | | 458 | |
News Corp. - Class B | | | 6 | | | | 135 | |
The Walt Disney Co. (a) | | | 91 | | | | 15,385 | |
ViacomCBS, Inc. - Class B | | | 30 | | | | 1,087 | |
| | | | | | | | 34,857 | |
Mining — 0.2% | | | | |
Freeport-McMoRan, Inc. | | | 74 | | | | 2,791 | |
Newmont Goldcorp Corp. | | | 40 | | | | 2,160 | |
| | | | | | | | 4,951 | |
Miscellaneous Manufacturing — 1.1% | | | | |
3M Co. | | | 29 | | | | 5,182 | |
A O Smith Corp. | | | 7 | | | | 512 | |
Eaton Corp. PLC | | | 20 | | | | 3,295 | |
General Electric Co. | | | 55 | | | | 5,768 | |
Illinois Tool Works, Inc. | | | 14 | | | | 3,190 | |
Parker-Hannifin Corp. | | | 6 | | | | 1,780 | |
| | | Shares | | | Value | |
Miscellaneous Manufacturing — 1.1% (Continued) |
Textron, Inc. | | | 11 | | | $ | 812 | |
Trane Technologies PLC | | | 12 | | | | 2,171 | |
| | | | | | | | 22,710 | |
Office/Business Equipment — 0.1% | | | | |
Zebra Technologies Corp. (a) | | | 3 | | | | 1,602 | |
| | | | | |
Oil & Gas — 2.2% | | | | |
APA Corp. | | | 19 | | | | 498 | |
Chevron Corp. | | | 97 | | | | 11,105 | |
ConocoPhillips | | | 67 | | | | 4,991 | |
Coterra Energy, Inc. | | | 20 | | | | 426 | |
Devon Energy Corp. | | | 32 | | | | 1,282 | |
Diamondback Energy, Inc. | | | 9 | | | | 965 | |
EOG Resources, Inc. | | | 29 | | | | 2,681 | |
Exxon Mobil Corp. | | | 212 | | | | 13,668 | |
Hess Corp. | | | 14 | | | | 1,156 | |
Marathon Oil Corp. | | | 40 | | | | 653 | |
Marathon Petroleum Corp. | | | 32 | | | | 2,110 | |
Occidental Petroleum Corp. | | | 45 | | | | 1,509 | |
Phillips 66 | | | 22 | | | | 1,645 | |
Pioneer Natural Resources Co. | | | 11 | | | | 2,057 | |
Valero Energy Corp. | | | 21 | | | | 1,624 | |
| | | | | | | | 46,370 | |
Oil & Gas Services — 0.2% | | | | |
Baker Hughes Co. | | | 42 | | | | 1,053 | |
Halliburton Co. | | | 45 | | | | 1,125 | |
Schlumberger Ltd. | | | 70 | | | | 2,258 | |
| | | | | | | | 4,436 | |
Packaging & Containers — 0.2% | | | | |
Amcor PLC | | | 77 | | | | 929 | |
Ball Corp. | | | 16 | | | | 1,464 | |
Packaging Corp. of America | | | 5 | | | | 687 | |
Sealed Air Corp. | | | 8 | | | | 475 | |
Westrock Co. | | | 13 | | | | 625 | |
| | | | | | | | 4,180 | |
Pharmaceuticals — 4.6% | | | | |
AbbVie, Inc. | | | 89 | | | | 10,206 | |
AmerisourceBergen Corp. | | | 8 | | | | 976 | |
Becton Dickinson and Co. | | | 14 | | | | 3,354 | |
Bristol-Myers Squibb Co. | | | 111 | | | | 6,483 | |
Cardinal Health, Inc. | | | 15 | | | | 717 | |
Cigna Corp. | | | 17 | | | | 3,631 | |
CVS Health Corp. | | | 66 | | | | 5,893 | |
DexCom, Inc. (a) | | | 5 | | | | 3,116 | |
Eli Lilly & Co. | | | 40 | | | | 10,190 | |
Johnson & Johnson | | | 132 | | | | 21,500 | |
McKesson Corp. | | | 8 | | | | 1,663 | |
Merck & Co., Inc. | | | 127 | | | | 11,182 | |
Organon & Co. | | | 13 | | | | 478 | |
The accompanying notes are an integral part of the financial statements.
124
Pacer Metaurus US Large Cap Dividend Multiplier 300 ETF
SCHEDULE OF INVESTMENTS
October 31, 2021 (Unaudited) (Continued)
| | | Shares | | | Value | |
COMMON STOCKS — 90.4% (Continued) |
Pharmaceuticals — 4.6% (Continued) |
Pfizer, Inc. | | | 281 | | | $ | 12,291 | |
Viatris, Inc. | | | 61 | | | | 814 | |
Zoetis, Inc. | | | 24 | | | | 5,189 | |
| | | | | | | | 97,683 | |
Pipelines — 0.2% | | | | |
Kinder Morgan, Inc. | | | 98 | | | | 1,642 | |
ONEOK, Inc. | | | 22 | | | | 1,400 | |
Williams Cos., Inc. | | | 61 | | | | 1,713 | |
| | | | | | | | 4,755 | |
Real Estate — 0.1% | | | | |
CBRE Group, Inc. (a) | | | 17 | | | | 1,769 | |
| | | | | |
Retail — 4.7% | | | | |
Advance Auto Parts, Inc. | | | 3 | | | | 677 | |
AutoZone, Inc. (a) | | | 1 | | | | 1,785 | |
Bath & Body Works, Inc. (a) | | | 13 | | | | 898 | |
Best Buy Co., Inc. | | | 11 | | | | 1,345 | |
CarMax, Inc. (a) | | | 8 | | | | 1,095 | |
Chipotle Mexican Grill, Inc. (a) | | | 1 | | | | 1,779 | |
Costco Wholesale Corp. | | | 22 | | | | 10,814 | |
Darden Restaurants, Inc. | | | 7 | | | | 1,009 | |
Dollar General Corp. | | | 12 | | | | 2,658 | |
Dollar Tree, Inc. (a) | | | 12 | | | | 1,293 | |
Domino’s Pizza, Inc. | | | 2 | | | | 978 | |
Genuine Parts Co. | | | 7 | | | | 918 | |
Lowe’s Cos., Inc. | | | 35 | | | | 8,184 | |
McDonald’s Corp. | | | 37 | | | | 9,085 | |
O’Reilly Automotive, Inc. (a) | | | 3 | | | | 1,867 | |
Ross Stores, Inc. | | | 18 | | | | 2,038 | |
Starbucks Corp. | | | 59 | | | | 6,258 | |
Target Corp. | | | 25 | | | | 6,490 | |
The Gap, Inc. | | | 11 | | | | 250 | |
The Home Depot, Inc. | | | 53 | | | | 19,702 | |
The TJX Cos., Inc. | | | 61 | | | | 3,995 | |
Tractor Supply Co. | | | 6 | | | | 1,303 | |
Ulta Beauty, Inc. (a) | | | 3 | | | | 1,102 | |
Walgreens Boots Alliance, Inc. | | | 36 | | | | 1,693 | |
Walmart, Inc. | | | 72 | | | | 10,758 | |
Yum! Brands, Inc. | | | 15 | | | | 1,874 | |
| | | | | | | | 99,848 | |
Savings & Loans — 0.0% (b) | | | | |
People’s United Financial, Inc. | | | 21 | | | | 360 | |
| | | | | |
Semiconductors — 5.2% | | | | |
Advanced Micro Devices, Inc. (a) | | | 61 | | | | 7,334 | |
Analog Devices, Inc. | | | 27 | | | | 4,684 | |
Applied Materials, Inc. | | | 46 | | | | 6,286 | |
Broadcom, Inc. | | | 21 | | | | 11,165 | |
| | | Shares | | | Value | |
Semiconductors — 5.2% (Continued) |
Intel Corp. | | | 204 | | | $ | 9,996 | |
IPG Photonics Corp. (a) | | | 2 | | | | 318 | |
KLA Corp. | | | 8 | | | | 2,982 | |
Lam Research Corp. | | | 7 | | | | 3,945 | |
Microchip Technology, Inc. | | | 28 | | | | 2,075 | |
Micron Technology, Inc. | | | 56 | | | | 3,870 | |
Monolithic Power Systems, Inc. | | | 2 | | | | 1,051 | |
NVIDIA Corp. | | | 125 | | | | 31,959 | |
NXP Semiconductors NV | | | 13 | | | | 2,611 | |
Qorvo, Inc. (a) | | | 6 | | | | 1,009 | |
QUALCOMM, Inc. | | | 57 | | | | 7,583 | |
Skyworks Solutions, Inc. | | | 8 | | | | 1,337 | |
Teradyne, Inc. | | | 8 | | | | 1,106 | |
Texas Instruments, Inc. | | | 46 | | | | 8,624 | |
Xilinx, Inc. | | | 12 | | | | 2,160 | |
| | | | | | | | 110,095 | |
Shipbuilding — 0.0% (b) | | | | |
Huntington Ingalls Industries, Inc. | | | 2 | | | | 405 | |
| | | | | |
Software — 10.3% | | | | |
Activision Blizzard, Inc. | | | 39 | | | | 3,049 | |
Adobe, Inc. (a) | | | 24 | | | | 15,609 | |
Akamai Technologies, Inc. (a) | | | 8 | | | | 844 | |
ANSYS, Inc. (a) | | | 4 | | | | 1,518 | |
Autodesk, Inc. (a) | | | 11 | | | | 3,494 | |
Broadridge Financial Solutions, Inc. | | | 6 | | | | 1,070 | |
Cadence Design System, Inc. (a) | | | 14 | | | | 2,424 | |
Ceridian HCM Holding, Inc. (a) | | | 7 | | | | 877 | |
Cerner Corp. | | | 15 | | | | 1,114 | |
Citrix Systems, Inc. | | | 6 | | | | 568 | |
Electronic Arts, Inc. | | | 14 | | | | 1,963 | |
Fidelity National Information Services, Inc. | | | 31 | | | | 3,433 | |
Fiserv, Inc. (a) | | | 30 | | | | 2,955 | |
Intuit, Inc. | | | 14 | | | | 8,764 | |
Jack Henry & Associates, Inc. | | | 4 | | | | 666 | |
Microsoft Corp. | | | 377 | | | | 125,021 | |
MSCI, Inc. | | | 4 | | | | 2,660 | |
Oracle Corp. | | | 83 | | | | 7,963 | |
Paychex, Inc. | | | 16 | | | | 1,972 | |
Paycom Software, Inc. (a) | | | 2 | | | | 1,096 | |
PTC, Inc. (a) | | | 5 | | | | 637 | |
Roper Technologies, Inc. | | | 5 | | | | 2,439 | |
salesforce.com, Inc. (a) | | | 49 | | | | 14,685 | |
ServiceNow, Inc. (a) | | | 10 | | | | 6,978 | |
Synopsys, Inc. (a) | | | 8 | | | | 2,665 | |
Take-Two Interactive Software, Inc. (a) | | | 6 | | | | 1,086 | |
The accompanying notes are an integral part of the financial statements.
125
Pacer Metaurus US Large Cap Dividend Multiplier 300 ETF
SCHEDULE OF INVESTMENTS
October 31, 2021 (Unaudited) (Continued)
| | | Shares | | | Value | |
COMMON STOCKS — 90.4% (Continued) |
Software — 10.3% (Continued) |
Tyler Technologies, Inc. (a) | | | 2 | | | $ | 1,086 | |
| | | | | | | | 216,636 | |
Telecommunications — 1.9% | | | | |
Arista Networks, Inc. (a) | | | 3 | | | | 1,229 | |
AT&T, Inc. | | | 358 | | | | 9,043 | |
Cisco Systems, Inc. | | | 211 | | | | 11,810 | |
Corning, Inc. | | | 39 | | | | 1,387 | |
Juniper Networks, Inc. | | | 16 | | | | 472 | |
Lumen Technologies, Inc. | | | 50 | | | | 593 | |
Motorola Solutions, Inc. | | | 8 | | | | 1,989 | |
T-Mobile US, Inc. (a) | | | 29 | | | | 3,336 | |
Verizon Communications, Inc. | | | 208 | | | | 11,022 | |
| | | | | | | | 40,881 | |
Textiles — 0.0% (b) | | | | |
Mohawk Industries, Inc. (a) | | | 3 | | | | 532 | |
| | | | | |
Toys/Games/Hobbies — 0.0% (b) | | | | |
Hasbro, Inc. | | | 6 | | | | 575 | |
| | | | | |
Transportation — 1.5% | | | | |
CH Robinson Worldwide, Inc. | | | 7 | | | | 679 | |
CSX Corp. | | | 113 | | | | 4,087 | |
Expeditors International of Washington, Inc. | | | 9 | | | | 1,109 | |
FedEx Corp. | | | 12 | | | | 2,826 | |
JB Hunt Trasport Services, Inc. | | | 4 | | | | 789 | |
Kansas City Southern | | | 5 | | | | 1,551 | |
Norfolk Southern Corp. | | | 12 | | | | 3,517 | |
Old Dominion Freight Line, Inc. | | | 5 | | | | 1,707 | |
Union Pacific Corp. | | | 33 | | | | 7,966 | |
United Parcel Service, Inc. - Class B | | | 37 | | | | 7,899 | |
| | | | | | | | 32,130 | |
Water — 0.1% | | | | |
American Water Works Co., Inc. | | | 9 | | | | 1,568 | |
TOTAL COMMON STOCKS (Cost $1,814,327) | | | | | | | 1,906,761 | |
| | | | | |
REAL ESTATE INVESTMENT TRUSTS — 2.4% | | | | |
Alexandria Real Estate Equities, Inc. | | | 7 | | | | 1,429 | |
American Tower Corp. | | | 23 | | | | 6,485 | |
AvalonBay Communities, Inc. | | | 7 | | | | 1,657 | |
Boston Properties, Inc. | | | 7 | | | | 795 | |
Crown Castle International Corp. | | | 22 | | | | 3,967 | |
Digital Realty Trust, Inc. | | | 14 | | | | 2,209 | |
Duke Realty Corp. | | | 19 | | | | 1,069 | |
Equinix, Inc. | | | 5 | | | | 4,185 | |
Equity Residential | | | 17 | | | | 1,469 | |
Essex Property Trust, Inc. | | | 3 | | | | 1,020 | |
| | | Shares | | | Value | |
REAL ESTATE INVESTMENT TRUSTS — 2.4% (Continued) |
Extra Space Storage, Inc. | | | 7 | | | $ | 1,382 | |
Federal Realty Investment Trust | | | 4 | | | | 481 | |
Healthpeak Properties, Inc. | | | 27 | | | | 959 | |
Host Hotels & Resorts, Inc. (a) | | | 36 | | | | 606 | |
Iron Mountain, Inc. | | | 15 | | | | 685 | |
Kimco Realty Corp. | | | 31 | | | | 701 | |
Mid-America Apartment Communities, Inc. | | | 6 | | | | 1,225 | |
Prologis, Inc. | | | 37 | | | | 5,364 | |
Public Storage | | | 8 | | | | 2,657 | |
Realty Income Corp. | | | 20 | | | | 1,429 | |
Regency Centers Corp. | | | 8 | | | | 563 | |
SBA Communications Corp. | | | 5 | | | | 1,727 | |
Simon Property Group, Inc. | | | 16 | | | | 2,345 | |
UDR, Inc. | | | 14 | | | | 777 | |
Ventas, Inc. | | | 19 | | | | 1,014 | |
Vornado Realty Trust | | | 8 | | | | 341 | |
Welltower, Inc. | | | 21 | | | | 1,688 | |
Weyerhaeuser Co. | | | 38 | | | | 1,357 | |
TOTAL REAL ESTATE INVESTMENT TRUSTS (Cost $48,367) | | | | | | | 49,586 | |
| | | | | |
| | | Principal
Amount | | | | | |
SHORT-TERM INVESTMENTS — 2.3% | | | | |
Money Market Deposit Accounts — 2.3% | | | | |
U.S. Bank Money Market Deposit Account, 0.003% (c) | | $ | 48,557 | | | | 48,557 | |
TOTAL SHORT-TERM INVESTMENTS (Cost $48,557) | | | | | | | 48,557 | |
| | | | | |
Total Investments (Cost $1,911,251) — 95.1% | | | | | | | 2,004,904 | |
Other Assets in Excess of Liabilities — 4.9% | | | | | | | 103,372 | |
TOTAL NET ASSETS — 100.0% | | | | | | $ | 2,108,276 | |
Percentages are stated as a percent of net assets.
| | (a) | Non-income producing security. |
| | (c) | The rate shown is as of October 31, 2021. |
For Fund compliance purposes, the Fund’s industry classifications refer to any one or more of the industry sub-classifications used by one or more widely recognized market indexes or ratings group indexes, and/or they may be defined by Fund management. This definition does not apply for all purposes of this report, which may combine sub-classifications for reporting ease. Categories are shown as a percentage of net assets.
The accompanying notes are an integral part of the financial statements.
126
Pacer Metaurus US Large Cap Dividend Multiplier 300 ETF
SCHEDULE OF OPEN FUTURES CONTRACTS
October 31, 2021 (Unaudited)
| | Number of
Contracts | | Long/Short | Description | | Expiration
Date | | | Notional Value | | | Value &
Unrealized
Appreciation
(Depreciation) | |
| | | 4 | | Long | S&P 500 Annual Dividend Futures Index (a) | | | 12/17/2021 | | | $ | 59,750 | | | $ | 86 | |
| | | 4 | | Long | S&P 500 Annual Dividend Futures Index (a) | | | 12/16/2022 | | | | 63,250 | | | | 1,036 | |
| | | 4 | | Long | S&P 500 Annual Dividend Futures Index (a) | | | 12/15/2023 | | | | 66,150 | | | | 2,136 | |
| | | | | | | | | | | | | | | | $ | 3,258 | |
The accompanying notes are an integral part of the financial statements.
127
Pacer Metaurus US Large Cap Dividend Multiplier 400 ETF
SCHEDULE OF INVESTMENTS
October 31, 2021 (Unaudited)
| | | Shares | | | Value | |
COMMON STOCKS — 87.2% | | | | |
Advertising — 0.1% | | | | |
Omnicom Group, Inc. | | | 124 | | | $ | 8,442 | |
The Interpublic Group of Cos., Inc. | | | 236 | | | | 8,630 | |
| | | | | | | | 17,072 | |
Aerospace/Defense — 1.2% | | | | |
General Dynamics Corp. | | | 140 | | | | 28,385 | |
Howmet Aerospace, Inc. | | | 233 | | | | 6,918 | |
L3Harris Technologies, Inc. | | | 120 | | | | 27,665 | |
Lockheed Martin Corp. | | | 145 | | | | 48,186 | |
Northrop Grumman Corp. | | | 91 | | | | 32,507 | |
Raytheon Technologies Corp. | | | 892 | | | | 79,263 | |
Teledyne Technologies, Inc. (a) | | | 26 | | | | 11,680 | |
The Boeing Co. (a) | | | 330 | | | | 68,320 | |
TransDigm Group, Inc. (a) | | | 28 | | | | 17,467 | |
| | | | | | | | 320,391 | |
Agriculture — 0.6% | | | | |
Altria Group, Inc. | | | 1,088 | | | | 47,992 | |
Archer-Daniels-Midland Co. | | | 333 | | | | 21,392 | |
Philip Morris International, Inc. | | | 919 | | | | 86,882 | |
| | | | | | | | 156,266 | |
Airlines — 0.2% | | | | |
Alaska Air Group, Inc. (a) | | | 73 | | | | 3,854 | |
American Airlines Group, Inc. (a) | | | 384 | | | | 7,373 | |
Delta Air Lines, Inc. (a) | | | 381 | | | | 14,909 | |
Southwest Airlines Co. (a) | | | 354 | | | | 16,737 | |
United Airlines Holdings, Inc. (a) | | | 192 | | | | 8,859 | |
| | | | | | | | 51,732 | |
Apparel — 0.6% | | | | |
Hanesbrands, Inc. | | | 210 | | | | 3,578 | |
NIKE, Inc. - Class B | | | 762 | | | | 127,475 | |
PVH Corp. (a) | | | 44 | | | | 4,811 | |
Ralph Lauren Corp. | | | 27 | | | | 3,434 | |
Tapestry, Inc. | | | 166 | | | | 6,471 | |
Under Armour, Inc. - Class A (a) | | | 115 | | | | 2,525 | |
Under Armour, Inc. - Class C (a) | | | 122 | | | | 2,303 | |
VF Corp. | | | 193 | | | | 14,066 | |
| | | | | | | | 164,663 | |
Auto Manufacturers — 2.6% | | | | |
Cummins, Inc. | | | 89 | | | | 21,346 | |
Ford Motor Co. (a) | | | 2,329 | | | | 39,779 | |
General Motors Co. (a) | | | 862 | | | | 46,919 | |
PACCAR, Inc. | | | 210 | | | | 18,820 | |
Tesla Motors, Inc. (a) | | | 481 | | | | 535,834 | |
| | | | | | | | 662,698 | |
Auto Parts & Equipment — 0.1% | | | | |
Aptiv PLC (a) | | | 163 | | | | 28,181 | |
BorgWarner, Inc. | | | 142 | | | | 6,400 | |
| | | | | | | | 34,581 | |
| | | Shares | | | Value | |
Banks — 4.8% | | | | |
Bank of America Corp. | | | 4,394 | | | $ | 209,945 | |
Citigroup, Inc. | | | 1,202 | | | | 83,130 | |
Citizens Financial Group, Inc. | | | 257 | | | | 12,177 | |
Comerica, Inc. | | | 76 | | | | 6,467 | |
Fifth Third Bancorp | | | 409 | | | | 17,804 | |
First Republic Bank | | | 101 | | | | 21,849 | |
Huntington Bancshares, Inc. | | | 871 | | | | 13,709 | |
JPMorgan Chase & Co. | | | 1,774 | | | | 301,385 | |
KeyCorp. | | | 571 | | | | 13,287 | |
M&T Bank Corp. | | | 74 | | | | 10,887 | |
Morgan Stanley | | | 865 | | | | 88,905 | |
Northern Trust Corp. | | | 122 | | | | 15,011 | |
Regions Financial Corp. | | | 570 | | | | 13,498 | |
State Street Corp. | | | 198 | | | | 19,513 | |
SVB Financial Group (a) | | | 30 | | | | 21,522 | |
The Bank of New York Mellon Corp. | | | 474 | | | | 28,061 | |
The Goldman Sachs Group, Inc. | | | 196 | | | | 81,017 | |
The PNC Financial Services Group, Inc. | | | 247 | | | | 52,124 | |
Truist Financial Corp. | | | 792 | | | | 50,268 | |
US Bancorp | | | 797 | | | | 48,115 | |
Wells Fargo & Co. | | | 2,431 | | | | 124,370 | |
Zions Bancorp | | | 96 | | | | 6,047 | |
| | | | | | | | 1,239,091 | |
Beverages — 1.2% | | | | |
Brown-Forman Corp. - Class B | | | 113 | | | | 7,672 | |
Constellation Brands, Inc. - Class A | | | 98 | | | | 21,247 | |
Molson Coors Brewing Co. - Class B | | | 115 | | | | 5,070 | |
Monster Beverage Corp. (a) | | | 220 | | | | 18,700 | |
PepsiCo, Inc. | | | 818 | | | | 132,189 | |
The Coca-Cola Co. | | | 2,305 | | | | 129,933 | |
| | | | | | | | 314,811 | |
Biotechnology — 1.4% | | | | |
Amgen, Inc. | | | 337 | | | | 69,749 | |
Biogen, Inc. (a) | | | 91 | | | | 24,268 | |
Bio-Rad Laboratories, Inc. - Class A (a) | | | 17 | | | | 13,509 | |
Corteva, Inc. | | | 434 | | | | 18,727 | |
Gilead Sciences, Inc. | | | 744 | | | | 48,271 | |
Illumina, Inc. (a) | | | 90 | | | | 37,355 | |
Incyte Corp. (a) | | | 114 | | | | 7,636 | |
Moderna, Inc. (a) | | | 211 | | | | 72,839 | |
Regeneron Pharmaceuticals, Inc. (a) | | | 66 | | | | 42,236 | |
Vertex Pharmaceuticals, Inc. (a) | | | 149 | | | | 27,555 | |
| | | | | | | | 362,145 | |
Building Materials — 0.4% | | | | |
Carrier Global Corp. | | | 510 | | | | 26,637 | |
Fortune Brands Home & Security, Inc. | | | 77 | | | | 7,808 | |
The accompanying notes are an integral part of the financial statements.
128
Pacer Metaurus US Large Cap Dividend Multiplier 400 ETF
SCHEDULE OF INVESTMENTS
October 31, 2021 (Unaudited) (Continued)
| | | Shares | | | Value | |
COMMON STOCKS — 87.2% (Continued) |
Building Materials — 0.4% (Continued) |
Johnson Controls International PLC | | | 426 | | | $ | 31,256 | |
Martin Marietta Materials, Inc. | | | 41 | | | | 16,106 | |
Masco Corp. | | | 145 | | | | 9,505 | |
Vulcan Materials Co. | | | 76 | | | | 14,449 | |
| | | | | | | | 105,761 | |
Chemicals — 1.5% | | | | |
Air Products & Chemicals, Inc. | | | 126 | | | | 37,776 | |
Albemarle Corp. | | | 70 | | | | 17,533 | |
Celanese Corp. | | | 68 | | | | 10,983 | |
CF Industries Holdings, Inc. | | | 124 | | | | 7,043 | |
Dow, Inc. | | | 438 | | | | 24,515 | |
DuPont de Nemours, Inc. | | | 310 | | | | 21,576 | |
Eastman Chemical Co. | | | 77 | | | | 8,010 | |
Ecolab, Inc. | | | 146 | | | | 32,444 | |
FMC Corp. | | | 74 | | | | 6,735 | |
International Flavors & Fragrances, Inc. | | | 146 | | | | 21,528 | |
Linde PLC | | | 308 | | | | 98,314 | |
LyondellBasell Industries NV | | | 161 | | | | 14,944 | |
Mosaic Co. | | | 209 | | | | 8,688 | |
PPG Industries, Inc. | | | 141 | | | | 22,640 | |
The Sherwin-Williams Co. | | | 144 | | | | 45,592 | |
| | | | | | | | 378,321 | |
Commercial Services — 2.0% | | | | |
Automatic Data Processing, Inc. | | | 246 | | | | 55,224 | |
Cintas Corp. | | | 50 | | | | 21,655 | |
Equifax, Inc. | | | 72 | | | | 19,975 | |
FleetCor Technologies, Inc. (a) | | | 49 | | | | 12,123 | |
Gartner, Inc. (a) | | | 49 | | | | 16,264 | |
Global Payments, Inc. | | | 171 | | | | 24,451 | |
IHS Markit Ltd. | | | 237 | | | | 30,981 | |
MarketAxess Holdings, Inc. | | | 22 | | | | 8,991 | |
Moody’s Corp. | | | 96 | | | | 38,798 | |
Nielsen Holdings PLC | | | 213 | | | | 4,313 | |
PayPal Holdings, Inc. (a) | | | 697 | | | | 162,115 | |
Quanta Services, Inc. | | | 78 | | | | 9,460 | |
Robert Half International, Inc. | | | 68 | | | | 7,689 | |
Rollins, Inc. | | | 138 | | | | 4,862 | |
S&P Global, Inc. | | | 142 | | | | 67,331 | |
United Rentals, Inc. (a) | | | 44 | | | | 16,681 | |
Verisk Analytics, Inc. | | | 96 | | | | 20,186 | |
| | | | | | | | 521,099 | |
Computers — 6.7% | | | | |
Accenture PLC - Class A | | | 379 | | | | 135,981 | |
Apple, Inc. | | | 9,307 | | | | 1,394,189 | |
Cognizant Technology Solutions Corp. | | | 312 | | | | 24,364 | |
DXC Technology Co. (a) | | | 147 | | | | 4,788 | |
| | | Shares | | | Value | |
Computers — 6.7% (Continued) |
Fortinet, Inc. (a) | | | 77 | | | $ | 25,898 | |
Hewlett Packard Enterprise Co. | | | 772 | | | | 11,310 | |
HP, Inc. | | | 715 | | | | 21,686 | |
International Business Machines Corp. | | | 530 | | | | 66,303 | |
Leidos Holdings, Inc. | | | 79 | | | | 7,898 | |
NetApp, Inc. | | | 137 | | | | 12,234 | |
Seagate Technology Holdings PLC | | | 122 | | | | 10,867 | |
Western Digital Corp. (a) | | | 186 | | | | 9,726 | |
| | | | | | | | 1,725,244 | |
Cosmetics/Personal Care — 1.1% | | | | |
Colgate-Palmolive Co. | | | 501 | | | | 38,171 | |
The Estee Lauder Cos., Inc. | | | 140 | | | | 45,406 | |
The Procter & Gamble Co. | | | 1,441 | | | | 206,049 | |
| | | | | | | | 289,626 | |
Distribution/Wholesale — 0.3% | | | | |
Copart, Inc. (a) | | | 123 | | | | 19,100 | |
Fastenal Co. | | | 339 | | | | 19,350 | |
LKQ Corp. (a) | | | 163 | | | | 8,978 | |
Pool Corp. | | | 24 | | | | 12,364 | |
W.W. Grainger, Inc. | | | 25 | | | | 11,578 | |
| | | | | | | | 71,370 | |
Diversified Financial Services — 3.4% | | | | |
American Express Co. | | | 382 | | | | 66,384 | |
Ameriprise Financial, Inc. | | | 69 | | | | 20,847 | |
BlackRock, Inc. | | | 89 | | | | 83,968 | |
Capital One Financial Corp. | | | 264 | | | | 39,872 | |
Cboe Global Markets, Inc. | | | 66 | | | | 8,708 | |
CME Group, Inc. | | | 213 | | | | 46,977 | |
Discover Financial Services | | | 173 | | | | 19,604 | |
Franklin Resources, Inc. | | | 168 | | | | 5,290 | |
Intercontinental Exchange, Inc. | | | 334 | | | | 46,246 | |
Invesco Ltd. | | | 198 | | | | 5,031 | |
MasterCard, Inc. - Class A | | | 511 | | | | 171,451 | |
Nasdaq, Inc. | | | 70 | | | | 14,691 | |
Raymond James Financial, Inc. | | | 104 | | | | 10,253 | |
Synchrony Financial | | | 337 | | | | 15,654 | |
T Rowe Price Group, Inc. | | | 138 | | | | 29,929 | |
The Charles Schwab Corp. | | | 890 | | | | 73,007 | |
The Western Union Co. | | | 241 | | | | 4,391 | |
Visa, Inc. - Class A | | | 1,004 | | | | 212,617 | |
| | | | | | | | 874,920 | |
Electric — 2.0% | | | | |
Alliant Energy Corp. | | | 146 | | | | 8,259 | |
Ameren Corp. | | | 149 | | | | 12,559 | |
American Electric Power Co., Inc. | | | 293 | | | | 24,820 | |
CenterPoint Energy, Inc. | | | 355 | | | | 9,244 | |
CMS Energy Corp. | | | 170 | | | | 10,260 | |
Consolidated Edison, Inc. | | | 212 | | | | 15,985 | |
The accompanying notes are an integral part of the financial statements.
129
Pacer Metaurus US Large Cap Dividend Multiplier 400 ETF
SCHEDULE OF INVESTMENTS
October 31, 2021 (Unaudited) (Continued)
| | | Shares | | | Value | |
COMMON STOCKS — 87.2% (Continued) |
Electric — 2.0% (Continued) |
Dominion Energy, Inc. | | | 480 | | | $ | 36,446 | |
DTE Energy Co. | | | 116 | | | | 13,149 | |
Duke Energy Corp. | | | 456 | | | | 46,517 | |
Edison International | | | 221 | | | | 13,908 | |
Entergy Corp. | | | 120 | | | | 12,362 | |
Evergy, Inc. | | | 139 | | | | 8,861 | |
Eversource Energy | | | 199 | | | | 16,895 | |
Exelon Corp. | | | 578 | | | | 30,744 | |
FirstEnergy Corp. | | | 318 | | | | 12,253 | |
NextEra Energy, Inc. | | | 1,159 | | | | 98,897 | |
NRG Energy, Inc. | | | 145 | | | | 5,784 | |
Pinnacle West Capital Corp. | | | 68 | | | | 4,385 | |
PPL Corp. | | | 456 | | | | 13,133 | |
Public Service Enterprise Group, Inc. | | | 295 | | | | 18,821 | |
Sempra Energy | | | 190 | | | | 24,250 | |
Southern Co. | | | 626 | | | | 39,012 | |
The AES Corp. | | | 390 | | | | 9,801 | |
WEC Energy Group, Inc. | | | 188 | | | | 16,931 | |
Xcel Energy, Inc. | | | 316 | | | | 20,410 | |
| | | | | | | | 523,686 | |
Electrical Components & Equipment — 0.3% | | | | |
AMETEK, Inc. | | | 139 | | | | 18,404 | |
Emerson Electric Co. | | | 356 | | | | 34,535 | |
Generac Holdings, Inc. (a) | | | 41 | | | | 20,441 | |
| | | | | | | | 73,380 | |
Electronics — 1.1% | | | | |
Agilent Technologies, Inc. | | | 175 | | | | 27,561 | |
Allegion PLC | | | 51 | | | | 6,543 | |
Amphenol Corp. | | | 356 | | | | 27,330 | |
Fortive Corp. | | | 213 | | | | 16,126 | |
Garmin Ltd. | | | 92 | | | | 13,211 | |
Honeywell International, Inc. | | | 409 | | | | 89,416 | |
Keysight Technologies, Inc. (a) | | | 113 | | | | 20,342 | |
Mettler-Toledo International, Inc. (a) | | | 17 | | | | 25,175 | |
TE Connectivity Ltd. | | | 193 | | | | 28,178 | |
Trimble, Inc. (a) | | | 147 | | | | 12,843 | |
Waters Corp. (a) | | | 41 | | | | 15,070 | |
| | | | | | | | 281,795 | |
Energy-Alternate Sources — 0.1% | | | | |
Enphase Energy, Inc. (a) | | | 76 | | | | 17,604 | |
| | | | | |
Engineering & Construction — 0.0% (c) | | | | |
Jacobs Engineering Group, Inc. | | | 75 | | | | 10,531 | |
| | | | | |
Entertainment — 0.1% | | | | |
Caesars Entertainment, Inc. (a) | | | 124 | | | | 13,573 | |
Live Nation Entertainment, Inc. (a) | | | 75 | | | | 7,586 | |
| | | Shares | | | Value | |
Entertainment — 0.1% (Continued) |
Penn National Gaming, Inc. (a) | | | 93 | | | $ | 6,659 | |
| | | | | | | | 27,818 | |
Environmental Control — 0.2% | | | | |
Pentair PLC | | | 97 | | | | 7,175 | |
Republic Services, Inc. | | | 123 | | | | 16,556 | |
Waste Management, Inc. | | | 234 | | | | 37,494 | |
| | | | | | | | 61,225 | |
Food — 0.8% | | | | |
Campbell Soup Co. | | | 120 | | | | 4,794 | |
Conagra Brands, Inc. | | | 285 | | | | 9,177 | |
General Mills, Inc. | | | 360 | | | | 22,248 | |
Hormel Foods Corp. | | | 168 | | | | 7,110 | |
Kellogg Co. | | | 148 | | | | 9,072 | |
Lamb Weston Holdings, Inc. | | | 90 | | | | 5,080 | |
McCormick & Co., Inc. | | | 146 | | | | 11,714 | |
Mondelez International, Inc. | | | 823 | | | | 49,989 | |
Sysco Corp. | | | 307 | | | | 23,608 | |
The Hershey Co. | | | 90 | | | | 15,781 | |
The JM Smucker Co. | | | 67 | | | | 8,232 | |
The Kraft Heinz Co. | | | 402 | | | | 14,428 | |
The Kroger Co. | | | 405 | | | | 16,208 | |
Tyson Foods, Inc. - Class A | | | 172 | | | | 13,755 | |
| | | | | | | | 211,196 | |
Forest Products & Paper — 0.0% (c) | | | | |
International Paper Co. | | | 235 | | | | 11,672 | |
Sylvamo Corp. (a) | | | 0 | | | | 13 | |
| | | | | | | | 11,685 | |
Gas — 0.1% | | | | |
Atmos Energy Corp. | | | 75 | | | | 6,909 | |
NiSource, Inc. | | | 235 | | | | 5,797 | |
| | | | | | | | 12,706 | |
Hand/Machine Tools — 0.1% | | | | |
Snap-On, Inc. | | | 28 | | | | 5,690 | |
Stanley Black & Decker, Inc. | | | 96 | | | | 17,254 | |
| | | | | | | | 22,944 | |
Healthcare-Products — 3.6% | | | | |
Abbott Laboratories | | | 1,053 | | | | 135,721 | |
ABIOMED, Inc. (a) | | | 26 | | | | 8,633 | |
Align Technology, Inc. (a) | | | 45 | | | | 28,097 | |
Baxter International, Inc. | | | 293 | | | | 23,135 | |
Bio-Techne Corp. | | | 24 | | | | 12,568 | |
Boston Scientific Corp. (a) | | | 843 | | | | 36,359 | |
Danaher Corp. | | | 379 | | | | 118,161 | |
DENTSPLY SIRONA, Inc. | | | 125 | | | | 7,151 | |
Edwards Lifesciences Corp. (a) | | | 365 | | | | 43,734 | |
Henry Schein, Inc. (a) | | | 78 | | | | 5,955 | |
Hologic, Inc. (a) | | | 148 | | | | 10,850 | |
IDEXX Laboratories, Inc. (a) | | | 49 | | | | 32,641 | |
Intuitive Surgical, Inc. (a) | | | 212 | | | | 76,559 | |
The accompanying notes are an integral part of the financial statements.
130
Pacer Metaurus US Large Cap Dividend Multiplier 400 ETF
SCHEDULE OF INVESTMENTS
October 31, 2021 (Unaudited) (Continued)
| | | Shares | | | Value | |
COMMON STOCKS — 87.2% (Continued) |
Healthcare-Products — 3.6% (Continued) |
Medtronic PLC | | | 795 | | | $ | 95,289 | |
PerkinElmer, Inc. | | | 68 | | | | 12,028 | |
ResMed, Inc. | | | 90 | | | | 23,662 | |
STERIS PLC | | | 54 | | | | 12,622 | |
Stryker Corp. | | | 196 | | | | 52,150 | |
Teleflex, Inc. | | | 26 | | | | 9,280 | |
The Cooper Cos., Inc. | | | 27 | | | | 11,257 | |
Thermo Fisher Scientific, Inc. | | | 236 | | | | 149,404 | |
West Pharmaceutical Services, Inc. | | | 45 | | | | 19,345 | |
Zimmer Biomet Holdings, Inc. | | | 122 | | | | 17,461 | |
| | | | | | | | 942,062 | |
Healthcare-Services — 2.0% | | | | |
Anthem, Inc. | | | 144 | | | | 62,659 | |
Catalent, Inc. (a) | | | 99 | | | | 13,648 | |
Centene Corp. (a) | | | 341 | | | | 24,293 | |
Charles River Laboratories International, Inc. (a) | | | 27 | | | | 12,114 | |
DaVita, Inc. (a) | | | 43 | | | | 4,439 | |
HCA Healthcare, Inc. | | | 145 | | | | 36,317 | |
Humana, Inc. | | | 74 | | | | 34,274 | |
IQVIA Holdings, Inc. (a) | | | 116 | | | | 30,325 | |
Laboratory Corp. of American Holdings (a) | | | 53 | | | | 15,212 | |
Quest Diagnostics, Inc. | | | 72 | | | | 10,568 | |
UnitedHealth Group, Inc. | | | 556 | | | | 256,021 | |
Universal Health Services, Inc. - Class B | | | 45 | | | | 5,585 | |
| | | | | | | | 505,455 | |
Home Builders — 0.2% | | | | |
DR Horton, Inc. | | | 193 | | | | 17,229 | |
Lennar Corp. - Class A | | | 164 | | | | 16,389 | |
PulteGroup, Inc. | | | 149 | | | | 7,164 | |
| | | | | | | | 40,782 | |
Home Furnishings — 0.1% | | | | |
Leggett & Platt, Inc. | | | 76 | | | | 3,561 | |
Whirlpool Corp. | | | 41 | | | | 8,644 | |
| | | | | | | | 12,205 | |
Household Products/Wares — 0.2% | | | | |
Avery Dennison Corp. | | | 49 | | | | 10,668 | |
Church & Dwight Co., Inc. | | | 145 | | | | 12,667 | |
Kimberly-Clark Corp. | | | 196 | | | | 25,380 | |
The Clorox Co. | | | 72 | | | | 11,737 | |
| | | | | | | | 60,452 | |
Housewares — 0.0% (c) | | | | |
Newell Brands, Inc. | | | 221 | | | | 5,059 | |
| | | | | |
Insurance — 2.9% | | | | |
Aflac, Inc. | | | 363 | | | | 19,482 | |
| | | Shares | | | Value | |
Insurance — 2.9% (Continued) |
American International Group, Inc. | | | 506 | | | $ | 29,900 | |
Aon PLC | | | 138 | | | | 44,149 | |
Arthur J Gallagher & Co. | | | 121 | | | | 20,288 | |
Assurant, Inc. | | | 30 | | | | 4,839 | |
Berkshire Hathaway, Inc. - Class B (a) | | | 1,101 | | | | 315,998 | |
Brown & Brown, Inc. | | | 140 | | | | 8,835 | |
Chubb Ltd. | | | 261 | | | | 50,994 | |
Cincinnati Financial Corp. | | | 91 | | | | 11,051 | |
Everest Re Group Ltd. | | | 24 | | | | 6,276 | |
Globe Life, Inc. | | | 52 | | | | 4,629 | |
Lincoln National Corp. | | | 101 | | | | 7,287 | |
Loews Corp. | | | 120 | | | | 6,728 | |
Marsh & McLennan Cos., Inc. | | | 295 | | | | 49,206 | |
MetLife, Inc. | | | 432 | | | | 27,130 | |
Principal Financial Group, Inc. | | | 146 | | | | 9,795 | |
Prudential Financial, Inc. | | | 233 | | | | 25,642 | |
The Allstate Corp. | | | 172 | | | | 21,271 | |
The Hartford Financial Services Group, Inc. | | | 210 | | | | 15,315 | |
The Progressive Corp. | | | 342 | | | | 32,449 | |
The Travelers Cos., Inc. | | | 146 | | | | 23,489 | |
W R Berkley Corp. | | | 78 | | | | 6,209 | |
Willis Towers Watson PLC | | | 74 | | | | 17,929 | |
| | | | | | | | 758,891 | |
Internet — 10.6% | | | | |
Alphabet, Inc. - Class A (a) | | | 174 | | | | 515,200 | |
Alphabet, Inc. - Class C (a) | | | 168 | | | | 498,189 | |
Amazon.com, Inc. (a) | | | 260 | | | | 876,832 | |
Booking Holdings, Inc. (a) | | | 24 | | | | 58,099 | |
CDW Corp. | | | 77 | | | | 14,372 | |
eBay, Inc. | | | 385 | | | | 29,537 | |
Etsy, Inc. (a) | | | 74 | | | | 18,551 | |
Expedia Group, Inc. (a) | | | 90 | | | | 14,797 | |
F5 Networks, Inc. (a) | | | 30 | | | | 6,334 | |
Match Group, Inc. (a) | | | 165 | | | | 24,879 | |
Meta Platforms, Inc. - Class A (a) | | | 1,416 | | | | 458,175 | |
Netflix, Inc. (a) | | | 262 | | | | 180,861 | |
NortonLifeLock, Inc. | | | 341 | | | | 8,678 | |
Twitter, Inc. (a) | | | 476 | | | | 25,485 | |
VeriSign, Inc. (a) | | | 53 | | | | 11,802 | |
| | | | | | | | 2,741,791 | |
Iron/Steel — 0.1% | | | | |
Nucor Corp. | | | 171 | | | | 19,092 | |
| | | | | |
Leisure Time — 0.1% | | | | |
Carnival Corp. (a) | | | 476 | | | | 10,548 | |
Norwegian Cruise Line Holdings Ltd. (a) | | | 218 | | | | 5,607 | |
The accompanying notes are an integral part of the financial statements.
131
Pacer Metaurus US Large Cap Dividend Multiplier 400 ETF
SCHEDULE OF INVESTMENTS
October 31, 2021 (Unaudited) (Continued)
| | | Shares | | | Value | |
COMMON STOCKS — 87.2% (Continued) |
Leisure Time — 0.1% (Continued) |
Royal Caribbean Cruises Ltd. (a) | | | 137 | | | $ | 11,567 | |
| | | | | | | | 27,722 | |
Lodging — 0.3% | | | | |
Hilton Worldwide Holdings, Inc. (a) | | | 166 | | | | 23,896 | |
Las Vegas Sands Corp. (a) | | | 199 | | | | 7,723 | |
Marriott International, Inc. (a) | | | 164 | | | | 26,243 | |
MGM Resorts International | | | 238 | | | | 11,224 | |
Wynn Resorts Ltd. (a) | | | 66 | | | | 5,927 | |
| | | | | | | | 75,013 | |
Machinery-Construction & Mining — 0.3% | | | | |
Caterpillar, Inc. | | | 329 | | | | 67,119 | |
| | | | | |
Machinery-Diversified — 0.6% | | | | |
Deere & Co. | | | 168 | | | | 57,508 | |
Dover Corp. | | | 89 | | | | 15,048 | |
IDEX Corp. | | | 45 | | | | 10,016 | |
Ingersoll Rand, Inc. (a) | | | 240 | | | | 12,902 | |
Otis Worldwide Corp. | | | 257 | | | | 20,640 | |
Rockwell Automation, Inc. | | | 69 | | | | 22,039 | |
Westinghouse Air Brake Technologies Corp. | | | 115 | | | | 10,434 | |
Xylem, Inc. | | | 102 | | | | 13,320 | |
| | | | | | | | 161,907 | |
Media — 1.6% | | | | |
Charter Communications, Inc. - Class A (a) | | | 74 | | | | 49,942 | |
Comcast Corp. - Class A | | | 2,716 | | | | 139,684 | |
Discovery, Inc. - Class A (a) | | | 98 | | | | 2,297 | |
Discovery, Inc. - Class C (a) | | | 175 | | | | 3,948 | |
DISH Network Corp. - Class A (a) | | | 146 | | | | 5,996 | |
Fox Corp. - Class A | | | 192 | | | | 7,630 | |
Fox Corp. - Class B | | | 91 | | | | 3,363 | |
News Corp. - Class A | | | 235 | | | | 5,382 | |
News Corp. - Class B | | | 72 | | | | 1,624 | |
The Walt Disney Co. (a) | | | 1,078 | | | | 182,258 | |
ViacomCBS, Inc. - Class B | | | 360 | | | | 13,039 | |
| | | | | | | | 415,163 | |
Mining — 0.2% | | | | |
Freeport-McMoRan, Inc. | | | 868 | | | | 32,741 | |
Newmont Goldcorp Corp. | | | 476 | | | | 25,704 | |
| | | | | | | | 58,445 | |
Miscellaneous Manufactur — 1.0% | | | | |
3M Co. | | | 340 | | | | 60,751 | |
A O Smith Corp. | | | 76 | | | | 5,553 | |
Eaton Corp. PLC | | | 237 | | | | 39,048 | |
General Electric Co. | | | 650 | | | | 68,166 | |
Illinois Tool Works, Inc. | | | 169 | | | | 38,510 | |
Parker-Hannifin Corp. | | | 74 | | | | 21,948 | |
| | | Shares | | | Value | |
Miscellaneous Manufactur — 1.0% (Continued) |
Textron, Inc. | | | 137 | | | $ | 10,117 | |
Trane Technologies PLC | | | 141 | | | | 25,511 | |
| | | | | | | | 269,604 | |
Office/Business Equipment — 0.1% | | | | |
Zebra Technologies Corp. (a) | | | 28 | | | | 14,951 | |
| | | | | |
Oil & Gas — 2.1% | | | | |
APA Corp. | | | 221 | | | | 5,793 | |
Cabot Oil & Gas Corp. | | | 238 | | | | 5,074 | |
Chevron Corp. | | | 1,149 | | | | 131,549 | |
ConocoPhillips | | | 794 | | | | 59,145 | |
Devon Energy Corp. | | | 377 | | | | 15,110 | |
Diamondback Energy, Inc. | | | 99 | | | | 10,612 | |
EOG Resources, Inc. | | | 342 | | | | 31,621 | |
Exxon Mobil Corp. | | | 2,505 | | | | 161,497 | |
Hess Corp. | | | 165 | | | | 13,624 | |
Marathon Oil Corp. | | | 463 | | | | 7,556 | |
Marathon Petroleum Corp. | | | 380 | | | | 25,053 | |
Occidental Petroleum Corp. | | | 526 | | | | 17,637 | |
Phillips 66 | | | 261 | | | | 19,518 | |
Pioneer Natural Resources Co. | | | 138 | | | | 25,803 | |
Valero Energy Corp. | | | 241 | | | | 18,637 | |
| | | | | | | | 548,229 | |
Oil & Gas Services — 0.2% | | | | |
Baker Hughes Co. | | | 486 | | | | 12,189 | |
Halliburton Co. | | | 528 | | | | 13,195 | |
Schlumberger Ltd. | | | 824 | | | | 26,582 | |
| | | | | | | | 51,966 | |
Packaging & Containers — 0.2% | | | | |
Amcor PLC | | | 914 | | | | 11,032 | |
Ball Corp. | | | 193 | | | | 17,656 | |
Packaging Corp. of America | | | 53 | | | | 7,281 | |
Sealed Air Corp. | | | 91 | | | | 5,398 | |
Westrock Co. | | | 162 | | | | 7,792 | |
| | | | | | | | 49,159 | |
Pharmaceuticals — 4.5% | | | | |
AbbVie, Inc. | | | 1,051 | | | | 120,518 | |
AmerisourceBergen Corp. | | | 91 | | | | 11,104 | |
Becton Dickinson and Co. | | | 169 | | | | 40,491 | |
Bristol-Myers Squibb Co. | | | 1,320 | | | | 77,088 | |
Cardinal Health, Inc. | | | 170 | | | | 8,128 | |
Cigna Corp. | | | 197 | | | | 42,081 | |
CVS Health Corp. | | | 786 | | | | 70,174 | |
DexCom, Inc. (a) | | | 53 | | | | 33,030 | |
Eli Lilly & Co. | | | 474 | | | | 120,756 | |
Johnson & Johnson | | | 1,561 | | | | 254,256 | |
McKesson Corp. | | | 93 | | | | 19,333 | |
Merck & Co., Inc. | | | 1,496 | | | | 131,723 | |
Organon & Co. | | | 148 | | | | 5,439 | |
The accompanying notes are an integral part of the financial statements.
132
Pacer Metaurus US Large Cap Dividend Multiplier 400 ETF
SCHEDULE OF INVESTMENTS
October 31, 2021 (Unaudited) (Continued)
| | | Shares | | | Value | |
COMMON STOCKS — 87.2% (Continued) |
Pharmaceuticals — 4.5% (Continued) |
Pfizer, Inc. | | | 3,321 | | | $ | 145,260 | |
Viatris, Inc. | | | 718 | | | | 9,585 | |
Zoetis, Inc. | | | 283 | | | | 61,185 | |
| | | | | | | | 1,150,151 | |
Pipelines — 0.2% | | | | |
Kinder Morgan, Inc. | | | 1,155 | | | | 19,346 | |
ONEOK, Inc. | | | 264 | | | | 16,796 | |
Williams Cos., Inc. | | | 721 | | | | 20,253 | |
| | | | | | | | 56,395 | |
Real Estate — 0.1% | | | | |
CBRE Group, Inc. (a) | | | 196 | | | | 20,400 | |
| | | | | |
Retail — 4.7% | | | | |
Advance Auto Parts, Inc. | | | 42 | | | | 9,472 | |
AutoZone, Inc. (a) | | | 17 | | | | 30,342 | |
Bath & Body Works, Inc. (a) | | | 151 | | | | 10,433 | |
Best Buy Co., Inc. | | | 137 | | | | 16,747 | |
CarMax, Inc. (a) | | | 96 | | | | 13,144 | |
Chipotle Mexican Grill, Inc. (a) | | | 19 | | | | 33,802 | |
Costco Wholesale Corp. | | | 262 | | | | 128,783 | |
Darden Restaurants, Inc. | | | 75 | | | | 10,810 | |
Dollar General Corp. | | | 141 | | | | 31,234 | |
Dollar Tree, Inc. (a) | | | 140 | | | | 15,086 | |
Domino’s Pizza, Inc. | | | 22 | | | | 10,757 | |
Genuine Parts Co. | | | 89 | | | | 11,669 | |
Lowe’s Cos., Inc. | | | 414 | | | | 96,801 | |
McDonald’s Corp. | | | 438 | | | | 107,551 | |
O’Reilly Automotive, Inc. (a) | | | 43 | | | | 26,760 | |
Ross Stores, Inc. | | | 213 | | | | 24,112 | |
Starbucks Corp. | | | 698 | | | | 74,037 | |
Target Corp. | | | 291 | | | | 75,549 | |
The Gap, Inc. | | | 124 | | | | 2,814 | |
The Home Depot, Inc. | | | 628 | | | | 233,453 | |
The TJX Cos., Inc. | | | 717 | | | | 46,956 | |
Tractor Supply Co. | | | 69 | | | | 14,985 | |
Ulta Beauty, Inc. (a) | | | 29 | | | | 10,653 | |
Walgreens Boots Alliance, Inc. | | | 428 | | | | 20,125 | |
Walmart, Inc. | | | 845 | | | | 126,260 | |
Yum! Brands, Inc. | | | 172 | | | | 21,490 | |
| | | | | | | | 1,203,825 | |
Savings & Loans — 0.0% (c) | | | | |
People’s United Financial, Inc. | | | 258 | | | | 4,422 | |
| | | | | |
Semiconductors — 5.0% | | | | |
Advanced Micro Devices, Inc. (a) | | | 720 | | | | 86,566 | |
Analog Devices, Inc. | | | 316 | | | | 54,823 | |
Applied Materials, Inc. | | | 546 | | | | 74,611 | |
Broadcom, Inc. | | | 242 | | | | 128,664 | |
| | | Shares | | | Value | |
Semiconductors — 5.0% (Continued) |
Intel Corp. | | | 2,405 | | | $ | 117,845 | |
IPG Photonics Corp. (a) | | | 22 | | | | 3,498 | |
KLA Corp. | | | 92 | | | | 34,294 | |
Lam Research Corp. | | | 89 | | | | 50,158 | |
Microchip Technology, Inc. | | | 329 | | | | 24,376 | |
Micron Technology, Inc. | | | 669 | | | | 46,228 | |
Monolithic Power Systems, Inc. | | | 25 | | | | 13,136 | |
NVIDIA Corp. | | | 1,472 | | | | 376,346 | |
NXP Semiconductors NV | | | 161 | | | | 32,339 | |
Qorvo, Inc. (a) | | | 68 | | | | 11,440 | |
QUALCOMM, Inc. | | | 670 | | | | 89,137 | |
Skyworks Solutions, Inc. | | | 97 | | | | 16,212 | |
Teradyne, Inc. | | | 97 | | | | 13,409 | |
Texas Instruments, Inc. | | | 549 | | | | 102,926 | |
Xilinx, Inc. | | | 146 | | | | 26,280 | |
| | | | | | | | 1,302,288 | |
Shipbuilding — 0.0% (c) | | | | |
Huntington Ingalls Industries, Inc. | | | 24 | | | | 4,865 | |
| | | | | |
Software — 9.9% | | | | |
Activision Blizzard, Inc. | | | 459 | | | | 35,889 | |
Adobe, Inc. (a) | | | 284 | | | | 184,702 | |
Akamai Technologies, Inc. (a) | | | 96 | | | | 10,124 | |
ANSYS, Inc. (a) | | | 50 | | | | 18,979 | |
Autodesk, Inc. (a) | | | 126 | | | | 40,019 | |
Broadridge Financial Solutions, Inc. | | | 69 | | | | 12,310 | |
Cadence Design System, Inc. (a) | | | 165 | | | | 28,563 | |
Ceridian HCM Holding, Inc. (a) | | | 76 | | | | 9,519 | |
Cerner Corp. | | | 172 | | | | 12,778 | |
Citrix Systems, Inc. | | | 73 | | | | 6,915 | |
Electronic Arts, Inc. | | | 169 | | | | 23,702 | |
Fidelity National Information Services, Inc. | | | 364 | | | | 40,309 | |
Fiserv, Inc. (a) | | | 356 | | | | 35,063 | |
Intuit, Inc. | | | 164 | | | | 102,662 | |
Jack Henry & Associates, Inc. | | | 45 | | | | 7,492 | |
Microsoft Corp. | | | 4,451 | | | | 1,476,041 | |
MSCI, Inc. | | | 49 | | | | 32,579 | |
Oracle Corp. | | | 980 | | | | 94,021 | |
Paychex, Inc. | | | 190 | | | | 23,423 | |
Paycom Software, Inc. (a) | | | 26 | | | | 14,244 | |
PTC, Inc. (a) | | | 66 | | | | 8,405 | |
Roper Technologies, Inc. | | | 66 | | | | 32,200 | |
salesforce.com, Inc. (a) | | | 576 | | | | 172,622 | |
ServiceNow, Inc. (a) | | | 118 | | | | 82,336 | |
Synopsys, Inc. (a) | | | 92 | | | | 30,653 | |
Take-Two Interactive Software, Inc. (a) | | | 69 | | | | 12,489 | |
The accompanying notes are an integral part of the financial statements.
133
Pacer Metaurus US Large Cap Dividend Multiplier 400 ETF
SCHEDULE OF INVESTMENTS
October 31, 2021 (Unaudited) (Continued)
| | | Shares | | | Value | |
COMMON STOCKS — 87.2% (Continued) |
Software — 9.9% (Continued) |
Tyler Technologies, Inc. (a) | | | 24 | | | $ | 13,037 | |
| | | | | | | | 2,561,076 | |
Telecommunications — 1.9% | | | | |
Arista Networks, Inc. (a) | | | 29 | | | | 11,881 | |
AT&T, Inc. | | | 4,232 | | | | 106,900 | |
Cisco Systems, Inc. | | | 2,499 | | | | 139,869 | |
Corning, Inc. | | | 456 | | | | 16,220 | |
Juniper Networks, Inc. | | | 193 | | | | 5,697 | |
Lumen Technologies, Inc. | | | 594 | | | | 7,045 | |
Motorola Solutions, Inc. | | | 98 | | | | 24,362 | |
T-Mobile US, Inc. (a) | | | 343 | | | | 39,455 | |
Verizon Communications, Inc. | | | 2,453 | | | | 129,985 | |
| | | | | | | | 481,414 | |
Textiles — 0.0% (c) | | | | |
Mohawk Industries, Inc. (a) | | | 29 | | | | 5,139 | |
| | | | | |
Toys/Games/Hobbies — 0.0% (c) | | | | |
Hasbro, Inc. | | | 75 | | | | 7,182 | |
| | | | | |
Transportation — 1.4% | | | | |
CH Robinson Worldwide, Inc. | | | 75 | | | | 7,274 | |
CSX Corp. | | | 1,340 | | | | 48,468 | |
Expeditors International of Washington, Inc. | | | 99 | | | | 12,203 | |
FedEx Corp. | | | 145 | | | | 34,152 | |
JB Hunt Trasport Services, Inc. | | | 49 | | | | 9,662 | |
Kansas City Southern | | | 51 | | | | 15,823 | |
Norfolk Southern Corp. | | | 145 | | | | 42,492 | |
Old Dominion Freight Line, Inc. | | | 52 | | | | 17,750 | |
Union Pacific Corp. | | | 386 | | | | 93,181 | |
United Parcel Service, Inc. - Class B | | | 432 | | | | 92,219 | |
| | | | | | | | 373,224 | |
Water — 0.1% | | | | |
American Water Works Co., Inc. | | | 102 | | | | 17,766 | |
TOTAL COMMON STOCKS (Cost $21,619,622) | | | | | | | 22,557,575 | |
| | | | | |
REAL ESTATE INVESTMENT TRUSTS — 2.3% | | | | |
Alexandria Real Estate Equities, Inc. | | | 78 | | | | 15,923 | |
American Tower Corp. | | | 267 | | | | 75,286 | |
AvalonBay Communities, Inc. | | | 78 | | | | 18,461 | |
Boston Properties, Inc. | | | 89 | | | | 10,114 | |
Crown Castle International Corp. | | | 259 | | | | 46,698 | |
Digital Realty Trust, Inc. | | | 168 | | | | 26,512 | |
Duke Realty Corp. | | | 221 | | | | 12,429 | |
Equinix, Inc. | | | 51 | | | | 42,691 | |
Equity Residential | | | 198 | | | | 17,107 | |
Essex Property Trust, Inc. | | | 42 | | | | 14,277 | |
| | | Shares | | | Value | |
REAL ESTATE INVESTMENT TRUSTS — 2.3% (Continued) |
Extra Space Storage, Inc. | | | 76 | | | $ | 15,000 | |
Federal Realty Investment Trust | | | 44 | | | | 5,295 | |
Healthpeak Properties, Inc. | | | 316 | | | | 11,221 | |
Host Hotels & Resorts, Inc. (a) | | | 427 | | | | 7,186 | |
Iron Mountain, Inc. | | | 170 | | | | 7,759 | |
Kimco Realty Corp. | | | 362 | | | | 8,181 | |
Mid-America Apartment Communities, Inc. | | | 69 | | | | 14,090 | |
Prologis, Inc. | | | 436 | | | | 63,203 | |
Public Storage | | | 92 | | | | 30,561 | |
Realty Income Corp. | | | 234 | | | | 16,715 | |
Regency Centers Corp. | | | 92 | | | | 6,478 | |
SBA Communications Corp. | | | 67 | | | | 23,137 | |
Simon Property Group, Inc. | | | 194 | | | | 28,437 | |
UDR, Inc. | | | 166 | | | | 9,218 | |
Ventas, Inc. | | | 221 | | | | 11,795 | |
Vornado Realty Trust | | | 94 | | | | 4,007 | |
Welltower, Inc. | | | 246 | | | | 19,778 | |
Weyerhaeuser Co. | | | 439 | | | | 15,681 | |
TOTAL REAL ESTATE INVESTMENT TRUSTS (Cost $555,729) | | | | | | | 577,240 | |
| | | | | |
| | | Principal
Amount | | | | | |
SHORT-TERM INVESTMENTS — 8.5% | | | | |
Money Market Deposit Accounts — 8.5% | | | | |
U.S. Bank Money Market Deposit Account, 0.003% (b) | | $ | 2,203,641 | | | | 2,203,641 | |
TOTAL SHORT-TERM INVESTMENTS (Cost $2,203,641) | | | | | | | 2,203,641 | |
| | | | | |
Total Investments (Cost $24,378,992) — 98.0% | | | | | | | 25,338,456 | |
Other Assets in Excess of Liabilities — 2.0% | | | | | | | 523,389 | |
TOTAL NET ASSETS — 100.0% | | | | | | $ | 25,861,845 | |
Percentages are stated as a percent of net assets.
| | (a) | Non-income producing security. |
| | (b) | The rate shown is as of October 31, 2021. |
For Fund compliance purposes, the Fund’s industry classifications refer to any one or more of the industry sub-classifications used by one or more widely recognized market indexes or ratings group indexes, and/or they may be defined by Fund management. This definition does not apply for all purposes of this report, which may combine sub-classifications for reporting ease. Categories are shown as a percentage of net assets.
The accompanying notes are an integral part of the financial statements.
134
Pacer Metaurus US Large Cap Dividend Multiplier 400 ETF
SCHEDULE OF OPEN FUTURES CONTRACTS
October 31, 2021 (Unaudited)
| | Number of
Contracts | | Long/Short | Description | | Expiration
Date | | | Notional Value | | | Value &
Unrealized
Appreciation
(Depreciation) | |
| | | 72 | | Long | S&P 500 Annual Dividend Futures Index (a) | | | 12/17/2021 | | | $ | 1,075,500 | | | $ | 560 | |
| | | 72 | | Long | S&P 500 Annual Dividend Futures Index (a) | | | 12/16/2022 | | | | 1,138,500 | | | | 3,261 | |
| | | 72 | | Long | S&P 500 Annual Dividend Futures Index (a) | | | 12/15/2023 | | | | 1,190,700 | | | | 18,823 | |
| | | | | | | | | | | | | | | | $ | 22,644 | |
The accompanying notes are an integral part of the financial statements.
135
Pacer Pacific Asset Floating Rate High Income
SCHEDULE OF INVESTMENTS
October 31, 2021 (Unaudited)
| | | Principal
Amount | | | Fair Value | |
BANK LOANS — 83.0% |
Advertising — 2.0% |
Clear Channel Outdoor Holdings, Inc. |
3.630% (1 Month LIBOR USD + 3.500%), 08/21/2026 (a) | | $ | 744,327 | | | $ | 733,546 | |
3.600% (2 Month LIBOR USD + 3.500%), 08/21/2026 (a) | | | 1,904 | | | | 1,876 | |
| | | | | | | | 735,422 | |
Aerospace/Defense — 2.4% |
Dynasty Acquisition Co., Inc. | | | | | | | | |
3.630% (3 Month LIBOR USD + 3.500%), 04/06/2026 (a) | | | 318,671 | | | | 311,817 | |
3.630% (3 Month LIBOR USD + 3.500%), 04/06/2026 (a) | | | 171,329 | | | | 167,643 | |
Transdigm, Inc. 2.340% (1 Month LIBOR USD + 2.250%), 12/09/2025 (a) | | | 417,413 | | | | 412,777 | |
| | | | | | | | 892,237 | |
Airlines — 2.9% |
AAdvantage Loyalty IP Ltd. 5.50% (3 Month LIBOR USD + 4.750%, 0.750% Floor), 04/20/2028 (a) | | | 500,000 | | | | 521,408 | |
Mileage Plus Holdings, LLC 6.250% (3 Month LIBOR USD + 5.250%, 1.000% Floor), 06/21/2027 (a) | | | 500,000 | | | | 533,157 | |
| | | | | | | | 1,054,565 | |
Building Materials — 1.3% |
QUIKRETE Holdings, Inc. 2.590% (1 Month LIBOR USD + 2.500%), 02/01/2027 (a) | | | 482,990 | | | | 479,044 | |
Chemicals — 1.9% |
Avantor Funding, Inc. 2.50% (1 Month LIBOR USD + 2.000%, 0.500% Floor), 11/21/2024 (a) | | | 45,619 | | | | 45,655 | |
Solenis International, L.P. 4.090% (1 Month LIBOR USD + 4.000%), 06/26/2025 (a) | | | 240,417 | | | | 240,506 | |
Starfruit US Holdco LLC 2.840% (1 Month LIBOR USD + 2.750%), 10/01/2025 (a) | | | 397,921 | | | | 395,560 | |
| | | | | | | | 681,721 | |
Coal — 0.6% |
Arch Coal, Inc. 3.750% (1 Month LIBOR USD + 2.750%, 1.000% Floor), 03/07/2024 (a) | | | 239,348 | | | | 229,176 | |
| | | | | | | | | |
Commercial Services — 3.4% |
CoreLogic, Inc. 4.000%, 06/02/2028 (b) | | | 750,000 | | | | 750,844 | |
| | | Principal
Amount | | | Fair Value | |
Commercial Services — 3.4% (Continued) |
Verscend Holding Corp. 4.090% (1 Month LIBOR USD + 4.000%), 08/27/2025 (a) | | $ | 498,750 | | | $ | 500,204 | |
| | | | | | | | 1,251,048 | |
Computers — 3.1% |
McAfee, LLC 3.840% (1 Month LIBOR USD + 3.750%), 09/30/2024 (a) | | | 684,192 | | | | 685,605 | |
Tempo Acquisition, LLC 3.750% (1 Month LIBOR USD + 3.250%, 0.500% Floor), 11/02/2026 (a) | | | 431,318 | | | | 432,935 | |
| | | | | | | | 1,118,540 | |
Cosmetics/Personal Care — 1.4% |
Sunshine Luxembourg VII SARL 4.500% (3 Month LIBOR USD + 3.750%, 0.750% Floor), 10/01/2026 (a) | | | 495,000 | | | | 496,611 | |
| | | | | | | | | |
Diversified Financial Services — 1.8% |
Avolon TLB Borrower 1 (US) LLC 2.500% (1 Month LIBOR USD + 1.750%, 0.750% Floor), 01/15/2025 (a) | | | 175,812 | | | | 175,842 | |
Deerfield Dakota Holding, LLC 4.750% (1 Month LIBOR USD + 3.750%, 1.000% Floor), 04/09/2027 (a) | | | 493,750 | | | | 495,604 | |
| | | | | | | | 671,446 | |
Engineering & Construction — 1.3% |
Brand Industrial Services, Inc. 5.250% (3 Month LIBOR USD + 4.250%, 1.000% Floor), 06/21/2024 (a) | | | 484,810 | | | | 481,499 | |
Entertainment — 2.7% |
Delta 2 (Lux) SARL 3.500% (1 Month LIBOR USD + 2.500%, 1.000% Floor), 02/01/2024 (a) | | | 500,000 | | | | 499,220 | |
Scientific Games International, Inc. 2.840% (1 Month LIBOR USD + 2.750%), 08/14/2024 (a) | | | 484,925 | | | | 483,574 | |
| | | | | | | | 982,794 | |
Environmental Control — 2.1% |
GFL Environmental, Inc. 3.500% (3 Month LIBOR USD + 3.000%, 0.500% Floor), 05/30/2025 (a) | | | 251,239 | | | | 252,024 | |
Madison IAQ LLC 3.750% (3 Month LIBOR USD + 3.250%, 0.500% Floor), 06/21/2028 (a) | | | 498,750 | | | | 498,334 | |
| | | | | | | | 750,358 | |
The accompanying notes are an integral part of the financial statements.
136
Pacer Pacific Asset Floating Rate High Income
SCHEDULE OF INVESTMENTS
October 31, 2021 (Unaudited) (Continued)
| | | Principal
Amount | | | Fair Value | |
BANK LOANS — 83.0% (Continued) |
Food — 1.1% |
US Foods, Inc. 1.840% (1 Month LIBOR USD + 1.750%), 06/27/2023 (a) | | $ | 400,421 | | | $ | 398,509 | |
| | | | | | | | | |
Hand/Machine Tools — 1.2% |
Apex Tool Group, LLC 6.500% (1 Month LIBOR USD + 5.250%, 1.250% Floor), 08/01/2024 (a) | | | 434,332 | | | | 435,357 | |
| | | | | | | | | |
Healthcare Products — 2.0% |
Mozart Borrower LP 3.750%, 10/21/2028 (b) | | | 750,000 | | | | 751,406 | |
| | | | | | | | | |
Healthcare Servicess — 2.7% |
Da Vinci Purchaser Corp. 5.000% (1 Month LIBOR USD + 4.000%, 1.000% Floor), 01/08/2027 (a) | | | 494,987 | | | | 498,160 | |
Phoenix Newco, Inc. 4.250%, 08/11/2028 (b) | | | 500,000 | | | | 500,903 | |
| | | | | | | | 999,063 | |
Insurance — 1.7% |
HUB International Limited | | | | | | | | |
2.870% (3 Month LIBOR USD + 2.750%), 04/25/2025 (a) | | | 241,250 | | | | 238,837 | |
2.850% (2 Month LIBOR USD + 2.750%), 04/25/2025 (a) | | | 625 | | | | 619 | |
USI, Inc. 3.130% (3 Month LIBOR USD + 3.000%), 05/16/2024 (a) | | | 384,000 | | | | 381,633 | |
| | | | | | | | 621,089 | |
Internet — 2.6% |
Arches Buyer, Inc. 3.750% (1 Month LIBOR USD + 3.250%, 0.500% Floor), 12/06/2027 (a) | | | 497,494 | | | | 495,939 | |
Uber Technologies, Inc. 3.590% (1 Month LIBOR USD + 3.500%), 02/25/2027 (a) | | | 475,000 | | | | 475,774 | |
| | | | | | | | 971,713 | |
Leisure Time — 3.2% |
Bombardier Recreational Products, Inc. 2.080% (1 Month LIBOR USD + 2.000%), 05/24/2027 (a) | | | 238,313 | | | | 235,565 | |
ClubCorp Holdings, Inc. 2.90% (3 Month LIBOR USD + 2.750%), 09/18/2024 (a) | | | 480,000 | | | | 454,049 | |
| | | Principal
Amount | | | Fair Value | |
Leisure Time — 3.2% (Continued) |
SeaWorld Parks & Entertainment, Inc. 3.50% (1 Month LIBOR USD + 3.000%, 0.500% Floor), 08/25/2028 (a) | | $ | 491,026 | | | $ | 490,360 | |
| | | | | | | | 1,179,974 | |
Lodging — 3.2% |
Caesars Resort Collection LLC 2.840% (1 Month LIBOR USD + 2.750%), 12/23/2024 (a) | | | 481,250 | | | | 479,513 | |
Hilton Worldwide Finance LLC 1.840% (1 Month LIBOR USD + 1.750%), 06/22/2026 (a) | | | 461,991 | | | | 458,914 | |
Playa Resorts Holding BV 3.750% (1 Month LIBOR USD + 2.750%, 1.000% Floor), 04/29/2024 (a) | | | 233,366 | | | | 228,189 | |
| | | | | | | | 1,166,616 | |
Machinery - Diversified — 1.3% |
Titan Acquisition Limited 3.160% (6 Month LIBOR USD + 3.000%), 03/28/2025 (a) | | | 484,923 | | | | 477,441 | |
| | | | | | | | | |
Media — 2.6% |
Charter Communications Operating, LLC. 1.840% (1 Month LIBOR USD + 1.750%), 02/01/2027 (a) | | | 488,756 | | | | 485,780 | |
CSC Holdings, LLC 2.340% (1 Month LIBOR USD + 2.250%), 07/17/2025 (a) | | | 484,772 | | | | 474,698 | |
| | | | | | | | 960,478 | |
Mining — 0.7% |
U.S. Silica Company 5.000% (1 Month LIBOR USD + 4.000%, 1.000% Floor), 05/01/2025 (a) | | | 248,056 | | | | 243,715 | |
| | | | | | | | | |
Miscellaneous Manufacturing — 0.6% |
Gates Global LLC 3.250% (1 Month LIBOR USD + 2.500%, 0.750% Floor), 03/31/2027 (a) | | | 235,914 | | | | 235,631 | |
| | | | | | | | | |
Packaging & Containers — 5.9% |
Graham Packaging Company, Inc 3.750% (1 Month LIBOR USD + 3.000%, 0.750% Floor), 08/04/2027 (a) | | | 487,381 | | | | 486,855 | |
Kleopatra Finco S.a.r.l 5.250% (3 Month LIBOR USD + 4.750%, 0.500% Floor), 02/12/2026 (a) | | | 497,500 | | | | 496,256 | |
The accompanying notes are an integral part of the financial statements.
137
Pacer Pacific Asset Floating Rate High Income
SCHEDULE OF INVESTMENTS
October 31, 2021 (Unaudited) (Continued)
| | | Principal
Amount | | | Fair Value | |
BANK LOANS — 83.0% (Continued) |
Packaging & Containers — 5.9% (Continued) |
Plastipak Packaging, Inc. 2.590% (1 Month LIBOR USD + 2.500%), 10/15/2024 (a) | | $ | 223,717 | | | $ | 223,696 | |
Pregis Topco LLC 4.090% (1 Month LIBOR USD + 4.000%), 07/31/2026 (a) | | | 496,212 | | | | 497,917 | |
Proampac PG Borrower LLC 4.50% (3 Month LIBOR USD + 3.750%, 0.750% Floor), 11/03/2025 (a) | | | 478,844 | | | | 479,861 | |
| | | | | | | | 2,184,585 | |
Pharmaceuticals — 2.2% |
Bausch Health Companies Inc. 3.080% (1 Month LIBOR USD + 3.000%), 06/02/2025 (a) | | | 309,224 | | | | 308,872 | |
Gainwell Acquisition Corp. 4.750%, 10/01/2027 (b) | | | 500,000 | | | | 501,840 | |
| | | | | | | | 810,712 | |
Pipelines — 2.0% |
CQP Holdco LP 4.250%, 06/04/2028 (b) | | | 500,000 | | | | 500,070 | |
Traverse Midstream Partners LLC 5.250%, 10/28/2024 (b) | | | 242,843 | | | | 243,222 | |
| | | | | | | | 743,292 | |
Retail — 7.0% |
1011778 B.C. Unlimited Liability Company 1.840% (1 Month LIBOR USD + 1.750%), 11/19/2026 (a) | | | 328,296 | | | | 322,551 | |
Great Outdoors Group, LLC 5.000%, 03/05/2028 (b) | | | 500,000 | | | | 502,293 | |
PetSmart, Inc. 4.50% (6 Month LIBOR USD + 3.750%, 0.750% Floor), 02/11/2028 (a) | | | 498,750 | | | | 500,042 | |
Pilot Travel Centers, LLC 2.080%, 08/06/2028 (b) | | | 750,000 | | | | 746,318 | |
SRS Distribution, Inc. 4.250% (6 Month LIBOR USD + 3.750%, 0.500% Floor), 06/02/2028 (a) | | | 498,750 | | | | 499,373 | |
| | | | | | | | 2,570,577 | |
Semiconductors — 0.5% |
ON Semiconductor Corporation 2.090% (1 Month LIBOR USD + 2.000%), 09/18/2026 (a) | | | 174,783 | | | | 174,810 | |
| | | | | | | | | |
Software — 9.4% |
Applied Systems, Inc. 3.750% (3 Month LIBOR USD + 3.250%, 0.500% Floor), 09/19/2024 (a) | | | 245,215 | | | | 245,242 | |
| | | Principal
Amount | | | Fair Value | |
Software — 9.4% (Continued) |
Athenahealth, Inc. 4.380% (3 Month LIBOR USD + 4.250%), 02/11/2026 (a) | | $ | 747,500 | | | $ | 750,770 | |
The Dun & Bradstreet Corporation 3.340% (1 Month LIBOR USD + 3.250%), 02/06/2026 (a) | | | 492,528 | | | | 491,122 | |
Epicor Software Corporation 4.000% (1 Month LIBOR USD + 3.250%, 0.750% Floor), 07/30/2027 (a) | | | 495,000 | | | | 495,136 | |
Almonde, Inc. 4.50% (6 Month LIBOR USD + 3.500%, 1.000% Floor), 06/13/2024 (a) | | | 246,616 | | | | 245,712 | |
Project Ruby Ultimate Parent Corp. 4.000% (1 Month LIBOR USD + 3.250%, 0.750% Floor), 03/10/2028 (a) | | | 498,747 | | | | 498,817 | |
Sophia, L.P. 4.000% (2 Month LIBOR USD + 3.500%, 0.750% Floor), 10/07/2027 (a) | | | 496,250 | | | | 497,270 | |
UKG Inc. 3.840% (1 Month LIBOR USD + 3.750%), 05/04/2026 (a) | | | 246,231 | | | | 246,908 | |
| | | | | | | | 3,470,977 | |
Telecommunications — 6.2% |
Intelsat Jackson Holdings S.A. 8.000% (Prime Rate + 4.750%, 1.000% Floor), 11/27/2023 (a) | | | 500,000 | | | | 505,572 | |
Level 3 Financing Inc 1.840% (1 Month LIBOR USD + 1.750%), 03/01/2027 (a) | | | 337,328 | | | | 333,292 | |
LogMeIn, Inc. 4.830%, 08/31/2027 (b) | | | 748,116 | | | | 748,000 | |
SBA Senior Finance II LLC 1.840% (1 Month LIBOR USD + 1.750%), 04/11/2025 (a) | | | 474,075 | | | | 470,866 | |
Zayo Group Holdings, Inc. 3.080% (1 Month LIBOR USD + 3.000%), 03/09/2027 (a) | | | 222,697 | | | | 219,534 | |
| | | | | | | | 2,277,264 | |
TOTAL BANK LOANS (Cost $30,485,489) | | | | | | | 30,497,670 | |
| | | | | | | | | |
CORPORATE BONDS — 12.7% |
Aerospace/Defense — 0.7% |
TransDigm, Inc. 5.500%, 11/15/2027 | | | 250,000 | | | | 256,250 | |
| | | | | | | | | |
Commercial Services — 1.4% |
Ahern Rentals, Inc. 7.375%, 05/15/2023 (c) | | | 250,000 | | | | 240,000 | |
The accompanying notes are an integral part of the financial statements.
138
Pacer Pacific Asset Floating Rate High Income
SCHEDULE OF INVESTMENTS
October 31, 2021 (Unaudited) (Continued)
| | | Principal
Amount | | | Fair Value | |
CORPORATE BONDS — 12.7% (Continued) |
Commercial Services — 1.4% (Continued) |
Allied Universal Holdco LLC / Allied Universal Finance Corp. 9.750%, 07/15/2027 (c) | | $ | 250,000 | | | $ | 269,062 | |
| | | | | | | | 509,062 | |
Distribution/Wholesale — 0.7% |
American Builders & Contractors Supply Co., Inc. 4.000%, 01/15/2028 (c) | | | 250,000 | | | | 253,750 | |
| | | | | | | | | |
Diversified Financial Services — 0.8% |
Ally Financial, Inc. 5.750%, 11/20/2025 | | | 250,000 | | | | 283,943 | |
| | | | | | | | | |
Electronics — 0.8% |
Sensata Tech Bv 5.625%, 11/01/2024 (c) | | | 250,000 | | | | 275,938 | |
| | | | | | | | | |
Entertainment — 3.5% |
Cedar Fair LP / Canada’s Wonderland Co. / Magnum Management Corp. / Millennium Op. 5.375%, 04/15/2027 | | | 500,000 | | | | 515,625 | |
Scientific Games International, Inc. 5.000%, 10/15/2025 (c) | | | 250,000 | | | | 257,697 | |
Six Flags Entertainment Corp. 5.500%, 04/15/2027 (c) | | | 500,000 | | | | 518,125 | |
| | | | | | | | 1,291,447 | |
Environmental Control — 0.7% |
Madison IAQ LLC 4.125%, 06/30/2028 (c) | | | 250,000 | | | | 249,017 | |
| | | | | | | | | |
Food — 0.7% |
JBS USA LUX SA / JBS USA Finance, Inc. 6.750%, 02/15/2028 (c) | | | 250,000 | | | | 270,003 | |
| | | | | | | | | |
Leisure Time — 1.3% |
Majordrive Holdings Iv LLC 6.375%, 06/01/2029 (c) | | | 250,000 | | | | 240,875 | |
Viking Cruises Ltd. 7.000%, 02/15/2029 (c) | | | 250,000 | | | | 251,659 | |
| | | | | | | | 492,534 | |
Oil & Gas — 0.7% |
Range Resources Corp. 9.250%, 02/01/2026 | | | 250,000 | | | | 270,313 | |
| | | | | | | | | |
Retail — 0.7% |
Golden Nugget, Inc. 6.750%, 10/15/2024 (c) | | | 250,000 | | | | 250,937 | |
| | | | | | | | | |
| | | Principal
Amount | | | Fair Value | |
Telecommunications — 0.7% |
Sprint Nextel Corp. 6.000%, 11/15/2022 | | $ | 250,000 | | | $ | 262,558 | |
TOTAL CORPORATE BONDS (Cost $4,634,387) | | | | | | | 4,665,752 | |
| | | | | | | | | |
ASSET BACKED SECURITIES — 2.5% |
Magnetite Xxx Ltd. 6.330%, 10/25/2034 (c) | | | 400,000 | | | | 400,000 | |
Rad CLO 12 Ltd. 6.490%, 10/30/2034 (c) | | | 500,000 | | | | 500,000 | |
TOTAL ASSET BACKED SECURITIES (Cost $900,000) | | | | | | | 900,000 | |
| | | Shares | | | | | |
CLOSED-END FUNDS — 0.1% |
Eagle Point Credit Co., Inc. | | | 1,905 | | | | 26,784 | |
TOTAL CLOSED-END FUNDS (Cost $33,494) | | | | | | | 26,784 | |
| | | | | | | | | |
Total Investments (Cost $36,053,370) — 98.3% | | | | | | | 36,090,206 | |
Other Assets in Excess of Liabilities — 1.7% | | | | | | | 641,923 | |
TOTAL NET ASSETS — 100.0% | | | | | | $ | 36,732,129 | |
Percentages are stated as a percent of net assets.
| | (a) | Variable rate instrument. The interest rate shown reflects the rate in effect at October 31, 2021. |
| | (b) | The loan will settle after October 31, 2021 at which time the interest rate will be determined. |
| | (c) | Security exempt from registration under Rule 144(a) of the Securities Act of 1933. Such securities are treated as liquid securities according to the Fund’s liquidity guidelines. The value of those securities total $3,977,063 or 10.8% of net assets. |
For Fund compliance purposes, the Fund’s industry classifications refer to any one or more of the industry sub-classifications used by one or more widely recognized market indexes or ratings group indexes, and/or they may be defined by Fund management. This definition does not apply for all purposes of this report, which may combine sub-classifications for reporting ease.
The accompanying notes are an integral part of the financial statements.
139
Pacer Funds
STATEMENTS OF ASSETS & LIABILITIES
October 31, 2021 (Unaudited)
| | | Pacer
Trendpilot®
US Large
Cap ETF | | | Pacer
Trendpilot®
US Mid
Cap ETF | | | Pacer
Trendpilot®
100 ETF | | | Pacer
Trendpilot®
European
Index ETF | | | Pacer
Trendpilot®
International
ETF | |
ASSETS | | | | | | | | | | | | | | | | | | | | |
Investments in Securities, at Value* ^ | | $ | 2,082,859,772 | | | $ | 538,094,311 | | | $ | 825,632,853 | | | $ | 59,435,436 | | | $ | 147,791,009 | |
Foreign Currency at Value* | | | — | | | | — | | | | — | | | | — | | | | 28,720 | |
Interest and Dividends Receivable | | | 1,523,341 | | | | 85,241 | | | | 56,644 | | | | 419,167 | | | | 392,048 | |
Receivable for Investment Securities Sold | | | — | | | | — | | | | 4,347,527 | | | | 19,631 | | | | 16,394 | |
Return of Capital Receivable | | | — | | | | — | | | | — | | | | — | | | | 1,172 | |
Securities Lending Income Receivable | | | 3,744 | | | | 3,708 | | | | 2,188 | | | | 722 | | | | 2,649 | |
Total Assets | | | 2,084,386,857 | | | | 538,183,260 | | | | 830,039,212 | | | | 59,874,956 | | | | 148,231,992 | |
| | | | | | | | | | | | | | | | | | | | | |
LIABILITIES | | | | | | | | | | | | | | | | | | | | |
Management Fees Payable | | | 994,303 | | | | 223,908 | | | | 441,009 | | | | 28,772 | | | | 76,878 | |
Payable for Fund Shares Redeemed | | | — | | | | — | | | | 5,803,110 | | | | — | | | | — | |
Due to Custodian | | | — | | | | — | | | | — | | | | 4,152 | | | | — | |
Collateral Received For Securities Loaned (See Note 5) | | | 66,236,144 | | | | 67,335,599 | | | | 10,310,192 | | | | 6,679,123 | | | | 6,653,842 | |
Total Liabilities | | | 67,230,447 | | | | 67,559,507 | | | | 16,554,311 | | | | 6,712,047 | | | | 6,730,720 | |
| | | | | | | | | | | | | | | | | | | | | |
NET ASSETS | | $ | 2,017,156,410 | | | $ | 470,623,753 | | | $ | 813,484,901 | | | $ | 53,162,909 | | | $ | 141,501,272 | |
| | | | | | | | | | | | | | | | | | | | | |
NET ASSETS CONSIST OF: | | | | | | | | | | | | | | | | | | | | |
Paid-in Capital | | $ | 1,805,032,096 | | | $ | 488,481,105 | | | $ | 662,805,934 | | | $ | 97,784,381 | | | $ | 125,639,620 | |
Total Distributable Earnings (Accumulated Deficit) | | | 212,124,314 | | | | (17,857,352 | ) | | | 150,678,967 | | | | (44,621,472 | ) | | | 15,861,652 | |
Net Assets | | $ | 2,017,156,410 | | | $ | 470,623,753 | | | $ | 813,484,901 | | | $ | 53,162,909 | | | $ | 141,501,272 | |
* Identified Cost: | | | | | | | | | | | | | | | | | | | | |
Investments in Securities | | $ | 1,435,508,715 | | | $ | 470,863,625 | | | $ | 631,648,139 | | | $ | 50,931,098 | | | $ | 123,048,470 | |
Foreign Currencies | | | — | | | | — | | | | — | | | | — | | | | 28,924 | |
^ Includes Loaned Securities with a value of | | | 64,610,813 | | | | 65,936,788 | | | | 10,138,298 | | | | 6,499,003 | | | | 6,397,493 | |
| | | | | | | | | | | | | | | | | | | | | |
Net Asset Value: | | | | | | | | | | | | | | | | | | | | |
Net Assets | | $ | 2,017,156,410 | | | $ | 470,623,753 | | | $ | 813,484,901 | | | $ | 53,162,909 | | | $ | 141,501,272 | |
Shares Outstanding (No Par Value) | | | 49,950,000 | | | | 13,000,000 | | | | 14,000,000 | | | | 2,100,000 | | | | 4,800,000 | |
Net Asset Value, Offering and Redemption Price per Share | | $ | 40.38 | | | $ | 36.20 | | | $ | 58.11 | | | $ | 25.32 | | | $ | 29.48 | |
The accompanying notes are an integral part of the financial statements.
140
Pacer Funds
STATEMENTS OF ASSETS & LIABILITIES
October 31, 2021 (Unaudited)
| | | Pacer
Trendpilot®
US Bond ETF | | | Pacer
Trendpilot®
Fund of Funds
ETF | | | Pacer
Global
Cash Cows
Dividend ETF | | | Pacer
US
Cash Cows
100 ETF | | | Pacer
US Small
Cap Cash
Cows
100 ETF | |
ASSETS | | | | | | | | | | | | | | | | | | | | |
Investments in Unaffiliated Securities, at Value* ^ | | $ | 1,651,873,058 | | | $ | 49,439 | | | $ | 153,402,356 | | | $ | 1,094,733,247 | | | $ | 667,685,387 | |
Investments in Affiliated Securities, at Value*^ | | $ | — | | | $ | 65,487,387 | | | $ | — | | | $ | — | | | $ | — | |
Foreign Currency at Value* | | | — | | | | — | | | | 3,365 | | | | — | | | | — | |
Interest and Dividends Receivable | | | 15,840,442 | | | | — | | | | 774,390 | | | | 987,270 | | | | 161,019 | |
Receivable for Fund Shares Sold | | | — | | | | — | | | | — | | | | 11,257,400 | | | | — | |
Receivable for Investment Securities Sold | | | — | | | | — | | | | — | | | | 48,017 | | | | — | |
Securities Lending Income Receivable | | | 29,275 | | | | — | | | | 2,185 | | | | 74,582 | | | | 7,836 | |
Total Assets | | | 1,667,742,775 | | | | 65,536,826 | | | | 154,182,296 | | | | 1,107,100,516 | | | | 667,854,242 | |
| | | | | | | | | | | | | | | | | | | | | |
LIABILITIES | | | | | | | | | | | | | | | | | | | | |
Management Fees Payable | | | 660,468 | | | | 7,987 | | | | 69,315 | | | | 363,871 | | | | 242,675 | |
Payable for Investment Securities Purchased | | | — | | | | — | | | | — | | | | 11,207,570 | | | | — | |
Collateral Received For Securities Loaned (See Note 5) | | | 345,897,645 | | | | — | | | | 18,658,940 | | | | 145,394,629 | | | | 154,675,918 | |
Total Liabilities | | | 346,558,113 | | | | 7,987 | | | | 18,728,255 | | | | 156,966,070 | | | | 154,918,593 | |
| | | | | | | | | | | | | | | | | | | | | |
NET ASSETS | | $ | 1,321,184,662 | | | $ | 65,528,839 | | | $ | 135,454,041 | | | $ | 950,134,446 | | | $ | 512,935,649 | |
| | | | | | | | | | | | | | | | | | | | | |
NET ASSETS CONSIST OF: | | | | | | | | | | | | | | | | | | | | |
Paid-in Capital | | $ | 1,327,455,028 | | | $ | 57,772,787 | | | $ | 165,343,839 | | | $ | 909,199,509 | | | $ | 497,786,078 | |
Total Distributable Earnings (Accumulated Deficit) | | | (6,270,366 | ) | | | 7,756,052 | | | | (29,889,798 | ) | | | 40,934,937 | | | | 15,149,571 | |
Net Assets | | $ | 1,321,184,662 | | | $ | 65,528,839 | | | $ | 135,454,041 | | | $ | 950,134,446 | | | $ | 512,935,649 | |
* Identified Cost: | | | | | | | | | | | | | | | | | | | | |
Investments in Unaffiliated Securities | | $ | 1,677,042,132 | | | $ | 49,439 | | | $ | 152,990,819 | | | $ | 1,047,066,139 | | | $ | 654,767,845 | |
Investments in Affiliated Securities | | | — | | | | 57,533,027 | | | | — | | | | — | | | | — | |
Foreign Currencies | | | — | | | | — | | | | 3,563 | | | | — | | | | — | |
^ Includes Loaned Securities with a value of | | | 338,595,751 | | | | — | | | | 18,044,636 | | | | 141,885,301 | | | | 150,546,918 | |
| | | | | | | | | | | | | | | | | | | | | |
Net Asset Value: | | | | | | | | | | | | | | | | | | | | |
Net Assets | | $ | 1,321,184,662 | | | $ | 65,528,839 | | | $ | 135,454,041 | | | $ | 950,134,446 | | | $ | 512,935,649 | |
Shares Outstanding (No Par Value) | | | 49,000,000 | | | | 2,100,000 | | | | 4,500,000 | | | | 21,100,000 | | | | 11,950,000 | |
Net Asset Value, Offering and Redemption Price per Share | | $ | 26.96 | | | $ | 31.20 | | | $ | 30.10 | | | $ | 45.03 | | | $ | 42.92 | |
The accompanying notes are an integral part of the financial statements.
141
Pacer Funds
STATEMENTS OF ASSETS & LIABILITIES
October 31, 2021 (Unaudited)
| | | Pacer
Developed
Markets
International
Cash Cows
100 ETF | | | Pacer US
Cash Cows
Growth ETF | | | Pacer
Emerging
Markets
Cash Cows
100 ETF | | | Pacer
Cash Cows
Fund of Funds
ETF | | | Pacer
WealthShield
ETF | |
ASSETS | | | | | | | | | | | | | | | | | | | | |
Investments in Unaffiliated Securities, at Value* ^ | | $ | 36,199,468 | | | $ | 7,333,155 | | | $ | 8,330,662 | | | $ | 3,967 | | | $ | 64,607,304 | |
Investments in Affiliated Securities, at Value*^ | | $ | — | | | $ | — | | | $ | — | | | $ | 3,441,056 | | | $ | — | |
Foreign Currency at Value* | | | 711 | | | | — | | | | — | | | | — | | | | — | |
Cash | | | — | | | | — | | | | — | | | | — | | | | — | |
Interest and Dividends Receivable | | | 175,540 | | | | 1,592 | | | | 29,721 | | | | — | | | | 23,984 | |
Receivable for Fund Shares Sold | | | — | | | | — | | | | — | | | | — | | | | — | |
Receivable for Investment Securities Sold | | | — | | | | — | | | | — | | | | — | | | | — | |
Securities Lending Income Receivable | | | 667 | | | | 36 | | | | 1 | | | | — | | | | 348 | |
Total Assets | | | 36,376,386 | | | | 7,334,783 | | | | 8,360,384 | | | | 3,445,023 | | | | 60,630,871 | |
| | | | | | | | | | | | | | | | | | | | | |
LIABILITIES | | | | | | | | | | | | | | | | | | | | |
Management Fees Payable | | | 18,039 | | | | 2,973 | | | | 5,070 | | | | 456 | | | | 27,765 | |
Payable for Investment Securities Purchased | | | 112,501 | | | | — | | | | — | | | | — | | | | — | |
Payable for Fund Shares Redeemed | | | — | | | | — | | | | — | | | | — | | | | — | |
Collateral Received For Securities Loaned (See Note 5) | | | 801,934 | | | | 1,217,976 | | | | — | | | | — | | | | 8,168,584 | |
Total Liabilities | | | 932,474 | | | | 1,220,949 | | | | 5,070 | | | | 456 | | | | 8,196,349 | |
| | | | | | | | | | | | | | | | | | | | | |
NET ASSETS | | $ | 35,443,912 | | | $ | 6,113,834 | | | $ | 8,355,314 | | | $ | 3,444,567 | | | $ | 56,435,287 | |
| | | | | | | | | | | | | | | | | | | | | |
NET ASSETS CONSIST OF: | | | | | | | | | | | | | | | | | | | | |
Paid-in Capital | | $ | 38,942,474 | | | $ | 5,646,315 | | | $ | 9,182,813 | | | $ | 3,289,892 | | | $ | 67,131,418 | |
Total Distributable Earnings (Accumulated Deficit) | | | (3,498,562 | ) | | | 467,519 | | | | (827,499 | ) | | | 154,675 | | | | (10,696,131 | ) |
Net Assets | | $ | 35,443,912 | | | $ | 6,113,834 | | | $ | 8,355,314 | | | $ | 3,444,567 | | | $ | 56,435,287 | |
* Identified Cost: | | | | | | | | | | | | | | | | | | | | |
Investments in Unaffiliated Securities | | $ | 35,436,544 | | | $ | 6,912,930 | | | $ | 9,192,185 | | | $ | 3,967 | | | $ | 58,896,729 | |
Investments in Affiliated Securities | | | — | | | | — | | | | — | | | | 3,447,353 | | | | — | |
Foreign Currencies | | | 702 | | | | — | | | | — | | | | — | | | | — | |
^ Includes Loaned Securities with a value of | | | 760,467 | | | | 1,216,204 | | | | — | | | | — | | | | 7,968,760 | |
| | | | | | | | | | | | | | | | | | | | | |
Net Asset Value: | | | | | | | | | | | | | | | | | | | | |
Net Assets | | $ | 35,443,912 | | | $ | 6,113,834 | | | $ | 8,355,314 | | | $ | 3,444,567 | | | $ | 56,435,287 | |
Shares Outstanding (No Par Value) | | | 1,150,000 | | | | 150,000 | | | | 350,000 | | | | 100,000 | | | | 1,650,000 | |
Net Asset Value, Offering and Redemption Price per Share | | $ | 30.82 | | | $ | 40.76 | | | $ | 23.87 | | | $ | 34.45 | | | $ | 34.20 | |
The accompanying notes are an integral part of the financial statements.
142
Pacer Funds
STATEMENTS OF ASSETS & LIABILITIES
October 31, 2021 (Unaudited)
| | | Pacer
Benchmark
Industrial
Real Estate
SCTRSM ETF | | | Pacer
Benchmark
Data &
Infrastructure
Real Estate
SCTRSM ETF | | | Pacer
CFRA-Stovall
Equal Weight
Seasonal
Rotation ETF | | | Pacer
CSOP FTSE
China A50
ETF | | | Pacer
BioThreat
Strategy
ETF | |
ASSETS | | | | | | | | | | | | | | | | | | | | |
Investments in Securities, at Value* ^ | | $ | 327,620,509 | | | $ | 1,797,733,854 | | | $ | 82,430,290 | | | $ | 8,718,057 | | | $ | 8,042,601 | |
Foreign Currency at Value* | | | — | | | | 578,959 | | | | — | | | | 6,593 | | | | — | |
Interest and Dividends Receivable | | | 193,770 | | | | 5 | | | | 87,104 | | | | — | | | | 4,557 | |
Receivable for Investment Securities Sold | | | — | | | | — | | | | 82,171,496 | | | | — | | | | — | |
Securities Lending Income Receivable | | | 1,320 | | | | 92,761 | | | | 641 | | | | — | | | | 33 | |
Total Assets | | | 327,815,599 | | | | 1,798,405,579 | | | | 164,689,531 | | | | 8,724,650 | | | | 8,047,191 | |
| | | | | | | | | | | | | | | | | | | | | |
LIABILITIES | | | | | | | | | | | | | | | | | | | | |
Management Fees Payable | | | 145,347 | | | | 788,989 | | | | 41,397 | | | | 5,128 | | | | 3,291 | |
Payable for Investment Securities Purchased | | | — | | | | — | | | | 82,264,012 | | | | — | | | | — | |
Collateral Received For Securities Loaned (See Note 5) | | | 20,263,470 | | | | 183,211,916 | | | | — | | | | — | | | | 1,133,416 | |
Total Liabilities | | | 20,408,817 | | | | 184,000,905 | | | | 82,305,409 | | | | 5,128 | | | | 1,136,707 | |
| | | | | | | | | | | | | | | | | | | | | |
NET ASSETS | | $ | 307,406,782 | | | $ | 1,614,404,674 | | | $ | 82,384,122 | | | $ | 8,719,522 | | | $ | 6,910,484 | |
| | | | | | | | | | | | | | | | | | | | | |
NET ASSETS CONSIST OF: | | | | | | | | | | | | | | | | | | | | |
Paid-in Capital | | $ | 237,919,670 | | | $ | 1,465,656,761 | | | $ | 94,099,714 | | | $ | 8,413,765 | | | $ | 5,823,779 | |
Total Distributable Earnings (Accumulated Deficit) | | | 69,487,112 | | | | 148,747,913 | | | | (11,715,592 | ) | | | 305,757 | | | | 1,086,705 | |
Net Assets | | $ | 307,406,782 | | | $ | 1,614,404,674 | | | $ | 82,384,122 | | | $ | 8,719,522 | | | $ | 6,910,484 | |
* Identified Cost: | | | | | | | | | | | | | | | | | | | | |
Investments in Securities | | $ | 263,465,686 | | | $ | 1,642,707,312 | | | $ | 82,437,429 | | | $ | 7,195,661 | | | $ | 7,363,440 | |
Foreign Currencies | | | — | | | | 579,128 | | | | — | | | | 6,593 | | | | — | |
^ Includes Loaned Securities with a value of | | | 19,776,460 | | | | 176,389,319 | | | | — | | | | — | | | | 1,114,901 | |
| | | | | | | | | | | | | | | | | | | | | |
Net Asset Value: | | | | | | | | | | | | | | | | | | | | |
Net Assets | | $ | 307,406,782 | | | $ | 1,614,404,674 | | | $ | 82,384,122 | | | $ | 8,719,522 | | | $ | 6,910,484 | |
Shares Outstanding (No Par Value) | | | 6,200,000 | | | | 39,800,000 | | | | 2,150,000 | | | | 405,882 | | | | 200,000 | |
Net Asset Value, Offering and Redemption Price per Share | | $ | 49.58 | | | $ | 40.56 | | | $ | 38.32 | | | $ | 21.48 | | | $ | 34.55 | |
The accompanying notes are an integral part of the financial statements.
143
Pacer Funds
STATEMENTS OF ASSETS & LIABILITIES
October 31, 2021 (Unaudited)
| | | Pacer
Lunt Large Cap
Alternator
ETF | | | Pacer
Lunt Midcap
Multi-Factor
Alternator
ETF | | | Pacer
Lunt Large Cap
Multi-Factor
Alternator
ETF | | | Pacer
US Export
Leaders
ETF | | | Pacer
Metaurus US
Large Cap
Dividend
Multiplier 300
ETF | |
ASSETS | | | | | | | | | | | | | | | | | | | | |
Investments in Securities, at Value* ^ | | $ | 299,694,854 | | | $ | 53,461,693 | | | $ | 160,791,498 | | | $ | 2,600,931 | | | $ | 2,004,904 | |
Foreign Currency at Value* | | | — | | | | — | | | | — | | | | — | | | | — | |
Interest and Dividends Receivable | | | 105,218 | | | | 18,207 | | | | 49,038 | | | | 773 | | | | 1,434 | |
Receivable for Investment Securities Sold | | | 67,277,905 | | | | — | | | | — | | | | — | | | | — | |
Receivable for Fund Shares Sold | | | — | | | | — | | | | — | | | | — | | | | — | |
Return of Capital Receivable | | | — | | | | — | | | | — | | | | — | | | | 41 | |
Securities Lending Income Receivable | | | 726 | | | | 376 | | | | 398 | | | | 11 | | | | — | |
Deposits at Broker for Futures | | | — | | | | — | | | | — | | | | — | | | | 103,267 | |
Total Assets | | | 367,078,703 | | | | 53,480,276 | | | | 160,840,934 | | | | 2,601,715 | | | | 2,109,646 | |
| | | | | | | | | | | | | | | | | | | | | |
LIABILITIES | | | | | | | | | | | | | | | | | | | | |
Management Fees Payable | | | 100,042 | | | | 20,983 | | | | 61,300 | | | | 1,085 | | | | 1,370 | |
Payable for Investment Securities Purchased | | | 66,750,827 | | | | — | | | | — | | | | — | | | | — | |
Payable for Fund Shares Redeemed | | | — | | | | — | | | | — | | | | — | | | | — | |
Collateral Received For Securities Loaned (See Note 5) | | | 22,435,006 | | | | 11,806,880 | | | | 14,937,333 | | | | 390,955 | | | | — | |
Total Liabilities | | | 89,285,875 | | | | 11,827,863 | | | | 14,998,633 | | | | 392,040 | | | | 1,370 | |
| | | | | | | | | | | | | | | | | | | | | |
NET ASSETS | | $ | 277,792,828 | | | $ | 41,652,413 | | | $ | 145,842,301 | | | $ | 2,209,675 | | | $ | 2,108,276 | |
| | | | | | | | | | | | | | | | | | | | | |
NET ASSETS CONSIST OF: | | | | | | | | | | | | | | | | | | | | |
Paid-in Capital | | $ | 251,200,139 | | | $ | 40,654,176 | | | $ | 135,594,199 | | | $ | 1,878,224 | | | $ | 2,025,500 | |
Total Distributable Earnings (Accumulated Deficit) | | | 26,592,689 | | | | 998,237 | | | | 10,248,102 | | | | 331,451 | | | | 82,776 | |
Net Assets | | $ | 277,792,828 | | | $ | 41,652,413 | | | $ | 145,842,301 | | | $ | 2,209,675 | | | $ | 2,108,276 | |
* Identified Cost: | | | | | | | | | | | | | | | | | | | | |
Investments in Securities | | $ | 289,884,119 | | | $ | 51,965,450 | | | $ | 151,088,976 | | | $ | 2,437,775 | | | $ | 1,911,251 | |
^ Includes Loaned Securities with a value of | | | 21,806,321 | | | | 11,556,475 | | | | 14,646,070 | | | | 382,041 | | | | — | |
| | | | | | | | | | | | | | | | | | | | | |
Net Asset Value: | | | | | | | | | | | | | | | | | | | | |
Net Assets | | $ | 277,792,828 | | | $ | 41,652,413 | | | $ | 145,842,301 | | | $ | 2,209,675 | | | $ | 2,108,276 | |
Shares Outstanding (No Par Value) | | | 6,400,000 | | | | 1,150,000 | | | | 3,500,000 | | | | 50,000 | | | | 50,000 | |
Net Asset Value, Offering and Redemption Price per Share | | $ | 43.41 | | | $ | 36.22 | | | $ | 41.67 | | | $ | 44.19 | | | $ | 42.17 | |
The accompanying notes are an integral part of the financial statements.
144
Pacer Funds
STATEMENTS OF ASSETS & LIABILITIES
October 31, 2021 (Unaudited)
| | | Pacer
Metaurus US
Large Cap
Dividend
Multiplier 400
ETF | | | Pacer
Pacific Asset
Floating Rate
High Income
ETF | |
ASSETS | | | | | | | | |
Investments in Securities, at Value* ^ | | $ | 25,338,456 | | | $ | 36,090,206 | |
Foreign Currency at Value* | | | — | | | | — | |
Cash | | | — | | | | 7,241,259 | |
Interest and Dividends Receivable | | | 15,174 | | | | 72,504 | |
Receivable for Investment Securities Sold | | | — | | | | — | |
Receivable for Fund Shares Sold | | | — | | | | — | |
Return of Capital Receivable | | | 484 | | | | — | |
Securities Lending Income Receivable | | | — | | | | — | |
Deposits at Broker for Futures | | | 522,644 | | | | — | |
Total Assets | | | 25,876,758 | | | | 43,403,969 | |
| | | | | | | | | |
LIABILITIES | | | | | | | | |
Management Fees Payable | | | 14,913 | | | | 19,608 | |
Payable for Investment Securities Purchased | | | — | | | | 6,652,232 | |
Payable for Fund Shares Redeemed | | | — | | | | — | |
Collateral Received For Securities Loaned (See Note 5) | | | — | | | | — | |
Total Liabilities | | | 14,913 | | | | 6,671,840 | |
| | | | | | | | | |
NET ASSETS | | $ | 25,861,845 | | | $ | 36,732,129 | |
| | | | | | | | | |
NET ASSETS CONSIST OF: | | | | | | | | |
Paid-in Capital | | $ | 25,033,782 | | | $ | 37,293,254 | |
Total Distributable Earnings (Accumulated Deficit) | | | 828,063 | | | | (561,125 | ) |
Net Assets | | $ | 25,861,845 | | | $ | 36,732,129 | |
* Identified Cost: | | | | | | | | |
Investments in Securities | | $ | 24,378,992 | | | $ | 36,053,370 | |
^ Includes Loaned Securities with a value of | | | — | | | | — | |
| | | | | | | | | |
Net Asset Value: | | | | | | | | |
Net Assets | | $ | 25,861,845 | | | $ | 36,732,129 | |
Shares Outstanding (No Par Value) | | | 720,000 | | | | 750,000 | |
Net Asset Value, Offering and Redemption Price per Share | | $ | 35.92 | | | $ | 48.98 | |
The accompanying notes are an integral part of the financial statements.
145
Pacer Funds
STATEMENTS OF OPERATIONS
For the Period Ended October 31, 2021 (Unaudited)
| | Pacer
Trendpilot®
US Large
Cap ETF | | | Pacer
Trendpilot®
US Mid
Cap ETF | | | Pacer
Trendpilot®
100 ETF | | | Pacer
Trendpilot®
European
Index ETF | | | Pacer
Trendpilot®
International
ETF | |
INVESTMENT INCOME | | | | | | | | | | | | | | | | | | | | |
Income: | | | | | | | | | | | | | | | | | | | | |
Dividends* | | $ | 13,329,196 | | | $ | 1,818,209 | | | $ | 1,494,557 | | | $ | 883,607 | | | $ | 1,811,039 | |
Interest | | | 36 | | | | 18,692 | | | | 42,969 | | | | 3 | | | | — | |
Securities Lending Income | | | 21,853 | | | | 18,538 | | | | 21,794 | | | | 10,965 | | | | 24,330 | |
Total Investment Income | | | 13,351,085 | | | | 1,855,439 | | | | 1,559,320 | | | | 894,575 | | | | 1,835,369 | |
| | | | | | | | | | | | | | | | | | | | | |
Expenses: | | | | | | | | | | | | | | | | | | | | |
Management fees | | | 5,836,312 | | | | 1,323,721 | | | | 2,593,119 | | | | 181,710 | | | | 451,667 | |
Total Expenses | | | 5,836,312 | | | | 1,323,721 | | | | 2,593,119 | | | | 181,710 | | | | 451,667 | |
Net Investment Income (Loss) | | | 7,514,773 | | | | 531,718 | | | | (1,033,799 | ) | | | 712,865 | | | | 1,383,702 | |
| | | | | | | | | | | | | | | | | | | | | |
REALIZED & UNREALIZED GAIN (LOSS) ON INVESTMENTS | | | | | | | | | | | | | | | | | | | | |
Net Realized Gain (Loss) on: | | | | | | | | | | | | | | | | | | | | |
Net Realized Gain (Loss) on Investments | | | 3,320,680 | | | | 6,243,973 | | | | 866,907 | | | | 133,382 | | | | (5,962 | ) |
Net Realized Gain (Loss) on In-Kind Redemptions | | | 20,171,913 | | | | 3,136,169 | | | | 7,132,089 | | | | 678,689 | | | | — | |
Net Realized Gain (Loss) on Foreign Currency | | | — | | | | — | | | | — | | | | (2,029 | ) | | | (1,943 | ) |
Total | | | 23,492,593 | | | | 9,380,142 | | | | 7,998,996 | | | | 810,042 | | | | (7,905 | ) |
Net Change in Unrealized Appreciation (Depreciation) of: | | | | | | | | | | | | | | | | | | | | |
Change in Unrealized Appreciation (Depreciation) on Investments | | | 162,580,862 | | | | (3,045,694 | ) | | | 50,954,159 | | | | 747,052 | | | | 4,523,473 | |
Change in Unrealized Appreciation (Depreciation) on Foreign Currency | | | — | | | | — | | | | — | | | | (11,019 | ) | | | (7,792 | ) |
Total | | | 162,580,862 | | | | (3,045,694 | ) | | | 50,954,159 | | | | 736,033 | | | | 4,515,681 | |
Net Realized and Unrealized Gain (Loss) on Investments | | | 186,073,455 | | | | 6,334,448 | | | | 58,953,155 | | | | 1,546,075 | | | | 4,507,776 | |
NET INCREASE (DECREASE) IN NET ASSETS RESULTING FROM OPERATIONS | | $ | 193,588,228 | | | $ | 6,866,166 | | | $ | 57,919,356 | | | $ | 2,258,940 | | | $ | 5,891,478 | |
| | | | | | | | | | | | | | | | | | | | | |
* Net of fees and foreign witholding tax of | | $ | 2,445 | | | $ | — | | | $ | 2,190 | | | $ | 148,904 | | | $ | 187,972 | |
| | | | | | | | | | | | | | | | | | | | | |
The accompanying notes are an integral part of the financial statements.
146
Pacer Funds
STATEMENTS OF OPERATIONS
For the Period Ended October 31, 2021 (Unaudited)
| | | Pacer
Trendpilot®
US Bond ETF | | | Pacer
Trendpilot®
Fund of Funds
ETF | | | Pacer
Global
Cash Cows
Dividend ETF | | | Pacer
US
Cash Cows
100 ETF | | | Pacer
US Small
Cap Cash
Cows
100 ETF | |
INVESTMENT INCOME | | | | | | | | | | | | | | | | | | | | |
Income: | | | | | | | | | | | | | | | | | | | | |
Dividends from Unaffiliated Investments* | | $ | — | | | $ | — | | | $ | 3,396,631 | | | $ | 7,187,900 | | | $ | 2,342,928 | |
Dividends from Affiliated Investments | | | — | | | | 139,362 | | | | — | | | | — | | | | — | |
Interest | | | 18,983,621 | | | | — | | | | 6 | | | | 21 | | | | 11 | |
Securities Lending Income | | | 58,331 | | | | — | | | | 21,881 | | | | 158,099 | | | | 37,122 | |
Total Investment Income | | | 19,041,952 | | | | 139,362 | | | | 3,418,518 | | | | 7,346,020 | | | | 2,380,061 | |
| | | | | | | | | | | | | | | | | | | | | |
Expenses: | | | | | | | | | | | | | | | | | | | | |
Management fees | | | 3,423,187 | | | | 40,883 | | | | 424,831 | | | | 1,731,250 | | | | 1,202,107 | |
Total Expenses | | | 3,423,187 | | | | 40,883 | | | | 424,831 | | | | 1,731,250 | | | | 1,202,107 | |
Net Investment Income (Loss) | | | 15,618,765 | | | | 98,479 | | | | 2,993,687 | | | | 5,614,770 | | | | 1,177,954 | |
| | | | | | | | | | | | | | | | | | | | | |
REALIZED & UNREALIZED GAIN (LOSS) ON INVESTMENTS | | | | | | | | | | | | | | | | | | | | |
Net Realized Gain (Loss) on: | | | | | | | | | | | | | | | | | | | | |
Net Realized Gain (Loss) on Investments in Unaffiliated Securities | | | (5,888,915 | ) | | | — | | | | (2,630,839 | ) | | | — | | | | (15,024,840 | ) |
Net Realized Gain (Loss) on Investments in Affiliated Securities | | | — | | | | (16,068 | ) | | | — | | | | — | | | | — | |
Net Realized Gain (Loss) on In-Kind Redemptions | | | 21,857,267 | | | | 357,516 | | | | 3,155,085 | | | | 60,979,914 | | | | 33,869,571 | |
Net Realized Gain (Loss) on Foreign Currency | | | — | | | | — | | | | (37,616 | ) | | | — | | | | — | |
Total | | | 15,968,352 | | | | 341,448 | | | | 486,630 | | | | 54,516,188 | | | | 18,844,731 | |
Net Change in Unrealized Appreciation (Depreciation) of: | | | | | | | | | | | | | | | | | | | | |
Change in Unrealized Appreciation (Depreciation) on Investments in Unaffiliated Securities | | | (42,021,330 | ) | | | — | | | | (4,832,391 | ) | | | (14,149,766 | ) | | | (16,663,314 | ) |
Change in Unrealized Appreciation (Depreciation) on Investments in Affiliated Securities | | | — | | | | 2,053,886 | | | | — | | | | — | | | | — | |
Change in Unrealized Appreciation (Depreciation) on Foreign Currency | | | — | | | | — | | | | (14,266 | ) | | | — | | | | — | |
Total | | | (42,021,330 | ) | | | 2,053,886 | | | | (4,846,657 | ) | | | (14,149,766 | ) | | | (16,663,314 | ) |
Net Realized and Unrealized Gain (Loss) on Investments | | | (26,052,978 | ) | | | 2,395,334 | | | | (4,360,027 | ) | | | 40,366,422 | | | | 2,181,417 | |
NET INCREASE (DECREASE) IN NET ASSETS RESULTING FROM OPERATIONS | | $ | (10,434,213 | ) | | $ | 2,493,813 | | | $ | (1,366,340 | ) | | $ | 45,981,192 | | | $ | 3,359,371 | |
| | | | | | | | | | | | | | | | | | | | | |
* Net of fees and foreign witholding tax of | | $ | — | | | $ | — | | | $ | 164,994 | | | $ | — | | | $ | 890 | |
| | | | | | | | | | | | | | | | | | | | | |
The accompanying notes are an integral part of the financial statements.
147
Pacer Funds
STATEMENTS OF OPERATIONS
For the Period Ended October 31, 2021 (Unaudited)
| | | Pacer
Developed
Markets
International
Cash Cows
100 ETF | | | Pacer US
Cash Cows
Growth ETF | | | Pacer
Emerging
Markets
Cash Cows
100 ETF | | | Pacer
Cash Cows
Fund of Funds
ETF | | | Pacer
WealthShield
ETF | |
INVESTMENT INCOME | | | | | | | | | | | | | | | | | | | | |
Income: | | | | | | | | | | | | | | | | | | | | |
Dividends from Unaffiliated Investments* | | $ | 504,421 | | | $ | 12,648 | | | $ | 286,628 | | | $ | — | | | $ | 492,175 | |
Dividends from Affiliated Investments | | | — | | | | — | | | | — | | | | 35,220 | | | | — | |
Interest | | | 2 | | | | — | | | | 2 | | | | — | | | | — | |
Securities Lending Income | | | 3,197 | | | | 159 | | | | 177 | | | | — | | | | 2,820 | |
Total Investment Income | | | 507,620 | | | | 12,807 | | | | 286,807 | | | | 35,220 | | | | 494,995 | |
| | | | | | | | | | | | | | | | | | | | | |
Expenses: | | | | | | | | | | | | | | | | | | | | |
Management fees | | | 94,507 | | | | 13,786 | | | | 28,006 | | | | 2,343 | | | | 157,132 | |
Total Expenses | | | 94,507 | | | | 13,786 | | | | 28,006 | | | | 2,343 | | | | 157,132 | |
Net Investment Income (Loss) | | | 413,113 | | | | (979 | ) | | | 258,801 | | | | 32,877 | | | | 337,863 | |
| | | | | | | | | | | | | | | | | | | | | |
REALIZED & UNREALIZED GAIN (LOSS) ON INVESTMENTS | | | | | | | | | | | | | | | | | | | | |
Net Realized Gain (Loss) on: | | | | | | | | | | | | | | | | | | | | |
Net Realized Gain (Loss) on Investments in Unaffiliated Securities | | | (372,223 | ) | | | (150,247 | ) | | | (92,295 | ) | | | — | | | | 949,650 | |
Net Realized Gain (Loss) on Investments in Affiliated Securities | | | — | | | | — | | | | — | | | | (52,164 | ) | | | — | |
Net Realized Gain (Loss) on In-Kind Redemptions | | | 881,143 | | | | 470,248 | | | | 210,906 | | | | 213,706 | | | | 2,123,868 | |
Net Realized Gain (Loss) on Foreign Currency | | | (18,322 | ) | | | — | | | | (5,055 | ) | | | — | | | | — | |
Total | | | 490,598 | | | | 320,001 | | | | 113,556 | | | | 161,542 | | | | 3,073,518 | |
Net Change in Unrealized Appreciation (Depreciation) of: | | | | | | | | | | | | | | | | | | | | |
Change in Unrealized Appreciation (Depreciation) on Investments in Unaffiliated Securities | | | (1,723,927 | ) | | | 176,676 | | | | (1,107,844 | ) | | | — | | | | 390,690 | |
Change in Unrealized Appreciation (Depreciation) on Investments in Affiliated Securities | | | — | | | | — | | | | — | | | | (153,795 | ) | | | — | |
Change in Unrealized Appreciation (Depreciation) on Foreign Currency | | | (4,324 | ) | | | — | | | | (232 | ) | | | — | | | | — | |
Total | | | (1,728,251 | ) | | | 176,676 | | | | (1,108,076 | ) | | | (153,795 | ) | | | 390,690 | |
Net Realized and Unrealized Gain (Loss) on Investments | | | (1,237,653 | ) | | | 496,677 | | | | (994,520 | ) | | | 7,747 | | | | 3,464,208 | |
NET INCREASE (DECREASE) IN NET ASSETS RESULTING FROM OPERATIONS | | $ | (824,540 | ) | | $ | 495,698 | | | $ | (735,719 | ) | | $ | 40,624 | | | $ | 3,802,071 | |
| | | | | | | | | | | | | | | | | | | | | |
* Net of fees and foreign witholding tax of | | $ | 47,958 | | | $ | — | | | $ | 32,048 | | | $ | — | | | $ | — | |
The accompanying notes are an integral part of the financial statements.
148
Pacer Funds
STATEMENTS OF OPERATIONS
For the Period Ended October 31, 2021 (Unaudited)
| | | Pacer
Benchmark
Industrial
Real Estate
SCTRSM ETF | | | Pacer
Benchmark
Data &
Infrastructure
Real Estate
SCTRSM ETF | | | Pacer
CFRA-Stovall
Equal Weight
Seasonal
Rotation ETF | | | Pacer
CSOP FTSE
China A50
ETF | | | Pacer
BioThreat
Strategy
ETF | |
INVESTMENT INCOME | | | | | | | | | | | | | | | | | | | | |
Income: | | | | | | | | | | | | | | | | | | | | |
Dividends* | | $ | 3,205,984 | | | $ | 14,664,151 | | | $ | 653,924 | | | $ | 190,347 | | | $ | 37,901 | |
Interest | | | 7 | | | | 56 | | | | — | | | | 3 | | | | — | |
Securities Lending Income | | | 6,281 | | | | 154,504 | | | | 2,398 | | | | — | | | | 140 | |
Total Investment Income | | | 3,212,272 | | | | 14,818,711 | | | | 656,322 | | | | 190,350 | | | | 38,041 | |
| | | | | | | | | | | | | | | | | | | | | |
Expenses: | | | | | | | | | | | | | | | | | | | | |
Management fees | | | 732,076 | | | | 4,254,448 | | | | 234,774 | | | | 35,107 | | | | 17,668 | |
Total Expenses | | | 732,076 | | | | 4,254,448 | | | | 234,774 | | | | 35,107 | | | | 17,668 | |
Net Investment Income (Loss) | | | 2,480,196 | | | | 10,564,263 | | | | 421,548 | | | | 155,243 | | | | 20,373 | |
| | | | | | | | | | | | | | | | | | | | | |
REALIZED & UNREALIZED GAIN (LOSS) ON INVESTMENTS | | | | | | | | | | | | | | | | | | | | |
Net Realized Gain (Loss) on: | | | | | | | | | | | | | | | | | | | | |
Net Realized Gain (Loss) on Investments | | | (1,613,045 | ) | | | 5,548,317 | | | | 2,232,046 | | | | (685,747 | ) | | | (49,100 | ) |
Net Realized Gain (Loss) on In-Kind Redemptions | | | 9,406,108 | | | | 12,156,823 | | | | — | | | | — | | | | 460,492 | |
Net Realized Gain (Loss) on Foreign Currency | | | — | | | | (53,091 | ) | | | — | | | | 13,967 | | | | — | |
Total | | | 7,793,063 | | | | 17,652,049 | | | | 2,232,046 | | | | (671,780 | ) | | | 411,392 | |
Net Change in Unrealized Appreciation (Depreciation) of: | | | | | | | | | | | | | | | | | | | | |
Change in Unrealized Appreciation (Depreciation) on Investments | | | 32,551,945 | | | | 37,613,861 | | | | 103 | | | | (473,616 | ) | | | 319,001 | |
Change in Unrealized Appreciation (Depreciation) on Foreign Currency | | | — | | | | (161 | ) | | | — | | | | (24 | ) | | | — | |
Total | | | 32,551,945 | | | | 37,613,700 | | | | 103 | | | | (473,640 | ) | | | 319,001 | |
Net Realized and Unrealized Gain (Loss) on Investments | | | 40,345,008 | | | | 55,265,749 | | | | 2,232,149 | | | | (1,145,420 | ) | | | 730,393 | |
NET INCREASE (DECREASE) IN NET ASSETS RESULTING FROM OPERATIONS | | $ | 42,825,204 | | | $ | 65,830,012 | | | $ | 2,653,697 | | | $ | (990,177 | ) | | $ | 750,766 | |
| | | | | | | | | | | | | | | | | | | | | |
* Net of fees and foreign witholding tax of | | $ | — | | | $ | 170,427 | | | $ | — | | | $ | 21,257 | | | $ | 1,019 | |
The accompanying notes are an integral part of the financial statements.
149
Pacer Funds
STATEMENTS OF OPERATIONS
For the Period Ended October 31, 2021 (Unaudited)
| | | Pacer
Lunt Large Cap
Alternator
ETF | | | Pacer
Lunt Midcap
Multi-Factor
Alternator
ETF | | | Pacer
Lunt Large Cap
Multi-Factor
Alternator
ETF | | | Pacer
US Export
Leaders
ETF | | | Pacer
Metaurus US
Large Cap
Dividend
Multiplier 300
ETF (a) | |
INVESTMENT INCOME | | | | | | | | | | | | | | | | | | | | |
Income: | | | | | | | | | | | | | | | | | | | | |
Dividends* | | $ | 1,340,528 | | | $ | 217,570 | | | $ | 557,606 | | | $ | 9,182 | | | $ | 7,290 | |
Interest | | | 4 | | | | — | | | | 2 | | | | — | | | | 10 | |
Securities Lending Income | | | 2,941 | | | | 1,650 | | | | 1,475 | | | | 63 | | | | — | |
Total Investment Income | | | 1,343,473 | | | | 219,220 | | | | 559,083 | | | | 9,245 | | | | 7,300 | |
| | | | | | | | | | | | | | | | | | | | | |
Expenses: | | | | | | | | | | | | | | | | | | | | |
Management fees | | | 408,834 | | | | 119,237 | | | | 245,297 | | | | 6,391 | | | | 4,874 | |
Total Expenses | | | 408,834 | | | | 119,237 | | | | 245,297 | | | | 6,391 | | | | 4,874 | |
Net Investment Income (Loss) | | | 934,639 | | | | 99,983 | | | | 313,786 | | | | 2,854 | | | | 2,426 | |
| | | | | | | | | | | | | | | | | | | | | |
REALIZED & UNREALIZED GAIN (LOSS) ON INVESTMENTS | | | | | | | | | | | | | | | | | | | | |
Net Realized Gain (Loss) on: | | | | | | | | | | | | | | | | | | | | |
Net Realized Gain (Loss) on Investments | | | (3,946,999 | ) | | | (4,416,810 | ) | | | (4,773,201 | ) | | | (442 | ) | | | 249 | |
Net Realized Gain (Loss) on In-Kind Redemptions | | | 22,468,124 | | | | 4,947,937 | | | | 5,616,361 | | | | 378,356 | | | | — | |
Net Realized Gain (Loss) on Foreign Currency | | | — | | | | — | | | | — | | | | — | | | | — | |
Total | | | 18,521,125 | | | | 531,127 | | | | 843,160 | | | | 377,914 | | | | 249 | |
Net Change in Unrealized Appreciation (Depreciation) of: | | | | | | | | | | | | | | | | | | | | |
Change in Unrealized Appreciation (Depreciation) on Investments | | | (9,979,650 | ) | | | (1,628,513 | ) | | | 8,419,052 | | | | (222,558 | ) | | | 93,653 | |
Change in Unrealized Appreciation (Depreciation) on Foreign Currency | | | — | | | | — | | | | — | | | | — | | | | — | |
Change in Unrealized Appreciation (Depreciation) on Futures | | | — | | | | — | | | | — | | | | — | | | | 3,258 | |
Total | | | (9,979,650 | ) | | | (1,628,513 | ) | | | 8,419,052 | | | | (222,558 | ) | | | 96,911 | |
Net Realized and Unrealized Gain (Loss) on Investments | | | 8,541,475 | | | | (1,097,386 | ) | | | 9,262,212 | | | | 155,356 | | | | 97,160 | |
NET INCREASE (DECREASE) IN NET ASSETS RESULTING FROM OPERATIONS | | $ | 9,476,114 | | | $ | (997,403 | ) | | $ | 9,575,998 | | | $ | 158,210 | | | $ | 99,586 | |
| | | | | | | | | | | | | | | | | | | | | |
* Net of fees and foreign witholding tax of | | $ | — | | | $ | — | | | $ | 95 | | | $ | 17 | | | $ | 1 | |
(a) | Fund commenced operations on July 12, 2021. The information presented is from July 12, 2021 to October 31, 2021. |
The accompanying notes are an integral part of the financial statements.
150
Pacer Funds
STATEMENTS OF OPERATIONS
For the Period Ended October 31, 2021 (Unaudited)
| | | Pacer
Metaurus US
Large Cap
Dividend
Multiplier 400
ETF (a) | | | Pacer
Pacific Asset
Floating Rate
High Income
ETF (b) | | | Pacer
Pacific Asset
Floating Rate
High Income
ETF (c) | |
INVESTMENT INCOME | | | | | | | | | | | | |
Income: | | | | | | | | | | | | |
Dividends* | | $ | 31,153 | | | $ | 800 | | | $ | 74 | |
Interest | | | 5 | | | | 420,489 | | | | 1,097,421 | |
Securities Lending Income | | | — | | | | — | | | | — | |
Total Investment Income | | | 31,158 | | | | 421,289 | | | | 1,097,495 | |
| | | | | | | | | | | | | |
Expenses: | | | | | | | | | | | | |
Management fees | | | 24,102 | | | | 74,053 | | | | 201,085 | |
Total Expenses | | | 24,102 | | | | 74,053 | | | | 201,085 | |
Net Investment Income (Loss) | | | 7,056 | | | | 347,236 | | | | 896,410 | |
| | | | | | | | | | | | | |
REALIZED & UNREALIZED GAIN (LOSS) ON INVESTMENTS | | | | | | | | | | | | |
Net Realized Gain (Loss) on: | | | | | | | | | | | | |
Net Realized Gain (Loss) on Investments | | | (9,976 | ) | | | 16,693 | | | | (23,314 | ) |
Net Realized Gain (Loss) on In-Kind Redemptions | | | — | | | | — | | | | — | |
Net Realized Gain (Loss) on Foreign Currency | | | — | | | | — | | | | — | |
Total | | | (9,976 | ) | | | 16,693 | | | | (23,314 | ) |
Net Change in Unrealized Appreciation (Depreciation) of: | | | | | | | | | | | | |
Change in Unrealized Appreciation (Depreciation) on Investments | | | 959,464 | | | | (44,905 | ) | | | 1,513,865 | |
Change in Unrealized Appreciation (Depreciation) on Foreign Currency | | | — | | | | — | | | | — | |
Change in Unrealized Appreciation (Depreciation) on Futures | | | 22,644 | | | | — | | | | — | |
Total | | | 982,108 | | | | (44,905 | ) | | | 1,513,865 | |
Net Realized and Unrealized Gain (Loss) on Investments | | | 972,132 | | | | (28,212 | ) | | | 1,490,551 | |
NET INCREASE (DECREASE) IN NET ASSETS RESULTING FROM OPERATIONS | | $ | 979,188 | | | $ | 319,024 | | | $ | 2,386,961 | |
| | | | | | | | | | | | | |
* Net of fees and foreign witholding tax of | | $ | 9 | | | $ | — | | | $ | 285 | |
(a) | Fund commenced operations on July 12, 2021. The information presented is from July 12, 2021 to October 31, 2021. |
(b) | For the period ended July 1, 2021 to October 31, 2021. Shares of the Predecessor Fund converted Shares at the close of business on October 22, 2021. See Note 1 to the Financial Statements. |
(c) | For the year ended June 30, 2021. See Note 1 to the Financial Statements. |
The accompanying notes are an integral part of the financial statements.
151
Pacer Funds
STATEMENTS OF CHANGES IN NET ASSETS
| | Pacer Trendpilot®
US Large Cap ETF | | | Pacer Trendpilot®
US Mid Cap ETF | |
| | | For the
Period Ended
October 31,
2021
(Unaudited) | | | For the
Year Ended
April 30,
2021 | | | For the
Period Ended
October 31,
2021
(Unaudited) | | | For the
Year Ended
April 30,
2021 | |
OPERATIONS | | | | | | | | | | | | | | | | |
Net Investment Income (Loss) | | $ | 7,514,773 | | | $ | 16,559,388 | | | $ | 531,718 | | | $ | 1,319,084 | |
Net Realized Gain (Loss) on Investments and Foreign Currency Transactions | | | 23,492,593 | | | | 115,242,879 | | | | 9,380,142 | | | | 25,501,647 | |
Change in Unrealized Appreciation (Depreciation) of Investments and Foreign Currency Transactions | | | 162,580,862 | | | | 484,413,235 | | | | (3,045,694 | ) | | | 70,012,190 | |
Net Increase (Decrease) in Net Assets Resulting from Operations | | | 193,588,228 | | | | 616,215,502 | | | | 6,866,166 | | | | 96,832,921 | |
| | | | | | | | | | | | | | | | | |
DISTRIBUTIONS TO SHAREHOLDERS | | | | | | | | | | | | | | | | |
Dividends and Distributions | | | — | | | | (20,840,884 | ) | | | — | | | | (2,277,219 | ) |
Total Distributions to Shareholders | | | — | | | | (20,840,884 | ) | | | — | | | | (2,277,219 | ) |
| | | | | | | | | | | | | | | | | |
CAPITAL SHARE TRANSACTIONS | | | | | | | | | | | | | | | | |
Proceeds from Shares Sold | | | 1,821,175 | | | | 65,551,735 | | | | 30,869,365 | | | | 29,031,925 | |
Payments for Shares Redeemed | | | (73,025,320 | ) | | | (1,169,993,320 | ) | | | (19,586,060 | ) | | | (211,163,865 | ) |
Net Increase (Decrease) in Net Assets Derived from Capital Share Transactions (a) | | | (71,204,145 | ) | | | (1,104,441,585 | ) | | | 11,283,305 | | | | (182,131,940 | ) |
Net Increase (Decrease) in Net Assets | | $ | 122,384,083 | | | $ | (509,066,967 | ) | | $ | 18,149,471 | | | $ | (87,576,238 | ) |
| | | | | | | | | | | | | | | | | |
NET ASSETS | | | | | | | | | | | | | | | | |
Beginning of Period | | $ | 1,894,772,327 | | | $ | 2,403,839,294 | | | $ | 452,474,282 | | | $ | 540,050,520 | |
End of Period | | $ | 2,017,156,410 | | | $ | 1,894,772,327 | | | $ | 470,623,753 | | | $ | 452,474,282 | |
(a) | Summary of capital share transactions is as follows: |
| | | Shares | | | Shares | | | Shares | | | Shares | |
Subscriptions | | | 50,000 | | | | 2,200,000 | | | | 850,000 | | | | 950,000 | |
Redemptions | | | (1,950,000 | ) | | | (39,400,000 | ) | | | (550,000 | ) | | | (7,300,000 | ) |
Net Increase (Decrease) | | | (1,900,000 | ) | | | (37,200,000 | ) | | | 300,000 | | | | (6,350,000 | ) |
The accompanying notes are an integral part of the financial statements.
152
Pacer Funds
STATEMENTS OF CHANGES IN NET ASSETS
| | | Pacer Trendpilot® 100 ETF | | | Pacer Trendpilot®
European Index ETF | |
| | | For the
Period Ended
October 31,
2021
(Unaudited) | | | For the
Year Ended
April 30,
2021 | | | For the
Period Ended
October 31,
2021
(Unaudited) | | | For the
Year Ended
April 30,
2021 | |
OPERATIONS | | | | | | | | | | | | | | | | |
Net Investment Income (Loss) | | $ | (1,033,799 | ) | | $ | 90,493 | | | $ | 712,865 | | | $ | 278,145 | |
Net Realized Gain (Loss) on Investments and Foreign Currency Transactions | | | 7,998,996 | | | | 236,233,333 | | | | 810,042 | | | | (8,218,211 | ) |
Change in Unrealized Appreciation (Depreciation) of Investments and Foreign Currency Transactions | | | 50,954,159 | | | | 48,511,580 | | | | 736,033 | | | | 7,774,742 | |
Net Increase (Decrease) in Net Assets Resulting from Operations | | | 57,919,356 | | | | 284,835,406 | | | | 2,258,940 | | | | (165,324 | ) |
| | | | | | | | | | | | | | | | | |
DISTRIBUTIONS TO SHAREHOLDERS | | | | | | | | | | | | | | | | |
Dividends and Distributions | | | — | | | | (1,304,636 | ) | | | — | | | | — | |
Total Distributions to Shareholders | | | — | | | | (1,304,636 | ) | | | — | | | | — | |
| | | | | | | | | | | | | | | | | |
CAPITAL SHARE TRANSACTIONS | | | | | | | | | | | | | | | | |
Proceeds from Shares Sold | | | 5,513,590 | | | | 392,693,120 | | | | — | | | | — | |
Payments for Shares Redeemed | | | (33,071,855 | ) | | | (632,357,880 | ) | | | (3,837,025 | ) | | | (36,581,355 | ) |
Transaction Fees (See Note 1) | | | — | | | | 16 | | | | 67 | | | | — | |
Net Increase (Decrease) in Net Assets Derived from Capital Share Transactions (a) | | | (27,558,265 | ) | | | (239,664,744 | ) | | | (3,837,025 | ) | | | (36,581,355 | ) |
Net Increase (Decrease) in Net Assets | | $ | 30,361,091 | | | $ | 43,866,026 | | | $ | (1,578,085 | ) | | $ | (36,746,679 | ) |
| | | | | | | | | | | | | | | | | |
NET ASSETS | | | | | | | | | | | | | | | | |
Beginning of Period | | $ | 783,123,810 | | | $ | 739,257,784 | | | $ | 54,740,994 | | | $ | 91,487,673 | |
End of Period | | $ | 813,484,901 | | | $ | 783,123,810 | | | $ | 53,162,909 | | | $ | 54,740,994 | |
(a) | Summary of capital share transactions is as follows: |
| | | Shares | | | Shares | | | Shares | | | Shares | |
Subscriptions | | | 100,000 | | | | 7,850,000 | | | | — | | | | — | |
Redemptions | | | (600,000 | ) | | | (12,850,000 | ) | | | (150,000 | ) | | | (1,600,000 | ) |
Net Increase (Decrease) | | | (500,000 | ) | | | (5,000,000 | ) | | | (150,000 | ) | | | (1,600,000 | ) |
The accompanying notes are an integral part of the financial statements.
153
Pacer Funds
STATEMENTS OF CHANGES IN NET ASSETS
| | | Pacer Trendpilot®
International ETF | | | Pacer Trendpilot®
US Bond ETF | |
| | | For the
Period Ended
October 31,
2021
(Unaudited) | | | For the
Year Ended
April 30,
2021 | | | For the
Period Ended
October 31,
2021
(Unaudited) | | | For the
Year Ended
April 30,
2021 | |
OPERATIONS | | | | | | | | | | | | | | | | |
Net Investment Income (Loss) | | $ | 1,383,702 | | | $ | 1,539,225 | | | $ | 15,618,765 | | | $ | 15,275,302 | |
Net Realized Gain (Loss) on Investments and Foreign Currency Transactions | | | (7,905 | ) | | | 2,055,052 | | | | 15,968,352 | | | | 1,270,299 | |
Change in Unrealized Appreciation (Depreciation) of Investments and Foreign Currency Transactions | | | 4,515,681 | | | | 20,188,051 | | | | (42,021,330 | ) | | | 13,752,423 | |
Net Increase (Decrease) in Net Assets Resulting from Operations | | | 5,891,478 | | | | 23,782,328 | | | | (10,434,213 | ) | | | 30,298,024 | |
| | | | | | | | | | | | | | | | | |
DISTRIBUTIONS TO SHAREHOLDERS | | | | | | | | | | | | | | | | |
Dividends and Distributions | | | — | | | | (994,630 | ) | | | (14,928,907 | ) | | | (11,952,976 | ) |
Total Distributions to Shareholders | | | — | | | | (994,630 | ) | | | (14,928,907 | ) | | | (11,952,976 | ) |
| | | | | | | | | | | | | | | | | |
CAPITAL SHARE TRANSACTIONS | | | | | | | | | | | | | | | | |
Proceeds from Shares Sold | | | 4,381,520 | | | | 20,782,070 | | | | 962,135,660 | | | | 751,806,520 | |
Payments for Shares Redeemed | | | — | | | | (63,379,965 | ) | | | (455,558,020 | ) | | | (74,527,390 | ) |
Transaction Fees (See Note 1) | | | — | | | | — | | | | — | | | | 18,911 | |
Net Increase (Decrease) in Net Assets Derived from Capital Share Transactions (a) | | | 4,381,520 | | | | (42,597,895 | ) | | | 506,577,640 | | | | 677,298,041 | |
Net Increase (Decrease) in Net Assets | | $ | 10,272,998 | | | $ | (19,810,197 | ) | | $ | 481,214,520 | | | $ | 695,643,089 | |
| | | | | | | | | | | | | | | | | |
NET ASSETS | | | | | | | | | | | | | | | | |
Beginning of Period | | $ | 131,228,274 | | | $ | 151,038,471 | | | $ | 839,970,142 | | | $ | 144,327,053 | |
End of Period | | $ | 141,501,272 | | | $ | 131,228,274 | | | $ | 1,321,184,662 | | | $ | 839,970,142 | |
(a) | Summary of capital share transactions is as follows: |
| | | Shares | | | Shares | | | Shares | | | Shares | |
Subscriptions | | | 150,000 | | | | 850,000 | | | | 34,900,000 | | | | 27,900,000 | |
Redemptions | | | — | | | | (2,650,000 | ) | | | (16,500,000 | ) | | | (2,900,000 | ) |
Net Increase (Decrease) | | | 150,000 | | | | (1,800,000 | ) | | | 18,400,000 | | | | 25,000,000 | |
The accompanying notes are an integral part of the financial statements.
154
Pacer Funds
STATEMENTS OF CHANGES IN NET ASSETS
| | | Pacer Trendpilot®
Fund of Funds ETF | | | Pacer Global Cash
Cows Dividend ETF | |
| | | For the
Period Ended
October 31,
2021
(Unaudited) | | | For the
Year Ended
April 30,
2021 | | | For the
Period Ended
October 31,
2021
(Unaudited) | | | For the
Year Ended
April 30,
2021 | |
OPERATIONS | | | | | | | | | | | | | | | | |
Net Investment Income (Loss) | | $ | 98,479 | | | $ | 289,076 | | | $ | 2,993,687 | | | $ | 5,590,153 | |
Net Realized Gain (Loss) on Investments and Foreign Currency Transactions | | | 341,448 | | | | 707,838 | | | | 486,630 | | | | (14,382,265 | ) |
Change in Unrealized Appreciation (Depreciation) of Investments and Foreign Currency Transactions | | | 2,053,886 | | | | 6,982,894 | | | | (4,846,657 | ) | | | 44,026,422 | |
Net Increase (Decrease) in Net Assets Resulting from Operations | | | 2,493,813 | | | | 7,979,808 | | | | (1,366,340 | ) | | | 35,234,310 | |
| | | | | | | | | | | | | | | | | |
DISTRIBUTIONS TO SHAREHOLDERS | | | | | | | | | | | | | | | | |
Dividends and Distributions | | | — | | | | (245,087 | ) | | | 3,609,385 | | | | (5,702,135 | ) |
Return of Capital | | | — | | | | — | | | | — | | | | — | |
Total Distributions to Shareholders | | | — | | | | (245,087 | ) | | | 3,609,385 | | | | (5,702,135 | ) |
| | | | | | | | | | | | | | | | | |
CAPITAL SHARE TRANSACTIONS | | | | | | | | | | | | | | | | |
Proceeds from Shares Sold | | | 19,823,555 | | | | 21,559,740 | | | | 25,574,520 | | | | 3,126,310 | |
Payments for Shares Redeemed | | | (1,516,875 | ) | | | (11,944,265 | ) | | | (20,414,160 | ) | | | (32,868,725 | ) |
Transaction Fees (See Note 1) | | | — | | | | — | | | | — | | | | — | |
Net Increase (Decrease) in Net Assets Derived from Capital Share Transactions (a) | | | 18,306,680 | | | | 9,615,475 | | | | 5,160,360 | | | | (29,742,415 | ) |
Net Increase (Decrease) in Net Assets | | $ | 20,800,493 | | | $ | 17,350,196 | | | $ | 184,635 | | | $ | (210,240 | ) |
| | | | | | | | | | | | | | | | | |
NET ASSETS | | | | | | | | | | | | | | | | |
Beginning of Period | | $ | 44,728,346 | | | $ | 27,378,150 | | | $ | 135,269,406 | | | $ | 135,479,646 | |
End of Period | | $ | 65,528,839 | | | $ | 44,728,346 | | | $ | 135,454,041 | | | $ | 135,269,406 | |
(a) | Summary of capital share transactions is as follows: |
| | | Shares | | | Shares | | | Shares | | | Shares | |
Subscriptions | | | 650,000 | | | | 800,000 | | | | 800,000 | | | | 100,000 | |
Redemptions | | | (50,000 | ) | | | (450,000 | ) | | | (650,000 | ) | | | (1,250,000 | ) |
Net Increase (Decrease) | | | 600,000 | | | | 350,000 | | | | 150,000 | | | | (1,150,000 | ) |
The accompanying notes are an integral part of the financial statements.
155
Pacer Funds
STATEMENTS OF CHANGES IN NET ASSETS
| | | Pacer US Cash Cows 100 ETF | | | Pacer US Small Cap
Cash Cows 100 ETF | |
| | | For the
Period Ended
October 31,
2021
(Unaudited) | | | For the
Year Ended
April 30,
2021 | | | For the
Period Ended
October 31,
2021
(Unaudited) | | | For the
Year Ended
April 30,
2021 | |
OPERATIONS | | | | | | | | | | | | | | | | |
Net Investment Income (Loss) | | $ | 5,614,770 | | | $ | 5,380,746 | | | $ | 1,177,954 | | | $ | 238,406 | |
Net Realized Gain (Loss) on Investments and Foreign Currency Transactions | | | 54,516,188 | | | | 46,486,167 | | | | 18,844,731 | | | | 12,403,913 | |
Change in Unrealized Appreciation (Depreciation) of Investments and Foreign Currency Transactions | | | (14,149,766 | ) | | | 78,216,603 | | | | (16,663,314 | ) | | | 32,162,390 | |
Net Increase (Decrease) in Net Assets Resulting from Operations | | | 45,981,192 | | | | 130,083,516 | | | | 3,359,371 | | | | 44,804,709 | |
| | | | | | | | | | | | | | | | | |
DISTRIBUTIONS TO SHAREHOLDERS | | | | | | | | | | | | | | | | |
Dividends and Distributions | | | (4,919,370 | ) | | | (5,246,948 | ) | | | (1,209,250 | ) | | | (268,296 | ) |
Return of Capital | | | — | | | | — | | | | — | | | | (74,624 | ) |
Total Distributions to Shareholders | | | (4,919,370 | ) | | | (5,246,948 | ) | | | (1,209,250 | ) | | | (342,920 | ) |
| | | | | | | | | | | | | | | | | |
CAPITAL SHARE TRANSACTIONS | | | | | | | | | | | | | | | | |
Proceeds from Shares Sold | | | 693,667,040 | | | | 336,649,250 | | | | 360,184,035 | | | | 267,545,490 | |
Payments for Shares Redeemed | | | (216,707,020 | ) | | | (219,400,055 | ) | | | (121,238,170 | ) | | | (54,701,560 | ) |
Net Increase (Decrease) in Net Assets Derived from Capital Share Transactions (a) | | | 476,960,020 | | | | 117,249,195 | | | | 238,945,865 | | | | 212,843,930 | |
Net Increase (Decrease) in Net Assets | | $ | 518,021,842 | | | $ | 242,085,763 | | | $ | 241,095,986 | | | $ | 257,305,719 | |
| | | | | | | | | | | | | | | | | |
NET ASSETS | | | | | | | | | | | | | | | | |
Beginning of Period | | $ | 432,112,604 | | | $ | 190,026,841 | | | $ | 271,839,663 | | | $ | 14,533,944 | |
End of Period | | $ | 950,134,446 | | | $ | 432,112,604 | | | $ | 512,935,649 | | | $ | 271,839,663 | |
(a) | Summary of capital share transactions is as follows: |
| | | Shares | | | Shares | | | Shares | | | Shares | |
Subscriptions | | | 15,800,000 | | | | 9,400,000 | | | | 8,300,000 | | | | 7,400,000 | |
Redemptions | | | (5,000,000 | ) | | | (6,650,000 | ) | | | (2,850,000 | ) | | | (1,600,000 | ) |
Net Increase (Decrease) | | | 10,800,000 | | | | 2,750,000 | | | | 5,450,000 | | | | 5,800,000 | |
The accompanying notes are an integral part of the financial statements.
156
Pacer Funds
STATEMENTS OF CHANGES IN NET ASSETS
| | | Pacer Developed Markets
International Cash Cows 100 ETF | | | Pacer US Cash Cows Growth ETF | |
| | | For the
Period Ended
October 31,
2021
(Unaudited) | | | For the
Year Ended
April 30,
2021 | | | For the
Period Ended
October 31,
2021
(Unaudited) | | | For the
Year Ended
April 30,
2021 | |
OPERATIONS | | | | | | | | | | | | | | | | |
Net Investment Income (Loss) | | $ | 413,113 | | | $ | 374,732 | | | $ | (979 | ) | | $ | 9,352 | |
Net Realized Gain (Loss) on Investments and Foreign Currency Transactions | | | 490,598 | | | | (2,992,117 | ) | | | 320,001 | | | | 555,630 | |
Change in Unrealized Appreciation (Depreciation) of Investments and Foreign Currency Transactions | | | (1,728,251 | ) | | | 8,873,845 | | | | 176,676 | | | | 312,180 | |
Net Increase (Decrease) in Net Assets Resulting from Operations | | | (824,540 | ) | | | 6,256,460 | | | | 495,698 | | | | 877,162 | |
| | | | | | | | | | | | | | | | | |
DISTRIBUTIONS TO SHAREHOLDERS | | | | | | | | | | | | | | | | |
Dividends and Distributions | | | (460,062 | ) | | | (374,692 | ) | | | (1,138 | ) | | | (11,770 | ) |
Total Distributions to Shareholders | | | (460,062 | ) | | | (374,692 | ) | | | (1,138 | ) | | | (11,770 | ) |
| | | | | | | | | | | | | | | | | |
CAPITAL SHARE TRANSACTIONS | | | | | | | | | | | | | | | | |
Proceeds from Shares Sold | | | 19,209,275 | | | | 3,174,460 | | | | 5,783,500 | | | | 7,659,260 | |
Payments for Shares Redeemed | | | (3,253,780 | ) | | | (9,279,055 | ) | | | (3,785,320 | ) | | | (6,047,890 | ) |
Transaction Fees (See Note 1) | | | 4,416 | | | | 116 | | | | — | | | | — | |
Net Increase (Decrease) in Net Assets Derived from Capital Share Transactions (a) | | | 15,959,911 | | | | (6,104,479 | ) | | | 1,998,180 | | | | 1,611,370 | |
Net Increase (Decrease) in Net Assets | | $ | 14,675,309 | | | $ | (222,711 | ) | | $ | 2,492,740 | | | $ | 2,476,762 | |
| | | | | | | | | | | | | | | | | |
NET ASSETS | | | | | | | | | | | | | | | | |
Beginning of Period | | $ | 20,768,603 | | | $ | 20,991,314 | | | $ | 3,621,094 | | | $ | 1,144,332 | |
End of Period | | $ | 35,443,912 | | | $ | 20,768,603 | | | $ | 6,113,834 | | | $ | 3,621,094 | |
(a) | Summary of capital share transactions is as follows: |
| | | Shares | | | Shares | | | Shares | | | Shares | |
Subscriptions | | | 600,000 | | | | 100,000 | | | | 150,000 | | | | 250,000 | |
Redemptions | | | (100,000 | ) | | | (450,000 | ) | | | (100,000 | ) | | | (200,000 | ) |
Net Increase (Decrease) | | | 500,000 | | | | (350,000 | ) | | | 50,000 | | | | 50,000 | |
The accompanying notes are an integral part of the financial statements.
157
Pacer Funds
STATEMENTS OF CHANGES IN NET ASSETS
| | | Pacer Emerging Markets
Cash Cows 100 ETF | | | Pacer Cash Cows Fund of Funds ETF | |
| | | For the
Period Ended
October 31,
2021
(Unaudited) | | | For the
Year Ended
April 30,
2021 | | | For the
Period Ended
October 31,
2021
(Unaudited) | | | For the
Year Ended
April 30,
2021 | |
OPERATIONS | | | | | | | | | | | | | | | | |
Net Investment Income (Loss) | | $ | 258,801 | | | $ | 65,319 | | | $ | 32,877 | | | $ | 38,744 | |
Net Realized Gain (Loss) on Investments and Foreign Currency Transactions | | | 113,556 | | | | 190,647 | | | | 161,542 | | | | 386,898 | |
Change in Unrealized Appreciation (Depreciation) of Investments and Foreign Currency Transactions | | | (1,108,076 | ) | | | 476,172 | | | | (153,795 | ) | | | 368,195 | |
Net Increase (Decrease) in Net Assets Resulting from Operations | | | (735,719 | ) | | | 732,138 | | | | 40,624 | | | | 793,837 | |
| | | | | | | | | | | | | | | | | |
DISTRIBUTIONS TO SHAREHOLDERS | | | | | | | | | | | | | | | | |
Dividends and Distributions | | | (259,128 | ) | | | (51,325 | ) | | | (37,913 | ) | | | (39,016 | ) |
Return of Capital | | | — | | | | — | | | | — | | | | — | |
Total Distributions to Shareholders | | | (259,128 | ) | | | (51,325 | ) | | | (37,913 | ) | | | (39,016 | ) |
| | | | | | | | | | | | | | | | | |
CAPITAL SHARE TRANSACTIONS | | | | | | | | | | | | | | | | |
Proceeds from Shares Sold | | | 8,093,140 | | | | 3,443,130 | | | | 5,179,260 | | | | 2,595,360 | |
Payments for Shares Redeemed | | | (2,635,630 | ) | | | (1,193,160 | ) | | | (3,409,180 | ) | | | (2,719,690 | ) |
Transaction Fees (See Note 1) | | | 1,606 | | | | 4,696 | | | | — | | | | — | |
Net Increase (Decrease) in Net Assets Derived from Capital Share Transactions (a) | | | 5,459,116 | | | | 2,254,666 | | | | 1,770,080 | | | | (124,330 | ) |
Net Increase (Decrease) in Net Assets | | $ | 4,464,269 | | | $ | 2,935,479 | | | $ | 1,772,791 | | | $ | 630,491 | |
| | | | | | | | | | | | | | | | | |
NET ASSETS | | | | | | | | | | | | | | | | |
Beginning of Period | | $ | 3,891,045 | | | $ | 955,566 | | | $ | 1,671,776 | | | $ | 1,041,285 | |
End of Period | | $ | 8,355,314 | | | $ | 3,891,045 | | | $ | 3,444,567 | | | $ | 1,671,776 | |
(a) | Summary of capital share transactions is as follows: |
| | | Shares | | | Shares | | | Shares | | | Shares | |
Subscriptions | | | 300,000 | | | | 150,000 | | | | 150,000 | | | | 100,000 | |
Redemptions | | | (100,000 | ) | | | (50,000 | ) | | | (100,000 | ) | | | (100,000 | ) |
Net Increase (Decrease) | | | 200,000 | | | | 100,000 | | | | 50,000 | | | | — | |
The accompanying notes are an integral part of the financial statements.
158
Pacer Funds
STATEMENTS OF CHANGES IN NET ASSETS
| | | Pacer WealthShield ETF | | | Pacer Benchmark
Industrial Real Estate SCTRSM ETF | |
| | | For the
Period Ended
October 31,
2021
(Unaudited) | | | For the
Year Ended
April 30,
2021 | | | For the
Period Ended
October 31,
2021
(Unaudited) | | | For the
Year Ended
April 30,
2021 | |
OPERATIONS | | | | | | | | | | | | | | | | |
Net Investment Income (Loss) | | $ | 337,863 | | | $ | 274,560 | | | $ | 2,480,196 | | | $ | 1,992,916 | |
Net Realized Gain (Loss) on Investments and Foreign Currency Transactions | | | 3,073,518 | | | | 13,576,065 | | | | 7,793,063 | | | | 7,497,477 | |
Change in Unrealized Appreciation (Depreciation) of Investments and Foreign Currency Transactions | | | 390,690 | | | | 1,577,908 | | | | 32,551,945 | | | | 33,190,969 | |
Net Increase (Decrease) in Net Assets Resulting from Operations | | | 3,802,071 | | | | 15,428,533 | | | | 42,825,204 | | | | 42,681,362 | |
| | | | | | | | | | | | | | | | | |
DISTRIBUTIONS TO SHAREHOLDERS | | | | | | | | | | | | | | | | |
Dividends and Distributions | | | (324,501 | ) | | | (310,992 | ) | | | (1,497,459 | ) | | | (2,023,062 | ) |
Long-Term Capital Gain | | | — | | | | — | | | | — | | | | — | |
Return of Capital | | | — | | | | — | | | | — | | | | (327,809 | ) |
Total Distributions to Shareholders | | | (324,501 | ) | | | (310,992 | ) | | | (1,497,459 | ) | | | (2,350,871 | ) |
| | | | | | | | | | | | | | | | | |
CAPITAL SHARE TRANSACTIONS | | | | | | | | | | | | | | | | |
Proceeds from Shares Sold | | | 12,909,725 | | | | 35,612,290 | | | | 97,170,275 | | | | 144,392,710 | |
Payments for Shares Redeemed | | | (8,095,450 | ) | | | (54,014,295 | ) | | | (31,177,115 | ) | | | (32,784,815 | ) |
Transaction Fees (See Note 1) | | | 1 | | | | — | | | | — | | | | 43 | |
Net Increase (Decrease) in Net Assets Derived from Capital Share Transactions (a) | | | 4,814,276 | | | | (18,402,005 | ) | | | 65,993,160 | | | | 111,607,938 | |
Net Increase (Decrease) in Net Assets | | $ | 8,291,846 | | | $ | (3,284,464 | ) | | $ | 107,320,905 | | | $ | 151,938,429 | |
| | | | | | | | | | | | | | | | | |
NET ASSETS | | | | | | | | | | | | | | | | |
Beginning of Period | | $ | 48,143,441 | | | $ | 51,427,905 | | | $ | 200,085,877 | | | $ | 48,147,448 | |
End of Period | | $ | 56,435,287 | | | $ | 48,143,441 | | | $ | 307,406,782 | | | $ | 200,085,877 | |
(a) | Summary of capital share transactions is as follows: |
| | | Shares | | | Shares | | | Shares | | | Shares | |
Subscriptions | | | 400,000 | | | | 1,250,000 | | | | 2,150,000 | | | | 4,050,000 | |
Redemptions | | | (250,000 | ) | | | (1,900,000 | ) | | | (700,000 | ) | | | (900,000 | ) |
Net Increase (Decrease) | | | 150,000 | | | | (650,000 | ) | | | 1,450,000 | | | | 3,150,000 | |
The accompanying notes are an integral part of the financial statements.
159
Pacer Funds
STATEMENTS OF CHANGES IN NET ASSETS
| | | Pacer Benchmark
Data & Infrastructure Real
Estate SCTRSM ETF | | | Pacer CFRA-Stovall Equal
Weight Seasonal Rotation ETF | |
| | | For the
Period Ended
October 31,
2021
(Unaudited) | | | For the
Year Ended
April 30,
2021 | | | For the
Period Ended
October 31,
2021
(Unaudited) | | | For the
Year Ended
April 30,
2021 | |
OPERATIONS | | | | | | | | | | | | | | | | |
Net Investment Income (Loss) | | $ | 10,564,263 | | | $ | 9,443,308 | | | $ | 421,548 | | | $ | 537,502 | |
Net Realized Gain (Loss) on Investments and Foreign Currency Transactions | | | 17,652,049 | | | | 44,426,650 | | | | 2,232,046 | | | | 22,538,856 | |
Change in Unrealized Appreciation (Depreciation) of Investments and Foreign Currency Transactions | | | 37,613,700 | | | | 81,234,708 | | | | 103 | | | | (253 | ) |
Net Increase (Decrease) in Net Assets Resulting from Operations | | | 65,830,012 | | | | 135,104,666 | | | | 2,653,697 | | | | 23,076,105 | |
| | | | | | | | | | | | | | | | | |
DISTRIBUTIONS TO SHAREHOLDERS | | | | | | | | | | | | | | | | |
Dividends and Distributions | | | (9,392,407 | ) | | | (9,533,565 | ) | | | (335,961 | ) | | | (557,732 | ) |
Long-Term Capital Gain | | | — | | | | — | | | | — | | | | | |
Return of Capital | | | — | | | | (4,446,515 | ) | | | — | | | | — | |
Total Distributions to Shareholders | | | (9,392,407 | ) | | | (13,980,080 | ) | | | (335,961 | ) | | | (557,732 | ) |
| | | | | | | | | | | | | | | | | |
CAPITAL SHARE TRANSACTIONS | | | | | | | | | | | | | | | | |
Proceeds from Shares Sold | | | 482,503,525 | | | | 766,413,780 | | | | 13,183,795 | | | | 78,034,485 | |
Payments for Shares Redeemed | | | (44,346,155 | ) | | | (319,943,095 | ) | | | — | | | | (94,224,645 | ) |
Transaction Fees (See Note 1) | | | — | | | | — | | | | — | | | | — | |
Net Increase (Decrease) in Net Assets Derived from Capital Share Transactions (a) | | | 438,157,370 | | | | 446,470,685 | | | | 13,183,795 | | | | (16,190,160 | ) |
Net Increase (Decrease) in Net Assets | | $ | 494,594,975 | | | $ | 567,595,271 | | | $ | 15,501,531 | | | $ | 6,328,213 | |
| | | | | | | | | | | | | | | | | |
NET ASSETS | | | | | | | | | | | | | | | | |
Beginning of Period | | $ | 1,119,809,699 | | | $ | 552,214,428 | | | $ | 66,882,591 | | | $ | 60,554,378 | |
End of Period | | $ | 1,614,404,674 | | | $ | 1,119,809,699 | | | $ | 82,384,122 | | | $ | 66,882,591 | |
(a) Summary of capital share transactions is as follows:
| | | Shares | | | Shares | | | Shares | | | Shares | |
Subscriptions | | | 11,800,000 | | | | 4,050,000 | | | | 350,000 | | | | 2,300,000 | |
Redemptions | | | (1,100,000 | ) | | | (900,000 | ) | | | — | | | | (2,900,000 | ) |
Net Increase (Decrease) | | | 10,700,000 | | | | 3,150,000 | | | | 350,000 | | | | (600,000 | ) |
The accompanying notes are an integral part of the financial statements.
160
Pacer Funds
STATEMENTS OF CHANGES IN NET ASSETS
| | | Pacer CSOP FTSE China A50 ETF | | | Pacer BioThreat Strategy ETF | |
| | | For the
Period Ended
October 31,
2021
(Unaudited) | | | For the
Year Ended
April 30,
2021 | | | For the
Period Ended
October 31,
2021
(Unaudited) | | | For the
Year Ended
April 30,
2021 | |
OPERATIONS | | | | | | | | | | | | | | | | |
Net Investment Income (Loss) | | $ | 155,243 | | | $ | 166,067 | | | $ | 20,373 | | | $ | 29,096 | |
Net Realized Gain (Loss) on Investments and Foreign Currency Transactions | | | (671,780 | ) | | | 477,886 | | | | 411,392 | | | | 552,342 | |
Change in Unrealized Appreciation (Depreciation) of Investments and Foreign Currency Transactions | | | (473,640 | ) | | | 2,611,715 | | | | 319,001 | | | | 360,160 | |
Net Increase (Decrease) in Net Assets Resulting from Operations | | | (990,177 | ) | | | 3,255,668 | | | | 750,766 | | | | 941,598 | |
| | | | | | | | | | | | | | | | | |
DISTRIBUTIONS TO SHAREHOLDERS | | | | | | | | | | | | | | | | |
Dividends and Distributions | | | — | | | | (152,212 | ) | | | (20,602 | ) | | | (29,096 | ) |
Return of Capital | | | — | | | | (2,717 | ) | | | — | | | | (352 | ) |
Total Distributions to Shareholders | | | — | | | | (154,929 | ) | | | (20,602 | ) | | | (29,448 | ) |
| | | | | | | | | | | | | | | | | |
CAPITAL SHARE TRANSACTIONS | | | | | | | | | | | | | | | | |
Proceeds from Shares Sold | | | 2,373,565 | | | | 1,246,115 | | | | 4,715,550 | | | | 6,545,070 | |
Payments for Shares Redeemed | | | (3,038,190 | ) | | | (2,974,140 | ) | | | (3,042,020 | ) | | | (2,950,430 | ) |
Transaction Fees (See Note 1) | | | 7,688 | | | | 1,575 | | | | — | | | | — | |
Net Increase (Decrease) in Net Assets Derived from Capital Share Transactions (a) | | | (656,937 | ) | | | (1,726,450 | ) | | | 1,673,530 | | | | 3,594,640 | |
Net Increase (Decrease) in Net Assets | | $ | (1,647,114 | ) | | $ | 1,374,289 | | | $ | 2,403,694 | | | $ | 4,506,790 | |
| | | | | | | | | | | | | | | | | |
NET ASSETS | | | | | | | | | | | | | | | | |
Beginning of Period | | $ | 10,366,636 | | | $ | 8,992,347 | | | $ | 4,506,790 | | | $ | — | |
End of Period | | $ | 8,719,522 | | | $ | 10,366,636 | | | $ | 6,910,484 | | | $ | 4,506,790 | |
(a) | Summary of capital share transactions is as follows: |
| | | Shares | | | Shares | | | Shares | | | Shares | |
Subscriptions | | | 100,000 | | | | 50,000 | | | | 150,000 | | | | 250,000 | |
Redemptions | | | (150,000 | ) | | | (150,000 | ) | | | (100,000 | ) | | | (100,000 | ) |
Net Increase (Decrease) | | | (50,000 | ) | | | (100,000 | ) | | | 50,000 | | | | 150,000 | |
The accompanying notes are an integral part of the financial statements.
161
Pacer Funds
STATEMENTS OF CHANGES IN NET ASSETS
| | | Pacer Lunt Large Cap Alternator ETF | | | Pacer Lunt Midcap Multi
Factor Alternator ETF | |
| | | For the
Period Ended
October 31,
2021
(Unaudited) | | | For the
Period Ended
April 30,
2021 (a) | | | For the
Period Ended
October 31,
2021
(Unaudited) | | | For the
Period Ended
April 30,
2021 (a) | |
OPERATIONS | | | | | | | | | | | | | | | | |
Net Investment Income (Loss) | | $ | 934,639 | | | $ | 712,468 | | | $ | 99,983 | | | $ | 42,541 | |
Net Realized Gain (Loss) on Investments and Foreign Currency Transactions | | | 18,521,125 | | | | 7,991,935 | | | | 531,127 | | | | 5,345,966 | |
Change in Unrealized Appreciation (Depreciation) of Investments and Foreign Currency Transactions | | | (9,979,650 | ) | | | 19,790,385 | | | | (1,628,513 | ) | | | 3,124,756 | |
Net Increase (Decrease) in Net Assets Resulting from Operations | | | 9,476,114 | | | | 28,494,788 | | | | (997,403 | ) | | | 8,513,263 | |
| | | | | | | | | | | | | | | | | |
DISTRIBUTIONS TO SHAREHOLDERS | | | | | | | | | | | | | | | | |
Dividends and Distributions | | | (754,768 | ) | | | (689,136 | ) | | | (82,780 | ) | | | (42,541 | ) |
Return of Capital | | | — | | | | — | | | | — | | | | (15,796 | ) |
Total Distributions to Shareholders | | | (754,768 | ) | | | (689,136 | ) | | | (82,780 | ) | | | (58,337 | ) |
| | | | | | | | | | | | | | | | | |
CAPITAL SHARE TRANSACTIONS | | | | | | | | | | | | | | | | |
Proceeds from Shares Sold | | | 219,500,730 | | | | 182,475,575 | | | | 48,968,700 | | | | 71,744,085 | |
Payments for Shares Redeemed | | | (80,782,240 | ) | | | (79,928,235 | ) | | | (41,455,510 | ) | | | (44,979,605 | ) |
Net Increase (Decrease) in Net Assets Derived from Capital Share Transactions (b) | | | 138,718,490 | | | | 102,547,340 | | | | 7,513,190 | | | | 26,764,480 | |
Net Increase (Decrease) in Net Assets | | $ | 147,439,836 | | | $ | 130,352,992 | | | $ | 6,433,007 | | | $ | 35,219,406 | |
| | | | | | | | | | | | | | | | | |
NET ASSETS | | | | | | | | | | | | | | | | |
Beginning of Period | | $ | 130,352,992 | | | $ | — | | | $ | 35,219,406 | | | $ | — | |
End of Period | | $ | 277,792,828 | | | $ | 130,352,992 | | | $ | 41,652,413 | | | $ | 35,219,406 | |
(a) | Fund commenced operations on June 24, 2020. The information presented is from June 24, 2020 to April 30, 2021. |
| (b) | Summary of capital share transactions is as follows: |
| | | Shares | | | Shares | | | Shares | | | Shares | |
Subscriptions | | | 5,150,000 | | | | 6,200,000 | | | | 1,350,000 | | | | 2,400,000 | |
Redemptions | | | (1,950,000 | ) | | | (3,000,000 | ) | | | (1,150,000 | ) | | | (1,450,000 | ) |
Net Increase (Decrease) | | | 3,200,000 | | | | 3,200,000 | | | | 200,000 | | | | 950,000 | |
The accompanying notes are an integral part of the financial statements.
162
Pacer Funds
STATEMENTS OF CHANGES IN NET ASSETS
| | | Pacer Lunt
Large Cap Multi Factor Alternator ETF | | | Pacer US Export Leaders ETF | |
| | | For the
Period Ended
October 31,
2021
(Unaudited) | | | For the
Period Ended
April 30,
2021 (a) | | | For the
Period Ended
October 31,
2021
(Unaudited) | | | For the
Period Ended
April 30,
2021 | |
OPERATIONS | | | | | | | | | | | | | | | | |
Net Investment Income (Loss) | | $ | 313,786 | | | $ | 186,010 | | | $ | 2,854 | | | $ | 7,012 | |
Net Realized Gain (Loss) on Investments and Foreign Currency Transactions | | | 843,160 | | | | 6,671,002 | | | | 377,914 | | | | 307,405 | |
Change in Unrealized Appreciation (Depreciation) of Investments and Foreign Currency Transactions | | | 8,419,052 | | | | 1,283,470 | | | | (222,558 | ) | | | 435,081 | |
Net Increase (Decrease) in Net Assets Resulting from Operations | | | 9,575,998 | | | | 8,140,482 | | | | 158,210 | | | | 749,498 | |
| | | | | | | | | | | | | | | | | |
DISTRIBUTIONS TO SHAREHOLDERS | | | | | | | | | | | | | | | | |
Dividends and Distributions | | | (299,820 | ) | | | (164,989 | ) | | | (3,007 | ) | | | (7,574 | ) |
Return of Capital | | | — | | | | — | | | | — | | | | — | |
Total Distributions to Shareholders | | | (299,820 | ) | | | (164,989 | ) | | | (3,007 | ) | | | (7,574 | ) |
| | | | | | | | | | | | | | | | | |
CAPITAL SHARE TRANSACTIONS | | | | | | | | | | | | | | | | |
Proceeds from Shares Sold | | | 155,478,745 | | | | 85,462,130 | | | | 2,044,300 | | | | 2,874,230 | |
Payments for Shares Redeemed | | | (62,165,975 | ) | | | (50,184,270 | ) | | | (2,010,390 | ) | | | (2,852,995 | ) |
Net Increase (Decrease) in Net Assets Derived from Capital Share Transactions (b) | | | 93,312,770 | | | | 35,277,860 | | | | 33,910 | | | | 21,235 | |
Net Increase (Decrease) in Net Assets | | $ | 102,588,948 | | | $ | 43,253,353 | | | $ | 189,113 | | | $ | 763,159 | |
| | | | | | | | | | | | | | | | | |
NET ASSETS | | | | | | | | | | | | | | | | |
Beginning of Period | | $ | 43,253,353 | | | $ | — | | | $ | 2,020,562 | | | $ | 1,257,403 | |
End of Period | | $ | 145,842,301 | | | $ | 43,253,353 | | | $ | 2,209,675 | | | $ | 2,020,562 | |
(a) | Fund commenced operations on June 24, 2020. The information presented is from June 24, 2020 to April 30, 2021. |
(b) Summary of capital share transactions is as follows:
| | | Shares | | | Shares | | | Shares | | | Shares | |
Subscriptions | | | 3,950,000 | | | | 2,650,000 | | | | 50,000 | | | | 100,000 | |
Redemptions | | | (1,600,000 | ) | | | (1,500,000 | ) | | | (50,000 | ) | | | (100,000 | ) |
Net Increase (Decrease) | | | 2,350,000 | | | | 1,150,000 | | | | — | | | | — | |
The accompanying notes are an integral part of the financial statements.
163
Pacer Funds
STATEMENTS OF CHANGES IN NET ASSETS
| | | Pacer Metaurus
US Large Cap
Dividend
Multiplier 300
ETF | | | Pacer Metaurus
US Large Cap
Dividend
Multiplier 400
ETF | |
| | | For the
Period Ended
October 31,
2021
(Unaudited) (a) | | | For the
Period Ended
October 31,
2021
(Unaudited) (a) | |
OPERATIONS | | | | | | | | |
Net Investment Income (Loss) | | $ | 2,426 | | | $ | 7,056 | |
Net Realized Gain (Loss) on Investments and Foreign Currency Transactions | | | 249 | | | | (9,976 | ) |
Change in Unrealized Appreciation (Depreciation) of Investments and Futures Contracts | | | 96,911 | | | | 982,108 | |
Net Increase (Decrease) in Net Assets Resulting from Operations | | | 99,586 | | | | 979,188 | |
| | | | | | | | | |
DISTRIBUTIONS TO SHAREHOLDERS | | | | | | | | |
Dividends and Distributions | | | (16,810 | ) | | | (151,125 | ) |
Total Distributions to Shareholders | | | (16,810 | ) | | | (151,125 | ) |
| | | | | | | | | |
CAPITAL SHARE TRANSACTIONS | | | | | | | | |
Proceeds from Shares Sold | | | 2,025,500 | | | | 25,033,782 | |
Payments for Shares Redeemed | | | — | | | | — | |
Net Increase (Decrease) in Net Assets Derived from Capital Share Transactions (b) | | | 2,025,500 | | | | 25,033,782 | |
Net Increase (Decrease) in Net Assets | | $ | 2,108,276 | | | $ | 25,861,845 | |
| | | | | | | | | |
NET ASSETS | | | | | | | | |
Beginning of Period | | $ | — | | | $ | — | |
End of Period | | $ | 2,108,276 | | | $ | 25,861,845 | |
(a) | Fund commenced operations on July 12, 2021. The information presented is from July 12, 2021 to October 31, 2021. |
(b) | Summary of capital share transactions is as follows: |
| | | Shares | | | Shares | |
Subscriptions | | | 50,000 | | | | 720,000 | |
Redemptions | | | — | | | | — | |
Net Increase (Decrease) | | | 50,000 | | | | 720,000 | |
The accompanying notes are an integral part of the financial statements.
164
Pacer Funds
STATEMENTS OF CHANGES IN NET ASSETS
| | | Pacer Pacific Asset
Floating Rate
High Income
ETF | | | Pacer Pacific Asset
Floating Rate
High Income
ETF | | | Pacer Pacific Asset
Floating Rate
High Income
ETF | |
| | | For the
Period Ended
October 31,
2021 (a)
(Unaudited) | | | For the
Year Ended
June 30,
2021 | | | For the
Year Ended
June 30,
2020 | |
OPERATIONS | | | | | | | | | | | | |
Net Investment Income (Loss) | | $ | 347,236 | | | $ | 896,410 | | | $ | 1,142,713 | |
Net Realized Gain (Loss) on Investments and Foreign Currency Transactions | | | 16,693 | | | | (23,314 | ) | | | (66,878 | ) |
Change in Unrealized Appreciation (Depreciation) of Investments and Foreign Currency | | | (44,905 | ) | | | 1,513,865 | | | | (1,259,441 | ) |
Net Increase (Decrease) in Net Assets Resulting from Operations | | | 319,024 | | | | 2,386,961 | | | | (183,606 | ) |
| | | | | | | | | | | | | |
DISTRIBUTIONS TO SHAREHOLDERS | | | | | | | | | | | | |
Dividends and Distributions | | | (266,460 | ) | | | (953,333 | ) | | | (1,145,455 | ) |
Total Distributions to Shareholders | | | (266,460 | ) | | | (953,333 | ) | | | (1,145,455 | ) |
| | | | | | | | | | | | | |
CAPITAL SHARE TRANSACTIONS | | | | | | | | | | | | |
Proceeds from Shares Sold | | | 4,891,375 | | | | 2,443,495 | | | | — | |
Payments for Shares Redeemed | | | — | | | | — | | | | — | |
Net Increase (Decrease) in Net Assets Derived from Capital Share Transactions (b) | | | 4,891,375 | | | | 2,443,495 | | | | — | |
Net Increase (Decrease) in Net Assets | | $ | 4,943,939 | | | $ | 3,877,123 | | | $ | (1,329,061 | ) |
| | | | | | | | | | | | | |
NET ASSETS | | | | | | | | | | | | |
Beginning of Period | | $ | 31,788,190 | | | $ | 27,911,067 | | | $ | 29,240,128 | |
End of Period | | $ | 36,732,129 | | | $ | 31,788,190 | | | $ | 27,911,067 | |
(a) | For the period ended July 1, 2021 to October 31, 2021. See Note 1 to Financial Statements. |
(b) | Shares of Predecessor Fund converted into Fund Shares at the close of business on October 22, 2021. See Note 1 to the Financial Statements. Summary of capital share transactions is as follows: |
| | | Shares | | | Shares | | | Shares | |
Subscriptions | | | 100,000 | | | | 50,000 | | | | — | |
Redemptions | | | — | | | | — | | | | — | |
Net Increase (Decrease) | | | 100,000 | | | | 50,000 | | | | — | |
The accompanying notes are an integral part of the financial statements.
165
Pacer Trendpilot® US Large Cap ETF
FINANCIAL HIGHLIGHTS
For a capital share outstanding throughout the year/period
| | For the
Period Ended
October 31,
2021
(Unaudited) | | | For the
Year Ended
April 30,
2021 | | | For the
Year Ended
April 30,
2020 | | | For the
Year Ended
April 30,
2019 | | | For the
Year Ended
April 30,
2018 | | | For the
Year Ended
April 30,
2017 | |
Net Asset Value, Beginning of Period | | $ | 36.54 | | | $ | 26.99 | | | $ | 30.56 | | | $ | 28.41 | | | $ | 25.48 | | | $ | 21.88 | |
| | | | | | | | | | | | | | | | | | | | | | | | | |
INCOME (LOSS) FROM INVESTMENT OPERATIONS: | | | | | | | | | | | | | | | | | | | | | | | | |
Net Investment Income (Loss) (a) | | | 0.15 | | | | 0.25 | | | | 0.39 | | | | 0.43 | | | | 0.37 | | | | 0.34 | |
Net Realized and Unrealized Gain (Loss) on Investments (b) | | | 3.69 | | | | 9.65 | | | | (3.59 | ) | | | 2.01 | | | | 2.84 | | | | 3.52 | |
Total from Investment Operations | | | 3.84 | | | | 9.90 | | | | (3.20 | ) | | | 2.44 | | | | 3.21 | | | | 3.86 | |
| | | | | | | | | | | | | | | | | | | | | | | | | |
LESS DISTRIBUTIONS: | | | | | | | | | | | | | | | | | | | | | | | | |
Distributions from Net Investment Income | | | — | | | | (0.35 | ) | | | (0.37 | ) | | | (0.29 | ) | | | (0.28 | ) | | | (0.26 | ) |
Total Distributions | | | — | | | | (0.35 | ) | | | (0.37 | ) | | | (0.29 | ) | | | (0.28 | ) | | | (0.26 | ) |
Net Asset Value, End of Period | | $ | 40.38 | | | $ | 36.54 | | | $ | 26.99 | | | $ | 30.56 | | | $ | 28.41 | | | $ | 25.48 | |
Total Return | | | 10.51 | %(d) | | | 36.86 | % | | | -10.71 | % | | | 8.65 | % | | | 12.56 | % | | | 17.72 | % |
| | | | | | | | | | | | | | | | | | | | | | | | | |
SUPPLEMENTAL DATA: | | | | | | | | | | | | | | | | | | | | | | | | |
Net Assets at End of Period (000’s) | | $ | 2,017,156 | | | $ | 1,894,772 | | | $ | 2,403,839 | | | $ | 2,163,990 | | | $ | 921,975 | | | $ | 456,180 | |
| | | | | | | | | | | | | | | | | | | | | | | | | |
RATIOS TO AVERAGE NET ASSETS: | | | | | | | | | | | | | | | | | | | | | | | | |
Expenses to Average Net Assets | | | 0.60 | %(e) | | | 0.60 | % | | | 0.60 | % | | | 0.60 | % | | | 0.60 | % | | | 0.60 | % |
Net Investment Income (Loss) to Average Net Assets | | | 0.77 | %(e) | | | 0.83 | % | | | 1.25 | % | | | 1.43 | % | | | 1.32 | % | | | 1.44 | % |
Portfolio Turnover Rate (c) | | | 1 | %(d) | | | 6 | % | | | 5 | % | | | 162 | % | | | 12 | % | | | 7 | % |
(a) | Calculated based on average shares outstanding during the period. |
(b) | Net realized and unrealized gain (loss) per share in this caption are balancing amounts necessary to reconcile the change in net asset value per share for the period, and may not reconcile with the aggregate gain (loss) in the Statement of Operations due to share transactions for the period. |
(c) | Excludes the impact of in-kind transactions. |
The accompanying notes are an integral part of the financial statements.
166
Pacer Trendpilot® US Mid Cap ETF
FINANCIAL HIGHLIGHTS
For a capital share outstanding throughout the year/period
| | | For the
Period Ended
October 31,
2021
(Unaudited) | | | For the
Year Ended
April 30,
2021 | | | For the
Year Ended
April 30,
2020 | | | For the
Year Ended
April 30,
2019 | | | For the
Year Ended
April 30,
2018 | | | For the
Year Ended
April 30,
2017 | |
Net Asset Value, Beginning of Period | | $ | 35.63 | | | $ | 28.35 | | | $ | 30.95 | | | $ | 30.72 | | | $ | 28.00 | | | $ | 23.78 | |
| | | | | | | | | | | | | | | | | | | | | | | | | |
INCOME (LOSS) FROM INVESTMENT OPERATIONS: | | | | | | | | | | | | | | | | | | | | | | | | |
Net Investment Income (Loss) (a) | | | 0.04 | | | | 0.09 | | | | 0.28 | | | | 0.41 | | | | 0.27 | | | | 0.27 | |
Net Realized and Unrealized Gain (Loss) on Investments (b) | | | 0.53 | | | | 7.36 | | | | (2.45 | ) | | | 0.10 | | | | 2.66 | | | | 4.13 | |
Total from Investment Operations | | | 0.57 | | | | 7.45 | | | | (2.17 | ) | | | 0.51 | | | | 2.93 | | | | 4.40 | |
| | | | | | | | | | | | | | | | | | | | | | | | | |
LESS DISTRIBUTIONS: | | | | | | | | | | | | | | | | | | | | | | | | |
Distributions from Net Investment Income | | | — | | | | (0.17 | ) | | | (0.43 | ) | | | (0.28 | ) | | | (0.21 | ) | | | (0.18 | ) |
Total Distributions | | | — | | | | (0.17 | ) | | | (0.43 | ) | | | (0.28 | ) | | | (0.21 | ) | | | (0.18 | ) |
Net Asset Value, End of Period | | $ | 36.20 | | | $ | 35.63 | | | $ | 28.35 | | | $ | 30.95 | | | $ | 30.72 | | | $ | 28.00 | |
Total Return | | | 1.61 | %(d) | | | 26.34 | % | | | -7.11 | % | | | 1.66 | % | | | 10.42 | % | | | 18.54 | % |
| | | | | | | | | | | | | | | | | | | | | | | | | |
SUPPLEMENTAL DATA: | | | | | | | | | | | | | | | | | | | | | | | | |
Net Assets at End of Period (000’s) | | $ | 470,624 | | | $ | 452,474 | | | $ | 540,051 | | | $ | 761,305 | | | $ | 497,590 | | | $ | 281,430 | |
| | | | | | | | | | | | | | | | | | | | | | | | | |
RATIOS TO AVERAGE NET ASSETS: | | | | | | | | | | | | | | | | | | | | | | | | |
Expenses to Average Net Assets | | | 0.60 | %(e) | | | 0.60 | % | | | 0.60 | % | | | 0.60 | % | | | 0.60 | % | | | 0.60 | % |
Net Investment Income (Loss) to Average Net Assets | | | 0.24 | %(e) | | | 0.30 | % | | | 0.96 | % | | | 1.30 | % | | | 0.91 | % | | | 1.02 | % |
Portfolio Turnover Rate (c) | | | 8 | %(d) | | | 304 | % | | | 143 | % | | | 405 | % | | | 66 | % | | | 27 | % |
(a) | Calculated based on average shares outstanding during the period. |
(b) | Net realized and unrealized gain (loss) per share in this caption are balancing amounts necessary to reconcile the change in net asset value per share for the period, and may not reconcile with the aggregate gain (loss) in the Statement of Operations due to share transactions for the period. |
(c) | Excludes the impact of in-kind transactions. |
The accompanying notes are an integral part of the financial statements.
167
Pacer Trendpilot® 100 ETF
FINANCIAL HIGHLIGHTS
For a capital share outstanding throughout the year/period
| | | For the
Period Ended
October 31,
2021
(Unaudited) | | | For the
Year Ended
April 30,
2021 | | | For the
Year Ended
April 30,
2020 | | | For the
Year Ended
April 30,
2019 | | | For the
Year Ended
April 30,
2018 | | | For the
Year Ended
April 30,
2017 | |
Net Asset Value, Beginning of Period | | $ | 54.01 | | | $ | 37.91 | | | $ | 36.00 | | | $ | 31.16 | | | $ | 26.32 | | | $ | 21.44 | |
| | | | | | | | | | | | | | | | | | | | | | | | | |
INCOME (LOSS) FROM INVESTMENT OPERATIONS: | | | | | | | | | | | | | | | | | | | | | | | | |
Net Investment Income (Loss) (a) | | | (0.07 | ) | | | 0.01 | | | | 0.15 | | | | 0.26 | | | | 0.11 | | | | 0.11 | |
Net Realized and Unrealized Gain (Loss) on Investments (b) | | | 4.17 | | | | 16.17 | | | | 1.94 | | | | 4.73 | | | | 4.83 | | | | 4.84 | |
Total from Investment Operations | | | 4.10 | | | | 16.18 | | | | 2.09 | | | | 4.99 | | | | 4.94 | | | | 4.95 | |
| | | | | | | | | | | | | | | | | | | | | | | | | |
LESS DISTRIBUTIONS: | | | | | | | | | | | | | | | | | | | | | | | | |
Distributions from Net Investment Income | | | — | | | | (0.08 | ) | | | (0.18 | ) | | | (0.15 | ) | | | (0.10 | ) | | | (0.07 | ) |
Total Distributions | | | — | | | | (0.08 | ) | | | (0.18 | ) | | | (0.15 | ) | | | (0.10 | ) | | | (0.07 | ) |
| | | | | | | | | | | | | | | | | | | | | | | | | |
CAPITAL SHARE TRANSACTIONS | | | | | | | | | | | | | | | | | | | | | | | | |
Transaction Fees (see Note 1) | | | — | | | | 0.00 | (c) | | | — | | | | — | | | | — | | | | — | |
Net Asset Value, End of Period | | $ | 58.11 | | | $ | 54.01 | | | $ | 37.91 | | | $ | 36.00 | | | $ | 31.16 | | | $ | 26.32 | |
Total Return | | | 7.59 | %(e) | | | 42.69 | % | | | 5.78 | % | | | 16.04 | % | | | 18.78 | % | | | 23.11 | % |
| | | | | | | | | | | | | | | | | | | | | | | | | |
SUPPLEMENTAL DATA: | | | | | | | | | | | | | | | | | | | | | | | | |
Net Assets at End of Period (000’s) | | $ | 813,485 | | | $ | 783,124 | | | $ | 739,258 | | | $ | 502,173 | | | $ | 211,906 | | | $ | 73,696 | |
| | | | | | | | | | | | | | | | | | | | | | | | | |
RATIOS TO AVERAGE NET ASSETS: | | | | | | | | | | | | | | | | | | | | | | | | |
Expenses to Average Net Assets | | | 0.65 | %(f) | | | 0.65 | % | | | 0.65 | % | | | 0.65 | % | | | 0.65 | % | | | 0.65 | % |
Net Investment Income (Loss) to Average Net Assets | | | -0.26 | %(f) | | | 0.01 | % | | | 0.40 | % | | | 0.76 | % | | | 0.38 | % | | | 0.46 | % |
Portfolio Turnover Rate (d) | | | 1 | %(e) | | | 6 | % | | | 61 | % | | | 107 | % | | | 3 | % | | | 125 | % |
(a) | Calculated based on average shares outstanding during the period. |
(b) | Net realized and unrealized gain (loss) per share in this caption are balancing amounts necessary to reconcile the change in net asset value per share for the period, and may not reconcile with the aggregate gain (loss) in the Statement of Operations due to share transactions for the period. |
(c) | Represents less than $0.005. |
(d) | Excludes the impact of in-kind transactions. |
The accompanying notes are an integral part of the financial statements.
168
Pacer Trendpilot® European Index ETF
FINANCIAL HIGHLIGHTS
For a capital share outstanding throughout the year/period
| | | For the
Period Ended
October 31,
2021
(Unaudited) | | | For the
Year Ended
April 30,
2021 | | | For the
Year Ended
April 30,
2020 | | | For the
Year Ended
April 30,
2019 | | | For the
Year Ended
April 30,
2018 | | | For the
Year Ended
April 30,
2017 | |
Net Asset Value, Beginning of Period | | $ | 24.33 | | | $ | 23.76 | | | $ | 26.77 | | | $ | 29.66 | | | $ | 27.03 | | | $ | 24.97 | |
| | | | | | | | | | | | | | | | | | | | | | | | | |
INCOME (LOSS) FROM INVESTMENT OPERATIONS: | | | | | | | | | | | | | | | | | | | | | | | | |
Net Investment Income (Loss) (a) | | | 0.32 | | | | 0.10 | | | | 0.54 | | | | 0.74 | | | | 0.51 | | | | 0.18 | |
Net Realized and Unrealized Gain (Loss) on Investments (b) | | | 0.67 | | | | 0.47 | | | | (2.61 | ) | | | (3.16 | ) | | | 2.31 | | | | 1.88 | (c) |
Total from Investment Operations | | | 0.99 | | | | 0.57 | | | | (2.07 | ) | | | (2.42 | ) | | | 2.82 | | | | 2.06 | |
| | | | | | | | | | | | | | | | | | | | | | | | | |
LESS DISTRIBUTIONS: | | | | | | | | | | | | | | | | | | | | | | | | |
Distributions from Net Investment Income | | | — | | | | — | | | | (0.94 | ) | | | (0.47 | ) | | | (0.19 | ) | | | — | |
Total Distributions | | | | | | | — | | | | (0.94 | ) | | | (0.47 | ) | | | (0.19 | ) | | | — | |
| | | | | | | | | | | | | | | | | | | | | | | | | |
CAPITAL SHARE TRANSACTIONS | | | | | | | | | | | | | | | | | | | | | | | | |
Transaction Fees (see Note 1) | | | 0.00 | (f) | | | — | | | | — | | | | — | | | | — | | | | — | |
Net Asset Value, End of Period | | $ | 25.32 | | | $ | 24.33 | | | $ | 23.76 | | | $ | 26.77 | | | $ | 29.66 | | | $ | 27.03 | |
Total Return | | | 4.06 | %(g) | | | 2.38 | % | | | -8.18 | % | | | -8.07 | % | | | 10.43 | % | | | 8.25 | %(d) |
| | | | | | | | | | | | | | | | | | | | | | | | | |
SUPPLEMENTAL DATA: | | | | | | | | | | | | | | | | | | | | | | | | |
Net Assets at End of Period (000’s) | | $ | 53,163 | | | $ | 54,741 | | | $ | 91,488 | | | $ | 183,379 | | | $ | 158,703 | | | $ | 31,081 | |
| | | | | | | | | | | | | | | | | | | | | | | | | |
RATIOS TO AVERAGE NET ASSETS: | | | | | | | | | | | | | | | | | | | | | | | | |
Expenses to Average Net Assets | | | 0.65 | %(h) | | | 0.65 | % | | | 0.65 | % | | | 0.65 | % | | | 0.65 | % | | | 0.65 | % |
Net Investment Income (Loss) to Average Net Assets | | | 2.55 | %(h) | | | 0.43 | % | | | 2.04 | % | | | 2.77 | % | | | 1.69 | % | | | 0.77 | % |
Portfolio Turnover Rate (e) | | | 3 | %(g) | | | 506 | % | | | 12 | % | | | 396 | % | | | 228 | % | | | 143 | % |
(a) | Calculated based on average shares outstanding during the period. |
(b) | Net realized and unrealized gain (loss) per share in this caption are balancing amounts necessary to reconcile the change in net asset value per share for the period, and may not reconcile with the aggregate gain (loss) in the Statement of Operations due to share transactions for the period. |
(c) | Includes $0.41 gain derived from contribution from a settlement. See Note 9. |
(d) | Before the contribution from a settlement, the total return for the year would have been 6.60%. See Note 8. |
(e) | Excludes the impact of in-kind transactions. |
(f) | Represents less than $0.005. |
The accompanying notes are an integral part of the financial statements.
169
Pacer Trendpilot International ETF
FINANCIAL HIGHLIGHTS
For a capital share outstanding throughout the year/period
| | | For the
Period Ended
October 31,
2021
(Unaudited) | | | For the
Year Ended
April 30,
2021 | | | For the
Period Ended
April 30,
2020(a) | |
Net Asset Value, Beginning of Period | | $ | 28.22 | | | $ | 23.42 | | | $ | 24.91 | |
| | | | | | | | | | | | | |
INCOME (LOSS) FROM INVESTMENT OPERATIONS: | | | | | | | | | | | | |
Net Investment Income (Loss) (a) | | | 0.29 | | | | 0.28 | | | | 0.32 | |
Net Realized and Unrealized Gain (Loss) on Investments (f) | | | 0.97 | | | | 4.72 | | | | (1.55 | ) |
Total from Investment Operations | | | 1.26 | | | | 5.00 | | | | (1.23 | ) |
| | | | | | | | | | | | | |
LESS DISTRIBUTIONS: | | | | | | | | | | | | |
Distributions from Net Investment Income | | | — | | | | (0.20 | ) | | | (0.26 | ) |
Total Distributions | | | — | | | | (0.20 | ) | | | (0.26 | ) |
Net Asset Value, End of Period | | $ | 29.48 | | | $ | 28.22 | | | $ | 23.42 | |
Total Return | | | 4.46 | %(c) | | | 21.46 | % | | | -5.08 | %(c) |
| | | | | | | | | | | | | |
SUPPLEMENTAL DATA: | | | | | | | | | | | | |
Net Assets at End of Period (000’s) | | $ | 141,501 | | | $ | 131,228 | | | $ | 151,038 | |
| | | | | | | | | | | | | |
RATIOS TO AVERAGE NET ASSETS: | | | | | | | | | | | | |
Expenses to Average Net Assets | | | 0.65 | %(d) | | | 0.65 | % | | | 0.65 | %(d) |
Net Investment Income (Loss) to Average Net Assets | | | 1.99 | %(d) | | | 1.15 | % | | | 1.26 | %(d) |
Portfolio Turnover Rate (e) | | | 4 | %(c) | | | 161 | % | | | 39 | %(c) |
(a) | Commencement of operations on May 02, 2019. |
(b) | Calculated based on average shares outstanding during the period. |
(e) | Excludes the impact of in-kind transactions. |
(f) | Net realized and unrealized gain (loss) per share in this caption are balancing amounts necessary to reconcile the change in net asset value per share for the period, and may not reconcile with the aggregate gain (loss) in the Statement of Operations due to share transactions for the period. |
The accompanying notes are an integral part of the financial statements.
170
Pacer Trendpilot US Bond ETF
FINANCIAL HIGHLIGHTS
For a capital share outstanding throughout the year/period
| | | For the
Period Ended
October 31,
2021
(Unaudited) | | | For the
Year Ended
April 30,
2021 | | | For the
Period Ended
April 30,
2020(a) | |
Net Asset Value, Beginning of Period | | $ | 27.45 | | | $ | 25.77 | | | $ | 25.00 | |
| | | | | | | | | | | | | |
INCOME (LOSS) FROM INVESTMENT OPERATIONS: | | | | | | | | | | | | |
Net Investment Income (Loss) (b) | | | 0.38 | | | | 1.09 | | | | 0.33 | |
Net Realized and Unrealized Gain (Loss) on Investments (f) | | | (0.53 | ) | | | 1.34 | | | | 0.72 | |
Total from Investment Operations | | | (0.15 | ) | | | 2.43 | | | | 1.05 | |
| | | | | | | | | | | | | |
LESS DISTRIBUTIONS: | | | | | | | | | | | | |
Distributions from Net Investment Income | | | (0.34 | ) | | | (0.75 | ) | | | (0.28 | ) |
Total Distributions | | | (0.34 | ) | | | (0.75 | ) | | | (0.28 | ) |
| | | | | | | | | | | | | |
CAPITAL SHARE TRANSACTIONS | | | | | | | | | | | | |
Transaction Fees (see Note 1) | | | — | | | | 0.00 | (g) | | | — | |
Net Asset Value, End of Period | | $ | 26.96 | | | $ | 27.45 | | | $ | 25.77 | |
Total Return | | | -0.53 | %(c) | | | 9.53 | % | | | 4.24 | %(c) |
| | | | | | | | | | | | | |
SUPPLEMENTAL DATA: | | | | | | | | | | | | |
Net Assets at End of Period (000’s) | | $ | 1,321,185 | | | $ | 839,970 | | | $ | 144,327 | |
| | | | | | | | | | | | | |
RATIOS TO AVERAGE NET ASSETS: | | | | | | | | | | | | |
Expenses to Average Net Assets | | | 0.60 | %(d) | | | 0.60 | % | | | 0.60 | %(d) |
Net Investment Income (Loss) to Average Net Assets | | | 2.74 | %(d) | | | 4.04 | % | | | 2.47 | %(d) |
Portfolio Turnover Rate (e) | | | 188 | %(c) | | | 55 | % | | | 131 | %(c) |
(a) | Commencement of operations on October 22, 2019. |
(b) | Calculated based on average shares outstanding during the period. |
(e) | Excludes the impact of in-kind transactions. |
(f) | Net realized and unrealized gain (loss) per share in this caption are balancing amounts necessary to reconcile the change in net asset value per share for the period, and may not reconcile with the aggregate gain (loss) in the Statement of Operations due to share transactions for the period. |
(g) | Represents less than $0.005. |
The accompanying notes are an integral part of the financial statements.
171
Pacer Trendpilot Fund of Funds ETF
FINANCIAL HIGHLIGHTS
For a capital share outstanding throughout the year/period
| | | For the
Period Ended
October 31,
2021
(Unaudited) | | | For the
Year Ended
April 30,
2021 | | | For the
Period Ended
April 30,
2020(a) | |
Net Asset Value, Beginning of Period | | $ | 29.82 | | | $ | 23.81 | | | $ | 25.39 | |
| | | | | | | | | | | | | |
INCOME (LOSS) FROM INVESTMENT OPERATIONS: | | | | | | | | | | | | |
Net Investment Income (Loss) (b)(c) | | | 0.06 | | | | 0.22 | | | | 0.26 | |
Net Realized and Unrealized Gain (Loss) on Investments (h) | | | 1.32 | | | | 5.96 | | | | (1.59 | ) |
Total from Investment Operations | | | 1.38 | | | | 6.18 | | | | (1.33 | ) |
| | | | | | | | | | | | | |
LESS DISTRIBUTIONS: | | | | | | | | | | | | |
Distributions from Net Investment Income | | | — | | | | (0.17 | ) | | | (0.25 | ) |
Total Distributions | | | — | | | | (0.17 | ) | | | (0.25 | ) |
Net Asset Value, End of Period | | $ | 31.20 | | | $ | 29.82 | | | $ | 23.81 | |
Total Return | | | 4.65 | %(d) | | | 26.02 | % | | | -5.37 | %(d) |
| | | | | | | | | | | | | |
SUPPLEMENTAL DATA: | | | | | | | | | | | | |
Net Assets at End of Period (000’s) | | $ | 65,529 | | | $ | 44,728 | | | $ | 27,378 | |
| | | | | | | | | | | | | |
RATIOS TO AVERAGE NET ASSETS: | | | | | | | | | | | | |
Expenses to Average Net Assets (f) | | | 0.15 | %(e) | | | 0.15 | % | | | 0.15 | %(e) |
Net Investment Income (Loss) to Average Net Assets (f) | | | 0.36 | %(e) | | | 0.82 | % | | | 1.03 | %(e) |
Portfolio Turnover Rate (g) | | | 1 | %(d) | | | 29 | % | | | 6 | %(d) |
(a) | Commencement of operations on May 3, 2019. |
(b) | Calculated based on average shares outstanding during the period. |
(c) | Recognition of net investment income by the Fund is affected by the timing of the declaration of dividends by the underlying investment companies in which the Fund invests. The ratio does not include the net investment income of the underlying companies in which the Fund invests. |
(f) | Does not include expenses of the investment companies in which the Fund invests. |
(g) | Excludes the impact of in-kind transactions. |
(h) | Realized and unrealized gain (loss) per share in this caption are balancing amounts necessary to reconcile the change in net asset value per share for the period, and may not reconcile with the aggregate gain (loss) in the Statement of Operations due to share transactions for the period. |
The accompanying notes are an integral part of the financial statements.
172
Pacer Global Cash Cows Dividend ETF
FINANCIAL HIGHLIGHTS
For a capital share outstanding throughout the year/period
| | | For the
Period Ended
October 31,
2021
(Unaudited) | | | For the
Year Ended
April 30,
2021 | | | For the
Year Ended
April 30,
2020 | | | For the
Year Ended
April 30,
2019 | | | For the
Year Ended
April 30,
2018 | | | For the
Year Ended
April 30,
2017 | |
Net Asset Value, Beginning of Period | | $ | 31.10 | | | $ | 24.63 | | | $ | 31.19 | | | $ | 30.75 | | | $ | 28.60 | | | $ | 27.16 | |
| | | | | | | | | | | | | | | | | | | | | | | | | |
INCOME (LOSS) FROM INVESTMENT OPERATIONS: | | | | | | | | | | | | | | | | | | | | | | | | |
Net Investment Income (Loss) (a) | | | 0.67 | | | | 1.17 | | | | 1.32 | | | | 1.21 | | | | 1.07 | | | | 0.88 | |
Net Realized and Unrealized Gain (Loss) on Investments (b) | | | (0.87 | ) | | | 6.51 | | | | (6.60 | ) | | | 0.43 | | | | 2.01 | | | | 1.26 | |
Total from Investment Operations | | | (0.20 | ) | | | 7.68 | | | | (5.28 | ) | | | 1.64 | | | | 3.08 | | | | 2.14 | |
| | | | | | | | | | | | | | | | | | | | | | | | | |
LESS DISTRIBUTIONS: | | | | | | | | | | | | | | | | | | | | | | | | |
Distributions from Net Investment Income | | | — | | | | (1.21 | ) | | | (1.28 | ) | | | (1.20 | ) | | | (0.93 | ) | | | (0.7 | ) |
Total Distributions | | | — | | | | (1.21 | ) | | | (1.28 | ) | | | (1.20 | ) | | | (0.93 | ) | | | (0.7 | ) |
| | | | | | | | | | | | | | | | | | | | | | | | | |
CAPITAL SHARE TRANSACTIONS | | | | | | | | | | | | | | | | | | | | | | | | |
Transaction Fees (see Note 1) | | | 0.00 | (d) | | | — | | | | — | | | | — | | | | — | | | | — | |
Net Asset Value, End of Period | | $ | 30.10 | | | $ | 31.10 | | | $ | 24.63 | | | $ | 31.19 | | | $ | 30.75 | | | $ | 28.60 | |
Total Return | | | -0.65 | %(e) | | | 32.05 | % | | | -17.32 | % | | | 5.56 | % | | | 10.86 | % | | | 8.03 | % |
| | | | | | | | | | | | | | | | | | | | | | | | | |
SUPPLEMENTAL DATA: | | | | | | | | | | | | | | | | | | | | | | | | |
Net Assets at End of Period (000’s) | | $ | 135,454 | | | $ | 135,269 | | | $ | 135,480 | | | $ | 210,505 | | | $ | 173,710 | | | $ | 70,059 | |
| | | | | | | | | | | | | | | | | | | | | | | | | |
RATIOS TO AVERAGE NET ASSETS: | | | | | | | | | | | | | | | | | | | | | | | | |
Expenses to Average Net Assets | | | 0.60 | %(f) | | | 0.60 | % | | | 0.60 | % | | | 0.60 | % | | | 0.60 | % | | | 0.60 | % |
Net Investment Income (Loss) to Average Net Assets | | | 4.23 | %(f) | | | 4.32 | % | | | 4.52 | % | | | 4.00 | % | | | 3.50 | % | | | 3.19 | % |
Portfolio Turnover Rate (c) | | | 20 | %(e) | | | 76 | % | | | 91 | % | | | 74 | % | | | 76 | % | | | 44 | % |
(a) | Calculated based on average shares outstanding during the period. |
(b) | Realized and unrealized gains and losses per share in this caption are balancing amounts necessary to reconcile to the change in net asset value for the period and may reconcile with the aggregate gains and losses in the statement of operations due to share transactions for the period. |
(c) | Excludes the impact of in-kind transactions. |
(d) | Represents less than $0.005. |
The accompanying notes are an integral part of the financial statements.
173
Pacer US Cash Cows 100 ETF
FINANCIAL HIGHLIGHTS
For a capital share outstanding throughout the year/period
| | | For the
Period Ended
October 31,
2021
(Unaudited) | | | For the
Year Ended
April 30,
2021 | | | For the
Year Ended
April 30,
2020 | | | For the
Year Ended
April 30,
2019 | | | For the
Year Ended
April 30,
2018 | | | For the
Period Ended
April 30,
2017(a) | |
Net Asset Value, Beginning of Period | | $ | 41.95 | | | $ | 25.17 | | | $ | 29.72 | | | $ | 28.98 | | | $ | 26.13 | | | $ | 25.00 | |
| | | | | | | | | | | | | | | | | | | | | | | | | |
INCOME (LOSS) FROM INVESTMENT OPERATIONS: | | | | | | | | | | | | | | | | | | | | | | | | |
Net Investment Income (Loss) (b) | | | 0.35 | | | | 0.71 | | | | 0.77 | | | | 0.53 | | | | 0.61 | | | | 0.13 | |
Net Realized and Unrealized Gain (Loss) on Investments (f) | | | 3.02 | | | | 16.76 | | | | (4.55 | ) | | | 0.67 | | | | 2.84 | | | | 1.09 | |
Total from Investment Operations | | | 3.37 | | | | 17.47 | | | | (3.78 | ) | | | 1.20 | | | | 3.45 | | | | 1.22 | |
| | | | | | | | | | | | | | | | | | | | | | | | | |
LESS DISTRIBUTIONS: | | | | | | | | | | | | | | | | | | | | | | | | |
Distributions from Net Investment Income | | | (0.29 | ) | | | (0.69 | ) | | | (0.77 | ) | | | (0.46 | ) | | | (0.60 | ) | | | (0.09 | ) |
Total Distributions | | | (0.29 | ) | | | (0.69 | ) | | | (0.77 | ) | | | (0.46 | ) | | | (0.60 | ) | | | (0.09 | ) |
Net Asset Value, End of Period | | $ | 45.03 | | | $ | 41.95 | | | $ | 25.17 | | | $ | 29.72 | | | $ | 28.98 | | | $ | 26.13 | |
Total Return | | | 8.05 | %(c) | | | 70.43 | % | | | -12.63 | % | | | 4.28 | % | | | 13.35 | % | | | 4.87 | %(c) |
| | | | | | | | | | | | | | | | | | | | | | | | | |
SUPPLEMENTAL DATA: | | | | | | | | | | | | | | | | | | | | | | | | |
Net Assets at End of Period (000’s) | | $ | 950,134 | | | $ | 432,113 | | | $ | 190,027 | | | $ | 266,018 | | | $ | 28,981 | | | $ | 11,759 | |
| | | | | | | | | | | | | | | | | | | | | | | | | |
RATIOS TO AVERAGE NET ASSETS: | | | | | | | | | | | | | | | | | | | | | | | | |
Expenses to Average Net Assets | | | 0.49 | %(d) | | | 0.49 | % | | | 0.49 | % | | | 0.49 | % | | | 0.49 | % | | | 0.49 | %(d) |
Net Investment Income (Loss) to Average Net Assets | | | 1.59 | %(d) | | | 2.23 | % | | | 2.73 | % | | | 1.82 | % | | | 2.16 | % | | | 1.37 | %(d) |
Portfolio Turnover Rate (e) | | | 63 | %(c) | | | 104 | % | | | 85 | % | | | 122 | % | | | 101 | % | | | 36 | %(c) |
(a) | Commencement of operations on December 16, 2016. |
(b) | Calculated based on average shares outstanding during the period. |
(e) | Excludes the impact of in-kind transactions. |
(f) | Net realized and unrealized gain (loss) per share in this caption are balancing amounts necessary to reconcile the change in net asset value per share for the period, and may not reconcile with the aggregate gain (loss) in the Statement of Operations due to share transactions for the period. |
The accompanying notes are an integral part of the financial statements.
174
Pacer US Small Cap Cash Cows 100 ETF
FINANCIAL HIGHLIGHTS
For a capital share outstanding throughout the year/period
| | | For the
Period Ended
October 31,
2021
(Unaudited) | | | For the
Year Ended
April 30,
2021 | | | For the
Year Ended
April 30,
2020 | | | For the
Year Ended
April 30,
2019 | | | For the
Period Ended
April 30,
2018(a) | |
Net Asset Value, Beginning of Period | | $ | 41.82 | | | $ | 20.76 | | | $ | 25.88 | | | $ | 26.17 | | | $ | 24.78 | |
| | | | | | | | | | | | | | | | | | | | | |
INCOME (LOSS) FROM INVESTMENT OPERATIONS: | | | | | | | | | | | | | | | | | | | | |
Net Investment Income (Loss) (b) | | | 0.13 | | | | 0.11 | | | | 0.27 | | | | 0.32 | | | | 0.28 | |
Net Realized and Unrealized Gain (Loss) on Investments (f) | | | 1.10 | | | | 21.13 | | | | (5.12 | ) | | | (0.29 | ) | | | 1.38 | |
Total from Investment Operations | | | 1.23 | | | | 21.24 | | | | (4.85 | ) | | | 0.03 | | | | 1.66 | |
| | | | | | | | | | | | | | | | | | | | | |
LESS DISTRIBUTIONS: | | | | | | | | | | | | | | | | | | | | |
Distributions from Net Investment Income | | | (0.13 | ) | | | (0.14 | ) | | | (0.27 | ) | | | (0.32 | ) | | | (0.27 | ) |
Distributions from Return of Capital | | | | | | | (0.04 | ) | | | — | | | | — | | | | — | |
Total Distributions | | | (0.13 | ) | | | (0.18 | ) | | | (0.27 | ) | | | (0.32 | ) | | | (0.27 | ) |
Net Asset Value, End of Period | | $ | 42.92 | | | $ | 41.82 | | | $ | 20.76 | | | $ | 25.88 | | | $ | 26.17 | |
Total Return | | | 2.94 | %(c) | | | 102.70 | % | | | -18.72 | % | | | 0.20 | % | | | 6.69 | %(c) |
| | | | | | | | | | | | | | | | | | | | | |
SUPPLEMENTAL DATA: | | | | | | | | | | | | | | | | | | | | |
Net Assets at End of Period (000’s) | | $ | 512,936 | | | $ | 271,840 | | | $ | 14,534 | | | $ | 50,474 | | | $ | 5,233 | |
| | | | | | | | | | | | | | | | | | | | | |
RATIOS TO AVERAGE NET ASSETS: | | | | | | | | | | | | | | | | | | | | |
Expenses to Average Net Assets | | | 0.59 | %(d) | | | 0.59 | % | | | 0.59 | % | | | 0.59 | % | | | 0.59 | %(d) |
Net Investment Income (Loss) to Average Net Assets | | | 0.58 | %(d) | | | 0.33 | % | | | 1.11 | % | | | 1.21 | % | | | 1.25 | %(d) |
Portfolio Turnover Rate (e) | | | 60 | %(c) | | | 123 | % | | | 128 | % | | | 123 | % | | | 97 | %(c) |
(a) | Commencement of operations on June 16, 2017. |
(b) | Calculated based on average shares outstanding during the period. |
(e) | Excludes the impact of in-kind transactions. |
(f) | Realized and unrealized gains and losses per share in this caption are balancing amounts necessary to reconcile to the change in net asset value for the period and may reconcile with the aggregate gains and losses in the statement of operations due to share transactions for the period. |
The accompanying notes are an integral part of the financial statements.
175
Pacer Developed Markets International Cash Cows 100 ETF
FINANCIAL HIGHLIGHTS
For a capital share outstanding throughout the year/period
| | | For the
Period Ended
October 31,
2021
(Unaudited) | | | For the
Year Ended
April 30,
2021 | | | For the
Year Ended
April 30,
2020 | | | For the
Year Ended
April 30,
2019 | | | For the
Period Ended
April 30,
2018(a) | |
Net Asset Value, Beginning of Period | | $ | 31.95 | | | $ | 20.99 | | | $ | 27.08 | | | $ | 28.91 | | | $ | 25.09 | |
| | | | | | | | | | | | | | | | | | | | | |
INCOME (LOSS) FROM INVESTMENT OPERATIONS: | | | | | | | | | | | | | | | | | | | | |
Net Investment Income (Loss) (b) | | | 0.46 | | | | 0.66 | | | | 0.74 | | | | 0.85 | | | | 0.60 | |
Net Realized and Unrealized Gain (Loss) on Investments (f) | | | (1.10 | ) | | | 10.98 | | | | (6.05 | ) | | | (2.01 | ) | | | 3.53 | |
Total from Investment Operations | | | (0.64 | ) | | | 11.64 | | | | (5.31 | ) | | | (1.16 | ) | | | 4.13 | |
| | | | | | | | | | | | | | | | | | | | | |
LESS DISTRIBUTIONS: | | | | | | | | | | | | | | | | | | | | |
Distributions from Net Investment Income | | | (0.52 | ) | | | (0.68 | ) | | | (0.78 | ) | | | (0.67 | ) | | | (0.31 | ) |
Total Distributions | | | (0.52 | ) | | | (0.68 | ) | | | (0.78 | ) | | | (0.67 | ) | | | (0.31 | ) |
| | | | | | | | | | | | | | | | | | | | | |
CAPITAL SHARE TRANSACTIONS | | | | | | | | | | | | | | | | | | | | |
Transaction Fees (see Note 1) | | | 0.03 | | | | 0.00 | (g) | | | — | | | | — | | | | — | |
Net Asset Value, End of Period | | $ | 30.82 | | | $ | 31.95 | | | $ | 20.99 | | | $ | 27.08 | | | $ | 28.91 | |
Total Return | | | -1.96 | %(c) | | | 56.41 | % | | | -20.04 | % | | | -3.92 | % | | | 16.48 | %(c) |
| | | | | | | | | | | | | | | | | | | | | |
SUPPLEMENTAL DATA: | | | | | | | | | | | | | | | | | | | | |
Net Assets at End of Period (000’s) | | $ | 35,444 | | | $ | 20,769 | | | $ | 20,991 | | | $ | 33,844 | | | $ | 20,235 | |
| | | | | | | | | | | | | | | | | | | | | |
RATIOS TO AVERAGE NET ASSETS: | | | | | | | | | | | | | | | | | | | | |
Expenses to Average Net Assets | | | 0.65 | %(d) | | | 0.65 | % | | | 0.65 | % | | | 0.65 | % | | | 0.65 | %(d) |
Net Investment Income (Loss) to Average Net Assets | | | 2.84 | %(d) | | | 2.52 | % | | | 2.96 | % | | | 3.18 | % | | | 2.42 | %(d) |
Portfolio Turnover Rate (e) | | | 30 | %(c) | | | 83 | % | | | 149 | % | | | 80 | % | | | 25 | %(c) |
(a) | Commencement of operations on June 16, 2017. |
(b) | Calculated based on average shares outstanding during the period. |
(e) | Excludes the impact of in-kind transactions. |
(f) | Net realized and unrealized gain (loss) per share in this caption are balancing amounts necessary to reconcile the change in net asset value per share for the period, and may not reconcile with the aggregate gain (loss) in the Statement of Operations due to share transactions for the period. |
(g) | Represents less than $0.005. |
The accompanying notes are an integral part of the financial statements.
176
Pacer US Cash Cows Growth ETF
FINANCIAL HIGHLIGHTS
For a capital share outstanding throughout the year/period
| | | For the
Period Ended
October 31,
2021
(Unaudited) | | | For the
Year Ended
April 30,
2021 | | | For the
Period Ended
April 30,
2020(a) | |
Net Asset Value, Beginning of Period | | $ | 36.21 | | | $ | 22.89 | | | $ | 24.78 | |
| | | | | | | | | | | | | |
INCOME (LOSS) FROM INVESTMENT OPERATIONS: | | | | | | | | | | | | |
Net Investment Income (Loss) (b) | | | (0.01 | ) | | | 0.14 | | | | 0.28 | |
Net Realized and Unrealized Gain (Loss) on Investments (f) | | | 4.57 | | | | 13.37 | | | | (1.90 | ) |
Total from Investment Operations | | | 4.56 | | | | 13.51 | | | | (1.62 | ) |
| | | | | | | | | | | | | |
LESS DISTRIBUTIONS: | | | | | | | | | | | | |
Distributions from Net Investment Income | | | (0.01 | ) | | | (0.19 | ) | | | (0.27 | ) |
Distributons from Realized Gains | | | — | | | | | | | | | |
Distributions from Return of Capital | | | — | | | | | | | | | |
Total Distributions | | | (0.01 | ) | | | (0.19 | ) | | | (0.27 | ) |
Net Asset Value, End of Period | | $ | 40.76 | | | $ | 36.21 | | | $ | 22.89 | |
Total Return | | | 12.59 | %(c) | | | 59.29 | % | | | -6.52 | %(c) |
| | | | | | | | | | | | | |
SUPPLEMENTAL DATA: | | | | | | | | | | | | |
Net Assets at End of Period (000’s) | | $ | 6,114 | | | $ | 3,621 | | | $ | 1,144 | |
| | | | | | | | | | | | | |
RATIOS TO AVERAGE NET ASSETS: | | | | | | | | | | | | |
Expenses to Average Net Assets | | | 0.60 | %(d) | | | 0.60 | % | | | 0.60 | %(d) |
Net Investment Income (Loss) to Average Net Assets | | | -0.04 | %(d) | | | 0.43 | % | | | 1.16 | %(d) |
Portfolio Turnover Rate (e) | | | 55 | %(c) | | | 170 | % | | | 166 | %(c) |
(a) | Commencement of operations on May 2, 2019. |
(b) | Calculated based on average shares outstanding during the period. |
(e) | Excludes the impact of in-kind transactions. |
(f) | Net realized and unrealized gain (loss) per share in this caption are balancing amounts necessary to reconcile the change in net asset value per share for the period, and may not reconcile with the aggregate gain (loss) in the Statement of Operations due to share transactions for the period. |
The accompanying notes are an integral part of the financial statements.
177
Pacer Emerging Markets Cash Cows 100 ETF
FINANCIAL HIGHLIGHTS
For a capital share outstanding throughout the year/period
| | | For the
Period Ended
October 31,
2021
(Unaudited) | | | For the
Year Ended
April 30,
2021 | | | For the
Period Ended
April 30,
2020(a) | |
Net Asset Value, Beginning of Period | | $ | 25.94 | | | $ | 19.11 | | | $ | 24.95 | |
| | | | | | | | | | | | | |
INCOME (LOSS) FROM INVESTMENT OPERATIONS: | | | | | | | | | | | | |
Net Investment Income (Loss) (b) | | | 0.84 | | | | 0.72 | | | | 1.05 | |
Net Realized and Unrealized Gain (Loss) on Investments (f) | | | (2.18 | ) | | | 6.91 | | | | (4.81 | ) |
Total from Investment Operations | | | (1.34 | ) | | | 7.63 | | | | (3.76 | ) |
| | | | | | | | | | | | | |
LESS DISTRIBUTIONS: | | | | | | | | | | | | |
Distributions from Net Investment Income | | | (0.74 | ) | | | (0.85 | ) | | | (2.08 | ) |
Total Distributions | | | (0.74 | ) | | | (0.85 | ) | | | (2.08 | ) |
| | | | | | | | | | | | | |
CAPITAL SHARE TRANSACTIONS | | | | | | | | | | | | |
Transaction Fees (see Note 1) | | | 0.01 | | | | 0.05 | | | | 0.00 | |
Net Asset Value, End of Period | | $ | 23.87 | | | $ | 25.94 | | | $ | 19.11 | |
Total Return | | | -5.25 | %(c) | | | 41.19 | % | | | -16.76 | %(c) |
| | | | | | | | | | | | | |
SUPPLEMENTAL DATA: | | | | | | | | | | | | |
Net Assets at End of Period (000’s) | | $ | 8,355 | | | $ | 3,891 | | | $ | 956 | |
| | | | | | | | | | | | | |
RATIOS TO AVERAGE NET ASSETS: | | | | | | | | | | | | |
Expenses to Average Net Assets | | | 0.70 | %(d) | | | 0.70 | % | | | 0.70 | %(d) |
Net Investment Income (Loss) to Average Net Assets | | | 6.47 | %(d) | | | 3.12 | % | | | 4.43 | %(d) |
Portfolio Turnover Rate (e) | | | 54 | %(c) | | | 109 | % | | | 144 | %(c) |
(a) | Commencement of operations on May 2, 2019. |
(b) | Calculated based on average shares outstanding during the period. |
(e) | Excludes the impact of in-kind transactions. |
(f) | Realized and unrealized gains and losses per share in this caption are balancing amounts necessary to reconcile to the change in net asset value for the period and may reconcile with the aggregate gains and losses in the statement of operations due to share transactions for the period. |
The accompanying notes are an integral part of the financial statements.
178
Pacer Cash Cows Fund of Funds ETF
FINANCIAL HIGHLIGHTS
For a capital share outstanding throughout the year/period
| | | For the
Period Ended
October 31,
2021
(Unaudited) | | | For the
Year Ended
April 30,
2021 | | | For the
Period Ended
April 30,
2020(a) | |
Net Asset Value, Beginning of Period | | $ | 33.44 | | | $ | 20.83 | | | $ | 25.31 | |
| | | | | | | | | | | | | |
INCOME (LOSS) FROM INVESTMENT OPERATIONS: | | | | | | | | | | | | |
Net Investment Income (Loss) (b)(c) | | | 0.37 | | | | 0.55 | | | | 0.53 | |
Net Realized and Unrealized Gain (Loss) on Investments (h) | | | 1.02 | | | | 12.56 | | | | (4.46 | ) |
Total from Investment Operations | | | 1.39 | | | | 13.11 | | | | (3.93 | ) |
| | | | | | | | | | | | | |
LESS DISTRIBUTIONS: | | | | | | | | | | | | |
Distributions from: | | | | | | | | | | | | |
Net Investment Income | | | (0.38 | ) | | | (0.50 | ) | | | (0.55 | ) |
Return of Capital | | | — | | | | — | | | | (0.00 | )(i) |
Total Distributions | | | (0.38 | ) | | | (0.50 | ) | | | (0.55 | ) |
Net Asset Value, End of Period | | $ | 34.45 | | | $ | 33.44 | | | $ | 20.83 | |
Total Return | | | 4.16 | %(d) | | | 63.73 | % | | | -15.71 | %(d) |
| | | | | | | | | | | | | |
SUPPLEMENTAL DATA: | | | | | | | | | | | | |
Net Assets at End of Period (000’s) | | $ | 3,445 | | | $ | 1,672 | | | $ | 1,041 | |
| | | | | | | | | | | | | |
RATIOS TO AVERAGE NET ASSETS: | | | | | | | | | | | | |
Expenses to Average Net Assets (f) | | | 0.15 | %(e) | | | 0.15 | % | | | 0.15 | %(e) |
Net Investment Income (Loss) to Average Net Assets (f) | | | 2.10 | %(e) | | | 2.09 | % | | | 2.27 | %(e) |
Portfolio Turnover Rate (g) | | | 26 | %(d) | | | 9 | % | | | 2 | %(d) |
(a) | Commencement of operations on May 3, 2019. |
(b) | Calculated based on average shares outstanding during the period. |
(c) | Recognition of net investment income by the Fund is affected by the timing of the declaration of dividends by the underlying investment companies in which the Fund invests. The ratio does not include the net investment income of the underlying companies in which the Fund invests. |
(f) | Does not include expenses of the investment companies in which the Fund invests. |
(g) | Excludes the impact of in-kind transactions. |
(h) | Realized and unrealized gain (loss) per share in this caption are balancing amounts necessary to reconcile the change in net asset value per share for the period, and may not reconcile with the aggregate gain (loss) in the Statement of Operations due to share transactions for the period. |
The accompanying notes are an integral part of the financial statements.
179
Pacer WealthShield ETF
FINANCIAL HIGHLIGHTS
For a capital share outstanding throughout the year/period
| | | For the
Period Ended
October 31,
2021
(Unaudited) | | | For the
Year Ended
April 30,
2021 | | | For the
Year Ended
April 30,
2020 | | | For the
Year Ended
April 30,
2019 | | | For the
Period Ended
April 30,
2018(a) | |
Net Asset Value, Beginning of Period | | $ | 32.10 | | | $ | 23.92 | | | $ | 25.02 | | | $ | 25.02 | | | $ | 25.02 | |
| | | | | | | | | | | | | | | | | | | | | |
INCOME (LOSS) FROM INVESTMENT OPERATIONS: | | | | | | | | | | | | | | | | | | | | |
Net Investment Income (Loss) (b) | | | 0.21 | | | | 0.14 | | | | 0.33 | | | | 0.38 | | | | 0.10 | |
Net Realized and Unrealized Gain (Loss) on Investments (f) | | | 2.09 | | | | 8.20 | | | | (1.10 | ) | | | (0.01 | ) | | | (0.05 | ) |
Total from Investment Operations | | | 2.30 | | | | 8.34 | | | | (0.77 | ) | | | 0.37 | | | | 0.05 | |
| | | | | | | | | | | | | | | | | | | | | |
LESS DISTRIBUTIONS: | | | | | | | | | | | | | | | | | | | | |
Distributions from Net Investment Income | | | (0.20 | ) | | | (0.16 | ) | | | (0.33 | ) | | | (0.37 | ) | | | (0.05 | ) |
Total Distributions | | | (0.20 | ) | | | (0.16 | ) | | | (0.33 | ) | | | (0.37 | ) | | | (0.05 | ) |
| | | | | | | | | | | | | | | | | | | | | |
CAPITAL SHARE TRANSACTIONS | | | | | | | | | | | | | | | | | | | | |
Transaction Fees (see Note 1) | | | 0.00 | (g) | | | — | | | | — | | | | — | | | | — | |
Net Asset Value, End of Period | | $ | 34.20 | | | $ | 32.10 | | | $ | 23.92 | | | $ | 25.02 | | | $ | 25.02 | |
Total Return | | | 7.22 | %(c) | | | 35.00 | % | | | -3.04 | % | | | 1.43 | % | | | 0.23 | %(c) |
| | | | | | | | | | | | | | | | | | | | | |
SUPPLEMENTAL DATA: | | | | | | | | | | | | | | | | | | | | |
Net Assets at End of Period (000’s) | | $ | 56,435 | | | $ | 48,143 | | | $ | 51,428 | | | $ | 110,078 | | | $ | 62,539 | |
| | | | | | | | | | | | | | | | | | | | | |
RATIOS TO AVERAGE NET ASSETS: | | | | | | | | | | | | | | | | | | | | |
Expenses to Average Net Assets | | | 0.60 | %(d) | | | 0.60 | % | | | 0.60 | % | | | 0.60 | % | | | 0.60 | %(d) |
Net Investment Income (Loss) to Average Net Assets | | | 1.29 | %(d) | | | 0.53 | % | | | 1.38 | % | | | 1.52 | % | | | 1.04 | %(d) |
Portfolio Turnover Rate (e) | | | 81 | %(c) | | | 227 | % | | | 676 | % | | | 542 | % | | | 131 | %(c) |
(a) | Commencement of operations on December 11, 2017. |
(b) | Calculated based on average shares outstanding during the period. |
(e) | Excludes the impact of in-kind transactions. |
(f) | Realized and unrealized gain (loss) per share in this caption are balancing amounts necessary to reconcile the change in net asset value per share for the period, and may not reconcile with the aggregate gain (loss) in the Statement of Operations due to share transactions for the period. |
(g) | Represents less than $0.005. |
The accompanying notes are an integral part of the financial statements.
180
Pacer Benchmark Industrial Real Estate SCTRSM ETF
FINANCIAL HIGHLIGHTS
For a capital share outstanding throughout the year/period
| | | For the
Period Ended
October 31,
2021
(Unaudited) | | | For the
Year Ended
April 30,
2021 | | | For the
Year Ended
April 30,
2020 | | | For the
Period Ended
April 30,
2019(a) | |
Net Asset Value, Beginning of Period | | $ | 42.12 | | | $ | 30.09 | | | $ | 29.42 | | | $ | 24.83 | |
| | | | | | | | | | | | | | | | | |
INCOME (LOSS) FROM INVESTMENT OPERATIONS: | | | | | | | | | | | | | | | | |
Net Investment Income (Loss) (b) | | | 0.46 | | | | 0.63 | | | | 0.77 | | | | 0.65 | |
Net Realized and Unrealized Gain (Loss) on Investments (f) | | | 7.27 | | | | 12.08 | | | | 0.52 | | | | 4.61 | |
Total from Investment Operations | | | 7.73 | | | | 12.71 | | | | 1.29 | | | | 5.26 | |
| | | | | | | | | | | | | | | | | |
LESS DISTRIBUTIONS: | | | | | | | | | | | | | | | | |
Distributions from: | | | | | | | | | | | | | | | | |
Net Investment Income | | | (0.27 | ) | | | (0.58 | ) | | | (0.61 | ) | | | (0.67 | ) |
Return of Capital | | | — | | | | (0.10 | ) | | | — | | | | — | |
Long-Term Capital Gain | | | — | | | | — | | | | (0.01 | ) | | | — | |
Total Distributions | | | (0.27 | ) | | | (0.68 | ) | | | (0.62 | ) | | | (0.67 | ) |
| | | | | | | | | | | | | | | | | |
CAPITAL SHARE TRANSACTIONS | | | | | | | | | | | | | | | | |
Transaction Fees (see Note 1) | | | — | | | | 0.00 | (g) | | | — | | | | — | |
Net Asset Value, End of Period | | $ | 49.58 | | | $ | 42.12 | | | $ | 30.09 | | | $ | 29.42 | |
Total Return | | | 18.41 | %(c) | | | 42.70 | % | | | 4.38 | % | | | 21.62 | %(c) |
| | | | | | | | | | | | | | | | | |
SUPPLEMENTAL DATA: | | | | | | | | | | | | | | | | |
Net Assets at End of Period (000’s) | | $ | 307,407 | | | $ | 200,086 | | | $ | 48,147 | | | $ | 7,356 | |
| | | | | | | | | | | | | | | | | |
RATIOS TO AVERAGE NET ASSETS: | | | | | | | | | | | | | | | | |
Expenses to Average Net Assets | | | 0.60 | %(d) | | | 0.60 | % | | | 0.60 | % | | | 0.60 | %(d) |
Net Investment Income (Loss) to Average Net Assets | | | 2.03 | %(d) | | | 1.75 | % | | | 2.40 | % | | | 2.60 | %(d) |
Portfolio Turnover Rate (e) | | | 10 | %(c) | | | 13 | % | | | 29 | % | | | 36 | %(c) |
(a) | Commencement of operations on May 14, 2018. |
(b) | Calculated based on average shares outstanding during the period. |
(e) | Excludes the impact of in-kind transactions. |
(f) | Realized and unrealized gain (loss) per share in this caption are balancing amounts necessary to reconcile the change in net asset value per share for the period, and may not reconcile with the aggregate gain (loss) in the Statement of Operations due to share transactions for the period. |
The accompanying notes are an integral part of the financial statements.
181
Pacer Benchmark Data & Infrastructure Real Estate SCTRSM ETF
FINANCIAL HIGHLIGHTS
For a capital share outstanding throughout the year/period
| | | For the
Period Ended
October 31,
2021
(Unaudited) | | | For the
Year Ended
April 30,
2021 | | | For the
Year Ended
April 30,
2020 | | | For the
Period Ended
April 30,
2019(a) | |
Net Asset Value, Beginning of Period | | $ | 38.48 | | | $ | 33.27 | | | $ | 28.36 | | | $ | 24.67 | |
| | | | | | | | | | | | | | | | | |
INCOME (LOSS) FROM INVESTMENT OPERATIONS: | | | | | | | | | | | | | | | | |
Net Investment Income (Loss) (b) | | | 0.30 | | | | 0.36 | | | | 0.54 | | | | 0.39 | |
Net Realized and Unrealized Gain (Loss) on Investments (f) | | | 2.06 | | | | 5.39 | | | | 4.92 | | | | 3.93 | |
Total from Investment Operations | | | 2.36 | | | | 5.75 | | | | 5.46 | | | | 4.32 | |
| | | | | | | | | | | | | | | | | |
LESS DISTRIBUTIONS: | | | | | | | | | | | | | | | | |
Distributions from: | | | | | | | | | | | | | | | | |
Net Investment Income | | | (0.28 | ) | | | (0.37 | ) | | | (0.49 | ) | | | (0.44 | ) |
Long-Term Capital Gain | | | — | | | | 0.00 | | | | 0.00 | | | | 0.01 | |
Return of Capital | | | — | | | | (0.17 | ) | | | (0.06 | ) | | | (0.18 | ) |
Total Distributions | | | (0.28 | ) | | | (0.54 | ) | | | (0.55 | ) | | | (0.63 | ) |
Net Asset Value, End of Period | | $ | 40.56 | | | $ | 38.48 | | | $ | 33.27 | | | $ | 28.36 | |
Total Return | | | 6.13 | %(c) | | | 17.46 | % | | | 19.50 | % | | | 17.89 | %(c) |
| | | | | | | | | | | | | | | | | |
SUPPLEMENTAL DATA: | | | | | | | | | | | | | | | | |
Net Assets at End of Period (000’s) | | $ | 1,614,405 | | | $ | 1,119,810 | | | $ | 552,214 | | | $ | 22,691 | |
| | | | | | | | | | | | | | | | | |
RATIOS TO AVERAGE NET ASSETS: | | | | | | | | | | | | | | | | |
Expenses to Average Net Assets | | | 0.60 | %(d) | | | 0.60 | % | | | 0.60 | % | | | 0.60 | %(d) |
Net Investment Income (Loss) to Average Net Assets | | | 1.49 | %(d) | | | 1.02 | % | | | 1.70 | % | | | 1.55 | %(d) |
Portfolio Turnover Rate (e) | | | 12 | %(c) | | | 30 | % | | | 28 | % | | | 27 | %(c) |
(a) | Commencement of operations on May 15, 2018. |
(b) | Calculated based on average shares outstanding during the period. |
(e) | Excludes the impact of in-kind transactions. |
(f) | Realized and unrealized gain (loss) per share in this caption are balancing amounts necessary to reconcile the change in net asset value per share for the period, and may not reconcile with the aggregate gain (loss) in the Statement of Operations due to share transactions for the period. |
The accompanying notes are an integral part of the financial statements.
182
Pacer CFRA-Stovall Equal Weight Seasonal Rotation ETF
FINANCIAL HIGHLIGHTS
For a capital share outstanding throughout the year/period
| | | For the
Period Ended
October 31,
2021
(Unaudited) | | | For the
Year Ended
April 30,
2021 | | | For the
Year Ended
April 30,
2020 | | | For the
Period Ended
April 30,
2019(a) | |
Net Asset Value, Beginning of Period | | $ | 37.16 | | | $ | 25.23 | | | $ | 28.16 | | | $ | 25.01 | |
| | | | | | | | | | | | | | | | | |
INCOME (LOSS) FROM INVESTMENT OPERATIONS: | | | | | | | | | | | | | | | | |
Net Investment Income (Loss) (b) | | | 0.21 | | | | 0.26 | | | | 0.50 | | | | 0.25 | |
Net Realized and Unrealized Gain (Loss) on Investments (g) | | | 1.12 | | | | 11.95 | | | | (3.00 | ) | | | 3.11 | |
Total from Investment Operations | | | 1.33 | | | | 12.21 | | | | (2.50 | ) | | | 3.36 | |
| | | | | | | | | | | | | | | | | |
LESS DISTRIBUTIONS: | | | | | | | | | | | | | | | | |
Distributions from Net Investment Income | | | (0.17 | ) | | | (0.28 | ) | | | (0.43 | ) | | | (0.21 | ) |
Total Distributions | | | (0.17 | ) | | | (0.28 | ) | | | (0.43 | ) | | | (0.21 | ) |
Net Asset Value, End of Period | | $ | 38.32 | | | $ | 37.16 | | | $ | 25.23 | | | $ | 28.16 | |
Total Return (f) | | | 3.57 | %(c) | | | 48.66 | % | | | -8.80 | % | | | 13.67 | %(c) |
| | | | | | | | | | | | | | | | | |
SUPPLEMENTAL DATA: | | | | | | | | | | | | | | | | |
Net Assets at End of Period (000’s) | | $ | 82,384 | | | $ | 66,883 | | | $ | 60,554 | | | $ | 7,040 | |
| | | | | | | | | | | | | | | | | |
RATIOS TO AVERAGE NET ASSETS: | | | | | | | | | | | | | | | | |
Expenses to Average Net Assets | | | 0.60 | %(d) | | | 0.60 | % | | | 0.60 | % | | | 0.60 | %(d) |
Net Investment Income (Loss) to Average Net Assets | | | 1.08 | %(d) | | | 0.89 | % | | | 1.75 | % | | | 1.23 | %(d) |
Portfolio Turnover Rate (e) | | | 118 | %(c) | | | 217 | % | | | 225 | % | | | 262 | %(c) |
(a) | Commencement of operations on July 23, 2018. |
(b) | Calculated based on average shares outstanding during the period. |
(e) | Excludes the impact of in-kind transactions. |
(f) | Total Return was calculated using the traded NAV due to the rebalancing of the portfolio at April 30, 2021, April 30, 2020 and April 30, 2019. |
(g) | Net realized and unrealized gain (loss) per share in this caption are balancing amounts necessary to reconcile the change in net asset value per share for the period, and may not reconcile with the aggregate gain (loss) in the Statement of Operations due to share transactions for the period. |
The accompanying notes are an integral part of the financial statements.
183
Pacer CSOP FTSE China A50 ETF
FINANCIAL HIGHLIGHTS
For a capital share outstanding throughout the year/period
| | | For the
Period Ended
October 31,
2021
(Unaudited) | | | For the
Year Ended
April 30,
2021 | | | For the
Period Ended
April 30,
2020 (a) | | | For the
Year Ended
September 30,
2019 | | | For the
Year Ended
September 30,
2018 | | | For the
Year Ended
September 30,
2017 | |
Net Asset Value, Beginning of Period | | $ | 22.74 | | | $ | 16.18 | | | $ | 16.85 | | | $ | 15.30 | | | $ | 16.74 | | | $ | 13.34 | |
| | | | | | | | | | | | | | | | | | | | | | | | | |
INCOME (LOSS) FROM INVESTMENT OPERATIONS: | | | | | | | | | | | | | | | | | | | | | | | | |
Net Investment Income (Loss) (b) | | | 0.34 | | | | 0.36 | | | | (0.07 | ) | | | 0.31 | | | | 0.31 | | | | 0.23 | |
Net Realized and Unrealized Gain (Loss) on Investments (f) | | | (1.62 | ) | | | 6.54 | | | | 0.15 | | | | 1.48 | | | | (0.59 | ) | | | 3.32 | |
Total from Investment Operations | | | (1.28 | ) | | | 6.90 | | | | 0.08 | | | | 1.79 | | | | (0.28 | ) | | | 3.55 | |
| | | | | | | | | | | | | | | | | | | | | | | | | |
LESS DISTRIBUTIONS: | | | | | | | | | | | | | | | | | | | | | | | | |
Distributions from: | | | | | | | | | | | | | | | | | | | | | | | | |
Net Investment Income | | | — | | | | (0.33 | ) | | | (0.71 | ) | | | (0.24 | ) | | | (1.16 | ) | | | (0.15 | ) |
Return of Capital | | | — | | | | (0.01 | ) | | | (0.04 | ) | | | — | | | | — | | | | — | |
Total Distributions | | | — | | | | (0.34 | ) | | | (0.75 | ) | | | (0.24 | ) | | | (1.16 | ) | | | (0.15 | ) |
| | | | | | | | | | | | | | | | | | | | | | | | | |
CAPITAL SHARE TRANSACTIONS | | | | | | | | | | | | | | | | | | | | | | | | |
Transaction Fees (see Note 1) | | | 0.02 | | | | 0.00 | (g) | | | — | | | | — | | | | — | | | | — | |
Net Asset Value, End of Period | | $ | 21.48 | | | $ | 22.74 | | | $ | 16.18 | | | $ | 16.85 | | | $ | 15.30 | | | $ | 16.74 | |
Total Return | | | -5.53 | %(c) | | | 42.73 | % | | | 0.14 | %(c) | | | 12.05 | % | | | -2.34 | % | | | 26.94 | % |
| | | | | | | | | | | | | | | | | | | | | | | | | |
SUPPLEMENTAL DATA: | | | | | | | | | | | | | | | | | | | | | | | | |
Net Assets at End of Period (000’s) | | $ | 8,720 | | | $ | 10,367 | | | $ | 8,992 | | | $ | 12,740 | | | $ | 9,269 | | | $ | 6,793 | |
| | | | | | | | | | | | | | | | | | | | | | | | | |
RATIOS TO AVERAGE NET ASSETS: | | | | | | | | | | | | | | | | | | | | | | | | |
Expenses to Average Net Assets | | | 0.70 | %(d) | | | 0.70 | % | | | 0.70 | %(d) | | | 0.70 | % | | | 0.70 | % | | | 0.70 | % |
Net Investment Income (Loss) to Average Net Assets | | | 3.10 | %(d) | | | 1.73 | % | | | -0.66 | %(d) | | | 1.97 | % | | | 1.84 | % | | | 1.57 | % |
Portfolio Turnover Rate (e) | | | 30 | %(c) | | | 32 | % | | | 193 | %(c) | | | 45 | % | | | 20 | % | | | 34 | % |
(a) | For the period October 1, 2019 to April 30, 2020. |
(b) | Calculated based on average shares outstanding during the period. |
(e) | Excludes the impact of in-kind transactions. |
(f) | Realized and unrealized gain (loss) per share in this caption are balancing amounts necessary to reconcile the change in net asset value per share for the period, and may not reconcile with the aggregate gain (loss) in the Statement of Operations due to share transactions for the period. |
(g) | Represents less than $0.005. |
The accompanying notes are an integral part of the financial statements.
184
Pacer BioThreat Strategy ETF
FINANCIAL HIGHLIGHTS
For a capital share outstanding throughout the period
| | | For the
Period Ended
October 31,
2021
(Unaudited) | | | For the
Period Ended
April 30,
2021 (a) | |
Net Asset Value, Beginning of Period | | $ | 30.05 | | | $ | 24.51 | |
| | | | | | | | | |
INCOME (LOSS) FROM INVESTMENT OPERATIONS: | | | | | | | | |
Net Investment Income (Loss) (b) | | | 0.13 | | | | 0.16 | |
Net Realized and Unrealized Gain (Loss) on Investments (f) | | | 4.51 | | | | 5.53 | |
Total from Investment Operations | | | 4.64 | | | | 5.69 | |
| | | | | | | | | |
LESS DISTRIBUTIONS: | | | | | | | | |
Distributions from Net Investment Income | | | (0.14 | ) | | | (0.15 | ) |
Distributions from Return of Capital | | | — | | | | — | (g) |
Total Distributions | | | (0.14 | ) | | | (0.15 | ) |
Net Asset Value, End of Period | | $ | 34.55 | | | $ | 30.05 | |
Total Return | | | 15.50 | %(c) | | | 23.23 | %(c) |
| | | | | | | | | |
SUPPLEMENTAL DATA: | | | | | | | | |
Net Assets at End of Period (000’s) | | $ | 6,910 | | | $ | 4,507 | |
| | | | | | | | | |
RATIOS TO AVERAGE NET ASSETS: | | | | | | | | |
Expenses to Average Net Assets | | | 0.70 | %(d) | | | 0.70 | %(d) |
Net Investment Income (Loss) to Average Net Assets | | | 0.81 | %(d) | | | 0.65 | %(d) |
Portfolio Turnover Rate (e) | | | 9 | %(c) | | | 5 | %(c) |
(a) | Commencement of operations on June 24, 2020. |
(b) | Calculated based on average shares outstanding during the period. |
(e) | Excludes the impact of in-kind transactions. |
(f) | Realized and unrealized gain (loss) per share in this caption are balancing amounts necessary to reconcile the change in net asset value per share for the period, and may not reconcile with the aggregate gain (loss) in the Statement of Operations due to share transactions for the period. |
(g) | Represents less than $0.005. |
The accompanying notes are an integral part of the financial statements.
185
Pacer Lunt Large Cap Alternator ETF
FINANCIAL HIGHLIGHTS
For a capital share outstanding throughout the period
| | | For the
Period Ended
October 31,
2021
(Unaudited) | | | For the
Period Ended
April 30,
2021 (a) | |
Net Asset Value, Beginning of Period | | $ | 40.74 | | | $ | 23.58 | |
| | | | | | | | | |
INCOME (LOSS) FROM INVESTMENT OPERATIONS: | | | | | | | | |
Net Investment Income (Loss) (b) | | | 0.29 | | | | 0.41 | |
Net Realized and Unrealized Gain (Loss) on Investments (f) | | | 2.60 | | | | 17.16 | |
Total from Investment Operations | | | 2.89 | | | | 17.57 | |
| | | | | | | | | |
LESS DISTRIBUTIONS: | | | | | | | | |
Distributions from Net Investment Income | | | (0.22 | ) | | | (0.41 | ) |
Total Distributions | | | (0.22 | ) | | | (0.41 | ) |
Net Asset Value, End of Period | | $ | 43.41 | | | $ | 40.74 | |
Total Return | | | 7.11 | %(c) | | | 74.99 | %(c) |
| | | | | | | | | |
SUPPLEMENTAL DATA: | | | | | | | | |
Net Assets at End of Period (000’s) | | $ | 277,793 | | | $ | 130,353 | |
| | | | | | | | | |
RATIOS TO AVERAGE NET ASSETS: | | | | | | | | |
Expenses to Average Net Assets | | | 0.60 | %(d) | | | 0.60 | %(d) |
Net Investment Income (Loss) to Average Net Assets | | | 1.37 | %(d) | | | 1.59 | %(d) |
Portfolio Turnover Rate (e) | | | 204 | %(c) | | | 193 | %(c) |
(a) | Commencement of operations on June 24, 2020. |
(b) | Calculated based on average shares outstanding during the period. |
(e) | Excludes the impact of in-kind transactions. |
(f) | Realized and unrealized gain (loss) per share in this caption are balancing amounts necessary to reconcile the change in net asset value per share for the period, and may not reconcile with the aggregate gain (loss) in the Statement of Operations due to share transactions for the period. |
The accompanying notes are an integral part of the financial statements.
186
Pacer Lunt Midcap Multi-Factor Alternator ETF
FINANCIAL HIGHLIGHTS
For a capital share outstanding throughout the period
| | | For the
Period Ended
October 31,
2021
(Unaudited) | | | For the
Period Ended
April 30,
2021 (a) | |
Net Asset Value, Beginning of Period | | $ | 37.07 | | | $ | 23.84 | |
| | | | | | | | | |
INCOME (LOSS) FROM INVESTMENT OPERATIONS: | | | | | | | | |
Net Investment Income (Loss) (b) | | | 0.09 | | | | 0.07 | |
Net Realized and Unrealized Gain (Loss) on Investments (f) | | | (0.86 | ) | | | 13.26 | |
Total from Investment Operations | | | (0.77 | ) | | | 13.33 | |
| | | | | | | | | |
LESS DISTRIBUTIONS: | | | | | | | | |
Distributions from Net Investment Income | | | (0.08 | ) | | | (0.07 | ) |
Distributions from Return of Capital | | | — | | | | (0.03 | ) |
Total Distributions | | | (0.08 | ) | | | (0.10 | ) |
Net Asset Value, End of Period | | $ | 36.22 | | | $ | 37.07 | |
Total Return | | | -2.09 | %(c) | | | 56.04 | %(c) |
| | | | | | | | | |
SUPPLEMENTAL DATA: | | | | | | | | |
Net Assets at End of Period (000’s) | | $ | 41,652 | | | $ | 35,219 | |
| | | | | | | | | |
RATIOS TO AVERAGE NET ASSETS: | | | | | | | | |
Expenses to Average Net Assets | | | 0.60 | %(d) | | | 0.60 | %(d) |
Net Investment Income (Loss) to Average Net Assets | | | 0.50 | %(d) | | | 0.27 | %(d) |
Portfolio Turnover Rate (e) | | | 296 | %(c) | | | 322 | %(c) |
(a) | Commencement of operations on June 24, 2020. |
(b) | Calculated based on average shares outstanding during the period. |
(e) | Excludes the impact of in-kind transactions. |
(f) | Realized and unrealized gain (loss) per share in this caption are balancing amounts necessary to reconcile the change in net asset value per share for the period, and may not reconcile with the aggregate gain (loss) in the Statement of Operations due to share transactions for the period. |
The accompanying notes are an integral part of the financial statements.
187
Pacer Lunt Large Cap Multi-Factor Alternator ETF
FINANCIAL HIGHLIGHTS
For a capital share outstanding throughout the period
| | | For the
Period Ended
October 31,
2021
(Unaudited) | | | For the
Period Ended
April 30,
2021 (a) | |
Net Asset Value, Beginning of Period | | $ | 37.61 | | | $ | 24.42 | |
| | | | | | | | | |
INCOME (LOSS) FROM INVESTMENT OPERATIONS: | | | | | | | | |
Net Investment Income (Loss) (b) | | | 0.15 | | | | 0.32 | |
Net Realized and Unrealized Gain (Loss) on Investments (f) | | | 4.07 | | | | 13.14 | |
Total from Investment Operations | | | 4.22 | | | | 13.46 | |
| | | | | | | | | |
LESS DISTRIBUTIONS: | | | | | | | | |
Distributions from Net Investment Income | | | (0.16 | ) | | | (0.27 | ) |
Total Distributions | | | (0.16 | ) | | | (0.27 | ) |
Net Asset Value, End of Period | | $ | 41.67 | | | $ | 37.61 | |
Total Return | | | 11.25 | %(c) | | | 55.41 | %(c) |
| | | | | | | | | |
SUPPLEMENTAL DATA: | | | | | | | | |
Net Assets at End of Period (000’s) | | $ | 145,842 | | | $ | 43,253 | |
| | | | | | | | | |
RATIOS TO AVERAGE NET ASSETS: | | | | | | | | |
Expenses to Average Net Assets | | | 0.60 | %(d) | | | 0.60 | %(d) |
Net Investment Income (Loss) to Average Net Assets | | | 0.77 | %(d) | | | 1.19 | %(d) |
Portfolio Turnover Rate (e) | | | 230 | %(c) | | | 304 | %(c) |
(a) | Commencement of operations on June 24, 2020. |
(b) | Calculated based on average shares outstanding during the period. |
(e) | Excludes the impact of in-kind transactions. |
(f) | Realized and unrealized gain (loss) per share in this caption are balancing amounts necessary to reconcile the change in net asset value per share for the period, and may not reconcile with the aggregate gain (loss) in the Statement of Operations due to share transactions for the period. |
The accompanying notes are an integral part of the financial statements.
188
Pacer US Export Leaders ETF
FINANCIAL HIGHLIGHTS
For a capital share outstanding throughout the year/period
| | | For the
Period Ended
October 31,
2021
(Unaudited) | | | For the
Year Ended
April 30,
2021 | | | For the
Year Ended
April 30,
2020 | | | For the
Period Ended
April 30,
2019 (a) | |
Net Asset Value, Beginning of Period | | $ | 40.41 | | | $ | 25.15 | | | $ | 25.97 | | | $ | 24.98 | |
| | | | | | | | | | | | | | | | | |
INCOME (LOSS) FROM INVESTMENT OPERATIONS: | | | | | | | | | | | | | | | | |
Net Investment Income (Loss) (b) | | | 0.06 | | | | 0.14 | | | | 0.16 | | | | 0.09 | |
Net Realized and Unrealized Gain (Loss) on Investments (f) | | | 3.78 | | | | 15.27 | | | | (0.82 | ) | | | 0.98 | |
Total from Investment Operations | | | 3.84 | | | | 15.41 | | | | (0.66 | ) | | | 1.07 | |
| | | | | | | | | | | | | | | | | |
LESS DISTRIBUTIONS: | | | | | | | | | | | | | | | | |
Distributions from Net Investment Income | | | (0.06 | ) | | | (0.15 | ) | | | (0.16 | ) | | | (0.08 | ) |
Total Distributions | | | (0.06 | ) | | | (0.15 | ) | | | (0.16 | ) | | | (0.08 | ) |
Net Asset Value, End of Period | | $ | 44.19 | | | $ | 40.41 | | | $ | 25.15 | | | $ | 25.97 | |
Total Return | | | 9.52 | %(c) | | | 61.47 | % | | | -2.53 | % | | | 4.33 | %(c) |
| | | | | | | | | | | | | | | | | |
SUPPLEMENTAL DATA: | | | | | | | | | | | | | | | | |
Net Assets at End of Period (000’s) | | $ | 2,210 | | | $ | 2,021 | | | $ | 1,257 | | | $ | 1,298 | |
| | | | | | | | | | | | | | | | | |
RATIOS TO AVERAGE NET ASSETS: | | | | | | | | | | | | | | | | |
Expenses to Average Net Assets | | | 0.60 | %(d) | | | 0.60 | % | | | 0.60 | % | | | 0.60 | %(d) |
Net Investment Income (Loss) to Average Net Assets | | | 0.27 | %(d) | | | 0.43 | % | | | 0.61 | % | | | 0.50 | %(d) |
Portfolio Turnover Rate (e) | | | 32 | %(c) | | | 111 | % | | | 79 | % | | | 55 | %(c) |
(a) | Commencement of operations on July 23, 2018. |
(b) | Calculated based on average shares outstanding during the period. |
(e) | Excludes the impact of in-kind transactions. |
(f) | Realized and unrealized gain (loss) per share in this caption are balancing amounts necessary to reconcile the change in net asset value per share for the period, and may not reconcile with the aggregate gain (loss) in the Statement of Operations due to share transactions for the period. |
The accompanying notes are an integral part of the financial statements.
189
Pacer Metaurus US Large Cap Dividend Multiplier 300 ETF
FINANCIAL HIGHLIGHTS
For a capital share outstanding throughout the period
| | | For the
Period Ended
October 31,
2021 (a)
(Unaudited) | |
Net Asset Value, Beginning of Period | | $ | 40.51 | |
| | | | | |
INCOME (LOSS) FROM INVESTMENT OPERATIONS: | | | | |
Net Investment Income (Loss) (b) | | | 0.05 | |
Net Realized and Unrealized Gain (Loss) on Investments (f) | | | 1.95 | |
Total from Investment Operations | | | 2.00 | |
| | | | | |
LESS DISTRIBUTIONS: | | | | |
Distributions from Net Investment Income | | | (0.34 | ) |
Total Distributions | | | (0.34 | ) |
Net Asset Value, End of Period | | $ | 42.17 | |
Total Return | | | 4.96 | %(c) |
| | | | | |
SUPPLEMENTAL DATA: | | | | |
Net Assets at End of Period (000’s) | | $ | 2,108 | |
| | | | | |
RATIOS TO AVERAGE NET ASSETS: | | | | |
Expenses to Average Net Assets | | | 0.79 | %(d) |
Net Investment Income (Loss) to Average Net Assets | | | 0.39 | %(d) |
Portfolio Turnover Rate (e) | | | 2 | %(c) |
(a) | Commencement of operations on July 12, 2021. |
(b) | Calculated based on average shares outstanding during the period. |
(e) | Excludes the impact of in-kind transactions. |
(f) | Realized and unrealized gain (loss) per share in this caption are balancing amounts necessary to reconcile the change in net asset value per share for the period, and may not reconcile with the aggregate gain (loss) in the Statement of Operations due to share transactions for the period. |
The accompanying notes are an integral part of the financial statements.
190
Pacer Metaurus US Large Cap Dividend Multiplier 400 ETF
FINANCIAL HIGHLIGHTS
For a capital share outstanding throughout the period
| | | For the
Period Ended
October 31,
2021 (a)
(Unaudited) | |
Net Asset Value, Beginning of Period | | $ | 34.65 | |
| | | | | |
INCOME (LOSS) FROM INVESTMENT OPERATIONS: | | | | |
Net Investment Income (Loss) (b) | | | 0.02 | |
Net Realized and Unrealized Gain (Loss) on Investments (f) | | | 1.64 | |
Total from Investment Operations | | | 1.66 | |
| | | | | |
LESS DISTRIBUTIONS: | | | | |
Distributions from Net Investment Income | | | (0.39 | ) |
Total Distributions | | | (0.39 | ) |
Net Asset Value, End of Period | | $ | 35.92 | |
Total Return | | | 4.84 | %(c) |
| | | | | |
SUPPLEMENTAL DATA: | | | | |
Net Assets at End of Period (000’s) | | $ | 25,862 | |
| | | | | |
RATIOS TO AVERAGE NET ASSETS: | | | | |
Expenses to Average Net Assets | | | 0.79 | %(d) |
Net Investment Income (Loss) to Average Net Assets | | | 0.23 | %(d) |
Portfolio Turnover Rate (e) | | | 2 | %(c) |
(a) | Commencement of operations on July 12, 2021 |
(b) | Calculated based on average shares outstanding during the period. |
(e) | Excludes the impact of in-kind transactions. |
(f) | Realized and unrealized gain (loss) per share in this caption are balancing amounts necessary to reconcile the change in net asset value per share for the period, and may not reconcile with the aggregate gain (loss) in the Statement of Operations due to share transactions for the period. |
The accompanying notes are an integral part of the financial statements.
191
Pacer Pacific Asset Floating Rate High Income ETF
FINANCIAL HIGHLIGHTS
For a capital share outstanding throughout the year/period
| | | For the
Period Ended
October 31,
2021(a)
(Unaudited) | | | For the
Year Ended
June 30,
2021 | | | For the
Year Ended
June 30,
2020 | | | For the
Year Ended
June 30,
2019 | | | For the
Year Ended
June 30,
2018 | | | For the
Year Ended
June 30,
2017 | |
Net Asset Value, Beginning of Period | | $ | 48.90 | | | $ | 46.52 | | | $ | 48.73 | | | $ | 48.87 | | | $ | 49.35 | | | $ | 48.73 | |
| | | | | | | | | | | | | | | | | | | | | | | | | |
INCOME (LOSS) FROM INVESTMENT OPERATIONS: | | | | | | | | | | | | | | | | | | | | | | | | |
Net Investment Income (Loss) (b) | | | 0.52 | | | | 1.47 | | | | 1.90 | | | | 2.10 | | | | 1.78 | | | | 1.73 | |
Net Realized and Unrealized Gain (Loss) on Investments (f) | | | (0.03 | ) | | | 2.47 | | | | (2.20 | ) | | | (0.15 | ) | | | (0.63 | ) | | | 0.58 | |
Total from Investment Operations | | | 0.49 | | | | 3.94 | | | | (0.30 | ) | | | 1.95 | | | | 1.15 | | | | 2.31 | |
| | | | | | | | | | | | | | | | | | | | | | | | | |
LESS DISTRIBUTIONS: | | | | | | | | | | | | | | | | | | | | | | | | |
Distributions from Net Investment Income | | | (0.41 | ) | | | (1.56 | ) | | | (1.91 | ) | | | (2.09 | ) | | | (1.63 | ) | | | (1.69 | ) |
Total Distributions | | | (0.41 | ) | | | (1.56 | ) | | | (1.91 | ) | | | (2.09 | ) | | | (1.63 | ) | | | (1.69 | ) |
Net Asset Value, End of Period | | $ | 48.98 | | | $ | 48.90 | | | $ | 46.52 | | | $ | 48.73 | | | $ | 48.87 | | | $ | 49.35 | |
Total Return | | | 0.99 | %(c) | | | 8.63 | % | | | -0.70 | % | | | 4.09 | % | | | 2.36 | % | | | 4.78 | % |
| | | | | | | | | | | | | | | | | | | | | | | | | |
SUPPLEMENTAL DATA: | | | | | | | | | | | | | | | | | | | | | | | | |
Net Assets at End of Period (000’s) | | $ | 36,732 | | | $ | 31,788 | | | $ | 27,911 | | | $ | 29,240 | | | $ | 29,323 | | | $ | 27,143 | |
| | | | | | | | | | | | | | | | | | | | | | | | | |
RATIOS TO AVERAGE NET ASSETS: | | | | | | | | | | | | | | | | | | | | | | | | |
Expenses to Average Net Assets | | | 0.67 | %(d) | | | 0.68 | % | | | 1.06 | % | | | 1.63 | % | | | 1.62 | % | | | 1.39 | % |
Expenses to Average Net Assets After Advisory Fees (Waived) and Other Fees (Reimbursed)/Recouped | | | N/A | | | | 0.68 | % | | | 0.86 | % | | | 1.10 | % | | | 1.10 | % | | | 1.10 | % |
Net Investment Income (Loss) to Average Net Assets | | | 3.16 | %(d) | | | 3.04 | % | | | 3.98 | % | | | 4.31 | % | | | 3.61 | % | | | 3.49 | % |
Portfolio Turnover Rate (e) | | | 12 | %(c) | | | 35 | % | | | 48 | % | | | 70 | % | | | 73 | % | | | 52 | % |
(a) | For the period ended July 1, 2021 to October 31, 2021. See Note 1 to Financial Statements. |
(b) | Calculated based on average shares outstanding during the period. |
(e) | Excludes the impact of in-kind transactions. |
(f) | Realized and unrealized gain (loss) per share in this caption are balancing amounts necessary to reconcile the change in net asset value per share for the period, and may not reconcile with the aggregate gain (loss) in the Statement of Operations due to share transactions for the period. |
The accompanying notes are an integral part of the financial statements.
192
Pacer Funds
NOTES TO FINANCIAL STATEMENTS
October 31, 2021 (Unaudited)
NOTE 1 – ORGANIZATION
Pacer Funds Trust (the “Trust”), a Delaware statutory trust organized on August 12, 2014. USAI, SLT, LSLT, PSCX, PSMD, PSFD, PSFF, PSCW, PSMR, PSFM, PSCJ, PSMJ, PSFJ, PSCQ, PSMO and PSFO’s fiscal year end is October 31st and as such are not included in these financial statements. The Trust is registered with the Securities and Exchange Commission (the “SEC”) under the Investment Company Act of 1940, as amended (the “1940 Act”), as an open-end management investment company and the offering of the Funds’ shares (“Shares”) is registered under the Securities Act of 1933, as amended (the “Securities Act”). The Trust currently consists of multiple operational series, of which are covered in this report, individually the (“Fund”) or collectively the (“Funds”).
Shares of the Funds are listed and traded on the Cboe BZX Exchange, Inc. (“Cboe”), Nasdaq Stock Market LLC (“Nasdaq”), or the NYSE Arca, Inc. (“NYSE”). Market prices for the shares may be different from their net asset value (“NAV”). The Funds issue and redeem shares on a continuous basis at NAV only in large blocks of shares, called “Creation Units,” which generally consist of 50,000 shares except PTBD which generally consist of 100,000 shares, TRPL which generally consist of 30,000 shares, QDPL which generally consist of 25,000 shares and FLRT which generally consist of 20,000 shares. Creation Units are issued and redeemed principally in-kind for securities included in a specified universe. Once created, Shares generally trade in the secondary market at market prices that change throughout the day in amounts less than a Creation Unit. Except when aggregated in Creation Units, Shares are not redeemable securities of a Fund. Shares of a Fund may only be purchased directly from or redeemed directly to a Fund by certain financial institutions (“Authorized Participants”). An Authorized Participant is either (i) a broker-dealer or other participant in the clearing process through the Continuous Net Settlement System of the National Securities Clearing Corporation or (ii) a DTC participant and, in each case, must have executed a Participant Agreement with Pacer Financial, Inc. (the “Distributor”). Prior to January 23, 2020, ALPS Distributors, Inc. acted as the principal underwriter for AFTY. Most retail investors do not qualify as Authorized Participants nor have the resources to buy and sell whole Creation Units. Therefore, they are unable to purchase or redeem the shares directly from a Fund. Rather, most retail investors may purchase Shares in the secondary market with the assistance of a broker and are subject to customary brokerage commissions or fees.
Pacific Global Senior Loan ETF (FLRT or the “Predecessor Fund”) is the successor to interest and has the same investment objective that was included as a series of another investment company, Pacific Global ETF Trust, and that was advised by Pacific Global Advisors LLC and Sub-Advised by Pacific Asset Management LLC. On October 20, 2021, the shareholders of the Predecessor Fund approved the tax-free reorganization of the Predecessor Fund with and into Pacer Pacific Asset Floating Rate High Income ETF, and effective as of the close of business on October 22, 2021, the assets and liabilities of the Predecessor Fund were transferred to the Trust in exchange for shares of Pacer Pacific Asset Floating Rate High Income ETF. For financial reporting purposes, assets received and shares issued by FLRT were recorded at fair value; however, the cost basis of the investments received from the Predecessor Fund was carried forward to align ongoing reporting of FLRT’s realized and unrealized gains and losses with amounts distributable to shareholders for tax purposes. Costs incurred by Pacer Pacific Asset Floating Rate High Income ETF in connection with the reorganization were paid by the Adviser. The fiscal year end of the Predecessor Fund was June 30. The reporting period ended October 31, 2021 for FLRT is July 1, 2021 through October 31, 2021. Operations prior to October 25, 2021 were for the Predecessor Fund. The net assets were $36,716,030, including $47,406 of net unrealized appreciation,$24,639 of undistributed (accumulated) net investment income, and ($649,269) of undistributed (accumulated) net realized loss and shares outstanding were 750,000, all of which were transferred into the Trust at NAV at the close of business on October 22, 2021.
The Funds each currently offer one class of Shares, which have no front end sales loads, no deferred sales charges, and no redemption fees. A purchase (i.e., creation) transaction fee is imposed for the transfer and other transaction costs associated with the purchase of Creation Units. Below are the charges for the standard fixed creation fee, payable to the Custodian. The fixed transaction fee may be waived on certain orders if the Fund’s Custodian has determined to waive some or all of the costs associated with the order, or another party, such as the Adviser, has agreed to pay such fee. In addition, a variable fee may be charged on all cash transactions or substitutes for Creation Units of up to a maximum of 2% as a percentage of the value of the Creation Units subject to the transaction for the Funds, except AFTY which may charge up to a maximum of 8% as a percentage of the value of the Creation Units subject to the transaction. Variable fees received by each Fund are displayed in the Capital Share Transaction section of the Statement of Changes in Net Assets. Each Fund may issue an unlimited number of shares of beneficial interest, with no par value. Shares of each Fund have equal rights and privileges with respect to such Fund.
Fund Name | | Ticker | | | Commencement
of Operations | | | Exchange | | | Transaction Fees | |
Pacer Trendpilot® US Large Cap ETF | | | PTLC | | | | June 11, 2015 | | | | Cboe | | | $ | 500 | * |
Pacer Trendpilot® US Mid Cap ETF | | | PTMC | | | | June 11, 2015 | | | | Cboe | | | | 500 | * |
Pacer Trendpilot® 100 ETF | | | PTNQ | | | | June 11, 2015 | | | | Cboe | | | | 250 | * |
Pacer Trendpilot® European Index ETF | | | PTEU | | | | December 14, 2015 | | | | Cboe | | | | 2,000 | * |
Pacer Trendpilot® International ETF | | | PTIN | | | | May 2, 2019 | | | | NYSE | | | | 8,000 | * |
Pacer Trendpilot® US Bond ETF | | | PTBD | | | | October 22, 2019 | | | | NYSE | | | | 500 | * |
193
Pacer Funds
NOTES TO FINANCIAL STATEMENTS
October 31, 2021 (Unaudited) (Continued)
Fund Name | | Ticker | | | Commencement
of Operations | | | Exchange | | | Transaction Fees | |
Pacer Trendpilot® Fund of Funds ETF | | | TRND | | | | May 3, 2019 | | | | NYSE | | | $ | 250 | |
Pacer Global Cash Cows Dividend ETF | | | GCOW | | | | February 22, 2016 | | | | Cboe | | | | 1,500 | |
Pacer US Cash Cows 100 ETF | | | COWZ | | | | December 16, 2016 | | | | Cboe | | | | 250 | |
Pacer US Small Cap Cash Cows 100 ETF | | | CALF | | | | June 16, 2017 | | | | Cboe | | | | 250 | |
Pacer Developed Markets International Cash Cows 100 ETF | | | ICOW | | | | June 16, 2017 | | | | Cboe | | | | 1,500 | |
Pacer US Cash Cows Growth ETF | | | BUL | | | | May 2, 2019 | | | | NYSE | | | | 250 | |
Pacer Emerging Markets Cash Cows 100 ETF | | | ECOW | | | | May 2, 2019 | | | | Nasdaq | | | | 1,750 | |
Pacer Cash Cows Fund of Funds ETF | | | HERD | | | | May 3, 2019 | | | | Nasdaq | | | | 250 | |
Pacer WealthShield ETF | | | PWS | | | | December 11, 2017 | | | | Cboe | | | | 500 | |
Pacer Benchmark Industrial Real Estate SCTRSM ETF | | | INDS | | | | May 14, 2018 | | | | NYSE | | | | 250 | |
Pacer Benchmark Data & Infrastructure Real Estate SCTRSM ETF | | | SRVR | | | | May 15, 2018 | | | | NYSE | | | | 250 | |
Pacer CFRA-Stovall Equal Weight Seasonal Rotation Index ETF | | | SZNE | | | | July 23, 2018 | | | | NYSE | | | | 500 | |
Pacer CSOP FTSE China A50 ETF | | | AFTY | | | | March 10, 2015 | | | | NYSE | | | | 250 | |
Pacer BioThreat Strategy ETF | | | VIRS | | | | June 24, 2020 | | | | Cboe | | | | 250 | |
Pacer Lunt Large Cap Alternator ETF | | | ALTL | | | | June 24, 2020 | | | | NYSE | | | | 250 | |
Pacer Lunt Midcap Multi-Factor Alternator ETF | | | PAMC | | | | June 24, 2020 | | | | NYSE | | | | 250 | |
Pacer Lunt Large Cap Multi-Factor Alternator ETF | | | PALC | | | | June 24, 2020 | | | | NYSE | | | | 250 | |
Pacer US Export Leaders ETF | | | PEXL | | | | July 23, 2018 | | | | NYSE | | | | 250 | |
Pacer Metaurus US Large Cap Dividend Multiplier 300 ETF | | | TRPL | | | | July 12, 2021 | | | | NYSE | | | | 250 | |
Pacer Metaurus US Large Cap Dividend Multiplier 400 ETF | | | QDPL | | | | July 12, 2021 | | | | NYSE | | | | 250 | |
Pacer Pacific Asset Floating Rate High Income ETF | | | FLRT | | | | February 18, 2015 | | | | NYSE | | | | 250 | |
* | For the PTLC, PTMC, PTNQ, PTEU, and PTIN, the standard fixed creation transaction fee is $200 when the Deposit Securities include only U.S. Treasury bills. For PTBD, the standard fixed creation transaction fee is $250 when the Deposit Securities include only U.S. Treasury bills. |
The investment objectives of the Funds are to seek to track the total return performance, before fees and expenses, of the following indexes, respectively.
Ticker | Index | Diversification |
PTLC | Pacer Trendpilot® US Large Cap Index | Diversified |
PTMC | Pacer Trendpilot® US Mid-Cap Index | Diversified |
PTNQ | Pacer NASDAQ-100 Trendpilot® Index | Non-Diversified |
PTEU | Pacer Trendpilot® European Index | Diversified |
PTIN | Pacer Trendpilot® International Index | Non-Diversified |
PTBD | Pacer Trendpilot® US Bond Index | Diversified |
TRND | Pacer Trendpilot® Fund of Funds Index | Non-Diversified |
GCOW | Pacer Global Cash Cows High Dividends 100 Index | Diversified |
COWZ | Pacer US Cash Cows 100 Index | Diversified |
CALF | Pacer US Small Cap Cash Cows Index | Diversified |
ICOW | Pacer Developed Markets International Cash Cows 100 Index | Diversified |
BUL | Pacer US Cash Cows Growth Index | Non-Diversified |
ECOW | Pacer Emerging Markets Cash Cows 100 Index | Non-Diversified |
HERD | Pacer Cash Cows Fund of Funds Index | Non-Diversified |
PWS | Pacer WealthShield Index | Non-Diversified |
INDS | Benchmark Industrial Real Estate SCTRSM Index | Non-Diversified |
SRVR | Benchmark Data & Infrastructure Real Estate SCTRSM Index | Non-Diversified |
SZNE | Pacer CFRA-Stovall Equal Weight Seasonal Rotation Index | Non-Diversified |
AFTY | FTSE China A50 Net Total Return Index | Diversified |
VIRS | LifeSci BioThreat Strategy Index | Non-Diversified |
ALTL | Lunt Capital U.S. Large Cap Equity Rotation Index | Non-Diversified |
PAMC | Lunt Capital U.S. MidCap Multi-Factor Rotation Index | Non-Diversified |
194
Pacer Funds
NOTES TO FINANCIAL STATEMENTS
October 31, 2021 (Unaudited) (Continued)
Ticker | Index | Diversification |
PALC | Lunt Capital U.S. Large Cap Multi-Factor Rotation Index | Non-Diversified |
PEXL | US Export Leaders Index | Non-Diversified |
TRPL | Metaurus US Large Cap Dividend Multiplier Index – Series 300 | Non-Diversified |
QDPL | Metaurus US Large Cap Dividend Multiplier Index – Series 400 | Non-Diversified |
The investment objective of FLRT is to seek to provide a high level of current income. FLRT is a non-diversified Fund.
NOTE 2 – SIGNIFICANT ACCOUNTING POLICIES
The following is a summary of significant accounting policies consistently followed by the Funds in the preparation of the financial statements. The financial statements have been prepared in conformity with accounting principals generally accepted in the United States of America (“GAAP”). The Funds are investment companies that follow the accounting and reporting guidelines of Accounting Standards Codification Topic 946 applicable to investment companies.
Securities listed on a securities exchange, market or automated quotation system for which quotations are readily available, are valued at the last quoted sale price on the primary exchange or market (foreign or domestic) on which they are traded, except for securities listed on Nasdaq Global Market (“Nasdaq”). If, on a particular day, there is no such reported sale, then the most recent quoted bid price will be used. For securities traded on Nasdaq, the Nasdaq Official Closing Price (“NOCP”) will be used. If a Fund holds foreign shares of a security for which there is no reported volume, and there is an actively trading local version of the security, the last quoted sale price of the local security shall be used. Prices denominated in foreign currencies are converted to U.S. dollar equivalents at the current exchange rate.
Investments in other open-end investment companies, including money market funds, are valued at the investment company’s net asset value per share, with the exception of exchange-traded open-end investment companies, which are priced as equity securities described above.
Fixed-income securities are normally valued on the basis of quotes obtained from independent pricing services in accordance with procedures adopted by the Board of Trustees. The independent pricing services may employ methodologies that utilize market transactions (if the security is actively traded), broker-dealer supplied valuations, or matrix pricing. Short-term securities that have maturities of less than 60 days, at the time of purchase, are valued at amortized cost, which, when combined with accrued interest, approximates market value.
Foreign currency forward contracts are valued at the current day’s interpolated foreign exchange rate, as calculated using the current day’s spot rate, and the twenty, sixty, ninety, and one-hundred eighty day forward rates provided by an independent source.
Futures contracts are valued at the settlement price on the exchange on which they are principally traded.
Units of Mount Vernon Liquid Assets Portfolio are not traded on an exchange and are valued at the investment company’s NAV per share as provided by its administrator.
Deposit accounts are valued at acquisition cost, which approximates fair value.
Any securities for which there are no readily available market quotations and other assets will be valued at their fair value as determined in good faith by the Fair Value Pricing Committee using the Fair Value Procedures approved by the Board of Trustees (the “Board”).
As described above, the Funds utilize various methods to measure the fair value of their investments on a recurring basis. GAAP establishes a hierarchy that prioritizes inputs to valuations methods. The three levels of inputs are:
| | Level 1 – | Unadjusted quoted prices in active markets for identical assets or liabilities that the Funds have the ability to access. |
| | Level 2 – | Observable inputs other than quoted prices included in Level 1 that are observable for the asset or liability, either directly or indirectly. These inputs may include quoted prices for the identical instrument on an inactive market, prices for similar instruments, interest rates, prepayment speeds, credit risk, yield curves, default rates and similar data. |
| | Level 3 – | Unobservable inputs for the asset or liability, to the extent relevant observable inputs are not available; representing the Funds’ own assumptions about the assumptions a market participant would use in valuing the asset or liability, and would be based on the best information available. |
195
Pacer Funds
NOTES TO FINANCIAL STATEMENTS
October 31, 2021 (Unaudited) (Continued)
The availability of observable inputs can vary from security to security and is affected by a wide variety of factors, including, for example, the type of security, whether the security is new and not yet established in the marketplace, the liquidity of markets, and other characteristics particular to the security. To the extent that valuation is based on models or inputs that are less observable or unobservable in the market, the determination of fair value requires more judgment. Accordingly, the degree of judgment exercised in determining fair value is greatest for instruments categorized in Level 3.
The inputs used to measure fair value may fall into different levels of the fair value hierarchy. In such cases, for disclosure purposes, the level in the fair value hierarchy within which the fair value measurement falls in its entirety, is determined based on the lowest level input that is significant to the fair value measurement in its entirety.
The following is a summary of the inputs used to value the Funds’ investments as of October 31, 2021:
PTLC
Description^ | | Level 1 | | | Level 2 | | | Level 3 | | | Investments
Measured at
Net Asset Value | | | Total | |
Common Stocks | | $ | 1,964,419,401 | | | $ | — | | | $ | — | | | $ | — | | | $ | 1,964,419,401 | |
Real Estate Investment Trusts | | | 49,965,635 | | | | — | | | | — | | | | — | | | | 49,965,635 | |
Short-Term Investments | | | 2,238,592 | | | | — | | | | — | | | | — | | | | 2,238,592 | |
Investments Purchased with Proceeds from Securities Lending | | | — | | | | — | | | | — | | | | 66,236,144 | | | | 66,236,144 | |
Total Investments in Securities | | $ | 2,016,623,628 | | | $ | — | | | $ | — | | | $ | 66,236,144 | | | $ | 2,082,859,772 | |
| | ^ | See Schedule of Investments for industry breakouts. |
PTMC
Description^ | | Level 1 | | | Level 2 | | | Level 3 | | | Investments
Measured at
Net Asset Value | | | Total | |
Common Stocks | | $ | 240,615,758 | | | $ | — | | | $ | — | | | $ | — | | | $ | 240,615,758 | |
Real Estate Investment Trusts | | | 24,984,381 | | | | — | | | | — | | | | — | | | | 24,984,381 | |
Short-Term Investments | | | 48,375,103 | | | | 156,783,470 | | | | — | | | | — | | | | 205,158,573 | |
Investments Purchased with Proceeds from Securities Lending | | | — | | | | — | | | | — | | | | 67,335,599 | | | | 67,335,599 | |
Total Investments in Securities | | $ | 313,975,242 | | | $ | 156,783,470 | | | $ | — | | | $ | 67,335,599 | | | $ | 538,094,311 | |
| | ^ | See Schedule of Investments for industry breakouts. |
PTNQ
Description^ | | Level 1 | | | Level 2 | | | Level 3 | | | Investments
Measured at
Net Asset Value | | | Total | |
Common Stocks | | $ | 465,628,927 | | | $ | — | | | $ | — | | | $ | — | | | $ | 465,628,927 | |
Short-Term Investments | | | 50,795,176 | | | | 298,898,558 | | | | — | | | | — | | | | 349,693,734 | |
Investments Purchased with Proceeds from Securities Lending | | | — | | | | — | | | | — | | | | 10,310,192 | | | | 10,310,192 | |
Total Investments in Securities | | $ | 516,424,103 | | | $ | 298,898,558 | | | $ | — | | | $ | 10,310,192 | | | $ | 825,632,853 | |
| | ^ | See Schedule of Investments for industry breakouts. |
196
Pacer Funds
NOTES TO FINANCIAL STATEMENTS
October 31, 2021 (Unaudited) (Continued)
PTEU
Description^ | | Level 1 | | | Level 2 | | | Level 3 | | | Investments
Measured at
Net Asset Value | | | Total | |
Common Stocks | | $ | 51,397,817 | | | $ | — | | | $ | 6,986 | | | $ | — | | | $ | 51,404,803 | |
Preferred Stocks | | | 861,318 | | | | — | | | | — | | | | — | | | | 861,318 | |
Real Estate Investment Trusts | | | 370,902 | | | | — | | | | — | | | | — | | | | 370,902 | |
Short-Term Investments | | | 119,290 | | | | — | | | | — | | | | — | | | | 119,290 | |
Investments Purchased with Proceeds from Securities Lending | | | — | | | | — | | | | — | | | | 6,679,123 | | | | 6,679,123 | |
Total Investments in Securities | | $ | 52,749,327 | | | $ | — | | | $ | 6,986 | | | $ | 6,679,123 | | | $ | 59,435,436 | |
| | ^ | See Schedule of Investments for country breakouts. |
The following is a reconciliation of investments in which significant unobservable inputs (Level 3) were used in determining fair value:
PTEU(a) | Balance
as of
4/30/2021 | Net
Realized
Gain
(Loss) | Change in Net
Unrealized
Appreciation
(Depreciation) | Purchases | Sales | Transfers
Into
Level 3 | Transfers
Out of
Level 3 | Balance as of
10/31/2021 |
Common Stocks | $ 7,265 | $ — | $ (279) | $ — | $ — | $ — | $ — | $ 6,986 |
The following is a summary of quantitative information about Level 3 Fair Value Measurements:
PTEU | | Fair Value as
of 10/31/2021 | | | Valuation
Techniques | | | Unobservable
Input | | | Impact to Valuation From
an Increase to Input | |
Common Stocks | | $ | 6,986 | | | | Last Trade Price | | | | Stale Data | | | | 4.80 EUR | |
| | (a) | Table presents information for one security, which has been valued at 4.80 EUR throughout the period. |
PTIN
Description^ | | Level 1 | | | Level 2 | | | Level 3 | | | Investments
Measured at
Net Asset Value | | | Total | |
Common Stocks | | $ | 132,335,208 | | | $ | — | | | | | | | $ | — | | | $ | 132,335,208 | |
Preferred Stocks | | | 707,313 | | | | — | | | | — | | | | — | | | | 707,313 | |
Real Estate Investment Trusts | | | 1,032,961 | | | | — | | | | — | | | | — | | | | 1,032,961 | |
Exchange Traded Funds | | | 6,857,285 | | | | — | | | | — | | | | — | | | | 6,857,285 | |
Short-Term Investments | | | 204,400 | | | | — | | | | — | | | | — | | | | 204,400 | |
Investments Purchased with Proceeds from Securities Lending | | | — | | | | — | | | | — | | | | 6,653,842 | | | | 6,653,842 | |
Total Investments in Securities | | $ | 141,137,167 | | | $ | — | | | $ | — | | | $ | 6,653,842 | | | $ | 147,791,009 | |
| | ^ | See Schedule of Investments for country breakouts. |
PTBD
Description^ | | Level 1 | | | Level 2 | | | Level 3 | | | Investments
Measured at
Net Asset Value | | | Total | |
Corporate Bonds | | $ | — | | | $ | 1,301,037,447 | | | $ | — | | | $ | — | | | $ | 1,301,037,447 | |
Short-Term Investments | | | 4,937,966 | | | | — | | | | — | | | | — | | | | 4,937,966 | |
Investments Purchased with Proceeds from Securities Lending | | | — | | | | — | | | | — | | | | 345,897,645 | | | | 345,897,645 | |
Total Investments in Securities | | $ | 4,937,966 | | | $ | 1,301,037,447 | | | $ | — | | | $ | 345,897,645 | | | $ | 1,651,873,058 | |
| | ^ | See Schedule of Investments for industry breakouts. |
197
Pacer Funds
NOTES TO FINANCIAL STATEMENTS
October 31, 2021 (Unaudited) (Continued)
TRND
Description^ | | Level 1 | | | Level 2 | | | Level 3 | | | Investments
Measured at
Net Asset Value | | | Total | |
Affiliated Exchange Traded Funds | | $ | 65,487,387 | | | $ | — | | | $ | — | | | $ | — | | | $ | 65,487,387 | |
Short-Term Investments | | | 49,439 | | | | — | | | | — | | | | — | | | | 49,439 | |
Total Investments in Securities | | $ | 65,536,826 | | | $ | — | | | $ | — | | | $ | — | | | $ | 65,536,826 | |
GCOW
Description^ | | Level 1 | | | Level 2 | | | Level 3 | | | Investments
Measured at
Net Asset Value | | | Total | |
Common Stocks | | $ | 134,627,912 | | | $ | — | | | $ | — | | | $ | — | | | $ | 134,627,912 | |
Real Estate Investment Trusts | | | — | | | | — | | | | — | | | | — | | | | — | |
Short-Term Investments | | | 115,504 | | | | — | | | | — | | | | — | | | | 115,504 | |
Investments Purchased with Proceeds from Securities Lending | | | — | | | | — | | | | — | | | | 18,658,940 | | | | 18,658,940 | |
Total Investments in Securities | | $ | 134,743,416 | | | $ | — | | | $ | — | | | $ | 18,658,940 | | | $ | 153,402,356 | |
| | ^ | See Schedule of Investments for country breakouts. |
COWZ
Description^ | | Level 1 | | | Level 2 | | | Level 3 | | | Investments
Measured at
Net Asset Value | | | Total | |
Common Stocks | | $ | 931,756,909 | | | $ | — | | | $ | — | | | $ | — | | | $ | 931,756,909 | |
Real Estate Investment Trusts | | | 15,852,429 | | | | — | | | | — | | | | — | | | | 15,852,429 | |
Short-Term Investments | | | 1,729,280 | | | | — | | | | — | | | | — | | | | 1,729,280 | |
Investments Purchased with Proceeds from Securities Lending | | | — | | | | — | | | | — | | | | 145,394,629 | | | | 145,394,629 | |
Total Investments in Securities | | $ | 949,338,618 | | | $ | — | | | $ | — | | | $ | 145,394,629 | | | $ | 1,094,733,247 | |
| | ^ | See Schedule of Investments for industry breakouts. |
CALF
Description^ | | Level 1 | | | Level 2 | | | Level 3 | | | Investments
Measured at
Net Asset Value | | | Total | |
Common Stocks | | $ | 499,020,075 | | | $ | — | | | $ | — | | | $ | — | | | $ | 499,020,075 | |
Real Estate Investment Trusts | | | 13,715,415 | | | | — | | | | — | | | | — | | | | 13,715,415 | |
Short-Term Investments | | | 273,979 | | | | — | | | | — | | | | — | | | | 273,979 | |
Investments Purchased with Proceeds from Securities Lending | | | — | | | | — | | | | — | | | | 154,675,918 | | | | 154,675,918 | |
Total Investments in Securities | | $ | 513,009,469 | | | $ | — | | | $ | — | | | $ | 154,675,918 | | | $ | 667,685,387 | |
| | ^ | See Schedule of Investments for industry breakouts. |
198
Pacer Funds
NOTES TO FINANCIAL STATEMENTS
October 31, 2021 (Unaudited) (Continued)
ICOW
Description^ | | Level 1 | | | Level 2 | | | Level 3 | | | Investments
Measured at
Net Asset Value | | | Total | |
Common Stocks | | $ | 35,220,387 | | | $ | — | | | $ | — | | | $ | — | | | $ | 35,220,387 | |
Short-Term Investments | | | 177,147 | | | | — | | | | — | | | | — | | | | 177,147 | |
Investments Purchased with Proceeds from Securities Lending | | | — | | | | — | | | | — | | | | 801,934 | | | | 801,934 | |
Total Investments in Securities | | $ | 35,397,534 | | | $ | — | | | $ | — | | | $ | 801,934 | | | $ | 36,199,468 | |
| | ^ | See Schedule of Investments for country breakouts. |
BUL
Description^ | | Level 1 | | | Level 2 | | | Level 3 | | | Investments
Measured at
Net Asset Value | | | Total | |
Common Stocks | | $ | 6,109,739 | | | $ | — | | | $ | — | | | $ | — | | | $ | 6,109,739 | |
Short-Term Investments | | | 5,440 | | | | — | | | | — | | | | — | | | | 5,440 | |
Investments Purchased with Proceeds from Securities Lending | | | — | | | | — | | | | — | | | | 1,217,976 | | | | 1,217,976 | |
Total Investments in Securities | | $ | 6,115,179 | | | $ | — | | | $ | — | | | $ | 1,217,976 | | | $ | 7,333,155 | |
| | ^ | See Schedule of Investments for industry breakouts. |
ECOW
Description^ | | Level 1 | | | Level 2 | | | Level 3 | | | Investments
Measured at
Net Asset Value | | | Total | |
Common Stocks | | $ | 7,852,752 | | | $ | — | | | $ | — | | | $ | — | | | $ | 7,852,752 | |
Preferred Stocks | | | 448,797 | | | | — | | | | — | | | | — | | | | 448,797 | |
Short-Term Investments | | | 29,113 | | | | — | | | | — | | | | — | | | | 29,113 | |
Total Investments in Securities | | $ | 8,330,662 | | | $ | — | | | $ | — | | | $ | — | | | $ | 8,330,662 | |
| | ^ | See Schedule of Investments for country breakouts. |
HERD
Description^ | | Level 1 | | | Level 2 | | | Level 3 | | | Investments
Measured at
Net Asset Value | | | Total | |
Affiliated Exchange Traded Funds | | $ | 3,441,056 | | | $ | — | | | $ | — | | | $ | — | | | $ | 3,441,056 | |
Short-Term Investments | | | 3,967 | | | | — | | | | — | | | | — | | | | 3,967 | |
Total Investments in Securities | | $ | 3,445,023 | | | $ | — | | | $ | — | | | $ | — | | | $ | 3,445,023 | |
199
Pacer Funds
NOTES TO FINANCIAL STATEMENTS
October 31, 2021 (Unaudited) (Continued)
PWS
Description^ | | Level 1 | | | Level 2 | | | Level 3 | | | Investments
Measured at
Net Asset Value | | | Total | |
Common Stocks | | $ | 45,436,035 | | | $ | — | | | $ | — | | | $ | — | | | $ | 45,436,035 | |
Real Estate Investment Trusts | | | 10,920,031 | | | | — | | | | — | | | | — | | | | 10,920,031 | |
Contingent Value Rights | | | — | | | | — | | | | 2,886 | | | | — | | | | 2,886 | |
Short-Term Investments | | | 79,768 | | | | — | | | | — | | | | — | | | | 79,768 | |
Investments Purchased with Proceeds from Securities Lending | | | — | | | | — | | | | — | | | | 8,168,584 | | | | 8,168,584 | |
Total Investments in Securities | | $ | 56,435,834 | | | $ | — | | | $ | 2,886 | | | $ | 8,168,584 | | | $ | 64,607,304 | |
| | ^ | See Schedule of Investments for industry breakouts. |
The following is a reconciliation of investments in which significant unobservable inputs (Level 3) were used in determining fair value:
PWS(a) | Balance
as of
4/30/2021 | Net
Realized
Gain
(Loss) | Change in Net
Unrealized
Appreciation
(Depreciation) | Purchases | Sales | Transfers
Out of
Level 3 | Transfers
Into Level 3 | Balance as of
10/31/2021 |
Contingent Value Rights | $ 2,886 | $ — | $ — | $ — | $ — | $ — | $ — | $ 2,886 |
The following is a summary of quantitative information about Level 3 Fair Value Measurements:
PWS | | Fair Value as
of 10/31/2021 | | | Valuation
Techniques | | | Unobservable
Input | | | Impact to Valuation From
an Increase to Input | |
Contingent Value Rights | | $ | 2,886 | | | | Acquisition Price | | | | Stale Data | | | | $0.46 | |
| | (a) | Table presents information for one security, which has been valued at $0.46 throughout the period. |
INDS
Description^ | | Level 1 | | | Level 2 | | | Level 3 | | | Investments
Measured at
Net Asset Value | | | Total | |
Real Estate Investment Trusts | | $ | 306,753,293 | | | $ | — | | | $ | — | | | $ | — | | | $ | 306,753,293 | |
Short-Term Investments | | | 603,746 | | | | — | | | | — | | | | — | | | | 603,746 | |
Investments Purchased with Proceeds from Securities Lending | | | — | | | | — | | | | — | | | | 20,263,470 | | | | 20,263,470 | |
Total Investments in Securities | | $ | 307,357,039 | | | $ | — | | | $ | — | | | $ | 20,263,470 | | | $ | 327,620,509 | |
| | ^ | See Schedule of Investments for industry breakouts. |
SRVR
Description^ | | Level 1 | | | Level 2 | | | Level 3 | | | Investments
Measured at
Net Asset Value | | | Total | |
Common Stocks | | $ | 335,956,250 | | | $ | — | | | $ | — | | | $ | — | | | $ | 335,956,250 | |
Real Estate Investment Trusts | | | 1,277,746,714 | | | | — | | | | — | | | | — | | | | 1,277,746,714 | |
Short-Term Investments | | | 818,974 | | | | — | | | | — | | | | — | | | | 818,974 | |
Investments Purchased with Proceeds from Securities Lending | | | — | | | | — | | | | — | | | | 183,211,916 | | | | 183,211,916 | |
Total Investments in Securities | | $ | 1,614,521,938 | | | $ | — | | | $ | — | | | $ | 183,211,916 | | | $ | 1,797,733,854 | |
| | ^ | See Schedule of Investments for industry breakouts. |
200
Pacer Funds
NOTES TO FINANCIAL STATEMENTS
October 31, 2021 (Unaudited) (Continued)
SZNE
Description^ | | Level 1 | | | Level 2 | | | Level 3 | | | Investments
Measured at
Net Asset Value | | | Total | |
Common Stocks | | $ | 82,256,873 | | | $ | — | | | $ | — | | | $ | — | | | $ | 82,256,873 | |
Short-Term Investments | | | 173,417 | | | | — | | | | — | | | | — | | | | 173,417 | |
Total Investments in Securities | | $ | 82,430,290 | | | $ | — | | | $ | — | | | $ | — | | | $ | 82,430,290 | |
| | ^ | See Schedule of Investments for industry breakouts. |
AFTY
Description^ | | Level 1 | | | Level 2 | | | Level 3 | | | Investments
Measured at
Net Asset Value | | | Total | |
Common Stocks | | $ | 8,710,456 | | | $ | — | | | $ | — | | | $ | — | | | $ | 8,710,456 | |
Short-Term Investments | | | 7,601 | | | | — | | | | — | | | | — | | | | 7,601 | |
Total Investments in Securities | | $ | 8,718,057 | | | $ | — | | | $ | — | | | $ | — | | | $ | 8,718,057 | |
| | ^ | See Schedule of Investments for industry breakouts. |
VIRS
Description^ | | Level 1 | | | Level 2 | | | Level 3 | | | Investments
Measured at
Net Asset Value | | | Total | |
Common Stocks | | $ | 6,897,704 | | | $ | — | | | $ | — | | | $ | — | | | $ | 6,897,704 | |
Short-Term Investments | | | 11,481 | | | | — | | | | — | | | | — | | | | 11,481 | |
Investments Purchased with Proceeds from Securities Lending | | | — | | | | — | | | | — | | | | 1,133,416 | | | | 1,133,416 | |
Total Investments in Securities | | $ | 6,909,185 | | | $ | — | | | $ | — | | | $ | 1,133,416 | | | $ | 8,042,601 | |
| | ^ | See Schedule of Investments for industry breakouts. |
ALTL
Description^ | | Level 1 | | | Level 2 | | | Level 3 | | | Investments
Measured at
Net Asset Value | | | Total | |
Common Stocks | | $ | 269,645,886 | | | $ | — | | | $ | — | | | $ | — | | | $ | 269,645,886 | |
Real Estate Investment Trusts | | | 7,255,774 | | | | — | | | | — | | | | — | | | | 7,255,774 | |
Short-Term Investments | | | 358,188 | | | | — | | | | — | | | | — | | | | 358,188 | |
Investments Purchased with Proceeds from Securities Lending | | | — | | | | — | | | | — | | | | 22,435,006 | | | | 22,435,006 | |
Total Investments in Securities | | $ | 277,259,848 | | | $ | — | | | $ | — | | | $ | 22,435,006 | | | $ | 299,694,854 | |
| | ^ | See Schedule of Investments for industry breakouts. |
201
Pacer Funds
NOTES TO FINANCIAL STATEMENTS
October 31, 2021 (Unaudited) (Continued)
PAMC
Description^ | | Level 1 | | | Level 2 | | | Level 3 | | | Investments
Measured at
Net Asset Value | | | Total | |
Common Stocks | | $ | 39,898,883 | | | $ | — | | | $ | — | | | $ | — | | | $ | 39,898,883 | |
Real Estate Investment Trusts | | | 1,733,460 | | | | — | | | | — | | | | — | | | | 1,733,460 | |
Short-Term Investments | | | 22,470 | | | | — | | | | — | | | | — | | | | 22,470 | |
Investments Purchased with Proceeds from Securities Lending | | | — | | | | — | | | | — | | | | 11,806,880 | | | | 11,806,880 | |
Total Investments in Securities | | $ | 41,654,813 | | | $ | — | | | $ | — | | | $ | 11,806,880 | | | $ | 53,461,693 | |
| | ^ | See Schedule of Investments for industry breakouts. |
PALC
Description^ | | Level 1 | | | Level 2 | | | Level 3 | | | Investments
Measured at
Net Asset Value | | | Total | |
Common Stocks | | $ | 140,569,252 | | | $ | — | | | $ | — | | | $ | — | | | $ | 140,569,252 | |
Real Estate Investment Trusts | | | 5,104,344 | | | | — | | | | — | | | | — | | | | 5,104,344 | |
Short-Term Investments | | | 180,569 | | | | — | | | | — | | | | — | | | | 180,569 | |
Investments Purchased with Proceeds from Securities Lending | | | — | | | | — | | | | — | | | | 14,937,333 | | | | 14,937,333 | |
Total Investments in Securities | | $ | 145,854,165 | | | $ | — | | | $ | — | | | $ | 14,937,333 | | | $ | 160,791,498 | |
| | ^ | See Schedule of Investments for industry breakouts. |
PEXL
Description^ | | Level 1 | | | Level 2 | | | Level 3 | | | Investments
Measured at
Net Asset Value | | | Total | |
Common Stocks | | $ | 2,208,657 | | | $ | — | | | $ | — | | | $ | — | | | $ | 2,208,657 | |
Real Estate Investment Trusts | | | — | | | | — | | | | — | | | | — | | | | — | |
Short-Term Investments | | | 1,319 | | | | — | | | | — | | | | — | | | | 1,319 | |
Investments Purchased with Proceeds from Securities Lending | | | — | | | | — | | | | — | | | | 390,955 | | | | 390,955 | |
Total Investments in Securities | | $ | 2,209,976 | | | $ | — | | | $ | — | | | $ | 390,955 | | | $ | 2,600,931 | |
| | ^ | See Schedule of Investments for industry breakouts. |
TRPL
Description^ | | Level 1 | | | Level 2 | | | Level 3 | | | Investments
Measured at Net
Asset Value | | | Total | |
Assets | | | | | | | | | | | | | | | | | | | | |
Common Stocks | | $ | 1,906,761 | | | $ | — | | | $ | — | | | $ | — | | | $ | 1,906,761 | |
Real Estate Investment Trusts | | | 49,586 | | | | — | | | | — | | | | — | | | | 49,586 | |
Short-Term Investments | | | 48,557 | | | | — | | | | — | | | | — | | | | 48,557 | |
Total Investments in Securities | | $ | 2,004,904 | | | $ | — | | | $ | — | | | $ | — | | | $ | 2,004,904 | |
Other Financial Instruments (a) | | | | | | | | | | | | | | | | | | | | |
Futures Contracts | | $ | 3,258 | | | $ | — | | | $ | — | | | $ | — | | | $ | 3,258 | |
| | ^ | See Schedule of Investments for industry breakouts. |
| | (a) | Other Financial Instruments are derivative instruments not reflected in the Schedule of Investments, such as futures contracts which are reflected at the unrealized appreciation on the instrument. |
202
Pacer Funds
NOTES TO FINANCIAL STATEMENTS
October 31, 2021 (Unaudited) (Continued)
QDPL
Description^ | | Level 1 | | | Level 2 | | | Level 3 | | | Investments
Measured at Net
Asset Value | | | Total | |
Assets | | | | | | | | | | | | | | | | | | | | |
Common Stocks | | $ | 22,557,575 | | | $ | — | | | $ | — | | | $ | — | | | $ | 22,557,575 | |
Real Estate Investment Trusts | | | 577,240 | | | | — | | | | — | | | | — | | | | 577,240 | |
Short-Term Investments | | | 2,203,641 | | | | — | | | | — | | | | — | | | | 2,203,641 | |
Total Investments in Securities | | $ | 25,338,456 | | | $ | — | | | $ | — | | | $ | — | | | $ | 25,338,456 | |
Other Financial Instruments (a) | | | | | | | | | | | | | | | | | | | | |
Futures Contracts | | $ | 22,644 | | | $ | — | | | $ | — | | | $ | — | | | $ | 22,644 | |
| | ^ | See Schedule of Investments for industry breakouts. |
| | (a) | Other Financial Instruments are derivative instruments not reflected in the Schedule of Investments, such as futures contracts which are reflected at the unrealized appreciation on the instrument. |
FLRT
Description^ | | Level 1 | | | Level 2 | | | Level 3 | | | Investments
Measured at Net
Asset Value | | | Total | |
Bank Loans | | $ | — | | | $ | 30,497,670 | | | $ | — | | | $ | — | | | $ | 30,497,670 | |
Corporate Bonds | | | — | | | | 4,665,752 | | | | — | | | | — | | | | 4,665,752 | |
Asset-Backed Securities | | | — | | | | 900,000 | | | | — | | | | — | | | | 900,000 | |
Closed-End Funds | | | 26,784 | | | | — | | | | — | | | | — | | | | 26,784 | |
Total Investments in Securities | | $ | 26,784 | | | $ | 36,063,422 | | | $ | — | | | $ | — | | | $ | 36,090,206 | |
^ See Schedule of Investments for industry breakouts.
B. | Foreign Currency. Investment securities and other assets and liabilities denominated in foreign currencies are translated into U.S. dollar amounts at the date of valuation. Purchases and sales of investment securities and income and expense items denominated in foreign currencies are translated into U.S. dollar amounts on the respective dates of such transactions. The Funds do not isolate that portion of the results of operations resulting from changes in foreign exchange rates on investments from fluctuations arising from changes in market prices of securities held. Such fluctuations are included with the net realized and unrealized gain or loss from investments. The Funds report net realized foreign exchange gains or losses that arise from sales of foreign currencies, currency gains or losses realized between the trade and settlement dates on foreign currency transactions, and the differences between the amounts of dividends, interest and foreign withholding taxes recorded on the Funds’ books and the U.S. dollar equivalent of the amounts actually received or paid. Net unrealized foreign exchange gains and losses arise from changes in the values of assets and liabilities, other than investments in securities at fiscal period end, resulting from changes in exchange rates. |
C. | Federal Income Taxes. The Funds comply with the requirements of Subchapter M of the Internal Revenue Code of 1986, as amended, necessary to qualify as regulated investment companies and distribute substantially all net taxable investment income and net realized gains to shareholders in a manner which results in no tax cost to the Funds. Therefore, no federal income tax provision is required. As of and during the fiscal period/year ended April 30, 2021, the Funds did not have any tax positions that did not meet the “more-likely-than-not” threshold of being sustained by the applicable tax authority. As of and during the fiscal period/year ended April 30, 2021, the Funds did not have liabilities for any unrecognized tax benefits on uncertain tax positions as income tax expense in the Statement of Operations. Management has analyzed each of the Fund’s tax positions and concluded that no liability for unrecognized tax benefits should be recorded related to uncertain tax positions taken on returns filed for open tax years (2018-2020) or expected to be taken in each of the Fund’s 2021 tax returns. During the year/period ended April 30, 2021, the Funds did not incur any interest or penalties. |
D. | Security Transactions and Investment Income. Investment securities transactions are accounted for on the trade date. Gains and losses realized on sales of securities are computed on the basis of highest amortized cost. Dividend income is recorded on the ex-dividend date. Interest income is recorded on an accrual basis. Discounts and premiums on securities purchased are accreted and amortized over the lives of the respective securities. Withholding taxes on foreign dividends have been provided for in accordance with the Funds’ understanding of the applicable tax rules and regulations. |
203
Pacer Funds
NOTES TO FINANCIAL STATEMENTS
October 31, 2021 (Unaudited) (Continued)
Distributions received from the Fund’s investments in Real Estate Investment Trusts (“REIT”) may be characterized as ordinary income, net capital gain, or a return of capital. The proper characterization of REIT distributions is generally not known until after the end of each calendar year. As such, the Funds must use estimates in reporting the character of their income and distributions for financial statement purposes. The actual character of distributions to the Fund’s shareholders will be reflected on the Form 1099 received by shareholders after the end of the calendar year. Due to the nature of REIT investments, a portion of the distributions received by the Fund’s shareholders may represent a return of capital.
E. | Distributions to Shareholders. Distributions to shareholders from net investment income for PTLC, PTMC, PTNQ, PTEU, PTIN, TRND, and AFTY, are declared and paid on an annual basis. GCOW, COWZ, CALF, ICOW, PWS, PEXL, INDS, SRVR, SZNE, BUL, ECOW, HERD, PTBD, VIRS, ALTL, PAMC, PALC, TRPL, QDPL and FLRT are declared and paid on a quarterly basis. The net realized gains on securities normally are declared and paid on an annual basis for all Funds. Distributions are recorded on the ex-dividend date. |
F. | Use of Estimates. The preparation of financial statements in conformity with GAAP requires management to make estimates and assumptions that affect the reported amounts of assets and liabilities and disclosure of contingent assets and liabilities at the date of the financial statements, and the reported amounts of increases and decreases in net assets from operations during the reporting period. Actual results could differ from those estimates. |
G. | Share Valuation. The NAV per share of each Fund is calculated by dividing the sum of the value of the securities held by the Fund, plus cash and other assets, minus all liabilities (including estimated accrued expenses) by the total number of shares outstanding for the Fund, rounded to the nearest cent. Each Fund’s shares will not be priced on the days on which the Cboe, Nasdaq and/or NYSE is closed for trading. The offering and redemption price per share for each Fund is equal to the Fund’s net asset value per share. |
H. | Guarantees and Indemnifications. In the normal course of business, the Funds enter into contracts with service providers that contain general indemnification clauses. Each Fund’s maximum exposure under these arrangements is unknown as this would involve future claims that may be against the Funds that have not yet occurred. |
I. | Reclassification of Capital Accounts. Additionally, U.S. GAAP requires that certain components of net assets relating to permanent differences be reclassified between financial and tax reporting. These reclassifications have no effect on net assets or net asset value per share. For the fiscal period/year ended April 30, 2021, the following table shows the reclassifications made: |
| | | Distributable
Earnings
(Accumulated
Deficit) | | | Paid-In Capital | |
PTLC | | $ | (105,999,239 | ) | | $ | 105,999,239 | |
PTMC | | | (6,114,536 | ) | | | 6,114,536 | |
PTNQ | | | (214,330,345 | ) | | | 214,330,345 | |
PTEU | | | 866,107 | | | | (866,107 | ) |
PTIN | | | (460,246 | ) | | | 460,246 | |
PTBD | | | (1,348,214 | ) | | | 1,348,214 | |
TRND | | | (1,330,672 | ) | | | 1,330,672 | |
GCOW | | | 1,308,897 | | | | (1,308,897 | ) |
COWZ | | | (65,397,666 | ) | | | 65,397,666 | |
CALF | | | (14,576,234 | ) | | | 14,576,234 | |
ICOW | | | 2,934,364 | | | | (2,934,364 | ) |
BUL | | | (612,289 | ) | | | 612,289 | |
ECOW | | | (247,910 | ) | | | 247,910 | |
HERD | | | (377,443 | ) | | | 377,443 | |
PWS | | | (9,533,205 | ) | | | 9,533,205 | |
INDS | | | (7,826,894 | ) | | | 7,826,894 | |
SRVR | | | (5,6270,952 | ) | | | 56,270,952 | |
SZNE | | | (21,538,511 | ) | | | 21,538,511 | |
AFTY | | | 2,717 | | | | (2,717 | ) |
VIRS | | | (555,609 | ) | | | 555,609 | |
ALTL | | | (9,934,309 | ) | | | 9,934,309 | |
204
Pacer Funds
NOTES TO FINANCIAL STATEMENTS
October 31, 2021 (Unaudited) (Continued)
| | | Distributable
Earnings
(Accumulated
Deficit) | | | Paid-In Capital | |
PAMC | | $ | (6,376,506 | ) | | $ | 6,376,506 | |
PALC | | | (7,003,569 | ) | | | 7,003,569 | |
PEXL | | | (249,073 | ) | | | 249,073 | |
During the fiscal year/period ended April 30, 2021, the Funds’ realized the following net capital gains/(losses) resulting from in-kind redemptions, in which shareholders exchanged Fund shares for securities held by the Fund rather than for cash. Because such gains are not taxable to the Fund, and are not distributed to shareholders, they have been reclassified from accumulated net realized losses to paid-in-capital.
PTLC | | $ | 20,171,913 | |
PTMC | | | 3,136,169 | |
PTNQ | | | 7,132,089 | |
PTEU | | | 678,689 | |
PTIN | | | — | |
PTBD | | | 21,857,267 | |
TRND | | | 357,516 | |
GCOW | | | 3,155,085 | |
COWZ | | | 60,979,914 | |
CALF | | | 33,869,571 | |
ICOW | | | 881,143 | |
BUL | | | 470,248 | |
ECOW | | | 210,906 | |
HERD | | | 213,706 | |
PWS | | | 2,123,868 | |
INDS | | | 9,406,108 | |
SRVR | | | 12,156,823 | |
SZNE | | | — | |
AFTY | | | — | |
VIRS | | | 460,492 | |
ALTL | | | 22,468,124 | |
PAMC | | | 4,947,937 | |
PALC | | | 5,616,361 | |
PEXL | | | 378,356 | |
FLRT | | | — | (a) |
| | (a) | For the period ended July 1, 2021 to October 31, 2021. |
TRPL and QDPL commenced operations after April 30, 2021.
NOTE 3 – COMMITMENTS AND OTHER RELATED PARTY TRANSACTIONS
Pacer Advisors, Inc. (“the Adviser”) serves as the investment adviser to the Funds. Pursuant to an Investment Advisory Agreement (“Investment Advisory Agreement”) between the Trust, on behalf of the Funds, and the Adviser, the Adviser provides investment advice to the Funds and oversees the day-to-day operations of the Funds, subject to the direction and control of the Board and the officers of the Trust. The Adviser administers the Funds’ business affairs, provides office facilities and equipment and certain clerical, bookkeeping and administrative
205
Pacer Funds
NOTES TO FINANCIAL STATEMENTS
October 31, 2021 (Unaudited) (Continued)
services. The Adviser bears the costs of all advisory and non-advisory services required to operate the Funds, in exchange for a single unitary management fee. For services provided to the Funds, the Funds pay the Adviser at the following annual rates based on each Fund’s average daily net assets:
| | Annual Rate of
Average Daily
Net Assets |
PTLC | 0.60% |
PTMC | 0.60% |
PTNQ | 0.65% |
PTEU | 0.65% |
PTIN | 0.65% |
PTBD | 0.60% |
TRND | 0.15% |
GCOW | 0.60% |
COWZ | 0.49% |
CALF | 0.59% |
ICOW | 0.65% |
BUL | 0.60% |
ECOW | 0.70% |
HERD | 0.15% |
PWS | 0.60% |
INDS | 0.60% |
SRVR | 0.60% |
SZNE | 0.60% |
AFTY | 0.70% |
VIRS | 0.70% |
ALTL | 0.60% |
PAMC | 0.60% |
PALC | 0.60% |
PEXL | 0.60% |
TRPL | 0.79% |
QDPL | 0.79% |
FLRT* | 0.60% |
For the period July 1, 2021 to October 22, 2021, the Predecessor Fund was obligated to pay Pacific Global Advisors LLC 0.68% at an annual rate of average daily net assets.*
The Adviser has overall responsibility for overseeing the investment of the Funds’ assets, managing the Funds’ business affairs and providing certain clerical, bookkeeping and other administrative services for the Trust. Vident Investment Advisory, LLC (“Vident”) serves as the sub-adviser to PTBD, CSOP serves as the sub-adviser to AFTY, Metaurus Advisors, LLC, (“Metaurus”) serves as the sub-adviser to TRPL and QDPL and Pacific Asset Management LLC (“Pacific Asset”) serves as the sub-adviser to FLRT. Each sub-adviser has responsibility for selecting and continuously monitoring the Fund’s investments. Sub-Advisory fees earned by Vident, CSOP, Metaurus and Pacific Asset are paid by the Adviser.
Pursuant to a Sub-Advisory Agreement between the Adviser and CSOP (the “Sub-Advisory Agreement”), CSOP is responsible for trading portfolio securities on behalf of AFTY, including selecting broker-dealers to execute purchase and sale transactions as instructed by the Adviser or in connection with any rebalancing or reconstitution of AFTY’s respective Index, subject to the supervision of the Adviser and the Board. For the services it provides to AFTY, CSOP is compensated by the Adviser from the management fees paid by AFTY to the Adviser.
Pursuant to a Sub-Advisory Agreement between the Adviser and Vident (the “Sub-Advisory Agreement”), Vident is responsible for trading portfolio securities on behalf of PTBD, including selecting broker-dealers to execute purchase and sale transactions as instructed by the Adviser or in connection with any rebalancing or reconstitution of PTBD’s respective Index, subject to the supervision of the Adviser and the Board. For the services it provides to PTBD, Vident is compensated by the Adviser from the management fees paid by PTBD to the Adviser.
206
Pacer Funds
NOTES TO FINANCIAL STATEMENTS
October 31, 2021 (Unaudited) (Continued)
Pusuant to a Sub-Advisory Agreement between the Adviser and Metaurus (the “Sub-Advisory Agreement”), Metaurus is responsible for trading portfolio securities on behalf of TRPL and QDPL, including selecting broker-dealers to execute purchase and sale transactions as instructed by the Adviser or in connection with any rebalancing or reconstitution of TRPL and QDPL respective Indexes, subject to the supervision of the Adviser and the Board. For the services it provides to TRPL and QDPL, Metaurus is compensated by the Adviser from the management fees paid by TRPL and QDPL to the Adviser.
Pursuant to a Sub-Advisory Agreement between the Adviser and the Pacific Asset (the “Sub-Advisory Agreement”), Pacific Asset is responsible for trading portfolio securities on behalf of FLRT, including selecting broker-dealers to execute purchase and sale transactions, subject to the supervision of the Adviser and the Board. For the services it provides to FLRT, Pacific Asset is compensated by the Adviser from the management fees paid by FLRT to the Adviser.
The Distributor acts as the Funds’ principal underwriter in a continuous public offering of the Funds’ shares. The Distributor is an affiliate of the Adviser. The Funds did not pay any fees or commissions to the Distributor during the fiscal period ended October 31, 2021.
Certain officers and a Trustee of the Trust are affiliated with the Adviser and Distributor.
NOTE 4 – SERVICE AND CUSTODY AGREEMENTS
The Funds have entered into Service Agreements with U.S. Bancorp Fund Services, LLC (“Fund Services” or “Administrator”) doing business as U.S. Global Fund Services and a Custody Agreement with U.S. Bank, N.A. (the “Custodian”), an affiliate of Fund Services. Under these agreements, Fund Services and the Custodian provide certain transfer agency, administrative, accounting and custody services. The Custodian acts as securities lending agent (the “Securities Lending Agent”) for the Funds.
NOTE 5 – SECURITIES LENDING
The Funds may lend up to 33 1/3% of the value of the securities in their portfolios to brokers, dealers and financial institutions (but not individuals) under terms of participation in a securities lending program administered by the Securities Lending Agent. The securities lending agreement requires that loans are collateralized at all times in an amount equal to at least 102% of the value of any domestic loaned securities at the time of the loan, plus accrued interest. The use of loans of foreign securities, which are denominated and payable in U.S. dollars, shall be collateralized in an amount equal to 105% of the value of any loaned securities at the time of the loan plus accrued interest. The Funds receive compensation in the form of fees and earn interest on the cash collateral. Due to timing issues of when a security is recalled from loan, the financial statements may differ in presentation. The amount of fees depends on a number of factors including the type of security and length of the loan. The Funds continue to receive interest payments or dividends on the securities loaned during the borrowing period. Gain or loss in the value of securities loaned that may occur during the term of the loan will be for the account of the Funds. The Funds have the right under the terms of the securities lending agreements to recall the securities from the borrower on demand.
As of October 31, 2021, the Funds in following table had loaned securities and received cash collateral for the loans. The cash collateral is invested in the Mount Vernon Liquid Assets Portfolio, LLC of which the investment objective is to seek to maximize income to the extent consistent with the preservation of capital and liquidity and maintain a stable Net Asset Value (“NAV”) of $1.00. Although risk is mitigated by the collateral, the Funds could experience a delay in recovering their securities and possible loss of income or value if the borrower fails to return the borrowed securities. In addition, the Funds bear the risk of loss associated with the investment of cash collateral received.
During the period ended October 31, 2021, the Funds (excluding TRND, HERD, AFTY, TRPL, QDPL and FLRT) had loaned securities that were collateralized by cash. The cash collateral received was invested in securities as listed in each Fund’s Schedule of Investments. Income earned from these investments is allocated to each Fund based on each Fund’s portion of total cash collateral received. Securities lending income is disclosed in each Fund’s Statement of Operations, as applicable.
207
Pacer Funds
NOTES TO FINANCIAL STATEMENTS
October 31, 2021 (Unaudited) (Continued)
NOTE 6 – SECURED BORROWINGS
The following represents gross obligations for secured borrowings by remaining time to maturity as of October 31, 2021.
Securities Lending Transactions
Overnight and Continuous | | Investments Purchased
with Proceeds from
Securities Lending
Collateral* | |
PTLC | | $ | 66,236,144 | |
PTMC | | | 67,335,599 | |
PTNQ | | | 10,310,192 | |
PTEU | | | 6,679,123 | |
PTIN | | | 6,653,842 | |
PTBD | | | 345,897,645 | |
TRND | | | — | |
GCOW | | | 18,658,940 | |
COWZ | | | 145,394,629 | |
CALF | | | 154,675,918 | |
ICOW | | | 801,934 | |
BUL | | | 1,217,976 | |
ECOW | | | — | |
HERD | | | — | |
PWS | | | 8,168,584 | |
INDS | | | 20,263,470 | |
SRVR | | | 183,211,916 | |
SZNE | | | — | |
AFTY | | | — | |
VIRS | | | 1,133,416 | |
ALTL | | | 22,435,006 | |
PAMC | | | 11,806,880 | |
PALC | | | 14,937,333 | |
PEXL | | | 390,955 | |
TRPL | | | — | |
QDPL | | | — | |
FLRT | | | — | |
* | Proceeds from securities lending (Investments Purchased with Proceeds from Securities Lending Collateral). |
Due to the absence of a master netting agreement related to the Funds’ participation in securities lending, no additional offsetting disclosures have been made on behalf of the Funds for the total borrowings listed above.
NOTE 7 – DERIVATIVES TRANSACTIONS
The Funds may enter into futures contracts to hedge various investments for risk management as well as speculative purposes. Initial margin deposits are made upon entering into futures contracts and can be either cash or securities. Secondary margin limits are required to be maintained while futures are held, as defined by each contract.
During the period a futures contract is open, changes in the value of the contract are recognized as unrealized gains or losses by “marking-to-market” on a daily basis to reflect the fair value of the contract at the end of each day’s trading. Variation margin receivables or payables represent the difference between the change in unrealized appreciation and depreciation on the open contracts and the cash deposits made on the margin accounts. When the contract is closed, the Funds record a realized gain or loss equal to the difference between the proceeds from the closing transaction and the Funds’ cost of entering into a contract. The use of futures contracts involves the risk of illiquid markets or imperfect correlation between the value of the instruments and the underlying securities, or that the counterparty will fail to perform its obligations.
208
Pacer Funds
NOTES TO FINANCIAL STATEMENTS
October 31, 2021 (Unaudited) (Continued)
The following table represents a summary of the value of derivative instruments as of October 31, 2021 and the effect of derivative instruments on the Statement of Assets and Liabilities as of October 31, 2021:
TRPL
Statement of Assets and Liabilities - Values of Derivative Instruments as of October 31, 2021
| | | Asset Derivatives | |
Derivatives | | Location | | | Value | |
Equity Contracts - Futures | | | Deposit at Broker for Futures | | | $ | 103,267 | |
The effect of Derivative Instruments on the Statement of Operations for the period ended October 31, 2021 is as follows:
Derivatives | Amount of Realized
Gain on Derivatives
Recognized in Income | Derivatives | Change in Unrealized
Appreciation on
Derivatives Recognized
in Income |
Equity Contracts - Futures | $0 | Equity Contracts - Futures | $3,258 |
QDPL
Statement of Assets and Liabilities - Values of Derivative Instruments as of October 31, 2021
| | | Asset Derivatives | |
Derivatives | | Location | | | Value | |
Equity Contracts - Futures | | | Deposit at Broker for Futures | | | $ | 522,644 | |
The effect of Derivative Instruments on the Statement of Operations for the period ended October 31, 2021 is as follows:
Derivatives | Amount of Realized
Gain on Derivatives
Recognized in Income | Derivatives | Change in Unrealized
Appreciation on
Derivatives Recognized
in Income |
Equity Contracts - Futures | $0 | Equity Contracts - Futures | $22,644 |
The average monthly value of long futures during the period ended October 31, 2021 in TRPL was $2,753. The average monthly value of long futures during the period ended October 31, 2021 in QDPL was $11,758.
209
Pacer Funds
NOTES TO FINANCIAL STATEMENTS
October 31, 2021 (Unaudited) (Continued)
NOTE 8 – OFFSETTING ASSETS AND LIABILITIES
The following is a summary of the Assets and Liabilities for each Fund subject to offsets as of October 31, 2021:
Assets
| | | | | | | | | | | | | | | Gross Amounts not offset in the
Statement of Assets and Liabilities | | | | | |
Description / Counterparty | | Gross Amounts
of Recognized
Assets | | | Gross Amounts
Offset in the
Statement of
Assets and
Liabilities | | | Net Amounts
Presented in
the Statement
of Assets and
Liabilities | | | Financial
Instruments | | | Collateral
Received | | | Net
Amount | |
TRPL | | | | | | | | | | | | | | | | | | | | | | | | |
Futures Contracts | | | | | | | | | | | | | | | | | | | | | | | | |
Morgan Stanley, LLC | | $ | 103,267 | | | $ | — | | | $ | 103,267 | | | $ | 103,267 | | | $ | — | | | $ | — | |
QDPL | | | | | | | | | | | | | | | | | | | | | | | | |
Futures Contracts | | | | | | | | | | | | | | | | | | | | | | | | |
Morgan Stanley, LLC | | $ | 522,644 | | | $ | — | | | $ | 522,644 | | | $ | 522,644 | | | $ | — | | | $ | — | |
Liabilities
| | | | | | | | | | | | | | | Gross Amounts Not Offset in the
Statements of Assets and Liabilities | | | | | |
Description | | Gross Amounts
of Recognized
Liabilities | | | Gross Amounts
Offset in the
Statements
of Assets and
Liabilities | | | Net Amounts
Presented in
the Statements
of Assets and
Liabilities | | | Financial
Instruments | | | Collateral
Pledged
(Received) | | | Net
Amount | |
PTLC | | | | | | | | | | | | | | | | | | | | | | | | |
Securities Lending | | $ | 66,236,144 | | | $ | — | | | $ | 66,236,144 | | | $ | 66,236,144 | | | $ | — | | | $ | — | |
PTMC | | | | | | | | | | | | | | | | | | | | | | | | |
Securities Lending | | | 67,335,599 | | | | — | | | | 67,335,599 | | | | 67,335,599 | | | | — | | | | — | |
PTNQ | | | | | | | | | | | | | | | | | | | | | | | | |
Securities Lending | | | 10,310,192 | | | | — | | | | 10,310,192 | | | | 10,310,192 | | | | — | | | | — | |
PTEU | | | | | | | | | | | | | | | | | | | | | | | | |
Securities Lending | | | 6,679,123 | | | | — | | | | 6,679,123 | | | | 6,679,123 | | | | — | | | | — | |
PTIN | | | | | | | | | | | | | | | | | | | | | | | | |
Securities Lending | | | 6,653,842 | | | | — | | | | 6,653,842 | | | | 6,653,842 | | | | — | | | | — | |
PTBD | | | | | | | | | | | | | | | | | | | | | | | | |
Securities Lending | | | 345,897,645 | | | | — | | | | 345,897,645 | | | | 345,897,645 | | | | — | | | | — | |
GCOW | | | | | | | | | | | | | | | | | | | | | | | | |
Securities Lending | | | 18,658,940 | | | | — | | | | 18,658,940 | | | | 18,658,940 | | | | — | | | | — | |
COWZ | | | | | | | | | | | | | | | | | | | | | | | | |
Securities Lending | | | 145,394,629 | | | | — | | | | 145,394,629 | | | | 145,394,629 | | | | — | | | | — | |
CALF | | | | | | | | | | | | | | | | | | | | | | | | |
Securities Lending | | | 154,675,918 | | | | — | | | | 154,675,918 | | | | 154,675,918 | | | | — | | | | — | |
ICOW | | | | | | | | | | | | | | | | | | | | | | | | |
Securities Lending | | | 801,934 | | | | — | | | | 801,934 | | | | 801,934 | | | | — | | | | — | |
BUL | | | | | | | | | | | | | | | | | | | | | | | | |
Securities Lending | | | 1,217,976 | | | | — | | | | 1,217,976 | | | | 1,217,976 | | | | — | | | | — | |
PWS | | | | | | | | | | | | | | | | | | | | | | | | |
Securities Lending | | | 8,168,584 | | | | — | | | | 8,168,584 | | | | 8,168,584 | | | | — | | | | — | |
INDS | | | | | | | | | | | | | | | | | | | | | | | | |
Securities Lending | | | 20,263,470 | | | | — | | | | 20,263,470 | | | | 20,263,470 | | | | — | | | | — | |
210
Pacer Funds
NOTES TO FINANCIAL STATEMENTS
October 31, 2021 (Unaudited) (Continued)
| | | | | | | | | | | | | | | Gross Amounts Not Offset in the
Statements of Assets and Liabilities | | | | | |
Description | | Gross Amounts
of Recognized
Liabilities | | | Gross Amounts
Offset in the
Statements
of Assets and
Liabilities | | | Net Amounts
Presented in
the Statements
of Assets and
Liabilities | | | Financial
Instruments | | | Collateral
Pledged
(Received) | | | Net
Amount | |
SRVR | | | | | | | | | | | | | | | | | | | | | | | | |
Securities Lending | | $ | 183,211,916 | | | $ | — | | | $ | 183,211,916 | | | $ | 183,211,916 | | | $ | — | | | $ | — | |
VIRS | | | | | | | | | | | | | | | | | | | | | | | | |
Securities Lending | | | 1,133,416 | | | | — | | | | 1,133,416 | | | | 1,133,416 | | | | — | | | | — | |
ALTL | | | | | | | | | | | | | | | | | | | | | | | | |
Securities Lending | | | 22,435,006 | | | | — | | | | 22,435,006 | | | | 22,435,006 | | | | — | | | | — | |
PAMC | | | | | | | | | | | | | | | | | | | | | | | | |
Securities Lending | | | 11,806,880 | | | | — | | | | 11,806,880 | | | | 11,806,880 | | | | — | | | | — | |
PALC | | | | | | | | | | | | | | | | | | | | | | | | |
Securities Lending | | | 14,937,333 | | | | — | | | | 14,937,333 | | | | 14,937,333 | | | | — | | | | — | |
PEXL | | | | | | | | | | | | | | | | | | | | | | | | |
Securities Lending | | | 390,955 | | | | — | | | | 390,955 | | | | 390,955 | | | | — | | | | — | |
NOTE 9 – INVESTMENT TRANSACTIONS
For the period ended October 31, 2021, the aggregate purchases and sales of securities by the Funds, excluding short-term securities and in-kind transactions, the in-kind transactions associated with creations and redemptions, and the long-term purchases and sales of U.S. Government Securities were as follows:
| | Purchases | | | Sales | | | In-Kind
Purchases | | | In-Kind Sales | | | U.S.
Government
Purchases | | | U.S.
Government
Sales | |
PTLC | | $ | 20,981,428 | | | $ | 83,064,647 | | | $ | 1,818,208 | | | $ | 72,835,657 | | | $ | — | | | $ | — | |
PTMC | | | 36,877,267 | | | | 30,995,962 | | | | 17,150,627 | | | | 10,787,690 | | | | — | | | | — | |
PTNQ | | | 10,563,606 | | | | 24,249,393 | | | | 2,997,374 | | | | 17,917,831 | | | | — | | | | — | |
PTEU | | | 2,460,559 | | | | 5,483,962 | | | | — | | | | 3,760,648 | | | | — | | | | — | |
PTIN | | | 11,188,905 | | | | 5,056,497 | | | | 4,281,779 | | | | — | | | | — | | | | — | |
PTBD | | | 3,040,512,277 | | | | 2,535,355,237 | | | | 955,463,203 | | | | 453,392,077 | | | | 1,364,353,881 | | | | 1,363,248,299 | |
TRND | | | 20,536,495 | | | | 2,152,440 | | | | 19,811,462 | | | | 1,511,664 | | | | — | | | | — | |
GCOW | | | 53,805,299 | | | | 48,728,723 | | | | 25,107,060 | | | | 20,586,437 | | | | — | | | | — | |
COWZ | | | 1,133,061,229 | | | | 652,962,623 | | | | 687,512,189 | | | | 216,161,553 | | | | — | | | | — | |
CALF | | | 607,526,189 | | | | 364,504,540 | | | | 359,112,434 | | | | 121,045,129 | | | | — | | | | — | |
ICOW | | | 27,599,581 | | | | 11,703,914 | | | | 17,808,973 | | | | 3,243,887 | | | | — | | | | — | |
BUL | | | 8,402,905 | | | | 6,370,161 | | | | 5,754,357 | | | | 3,777,393 | | | | — | | | | — | |
ECOW | | | 12,372,394 | | | | 6,948,791 | | | | 5,814,524 | | | | 2,611,048 | | | | — | | | | — | |
HERD | | | 5,934,880 | | | | 4,172,839 | | | | 5,180,377 | | | | 3,379,309 | | | | — | | | | — | |
PWS | | | 54,092,530 | | | | 49,215,151 | | | | 11,329,516 | | | | 8,101,558 | | | | — | | | | — | |
INDS | | | 121,740,169 | | | | 54,983,097 | | | | 96,835,900 | | | | 31,065,945 | | �� | | — | | | | — | |
SRVR | | | 647,392,413 | | | | 206,421,299 | | | | 450,880,986 | | | | 43,988,733 | | | | — | | | | — | |
SZNE | | | 103,672,463 | | | | 90,168,423 | | | | 13,099,099 | | | | — | | | | — | | | | — | |
AFTY | | | 2,894,985 | | | | 3,324,880 | | | | — | | | | — | | | | — | | | | — | |
VIRS | | | 5,149,515 | | | | 3,478,194 | | | | 4,690,483 | | | | 3,029,554 | | | | — | | | | — | |
ALTL | | | 537,735,525 | | | | 399,240,111 | | | | 218,009,584 | | | | 81,374,652 | | | | — | | | | — | |
PAMC | | | 163,098,225 | | | | 155,496,375 | | | | 48,688,052 | | | | 41,064,576 | | | | — | | | | — | |
PALC | | | 348,391,261 | | | | 255,070,989 | | | | 153,793,692 | | | | 62,168,378 | | | | — | | | | — | |
PEXL | | | 2,716,107 | | | | 2,681,580 | | | | 2,040,511 | | | | 2,005,565 | | | | — | | | | — | |
211
Pacer Funds
NOTES TO FINANCIAL STATEMENTS
October 31, 2021 (Unaudited) (Continued)
| | Purchases | | | Sales | | | In-Kind
Purchases | | | In-Kind Sales | | | U.S.
Government
Purchases | | | U.S.
Government
Sales | |
TRPL | | $ | 1,899,893 | | | $ | 36,635 | | | $ | — | | | $ | — | | | $ | — | | | $ | — | |
QDPL | | | 22,363,887 | | | | 177,385 | | | | 20,331,458 | | | | — | | | | — | | | | — | |
FLRT | | | 8,900,211 | | | | 3,670,651 | | | | — | | | | — | | | | — | | | | — | |
During the fiscal year ended April 30, 2017, PTEU accepted a cash contribution in the amount of $409,837 to reimburse the Fund from prior securities transactions.
NOTE 10 – TRANSACTIONS WITH AFFILIATED SECURITIES
The Pacer Cash Cows Fund of Funds Index uses an objective, rules-based approach to construct a portfolio that, as of each quarterly rebalance, is composed of the ETFs listed in the following table, each advised by the Adviser (collectively, the “Cash Cows ETFs”). Each of the Cash Cows ETFs is an index-based ETF that seeks to track the total return performance, before fees and expenses, of the applicable underlying index listed in the following table (collectively, the “Cash Cows Indexes”). Each Cash Cows Index uses an objective, rules-based methodology to provide exposure to companies with high free cash flow yields (commonly referred to as “cash cows”) selected from the applicable “Equity Universe” as indicated in the following table.
Weight | Cash Cows ETF | Cash Cows Index | Equity Universe |
20% | Pacer US Cash Cows 100 ETF | Pacer US Cash Cows 100 ETF | Russell 1000 Index |
20% | Pacer Global Cash Cows Dividend ETF | Pacer Global Cash Cows Dividend Index | FTSE Developed Large Cap Index |
20% | Pacer US Small Cap Cash Cows 100 ETF | Pacer US Small Cap Cash Cows 100 Index | S&P Small Cap 600® Index |
20% | Pacer US Cash Cows Growth ETF | Pacer US Cash Cows Growth Index | S&P 900® Pure Growth Index |
20% | Pacer Developed Markets International Cash Cows 100 ETF | Pacer Developed Markets International Cash Cows 100 Index | FTSE Developed ex US Index |
HERD had the following transactions during the current fiscal period with affiliates:
| | | Share Activity | |
Security Name | | Balance
May 1, 2021 | | | Purchases | | | Sales | | | Balance
October 31, 2021 | |
BUL | | | 9,252 | | | | 36,238 | | | | (27,756 | ) | | | 17,734 | |
CALF | | | 8,142 | | | | 25,798 | | | | (18,404 | ) | | | 15,536 | |
COWZ | | | 7,989 | | | | 32,086 | | | | (24,767 | ) | | | 15,308 | |
GCOW | | | 10,508 | | | | 31,941 | | | | (19,754 | ) | | | 22,695 | |
ICOW | | | 10,384 | | | | 31,289 | | | | (19,874 | ) | | | 21,799 | |
| | | Period Ended October 31, 2021 | |
Security Name | | Value | | | Dividend Income | | | Gain Realized on
Sale of Shares | | | Net Change
in Unrealized
Appreciation
(Depreciation)
on Investments
in Affiliate | |
BUL | | $ | 723,483 | | | $ | 211 | | | $ | 49,012 | | | $ | 29,820 | |
CALF | | | 666,805 | | | | 2,022 | | | | 65,840 | | | | (82,975 | ) |
COWZ | | | 689,472 | | | | 4,707 | | | | 67,333 | | | | (39,877 | ) |
GCOW | | | 683,347 | | | | 17,365 | | | | (20,026 | ) | | | (18,150 | ) |
ICOW | | | 677,949 | | | | 10,916 | | | | (618 | ) | | | (42,612 | ) |
Total | | | 3,441,056 | | | | 35,221 | | | | 161,541 | | | | (153,794 | ) |
212
Pacer Funds
NOTES TO FINANCIAL STATEMENTS
October 31, 2021 (Unaudited) (Continued)
The Pacer Trendpilot Fund of Funds Index uses an objective, rules-based approach to construct a portfolio that, as of each quarterly rebalance, is composed of the ETFs listed in the following table, each advised by the Adviser (collectively, the “Trendpilot ETFs”). Each of the Trendpilot ETFs is an index-based ETF that seeks to track the total return performance, before fees and expenses, of the underlying index listed in the following table (collectively, the “Trendpilot Indexes”). Each Trendpilot Index other than the Pacer Trendpilot US Bond Index (collectively, the “Trendpilot Equity Indexes”) uses an objective, rules-based methodology to implement a systematic trend-following strategy that directs exposure (i) 100% to the “Underlying Component” specified in the table below, (ii) 50% to the applicable Underlying Component and 50% to 3-Month US Treasury bills, or (iii) 100% to 3-Month US Treasury bills, depending on the relative performance of the Underlying Component and its 200-business day historical simple moving average (the “200-day moving average”). The calculation of the 200-day moving average for each Underlying Component is based on the total return version of such Underlying Component and reflects the reinvestment of dividends paid by the securities in such Underlying Component.
The Pacer Trendpilot US Bond Index (the “Trendpilot Bond Index”) uses an objective, rules-based methodology to implement a systematic trend-following strategy that directs exposure to one of the following positions: (i) 100% to the S&P U.S. High Yield Corporate Bond Index, (ii) 50% to the S&P U.S. High Yield Corporate Bond Index and 50% to the S&P U.S. Treasury Bond 7-10 Year Index or (iii) 100% to S&P U.S. Treasury Bond 7-10 Year Index, depending on the value of the S&P U.S. High Yield Corporate Bond Index divided by the value of the S&P U.S.Treasury Bond 7-10 Year Index (the “Risk Ratio”).
Weight | Trendpilot ETF | Trendpilot Index | Equity Component |
20% | Pacer Trendpilot® US Large Cap ETF | Pacer Trendpilot® US Large Cap Index | S&P 500® Index |
20% | Pacer Trendpilot® US Mid Cap ETF | Pacer Trendpilot® US Mid Cap Index | S&P MidCap 400® Index |
20% | Pacer Trendpilot® 100 ETF | Pacer NASDAQ-100 Trendpilot® Index | NASDAQ-100® Index |
20% | Pacer Trendpilot® International ETF | Pacer Trendpilot® International Index | S&P Developed Ex-US Large Cap Index |
20% | Pacer Trendpilot® US Bond ETF | Pacer Trendpilot® US Bond Index | S&P U.S. High Yield Corporate Bond Index |
TRND had the following transactions during the current fiscal period with affiliates:
| | | Share Activity | |
Security Name | | Balance
May 1, 2021 | | | Purchases | | | Sales | | | Balance
October 31, 2021 | |
PTBD | | | 319,645 | | | | 157,290 | | | | (7,228 | ) | | | 469,707 | |
PTIN | | | 314,720 | | | | 142,204 | | | | (14,317 | ) | | | 442,607 | |
PTLC | | | 249,757 | | | | 105,766 | | | | (21,758 | ) | | | 333,765 | |
PTMC | | | 250,800 | | | | 113,708 | | | | (5,317 | ) | | | 359,191 | |
PTNQ | | | 166,100 | | | | 71,363 | | | | (9,566 | ) | | | 227,897 | |
| | | Period Ended October 31, 2021 | |
Security Name | | Value | | | Dividend Income | | | Gain Realized on
Sale of Shares | | | Net Change
in Unrealized
Appreciation
(Depreciation)
on Investments
in Affiliate | |
PTBD | | $ | 12,667,998 | | | $ | 139,361 | | | $ | 7,680 | | | $ | (254,052 | ) |
PTIN | | | 13,083,463 | | | | — | | | | 57,991 | | | | 421,037 | |
PTLC | | | 13,480,768 | | | | — | | | | 128,389 | | | | 998,920 | |
PTMC | | | 13,009,898 | | | | — | | | | 38,233 | | | | 187,325 | |
PTNQ | | | 13,245,260 | | | | — | | | | 109,156 | | | | 700,656 | |
Total | | | 65,487,387 | | | | 139,361 | | | | 341,449 | | | | 2,053,886 | |
213
Pacer Funds
NOTES TO FINANCIAL STATEMENTS
October 31, 2021 (Unaudited) (Continued)
NOTE 11 – TAX COST BASIS
The components of tax basis cost of investments and net unrealized appreciation for federal income tax purposes at April 30, 2021 were as follows:
| | | PTLC | | | PTMC | | | PTNQ | | | PTEU | | | PTIN | |
Tax cost of investments | | $ | 1,509,206,703 | | | $ | 519,491,633 | | | $ | 900,976,808 | | | $ | 57,278,390 | | | $ | 132,155,003 | |
Gross tax unrealized appreciation | | | 492,546,380 | | | | 73,138,437 | | | | 144,660,548 | | | | 8,101,972 | | | | 22,333,257 | |
Gross tax unrealized depreciation | | | (8,034,284 | ) | | | (2,870,512 | ) | | | (24,995,687 | ) | | | (6,606,935 | ) | | | (4,207,564 | ) |
Net tax unrealized appreciation (depreciation) | | | 484,512,096 | | | | 70,267,925 | | | | 119,664,861 | | | | 1,495,037 | | | | 18,125,693 | |
Undistributed ordinary income | | | 4,577,920 | | | | — | | | | — | | | | 26,527 | | | | 1,096,029 | |
Undistributed long-term gain | | | — | | | | — | | | | — | | | | — | | | | — | |
Total distributable earnings | | | 4,577,920 | | | | — | | | | — | | | | 26,527 | | | | 1,096,029 | |
Other accumulated (loss) | | | (470,553,930 | ) | | | (94,991,443 | ) | | | (26,905,250 | ) | | | (48,401,976 | ) | | | (9,251,548 | ) |
Total accumulated gain (loss) | | $ | 18,536,086 | | | $ | (24,723,518 | ) | | $ | 92,759,611 | | | $ | (46,880,412 | ) | | $ | 9,970,174 | |
| | | PTBD | | | TRND | | | GCOW | | | COWZ | | | CALF | |
Tax cost of investments | | $ | 869,270,948 | | | $ | 38,936,196 | | | $ | 154,745,832 | | | $ | 426,730,943 | | | $ | 314,926,441 | |
Gross tax unrealized appreciation | | | 20,563,153 | | | | 5,907,979 | | | | 12,710,402 | | | | 65,422,227 | | | | 35,674,096 | |
Gross tax unrealized depreciation | | | (3,958,396 | ) | | | (110,536 | ) | | | (8,406,987 | ) | | | (7,749,335 | ) | | | (7,935,817 | ) |
Net tax unrealized appreciation (depreciation) | | | 16,604,757 | | | | 5,797,443 | | | | 4,303,415 | | | | 57,672,892 | | | | 27,738,279 | |
Undistributed ordinary income | | | 3,362,778 | | | | 37,969 | | | | 1,054,591 | | | | 428,529 | | | | — | |
Undistributed long-term gain | | | — | | | | — | | | | — | | | | — | | | | — | |
Total distributable earnings | | | 3,362,778 | | | | 37,969 | | | | 1,054,591 | | | | 428,529 | | | | — | |
Other accumulated (loss) | | | (874,781 | ) | | | (573,173 | ) | | | (30,272,079 | ) | | | (58,228,306 | ) | | | (14,738,829 | ) |
Total accumulated gain (loss) | | $ | 19,092,754 | | | $ | 5,262,239 | | | $ | (24,914,073 | ) | | $ | (126,885 | ) | | $ | 12,999,450 | |
| | ICOW | | | BUL | | | ECOW | | | HERD | | | PWS | |
Tax cost of investments | | $ | 20,527,747 | | | $ | 3,688,333 | | | $ | 3,782,737 | | | $ | 1,524,484 | | | $ | 48,599,838 | |
Gross tax unrealized appreciation | | | 3,203,042 | | | | 290,301 | | | | 427,738 | | | | 147,873 | | | | 5,486,790 | |
Gross tax unrealized depreciation | | | (746,019 | ) | | | (84,462 | ) | | | (198,206 | ) | | | (375 | ) | | | (1,487,479 | ) |
Net tax unrealized appreciation (depreciation) | | | 2,457,023 | | | | 205,839 | | | | 229,532 | | | | 147,498 | | | | 3,999,311 | |
Undistributed ordinary income | | | 131,090 | | | | — | | | | 36,981 | | | | 4,466 | | | | 13,644 | |
Undistributed long-term gain | | | — | | | | — | | | | — | | | | — | | | | — | |
Total distributable earnings | | | 131,090 | | | | — | | | | 36,981 | | | | 4,466 | | | | 13,644 | |
Other accumulated (loss) | | | (4,802,073 | ) | | | (232,880 | ) | | | (99,165 | ) | | | — | | | | (18,186,656 | ) |
Total accumulated gain (loss) | | $ | (2,213,960 | ) | | $ | (27,041 | ) | | $ | 167,348 | | | $ | 151,964 | | | $ | (14,173,701 | ) |
| | INDS | | | SRVR | | | SZNE | | | AFTY | | | VIRS | |
Tax cost of investments | | $ | 177,857,299 | | | $ | 1,129,999,014 | | | $ | 73,616,724 | | | $ | 8,388,865 | | | $ | 5,079,194 | |
Gross tax unrealized appreciation | | | 31,837,017 | | | | 132,944,297 | | | | — | | | | 2,331,891 | | | | 486,319 | |
Gross tax unrealized depreciation | | | (2,134,659 | ) | | | (29,241,906 | ) | | | (7,242 | ) | | | (354,756 | ) | | | (128,890 | ) |
Net tax unrealized appreciation (depreciation) | | | 29,702,358 | | | | 103,702,391 | | | | (7,242 | ) | | | 1,977,135 | | | | 357,429 | |
Undistributed ordinary income | | | — | | | | — | | | | 2,860 | | | | — | | | | — | |
Undistributed long-term gain | | | — | | | | — | | | | — | | | | — | | | | — | |
Total distributable earnings | | | — | | | | — | | | | 2,860 | | | | — | | | | — | |
Other accumulated (loss) | | | (1,542,991 | ) | | | (11,392,083 | ) | | | (14,028,946 | ) | | | (681,201 | ) | | | (888 | ) |
Total accumulated gain (loss) | | $ | 28,159,367 | | | $ | 92,310,308 | | | $ | (14,033,328 | ) | | $ | 1,295,934 | | | $ | 356,541 | |
214
Pacer Funds
NOTES TO FINANCIAL STATEMENTS
October 31, 2021 (Unaudited) (Continued)
| | ALTL | | | PAMC | | | PALC | | | PEXL | |
Tax cost of investments | | $ | 121,065,077 | | | $ | 37,472,178 | | | $ | 49,028,218 | | | $ | 2,041,357 | |
Gross tax unrealized appreciation | | | 20,112,845 | | | | 3,397,595 | | | | 1,673,122 | | | | 395,806 | |
Gross tax unrealized depreciation | | | (385,720 | ) | | | (480,814 | ) | | | (604,032 | ) | | | (34,654 | ) |
Net tax unrealized appreciation (depreciation) | | | 19,727,125 | | | | 2,916,781 | | | | 1,069,090 | | | | 361,152 | |
Undistributed ordinary income | | | 23,332 | | | | — | | | | 21,021 | | | | 55 | |
Undistributed long-term gain | | | — | | | | — | | | | — | | | | — | |
Total distributable earnings | | | 23,332 | | | | — | | | | 21,021 | | | | 55 | |
Other accumulated (loss) | | | (1,879,114 | ) | | | (838,361 | ) | | | (118,187 | ) | | | (184,959 | ) |
Total accumulated gain (loss) | | $ | 17,871,343 | | | $ | 2,078,420 | | | $ | 971,924 | | | $ | 176,248 | |
The difference between book and tax-basis cost is attributable to the realization for tax purposes of unrealized gains on investments in Real Estate Investment Trusts, partnerships, passive foreign investment companies and wash sales. Under tax law, certain capital and foreign currency losses realized after April 30, 2021 and within the taxable year are deemed to arise on the first business day of the Fund’s next taxable year.
At April 30, 2021, the Funds had the following capital loss carryforwards:
| | | Short-Term | | | Long-Term | | | Expires | |
PTLC | | $ | 219,496,018 | | | $ | 251,057,912 | | | | Indefinite | |
PTMC | | | 87,498,800 | | | | 7,451,121 | | | | Indefinite | |
PTNQ | | | 19,170,119 | | | | 7,051,203 | | | | Indefinite | |
PTEU | | | 39,646,200 | | | | 8,767,332 | | | | Indefinite | |
PTIN | | | 9,253,171 | | | | — | | | | Indefinite | |
PTBD | | | 874,781 | | | | — | | | | Indefinite | |
TRND | | | 385,316 | | | | 187,857 | | | | Indefinite | |
GCOW | | | 12,098,067 | | | | 18,183,729 | | | | Indefinite | |
COWZ | | | 33,960,327 | | | | 24,267,980 | | | | Indefinite | |
CALF | | | 11,880,633 | | | | 2,858,196 | | | | Indefinite | |
ICOW | | | 2,653,309 | | | | 2,152,107 | | | | Indefinite | |
BUL | | | 230,786 | | | | — | | | | Indefinite | |
ECOW | | | 50,235 | | | | 48,909 | | | | Indefinite | |
HERD | | | — | | | | — | | | | Indefinite | |
PWS | | | 18,186,656 | | | | — | | | | Indefinite | |
INDS | | | 1,542,991 | | | | — | | | | Indefinite | |
SRVR | | | 11,392,083 | | | | — | | | | Indefinite | |
SZNE | | | 14,028,946 | | | | — | | | | Indefinite | |
AFTY | | | 648,012 | | | | 30,704 | | | | Indefinite | |
VIRS | | | 888 | | | | — | | | | Indefinite | |
ALTL | | | 1,879,114 | | | | — | | | | Indefinite | |
PAMC | | | 838,361 | | | | — | | | | Indefinite | |
PALC | | | 118,187 | | | | — | | | | Indefinite | |
PEXL | | | 152,458 | | | | 32,501 | | | | Indefinite | |
At April 30, 2021, PTMC, PTNQ, AFTY and BUL deferred on a tax basis, post-December ordinary late-year losses of $41,522, $683,928, $2,485 and $2,094, respectively. None of the Funds deferred on a tax basis post-October capital losses.
215
Pacer Funds
NOTES TO FINANCIAL STATEMENTS
October 31, 2021 (Unaudited) (Continued)
NOTE 12 – DISTRIBUTIONS TO SHAREHOLDERS
The tax character of distributions paid by the Funds during the fiscal period ended October 31, 2021 was as follows:
| | | Ordinary Income | | | Capital Gains | | | Return of Capital | |
PTLC | | $ | — | | | $ | — | | | $ | — | |
PTMC | | | — | | | | — | | | | — | |
PTNQ | | | — | | | | — | | | | — | |
PTEU | | | — | | | | — | | | | — | |
PTIN | | | — | | | | — | | | | — | |
PTBD | | | 14,928,907 | | | | — | | | | — | |
TRND | | | — | | | | — | | | | — | |
GCOW | | | 3,609,385 | | | | — | | | | — | |
COWZ | | | 4,919,370 | | | | — | | | | — | |
CALF | | | 1,209,250 | | | | — | | | | — | |
ICOW | | | 460,062 | | | | — | | | | — | |
BUL | | | 1,138 | | | | — | | | | — | |
ECOW | | | 259,128 | | | | — | | | | — | |
HERD | | | 37,913 | | | | — | | | | — | |
PWS | | | 324,501 | | | | — | | | | — | |
INDS | | | 1,497,459 | | | | — | | | | — | |
SRVR | | | 9,392,407 | | | | — | | | | — | |
SZNE | | | 335,961 | | | | — | | | | — | |
AFTY | | | — | | | | — | | | | — | |
VIRS | | | 20,602 | | | | — | | | | — | |
ALTL | | | 754,768 | | | | — | | | | — | |
PAMC | | | 82,780 | | | | — | | | | — | |
PALC | | | 299,820 | | | | — | | | | — | |
PEXL | | | 3,007 | | | | — | | | | — | |
TRPL | | | 16,810 | | | | — | | | | — | |
QDPL | | | 151,125 | | | | — | | | | — | |
FLRT | | | 266,460 | | | | — | | | | — | |
(a) | For the period ended July 1, 2021 to October 31, 2021. |
The tax character of distributions paid by the Funds during the fiscal period ended April 30, 2021 was as follows:
| | Ordinary Income | | | Capital Gains | | | Return of Capital | |
PTLC | | $ | 20,840,884 | | | $ | — | | | $ | — | |
PTMC | | | 2,277,219 | | | | — | | | | — | |
PTNQ | | | 1,304,636 | | | | — | | | | — | |
PTEU | | | — | | | | — | | | | — | |
PTIN | | | 994,630 | | | | — | | | | — | |
PTBD | | | 11,952,976 | | | | — | | | | — | |
TRND | | | 245,087 | | | | — | | | | — | |
GCOW | | | 5,702,135 | | | | — | | | | — | |
COWZ | | | 5,246,948 | | | | — | | | | — | |
CALF | | | 268,296 | | | | — | | | | 74,624 | |
ICOW | | | 374,692 | | | | — | | | | — | |
BUL | | | 11,770 | | | | — | | | | — | |
ECOW | | | 51,325 | | | | — | | | | — | |
HERD | | | 39,016 | | | | — | | | | — | |
PWS | | | 310,992 | | | | — | | | | — | |
216
Pacer Funds
NOTES TO FINANCIAL STATEMENTS
October 31, 2021 (Unaudited) (Continued)
| | Ordinary Income | | | Capital Gains | | | Return of Capital | |
INDS | | $ | 2,023,062 | | | $ | — | | | $ | 327,809 | |
SRVR | | | 9,533,565 | | | | — | | | | 4,446,515 | |
SZNE | | | 557,732 | | | | — | | | | — | |
AFTY | | | 152,212 | | | | — | | | | 2,717 | |
VIRS | | | 29,096 | | | | — | | | | 352 | |
ALTL | | | 689,136 | | | | — | | | | — | |
PAMC | | | 42,541 | | | | — | | | | 15,796 | |
PALC | | | 164,989 | | | | — | | | | — | |
PEXL | | | 7,574 | | | | — | | | | — | |
NOTE 13 – NEW ACCOUNTING PRONOUNCEMENTS
In March 2020, FASB issued ASU 2020-04, Reference Rate Reform: Facilitation of the Effects of Reference Rate Reform on Financial Reporting. The main objective of the new guidance is to provide relief to companies that will be impacted by the expected change in benchmark interest rates at the end of 2021, when participating banks will no longer be required to submit London Interbank Offered Rate (“LIBOR”) quotes by the UK Financial Conduct Authority. The new guidance allows companies to, provided the only change to existing contracts are a change to an approved benchmark interest rate, account for modifications as a continuance of the existing contract without additional analysis. In addition, derivative contracts that qualified for hedge accounting prior to modification, will be allowed to continue to receive such treatment, even if critical terms change due to a change in the benchmark interest rate. For new and existing contracts, the Funds may elect to apply the amendments as of March 12, 2020 through December 31, 2022. Management is currently assessing the impact of the ASU’s adoption to the Funds’ financial statements and various filings.
NOTE 14 – SUBSEQUENT EVENT
Management of the Funds has evaluated the need for disclosures and/or adjustments resulting from subsequent events through the date these financial statements were issued. The evaluation did not result in any subsequent events that necessitated disclosures and/or adjustments other than below.
On December 22, 2021, the following Funds declared distributions from ordinary income to shareholders of record as of December 27, 2021, Payable December 30, 2021, as follows:
| | | Ordinary Income | | | Per Share Amount | |
PTLC | | $ | 15,230,923 | | | | 0.30522892 | |
PTMC | | | 541,281 | | | | 0.04418621 | |
PTEU | | | 787,274 | | | | 0.38403610 | |
PTIN | | | 3,379,160 | | | | 0.68962449 | |
PTBD | | | 9,571,999 | | | | 0.19655029 | |
GCOW | | | 1,229,952 | | | | 0.28274759 | |
COWZ | | | 7,236,692 | | | | 0.27833431 | |
CALF | | | 13,817,289 | | | | 0.98694922 | |
ICOW | | | 212,807 | | | | 0.11822612 | |
ECOW | | | 89,732 | | | | 0.25637715 | |
PWS | | | 92,574 | | | | 0.05610546 | |
INDS | | | 2,026,227 | | | | 0.26144865 | |
SRVR | | | 4,286,653 | | | | 0.11206936 | |
SZNE | | | 245,058 | | | | 0.10428000 | |
AFTY | | | 155,777 | | | | 0.38379874 | |
VIRS | | | 9,358 | | | | 0.03743200 | |
ALTL | | | 670,714 | | | | 0.09315473 | |
PAMC | | | 57,205 | | | | 0.04576400 | |
PALC | | | 237,128 | | | | 0.05269512 | |
PEXL | | | 1,397 | | | | 0.02794000 | |
FLRT | | | 301,460 | | | | 0.42459155 | |
217
Pacer Funds
NOTES TO FINANCIAL STATEMENTS
October 31, 2021 (Unaudited) (Continued)
On December 23, 2021, the following Funds declared distributions from ordinary income to shareholders of record as of December 28, 2021, Payable December 31, 2021, as follows:
| | | Ordinary Income | | | Per Share Amount | |
TRND | | $ | 640,806 | | | | 0.29127546 | |
HERD | | | 27,082 | | | | 0.27082000 | |
The global outbreak of COVID-19 (commonly referred to as “coronavirus”) has disrupted economic markets and the prolonged economic impact is uncertain. The ultimate economic fallout from the pandemic, and the long-term impact on economies, markets, industries and individual issuers, are not known. The operational and financial performance of the issuers of securities in which each Funds invests depends on future developments, including the duration and spread of the outbreak, and such uncertainty may in turn adversely affect the value and liquidity of each Fund’s investments, impair the Fund’s ability to satisfy redemption requests, and negatively impact the Fund’s performance.
218
Pacer Funds
ADDITIONAL INFORMATION
(Unaudited)
NOTE 1 – FREQUENCY DISTRIBUTION OF PREMIUMS AND DISCOUNTS
Information regarding how often shares of each other Fund traded on the Exchange at a price above (i.e., at a premium) or below (i.e., at a discount) the NAV of the Fund is available on the Funds’ website at www.PacerETFs.com.
NOTE 2 – FEDERAL TAX INFORMATION
Qualified Dividend Income/Dividends Received Deduction/Short Term Capital Gains
For the fiscal year/period ended April 30, 2021, certain dividends paid by the Funds may be subject to a maximum tax rate of 23%, as provided for by the Tax Cuts and Jobs Act of 2017. The following are the percentage of dividends declared from ordinary income designated as qualified dividend income (“QDI”), for corporate shareholders, the percent qualifying for the corporate dividends received deduction (“DRD”), and the percentage of taxable ordinary income distributions that are designated as short-term capital gain (“STCG”) distributions under Internal Revenue Section 871(k)(2)(C) for each fund.
| | QDI | DRD | STCG |
PTLC | 96.00% | 100.00% | 0.00% |
PTMC | 98.86% | 98.86% | 0.00% |
PTNQ | 100.00% | 100.00% | 0.00% |
PTEU | 0.00% | 0.00% | 0.00% |
PTIN | 100.00% | 7.36% | 0.00% |
PTBD | 0.00% | 0.00% | 0.00% |
TRND | 68.92% | 50.30% | 0.00% |
GCOW | 100.00% | 28.18% | 0.00% |
COWZ | 100.00% | 100.00% | 0.00% |
CALF | 100.00% | 100.00% | 0.00% |
ICOW | 100.00% | 0.00% | 0.00% |
BUL | 100.00% | 100.00% | 0.00% |
ECOW | 63.09% | 0.00% | 0.00% |
HERD | 90.00% | 33.31% | 0.00% |
PWS | 94.64% | 94.39% | 0.00% |
INDS | 0.75% | 0.09% | 0.00% |
SRVR | 13.34% | 12.03% | 0.00% |
SZNE | 100.00% | 100.00% | 0.00% |
AFTY | 100.00% | 0.00% | 0.00% |
VIRS | 100.00% | 100.00% | 0.00% |
ALTL | 97.43% | 78.64% | 0.00% |
PAMC | 100.00% | 100.00% | 0.00% |
PALC | 100.00% | 100.00% | 0.00% |
PEXL | 100.00% | 100.00% | 0.00% |
Foreign Tax Credit Pass Through
Pursuant to Section 853 of the Internal Revenue code, the Funds designate the following amounts as foreign taxes paid for the year/period ended April 30, 2021. Foreign taxes paid for purposes of Section 853 may be less than actual foreign taxes paid for financial statement purposes.
| | | | | | | | | | | Per Share | |
Fund | | Gross Foreign
Source Income | | | Foreign Taxes
Passthrough | | | Gross Foreign
Source Income | | | Foreign Taxes
Passthrough | |
PTLC | | $ | — | | | $ | — | | | $ | — | | | $ | — | |
PTMC | | | — | | | | — | | | | — | | | | — | |
PTNQ | | | — | | | | — | | | | — | | | | — | |
PTEU | | | — | | | | — | | | | — | | | | — | |
219
Pacer Funds
ADDITIONAL INFORMATION
(Unaudited) (Continued)
| | | | | | | | | | | Per Share | |
Fund | | Gross Foreign
Source Income | | | Foreign Taxes
Passthrough | | | Gross Foreign
Source Income | | | Foreign Taxes
Passthrough | |
PTIN | | $ | 237,920 | | | $ | 237,066 | | | $ | 0.05 | | | $ | 0.05 | |
PTBD | | | — | | | | — | | | | — | | | | — | |
TRND | | | 10,150 | | | | 10,150 | | | | 0.01 | | | | 0.01 | |
GCOW | | | 6,693,148 | | | | 347,972 | | | | 1.54 | | | | 0.08 | |
COWZ | | | — | | | | — | | | | — | | | | — | |
CALF | | | — | | | | — | | | | — | | | | — | |
ICOW | | | 523,458 | | | | 52,187 | | | | 0.81 | | | | 0.08 | |
BUL | | | — | | | | — | | | | — | | | | — | |
ECOW | | | 89,850 | | | | 9,976 | | | | 0.60 | | | | 0.07 | |
HERD | | | 2,654 | | | | 2,654 | | | | 0.05 | | | | 0.05 | |
PWS | | | — | | | | — | | | | — | | | | — | |
INDS | | | — | | | | — | | | | — | | | | — | |
SRVR | | | — | | | | — | | | | — | | | | — | |
SZNE | | | — | | | | — | | | | — | | | | — | |
AFTY | | | 259,331 | | | | 25,990 | | | | 0.57 | | | | 0.06 | |
VIRS | | | — | | | | — | | | | — | | | | — | |
ALTL | | | — | | | | — | | | | — | | | | — | |
PAMC | | | — | | | | — | | | | — | | | | — | |
PALC | | | — | | | | — | | | | — | | | | — | |
PEXL | | | — | | | | — | | | | — | | | | — | |
Foreign taxes paid or withheld should be included in taxable income with an offsetting deduction from gross income or as a credit for taxes paid to foreign governments.
Above figures may differ from those cited elsewhere in this report due to difference in the calculation of income and gains under GAAP purposes and Internal Revenue Service purposes.
Shareholders are strongly advised to consult their own tax advisers with respect to the tax consequences of their investments in the Funds.
NOTE 3 – DISCLOSURE OF PORTFOLIO HOLDINGS
The Funds file their complete schedule of portfolio holdings for their first and third fiscal quarters with the Securities and Exchange Commission (“SEC”) on Part F of Form N-PORT. The Funds’ Part F of Form N-PORT is available without charge, upon request, by calling toll-free at (800) 617-0004. Furthermore, you may obtain Part F of Form N-PORT on the SEC’s website at www.sec.gov. Each Fund’s portfolio holdings are posted on their website at www.paceretfs.com daily.
NOTE 4 – PROXY VOTING POLICIES AND PROCEDURES
A description of the policies and procedures the Funds use to determine how to vote proxies relating to portfolio securities is provided in the Statement of Additional Information (“SAI”). The SAI is available without charge upon request by calling toll-free at (800) 617-0004, by accessing the SEC’s website at http://www.sec.gov, or by accessing the Funds’ website at www.paceretfs.com. Information on how the Fund voted proxies relating to portfolio securities during the year ended June 30 is available without charge, upon request, by calling (800) 617-0004 or by accessing the website of the SEC.
NOTE 5 – BOARD CONSIDERATIONS IN APPROVING THE INVESTMENT ADVISORY AGREEMENT FOR THE FUNDS
The Board of Trustees (the “Board”) of Pacer Funds Trust (the “Trust”), including the Trustees thereof who are not “interested persons,” as defined by the Investment Company Act of 1940, as amended (the “1940 Act”), of the Trust (the “Independent Trustees”), held meetings on June 28, 2021 and September 15, 2021 (the “Meetings”) for the purpose of, among other things, the consideration of, and voting on, the proposed approval of the investment advisory agreement (the “Investment Advisory Agreement”) between the Trust and Pacer Advisors, Inc. (the “Advisor”) with respect to Pacer Metaurus US Large Cap Dividend Multiplier 300 ETF (TRPL), Pacer Metaurus US Large Cap Dividend
220
Pacer Funds
ADDITIONAL INFORMATION
(Unaudited) (Continued)
Multiplier 400 ETF (QDPL), Pacer Trendpilot US Bond ETF (PTBD), Pacer CSOP FTSE China ETF (AFTY) and the Pacer Pacific Asset Floating Rate High Income ETF (FLRT) and the proposed approval of an investment sub-advisory agreement (the “Sub-Advisory Agreement”) between the Advisor and Metaurus Advisors, LLC, Vident Investment Advisory, LLC, CSOP Asset Management Limited, and Pacific Asset Management, LLC (the “Sub-Advisors”) with respect to TRPL, QDPL, PTBD, AFTY and FLRT, respectively. Each of the aforenamed funds is referred to as a “Fund” and, together, as the “Funds”. Each of the aforementioned meetings is referred to as a “Meeting” and, together, as the “Meetings”.
The Board, including a majority of the Trust’s Independent Trustees voting separately, approved the Investment Advisory Agreement and the Sub-Advisory Agreements on behalf of the respective Funds at the Meetings, based on its review of qualitative and quantitative information provided by the Advisor and the Sub-Advisors, as well as the Trust’s other service providers. Prior to deciding to approve the Investment Advisory Agreement and the respective Sub-Advisory Agreements for the Funds at the Meetings, the Independent Trustees requested and obtained from the Advisor and the Sub-Advisors such information as the Independent Trustees deemed reasonably necessary to evaluate the terms of the Investment Advisory Agreement and the Sub-Advisory Agreements. The Independent Trustees received assistance and advice from, and met separately with, independent counsel. In addition, the Independent Trustees received a memorandum from independent counsel regarding the responsibilities of the Board with respect to the approval of the Investment Advisory Agreement and the Sub-Advisory Agreements.
Prior to approval, the Board obtained and reviewed a variety of information, including certain information regarding each Fund’s proposed expenses relative to the expenses of other comparable funds. At the Meetings, the Board, including the Independent Trustees, evaluated a number of factors and various materials in connection with the approval process, including: (1) a copy of the Investment Advisory Agreement and the Sub-Advisory Agreement for each Fund; (2) the Advisor’s and the Sub-Advisor’s responses to questionnaires designed to provide the Board with information reasonably necessary to evaluate the terms of the Investment Advisory Agreement and the Sub-Advisory Agreement on behalf of the respective Fund; (3) the Advisor’s and Sub-Advisor’s Form ADV disclosures; (4) information describing the nature, quality and extent of services that the Advisor and the Sub-Advisor is prepared to provide to each Fund under consideration; (5) the advisory fee payable by each Fund to the Advisor for its services and the sub-advisory fee payable to the respective Sub-Advisors by the Advisor under its respective Sub-Advisory Agreement; (6) certain comparative information regarding each Fund’s expenses and performance (as applicable) relative to the expenses and performance of other funds; (7) a copy of the Trust’s registration statement and prospectuses; and (8) information regarding the ownership and management structure, financial condition, and compliance program of the Advisor and the Sub-Advisors. Representatives from the Advisor and the Sub-Advisors presented additional information and participated in question and answer sessions at the Meetings to help the Board evaluate the Advisor’s and the Sub-Advisors’ services and fees, as well as other aspects of the Investment Advisory Agreement and the Sub-Advisory Agreements.
In considering the approval of the Investment Advisory Agreement and the Sub-Advisory Agreements at the Meetings, respectively, the Board considered various factors that the Trustees determined were relevant, including: (i) the nature, extent and quality of the services to be provided by the Advisor and the Sub-Advisor, including the performance of the Advisor and Sub-Advisor with respect to the respective Fund or Funds (as applicable); (ii) the costs and benefits, including the fee to be paid to the Advisor by each Fund, of the advisory services to be provided to the Funds; (iii) the cost and benefits, including the fee paid, to the Sub-Advisor by the Advisor as it relates to the investment advisory services provided to each Fund; and (iv) potential economies of scale. The Board’s findings as it relates to each of the factors for the respective Funds are set forth below.
TRPL and QDPL
● | Nature, Extent and Quality of Services to be Provided by the Advisor and the Sub-Advisor. The Board reviewed the scope of services to be provided by the Advisor under the Investment Advisory Agreement and the Sub-Advisor under the Sub-Advisory Agreement. In this regard, the Trustees reviewed each Fund’s investment goal and proposed investment strategy, and each of the Advisor’s and Sub-Advisor’s ability to implement such investment goal and/or investment strategy, including, but not limited to, trading practices. With respect to sub-advisory services to be provided by the Sub-Advisor, the Board noted that the Sub-Advisor would have assets allocated to it by the Advisor and considered the proposed Sub-Advisor’s ability to ensure compliance with each Fund’s strategies, policies, and limitations. The Trustees also considered the successful performance of the Sub-Advisor in managing investment products with investment strategies similar to the investment strategy of each Fund. In addition, the Trustees reviewed the management team at the Advisor and the Sub-Advisor that would be responsible for managing each Fund, including staffing, skills and compensation program, and considered various other portfolios advised by the Advisor and the Sub-Advisor and any potential conflicts. The Board also considered a report from the Trust’s Chief Compliance Officer regarding the Sub-Advisor’s compliance program as such relates to the operation of each Fund. Finally, the Board considered the selection and due diligence process employed by the Advisor in proposing the Sub-Advisor to each Fund, including the due diligence undertaken with respect to the Sub-Advisor’s compliance capabilities. |
221
Pacer Funds
ADDITIONAL INFORMATION
(Unaudited) (Continued)
Based on its review, the Board determined that each of the Advisor and the Sub-Advisor is capable of providing all necessary advisory and sub-advisory services required by each Fund, as indicated by the Advisor’s and Sub-Advisor’s management capabilities, the professional qualifications and experience of its portfolio management personnel and the performance of the Funds relative to comparable funds managed by other investment advisers (each a “Peer Group”) and other products managed by the Advisor and the Sub-Advisor with similar investment objectives and strategies as each Fund. The Board also considered other services provided to the Funds by the Advisor and the Sub-Advisor, where relevant, such as selecting broker-dealers for executing portfolio transactions, monitoring adherence to each Fund’s investment restrictions, and monitoring compliance with various policies and procedures and with applicable securities regulations.
Based on the factors above, as well as those discussed below, the Board concluded, within the context of its full deliberations, that it was satisfied with the nature, extent and quality of the services provided and to be provided to the Funds by the Advisor and the Sub-Advisor, respectively.
● | Costs and Benefits of Advisory Services to be Provided to the Funds. In considering the advisory fees payable by the Trust to the Advisor and each Fund’s expense ratio, the Board reviewed data compiled by the Advisor comparing the expense ratios of each Fund with the expense ratios of the ETFs and other funds in each Fund’s Peer Group. The Board compared each Fund’s expense ratio to the expense ratios of funds in its Peer Group, focusing on whether each Fund was charged fees that were within the range of fees charged by those in the Peer Group. It also noted that the Advisor had contractually agreed to pay the operating expenses of each Fund, including the cost of transfer agency, custody, fund administration, legal, audit and other services, except interest, taxes, brokerage commissions and other expenses in connection with the execution of portfolio transactions, and extraordinary and non-routine expenses. It was noted that this contractual agreement cannot be changed without shareholder approval. The Board also evaluated the compensation and incidental or “fall-out” benefits received (or proposed or likely to be received) by the Advisor from its relationship with the Funds, taking into account assessments of the Advisor’s profitability prepared and shared by the Advisor’s management. |
Based on the factors above, as well as those discussed below, the Board concluded, within the context of its full deliberations, that each Fund’s advisory fee was reasonable in light of the nature and quality of the services expected to be rendered by the Advisor.
● | Costs and Benefits of Sub-Advisory Advisory Services to be Provided to the Funds. The Board noted that the sub-advisory fees paid to the Sub-Advisor would be paid by the Advisor and would not be additional fees to be borne by each Fund. The Board also noted that the sub-advisory fees were the product of arms-length negotiations between the Advisor and the Sub-Advisor. In considering the sub-advisory fees payable by the Advisor to the Sub-Advisor, the Board evaluated the compensation and benefits proposed or likely to be received by the Sub-Advisor from the Advisor relating to each Fund. Based on the factors above, as well as those discussed below, the Board concluded, within the context of its full deliberations, that the sub-advisory fees payable to the Sub-Advisor under the Sub-Advisory Agreement with the Advisor were reasonable in light of the nature and quality of the services rendered and, where relevant, expected to be rendered by the Sub-Advisor. |
● | Economies of Scale. The Board also reviewed and considered the extent to which economies of scale would be realized by the Advisor and the Sub-Advisor as the assets of the Funds may grow in the future. |
PTBD
● | Nature, Extent and Quality of Services to be Provided by the Advisor and the Sub-Advisor. The Board reviewed the scope of services provided by the Advisor under the Investment Advisory Agreement and Sub-Advisor under the Sub-Advisory Agreement. In this regard, the Trustees reviewed Fund’s investment goal and investment strategy, and each of the Advisor’s and Sub-Advisor’s ability to implement such investment goal and/or investment strategy, including, but not limited to, trading practices. With respect to sub-advisory services to be provided by the Sub-Advisor, the Board noted that the Sub-Advisor has assets allocated to it by the Advisor and considered the Sub-Advisor’s ability to ensure compliance with the Fund’s strategies, policies, and limitations. The Trustees also considered the successful performance of the Sub-Advisor in managing the Fund and compared such performance to comparable funds managed by other investment advisers (the “Peer Group”). In addition, the Trustees reviewed the management team at the Advisor and the Sub-Advisor that is responsible for managing the Fund, including staffing, skills and compensation program, and considered various other portfolios advised by the Advisor and the Sub-Advisor and any potential conflicts. They discussed the personnel changes at the Sub-Advisor and considered the quality of the professionals brought in to replace such personnel. The Board also considered a report from the Trust’s Chief Compliance Officer regarding the Sub-Advisor’s compliance program as such relates to the operation of the Fund. |
Based on its review, the Board determined that each of the Advisor and the Sub-Advisor is capable of providing all necessary advisory and sub-advisory services required by the Fund, as indicated by the Advisor’s and the Sub-Advisor’s management capabilities, the professional qualifications and experience of its portfolio management personnel and the performance of the Fund relative to the Peer Group and other products managed by the Advisor and the Sub-Advisor with similar investment objectives and strategies as the Fund. The Board also considered
222
Pacer Funds
ADDITIONAL INFORMATION
(Unaudited) (Continued)
other services provided to the Fund by the Advisor and the Sub-Advisor, where relevant, such as selecting broker-dealers for executing portfolio transactions, monitoring adherence to the Fund’s investment restrictions, and monitoring compliance with various policies and procedures and with applicable securities regulations.
Based on the factors above, as well as those discussed below, the Board concluded, within the context of its full deliberations, that it was satisfied with the nature, extent and quality of the services provided and to be provided to the Fund by the Advisor and the Sub-Advisor, respectively.
● | Costs and Benefits of Advisory Services to be Provided to the Fund. In considering the advisory fees payable by the Trust to the Advisor and the Fund’s expense ratio, the Board reviewed data compiled by the Advisor comparing the expense ratios of the Fund with the expense ratios of the Peer Group. The Board compared Fund’s expense ratio to the expense ratios of funds in its Peer Group, focusing on whether the Fund was charged fees that were within the range of fees charged by those in the Peer Group. It also noted that the Advisor had contractually agreed to pay the operating expenses of the Fund, including the cost of transfer agency, custody, fund administration, legal, audit and other services, except interest, taxes, brokerage commissions and other expenses in connection with the execution of portfolio transactions, and extraordinary and non-routine expenses. It was further noted that this contractual agreement cannot be changed without shareholder approval. The Board also evaluated the compensation and incidental or “fall-out” benefits received by the Advisor from its relationship with the Fund, considering the Advisor’s profitability analysis prepared and shared by the Advisor’s management. |
Based on the factors above, as well as those discussed below, the Board concluded, within the context of its full deliberations, that the Fund’s advisory fee was reasonable in light of the nature and quality of the services expected to be rendered by the Advisor.
● | Costs and Benefits of the Sub-Advisory Services to be Provided to the Fund. The Board noted that the sub-advisory fees paid to the Sub-Advisor are paid by the Advisor and would not be additional fees to be borne by the Fund. The Board also noted that the sub-advisory fees were the product of arms-length negotiations between the Advisor and the Sub-Advisor. In considering the sub-advisory fees payable by the Advisor to the Sub-Advisor, the Board evaluated the compensation and benefits received or likely to be received by the Sub-Advisor from the Advisor relating to the services provided to the Fund. Based on the factors above, as well as those discussed below, the Board concluded, within the context of its full deliberations, that the sub-advisory fees payable to the Sub-Advisor under the Sub-Advisory Agreement with the Advisor were reasonable in light of the nature and quality of the services rendered and, where relevant, expected to be rendered by the Sub-Advisor. |
● | Economies of Scale. The Board also reviewed and considered the extent to which economies of scale would be realized by the Advisor and the Sub-Advisor as the assets of the Fund may grow in the future. |
AFTY
● | Nature, Extent and Quality of Services to be Provided by the Advisor and the Sub-Advisor. The Board reviewed the scope of services provided by the Advisor under the Investment Advisory Agreement and the Sub-Advisor under the Sub-Advisory Agreement. In this regard, the Trustees reviewed the Fund’s investment goal and investment strategy, and each of the Advisor’s and the Sub-Advisor’s ability to implement such investment goal and/or investment strategy, including, but not limited to, trading practices. With respect to sub-advisory services to be provided by the Sub-Advisor, the Board noted that the Sub-Advisor has assets allocated to it by the Advisor and considered the Sub-Advisor’s ability to ensure compliance with the Fund’s strategies, policies, and limitations. The Trustees also considered the successful performance of the Sub-Advisor in managing the Fund and compared such performance to comparable funds managed by other investment advisers (the “Peer Group”). In addition, the Trustees reviewed the management team at the Advisor and the Sub-Advisor that is responsible for managing the Fund, including staffing, skills and compensation program, and considered various other portfolios advised by the Advisor and the Sub-Advisor and any potential conflicts. The Board also considered a report from the Trust’s Chief Compliance Officer regarding the Sub-Advisor’s compliance program as such relates to the operation of the Fund. |
Based on its review, the Board determined that each of the Advisor and the Sub-Advisor is capable of providing all necessary advisory and sub-advisory services required by the Fund, as indicated by the Advisor’s and the Sub-Advisor’s management capabilities, the professional qualifications and experience of its portfolio management personnel and the performance of the Fund relative to the Peer Group and other products managed by the Advisor and the Sub-Advisor with similar investment objectives and strategies as the Fund. The Board also considered other services provided to the Fund by the Advisor and the Sub-Advisor, where relevant, such as selecting broker-dealers for executing portfolio transactions, monitoring adherence to the Fund’s investment restrictions, and monitoring compliance with various policies and procedures and with applicable securities regulations.
223
Pacer Funds
ADDITIONAL INFORMATION
(Unaudited) (Continued)
Based on the factors above, as well as those discussed below, the Board concluded, within the context of its full deliberations, that it was satisfied with the nature, extent and quality of the services provided and to be provided to the Fund by the Advisor and the Sub-Advisor, respectively.
● | Costs and Benefits of Advisory Services to be Provided to the Fund. In considering the advisory fees payable by the Trust to the Advisor and the Fund’s expense ratio, the Board reviewed data compiled by the Advisor comparing the expense ratio of the Fund with the expense ratios of the Peer Group. The Board compared the Fund’s expense ratio to the expense ratios of funds in its Peer Group, focusing on whether the Fund was charged fees that were within the range of fees charged by those in the Peer Group. It also noted that the Advisor had contractually agreed to pay the operating expenses of the Fund, including the cost of transfer agency, custody, fund administration, legal, audit and other services, except interest, taxes, brokerage commissions and other expenses in connection with the execution of portfolio transactions, and extraordinary and non-routine expenses. It was further noted that this contractual agreement cannot be changed without shareholder approval. The Board also evaluated the compensation and incidental or “fall-out” benefits received by the Advisor from its relationship with the Fund, considering the Advisor’s profitability prepared and shared by the Advisor’s management. |
Based on the factors above, as well as those discussed below, the Board concluded, within the context of its full deliberations, that the Fund’s advisory fee was reasonable in light of the nature and quality of the services expected to be rendered by the Advisor.
● | Costs and Benefits of the Sub-Advisory Services to be Provided to the Fund. The Board noted that the sub-advisory fees paid to the Sub-Advisor are paid by the Advisor and would not be additional fees to be borne by the Fund. The Board also noted that the sub-advisory fees were the product of arms-length negotiations between the Advisor and the Sub-Advisor. In considering the sub-advisory fees payable by the Advisor to the Sub-Advisor, the Board evaluated the compensation and benefits received or likely to be received by the Sub-Advisor from the Advisor relating to the services provided to the Fund. Based on the factors above, as well as those discussed below, the Board concluded, within the context of its full deliberations, that the sub-advisory fees payable to the Sub-Advisor under the Sub-Advisory Agreement with the Advisor were reasonable in light of the nature and quality of the services rendered and, where relevant, expected to be rendered by the Sub-Advisor. |
● | Economies of Scale. The Board also reviewed and considered the extent to which economies of scale would be realized by the Advisor and the Sub-Advisor as the assets of the Fund may grow in the future. |
FLRT
● | Nature, Extent and Quality of Services to be Provided by the Advisor and the Sub-Advisor. The Board reviewed the scope of services provided by the Advisor under the Investment Advisory Agreement and the Sub-Advisor under the Sub-Advisory Agreement. In this regard, the Trustees reviewed Fund’s investment goal and investment strategy, and each of the Advisor’s and the Sub-Advisor’s ability to implement such investment goal and/or investment strategy, including, but not limited to, trading practices. With respect to sub-advisory services to be provided by the Sub-Advisor, the Board noted that Sub-Advisor has assets allocated to it by the Advisor and considered the Sub-Advisor’s ability to ensure compliance with the Fund’s strategies, policies, and limitations. The Trustees also considered the successful performance of the Sub-Advisor in managing the predecessor fund to the Fund and compared such performance to comparable funds managed by other investment advisers (the “Peer Group”). In addition, the Trustees reviewed the management team at the Advisor and the Sub-Advisor that is responsible for managing the Fund, including staffing, skills and compensation program, and considered various other portfolios advised by the Advisor and Sub-Advisor and any potential conflicts. The Trustees also considered the strong reputation of the Sub-Advisor in the industry and the potential positive impact that might have on investment interest in the Fund. The Board also considered a report from the Trust’s Chief Compliance Officer regarding the Sub-Advisor’s compliance program as such relates to the operation of the Fund. |
Based on its review, the Board determined that each of the Advisor and Sub-Advisor is capable of providing all necessary advisory and sub-advisory services required by the Fund, as indicated by the Advisor’s and Sub-Advisor’s management capabilities, the professional qualifications and experience of its portfolio management personnel and the performance of the predecessor fund to the Fund relative to the Peer Group and other products managed by the Advisor and Sub-Advisor with similar investment objectives and strategies as the Fund. The Board also considered other services provided to the Fund by the Advisor and Sub-Advisor, where relevant, such as selecting broker-dealers for executing portfolio transactions, monitoring adherence to the Fund’s investment restrictions, and monitoring compliance with various policies and procedures and with applicable securities regulations.
Based on the factors above, as well as those discussed below, the Board concluded, within the context of its full deliberations, that it was satisfied with the nature, extent and quality of the services provided and to be provided to the Fund by the Advisor and Sub-Advisor, respectively.
224
Pacer Funds
ADDITIONAL INFORMATION
(Unaudited) (Continued)
● | Costs and Benefits of Advisory Services to be Provided to the Fund. In considering the advisory fees payable by the Trust to the Advisor and the Fund’s expense ratio, the Board reviewed data compiled by the Advisor comparing the expense ratio of the Fund with the expense ratios of the Peer Group. The Board compared Fund’s expense ratio to the expense ratios of funds in its Peer Group, focusing on whether the Fund was charged fees that were within the range of fees charged by those in the Peer Group. It also noted that the Advisor had contractually agreed to pay the operating expenses of the Fund, including the cost of transfer agency, custody, fund administration, legal, audit and other services, except interest, taxes, brokerage commissions and other expenses in connection with the execution of portfolio transactions, and extraordinary and non-routine expenses. It was further noted that this contractual agreement cannot be changed without shareholder approval. The Board also evaluated the compensation and incidental or “fall-out” benefits received by the Advisor from its relationship with the Fund, considering the Advisor’s profitability analysis prepared and shared by the Advisor’s management. |
Based on the factors above, as well as those discussed below, the Board concluded, within the context of its full deliberations, that Fund’s advisory fee was reasonable in light of the nature and quality of the services expected to be rendered by the Advisor.
● | Costs and Benefits of Sub-Advisor’s Services to be Provided to the Fund. The Board noted that the sub-advisory fees paid to Sub-Advisor are paid by the Advisor and would not be additional fees to be borne by Fund. The Board also noted that the sub-advisory fees were the product of arms-length negotiations between the Advisor and Sub-Advisor. In considering the sub-advisory fees payable by the Advisor to Sub-Advisor, the Board evaluated the compensation and benefits received or likely to be received by the Sub-Advisor from the Advisor relating to the services provided to the Fund. Based on the factors above, as well as those discussed below, the Board concluded, within the context of its full deliberations, that the sub-advisory fees payable to Sub-Advisor under the Sub-Advisory Agreement with the Advisor were reasonable in light of the nature and quality of the services rendered and, where relevant, expected to be rendered by the Sub-Advisor. |
● | Economies of Scale. The Board also reviewed and considered the extent to which economies of scale would be realized by the Advisor and Sub-Advisor as the assets of the Fund may grow in the future. |
Overall Findings and Conclusions of the Board
Based on its deliberations and its evaluation of the information described above as it relates to each Fund, at the Meetings, respectively, the Board, including the Independent Trustees: (a) concluded that the terms of the Investment Advisory Agreement with respect to each Fund are fair and reasonable; (b) concluded that the terms of the Sub-Advisory Agreement with respect to each Fund are fair and reasonable; (c) concluded that the Advisor’s fees are reasonable in light of the nature and quality of the services expected to be rendered by the Advisor to each Fund; (d) concluded that the Sub-Advisor’s fees are reasonable in light of the nature and quality of the services expected to be rendered to each Fund by the respective Sub- Advisor; (e) agreed to approve the Investment Advisory Agreement as to each Fund; and (f) agreed to approve the Sub-Advisory Agreement as to each Fund. In its deliberations at the Meetings, the Board did not identify any particular factor (or conclusion with respect thereto) or single piece of information that was all-important, controlling or determinative of its decision, but considered all of the factors together, and each Trustee may have attributed different weights to the various factors (and conclusions with respect thereto) and information.
NOTE 6 – REVIEW OF LIQUIDITY RISK MANAGEMENT PROGRAM (UNAUDITED)
Pursuant to Rule 22e-4 under the Investment Company Act of 1940, the Trust has adopted a liquidity risk management program to govern the Trust’s approach to managing liquidity risk. Rule 22e-4 seeks to promote effective liquidity risk management, thereby reducing the risk that a fund will be unable to meet its redemption obligations and mitigating dilution of the interests of Fund shareholders. The Trust’s liquidity risk management program is tailored to reflect its particular risks, but not to eliminate all adverse impacts of liquidity risk.
The Investment Adviser to the Trust has adopted and implemented its own written liquidity risk management program (the “Program”) tailored specifically to assess and manage the liquidity risk of the Funds it advises.
On June 28, 2021, the Trustees of Pacer Funds Trust reviewed and considered a written report prepared by the program administrator of the Funds’ Liquidity Risk Management Program (the “Program”), which addressed the operation of the Program and assessed the Program’s adequacy and effectiveness of implementation. In considering the report, the Trustees noted that the Program Administrator has determined that several of the funds within the Pacer Funds Trust are deemed “In-Kind” in accordance with Rule 22e-4. They then confirmed with the Program Administrator that no material changes were made to the Program, and reviewed all of the material features of the Program to ensure that they understand how the Program is designed to assess and manage the risk that the Funds within the Trust could not meet requests to redeem shares issued by the Funds without significant dilution of remaining investors in the Funds. Following this review and discussion,
225
Pacer Funds
ADDITIONAL INFORMATION
(Unaudited) (Continued)
the Trustees determined that they believe the disclosures in the report, taken as a whole, provide the information necessary for the Trustees to effectively assess the Program and its implementation, and that they are comfortable with the report’s conclusion that the Program is reasonably designed to assess and manage the Funds’ liquidity risk, and that the Program has operated as intended during the past year.
NOTE 7 – TRUSTEES AND OFFICERS
The business of the Funds is managed under the direction of the Board of Trustees. The Board of Trustees formulates the general policies of the Funds and meets periodically to review the Funds’ performance, monitor investment activities and practices, and discuss other matters affecting the Funds. The Trustees are fiduciaries for the Funds’ shareholders and are governed by the laws of the State of Delaware in this regard. The names and addresses of the Trustees and officers of the Trust are listed below along with a description of their principal occupations over at least the last five years. There are currently four Trustees, three of whom are not “interested persons” of the Trust within the meaning of that term under the 1940 Act (“Independent Trustee”). The Trustees, in turn, elect the officers of the Trust to actively supervise its day-to-day operations. The address of each Trustee and officer of the Trust, unless otherwise indicated below, is c/o Pacer Advisors, Inc., 500 Chesterfield Parkway, Malvern, PA 19335. The Funds’ Statement of Additional Information includes additional information about the Trustees and is available upon request by calling toll free (800) 617-0004.
Name and Year of Birth | Position(s)
Held with
the Trust | Term of Office
and Length of
Time Served | Principal Occupation(s)
During Past 5 Years | Number of
Portfolios in
Fund
Complex
Overseen
By Trustee | Other
Directorships
held by
Trustee During
Past Five Years |
Interested Trustee | | | | | |
Joe M. Thomson
Born: 1944 | Trustee, Chairman, President and Principal Executive Officer | Indefinite Term; since 2014 | Founder/President, Pacer Advisors, Inc. (since 2005); President and Chief Compliance Officer, Pacer Financial, Inc. (since 2004) | 43 | Director, First Cornerstone Bank (2000-2016) |
Independent Trustees | | | | | |
Deborah G. Wolk
Born: 1950 | Lead Independent Trustee | Indefinite Term; since 2015 | Self-employed providing accounting services and computer modeling (since 1997) | 43 | None |
Jonathan H. Newman, Sr.
Born: 1962 | Trustee | Indefinite Term; since 2015 | CEO and Chairman, Newman Wine & Spirits (since 2007) | 43 | None |
Colin C. Lake
Born: 1971 | Trustee | Indefinite Term; since 2021 | Founder/President, Developing the Next Leaders, Inc. (consulting) (since 2016) | 43 | None |
Officers who are not Trustees: | | | | | |
Sean E. O’Hara
Born: 1962 | Treasurer and Principal Financial Officer | Indefinite Term; since 2014 | Director, Index Design Group (since 2015); Director, Pacer Financial, Inc. (since 2007); Director, Pacer Advisors, Inc. (since 2007) | N/A | None |
Bruce Kavanaugh
Born: 1964 | Secretary and Portfolio Manager | Indefinite Term; since 2016 | Vice President, Pacer Advisors, Inc. (since 2005), Vice President, Pacer Financial, Inc. (since 2004) | N/A | None |
226
Pacer Funds
ADDITIONAL INFORMATION
(Unaudited) (Continued)
Name and Year of Birth | Position(s)
Held with
the Trust | Term of Office
and Length of
Time Served | Principal Occupation(s)
During Past 5 Years | Number of
Portfolios in
Fund
Complex
Overseen
By Trustee | Other
Directorships
held by
Trustee During
Past Five Years |
Justin Dausch
Gateway Corporate Center, Suite 216
223 Wilmington West Chester Pike
Chadds Ford, PA 19317
Born: 1990 | Chief Compliance Officer and AML Officer | Indefinite Term; since 2021 | Director, Vigilant, since 2017; Compliance Associate; HSBC (investment banking company), 2015-2017 | N/A | None |
Mr. Thomson is an “Interested Person” by reason of his relationship with the Adviser.
Each Trustee shall serve during the lifetime of the Trust until he or she: (a) dies; (b) resigns; (c) has reached the mandatory retirement age, if any, as set by the Trustees; (d) is declared incompetent by a court of appropriate jurisdiction; or (e) is removed, or, if sooner, until the next meeting of shareholders called for the purpose of electing Trustees and until the election and qualification of his or her successor in accordance with the Trust’s Declaration of Trust and By-laws. Each officer holds office at the pleasure of the Board and services for a period of one year, or until his or her successor is duly elected and qualified.
The Statement of Additional Information includes additional information, including compensation, about the Funds’ Trustees.
NOTE 8 – CHANGE IN INDEPENDENT REGISTERED PUBLIC ACCOUNTING FIRM
Deloitte & Touche, LLP (“Deloitte”) was the principal accountant for FLRT while the Fund was part of a different trust. On October 22, 2021, Sanville & Company was engaged as principal accountants for the Fund as a series of the Trust. During the most recent period ended June 30, 2021, there were no: (1) disagreements with Deloitte on any matter of accounting principles or practices, financial statement disclosure or auditing scope or procedures, which disagreements if not resolved to their satisfaction would have caused them to make reference in connection with their opinion to the subject matter of the disagreements, or (2) reportable events. The audit report of Deloitte on the financial statements of FLRT as of and for the period ended June 30, 2021 did not contain any adverse opinion or disclaimer of opinion, nor were they qualified or modified as to uncertainty, audit scope or accounting principles.
227
(This Page Intentionally Left Blank.)
(This Page Intentionally Left Blank.)
Advisor Pacer Advisors, Inc.
500 Chesterfield Parkway
Malvern, PA 19355 |
Index Provider Index Design Group, LLC
500 Chesterfield Parkway
Malvern, PA 19355 Benchmark Investments, LLC
1115 Broadway, 12th Floor
New York, NY 10010 CFRA
One New York Plaza, 34th Floor
New York, NY 10004 LifeSci Index Partners, LLC
250 W 55th St, Suite 16b
New York, NY 10019 Lunt Capital Management, Inc.
215 S State St, Suite 100
Salt Lake City, UT 84111 FTSE International Limited
12th Floor, 10 Upper Bank Street
Canary Wharf, London E14 5NP S&P Dow Jones Indices LLC
55 Water Street
New York, NY 10041 |
Custodian U.S. Bank National Association
Custody Operations
1555 North Rivercenter Drive
Milwaukee, WI 53212 |
Sub Adviser Vident Investment Advisory, LLC
1125 Sanctuary Parkway, Suite 515
Alpharetta, GA 30009 CSOP Asset Management Limited
2801-2803, Two Exchange Square, 8 Connaught Place
Central, Hong Kong Metaurus Advisors LLC
22 Hudson Place, Third Floor
Hoboken, New Jersey 07030 Pacific Asset Management LLC
840 Newport Center Drice, 7th Fl
Newport Beach, CA 92660 |
Distributor Pacer Financial, Inc.
500 Chesterfield Parkway
Malvern, PA 19355 |
Transfer Agent U.S. Bancorp Fund Services, LLC
615 East Michigan Street
Milwaukee, WI 53202 |
Independent Registered
Public Accounting Firm Sanville & Company
1514 Old York Rd.
Abington, PA 19001 |
Legal Counsel Practus, LLP
11300 Tomahawk Creek Parkway, Suite 310
Leawood, Kansas 66211 |

Item 2. Code of Ethics.
Not applicable for semi-annual reports.
Item 3. Audit Committee Financial Expert.
Not applicable for semi-annual reports.
Item 4. Principal Accountant Fees and Services.
Not applicable for semi-annual reports.
Item 5. Audit Committee of Listed Registrants.
Not applicable for semi-annual reports.
Item 6. Investments.
Schedule of Investments is included as part of the report to shareholders filed under Item 1 of this Form.
Item 7. Disclosure of Proxy Voting Policies and Procedures for Closed-End Management Investment Companies.
Not applicable to open-end investment companies.
Item 8. Portfolio Managers of Closed-End Management Investment Companies.
Not applicable to open-end investment companies.
Item 9. Purchases of Equity Securities by Closed-End Management Investment Company and Affiliated Purchasers.
Not applicable to open-end investment companies.
Item 10. Submission of Matters to a Vote of Security Holders.
There have been no material changes to the procedures by which shareholders may recommend nominees to the registrant’s board of trustees.
Item 11. Controls and Procedures.
| (a) | The Registrant’s President/Principal Executive Officer and Treasurer/Principal Financial Officer have reviewed the Registrant's disclosure controls and procedures (as defined in Rule 30a-3(c) under the Investment Company Act of 1940 (the “Act”)) as of a date within 90 days of the filing of this report, as required by Rule 30a-3(b) under the Act and Rules 13a-15(b) or 15d-15(b) under the Securities Exchange Act of 1934. Based on their review, such officers have concluded that the disclosure controls and procedures are effective in ensuring that information required to be disclosed in this report is appropriately recorded, processed, summarized and reported and made known to them by others within the Registrant and by the Registrant’s service provider. |
| (b) | There were no changes in the Registrant's internal control over financial reporting (as defined in Rule 30a-3(d) under the Act) that occurred during the period covered by this report that have materially affected, or are reasonably likely to materially affect, the Registrant's internal control over financial reporting. |
Item 12. Disclosure of Securities Lending Activities for Closed-End Management Investment Companies
Not applicable to open-end investment companies.
Item 13. Exhibits.
| (a) | (1) Any code of ethics or amendment thereto, that is the subject of the disclosure required by Item 2, to the extent that the registrant intends to satisfy Item 2 requirements through filing an exhibit. Not Applicable |
(2) A separate certification for each principal executive officer and principal financial officer pursuant to Section 302 of the Sarbanes-Oxley Act of 2002. Furnished herewith.
(3) Any written solicitation to purchase securities under Rule 23c-1 under the Act sent or given during the period covered by the report by or on behalf of the registrant to 10 or more persons. Not applicable to open-end investment companies.
(4) Change in the registrant’s independent public accountant. Furnished herewith.
SIGNATURES
Pursuant to the requirements of the Securities Exchange Act of 1934 and the Investment Company Act of 1940, the registrant has duly caused this report to be signed on its behalf by the undersigned, thereunto duly authorized.
| | (Registrant) | Pacer Funds Trust | |
| | | | |
| | By (Signature and Title) | /s/ Joe M. Thomson | |
| | | Joe M. Thomson, President (Principal Executive Officer) | |
| | | | |
| | Date | 12/30/2021 | |
Pursuant to the requirements of the Securities Exchange Act of 1934 and the Investment Company Act of 1940, this report has been signed below by the following persons on behalf of the registrant and in the capacities and on the dates indicated.
| | By (Signature and Title) | /s/ Joe M. Thomson | |
| | | Joe M. Thomson, President (Principal Executive Officer) | |
| | | | |
| | Date | 12/30/2021 | |
| | | | |
| | By (Signature and Title) | /s/ Sean E. O’Hara | |
| | | Sean E. O’Hara, Treasurer (Principal Financial Officer) | |
| | | | |
| | Date | 12/30/2021 | |
* Print the name and title of each signing officer under his or her signature.