As filed with the U.S. Securities and Exchange Commission on [date]
UNITED STATES
SECURITIES AND EXCHANGE COMMISSION
Washington, D.C. 20549
FORM N-CSR
CERTIFIED SHAREHOLDER REPORT OF REGISTERED
MANAGEMENT INVESTMENT COMPANIES
Investment Company Act file number 811-23024
Pacer Funds Trust
(Exact name of registrant as specified in charter)
500 Chesterfield Parkway
Malvern, PA 19355
(Address of principal executive offices) (Zip code)
Joe M. Thomson, President
500 Chesterfield Parkway
Malvern, PA 19355
(Name and address of agent for service)
610-644-8100
Registrant's telephone number, including area code
Date of fiscal year end: October 31
Date of reporting period: November 1, 2021 to October 31, 2022
Item 1. Reports to Stockholders.
Pacer Funds
TABLE OF CONTENTS
| | Page |
Letter to Shareholders | 1 |
Portfolio Allocation | 7 |
Performance Summary | 10 |
Expense Example | 26 |
Schedules of Investments | 28 |
Statements of Assets & Liabilities | 46 |
Statements of Operations | 50 |
Statements of Changes in Net Assets | 56 |
Financial Highlights | 65 |
Notes to Financial Statements | 81 |
Report of Independent Registered Public Accounting Firm | 102 |
Additional Information | 104 |
Pacer Funds
Dear Shareholder,
Seemingly in a blink, it’s the end of the year again. And I can only look back on 2022 with a tremendous sense of thankfulness and pride when I look at what this company achieved over the past year. In a year where normalcy returned, global geopolitical tensions and rising interest rates disrupted the markets, creating one of the most challenging market environments in decades. Despite this, the Pacer team persevered. And I can once again inform you that for the second year in a row, we were able to almost double our assets under management, growing from $10.2 billion at the end of 2021 to nearly $20 billion at the end of 2022.
This year, The Cash Cows Series became a standout in the value investing space. It became our most popular series growing from $2 billion in assets to $13 billion this year. We are now in a higher interest rate investing era, and the series’ usage of free cash flow yield as a screen proved relevant for many investors this year. As we enter the new year, we are adding to the series by launching the Pacer US Large Cap Cash Cows Growth Leaders ETF, COWG, which will apply a Free Cash Flow Margin strategy to growth names. Over the past year, we also introduced four new funds inside our new thematic ETF series: Pacer Industrials and Logistics ETF (SHPP), Pacer Data and Digital Revolution ETF (TRFK), Pacer BlueStar Digital Entertainment ETF (ODDS), and Pacer BlueStar Engineering the Future ETF (BULD).
Thank you to all the investors, financial advisors, and partners for entrusting us with your assets for another year. And as we move into 2023, we look forward to growing with you once again.
Joe M. Thomson, Chairman, Pacer Funds Trust
Market Environment Overview
2022 was a year of increased inflation, tightening monetary policy, strong labor markets, continued supply chain disruptions, and volatile markets. Most major indices declined substantially from the all-time highs set in 2021, with the S&P 500 falling 14.61% from 11/01/21 to 10/31/22.
As economies across the globe continued to reopen, demand for commodities increased further and strained already tight markets. Supply demand imbalances in key energy markets like oil and natural gas were exacerbated by the Russian invasion of Ukraine, which put upward pressure on energy and commodity prices, accelerating an already high inflation rate. As a result, the energy sector continued its winning streak, returning 61.66%, by far the highest of any sector. The only other sectors that were positive in the year ending 10/31/22 were Consumer Staples, Utilities, and Healthcare, which returned 4.78%, 2.46%, and .95%, respectively.
The primary focus of markets in 2022 was historically high inflation, which caused negative shocks to both equity and fixed income markets. Consensus expectations heading into the year were for inflation to moderate rapidly. Instead, inflation continued to climb higher, reaching levels which hadn’t been seen since the ‘Great Inflation’ period of 1967 – 1982. Unexpectedly high inflation put pressure on global central banks to tighten monetary policy swiftly and aggressively. As a result, a traditional portfolio of 60% stocks and 40% bonds had the worst year-to-date performance ever (adjusted for inflation) through the end of Q3 2022. US inflation averaged 8.0% for the year ended 10/31/22 and peaked at 9.1% in June 2022. The yield on a 10-year US Treasury spiked from 1.55% to a peak of 4.24% on 10/24/22. Higher than expected inflation caused the Fed to hike interest rates significantly faster than expected. Heading into 2022, consensus expectations were for three interest rate hikes in 2022, or an increase of 75 basis points in the Fed Funds Rate. Instead, the FFR increased to 3.0% - 3.25%, and the Fed hiked the overnight rate by 75 basis points on three separate occasions in 2022. Higher discount rates in the form of higher interest rates and higher inflation put downward pressure on stock prices, which entered the year at some of the highest valuation levels since the dot-com bubble.
Systemic shocks to supply chains persisted in 2022, with the primary shocks coming from the Russian invasion of Ukraine in February, and the continuation of lockdowns in China from their Zero-Covid policies. The Russian invasion of Ukraine caused NATO nations to impose sanctions on Russia. The primary effects of the shock caused by the invasion and the subsequent sanctions were higher energy and food costs across the globe, but especially in European nations, which were highly reliant on Russian energy. Following the invasion in February, energy costs in Europe spiked at never-before-seen rates, which worsened inflation in Europe, and forced the Bank of England, and the ECB to increase interest rates faster than expected, following in the footsteps of the Fed in the US.
Bad news from record high inflation was offset by good news in the labor market, with the US unemployment rate decreasing to 50-year lows in 2022 at 3.5% in July and September. Tightness in the labor market continues to put pressure on the Fed to increase rates and cool off an overheating economy. Earnings remained resilient through the year ended 10/31/22, though forward-looking guidance has become increasingly more negative as companies anticipate the delayed effects of rate hikes and tighter financial conditions on the broader economy.
1
Pacer Funds
Pacer American Energy Independence ETF
The Pacer American Energy Independence ETF (the “Fund”) is an exchange traded fund (“ETF”) that seeks to track the performance, before fees and expenses, of the American Energy Independence Index (the “Index”).
For the fiscal year, the Fund had a NAV total return of 16.26%. The Index had a total return of 17.39%. The S&P 500 had a total return of -14.61%.
The Fund’s top three contributors to its return were Cheniere Energy at 69.27%, New Fortress Energy Inc. Class A at 77.58%, and PBF Logistics LP at 67.23%. The Fund’s bottom three contributors to return were Tellurian Inc. -35.41%, TC Energy Corporation at -14.96%, and Equitrans Midstream Corporation at -14.06%.
Pacer Swan SOS Conservative (January) ETF
The Pacer Swan SOS Conservative (January) ETF (the “Fund”) seeks to provide investors with returns that, before fees and expenses of the Fund, match those of the SPDR® S&P 500® ETF Trust (the “Underlying ETF”) up to a predetermined upside cap of 8.60% (before fees and expenses of the Fund) and 7.85% (after fees and expenses of the Fund), while providing a buffer against Underlying ETF losses between 5% and 30% over the period from December 20, 2021 to December 31, 2022.
The Fund uses FLEX Options to employ a “structured outcome strategy.” Structured outcome strategies seek to produce pre-determined target investment outcomes based upon the performance of an underlying security or index. The predetermined outcomes sought by the Fund are intended to reflect the performance of the Underlying ETF over an approximate one-year period (the “Investment Period”), subject to a buffer (the “Buffer”) against certain Underlying ETF losses and a cap (the “Cap”) as set forth in the following table:
Investment Period Start: December 20, 2021
Investment Period End: December 31, 2022
Cap (after Fund fees and expenses): 8.60%
Cap (after Fund fees and expenses): 7.85%
Year-To-Date, the Fund had a NAV total return of -5.85%. The S&P 500 Index had a price return of -14.61%.
Pacer Swan SOS Moderate (January) ETF
The Pacer Swan SOS Moderate (January) ETF (the “Fund”) seeks to provide investors with returns that, before fees and expenses of the Fund, match those of the SPDR® S&P 500® ETF Trust (“the Underlying ETF”) up to a a predetermined upside cap of 10.30% (before fees and expenses of the Fund) and 9.55% (after fees and expenses of the Fund), while providing a buffer against the first 15% of Underlying ETF losses, over the period from December 20, 2021 to December 31, 2022.
The Fund uses FLEX Options to employ a “structured outcome strategy.” Structured outcome strategies seek to produce pre-determined target investment outcomes based upon the performance of an underlying security or index. The predetermined outcomes sought by the Fund are intended to reflect the performance of the Underlying ETF over an approximate one-year period (the “Investment Period”), subject to a buffer (the “Buffer”) against certain Underlying ETF losses and a cap (the “Cap”) as set forth in the following table:
Investment Period Start: December 20, 2021
Investment Period End: December 31, 2022
Cap (before Fund fees and expenses): 10.30%
Cap (after Fund fees and expenses): 9.55%
Year-To-Date, the Fund had a NAV total return of -4.65%. The S&P 500 Index had a price return of -14.61%.
Pacer Swan SOS Flex (January) ETF
The Pacer Swan SOS Flex (January) ETF (the “Fund”) seeks to provide investors with returns that match those of the SPDR® S&P 500® ETF Trust (the “Underlying ETF”) up to a predetermined upside cap of 14.70% (before fees and expenses of the Fund) and 13.95% (after fees and expenses of the Fund), while providing a buffer against the first 20% of Underlying ETF losses with the benefits of such buffer declining from 20% to 0% for Underlying ETF losses between 20% and 40%, over the period from December 20, 2021 to December 31, 2022.
2
Pacer Funds
The Fund uses FLEX Options to employ a “structured outcome strategy.” Structured outcome strategies seek to produce pre-determined target investment outcomes based upon the performance of an underlying security or index. The predetermined outcomes sought by the Fund are intended to reflect the performance of the Underlying ETF over an approximate one-year period (the “Investment Period”), subject to a buffer (the “Buffer”) against certain Underlying ETF losses and a cap (the “Cap”) as set forth in the following table:
Investment Period Start: December 20, 2021
Investment Period End: December 31, 2022
Cap (before Fund fees and expenses): 14.70%
Cap (after Fund fees and expenses): 13.95%
Year-To-Date, the Fund had a NAV total return of -3.74%. The S&P 500 Index had a price return of -14.61%.
Pacer Swan SOS Fund of Funds ETF
The Pacer Swan SOS Fund of Funds ETF (the “Fund”) seeks capital appreciation with downside protection
Year-To-Date, the Fund had a NAV total return of -4.12%. The S&P 500 Index had a price return of -14.61%.
Pacer Swan SOS Conservative (April) ETF
The Pacer Swan SOS Conservative (April) ETF (the “Fund”) seeks to provide investors with returns that, before fees and expenses of the Fund, match those of the SPDR® S&P 500® ETF Trust (the “Underlying ETF”) up to a predetermined upside cap of 10.23% (before fees and expenses of the Fund) and 9.48% (after fees and expenses of the Fund), while providing a buffer against Underlying ETF losses between 5% and 30% over the period from April 1, 2022 to March 31, 2023.
The Fund uses FLEX Options to employ a “structured outcome strategy.” Structured outcome strategies seek to produce pre-determined target investment outcomes based upon the performance of an underlying security or index. The predetermined outcomes sought by the Fund are intended to reflect the performance of the Underlying ETF over an approximate one-year period (the “Investment Period”), subject to a buffer (the “Buffer”) against certain Underlying ETF losses and a cap (the “Cap”) as set forth in the following table:
Investment Period Start: April 1, 2022
Investment Period End: March 31, 2023
Cap (before Fund fees and expenses): 10.23%
Cap (after Fund fees and expenses): 9.48%
Year-To-Date, the Fund had a NAV total return of -4.52%. The S&P 500 Index had a price return of -14.61%.
Pacer Swan SOS Moderate (April) ETF
The Pacer Swan SOS Moderate (April) ETF (the “Fund”) seeks to provide investors with returns that, before fees and expenses of the Fund, match those of the SPDR® S&P 500® ETF Trust (“the Underlying ETF”) up to a predetermined upside cap of 11.31% (before fees and expenses of the Fund) and 10.56% (after fees and expenses of the Fund), while providing a buffer against the first 15% of Underlying ETF losses, over the period from April 1, 2022 to March 31, 2023.
The Fund uses FLEX Options to employ a “structured outcome strategy.” Structured outcome strategies seek to produce pre-determined target investment outcomes based upon the performance of an underlying security or index. The predetermined outcomes sought by the Fund are intended to reflect the performance of the Underlying ETF over an approximate one-year period (the “Investment Period”), subject to a buffer (the “Buffer”) against certain Underlying ETF losses and a cap (the “Cap”) as set forth in the following table:
Investment Period Start: April 1, 2022
Investment Period End: March 31, 2023
Cap (before Fund fees and expenses): 11.31%
Cap (after Fund fees and expenses): 10.56%
Year-To-Date, the Fund had a NAV total return of -3.92%. The S&P 500 Index had a price return of -14.61%.
3
Pacer Funds
Pacer Swan SOS Flex (April) ETF
The Pacer Swan SOS Flex (April) ETF (the “Fund”) seeks to provide investors with returns that match those of the SPDR® S&P 500® ETF Trust (the “Underlying ETF”) up to a predetermined upside cap of 14.88% (before fees and expenses of the Fund) and 14.13% (after fees and expenses of the Fund), while providing a buffer against the first 20% of Underlying ETF losses with the benefits of such buffer declining from 20% to 0% for Underlying ETF losses between 20% and 40%, over the period from April 1, 2022 to March 31, 2023.
The Fund uses FLEX Options to employ a “structured outcome strategy.” Structured outcome strategies seek to produce pre-determined target investment outcomes based upon the performance of an underlying security or index. The predetermined outcomes sought by the Fund are intended to reflect the performance of the Underlying ETF over an approximate one-year period (the “Investment Period”), subject to a buffer (the “Buffer”) against certain Underlying ETF losses and a cap (the “Cap”) as set forth in the following table:
Investment Period Start: April 1, 2022
Investment Period End: March 31, 2023
Cap (before Fund fees and expenses): 14.88%
Cap (after Fund fees and expenses): 14.13%
Year-To-Date, the Fund had a NAV total return of -5.15%. The S&P 500 Index had a price return of -14.61%.
Pacer Swan SOS Conservative (July) ETF
The Pacer Swan SOS Conservative (July) ETF (the “Fund”) seeks to provide investors with returns that, before fees and expenses of the Fund, match those of the SPDR® S&P 500® ETF Trust (the “Underlying ETF”) up to a predetermined upside cap of 15.30% (before fees and expenses of the Fund) and 14.55% (after fees and expenses of the Fund), while providing a buffer against Underlying ETF losses between 5% and 30% over the period from July 1, 2022 to June 30, 2023.
The Fund uses FLEX Options to employ a “structured outcome strategy.” Structured outcome strategies seek to produce predetermined target investment outcomes based upon the performance of an underlying security or index. The pre-determined outcomes sought by the Fund are intended to reflect the performance of the Underlying ETF over an approximate one-year period (the “Investment Period”), subject to a buffer (the “Buffer”) against certain Underlying ETF losses and a cap (the “Cap”) as set forth in the following table:
Investment Period Start: July 1, 2022
Investment Period End: June 30, 2023
Cap (before Fund fees and expenses): 15.30%
Cap (after Fund fees and expenses): 14.55%
Year-To-Date, the Fund had a NAV total return of -6.88%. The S&P 500 Index had a price return of -14.61%.
Pacer Swan SOS Moderate (July) ETF
The Pacer Swan SOS Moderate (July) ETF (the “Fund”) seeks to provide investors with returns that, before fees and expenses of the Fund, match those of the SPDR® S&P 500® ETF Trust (“the Underlying ETF”) up to a predetermined upside cap of 17.10% (before fees and expenses of the Fund) and 16.35% (after fees and expenses of the Fund), while providing a buffer against the first 15% of Underlying ETF losses, over the period from July 1, 2022 to June 30, 2023.
The Fund uses FLEX Options to employ a “structured outcome strategy.” Structured outcome strategies seek to produce pre-determined target investment outcomes based upon the performance of an underlying security or index. The predetermined outcomes sought by the Fund are intended to reflect the performance of the Underlying ETF over an approximate one-year period (the “Investment Period”), subject to a buffer (the “Buffer”) against certain Underlying ETF losses and a cap (the “Cap”) as set forth in the following table:
Investment Period Start: July 1, 2022
Investment Period End: June 30, 2023
Cap (before Fund fees and expenses): 17.10%
Cap (after Fund fees and expenses): 16.35%
Year-To-Date, the Fund had a NAV total return of -1.74%. The S&P 500 Index had a price return of -14.61%.
4
Pacer Funds
Pacer Swan SOS Flex (July) ETF
The Pacer Swan SOS Flex (July) ETF (the “Fund”) seeks to provide investors with returns that match those of the SPDR® S&P 500® ETF Trust (the “Underlying ETF”) up to a predetermined upside cap of 22.28% (before fees and expenses of the Fund) and 21.53% (after fees and expenses of the Fund), while providing a buffer against the first 20% of Underlying ETF losses with the benefits of such buffer declining from 20% to 0% for Underlying ETF losses between 20% and 40%, over the period from July 1, 2022 to June 30, 2023.
The Fund uses FLEX Options to employ a “structured outcome strategy.” Structured outcome strategies seek to produce pre-determined target investment outcomes based upon the performance of an underlying security or index. The predetermined outcomes sought by the Fund are intended to reflect the performance of the Underlying ETF over an approximate one-year period (the “Investment Period”), subject to a buffer (the “Buffer”) against certain Underlying ETF losses and a cap (the “Cap”) as set forth in the following table:
Investment Period Start: July 1, 2022
Investment Period End: June 30, 2023
Cap (before Fund fees and expenses): 22.28%
Cap (after Fund fees and expenses): 21.553%
Year-To-Date, the Fund had a NAV total return of -2.49%. The S&P 500 Index had a price return of -14.61%.
Pacer Swan SOS Conservative (October) ETF
The Pacer Swan SOS Conservative (October) ETF (the “Fund”) seeks to provide investors with returns that, before fees and expenses of the Fund, match those of the SPDR® S&P 500® ETF Trust (the “Underlying ETF”) up to a predetermined upside cap of 18.44% (before fees and expenses of the Fund) and 17.69% (after fees and expenses of the Fund), while providing a buffer against Underlying ETF losses between 5% and 30% over the period from October 1, 2022 to September 30, 2023.
The Fund uses FLEX Options to employ a “structured outcome strategy.” Structured outcome strategies seek to produce predetermined target investment outcomes based upon the performance of an underlying security or index. The pre-determined outcomes sought by the Fund are intended to reflect the performance of the Underlying ETF over an approximate one-year period (the “Investment Period”), subject to a buffer (the “Buffer”) against certain Underlying ETF losses and a cap (the “Cap”) as set forth in the following table:
Investment Period Start: October 1, 2022
Investment Period End: September 30, 2023
Cap (before Fund fees and expenses): 18.44%
Cap (after Fund fees and expenses): 17.69%
Year-To-Date, the Fund had a NAV total return of -4.67%. The S&P 500 Index had a price return of -14.61%.
Pacer Swan SOS Moderate (October) ETF
The Pacer Swan SOS Moderate (October) ETF (the “Fund”) seeks to provide investors with returns that, before fees and expenses of the Fund, match those of the SPDR® S&P 500® ETF Trust (“the Underlying ETF”) up to a predetermined upside cap of 20.60% (before fees and expenses of the Fund) and 19.85% (after fees and expenses of the Fund), while providing a buffer against the first 15% of Underlying ETF losses, over the period from October 1, 2022 to September 30, 2023.
The Fund uses FLEX Options to employ a “structured outcome strategy.” Structured outcome strategies seek to produce predetermined target investment outcomes based upon the performance of an underlying security or index. The pre-determined outcomes sought by the Fund are intended to reflect the performance of the Underlying ETF over an approximate one-year period (the “Investment Period”), subject to a buffer (the “Buffer”) against certain Underlying ETF losses and a cap (the “Cap”) as set forth in the following table:
Investment Period Start: October 1, 2022
Investment Period End: September 30, 2023
Cap (before Fund fees and expenses): 20.60%
Cap (after Fund fees and expenses): 19.85%
Year-To-Date, the Fund had a NAV total return of -1.40%. The S&P 500 Index had a price return of -14.61%.
5
Pacer Funds
Pacer Swan SOS Flex (October) ETF
The Pacer Swan SOS Flex (October) ETF (the “Fund”) seeks to provide investors with returns that match those of the SPDR® S&P 500® ETF Trust (the “Underlying ETF”) up to a predetermined upside cap of 26.30% (before fees and expenses of the Fund) and 25.55% (after fees and expenses of the Fund), while providing a buffer against the first 20% of Underlying ETF losses with the benefits of such buffer declining from 20% to 0% for Underlying ETF losses between 20% and 40%, over the period from October 1, 2022 to September 30, 2023.
The Fund uses FLEX Options to employ a “structured outcome strategy.” Structured outcome strategies seek to produce predetermined target investment outcomes based upon the performance of an underlying security or index. The pre-determined outcomes sought by the Fund are intended to reflect the performance of the Underlying ETF over an approximate one-year period (the “Investment Period”), subject to a buffer (the “Buffer”) against certain Underlying ETF losses and a cap (the “Cap”) as set forth in the following table:
Investment Period Start: October 1, 2022
Investment Period End: September 30, 2023
Cap (before Fund fees and expenses): 26.30%
Cap (after Fund fees and expenses): 25.55%
Year-To-Date, the Fund had a NAV total return of 0.31%. The S&P 500 Index had a price return of -14.61%.
Pacer BlueStar Digital Entertainment ETF
The Pacer BlueStar Digital Entertainment ETF (the “Fund”) employs a “passive management”(or indexing) investment approach designed to track the total return performance, before fees and expenses, of the BlueStar Global Online Gambling, Video Gaming, and eSports Index (the Index).
For the fiscal period, the Fund had a NAV total return of -21.58%. The Index had a total return of -22.26%. The S&P 500 had a total return of -13.18%.
The Fund’s top three contributors to its return were: LeoVegas AB +35.53%, Betsson AB Class B +27.26% and NeoGames SA +26.38%. The Fund’s bottom three contributors to return were: Bilibili Inc ADR -67.65%, Unity Software, Inc -67.41% and 888 holdings -61.64%.
Pacer BlueStar Engineering the Future ETF
The Pacer BlueStar Engineering the Future ETF (the “Fund”) employs a “passive management” (or indexing) investment approach designed to track the total return performance, before fees and expenses, of the BlueStar Robotics and 3D Printing Index (the“Index”).
For the fiscal period, the Fund had a NAV total return of -17.14%. The Index had a total return of -17.18%. The S&P 500 had a total return of -9.19%.
The Fund’s top three contributors to its return were: PTC, Inc +16.25%, AVEVA Group, PLC +15.11% and ANDRITZ AG +14.43%. The Fund’s bottom three contributors to return were: BICO Group AB Class B -78.53%, Nemetschek SE -46.36% and Desktop Meta, Inc Class A – 43.40.
6
Pacer Funds
PORTFOLIO ALLOCATION (Unaudited)
As of October 31, 2022
Pacer American Energy Independence ETF
Sector(a) | | Percentage of
Net Assets | |
Energy | | | 99.4 | % |
Short-Term Investments | | | 0.0 | %(b) |
Investments Purchased With Proceeds From Securities Lending | | | 14.0 | % |
Liabilities in Excess of Other Assets | | | -13.4 | % |
| | | | 100.0 | % |
(a) | The Fund may classify a company in a different category than the American Energy Independence Index. |
Pacer Swan SOS Conservative (January) ETF
Sector | | Percentage of
Net Assets | |
Purchased Options | | | 99.8 | % |
Short-Term Investments | | | 0.6 | % |
Liabilities in Excess of Other Assets | | | -0.4 | % |
| | | | 100.0 | % |
Pacer Swan SOS Moderate (January) ETF
Sector | | Percentage of
Net Assets | |
Purchased Options | | | 103.8 | % |
Short-Term Investments | | | 0.2 | % |
Liabilities in Excess of Other Assets | | | -4.0 | % |
| | | | 100.0 | % |
Pacer Swan SOS Flex (January) ETF
Sector | | Percentage of
Net Assets | |
Purchased Options | | | 103.6 | % |
Short-Term Investments | | | 0.2 | % |
Liabilities in Excess of Other Assets | | | -3.8 | % |
| | | | 100.0 | % |
Pacer Swan SOS Fund of Funds ETF
Sector | | Percentage of
Net Assets | |
Affiliated Exchange-Traded Funds | | | 99.2 | % |
Short-Term Investments | | | 0.8 | % |
Liabilities in Excess of Other Assets | | | 0.0 | %(a) |
| | | | 100.0 | % |
Pacer Swan SOS Conservative (April) ETF
Sector | | Percentage of
Net Assets | |
Purchased Options | | | 100.7 | % |
Short-Term Investments | | | 0.7 | % |
Liabilities in Excess of Other Assets | | | -1.4 | % |
| | | | 100.0 | % |
7
Pacer Funds
PORTFOLIO ALLOCATION (Unaudited)
As of October 31, 2022 (Continued)
Pacer Swan SOS Moderate (April) ETF
Sector | | Percentage of
Net Assets | |
Purchased Options | | | 104.8 | % |
Short-Term Investments | | | 0.3 | % |
Liabilities in Excess of Other Assets | | | -5.1 | % |
| | | | 100.0 | % |
Pacer Swan SOS Flex (April) ETF
Sector | | Percentage of
Net Assets | |
Purchased Options | | | 106.3 | % |
Short-Term Investments | | | 0.3 | % |
Liabilities in Excess of Other Assets | | | -6.6 | % |
| | | | 100.0 | % |
Pacer Swan SOS Conservative (July) ETF
Sector | | Percentage of
Net Assets | |
Purchased Options | | | 103.4 | % |
Short-Term Investments | | | 0.8 | % |
Liabilities in Excess of Other Assets | | | -4.2 | % |
| | | | 100.0 | % |
Pacer Swan SOS Moderate (July) ETF
Sector | | Percentage of
Net Assets | |
Purchased Options | | | 104.3 | % |
Short-Term Investments | | | 0.9 | % |
Liabilities in Excess of Other Assets | | | -5.2 | % |
| | | | 100.0 | % |
Pacer Swan SOS Flex (July) ETF
Sector | | Percentage of
Net Assets | |
Purchased Options | | | 104.0 | % |
Short-Term Investments | | | 1.1 | % |
Liabilities in Excess of Other Assets | | | -5.1 | % |
| | | | 100.0 | % |
Pacer Swan SOS Conservative (October) ETF
Sector | | Percentage of
Net Assets | |
Purchased Options | | | 105.6 | % |
Short-Term Investments | | | 1.7 | % |
Liabilities in Excess of Other Assets | | | -7.3 | % |
| | | | 100.0 | % |
8
Pacer Funds
PORTFOLIO ALLOCATION (Unaudited)
As of October 31, 2022 (Continued)
Pacer Swan SOS Moderate (October) ETF
Sector | | Percentage of
Net Assets | |
Purchased Options | | | 106.7 | % |
Short-Term Investments | | | 1.3 | % |
Liabilities in Excess of Other Assets | | | -8.0 | % |
| | | | 100.0 | % |
Pacer Swan SOS Flex (October) ETF
Sector | | Percentage of
Net Assets | |
Purchased Options | | | 106.3 | % |
Short-Term Investments | | | 1.1 | % |
Liabilities in Excess of Other Assets | | | -7.4 | % |
| | | | 100.0 | % |
Pacer BlueStar Digital Entertainment ETF
Sector(a) | | Percentage of
Net Assets | |
Consumer Durables & Apparel | | | 1.7 | % |
Consumer Services | | | 54.5 | % |
Media & Entertainment | | | 32.6 | % |
Semiconductors & Semiconductor | | | 5.5 | % |
Software & Services | | | 1.1 | % |
Exchange Traded Funds | | | 4.5 | % |
Short-Term Investments | | | 0.0 | %(b) |
Other Assets in Excess of Liabilities | | | 0.1 | % |
Total | | | 100.0 | % |
(a) | The Fund may classify a company in a different category than the BlueStar Global Online Gambling, Video Gaming, and eSports Index. |
Pacer BlueStar Engineering the Future ETF
Sector(a) | | Percentage of
Net Assets | |
Automobiles & Components | | | 1.8 | % |
Capital Goods | | | 25.9 | % |
Pharmaceuticals, Biotechnology | | | 0.6 | % |
Semiconductors & Semiconductor | | | 24.3 | % |
Software & Services | | | 29.6 | % |
Technology Hardware & Equipmen | | | 17.6 | % |
Short-Term Investments | | | 0.1 | % |
Other Assets in Excess of Liabilities | | | 0.1 | % |
Total | | | 100.0 | % |
(a) | The Fund may classify a company in a different category than the BlueStar Robotics and 3D Printing Index. |
9
Pacer American Energy Independence ETF
PERFORMANCE SUMMARY
(Unaudited)
Growth of $10,000
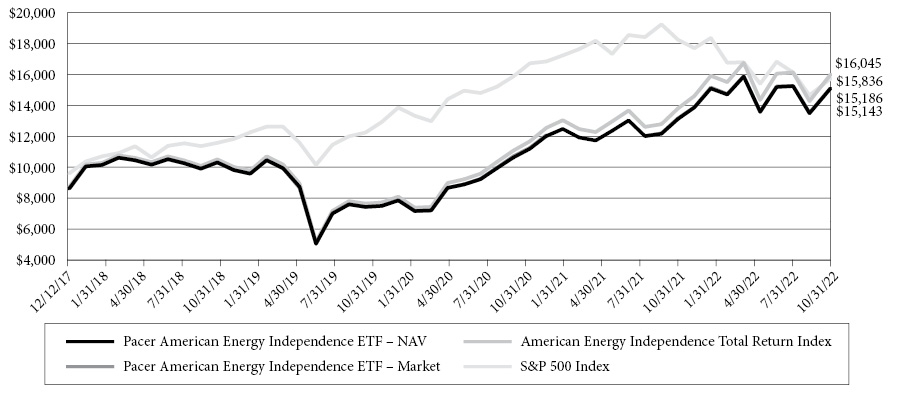
This chart illustrates the performance of a hypothetical $10,000 investment made on December 12, 2017, and is not intended to imply any future performance. The returns shown do not reflect the deduction of taxes that a shareholder would pay on fund distributions or the redemption of fund shares. The chart assumes reinvestment of capital gains and dividends.
The American Energy Independence Total Return (the “Index”) uses a proprietary, rules-based methodology to measure the performance of a portfolio of U.S. and Canadian exchange-listed equity securities of companies that generate a majority of their cash flow from certain qualifying “midstream” energy infrastructure activities. The companies in the Index are expected to benefit from regulatory policies favoring and industry trends toward American energy independence (i.e., a reduced or eliminated need for the United States to import fuels, such as coal, crude oil, or natural gas). Midstream energy infrastructure refers to the processing, storage, transportation, and distribution of crude oil, natural gas, refined products, and their related products, as well as the transmission or storage of renewable energy. The following activity segments are considered qualifying midstream energy infrastructure activities: gathering & processing, compression, fractionation, logistics, midstream services, pipeline transportation, storage and terminaling of oil, gas, natural gas liquids, and refined products, as well as operating liquid natural gas facilities. The following activity segments are not qualifying activities: refining, shipping, exploration, production, retail distribution, or oil services. The Index may include small-, mid-, and large-capitalization companies.
The S&P 500 Index consists of approximately 500 leading U.S.-listed companies.
Annualized Returns (1)
(For the periods ended October 31, 2022)
| | One Year | Three Year | Since Inception(2) |
Pacer American Energy Independence ETF - NAV | 16.26% | 15.53% | 8.87% |
Pacer American Energy Independence ETF - Market | 16.74% | 15.66% | 8.93% |
American Energy Independence Total Return Index (3) | 17.39% | 16.99% | 10.16% |
S&P 500 Index (3) | -14.61% | 10.22% | 9.87% |
(1) | The performance data quoted is historical. Past performance is no guarantee of future results. Current performance may be higher or lower than the performance data quoted. The principal value and investment return of an investment will fluctuate so that investor’s shares, when redeemed, may be worth more or less than the original cost. The returns shown do not reflect the deduction of taxes that a shareholder would pay on Fund distributions or on redemptions of Fund shares. The total annual operating expenses as stated in the fee table to the Fund’s prospectus dated February 28, 2022 supplemented June 10, 2022, is 0.75%. For performance information current to the most recent month-end, please call 1-877-337-0500. |
(2) | Inception date is December 12, 2017. The Fund is the sucessor to the investment performance of the American Energy Independence ETF (the “Predecessor USAI”) as a result of the reorganization of the Predecessor USAI Fund into the Fund on December 16, 2019. Accordingly, the performance information shown in the chart and table above for periods prior to December 16, 2019 is that of the Predecessor USAI Fund’s Shares for the Fund. The Predecessor USAI Fund was advised by SL Advisors, LLC and sub-advised by Penserra Capital Management LLC and had substantially the same investment objectives, policies, and strategies as the Fund. |
(3) | Indexes are unmanaged statistical composites and their returns do not include fees an investor would pay to purchase the securities they represent. Such costs would lower performance. It is not possible to invest directly in an index. |
10
Pacer Swan SOS Conservative (January) ETF
PERFORMANCE SUMMARY
(Unaudited)
Growth of $10,000
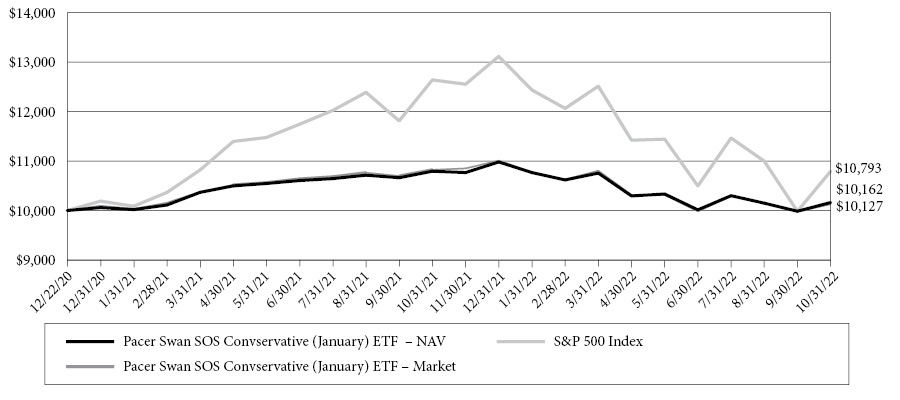
This chart illustrates the performance of a hypothetical $10,000 investment made on December 22, 2020, and is not intended to imply any future performance. The returns shown do not reflect the deduction of taxes that a shareholder would pay on fund distributions or the redemption of fund shares. The chart assumes reinvestment of capital gains and dividends.
The Pacer Swan SOS Conservative (January) ETF (the “Fund”) seeks to provide investors with returns that, before fees and expenses of the Fund, match those of the SPDR® S&P 500® ETF Trust (the “Underlying ETF”) up to a predetermined upside cap of 8.60% (before fees and expenses of the Fund) and 7.85% (after fees and expenses of the Fund), while providing a buffer against Underlying ETF losses between 5% and 30% over the period from December 20, 2021 to December 31, 2022.
The S&P 500 Index consists of approximately 500 leading U.S.-listed companies representing approximately 8% of the U.S. equity market capitalization.
Annualized Returns (1)
(For the periods ended October 31, 2022)
| | One Year | Since Inception(2) |
Pacer Swan SOS Conservative (January) ETF - NAV | -5.85% | 0.87% |
Pacer Swan SOS Conservative (January) ETF - Market | -6.43% | 0.68% |
S&P 500 Index (3) | -14.61% | 4.19% |
(1) | The performance data quoted is historical. Past performance is no guarantee of future results. Current performance may be higher or lower than the performance data quoted. The principal value and investment return of an investment will fluctuate so that investor’s shares, when redeemed, may be worth more or less than the original cost. The returns shown do not reflect the deduction of taxes that a shareholder would pay on Fund distributions or on redemptions of Fund shares. The total annual operating expenses as stated in the fee table to the Fund’s prospectus dated February 28, 2022 as supplemented April 1, 2022, is 0.75%. For performance information current to the most recent month-end, please call 1-877-337-0500. |
(2) | Inception date is December 22, 2020. |
(3) | Indexes are unmanaged statistical composites and their returns do not include fees an investor would pay to purchase the securities they represent. Such costs would lower performance. It is not possible to invest directly in an index. |
11
Pacer Swan SOS Moderate (January) ETF
PERFORMANCE SUMMARY
(Unaudited)
Growth of $10,000
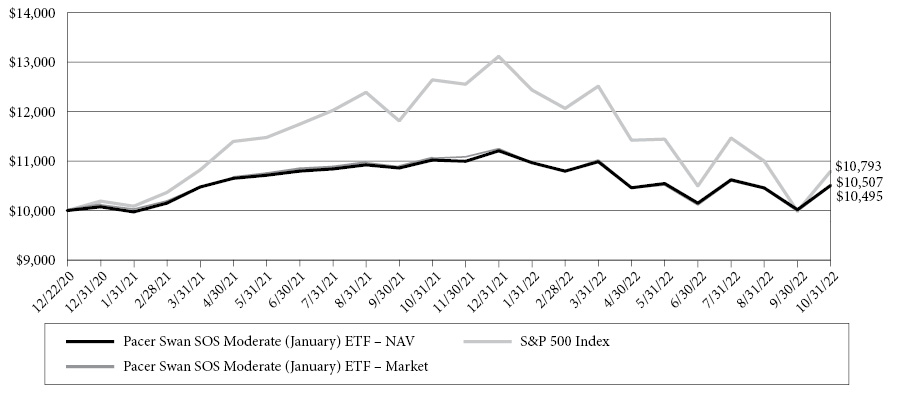
This chart illustrates the performance of a hypothetical $10,000 investment made on December 22, 2020, and is not intended to imply any future performance. The returns shown do not reflect the deduction of taxes that a shareholder would pay on fund distributions or the redemption of fund shares. The chart assumes reinvestment of capital gains and dividends.
The Pacer Swan SOS Moderate (January) ETF (the “Fund”) seeks to provide investors with returns that, before fees and expenses of the Fund, match those of the SPDR® S&P 500® ETF Trust (“the Underlying ETF”) up to a predetermined upside cap of 10.30% (before fees and expenses of the Fund) and 9.55% (after fees and expenses of the Fund), while providing a buffer against the first 15% of Underlying ETF losses, over the period from December 20, 2021 to December 31, 2022.
The S&P 500 Index consists of approximately 500 leading U.S.-listed companies representing approximately 8% of the U.S. equity market capitalization.
Annualized Returns (1)
(For the periods ended October 31, 2022)
| | One Year | Since Inception(2) |
Pacer Swan SOS Moderate (January) ETF - NAV | -4.65% | 2.70% |
Pacer Swan SOS Moderate (January) ETF - Market | -5.07% | 2.64% |
S&P 500 Index (3) | -14.61% | 4.19% |
(1) | The performance data quoted is historical. Past performance is no guarantee of future results. Current performance may be higher or lower than the performance data quoted. The principal value and investment return of an investment will fluctuate so that investor’s shares, when redeemed, may be worth more or less than the original cost. The returns shown do not reflect the deduction of taxes that a shareholder would pay on Fund distributions or on redemptions of Fund shares. The total annual operating expenses as stated in the fee table to the Fund’s prospectus dated February 28, 2022 as supplemented April 1, 2022, is 0.75%. For performance information current to the most recent month-end, please call 1-877-337-0500. |
(2) | Inception date is December 22, 2020. |
(3) | Indexes are unmanaged statistical composites and their returns do not include fees an investor would pay to purchase the securities they represent. Such costs would lower performance. It is not possible to invest directly in an index. |
12
Pacer Swan SOS Flex (January) ETF
PERFORMANCE SUMMARY
(Unaudited)
Growth of $10,000
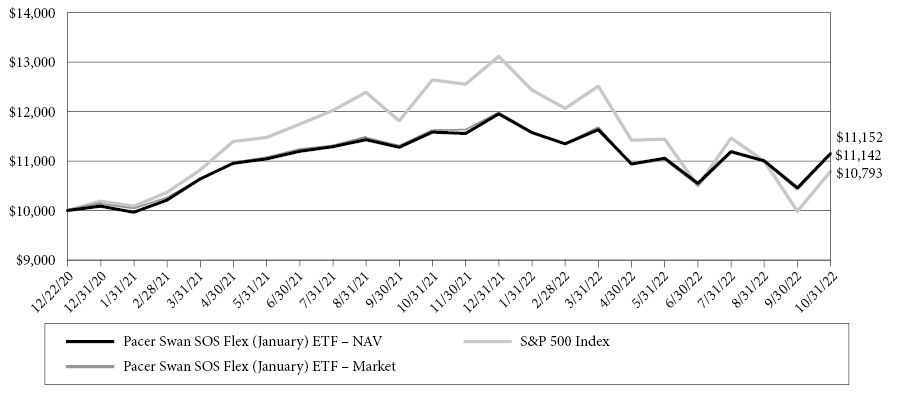
This chart illustrates the performance of a hypothetical $10,000 investment made on December 22, 2020, and is not intended to imply any future performance. The returns shown do not reflect the deduction of taxes that a shareholder would pay on fund distributions or the redemption of fund shares. The chart assumes reinvestment of capital gains and dividends.
The Pacer Swan SOS Flex (January) ETF (the “Fund”) seeks to provide investors with returns that match those of the SPDR® S&P 500® ETF Trust (the “Underlying ETF”) up to a predetermined upside cap of 14.70% (before fees and expenses of the Fund) and 13.95% (after fees and expenses of the Fund), while providing a buffer against the first 20% of Underlying ETF losses with the benefits of such buffer declining from 20% to 0% for Underlying ETF losses between 20% and 40%, over the period from December 20, 2021 to December 31, 2022.
The S&P 500 Index consists of approximately 500 leading U.S.-listed companies representing approximately 8% of the U.S. equity market capitalization.
Annualized Returns (1)
(For the periods ended October 31, 2022)
| | One Year | Since Inception(2) |
Pacer Swan SOS Flex (January) ETF - NAV | -3.74% | 6.04% |
Pacer Swan SOS Flex (January) ETF - Market | -4.17% | 5.99% |
S&P 500 Index (3) | -14.61% | 4.19% |
(1) | The performance data quoted is historical. Past performance is no guarantee of future results. Current performance may be higher or lower than the performance data quoted. The principal value and investment return of an investment will fluctuate so that investor’s shares, when redeemed, may be worth more or less than the original cost. The returns shown do not reflect the deduction of taxes that a shareholder would pay on Fund distributions or on redemptions of Fund shares. The total annual operating expenses as stated in the fee table to the Fund’s prospectus dated February 28, 2022 as supplemented April 1, 2022, is 0.75%. For performance information current to the most recent month-end, please call 1-877-337-0500. |
(2) | Inception date is December 22, 2020. |
(3) | Indexes are unmanaged statistical composites and their returns do not include fees an investor would pay to purchase the securities they represent. Such costs would lower performance. It is not possible to invest directly in an index. |
13
Pacer Swan SOS Fund of Funds ETF
PERFORMANCE SUMMARY
(Unaudited)
Growth of $10,000
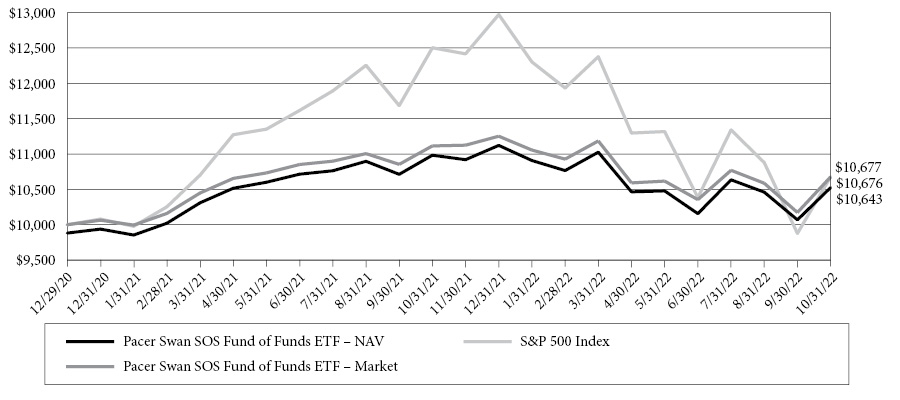
This chart illustrates the performance of a hypothetical $10,000 investment made on December 29, 2020, and is not intended to imply any future performance. The returns shown do not reflect the deduction of taxes that a shareholder would pay on fund distributions or the redemption of fund shares. The chart assumes reinvestment of capital gains and dividends.
The Pacer Swan SOS Fund of Funds ETF (the “Fund”) seeks capital appreciation with downside protection.
The S&P 500 Index consists of approximately 500 leading U.S.-listed companies representing approximately 8% of the U.S. equity market capitalization.
Annualized Returns (1)
(For the periods ended October 31, 2022)
| | One Year | Since Inception(2) |
Pacer Swan SOS Fund of Funds ETF - NAV | -4.12% | 3.45% |
Pacer Swan SOS Fund of Funds ETF - Market | -3.94% | 3.62% |
S&P 500 Index (3) | -14.61% | 3.63% |
(1) | The performance data quoted is historical. Past performance is no guarantee of future results. Current performance may be higher or lower than the performance data quoted. The principal value and investment return of an investment will fluctuate so that investor’s shares, when redeemed, may be worth more or less than the original cost. The returns shown do not reflect the deduction of taxes that a shareholder would pay on Fund distributions or on redemptions of Fund shares. The total annual operating expenses as stated in the fee table to the Fund’s prospectus dated February 28, 2022 as supplemented April 1, 2022, is 0.93%. For performance information current to the most recent month-end, please call 1-877-337-0500. |
(2) | Inception date is December 29, 2020. |
(3) | Indexes are unmanaged statistical composites and their returns do not include fees an investor would pay to purchase the securities they represent. Such costs would lower performance. It is not possible to invest directly in an index. |
14
Pacer Swan SOS Conservative (April) ETF
PERFORMANCE SUMMARY
(Unaudited)
Growth of $10,000
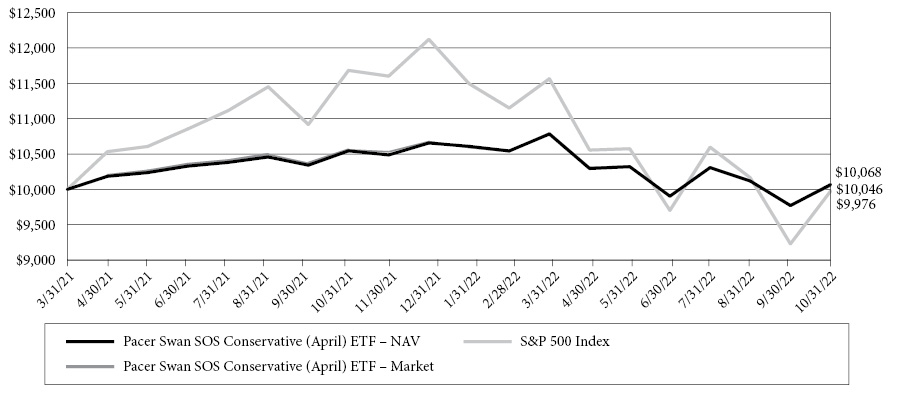
This chart illustrates the performance of a hypothetical $10,000 investment made on March 31, 2021, and is not intended to imply any future performance. The returns shown do not reflect the deduction of taxes that a shareholder would pay on fund distributions or the redemption of fund shares. The chart assumes reinvestment of capital gains and dividends.
The Pacer Swan SOS Conservative (April) ETF (the “Fund”) seeks to provide investors with returns that, before fees and expenses of the Fund, match those of the SPDR® S&P 500® ETF Trust (the “Underlying ETF”) up to a predetermined upside cap of 10.23% (before fees and expenses of the Fund) and 9.48% (after fees and expenses of the Fund), while providing a buffer against Underlying ETF losses between 5% and 30% over the period from April 1, 2022 to March 31, 2023.
The S&P 500 Index consists of approximately 500 leading U.S.-listed companies representing approximately 8% of the U.S. equity market capitalization.
Annualized Returns (1)
(For the periods ended October 31, 2022)
| | One Year | Since Inception(2) |
Pacer Swan SOS Conservative (April) ETF - NAV | -4.52% | 0.43% |
Pacer Swan SOS Conservative (April) ETF - Market | -4.85% | 0.29% |
S&P 500 Index (3) | -14.61% | -0.15% |
(1) | The performance data quoted is historical. Past performance is no guarantee of future results. Current performance may be higher or lower than the performance data quoted. The principal value and investment return of an investment will fluctuate so that investor’s shares, when redeemed, may be worth more or less than the original cost. The returns shown do not reflect the deduction of taxes that a shareholder would pay on Fund distributions or on redemptions of Fund shares. The total annual operating expenses as stated in the fee table to the Fund’s prospectus dated February 28, 2022 as supplemented April 1, 2022, is 0.75%. For performance information current to the most recent month-end, please call 1-877-337-0500. |
(2) | Inception date is March 31, 2021. |
(3) | Indexes are unmanaged statistical composites and their returns do not include fees an investor would pay to purchase the securities they represent. Such costs would lower performance. It is not possible to invest directly in an index. |
15
Pacer Swan SOS Moderate (April) ETF
PERFORMANCE SUMMARY
(Unaudited)
Growth of $10,000
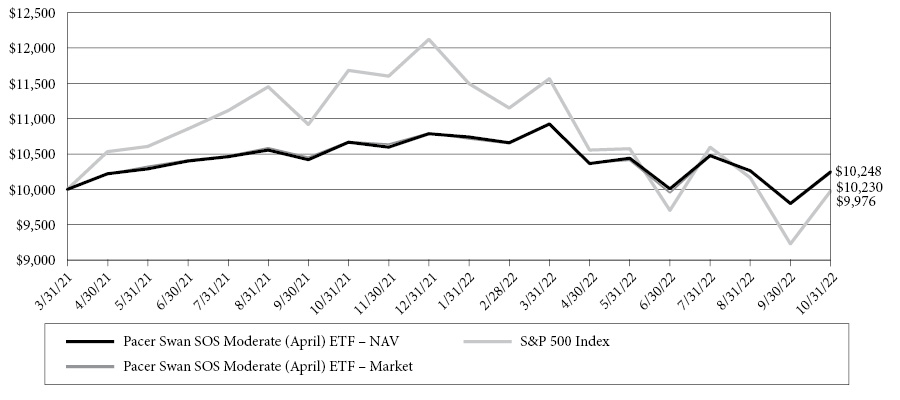
This chart illustrates the performance of a hypothetical $10,000 investment made on March 31, 2021, and is not intended to imply any future performance. The returns shown do not reflect the deduction of taxes that a shareholder would pay on fund distributions or the redemption of fund shares. The chart assumes reinvestment of capital gains and dividends.
The Pacer Swan SOS Moderate (April) ETF (the “Fund”) seeks to provide investors with returns that, before fees and expenses of the Fund, match those of the SPDR® S&P 500® ETF Trust (“the Underlying ETF”) up to a predetermined upside cap of 11.31% (before fees and expenses of the Fund) and 10.56% (after fees and expenses of the Fund), while providing a buffer against the first 15% of Underlying ETF losses, over the period from April 1, 2022 to March 31, 2023.
The S&P 500 Index consists of approximately 500 leading U.S.-listed companies representing approximately 8% of the U.S. equity market capitalization.
Annualized Returns (1)
(For the periods ended October 31, 2022)
| | One Year | Since Inception(2) |
Pacer Swan SOS Moderate (April) ETF - NAV | -3.92% | 1.56% |
Pacer Swan SOS Moderate (April) ETF - Market | -4.18% | 1.44% |
S&P 500 Index (3) | -14.61% | -0.15% |
(1) | The performance data quoted is historical. Past performance is no guarantee of future results. Current performance may be higher or lower than the performance data quoted. The principal value and investment return of an investment will fluctuate so that investor’s shares, when redeemed, may be worth more or less than the original cost. The returns shown do not reflect the deduction of taxes that a shareholder would pay on Fund distributions or on redemptions of Fund shares. The total annual operating expenses as stated in the fee table to the Fund’s prospectus dated February 28, 2022 as supplemented April 1, 2022, is 0.75%. For performance information current to the most recent month-end, please call 1-877-337-0500. |
(2) | Inception date is March 31, 2021. |
(3) | Indexes are unmanaged statistical composites and their returns do not include fees an investor would pay to purchase the securities they represent. Such costs would lower performance. It is not possible to invest directly in an index. |
16
Pacer Swan SOS Flex (April) ETF
PERFORMANCE SUMMARY
(Unaudited)
Growth of $10,000
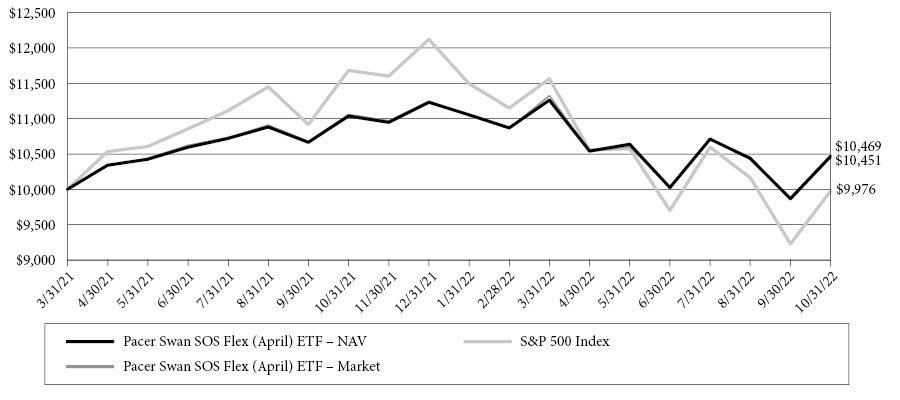
This chart illustrates the performance of a hypothetical $10,000 investment made on March 31, 2021, and is not intended to imply any future performance. The returns shown do not reflect the deduction of taxes that a shareholder would pay on fund distributions or the redemption of fund shares. The chart assumes reinvestment of capital gains and dividends.
The Pacer Swan SOS Flex (April) ETF (the “Fund”) seeks to provide investors with returns that match those of the SPDR® S&P 500® ETF Trust (the “Underlying ETF”) up to a predetermined upside cap of 14.88% (before fees and expenses of the Fund) and 14.13% (after fees and expenses of the Fund), while providing a buffer against the first 20% of Underlying ETF losses with the benefits of such buffer declining from 20% to 0% for Underlying ETF losses between 20% and 40%, over the period from April 1, 2022 to March 31, 2023.
The S&P 500 Index consists of approximately 500 leading U.S.-listed companies representing approximately 8% of the U.S. equity market capitalization.
Annualized Returns (1)
(For the periods ended October 31, 2022)
| | One Year | Since Inception(2) |
Pacer Swan SOS Flex (April) ETF - NAV | -5.15% | 2.93% |
Pacer Swan SOS Flex (April) ETF - Market | -5.49% | 2.82% |
S&P 500 Index (3) | -14.61% | -0.15% |
(1) | The performance data quoted is historical. Past performance is no guarantee of future results. Current performance may be higher or lower than the performance data quoted. The principal value and investment return of an investment will fluctuate so that investor’s shares, when redeemed, may be worth more or less than the original cost. The returns shown do not reflect the deduction of taxes that a shareholder would pay on Fund distributions or on redemptions of Fund shares. The total annual operating expenses as stated in the fee table to the Fund’s prospectus dated February 28, 2022 as supplemented April 1, 2022, is 0.75%. For performance information current to the most recent month-end, please call 1-877-337-0500. |
(2) | Inception date is March 31, 2021. |
(3) | Indexes are unmanaged statistical composites and their returns do not include fees an investor would pay to purchase the securities they represent. Such costs would lower performance. It is not possible to invest directly in an index. |
17
Pacer Swan SOS Conservative (July) ETF
PERFORMANCE SUMMARY
(Unaudited)
Growth of $10,000
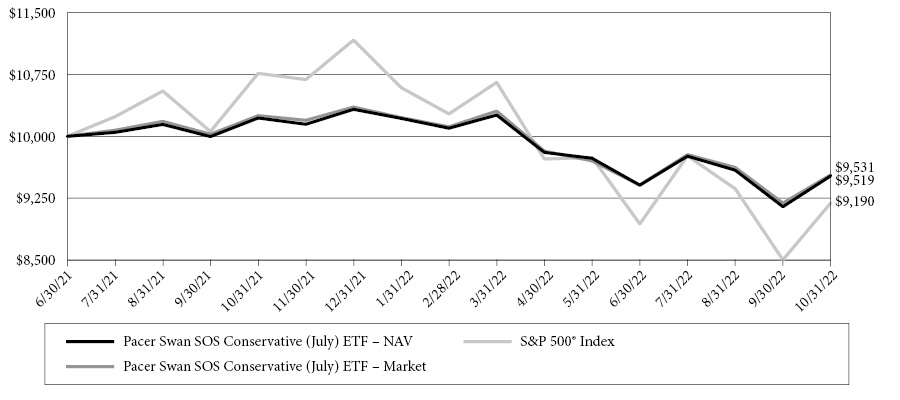
This chart illustrates the performance of a hypothetical $10,000, investment made on June 30, 2021, and is not intended to imply any future performance. The returns shown do not reflect the deduction of taxes that a shareholder would pay on fund distributions or the redemption of fund shares. The chart assumes reinvestment of capital gains and dividends.
The Pacer Swan SOS Conservative (July) ETF (the “Fund”) seeks to provide investors with returns that, before fees and expenses of the Fund, match those of the SPDR® S&P 500® ETF Trust (the “Underlying ETF”) up to a predetermined upside cap of 15.30% (before fees and expenses of the Fund) and 14.55% (after fees and expenses of the Fund), while providing a buffer against Underlying ETF losses between 5% and 30% over the period from July 1, 2022 to June 30, 2023.
The S&P 500 Index consists of approximately 500 leading U.S.-listed companies representing approximately 8% of the U.S. equity market capitalization.
Annualized Returns (1)
(For the periods ended October 31, 2022)
| | One Year | Since Inception(2) |
Pacer Swan SOS Conservative (July) ETF - NAV | -6.88% | -3.62% |
Pacer Swan SOS Conservative (July) ETF - Market | -7.02% | -3.53% |
S&P 500 Index (3) | -14.61% | -6.12% |
(1) | The performance data quoted is historical. Past performance is no guarantee of future results. Current performance may be higher or lower than the performance data quoted. The principal value and investment return of an investment will fluctuate so that investor’s shares, when redeemed, may be worth more or less than the original cost. The returns shown do not reflect the deduction of taxes that a shareholder would pay on Fund distributions or on redemptions of Fund shares. The total annual operating expenses as stated in the fee table to the Fund’s prospectus dated July 1, 2022, is 0.75%. For performance information current to the most recent month-end, please call 1-877-337-0500. |
(2) | Inception date is June 30, 2021. |
(3) | Indexes are unmanaged statistical composites and their returns do not include fees an investor would pay to purchase the securities they represent. Such costs would lower performance. It is not possible to invest directly in an index. |
18
Pacer Swan SOS Moderate (July) ETF
PERFORMANCE SUMMARY
(Unaudited)
Growth of $10,000
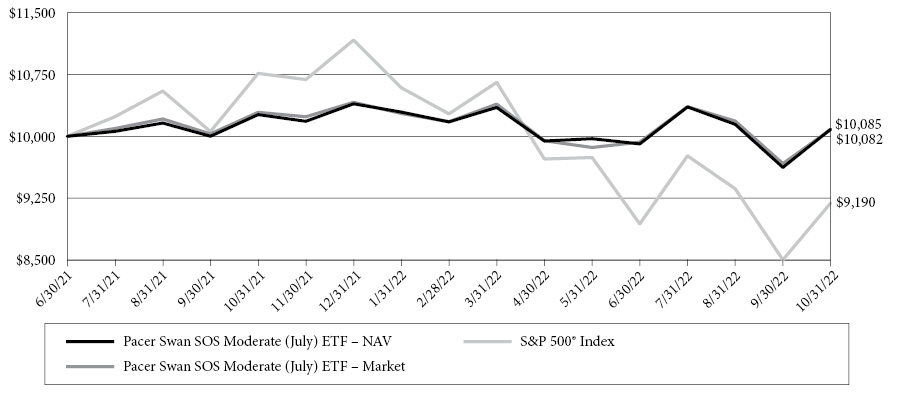
This chart illustrates the performance of a hypothetical $10,000, investment made on June 30, 2021, and is not intended to imply any future performance. The returns shown do not reflect the deduction of taxes that a shareholder would pay on fund distributions or the redemption of fund shares. The chart assumes reinvestment of capital gains and dividends.
The Pacer Swan SOS Moderate (July) ETF (the “Fund”) seeks to provide investors with returns that, before fees and expenses of the Fund, match those of the SPDR® S&P 500® ETF Trust (“the Underlying ETF”) up to a predetermined upside cap of 17.10% (before fees and expenses of the Fund) and 16.35% (after fees and expenses of the Fund), while providing a buffer against the first 15% of Underlying ETF losses, over the period from July 1, 2022 to June 30, 2023.
The S&P 500 Index consists of approximately 500 leading U.S.-listed companies representing approximately 8% of the U.S. equity market capitalization.
Annualized Returns (1)
(For the periods ended October 31, 2022)
| | One Year | Since Inception(2) |
Pacer Swan SOS Moderate (July) ETF - NAV | -1.74% | 0.63% |
Pacer Swan SOS Moderate (July) ETF - Market | -2.02% | 0.61% |
S&P 500 Index (3) | -14.61% | -6.12% |
(1) | The performance data quoted is historical. Past performance is no guarantee of future results. Current performance may be higher or lower than the performance data quoted. The principal value and investment return of an investment will fluctuate so that investor’s shares, when redeemed, may be worth more or less than the original cost. The returns shown do not reflect the deduction of taxes that a shareholder would pay on Fund distributions or on redemptions of Fund shares. The total annual operating expenses as stated in the fee table to the Fund’s prospectus dated July 1, 2022, is 0.75%. For performance information current to the most recent month-end, please call 1-877-337-0500. |
(2) | Inception date is June 30, 2021. |
(3) | Indexes are unmanaged statistical composites and their returns do not include fees an investor would pay to purchase the securities they represent. Such costs would lower performance. It is not possible to invest directly in an index. |
19
Pacer Swan SOS Flex (July) ETF
PERFORMANCE SUMMARY
(Unaudited)
Growth of $10,000
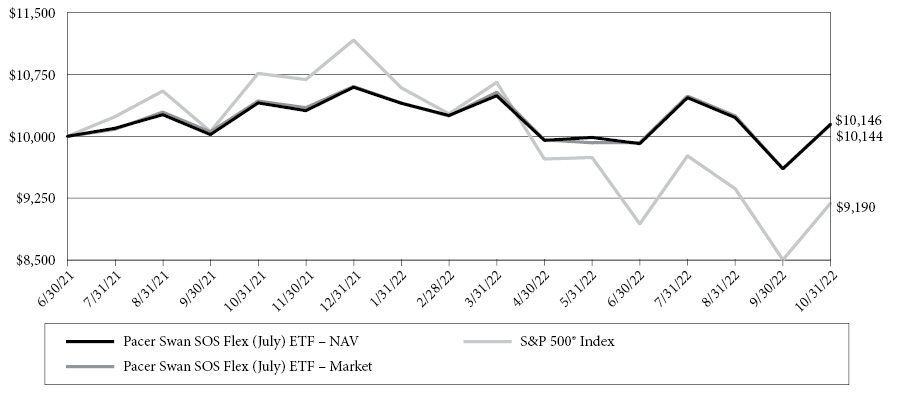
This chart illustrates the performance of a hypothetical $10,000, investment made on June 30, 2021, and is not intended to imply any future performance. The returns shown do not reflect the deduction of taxes that a shareholder would pay on fund distributions or the redemption of fund shares. The chart assumes reinvestment of capital gains and dividends.
The Pacer Swan SOS Flex (July) ETF (the “Fund”) seeks to provide investors with returns that match those of the SPDR® S&P 500® ETF Trust (the “Underlying ETF”) up to a predetermined upside cap of 22.28% (before fees and expenses of the Fund) and 21.53% (after fees and expenses of the Fund), while providing a buffer against the first 20% of Underlying ETF losses with the benefits of such buffer declining from 20% to 0% for Underlying ETF losses between 20% and 40%, over the period from July 1, 2022 to June 30, 2023.
The S&P 500 Index consists of approximately 500 leading U.S.-listed companies representing approximately 8% of the U.S. equity market capitalization.
Annualized Returns (1)
(For the periods ended October 31, 2022)
| | One Year | Since Inception(2) |
Pacer Swan SOS Flex (July) ETF - NAV | -2.49% | 1.09% |
Pacer Swan SOS Flex (July) ETF - Market | -2.71% | 1.08% |
S&P 500 Index (3) | -14.61% | -6.12% |
(1) | The performance data quoted is historical. Past performance is no guarantee of future results. Current performance may be higher or lower than the performance data quoted. The principal value and investment return of an investment will fluctuate so that investor’s shares, when redeemed, may be worth more or less than the original cost. The returns shown do not reflect the deduction of taxes that a shareholder would pay on Fund distributions or on redemptions of Fund shares. The total annual operating expenses as stated in the fee table to the Fund’s prospectus dated July 1, 2022, is 0.75%. For performance information current to the most recent month-end, please call 1-877-337-0500. |
(2) | Inception date is June 30, 2021. |
(3) | Indexes are unmanaged statistical composites and their returns do not include fees an investor would pay to purchase the securities they represent. Such costs would lower performance. It is not possible to invest directly in an index. |
20
Pacer Swan SOS Conservative (October) ETF
PERFORMANCE SUMMARY
(Unaudited)
Growth of $10,000
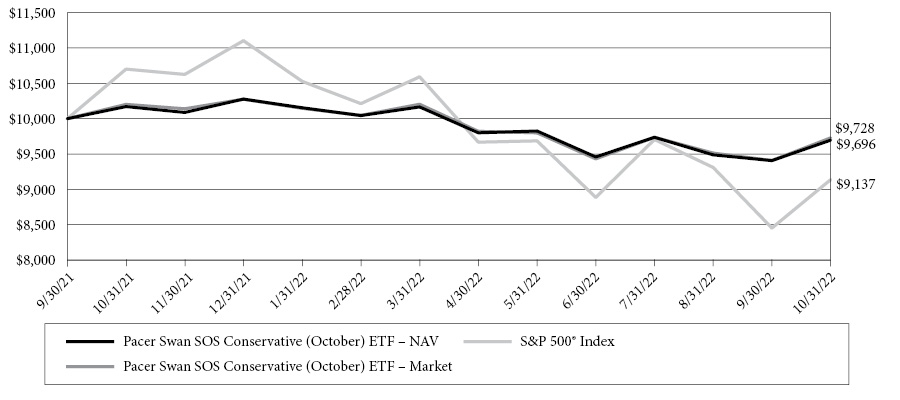
This chart illustrates the performance of a hypothetical $10,000 investment made on September 30, 2021, and is not intended to imply any future performance. The returns shown do not reflect the deduction of taxes that a shareholder would pay on fund distributions or the redemption of fund shares. The chart assumes reinvestment of capital gains and dividends.
The Pacer Swan SOS Conservative (October) ETF (the “Fund”) seeks to provide investors with returns that, before fees and expenses of the Fund, match those of the SPDR® S&P 500® ETF Trust (the “Underlying ETF”) up to a predetermined upside cap of 18.44% (before fees and expenses of the Fund) and 17.69% (after fees and expenses of the Fund), while providing a buffer against Underlying ETF losses between 5% and 30% over the period from October 1, 2022 to September 30, 2023.
The S&P 500 Index consists of approximately 500 leading U.S.-listed companies representing approximately 8% of the U.S. equity market capitalization.
Annualized Returns (1)
(For the periods ended October 31, 2022)
| | One Year | Since Inception(2) |
Pacer Swan SOS Conservative (October) ETF - NAV | -4.67% | -2.81% |
Pacer Swan SOS Conservative (October) ETF - Market | -4.65% | -2.51% |
S&P 500 Index (3) | -14.61% | -7.98% |
(1) | The performance data quoted is historical. Past performance is no guarantee of future results. Current performance may be higher or lower than the performance data quoted. The principal value and investment return of an investment will fluctuate so that investor’s shares, when redeemed, may be worth more or less than the original cost. The returns shown do not reflect the deduction of taxes that a shareholder would pay on Fund distributions or on redemptions of Fund shares. The total annual operating expenses as stated in the fee table to the Fund’s prospectus dated October 1, 2022, is 0.75%. For performance information current to the most recent month-end, please call 1-877-337-0500. |
(2) | Inception date is September 30, 2021. |
(3) | Indexes are unmanaged statistical composites and their returns do not include fees an investor would pay to purchase the securities they represent. Such costs would lower performance. It is not possible to invest directly in an index. |
21
Pacer Swan SOS Moderate (October) ETF
PERFORMANCE SUMMARY
(Unaudited)
Growth of $10,000

This chart illustrates the performance of a hypothetical $10,000 investment made on September 30, 2021, and is not intended to imply any future performance. The returns shown do not reflect the deduction of taxes that a shareholder would pay on fund distributions or the redemption of fund shares. The chart assumes reinvestment of capital gains and dividends.
The Pacer Swan SOS Moderate (October) ETF (the “Fund”) seeks to provide investors with returns that, before fees and expenses of the Fund, match those of the SPDR® S&P 500® ETF Trust (“the Underlying ETF”) up to a predetermined upside cap of 20.60% (before fees and expenses of the Fund) and 19.85% (after fees and expenses of the Fund), while providing a buffer against the first 15% of Underlying ETF losses, over the period from October 1, 2022 to September 30, 2023.
The S&P 500 Index consists of approximately 500 leading U.S.-listed companies representing approximately 8% of the U.S. equity market capitalization.
Annualized Returns (1)
(For the periods ended October 31, 2022)
| | One Year | Since Inception(2) |
Pacer Swan SOS Moderate (October) ETF - NAV | -1.40% | 0.75% |
Pacer Swan SOS Moderate (October) ETF - Market | -1.37% | 0.99% |
S&P 500 Index (3) | -14.61% | -7.98% |
(1) | The performance data quoted is historical. Past performance is no guarantee of future results. Current performance may be higher or lower than the performance data quoted. The principal value and investment return of an investment will fluctuate so that investor’s shares, when redeemed, may be worth more or less than the original cost. The returns shown do not reflect the deduction of taxes that a shareholder would pay on Fund distributions or on redemptions of Fund shares. The total annual operating expenses as stated in the fee table to the Fund’s prospectus dated October 1, 2022, is 0.75%. For performance information current to the most recent month-end, please call 1-877-337-0500. |
(2) | Inception date is September 30, 2021. |
(3) | Indexes are unmanaged statistical composites and their returns do not include fees an investor would pay to purchase the securities they represent. Such costs would lower performance. It is not possible to invest directly in an index. |
22
Pacer Swan SOS Flex (October) ETF
PERFORMANCE SUMMARY
(Unaudited)
Growth of $10,000
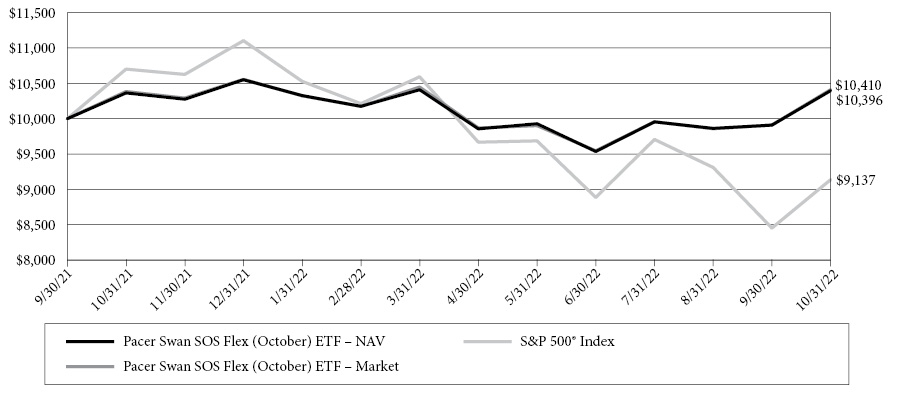
This chart illustrates the performance of a hypothetical $10,000 investment made on September 30, 2021, and is not intended to imply any future performance. The returns shown do not reflect the deduction of taxes that a shareholder would pay on fund distributions or the redemption of fund shares. The chart assumes reinvestment of capital gains and dividends.
The Pacer Swan SOS Flex (October) ETF (the “Fund”) seeks to provide investors with returns that match those of the SPDR® S&P 500® ETF Trust (the “Underlying ETF”) up to a predetermined upside cap of 26.30% (before fees and expenses of the Fund) and 25.55% (after fees and expenses of the Fund), while providing a buffer against the first 20% of Underlying ETF losses with the benefits of such buffer declining from 20% to 0% for Underlying ETF losses between 20% and 40%, over the period from October 1, 2022 to September 30, 2023.
The S&P 500 Index consists of approximately 500 leading U.S.-listed companies representing approximately 8% of the U.S. equity market capitalization.
Annualized Returns (1)
(For the periods ended October 31, 2022)
| | One Year | Since Inception(2) |
Pacer Swan SOS Flex (October) ETF - NAV | 0.31% | 3.65% |
Pacer Swan SOS Flex (October) ETF - Market | 0.25% | 3.77% |
S&P 500 Index (3) | -14.61% | -7.98% |
(1) | The performance data quoted is historical. Past performance is no guarantee of future results. Current performance may be higher or lower than the performance data quoted. The principal value and investment return of an investment will fluctuate so that investor’s shares, when redeemed, may be worth more or less than the original cost. The returns shown do not reflect the deduction of taxes that a shareholder would pay on Fund distributions or on redemptions of Fund shares. The total annual operating expenses as stated in the fee table to the Fund’s prospectus dated October 1, 2022, is 0.75%. For performance information current to the most recent month-end, please call 1-877-337-0500. |
(2) | Inception date is September 30, 2021. |
(3) | Indexes are unmanaged statistical composites and their returns do not include fees an investor would pay to purchase the securities they represent. Such costs would lower performance. It is not possible to invest directly in an index. |
23
Pacer BlueStar Digital Entertainment ETF
PERFORMANCE SUMMARY
(Unaudited)
Growth of $10,000
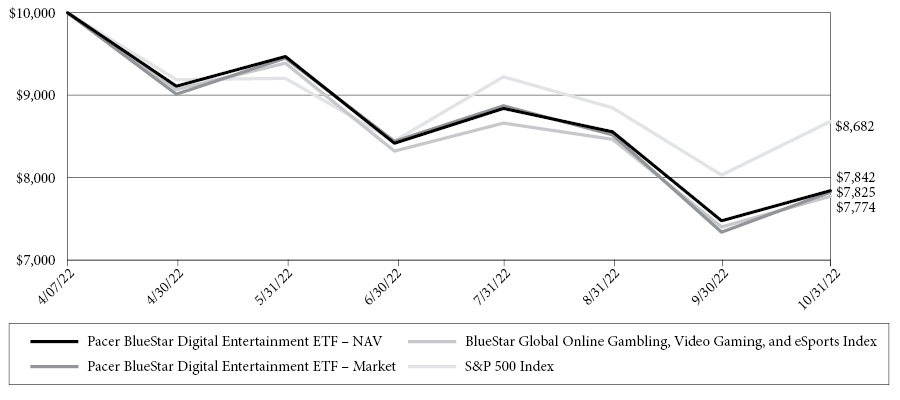
This chart illustrates the performance of a hypothetical $10,000 investment made on April 7, 2022, and is not intended to imply any future performance. The returns shown do not reflect the deduction of taxes that a shareholder would pay on fund distributions or the redemption of fund shares. The chart assumes reinvestment of capital gains and dividends.
The BlueStar Global Online Gambling, Video Gaming, and eSports Index (the “Index”) is a rules-based index that consists of globally-listed stocks and depositary receipts of digital entertainment companies. Companies eligible to be added to the Index are those that derive at least 50% of their revenues from the following activities: online gambling platforms or software related to online gambling; video game development and software related to the development of video games or hardware such as computer processors and graphics cards used in video gaming systems, controllers, headsets, and gaming consoles; and streaming services or video games and/or hardware for use in eSports events or that are involved in eSports events such as league operators, teams, distributors and platforms, (collectively, “Digital Entertainment”) as determined by MV Index Solutions (the “Index Provider”).
The S&P 500 Index consists of approximately 500 leading U.S.-listed companies representing approximately 8% of the U.S. equity market capitalization.
Cumulative Returns (1)
(For the periods ended October 31, 2022)
| | Six Months | Since Inception(2) |
Pacer BlueStar Digital Entertainment ETF - NAV | -13.90% | -21.58% |
Pacer BlueStar Digital Entertainment ETF - Market | -13.16% | -21.75% |
BlueStar Global Online Gambling, Video Gaming, and eSports Index | -14.26% | -22.26% |
S&P 500 Index (3) | -5.50% | -13.18% |
(1) | The performance data quoted is historical. Past performance is no guarantee of future results. Current performance may be higher or lower than the performance data quoted. The principal value and investment return of an investment will fluctuate so that investor’s shares, when redeemed, may be worth more or less than the original cost. The returns shown do not reflect the deduction of taxes that a shareholder would pay on Fund distributions or on redemptions of Fund shares. The total annual operating expenses as stated in the fee table to the Fund’s prospectus dated April 6, 2022 as supplemented April 27, 2022, is 0.60%. For performance information current to the most recent month-end, please call 1-877-337-0500. |
(2) | Inception date is April 7, 2022. |
(3) | Indexes are unmanaged statistical composites and their returns do not include fees an investor would pay to purchase the securities they represent. Such costs would lower performance. It is not possible to invest directly in an index. |
24
Pacer BlueStar Engineering the Future ETF
PERFORMANCE SUMMARY
(Unaudited)
Growth of $10,000
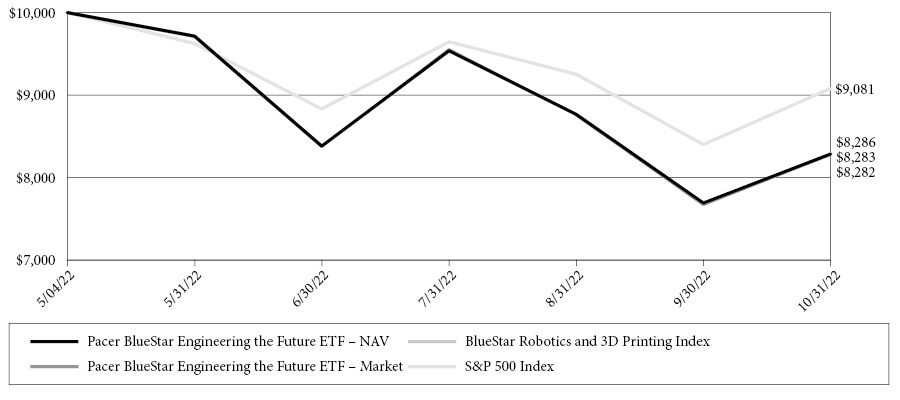
This chart illustrates the performance of a hypothetical $10,000 investment made on May 4, 2022, and is not intended to imply any future performance. The returns shown do not reflect the deduction of taxes that a shareholder would pay on fund distributions or the redemption of fund shares. The chart assumes reinvestment of capital gains and dividends.
The BlueStar Robotics and 3D Printing Index (the “Index”) is a rules-based index that consists of globally-listed stocks and depositary receipts of companies that, at the time of being added to the Index, derive at least 50% of their revenues (25% for current Index components) from robots or manufacturing automation equipment (“robotics”); computer aided design (“CAD”) software; or 3D printing centers, 3D printing hardware, 3D printing simulation software, 3D scanning and measurement software, and 3D printing materials (collectively, “Robotics and 3D Printing Companies”), as determined by MV Index Solutions (the “Index Provider”).
The S&P 500 Index consists of approximately 500 leading U.S.-listed companies representing approximately 8% of the U.S. equity market capitalization.
Cumulative Returns (1)
(For the periods ended October 31, 2022)
| | Since Inception(2) |
Pacer BlueStar Engineering the Future ETF - NAV | -17.14% |
Pacer BlueStar Engineering the Future ETF - Market | -17.17% |
BlueStar Robotics and 3D Printing Index | -17.18% |
S&P 500 Index (3) | -9.19% |
(1) | The performance data quoted is historical. Past performance is no guarantee of future results. Current performance may be higher or lower than the performance data quoted. The principal value and investment return of an investment will fluctuate so that investor’s shares, when redeemed, may be worth more or less than the original cost. The returns shown do not reflect the deduction of taxes that a shareholder would pay on Fund distributions or on redemptions of Fund shares. The total annual operating expenses as stated in the fee table to the Fund’s prospectus dated April 6, 2022 as supplemented April 27, 2022, is 0.60%. For performance information current to the most recent month-end, please call 1-877-337-0500. |
(2) | Inception date is May 4, 2022. |
(3) | Indexes are unmanaged statistical composites and their returns do not include fees an investor would pay to purchase the securities they represent. Such costs would lower performance. It is not possible to invest directly in an index. |
25
Pacer Funds
EXPENSE EXAMPLE
For the Period Ended October 31, 2022 (Unaudited)
As a shareholder of a Fund, you pay ongoing expenses, such as advisory fees, and other Fund expenses. The following examples are intended to help you understand the ongoing cost (in dollars) of investing in a Fund and to compare these costs with the ongoing costs of investing in other funds. Please note, the expenses shown in the tables are meant to highlight ongoing costs only and do not reflect any transactional costs. You may pay brokerage commissions on your purchase and sale of Fund shares, which are not reflected in the following examples. Each example is based on an investment of $1,000 invested at the beginning of the period and held for the entire period as indicated below.
Actual Expenses
The columns under the heading entitled “Actual” help you estimate the actual expenses you paid over the period. The “Actual Ending Account Value” shown is derived from a Fund’s actual return and the “Actual Expenses Paid During Period” show the dollar amount that would have been paid by an investor who started with $1,000 in the Fund. To estimate the expenses you paid on your account during this period, simply divide your account value by $1,000 (for example, an $8,600 account value divided by $1,000=8.6), then multiply the result by the number in the column under the heading untitled “Actual Expenses Paid During Period”.
Hypothetical Example for Comparison Purposes
The columns under the heading entitled “Hypothetical” provide information about hypothetical account value and hypothetical expenses based on a Fund’s actual expense ratio and an assumed rate of return of 5% per year before expenses, which is not the Fund’s return. The hypothetical account value and expenses may not be used to estimate the actual ending account balance or expenses you paid for the period. You may use this information to compare the ongoing costs of investing in a Fund and other funds. To do so, compare this 5% hypothetical example with the 5% hypothetical examples that appear in the shareholder reports of other funds.
Please note that the expenses shown in the table are meant to highlight your ongoing costs only and do not reflect any transactional costs which may be applicable to your account. Therefore, the last column of the table (Hypothetical Expenses Paid During Period) is useful in comparing ongoing costs only and will not help you determine the relative total costs of owning different funds. In addition, if these transactional costs were included, your costs would have been higher.
| | Fund’s Annual
Expense Ratio | Beginning
Account Value
05/01/22 | Ending
Account Value
10/31/22 | Expenses Paid
During Period(a) |
Pacer American Energy Independence ETF | | | | |
Actual | 0.75% | $ 1,000.00 | $ 1,030.00 | $ 3.84 |
Hypothetical(b) | 0.75% | $ 1,000.00 | $ 1,021.42 | $ 3.82 |
Pacer Swan SOS Conservative (January) ETF | | | | |
Actual | 0.75% | $ 1,000.00 | $ 987.10 | $ 3.76 |
Hypothetical(b) | 0.75% | $ 1,000.00 | $ 1,021.42 | $ 3.82 |
Pacer Swan SOS Moderate (January) ETF | | | | |
Actual | 0.75% | $ 1,000.00 | $ 1,004.50 | $ 3.79 |
Hypothetical(b) | 0.75% | $ 1,000.00 | $ 1,021.42 | $ 3.82 |
Pacer Swan SOS Flex (January) ETF | | | | |
Actual | 0.75% | $ 1,000.00 | $ 1,019.20 | $ 3.82 |
Hypothetical(b) | 0.75% | $ 1,000.00 | $ 1,021.42 | $ 3.82 |
Pacer Swan SOS Fund of Funds ETF | | | | |
Actual | 0.18% | $ 1,000.00 | $ 1,005.70 | $ 0.91 |
Hypothetical(b) | 0.18% | $ 1,000.00 | $ 1,024.30 | $ 0.92 |
Pacer Swan SOS Conservative (April) ETF | | | | |
Actual | 0.75% | $ 1,000.00 | $ 977.90 | $ 3.74 |
Hypothetical(b) | 0.75% | $ 1,000.00 | $ 1,021.42 | $ 3.82 |
Pacer Swan SOS Moderate (April) ETF | | | | |
Actual | 0.75% | $ 1,000.00 | $ 988.80 | $ 3.76 |
Hypothetical(b) | 0.75% | $ 1,000.00 | $ 1,021.42 | $ 3.82 |
Pacer Swan SOS Flex (April) ETF | | | | |
Actual | 0.75% | $ 1,000.00 | $ 993.08 | $ 3.77 |
Hypothetical(b) | 0.75% | $ 1,000.00 | $ 1,021.42 | $ 3.82 |
26
Pacer Funds
EXPENSE EXAMPLE
For the Period Ended October 31, 2022 (Unaudited) (Continued)
| | Fund’s Annual
Expense Ratio | Beginning
Account Value
05/01/22 | Ending
Account Value
10/31/22 | Expenses Paid
During Period(a) |
Pacer Swan SOS Conservative (July) ETF | | | | |
Actual | 0.75% | $ 1,000.00 | $ 970.80 | $ 3.73 |
Hypothetical(b) | 0.75% | $ 1,000.00 | $ 1,021.42 | $ 3.82 |
Pacer Swan SOS Moderate (July) ETF | | | | |
Actual | 0.75% | $ 1,000.00 | $ 1,014.30 | $ 3.81 |
Hypothetical(b) | 0.75% | $ 1,000.00 | $ 1,021.42 | $ 3.82 |
Pacer Swan SOS Flex (July) ETF | | | | |
Actual | 0.75% | $ 1,000.00 | $ 1,019.70 | $ 3.82 |
Hypothetical(b) | 0.75% | $ 1,000.00 | $ 1,021.42 | $ 3.82 |
Pacer Swan SOS Conservative (October) ETF | | | | |
Actual | 0.75% | $ 1,000.00 | $ 989.30 | $ 3.76 |
Hypothetical(b) | 0.75% | $ 1,000.00 | $ 1,021.42 | $ 3.82 |
Pacer Swan SOS Moderate (October) ETF | | | | |
Actual | 0.75% | $ 1,000.00 | $ 1,023.80 | $ 3.83 |
Hypothetical(b) | 0.75% | $ 1,000.00 | $ 1,021.42 | $ 3.82 |
Pacer Swan SOS Flex (October) ETF | | | | |
Actual | 0.75% | $ 1,000.00 | $ 1,054.90 | $ 3.88 |
Hypothetical(b) | 0.75% | $ 1,000.00 | $ 1,021.42 | $ 3.82 |
Pacer BlueStar Digital Entertainment ETF | | | | |
Actual | 0.60% | $ 1,000.00 | $ 861.00 | $ 2.81 |
Hypothetical(b) | 0.60% | $ 1,000.00 | $ 1,022.18 | $ 3.06 |
(a) | The dollar amounts shown as expenses paid during the period are equal to the annualized six-month expense ratio multiplied by the average account value during the period, multiplied by the number of days (184) in the most recent six-month period and divided by the number of days in the most recent twelve-month period (365). |
(b) | Assumes 5% return before expenses. |
| | Fund’s Annual
Expense Ratio | Beginning
Account Value
05/04/22(a) | Ending
Account Value
10/31/22 | Expenses Paid
During Period |
Pacer BlueStar Engineering the Future ETF | | | | |
Actual | 0.60% | $ 1,000.00 | $ 828.60 | $ 2.71(b) |
Hypothetical(d) | 0.60% | $ 1,000.00 | $ 1,022.18 | $ 3.06(c) |
(a) | Inception Date of the Fund. |
(b) | The dollar amounts shown as expenses paid during the period are equal to the annualized six-month expense ratio multiplied by the average account value during the period, multiplied by the number of days (180) in the most recent period and divided by the number of days in the most recent twelve-month period (365). |
(c) | The dollar amounts shown as expenses paid during the period are equal to the annualized six-month expense ratio multiplied by the average account value during the period, multiplied by the number of days (184) in the most recent sixth-month period and divided by the number of days in the most recent twelve-month period (365). |
(d) | Assumes 5% return before expenses. |
27
Pacer American Energy Independence ETF
SCHEDULE OF INVESTMENTS
October 31, 2022
| | | Shares | | | Value | |
COMMON STOCKS — 78.9% | | | | |
| | | | | | | | | |
Energy — 78.9% | | | | |
Antero Midstream Corp. | | | 120,563 | | | $ | 1,283,996 | |
Archrock, Inc. | | | 132,249 | | | | 993,190 | |
Cheniere Energy, Inc. (a) | | | 19,765 | | | | 3,486,743 | |
DT Midstream, Inc. (a) | | | 25,480 | | | | 1,521,156 | |
Enbridge, Inc. | | | 82,353 | | | | 3,208,645 | |
EnLink Midstream LLC | | | 113,318 | | | | 1,346,218 | |
Equitrans Midstream Corp. (a) | | | 134,666 | | | | 1,133,888 | |
Gibson Energy, Inc. | | | 61,389 | | | | 1,047,671 | |
Hess Midstream LP - Class A (a) | | | 35,343 | | | | 1,022,826 | |
Keyera Corp. | | | 60,747 | | | | 1,302,024 | |
Kinder Morgan, Inc. | | | 189,556 | | | | 3,434,755 | |
Kinetik Holdings, Inc. | | | 26,059 | | | | 958,450 | |
New Fortress Energy, Inc. | | | 22,455 | | | | 1,236,597 | |
NextDecade Corp. (b) | | | 126,015 | | | | 882,105 | |
ONEOK, Inc. (a) | | | 33,381 | | | | 1,980,161 | |
Pembina Pipeline Corp. | | | 57,648 | | | | 1,903,334 | |
Plains GP Holdings LP - Class A | | | 89,735 | | | | 1,125,277 | |
Targa Resources Corp. | | | 29,390 | | | | 2,009,394 | |
TC Energy Corp. | | | 71,239 | | | | 3,129,109 | |
Tellurian, Inc. (a)(b) | | | 348,753 | | | | 941,633 | |
The Williams Cos., Inc. (a) | | | 105,345 | | | | 3,447,942 | |
| | | | | | | | 37,395,114 | |
TOTAL COMMON STOCKS (Cost $30,379,645) | | | | | | | 37,395,114 | |
| | | | | |
MASTER LIMITED PARTNERSHIPS AND RELATED COMPANIES — 20.5% | | | | |
| | | | | | | | | |
Energy — 20.5% | | | | |
Crestwood Equity Partners LP | | | 10,447 | | | | 320,723 | |
Energy Transfer LP | | | 169,917 | | | | 2,169,840 | |
Enterprise Products Partners LP | | | 131,746 | | | | 3,326,586 | |
Genesis Energy LP | | | 20,078 | | | | 230,696 | |
Holly Energy Partners LP | | | 10,305 | | | | 194,146 | |
Magellan Midstream Partners LP | | | 21,240 | | | | 1,145,898 | |
MPLX LP | | | 36,714 | | | | 1,231,388 | |
NuStar Energy LP | | | 16,555 | | | | 266,535 | |
PBF Logistics LP | | | 8,399 | | | | 179,067 | |
Western Midstream Partners LP | | | 21,962 | | | | 630,529 | |
| | | | | | | | 9,695,408 | |
TOTAL MASTER LIMITED PARTNERSHIPS AND RELATED COMPANIES (Cost $7,317,664) | | | | | | | 9,695,408 | |
| | | | | |
| | | Principal
Amount | | | Value | |
| SHORT-TERM INVESTMENTS — 0.0% (c) | | | | | | | | |
| | | | | | | | | |
| Money Market Deposit Accounts — 0.0% (c) | | | | | | | | |
| U.S. Bank Money Market Deposit Account, 2.300% (d) | | $ | 23,125 | | | $ | 23,125 | |
| TOTAL SHORT-TERM INVESTMENTS (Cost $23,125) | | | | | | | 23,125 | |
| | | Shares | | | | |
| INVESTMENTS PURCHASED WITH PROCEEDS FROM SECURITIES LENDING — 14.0% |
| Mount Vernon Liquid Assets Portfolio, LLC, 3.24% (d) | | | 6,624,646 | | | | 6,624,646 | |
| TOTAL INVESTMENTS PURCHASED WITH PROCEEDS FROM SECURITIES LENDING (Cost $6,624,646) | | | | | | | 6,624,646 | |
| | | | | | | | | |
Total Investments (Cost $44,345,080) — 113.4% | | | | | | | 53,738,293 | |
Liabilities in Excess of Other Assets — (13.4)% | | | | | | | (6,361,724 | ) |
TOTAL NET ASSETS — 100.0% | | | | | | $ | 47,376,569 | |
Percentages are stated as a percent of net assets.
| | (a) | All or a portion of this security is on loan as of October 31, 2022. The total value of securities on loan is $6,518,906 or 13.8% of net assets. |
| | (b) | Non-income producing security. |
| | (d) | The rate shown is as of October 31, 2022. |
The Global Industry Classification Standard (GICS®) was developed by and/or is the exclusive property of MSCI, Inc. and Standard & Poor Financial Services LLC (“S&P”). GICS® is a service mark of MSCI, Inc. and S&P and has been licensed for use by the Fund’s Administrator, U.S. Bancorp Fund Services, LLC.
For Fund compliance purposes, the Fund’s industry classifications refer to any one or more of the industry sub-classifications used by one or more widely recognized market indexes or ratings group indexes, and/or they may be defined by Fund management. This definition does not apply for all purposes of this report, which may combine sub-classifications for reporting ease.
The accompanying notes are an integral part of the financial statements.
28
Pacer Swan SOS Conservative (January) ETF
SCHEDULE OF INVESTMENTS
October 31, 2022
| | | Contracts | | | Notional Amount | | | Value | |
PURCHASED OPTIONS — 99.8% (a) (b) | | | | | | | | | | | | |
| | | | | | | | | | | | | |
CALL OPTIONS — 88.0% | | | | | | | | | | | | |
SPDR S&P 500 ETF Trust, Expires 12/30/2022, Strike Price $5.52 | | | 364 | | | $ | 14,058,044 | | | $ | 13,790,748 | |
| | | | | | | | | | | | 13,790,748 | |
PUT OPTIONS — 11.8% | | | | | | | | | | | | |
SPDR S&P 500 ETF Trust, Expires 12/30/2022, Strike Price $436.88 | | | 364 | | | | 14,058,044 | | | | 1,850,077 | |
| | | | | | | | | | | | 1,850,077 | |
TOTAL PURCHASED OPTIONS (Cost $16,445,742) | | | | | | | | | | | 15,640,825 | |
| | | | | | | | | | | | | |
| | | Principal
Amount | | | | | | | | | |
SHORT-TERM INVESTMENTS — 0.6% | | | | | | | | | | | | |
| | | | | | | | | | | | | |
Money Market Deposit Accounts — 0.6% | | | | | | | | | | | | |
U.S. Bank Money Market Deposit Account, 2.300% (c) | | $ | 92,402 | | | | | | | | 92,402 | |
TOTAL SHORT-TERM INVESTMENTS (Cost $92,402) | | | | | | | | | | | 92,402 | |
| | | | | | | | | | | | | |
Total Investments (Cost $16,538,144) — 100.4% | | | | | | | | | | | 15,733,227 | |
Liabilities in Excess of Other Assets — (0.4%) | | | | | | | | | | | (62,793) | |
TOTAL NET ASSETS — 100.0% | | | | | | | | | | $ | 15,670,434 | |
Percentages are stated as a percent of net assets.
| | (b) | Purchased option contracts are held in connection with corresponding written option contracts. |
| | (c) | The rate shown is as of October 31, 2022. |
SCHEDULE OF WRITTEN OPTIONS
October 31, 2022
| | | Contracts | | | Notional Amount | | | Value | |
WRITTEN OPTIONS — (0.4%) (a) | | | | | | | | | | | | |
| | | | | | | | | | | | | |
CALL OPTIONS — (0.0%) (d) | | | | | | | | | | | | |
SPDR S&P 500 ETF Trust, Expires 12/30/2022, Strike Price $499.42 | | | 364 | | | $ | (14,058,044 | ) | | $ | (904) | |
| | | | | | | | | | | | (904) | |
PUT OPTIONS — (0.4%) | | | | | | | | | | | | |
SPDR S&P 500 ETF Trust, Expires 12/30/2022, Strike Price $321.91 | | | 364 | | | | (14,058,044 | ) | | | (59,081) | |
| | | | | | | | | | | | (59,081) | |
TOTAL WRITTEN OPTIONS (Premiums Received $640,309) | | | | | | | | | | $ | (59,985) | |
Percentages are stated as a percent of net assets.
The accompanying notes are an integral part of the financial statements.
29
Pacer Swan SOS Moderate (January) ETF
SCHEDULE OF INVESTMENTS
October 31, 2022
| | | Contracts | | | Notional Amount | | | Value | |
PURCHASED OPTIONS — 103.8% (a) (b) | | | | | | | | | | | | |
| | | | | | | | | | | | | |
CALL OPTIONS — 87.0% | | | | | | | | | | | | |
SPDR S&P 500 ETF Trust, Expires 12/30/2022, Strike Price $5.56 | | | 469 | | | $ | 18,113,249 | | | $ | 17,766,985 | |
| | | | | | | | | | | | 17,766,985 | |
PUT OPTIONS — 16.8% | | | | | | | | | | | | |
SPDR S&P 500 ETF Trust, Expires 12/30/2022, Strike Price $459.92 | | | 469 | | | | 18,113,249 | | | | 3,426,764 | |
| | | | | | | | | | | | 3,426,764 | |
TOTAL PURCHASED OPTIONS (Cost $22,279,292) | | | | | | | | | | | 21,193,749 | |
| | | | | | | | | | | | | |
| | | Principal
Amount | | | | | | | | | |
SHORT-TERM INVESTMENTS — 0.2% | | | | | | | | | | | | |
| | | | | | | | | | | | | |
Money Market Deposit Accounts — 0.2% | | | | | | | | | | | | |
U.S. Bank Money Market Deposit Account, 2.300% (c) | | $ | 39,750 | | | | | | | | 39,750 | |
TOTAL SHORT-TERM INVESTMENTS (Cost $39,750) | | | | | | | | | | | 39,750 | |
| | | | | | | | | | | | | |
Total Investments (Cost $22,319,042) — 104.0% | | | | | | | | | | | 21,233,499 | |
Liabilities in Excess of Other Assets — (4.0)% | | | | | | | | | | | (808,480) | |
TOTAL NET ASSETS — 100.0% | | | | | | | | | | $ | 20,425,019 | |
Percentages are stated as a percent of net assets.
| | (b) | Purchased option contracts are held in connection with corresponding written option contracts. |
| | (c) | The rate shown is as of October 31, 2022 |
SCHEDULE OF WRITTEN OPTIONS
October 31, 2022
| | | Contracts | | | Notional Amount | | | Value | |
WRITTEN OPTIONS — (3.9%) (a) | | | | | | | | | | | | |
| | | | | | | | | | | | | |
CALL OPTIONS — (0.0%) (d) | | | | | | | | | | | | |
SPDR S&P 500 ETF Trust, Expires 12/30/2022, Strike Price $507.24 | | | 469 | | | $ | (18,113,249) | | | $ | (709) | |
| | | | | | | | | | | | (709) | |
PUT OPTIONS — (3.9%) | | | | | | | | | | | | |
SPDR S&P 500 ETF Trust, Expires 12/30/2022, Strike Price $390.89 | | | 469 | | | | (18,113,249) | | | | (800,441) | |
| | | | | | | | | | | | (800,441) | |
TOTAL WRITTEN OPTIONS (Premiums Received $1,701,801) | | | | | | | | | | $ | (801,150) | |
Percentages are stated as a percent of net assets.
The accompanying notes are an integral part of the financial statements.
30
Pacer Swan SOS Flex (January) ETF
SCHEDULE OF INVESTMENTS
October 31, 2022
| | | Contracts | | | Notional Amount | | | Value | |
PURCHASED OPTIONS — 103.6% (a) (b) | | | | | | | | | | | | |
| | | | | | | | | | | | | |
CALL OPTIONS — 86.8% | | | | | | | | | | | | |
SPDR S&P 500 ETF Trust, Expires 12/30/2022, Strike Price $5.61 | | | 394 | | | $ | 15,216,674 | | | $ | 14,923,825 | |
| | | | | | | | | | | | 14,923,825 | |
PUT OPTIONS — 16.8% | | | | | | | | | | | | |
SPDR S&P 500 ETF Trust, Expires 12/30/2022, Strike Price $275.92 | | | 394 | | | | 15,216,674 | | | | 17,519 | |
SPDR S&P 500 ETF Trust, Expires 12/30/2022, Strike Price $459.87 | | | 394 | | | | 15,216,674 | | | | 2,876,815 | |
| | | | | | | | | | | | 2,894,334 | |
TOTAL PURCHASED OPTIONS (Cost $17,875,288) | | | | | | | | | | | 17,818,159 | |
| | | | | | | | | | | | | |
| | | Principal
Amount | | | | | | | | | |
SHORT-TERM INVESTMENTS — 0.2% | | | | | | | | | | | | |
| | | | | | | | | | | | | |
Money Market Deposit Accounts — 0.2% | | | | | | | | | | | | |
U.S. Bank Money Market Deposit Account, 2.300% (c) | | $ | 37,690 | | | | | | | | 37,690 | |
TOTAL SHORT-TERM INVESTMENTS (Cost $37,690) | | | | | | | | | | | 37,690 | |
| | | | | | | | | | | | | |
Total Investments (Cost $17,912,978) — 103.8% | | | | | | | | | | | 17,855,849 | |
Liabilities in Excess of Other Assets — (3.8)% | | | | | | | | | | | (659,686) | |
TOTAL NET ASSETS — 100.0% | | | | | | | | | | $ | 17,196,163 | |
Percentages are stated as a percent of net assets.
| | (b) | Purchased option contracts are held in connection with corresponding written option contracts. |
| | (c) | The rate shown is as of October 31, 2022 |
SCHEDULE OF WRITTEN OPTIONS
October 31, 2022
| | | Contracts | | | Notional Amount | | | Value | |
WRITTEN OPTIONS — (3.8%) (a) | | | | | | | | | | | | |
| | | | | | | | | | | | | |
CALL OPTIONS — (0.0%) (d) | | | | | | | | | | | | |
SPDR S&P 500 ETF Trust, Expires 12/30/2022, Strike Price $527.47 | | | 394 | | | $ | (15,216,674) | | | $ | (236) | |
| | | | | | | | | | | | (236) | |
PUT OPTIONS — (3.8%) | | | | | | | | | | | | |
SPDR S&P 500 ETF Trust, Expires 12/30/2022, Strike Price $367.90 | | | 788 | | | �� | (30,433,348) | | | | (654,548) | |
| | | | | | | | | | | | (654,548) | |
TOTAL WRITTEN OPTIONS (Premiums Received $1,901,405) | | | | | | | | | | $ | (654,784) | |
Percentages are stated as a percent of net assets.
The accompanying notes are an integral part of the financial statements.
31
Pacer Swan SOS Fund of Funds ETF
SCHEDULE OF INVESTMENTS
October 31, 2022
| | | Shares | | | Value | |
AFFILIATED EXCHANGE-TRADED FUNDS — 99.2% | | | | |
| | | | | | | | | |
Pacer Swan SOS Conservative (April) ETF (a) | | | 219,929 | | | $ | 4,553,564 | |
Pacer Swan SOS Conservative (January) ETF (a) | | | 233,148 | | | | 4,854,165 | |
Pacer Swan SOS Conservative (July) ETF (a) | | | 229,999 | | | | 4,489,419 | |
Pacer Swan SOS Conservative (October) ETF (a) | | | 191,388 | | | | 3,818,573 | |
Pacer Swan SOS Flex (April) ETF (a) | | | 353,577 | | | | 7,615,978 | |
Pacer Swan SOS Flex (January) ETF (a) | | | 326,782 | | | | 7,485,726 | |
Pacer Swan SOS Flex (July) ETF (a) | | | 354,801 | | | | 7,371,133 | |
Pacer Swan SOS Flex (October) ETF (a) | | | 337,055 | | | | 7,196,192 | |
Pacer Swan SOS Moderate (April) ETF (a) | | | 765,441 | | | | 16,137,869 | |
Pacer Swan SOS Moderate (January) ETF | | | 788,120 | | | | 16,926,296 | |
Pacer Swan SOS Moderate (July) ETF | | | 873,453 | | | | 18,032,262 | |
Pacer Swan SOS Moderate (October) ETF (a) | | | 899,006 | | | | 18,636,215 | |
TOTAL AFFILIATED EXCHANGE-TRADED FUNDS (Cost $120,216,842) | | | | | | | 117,117,392 | |
| | | | | |
| | | Principal
Amount | | | | | |
SHORT-TERM INVESTMENTS — 0.8% | | | | |
| | | | | |
Money Market Deposit Accounts — 0.8% | | | | |
U.S. Bank Money Market Deposit Account, 2.300% (b) | | $ | 956,797 | | | | 956,797 | |
TOTAL SHORT-TERM INVESTMENTS (Cost $956,797) | | | | | | | 956,797 | |
| | | | | |
Total Investments (Cost $121,173,638) — 100.0% | | | | | | | 118,074,189 | |
Liabilities in Excess of Other Assets — (0.0%) (c) | | | | | | | (14,037) | |
TOTAL NET ASSETS — 100.0% | | | | | | $ | 118,060,152 | |
Percentages are stated as a percent of net assets.
| | (a) | Non-income producing security. |
| | (b) | The rate shown is as of October 31, 2022. |
The accompanying notes are an integral part of the financial statements.
32
Pacer Swan SOS Conservative (April) ETF
SCHEDULE OF INVESTMENTS
October 31, 2022
| | | Contracts | | | Notional Amount | | | Value | |
PURCHASED OPTIONS — 100.7% (a) (b) | | | | | | | | | | | | |
| | | | | | | | | | | | | |
CALL OPTIONS — 89.7% | | | | | | | | | | | | |
SPDR S&P 500 ETF Trust, Expires 3/31/2023, Strike Price $5.42 | | | 382 | | | $ | 14,753,222 | | | $ | 14,420,299 | |
| | | | | | | | | | | | 14,420,299 | |
PUT OPTIONS — 11.0% | | | | | | | | | | | | |
SPDR S&P 500 ETF Trust, Expires 3/31/2023, Strike Price $429.06 | | | 382 | | | | 14,753,222 | | | | 1,774,660 | |
| | | | | | | | | | | | 1,774,660 | |
TOTAL PURCHASED OPTIONS (Cost $17,474,857) | | | | | | | | | | | 16,194,959 | |
| | | | | | | | | | | | | |
| | | Principal
Amount | | | | | | | | | |
SHORT-TERM INVESTMENTS — 0.7% | | | | | | | | | | | | |
| | | | | | | | | | | | | |
Money Market Deposit Accounts — 0.7% | | | | | | | | | | | | |
U.S. Bank Money Market Deposit Account, 2.300% (c) | | $ | 106,895 | | | | | | | | 106,895 | |
TOTAL SHORT-TERM INVESTMENTS (Cost $106,895) | | | | | | | | | | | 106,895 | |
| | | | | | | | | | | | | |
Total Investments (Cost $17,581,752) — 101.4% | | | | | | | | | | | 16,301,854 | |
Liabilities in Excess of Other Assets — (1.4)% | | | | | | | | | | | (220,491) | |
TOTAL NET ASSETS — 100.0% | | | | | | | | | | $ | 16,081,363 | |
Percentages are stated as a percent of net assets.
| | (b) | Purchased option contracts are held in connection with corresponding written option contracts. |
| | (c) | The rate shown is as of October 31, 2022. |
SCHEDULE OF WRITTEN OPTIONS
October 31, 2022
| | | Contracts | | | Notional Amount | | | Value | |
WRITTEN OPTIONS — (1.3%) (a) | | | | | | | | | | | | |
| | | | | | | | | | | | | |
CALL OPTIONS — (0.1%) | | | | | | | | | | | | |
SPDR S&P 500 ETF Trust, Expires 3/31/2023, Strike Price $497.84 | | | 382 | | | $ | (14,753,222) | | | $ | (17,522) | |
| | | | | | | | | | | | (17,522) | |
PUT OPTIONS — (1.2%) | | | | | | | | | | | | |
SPDR S&P 500 ETF Trust, Expires 3/31/2023, Strike Price $316.15 | | | 382 | | | | (14,753,222) | | | | (199,061) | |
| | | | | | | | | | | | (199,061) | |
TOTAL WRITTEN OPTIONS (Premiums Received $302,514) | | | | | | | | | | $ | (216,583) | |
Percentages are stated as a percent of net assets.
The accompanying notes are an integral part of the financial statements.
33
Pacer Swan SOS Moderate (April) ETF
SCHEDULE OF INVESTMENTS
October 31, 2022
| | | Contracts | | | Notional Amount | | | Value | |
PURCHASED OPTIONS — 104.8% (a) (b) | | | | | | | | | | | | |
| | | | | | | | | | | | | |
CALL OPTIONS — 89.6% | | | | | | | | | | | | |
SPDR S&P 500 ETF Trust, Expires 3/31/2023, Strike Price $5.46 | | | 426 | | | $ | 16,452,546 | | | $ | 16,079,603 | |
| | | | | | | | | | | | 16,079,603 | |
PUT OPTIONS — 15.2% | | | | | | | | | | | | |
SPDR S&P 500 ETF Trust, Expires 3/31/2023, Strike Price $451.69 | | | 426 | | | | 16,452,546 | | | | 2,739,560 | |
| | | | | | | | | | | | 2,739,560 | |
TOTAL PURCHASED OPTIONS (Cost $21,311,472) | | | | | | | | | | | 18,819,163 | |
| | | | | | | | | | | | | |
| | | Principal
Amount | | | | | | | | | |
SHORT-TERM INVESTMENTS — 0.3% | | | | | | | | | | | | |
| | | | | | | | | | | | | |
Money Market Deposit Account — 0.3% | | | | | | | | | | | | |
U.S. Bank Money Market Deposit Account, 2.300% (c) | | $ | 57,974 | | | | | | | | 57,974 | |
TOTAL SHORT-TERM INVESTMENTS (Cost $57,974) | | | | | | | | | | | 57,974 | |
| | | | | | | | | | | | | |
Total Investments (Cost $21,369,446) — 105.1% | | | | | | | | | | | 18,877,137 | |
Liabilities in Excess of Other Assets — (5.1)% | | | | | | | | | | | (923,311) | |
TOTAL NET ASSETS — 100.0% | | | | | | | | | | $ | 17,953,826 | |
Percentages are stated as a percent of net assets.
| | (b) | Purchased option contracts are held in connection with corresponding written option contracts. |
| | (c) | The rate shown is as of October 31, 2022. |
SCHEDULE OF WRITTEN OPTIONS
October 31, 2022
| | | Contracts | | | Notional Amount | | | Value | |
WRITTEN OPTIONS — (5.1%) (a) | | | | | | | | | | | | |
| | | | | | | | | | | | | |
CALL OPTIONS — (0.1%) | | | | | | | | | | | | |
SPDR S&P 500 ETF Trust, Expires 3/31/2023, Strike Price $502.72 | | | 426 | | | $ | (16,452,546) | | | $ | (15,816) | |
| | | | | | | | | | | | (15,816) | |
PUT OPTIONS — (5.0%) | | | | | | | | | | | | |
SPDR S&P 500 ETF Trust, Expires 3/31/2023, Strike Price $383.89 | | | 426 | | | | (16,452,546) | | | | (902,936) | |
| | | | | | | | | | | | (902,936) | |
TOTAL WRITTEN OPTIONS (Premiums Received $816,322) | | | | | | | | | | $ | (918,751) | |
Percentages are stated as a percent of net assets.
The accompanying notes are an integral part of the financial statements.
34
Pacer Swan SOS Flex (April) ETF
SCHEDULE OF INVESTMENTS
October 31, 2022
| | | Contracts | | | Notional Amount | | | Value | |
PURCHASED OPTIONS — 106.3% (a) (b) | | | | | | | | | | | | |
| | | | | | | | | | | | | |
CALL OPTIONS — 90.4% | | | | | | | | | | | | |
SPDR S&P 500 ETF Trust, Expires 3/31/2023, Strike Price $5.51 | | | 297 | | | $ | 11,470,437 | | | $ | 11,208,969 | |
| | | | | | | | | | | | 11,208,969 | |
PUT OPTIONS — 15.9% | | | | | | | | | | | | |
SPDR S&P 500 ETF Trust, Expires 3/31/2023, Strike Price $270.98 | | | 297 | | | | 11,470,437 | | | | 62,906 | |
SPDR S&P 500 ETF Trust, Expires 3/31/2023, Strike Price $451.64 | | | 297 | | | | 11,470,437 | | | | 1,908,727 | |
| | | | | | | | | | | | 1,971,633 | |
TOTAL PURCHASED OPTIONS (Cost $15,162,419) | | | | | | | | | | | 13,180,602 | |
| | | | | | | | | | | | | |
| | | Principal
Amount | | | | | | | | | |
SHORT-TERM INVESTMENTS — 0.3% | | | | | | | | | | | | |
| | | | | | | | | | | | | |
Money Market Deposit Accounts — 0.3% | | | | | | | | | | | | |
U.S. Bank Money Market Deposit Account, 2.300% (c) | | $ | 41,055 | | | | | | | | 41,055 | |
TOTAL SHORT-TERM INVESTMENTS (Cost $41,055) | | | | | | | | | | | 41,055 | |
| | | | | | | | | | | | | |
Total Investments (Cost $15,203,475) — 106.6% | | | | | | | | | | | 13,221,657 | |
Liabilities in Excess of Other Assets — (6.6)% | | | | | | | | | | | (815,303) | |
TOTAL NET ASSETS — 100.0% | | | | | | | | | | $ | 12,406,354 | |
Percentages are stated as a percent of net assets.
| | (b) | Purchased option contracts are held in connection with corresponding written option contracts. |
| | (c) | The rate shown is as of July 31, 2022. |
SCHEDULE OF WRITTEN OPTIONS
October 31, 2022
| | | Contracts | | | Notional Amount | | | Value | |
WRITTEN OPTIONS — (6.6%) (a) | | | | | | | | | | | | |
| | | | | | | | | | | | | |
CALL OPTIONS — (0.1%) | | | | | | | | | | | | |
SPDR S&P 500 ETF Trust, Expires 3/31/2023, Strike Price $518.84 | | | 297 | | | $ | (11,470,437) | | | $ | (5,729) | |
| | | | | | | | | | | | (5,729) | |
PUT OPTIONS — (6.5%) | | | | | | | | | | | | |
SPDR S&P 500 ETF Trust, Expires 3/31/2023, Strike Price $361.31 | | | 594 | | | | (22,940,874) | | | | (808,110) | |
| | | | | | | | | | | | (808,110) | |
TOTAL WRITTEN OPTIONS (Premiums Received $828,314) | | | | | | | | | | $ | (813,839) | |
Percentages are stated as a percent of net assets.
The accompanying notes are an integral part of the financial statements.
35
Pacer Swan SOS Conservative (July) ETF
SCHEDULE OF INVESTMENTS
October 31, 2022
| | | Contracts | | | Notional Amount | | | Value | |
PURCHASED OPTIONS — 103.4% (a) (b) | | | | | | | | | | | | |
| | | | | | | | | | | | | |
CALL OPTIONS — 98.8% | | | | | | | | | | | | |
SPDR S&P 500 ETF Trust, Expires 6/30/2023, Strike Price $4.15 | | | 166 | | | $ | 6,411,086 | | | $ | 6,259,268 | |
| | | | | | | | | | | | 6,259,268 | |
PUT OPTIONS — 4.6% | | | | | | | | | | | | |
SPDR S&P 500 ETF Trust, Expires 6/30/2023, Strike Price $358.39 | | | 166 | | | | 6,411,086 | | | | 291,303 | |
| | | | | | | | | | | | 291,303 | |
TOTAL PURCHASED OPTIONS (Cost $6,560,992) | | | | | | | | | | | 6,550,571 | |
| | | | | | | | | | | | | |
| | | Principal
Amount | | | | | | | | | |
SHORT-TERM INVESTMENTS — 0.8% | | | | | | | | | | | | |
| | | | | | | | | | | | | |
Money Market Deposit Accounts — 0.8% | | | | | | | | | | | | |
U.S. Bank Money Market Deposit Account, 2.300% (c) | | $ | 52,887 | | | | | | | | 52,887 | |
TOTAL SHORT-TERM INVESTMENTS (Cost $52,887) | | | | | | | | | | | 52,887 | |
| | | | | | | | | | | | | |
Total Investments (Cost $6,613,879) — 104.2% | | | | | | | | | | | 6,603,458 | |
Liabilities in Excess of Other Assets — (4.2)% | | | | | | | | | | | (267,559) | |
TOTAL NET ASSETS — 100.0% | | | | | | | | | | $ | 6,335,899 | |
Percentages are stated as a percent of net assets.
| | (b) | Purchased option contracts are held in connection with corresponding written option contracts. |
| | (c) | The rate shown is as of October 31, 2022. |
SCHEDULE OF WRITTEN OPTIONS
October 31, 2022
| | | Contracts | | | Notional Amount | | | Value | |
WRITTEN OPTIONS — (4.2%) (a) | | | | | | | | | | | | |
| | | | | | | | | | | | | |
CALL OPTIONS — (3.3%) | | | | | | | | | | | | |
SPDR S&P 500 ETF Trust, Expires 6/30/2023, Strike Price $434.97 | | | 166 | | | $ | (6,411,086) | | | $ | (206,579) | |
| | | | | | | | | | | | (206,579) | |
PUT OPTIONS — (0.9%) | | | | | | | | | | | | |
SPDR S&P 500 ETF Trust, Expires 6/30/2023, Strike Price $264.08 | | | 166 | | | | (6,411,086) | | | | (60,015) | |
| | | | | | | | | | | | (60,015) | |
TOTAL WRITTEN OPTIONS (Premiums Received $355,925) | | | | | | | | | | $ | (266,594) | |
Percentages are stated as a percent of net assets.
The accompanying notes are an integral part of the financial statements.
36
Pacer Swan SOS Moderate (July) ETF
SCHEDULE OF INVESTMENTS
October 31, 2022
| | | Contracts | | | Notional Amount | | | Value | |
PURCHASED OPTIONS — 104.3% (a) (b) | | | | | | | | | | | | |
| | | | | | | | | | | | | |
CALL OPTIONS — 98.2% | | | | | | | | | | | | |
SPDR S&P 500 ETF Trust, Expires 6/30/2023, Strike Price $4.19 | | | 874 | | | $ | 33,754,754 | | | $ | 32,952,035 | |
| | | | | | | | | | | | 32,952,035 | |
PUT OPTIONS — 6.1% | | | | | | | | | | | | |
SPDR S&P 500 ETF Trust, Expires 6/30/2023, Strike Price $377.29 | | | 874 | | | | 33,754,754 | | | | 2,056,628 | |
| | | | | | | | | | | | 2,056,628 | |
TOTAL PURCHASED OPTIONS (Cost $34,545,200) | | | | | | | | | | | 35,008,663 | |
| | | | | | | | | | | | | |
| | | Principal
Amount | | | | | | | | | |
SHORT-TERM INVESTMENTS — 0.9% | | | | | | | | | | | | |
| | | | | | | | | | | | | |
Money Market Deposit Accounts — 0.9% | | | | | | | | | | | | |
U.S. Bank Money Market Deposit Account, 2.300% (c) | | $ | 288,553 | | | | | | | | 288,553 | |
TOTAL SHORT-TERM INVESTMENTS (Cost $288,553) | | | | | | | | | | | 288,553 | |
| | | | | | | | | | | | | |
Total Investments (Cost $34,833,753) — 105.2% | | | | | | | | | | | 35,297,216 | |
Liabilities in Excess of Other Assets — (5.2)% | | | | | | | | | | | (1,741,153) | |
TOTAL NET ASSETS — 100.0% | | | | | | | | | | $ | 33,556,063 | |
Percentages are stated as a percent of net assets.
| | (b) | Purchased option contracts are held in connection with corresponding written option contracts. |
| | (c) | The rate shown is as of October 31, 2022. |
SCHEDULE OF WRITTEN OPTIONS
October 31, 2022
| | | Contracts | | | Notional Amount | | | Value | |
WRITTEN OPTIONS — (5.1%) (a) | | | | | | | | | | | | |
| | | | | | | | | | | | | |
CALL OPTIONS — (2.7%) | | | | | | | | | | | | |
SPDR S&P 500 ETF Trust, Expires 6/30/2023, Strike Price $441.76 | | | 874 | | | $ | (33,754,754) | | | $ | (909,651) | |
| | | | | | | | | | | | (909,651) | |
PUT OPTIONS — (2.4%) | | | | | | | | | | | | |
SPDR S&P 500 ETF Trust, Expires 6/30/2023, Strike Price $320.66 | | | 874 | | | | (33,754,754) | | | | (816,324) | |
| | | | | | | | | | | | (816,324) | |
TOTAL WRITTEN OPTIONS (Premiums Received $2,090,424) | | | | | | | | | | $ | (1,725,975) | |
Percentages are stated as a percent of net assets.
The accompanying notes are an integral part of the financial statements.
37
Pacer Swan SOS Flex (July) ETF
SCHEDULE OF INVESTMENTS
October 31, 2022
| | | Contracts | | | Notional Amount | | | Value | |
PURCHASED OPTIONS — 104.0% (a) (b) | | | | | | | | | | | | |
| | | | | | | | | | | | | |
CALL OPTIONS — 97.4% | | | | | | | | | | | | |
SPDR S&P 500 ETF Trust, Expires 6/30/2023, Strike Price $4.23 | | | 322 | | | $ | 12,435,962 | | | $ | 12,138,974 | |
| | | | | | | | | | | | 12,138,974 | |
PUT OPTIONS — 6.6% | | | | | | | | | | | | |
SPDR S&P 500 ETF Trust, Expires 6/30/2023, Strike Price $226.35 | | | 322 | | | | 12,435,962 | | | | 64,265 | |
SPDR S&P 500 ETF Trust, Expires 6/30/2023, Strike Price $377.25 | | | 322 | | | | 12,435,962 | | | | 757,286 | |
| | | | | | | | | | | | 821,551 | |
TOTAL PURCHASED OPTIONS (Cost $12,988,976) | | | | | | | | | | | 12,960,525 | |
| | | | | | | | | | | | | |
| | | Principal
Amount | | | | | | | | | |
SHORT-TERM INVESTMENTS — 1.1% | | | | | | | | | | | | |
| | | | | | | | | | | | | |
Money Market Deposit Accounts — 1.1% | | | | | | | | | | | | |
U.S. Bank Money Market Deposit Account, 2.300% (c) | | $ | 135,338 | | | | | | | | 135,338 | |
TOTAL SHORT-TERM INVESTMENTS (Cost $135,338) | | | | | | | | | | | 135,338 | |
| | | | | | | | | | | | | |
Total Investments (Cost $13,124,314) — 105.1% | | | | | | | | | | | 13,095,863 | |
Liabilities in Excess of Other Assets — (5.1)% | | | | | | | | | | | (628,264) | |
TOTAL NET ASSETS — 100.0% | | | | | | | | | | $ | 12,467,599 | |
Percentages are stated as a percent of net assets.
| | (b) | Purchased option contracts are held in connection with corresponding written option contracts. |
| | (c) | The rate shown is as of October 31, 2022. |
SCHEDULE OF WRITTEN OPTIONS
October 31, 2022
| | | Contracts | | | Notional Amount | | | Value | |
WRITTEN OPTIONS — (5.0%) (a) | | | | | | | | | | | | |
| | | | | | | | | | | | | |
CALL OPTIONS — (1.5%) | | | | | | | | | | | | |
SPDR S&P 500 ETF Trust, Expires 6/30/2023, Strike Price $461.30 | | | 322 | | | $ | (12,435,962) | | | $ | (192,451) | |
| | | | | | | | | | | | (192,451) | |
PUT OPTIONS — (3.5%) | | | | | | | | | | | | |
SPDR S&P 500 ETF Trust, Expires 6/30/2023, Strike Price $301.80 | | | 644 | | | | (24,871,924) | | | | (434,595) | |
| | | | | | | | | | | | (434,595) | |
TOTAL WRITTEN OPTIONS (Premiums Received $971,447) | | | | | | | | | | $ | (627,046) | |
Percentages are stated as a percent of net assets.
The accompanying notes are an integral part of the financial statements.
38
Pacer Swan SOS Conservative (October) ETF
SCHEDULE OF INVESTMENTS
October 31, 2022
| | | Contracts | | | Notional Amount | | | Value | |
PURCHASED OPTIONS — 105.6% (a) (b) | | | | | | | | | | | | |
| | | | | | | | | | | | | |
CALL OPTIONS — 101.2% | | | | | | | | | | | | |
SPDR S&P 500 ETF Trust, Expires 9/29/2023, Strike Price $3.93 | | | 134 | | | $ | 5,175,214 | | | $ | 5,032,169 | |
| | | | | | | | | | | | 5,032,169 | |
PUT OPTIONS — 4.4% | | | | | | | | | | | | |
SPDR S&P 500 ETF Trust, Expires 9/29/2023, Strike Price $339.32 | | | 134 | | | | 5,175,214 | | | | 218,932 | |
| | | | | | | | | | | | 218,932 | |
TOTAL PURCHASED OPTIONS (Cost $4,995,817) | | | | | | | | | | | 5,251,101 | |
| | | | | | | | | | | | | |
| | | Principal
Amount | | | | | | | | | |
SHORT-TERM INVESTMENTS — 1.7% | | | | | | | | | | | | |
| | | | | | | | | | | | | |
Money Market Deposit Accounts — 1.7% | | | | | | | | | | | | |
U.S. Bank Money Market Deposit Account, 2.300% (c) | | $ | 83,052 | | | | | | | | 83,052 | |
TOTAL SHORT-TERM INVESTMENTS (Cost $83,052) | | | | | | | | | | | 83,052 | |
| | | | | | | | | | | | | |
Total Investments (Cost $5,078,869) — 107.3% | | | | | | | | | | | 5,334,153 | |
Liabilities in Excess of Other Assets — (7.3)% | | | | | | | | | | | (362,741) | |
TOTAL NET ASSETS — 100.0% | | | | | | | | | | $ | 4,971,412 | |
Percentages are stated as a percent of net assets.
| | (b) | Purchased option contracts are held in connection with corresponding written option contracts. |
| | (c) | The rate shown is as of October 31, 2022. |
SCHEDULE OF WRITTEN OPTIONS
October 31, 2022
| | | Contracts | | | Notional Amount | | | Value | |
WRITTEN OPTIONS — (7.3%) (a) | | | | | | | | | | | | |
| | | | | | | | | | | | | |
CALL OPTIONS — (6.2%) | | | | | | | | | | | | |
SPDR S&P 500 ETF Trust, Expires 9/29/2023, Strike Price $423.04 | | | 134 | | | $ | (5,175,214) | | | $ | (308,675) | |
| | | | | | | | | | | | (308,675) | |
PUT OPTIONS — (1.1%) | | | | | | | | | | | | |
SPDR S&P 500 ETF Trust, Expires 9/29/2023, Strike Price $250.03 | | | 134 | | | | (5,175,214) | | | | (56,667) | |
| | | | | | | | | | | | (56,667) | |
TOTAL WRITTEN OPTIONS (Premiums Received $261,066) | | | | | | | | | | $ | (365,342) | |
Percentages are stated as a percent of net assets.
The accompanying notes are an integral part of the financial statements.
39
Pacer Swan SOS Moderate (October) ETF
SCHEDULE OF INVESTMENTS
October 31, 2022
| | | Contracts | | | Notional Amount | | | Value | |
PURCHASED OPTIONS — 106.7% (a) (b) | | | | | | | | | | | | |
| | | | | | | | | | | | | |
CALL OPTIONS — 101.1% | | | | | | | | | | | | |
SPDR S&P 500 ETF Trust, Expires 9/29/2023, Strike Price $3.96 | | | 626 | | | $ | 24,176,746 | | | $ | 23,506,690 | |
| | | | | | | | | | | | 23,506,690 | |
PUT OPTIONS — 5.6% | | | | | | | | | | | | |
SPDR S&P 500 ETF Trust, Expires 9/29/2023, Strike Price $357.22 | | | 626 | | | | 24,176,746 | | | | 1,312,350 | |
| | | | | | | | | | | | 1,312,350 | |
TOTAL PURCHASED OPTIONS (Cost $23,791,356) | | | | | | | | | | | 24,819,040 | |
| | | | | | | | | | | | | |
| | | Principal
Amount | | | | | | | | | |
SHORT-TERM INVESTMENTS — 1.3% | | | | | | | | | | | | |
| | | | | | | | | | | | | |
Money Market Deposit Accounts — 1.3% | | | | | | | | | | | | |
U.S. Bank Money Market Deposit Account, 2.300% (c) | | $ | 291,995 | | | | | | | | 291,995 | |
TOTAL SHORT-TERM INVESTMENTS (Cost $291,995) | | | | | | | | | | | 291,995 | |
| | | | | | | | | | | | | |
Total Investments (Cost $24,083,352) — 108.0% | | | | | | | | | | | 25,111,035 | |
Liabilities in Excess of Other Assets — (8.0)% | | | | | | | | | | | (1,850,249) | |
TOTAL NET ASSETS — 100.0% | | | | | | | | | | $ | 23,260,786 | |
Percentages are stated as a percent of net assets.
| | (b) | Purchased option contracts are held in connection with corresponding written option contracts. |
| | (c) | The rate shown is as of October 31, 2022. |
SCHEDULE OF WRITTEN OPTIONS
October 31, 2022
| | | Contracts | | | Notional Amount | | | Value | |
WRITTEN OPTIONS — (8.0%) (a) | | | | | | | | | | | | |
| | | | | | | | | | | | | |
CALL OPTIONS — (5.4%) | | | | | | | | | | | | |
SPDR S&P 500 ETF Trust, Expires 9/29/2023, Strike Price $430.76 | | | 626 | | | $ | (24,176,746) | | | $ | (1,244,997) | |
| | | | | | | | | | | | (1,244,997) | |
PUT OPTIONS — (2.6%) | | | | | | | | | | | | |
SPDR S&P 500 ETF Trust, Expires 9/29/2023, Strike Price $303.60 | | | 626 | | | | (24,176,746) | | | | (597,830) | |
| | | | | | | | | | | | (597,830) | |
TOTAL WRITTEN OPTIONS (Premiums Received $1,627,239) | | | | | | | | | | $ | (1,842,827) | |
Percentages are stated as a percent of net assets.
The accompanying notes are an integral part of the financial statements.
40
Pacer Swan SOS Flex (October) ETF
SCHEDULE OF INVESTMENTS
October 31, 2022
| | | Contracts | | | Notional Amount | | | Value | |
PURCHASED OPTIONS — 106.3% (a) (b) | | | | | | | | | | | | |
| | | | | | | | | | | | | |
CALL OPTIONS — 100.0% | | | | | | | | | | | | |
SPDR S&P 500 ETF Trust, Expires 9/29/2023, Strike Price $4.00 | | | 284 | | | $ | 10,968,364 | | | $ | 10,663,288 | |
| | | | | | | | | | | | 10,663,288 | |
PUT OPTIONS — 6.3% | | | | | | | | | | | | |
SPDR S&P 500 ETF Trust, Expires 9/29/2023, Strike Price $214.31 | | | 284 | | | | 10,968,364 | | | | 70,613 | |
SPDR S&P 500 ETF Trust, Expires 9/29/2023, Strike Price $357.18 | | | 284 | | | | 10,968,364 | | | | 601,512 | |
| | | | | | | | | | | | 672,125 | |
TOTAL PURCHASED OPTIONS (Cost $10,942,849) | | | | | | | | | | | 11,335,413 | |
| | | | | | | | | | | | | |
| | | Principal
Amount | | | | | | | | | |
SHORT-TERM INVESTMENTS — 1.1% | | | | | | | | | | | | |
| | | | | | | | | | | | | |
Money Market Deposit Accounts — 1.1% | | | | | | | | | | | | |
U.S. Bank Money Market Deposit Account, 2.300% (c) | | $ | 112,628 | | | | | | | | 112,628 | |
TOTAL SHORT-TERM INVESTMENTS (Cost $112,628) | | | | | | | | | | | 112,628 | |
| | | | | | | | | | | | | |
Total Investments (Cost $11,055,477) — 107.4% | | | | | | | | | | | 11,448,041 | |
Liabilities in Excess of Other Assets — (7.4)% | | | | | | | | | | | (786,524) | |
TOTAL NET ASSETS — 100.0% | | | | | | | | | | $ | 10,661,517 | |
Percentages are stated as a percent of net assets.
| | (b) | Purchased option contracts are held in connection with corresponding written option contracts. |
| | (c) | The rate shown is as of October 31, 2022. |
SCHEDULE OF WRITTEN OPTIONS
October 31, 2022
| | | Contracts | | | Notional Amount | | | Value | |
WRITTEN OPTIONS — (7.4%) (a) | | | | | | | | | | | | |
| | | | | | | | | | | | | |
CALL OPTIONS — (3.5%) | | | | | | | | | | | | |
SPDR S&P 500 ETF Trust, Expires 9/29/2023, Strike Price $451.12 | | | 284 | | | $ | (10,968,364) | | | $ | (368,464) | |
| | | | | | | | | | | | (368,464) | |
PUT OPTIONS — (3.9%) | | | | | | | | | | | | |
SPDR S&P 500 ETF Trust, Expires 9/29/2023, Strike Price $285.74 | | | 568 | | | | (21,936,728) | | | | (418,814) | |
| | | | | | | | | | | | (418,814) | |
TOTAL WRITTEN OPTIONS (Premiums Received $853,518) | | | | | | | | | | $ | (787,278) | |
Percentages are stated as a percent of net assets.
The accompanying notes are an integral part of the financial statements.
41
Pacer BlueStar Digital Entertainment ETF
SCHEDULE OF INVESTMENTS
October 31, 2022
| | | Shares | | | Value | |
COMMON STOCKS — 95.4% | | | | |
| | | | | | | | | |
Communication Services — 32.6% | | | | |
Activision Blizzard, Inc. | | | 299 | | | $ | 21,767 | |
Better Collective A/S (a) | | | 224 | | | | 2,909 | |
Bilibili, Inc. - ADR (a) | | | 341 | | | | 3,042 | |
Capcom Co. Ltd. | | | 306 | | | | 8,533 | |
Catena Media PLC (a) | | | 1,070 | | | | 2,757 | |
Electronic Arts, Inc. | | | 126 | | | | 15,871 | |
Embracer Group AB - Class A (a) | | | 1,267 | | | | 6,096 | |
Kingsoft Corp. Ltd. | | | 2,366 | | | | 7,158 | |
Konami Holdings Corp. | | | 159 | | | | 6,985 | |
NetEase, Inc. - ADR - | | | 208 | | | | 11,569 | |
Nexon Co. Ltd. | | | 463 | | | | 7,778 | |
Nintendo Co. Ltd. | | | 470 | | | | 19,194 | |
ROBLOX Corp. - Class A (a) | | | 284 | | | | 12,706 | |
Sea Ltd. - ADR (a) | | | 238 | | | | 11,824 | |
Skillz, Inc. (a) | | | 3,315 | | | | 3,414 | |
Square Enix Holdings Co. Ltd. | | | 169 | | | | 7,550 | |
Take-Two Interactive Software, Inc. (a) | | | 101 | | | | 11,967 | |
Tencent Holdings Ltd. | | | 1,316 | | | | 34,468 | |
Ubisoft Entertainment SA (a) | | | 214 | | | | 5,874 | |
| | | | | | | | 201,462 | |
Consumer Discretionary — 56.3% | | | | | | | | |
888 Holdings PLC | | | 3,513 | | | | 3,753 | |
Aristocrat Leisure Ltd. | | | 475 | | | | 11,260 | |
Bally’s Corp. (a) | | | 246 | | | | 5,545 | |
Bandai Namco Holdings, Inc. | | | 162 | | | | 10,727 | |
Betmakers Technology Group Ltd. (a) | | | 10,864 | | | | 1,910 | |
Betsson AB | | | 926 | | | | 6,737 | |
DraftKings, Inc. (a) | | | 2,551 | | | | 40,306 | |
Entain PLC | | | 2,768 | | | | 40,251 | |
Everi Holdings, Inc. (a) | | | 521 | | | | 9,889 | |
Evolution AB (b) | | | 633 | | | | 59,173 | |
Flutter Entertainment PLC (a) | | | 441 | | | | 58,362 | |
GAN Ltd. (a) | | | 1,112 | | | | 2,235 | |
Jumbo Interactive Ltd. | | | 561 | | | | 4,893 | |
Kambi Group PLC (a) | | | 275 | | | | 4,345 | |
Kindred Group PLC | | | 1,297 | | | | 11,268 | |
La Francaise des Jeux SAEM (b) | | | 765 | | | | 24,951 | |
NEOGAMES SA (a) | | | 212 | | | | 3,646 | |
OPAP SA | | | 1,285 | | | | 15,748 | |
Playtech PLC (a) | | | 2,088 | | | | 12,477 | |
PointsBet Holdings Ltd. (a) | | | 2,714 | | | | 3,540 | |
Rank Group Plc (a) | | | 3,331 | | | | 2,010 | |
Rush Street Interactive, Inc. (a) | | | 625 | | | | 2,594 | |
Sportradar Holding AG (a) | | | 607 | | | | 6,009 | |
Super Group SGHC Ltd. (a) | | | 1,441 | | | | 5,937 | |
| | | | | | | | 347,566 | |
| | | Shares | | | Value | |
Information Technology — 6.5% | | | | | | | | |
Advanced Micro Devices, Inc. (a) | | | 244 | | | $ | 14,655 | |
NVIDIA Corp. | | | 142 | | | | 19,166 | |
Unity Software, Inc. (a) | | | 221 | | | | 6,519 | |
| | | | | | | | 40,340 | |
TOTAL COMMON STOCKS (Cost $765,161) | | | | | | | 589,368 | |
| | | | | | | | | |
EXCHANGE TRADED FUNDS — 4.5% | | | | |
| | | | | |
iShares MSCI Poland ETF | | | 597 | | | | 7,415 | |
iShares MSCI South Korea ETF | | | 258 | | | | 13,367 | |
iShares MSCI Taiwan ETF | | | 159 | | | | 6,624 | |
TOTAL EXCHANGE TRADED FUNDS (Cost $29,034) | | | | | | | 27,406 | |
| | | | | |
WARRANTS — 0.0% (d) | | | | |
| | | | | |
Consumer Discretionary — 0.0% | | | | |
PointsBet Holdings Ltd., 7/8/2024 (a)(c) | | | 252 | | | | — | |
TOTAL WARRANTS (Cost $0) | | | | | | | — | |
The accompanying notes are an integral part of the financial statements.
42
Pacer BlueStar Digital Entertainment ETF
SCHEDULE OF INVESTMENTS
October 31, 2022 (Continued)
| | Principal
Amount | Value |
SHORT-TERM INVESTMENTS — 0.0% (d) | |
| | |
Money Market Deposit Accounts — 0.0% | |
U.S. Bank Money Market Deposit Account, 2.300% (e) | $ 148 | $ 148 |
TOTAL SHORT-TERM INVESTMENTS (Cost $148) | | 148 |
| | | |
Total Investments (Cost $794,343) — 99.9% | | 616,922 |
Other Assets in Excess of Liabilities — 0.1% | | 790 |
TOTAL NET ASSETS — 100.0% | | $ 617,712 |
Percentages are stated as a percent of net assets.
| | (a) | Non-income producing security. |
| | (b) | Security exempt from registration under Rule 144(a) and Regulation S of the Securities Act of 1933. Such securities are treated as liquid securities according to the Fund’s liquidity guidelines. The value of those securities total $84,124 or 13.6% of net assets. |
| | (c) | Value determined using significant unobservable inputs. |
| | (e) | The rate shown is as of October 31, 2022. |
The Global Industry Classification Standard (GICS®) was developed by and/or is the exclusive property of MSCI, Inc. and Standard & Poor Financial Services LLC (“S&P”). GICS® is a service mark of MSCI, Inc. and S&P and has been licensed for use by the Fund’s Administrator, U.S. Bancorp Fund Services, LLC.
For Fund compliance purposes, the Fund’s industry classifications refer to any one or more of the industry sub-classifications used by one or more widely recognized market indexes or ratings group indexes, and/or they may be defined by Fund management. This definition does not apply for all purposes of this report, which may combine sub-classifications for reporting ease.
The accompanying notes are an integral part of the financial statements.
43
Pacer BlueStar Engineering the Future ETF
SCHEDULE OF INVESTMENTS
October 31, 2022
| | | Shares | | | Value | |
COMMON STOCKS — 99.8% | | | | |
| | | | | | | | | |
Consumer Discretionary — 1.8% | | | | |
Denso Corp. | | | 485 | | | $ | 24,114 | |
| | | | | | | | | |
Health Care — 0.6% | | | | | | | | |
BICO Group AB (a) | | | 2,289 | | | | 8,783 | |
| | | | | | | | | |
Industrials — 25.9% | | | | | | | | |
3D Systems Corp. (a) | | | 5,128 | | | | 45,280 | |
Amada Co Ltd. | | | 396 | | | | 2,789 | |
ANDRITZ AG | | | 102 | | | | 4,744 | |
ATS Automation Tooling Systems, Inc. (a) | | | 122 | | | | 3,855 | |
Daifuku Co. Ltd. | | | 132 | | | | 6,057 | |
Desktop Metal, Inc. (a) | | | 13,025 | | | | 32,953 | |
Duerr AG | | | 102 | | | | 2,700 | |
Emerson Electric Co. | | | 541 | | | | 46,851 | |
FANUC Corp. | | | 154 | | | | 20,339 | |
Fuji Corp/Aichi | | | 170 | | | | 2,251 | |
Konecranes Oyj | | | 112 | | | | 2,818 | |
Lincoln Electric Holdings, Inc. | | | 53 | | | | 7,526 | |
Markforged Holding Corp. (a) | | | 3,578 | | | | 7,800 | |
Maxar Technologies, Inc. | | | 109 | | | | 2,435 | |
Proto Labs, Inc. (a) | | | 858 | | | | 32,767 | |
Rockwell Automation, Inc. | | | 101 | | | | 25,785 | |
Siemens AG | | | 754 | | | | 82,450 | |
Velo3D, Inc. (a) | | | 4,480 | | | | 17,651 | |
Yaskawa Electric Corp. | | | 184 | | | | 5,113 | |
| | | | | | | | 352,164 | |
Information Technology — 71.5% | | | | | | | | |
Advantest Corp. | | | 146 | | | | 7,721 | |
Altair Engineering, Inc. (a) - Class A | | | 148 | | | | 7,259 | |
Ambarella, Inc. (a) | | | 48 | | | | 2,627 | |
| | | Shares | | | Value | |
Information Technology — 71.5% (Continued) | | | | |
ANSYS, Inc. (a) | | | 241 | | | $ | 53,300 | |
Applied Materials, Inc. | | | 677 | | | | 59,772 | |
ASM International NV | | | 45 | | | | 9,998 | |
ASM Pacific Technology Ltd. | | | 373 | | | | 2,053 | |
ASML Holding NV | | | 221 | | | | 104,405 | |
Autodesk, Inc. (a) | | | 616 | | | | 132,009 | |
AVEVA Group Plc | | | 490 | | | | 17,602 | |
Azbil Corp. | | | 114 | | | | 3,102 | |
BE Semiconductor Industries NV | | | 96 | | | | 4,907 | |
Bentley Systems, Inc. - Class B | | | 777 | | | | 27,413 | |
Cognex Corp. | | | 157 | | | | 7,258 | |
Dassault Systemes SE | | | 2,642 | | | | 88,651 | |
Disco Corp. | | | 32 | | | | 7,686 | |
FARO Technologies, Inc. (a) | | | 640 | | | | 18,694 | |
Keyence Corp. | | | 180 | | | | 68,205 | |
KLA Corp. | | | 120 | | | | 37,974 | |
Lam Research Corp. | | | 112 | | | | 45,335 | |
Lasertec Corp. | | | 80 | | | | 11,459 | |
Materialise NV (a) - ADR | | | 2,689 | | | | 28,476 | |
Nano Dimension Ltd. (a) - ADR | | | 11,757 | | | | 29,157 | |
Nemetschek SE | | | 220 | | | | 10,515 | |
Nova Ltd. (a) | | | 37 | | | | 2,727 | |
Omron Corp. | | | 181 | | | | 8,471 | |
Onto Innovation, Inc. (a) | | | 53 | | | | 3,543 | |
PTC, Inc. (a) | | | 320 | | | | 37,706 | |
Renishaw Plc | | | 1,305 | | | | 52,618 | |
SCREEN Holdings Co. Ltd. | | | 52 | | | | 2,865 | |
Stratasys Ltd. (a) | | | 2,694 | | | | 38,982 | |
Teledyne Technologies, Inc. (a) | | | 34 | | | | 13,531 | |
Tokyo Electron Ltd. | | | 101 | | | | 26,834 | |
| | | | 972,855 | |
TOTAL COMMON STOCKS (Cost $1,550,201) | | | | | | | 1,357,916 | |
| | | | | | | | | |
The accompanying notes are an integral part of the financial statements.
44
Pacer BlueStar Engineering the Future ETF
SCHEDULE OF INVESTMENTS
October 31, 2022 (Continued)
| | Principal
Amount | Value |
SHORT-TERM INVESTMENTS — 0.1% | |
| | |
Money Market Deposit Accounts — 0.1% | |
U.S. Bank Money Market Deposit Account, 2.300% (b) | $ 1,645 | $ 1,645 |
TOTAL SHORT-TERM INVESTMENTS (Cost $1,645) | | 1,645 |
| | | |
Total Investments (Cost $1,551,846) — 99.9% | | 1,359,561 |
Other Assets in Excess of Liabilities — 0.1% | | 734 |
TOTAL NET ASSETS — 100.0% | | $ 1,360,295 |
Percentages are stated as a percent of net assets.
ADR American Depositary Receipt
| | (a) | Non-income producing security. |
| | (b) | The rate shown is as of October 31, 2022. |
The Global Industry Classification Standard (GICS®) was developed by and/or is the exclusive property of MSCI, Inc. and Standard & Poor Financial Services LLC (“S&P”). GICS® is a service mark of MSCI, Inc. and S&P and has been licensed for use by the Fund’s Administrator, U.S. Bancorp Fund Services, LLC.
For Fund compliance purposes, the Fund’s industry classifications refer to any one or more of the industry sub-classifications used by one or more widely recognized market indexes or ratings group indexes, and/or they may be defined by Fund management. This definition does not apply for all purposes of this report, which may combine sub-classifications for reporting ease.
The accompanying notes are an integral part of the financial statements.
45
Pacer Funds
STATEMENTS OF ASSETS & LIABILITIES
October 31, 2022
| | Pacer
American Energy
Independence
ETF | | | Pacer
Swan SOS
Conservative
(January) ETF | | | Pacer Swan
SOS Moderate
(January) ETF | | | Pacer Swan
SOS Flex
(January) ETF | |
ASSETS | | | | | | | | | | | | | | | | |
Investments in Unaffiliated Securities, at Value* | | $ | 53,738,293 | | | $ | 15,733,227 | | | $ | 21,233,499 | | | $ | 17,855,849 | |
Foreign Currency at Value* | | | 2,820 | | | | — | | | | — | | | | — | |
Interest and Dividends Receivable | | | 286,424 | | | | 83 | | | | 83 | | | | 92 | |
Deposits with Broker for Options | | | — | | | | 5,084 | | | | 5,236 | | | | 5,767 | |
Securities Lending Income Receivable | | | 1,710 | | | | — | | | | — | | | | — | |
Total Assets | | | 54,029,247 | | | | 15,738,394 | | | | 21,238,818 | | | | 17,861,708 | |
| | | | | | | | | | | | | | | | | |
LIABILITIES | | | | | | | | | | | | | | | | |
Options Written, at Value | | | — | | | | 59,985 | | | | 801,150 | | | | 654,784 | |
Management Fees Payable | | | 28,032 | | | | 7,975 | | | | 12,649 | | | | 10,761 | |
Collateral Received for Securities Loaned | | | 6,624,646 | | | | — | | | | — | | | | — | |
Total Liabilities | | | 6,652,678 | | | | 67,960 | | | | 813,799 | | | | 665,545 | |
| | | | | | | | | | | | | | | | | |
NET ASSETS | | $ | 47,376,569 | | | $ | 15,670,434 | | | $ | 20,425,019 | | | $ | 17,196,163 | |
| | | | | | | | | | | | | | | | | |
NET ASSETS CONSIST OF: | | | | | | | | | | | | | | | | |
Paid-in Capital | | $ | 40,616,524 | | | $ | 16,650,980 | | | $ | 22,141,756 | | | $ | 19,636,747 | |
Total Distributable Earnings (Accumulated Deficit) | | | 6,760,045 | | | | (980,546) | | | | ( 1,716,737) | | | | (2,440,584) | |
Net Assets | | $ | 47,376,569 | | | $ | 15,670,434 | | | $ | 20,425,019 | | | $ | 17,196,163 | |
* Identified Cost: | | | | | | | | | | | | | | | | |
Investments in Unaffiliated Securities | | $ | 44,345,080 | | | $ | 16,538,143 | | | $ | 22,319,042 | | | $ | 17,912,978 | |
Foreign Currencies | | | 2,718 | | | | — | | | | — | | | | — | |
Includes Loaned Securities with a value of | | | 6,518,906 | | | | — | | | | — | | | | — | |
Premiums Received: | | | | | | | | | | | | | | | | |
Written Options | | $ | — | | | $ | 640,309 | | | $ | 1,701,801 | | | $ | 1,901,405 | |
| | | | | | | | | | | | | | | | | |
Net Asset Value: | | | | | | | | | | | | | | | | |
Net Assets | | $ | 47,376,569 | | | $ | 15,670,434 | | | $ | 20,425,019 | | | $ | 17,196,163 | |
Shares Outstanding (No Par Value) | | | 1,700,000 | | | | 750,000 | | | | 950,000 | | | | 750,000 | |
Net Asset Value, Offering and Redemption Price per Share | | $ | 27.87 | | | $ | 20.89 | | | $ | 21.50 | | | $ | 22.93 | |
The accompanying notes are an integral part of the financial statements.
46
Pacer Funds
STATEMENTS OF ASSETS & LIABILITIES
October 31, 2022
| | | Pacer Swan
SOS Fund of
Funds ETF | | | Pacer Swan SOS
Conservative
(April) ETF | | | Pacer Swan
SOS Moderate
(April) ETF | | | Pacer Swan SOS
Flex (April) ETF | |
ASSETS | | | | | | | | | | | | | | | | |
Investments in Unaffiliated Securities, at Value* | | $ | 956,797 | | | $ | 16,301,854 | | | $ | 18,877,137 | | | $ | 13,221,657 | |
Investments in Affiliated Securities, at Value* | | $ | 117,117,392 | | | $ | — | | | $ | — | | | $ | — | |
Interest and Dividends Receivable | | | 1,891 | | | | 224 | | | | 133 | | | | 92 | |
Receivable for Capital Shares Sold | | | 1,706 | | | | — | | | | — | | | | — | |
Deposits with Broker for Options | | | — | | | | 6,282 | | | | 6,911 | | | | 6,333 | |
Total Assets | | | 118,077,786 | | | | 16,308,360 | | | | 18,884,181 | | | | 13,228,082 | |
| | | | | | | | | | | | | | | | | |
LIABILITIES | | | | | | | | | | | | | | | | |
Options Written, at Value | | | — | | | | 216,583 | | | | 918,751 | | | | 813,839 | |
Management Fees Payable | | | 17,634 | | | | 10,414 | | | | 11,604 | | | | 7,889 | |
Total Liabilities | | | 17,634 | | | | 226,997 | | | | 930,355 | | | | 821,728 | |
| | | | | | | | | | | | | | | | | |
NET ASSETS | | $ | 118,060,152 | | | $ | 16,081,363 | | | $ | 17,953,826 | | | $ | 12,406,354 | |
| | | | | | | | | | | | | | | | | |
NET ASSETS CONSIST OF: | | | | | | | | | | | | | | | | |
Paid-in Capital | | $ | 121,617,259 | | | $ | 17,577,500 | | | $ | 21,302,490 | | | $ | 15,075,222 | |
Total Distributable Earnings (Accumulated Deficit) | | | (3,557,107 | ) | | | (1,496,137) | | | | (3,348,664) | | | | (2,668,868) | |
Net Assets | | $ | 118,060,152 | | | $ | 16,081,363 | | | $ | 17,953,826 | | | $ | 12,406,354 | |
* Identified Cost: | | | | | | | | | | | | | | | | |
Investments in Unaffiliated Securities | | $ | 956,797 | | | $ | 17,581,752 | | | $ | 21,369,446 | | | $ | 15,203,474 | |
Investments in Affiliated Securities | | $ | 120,216,842 | | | $ | — | | | $ | — | | | $ | — | |
Premiums Received: | | | | | | | | | | | | | | | | |
Written Options | | $ | — | | | $ | 302,514 | | | $ | 816,322 | | | $ | 828,314 | |
| | | | | | | | | | | | | | | | | |
Net Asset Value: | | | | | | | | | | | | | | | | |
Net Assets | | $ | 118,060,152 | | | $ | 16,081,363 | | | $ | 17,953,826 | | | $ | 12,406,354 | |
Shares Outstanding (No Par Value) | | | 5,475,000 | | | | 775,000 | | | | 850,000 | | | | 575,000 | |
Net Asset Value, Offering and Redemption Price per Share | | $ | 21.56 | | | $ | 20.75 | | | $ | 21.12 | | | $ | 21.58 | |
The accompanying notes are an integral part of the financial statements.
47
Pacer Funds
STATEMENTS OF ASSETS & LIABILITIES
October 31, 2022
| | | Pacer Swan SOS
Conservative
(July) ETF | | | Pacer Swan
SOS Moderate
(July) ETF | | | Pacer Swan SOS
Flex (July) ETF | | | Pacer Swan SOS
Conservative
(October) ETF | |
ASSETS | | | | | | | | | | | | | | | | |
Investments in Unaffiliated Securities, at Value* | | $ | 6,603,458 | | | $ | 35,297,216 | | | $ | 13,095,863 | | | $ | 5,334,153 | |
Interest and Dividends Receivable | | | 105 | | | | 606 | | | | 171 | | | | 144 | |
Deposits with Broker for Options | | | 2,874 | | | | 5,733 | | | | 5,993 | | | | 5,563 | |
Total Assets | | | 6,606,437 | | | | 35,303,555 | | | | 13,102,027 | | | | 5,339,860 | |
| | | | | | | | | | | | | | | | | |
LIABILITIES | | | | | | | | | | | | | | | | |
Options Written, at Value | | | 266,594 | | | | 1,725,975 | | | | 627,046 | | | | 365,342 | |
Management Fees Payable | | | 3,944 | | | | 21,517 | | | | 7,382 | | | | 3,106 | |
Total Liabilities | | | 270,538 | | | | 1,747,492 | | | | 634,428 | | | | 368,448 | |
| | | | | | | | | | | | | | | | | |
NET ASSETS | | $ | 6,335,899 | | | $ | 33,556,063 | | | $ | 12,467,599 | | | $ | 4,971,412 | |
| | | | | | | | | | | | | | | | | |
NET ASSETS CONSIST OF: | | | | | | | | | | | | | | | | |
Paid-in Capital | | $ | 6,540,622 | | | $ | 33,377,450 | | | $ | 12,466,463 | | | $ | 5,152,182 | |
Total Distributable Earnings (Accumulated Deficit) | | | (204,723) | | | | 178,613 | | | | 1,136 | | | | (180,770) | |
Net Assets | | $ | 6,335,899 | | | $ | 33,556,063 | | | $ | 12,467,599 | | | $ | 4,971,412 | |
* Identified Cost: | | | | | | | | | | | | | | | | |
Investments in Unaffiliated Securities | | $ | 6,613,879 | | | $ | 34,833,753 | | | $ | 13,124,314 | | | $ | 5,078,869 | |
Premiums Received: | | | | | | | | | | | | | | | | |
Written Options | | $ | 355,925 | | | $ | 2,090,424 | | | $ | 971,447 | | | $ | 261,066 | |
| | | | | | | | | | | | | | | | | |
Net Asset Value: | | | | | | | | | | | | | | | | |
Net Assets | | $ | 6,335,899 | | | $ | 33,556,063 | | | $ | 12,467,599 | | | $ | 4,971,412 | |
Shares Outstanding (No Par Value) | | | 325,000 | | | | 1,625,000 | | | | 600,000 | | | | 250,000 | |
Net Asset Value, Offering and Redemption Price per Share | | $ | 19.50 | | | $ | 20.65 | | | $ | 20.78 | | | $ | 19.89 | |
The accompanying notes are an integral part of the financial statements.
48
Pacer Funds
STATEMENTS OF ASSETS & LIABILITIES
October 31, 2022
| | | Pacer Swan
SOS Moderate
(October) ETF | | | Pacer Swan
SOS Flex
(October) ETF | | | Pacer
BlueStar Digital
Entertainment
ETF | | | Pacer BlueStar
Engineering the
Future ETF | |
ASSETS | | | | | | | | | | | | | | | | |
Investments in Unaffiliated Securities, at Value* | | $ | 25,111,035 | | | $ | 11,448,041 | | | $ | 616,922 | | | $ | 1,359,561 | |
Interest and Dividends Receivable | | | 856 | | | | 185 | | | | 1,322 | | | | 1,396 | |
Deposits with Broker for Options | | | 5,803 | | | | 6,740 | | | | — | | | | — | |
Total Assets | | | 25,117,694 | | | | 11,454,966 | | | | 618,244 | | | | 1,360,957 | |
| | | | | | | | | | | | | | | | | |
LIABILITIES | | | | | | | | | | | | | | | | |
Options Written, at Value | | | 1,842,827 | | | | 787,278 | | | | — | | | | — | |
Management Fees Payable | | | 14,081 | | | | 6,171 | | | | 532 | | | | 662 | |
Total Liabilities | | | 1,856,908 | | | | 793,449 | | | | 532 | | | | 662 | |
| | | | | | | | | | | | | | | | | |
NET ASSETS | | $ | 23,260,786 | | | $ | 10,661,517 | | | $ | 617,712 | | | $ | 1,360,295 | |
| | | | | | | | | | | | | | | | | |
NET ASSETS CONSIST OF: | | | | | | | | | | | | | | | | |
Paid-in Capital | | $ | 23,124,299 | | | $ | 10,371,375 | | | $ | 834,540 | | | $ | 1,559,198 | |
Total Distributable Earnings (Accumulated Deficit) | | | 136,487 | | | | 290,142 | | | | (216,828) | | | | (198,903) | |
Net Assets | | $ | 23,260,786 | | | $ | 10,661,517 | | | $ | 617,712 | | | $ | 1,360,295 | |
* Identified Cost: | | | | | | | | | | | | | | | | |
Investments in Unaffiliated Securities | | $ | 24,083,351 | | | $ | 11,055,477 | | | $ | 794,343 | | | $ | 1,551,846 | |
Premiums Received: | | | | | | | | | | | | | | | | |
Written Options | | $ | 1,627,239 | | | $ | 853,518 | | | $ | — | | | $ | — | |
| | | | | | | | | | | | | | | | | |
Net Asset Value: | | | | | | | | | | | | | | | | |
Net Assets | | $ | 23,260,786 | | | $ | 10,661,517 | | | $ | 617,712 | | | $ | 1,360,295 | |
Shares Outstanding (No Par Value) | | | 1,125,000 | | | | 500,000 | | | | 40,000 | | | | 80,000 | |
Net Asset Value, Offering and Redemption Price per Share | | $ | 20.68 | | | $ | 21.32 | | | $ | 15.44 | | | $ | 17.00 | |
The accompanying notes are an integral part of the financial statements.
49
Pacer Funds
STATEMENT OF OPERATIONS
For the Year Ended October 31, 2022
| | Pacer American
Energy
Independence
ETF | |
INVESTMENT INCOME | | | | |
Income: | | | | |
Dividends* | | $ | 813,011 | |
Interest | | | 647 | |
Securities Lending Income, Net | | | 13,150 | |
Total Investment Income | | | 826,808 | |
| | | | | |
Expenses | | | | |
Management fees | | | 272,049 | |
Miscellaneous Expense | | | 1,104 | |
Total Expenses | | | 273,153 | |
Net Investment Income | | | 553,655 | |
| | | | | |
REALIZED & UNREALIZED GAIN (LOSS) ON INVESTMENTS | | | | |
Net Realized Gain (Loss) on: | | | | |
Net Realized Gain (Loss) on Investments | | | 557,832 | |
Net Realized Gain (Loss) on In-Kind Redemptions | | | (1,161) | |
Net realized Gain (Loss) on Foreign Currency | | | (12,383) | |
Total | | | 544,288 | |
Net Change in Unrealized Appreciation (Depreciation) of: | | | | |
Change in Unrealized Appreciation (Depreciation) on Investments | | | 3,286,887 | |
Change in Unrealized Appreciation (Depreciation) on Foreign Currency | | | 177 | |
Total | | | 3,287,064 | |
Net Realized and Unrealized Gain (Loss) on Investments | | | 3,831,352 | |
NET INCREASE (DECREASE) IN NET ASSETS RESULTING FROM OPERATIONS | | $ | 4,385,007 | |
| | | | | |
* Net of fees and foreign withholding tax of | | $ | 73,241 | |
The accompanying notes are an integral part of the financial statements.
50
Pacer Funds
STATEMENTS OF OPERATIONS
For the Year Ended October 31, 2022
| | | Pacer Swan SOS
Conservative
(January) ETF | | | Pacer Swan
SOS Moderate
(January) ETF | | | Pacer Swan
SOS Flex
(January) ETF | |
INVESTMENT INCOME | | | | | | | | | | | | |
Income: | | | | | | | | | | | | |
Interest | | $ | 376 | | | $ | 740 | | | $ | 704 | |
Total Investment Income | | | 376 | | | | 740 | | | | 704 | |
| | | | | | | | | | | | | |
EXPENSES | | | | | | | | | | | | |
Management fees | | | 69,766 | | | | 137,047 | | | | 167,398 | |
Miscellaneous Expense | | | 54 | | | | 49 | | | | 57 | |
Broker fees and interest | | | 640 | | | | 702 | | | | 1,848 | |
Total Expenses | | | 70,460 | | | | 137,798 | | | | 169,303 | |
Net Investment Income/(Loss) | | | (70,084) | | | | (137,058) | | | | (168,599) | |
| | | | | | | | | | | | | |
REALIZED & UNREALIZED GAIN (LOSS) ON INVESTMENTS | | | | | | | | | | | | |
Net Realized Gain (Loss) on Investments | | | | | | | | | | | | |
Net Realized Gain (Loss) on Investments in Unaffiliated Securities | | | (537,837) | | | | (1,147,234) | | | | (3,424,521) | |
Net Realized Gain (Loss) on In-Kind Redemptions | | | 615,235 | | | | 858,743 | | | | 624,454 | |
Net Realized Gain (Loss) on Written Options | | | (152,593) | | | | 5,367 | | | | 24,442 | |
Total | | | (75,195) | | | | (283,124) | | | | (2,775,625) | |
Net Change in Unrealized Appreciation (Depreciation) of: | | | | | | | | | | | | |
Change in Unrealized Appreciation (Depreciation) on Investments in Unaffiliated Securities | | | (1,177,285) | | | | (1,642,080) | | | | (415,977) | |
Change in Unrealized Appreciation (Depreciation) on Investments in Written Options | | | 795,838 | | | | 962,796 | | | | 1,257,964 | |
Total | | | (381,447) | | | | (679,284) | | | | 841,987 | |
Net Realized and Unrealized Gain (Loss) on Investments | | | (456,642) | | | | (962,408) | | | | (1,933,638) | |
NET INCREASE (DECREASE) IN NET ASSETS RESULTING FROM OPERATIONS | | $ | (526,726) | | | $ | (1,099,466) | | | $ | (2,102,237) | |
The accompanying notes are an integral part of the financial statements.
51
Pacer Funds
STATEMENTS OF OPERATIONS
For the Year Ended October 31, 2022
| | | Pacer Swan
SOS Fund of
Funds ETF | | | Pacer Swan SOS
Conservative
(April) ETF | | | Pacer Swan
SOS Moderate
(April) ETF | |
INVESTMENT INCOME | | | | | | | | | | | | |
Income: | | | | | | | | | | | | |
Dividends from Affiliated Investments | | $ | 43,629 | | | $ | — | | | $ | — | |
Interest | | | 7,031 | | | | 780 | | | | 796 | |
Total Investment Income | | | 50,660 | | | | 780 | | | | 796 | |
| | | | | | | | | | | | | |
EXPENSES | | | | | | | | | | | | |
Management fees | | | 171,610 | | | | 69,827 | | | | 104,678 | |
Miscellaneous Expense | | | 1,181 | | | | 27 | | | | 61 | |
Broker fees and interest | | | — | | | | 882 | | | | 1,248 | |
Total Expenses | | | 172,791 | | | | 70,736 | | | | 105,987 | |
Net Investment Income/(Loss) | | | (122,131) | | | | (69,956) | | | | (105,191) | |
| | | | | | | | | | | | | |
REALIZED & UNREALIZED GAIN (LOSS) ON INVESTMENTS | | | | | | | | | | | | |
Net Realized Gain (Loss) on Investments | | | | | | | | | | | | |
Net Realized Gain (Loss) on Investments in Unaffiliated Securities | | | — | | | | (548,251) | | | | (1,372,461) | |
Net Realized Gain (Loss) on Investments in Affiliated Securities | | | (346,484) | | | | — | | | | — | |
Net Realized Gain (Loss) on In-Kind Redemptions | | | 441,229 | | | | 1,392,930 | | | | 3,240,080 | |
Net Realized Gain (Loss) on Written Options | | | — | | | | 411,813 | | | | 759,998 | |
Total | | | 94,745 | | | | 1,256,492 | | | | 2,627,617 | |
Net Change in Unrealized Appreciation (Depreciation) of: | | | | | | | | | | | | |
Change in Unrealized Appreciation (Depreciation) on Investments in Unaffiliated Securities | | | — | | | | (1,529,733) | | | | (2,938,863) | |
Change in Unrealized Appreciation (Depreciation) on Investments in Affiliated Securities | | | (3,837,360) | | | | — | | | | — | |
Change in Unrealized Appreciation (Depreciation) on Investments in Written Options | | | — | | | | 158,807 | | | | (35,042) | |
Total | | | (3,837,360) | | | | (1,370,926) | | | | (2,973,905) | |
Net Realized and Unrealized Gain (Loss) on Investments | | | (3,742,615) | | | | (114,434) | | | | (346,288) | |
NET INCREASE (DECREASE) IN NET ASSETS RESULTING FROM OPERATIONS | | $ | (3,864,746) | | | $ | (184,390) | | | $ | (451,479) | |
The accompanying notes are an integral part of the financial statements.
52
Pacer Funds
STATEMENTS OF OPERATIONS
For the Year Ended October 31, 2022
| | | Pacer Swan
SOS Flex
(April) ETF | | | Pacer Swan SOS
Conservative
(July) ETF | | | Pacer Swan
SOS Moderate
(July) ETF | |
INVESTMENT INCOME | | | | | | | | | | | | |
Income: | | | | | | | | | | | | |
Interest | | $ | 498 | | | $ | 333 | | | $ | 2,249 | |
Total Investment Income | | | 498 | | | | 333 | | | | 2,249 | |
| | | | | | | | | | | | | |
EXPENSES | | | | | | | | | | | | |
Management fees | | | 81,373 | | | | 33,422 | | | | 160,036 | |
Miscellaneous Expense | | | 580 | | | | 30 | | | | 103 | |
Broker fees and interest | | | 1,314 | | | | 454 | | | | 1,693 | |
Total Expenses | | | 83,267 | | | | 33,906 | | | | 161,832 | |
Net Investment Income/(Loss) | | | (82,769) | | | | (33,573) | | | | (159,583) | |
| | | | | | | | | | | | | |
REALIZED & UNREALIZED GAIN (LOSS) ON INVESTMENTS | | | | | | | | | | | | |
Net Realized Gain (Loss) on Investments | | | | | | | | | | | | |
Net Realized Gain (Loss) on Investments in Unaffiliated Securities | | | (1,370,286) | | | | (370,666) | | | | (1,217,948) | |
Net Realized Gain (Loss) on In-Kind Redemptions | | | 2,874,708 | | | | — | | | | — | |
Net Realized Gain (Loss) on Written Options | | | 715,607 | | | | 165,816 | | | | 887,346 | |
Total | | | 2,220,029 | | | | (204,850) | | | | (330,602) | |
Net Change in Unrealized Appreciation (Depreciation) of: | | | | | | | | | | | | |
Change in Unrealized Appreciation (Depreciation) on Investments in Unaffiliated Securities | | | (2,458,741) | | | | (154,690) | | | | (63,265) | |
Change in Unrealized Appreciation (Depreciation) on Investments in Written Options | | | (16,496) | | | | 118,562 | | | | 412,046 | |
Total | | | (2,475,237) | | | | (36,128) | | | | 348,781 | |
Net Realized and Unrealized Gain (Loss) on Investments | | | (255,208) | | | | (240,978) | | | | 18,179 | |
NET INCREASE (DECREASE) IN NET ASSETS RESULTING FROM OPERATIONS | | $ | (337,977) | | | $ | (274,551) | | | $ | (141,404) | |
The accompanying notes are an integral part of the financial statements.
53
Pacer Funds
STATEMENTS OF OPERATIONS
For the Year Ended October 31, 2022
| | | Pacer Swan
SOS Flex
(July) ETF | | | Pacer Swan SOS
Conservative
(October) ETF | | | Pacer Swan
SOS Moderate
(October) ETF | | | Pacer Swan
SOS Flex
(October) ETF | |
INVESTMENT INCOME | | | | | | | | | | | | | | | | |
Income: | | | | | | | | | | | | | | | | |
Interest | | $ | 707 | | | $ | 214 | | | $ | 2,716 | | | $ | 280 | |
Total Investment Income | | | 707 | | | | 214 | | | | 2,716 | | | | 280 | |
| | | | | | | | | | | | | | | | | |
EXPENSES | | | | | | | | | | | | | | | | |
Management fees | | | 60,712 | | | | 34,250 | | | | 128,256 | | | | 50,107 | |
Miscellaneous Expense | | | 58 | | | | — | | | | — | | | | — | |
Broker fees and interest | | | 907 | | | | 409 | | | | 487 | | | | 433 | |
Total Expenses | | | 61,677 | | | | 34,659 | | | | 128,743 | | | | 50,540 | |
Net Investment Income/(Loss) | | | (60,970) | | | | (34,445) | | | | (126,027) | | | | (50,260) | |
| | | | | | | | | | | | | | | | | |
REALIZED & UNREALIZED GAIN (LOSS) ON INVESTMENTS | | | | | | | | | | | | | | | | |
Net Realized Gain (Loss) on Investments | | | | | | | | | | | | | | | | |
Net Realized Gain (Loss) on Investments in Unaffiliated Securities | | | (575,795) | | | | (655,258) | | | | (1,973,814) | | | | (691,134) | |
Net Realized Gain (Loss) on Written Options | | | 396,169 | | | | 353,481 | | | | 1,403,220 | | | | 564,637 | |
Total | | | (179,626) | | | | (301,777) | | | | (570,594) | | | | (126,497) | |
Net Change in Unrealized Appreciation (Depreciation) of: | | | | | | | | | | | | | | | | |
Change in Unrealized Appreciation (Depreciation) on Investments in Unaffiliated Securities | | | (227,192) | | | | 208,024 | | | | 940,831 | | | | 327,560 | |
Change in Unrealized Appreciation (Depreciation) on Investments in Written Options | | | 278,543 | | | | (76,811) | | | | (198,535) | | | | 69,516 | |
Total | | | 51,351 | | | | 131,213 | | | | 742,296 | | | | 397,076 | |
Net Realized and Unrealized Gain (Loss) on Investments | | | (128,275) | | | | (170,564) | | | | 171,702 | | | | 270,579 | |
NET INCREASE (DECREASE) IN NET ASSETS RESULTING FROM OPERATIONS | | $ | (189,245) | | | $ | (205,009) | | | $ | 45,675 | | | $ | 220,319 | |
The accompanying notes are an integral part of the financial statements.
54
Pacer Funds
STATEMENTS OF OPERATIONS
For the Period Ended October 31, 2022
| | | Pacer BlueStar
Digital
Entertainment
ETF | | | Pacer BlueStar
Engineering the
Future ETF | |
| | | For the
Period Ended
October 31,
2022 (a) | | | For the
Period Ended
October 31,
2022 (b) | |
INVESTMENT INCOME | | | | | | | | |
Income: | | | | | | | | |
Dividends* | | $ | 8,036 | | | $ | 3,765 | |
Interest | | | 17 | | | | 9 | |
Total Investment Income | | | 8,053 | | | | 3,774 | |
| | | | | | | | | |
EXPENSES | | | | | | | | |
Management fees | | | 4,275 | | | | 3,390 | |
Total Expenses | | | 4,275 | | | | 3,390 | |
Net Investment Income | | | 3,778 | | | | 384 | |
| | | | | | | | | |
REALIZED & UNREALIZED GAIN (LOSS) ON INVESTMENTS | | | | | | | | |
Net Realized Gain (Loss) on: | | | | | | | | |
Net Realized Gain (Loss) on Investments | | | (44,147) | | | | (6,976) | |
Net Realized Gain (Loss) on In-Kind Redemptions | | | (109,424) | | | | — | |
Net Realized Gain (Loss) on Foreign Currency | | | 97 | | | | 13 | |
Total | | | (153,474) | | | | (6,963) | |
Net Change in Unrealized Appreciation (Depreciation) of: | | | | | | | | |
Change in Unrealized Appreciation (Depreciation) on Investments | | | (177,421) | | | | (192,285) | |
Change in Unrealized Appreciation (Depreciation) on Foreign Currency | | | (15) | | | | (39) | |
Total | | | (177,436) | | | | (192,324) | |
Net Realized and Unrealized Gain (Loss) on Investments | | | (330,910) | | | | (199,287) | |
NET INCREASE (DECREASE) IN NET ASSETS RESULTING FROM OPERATIONS | | $ | (327,132) | | | $ | (198,903) | |
| | | | | | | | | |
* Net of fees and foreign withholding tax of | | $ | 694 | | | $ | 365 | |
(a) | The Fund commenced operations on April 7, 2022. The information presented is for the period from April 7, 2022 to October 31, 2022. |
(b) | The Fund commenced operations on May 4, 2022. The information presented is for the period from May 4, 2022 to October 31, 2022. |
The accompanying notes are an integral part of the financial statements.
55
Pacer Funds
STATEMENTS OF CHANGES IN NET ASSETS
| | Pacer American Energy
Independence ETF | |
| | | For the
Year Ended
October 31, 2022 | | | For the
Year Ended
October 31, 2021 | |
OPERATIONS | | | | | | | | |
Net Investment Income | | $ | 553,655 | | | $ | 362,622 | |
Net Realized Gain (Loss) on Investments and Foreign Currency Transactions | | | 544,288 | | | | 1,070,261 | |
Change in Unrealized Appreciation (Depreciation) of Investments and Foreign Currency Transactions | | | 3,287,064 | | | | 8,482,857 | |
Net Increase (Decrease) in Net Assets Resulting from Operations | | | 4,385,007 | | | | 9,915,740 | |
| | | | | | | | | |
DISTRIBUTIONS TO SHAREHOLDERS | | | | | | | | |
Net Investment Income | | | (380,508) | | | | (456,943) | |
Return of Capital | | | (1,599,492) | | | | (845,057) | |
Total Distributions to Shareholders | | | (1,980,000) | | | | (1,302,000) | |
| | | | | | | | | |
CAPITAL SHARE TRANSACTIONS | | | | | | | | |
Proceeds from Shares Sold | | | 19,662,605 | | | | 8,838,065 | |
Payments for Shares Redeemed | | | — | | | | (4,108,890) | |
Net Increase (Decrease) in Net Assets Derived from Capital Share Transactions (a) | | | 19,662,605 | | | | 4,729,175 | |
Net Increase (Decrease) in Net Assets | | $ | 22,067,612 | | | $ | 13,342,915 | |
| | | | | | | | | |
NET ASSETS | | | | | | | | |
Beginning of Period | | $ | 25,308,957 | | | $ | 11,966,042 | |
End of Period | | $ | 47,376,569 | | | $ | 25,308,957 | |
(a) | A summary of capital share transactions is as follows: |
| | | Shares | | | Shares | |
Subscriptions | | | 700,000 | | | | 400,000 | |
Redemptions | | | — | | | | (200,000) | |
Net Increase (Decrease) | | | 700,000 | | | | 200,000 | |
The accompanying notes are an integral part of the financial statements.
56
Pacer Funds
STATEMENTS OF CHANGES IN NET ASSETS
| | | Pacer Swan SOS Conservative
(January) ETF | | | Pacer Swan SOS Moderate
(January) ETF | |
| | | For the
Year Ended
October 31,
2022 | | | For the
Period Ended
October 31,
2021 (a) | | | For the
Year Ended
October 31,
2022 | | | For the
Period Ended
October 31,
2021 (a) | |
OPERATIONS | | | | | | | | | | | | | | | | |
Net Investment Income (Loss) | | $ | (70,084) | | | $ | (13,490) | | | $ | (137,058) | | | $ | (23,746) | |
Net Realized Gain (Loss) on Investments | | | (75,195) | | | | — | | | | (283,124) | | | | (153,122) | |
Change in Unrealized Appreciation (Depreciation) of Investments | | | (381,447) | | | | 156,855 | | | | (679,284) | | | | 494,392 | |
Net Increase (Decrease) in Net Assets Resulting from Operations | | | (526,726) | | | | 143,365 | | | | (1,099,466) | | | | 317,524 | |
| | | | | | | | | | | | | | | | | |
DISTRIBUTIONS TO SHAREHOLDERS | | | | | | | | | | | | | | | | |
Net Investment Income | | | — | | | | — | | | | (32,631) | | | | — | |
Total Distributions to Shareholders | | | — | | | | — | | | | (32,631) | | | | — | |
| | | | | | | | | | | | | | | | | |
CAPITAL SHARE TRANSACTIONS | | | | | | | | | | | | | | | | |
Proceeds from Shares Sold | | | 18,360,320 | | | | 2,630,390 | | | | 29,308,080 | | | | 5,865,068 | |
Payments for Shares Redeemed | | | (4,938,728) | | | | — | | | | (10,585,903) | | | | (3,351,426) | |
Transaction Fees (See Note 1) | | | 1,550 | | | | 263 | | | | 2,851 | | | | 922 | |
Net Increase (Decrease) in Net Assets Derived from Capital Share Transactions (b) | | | 13,423,142 | | | | 2,630,653 | | | | 18,725,028 | | | | 2,514,564 | |
Net Increase (Decrease) in Net Assets | | $ | 12,896,416 | | | $ | 2,774,018 | | | $ | 17,592,931 | | | $ | 2,832,088 | |
| | | | | | | | | | | | | | | | | |
NET ASSETS | | | | | | | | | | | | | | | | |
Beginning of Period | | $ | 2,774,018 | | | $ | — | | | $ | 2,832,088 | | | $ | — | |
End of Period | | $ | 15,670,434 | | | $ | 2,774,018 | | | $ | 20,425,019 | | | $ | 2,832,088 | |
(a) | Fund commenced operations on December 22, 2020. The information presented is from December 22, 2020 to October 31, 2021. |
(b) | Summary of capital share transactions is as follows: |
| | | Shares | | | Shares | | | Shares | | | Shares | |
Subscriptions | | | 850,000 | | | | 125,000 | | | | 1,300,000 | | | | 275,000 | |
Redemptions | | | (225,000) | | | | — | | | | (475,000) | | | | (150,000) | |
Net Increase (Decrease) | | | 625,000 | | | | 125,000 | | | | 825,000 | | | | 125,000 | |
The accompanying notes are an integral part of the financial statements.
57
Pacer Funds
STATEMENTS OF CHANGES IN NET ASSETS
| | | Pacer Swan SOS Flex (January) ETF | | | Pacer Swan SOS Fund of Funds ETF | |
| | | For the
Year Ended
October 31,
2022 | | | For the
Period Ended
October 31,
2021 (a) | | | For the
Year Ended
October 31,
2022 | | | For the
Period Ended
October 31,
2021 (b) | |
OPERATIONS | | | | | | | | | | | | | | | | |
Net Investment Income (Loss) | | $ | (168,599) | | | $ | (13,881) | | | $ | (122,131) | | | $ | (21,461) | |
Net Realized Gain (Loss) on Investments | | | (2,775,625) | | | | (53,597) | | | | 94,745 | | | | 273,078 | |
Change in Unrealized Appreciation (Depreciation) of Investments | | | 841,987 | | | | 347,505 | | | | (3,837,360) | | | | 737,910 | |
Net Increase (Decrease) in Net Assets Resulting from Operations | | | (2,102,237) | | | | 280,027 | | | | (3,864,746) | | | | 989,527 | |
| | | | | | | | | | | | | | | | | |
CAPITAL SHARE TRANSACTIONS | | | | | | | | | | | | | | | | |
Proceeds from Shares Sold | | | 45,905,485 | | | | 4,461,535 | | | | 107,662,908 | | | | 47,119,153 | |
Payments for Shares Redeemed | | | (30,186,698) | | | | (1,169,400) | | | | (24,244,098) | | | | (9,927,608) | |
Transaction Fees (See Note 1) | | | 6,888 | | | | 563 | | | | 271,792 | | | | 53,224 | |
Net Increase (Decrease) in Net Assets Derived from Capital Share Transactions (c) | | | 15,725,675 | | | | 3,292,698 | | | | 83,690,602 | | | | 37,244,769 | |
Net Increase (Decrease) in Net Assets | | $ | 13,623,438 | | | $ | 3,572,725 | | | $ | 79,825,856 | | | $ | 38,234,296 | |
| | | | | | | | | | | | | | | | | |
NET ASSETS | | | | | | | | | | | | | | | | |
Beginning of Period | | $ | 3,572,725 | | | $ | — | | | $ | 38,234,296 | | | $ | — | |
End of Period | | $ | 17,196,163 | | | $ | 3,572,725 | | | $ | 118,060,152 | | | $ | 38,234,296 | |
(a) | Fund commenced operations on December 22, 2020. The information presented is from December 22, 2020 to October 31, 2021. |
(b) | Fund commenced operations on December 29, 2020. The information presented is from December 29, 2020 to October 31, 2021. |
(c) | Summary of capital share transactions is as follows: |
| | | Shares | | | Shares | | | Shares | | | Shares | |
Subscriptions | | | 1,925,000 | | | | 200,000 | | | | 4,900,000 | | | | 2,150,000 | |
Redemptions | | | (1,325,000) | | | | (50,000) | | | | (1,125,000) | | | | (450,000) | |
Net Increase (Decrease) | | | 600,000 | | | | 150,000 | | | | 3,775,000 | | | | 1,700,000 | |
The accompanying notes are an integral part of the financial statements.
58
Pacer Funds
STATEMENTS OF CHANGES IN NET ASSETS
| | | Pacer Swan SOS Conservative
(April) ETF | | | Pacer Swan SOS Moderate
(April) ETF | |
| | | For the
Year Ended
October 31,
2022 | | | For the
Period Ended
October 31,
2021 (a) | | | For the
Year Ended
October 31,
2022 | | | For the
Period Ended
October 31,
2021 (a) | |
OPERATIONS | | | | | | | | | | | | | | | | |
Net Investment Income (Loss) | | $ | (69,956) | | | $ | (8,805) | | | $ | (105,191) | | | $ | (21,025) | |
Net Realized Gain (Loss) on Investments | | | 1,256,492 | | | | (70,355) | | | | 2,627,617 | | | | (125,975) | |
Change in Unrealized Appreciation (Depreciation) of Investments | | | (1,370,926) | | | | 176,960 | | | | (2,973,905) | | | | 379,167 | |
Net Increase (Decrease) in Net Assets Resulting from Operations | | | (184,390) | | | | 97,800 | | | | (451,479) | | | | 232,167 | |
| | | | | | | | | | | | | | | | | |
CAPITAL SHARE TRANSACTIONS | | | | | | | | | | | | | | | | |
Proceeds from Shares Sold | | | 36,334,938 | | | | 3,699,257 | | | | 48,195,318 | | | | 7,994,080 | |
Payments for Shares Redeemed | | | (22,787,200) | | | | (1,081,000) | | | | (35,287,600) | | | | (2,731,363) | |
Transaction Fees (See Note 1) | | | 1,480 | | | | 478 | | | | 1,630 | | | | 1,073 | |
Net Increase (Decrease) in Net Assets Derived from Capital Share Transactions (b) | | | 13,549,218 | | | | 2,618,735 | | | | 12,909,348 | | | | 5,263,790 | |
Net Increase (Decrease) in Net Assets | | $ | 13,364,828 | | | $ | 2,716,535 | | | $ | 12,457,869 | | | $ | 5,495,957 | |
| | | | | | | | | | | | | | | | | |
NET ASSETS | | | | | | | | | | | | | | | | |
Beginning of Period | | $ | 2,716,535 | | | $ | — | | | $ | 5,495,957 | | | $ | — | |
End of Period | | $ | 16,081,363 | | | $ | 2,716,535 | | | $ | 17,953,826 | | | $ | 5,495,957 | |
(a) | Fund commenced operations on March 31, 2021. The information presented is from March 31, 2021 to October 31, 2021. |
(b) | Summary of capital share transactions is as follows: |
| | | Shares | | | Shares | | | Shares | | | Shares | |
Subscriptions | | | 1,725,000 | | | | 175,000 | | | | 2,225,000 | | | | 375,000 | |
Redemptions | | | (1,075,000) | | | | (50,000) | | | | (1,625,000) | | | | (125,000) | |
Net Increase (Decrease) | | | 650,000 | | | | 125,000 | | | | 600,000 | | | | 250,000 | |
The accompanying notes are an integral part of the financial statements.
59
Pacer Funds
STATEMENTS OF CHANGES IN NET ASSETS
| | | Pacer Swan
SOS Flex (April) ETF | | | Pacer Swan SOS Conservative
(July) ETF | |
| | | For the
Year Ended
October 31,
2022 | | | For the
Period Ended
October 31,
2021 (a) | | | For the
Year Ended
October 31,
2022 | | | For the
Period Ended
October 31,
2021 (b) | |
OPERATIONS | | | | | | | | | | | | | | | | |
Net Investment Income (Loss) | | $ | (82,769) | | | $ | (26,405) | | | $ | (33,573) | | | $ | (6,902) | |
Net Realized Gain (Loss) on Investments | | | 2,220,029 | | | | — | | | | (204,850) | | | | (49,670) | |
Change in Unrealized Appreciation (Depreciation) of Investments | | | (2,475,237) | | | | 507,895 | | | | (36,128) | | | | 115,038 | |
Net Increase (Decrease) in Net Assets Resulting from Operations | | | (337,977) | | | | 481,490 | | | | (274,551) | | | | 58,466 | |
| | | | | | | | | | | | | | | | | |
CAPITAL SHARE TRANSACTIONS | | | | | | | | | | | | | | | | |
Proceeds from Shares Sold | | | 30,637,810 | | | | 7,479,425 | | | | 4,944,280 | | | | 5,683,273 | |
Payments for Shares Redeemed | | | (25,855,988) | | | | — | | | | (1,998,215) | | | | (2,078,825) | |
Transaction Fees (See Note 1) | | | 846 | | | | 748 | | | | 695 | | | | 776 | |
Net Increase (Decrease) in Net Assets Derived from Capital Share Transactions (c) | | | 4,782,668 | | | | 7,480,173 | | | | 2,946,760 | | | | 3,605,224 | |
Net Increase (Decrease) in Net Assets | | $ | 4,444,691 | | | $ | 7,961,663 | | | $ | 2,672,209 | | | $ | 3,663,690 | |
| | | | | | | | | | | | | | | | | |
NET ASSETS | | | | | | | | | | | | | | | | |
Beginning of Period | | $ | 7,961,663 | | | $ | — | | | $ | 3,663,690 | | | $ | — | |
End of Period | | $ | 12,406,354 | | | $ | 7,961,663 | | | $ | 6,335,899 | | | $ | 3,663,690 | |
(a) | Fund commenced operations on March 31, 2021. The information presented is from March 31, 2021 to October 31, 2021. |
(b) | Fund commenced operations on June 30, 2021. The information presented is from June 30, 2021 to October 31, 2021. |
(c) | Summary of capital share transactions is as follows: |
| | | Shares | | | Shares | | | Shares | | | Shares | |
Subscriptions | | | 1,375,000 | | | | 350,000 | | | | 250,000 | | | | 275,000 | |
Redemptions | | | (1,150,000) | | | | — | | �� | | (100,000) | | | | (100,000) | |
Net Increase (Decrease) | | | 225,000 | | | | 350,000 | | | | 150,000 | | | | 175,000 | |
The accompanying notes are an integral part of the financial statements.
60
Pacer Funds
STATEMENTS OF CHANGES IN NET ASSETS
| | | Pacer Swan SOS Moderate (July) ETF | | | Pacer Swan SOS Flex (July) ETF | |
| | | For the
Year Ended
October 31,
2022 | | | For the
Period Ended
October 31,
2021 (a) | | | For the
Year Ended
October 31,
2022 | | | For the
Period Ended
October 31,
2021 (a) | |
OPERATIONS | | | | | | | | | | | | | | | | |
Net Investment Income (Loss) | | $ | (159,583) | | | $ | (29,778) | | | $ | (60,970) | | | $ | (12,773) | |
Net Realized Gain (Loss) on Investments | | | (330,602) | | | | (113,135) | | | | (179,626) | | | | (71,819) | |
Change in Unrealized Appreciation (Depreciation) of Investments | | | 348,781 | | | | 479,131 | | | | 51,351 | | | | 264,599 | |
Net Increase (Decrease) in Net Assets Resulting from Operations | | | (141,404) | | | | 336,218 | | | | (189,245) | | | | 180,007 | |
| | | | | | | | | | | | | | | | | |
DISTRIBUTIONS TO SHAREHOLDERS | | | | | | | | | | | | | | | | |
Net Investment Income | | | (2,015) | | | | — | | | | — | | | | — | |
Total Distributions to Shareholders | | | (2,015) | | | | — | | | | — | | | | — | |
| | | | | | | | | | | | | | | | | |
CAPITAL SHARE TRANSACTIONS | | | | | | | | | | | | | | | | |
Proceeds from Shares Sold | | | 29,856,733 | | | | 22,764,348 | | | | 10,848,998 | | | | 10,880,215 | |
Payments for Shares Redeemed | | | (14,027,955) | | | | (5,237,050) | | | | (3,520,893) | | | | (5,734,580) | |
Transaction Fees (See Note 1) | | | 4,388 | | | | 2,800 | | | | 1,436 | | | | 1,661 | |
Net Increase (Decrease) in Net Assets Derived from Capital Share Transactions (b) | | | 15,833,166 | | | | 17,530,098 | | | | 7,329,541 | | | | 5,147,296 | |
Net Increase (Decrease) in Net Assets | | $ | 15,689,747 | | | $ | 17,866,316 | | | $ | 7,140,296 | | | $ | 5,327,303 | |
| | | | | | | | | | | | | | | | | |
NET ASSETS | | | | | | | | | | | | | | | | |
Beginning of Period | | $ | 17,866,316 | | | $ | — | | | $ | 5,327,303 | | | $ | — | |
End of Period | | $ | 33,556,063 | | | $ | 17,866,316 | | | $ | 12,467,599 | | | $ | 5,327,303 | |
(a) | Fund commenced operations on June 30, 2021. The information presented is from June 30, 2021 to October 31, 2021. |
(b) | Summary of capital share transactions is as follows: |
| | | Shares | | | Shares | | | Shares | | | Shares | |
Subscriptions | | | 1,450,000 | | | | 1,100,000 | | | | 525,000 | | | | 525,000 | |
Redemptions | | | (675,000) | | | | (250,000) | | | | (175,000) | | | | (275,000) | |
Net Increase (Decrease) | | | 775,000 | | | | 850,000 | | | | 350,000 | | | | 250,000 | |
The accompanying notes are an integral part of the financial statements.
61
Pacer Funds
STATEMENTS OF CHANGES IN NET ASSETS
| | | Pacer Swan SOS Conservative
(October) ETF | | | Pacer Swan SOS Moderate
(October) ETF | |
| | | For the
Year Ended
October 31,
2022 | | | For the
Period Ended
October 31,
2021 (a) | | | For the
Year Ended
October 31,
2022 | | | For the
Period Ended
October 31,
2021 (a) | |
OPERATIONS | | | | | | | | | | | | | | | | |
Net Investment Income (Loss) | | $ | (34,445) | | | $ | (841) | | | $ | (126,027) | | | $ | (2,478) | |
Net Realized Gain (Loss) on Investments | | | (301,777) | | | | — | | | | (570,594) | | | | | |
Change in Unrealized Appreciation (Depreciation) of Investments | | | 131,213 | | | | 19,795 | | | | 742,296 | | | | 69,800 | |
Net Increase (Decrease) in Net Assets Resulting from Operations | | | (205,009) | | | | 18,954 | | | | 45,675 | | | | 67,322 | |
| | | | | | | | | | | | | | | | | |
CAPITAL SHARE TRANSACTIONS | | | | | | | | | | | | | | | | |
Proceeds from Shares Sold | | | 5,073,705 | | | | 2,588,245 | | | | 21,607,730 | | | | 8,843,790 | |
Payments for Shares Redeemed | | | (2,505,500) | | | | — | | | | (7,307,508) | | | | — | |
Transaction Fees (See Note 1) | | | 758 | | | | 259 | | | | 2,893 | | | | 884 | |
Net Increase (Decrease) in Net Assets Derived from Capital Share Transactions (b) | | | 2,568,963 | | | | 2,588,504 | | | | 14,303,115 | | | | 8,844,674 | |
Net Increase (Decrease) in Net Assets | | $ | 2,363,954 | | | $ | 2,607,458 | | | $ | 14,348,790 | | | $ | 8,911,996 | |
| | | | | | | | | | | | | | | | | |
NET ASSETS | | | | | | | | | | | | | | | | |
Beginning of Period | | $ | 2,607,458 | | | $ | — | | | $ | 8,911,996 | | | $ | — | |
End of Period | | $ | 4,971,412 | | | $ | 2,607,458 | | | $ | 23,260,786 | | | $ | 8,911,996 | |
(a) | Fund commenced operations on September 30, 2021. The information presented is from September 30, 2021 to October 31, 2021. |
(b) | Summary of capital share transactions is as follows: |
| | | Shares | | | Shares | | | Shares | | | Shares | |
Subscriptions | | | 250,000 | | | | 125,000 | | | | 1,050,000 | | | | 425,000 | |
Redemptions | | | (125,000) | | | | — | | | | (350,000) | | | | — | |
Net Increase (Decrease) | | | 125,000 | | | | 125,000 | | | | 700,000 | | | | 425,000 | |
The accompanying notes are an integral part of the financial statements.
62
Pacer Funds
STATEMENTS OF CHANGES IN NET ASSETS
| | | Pacer Swan SOS Flex (October) ETF | | | Pacer BlueStar
Digital
Entertainment
ETF | |
| | | For the
Year Ended
October 31,
2022 | | | For the
Period Ended
October 31,
2021 (a) | | | For the
Period Ended
October 31,
2022 (b) | |
OPERATIONS | | | | | | | | | | | | |
Net Investment Income (Loss) | | $ | (50,260) | | | $ | (1,230) | | | $ | 3,778 | |
Net Realized Gain (Loss) on Investments | | | (126,497) | | | | — | | | | (153,474) | |
Change in Unrealized Appreciation (Depreciation) of Investments | | | 397,076 | | | | 61,728 | | | | (177,436) | |
Net Increase (Decrease) in Net Assets Resulting from Operations | | | 220,319 | | | | 60,498 | | | | (327,132) | |
| | | | | | | | | | | | | |
DISTRIBUTIONS TO SHAREHOLDERS | | | | | | | | | | | | |
Net Investment Income | | | — | | | | — | | | | (2,886) | |
Total Distributions to Shareholders | | | — | | | | — | | | | (2,886) | |
| | | | | | | | | | | | | |
CAPITAL SHARE TRANSACTIONS | | | | | | | | | | | | |
Proceeds from Shares Sold | | | 9,392,058 | | | | 3,659,050 | | | | 1,540,146 | |
Payments for Shares Redeemed | | | (2,671,980) | | | | — | | | | (593,320) | |
Transaction Fees (See Note 1) | | | 1,206 | | | | 366 | | | | 904 | |
Net Increase (Decrease) in Net Assets Derived from Capital Share Transactions (c) | | | 6,721,284 | | | | 3,659,416 | | | | 947,730 | |
Net Increase (Decrease) in Net Assets | | $ | 6,941,603 | | | $ | 3,719,914 | | | $ | 617,712 | |
| | | | | | | | | | | | | |
NET ASSETS | | | | | | | | | | | | |
Beginning of Period | | $ | 3,719,914 | | | $ | — | | | $ | — | |
End of Period | | $ | 10,661,517 | | | $ | 3,719,914 | | | $ | 617,712 | |
(a) | Fund commenced operations on September 30, 2021. The information presented is from September 30, 2021 to October 31, 2021. |
(b) | The Fund commenced operations on April 7, 2022. The information presented is for the period from April 7, 2022 to October 31, 2022. |
(c) | Summary of capital share transactions is as follows: |
| | | Shares | | | Shares | | | Shares | |
Subscriptions | | | 450,000 | | | | 175,000 | | | | 80,000 | |
Redemptions | | | (125,000) | | | | — | | | | (40,000) | |
Net Increase (Decrease) | | | 325,000 | | | | 175,000 | | | | 40,000 | |
The accompanying notes are an integral part of the financial statements.
63
Pacer Funds
STATEMENTS OF CHANGES IN NET ASSETS
| | | Pacer BlueStar
Engineering the
Future ETF | |
| | | For the
Period Ended
October 31,
2022 (a) | |
OPERATIONS | | | | |
Net Investment Income (Loss) | | $ | 384 | |
Net Realized Gain (Loss) on Investments | | | (6,963) | |
Change in Unrealized Appreciation (Depreciation) of Investments | | | (192,324) | |
Net Increase (Decrease) in Net Assets Resulting from Operations | | | (198,903) | |
| | | | | |
CAPITAL SHARE TRANSACTIONS | | | | |
Proceeds from Shares Sold | | | 1,559,198 | |
Net Increase (Decrease) in Net Assets Derived from Capital Share Transactions (b) | | | 1,559,198 | |
Net Increase (Decrease) in Net Assets | | $ | 1,360,295 | |
| | | | | |
NET ASSETS | | | | |
Beginning of Period | | $ | — | |
End of Period | | $ | 1,360,295 | |
(a) | The Fund commenced operations on May 4, 2022. The information presented is for the period from May 4, 2022 to October 31, 2022. |
(b) | Summary of capital share transactions is as follows: |
| | | Shares | |
Subscriptions | | | 80,000 | |
Redemptions | | | — | |
Net Increase (Decrease) | | | 80,000 | |
The accompanying notes are an integral part of the financial statements.
64
Pacer American Energy Independence ETF
FINANCIAL HIGHLIGHTS
For a capital share outstanding throughout the year/period
| | For the
Year Ended
October 31,
2022 | | | For the
Year Ended
October 31,
2021 | | | For the
Period Ended
October 31,
2020(a) | | | For the
Year Ended
November 30,
2019 | | | For the
Period Ended
November 30,
2018(b) | |
Net Asset Value, Beginning of Period | | $ | 25.31 | | | $ | 14.96 | | | $ | 21.79 | | | $ | 23.21 | | | $ | 25.00 | |
| | | | | | | | | | | | | | | | | | | | | |
INCOME (LOSS) FROM INVESTMENT OPERATIONS: | | | | | | | | | | | | | | | | | | | | |
Net Investment Income (c) | | | 0.41 | | | | 0.40 | | | | 0.28 | | | | 0.37 | | | | 0.55 | |
Net Realized and Unrealized Gain (Loss) on Investments (d) | | | 3.59 | | | | 11.39 | | | | (5.55 | ) | | | (0.34 | ) | | | (1.51 | ) |
Total from Investment Operations | | | 4.00 | | | | 11.79 | | | | (5.27 | ) | | | 0.03 | | | | (0.96 | ) |
| | | | | | | | | | | | | | | | | | | | | |
LESS DISTRIBUTIONS: | | | | | | | | | | | | | | | | | | | | |
Distributions From: | | | | | | | | | | | | | | | | | | | | |
Net Investment Income | | | (0.26 | ) | | | (0.50 | ) | | | (0.52 | ) | | | (0.22 | ) | | | (0.50 | ) |
Return of Capital | | | (1.18 | ) | | | (0.94 | ) | | | (1.04 | ) | | | (1.23 | ) | | | (0.33 | ) |
Total Distributions | | | (1.44 | ) | | | (1.44 | ) | | | (1.56 | ) | | | (1.45 | ) | | | (0.83 | ) |
| | | | | | | | | | | | | | | | | | | | | |
CAPITAL SHARE TRANSACTIONS: | | | | | | | | | | | | | | | | | | | | |
Transaction Fees (See Note 1) | | | — | | | | — | | | | — | | | | 0.00 | (e) | | | — | |
| | | | | | | | | | | | | | | | | | | | | |
Net Asset Value, End of Period | | $ | 27.87 | | | $ | 25.31 | | | $ | 14.96 | | | $ | 21.79 | | | $ | 23.21 | |
Total return | | | 16.26 | % | | | 80.71 | % | | | -24.76 | %(f) | | | -0.13 | % | | | -4.06 | %(f) |
| | | | | | | | | | | | | | | | | | | | | |
SUPPLEMENTAL DATA: | | | | | | | | | | | | | | | | | | | | |
Net Assets at End of Period (000’s) | | $ | 47,377 | | | $ | 25,309 | | | $ | 11,966 | | | $ | 10,897 | | | $ | 9,284 | |
| | | | | | | | | | | | | | | | | | | | | |
RATIOS TO AVERAGE NET ASSETS: | | | | | | | | | | | | | | | | | | | | |
Expenses to Average Net Assets | | | 0.75 | % | | | 0.75 | % | | | 0.75 | %(g) | | | 0.75 | % | | | 0.75 | %(g) |
Net Investment Income (Loss) to Average Net Assets | | | 1.53 | % | | | 1.82 | % | | | 1.81 | %(g) | | | 1.58 | % | | | 2.25 | %(g) |
Portfolio Turnover Rate (h) | | | 25 | % | | | 22 | % | | | 41 | %(f) | | | 26 | % | | | 61 | %(f) |
(a) | Shares of the Predecessor USAI Fund converted Shares at the close of business on December 13, 2019. See Note 1 in the Financial Statements. For the period ended December 1, 2019 to October 31, 2020. |
(b) | Commencement of operations on December 12, 2017. |
(c) | Calculated based on average shares outstanding during the period. |
(d) | Realized and unrealized gains and losses per share are balancing amounts necessary to reconcile to the change in net asset value for the period and may reconcile with aggregate gains and losses in the statement of operations due to share transactions for the period. |
(e) | Represents less than $0.005. |
(h) | Excludes the impact of in-kind transactions. |
The accompanying notes are an integral part of the financial statements.
65
Pacer Swan SOS Conservative (January) ETF
FINANCIAL HIGHLIGHTS
For a capital share outstanding throughout the year/period
| | | For the
Year Ended
October 31,
2022 | | | For the
Period Ended
October 31,
2021 (a) | |
Net Asset Value, Beginning of Period | | $ | 22.19 | | | $ | 20.56 | |
| | | | | | | | | |
INCOME (LOSS) FROM INVESTMENT OPERATIONS: | | | | | | | | |
Net Investment Income (Loss) (b) | | | (0.16 | ) | | | (0.14 | ) |
Net Realized and Unrealized Gain (Loss) on Investments (c) | | | (1.14 | ) | | | 1.77 | |
Total from Investment Operations | | | (1.30 | ) | | | 1.63 | |
| | | | | | | | | |
CAPITAL SHARE TRANSACTIONS: | | | | | | | | |
Transaction Fees (See Note 1) | | | 0.00 | (g) | | | — | |
| | | | | | | | | |
Net Asset Value, End of Period | | $ | 20.89 | | | $ | 22.19 | |
Total Return | | | -5.85 | % | | | 7.94 | %(f) |
| | | | | | | | | |
SUPPLEMENTAL DATA: | | | | | | | | |
Net Assets at End of Period (000’s) | | $ | 15,670 | | | $ | 2,774 | |
| | | | | | | | | |
RATIOS TO AVERAGE NET ASSETS: | | | | | | | | |
Expenses to Average Net Assets | | | 0.76 | % | | | 0.75 | %(e) |
Net Investment Income (Loss) to Average Net Assets | | | -0.75 | % | | | -0.75 | %(e) |
Portfolio Turnover Rate (d) | | | 19 | % | | | 0 | %(f) |
(a) | Fund commenced operations on December 22, 2020. The information presented is from December 22, 2020 to October 31, 2021. |
(b) | Calculated based on average shares outstanding during the period. |
(c) | Realized and unrealized gains and losses per share are balancing amounts necessary to reconcile to the change in net asset value for the period and may reconcile with aggregate gains and losses in the statement of operations due to share transactions for the period. |
(d) | Excludes the impact of in-kind transactions. |
(g) | Represents less than $0.005. |
The accompanying notes are an integral part of the financial statements.
66
Pacer Swan SOS Moderate (January) ETF
FINANCIAL HIGHLIGHTS
For a capital share outstanding throughout the year/period
| | | For the
Year Ended
October 31,
2022 | | | For the
Period Ended
October 31,
2021 (a) | |
Net Asset Value, Beginning of Period | | $ | 22.66 | | | $ | 20.56 | |
| | | | | | | | | |
INCOME (LOSS) FROM INVESTMENT OPERATIONS: | | | | | | | | |
Net Investment Income (Loss) (b) | | | (0.16 | ) | | | (0.14 | ) |
Net Realized and Unrealized Gain (Loss) on Investments (c) | | | (0.89 | ) | | | 2.24 | |
Total from Investment Operations | | | (1.05 | ) | | | 2.10 | |
| | | | | | | | | |
CAPITAL SHARE TRANSACTIONS: | | | | | | | | |
Transaction Fees (See Note 1) | | | 0.00 | (g) | | | — | |
| | | | | | | | | |
LESS DISTRIBUTIONS: | | | | | | | | |
Distributions From: | | | | | | | | |
Net Investment Income | | | (0.11 | ) | | | — | |
Total Distributions | | | (0.11 | ) | | | — | |
Net Asset Value, End of Period | | $ | 21.50 | | | $ | 22.66 | |
Total Return | | | -4.65 | % | | | 10.20 | %(f) |
| | | | | | | | | |
SUPPLEMENTAL DATA: | | | | | | | | |
Net Assets at End of Period (000’s) | | $ | 20,425 | | | $ | 2,832 | |
| | | | | | | | | |
RATIOS TO AVERAGE NET ASSETS: | | | | | | | | |
Expenses to Average Net Assets | | | 0.75 | % | | | 0.75 | %(e) |
Net Investment Income (Loss) to Average Net Assets | | | -0.75 | % | | | -0.75 | %(e) |
Portfolio Turnover Rate (d) | | | 48 | % | | | 0 | %(f) |
(a) | Fund commenced operations on December 22, 2020. The information presented is from December 22, 2020 to October 31, 2021. |
(b) | Calculated based on average shares outstanding during the period. |
(c) | Realized and unrealized gains and losses per share are balancing amounts necessary to reconcile to the change in net asset value for the period and may reconcile with aggregate gains and losses in the statement of operations due to share transactions for the period. |
(d) | Excludes the impact of in-kind transactions. |
(g) | Represents less than $0.005. |
The accompanying notes are an integral part of the financial statements.
67
Pacer Swan SOS Flex (January) ETF
FINANCIAL HIGHLIGHTS
For a capital share outstanding throughout the year/period
| | | For the
Year Ended
October 31,
2022 | | | For the
Period Ended
October 31,
2021 (a) | |
Net Asset Value, Beginning of Period | | $ | 23.82 | | | $ | 20.56 | |
| | | | | | | | | |
INCOME (LOSS) FROM INVESTMENT OPERATIONS: | | | | | | | | |
Net Investment Income (Loss) (b) | | | (0.17 | ) | | | (0.15 | ) |
Net Realized and Unrealized Gain (Loss) on Investments (c) | | | (0.73 | ) | | | 3.41 | |
Total from Investment Operations | | | (0.90 | ) | | | 3.26 | |
| | | | | | | | | |
CAPITAL SHARE TRANSACTIONS: | | | | | | | | |
Transaction Fees (See Note 1) | | | 0.01 | | | | — | |
| | | | | | | | | |
Net Asset Value, End of Period | | $ | 22.93 | | | $ | 23.82 | |
Total Return | | | -3.74 | % | | | 15.85 | %(f) |
| | | | | | | | | |
SUPPLEMENTAL DATA: | | | | | | | | |
Net Assets at End of Period (000’s) | | $ | 17,196 | | | $ | 3,573 | |
| | | | | | | | | |
RATIOS TO AVERAGE NET ASSETS: | | | | | | | | |
Expenses to Average Net Assets | | | 0.76 | % | | | 0.75 | %(e) |
Net Investment Income (Loss) to Average Net Assets | | | -0.76 | % | | | -0.75 | %(e) |
Portfolio Turnover Rate (d) | | | 226 | % | | | 0 | %(f) |
(a) | Fund commenced operations on December 22, 2020. The information presented is from December 22, 2020 to October 31, 2021. |
(b) | Calculated based on average shares outstanding during the period. |
(c) | Realized and unrealized gains and losses per share are balancing amounts necessary to reconcile to the change in net asset value for the period and may reconcile with aggregate gains and losses in the statement of operations due to share transactions for the period. |
(d) | Excludes the impact of in-kind transactions. |
The accompanying notes are an integral part of the financial statements.
68
Pacer Swan SOS Fund of Funds ETF
FINANCIAL HIGHLIGHTS
For a capital share outstanding throughout the year/period
| | | For the
Year Ended
October 31,
2022 | | | For the
Period Ended
October 31,
2021 (a) | |
Net Asset Value, Beginning of Period | | $ | 22.49 | | | $ | 20.26 | |
| | | | | | | | | |
INCOME (LOSS) FROM INVESTMENT OPERATIONS: | | | | | | | | |
Net Investment Income (Loss) (b) | | | (0.03 | ) | | | (0.03 | ) |
Net Realized and Unrealized Gain (Loss) on Investments (c) | | | (0.96 | ) | | | 2.26 | |
Total from Investment Operations | | | (0.99 | ) | | | 2.23 | |
| | | | | | | | | |
CAPITAL SHARE TRANSACTIONS: | | | | | | | | |
Transaction Fees (See Note 1) | | | 0.06 | | | | — | |
| | | | | | | | | |
Net Asset Value, End of Period | | $ | 21.56 | | | $ | 22.49 | |
Total Return | | | -4.12 | % | | | 11.01 | %(f) |
| | | | | | | | | |
SUPPLEMENTAL DATA: | | | | | | | | |
Net Assets at End of Period (000’s) | | $ | 118,060 | | | $ | 38,234 | |
| | | | | | | | | |
RATIOS TO AVERAGE NET ASSETS: | | | | | | | | |
Expenses to Average Net Assets (g) | | | 0.18 | % | | | 0.18 | %(e) |
Net Investment Income (Loss) to Average Net Assets | | | -0.13 | % | | | -0.18 | %(e) |
Portfolio Turnover Rate (d) | | | 11 | % | | | 69 | %(f) |
(a) | Fund commenced operations on December 29, 2020. The information presented is from December 29, 2020 to October 31, 2021. |
(b) | Calculated based on average shares outstanding during the period. |
(c) | Realized and unrealized gains and losses per share are balancing amounts necessary to reconcile to the change in net asset value for the period and may reconcile with aggregate gains and losses in the statement of operations due to share transactions for the period. |
(d) | Excludes the impact of in-kind transactions. |
(g) | The expense ratios exclude the impact of fees/expenses paid by each underlying fund. |
The accompanying notes are an integral part of the financial statements.
69
Pacer Swan SOS Conservative (April) ETF
FINANCIAL HIGHLIGHTS
For a capital share outstanding throughout the year/period
| | | For the
Year Ended
October 31,
2022 | | | For the
Period Ended
October 31,
2021 (a) | |
Net Asset Value, Beginning of Period | | $ | 21.73 | | | $ | 20.61 | |
| | | | | | | | | |
INCOME (LOSS) FROM INVESTMENT OPERATIONS: | | | | | | | | |
Net Investment Income (Loss) (b) | | | (0.16 | ) | | | (0.09 | ) |
Net Realized and Unrealized Gain (Loss) on Investments (c) | | | (0.82 | ) | | | 1.21 | |
Total from Investment Operations | | | (0.98 | ) | �� | | 1.12 | |
| | | | | | | | | |
CAPITAL SHARE TRANSACTIONS: | | | | | | | | |
Transaction Fees (See Note 1) | | | 0.00 | (g) | | | — | |
| | | | | | | | | |
Net Asset Value, End of Period | | $ | 20.75 | | | $ | 21.73 | |
Total Return | | | -4.52 | % | | | 5.45 | %(f) |
| | | | | | | | | |
SUPPLEMENTAL DATA: | | | | | | | | |
Net Assets at End of Period (000’s) | | $ | 16,081 | | | $ | 2,717 | |
| | | | | | | | | |
RATIOS TO AVERAGE NET ASSETS: | | | | | | | | |
Expenses to Average Net Assets | | | 0.76 | % | | | 0.75 | %(e) |
Net Investment Income (Loss) to Average Net Assets | | | -0.75 | % | | | -0.75 | %(e) |
Portfolio Turnover Rate (d) | | | 0 | % | | | 0 | %(f) |
(a) | Fund commenced operations on March 31, 2021. The information presented is from March 31, 2021 to October 31, 2021. |
(b) | Calculated based on average shares outstanding during the period. |
(c) | Realized and unrealized gains and losses per share are balancing amounts necessary to reconcile to the change in net asset value for the period and may reconcile with aggregate gains and losses in the statement of operations due to share transactions for the period. |
(d) | Excludes the impact of in-kind transactions. |
(g) | Represents less than $0.005. |
The accompanying notes are an integral part of the financial statements.
70
Pacer Swan SOS Moderate (April) ETF
FINANCIAL HIGHLIGHTS
For a capital share outstanding throughout the year/period
| | | For the
Year Ended
October 31,
2022 | | | For the
Period Ended
October 31,
2021 (a) | |
Net Asset Value, Beginning of Period | | $ | 21.98 | | | $ | 20.61 | |
| | | | | | | | | |
INCOME (LOSS) FROM INVESTMENT OPERATIONS: | | | | | | | | |
Net Investment Income (Loss) (b) | | | (0.16 | ) | | | (0.10 | ) |
Net Realized and Unrealized Gain (Loss) on Investments (c) | | | (0.70 | ) | | | 1.47 | |
Total from Investment Operations | | | (0.86 | ) | | | 1.37 | |
| | | | | | | | | |
CAPITAL SHARE TRANSACTIONS: | | | | | | | | |
Transaction Fees (See Note 1) | | | 0.00 | (g) | | | — | |
| | | | | | | | | |
Net Asset Value, End of Period | | $ | 21.12 | | | $ | 21.98 | |
Total Return | | | -3.92 | % | | | 6.67 | %(f) |
| | | | | | | | | |
SUPPLEMENTAL DATA: | | | | | | | | |
Net Assets at End of Period (000’s) | | $ | 17,954 | | | $ | 5,496 | |
| | | | | | | | | |
RATIOS TO AVERAGE NET ASSETS: | | | | | | | | |
Expenses to Average Net Assets | | | 0.76 | % | | | 0.75 | %(e) |
Net Investment Income (Loss) to Average Net Assets | | | -0.75 | % | | | -0.75 | %(e) |
Portfolio Turnover Rate (d) | | | 0 | % | | | 0 | %(f) |
(a) | Fund commenced operations on March 31, 2021. The information presented is from March 31, 2021 to October 31, 2021. |
(b) | Calculated based on average shares outstanding during the period. |
(c) | Realized and unrealized gains and losses per share are balancing amounts necessary to reconcile to the change in net asset value for the period and may reconcile with aggregate gains and losses in the statement of operations due to share transactions for the period. |
(d) | Excludes the impact of in-kind transactions. |
(g) | Represents less than $0.005. |
The accompanying notes are an integral part of the financial statements.
71
Pacer Swan SOS Flex (April) ETF
FINANCIAL HIGHLIGHTS
For a capital share outstanding throughout the year/period
| | | For the
Year Ended
October 31,
2022 | | | For the
Period Ended
October 31,
2021 (a) | |
Net Asset Value, Beginning of Period | | $ | 22.75 | | | $ | 20.61 | |
| | | | | | | | | |
INCOME (LOSS) FROM INVESTMENT OPERATIONS: | | | | | | | | |
Net Investment Income (Loss) (b) | | | (0.17 | ) | | | (0.10 | ) |
Net Realized and Unrealized Gain (Loss) on Investments (c) | | | (1.00 | ) | | | 2.24 | |
Total from Investment Operations | | | (1.17 | ) | | | 2.14 | |
| | | | | | | | | |
CAPITAL SHARE TRANSACTIONS: | | | | | | | | |
Transaction Fees (See Note 1) | | | 0.00 | (g) | | | — | |
| | | | | | | | | |
Net Asset Value, End of Period | | $ | 21.58 | | | $ | 22.75 | |
Total Return | | | -5.15 | % | | | 10.37 | %(f) |
| | | | | | | | | |
SUPPLEMENTAL DATA: | | | | | | | | |
Net Assets at End of Period (000’s) | | $ | 12,406 | | | $ | 7,962 | |
| | | | | | | | | |
RATIOS TO AVERAGE NET ASSETS: | | | | | | | | |
Expenses to Average Net Assets | | | 0.77 | % | | | 0.75 | %(e) |
Net Investment Income (Loss) to Average Net Assets | | | -0.76 | % | | | -0.75 | %(e) |
Portfolio Turnover Rate (d) | | | 0 | % | | | 0 | %(f) |
(a) | Fund commenced operations on March 31, 2021. The information presented is from March 31, 2021 to October 31, 2021. |
(b) | Calculated based on average shares outstanding during the period. |
(c) | Realized and unrealized gains and losses per share are balancing amounts necessary to reconcile to the change in net asset value for the period and may reconcile with aggregate gains and losses in the statement of operations due to share transactions for the period. |
(d) | Excludes the impact of in-kind transactions. |
(g) | Represents less than $0.005. |
The accompanying notes are an integral part of the financial statements.
72
Pacer Swan SOS Conservative (July) ETF
FINANCIAL HIGHLIGHTS
For a capital share outstanding throughout the year/period
| | | For the
Year Ended
October 31,
2022 | | | For the
Period Ended
October 31,
2021 (a) | |
Net Asset Value, Beginning of Period | | $ | 20.94 | | | $ | 20.48 | |
| | | | | | | | | |
INCOME (LOSS) FROM INVESTMENT OPERATIONS: | | | | | | | | |
Net Investment Income (Loss) (b) | | | (0.15 | ) | | | (0.05 | ) |
Net Realized and Unrealized Gain (Loss) on Investments (c) | | | (1.29 | ) | | | 0.51 | |
Total from Investment Operations | | | (1.44 | ) | | | 0.46 | |
| | | | | | | | | |
CAPITAL SHARE TRANSACTIONS: | | | | | | | | |
Transaction Fees (See Note 1) | | | 0.00 | (g) | | | — | |
| | | | | | | | | |
Net Asset Value, End of Period | | $ | 19.50 | | | $ | 20.94 | |
Total Return | | | -6.88 | % | | | 2.22 | %(f) |
| | | | | | | | | |
SUPPLEMENTAL DATA: | | | | | | | | |
Net Assets at End of Period (000’s) | | $ | 6,336 | | | $ | 3,664 | |
| | | | | | | | | |
RATIOS TO AVERAGE NET ASSETS: | | | | | | | | |
Expenses to Average Net Assets | | | 0.76 | % | | | 0.76 | %(e) |
Net Investment Income (Loss) to Average Net Assets | | | -0.75 | % | | | -0.76 | %(e) |
Portfolio Turnover Rate (d) | | | 0 | % | | | 0 | %(f) |
(a) | Fund commenced operations on June 30, 2021. The information presented is from June 30, 2021 to October 31, 2021. |
(b) | Calculated based on average shares outstanding during the period. |
(c) | Realized and unrealized gains and losses per share are balancing amounts necessary to reconcile to the change in net asset value for the period and may reconcile with aggregate gains and losses in the statement of operations due to share transactions for the period. |
(d) | Excludes the impact of in-kind transactions. |
(g) | Represents less than $0.005. |
The accompanying notes are an integral part of the financial statements.
73
Pacer Swan SOS Moderate (July) ETF
FINANCIAL HIGHLIGHTS
For a capital share outstanding throughout the year/period
| | | For the
Year Ended
October 31,
2022 | | | For the
Period Ended
October 31,
2021 (a) | |
Net Asset Value, Beginning of Period | | $ | 21.02 | | | $ | 20.48 | |
| | | | | | | | | |
INCOME (LOSS) FROM INVESTMENT OPERATIONS: | | | | | | | | |
Net Investment Income (Loss) (b) | | | (0.15 | ) | | | (0.05 | ) |
Net Realized and Unrealized Gain (Loss) on Investments (c) | | | (0.22 | ) | | | 0.59 | |
Total from Investment Operations | | | (0.37 | ) | | | 0.54 | |
| | | | | | | | | |
CAPITAL SHARE TRANSACTIONS: | | | | | | | | |
Transaction Fees (See Note 1) | | | 0.00 | (g) | | | — | |
| | | | | | | | | |
LESS DISTRIBUTIONS: | | | | | | | | |
Distributions From: | | | | | | | | |
Net Investment Income | | | (0.00 | )(g) | | | — | |
Total Distributions | | | (0.00 | )(g) | | | — | |
Net Asset Value, End of Period | | $ | 20.65 | | | $ | 21.02 | |
Total Return | | | -1.74 | % | | | 2.63 | %(f) |
| | | | | | | | | |
SUPPLEMENTAL DATA: | | | | | | | | |
Net Assets at End of Period (000’s) | | $ | 33,556 | | | $ | 17,866 | |
| | | | | | | | | |
RATIOS TO AVERAGE NET ASSETS: | | | | | | | | |
Expenses to Average Net Assets | | | 0.76 | % | | | 0.75 | %(e) |
Net Investment Income (Loss) to Average Net Assets | | | -0.75 | % | | | -0.75 | %(e) |
Portfolio Turnover Rate (d) | | | 0 | % | | | 0 | %(f) |
(a) | Fund commenced operations on June 30, 2021. The information presented is from June 30, 2021 to October 31, 2021. |
(b) | Calculated based on average shares outstanding during the period. |
(c) | Realized and unrealized gains and losses per share are balancing amounts necessary to reconcile to the change in net asset value for the period and may reconcile with aggregate gains and losses in the statement of operations due to share transactions for the period. |
(d) | Excludes the impact of in-kind transactions. |
(g) | Represents less than $0.005. |
The accompanying notes are an integral part of the financial statements.
74
Pacer Swan SOS Flex (July) ETF
FINANCIAL HIGHLIGHTS
For a capital share outstanding throughout the year/period
| | | For the
Year Ended
October 31,
2022 | | | For the
Period Ended
October 31,
2021 (a) | |
Net Asset Value, Beginning of Period | | $ | 21.31 | | | $ | 20.48 | |
| | | | | | | | | |
INCOME (LOSS) FROM INVESTMENT OPERATIONS: | | | | | | | | |
Net Investment Income (Loss) (b) | | | (0.16 | ) | | | (0.05 | ) |
Net Realized and Unrealized Gain (Loss) on Investments (c) | | | (0.37 | ) | | | 0.88 | |
Total from Investment Operations | | | (0.53 | ) | | | 0.83 | |
| | | | | | | | | |
CAPITAL SHARE TRANSACTIONS: | | | | | | | | |
Transaction Fees (See Note 1) | | | 0.00 | (g) | | | — | |
| | | | | | | | | |
Net Asset Value, End of Period | | $ | 20.78 | | | $ | 21.31 | |
Total Return | | | -2.49 | % | | | 4.05 | %(f) |
| | | | | | | | | |
SUPPLEMENTAL DATA: | | | | | | | | |
Net Assets at End of Period (000’s) | | $ | 12,468 | | | $ | 5,327 | |
| | | | | | | | | |
RATIOS TO AVERAGE NET ASSETS: | | | | | | | | |
Expenses to Average Net Assets | | | 0.76 | % | | | 0.76 | %(e) |
Net Investment Income (Loss) to Average Net Assets | | | -0.75 | % | | | -0.76 | %(e) |
Portfolio Turnover Rate (d) | | | 0 | % | | | 0 | %(f) |
(a) | Fund commenced operations on June 30, 2021. The information presented is from June 30, 2021 to October 31, 2021. |
(b) | Calculated based on average shares outstanding during the period. |
(c) | Realized and unrealized gains and losses per share are balancing amounts necessary to reconcile to the change in net asset value for the period and may reconcile with aggregate gains and losses in the statement of operations due to share transactions for the period. |
(d) | Excludes the impact of in-kind transactions. |
(g) | Represents less than $0.005. |
The accompanying notes are an integral part of the financial statements.
75
Pacer Swan SOS Conservative (October) ETF
FINANCIAL HIGHLIGHTS
For a capital share outstanding throughout the year/period
| | | For the
Year Ended
October 31,
2022 | | | For the
Period Ended
October 31,
2021 (a) | |
Net Asset Value, Beginning of Period | | $ | 20.86 | | | $ | 20.51 | |
| | | | | | | | | |
INCOME (LOSS) FROM INVESTMENT OPERATIONS: | | | | | | | | |
Net Investment Income (Loss) (b) | | | (0.15 | ) | | | (0.01 | ) |
Net Realized and Unrealized Gain (Loss) on Investments (c) | | | (0.82 | ) | | | 0.36 | |
Total from Investment Operations | | | (0.97 | ) | | | 0.35 | |
| | | | | | | | | |
CAPITAL SHARE TRANSACTIONS: | | | | | | | | |
Transaction Fees (See Note 1) | | | 0.00 | (g) | | | — | |
| | | | | | | | | |
Net Asset Value, End of Period | | $ | 19.89 | | | $ | 20.86 | |
Total Return | | | -4.67 | % | | | 1.71 | %(f) |
| | | | | | | | | |
SUPPLEMENTAL DATA: | | | | | | | | |
Net Assets at End of Period (000’s) | | $ | 4,971 | | | $ | 2,607 | |
| | | | | | | | | |
RATIOS TO AVERAGE NET ASSETS: | | | | | | | | |
Expenses to Average Net Assets | | | 0.76 | % | | | 0.75 | %(e) |
Net Investment Income (Loss) to Average Net Assets | | | -0.75 | % | | | -0.75 | %(e) |
Portfolio Turnover Rate (d) | | | 0 | % | | | 0 | %(f) |
(a) | Fund commenced operations on September 30, 2021. The information presented is from September 30, 2021 to October 31, 2021. |
(b) | Calculated based on average shares outstanding during the period. |
(c) | Realized and unrealized gains and losses per share are balancing amounts necessary to reconcile to the change in net asset value for the period and may reconcile with aggregate gains and losses in the statement of operations due to share transactions for the period. |
(d) | Excludes the impact of in-kind transactions. |
(g) | Represents less than $0.005. |
The accompanying notes are an integral part of the financial statements.
76
Pacer Swan SOS Moderate (October) ETF
FINANCIAL HIGHLIGHTS
For a capital share outstanding throughout the year/period
| | | For the
Year Ended
October 31,
2022 | | | For the
Period Ended
October 31,
2021 (a) | |
Net Asset Value, Beginning of Period | | $ | 20.97 | | | $ | 20.51 | |
| | | | | | | | | |
INCOME (LOSS) FROM INVESTMENT OPERATIONS: | | | | | | | | |
Net Investment Income (Loss) (b) | | | (0.15 | ) | | | (0.01 | ) |
Net Realized and Unrealized Gain (Loss) on Investments (c) | | | (0.14 | ) | | | 0.47 | |
Total from Investment Operations | | | (0.29 | ) | | | 0.46 | |
| | | | | | | | | |
CAPITAL SHARE TRANSACTIONS: | | | | | | | | |
Transaction Fees (See Note 1) | | | 0.00 | (g) | | | — | |
| | | | | | | | | |
Net Asset Value, End of Period | | $ | 20.68 | | | $ | 20.97 | |
Total Return | | | -1.40 | % | | | 2.24 | %(f) |
| | | | | | | | | |
SUPPLEMENTAL DATA: | | | | | | | | |
Net Assets at End of Period (000’s) | | $ | 23,261 | | | $ | 8,912 | |
| | | | | | | | | |
RATIOS TO AVERAGE NET ASSETS: | | | | | | | | |
Expenses to Average Net Assets | | | 0.75 | % | | | 0.75 | %(e) |
Net Investment Income (Loss) to Average Net Assets | | | -0.74 | % | | | -0.75 | %(e) |
Portfolio Turnover Rate (d) | | | 0 | % | | | 0 | %(f) |
(a) | Fund commenced operations on September 30, 2021. The information presented is from September 30, 2021 to October 31, 2021. |
(b) | Calculated based on average shares outstanding during the period. |
(c) | Realized and unrealized gains and losses per share are balancing amounts necessary to reconcile to the change in net asset value for the period and may reconcile with aggregate gains and losses in the statement of operations due to share transactions for the period. |
(d) | Excludes the impact of in-kind transactions. |
(g) | Represents less than $0.005. |
The accompanying notes are an integral part of the financial statements.
77
Pacer Swan SOS Flex (October) ETF
FINANCIAL HIGHLIGHTS
For a capital share outstanding throughout the year/period
| | | For the
Year Ended
October 31,
2022 | | | For the
Period Ended
October 31,
2021 (a) | |
Net Asset Value, Beginning of Period | | $ | 21.26 | | | $ | 20.51 | |
| | | | | | | | | |
INCOME (LOSS) FROM INVESTMENT OPERATIONS: | | | | | | | | |
Net Investment Income (Loss) (b) | | | (0.16 | ) | | | (0.01 | ) |
Net Realized and Unrealized Gain (Loss) on Investments (c) | | | 0.22 | | | | 0.76 | |
Total from Investment Operations | | | 0.06 | | | | 0.75 | |
| | | | | | | | | |
CAPITAL SHARE TRANSACTIONS: | | | | | | | | |
Transaction Fees (See Note 1) | | | 0.00 | (g) | | | — | |
| | | | | | | | | |
Net Asset Value, End of Period | | $ | 21.32 | | | $ | 21.26 | |
Total Return | | | 0.31 | % | | | 3.64 | %(f) |
| | | | | | | | | |
SUPPLEMENTAL DATA: | | | | | | | | |
Net Assets at End of Period (000’s) | | $ | 10,662 | | | $ | 3,720 | |
| | | | | | | | | |
RATIOS TO AVERAGE NET ASSETS: | | | | | | | | |
Expenses to Average Net Assets | | | 0.76 | % | | | 0.75 | %(e) |
Net Investment Income (Loss) to Average Net Assets | | | -0.75 | % | | | -0.75 | %(e) |
Portfolio Turnover Rate (d) | | | 0 | % | | | 0 | %(f) |
(a) | Fund commenced operations on September 30, 2021. The information presented is from September 30, 2021 to October 31, 2021. |
(b) | Calculated based on average shares outstanding during the period. |
(c) | Realized and unrealized gains and losses per share are balancing amounts necessary to reconcile to the change in net asset value for the period and may reconcile with aggregate gains and losses in the statement of operations due to share transactions for the period. |
(d) | Excludes the impact of in-kind transactions. |
(g) | Represents less than $0.005. |
The accompanying notes are an integral part of the financial statements.
78
Pacer BlueStar Digital Entertainment ETF
FINANCIAL HIGHLIGHTS
For a capital share outstanding throughout the period
| | | For the
Period Ended
October 31,
2022 (a) | |
Net Asset Value, Beginning of Period | | $ | 19.74 | |
| | | | | |
INCOME (LOSS) FROM INVESTMENT OPERATIONS: | | | | |
Net Investment Income (Loss) (b) | | | 0.05 | |
Net Realized and Unrealized Gain (Loss) on Investments (c) | | | (4.32 | ) |
Total from Investment Operations | | | (4.27 | ) |
| | | | | |
LESS DISTRIBUTIONS: | | | | |
Distributions from Net Investment Income | | | (0.04 | ) |
Total Distributions | | | (0.04 | ) |
| | | | | |
CAPITAL SHARE TRANSACTIONS | | | | |
Transaction Fees (see Note 6) | | | 0.01 | |
| | | | | |
Net Asset Value, End of Period | | $ | 15.44 | |
Total Return | | | -21.58 | %(f) |
| | | | | |
SUPPLEMENTAL DATA: | | | | |
Net Assets at End of Period (000’s) | | $ | 618 | |
| | | | | |
RATIOS TO AVERAGE NET ASSETS: | | | | |
Expenses to Average Net Assets | | | 0.60 | %(e) |
Net Investment Income (Loss) to Average Net Assets | | | 0.53 | %(e) |
Portfolio Turnover Rate (d) | | | 33 | %(f) |
(a) | Fund commenced operations on April 7, 2022. The information presented is from April 7, 2022 to October 31, 2022. |
(b) | Calculated based on average shares outstanding during the period. |
(c) | Realized and unrealized gains and losses per share are balancing amounts necessary to reconcile to the change in net asset value for the period and may reconcile with aggregate gains and losses in the statement of operations due to share transactions for the period. |
(d) | Excludes the impact of in-kind transactions. |
The accompanying notes are an integral part of the financial statements.
79
Pacer BlueStar Engineering the Future ETF
FINANCIAL HIGHLIGHTS
For a capital share outstanding throughout the period
| | | For the
Period Ended
October 31,
2022 (a) | |
Net Asset Value, Beginning of Period | | $ | 20.52 | |
| | | | | |
INCOME (LOSS) FROM INVESTMENT OPERATIONS: | | | | |
Net Investment Income (Loss) (b) | | | 0.01 | |
Net Realized and Unrealized Gain (Loss) on Investments (c) | | | (3.53 | ) |
Total from Investment Operations | | | (3.52 | ) |
| | | | | |
Net Asset Value, End of Period | | $ | 17.00 | |
Total Return | | | -17.14 | %(f) |
| | | | | |
SUPPLEMENTAL DATA: | | | | |
Net Assets at End of Period (000’s) | | $ | 1,360 | |
| | | | | |
RATIOS TO AVERAGE NET ASSETS: | | | | |
Expenses to Average Net Assets | | | 0.60 | %(e) |
Net Investment Income (Loss) to Average Net Assets | | | 0.07 | %(e) |
Portfolio Turnover Rate (d) | | | 0 | %(f) |
(a) | Fund commenced operations on May 4, 2022. The information presented is from April 7, 2022 to October 31, 2022. |
(b) | Calculated based on average shares outstanding during the period. |
(c) | Realized and unrealized gains and losses per share are balancing amounts necessary to reconcile to the change in net asset value for the period and may reconcile with aggregate gains and losses in the statement of operations due to share transactions for the period. |
(d) | Excludes the impact of in-kind transactions. |
The accompanying notes are an integral part of the financial statements.
80
Pacer Funds
NOTES TO FINANCIAL STATEMENTS
October 31, 2022
NOTE 1 – ORGANIZATION
Pacer Funds Trust (the “Trust”) is a Delaware statutory trust organized on August 12, 2014. All Funds in the Trust, except PTLC, PTMC, PTNQ, PTEU, PTIN, PTBD, TRND, GCOW, COWZ, CALF, ICOW, BUL, ECOW, HERD, PWS, INDS, SRVR, SZNE, AFTY, VIRS, ALTL, PAMC, PALC, PEXL, TRPL, QDPL, FLRT, SHPP and TRFK’s fiscal year ends are October 31st and as such are not included in these financial statements. The Trust is registered with the Securities and Exchange Commission (the “SEC”) under the Investment Company Act of 1940, as amended (the “1940 Act”), as an open-end management investment company and the offering of the Funds’ shares (“Shares”) is registered under the Securities Act of 1933, as amended (the “Securities Act”). The Trust currently consists of multiple operational series, of which are covered in this report, individually the (“Fund”) or collectively the (“Funds”);
Fund Name | Ticker | Commencement
of Operations | Exchange | Transaction Fees |
Pacer American Energy ETF | USAI | December 12, 2017 | NYSE | $300 |
Pacer Swan SOS Conservative (January) ETF | PSCX | December 22, 2020 | Cboe | 300 |
Pacer Swan SOS Moderate (January) ETF | PSMD | December 22, 2020 | Cboe | 300 |
Pacer Swan SOS Flex (January) ETF | PSFD | December 22, 2020 | Cboe | 300 |
Pacer Swan SOS Fund of Funds ETF | PSFF | December 29, 2020 | Cboe | 300 |
Pacer Swan SOS Conservative (April) ETF | PSCW | March 31, 2021 | Cboe | 300 |
Pacer Swan SOS Moderate (April) ETF | PSMR | March 31, 2021 | Cboe | 300 |
Pacer Swan SOS Flex (April) ETF | PSFM | March 31, 2021 | Cboe | 300 |
Pacer Swan SOS Conservative (July) ETF | PSCJ | June 30, 2021 | Cboe | 300 |
Pacer Swan SOS Moderate (July) ETF | PSMJ | June 30, 2021 | Cboe | 300 |
Pacer Swan SOS Flex (July) ETF | PSFJ | June 30, 2021 | Cboe | 300 |
Pacer Swan SOS Conservative (October) ETF | PSCQ | September 30, 2021 | Cboe | 300 |
Pacer Swan SOS Moderate (October) ETF | PSMO | September 30, 2021 | Cboe | 300 |
Pacer Swan SOS Flex (October) ETF | PSFO | September 30, 2021 | Cboe | 300 |
Pacer BlueStar Digital Entertainment ETF | ODDS | April 7, 2022 | Nasdaq | 750 |
Pacer Bluestar Engineering the Future ETF | BULD | May 4, 2022 | Nasdaq | 750 |
Each of the Funds are non-diversified series of the Trust. The investment objective of the following Funds is to track the performance, before fees and expenses, of the
Ticker | Index |
USAI | American Energy Independence Index |
ODDS | BlueStar Global Online Gambling, Video Gaming, and eSports Index |
BULD | BlueStar Robotics and 3D Printing Index |
The investment objective of the following Funds is to seek
Ticker | Objective |
PSCX | to provide investors with returns that, before fees and expenses of the Fund, match those of the SPDR® S&P 500® ETF Trust (the “Underlying ETF”) up to a predetermined upside cap of 8.60% (before fees and expenses of the Fund) and 7.85% (after fees and expenses of the Fund), while providing a buffer against Underlying ETF losses between 5% and 30% over the period from December 20, 2021 to December 31, 2022. |
PSMD | to provide investors with returns that, before fees and expenses of the Fund, match those of the SPDR® S&P 500® ETF Trust (“the Underlying ETF”) up to a predetermined upside cap of 10.30% (before fees and expenses of the Fund) and 9.55% (after fees and expenses of the Fund), while providing a buffer against the first 15% of Underlying ETF losses, over the period from December 20, 2021 to December 31, 2022. |
PSFD | to provide investors with returns that match those of the SPDR® S&P 500® ETF Trust (the “Underlying ETF”) up to a predetermined upside cap of 14.70% (before fees and expenses of the Fund) and 13.95% (after fees and expenses of the Fund), while providing a buffer against the first 20% of Underlying ETF losses with the benefits of such buffer declining from 20% to 0% for Underlying ETF losses between 20% and 40%, over the period from December 20, 2021 to December 31, 2022. |
PSFF | capital appreciation with downside protection. |
81
Pacer Funds
NOTES TO FINANCIAL STATEMENTS
October 31, 2022 (Continued)
Ticker | Objective |
PSCW | to provide investors with returns that, before fees and expenses of the Fund, match those of the SPDR® S&P 500® ETF Trust (the “Underlying ETF”) up to a predetermined upside cap of 10.23% (before fees and expenses of the Fund) and 9.48% (after fees and expenses of the Fund), while providing a buffer against Underlying ETF losses between 5% and 30% over the period from April 1, 2022 to March 31, 2023. |
PSMR | to provide investors with returns that, before fees and expenses of the Fund, match those of the SPDR® S&P 500® ETF Trust (“the Underlying ETF”) up to a predetermined upside cap of 11.31% (before fees and expenses of the Fund) and 10.56% (after fees and expenses of the Fund), while providing a buffer against the first 15% of Underlying ETF losses, over the period from April 1, 2022 to March 31, 2023. |
PSFM | to provide investors with returns that match those of the SPDR® S&P 500® ETF Trust (the “Underlying ETF”) up to a predetermined upside cap of 14.88% (before fees and expenses of the Fund) and 14.13% (after fees and expenses of the Fund), while providing a buffer against the first 20% of Underlying ETF losses with the benefits of such buffer declining from 20% to 0% for Underlying ETF losses between 20% and 40%, over the period from April 1, 2022 to March 31, 2023. |
PSCJ | to provide investors with returns that, before fees and expenses of the Fund, match those of the SPDR® S&P 500® ETF Trust (the “Underlying ETF”) up to a predetermined upside cap of 15.30% (before fees and expenses of the Fund) and 14.55% (after fees and expenses of the Fund), while providing a buffer against Underlying ETF losses between 5% and 30% over the period from July 1, 2022 to June 30, 2023. |
PSMJ | to provide investors with returns that, before fees and expenses of the Fund, match those of the SPDR® S&P 500® ETF Trust (“the Underlying ETF”) up to a predetermined upside cap of 17.10% (before fees and expenses of the Fund) and 16.35% (after fees and expenses of the Fund), while providing a buffer against the first 15% of Underlying ETF losses, over the period from July 1, 2022 to June 30, 2023. |
PSFJ | to provide investors with returns that match those of the SPDR® S&P 500® ETF Trust (the “Underlying ETF”) up to a predetermined upside cap of 22.28% (before fees and expenses of the Fund) and 21.53% (after fees and expenses of the Fund), while providing a buffer against the first 20% of Underlying ETF losses with the benefits of such buffer declining from 20% to 0% for Underlying ETF losses between 20% and 40%, over the period from July 1, 2022 to June 30, 2023. |
PSCQ | to provide investors with returns that, before fees and expenses of the Fund, match those of the SPDR® S&P 500® ETF Trust (the “Underlying ETF”) up to a predetermined upside cap of 18.44% (before fees and expenses of the Fund) and 17.69% (after fees and expenses of the Fund), while providing a buffer against Underlying ETF losses between 5% and 30% over the period from October 1, 2022 to September 30, 2023. |
PSMO | to provide investors with returns that, before fees and expenses of the Fund, match those of the SPDR® S&P 500® ETF Trust (“the Underlying ETF”) up to a predetermined upside cap of 20.60% (before fees and expenses of the Fund) and 19.85% (after fees and expenses of the Fund), while providing a buffer against the first 15% of Underlying ETF losses, over the period from October 1, 2022 to September 30, 2023. |
PSFO | to provide investors with returns that match those of the SPDR® S&P 500® ETF Trust (the “Underlying ETF”) up to a predetermined upside cap of 26.30% (before fees and expenses of the Fund) and 25.55% (after fees and expenses of the Fund), while providing a buffer against the first 20% of Underlying ETF losses with the benefits of such buffer declining from 20% to 0% for Underlying ETF losses between 20% and 40%, over the period from October 1, 2022 to September 30, 2023. |
Market prices for the shares may be different from their net asset value (“NAV”). The Funds issue and redeem shares on a continuous basis at NAV only in large blocks of shares, called “Creation Units,” which generally consist of 25,000 shares except USAI which generally consist of 50,000 shares, along with ODDS and BULD which generally consist of 20,000 shares. Creation Units are issued and redeemed principally in-kind for securities included in a specified universe. Once created, Shares generally trade in the secondary market at market prices that change throughout the day in amounts less than a Creation Unit. Except when aggregated in Creation Units, Shares are not redeemable securities of a Fund. Shares of a Fund may only be purchased directly from or redeemed directly to a Fund by certain financial institutions (“Authorized Participants”). An Authorized Participant is either (i) a broker-dealer or other participant in the clearing process through the Continuous Net Settlement System of the National Securities Clearing Corporation or (ii) a DTC participant and, in each case, must have executed a Participant Agreement with Pacer Financial, Inc. (the “Distributor”). Most retail investors do not qualify as Authorized Participants nor have the resources to buy and sell whole Creation Units. Therefore, they are unable to purchase or redeem the shares directly from a Fund. Rather, most retail investors may purchase Shares in the secondary market with the assistance of a broker and are subject to customary brokerage commissions or fees. The Funds currently offer one class of Shares, which have no front end sales load, no deferred sales charge, and no redemption fee. A purchase (i.e., creation) transaction fee is imposed for the transfer and other transaction costs associated with the purchase of Creation Units. Each Fund charges $300 for the standard fixed creation fee, payable to the Custodian except ODDS and BULD which charges $750. The fixed transaction fee may be waived on certain orders if the Funds’ Custodian has determined to waive some or all of the costs associated with the order, or another party, such as the Adviser, has agreed to pay such fee. In regards to USAI, a variable fee, payable to the Fund, may be charged on all cash transactions or substitutes for Creation Units of up to a maximum of 2% as a percentage of the value of the Creation Units subject to the transaction. In regards to PSCX, PSMD. PSFD, PSFF, PSCW, PSMR, PSFM, PSCJ, PSMJ, PSFJ, PSCQ,
82
Pacer Funds
NOTES TO FINANCIAL STATEMENTS
October 31, 2022 (Continued)
PSMO, PSFO, ODDS and BULD a variable fee, payable to a Fund, of up to a maximum of 2% of the value of the Creation Units subject to the transaction may be imposed for cash purchases, non-standard orders, or partial cash purchases of Creation Units. The variable charge is primarily designed to cover additional costs (e.g., brokerage, taxes) involved with buying the securities with cash. For orders comprised entirely of cash, a variable fee of 0.01% of the value of the order will be charged by a Fund. For orders partially comprised of cash in lieu of certain Deposit Securities, a variable fee of 0.01% of the value of such cash in lieu of Deposit Securities will be charged by PSCX, PSMD, PSFD, PSFF, PSCW, PSMR, PSFM, PSCJ, PSMJ, PSFJ, PSCQ, PSMO and PSFO. A Fund may determine to not charge a variable fee on certain orders when the Adviser has determined that doing so is in the best interests of Fund shareholders (e.g., for creation orders that facilitate changes to the Fund’s portfolio in a more tax efficient manner than could be achieved without such order). Investors who use the services of a broker or other such intermediary may be charged a fee for such services. Investors are responsible for the fixed costs of transferring the Fund Securities from the Fund to their account or on their order. Variable fees received by the Funds, if any, are displayed in the Capital Shares Transactions section of the Statements of Changes in Net Assets. Each Fund may issue an unlimited number of shares of beneficial interest, with no par value. Shares of each Fund have equal rights and privileges to such Fund.
NOTE 2 – SIGNIFICANT ACCOUNTING POLICIES
The following is a summary of significant accounting policies consistently followed by the Funds in the preparation of the financial statements. The financial statements have been prepared in conformity with accounting principals generally accepted in the United States of America (“GAAP”). The Funds are investment companies that follow the accounting and reporting guidelines of Accounting Standards Codification Topic 946 applicable to investment companies.
Securities, including master limited partnerships (“”MLPs””), listed on a securities exchange, market or automated quotation system for which quotations are readily available, are valued at the last quoted sale price on the primary exchange or market (foreign or domestic) on which they are traded, except for securities listed on Nasdaq Global Market (“Nasdaq”). If, on a particular day, there is no such reported sale, then the most recent quoted bid price will be used. For securities traded on Nasdaq, the Nasdaq Official Closing Price (“NOCP”) will be used. If a Fund holds foreign shares of a security for which there is no reported volume, and there is an actively trading local version of the security, the last quoted sale price of the local security shall be used. Prices denominated in foreign currencies are converted to U.S. dollar equivalents at the current exchange rate.
Investments in other open-end investment companies, including money market funds, are valued at the investment company’s net asset value per share, with the exception of exchange-traded open-end investment companies, which are priced as equity securities described above.
Fixed-income securities are normally valued on the basis of quotes obtained from independent pricing services in accordance with procedures adopted by the Board of Trustees. The independent pricing services may employ methodologies that utilize market transactions (if the security is actively traded), broker-dealer supplied valuations, or matrix pricing. Short-term securities that have maturities of less than 60 days, at the time of purchase, are valued at amortized cost, which, when combined with accrued interest, approximates market value.
Options on securities that are listed on an exchange shall be valued at the sale price on such exchange (or any other exchange on which such options are listed) having the trade closest to the close of the New York Stock Exchange (“NYSE”) on the day of valuation or, if there was no sale on any of the applicable options exchanges on such day, at the mean between the highest bid and lowest ask price on any of such exchanges on such day closest to the close of the NYSE on such day. On the last trading day prior to expiration, expiring options may be priced at intrinsic value.
Foreign currency forward contracts are valued at the current day’s interpolated foreign exchange rate, as calculated using the current day’s spot rate, and the twenty, sixty, ninety, and one-hundred eighty day forward rates provided by an independent source.
Futures contracts are valued at the settlement price on the exchange on which they are principally traded.
Units of Mount Vernon Liquid Assets Portfolio are not traded on an exchange and are valued at the investment company’s NAV per share as provided by its administrator.
Deposit accounts are valued at acquisition cost, which approximates fair value.
Any securities for which there are no readily available market quotations and other assets will be valued at their fair value as determined in good faith by the Fair Value Pricing Committee using the Fair Value Procedures approved by the Board of Trustees (the “Board”).
As described above, the Funds utilize various methods to measure the fair value of their investments on a recurring basis. GAAP establishes a hierarchy that prioritizes inputs to valuations methods. The three levels of inputs are:
| | Level 1 | – Unadjusted quoted prices in active markets for identical assets or liabilities that the Funds have the ability to access. |
83
Pacer Funds
NOTES TO FINANCIAL STATEMENTS
October 31, 2022 (Continued)
| | Level 2 | – Observable inputs other than quoted prices included in Level 1 that are observable for the asset or liability, either directly or indirectly. These inputs may include quoted prices for the identical instrument on an inactive market, prices for similar instruments, interest rates, prepayment speeds, credit risk, yield curves, default rates and similar data. |
| | Level 3 | – Unobservable inputs for the asset or liability, to the extent relevant observable inputs are not available; representing the Funds’ own assumptions about the assumptions a market participant would use in valuing the asset or liability, and would be based on the best information available. |
The availability of observable inputs can vary from security to security and is affected by a wide variety of factors, including, for example, the type of security, whether the security is new and not yet established in the marketplace, the liquidity of markets, and other characteristics particular to the security. To the extent that valuation is based on models or inputs that are less observable or unobservable in the market, the determination of fair value requires more judgment. Accordingly, the degree of judgment exercised in determining fair value is greatest for instruments categorized in Level 3.
The inputs used to measure fair value may fall into different levels of the fair value hierarchy. In such cases, for disclosure purposes, the level in the fair value hierarchy within which the fair value measurement falls in its entirety, is determined based on the lowest level input that is significant to the fair value measurement in its entirety.
The following is a summary of the inputs used to value the Fund’s investments as of October 31, 2022:
USAI | | | | | | | | | | | | | | | | | | | | |
Description^ | | Level 1 | | | Level 2 | | | Level 3 | | | Investments
Measured at Net
Asset Value | | | Total | |
Common Stocks | | $ | 37,395,114 | | | $ | — | | | $ | — | | | $ | — | | | $ | 37,395,114 | |
Master Limited Partnerships and Related Companies | | | 9,695,408 | | | | — | | | | — | | | | — | | | | 9,695,408 | |
Short-Term Investments | | | 23,125 | | | | — | | | | — | | | | — | | | | 23,125 | |
Investments Purchased with Proceeds from Securities Lending | | | — | | | | — | | | | — | | | | 6,624,646 | | | | 6,624,646 | |
Total Investments in Securities | | $ | 47,113,647 | | | $ | — | | | $ | — | | | $ | 6,624,646 | | | $ | 53,738,293 | |
| ^ | See Schedules of Investments for industry breakouts. |
PSCX | | | | | | | | | | | | | | | | | | | | |
Description^ | | Level 1 | | | Level 2 | | | Level 3 | | | Investments
Measured at Net
Asset Value | | | Total | |
Assets | | | | | | | | | | | | | | | | | | | | |
Purchased Options | | $ | — | | | $ | 15,640,825 | | | $ | — | | | $ | — | | | $ | 15,640,825 | |
Short-Term Investments | | | 92,402 | | | | — | | | | — | | | | — | | | | 92,402 | |
Total Investments in Securities | | $ | 92,402 | | | $ | 15,640,825 | | | $ | — | | | $ | — | | | $ | 15,733,227 | |
Liabilities |
Options Written | | $ | — | | | $ | 59,985 | | | $ | — | | | $ | — | | | $ | 59,985 | |
Total Investments in Securities | | $ | — | | | $ | 59,985 | | | $ | — | | | $ | — | | | $ | 59,985 | |
| ^ | See the Schedules of Investments for further disaggregation of investment categories. |
84
Pacer Funds
NOTES TO FINANCIAL STATEMENTS
October 31, 2022 (Continued)
PSMD | | | | | | | | | | | | | | | | | | | | |
Description^ | | Level 1 | | | Level 2 | | | Level 3 | | | Investments
Measured at Net
Asset Value | | | Total | |
Assets | | | | | | | | | | | | | | | | | | | | |
Purchased Options | | $ | — | | | $ | 21,193,749 | | | $ | — | | | $ | — | | | $ | 21,193,749 | |
Short-Term Investments | | | 39,750 | | | | — | | | | — | | | | — | | | | 39,750 | |
Total Investments in Securities | | $ | 39,750 | | | $ | 21,193,749 | | | $ | — | | | $ | — | | | $ | 21,233,499 | |
Liabilities |
Options Written | | $ | — | | | $ | 801,150 | | | $ | — | | | $ | — | | | $ | 801,150 | |
Total Investments in Securities | | $ | — | | | $ | 801,150 | | | $ | — | | | $ | — | | | $ | 801,150 | |
^ See the Schedules of Investments for further disaggregation of investment categories.
PSFD | | | | | | | | | | | | | | | | | | | | |
Description^ | | Level 1 | | | Level 2 | | | Level 3 | | | Investments
Measured at Net
Asset Value | | | Total | |
Assets | | | | | | | | | | | | | | | | | | | | |
Purchased Options | | $ | — | | | $ | 17,818,159 | | | $ | — | | | $ | — | | | $ | 17,818,159 | |
Short-Term Investments | | | 37,690 | | | | — | | | | — | | | | — | | | | 37,690 | |
Total Investments in Securities | | $ | 37,690 | | | $ | 17,818,159 | | | $ | — | | | $ | — | | | $ | 17,855,849 | |
Liabilities |
Options Written | | $ | — | | | $ | 654,784 | | | $ | — | | | $ | — | | | $ | 654,784 | |
Total Investments in Securities | | $ | — | | | $ | 654,784 | | | $ | — | | | $ | — | | | $ | 654,784 | |
| ^ | See the Schedules of Investments for further disaggregation of investment categories. |
PSFF | | | | | | | | | | | | | | | | | | | | |
Description^ | | Level 1 | | | Level 2 | | | Level 3 | | | Investments
Measured at Net
Asset Value | | | Total | |
Affiliated Exchange Traded Funds | | $ | — | | | $ | 117,117,392 | | | $ | — | | | $ | — | | | $ | 117,117,392 | |
Short-Term Investments | | | 956,797 | | | | — | | | | — | | | | — | | | | 956,797 | |
Total Investments in Securities | | $ | 956,797 | | | $ | 117,117,392 | | | $ | — | | | $ | — | | | $ | 118,074,189 | |
PSCW | | | | | | | | | | | | | | | | | | | | |
Description^ | | Level 1 | | | Level 2 | | | Level 3 | | | Investments
Measured at Net
Asset Value | | | Total | |
Assets | | | | | | | | | | | | | | | | | | | | |
Purchased Options | | $ | — | | | $ | 16,194,959 | | | $ | — | | | $ | — | | | $ | 16,194,959 | |
Short-Term Investments | | | 106,895 | | | | — | | | | — | | | | — | | | | 106,895 | |
Total Investments in Securities | | $ | 106,895 | | | $ | 16,194,959 | | | $ | — | | | $ | — | | | $ | 16,301,854 | |
Liabilities |
Options Written | | $ | — | | | $ | 216,583 | | | $ | — | | | $ | — | | | $ | 216,583 | |
Total Investments in Securities | | $ | — | | | $ | 216,583 | | | $ | — | | | $ | — | | | $ | 216,583 | |
| ^ | See the Schedules of Investments for further disaggregation of investment categories. |
85
Pacer Funds
NOTES TO FINANCIAL STATEMENTS
October 31, 2022 (Continued)
PSMR | | | | | | | | | | | | | | | | | | | | |
Description^ | | Level 1 | | | Level 2 | | | Level 3 | | | Investments
Measured at Net
Asset Value | | | Total | |
Assets | | | | | | | | | | | | | | | | | | | | |
Purchased Options | | $ | — | | | $ | 18,819,163 | | | $ | — | | | $ | — | | | $ | 18,819,163 | |
Short-Term Investments | | | 57,974 | | | | — | | | | — | | | | — | | | | 57,974 | |
Total Investments in Securities | | $ | 57,974 | | | $ | 18,819,163 | | | $ | — | | | $ | — | | | $ | 18,877,137 | |
Liabilities |
Options Written | | $ | — | | | $ | 918,751 | | | $ | — | | | $ | — | | | $ | 918,751 | |
Total Investments in Securities | | $ | — | | | $ | 918,751 | | | $ | — | | | $ | — | | | $ | 918,751 | |
| ^ | See the Schedules of Investments for further disaggregation of investment categories. |
PSFM | | | | | | | | | | | | | | | | | | | | |
Description^ | | Level 1 | | | Level 2 | | | Level 3 | | | Investments
Measured at Net
Asset Value | | | Total | |
Assets | | | | | | | | | | | | | | | | | | | | |
Purchased Options | | $ | — | | | $ | 13,180,602 | | | $ | — | | | $ | — | | | $ | 13,180,602 | |
Short-Term Investments | | | 41,055 | | | | — | | | | — | | | | — | | | | 41,055 | |
Total Investments in Securities | | $ | 41,055 | | | $ | 13,180,602 | | | $ | — | | | $ | — | | | $ | 13,221,657 | |
Liabilities |
Options Written | | $ | — | | | $ | 813,839 | | | $ | — | | | $ | — | | | $ | 813,839 | |
Total Investments in Securities | | $ | — | | | $ | 813,839 | | | $ | — | | | $ | — | | | $ | 813,839 | |
| ^ | See the Schedules of Investments for further disaggregation of investment categories. |
PSCJ | | | | | | | | | | | | | | | | | | | | |
Description^ | | Level 1 | | | Level 2 | | | Level 3 | | | Investments
Measured at Net
Asset Value | | | Total | |
Assets | | | | | | | | | | | | | | | | | | | | |
Purchased Options | | $ | — | | | $ | 6,550,571 | | | $ | — | | | $ | — | | | $ | 6,550,571 | |
Short-Term Investments | | | 52,887 | | | | — | | | | — | | | | — | | | | 52,887 | |
Total Investments in Securities | | $ | 52,887 | | | $ | 6,550,571 | | | $ | — | | | $ | — | | | $ | 6,603,458 | |
Liabilities |
Options Written | | $ | — | | | $ | 266,594 | | | $ | — | | | $ | — | | | $ | 266,594 | |
Total Investments in Securities | | $ | — | | | $ | 266,594 | | | $ | — | | | $ | — | | | $ | 266,594 | |
| ^ | See the Schedules of Investments for further disaggregation of investment categories. |
86
Pacer Funds
NOTES TO FINANCIAL STATEMENTS
October 31, 2022 (Continued)
PSMJ | | | | | | | | | | | | | | | | | | | | |
Description^ | | Level 1 | | | Level 2 | | | Level 3 | | | Investments
Measured at Net
Asset Value | | | Total | |
Assets | | | | | | | | | | | | | | | | | | | | |
Purchased Options | | $ | — | | | $ | 35,008,663 | | | $ | — | | | $ | — | | | $ | 35,008,663 | |
Short-Term Investments | | | 288,553 | | | | — | | | | — | | | | — | | | | 288,553 | |
Total Investments in Securities | | $ | 288,553 | | | $ | 35,008,663 | | | $ | — | | | $ | — | | | $ | 35,297,216 | |
Liabilities |
Options Written | | $ | — | | | $ | 1,725,975 | | | $ | — | | | $ | — | | | $ | 1,725,975 | |
Total Investments in Securities | | $ | — | | | $ | 1,725,975 | | | $ | — | | | $ | — | | | $ | 1,725,975 | |
| ^ | See the Schedules of Investments for further disaggregation of investment categories. |
PSFJ | | | | | | | | | | | | | | | | | | | | |
Description^ | | Level 1 | | | Level 2 | | | Level 3 | | | Investments
Measured at Net
Asset Value | | | Total | |
Assets | | | | | | | | | | | | | | | | | | | | |
Purchased Options | | $ | — | | | $ | 12,960,525 | | | $ | — | | | $ | — | | | $ | 12,960,525 | |
Short-Term Investments | | | 135,338 | | | | — | | | | — | | | | — | | | | 135,338 | |
Total Investments in Securities | | $ | 135,338 | | | $ | 12,960,525 | | | $ | — | | | $ | — | | | $ | 13,095,863 | |
Liabilities |
Options Written | | $ | — | | | $ | 627,046 | | | $ | — | | | $ | — | | | $ | 627,046 | |
Total Investments in Securities | | $ | — | | | $ | 627,046 | | | $ | — | | | $ | — | | | $ | 627,046 | |
| ^ | See the Schedules of Investments for further disaggregation of investment categories. |
PSCQ | | | | | | | | | | | | | | | | | | | | |
Description^ | | Level 1 | | | Level 2 | | | Level 3 | | | Investments
Measured at Net
Asset Value | | | Total | |
Assets | | | | | | | | | | | | | | | | | | | | |
Purchased Options | | $ | — | | | $ | 5,251,101 | | | $ | — | | | $ | — | | | $ | 5,251,101 | |
Short-Term Investments | | | 83,052 | | | | — | | | | — | | | | — | | | | 83,052 | |
Total Investments in Securities | | $ | 83,052 | | | $ | 5,251,101 | | | $ | — | | | $ | — | | | $ | 5,334,153 | |
Liabilities |
Options Written | | $ | — | | | $ | 365,342 | | | $ | — | | | $ | — | | | $ | 365,342 | |
Total Investments in Securities | | $ | — | | | $ | 365,342 | | | $ | — | | | $ | — | | | $ | 365,342 | |
| ^ | See the Schedules of Investments for further disaggregation of investment categories. |
87
Pacer Funds
NOTES TO FINANCIAL STATEMENTS
October 31, 2022 (Continued)
PSMO | | | | | | | | | | | | | | | | | | | | |
Description^ | | Level 1 | | | Level 2 | | | Level 3 | | | Investments
Measured at Net
Asset Value | | | Total | |
Assets | | | | | | | | | | | | | | | | | | | | |
Purchased Options | | $ | — | | | $ | 24,819,040 | | | $ | — | | | $ | — | | | $ | 24,819,040 | |
Short-Term Investments | | | 291,995 | | | | — | | | | — | | | | — | | | | 291,995 | |
Total Investments in Securities | | $ | 291,995 | | | $ | 24,819,040 | | | $ | — | | | $ | — | | | $ | 25,111,035 | |
Liabilities |
Options Written | | $ | — | | | $ | 1,842,827 | | | $ | — | | | $ | — | | | $ | 1,842,827 | |
Total Investments in Securities | | $ | — | | | $ | 1,842,827 | | | $ | — | | | $ | — | | | $ | 1,842,827 | |
| ^ | See the Schedules of Investments for further disaggregation of investment categories. |
PSFO | | | | | | | | | | | | | | | | | | | | |
Description^ | | Level 1 | | | Level 2 | | | Level 3 | | | Investments
Measured at Net
Asset Value | | | Total | |
Assets | | | | | | | | | | | | | | | | | | | | |
Purchased Options | | $ | — | | | $ | 11,335,413 | | | $ | — | | | $ | — | | | $ | 11,335,413 | |
Short-Term Investments | | | 112,628 | | | | — | | | | — | | | | — | | | | 112,628 | |
Total Investments in Securities | | $ | 112,628 | | | $ | 11,335,413 | | | $ | — | | | $ | — | | | $ | 11,448,041 | |
Liabilities |
Options Written | | $ | — | | | $ | 787,278 | | | $ | — | | | $ | — | | | $ | 787,278 | |
Total Investments in Securities | | $ | — | | | $ | 787,278 | | | $ | — | | | $ | — | | | $ | 787,278 | |
| ^ | See the Schedules of Investments for further disaggregation of investment categories. |
ODDS | | | | | | | | | | | | | | | | | | | | |
Description^ | | Level 1 | | | Level 2 | | | Level 3 | | | Investments
Measured at Net
Asset Value | | | Total | |
Common Stocks | | $ | 589,368 | | | $ | — | | | $ | — | | | $ | — | | | $ | 589,368 | |
Exchange Traded Funds | | | 27,406 | | | | — | | | | — | | | | — | | | | 27,406 | |
Warrants | | | — | | | | — | | | | — | | | | — | | | | — | |
Short-Term Investments | | | 148 | | | | — | | | | — | | | | — | | | | 148 | |
Total Investments in Securities | | $ | 616,922 | | | $ | — | | | $ | — | | | $ | — | | | $ | 616,922 | |
| ^ | See Schedules of Investments for industry breakouts. |
ODDS(a) | Balance
as of
4/7/2022 | Net Realized
Gain (Loss) | Change in Net
Unrealized
Appreciation
(Depreciation) | Purchases | Sales | Corporate
Action | Transfers Out
of Level 3 | Transfers
Into Level 3 | Balance as of
10/31/2022 |
Warrants | $ — | $ — | $ — | $ — | $ — | $ 0 | $ — | $ — | $ 0 |
88
Pacer Funds
NOTES TO FINANCIAL STATEMENTS
October 31, 2022 (Continued)
The following is a summary of quantitative information about Level 3 Fair Value Measurements:
| | Fair Value as of
10/31/2022 | Valuation Techniques | Unobservable Input | Impact to Valuation
From an Increase
to Input |
Warrants | $ 0 | Corporate Action | None | $ 0 |
| | (a) | Table presents information for one security, which has been valued at $0.00 AUD throughout the period. |
BULD | | | | | | | | | | | | | | | | | | | | |
Description^ | | Level 1 | | | Level 2 | | | Level 3 | | | Investments
Measured at Net
Asset Value | | | Total | |
Common Stocks | | $ | 1,357,916 | | | $ | — | | | $ | — | | | $ | — | | | $ | 1,357,916 | |
Short-Term Investments | | | 1,645 | | | | — | | | | — | | | | — | | | | 1,645 | |
Total Investments in Securities | | $ | 1,359,561 | | | $ | — | | | $ | — | | | $ | — | | | $ | 1,359,561 | |
| ^ | See Schedules of Investments for industry breakouts. |
During the period ended October 31, 2022, the Funds did not recognize any transfers to or from Level 3.
OPTIONS CONTRACTS
In general, an option contract is an agreement between a buyer and seller that gives the purchaser of the option the right to buy or sell a particular asset at a specified future date at an agreed upon price (commonly known as the “strike price”). PSCX, PSMD, PSFD, PSCW, PSMR, PSFM, PSCJ, PSMJ, PSFJ, PSCQ, PSMO and PSFO portfolios include several types of FLEX Options, including both purchased and written put and call options (as further described below). The FLEX Options are all European style options, which means that they are exercisable at the strike price only on the FLEX Option expiration date. FLEX Options are customized option contracts available through national securities exchanges that are guaranteed for settlement by the Options Clearing Corporation (“OCC”), a market clearinghouse. FLEX Options provide investors with the ability to customize terms of an option, including exercise prices, exercise styles (European style versus American style options which are exercisable any time prior to the expiration date) and expiration dates, while achieving price discovery in competitive, transparent auctions markets and avoiding the counterparty exposure of the over-the-counter option positions.
Each FLEX Option contract entitles the holder thereof (i.e., the purchaser of the FLEX Option) the option to purchase (for the call options) or sell (for the put options) the cash value of the reference asset as of the close of the market on the FLEX Option expiration date at the strike price. The Fund intends to be structured so that any amount owed by the Fund on the written FLEX Options will be covered by payouts at expiration from the purchased FLEX Options. As a result, the FLEX Options will be fully covered, and no additional collateral will be necessary during the life of the Fund. The Fund receives premiums in exchange for the written FLEX Options and pays premiums in exchange for the purchased FLEX Options. The OCC and securities exchange that the FLEX Options are listed on do not charge ongoing fees to writers or purchasers of the FLEX Options during their life for continuing to hold the option contracts. In general, put options give the holder (i.e., the buyer) the right to sell an asset (or deliver the cash value of the index, in case of an index put option) and the seller (i.e., the writer) of the put has the obligation to buy the asset (or receive cash value of the index, in case of an index put option) at a certain defined price. Call options give the holder (i.e., the buyer) the right to buy an asset (or receive cash value of the index, in case of an index call option) and the seller (i.e., the writer) the obligation to sell the asset (or deliver cash value of the index, in case of an index call option) at a certain defined price.
When the Funds purchase an option, an amount equal to the premium paid by the Funds are recorded as an investment and is subsequently adjusted to the current value of the option purchased. If an option expires on the stipulated expiration date or if the Funds enter into a closing sale transaction, a gain or loss is realized. If a call option is exercised, the cost of the security acquired is increased by the premium paid for the call. If a put option is exercised, a gain or loss is realized from the sale of the underlying security, and the proceeds from such sale are decreased by the premium originally paid. Purchased options are non-income producing securities. When the Funds write an option, an amount equal to the premium received by the Funds are recorded as a liability and is subsequently adjusted to the current value of the option written. Premiums received from writing options that expire unexercised are treated by the Funds on the expiration date as realized gain from written options. The difference between the premium and the amount paid on effecting a closing purchase transaction, including brokerage commissions, is also treated as a realized gain, or if the premium is less than the amount paid for the closing purchase transaction, as a realized
89
Pacer Funds
NOTES TO FINANCIAL STATEMENTS
October 31, 2022 (Continued)
loss. If a call option is exercised, the premium is added to the proceeds from the sale of the underlying security in determining whether the Funds have realized a gain or loss. If a put option is exercised, the premium reduces the cost basis of the securities purchased by the Funds. The Funds, as writers of an option, bear the market risk of an unfavorable change in the price of the security underlying the written option.
The OCC guarantees performance by each of the counterparties to FLEX Options, becoming the “buyer for every seller and the seller for every buyer,” protecting clearing members and options traders from counterparty risk. Subject to determination by the Securities Committee of the OCC, adjustments may be made to the FLEX Options for certain events (collectively, “Corporate Actions”) specified in the OCC’s by-laws and rules: certain stock dividends or distributions, stock splits, reverse stock splits, rights offerings, distributions, reorganizations, recapitalizations, or reclassifications with respect to an underlying security, or a merger, consolidation, dissolution or liquidation of the issuer of the underlying security. According to the OCC’s by-laws, the nature and extent of any such adjustment is to be determined by the OCC’s Securities Committee, in light of the circumstances known to it at the time such determination is made, based on its judgment as to what is appropriate for the protection of investors and the public interest, taking into account such factors as fairness to holders and writers (or purchasers and sellers) of the affected options, the maintenance of a fair and orderly market in the affected options, consistency of interpretation and practice, efficiency of exercise settlement procedures, and the coordination with other clearing agencies of the clearance and settlement of transactions in the underlying interest.
The value of derivative instruments on the Statements of Assets and Liabilities for the Funds as of October 31, 2022, is as follows:
| | | Equity Risk - Call and Put Options not
Accounted for as Hedging Instruments | |
| | | Asset Derivatives | | | Liability Derivatives | |
| | | Investments,
at Value | | | Written Options,
at value | |
PSCX | | $ | 15,640,825 | | | $ | 59,985 | |
PSMD | | | 21,193,749 | | | | 801,150 | |
PSFD | | | 17,818,159 | | | | 654,784 | |
PSCW | | | 16,194,959 | | | | 216,583 | |
PSMR | | | 18,819,163 | | | | 918,751 | |
PSFM | | | 13,180,602 | | | | 813,839 | |
PSCJ | | | 6,550,571 | | | | 266,594 | |
PSMJ | | | 35,008,663 | | | | 1,725,975 | |
PSFJ | | | 12,960,525 | | | | 627,046 | |
PSCQ | | | 5,251,101 | | | | 365,342 | |
PSMO | | | 24,819,040 | | | | 1,842,827 | |
PSFO | | | 11,335,413 | | | | 787,278 | |
90
Pacer Funds
NOTES TO FINANCIAL STATEMENTS
October 31, 2022 (Continued)
The effect of derivative instruments on the Statement of Operations for the period ended October 31, 2022 is as follows:
| | | Equity Risk - Call and Put Options not Accounted for as Hedging Instruments | |
| | | Amount of Realized Gain (Loss) on
Derivatives Recognized in Income | | | Amount of Unrealized Gain (Loss) on
Derivatives Recognized in Income | |
| | | Investments | | | Written Options | | | Investments | | | Written Options | |
PSCX | | $ | 77,399 | | | $ | (152,593 | ) | | $ | (1,177,285 | ) | | $ | 795,838 | |
PSMD | | | (288,492 | ) | | | 5,367 | | | | (1,642,080 | ) | | | 962,796 | |
PSFD | | | (2,800,067 | ) | | | 24,442 | | | | (415,977 | ) | | | 1,257,964 | |
PSCW | | | 844,678 | | | | 411,813 | | | | (1,529,733 | ) | | | 158,807 | |
PSMR | | | 1,867,619 | | | | 759,998 | | | | (2,938,863 | ) | | | (35,042 | ) |
PSFM | | | 1,504,422 | | | | 715,607 | | | | (2,458,741 | ) | | | (16,496 | ) |
PSCJ | | | (370,665 | ) | | | 165,816 | | | | (154,690 | ) | | | 118,562 | |
PSMJ | | | (1,217,948 | ) | | | 887,346 | | | | (63,265 | ) | | | 412,046 | |
PSFJ | | | (575,796 | ) | | | 396,169 | | | | (227,192 | ) | | | 278,543 | |
PSCQ | | | (655,258 | ) | | | 353,481 | | | | 208,024 | | | | (76,811 | ) |
PSMO | | | (1,973,814 | ) | | | 1,403,220 | | | | 940,831 | | | | (198,535 | ) |
PSFO | | | (691,134 | ) | | | 564,637 | | | | 327,560 | | | | 69,516 | |
The effect of derivative instruments on the Statement of Operations for the period ended October 31, 2022 is as follows:
| | | Equity Risk - Call and Put Options not
Accounted for as Hedging Instruments | |
| | | Average Volume of Derivative Activity
During the Period Ended October 31, 2022 | |
| | | Investments | | | Written Options | |
PSCX | | $ | 10,228,261 | | | $ | (256,008 | ) |
PSMD | | | 20,414,657 | | | | (1,134,437 | ) |
PSFD | | | 24,236,645 | | | | (1,646,999 | ) |
PSCW | | | 10,163,771 | | | | (319,285 | ) |
PSMR | | | 15,240,636 | | | | (927,017 | ) |
PSFM | | | 11,733,337 | | | | (827,703 | ) |
PSCJ | | | 4,735,758 | | | | (203,154 | ) |
PSMJ | | | 22,545,270 | | | | (1,176,883 | ) |
PSFJ | | | 8,561,050 | | | | (440,195 | ) |
PSCQ | | | 4,831,887 | | | | (180,527 | ) |
PSMO | | | 18,345,665 | | | | (928,343 | ) |
PSFO | | | 7,257,918 | | | | (367,917 | ) |
B. | Foreign Currency. Investment securities and other assets and liabilities denominated in foreign currencies are translated into U.S. dollar amounts at the date of valuation. Purchases and sales of investment securities and income and expense items denominated in foreign currencies are translated into U.S. dollar amounts on the respective dates of such transactions. The Funds do not isolate that portion of the result of operations resulting from changes in foreign exchange rates on investments from fluctuations arising from changes in market prices of securities held. Such fluctuations are included with the net realized and unrealized gain or loss from investments. The Funds report net realized foreign exchange gains or losses that arise from sales of foreign currencies, currency gains or losses realized between the trade and settlement dates on foreign currency transactions, and the differences between the amounts of dividends, interest and foreign withholding taxes recorded on the Funds’ books and the U.S. dollar equivalent of the amounts actually received or paid. Net unrealized foreign exchange gains and losses arise from changes in the values of assets and liabilities, other than investments in securities at fiscal period end, resulting from changes in exchange rates. |
91
Pacer Funds
NOTES TO FINANCIAL STATEMENTS
October 31, 2022 (Continued)
C. | Federal Income Taxes. The Funds have complied and intend to continue to comply with the requirements of Subchapter M of the Internal Revenue Code of 1986, as amended, necessary to qualify as regulated investment companies and distribute substantially all net taxable investment income and net realized gains to shareholders in a manner which results in no tax cost to the Funds. Therefore, no federal income tax provision is required. As of and during the fiscal period ended October 31, 2022, the Funds did not have any tax positions that did not meet the “more-likely-than-not” threshold of being sustained by the applicable tax authority. As of and during the fiscal year or period ended October 31, 2022, the Funds did not have liabilities for any unrecognized tax benefits on uncertain tax positions as income tax expense in the Statement of Operations. Management has analyzed each of the Fund’s tax positions and concluded that no liability for unrecognized tax benefits should be recorded related to uncertain tax positions taken on returns filed for open tax years (2019-2021) for the applicable funds, or expected to be taken in each of the Fund’s 2022 tax returns. During the period ended October 31, 2022, the Funds did not incur any interest or penalties. |
D. | Security Transactions and Investment Income. Investment securities transactions are accounted for on the trade date. Gains and losses realized on sales of securities are computed on the basis of highest amortized cost. Dividend income is recorded on the ex-dividend date. Interest income is recorded on an accrual basis. Discounts and premiums on securities purchased are accreted and amortized over the lives of the respective securities. Withholding taxes on foreign dividends have been provided for in accordance with the Funds’ understanding of the applicable tax rules and regulations. |
Distributions received from a Funds’ investments in REITs and MLPs may be characterized as ordinary income, net capital gain, or return of capital. The proper characterization of such distributions is generally not known until after the end of each calendar year. As such, the Funds must use estimates in reporting the character of their income and distributions for financial statement purposes. Such estimates are based on historical information available from each MLP and other industry sources. The actual character of distributions to each Fund’s shareholders will be reflected on the Form 1099 received by shareholders after the end of the calendar year. Due to the nature of such investments, a portion of the distributions received by each Fund’s shareholders may represent a return of capital.
E. | Distributions to Shareholders. Distributions to shareholders from net investment income for USAI is declared and paid on a monthly basis, distributions to shareholders from net investment income for PSCX, PSMD. PSFD, PSFF, PSCW, PSMR, PSFM, PSCJ, PSMJ, PSFJ, PSCQ, PSMO and PSFO are declared and paid at least annually, distributions to shareholders from net investment income for BULD are declared and paid on a semi-annual basis, and distributions to shareholders from net investment income for ODDS are declared and paid on a quarterly basis. Distributions for all Funds from net realized gains on securities, if any, normally are declared and paid on an annual basis. Distributions are recorded on the ex-dividend date. |
F. | Use of Estimates. The preparation of financial statements in conformity with GAAP requires management to make estimates and assumptions that affect the reported amounts of assets and liabilities and disclosure of contingent assets and liabilities at the date of the financial statements, and the reported amounts of increases and decreases in net assets from operations during the reporting period. Actual results could differ from those estimates. |
G. | Share Valuation. The NAV per share of each Fund is calculated by dividing the sum of the value of the securities held by the Fund, plus cash and other assets, minus all liabilities (including estimated accrued expenses) by the total number of shares outstanding for the Fund, rounded to the nearest cent. The Funds’ shares will not be priced on the days on which the NYSE are closed for trading. The offering and redemption price per share of the Fund is equal to each Fund’s NAV per share. |
H. | Guarantees and Indemnifications. In the normal course of business, the Funds enters into contracts with service providers that contain general indemnification clauses. Each Fund’s maximum exposure under these arrangements is unknown as this would involve future claims that may be against the Funds that have not yet occurred. |
92
Pacer Funds
NOTES TO FINANCIAL STATEMENTS
October 31, 2022 (Continued)
I. | Reclassification of Capital Accounts. Additionally, U.S. GAAP requires that certain components of net assets relating to permanent differences be reclassified between financial and tax reporting. These reclassifications have no effect on net assets or net asset value per share. For the fiscal period ended October 31, 2022, the following table shows the reclassifications made: |
| | | Distributable
Earnings
(Accumulated
Deficit) | | | Paid in Capital | |
USAI | | $ | 1,586,247 | | | $ | (1,586,247 | ) |
PSCX | | | (597,354 | ) | | | 597,354 | |
PSMD | | | (852,309 | ) | | | 852,309 | |
PSFD | | | (617,431 | ) | | | 617,431 | |
PSFF | | | (406,929 | ) | | | 406,929 | |
PSCW | | | (1,389,181 | ) | | | 1,389,181 | |
PSMR | | | (3,150,377 | ) | | | 3,150,377 | |
PSFM | | | (2,838,786 | ) | | | 2,838,786 | |
PSCJ | | | 4,460 | | | | (4,460 | ) |
PSMJ | | | 22,059 | | | | (22,059 | ) |
PSFJ | | | 6,749 | | | | (6,749 | ) |
PSCQ | | | 4,444 | | | | (4,444 | ) |
PSMO | | | 21,012 | | | | (21,012 | ) |
PSFO | | | 8,095 | | | | (8,095 | ) |
ODDS | | | 113,190 | | | | (113,190 | ) |
BULD | | | — | | | | — | |
During the fiscal period ended October 31, 2022, the Fund realized the following in net capital gains/(losses) resulting from in-kind redemptions, in which shareholders exchanged Fund shares for securities held by the Fund rather than for cash. Because such gains are not taxable to the Fund, and are not distributed to shareholders, they have been reclassified from net realized losses to paid-in capital.
USAI | $ (1,161) |
PSCX | 615,235 |
PSMD | 858,743 |
PSFD | 624,454 |
PSFF | 441,229 |
PSCW | 1,392,930 |
PSMR | 3,240,080 |
PSFM | 2,874,708 |
PSCJ | — |
PSMJ | — |
PSFJ | — |
PSCQ | — |
PSMO | — |
PSFO | — |
ODDS | (109,424) |
BULD | — |
NOTE 3 – COMMITMENTS AND OTHER RELATED PARTY TRANSACTIONS
Pursuant to an Investment Advisory Agreement (“Investment Advisory Agreement”) between the Trust, on behalf of the Funds, and the Adviser, the Adviser provides investment advice to the Funds and oversees the day-to-day operations of the Funds, subject to the direction and control of the Board and the officers of the Trust. The Adviser administers the Funds’ business affairs, provides office facilities and equipment
93
Pacer Funds
NOTES TO FINANCIAL STATEMENTS
October 31, 2022 (Continued)
and certain clerical, bookkeeping and administrative services. The Adviser bears the costs of all advisory and non-advisory services required to operate the Funds, in exchange for a single unitary management fee. For services provided to the Funds, the Funds pay the Adviser at an annual rate based on the Fund’s average daily net assets:
Ticker | Adviser Fee |
USAI | 0.75% |
PSCX | 0.75% |
PSMD | 0.75% |
PSFD | 0.75% |
PSFF | 0.18% |
PSCW | 0.75% |
PSMR | 0.75% |
PSFM | 0.75% |
PSCJ | 0.75% |
PSMJ | 0.75% |
PSFJ | 0.75% |
PSCQ | 0.75% |
PSMO | 0.75% |
PSFO | 0.75% |
ODDS | 0.60% |
BULD | 0.60% |
Swan Global Management, LLC (“Swan”) serves as the sub-adviser to PSCX, PSMD, PSFD, PSFF, PSCW, PSMR, PSFM, PSCJ, PSMJ, PSFJ, PSCQ, PSMO and PSFO. The sub-adviser has responsibility for selecting and continuously monitoring the Fund’s investments. Sub-Advisory fees earned by Swan are paid by the Adviser.
The Distributor acts as the Funds’ principal underwriter in a continuous public offering of the Funds’ shares. The Distributor is an affiliate of the Adviser. The Funds did not pay any fees or commissions to the Distributor during the fiscal period ended October 31, 2022.
Certain officers and a Trustee of the Trust are affiliated with the Adviser and Distributor.
NOTE 4 – SERVICE AND CUSTODY AGREEMENTS
The Funds have entered into Service Agreements with U.S. Bancorp Fund Services, LLC (“Fund Services” or “Administrator”) doing business as U.S. Global Fund Services and a Custody Agreement with U.S. Bank, N.A. (the “Custodian”), an affiliate of Fund Services. Under these agreements, Fund Services and the Custodian provide certain transfer agency, administrative, accounting and custody services. The Custodian acts as securities lending agent (the “Securities Lending Agent”) for the Funds.
NOTE 5 – SECURITIES LENDING
The Funds may lend up to 33 1/3% of the value of the securities in their portfolios to brokers, dealers and financial institutions (but not individuals) under terms of participation in a securities lending program administered by the Securities Lending Agent. The securities lending agreement requires that loans are collateralized at all times in an amount equal to at least 102% of the value of any domestic loaned securities at the time of the loan, plus accrued interest. The use of loans of foreign securities, which are denominated and payable in U.S. dollars, shall be collateralized in an amount equal to 105% of the value of any loaned securities at the time of the loan plus accrued interest. The Funds receive compensation in the form of fees and earn interest on the cash collateral. Due to timing issues of when a security is recalled from loan, the financial statements may differ in presentation. The amount of fees depends on a number of factors including the type of security and length of the loan. The Funds continue to receive interest payments or dividends on the securities loaned during the borrowing period. Gain or loss in the value of securities loaned that may occur during the term of the loan will be for the account of the Funds. The Funds have the right under the terms of the securities lending agreements to recall the securities from the borrower on demand.
94
Pacer Funds
NOTES TO FINANCIAL STATEMENTS
October 31, 2022 (Continued)
As of October 31, 2022, USAI had loaned securities and received cash collateral for the loans. The cash collateral is invested in the Mount Vernon Liquid Assets Portfolio, LLC of which the investment objective is to seek to maximize income to the extent consistent with the preservation of capital and liquidity and maintain a stable NAV of $1.00. Although risk is mitigated by the collateral, the Fund could experience a delay in recovering their securities and possible loss of income or value if the borrower fails to return the borrowed securities. In addition, the Fund bears the risk of loss associated with the investment of cash collateral received.
During the period ended October 31, 2022, USAI had loaned securities that were collateralized by cash. The cash collateral received was invested in securities as listed in the Fund’s Schedule of Investments. Income earned from these investments is allocated to the Fund based on the Fund’s portion of total cash collateral received. Securities lending income is disclosed in the Fund’s Statement of Operations.
NOTE 6 – SECURED BORROWINGS
The following represents gross obligations for secured borrowings by remaining time to maturity as of October 31, 2022.
Securities Lending Transactions
Overnight and Continuous | | Investments
Purchased with
Proceeds from
Securities Lending
Collateral* | |
USAI | | $ | 6,624,646 | |
* | Proceeds from securities lending (Investments Purchased with Proceeds from Securities Lending Collateral). |
Due to the absence of a master netting agreement related to the Funds’ participation in securities lending, no additional offsetting disclosures have been made on behalf of the Funds for the total borrowings listed above.
NOTE 7 – OFFSETTING ASSETS AND LIABILITIES
The following is a summary of the Assets and Liabilities for each Fund subject to offsets as of October 31, 2022:
Liabilities
| | | | | | | | | | | | | | | Gross Amounts Not Offset in the
Statements of Assets and Liabilities | | | | | |
Description | | Gross Amounts
of Recognized
Liabilities | | | Gross Amounts
Offset in the
Statements
of Assets and
Liabilities | | | Net Amounts
Presented in
the Statements
of Assets and
Liabilities | | | Financial
Instruments | | | Collateral
Pledged
(Received) | | | Net Amount | |
USAI | | | | | | | | | | | | | | | | | | | | | | | | |
Securities Lending | | $ | 6,624,646 | | | $ | — | | | $ | 6,624,646 | | | $ | 6,624,646 | | | $ | — | | | $ | — | |
95
Pacer Funds
NOTES TO FINANCIAL STATEMENTS
October 31, 2022 (Continued)
NOTE 8 – INVESTMENT TRANSACTIONS
For the period ended October 31, 2022, the aggregate purchases and sales of securities by the Funds, excluding short-term securities and in-kind transactions were as follows:
| | | Purchases | | | Sales | |
USAI | | $ | 8,836,393 | | | $ | 9,160,831 | |
PSCX | | | 6,877,109 | | | | 916,702 | |
PSMD | | | 16,293,590 | | | | 4,731,427 | |
PSFD | | | 21,774,397 | | | | 19,056,147 | |
PSFF | | | 103,225,707 | | | | 10,389,508 | |
PSCW | | | — | | | | — | |
PSMR | | | — | | | | — | |
PSFM | | | — | | | | — | |
PSCJ | | | — | | | | — | |
PSMJ | | | — | | | | — | |
PSFJ | | | — | | | | — | |
PSCQ | | | — | | | | — | |
PSMO | | | — | | | | — | |
PSFO | | | — | | | | — | |
ODDS | | | 487,530 | | | | 393,035 | |
BULD | | | 73,009 | | | | 70,511 | |
For the period ended October 31, 2022, in-kind transactions associated with creations and redemptions are as follows:
| | | Purchases | | | Sales | |
USAI | | $ | 19,623,899 | | | $ | — | |
PSCX | | | — | | | | — | |
PSMD | | | — | | | | — | |
PSFD | | | — | | | | — | |
PSFF | | | 9,443,446 | | | | 19,280,327 | |
PSCW | | | — | | | | — | |
PSMR | | | — | | | | — | |
PSFM | | | — | | | | — | |
PSCJ | | | — | | | | — | |
PSMJ | | | — | | | | — | |
PSFJ | | | — | | | | — | |
PSCQ | | | — | | | | — | |
PSMO | | | — | | | | — | |
PSFO | | | — | | | | — | |
ODDS | | | 1,456,872 | | | | 591,409 | |
BULD | | | 1,554,687 | | | | — | |
For the period ended October 31, 2022, there were no long-term purchases or sales of U.S. Government Securities for the Funds.
NOTE 9 – TRANSACTIONS WITH AFFILIATED SECURITIES
PSFF seeks capital appreciation with downside protection. The Fund is an actively-managed exchange-traded fund that seeks to achieve its investment objective by investing in a portfolio of other ETFs also managed by the Fund’s Adviser, that seek exposure to U.S. equity securities, while limiting downside risk (the “Underlying ETFs”). Certain Underlying ETFs may also be sub-advised by the Fund’s Sub-Adviser. Underlying ETFs generally invest in equity securities or options on equity securities (including other ETFs) to obtain their long exposure to the U.S. equity market. Additionally, the Underlying ETFs may invest in cash or short-term U.S. Treasury securities or utilize options on equity securities (including other ETFs) to hedge their exposure to U.S. equities. The Fund may also invest directly in equity
96
Pacer Funds
NOTES TO FINANCIAL STATEMENTS
October 31, 2022 (Continued)
securities, options on equity securities (including other ETFs) or indices, cash, or cash equivalents. While the Fund is not limited in the types of strategies the Underlying ETFs may utilize, the Fund is expected to primarily utilize “trend-following strategy” and “structured outcome strategy” styles of Underlying ETFs.
PSFF had the following transactions during the current fiscal period with affiliates:
| | | Share Activity | |
Security Name | | Balance
November 1, 2021 | | | Purchases | | | Sales | | | Balance
October 31, 2022 | |
PSCX | | | 23,016 | | | | 275,294 | | | | (65,162 | ) | | | 233,148 | |
PSFD | | | 33,966 | | | | 386,240 | | | | (93,424 | ) | | | 326,782 | |
PSMO | | | 403,672 | | | | 825,926 | | | | (330,592 | ) | | | 899,006 | |
PSCW | | | 40,540 | | | | 215,428 | | | | (36,039 | ) | | | 219,929 | |
PSFO | | | 145,023 | | | | 320,847 | | | | (128,815 | ) | | | 337,055 | |
PSCJ | | | 80,308 | | | | 185,768 | | | | (36,077 | ) | | | 229,999 | |
PSMJ | | | 400,090 | | | | 627,695 | | | | (154,332 | ) | | | 873,453 | |
PSCQ | | | 87,868 | | | | 179,888 | | | | (76,368 | ) | | | 191,388 | |
PSFJ | | | 157,680 | | | | 259,658 | | | | (62,537 | ) | | | 354,801 | |
PSMD | | | 78,282 | | | | 938,339 | | | | (228,501 | ) | | | 788,120 | |
PSMR | | | 180,189 | | | | 716,676 | | | | (131,424 | ) | | | 765,441 | |
PSFM | | | 132,237 | | | | 283,447 | | | | (62,107 | ) | | | 353,577 | |
| | | Period Ended October 31, 2022 | |
Security Name | | Value | | | Dividend Income | | | Gain/Loss Realized
on Sale of Shares | | | Net Change
in Unrealized
Appreciation
(Depreciation)
on Investments
in Affiliate | |
PSCX | | $ | 4,854,165 | | | $ | — | | | $ | (31,323 | ) | | $ | (380,271 | ) |
PSFD | | | 7,485,726 | | | | — | | | | (21,368 | ) | | | (482,938 | ) |
PSMO | | | 18,636,215 | | | | — | | | | 54,358 | | | | (53,262 | ) |
PSCW | | | 4,553,564 | | | | — | | | | 6,793 | | | | (219,957 | ) |
PSFO | | | 7,196,192 | | | | — | | | | 35,609 | | | | 125,514 | |
PSCJ | | | 4,489,419 | | | | — | | | | 1,062 | | | | (216,748 | ) |
PSMJ | | | 18,032,262 | | | | 1,552 | | | | 49,148 | | | | (205,282 | ) |
PSCQ | | | 3,818,573 | | | | — | | | | 4,724 | | | | (113,182 | ) |
PSFJ | | | 7,371,133 | | | | — | | | | 23,210 | | | | (98,422 | ) |
PSMD | | | 16,926,296 | | | | 42,077 | | | | (104,992 | ) | | | (1,098,163 | ) |
PSMR | | | 16,137,869 | | | | — | | | | 44,488 | | | | (687,074 | ) |
PSFM | | | 7,615,978 | | | | — | | | | 33,036 | | | | (407,575 | ) |
Total | | $ | 117,117,392 | | | $ | 43,629 | | | $ | 94,745 | | | $ | (3,837,360 | ) |
97
Pacer Funds
NOTES TO FINANCIAL STATEMENTS
October 31, 2022 (Continued)
NOTE 10 – TAX COST BASIS
The components of tax basis cost of investments and net unrealized appreciation for federal income tax purposes at October 31, 2022, were as follows:
| | | USAI | | | PSCX | | | PSMD | | | PSFD | | | PSFF | |
Tax cost of investments | | $ | 45,869,742 | | | $ | 15,908,319 | | | $ | 20,911,730 | | | $ | 17,672,089 | | | $ | 121,391,079 | |
Gross tax unrealized appreciation | | | 10,572,928 | | | | 1,076,040 | | | | 2,752,053 | | | | 2,856,365 | | | | 446,086 | |
Gross tax unrealized depreciation | | | (2,701,557 | ) | | | (1,311,117 | ) | | | (3,231,434 | ) | | | (3,327,389 | ) | | | (3,762,976 | ) |
Net tax unrealized appreciation (depreciation) | | | 7,871,371 | | | | (235,077 | ) | | | (479,381 | ) | | | (471,024 | ) | | | (3,316,890 | ) |
Undistributed ordinary income | | | — | | | | — | | | | — | | | | — | | | | — | |
Undistributed long-term gain | | | — | | | | — | | | | — | | | | — | | | | — | |
Total distributable earnings | | | — | | | | — | | | | — | | | | — | | | | — | |
Other accumulated (loss) | | | (1,111,326 | ) | | | (745,469 | ) | | | (1,237,356 | ) | | | (1,969,560 | ) | | | (240,217 | ) |
Total accumulated gain (loss) | | $ | 6,760,045 | | | $ | (980,546 | ) | | $ | (1,716,737 | ) | | $ | (2,440,584 | ) | | $ | (3,557,107 | ) |
| | | PSCW | | | PSMR | | | PSFM | | | PSCJ | | | PSMJ | |
Tax cost of investments | | $ | 17,279,237 | | | $ | 20,707,071 | | | $ | 14,422,895 | | | $ | 6,299,648 | | | $ | 32,959,478 | |
Gross tax unrealized appreciation | | | 102,335 | | | | 66,008 | | | | 18,103 | | | | 203,791 | | | | 1,041,642 | |
Gross tax unrealized depreciation | | | (1,296,301 | ) | | | (2,814,693 | ) | | | (2,033,180 | ) | | | (166,575 | ) | | | (429,879 | ) |
Net tax unrealized appreciation (depreciation) | | | (1,193,966 | ) | | | (2,748,685 | ) | | | (2,015,077 | ) | | | 37,216 | | | | 611,763 | |
Undistributed ordinary income | | | — | | | | — | | | | — | | | | — | | | | — | |
Undistributed long-term gain | | | — | | | | — | | | | — | | | | — | | | | — | |
Total distributable earnings | | | — | | | | — | | | | — | | | | — | | | | — | |
Other accumulated (loss) | | | (302,171 | ) | | | (599,979 | ) | | | (653,791 | ) | | | (241,939 | ) | | | (433,150 | ) |
Total accumulated gain (loss) | | $ | (1,496,137 | ) | | $ | (3,348,664 | ) | | $ | (2,668,868 | ) | | $ | (204,723 | ) | | $ | 178,613 | |
| | | PSFJ | | | PSCQ | | | PSMO | | | PSFO | | | ODDS | |
Tax cost of investments | | $ | 12,201,937 | | | $ | 4,817,803 | | | $ | 22,456,112 | | | $ | 10,219,202 | | | $ | 794,343 | |
Gross tax unrealized appreciation | | | 543,007 | | | | 414,169 | | | | 2,013,791 | | | | 916,515 | | | | 14,762 | |
Gross tax unrealized depreciation | | | (276,127 | ) | | | (263,161 | ) | | | (1,201,695 | ) | | | (474,954 | ) | | | (192,183 | ) |
Net tax unrealized appreciation (depreciation) | | | 266,880 | | | | 151,008 | | | | 812,096 | | | | 441,561 | | | | (177,421 | ) |
Undistributed ordinary income | | | — | | | | — | | | | — | | | | — | | | | 713 | |
Undistributed long-term gain | | | — | | | | — | | | | — | | | | — | | | | — | |
Total distributable earnings | | | — | | | | — | | | | — | | | | — | | | | 713 | |
Other accumulated (loss) | | | (265,744 | ) | | | (331,778 | ) | | | (675,609 | ) | | | (151,419 | ) | | | (40,120 | ) |
Total accumulated gain (loss) | | $ | 1,136 | | | $ | (180,770 | ) | | $ | 136,487 | | | $ | 290,142 | | | $ | (216,828 | ) |
| | | BULD | |
| Tax cost of investments | | $ | 1,551,964 | |
| Gross tax unrealized appreciation | | | 26,434 | |
| Gross tax unrealized depreciation | | | (218,837 | ) |
| Net tax unrealized appreciation (depreciation) | | | (192,403 | ) |
| Undistributed ordinary income | | | 405 | |
| Undistributed long-term gain | | | — | |
| Total distributable earnings | | | 405 | |
| Other accumulated (loss) | | | (6,905 | ) |
| Total accumulated gain (loss) | | $ | (198,903 | ) |
98
Pacer Funds
NOTES TO FINANCIAL STATEMENTS
October 31, 2022 (Continued)
The difference between book and tax-basis cost is attributable to the realization for tax purposes of unrealized gains on investments in Real Estate Investment Trusts, partnerships (REITs), passive foreign investment companies and wash sales. Under tax law, certain capital and foreign currency losses realized after October 31 and within the taxable year are deemed to arise on the first business day of a Fund’s next taxable year. At October 31, 2022, the Funds, on a tax basis, did not defer any post-October.
At October 31, 2022, the following Funds deferred, on a tax basis, ordinary late year loses:
| | | Ordinary Late Year
Loss Deferral | |
| USAI | | $ | — | |
| PSCX | | | 65,524 | |
| PSMD | | | 130,624 | |
| PSFD | | | 161,576 | |
| PSFF | | | 143,327 | |
| PSCW | | | 66,507 | |
| PSMR | | | 97,640 | |
| PSFM | | | 72,566 | |
| PSCJ | | | 29,113 | |
| PSMJ | | | 137,524 | |
| PSFJ | | | 54,221 | |
| PSCQ | | | 30,001 | |
| PSMO | | | 105,015 | |
| PSFO | | | 42,165 | |
| ODDS | | | — | |
| BULD | | | — | |
At October 31, 2022, the Fund had the following capital loss carryforwards:
| | | Short-Term | | | Long-Term | | | Expires | |
USAI | | $ | (541,919 | ) | | $ | (561,018 | ) | | | Indefinite | |
PSCX | | | (679,945 | ) | | | — | | | | Indefinite | |
PSMD | | | (1,060,103 | ) | | | (46,629 | ) | | | Indefinite | |
PSFD | | | (1,807,984 | ) | | | — | | | | Indefinite | |
PSFF | | | (69,971 | ) | | | — | | | | Indefinite | |
PSCW | | | (171,494 | ) | | | (64,170 | ) | | | Indefinite | |
PSMR | | | (502,339 | ) | | | — | | | | Indefinite | |
PSFM | | | (581,225 | ) | | | — | | | | Indefinite | |
PSCJ | | | (212,826 | ) | | | — | | | | Indefinite | |
PSMJ | | | (273,683 | ) | | | — | | | | Indefinite | |
PSFJ | | | (211,523 | ) | | | — | | | | Indefinite | |
PSCQ | | | (301,777 | ) | | | — | | | | Indefinite | |
PSMO | | | (570,594 | ) | | | — | | | | Indefinite | |
PSFO | | | (109,254 | ) | | | — | | | | Indefinite | |
ODDS | | | (40,105 | ) | | | — | | | | Indefinite | |
BULD | | | (6,866 | ) | | | — | | | | Indefinite | |
99
Pacer Funds
NOTES TO FINANCIAL STATEMENTS
October 31, 2022 (Continued)
NOTE 11 – DISTRIBUTIONS TO SHAREHOLDERS
The tax character of distributions paid by the Funds during the fiscal period ended October 31, 2022, was as follows:
| | | Ordinary Income | | | Capital Gains | | | Return of Capital | |
USAI | | $ | 380,508 | | | $ | — | | | $ | 1,599,492 | |
PSCX | | | — | | | | — | | | | — | |
PSMD | | | 32,631 | | | | — | | | | — | |
PSFD | | | — | | | | — | | | | — | |
PSFF | | | — | | | | — | | | | — | |
PSCW | | | — | | | | — | | | | — | |
PSMR | | | — | | | | — | | | | — | |
PSFM | | | — | | | | — | | | | — | |
PSCJ | | | — | | | | — | | | | — | |
PSMJ | | | 2,015 | | | | — | | | | — | |
PSFJ | | | — | | | | — | | | | — | |
PSCQ | | | — | | | | — | | | | — | |
PSMO | | | — | | | | — | | | | — | |
PSFO | | | — | | | | — | | | | — | |
ODDS | | | 2,886 | | | | — | | | | — | |
BULD | | | — | | | | — | | | | — | |
The tax character of distributions paid by the Fund during the fiscal period ended October 31, 2021, was as follows:
| | | Ordinary Income | | | Capital Gains | | | Return of Capital | |
USAI | | $ | 456,943 | | | $ | — | | | $ | 845,057 | |
PSCX | | | — | | | | — | | | | — | |
PSMD | | | — | | | | — | | | | — | |
PSFD | | | — | | | | — | | | | — | |
PSFF | | | — | | | | — | | | | — | |
PSCW | | | — | | | | — | | | | — | |
PSMR | | | — | | | | — | | | | — | |
PSFM | | | — | | | | — | | | | — | |
PSCJ | | | — | | | | — | | | | — | |
PSMJ | | | — | | | | — | | | | — | |
PSFJ | | | — | | | | — | | | | — | |
PSCQ | | | — | | | | — | | | | — | |
PSMO | | | — | | | | — | | | | — | |
PSFO | | | — | | | | — | | | | — | |
NOTE 12 – RISKS
The global outbreak of COVID-19 (commonly referred to as “coronavirus”) has disrupted economic markets and the prolonged economic impact is uncertain. The ultimate economic fallout from the pandemic, and the long-term impact on economies, markets, industries and individual issuers, are not known. The operational and financial performance of the issuers of securities in which each Funds invests depends on future developments, including the duration and spread of the outbreak, and such uncertainty may in turn adversely affect the value and liquidity of each Fund’s investments, impair the Fund’s ability to satisfy redemption requests, and negatively impact the Fund’s performance.
On February 24, 2022, Russia commenced a military attack on Ukraine. The outbreak of hostilities between the two countries could result in more widespread conflict and could have a severe adverse effect on the region and the markets. In addition, sanctions imposed on Russia by the United States and other countries, and any sanctions imposed in the future could have a significant adverse impact on the Russian economy and related markets. The price and liquidity of investments may fluctuate widely as a result of the conflict and related events. How long such conflict and related events will last and whether it will escalate further cannot be predicted, nor its effect on the Funds.
100
Pacer Funds
NOTES TO FINANCIAL STATEMENTS
October 31, 2022 (Continued)
NOTE 13 – SUBSEQUENT EVENTS
Management of the Fund has evaluated the need for disclosures and/or adjustments resulting from subsequent events through the date these financial statements were issued. The evaluation did not result in any subsequent events that necessitated disclosures and/or adjustments other than the below:
On November 23, 2022, the following Funds declared a distribution from ordinary income to shareholders of record as of November 28, 2022, Payable November 29, 2022, as follows:
| | | Ordinary Income | | | Per Share Amount | |
USAI | | $ | 210,000 | | | $ | 0.12000000 | |
On December 21, 2022, the following Fund declared a distribution from ordinary income to shareholders of record as of December 23, 2022, Payable December 27, 2022, as follows:
| | | Ordinary Income | | | Per Share Amount | |
USAI | | $ | 210,000 | | | $ | 0.12000000 | |
On December 21, 2022, the following Funds declared a distribution from ordinary income to shareholders of record as of December 23, 2022, Payable December 29, 2022, as follows:
| | | Ordinary Income | | | Per Share Amount | |
PSCX | | $ | — | | | $ | — | |
PSMD | | $ | — | | | $ | — | |
PSFD | | $ | — | | | $ | — | |
PSFF | | $ | 6,428 | | | $ | 0.00117945 | |
PSCW | | $ | — | | | $ | — | |
PSMR | | $ | — | | | $ | — | |
PSFM | | $ | — | | | $ | — | |
PSCJ | | $ | — | | | $ | — | |
PSMJ | | $ | — | | | $ | — | |
PSCQ | | $ | — | | | $ | — | |
PSMO | | $ | — | | | $ | — | |
PSFO | | $ | — | | | $ | — | |
ODDS | | $ | 1,283 | | | $ | 0.03207500 | |
BULD | | $ | 1,134 | | | $ | 0.01417500 | |
On December 21, 2022, the Pacer Cash Cows Growth Leaders ETF commenced operations.
101
Pacer Funds
REPORT OF INDEPENDENT REGISTERED PUBLIC ACCOUNTING FIRM
To the Board of Trustees of Pacer Funds Trust and the Shareholders of
Pacer American Energy Independence ETF, Pacer Swan SOS Conservative (January) ETF, Pacer Swan SOS Moderate (January) ETF, Pacer Swan SOS Flex(January) ETF, Pacer Swan SOS Fund of Funds ETF, Pacer Swan SOS Conservative (April) ETF, Pacer Swan SOS Moderate (April) ETF, Pacer Swan SOS Flex (April) ETF, Pacer Swan SOS Conservative (July) ETF, Pacer Swan SOS Moderate (July) ETF, Pacer Swan SOS Flex (July) ETF, Pacer Swan SOS Conservative (October) ETF, Pacer Swan SOS Moderate (October) ETF, Pacer Swan SOS Flex (October) ETF, Pacer BlueStar Digital Entertainment ETF and Pacer BlueStar Engineering the Future ETF
Opinion on the Financial Statements
We have audited the accompanying statements of assets and liabilities of the Pacer American Energy Independence ETF (“USAI”), Pacer Swan SOS Conservative (January) ETF (“PSCX”), Pacer Swan SOS Moderate (January) ETF (“PSMD”), Pacer Swan SOS Flex (January) ETF (“PSFD”), Pacer Swan SOS Fund of Funds ETF (“PSFF”), Pacer Swan SOS Conservative (April) ETF (“PSCW”), Pacer Swan SOS Moderate (April) ETF (“PSMR”), Pacer Swan SOS Flex (April) ETF (“PSFM”), Pacer Swan SOS Conservative (July) ETF (“PSCJ”), Pacer Swan SOS Moderate (July) ETF (“PSMJ”), Pacer Swan SOS Flex (July) ETF (“PSFJ”), Pacer Swan SOS Conservative (October) ETF (“PSCQ”), Pacer Swan SOS Moderate (October) ETF (“PSMO”), Pacer Swan SOS Flex (October) ETF (“PSFO”), Pacer BlueStar Digital Entertainment ETF (“ODDS”) and Pacer BlueStar Engineering the Future ETF (“BULD”) (collectively the “Funds”), each a series of the Pacer Funds Trust (the “Trust”) including the schedules of investments, as of October 31, 2022, the related statements of operations, the statements of changes in net assets, the related notes (collectively, referred to as the “financial statements”) and the financial highlights for the periods indicated in the table below. The financial highlights for each of the year or period in the two-year period ended November 30, 2019 for the USAI Fund were audited by other auditors whose opinion dated January 28, 2020, expressed an unqualified opinion on those financial statements.
In our opinion, the financial statements and financial highlights present fairly, in all material respects, the financial positions of the Funds, as of October 31, 2022, the results of their operations for the period then ended, the changes in their net assets, and the financial highlights for each of the periods indicated below, in conformity with accounting principles generally accepted in the United States of America.
Individual Funds
Included in the Trust | Statements of
Operations | Statements of Changes
in Net Assets | Financial
Highlights |
Pacer American Energy Independence ETF | For the year ended October 31, 2022 | For the years ended October 31, 2022 and 2021 | For the years ended October 31, 2022 and 2021 and for the period December 1, 2019 to October 31, 2020 |
Pacer Swan SOS Conservative (January) ETF | For the year ended October 31, 2022 | For the year ended October 31, 2022 and for the period December 22, 2020 to October 31, 2021 | For the year ended October 31, 2022 and for the period December 22, 2020 to October 31, 2021 |
Pacer Swan SOS Moderate (January) ETF | For the year ended October 31, 2022 | For the year ended October 31, 2022 and for the period December 22, 2020 to October 31, 2021 | For the year ended October 31, 2022 and for the period December 22, 2020 to October 31, 2021 |
Pacer Swan SOS Flex (January) ETF | For the year ended October 31, 2022 | For the year ended October 31, 2022 and for the period December 22, 2020 to October 31, 2021 | For the year ended October 31, 2022 and for the period December 22, 2020 to October 31, 2021 |
Pacer Swan SOS Fund of Funds ETF | For the year ended October 31, 2022 | For the year ended October 31, 2022 and for the period December 29, 2020 to October 31, 2021 | For the year ended October 31, 2022 and for the period December 29, 2020 to October 31, 2021 |
Pacer Swan SOS Conservative (April) ETF | For the year ended October 31, 2022 | For the year ended October 31, 2022 and for the period March 31, 2021 to October 31, 2021 | For the year ended October 31, 2022 and for the period March 31, 2021 to October 31, 2021 |
Pacer Swan SOS Moderate (April) ETF | For the year ended October 31, 2022 | For the year ended October 31, 2022 and for the period March 31, 2021 to October 31, 2021 | For the year ended October 31, 2022 and for the period March 31, 2021 to October 31, 2021 |
Pacer Swan SOS Flex (April) ETF | For the year ended October 31, 2022 | For the year ended October 31, 2022 and for the period March 31, 2021 to October 31, 2021 | For the year ended October 31, 2022 and for the period March 31, 2021 to October 31, 2021 |
Pacer Swan SOS Conservative (July) ETF | For the year ended October 31, 2022 | For the year ended October 31, 2022 and for the period June 30, 2021 to October 31, 2021 | For the year ended October 31 2022 and for the period June 30, 2021 to October 31, 2021 |
102
Pacer Funds
REPORT OF INDEPENDENT REGISTERED PUBLIC ACCOUNTING FIRM
(Continued)
Individual Funds
Included in the Trust | Statements of
Operations | Statements of Changes
in Net Assets | Financial
Highlights |
Pacer Swan SOS Moderate (July) ETF | For the year ended October 31, 2022 | For the year ended October 31, 2022 and for the period June 30, 2021 to October 31, 2021 | For the year ended October 31, 2022 and for the period June 30, 2021 to October 31, 2021 |
Pacer Swan SOS Flex (July) ETF | For the year ended October 31, 2022 | For the year ended October 31, 2022 and for the period June 30, 2021 to October 31, 2021 | For the year ended October 31, 2022 and for the period June 30, 2021 to October 31, 2021 |
Pacer Swan SOS Conservative (October) ETF | For the year ended October 31, 2022 | For the year ended October 31, 2022 and for the period September 30, 2021 to October 31, 2021 | For the year ended October 31, 2022 and for the period September 30, 2021 to October 31, 2021 |
Pacer Swan SOS Moderate (October) ETF | For the year ended October 31, 2022 | For the year ended October 31, 2022 and for the period September 30, 2021 to October 31, 2021 | For the year ended October 31, 2022 and for the period September 30, 2021 to October 31, 2021 |
Pacer Swan SOS Flex (October) ETF | For the year ended October 31, 2022 | For the year ended October 31, 2022 and for the period September 30, 2021 to October 31, 2021 | For the year ended October 31, 2022 and for the period September 30, 2021 to October 31, 2021 |
Pacer BlueStar Digital Entertainment ETF | For the period April 7, 2022 to October 31, 2022 | For the period April 7, 2022 to October 31, 2022 | For the period April 7, 2022 to October 31, 2022 |
Pacer BlueStar Engineering the Future ETF | For the period May 4, 2022 to October 31, 2022 | For the period May 4, 2022 to October 31, 2022 | For the period May 4, 2022 to October 31, 2022 |
Basis for Opinion
These financial statements and financial highlights are the responsibility of the Funds’ management. Our responsibility is to express an opinion on these financial statements and financial highlights based on our audits. We are a public accounting firm registered with the Public Company Accounting Oversight Board (United States) (“PCAOB”) and are required to be independent with respect to the Funds in accordance with the U.S. federal securities laws and the applicable rules and regulations of the Securities and Exchange Commission and the PCAOB.
We conducted our audits in accordance with the standards of the PCAOB. Those standards require that we plan and perform the audit to obtain reasonable assurance about whether the financial statements and financial highlights are free of material misstatement, whether due to error or fraud. The Funds are not required to have, nor were we engaged to perform, an audit of their internal control over financial reporting. As part of our audits, we are required to obtain an understanding of internal control over financial reporting but not for the purpose of expressing an opinion on the effectiveness of the Funds’ internal control over financial reporting. Accordingly, we express no such opinion.
Our audits included performing procedures to assess the risk of material misstatement of the financial statements and financial highlights, whether due to error or fraud, and performing procedures that respond to those risks. Such procedures included examining, on a test basis, evidence regarding the amounts and disclosures in the financial statements and financial highlights. Our procedures included confirmation of securities and cash owned as of October 31, 2022, by correspondence with the custodian and brokers. Our audits also included evaluating the accounting principles used and significant estimates made by management, as well as evaluating the overall presentation of the financial statements and financial highlights. We believe that our audits provide a reasonable basis for our opinion.

We have served as the auditor for the Pacer Funds Trust since 2015
Abington, Pennsylvania
December 19, 2022
103
Pacer Funds
ADDITIONAL INFORMATION
(Unaudited)
NOTE 1 – FREQUENCY DISTRIBUTION OF PREMIUMS AND DISCOUNTS
Information regarding how often shares of the Fund trade on the Exchange at a price above (i.e., at a premium) or below (i.e., at a discount) the NAV of the Fund is available on the Fund’s website at www.PacerETFs.com.
NOTE 2 – FEDERAL TAX INFORMATION
Qualified Dividend Income/Dividends Received Deduction
For the fiscal year ended October 31, 2022, certain dividends paid by the Funds may be subject to a maximum tax rate of 23%, as provided for by the Tax Cuts and Jobs Act of 2017.
The percentage of dividends declared from ordinary income designated as qualified dividend income was as follows:
Pacer American Energy Independence ETF | 100.00% |
Pacer Swan SOS Conservative (October) ETF | 0.00% |
Pacer Swan SOS Moderate (October) ETF | 0.00% |
Pacer Swan SOS Flex (October) ETF | 0.00% |
Pacer Swan SOS Conservative (April) ETF | 0.00% |
Pacer Swan SOS Flex (April) ETF | 0.00% |
Pacer Swan SOS Moderate (April) ETF | 0.00% |
Pacer Swan SOS Conservative (January) ETF | 0.00% |
Pacer Swan SOS Flex (January) ETF | 0.00% |
Pacer Swan SOS Moderate (January) ETF | 0.00% |
Pacer Swan SOS Fund of Funds ETF | 0.00% |
Pacer Swan SOS Conservative (July) ETF | 0.00% |
Pacer Swan SOS Flex (July) ETF | 0.00% |
Pacer Swan SOS Mod (July) ETF | 0.00% |
Pacer Bluestar Engineering the Future ETF | 0.00% |
Pacer BlueStar Digital Entertainment ETF | 100.00% |
For corporate shareholders, the percent of ordinary income distributions qualifying for the corporate dividends received deduction for the fiscal year ended October 31, 2022 was as follows:
Pacer American Energy Independence ETF | 100.00% |
Pacer Swan SOS Conservative (October) ETF | 0.00% |
Pacer Swan SOS Moderate (October) ETF | 0.00% |
Pacer Swan SOS Flex (October) ETF | 0.00% |
Pacer Swan SOS Conservative (April) ETF | 0.00% |
Pacer Swan SOS Flex (April) ETF | 0.00% |
Pacer Swan SOS Moderate (April) ETF | 0.00% |
Pacer Swan SOS Conservative (January) ETF | 0.00% |
Pacer Swan SOS Flex (January) ETF | 0.00% |
Pacer Swan SOS Moderate (January) ETF | 0.00% |
Pacer Swan SOS Fund of Funds ETF | 0.00% |
Pacer Swan SOS Conservative (July) ETF | 0.00% |
Pacer Swan SOS Flex (July) ETF | 0.00% |
Pacer Swan SOS Mod (July) ETF | 0.00% |
Pacer Bluestar Engineering the Future ETF | 0.00% |
Pacer BlueStar Digital Entertainment ETF | 7.99% |
104
Pacer Funds
ADDITIONAL INFORMATION
(Unaudited) (Continued)
The Percentage of taxable ordinary income distributions that are designated as short-term capital gain distributions under Internal Revenue Section 871(k)(2)(C) for each Fund were as follows (unaudited).
Pacer American Energy Independence ETF | 0.00% |
Pacer Swan SOS Conservative (October) ETF | 0.00% |
Pacer Swan SOS Moderate (October) ETF | 0.00% |
Pacer Swan SOS Flex (October) ETF | 0.00% |
Pacer Swan SOS Conservative (April) ETF | 0.00% |
Pacer Swan SOS Flex (April) ETF | 0.00% |
Pacer Swan SOS Moderate (April) ETF | 0.00% |
Pacer Swan SOS Conservative (January) ETF | 0.00% |
Pacer Swan SOS Flex (January) ETF | 0.00% |
Pacer Swan SOS Moderate (January) ETF | 100.00% |
Pacer Swan SOS Fund of Funds ETF | 0.00% |
Pacer Swan SOS Conservative (July) ETF | 0.00% |
Pacer Swan SOS Flex (July) ETF | 0.00% |
Pacer Swan SOS Mod (July) ETF | 100.00% |
Pacer Bluestar Engineering the Future ETF | 0.00% |
Pacer BlueStar Digital Entertainment ETF | 0.00% |
NOTE 3 – DISCLOSURE OF PORTFOLIO HOLDINGS
The Funds files their complete schedule of portfolio holdings for their first and third fiscal quarters with the Securities and Exchange Commission (“SEC”) on Part F of Form N-PORT. The Funds’ Part F of Form N-PORT is available on the website of the SEC at www.sec.gov. Each Fund’s portfolio holdings are posted on its website at www.PacerETFs.com daily.
NOTE 4 – PROXY VOTING POLICIES AND PROCEDURES
A description of the policies and procedures the Funds use to determine how to vote proxies relating to portfolio securities is provided in the Statement of Additional Information (“SAI”). The SAI is available without charge upon request by calling toll-free at (800) 617-0004, by accessing the SEC’s website at www.sec.gov, or by accessing the Funds’ website at www.paceretfs.com. Information how the Funds voted proxies relating to portfolio securities during the year ended June 30 is available without charge, upon request, by calling (800) 617-0004 or by accessing the website of the SEC.
NOTE 5 – REVIEW OF LIQUIDITY RISK MANAGEMENT PROGRAM
Pursuant to Rule 22e-4 under the Investment Company Act of 1940, the Trust has adopted a liquidity risk management program to govern the Trust’s approach to managing liquidity risk Rule 22e-4 seeks to promote effective liquidity risk management, thereby reducing the risk that a fund will be unable to meet its redemption obligations and mitigating dilution of the interests of fund shareholders. The Trust’s liquidity risk management program is tailored to reflect its particular risks, but not to eliminate all adverse impacts of liquidity risk.
The Investment Adviser to the Trust has adopted and implemented its own written liquidity risk management program (the “Program”) tailored specifically to assess and manage the liquidity risk of the funds it advises.
On June 27, 2022, the Trustees of Pacer Funds Trust reviewed and considered a written report prepared by the program administrator of the Funds’ program, which addressed the operation of the Program and assessed the Program’s adequacy and effectiveness of implementation. In considering the report, the Trustees noted that the Program Administrator has determined that several of the funds within the Pacer Funds Trust are deemed “In-Kind” in accordance with Rule 22e-4. They then confirmed with the Program Administrator that no material changes were made to the Program, and reviewed all of the material features of the Program to ensure that they understand how the Program is designed to assess and manage the risk that the funds within the Trust could not meet requests to redeem shares issued by the funds without significant dilution of remaining investors in the funds. Following this review and discussion, the Trustees determined that they believe the disclosures in the report, taken as a whole, provide the information necessary for the Trustees to effectively assess the Program and its implementation, and that they are comfortable with the report’s conclusion that the Program is reasonably designed to assess and manage each Fund’s liquidity risk, and that the Program has operated as intended during the past year.
105
Pacer Funds
ADDITIONAL INFORMATION
(Unaudited) (Continued)
NOTE 6 - BOARD CONSIDERATIONS IN APPROVING THE INVESTMENT ADVISORY AGREEMENT FOR THE FUNDS
USAI, GCOW, COWZ, PTEU and PWS
The Board of Trustees (the “Board”) of Pacer Funds Trust (the “Trust”), including the Trustees thereof who are not “interested persons,” as defined by the Investment Company Act of 1940, as amended (the “1940 Act”), of the Trust (the “Independent Trustees”), held a meeting on September 27, 2022 (the “Meeting”) for the purpose of, among other things, the consideration of, and voting on, the proposed renewal of the investment advisory agreement (the “Investment Advisory Agreement”) between the Trust and Pacer Advisors, Inc. (the “Advisor”), relating to the Pacer American Energy Independence ETF (USAI), Pacer Global Cash Cows Dividend ETF (GCOW), Pacer US Cash Cows 100 ETF (COWZ), Pacer Trendpilot European ETF (PTEU) and Pacer Wealthshield ETF (PWS) (each, a “Fund” and together, the “Funds”).
The Board, including a majority of the Trust’s Independent Trustees voting separately, approved the renewal of the Investment Advisory Agreement as it relates to each Fund at the Meeting, based on its review of qualitative and quantitative information provided by the Advisor as well as the Trust’s other service providers. Prior to deciding to approve the renewal of the Investment Advisory Agreement at the Meeting, the Independent Trustees requested and obtained from the Advisor such information as the Independent Trustees deemed reasonably necessary to evaluate the terms of the Investment Advisory Agreement. The Independent Trustees received assistance and advice from, and met separately with, independent counsel. In addition, the Independent Trustees received a memorandum from independent counsel regarding the responsibilities of the Board with respect to the renewal of the Investment Advisory Agreement.
Prior to approval, the Board obtained and reviewed a variety of information, including certain information regarding each Fund’s expenses relative to the expenses of other comparable funds. At the Meeting, the Board, including the Independent Trustees, evaluated a number of factors and various materials in connection with the approval process, including: (1) a copy of the Investment Advisory Agreement; (2) the Advisor’s responses to questionnaires designed to provide the Board with information reasonably necessary to evaluate the terms of the Investment Advisory Agreement; (3) the Advisor’s Form ADV disclosures; (4) information describing the nature, quality and extent of services to be provided to a Fund by the Advisor; (5) the advisory fee payable by a Fund to the Advisor for its services; (6) certain comparative information regarding a Fund’s expenses and performance relative to the expenses and performance of other comparable funds; (7) a copy of the Trust’s registration statement; and (8) information regarding the ownership and management structure, financial condition, and compliance program of the Advisor. Representatives from the Advisor presented additional information and participated in question-and-answer sessions at the Meeting to help the Board evaluate the Advisor’s services and fees, as well as other aspects of the Investment Advisory Agreement.
In considering the renewal of the Investment Advisory Agreement at the Meeting, the Board considered various factors that the Trustees determined were relevant, including: (i) the nature, extent and quality of the services to be provided by the Advisor, including the performance of the Advisor with respect to each Fund; (ii) the costs and benefits, including the fee to be paid to the Advisor by each Fund, of the advisory services to be provided to each Fund; and (iii) potential economies of scale as it relates to each Fund.
● | Nature, Extent and Quality of Services to be Provided by the Advisor. The Board reviewed the scope of services to be provided by the Advisor under the Investment Advisory Agreement. In this regard, the Trustees reviewed each Fund’s investment goal and investment strategy, and the Advisor’s ability to implement such investment goal and/or investment strategy, including, but not limited to, trading practices. In addition, the Trustees reviewed the management team at the Advisor that would be responsible for managing each Fund, including staffing, skills and compensation program, and considered various other funds advised by the Advisor and any potential conflicts. |
Based on its review, the Board determined that the Advisor is capable of providing all necessary advisory services required by each Fund, as indicated by the Advisor’s management capabilities, the professional qualifications and experience of its portfolio management personnel and the performance of each Fund relative to comparable funds managed by other investment advisers (each a “Peer Group”). The Board also considered other services provided to the Funds by the Advisor, where relevant, such as selecting broker-dealers for executing portfolio transactions, monitoring adherence to the Fund’s investment restrictions, and monitoring compliance with various policies and procedures and with applicable securities regulations.
Based on the factors above, as well as those discussed below, the Board concluded, within the context of its full deliberations, that it was satisfied with the nature, extent and quality of the services provided and to be provided to each Fund by the Advisor.
● | Costs and Benefits of Advisory Services to be Provided to the Funds. In considering the advisory fees payable by the Trust to the Advisor and each Fund’s expense ratio, the Board reviewed data compiled by the Advisor comparing the expense ratio of the Fund with the expense ratios of the Fund’s Peer Group. The Board compared each Fund’s expense ratio to the expense ratios of funds in its Peer Group, focusing on whether the Fund was charged fees that were within the range of fees charged by those in the Peer Group. It also noted that the Advisor had contractually agreed to pay the operating expenses of each Fund, including the cost of transfer agency, custody, fund administration, |
106
Pacer Funds
ADDITIONAL INFORMATION
(Unaudited) (Continued)
| legal, audit and other services, except interest, taxes, brokerage commissions and other expenses in connection with the execution of portfolio transactions, and extraordinary and non-routine expenses. It was noted that this contractual agreement cannot be changed without shareholder approval. The Board also evaluated the compensation and incidental or “fall-out” benefits received (or proposed or likely to be received) by the Advisor from its relationship with each Fund, taking into account assessments of the Advisor’s profitability prepared and shared by the Advisor’s management. |
Based on the factors above, as well as those discussed below, the Board concluded, within the context of its full deliberations, that each Fund’s advisory fee was reasonable in light of the nature and quality of the services expected to be rendered by the Advisor.
● | Economies of Scale. The Board also reviewed and considered the extent to which economies of scale would be realized by the Advisor as the assets of a Fund may grow in the future. In considering the extent to which economies of scale would be realized as a Fund grows and whether advisory fee levels reflect those economies of scale for the benefit of the Fund’s investors, the Trustees considered that each Fund’s fee arrangement with the Advisor involved a contractual commitment by the Advisor to pay the operating expenses of the Fund. The Trustees considered that, while the investment advisory fee would remain the same at all asset levels, each Fund’s shareholders benefited from the Advisor’s commitment to pay the Fund’s operating expenses out of its investment advisory fee. The Trustees noted that the advisory fee structure of each Fund would not directly result in economies of scale for shareholders. |
Based on its deliberations and its evaluation of the information described above, at the Meeting, the Board, including the Independent Trustees: (a) concluded that the terms of the Investment Advisory Agreement with respect to each Fund are fair and reasonable; (b) concluded that the Advisor’s fees are reasonable in light of the nature and quality of the services expected to be rendered by the Advisor to each Fund; and (c) agreed to approve the renewal of the Investment Advisory Agreement as to each Fund for an additional annual period. In its deliberations at the Meeting, the Board did not identify any particular factor (or conclusion with respect thereto) or single piece of information that was all-important, controlling or determinative of its decision, but considered all of the factors together, and each Trustee may have attributed different weights to the various factors (and conclusions with respect thereto) and information.
PACER SWAN SOS FUNDS
The Board of Trustees (the “Board”) of Pacer Funds Trust (the “Trust”), including the Trustees thereof who are not “interested persons,” as defined by the Investment Company Act of 1940, as amended (the “1940 Act”), of the Trust (the “Independent Trustees”), held a meeting on September 27, 2022 (the “Meeting”) for the purpose of, among other things, the consideration of, and voting on, the proposed renewal of the investment advisory agreement (the “Investment Advisory Agreement”) between the Trust and Pacer Advisors, Inc. (the “Advisor”), relating to the Pacer Swan SOS Fund of Funds ETF, Pacer Swan SOS Conservative ETF, Pacer Swan SOS Moderate ETF, and Pacer Swan SOS Flex ETF (each, a “Fund” together, the “Funds”). The Board also considered the continuation of the investment sub-advisory agreement (the “Sub-Advisory Agreement”) between the Advisor and Swan Global Management (the “Sub-Advisor”) with respect to each Fund.
The Board, including a majority of the Trust’s Independent Trustees voting separately, approved the renewal of the Investment Advisory Agreement and the Sub-Advisory Agreement as it relates to each Fund at the Meeting, based on its review of qualitative and quantitative information provided by the Advisor, Sub-Advisor as well as the Trust’s other service providers. Prior to deciding to approve the renewal of the Investment Advisory Agreement and Sub-Advisory Agreement at the Meeting, the Independent Trustees requested and obtained from the Advisor and the Sub-Advisor such information as the Independent Trustees deemed reasonably necessary to evaluate the terms of the respective agreements. The Independent Trustees received assistance and advice from, and met separately with, independent counsel. In addition, the Independent Trustees received a memorandum from independent counsel regarding the responsibilities of the Board with respect to the renewal of the Investment Advisory Agreement and the Sub-Advisory Agreement.
Prior to approval, the Board obtained and reviewed a variety of information, including certain information regarding each Fund’s expenses relative to the expenses of other comparable funds. At the Meeting, the Board, including the Independent Trustees, evaluated a number of factors and various materials in connection with the approval process, including: (1) a copy of the Investment Advisory Agreement and the Sub-Advisory Agreement; (2) the Advisor’s and Sub-Advisor’s responses to questionnaires designed to provide the Board with information reasonably necessary to evaluate the terms of the Investment Advisory Agreement and Sub-Advisory Agreement, respectively; (3) the Advisor’s and the Sub-Advisor’s Form ADV disclosures; (4) information describing the nature, quality and extent of services to be provided to each Fund by the Advisor and the Sub-Advisor, respectively; (5) the advisory fee payable by the Fund to the Advisor for its services and the sub-advisory fee payable to the Sub-Advisor by the Advisor under the Sub-Advisory Agreement; (6) certain comparative information regarding each Fund’s expenses and performance relative to the expenses and performance of other comparable funds; (7) a copy of the Trust’s registration statement; and (8) information regarding the ownership and management structure, financial condition, and compliance program
107
Pacer Funds
ADDITIONAL INFORMATION
(Unaudited) (Continued)
of the Advisor and Sub-Advisor, respectively. Representatives from the Advisor and the Sub-Advisor presented additional information and participated in question-and-answer sessions at the Meeting to help the Board evaluate the services and fees, as well as other aspects of the Investment Advisory Agreement and Sub-Advisory Agreement.
In considering the renewal of the Investment Advisory Agreement and Sub-Advisory Agreement at the Meeting, the Board considered various factors that the Trustees determined were relevant, including: : (i) the nature, extent and quality of the services to be provided by the Advisor and the Sub-Advisor, including the performance of the Advisor and Sub-Advisor with respect to each Fund; (ii) the costs and benefits, including the fee to be paid to the Advisor by each Fund, of the advisory services to be provided to the Fund; (iii) the fee paid to the Sub-Advisor by the Advisor; and (iv) potential economies of scale.
● | Nature, Extent and Quality of Services to be Provided by the Advisor and Sub-Advisor. The Board reviewed the scope of services to be provided by the Advisor under the Investment Advisory Agreement and the Sub-Advisor under the Sub-Advisory Agreement. In this regard, the Trustees reviewed each Fund’s investment goal and investment strategy, and each of the Advisor’s and Sub-Advisor’s ability to implement such investment goal and/or investment strategy, including, but not limited to, trading practices. With respect to sub-advisory services to be provided by the Sub-Advisor, the Board noted that the Sub-Advisor has assets allocated to it by the Advisor and considered the Sub-Advisor’s ability to ensure compliance with each Fund’s strategies, policies, and limitations. The Trustees also considered the successful performance of the Sub-Advisor in managing each Fund and compared such performance to comparable funds managed by other investment advisers (the “Peer Group”). In addition, the Trustees reviewed the management team at the Advisor and the Sub-Advisor that is responsible for managing the Funds, including staffing, skills and compensation program, and considered various other portfolios advised by the Advisor and the Sub-Advisor and any potential conflicts. The Board also considered a report from the Trust’s Chief Compliance Officer regarding the Sub-Advisor’s compliance program as such relates to the operation of the Funds. |
Based on its review, the Board determined that each of the Advisor and the Sub-Advisor is capable of providing all necessary advisory and sub-advisory services required by the Funds, as indicated by the Advisor’s and Sub-Advisor’s management capabilities, the professional qualifications and experience of its portfolio management personnel and the performance of each Fund relative to the Peer Group and other products managed by the Advisor and the Sub-Advisor with similar investment objectives and strategies as the Funds. The Board also considered other services provided to the Funds by the Advisor and Sub-Advisor, where relevant, such as selecting broker-dealers for executing portfolio transactions, monitoring adherence to each Fund’s investment restrictions, and monitoring compliance with various policies and procedures and with applicable securities regulations
Based on the factors above, as well as those discussed below, the Board concluded, within the context of its full deliberations, that it was satisfied with the nature, extent and quality of the services provided and to be provided to the Funds by the Advisor and Sub-Advisor, respectively.
● | Costs and Benefits of Advisory Services to be Provided to the Funds. In considering the advisory fees payable by the Trust to the Advisor and each Fund’s expense ratio, the Board reviewed data compiled by the Advisor comparing the expense ratio of the Fund with the expense ratios of the Fund’s Peer Group. The Board compared each Fund’s expense ratio to the expense ratios of funds in its Peer Group, focusing on whether the Fund was charged fees that were within the range of fees charged by those in the Peer Group. It also noted that the Advisor had contractually agreed to pay the operating expenses of each Fund, including the cost of transfer agency, custody, fund administration, legal, audit and other services, except interest, taxes, brokerage commissions and other expenses in connection with the execution of portfolio transactions, and extraordinary and non-routine expenses. It was noted that this contractual agreement cannot be changed without shareholder approval. The Board also evaluated the compensation and incidental or “fall-out” benefits received (or proposed or likely to be received) by the Advisor from its relationship with each Fund, taking into account assessments of the Advisor’s profitability prepared and shared by the Advisor’s management. |
Based on the factors above, as well as those discussed below, the Board concluded, within the context of its full deliberations, that the Fund’s advisory fee was reasonable in light of the nature and quality of the services expected to be rendered by the Advisor.
Costs and Benefits of Sub-Advisor’s Sub-Advisory Services to be Provided to the Funds. The Board noted that the sub-advisory fees paid to the Sub-Advisor are paid by the Advisor and would not be additional fees to be borne by a Fund. The Board also noted that the sub-advisory fees were the product of arms-length negotiations between the Advisor and the Sub-Advisor. In considering the sub-advisory fees payable by the Advisor to the Sub-Advisor, the Board evaluated the compensation and benefits received or likely to be received by the Sub-Advisor from the Advisor relating to the services provided to each Fund. Based on the factors above, as well as those discussed below, the Board concluded, within the context of its full deliberations, that the sub-advisory fees payable to the Sub-Advisor under the Sub-Advisory Agreement with the Advisor were reasonable in light of the nature and quality of the services rendered and, where relevant, expected to be rendered by the Sub-Advisor.
108
Pacer Funds
ADDITIONAL INFORMATION
(Unaudited) (Continued)
● | Economies of Scale. The Board also reviewed and considered the extent to which economies of scale would be realized by the Advisor and the Sub-Advisor as the assets of the Fund may grow in the future. |
Based on its deliberations and its evaluation of the information described above, at the Meeting, the Board, including the Independent Trustees: (a) concluded that the terms of the Investment Advisory Agreement and the Sub-Advisory Agreement with respect to each Fund are fair and reasonable; (b) concluded that the Advisor’s fees and the Sub-Advisor’s fees are reasonable in light of the nature and quality of the services expected to be rendered by the Advisor and the Sub-Advisor, respectively, to each Fund; and (c) agreed to approve the renewal of the Investment Advisory Agreement and the Sub-Advisory Agreement as to each Fund for an additional annual period. In its deliberations at the Meeting, the Board did not identify any particular factor (or conclusion with respect thereto) or single piece of information that was all-important, controlling or determinative of its decision, but considered all of the factors together, and each Trustee may have attributed different weights to the various factors (and conclusions with respect thereto) and information.
BULD
The Board of Trustees (the “Board”) of Pacer Funds Trust (the “Trust”), including the Trustees thereof who are not “interested persons,” as defined by the Investment Company Act of 1940, as amended (the “1940 Act”), of the Trust (the “Independent Trustees”), held a meeting on September 15, 2021 (the “Meeting”) for the purpose of, among other things, the consideration of, and voting on, the proposed investment advisory agreement (the “Investment Advisory Agreement”) between the Trust and Pacer Advisors, Inc. (the “Advisor”), relating to the Pacer Bluestar Engineering the Future ETF (the “Fund”).
The Board, including a majority of the Trust’s Independent Trustees voting separately, approved the Investment Advisory Agreement at the Meeting, based on its review of qualitative and quantitative information provided by the Advisor as well as the Trust’s other service providers. Prior to deciding to approve the renewal of the Investment Advisory Agreement at the Meeting, the Independent Trustees requested and obtained from the Advisor such information as the Independent Trustees deemed reasonably necessary to evaluate the terms of the Investment Advisory Agreement. The Independent Trustees received assistance and advice from, and met separately with, independent counsel. In addition, the Independent Trustees received a memorandum from independent counsel regarding the responsibilities of the Board with respect to the approval of the Investment Advisory Agreement.
In considering the approval of the Investment Advisory Agreement, the Trustees considered various materials, including information that had previously been provided to the Board at its various meetings including: (1) a copy of the proposed Investment Advisory Agreement and Schedule thereto; (2) Pacer’s responses to a questionnaire requesting information pursuant to Section 15(c) of the 1940 Act (the “15(c) Questionnaire”); (3) Pacer’s Form ADV disclosures; (4) information describing the nature, quality and extent of services that Pacer will provide to the Fund, and the proposed advisory fees payable to Pacer; (5) comparable fund expense and performance data; (6) a copy of the prospectus and statement of additional information that are part of the Trust’s registration statement on Form N-1A that include the Fund; and (7) information regarding the financial condition of Pacer.
Trust counsel reviewed the factors that the Trustees should consider in approving the Investment Advisory Agreement. In considering the Investment Advisory Agreement, the Trustees considered the following factors, to the extent applicable: (1) the nature, quality and extent of the services to be provided by Pacer to the Fund; (2) the general costs of providing the services and the profits anticipated to be realized by Pacer from its services to be rendered to the Fund; (3) comparative fee and expense data for the Fund and other investment companies with similar investment objectives; (4) the extent to which economies of scale would be realized as the Fund grows in assets, and whether the proposed advisory fee for the Fund reflects any such economies of scale; and (5) other benefits to Pacer and its affiliates resulting from services rendered to the Fund.
Pacer then presented on the anticipated profitability to the Advisor of managing the Fund, discussing such profitability at different projected asset levels. Pacer then discussed the nature, quality and extent of services to be provided by the Advisor to the Fund, including the types of securities to be included in its portfolio, the methodology and performance of the Fund’s underlying index, brokerage selection process with respect to domestic securities, and compliance with the Fund’s investment objectives and strategies and applicable laws and regulations, including portfolio liquidity requirements and tax diversification requirements, and responded to questions with respect thereto. The Advisor provided background information on and discussed the qualifications of key personnel at Pacer to provide services to the Fund, including the proposed portfolio managers of the Fund. The Advisor also discussed the services that Pacer would provide to the Fund and the fees that would be paid with respect to such services. The Advisor further reviewed Pacer’s business continuity plan and policies and procedures designed to address any conflicts of interest in managing the Fund relative to other accounts. Pacer discussed its plans to grow the Fund’s assets and the proposed timetable for commencing operations for the Fund.
109
Pacer Funds
ADDITIONAL INFORMATION
(Unaudited) (Continued)
Pacer then discussed the proposed investment advisory fee to be paid by the Fund to Pacer. The Advisor reviewed the comparisons included in their Board meeting materials of the proposed fee payable by the Fund to those charged by a group of comparably managed funds, commenting on where the fee payable by the Fund fell within the range of fees charged to comparable funds. The Advisor also reviewed the methodology used to develop the list of comparable funds. Pacer then discussed the factors that were considered when determining the proposed advisory fee for the Fund. The Advisor then responded to questions from the Trustees regarding, among other things: (a) the proposed advisory fees, (b) how such fees compared to advisory fees charged to comparable funds and (c) Pacer’s views with respect to what constitutes a comparable fund for purposes of fee comparisons.
The Trustees were assisted by Trust counsel and independent trustees’ counsel throughout the review process. The Trustees relied upon the advice of counsel and exercised their own business judgment in determining the material factors to be considered in evaluating the Investment Advisory Agreement and the weight to be given to each such factors. The conclusions reached by the Trustees were based on a comprehensive evaluation of all of the information provided and were not the result of any one factor. Moreover, each Trustee may have afforded different weight to the various factors in reaching his or her conclusions with respect to the Investment Advisory Agreement. In their deliberations, the Trustees did not identify any particular information that was allimportant or controlling.
Nature, Quality, and Extent of Services and Investment Performance.
The Trustees considered the scope of services to be provided under the Investment Advisory Agreement between the Trust and Pacer, noting that Pacer will be providing investment management services to the Fund. In considering the nature, extent and quality of the services to be provided by the Advisor, the Board reviewed the portfolio management services to be provided by the Advisor to the Fund and discussed these services with the Advisor. Among other things, the Trustees considered the quality of the Advisor’s portfolio management personnel and the level of services provided to the existing Funds. The Advisor’s registration form (“Form ADV”) was provided to the Trustees, as was the Advisor’s response to the 15(c) Questionnaire which included, among other things, information about the background and experience of the portfolio managers primarily responsible for the day-to-day management of the Fund. The Trustees considered the methodology of the Fund’s underlying index and the performance results provided at the Meeting for the index. The Trustees also considered the Fund’s investment strategy and the manner in which the Advisor would manage the Fund pursuant to such strategy. The Trustees also considered other services to be provided to the Fund by the Advisor, such as selecting broker-dealers for executing portfolio transactions, monitoring adherence to the Fund’s investment restrictions, and monitoring compliance with various Fund policies and procedures with applicable securities regulations and with the exemptive order applicable to the Fund. Based on the factors above, as well as those discussed below, the Trustees concluded that they were satisfied with the nature, extent and quality of the services to be provided to the Fund by the Advisor.
Cost of Services Provided and Economies of Scale.
The Trustees reviewed the proposed expense ratio and the proposed advisory fee to be paid to the Fund, considered fees paid by comparable funds, and concluded that the advisory fees were reasonable and comparable to those that would result from an arm’s length negotiation. Additionally, the Trustees took into consideration that the advisory fee was a “unified fee,” meaning that the Fund would pay no expenses other than its advisory fee and certain other costs such as interest, brokerage, and extraordinary expenses and, to the extent it is implemented, fees pursuant to the Fund’s Rule 12b-1 distribution plan. The Trustees noted that the Advisor would be responsible for compensating the Trust’s other service providers and paying the Fund’s other expenses out of its own fee and resources. The Trustees also evaluated the compensation and benefits expected to be received by the Advisor from its relationship with the Fund. The Trustees then evaluated the anticipated profitability of the Advisor with respect to its costs to manage the Fund.
Based on its deliberations and its evaluation of the information described above, at the Meeting, respectively, the Board, including the Independent Trustees: (a) concluded that the terms of the Investment Advisory Agreement with respect to the Fund are fair and reasonable; (b) concluded that the Advisor’s fees are reasonable in light of the nature and quality of the services expected to be rendered by the Advisor to the Fund; and (c) agreed to approve the Investment Advisory Agreement as to the Fund. In its deliberations at the Meeting, the Board did not identify any particular factor (or conclusion with respect thereto) or single piece of information that was all-important, controlling or determinative of its decision, but considered all of the factors together, and each Trustee may have attributed different weights to the various factors (and conclusions with respect thereto) and information.
110
Pacer Funds
ADDITIONAL INFORMATION
(Unaudited) (Continued)
NOTE 7 – TRUSTEES AND OFFICERS
The business of the Funds is managed under the direction of the Board of Trustees. The Board of Trustees formulates the general policies of the Funds and meets periodically to review the Funds’ performance, monitor investment activities and practices, and discuss other matters affecting the Funds. The Trustees are fiduciaries for the Funds’ shareholders and are governed by the laws of the State of Delaware in this regard. The names and addresses of the Trustees and officers of the Trust are listed below along with a description of their principal occupations over at least the last five years. There are currently four Trustees, three of whom are not “interested persons” of the Trust within the meaning of that term under the 1940 Act (“Independent Trustee”).The Trustees, in turn, elect the officers of the Trust to actively supervise its day-to-day operations. The address of each Trustee and officer of the Trust, unless otherwise indicated below, is c/o Pacer Advisors, Inc., 500 Chesterfield Parkway, Malvern, PA 19335.The Funds’ Statement of Additional Information includes additional information about the Trustees and is available upon request by calling toll free (800) 617-0004.
Additional information about each Trustee of the Trust is set forth below. The address of each Trustee of the Trust is c/o Pacer Advisors, Inc., 500 Chesterfield Parkway, Malvern, Pennsylvania 19355.
Name and Year of Birth | Position(s)
Held with
the Trust | Term of Office
and Length of
Time Served | Principal Occupation(s)
During Past 5 Years | Number of
Portfolios in
Fund
Complex
Overseen
By Trustee | Other
Directorships
held by
Trustee During
Past Five Years |
Interested Trustee | | | | | |
Joe M. Thomson
Born: 1944 | Trustee, Chairman, President, and Principal Executive Officer | Indefinite Term; since 2014 | Founder/President at Pacer Advisors, Inc. (since 2005) | 51 | Director, First Cornerstone Bank (2000–2016) |
Independent Trustees | | | | | |
Deborah G. Wolk
Born: 1950 | Lead Independent Trustee | Indefinite Term; since 2015 | Self-employed providing accounting services and computer modeling (since 1997) | 51 | 0 |
Jane K. Sagendorph
Born: 1951 | Trustee | Indefinite Term; since 2021 | Accountant, BluFish Designs (since 2011) | 51 | 0 |
Colin C. Lake
Born: 1971 | Trustee | Indefinite Term; since 2021 | Founder/President, Developing the Next Leaders, Inc. (consulting) (since 2016) | 51 | 0 |
111
Pacer Funds
ADDITIONAL INFORMATION
(Unaudited) (Continued)
The officers of the Trust conduct and supervise its daily business. The address of each officer of the Trust, unless otherwise indicated below, is c/o Pacer Advisors, Inc., 500 Chesterfield Parkway, Malvern, Pennsylvania 19355.
Name and Year of Birth | Position(s) Held
with Funds | Term of Office and
Length of Time Served | Principal Occupation(s)
During Past Five Years |
Principal Officers of the Trust | | | |
Joe M. Thomson
Born: 1944 | Trustee, Chairman, President, and Principal Executive Officer | Indefinite Term; since 2014 | Founder/President, Pacer Advisors, Inc. (since 2005); President and Chief Compliance Officer, Pacer Financial, Inc. (since 2004) |
Sean E. O’Hara
Born: 1962 | Treasurer and Principal Financial Officer | Indefinite Term; since 2014 | Director, Index Design Group (since 2015); Director, Pacer Financial, Inc. (since 2007); Director, Pacer Advisors, Inc. (since 2007) |
Bruce Kavanaugh
Born: 1964 | Secretary and Portfolio Manager | Indefinite Term; since 2016 | Vice President, Pacer Advisors, Inc. (since 2005); Vice President, Pacer Financial, Inc. (since 2004) |
Justin Dausch
Gateway Corporate Center
Suite 216
223 Wilmington West Chester Pike
Chadds Ford, PA 19317
Born: 1989 | Chief Compliance Officer and AML Officer | Indefinite Term; since 2021 | Director, Vigilant, since 2017; Compliance Associate, HSBC (investment banking company), 2015-2017 |
Mr. Thomson is an “Interested Person” by reason of his relationship with the Adviser.
Each Trustee shall serve during the lifetime of the Trust until he or she: (a) dies; (b) resigns; (c) has reached the mandatory retirement age, if any, as set by the Trustees; (d) is declared incompetent by a court of appropriate jurisdiction; or (e) is removed, or, if sooner, until the next meeting of shareholders called for the purpose of electing Trustees and until the election and qualification of his or her successor in accordance with the Trust’s Declaration of Trust and By-laws. Each officer holds office at the pleasure of the Board and services for a period of one year, or until his or her successor is duly elected and qualified.
The Statement of Additional Information includes additional information, including compensation, about the Funds’ Trustees.
NOTE 8 – SPECIAL MEETING OF SHAREHOLDERS
On November 15, 2021, a special meeting of the shareholders of each series of Pacer Funds Trust was held at the offices of the Administrator for the purpose of approving the election of two trustees to serve until his or her successor is elected and qualified.
Below are the voting results from the special meeting of the Trust:
Election of Trustee | | For | | | Abstain | |
Colin C. Lake | | | 187,708,430 | | | | 1,376,292 | |
Jane K. Sagendorph | | | 187,795,703 | | | | 1,289,019 | |
112
(This Page Intentionally Left Blank.)
Advisor Pacer Advisors, Inc.
500 Chesterfield Parkway
Malvern, PA 19355 |
Index Provider SL Advisors, LLC
220 Lenox Avenue, Suite 303
Westfield, New Jersey 07090 MV Index Solutions
Kreuznacher Str. 30,
60486 Frankfurt am
Main, Germany |
Custodian U.S. Bank National Association
Custody Operations
1555 North Rivercenter Drive
Milwaukee, WI 53212 |
Sub Adviser Swan Global Management, LLC
20 Ridge Top Palmas Del Mar
Humacao, PR 00791 |
Distributor Pacer Financial, Inc.
500 Chesterfield Parkway
Malvern, PA 19355 |
Transfer Agent U.S. Bancorp Fund Services, LLC
615 East Michigan Street
Milwaukee, WI 53202 |
Independent Registered
Public Accounting Firm Sanville & Company
1514 Old York Rd.
Abington, PA 19001 |
Legal Counsel Practus, LLP
11300 Tomahawk Creek Parkway, Suite 310
Leawood, Kansas 66211 |


Item 2. Code of Ethics.
The registrant has adopted a code of ethics that applies to the registrant’s principal executive officer and principal financial officer. The registrant has not made any substantive amendments to its code of ethics during the period covered by this report. The registrant has not granted any waivers from any provisions of the code of ethics during the period covered by this report.
| (1) | A copy of the registrant’s Code of Ethics is filed herewith. |
Item 3. Audit Committee Financial Expert.
The registrant’s board of trustees has determined that there is at least one audit committee financial expert serving on its audit committee. Deborah Wolk is the “audit committee financial expert” and is considered to be “independent” as each term is defined in Item 3 of Form N-CSR.
Item 4. Principal Accountant Fees and Services.
The registrant has engaged its principal accountant to perform audit services, audit-related services, tax services and other services during the past two fiscal years. “Audit services” refer to performing an audit of the registrant's annual financial statements or services that are normally provided by the accountant in connection with statutory and regulatory filings or engagements for those fiscal years. “Audit-related services” refer to the assurance and related services by the principal accountant that are reasonably related to the performance of the audit. “Tax services” refer to professional services rendered by the principal accountant for tax compliance, tax advice, and tax planning. “Other services” provided by the principal accountant were. The following table details the aggregate fees billed or expected to be billed for each of the last two fiscal years for audit fees, audit-related fees, tax fees and other fees by the principal accountant.
| | FYE 10/31/2022 | FYE 10/31/2021 |
| ( a ) Audit Fees | $129,600 | $129,600 |
| ( b ) Audit-Related Fees | $0 | $0 |
| ( c ) Tax Fees | $16,000 | $16,000 |
| ( d ) All Other Fees | $0 | $0 |
The audit committee has adopted pre-approval policies and procedures that require the audit committee to pre-approve all audit and non-audit services of the registrant, including services provided to any entity affiliated with the registrant.
The percentage of fees billed by Sanville & Company applicable to non-audit services pursuant to waiver of pre-approval requirement were as follows:
| | FYE 10/31/2022 | FYE 10/31/2021 |
| Audit-Related Fees | 0% | 0% |
| Tax Fees | 0% | 0% |
| All Other Fees | 0% | 0% |
All of the principal accountant’s hours spent on auditing the registrant’s financial statements were attributed to work performed by full-time permanent employees of the principal accountant.
The following table indicates the non-audit fees billed or expected to be billed by the registrant’s accountant for services to the registrant and to the registrant’s investment adviser (and any other controlling entity, etc.—not sub-adviser) for the last two years.
| Non-Audit Related Fees | FYE 10/31/2022 | FYE 10/31/2021 |
| Registrant | $0 | $0 |
| Registrant’s Investment Adviser | $0 | $0 |
The audit committee of the board of trustees/directors has considered whether the provision of non-audit services that were rendered to the registrant's investment adviser is compatible with maintaining the principal accountant's independence and has concluded that the provision of such non-audit services by the accountant has not compromised the accountant’s independence.
( i ) Not applicable
Item 5. Audit Committee of Listed Registrants.
The registrant is an issuer as defined in Rule 10A-3 under the Securities Exchange Act of 1934, (the “Act”) and has a separately-designated standing audit committee established in accordance with Section 3(a)(58)(A) of the Act. The independent members of the committee are as follows: Jane Sagendorph, Colin Lake and Deborah Wolk.
(b) Not applicable.
Item 6. Investments.
Schedule of Investments is included as part of the report to shareholders filed under Item 1 of this Form.
Item 7. Disclosure of Proxy Voting Policies and Procedures for Closed-End Management Investment Companies.
Not applicable to open-end investment companies.
Item 8. Portfolio Managers of Closed-End Management Investment Companies.
Not applicable to open-end investment companies.
Item 9. Purchases of Equity Securities by Closed-End Management Investment Company and Affiliated Purchasers.
Not applicable to open-end investment companies.
Item 10. Submission of Matters to a Vote of Security Holders.
There have been no material changes to the procedures by which shareholders may recommend nominees to the registrant’s board of Trustees
Item 11. Controls and Procedures.
| (a) | The Registrant’s President/Principal Executive Officer and Treasurer/Principal Financial Officer have reviewed the Registrant's disclosure controls and procedures (as defined in Rule 30a-3(c) under the Investment Company Act of 1940 (the “Act”)) as of a date within 90 days of the filing of this report, as required by Rule 30a-3(b) under the Act and Rules 13a-15(b) or 15d-15(b) under the Securities Exchange Act of 1934. Based on their review, such officers have concluded that the disclosure controls and procedures are effective in ensuring that information required to be disclosed in this report is appropriately recorded, processed, summarized and reported and made known to them by others within the Registrant and by the Registrant’s service provider. |
| (b) | There were no changes in the Registrant's internal control over financial reporting (as defined in Rule 30a-3(d) under the Act) that occurred during the period covered by this report that have materially affected, or are reasonably likely to materially affect, the Registrant's internal control over financial reporting. |
Item 12. Disclosure of Securities Lending Activities for Closed-End Management Investment Companies
Not applicable to open-end investment companies.
Item 13. Exhibits.
| (a) | (1) Any code of ethics or amendment thereto, that is the subject of the disclosure required by Item 2, to the extent that the registrant intends to satisfy Item 2 requirements through filing an exhibit. Filed herewith. |
(2) A separate certification for each principal executive officer and principal financial officer pursuant to Section 302 of the Sarbanes-Oxley Act of 2002. Filed herewith.
(3) Any written solicitation to purchase securities under Rule 23c-1 under the Act sent or given during the period covered by the report by or on behalf of the registrant to 10 or more persons. Not applicable to open-end investment companies.
(4)Change in the registrant’s independent public accountant. There was no change in the registrant’s independent public accountant for the period covered by this report.
| (b) | Certifications pursuant to Section 906 of the Sarbanes-Oxley Act of 2002. Furnished herewith. |
SIGNATURES
Pursuant to the requirements of the Securities Exchange Act of 1934 and the Investment Company Act of 1940, the registrant has duly caused this report to be signed on its behalf by the undersigned, thereunto duly authorized.
| (Registrant) | Pacer Funds Trust | |
| | | |
| By (Signature and Title)* | /s/ Joe M. Thomson | |
| | Joe M. Thomson, President/Principal Executive Officer | |
| | | |
| Date | 1/3/2023 | |
Pursuant to the requirements of the Securities Exchange Act of 1934 and the Investment Company Act of 1940, this report has been signed below by the following persons on behalf of the registrant and in the capacities and on the dates indicated.
| By (Signature and Title)* | /s/ Joe M. Thomson | |
| | Joe M. Thomson, President/Principal Executive Officer | |
| | | |
| Date | 1/3/2023 | |
| | | |
| By (Signature and Title)* | /s/ Sean E. O’Hara | |
| | Sean E. O’Hara, Treasurer/Principal Financial Officer | |
| | | |
| Date | 1/5/2023 | |
| * | Print the name and title of each signing officer under his or her signature. |