Free Writing Prospectus Filed Pursuant to Rule 433 Registration Statement No. 333-206640 January 12, 2017 |
|
Free Writing Prospectus
Filed Pursuant to Rule 433
Registration StatementNo. 333-206640
January 12, 2017
GLDW
SPDR® Long Dollar Gold Trust
The performance of the Solactive GLD® Long USD Gold Index provided in this material is hypothetical and for informational purposes only. It was calculated with the benefit of hindsight and does not represent actual past performance. Past performance, whether actual or hypothetical, is not a guarantee of future performance of any investment product.
For Qualified Institutional Buyers and Institutional Accredited Investors Only. All other dissemination is prohibited.IBG-21266
|
Product Overview
SPDR® Long Dollar Gold Trust (GLDW)
Name and Ticker
Gold for a Strong Dollar Environment™
• |
| Holds physical gold bullion |
• |
| Seeks to counter the historically negative correlation between a strengthening dollar and gold prices |
GLDW Product • Designed to provide investors with the economic effect of holding gold with a basket ofnon-US currencies
Highlights • May help increase portfolio diversification and preserve purchasing power
• |
| Designed to take advantage of USD strength that has historically at times accompanied surges in the gold price during downturns and |
times of market stress
GLDW seeks to track the Solactive GLD® Long USD Gold Index (the “Index”), less fund expenses. The Index combines 1) a long position
in physical gold (as represented by the LBMA Gold Price AM) and 2) a long dollar exposure against a basket (“FX Basket”) ofnon-US
Investment Objective currencies comprising the euro (EUR), the Japanese yen (JPY), the British pound (GBP), the Canadian dollar (CAD), the Swedish krona
and Index Description (SEK) and the Swiss Franc (CHF).
The specific Reference Currencies and approximate weights in the FX Basket for purposes of the Index are EUR (57.6%), JPY (13.6%), GBP
(11.9%), CAD (9.1%), SEK (4.2%) and CHF (3.6%).
GLDW will own gold bullion. It will also engage in a gold delivery agreement with Merrill Lynch International under which Merrill Lynch
Basic
will make or take delivery of gold bullion each business day that will reflect how the fund’s gold holdings performed in terms of the FX
Structure
Basket. GLDW is seeking registration under the 1933 Act to continuously offer shares, and is seeking tax treatment as a “grantor trust.”
Total Expense Ratio 50 bps
WGC USA Asset Management Company, LLC (“WGC AM”), an affiliate of the World Gold Council (“WGC”).
Sponsor and Commodity
In 2004, WGC through an affiliate, launched SPDR® Gold Shares (GLD®), the firstUS-listed physical
Pool Operator
gold ETF.
Administrator BNY Mellon Asset Servicing
Key Gold Custodian HSBC Bank plc
Participants
Index Provider Solactive AG
Gold Delivery Provider Merrill Lynch International
Marketing Agent State Street Global Markets, LLC
Listing Exchange NYSE Arca
For Qualified Institutional Buyers and Institutional Accredited Investors Only.
All other dissemination isprohibited.IBG-212662
|
Table of Contents
1. The Investment Case for Gold
2. Rationale Behind a Long Dollar and Long Gold Strategy
3. Implementing a Long Dollar and Long Gold Strategy with GLDW
Appendix
Appendix A: Important Disclosures
The material contained in this presentation is current as of the presentation date, unless otherwise indicated.
For Qualified Institutional Buyers and Institutional Accredited Investors Only.
All other dissemination is prohibited.IBG-21266 3
|
The Investment Case for Gold
For Qualified Institutional Buyers and Institutional Accredited Investors Only.
All other dissemination is prohibited.IBG-21266 4
|
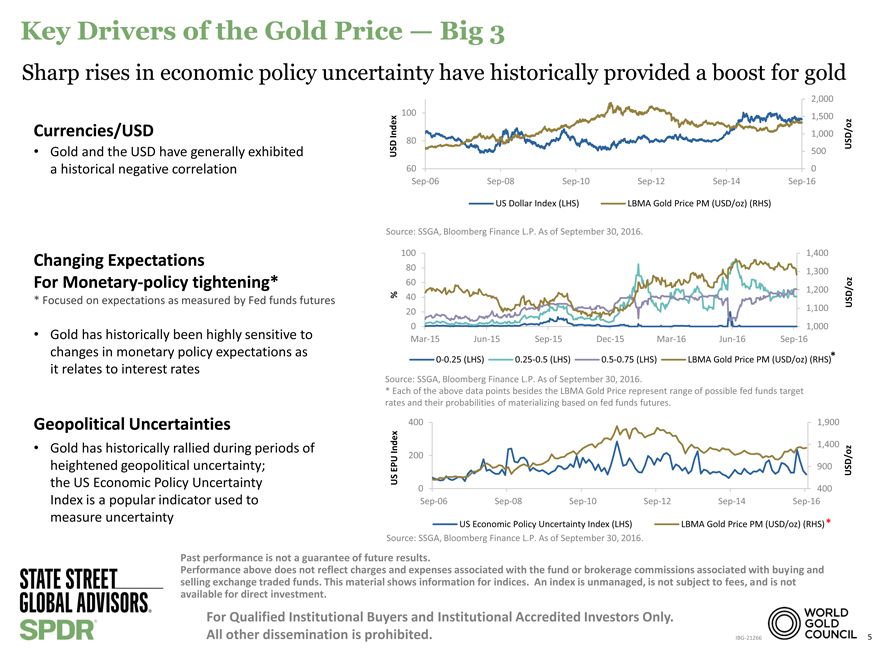
Currencies/USD
• Gold and the USD have generally exhibited a historical negative correlation
Changing Expectations
For Monetary-policy tightening*
* Focused on expectations as measured by Fed funds futures
• Gold has historically been highly sensitive to changes in monetary policy expectations as it relates to interest rates
Geopolitical Uncertainties
• Gold has historically rallied during periods of heightened geopolitical uncertainty; the US Economic Policy Uncertainty Index is a popular indicator used to measure uncertainty
2,000
100 1,500
1,000
Index 80 USD/oz
USD 500
60 0
Sep-06 Sep-08Sep-10Sep-12Sep-14Sep-16
US Dollar Index (LHS) LBMA Gold Price PM (USD/oz) (RHS)
Source: SSGA, Bloomberg Finance L.P. As of September 30, 2016.
100 1,400
80 1,300
60
1,200
% 40 USD/oz
20 1,100
0 1,000
Mar-15 Jun-15Sep-15Dec-15Mar-16Jun-16Sep-16
0-0.25(LHS) 0.25-0.5 (LHS)0.5-0.75 (LHS)LBMA Gold Price PM (USD/oz) (RHS) *
Source: SSGA, Bloomberg Finance L.P. As of September 30, 2016.
* Each of the above data points besides the LBMA Gold Price represent range of possible fed funds target
rates and their probabilities of materializing based on fed funds futures.
400 1,900
Index 1,400
200
EPU 900 USD/oz
US
0 400
Sep-06 Sep-08Sep-10Sep-12Sep-14Sep-16
US Economic Policy Uncertainty Index (LHS) LBMA Gold Price PM (USD/oz) (RHS) *
Source: SSGA, Bloomberg Finance L.P. As of September 30, 2016.
Past performance is not a guarantee of future results.
Performance above does not reflect charges and expenses associated with the fund or brokerage commissions associated with buying and selling exchange traded funds. This material shows information for indices. An index is unmanaged, is not subject to fees, and is not available for direct investment.
For Qualified Institutional Buyers and Institutional Accredited Investors Only.
All other dissemination is prohibited.IBG-21266 5
|
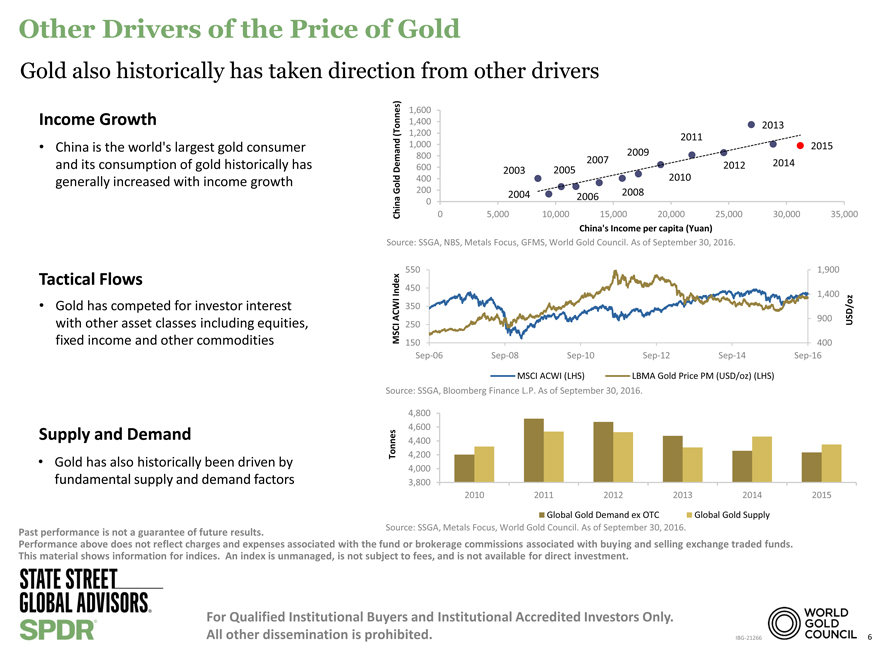
Other Drivers of the Price of Gold
Gold also historically has taken direction from other drivers
Income Growth
• China is the world’s largest gold consumer and its consumption of gold historically has generally increased with income growth
Tactical Flows
• Gold has competed for investor interest with other asset classes including equities, fixed income and other commodities
Supply and Demand
• Gold has also historically been driven by fundamental supply and demand factors
1,600
1,400 2013
(Tonnes) 1,200
1,000 2011
2015 800 2009 2007 2014
Demand 600 2012
2003 2005
2010
400
Gold 200 2008
2004 2006
0
China 0 5,000 10,000 15,000 20,000 25,000 30,000 35,000
China’s Income per capita (Yuan)
Source: SSGA, NBS, Metals Focus, GFMS, World Gold Council. As of September 30, 2016.
550 1,900 450
Index 1,400 ACWI 350 900 USD/oz MSCI 250 150 400Sep-06Sep-08Sep-10Sep-12Sep-14Sep-16
MSCI ACWI (LHS) LBMA Gold Price PM (USD/oz) (LHS) Source: SSGA, Bloomberg Finance L.P. As of September 30, 2016.
4,800 4,600 4,400
Tonnes 4,200 4,000 3,800
2010 2011 2012 2013 2014 2015
Global Gold Demand ex OTC Global Gold Supply Source: SSGA, Metals Focus, World Gold Council. As of September 30, 2016.
Source: SSGA, Metals Focus, World Gold Council. As of September 30, 2016.
Past performance is not a guarantee of future results.
Performance above does not reflect charges and expenses associated with the fund or brokerage commissions associated with buying and selling exchange traded funds. This material shows information for indices. An index is unmanaged, is not subject to fees, and is not available for direct investment.
For Qualified Institutional Buyers and Institutional Accredited Investors Only.
All other dissemination is prohibited.IBG-21266 6
|
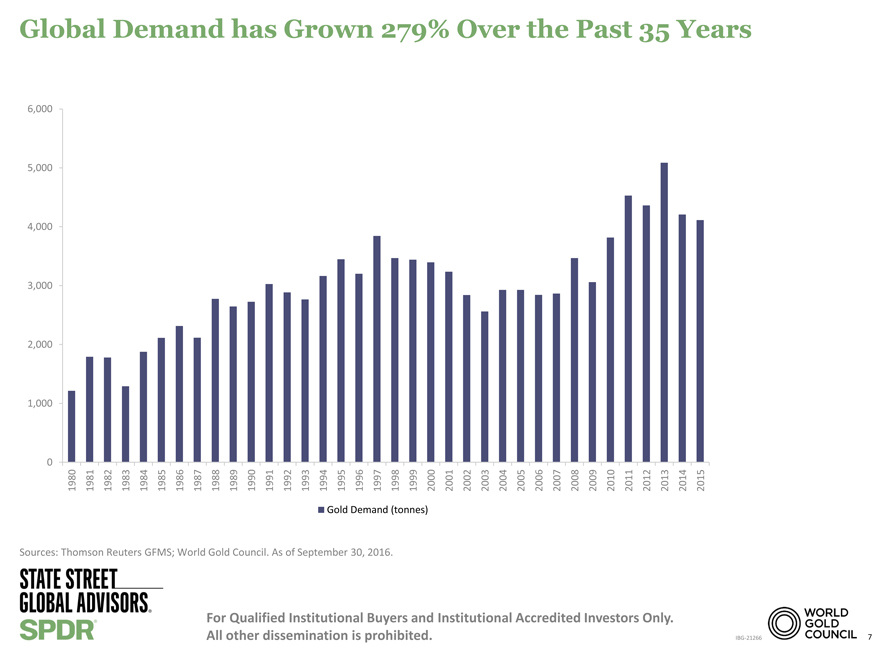
Global Demand has Grown 279% Over the Past 35 Years
6,000
5,000
4,000
3,000
2,000
1,000
0
1980 1981 1982 1983 1984 1985 1986 1987 1988 1989 1990 1991 1992 1993 1994 1995 1996 1997 1998 1999 2000 2001 2002 2003 2004 2005 2006 2007 2008 2009 2010 2011 2012 2013 2014 2015
Gold Demand (tonnes)
Sources: Thomson Reuters GFMS; World Gold Council. As of September 30, 2016.
For Qualified Institutional Buyers and Institutional Accredited Investors Only.
All other dissemination isprohibited. IBG-21266 7
|
The Value Proposition of Gold is the Potential for Portfolio Risk Management and Long Term Capital Preservation
• The different economic forces that affect gold have resulted in historically low to negative correlations to major asset classes, which can provide potential diversification benefits
• It has historically performed well in periods of systemic risk, which are usually associated with strong stock market corrections, higher credit spreads and overall negative investor sentiment*
• Gold has historically done well in higher inflation environments with an average annual nominal rate of return of over 18% when year-over-year CPI is greater than 4%**
• Gold has outperformed fiat currencies including the USD since 1900, which is one reason why we believe central banks use gold as a reserve currency.***
An investment in GLDW entails a risk of loss and the diversification offered by the fund does not ensure a profit or a guarantee against loss. GLDW may not be suitable for all investors. GLDW may perform differently in market conditions not described above.
Past performance is not a guarantee of future results.
Performance above does not reflect charges and expenses associated with the fund or brokerage commissions associated with buying and selling exchange traded funds.
* Source: Bloomberg Finance L.P., SSGA; see Slide 13)
** Inflation is computed using annual US CPIyear-on-year changes between 1970 and 2015 and the gold price is computed using LBMA Gold Price PM. Source: gold.org, http://www.gold.org/download/file/5003/Gold_Investor_June_2016.pdf. See page 23: “Chart 5: Gold returns as a function of annual inflation” and “Chart 4: Value of major currencies relative to gold through history.” *** Source: Bloomberg Finance L.P.; Harold Marcuse – UC Santa Barbara; World Gold Council, as of October 31, 2016. Also, gold.org, http://www.gold.org/download/file/5003/Gold_Investor_June_2016.pdf. See page 23: “Chart 4: Value of major currencies relative to gold through history.”
For Qualified Institutional Buyers and Institutional Accredited Investors Only.
All other dissemination is prohibited.IBG-21266 8
|
Rationale Behind a Long Dollar and Long Gold Strategy
For Qualified Institutional Buyers and Institutional Accredited Investors Only.
All other dissemination is prohibited.IBG-21266 9
|
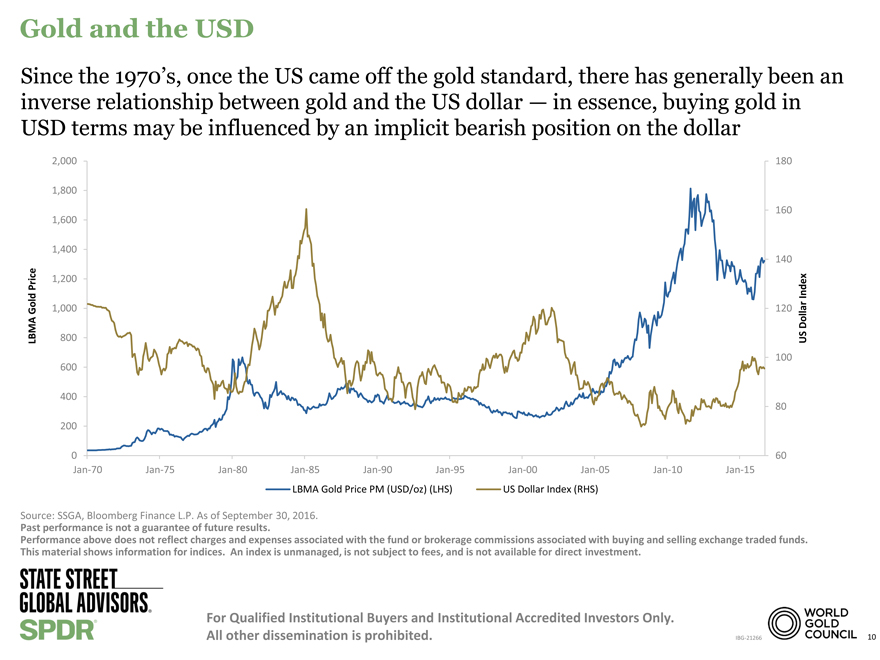
Gold and the USD
Since the 1970’s, once the US came off the gold standard, there has generally been an
inverse relationship between gold and the US dollar — in essence, buying gold in
USD terms may be influenced by an implicit bearish position on the dollar
2,000 180
1,800
160
1,600
1,400
140
Price 1,200 Index
Gold 1,000 120 Dollar
LBMA 800 US
100
600
400
80
200
0 60
Jan-70 Jan-75Jan-80Jan-85Jan-90Jan-95Jan-00Jan-05Jan-10Jan-15
LBMA Gold Price PM (USD/oz) (LHS)US Dollar Index (RHS)
Source: SSGA, Bloomberg Finance L.P. As of September 30, 2016.
Past performance is not a guarantee of future results.
Performance above does not reflect charges and expenses associated with the fund or brokerage commissions associated with buying and selling exchange traded funds. This material shows information for indices. An index is unmanaged, is not subject to fees, and is not available for direct investment.
For Qualified Institutional Buyers and Institutional Accredited Investors Only.
All other dissemination is prohibited.IBG-21266 10
|
Average Weekly Returns of Gold, the US Dollar and the Backtested (Hypothetical) Index
Average Weekly Returns* * * Weekly back-tested returns from Jan. 1, 2007 to June 30, 2016. Each quadrant represents average weekly returns of gold and the USD when a particular relationship between gold and dollar values prevailed. Net of fees of the backtested Index; returns are net of a 50 basis point/year expense ratio that has been prorated on a weekly basis.
Quadrant I shows weeks when gold was positive and the dollar was positive; Quadrant II shows weeks when gold was negative and the dollar was positive; Quadrant III shows weeks when gold was negative
and the dollar was negative; Quadrant IV shows weeks when gold was positive and the dollar was negative.
A return of zero for either gold or the USD is considered positive for the purpose of the quadrants. Gold prices based on the LBMA Gold Price AM. USD prices based on US Dollar Index.
Source: Bloomberg Finance L.P., World Gold Council, SSGA and Solactive.
Average Weekly Returns*
Gold Down / USD Up Gold Up / USD Up
Gold: -2.322% Gold:+1.753%
USD: +0.997% USD:+0.832%
Backtested Index: -1.452% Backtested Index:+2.233%
Backtested Backtested
Index ex 50bp: -1.464% Index ex 50bp:+2.228%
Quadrant II Quadrant I
Gold Down / USD Down Gold Up / USD Down
Gold: -1.762% Gold:+2.156%
USD: -0.616% USD:-0.970%
Backtested Backtested
Index: -2.053% Index:+1.319%
Backtested Backtested
Index ex 50bp: -2.067% Index ex 50bp:+1.313%
Quadrant III Quadrant IV
Weekly returns from January 1, 2007 to June 30, 2016. Gold prices based on the LBMA Gold Price. The individual performance of gold and the US dollar above represent live performance of the LBMA Gold
Price AM and the US Dollar Index in the periods shown. Gold’s performance does not reflect the deduction of any fund fees or expenses. Past performance is not a guarantee of future results. Performance of gold above does not reflect charges and expenses associated with the fund or brokerage commissions associated with buying and selling exchange traded funds.Pre-Inception Index Performance shown above is back tested (hypothetical) and is not a guarantee of past or future results. The performance quoted is not intended to represent the performance of any particular exchange-traded fund or security. Actual performance of any investment may have differed substantially from the back-tested performance presented, as the performance was calculated with the benefit of hindsight and cannot account for all financial risk that may affect the actual performance. The performance includes the reinvestment of capital gains related to underlying gold holdings as well as income related to the back-tested Index’s currency exposure, if any. The performance of the back tested index is shown on agross-of-fee andnet-of-fee basis, as indicated above.Net-of-fee performance for the benchmark index takes into account GLDW’s gross expense ratio of 0.50%. Performance prior to the July 20, 2016 inception date of the index referenced herein, is derived in accordance with the index calculation methodology which takes into account the LBMA Gold Price A.M. in reference to the gold component, and utilizes the WMR Fix Rate to measure the value of the USD relative to the “Reference
Currencies” which takes into account the LBMA Gold Price A.M. and P.M. to determine the profit and loss of the currency portion.
These results are based on simulated or hypothetical performance results that have certain inherent limitations. Unlike the results shown in an actual performance record, these results do not represent actual trading. Also, because these trades have not actually been executed, these results may haveunder-or over-compensated for the impact, if any, of certain market factors, such as lack of liquidity. Simulated or hypothetical trading programs in general are also subject to the fact that they are designed with the benefit of hindsight. No representation is being made that any account will or is likely to achieve profits or losses similar to these being shown.
This material shows information for indices. An index is unmanaged, is not subject to fees, and is not available for direct investment.
For Qualified Institutional Buyers and Institutional Accredited Investors Only.
All other dissemination is prohibited.IBG-21266 11
|
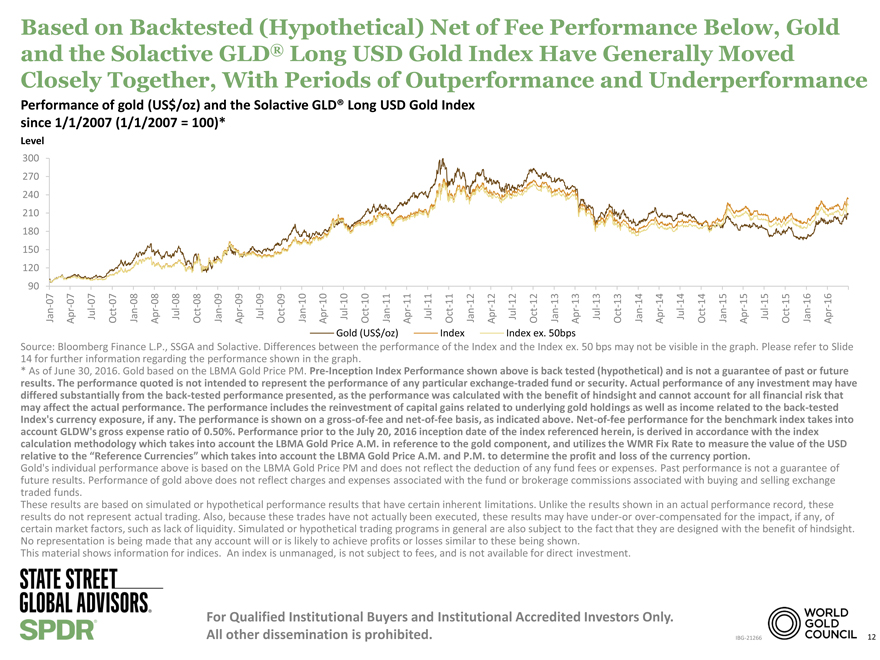
Based on Backtested (Hypothetical) Net of Fee Performance Below, Gold and the Solactive GLD® Long USD Gold Index Have Generally Moved Closely Together, With Periods of Outperformance and Underperformance
Performance of gold (US$/oz) and the Solactive GLD® Long USD Gold Index since 1/1/2007 (1/1/2007 = 100)*
Level
90 120 150180210240270300
Jan-07
Apr-07
Jul-07
Oct-07
Jan-08
Apr-08
Jul-08
Oct-08
Jan-09
Apr-09
Jul-09
Oct-09
Jan-10
Apr-10
GoldJul-10
(USOct-10
$
/oz)Jan-11
Apr-11
Jul-11
IndexOct-11
Jan-12
Apr-12
IndexJul-12
ex.Oct-12
50bpsJan-13
Apr-13
Jul-13
Oct-13
Jan-14
Apr-14
Jul-14
Oct-14
Jan-15
Apr-15
Jul-15
Oct-15
Jan-16
Apr-16
Source: Bloomberg Finance L.P., SSGA and Solactive. Differences between the performance of the Index and the Index ex. 50 bps may not be visible in the graph. Please refer to Slide 14 for further information regarding the performance shown in the graph.
* As of June 30, 2016. Gold based on the LBMA Gold Price PM.Pre-Inception Index Performance shown above is back tested (hypothetical) and is not a guarantee of past or future results. The performance quoted is not intended to represent the performance of any particular exchange-traded fund or security. Actual performance of any investment may have differed substantially from the back-tested performance presented, as the performance was calculated with the benefit of hindsight and cannot account for all financial risk that may affect the actual performance. The performance includes the reinvestment of capital gains related to underlying gold holdings as well as income related to the back-
tested Index’s currency exposure, if any. The performance is shown on agross-of-fee andnet-of-fee basis, as indicated above.Net-of-fee performance for the benchmark index takes into account GLDW’s gross expense ratio of 0.50%. Performance prior to the July 20, 2016 inception date of the index referenced herein, is derived in accordance with the index calculation methodology which takes into account the LBMA Gold Price A.M. in reference to the gold component, and utilizes the WMR Fix Rate to measure the value of the USD relative to the “Reference Currencies” which takes into account the LBMA Gold Price A.M. and P.M. to determine the profit and loss of the currency portion.
Gold’s individual performance above is based on the LBMA Gold Price PM and does not reflect the deduction of any fund fees or expenses. Past performance is not a guarantee of future results. Performance of gold above does not reflect charges and expenses associated with the fund or brokerage commissions associated with buying and selling exchange traded funds.
These results are based on simulated or hypothetical performance results that have certain inherent limitations. Unlike the results shown in an actual performance record, these results do not represent actual trading. Also, because these trades have not actually been executed, these results may haveunder-or over-compensated for the impact, if any, of certain market factors, such as lack of liquidity. Simulated or hypothetical trading programs in general are also subject to the fact that they are designed with the benefit of hindsight. No representation is being made that any account will or is likely to achieve profits or losses similar to these being shown.
This material shows information for indices. An index is unmanaged, is not subject to fees, and is not available for direct investment.
For Qualified Institutional Buyers and Institutional Accredited Investors Only.
All other dissemination is prohibited.IBG-21266 12
|
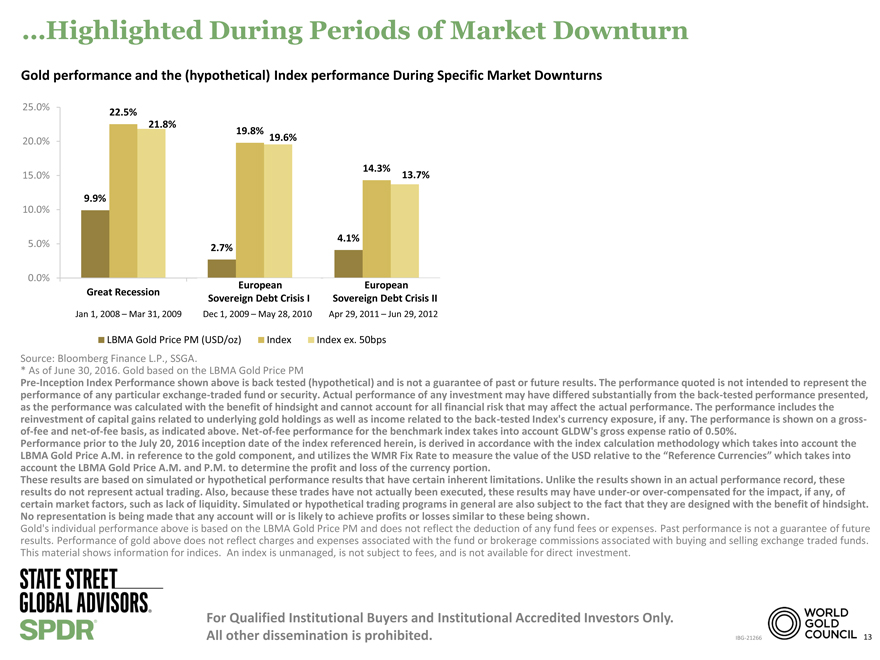
…Highlighted During Periods of Market Downturn
Gold performance and the (hypothetical) Index performance During Specific Market Downturns
25.0% 22.5%
21.8%
19.8% 19.6%
20.0%
14.3%
15.0% 13.7%
9.9%
10.0%
4.1%
5.0% 2.7%
0.0%
EuropeanEuropean
Great Recession Sovereign Debt Crisis ISovereign Debt Crisis II
Jan 1, 2008 – Mar 31, 2009 Dec 1, 2009 – May 28, 2010Apr 29, 2011 – Jun 29, 2012
LBMA Gold Price PM (USD/oz) IndexIndex ex. 50bps
Source: Bloomberg Finance L.P., SSGA.
* As of June 30, 2016. Gold based on the LBMA Gold Price PM
Pre-Inception Index Performance shown above is back tested (hypothetical) and is not a guarantee of past or future results. The performance quoted is not intended to represent the performance of any particular exchange-traded fund or security. Actual performance of any investment may have differed substantially from the back-tested performance presented, as the performance was calculated with the benefit of hindsight and cannot account for all financial risk that may affect the actual performance. The performance includes the reinvestment of capital gains related to underlying gold holdings as well as income related to the back-tested Index’s currency exposure, if any. The performance is shown on agross-of-fee andnet-of-fee basis, as indicated above.Net-of-fee performance for the benchmark index takes into account GLDW’s gross expense ratio of 0.50%.
Performance prior to the July 20, 2016 inception date of the index referenced herein, is derived in accordance with the index calculation methodology which takes into account the LBMA Gold Price A.M. in reference to the gold component, and utilizes the WMR Fix Rate to measure the value of the USD relative to the “Reference Currencies” which takes into account the LBMA Gold Price A.M. and P.M. to determine the profit and loss of the currency portion.
These results are based on simulated or hypothetical performance results that have certain inherent limitations. Unlike the results shown in an actual performance record, these results do not represent actual trading. Also, because these trades have not actually been executed, these results may haveunder-or over-compensated for the impact, if any, of certain market factors, such as lack of liquidity. Simulated or hypothetical trading programs in general are also subject to the fact that they are designed with the benefit of hindsight. No representation is being made that any account will or is likely to achieve profits or losses similar to these being shown.
Gold’s individual performance above is based on the LBMA Gold Price PM and does not reflect the deduction of any fund fees or expenses. Past performance is not a guarantee of future results. Performance of gold above does not reflect charges and expenses associated with the fund or brokerage commissions associated with buying and selling exchange traded funds. This material shows information for indices. An index is unmanaged, is not subject to fees, and is not available for direct investment.
For Qualified Institutional Buyers and Institutional Accredited Investors Only.
All other dissemination is prohibited.IBG-21266 13
|

Backtested (Hypothetical) Performance Using Historical Data
Performance of gold (US$/oz) versus Returns of the Backtested Index Gross of Fee and Net of Fee over various periods of time*
Annualized ReturnAnnualized Volatility**Correlation w/ US$**
IndexIndex ex.Index
GoldIndexex. 50bpGoldIndex50bpGoldIndexex. 50bp
Since 1/1/2007 1/1/2007–6/30/2016 7.9%9.3%8.8%19.8%18.1%18.2%-0.30-0.03-0.03
5-year average 6/30/2011–6/30/2016 -2.62.21.718.216.216.3-0.260.000.00
3-year average 6/30/2013–6/30/2016 3.58.07.516.213.713.7-0.290.030.03
1-year average 6/30/2015–6/30/2016 12.812.812.317.414.114.1-0.320.090.09
Cumulative ReturnAnnualized Volatility**Correlation w/ US$**
IndexIndex ex.Index
GoldIndexex. 50bpGoldIndex50bpGoldIndexex. 50bp
Great Recession 1/1/2008–3/31/2009 9.9%22.5%21.8%31.3%29.3%29.4%-0.35-0.08-0.08
Sovereign Debt Crisis I 12/1/2009–5/28/2010 2.719.819.617.819.419.4-0.27-0.05-0.04
Sovereign Debt Crisis II 4/29/2011–6/29/2012 4.114.313.722.021.621.6-0.250.000.00
2007 1/1/2007–12/31/2007 29.720.820.315.813.813.8-0.46-0.03-0.18
2008 12/31/2007–12/31/2008 4.39.79.231.629.029.1-0.43-0.15-0.15
2009 12/31/2008–12/31/2009 25.021.821.321.520.120.1-0.190.030.03
2010 12/31/2009–12/31/2010 29.229.929.416.116.716.8-0.210.090.09
2011 12/31/2010–12/31/2011 8.912.211.720.921.922.0-0.180.060.06
2012 12/31/2011–12/31/2012 8.34.74.216.713.213.2-0.44-0.18-0.18
2013 12/31/2012–12/31/2013 -27.3-27.4-27.921.718.318.3-0.23-0.05-0.05
2014 12/31/2013–12/31/2014 0.112.011.513.011.311.3-0.29-0.09-0.09
2015 12/31/2014–12/31/2015 -12.1-3.5-4.014.312.812.8-0.320.080.08
2016* 12/31/2015–6/30/2016 24.621.020.719.315.715.7-0.260.090.09
Source: Bloomberg Finance L.P., SSGA and Solactive. From January 1, 2007 to June 30, 2016.
* As of June 30, 2016. Gold corresponds to the LBMA Gold Price PM. ** Volatility and correlation computed using daily returns. Correlations compare the LBMA Gold Price PM and the
Index to the US Dollar Index.Pre-Inception Index Performance shown above is back tested (hypothetical) and is not a guarantee of past or future results. The performance quoted is not intended to represent the performance of any particular exchange-traded fund or security. Actual performance of any investment may have differed substantially from the back-tested performance presented, as the performance was calculated with the benefit of hindsight and cannot account for all financial risk that may affect the actual performance. The performance includes the reinvestment of capital gains related to underlying gold holdings as well as income related to the back-tested Index’s currency exposure, if any. The performance is shown on agross-of-fee andnet-of-fee basis, as indicated above.Net-of-fee performance for the benchmark index takes into account GLDW’s gross expense ratio of 0.50%. Performance prior to the July 20, 2016 inception date of the index referenced herein, is derived in accordance with the index calculation methodology which takes into account the LBMA Gold Price A.M. in reference to the gold component, and utilizes the WMR Fix Rate to measure the value of the USD relative to the “Reference Currencies” which takes into account the LBMA Gold Price A.M. and P.M. to determine the profit and loss of the currency portion. Gold’s individual performance above is based on the LBMA Gold Price
PM and does not reflect the deduction of any fund fees or expenses. Past performance is not a guarantee of future results. Performance of gold above does not reflect charges and expenses associated with the fund or brokerage commissions associated with buying and selling exchange traded funds.
These results are based on simulated or hypothetical performance results that have certain inherent limitations. Unlike the results shown in an actual performance record, these results do not represent actual trading. Also, because these trades have not actually been executed, these results may haveunder-or over-compensated for the impact, if any, of certain market factors, such as lack of liquidity. Simulated or hypothetical trading programs in general are also subject to the fact that they are designed with the benefit of hindsight. No representation is being made that any account will or is likely to achieve profits or losses similar to these being shown.
For Qualified Institutional Buyers and Institutional Accredited Investors Only.
All other dissemination is prohibited.IBG-21266 14
|
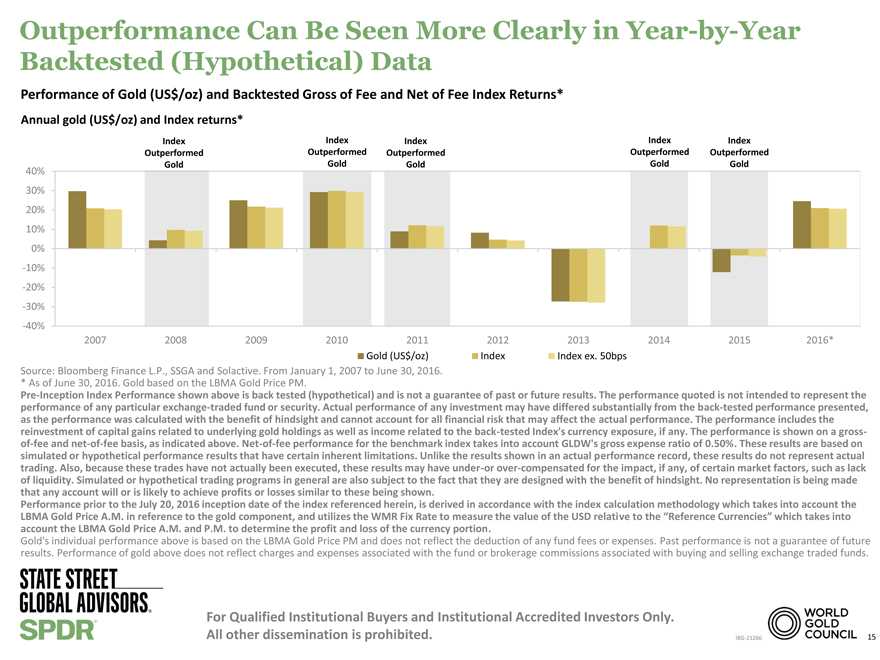
Outperformance Can Be Seen More Clearly inYear-by-Year Backtested (Hypothetical) Data
Performance of Gold (US$/oz) and Backtested Gross of Fee and Net of Fee Index Returns*
Annual gold (US$/oz) and Index returns*
Index Index Index Index Index Outperformed Outperformed Outperformed Outperformed Outperformed Gold Gold Gold Gold Gold
40%
30%
20%
10%
0%
-10%
-20%
-30%
-40%
2007 200820092010201120122013201420152016*
Gold (US$/oz)IndexIndex ex. 50bps
Source: Bloomberg Finance L.P., SSGA and Solactive. From January 1, 2007 to June 30, 2016.
* As of June 30, 2016. Gold based on the LBMA Gold Price PM.
Pre-Inception Index Performance shown above is back tested (hypothetical) and is not a guarantee of past or future results. The performance quoted is not intended to represent the performance of any particular exchange-traded fund or security. Actual performance of any investment may have differed substantially from the back-tested performance presented, as the performance was calculated with the benefit of hindsight and cannot account for all financial risk that may affect the actual performance. The performance includes the reinvestment of capital gains related to underlying gold holdings as well as income related to the back-tested Index’s currency exposure, if any. The performance is shown on agross-of-fee andnet-of-fee basis, as indicated above.Net-of-fee performance for the benchmark index takes into account GLDW’s gross expense ratio of 0.50%. These results are based on simulated or hypothetical performance results that have certain inherent limitations. Unlike the results shown in an actual performance record, these results do not represent actual trading. Also, because these trades have not actually been executed, these results may haveunder-or over-compensated for the impact, if any, of certain market factors, such as lack of liquidity. Simulated or hypothetical trading programs in general are also subject to the fact that they are designed with the benefit of hindsight. No representation is being made that any account will or is likely to achieve profits or losses similar to these being shown.
Performance prior to the July 20, 2016 inception date of the index referenced herein, is derived in accordance with the index calculation methodology which takes into account the LBMA Gold Price A.M. in reference to the gold component, and utilizes the WMR Fix Rate to measure the value of the USD relative to the “Reference Currencies” which takes into account the LBMA Gold Price A.M. and P.M. to determine the profit and loss of the currency portion.
Gold’s individual performance above is based on the LBMA Gold Price PM and does not reflect the deduction of any fund fees or expenses. Past performance is not a guarantee of future results. Performance of gold above does not reflect charges and expenses associated with the fund or brokerage commissions associated with buying and selling exchange traded funds.
For Qualified Institutional Buyers and Institutional Accredited Investors Only.
All other dissemination is prohibited.IBG-21266 15
|
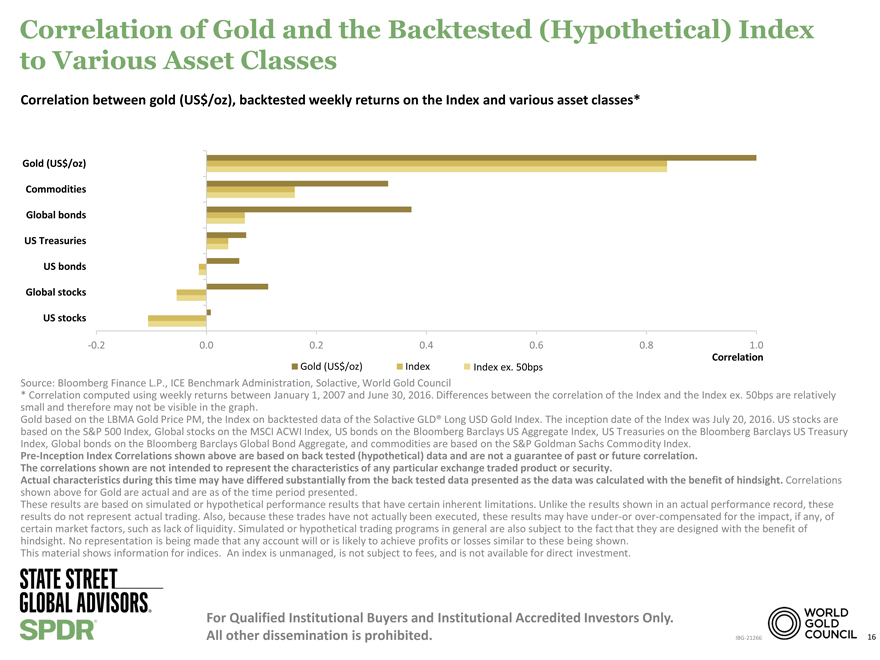
Correlation of Gold and the Backtested (Hypothetical) Index to Various Asset Classes
Correlation between gold (US$/oz), backtested weekly returns on the Index and various asset classes*
Gold (US$/oz) Commodities Global bonds US Treasuries US bonds Global stocks US stocks
-0.2 0.0 0.2 0.4 0.6 0.8 1.0
Correlation
Gold (US$/oz) Index Index ex. 50bps
Source: Bloomberg Finance L.P., ICE Benchmark Administration, Solactive, World Gold Council
* Correlation computed using weekly returns between January 1, 2007 and June 30, 2016. Differences between the correlation of the Index and the Index ex. 50bps are relatively small and therefore may not be visible in the graph.
Gold based on the LBMA Gold Price PM, the Index on backtested data of the Solactive GLD® Long USD Gold Index. The inception date of the Index was July 20, 2016. US stocks are based on the S&P 500 Index, Global stocks on the MSCI ACWI Index, US bonds on the Bloomberg Barclays US Aggregate Index, US Treasuries on the Bloomberg Barclays US Treasury Index, Global bonds on the Bloomberg Barclays Global Bond Aggregate, and commodities are based on the S&P Goldman Sachs Commodity Index.
Pre-Inception Index Correlations shown above are based on back tested (hypothetical) data and are not a guarantee of past or future correlation. The correlations shown are not intended to represent the characteristics of any particular exchange traded product or security.
Actual characteristics during this time may have differed substantially from the back tested data presented as the data was calculated with the benefit of hindsight. Correlations shown above for Gold are actual and are as of the time period presented.
These results are based on simulated or hypothetical performance results that have certain inherent limitations. Unlike the results shown in an actual performance record, these results do not represent actual trading. Also, because these trades have not actually been executed, these results may haveunder-or over-compensated for the impact, if any, of certain market factors, such as lack of liquidity. Simulated or hypothetical trading programs in general are also subject to the fact that they are designed with the benefit of hindsight. No representation is being made that any account will or is likely to achieve profits or losses similar to these being shown.
This material shows information for indices. An index is unmanaged, is not subject to fees, and is not available for direct investment.
For Qualified Institutional Buyers and Institutional Accredited Investors Only.
All other dissemination is prohibited.IBG-21266 16
|
Implementing a Long Dollar and Long Gold Strategy with GLDW
For Qualified Institutional Buyers and Institutional Accredited Investors Only.
All other dissemination is prohibited.IBG-21266 17
|
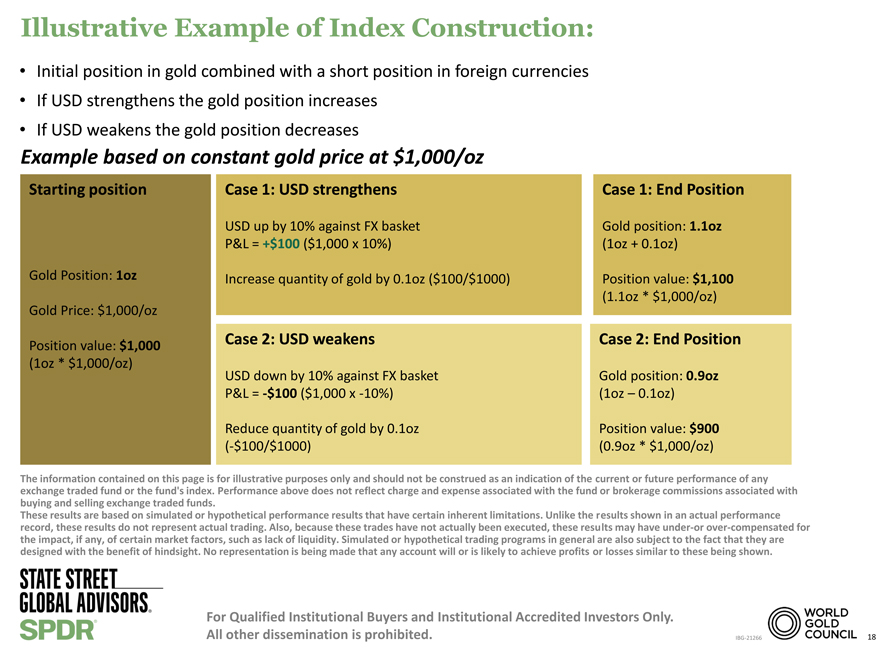
Illustrative Example of Index Construction:
• Initial position in gold combined with a short position in foreign currencies
• If USD strengthens the gold position increases
• If USD weakens the gold position decreases
Example based on constant gold price at $1,000/oz
Starting position Case 1: USD strengthens Case 1: End Position
USD up by 10% against FX basket Gold position: 1.1oz
P&L = +$100 ($1,000 x 10%) (1oz + 0.1oz)
Gold Position: 1oz Increase quantity of gold by 0.1oz ($100/$1000) Position value: $1,100
(1.1oz * $1,000/oz)
Gold Price: $1,000/oz
Position value: $1,000 Case 2: USD weakens Case 2: End Position
(1oz * $1,000/oz)
USD down by 10% against FX basket Gold position: 0.9oz
P&L = -$100 ($1,000 x-10%) (1oz – 0.1oz)
Reduce quantity of gold by 0.1oz Position value: $900
(-$100/$1000) (0.9oz * $1,000/oz)
The information contained on this page is for illustrative purposes only and should not be construed as an indication of the current or future performance of any
exchange traded fund or the fund’s index. Performance above does not reflect charge and expense associated with the fund or brokerage commissions associated with
buying and selling exchange traded funds.
These results are based on simulated or hypothetical performance results that have certain inherent limitations. Unlike the results shown in an actual performance
record, these results do not represent actual trading. Also, because these trades have not actually been executed, these results may haveunder-or over-compensated for
the impact, if any, of certain market factors, such as lack of liquidity. Simulated or hypothetical trading programs in general are also subject to the fact that they are
designed with the benefit of hindsight. No representation is being made that any account will or is likely to achieve profits or losses similar to these being shown.
For Qualified Institutional Buyers and Institutional Accredited Investors Only.
All other dissemination isprohibited. IBG-IBG-21266 18
|
Appendix A: Important Disclosures
For Qualified Institutional Buyers and Institutional Accredited Investors Only.
All other dissemination is prohibited.IBG-21266 19
|
Pre-Inception Index Performance Disclosures
HypotheticalPre-Inception Index Performance is not a guarantee of past or future results. The performance quoted is not intended to represent the performance of any particular exchange-traded fund security. Actual performance of any investment may have differed substantially from the back-tested performance presented, as the performance was calculated with the benefit of hindsight and
cannot account for all financial risk that may affect the actual performance. The performance includes the reinvestment of capital gains related to underlying gold holdings as well as income related to the back-tested Index’s currency exposure, if any. The performance is shown on agross-of-fee andnet-of-fee basis, as indicated above.Net-of-fee performance for the benchmark index takes into account GLDW’s gross expense ratio of 0.50%. Performance prior to the July 20, 2016 inception date of the index referenced herein is derived from actual data in accordance with the index calculation methodology which takes into account the LBMA Gold Price A.M. in reference to the gold component and utilizes the WMR
Fix Rate to measure the value of the USD relative to the “Reference Currencies” which takes into account the LBMA Gold Price A.M. and P.M. to determine the profit and loss of the currency portion.
During the time period presented in the back test, a portion took place during the global financial crisis of 2007–2009. Briefly, during that period, all asset classes became correlated, an event that may not be repeatable in the future.
State Street Global Markets LLC (marketing agent) provided no compensation for the Solactive GLD® Long USD Gold Index. However WGC USA Asset Management Company, LLC (Fund Sponsor) did provide compensation for the Solactive GLD® Long USD Gold Index back-tested return information.
The methodology of the Solactive GLD® Long USD Gold Index can be found here. Solactive GLD® Long USD Gold Index launch date was July 20, 2016.
For Qualified Institutional Buyers and Institutional Accredited Investors Only.
All other dissemination is prohibited.IBG-21266 20
|
Important Disclosures
We are not soliciting orders on the basis of this information. Such solicitations can only be made by a prospectus approved by the National Futures Association.
Investing involves risk, and you could lose money on an investment in the SPDR® Long Dollar Gold Trust (“GLDW”).
Commodities and commodity-index linked securities may be affected by changes in overall market movements, changes in interest rates, and other factors such as weather, disease, embargoes, or political and regulatory developments, as well as trading activity of speculators and arbitrageurs in the underlying commodities.
GLDW is subject to regulation under the Commodity Exchange Act of 1936 (the “CEA”). US regulation of swap agreements is rapidly changing and is subject to further regulatory developments which could be adverse to GLDW. GLDW’s swap agreements will be subject to counterparty risk and liquidity risk.
Currency exchange rates between the US dollar andnon-US currencies may fluctuate significantly over short periods of time and may cause the value of GLDW’s investments to decline.
GLDW is a passive investment vehicle that is designed to track the Index. GLDW’s performance may deviate from changes in the levels of its Index (i.e., create “tracking error” between GLDW and the Index) for a number of reasons, such as the fees and expenses of GLDW, which are not accounted for by the Index.
Frequent trading of ETFs could significantly increase commissions and other costs such that they may offset any savings from low fees or costs.
Diversification does not ensure a profit or guarantee against loss.
Investing in commodities entails significant risk and is not appropriate for all investors.
Important Information Relating to the SPDR® Long Dollar Gold Trust (“GLDW”):
The SPDR® Long Dollar Gold Trust (“GLDW”) has filed a registration statement (including a prospectus) with the Securities and Exchange Commission (“SEC”) and has also filed the prospectus with the National Futures Association, for the offering to which this communication relates. Before you invest, you should read the prospectus in that registration statement and other documents GLDW has filed with the SEC for more complete information about GLDW and this offering. You may get these documents for free by visiting EDGAR on the SEC website at sec.gov.
GLDW is not an investment company registered under the Investment Company Act of 1940 (the “1940 Act”). As a result, shareholders of the Trust do not have the protections associated with ownership of shares in an investment company registered under the 1940 Act.
GLDW shares trade like stocks, are subject to investment risk and will fluctuate in market value. The value of GLDW shares relates directly to the value of the gold held by GLDW (less its expenses) and the value of a basket comprising the euro, Japanese yen, British pound sterling, Canadian dollar, Swedish krona, and Swiss franc (“Reference Currencies”) against the US dollar. A decline in the price of gold and/or an increase in the value of the Reference Currencies comprising the FX basket against the US dollar could materially and adversely affect an investment in the shares. The price received upon the sale of the shares, which trade at market price, may be more or less than the value of the gold including the gold that GLDW receives or delivers to reflect how GLDW’s US dollar-denominated gold performed in terms of the basket of Reference
Currencies represented by them. GLDW does not generate any income, and as GLDW regularly sells gold to pay for its ongoing expenses, the amount of gold represented by each Share will decline over time to that extent. Investing involves risk, and you could lose money on an investment in GLDW.
For Qualified Institutional Buyers and Institutional Accredited Investors Only.
All other dissemination is prohibited.IBG-21266 21
|
Important Disclosures
Please see the GLDW prospectus for a detailed discussion of the risks of investing in GLDW shares. The GLDW prospectus is available by clicking here.
The World Gold Council name and logo are a registered trademark and used with the permission of the World Gold Council pursuant to a license agreement.
The World Gold Council in not responsible for the content of, and is not liable for the use of or reliance on, this material. World Gold Council is an affiliate
of GLDW’s Sponsor.
SPDR® is a registered trademark of Standard & Poor’s Financial Services LLC (“SPFS”) and has been sublicensed by S&P Dow Jones Indices LLC (“SPDJI” and together with
its affiliates and SPFS, “S&P”) for use by State Street Global Advisors. No financial product offered by State Street Global Advisors, a division of State Street Bank and Trust
Company, or its affiliates is sponsored, endorsed, sold or promoted by S&P. S&P makes no representation regarding the advisability of investing in such product(s) nor
does S&P have any liability in relation thereto.
Important Information Relating to Solactive GLD® Long USD Gold Index:
GLDW is not sponsored, promoted, sold or supported in any other manner by Solactive AG nor does Solactive AG offer any express or implicit guarantee or assurance
either with regard to the results of using the Index and/or Index trademark or the Index value at any time or in any other respect. The Index is calculated and published
by Solactive AG. Solactive AG uses its best efforts to ensure that the Index is calculated correctly. Irrespective of its obligations towards GLDW, Solactive AG has no
obligation to point out errors in the Index to third parties including but not limited to investors in and/or financial intermediaries transacting in or with GLDW. Neither
publication of the Index by Solactive AG nor the licensing of the Index or Index trademark for the purpose of use in connection with GLDW constitutes a recommendation
by Solactive AG to invest capital in GLDW nor does it in any way represent an assurance or opinion of Solactive AG with regard to any investment in GLDW.
For more information, please contact the Marketing Agent for GLDW: State Street Global Markets, LLC, One Lincoln Street, Boston, MA, 02111; T: +1 866 320 4053
spdrgoldshares.com
© 2016 State Street Corporation. All Rights Reserved.
State Street Global Advisors, One Lincoln Street, Boston, MA 02111.
Not FDIC Insured — No Bank Guarantee — May Lose Value.
Tracking Number:IBG-21266
Expiration Date: January 31, 2017
For Qualified Institutional Buyers and Institutional Accredited Investors Only.
All other dissemination isprohibited. IBG-21266 22