UNITED STATES
SECURITIES AND EXCHANGE COMMISSION
Washington, D.C. 20549
FORM N-CSR
CERTIFIED SHAREHOLDER REPORT OF REGISTERED MANAGEMENT INVESTMENT COMPANIES
Investment Company Act file number 811-23011
PENN CAPITAL FUNDS TRUST
(Exact name of registrant as specified in charter)
Navy Yard Corporate Center
1200 Intrepid Ave., Suite 400
Philadelphia, Pennsylvania 19112
(Address of principal executive offices) (Zip code)
Richard A. Hocker
Navy Yard Corporate Center
1200 Intrepid Ave., Suite 400
Philadelphia, Pennsylvania 19112
(Name and address of agent for service)
With copies to:
Lisa L.B. Matson, Esq.
Navy Yard Corporate Center
1200 Intrepid Ave., Suite 400
Philadelphia, Pennsylvania 19112
Michael P. O’Hare, Esq.
Stradley Ronon Stevens & Young, LLP
2005 Market Street, Suite 2600
Philadelphia, Pennsylvania 19103
(215) 302-1500
Registrant's telephone number, including area code
Date of fiscal year end: June 30, 2018
Date of reporting period: June 30, 2018
Item 1. Reports to Stockholders.
![]()
ANNUAL REPORT
JUNE 30, 2018
PENN CAPITAL MANAGED ALPHA SMID CAP EQUITY FUND
PENN CAPITAL SPECIAL SITUATIONS SMALL CAP EQUITY FUND
PENN CAPITAL MULTI-CREDIT HIGH INCOME FUND
PENN CAPITAL DEFENSIVE FLOATING RATE INCOME FUND
PENN CAPITAL DEFENSIVE SHORT DURATION HIGH INCOME FUND
PENN CAPITAL FUNDS TRUST
PRESIDENT’S LETTER TO SHAREHOLDERS (UNAUDITED)
Dear Penn Capital Funds Shareholder:
As we approach the three-year anniversary of launching the PENN Capital Funds Trust, I would like to thank our shareholders for entrusting their investments with our firm. Our team remains committed to focusing our efforts on our shareholders, and we value your confidence in our vision.
Our investment strategies incorporate Penn Capital’s Complete Capital Structure Analysis®, an in-depth high yield and equity research philosophy used to identify a company’s optimal capital structure. Our investment professionals are capital structure generalists, meaning they are responsible for understanding the entire capital structure of the companies they follow. By following this philosophy, we believe that integrating credit and equity research allows us to construct a more comprehensive investment mosaic. Participating in both credit and equity markets, along with this integrated research process, provides Penn Capital’s investment team with what we believe is an informational advantage. Finding inefficiencies in the market has never been more challenging, but we remain committed to the pursuit of strong investment returns on behalf of our shareholders.
The current Penn Capital fund line-up embodies our investment philosophy and our research-driven process. We are excited to note that this year’s annual report includes the most recent addition to our fund family: the Penn Capital Defensive Short Duration High Income Fund (the “Short Duration Fund”), which launched in July 2017 and which seeks to provide a high level of current income through primarily investing in fixed income securities and senior floating rate loans that are rated below investment grade.
Finally, I am excited to share with you recent ventures by Penn Capital to expand our philanthropic endeavors and support diversity in the financial services industry. Through a partnership with Invest in Girls, Penn Capital’s PRIME Program is sponsoring a three-year financial literacy and investing curriculum for female high school students attending a school in the Philadelphia School District. The PRIME Program is also pleased to announce the first year of the PRIME Internship, which will further expand our commitment to community outreach and promoting gender and racial diversity by offering a summer Internship to a collegiate female majoring in business or finance.
The following pages review the current market environment and provides additional insight into our funds over the past year. Once again, I would like to thank you for your confidence in investing with us.
Overview
Looking ahead, we anticipate nominal Gross Domestic Product (GDP) growth should benefit the cyclical sectors where our equity strategies tend to favor. Smaller, domestically-focused companies should, in our view, benefit disproportionately from the recently enacted US tax policy and are poised to outperform the global large-cap companies, which could be negatively impacted by evolving trade policies. We expect a moderation of spreads to continue in the latter half of 2018 as the US economy absorbs measured Federal Reserve (Fed) interest rate increases. We believe commodities will continue to rebound over the next year as we anticipate that the supply and demand for both oil and natural gas will come into balance. Most of our equity strategies continue to underweight the defensive-oriented areas of their respective benchmarks that generally offer low earnings growth with high dividend payouts such as the Utilities, Consumer Staples, and Real Estate sectors. These sectors are more influenced by rising interest rates because of their increased cost of capital without the offset of growth in their earnings power. We expect that rising rates will also make dividend yields less attractive since yields tend to rise on more traditional fixed income products.
With solid recovery in both the employment and housing fronts, we believe the US economy will accelerate from last year’s moderate growth. As a result, we continue to be overweight our respective benchmarks in the Consumer Discretionary sector and believe the US consumer stands to benefit from these trends.
During the last fiscal year, economic numbers continued to impress with the Fed raising interest rates three times during the period, in-line with expectations. After a period of GDP growth during the first half of the fiscal year, the stock market began to experience a bout of volatility in 2018 as the reality of potential US tariff conflicts emerged. The current White House Administration continues to raise expectations for fiscal policies with a focus on higher domestic growth rates despite recent news at fiscal year-end regarding potential US tariff wars. With this in mind, we continue to stress the importance of asset allocation in a potentially higher growth and interest rate environment. Typically, high yield and smaller cap equity asset classes are more influenced by economic growth than by rising interest rates. As a manager of both below investment grade debt and smaller (micro, small, and small to mid) cap equities, we believe our funds could benefit in an environment of expanding GDP growth and government spending.
Spreads have compressed modestly during the fiscal year and we are still forecasting coupon-like bond market returns in 2018. In a low-rate world, we believe mid-single digit returns with relatively less duration risk still represent attractive value relative
1
PENN CAPITAL FUNDS TRUST
PRESIDENT’S LETTER TO SHAREHOLDERS (UNAUDITED)
to most other fixed income asset classes due to a defensive nature. To the extent that long-term interest rates rise in a growing economy, we believe larger-cap dividend paying equities and longer duration fixed income asset classes, including investment-grade corporates, may underperform. We continue to favor the senior floating rate bank loan asset class, especially for more conservative investors. Although bank loan returns have generally lagged bonds, we believe they provide an effective complement to bonds, particularly given their seniority and floating rate nature.
The following paragraphs provide more detailed information on the performance of our funds, as well as selected holdings.
Penn Capital Defensive Floating Rate Income Fund
For the fiscal year ended June 30, 2018, the Penn Capital Defensive Floating Rate Income Fund (formerly the Penn Capital Senior Floating Rate Income Fund) (the “Floating Rate Income Fund”) generated a 3.71% return versus 4.19% for its benchmark, S&P/LSTA Leveraged BB/B Loan Index. The three-month LIBOR rate rose 100 basis points during the fiscal year, providing a tailwind for bank loans compared with other fixed income asset classes. The Floating Rate Income Fund is managed with a conservative bias, prioritizing safety of principal over maximizing yield. To carry out this objective, the Floating Rate Income Fund excludes CCC-rated bank loans or second lien loans; both areas of the market are exposed to a higher degree of volatility and potential investment losses. With bank loans outperforming bonds during the fiscal year, the Floating Rate Income Fund’s high yield allocation, nearly 12% of Fund assets, was a modest detractor from performance. The Floating Rate Income Fund holds conservative short duration high yield bonds in an effort to enhance the Fund’s liquidity, as opposed to seeking higher yields and adding additional risk.
The Floating Rate Income Fund’s investments in Healthcare, Materials, and Transportation sectors made positive contributions to performance. However, the Fund’s exposure to Financial and Media sectors detracted from performance. Top single name contributors were Windstream and GIII Apparel. As of fiscal year-end, the Floating Rate Income Fund maintained its allocation in the Windstream term loan and had exited GIII Apparel on valuation concerns. Top single name detractors included PetSmart and Save-A-Lot. Both names triggered our sell discipline threshold and were sold from the Fund as of fiscal year-end.
We continue to be very selective in credit selection reflecting our belief that we are in the mid-to-late stages of the current credit cycle, and as we focus on risk-adjusted, rather than absolute, returns.
Penn Capital Defensive Short Duration High Income Fund
For the period beginning July 17, 2017 (inception) through June 30, 2018, the Penn Capital Defensive Short Duration High Income Fund (the “Short Duration Fund”) generated a 1.03% return versus 1.64% for its benchmark, the ICE BofAML1-3 Year BB-Rated US Cash Pay High Yield Index.
The Short Duration Fund benefitted from security selection within the Metals & Mining and Technology sectors. Technology benefitted as several high coupon bonds were tendered for refinancing, including Allegheny Technologies, Cleveland-Cliffs, and Western Digital. The Fund maintained an underweight position in the sector compared to its benchmark, which further strengthened performance. Within Energy, the Short Duration Fund benefitted from its security selection within the Distribution segment of that sector from improved fundamentals at PBF Holding Company and NGPL PipeCo. An overweight position compared to its benchmark in the Exploration & Production segment saw rising oil prices that also helped to contribute to the Fund’s performance. Security selection within Utilities added value as Dynegy refinanced debt and was then acquired by Vistra, a higher quality company. Weakness within the Media & Telecommunications sector was the primary detractor for the fiscal year, mainly in the first quarter of 2018, including DISH Network, Frontier, Windstream, CenturyLink, and Sprint. However, this underperformance was partially offset by a benchmark overweight to the Aerospace & Defense sector.
During the fiscal year, LIBOR rose over 100 basis points and loan coupons began to rise. During the period, the Short Duration Fund held an average weighting of 10% in bank loans (through its investment in the Penn Capital Defensive Floating Rate Income Fund). The position contributed positively to the Short Duration Fund’s performance and was gradually increased throughout the period to end the fiscal year representing approximately 15% of the Fund’s assets.
We continue to believe that a complementary allocation to bank loans is prudent given today’s rising interest rate environment.
Penn Capital Multi-Credit High Income Fund
For the fiscal year ended June 30, 2018, the Penn Capital Multi-Credit High Income Fund (formerly the Penn Capital Opportunistic High Yield Fund) (the “High Income Fund”) generated a 3.81% return, outperforming the 2.52% return of its
2
PENN CAPITAL FUNDS TRUST
PRESIDENT’S LETTER TO SHAREHOLDERS (UNAUDITED)
benchmark, the ICE BofAML US High Yield Constrained Index. The High Income Fund increased its bank loan exposure to approximately 26% of its assets at period end, a shift that proved beneficial as loans outperformed bonds during the fiscal year. With LIBOR rising 100 basis points over the past year, we believe the bias towards floating rate bank loans will likely increase the Fund’s allocation within this segment of the market.
Over the last twelve (12) months, Transportation and Metals & Mining sectors were the largest positive contributors to performance as a combination of credit specific developments, strong industry fundamentals, and recovering commodity prices aided these sectors. The Fund also benefitted from strong security selection within Energy, specifically in the Exploration & Production segment of the market. The Fund’s investment in VistaJet, a private aviation company, benefitted from a large capital injection provided by a European private equity sponsor. News of this capitalization event relieved market uncertainty concerning their ability to address a 2020 bond maturity (as of fiscal year-end, the Fund maintained its holding in VistaJet bonds). The Fund also benefitted from an overweight investment position compared to its benchmark in Valeant Pharmaceuticals as those bonds outperformed due to a successful tender offer and refinancing transaction that allowed for additional operating capital. As of fiscal year-end, the Fund maintained this overweight position to the Valeant Pharmaceuticals complex. Financial Services and Telecommunication sectors contributed the greatest share of negative performance during the fiscal period. PetroQuest, a distressed natural gas producer, underwent an out-of-court restructuring detracted from performance as the Fund exited this position by the conclusion of the fiscal period. Performance was also negatively impacted by DISH Network, a satellite TV company. However, we believe this company controls a highly valuable strategic asset in its ownership of Spectrum, a cable service provider, and we retain our conviction in this investment.
Penn Capital Managed Alpha SMID Cap Equity Fund
For the fiscal year ended June 30, 2018, the Penn Capital Managed Alpha SMID Cap Equity Fund (formerly the Penn Capital Small/Mid Cap Equity Fund) (the “Managed Alpha SMID Fund”) generated a 17.41% return outperforming the 16.24% returns of its benchmark, the Russell 2500™ Index. At the sector level, Consumer Discretionary, Information Technology, and Industrials contributed positively to performance driven by favorable bottom-up stock selection. In the Consumer Discretionary sector, Roku, Inc., a streaming video player manufacturer, performed well as an increased number of users viewed more hours on Roku’s over-the-top platform. Building product companies also benefitted as a solid housing market lead to new home starts and increased investments in renovations. Within Technology, consumer focused software companies performed well as their user base expanded while increasing average revenue per user. In the Industrials sector, transportation stocks strengthened as freight pricing increased as new regulations pressured industry capacity.
The Healthcare, Materials, and Energy sectors hindered relative performance in the Managed Alpha SMID Fund. In Healthcare, Acadia Healthcare struggled to integrate their United Kingdom-based acquisition due to local market challenges. Pharmaceutical companies, such as Pacira Pharmaceuticals, struggled to realize pricing and procedure volume growth, while managed care companies focused on cost containment. Materials companies, such as Commercial Metals Company and Berry Global Group, suffered margin pressures as higher energy prices increased input costs, reduced margins, and required higher levels of working capital. Energy services companies experienced increased activity, but demand fell short in an effort to raise prices in line with expectations.
Penn Capital Special Situations Small Cap Equity Fund
For the fiscal year ended June 30, 2018 the Penn Capital Special Situations Small Cap Equity Fund (formerly the Penn Capital Small Cap Equity Fund) (the “Special Situations Fund”) generated a 20.31% return outperforming the 17.57% return of its benchmark, the Russell 2000® Index. At the sector level, Utilities, Real Estate and Financials contributed positively to performance driven by favorable bottom-up stock selection. In the Utilities space, Dynegy was acquired by Vistra Energy for a sizeable premium, which bested the Index by a considerable margin. Real Estate was the weakest sector in an otherwise strong environment, as the Fund’s overall underweight to the group compared to its benchmark was rewarded. Pebblebrook Hotel Trust is a lone position in the space and benefited from an uptick in corporate group and leisure travel. In Financials, higher rate expectations propelled the sector broadly with both banks and financial services firms benefitting. As a result, Hamilton Lane and PJT Partners experienced strong performance.
The Healthcare, Materials, and Energy sectors hindered relative performance during the period. In Healthcare, Acadia Healthcare struggled to integrate their United Kingdom- based acquisition due to local market challenges. Within the Healthcare sector, companies such as NuVasive, Inc. struggled to realize pricing and procedure volume growth as managed care companies focused on cost containment. In Materials, the Fund suffered margin pressures from Venator Materials and Cleveland-Cliffs, Inc.
3
PENN CAPITAL FUNDS TRUST
PRESIDENT’S LETTER TO SHAREHOLDERS (UNAUDITED)
as higher energy prices reduced margins and required higher levels of working capital. Energy services companies experienced increased activity, but demand fell short in an effort to raise prices in line with expectations. Despite the positive commodity backdrop, Sanchez Energy, an exploration and production company, struggled operationally with an acquired asset which offset the positive effects of higher oil prices.
Looking Forward
This report contains Fund performance data and financial information. Please keep in mind that all securities markets, as well as mutual fund prices, fluctuate in value. If you would like more frequent updates, http://www.penncapitalfunds.com provides daily NAV, monthly performance figures, portfolio holdings, and other valuable information. We encourage you to visit penncapitalfunds.com, through which you may access your account, buy and sell shares, and find other helpful tools.
At Penn Capital Funds, we believe that active management continues to serve as a critical element of investing in high yield debt securities and equity securities of smaller companies. Although challenges remain, and markets may continue to be uneven, we are confident that investors with a well-diversified portfolio and a patient, long-term outlook should be well positioned for the years ahead.
We thank you for investing with us and look forward to continuing to serve your investment needs.
Sincerely,

Richard A. Hocker
Chairman & President
PENN Capital Funds Trust
This letter reflects Penn Capital’s analysis and opinions as of the most recent fiscal year-end. The information is not a complete analysis of any market, country, industry, security, or fund and should not be considered as a recommendation to buy, sell or hold any specific security or securities.
All investments involve risk, including possible loss of principal, and there is no guarantee the Funds will achieve their investment objectives. Investments made in small and mid-capitalization companies may be more volatile and less liquid due to limited resources or product lines and more sensitive to economic factors. Investments in ETFs are subject to the same risks as the underlying securities in which the ETF invests as well as entails higher expenses than if invested into the underlying ETF directly. Investments in foreign securities and ADRs involve certain risks such as currency volatility, political and social instability and reduced market liquidity. As interest rates rise the value of bond prices will decline. Credit risk refers to the loss in the value of a security based on a default in the payment of principle and/or interest of the security, or the perception of the market of such default. High-yield bonds have a higher risk of default or other adverse credit events, but have the potential to pay higher earnings over investment grade bonds. The value of convertible securities tends to decline as interest rates rise and, because of the conversion feature, tends to vary with fluctuations in the market value of the underlying securities. Bank loans in which the Fund may invest have similar risks to below investment grade fixed income securities. In the event of the insolvency of an agent bank, a loan could be subject to settlement risk as well as the risk of interruptions in the administrative duties performed in the day to day administration of the loan.
Index Definitions
The ICE BofAML US High Yield Constrained Index contains all securities in the ICE BofAML US High Yield Index but caps issuer exposure at 2%.
The ICE BofAML 1-3 Year BB US Cash Pay High Yield Index is a subset of the ICE BofAML US Cash Pay High Yield Index, which tracks the performance of non-investment-grade corporate bonds with a remaining term to final maturity less than three years and rated BB.
4
PENN CAPITAL FUNDS TRUST
PRESIDENT’S LETTER TO SHAREHOLDERS (UNAUDITED)
The S&P/LSTA Leveraged BB/B Loan Index is a market value-weighted index designed to measure the performance of the US leveraged loan market and is comprised of loans whose rating is BB+, BB, BB-, B+, B or B-. Standard & Poor’s Rating Services is used to determine membership within this sub-index.
The Russell 2000® Index measures the performance of the small-cap segment of the U.S. equity universe. The Russell 2000 is a subset of the Russell 3000® Index representing approximately 10% of the total market capitalization of that index. It includes approximately 2000 of the smallest securities based on a combination of their market cap and current index membership. The Russell 2000 Index is constructed to provide a comprehensive and unbiased small-cap opportunity barometer and is completely reconstituted annually to ensure larger stocks do not distort the performance and characteristics of the true small-cap opportunity set.
The Russell 2500™ Index is composed of the bottom 500 stocks in the Russell 1000® Index and all the stocks in the Russell 2000® Index. The Russell 2500™ Index return reflect adjustments for income dividends and capital gains distributions reinvested as of the ex-dividend dates.
5
PENN CAPITAL MANAGED ALPHA SMID CAP EQUITY FUND
FUND SUMMARY (UNAUDITED)
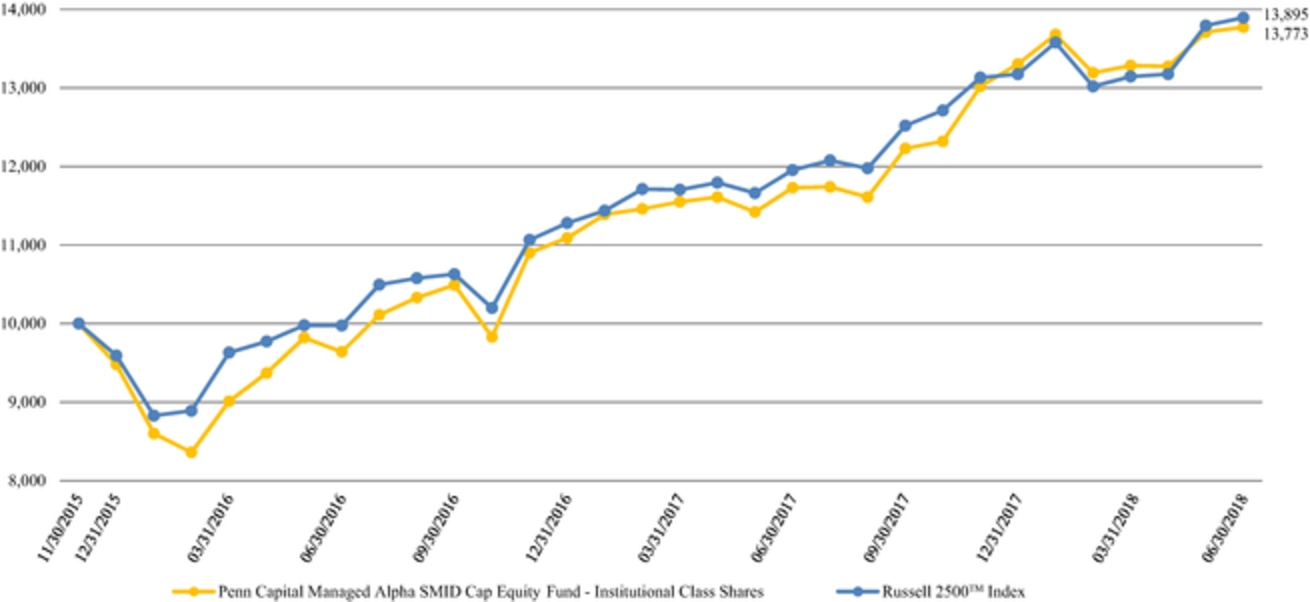
This chart assumes an initial gross investment of $10,000 made on December 1, 2015, inception of the Institutional Class shares. Returns shown in the chart and table include the reinvestment of all dividends, but do not reflect the deduction of taxes that a shareholder would pay on Fund distributions or the redemption of Fund shares. In the absence of fee waivers and reimbursements, when they are necessary to keep expenses at the expense cap, total return would be reduced. Past performance is not predictive of future performance. Investment return and principal value will fluctuate so that your shares, when redeemed, may be worth more or less than the original cost. Index returns do not reflect the effects of fees, transaction costs or expenses. It is not possible to invest directly in an index. No information is provided for Investor Class shares because shares of that class had not yet been issued as of June 30, 2018.
Average Annual Total Returns for the Year Ended June 30, 2018 | One Year | Since Inception(1) | ||||
Penn Capital Managed Alpha SMID Cap Equity Fund | ||||||
Institutional Class Shares | 17.41 | % | 13.19 | % | ||
Russell 2500™ Index | 16.24 | % | 13.58 | %(2) | ||
| (1) | Inception date is 12/1/15. |
| (2) | The return shown for the Russell 2500™ Index is from the inception date of the Institutional Class shares. |
6
PENN CAPITAL SPECIAL SITUATIONS SMALL CAP EQUITY FUND
FUND SUMMARY (UNAUDITED)
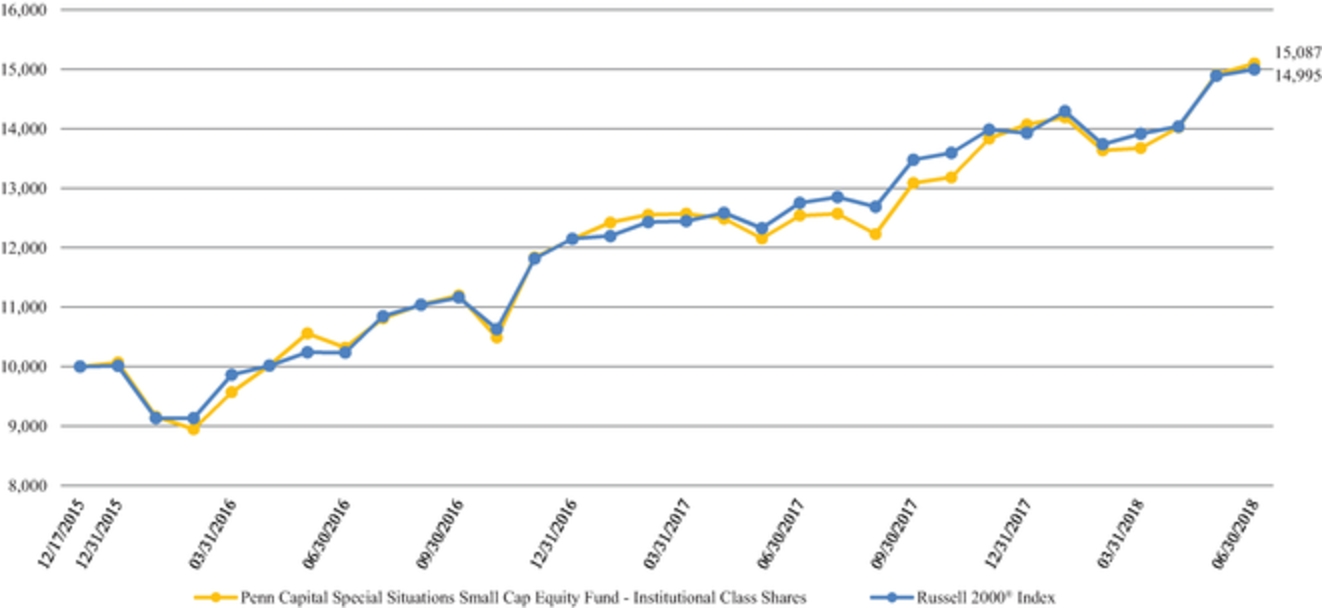
This chart assumes an initial gross investment of $10,000 made on December 18, 2015, inception of the Institutional Class shares. Returns shown in the chart and table include the reinvestment of all dividends, but do not reflect the deduction of taxes that a shareholder would pay on Fund distributions or the redemption of Fund shares. In the absence of fee waivers and reimbursements, when they are necessary to keep expenses at the expense cap, total return would be reduced. Past performance is not predictive of future performance. Investment return and principal value will fluctuate so that your shares, when redeemed, may be worth more or less than the original cost. Index returns do not reflect the effects of fees, transaction costs or expenses. It is not possible to invest directly in an index. No information is provided for Investor Class shares because shares of that class had not yet been issued as of June 30, 2018.
Average Annual Total Returns for the Year Ended June 30, 2018 | One Year | Since Inception(1) | ||||
Penn Capital Special Situations Small Cap Equity Fund | ||||||
Institutional Class Shares | 20.31 | % | 17.60 | % | ||
Russell 2000® Index | 17.57 | % | 17.31 | %(2) | ||
| (1) | Inception date is 12/18/15. |
| (2) | The return shown for the Russell 2000® Index is from the inception date of the Institutional Class shares. |
7
PENN CAPITAL MULTI-CREDIT HIGH INCOME FUND
FUND SUMMARY (UNAUDITED)

This chart assumes an initial gross investment of $10,000 made on December 1, 2015, inception of the Institutional Class shares. Returns shown in the chart and table include the reinvestment of all dividends, but do not reflect the deduction of taxes that a shareholder would pay on Fund distributions or the redemption of Fund shares. In the absence of fee waivers and reimbursements, when they are necessary to keep expenses at the expense cap, total return would be reduced. Past performance is not predictive of future performance. Investment return and principal value will fluctuate so that your shares, when redeemed, may be worth more or less than the original cost. Index returns do not reflect the effects of fees, transaction costs or expenses. It is not possible to invest directly in an index. No information is provided for Investor Class shares because shares of that class had not yet been issued as of June 30, 2018.
Average Annual Total Returns for the Year Ended June 30, 2018 | One Year | Since Inception(1) | ||||
Penn Capital Multi-Credit High Income Fund | ||||||
Institutional Class Shares | 3.81 | % | 7.59 | % | ||
ICE BofAML US High Yield Constrained Index | 2.52 | % | 8.38 | %(2) | ||
| (1) | Inception date is 12/1/15. |
| (2) | The return shown for the ICE BofAML US High Yield Constrained Index is from the inception date of the Institutional Class shares. |
8
PENN CAPITAL DEFENSIVE FLOATING RATE INCOME FUND
FUND SUMMARY (UNAUDITED)
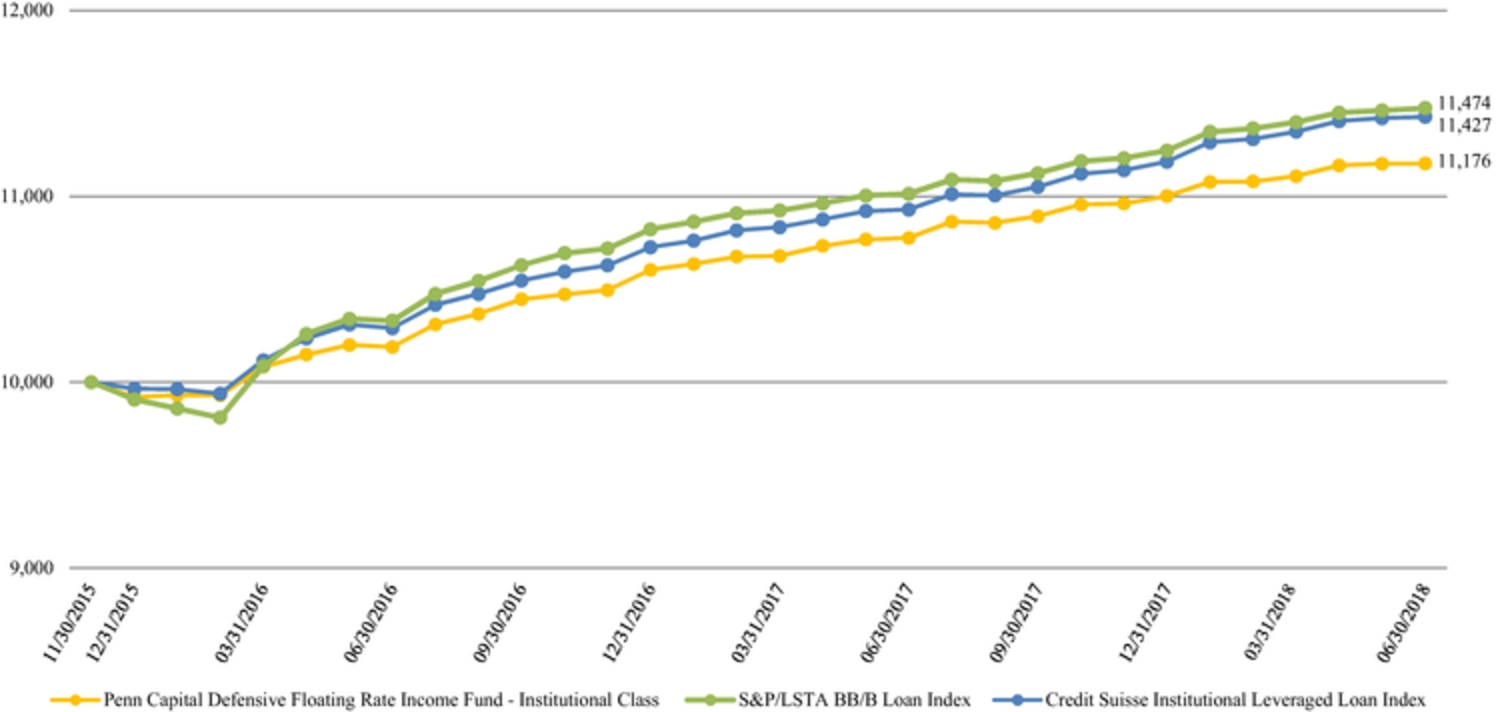
This chart assumes an initial gross investment of $10,000 made on December 1, 2015, inception of the Institutional Class shares. Returns shown in the chart and table include the reinvestment of all dividends, but do not reflect the deduction of taxes that a shareholder would pay on Fund distributions or the redemption of Fund shares. In the absence of fee waivers and reimbursements, when they are necessary to keep expenses at the expense cap, total return would be reduced. Past performance is not predictive of future performance. Investment return and principal value will fluctuate so that your shares, when redeemed, may be worth more or less than the original cost. Index returns do not reflect the effects of fees, transaction costs or expenses. It is not possible to invest directly in an index. No information is provided for Investor Class shares because shares of that class had not yet been issued as of June 30, 2018.
Average Annual Total Returns for the Year Ended June 30, 2018 | One Year | Since Inception(1) | ||||
Penn Capital Defensive Floating Rate Income Fund | ||||||
Institutional Class Shares | 3.71 | % | 4.40 | % | ||
S&P/LSTA BB/B Loan Index(2) | 4.19 | % | 5.47 | %(3) | ||
Credit Suisse Institutional Leveraged Loan Index | 4.56 | % | 5.31 | %(4) | ||
| (1) | Inception date is 12/1/15. |
| (2) | The S&P/LSTA BB/B Loan Index has replaced the Credit Suisse Institutional Leveraged Loan Index as the Fund’s primary benchmark. Penn Capital Management Company, Inc. believes that the new index is more appropriate given the Fund’s holdings. |
| (3) | The return shown for the S&P/LSTA BB/B Loan Index is from the inception date of the Institutional Class shares. |
| (4) | The return shown for the Credit Suisse Institutional Leveraged Loan Index is from the inception date of the Institutional Class shares. |
9
PENN CAPITAL DEFENSIVE SHORT DURATION HIGH INCOME FUND
FUND SUMMARY (UNAUDITED)
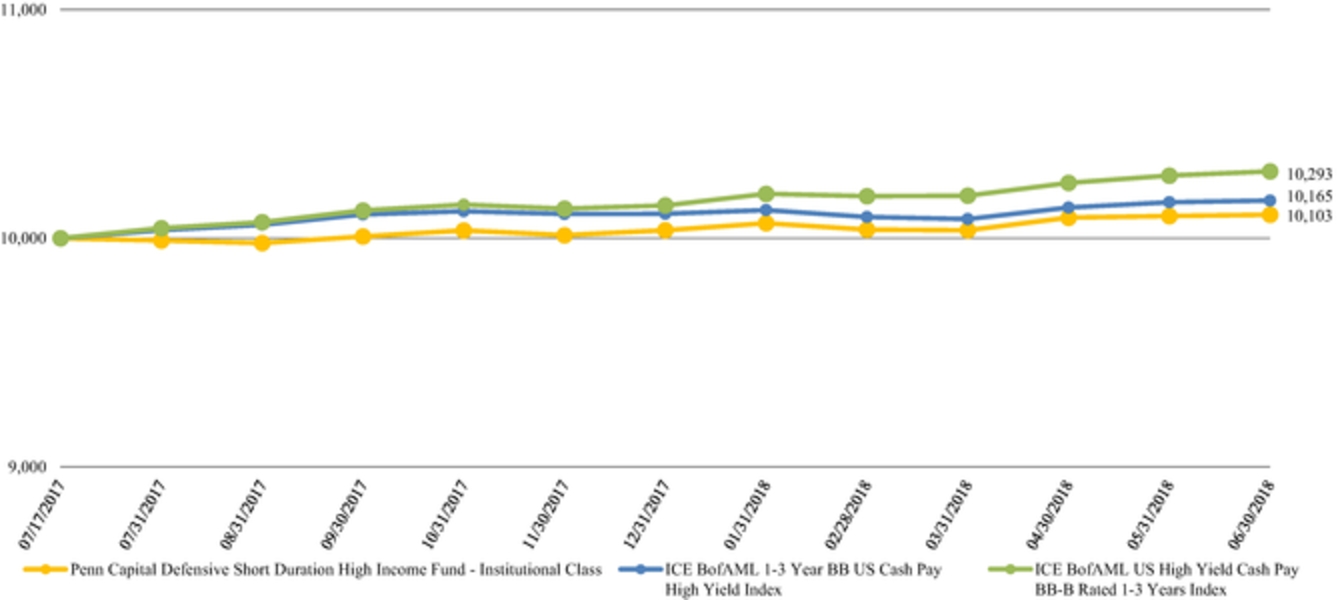
This chart assumes an initial gross investment of $10,000 made on July 17, 2017, inception of the Institutional Class shares. Returns shown in the chart and table include the reinvestment of all dividends, but do not reflect the deduction of taxes that a shareholder would pay on Fund distributions or the redemption of Fund shares. In the absence of fee waivers and reimbursements, when they are necessary to keep expenses at the expense cap, total return would be reduced. Past performance is not predictive of future performance. Investment return and principal value will fluctuate so that your shares, when redeemed, may be worth more or less than the original cost. Index returns do not reflect the effects of fees, transaction costs or expenses. It is not possible to invest directly in an index.
Total Returns for the Fiscal Period Ended June 30, 2018 | Since Inception(1) | ||
Penn Capital Defensive Short Duration High Income Fund | |||
Institutional Class Shares | 1.03 | % | |
ICE BofAML 1-3 Year BB US Cash Pay High Yield Index | 1.64 | %(2) | |
ICE BofAML US High Yield Cash Pay BB-B Rated 1-3 Years Index | 2.91 | %(3) | |
| (1) | Inception date is 7/17/17. |
| (2) | The return shown for the ICE BofAML 1-3 Year BB US Cash Pay High Yield Index is from the inception date of the Institutional Class shares. |
| (3) | The return shown for the ICE BofAML US High Yield Cash Pay BB-B Rated 1-3 Years Index is from the inception date of the Institutional Class shares. |
10
PENN CAPITAL FUNDS TRUST
DISCLOSURE OF FUND EXPENSES (UNAUDITED)
FOR THE SIX MONTH PERIOD FROM JANUARY 1, 2018 TO JUNE 30, 2018
Cost in Dollars of a $1,000 Investment in Penn Capital Managed Alpha SMID Cap Equity Fund (Unaudited)
The example below is intended to describe the fees and expenses borne by shareholders during the six-month period from January 1, 2018 to June 30, 2018, and the impact of those costs on your investment.
Example
As a shareholder of the Fund, you incur two types of costs: (1) transaction costs, including redemption fees on sales (as applicable) and (2) ongoing costs, including management fees, distribution and/or service (12b-1) fees, and other Fund expenses (as applicable). This example is intended to help you understand your ongoing costs (in dollars) of investing in the Fund and to compare these costs with the ongoing costs of investing in other mutual funds. The example is based on an investment of $1,000 made at the beginning of the six-month period and held for the entire period from January 1, 2018 to June 30, 2018.
This example illustrates your Fund’s ongoing costs in two ways:
Actual Expenses
The second and third data columns in the table below provide information about actual account values and actual expenses. You may use the information in these columns, together with the amount you invested, to estimate the expenses that you paid during the six months ended June 30, 2018. Simply divide your account value by $1,000 (for example, an $8,600 account value divided by $1,000 = 8.6), then multiply the result by the number under the heading entitled Expenses Paid During Period to estimate the expenses you paid on your account during this period.
Hypothetical Example for Comparison Purposes
The fourth and fifth data columns in the table below provide information about hypothetical account values and hypothetical expenses based on the Fund’s actual expense ratio and an assumed rate of return of 5% per year before expenses, which is not the Fund’s actual return. The hypothetical account values and expenses may not be used to estimate the actual ending account balances or expenses you paid for the six-month period shown. You may use this information to compare the ongoing costs of investing in the Fund with the ongoing costs of investing in other funds. To do so, compare this 5% hypothetical example with the 5% hypothetical examples that appear in the shareholder reports of the other funds.
Please note that the expenses shown in the table are meant to highlight your ongoing costs only and do not reflect any transactional costs, such as redemption fees. Therefore, the fourth and fifth data columns of the table are useful in comparing ongoing costs only and will not help you determine the relative total costs of owning different funds. In addition, if these transactional costs were included, your costs would have been higher.
Actual | Hypothetical | ||||||||||||||
Share Class1 | Beginning Account Value 1/1/18 | Ending Account Value (Based on Actual Returns and Expenses) 6/30/18 | Expenses Paid During Period2 | Ending Account Value (Based on Hypothetical 5% Annualized Return and Actual Expenses) 6/30/18 | Expenses Paid During Period2 | ||||||||||
Institutional Class Shares | $ | 1,000.00 | $ | 1,035.10 | $ | 5.35 | $ | 1,019.54 | $ | 5.31 | |||||
| 1. | No information is provided for Investor Class shares because shares of that class had not yet been issued as of June 30, 2018. |
| 2. | Expenses are equal to the Fund’s annualized expense ratio, net of waivers and excluding acquired fund fees and expenses if any (1.06% for the Institutional Class), multiplied by the average account value over the period, divided by 365 and multiplied by 181 for the Institutional Class (to reflect the six-month period). The table above represents the actual expenses incurred during the six-month period. |
11
PENN CAPITAL FUNDS TRUST
DISCLOSURE OF FUND EXPENSES (UNAUDITED)
FOR THE SIX MONTH PERIOD FROM JANUARY 1, 2018 TO JUNE 30, 2018
Cost in Dollars of a $1,000 Investment in Penn Capital Special Situations Small Cap Equity Fund (Unaudited)
The example below is intended to describe the fees and expenses borne by shareholders during the six-month period from January 1, 2018 to June 30, 2018, and the impact of those costs on your investment.
Example
As a shareholder of the Fund, you incur two types of costs: (1) transaction costs, including redemption fees on sales (as applicable) and (2) ongoing costs, including management fees, distribution and/or service (12b-1) fees, and other Fund expenses (as applicable). This example is intended to help you understand your ongoing costs (in dollars) of investing in the Fund and to compare these costs with the ongoing costs of investing in other mutual funds. The example is based on an investment of $1,000 made at the beginning of the six-month period and held for the entire period from January 1, 2018 to June 30, 2018.
This example illustrates your Fund’s ongoing costs in two ways:
Actual Expenses
The second and third data columns in the table below provide information about actual account values and actual expenses. You may use the information in these columns, together with the amount you invested, to estimate the expenses that you paid during the six months ended June 30, 2018. Simply divide your account value by $1,000 (for example, an $8,600 account value divided by $1,000 = 8.6), then multiply the result by the number under the heading entitled Expenses Paid During Period to estimate the expenses you paid on your account during this period.
Hypothetical Example for Comparison Purposes
The fourth and fifth data columns in the table below provide information about hypothetical account values and hypothetical expenses based on the Fund’s actual expense ratio and an assumed rate of return of 5% per year before expenses, which is not the Fund’s actual return. The hypothetical account values and expenses may not be used to estimate the actual ending account balances or expenses you paid for the six-month period shown. You may use this information to compare the ongoing costs of investing in the Fund with the ongoing costs of investing in other funds. To do so, compare this 5% hypothetical example with the 5% hypothetical examples that appear in the shareholder reports of the other funds.
Please note that the expenses shown in the table are meant to highlight your ongoing costs only and do not reflect any transactional costs, such as redemption fees. Therefore, the fourth and fifth data columns of the table are useful in comparing ongoing costs only and will not help you determine the relative total costs of owning different funds. In addition, if these transactional costs were included, your costs would have been higher.
Actual | Hypothetical | ||||||||||||||
Share Class1 | Beginning Account Value 1/1/18 | Ending Account Value (Based on Actual Returns and Expenses) 6/30/18 | Expenses Paid During Period2 | Ending Account Value (Based on Hypothetical 5% Annualized Return and Actual Expenses) 6/30/18 | Expenses Paid During Period2 | ||||||||||
Institutional Class Shares | $ | 1,000.00 | $ | 1,072.40 | $ | 5.60 | $ | 1,019.39 | $ | 5.46 | |||||
| 1. | No information is provided for Investor Class shares because shares of that class had not yet been issued as of June 30, 2018. |
| 2. | Expenses are equal to the Fund’s annualized expense ratio, net of waivers and excluding acquired fund fees and expenses if any (1.09% for the Institutional Class), multiplied by the average account value over the period, divided by 365 and multiplied by 181 for the Institutional Class (to reflect the six-month period). The table above represents the actual expenses incurred during the six-month period. |
12
PENN CAPITAL FUNDS TRUST
DISCLOSURE OF FUND EXPENSES (UNAUDITED)
FOR THE SIX MONTH PERIOD FROM JANUARY 1, 2018 TO JUNE 30, 2018
Cost in Dollars of a $1,000 Investment in Penn Capital Multi-Credit High Income Fund (Unaudited)
The example below is intended to describe the fees and expenses borne by shareholders during the six-month period from January 1, 2018 to June 30, 2018, and the impact of those costs on your investment.
Example
As a shareholder of the Fund, you incur two types of costs: (1) transaction costs, including redemption fees on sales (as applicable) and (2) ongoing costs, including management fees, distribution and/or service (12b-1) fees, and other Fund expenses (as applicable). This example is intended to help you understand your ongoing costs (in dollars) of investing in the Fund and to compare these costs with the ongoing costs of investing in other mutual funds. The example is based on an investment of $1,000 made at the beginning of the six-month period and held for the entire period from January 1, 2018 to June 30, 2018.
This example illustrates your Fund’s ongoing costs in two ways:
Actual Expenses
The second and third data columns in the table below provide information about actual account values and actual expenses. You may use the information in these columns, together with the amount you invested, to estimate the expenses that you paid during the six months ended June 30, 2018. Simply divide your account value by $1,000 (for example, an $8,600 account value divided by $1,000 = 8.6), then multiply the result by the number under the heading entitled Expenses Paid During Period to estimate the expenses you paid on your account during this period.
Hypothetical Example for Comparison Purposes
The fourth and fifth data columns in the table below provide information about hypothetical account values and hypothetical expenses based on the Fund’s actual expense ratio and an assumed rate of return of 5% per year before expenses, which is not the Fund’s actual return. The hypothetical account values and expenses may not be used to estimate the actual ending account balances or expenses you paid for the six-month period shown. You may use this information to compare the ongoing costs of investing in the Fund with the ongoing costs of investing in other funds. To do so, compare this 5% hypothetical example with the 5% hypothetical examples that appear in the shareholder reports of the other funds.
Please note that the expenses shown in the table are meant to highlight your ongoing costs only and do not reflect any transactional costs, such as redemption fees. Therefore, the fourth and fifth data columns of the table are useful in comparing ongoing costs only and will not help you determine the relative total costs of owning different funds. In addition, if these transactional costs were included, your costs would have been higher.
Actual | Hypothetical | ||||||||||||||
Share Class1 | Beginning Account Value 1/1/18 | Ending Account Value (Based on Actual Returns and Expenses) 6/30/18 | Expenses Paid During Period2 | Ending Account Value (Based on Hypothetical 5% Annualized Return and Actual Expenses) 6/30/18 | Expenses Paid During Period2 | ||||||||||
Institutional Class Shares | $ | 1,000.00 | $ | 1,010.50 | $ | 3.59 | $ | 1,021.22 | $ | 3.61 | |||||
| 1. | No information is provided for Investor Class shares because shares of that class had not yet been issued as of June 30, 2018. |
| 2. | Expenses are equal to the Fund’s annualized expense ratio, net of waivers and excluding acquired fund fees and expenses if any (0.72% for the Institutional Class), multiplied by the average account value over the period, divided by 365 and multiplied by 181 for the Institutional Class (to reflect the six-month period). The table above represents the actual expenses incurred during the six-month period. |
13
PENN CAPITAL FUNDS TRUST
DISCLOSURE OF FUND EXPENSES (UNAUDITED)
FOR THE SIX MONTH PERIOD FROM JANUARY 1, 2018 TO JUNE 30, 2018
Cost in Dollars of a $1,000 Investment in Penn Capital Defensive Floating Rate Income Fund (Unaudited)
The example below is intended to describe the fees and expenses borne by shareholders during the six-month period from January 1, 2018 to June 30, 2018, and the impact of those costs on your investment.
Example
As a shareholder of the Fund, you incur two types of costs: (1) transaction costs, including redemption fees on sales (as applicable) and (2) ongoing costs, including management fees, distribution and/or service (12b-1) fees, and other Fund expenses (as applicable). This example is intended to help you understand your ongoing costs (in dollars) of investing in the Fund and to compare these costs with the ongoing costs of investing in other mutual funds. The example is based on an investment of $1,000 made at the beginning of the six-month period and held for the entire period from January 1, 2018 to June 30, 2018.
This example illustrates your Fund’s ongoing costs in two ways:
Actual Expenses
The second and third data columns in the table below provide information about actual account values and actual expenses. You may use the information in these columns, together with the amount you invested, to estimate the expenses that you paid during the six months ended June 30, 2018. Simply divide your account value by $1,000 (for example, an $8,600 account value divided by $1,000 = 8.6), then multiply the result by the number under the heading entitled Expenses Paid During Period to estimate the expenses you paid on your account during this period.
Hypothetical Example for Comparison Purposes
The fourth and fifth data columns in the table below provide information about hypothetical account values and hypothetical expenses based on the Fund’s actual expense ratio and an assumed rate of return of 5% per year before expenses, which is not the Fund’s actual return. The hypothetical account values and expenses may not be used to estimate the actual ending account balances or expenses you paid for the six-month period shown. You may use this information to compare the ongoing costs of investing in the Fund with the ongoing costs of investing in other funds. To do so, compare this 5% hypothetical example with the 5% hypothetical examples that appear in the shareholder reports of the other funds.
Please note that the expenses shown in the table are meant to highlight your ongoing costs only and do not reflect any transactional costs, such as redemption fees. Therefore, the fourth and fifth data columns of the table are useful in comparing ongoing costs only and will not help you determine the relative total costs of owning different funds. In addition, if these transactional costs were included, your costs would have been higher.
Actual | Hypothetical | ||||||||||||||
Share Class1 | Beginning Account Value 1/1/18 | Ending Account Value (Based on Actual Returns and Expenses) 6/30/18 | Expenses Paid During Period2 | Ending Account Value (Based on Hypothetical 5% Annualized Return and Actual Expenses) 6/30/18 | Expenses Paid During Period2 | ||||||||||
Institutional Class Shares | $ | 1,000.00 | $ | 1,015.80 | $ | 3.20 | $ | 1,021.62 | $ | 3.21 | |||||
| 1. | No information is provided for Investor Class shares because shares of that class had not yet been issued as of June 30, 2018. |
| 2. | Expenses are equal to the Fund’s annualized expense ratio, net of waivers and excluding acquired fund fees and expenses if any (0.64% for the Institutional Class), multiplied by the average account value over the period, divided by 365 and multiplied by 181 for the Institutional Class (to reflect the six-month period). The table above represents the actual expenses incurred during the six-month period. |
14
PENN CAPITAL FUNDS TRUST
DISCLOSURE OF FUND EXPENSES (UNAUDITED)
FOR THE PERIOD FROM JANUARY 1, 2018 TO JUNE 30, 2018
Cost in Dollars of a $1,000 Investment in Penn Capital Defensive Short Duration High Income Fund (Unaudited)
The example below is intended to describe the fees and expenses borne by shareholders during the six-month period from January 1, 2018 to June 30, 2018, and the impact of those costs on your investment.
Example
As a shareholder of the Fund, you incur two types of costs: (1) transaction costs, including redemption fees on sales (as applicable) and (2) ongoing costs, including management fees, distribution and/or service (12b-1) fees, and other Fund expenses (as applicable). This example is intended to help you understand your ongoing costs (in dollars) of investing in the Fund and to compare these costs with the ongoing costs of investing in other mutual funds. The example is based on an investment of $1,000 made at the beginning of the six-month period and held for the entire period from January 1, 2018 to June 30, 2018.
This example illustrates your Fund’s ongoing costs in two ways:
Actual Expenses
The second and third data columns in the table below provide information about actual account values and actual expenses. You may use the information in these columns, together with the amount you invested, to estimate the expenses that you paid during the period ended June 30, 2018. Simply divide your account value by $1,000 (for example, an $8,600 account value divided by $1,000 = 8.6), then multiply the result by the number under the heading entitled Expenses Paid During Period to estimate the expenses you paid on your account during this period.
Hypothetical Example for Comparison Purposes
The fourth and fifth data columns in the table below provide information about hypothetical account values and hypothetical expenses based on the Fund’s actual expense ratio and an assumed rate of return of 5% per year before expenses, which is not the Fund’s actual return. The hypothetical account values and expenses may not be used to estimate the actual ending account balances or expenses you paid for the six-month period shown. You may use this information to compare the ongoing costs of investing in the Fund with the ongoing costs of investing in other funds. To do so, compare this 5% hypothetical example with the 5% hypothetical examples that appear in the shareholder reports of the other funds.
Please note that the expenses shown in the table are meant to highlight your ongoing costs only and do not reflect any transactional costs, such as redemption fees. Therefore, the fourth and fifth data columns of the table are useful in comparing ongoing costs only and will not help you determine the relative total costs of owning different funds. In addition, if these transactional costs were included, your costs would have been higher.
Actual | Hypothetical | ||||||||||||||
Share Class | Beginning Account Value 1/1/18 | Ending Account Value (Based on Actual Returns and Expenses) 6/30/18 | Expenses Paid During Period1 | Ending Account Value (Based on Hypothetical 5% Annualized Return and Actual Expenses) 6/30/18 | Expenses Paid During Period1 | ||||||||||
Institutional Class Shares2 | $ | 1,000.00 | $ | 1,006.80 | $ | 2.69 | $ | 1,022.12 | $ | 2.71 | |||||
| 1. | No information is provided for Investor Class shares because shares of that class had not yet been issued as of June 30, 2018. |
| 2. | Expenses are equal to the Fund’s annualized expense ratio, net of waivers and excluding acquired fund fees and expenses if any (0.54% for the Institutional Class), multiplied by the average account value over the period, divided by 365 and multiplied by 181 for the Institutional Class (to reflect the six-month period). The table above represents the actual expenses incurred during the six-month period. |
15
PENN CAPITAL FUNDS TRUST |
PENN CAPITAL MANAGED ALPHA SMID CAP EQUITY FUND |
SCHEDULE OF INVESTMENTS |
JUNE 30, 2018 |
Shares | Value | |||||
Common Stocks: 91.6% | ||||||
Air Freight & Logistics: 1.3% | ||||||
XPO Logistics, Inc. (a) | 2,011 | $ | 201,462 | |||
Banks: 9.6% | ||||||
BOK Financial Corp. | 2,635 | 247,716 | ||||
Chemical Financial Corp. | 4,167 | 231,977 | ||||
Pinnacle Financial Partners, Inc. | 3,186 | 195,461 | ||||
Sterling Bancorp | 10,243 | 240,711 | ||||
Webster Financial Corp. | 4,413 | 281,108 | ||||
Western Alliance Bancorp (a) | 4,105 | 232,384 | ||||
1,429,357 | ||||||
Biotechnology: 2.8% | ||||||
Exelixis, Inc. (a) | 8,382 | 180,381 | ||||
Ironwood Pharmaceuticals, Inc. (a) | 12,361 | 236,342 | ||||
416,723 | ||||||
Building Products: 1.3% | ||||||
Allegion PLC | 2,480 | 191,853 | ||||
Capital Markets: 1.4% | ||||||
Affiliated Managers Group, Inc. | 1,415 | 210,368 | ||||
Chemicals: 2.5% | ||||||
HB Fuller Co. | 4,146 | 222,557 | ||||
Valvoline, Inc. | 6,995 | 150,882 | ||||
373,439 | ||||||
Commercial Services & Supplies: 1.8% | ||||||
KAR Auction Services, Inc. | 4,800 | 263,040 | ||||
Construction Materials: 1.4% | ||||||
Summit Materials, Inc. - Class A (a) | 7,806 | 204,907 | ||||
Consumer Finance: 1.3% | ||||||
SLM Corp. (a) | 17,400 | 199,230 | ||||
Containers & Packaging: 1.2% | ||||||
Berry Global Group, Inc. (a) | 3,745 | 172,045 | ||||
Diversified Financial Services: 3.2% | ||||||
FNF Group | 5,482 | 206,233 | ||||
Voya Financial, Inc. | 5,713 | 268,511 | ||||
474,744 | ||||||
Electronic Equipment, Instruments & Components: 1.1% | ||||||
Mercury Systems, Inc. (a) | 4,398 | 167,388 | ||||
Energy Equipment & Services: 0.7% | ||||||
FTS International, Inc. (a) | 7,722 | 109,961 | ||||
Health Care Equipment & Supplies: 4.6% | ||||||
ICU Medical, Inc. (a) | 913 | 268,102 | ||||
Teleflex, Inc. | 784 | 210,277 | ||||
Wright Medical Group NV (a) | 7,965 | 206,771 | ||||
685,150 | ||||||
Health Care Providers & Services: 2.9% | ||||||
LHC Group, Inc. (a) | 1,437 | 122,993 | ||||
WellCare Health Plans, Inc. (a) | 1,234 | 303,860 | ||||
426,853 | ||||||
Shares | Value | |||||
Hotels, Restaurants & Leisure: 5.1% | ||||||
Boyd Gaming Corp. | 7,160 | 248,166 | ||||
Red Rock Resorts, Inc. - Class A | 7,392 | 247,632 | ||||
Vail Resorts, Inc. | 983 | 269,529 | ||||
765,327 | ||||||
Household Durables: 2.0% | ||||||
Roku, Inc. (a) | 3,573 | 152,281 | ||||
TopBuild Corp. (a) | 1,811 | 141,874 | ||||
294,155 | ||||||
Independent Power and Renewable Electricity Producers: 1.5% | ||||||
Ormat Technologies, Inc. | 4,150 | 220,739 | ||||
Insurance: 1.8% | ||||||
Arch Capital Group Ltd. (a) | 9,936 | 262,907 | ||||
Internet Software & Services: 6.4% | ||||||
Five9, Inc. (a) | 3,419 | 118,195 | ||||
GoDaddy, Inc. - Class A (a) | 4,519 | 319,041 | ||||
IAC/InterActiveCorp (a) | 1,284 | 195,797 | ||||
Match Group, Inc. (a) | 3,030 | 117,382 | ||||
MongoDB, Inc. (a) | 4,005 | 198,768 | ||||
949,183 | ||||||
IT Services: 1.6% | ||||||
Black Knight, Inc. (a) | 4,591 | 245,848 | ||||
Machinery: 2.9% | ||||||
Allison Transmission Holdings, Inc. | 4,407 | 178,439 | ||||
Oshkosh Corp. | 3,666 | 257,793 | ||||
436,232 | ||||||
Media: 5.4% | ||||||
Gray Television, Inc. (a) | 13,060 | 206,348 | ||||
Live Nation Entertainment, Inc. (a) | 6,252 | 303,660 | ||||
Nexstar Media Group, Inc. - Class A | 3,927 | 288,242 | ||||
798,250 | ||||||
Metals & Mining: 0.9% | ||||||
Commercial Metals Co. | 6,066 | 128,053 | ||||
Multiline Retail: 1.8% | ||||||
Burlington Stores, Inc. (a) | 1,784 | 268,546 | ||||
Oil, Gas & Consumable Fuels: 4.5% | ||||||
Arch Coal, Inc. - Class A | 1,262 | 98,979 | ||||
Cabot Oil & Gas Corp. | 7,796 | 185,545 | ||||
Callon Petroleum Co. (a) | 17,605 | 189,078 | ||||
Cimarex Energy Co. | 2,012 | 204,701 | ||||
678,303 | ||||||
Pharmaceuticals: 1.1% | ||||||
Pacira Pharmaceuticals, Inc. (a) | 5,088 | 163,070 | ||||
Professional Services: 2.4% | ||||||
TransUnion | 5,105 | 365,722 | ||||
Road & Rail: 1.7% | ||||||
Schneider National, Inc. - Class B | 9,165 | 252,129 | ||||
The Accompanying Notes are an Integral Part of these Financial Statements.
16
PENN CAPITAL FUNDS TRUST |
PENN CAPITAL MANAGED ALPHA SMID CAP EQUITY FUND |
SCHEDULE OF INVESTMENTS |
JUNE 30, 2018 |
Shares | Value | |||||
Semiconductors & Semiconductor Equipment: 5.4% | ||||||
Cavium, Inc. (a) | 1,873 | 162,015 | ||||
Semtech Corp. (a) | 2,726 | 128,258 | ||||
Silicon Laboratories, Inc. (a) | 2,559 | 254,876 | ||||
Teradyne, Inc. | 6,942 | 264,282 | ||||
809,431 | ||||||
Software: 3.0% | ||||||
Nice Ltd. - ADR (a) | 2,093 | 217,191 | ||||
Tyler Technologies, Inc. (a) | 1,031 | 228,985 | ||||
446,176 | ||||||
Specialty Retail: 2.8% | ||||||
Camping World Holdings, Inc. - Class A | 6,683 | 166,941 | ||||
Floor & Decor Holdings, Inc. - Class A (a) | 5,104 | 251,780 | ||||
TravelCenters of America LLC (a) | - | 2 | ||||
418,723 | ||||||
Trading Companies & Distributors: 2.9% | ||||||
United Rentals, Inc. (a) | 1,788 | 263,945 | ||||
WESCO International, Inc. (a) | 2,894 | 165,247 | ||||
429,192 | ||||||
Water Utilities: 1.3% | ||||||
Aqua America, Inc. | 5,461 | 192,118 | ||||
Total Common Stocks (cost $11,369,380) | 13,650,624 | |||||
Real Estate Investment Trusts (REITs): 6.3% | ||||||
CyrusOne, Inc. | 4,457 | 260,110 | ||||
Invitation Homes, Inc. | 10,262 | 236,642 | ||||
MGM Growth Properties LLC - Class A | 8,146 | 248,127 | ||||
The GEO Group, Inc. | 7,063 | 194,515 | ||||
Total REITS (cost $862,609) | 939,394 | |||||
Short-Term Investment: 2.4% | ||||||
Short-Term Investment Trust Treasury Portfolio Institutional Class, 1.750% (b) | 362,429 | 362,429 | ||||
Total Short-Term Investment (cost $362,429) | 362,429 | |||||
Total Investments - 100.3% (cost $12,594,418) | 14,952,447 | |||||
Liabilities in Excess of Other Assets (0.3)% | (42,264 | ) | ||||
Net Assets: 100.0% | $ | 14,910,183 | ||||
Percentages are stated as a percent of net assets.
| (a) | No distribution or dividend was made during the year ending June 30, 2018. As such, it is classified as a non-income producing security as of June 30, 2018. |
| (b) | Rate reported is the 7-day effective yield as of June 30, 2018. |
Country Exposure (as a percentage of total investments) (Unaudited) | |||
United States | 94.13 | % | |
Bermuda | 1.76 | % | |
Israel | 1.45 | % | |
Netherlands | 1.38 | % | |
Ireland | 1.28 | % | |
Sector Allocation (as a percentage of total investments) (Unaudited) |
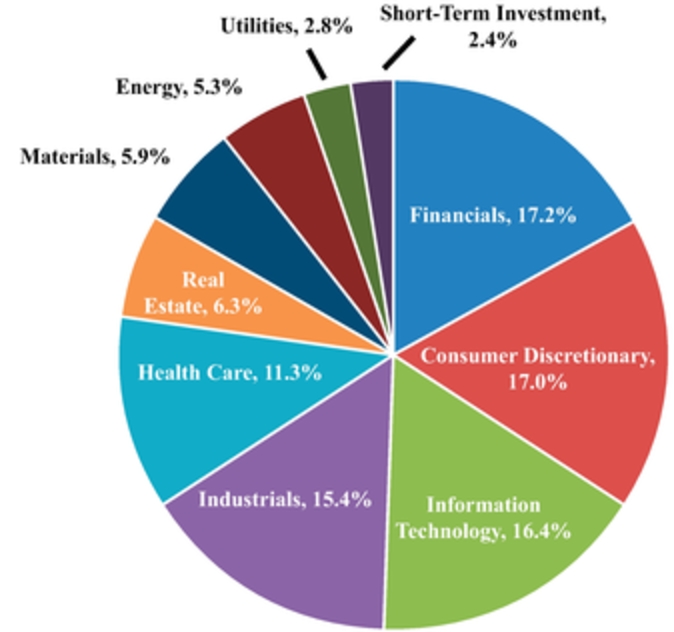
The industry classifications presented in this report, present the Global Industry Classification Standard (GICS®). GICS® was developed by and/or is the exclusive property of MSCI, Inc. and Standard & Poor Financial Services LLC (“S&P”). GICS® is a service mark of MSCI and S&P and has been licensed for use by U.S. Bancorp Fund Services, LLC.
The Accompanying Notes are an Integral Part of these Financial Statements.
17
PENN CAPITAL FUNDS TRUST |
PENN CAPITAL SPECIAL SITUATIONS SMALL CAP EQUITY FUND |
SCHEDULE OF INVESTMENTS |
JUNE 30, 2018 |
Shares | Value | |||||
Common Stocks: 97.9% | ||||||
Auto Components: 1.4% | ||||||
Modine Manufacturing Co. (a) | 15,907 | $ | 290,303 | |||
Banks: 10.6% | ||||||
Banc of California, Inc. | 14,583 | 285,098 | ||||
Chemical Financial Corp. | 5,041 | 280,632 | ||||
FB Financial Corp. | 9,392 | 382,442 | ||||
Sterling Bancorp | 15,392 | 361,712 | ||||
Texas Capital Bancshares, Inc. (a) | 4,169 | 381,463 | ||||
Webster Financial Corp. | 3,865 | 246,201 | ||||
Western Alliance Bancorp (a) | 5,790 | 327,772 | ||||
2,265,320 | ||||||
Biotechnology: 1.6% | ||||||
Ironwood Pharmaceuticals, Inc. (a) | 18,227 | 348,500 | ||||
Capital Markets: 2.6% | ||||||
Hamilton Lane, Inc. - Class A | 5,943 | 285,086 | ||||
PJT Partners, Inc. - Class A | 5,002 | 267,057 | ||||
552,143 | ||||||
Chemicals: 1.2% | ||||||
Venator Materials PLC (a) | 16,126 | 263,821 | ||||
Construction & Engineering: 1.5% | ||||||
MasTec, Inc. (a) | 6,193 | 314,295 | ||||
Diversified Consumer Services: 1.3% | ||||||
Chegg, Inc. (a) | 9,532 | 264,894 | ||||
Electronic Equipment, Instruments & Components: 1.2% | ||||||
Mercury Systems, Inc. (a) | 6,818 | 259,493 | ||||
Energy Equipment & Services: 5.6% | ||||||
C&J Energy Services, Inc. (a) | 6,299 | 148,657 | ||||
Keane Group, Inc. (a) | 21,303 | 291,212 | ||||
Mammoth Energy Services, Inc. (a) | 12,365 | 419,915 | ||||
Noble Corp. PLC (a) | 52,303 | 331,078 | ||||
1,190,862 | ||||||
Food & Staples Retailing: 0.6% | ||||||
BJ’s Wholesale Club Holdings, Inc. (a) | 5,190 | 122,744 | ||||
Health Care Equipment & Supplies: 6.0% | ||||||
ICU Medical, Inc. (a) | 1,316 | 386,443 | ||||
K2M Group Holdings, Inc. (a) | 13,628 | 306,630 | ||||
LivaNova PLC (a) | 2,989 | 298,362 | ||||
Wright Medical Group NV (a) | 11,335 | 294,257 | ||||
1,285,692 | ||||||
Health Care Providers & Services: 3.7% | ||||||
LHC Group, Inc. (a) | 3,243 | 277,568 | ||||
R1 RCM, Inc. (a) | 25,633 | 222,495 | ||||
WellCare Health Plans, Inc. (a) | 1,193 | 293,764 | ||||
793,827 | ||||||
Health Care Technology: 1.3% | ||||||
Omnicell, Inc. (a) | 5,212 | 273,369 | ||||
Shares | Value | |||||
Hotels, Restaurants & Leisure: 9.8% | ||||||
Extended Stay America, Inc. | 6,874 | 148,547 | ||||
Full House Resorts, Inc. (a) | 64,588 | 215,078 | ||||
Golden Entertainment, Inc. (a) | 6,077 | 164,018 | ||||
Penn National Gaming, Inc. (a) | 11,441 | 384,303 | ||||
Planet Fitness, Inc. - Class A (a) | 5,362 | 235,606 | ||||
Red Rock Resorts, Inc. - Class A | 10,345 | 346,558 | ||||
Scientific Games Corp. (a) | 6,271 | 308,220 | ||||
SeaWorld Entertainment, Inc. (a) | 12,715 | 277,441 | ||||
2,079,771 | ||||||
Household Durables: 1.4% | ||||||
TopBuild Corp. (a) | 3,767 | 295,107 | ||||
Internet Software & Services: 8.3% | ||||||
Carbonite, Inc. (a) | 7,370 | 257,213 | ||||
Five9, Inc. (a) | 6,034 | 208,595 | ||||
Gogo, Inc. (a) | 29,194 | 141,883 | ||||
Hortonworks, Inc. (a) | 16,983 | 309,430 | ||||
Instructure, Inc. (a) | 5,948 | 253,088 | ||||
Mimecast Ltd. (a) | 5,129 | 211,366 | ||||
MINDBODY, Inc. (a) - Class A | 3,748 | 144,673 | ||||
Q2 Holdings, Inc. (a) | 4,305 | 245,600 | ||||
1,771,848 | ||||||
IT Services: 2.6% | ||||||
Everi Holdings, Inc. (a) | 35,534 | 255,845 | ||||
InterXion Holding NV (a) | 4,839 | 302,050 | ||||
557,895 | ||||||
Machinery: 3.9% | ||||||
Astec Industries, Inc. | 5,732 | 342,774 | ||||
Milacron Holdings Corp. (a) | 13,140 | 248,740 | ||||
Woodward, Inc. | 2,953 | 226,967 | ||||
818,481 | ||||||
Media: 8.7% | ||||||
AMC Entertainment Holdings, Inc. - Class A | 17,384 | 276,405 | ||||
The E. W. Scripps Co. - Class A | 15,877 | 212,593 | ||||
Gray Television, Inc. (a) | 37,977 | 600,037 | ||||
Nexstar Media Group, Inc. - Class A | 5,344 | 392,250 | ||||
Sinclair Broadcast Group, Inc. - Class A | 11,273 | 362,427 | ||||
1,843,712 | ||||||
Metals & Mining: 0.9% | ||||||
Cleveland-Cliffs, Inc. (a) | 23,490 | 198,021 | ||||
Oil, Gas & Consumable Fuels: 5.9% | ||||||
Enerplus Corp. | 24,851 | 313,123 | ||||
Resolute Energy Corp. (a) | 9,670 | 301,704 | ||||
Sanchez Energy Corp. (a) | 29,537 | 133,507 | ||||
Whiting Petroleum Corp. (a) | 5,238 | 276,147 | ||||
WPX Energy, Inc. (a) | 12,946 | 233,417 | ||||
1,257,898 | ||||||
The Accompanying Notes are an Integral Part of these Financial Statements.
18
PENN CAPITAL FUNDS TRUST |
PENN CAPITAL SPECIAL SITUATIONS SMALL CAP EQUITY FUND |
SCHEDULE OF INVESTMENTS |
JUNE 30, 2018 |
Shares | Value | |||||
Pharmaceuticals: 1.0% | ||||||
Pacira Pharmaceuticals, Inc. (a) | 6,854 | 219,671 | ||||
Road & Rail: 2.2% | ||||||
Marten Transport Ltd. | 6,810 | 159,695 | ||||
Schneider National, Inc. - Class B | 10,999 | 302,582 | ||||
462,277 | ||||||
Semiconductors & Semiconductor Equipment: 2.6% | ||||||
Semtech Corp. (a) | 7,019 | 330,244 | ||||
Versum Materials, Inc. | 6,088 | 226,169 | ||||
556,413 | ||||||
Software: 3.2% | ||||||
Nice Ltd. - ADR (a) | 2,693 | 279,453 | ||||
Tyler Technologies, Inc. (a) | 816 | 181,233 | ||||
Zynga, Inc. - Class A (a) | 51,589 | 209,967 | ||||
670,653 | ||||||
Specialty Retail: 2.0% | ||||||
Camping World Holdings, Inc. - Class A | 8,488 | 212,030 | ||||
Five Below, Inc. (a) | 2,250 | 219,848 | ||||
431,878 | ||||||
Textiles, Apparel & Luxury Goods: 1.5% | ||||||
G-III Apparel Group Ltd. (a) | 7,297 | 323,987 | ||||
Thrifts & Mortgage Finance: 1.5% | ||||||
WSFS Financial Corp. | 6,117 | 326,036 | ||||
Trading Companies & Distributors: 3.8% | ||||||
Beacon Roofing Supply, Inc. (a) | 8,230 | 350,763 | ||||
DXP Enterprises, Inc. (a) | 5,330 | 203,606 | ||||
Triton International Ltd. | 8,003 | 245,372 | ||||
799,741 | ||||||
Total Common Stocks (cost $18,047,942) | 20,838,652 | |||||
Contingent Value Right - 0.0% | ||||||
Media - 0.0% | ||||||
Media General, Inc. | 1,867 | 93 | ||||
Total Contingent Value Right (cost $0) | 93 | |||||
Real Estate Investment Trust (REIT): 1.2% | ||||||
Pebblebrook Hotel Trust | 6,308 | 244,750 | ||||
Total REIT (cost $227,382) | 244,750 | |||||
Short-Term Investment: 0.4% | ||||||
Money Market Fund - 0.4% | ||||||
Short-Term Investments Trust Treasury Portfolio Institutional Class, 1.750% (b) | 90,106 | 90,106 | ||||
Total Short-Term Investment (cost $90,106) | 90,106 | |||||
Shares | Value | |||||
Total Investments - 99.5% (cost $18,365,430) | 21,173,601 | |||||
Other Assets and Liabilities 0.5% | 115,307 | |||||
Net Assets: 100.0% | $ | 21,288,908 | ||||
Percentages are stated as a percent of net assets.
| (a) | No distribution or dividend was made during the year ending June 30, 2018. As such, it is classified as a non-income producing security as of June 30, 2018. |
| (b) | Rate reported is the 7-day effective yield as of June 30, 2018. |
Country Exposure (as a percentage of total investments) (Unaudited) | |||
United States | 88.01 | % | |
United Kingdom | 4.22 | % | |
Netherlands | 2.81 | % | |
Canada | 1.48 | % | |
Israel | 1.32 | % | |
Bermuda | 1.16 | % | |
Jersey | 1.00 | % | |
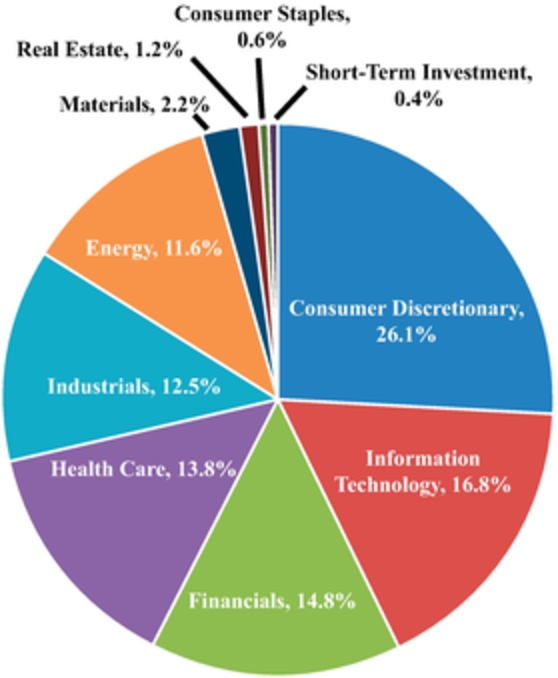
Sector Allocation (as a percentage of total investments) (Unaudited) |
The Accompanying Notes are an Integral Part of these Financial Statements.
19
PENN CAPITAL FUNDS TRUST |
PENN CAPITAL MULTI-CREDIT HIGH INCOME FUND |
SCHEDULE OF INVESTMENTS |
JUNE 30, 2018 |
Principal | Value | |||||
Corporate Bonds: 70.9% | ||||||
Aerospace: 0.8% | ||||||
Bombardier, Inc., 8.750%, 12/1/21 (a) | 105,000 | $ | 115,500 | |||
Agriculture: 0.2% | ||||||
Simmons Foods, Inc., 5.750%, 11/1/24 (a) | 40,000 | 34,700 | ||||
Airline Companies: 1.8% | ||||||
Air Canada, 7.750%, 4/15/21 (a) | 50,000 | 53,375 | ||||
VistaJet Malta Finance PLC, 7.750%, 6/1/20 (a) | 200,000 | 198,000 | ||||
251,375 | ||||||
Auto Parts & Equipment: 0.3% | ||||||
Meritor, Inc., 6.250%, 2/15/24 | 35,000 | 35,263 | ||||
Automotive: 0.7% | ||||||
Navistar International Corp., 6.625%, 11/1/25 (a) | 100,000 | 102,750 | ||||
Banking: 1.2% | ||||||
Ally Financial, Inc., 8.000%, 11/1/31 | 25,000 | 29,750 | ||||
Ally Financial, Inc., 5.750%, 11/20/25 | 90,000 | 91,687 | ||||
Ally Financial, Inc., 5.125%, 9/30/24 | 50,000 | 50,875 | ||||
�� | 172,312 | |||||
Brokerage: 0.4% | ||||||
Oppenheimer Holdings, Inc., 6.750%, 7/1/22 | 60,000 | 61,275 | ||||
Building & Construction: 0.5% | ||||||
Ashton Woods USA LLC, 6.750%, 8/1/25 (a) | 50,000 | 47,500 | ||||
Ashton Woods USA LLC, 6.875%, 2/15/21 (a) | 24,000 | 24,120 | ||||
71,620 | ||||||
Building Materials: 1.2% | ||||||
Griffon Corp., 5.250%, 3/1/22 | 105,000 | 102,155 | ||||
U.S. Concrete, Inc., 6.375%, 6/1/24 | 60,000 | 60,000 | ||||
162,155 | ||||||
Chemical Companies: 1.4% | ||||||
Platform Specialty Products Corp., 5.875%, 12/1/25 (a) | 80,000 | 78,200 | ||||
Trinseo Materials Operating SCA, 5.375%, 9/1/25 (a) | 45,000 | 44,606 | ||||
Versum Materials, Inc., 5.500%, 9/30/24 (a) | 65,000 | 65,904 | ||||
188,710 | ||||||
Computer Hardware: 1.1% | ||||||
Dell International LLC, 8.100%, 7/15/36 (a) | 85,000 | 99,255 | ||||
Western Digital Corp., 4.750%, 2/15/26 | 55,000 | 53,487 | ||||
152,742 | ||||||
Consumer/Commercial/Lease Financing: 1.9% | ||||||
International Lease Finance Corp., 8.625%, 1/15/22 | 35,000 | 40,145 | ||||
Navient Corp., 7.250%, 9/25/23 | 35,000 | 36,662 | ||||
Navient Corp., 6.125%, 3/25/24 | 15,000 | 14,813 | ||||
Navient Corp., 5.875%, 10/25/24 | 65,000 | 62,806 | ||||
Navient Corp., 6.625%, 7/26/21 | 10,000 | 10,272 | ||||
Principal | Value | |||||
Park Aerospace Holdings Ltd., 5.250%, 8/15/22 (a) | 100,000 | 99,001 | ||||
263,699 | ||||||
Electric-Generation: 2.1% | ||||||
Calpine Corp., 5.375%, 1/15/23 (a) | 35,000 | 33,294 | ||||
Calpine Corp., 5.875%, 1/15/24 (a) | 25,000 | 24,750 | ||||
NRG Energy, Inc., 5.750%, 1/15/28 (a) | 25,000 | 24,563 | ||||
NRG Energy, Inc., 6.625%, 1/15/27 | 25,000 | 25,688 | ||||
NRG Energy, Inc., 7.250%, 5/15/26 | 20,000 | 21,300 | ||||
Vistra Energy Corp, 8.125%, 1/30/26 (a) | 50,000 | 54,312 | ||||
Vistra Energy Corp., 7.625%, 11/1/24 | 70,000 | 74,637 | ||||
Vistra Energy Corp., 7.375%, 11/1/22 | 25,000 | 26,125 | ||||
284,669 | ||||||
Electric-Integrated: 0.2% | ||||||
Talen Energy Supply LLC, 9.500%, 7/15/22 (a) | 35,000 | 34,366 | ||||
Energy-Exploration & Production: 4.7% | ||||||
Antero Resources Corp., 5.125%, 12/1/22 | 50,000 | 50,125 | ||||
Approach Resources, Inc., 7.000%, 6/15/21 | 40,000 | 39,000 | ||||
Callon Petroleum Co., 6.125%, 10/1/24 | 35,000 | 35,437 | ||||
Carrizo Oil & Gas, Inc., 8.250%, 7/15/25 | 25,000 | 26,500 | ||||
Centennial Resource Production LLC, 5.375%, 1/15/26 (a) | 30,000 | 29,175 | ||||
Gulfport Energy Corp., 6.000%, 10/15/24 | 60,000 | 57,750 | ||||
Gulfport Energy Corp., 6.625%, 5/1/23 | 15,000 | 15,113 | ||||
HighPoint Operating Corp., 7.000%, 10/15/22 | 35,000 | 35,000 | ||||
Jagged Peak Energy LLC, 5.875%, 5/1/26 (a) | 40,000 | 39,200 | ||||
Range Resources Corp., 5.000%, 8/15/22 | 80,000 | 79,200 | ||||
Resolute Energy Corp., 8.500%, 5/1/20 | 125,000 | 124,922 | ||||
Sanchez Energy Corp., 7.250%, 2/15/23 (a) | 55,000 | 54,450 | ||||
Unit Corp., 6.625%, 5/15/21 | 70,000 | 69,825 | ||||
655,697 | ||||||
Entertainment: 0.8% | ||||||
AMC Entertainment Holdings, Inc., 5.875%, 11/15/26 | 25,000 | 24,062 | ||||
AMC Entertainment Holdings, Inc., 5.750%, 6/15/25 | 55,000 | 53,900 | ||||
National CineMedia LLC, 5.750%, 8/15/26 | 40,000 | 36,500 | ||||
114,462 | ||||||
Food-Wholesale: 1.3% | ||||||
JBS USA LUX SA, 5.875%, 7/15/24 (a) | 100,000 | 95,500 | ||||
JBS USA LUX SA, 7.250%, 6/1/21 (a) | 15,000 | 15,150 | ||||
JBS USA LUX SA, 7.250%, 6/1/21 (a) | 15,000 | 15,150 | ||||
Pilgrim’s Pride Corp., 5.750%, 3/15/25 (a) | 60,000 | 57,600 | ||||
183,400 | ||||||
Food & Drug Retailers: 1.1% | ||||||
Albertsons Cos LLC, 6.625%, 6/15/24 | 60,000 | 56,550 | ||||
Albertsons Cos, Inc., 6.085% (3 Month LIBOR USD + 3.750%), 1/15/24 (a)(b) | 35,000 | 35,087 | ||||
Ingles Markets, Inc., 5.750%, 6/15/23 | 65,000 | 64,025 | ||||
The Accompanying Notes are an Integral Part of these Financial Statements.
20
PENN CAPITAL FUNDS TRUST |
PENN CAPITAL MULTI-CREDIT HIGH INCOME FUND |
SCHEDULE OF INVESTMENTS |
JUNE 30, 2018 |
Principal | Value | |||||
155,662 | ||||||
Forestry/Paper: 0.5% | ||||||
Rayonier AM Products, Inc., 5.500%, 6/1/24 (a) | 70,000 | 65,800 | ||||
Gaming: 1.3% | ||||||
Gateway Casinos & Entertainment Ltd., 8.250%, 3/1/24 (a) | 40,000 | 42,200 | ||||
MGM Resorts International, 7.750%, 3/15/22 | 30,000 | 32,700 | ||||
The Stars Group Holdings, 7.000%, 7/15/26 (a) | 50,000 | 50,500 | ||||
Wynn Las Vegas LLC, 5.500%, 3/1/25 (a) | 55,000 | 54,038 | ||||
179,438 | ||||||
Gas Distribution: 3.6% | ||||||
Blue Racer Midstream LLC, 6.125%, 11/15/22 (a) | 45,000 | 45,450 | ||||
Cheniere Energy Partners LP, 5.250%, 10/1/25 (a) | 65,000 | 63,404 | ||||
DCP Midstream Operating LP, 3.875%, 3/15/23 (a) | 55,000 | 53,144 | ||||
DCP Midstream Operating LP, 4.950%, 4/1/22 | 33,000 | 33,371 | ||||
DCP Midstream Operating LP, 5.850% (3 Month LIBOR USD + 3.850%), 5/21/43 (b) | 90,000 | 82,350 | ||||
NGL Energy Partners LP, 5.125%, 7/15/19 | 65,000 | 65,081 | ||||
NGL Energy Partners LP, 6.875%, 10/15/21 | 20,000 | 20,250 | ||||
NGPL PipeCo LLC, 7.768%, 12/15/37 (a) | 45,000 | 52,875 | ||||
Rockies Express Pipeline LLC, 6.875%, 4/15/40 (a) | 45,000 | 51,300 | ||||
Targa Resources Partners LP, 5.250%, 5/1/23 | 30,000 | 30,000 | ||||
497,225 | ||||||
Health Services: 2.0% | ||||||
Acadia Healthcare Co., Inc., 5.625%, 2/15/23 | 50,000 | 50,375 | ||||
Acadia Healthcare Co., Inc., 6.125%, 3/15/21 | 35,000 | 35,350 | ||||
Centene Escrow I Corp., 5.375%, 6/1/26 | 30,000 | 31,612 | ||||
Centene Corp., 6.125%, 2/15/24 (a) | 30,000 | 30,394 | ||||
DaVita, Inc., 5.125%, 6/15/24 | 40,000 | 38,800 | ||||
Encompass Health Corp., 5.750%, 9/15/25 | 50,000 | 50,500 | ||||
Universal Hospital Services, Inc., 7.625%, 8/15/20 | 35,000 | 34,913 | ||||
271,944 | ||||||
Hospitals: 1.6% | ||||||
HCA, Inc., 7.500%, 2/15/22 | 25,000 | 27,188 | ||||
HCA, Inc., 5.250%, 6/15/26 | 40,000 | 39,728 | ||||
HCA, Inc., 5.375%, 2/1/25 | 65,000 | 64,005 | ||||
Tenet Healthcare Corp., 8.125%, 4/1/22 | 80,000 | 83,500 | ||||
214,421 | ||||||
Household & Leisure Products/Durables: 0.3% | ||||||
Tempur Sealy International, Inc., 5.500%, 6/15/26 | 45,000 | 43,538 | ||||
Principal | Value | |||||
Investments & Misc Financial Services: 2.4% | ||||||
First Data Corp., 5.750%, 1/15/24 (a) | 50,000 | 49,968 | ||||
First Data Corp., 7.000%, 12/1/23 (a) | 75,000 | 78,118 | ||||
Icahn Enterprises LP, 6.375%, 12/15/25 | 60,000 | 60,075 | ||||
Icahn Enterprises LP, 6.750%, 2/1/24 | 110,000 | 110,825 | ||||
VFH Parent LLC, 6.750%, 6/15/22 (a) | 35,000 | 36,269 | ||||
335,255 | ||||||
Machinery Companies: 0.7% | ||||||
Apergy Corp., 6.375%, 5/1/26 (a) | 35,000 | 35,569 | ||||
Zekelman Industries, Inc., 9.875%, 6/15/23 (a) | 50,000 | 54,750 | ||||
90,319 | ||||||
Media-Broadcast: 3.2% | ||||||
Gray Television, Inc., 5.125%, 10/15/24 (a) | 25,000 | 23,875 | ||||
Gray Television, Inc., 5.875%, 7/15/26 (a) | 25,000 | 23,781 | ||||
Salem Media Group, Inc., 6.750%, 6/1/24 (a) | 45,000 | 40,838 | ||||
Sinclair Television Group, Inc., 5.625%, 8/1/24 (a) | 65,000 | 64,513 | ||||
Townsquare Media, Inc., 6.500%, 4/1/23 (a) | 40,000 | 36,000 | ||||
Univision Communications, Inc., 5.125%, 5/15/23 (a) | 60,000 | 57,600 | ||||
Univision Communications, Inc., 5.125%, 2/15/25 (a) | 15,000 | 13,856 | ||||
Urban One, Inc., 7.375%, 4/15/22 (a) | 45,000 | 43,537 | ||||
Urban One, Inc., 9.250%, 2/15/20 (a) | 140,000 | 135,800 | ||||
439,800 | ||||||
Media-Cable: 4.4% | ||||||
Altice France SA, 6.000%, 5/15/22 (a) | 200,000 | 201,250 | ||||
Altice Luxembourg SA, 7.750%, 5/15/22 (a) | 200,000 | 193,500 | ||||
DISH DBS Corp., 5.875%, 7/15/22 | 185,000 | 173,900 | ||||
DISH DBS Corp., 7.750%, 7/1/26 | 40,000 | 35,050 | ||||
603,700 | ||||||
Media-Services: 0.7% | ||||||
Clear Channel Worldwide Holdings, Inc., 7.625%, 3/15/20 | 40,000 | 39,700 | ||||
MDC Partners, Inc., 6.500%, 5/1/24 (a) | 70,000 | 60,725 | ||||
100,425 | ||||||
Metals/Mining Excluding Steel: 3.8% | ||||||
Alliance Resource Operating Partners LP, 7.500%, 5/1/25 (a) | 65,000 | 69,225 | ||||
Century Aluminum Co., 7.500%, 6/1/21 (a) | 60,000 | 60,450 | ||||
Cleveland-Cliffs, Inc., 5.750%, 3/1/25 | 35,000 | 33,162 | ||||
CONSOL Energy, Inc., 11.000%, 11/15/25 (a) | 90,000 | 99,000 | ||||
Freeport-McMoRan, Inc., 4.550%, 11/14/24 | 15,000 | 14,250 | ||||
Freeport-McMoRan, Inc., 5.450%, 3/15/43 | 50,000 | 43,860 | ||||
Freeport-McMoRan, Inc., 3.875%, 3/15/23 | 5,000 | 4,725 | ||||
Peabody Energy Corp., 10.000%, 3/15/22 (c) | 95,000 | 0 | ||||
Peabody Energy Corp., 6.375%, 3/31/25 (a) | 45,000 | 46,237 | ||||
SunCoke Energy Partners LP, 7.500%, 6/15/25 (a) | 65,000 | 66,138 | ||||
The Accompanying Notes are an Integral Part of these Financial Statements.
21
PENN CAPITAL FUNDS TRUST |
PENN CAPITAL MULTI-CREDIT HIGH INCOME FUND |
SCHEDULE OF INVESTMENTS |
JUNE 30, 2018 |
Principal | Value | |||||
Teck Resources Ltd., 5.200%, 3/1/42 | 35,000 | 30,669 | ||||
Teck Resources Ltd., 3.750%, 2/1/23 | 35,000 | 33,206 | ||||
Teck Resources Ltd., 6.250%, 7/15/41 | 25,000 | 24,875 | ||||
525,797 | ||||||
Non-Food & Drug Retailers: 0.9% | ||||||
Hot Topic, Inc., 9.250%, 6/15/21 (a) | 65,000 | 61,994 | ||||
The Men’s Wearhouse, Inc., 7.000%, 7/1/22 | 55,000 | 56,787 | ||||
118,781 | ||||||
Oil Field Equipment & Services: 3.0% | ||||||
CSI Compressco LP, 7.250%, 8/15/22 | 45,000 | 41,175 | ||||
CSI Compressco LP, 7.500%, 4/1/25 (a) | 25,000 | 25,094 | ||||
Nabors Industries, Inc., 5.500%, 1/15/23 | 60,000 | 57,360 | ||||
Noble Holding International Ltd., 7.875%, 2/1/26 (a) | 25,000 | 25,750 | ||||
Noble Holding International Ltd., 7.750%, 1/15/24 | 130,000 | 123,175 | ||||
Pioneer Energy Services Corp., 6.125%, 3/15/22 | 60,000 | 57,000 | ||||
Transocean, Inc., 8.375%, 12/15/21 | 35,000 | 37,450 | ||||
Transocean, Inc., 6.800%, 3/15/38 | 50,000 | 40,625 | ||||
407,629 | ||||||
Oil Refining & Marketing: 0.6% | ||||||
PBF Holding Co. LLC, 7.250%, 6/15/25 | 35,000 | 36,794 | ||||
PBF Holding Co. LLC, 7.000%, 11/15/23 | 40,000 | 41,400 | ||||
78,194 | ||||||
Pharmaceuticals & Devices: 4.6% | ||||||
Endo Finance LLC, 5.375%, 1/15/23 (a) | 55,000 | 44,000 | ||||
Jaguar Holding Co. II, 6.375%, 8/1/23 (a) | 55,000 | 54,736 | ||||
Kinetic Concepts, Inc., 12.500%, 11/1/21 (a) | 75,000 | 82,875 | ||||
Mallinckrodt International Finance SA, 4.875%, 4/15/20 (a) | 65,000 | 63,862 | ||||
Mallinckrodt International Finance SA, 5.750%, 8/1/22 (a) | 75,000 | 67,500 | ||||
Valeant Pharmaceuticals International, Inc., 5.625%, 12/1/21 (a) | 30,000 | 29,512 | ||||
Valeant Pharmaceuticals International, Inc., 7.500%, 7/15/21 (a) | 60,000 | 60,938 | ||||
Valeant Pharmaceuticals International, Inc., 5.875%, 5/15/23 (a) | 210,000 | 197,269 | ||||
Valeant Pharmaceuticals International, Inc., 6.125%, 4/15/25 (a) | 35,000 | 32,244 | ||||
632,936 | ||||||
Printing & Publishing: 1.3% | ||||||
Lee Enterprises, Inc., 9.500%, 3/15/22 (a) | 45,000 | 46,969 | ||||
Meredith Corp., 6.875%, 2/1/26 (a) | 130,000 | 128,212 | ||||
175,181 | ||||||
Railroads: 0.4% | ||||||
Watco Cos LLC, 6.375%, 4/1/23 (a) | 60,000 | 60,975 | ||||
Real Estate Development & Management: 0.4% | ||||||
Realogy Group LLC, 5.250%, 12/1/21 (a) | 50,000 | 49,875 | ||||
Principal | Value | |||||
Restaurants: 0.7% | ||||||
Golden Nugget, Inc., 6.750%, 10/15/24 (a) | 50,000 | 50,009 | ||||
P.F. Chang’s China Bistro, Inc., 10.250%, 6/30/20 (a) | 45,000 | 40,500 | ||||
90,509 | ||||||
Steel Producers & Products: 1.0% | ||||||
Joseph T. Ryerson & Son, Inc., 11.000%, 5/15/22 (a) | 50,000 | 55,000 | ||||
United States Steel Corp., 6.875%, 8/15/25 | 55,000 | 55,327 | ||||
United States Steel Corp., 7.375%, 4/1/20 | 25,000 | 26,500 | ||||
136,827 | ||||||
Support-Services: 1.4% | ||||||
Herc Rentals, Inc., 7.750%, 6/1/24 (a) | 35,000 | 37,363 | ||||
The ADT Corp., 4.875%, 7/15/32 (a) | 50,000 | 39,125 | ||||
The ADT Corp., 6.250%, 10/15/21 | 20,000 | 20,700 | ||||
The GEO Group, Inc., 5.875%, 10/15/24 | 45,000 | 44,325 | ||||
The Hertz Corp., 5.875%, 10/15/20 | 55,000 | 53,762 | ||||
195,275 | ||||||
Telecom-Integrated/Services: 6.7% | ||||||
CenturyLink, Inc., 7.500%, 4/1/24 | 65,000 | 66,787 | ||||
CenturyLink, Inc., 6.450%, 6/15/21 | 35,000 | 35,986 | ||||
Cincinnati Bell, Inc., 7.000%, 7/15/24 (a) | 35,000 | 31,937 | ||||
Cogent Communications Finance, Inc., 5.625%, 4/15/21 (a) | 65,000 | 65,406 | ||||
Consolidated Communications, Inc., 6.500%, 10/1/22 | 70,000 | 65,275 | ||||
Frontier Communications Corp., 8.500%, 4/1/26 (a) | 20,000 | 19,300 | ||||
Frontier Communications Corp., 10.500%, 9/15/22 | 30,000 | 27,225 | ||||
Frontier Communications Corp., 8.750%, 4/15/22 | 40,000 | 33,800 | ||||
Gogo Intermediate Holdings LLC, 12.500%, 7/1/22 (a) | 90,000 | 96,075 | ||||
Intelsat Jackson Holdings SA, 5.500%, 8/1/23 (a) | 45,000 | 40,374 | ||||
Intelsat Jackson Holdings SA, 7.250%, 10/15/20 | 180,000 | 179,100 | ||||
Intelsat Connect Finance SA, 12.500%, 4/1/22 (a) | 35,000 | 34,552 | ||||
Level 3 Financing, Inc., 5.125%, 5/1/23 | 40,000 | 39,200 | ||||
Uniti Group LP, 6.000%, 4/15/23 (a) | 90,000 | 86,794 | ||||
Uniti Group LP, 7.125%, 12/15/24 (a) | 25,000 | 22,875 | ||||
Windstream Services LLC, 7.750%, 10/15/20 | 91,000 | 81,673 | ||||
926,359 | ||||||
Telecom-Wireless: 2.5% | ||||||
GTT Communications, Inc., 7.875%, 12/31/24 (a) | 35,000 | 34,650 | ||||
Sprint Capital Corp., 6.875%, 11/15/28 | 55,000 | 52,800 | ||||
Sprint Communications, Inc., 6.000%, 11/15/22 | 25,000 | 24,781 | ||||
The Accompanying Notes are an Integral Part of these Financial Statements.
22
PENN CAPITAL FUNDS TRUST |
PENN CAPITAL MULTI-CREDIT HIGH INCOME FUND |
SCHEDULE OF INVESTMENTS |
JUNE 30, 2018 |
Principal | Value | |||||
Sprint Corp., 7.125%, 6/15/24 | 90,000 | 90,863 | ||||
Sprint Corp., 7.625%, 3/1/26 | 25,000 | 25,469 | ||||
Sprint Corp., 7.250%, 9/15/21 | 20,000 | 20,800 | ||||
Sprint Corp., 7.875%, 9/15/23 | 40,000 | 41,475 | ||||
Telesat Canada, 8.875%, 11/15/24 (a) | 25,000 | 26,750 | ||||
United States Cellular Corp., 6.700%, 12/15/33 | 30,000 | 31,350 | ||||
348,938 | ||||||
Telecommunications Equipment: 0.3% | ||||||
CommScope, Inc., 5.500%, 6/15/24 (a) | 40,000 | 40,200 | ||||
Transportation Excluding Air/Rail: 0.9% | ||||||
Deck Chassis Acquisition, Inc., 10.000%, 6/15/23 (a) | 70,000 | 74,200 | ||||
The Kenan Advantage Group, Inc., 7.875%, 7/31/23 (a) | 45,000 | 45,900 | ||||
120,100 | ||||||
Total Corporate Bonds (cost $9,735,200) | 9,789,798 | |||||
Convertible Bond: 0.3% | ||||||
Support-Services: 0.3% | ||||||
Gogo, Inc., 3.750%, 3/1/20 | 45,000 | 39,264 | ||||
Total Convertible Bond (cost $41,533) | 39,264 | |||||
Bank Loans: 7.9% (d) | ||||||
Chemical Companies: 0.4% | ||||||
Tronox Blocked Borrower LLC, 5.093% (1 Month US LIBOR + 3.000%), 9/22/24 | 34,709 | 34,674 | ||||
Tronox Finance LLC, 5.093% (1 Month US LIBOR + 3.000%), 9/22/24 | 15,041 | 15,026 | ||||
49,700 | ||||||
Consumer-Products: 0.7% | ||||||
Bob’s Discount Furniture, 7.270% (1 Month US LIBOR + 5.250%), 8/8/23 | 50,000 | 49,312 | ||||
HLF Financing Sarl, 7.593% (1 Month US LIBOR + 5.500%), 2/15/23 | 48,986 | 49,324 | ||||
98,636 | ||||||
Entertainment: 0.3% | ||||||
Delta 2 Lux Sarl, 4.593% (1 Month US LIBOR + 2.500%), 2/1/24 | 50,000 | 49,282 | ||||
Gas Distribution: 0.3% | ||||||
Woodford Express LLC, 7.093% (1 Month US LIBOR + 5.000%), 1/26/25 | 49,875 | 48,154 | ||||
Health Care Providers & Services: 0.4% | ||||||
R1 RCM, Inc., 7.619%, (3 Month US Libor + 5.250%), 5/2/25 | 50,000 | 49,750 | ||||
Health Services: 0.4% | ||||||
Gentiva Health Services, Inc., 5.840% (3 Month US LIBOR + 3.750%), 6/21/25 | 19,231 | 19,087 | ||||
Gentiva Health Services, Inc., 5.840% (3 Month US LIBOR + 3.750%), 6/21/25 | 30,769 | 30,538 | ||||
49,625 | ||||||
Principal | Value | |||||
Industrial Conglomerates: 0.4% | ||||||
Deliver Buyer, Inc., 6.000% (3 Month US LIBOR + 5.000%), 5/1/24 | 49,874 | 49,781 | ||||
Investments & Miscellaneous Financial Services: 0.7% | ||||||
Edelman Financial Services LLC, 5.340%, (3 Month US LIBOR + 3.250%), 6/26/25 | 50,000 | 49,906 | ||||
Russell Investments US Institutional Holdco, Inc., 5.343%, 6/1/23 | ||||||
(1 Month US LIBOR + 3.250%) | 13,169 | 13,219 | ||||
(1 Month US LIBOR + 3.250%) | 36,704 | 36,841 | ||||
99,966 | ||||||
Metals & Mining: 0.4% | ||||||
Big River Steel LLC, 7.334% (3 Month US LIBOR + 5.000%), 8/23/23 | 49,874 | 50,467 | ||||
Metals/Mining Excluding Steel: 0.4% | ||||||
Aleris International, Inc., 6.856% (1 Month US LIBOR + 4.750%), 4/15/23 | 50,000 | 49,516 | ||||
Non-Food & Drug Retailers: 0.4% | ||||||
The Men’s Wearhouse, Inc., 5.482% (1 Month US LIBOR + 3.500%), 4/9/25 | 49,875 | 50,083 | ||||
Oil Field Equipment & Services: 0.7% | ||||||
Keane Group Holdings LLC, 5.750% (1 Month US LIBOR + 3.750%), 5/25/25 | 50,000 | 49,875 | ||||
McDermott Technology Americas, Inc., 7.093% (1 Month US LIBOR + 5.000%), 5/10/25 | 50,000 | 50,187 | ||||
100,062 | ||||||
Pharmaceuticals: 0.4% | ||||||
Amneal Pharmaceuticals LLC, 5.625% (2 Month US LIBOR + 3.500%), 5/4/25 | 49,988 | 49,848 | ||||
Pharmaceuticals & Devices: 0.7% | ||||||
Endo International PLC, 6.375% (1 Month US LIBOR + 4.250%), 4/27/24 | 50,000 | 49,875 | ||||
Valeant Pharmaceuticals International, Inc., 4.982% (1 Month US LIBOR + 3.000%), 5/30/25 | 50,000 | 49,797 | ||||
99,672 | ||||||
Software/Services: 0.4% | ||||||
New Media Holdings II LLC, 8.343% (1 Month US LIBOR + 6.250%), 7/14/22 | 49,749 | 49,967 | ||||
Specialty Retail: 0.3% | ||||||
Staples, Inc., 6.358% (3 Month US LIBOR + 4.000%), 9/12/24 | 50,000 | 49,297 | ||||
Support-Services: 0.3% | ||||||
Monitronics International, Inc., 7.834% (3 Month US LIBOR + 5.500%), 9/30/22 | 49,747 | 47,384 | ||||
Telecom-Integrated/Services: 0.3% | ||||||
Frontier Communications Corp., 4.850% (1 Month US LIBOR + 2.750%), 3/31/21 | 50,000 | 49,203 | ||||
Total Bank Loans (cost $1,092,196) | 1,090,393 | |||||
The Accompanying Notes are an Integral Part of these Financial Statements.
23
PENN CAPITAL FUNDS TRUST |
PENN CAPITAL MULTI-CREDIT HIGH INCOME FUND |
SCHEDULE OF INVESTMENTS |
JUNE 30, 2018 |
Shares | ||||||
Common Stock: 0.0% | ||||||
Media - Cable: 0.0% | ||||||
ACC Claims Holdings LLC (e)(f) | 11,610 | 46 | ||||
Total Common Stock (cost $237) | 46 | |||||
Mutual Fund: 18.1% | ||||||
Penn Capital Defensive Floating Rate Income Fund-Institutional Class (g) | 248,153 | 2,503,862 | ||||
Total Mutual Funds (cost $2,520,274) | 2,503,862 | |||||
Preferred Stock: 0.0% | ||||||
Spanish Broadcasting Systems, Inc. 10.750% Cash or 10.750% PIK (e)(h) | 1 | 41 | ||||
Total Preferred Stock (cost $613) | 41 | |||||
Short-Term Investment: 5.7% | ||||||
Short-Term Investments Trust Treasury Portfolio Institutional Class, 1.750% (i) | 786,796 | 786,796 | ||||
Total Short-Term Investments (cost $786,796) | 786,796 | |||||
Total Investments - 102.9% (cost $14,176,849) | 14,210,200 | |||||
Liabilities in Excess of Other Assets (2.9)% | (396,340 | ) | ||||
Net Assets: 100.0% | $ | 13,813,860 | ||||
Percentages are stated as a percent of net assets.
| (a) | Securities purchased pursuant to Rule 144A of the Securities Act of 1933, as amended, and may be sold only to dealers in that program or other “qualified institutional buyers.” As of June 30, 2018, the value of these investments was $5,348,427, or 38.7% of total net assets. |
| (b) | Variable rate security. The rate listed is as of June 30, 2018. |
| (c) | Item identified as in default as to payment of interest, the value of these investments were $0.00 or 0.0% of total net assets. |
| (d) | Bank Loans typically have rates of interest which are redetermined either daily, monthly, quarterly or semi-annually by reference to a base lending rate, plus a premium. These base lending rates are primarily the London Interbank Offered Rate (“LIBOR”) and secondarily, the prime rate offered by one or more major United States banks (the “Prime Rate”) and the certificate of deposit (“CD”) rate or other base lending rates used by commercial lenders. |
| (e) | This security is currently being fair valued in accordance with procedures established by the Board of Trustees and is deemed a level 3 security as it is valued using significant unobservable inputs. |
| (f) | No distribution or dividend was made during the year ending June 30, 2018. As such, it is classified as a non-income producing security as of June 30, 2018. |
| (g) | Affiliated company. See Note 7. |
| (h) | Payment-in-kind security which may pay interest/dividends in additional par/shares and/or in cash. No distribution or dividend was made during the year ended June 30, 2018. As such, it is classified as a non-income producing security as of June 30, 2018. |
| (i) | Rate reported is the 7-day effective yield as of June 30, 2018. |
Country Exposure (as a percentage of total investments) (Unaudited) | |||
United States | 85.18 | % | |
Canada | 4.98 | % | |
Luxembourg | 4.39 | % | |
Cayman Islands | 2.29 | % | |
France | 1.42 | % | |
Malta | 1.39 | % | |
Netherlands | 0.35 | % | |
Asset Type (as a percentage of total investments) (Unaudited) |
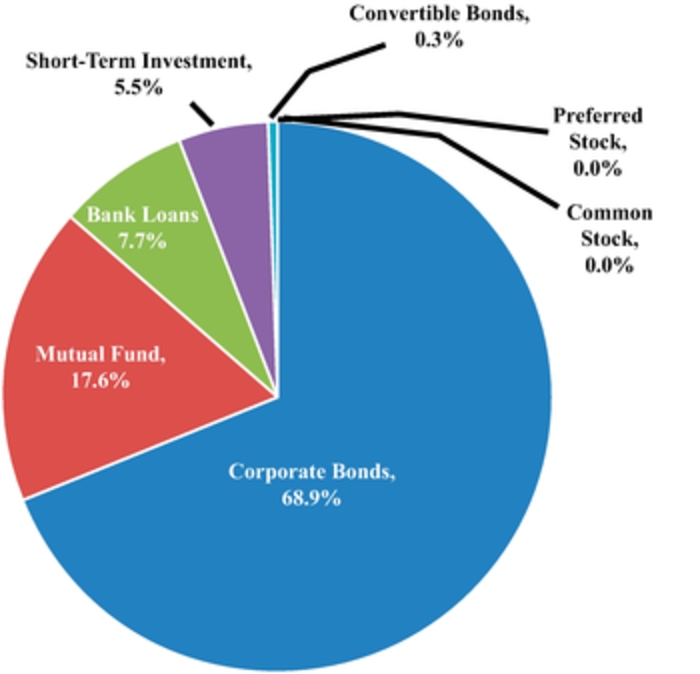
The Accompanying Notes are an Integral Part of these Financial Statements.
24
PENN CAPITAL FUNDS TRUST |
PENN CAPITAL DEFENSIVE FLOATING RATE INCOME FUND |
SCHEDULE OF INVESTMENTS |
JUNE 30, 2018 |
Principal | Value | |||||
Bank Loans: 85.6% (a) | ||||||
Airline Companies: 1.1% | ||||||
American Airlines, Inc., 4.093% (1 Month US LIBOR + 2.000%), 4/28/23 | 98,000 | $ | 96,824 | |||
United Airlines, Inc., 3.843% (1 Month US LIBOR + 1.750%), 4/1/24 | 246,875 | 244,098 | ||||
340,922 | ||||||
Automotive: 1.6% | ||||||
Navistar, Inc., 5.530% (1 Month US LIBOR + 3.500%), 11/6/24 | 249,375 | 249,220 | ||||
Octavius Corp., 5.720% (1 Month US LIBOR + 3.500%), 11/8/23 | ||||||
(3 Month US LIBOR + 3.500%) | 163,462 | 164,279 | ||||
(1 Month US LIBOR + 3.500%) | 86,538 | 86,971 | ||||
500,470 | ||||||
Building Materials: 2.0% | ||||||
Foundation Building Materials, 5.180% (3 Month US LIBOR + 3.250%), 5/11/25 | 150,000 | 149,532 | ||||
NCI Building Systems, Inc., 4.093% (1 Month US LIBOR + 2.000%), 2/8/25 | 124,688 | 124,103 | ||||
Pike Corp., 5.600% (1 Month US LIBOR + 3.500%), 3/23/25 | 118,182 | 118,427 | ||||
Quikrete Holdings, Inc., 4.843% (1 Month US LIBOR + 2.750%), 11/15/23 | 240,385 | 239,082 | ||||
631,144 | ||||||
Building Products: 0.8% | ||||||
Atkore International, Inc., 5.090% (3 Month US LIBOR + 2.750%), 12/22/23 | 246,262 | 245,585 | ||||
Chemical Companies: 1.8% | ||||||
Composite Resins Holdings, 5.250% (3 Month US LIBOR + 4.250%), 6/28/25 | 75,000 | 74,437 | ||||
HB Fuller Co., 4.084% (1 Month US LIBOR + 2.000%), 10/20/24 | 247,006 | 244,845 | ||||
Tronox Blocked Borrower LLC, 5.093% (1 Month US LIBOR + 3.000%), 9/22/24 | 173,547 | 173,373 | ||||
Tronox Finance LLC, 5.093% (1 Month US LIBOR + 3.000%), 9/22/24 | 75,204 | 75,128 | ||||
567,783 | ||||||
Chemicals: 0.4% | ||||||
Encapsys LLC, 5.343% (1 Month US LIBOR + 3.250%), 10/27/24 | 124,687 | 124,688 | ||||
Commercial Services & Supplies: 0.3% | ||||||
Helix Acquisition Holdings, Inc., 5.834% (3 Month US LIBOR + 3.500%), 9/29/24 | 96,756 | 96,514 | ||||
Communications Equipment: 0.6% | ||||||
Polycom, Inc., 7.343%, 9/27/23 | ||||||
(1 Month US LIBOR + 5.250%) | 108,396 | 108,396 | ||||
(1 Month US LIBOR + 5.250%) | 77,000 | 77,000 | ||||
185,396 | ||||||
Computers & Peripherals: 0.6% | ||||||
Western Digital Corp., 3.843% (1 Month US LIBOR + 1.750%), 4/29/23 | 203,165 | 202,911 | ||||
Principal | Value | |||||
Consumer/Commercial/Lease Financing: 0.8% | ||||||
Avolon TLB Borrower 1 US LLC, 4.088% (1 Month US LIBOR + 2.000%), 1/15/25 | 125,000 | 123,385 | ||||
NAI Entertainment Holdings LLC, 4.600% (1 Month US LIBOR + 2.500%), 5/8/25 | 125,000 | 124,219 | ||||
247,604 | ||||||
Consumer-Products: 1.7% | ||||||
BDF Acquisition Corp., 7.270% (1 Month US LIBOR + 5.250%), 8/8/23 | 199,481 | 196,738 | ||||
HLF Financing Sarl, 7.593% (1 Month US LIBOR + 5.500%), 2/15/23 | 226,562 | 228,121 | ||||
Lifetime Brands, Inc., 5.545%, 2/28/25 | ||||||
(1 Month US LIBOR + 3.500%) | 67,870 | 67,530 | ||||
(1 Month US LIBOR + 3.500%) | 56,818 | 56,534 | ||||
548,923 | ||||||
Defense: 0.5% | ||||||
The KeyW, 6.530% (1 Month US LIBOR + 4.500%), 5/8/24 | 150,000 | 150,750 | ||||
Diversified Capital Goods: 1.5% | ||||||
Gardner Denver, Inc., 4.843% (1 Month US LIBOR + 2.750%), 7/30/24 | 114,339 | 114,296 | ||||
Harsco Corp., 4.375% (1 Month US LIBOR + 2.250%), 12/9/24 | 247,505 | 247,272 | ||||
Thermon Industries, Inc., 5.732% (1 Month US LIBOR + 3.750%), 10/30/24 | 112,188 | 112,468 | ||||
474,036 | ||||||
Diversified Financial Services: 0.7% | ||||||
Canyon Valor Cos, Inc., 5.584% (3 Month US LIBOR + 3.250%), 6/16/23 | 238,463 | 237,748 | ||||
Diversified Telecommunication Services: 0.8% | ||||||
Consolidated Communications, Inc., 5.100% (1 Month US LIBOR + 3.000%), 10/5/23 | 247,810 | 243,888 | ||||
Electric-Generation: 3.0% | ||||||
Calpine Corp., 4.840% (3 Month US LIBOR + 2.500%), 1/15/23 | 241,908 | 241,152 | ||||
Exgen Renewables IV LLC, 5.310% (3 Month US LIBOR + 3.000%), 11/28/24 | 122,587 | 122,894 | ||||
Helix Gen Funding LLC, 5.843% (1 Month US LIBOR + 3.750%), 6/3/24 | 230,323 | 230,563 | ||||
Lightstone Holdco LLC, 5.843% (1 Month US LIBOR + 3.750%), 1/30/24 | 14,493 | 14,538 | ||||
Lightstone Holdco LLC, 5.843% (1 Month US LIBOR + 3.750%), 1/30/24 | 226,359 | 227,067 | ||||
TerraForm Power, 4.093% (1 Month US LIBOR + 2.000%), 11/8/22 | 124,375 | 124,167 | ||||
960,381 | ||||||
Electric Utilities: 0.4% | ||||||
Compass Power Generation LLC, 5.843% (1 Month US LIBOR + 3.750%), 12/20/24 | 124,023 | 124,519 | ||||
The Accompanying Notes are an Integral Part of these Financial Statements.
25
PENN CAPITAL FUNDS TRUST |
PENN CAPITAL DEFENSIVE FLOATING RATE INCOME FUND |
SCHEDULE OF INVESTMENTS |
JUNE 30, 2018 |
Principal | Value | |||||
Electronics: 0.8% | ||||||
Micron Technology, Inc., 3.850% (1 Month US LIBOR + 1.750%), 4/26/22 | 245,000 | 245,368 | ||||
Entertainment: 2.9% | ||||||
Alterra Mountain Co., 5.093% (1 Month US LIBOR + 3.000%), 7/31/24 | 248,750 | 248,285 | ||||
Crown Finance US, Inc., 4.593% (1 Month US LIBOR + 2.500%), 2/22/25 | 124,687 | 123,664 | ||||
Delta 2 Lux Sarl, 4.593% (1 Month US LIBOR + 2.500%), 2/1/24 | 200,000 | 197,126 | ||||
Life Time Fitness, Inc., 5.057% (3 Month US LIBOR + 2.750%), 6/15/22 | 243,789 | 242,814 | ||||
SeaWorld Parks & Entertainment, Inc., 5.093% (1 Month US LIBOR + 3.000%), 3/31/24 | 124,058 | 123,017 | ||||
934,906 | ||||||
Food & Drug Retailers: 1.1% | ||||||
Albertson’s LLC, 5.337% (3 Month US LIBOR + 3.000%), 12/21/22 | 245,648 | 243,238 | ||||
SuperValu, Inc., 5.593% (1 Month US LIBOR + 3.500%), 6/8/24 | 65,409 | 65,376 | ||||
SuperValu, Inc., 5.593% (1 Month US LIBOR + 3.500%), 6/8/24 | 39,245 | 39,226 | ||||
347,840 | ||||||
Food-Wholesale: 1.5% | ||||||
American Seafoods Group LLC, 4.850% (1 Month US LIBOR + 2.750%), 8/21/23 | 242,708 | 241,495 | ||||
JBS USA LUX SA, 4.835%, 10/30/22 | ||||||
(3 Month US LIBOR + 2.500%) | 209,679 | 207,897 | ||||
(3 Month US LIBOR + 2.500%) | 37,196 | 36,880 | ||||
486,272 | ||||||
Gaming: 2.7% | ||||||
Boyd Gaming Corp., 4.487% (1 Week US LIBOR + 2.500%), 9/15/23 | 229,142 | 229,458 | ||||
Eldorado Resorts, Inc., 4.375%, 4/17/24 | ||||||
(1 Month US LIBOR + 2.250%) | 77,198 | 76,861 | ||||
(2 Month US LIBOR + 2.250%) | 68,793 | 68,492 | ||||
(2 Month US LIBOR + 2.250%) | 18,966 | 18,883 | ||||
Gateway Casinos & Entertainment Ltd., 5.472% (6 Month US LIBOR + 3.000%), 3/13/25 | 75,000 | 75,000 | ||||
Scientific Games International, Inc., 4.921%, 8/14/24 | ||||||
(2 Month US LIBOR + 2.750%) | 200,962 | 199,455 | ||||
(1 Month US LIBOR + 2.750%) | 47,790 | 47,431 | ||||
The Stars Group Holdings, 4.590% (1 Month US LIBOR + 3.000%), 7/29/25 | 150,000 | 149,269 | ||||
864,849 | ||||||
Gas Distribution: 0.4% | ||||||
Woodford Express LLC, 7.093% (1 Month US LIBOR + 5.000%), 1/26/25 | 124,687 | 120,386 | ||||
Principal | Value | |||||
Gas Utilities: 0.8% | ||||||
Vistra Operations Co. LLC, 4.343% (1 Month US LIBOR + 2.250%), 12/14/23 | 246,250 | 244,866 | ||||
Health Care Equipment & Supplies: 0.7% | ||||||
Exactech, Inc., 5.843% (1 Month US LIBOR + 3.750%), 2/14/25 | 124,687 | 124,999 | ||||
Mallinckrodt International Finance SA, 5.203% (6 Month US LIBOR + 2.750%), 9/24/24 | 107,888 | 105,596 | ||||
230,595 | ||||||
Health Care Providers & Services: 1.0% | ||||||
Press Ganey Holdings, Inc., 4.843% (1 Month US LIBOR + 2.750%), 10/23/23 | 124,055 | 123,745 | ||||
Prospect Medical Holdings, Inc., 7.500% (1 Month US LIBOR + 5.500%), 2/24/24 | 124,688 | 124,376 | ||||
R1 RCM, Inc., 7.619% (3 Month US LIBOR + 5.250%), 5/2/25 | 75,000 | 74,625 | ||||
322,746 | ||||||
Health Services: 3.5% | ||||||
Acadia Healthcare Co., Inc., 4.593% (1 Month US LIBOR + 2.500%), 2/16/23 | 237,931 | 238,271 | ||||
Concentra, Inc., 4.740% (1 Month US LIBOR + 2.750%), 6/1/22 | 239,804 | 239,505 | ||||
Envision Healthcare Corp., 5.100% (1 Month US LIBOR + 3.000%), 12/1/23 | 139,122 | 138,832 | ||||
Gentiva Health Services, Inc., 5.840% (3 Month US LIBOR + 3.750%), 6/21/25 | 96,154 | 95,433 | ||||
Gentiva Health Services, Inc., 5.840% (3 Month US LIBOR + 3.750%), 6/21/25 | 153,846 | 152,692 | ||||
Select Medical Corp., 4.800%, 3/6/25 | ||||||
(1 Month US LIBOR + 2.750%) | 246,739 | 246,122 | ||||
(Prime US LIBOR + 1.750%) | 136 | 136 | ||||
1,110,991 | ||||||
Hotels: 0.8% | ||||||
Belmond Interfin Ltd., 4.843% (1 Month US LIBOR + 2.750%), 7/3/24 | 247,500 | 247,500 | ||||
Household Durables: 0.4% | ||||||
Floor & Decor Outlets of America, Inc., 4.600% (1 Month US LIBOR + 2.500%), 9/30/23 | 122,848 | 123,156 | ||||
Industrial Conglomerates: 0.5% | ||||||
Deliver Buyer, Inc., 6.000% (3 Month US LIBOR + 5.000%), 5/1/24 | 149,622 | 149,342 | ||||
Insurance: 0.8% | ||||||
Meredith Corp., 5.093% (1 Month US LIBOR + 3.000%), 1/31/25 | 249,375 | 249,063 | ||||
Internet & Catalog Retail: 0.4% | ||||||
Shutterfly, Inc., 4.850% (1 Month US LIBOR + 2.750%), 8/17/24 | 125,000 | 125,053 | ||||
The Accompanying Notes are an Integral Part of these Financial Statements.
26
PENN CAPITAL FUNDS TRUST |
PENN CAPITAL DEFENSIVE FLOATING RATE INCOME FUND |
SCHEDULE OF INVESTMENTS |
JUNE 30, 2018 |
Principal | Value | |||||
Investments & Miscellaneous Financial Services: 4.0% | ||||||
Edelman Financial Center LLC, 5.340% (3 Month US LIBOR + 3.250%), 6/26/25 | 200,000 | 199,626 | ||||
FinCo I LLC, 4.093% (1 Month US LIBOR + 2.000%), 12/27/22 | 214,485 | 214,055 | ||||
Janus International Group LLC, 5.093% (1 Month US LIBOR + 3.000%), 2/15/25 | 124,687 | 122,505 | ||||
LPL Holdings, Inc., 4.489%, 9/21/24 | ||||||
(6 Month US LIBOR + 2.250%) | 123,753 | 122,979 | ||||
(1 Month US LIBOR + 2.250%) | 123,752 | 122,979 | ||||
Russell Investments US Institutional Holdco, Inc., 5.343%, 6/1/23 | ||||||
(1 Month US LIBOR + 3.250%) | 180,306 | 180,982 | ||||
(1 Month US LIBOR + 3.250%) | 64,694 | 64,937 | ||||
TransUnion, 4.020% (1 Month US LIBOR + 2.000%), 6/19/25 | 250,000 | 249,062 | ||||
1,277,125 | ||||||
IT Services: 1.5% | ||||||
NAB Holdings LLC, 5.334% (3 Month US LIBOR + 3.000%), 6/30/24 | 248,128 | 246,424 | ||||
Pi US Mergerco, Inc., 5.593% (1 Month US LIBOR + 3.500%), 1/1/25 | 249,375 | 245,634 | ||||
492,058 | ||||||
Media-Broadcast: 7.4% | ||||||
Altice US Finance I Corp., 4.343% (1 Month US LIBOR + 2.250%), 7/28/25 | 245,030 | 243,040 | ||||
Beasley Mezzanine Holdings LLC, 6.085% (1 Month US LIBOR + 4.000%), 11/1/23 | 244,444 | 245,972 | ||||
CBS Radio, Inc., 4.838% (1 Month US LIBOR + 2.750%), 11/17/24 | 149,624 | 147,380 | ||||
CSC Holdings LLC, 4.323% (1 Month US LIBOR + 2.250%), 7/17/25 | 248,120 | 246,259 | ||||
Gray Television, Inc., 4.251%, 2/7/24 | ||||||
(1 Month US LIBOR + 2.250%) | 231,834 | 230,849 | ||||
(1 Month US LIBOR + 2.250%) | 14,416 | 14,355 | ||||
Lions Gate Capital Holdings LLC, 4.341% (1 Month US LIBOR + 2.250%), 3/24/25 | 124,688 | 124,064 | ||||
Radiate Holdco LLC, 5.093% (1 Month US LIBOR + 3.000%), 2/1/24 | 246,875 | 243,132 | ||||
Sinclair Television Group, Inc., 4.350% (1 Month US LIBOR + 2.250%), 1/3/24 | 246,250 | 244,915 | ||||
Univision Communications, Inc., 4.843% (1 Month US LIBOR + 2.750%), 3/15/24 | 247,972 | 239,398 | ||||
Urban One, Inc., 6.100% (1 Month US LIBOR + 4.000%), 4/18/23 | 122,817 | 120,514 | ||||
WideOpenWest Finance LLC, 5.335% (1 Month US LIBOR + 3.250%), 8/19/23 | 248,125 | 236,339 | ||||
2,336,217 | ||||||
Metals & Mining: 1.9% | ||||||
Big River Steel LLC, 7.334% (3 Month US LIBOR + 5.000%), 8/23/23 | 248,125 | 251,073 | ||||
Principal | Value | |||||
Phoenix Services Merger Sub LLC, 5.751% (1 Month US LIBOR + 3.750%), 3/1/25 | 124,688 | 124,843 | ||||
Zekelman Industries, Inc., 4.582% (3 Month US LIBOR + 2.250%), 6/14/21 | 245,019 | 244,406 | ||||
620,322 | ||||||
Metals/Mining Excluding Steel: 0.9% | ||||||
Aleris International, Inc., 6.856% (1 Month US LIBOR + 4.750%), 4/15/23 | 150,000 | 148,546 | ||||
American Rock Salt Co. LLC, 5.843% (1 Month US LIBOR + 3.750%), 3/21/25 | 124,687 | 124,532 | ||||
273,078 | ||||||
Multi-Line Insurance: 0.8% | ||||||
HUB International Ltd., 5.360% (3 Month US LIBOR + 3.000%), 4/25/25 | 250,000 | 248,345 | ||||
Multi-Utilities: 0.4% | ||||||
PowerTeam Services LLC, 5.584% (3 Month US LIBOR + 3.250%), 3/5/25 | 124,688 | 123,052 | ||||
Non-Food & Drug Retailers: 0.8% | ||||||
The Men’s Wearhouse, Inc., 5.482% (1 Month US LIBOR + 3.500%), 4/9/25 | 249,375 | 250,415 | ||||
Oil Field Equipment & Services: 1.2% | ||||||
Keane Group Holdings LLC, 5.750% (1 Month US LIBOR + 3.750%), 5/25/25 | 200,000 | 199,500 | ||||
McDermott Technology Americas, Inc., 7.093% (1 Month US LIBOR + 5.000%), 5/10/25 | 174,563 | 175,217 | ||||
374,717 | ||||||
Oil, Gas & Consumable Fuel: 0.4% | ||||||
Apergy Corp., 4.562% (1 Month US LIBOR + 2.500%), 5/9/25 | 125,000 | 125,000 | ||||
Other Industrial & Manufacturing: 2.5% | ||||||
Harland Clarke Holdings Corp., 7.084% (3 Month US LIBOR + 4.750%), 11/3/23 | 240,726 | 233,906 | ||||
PS HoldCo LLC, 7.297% (1 Month US LIBOR + 5.250%), 3/13/25 | 125,000 | 125,625 | ||||
RBS Global, Inc., 4.341% (1 Month US LIBOR + 2.250%), 8/21/24 | 250,000 | 249,533 | ||||
XPO Logistics, Inc., 4.091% (1 Month US LIBOR + 2.000%), 2/24/25 | 181,427 | 179,774 | ||||
788,838 | ||||||
Packaging: 0.6% | ||||||
Berry Global, Inc., 4.093%, 10/1/22 | ||||||
(1 Month US LIBOR + 2.000%) | 113,080 | 112,838 | ||||
(1 Month US LIBOR + 2.000%) | 72,908 | 72,752 | ||||
185,590 | ||||||
Pharmaceuticals: 0.3% | ||||||
Amneal Pharmaceuticals LLC, 5.625% (2 Month US LIBOR + 3.500%), 5/4/25 | 99,977 | 99,696 | ||||
The Accompanying Notes are an Integral Part of these Financial Statements.
27
PENN CAPITAL FUNDS TRUST |
PENN CAPITAL DEFENSIVE FLOATING RATE INCOME FUND |
SCHEDULE OF INVESTMENTS |
JUNE 30, 2018 |
Principal | Value | |||||
Pharmaceuticals & Devices: 2.3% | ||||||
Endo International PLC, 6.375% (1 Month US LIBOR + 4.250%), 4/27/24 | 247,500 | 246,881 | ||||
Kinetic Concepts, Inc., 5.584% (3 Month US LIBOR + 3.250%), 2/3/24 | 123,128 | 123,166 | ||||
LUX HOLDCO III, 5.099% (2 Month US LIBOR + 3.000%), 3/28/25 | 124,687 | 124,532 | ||||
Valeant Pharmaceuticals International, Inc., 4.982% (1 Month US LIBOR + 3.000%), 5/30/25 | 250,005 | 248,990 | ||||
743,569 | ||||||
Real Estate Investment Trusts (REITs): 0.8% | ||||||
Brookfield Retail Holdings VII Sub 3 LLC, 4.410% (3 Month US LIBOR + 2.500%), 5/7/25 | 250,000 | 245,313 | ||||
Restaurants: 0.8% | ||||||
Burger King, 4.343%, 2/17/24 | ||||||
(1 Month US LIBOR + 2.250%) | 66,885 | 66,551 | ||||
(1 Month US LIBOR + 2.250%) | 54,587 | 54,314 | ||||
P.F. Chang’s China Bistro, Inc., 6.330%, 9/1/22 | ||||||
(3 Month US LIBOR + 5.000%) | 123,128 | 122,358 | ||||
(3 Month US LIBOR + 5.000%) | 624 | 620 | ||||
243,843 | ||||||
Road & Rail: 0.4% | ||||||
Daseke Cos, Inc., 7.093% (1 Month US LIBOR + 5.000%), 2/27/24 | 124,375 | 124,609 | ||||
Semiconductors & Semiconductor Equipment: 0.6% | ||||||
Xperi Corp., 4.593% (1 Month US LIBOR + 2.500%), 12/1/23 | 205,833 | 205,125 | ||||
Software: 0.8% | ||||||
Omnitracs LLC, 5.085% (3 Month US LIBOR + 2.750%), 3/23/25 | 125,000 | 123,360 | ||||
Quest Software US Holdings, Inc., 6.576%, 5/18/25 | ||||||
(3 Month US LIBOR + 4.250%) | 64,827 | 64,530 | ||||
(3 Month US LIBOR + 4.250%) | 63,193 | 62,903 | ||||
(3 Month US LIBOR + 4.250%) | 21,980 | 21,880 | ||||
272,673 | ||||||
Software/Services: 5.2% | ||||||
Almonde, Inc., 5.807%, 6/16/24 | ||||||
(3 Month US LIBOR + 3.500%) | 181,972 | 178,586 | ||||
(3 Month US LIBOR + 3.500%) | 34,635 | 33,990 | ||||
(3 Month US LIBOR + 3.500%) | 31,518 | 30,931 | ||||
Avaya, Inc., 6.323% (1 Month US LIBOR + 4.250%), 12/15/24 | 124,375 | 124,453 | ||||
Blucora, Inc., 5.334% (3 Month US LIBOR + 3.000%), 5/22/24 | 176,667 | 176,446 | ||||
First Data Corp., 4.091% (1 Month US LIBOR + 2.000%), 4/26/24 | 230,733 | 229,208 | ||||
Principal | Value | |||||
Match Group, Inc., 4.585% (1 Month US LIBOR + 2.500%), 11/16/22 | 109,375 | 109,785 | ||||
McAfee LLC, 6.593% (1 Month US LIBOR + 4.500%), 9/29/24 | 248,125 | 249,145 | ||||
MTS Systems Corp., 5.340% (1 Month US LIBOR + 3.250%), 7/5/23 | 214,963 | 214,963 | ||||
New Media Holdings II LLC, 8.343% (1 Month US LIBOR + 6.250%), 7/14/22 | 74,623 | 74,950 | ||||
SS&C European Holdings Sarl, 4.593% (1 Month US LIBOR + 2.500%), 4/16/25 | 64,602 | 64,566 | ||||
SS&C Technologies, Inc., 4.593% (1 Month US LIBOR + 2.500%), 4/16/25 | 170,762 | 170,667 | ||||
1,657,690 | ||||||
Specialty Retail: 0.5% | ||||||
Staples, Inc., 6.358% (3 Month US LIBOR + 4.000%), 9/12/24 | 150,000 | 147,891 | ||||
Support-Services: 4.5% | ||||||
Aramark Services, Inc., 4.084% (3 Month US LIBOR + 1.750%), 3/11/25 | 249,375 | 248,909 | ||||
Monitronics International, Inc., 7.834% (3 Month US LIBOR + 5.500%), 9/30/22 | 74,620 | 71,076 | ||||
Prime Security Services Borrower LLC, 4.843% (1 Month US LIBOR + 2.750%), 5/2/22 | 249,370 | 247,896 | ||||
Pearl Intermediate Parent LLC, 4.800% (3 Month US LIBOR + 2.750%), 2/14/25 (b) | 28,409 | 27,841 | ||||
Pearl Intermediate Parent LLC, 4.835% (1 Month US LIBOR + 2.750%), 2/14/25 | 96,349 | 94,422 | ||||
The ServiceMaster Co. LLC, 4.593% (1 Month US LIBOR + 2.500%), 11/8/23 | 246,250 | 245,531 | ||||
TruGreen LP, 6.046% (1 Month US LIBOR + 4.000%), 4/13/23 | 245,644 | 248,100 | ||||
UOS LLC, 7.593% (1 Month US LIBOR + 5.500%), 4/18/23 | 247,500 | 253,069 | ||||
1,436,844 | ||||||
Telecom-Integrated/Services: 6.2% | ||||||
CenturyLink, Inc., 4.843% (1 Month US LIBOR + 2.750%), 1/31/25 | 224,124 | 219,362 | ||||
Cincinnati Bell, Inc., 5.343% (1 Month US LIBOR + 3.250%), 10/2/24 | 250,000 | 249,647 | ||||
Cyxtera DC Holdings, Inc., 4.380% (3 Month US LIBOR + 3.000%), 5/1/24 | 124,685 | 124,436 | ||||
Frontier Communications Corp., 4.850% (1 Month US LIBOR + 2.750%), 3/31/21 | 147,917 | 145,559 | ||||
Intelsat Jackson Holdings SA, 5.853% (1 Month US LIBOR + 3.750%), 11/27/23 | 125,000 | 124,589 | ||||
Level 3 Parent LLC, 4.334% (1 Month US LIBOR + 2.250%), 2/22/24 | 250,000 | 249,062 | ||||
Maxar Technologies Ltd., 4.854% (1 Month US LIBOR + 2.750%), 10/5/24 | 248,750 | 247,568 | ||||
Sprint Communications, Inc., 4.625% (1 Month US LIBOR + 2.500%), 2/2/24 | 122,505 | 121,841 | ||||
The Accompanying Notes are an Integral Part of these Financial Statements.
28
PENN CAPITAL FUNDS TRUST |
PENN CAPITAL DEFENSIVE FLOATING RATE INCOME FUND |
SCHEDULE OF INVESTMENTS |
JUNE 30, 2018 |
Principal | Value | |||||
Telenet Financing USD LLC, 4.323% (1 Month US LIBOR + 2.250%), 8/15/26 | 250,000 | 247,395 | ||||
Telesat Canada, 4.840% (3 Month US LIBOR + 2.500%), 11/17/23 | 240,511 | 238,481 | ||||
1,967,940 | ||||||
Telecom-Wireless: 1.4% | ||||||
Sable International Finance Ltd., 5.343% (1 Month US LIBOR + 3.250%), 1/31/26 | 250,000 | 249,827 | ||||
Windstream Services LLC, 6.090%, 3/30/21 | ||||||
(1 Month US LIBOR + 4.000%) | 221,707 | 210,147 | ||||
459,974 | ||||||
Trading Companies & Distributors: 0.8% | ||||||
DXP Enterprises, Inc., 7.401% (1 Month US LIBOR + 4.750%), 8/29/23 | 248,125 | 248,435 | ||||
Transportation Excluding Air/Rail: 0.8% | ||||||
CB URS Holdings Corp., 7.343% (1 Month US LIBOR + 5.250%), 10/19/24 | 122,188 | 123,104 | ||||
Deck Chassis Acquisition, Inc., 8.093% (1 Month US LIBOR + 6.000%), 6/15/23 | 125,000 | 125,937 | ||||
249,041 | ||||||
Water Utilities: 0.9% | ||||||
EWT Holdings III Corp., 5.093% (1 Month US LIBOR + 3.000%), 12/20/24 | 157,458 | 157,262 | ||||
Shape Technologies Group, Inc., 5.153%, 4/20/25 | ||||||
(1 Month US LIBOR + 3.000%) | 100,000 | 99,500 | ||||
(3 Month US LIBOR + 3.000%) | 12,500 | 12,438 | ||||
(6 Month US LIBOR + 3.000%) | 12,500 | 12,437 | ||||
281,637 | ||||||
Total Bank Loans (cost $27,150,118) | 27,165,232 | |||||
Corporate Bonds: 11.9% | ||||||
Chemicals: 0.2% | ||||||
CF Industries, Inc., 7.125%, 5/1/20 | 47,000 | 49,644 | ||||
Consumer/Commercial/Lease Financing: 0.5% | ||||||
Navient Corp., 8.000%, 3/25/20 | 150,000 | 158,250 | ||||
Electric-Generation: 0.9% | ||||||
DPL, Inc., 7.250%, 10/15/21 | 150,000 | 161,977 | ||||
NRG Energy, Inc., 6.250%, 7/15/22 | 115,000 | 118,341 | ||||
280,318 | ||||||
Electric-Integrated: 0.4% | ||||||
Vistra Energy Corp., 5.875%, 6/1/23 | 125,000 | 128,594 | ||||
Entertainment: 0.3% | ||||||
NCL Corp. Ltd., 4.750%, 12/15/21 (c) | 101,000 | 100,748 | ||||
Food & Drug Retailers: 0.2% | ||||||
Ingles Markets, Inc., 5.750%, 6/15/23 | 70,000 | 68,950 | ||||
Principal | Value | |||||
Gas Distribution: 0.4% | ||||||
NGL Energy Partners LP, 5.125%, 7/15/19 | 130,000 | 130,163 | ||||
Health Services: 0.6% | ||||||
Universal Hospital Services, Inc., 7.625%, 8/15/20 | 195,000 | 194,513 | ||||
Hospitals: 0.4% | ||||||
HCA, Inc., 7.500%, 2/15/22 | 125,000 | 135,937 | ||||
Investments & Miscellaneous Financial Services: 0.9% | ||||||
Icahn Enterprises LP, 6.750%, 2/1/24 | 195,000 | 196,462 | ||||
Icahn Enterprises, LP, 6.250%, 2/1/22 | 100,000 | 102,000 | ||||
298,462 | ||||||
Media-Cable: 1.6% | ||||||
Altice France SA, 6.000%, 5/15/22 (c) | 200,000 | 201,250 | ||||
DISH DBS Corp., 7.875%, 9/1/19 | 75,000 | 77,812 | ||||
DISH DBS Corp., 5.875%, 7/15/22 | 230,000 | 216,200 | ||||
495,262 | ||||||
Metals/Mining Excluding Steel: 0.2% | ||||||
Peabody Energy Corp., 6.000%, 3/31/22 (c) | 65,000 | 65,813 | ||||
Non-Food & Drug Retailers: 0.4% | ||||||
Hot Topic, Inc., 9.250%, 6/15/21 (c) | 140,000 | 133,525 | ||||
Oil Field Equipment & Services: 0.4% | ||||||
Nabors Industries, Inc., 4.625%, 9/15/21 | 125,000 | 122,188 | ||||
Pharmaceuticals & Devices: 0.9% | ||||||
Mallinckrodt International Finance SA, 4.875%, 4/15/20 (c) | 150,000 | 147,375 | ||||
Valeant Pharmaceuticals International, Inc., 5.875%, 5/15/23 (c) | 150,000 | 140,906 | ||||
288,281 | ||||||
Steel Producers & Products: 0.7% | ||||||
United States Steel Corp., 7.375%, 4/1/20 | 102,000 | 108,120 | ||||
Joseph T Ryerson & Son, Inc., 11.000%, 5/15/22 (c) | 100,000 | 110,000 | ||||
218,120 | ||||||
Support-Services: 0.4% | ||||||
The Hertz Corp., 5.875%, 10/15/20 | 125,000 | 122,187 | ||||
Telecom-Integrated/Services: 2.1% | ||||||
Frontier Communications Corp., 8.125%, 10/1/18 | 195,000 | 195,975 | ||||
Gogo Intermediate Holdings LLC, 12.500%, 7/1/22 (c) | 115,000 | 122,762 | ||||
Hughes Satellite Systems Corp., 7.625%, 6/15/21 | 125,000 | 132,969 | ||||
Qwest Corp., 6.750%, 12/1/21 | 125,000 | 133,002 | ||||
Uniti Group LP, 6.000%, 4/15/23 (c) | 80,000 | 77,150 | ||||
661,858 | ||||||
Telecom-Wireless: 0.4% | ||||||
Sprint Communications, Inc., 6.000%, 11/15/22 | 125,000 | 123,906 | ||||
Total Corporate Bonds (cost $3,797,052) | 3,776,719 | |||||
The Accompanying Notes are an Integral Part of these Financial Statements.
29
PENN CAPITAL FUNDS TRUST |
PENN CAPITAL DEFENSIVE FLOATING RATE INCOME FUND |
SCHEDULE OF INVESTMENTS |
JUNE 30, 2018 |
Shares | ||||||
Short-Term Investment: 6.0% | ||||||
Money Market Fund: 6.0% | ||||||
Short-Term Investment Trust Treasury Portfolio Institutional Class, 1.750% (d) | 1,895,482 | 1,895,482 | ||||
Total Short-Term Investment (cost $1,895,482) | 1,895,482 | |||||
Total Investments - 103.5% (cost $32,842,652) | 32,837,433 | |||||
Liabilities in Excess of Other Assets (3.5)% | (1,108,677 | ) | ||||
Net Assets: 100.0% | $ | 31,728,756 | ||||
Percentages are stated as a percent of net assets.
| (a) | Bank Loans typically have rates of interest which are redetermined either daily, monthly, quarterly or semi-annually by reference to a base lending rate, plus a premium. These base lending rates are primarily the London Interbank Offered Rate (“LIBOR”) and secondarily, the prime rate offered by one or more major United States banks (the “Prime Rate”) and the certificate of deposit (“CD”) rate or other base lending rates used by commercial lenders. |
| (b) | All or a portion of the loan is unfunded. |
| (c) | Securities purchased pursuant to Rule 144A of the Securities Act of 1933, as amended, and may be sold only to dealers in that program or other “qualified institutional buyers.” As of June 30, 2018, the value of these investments was $1,099,529, or 3.5% of total net assets. |
| (d) | Rate reported is the 7-day effective yield as of June 30, 2018. |
Country Exposure (as a percentage of total investments) (Unaudited) | |||
United States | 98.20 | % | |
France | 0.61 | % | |
Luxembourg | 0.45 | % | |
Canada | 0.43 | % | |
Bermuda | 0.31 | % | |
Asset Type (as a percentage of total investments) (Unaudited) |
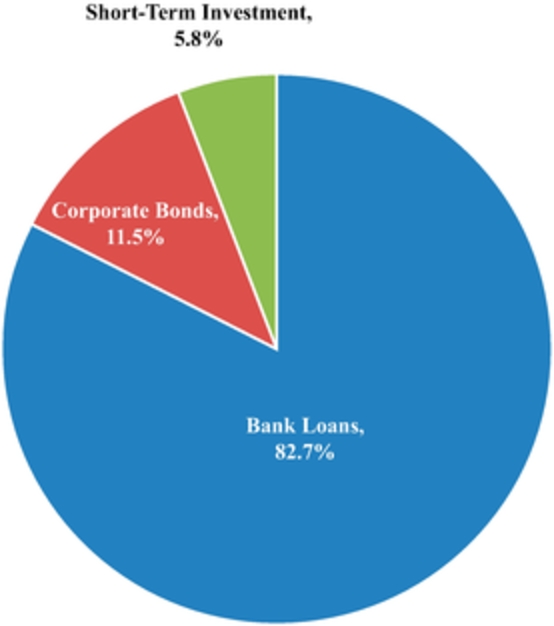
The Accompanying Notes are an Integral Part of these Financial Statements.
30
PENN CAPITAL FUNDS TRUST |
PENN CAPITAL DEFENSIVE SHORT DURATION HIGH INCOME FUND |
SCHEDULE OF INVESTMENTS |
JUNE 30, 2018 |
Principal | Value | |||||
Corporate Bonds: 80.3% | ||||||
Aerospace: 1.3% | ||||||
Bombardier, Inc., 8.750%, 12/1/21 (a) | 60,000 | $ | 66,000 | |||
Bombardier, Inc., 7.750%, 3/15/20 (a) | 95,000 | 100,225 | ||||
166,225 | ||||||
Airline Companies: 2.3% | ||||||
Air Canada, 7.750%, 4/15/21 (a) | 129,000 | 137,707 | ||||
Allegiant Travel Co., 5.500%, 7/15/19 | 80,000 | 80,400 | ||||
American Airlines Group, Inc., 5.500%, 10/1/19 (a) | 65,000 | 65,650 | ||||
283,757 | ||||||
Auto Parts & Equipment: 1.0% | ||||||
American Axle & Manufacturing, Inc., 7.750%, 11/15/19 | 45,000 | 47,250 | ||||
The Goodyear Tire & Rubber Co., 8.750%, 8/15/20 | 75,000 | 81,562 | ||||
128,812 | ||||||
Automotive: 2.0% | ||||||
Fiat Chrysler Automobiles NV, 4.500%, 4/15/20 | 200,000 | 199,938 | ||||
Penske Automotive Group, Inc., 3.750%, 8/15/20 | 45,000 | 44,550 | ||||
244,488 | ||||||
Banking: 5.1% | ||||||
Ally Financial, Inc., 4.125%, 2/13/22 | 60,000 | 58,932 | ||||
Ally Financial, Inc., 8.000%, 12/31/18 | 75,000 | 76,406 | ||||
Ally Financial, Inc., 8.000%, 3/15/20 | 155,000 | 165,656 | ||||
Ally Financial, Inc., 3.750%, 11/18/19 | 60,000 | 59,925 | ||||
CIT Group, Inc., 5.375%, 5/15/20 | 165,000 | 169,331 | ||||
CIT Group, Inc., 4.125%, 3/9/21 | 110,000 | 109,313 | ||||
639,563 | ||||||
Building & Construction: 1.8% | ||||||
KB Home, 8.000%, 3/15/20 | 75,000 | 79,875 | ||||
Lennar Corp., 8.375%, 1/15/21 | 65,000 | 71,012 | ||||
Toll Brothers Finance Corp., 6.750%, 11/1/19 | 35,000 | 36,444 | ||||
William Lyon Homes, Inc., 7.000%, 8/15/22 | 40,000 | 40,750 | ||||
228,081 | ||||||
Chemical Companies: 1.7% | ||||||
Blue Cube Spinco LLC, 9.750%, 10/15/23 | 55,000 | 62,150 | ||||
CF Industries, Inc., 7.125%, 5/1/20 | 54,000 | 57,038 | ||||
Huntsman International LLC, 4.875%, 11/15/20 | 90,000 | 91,350 | ||||
210,538 | ||||||
Computer Hardware: 2.3% | ||||||
EMC Corp., 2.650%, 6/1/20 | 290,000 | 281,619 | ||||
Consumer/Commercial/Lease Financing: 4.9% | ||||||
Aircastle Ltd., 6.250%, 12/1/19 | 55,000 | 56,783 | ||||
International Lease Finance Corp., 6.250%, 5/15/19 | 70,000 | 71,769 | ||||
Navient Corp., 8.000%, 3/25/20 | 360,000 | 379,800 | ||||
Principal | Value | |||||
Navient Corp., 6.500%, 6/15/22 | 40,000 | 40,950 | ||||
Springleaf Finance Corp., 8.250%, 12/15/20 | 50,000 | 54,000 | ||||
603,302 | ||||||
Diversified Capital Goods: 0.5% | ||||||
Anixter, Inc., 5.625%, 5/1/19 | 60,000 | 61,050 | ||||
Electric-Generation: 2.5% | ||||||
DPL, Inc., 7.250%, 10/15/21 | 105,000 | 113,384 | ||||
DPL, Inc., 6.750%, 10/1/19 | 27,000 | 27,844 | ||||
NRG Energy, Inc., 6.250%, 7/15/22 | 95,000 | 97,760 | ||||
Vistra Energy Corp., 7.375%, 11/1/22 | 65,000 | 67,925 | ||||
306,913 | ||||||
Energy-Exploration & Production: 2.2% | ||||||
Comstock Resources, Inc., 10.000% Cash or 12.250% PIK, 3/15/20 (b) | 60,000 | 62,700 | ||||
Resolute Energy Corp., 8.500%, 5/1/20 | 65,000 | 64,959 | ||||
SM Energy Co., 6.500%, 11/15/21 | 55,000 | 56,265 | ||||
Unit Corp., 6.625%, 5/15/21 | 25,000 | 24,937 | ||||
WPX Energy, Inc., 8.250%, 8/1/23 | 55,000 | 62,288 | ||||
271,149 | ||||||
Entertainment: 0.6% | ||||||
NCL Corp. Ltd., 4.750%, 12/15/21 (a) | 70,000 | 69,825 | ||||
Food & Drug Retailers: 0.5% | ||||||
Albertsons Cos, Inc., 6.085% (3 Month LIBOR USD + 3.750%), 1/15/24 (a)(c) | 60,000 | 60,150 | ||||
Food-Wholesale: 1.0% | ||||||
JBS USA LUX SA, 7.250%, 6/1/21 (a) | 40,000 | 40,400 | ||||
JBS USA LUX SA, 7.250%, 6/1/21 (a) | 40,000 | 40,400 | ||||
TreeHouse Foods, Inc., 4.875%, 3/15/22 | 45,000 | 45,056 | ||||
125,856 | ||||||
Gaming: 4.4% | ||||||
GLP Capital LP, 4.375%, 4/15/21 | 120,000 | 120,000 | ||||
MGM Resorts International, 6.750%, 10/1/20 | 255,000 | 267,113 | ||||
MGM Resorts International, 8.625%, 2/1/19 | 40,000 | 41,000 | ||||
Scientific Games International, Inc., 10.000%, 12/1/22 | 115,000 | 122,475 | ||||
550,588 | ||||||
Gas Distribution: 5.9% | ||||||
DCP Midstream Operating LP, 5.350%, 3/15/20 (a) | 40,000 | 40,750 | ||||
DCP Midstream Operating LP, 9.750%, 3/15/19 (a) | 80,000 | 83,300 | ||||
Energy Transfer Equity LP, 7.500%, 10/15/20 | 240,000 | 255,900 | ||||
Midcontinent Express Pipeline LLC, 6.700%, 9/15/19 (a) | 105,000 | 108,097 | ||||
NGL Energy Partners LP, 5.125%, 7/15/19 | 95,000 | 95,119 | ||||
Rockies Express Pipeline LLC, 5.625%, 4/15/20 (a) | 145,000 | 148,444 | ||||
731,610 | ||||||
The Accompanying Notes are an Integral Part of these Financial Statements.
31
PENN CAPITAL FUNDS TRUST |
PENN CAPITAL DEFENSIVE SHORT DURATION HIGH INCOME FUND |
SCHEDULE OF INVESTMENTS |
JUNE 30, 2018 |
Principal | Value | |||||
Health Services: 2.4% | ||||||
Fresenius Medical Care US Finance II, Inc., 5.625%, 7/31/19 (a) | 65,000 | 66,584 | ||||
Kindred Healthcare, Inc., 8.000%, 1/15/20 | 15,000 | 16,073 | ||||
Select Medical Corp., 6.375%, 6/1/21 | 115,000 | 116,567 | ||||
Universal Hospital Services, Inc., 7.625%, 8/15/20 | 95,000 | 94,762 | ||||
293,986 | ||||||
Hospitals: 7.0% | ||||||
HCA Healthcare, Inc., 6.250%, 2/15/21 | 205,000 | 212,687 | ||||
HCA, Inc., 7.500%, 2/15/22 | 100,000 | 108,750 | ||||
HCA, Inc., 3.750%, 3/15/19 | 55,000 | 55,206 | ||||
HCA, Inc., 6.500%, 2/15/20 | 80,000 | 83,300 | ||||
Tenet Healthcare Corp., 4.750%, 6/1/20 | 45,000 | 45,113 | ||||
Tenet Healthcare Corp., 6.000%, 10/1/20 | 353,000 | 362,708 | ||||
867,764 | ||||||
Hotels: 1.1% | ||||||
RHP Hotel Properties LP, 5.000%, 4/15/21 | 50,000 | 50,125 | ||||
Wyndham Destinations, Inc., 5.625%, 3/1/21 | 90,000 | 92,025 | ||||
142,150 | ||||||
Investments & Miscellaneous Financial Services: 2.1% | ||||||
Icahn Enterprises LP, 6.000%, 8/1/20 | 185,000 | 187,313 | ||||
Icahn Enterprises LP, 6.250%, 2/1/22 | 73,000 | 74,460 | ||||
261,773 | ||||||
Media-Broadcast: 0.4% | ||||||
Sinclair Television Group, Inc., 5.375%, 4/1/21 | 45,000 | 45,338 | ||||
Media-Cable: 3.4% | ||||||
Cablevision Systems Corp., 8.000%, 4/15/20 | 110,000 | 115,467 | ||||
CSC Holdings LLC, 6.750%, 11/15/21 | 60,000 | 62,850 | ||||
DISH DBS Corp., 5.125%, 5/1/20 | 35,000 | 34,650 | ||||
DISH DBS Corp., 6.750%, 6/1/21 | 100,000 | 100,125 | ||||
DISH DBS Corp., 7.875%, 9/1/19 | 110,000 | 114,125 | ||||
427,217 | ||||||
Media-Diversified: 0.2% | ||||||
Netflix, Inc., 5.375%, 2/1/21 | 25,000 | 25,695 | ||||
Metals/Mining Excluding Steel: 2.3% | ||||||
Arconic, Inc., 6.150%, 8/15/20 | 115,000 | 119,600 | ||||
Freeport-McMoRan, Inc., 3.100%, 3/15/20 | 105,000 | 102,900 | ||||
Peabody Energy Corp., 6.000%, 3/31/22 (a) | 65,000 | 65,812 | ||||
288,312 | ||||||
Non-Food & Drug Retailers: 2.0% | ||||||
Hot Topic, Inc., 9.250%, 6/15/21 (a) | 45,000 | 42,919 | ||||
L Brands, Inc., 7.000%, 5/1/20 | 160,000 | 168,000 | ||||
The Men’s Wearhouse, Inc., 7.000%, 7/1/22 | 40,000 | 41,300 | ||||
252,219 | ||||||
Office Equipment: 0.5% | ||||||
Avnet, Inc., 3.750%, 12/1/21 | 60,000 | 59,782 | ||||
Principal | Value | |||||
Oil Field Equipment & Services: 1.8% | ||||||
Nabors Industries, Inc., 4.625%, 9/15/21 | 20,000 | 19,550 | ||||
Nabors Industries, Inc., 9.250%, 1/15/19 | 47,000 | 48,645 | ||||
Rowan Cos, Inc., 7.875%, 8/1/19 | 50,000 | 51,500 | ||||
SESI LLC, 7.125%, 12/15/21 | 45,000 | 45,788 | ||||
Transocean, Inc., 8.375%, 12/15/21 | 60,000 | 64,200 | ||||
229,683 | ||||||
Oil Refining & Marketing: 0.3% | ||||||
PBF Holding Co. LLC, 7.000%, 11/15/23 | 40,000 | 41,400 | ||||
Packaging: 1.5% | ||||||
Greif, Inc., 7.750%, 8/1/19 | 50,000 | 51,750 | ||||
Reynolds Group Issuer, Inc., 5.750%, 10/15/20 | 130,829 | 131,320 | ||||
183,070 | ||||||
Pharmaceuticals & Devices: 2.2% | ||||||
Kinetic Concepts, Inc., 7.875%, 2/15/21 (a) | 70,000 | 71,050 | ||||
Mallinckrodt International Finance SA, 4.875%, 4/15/20 (a) | 60,000 | 58,950 | ||||
Teva Pharmaceutical Finance IV LLC, 2.250%, 3/18/20 | 60,000 | 57,834 | ||||
Valeant Pharmaceuticals International, Inc., 7.500%, 7/15/21 (a) | 80,000 | 81,250 | ||||
269,084 | ||||||
Printing & Publishing: 0.5% | ||||||
Harland Clarke Holdings Corp., 6.875%, 3/1/20 (a) | 65,000 | 64,350 | ||||
Real Estate Investment Trusts (REITs): 1.1% | ||||||
iStar, Inc., 4.625%, 9/15/20 | 140,000 | 137,900 | ||||
Software/Services: 0.6% | ||||||
Symantec Corp., 4.200%, 9/15/20 | 75,000 | 75,215 | ||||
Steel Producers/Products: 3.0% | ||||||
AK Steel Corp., 7.625%, 10/1/21 | 65,000 | 66,280 | ||||
ArcelorMittal, 5.125%, 6/1/20 | 75,000 | 76,875 | ||||
Joseph T. Ryerson & Son, Inc., 11.000%, 5/15/22 (a) | 50,000 | 55,000 | ||||
United States Steel Corp., 7.375%, 4/1/20 | 160,000 | 169,600 | ||||
367,755 | ||||||
Support-Services: 1.5% | ||||||
CoreCivic, Inc., 4.125%, 4/1/20 | 75,000 | 74,812 | ||||
The ADT Corp., 6.250%, 10/15/21 | 55,000 | 56,925 | ||||
The Hertz Corp., 5.875%, 10/15/20 | 60,000 | 58,650 | ||||
190,387 | ||||||
Telecom-Integrated/Services: 3.5% | ||||||
CenturyLink, Inc., 5.625%, 4/1/20 | 70,000 | 70,787 | ||||
Frontier Communications Corp., 8.125%, 10/1/18 | 120,000 | 120,600 | ||||
Frontier Communications Corp., 7.125%, 3/15/19 | 20,000 | 20,150 | ||||
Gogo Intermediate Holdings LLC, 12.500%, 7/1/22 (a) | 35,000 | 37,363 | ||||
The Accompanying Notes are an Integral Part of these Financial Statements.
32
PENN CAPITAL FUNDS TRUST |
PENN CAPITAL DEFENSIVE SHORT DURATION HIGH INCOME FUND |
SCHEDULE OF INVESTMENTS |
JUNE 30, 2018 |
Principal | Value | |||||
Hughes Satellite Systems Corp., 6.500%, 6/15/19 | 65,000 | 66,524 | ||||
Hughes Satellite Systems Corp., 7.625%, 6/15/21 | 35,000 | 37,231 | ||||
Qwest Corp., 6.750%, 12/1/21 | 72,000 | 76,609 | ||||
429,264 | ||||||
Telecom-Wireless: 2.6% | ||||||
Sprint Capital Corp., 6.900%, 5/1/19 | 80,000 | 81,616 | ||||
Sprint Communications, Inc., 7.000%, 8/15/20 | 180,000 | 186,300 | ||||
Sprint Corp., 7.250%, 9/15/21 | 55,000 | 57,200 | ||||
325,116 | ||||||
Transportation Excluding Air/Rail: 0.3% | ||||||
XPO Logistics, Inc., 6.500%, 6/15/22 (a) | 40,000 | 41,000 | ||||
Total Corporate Bonds (cost $10,109,084) | 9,981,986 | |||||
Shares | ||||||
Mutual Fund: 14.9% | ||||||
Penn Capital Defensive Floating Rate Income Fund - Institutional Class (d) | 183,599 | 1,852,519 | ||||
Total Mutual Fund (cost $1,865,035) | 1,852,519 | |||||
Short-Term Investment: 3.1% | ||||||
Money Market Fund: 3.1% | ||||||
Short-Term Investment Trust Treasury Portfolio Institutional Class, 1.750% (e) | 386,382 | 386,382 | ||||
Total Short-Term Investment (cost $386,382) | 386,382 | |||||
Total Investments - 98.3% (cost $12,360,501) | 12,220,887 | |||||
Other Assets and Liabilities 1.7% | 214,955 | |||||
Net Assets: 100.0% | $ | 12,435,842 | ||||
Percentages are stated as a percent of net assets.
| (a) | Securities purchased pursuant to Rule 144A of the Securities Act of 1933, as amended, and may be sold only to dealers in that program or other “qualified institutional buyers.” As of June 30, 2018, the value of these investments was $1,545,226, or 12.4% of total net assets. |
| (b) | Payment-in-kind security which may pay interest/dividends in additional par/shares and/or in cash. As of June 30, 2018, the total payment-in-kind was $0, or 0.0% of total net assets. |
| (c) | Variable rate security. The rate listed is as of June 30, 2018. |
| (d) | Affiliated company. See Note 7. |
| (e) | Rate reported is the 7-day effective yield as of June 30, 2018. |
Country Exposure (as a percentage of total investments) (Unaudited) | |||
United States | 92.54 | % | |
Canada | 3.15 | % | |
Netherlands | 1.64 | % | |
Luxembourg | 1.11 | % | |
Bermuda | 1.04 | % | |
Cayman Islands | 0.52 | % | |
Asset Type (as a percentage of total investments) (Unaudited) |
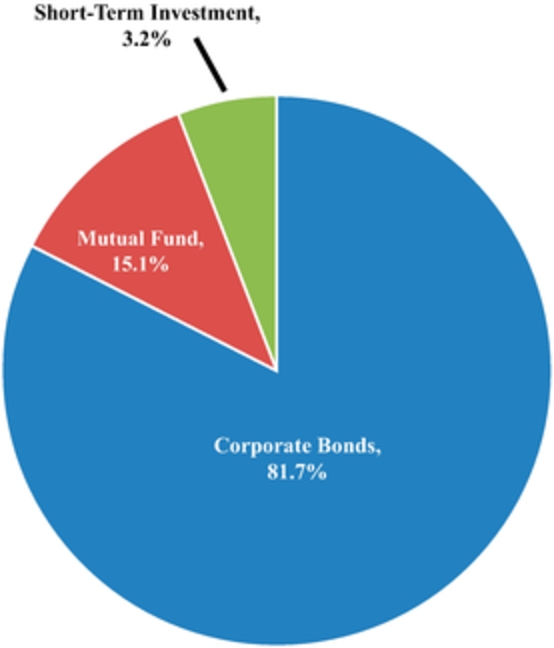
The Accompanying Notes are an Integral Part of these Financial Statements.
33
PENN CAPITAL FUNDS TRUST
STATEMENTS OF ASSETS AND LIABILITIES
JUNE 30, 2018
Assets | Penn Capital Managed Alpha SMID Cap Equity Fund | Penn Capital Special Situations Small Cap Equity Fund | Penn Capital Multi-Credit High Income Fund | Penn Capital Defensive Floating Rate Income Fund | Penn Capital Defensive Short Duration High Income Fund | ||||||||||
Investments, at fair value(1) | |||||||||||||||
Unaffiliated issuers | $ | 14,952,447 | $ | 21,173,601 | $ | 11,706,338 | $ | 32,837,433 | $ | 10,368,368 | |||||
Affiliated mutual fund (see Note 7) | — | — | 2,503,862 | — | 1,852,519 | ||||||||||
14,952,447 | 21,173,601 | 14,210,200 | 32,837,433 | 12,220,887 | |||||||||||
Receivables: | |||||||||||||||
Advisor reimbursement due | 17,823 | 12,011 | 24,767 | 23,777 | 26,643 | ||||||||||
Dividends and interest | 10,295 | 6,668 | 180,176 | 210,485 | 159,503 | ||||||||||
Investments sold | 316,026 | 628,672 | 21,403 | 475,916 | 15,265 | ||||||||||
Fund shares sold | 4,050 | 8,024 | — | — | 75,500 | ||||||||||
Cash | 521 | 1,092 | — | — | — | ||||||||||
Other assets | 3,503 | 8,496 | 2,543 | 6,728 | 7,807 | ||||||||||
Total assets | 15,304,665 | 21,838,564 | 14,439,089 | 33,554,339 | 12,505,605 | ||||||||||
Liabilities | |||||||||||||||
Payables: | |||||||||||||||
Investments purchased | 330,000 | 434,862 | 546,367 | 1,735,670 | — | ||||||||||
Fund shares redeemed | — | 43,637 | — | 2,300 | — | ||||||||||
Accrued expenses: | |||||||||||||||
Professional fees | 28,413 | 28,718 | 38,413 | 38,718 | 40,557 | ||||||||||
Administration fees | 16,701 | 16,741 | 24,921 | 29,906 | 17,952 | ||||||||||
Custody fees | 1,843 | 4,070 | 2,135 | 2,808 | 1,766 | ||||||||||
Transfer agent fees and expenses | 4,919 | 5,938 | 4,623 | 6,236 | 4,200 | ||||||||||
Trustee fees and expenses | 1,720 | 2,473 | 1,417 | 3,302 | 1,313 | ||||||||||
Other accrued expenses | 10,886 | 13,217 | 7,353 | 6,643 | 3,975 | ||||||||||
Total liabilities | 394,482 | 549,656 | 625,229 | 1,825,583 | 69,763 | ||||||||||
Net assets | $ | 14,910,183 | $ | 21,288,908 | $ | 13,813,860 | $ | 31,728,756 | $ | 12,435,842 | |||||
Composition of Net Assets | |||||||||||||||
Paid-in capital | $ | 11,258,866 | $ | 17,394,232 | $ | 13,741,861 | $ | 31,668,434 | $ | 12,549,307 | |||||
Accumulated net investment income | — | — | 43,679 | 115,673 | 33,307 | ||||||||||
Accumulated net realized gain (loss) on investments | 1,293,288 | 1,086,502 | (5,031 | ) | (50,132 | ) | (7,158 | ) | |||||||
Net unrealized appreciation (depreciation) on investments | 2,358,029 | 2,808,174 | 33,351 | (5,219 | ) | (139,614 | ) | ||||||||
Net assets | $ | 14,910,183 | $ | 21,288,908 | $ | 13,813,860 | $ | 31,728,756 | $ | 12,435,842 | |||||
Institutional Class | |||||||||||||||
Net assets applicable to outstanding shares | $ | 14,910,183 | $ | 21,288,908 | $ | 13,813,860 | $ | 31,728,756 | $ | 12,435,842 | |||||
Shares of beneficial interest outstanding, no par value, unlimited authorization | 1,100,696 | 1,690,323 | 1,373,371 | 3,146,049 | 1,262,518 | ||||||||||
Net asset value per share outstanding | $ | 13.55 | $ | 12.59 | $ | 10.06 | $ | 10.09 | $ | 9.85 | |||||
Investor Class (2) | |||||||||||||||
Net assets applicable to outstanding shares | $ | — | $ | — | $ | — | $ | — | $ | — | |||||
Shares of beneficial interest outstanding, no par value, unlimited authorization | — | — | — | — | — | ||||||||||
Net asset value per share outstanding | $ | — | $ | — | $ | — | $ | — | $ | — | |||||
_________ (1) Investment in securities at cost | |||||||||||||||
Unaffiliated issuers | $ | 12,594,418 | $ | 18,365,430 | $ | 11,656,575 | $ | 32,842,652 | $ | 10,495,466 | |||||
Affiliated mutual fund (see Note 7) | — | — | 2,520,274 | — | 1,865,035 | ||||||||||
(2) No information is provided for Investor Share Class shares because shares of that Class had not yet been issued as of June 30, 2018. | |||||||||||||||
The accompanying Notes are an integral part of the financial statements.
34
PENN CAPITAL FUNDS TRUST
STATEMENTS OF OPERATIONS
JUNE 30, 2018
Penn Capital Managed Alpha SMID Cap Equity Fund | Penn Capital Special Situations Small Cap Equity Fund | Penn Capital Multi-Credit High Income Fund | Penn Capital Defensive Floating Rate Income Fund | Penn Capital Defensive Short Duration High Income Fund | |||||||||||
Investment Income (Loss) | July 1, 2017 - June 30, 2018 | July 1, 2017 - June 30, 2018 | July 1, 2017 - June 30, 2018 | July 1, 2017 - June 30, 2018 | July 17, 2017* - June 30, 2018 | ||||||||||
Income | |||||||||||||||
Dividends** | |||||||||||||||
Unaffiliated dividends | $ | 89,402 | $ | 91,120 | $ | 656 | $ | — | $ | —- | |||||
Dividend distributions from affiliated mutual fund (see Note 7) | — | — | 44,283 | — | 35,038 | ||||||||||
Interest | 5,729 | 3,202 | 671,951 | 1,405,582 | 246,950 | ||||||||||
Total income | 95,131 | 94,322 | 716,890 | 1,405,582 | 281,988 | ||||||||||
Expenses | |||||||||||||||
Investment advisory fees | 119,195 | 198,297 | 74,798 | 158,946 | 35,111 | ||||||||||
Administration and accounting | 63,175 | 64,094 | 96,283 | 138,748 | 68,567 | ||||||||||
Professional fees | 45,705 | 46,068 | 56,054 | 60,929 | 48,599 | ||||||||||
Registration | 27,316 | 28,615 | 27,400 | 27,420 | 13,878 | ||||||||||
Transfer agent expense | 19,159 | 22,131 | 17,897 | 23,094 | 16,138 | ||||||||||
Compliance fees | 14,060 | 14,176 | 14,019 | 14,359 | 12,834 | ||||||||||
Miscellaneous | 8,874 | 8,874 | 113 | 114 | 114 | ||||||||||
Custodian | 6,941 | 10,610 | 7,927 | 14,492 | 6,570 | ||||||||||
Trustees | 5,529 | 7,871 | 4,590 | 11,505 | 4,735 | ||||||||||
Insurance | 4,706 | 8,471 | 3,695 | 10,170 | 554 | ||||||||||
Shareholder servicing fees | 741 | 10,266 | 897 | 4,007 | 83 | ||||||||||
Shareholder communication | 108 | 16,995 | 450 | 1,592 | 3,342 | ||||||||||
Total expenses | 315,509 | 436,468 | 304,123 | 465,376 | 210,525 | ||||||||||
Expense waiver and reimbursement from Advisor | (175,125 | ) | (208,947 | ) | (226,073 | ) | (281,780 | ) | (168,391 | ) | |||||
Net expenses | 140,384 | 227,521 | 78,050 | 183,596 | 42,134 | ||||||||||
Net investment income (loss) | (45,253 | ) | (133,199 | ) | 638,840 | 1,221,986 | 239,854 | ||||||||
Realized and Unrealized Gain (Loss) on Investments | |||||||||||||||
Net realized gain (loss) on investments | |||||||||||||||
Unaffiliated issuers | 1,333,038 | 2,322,912 | 1,085 | (49,428 | ) | (7,382 | ) | ||||||||
Capital gain distribution from affiliated mutual fund (see Note 7) | — | — | 5,991 | — | 4,997 | ||||||||||
Net change in unrealized appreciation (depreciation) | 815,952 | 1,826,691 | (261,461 | ) | (177,558 | ) | (139,614 | ) | |||||||
Net realized and unrealized gain (loss) on investments | 2,148,990 | 4,149,603 | (254,385 | ) | (226,986 | ) | (141,999 | ) | |||||||
Net increase in net assets resulting from operations | $ | 2,103,737 | $ | 4,016,404 | $ | 384,455 | $ | 995,000 | $ | 97,855 | |||||
**Net of foreign taxes withheld of: | $ | 56 | $ | 28 | $ | — | $ | — | $ | — | |||||
_________ * Commencement of operations. | |||||||||||||||
The accompanying Notes are an integral part of the financial statements.
35
PENN CAPITAL FUNDS TRUST
STATEMENTS OF CHANGES IN NET ASSETS
JUNE 30, 2018
Penn Capital Managed Alpha SMID Cap Equity Fund | Penn Capital Special Situations Small Cap Equity Fund | Penn Capital Multi-Credit High Income Fund | Penn Capital Defensive Floating Rate Income Fund | Penn Capital Defensive Short Duration High Income Fund | |||||||||||||||||||||||
Increase (Decrease) in Net Assets | Year Ended June 30, 2018 | Year Ended June 30, 2017 | Year Ended June 30, 2018 | Year Ended June 30, 2017 | Year Ended June 30, 2018 | Year Ended June 30, 2017 | Year Ended June 30, 2018 | Year Ended June 30, 2017 | July 17, 2017* - June 30, 2018 | ||||||||||||||||||
Operations | |||||||||||||||||||||||||||
Net investment income (loss) | $ | (45,253 | ) | $ | (29,053 | ) | $ | (133,199 | ) | $ | (78,582 | ) | $ | 638,840 | $ | 603,650 | $ | 1,221,986 | $ | 844,177 | $ | 239,854 | |||||
Net realized gain (loss) on investments: | |||||||||||||||||||||||||||
Unaffiliated issuers | 1,333,038 | 324,087 | 2,322,912 | 1,733,389 | 1,085 | 366,485 | (49,428 | ) | 228,049 | (7,382 | ) | ||||||||||||||||
Capital gain distribution from affiliated mutual fund | — | — | — | — | 5,991 | — | — | — | 4,997 | ||||||||||||||||||
Net change in unrealized appreciation (depreciation) | 815,952 | 1,669,969 | 1,826,691 | 408,497 | (261,461 | ) | 99,903 | (177,558 | ) | 73,586 | (139,614 | ) | |||||||||||||||
Net increase in net assets resulting from operations | 2,103,737 | 1,965,003 | 4,016,404 | 2,063,304 | 384,455 | 1,070,038 | 995,000 | 1,145,812 | 97,855 | ||||||||||||||||||
Dividends and distributions to shareholders | |||||||||||||||||||||||||||
From net investment income | |||||||||||||||||||||||||||
Institutional Class | — | — | — | — | (632,448 | ) | (596,135 | ) | (1,186,100 | ) | (826,690 | ) | (211,320 | ) | |||||||||||||
From realized gain | |||||||||||||||||||||||||||
Institutional Class | (217,398 | ) | — | (2,239,983 | ) | (850,482 | ) | (222,565 | ) | — | (167,014 | ) | (95,164 | ) | — | ||||||||||||
Total dividends and distributions to shareholders | (217,398 | ) | — | (2,239,983 | ) | (850,482 | ) | (855,013 | ) | (596,135 | ) | (1,353,114 | ) | (921,854 | ) | (211,320 | ) | ||||||||||
Capital share transactions | |||||||||||||||||||||||||||
Net proceeds from sale of shares | 2,179,641 | 240,732 | 6,262,562 | 12,938,608 | 4,996,417 | 457,456 | 7,039,836 | 6,674,297 | 12,597,665 | ||||||||||||||||||
Dividends and distributions reinvested | 217,014 | — | 2,233,477 | 845,459 | 824,258 | 558,116 | 1,346,434 | 916,744 | 211,090 | ||||||||||||||||||
Cost of shares redeemed** | (400,183 | ) | (640,048 | ) | (10,850,646 | ) | (1,684,172 | ) | (307,821 | ) | (560,783 | ) | (1,330,752 | ) | (1,408,771 | ) | (259,448 | ) | |||||||||
Net increase (decrease) in net assets resulting from capital share transactions | 1,996,472 | (399,316 | ) | (2,354,607 | ) | 12,099,895 | 5,512,854 | 454,789 | 7,055,518 | 6,182,270 | 12,549,307 | ||||||||||||||||
Net increase (decrease) in net assets | 3,882,811 | 1,565,687 | (578,186 | ) | 13,312,717 | 5,042,296 | 928,692 | 6,697,404 | 6,406,228 | 12,435,842 | |||||||||||||||||
Net Assets | |||||||||||||||||||||||||||
Beginning of period | 11,027,372 | 9,461,685 | 21,867,094 | 8,554,377 | 8,771,564 | 7,842,872 | 25,031,352 | 18,625,124 | — | ||||||||||||||||||
End of period | $ | 14,910,183 | $ | 11,027,372 | $ | 21,288,908 | $ | 21,867,094 | $ | 13,813,860 | $ | 8,771,564 | $ | 31,728,756 | $ | 25,031,352 | $ | 12,435,842 | |||||||||
** Net of redemption fees of: | $ | — | $ | — | $ | 741 | $ | 1,853 | $ | 32 | $ | — | $ | — | $ | — | $ | — | |||||||||
Accumulated net investment income (loss) at the end of period | $ | — | $ | (51,724 | ) | $ | — | $ | (78,582 | ) | $ | 43,679 | $ | 49,801 | $ | 115,673 | $ | 79,799 | $ | 33,307 | |||||||
* Commencement of operations. | |||||||||||||||||||||||||||
The accompanying Notes are an integral part of the financial statements.
36
PENN CAPITAL FUNDS TRUST
FINANCIAL HIGHLIGHTS
JUNE 30, 2018
Per Common Share Data(a) | Supplemental data and ratios | ||||||||||||||||||||||||||||||||||||||||||||
Income from investment operations | Distributions to shareholders | ||||||||||||||||||||||||||||||||||||||||||||
 |  |  |  |  |  |  |  |  |  |  |  |  |  |  | |||||||||||||||||||||||||||||||
Penn Capital Managed Alpha SMID Cap Equity Fund | |||||||||||||||||||||||||||||||||||||||||||||
Institutional Class | |||||||||||||||||||||||||||||||||||||||||||||
7/1/17 to 6/30/18 | $ | 11.73 | (0.04 | ) | 2.07 | 2.03 | — | (0.21 | ) | (0.21 | ) | $ | 13.55 | 17.41 | % | $ | 14,910 | 1.06 | % | 2.38 | % | (0.34 | )% | (1.66 | )% | 64 | % | ||||||||||||||||||
7/1/16 to 6/30/17 | $ | 9.65 | (0.02 | ) | 2.10 | 2.08 | — | — | — | $ | 11.73 | 21.55 | % | $ | 11,027 | 1.06 | % | 2.63 | % | (0.29 | )% | (1.86 | )% | 91 | % | ||||||||||||||||||||
12/1/15(e) to 6/30/16 | $ | 10.00 | (0.03 | ) | (0.32 | ) | (0.35 | ) | — | — | — | $ | 9.65 | (3.50 | )%(d) | $ | 9,462 | 1.06 | % | 3.74 | % | (0.53 | )% | (3.21 | )% | 70 | %(d) | ||||||||||||||||||
Penn Capital Special Situations Small Cap Equity Fund | |||||||||||||||||||||||||||||||||||||||||||||
Institutional Class | |||||||||||||||||||||||||||||||||||||||||||||
7/1/17 to 6/30/18 | $ | 11.71 | (0.08 | ) | 2.36 | 2.28 | (f) | — | (1.40 | ) | (1.40 | ) | $ | 12.59 | 20.31 | % | $ | 21,289 | 1.09 | % | 2.09 | % | (0.64 | )% | (1.64 | )% | 105 | % | |||||||||||||||||
7/1/16 to 6/30/17 | $ | 10.32 | (0.04 | ) | 2.24 | 2.20 | (f) | — | (0.81 | ) | (0.81 | ) | $ | 11.71 | 21.52 | % | $ | 21,867 | 1.09 | % | 2.19 | % | (0.54 | )% | (1.64 | )% | 101 | % | |||||||||||||||||
12/18/15(e) to 6/30/16 | $ | 10.00 | (0.02 | ) | 0.34 | 0.32 | — | — | — | $ | 10.32 | 3.20 | %(d) | $ | 8,554 | 1.09 | % | 5.63 | % | (0.48 | )% | (5.02 | )% | 102 | %(d) | ||||||||||||||||||||
Penn Capital Multi-Credit High Income Fund | |||||||||||||||||||||||||||||||||||||||||||||
Institutional Class | |||||||||||||||||||||||||||||||||||||||||||||
7/1/17 to 6/30/18 | $ | 10.52 | 0.61 | (0.22 | ) | 0.39 | (f) | (0.63 | ) | (0.22 | ) | (0.85 | ) | $ | 10.06 | 3.81 | % | $ | 13,814 | 0.72 | % | 2.80 | % | 5.89 | % | 3.81 | % | 66 | % | ||||||||||||||||
7/1/16 to 6/30/17 | $ | 9.95 | 0.73 | 0.56 | 1.29 | (0.72 | ) | — | (0.72 | ) | $ | 10.52 | 13.36 | % | $ | 8,772 | 0.72 | % | 3.25 | % | 7.01 | % | 4.48 | % | 79 | % | |||||||||||||||||||
12/1/15(e) to 6/30/16 | $ | 10.00 | 0.35 | (0.10 | ) | 0.25 | (0.30 | ) | — | (0.30 | ) | $ | 9.95 | 2.66 | %(d) | $ | 7,843 | 0.72 | % | 5.14 | % | 6.34 | % | 1.92 | % | 62 | %(d) | ||||||||||||||||||
Penn Capital Defensive Floating Rate Income Fund | |||||||||||||||||||||||||||||||||||||||||||||
Institutional Class | |||||||||||||||||||||||||||||||||||||||||||||
7/1/17 to 6/30/18 | $ | 10.21 | 0.43 | (0.06 | ) | 0.37 | (0.43 | ) | (0.06 | ) | (0.49 | ) | $ | 10.09 | 3.71 | % | $ | 31,729 | 0.65 | %(g) | 1.64 | % | 4.31 | %(g) | 3.32 | % | 65 | % | |||||||||||||||||
7/1/16 to 6/30/17 | $ | 10.09 | 0.40 | 0.17 | 0.57 | (0.40 | ) | (0.05 | ) | (0.45 | ) | $ | 10.21 | 5.66 | % | $ | 25,031 | 0.74 | % | 1.95 | % | 3.90 | % | 2.69 | % | 108 | % | ||||||||||||||||||
12/1/15(e) to 6/30/16 | $ | 10.00 | 0.14 | 0.06 | 0.20 | (0.11 | ) | — | (0.11 | ) | $ | 10.09 | 1.99 | %(d) | $ | 18,625 | 0.74 | % | 2.77 | % | 2.56 | % | 0.53 | % | 43 | %(d) | |||||||||||||||||||
Penn Capital Defensive Short Duration High Income Fund | |||||||||||||||||||||||||||||||||||||||||||||
Institutional Class | |||||||||||||||||||||||||||||||||||||||||||||
7/17/17(e) to 6/30/18 | $ | 10.00 | 0.27 | (0.17 | ) | 0.10 | (0.25 | ) | — | (0.25 | ) | $ | 9.85 | 1.03 | %(d) | $ | 12,436 | 0.54 | % | 2.70 | % | 3.08 | % | 0.92 | % | 39 | %(d) | ||||||||||||||||||
| * | No information is provided for Investor Class shares because shares of that class had not yet been issued as of June 30, 2018. |
| (a) | Information presented related to a share outstanding for the entire period. |
| (b) | Annualized for periods less than one full year. |
| (c) | Portfolio turnover is calculated on the basis of the Fund as a whole without distinguishing between the classes of shares issued. |
| (d) | Not annualized. |
| (e) | Commencement of operations. |
| (f) | Total from investment operations per share includes redemption fees of less than $0.01 per share. |
| (g) | Expense waiver of 0.64% was implemented on August 1, 2017. |
The accompanying Notes are an integral part of the financial statements.
37
PENN CAPITAL FUNDS TRUST
NOTES TO THE FINANCIAL STATEMENTS
JUNE 30, 2018
1. Organization (Unaudited)
PENN Capital Funds Trust (the “Trust”) was organized as a Delaware statutory trust on August 29, 2014, and is registered under the Investment Company Act of 1940 (the “1940 Act”), as amended, as an open-end management investment company. The Trust consists of five series that are available for investment: the Penn Capital Managed Alpha SMID Cap Equity Fund, the Penn Capital Special Situations Small Cap Equity Fund, the Penn Capital Multi-Credit High Income Fund, the Penn Capital Defensive Floating Rate Income Fund and the Penn Capital Defensive Short Duration High Income Fund (collectively referred to as the “Funds” and each individually referred to as a “Fund”). Two other series: the Penn Capital Micro Cap Equity Fund and the Penn Capital Enterprise Value Small Cap Equity Fund are not currently offered. The Funds follow the Financial Accounting Standards Board (“FASB”) Accounting Standard Codification Topic 946 “Financial Services- Investment Companies.”
The Penn Capital Managed Alpha SMID Cap Equity Fund and the Penn Capital Special Situations Small Cap Equity Fund’s investment objective is to seek to provide capital appreciation. The Penn Capital Managed Alpha SMID Cap Equity Fund commenced operations on December 1, 2015. The Penn Capital Special Situations Small Cap Equity Fund commenced operations on December 18, 2015.
The Penn Capital Multi-Credit High Income Fund’s investment objective is to seek to provide total return through interest income and capital appreciation. The Penn Capital Mulit-Credit High Income Fund commenced operations on December 1, 2015.
The Penn Capital Defensive Floating Rate Income Fund’s investment objective is to seek to provide current income. The Penn Capital Defensive Floating Rate Income Fund commenced operations on December 1, 2015.
The Penn Capital Defensive Short Duration High Income Fund’s investment objective is to seek to provide a high level of current income. The Penn Capital Defensive Short Duration High Income Fund commenced operations on July 17, 2017.
Each Fund’s investment objective is non-fundamental, and may be changed by the Trust’s Board of Trustees (the “Board” or “Trustees”) without shareholder approval. Unless otherwise noted, all of the other investment policies and strategies described in the Prospectus or hereafter are nonfundamental. The Advisor serves as the investment advisor to the Funds.
The Trust offers two classes of shares for the Penn Capital Managed Alpha SMID Cap Equity Fund, the Penn Capital Special Situations Small Cap Equity Fund, the Penn Capital Multi-Credit High Income Fund and the Penn Capital Defensive Floating Rate Income Fund: Institutional and Investor Class. The Trust offers Institutional Class shares for the Penn Capital Defensive Short Duration High Income Fund. The Trust has also registered two other series, each with one class: the Penn Capital Micro Cap Equity Fund and the Penn Capital Enterprise Value Small Cap Equity Fund: Institutional Class. No information is provided in this report for Investor Class shares because shares of that class had not yet been issued as of June 30, 2018. Neither class has a front-end or back-end sales charge. The Penn Capital Micro Cap Equity Fund and Penn Capital Enterprise Value Small Cap Fund have not commenced operations as of June 30, 2018.
2. Significant Accounting Policies
The following is a summary of significant accounting policies consistently followed by the Funds in the preparation of their financial statements. The financial statements have been prepared in conformity with accounting principles generally accepted in the United States of America (“GAAP”).
A. Investment Valuation
The Funds use the following valuation methods to determine fair value as either fair value for investments for which market quotations are available, or if not available, the fair value, as determined in good faith pursuant to such policies and procedures as may be approved by the Trust’s Board from time to time. The valuation of the portfolio investments of the Funds currently includes the following processes:
Portfolio securities listed on a national or foreign securities exchange, except those listed on the NASDAQ® Stock Market and Small CapSM exchanges (“NASDAQ®”), for which market quotations are available, are valued at the official closing price of such exchange on each business day (defined as days on which the Funds are open for business (“Business Day”)). Portfolio securities traded on the NASDAQ® will be valued at the NASDAQ® Official Closing Price on each Business Day. If there is no such reported sale on an exchange or NASDAQ®, the portfolio security will be valued at the most recent quoted bid price. Price information on listed securities is taken from the exchange where the security is primarily traded.
38
PENN CAPITAL FUNDS TRUST
NOTES TO THE FINANCIAL STATEMENTS
JUNE 30, 2018
Other assets and securities for which no quotations are readily available (such as for certain restricted or unlisted securities and private placements) or that may not be reliably priced (such as in the case of trade suspensions or halts, price movement limits set by certain foreign markets, and thinly traded or illiquid securities) will be valued in good faith at fair value using procedures and methods approved by the Board. Under the procedures adopted by the Board, the Board has delegated day-to-day responsibility for fair value determinations to a Valuation Committee comprised of representatives from the Advisor.
A Fund’s portfolio holdings may also consist of shares of other investment companies in which the Fund invests. The value of each such investment company will be its net asset value (“NAV”) at the time the Fund’s shares are priced. Each investment company calculates its NAV based on the current market value for its portfolio holdings. Each investment company values securities and other instruments in a manner as described in that investment company’s prospectus. The investment company’s prospectus explains the circumstances under which the company will use fair value pricing and the effects of using fair value pricing.
Because a Fund may invest in foreign securities, the Fund’s NAV may change on days when a shareholder will not be able to purchase or redeem Fund shares because foreign markets are open at times and on days when U.S. markets are not. Investments quoted in foreign currencies will be valued daily in U.S. dollars on the basis of the foreign currency exchange rates prevailing at the time such valuation is determined. Foreign currency exchange rates are generally determined as of the close of the New York Stock Exchange (“NYSE”) (generally 4:00 p.m. Eastern time). If an event that could materially affect the value of the Fund’s foreign securities has occurred between the time the securities were last traded and the time that the Fund calculates its NAV, the closing price of the Fund’s securities may no longer reflect their market value at the time the Fund calculates its NAV. In such a case, the Fund may use fair value methods to value such securities.
Fixed income securities shall be valued at the evaluated bid price supplied by the Fund’s pricing agent based on broker-dealer supplied valuations and other criteria, or directly by independent brokers when the pricing agent does not provide a price or the Valuation Committee does not believe that the pricing agent price reflects the current market value. If a price of a position is sought using independent brokers, the Advisor shall seek to obtain an evaluation bid price from at least two independent brokers who are knowledgeable about the position. The price of the position would be deemed to be an average of such bid prices. In the absence of sufficient broker dealer quotes, securities shall be valued at fair value pursuant to procedures adopted by the Board.
Bank loans are not listed on any securities exchange or board of trade. They are typically bought and sold by institutional investors in individually negotiated private transactions that function in many respects like an over-the-counter secondary market. This market generally has fewer trades and less liquidity than the secondary market for other types of securities. Some bank loans have few or no trades, or trade infrequently, and information regarding a specific bank loan may not be widely available or may be incomplete. Except as otherwise specified, bank loan securities shall be valued at the evaluated bid prices supplied by the Fund’s pricing agent based on broker-dealer supplied valuations and other criteria, or directly by independent brokers when the pricing agent does not provide a price or the Valuation Committee does not believe that the pricing agent price reflects the current market value. If a price of a position is sought using independent brokers, the Advisor shall seek to obtain a bid price from at least two independent brokers who are knowledgeable about the position. The price of the position would be deemed to be an average of such bid prices. In the absence of sufficient broker dealer quotes, securities shall be valued at fair value pursuant to procedures adopted by the Board.
Occasionally, reliable market quotations are not readily available (such as for certain restricted or unlisted securities and private placements) or securities and other assets may not be reliably priced (such as in the case of trade suspensions or halts, price movement limits set by certain foreign markets, and thinly traded or illiquid securities), or there may be events affecting the value of foreign securities or other securities held by the Funds that occur when regular trading on foreign or other exchanges is closed, but before trading on the NYSE is closed. Fair value determinations are then made in good faith in accordance with procedures adopted by the Board. Under the procedures adopted by the Board, the Board has delegated the responsibility for making fair value determinations to a Valuation Committee, subject to the Board’s oversight. Generally, the fair value of a portfolio security or other asset shall be the amount that the owner of the security or asset might reasonably expect to receive upon its current sale. A three-tier hierarchy is utilized to maximize the use of observable market data and minimize the use of unobservable inputs and to establish classification of fair value measurements for disclosure purposes. Inputs may be observable or unobservable and refer broadly to the assumptions that market participants would use in pricing the asset or liability, including assumptions about risk. Observable inputs are inputs that reflect the assumptions market participants would use in pricing the asset or liability and are developed based
39
PENN CAPITAL FUNDS TRUST
NOTES TO THE FINANCIAL STATEMENTS
JUNE 30, 2018
on market data obtained from sources independent of the reporting entity. Unobservable inputs are inputs that reflect the reporting entity’s own assumptions about the assumptions market participants would use in pricing the asset or liability and are developed based on the best information available under the circumstances. The three-tier hierarchy of inputs is summarized in the three broad levels listed below.
Level 1 — unadjusted quoted prices in active markets for identical securities that the Funds have the ability to access
Level 2 — other significant observable inputs (including quoted prices for similar securities, interest rates, prepayment speeds, credit risk, etc.)
Level 3 — significant unobservable inputs (including a Fund’s own assumptions in determining the fair value of investments)
The availability of observable inputs can vary from security to security and is affected by a wide variety of factors, including, for example, the type of security, whether the security is new and not yet established in the marketplace, the liquidity of markets, and other characteristics particular to the security. To the extent that valuation is based on models or inputs that are less observable or unobservable in the market, the determination of fair value requires more judgment. Accordingly, the degree of judgment exercised in determining fair value is greatest for instruments categorized in Level 3.
The inputs used to measure fair value may fall into different levels of the fair value hierarchy. In such cases, for disclosure purposes, the level in the fair value hierarchy within which the fair value measurement falls in its entirety is determined based on the lowest level input that is significant to the fair value measurement in its entirety.
The following table summarizes the inputs used as of June 30, 2018 in valuing each Fund’s investments:
Description | Level 1 | Level 2 | Level 3 | Total | ||||||||
Penn Capital Managed Alpha SMID Cap Equity | ||||||||||||
Investments in Securities(a) | ||||||||||||
Common Stocks | $ | 13,650,624 | $ | — | $ | — | $ | 13,650,624 | ||||
Real Estate Investment Trusts (REITs) | 939,394 | — | — | 939,394 | ||||||||
Short-Term Investment | 362,429 | — | — | 362,429 | ||||||||
Total Investments in Securities | $ | 14,952,447 | $ | — | $ | — | $ | 14,952,447 | ||||
Penn Capital Special Situations Small Cap Equity Fund | ||||||||||||
Investments in Securities(a) | Level 1 | Level 2 | Level 3 | Total | ||||||||
Common Stocks | 20,838,652 | — | 20,838,652 | |||||||||
Contingent Value Right | — | 93 | — | 93 | ||||||||
Real Estate Investment Trust (REIT) | 244,750 | — | — | 244,750 | ||||||||
Short-Term Investment | 90,106 | — | — | 90,106 | ||||||||
Total Investments in Securities | $ | 21,173,508 | $ | 93 | $ | — | $ | 21,173,601 | ||||
Penn Capital Multi-Credit High Income Fund | ||||||||||||
Investments in Securities(a) | Level 1 | Level 2 | Level 3 | Total | ||||||||
Corporate Bonds | $ | — | $ | 9,789,798 | $ | — | $ | 9,789,798 | ||||
Convertible Bond | — | 39,264 | — | 39,264 | ||||||||
Bank Loans | — | 1,090,393 | — | 1,090,393 | ||||||||
Common Stock | — | — | 46 | 46 | ||||||||
Mutual Fund | 2,503,862 | — | — | 2,503,862 | ||||||||
Preferred Stock | — | — | 41 | 41 | ||||||||
Short-Term Investment | 786,796 | — | — | 786,796 | ||||||||
Total Investments in Securities | $ | 3,290,658 | $ | 10,919,455 | $ | 87 | $ | 14,210,200 | ||||
Penn Capital Defensive Floating Rate Income Fund | ||||||||||||
Investments in Securities(a) | Level 1 | Level 2 | Level 3 | Total | ||||||||
Bank Loans | $ | — | $ | 27,165,232 | $ | — | $ | 27,165,232 | ||||
Corporate Bonds | — | 3,776,719 | — | 3,776,719 | ||||||||
Short-Term Investment | 1,895,482 | — | — | 1,895,482 | ||||||||
Total Investments in Securities | $ | 1,895,482 | $ | 30,941,951 | $ | — | $ | 32,837,433 | ||||
40
PENN CAPITAL FUNDS TRUST
NOTES TO THE FINANCIAL STATEMENTS
JUNE 30, 2018
Penn Capital Defensive Short Duration High Income Fund | ||||||||||||
Investments in Securities(a) | Level 1 | Level 2 | Level 3 | Total | ||||||||
Corporate Bonds | $ | — | $ | 9,981,986 | $ | — | $ | 9,981,986 | ||||
Mutual Fund | 1,852,519 | — | — | 1,852,519 | ||||||||
Short-Term Investment | 386,382 | — | — | 386,382 | ||||||||
Total Investments in Securities | $ | 2,238,901 | $ | 9,981,986 | $ | — | $ | 12,220,887 | ||||
| (a) | All other industry classifications are identified in the Schedule of Investments for each Fund. |
The following table summarizes quantitative information about significant unobservable valuation inputs for Level 3 fair value measurement as of June 30, 2018:
Type of Assets | Fair Value as of June 30, 2018 | Valuation Techniques | Unobservable Input | ||||||
Penn Capital Multi-Credit High Income Fund | |||||||||
Common Stock | |||||||||
ACC Claims Holdings LLC | $ | 46 | Broker Quote | Unpublished independent broker quote | |||||
Preferred Stock | |||||||||
Spanish Broadcasting Systems, Inc. | $ | 41 | Broker Quote | Unpublished independent broker quote | |||||
The following table reconciles Level 3 investments based on the inputs used to determine fair value:
Balance as of July 1, 2017 | Purchases | Sales | Accretion of Discount | Net Realized Gain/Loss | Balance as of June 30, 2018 | Change in Unrealized Appreciation from Investments Held as of June 30, 2018 | |||||||||||||||
Penn Capital Multi-Credit High Income Fund | |||||||||||||||||||||
Common Stock | |||||||||||||||||||||
ACC Claims Holdings LLC | $ | 44 | $ | — | $ | — | $ | — | $ | — | $ | 46 | $ | 2 | |||||||
Preferred Stock | |||||||||||||||||||||
Spanish Broadcasting Systems, Inc. | $ | 32 | — | — | — | — | $ | 41 | $ | 9 | |||||||||||
The Funds disclose transfers between Levels based on valuations at the end of the reporting period. There were no transfers between Levels 1, 2, or 3 for the period ended June 30, 2018.
B. Investment Transactions and Related Investment Income
Investment transactions are accounted for on a trade-date basis. Interest income is recorded on the accrual basis, including the amortization of premiums and accretion of discounts on bonds held using the yield-to-maturity method. Dividend income is recognized on ex-dividend date.
Realized gains and losses on investment transactions and unrealized appreciation and depreciation of investments are reported for financial statement and Federal income tax purposes on the identified cost method.
C. Expenses
The Trust’s expenses are allocated to the individual Fund in proportion to the net assets of the respective Fund when the expenses were incurred, except where direct allocations of expenses can be made.
41
PENN CAPITAL FUNDS TRUST
NOTES TO THE FINANCIAL STATEMENTS
JUNE 30, 2018
D. Use of Estimates
The preparation of the financial statements in conformity with GAAP requires management to make estimates and assumptions that affect the reported amounts of assets and liabilities and disclosure of contingent assets and liabilities at the date of the financial statements and the reported amounts of increases and decreases in net assets from operations during the reporting period. Actual results could differ from those estimates.
E. Dividends and Distributions
Dividends and distributions to Shareholders are recorded on the ex-date. The Penn Capital Multi-Credit High Income Fund, the Penn Capital Defensive Floating Rate Income Fund and the Penn Capital Defensive Short Duration High Income Fund declare and distribute their net investment income, if any, monthly and make distributions of their net realized capital gains, if any, at least annually, usually in December. The Penn Capital Managed Alpha SMID Cap Equity Fund and the Penn Capital Special Situations Small Cap Equity Fund declare and distribute their net investment income, if any, annually and make distributions of net realized capital gains, if any, at least annually, usually in December.
The character of distributions made during the period from net investment income or net realized gains may differ from its ultimate characterization for federal income tax purposes. In addition, due to the timing of dividend distributions, the fiscal period in which the amounts are distributed may differ from the period that income or realized gains (losses) were recorded by each Fund.
F. Federal Income Taxes
Each Fund intends to qualify as a regulated investment company under Subchapter M of the Internal Revenue Code of 1986, as amended. If so qualified, the Funds will not be subject to federal income tax to the extent they distribute all of their net investment income and capital gains to shareholders. Therefore, no federal income tax provision is required.
The Funds evaluate tax positions taken or expected to be taken in the course of preparing their tax returns to determine whether it is more-likely-than-not (i.e., greater than 50%) that each tax position will be sustained upon examination by a taxing authority based on the technical merits of the position. Tax positions not deemed to meet the more-likely-than-not threshold are recorded as a tax benefit or expense in the current year. The Funds did not record any tax provision in the current period and have no provision for taxes in the financial statements. However, management’s conclusions regarding tax positions taken may be subject to review and adjustment at a later date based on factors including, but not limited to, examination by tax authorities (i.e., the last three open tax year ends, as applicable) and on-going analysis of and changes to tax laws, regulations and interpretations thereof.
G. Indemnifications
Under the Trust’s organizational documents, its officers and Trustees are indemnified against certain liabilities arising out of the performance of their duties to the Trust and each Fund. In addition, in the normal course of business, the Trust may enter into contracts that provide general indemnification to other parties. The Trust’s maximum exposure under these arrangements is unknown, as this would involve future claims that may be made against the Trust that have not yet occurred, and may not occur. However, the Trust has not had prior claims or losses pursuant to these contracts and considers the risk of loss to be remote.
3. Agreements and Related Party Transactions
Investment Advisory Agreement
The Trust has entered into an investment advisory agreement with the Advisor. Under the terms of the agreement, each Fund pays the Advisor a fee, payable at the end of each month, at an annual rate, set forth in the table below, of the respective Fund’s average daily net assets.
Penn Capital Managed Alpha SMID Cap Equity Fund | 0.90 | % | |
Penn Capital Special Situations Small Cap Equity Fund | 0.95 | % | |
Penn Capital Multi-Credit High Income Fund | 0.69 | % | |
Penn Capital Defensive Floating Rate Income Fund | 0.55 | %* | |
Penn Capital Defensive Short Duration High Income Fund | 0.45 | % |
| * | Advisor fee reduced to 0.55% effective August 1, 2017. Prior to August 1, 2017, the Fund’s contractual advisory fee rate was 0.69%. |
42
PENN CAPITAL FUNDS TRUST
NOTES TO THE FINANCIAL STATEMENTS
JUNE 30, 2018
With respect to each Fund other than the Penn Capital Multi-Credit High Income Fund and the Penn Capital Defensive Short Duration High Income Fund, the Advisor has contractually agreed to waive its fees and/or pay Fund expenses so that the Funds’ total annual operating expenses (excluding any acquired fund fees and expenses, taxes, interest, brokerage fees, certain insurance costs, and extraordinary and other non-routine expenses) do not exceed the amounts shown below as a percentage of each Fund’s average daily net assets. With respect to the Penn Capital Multi-Credit High Income Fund and the Penn Capital Defensive Short Duration High Income Fund, the Advisor has contractually agreed to waive its fees and/or pay Fund expenses so that the Fund’s total annual operating expenses (including any acquired fund fees and expenses incurred by the Fund as a result of its investments in other investment companies managed by the Advisor, but excluding any acquired fund fees and expenses incurred by the Fund as a result of its investments in unaffiliated investment companies, taxes, interest, brokerage fees, certain insurance costs, and extraordinary and other non-routine expenses) do not exceed the amounts shown below as a percentage of each Fund’s average daily net assets. The expense limitation agreement will remain in place through October 30, 2018. Thereafter, the expense limitation agreement for the Funds will be reviewed annually by the Advisor and the Board.
Institutional Class | Investor Class | |||||
Penn Capital Managed Alpha SMID Cap Equity Fund | 1.06 | % | 1.31 | % | ||
Penn Capital Special Situations Small Cap Equity Fund | 1.09 | % | 1.34 | % | ||
Penn Capital Multi-Credit High Income Fund | 0.72 | % | 0.97 | % | ||
Penn Capital Defensive Floating Rate Income Fund | 0.64 | %* | 0.89 | %* | ||
Penn Capital Defensive Short Duration High Income Fund | 0.54 | % | N/A | |||
| * | Prior to August 1, 2017, the Penn Capital Defensive Floating Rate Income Fund’s total annual operating expenses (excluding certain specified items) were limited to 0.74% for Institutional Class shares and 0.99% for Investor Class shares. |
Any waived or reimbursed expenses by the Advisor to the Funds excluding any waivers related to acquired fund fees and expenses incurred by the Funds as a result of its investments in other investment companies managed by the Advisor, are subject to repayment by a Fund in the three years following the date the payment was made, provided that the respective Fund is able to make the repayment without exceeding the Fund’s expense limitation in place when the fees were waived or expenses paid. The Advisor’s waived fees and paid expenses that are subject to potential recoupment are as follows:
Fiscal Period Incurred | Amount Waived/ Expenses Assumed | Amount Recouped | Amount Subject to Potential Recoupment | Year of Expiration | ||||||||
Penn Capital Managed Alpha SMID Cap Equity Fund | ||||||||||||
June 30, 2016 | $ | 146,572 | $ | — | $ | 146,572 | 2019 | |||||
June 30, 2017 | 162,111 | — | 162,111 | 2020 | ||||||||
June 30, 2018 | 175,125 | — | 175,125 | 2021 | ||||||||
Total | $ | 483,808 | $ | — | $ | 483,808 | ||||||
Penn Capital Special Situations Small Cap Equity Fund | ||||||||||||
June 30, 2016 | $ | 128,464 | $ | — | $ | 128,464 | 2019 | |||||
June 30, 2017 | 158,820 | — | 158,820 | 2020 | ||||||||
June 30, 2018 | 208,947 | — | 208,947 | 2021 | ||||||||
Total | $ | 496,231 | $ | — | $ | 496,231 | ||||||
Penn Capital Multi-Credit High Income Fund | ||||||||||||
June 30, 2016 | $ | 171,803 | $ | — | $ | 171,803 | 2019 | |||||
June 30, 2017 | 218,116 | — | 218,116 | 2020 | ||||||||
June 30, 2018 | 226,073 | — | 226,073 | 2021 | ||||||||
Total | $ | 615,992 | $ | — | $ | 615,992 | ||||||
Penn Capital Defensive Floating Rate Income Fund | ||||||||||||
June 30, 2016 | $ | 205,304 | $ | — | $ | 205,304 | 2019 | |||||
June 30, 2017 | 261,441 | — | 261,441 | 2020 | ||||||||
June 30, 2018 | 281,780 | — | 281,780 | 2021 | ||||||||
Total | $ | 748,525 | $ | — | $ | 748,525 | ||||||
Penn Capital Defensive Short Duration High Income Fund | ||||||||||||
June 30, 2018 | $ | 164,748 | $ | — | $ | 164,748 | 2021 | |||||
Total | $ | 164,748 | $ | — | $ | 164,748 | ||||||
Certain Officers and Trustees of the Funds are also Officers of the Advisor.
43
PENN CAPITAL FUNDS TRUST
NOTES TO THE FINANCIAL STATEMENTS
JUNE 30, 2018
The Trust has engaged Foreside Fund Officers Services, LLC to provide compliance services including the appointment of the Trust’s Chief Compliance Officer and Anti-Money Laundering Officer.
Distribution Agreement
Foreside Fund Services, LLC is the Trust’s distributor and principal underwriter (the Distributor). The Trust has adopted a plan of distribution under Rule 12b-1 of the 1940 Act applicable to the Investor Class. Under the plan, 12b-1 distribution fees at an annual rate of 0.25% of average daily net assets of Investor Class shares are paid to the Distributor or others for distribution and shareholder services. For the period ended June 30, 2018, there were no distribution fees paid under the plan because the Investor Class shares had not yet been issued as of June 30, 2018.
The Trust has engaged U.S. Bancorp Fund Services, LLC to serve as the Fund’s administrator, fund accountant, and transfer agent. The Trust has engaged U.S. Bank, N.A. to serve as the Fund’s custodian.
Shareholder Servicing Plan
The Trust has adopted a Shareholder Servicing Plan on behalf of each Fund’s Investor Class and Institutional Class. Under the plan, each Class can pay for non-distribution related shareholder support services (“service fees”) in an amount up to 0.15% of its average daily net assets. For the period ended June 30, 2018, there were no service fees incurred by the Investor Class shares because the Investor Class shares had not yet been issued as of June 30, 2018. The amount actually incurred by the Institutional Class shares for the period ended June 30, 2018 on an annualized basis was 0.01% for the Penn Capital Managed Alpha SMID Cap Equity Fund, 0.05% for the Penn Capital Special Situations Small Cap Equity Fund, 0.01% for the Penn Capital Multi-Credit High Income Fund, 0.01% for the Penn Capital Defensive Floating Rate Income Fund, and less than 0.01% for the Penn Capital Defensive Short Duration High Income Fund.
4. Federal Tax Information
It is each Fund’s intention to continue to qualify as a regulated investment company under Subchapter M of the Internal Revenue Code and distribute all of its taxable income. Accordingly, no provision for federal income taxes is required in the financial statements.
The amount and character of income and capital gain distributions to be paid, if any, are determined in accordance with federal income tax regulations, which may differ from GAAP. These differences are primarily due to differences in the timing of recognition of gains or losses on investments. Permanent book and tax basis differences, if any, may result in reclassifications to undistributed net investment income (loss), undistributed net realized gain (loss) and additional paid-in capital.
The following information is provided on a tax basis as of June 30, 2018:
Penn Capital Managed Alpha SMID Cap Equity Fund | Penn Capital Special Situations Small Cap Equity Fund | Penn Capital Multi-Credit High Income Fund | Penn Capital Defensive Floating Rate Income Fund | Penn Capital Defensive Short Duration High Income Fund | |||||||||||
Cost of investments | $ | 12,431,271 | $ | 18,473,409 | $ | 14,181,880 | $ | 32,842,652 | $ | 12,363,215 | |||||
Gross unrealized appreciation | 2,970,093 | 3,608,110 | 229,027 | 142,170 | 8,708 | ||||||||||
Gross unrealized depreciation | (448,917 | ) | (907,915 | ) | (200,706 | ) | (147,389 | ) | (151,036 | ) | |||||
Net unrealized appreciation (depreciation) | 2,521,176 | 2,700,195 | 28,320 | (5,219 | ) | (142,328 | ) | ||||||||
Undistributed ordinary income | 385,888 | 272,534 | 43,679 | 115,673 | 33,307 | ||||||||||
Undistributed long-term capital gains | 744,253 | 921,947 | — | — | — | ||||||||||
Total distributable earnings | 1,130,141 | 1,194,481 | 43,679 | 115,673 | 33,307 | ||||||||||
Other accumulated losses | — | — | — | (50,132 | ) | (4,444 | ) | ||||||||
Total accumulated earnings (losses) | $ | 3,651,317 | $ | 3,894,676 | $ | 71,999 | $ | 60,322 | $ | (113,465 | ) | ||||
Net investment income and realized gains and losses for federal income tax purposes may differ from that reported on the financial statements because of permanent book-to-tax differences. GAAP requires that permanent differences between financial reporting and tax reporting be reclassified between various components of net assets.
44
PENN CAPITAL FUNDS TRUST
NOTES TO THE FINANCIAL STATEMENTS
JUNE 30, 2018
These differences are primarily due to net operating losses. On the Statement of Assets and Liabilities, the following adjustments were made:
Undistributed Net Investment Income | Accumulated Net Realized Gain (Loss) on Investments | Paid-In Capital | |||||||
Penn Capital Managed Alpha SMID Cap Equity Fund | $ | 45,253 | $ | (45,253 | ) | $ | — | ||
Penn Capital Special Situations Small Cap Equity Fund | 133,199 | (133,199 | ) | — | |||||
Penn Capital Multi-Credit High Income Fund | (12,514 | ) | 12,796 | (282 | ) | ||||
Penn Capital Defensive Floating Rate Income Fund | (12 | ) | 12 | — | |||||
Penn Capital Defensive Short Duration High Income Fund | 4,773 | (4,773 | ) | — | |||||
The Funds intend to utilize capital loss carryforwards to offset future realized capital gains. Capital loss carry forwards available for federal income tax purposes are as follows:
Capital Loss Available Through | Short-Term Capital Loss Amounts | Long-Term Capital Loss Amounts | |||||||
Penn Capital Managed Alpha SMID Cap Equity Fund | Unlimited | $ | — | $ | — | ||||
Penn Capital Special Situations Small Cap Equity Fund | Unlimited | — | — | ||||||
Penn Capital Multi-Credit High Income Fund | Unlimited | — | — | ||||||
Penn Capital Defensive Floating Rate Income Fund | Unlimited | 50,132 | — | ||||||
Penn Capital Defensive Short Duration High Income Fund | Unlimited | 4,444 | — | ||||||
A regulated investment company may elect for any taxable year to treat any portion of the qualified late year loss as arising on the first day of the next taxable year. Qualified late year losses are certain capital and ordinary losses which occur during the portion of the taxable year subsequent to October 31 and December 31, respectively.
The character of distributions for tax purposes paid during the period ended June 30, 2018 is as follows:
Ordinary Income Distributions | Long-Term Capital Gain Distributions | |||||
Penn Capital Managed Alpha SMID Cap Equity Fund | $ | 103,969 | $ | 113,429 | ||
Penn Capital Special Situations Small Cap Equity Fund | 1,149,801 | 1,090,182 | ||||
Penn Capital Multi-Credit High Income Fund | 831,287 | 23,726 | ||||
Penn Capital Defensive Floating Rate Income Fund | 1,345,610 | 7,504 | ||||
Penn Capital Defensive Short Duration High Income Fund | 211,320 | — | ||||
The character of distributions for tax purposes paid during the fiscal year ended June 30, 2017 is as follows:
Ordinary Income Distributions | Long-Term Capital Gain Distributions | |||||
Penn Capital Managed Alpha SMID Cap Equity Fund | $ | — | $ | — | ||
Penn Capital Special Situations Small Cap Equity Fund | 850,428 | 54 | ||||
Penn Capital Multi-Credit High Income Fund | 596,135 | — | ||||
Penn Capital Defensive Floating Rate Income Fund | 921,854 | — | ||||
45
PENN CAPITAL FUNDS TRUST
NOTES TO THE FINANCIAL STATEMENTS
JUNE 30, 2018
5. Investment Transactions
The cost of security purchases and the proceeds from security sales, other than short-term investments, for the period ended June 30, 2018, were as follows:
Purchases | Sales | |||||
Penn Capital Managed Alpha SMID Cap Equity Fund | $ | 9,825,871 | $ | 8,244,587 | ||
Penn Capital Special Situations Small Cap Equity Fund | 21,866,815 | 26,575,531 | ||||
Penn Capital Multi-Credit High Income Fund | 12,042,205 | 6,822,702 | ||||
Penn Capital Defensive Floating Rate Income Fund | 23,876,518 | 17,579,479 | ||||
Penn Capital Defensive Short Duration High Income Fund | 15,043,530 | 2,940,172 | ||||
6. Capital Share Transactions
Penn Capital Managed Alpha SMID Cap Equity Fund Year Ended June 30, 2018 | Penn Capital Special Situations Small Cap Fund Year Ended June 30, 2018 | Penn Capital Multi-Credit High Income Fund Year Ended June 30, 2018 | Penn Capital Defensive Floating Rate Income Fund Year Ended June 30, 2018 | Penn Capital Defensive Short Duration High Income Fund Period Ended June 30, 2018 | |||||||||||
Institutional Class Shares | |||||||||||||||
Share sold | 175,264 | 531,370 | 489,121 | 692,903 | 1,267,496 | ||||||||||
Shares sold to holders in reinvestment of dividends | 16,642 | 189,922 | 80,338 | 132,711 | 21,354 | ||||||||||
Shares redeemed | (31,443 | ) | (898,039 | ) | (29,546 | ) | (130,898 | ) | (26,332 | ) | |||||
Net increase (decrease) | 160,463 | (176,747 | ) | 539,913 | 694,716 | 1,262,518 | |||||||||
Institutional Amount | |||||||||||||||
Shares sold | $ | 2,179,641 | $ | 6,262,562 | $ | 4,996,417 | $ | 7,039,836 | $ | 12,597,665 | |||||
Shares sold to holders in reinvestment of dividends | 217,014 | 2,233,477 | 824,258 | 1,346,434 | 211,090 | ||||||||||
Shares redeemed | (400,183 | ) | (10,850,646 | ) | (307,821 | ) | (1,330,752 | ) | (259,448 | ) | |||||
Net increase (decrease) | $ | 1,996,472 | $ | (2,354,607 | ) | $ | 5,512,854 | $ | 7,055,518 | $ | 12,549,307 | ||||
Penn Capital Managed Alpha SMID Cap Equity Fund Year Ended June 30, 2017 | Penn Capital Special Situations Small Cap Equity Fund Year Ended June 30, 2017 | Penn Capital Multi-Credit High Income Fund Year Ended June 30, 2017 | Penn Capital Defensive Floating Rate Income Fund Year Ended June 30, 2017 | |||||||||
Institutional Class Shares | ||||||||||||
Shares sold | 21,067 | 1,115,266 | 45,061 | 653,532 | ||||||||
Shares sold to holders in reinvestment of dividends | — | 74,359 | 53,946 | 90,055 | ||||||||
Shares redeemed | (61,810 | ) | (151,648 | ) | (54,000 | ) | (137,775 | ) | ||||
Net increase (decrease) | (40,743 | ) | 1,037,977 | 45,007 | 605,812 | |||||||
Institutional Amount | ||||||||||||
Shares sold | $ | 240,732 | $ | 12,938,608 | $ | 457,456 | $ | 6,674,297 | ||||
Shares sold to holders in reinvestment of dividends | — | 845,459 | 558,116 | 916,744 | ||||||||
Shares redeemed | (640,048 | ) | (1,684,172 | ) | (560,783 | ) | (1,408,771 | ) | ||||
Net increase (decrease) | $ | (399,316 | ) | $ | 12,099,895 | $ | 454,789 | $ | 6,182,270 | |||
46
PENN CAPITAL FUNDS TRUST
NOTES TO THE FINANCIAL STATEMENTS
JUNE 30, 2018
7. Transactions with Affiliates
The following issuers are affiliated with the Funds; that is, the Adviser had control of 5% or more of the outstanding voting securities during the period from July 1, 2017 through June 30, 2018. As defined in Section (2)(a)(3) of the Investment Company Act of 1940; such issues are:
July 1, 2017 | Additions | Reductions | June 30, 2018 | Dividend | Unrealized | Realized | June 30, 2018 | ||||||||||||||||||||||||||||||||
Issuer Name | Share Balance | Cost | Share Balance | Cost | Share Balance | Cost | Share Balance | Income | Capital Gain Distribution | Depreciation Change | Gain/(Loss) | Value | Cost | ||||||||||||||||||||||||||
Penn Capital Multi-Credit High Income Fund | �� | ||||||||||||||||||||||||||||||||||||||
Penn Capital Defensive Floating Rate Income Fund | — | $ | — | 248,153 | $ | 2,520,274 | — | $ | — | 248,153 | $ | 44,283 | $ | 5,991 | $ | (16,412 | ) | $ | — | $ | 2,503,862 | $ | 2,520,274 | ||||||||||||||||
$ | — | $ | 2,520,274 | $ | — | $ | 44,283 | $ | 5,991 | $ | (16,412 | ) | $ | — | $ | 2,503,862 | $ | 2,520,274 | |||||||||||||||||||||
Penn Capital Defensive Short Duration High Income Fund | |||||||||||||||||||||||||||||||||||||||
Penn Capital Defensive Floating Rate Income Fund | — | $ | — | 183,599 | $ | 1,865,035 | — | $ | — | 183,599 | $ | 35,038 | $ | 4,997 | $ | (12,516 | ) | $ | — | $ | 1,852,519 | $ | 1,865,035 | ||||||||||||||||
$ | — | $ | 1,865,035 | $ | — | $ | 35,038 | $ | 4,997 | $ | (12,516 | ) | $ | — | $ | 1,852,519 | $ | 1,865,035 | |||||||||||||||||||||
8. Credit Risk and Asset Concentration
Small- and mid-capitalization companies may not have the size, resources and other assets of large capitalization companies. As a result, the securities of small- and mid-capitalization companies may be subject to greater market risks and fluctuations in value than large capitalization companies or may not correspond to changes in the stock market in general. In addition, small- and mid-capitalization companies may be particularly affected by interest rate increases, as they may find it more difficult to borrow money to continue or expand operations, or may have difficulty in repaying any loans.
High yield securities and unrated securities of similar credit quality have speculative characteristics and involve greater volatility of price and yield, greater of liquidity risk, and generally reflect a greater possibility of an adverse change in financial condition that could affect an issuer’s ability to honor its obligations.
There are a number of risks associated with an investment in bank loans, including credit risk, interest rate risk, liquidity risk and prepayment risk. Lack of an active trading market, restrictions on resale, irregular trading activity, wide bid/ask spreads and extended trade settlement periods may impair the Fund’s ability to sell bank loans within its desired time frame or at an acceptable price and its ability to accurately value existing and prospective investments. Extended trade settlement periods may result in cash not being immediately available to the Fund. As a result of such illiquidity, the Fund may have to sell other investments or engage in borrowing transactions to raise cash to meet its obligations.
9. Line of Credit
The Penn Capital Defensive Floating Rate Income Fund has a Credit Agreement for a line of credit equal to the lesser of (i) $3.0 Million, (ii) 20% of the gross market value of the Fund or (iii) 33.3% of the net market value of the Fund. Borrowings pursuant to the agreement are collateralized by the investments in the Fund. The line of credit is intended to provide short term financing, if necessary, in connection with shareholder redemptions. The interest rate as of June 30, 2018 was 5.00%. The Fund did not utilize any borrowings under the line of credit for the fiscal year ended June 30, 2018.
47
PENN CAPITAL FUNDS TRUST
NOTES TO THE FINANCIAL STATEMENTS
JUNE 30, 2018
10. Recent Accounting Pronouncements
In March 2017, the Financial Accounting Standards Board (FASB) issued Accounting Standards Update (ASU) No. 2017-08, Receivables—Nonrefundable Fees and Other Costs (Subtopic 310-20): Premium Amortization on Purchased Callable Debt Securities. The amendments in the ASU shorten the amortization period for certain callable debt securities, held at a premium, to be amortized to the earliest call date. The ASU does not require an accounting change for securities held at a discount; which continues to be amortized to maturity. The ASU is effective for fiscal years and interim periods within those fiscal years beginning after December 15, 2018. Management is currently evaluating the impact, if any, of applying this provision.
11. Subsequent Events
Except as disclosed above, as of the date the financial statements were available to be issued, Management has determined that no additional material events or transactions occurred that would require recognition or disclosure in the Funds’ financial statements.
48
PENN CAPITAL FUNDS TRUST
ADDITIONAL INFORMATION
JUNE 30, 2018 (UNAUDITED)
Shareholder Notification of Federal Tax Status
For the fiscal period ended June 30, 2018, certain dividends paid by the Funds may be subject to a maximum tax rate of 15%, as provided for by the Jobs and Growth Tax Relief Reconciliation Act of 2003. The percentage of dividends declared from ordinary income designated as qualified dividend income was as follows:
Penn Capital Managed Alpha SMID Cap Equity Fund | 55.03 | % | |
Penn Capital Special Situations Small Cap Equity Fund | 8.08 | % | |
Penn Capital Multi-Credit High Income Fund | 0.00 | % | |
Penn Capital Defensive Floating Rate Income Fund | 0.00 | % | |
Penn Capital Defensive Short Duration High Income Fund | 0.00 | % |
For corporate shareholders, the percentage of ordinary income distributions qualifying for the corporate dividends received deduction for the fiscal period ended June 30, 2018 was as follows:
Penn Capital Managed Alpha SMID Cap Equity Fund | 34.88 | % | |
Penn Capital Special Situations Small Cap Equity Fund | 7.60 | % | |
Penn Capital Multi-Credit High Income Fund | 0.00 | % | |
Penn Capital Defensive Floating Rate Income Fund | 0.00 | % | |
Penn Capital Defensive Short Duration High Income Fund | 0.00 | % |
The percentage of taxable ordinary income distributions designated as short-term capital gain distributions under Internal Revenue Section 871(k)(2)(c) for the fiscal period ended June 30, 2018 was as follows:
Penn Capital Managed Alpha SMID Cap Equity Fund | 100.00 | % | |
Penn Capital Special Situations Small Cap Equity Fund | 100.00 | % | |
Penn Capital Multi-Credit High Income Fund | 23.92 | % | |
Penn Capital Defensive Floating Rate Income Fund | 11.85 | % | |
Penn Capital Defensive Short Duration High Income Fund | 0.00 | % |
Trustee and Officer Compensation
The Trust does not compensate any of its Trustees who are interested persons nor any of its officers. For the year ended June 30, 2018, the aggregate compensation paid by the Trust to the independent Trustees was $36,000. The Trust did not pay any special compensation to any of its Trustees or officers. The Statement of Additional Information includes additional information about the Trustees and is available without charge, upon request, by calling 844-302-7366.
Proxy Voting Policies
A description of the policies and procedures that each Fund uses to determine how to vote proxies relating to portfolio securities owned by that Fund is available: (1) without charge, upon request, by calling 844-302-7366; (2) in the Statement of Additional Information on the Trust’s website www.penncapitalfunds.com; and (3) on the SEC’s website at www.sec.gov. Information about how the Funds voted proxies relating to portfolio securities during the most recent twelve-month period ended June 30 may be obtained (1) without charge, upon request, by calling 844-302-7366 and (2) on the SEC’s website at www.sec.gov.
Form N-Q
Each Fund files its complete schedule of portfolio holdings for the first and third quarters of each fiscal year with the SEC on Form N-Q. Each Fund’s Forms N-Q are available without charge by visiting the SEC’s website at www.sec.gov. In addition, you may review and copy each Fund’s Forms N-Q at the SEC’s Public Reference Room in Washington D.C. You may obtain information on the operation of the Public Reference Room by calling (800) SEC-0330.
Householding
In an effort to decrease costs, the Funds intend to reduce the number of duplicate prospectuses, annual and semi-annual reports, proxy statements and other similar documents you receive by sending only one copy of each to those addresses shared by two or more accounts and to shareholders that the transfer agent reasonably believes are from the same family or household. Once implemented, if you would like to discontinue householding for your accounts, please call (844) 302-7366 to request individual copies of these documents. The transfer agent will begin sending individual copies thirty days after receiving your request to stop householding. This policy does not apply to account statements.
49
PENN CAPITAL FUNDS TRUST
REPORT OF INDEPENDENT REGISTERED PUBLIC ACCOUNTING FIRM
To the Shareholders and Board of Trustees of
PENN Capital Funds Trust:
Opinion on the Financial Statements
We have audited the accompanying statements of assets and liabilities of the Penn Capital Managed Alpha SMID Cap Equity Fund, Penn Capital Special Situations Small Cap Equity Fund, Penn Capital Multi-Credit High Income Fund, Penn Capital Defensive Floating Rate Income Fund and Penn Capital Defensive Short Duration High Income Fund (inception of July 17, 2017), each a series of the PENN Capital Funds Trust, (collectively, the “Funds”), including the schedules of investments as of June 30, 2018, the related statements of operations for the year or period ended June 30, 2018, the statements of changes in net assets for each of the years or period in the two-year period then ended, and the related notes (collectively, the “financial statements”) and financial highlights for each of the years or periods in the three-year period then ended. In our opinion, the financial statements and financial highlights present fairly, in all material respects, the financial position of the Funds as of June 30, 2018, the results of their operations for the year or period then ended, the changes in their net assets for each of the years or period in the two year period then ended, and the financial highlights for each of the years or periods in the three year period then ended, in conformity with U.S. generally accepted accounting principles.
Basis for Opinion
These financial statements and financial highlights are the responsibility of the Funds’ management. Our responsibility is to express an opinion on these financial statements and financial highlights based on our audits. We are a public accounting firm registered with the Public Company Accounting Oversight Board (United States) (PCAOB) and are required to be independent with respect to the Funds in accordance with the U.S. federal securities laws and the applicable rules and regulations of the Securities and Exchange Commission and the PCAOB.
We conducted our audits in accordance with the standards of the PCAOB. Those standards require that we plan and perform the audits to obtain reasonable assurance about whether the financial statements and financial highlights are free of material misstatement, whether due to error or fraud. Our audits included performing procedures to assess the risks of material misstatement of the financial statements and financial highlights, whether due to error or fraud, and performing procedures that respond to those risks. Such procedures included examining, on a test basis, evidence regarding the amounts and disclosures in the financial statements and financial highlights. Such procedures also included confirmation of securities owned as of June 30, 2018, by correspondence with custodians, agent banks, and brokers or other appropriate auditing procedures. Our audits also included evaluating the accounting principles used and significant estimates made by management, as well as evaluating the overall presentation of the financial statements and financial highlights. We believe that our audits provide a reasonable basis for our opinion.
We have served as the auditor of one or more PENN Capital Management Inc. investment companies since 2015.

Philadelphia, Pennsylvania
August 28, 2018
50
PENN CAPITAL FUNDS TRUST
TRUSTEES AND OFFICERS (UNAUDITED)
Name, Address and Year of Birth | Position with the Trust | Term of Office and Length of Time Served | Principal Occupation During the Past Five Years | Number of Portfolios in Fund Complex Overseen by Trustee | Other Directorship/ Trusteeship Positions held by Trustee During the Past 5 Years |
Independent Trustees | |||||
Dennis S. Hudson, III c/o Penn Capital Management Company, Inc. 1200 Intrepid Avenue, Suite 400 Philadelphia, Pennsylvania 19112 Year of Birth: 1955 | Trustee | Since 2015 | Chief Executive Officer (since 1998) and Chairman (since 2005), Seacoast Banking Corporation of Florida; Chairman and Chief Executive Officer, Seacoast National Bank (since 1992). | 7 | Chesapeake Utilities Corporation (since 2006). Martin Health System (medical) (since 2017). |
John R. Schwab c/o Penn Capital Management Company, Inc. 1200 Intrepid Avenue, Suite 400 Philadelphia, Pennsylvania 19112 Year of Birth: 1967 | Trustee | Since 2015 | Chief Financial Officer, Flagship Credit Corp. (since 2015); Executive Vice President and Chief Financial Officer, The J.G. Wentworth Company (from 2013 to 2015); Executive Vice President and Chief Financial Officer, Expert Global Solutions (from 2004 to 2012). | 7 | N/A |
Interested Trustee | |||||
Richard A. Hocker* c/o Penn Capital Management Company, Inc. 1200 Intrepid Avenue, Suite 400 Philadelphia, Pennsylvania 19112 Year of Birth: 1946 | Trustee, President and Chairman | Since 2014 | Founder, Chief Investment Officer and Chief Executive Officer, Penn Capital Management Company, Inc. (since 1987). | 7 | N/A |
51
PENN CAPITAL FUNDS TRUST
TRUSTEES AND OFFICERS (UNAUDITED)
Name, Address and Year of Birth | Position with the Trust | Term of Office and Length of Time Served | Principal Occupations During the Past Five Years |
Officers of the Trust** | |||
Gerald McBride c/o Penn Capital Management Company, Inc. 1200 Intrepid Avenue, Suite 400 Philadelphia, Pennsylvania 19112 Year of Birth: 1963 | Treasurer | Since 2014 | Chief Operating Officer and Chief Financial Officer, Penn Capital Management Company, Inc. (since 2007). |
Lisa L.B. Matson c/o Penn Capital Management Company, Inc. 1200 Intrepid Avenue, Suite 400 Philadelphia, Pennsylvania 19112 Year of Birth: 1970 | Secretary | Since 2014 | General Counsel, Penn Capital Management Company, Inc. (since 2014); Senior Counsel and Assistant Vice President, Lincoln Financial Group, Inc., and Assistant Secretary, Lincoln Investment Advisors, Corp., Lincoln Variable Insurance Products Trust and Lincoln Advisors Trust (from 2012 to 2014); Associate Counsel, The Vanguard Group, Inc. (from 2002 to 2012). |
Jack P. Huntington 10 High Street Suite 302 Boston, MA 02110 Year of Birth: 1970 | Chief Compliance Officer | Since 2015 | Fund Chief Compliance Officer, Foreside Fund Officer Services, LLC (since 2015); Senior Vice President of Regulatory Administration, Citi Fund Services, Ohio, Inc. (from 2008 to 2015). |
| * | Richard A. Hocker is a Trustee who is an “interested person” of the Trust as defined in the 1940 Act because he is an officer of the Advisor and certain of its affiliates. |
| ** | Each Officer serves at the pleasure of the Board. |
52
PENN CAPITAL FUNDS TRUST
PRIVACY POLICY
FACTS | WHAT DOES THE PENN CAPITAL FUNDS TRUST DO WITH YOUR PERSONAL INFORMATION? | ||
Why? | Financial companies choose how they share your personal information. Federal law gives consumers the right to limit some but not all sharing. Federal law also requires us to tell you how we collect, share, and protect your personal information. Please read this notice carefully to understand what we do. | ||
What? | The types of personal information we collect and share depend on the product or service you have with us. The information can include: • Social Security number • Account balances and account transactions • Assets and transaction history When you are no longer our client, we continue to share your information as described in this notice. | ||
How? | All financial companies need to share clients’ personal information to run the everyday business. In the section below, we list the reasons financial companies can share their clients’ personal information; the reasons PENN chooses to share; and whether you can limit this sharing. | ||
Reasons we can share your personal information | Does Penn share? | Can you limit this sharing? | |
For everyday business purposes - such as to process your transactions, maintain your account(s), respond to court orders and legal investigations, or report to credit bureaus | Yes | No | |
For marketing purposes - to offer our products and services to you | No | No | |
For joint marketing with other financial companies | No | No | |
For affiliates’ everyday business purposes - information about transaction(s) and experiences | Yes | No | |
For affiliates’ everyday business purposes - information about your creditworthiness | No | No | |
For nonaffiliates to market to you | No | No | |
Questions? | Call 215-302-1500 or go to ww.penncapital.com |
53
PENN CAPITAL FUNDS TRUST
PRIVACY POLICY
Who we are | |
Who is providing this notice? | Penn Capital Management Company, Inc. and its affiliates (“Penn”) |
What we do | |
How does Penn protect my personal information? | To protect your personal information from unauthorized access and use, we use security measures that comply with federal law. These measures include computer and secured files and buildings. |
How does Penn collect my personal information? | We collect your personal information, for example, when you • Open an account or deposit money • Provide information on client questionaires |
Why can’t I limit all sharing? | Federal law gives you the right to limit only • sharing for affiliates everyday business purposes - information about your creditworthiness • affiliates from using you information to market to you • sharing for nonaffiliates to market to you State laws and individual companies may give you additional rights to limit sharing. |
Definitions | |
Affiliates | Companies related by common ownership or control. They can be financial or nonfinancial companies • PENN Capital Funds Group LLC • PENN Capital Funds Trust • Penn Capital Management Company, Inc. |
Nonaffiliates | Companies not related by common ownership or control. They can be financial or nonfinancial companies • Penn does not share information with nonaffiliates |
Joint marketing | A formal agreement between non affiliated companies that together market financial products or services to you • Penn does not have joint marketing partners |
Other important information | |
This notice replaces all previous notices of our consumer privacy policy, and may be amended from time to time. Penn will inform you of updates or changes as required by law. | |
54
Board of Trustees
Dennis S. Hudson, III
John R. Schwab
Richard A. Hocker
Investment Advisor
Penn Capital Management Company, Inc.
Navy Yard Corporate Center
1200 Intrepid Avenue, Suite 400
Philadelphia, Pennsylvania 19112
Legal Counsel
Stradley Ronon Stevens & Young, LLP
2005 Market Street, Suite 2600
Philadelphia, Pennsylvania 19103
Custodian
U.S. Bank, N.A.
1555 N. Rivercenter Drive, Suite 302
Milwaukee, WI 53212
Distributor
Foreside Fund Services, LLC
Three Canal Plaza
Portland, ME 04101
Administrator, Transfer Agent
and Dividend Disbursing Agent
U.S. Bancorp Fund Services, LLC
615 East Michigan Street
Milwaukee, WI 53202
Shareholder/Investor Information
1.844.302.PENN (7366)
www.penncapitalfunds.com
BEFORE INVESTING YOU SHOULD CAREFULLY CONSIDER THE FUND’S INVESTMENT OBJECTIVES, RISKS, CHARGES AND EXPENSES. THIS AND OTHER RELEVANT INFORMATION CAN BE FOUND IN THE PROSPECTUS AND STATEMENT OF ADDITIONAL INFORMATION, COPIES OF WHICH MAY BE OBTAINED BY CALLING (844) 302-PENN (7366) OR BY VISITING WWW.PENNCAPITALFUNDS.COM. PLEASE READ THE PROSPECTUS CAREFULLY BEFORE YOU INVEST.
Item 2. Code of Ethics.
The registrant has adopted a code of ethics that applies to the registrant’s principal executive officer and principal financial officer. The registrant has not made any substantive amendments to its code of ethics during the period covered by this report. The registrant has not granted any waivers from any provisions of the code of ethics during the period covered by this report.
A copy of the registrant’s Code of Ethics is filed herewith.
Item 3. Audit Committee Financial Expert.
The registrant’s board of trustees has determined that there is at least one audit committee financial expert serving on its audit committee. Mr. John Schwab is the “audit committee financial expert” and is considered to be “independent” as each term is defined in Item 3 of Form N-CSR.
Item 4. Principal Accountant Fees and Services.
The registrant has engaged its principal accountant to perform audit and tax services during the past two fiscal years. “Audit services” refer to performing an audit of the registrant's annual financial statements or services that are normally provided by the accountant in connection with statutory and regulatory filings or engagements for those fiscal years. “Audit-related services” refer to the assurance and related services by the principal accountant that are reasonably related to the performance of the audit. “Tax services” refer to professional services rendered by the principal accountant for tax compliance, tax advice, and tax planning. There were no “Other services” provided by the principal accountant. The following table details the aggregate fees billed or expected to be billed for each of the last two fiscal years for audit fees, audit-related fees, tax fees and other fees by the principal accountant.
FYE 6/30/2018 | FYE 6/30/2017 | |||||
Audit Fees | $ | 120,000 | $ | 92,000 | ||
Audit-Related Fees | None | None | ||||
Tax Fees | 23,875 | 19,100 | ||||
All Other Fees | None | None | ||||
The audit committee has adopted pre-approval policies and procedures that require the audit committee to pre-approve all audit and non-audit services of the registrant, including services provided to any entity affiliated with the registrant.
The percentage of fees billed by KPMG applicable to non-audit services pursuant to waiver of pre-approval requirement were as follows:
FYE 6/30/2018 | FYE 6/30/2017 | |||||
Audit-Related Fees | 0 | % | 0 | % | ||
Tax Fees | 0 | % | 0 | % | ||
All Other Fees | 0 | % | 0 | % | ||
All of the principal accountant’s hours spent on auditing the registrant’s financial statements were attributed to work performed by full-time permanent employees of the principal accountant. (If more than 50 percent of the accountant’s hours were spent to audit the registrant's financial statements for the most recent fiscal year, state how many hours were attributed to work performed by persons other than the principal accountant's full-time, permanent employees.)
The following table indicates the non-audit fees billed or expected to be billed by the registrant’s accountant for services to the registrant and to the registrant’s investment adviser (and any other controlling entity, etc.—not sub-adviser) for the last two years. The audit committee of the board of trustees/directors has considered whether the provision of non-audit services that were rendered to the registrant's investment adviser is compatible with maintaining the principal accountant's independence and has concluded that the provision of such non-audit services by the accountant has not compromised the accountant’s independence.
Non-Audit Related Fees | FYE 6/30/2018 | FYE 6/30/2017 | ||||
Registrant | None | None | ||||
Registrant’s Investment Adviser | None | None | ||||
KPMG LLP (“KPMG”) has informed the Trust that it has identified an issue related to its independence under Rule 2-01(c)(1)(ii)(A) of Regulation S-X (referred to as the “Loan Rule”). The Loan Rule prohibits accounting firms, such as KPMG, from being considered independent if they have certain financial relationships with their audit clients or certain affiliates of those clients. Specifically, the Loan Rule provides, in relevant part, that an accounting firm generally would not be independent if it receives a loan from a lender that is “record or beneficial [owner] of more than ten percent of the audit client’s equity securities.” The Trust is required under various securities laws to have its financial statements audited by an independent accounting firm. KPMG has informed the Trust that KPMG has relationships
with a lender who is the holder of record of more than ten percent of the shares of certain series of the Trust (each, a “Fund”). These relationships call into question KPMG’s independence under the Loan Rule with respect to the Fund, as well as all other funds in the complex. The SEC has granted no-action relief to another fund complex in circumstances that appear to be substantially similar to the Trust’s (see Fidelity Management & Research Company et al., No-Action Letter (June 20, 2016)). In addition, KPMG has advised the Trust’s Audit Committee that KPMG believes that under the facts and circumstances surrounding KPMG’s lending relationships, its ability to exercise objective and impartial judgment in connection with its audit engagement with the Trust has not been impaired and that a reasonable investor with knowledge of all relevant facts and circumstances would reach the same conclusion. If in the future the independence of KPMG is called into question under the Loan Rule by circumstances that are not addressed in the SEC’s no-action letter, the Fund may need to take other action in order for the Fund’s filings with the SEC containing financial statements to be deemed compliant with applicable securities laws. Such additional actions could result in additional costs, impair the ability of the Funds to issue new shares or have other material adverse effects on the Funds. The SEC no-action relief was initially set to expire 18 months from issuance, but has been extended by the SEC without an expiration date, except that the no-action letter will be withdrawn upon the effectiveness of any amendments to the Loan Rule designed to address the concerns expressed in the letter.
Item 5. Audit Committee of Listed Registrants.
Not applicable to registrants who are not listed issuers (as defined in Rule 10A-3 under the Securities Exchange Act of 1934).
Item 6. Investments.
| (a) | Schedule of Investments is included as part of the report to shareholders filed under Item 1 of this Form. |
| (b) | Not Applicable. |
Item 7. Disclosure of Proxy Voting Policies and Procedures for Closed-End Management Investment Companies.
Not applicable to open-end investment companies.
Item 8. Portfolio Managers of Closed-End Management Investment Companies.
Not applicable to open-end investment companies.
Item 9. Purchases of Equity Securities by Closed-End Management Investment Company and Affiliated Purchasers.
Not applicable to open-end investment companies.
Item 10. Submission of Matters to a Vote of Security Holders.
There have been no material changes to the procedures by which shareholders may recommend nominees to the registrant’s board of trustees.
Item 11. Controls and Procedures.
| (a) | The Registrant’s President and Treasurer have reviewed the Registrant's disclosure controls and procedures (as defined in Rule 30a-3(c) under the Investment Company Act of 1940 (the “Act”)) as of a date within 90 days of the filing of this report, as required by Rule 30a-3(b) under the Act and Rules 13a-15(b) or 15d-15(b) under the Securities Exchange Act of 1934. Based on their review, such officers have concluded that the disclosure controls and procedures are effective in ensuring that information required to be disclosed in this report is appropriately recorded, processed, summarized and reported and made known to them by others within the Registrant and by the Registrant’s service provider. |
| (b) | There were no changes in the Registrant's internal control over financial reporting (as defined in Rule 30a-3(d) under the Act) that occurred during the second fiscal quarter of the period covered by this report that have materially affected, or are reasonably likely to materially affect, the Registrant's internal control over financial reporting. |
Item 12. Disclosure of Securities Lending Activities for Closed-End Management Investment Companies
Not applicable to open-end investment companies.
Item 13. Exhibits.
| (2) A separate certification for each principal executive officer and principal financial officer pursuant to Section 302 of the Sarbanes-Oxley Act of 2002. Filed herewith. |
| (3) Any written solicitation to purchase securities under Rule 23c-1 under the Act sent or given during the period covered by the report by or on behalf of the registrant to 10 or more persons. Not applicable to open-end investment companies. |
| (b) | Certifications pursuant to Section 906 of the Sarbanes-Oxley Act of 2002. Furnished herewith. |
SIGNATURES
Pursuant to the requirements of the Securities Exchange Act of 1934 and the Investment Company Act of 1940, the registrant has duly caused this report to be signed on its behalf by the undersigned, thereunto duly authorized.
(Registrant) | PENN Capital Funds Trust |
By (Signature and Title) | /s/ Richard A. Hocker, President |
Richard A. Hocker, President | |
Date | 9/6/2018 |
Pursuant to the requirements of the Securities Exchange Act of 1934 and the Investment Company Act of 1940, this report has been signed below by the following persons on behalf of the registrant and in the capacities and on the dates indicated.
By (Signature and Title) | /s/ Richard A. Hocker, President |
Richard A. Hocker, President | |
Date | 9/6/2018 |
By (Signature and Title) | /s/ Gerald McBride, Treasurer |
Gerald McBride, Treasurer | |
Date | 9/6/2018 |