UNITED STATES
SECURITIES AND EXCHANGE COMMISSION
Washington, D.C. 20549
FORM N-CSR
CERTIFIED SHAREHOLDER REPORT OF REGISTERED MANAGEMENT INVESTMENT COMPANIES
Investment Company Act file number 811-23011
PENN CAPITAL FUNDS TRUST
(Exact name of registrant as specified in charter)
Navy Yard Corporate Center
1200 Intrepid Ave., Suite 400
Philadelphia, Pennsylvania 19112
(Address of principal executive offices) (Zip code)
Richard A. Hocker
Navy Yard Corporate Center
1200 Intrepid Ave., Suite 400
Philadelphia, Pennsylvania 19112
(Name and address of agent for service)
With copies to:
Lisa L.B. Matson, Esq.
Navy Yard Corporate Center
1200 Intrepid Ave., Suite 400
Philadelphia, Pennsylvania 19112
Michael P. O’Hare, Esq.
Stradley Ronon Stevens & Young, LLP
2005 Market Street, Suite 2600
Philadelphia, Pennsylvania 19103
(215) 302-1500
Registrant's telephone number, including area code
Date of fiscal year end: June 30, 2019
Date of reporting period: December 31, 2018
Item 1. Reports to Stockholders.
![]()
SEMIANNUAL REPORT
DECEMBER 31, 2018
PENN CAPITAL MANAGED ALPHA SMID CAP EQUITY FUND
PENN CAPITAL SPECIAL SITUATIONS SMALL CAP EQUITY FUND
PENN CAPITAL MULTI-CREDIT HIGH INCOME FUND
PENN CAPITAL DEFENSIVE FLOATING RATE INCOME FUND
PENN CAPITAL DEFENSIVE SHORT DURATION HIGH INCOME FUND
Beginning on January 1, 2021, as permitted by regulations adopted by the SEC, paper copies of the Fund’s shareholder reports will no longer be sent by mail, unless you specifically request paper copies of the reports from the Fund (defined herein) or from your financial intermediary, such as a broker-dealer or bank. Instead, the reports will be made available on the Fund’s website (www.penncapitalfunds.com), and you will be notified by mail each time a report is posted and provided with a website link to access the report.
If you already elected to receive shareholder reports electronically, you will not be affected by this change and you need not take any action. You may elect to receive shareholder reports and other communications from the Fund by contacting your financial intermediary (such as a broker-dealer or bank) or, if you are a direct investor, by calling 1-844-302-7366.
You may elect to receive all future reports in paper free of charge. If you invest through a financial intermediary, you can contact your financial intermediary to request that you continue to receive paper copies of your shareholder reports. If you invest directly with the Fund, you can call 1-844-302-7366 to let the Fund know you wish to continue receiving paper copies of your shareholder reports. Your election to receive reports in paper will apply to all funds held in your account if you invest through your financial intermediary.
PENN CAPITAL MANAGED ALPHA SMID CAP EQUITY FUND
FUND SUMMARY (UNAUDITED)

This chart assumes an initial gross investment of $10,000 made on December 1, 2015, inception of the Institutional Class shares. Returns shown in the chart and table include the reinvestment of all dividends, but do not reflect the deduction of taxes that a shareholder would pay on Fund distributions or the redemption of Fund shares. In the absence of fee waivers and reimbursements, when they are necessary to keep expenses at the expense cap, total return would be reduced. Past performance is not predictive of future performance. Investment return and principal value will fluctuate so that your shares, when redeemed, may be worth more or less than the original cost. Index returns do not reflect the effects of fees, transaction costs or expenses. It is not possible to invest directly in an index. No information is provided for Investor Class shares because shares of that class had not yet been issued as of December 31, 2018.
Average Annual Total Returns for the Period Ended December 31, 2018 | One Year | Three Years | Since Inception(1) | ||||||
Penn Capital Managed Alpha SMID Cap Equity Fund | |||||||||
Institutional Class Shares | -9.98 | % | 8.11 | % | 6.03 | % | |||
Russell 2500® Index | -10.00 | % | 7.32 | % | 5.68 | %(2) | |||
| (1) | Inception date is 12/1/15. |
| (2) | The return shown for the Russell 2500® Index is from the inception date of the Institutional Class shares. |
1
PENN CAPITAL SPECIAL SITUATIONS SMALL CAP EQUITY FUND
FUND SUMMARY (UNAUDITED)
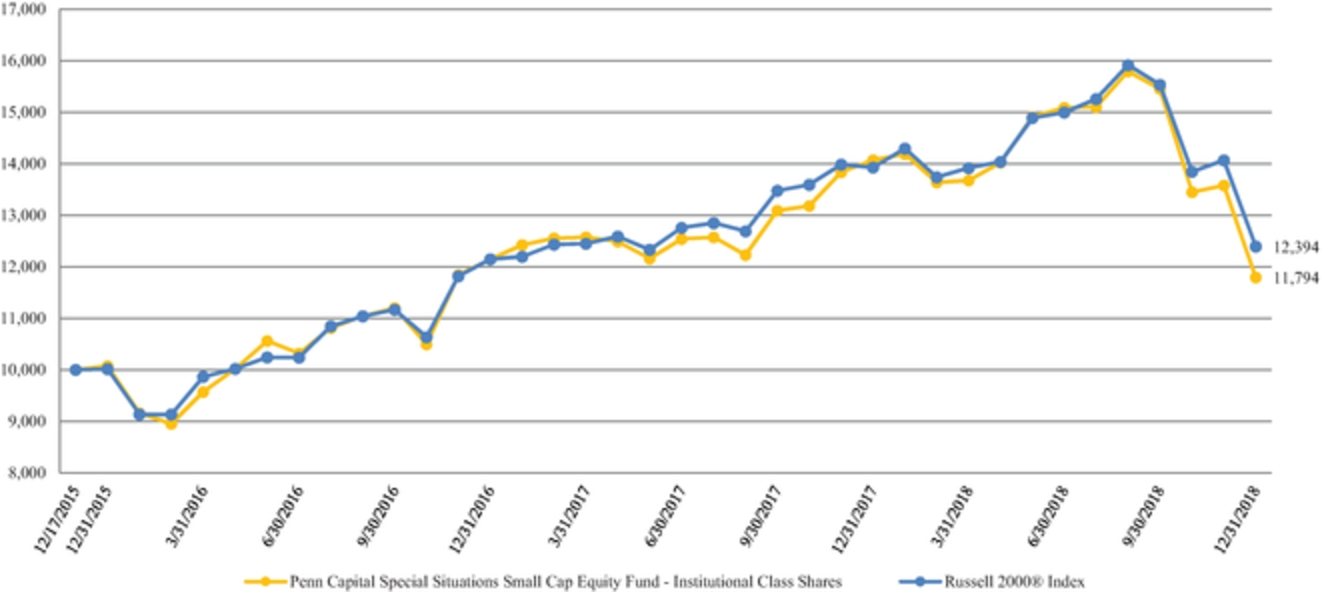
This chart assumes an initial gross investment of $10,000 made on December 18, 2015, inception of the Institutional Class shares. Returns shown in the chart and table include the reinvestment of all dividends, but do not reflect the deduction of taxes that a shareholder would pay on Fund distributions or the redemption of Fund shares. In the absence of fee waivers and reimbursements, when they are necessary to keep expenses at the expense cap, total return would be reduced. Past performance is not predictive of future performance. Investment return and principal value will fluctuate so that your shares, when redeemed, may be worth more or less than the original cost. Index returns do not reflect the effects of fees, transaction costs or expenses. It is not possible to invest directly in an index. No information is provided for Investor Class shares because shares of that class had not yet been issued as of December 31, 2018.
Average Annual Total Returns for the Period Ended December 31, 2018 | One Year | Three Years | Since Inception(1) | ||||||
Penn Capital Special Situations Small Cap Equity Fund | |||||||||
Institutional Class Shares | -16.17 | % | 5.41 | % | 5.58 | % | |||
Russell 2000® Index | -11.01 | % | 7.36 | % | 7.32 | %(2) | |||
| (1) | Inception date is 12/18/15. |
| (2) | The return shown for the Russell 2000® Index is from the inception date of the Institutional Class shares. |
2
PENN CAPITAL MULTI-CREDIT HIGH INCOME FUND
FUND SUMMARY (UNAUDITED)

This chart assumes an initial gross investment of $10,000 made on December 1, 2015, inception of the Institutional Class shares. Returns shown in the chart and table include the reinvestment of all dividends, but do not reflect the deduction of taxes that a shareholder would pay on Fund distributions or the redemption of Fund shares. In the absence of fee waivers and reimbursements, when they are necessary to keep expenses at the expense cap, total return would be reduced. Past performance is not predictive of future performance. Investment return and principal value will fluctuate so that your shares, when redeemed, may be worth more or less than the original cost. Index returns do not reflect the effects of fees, transaction costs or expenses. It is not possible to invest directly in an index. No information is provided for Investor Class shares because shares of that class had not yet been issued as of December 31, 2018.
Average Annual Total Returns for the Period Ended December 31, 2018 | One Year | Three Years | Since Inception(1) | ||||||
Penn Capital Multi-Credit High Income Fund | |||||||||
Institutional Class Shares | -1.04 | % | 6.81 | % | 5.60 | % | |||
ICE BofAML US High Yield Constrained Index | -2.25 | % | 7.27 | % | 6.16 | %(2) | |||
50% ICE BofAML High Yield Constrained Index -50% S&P/LSTA BB Loan Index | -1.33 | % | 5.33 | % | 4.66 | %(3) | |||
| (1) | Inception date is 12/1/15. |
| (2) | The return shown for the ICE BofAML US High Yield Constrained Index is from the inception date of the Institutional Class shares. |
| (3) | The return for the 50% ICE BofAML High Yield Constrained Index -50% S&P/LSTA BB Loan Index is from the inception date of the Institutional class shares. |
3
PENN CAPITAL DEFENSIVE FLOATING RATE INCOME FUND
FUND SUMMARY (UNAUDITED)

This chart assumes an initial gross investment of $10,000 made on December 1, 2015, inception of the Institutional Class shares. Returns shown in the chart and table include the reinvestment of all dividends, but do not reflect the deduction of taxes that a shareholder would pay on Fund distributions or the redemption of Fund shares. In the absence of fee waivers and reimbursements, when they are necessary to keep expenses at the expense cap, total return would be reduced. Past performance is not predictive of future performance. Investment return and principal value will fluctuate so that your shares, when redeemed, may be worth more or less than the original cost. Index returns do not reflect the effects of fees, transaction costs or expenses. It is not possible to invest directly in an index. No information is provided for Investor Class shares because shares of that class had not yet been issued as of December 31, 2018.
Average Annual Total Returns for the Period Ended December 31, 2018 | One Year | Three Years | Since Inception(1) | ||||||
Penn Capital Defensive Floating Rate Income Fund | |||||||||
Institutional Class Shares | 0.16 | % | 3.57 | % | 3.20 | % | |||
S&P/LSTA BB Loan Index | -0.42 | % | 3.40 | % | 3.16 | %(2) | |||
S&P/LSTA BB/B Loan Index | 0.38 | % | 4.44 | % | 4.00 | %(3) | |||
| (1) | Inception date is 12/1/15. |
| (2) | The return shown for the S&P/LSTA BB Loan Index in from the inception date of the Institutional class shares. |
| (3) | The return shown for the S&P/LSTA BB/B Loan Index is from the inception date of the Institutional Class shares. |
4
PENN CAPITAL DEFENSIVE SHORT DURATION HIGH INCOME FUND
FUND SUMMARY (UNAUDITED)
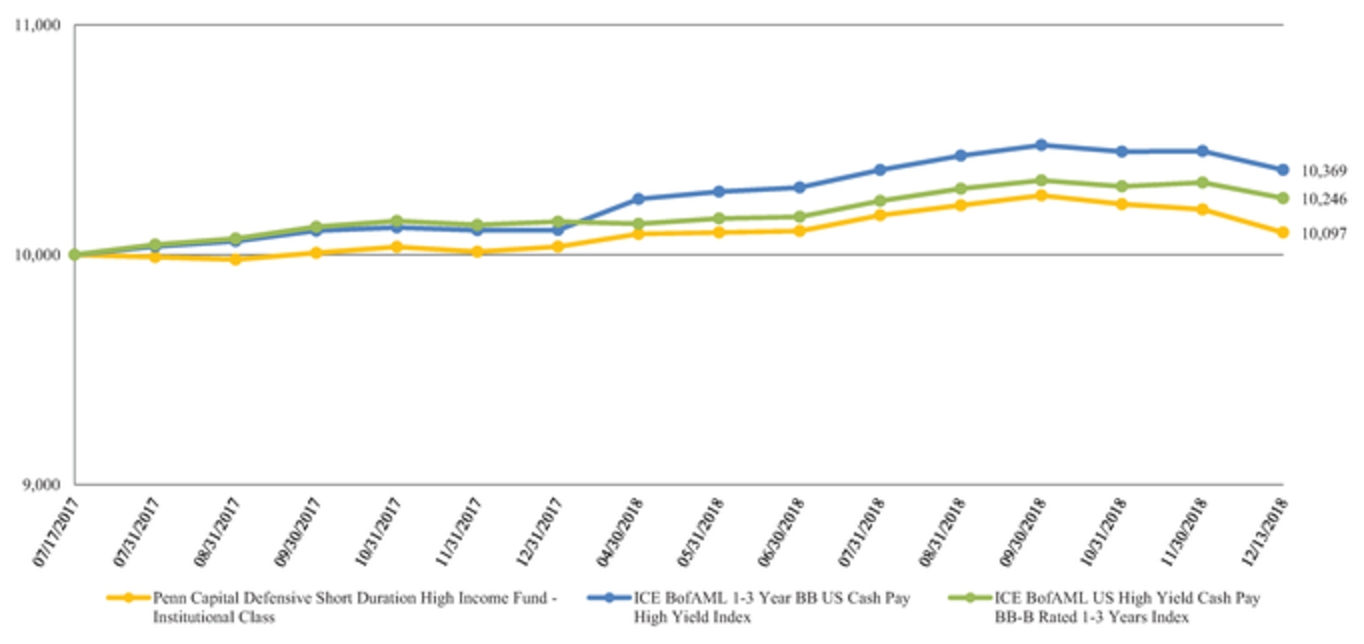
This chart assumes an initial gross investment of $10,000 made on July 17, 2017, inception of the Institutional Class shares. Returns shown in the chart and table include the reinvestment of all dividends, but do not reflect the deduction of taxes that a shareholder would pay on Fund distributions or the redemption of Fund shares. In the absence of fee waivers and reimbursements, when they are necessary to keep expenses at the expense cap, total return would be reduced. Past performance is not predictive of future performance. Investment return and principal value will fluctuate so that your shares, when redeemed, may be worth more or less than the original cost. Index returns do not reflect the effects of fees, transaction costs or expenses. It is not possible to invest directly in an index.
Total Returns for the Fiscal Period Ended December 31, 2018 | One Year | Since Inception(1) | ||||
Penn Capital Defensive Short Duration High Income Fund | ||||||
Institutional Class Shares | 0.61 | % | 0.66 | % | ||
ICE BofAML 1-3 Year BB US Cash Pay High Yield Index | 1.35 | % | 1.66 | %(2) | ||
ICE BofAML US High Yield Cash Pay BB-B Rated 1-3 Years Index | 2.22 | % | 2.51 | %(3) | ||
| (1) | Inception date is 7/17/17. |
| (2) | The return shown for the ICE BofAML 1-3 Year BB US Cash Pay High Yield Index is from the inception date of the Institutional Class shares. |
| (3) | The return shown for the ICE BofAML US High Yield Cash Pay BB-B Rated 1-3 Years Index is from the inception date of the Institutional Class shares. |
5
PENN CAPITAL FUNDS TRUST
DISCLOSURE OF FUND EXPENSES (UNAUDITED)
FOR THE SIX MONTH PERIOD FROM JULY 1, 2018 TO DECEMBER 31, 2018
Cost in Dollars of a $1,000 Investment in Penn Capital Managed Alpha SMID Cap Equity Fund (Unaudited)
The example below is intended to describe the fees and expenses borne by shareholders during the six-month period from July 1, 2018 to December 31, 2018, and the impact of those costs on your investment.
Example
As a shareholder of the Fund, you incur two types of costs: (1) transaction costs, including redemption fees on sales (as applicable) and (2) ongoing costs, including management fees, distribution and/or service (12b-1) fees, and other Fund expenses (as applicable). This example is intended to help you understand your ongoing costs (in dollars) of investing in the Fund and to compare these costs with the ongoing costs of investing in other mutual funds. The example is based on an investment of $1,000 made at the beginning of the six-month period and held for the entire period from July 1, 2018 to December 31, 2018.
This example illustrates your Fund’s ongoing costs in two ways:
Actual Expenses
The second and third data columns in the table below provide information about actual account values and actual expenses. You may use the information in these columns, together with the amount you invested, to estimate the expenses that you paid during the six months ended December 31, 2018. Simply divide your account value by $1,000 (for example, an $8,600 account value divided by $1,000 = 8.6), then multiply the result by the number under the heading entitled Expenses Paid During Period to estimate the expenses you paid on your account during this period.
Hypothetical Example for Comparison Purposes
The fourth and fifth data columns in the table below provide information about hypothetical account values and hypothetical expenses based on the Fund’s actual expense ratio and an assumed rate of return of 5% per year before expenses, which is not the Fund’s actual return. The hypothetical account values and expenses may not be used to estimate the actual ending account balances or expenses you paid for the six-month period shown. You may use this information to compare the ongoing costs of investing in the Fund with the ongoing costs of investing in other funds. To do so, compare this 5% hypothetical example with the 5% hypothetical examples that appear in the shareholder reports of the other funds.
Please note that the expenses shown in the table are meant to highlight your ongoing costs only and do not reflect any transactional costs, such as redemption fees. Therefore, the fourth and fifth data columns of the table are useful in comparing ongoing costs only and will not help you determine the relative total costs of owning different funds. In addition, if these transactional costs were included, your costs would have been higher.
Actual | Hypothetical | ||||||||||||||
Share Class1 | Beginning Account Value 7/1/18 | Ending Account Value (Based on Actual Returns and Expenses) 12/31/18 | Expenses Paid During Period2 | Ending Account Value (Based on Hypothetical 5% Annualized Return and Actual Expenses) 12/31/18 | Expenses Paid During Period2 | ||||||||||
Institutional Class Shares | $ | 1,000.00 | $ | 869.70 | $ | 5.00 | $ | 1,019.86 | $ | 5.40 | |||||
| 1. | No information is provided for Investor Class shares because shares of that class had not yet been issued as of December 31, 2018. |
| 2. | Expenses are equal to the Fund’s annualized expense ratio, net of waivers and excluding acquired fund fees and expenses if any (1.06% for the Institutional Class), multiplied by the average account value over the period, divided by 365 and multiplied by 184 for the Institutional Class (to reflect the six-month period). The table above represents the actual expenses incurred during the six-month period. |
6
PENN CAPITAL FUNDS TRUST
DISCLOSURE OF FUND EXPENSES (UNAUDITED)
FOR THE SIX MONTH PERIOD FROM JULY 1, 2018 TO DECEMBER 31, 2018
Cost in Dollars of a $1,000 Investment in Penn Capital Special Situations Small Cap Equity Fund (Unaudited)
The example below is intended to describe the fees and expenses borne by shareholders during the six-month period from July 1, 2018 to December 31, 2018, and the impact of those costs on your investment.
Example
As a shareholder of the Fund, you incur two types of costs: (1) transaction costs, including redemption fees on sales (as applicable) and (2) ongoing costs, including management fees, distribution and/or service (12b-1) fees, and other Fund expenses (as applicable). This example is intended to help you understand your ongoing costs (in dollars) of investing in the Fund and to compare these costs with the ongoing costs of investing in other mutual funds. The example is based on an investment of $1,000 made at the beginning of the six-month period and held for the entire period from July 1, 2018 to December 31, 2018.
This example illustrates your Fund’s ongoing costs in two ways:
Actual Expenses
The second and third data columns in the table below provide information about actual account values and actual expenses. You may use the information in these columns, together with the amount you invested, to estimate the expenses that you paid during the six months ended December 31, 2018. Simply divide your account value by $1,000 (for example, an $8,600 account value divided by $1,000 = 8.6), then multiply the result by the number under the heading entitled Expenses Paid During Period to estimate the expenses you paid on your account during this period.
Hypothetical Example for Comparison Purposes
The fourth and fifth data columns in the table below provide information about hypothetical account values and hypothetical expenses based on the Fund’s actual expense ratio and an assumed rate of return of 5% per year before expenses, which is not the Fund’s actual return. The hypothetical account values and expenses may not be used to estimate the actual ending account balances or expenses you paid for the six-month period shown. You may use this information to compare the ongoing costs of investing in the Fund with the ongoing costs of investing in other funds. To do so, compare this 5% hypothetical example with the 5% hypothetical examples that appear in the shareholder reports of the other funds.
Please note that the expenses shown in the table are meant to highlight your ongoing costs only and do not reflect any transactional costs, such as redemption fees. Therefore, the fourth and fifth data columns of the table are useful in comparing ongoing costs only and will not help you determine the relative total costs of owning different funds. In addition, if these transactional costs were included, your costs would have been higher.
Actual | Hypothetical | ||||||||||||||
Share Class1 | Beginning Account Value 7/1/18 | Ending Account Value (Based on Actual Returns and Expenses) 12/31/18 | Expenses Paid During Period2 | Ending Account Value (Based on Hypothetical 5% Annualized Return and Actual Expenses) 12/31/18 | Expenses Paid During Period2 | ||||||||||
Institutional Class Shares | $ | 1,000.00 | $ | 781.70 | $ | 4.90 | $ | 1,019.71 | $ | 5.55 | |||||
| 1. | No information is provided for Investor Class shares because shares of that class had not yet been issued as of December 31, 2018. |
| 2. | Expenses are equal to the Fund’s annualized expense ratio, net of waivers and excluding acquired fund fees and expenses if any (1.09% for the Institutional Class), multiplied by the average account value over the period, divided by 365 and multiplied by 184 for the Institutional Class (to reflect the six-month period). The table above represents the actual expenses incurred during the six-month period. |
7
PENN CAPITAL FUNDS TRUST
DISCLOSURE OF FUND EXPENSES (UNAUDITED)
FOR THE SIX MONTH PERIOD FROM JULY 1, 2018 TO DECEMBER 31, 2018
Cost in Dollars of a $1,000 Investment in Penn Capital Multi-Credit High Income Fund (Unaudited)
The example below is intended to describe the fees and expenses borne by shareholders during the six-month period from July 1, 2018 to December 31, 2018, and the impact of those costs on your investment.
Example
As a shareholder of the Fund, you incur two types of costs: (1) transaction costs, including redemption fees on sales (as applicable) and (2) ongoing costs, including management fees, distribution and/or service (12b-1) fees, and other Fund expenses (as applicable). This example is intended to help you understand your ongoing costs (in dollars) of investing in the Fund and to compare these costs with the ongoing costs of investing in other mutual funds. The example is based on an investment of $1,000 made at the beginning of the six-month period and held for the entire period from July 1, 2018 to December 31, 2018.
This example illustrates your Fund’s ongoing costs in two ways:
Actual Expenses
The second and third data columns in the table below provide information about actual account values and actual expenses. You may use the information in these columns, together with the amount you invested, to estimate the expenses that you paid during the six months ended December 31, 2018. Simply divide your account value by $1,000 (for example, an $8,600 account value divided by $1,000 = 8.6), then multiply the result by the number under the heading entitled Expenses Paid During Period to estimate the expenses you paid on your account during this period.
Hypothetical Example for Comparison Purposes
The fourth and fifth data columns in the table below provide information about hypothetical account values and hypothetical expenses based on the Fund’s actual expense ratio and an assumed rate of return of 5% per year before expenses, which is not the Fund’s actual return. The hypothetical account values and expenses may not be used to estimate the actual ending account balances or expenses you paid for the six-month period shown. You may use this information to compare the ongoing costs of investing in the Fund with the ongoing costs of investing in other funds. To do so, compare this 5% hypothetical example with the 5% hypothetical examples that appear in the shareholder reports of the other funds.
Please note that the expenses shown in the table are meant to highlight your ongoing costs only and do not reflect any transactional costs, such as redemption fees. Therefore, the fourth and fifth data columns of the table are useful in comparing ongoing costs only and will not help you determine the relative total costs of owning different funds. In addition, if these transactional costs were included, your costs would have been higher.
Actual | Hypothetical | ||||||||||||||
Share Class1 | Beginning Account Value 7/1/18 | Ending Account Value (Based on Actual Returns and Expenses) 12/31/18 | Expenses Paid During Period2 | Ending Account Value (Based on Hypothetical 5% Annualized Return and Actual Expenses) 12/31/18 | Expenses Paid During Period2 | ||||||||||
Institutional Class Shares | $ | 1,000.00 | $ | 979.30 | $ | 3.59 | $ | 1,021.58 | $ | 3.67 | |||||
| 1. | No information is provided for Investor Class shares because shares of that class had not yet been issued as of December 31, 2018. |
| 2. | Expenses are equal to the Fund’s annualized expense ratio, net of waivers and excluding acquired fund fees and expenses if any (0.72% for the Institutional Class), multiplied by the average account value over the period, divided by 365 and multiplied by 184 for the Institutional Class (to reflect the six-month period). The table above represents the actual expenses incurred during the six-month period. |
8
PENN CAPITAL FUNDS TRUST
DISCLOSURE OF FUND EXPENSES (UNAUDITED)
FOR THE SIX MONTH PERIOD FROM JULY 1, 2018 TO DECEMBER 31, 2018
Cost in Dollars of a $1,000 Investment in Penn Capital Defensive Floating Rate Income Fund (Unaudited)
The example below is intended to describe the fees and expenses borne by shareholders during the six-month period from July 1, 2018 to December 31, 2018, and the impact of those costs on your investment.
Example
As a shareholder of the Fund, you incur two types of costs: (1) transaction costs, including redemption fees on sales (as applicable) and (2) ongoing costs, including management fees, distribution and/or service (12b-1) fees, and other Fund expenses (as applicable). This example is intended to help you understand your ongoing costs (in dollars) of investing in the Fund and to compare these costs with the ongoing costs of investing in other mutual funds. The example is based on an investment of $1,000 made at the beginning of the six-month period and held for the entire period from July 1, 2018 to December 31, 2018.
This example illustrates your Fund’s ongoing costs in two ways:
Actual Expenses
The second and third data columns in the table below provide information about actual account values and actual expenses. You may use the information in these columns, together with the amount you invested, to estimate the expenses that you paid during the six months ended December 31, 2018. Simply divide your account value by $1,000 (for example, an $8,600 account value divided by $1,000 = 8.6), then multiply the result by the number under the heading entitled Expenses Paid During Period to estimate the expenses you paid on your account during this period.
Hypothetical Example for Comparison Purposes
The fourth and fifth data columns in the table below provide information about hypothetical account values and hypothetical expenses based on the Fund’s actual expense ratio and an assumed rate of return of 5% per year before expenses, which is not the Fund’s actual return. The hypothetical account values and expenses may not be used to estimate the actual ending account balances or expenses you paid for the six-month period shown. You may use this information to compare the ongoing costs of investing in the Fund with the ongoing costs of investing in other funds. To do so, compare this 5% hypothetical example with the 5% hypothetical examples that appear in the shareholder reports of the other funds.
Please note that the expenses shown in the table are meant to highlight your ongoing costs only and do not reflect any transactional costs, such as redemption fees. Therefore, the fourth and fifth data columns of the table are useful in comparing ongoing costs only and will not help you determine the relative total costs of owning different funds. In addition, if these transactional costs were included, your costs would have been higher.
Actual | Hypothetical | ||||||||||||||
Share Class1 | Beginning Account Value 7/1/18 | Ending Account Value (Based on Actual Returns and Expenses) 12/31/18 | Expenses Paid During Period2 | Ending Account Value (Based on Hypothetical 5% Annualized Return and Actual Expenses) 12/31/18 | Expenses Paid During Period2 | ||||||||||
Institutional Class Shares | $ | 1,000.00 | $ | 986.00 | $ | 3.20 | $ | 1,021.98 | $ | 3.26 | |||||
| 1. | No information is provided for Investor Class shares because shares of that class had not yet been issued as of December 31, 2018. |
| 2. | Expenses are equal to the Fund’s annualized expense ratio, net of waivers and excluding acquired fund fees and expenses if any (0.64% for the Institutional Class), multiplied by the average account value over the period, divided by 365 and multiplied by 184 for the Institutional Class (to reflect the six-month period). The table above represents the actual expenses incurred during the six-month period. |
9
PENN CAPITAL FUNDS TRUST
DISCLOSURE OF FUND EXPENSES (UNAUDITED)
FOR THE PERIOD FROM JULY 1, 2018 TO DECEMBER 31, 2018
Cost in Dollars of a $1,000 Investment in Penn Capital Defensive Short Duration High Income Fund (Unaudited)
The example below is intended to describe the fees and expenses borne by shareholders during the six-month period from July 1, 2018 to December 31, 2018, and the impact of those costs on your investment.
Example
As a shareholder of the Fund, you incur two types of costs: (1) transaction costs, including redemption fees on sales (as applicable) and (2) ongoing costs, including management fees, distribution and/or service (12b-1) fees, and other Fund expenses (as applicable). This example is intended to help you understand your ongoing costs (in dollars) of investing in the Fund and to compare these costs with the ongoing costs of investing in other mutual funds. The example is based on an investment of $1,000 made at the beginning of the six-month period and held for the entire period from July 1, 2018 to December 31, 2018.
This example illustrates your Fund’s ongoing costs in two ways:
Actual Expenses
The second and third data columns in the table below provide information about actual account values and actual expenses. You may use the information in these columns, together with the amount you invested, to estimate the expenses that you paid during the period ended December 31, 2018. Simply divide your account value by $1,000 (for example, an $8,600 account value divided by $1,000 = 8.6), then multiply the result by the number under the heading entitled Expenses Paid During Period to estimate the expenses you paid on your account during this period.
Hypothetical Example for Comparison Purposes
The fourth and fifth data columns in the table below provide information about hypothetical account values and hypothetical expenses based on the Fund’s actual expense ratio and an assumed rate of return of 5% per year before expenses, which is not the Fund’s actual return. The hypothetical account values and expenses may not be used to estimate the actual ending account balances or expenses you paid for the six-month period shown. You may use this information to compare the ongoing costs of investing in the Fund with the ongoing costs of investing in other funds. To do so, compare this 5% hypothetical example with the 5% hypothetical examples that appear in the shareholder reports of the other funds.
Please note that the expenses shown in the table are meant to highlight your ongoing costs only and do not reflect any transactional costs, such as redemption fees. Therefore, the fourth and fifth data columns of the table are useful in comparing ongoing costs only and will not help you determine the relative total costs of owning different funds. In addition, if these transactional costs were included, your costs would have been higher.
Actual | Hypothetical | ||||||||||||||
Share Class1 | Beginning Account Value 7/1/18 | Ending Account Value (Based on Actual Returns and Expenses) 12/31/18 | Expenses Paid During Period2 | Ending Account Value (Based on Hypothetical 5% Annualized Return and Actual Expenses) 12/31/18 | Expenses Paid During Period2 | ||||||||||
Institutional Class Shares | $ | 1,000.00 | $ | 999.30 | $ | 2.72 | $ | 1,022.48 | $ | 2.75 | |||||
| 1. | No information is provided for Investor Class shares because shares of that class had not yet been issued as of December 31, 2018. |
| 2. | Expenses are equal to the Fund’s annualized expense ratio, net of waivers and excluding acquired fund fees and expenses if any (0.54% for the Institutional Class), multiplied by the average account value over the period, divided by 365 and multiplied by 184 for the Institutional Class (to reflect the six-month period). The table above represents the actual expenses incurred during the six-month period. |
10
PENN CAPITAL FUNDS TRUST |
PENN CAPITAL MANAGED ALPHA SMID CAP EQUITY FUND |
SCHEDULE OF INVESTMENTS |
DECEMBER 31, 2018 (UNAUDITED) |
Shares | Value | |||||
Common Stocks: 88.0% | ||||||
Aerospace & Defense: 3.3% | ||||||
Huntington Ingalls Industries, Inc. | 1,075 | $ | 204,583 | |||
Mercury Systems, Inc. (a) | 4,234 | 200,226 | ||||
404,809 | ||||||
Banks: 7.4% | ||||||
BOK Financial Corp. | 2,536 | 185,965 | ||||
Pinnacle Financial Partners, Inc. | 3,896 | 179,605 | ||||
Sterling Bancorp | 8,029 | 132,559 | ||||
Webster Financial Corp. | 4,249 | 209,433 | ||||
Western Alliance Bancorp (a) | 4,971 | 196,305 | ||||
903,867 | ||||||
Beverages: 1.3% | ||||||
MGP Ingredients, Inc. | 2,756 | 157,230 | ||||
Biotechnology: 1.7% | ||||||
Exelixis, Inc. (a) | 10,485 | 206,240 | ||||
Building Products: 1.3% | ||||||
Allegion PLC | 1,896 | 151,130 | ||||
Chemicals: 2.5% | ||||||
HB Fuller Co. | 3,991 | 170,296 | ||||
Valvoline, Inc. | 6,737 | 130,361 | ||||
300,657 | ||||||
Commercial Services & Supplies: 1.8% | ||||||
KAR Auction Services, Inc. | 4,621 | 220,514 | ||||
Containers & Packaging: 1.4% | ||||||
Berry Global Group, Inc. (a) | 3,606 | 171,393 | ||||
Diversified Financial Services: 2.1% | ||||||
Voya Financial, Inc. | 6,245 | 250,674 | ||||
Electric Utilities: 2.0% | ||||||
ALLETE, Inc. | 3,124 | 238,111 | ||||
Entertainment: 2.0% | ||||||
Live Nation Entertainment, Inc. (a) | 4,829 | 237,828 | ||||
Food Products: 1.2% | ||||||
Lamb Weston Holdings, Inc. | 1,971 | 144,987 | ||||
Health Care Equipment & Supplies: 6.5% | ||||||
ICU Medical, Inc. (a) | 879 | 201,845 | ||||
LivaNova PLC (a) | 1,538 | 140,681 | ||||
Teleflex, Inc. | 754 | 194,894 | ||||
Wright Medical Group NV (a) | 9,125 | 248,382 | ||||
785,802 | ||||||
Health Care Providers & Services: 3.9% | ||||||
LHC Group, Inc. (a) | 2,064 | 193,768 | ||||
WellCare Health Plans, Inc. (a) | 1,187 | 280,239 | ||||
474,007 | ||||||
Health Care Technology: 1.6% | ||||||
Allscripts Healthcare Solutions, Inc. (a) | 20,545 | 198,054 | ||||
Shares | Value | |||||
Hotels, Restaurants & Leisure: 3.5% | ||||||
Boyd Gaming Corp. | 5,507 | $ | 114,436 | |||
Red Rock Resorts, Inc. - Class A | 7,120 | 144,607 | ||||
Vail Resorts, Inc. | 771 | 162,542 | ||||
421,585 | ||||||
Household Durables: 0.6% | ||||||
Roku, Inc. (a) | 2,351 | 72,035 | ||||
Independent Power and Renewable Electricity Producers: 1.6% | ||||||
Ormat Technologies, Inc. | 3,721 | 194,608 | ||||
Insurance: 4.9% | ||||||
Arch Capital Group Ltd. (a) | 11,313 | 302,283 | ||||
Fidelity National Financial, Inc. | 4,250 | 133,620 | ||||
Reinsurance Group of America, Inc. | 1,100 | 154,253 | ||||
590,156 | ||||||
Interactive Media & Services: 1.9% | ||||||
IAC (a) | 1,236 | 226,238 | ||||
IT Services: 4.7% | ||||||
Black Knight, Inc. (a) | 4,420 | 199,165 | ||||
GoDaddy, Inc. - Class A (a) | 3,381 | 221,861 | ||||
MongoDB, Inc. (a) | 1,708 | 143,028 | ||||
564,054 | ||||||
Machinery: 1.5% | ||||||
Allison Transmission Holdings, Inc. | 4,243 | 186,310 | ||||
Media: 1.7% | ||||||
Nexstar Media Group, Inc. - Class A | 2,652 | 208,554 | ||||
Metals & Mining: 1.0% | ||||||
Commercial Metals Co. | 7,514 | 120,374 | ||||
Oil, Gas & Consumable Fuels: 4.6% | ||||||
Arch Coal, Inc. - Class A | 2,023 | 167,889 | ||||
Cabot Oil & Gas Corp. | 7,459 | 166,709 | ||||
Callon Petroleum Co. (a) | 12,153 | 78,873 | ||||
Diamondback Energy, Inc. | 1,565 | 145,075 | ||||
558,546 | ||||||
Pharmaceuticals: 3.8% | ||||||
Elanco Animal Health, Inc. (a) | 7,824 | 246,691 | ||||
Pacira Pharmaceuticals, Inc. (a) | 4,899 | 210,755 | ||||
457,446 | ||||||
Professional Services: 2.3% | ||||||
TransUnion | 4,915 | 279,172 | ||||
Road & Rail: 1.1% | ||||||
Schneider National, Inc. - Class B | 7,167 | 133,808 | ||||
Semiconductors & Semiconductor Equipment: 4.0% | ||||||
Marvell Technology Group Ltd. | 8,314 | 134,604 | ||||
Semtech Corp. (a) | 3,678 | 168,710 | ||||
Teradyne, Inc. | 5,949 | 186,679 | ||||
489,993 | ||||||
The Accompanying Notes are an Integral Part of these Financial Statements.
11
PENN CAPITAL FUNDS TRUST |
PENN CAPITAL MANAGED ALPHA SMID CAP EQUITY FUND |
SCHEDULE OF INVESTMENTS |
DECEMBER 31, 2018 (UNAUDITED) |
Shares | Value | |||||
Software: 4.9% | ||||||
Five9, Inc. (a) | 4,339 | $ | 189,701 | |||
Nice Ltd. - ADR (a) | 2,015 | 218,043 | ||||
Tyler Technologies, Inc. (a) | 992 | 184,334 | ||||
592,078 | ||||||
Specialty Retail: 3.2% | ||||||
Burlington Stores, Inc. (a) | 1,717 | 279,304 | ||||
Floor & Decor Holdings, Inc. - Class A (a) | 4,153 | 107,563 | ||||
TravelCenters of America LLC (a) | 1 | 2 | ||||
386,869 | ||||||
Trading Companies & Distributors: 0.9% | ||||||
United Rentals, Inc. (a) | 1,129 | 115,756 | ||||
Water Utilities: 1.8% | ||||||
Aqua America, Inc. | 6,476 | 221,415 | ||||
Total Common Stocks (cost $10,278,591) | 10,664,300 | |||||
Real Estate Investment Trusts (REITs): 9.7% | ||||||
Camden Property Trust | 2,614 | 230,163 | ||||
CyrusOne, Inc. | 4,291 | 226,908 | ||||
Healthcare Trust of America, Inc. - Class A | 9,559 | 241,938 | ||||
Invitation Homes, Inc. | 11,771 | 236,362 | ||||
MGM Growth Properties LLC - Class A | 9,074 | 239,644 | ||||
Total REITs (cost $1,246,596) | 1,175,015 | |||||
Short-Term Investment: 2.6% | ||||||
Money Market Deposit Account - 2.6% | ||||||
U.S. Bank Money Market Deposit Account, 2.200% | 319,509 | 319,509 | ||||
Total Short-Term Investment (cost $319,509) | 319,509 | |||||
Total Investments - 100.3% (cost $11,844,696) | 12,158,824 | |||||
Liabilities in Excess of Other Assets (0.3)% | (33,921 | ) | ||||
Net Assets: 100.0% | $ | 12,124,903 | ||||
Percentages are stated as a percent of net assets.
| ADR | American Depository Receipt |
| (a) | No distribution or dividend was made during the period ending December 31, 2018. As such, it is classified as a non-income producing security as of December 31, 2018. |
The cost basis of investments for federal income tax purposes at December 31, 2018 was as follows*: | |||
Cost of investments | $ | 11,844,696 | |
Gross unrealized appreciation | 1,210,158 | ||
Gross unrealized depreciation | (896,030 | ) | |
Net unrealized appreciation | $ | 314,128 | |
| * | Because tax adjustments are calculated annually, the above table does not reflect tax adjustments. For the previous fiscal year's federal income tax information, please refer to the Notes to Financial Statements section in the Fund's most recent annual report. |
Country Exposure (as a percentage of total investments) | |
United States | 90.17% |
Bermuda | 3.59% |
Netherlands | 2.04% |
Israel | 1.80% |
Ireland | 1.24% |
United Kingdom | 1.16% |
Sector Allocation (as a percentage of total investments) (Unaudited) |

The industry classifications presented in this report, present the Global Industry Classification Standard (GICS®). GICS® was developed by and/or is the exclusive property of MSCI, Inc. and Standard & Poor Financial Services LLC (“S&P”). GICS® is a service mark of MSCI and S&P and has been licensed for use by U.S. Bank Global Fund Services.
The Accompanying Notes are an Integral Part of these Financial Statements.
12
PENN CAPITAL FUNDS TRUST |
PENN CAPITAL SPECIAL SITUATIONS SMALL CAP EQUITY FUND |
SCHEDULE OF INVESTMENTS |
DECEMBER 31, 2018 (UNAUDITED) |
Shares | Value | |||||
Common Stocks: 95.9% | ||||||
Banks: 7.3% | ||||||
FB Financial Corp. | 4,588 | $ | 160,672 | |||
First BanCorp | 12,906 | 110,991 | ||||
Sterling Bancorp | 7,166 | 118,311 | ||||
Webster Financial Corp. | 1,851 | 91,236 | ||||
Western Alliance Bancorp (a) | 4,569 | 180,430 | ||||
661,640 | ||||||
Biotechnology: 1.7% | ||||||
Exelixis, Inc. (a) | 7,970 | 156,770 | ||||
Capital Markets: 2.1% | ||||||
Hamilton Lane, Inc. - Class A | 2,567 | 94,979 | ||||
PJT Partners, Inc. - Class A | 2,397 | 92,908 | ||||
187,887 | ||||||
Construction & Engineering: 1.7% | ||||||
MasTec, Inc. (a) | 3,720 | 150,883 | ||||
Construction Materials: 1.2% | ||||||
Summit Materials, Inc. - Class A (a) | 8,755 | 108,562 | ||||
Diversified Consumer Services: 1.6% | ||||||
Chegg, Inc. (a) | 5,123 | 145,596 | ||||
Electrical Equipment: 1.0% | ||||||
TPI Composites, Inc. (a) | 3,820 | 93,896 | ||||
Electronic Equipment, Instruments & Components: 0.8% | ||||||
Itron, Inc. (a) | 1,594 | 75,380 | ||||
Energy Equipment & Services: 4.8% | ||||||
Keane Group, Inc. (a) | 14,230 | 116,401 | ||||
Mammoth Energy Services, Inc. | 7,015 | 126,130 | ||||
Noble Corp. PLC (a) | 44,759 | 117,269 | ||||
Patterson-UTI Energy, Inc. | 6,657 | 68,900 | ||||
428,700 | ||||||
Entertainment: 3.0% | ||||||
AMC Entertainment Holdings, Inc. - Class A | 10,424 | 128,007 | ||||
Zynga, Inc. - Class A (a) | 36,416 | 143,115 | ||||
271,122 | ||||||
Food & Staples Retailing: 1.4% | ||||||
BJ's Wholesale Club Holdings, Inc. (a) | 5,672 | 125,691 | ||||
Health Care Equipment & Supplies: 6.9% | ||||||
ICU Medical, Inc. (a) | 750 | 172,222 | ||||
LivaNova PLC (a) | 1,516 | 138,669 | ||||
OraSure Technologies, Inc. (a) | 12,132 | 141,702 | ||||
Wright Medical Group NV (a) | 6,343 | 172,656 | ||||
625,249 | ||||||
Health Care Providers & Services: 3.2% | ||||||
LHC Group, Inc. (a) | 1,499 | 140,726 | ||||
R1 RCM, Inc. (a) | 18,396 | 146,248 | ||||
286,974 | ||||||
Shares | Value | |||||
Health Care Technology: 3.1% | ||||||
Allscripts Healthcare Solutions, Inc. (a) | 14,958 | $ | 144,195 | |||
Omnicell, Inc. (a) | 2,274 | 139,260 | ||||
283,455 | ||||||
Hotels, Restaurants & Leisure: 11.6% | ||||||
Extended Stay America, Inc. | 7,475 | 115,862 | ||||
Full House Resorts, Inc. (a) | 62,873 | 127,003 | ||||
Golden Entertainment, Inc. (a) | 10,837 | 173,609 | ||||
Penn National Gaming, Inc. (a) | 8,066 | 151,883 | ||||
Planet Fitness, Inc. - Class A (a) | 2,391 | 128,205 | ||||
Red Rock Resorts, Inc. - Class A | 6,599 | 134,026 | ||||
Scientific Games Corp. (a) | 5,536 | 98,984 | ||||
SeaWorld Entertainment, Inc. (a) | 5,407 | 119,441 | ||||
1,049,013 | ||||||
IT Services: 3.9% | ||||||
Carbonite, Inc. (a) | 3,590 | 90,684 | ||||
Everi Holdings, Inc. (a) | 23,603 | 121,555 | ||||
InterXion Holding NV (a) | 2,566 | 138,975 | ||||
351,214 | ||||||
Machinery: 5.8% | ||||||
EnPro Industries, Inc. | 1,571 | 94,417 | ||||
Evoqua Water Technologies Corp. (a) | 13,407 | 128,707 | ||||
Gardner Denver Holdings, Inc. (a) | 5,768 | 117,956 | ||||
Milacron Holdings Corp. (a) | 8,786 | 104,466 | ||||
Welbilt, Inc. (a) | 7,013 | 77,914 | ||||
523,460 | ||||||
Media: 7.1% | ||||||
The E. W. Scripps Co. - Class A | 10,034 | 157,835 | ||||
Gray Television, Inc. (a) | 11,704 | 172,517 | ||||
Nexstar Media Group, Inc. - Class A | 1,940 | 152,561 | ||||
Sinclair Broadcast Group, Inc. - Class A | 6,047 | 159,278 | ||||
642,191 | ||||||
Metals & Mining: 0.8% | ||||||
Cleveland-Cliffs, Inc. (a) | 9,595 | 73,785 | ||||
Oil, Gas & Consumable Fuels: 3.4% | ||||||
Enerplus Corp. | 15,042 | 116,726 | ||||
Whiting Petroleum Corp. (a) | 3,520 | 79,869 | ||||
WPX Energy, Inc. (a) | 9,911 | 112,490 | ||||
309,085 | ||||||
Pharmaceuticals: 1.5% | ||||||
Pacira Pharmaceuticals, Inc. (a) | 3,180 | 136,804 | ||||
Road & Rail: 2.0% | ||||||
Marten Transport Ltd. | 5,522 | 89,401 | ||||
Schneider National, Inc. - Class B | 4,694 | 87,637 | ||||
177,038 | ||||||
The Accompanying Notes are an Integral Part of these Financial Statements.
13
PENN CAPITAL FUNDS TRUST |
PENN CAPITAL SPECIAL SITUATIONS SMALL CAP EQUITY FUND |
SCHEDULE OF INVESTMENTS |
DECEMBER 31, 2018 (UNAUDITED) |
Shares | Value | |||||
Semiconductors & Semiconductor Equipment: 3.0% | ||||||
Semtech Corp. (a) | 3,439 | $ | 157,747 | |||
Versum Materials, Inc. | 4,109 | 113,901 | ||||
271,648 | ||||||
Software: 7.6% | ||||||
Five9, Inc. (a) | 3,250 | 142,090 | ||||
Hortonworks, Inc. (a) | 8,188 | 118,071 | ||||
Instructure, Inc. (a) | 2,814 | 105,553 | ||||
Mimecast Ltd. (a) | 3,328 | 111,921 | ||||
Nice Ltd. - ADR (a) | 1,292 | 139,807 | ||||
Q2 Holdings, Inc. (a) | 1,457 | 72,194 | ||||
689,636 | ||||||
Specialty Retail: 2.3% | ||||||
Five Below, Inc. (a) | 1,233 | 126,161 | ||||
Floor & Decor Holdings, Inc. - Class A (a) | 3,198 | 82,828 | ||||
208,989 | ||||||
Textiles, Apparel & Luxury Goods: 1.3% | ||||||
G-III Apparel Group Ltd. (a) | 4,328 | 120,708 | ||||
Thrifts & Mortgage Finance: 1.4% | ||||||
WSFS Financial Corp. | 3,281 | 124,383 | ||||
Trading Companies & Distributors: 3.6% | ||||||
Beacon Roofing Supply, Inc. (a) | 4,602 | 145,975 | ||||
DXP Enterprises, Inc. (a) | 2,107 | 58,659 | ||||
Triton International Ltd. | 3,828 | 118,936 | ||||
323,570 | ||||||
Wireless Telecommunication Services: 0.8% | ||||||
Gogo, Inc. (a) | 24,776 | 74,080 | ||||
Total Common Stocks (cost $9,142,562) | 8,677,409 | |||||
Contingent Value Right - 0.0% | ||||||
Media - 0.0% | ||||||
Media General, Inc. (a) | 1,867 | 93 | ||||
Total Contingent Value Right (cost $0) | 93 | |||||
Real Estate Investment Trusts (REITs): 3.6% | ||||||
NexPoint Residential Trust, Inc. | 2,779 | 97,404 | ||||
Pebblebrook Hotel Trust | 3,833 | 108,512 | ||||
Physicians Realty Trust | 7,194 | 115,320 | ||||
Total REITs (cost $353,704) | 321,236 | |||||
Short-Term Investment: 1.0% | ||||||
Money Market Deposit Account - 1.0% | ||||||
U.S. Bank Money Market Deposit Account, 2.200% | 92,529 | 92,529 | ||||
Total Short-Term Investment (cost $92,529) | 92,529 | |||||
Shares | Value | |||||
Total Investments - 100.5% (cost $9,588,795) | $ | 9,091,267 | ||||
Liabilities in Excess of Other Assets (0.5)% | (45,128 | ) | ||||
Net Assets: 100.0% | $ | 9,046,139 | ||||
Percentages are stated as a percent of net assets.
ADR - American Depository Receipt
| (a) | No distribution or dividend was made during the period ending December 31, 2018. As such, it is classified as a non-income producing security as of December 31, 2018. |
The cost basis of investments for federal income tax purposes at December 31, 2018 was as follows*: | |||
Cost of investments | $ | 9,588,795 | |
Gross unrealized appreciation | 928,413 | ||
Gross unrealized depreciation | (1,425,941 | ) | |
Net unrealized depreciation | $ | (497,528 | ) |
| * | Because tax adjustments are calculated annually, the above table does not reflect tax adjustments. For the previous fiscal year's federal income tax information, please refer to the Notes to Financial Statements section in the Fund's most recent annual report. |
Country Exposure (as a percentage of total investments) | |
United States | 87.17% |
Netherlands | 3.43% |
United Kingdom | 2.82% |
Israel | 1.54% |
Bermuda | 1.31% |
Canada | 1.28% |
Jersey | 1.23% |
Puerto Rico | 1.22% |
Sector Allocation (as a percentage of total investments) (Unaudited) |

The Accompanying Notes are an Integral Part of these Financial Statements.
14
PENN CAPITAL FUNDS TRUST |
PENN CAPITAL MULTI-CREDIT HIGH INCOME FUND |
SCHEDULE OF INVESTMENTS |
DECEMBER 31, 2018 (UNAUDITED) |
Principal | Value | |||||
Corporate Bonds: 56.3% | ||||||
Aerospace: 1.0% | ||||||
Bombardier, Inc., 7.750%, 3/15/20 (a) | 30,000 | $ | 30,450 | |||
Bombardier, Inc., 8.750%, 12/1/21 (a) | 105,000 | 108,150 | ||||
138,600 | ||||||
Auto Parts & Equipment: 0.8% | ||||||
American Axle & Manufacturing, Inc., 6.625%, 10/15/22 | 35,000 | 34,650 | ||||
Meritor, Inc., 6.250%, 2/15/24 | 70,000 | 66,850 | ||||
101,500 | ||||||
Banking: 0.9% | ||||||
Ally Financial, Inc., 8.000%, 3/15/20 | 35,000 | 36,225 | ||||
Ally Financial, Inc., 5.750%, 11/20/25 | 90,000 | 89,550 | ||||
125,775 | ||||||
Brokerage: 0.4% | ||||||
Oppenheimer Holdings, Inc., 6.750%, 7/1/22 | 60,000 | 59,400 | ||||
Building & Construction: 0.5% | ||||||
Ashton Woods USA LLC, 6.875%, 2/15/21 (a) | 24,000 | 23,040 | ||||
Ashton Woods USA LLC, 6.750%, 8/1/25 (a) | 50,000 | 43,500 | ||||
66,540 | ||||||
Building Materials: 1.5% | ||||||
Beacon Roofing Supply, Inc., 4.875%, 11/1/25 (a) | 75,000 | 65,906 | ||||
Griffon Corp., 5.250%, 3/1/22 | 105,000 | 95,025 | ||||
U.S. Concrete, Inc., 6.375%, 6/1/24 | 50,000 | 46,000 | ||||
206,931 | ||||||
Computer Hardware: 1.1% | ||||||
Dell International LLC, 8.100%, 7/15/36 (a) | 45,000 | 48,556 | ||||
Dell International LLC, 5.875%, 6/15/21 (a) | 25,000 | 24,972 | ||||
NCR Corp., 5.000%, 7/15/22 | 35,000 | 32,987 | ||||
NCR Corp., 6.375%, 12/15/23 | 50,000 | 48,461 | ||||
154,976 | ||||||
Consumer/Commercial/Lease Financing: 2.2% | ||||||
DAE Funding LLC, 5.750%, 11/15/23 (a) | 65,000 | 64,350 | ||||
Navient Corp., 5.875%, 10/25/24 | 65,000 | 54,275 | ||||
Navient Corp., 7.250%, 9/25/23 | 35,000 | 32,112 | ||||
Navient Corp., 6.125%, 3/25/24 | 15,000 | 12,863 | ||||
Park Aerospace Holdings Ltd., 5.250%, 8/15/22 (a) | 100,000 | 96,750 | ||||
Park Aerospace Holdings Ltd., 4.500%, 3/15/23 (a) | 45,000 | 42,075 | ||||
302,425 | ||||||
Consumer-Products: 0.7% | ||||||
HLF Financing Sarl LLC, 7.250%, 8/15/26 (a) | 95,000 | 93,575 | ||||
Electric-Generation: 1.2% | ||||||
Calpine Corp., 5.875%, 1/15/24 (a) | 25,000 | 24,500 | ||||
Calpine Corp., 5.375%, 1/15/23 | 35,000 | 32,812 | ||||
Vistra Operations Co. LLC, 5.500%, 9/1/26 (a) | 105,000 | 101,063 | ||||
158,375 | ||||||
Principal | Value | |||||
Electric-Integrated: 0.5% | ||||||
Talen Energy Supply LLC, 9.500%, 7/15/22 (a) | 70,000 | $ | 70,350 | |||
Energy-Exploration & Production: 5.6% | ||||||
Callon Petroleum Co., 6.125%, 10/1/24 | 35,000 | 32,550 | ||||
Carrizo Oil & Gas, Inc., 8.250%, 7/15/25 | 25,000 | 24,500 | ||||
Chesapeake Energy Corp., 7.000%, 10/1/24 | 50,000 | 43,250 | ||||
Comstock Escrow Corp., 9.750%, 8/15/26 (a) | 105,000 | 88,725 | ||||
Covey Park Energy LLC, 7.500%, 5/15/25 (a) | 35,000 | 30,100 | ||||
Eclipse Resources Corp., 8.875%, 7/15/23 | 70,000 | 60,025 | ||||
Gulfport Energy Corp., 6.625%, 5/1/23 | 15,000 | 14,175 | ||||
Gulfport Energy Corp., 6.000%, 10/15/24 | 60,000 | 53,100 | ||||
Jagged Peak Energy LLC, 5.875%, 5/1/26 (a) | 40,000 | 37,200 | ||||
Matador Resources Co., 5.875%, 9/15/26 | 50,000 | 46,000 | ||||
Murphy Oil Corp., 5.750%, 8/15/25 | 55,000 | 51,397 | ||||
Oasis Petroleum, Inc., 6.250%, 5/1/26 (a) | 50,000 | 42,000 | ||||
PDC Energy, Inc., 6.125%, 9/15/24 | 50,000 | 46,250 | ||||
Range Resources Corp., 5.000%, 8/15/22 | 80,000 | 71,600 | ||||
Resolute Energy Corp., 8.500%, 5/1/20 | 90,000 | 88,650 | ||||
Southwestern Energy Co., 6.200%, 1/23/25 | 35,000 | 31,281 | ||||
760,803 | ||||||
Entertainment: 1.0% | ||||||
AMC Entertainment Holdings, Inc., 5.750%, 6/15/25 | 110,000 | 96,800 | ||||
National CineMedia LLC, 5.750%, 8/15/26 | 40,000 | 35,911 | ||||
132,711 | ||||||
Food & Drug Retailers: 1.0% | ||||||
Albertsons Cos LLC., 6.625%, 6/15/24 | 75,000 | 69,562 | ||||
Ingles Markets, Inc., 5.750%, 6/15/23 | 65,000 | 64,188 | ||||
133,750 | ||||||
Food-Wholesale: 0.9% | ||||||
Pilgrim's Pride Corp., 5.750%, 3/15/25 (a) | 60,000 | 56,250 | ||||
Simmons Foods, Inc., 5.750%, 11/1/24 (a) | 90,000 | 63,900 | ||||
120,150 | ||||||
Forestry/Paper: 0.9% | ||||||
Mercer International, Inc., 7.375%, 1/15/25 (a) | 40,000 | 39,900 | ||||
Rayonier AM Products, Inc., 5.500%, 6/1/24 (a) | 100,000 | 88,250 | ||||
128,150 | ||||||
Gaming: 1.8% | ||||||
Gateway Casinos & Entertainment Ltd., 8.250%, 3/1/24 (a) | 40,000 | 40,600 | ||||
Scientific Games International, Inc., 10.000%, 12/1/22 | 35,000 | 35,437 | ||||
Stars Group Holdings BV, 7.000%, 7/15/26 (a) | 50,000 | 48,625 | ||||
The Enterprise Development Authority, 12.000%, 7/15/24 (a) | 70,000 | 63,700 | ||||
Wynn Las Vegas LLC, 5.500%, 3/1/25 (a) | 55,000 | 51,288 | ||||
239,650 | ||||||
The Accompanying Notes are an Integral Part of these Financial Statements.
15
PENN CAPITAL FUNDS TRUST |
PENN CAPITAL MULTI-CREDIT HIGH INCOME FUND |
SCHEDULE OF INVESTMENTS |
DECEMBER 31, 2018 (UNAUDITED) |
Principal | Value | |||||
Gas Distribution: 2.5% | ||||||
DCP Midstream Operating LP, 5.850% (3 Month US LIBOR + 3.850%), 5/21/43 (a)(b) | 90,000 | $ | 72,000 | |||
DCP Midstream Operating LP, 3.875%, 3/15/23 | 55,000 | 51,562 | ||||
Enterprise Products Operating LLC, 4.875% (3 Month US LIBOR + 2.986%), 8/16/77 (b) | 50,000 | 41,447 | ||||
NGL Energy Partners LP, 5.125%, 7/15/19 | 25,000 | 24,813 | ||||
NGL Energy Partners LP, 7.500%, 11/1/23 | 55,000 | 52,800 | ||||
NGPL PipeCo LLC, 7.768%, 12/15/37 (a) | 45,000 | 51,300 | ||||
Rockies Express Pipeline LLC, 6.875%, 4/15/40 (a) | 45,000 | 47,025 | ||||
340,947 | ||||||
Health Services: 0.3% | ||||||
Agiliti Health, Inc., 7.625%, 8/15/20 | 35,000 | 34,738 | ||||
Hospitals: 0.8% | ||||||
Tenet Healthcare Corp., 8.125%, 4/1/22 | 40,000 | 40,100 | ||||
Tenet Healthcare Corp., 6.750%, 6/15/23 | 70,000 | 65,713 | ||||
105,813 | ||||||
Hotels: 0.2% | ||||||
Marriott Ownership Resorts, Inc., 6.500%, 9/15/26 (a) | 30,000 | 28,950 | ||||
Household & Leisure Products/Durables: 0.3% | ||||||
Tempur Sealy International, Inc., 5.500%, 6/15/26 | 45,000 | 41,063 | ||||
Investments & Miscellaneous Financial Services: 1.2% | ||||||
Icahn Enterprises LP, 6.750%, 2/1/24 | 110,000 | 108,900 | ||||
Icahn Enterprises LP, 6.375%, 12/15/25 | 60,000 | 57,750 | ||||
166,650 | ||||||
Machinery Companies: 0.4% | ||||||
Zekelman Industries, Inc., 9.875%, 6/15/23 (a) | 50,000 | 52,625 | ||||
Media-Broadcast: 2.2% | ||||||
Gray Escrow, Inc., 7.000%, 5/15/27 (a) | 30,000 | 29,248 | ||||
Gray Television, Inc., 5.875%, 7/15/26 (a) | 25,000 | 23,307 | ||||
Gray Television, Inc., 5.125%, 10/15/24 (a) | 65,000 | 59,930 | ||||
Salem Media Group, Inc., 6.750%, 6/1/24 (a) | 45,000 | 39,938 | ||||
Sinclair Television Group, Inc., 5.625%, 8/1/24 (a) | 30,000 | 28,125 | ||||
Townsquare Media, Inc., 6.500%, 4/1/23 (a) | 40,000 | 36,800 | ||||
Univision Communications, Inc., 5.125%, 5/15/23 (a) | 50,000 | 44,875 | ||||
Urban One, Inc., 7.375%, 10/15/22 (a) | 45,000 | 42,525 | ||||
304,748 | ||||||
Media-Cable: 3.7% | ||||||
Altice France SA, 6.250%, 5/15/24 (a) | 250,000 | 233,125 | ||||
CSC Holdings LLC, 6.750%, 11/15/21 | 65,000 | 66,625 | ||||
DISH DBS Corp., 5.875%, 7/15/22 | 185,000 | 170,200 | ||||
DISH DBS Corp., 7.750%, 7/1/26 | 40,000 | 33,100 | ||||
503,050 | ||||||
Principal | Value | |||||
Media-Services: 0.3% | ||||||
Clear Channel Worldwide Holdings, Inc., 7.625%, 3/15/20 | 40,000 | $ | 39,300 | |||
Metals/Mining Excluding Steel: 2.5% | ||||||
Alliance Resource Operating Partners LP, 7.500%, 5/1/25 (a) | 65,000 | 65,162 | ||||
Cleveland-Cliffs, Inc., 5.750%, 3/1/25 | 75,000 | 67,500 | ||||
CONSOL Energy, Inc., 11.000%, 11/15/25 (a) | 90,000 | 98,550 | ||||
Freeport-McMoRan, Inc., 3.875%, 3/15/23 | 5,000 | 4,625 | ||||
Freeport-McMoRan, Inc., 4.550%, 11/14/24 | 15,000 | 13,837 | ||||
Peabody Energy Corp., 6.375%, 3/31/25 (a) | 45,000 | 41,850 | ||||
Teck Resources Ltd., 6.250%, 7/15/41 | 25,000 | 23,688 | ||||
Teck Resources Ltd., 5.200%, 3/1/42 | 35,000 | 29,400 | ||||
344,612 | ||||||
Multi-Line Insurance: 0.6% | ||||||
Genworth Holdings, Inc., 7.625%, 9/24/21 | 80,000 | 79,000 | ||||
Non-Food & Drug Retailers: 0.6% | ||||||
Hot Topic, Inc., 9.250%, 6/15/21 (a) | 50,000 | 49,000 | ||||
The Men's Wearhouse, Inc., 7.000%, 7/1/22 | 31,000 | 31,155 | ||||
80,155 | ||||||
Oil Field Equipment & Services: 2.1% | ||||||
Apergy Corp., 6.375%, 5/1/26 | 35,000 | 33,950 | ||||
CSI Compressco LP, 7.500%, 4/1/25 (a) | 25,000 | 23,250 | ||||
CSI Compressco LP, 7.250%, 8/15/22 | 45,000 | 39,600 | ||||
Nabors Industries, Inc., 4.625%, 9/15/21 | 50,000 | 44,832 | ||||
Nabors Industries, Inc., 5.500%, 1/15/23 | 60,000 | 47,621 | ||||
Noble Holding International Ltd., 7.750%, 1/15/24 | 50,000 | 37,875 | ||||
Transocean, Inc., 6.800%, 3/15/38 | 45,000 | 29,925 | ||||
Transocean, Inc., 9.000%, 7/15/23 (a) | 30,000 | 29,850 | ||||
286,903 | ||||||
Oil Refining & Marketing: 0.6% | ||||||
PBF Holding Co. LLC, 7.000%, 11/15/23 | 20,000 | 19,100 | ||||
PBF Holding Co. LLC, 7.250%, 6/15/25 | 60,000 | 56,400 | ||||
75,500 | ||||||
Pharmaceuticals & Devices: 4.4% | ||||||
Endo Finance LLC, 5.375%, 1/15/23 (a) | 55,000 | 41,800 | ||||
Jaguar Holding Co. II, 6.375%, 8/1/23 (a) | 90,000 | 86,003 | ||||
Kinetic Concepts, Inc., 12.500%, 11/1/21 (a) | 100,000 | 107,000 | ||||
Mallinckrodt International Finance SA, 5.750%, 8/1/22 (a) | 60,000 | 51,600 | ||||
Mallinckrodt International Finance SA, 4.875%, 4/15/20 (a) | 45,000 | 43,425 | ||||
Bausch Health Cos, Inc., 5.875%, 5/15/23 (a) | 210,000 | 194,250 | ||||
Bausch Health Cos, Inc., 6.125%, 4/15/25 (a) | 35,000 | 30,538 | ||||
Bausch Health Cos, Inc., 9.250%, 4/1/26 (a) | 30,000 | 30,000 | ||||
584,616 | ||||||
The Accompanying Notes are an Integral Part of these Financial Statements.
16
PENN CAPITAL FUNDS TRUST |
PENN CAPITAL MULTI-CREDIT HIGH INCOME FUND |
SCHEDULE OF INVESTMENTS |
DECEMBER 31, 2018 (UNAUDITED) |
Principal | Value | |||||
Printing & Publishing: 1.3% | ||||||
Lee Enterprises, Inc., 9.500%, 3/15/22 (a) | 45,000 | $ | 45,900 | |||
Meredith Corp., 6.875%, 2/1/26 (a) | 130,000 | 127,075 | ||||
172,975 | ||||||
Railroads: 0.4% | ||||||
Watco Cos LLC, 6.375%, 4/1/23 (a) | 60,000 | 60,150 | ||||
Real Estate Development & Management: 0.2% | ||||||
Realogy Group LLC, 4.875%, 6/1/23 (a) | 35,000 | 30,450 | ||||
Support-Services: 1.1% | ||||||
The Hertz Corp., 7.625%, 6/1/22 (a) | 85,000 | 80,112 | ||||
Staples, Inc., 8.500%, 9/15/25 (a) | 40,000 | 36,088 | ||||
The ADT Security Corp., 4.875%, 7/15/32 (a) | 50,000 | 37,000 | ||||
153,200 | ||||||
Telecom-Integrated/Services: 5.6% | ||||||
CenturyLink, Inc., 7.600%, 9/15/39 | 75,000 | 59,250 | ||||
CenturyLink, Inc., 7.500%, 4/1/24 | 80,000 | 77,200 | ||||
Cogent Communications Finance, Inc., 5.625%, 4/15/21 (a) | 65,000 | 64,675 | ||||
Consolidated Communications, Inc., 6.500%, 10/1/22 | 70,000 | 61,600 | ||||
Frontier Communications Corp., 8.750%, 4/15/22 | 40,000 | 25,300 | ||||
Frontier Communications Corp., 10.500%, 9/15/22 | 40,000 | 27,800 | ||||
Gogo Intermediate Holdings LLC, 12.500%, 7/1/22 (a) | 90,000 | 96,352 | ||||
Intelsat Connect Finance SA, 9.500%, 2/15/23 (a) | 80,000 | 68,800 | ||||
Intelsat Luxembourg SA, 7.750%, 6/1/21 | 75,000 | 68,250 | ||||
Level 3 Financing, Inc., 5.125%, 5/1/23 | 40,000 | 38,600 | ||||
Qwest Corp., 6.875%, 9/15/33 | 45,000 | 40,228 | ||||
Uniti Group LP, 6.000%, 4/15/23 (a) | 65,000 | 58,825 | ||||
Uniti Group LP, 7.125%, 12/15/24 (a) | 25,000 | 20,500 | ||||
Windstream Services LLC, 7.750%, 10/15/20 | 91,000 | 57,330 | ||||
764,710 | ||||||
Telecom-Wireless: 2.5% | ||||||
GTT Communications, Inc., 7.875%, 12/31/24 (a) | 35,000 | 30,275 | ||||
Sprint Capital Corp., 6.875%, 11/15/28 | 55,000 | 51,975 | ||||
Sprint Communications, Inc., 6.000%, 11/15/22 | 25,000 | 24,533 | ||||
Sprint Corp., 7.250%, 9/15/21 | 20,000 | 20,470 | ||||
Sprint Corp., 7.875%, 9/15/23 | 40,000 | 41,050 | ||||
Sprint Corp., 7.125%, 6/15/24 | 90,000 | 89,195 | ||||
Sprint Corp., 7.625%, 3/1/26 | 25,000 | 24,688 | ||||
Telesat Canada, 8.875%, 11/15/24 (a) | 25,000 | 26,000 | ||||
United States Cellular Corp., 6.700%, 12/15/33 | 30,000 | 29,148 | ||||
337,334 | ||||||
Principal | Value | |||||
Transportation Excluding Air/Rail: 0.5% | ||||||
Deck Chassis Acquisition, Inc., 10.000%, 6/15/23 (a) | 70,000 | $ | 67,200 | |||
Total Corporate Bonds (cost $8,068,829) | 7,648,350 | |||||
Convertible Bond: 0.3% | ||||||
Telecom-Wireless: 0.3% | ||||||
Gogo, Inc., 3.750%, 3/1/20 | 40,000 | 34,052 | ||||
Total Convertible Bond (cost $34,728) | 34,052 | |||||
Bank Loans: 14.3% (c) | ||||||
Automotive: 0.7% | ||||||
Navistar International Corp., 6.312% (1 Month US LIBOR + 3.750%), 7/30/25 | 99,750 | 95,261 | ||||
Chemical Companies: 0.4% | ||||||
Tronox Blocked Borrower LLC, 5.522% (1 Month US LIBOR + 3.000%), 9/22/24 | 34,535 | 33,449 | ||||
Tronox Finance LLC, 5.522% (1 Month US LIBOR + 3.000%), 9/22/24 | 14,965 | 14,495 | ||||
47,944 | ||||||
Consumer-Products: 1.1% | ||||||
BDF Acquisition Corp., 7.772% (1 Month US LIBOR + 5.250%), 8/8/23 | 49,610 | 45,766 | ||||
HLF Financing Sarl LLC, 5.772% (1 Month US LIBOR + 3.250%), 8/16/25 | 49,875 | 48,414 | ||||
JP Intermediate B LLC, 8.153% (3 Month US LIBOR + 5.500%), 11/20/25 | 50,000 | 47,750 | ||||
141,930 | ||||||
Environmental & Waste: 0.3% | ||||||
GFL Environmental, Inc., 5.522% (1 Month US LIBOR + 3.000%), 5/31/25 | 49,875 | 46,408 | ||||
Food-Wholesale: 0.8% | ||||||
JBS USA LUX SA, 5.260% (3 Month US LIBOR + 2.500%), 10/30/22 | 60,000 | 57,600 | ||||
Weight Watchers International, Inc., 7.560% (3 Month US LIBOR + 4.750%), 11/29/24 | 50,000 | 49,290 | ||||
106,890 | ||||||
Gaming: 0.4% | ||||||
Stars Group Holdings BV, 6.303% (3 Month US LIBOR + 3.500%), 7/10/25 | 50,000 | 48,209 | ||||
Gas Distribution: 0.4% | ||||||
Woodford Express LLC, 7.522% (3 Month US LIBOR + 5.000%), 1/26/25 | 49,625 | 47,103 | ||||
Health Care Providers & Services: 0.4% | ||||||
R1 RCM, Inc., 7.772% (1 Month US LIBOR + 5.250%), 5/8/25 | 49,750 | 49,004 | ||||
Health Services: 0.9% | ||||||
American Renal Holdings, Inc., 5.772% (1 Month US LIBOR + 3.250%), 6/22/24 | 74,684 | 72,817 | ||||
Gentiva Health Services, Inc., 6.312% (1 Month US LIBOR + 3.750%), 7/2/25 | 48,747 | 47,163 | ||||
119,980 | ||||||
The Accompanying Notes are an Integral Part of these Financial Statements.
17
PENN CAPITAL FUNDS TRUST |
PENN CAPITAL MULTI-CREDIT HIGH INCOME FUND |
SCHEDULE OF INVESTMENTS |
DECEMBER 31, 2018 (UNAUDITED) |
Principal | Value | |||||
Hotels: 0.4% | ||||||
Marriott Ownership Resorts, Inc., 4.772% (1 Month US LIBOR + 2.250%), 8/29/25 | 50,000 | $ | 48,750 | |||
Industrial Conglomerates: 0.4% | ||||||
Deliver Buyer, Inc., 7.707% (3 Month US LIBOR + 5.000%), 5/1/24 | 49,747 | 48,690 | ||||
Investments & Miscellaneous Financial Services: 1.1% | ||||||
Edelman Financial Center LLC, 5.686% (3 Month US LIBOR + 3.250%), 7/19/25 | 50,000 | 48,035 | ||||
Russell Investments US Institutional Holdco, Inc., 5.772% (1 Month US LIBOR + 3.250%), 6/1/23 | 49,618 | 48,325 | ||||
VeriFone Systems, Inc., 6.644% (3 Month US LIBOR + 4.000%), 8/20/25 | 50,000 | 48,197 | ||||
144,557 | ||||||
Media-Broadcast: 0.3% | ||||||
Univision Communications, Inc., 5.272% (1 Month US LIBOR + 2.750%), 3/15/24 | 50,000 | 45,146 | ||||
Metals & Mining: 0.7% | ||||||
Big River Steel LLC, 7.803% (3 Month US LIBOR + 5.000%), 8/23/23 | 99,497 | 98,253 | ||||
Metals/Mining Excluding Steel: 0.7% | ||||||
Aleris International, Inc., 7.245% (2 Month US LIBOR + 4.750%), 2/27/23 | 49,750 | 49,222 | ||||
American Rock Salt Co. LLC, 6.272% (1 Month US LIBOR + 3.750%), 3/21/25 | 50,000 | 48,375 | ||||
97,597 | ||||||
Mortgage Real Estate Investment Trusts (REITs): 0.4% | ||||||
GGP Nimbus LP, 5.022% (1 Month US LIBOR + 2.500%), 8/24/25 | 50,000 | 47,016 | ||||
Multi-Line Insurance: 0.4% | ||||||
Asurion LLC, 5.230% (1 Month US LIBOR + 3.000%), 8/4/22 | 50,000 | 47,928 | ||||
Non-Food & Drug Retailers: 0.4% | ||||||
The Men's Wearhouse, Inc., 5.599% (1 Month US LIBOR + 3.250%), 4/9/25 | 49,625 | 47,702 | ||||
Pharmaceuticals: 0.4% | ||||||
Amneal Pharmaceuticals LLC, 6.062% (1 Month US LIBOR + 3.500%), 5/4/25 | 49,738 | 47,044 | ||||
Pharmaceuticals & Devices: 0.7% | ||||||
Endo International PLC, 6.812% (1 Month US LIBOR + 4.250%), 4/27/24 | 49,622 | 46,893 | ||||
Bausch Health Cos, Inc., 5.379% (1 Month US LIBOR + 3.000%), 6/1/25 | 48,125 | 45,866 | ||||
92,759 | ||||||
Restaurants: 0.5% | ||||||
Del Frisco's Restaurant Group, Inc., 8.562% (1 Month US LIBOR + 6.000%), 6/27/25 | 74,625 | 68,282 | ||||
Principal | Value | |||||
Software/Services: 0.9% | ||||||
Go Daddy Operating Co. LLC, 3.600% (1 Month US LIBOR + 2.250%), 2/15/24 | 50,000 | $ | 47,650 | |||
New Media Holdings II LLC, 8.595% (1 Month US LIBOR + 6.250%), 7/14/22 | 74,623 | 73,690 | ||||
121,340 | ||||||
Specialty Retail: 0.3% | ||||||
Staples, Inc., 6.541% (3 Month US LIBOR + 4.000%), 9/12/24 | 49,749 | 47,593 | ||||
Support-Services: 0.4% | ||||||
UOS LLC, 8.022% (1 Month US LIBOR + 5.500%), 4/18/23 | 49,873 | 49,624 | ||||
Telecom-Integrated/Services: 1.0% | ||||||
Altice France SA, 6.455% (1 Month US LIBOR + 4.000%), 1/31/26 | 50,000 | 47,125 | ||||
Frontier Communications Corp., 5.280% (1 Month US LIBOR + 2.750%), 3/31/21 | 47,917 | 45,449 | ||||
Maxar Technologies Ltd., 5.148% (3 Month US LIBOR + 2.750%), 10/5/24 | 50,000 | 45,875 | ||||
138,449 | ||||||
Transportation Excluding Air/Rail: 0.3% | ||||||
YRC Worldwide, Inc., 11.022% (1 Month US LIBOR + 8.500%), 7/26/22 | 49,604 | 46,400 | ||||
Total Bank Loans (cost $2,003,055) | 1,939,859 | |||||
Shares | ||||||
Common Stock: 0.0% | ||||||
Media-Cable: 0.0% | ||||||
ACC Claims Holdings LLC (d)(e) | 11,610 | — | ||||
Total Common Stock (cost $237) | — | |||||
Mutual Fund: 24.4% | ||||||
Bank Loan Related: 24.4% | ||||||
Penn Capital Defensive Floating Rate Income Fund - Institutional Class (f) | 342,389 | 3,317,753 | ||||
Total Mutual Fund (cost $3,474,135) | 3,317,753 | |||||
Preferred Stock: 0.0% | ||||||
Spanish Broadcasting Systems, Inc. 10.750% Cash or 10.750% PIK (d)(g) | 1 | 40 | ||||
Total Preferred Stock (cost $613) | 40 | |||||
Principal Amount | ||||||
U.S. Government Notes: 2.0% | ||||||
United States Treasury Fixed Rate Note 2.875%, 10/31/20 | $ | 135,000 | 135,822 | |||
United States Treasury Fixed Rate Note 2.750%, 11/30/20 | 140,000 | 140,608 | ||||
Total U.S. Government Notes (cost $275,150) | 276,430 | |||||
The Accompanying Notes are an Integral Part of these Financial Statements.
18
PENN CAPITAL FUNDS TRUST |
PENN CAPITAL MULTI-CREDIT HIGH INCOME FUND |
SCHEDULE OF INVESTMENTS |
DECEMBER 31, 2018 (UNAUDITED) |
Principal | Value | |||||
Short-Term Investment: 3.4% | ||||||
Money Market Deposit Account: 3.4% | ||||||
U.S. Bank Money Market Deposit Account, 2.200% | 456,968 | $ | 456,968 | |||
Total Short-Term Investment (cost $456,968) | 456,968 | |||||
Total Investments - 100.7% (cost $14,313,715) | $ | 13,673,452 | ||||
Liabilities in Excess of Other Assets (0.7)% | (92,963 | ) | ||||
Net Assets: 100.0% | $ | 13,580,489 | ||||
| (a) | Securities purchased pursuant to Rule 144A of the Securities Act of 1933, as amended, and may be sold only to dealers in that program or other “qualified institutional buyers.” As of December 31, 2018, the value of these investments was $4,019,228, or 29.6% of total net assets. |
| (b) | Variable rate security. The rate listed is as of December 31, 2018. |
| (c) | Bank Loans typically have rates of interest which are redetermined either daily, monthly, quarterly or semi-annually by reference to a base lending rate, plus a premium. These base lending rates are primarily the London Interbank Offered Rate (“LIBOR”) and secondarily, the prime rate offered by one or more major United States banks (the “Prime Rate”) and the certificate of deposit (“CD”) rate or other base lending rates used by commercial lenders. |
| (d) | This security is currently being fair valued in accordance with procedures established by the Board of Trustees and is deemed a Level 3 security as it is valued using significant unobservable inputs. |
| (e) | No distribution or dividend was made during the period ending December 31, 2018. As such, it is classified as a non-income producing security as of December 31, 2018. |
| (f) | Affiliated company. See Note 7. |
| (g) | Payment-in-kind security which may pay interest/dividends in additional par/shares and/or in cash. No distribution or dividend was made during the period ended December 31, 2018. As such, it is classified as a non-income producing security as of December 31, 2018. |
The cost basis of investments for federal income tax purposes at December 31, 2018 was as follows*: | |||
Cost of investments | $ | 14,313,715 | |
Gross unrealized appreciation | 47,880 | ||
Gross unrealized depreciation | (688,143 | ) | |
Net unrealized depreciation | $ | (640,263 | ) |
| * | Because tax adjustments are calculated annually, the above table does not reflect tax adjustments. For the previous fiscal year's federal income tax information, please refer to the Notes to Financial Statements section in the Fund's most recent annual report. |
Country Exposure (as a percentage of total investments) (Unaudited) | |
United States | 90.98% |
Canada | 3.53% |
Cayman Islands | 1.73% |
France | 1.70% |
Luxembourg | 1.70% |
Netherlands | 0.36% |
Asset Type (as a percentage of total investments) |

The Accompanying Notes are an Integral Part of these Financial Statements.
19
PENN CAPITAL FUNDS TRUST |
PENN CAPITAL DEFENSIVE FLOATING RATE INCOME FUND |
SCHEDULE OF INVESTMENTS |
DECEMBER 31, 2018 (UNAUDITED) |
Principal | Value | |||||
Bank Loans: 86.4% (a) | ||||||
Aerospace: 0.3% | ||||||
Ducommun, Inc., 6.522% (1 Month US LIBOR + 4.000%), 11/21/25 | 121,354 | $ | 118,320 | |||
Airline Companies: 1.3% | ||||||
American Airlines, Inc., 4.256% (1 Month US LIBOR + 1.750%), 6/27/25 | 334,545 | 312,381 | ||||
United Airlines, Inc., 4.272% (1 Month US LIBOR + 1.750%), 4/1/24 | 149,619 | 143,261 | ||||
455,642 | ||||||
Auto Parts & Equipment: 0.4% | ||||||
Gates Global LLC, 5.272% (1 Month US LIBOR + 2.750%), 3/31/24 | 149,621 | 141,812 | ||||
Automotive: 0.7% | ||||||
Navistar, Inc., 5.890% (1 Month US LIBOR + 3.500%), 11/6/24 | 248,125 | 238,820 | ||||
Building & Construction: 0.3% | ||||||
Janus International Group LLC, 5.522% (1 Month US LIBOR + 3.000%), 2/15/25 | 124,063 | 119,720 | ||||
Building Materials: 1.4% | ||||||
Beacon Roofing Supply, Inc., 4.570% (1 Month US LIBOR + 2.250%), 1/2/25 | 149,623 | 141,992 | ||||
Foundation Building Materials LLC, 5.705% (1 Month US LIBOR + 3.250%), 7/30/25 | 150,000 | 140,250 | ||||
Quikrete Holdings, Inc., 5.272% (1 Month US LIBOR + 2.750%), 11/15/23 | 240,385 | 228,517 | ||||
510,759 | ||||||
Building Products: 0.7% | ||||||
Atkore International, Inc., 5.560% (3 Month US LIBOR + 2.750%), 12/22/23 | 245,025 | 236,858 | ||||
Chemical Companies: 1.8% | ||||||
AOC Aliancys, 6.831% (3 Month US LIBOR + 4.250%), 8/1/25 | 74,625 | 72,573 | ||||
Encapsys LLC, 5.772% (1 Month US LIBOR + 3.250%), 10/27/24 | 124,063 | 120,444 | ||||
HB Fuller Co., 4.470% (1 Month US LIBOR + 2.000%), 10/20/24 | 228,401 | 214,354 | ||||
Tronox Blocked Borrower LLC, 5.522% (1 Month US LIBOR + 3.000%), 9/22/24 | 172,674 | 167,247 | ||||
Tronox Finance LLC, 5.522% (1 Month US LIBOR + 3.000%), 9/22/24 | 74,826 | 72,474 | ||||
647,092 | ||||||
Computer Hardware: 0.4% | ||||||
Dell International LLC, 4.280% (1 Month US LIBOR + 1.750%), 9/7/21 | 150,000 | 145,469 | ||||
Consumer/Commercial/Lease Financing: 0.6% | ||||||
Avolon TLB Borrower 1 US LLC, 4.470% (1 Month US LIBOR + 2.000%), 1/15/25 | 207,143 | 198,685 | ||||
Principal | Value | |||||
Consumer-Products: 1.9% | ||||||
BDF Acquisition Corp., 7.772% (1 Month US LIBOR + 5.250%), 8/8/23 | 198,442 | $ | 183,062 | |||
HLF Financing Sarl LLC, 5.772% (1 Month US LIBOR + 3.250%), 8/16/25 | 249,375 | 242,071 | ||||
JP Intermediate B LLC, 8.153% (3 Month US LIBOR + 5.500%), 11/20/25 | 150,000 | 143,250 | ||||
Lifetime Brands, Inc., 6.022% (1 Month US LIBOR + 3.500%), 2/28/25 | 124,063 | 118,325 | ||||
686,708 | ||||||
Defense: 0.4% | ||||||
KeyW Holding Corp., 6.887% (1 Month US LIBOR + 4.500%), 5/8/24 | 139,535 | 137,267 | ||||
Diversified Capital Goods: 1.0% | ||||||
Harsco Corp., 4.812% (1 Month US LIBOR + 2.250%), 12/8/24 | 246,267 | 240,726 | ||||
Thermon Industries, Inc., 6.099% (1 Month US LIBOR + 3.750%), 10/30/24 | 110,063 | 107,036 | ||||
347,762 | ||||||
Diversified Financial Services: 0.6% | ||||||
Canyon Valor Cos, Inc., 5.553% (3 Month US LIBOR + 2.750%), 6/16/23 | 234,798 | 225,171 | ||||
Diversified Telecommunication Services: 0.7% | ||||||
Consolidated Communications, Inc., 5.530% (1 Month US LIBOR + 3.000%), 10/5/23 | 246,556 | 230,221 | ||||
Electric Utilities: 0.3% | ||||||
Compass Power Generation LLC, 6.022% (1 Month US LIBOR + 3.500%), 12/20/24 | 123,403 | 121,552 | ||||
Electric-Generation: 2.6% | ||||||
Calpine Corp., 5.310% (3 Month US LIBOR + 2.500%), 1/15/23 | 240,667 | 228,634 | ||||
Edgewater Generation LLC, 6.272% (1 Month US LIBOR + 3.750%), 12/13/25 | 175,000 | 170,844 | ||||
Exgen Renewables IV LLC, 5.710% (3 Month US LIBOR + 3.000%), 11/28/24 | 122,587 | 115,845 | ||||
Lightstone Holdco LLC, 6.272% (1 Month US LIBOR + 3.750%), 1/30/24 | 299,752 | 283,017 | ||||
Lightstone Holdco LLC, 6.272% (1 Month US LIBOR + 3.750%), 1/30/24 | 16,099 | 15,200 | ||||
TerraForm Power Operating LLC, 4.522% (1 Month US LIBOR + 2.000%), 11/8/22 | 123,750 | 119,316 | ||||
932,856 | ||||||
Electric-Integrated: 1.1% | ||||||
Pike Corp., 6.030% (1 Month US LIBOR + 3.500%), 3/23/25 | 240,109 | 234,606 | ||||
Talen Energy Supply LLC, 6.522% (1 Month US LIBOR + 4.000%), 4/13/24 | 174,376 | 171,687 | ||||
406,293 | ||||||
The Accompanying Notes are an Integral Part of these Financial Statements.
20
PENN CAPITAL FUNDS TRUST |
PENN CAPITAL DEFENSIVE FLOATING RATE INCOME FUND |
SCHEDULE OF INVESTMENTS |
DECEMBER 31, 2018 (UNAUDITED) |
Principal | Value | |||||
Entertainment: 3.1% | ||||||
Alterra Mountain Co., 5.522% (1 Month US LIBOR + 3.000%), 7/31/24 | 247,500 | $ | 236,776 | |||
Crown Finance US, Inc., 5.022% (1 Month US LIBOR + 2.500%), 2/28/25 | 223,561 | 210,892 | ||||
Formula One Management Ltd., 5.022% (1 Month US LIBOR + 2.500%), 2/1/24 | 200,000 | 188,666 | ||||
Life Time Fitness, Inc., 5.457% (3 Month US LIBOR + 2.750%), 6/15/22 | 242,561 | 232,926 | ||||
SeaWorld Parks & Entertainment, Inc., 5.522% (1 month US LIBOR + 3.000%), 3/31/24 | 247,797 | 236,027 | ||||
1,105,287 | ||||||
Environmental & Waste: 0.5% | ||||||
GFL Environmental, Inc., 5.522% (1 Month US LIBOR + 3.000%), 5/31/25 | 199,499 | 185,634 | ||||
Food & Drug Retailers: 0.7% | ||||||
Albertson's LLC, 5.822% (3 Month US LIBOR + 3.000%), 12/21/22 | 244,408 | 234,189 | ||||
Food-Wholesale: 1.7% | ||||||
American Seafoods Group LLC, 5.280% (1 Month US LIBOR + 2.750%), 8/21/23 | 239,099 | 229,237 | ||||
JBS USA LUX SA, 5.260% (3 Month US LIBOR + 2.500%), 10/30/22 | 245,625 | 235,800 | ||||
Weight Watchers International, Inc., 7.560% (3 Month US LIBOR + 4.750%), 11/29/24 | 148,052 | 145,954 | ||||
610,991 | ||||||
Gaming: 3.0% | ||||||
Boyd Gaming Corp., 4.661% (1 Week US LIBOR + 2.250%), 9/15/23 | 227,892 | 219,061 | ||||
Eldorado Resorts, Inc., 4.750% (2 Month US LIBOR + 2.000%), 4/17/24 | 164,957 | 157,397 | ||||
Gateway Casinos & Entertainment Ltd., 5.803% (3 Month US LIBOR + 3.000%), 3/13/25 | 224,062 | 214,539 | ||||
Scientific Games International, Inc., 5.270% (2 Month US LIBOR + 2.750%), 8/14/24 | 247,505 | 231,682 | ||||
Stars Group Holdings BV, 6.303% (3 Month US LIBOR + 3.500%), 7/10/25 | 248,999 | 240,078 | ||||
1,062,757 | ||||||
Gas Distribution: 0.3% | ||||||
Woodford Express LLC, 7.522% (1 Month US LIBOR + 5.000%), 1/26/25 | 124,063 | 117,756 | ||||
Gas Utilities: 0.7% | ||||||
Vistra Operations Co. LLC, 4.772% (1 Month US LIBOR + 2.250%), 12/14/23 | 245,000 | 234,997 | ||||
Principal | Value | |||||
Health Care Equipment & Supplies: 0.9% | ||||||
Exactech, Inc., 6.272% (1 Month US LIBOR + 3.750%), 2/14/25 | 124,063 | $ | 120,961 | |||
Mallinckrodt International Finance SA, 5.553% (3 Month US LIBOR + 2.750%), 9/24/24 | 203,623 | 186,315 | ||||
307,276 | ||||||
Health Care Providers & Services: 1.2% | ||||||
Press Ganey Holdings, Inc., 5.272% (1 Month US LIBOR + 2.750%), 10/23/23 | 223,171 | 213,965 | ||||
Prospect Medical Holdings, Inc., 7.937% (1 Month US LIBOR + 5.500%), 2/24/24 | 124,063 | 122,202 | ||||
R1 RCM, Inc., 7.772% (1 Month US LIBOR + 5.250%), 5/8/25 | 74,625 | 73,506 | ||||
409,673 | ||||||
Health Services: 3.5% | ||||||
Acadia Healthcare Co., Inc., 5.022% (1 Month US LIBOR + 2.500%), 2/16/23 | 236,726 | 227,922 | ||||
American Renal Holdings, Inc., 5.772% (1 Month US LIBOR + 3.250%), 6/22/24 | 223,674 | 218,082 | ||||
Concentra, Inc., 5.130% (1 Month US LIBOR + 2.750%), 6/1/22 | 239,804 | 229,013 | ||||
Envision Healthcare Corp., 6.272% (1 Month US LIBOR + 3.750%), 10/11/25 | 100,000 | 92,964 | ||||
Gentiva Health Services, Inc., 6.312% (1 Month US LIBOR + 3.750%), 7/2/25 | 243,733 | 235,812 | ||||
Select Medical Corp., 4.960% (1 Month US LIBOR + 2.500%), 3/6/25 | 245,625 | 234,572 | ||||
1,238,365 | ||||||
Hotels: 1.4% | ||||||
Belmond Interfin Ltd., 5.272% (1 Month US LIBOR + 2.750%), 7/3/24 | 246,250 | 243,583 | ||||
Marriott Ownership Resorts, Inc., 4.772% (1 Month US LIBOR + 2.250%), 8/29/25 | 250,000 | 243,750 | ||||
487,333 | ||||||
Industrial Conglomerates: 1.0% | ||||||
Deliver Buyer, Inc., 7.707% (3 Month US LIBOR + 5.000%), 5/1/24 | 149,242 | 146,071 | ||||
MTS Systems Corp., 5.710% (1 month US LIBOR + 3.250%), 7/5/23 | 213,704 | 205,690 | ||||
351,761 | ||||||
Insurance: 0.5% | ||||||
Meredith Corp., 5.272% (1 Month US LIBOR + 2.750%), 1/31/25 | 177,431 | 171,960 | ||||
Internet & Direct Marketing Retail: 0.6% | ||||||
Shutterfly, Inc., 5.280% (1 Month US LIBOR + 2.750%), 8/17/24 | 224,126 | 216,423 | ||||
The Accompanying Notes are an Integral Part of these Financial Statements.
21
PENN CAPITAL FUNDS TRUST |
PENN CAPITAL DEFENSIVE FLOATING RATE INCOME FUND |
SCHEDULE OF INVESTMENTS |
DECEMBER 31, 2018 (UNAUDITED) |
Principal | Value | |||||
Investments & Miscellaneous Financial Services: 5.6% | ||||||
DJO Finance LLC, 5.480% (1 Month US LIBOR + 3.250%), 6/7/20 | 149,612 | $ | 147,443 | |||
The Edelman Financial Center LLC, 5.686% (3 Month US LIBOR + 3.250%), 7/19/25 | 200,000 | 192,142 | ||||
FinCo I LLC, 4.522% (1 Month US LIBOR + 2.000%), 12/27/22 | 214,387 | 207,634 | ||||
iStar, Inc., 5.175% (1 Month US LIBOR + 2.750%), 6/28/23 | 248,750 | 238,178 | ||||
LPL Holdings, Inc., 4.729% (1 Month US LIBOR + 2.250%), 9/21/24 | 246,258 | 236,563 | ||||
Russell Investments US Institutional Holdco, Inc., 5.772% (1 Month US LIBOR + 3.250%), 6/1/23 | 343,240 | 334,291 | ||||
Trans Union LLC, 4.522% (1 Month US LIBOR + 2.000%), 6/19/25 | 248,750 | 239,422 | ||||
VeriFone Systems, Inc., 6.644% (3 Month US LIBOR + 4.000%), 8/20/25 | 200,000 | 192,786 | ||||
WisdomTree International Holdings Ltd., 4.205% (1 Month US LIBOR + 1.750%), 1/31/21 | 200,000 | 198,000 | ||||
1,986,459 | ||||||
IT Services: 1.3% | ||||||
NAB Holdings LLC, 5.803% (3 Month US LIBOR + 3.000%), 6/30/24 | 246,884 | 234,231 | ||||
Pi US Mergerco, Inc., 6.022% (1 Month US LIBOR + 3.500%), 1/1/25 | 248,125 | 239,441 | ||||
473,672 | ||||||
Machinery: 0.8% | ||||||
Milacron LLC, 5.022% (1 Month US LIBOR + 2.500%), 9/28/23 | 145,652 | 136,185 | ||||
Savage Enterprises LLC, 6.880% (1 Month US LIBOR + 4.500%), 8/1/25 | 144,034 | 141,694 | ||||
277,879 | ||||||
Machinery Companies: 0.6% | ||||||
Welbilt, Inc., 5.022% (1 Month US LIBOR + 2.500%), 10/23/25 | 237,500 | 225,822 | ||||
Media-Broadcast: 4.9% | ||||||
Beasley Mezzanine Holdings LLC, 6.470% (1 Month US LIBOR + 4.000%), 11/1/23 | 241,265 | 236,439 | ||||
CBS Radio, Inc., 5.256% (1 Month US LIBOR + 2.750%), 11/17/24 | 146,046 | 137,283 | ||||
CSC Holdings LLC, 4.705% (1 Month US LIBOR + 2.250%), 7/17/25 | 246,867 | 233,660 | ||||
Gray Television, Inc., 4.599% (1 Month US LIBOR + 2.250%), 2/7/24 | 231,834 | 221,981 | ||||
Lions Gate Capital Holdings LLC, 4.772% (1 Month US LIBOR + 2.250%), 3/24/25 | 124,063 | 119,178 | ||||
Sinclair Television Group, Inc., 4.780% (1 Month US LIBOR + 2.250%), 1/3/24 | 245,000 | 232,137 | ||||
Univision Communications, Inc., 5.272% (1 Month US LIBOR + 2.750%), 3/15/24 | 246,621 | 222,679 | ||||
Principal | Value | |||||
Urban One, Inc., 6.530% (1 Month US LIBOR + 4.000%), 4/18/23 | 115,106 | $ | 109,639 | |||
WideOpenWest Finance LLC, 5.720% (1 Month US LIBOR + 3.250%), 8/19/23 | 246,875 | 228,051 | ||||
1,741,047 | ||||||
Media-Cable: 1.3% | ||||||
Cogeco Communications USA II LP, 4.897% (1 Month US LIBOR + 2.375%), 1/31/25 | 250,000 | 236,043 | ||||
Radiate Holdco LLC, 5.522% (1 Month US LIBOR + 3.000%), 2/1/24 | 245,625 | 231,155 | ||||
467,198 | ||||||
Metals & Mining: 2.2% | ||||||
Big River Steel LLC, 7.803% (3 Month US LIBOR + 5.000%), 8/23/23 | 296,749 | 293,039 | ||||
Peabody Energy Corp., 5.272% (1 Month US LIBOR + 2.750%), 3/31/25 | 248,747 | 240,663 | ||||
Zekelman Industries, Inc., 4.862% (3 Month US LIBOR + 2.250%), 6/14/21 | 244,397 | 235,599 | ||||
769,301 | ||||||
Metals/Mining Excluding Steel: 1.0% | ||||||
Aleris International, Inc., 7.245% (2 Month US LIBOR + 4.750%), 2/27/23 | 149,250 | 147,665 | ||||
American Rock Salt Co. LLC, 6.272% (1 Month US LIBOR + 3.750%), 3/21/25 | 198,874 | 192,411 | ||||
340,076 | ||||||
Mortgage Real Estate Investment Trusts (REITs): 0.7% | ||||||
GGP Nimbus LP, 5.022% (1 Month US LIBOR + 2.500%), 8/24/25 | 250,000 | 235,078 | ||||
Multi-Line Insurance: 1.0% | ||||||
Asurion LLC, 5.230% (1 Month US LIBOR + 3.000%), 8/4/22 | 137,573 | 131,874 | ||||
HUB International Ltd., 5.490% (3 Month US LIBOR + 2.750%), 4/25/25 | 248,750 | 234,370 | ||||
366,244 | ||||||
Multi-Utilities: 0.6% | ||||||
PowerTeam Services LLC, 6.063% (3 Month US LIBOR + 3.250%), 3/5/25 | 219,009 | 211,344 | ||||
Non-Food & Drug Retailers: 1.3% | ||||||
Michaels Stores, Inc., 5.022% (1 Month US LIBOR + 2.500%), 1/28/23 | 224,436 | 214,056 | ||||
The Men's Wearhouse, Inc., 5.599% (1 Month US LIBOR + 3.250%), 4/9/25 | 248,125 | 238,510 | ||||
452,566 | ||||||
Oil, Gas & Consumable Fuel: 0.5% | ||||||
Apergy Corp., 5.062% (1 Month US LIBOR + 2.500%), 5/9/25 | 111,446 | 104,480 | ||||
Lotus Midstream LLC, 6.053% (3 Month US LIBOR + 3.250%), 9/30/25 | 200,000 | 190,000 | ||||
294,480 | ||||||
The Accompanying Notes are an Integral Part of these Financial Statements.
22
PENN CAPITAL FUNDS TRUST |
PENN CAPITAL DEFENSIVE FLOATING RATE INCOME FUND |
SCHEDULE OF INVESTMENTS |
DECEMBER 31, 2018 (UNAUDITED) |
Principal | Value | |||||
Other Industrial & Manufacturing: 1.6% | ||||||
PS HoldCo LLC, 7.277% (3 Month US LIBOR + 4.750%), 3/13/25 | 164,588 | $ | 159,650 | |||
RBS Global, Inc., 4.522% (1 Month US LIBOR + 2.000%), 8/21/24 | 250,000 | 241,875 | ||||
XPO Logistics, Inc., 4.509% (3 Month US LIBOR + 2.000%), 2/24/25 | 181,427 | 172,860 | ||||
574,385 | ||||||
Packaging: 0.9% | ||||||
Berry Global, Inc., 4.387% (1 Month US LIBOR + 1.750%), 10/1/22 | 174,680 | 170,313 | ||||
Reynolds Group Holdings, Inc., 5.272% (1 Month US LIBOR + 2.750%), 2/5/23 | 149,618 | 142,137 | ||||
312,450 | ||||||
Pharmaceuticals: 1.2% | ||||||
Amneal Pharmaceuticals LLC, 6.062% (1 Month US LIBOR + 3.500%), 5/4/25 | 199,226 | 188,434 | ||||
Jaguar Holding Co II, 4.820% (1 Month US LIBOR + 2.500%), 8/18/22 | 249,354 | 236,263 | ||||
424,697 | ||||||
Pharmaceuticals & Devices: 2.4% | ||||||
Endo International PLC, 6.812% (1 Month US LIBOR + 4.250%), 4/27/24 | 246,250 | 232,706 | ||||
Greatbatch Ltd., 5.320% (1 Month US LIBOR + 3.000%), 10/27/22 | 150,000 | 145,851 | ||||
Kinetic Concepts, Inc., 6.053% (3 Month US LIBOR + 3.250%), 2/3/24 | 122,506 | 117,453 | ||||
LUX HOLDCO III, 5.495% (2 Month US LIBOR + 3.000%), 3/28/25 | 124,063 | 120,548 | ||||
Bausch Health Cos, Inc., 5.379% (1 Month US LIBOR + 3.000%), 6/1/25 | 240,630 | 229,334 | ||||
845,892 | ||||||
Restaurants: 0.8% | ||||||
Del Frisco's Restaurant Group, Inc., 8.562% (1 Month US LIBOR + 6.000%), 6/27/25 | 149,250 | 136,564 | ||||
IRB Holding Corp., 5.570% (1 Month US LIBOR + 3.250%), 2/5/25 | 149,623 | 142,366 | ||||
278,930 | ||||||
Road & Rail: 0.3% | ||||||
Daseke Companies, Inc., 7.522% (1 Month US LIBOR + 5.000%), 2/27/24 | 123,750 | 120,347 | ||||
Semiconductors & Semiconductor Equipment: 1.0% | ||||||
Cohu, Inc., 5.813% (3 Month US LIBOR + 3.000%), 10/1/25 | 174,563 | 167,580 | ||||
Xperi Corp., 5.022% (1 Month US LIBOR + 2.500%), 12/1/23 | 205,833 | 190,910 | ||||
358,490 | ||||||
Principal | Value | |||||
Software: 0.7% | ||||||
Omnitracs LLC, 5.574% (3 Month US LIBOR + 2.750%), 3/23/25 | 248,812 | $ | 234,008 | |||
Software/Services: 5.4% | ||||||
Almonde, Inc., 6.303% (3 Month US LIBOR + 3.500%), 6/16/24 | 116,432 | 108,199 | ||||
Avaya, Inc., 6.701% (1 Month US LIBOR + 4.250%), 12/15/24 | 248,185 | 239,188 | ||||
Blucora, Inc., 5.522% (1 Month US LIBOR + 3.000%), 5/22/24 | 176,667 | 171,146 | ||||
First Data Corp., 4.504% (1 Month US LIBOR + 2.000%), 4/26/24 | 230,733 | 219,888 | ||||
Go Daddy Operating Co. LLC, 3.600% (1 Month US LIBOR + 2.250%), 2/15/24 | 199,493 | 190,117 | ||||
Infor, Inc., 5.272% (1 Month US LIBOR + 2.750%), 2/1/22 | 150,000 | 143,508 | ||||
Match Group, Inc., 5.090% (2 Month US LIBOR + 2.500%), 11/16/22 | 109,375 | 108,281 | ||||
McAfee LLC, 6.272% (1 Month US LIBOR + 3.750%), 9/29/24 | 244,116 | 236,895 | ||||
New Media Holdings II LLC, 8.595% (1 Month US LIBOR + 6.250%), 7/14/22 | 149,435 | 147,567 | ||||
SS&C Technologies Holdings Europe Sarl, 4.772% (1 Month US LIBOR + 2.250%), 4/16/25 | 60,044 | 56,527 | ||||
SS&C Technologies, Inc., 4.772% (1 Month US LIBOR + 2.250%), 4/16/25 | 158,296 | 149,025 | ||||
Web.com Group, Inc., 6.170% (3 Month US LIBOR + 3.750%), 10/11/25 | 150,000 | 144,000 | ||||
1,914,341 | ||||||
Specialty Retail: 0.7% | ||||||
Staples, Inc., 6.541% (3 Month US LIBOR + 4.000%), 9/12/24 | 248,994 | 238,205 | ||||
Support-Services: 4.1% | ||||||
Aramark Services, Inc., 4.272% (1 Month US LIBOR + 1.750%), 3/11/25 | 233,166 | 225,977 | ||||
PetVet Care Centers LLC, 5.254% (1 Month US LIBOR + 2.750%), 2/14/25 | 172,708 | 163,425 | ||||
PetVet Care Centers LLC, 4.800% (1 Month US LIBOR + 2.750%), 2/14/25 | 51,047 | 48,304 | ||||
Prime Security Services Borrower, LLC 5.272% (1 Month US LIBOR + 2.750%), 5/2/22 | 248,119 | 235,961 | ||||
The Hertz Corp., 5.280% (1 Month US LIBOR + 2.750%), 6/30/23 | 247,429 | 237,356 | ||||
TruGreen LP, 6.420% (1 Month US LIBOR + 4.000%), 4/13/23 | 244,406 | 241,351 | ||||
UOS LLC, 8.022% (1 Month US LIBOR + 5.500%), 4/18/23 | 296,123 | 294,643 | ||||
1,447,017 | ||||||
The Accompanying Notes are an Integral Part of these Financial Statements.
23
PENN CAPITAL FUNDS TRUST |
PENN CAPITAL DEFENSIVE FLOATING RATE INCOME FUND |
SCHEDULE OF INVESTMENTS |
DECEMBER 31, 2018 (UNAUDITED) |
Principal | Value | |||||
Telecom-Integrated/Services: 6.0% | ||||||
Altice France SA, 6.455% (1 Month US LIBOR + 4.000%), 1/31/26 | 150,000 | $ | 141,375 | |||
CenturyLink, Inc., 5.272% (1 Month US LIBOR + 2.750%), 1/31/25 | 222,998 | 207,611 | ||||
Cincinnati Bell, Inc., 5.772% (1 Month US LIBOR + 3.250%), 10/2/24 | 249,375 | 239,577 | ||||
Cyxtera DC Holdings, Inc., 5.380% (1 Month US LIBOR + 3.000%), 5/1/24 | 124,055 | 118,473 | ||||
Frontier Communications Corp., 5.280% (1 Month US LIBOR + 2.750%), 3/31/21 | 197,143 | 186,990 | ||||
GTT Communications, Inc., 5.270% (1 Month US LIBOR + 2.750%), 5/31/25 | 124,687 | 117,102 | ||||
Intelsat Jackson Holdings SA, 6.256% (1 Month US LIBOR + 3.750%), 11/27/23 | 125,000 | 120,759 | ||||
Level 3 Parent LLC, 4.754% (1 Month US LIBOR + 2.250%), 2/22/24 | 250,000 | 236,875 | ||||
Maxar Technologies Ltd., 5.148% (3 Month US LIBOR + 2.750%), 10/5/24 | 198,128 | 181,783 | ||||
MLN US Holdco LLC, 7.022% (1 Month US LIBOR + 4.500%), 11/30/25 | 150,000 | 145,032 | ||||
Sprint Communications, Inc., 5.062% (1 Month US LIBOR + 2.500%), 2/3/24 | 221,631 | 210,365 | ||||
Telesat Canada, 5.310% (3 Month US LIBOR + 2.500%), 11/17/23 | 239,305 | 226,024 | ||||
2,131,966 | ||||||
Telecommunications Equipment: 0.5% | ||||||
Dawn Acquisition LLC, 5.840% (3 Month US LIBOR + 3.750%), 1/1/26 | 175,000 | 163,625 | ||||
Telecom-Wireless: 0.7% | ||||||
Sable International Finance Ltd., 5.772% (1 Month US LIBOR + 3.250%), 1/31/26 | 250,000 | 240,535 | ||||
Trading Companies & Distributors: 0.7% | ||||||
DXP Enterprises, Inc., 7.272% (1 Month US LIBOR + 4.750%), 8/29/23 | 246,875 | 243,172 | ||||
Transportation Excluding Air/Rail: 0.7% | ||||||
CB URS Holdings Corp., 7.772% (1 Month US LIBOR + 5.250%), 10/19/24 | 120,313 | 116,854 | ||||
Deck Chassis Acquisition, Inc., 8.527% (3 Month US LIBOR + 6.000%), 6/15/23 | 125,000 | 119,375 | ||||
236,229 | ||||||
Water Utilities: 1.3% | ||||||
EWT Holdings III Corp., 5.522% (1 Month US LIBOR + 3.000%), 12/20/24 | 256,413 | 248,399 | ||||
Shape Technologies Group, Inc., 5.479% (1 Month US LIBOR + 3.000%), 4/20/25 | 223,875 | 217,159 | ||||
465,558 | ||||||
Total Bank Loans (cost $31,872,707) | 30,706,422 | |||||
Principal | Value | |||||
Corporate Bonds: 10.3% | ||||||
Aerospace: 0.3% | ||||||
Bombardier, Inc., 8.750%, 12/1/21 (b) | 90,000 | $ | 92,700 | |||
Auto Parts & Equipment: 0.8% | ||||||
American Axle & Manufacturing, Inc., 6.625%, 10/15/22 | 95,000 | 94,050 | ||||
Meritor, Inc., 6.250%, 2/15/24 | 200,000 | 191,000 | ||||
285,050 | ||||||
Computer Hardware: 0.5% | ||||||
NCR Corp., 5.000%, 7/15/22 | 195,000 | 183,787 | ||||
Electric-Integrated: 0.3% | ||||||
Talen Energy Supply LLC, 9.500%, 7/15/22 (b) | 100,000 | 100,500 | ||||
Entertainment: 0.6% | ||||||
NCL Corp. Ltd., 4.750%, 12/15/21 (b) | 201,000 | 199,492 | ||||
Food & Drug Retailers: 0.6% | ||||||
Ingles Markets, Inc., 5.750%, 6/15/23 | 235,000 | 232,062 | ||||
Forestry/Paper: 0.4% | ||||||
Rayonier AM Products, Inc., 5.500%, 6/1/24 (b) | 175,000 | 154,438 | ||||
Gas Distribution: 0.4% | ||||||
NGL Energy Partners LP, 5.125%, 7/15/19 | 130,000 | 129,025 | ||||
Health Services: 0.6% | ||||||
Universal Hospital Services, Inc., 7.625%, 8/15/20 | 195,000 | 193,538 | ||||
Investments & Miscellaneous Financial Services: 0.8% | ||||||
Icahn Enterprises LP, 6.750%, 2/1/24 | 195,000 | 193,050 | ||||
Icahn Enterprises LP, 6.250%, 2/1/22 | 100,000 | 98,750 | ||||
291,800 | ||||||
Media-Broadcast: 0.3% | ||||||
Gray Television, Inc., 5.125%, 10/15/24 (b) | 100,000 | 92,200 | ||||
Media-Cable: 1.1% | ||||||
Altice France SA, 6.250%, 5/15/24 (b) | 200,000 | 186,500 | ||||
DISH DBS Corp., 5.875%, 7/15/22 | 230,000 | 211,600 | ||||
398,100 | ||||||
Non-Food & Drug Retailers: 0.3% | ||||||
Hot Topic, Inc., 9.250%, 6/15/21 (b) | 109,000 | 106,820 | ||||
Oil Field Equipment & Services: 0.5% | ||||||
Nabors Industries, Inc., 5.000%, 9/15/20 | 190,000 | 182,774 | ||||
Steel Producers/Products: 0.3% | ||||||
Joseph T Ryerson & Son, Inc., 11.000%, 5/15/22 (b) | 100,000 | 100,750 | ||||
Support-Services: 0.5% | ||||||
The Hertz Corp., 7.625%, 6/1/22 (b) | 200,000 | 188,500 | ||||
The Accompanying Notes are an Integral Part of these Financial Statements.
24
PENN CAPITAL FUNDS TRUST |
PENN CAPITAL DEFENSIVE FLOATING RATE INCOME FUND |
SCHEDULE OF INVESTMENTS |
DECEMBER 31, 2018 (UNAUDITED) |
Principal | Value | |||||
Telecom-Integrated/Services: 1.4% | ||||||
Hughes Satellite Systems Corp., 7.625%, 6/15/21 | 200,000 | $ | 207,500 | |||
Intelsat Jackson Holdings SA, 9.500%, 9/30/22 (b) | 80,000 | 91,200 | ||||
Qwest Corp., 6.750%, 12/1/21 | 125,000 | 127,801 | ||||
Uniti Group LP, 6.000%, 4/15/23 (b) | 80,000 | 72,400 | ||||
498,901 | ||||||
Telecom-Wireless: 0.6% | ||||||
Sprint Communications, Inc., 6.000%, 11/15/22 | 225,000 | 220,799 | ||||
Total Corporate Bonds (cost $3,777,011) | 3,651,236 | |||||
Shares | ||||||
Short-Term Investment: 1.0% | ||||||
Money Market Deposit Account: 1.0% | ||||||
U.S. Bank Money Market Deposit Account, 2.200% | 348,099 | 348,099 | ||||
Total Short-Term Investment (cost $348,099) | 348,099 | |||||
Total Investments - 97.7% (cost $35,997,817) | 34,705,757 | |||||
Other Assets and Liabilities 2.3% | 804,020 | |||||
Net Assets: 100.0% | $ | 35,509,777 | ||||
| (a) | Bank Loans typically have rates of interest which are redetermined either daily, monthly, quarterly or semi-annually by reference to a base lending rate, plus a premium. These base lending rates are primarily the London Interbank Offered Rate (“LIBOR”) and secondarily, the prime rate offered by one or more major United States banks (the “Prime Rate”) and the certificate of deposit (“CD”) rate or other base lending rates used by commercial lenders. |
| (b) | Securities purchased pursuant to Rule 144A of the Securities Act of 1933, as amended, and may be sold only to dealers in that program or other “qualified institutional buyers.” As of December 31, 2018, the value of these investments was $1,385,500, or 3.9% of total net assets. |
The cost basis of investments for federal income tax purposes at December 31, 2018 was as follows*: | |||
Cost of investments | $ | 35,997,817 | |
Gross unrealized appreciation | 5,996 | ||
Gross unrealized depreciation | (1,298,056 | ) | |
Net unrealized depreciation | $ | (1,292,060 | ) |
| * | Because tax adjustments are calculated annually, the above table does not reflect tax adjustments. For the previous fiscal year's federal income tax information, please refer to the Notes to Financial Statements section in the Fund’s most recent annual report. |
Country Exposure (as a percentage of total investments) (Unaudited) | |
United States | 98.36% |
Bermuda | 0.57% |
France | 0.54% |
Canada | 0.27% |
Luxembourg | 0.26% |
Asset Type (as a percentage of total investments) |

The Accompanying Notes are an Integral Part of these Financial Statements.
25
PENN CAPITAL FUNDS TRUST |
PENN CAPITAL DEFENSIVE SHORT DURATION HIGH INCOME FUND |
SCHEDULE OF INVESTMENTS |
DECEMBER 31, 2018 (UNAUDITED) |
Principal | Value | |||||
Corporate Bonds: 74.1% | ||||||
Aerospace: 0.6% | ||||||
Bombardier, Inc., 7.750%, 3/15/20 (a) | 140,000 | $ | 142,100 | |||
Airline Companies: 2.3% | ||||||
Air Canada, 7.750%, 4/15/21 (a) | 269,000 | 284,400 | ||||
Allegiant Travel Co., 5.500%, 7/15/19 | 160,000 | 160,000 | ||||
American Airlines Group, Inc., 5.500%, 10/1/19 (a) | 65,000 | 65,163 | ||||
509,563 | ||||||
Auto Parts & Equipment: 0.5% | ||||||
American Axle & Manufacturing, Inc., 7.750%, 11/15/19 | 23,000 | 23,402 | ||||
The Goodyear Tire & Rubber Co., 8.750%, 8/15/20 | 75,000 | 79,500 | ||||
102,902 | ||||||
Automotive: 2.7% | ||||||
Fiat Chrysler Automobiles NV, 4.500%, 4/15/20 | 200,000 | 200,240 | ||||
Jaguar Land Rover Automotive PLC, 3.500%, 3/15/20 (a) | 410,000 | 391,550 | ||||
591,790 | ||||||
Banking: 5.1% | ||||||
Ally Financial, Inc., 8.000%, 3/15/20 | 525,000 | 543,375 | ||||
Ally Financial, Inc., 7.500%, 9/15/20 | 190,000 | 197,125 | ||||
Ally Financial, Inc., 3.750%, 11/18/19 | 60,000 | 59,775 | ||||
Ally Financial, Inc., 4.125%, 2/13/22 | 60,000 | 58,275 | ||||
CIT Group, Inc., 4.125%, 3/9/21 | 275,000 | 270,875 | ||||
1,129,425 | ||||||
Building & Construction: 2.3% | ||||||
KB Home, 8.000%, 3/15/20 | 115,000 | 118,737 | ||||
Lennar Corp., 4.500%, 11/15/19 | 210,000 | 208,425 | ||||
Lennar Corp., 8.375%, 1/15/21 | 65,000 | 69,063 | ||||
Toll Brothers Finance Corp., 6.750%, 11/1/19 | 35,000 | 35,350 | ||||
William Lyon Homes, Inc., 7.000%, 8/15/22 | 90,000 | 89,100 | ||||
520,675 | ||||||
Chemical Companies: 1.7% | ||||||
Blue Cube Spinco LLC, 9.750%, 10/15/23 | 105,000 | 115,500 | ||||
CF Industries, Inc., 7.125%, 5/1/20 | 54,000 | 55,620 | ||||
Huntsman International LLC, 4.875%, 11/15/20 | 90,000 | 90,225 | ||||
WR Grace & Co-Conn, 5.125%, 10/1/21 (a) | 115,000 | 113,850 | ||||
375,195 | ||||||
Computer Hardware: 4.7% | ||||||
Dell International LLC, 5.875%, 6/15/21 (a) | 365,000 | 364,593 | ||||
EMC Corp., 2.650%, 6/1/20 | 535,000 | 513,749 | ||||
NCR Corp., 4.625%, 2/15/21 | 165,000 | 160,875 | ||||
1,039,217 | ||||||
Principal | Value | |||||
Consumer/Commercial/Lease Financing: 4.1% | ||||||
DAE Funding LLC, 5.250%, 11/15/21 (a) | 175,000 | $ | 172,156 | |||
Navient Corp., 6.500%, 6/15/22 | 90,000 | 83,861 | ||||
Navient Corp., 8.000%, 3/25/20 | 415,000 | 421,682 | ||||
Park Aerospace Holdings Ltd., 5.250%, 8/15/22 (a) | 140,000 | 135,450 | ||||
Springleaf Finance Corp., 8.250%, 12/15/20 | 100,000 | 103,500 | ||||
916,649 | ||||||
Electric - Generation: 1.6% | ||||||
DPL, Inc., 6.750%, 10/1/19 | 27,000 | 27,270 | ||||
DPL, Inc., 7.250%, 10/15/21 | 180,000 | 188,078 | ||||
Vistra Energy Corp., 7.375%, 11/1/22 | 65,000 | 67,113 | ||||
Vistra Energy Corp., 7.625%, 11/1/24 | 60,000 | 63,300 | ||||
345,761 | ||||||
Energy - Exploration & Production: 2.3% | ||||||
QEP Resources, Inc., 6.875%, 3/1/21 | 120,000 | 120,900 | ||||
Range Resources Corp., 5.750%, 6/1/21 | 120,000 | 116,100 | ||||
Resolute Energy Corp., 8.500%, 5/1/20 | 65,000 | 64,025 | ||||
Unit Corp., 6.625%, 5/15/21 | 80,000 | 72,800 | ||||
Whiting Petroleum Corp., 6.250%, 4/1/23 | 55,000 | 50,050 | ||||
WPX Energy, Inc., 8.250%, 8/1/23 | 75,000 | 78,375 | ||||
502,250 | ||||||
Entertainment: 0.3% | ||||||
NCL Corp. Ltd., 4.750%, 12/15/21 (a) | 70,000 | 69,475 | ||||
Food & Drug Retailers: 0.2% | ||||||
Ingles Markets, Inc., 5.750%, 6/15/23 | 40,000 | 39,500 | ||||
Food - Wholesale: 0.4% | ||||||
TreeHouse Foods, Inc., 4.875%, 3/15/22 | 95,000 | 93,338 | ||||
Gaming: 2.9% | ||||||
GLP Capital LP, 4.375%, 4/15/21 | 120,000 | 119,512 | ||||
MGM Resorts International, 8.625%, 2/1/19 | 40,000 | 40,050 | ||||
MGM Resorts International, 6.750%, 10/1/20 | 305,000 | 313,387 | ||||
Scientific Games International, Inc., 10.000%, 12/1/22 | 165,000 | 167,061 | ||||
640,010 | ||||||
Gas Distribution: 4.6% | ||||||
DCP Midstream Operating LP, 5.350%, 3/15/20 (a) | 90,000 | 90,337 | ||||
Energy Transfer LP, 7.500%, 10/15/20 | 240,000 | 249,600 | ||||
Midcontinent Express Pipeline LLC, 6.700%, 9/15/19 (a) | 155,000 | 156,456 | ||||
NGL Energy Partners LP, 5.125%, 7/15/19 | 180,000 | 178,650 | ||||
Rockies Express Pipeline LLC, 5.625%, 4/15/20 (a) | 255,000 | 255,000 | ||||
Targa Resources Partners LP, 4.125%, 11/15/19 | 90,000 | 89,213 | ||||
1,019,256 | ||||||
The Accompanying Notes are an Integral Part of these Financial Statements.
26
PENN CAPITAL FUNDS TRUST |
PENN CAPITAL DEFENSIVE SHORT DURATION HIGH INCOME FUND |
SCHEDULE OF INVESTMENTS |
DECEMBER 31, 2018 (UNAUDITED) |
Principal | Value | |||||
Health Services: 4.8% | ||||||
Agiliti Health, Inc., 7.625%, 8/15/20 | 205,000 | $ | 203,463 | |||
Centene Corp., 5.625%, 2/15/21 | 450,000 | 451,125 | ||||
Select Medical Corp., 6.375%, 6/1/21 | 405,000 | 403,987 | ||||
1,058,575 | ||||||
Hospitals: 8.0% | ||||||
HCA Healthcare, Inc., 6.250%, 2/15/21 | 355,000 | 362,987 | ||||
HCA, Inc., 6.500%, 2/15/20 | 80,000 | 82,000 | ||||
HCA, Inc., 7.500%, 2/15/22 | 420,000 | 446,250 | ||||
Tenet Healthcare Corp., 6.000%, 10/1/20 | 838,000 | 848,475 | ||||
Tenet Healthcare Corp., 4.750%, 6/1/20 | 45,000 | 44,892 | ||||
1,784,604 | ||||||
Hotels: 0.8% | ||||||
RHP Hotel Properties LP, 5.000%, 4/15/21 | 50,000 | 49,625 | ||||
Wyndham Destinations, Inc., 5.625%, 3/1/21 | 140,000 | 139,300 | ||||
188,925 | ||||||
Investments & Miscellaneous Financial Services: 2.8% | ||||||
Icahn Enterprises LP, 6.000%, 8/1/20 | 500,000 | 499,375 | ||||
Icahn Enterprises LP, 6.250%, 2/1/22 | 123,000 | 121,462 | ||||
620,837 | ||||||
Media - Broadcast: 1.3% | ||||||
Charter Communications Operating LLC, 3.579%, 7/23/20 | 145,000 | 144,820 | ||||
Sinclair Television Group, Inc., 5.375%, 4/1/21 | 45,000 | 44,887 | ||||
Tribune Media Co., 5.875%, 7/15/22 | 100,000 | 100,500 | ||||
290,207 | ||||||
Media - Cable: 2.3% | ||||||
Cablevision Systems Corp., 8.000%, 4/15/20 | 110,000 | 111,375 | ||||
CSC Holdings LLC, 6.750%, 11/15/21 | 120,000 | 123,000 | ||||
DISH DBS Corp., 7.875%, 9/1/19 | 110,000 | 112,233 | ||||
DISH DBS Corp., 6.750%, 6/1/21 | 160,000 | 158,352 | ||||
504,960 | ||||||
Media - Diversified: 0.4% | ||||||
Netflix, Inc., 5.375%, 2/1/21 | 95,000 | 96,188 | ||||
Metals/Mining Excluding Steel: 2.1% | ||||||
Arconic, Inc., 6.150%, 8/15/20 | 295,000 | 300,921 | ||||
Freeport-McMoRan, Inc., 3.100%, 3/15/20 | 105,000 | 102,638 | ||||
Peabody Energy Corp., 6.000%, 3/31/22 (a) | 65,000 | 63,050 | ||||
466,609 | ||||||
Multi-Line Insurance: 0.3% | ||||||
Genworth Holdings, Inc., 7.700%, 6/15/20 | 70,000 | 70,700 | ||||
Non-Food & Drug Retailers: 1.6% | ||||||
Hot Topic, Inc., 9.250%, 6/15/21 (a) | 35,000 | 34,300 | ||||
L Brands, Inc., 7.000%, 5/1/20 | 160,000 | 164,800 | ||||
Penske Automotive Group, Inc., 3.750%, 8/15/20 | 85,000 | 82,875 | ||||
The Men's Wearhouse, Inc., 7.000%, 7/1/22 | 83,000 | 83,415 | ||||
365,390 | ||||||
Principal | Value | |||||
Office Equipment: 0.3% | ||||||
Avnet, Inc., 3.750%, 12/1/21 | 60,000 | $ | 60,347 | |||
Oil Field Equipment & Services: 1.4% | ||||||
Nabors Industries, Inc., 5.000%, 9/15/20 | 100,000 | 96,197 | ||||
Pride International LLC, 6.875%, 8/15/20 | 55,000 | 55,687 | ||||
Rowan Companies, Inc., 7.875%, 8/1/19 | 50,000 | 49,500 | ||||
SESI LLC, 7.125%, 12/15/21 | 45,000 | 38,250 | ||||
Transocean, Inc., 8.375%, 12/15/21 | 60,000 | 59,550 | ||||
299,184 | ||||||
Oil Refining & Marketing: 0.4% | ||||||
PBF Holding Co. LLC, 7.000%, 11/15/23 | 90,000 | 85,950 | ||||
Packaging: 0.8% | ||||||
Greif, Inc., 7.750%, 8/1/19 | 50,000 | 50,875 | ||||
Reynolds Group Issuer, Inc., 5.750%, 10/15/20 | 130,829 | 130,502 | ||||
181,377 | ||||||
Pharmaceuticals & Devices: 2.0% | ||||||
Bausch Health Cos, Inc., 6.500%, 3/15/22 (a) | 75,000 | 75,493 | ||||
Elanco Animal Health, Inc., 3.912%, 8/27/21 (a) | 75,000 | 75,464 | ||||
Kinetic Concepts, Inc., 7.875%, 2/15/21 (a) | 120,000 | 121,500 | ||||
Mallinckrodt International Finance SA, 4.875%, 4/15/20 (a) | 60,000 | 57,900 | ||||
Teva Pharmaceutical Finance IV LLC, 2.250%, 3/18/20 | 110,000 | 107,032 | ||||
437,389 | ||||||
Railroads: 0.4% | ||||||
Watco Companies LLC, 6.375%, 4/1/23 (a) | 80,000 | 80,200 | ||||
Real Estate Investment Trusts (REITs): 0.8% | ||||||
iStar, Inc., 4.625%, 9/15/20 | 190,000 | 185,250 | ||||
Software/Services: 0.3% | ||||||
Symantec Corp., 4.200%, 9/15/20 | 75,000 | 74,156 | ||||
Steel Producers/Products: 0.9% | ||||||
AK Steel Corp., 7.625%, 10/1/21 | 65,000 | 58,662 | ||||
ArcelorMittal, 5.125%, 6/1/20 | 75,000 | 76,265 | ||||
Joseph T Ryerson & Son, Inc., 11.000%, 5/15/22 (a) | 73,000 | 73,548 | ||||
208,475 | ||||||
Support - Services: 1.2% | ||||||
The ADT Security Corp., 6.250%, 10/15/21 | 170,000 | 172,337 | ||||
The Hertz Corp., 5.875%, 10/15/20 | 92,000 | 89,240 | ||||
261,577 | ||||||
The Accompanying Notes are an Integral Part of these Financial Statements.
27
PENN CAPITAL FUNDS TRUST |
PENN CAPITAL DEFENSIVE SHORT DURATION HIGH INCOME FUND |
SCHEDULE OF INVESTMENTS |
DECEMBER 31, 2018 (UNAUDITED) |
Principal | Value | |||||
Telecom - Integrated/Services: 2.5% | ||||||
CenturyLink, Inc., 5.625%, 4/1/20 | 130,000 | $ | 129,350 | |||
Hughes Satellite Systems Corp., 7.625%, 6/15/21 | 90,000 | 93,375 | ||||
Hughes Satellite Systems Corp., 6.500%, 6/15/19 | 65,000 | 65,569 | ||||
Intelsat Jackson Holdings SA, 9.500%, 9/30/22 (a) | 75,000 | 85,500 | ||||
Qwest Corp., 6.750%, 12/1/21 | 172,000 | 175,854 | ||||
549,648 | ||||||
Telecommunications Equipment: 0.6% | ||||||
CommScope, Inc., 5.000%, 6/15/21 (a) | 125,000 | 123,750 | ||||
Telecom - Wireless: 1.7% | ||||||
Sprint Capital Corp., 6.900%, 5/1/19 | 80,000 | 80,400 | ||||
Sprint Communications, Inc., 7.000%, 8/15/20 | 180,000 | 184,284 | ||||
Sprint Corp., 7.250%, 9/15/21 | 105,000 | 107,468 | ||||
372,152 | ||||||
Transportation Excluding Air/Rail: 0.1% | ||||||
XPO Logistics, Inc., 6.500%, 6/15/22 (a) | 30,000 | 29,738 | ||||
Total Corporate Bonds (cost $16,808,387) | 16,433,294 | |||||
Bank Loans: 9.1% (b) | ||||||
Airline Companies: 0.5% | ||||||
American Airlines, Inc., 4.522% (1 Month US LIBOR + 2.000%), 4/28/23 | 125,000 | 118,646 | ||||
Chemicals: 1.1% | ||||||
Big Jack Holdings LP, 4.137% (1 Month US LIBOR + 1.750%), 1/6/21 | 250,000 | 243,680 | ||||
Computer Hardware: 0.5% | ||||||
Dell International LLC, 4.280% (1 Month US LIBOR + 1.750%), 9/7/21 | 123,377 | 119,649 | ||||
Food - Wholesale: 1.1% | ||||||
JBS USA LUX SA, 5.260% (3 Month US LIBOR + 2.500%), 10/30/22 | 249,365 | 239,391 | ||||
Health Services: 0.9% | ||||||
DaVita, Inc., 5.272% (1 Month US LIBOR + 2.750%), 6/24/21 | 200,000 | 198,150 | ||||
Independent Power and Renewable Electricity Producers: 0.6% | ||||||
NRG Energy, Inc., 4.272% (1 Month US LIBOR + 1.750%), 6/30/23 | 124,680 | 119,631 | ||||
Investments & Miscellaneous Financial Services: 0.6% | ||||||
WisdomTree International Holdings Ltd., 4.205% (1 Month US LIBOR + 1.750%), 1/31/21 | 125,000 | 123,750 | ||||
Principal | Value | |||||
Metals & Mining: 1.2% | ||||||
Big River Steel LLC, 7.803% (3 Month US LIBOR + 5.000%), 8/23/23 | 124,684 | $ | 123,126 | |||
Zekelman Industries, Inc., 4.862% (3 Month US LIBOR + 2.250%), 6/14/21 | 150,000 | 144,600 | ||||
267,726 | ||||||
Non - Food & Drug Retailers: 0.5% | ||||||
Michaels Stores, Inc., 5.022% (1 Month US LIBOR + 2.500%), 1/28/23 | 124,687 | 118,920 | ||||
Pharmaceuticals: 1.1% | ||||||
Jaguar Holding Co. II, 4.820% (1 Month US LIBOR + 2.500%), 8/18/22 | 250,000 | 236,875 | ||||
Semiconductors & Semiconductor Equipment: 0.5% | ||||||
Cypress Semiconductor Corp., 4.530% (1 Month US LIBOR + 2.000%), 7/5/21 | 125,000 | 120,860 | ||||
Telecom - Integrated/Services: 0.5% | ||||||
CenturyLink, Inc., 5.272% (1 Month US LIBOR + 2.750%), 9/30/22 | 121,795 | 117,349 | ||||
Total Bank Loans (cost $2,093,488) | 2,024,627 | |||||
Shares | ||||||
Mutual Fund: 6.1% | ||||||
Bank Loan Related: 6.1% | ||||||
Penn Capital Defensive Floating Rate Income Fund (c) | 140,632 | 1,362,724 | ||||
Total Mutual Fund (cost $1,420,228) | 1,362,724 | |||||
Principal | ||||||
U.S. Government Notes: 4.0% | ||||||
United States Treasury Fixed Rate Note 2.875%, 10/31/20 | 180,000 | 181,095 | ||||
United States Treasury Fixed Rate Note 2.750%, 11/30/20 | 250,000 | 251,086 | ||||
United States Treasury Fixed Rate Note 1.375%, 12/15/19 | 450,000 | 444,639 | ||||
Total US Government Notes (cost $875,003) | 876,820 | |||||
Short-Term Investment: 7.7% | ||||||
Money Market Deposit Account: 7.7% | ||||||
U.S. Bank Money Market Deposit Account, 2.200% | 1,709,456 | 1,709,456 | ||||
Total Short-Term Investment (cost $1,709,456) | 1,709,456 | |||||
The Accompanying Notes are an Integral Part of these Financial Statements.
28
PENN CAPITAL FUNDS TRUST |
PENN CAPITAL DEFENSIVE SHORT DURATION HIGH INCOME FUND |
SCHEDULE OF INVESTMENTS |
DECEMBER 31, 2018 (UNAUDITED) |
Principal | Value | |||||
Total Investments - 101.0% (cost $22,906,562) | 22,406,921 | |||||
Liabilities in Excess of Other Assets (1.0)% | (227,479 | ) | ||||
Net Assets: 100.0% | $ | 22,179,442 | ||||
Percentages are stated as a percent of net assets.
| (a) | Securities purchased pursuant to Rule 144A of the Securities Act of 1933, as amended, and may be sold only to dealers in that program or other “qualified institutional buyers.” As of December 31, 2018, the value of these investments was $3,060,973, or 13.8% of total net assets. |
| (b) | Bank Loans typically have rates of interest which are redetermined either daily, monthly, quarterly or semi-annually by reference to a base lending rate, plus a premium. These base lending rates are primarily the London Interbank Offered Rate (“LIBOR”) and secondarily, the prime rate offered by one or more major United States banks (the “Prime Rate”) and the certificate of deposit (“CD”) rate or other base lending rates used by commercial lenders. |
| (c) | Affiliated company. See Note 7. |
The cost basis of investments for federal income tax purposes at December 31, 2018 was as follows*: | |||
Cost of investments | $ | 22,906,562 | |
Gross unrealized appreciation | 4,551 | ||
Gross unrealized depreciation | (504,192 | ) | |
Net unrealized depreciation | $ | (499,641 | ) |
| * | Because tax adjustments are calculated annually, the above table does not reflect tax adjustments. For the previous fiscal year's federal income tax information, please refer to the Notes to Financial Statements section in the Fund's most recent annual report. |
Country Exposure (as a percentage of total investments) (Unaudited) | |
United States | 92.96% |
Canada | 2.24% |
United Kingdom | 1.75% |
Luxembourg | 0.98% |
Netherlands | 0.89% |
Cayman Islands | 0.87% |
Bermuda | 0.31% |
Asset Type (as a percentage of total investments) |

The Accompanying Notes are an Integral Part of these Financial Statements.
29
PENN CAPITAL FUNDS TRUST
STATEMENTS OF ASSETS AND LIABILITIES
DECEMBER 31, 2018 (UNAUDITED)
Assets | Penn Capital Managed Alpha SMID Cap Equity Fund | Penn Capital Special Situations Small Cap Equity Fund | Penn Capital Multi-Credit High Income Fund | Penn Capital Defensive Floating Rate Income Fund | Penn Capital Defensive Short Duration High Income Fund | ||||||||||
Investments, at fair value(1) | |||||||||||||||
Unaffiliated issuers | $ | 12,158,824 | $ | 9,091,267 | $ | 10,355,699 | $ | 34,705,757 | $ | 21,044,197 | |||||
Affiliated mutual fund (see Note 7) | — | — | 3,317,753 | — | 1,362,724 | ||||||||||
12,158,824 | 9,091,267 | 13,673,452 | 34,705,757 | 22,406,921 | |||||||||||
Receivables: | |||||||||||||||
Advisor reimbursement due | 7,128 | 9,983 | 18,204 | 2,682 | 10,269 | ||||||||||
Dividends and interest | 16,149 | 4,345 | 165,051 | 336,232 | 267,130 | ||||||||||
Investments sold | — | — | 160,500 | 2,530,222 | 120,613 | ||||||||||
Fund shares sold | 50 | 8,478 | — | — | — | ||||||||||
Other assets | 13,315 | 14,624 | 11,818 | 16,469 | 8,175 | ||||||||||
Total assets | 12,195,466 | 9,128,697 | 14,029,025 | 37,591,362 | 22,813,108 | ||||||||||
Liabilities | |||||||||||||||
Payables: | |||||||||||||||
Investments purchased | — | — | 374,920 | 1,992,934 | 574,431 | ||||||||||
Fund shares redeemed | 2 | 2 | 4 | 3 | 3 | ||||||||||
Accrued expenses: | |||||||||||||||
Professional fees | 22,870 | 23,115 | 27,965 | 28,422 | 20,782 | ||||||||||
Administration fees | 16,880 | 16,833 | 23,781 | 25,974 | 15,482 | ||||||||||
Custody fees | 3,017 | 4,650 | 2,946 | 5,918 | 2,435 | ||||||||||
Transfer agent fees and expenses | 5,004 | 6,246 | 4,627 | 6,402 | 3,999 | ||||||||||
Trustee fees and expenses | 4,313 | 6,014 | 3,790 | 9,501 | 3,718 | ||||||||||
Interest expense | — | 133 | — | — | — | ||||||||||
Other accrued expenses | 18,477 | 25,565 | 10,503 | 12,431 | 12,816 | ||||||||||
Total liabilities | 70,563 | 82,558 | 448,536 | 2,081,585 | 633,666 | ||||||||||
Net assets | $ | 12,124,903 | $ | 9,046,139 | $ | 13,580,489 | $ | 35,509,777 | $ | 22,179,442 | |||||
Composition of Net Assets | |||||||||||||||
Paid-in capital | $ | 11,587,801 | $ | 10,098,877 | $ | 14,278,492 | $ | 36,987,290 | $ | 22,729,480 | |||||
Total distributable earnings | 537,102 | (1,052,738 | ) | (698,003 | ) | (1,477,513 | ) | (550,038 | ) | ||||||
Net assets | $ | 12,124,903 | $ | 9,046,139 | $ | 13,580,489 | $ | 35,509,777 | $ | 22,179,442 | |||||
Institutional Class | |||||||||||||||
Net assets applicable to outstanding shares | $ | 12,124,903 | $ | 9,046,139 | $ | 13,580,489 | $ | 35,509,777 | $ | 22,179,442 | |||||
Shares of beneficial interest outstanding, no par value, unlimited authorization | 1,139,463 | 1,001,025 | 1,428,825 | 3,665,672 | 2,298,880 | ||||||||||
Net asset value per share outstanding | $ | 10.64 | $ | 9.04 | $ | 9.50 | $ | 9.69 | $ | 9.65 | |||||
Investor Class(2) | |||||||||||||||
Net assets applicable to outstanding shares | $ | — | $ | — | $ | — | $ | — | $ | — | |||||
Shares of beneficial interest outstanding, no par value, unlimited authorization | — | — | — | — | — | ||||||||||
Net asset value per share outstanding | $ | — | $ | — | $ | — | $ | — | $ | — | |||||
_________ | |||||||||||||||
(1) Investment in securities at cost | |||||||||||||||
Unaffiliated issuers | $ | 11,844,696 | $ | 9,588,795 | $ | 10,839,580 | $ | 35,997,817 | $ | 21,486,334 | |||||
Affiliated mutual fund (see Note 7) | — | — | 3,474,135 | — | 1,420,228 | ||||||||||
(2) No information is provided for Investor Share Class shares because shares of that Class had not yet been issued as of December 31, 2018. | |||||||||||||||
The Accompanying Notes are an Integral Part of these Financial Statements.
30
PENN CAPITAL FUNDS TRUST
STATEMENTS OF OPERATIONS
FOR THE SIX MONTH PERIOD ENDED
DECEMBER 31, 2018 (UNAUDITED)
Penn Capital Managed Alpha SMID Cap Equity Fund | Penn Capital Special Situations Small Cap Equity Fund | Penn Capital Multi-Credit High Income Fund | Penn Capital Defensive Floating Rate Income Fund | Penn Capital Defensive Short Duration High Income Fund | |||||||||||
Investment Income (Loss) | July 1, 2018 - December 31, 2018 | July 1, 2018 - December 31, 2018 | July 1, 2018 - December 31, 2018 | July 1, 2018 - December 31, 2018 | July 1, 2018 - December 31, 2018 | ||||||||||
Income | |||||||||||||||
Dividends** | |||||||||||||||
Unaffiliated dividends | $ | 74,265 | $ | 78,366 | $ | — | $ | — | $ | — | |||||
Dividend distributions from affiliated mutual fund (see Note 7) | — | — | 78,860 | — | 49,727 | ||||||||||
Interest*** | 3,655 | 1,183 | 380,835 | 972,441 | 295,962 | ||||||||||
Total income | 77,920 | 79,549 | 459,695 | 972,441 | 345,689 | ||||||||||
Expenses | |||||||||||||||
Investment advisory fees | 65,607 | 89,209 | 47,996 | 100,756 | 37,632 | ||||||||||
Administration and accounting | 33,846 | 34,145 | 52,751 | 57,245 | 38,220 | ||||||||||
Professional fees | 20,125 | 20,065 | 25,219 | 25,372 | 22,256 | ||||||||||
Transfer agent expense | 9,924 | 10,786 | 9,280 | 11,965 | 8,848 | ||||||||||
Compliance fees | 7,091 | 7,092 | 7,091 | 7,087 | 6,819 | ||||||||||
Miscellaneous | 6,341 | 6,341 | 56 | 55 | 55 | ||||||||||
Registration | 6,305 | 9,310 | 6,150 | 4,825 | 5,995 | ||||||||||
Custodian | 3,594 | 4,382 | 3,867 | 5,828 | 3,361 | ||||||||||
Shareholder communication | 2,835 | 6,345 | 2,784 | 5,846 | 2,286 | ||||||||||
Trustees | 2,644 | 3,614 | 2,419 | 6,306 | 2,446 | ||||||||||
Insurance | 1,996 | 2,531 | 1,715 | 4,226 | 1,447 | ||||||||||
Shareholder servicing fees | 548 | 5,349 | 483 | 1,973 | 66 | ||||||||||
Interest expense | — | 133 | — | — | — | ||||||||||
Total expenses | 160,856 | 199,302 | 159,811 | 231,484 | 129,431 | ||||||||||
Expense waiver and reimbursement from Advisor | (83,585 | ) | (96,813 | ) | (109,728 | ) | (116,241 | ) | (84,273 | ) | |||||
Net expenses | 77,271 | 102,489 | 50,083 | 115,243 | 45,158 | ||||||||||
Net investment income (loss) | 649 | (22,940 | ) | 409,612 | 857,198 | 300,531 | |||||||||
Realized and Unrealized Gain (Loss) on Investments | |||||||||||||||
Net realized gain (loss) on investments | |||||||||||||||
Unaffiliated issuers | 204,032 | (424,273 | ) | (8,856 | ) | (147,278 | ) | (26,759 | ) | ||||||
Affiliated mutual fund (see Note 7) | — | — | — | — | (9,534 | ) | |||||||||
Net change in unrealized depreciation | (2,043,901 | ) | (3,305,702 | ) | (673,614 | ) | (1,286,841 | ) | (360,027 | ) | |||||
Net realized loss on investments | (1,839,869 | ) | (3,729,975 | ) | (682,470 | ) | (1,434,119 | ) | (396,320 | ) | |||||
Net decrease in net assets resulting from operations | $ | (1,839,220 | ) | $ | (3,752,915 | ) | $ | (272,858 | ) | $ | (576,921 | ) | $ | (95,789 | ) |
** Net of foreign taxes withheld of: | $ | — | $ | 213 | $ | — | $ | — | $ | — | |||||
*** Net of foreign taxes withheld of: | $ | — | $ | — | $ | — | $ | — | $ | 149 | |||||
The Accompanying Notes are an Integral Part of these Financial Statements.
31
PENN CAPITAL FUNDS TRUST
STATEMENTS OF CHANGES IN NET ASSETS
Penn Capital Managed Alpha SMID Cap Equity Fund | Penn Capital Special Situations Small Cap Equity Fund | Penn Capital Multi-Credit High Income Fund | Penn Capital Defensive Floating Rate Income Fund | Penn Capital Defensive Short Duration High Income Fund | ||||||||||||||||||||||||||
Increase (Decrease) in Net Assets | July 1, 2018 - December 31, 2018 | July 1, 2017 - June 30, 2018 | July 1, 2018 - December 31, 2018 | July 1, 2017 - June 30, 2018 | July 1, 2018 - December 31, 2018 | July 1, 2017 - June 30, 2018 | July 1, 2018 - December 31, 2018 | July 1, 2017 - June 30, 2018 | July 1, 2018 - December 31, 2018 | July 17, 2017* - June 30, 2018 | ||||||||||||||||||||
Operations | (Unaudited | ) | (Unaudited | ) | (Unaudited | ) | (Unaudited | ) | (Unaudited | ) | ||||||||||||||||||||
Net investment income (loss) | $ | 649 | $ | (45,253 | ) | $ | (22,940 | ) | $ | (133,199 | ) | $ | 409,612 | $ | 638,840 | $ | 857,198 | $ | 1,221,986 | $ | 300,531 | $ | 239,854 | |||||||
Net realized gain (loss) on investments: | 204,032 | 1,333,038 | (424,273 | ) | 2,322,912 | (8,856 | ) | 1,085 | (147,278 | ) | (49,428 | ) | (36,293 | ) | (7,382 | ) | ||||||||||||||
Capital gain distribution from affiliated mutual fund | — | — | — | — | — | 5,991 | — | — | — | 4,997 | ||||||||||||||||||||
Net change in unrealized appreciation (depreciation) | (2,043,901 | ) | 815,952 | (3,305,702 | ) | 1,826,691 | (673,614 | ) | (261,461 | ) | (1,286,841 | ) | (177,558 | ) | (360,027 | ) | (139,614 | ) | ||||||||||||
Net increase (decrease) in net assets resulting from operations | (1,839,220 | ) | 2,103,737 | (3,752,915 | ) | 4,016,404 | (272,858 | ) | 384,455 | (576,921 | ) | 995,000 | (95,789 | ) | 97,855 | |||||||||||||||
Dividends and distributions to shareholders | ||||||||||||||||||||||||||||||
Net dividends and distributions from net investment income and realized gain— Institutional Class | (1,274,995 | ) | (217,398 | ) | (1,194,499 | ) | (2,239,983 | ) | (497,144 | ) | (855,013 | ) | (960,914 | ) | (1,353,114 | ) | (340,784 | ) | (211,320 | ) | ||||||||||
Total dividends and distributions to shareholders | (1,274,995 | ) | (217,398 | )(1) | (1,194,499 | ) | (2,239,983 | )(2) | (497,144 | ) | (855,013 | )(3) | (960,914 | ) | (1,353,114 | )(4) | (340,784 | ) | (211,320 | )(5) | ||||||||||
Capital share transactions | ||||||||||||||||||||||||||||||
Net proceeds from sale of shares | 36,952 | 2,179,641 | 825,366 | 6,262,562 | 782,757 | 4,996,417 | 7,946,167 | 7,039,836 | 10,239,740 | 12,597,665 | ||||||||||||||||||||
Dividends and distributions reinvested | 1,251,646 | 217,014 | 1,167,457 | 2,233,477 | 491,817 | 824,258 | 799,195 | 1,346,434 | 338,883 | 211,090 | ||||||||||||||||||||
Cost of shares redeemed** | (959,663 | ) | (400,183 | ) | (9,288,178 | ) | (10,850,646 | ) | (737,943 | ) | (307,821 | ) | (3,426,506 | ) | (1,330,752 | ) | (398,450 | ) | (259,448 | ) | ||||||||||
Net increase (decrease) in net assets resulting from capital share transactions | 328,935 | 1,996,472 | (7,295,355 | ) | (2,354,607 | ) | 536,631 | 5,512,854 | 5,318,856 | 7,055,518 | 10,180,173 | 12,549,307 | ||||||||||||||||||
Net increase (decrease) in net assets | (2,785,280 | ) | 3,882,811 | (12,242,769 | ) | (578,186 | ) | (233,371 | ) | 5,042,296 | 3,781,021 | 6,697,404 | 9,743,600 | 12,435,842 | ||||||||||||||||
Net Assets | ||||||||||||||||||||||||||||||
Beginning of period | 14,910,183 | 11,027,372 | 21,288,908 | 21,867,094 | 13,813,860 | 8,771,564 | 31,728,756 | 25,031,352 | 12,435,842 | — | ||||||||||||||||||||
End of period | $ | 12,124,903 | $ | 14,910,183 | $ | 9,046,139 | $ | 21,288,908 | $ | 13,580,489 | $ | 13,813,860 | (6) | $ | 35,509,777 | $ | 31,728,756 | (7) | $ | 22,179,442 | $ | 12,435,842 | (8) | |||||||
** Net of redemption fees of: | $ | — | $ | — | $ | 644 | $ | 741 | $ | — | $ | 32 | $ | 81 | $ | — | $ | 833 | $ | — | ||||||||||
| (1) | Includes net realized gain distributions of $217,398. |
| (2) | Includes net realized gain distributions of $2,239,983. |
| (3) | Includes net investment income distributions of $632,448 and net realized gain distributions of $222,565. |
| (4) | Includes net investment income distributions of $1,186,100 and net realized gain distributions of $167,014. |
| (5) | Includes net investment income distributions of $211,320. |
| (6) | Includes accumulated net investment income of $43,679. |
| (7) | Includes accumulated net investment income of $115,673. |
| (8) | Includes accumulated net investment income of $33,307. |
| * | Commencement of operations. |
The Accompanying Notes are an Integral Part of these Financial Statements.
32
PENN CAPITAL FUNDS TRUST
FINANCIAL HIGHLIGHTS
Per Common Share Data(a) | Supplemental data and ratios | ||||||||||||||||||||||||||||||||||||||||||||
Income from investment operations | Distributions to shareholders | ||||||||||||||||||||||||||||||||||||||||||||
 |  |  |  |  |  |  |  |  |  |  |  |  |  |  | |||||||||||||||||||||||||||||||
Penn Capital Managed Alpha SMID Cap Equity Fund | |||||||||||||||||||||||||||||||||||||||||||||
Institutional Class | |||||||||||||||||||||||||||||||||||||||||||||
7/1/18 to 12/31/18 (Unaudited) | $ | 13.55 | 0.00 | (1.68 | ) | (1.68 | ) | — | (1.23 | ) | (1.23 | ) | $ | 10.64 | -13.03 | %(d) | $ | 12,125 | 1.06 | % | 2.21 | % | 0.01 | % | (1.14 | )% | 27 | % | |||||||||||||||||
7/1/17 to 6/30/18 | $ | 11.73 | (0.04 | ) | 2.07 | 2.03 | — | (0.21 | ) | (0.21 | ) | $ | 13.55 | 17.41 | % | $ | 14,910 | 1.06 | % | 2.38 | % | (0.34 | )% | (1.66 | )% | 64 | % | ||||||||||||||||||
7/1/16 to 6/30/17 | $ | 9.65 | (0.02 | ) | 2.10 | 2.08 | — | — | — | $ | 11.73 | 21.55 | % | $ | 11,027 | 1.06 | % | 2.63 | % | (0.29 | )% | (1.86 | )% | 91 | % | ||||||||||||||||||||
12/1/15(e) to 6/30/16 | 10.00 | (0.03 | ) | (0.32 | ) | (0.35 | ) | — | — | — | $ | 9.65 | -3.50 | %(d) | $ | 9,462 | 1.06 | % | 3.74 | % | (0.53 | )% | (3.21 | )% | 70 | %(d) | |||||||||||||||||||
Penn Capital Special Situations Small Cap Equity Fund | |||||||||||||||||||||||||||||||||||||||||||||
Institutional Class | |||||||||||||||||||||||||||||||||||||||||||||
7/1/18 to 12/31/18 (Unaudited) | $ | 12.59 | (0.02 | ) | (2.64 | ) | (2.66 | )(f) | — | (0.89 | ) | (0.89 | ) | $ | 9.04 | -21.83 | %(d) | $ | 9,046 | 1.09 | % | 2.12 | % | (0.24 | )% | (1.27 | )% | 57 | % | ||||||||||||||||
7/1/17 to 6/30/18 | $ | 11.71 | (0.08 | ) | 2.36 | 2.28(f | ) | — | (1.40 | ) | (1.40 | ) | $ | 12.59 | 20.31 | % | $ | 21,289 | 1.09 | % | 2.09 | % | (0.64 | )% | (1.64 | )% | 105 | % | |||||||||||||||||
7/1/16 to 6/30/17 | $ | 10.32 | (0.04 | ) | 2.24 | 2.20(f | ) | — | (0.81 | ) | (0.81 | ) | $ | 11.71 | 21.52 | % | $ | 21,867 | 1.09 | % | 2.19 | % | (0.54 | )% | (1.64 | )% | 101 | % | |||||||||||||||||
12/18/15(e) to 6/30/16 | $ | 10.00 | (0.02 | ) | 0.34 | 0.32 | — | — | — | $ | 10.32 | 3.20 | %(d) | $ | 8,554 | 1.09 | % | 5.63 | % | (0.48 | )% | (5.02 | )% | 102 | %(d) | ||||||||||||||||||||
Penn Capital Multi—Credit High Income Fund | |||||||||||||||||||||||||||||||||||||||||||||
Institutional Class | |||||||||||||||||||||||||||||||||||||||||||||
7/1/18 to 12/31/18 (Unaudited) | $ | 10.06 | 0.30 | (0.50 | ) | (0.20 | ) | (0.33 | ) | (0.03 | ) | (0.36 | ) | $ | 9.50 | -2.07 | %(d) | $ | 13,580 | 0.72 | % | 2.30 | % | 5.89 | % | 4.31 | % | 40 | % | ||||||||||||||||
7/1/17 to 6/30/18 | $ | 10.52 | 0.61 | (0.22 | ) | 0.39(f | ) | (0.63 | ) | (0.22 | ) | (0.85 | ) | $ | 10.06 | 3.81 | % | $ | 13,814 | 0.72 | % | 2.80 | % | 5.89 | % | 3.81 | % | 66 | % | ||||||||||||||||
7/1/16 to 6/30/17 | $ | 9.95 | 0.73 | 0.56 | 1.29 | (0.72 | ) | — | (0.72 | ) | $ | 10.52 | 13.36 | % | $ | 8,772 | 0.72 | % | 3.25 | % | 7.01 | % | 4.48 | % | 79 | % | |||||||||||||||||||
12/1/15(e) to 6/30/16 | $ | 10.00 | 0.35 | (0.10 | ) | 0.25 | (0.30 | ) | — | (0.30 | ) | $ | 9.95 | 2.66 | %(d) | $ | 7,843 | 0.72 | % | 5.14 | % | 6.34 | % | 1.92 | % | 62 | %(d) | ||||||||||||||||||
Penn Capital Defensive Floating Rate Income Fund | |||||||||||||||||||||||||||||||||||||||||||||
Institutional Class | |||||||||||||||||||||||||||||||||||||||||||||
7/1/18 to 12/31/18 (Unaudited) | $ | 10.09 | 0.23 | (0.37 | ) | (0.14 | )(f) | (0.26 | ) | — | (0.26 | ) | $ | 9.69 | -1.40 | %(d) | $ | 35,510 | 0.64 | % | 1.26 | % | 4.68 | % | 4.06 | % | 29 | % | |||||||||||||||||
7/1/17 to 6/30/18 | $ | 10.21 | 0.43 | (0.06 | ) | 0.37 | (0.43 | ) | (0.06 | ) | (0.49 | ) | $ | 10.09 | 3.71 | % | $ | 31,729 | 0.65 | % (g) | 1.64 | % | 4.31 | %(g) | 3.32 | % | 65 | % | |||||||||||||||||
7/1/16 to 6/30/17 | $ | 10.09 | 0.40 | 0.17 | 0.57 | (0.40 | ) | (0.05 | ) | (0.45 | ) | $ | 10.21 | 5.66 | % | $ | 25,031 | 0.74 | % | 1.95 | % | 3.90 | % | 2.69 | % | 108 | % | ||||||||||||||||||
12/1/15(e) to 6/30/16 | $ | 10.00 | 0.14 | 0.06 | 0.20 | (0.11 | ) | — | (0.11 | ) | $ | 10.09 | 1.99 | %(d) | $ | 18,625 | 0.74 | % | 2.77 | % | 2.56 | % | 0.53 | % | 43 | %(d) | |||||||||||||||||||
Penn Capital Defensive Short Duration High Income Fund | |||||||||||||||||||||||||||||||||||||||||||||
Institutional Class | |||||||||||||||||||||||||||||||||||||||||||||
7/1/18 to 12/31/18 (Unaudited) | $ | 9.85 | 0.19 | (0.20 | ) | (0.01 | )(f) | (0.19 | ) | — | (0.19 | ) | $ | 9.65 | -0.07 | %(d) | $ | 22,179 | 0.54 | % | 1.55 | % | 3.59 | % | 2.59 | % | 23 | % | |||||||||||||||||
7/17/17(e) to 6/30/18 | $ | 10.00 | 0.27 | (0.17 | ) | 0.10 | (0.25 | ) | — | (0.25 | ) | $ | 9.85 | 1.03 | %(d) | $ | 12,436 | 0.54 | % | 2.70 | % | 3.08 | % | 0.92 | % | 39 | %(d) | ||||||||||||||||||
| * | No information is provided for Investor Class shares because shares of that class had not yet been issued as of December 31, 2018. |
| (a) | Information presented related to a share outstanding for the entire period. |
| (b) | Annualized for periods less than one full year. |
| (c) | Portfolio turnover is calculated on the basis of the Fund as a whole without distinguishing between the classes of shares issued. |
| (d) | Not annualized. |
| (e) | Commencement of operations. |
| (f) | Total from investment operations per share includes redemption fees of less than $0.01 per share. |
| (g) | Expense waiver of 0.64% was implemented on August 1, 2017. |
The Accompanying Notes are an Integral Part of these Financial Statements.
33
PENN CAPITAL FUNDS TRUST
NOTES TO THE FINANCIAL STATEMENTS
DECEMBER 31, 2018
1. Organization (Unaudited)
PENN Capital Funds Trust (the “Trust”) was organized as a Delaware statutory trust on August 29, 2014, and is registered under the Investment Company Act of 1940 (the “1940 Act”), as amended, as an open-end management investment company. The Trust consists of five series that are available for investment: the Penn Capital Managed Alpha SMID Cap Equity Fund, the Penn Capital Special Situations Small Cap Equity Fund, the Penn Capital Multi-Credit High Income Fund, the Penn Capital Defensive Floating Rate Income Fund and the Penn Capital Defensive Short Duration High Income Fund (collectively referred to as the “Funds” and each individually referred to as a “Fund”). Two other series: the Penn Capital Micro Cap Equity Fund and the Penn Capital Enterprise Value Small Cap Equity Fund are not currently offered. The Funds follow the Financial Accounting Standards Board (“FASB”) Accounting Standard Codification Topic 946 “Financial Services- Investment Companies.”
The Penn Capital Managed Alpha SMID Cap Equity Fund and the Penn Capital Special Situations Small Cap Equity Fund’s investment objective is to seek to provide capital appreciation. The Penn Capital Managed Alpha SMID Cap Equity Fund commenced operations on December 1, 2015. The Penn Capital Special Situations Small Cap Equity Fund commenced operations on December 18, 2015.
The Penn Capital Multi-Credit High Income Fund’s investment objective is to seek to provide total return through interest income and capital appreciation. The Penn Capital Mulit-Credit High Income Fund commenced operations on December 1, 2015.
The Penn Capital Defensive Floating Rate Income Fund’s investment objective is to seek to provide current income. The Penn Capital Defensive Floating Rate Income Fund commenced operations on December 1, 2015.
The Penn Capital Defensive Short Duration High Income Fund’s investment objective is to seek to provide a high level of current income. The Penn Capital Defensive Short Duration High Income Fund commenced operations on July 17, 2017.
Each Fund’s investment objective is non-fundamental, and may be changed by the Trust’s Board of Trustees (the “Board” or “Trustees”) without shareholder approval. Unless otherwise noted, all of the other investment policies and strategies described in the Prospectus or hereafter are nonfundamental. The Penn Capital Management Company, Inc. (“Advisor”) serves as the investment advisor to the Funds.
The Trust offers two classes of shares for the Penn Capital Managed Alpha SMID Cap Equity Fund, the Penn Capital Special Situations Small Cap Equity Fund, the Penn Capital Multi-Credit High Income Fund and the Penn Capital Defensive Floating Rate Income Fund: Institutional and Investor Class. The Trust offers Institutional Class shares for the Penn Capital Defensive Short Duration High Income Fund. The Trust has also registered two other series, each with one class: the Penn Capital Micro Cap Equity Fund and the Penn Capital Enterprise Value Small Cap Equity Fund: Institutional Class. No information is provided in this report for Investor Class shares because shares of that class had not yet been issued as of December 31, 2018. Neither class has a front-end or back-end sales charge. The Penn Capital Micro Cap Equity Fund and Penn Capital Enterprise Value Small Cap Fund have not commenced operations as of December 31, 2018.
2. Significant Accounting Policies
The following is a summary of significant accounting policies consistently followed by the Funds in the preparation of their financial statements. The financial statements have been prepared in conformity with accounting principles generally accepted in the United States of America (“GAAP”).
A. Investment Valuation
The Funds use the following valuation methods to determine fair value as either fair value for investments for which market quotations are available, or if not available, the fair value, as determined in good faith pursuant to such policies and procedures as may be approved by the Trust’s Board from time to time. The valuation of the portfolio investments of the Funds currently includes the following processes:
Portfolio securities listed on a national or foreign securities exchange, except those listed on the NASDAQ® Stock Market and Small CapSM exchanges (“NASDAQ®”), for which market quotations are available, are valued at the official closing price of such exchange on each business day (defined as days on which the Funds are open for business (“Business Day”)). Portfolio securities traded on the NASDAQ® will be valued at the NASDAQ® Official Closing Price on each Business Day. If there is no such reported sale on an exchange or NASDAQ®, the portfolio security will be valued at the most recent quoted bid price. Price information on listed securities is taken from the exchange where the security is primarily traded.
34
PENN CAPITAL FUNDS TRUST
NOTES TO THE FINANCIAL STATEMENTS
DECEMBER 31, 2018
Other assets and securities for which no quotations are readily available (such as for certain restricted or unlisted securities and private placements) or that may not be reliably priced (such as in the case of trade suspensions or halts, price movement limits set by certain foreign markets, and thinly traded or illiquid securities) will be valued in good faith at fair value using procedures and methods approved by the Board. Under the procedures adopted by the Board, the Board has delegated day-to-day responsibility for fair value determinations to a Valuation Committee comprised of representatives from the Advisor.
A Fund’s portfolio holdings may also consist of shares of other investment companies in which the Fund invests. The value of each such investment company will be its net asset value (“NAV”) at the time the Fund’s shares are priced. Each investment company calculates its NAV based on the current market value for its portfolio holdings. Each investment company values securities and other instruments in a manner as described in that investment company’s prospectus. The investment company’s prospectus explains the circumstances under which the company will use fair value pricing and the effects of using fair value pricing.
Because a Fund may invest in foreign securities, the Fund’s NAV may change on days when a shareholder will not be able to purchase or redeem Fund shares because foreign markets are open at times and on days when U.S. markets are not. Investments quoted in foreign currencies will be valued daily in U.S. dollars on the basis of the foreign currency exchange rates prevailing at the time such valuation is determined. Foreign currency exchange rates are generally determined as of the close of the New York Stock Exchange (“NYSE”) (generally 4:00 p.m. Eastern time). If an event that could materially affect the value of the Fund’s foreign securities has occurred between the time the securities were last traded and the time that the Fund calculates its NAV, the closing price of the Fund’s securities may no longer reflect their market value at the time the Fund calculates its NAV. In such a case, the Fund may use fair value methods to value such securities.
Fixed income securities shall be valued at the evaluated bid price supplied by the Fund’s pricing agent based on broker-dealer supplied valuations and other criteria, or directly by independent brokers when the pricing agent does not provide a price or the Valuation Committee does not believe that the pricing agent price reflects the current market value. If a price of a position is sought using independent brokers, the Advisor shall seek to obtain an evaluation bid price from at least two independent brokers who are knowledgeable about the position. The price of the position would be deemed to be an average of such bid prices. In the absence of sufficient broker dealer quotes, securities shall be valued at fair value pursuant to procedures adopted by the Board.
Bank loans are not listed on any securities exchange or board of trade. They are typically bought and sold by institutional investors in individually negotiated private transactions that function in many respects like an over-the-counter secondary market. This market generally has fewer trades and less liquidity than the secondary market for other types of securities. Some bank loans have few or no trades, or trade infrequently, and information regarding a specific bank loan may not be widely available or may be incomplete. Except as otherwise specified, bank loan securities shall be valued at the evaluated bid prices supplied by the Fund’s pricing agent based on broker-dealer supplied valuations and other criteria, or directly by independent brokers when the pricing agent does not provide a price or the Valuation Committee does not believe that the pricing agent price reflects the current market value. If a price of a position is sought using independent brokers, the Advisor shall seek to obtain a bid price from at least two independent brokers who are knowledgeable about the position. The price of the position would be deemed to be an average of such bid prices. In the absence of sufficient broker dealer quotes, securities shall be valued at fair value pursuant to procedures adopted by the Board.
Occasionally, reliable market quotations are not readily available (such as for certain restricted or unlisted securities and private placements) or securities and other assets may not be reliably priced (such as in the case of trade suspensions or halts, price movement limits set by certain foreign markets, and thinly traded or illiquid securities), or there may be events affecting the value of foreign securities or other securities held by the Funds that occur when regular trading on foreign or other exchanges is closed, but before trading on the NYSE is closed. Fair value determinations are then made in good faith in accordance with procedures adopted by the Board. Under the procedures adopted by the Board, the Board has delegated the responsibility for making fair value determinations to a Valuation Committee, subject to the Board’s oversight. Generally, the fair value of a portfolio security or other asset shall be the amount that the owner of the security or asset might reasonably expect to receive upon its current sale. A three-tier hierarchy is utilized to maximize the use of observable market data and minimize the use of unobservable inputs and to establish classification of fair value measurements for disclosure purposes. Inputs may be observable or unobservable and refer broadly to the assumptions that market participants would use in pricing the asset or liability, including assumptions about risk. Observable inputs are inputs that reflect the assumptions market participants would use in pricing the asset or liability and are developed based
35
PENN CAPITAL FUNDS TRUST
NOTES TO THE FINANCIAL STATEMENTS
DECEMBER 31, 2018
on market data obtained from sources independent of the reporting entity. Unobservable inputs are inputs that reflect the reporting entity’s own assumptions about the assumptions market participants would use in pricing the asset or liability and are developed based on the best information available under the circumstances. The three-tier hierarchy of inputs is summarized in the three broad levels listed below.
Level 1 — unadjusted quoted prices in active markets for identical securities that the Funds have the ability to access
Level 2 — other significant observable inputs (including quoted prices for similar securities, interest rates, prepayment speeds, credit risk, etc.)
Level 3 — significant unobservable inputs (including a Fund’s own assumptions in determining the fair value of investments)
The availability of observable inputs can vary from security to security and is affected by a wide variety of factors, including, for example, the type of security, whether the security is new and not yet established in the marketplace, the liquidity of markets, and other characteristics particular to the security. To the extent that valuation is based on models or inputs that are less observable or unobservable in the market, the determination of fair value requires more judgment. Accordingly, the degree of judgment exercised in determining fair value is greatest for instruments categorized in Level 3.
The inputs used to measure fair value may fall into different levels of the fair value hierarchy. In such cases, for disclosure purposes, the level in the fair value hierarchy within which the fair value measurement falls in its entirety is determined based on the lowest level input that is significant to the fair value measurement in its entirety.
The following table summarizes the inputs used as of December 31, 2018 in valuing each Fund’s investments:
Description | Level 1 | Level 2 | Level 3 | Total | ||||||||
Penn Capital Managed Alpha SMID Cap Equity | ||||||||||||
Investments in Securities(a) | ||||||||||||
Common Stocks | $ | 10,664,300 | $ | — | $ | — | $ | 10,664,300 | ||||
Real Estate Investment Trusts (REITs) | 1,175,015 | — | — | 1,175,015 | ||||||||
Money Market Deposit Account | — | 319,509 | — | 319,509 | ||||||||
Total Investments in Securities | $ | 11,839,315 | $ | 319,509 | $ | — | $ | 12,158,824 | ||||
Penn Capital Special Situations Small Cap Equity Fund | Level 1 | Level 2 | Level 3 | Total | ||||||||
Investments in Securities(a) | ||||||||||||
Common Stocks | $ | 8,677,409 | $ | — | $ | — | $ | 8,677,409 | ||||
Contingent Value Right | — | 93 | — | 93 | ||||||||
Real Estate Investment Trust (REIT) | 321,236 | — | — | 321,236 | ||||||||
Money Market Deposit Account | — | 92,529 | — | 92,529 | ||||||||
Total Investments in Securities | $ | 8,998,645 | $ | 92,622 | $ | — | $ | 9,091,267 | ||||
Penn Capital Multi-Credit High Income Fund | Level 1 | Level 2 | Level 3 | Total | ||||||||
Investments in Securities(a) | ||||||||||||
Corporate Bonds | $ | — | $ | 7,648,350 | $ | — | $ | 7,648,350 | ||||
Convertible Bond | — | 34,052 | — | 34,052 | ||||||||
Bank Loans | — | 1,939,859 | — | 1,939,859 | ||||||||
Mutual Fund | 3,317,753 | — | — | 3,317,753 | ||||||||
Preferred Stock | — | — | 40 | 40 | ||||||||
U.S. Government Notes | — | 276,430 | — | 276,430 | ||||||||
Money Market Deposit Account | — | 456,968 | — | 456,968 | ||||||||
Total Investments in Securities | $ | 3,317,753 | $ | 10,355,659 | $ | 40 | $ | 13,673,452 | ||||
Penn Capital Defensive Floating Rate Income Fund | ||||||||||||
Investments in Securities(a) | Level 1 | Level 2 | Level 3 | Total | ||||||||
Bank Loans | $ | — | $ | 30,706,422 | $ | — | $ | 30,706,422 | ||||
Corporate Bonds | — | 3,651,236 | — | 3,651,236 | ||||||||
Money Market Deposit Account | — | 348,099 | — | 348,099 | ||||||||
Total Investments in Securities | $ | — | $ | 34,705,757 | $ | — | $ | 34,705,757 | ||||
36
PENN CAPITAL FUNDS TRUST
NOTES TO THE FINANCIAL STATEMENTS
DECEMBER 31, 2018
Penn Capital Defensive Short Duration High Income Fund | ||||||||||||
Investments in Securities(a) | Level 1 | Level 2 | Level 3 | Total | ||||||||
Corporate Bonds | $ | — | $ | 16,433,294 | $ | — | $ | 16,433,294 | ||||
Bank Loans | — | 2,024,627 | — | 2,024,627 | ||||||||
Mutual Fund | 1,362,724 | — | — | 1,362,724 | ||||||||
U.S. Government Notes | — | 876,820 | — | 876,820 | ||||||||
Money Market Deposit Account | — | 1,709,456 | — | 1,709,456 | ||||||||
Total Investments in Securities | $ | 1,362,724 | $ | 21,044,197 | $ | — | $ | 22,406,921 | ||||
| (a) | All other industry classifications are identified in the Schedule of Investments for each Fund. |
The following table summarizes quantitative information about significant unobservable valuation inputs for Level 3 fair value measurement as of December 31, 2018:
Type of Assets | Fair Value as of December 31, 2018 | Valuation Techniques | Unobservable Input | ||||||
Penn Capital Multi-Credit High Income Fund | |||||||||
Preferred Stock | |||||||||
Spanish Broadcasting Systems, Inc. | 40 | Broker Quote | Unpublished Independent broker quote | ||||||
The following table reconciles Level 3 investments based on the inputs used to determine fair value:
Balance as of July 1, 2018 | Purchases | Sales | Accretion of Discount | Net Realized Gain/Loss | Balance as of December 31, 2018 | Change in Unrealized Depreciation from Investments Held as of December 31, 2018 | |||||||||||||||
Penn Capital Multi-Credit High Income Fund | |||||||||||||||||||||
Common Stock | |||||||||||||||||||||
ACC Claims Holdings LLC | $ | 46 | $ | — | $ | — | $ | — | $ | — | $ | — | $ | (46 | ) | ||||||
Preferred Stock | |||||||||||||||||||||
Spanish Broadcasting Systems, Inc. | $ | 41 | — | — | — | — | $ | 40 | $ | (1 | ) | ||||||||||
As of December 31, 2018 the change in unrealized depreciation on positions still held for securities that were considered Level 3 was $(47).
B. Investment Transactions and Related Investment Income
Investment transactions are accounted for on a trade-date basis. Interest income is recorded on the accrual basis, including the amortization of premiums and accretion of discounts on bonds held using the yield-to-maturity method. Dividend income is recognized on ex-dividend date.
Realized gains and losses on investment transactions and unrealized appreciation and depreciation of investments are reported for financial statement and Federal income tax purposes on the identified cost method.
C. Expenses
The Trust’s expenses are allocated to the individual Fund in proportion to the net assets of the respective Fund when the expenses were incurred, except where direct allocations of expenses can be made.
37
PENN CAPITAL FUNDS TRUST
NOTES TO THE FINANCIAL STATEMENTS
DECEMBER 31, 2018
D. Use of Estimates
The preparation of the financial statements in conformity with GAAP requires management to make estimates and assumptions that affect the reported amounts of assets and liabilities and disclosure of contingent assets and liabilities at the date of the financial statements and the reported amounts of increases and decreases in net assets from operations during the reporting period. Actual results could differ from those estimates.
E. Dividends and Distributions
Dividends and distributions to Shareholders are recorded on the ex-date. The Penn Capital Multi-Credit High Income Fund, the Penn Capital Defensive Floating Rate Income Fund and the Penn Capital Defensive Short Duration High Income Fund declare and distribute their net investment income, if any, monthly and make distributions of their net realized capital gains, if any, at least annually, usually in December. The Penn Capital Managed Alpha SMID Cap Equity Fund and the Penn Capital Special Situations Small Cap Equity Fund declare and distribute their net investment income, if any, annually and make distributions of net realized capital gains, if any, at least annually.
The character of distributions made during the period from net investment income or net realized gains may differ from its ultimate characterization for federal income tax purposes. In addition, due to the timing of dividend distributions, the fiscal period in which the amounts are distributed may differ from the period that income or realized gains (losses) were recorded by each Fund.
F. Federal Income Taxes
Each Fund intends to qualify as a regulated investment company under Subchapter M of the Internal Revenue Code of 1986, as amended. If so qualified, the Funds will not be subject to federal income tax to the extent they distribute all of their net investment income and capital gains to shareholders. Therefore, no federal income tax provision is required.
The Funds evaluate tax positions taken or expected to be taken in the course of preparing their tax returns to determine whether it is more-likely-than-not (i.e., greater than 50%) that each tax position will be sustained upon examination by a taxing authority based on the technical merits of the position. Tax positions not deemed to meet the more-likely-than-not threshold are recorded as a tax benefit or expense in the current year. The Funds did not record any tax provision in the current period and have no provision for taxes in the financial statements. However, management’s conclusions regarding tax positions taken may be subject to review and adjustment at a later date based on factors including, but not limited to, examination by tax authorities (i.e., the last three open tax year ends, as applicable) and on-going analysis of and changes to tax laws, regulations and interpretations thereof.
G. Indemnifications
Under the Trust’s organizational documents, its officers and Trustees are indemnified against certain liabilities arising out of the performance of their duties to the Trust and each Fund. In addition, in the normal course of business, the Trust may enter into contracts that provide general indemnification to other parties. The Trust’s maximum exposure under these arrangements is unknown, as this would involve future claims that may be made against the Trust that have not yet occurred, and may not occur. However, the Trust has not had prior claims or losses pursuant to these contracts and considers the risk of loss to be remote.
3. Agreements and Related Party Transactions
Investment Advisory Agreement
The Trust has entered into an investment advisory agreement with the Advisor. Under the terms of the agreement, each Fund pays the Advisor a fee, payable at the end of each month, at an annual rate, set forth in the table below, of the respective Fund’s average daily net assets.
Penn Capital Managed Alpha SMID Cap Equity Fund | 0.90 | % | |
Penn Capital Special Situations Small Cap Equity Fund | 0.95 | % | |
Penn Capital Multi-Credit High Income Fund | 0.69 | % | |
Penn Capital Defensive Floating Rate Income Fund | 0.55 | % | |
Penn Capital Defensive Short Duration High Income Fund | 0.45 | % |
With respect to each Fund other than the Penn Capital Multi-Credit High Income Fund and the Penn Capital Defensive Short Duration High Income Fund, the Advisor has contractually agreed to waive its fees and/or pay Fund expenses so that the
38
PENN CAPITAL FUNDS TRUST
NOTES TO THE FINANCIAL STATEMENTS
DECEMBER 31, 2018
Funds’ total annual operating expenses (excluding any acquired fund fees and expenses, taxes, interest, brokerage fees, certain insurance costs, and extraordinary and other non-routine expenses) do not exceed the amounts shown below as a percentage of each Fund’s average daily net assets. With respect to the Penn Capital Multi-Credit High Income Fund and the Penn Capital Defensive Short Duration High Income Fund, the Advisor has contractually agreed to waive its fees and/or pay Fund expenses so that the Fund’s total annual operating expenses (including any acquired fund fees and expenses incurred by the Fund as a result of its investments in other investment companies managed by the Advisor, but excluding any acquired fund fees and expenses incurred by the Fund as a result of its investments in unaffiliated investment companies, taxes, interest, brokerage fees, certain insurance costs, and extraordinary and other non-routine expenses) do not exceed the amounts shown below as a percentage of each Fund’s average daily net assets. The expense limitation agreement will remain in place through October 31, 2019. Thereafter, the expense limitation agreement for the Funds will be reviewed annually by the Advisor and the Board.
Institutional Class | Investor Class | |||||
Penn Capital Managed Alpha SMID Cap Equity Fund | 1.06 | % | 1.31 | % | ||
Penn Capital Special Situations Small Cap Equity Fund | 1.09 | % | 1.34 | % | ||
Penn Capital Multi-Credit High Income Fund | 0.72 | % | 0.97 | % | ||
Penn Capital Defensive Floating Rate Income Fund | 0.64 | % | 0.89 | % | ||
Penn Capital Defensive Short Duration High Income Fund | 0.54 | % | N/A | |||
Any waived or reimbursed expenses by the Advisor to the Funds excluding any waivers related to acquired fund fees and expenses incurred by the Funds as a result of its investments in other investment companies managed by the Advisor, are subject to repayment by a Fund in the three years following the date the fees were waived or the expenses were paid, provided that the respective Fund is able to make the repayment without exceeding the Fund’s expense limitation in place when the fees were waived or expenses paid. The Advisor’s waived fees and paid expenses that are subject to potential recoupment are as follows:
Fiscal Period Incurred | Amount Waived/ Expenses Assumed | Amount Recouped | Amount Subject to Potential Recoupment | Year of Expiration | ||||||||
Penn Capital Managed Alpha SMID Cap Equity Fund | ||||||||||||
June 30, 2016 | $ | 146,572 | — | $ | 146,572 | 2019 | ||||||
June 30, 2017 | 162,111 | — | 162,111 | 2020 | ||||||||
June 30, 2018 | 175,125 | — | 175,125 | 2021 | ||||||||
June 30, 2019 | 83,585 | — | 83,585 | 2022 | ||||||||
Total | $ | 567,393 | $ | — | $ | 567,393 | ||||||
Penn Capital Special Situations Small Cap Equity Fund | �� | |||||||||||
June 30, 2016 | $ | 128,464 | — | $ | 128,464 | 2019 | ||||||
June 30, 2017 | 158,820 | — | 158,820 | 2020 | ||||||||
June 30, 2018 | 208,947 | — | 208,947 | 2021 | ||||||||
June 30, 2019 | 96,813 | — | 96,813 | 2022 | ||||||||
Total | $ | 593,044 | $ | — | $ | 593,044 | ||||||
Penn Capital Multi-Credit High Income Fund | ||||||||||||
June 30, 2016 | $ | 171,803 | — | $ | 171,803 | 2019 | ||||||
June 30, 2017 | 218,116 | — | 218,116 | 2020 | ||||||||
June 30, 2018 | 226,073 | — | 226,073 | 2021 | ||||||||
June 30, 2019 | 106,475 | — | 106,475 | 2022 | ||||||||
Total | $ | 722,467 | $ | — | $ | 722,467 | ||||||
Penn Capital Defensive Floating Rate Income Fund | ||||||||||||
June 30, 2016 | $ | 205,304 | — | $ | 205,304 | 2019 | ||||||
June 30, 2017 | 261,441 | — | 261,441 | 2020 | ||||||||
June 30, 2018 | 281,780 | — | 281,780 | 2021 | ||||||||
June 30, 2019 | 116,241 | — | 116,241 | 2022 | ||||||||
Total | $ | 864,766 | $ | — | $ | 864,766 | ||||||
Penn Capital Defensive Short Duration High Income Fund | ||||||||||||
June 30, 2018 | $ | 164,748 | — | $ | 164,748 | 2021 | ||||||
June 30, 2019 | 82,845 | — | 82,845 | 2022 | ||||||||
Total | $ | 247,593 | $ | — | $ | 247,593 | ||||||
Certain Officers and Trustees of the Funds are also Officers of the Advisor.
39
PENN CAPITAL FUNDS TRUST
NOTES TO THE FINANCIAL STATEMENTS
DECEMBER 31, 2018
As of December 31, 2018, greater than 5% of the following PENN Capital Funds was held by other PENN Capital Funds as follows:
Affiliated Fund Held | % Owned | Significant Owner | ||
Penn Capital Defensive Floating Rate Income Fund | 9 | % | Penn Capital Multi-Credit High Income Fund | |
The Trust has engaged Foreside Fund Officers Services, LLC to provide compliance services including the appointment of the Trust’s Chief Compliance Officer and Anti-Money Laundering Officer.
Distribution Agreement
Foreside Fund Services, LLC is the Trust’s distributor and principal underwriter (the Distributor). The Trust has adopted a plan of distribution under Rule 12b-1 of the 1940 Act applicable to the Investor Class. Under the plan, 12b-1 distribution fees at an annual rate of 0.25% of average daily net assets of Investor Class shares are paid to the Distributor or others for distribution and shareholder services. For the period ended December 31, 2018, there were no distribution fees paid under the plan because the Investor Class shares had not yet been issued as of December 31, 2018.
The Trust has engaged U.S. Bank Global Fund Services to serve as the Fund’s administrator, fund accountant, and transfer agent. The Trust has engaged U.S. Bank, N.A. to serve as the Fund’s custodian.
Shareholder Servicing Plan
The Trust has adopted a Shareholder Servicing Plan on behalf of each Fund’s Investor Class and Institutional Class. Under the plan, each Class can pay for non-distribution related shareholder support services (“service fees”) in an amount up to 0.15% of its average daily net assets. For the period ended December 31, 2018, there were no service fees incurred by the Investor Class shares because the Investor Class shares had not yet been issued as of December 31, 2018. The amount actually incurred by the Institutional Class shares for the period ended December 31, 2018 on an annualized basis was 0.01% for the Penn Capital Managed Alpha SMID Cap Equity Fund, 0.06% for the Penn Capital Special Situations Small Cap Equity Fund, 0.01% for the Penn Capital Multi-Credit High Income Fund, 0.01% for the Penn Capital Defensive Floating Rate Income Fund, and less than 0.01% for the Penn Capital Defensive Short Duration High Income Fund.
Other Related Party Transactions
The Advisor, and the officers of the Trust, have made investments in the Funds and accordingly pay the Funds’ investment advisory fees and other expenses identified in each Fund’s Prospectus.
4. Federal Tax Information
It is each Fund’s intention to continue to qualify as a regulated investment company under Subchapter M of the Internal Revenue Code and distribute all of its taxable income. Accordingly, no provision for federal income taxes is required in the financial statements.
The amount and character of income and capital gain distributions to be paid, if any, are determined in accordance with federal income tax regulations, which may differ from GAAP. These differences are primarily due to differences in the timing of recognition of gains or losses on investments. Permanent book and tax basis differences, if any, may result in reclassifications to undistributed net investment income (loss), undistributed net realized gain (loss) and additional paid-in capital.
A regulated investment company may elect for any taxable year to treat any portion of the qualified late year loss as arising on the first day of the next taxable year. Qualified late year losses are certain capital and ordinary losses which occur during the portion of the taxable year subsequent to October 31 and December 31, respectively.
40
PENN CAPITAL FUNDS TRUST
NOTES TO THE FINANCIAL STATEMENTS
DECEMBER 31, 2018
The character of distributions for tax purposes paid during the six month period ended December 31, 2018 is as follows:
Ordinary Income Distributions | Long-Term Capital Gain Distributions | |||||
Penn Capital Managed Alpha SMID Cap Equity Fund | $ | 385,893 | $ | 889,102 | ||
Penn Capital Special Situations Small Cap Equity Fund | 272,540 | 921,959 | ||||
Penn Capital Multi-Credit High Income Fund | 483,108 | 14,036 | ||||
Penn Capital Defensive Floating Rate Income Fund | 960,914 | — | ||||
Penn Capital Defensive Short Duration High Income Fund | 340,784 | — | ||||
The character of distributions for tax purposes paid during the fiscal year ended June 30, 2018 is as follows:
Ordinary Income Distributions | Long-Term Capital Gain Distributions | |||||
Penn Capital Managed Alpha SMID Cap Equity Fund | $ | 103,969 | $ | 113,429 | ||
Penn Capital Special Situations Small Cap Equity Fund | 1,149,801 | 1,090,182 | ||||
Penn Capital Multi-Credit High Income Fund | 831,287 | 23,726 | ||||
Penn Capital Defensive Floating Rate Income Fund | 1,345,610 | 7,504 | ||||
Penn Capital Defensive Short Duration High Income Fund | 211,320 | — | ||||
5. Investment Transactions
The cost of security purchases and the proceeds from security sales, other than short-term investments, for the period ended December 31, 2018, were as follows:
Non-U.S. Government | U.S. Government | |||||||||||
Purchases | Sales | Purchases | Sales | |||||||||
Penn Capital Managed Alpha SMID Cap Equity Fund | $ | 3,818,563 | $ | 4,653,447 | $ | — | $ | — | ||||
Penn Capital Special Situations Small Cap Equity Fund | 9,545,309 | 17,897,123 | — | — | ||||||||
Penn Capital Multi-Credit High Income Fund | 5,592,332 | 5,406,293 | 275,156 | — | ||||||||
Penn Capital Defensive Floating Rate Income Fund | 14,807,919 | 9,751,254 | 375,703 | 375,762 | ||||||||
Penn Capital Defensive Short Duration High Income Fund | 11,688,703 | 3,610,053 | 430,280 | — | ||||||||
6. Capital Share Transactions
Penn Capital Managed Alpha SMID Cap Equity Fund July 1, 2018 - December 31, 2018 | Penn Capital Special Situations Small Cap Fund July 1, 2018 - December 31, 2018 | Penn Capital Multi-Credit High Income Fund July 1, 2018 - December 31, 2018 | Penn Capital Defensive Floating Rate Income Fund July 1, 2018 - December 31, 2018 | Penn Capital Defensive Short Duration High Income Fund July 1, 2018 - December 31, 2018 | |||||||||||
Institutional Class Shares | |||||||||||||||
Share sold | 2,789 | 66,087 | 79,057 | 787,588 | 1,042,820 | ||||||||||
Shares sold to holders in reinvestment of dividends | 109,219 | 116,513 | 49,668 | 79,748 | 34,560 | ||||||||||
Shares redeemed | (73,241 | ) | (871,898 | ) | (73,271 | ) | (347,713 | ) | (41,018 | ) | |||||
Net increase (decrease) | 38,767 | (689,298 | ) | 55,454 | 519,623 | 1,036,362 | |||||||||
Institutional Amount | |||||||||||||||
Shares sold | $ | 36,952 | $ | 825,366 | $ | 782,757 | $ | 7,946,167 | $ | 10,239,740 | |||||
Shares sold to holders in reinvestment of dividends | 1,251,646 | 1,167,457 | 491,817 | 799,195 | 338,883 | ||||||||||
Shares redeemed | (959,663 | ) | (9,288,178 | ) | (737,943 | ) | (3,426,506 | ) | (398,450 | ) | |||||
Net increase (decrease) | $ | 328,935 | $ | (7,295,355 | ) | $ | 536,631 | $ | 5,318,856 | $ | 10,180,173 | ||||
41
PENN CAPITAL FUNDS TRUST
NOTES TO THE FINANCIAL STATEMENTS
DECEMBER 31, 2018
Penn Capital Managed Alpha SMID Cap Equity Fund Year Ended June 30, 2018 | Penn Capital Special Situations Small Cap Equity Fund Year Ended June 30, 2018 | Penn Capital Multi-Credit High Income Fund Year Ended June 30, 2018 | Penn Capital Defensive Floating Rate Income Fund Year Ended June 30, 2018 | Penn Capital Defensive Short Duration High Income Fund Period Ended June 30, 2018 | |||||||||||
Institutional Class Shares | |||||||||||||||
Shares sold | 175,264 | 531,370 | 489,121 | 692,903 | 1,267,496 | ||||||||||
Shares sold to holders in reinvestment of dividends | 16,642 | 189,922 | 80,338 | 132,711 | 21,354 | ||||||||||
Shares redeemed | (31,443 | ) | (898,039 | ) | (29,546 | ) | (130,898 | ) | (26,332 | ) | |||||
Net increase (decrease) | 160,463 | (176,747 | ) | 539,913 | 694,716 | 1,262,518 | |||||||||
Institutional Amount | |||||||||||||||
Shares sold | $ | 2,179,641 | $ | 6,262,562 | $ | 4,996,417 | $ | 7,039,836 | $ | 12,597,665 | |||||
Shares sold to holders in reinvestment of dividends | 217,014 | 2,233,477 | 824,258 | 1,346,434 | 211,090 | ||||||||||
Shares redeemed | (400,183 | ) | (10,850,646 | ) | (307,821 | ) | (1,330,752 | ) | (259,448 | ) | |||||
Net increase (decrease) | $ | 1,996,472 | $ | (2,354,607 | ) | $ | 5,512,854 | $ | 7,055,518 | $ | 12,549,307 | ||||
7. Transactions with Affiliates
The following issuers are affiliated with the Funds; that is, the Adviser had control of 5% or more of the outstanding voting securities during the period from July 1, 2018 through December 31, 2018. As defined in Section (2)(a)(3) of the Investment Company Act of 1940; such issues are:
July 1, 2018 | Additions | Reductions | December 31, 2018 | Dividend | Unrealized | Realized | December 31, 2018 | ||||||||||||||||||||||||||||||||
Issuer Name | Share Balance | Cost | Share Balance | Cost | Share Balance | Cost | Share Balance | Income | Capital Gain Distribution | Depreciation Change | Loss | Value | Cost | ||||||||||||||||||||||||||
Penn Capital Multi-Credit High Income Fund | |||||||||||||||||||||||||||||||||||||||
Penn Capital Defensive Floating Rate Income Fund | 248,153 | $ | 2,520,274 | 94,236 | $ | 953,861 | — | $ | — | 342,389 | $ | 78,860 | $ | — | $ | (139,969 | ) | $ | — | $ | 3,317,753 | $ | 3,474,135 | ||||||||||||||||
$ | 2,520,274 | $ | 953,861 | $ | — | $ | 78,860 | $ | — | $ | (139,969 | ) | $ | — | $ | 3,317,753 | $ | 3,474,135 | |||||||||||||||||||||
Penn Capital Defensive Short Duration High Income Fund | |||||||||||||||||||||||||||||||||||||||
Penn Capital Defensive Floating Rate Income Fund | 183,599 | $ | 1,865,035 | 68,430 | $ | 689,727 | (111,397 | ) | $ | (1,134,534 | ) | 140,632 | $ | 49,727 | $ | — | $ | (44,987 | ) | $ | (9,534 | ) | $ | 1,362,724 | $ | 1,420,228 | |||||||||||||
$ | 1,865,035 | $ | 689,727 | $ | (1,134,534 | ) | $ | 49,727 | $ | — | $ | (44,987 | ) | $ | (9,534 | ) | $ | 1,362,724 | $ | 1,420,228 | |||||||||||||||||||
8. Credit Risk and Asset Concentration
Small- and mid-capitalization companies may not have the size, resources and other assets of large capitalization companies. As a result, the securities of small- and mid-capitalization companies may be subject to greater market risks and fluctuations in value than large capitalization companies or may not correspond to changes in the stock market in general. In addition, small- and mid-capitalization companies may be particularly affected by interest rate increases, as they may find it more difficult to borrow money to continue or expand operations, or may have difficulty in repaying any loans.
High yield securities and unrated securities of similar credit quality have speculative characteristics and involve greater volatility of price and yield, greater of liquidity risk, and generally reflect a greater possibility of an adverse change in financial condition that could affect an issuer’s ability to honor its obligations.
42
PENN CAPITAL FUNDS TRUST
NOTES TO THE FINANCIAL STATEMENTS
DECEMBER 31, 2018
There are a number of risks associated with an investment in bank loans, including credit risk, interest rate risk, liquidity risk and prepayment risk. Lack of an active trading market, restrictions on resale, irregular trading activity, wide bid/ask spreads and extended trade settlement periods may impair the Fund’s ability to sell bank loans within its desired time frame or at an acceptable price and its ability to accurately value existing and prospective investments. Extended trade settlement periods may result in cash not being immediately available to the Fund. As a result of such illiquidity, the Fund may have to sell other investments or engage in borrowing transactions to raise cash to meet its obligations.
9. Line of Credit
PENN Capital Funds Trust has a $10,000,000 uncommitted, unsecured, umbrella 364-day line of credit, for temporary purposes, including to meet redemption requests. The interest rate as of December 31, 2018 was 5.00%. During the period ended December 31, 2018, Penn Capital Special Situations Small Cap Equity Fund’s maximum borrowing was $175,000 and average borrowing was $2,740. This borrowing resulted in interest expenses of $133. The Penn Capital Managed Alpha SMID Cap Equity Fund, Penn Capital Multi-Credit High Income Fund, Penn Capital Defensive Floating Rate Income Fund and Penn Capital Defensive Short Duration High Income Fund did not use the credit line.
10. Recent Accounting Pronouncement
In August 2018, FASB issued ASU 2018-13, Fair Value Measurement (Topic 820):Disclosure Framework—Changes to the Disclosure Requirements for Fair Value Measurement (“ASU 2018-13”). The primary focus of ASU 2018-13 is to improve the effectiveness of the disclosure requirements for fair value measurements. The changes affect all companies that are required to include fair value measurement disclosures. In general, the amendments in ASU 2018-13 are effective for all entities for fiscal years and interim periods within those fiscal years, beginning after December 15, 2019. An entity is permitted to early adopt the removed or modified disclosures upon the issuance of ASU 2018-13 and may delay adoption of the additional disclosures, which are required for public companies only, until their effective date. Management is currently evaluating the impact these changes will have on the Fund’s financial statements and disclosures.
11. Subsequent Events
Except as disclosed above, as of the date the financial statements were available to be issued, Management has determined that no additional material events or transactions occurred that would require recognition or disclosure in the Funds’ financial statements.
12. Concentration Risks
The Advisor and its employees collectively have beneficial ownership, either directly or indirectly, of more than 25% of each of the Funds as of December 31, 2018. Additionally, there is an investor that owns more than 10% of the Penn Capital Defensive Floating Rate Fund, Penn Capital Multi-Credit High Income Fund and Penn Capital Short Duration High Income Fund as of December 31, 2018. Also, to the extent multiple investors in the Funds rely on the advice of a common investment advisor the funds may have a concentration risk.
43
PENN CAPITAL FUNDS TRUST
ADDITIONAL INFORMATION
DECEMBER 31, 2018 (UNAUDITED)
Trustee and Officer Compensation
The Trust does not compensate any of its Trustees who are interested persons nor any of its officers. For the period ended December 31, 2018, the aggregate compensation paid by the Trust to the independent Trustees was $17,500. The Trust did not pay any special compensation to any of its Trustees or officers. The Statement of Additional Information includes additional information about the Trustees and is available without charge, upon request, by calling 844-302-7366.
Proxy Voting Policies
A description of the policies and procedures that each Fund uses to determine how to vote proxies relating to portfolio securities owned by that Fund is available: (1) without charge, upon request, by calling 844-302-7366; (2) in the Statement of Additional Information on the Trust’s website www.penncapitalfunds.com; and (3) on the SEC’s website at www.sec.gov. Information about how the Funds voted proxies relating to portfolio securities during the most recent twelve-month period ended June 30 may be obtained (1) without charge, upon request, by calling 844-302-7366 and (2) on the SEC’s website at www.sec.gov.
Form N-Q
Each Fund files its complete schedule of portfolio holdings for the first and third quarters of each fiscal year with the SEC on Form N-Q. Each Fund’s Forms N-Q are available without charge by visiting the SEC’s website at www.sec.gov. In addition, you may review and copy each Fund’s Forms N-Q at the SEC’s Public Reference Room in Washington D.C. You may obtain information on the operation of the Public Reference Room by calling (800) SEC-0330.
Householding
In an effort to decrease costs, the Funds intend to reduce the number of duplicate prospectuses, annual and semi-annual reports, proxy statements and other similar documents you receive by sending only one copy of each to those addresses shared by two or more accounts and to shareholders that the transfer agent reasonably believes are from the same family or household. Once implemented, if you would like to discontinue householding for your accounts, please call (844) 302-7366 to request individual copies of these documents. The transfer agent will begin sending individual copies thirty days after receiving your request to stop householding. This policy does not apply to account statements.
44
Board Approval of Investment Advisory Agreements
At the September 6, 2018 meeting (collectively, the “Meeting”) of the Board of Trustees (the “Board” or “Trustees”) of the PENN Capital Funds Trust (the “Trust”), the Board, including those Trustees who are not “interested persons” (as that term is defined in the Investment Company Act of 1940, as amended (the “1940 Act”)) of the Trust (the “Independent Trustees”), approved the renewal of the investment advisory agreement (the “Investment Advisory Agreement”) between Penn Capital Management Company, Inc. (the “Adviser”) and the Trust, on behalf of the Penn Capital Managed Alpha SMID Cap Equity Fund, Penn Capital Special Situations Small Cap Equity Fund, Penn Capital Multi Credit High Income Fund, Penn Capital Defensive Floating Rate Income Fund and Penn Capital Defensive Short Duration High Income Fund series of the Trust (each a “Fund” and collectively, the “Funds”).
In connection with considering the approval of the Investment Advisory Agreement, the Independent Trustees met in executive session. The Board, including the Independent Trustees, evaluated the terms of the Investment Advisory Agreement, reviewed the information provided by the Adviser in connection with the consideration of approving the continuation of the Investment Advisory Agreement, and reviewed the duties and responsibilities of the Trustees in evaluating and approving the continuation of the agreement.
In considering approval of the continuation of the Investment Advisory Agreement, the Board, including the Independent Trustees, reviewed the Meeting Materials and other information from counsel and from Penn Capital, including: (i) a copy of the Investment Advisory Agreement; (ii) information describing the nature, quality and extent of the services that Penn Capital provides and expects to provide to the Funds; (iii) information concerning Penn Capital’s financial condition, business, operations, portfolio management teams and compliance program; (iv) information describing each Fund’s advisory fee and operating expenses; (v) a copy of the current Form ADV for Penn Capital; and (vi) a memorandum from counsel on the responsibilities of trustees in considering investment advisory arrangements under the Investment Company Act of 1940, as amended. The Board also considered presentations made by, and discussions held with, representatives of Penn Capital, as well as information presented at Board meetings throughout the year. The Board also received information comparing the advisory fee, expenses and performance of each Fund to other investment companies considered to be in the Funds’ peer group.
During its review of this information, the Board focused on and analyzed the factors that the Board deemed relevant, including: (i) the nature, quality and extent of the services provided and expected to be provided to each Fund by Penn Capital; (ii) Penn Capital’s personnel and operations; (iii) each Fund’s expense level; (iv) the profitability to Penn Capital under the Investment Advisory Agreement; (v) any “fall-out” benefits to Penn Capital and its affiliates (i.e., the ancillary benefits realized by Penn Capital and its affiliates from Penn Capital’s relationship with the Trust); (vi) the effect of asset growth on each Fund’s expenses; (vii) possible conflicts of interest; and (viii) the investment performance of the Funds.
The Board, including the Independent Trustees, considered the following in respect of each Fund:
(a) The nature, extent and quality of services provided and expected to be provided by Penn Capital to the Funds; Penn Capital’s personnel and operations. The Board reviewed the services that Penn Capital provides and expected to provide to each Fund. The Board noted the responsibilities that Penn Capital has as the Funds’ investment adviser, including: the responsibility for the management and investment of each Fund’s securities portfolio; executing portfolio security trades; monitoring compliance with each Fund’s investment objective, policies and limitations; the responsibility for quarterly reporting to the Board; the oversight of general portfolio compliance with relevant law; and the implementation of Board directives as they relate to each Fund.
The Board reviewed Penn Capital’s experience, resources and strengths in managing the Funds, as well as other pooled investment vehicles, and Penn Capital’s personnel. Based on its consideration and review of the foregoing information, the Board determined that each Fund was likely to continue to benefit from the nature, quality and extent of these services, as well as Penn Capital’s ability to render such services based on their experience, personnel, operations, and resources.
(b) Comparison of services provided and fees paid to those under other investment advisory contracts. The Board compared both the services provided and the fees paid pursuant to the Investment Advisory Agreement to those under other contracts of Penn Capital, and under contracts of other investment advisers with respect to similar funds. In particular, the Board compared each Fund’s advisory fee and expense ratio to other investment companies considered to be in that Fund’s peer group. The Board noted that Penn Capital entered into an Expense Limitation Agreement whereby Penn Capital waives advisory fees and/or assumes expenses to keep the Funds’ expenses from exceeding certain levels. The Board also noted that Penn Capital has agreed to waive advisory fees and/or assume expenses with respect to the Penn Capital Multi-Credit High Income Fund and Penn Capital Defensive Short Duration High Income Fund to the extent of any acquired fund fees and expenses incurred by the Funds as a result of its investment in other investment companies managed by Penn Capital. The Board received and considered information about the fee rates charged to other accounts and clients that are managed by Penn Capital, including information about the differences in services provided to the non-registered investment company clients.
45
Consideration was given to the advisory fees and expense ratios of the Institutional Class Shares of the Funds, the only share class with assets to date. With respect to the Penn Capital Defensive Floating Rate Income Fund, the Board considered that the Fund’s advisory fee was below both the median and average of its peer group, and the Fund’s total expenses (including the fee waiver) were below the median and average of its peer group. With respect to the Penn Capital Defensive Short Duration High Income Fund, the Board considered that the Fund’s advisory fee was below both the median and average of its peer group, and the Fund’s total expenses (including the fee waiver) were below the median and average of its peer group. With respect to the Penn Capital Multi-Credit High Income Fund, the Board considered that the Fund’s advisory fee was above the median and below the average of its peer group, but the Fund’s total expenses (including the fee waiver) were below the median and average of its peer group. With respect to the Penn Capital Managed Alpha SMID Cap Equity Fund and Penn Capital Special Situations Small Cap Equity Fund, the Board considered that each Fund’s advisory fee was above both the median and average of its respective expense peer group, while each Fund’s total expenses (including the fee waiver) was above the median but below the average of its respective expense peer group. To the extent that a Fund’s advisory fee was above the median and average of its respective peer group, Penn Capital explained and the Board considered the reasons for the higher advisory fees.
After comparing each Fund’s fees with those of other funds in the Fund’s peer group, and considering the information about fee rates Penn Capital charged to other accounts and clients, and in light of the nature, quality and extent of services provided by Penn Capital and the costs Penn Capital incurred by providing those services, the Board concluded that the level of fees paid to Penn Capital with respect to the Funds was fair and reasonable.
(c) The cost of the services provided and profits realized by Penn Capital from the relationship with the Funds; the extent to which economies of scale were realized as the Funds grew, and whether fee levels reflect such economies of scale; “fall-out” benefits; possible conflicts of interest.
The Board discussed the costs, including operational costs, and Penn Capital’s profitability in connection with its serving as each Fund’s investment adviser. The Board considered that the Funds were still not yet of a sufficient size to be experiencing economies of scale. The Board concluded that the profitability of Penn Capital, and the extent to which economies of scale were reflected in the Funds’ advisory fees, were reasonable for the Funds in relation to the performance and asset sizes of the Funds.
The Board considered that Penn Capital may experience reputational “fall-out” benefits based on the success of the Funds, but that such benefits are not easily quantifiable. The Board noted that since the Trust’s service providers are not affiliated with Penn Capital, such services do not give rise to “fall-out” benefits for Penn Capital. The Board also noted Penn Capital’s procedures to manage potential conflicts of interest and Penn Capital’s belief that its management of the series of the Trust does not present a material conflict of interest.
(d) Investment performance of the Funds. The Board considered the investment performance of the Funds. In particular, the Board considered the investment performance of the Funds relative to their stated investment objectives and strategies and the success of Penn Capital in reaching such objectives. The Board considered each Fund’s investment performance compared to the benchmark index that each Fund uses for comparison in its Prospectus and shareholder reports. The Board also considered each Fund’s investment performance compared to the Fund’s respective peer group.
Consideration was given to the performance of the Institutional Class Shares of the Funds, the only share class with performance to date. The Board examined the Funds’ performance figures in comparison to their respective benchmarks and concluded that the performance of the Funds was reasonable in light of the respective investment objectives and policies of the Funds.
Conclusion. No single factor was determinative to the Board’s decision. Based on the foregoing and such other matters as were deemed relevant, such as the Expense Limitation Agreement, the Board concluded that the advisory fee rates and total expense ratios were reasonable in relation to the services provided, and to be provided, by Penn Capital to each Fund, as well as the costs incurred and benefits gained by Penn Capital in providing such services. The Board also found the advisory fees to be reasonable in comparison to the fees charged by advisers to other comparable funds of similar size. As a result, the Board concluded that the approval of the continuation of the Investment Advisory Agreement was in the best interests of each Fund.
In considering approval of the continuation of the Investment Advisory Agreement, the Board, including the Independent Trustees, reviewed the Meeting Materials and other information from counsel and from Penn Capital, including: (i) a copy of the Investment Advisory Agreement; (ii) information describing the nature, quality and extent of the services that Penn Capital provides and expects to provide to the Funds; (iii) information concerning Penn Capital’s financial condition, business, operations, portfolio management teams and compliance program; (iv) information describing each Fund’s advisory fee and operating expenses; (v) a copy of the current Form ADV for Penn Capital; and (vi) a memorandum from counsel on the responsibilities of trustees in considering investment advisory arrangements under the Investment Company Act of 1940, as amended. The Board also considered
46
presentations made by, and discussions held with, representatives of Penn Capital, as well as information presented at Board meetings throughout the year. The Board also received information comparing the advisory fee, expenses and performance of each Fund to other investment companies considered to be in the Funds’ peer group.
During its review of this information, the Board focused on and analyzed the factors that the Board deemed relevant, including: (i) the nature, quality and extent of the services provided and expected to be provided to each Fund by Penn Capital; (ii) Penn Capital’s personnel and operations; (iii) each Fund’s expense level; (iv) the profitability to Penn Capital under the Investment Advisory Agreement; (v) any “fall-out” benefits to Penn Capital and its affiliates (i.e., the ancillary benefits realized by Penn Capital and its affiliates from Penn Capital’s relationship with the Trust); (vi) the effect of asset growth on each Fund’s expenses; (vii) possible conflicts of interest; and (viii) the investment performance of the Funds.
The Board, including the Independent Trustees, considered the following in respect of each Fund:
(a) The nature, extent and quality of services provided and expected to be provided by Penn Capital to the Funds; Penn Capital’s personnel and operations. The Board reviewed the services that Penn Capital provides and expected to provide to each Fund. The Board noted the responsibilities that Penn Capital has as the Funds’ investment adviser, including: the responsibility for the management and investment of each Fund’s securities portfolio; executing portfolio security trades; monitoring compliance with each Fund’s investment objective, policies and limitations; the responsibility for quarterly reporting to the Board; the oversight of general portfolio compliance with relevant law; and the implementation of Board directives as they relate to each Fund.
The Board reviewed Penn Capital’s experience, resources and strengths in managing the Funds, as well as the other series of the Trust and other pooled investment vehicles, and Penn Capital’s personnel. Based on its consideration and review of the foregoing information, the Board determined that each Fund was likely to continue to benefit from the nature, quality and extent of these services, as well as Penn Capital’s ability to render such services based on their experience, personnel, operations, and resources.
(b) Comparison of services provided and fees paid to those under other investment advisory contracts. The Board compared both the services provided and the fees paid pursuant to the Investment Advisory Agreement to those under other contracts of Penn Capital, and under contracts of other investment advisers with respect to similar funds. In particular, the Board compared each Fund’s advisory fee and expense ratio to other investment companies considered to be in that Fund’s peer group. The Board noted that Penn Capital entered into an Expense Limitation Agreement whereby Penn Capital waives advisory fees and/or assumes expenses to keep the Funds’ expenses from exceeding certain levels. The Board also noted that Penn Capital has agreed to waive advisory fees and/or assume expenses with respect to the Penn Capital Multi-Credit High Income Fund and Penn Capital Defensive Short Duration High Income Fund to the extent of any acquired fund fees and expenses incurred by the Funds as a result of its investment in other investment companies managed by Penn Capital. The Board received and considered information about the fee rates charged to other accounts and clients that are managed by Penn Capital, including information about the differences in services provided to the non-registered investment company clients.
Consideration was given to the advisory fees and expense ratios of the Institutional Class Shares of the Funds, the only share class with assets to date. With respect to the Penn Capital Defensive Floating Rate Income Fund, the Board considered that the Fund’s advisory fee was below both the median and average of its peer group, and the Fund’s total expenses (including the fee waiver) were below the median and average of its peer group. With respect to the Penn Capital Defensive Short Duration High Income Fund, the Board considered that the Fund’s advisory fee was below both the median and average of its peer group, and the Fund’s total expenses (including the fee waiver) were below the median and average of its peer group. With respect to the Penn Capital Multi-Credit High Income Fund, the Board considered that the Fund’s advisory fee was above the median and below the average of its peer group, but the Fund’s total expenses (including the fee waiver) were below the median and average of its peer group. With respect to the Penn Capital Managed Alpha SMID Cap Equity Fund and Penn Capital Special Situations Small Cap Equity Fund, the Board considered that each Fund’s advisory fee was above both the median and average of its respective expense peer group, while each Fund’s total expenses (including the fee waiver) was above the median but below the average of its respective expense peer group. To the extent that a Fund’s advisory fee was above the median and average of its respective peer group, Penn Capital explained and the Board considered the reasons for the higher advisory fees.
After comparing each Fund’s fees with those of other funds in the Fund’s peer group, and considering the information about fee rates Penn Capital charged to other accounts and clients, and in light of the nature, quality and extent of services provided by Penn Capital and the costs Penn Capital incurred by providing those services, the Board concluded that the level of fees paid to Penn Capital with respect to the Funds was fair and reasonable.
47
(c) The cost of the services provided and profits realized by Penn Capital from the relationship with the Funds; the extent to which economies of scale were realized as the Funds grew, and whether fee levels reflect such economies of scale; “fall-out” benefits; possible conflicts of interest.
The Board discussed the costs, including operational costs, and Penn Capital’s profitability in connection with its serving as each Fund’s investment adviser. The Board considered that the Funds were still not yet of a sufficient size to be experiencing economies of scale. The Board concluded that the profitability of Penn Capital, and the extent to which economies of scale were reflected in the Funds’ advisory fees, were reasonable for the Funds in relation to the performance and asset sizes of the Funds.
The Board considered that Penn Capital may experience reputational “fall-out” benefits based on the success of the Funds, but that such benefits are not easily quantifiable. The Board noted that since the Trust’s service providers are not affiliated with Penn Capital, such services do not give rise to “fall-out” benefits for Penn Capital. The Board also noted Penn Capital’s procedures to manage potential conflicts of interest and Penn Capital’s belief that its management of the series of the Trust does not present a material conflict of interest.
(d) Investment performance of the Funds. The Board considered the investment performance of the Funds. In particular, the Board considered the investment performance of the Funds relative to their stated investment objectives and strategies and the success of Penn Capital in reaching such objectives. The Board considered each Fund’s investment performance compared to the benchmark index that each Fund uses for comparison in its Prospectus and shareholder reports. The Board also considered each Fund’s investment performance compared to the Fund’s respective peer group.
Consideration was given to the performance of the Institutional Class Shares of the Funds, the only share class with performance to date. The Board examined the Funds’ performance figures in comparison to their respective benchmarks and concluded that the performance of the Funds was reasonable in light of the respective investment objectives and policies of the Funds.
Conclusion. No single factor was determinative to the Board’s decision. Based on the foregoing and such other matters as were deemed relevant, such as the Expense Limitation Agreement, the Board concluded that the advisory fee rates and total expense ratios were reasonable in relation to the services provided, and to be provided, by Penn Capital to each Fund, as well as the costs incurred and benefits gained by Penn Capital in providing such services. The Board also found the advisory fees to be reasonable in comparison to the fees charged by advisers to other comparable funds of similar size. As a result, the Board concluded that the approval of the continuation of the Investment Advisory Agreement was in the best interests of each Fund.
48
Board of Trustees
Dennis S. Hudson, III
John R. Schwab
Richard A. Hocker
Investment Advisor
Penn Capital Management Company, Inc.
Navy Yard Corporate Center
1200 Intrepid Avenue, Suite 400
Philadelphia, Pennsylvania 19112
Legal Counsel
Stradley Ronon Stevens & Young, LLP
2005 Market Street, Suite 2600
Philadelphia, Pennsylvania 19103
Custodian
U.S. Bank, N.A.
1555 N. Rivercenter Drive, Suite 302
Milwaukee, WI 53212
Distributor
Foreside Fund Services, LLC
Three Canal Plaza
Portland, ME 04101
Administrator, Transfer Agent
and Dividend Disbursing Agent
U.S. Bancorp Fund Services, LLC
doing business as U.S. Bank Global Fund Services
615 East Michigan Street
Milwaukee, WI 53202
Shareholder/Investor Information
1.844.302.PENN (7366)
www.penncapitalfunds.com
BEFORE INVESTING YOU SHOULD CAREFULLY CONSIDER THE FUND’S INVESTMENT OBJECTIVES, RISKS, CHARGES AND EXPENSES. THIS AND OTHER RELEVANT INFORMATION CAN BE FOUND IN THE PROSPECTUS AND STATEMENT OF ADDITIONAL INFORMATION, COPIES OF WHICH MAY BE OBTAINED BY CALLING (844) 302-PENN (7366) OR BY VISITING WWW.PENNCAPITALFUNDS.COM. PLEASE READ THE PROSPECTUS CAREFULLY BEFORE YOU INVEST.
Item 2. Code of Ethics.
Not applicable for semi-annual reports.
Item 3. Audit Committee Financial Expert.
Not applicable for semi-annual reports.
Item 4. Principal Accountant Fees and Services.
Not applicable for semi-annual reports.
Item 5. Audit Committee of Listed Registrants.
Not applicable to registrants who are not listed issuers (as defined in Rule 10A-3 under the Securities Exchange Act of 1934).
Item 6. Investments.
| (a) | Schedule of Investments is included as part of the report to shareholders filed under Item 1 of this Form. |
| (b) | Not applicable. |
Item 7. Disclosure of Proxy Voting Policies and Procedures for Closed-End Management Investment Companies.
Not applicable to open-end investment companies.
Item 8. Portfolio Managers of Closed-End Management Investment Companies.
Not applicable to open-end investment companies.
Item 9. Purchases of Equity Securities by Closed-End Management Investment Company and Affiliated Purchasers.
Not applicable to open-end investment companies.
Item 10. Submission of Matters to a Vote of Security Holders.
There have been no material changes to the procedures by which shareholders may recommend nominees to the registrant’s board of trustees.
Item 11. Controls and Procedures.
| (a) | The Registrant’s President and Treasurer have reviewed the Registrant's disclosure controls and procedures (as defined in Rule 30a-3(c) under the Investment Company Act of 1940 (the “Act”)) as of a date within 90 days of the filing of this report, as required by Rule 30a-3(b) under the Act and Rules 13a-15(b) or 15d-15(b) under the Securities Exchange Act of 1934. Based on their review, such officers have concluded that the disclosure controls and procedures are effective in ensuring that information required to be disclosed in this report is appropriately recorded, processed, summarized and reported and made known to them by others within the Registrant and by the Registrant’s service provider. |
| (b) | There were no changes in the Registrant's internal control over financial reporting (as defined in Rule 30a-3(d) under the Act) that occurred during the second fiscal quarter of the period covered by this report that has materially affected, or is reasonably likely to materially affect, the Registrant's internal control over financial reporting. |
Item 12. Disclosure of Securities Lending Activities for Closed-End Management Investment Companies
Not applicable to open-end investment companies.
Item 13. Exhibits.
| (a) | (1) Any code of ethics or amendment thereto, that is the subject of the disclosure required by Item 2, to the extent that the registrant intends to satisfy Item 2 requirements through filing an exhibit. Not applicable for semi-annual reports. |
| (2) A separate certification for each principal executive officer and principal financial officer pursuant to Section 302 of the Sarbanes-Oxley Act of 2002. Filed herewith. |
| (3) Any written solicitation to purchase securities under Rule 23c-1 under the Act sent or given during the period covered by the report by or on behalf of the registrant to 10 or more persons. Not applicable to open-end investment companies. |
| (b) | Certifications pursuant to Section 906 of the Sarbanes-Oxley Act of 2002. Furnished herewith. |
SIGNATURES
Pursuant to the requirements of the Securities Exchange Act of 1934 and the Investment Company Act of 1940, the registrant has duly caused this report to be signed on its behalf by the undersigned, thereunto duly authorized.
(Registrant) | PENN Capital Funds Trust |
By (Signature and Title) | /s/ Richard A. Hocker, President |
Richard A. Hocker, President | |
Date | 2/20/2019 |
Pursuant to the requirements of the Securities Exchange Act of 1934 and the Investment Company Act of 1940, this report has been signed below by the following persons on behalf of the registrant and in the capacities and on the dates indicated.
By (Signature and Title) | /s/ Richard A. Hocker, President |
Richard A. Hocker, President | |
Date | 2/20/2019 |
By (Signature and Title) | /s/ Gerald McBride, Treasurer |
Gerald McBride, Treasurer | |
Date | 2/20/2019 |