Exhibit 99.1

FOR IMMEDIATE RELEASE
Contact:
Marilynn Meek
Financial Relations Board
212-827-3773
NEXPOINT RESIDENTIAL TRUST, INC. REPORTS THIRD QUARTER 2018 RESULTS
NXRT Boosts Quarterly Dividend, Same Store NOI and Core FFO Guidance;
Acquires $131 million of Properties in Nashville and Dallas
Dallas, TX, October 30, 2018 – NexPoint Residential Trust, Inc. (NYSE:NXRT) reported financial results for the third quarter ended September 30, 2018.
Highlights
| • | NXRT1 reported Net Loss, FFO2, Core FFO2 and AFFO2 of $(5.2)M, $5.9M, $8.9M and $10.3M, respectively, attributable to common stockholders for the quarter ended September 30, 2018, compared to Net Income, FFO, Core FFO, and AFFO of $53.9M, $6.8M, $7.5M and $8.7M, respectively, attributable to common stockholders for the quarter ended September 30, 2017. |
| • | For the three months ended September 30, 2018, Q3 Same Store properties3 average effective rent, total revenue and NOI2 increased 4.1%, 4.7% and 8.3%, respectively, and occupancy decreased 0.2% over the prior year period. |
| • | For the three months ended September 30, 2018, Q3 Same Store properties expenses increased 0.7% over the prior year period, primarily due to increases in property taxes of 3.9%, partially offset by decreases in property operating expenses of 1.9%. |
| • | During the third quarter, NXRT acquired two properties in Nashville (Cedar Pointe and Brandywine I & II) and one in Dallas (Crestmont Reserve) for a combined purchase price of approximately $131.0M. |
| • | During the third quarter, NXRT refinanced six mortgage loans, reducing the borrowing rates on each of the loans. These refinances, along with the refinanced mortgage loan in Q2, reduced spreads by a weighted average 54 basis points. |
| • | On September 26, 2018, NXRT repaid the $30.0 million outstanding under the $30 Million Credit Facility and amended the loan agreement, extending the maturity date to September 26, 2020 and increasing the loan commitment to $60.0 million (the “$60 Million Credit Facility”). NXRT immediately drew $50.0 million to fund a portion of the purchase price of Brandywine I & II and Crestmont Reserve. |
| • | On September 26, 2018, NXRT entered into a $30.0 million bridge facility (the “$30 Million Bridge Facility”) with KeyBank and immediately drew $30.0 million to fund a portion of the purchase price of Brandywine I & II and Crestmont Reserve. |
| • | The weighted average effective monthly rent per unit across all 35 properties held as of September 30, 2018 (the “Portfolio”), consisting of 12,555 units, was $979, while physical occupancy was 93.8%. |
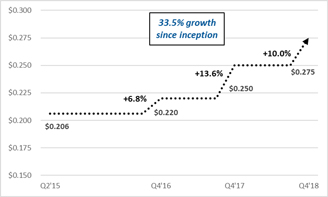
| • | NXRT paid a third quarter dividend of $0.25 per share of common stock on September 28, 2018. |
| • | On October 29, 2018, our board of directors increased our quarterly dividend 10.0%, or by $0.025 per share, declaring a quarterly dividend of $0.275 per share, payable on December 31, 2018 to stockholders of record on December 17, 2018. The increase in our quarterly dividend to $0.275 per share is the third time we’ve increased our quarterly dividend, and results in a cumulative 33.5% increase in the dividend since becoming a public company on April 1, 2015. |
| www.NexPointLiving.com | Page 1 | AN AFFILIATE OF |  |
NEXPOINT RESIDENTIAL TRUST, INC. [NYSE:NXRT]
| • | During the third quarter, for the properties in our Portfolio, we completed 439 full and partial upgrades and leased 330 upgraded units, achieving $110 average monthly rent premiums and a 25.4% ROI4. Since inception, for the properties in our Portfolio, we have completed 5,345 full and partial upgrades and achieved a $95 average monthly rental increase per unit, equating to a 22.6% ROI on all units leased as of September 30, 2018. |
| (1) | In this release, “we,” “us,” “our,” the “Company,” “NexPoint Residential Trust,” and “NXRT” each refer to NexPoint Residential Trust, Inc., a Maryland corporation. |
| (2) | FFO, Core FFO, AFFO and NOI arenon-GAAP measures. For a discussion of why we consider thesenon-GAAP measures useful and reconciliations of FFO, Core FFO, AFFO and NOI to net income (loss), see the “Definitions and Reconciliations ofNon-GAAP Measures” and “FFO, Core FFO and AFFO” sections of this release. |
| (3) | We define “Same Store” properties as properties that were in our portfolio for the entirety of the periods being compared. There are 31 properties encompassing 11,091 units of apartment space in our Same Store pool for the three months ended September 30, 2018 (our “Q3 Same Store” properties). |
| (4) | We define Return on Investment (“ROI”) as the sum of the actual rent premium divided by the sum of the total cost. |
“We continued to experience robust demand for our well-locatedvalue-add communities in the third quarter, evidenced by 8.3% same store NOI growth. We are also pleased with the Board’s approval of another double-digit increase to NXRT’s quarterly dividend, buoyed by $131 million of accretive acquisitions in our core markets of Nashville and Dallas,” stated NXRT Chairman and President, Jim Dondero.
Third Quarter 2018 Financial Results
| • | Total revenues were $36.5 million for the third quarter of 2018, compared to $37.1 million for the third quarter of 2017. |
| • | Net loss for the third quarter of 2018 totaled $(5.3) million, or a loss of $(0.25) per diluted share, which included $11.2 million of depreciation and amortization expense and $2.9 million of loss on extinguishment of debt and modification costs. This compared to net income of $54.1 million, or earnings of $2.51 per diluted share, for the third quarter of 2017, which included $58.5 million of gain on sales of real estate, $11.2 million of depreciation and amortization expense and $0.9 million of loss on extinguishment and debt modification costs. |
| • | The change in our net income (loss) between the periods primarily relates to decreases in total revenues and gain on sales of real estate and an increase is loss on extinguishment of debt and modification costs, and was partially offset by decreases in total property operating expenses and interest expense. |
| • | For the third quarter of 2018, NOI was $20.0 million on 35 properties, compared to $19.5 million for the third quarter of 2017 on 32 properties. |
| • | For the third quarter of 2018, Q3 Same Store NOI increased 8.3% to $19.0 million, compared to $17.6 million for the third quarter of 2017. |
| • | For the third quarter of 2018, FFO totaled $5.9 million, or $0.28 per diluted share, compared to $6.8 million, or $0.32 per diluted share, for the third quarter of 2017. |
| • | For the third quarter of 2018, Core FFO totaled $8.9 million, or $0.42 per diluted share, compared to $7.5 million, or $0.35 per diluted share, for the third quarter of 2017. |
| • | For the third quarter of 2018, AFFO totaled $10.3 million, or $0.48 per diluted share, compared to $8.7 million, or $0.40 per diluted share, for the third quarter of 2017. |
Third Quarter Earnings Conference Call
NXRT will host a call on Tuesday, October 30, 2018 at 11:00 a.m. ET to discuss its third quarter financial results. The conference call can be accessed live over the phone by dialing (800)667-5617 or, for international callers, (334)323-0505, and entering passcode 8481837. A live audio webcast of the call will be available online at the Company’s website, http://www.nexpointliving.com (under “Investor Relations”). An online replay will be available shortly after the call on the Company’s website and continue to be available for 60 days.
A replay of the conference call will also be available through Tuesday, November 6, 2018, by dialing (888)203-1112 or, for international callers, (719)457-0820 and entering passcode 8481837.
| www.NexPointLiving.com | Page 2 | AN AFFILIATE OF | |
NEXPOINT RESIDENTIAL TRUST, INC. [NYSE:NXRT]
About NXRT
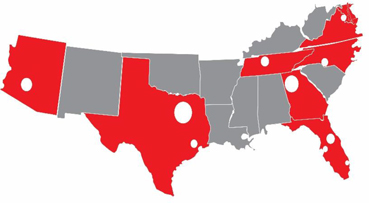
NexPoint Residential Trust is a publicly traded REIT, with its shares listed on the New York Stock Exchange under the symbol “NXRT,” primarily focused on acquiring, owning and operating well-located middle-income multifamily properties with“value-add” potential in large cities and suburban submarkets of large cities, primarily in the Southeastern and Southwestern United States. NXRT is externally advised by NexPoint Real Estate Advisors, L.P., an affiliate of Highland Capital Management, L.P., a leading global alternative asset manager and anSEC-registered investment adviser. Our filings with the Securities and Exchange Commission (the “SEC”) are available on our website, www.nexpointliving.com, under the “Investor Relations” tab.
Cautionary Statement Regarding Forward-Looking Statements
This release contains forward-looking statements within the meaning of the Private Securities Litigation Reform Act of 1995 that are based on management’s current expectations, assumptions and beliefs. Forward-looking statements can often be identified by words such as “expect,” “anticipate,” “estimate,” “may,” “should,” “intend” and similar expressions, and variations or negatives of these words. These forward-looking statements include, but are not limited to, statements regarding NXRT’s business and industry in general, NXRT’s guidance for financial results for the fourth quarter of 2018 and for the full year 2018, expected acquisitions and dispositions and the expected redevelopment of units. They are not guarantees of future results and are subject to risks, uncertainties and assumptions that could cause actual results to differ materially from those expressed in any forward-looking statement. Readers should not place undue reliance on any forward-looking statements and are encouraged to review the Company’s most recent Annual Report on Form10-K and other filings with the SEC for a more complete discussion of the risks and other factors that could affect any forward-looking statements. The statements made herein speak only as of the date of this release and except as required by law, NXRT does not undertake any obligation to publicly update or revise any forward-looking statements.
| www.NexPointLiving.com | Page 3 | AN AFFILIATE OF | |
NEXPOINT RESIDENTIAL TRUST, INC. [NYSE:NXRT]
NEXPOINT RESIDENTIAL TRUST, INC: THIRD QUARTER 2018 OVERVIEW
Company Profile
| (share counts in thousands) | ||||
Exchange/Ticker | NYSE: NXRT | |||
Share Price (1) | $35.03 | |||
Inside Ownership | 22.17% | |||
2018 Q4 Dividend Per Share | $0.275 | |||
Dividend Yield (1) | 3.14% | |||
Shares Outstanding - basic (Wtd Avg. 3 mo. ended 9/30/2018) | 20,775 | |||
Shares Outstanding - diluted (Wtd Avg. 3 mo. ended 9/30/2018) | 21,262 | |||
| (1) | As of the close of market trading on October 29, 2018. |
Portfolio Composition by Market
Market | % of Units | |||
Dallas/Fort Worth | 27.8 | % | ||
Atlanta | 17.8 | % | ||
Nashville | 15.0 | % | ||
Phoenix | 9.5 | % | ||
Houston | 9.4 | % | ||
Orlando | 6.6 | % | ||
Charlotte | 4.6 | % | ||
Tampa | 4.6 | % | ||
West Palm Beach | 3.5 | % | ||
D.C. Metro | 1.2 | % | ||
|
| |||
Total | 100.0 | % | ||
Revenue & Average Rent Per Unit

Stock Price Performance (Since Inception; 4/1/2015)(1)

| www.NexPointLiving.com | Page 4 | AN AFFILIATE OF | |
NEXPOINT RESIDENTIAL TRUST, INC. [NYSE:NXRT]
Highlights of Recent Activity
ACQUISITIONS
(dollar amounts in thousands)
| ||||||||||||||||
Property Name | Location | Date of Acquisition | Purchase Price | Mortgage Debt | # Units | |||||||||||
Cedar Pointe | Antioch, Tennessee | August 24, 2018 | $ | 26,500 | $ | 17,300 | 210 | |||||||||
Crestmont Reserve | Dallas, Texas | September 26, 2018 | 24,680 | 12,061 | 242 | |||||||||||
Brandywine I & II | Nashville, Tennessee | September 26, 2018 | 79,800 | 43,835 | 632 | |||||||||||
|
|
|
|
|
| |||||||||||
| $ | 130,980 | $ | 73,196 | 1,084 | ||||||||||||
|
|
|
|
|
| |||||||||||
REFINANCINGS
(dollar amounts in thousands)
| ||||||||||||||||
Property Name | Occurred | Former Outstanding Principal | New Outstanding Principal | Reduction in Spread (in bps) (1) | ||||||||||||
Belmont at Duck Creek | Q2 | $ | 10,853 | $ | 17,760 | 103 | (2) | |||||||||
Sabal Palm at Lake Buena Vista | Q3 | 37,166 | 42,100 | 51 | ||||||||||||
Abbington Heights | Q3 | 9,868 | 16,920 | 28 | (2) | |||||||||||
Beechwood Terrace | Q3 | 20,150 | 23,365 | 24 | ||||||||||||
Timber Creek | Q3 | 19,137 | 24,100 | 56 | ||||||||||||
Radbourne Lake | Q3 | 18,881 | 20,000 | 52 | ||||||||||||
Hollister Place | Q3 | 13,475 | 14,811 | 90 | ||||||||||||
|
|
|
|
|
| |||||||||||
| $ | 129,530 | $ | 159,056 | 54 | (3) | |||||||||||
|
|
|
|
|
| |||||||||||
| (1) | For previous floating rate mortgages, represents the reduction in the borrowing spread from the previous mortgage to the current mortgage. For previous fixed-rate mortgages, represents the reduction in the borrowing rate from the previous mortgage to the current mortgage (usingone-month LIBOR as of September 30, 2018). |
| (2) | Previous mortgage was a fixed-rate loan. |
| (3) | Represents the weighted average reduction in the borrowing spreads |
DIVIDEND INCREASE: Q4 2018
$0.275/SHARE
GREEN IMPROVEMENTS
32% AVERAGE MONTHLY SAVINGS
(WATER UTILITY COST)
| • | Replacement of showerheads, plumbing fixtures and toilets with modern energy efficient upgrades |
| • | As of September 30, 2018, NXRT has completed 16 of the planned 26 green improvement projects |
| • | Savings analysis has been completed on 14 properties with results shown below: |
Metric | Amount | |
# of Units | 5,164 | |
Annual Gallons Saved | ~163,000,000 | |
Annual Cost Savings | ~$1,000,000 | |
Monthly Savings per unit | $16 | |
Average Monthly Cost Savings | 32% |
| www.NexPointLiving.com | Page 5 | AN AFFILIATE OF | |
NEXPOINT RESIDENTIAL TRUST, INC. [NYSE:NXRT]
Financial Summary
| Q3 2018 | Q3 2017 | YTD 2018 | YTD 2017 | |||||||||||||
| (in thousands, except for per share and unit data) | ||||||||||||||||
Company Profile | ||||||||||||||||
Market Capitalization | $ | 690,000 | $ | 501,000 | ||||||||||||
Share Price (as of the last day of the period) | $ | 33.20 | $ | 23.73 | ||||||||||||
Weighted average common shares outstanding - basic | 20,775 | 21,085 | 20,847 | 21,057 | ||||||||||||
Weighted average common shares outstanding - diluted | 21,262 | 21,453 | 21,328 | 21,407 | ||||||||||||
Earnings Profile | ||||||||||||||||
Total revenues | $ | 36,495 | $ | 37,097 | $ | 107,207 | $ | 109,322 | ||||||||
Net income (loss) attributable to common stockholders | (5,245 | ) | 53,914 | 3,158 | 57,704 | |||||||||||
NOI (1) | 19,959 | 19,512 | 58,924 | 57,317 | ||||||||||||
Same Store NOI (2) | 19,013 | 17,553 | 50,771 | 46,581 | ||||||||||||
Same Store NOI Growth (%) (2) | 8.3 | % | 9.0 | % | ||||||||||||
Earnings Metrics Per Common Share (diluted basis) (3) | ||||||||||||||||
Earnings (loss) | $ | (0.25 | ) | $ | 2.51 | $ | 0.15 | $ | 2.70 | |||||||
FFO (1) | $ | 0.28 | $ | 0.32 | $ | 1.08 | $ | 0.77 | ||||||||
Core FFO (1) | $ | 0.42 | $ | 0.35 | $ | 1.21 | $ | 1.01 | ||||||||
AFFO (1) | $ | 0.48 | $ | 0.40 | $ | 1.41 | $ | 1.18 | ||||||||
Dividends declared per common share | $ | 0.25 | $ | 0.22 | $ | 0.75 | $ | 0.66 | ||||||||
FFO Coverage | 1.12x | 1.44x | 1.44x | 1.17x | ||||||||||||
Core FFO Coverage | 1.67x | 1.58x | 1.62x | 1.53x | ||||||||||||
AFFO Coverage | 1.93x | 1.84x | 1.88x | 1.79x | ||||||||||||
Portfolio | ||||||||||||||||
Total Properties | 35 | 32 | ||||||||||||||
Total Units | 12,555 | 11,395 | ||||||||||||||
Occupancy | 93.8 | % | 94.0 | % | ||||||||||||
Average Effective Monthly Rent per Unit | $ | 979 | $ | 932 | ||||||||||||
Same Store Portfolio Metrics (2) | ||||||||||||||||
Total Same Store Properties | 31 | 31 | 29 | 29 | ||||||||||||
Total Same Store Units | 11,091 | 11,091 | 10,123 | 10,123 | ||||||||||||
Occupancy | 93.8 | % | 94.0 | % | 93.8 | % | 94.2 | % | ||||||||
Average Effective Monthly Rent per Unit | $ | 972 | $ | 934 | $ | 958 | $ | 918 | ||||||||
Value-Add Program | ||||||||||||||||
Completed Rehab Units | 439 | 422 | 1,116 | 1,253 | ||||||||||||
Cumulative Completed Rehab Units (4) | 5,345 | |||||||||||||||
Average Increase to Effective Monthly Rent per Unit (Post-Rehab) | $ | 95 | ||||||||||||||
ROI on Post-Rehab Units | 22.6 | % | ||||||||||||||
Outstanding Debt Summary | ||||||||||||||||
Total Mortgage Debt | $ | 845,945 | $ | 733,300 | ||||||||||||
Credit Facility | 50,000 | 30,000 | ||||||||||||||
Bridge Facility | 30,000 | 54,597 | ||||||||||||||
|
|
|
| |||||||||||||
Total Debt Outstanding | $ | 925,945 | $ | 817,897 | ||||||||||||
|
|
|
| |||||||||||||
Leverage Ratio (Net Debt to Enterprise Value) (5) | 57 | % | 59 | % | ||||||||||||
| (1) | For more information and reconciliations of NOI, FFO, Core FFO and AFFO, see the “FFO, Core FFO and AFFO” and “Definitions and Reconciliations ofNon-GAAP Measures” sections of this release. |
| (2) | We define “Same Store” properties as properties that were in our portfolio for the periods being compared. For additional information regarding our Q3 and YTD Same Store properties, see the “Q3 Same Store Results” and “YTD Same Store Results” sections of this release. |
| (3) | Indicates coverage ratio of FFO/Core FFO/AFFO per common share (diluted) over dividends declared per common share during the period. |
| (4) | Inclusive of all full and partial interior upgrades completed through September 30, 2018. Cumulative results exclude rehabs completed for properties sold through September 30, 2018. |
| (5) | For more information and a reconciliation of debt to net debt, see the “Definitions and Reconciliations ofNon-GAAP Measures” section of this release. |
| www.NexPointLiving.com | Page 6 | AN AFFILIATE OF | |
NEXPOINT RESIDENTIAL TRUST, INC. [NYSE:NXRT]
2018 Full Year Guidance Summary
NXRT has revised full year 2018 guidance ranges for Earnings (loss) per diluted share, Same Store Total Expenses, and Same Store NOI; raised themid-point and tightened its 2018 guidance range for Core FFO per diluted share and reaffirmed 2018 guidance ranges for Same Store Rental Income and Same Store Total Revenue as follows:
| Guidance Range (1) | ||||||||||||||||
| Low-End | Mid-Point | High-End | Prior Mid-Point | |||||||||||||
Earnings (loss) per diluted share (2) (3) | $ | (0.08 | ) | $ | (0.05 | ) | $ | (0.02 | ) | $ | 0.10 | |||||
Core FFO per diluted share (3) (4) (5) | $ | 1.64 | $ | 1.67 | $ | 1.70 | $ | 1.66 | ||||||||
Same Store Growth: (6) | ||||||||||||||||
Rental Income | 4.8 | % | 5.3 | % | 5.8 | % | ||||||||||
Total Revenue | 5.0 | % | 5.5 | % | 6.0 | % | ||||||||||
Total Expenses (7) | 1.0 | % | 1.5 | % | 2.0 | % | 2.5 | % | ||||||||
Same Store NOI (5) (8) | 7.0 | % | 7.8 | % | 8.5 | % | 7.0 | % | ||||||||
| (1) | Full Year 2018 guidance forecast includes Same Store growth projections presented above, the effect of the Timberglen sale and the acquisitions of Cedar Pointe, Crestmont Reserve and Brandywine I & II, and no further acquisition or disposition activity for the remainder of the year. |
| (2) | 2018 Full Year Guidance for earnings (loss) per diluted share revised due to the impact of recent refinancing activity. |
| (3) | Weighted average diluted share count estimate for FY 2018 is approximately 21.3 million. For the three months ended March 31, June 30 and September 30, 2018, earnings (loss) per diluted share was $0.47, $(0.08) and $(0.25), respectively. For the three months ended December 31, 2018, loss per diluted share is estimated to be $(0.17) at thelow-end and $(0.23) at thehigh-end. |
| (4) | NXRT increased themid-point and tightened Full Year 2018 Core FFO Guidance due to the factors listed in footnotes 2 and 8. |
| (5) | Same Store NOI and Core FFO arenon-GAAP measures. For reconciliations of Same Store NOI and Core FFO guidance to net income (loss) guidance, and a discussion of why we consider thesenon-GAAP measures useful, see the “Definitions and Reconciliations ofNon-GAAP Measures” section of this release. |
| (6) | Year-over-year growth for 2018 pro forma Same Store pool (29 properties). |
| (7) | 2018 Full Year Guidance for Same Store Total Expenses growth revised lower due to tax settlements, utility reductions and other favorable expense controls. |
| (8) | 2018 Full Year Guidance for Same Store NOI increased as a result of better than expected operating performance. |
Additional information on third quarter 2018 results and 2018 financial and earnings guidance is included in the following sections of this release.
| www.NexPointLiving.com | Page 7 | AN AFFILIATE OF | |
NEXPOINT RESIDENTIAL TRUST, INC. [NYSE:NXRT]
Components of Net Asset Value
(dollar and share amounts in thousands, except per share and per unit data)
REAL ESTATE VALUE BY MARKET
| Property | NOI | Cap Rate Range (1) | Value Range (2) | |||||||||||||||||
Market | Contribution | Min | Max | Min | Max | |||||||||||||||
Texas | ||||||||||||||||||||
Dallas/Fort Worth | 26.2 | % | 5.3 | % | 5.8 | % | $ | 392,623 | $ | 447,958 | ||||||||||
Houston | 9.4 | % | 5.5 | % | 5.9 | % | 139,107 | 154,133 | ||||||||||||
North Carolina |
| |||||||||||||||||||
Charlotte | 4.7 | % | 5.2 | % | 5.7 | % | 70,968 | 81,038 | ||||||||||||
Georgia | ||||||||||||||||||||
Atlanta | 17.8 | % | 5.2 | % | 5.7 | % | 269,099 | 307,282 | ||||||||||||
Tennessee | ||||||||||||||||||||
Nashville | 15.2 | % | 5.5 | % | 5.9 | % | 223,512 | 247,656 | ||||||||||||
Florida | ||||||||||||||||||||
Orlando | 8.2 | % | 5.5 | % | 5.8 | % | 123,573 | 134,580 | ||||||||||||
Tampa | 4.0 | % | 5.5 | % | 5.8 | % | 59,603 | 64,912 | ||||||||||||
West Palm Beach | 3.8 | % | 5.5 | % | 5.9 | % | 56,100 | 62,160 | ||||||||||||
Washington D.C. |
| |||||||||||||||||||
Other | 1.5 | % | 5.8 | % | 5.9 | % | 22,624 | 23,978 | ||||||||||||
Arizona | ||||||||||||||||||||
Phoenix | 9.2 | % | 5.2 | % | 5.7 | % | 139,740 | 159,568 | ||||||||||||
|
|
|
|
|
|
|
|
|
| |||||||||||
Total / Ave | 100.0 | % | 5.3 | % | 5.8 | % | $ | 1,496,949 | $ | 1,683,265 | ||||||||||
|
|
|
|
|
|
|
|
|
| |||||||||||
NAV SUMMARY
Component | Min | Max | ||||||
Tangible Assets | ||||||||
Real Estate | $ | 1,496,949 | $ | 1,683,265 | ||||
Cash | 19,324 | |||||||
Restricted Cash - Renovation & Green Reserves (4) | 5,488 | |||||||
Renovation & Green Capital Expenditures (4) | (5,488) | |||||||
Cash Adjustments (5) | (31,000) | |||||||
Fair Market Value of Interest Rate Swaps | 27,974 | |||||||
Other Assets | 28,439 | |||||||
|
| |||||||
Value of Assets | $ | 1,541,686 | $ | 1,728,002 | ||||
|
|
|
| |||||
Tangible Liabilities | ||||||||
Credit and Bridge Facilities (5) | $80,000 | |||||||
Mortgage Debt | 845,945 | |||||||
|
| |||||||
Total Outstanding Debt | 925,945 | |||||||
Forward12-month Principal Payments (5) | (31,000) | |||||||
|
| |||||||
Total Outstanding Debt (FY 2018 Est.) | 894,945 | |||||||
Other Tangible Liabilities (at Book) | 25,233 | |||||||
|
| |||||||
Value of Liabilities | $920,178 | |||||||
|
| |||||||
Net Leverage(mid-point) | 56% | |||||||
|
| |||||||
Net Asset Value | $ | 621,508 | $ | 807,824 | ||||
|
|
|
| |||||
Shares outstanding - diluted (FY 2018 Est.) | 21,310 | |||||||
|
| |||||||
Est. NAV / Share | $ | 29.17 | $ | 37.91 | ||||
|
|
|
| |||||
NAV / Share(mid-point) | $33.54 | |||||||
NOI ESTIMATE
1Q 2018 NOI Actual | $ 19,127 | |||||||
2Q 2018 NOI Actual | 19,838 | |||||||
3Q 2018 NOI Actual | 19,959 | |||||||
| Low | High | |||||||
Estimated 4Q 2018 NOI Guidance (3) | 19,776 | 20,576 | ||||||
Estimated 4Q 2018 NOI - Acquisitions (3) | 1,793 | 1,893 | ||||||
|
|
|
| |||||
Revised 4Q 2018 NOI Guidance, annualized (3) | $ | 86,276 | $ | 89,876 | ||||
|
|
|
| |||||
IMPLIED VALUATION METRICS
| Min | Max | |||||||
Implied Real Estate Value | $ | 1,496,949 | $ | 1,683,265 | ||||
|
|
|
| |||||
No of Units (December 31, 2018 E.) (2) | 12,555 | |||||||
|
|
|
| |||||
Implied Value/Apartment Unit | $ | 119.2 | $ | 134.1 | ||||
|
|
|
| |||||
Implied Value/Apartment Unit(mid-point) | $126.7 | |||||||
| (1) | Management estimates based on independent third party review of our properties. |
| (2) | Estimated value ranges, based on revised fourth quarter NOI guidance annualized, are presented for the existing portfolio (35 properties at September 30, 2018). |
| (3) | We anticipate net loss will be between $0.4 million and $1.6 million for the full year of 2018 and between $3.6 million and $4.8 million for the fourth quarter of 2018. Fourth quarter net operating income for the new acquisitions are forecast using Management’s year one estimates; the new acquisitions NOI contributions are then added to the Company’s original estimated 4Q 2018 guidance for the 32 properties. |
| (4) | Includes approximately $2.5 million that is held forvalue-add upgrades and approximately $3.0 million that is escrowed to finance green property improvements; reduced by $5.5 million for estimated forward12-month rehab and green capital expenditures. |
| (5) | Includes approximately $31.0 million in forward12-month principal payments. The $30 Million Bridge Facility matures on March 26, 2019. |
| www.NexPointLiving.com | Page 8 | AN AFFILIATE OF | |
NEXPOINT RESIDENTIAL TRUST, INC. [NYSE:NXRT]
NEXPOINT RESIDENTIAL TRUST, INC. AND SUBSIDIARIES
CONSOLIDATED BALANCE SHEETS
(in thousands, except share and per share amounts)
| September 30, 2018 | December 31, 2017 | |||||||
| (Unaudited) | ||||||||
| ASSETS | ||||||||
Operating Real Estate Investments | ||||||||
Land | $ | 202,347 | $ | 189,615 | ||||
Buildings and improvements | 929,275 | 806,981 | ||||||
Intangible lease assets | 3,049 | 1,340 | ||||||
Construction in progress | 5,048 | 3,786 | ||||||
Furniture, fixtures, and equipment | 57,655 | 44,725 | ||||||
|
|
|
| |||||
Total Gross Operating Real Estate Investments | 1,197,374 | 1,046,447 | ||||||
Accumulated depreciation and amortization | (120,292 | ) | (88,252 | ) | ||||
|
|
|
| |||||
Total Net Operating Real Estate Investments | 1,077,082 | 958,195 | ||||||
Real estate held for sale, net of accumulated depreciation of $897 and $3,397, respectively | 17,406 | 32,961 | ||||||
|
|
|
| |||||
Total Net Real Estate Investments | 1,094,488 | 991,156 | ||||||
Cash and cash equivalents | 19,324 | 16,036 | ||||||
Restricted cash | 26,253 | 27,212 | ||||||
Accounts receivable | 5,014 | 2,932 | ||||||
Prepaid and other assets | 2,660 | 1,559 | ||||||
Fair market value of interest rate swaps | 27,974 | 16,480 | ||||||
|
|
|
| |||||
TOTAL ASSETS | $ | 1,175,713 | $ | 1,055,375 | ||||
|
|
|
| |||||
| LIABILITIES AND STOCKHOLDERS’ EQUITY | ||||||||
Liabilities: | ||||||||
Mortgages payable, net | $ | 824,546 | $ | 724,057 | ||||
Mortgages payable held for sale, net | 13,368 | 30,348 | ||||||
Credit facility, net | 49,100 | 29,843 | ||||||
Bridge facility, net | 29,550 | 8,576 | ||||||
Accounts payable and other accrued liabilities | 6,181 | 6,226 | ||||||
Accrued real estate taxes payable | 13,492 | 9,684 | ||||||
Accrued interest payable | 2,284 | 2,074 | ||||||
Security deposit liability | 1,917 | 1,518 | ||||||
Prepaid rents | 1,359 | 1,470 | ||||||
|
|
|
| |||||
Total Liabilities | 941,797 | 813,796 | ||||||
Redeemable noncontrolling interests in the Operating Partnership | 2,431 | 2,135 | ||||||
Stockholders’ Equity: | ||||||||
Preferred stock, $0.01 par value: 100,000,000 shares authorized; 0 shares issued | — | — | ||||||
Common stock, $0.01 par value: 500,000,000 shares authorized; 20,797,135 and 21,049,565 shares issued and outstanding, respectively | 207 | 210 | ||||||
Additionalpaid-in capital | 199,661 | 206,227 | ||||||
Accumulated earnings less dividends | 4,798 | 17,885 | ||||||
Accumulated other comprehensive income | 26,819 | 15,122 | ||||||
|
|
|
| |||||
Total Stockholders’ Equity | 231,485 | 239,444 | ||||||
|
|
|
| |||||
TOTAL LIABILITIES AND STOCKHOLDERS’ EQUITY | $ | 1,175,713 | $ | 1,055,375 | ||||
|
|
|
| |||||
| www.NexPointLiving.com | Page 9 | AN AFFILIATE OF | |
NEXPOINT RESIDENTIAL TRUST, INC. [NYSE:NXRT]
NEXPOINT RESIDENTIAL TRUST, INC. AND SUBSIDIARIES
CONSOLIDATED STATEMENTS OF OPERATIONS
AND COMPREHENSIVE INCOME (LOSS)
(in thousands, except per share amounts)
(Unaudited)
| For the Three Months Ended September 30, | For the Nine Months Ended September 30, | |||||||||||||||
| 2018 | 2017 | 2018 | 2017 | |||||||||||||
Revenues | ||||||||||||||||
Rental income | $ | 31,724 | $ | 32,148 | $ | 93,366 | $ | 94,564 | ||||||||
Other income | 4,771 | 4,949 | 13,841 | 14,758 | ||||||||||||
|
|
|
|
|
|
|
| |||||||||
Total revenues | 36,495 | 37,097 | 107,207 | 109,322 | ||||||||||||
|
|
|
|
|
|
|
| |||||||||
Expenses | ||||||||||||||||
Property operating expenses | 9,231 | 10,075 | 26,339 | 29,611 | ||||||||||||
Real estate taxes and insurance | 5,048 | 4,853 | 14,492 | 14,911 | ||||||||||||
Property management fees (1) | 1,085 | 1,110 | 3,205 | 3,280 | ||||||||||||
Advisory and administrative fees (2) | 1,885 | 1,870 | 5,586 | 5,544 | ||||||||||||
Corporate general and administrative expenses | 1,932 | 1,623 | 5,731 | 4,842 | ||||||||||||
Property general and administrative expenses | 1,280 | 1,594 | 4,475 | 4,756 | ||||||||||||
Depreciation and amortization | 11,228 | 11,215 | 33,638 | 35,866 | ||||||||||||
|
|
|
|
|
|
|
| |||||||||
Total expenses | 31,689 | 32,340 | 93,466 | 98,810 | ||||||||||||
|
|
|
|
|
|
|
| |||||||||
Operating income | 4,806 | 4,757 | 13,741 | 10,512 | ||||||||||||
Interest expense | (7,119 | ) | (8,257 | ) | (20,739 | ) | (22,479 | ) | ||||||||
Loss on extinguishment of debt and modification costs | (2,947 | ) | (914 | ) | (3,576 | ) | (5,717 | ) | ||||||||
Gain on sales of real estate | — | 58,490 | 13,742 | 78,386 | ||||||||||||
|
|
|
|
|
|
|
| |||||||||
Net income (loss) | (5,260 | ) | 54,076 | 3,168 | 60,702 | |||||||||||
Net income attributable to noncontrolling interests | — | — | — | 2,836 | ||||||||||||
Net income (loss) attributable to redeemable noncontrolling interests in the Operating Partnership | (15 | ) | 162 | 10 | 162 | |||||||||||
|
|
|
|
|
|
|
| |||||||||
Net income (loss) attributable to common stockholders | $ | (5,245 | ) | $ | 53,914 | $ | 3,158 | $ | 57,704 | |||||||
|
|
|
|
|
|
|
| |||||||||
Other comprehensive income (loss) | ||||||||||||||||
Unrealized gains (losses) on interest rate derivatives | 1,222 | 214 | 11,732 | (835 | ) | |||||||||||
|
|
|
|
|
|
|
| |||||||||
Total comprehensive income (loss) | (4,038 | ) | 54,290 | 14,900 | 59,867 | |||||||||||
Comprehensive income attributable to noncontrolling interests | — | — | — | 2,720 | ||||||||||||
Comprehensive income (loss) attributable to redeemable noncontrolling interests in the Operating Partnership | (12 | ) | 163 | 45 | 163 | |||||||||||
|
|
|
|
|
|
|
| |||||||||
Comprehensive income (loss) attributable to common stockholders | $ | (4,026 | ) | $ | 54,127 | $ | 14,855 | $ | 56,984 | |||||||
|
|
|
|
|
|
|
| |||||||||
Weighted average common shares outstanding - basic | 20,775 | 21,085 | 20,847 | 21,057 | ||||||||||||
|
|
|
|
|
|
|
| |||||||||
Weighted average common shares outstanding - diluted | 21,262 | 21,453 | 21,328 | 21,407 | ||||||||||||
|
|
|
|
|
|
|
| |||||||||
Earnings (loss) per share - basic | $ | (0.25 | ) | $ | 2.56 | $ | 0.15 | $ | 2.74 | |||||||
|
|
|
|
|
|
|
| |||||||||
Earnings (loss) per share - diluted | $ | (0.25 | ) | $ | 2.51 | $ | 0.15 | $ | 2.70 | |||||||
|
|
|
|
|
|
|
| |||||||||
Dividends declared per common share | $ | 0.25 | $ | 0.22 | $ | 0.75 | $ | 0.66 | ||||||||
|
|
|
|
|
|
|
| |||||||||
| (1) | Fees incurred to an unaffiliated third party that is an affiliate of the noncontrolling limited partner of the OP. |
| (2) | Fees incurred to the Company’s adviser. |
| www.NexPointLiving.com | Page 10 | AN AFFILIATE OF | |
NEXPOINT RESIDENTIAL TRUST, INC. [NYSE:NXRT]
Q3 Same Store Results of Operations for the Three Months Ended September 30, 2018 and 2017
There are 31 properties encompassing 11,091 units of apartment space, or approximately 88% of our Portfolio, in our same store pool for the three months ended September 30, 2018 and 2017 (our “Q3 Same Store” properties). Our Q3 Same Store properties exclude the following four properties in our Portfolio as of September 30, 2018: Atera Apartments, Cedar Pointe, Crestmont Reserve and Brandywine I & II.
As of September 30, 2018, our Q3 Same Store properties were approximately 93.8% leased with a weighted average monthly effective rent per occupied apartment unit of $972, a year over year decrease of (20) bps and an increase of $38, respectively.
The following table reflects the revenues, property operating expenses and NOI for the three months ended September 30, 2018 and 2017 for our Q3 Same Store andNon-Same Store properties (dollars in thousands):
| For the Three Months Ended September 30, | ||||||||||||||||
| 2018 | 2017 | $ Change | % Change | |||||||||||||
Revenues | ||||||||||||||||
Same Store | ||||||||||||||||
Rental income | $ | 30,130 | $ | 28,725 | $ | 1,405 | 4.9 | % | ||||||||
Other income | 4,582 | 4,413 | 169 | 3.8 | % | |||||||||||
|
|
|
|
|
|
|
| |||||||||
Same Store revenues | 34,712 | 33,138 | 1,574 | 4.7 | % | |||||||||||
Non-Same Store | ||||||||||||||||
Rental income | 1,594 | 3,423 | (1,829 | ) | -53.4 | % | ||||||||||
Other income | 189 | 536 | (347 | ) | -64.7 | % | ||||||||||
|
|
|
|
|
|
|
| |||||||||
Non-Same Store revenues | 1,783 | 3,959 | (2,176 | ) | -55.0 | % | ||||||||||
|
|
|
|
|
|
|
| |||||||||
Total revenues | 36,495 | 37,097 | (602 | ) | -1.6 | % | ||||||||||
|
|
|
|
|
|
|
| |||||||||
Operating expenses | ||||||||||||||||
Same Store | ||||||||||||||||
Property operating expenses (1) | 8,913 | 9,083 | (170 | ) | -1.9 | % | ||||||||||
Real estate taxes and insurance | 4,670 | 4,493 | 177 | 3.9 | % | |||||||||||
Property management fees (2) | 1,029 | 987 | 42 | 4.3 | % | |||||||||||
Property general and administrative expenses (3) | 1,087 | 1,022 | 65 | 6.4 | % | |||||||||||
|
|
|
|
|
|
|
| |||||||||
Same Store operating expenses | 15,699 | 15,585 | 114 | 0.7 | % | |||||||||||
Non-Same Store | ||||||||||||||||
Property operating expenses | 354 | 1,372 | (1,018 | ) | -74.2 | % | ||||||||||
Real estate taxes and insurance | 378 | 360 | 18 | 5.0 | % | |||||||||||
Property management fees (2) | 56 | 123 | (67 | ) | -54.5 | % | ||||||||||
Property general and administrative expenses (4) | 49 | 145 | (96 | ) | -66.2 | % | ||||||||||
|
|
|
|
|
|
|
| |||||||||
Non-Same Store operating expenses | 837 | 2,000 | (1,163 | ) | -58.2 | % | ||||||||||
|
|
|
|
|
|
|
| |||||||||
Total operating expenses | 16,536 | 17,585 | (1,049 | ) | -6.0 | % | ||||||||||
|
|
|
|
|
|
|
| |||||||||
NOI | ||||||||||||||||
Same Store | 19,013 | 17,553 | 1,460 | 8.3 | % | |||||||||||
Non-Same Store | 946 | 1,959 | (1,013 | ) | -51.7 | % | ||||||||||
|
|
|
|
|
|
|
| |||||||||
Total NOI (5) | $ | 19,959 | $ | 19,512 | $ | 447 | 2.3 | % | ||||||||
|
|
|
|
|
|
|
| |||||||||
| (1) | For the three months ended September 30, 2018 and 2017, excludes approximately $36,000 and $380,000, respectively, of casualty-related recoveries. |
| (2) | Fees incurred to an unaffiliated third party that is an affiliate of the noncontrolling limited partner of NexPoint Residential Trust Operating Partnership, L.P. (the “OP”). |
| (3) | For the three months ended September 30, 2018 and 2017, excludes approximately $96,000 and $388,000, respectively, of expenses that are not reflective of the continuing operations of the properties or are incurred on our behalf at the property for expenses such as legal, professional and franchise tax fees. |
| (4) | For the three months ended September 30, 2018 and 2017, excludes approximately $48,000 and $39,000, respectively, of expenses that are not reflective of the continuing operations of the properties or are incurred on our behalf at the property for expenses such as legal, professional and franchise tax fees. |
| (5) | For additional information regarding NOI, see the “Definitions and Reconciliations ofNon-GAAP Measures” section of this release. |
| www.NexPointLiving.com | Page 11 | AN AFFILIATE OF | |
NEXPOINT RESIDENTIAL TRUST, INC. [NYSE:NXRT]
The following table contains additional information about our Q3 Same Store properties rent and occupancy metrics, revenues, operating expenses and NOI for the three months ended September 30, 2018 and 2017 (dollars in thousands, except for per unit data):
| Q3 2018 | Q3 2017 | % Change | ||||||||||
Same Store Total Units | 11,091 | 11,091 | ||||||||||
Same Store Occupied Units | 10,405 | 10,425 | ||||||||||
Same Store Ending Occupancy | 93.8 | % | 94.0 | % | -0.2 | % | ||||||
Same Store Average Rent per Unit | $ | 972 | $ | 934 | 4.1 | % | ||||||
Same Store Revenues | ||||||||||||
Same Store Rental Income | $ | 30,130 | $ | 28,725 | 4.9 | % | ||||||
Same Store Other Income | 4,582 | 4,413 | 3.8 | % | ||||||||
|
|
|
|
|
| |||||||
Total Same Store Revenues | 34,712 | 33,138 | 4.7 | % | ||||||||
Same Store Operating Expenses | ||||||||||||
Payroll | 3,532 | 3,523 | 0.3 | % | ||||||||
Repairs & Maintenance | 3,033 | 2,984 | 1.6 | % | ||||||||
Utilities | 2,348 | 2,576 | -8.9 | % | ||||||||
Real Estate Taxes | 3,975 | 3,844 | 3.4 | % | ||||||||
Insurance | 695 | 649 | 7.1 | % | ||||||||
Property Management Fees | 1,029 | 987 | 4.3 | % | ||||||||
Office Operations | 617 | 580 | 6.4 | % | ||||||||
Marketing | 470 | 442 | 6.3 | % | ||||||||
|
|
|
|
|
| |||||||
Total Same Store Operating Expenses | 15,699 | 15,585 | 0.7 | % | ||||||||
|
|
|
|
|
| |||||||
Q3 Same Store NOI | $ | 19,013 | $ | 17,553 | 8.3 | % | ||||||
|
|
|
|
|
| |||||||
| www.NexPointLiving.com | Page 12 | AN AFFILIATE OF | |
NEXPOINT RESIDENTIAL TRUST, INC. [NYSE:NXRT]
Q3 Same Store Properties Operating Metrics
| (dollars in thousands, except for per unit data) | ||||||||||||||||||||||||||||||||||||||||
Properties by Market (1) | Unit Count | Average Effective Rent | Occupancy | Total Rental Income | ||||||||||||||||||||||||||||||||||||
| Total | Q3 2018 | Q3 2017 | % Change | Q3 2018 | Q3 2017 | bps D | Q3 2018 | Q3 2017 | % Change | |||||||||||||||||||||||||||||||
Texas | ||||||||||||||||||||||||||||||||||||||||
Dallas | 2,872 | $ | 895 | $ | 857 | 4.4 | % | 94.0 | % | 94.8 | % | -80 | $ | 7,335 | $ | 6,902 | 6.3 | % | ||||||||||||||||||||||
Houston | 1,184 | 1,137 | 1,133 | 0.4 | % | 93.5 | % | 93.1 | % | 40 | 3,751 | 3,518 | 6.6 | % | ||||||||||||||||||||||||||
|
|
|
|
|
|
|
|
|
|
|
|
|
|
|
|
|
|
|
| |||||||||||||||||||||
Average/Total | 4,056 | 966 | 938 | 3.0 | % | 93.8 | % | 94.3 | % | -50 | 11,086 | 10,420 | 6.4 | % | ||||||||||||||||||||||||||
|
|
|
|
|
|
|
|
|
|
|
|
|
|
|
|
|
|
|
| |||||||||||||||||||||
North Carolina | ||||||||||||||||||||||||||||||||||||||||
Charlotte | 577 | 931 | 911 | 2.2 | % | 93.1 | % | 94.5 | % | -140 | 1,498 | 1,476 | 1.5 | % | ||||||||||||||||||||||||||
|
|
|
|
|
|
|
|
|
|
|
|
|
|
|
|
|
|
|
| |||||||||||||||||||||
Average/Total | 577 | 931 | 911 | 2.2 | % | 93.1 | % | 94.5 | % | -140 | 1,498 | 1,476 | 1.5 | % | ||||||||||||||||||||||||||
|
|
|
|
|
|
|
|
|
|
|
|
|
|
|
|
|
|
|
| |||||||||||||||||||||
Georgia | ||||||||||||||||||||||||||||||||||||||||
Atlanta | 2,220 | 1,013 | 973 | 4.1 | % | 93.1 | % | 93.2 | % | -10 | 6,157 | 5,988 | 2.8 | % | ||||||||||||||||||||||||||
|
|
|
|
|
|
|
|
|
|
|
|
|
|
|
|
|
|
|
| |||||||||||||||||||||
Average/Total | 2,220 | 1,013 | 973 | 4.1 | % | 93.1 | % | 93.2 | % | -10 | 6,157 | 5,988 | 2.8 | % | ||||||||||||||||||||||||||
|
|
|
|
|
|
|
|
|
|
|
|
|
|
|
|
|
|
|
| |||||||||||||||||||||
Tennessee | ||||||||||||||||||||||||||||||||||||||||
Nashville | 1,038 | 948 | 913 | 3.8 | % | 93.3 | % | 94.7 | % | -140 | 2,722 | 2,658 | 2.4 | % | ||||||||||||||||||||||||||
|
|
|
|
|
|
|
|
|
|
|
|
|
|
|
|
|
|
|
| |||||||||||||||||||||
Average/Total | 1,038 | 948 | 913 | 3.8 | % | 93.3 | % | 94.7 | % | -140 | 2,722 | 2,658 | 2.4 | % | ||||||||||||||||||||||||||
|
|
|
|
|
|
|
|
|
|
|
|
|
|
|
|
|
|
|
| |||||||||||||||||||||
Florida | ||||||||||||||||||||||||||||||||||||||||
Orlando | 830 | 1,112 | 1,029 | 8.1 | % | 95.5 | % | 94.2 | % | 130 | 2,629 | 2,406 | 9.3 | % | ||||||||||||||||||||||||||
Tampa | 576 | 916 | 857 | 6.9 | % | 95.0 | % | 94.4 | % | 60 | 1,474 | 1,391 | 6.0 | % | ||||||||||||||||||||||||||
West Palm Beach | 439 | 1,172 | 1,110 | 5.6 | % | 95.4 | % | 94.8 | % | 60 | 1,442 | 1,367 | 5.5 | % | ||||||||||||||||||||||||||
|
|
|
|
|
|
|
|
|
|
|
|
|
|
|
|
|
|
|
| |||||||||||||||||||||
Average/Total | 1,845 | 1,065 | 995 | 7.0 | % | 95.3 | % | 94.4 | % | 90 | 5,545 | 5,164 | 7.4 | % | ||||||||||||||||||||||||||
|
|
|
|
|
|
|
|
|
|
|
|
|
|
|
|
|
|
|
| |||||||||||||||||||||
Washington D.C. | ||||||||||||||||||||||||||||||||||||||||
D.C. Metro | 156 | 1,100 | 1,069 | 2.9 | % | 94.9 | % | 96.8 | % | -190 | 486 | 460 | 5.7 | % | ||||||||||||||||||||||||||
|
|
|
|
|
|
|
|
|
|
|
|
|
|
|
|
|
|
|
| |||||||||||||||||||||
Average/Total | 156 | 1,100 | 1,069 | 2.9 | % | 94.9 | % | 96.8 | % | -190 | 486 | 460 | 5.7 | % | ||||||||||||||||||||||||||
|
|
|
|
|
|
|
|
|
|
|
|
|
|
|
|
|
|
|
| |||||||||||||||||||||
Arizona | ||||||||||||||||||||||||||||||||||||||||
Phoenix | 1,199 | 798 | 771 | 3.5 | % | 93.5 | % | 92.5 | % | 100 | 2,636 | 2,559 | 3.0 | % | ||||||||||||||||||||||||||
|
|
|
|
|
|
|
|
|
|
|
|
|
|
|
|
|
|
|
| |||||||||||||||||||||
Average/Total | 1,199 | 798 | 771 | 3.5 | % | 93.5 | % | 92.5 | % | 100 | 2,636 | 2,559 | 3.0 | % | ||||||||||||||||||||||||||
|
|
|
|
|
|
|
|
|
|
|
|
|
|
|
|
|
|
|
| |||||||||||||||||||||
Average/Total | 11,091 | $ | 972 | $ | 934 | 4.1 | % | 93.8 | % | 94.0 | % | -20 | $ | 30,130 | $ | 28,725 | 4.9 | % | ||||||||||||||||||||||
|
|
|
|
|
|
|
|
|
|
|
|
|
|
|
|
|
|
|
| |||||||||||||||||||||
| (1) | This table only includes the 31 properties in our Q3 Same Store pool. |
| www.NexPointLiving.com | Page 13 | AN AFFILIATE OF | |
NEXPOINT RESIDENTIAL TRUST, INC. [NYSE:NXRT]
YTD Same Store Results of Operations for the Nine Months Ended September 30, 2018 and 2017
There are 29 properties encompassing 10,123 units of apartment space, or approximately 81% of our Portfolio, in our same store pool for the nine months ended September 30, 2018 and 2017 (our “YTD Same Store” properties). Our YTD Same Store properties exclude the following six properties in our portfolio as of September 30, 2018: Hollister Place, Rockledge Apartments, Atera Apartments, Cedar Pointe, Crestmont Reserve and Brandywine I & II.
As of September 30, 2018, our YTD Same Store properties were approximately 93.8% leased with a weighted average monthly effective rent per occupied apartment unit of $958, a year over year decrease of (40) bps and an increase of $40, respectively.
The following table reflects the revenues, property operating expenses and NOI for the nine months ended September 30, 2018 and 2017 for our YTD Same Store andNon-Same Store properties (dollars in thousands):
| For the Nine Months Ended September 30, | ||||||||||||||||
| 2018 | 2017 | $ Change | % Change | |||||||||||||
Revenues | ||||||||||||||||
Same Store | ||||||||||||||||
Rental income | $ | 80,085 | $ | 76,566 | $ | 3,519 | 4.6 | % | ||||||||
Other income | 12,258 | 12,003 | 255 | 2.1 | % | |||||||||||
|
|
|
|
|
|
|
| |||||||||
Same Store revenues | 92,343 | 88,569 | 3,774 | 4.3 | % | |||||||||||
Non-Same Store | ||||||||||||||||
Rental income | 13,281 | 17,998 | (4,717 | ) | -26.2 | % | ||||||||||
Other income | 1,583 | 2,755 | (1,172 | ) | -42.5 | % | ||||||||||
|
|
|
|
|
|
|
| |||||||||
Non-Same Store revenues | 14,864 | 20,753 | (5,889 | ) | -28.4 | % | ||||||||||
|
|
|
|
|
|
|
| |||||||||
Total revenues | 107,207 | 109,322 | (2,115 | ) | -1.9 | % | ||||||||||
|
|
|
|
|
|
|
| |||||||||
Operating expenses | ||||||||||||||||
Same Store | ||||||||||||||||
Property operating expenses (1) | 23,732 | 23,826 | (94 | ) | -0.4 | % | ||||||||||
Real estate taxes and insurance | 11,955 | 12,406 | (451 | ) | -3.6 | % | ||||||||||
Property management fees (2) | 2,773 | 2,659 | 114 | 4.3 | % | |||||||||||
Property general and administrative expenses (3) | 3,112 | 3,097 | 15 | 0.5 | % | |||||||||||
|
|
|
|
|
|
|
| |||||||||
Same Store operating expenses | 41,572 | 41,988 | (416 | ) | -1.0 | % | ||||||||||
Non-Same Store | ||||||||||||||||
Property operating expenses (4) | 3,309 | 6,136 | (2,827 | ) | -46.1 | % | ||||||||||
Real estate taxes and insurance | 2,537 | 2,505 | 32 | 1.3 | % | |||||||||||
Property management fees (2) | 432 | 621 | (189 | ) | -30.4 | % | ||||||||||
Property general and administrative expenses (5) | 433 | 755 | (322 | ) | -42.6 | % | ||||||||||
|
|
|
|
|
|
|
| |||||||||
Non-Same Store operating expenses | 6,711 | 10,017 | (3,306 | ) | -33.0 | % | ||||||||||
|
|
|
|
|
|
|
| |||||||||
Total operating expenses | 48,283 | 52,005 | (3,722 | ) | -7.2 | % | ||||||||||
|
|
|
|
|
|
|
| |||||||||
NOI | ||||||||||||||||
Same Store | 50,771 | 46,581 | 4,190 | 9.0 | % | |||||||||||
Non-Same Store | 8,153 | 10,736 | (2,583 | ) | -24.1 | % | ||||||||||
|
|
|
|
|
|
|
| |||||||||
Total NOI (6) | $ | 58,924 | $ | 57,317 | $ | 1,607 | 2.8 | % | ||||||||
|
|
|
|
|
|
|
| |||||||||
| (1) | For the nine months ended September 30, 2018 and 2017, excludes approximately $709,000 and $370,000, respectively, of casualty-related recoveries. |
| (2) | Fees incurred to an unaffiliated third party that is an affiliate of the noncontrolling limited partner of the OP. |
| www.NexPointLiving.com | Page 14 | AN AFFILIATE OF | |
NEXPOINT RESIDENTIAL TRUST, INC. [NYSE:NXRT]
| (3) | For the nine months ended September 30, 2018 and 2017, excludes approximately $779,000 and $742,000, respectively, of expenses that are not reflective of the continuing operations of the properties or are incurred on our behalf at the property for expenses such as legal, professional and franchise tax fees. |
| (4) | For the nine months ended September 30, 2018 and 2017, excludes approximately $7,000 and $19,000, respectively, of casualty-related expenses. |
| (5) | For the nine months ended September 30, 2018 and 2017, excludes approximately $151,000 and $162,000, respectively, of expenses that are not reflective of the continuing operations of the properties or are incurred on our behalf at the property for expenses such as legal, professional and franchise tax fees. |
| (6) | For additional information regarding NOI, see the “Definitions and Reconciliations ofNon-GAAP Measures” section of this release. |
The following table contains additional information about our YTD Same Store properties rent and occupancy metrics, revenues, operating expenses and NOI for the nine months ended September 30, 2018 and 2017 (dollars in thousands, except for per unit data):
| YTD 2018 | YTD 2017 | % Change | ||||||||||
Same Store Total Units | 10,123 | 10,123 | ||||||||||
Same Store Occupied Units | 9,492 | 9,531 | ||||||||||
Same Store Ending Occupancy | 93.8 | % | 94.2 | % | -0.4 | % | ||||||
Same Store Average Rent per Unit | $ | 958 | $ | 918 | 4.3 | % | ||||||
Same Store Revenues | ||||||||||||
Same Store Rental Income | $ | 80,085 | $ | 76,566 | 4.6 | % | ||||||
Same Store Other Income | 12,258 | 12,003 | 2.1 | % | ||||||||
|
|
|
|
|
| |||||||
Total Same Store Revenues | 92,343 | 88,569 | 4.3 | % | ||||||||
Same Store Operating Expenses | ||||||||||||
Payroll | 9,664 | 9,450 | 2.3 | % | ||||||||
Repairs & Maintenance | 7,888 | 7,753 | 1.7 | % | ||||||||
Utilities | 6,180 | 6,623 | -6.7 | % | ||||||||
Real Estate Taxes | 10,085 | 10,653 | -5.3 | % | ||||||||
Insurance | 1,870 | 1,753 | 6.7 | % | ||||||||
Property Management Fees | 2,773 | 2,659 | 4.3 | % | ||||||||
Office Operations | 1,832 | 1,875 | -2.3 | % | ||||||||
Marketing | 1,280 | 1,222 | 4.7 | % | ||||||||
|
|
|
|
|
| |||||||
Total Same Store Operating Expenses | 41,572 | 41,988 | -1.0 | % | ||||||||
|
|
|
|
|
| |||||||
YTD Same Store NOI | $ | 50,771 | $ | 46,581 | 9.0 | % | ||||||
|
|
|
|
|
| |||||||
| www.NexPointLiving.com | Page 15 | AN AFFILIATE OF | |
NEXPOINT RESIDENTIAL TRUST, INC. [NYSE:NXRT]
FFO, Core FFO and AFFO
The following table reconciles our calculations of FFO, Core FFO and AFFO to net income (loss), the most directly comparable GAAP financial measure, for the three and nine months ended September 30, 2018 and 2017 (in thousands, except per share amounts):
| For the Three Months Ended September 30, | For the Nine Months Ended September 30, | |||||||||||||||
| 2018 | 2017 | 2018 | 2017 | |||||||||||||
Net income (loss) | $ | (5,260 | ) | $ | 54,076 | $ | 3,168 | $ | 60,702 | |||||||
Depreciation and amortization | 11,228 | 11,215 | 33,638 | 35,866 | ||||||||||||
Gain on sales of real estate | — | (58,490 | ) | (13,742 | ) | (78,386 | ) | |||||||||
Adjustment for noncontrolling interests | (19 | ) | (21 | ) | (70 | ) | (1,670 | ) | ||||||||
|
|
|
|
|
|
|
| |||||||||
FFO attributable to common stockholders | 5,949 | 6,780 | 22,994 | 16,512 | ||||||||||||
|
|
|
|
|
|
|
| |||||||||
FFO per share - basic | $ | 0.29 | $ | 0.32 | $ | 1.10 | $ | 0.78 | ||||||||
|
|
|
|
|
|
|
| |||||||||
FFO per share - diluted | $ | 0.28 | $ | 0.32 | $ | 1.08 | $ | 0.77 | ||||||||
|
|
|
|
|
|
|
| |||||||||
Loss on extinguishment of debt and modification costs | 2,947 | 914 | 3,576 | 5,717 | ||||||||||||
Casualty-related recoveries | (36 | ) | (380 | ) | (702 | ) | (351 | ) | ||||||||
Change in fair value on derivative instruments – ineffective portion | — | (32 | ) | — | (97 | ) | ||||||||||
Amortization of deferred financing costs – acquisition term notes | — | 197 | 21 | 323 | ||||||||||||
Adjustment for noncontrolling interests | (9 | ) | (3 | ) | (9 | ) | (430 | ) | ||||||||
|
|
|
|
|
|
|
| |||||||||
Core FFO attributable to common stockholders | 8,851 | 7,476 | 25,880 | 21,674 | ||||||||||||
|
|
|
|
|
|
|
| |||||||||
Core FFO per share - basic | $ | 0.43 | $ | 0.35 | $ | 1.24 | $ | 1.03 | ||||||||
|
|
|
|
|
|
|
| |||||||||
Core FFO per share - diluted | $ | 0.42 | $ | 0.35 | $ | 1.21 | $ | 1.01 | ||||||||
|
|
|
|
|
|
|
| |||||||||
Amortization of deferred financing costs – long term debt | 341 | 375 | 1,061 | 1,225 | ||||||||||||
Equity-based compensation expense | 1,094 | 822 | 3,103 | 2,414 | ||||||||||||
Adjustment for noncontrolling interests | (4 | ) | (3 | ) | (12 | ) | (72 | ) | ||||||||
|
|
|
|
|
|
|
| |||||||||
AFFO attributable to common stockholders | 10,282 | 8,670 | 30,032 | 25,241 | ||||||||||||
|
|
|
|
|
|
|
| |||||||||
AFFO per share - basic | $ | 0.49 | $ | 0.41 | $ | 1.44 | $ | 1.20 | ||||||||
|
|
|
|
|
|
|
| |||||||||
AFFO per share - diluted | $ | 0.48 | $ | 0.40 | $ | 1.41 | $ | 1.18 | ||||||||
|
|
|
|
|
|
|
| |||||||||
Weighted average common shares outstanding - basic | 20,775 | 21,085 | 20,847 | 21,057 | ||||||||||||
|
|
|
|
|
|
|
| |||||||||
Weighted average common shares outstanding - diluted | 21,262 | 21,453 | 21,328 | 21,407 | ||||||||||||
|
|
|
|
|
|
|
| |||||||||
Dividends declared per common share | $ | 0.25 | $ | 0.22 | $ | 0.75 | $ | 0.66 | ||||||||
FFO Coverage - diluted | 1.12x | 1.44x | 1.44x | 1.17x | ||||||||||||
Core FFO Coverage - diluted | 1.67x | 1.58x | 1.62x | 1.53x | ||||||||||||
AFFO Coverage - diluted | 1.93x | 1.84x | 1.88x | 1.79x | ||||||||||||
| www.NexPointLiving.com | Page 16 | AN AFFILIATE OF | |
NEXPOINT RESIDENTIAL TRUST, INC. [NYSE:NXRT]
The three months ended September 30, 2018 as compared to the three months ended September 30, 2017
The change in our net loss of $5.3 million for the three months ended September 30, 2018 as compared to our net income of $54.1 million for the three months ended September 30, 2017 primarily relates to decreases in total revenues and gain on sales of real estate and an increase in loss on extinguishment of debt and modification costs, and was partially offset by decreases in total property operating expenses and interest expense. The change in our net income (loss) between the periods was also due to our acquisition and disposition activity in 2017 and 2018 and the timing of the transactions (we acquired one property in the first quarter of 2017, one property in the second quarter of 2017, one property in the fourth quarter of 2017 and three properties in the third quarter of 2018; we sold four properties in the second quarter of 2017, five properties in the third quarter of 2017 and one property in the first quarter of 2018).
FFO was $5.9 million for the three months ended September 30, 2018 compared to $6.8 million for the three months ended September 30, 2017, which was a decrease of approximately $0.9 million. The change in our FFO between the periods primarily relates to an increase in loss on extinguishment and modification costs of $2.0 million and a decrease in total revenues of $0.6 million, partially offset by decreases in total property operating expenses of $1.0 million and interest expense of $1.1 million and adjustments for amounts attributable to noncontrolling interests.
Core FFO was $8.9 million for the three months ended September 30, 2018 compared to $7.5 million for the three months ended September 30, 2017, which was an increase of approximately $1.4 million. The change in our Core FFO between the periods primarily relates to an increase in loss on extinguishment of debt and modification costs of $2.0 million, partially offset by a decrease in FFO and adjustments for amounts attributable to noncontrolling interests.
AFFO was $10.3 million for the three months ended September 30, 2018 compared to $8.7 million for the three months ended September 30, 2017, which was an increase of approximately $1.6 million. The change in our AFFO between the periods primarily relates to increases in Core FFO and equity-based compensation expense of $0.3 million.
The nine months ended September 30, 2018 as compared to the nine months ended September 30, 2017
The change in our net income of $3.2 million for the nine months ended September 30, 2018 as compared to our net income of $60.7 million for the nine months ended September 30, 2017 primarily relates to decreases in total revenues and gain on sales of real estate, and was partially offset by decreases in total property operating expenses, depreciation and amortization, interest expense and loss on extinguishment of debt and modification costs. The change in our net income between the periods was also due to our acquisition and disposition activity in 2017 and 2018 and the timing of the transactions, as described above.
FFO was $23.0 million for the nine months ended September 30, 2018 compared to $16.5 million for the nine months ended September 30, 2017, which was an increase of approximately $6.5 million. The change in our FFO between the periods primarily relates to decreases in total property operating expenses of $4.0 million, interest expense of $1.7 million and loss on extinguishment of debt and modification costs of $2.1 million, partially offset by a decrease in total revenues of $2.1 million and adjustments for amounts attributable to noncontrolling interests.
Core FFO was $25.9 million for the nine months ended September 30, 2018 compared to $21.7 million for the nine months ended September 30, 2017, which was an increase of approximately $4.2 million. The change in our Core FFO between the periods primarily relates to an increase in FFO, partially offset by a $2.1 million decrease in loss on extinguishment of debt and modification costs and adjustments for amounts attributable to noncontrolling interests.
AFFO was $30.0 million for the nine months ended September 30, 2018 compared to $25.2 million for the nine months ended September 30, 2017, which was an increase of approximately $4.8 million. The change in our AFFO between the periods primarily relates to increases in Core FFO and equity-based compensation expense of $0.7 million.
| www.NexPointLiving.com | Page 17 | AN AFFILIATE OF | |
NEXPOINT RESIDENTIAL TRUST, INC. [NYSE:NXRT]
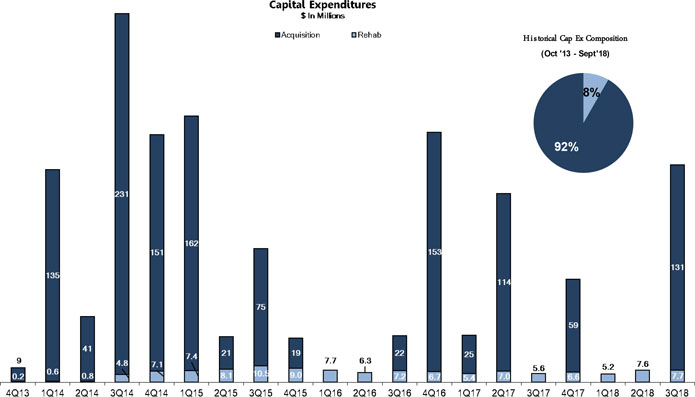
Historical Capital Expenditures
| Q3 2018 | Q3 2017 | % Change | YTD 2018 | YTD 2017 | % Change | |||||||||||||||||||
($ in thousands) | ||||||||||||||||||||||||
Capital Expenditures | ||||||||||||||||||||||||
Acquisition Capital Expenditures | $ | 130,980 | $ | — | N/A | $ | 130,980 | $ | 138,000 | -5.1 | % | |||||||||||||
Capitalized Rehab Expenditures | ||||||||||||||||||||||||
Interior | 2,582 | 1,883 | 37.1 | % | 6,138 | 6,647 | -7.7 | % | ||||||||||||||||
Exterior and common area | 2,322 | 1,166 | 99.1 | % | 7,314 | 5,067 | 44.3 | % | ||||||||||||||||
Capitalized Maintenance Expenditures | ||||||||||||||||||||||||
Recurring | 1,463 | 1,334 | 9.7 | % | 3,782 | 3,647 | 3.7 | % | ||||||||||||||||
Non-Recurring | 1,340 | 1,184 | 13.2 | % | 3,265 | 2,592 | 26.0 | % | ||||||||||||||||
|
|
|
|
|
|
|
|
|
|
|
| |||||||||||||
Total Capital Expenditures | $ | 138,687 | $ | 5,567 | 2391.2 | % | $ | 151,479 | $ | 155,953 | -2.9 | % | ||||||||||||
|
|
|
|
|
|
|
|
|
|
|
| |||||||||||||
| www.NexPointLiving.com | Page 18 | AN AFFILIATE OF | |
NEXPOINT RESIDENTIAL TRUST, INC. [NYSE:NXRT]
Value-Add Program Details
| Property Name (1) | Units | Rehab Units Completed (2) | Average Rent Pre-Rehab | Average Rent Post-Rehab | Avg. Rehab Cost Per Unit (3) | Post-Rehab Rent Change % | ROI (3) | |||||||||||||||||||||
CompletedValue-Add Programs | ||||||||||||||||||||||||||||
Southpoint Reserve at Stoney Creek (4) | 156 | 55 | $ | 990 | $ | 1,096 | $ | 7,428 | 10.7 | % | 17.1 | % | ||||||||||||||||
|
|
|
|
|
|
|
|
|
|
|
|
|
| |||||||||||||||
Total/Weighted Average | 156 | 55 | $ | 990 | $ | 1,096 | $ | 7,428 | 10.7 | % | 17.1 | % | ||||||||||||||||
|
|
|
|
|
|
|
|
|
|
|
|
|
| |||||||||||||||
Value-Add Programs In Progress | ||||||||||||||||||||||||||||
Abbington Heights | 274 | 172 | $ | 797 | $ | 896 | $ | 4,759 | 12.5 | % | 25.1 | % | ||||||||||||||||
Arbors on Forest Ridge | 210 | 174 | 794 | 875 | 3,220 | 10.2 | % | 30.1 | % | |||||||||||||||||||
Atera Apartments | 380 | 52 | 1,222 | 1,381 | 3,297 | 13.0 | % | 57.9 | % | |||||||||||||||||||
Beechwood Terrace | 300 | 208 | 877 | 971 | 5,341 | 10.7 | % | 21.1 | % | |||||||||||||||||||
Belmont at Duck Creek | 240 | 189 | 932 | 1,024 | 3,650 | 9.9 | % | 30.3 | % | |||||||||||||||||||
Cornerstone | 430 | 209 | 924 | 1,005 | 5,351 | 8.8 | % | 18.1 | % | |||||||||||||||||||
Courtney Cove | 324 | 123 | 787 | 890 | 4,684 | 13.0 | % | 26.3 | % | |||||||||||||||||||
Cutter’s Point | 196 | 165 | 1,040 | 1,135 | 4,224 | 9.1 | % | 26.9 | % | |||||||||||||||||||
Eagle Crest | 447 | 98 | 783 | 864 | 2,679 | 10.3 | % | 36.2 | % | |||||||||||||||||||
Edgewater at Sandy Springs | 760 | 389 | 882 | 987 | 7,439 | 11.9 | % | 17.0 | % | |||||||||||||||||||
Heatherstone | 152 | 156 | 806 | 884 | 4,281 | 9.6 | % | 21.7 | % | |||||||||||||||||||
Hollister Place | 260 | 113 | 918 | 1,066 | 7,313 | 16.2 | % | 24.3 | % | |||||||||||||||||||
Madera Point | 256 | 138 | 808 | 901 | 4,041 | 11.5 | % | 27.5 | % | |||||||||||||||||||
Parc500 | 217 | 96 | 1,178 | 1,354 | 14,093 | 14.9 | % | 14.9 | % | |||||||||||||||||||
Radbourne Lake | 225 | 257 | 986 | 1,039 | 955 | 5.3 | % | 65.8 | % | |||||||||||||||||||
Rockledge Apartments | 708 | 87 | 1,046 | 1,269 | 11,690 | 21.2 | % | 22.8 | % | |||||||||||||||||||
Sabal Palm at Lake Buena Vista | 400 | 192 | 1,131 | 1,210 | 694 | 7.0 | % | 136.8 | % | |||||||||||||||||||
Seasons 704 Apartments | 222 | 127 | 1,056 | 1,121 | 5,903 | 6.2 | % | 13.3 | % | |||||||||||||||||||
Silverbrook | 642 | 420 | 786 | 851 | 3,040 | 8.3 | % | 25.6 | % | |||||||||||||||||||
The Ashlar | 264 | 258 | 827 | 898 | 3,897 | 8.7 | % | 22.0 | % | |||||||||||||||||||
The Colonnade | 415 | 74 | 652 | 915 | 10,658 | 40.3 | % | 29.6 | % | |||||||||||||||||||
The Pointe at the Foothills | 528 | 63 | 914 | 948 | 1,940 | 3.8 | % | 21.5 | % | |||||||||||||||||||
The Preserve at Terrell Mill | 752 | 392 | 766 | 901 | 8,562 | 17.6 | % | 18.9 | % | |||||||||||||||||||
The Summit at Sabal Park | 252 | 177 | 886 | 968 | 4,526 | 9.3 | % | 21.8 | % | |||||||||||||||||||
Timber Creek | 352 | 61 | 843 | 946 | 4,712 | 12.3 | % | 26.4 | % | |||||||||||||||||||
Venue at 8651 | 333 | 265 | 831 | 907 | 4,199 | 9.2 | % | 21.8 | % | |||||||||||||||||||
Versailles | 388 | 413 | 834 | 909 | 3,956 | 8.9 | % | 22.6 | % | |||||||||||||||||||
Willow Grove | 244 | 129 | 820 | 926 | 5,620 | 12.9 | % | 22.6 | % | |||||||||||||||||||
Woodbridge | 220 | 93 | 958 | 1,047 | 5,315 | 9.3 | % | 20.1 | % | |||||||||||||||||||
|
|
|
|
|
|
|
|
|
|
|
|
|
| |||||||||||||||
Total/Weighted Average | 10,391 | 5,290 | $ | 875 | $ | 970 | $ | 5,010 | 10.8 | % | 24.0 | % | ||||||||||||||||
|
|
|
|
|
|
|
|
|
|
|
|
|
| |||||||||||||||
Total/Weighted Average Completed | 10,547 | 5,345 | $ | 876 | $ | 971 | $ | 5,033 | 10.8 | % | 22.6 | % | ||||||||||||||||
|
|
|
|
|
|
|
|
|
|
|
|
|
| |||||||||||||||
PlannedValue-Add Programs |
| Projected Avg. Rent |
| | Rent Change & ROI (Projections) |
| ||||||||||||||||||||||
Old Farm | 734 | — | $ | 1,226 | $ | 1,316 | TBD | 7.3 | % | TBD | ||||||||||||||||||
Stone Creek at Old Farm | 190 | — | 1,261 | 1,305 | TBD | 3.5 | % | TBD | ||||||||||||||||||||
Cedar Pointe | 210 | — | 1,058 | 1,188 | TBD | 12.3 | % | TBD | ||||||||||||||||||||
Crestmont Reserve | 242 | — | 910 | 1,010 | TBD | 11.0 | % | TBD | ||||||||||||||||||||
Brandywine I & II | 632 | — | 959 | 1,079 | TBD | 12.5 | % | TBD | ||||||||||||||||||||
|
|
|
|
|
|
|
|
|
|
|
|
|
| |||||||||||||||
Total/Weighted Average Planned | 2,008 | — | $ | 1,090 | $ | 1,190 | TBD | 9.2 | % | TBD | ||||||||||||||||||
|
|
|
|
|
|
|
|
|
|
|
|
|
| |||||||||||||||
| (1) | We do not plan to upgrade 100% of the units at each of our properties. |
| (2) | Inclusive of all full and partial interior upgrades completed through September 30, 2018. |
| (3) | Inclusive of all full and partial interior upgrades completed and leased through September 30, 2018. |
| (4) | Property was classified as held for sale as of September 30, 2018. |
| www.NexPointLiving.com | Page 19 | AN AFFILIATE OF | |
NEXPOINT RESIDENTIAL TRUST, INC. [NYSE:NXRT]
Outstanding Debt Details
Mortgage Debt
The following table contains summary information concerning the mortgage debt of the Company as of September 30, 2018 (dollars in thousands):
Operating Properties | Type | Term (months) | Outstanding Principal (1) | Interest Rate (2) | Maturity Date | |||||||||||||
Arbors on Forest Ridge | Floating | 84 | $ | 13,130 | 3.94 | % | 7/1/2024 | |||||||||||
Cutter’s Point | Floating | 84 | 16,640 | 3.94 | % | 7/1/2024 | ||||||||||||
Eagle Crest | Floating | 84 | 29,510 | 3.94 | % | 7/1/2024 | ||||||||||||
Silverbrook | Floating | 84 | 30,590 | 3.94 | % | 7/1/2024 | ||||||||||||
Edgewater at Sandy Springs | Floating | 84 | 52,000 | 3.94 | % | 7/1/2024 | ||||||||||||
Beechwood Terrace (3) | Floating | 84 | 23,365 | 3.70 | % | 9/1/2025 | ||||||||||||
Willow Grove | Floating | 84 | 14,818 | 4.04 | % | 7/1/2024 | ||||||||||||
Woodbridge | Floating | 84 | 13,677 | 4.04 | % | 7/1/2024 | ||||||||||||
The Summit at Sabal Park | Floating | 84 | 13,560 | 3.88 | % | 7/1/2024 | ||||||||||||
Courtney Cove | Floating | 84 | 13,680 | 3.88 | % | 7/1/2024 | ||||||||||||
The Preserve at Terrell Mill | Floating | 84 | 42,480 | 3.88 | % | 7/1/2024 | ||||||||||||
The Ashlar | Floating | 84 | 14,520 | 3.88 | % | 7/1/2024 | ||||||||||||
Heatherstone | Floating | 84 | 8,880 | 3.88 | % | 7/1/2024 | ||||||||||||
Versailles | Floating | 84 | 23,880 | 3.88 | % | 7/1/2024 | ||||||||||||
Seasons 704 Apartments | Floating | 84 | 17,460 | 3.88 | % | 7/1/2024 | ||||||||||||
Madera Point | Floating | 84 | 15,150 | 3.88 | % | 7/1/2024 | ||||||||||||
The Pointe at the Foothills | Floating | 84 | 34,800 | 3.88 | % | 7/1/2024 | ||||||||||||
Venue at 8651 | Floating | 84 | 13,734 | 4.04 | % | 7/1/2024 | ||||||||||||
The Colonnade | Floating | 84 | 28,093 | 3.94 | % | 7/1/2024 | ||||||||||||
Old Farm | Floating | 84 | 52,886 | 3.94 | % | 7/1/2024 | ||||||||||||
Stone Creek at Old Farm | Floating | 84 | 15,274 | 3.94 | % | 7/1/2024 | ||||||||||||
Timber Creek (4) | Floating | 84 | 24,100 | 3.52 | % | 10/1/2025 | ||||||||||||
Radbourne Lake (5) | Floating | 84 | 20,000 | 3.55 | % | 10/1/2025 | ||||||||||||
Sabal Palm at Lake Buena Vista (6) | Floating | 84 | 42,100 | 3.56 | % | 9/1/2025 | ||||||||||||
Abbington Heights (7) | Floating | 84 | 16,920 | 3.51 | % | 9/1/2025 | ||||||||||||
Belmont at Duck Creek | Floating | 84 | 17,760 | 3.65 | % | 6/1/2025 | ||||||||||||
Cornerstone | Fixed | 120 | 22,339 | 4.24 | % | 3/1/2023 | ||||||||||||
Parc500 | Fixed | 120 | 15,547 | 4.49 | % | 8/1/2025 | ||||||||||||
Hollister Place (8) | Floating | 84 | 14,811 | 3.60 | % | 10/1/2025 | ||||||||||||
Rockledge Apartments | Floating | 84 | 68,100 | 3.83 | % | 7/1/2024 | ||||||||||||
Atera Apartments | Floating | 84 | 29,500 | 3.74 | % | 11/1/2024 | ||||||||||||
Cedar Pointe | Floating | 84 | 17,300 | 3.61 | % | 9/1/2025 | ||||||||||||
Crestmont Reserve | Floating | 84 | 12,061 | 3.44 | % | 10/1/2025 | ||||||||||||
Brandywine I & II | Floating | 84 | 43,835 | 3.44 | % | 10/1/2025 | ||||||||||||
|
| |||||||||||||||||
| $ | 832,500 | |||||||||||||||||
Fair market value adjustment | 656 | |||||||||||||||||
Deferred financing costs, net of accumulated amortization of $1,424 |
| (8,610 | ) | |||||||||||||||
|
| |||||||||||||||||
| $ | 824,546 | |||||||||||||||||
|
| |||||||||||||||||
Held For Sale Property | ||||||||||||||||||
Southpoint Reserve at Stoney Creek | Floating | 84 | 13,445 | 4.37 | % | 1/1/2022 | ||||||||||||
Deferred financing costs, net of accumulated amortization of $88 |
| (77 | ) | |||||||||||||||
|
| |||||||||||||||||
| $ | 13,368 | |||||||||||||||||
|
| |||||||||||||||||
| (1) | Mortgage debt that isnon-recourse to the Company and encumbers the multifamily properties. |
| (2) | Interest rate is based onone-month LIBOR plus an applicable margin, except for fixed rate mortgage debt.One-month LIBOR as of September 30, 2018 was 2.2606%. |
| (3) | On August 31, 2018, the Company refinanced the existing floating rate mortgage of approximately $20.2 million. |
| (4) | On September 28, 2018, the Company refinanced the existing floating rate mortgage of approximately $19.1 million. |
| www.NexPointLiving.com | Page 20 | AN AFFILIATE OF | |
NEXPOINT RESIDENTIAL TRUST, INC. [NYSE:NXRT]
| (5) | On September 28, 2018, the Company refinanced the existing floating rate mortgage of approximately $18.9 million. |
| (6) | On August 20, 2018, the Company refinanced the existing floating rate mortgage of approximately $37.2 million. |
| (7) | On August 21, 2018, the Company refinanced the existing fixed rate mortgage of approximately $9.9 million, which was assumed upon acquisition of this property, into a floating rate mortgage. |
| (8) | On September 28, 2018, the Company refinanced the existing floating rate mortgage of approximately $13.5 million. |
Credit and Bridge Facilities
The following table contains summary information concerning the Company’s credit and bridge facilities as of September 30, 2018 (dollars in thousands):
| Type | Term (months) | Outstanding Principal | Interest Rate (1) | Maturity Date | ||||||||||||||||
$60 Million Credit Facility | Floating | 24 | $ | 50,000 | 4.26 | % | 9/26/2020 | |||||||||||||
Deferred financing costs, net of accumulated amortization of $0 | (900 | ) | ||||||||||||||||||
|
| |||||||||||||||||||
| $ | 49,100 | |||||||||||||||||||
|
| |||||||||||||||||||
$30 Million Bridge Facility | Floating | 6 | $ | 30,000 | 4.26 | % | 3/26/2019 | |||||||||||||
Deferred financing costs, net of accumulated amortization of $0 | (450 | ) | ||||||||||||||||||
|
| |||||||||||||||||||
| $ | 29,550 | |||||||||||||||||||
|
| |||||||||||||||||||
| (1) | Interest rate is based onone-month LIBOR plus an applicable margin.One-month LIBOR as of September 30, 2018 was 2.2606%. |
As of September 30, 2018, the Company had the following outstanding interest rate swaps that were designated as cash flow hedges of interest rate risk (dollars in thousands):
Effective Date | Termination Date | Notional | Fixed Rate (1) | |||||||
July 1, 2016 | June 1, 2021 | $ | 100,000 | 1.1055 | % | |||||
July 1, 2016 | June 1, 2021 | 100,000 | 1.0210 | % | ||||||
July 1, 2016 | June 1, 2021 | 100,000 | 0.9000 | % | ||||||
September 1, 2016 | June 1, 2021 | 100,000 | 0.9560 | % | ||||||
April 1, 2017 | April 1, 2022 | 100,000 | 1.9570 | % | ||||||
May 1, 2017 | April 1, 2022 | 50,000 | 1.9610 | % | ||||||
July 1, 2017 | July 1, 2022 | 100,000 | 1.7820 | % | ||||||
|
|
|
| |||||||
| $ | 650,000 | 1.3388 | %(2) | |||||||
|
|
|
| |||||||
| (1) | The floating rate option for the interest rate swaps inone-month LIBOR. As of September 30, 2018,one-month LIBOR was 2.2606%. |
| (2) | Represents the weighted average fixed rate of the interest rate swaps. |
| www.NexPointLiving.com | Page 21 | AN AFFILIATE OF | |
NEXPOINT RESIDENTIAL TRUST, INC. [NYSE:NXRT]
Debt Maturity Schedule
| Payments Due by Period (in thousands) | ||||||||||||||||||||||||||||
| Total | 2018 | 2019 | 2020 | 2021 | 2022 | Thereafter | ||||||||||||||||||||||
Operating Properties Mortgage Debt | ||||||||||||||||||||||||||||
Principal payments | $ | 832,500 | $ | 175 | $ | 716 | $ | 744 | $ | 782 | $ | 817 | $ | 829,266 | ||||||||||||||
Interest expense (1) | 177,994 | 6,607 | 26,191 | 26,248 | 29,133 | 31,812 | 58,003 | |||||||||||||||||||||
|
|
|
|
|
|
|
|
|
|
|
|
|
| |||||||||||||||
Total | $ | 1,010,494 | $ | 6,782 | $ | 26,907 | $ | 26,992 | $ | 29,915 | $ | 32,629 | $ | 887,269 | ||||||||||||||
Held For Sale Property Mortgage Debt | ||||||||||||||||||||||||||||
Principal payments | $ | 13,445 | $ | 56 | $ | 207 | $ | 205 | $ | 219 | $ | 12,758 | $ | — | ||||||||||||||
Interest expense | 1,889 | 150 | 588 | 581 | 570 | — | — | |||||||||||||||||||||
|
|
|
|
|
|
|
|
|
|
|
|
|
| |||||||||||||||
Total | $ | 15,334 | $ | 206 | $ | 795 | $ | 786 | $ | 789 | $ | 12,758 | $ | — | ||||||||||||||
Credit and Bridge Facilities | ||||||||||||||||||||||||||||
Principal payments (2) | $ | 80,000 | $ | — | $ | 30,000 | $ | 50,000 | $ | — | $ | — | $ | — | ||||||||||||||
Interest expense | 4,929 | 870 | 2,464 | 1,595 | — | — | — | |||||||||||||||||||||
|
|
|
|
|
|
|
|
|
|
|
|
|
| |||||||||||||||
Total | $ | 84,929 | $ | 870 | $ | 32,464 | $ | 51,595 | $ | — | $ | — | $ | — | ||||||||||||||
|
|
|
|
|
|
|
|
|
|
|
|
|
| |||||||||||||||
Total contractual obligations and commitments | $ | 1,110,757 | $ | 7,858 | $ | 60,166 | $ | 79,373 | $ | 30,704 | $ | 45,387 | $ | 887,269 | ||||||||||||||
|
|
|
|
|
|
|
|
|
|
|
|
|
| |||||||||||||||
| (1) | Interest expense obligations includes the impact of expected settlements on interest rate swaps which have been entered into in order to fix the interest rate on the hedged portion of our floating rate debt obligations. As of September 30, 2018, we had entered into seven interest rate swap transactions with a combined notional amount of $650.0 million. We have allocated the total impact of expected settlements on the $650.0 million notional amount of interest rate swaps to ‘Operating Properties Mortgage Debt.’ We usedone-month LIBOR as of September 30, 2018 to determine our expected settlements through the terms of the interest rate swaps. |
| (2) | The $30 Million Bridge Facility, which had $30.0 million outstanding as of September 30, 2018, is scheduled to mature on March 26, 2019. The $60 Million Credit Facility, which had $50.0 million outstanding as of September 30, 2018, is scheduled to mature on September 26, 2020. The $60 Million Credit Facility has one12-month extension option, at our election. |

| (1) | As of September 30, 2018, we had total indebtedness of $925.9 million at a weighted average interest rate of 3.87%, of which $888.1 million was debt with a floating rate. The interest rate swap agreements we have entered into effectively fix the rate on $650.0 million, or 80% of our $808.1 million of floating rate mortgage debt outstanding. As of September 30, 2018, the adjusted weighted average interest rate of our total indebtedness was 3.20%. For purposes of calculating the adjusted weighted average interest rate of the total indebtedness, we have included the weighted average fixed rate of 1.3388% forone-month LIBOR on the $650.0 million national amount of interest rate swap agreements that we have entered into as of September 30, 2018, which effectively fix the interest rate on $650.0 million of our floating rate mortgage debt outstanding. |
| www.NexPointLiving.com | Page 22 | AN AFFILIATE OF | |
NEXPOINT RESIDENTIAL TRUST, INC. [NYSE:NXRT]
Historical Acquisition Details
(in thousands, except for unit and per unit amounts)
Property Name (1) | Location | Units | Transaction Date | Purchase Price | Rehab Budget (2) | Total Investment | Per Unit | |||||||||||||||||
Arbors on Forest Ridge | Bedford, TX | 210 | 1/31/2014 | $ | 12,805 | $ | 1,449 | $ | 14,254 | $ | 67,876 | |||||||||||||
Cutter’s Point | Richardson, TX | 196 | 1/31/2014 | 15,845 | 1,357 | 17,202 | 87,765 | |||||||||||||||||
Eagle Crest | Irving, TX | 447 | 1/31/2014 | 27,325 | 1,120 | 28,445 | 63,635 | |||||||||||||||||
Silverbrook | Grand Prairie, TX | 642 | 1/31/2014 | 30,400 | 1,661 | 32,061 | 49,939 | |||||||||||||||||
Edgewater at Sandy Springs | Atlanta, GA | 760 | 7/18/2014 | 58,000 | 5,281 | 63,281 | 83,264 | |||||||||||||||||
Beechwood Terrace | Antioch, TN | 300 | 7/21/2014 | 21,400 | 1,815 | 23,215 | 77,383 | |||||||||||||||||
Willow Grove | Nashville, TN | 244 | 7/21/2014 | 13,750 | 2,116 | 15,866 | 65,025 | |||||||||||||||||
Woodbridge | Nashville, TN | 220 | 7/21/2014 | 16,000 | 1,641 | 17,641 | 80,186 | |||||||||||||||||
Abbington Heights | Antioch, TN | 274 | 8/1/2014 | 17,900 | 1,617 | 19,517 | 71,230 | |||||||||||||||||
The Summit at Sabal Park | Tampa, FL | 252 | 8/20/2014 | 19,050 | 1,656 | 20,706 | 82,167 | |||||||||||||||||
Courtney Cove | Tampa, FL | 324 | 8/20/2014 | 18,950 | 1,691 | 20,641 | 63,707 | |||||||||||||||||
Radbourne Lake | Charlotte, NC | 225 | 9/30/2014 | 24,250 | 1,438 | 25,688 | 114,169 | |||||||||||||||||
Timber Creek | Charlotte, NC | 352 | 9/30/2014 | 22,750 | 4,334 | 27,084 | 76,943 | |||||||||||||||||
Belmont at Duck Creek | Garland, TX | 240 | 9/30/2014 | 18,525 | 1,174 | 19,699 | 82,079 | |||||||||||||||||
Sabal Palm at Lake Buena Vista | Orlando, FL | 400 | 11/5/2014 | 49,500 | 1,346 | 50,846 | 127,115 | |||||||||||||||||
Southpoint Reserve at Stoney Creek (3) | Fredericksburg, VA | 156 | 12/18/2014 | 17,000 | 1,737 | 18,737 | 120,109 | |||||||||||||||||
Cornerstone | Orlando, FL | 430 | 1/15/2015 | 31,550 | 2,662 | 34,212 | 79,563 | |||||||||||||||||
The Preserve at Terrell Mill | Marietta, GA | 752 | 2/6/2015 | 58,000 | 6,688 | 64,688 | 86,021 | |||||||||||||||||
The Ashlar | Dallas, TX | 264 | 2/26/2015 | 16,235 | 2,165 | 18,400 | 69,697 | |||||||||||||||||
Heatherstone | Dallas, TX | 152 | 2/26/2015 | 9,450 | 1,648 | 11,098 | 73,013 | |||||||||||||||||
Versailles | Dallas, TX | 388 | 2/26/2015 | 26,165 | 3,917 | 30,082 | 77,531 | |||||||||||||||||
Seasons 704 Apartments | West Palm Beach, FL | 222 | 4/15/2015 | 21,000 | 1,900 | 22,900 | 103,153 | |||||||||||||||||
Madera Point | Mesa, AZ | 256 | 8/5/2015 | 22,525 | 1,808 | 24,333 | 95,051 | |||||||||||||||||
The Pointe at the Foothills | Mesa, AZ | 528 | 8/5/2015 | 52,275 | 1,372 | 53,647 | 101,604 | |||||||||||||||||
Venue at 8651 | Fort Worth, TX | 333 | 10/30/2015 | 19,250 | 4,592 | 23,842 | 71,598 | |||||||||||||||||
Parc500 | West Palm Beach, FL | 217 | 7/27/2016 | 22,421 | 5,082 | 27,503 | 126,742 | |||||||||||||||||
The Colonnade | Phoenix, AZ | 415 | 10/11/2016 | 44,600 | 6,018 | 50,618 | 121,971 | |||||||||||||||||
Old Farm | Houston, TX | 734 | 12/29/2016 | 84,721 | 1,135 | 85,856 | 116,970 | |||||||||||||||||
Stone Creek at Old Farm | Houston, TX | 190 | 12/29/2016 | 23,332 | 456 | 23,788 | 125,200 | |||||||||||||||||
Hollister Place | Houston, TX | 260 | 2/1/2017 | 24,500 | 2,952 | 27,452 | 105,585 | |||||||||||||||||
Rockledge Apartments | Marietta, GA | 708 | 6/30/2017 | 113,500 | 7,685 | 121,185 | 171,165 | |||||||||||||||||
Atera Apartments | Dallas, TX | 380 | 10/25/2017 | 59,200 | 3,721 | 62,921 | 165,582 | |||||||||||||||||
Cedar Pointe | Antioch, TN | 210 | 8/24/2018 | 26,500 | 2,252 | 28,752 | 136,914 | |||||||||||||||||
Crestmont Reserve | Dallas, TX | 242 | 9/26/2018 | 24,680 | 2,797 | 27,477 | 113,541 | |||||||||||||||||
Brandywine I & II | Nashville, TN | 632 | 9/26/2018 | 79,800 | 7,762 | 87,562 | 138,547 | |||||||||||||||||
|
|
|
|
|
|
|
|
|
| |||||||||||||||
Total/Weighted Average | 12,555 | $ | 1,143,154 | $ | 98,045 | $ | 1,241,199 | $ | 98,861 | |||||||||||||||
|
|
|
|
|
|
|
|
|
| |||||||||||||||
| (1) | Only includes properties currently owned. |
| (2) | Includes interior and exterior rehab. |
| (3) | Property was classified as held for sale as of September 30, 2018. |
| www.NexPointLiving.com | Page 23 | AN AFFILIATE OF | |
NEXPOINT RESIDENTIAL TRUST, INC. [NYSE:NXRT]
Historical Disposition Details
| (in thousands, except unit and per unit amounts) | ||||||||||||||||||||||||||||
Property Name | Location | Units | Purchase Price | Sale Price | Per Unit | Sale Date | Net Cash Proceeds (1) | Gain on Sale | ||||||||||||||||||||
Meridian | Austin, TX | 200 | $ | 12,300 | $ | 17,250 | $ | 86,250 | 5/10/2016 | $ | 16,981 | $ | 4,786 | |||||||||||||||
Park at Regency and Mandarin Reserve | Jacksonville, FL | 679 | 34,500 | 47,000 | 69,219 | 6/6/2016 | 46,239 | 11,584 | ||||||||||||||||||||
Park at Blanding and Colonial Forest | Jacksonville, FL | 291 | 12,000 | 14,500 | 49,828 | 8/31/2016 | 14,259 | 2,007 | ||||||||||||||||||||
Willowdale Crossings | Frederick, MD | 432 | 41,000 | 45,200 | 104,630 | 9/15/2016 | 44,439 | 5,576 | ||||||||||||||||||||
Jade Park | Dayton Beach, FL | 144 | 7,800 | 10,000 | 69,444 | 9/30/2016 | 9,868 | 1,979 | ||||||||||||||||||||
The Miramar Apartments | Dallas, TX | 314 | 8,875 | 16,550 | 52,707 | 4/3/2017 | 16,326 | 6,368 | ||||||||||||||||||||
Toscana | Dallas, TX | 192 | 8,875 | 13,250 | 69,010 | 4/3/2017 | 13,040 | 4,283 | ||||||||||||||||||||
The Grove at Alban | Frederick, MD | 290 | 23,050 | 27,500 | 94,828 | 4/3/2017 | 27,021 | 4,514 | ||||||||||||||||||||
Twelve 6 Ten at the Park | Dallas, TX | 402 | 20,984 | 26,600 | 66,169 | 4/27/2017 | 26,349 | 4,731 | ||||||||||||||||||||
Regatta Bay | Seabrook, TX | 240 | 18,200 | 28,200 | 117,500 | 7/14/2017 | 27,670 | 10,423 | ||||||||||||||||||||
NAVA Portfolio (2) | Atlanta, GA | 1,100 | 66,200 | 116,000 | 105,455 | 9/27/2017 | 114,010 | 48,046 | ||||||||||||||||||||
Timberglen | Dallas, TX | 304 | 16,950 | 30,000 | 98,684 | 1/31/2018 | 29,553 | 13,742 | ||||||||||||||||||||
|
|
|
|
|
|
|
|
|
|
|
| |||||||||||||||||
Total/Weighted Average | 4,588 | $ | 270,734 | $ | 392,050 | $ | 85,451 | $ | 385,755 | $ | 118,039 | |||||||||||||||||
|
|
|
|
|
|
|
|
|
|
|
| |||||||||||||||||
| (1) | Represents sales price, net of closing costs. |
| (2) | The NAVA Portfolio consists of The Arbors, The Crossings, The Crossings at Holcomb Bridge and The Knolls. |
| www.NexPointLiving.com | Page 24 | AN AFFILIATE OF | |
NEXPOINT RESIDENTIAL TRUST, INC. [NYSE:NXRT]
Definitions and Reconciliations ofNon-GAAP Measures
Definitions
This presentation containsnon-GAAP financial measures. A“non-GAAP financial measure” is defined as a numerical measure of a company’s financial performance that excludes or includes amounts so as to be different than the most directly comparable measure calculated and presented in accordance with GAAP in the statements of income, balance sheets or statements of cash flows of the Company. Thenon-GAAP financial measures used within this presentation are net operating income (“NOI”), revised fourth quarter 2018 NOI guidance annualized (“Annualized 4th Quarter NOI”), funds from operations attributable to common stockholders (“FFO”), FFO per diluted share, Core FFO, Core FFO per diluted share, adjusted FFO (“AFFO”), AFFO per diluted share and net debt.
NOI and Annualized 4th Quarter NOI are used by investors and our management to evaluate and compare the performance of our properties to other comparable properties, to determine trends in earnings and to compute the fair value of our properties. NOI is calculated by adjusting net income (loss) to add back (1) the cost of funds, (2) acquisition costs, (3) advisory and administrative fees, (4) the impact of depreciation and amortization expenses as well as gains or losses from the sale of operating real estate assets that are included in net income computed in accordance with GAAP, (5) corporate general and administrative expenses, (6) other gains and losses that are specific to us, (7) casualty-related expenses/(recoveries), and (8) property general and administrative expenses that are not reflective of the continuing operations of the properties or are incurred on behalf of the Company at the property for expenses such as legal, professional and franchise tax fees. Annualized 4th Quarter NOI is calculated by annualizing themid-point of the Company’s fourth quarter NOI guidance. We define “Same Store NOI” as NOI for our properties that are comparable between periods. We view Same Store NOI as an important measure of the operating performance of our properties because it allows us to compare operating results of properties owned for the entirety of the current and comparable periods and therefore eliminates variations caused by acquisitions or dispositions during the periods.
FFO is defined by the National Association of Real Estate Investment Trusts (“NAREIT”), as net income (loss) computed in accordance with GAAP, excluding gains or losses from real estate dispositions, plus real estate depreciation and amortization and impairment charges. We compute FFO in accordance with NAREIT’s definition. Our presentation differs slightly in that we begin with net income (loss) before adjusting for amounts attributable to (1) noncontrolling interests in consolidated joint ventures and (2) redeemable noncontrolling interests in the OP and we show the combined amounts attributable to such noncontrolling interests as an adjustment to arrive at FFO attributable to common stockholders.
Core FFO makes certain adjustments to FFO, which are either not likely to occur on a regular basis or are otherwise not representative of the ongoing operating performance of our portfolio. Core FFO adjusts FFO to remove items such as losses on extinguishment of debt and modification costs (includes prepayment penalties incurred and thewrite-off of unamortized deferred financing costs and fair market value adjustments of assumed debt related to the retirement of debt and costs incurred in connection with a debt modification that are expensed), casualty-related expenses and recoveries, the amortization of deferred financing costs incurred in connection with obtaining short-term debt financing, the ineffective portion of fair value adjustments on our interest rate derivatives designated as cash flow hedges, and the noncontrolling interests related to these items.
AFFO makes certain adjustments to Core FFO. There is no industry standard definition of AFFO and practice is divergent across the industry. AFFO adjusts Core FFO to remove items such as equity-based compensation expense and the amortization of deferred financing costs incurred in connection with obtaining long-term debt financing, and the noncontrolling interests related to these items.
Net debt is calculated by subtracting cash and cash equivalents and restricted cash held forvalue-add upgrades from total debt outstanding.
We believe that the use of NOI, Annualized 4th Quarter NOI, FFO, Core FFO, AFFO and net debt, combined with the required GAAP presentations, improves the understanding of operating results and debt levels of real estate investment trusts (“REITs”) among investors and makes comparisons of operating results and debt levels among such companies more meaningful. While NOI, Annualized 4th Quarter NOI, FFO, Core FFO, AFFO and net debt are relevant and widely used measures of operating performance and debt levels of REITs, they do not represent cash flows from operations, net income (loss) or total debt as defined by GAAP and should not be considered an alternative to those measures in evaluating our liquidity, operating performance and debt levels. NOI, Annualized 4th Quarter NOI, FFO, Core FFO and AFFO do not purport to be indicative of cash available to fund our future cash requirements. We present net debt because we believe it provides our investors a better understanding of our leverage ratio. Net debt should not be considered an alternative to total debt, as we may not always be able to use our available cash to repay debt. Our computation of NOI, Annualized 4th Quarter NOI, FFO, Core FFO, AFFO and net debt may not be comparable to NOI, Annualized 4th Quarter NOI, FFO, Core FFO, AFFO and net debt reported by other REITs. For a more complete discussion of NOI, Annualized 4th Quarter NOI, FFO, Core FFO and AFFO, see our most recent Annual Report on Form10-K and our other filings with the SEC.
| www.NexPointLiving.com | Page 25 | AN AFFILIATE OF | |
NEXPOINT RESIDENTIAL TRUST, INC. [NYSE:NXRT]
Reconciliations
NOI and Same Store NOI for the three and nine months ended September 30, 2018 and 2017
The following table, which has not been adjusted for the effects of noncontrolling interests, reconciles NOI and our Q3 and YTD Same Store NOI for the three and nine months ended September 30, 2018 and 2017 to net income (loss), the most directly comparable GAAP financial measure (in thousands):
| For the Three Months Ended September 30, | For the Nine Months Ended September 30, | |||||||||||||||
| 2018 | 2017 | 2018 | 2017 | |||||||||||||
Net income (loss) | $ | (5,260 | ) | $ | 54,076 | $ | 3,168 | $ | 60,702 | |||||||
Adjustments to reconcile net income (loss) to NOI: | ||||||||||||||||
Advisory and administrative fees | 1,885 | 1,870 | 5,586 | 5,544 | ||||||||||||
Corporate general and administrative expenses | 1,932 | 1,623 | 5,731 | 4,842 | ||||||||||||
Casualty-related recoveries (1) | (36 | ) | (380 | ) | (702 | ) | (351 | ) | ||||||||
Property general and administrative expenses (2) | 144 | 427 | 930 | 904 | ||||||||||||
Depreciation and amortization | 11,228 | 11,215 | 33,638 | 35,866 | ||||||||||||
Interest expense | 7,119 | 8,257 | 20,739 | 22,479 | ||||||||||||
Loss on extinguishment of debt and modification costs | 2,947 | 914 | 3,576 | 5,717 | ||||||||||||
Gain on sales of real estate | — | (58,490 | ) | (13,742 | ) | (78,386 | ) | |||||||||
|
|
|
|
|
|
|
| |||||||||
NOI | $ | 19,959 | $ | 19,512 | $ | 58,924 | $ | 57,317 | ||||||||
|
|
|
|
|
|
|
| |||||||||
LessNon-Same Store | ||||||||||||||||
Revenues (3) | (1,783 | ) | (3,959 | ) | (14,864 | ) | (20,753 | ) | ||||||||
Operating expenses (3) | 837 | 2,000 | 6,711 | 10,017 | ||||||||||||
|
|
|
|
|
|
|
| |||||||||
Same Store NOI (3) | $ | 19,013 | $ | 17,553 | $ | 50,771 | $ | 46,581 | ||||||||
|
|
|
|
|
|
|
| |||||||||
| (1) | Adjustment to net income (loss) to exclude certain property operating expenses that are casualty-related recoveries. |
| (2) | Adjustment to net income (loss) to exclude certain property general and administrative expenses that are not reflective of the continuing operations of the properties or are incurred on our behalf at the property for expenses such as legal, professional and franchise tax fees. |
| (3) | Amounts for the three months ended September 30, 2018 and 2017 are derived from the operations of our Q3 Same Store andNon-Same Store properties; amounts for the nine months ended September 30, 2018 and 2017 are derived from the operations of our YTD Same Store andNon-Same Store properties. |
Reconciliation of Debt to Net Debt
| (dollar amounts in thousands) | Q3 2018 | Q3 2017 | ||||||
Total mortgage debt | $ | 845,945 | $ | 733,300 | ||||
Credit facility | 50,000 | 30,000 | ||||||
Bridge facility | 30,000 | 54,597 | ||||||
Adjustments to arrive at net debt: | ||||||||
Cash and cash equivalents | (19,324 | ) | (92,695 | ) | ||||
Restricted cash held forvalue-add upgrades | (2,502 | ) | (6,291 | ) | ||||
|
|
|
| |||||
Net Debt | $ | 904,119 | $ | 718,911 | ||||
|
|
|
| |||||
Enterprise Value (1) | $ | 1,594,119 | $ | 1,219,911 | ||||
Leverage Ratio | 57 | % | 59 | % | ||||
| (1) | Enterprise Value is calculated as Market Capitalization plus Net Debt. |
| www.NexPointLiving.com | Page 26 | AN AFFILIATE OF | |
NEXPOINT RESIDENTIAL TRUST, INC. [NYSE:NXRT]
Reconciliations of NOI, Same Store NOI, FFO, Core FFO and AFFO
The following table, which has not been adjusted for the effects of noncontrolling interests, reconciles NOI to net income (loss) (the most directly comparable GAAP financial measure) for the periods presented below (in thousands):
| For the Year Ended December 31, | 2018 Quarters Ended | |||||||||||||||||||||||
| 2018 (1) | 2017 | March 31 | June 30 | September 30 | December 31 (1) | |||||||||||||||||||
Net income (loss) | $ | (1,030 | ) | $ | 56,359 | $ | 10,094 | $ | (1,666 | ) | $ | (5,260 | ) | $ | (4,198 | ) | ||||||||
Adjustments to reconcile net income (loss) to NOI: | ||||||||||||||||||||||||
Advisory and administrative fees | 7,473 | 7,419 | 1,838 | 1,863 | 1,885 | 1,887 | ||||||||||||||||||
Corporate general and administrative expenses | 7,612 | 6,275 | 1,813 | 1,986 | 1,932 | 1,881 | ||||||||||||||||||
Casualty-related expenses/(recoveries) (2) | (702 | ) | (287 | ) | 24 | (690 | ) | (36 | ) | — | ||||||||||||||
Property general and administrative expenses (3) | 1,140 | 1,130 | 380 | 406 | 144 | 210 | ||||||||||||||||||
Depreciation and amortization | 47,455 | 48,752 | 11,372 | 11,038 | 11,228 | 13,817 | ||||||||||||||||||
Interest expense | 29,161 | 29,576 | 6,797 | 6,823 | 7,119 | 8,422 | ||||||||||||||||||
Loss on extinguishment of debt and modification costs | 3,576 | 5,719 | 551 | 78 | 2,947 | — | ||||||||||||||||||
Gain on sales of real estate | (13,742 | ) | (78,365 | ) | (13,742 | ) | — | — | — | |||||||||||||||
|
|
|
|
|
|
|
|
|
|
|
| |||||||||||||
NOI | $ | 80,943 | $ | 76,578 | $ | 19,127 | $ | 19,838 | $ | 19,959 | $ | 22,019 | ||||||||||||
|
|
|
|
|
|
|
|
|
|
|
| |||||||||||||
LessNon-Same Store | ||||||||||||||||||||||||
Revenues (4) | (23,404 | ) | (25,764 | ) | ||||||||||||||||||||
Operating expenses (4) | 10,611 | 12,433 | ||||||||||||||||||||||
|
|
|
| |||||||||||||||||||||
Same Store NOI (4) | $ | 68,150 | $ | 63,247 | ||||||||||||||||||||
|
|
|
| |||||||||||||||||||||
| (1) | Mid-point estimates shown for full year and fourth quarter 2018 guidance. Assumptions made for full year and fourth quarter 2018 NOI guidance include the Same Store operating growth projections included in the “2018 Full Year Guidance Summary” section of this release, the effect of the Timberglen sale and the acquisitions of Cedar Pointe, Crestmont Reserve and Brandywine I & II, and no further acquisition or disposition activity for the remainder of the year. |
| (2) | Adjustment to net income (loss) to exclude certain property operating expenses that are casualty-related expenses/(recoveries). |
| (3) | Adjustment to net income (loss) to exclude certain property general and administrative expenses that are not reflective of the continuing operations of the properties or are incurred on our behalf at the property for expenses such as legal, professional and franchise tax fees. |
| (4) | Amounts are derived from the results of operations of our pro forma Full Year 2018 Same Store properties andNon-Same Store properties. There are 29 properties in our pro forma Full Year 2018 Same Store pool. |
| www.NexPointLiving.com | Page 27 | AN AFFILIATE OF | |
NEXPOINT RESIDENTIAL TRUST, INC. [NYSE:NXRT]
The following table reconciles our FFO, Core FFO and AFFO guidance to our net loss (the most directly comparable GAAP financial measure) guidance for the year ended December 31, 2018 (in thousands, except per share data):
| For the Year Ended December 31, 2018 | ||||
| Mid-Point | ||||
Net loss | $ | (1,030 | ) | |
Depreciation and amortization | 47,455 | |||
Gain on sale of real estate | (13,742 | ) | ||
Adjustment for noncontrolling interests | (98 | ) | ||
|
| |||
FFO attributable to common stockholders | 32,585 | |||
|
| |||
FFO per share - diluted (1) | $ | 1.53 | ||
|
| |||
Loss on extinguishment of debt and modification costs | 3,576 | |||
Casualty-related recoveries | (702 | ) | ||
Amortization of deferred financing costs - acquisition term notes | 244 | |||
Adjustment for noncontrolling interests | (9 | ) | ||
|
| |||
Core FFO attributable to common stockholders | 35,694 | |||
|
| |||
Core FFO per share - diluted (1) | $ | 1.67 | ||
|
| |||
Amortization of deferred financing costs - long term debt | 1,536 | |||
Equity-based compensation expense | 4,198 | |||
Adjustment for noncontrolling interests | (17 | ) | ||
|
| |||
AFFO attributable to common stockholders | 41,411 | |||
|
| |||
AFFO per share - diluted (1) | $ | 1.94 | ||
|
| |||
Weighted average common shares outstanding - diluted | 21,310 | |||
| (1) | For purposes of calculating per share data, NXRT assumes a weighted average diluted share count of approximately 21.3 million for the full year 2018. |
| www.NexPointLiving.com | Page 28 | AN AFFILIATE OF | |