UNITED STATES
SECURITIES AND EXCHANGE COMMISSION
WASHINGTON, D.C. 20549
FORM 10-K
☒ ANNUAL REPORT PURSUANT TO SECTION 13 OR 15(d) OF THE SECURITIES EXCHANGE ACT OF 1934
For the Fiscal Year Ended: December 31, 2024
OR
☐ TRANSITION REPORT PURSUANT TO SECTION 13 OR 15(d) OF THE SECURITIES EXCHANGE ACT OF 1934
For the transition period from To
Commission File Number: 001-36834
EASTERLY GOVERNMENT PROPERTIES, INC.
(Exact name of registrant as specified in its charter)
| |
Maryland | 47-2047728 |
(State or other jurisdiction of incorporation or organization) | (IRS Employer Identification No.) |
| |
2001 K Street NW, Suite 775 North, Washington, D.C. | 20006 |
(Address of principal executive offices) | (Zip Code) |
Registrant’s telephone number, including area code: (202) 595-9500
Securities registered pursuant to Section 12(b) of the Act:
| | |
Title of each class | Trading Symbol(s) | Name of each exchange on which registered |
Common Stock | DEA | New York Stock Exchange |
Securities registered pursuant to Section 12(g) of the Act: None
Indicate by check mark if the registrant is a well-known seasoned issuer, as defined in Rule 405 of the Securities Act. Yes ☒ NO ☐
Indicate by check mark if the registrant is not required to file reports pursuant to Section 13 or Section 15(d) of the Act. YES ☐ No ☒
Indicate by check mark whether the registrant (1) has filed all reports required to be filed by Section 13 or 15(d) of the Securities Exchange Act of 1934 during the preceding 12 months (or for such shorter period that the registrant was required to file such reports), and (2) has been subject to such filing requirements for the past 90 days. Yes ☒ NO ☐
Indicate by check mark whether the registrant has submitted electronically every Interactive Data File required to be submitted pursuant to Rule 405 of Regulation S-T (Section 232.405 of this chapter) during the preceding 12 months (or for such shorter period that the registrant was required to submit such files). Yes ☒ NO ☐
Indicate by check mark whether the registrant is a large accelerated filer, accelerated filer, a non-accelerated filer, a smaller reporting company or an emerging growth company. See the definitions of “large accelerated filer,” “accelerated filer,” “smaller reporting company” and “emerging growth company” in Rule 12b-2 of the Exchange Act.
| | | |
Large Accelerated Filer | ☒ | Accelerated Filer | ☐ |
Non-Accelerated Filer | ☐ | Smaller Reporting Company | ☐ |
| | Emerging Growth Company | ☐ |
If an emerging growth company, indicate by check mark if the registrant has elected not to use the extended transition period for complying with any new or revised financial accounting standards provided pursuant to Section 13(a) of the Exchange Act. ☐
Indicate by check mark whether the registrant has filed a report on and attestation to its management’s assessment of the effectiveness of its internal control over financial reporting under Section 404(b) of the Sarbanes-Oxley Act (15 U.S.C. 7262(b)) by the registered public accounting firm that prepared or issued its audit report. ☒
If securities are registered pursuant to Section 12(b) of the Act, indicate by check mark whether the financial statements of the registrant included in the filing reflect the correction of an error to previously issued financial statements. ☐
Indicate by check mark whether any of those error corrections are restatements that required a recovery analysis of incentive-based compensation received by any of the registrant’s executive officers during the relevant recovery period pursuant to §240.10D-1(b). ☐
Indicate by check mark whether the registrant is a shell company (as defined in Rule 12b-2 of the Act). YES ☐ NO ☒
The number of shares of Registrant’s common stock outstanding as of February 18, 2025 was 107,970,559.
As of June 30, 2024, the aggregate market value of the shares of common stock held by non-affiliates of the registrant was approximately $1.19 billion based on the closing sale price of $12.37 as reported on the New York Stock Exchange on June 28, 2024. For this computation, the registrant has excluded the market value of all shares of common stock reported as beneficially owned by executive officers and directors of the registrant; such exclusion shall not be deemed to constitute an admission that any such person is an affiliate of the registrant.
DOCUMENTS INCORPORATED BY REFERENCE
Portions of the Proxy Statement for the Annual Stockholders’ Meeting to be filed within 120 days after the end of the registrant’s fiscal year are incorporated by reference in Part III of this Annual Report on Form 10-K.
Table of Contents
PART I
Forward-Looking Statements
This Annual Report on Form 10-K contains forward-looking statements within the meaning of the Private Securities Litigation Reform Act of 1995, Section 27A of the Securities Act of 1933, as amended (the “Securities Act”) and Section 21E of the Securities Exchange Act of 1934, as amended (the “Exchange Act”). We caution investors that forward-looking statements are based on management’s beliefs and on assumptions made by, and information currently available to, management. When used, the words “anticipate”, “believe”, “estimate”, “expect”, “intend”, “may”, “might”, “plan”, “potential”, “project”, “result”, “seek”, “should”, “target”, “will”, and similar expressions which do not relate solely to historical matters are intended to identify forward-looking statements. These statements are subject to risks, uncertainties, and assumptions and are not guarantees of future performance, which may be affected by known and unknown risks, trends, uncertainties, and factors that are beyond our control. Should one or more of these risks or uncertainties materialize, or should underlying assumptions prove incorrect, actual results may vary materially from those anticipated, estimated, or projected. We expressly disclaim any responsibility to update our forward-looking statements, whether as a result of new information, future events, or otherwise. Accordingly, investors should use caution in relying on forward-looking statements, which are based on results and trends at the time they are made, to anticipate future results or trends.
Some of the risks and uncertainties that may cause our actual results, performance, or achievements to differ materially from those expressed or implied by forward-looking statements include, among others, the following:
•risks associated with our dependence on the U.S. Government and its agencies for substantially all of our revenues, including credit risk and risk that the U.S. Government reduces its spending on real estate or that it changes its preference away from leased properties;
•risks associated with ownership and development of real estate;
•the risk of decreased rental rates or increased vacancy rates;
•the loss of key personnel;
•general volatility of the capital and credit markets and the market price of our common stock;
•the risk we may lose one or more major tenants;
•difficulties in completing and successfully integrating acquisitions;
•failure of acquisitions or development projects to occur at anticipated levels or yield anticipated results;
•risks associated with actual or threatened terrorist attacks;
•risks associated with our joint venture activities;
•intense competition in the real estate market that may limit our ability to attract or retain tenants or re-lease space;
•insufficient amounts of insurance or exposure to events that are either uninsured or underinsured;
•uncertainties and risks related to adverse weather conditions, natural disasters and climate change;
•exposure to liability relating to environmental and health and safety matters;
•limited ability to dispose of assets because of the relative illiquidity of real estate investments and the nature of our assets;
•exposure to litigation or other claims;
•risks associated with breaches of our data security;
•risks associated with our indebtedness, including failure to refinance current or future indebtedness on favorable terms, or at all, failure to meet the restrictive covenants and requirements in our existing and new debt agreements, fluctuations in interest rates and increased costs to refinance or issue new debt;
•risks associated with derivatives or hedging activity;
•risks associated with mortgage debt or unsecured financing or the unavailability thereof, which could make it difficult to finance or refinance properties and could subject us to foreclosure; and
•adverse impacts from any future pandemic, epidemic or outbreak of any highly infectious disease on the U.S., regional and global economies and our financial condition and results of operations.
While forward-looking statements reflect our good faith beliefs, they are not guarantees of future performance. For further information on these and other factors that could affect us and the statements contained herein, you should refer to Item 1A below entitled “Risk Factors.”
Summary Risk Factors
The risk factors detailed in Item 1A entitled “Risk Factors” in this Annual Report on Form 10-K are the risks that we believe are material to our investors and a reader should carefully consider them. Those risks are not all of the risks we face and other factors not presently known to us or that we currently believe are immaterial may also affect our business if they occur. The following is a summary of the risk factors detailed in Item 1A.
•We depend on the U.S. Government and its agencies for substantially all of our revenues and any failure by the U.S. Government and its agencies to perform their obligations under their leases or to renew their leases upon expiration could have a material adverse effect on our business, financial condition and results of operations.
•We may be unable to renew leases or lease vacating space on favorable terms or at all as leases expire, which could adversely affect our business, financial condition and results of operations.
•We are exposed to risks associated with property development and redevelopment, including new developments for anticipated tenant agencies and build-to-suit renovations for existing tenant agencies.
•Unfavorable market and economic conditions in the United States and globally could adversely affect occupancy levels, rental rates, rent collections, operating expenses and the overall market value of our assets and have a material adverse effect on our business, financial condition and results of operations.
•Our properties are leased to a limited number of U.S. Government tenant agencies, and a change to any of these agencies’ missions could have a material adverse effect on our business, financial condition and results of operations.
•Some of our leases with U.S. Government tenant agencies permit the tenant agency to vacate the property and discontinue paying rent prior to their lease expiration date.
•The impact of prolonged government shutdowns and budgetary reductions or impasses could have a material adverse effect on our business, financial condition and results of operations.
•Capital and credit market conditions may adversely affect our access to various sources of capital or financing or the cost of capital, which could impact our business activities, dividends, earnings and common stock price, among other things.
•We may be unable to identify and successfully complete acquisitions and, even if acquisitions are identified and completed, completed acquisitions may not achieve the intended benefits or may disrupt our plans and operations.
•Because our principal tenants are agencies of the U.S. Government, our properties have a higher risk of terrorist attack and are more likely to be the site of civil unrest than similar properties leased to non-governmental tenants.
•Competition could limit our ability to acquire attractive investment opportunities and to attract and retain tenants, which may adversely affect us, including our profitability and impede our growth.
•We may be subject to unknown or contingent liabilities related to properties or businesses that we have acquired or may acquire in the future for which we may have limited recourse against the sellers.
•Any future pandemic, epidemic or outbreak of any highly infectious disease could have an adverse effect on our business, financial condition, results of operations and cash flows.
•We are subject to risks involved in real estate activity through joint venture.
•The ability of stockholders to control our policies and effect a change of control of our company is limited by certain provisions of our charter and bylaws and by Maryland law.
•We have a substantial amount of indebtedness that may limit our financial and operating activities and may adversely affect our ability to incur additional debt to fund future needs.
•We may not have sufficient cash flow to meet the required payments of principal and interest on our debt or to pay distributions on our shares at expected levels.
•Hedging activity may expose us to risks, including the risks that a counterparty will not perform and that the hedge will not yield the economic benefits we anticipate, which could adversely affect us.
•We are subject to risks from natural disasters and climate change.
•High mortgage rates or unavailability of mortgage debt may make it difficult for us to finance or refinance properties, which could reduce the number of properties we can acquire, our net income and the amount of cash distributions we can make.
•The form, timing or amount of dividend distributions in future periods may vary and be impacted by economic and other considerations.
•Failure to qualify or maintain our qualification as a REIT would have significant adverse consequences to the value of our common stock.
•We may owe certain taxes notwithstanding our qualification as a REIT.
•REIT distribution requirements could adversely affect our liquidity and our ability to execute our business plan.
•We depend on the members of our senior management team and the loss of any of their services, or an inability to attract and retain highly qualified personnel, could have a material adverse effect on our business, financial condition and results of operations.
•We rely on information technology in our operations, and any material failure, inadequacy, interruption or security failure of that technology could harm our business.
•We may from time to time be subject to litigation, which could have a material adverse effect on our business, financial condition and results of operations.
This section contains forward-looking statements. You should refer to the explanation of the qualifications and limitations on forward-looking statements beginning on page 1.
Item 1. Business
General
References to “Easterly,” “we,” “our,” “us” and “our company” refer to Easterly Government Properties, Inc., a Maryland corporation, together with our consolidated subsidiaries including Easterly Government Properties LP, a Delaware limited partnership, which we refer to herein as our operating partnership. We present certain financial information and metrics “at Easterly Share,” which is calculated on an entity-by-entity basis. At Easterly Share information, which we also refer to as being “at share,” “pro rata,” “our pro rata share” or “our share” is not, and is not intended to be, a presentation in accordance with accounting principles generally accepted in the United States of America (“GAAP”).
We are an internally managed real estate investment trust, or REIT, focused primarily on the acquisition, development and management of Class A commercial properties that are leased to U.S. Government agencies that serve essential functions. We generate over 90% of our revenue by leasing our properties to such agencies either directly or through the U.S. General Services Administration (“GSA”). Our objective is to generate attractive risk-adjusted returns for our stockholders over the long term through dividends and capital appreciation.
We focus primarily on acquiring, developing and managing U.S. Government-leased properties that are essential to supporting the mission of the tenant agency and strive to be a partner of choice for the U.S. Government, working closely with the tenant agency to meet its needs and objectives. We may also consider other potential opportunities to add properties to our portfolio, including acquiring properties leased to state and local governments with strong creditworthiness and other opportunities that directly or indirectly support the mission of select government agencies. As of December 31, 2024, we wholly owned 90 operating properties and ten operating properties through an unconsolidated joint venture (the “JV”) in the United States encompassing approximately 9.7 million leased square feet (9.2 million pro rata), including 92 operating properties that were leased primarily to U.S. Government tenant agencies, four operating properties leased to tenant agencies of a U.S. state or local government and three operating properties that were entirely leased to private tenants. As of December 31, 2024, our operating properties were 97% leased. For purposes of calculating percentage leased, we exclude from the denominator total square feet that was unleased and to which we attributed no value at the time of acquisition. In addition, we wholly owned two properties under development that we expect will encompass approximately 0.2 million leased square feet upon completion.
Our operating partnership holds substantially all of our assets and conducts substantially all of our business. We are the sole general partner of our operating partnership and owned approximately 95.2% of the aggregate limited partnership interests in our operating partnership, which we refer to herein as common units, as of December 31, 2024. We have elected to be taxed as a REIT and believe that we have operated and have been organized in conformity with the requirements for qualification and taxation as a REIT for U.S. federal income tax purposes commencing with our taxable year ended December 31, 2015.
Our Competitive Strengths
We believe that we distinguish ourselves from other owners and operators of office and other commercial properties, including properties leased to the U.S. Government, through the following competitive strengths:
•High Quality Portfolio Leased to Mission-Critical U.S. Government Agencies. We focus primarily on the acquisition, development and management of Class A commercial properties that are leased to U.S. Government agencies that serve mission-critical functions and are of high importance within the hierarchy of these agencies. These properties generally meet our investment criteria, which targets major federal buildings of Class A construction that are less than 20 years old, or have undergone a substantial renovation-to-suit for the tenant agency, are at least 85% leased to a single U.S. Government agency, are in excess of 40,000 rentable square feet with expansion potential, are in strategic locations to facilitate the tenant agency’s mission, include build-to-suit features. As of December 31, 2024, the weighted average age of our wholly owned and unconsolidated operating properties was approximately 15.7 years based on the date the property was built or renovated-to-suit, where applicable, and the weighted average remaining lease term was approximately 10.0 years.
•Primarily U.S. Government Tenant Base with Strong History of Renewal. Our leases with U.S. Government agencies are backed by the full faith and credit of the U.S. Government. For the GSA leases, rents are paid from the Federal Buildings Fund and are not subject to direct federal appropriations. All of our leases with other federal agencies were executed under delegation from the GSA, and therefore the Federal Buildings Fund stands behind these leases as a guarantor, even though the rent is paid from appropriated funds by the agencies who executed the lease contracts. Furthermore, the U.S. Government has never experienced a financial default to date. In addition to stable rent payments, our U.S. Government leases typically have initial total terms of ten to 20 years with renewal leases having terms of five to 15 years. U.S. Government leases governing properties similar to the properties that we target have historically had high renewal rates, which limit operational risk. We believe that the strong credit quality of our government tenant base, our long-term leases, the likelihood of lease renewal and the high tenant recovery rate for our property-related operating expenses contribute to the stability of our operating cash flows and expected distributions.
•Experienced and Aligned Management Team. Our senior management team has a proven track record of sourcing, acquiring, developing and managing properties leased to government agencies. For example, our senior management team has collectively been responsible for the acquisition of an aggregate of approximately 10.0 million square feet of U.S. Government, state, local and private-leased properties, of which 1.2 million square feet was acquired through the JV and approximately 1.4 million aggregate square feet was internally developed. We believe that our management expertise provides us with a significant advantage over our competitors when pursuing acquisition opportunities and engaging U.S. Government agencies in property development opportunities and provides us with superior property management and tenant service capabilities.
•Access to Acquisition Opportunities with an Active Pipeline. Our senior management team has an extensive network of longstanding relationships with owners, specialized developers, leasing brokers, lenders and other participants in the government-leased property market. Our team seeks to leverage these relationships to access a wide variety of sourcing opportunities, frequently resulting in the acquisition of properties that were not broadly marketed. In addition, we maintain a proprietary database that tracks buildings encompassing approximately 96.7 million rentable square feet and includes substantially every major U.S. Government-leased property that meets our investment criteria as well as information about the building’s ownership. This proprietary database incorporates recent updates to the GSA inventory and the portfolio of VA leased assets across the United States. We believe that our longstanding industry relationships, coupled with our proprietary database, improve our ability to source and execute attractive acquisition opportunities. Further, these factors enable us to effectively initiate transactions with property owners who may not currently be seeking to sell their property, which we believe gives us a competitive advantage over others bidding in broadly marketed transactions.
•Extensive Development Experience with U.S. Government-Leased Properties. Our senior management team has developed projects comprising approximately 4.6 million square feet, including 40 build-to-suit projects for the U.S. Government as well as other corporate tenants. In the aggregate, our senior management team has developed 23 projects for the GSA and U.S. Government agencies. Development of government projects, particularly build-to-suit projects, requires expertise in GSA and other U.S. Government requirements and the needs of tenant agencies. Since 1994, members of our senior management team have developed an average of approximately 46,000 square feet per year of U.S. Government-leased build-to-suit properties. We believe that our thorough understanding of the U.S. Government’s procurement processes and standards, our longstanding relationships with the GSA and other agencies of the U.S. Government, and our differentiated capabilities enable us to continue to compete effectively for U.S. Government development opportunities.
•Value-Enhancing Asset Management. Our management team focuses on the efficient management of our properties and on improvements to our properties that enhance their value for a tenant agency and improve the likelihood of lease renewal. We work in close partnership with the U.S. Government tenant agencies to manage the construction of specialized, agency-specific design enhancements. These highly tailored build-outs substantially increase the likelihood of the tenant agency’s renewal and also typically generate a construction management fee paid by the tenant agency to us in the amount of approximately 10% of the actual cost of construction. We also seek to reduce operating costs at all of our properties, often by implementing energy efficiency programs. Our asset management team also conducts frequent audits of each of our properties in concert with the U.S. Government tenant agency to keep each facility in optimal condition, allow the tenant agency to better perform its stated mission and help to position us as a partner of choice for the U.S. Government and its tenant agencies.
•Growth-Oriented Capital Structure. Our capital structure provides us with the resources, financial flexibility and the capacity to support the future growth of our business. Since our initial public offering, we have raised capital through four underwritten public offerings of our common stock and sales of our common stock under our at-the-market equity offering programs (“ATM Programs”). Additionally, during 2021, we formed the JV with a leading global investor to acquire a portfolio of properties, in which we own a 53% interest. During the year ended December 31, 2024, we received net proceeds of $71.1 million through the issuance of 5,491,217 shares of our common stock under our ATM Programs. All shares were issued in settlement of previously entered into forward sale transactions in connection with the ATM Programs. As of December 31, 2024, there were no unsettled shares outstanding under our ATM Programs, and we had the capacity to issue an additional $315.4 million under such programs. As of December 31, 2024, we had total indebtedness of approximately $1.6 billion, including borrowings of approximately $274.6 million outstanding under our $400.0 million senior unsecured revolving credit facility.
Business & Growth Strategies
Our objective is to generate attractive risk-adjusted returns for our stockholders over the long term through dividends and capital appreciation. We pursue the following strategies to achieve these goals:
•Pursue Attractive Acquisition Opportunities. We seek to pursue strategic and disciplined acquisitions of properties that we believe are directly and indirectly essential to the mission of select government agencies and that, in many cases, contain agency-specific design enhancements that allow each tenant agency to better satisfy its mission. We target for acquisition primarily major federal buildings of Class A construction that are less than 20 years old, or have undergone substantial renovation-to-suit for the tenant agency, are at least 85% leased to a single U.S. Government agency, are in excess of 40,000 rentable square feet with expansion potential, and are in strategic locations to facilitate the tenant agency’s mission and include build-to-suit features.
•Develop Build-to-Suit U.S. Government Properties. We target attractive opportunities to develop build-to-suit properties for the benefit of certain U.S. Government agencies. As U.S. Government agencies expand, they often require additional space tailored specifically to their needs, which may not be available in the agency’s target market and therefore require new construction. The U.S. Government has historically solicited proposals to develop and lease such properties to the agency, rather than developing and owning the property itself. We expect to bid for those property development opportunities published by the GSA or the relevant U.S. Government agency, as well as seeking other potential development opportunities that suit our investment criteria.
•Renew Existing Leases at Positive Spreads. We seek to renew leases at our U.S. Government-leased properties at positive spreads upon expiration. Upon lease renewal, U.S. Government rental rates have historically reset based on a number of factors, including inflation, the replacement cost of the building at the time of renewal and enhancements to the property since the date of the prior lease. During the term of a U.S. Government lease, we work in close partnership with the tenant agency to implement improvements at our properties to enhance the U.S. Government tenant agency’s ability to perform its stated mission, thereby increasing the importance of the building to the tenant agency and the probability of an increase in rent upon lease renewal.
•Reduce Property-Level Operating Expenses. We manage our properties with a focus on increasing our income by continuing to reduce property-level operating costs and identifying cost efficiencies so as to eliminate any excess spending and streamline our operating costs. In conjunction with these goals, we also seek to reduce the environmental impact of our portfolio through the implementation of environmentally prudent building operation measures. When we acquire a property, we review all property-level operating expenditures to determine whether and how the property can be managed more efficiently.
Employees and Human Capital
As of December 31, 2024, we had 50 employees, including 34 employees based in our corporate headquarters in Washington, D.C. and 16 employees based in other locations throughout the United States. None of our employees are represented by a collective bargaining agreement. We believe that our relationship with our employees is good.
From the top down, including our board of directors and senior management team, we are committed to cultivating an inclusive company culture that attracts top talent and creates an environment that fosters collaboration, innovation and a variety of perspectives, while providing professional development opportunities and training. Our human capital objectives include identifying, recruiting, retaining, developing, incentivizing and integrating our existing and prospective employees. To further these objectives, we have established a number of policies and programs and undertaken various initiatives, including:
•Employee Training and Professional Development. We encourage our employees to take advantage of various internal training opportunities, as well as those provided by outside service providers to the extent they are business related. For example, all employees, including members of our management team, are trained annually about the business and structure of our company and the important laws and policies that affect us, with a focus on ethics, compliance and internal controls. Our employees also receive extensive and ongoing training concerning important cybersecurity issues. Many of our employees hold professional licenses and we encourage them, and in many cases reimburse them, to attend ongoing continuing professional education certifications such as is typically required of certified public accountants. Furthermore, we provide a professional development allowance to each of our employees on an annual basis for them to pursue development opportunities such as but not limited to conferences, workshops, webinar and education courses. We also provide all employees with biannual performance and career development reviews.
•Employee Retention, Compensation and Benefits. We value employee retention and actively seek to promote from within our company. We maintain cash- and equity-based compensation programs designed to attract, retain and motivate our employees based on merit and their contributions.
•Employee Health and Safety. We recognize the importance of the health, safety and environmental well-being of our employees, and are committed to providing and maintaining a healthy work environment. We offer a comprehensive benefits program as well as a 401(k) with a matching employer contribution, flexible spending accounts, remote work policies, income protection through our sick pay, salary continuation and long term disability policies, paid vacation, paid maternity, paternity and adoption leave and holiday and personal days to balance work and personal life.
Significant Tenants
As of December 31, 2024, our U.S. Government tenant agencies accounted for 93.3% of our annualized lease income. For further information on the composition of our tenant base, see Item 2, “Properties.”
Insurance
We carry comprehensive general liability coverage on all of our properties, with limits of liability customary within the industry to insure against liability claims and related defense costs. Similarly, we are insured against the risk of direct physical damage in amounts necessary to reimburse us on a replacement-cost basis for costs incurred to repair or rebuild each property, including loss of rental income during the reconstruction period. The majority of our property policies include coverage for the perils of flood and earthquake shock with limits and deductibles customary in the industry and specific to the property. We also generally obtain title insurance policies when acquiring new properties, which insure fee title to our real properties. We currently have coverage for losses incurred in connection with both domestic and foreign terrorist-related activities. While we do carry commercial general liability insurance, property insurance and terrorism insurance with respect to our properties, these policies include limits and terms we consider commercially reasonable. There are certain losses that are not insured, in full or in part, because they are either uninsurable or the cost of insurance makes it, in our belief, economically impractical to maintain such coverage. Should an uninsured loss arise against us, we would be required to use our own funds to resolve the issue, including litigation costs. We believe the policy specifications and insured limits are adequate given the relative risk of loss, the cost of the coverage and industry practice and, in the opinion of our management, the properties in our portfolio are adequately insured.
Competition
We compete with numerous developers, real estate companies and other owners of commercial properties for acquisitions and pursuing buyers for dispositions. We expect that other real estate investors, including insurance companies, private equity funds, sovereign wealth funds, pension funds, other REITs and other well-capitalized investors will compete with us to acquire existing properties and to develop new properties. In addition, U.S. Government tenants are viewed as desirable tenants by other landlords
because of their strong credit profile, and properties leased to U.S. Government tenant agencies often attract many potential buyers. This competition could increase prices for properties of the type we may pursue and adversely affect our profitability and impede our growth. In addition, substantially all of our properties face competition for tenants. Some competing properties may be newer, better located or more attractive to tenants. Competing properties may have lower rates of occupancy than our properties, which may result in competing owners offering available space at lower rents than we offer at our properties. This competition may affect our ability to attract and retain tenants, may reduce the rents we are able to charge and could have a material adverse effect on our business, financial condition and results of operations.
Governmental Regulations
Compliance with various governmental regulations has an impact on our business, including our capital expenditures, earnings and competitive position, which can be material. We incur costs to monitor and take actions to comply with governmental regulations that are applicable to our business, which include, among others, federal securities laws and regulations, applicable stock exchange requirements, REIT and other tax laws and regulations, environmental and health and safety laws and regulations, local zoning, usage and other regulations relating to real property, the Americans with Disabilities Act of 1990 and related laws and regulations.
See Item 1A, “Risk Factors” for a discussion of material risks to us, including, to the extent material, to our competitive position, relating to governmental regulations, and see Item 7, “Management’s Discussion and Analysis of Financial Condition and Results of Operations” together with our consolidated financial statements, including the related notes included therein, for a discussion of material information relevant to an assessment of our financial condition and results of operations, including, to the extent material, the effects that compliance with governmental regulations may have upon our capital expenditures and earnings.
Environmental, Social and Corporate Governance
We are committed to sustainability and continually seek to improve our environmental responsibility initiatives, efforts, programs and policies. We have an in-house committee, comprised of employees and members of senior management, that meets regularly to identify, initiate, and monitor sustainable practices in all aspects of our business for the benefit of our tenants, shareholders, employees, and the community at large. In 2024, we published our third annual Environmental, Social, and Governance (“ESG”) report which included information on our progress towards meeting our previously announced environmental and social goals as well as an update to our alignment with five United Nations Sustainable Development Goals. These goals aim to help reduce our greenhouse gas emissions and address climate change performance.
The U.S. Government maintains “green lease” policies that include the “Promotion of Energy Efficiency and Use of Renewable Energy” as one of the many factors it considers when leasing property and we continue to partner with the GSA to promote sustainability. In 2023, we were recognized as a Premier Member of the EPA’s ENERGY STAR Certification Nation as well as a Silver Level Green Lease Leader by the Department of Energy’s Better Building Alliance. For the 2024 certification year, we had 19 ENERGY STAR certified buildings. Additionally, over 45% of our assets have achieved at least one sustainability related certification such as ENERGY STAR, LEED, or Green Globes.
Corporate Responsibility
We are committed to volunteerism and philanthropy and strive to positively impact the communities in which we work and live. We have a gift-matching program where Easterly will match each employee’s qualifying charitable contribution up to a specified amount each year. We also announced enhancements to our companywide volunteering program beginning in 2022. We believe these commitments mutually benefit our tenants, investors, employees, and local communities.
We are also committed to conducting our business consistent with the highest standards of business ethics. Through our Code of Business Conduct and Ethics (our “Code of Conduct”), we have established companywide standards for ethical business practices and regulatory compliance. Our Code of Conduct applies to all of our employees, directors, and officers, each of whom has a personal responsibility to uphold our standards. Similarly, we expect our vendors, service providers, contractors, and consultants, as well as their employees, agents, and subcontractors (collectively referred to as “Vendors”), to embrace our commitment to integrity and personal responsibility by complying with the Vendor Code of Business Conduct and Ethics (the “Vendor Code”) while conducting business with or on behalf of the Company. To the extent the Vendor Code requires a higher standard than required by commercial practice or applicable laws, rules or regulations, or, as applicable, the Federal Acquisition Regulations, our Vendors are expected to adhere to these higher standards.
REIT Qualification
We believe that we have operated and have been organized in conformity with the requirements for qualification and taxation as a REIT for U.S. federal income tax purposes commencing with our taxable year ended December 31, 2015. So long as we qualify as a REIT, we generally will not be subject to U.S. federal income tax on net taxable income that we distribute annually to our stockholders. In order to qualify as a REIT for U.S. federal income tax purposes, we must continually satisfy tests concerning, among other things, the sources of our income, the composition and values of our assets, the amounts we distribute to our stockholders and the diversity of ownership of our stock. In order to comply with REIT requirements, we may need to forego otherwise attractive opportunities and limit our expansion opportunities and the manner in which we conduct our operations. See Item 1A. “Risk Factors.”
Corporate Headquarters
Our principal executive offices are located at 2001 K Street NW, Suite 775 North, Washington, DC 20006, and our telephone number is 202-595-9500.
Available Information
Our website address is www.easterlyreit.com. Information on our website is not incorporated by reference herein and is not a part of this Annual Report on Form 10-K. We make available free of charge on our website or provide a link on our website to our Annual Reports on Form 10-K, Quarterly Reports on Form 10-Q and Current Reports on Form 8-K, including exhibits and any amendments to those reports filed or furnished pursuant to Section 13(a) or 15(d) of the Exchange Act, as soon as reasonably practicable after those reports are electronically filed with, or furnished to, the Securities and Exchange Commission (the “SEC”). We also make available through our website other reports filed with or furnished to the SEC under the Exchange Act, including our proxy statements and reports filed by officers and directors under Section 16(a) of the Exchange Act. To access these filings, go to the “Financials” portion of our “Investor Relations” page on our website, and then click on “SEC Filings.” In addition, these reports and the other documents we file with the SEC are available at a website maintained by the SEC at http://www.sec.gov.
Item 1A. Risk Factors
Set forth below are the risks that we believe are material to our investors and they should be carefully considered. These risks are not all of the risks that we face and other factors not presently known to us or that we currently believe are immaterial may also affect our business if they occur. This section contains forward looking statements. You should refer to the explanation of the qualifications and limitations on forward-looking statements beginning on page 1.
Risks Related to our Business and Operations
We depend on the U.S. Government and its agencies for over 90% of our revenues and any failure by the U.S. Government and its agencies to perform their obligations under their leases or renew their leases upon expiration could have a material adverse effect on our business, financial condition and results of operations.
As of December 31, 2024, our U.S. Government tenant agencies accounted for 93.3% of our annualized lease income. We expect that leases to agencies of the U.S. Government will continue to be the primary source of our revenues for the foreseeable future. Due to such concentration, any failure by the U.S. Government to perform its obligations under its leases or a failure to renew its leases upon expiration, could cause interruptions in the receipt of lease revenue or result in vacancies, or both, which would reduce our revenue until the affected properties are leased, and could decrease the ultimate value of the affected property upon sale and have a material adverse effect on our business, financial condition and results of operations. In addition, as part of ongoing efforts to reduce waste, the U.S. Government and the GSA are reaching out to all tenant agencies to see if there are opportunities to reduce space usage.
We may be unable to renew leases or lease vacating space on favorable terms or at all as leases expire, which could adversely affect our business, financial condition and results of operations.
As of December 31, 2024, leases representing approximately 15.4% of our total annualized lease income and approximately 15.8% of the square footage of the properties in our portfolio will expire by the end of 2027. We may be unable to renew such expiring leases or our properties may not be released at net effective rental rates equal to or above the current average net effective rental rates.
In addition, when we renew leases or lease to new tenants, especially U.S. Government tenant agencies, we may spend substantial amounts for leasing commissions, tenant fit-outs or other tenant inducements. As part of our strategy, we may design build-to-suit property improvements designed to enhance the agency’s mission-critical capabilities. Because these properties have been designed or physically modified to meet the needs of a particular tenant agency, if the current lease is terminated or not renewed, we
may be required to renovate the property at substantial costs, decrease the rent we intend to charge or provide other concessions in order to lease the property to another tenant, which could adversely affect our business, financial condition and results of operations.
We are exposed to risks associated with property development and redevelopment, including new developments for anticipated tenant agencies and build-to-suit renovations for existing tenant agencies.
As of December 31, 2024, we had two properties under development. We intend to continue to engage in development and redevelopment activities with respect to our properties, including build-to-suit renovations for existing U.S. Government tenant agencies and new developments for anticipated tenant agencies and, as a result, will be subject to certain risks, which could adversely affect us, including our business, financial condition and results of operations. These risks include:
•the availability and pricing of financing on favorable terms or at all;
•development costs that may be higher than anticipated;
•cost overruns and untimely completion of construction (including risks beyond our control, such as weather, labor conditions or material shortages);
•the potential that we may expend funds on, and devote management time to projects that we do not complete; and
•the inability to complete construction and leasing of a property on schedule, resulting in increased debt service expense and development and renovation costs.
Additionally, inflationary pricing may have a negative effect on the construction costs necessary to initiate or complete redevelopment projects, including, but not limited to, costs of construction materials, labor, and services from third-party contractors and suppliers. These risks could result in substantial unanticipated delays or expenses and could prevent the initiation or the completion of development and renovation activities, any of which could have a material adverse effect on our business, financial condition and results of operations.
Unfavorable market and economic conditions in the United States and globally could adversely affect occupancy levels, rental rates, rent collections, operating expenses and the overall market value of our assets and have a material adverse effect on our business, financial condition and results of operations.
Unfavorable market conditions in the geographic markets in which we operate and unfavorable economic conditions in the United States and globally may significantly affect our occupancy levels, rental rates, rent collections, operating expenses, the market value of our assets and our ability to strategically acquire, dispose of, recapitalize or refinance our properties on economically favorable terms or at all. Our ability to lease our properties at favorable rates may be adversely affected by increases in supply of office space and is dependent upon overall economic conditions, which are adversely affected by, among other things, job losses and unemployment levels, inflation, rising interest rates, recessions, stock market volatility and uncertainty about the future. Continued economic uncertainty in the United States and abroad could lead to sustained periods of economic slowdown or recession, continued inflation and higher interest rates or declining demand for real estate, and the occurrence of such events, or public perception that any of these events may occur, could result in a general decrease in rental rates. Some of our major expenses, including mortgage payments and real estate taxes, generally do not decline when related rents decline. Any declines in our occupancy levels, rental revenues or the values of our buildings would cause us to have less cash available to pay our indebtedness, fund necessary capital expenditures and make distributions to our stockholders, which could negatively affect our financial condition and the market value of our common stock. Our business may be affected by the volatility and illiquidity in the financial and credit markets, a general global economic recession and other market or economic challenges experienced by the real estate industry or the United States economy as a whole.
Our business may also be adversely affected by local economic conditions in the areas in which we operate. Factors that may affect our occupancy levels, our rental revenues, our net operating income, our Funds From Operations (“FFO”) or the value of our properties include the following, among others:
•downturns in global, national, regional and local economic conditions, including as a result of elevated inflation and interest rates;
•possible reduction of the U.S. Government workforce; and
•economic conditions that could cause an increase in our operating expenses, such as inflation, increases in property taxes (particularly as a result of increased local, state and national government budget deficits and debt and potentially reduced federal aid to state and local governments), utilities, insurance, compensation of on-site associates and routine maintenance.
Our properties are leased to a limited number of U.S. Government tenant agencies, and a change to any of these agencies’ missions could have a material adverse effect on our business, financial condition and results of operations.
As of December 31, 2024, three of our U.S. Government tenant agencies, the Department of Veteran Affairs (“VA”), Federal Bureau of Investigation (“FBI”), and Drug Enforcement Administration (“DEA”), accounted for an aggregate of approximately 44.9% of our total leased square feet and an aggregate of approximately 51.4% of our total annualized lease income. Each U.S. Government agency has its own customs, procedures, culture, needs and mission, which translate into different requirements for its leased space, and we work with the tenant agency to design and construct specialized, agency-specific enhancements. In addition, under the terms of our GSA leases, the GSA generally has the right to designate another U.S. Government agency to occupy all or a portion of the leased property. The recent change in the Administration of the U.S. Government may also add uncertainty to future plans for the structure, mission, or leasing requirements of any one of our U.S. Government tenant agencies. A change in the mission of any one of these agencies, a significant reduction in the agency’s workforce, a relocation of personnel resources, other internal reorganization or a change in the tenant agency occupying the leased space, could affect our lease renewal opportunities and have a material adverse effect on our business, financial condition and results of operations.
Some of our leases with U.S. Government tenant agencies permit the tenant agency to vacate the property and discontinue paying rent prior to their lease expiration date.
Some of our leases are currently in the soft-term period of the lease and tenants under such leases have the right to vacate their space during a specified period before the stated terms of their leases expire. Tenants occupying approximately 5.8% of our leased square feet and contributing approximately 5.2% of our annualized lease income (in each case, as of December 31, 2024) currently have exercisable rights to terminate their leases before the stated soft-term of their lease expires. For fiscal policy reasons, security concerns or other reasons, some or all of our U.S. Government tenant agencies under leases within the soft-term period may decide to exercise their termination rights before the stated term of their lease expires. Due to such concentration, any failure by the U.S. Government to perform its obligations under its leases or a failure to renew its leases upon expiration, including as part of ongoing cost-cutting initiatives undertaken by the new Administration, could cause interruptions in the receipt of lease revenue or result in vacancies, or both, which would reduce our revenue until the affected properties are leased, and could decrease the ultimate value of the affected property upon sale and have a material adverse effect on our business, financial condition and results of operations.
We currently have a concentration of properties located in California and are exposed to changes in market conditions and natural disasters in this state.
Eighteen of our properties are located in California, accounting for approximately 14.2% of our total leased square feet and approximately 18.7% of our total annualized lease income as of December 31, 2024. As a result of this concentration, a material portion of our portfolio may be exposed to the effects of economic and real estate conditions in California markets, such as the supply of competing properties, general levels of employment and economic activity. In addition, historically, California has been vulnerable to natural disasters, such as earthquakes, wildfires, floods and mudslides. To the extent that weak economic conditions, real estate conditions or natural disasters affect California, our business, financial condition and results of operations could be negatively impacted.
We are subject to risks from natural disasters and climate change.
Natural disasters and severe weather such as earthquakes, tornadoes, hurricanes, floods, or rising sea levels due to climate change may result in significant damage to our properties. The extent of our casualty losses and loss in operating income in connection with such events is a function of the severity of the event and the total amount of exposure in the affected area. When we have geographic concentration of exposures, a single catastrophe, such as an earthquake affecting our properties in California, or destructive weather event, such as a tornado affecting our properties in Nebraska, may have a significant negative effect on our business, financial condition and results of operations. Additionally, risks associated with climate change including, for example, rising sea levels, could cause property loss or damage to our properties located in coastal states such as Georgia, Louisiana, California, Florida and South Carolina. As a result, our operating and financial results may vary significantly from one period to the next. Our financial results may be adversely affected by our exposure to losses arising from natural disasters or severe weather. We also are exposed to risks associated with inclement winter weather, particularly on the Atlantic coast, a region in which some of our properties are located, including increased need for maintenance and repair of our buildings.
As a result of climate change, we may also experience extreme weather and changes in precipitation and temperature, all of which may result in physical damage to, or decreased demand for, our properties, increases in the cost of insurance for our properties located in the areas affected by these conditions and impacts to our ability to lease, develop or dispose of our properties. Should the impact of climate change be material in nature, our business, financial condition or results of operations would be adversely affected.
In addition, changes in federal and state legislation and regulation on climate change could result in increased capital expenditures to improve the energy efficiency of our existing properties in order to comply with such regulations. Numerous treaties, laws and regulations have been enacted or proposed in an effort to regulate climate change, including regulations aimed at limiting greenhouse gas emissions and the implementation of “green” building codes. These laws and regulations may require us to make improvements to our existing properties and result in increased operating costs. We may also incur costs associated with increased regulations or investor requirements for increased environmental and social disclosures and reporting. The cost of compliance with, or failure to comply with, such laws and regulations could impact our financial condition.
Any future pandemic, epidemic or outbreak of any highly infectious disease could have an adverse effect on our business, financial condition, results of operations and cash flows.
Any future pandemic, epidemic or outbreak of any highly infectious disease, including the emergence of additional COVID-19 variants, may cause significant disruptions to the U.S. and global economy and could contribute to significant volatility and negative pressure in financial markets.
The extent to which any future pandemic, epidemic or outbreak of any highly infectious disease impacts our operations will depend on future developments, which are highly uncertain and cannot be predicted with confidence, including the scope, severity and duration of such pandemic, the actions taken to contain the pandemic or mitigate its impact and the direct and indirect economic effects of the pandemic and containment measures, among others. Any future pandemic, epidemic or outbreak of any highly infectious disease may adversely affect our business, financial condition, results of operations and cash flows, and may have the effect of heightening many of the risks within this “Risk Factors” section.
A U.S. Government tenant agency could institute condemnation proceedings against us and seek to take our property, or a leasehold interest therein, through its power of eminent domain.
A U.S. Government tenant agency could institute condemnation proceedings against us and seek to take our property, or a leasehold interest therein, through its power of eminent domain. The procedures for settling a dispute with a U.S. Government tenant or seeking to evict a U.S. Government tenant in default may be costly, time consuming and may divert the attention of management from the operations of our business as the process requires first appealing to a U.S. Government assigned contracting officer or through the Civilian Board of Directors of Contract Appeals and ultimately before the U.S. Court of Federal Claims. Furthermore, we may not be able to successfully appeal a condemnation proceeding brought by a U.S. Government tenant agency which could have a material adverse effect on our business, financial condition and results of operations.
The impact of prolonged government shutdowns and budgetary reductions or impasses could have a material adverse effect on our business, financial condition and results of operations.
Substantially all of our revenue is dependent on the receipt of rent payments from the GSA and U.S. Government tenant agencies. While rents under our leases with the GSA are paid for from the Federal Buildings Fund, which is not subject to direct federal appropriations, and our leases with other federal agencies have been executed under delegation from the GSA and are therefore guaranteed by the Federal Buildings Fund, a prolonged government shutdown or a federal budget impasse could result in delays in our receipt of rental payments. In addition, the impact of a prolonged government shutdown on federal personnel resources could hinder our ability to renew expiring leases, initiate or complete tenant agency build-out and construction projects and otherwise interfere with our ongoing partnership with the U.S. Government, any of which could have a material adverse effect on our business, financial condition and results of operations.
An increase in the amount of U.S. Government-owned real estate may adversely affect us.
If there is a large increase in the amount of U.S. Government-owned real estate, certain U.S. Government tenant agencies may relocate from our properties to U.S. Government-owned real estate at the expiration of their respective leases. Similarly, it may become more difficult for us to renew our leases with U.S. Government tenant agencies when they expire or to locate additional properties that are leased to U.S. Government tenant agencies in order to grow our business. Therefore, an increase in the amount of U.S. Government-owned real estate could have a material adverse effect on our business, financial condition and results of operations.
We may be required to make significant capital expenditures to improve our properties in order to retain and attract tenants, including U.S. Government tenant agencies.
Under our leases, including our leases with U.S. Government tenant agencies, we retain certain obligations with respect to the property, including, among other things, the responsibility for maintenance and repair of the property, the provision of adequate parking, maintenance of common areas, responsibility for capital improvements such as roof replacement and major structural
improvements and compliance with other affirmative covenants in the lease. The expenditure of any sums in connection therewith will reduce the cash available for distribution and may require us to fund deficits resulting from operating a property. No assurance can be given that we will have funds available to make such repairs or improvements. In addition, risks beyond our control, such as weather, labor conditions, material shortages caused by supply chain disruptions, or inflationary price increases for materials, could lead to cost overruns and untimely completion of projects. On February 1, 2025, President Donald J. Trump announced tariffs on imports from Canada, Mexico and China, and President Trump has expressed a strong desire to impose new, or further increase other existing tariffs. The ultimate impact of the announced tariffs and any future tariffs will depend on various factors, including if such tariffs are ultimately implemented, the timing of implementation and the amount, scope and nature of such tariffs. If we were to fail to meet these obligations, then the applicable tenant could abate rent or terminate the applicable lease, which may result in a loss of capital invested and reduce our anticipated profits which, in turn, could have a material adverse effect on our business, financial condition and results of operations.
Capital and credit market conditions may adversely affect our access to various sources of capital or financing or the cost of capital, which could impact our business activities, dividends, earnings and common stock price, among other things.
In periods when the capital and credit markets experience significant volatility, the amounts, sources and cost of capital available to us may be adversely affected. We primarily use external financing to fund acquisition, development and renovation activities. As of December 31, 2024, we had total indebtedness of approximately $1.6 billion, including approximately $274.6 million outstanding under our $400.0 million senior unsecured revolving credit facility, which we refer to as our 2024 revolving credit facility, $174.5 million outstanding under our $200.0 million senior unsecured term loan facility, which we refer to as our 2018 term loan facility, $100.0 million outstanding under our $100.0 million senior unsecured term loan facility, which we refer to as our 2016 term loan facility, $175.0 million of outstanding fixed rate, senior unsecured notes, which we refer to as our 2017 senior unsecured notes, $275.0 million of outstanding fixed rate, senior unsecured notes, which we refer to as our 2019 senior unsecured notes, $250.0 million of outstanding fixed rate, senior unsecured notes, which we refer to as our 2021 senior unsecured notes and $200.0 million of outstanding fixed rate, senior unsecured notes, which we refer to as our 2024 senior unsecured notes. If sufficient sources of external financing are not available to us on cost effective terms, we could be forced to limit our acquisition, development and renovation activities or take other actions to fund our business activities and repayment of debt, such as selling assets, reducing our cash dividend or paying out a smaller percentage of our taxable income (subject to the annual distribution requirements applicable to REITs under the Internal Revenue Code of 1986, as amended (the “Code”)). To the extent that we are able or choose to access capital at a higher cost than we have experienced in recent years, as reflected in higher interest rates for debt financing or a lower stock price for equity financing, our earnings per share and cash flow could be adversely affected. In addition, the price of common stock may fluctuate significantly or decline in a high interest rate or volatile economic environment. If economic conditions deteriorate, the ability of lenders to fulfill their obligations under working capital or other credit facilities that we may have in the future may be adversely impacted.
We may be unable to identify and successfully complete acquisitions and, even if acquisitions are identified and completed, completed acquisitions may not achieve the intended benefits or may disrupt our plans and operations.
We may be unable to acquire additional properties and grow our business and any acquisitions we make may prove unsuccessful. Agreements for the acquisition of properties are subject to customary conditions to closing, including completion of due diligence investigations and other conditions that are not within our control that may not be satisfied. In this event, we may be unable to complete an acquisition after incurring certain acquisition-related costs. In the case of a portfolio acquisition with staggered closings, we cannot ensure they will close on the timeline anticipated or at all. In addition, if mortgage debt is unavailable at reasonable rates, we may be unable to finance the acquisition on favorable terms in the time period we desire, or at all.
Our ability to identify and acquire properties on favorable terms and successfully operate or renovate them may be exposed to significant risks. Acquired properties may be located in markets where we may face risks associated with a lack of market knowledge or understanding of the local economy, lack of business relationships in the area and unfamiliarity with local governmental and permitting procedures. We may spend more than budgeted to make necessary improvements or renovations to acquired properties and may not be able to obtain adequate insurance coverage for new properties. There can be no assurance that we will be able to successfully integrate acquired properties with our business or otherwise realize the expected benefits of these acquisitions. In addition, the integration of acquisitions into our existing portfolio may require significant time and focus from our management team and may divert attention from the day-to-day operations of our business, which could delay the achievement of our strategic objectives.
Any delay or failure on our part to identify, negotiate, finance and consummate such acquisitions in a timely manner and on favorable terms, or operate acquired properties to meet our financial expectations, could impede our growth and have an adverse effect on us, including our financial condition, results of operations, cash flow and the market value of our securities.
Certain of our properties are leased to private tenants and we may be unable to collect balances due from private tenants that file for bankruptcy protection.
If a private tenant or lease guarantor files for bankruptcy, we will become a creditor of such entity, but may not be able to collect all pre-bankruptcy amounts owed by that party. In addition, a tenant that files for bankruptcy protection may terminate its lease with us under federal law, in which event we would have a general unsecured claim against such tenant that would likely be worth less than the full amount owed to us for the remainder of the lease term, which could adversely affect our business, financial condition and results of operations.
Because our principal tenants are agencies of the U.S. Government, our properties have a higher risk of terrorist attack and are more likely to be the site of civil unrest than similar properties leased to non-governmental tenants.
Terrorist attacks and civil unrest may materially adversely affect our operations, as well as directly or indirectly damage our assets, both physically and financially. Because our principal tenants are, and are expected to continue to be, agencies of the U.S. Government, our properties are presumed to have a higher risk of terrorist attack and are more likely to be the site of civil unrest than similar properties that are leased to non-governmental tenants. Further, some of our properties may be considered “high profile” targets because of the particular U.S. Government tenant (e.g., the DEA and FBI). Terrorist attacks or damage related to civil unrest, to the extent that these properties are not fully insured, could have a material adverse effect on our business, financial condition and results of operations.
Competition could limit our ability to acquire attractive investment opportunities and to attract and retain tenants.
We compete with numerous developers, real estate companies and other owners of commercial properties for acquisitions and in pursuing buyers for dispositions. We expect that other real estate investors, including insurance companies, private equity funds, sovereign wealth funds, pension funds, other REITs and other well-capitalized investors will compete with us to acquire existing properties and to develop new properties. Because of their strong credit profile, U.S. Government tenants are viewed as desirable tenants by other landlords and properties leased to U.S. Government tenant agencies often attract many potential buyers. This competition could increase prices for properties of the type we may pursue and adversely affect our profitability and impede our growth. In addition, substantially all of our properties face competition for tenants. Some competing properties may be newer, better located or more attractive to tenants. Competing properties may have lower rates of occupancy than our properties, which may result in competing owners offering available space at lower rents than we offer at our properties. This competition may affect our ability to attract and retain tenants, may reduce the rents we are able to charge and could have a material adverse effect on our business, financial condition and results of operations.
We may be subject to increased costs of insurance and limitations on coverage, particularly regarding acts of terrorism.
We maintain comprehensive insurance coverage for general liability, property and other risks on all of our properties, including coverage for acts of terrorism. Future changes in the insurance industry’s risk assessment approach and pricing structure may increase the cost of insuring our properties and decrease the scope of insurance coverage, either of which could adversely affect our financial position and operating results. Most of our debt agreements contain customary covenants requiring us to maintain insurance. We may not be able to obtain an appropriate amount of coverage at reasonable costs, or at all, in the future. In addition, if lenders insist on greater insurance coverage than we are able to obtain, it could adversely affect our ability to finance or refinance our properties and execute our growth strategies, which, in turn, could have a material adverse effect on our business, financial condition and results of operations.
We may become subject to liability relating to environmental and health and safety matters, which could have a material adverse effect on our business, financial condition and results of operations.
Under various federal, state or local laws, ordinances and regulations, as a current or former owner or operator of real property, we may be liable for costs and damages resulting from the presence or release of hazardous substances, waste or petroleum products at, on, in, under or from such property, including costs for investigation or remediation, natural resource damages or third-party liability for personal injury or property damage. These laws often impose liability without regard to whether the owner or operator knew of, or was responsible for, the presence or release of such materials, and the liability may be joint and several. Some of our properties may be impacted by contamination arising from current uses of the property or from adjacent properties used for commercial, industrial or other purposes. Such contamination may arise from spills of petroleum or hazardous substances or releases from tanks used to store such materials. We also may be liable for the costs of remediating contamination at off-site disposal or treatment facilities when we arrange for disposal or treatment of hazardous substances at such facilities, without regard to whether we comply with environmental laws in doing so. The presence of contamination or the failure to remediate contamination on our properties may adversely affect our ability to attract or retain tenants and our ability to develop or sell or borrow against those
properties. In addition to potential liability for cleanup costs, private plaintiffs may bring claims for personal injury, property damage or for similar reasons. Environmental laws also may create liens on contaminated sites in favor of the U.S. Government for damages and costs it incurs to address such contamination. Moreover, if contamination is discovered on our properties, environmental laws may impose restrictions on the manner in which that property may be used or how businesses may be operated on that property.
Some of our properties are, and may be adjacent to or near, other properties used for industrial or commercial purposes. These properties may have contained or currently contain underground storage tanks used to store petroleum products or other hazardous or toxic substances. Releases from these properties could impact our properties.
In addition, our properties are subject to various federal, state and local environmental and health and safety laws and regulations. Noncompliance with these environmental and health and safety laws and regulations could subject us or our tenants to liability. These liabilities could affect a commercial tenant’s ability to make rental payments to us. Moreover, changes in laws could increase the potential costs of compliance with such laws and regulations or increase liability for noncompliance. This may result in significant unanticipated expenditures or may otherwise adversely affect our operations, or those of our tenants, which could in turn have an adverse effect on us. As the owner or operator of real property, we may also incur liability based on various building conditions.
In addition, our properties may contain or develop harmful mold or suffer from other indoor air quality issues. Indoor air quality issues also can stem from inadequate ventilation, chemical contamination from indoor or outdoor sources and other biological contaminants such as pollen, viruses and bacteria. Indoor exposure to airborne toxins or irritants can be alleged to cause a variety of adverse health effects and symptoms, including allergic or other reactions. As a result, the presence of significant mold or other airborne contaminants at any of our properties could require us to undertake a costly remediation program to contain or remove the mold or other airborne contaminants or to increase ventilation. In addition, the presence of significant mold or other airborne contaminants could expose us to liability from our tenants or others if property damage or personal injury occurs.
The costs or liabilities incurred as a result of environmental issues may affect our ability to make distributions to our stockholders and could have a material adverse effect on our business, financial condition and results of operations.
Failure to comply with U.S. Government contractor requirements could result in substantial costs and loss of substantial revenue.
As a lessor of properties leased to the U.S. Government, we are subject to compliance with a wide variety of complex legal requirements applicable to U.S. Government contractors. These laws regulate how we conduct business and require us to administer various compliance programs and to impose compliance responsibilities on some of our contractors. A material failure to comply with these laws could subject us to fines, penalties and damages, cause us to be in default of our leases and other contracts with the U.S. Government and bar us from entering into future leases and other contracts with the U.S. Government. The costs and loss of revenue associated with a failure to comply with U.S. Government contractor requirements could have a material adverse effect on our properties, business or financial condition.
Our development activities may be subject to risks relating to various local, state and federal statutes, ordinances, rules and regulations concerning zoning, building design, construction and similar matters, including local regulations that impose restrictive zoning requirements.
Our development activities may be subject to risks relating to various local, state and federal statutes, ordinances, rules and regulations concerning zoning, building design, construction and similar matters, including local regulations that impose restrictive zoning requirements. In addition, we will be subject to registration and filing requirements in connection with these developments in certain states and localities in which we operate even if all necessary U.S. Government approvals have been obtained. We may also be subject to periodic delays or may be precluded entirely from developing properties due to building moratoriums that could be implemented in the future in certain states in which we intend to operate. These risks could result in substantial unanticipated delays or expenses and, under certain circumstances, could prevent completion of development activities once undertaken.
Failure to comply with the Americans with Disabilities Act and other similar regulations could result in substantial costs.
Our properties must comply with Title III of the Americans with Disabilities Act of 1990, (the “ADA”), to the extent that such properties are deemed to be “public accommodations,” as such term is defined by the ADA. Noncompliance could result in the imposition of fines or the award of damages to private litigants. Additionally, the ADA may require removal of structural barriers to improve access by persons with disabilities in certain public areas of our properties where such removal is readily achievable. We believe our existing properties are in substantial compliance with the ADA and that we will not be required to make substantial capital
expenditures to address the requirements of the ADA. However, the obligation to make readily achievable accommodations is an ongoing one, and we will continue to assess our properties and to make alterations as appropriate in this respect.
Real estate investments are relatively illiquid and may limit our flexibility.
Real estate investments are relatively illiquid, which may tend to limit our ability to react promptly to changes in economic or other market conditions. Our ability to dispose of assets in the future will depend on prevailing economic and market conditions. Our inability to sell our properties on favorable terms or at all could have an adverse effect on our sources of working capital and our ability to satisfy our debt obligations. In addition, real estate can at times be difficult to sell quickly at prices we find acceptable. For example, rising interest rates could decrease the amount third parties are willing to pay for our properties and periods of economic slowdown or recession, or public perception that these events may occur, may result in less demand for our properties overall. The Code also imposes restrictions on REITs, which are not applicable to other types of real estate companies, with respect to the disposition of properties. These potential difficulties in selling real estate in our markets may limit our ability to change or reduce the properties in our portfolio promptly in response to changes in economic or other conditions.
Debt investments could cause us to incur expenses, which could adversely affect our results of operations.
We have made a construction loan to a third party developer to fund a property under development and may make similar loans in the future. Some of these instruments may have some recourse to their borrower, while others may be limited to the collateral securing the loan. In the event of a default under these obligations, if applicable, we may elect to take possession of the collateral securing these interests. Borrowers may contest our enforcement actions, including, foreclosure, assignment in lieu of foreclosure or other remedies. In addition, borrowers may seek bankruptcy protection against such enforcement and/or bring claims for lender liability in response to actions to enforce their obligations to us. Declines in the value of the underlying properties may prevent us from realizing an amount equal to our investment upon foreclosure or other remedies even if we make substantial improvements or repairs to maximize such properties' investment potential.
We cannot be certain that our estimate of future credit losses will be adequate over time because of unanticipated adverse changes in the economy or events adversely affecting specific properties, assets, tenants, borrowers, industries in which our tenants and borrowers operate or markets in which our tenants and borrowers or their properties are located. The ultimate resolutions may differ from our expectation, and we could suffer losses that would have a material adverse effect on our financial performance, the trading price of our securities and our ability to pay dividends and distributions.
Our properties may be subject to impairment charges.
On a quarterly basis, we assess whether there are any indicators that the value of our properties may be impaired. A property’s value is considered to be impaired only if the estimated aggregate future cash flows (undiscounted and without interest charges) to be generated by the property are less than the carrying value of the property. In our estimate of cash flows, we consider factors such as expected future operating income, trends and prospects, the effects of demand, competition and other factors. If we are evaluating the potential sale of an asset or development alternatives, the undiscounted future cash flows analysis considers the most likely course of action at the balance sheet date based on current plans, intended holding periods and available market information. We are required to make subjective assessments as to whether there are impairments in the value of our properties. These assessments may be influenced by factors beyond our control, such as early vacating by a tenant or damage to properties due to earthquakes, tornadoes, hurricanes and other natural disasters, fire, civil unrest, terrorist acts or acts of war. These assessments may have a direct impact on our earnings because recording an impairment charge results in an immediate negative adjustment to earnings. There can be no assurance that we will not take charges in the future related to the impairment of our properties. Any such impairment could have a material adverse effect on our business, financial condition and results of operations in the period in which the charge is taken.
We may be subject to unknown or contingent liabilities related to properties or businesses that we have acquired or may acquire in the future for which we may have limited recourse against the sellers.
Assets and entities that we have acquired or may acquire in the future may be subject to unknown or contingent liabilities for which we may have limited recourse against the sellers. Unknown or contingent liabilities might include liabilities for clean-up or remediation of environmental conditions, claims of customers, vendors or other persons dealing with the acquired entities, tax liabilities and other liabilities whether incurred in the ordinary course of business or otherwise. In the future we may enter into transactions with limited representations and warranties or with representations and warranties that do not survive the closing of the transactions, in which event we would have no or limited recourse against the sellers of such properties. While we usually require the sellers to indemnify us with respect to breaches of representations and warranties that survive, such indemnification is often limited and subject to various materiality thresholds, a significant deductible or an aggregate cap on losses. As a result, there is no guarantee that we will recover any amounts with respect to losses due to breaches by the sellers of their representations and warranties. In
addition, the total amount of costs and expenses that we may incur with respect to liabilities associated with acquired properties and entities may exceed our expectations, which may adversely affect our business, financial condition and results of operations. Finally, indemnification agreements between us and the sellers typically provide that the sellers will retain certain specified liabilities relating to the assets and entities acquired by us.
We may need to borrow funds or dispose of assets to meet our distribution requirements.
We may need to borrow funds or dispose of assets to meet our distribution requirements. In order for us to continue to qualify as a REIT, we are required to make annual distributions generally equal to at least 90% of our taxable income, computed without regard to the dividends paid deduction and excluding net capital gain. In addition, as a REIT, we will be subject to U.S. federal income tax to the extent that we distribute less than 100% of our taxable income (including capital gains) and will be subject to a 4% nondeductible excise tax on the amount by which our distributions in any calendar year are less than a minimum amount specified by the Code. Under some circumstances, we may be required to pay distributions in excess of cash available for distribution in order to meet these distribution requirements or to avoid or minimize the imposition of tax, and we may need to borrow funds or dispose of assets at disadvantageous prices, distribute amounts that would otherwise be invested in future acquisitions or capital expenditures or used for the repayment of debt, pay dividends in the form of “taxable stock dividends” or find another alternative source of funds to make such distributions, which could have a material adverse effect on our financial condition, results of operations, cash flow and the trading price of our common stock.
Our subsidiaries may be prohibited from making distributions and other payments to us.
All of our properties (including our share of properties held through the JV) are owned, and all of our operations are conducted by our operating partnership and our other subsidiaries. As a result, we depend on distributions and other payments from our operating partnership and our other subsidiaries in order to satisfy our financial obligations and make payments to our investors. The ability of our subsidiaries to make such distributions and other payments depends on their earnings and cash flow and may be subject to statutory or contractual limitations. As an equity investor in our subsidiaries, our right to receive assets upon their liquidation or reorganization will be effectively subordinated to the claims of their creditors. To the extent that we are recognized as a creditor of such subsidiaries, our claims may still be subordinate to any security interest in or other lien on their assets and to any of such subsidiaries’ debt or other obligations that are senior to our claims.
Our existing tax protection agreements, and any similar agreements that we enter into in the future, could limit our flexibility with respect to selling or otherwise disposing of properties contributed to our operating partnership.
In connection with certain contributions of properties to our operating partnership, we and our operating partnership have entered into tax protection agreements with the contributor(s) of such properties that generally provide that if we dispose of any interest in the contributed properties in a taxable transaction within a certain time period, subject to certain exceptions, we may be required to indemnify the contributor(s) for their tax liabilities attributable to the built-in gain that existed with respect to such property interests, and certain tax liabilities incurred as a result of such tax protection payments. Therefore, although it may be in our stockholders’ best interests that we sell a contributed property, it may be economically prohibitive for us to do so because of these obligations. In the future, we and our operating partnership may enter into additional tax protection agreements which could further limit our flexibility to sell or otherwise dispose of our properties.
We are subject to risks involved in real estate activity through joint ventures.
We have acquired, are currently acquiring and may in the future acquire and own properties in joint ventures with other persons or entities when we believe circumstances warrant the use of such structures. Therefore, we may not be in a position to exercise sole decision-making authority regarding such joint venture or the properties held by such joint venture. Investments in joint ventures may involve risks not present were a third party not involved, including the possibility that our partners might become financially distressed or otherwise fail to fund their share of required capital contributions. Our partners might at any time have business, tax, or economic goals that are inconsistent with ours. These investments may also have the potential risk of impasses on decisions such as a sale, because neither we, nor the partner, would have full control over the joint venture. In addition, we may in certain circumstances
be liable for the actions of our partners. If any of the foregoing were to occur, our cash flow, financial condition and results of operations could be adversely affected.
Risks Related to Our Organization and Structure
The ability of stockholders to control our policies and effect a change of control of our company is limited by certain provisions of our charter and bylaws and by Maryland law.
There are provisions in our charter and bylaws that may discourage a third party from making a proposal to acquire us, even if some of our stockholders might consider the proposal to be in their best interests. These provisions include the following:
Our charter authorizes our board of directors to amend our charter to increase or decrease the aggregate number of authorized shares of stock, to authorize us to issue additional shares of our common stock or preferred stock and to classify or reclassify unissued shares of our common stock or preferred stock and thereafter to authorize us to issue such classified or reclassified shares of stock. We believe these charter provisions will provide us with increased flexibility in structuring possible future financings and acquisitions and in meeting other needs that might arise. The additional classes or series, as well as the additional authorized shares of our common stock, will be available for issuance without further action by our stockholders, unless such action is required by applicable law or the rules of any stock exchange or automated quotation system on which our securities may be listed or traded. Although our board of directors does not currently intend to do so, it could authorize us to issue a class or series of stock that could, depending upon the terms of the particular class or series, delay, defer or prevent a transaction or a change of control of our company that might involve a premium price for holders of our common stock or that our common stockholders otherwise believe to be in their best interests.
In order to qualify as a REIT, not more than 50% in value of our outstanding stock may be owned, directly or indirectly, by or for five or fewer individuals (as defined in the Code to include certain entities such as private foundations) at any time during the last half of any taxable year (beginning with our second taxable year as a REIT). In order to help us qualify as a REIT, our charter generally prohibits any person or entity from actually owning or being deemed to own by virtue of the applicable constructive ownership provisions of the Code, (i) more than 7.1% (in value or in number of shares, whichever is more restrictive) of the issued and outstanding shares of any class or series of our stock or (ii) more than 7.1% in value of the aggregate of the outstanding shares of all classes and series of our stock (the “ownership limits”). Our charter also prohibits the owners of 50% or more of any historic REIT affiliated with Easterly Partners, LLC and its consolidated subsidiaries (each, an “Easterly Fund REIT”), from which our operating partnership acquired 15 properties in connection with our initial public offering in 2015, from owning 50% or more of us, applying certain attribution of ownership rules. This limitation is intended to prevent us from being treated as a successor of any such REIT. These ownership restrictions may prevent or delay a change in control and, as a result, could adversely affect our stockholders’ ability to realize a premium for their shares of our common stock.
In addition, certain provisions of the Maryland General Corporation Law (the “MGCL”) may have the effect of inhibiting a third party from making a proposal to acquire us or of impeding a change of control under circumstances that otherwise could provide the holders of shares of our common stock with the opportunity to realize a premium over the then-prevailing market price of such shares, including the Maryland business combination and control share provisions.
As permitted by the MGCL, our board of directors has adopted a resolution exempting any business combinations between us and any other person or entity from the business combination provisions of the MGCL. Our bylaws provide that this resolution or any other resolution of our board of directors exempting any business combination from the business combination provisions of the MGCL may only be revoked, altered or amended, and our board of directors may only adopt any resolution inconsistent with any such resolution (including an amendment to that bylaw provision), which we refer to as an opt-in to the business combination provisions, with the affirmative vote of a majority of the votes cast on the matter by holders of outstanding shares of our common stock. In addition, as permitted by the MGCL, our bylaws contain a provision exempting from the control share acquisition provisions of the MGCL any and all acquisitions by any person of shares of our stock. This bylaw provision may be amended, which we refer to as an opt-in to the control share acquisition provisions, only with the affirmative vote of a majority of the votes cast on such an amendment by holders of outstanding shares of our common stock.
Subtitle 8 of Title 3 of the MGCL permits a board of directors, without stockholder approval and regardless of what is currently provided in our charter or bylaws, to implement certain takeover defenses, including adopting a classified board or increasing the vote required to remove a director. We have elected in our charter to be subject to the provision of Subtitle 8 that provides that vacancies on our board of directors may be filled only by the remaining directors. We have not elected to be subject to any of the other provisions of Subtitle 8, including the provisions that would permit us to classify our board of directors or increase the vote required to remove a director without stockholder approval. Moreover, our charter provides that, without the affirmative vote of a majority of the votes cast on the matter by our stockholders entitled to vote generally in the election of directors, we may not elect to be subject to any of these additional provisions of Subtitle 8.
Such takeover defenses may have the effect of inhibiting a third party from making an acquisition proposal for us or of delaying, deferring or preventing a change in control of us under the circumstances that otherwise could provide our common stockholders with the opportunity to realize a premium over the then current market price. In addition, the provisions of our charter on the removal of directors and the advance notice provisions of our bylaws, among others, could delay, defer or prevent a transaction or a change of control of our company that might involve a premium price for holders of our common stock or otherwise be in their best interest. Each item discussed above may delay, deter or prevent a change in control of our company, even if a proposed transaction is at a premium over the then-current market price for our common stock. Further, these provisions may apply in instances where some stockholders consider a transaction beneficial to them. As a result, our stock price may be negatively affected by these provisions.
Certain provisions in the partnership agreement of our operating partnership may delay or prevent acquisitions of us.
Provisions in the partnership agreement of our operating partnership may delay, or make more difficult, acquisitions of us or changes of our control. These provisions could discourage third parties from making proposals involving an acquisition of us or change of our control, although some holders of our common stock might consider such proposals, if made, desirable. These provisions include:
•redemption rights for holders of common units;
•a requirement that we may not be removed as the general partner of our operating partnership without our consent;
•transfer restrictions on common units; and
•our ability, as general partner, in some cases, to amend the partnership agreement and to cause the operating partnership to issue units with terms that could delay, defer or prevent a merger or other change of control of us or our operating partnership without the consent of the limited partners.
We may decide to change our investment strategy without stockholder approval and acquire and develop properties outside of our target market, which could have a material adverse effect on our business, financial condition and results of operations.
We may decide to change our investment strategy without stockholder approval and seek to acquire and develop properties that are not leased to U.S. Government agencies that serve essential functions. Any change to our investment strategy, including the making of investments outside our target market, could have a material adverse effect on our business, financial condition and results of operations.
Our board of directors may change our policies without stockholder approval.
Our policies, including any policies with respect to investments, leverage, financing, growth, debt and capitalization, are determined by our board of directors or those committees or officers to whom our board of directors may delegate such authority. Our board of directors also establishes the amount of any dividends or other distributions that we may pay to our stockholders. Our board of directors or the committees or officers to which such decisions are delegated have the ability to amend or revise these and our other policies at any time without stockholder vote. Accordingly, our stockholders are not entitled to approve changes in our policies.
Our rights and the rights of our stockholders to take action against our directors and officers are limited, which could limit your recourse in the event of actions that you do not believe are in your best interests.
Maryland law provides that a director has no liability in that capacity if he or she satisfies his or her duties to us and our stockholders. Our charter limits the liability of our directors and officers to us and our stockholders for money damages, except for liability resulting from:
•actual receipt of an improper benefit or profit in money, property or services; or
•a final judgment based upon a finding of active and deliberate dishonesty by the director or officer that was material to the cause of action adjudicated.
In addition, our charter authorizes us, and our bylaws require us, to indemnify our directors for actions taken by them in those capacities to the maximum extent permitted by Maryland law. Our charter and bylaws also authorize us to indemnify our officers for actions taken by them in those capacities to the maximum extent permitted by Maryland law and indemnification agreements that we have entered into with our executive officers require us to indemnify such officers for actions taken by them in those capacities to the maximum extent permitted by Maryland law. As a result, we and our stockholders may have more limited rights against our directors and officers than might otherwise exist. Accordingly, in the event that actions taken in good faith by any of our directors or officers impede the performance of our company, your ability to recover damages from such director or officer will be limited with respect to
directors and may be limited with respect to officers. In addition, we will be obligated to advance the defense costs incurred by our directors and our executive officers pursuant to indemnification agreements, and may, in the discretion of our board of directors, advance the defense costs incurred by our officers, our employees and other agents, in connection with legal proceedings.
Conflicts of interest may exist or could arise in the future between the interests of our stockholders and the interests of holders of common units, which may impede business decisions that could benefit our stockholders.
Conflicts of interest may exist or could arise in the future as a result of the relationships between us and our affiliates, on the one hand, and our operating partnership or any of its partners, on the other. Our directors and officers have duties to our company under Maryland law in connection with their management of our company. At the same time, we have duties and obligations to our operating partnership and its limited partners under Delaware law as modified by the partnership agreement of our operating partnership in connection with the management of our operating partnership as the sole general partner. The limited partners of our operating partnership expressly acknowledge that the general partner of our operating partnership acts for the benefit of our operating partnership, the limited partners and our stockholders collectively. When deciding whether to cause our operating partnership to take or decline to take any actions, the general partner will be under no obligation to give priority to the separate interests of (i) the limited partners of our operating partnership (including the tax interests of our limited partners, except as provided in a separate written agreement) or (ii) our stockholders. Nevertheless, the duties and obligations of the general partner of our operating partnership may come into conflict with the duties of our directors and officers to our company and our stockholders.
We do not own the Easterly name, but have entered into a license agreement with Easterly Capital, LLC (“Easterly Capital”) consenting to our use of the Easterly logo and name. Use of the name by other parties or the termination of our license agreement may have a material adverse effect on our business, financial condition and results of operations.
We have entered into a license agreement with Easterly Capital, pursuant to which it granted us a perpetual, royalty-free license to use the Easterly logo and the Easterly name and variations thereof, which license is exclusive to business activities involving properties to be leased to or developed for governmental entities, including properties leased to the GSA. We have a right to use this logo and name for so long as we are not in breach of the terms of the license agreement. Easterly Capital retains the right to continue using the Easterly name. We will be unable to preclude Easterly Capital from licensing or transferring the ownership of the Easterly name to third parties, except in the limited circumstance where our license is exclusive. Consequently, we will be unable to prevent any damage to goodwill that may occur as a result of the activities of Easterly Capital or others. Furthermore, in the event the license agreement is terminated, we will be required to change our name and cease using the Easterly name. Any of these events could disrupt our recognition in the marketplace, damage any goodwill we may have generated and have a material adverse effect on our business, financial condition and results of operations.
Risks Related to Our Indebtedness and Financing
We have a substantial amount of indebtedness that may limit our financial and operating activities and may adversely affect our ability to incur additional debt to fund future needs.
As of December 31, 2024, we had total indebtedness of approximately $1.6 billion including approximately $274.6 million outstanding under our revolving credit facility, $274.5 million outstanding in the aggregate under our 2018 term loan facility and our 2016 term loan facility and $900.0 million in the aggregate under our 2017 senior unsecured notes, 2019 senior unsecured notes, 2021 senior unsecured notes and 2024 senior unsecured notes. Payments of principal and interest on borrowings may leave us with insufficient cash resources to operate our properties, fully implement our capital expenditure, acquisition and redevelopment activities, or meet the REIT distribution requirements imposed by the Code. Our level of debt and the limitations imposed on us by our debt agreements could have significant adverse consequences, including the following:
•require us to dedicate a substantial portion of cash flow from operations to the payment of principal and interest on indebtedness, thereby reducing the funds available for other purposes;
•make it more difficult for us to borrow additional funds as needed or on favorable terms, which could, among other things, adversely affect our ability to meet operational needs;
•force us to dispose of one or more of our properties, possibly on unfavorable terms (including the possible application of the 100% tax on income from “prohibited transactions”), or in violation of certain covenants to which we may be subject;
•subject us to increased sensitivity to interest rate increases;
•make us more vulnerable to economic downturns, adverse industry conditions or catastrophic external events;
•limit our ability to withstand competitive pressures;
•limit our ability to refinance our indebtedness at maturity or the refinancing terms may be less favorable than the terms of our original indebtedness;
•reduce our flexibility in planning for or responding to changing business, industry and economic conditions; or
•place us at a competitive disadvantage to competitors that have relatively less debt than we have.
If any one of these events were to occur, our financial condition, results of operations, cash flow and the trading price of our common stock could be adversely affected. Furthermore, foreclosures could create taxable income without accompanying cash proceeds, which could hinder our ability to meet the REIT distribution requirements imposed by the Code.
We may be unable to refinance current or future indebtedness on favorable terms, if at all.
We may be unable to refinance existing debt on terms as favorable as the terms of existing indebtedness, or at all, including as a result of increases in interest rates or a decline in the value of our portfolio or portions thereof. If, at the time of any refinancing of outstanding debt, prevailing interest rates or other factors result in a higher interest rate on the refinanced indebtedness compared to the existing indebtedness to be refinanced, the increase in interest expense would adversely affect our cash flows, and consequently, cash available for distribution to our stockholders. If principal payments due at maturity cannot be refinanced, extended or paid with proceeds from other capital transactions, such as new equity capital, our operating cash flow will not be sufficient in all years to repay all maturing debt. As a result, certain of our other debt may cross-default, we may be forced to postpone capital expenditures necessary for the maintenance of our properties, we may have to dispose of one or more properties on terms that would otherwise be unacceptable to us or we may be forced to allow the mortgage holder to foreclose on a property. We also may be forced to limit distributions and may be unable to meet the REIT distribution requirements imposed by the Code. Foreclosure on mortgaged properties or an inability to refinance existing indebtedness would likely have a negative impact on our business, financial condition and results of operations and could adversely affect our ability to make distributions to our stockholders.
We may not have sufficient cash flow to meet the required payments of principal and interest on our debt or to pay distributions on our shares at expected levels.
In the future, our cash flow could be insufficient to meet required payments of principal and interest or to pay distributions on our shares at expected levels. In this regard, we note that in order for us to continue to qualify as a REIT, we are required to make annual distributions generally equal to at least 90% of our taxable income, computed without regard to the dividends paid deduction and excluding net capital gain. In addition, as a REIT, we will be subject to U.S. federal income tax to the extent that we distribute less than 100% of our taxable income (including capital gains) and will be subject to a 4% nondeductible excise tax on the amount by which our distributions in any calendar year are less than a minimum amount specified by the Code. These requirements and considerations may limit the amount of our cash flow available to meet required principal and interest payments. If we are unable to make required payments on indebtedness that is secured by a mortgage on our property, the asset may be transferred to the lender with a resulting loss of income and value to us, including adverse tax consequences related to such a transfer.
Certain of our debt agreements include restrictive covenants, requirements to maintain financial ratios and default provisions, which could limit our flexibility, limit our ability to make distributions and require us to repay the indebtedness prior to its maturity.
Certain mortgages on our properties contain customary negative covenants that, among other things, limit our ability, without the prior consent of the lender, to further mortgage the property and to reduce or change insurance coverage. As of December 31, 2024, we had $156.3 million of combined United States property mortgages and other secured debt. Additionally, our debt agreements contain customary covenants that, among other things, restrict our ability to incur additional indebtedness and, in certain instances, restrict our ability to engage in material asset sales, mergers, consolidations and acquisitions, and restrict our ability to make capital expenditures. These debt agreements, in some cases, also subject us to guarantor and liquidity covenants and our senior unsecured revolving credit facility, our senior unsecured term loan facilities, our senior unsecured notes, and other future debt may, require us to maintain various financial ratios. Some of our debt agreements contain certain cash flow sweep requirements and mandatory escrows, and our property mortgages generally require certain mandatory prepayments upon disposition of underlying collateral. Early repayment of certain mortgages may be subject to prepayment penalties.
Variable rate debt is subject to interest rate risk that could increase our interest expense, increase the cost to refinance and increase the cost of issuing new debt.
As of December 31, 2024, we had $249.1 million of outstanding consolidated debt that, pursuant to the documentation governing such debt, bears interest at variable rates, and we expect that we may also borrow additional money at variable interest rates
in the future. Unless we have made arrangements that hedge against the risk of rising interest rates, increases in interest rates would increase our interest expense under the applicable governing documents, increase the cost of refinancing such debt or issuing new debt, and adversely affect cash flow and our ability to service our indebtedness and make distributions to our stockholders, which could adversely affect the market price of our common stock.
Hedging activity may expose us to risks, including the risks that a counterparty will not perform and that the hedge will not yield the economic benefits we anticipate, which could adversely affect us.
As of December 31, 2024, we had five interest rate swaps in place with an aggregate notional value of $300.0 million to mitigate our exposure to fluctuations in short term interest rates and fix the interest rate on our 2016 term loan facility, 2018 term loan facility and a portion of our revolving credit facility. We may continue, in a manner consistent with our qualification as a REIT, to seek to manage our exposure to interest rate volatility by using interest rate hedging arrangements. Such hedging arrangements involve risks, such as the risk that counterparties may fail to honor their obligations under these arrangements, and that these arrangements may not be effective in reducing our exposure to interest rate changes. Moreover, there can be no assurance that our hedging arrangements will qualify for hedge accounting or that our hedging activities will have the desired beneficial impact on our results of operations. Should we desire to terminate a hedging agreement, there could be significant costs and cash requirements involved to fulfill our obligation under the hedging agreement. Failure to hedge effectively against interest rate changes may adversely affect our results of operations.
Complying with REIT requirements may limit our ability to hedge effectively and may cause us to incur tax liabilities.
The REIT provisions of the Code limit our ability to hedge our liabilities. Generally, income from a hedging transaction we enter into (i) to manage the risk of interest rate changes with respect to borrowings incurred or to be incurred to acquire or carry real estate assets, (ii) to manage the risk of currency fluctuations with respect to any item of income or gain that constitutes “qualifying income” for purposes of the 75% or 95% gross income tests applicable to REITs (or any property that generates such income or gain) or (iii) that hedges against transactions described in clauses (i) and (ii) and is entered into in connection with the extinguishment of debt or sale of property that is being hedged against by the transactions described in clauses (i) and (ii) does not constitute “gross income” for purposes of the 75% or 95% gross income tests, provided that we comply with certain identification requirements pursuant to the applicable sections of the Code and Treasury Regulations. To the extent that we enter into other types of hedging transactions, the income from those transactions is likely to be treated as non-qualifying income for purposes of both gross income tests. As a result of these rules, we may need to limit our use of otherwise advantageous hedging techniques or implement those hedges through a “Taxable REIT Subsidiary” (“TRS”). The use of a TRS could increase the cost of our hedging activities (because our TRS would be subject to tax on income or gain resulting from hedges entered into by it) or expose us to greater risks than we would otherwise want to bear. In addition, net losses in any of our TRSs will generally not provide any tax benefit except for being carried forward for use against future taxable income in the TRSs.
Mortgage debt obligations expose us to the possibility of foreclosure, which could result in the loss of our investment in a property or group of properties subject to mortgage debt.
Incurring mortgage and other secured debt obligations increases our risk of property losses because defaults on indebtedness secured by properties may result in foreclosure actions initiated by lenders and ultimately our loss of the property securing any loans for which we are in default. Any foreclosure on a mortgaged property or group of properties could adversely affect the overall value of our portfolio of properties. For tax purposes, a foreclosure of any of our properties that is subject to a nonrecourse mortgage loan would be treated as a sale of the property for a purchase price equal to the outstanding balance of the debt secured by the mortgage. If the outstanding balance of the debt secured by the mortgage exceeds our tax basis in the property, we would recognize taxable income on foreclosure, but would not receive any cash proceeds, which could hinder our ability to meet the distribution requirements applicable to REITs under the Code.
High mortgage rates or unavailability of mortgage debt may make it difficult for us to finance or refinance properties, which could reduce the number of properties we can acquire, our net income and the amount of cash distributions we can make.
If mortgage debt is unavailable at reasonable rates, we may not be able to finance the purchase of properties. If we place mortgage debt on properties, we may be unable to refinance the properties when the loans become due, or to refinance on favorable terms. If interest rates are higher when we refinance our properties, our income could be reduced. If any of these events occur, our cash flow could be reduced. This, in turn, could reduce cash available for distribution to our stockholders and may hinder our ability to raise more capital by issuing more stock or by borrowing more money. In addition, payments of principal and interest made to service our debts may leave us with insufficient cash to make distributions necessary to meet the distribution requirements imposed on REITs under the Code.
Risks Related to Our Common Stock
The market price and trading volume of our common stock may be volatile.
The trading price of our common stock may be volatile. In addition, the trading volume in our common stock may fluctuate and cause significant price variations to occur.
Some of the factors that could negatively affect our share price or result in fluctuations in the price or trading volume of our common stock include:
•actual or anticipated variations in our quarterly operating results or dividends;
•changes in guidance related to financial performance;
•publication of research reports about us or the real estate industry;
•increases in market interest rates that lead purchasers of our shares to demand a higher yield;
•changes in market valuations of similar companies;
•adverse market reaction to any additional debt we incur in the future;
•additions or departures of key management personnel;
•actions by institutional stockholders;
•speculation in the press or investment community;
•the realization of any of the other risk factors presented in this report;
•the extent of investor interest in our securities;
•the general reputation of REITs and the attractiveness of our equity securities in comparison to other equity securities, including securities issued by other real estate-based companies;
•our underlying asset value;
•investor confidence in the stock and bond markets, generally;
•future equity issuances;
•failure to meet guidance related to financial performance;
•failure to meet and maintain REIT qualifications; and
•general market and economic conditions.
In the past, securities class-action litigation has often been instituted against companies following periods of volatility in the price of their common stock. This type of litigation could result in substantial costs and divert our management’s attention and resources, which could have an adverse effect on our financial condition, results of operations, cash flow and trading price of our common stock.
The form, timing or amount of dividend distributions in future periods may vary and be impacted by economic and other considerations.
The form, timing or amount of dividend distributions will be declared at the discretion of our board of directors and will depend on actual cash from operations, our financial condition, capital requirements, the annual distribution requirements applicable to REITs under the Code and other factors as our board of directors may consider relevant.
We cannot guarantee that we will repurchase our common stock pursuant to our share repurchase program or that our share repurchase program will enhance long-term stockholder value. Share repurchases could also increase the volatility of the price of our common stock and could diminish our cash reserves.
The timing and amount of repurchases of shares of our common stock, if any, will depend upon several factors, including market and business conditions, the trading price of our common stock, our cost of capital and the nature of other investment opportunities. Our share repurchase program may be limited, suspended or discontinued at any time without prior notice. In addition,
repurchases of our common stock pursuant to our share repurchase program could affect our stock price and increase its volatility. The existence of our share repurchase program could cause our stock price to be higher than it would be in the absence of such a program and could potentially reduce the market liquidity for our stock. Additionally, our share repurchase program could diminish our cash reserves, which may impact our ability to finance future growth and to pursue possible future strategic opportunities and acquisitions. There can be no assurance that any share repurchases will enhance stockholder value because the market price of our common stock may decline below the levels at which we repurchased shares of stock. Although our share repurchase program is intended to enhance long-term stockholder value, there is no assurance that it will do so and short-term stock price fluctuations could reduce the program’s effectiveness.
The number of shares available for future sale could adversely affect the market price of our common stock.
We cannot predict whether future issuances of shares of our common stock or the availability of shares for resale in the open market will decrease the market price per share of our common stock. Sales of a substantial number of shares of our common stock in the public market, the issuance of substantial additional shares or the perception that such sales or issuances might occur could materially adversely affect the market price of the shares of our common stock. Some of the potential share issuances that may adversely affect the market price of the shares of our common stock could include: the exchange of our common units in our operating partnership for our common stock, the granting, exercise or vesting of any options, restricted stock or restricted stock units or long-term incentive units in our operating partnership granted or that may be granted to certain directors, executive officers and other employees under our 2024 Equity Incentive Plan, as amended, and other issuances of our common stock or our operating partnership’s securities exchangeable for or convertible into our common stock. Under a registration statement we have filed with the SEC, we may also offer, from time to time, equity securities (including common or preferred stock) on an as-needed basis and subject to our ability to affect offerings on satisfactory terms based on prevailing conditions. No prediction can be made about the effect that future sales of our common stock will have on the market price of our shares of common stock. In addition, future sales by us of our common stock may be dilutive to existing stockholders.
Risks Related to Our Status as a REIT
Failure to qualify or to maintain our qualification as a REIT would have significant adverse consequences to the value of our common stock.
We elected to be a REIT for U.S. federal income tax purposes commencing with our taxable year ended December 31, 2015. The Code generally requires that a REIT distribute at least 90% of its taxable income (without regard to the dividends paid deduction and excluding net capital gains) to stockholders annually, and a REIT must pay income tax at regular corporate rates to the extent that it distributes less than 100% of its taxable income (including capital gains) in a given year. In addition, a REIT is required to pay a 4% nondeductible excise tax on the amount, if any, by which the distributions it makes in a calendar year are less than the sum of 85% of its ordinary income, 95% of its capital gain net income and 100% of its undistributed income from prior years. To avoid entity-level U.S. federal income and excise taxes, we anticipate distributing at least 100% of our taxable income.
We believe that we have been and will continue to be owned and organized, and have operated and will operate, in a manner that allows us to qualify as a REIT commencing with our taxable year ended December 31, 2015. However, we cannot assure you that we have been and will continue to be owned and organized and have operated and will continue to operate as such. Qualification as a REIT involves the application of highly technical and complex provisions of the Code as to which there may only be limited judicial and administrative interpretations and involves the determination of facts and circumstances not entirely within our control. We have not requested and do not intend to request a ruling from the IRS that we qualify as a REIT. The complexity of these provisions and of the applicable Treasury Regulations is greater in the case of a REIT that, like us, holds its assets through one or more partnerships. Moreover, in order to qualify as a REIT, we must meet, on an ongoing basis, various tests regarding the nature and diversification of our assets and our income, the ownership of our outstanding stock, the absence of inherited retained earnings from non-REIT periods and the amount of our distributions. Our ability to satisfy the asset tests imposed on REITs depends upon our analysis of the characterization and fair market values of our assets, some of which are not susceptible to a precise determination, and for which we will not obtain independent appraisals. Our compliance with the REIT gross income and quarterly asset requirements also depends upon our ability to successfully manage the composition of our gross income and assets on an ongoing basis. Future legislation, new regulations, administrative interpretations or court decisions may significantly change the tax laws or the application of the tax laws with respect to qualification as a REIT for U.S. federal income tax purposes or the U.S. federal income tax consequences of such qualification. Accordingly, it is possible that we may not meet the requirements for qualification as a REIT.
If, with respect to any taxable year, we fail to maintain our qualification as a REIT, we would not be allowed to deduct distributions to stockholders in computing our REIT taxable income. If we were not entitled to relief under the relevant statutory provisions, we would also be disqualified from treatment as a REIT for the four subsequent taxable years. If we fail to qualify as a REIT, we would be subject to entity-level income tax on our REIT taxable income at regular corporate tax rates. As a result, the
amount available for distribution to holders of our common stock would be reduced for the year or years involved, and we would no longer be required to make distributions to our stockholders. In addition, our failure to qualify as a REIT could impair our ability to expand our business and raise capital, and adversely affect the value of our common stock.
In addition, we currently hold interests in certain of our properties through a joint venture that utilizes a subsidiary that has elected to be taxed as a REIT (a “REIT subsidiary”) and we may in the future determine that it is in our best interests to hold one or more of our other properties through one or more REIT subsidiaries. If any of these REIT subsidiaries fails to qualify as a REIT for U.S. federal income tax purposes, then we may also fail to qualify as a REIT for U.S. federal income tax purposes.
We may owe certain taxes notwithstanding our qualification as a REIT.
Even if we qualify as a REIT, we will be subject to certain U.S. federal, state and local taxes on our income and property, on taxable income that we do not distribute to our stockholders, on net income from certain “prohibited transactions,” and on income from certain activities conducted as a result of foreclosure. We may, in certain circumstances, be required to pay an excise or penalty tax (which could be significant in amount) in order to utilize one or more relief provisions under the Code to maintain our qualification as a REIT. In addition, we may provide services that are not customarily provided by a landlord, hold properties for sale and engage in other activities (such as a management business) through TRSs and the income of those subsidiaries will be subject to U.S. federal and state income tax at regular corporate rates. Furthermore, to the extent that we conduct operations outside of the United States, our operations would subject us to applicable foreign taxes, regardless of our status as a REIT for U.S. tax purposes.
If our operating partnership is treated as a corporation for U.S. federal income tax purposes, we will cease to qualify as a REIT.
We believe our operating partnership qualifies and will continue to qualify as a partnership for U.S. federal income tax purposes. Assuming that it qualifies as a partnership for U.S. federal income tax purposes, our operating partnership itself generally will not be subject to U.S. federal income tax on its income. Instead, its partners, including us, generally are required to pay tax on their respective allocable share of our operating partnership’s income. No assurance can be provided, however, that the IRS will not challenge our operating partnership’s status as a partnership for U.S. federal income tax purposes, or that a court would not sustain such a challenge. For example, our operating partnership would be treated as a corporation for U.S. federal income tax purposes if it were deemed to be a “publicly traded partnership” and less than 90% of its income consisted of “qualified income” under the Code. If the IRS were successful in treating our operating partnership as a corporation for U.S. federal income tax purposes, we would fail to meet the gross income tests and certain of the asset tests applicable to REITs and, therefore, cease to qualify as a REIT, and our operating partnership would become subject to U.S. federal, state and local income tax. The payment by our operating partnership of income tax would significantly reduce the amount of cash available to our operating partnership to satisfy obligations to make principal and interest payments on its debt and to make distribution to its partners, including us.
Our REIT status may depend on the REIT status of an Easterly Fund REIT.
If the owners of 50% or more of any Easterly Fund REIT were to acquire 50% or more of our stock, we could be deemed a “successor” to such Easterly Fund REIT for purposes of the REIT rules. Successor treatment would mean that our election to be taxed as a REIT could be terminated if it were determined that the applicable Easterly Fund REIT had failed to qualify as a REIT for a prior period. We do not intend to issue stock to former stockholders of an Easterly Fund REIT if we believe it could cause us to be treated as its successor. Our charter contains ownership restrictions that will prevent any overlapping ownership that would cause us to be a successor of an Easterly Fund REIT, and we intend to enforce such provisions.
Dividends payable by REITs generally do not qualify for reduced tax rates applicable to non-corporate taxpayers.
The maximum U.S. federal income tax rate for certain qualified dividends payable to United States stockholders that are individuals, trusts and estates generally is currently 20%. Dividends payable by REITs, however, are generally not eligible for the reduced rates and therefore are taxable as ordinary income when paid to such stockholders. However, current law provides a deduction of 20% of a non-corporate taxpayer’s ordinary REIT dividends with such deduction scheduled to expire for taxable years beginning after December 31, 2025. Although the reduced U.S. federal income tax rate applicable to dividend income from regular corporate dividends does not adversely affect the taxation of REITs or dividends paid by REITs, the more favorable rates applicable to regular corporate dividends could cause investors who are individuals, trusts and estates or are otherwise sensitive to these lower rates to perceive investments in REITs to be relatively less attractive than investments in the stock of non-REIT corporations that pay dividends, which could adversely affect the value of the shares of REITs, including our common stock.
A portion of our distributions may be treated as a return of capital for U.S. federal income tax purposes, which could reduce the basis of a stockholder’s investment in shares of our common stock and, if greater than such basis, may trigger taxable gain.
A portion of our distributions may be treated as a return of capital for U.S. federal income tax purposes. As a general matter, a portion of our distributions will be treated as a return of capital for U.S. federal income tax purposes if the aggregate amount of our distributions for a year exceeds our current and accumulated earnings and profits for that year. To the extent that a distribution is treated as a return of capital for U.S. federal income tax purposes, it will reduce a holder’s adjusted tax basis in the holder’s shares, and to the extent that it exceeds the holder’s adjusted tax basis such distribution will be treated as gain resulting from a sale or exchange of such shares.
Complying with the REIT requirements may cause us to forego otherwise attractive opportunities or liquidate certain of our investments.
To qualify as a REIT for U.S. federal income tax purposes, we must continually satisfy tests concerning, among other things, the sources of our income, the nature and diversification of our assets, the amounts we distribute to our stockholders and the ownership of our stock. We may be required to make distributions to our stockholders at disadvantageous times or when we do not have funds readily available for distribution. Thus, compliance with the REIT requirements may, for instance, hinder our ability to make certain otherwise attractive investments or undertake other activities that might otherwise be beneficial to us and our stockholders, or may require us to borrow or liquidate investments in unfavorable market conditions and, therefore, may hinder our investment performance. As a REIT, at the end of each calendar quarter, at least 75% of the value of our assets must consist of cash, cash items, U.S. Government securities, debt instruments issued by a publicly traded REIT and qualified “real estate assets.” The REIT asset tests further require that with respect to our assets that are not qualifying assets for purposes of this 75% assets test and that are not securities issued by a TRS, we generally cannot hold at the close of any calendar quarter (i) securities representing more than 10% of the outstanding voting securities of any one issuer or more than 10% of the total value of the outstanding securities of any one issuer or (ii) securities of any one issuer that represent more than 5% of the value of our total assets. In addition, securities (other than qualified real estate assets) issued by one or more of our TRSs cannot represent more than 20% of the value of our total assets at the close of any calendar quarter. Further, even though debt instruments issued by a publicly traded REIT that are not secured by a mortgage on real property are qualifying assets for purposes of the 75% asset test, no more than 25% of the value of our total assets can be represented by such unsecured debt instruments. After meeting these asset test requirements at the close of a calendar quarter, if we fail to comply with these requirements at the end of any subsequent calendar quarter, we must correct the failure within 30 days after the end of the calendar quarter or qualify for certain other statutory relief provisions to avoid losing our REIT qualification. As a result, we may be required to liquidate from our portfolio or forego otherwise attractive investments. These actions could have the effect of reducing our income and amounts available for distribution to our stockholders.
We may be subject to a 100% penalty tax on any prohibited transactions that we enter into, or may be required to forego certain otherwise beneficial opportunities in order to avoid the penalty tax on prohibited transactions.
If we are found to have held, acquired or developed property primarily for sale to customers in the ordinary course of business, we may be subject to a 100% “prohibited transactions” tax under U.S. federal tax laws on the gain from disposition of the property unless the disposition qualifies for one or more safe harbor exceptions for properties that have been held by us for at least two years and satisfy certain additional requirements (or the disposition is made through a TRS and, therefore, is subject to corporate U.S. federal and state income tax). Under existing law, whether property is held primarily for sale to customers in the ordinary course of a trade or business is a question of fact that depends on all the facts and circumstances. We intend to hold, and, to the extent within our control, to have any joint venture to which our operating partnership is a partner hold, properties for investment with a view to long-term appreciation, to engage in the business of acquiring, owning, operating and developing the properties, and to make sales of our properties and other properties acquired subsequent to the date hereof as are consistent with our investment objectives (and to hold investments that do not meet these criteria through a TRS). Based upon our investment objectives, we believe that overall, our properties should not be considered property held primarily for sale to customers in the ordinary course of business. However, it may not always be practical for us to comply with one of the safe harbors, and, therefore, we may be subject to the 100% penalty tax on the gain from dispositions of property if we otherwise are deemed to have held the property primarily for sale to customers in the ordinary course of business. The potential application of the prohibited transactions tax could cause us to forego potential dispositions of other property or to forego other opportunities that might otherwise be attractive to us, or to hold investments or undertake such dispositions or other opportunities through a TRS, which would generally result in corporate income taxes being incurred.
REIT distribution requirements could adversely affect our liquidity and our ability to execute our business plan.
In order to maintain our qualification as a REIT and to meet the REIT distribution requirements, we may need to modify our business plans. Our cash flow from operations may be insufficient to fund required distributions, for example, as a result of differences in timing between our cash flow, the receipt of income for GAAP purposes and the recognition of income for U.S. federal
income tax purposes, the effect of non-deductible capital expenditures, the effect of limitations on interest and net operating loss deductibility, the creation of reserves, payment of required debt service or amortization payments, or the need to make additional investments in qualifying real estate assets. The insufficiency of our cash flow to cover our distribution requirements could require us to (i) sell assets in adverse market conditions, (ii) borrow on unfavorable terms, (iii) distribute amounts that would otherwise be invested in future acquisitions or capital expenditures or used for the repayment of debt, (iv) pay dividends in the form of “taxable stock dividends” or (v) use cash reserves, in order to comply with the REIT distribution requirements. As a result, compliance with the REIT distribution requirements could adversely affect the market value of our common stock. The inability of our cash flow to cover our distribution requirements could have an adverse impact on our ability to raise short and long-term debt or sell equity securities. In addition, if we are compelled to liquidate our assets to repay obligations to our lenders or make distributions to our stockholders, we may be subject to a 100% tax on any resultant gain if we sell assets that are treated as property held primarily for sale to customers in the ordinary course of business.
The ability of our board of directors to revoke our REIT qualification without stockholder approval may cause adverse consequences to our stockholders.
Our charter provides that our board of directors may revoke or otherwise terminate our REIT election, without the approval of our stockholders, if it determines that it is no longer in our best interest to continue to qualify as a REIT. If we cease to be a REIT, we will not be allowed a deduction for dividends paid to stockholders in computing our taxable income and will be subject to U.S. federal income tax at regular corporate rates, as well as state and local taxes, which may have adverse consequences on our total return to our stockholders.
Our ability to provide certain services to our tenants may be limited by the REIT rules, or may have to be provided through a TRS.
As a REIT, we generally cannot provide services to our tenants other than those that are customarily provided by landlords, nor can we derive income from a third party that provides such services. If we forego providing such services to our tenants, we may be at a disadvantage to competitors who are not subject to the same restrictions. However, we can provide such non-customary services to tenants or share in the revenue from such services if we do so through a TRS, though income earned through the TRS will be subject to corporate income taxes.
We earn fees from certain tenant improvement services and other non-customary services provided to our tenants. Gross income from such tenant improvement services generally may only constitute qualifying income for purposes of the 75% and 95% gross income tests to the extent that it is attributable to services provided to our tenants in connection with the entering into or renewal or extension of a lease. In addition, tenant improvement services provided to our tenants other than in such circumstances might constitute non-customary services. As a result, to the extent that we provide tenant improvement services to tenants other than in connection with the entering into or renewal or extension of a lease, or provide other non-customary services, we provide such services through a TRS, which is subject to full corporate tax with respect to such income.
Although our use of TRSs may partially mitigate the impact of meeting certain requirements necessary to maintain our qualification as a REIT, there are limits on our ability to own and engage in transactions with TRSs, and a failure to comply with the limits would jeopardize our REIT qualification and may result in the application of a 100% excise tax.
A REIT may own up to 100% of the stock of one or more TRSs. A TRS may hold assets and earn income that would not be qualifying assets or income if held or earned directly by a REIT. Both the subsidiary and the REIT must jointly elect to treat the subsidiary as a TRS. A corporation of which a TRS directly or indirectly owns more than 35% of the voting power or value of the stock will automatically be treated as a TRS. Overall, no more than 20% of the value of a REIT’s assets may consist of securities of one or more TRSs. In addition, rules impose a 100% excise tax on certain transactions between a TRS and its parent REIT that are treated as not being conducted on an arm’s-length basis. We have jointly elected with three subsidiaries for such subsidiaries to be treated as TRSs for U.S. federal income tax purposes. These three subsidiaries and any other TRSs that we form will pay U.S. federal, state and local income tax on their taxable income, and their after-tax net income will be available for distribution to us but is not required to be distributed to us unless necessary to maintain our REIT qualification. Although we will monitor the aggregate value of the securities of such TRSs and intend to conduct our affairs so that such securities will represent less than 20% of the value of our total assets, there can be no assurance that we will be able to comply with the TRS limitation in all market conditions.
We may face risks in connection with Section 1031 exchanges.
If a transaction intended to qualify as a tax-deferred Section 1031 exchange is later determined to be taxable, we may face adverse consequences, and if the laws applicable to such transactions are amended or repealed, we may not be able to dispose of properties on a tax-deferred basis. Under current law, Section 1031 exchanges only apply to real property and do not apply to any
related personal property transferred with the real property. As a result, any gain on appreciated personal property that is transferred in connection with a Section 1031 exchange of real property will be recognized, and such gain is generally treated as non-qualifying income for the 95% and 75% gross income tests. Any such non-qualifying income could have an adverse effect on our REIT status.
The partnership audit rules may alter who bears the liability in the event any subsidiary partnership (such as our operating partnership) is audited and an adjustment is assessed.
In the case of an audit of a partnership, the partnership itself may be liable for a hypothetical increase in partner-level taxes (including interest and penalties) resulting from an adjustment of partnership tax items on audit, regardless of changes in the composition of the partners (or their relative ownership) between the year under audit and the year of the adjustment. Thus, for example, an audit assessment attributable to former partners of the operating partnership could be shifted to the partners in the year of the adjustment. The partnership audit rules also include, among other procedures, an elective alternative method under which the additional taxes resulting from the adjustment are assessed from the affected partners (often referred to as a “push-out election”), subject to a higher rate of interest than otherwise would apply. The rules provide that when a push-out election causes a partner that is itself a partnership to be assessed with its share of such additional taxes from the adjustment, such partnership may cause such additional taxes to be pushed out to its own partners. In addition, applicable Treasury Regulations provide that a partnership may be able to request a modification of an adjustment that is based on deficiency dividends distributed by a partner that is a REIT. Many questions remain as to how the partnership audit rules will apply in practice, and it is not clear at this time what effect these rules will have on us. However, it is possible that a partnership in which we directly or indirectly invest may be subject to U.S. federal income tax, interest, and penalties in the event of a U.S. federal income tax audit as a result of these rules, and as a result could increase the U.S. federal income tax, interest, and/or penalties otherwise borne by us as a direct or indirect partner in any such partnership.
Possible legislative, regulatory or other actions could adversely affect our stockholders and us.
The rules dealing with U.S. federal, state and local income taxation are constantly under review by persons involved in the legislative process and by the IRS and the U.S. Treasury Department. Changes to tax laws (which changes may have retroactive application) could adversely affect our stockholders or us. In recent years, many such changes have been made and changes are likely to continue to occur in the future. We cannot predict whether, when, in what form, or with what effective dates, tax laws, regulations and rulings may be enacted, promulgated or decided, which could result in an increase in our, or our stockholders’, tax liability or require changes in the manner in which we operate in order to minimize increases in our tax liability. A shortfall in tax revenues for states and municipalities in which we operate may lead to an increase in the frequency and size of such changes. If such changes occur, we may be required to pay additional taxes on our assets or income or be subject to additional restrictions. These increased tax costs could, among other things, adversely affect our financial condition, the results of operations and the amount of cash available for the payment of dividends.
General Risk Factors
We depend on the members of our senior management team and the loss of any of their services, or an inability to attract and retain highly qualified personnel, could have a material adverse effect on our business, financial condition and results of operations.
Our senior management team consists of individuals with experience in identifying, acquiring, developing, financing and managing U.S. Government-leased assets and has developed long-term relationships across the commercial real estate industry, including at all levels of the GSA and at numerous government agencies. Each of these individuals brings specialized knowledge and skills in the U.S. Government-leased property sector. The loss of services of one or more of these members of our senior management team, or our inability to attract and retain highly qualified personnel, could have a material adverse effect on our business, financial condition and results of operations and weaken our relationships with lenders, business partners, industry participants, the GSA and U.S. Government agencies.
We may from time to time be subject to litigation, which could have a material adverse effect on our business, financial condition and results of operations.
We may be a party to various claims and routine litigation arising in the ordinary course of business. Some of these claims or others to which we may be subject from time to time may result in defense costs, settlements, fines or judgments against us, some of which are not, or cannot be, covered by insurance. Payment of any such costs, settlements, fines or judgments that are not insured could have an adverse impact on our financial position and results of operations. In addition, certain litigation or the resolution of certain litigation may affect the availability or cost of some of our insurance coverage, which could adversely impact our results of operations and cash flow, expose us to increased risks that would be uninsured, or adversely impact our ability to attract officers and directors.
We rely on information technology (“IT”) in our operations and any material failure, inadequacy, interruption or security failure of that technology could harm our business.
We rely on IT networks and systems, including the Internet, to process, transmit and store electronic information and to manage or support a variety of our business processes, including financial transactions and maintenance of records, which may include confidential information of tenants and lease data. We rely on commercially available systems, software, tools and monitoring and third-party providers to provide security for processing, transmitting and storing confidential tenant information, such as individually identifiable information relating to financial accounts. It is possible that our security measures will not be able to prevent the systems’ improper functioning, or the improper disclosure of personally identifiable information such as in the event of cyber-attacks. Security breaches, incidents, and compromises, including physical or electronic break-ins, computer viruses, attacks by hackers and similar breaches, can create system disruptions, shutdowns or unauthorized disclosure of confidential information. Any failure to maintain proper function, security and availability of our information systems could interrupt our operations, and those of our tenants; result in our inability to properly monitor our compliance with the rules and regulations regarding our compliance as a REIT; result in the unauthorized access to, and destruction, loss, theft, misappropriation or release of, proprietary, confidential, sensitive or otherwise valuable information of ours or others; result in our inability to maintain the building systems relied upon by our tenants for the efficient use of their leased space; require significant management attention and resources to remedy any damages that may result; damage our reputation among our tenants and investors, or subject us to liability claims or regulatory penalties. Additionally, third-party security events at our vendors or other service providers could also impact our data and operations via unauthorized access to information or disruption of services. Any or all of the above could have a material adverse effect on our business, financial condition and results of operations.
The risk of a security breach, incident, compromise or disruption, particularly through cyber-attack or cyber intrusion, including by computer hackers, foreign governments and cyber terrorists, has generally increased as the number, intensity and sophistication of attempted attacks and intrusions from around the world have increased, which, in turn, may lead to increased costs to protect our network, data and systems. Although we make efforts to maintain the security and integrity of our IT networks and related systems, and we have implemented various measures to manage the risk of a security breach, incident, compromise, or disruption, there can be no assurance that our security efforts and measures will be effective or that attempted security breaches or disruptions would not be successful or damaging. Even the most well protected information, networks, systems and facilities remain potentially vulnerable because the techniques used in such attempted security breaches, incidents, and compromises evolve and generally are not recognized until launched against a target, and in some cases, are designed to not be detected and, in fact, may not be detected. Accordingly, we may be unable to anticipate these techniques or to implement adequate security barriers or other preventative measures or to adequately address or mitigate any security breach, incident, or compromise, and thus it is impossible for us to entirely mitigate this risk.
If there are deficiencies in our disclosure controls and procedures or internal control over financial reporting, we may not be able to accurately present our financial statements, which could materially and adversely affect us, including our business, reputation, results of operations, financial condition or liquidity.
The design and effectiveness of our disclosure controls and procedures and internal controls over financial reporting may not prevent all errors, misstatements or misrepresentations. While management will continue to review the effectiveness of our disclosure controls and procedures and internal controls over financial reporting, there can be no guarantee that our internal controls over financial reporting will be effective in accomplishing all control objectives all of the time. Furthermore, as we grow our business, our internal controls will become more complex, and we may require significantly more resources to ensure our internal controls remain effective. Deficiencies, including any material weakness, in our internal controls over financial reporting which may occur in the future could result in misstatements of our results of operations that could require a restatement, failing to meet our public company reporting obligations and causing investors to lose confidence in our reported financial information. These events could materially and adversely affect us, including our business, reputation, results of operations, financial condition or liquidity.
None.
Item 1C. Cybersecurity
Risk management and strategy
We rely on IT networks and systems to process, transmit and store electronic information and to manage or support our business. We have implemented information security processes designed to identify, assess and manage risks from cybersecurity threats to our systems and data.
These processes are supported by a multidisciplinary team, including our legal department, management and third-party information security service providers, as described further below. We leverage internal and external resources to monitor and evaluate our threat environment, including the use of our third-party managed service provider, manual and automated tools, threat intelligence reporting and analysis services, security scans and testing and internal and external audits. In addition, as part of our ongoing cybersecurity efforts, we have implemented a process for mandatory cybersecurity awareness training for new employees during onboarding and at least annually thereafter. We also conduct ongoing phishing simulations in an effort to raise awareness and support our training efforts.
Our cybersecurity risk assessment process includes quarterly reviews of our cybersecurity controls, annual third-party penetration tests and annual internal assessments of our cybersecurity program as informed by the NIST Cybersecurity Framework. The results of our assessments are discussed with management and the audit committee of our board of directors. We have also established incident response processes for reporting to the audit committee for certain cybersecurity incidents, as appropriate.
We utilize certain third-party service providers to perform a variety of functions relating to the acquisition, development and management of our properties. We seek to engage reliable, reputable service providers that maintain cybersecurity programs. Depending on the nature of the services provided, the sensitivity and quantity of information processed, and the identity of the service provider, our vendor management process may include a review of the cybersecurity practices of such provider, including through security questionnaires and applicable security certifications or reports, as appropriate.
We are not aware of any risks from cybersecurity threats, including as a result of any cybersecurity incidents, to date that have materially affected or are reasonably likely to materially affect us, including our business strategy, results of operations, or financial condition. Refer to “Item 1A. Risk Factors” in this Annual Report on Form 10-K for additional discussion about cybersecurity-related risks.
Governance
Our board of directors is responsible for overseeing our strategy and risk management process and discharges its duties both as a full board and through its committees. As reflected in the audit committee charter, our board has delegated to the audit committee oversight of our risk assessment and management process, including processes related to cybersecurity. The audit committee meets at least annually with management, our internal auditor and our contracted Chief Technology Officer to discuss our cybersecurity program in regards to potential significant financial or operational risk exposures and the measures implemented to monitor and address those risks, including those that may result from cybersecurity threats. As necessary or appropriate, these discussions may include our risk assessment and risk management policies.
In addition to our multidisciplinary management team, we rely on our internal audit function in collaboration with a third-party information security service provider to lead our cybersecurity risk assessment and management processes and oversee their implementation and maintenance. We have a longstanding relationship with our third-party information security service provider, which includes services from our contracted Chief Technology Officer. The contracted Chief Technology Officer has approximately 16 years of information technology experience, including nine years in the finance and real estate sectors, and our Head of Internal Audit, has approximately 31 years of audit experience, including 21 years in the real estate and financial services sectors.
Management is responsible for hiring personnel to support our cybersecurity strategy, as appropriate, helping to integrate cybersecurity risk considerations into our overall risk management strategy, and communicating key priorities to relevant personnel. Management is also responsible for approving technology budgets, approving cybersecurity processes, and reviewing cybersecurity assessments and other cybersecurity-related matters.
Item 2. Properties
As of December 31, 2024, we wholly owned 90 operating properties and ten operating properties through the JV in the United States encompassing approximately 9.7 million leased square feet (9.2 million pro rata), including 92 operating properties that were leased to U.S. Government tenant agencies, four operating properties leased to tenant agencies of a U.S. state or local government and three operating properties leased entirely to private tenants. In addition, we wholly owned two properties under development that we expect to encompass approximately 0.2 million leased square feet upon completion. As of December 31, 2024, our operating properties were 97% leased with a weighted average annualized lease income per leased square foot of $35.60 ($35.22 pro rata) and a weighted average age of approximately 15.7 years based on the date the property was built or renovated-to-suit, where applicable. For purposes of calculating percentage leased, we exclude from the denominator total square feet that was unleased and to which we attributed no value at the time of acquisition. We calculate annualized lease income as annualized contractual base rent for the last month in a specified period, plus the annualized straight line rent adjustments for the last month in such period and the annualized net expense reimbursements earned by us for the last month in such period.
The table set forth below shows information relating to the properties we owned, or in which we had an ownership interest, at December 31, 2024, and it includes properties held by the JV:
| | | | | | | | | | | | | | | | | | | | | | | | |
Property Name | | Location | | Property
Type (1) | | Tenant Lease
Expiration
Year (2) | | | Leased
Square
Feet | | | Annualized
Lease
Income | | | Percentage
of Total
Annualized
Lease
Income | | | Annualized
Lease
Income per
Leased
Square
Foot | |
Wholly Owned U.S. Government Leased Properties | | | | | | | |
VA - Loma Linda | | Loma Linda, CA | | OC | | | 2036 | | | | 327,614 | | | $ | 16,850,124 | | | | 4.9 | % | | $ | 51.43 | |
USCIS - Kansas City (3) | | Lee's Summit, MO | | O | | 2025 - 2042 | | | | 403,178 | | | | 10,007,859 | | | | 2.9 | % | | | 24.82 | |
JSC - Suffolk | | Suffolk, VA | | SF | | | 2028 | | | | 403,737 | | | | 8,503,831 | | | | 2.5 | % | | | 21.06 | |
Various GSA - Chicago | | Des Plaines, IL | | O | | | 2026 | | | | 188,768 | | | | 7,789,151 | | | | 2.2 | % | | | 41.26 | |
IRS - Fresno | | Fresno, CA | | O | | | 2033 | | | | 180,481 | | | | 6,972,352 | | | | 2.0 | % | | | 38.63 | |
Various GSA - Portland (4) | | Portland, OR | | O | | 2025 - 2039 | | | | 205,478 | | | | 6,927,716 | | | | 2.0 | % | | | 33.72 | |
Various GSA - Buffalo (5) | | Buffalo, NY | | O | | 2025 - 2039 | | | | 273,678 | | | | 6,893,503 | | | | 2.0 | % | | | 25.19 | |
FBI - Salt Lake | | Salt Lake City, UT | | SF | | | 2032 | | | | 169,542 | | | | 6,789,358 | | | | 2.0 | % | | | 40.05 | |
VA - San Jose | | San Jose, CA | | OC | | | 2038 | | | | 90,085 | | | | 5,819,576 | | | | 1.7 | % | | | 64.60 | |
EPA - Lenexa | | Lenexa, KS | | O | | | 2027 | | | | 169,585 | | | | 5,796,626 | | | | 1.7 | % | | | 34.18 | |
FBI - Tampa | | Tampa, FL | | SF | | | 2040 | | | | 138,000 | | | | 5,314,469 | | | | 1.5 | % | | | 38.51 | |
FBI - San Antonio | | San Antonio, TX | | SF | | | 2025 | | | | 148,584 | | | | 5,206,053 | | | | 1.5 | % | | | 35.04 | |
FDA - Alameda | | Alameda, CA | | L | | | 2039 | | | | 69,624 | | | | 4,966,674 | | | | 1.4 | % | | | 71.34 | |
FBI / DEA - El Paso | | El Paso, TX | | SF | | | 2028 | | | | 203,683 | | | | 4,727,462 | | | | 1.4 | % | | | 23.21 | |
PTO - Arlington | | Arlington, VA | | SF | | | 2035 | | | | 190,546 | | | | 4,683,980 | | | | 1.4 | % | | | 24.58 | |
FEMA - Tracy | | Tracy, CA | | W | | | 2038 | | | | 210,373 | | | | 4,652,852 | | | | 1.3 | % | | | 22.12 | |
TREAS - Parkersburg | | Parkersburg, WV | | O | | | 2041 | | | | 182,500 | | | | 4,399,697 | | | | 1.3 | % | | | 24.11 | |
FDA - Lenexa | | Lenexa, KS | | L | | | 2040 | | | | 59,690 | | | | 4,333,387 | | | | 1.3 | % | | | 72.60 | |
ICE - Dallas (6) | | Irvine, TX | | SF | | 2032 / 2040 | | | | 129,046 | | | | 4,090,572 | | | | 1.2 | % | | | 31.70 | |
FBI - Pittsburgh | | Pittsburgh, PA | | SF | | | 2027 | | | | 100,054 | | | | 4,079,780 | | | | 1.2 | % | | | 40.78 | |
VA - South Bend | | Mishakawa, IN | | OC | | | 2032 | | | | 86,363 | | | | 4,026,610 | | | | 1.2 | % | | | 46.62 | |
FBI - New Orleans | | New Orleans, LA | | SF | | | 2029 | | | | 137,679 | | | | 3,968,050 | | | | 1.1 | % | | | 28.82 | |
FBI - Omaha | | Omaha, NE | | SF | | | 2044 | | | | 112,196 | | | | 3,959,898 | | | | 1.1 | % | | | 35.29 | |
USCIS - Lincoln | | Lincoln, NE | | O | | | 2025 | | | | 137,671 | | | | 3,904,639 | | | | 1.1 | % | | | 28.36 | |
VA - Mobile | | Mobile, AL | | OC | | | 2033 | | | | 79,212 | | | | 3,798,371 | | | | 1.1 | % | | | 47.95 | |
FBI - Birmingham | | Birmingham, AL | | SF | | | 2042 | | | | 96,278 | | | | 3,692,036 | | | | 1.1 | % | | | 38.35 | |
FBI - Knoxville | | Knoxville, TN | | SF | | | 2025 | | | | 99,130 | | | | 3,629,035 | | | | 1.0 | % | | | 36.61 | |
FBI - Albany | | Albany, NY | | SF | | | 2036 | | | | 69,476 | | | | 3,591,446 | | | | 1.0 | % | | | 51.69 | |
EPA - Kansas City | | Kansas City, KS | | L | | | 2043 | | | | 55,833 | | | | 3,589,765 | | | | 1.0 | % | | | 64.29 | |
USFS II - Albuquerque | | Albuquerque, NM | | O | | | 2026 | | | | 98,720 | | | | 3,553,436 | | | | 1.0 | % | | | 36.00 | |
DOT - Lakewood | | Lakewood, CO | | O | | | 2039 | | | | 116,046 | | | | 3,416,355 | | | | 1.0 | % | | | 29.44 | |
ICE - Charleston | | North Charleston, SC | | SF | | | 2027 | | | | 65,124 | | | | 3,373,468 | | | | 1.0 | % | | | 51.80 | |
VA - Chico | | Chico, CA | | OC | | | 2034 | | | | 51,647 | | | | 3,341,875 | | | | 1.0 | % | | | 64.71 | |
FBI - Richmond | | Richmond, VA | | SF | | | 2041 | | | | 96,607 | | | | 3,334,875 | | | | 1.0 | % | | | 34.52 | |
JUD - Del Rio | | Del Rio, TX | | C | | | 2041 | | | | 89,880 | | | | 3,291,972 | | | | 1.0 | % | | | 36.63 | |
FBI - Mobile | | Mobile, AL | | SF | | | 2029 | | | | 76,112 | | | | 3,262,209 | | | | 0.9 | % | | | 42.86 | |
FBI - Little Rock | | Little Rock, AR | | SF | | | 2041 | | | | 102,377 | | | | 3,237,405 | | | | 0.9 | % | | | 31.62 | |
DEA - Sterling | | Sterling, VA | | L | | | 2038 | | | | 57,692 | | | | 3,222,788 | | | | 0.9 | % | | | 55.86 | |
DEA - Vista | | Vista, CA | | L | | | 2035 | | | | 52,293 | | | | 3,147,780 | | | | 0.9 | % | | | 60.20 | |
USCIS - Tustin | | Tustin, CA | | O | | | 2034 | | | | 66,818 | | | | 3,142,255 | | | | 0.9 | % | | | 47.03 | |
VA - Orange | | Orange, CT | | OC | | | 2034 | | | | 56,330 | | | | 2,998,139 | | | | 0.9 | % | | | 53.22 | |
| | | | | | | | | | | | | | | | | | | | | | | | |
Property Name | | Location | | Property
Type (1) | | Tenant Lease
Expiration
Year (2) | | | Leased
Square
Feet | | | Annualized
Lease
Income | | | Percentage
of Total
Annualized
Lease
Income | | | Annualized
Lease
Income per
Leased
Square
Foot | |
Wholly Owned U.S. Government Leased Properties (Cont.) | |
VA - Indianapolis | | Brownsburg, IN | | OC | | | 2041 | | | | 80,000 | | | | 2,980,495 | | | | 0.9 | % | | | 37.26 | |
ICE - Albuquerque | | Albuquerque, NM | | SF | | | 2027 | | | | 71,100 | | | | 2,841,105 | | | | 0.8 | % | | | 39.96 | |
JUD - El Centro | | El Centro, CA | | C | | | 2034 | | | | 43,345 | | | | 2,814,240 | | | | 0.8 | % | | | 64.93 | |
SSA - Charleston | | Charleston, WV | | O | | | 2029 | | | | 110,000 | | | $ | 2,805,454 | | | | 0.8 | % | | $ | 25.50 | |
DEA - Dallas Lab | | Dallas, TX | | L | | | 2038 | | | | 49,723 | | | | 2,798,999 | | | | 0.8 | % | | | 56.29 | |
DEA - Pleasanton | | Pleasanton, CA | | L | | | 2035 | | | | 42,480 | | | | 2,779,748 | | | | 0.8 | % | | | 65.44 | |
DEA - Upper Marlboro | | Upper Marlboro, MD | | L | | | 2037 | | | | 50,978 | | | | 2,761,612 | | | | 0.8 | % | | | 54.17 | |
NARA - Broomfield | | Broomfield, CO | | W | | | 2032 | | | | 161,730 | | | | 2,690,321 | | | | 0.8 | % | | | 16.63 | |
TREAS - Birmingham | | Birmingham, AL | | O | | | 2029 | | | | 83,676 | | | | 2,627,473 | | | | 0.8 | % | | | 31.40 | |
DHS - Atlanta (7) | | Atlanta, GA | | SF | | 2031 - 2038 | | | | 91,185 | | | | 2,579,815 | | | | 0.7 | % | | | 28.29 | |
USAO - Louisville | | Louisville, KY | | SF | | | 2031 | | | | 60,000 | | | | 2,540,094 | | | | 0.7 | % | | | 42.33 | |
JUD - Charleston | | Charleston, SC | | C | | | 2040 | | | | 52,339 | | | | 2,518,931 | | | | 0.7 | % | | | 48.13 | |
JUD - Jackson | | Jackson, TN | | C | | | 2043 | | | | 75,043 | | | | 2,403,192 | | | | 0.7 | % | | | 32.02 | |
IRS - Ogden | | Ogden, UT | | W | | | 2029 | | | | 100,000 | | | | 2,352,291 | | | | 0.7 | % | | | 23.52 | |
CBP - Savannah | | Savannah, GA | | L | | | 2033 | | | | 35,000 | | | | 2,289,518 | | | | 0.7 | % | | | 65.41 | |
DEA - Dallas | | Dallas, TX | | SF | | | 2041 | | | | 71,827 | | | | 2,272,075 | | | | 0.7 | % | | | 31.63 | |
Various GSA - Cleveland (8) | | Brooklyn Heights, OH | | O | | 2028 - 2040 | | | | 61,384 | | | | 2,245,513 | | | | 0.6 | % | | | 36.58 | |
NWS - Kansas City | | Kansas City, MO | | SF | | | 2033 | | | | 94,378 | | | | 2,155,680 | | | | 0.6 | % | | | 22.84 | |
DEA - Santa Ana | | Santa Ana, CA | | SF | | | 2029 | | | | 39,905 | | | | 2,019,910 | | | | 0.6 | % | | | 50.62 | |
NPS - Omaha | | Omaha, NE | | SF | | | 2029 | | | | 62,772 | | | | 1,891,182 | | | | 0.5 | % | | | 30.13 | |
DEA - North Highlands | | Sacramento, CA | | SF | | | 2033 | | | | 37,975 | | | | 1,885,075 | | | | 0.5 | % | | | 49.64 | |
GSA - Clarksburg | | Clarksburg, WV | | O | | | 2039 | | | | 70,495 | | | | 1,880,219 | | | | 0.5 | % | | | 26.67 | |
VA - Golden | | Golden, CO | | W | | | 2026 | | | | 56,753 | | | | 1,782,038 | | | | 0.5 | % | | | 31.40 | |
JUD - Newport News | | Newport News, VA | | C | | | 2033 | | | | 35,005 | | | | 1,676,464 | | | | 0.5 | % | | | 47.89 | |
ICE - Orlando | | Orlando, FL | | SF | | | 2040 | | | | 49,420 | | | | 1,668,211 | | | | 0.5 | % | | | 33.76 | |
USCG - Martinsburg | | Martinsburg, WV | | SF | | | 2027 | | | | 59,547 | | | | 1,624,577 | | | | 0.5 | % | | | 27.28 | |
JUD - Aberdeen | | Aberdeen, MS | | C | | | 2025 | | | | 46,979 | | | | 1,577,074 | | | | 0.5 | % | | | 33.57 | |
VA - Charleston | | North Charleston, SC | | W | | | 2040 | | | | 97,718 | | | | 1,504,645 | | | | 0.4 | % | | | 15.40 | |
DEA - Albany | | Albany, NY | | SF | | | 2042 | | | | 31,976 | | | | 1,407,704 | | | | 0.4 | % | | | 44.02 | |
USAO - Springfield | | Springfield, IL | | SF | | | 2038 | | | | 43,600 | | | | 1,391,454 | | | | 0.4 | % | | | 31.91 | |
JUD - Council Bluffs | | Council Bluffs, IA | | C | | | 2041 | | | | 28,900 | | | | 1,367,675 | | | | 0.4 | % | | | 47.32 | |
DEA - Riverside | | Riverside, CA | | SF | | | 2032 | | | | 34,354 | | | | 1,321,949 | | | | 0.4 | % | | | 38.48 | |
DEA - Birmingham | | Birmingham, AL | | SF | | | 2038 | | | | 35,616 | | | | 1,256,899 | | | | 0.4 | % | | | 35.29 | |
HSI - Orlando | | Orlando, FL | | SF | | | 2036 | | | | 27,840 | | | | 1,075,437 | | | | 0.3 | % | | | 38.63 | |
SSA - Dallas | | Dallas, TX | | SF | | | 2035 | | | | 27,200 | | | | 1,069,445 | | | | 0.3 | % | | | 39.32 | |
JUD - South Bend | | South Bend, IN | | C | | | 2027 | | | | 30,119 | | | | 802,002 | | | | 0.2 | % | | | 26.63 | |
ICE - Louisville | | Louisville, KY | | SF | | | 2036 | | | | 17,420 | | | | 657,841 | | | | 0.2 | % | | | 37.76 | |
DEA - San Diego | | San Diego, CA | | W | | | 2032 | | | | 16,100 | | | | 561,172 | | | | 0.2 | % | | | 34.86 | |
DEA - Bakersfield | | Bakersfield, CA | | SF | | | 2038 | | | | 9,800 | | | | 493,373 | | | | 0.1 | % | | | 50.34 | |
SSA - San Diego | | San Diego, CA | | SF | | | 2032 | | | | 10,059 | | | | 452,386 | | | | 0.1 | % | | | 44.97 | |
ICE - Otay | | San Diego, CA | | O | | | 2027 | | | | 7,434 | | | | 261,222 | | | | 0.1 | % | | | 35.14 | |
Subtotal | | | | | | | | | | 7,858,905 | | | $ | 278,371,939 | | | | 80.4 | % | | $ | 35.42 | |
| | | | | | | | | | | | | | | | | | | | | | | | |
Wholly Owned State and Local Government Leased Property | | | | | | | | | | | | | |
Wake County III - Cary (9) | | Cary, NC | | O | | 2027 / 2034 | | | | 113,722 | | | | 3,555,902 | | | | 1.0 | % | | $ | 31.27 | |
CA - Anaheim | | Anaheim, CA | | O | | 2033 / 2034 | | | | 95,273 | | | | 3,364,379 | | | | 1.0 | % | | $ | 35.31 | |
Wake County II - Cary | | Cary, NC | | O | | | 2034 | | | | 98,340 | | | | 2,953,908 | | | | 0.9 | % | | $ | 30.04 | |
Wake County I - Cary | | Cary, NC | | O | | | 2034 | | | | 75,401 | | | | 2,254,676 | | | | 0.7 | % | | $ | 29.90 | |
Subtotal | | | | | | | | | | 382,736 | | | $ | 12,128,865 | | | | 3.6 | % | | $ | 31.69 | |
Wholly Owned Privately Leased Property | | | | | | | | | | | | | |
Northrop Grumman - Dayton | | Beavercreek, OH | | SF | | | 2029 | | | | 99,246 | | | | 2,579,090 | | | | 0.7 | % | | $ | 25.99 | |
Northrop Grumman - Aurora | | Aurora, CO | | SF | | | 2032 | | | | 104,136 | | | | 2,368,386 | | | | 0.7 | % | | $ | 22.74 | |
501 East Hunter Street - Lummus Corporation | | Lubbock, TX | | W | | | 2028 | | | | 70,078 | | | | 412,024 | | | | 0.1 | % | | $ | 5.88 | |
Subtotal | | | | | | | | | | 273,460 | | | $ | 5,359,500 | | | | 1.5 | % | | $ | 19.60 | |
| | | | | | | | | | | | | | | | | | | |
Wholly Owned Properties Total / Weighted Average | | | | 8,515,101 | | | | 295,860,304 | | | | 85.5 | % | | $ | 34.75 | |
| | | | | | | | | | | | | | | | | | | |
Property Name | | Location | | Property
Type (1) | | Tenant Lease
Expiration
Year (2) | | | Leased
Square
Feet | | | Annualized
Lease
Income | | | Percentage
of Total
Annualized
Lease
Income | | | Annualized
Lease
Income per
Leased
Square
Foot | |
Unconsolidated Real Estate Venture U.S. Government Leased Properties | | | | | | | | | | |
VA - Phoenix (10) | | Phoenix, AZ | | OC | | | 2042 | | | | 257,294 | | | $ | 10,781,681 | | | | 3.1 | % | | $ | 41.90 | |
VA - San Antonio (10) | | San Antonio, TX | | OC | | | 2041 | | | | 226,148 | | | | 9,308,441 | | | | 2.7 | % | | | 41.16 | |
VA - Jacksonville (10) | | Jacksonville, FL | | OC | | | 2043 | | | | 193,100 | | | | 7,372,700 | | | | 2.1 | % | | | 38.18 | |
VA - Chattanooga (10) | | Chattanooga, TN | | OC | | | 2035 | | | | 94,566 | | | | 4,385,607 | | | | 1.3 | % | | | 46.38 | |
VA - Lubbock (10)(11) | | Lubbock, TX | | OC | | | 2040 | | | | 120,916 | | | | 4,251,052 | | | | 1.2 | % | | | 35.16 | |
VA - Marietta (10) | | Marietta, GA | | OC | | | 2041 | | | | 76,882 | | | | 3,958,402 | | | | 1.1 | % | | | 51.49 | |
VA - Birmingham (10) | | Irondale, AL | | OC | | | 2041 | | | | 77,128 | | | | 3,192,361 | | | | 0.9 | % | | | 41.39 | |
VA - Corpus Christi (10) | | Corpus Christi, TX | | OC | | | 2042 | | | | 69,276 | | | | 2,947,359 | | | | 0.9 | % | | | 42.55 | |
VA - Columbus (10) | | Columbus, GA | | OC | | | 2042 | | | | 67,793 | | | | 2,917,896 | | | | 0.8 | % | | | 43.04 | |
VA - Lenexa (10) | | Lenexa, KS | | OC | | | 2041 | | | | 31,062 | | | | 1,349,757 | | | | 0.4 | % | | | 43.45 | |
| | | | | | | | | | 1,214,165 | | | $ | 50,465,256 | | | | 14.5 | % | | $ | 41.56 | |
| | | | | | | | | | | | | | | | | | | |
Total / Weighted Average | | | | | | | | | | 9,729,266 | | | $ | 346,325,560 | | | | 100.0 | % | | $ | 35.60 | |
| | | | | | | | | | | | | | | | | | | |
Total / Weighted Average at Easterly's Share | | | | | | | | 9,158,607 | | | $ | 322,606,890 | | | | | | $ | 35.22 | |
(1)OC=Outpatient Clinic; SF=Specialized Facility; O=Office; C=Courthouse; L=Laboratory; W=Warehouse.
(2)The year of lease expiration does not include renewal options.
(3)Private tenants occupy 86,860 leased square feet.
(4)Private tenants occupy 36,610 leased square feet.
(5)A state government tenant occupies 14,274 leased square feet.
(6)Private tenants occupy 48,523 leased square feet.
(7)A private tenant occupies 17,373 leased square feet.
(8)A private tenant occupies 11,402 leased square feet.
(9)A private tenant occupies 37,858 leased square feet.
(10)We own 53.0% of the property through the JV.
(11)Asset is subject to a ground lease where the JV is the lessee.
Our assets are located throughout the United States. The following table sets forth the geographic diversification of our operating properties, by market, based on the GSA’s definition of regions, as of December 31, 2024, and it includes properties held by the JV:
| | | | | | | | | | | | | | | | | | | | | | | | | | |
Location | | Market | | Number of Properties | | Number of Leases | | Leased Square Feet | | | Percentage of Total Leased Square Feet | | | Percent Leased | | | Annualized
Lease
Income | | | Percentage
of Total
Annualized
Lease Income | |
State | | | | | | | | | | | | | | | | | | | | | |
California | | Pacific Rim | | 18 | | 22 | | | 1,385,660 | | | | 14.2 | % | | | 97 | % | | $ | 64,846,942 | | | | 18.7 | % |
Texas (1) | | Greater Southwest | | 11 | | 15 | | | 1,206,361 | | | | 12.4 | % | | | 100 | % | | | 40,375,454 | | | | 11.7 | % |
Virginia | | National Capital | | 5 | | 5 | | | 783,587 | | | | 8.1 | % | | | 100 | % | | | 21,421,938 | | | | 6.2 | % |
Alabama | | Southeast Sunbelt | | 6 | | 6 | | | 448,022 | | | | 4.6 | % | | | 100 | % | | | 17,829,349 | | | | 5.1 | % |
Florida | | Southeast Sunbelt | | 4 | | 4 | | | 408,360 | | | | 4.2 | % | | | 100 | % | | | 15,430,817 | | | | 4.5 | % |
Kansas | | The Heartland | | 4 | | 4 | | | 316,170 | | | | 3.2 | % | | | 96 | % | | | 15,069,535 | | | | 4.4 | % |
Missouri | | The Heartland | | 2 | | 6 | | | 497,556 | | | | 5.1 | % | | | 84 | % | | | 12,163,539 | | | | 3.5 | % |
New York | | Northeast & Caribbean | | 3 | | 8 | | | 375,130 | | | | 3.9 | % | | | 100 | % | | | 11,892,653 | | | | 3.4 | % |
Georgia | | Southeast Sunbelt | | 4 | | 6 | | | 270,860 | | | | 2.8 | % | | | 100 | % | | | 11,745,631 | | | | 3.4 | % |
Arizona | | Pacific Rim | | 1 | | 1 | | | 257,294 | | | | 2.6 | % | | | 100 | % | | | 10,781,681 | | | | 3.1 | % |
West Virginia | | Mid-Atlantic | | 4 | | 4 | | | 422,542 | | | | 4.3 | % | | | 99 | % | | | 10,709,947 | | | | 3.1 | % |
Tennessee | | Southeast Sunbelt | | 3 | | 3 | | | 268,739 | | | | 2.8 | % | | | 100 | % | | | 10,417,834 | | | | 3.0 | % |
Colorado | | Rocky Mountain | | 4 | | 4 | | | 438,665 | | | | 4.5 | % | | | 100 | % | | | 10,257,100 | | | | 3.0 | % |
Nebraska | | The Heartland | | 3 | | 3 | | | 312,639 | | | | 3.2 | % | | | 100 | % | | | 9,755,719 | | | | 2.8 | % |
Illinois | | Great Lakes | | 2 | | 2 | | | 232,368 | | | | 2.4 | % | | | 84 | % | | | 9,180,605 | | | | 2.7 | % |
Utah | | Rocky Mountain | | 2 | | 2 | | | 269,542 | | | | 2.8 | % | | | 100 | % | | | 9,141,649 | | | | 2.6 | % |
North Carolina | | Southeast Sunbelt | | 3 | | 4 | | | 287,463 | | | | 3.0 | % | | | 100 | % | | | 8,764,486 | | | | 2.5 | % |
Indiana | | Great Lakes | | 3 | | 3 | | | 196,482 | | | | 2.0 | % | | | 100 | % | | | 7,809,107 | | | | 2.3 | % |
South Carolina | | Southeast Sunbelt | | 3 | | 3 | | | 215,181 | | | | 2.2 | % | | | 89 | % | | | 7,397,044 | | | | 2.1 | % |
Oregon | | Northwest Arctic | | 1 | | 15 | | | 205,478 | | | | 2.1 | % | | | 92 | % | | | 6,927,716 | | | | 2.0 | % |
New Mexico | | Greater Southwest | | 3 | | 2 | | | 169,820 | | | | 1.7 | % | | | 65 | % | | | 6,394,541 | | | | 1.8 | % |
Ohio | | Great Lakes | | 2 | | 4 | | | 160,630 | | | | 1.7 | % | | | 100 | % | | | 4,824,603 | | | | 1.4 | % |
Pennsylvania | | Mid-Atlantic | | 1 | | 1 | | | 100,054 | | | | 1.0 | % | | | 100 | % | | | 4,079,780 | | | | 1.2 | % |
Louisiana | | Greater Southwest | | 1 | | 1 | | | 137,679 | | | | 1.4 | % | | | 100 | % | | | 3,968,050 | | | | 1.1 | % |
| | | | | | | | | | | | | | | | | | | | | | | | | | |
Arkansas | | Greater Southwest | | 1 | | 1 | | | 102,377 | | | | 1.1 | % | | | 100 | % | | | 3,237,405 | | | | 0.9 | % |
Kentucky | | Southeast Sunbelt | | 2 | | 2 | | | 77,420 | | | | 0.8 | % | | | 100 | % | | | 3,197,935 | | | | 0.9 | % |
Connecticut | | New England | | 1 | | 1 | | | 56,330 | | | | 0.6 | % | | | 100 | % | | | 2,998,139 | | | | 0.9 | % |
Maryland | | National Capital | | 1 | | 1 | | | 50,978 | | | | 0.5 | % | | | 100 | % | | | 2,761,612 | | | | 0.8 | % |
Mississippi | | Southeast Sunbelt | | 1 | | 1 | | | 46,979 | | | | 0.5 | % | | | 100 | % | | | 1,577,074 | | | | 0.5 | % |
Iowa | | The Heartland | | 1 | | 1 | | | 28,900 | | | | 0.3 | % | | | 100 | % | | | 1,367,675 | | | | 0.4 | % |
Total / Weighted Average | | 100 | | 135 | | | 9,729,266 | | | | 100.0 | % | | | 97 | % | | $ | 346,325,560 | | | | 100.0 | % |
| | | | | | | | | | | | | | | | | | | | | |
Market | | | | | | | | | | | | | | | | | | | | | |
Southeast Sunbelt | | | | 26 | | 29 | | | 2,023,024 | | | | 20.7 | % | | | 99 | % | | | 76,360,170 | | | | 22.0 | % |
Pacific Rim | | | | 19 | | 23 | | | 1,642,954 | | | | 16.8 | % | | | 97 | % | | | 75,628,623 | | | | 21.8 | % |
Greater Southwest | | | | 16 | | 19 | | | 1,616,237 | | | | 16.6 | % | | | 95 | % | | | 53,975,450 | | | | 15.6 | % |
The Heartland | | | | 10 | | 14 | | | 1,155,265 | | | | 11.9 | % | | | 91 | % | | | 38,356,468 | | | | 11.1 | % |
National Capital | | | | 6 | | 6 | | | 834,565 | | | | 8.6 | % | | | 100 | % | | | 24,183,550 | | | | 7.0 | % |
Great Lakes | | | | 7 | | 9 | | | 589,480 | | | | 6.1 | % | | | 93 | % | | | 21,814,315 | | | | 6.3 | % |
Rocky Mountain | | | | 6 | | 6 | | | 708,207 | | | | 7.3 | % | | | 100 | % | | | 19,398,749 | | | | 5.6 | % |
Mid-Atlantic | | | | 5 | | 5 | | | 522,596 | | | | 5.4 | % | | | 99 | % | | | 14,789,727 | | | | 4.3 | % |
Northeast & Caribbean | | | | 3 | | 8 | | | 375,130 | | | | 3.9 | % | | | 100 | % | | | 11,892,653 | | | | 3.4 | % |
Northwest Arctic | | | | 1 | | 15 | | | 205,478 | | | | 2.1 | % | | | 92 | % | | | 6,927,716 | | | | 2.0 | % |
New England | | | | 1 | | 1 | | | 56,330 | | | | 0.6 | % | | | 100 | % | | | 2,998,139 | | | | 0.9 | % |
Total / Weighted Average | | 100 | | 135 | | | 9,729,266 | | | | 100.0 | % | | | 97 | % | | $ | 346,325,560 | | | | 100.0 | % |
Our portfolio of operating properties has a stable tenant base that is diversified among U.S. Government agencies. Our U.S. Government tenant agencies include a number of the U.S. Government’s largest and most essential agencies. As of December 31, 2024 our operating properties were 97% leased by 59 tenants. The following table provides information about the tenants that leased our properties as of December 31, 2024, and includes tenants of properties held by our unconsolidated joint venture:
| | | | | | | | | | | | | | | | | | | | |
Tenant(1) | | Weighted
Average
Remaining
Lease
Term(2) | | | Leased
Square
Feet | | | Percentage
of Leased
Square
Feet | | | Annualized
Lease
Income | | | Percentage
of Total
Annualized
Lease
Income | |
U.S. Government | | | | | | | | | | | | | | | |
Department of Veteran Affairs (“VA”) | | | 14.1 | | | | 2,251,131 | | | | 23.2 | % | | $ | 96,083,994 | | | | 27.8 | % |
Federal Bureau of Investigation (“FBI”) | | | 9.0 | | | | 1,498,607 | | | | 15.5 | % | | | 53,767,038 | | | | 15.5 | % |
Drug Enforcement Administration (“DEA”) | | | 10.7 | | | | 607,290 | | | | 6.2 | % | | | 27,941,589 | | | | 8.1 | % |
Judiciary of the U.S. (“JUD”) | | | 12.3 | | | | 401,610 | | | | 4.1 | % | | | 16,451,550 | | | | 4.8 | % |
U.S. Citizenship and Immigration Services (“USCIS”) | | | 11.8 | | | | 520,807 | | | | 5.4 | % | | | 15,012,669 | | | | 4.3 | % |
Immigration and Customs Enforcement (“ICE”) | | | 8.8 | | | | 313,837 | | | | 3.2 | % | | | 12,186,554 | | | | 3.5 | % |
Internal Revenue Service (“IRS”) | | | 7.2 | | | | 333,334 | | | | 3.4 | % | | | 10,626,239 | | | | 3.1 | % |
Environmental Protection Agency (“EPA”) | | | 6.7 | | | | 225,418 | | | | 2.3 | % | | | 9,386,391 | | | | 2.7 | % |
Food and Drug Administration (“FDA”) | | | 15.2 | | | | 129,314 | | | | 1.3 | % | | | 9,300,061 | | | | 2.7 | % |
U.S. Joint Staff Command (“JSC”) | | | 3.4 | | | | 403,737 | | | | 4.1 | % | | | 8,503,831 | | | | 2.5 | % |
Federal Aviation Administration (“FAA”) | | | 1.8 | | | | 188,768 | | | | 1.9 | % | | | 7,789,151 | | | | 2.2 | % |
Social Security Administration (“SSA”) | | | 12.7 | | | | 266,176 | | | | 2.7 | % | | | 7,027,170 | | | | 2.0 | % |
Patent and Trademark Office (“PTO”) | | | 8.0 | | | | 192,185 | | | | 2.0 | % | | | 5,525,502 | | | | 1.6 | % |
Federal Emergency Management Agency (“FEMA”) | | | 10.0 | | | | 190,546 | | | | 2.0 | % | | | 4,683,980 | | | | 1.4 | % |
Patent and Trademark Office (“PTO”) | | | 13.8 | | | | 210,373 | | | | 2.2 | % | | | 4,652,852 | | | | 1.3 | % |
U.S. Attorney Office (“USAO”) | | | 9.9 | | | | 110,776 | | | | 1.1 | % | | | 4,122,947 | | | | 1.2 | % |
Department of Transportation (“DOT”) | | | 13.7 | | | | 123,480 | | | | 1.3 | % | | | 3,677,577 | | | | 1.1 | % |
U.S. Forest Service (“USFS”) | | | 1.5 | | | | 98,720 | | | | 1.0 | % | | | 3,553,436 | | | | 1.0 | % |
Customs and Border Protection (“CBP”) | | | 10.7 | | | | 64,737 | | | | 0.7 | % | | | 3,226,943 | | | | 0.9 | % |
National Archives and Records Administration (“NARA”) | | | 7.4 | | | | 161,730 | | | | 1.7 | % | | | 2,690,321 | | | | 0.8 | % |
National Weather Service (“NWS”) | | | 9.0 | | | | 94,378 | | | | 1.0 | % | | | 2,155,680 | | | | 0.6 | % |
U.S. Department of Agriculture (“USDA”) | | | 3.1 | | | | 60,257 | | | | 0.6 | % | | | 1,909,389 | | | | 0.6 | % |
National Park Service (“NPS”) | | | 4.5 | | | | 62,772 | | | | 0.6 | % | | | 1,891,182 | | | | 0.5 | % |
General Services Administration - Other | | | 0.7 | | | | 55,807 | | | | 0.6 | % | | | 1,714,806 | | | | 0.5 | % |
U.S. Coast Guard (“USCG”) | | | 3.0 | | | | 59,547 | | | | 0.6 | % | | | 1,624,577 | | | | 0.5 | % |
National Oceanic and Atmospheric Administration (“NOAA”) | | | 6.7 | | | | 33,403 | | | | 0.3 | % | | | 1,426,062 | | | | 0.4 | % |
Transportation Security Administration (“TSA”) | | | 9.0 | | | | 44,075 | | | | 0.5 | % | | | 1,161,242 | | | | 0.3 | % |
U.S. Army Corps of Engineers (“ACOE”) | | | 0.1 | | | | 39,320 | | | | 0.4 | % | | | 1,147,120 | | | | 0.3 | % |
Small Business Administration (“SBA”) | | | 14.6 | | | | 44,969 | | | | 0.5 | % | | | 1,114,230 | | | | 0.3 | % |
Homeland Security Investigations (“HSI”) | | | 11.2 | | | | 27,840 | | | | 0.3 | % | | | 1,075,437 | | | | 0.3 | % |
Bureau of Alcohol, Tobacco, Firearms and Explosives (“ATF”) | | | 8.2 | | | | 23,775 | | | | 0.2 | % | | | 734,101 | | | | 0.2 | % |
Federal Energy Regulatory Commission (“FERC”) | | | 14.6 | | | | 6,214 | | | | 0.1 | % | | | 248,307 | | | | 0.1 | % |
Department of Energy (“DOE”) | | | 8.3 | | | | 4,846 | | | | 0.0 | % | | | 187,782 | | | | 0.1 | % |
U.S. Probation Office (“USPO”) | | | 14.1 | | | | 6,621 | | | | 0.1 | % | | | 176,606 | | | | 0.1 | % |
U.S. Marshals Service (“USMS”) | | | 2.1 | | | | 1,054 | | | | 0.0 | % | | | 50,583 | | | | 0.0 | % |
Department of Labor (“DOL”) | | | 14.1 | | | | 574 | | | | 0.0 | % | | | 15,316 | | | | 0.0 | % |
Subtotal | | | 10.3 | | | | 8,858,028 | | | | 91.1 | % | | $ | 322,842,215 | | | | 93.3 | % |
| | | | | | | | | | | | | | | | | | | | |
Tenant(1) | | Weighted
Average
Remaining
Lease
Term(2) | | | Leased
Square
Feet | | | Percentage
of Leased
Square
Feet | | | Annualized
Lease
Income | | | Percentage
of Total
Annualized
Lease
Income | |
State and Local Government Tenants | | | | | | | | | | | | | | | |
Wake County Public School System | | | 9.5 | | | | 249,605 | | | | 2.6 | % | | $ | 7,605,214 | | | | 2.2 | % |
State of California Employee Development Department | | | 9.1 | | | | 65,133 | | | | 0.7 | % | | $ | 2,296,631 | | | | 0.7 | % |
State of California Department of Industrial Relations | | | 8.8 | | | | 30,140 | | | | 0.3 | % | | | 1,067,748 | | | | 0.3 | % |
New York State Court of Claims | | | 1.7 | | | | 14,274 | | | | 0.1 | % | | | 391,875 | | | | 0.1 | % |
Subtotal | | | 9.1 | | | | 359,152 | | | | 3.7 | % | | $ | 11,361,468 | | | | 3.3 | % |
| | | | | | | | | | | | | | | |
Private Tenants | | | | | | | | | | | | | | | |
Northrup Grumman Systems Corporation | | | 5.9 | | | | 203,382 | | | | 2.1 | % | | | 4,947,476 | | | | 1.4 | % |
Other Private Tenants | | | 4.2 | | | | 58,869 | | | | 0.6 | % | | | 1,673,709 | | | | 0.5 | % |
Jacobs Engineering Group, Inc. | | | 3.0 | | | | 37,858 | | | | 0.4 | % | | | 1,159,272 | | | | 0.3 | % |
St. Luke's Health System | | | 2.0 | | | | 32,043 | | | | 0.3 | % | | | 924,624 | | | | 0.3 | % |
HUB International Midwest Limited | | | 7.8 | | | | 29,074 | | | | 0.3 | % | | | 841,506 | | | | 0.2 | % |
CVS Health | | | 0.4 | | | | 39,690 | | | | 0.4 | % | | | 776,210 | | | | 0.2 | % |
Providence Health & Services | | | 0.7 | | | | 21,643 | | | | 0.2 | % | | | 747,258 | | | | 0.2 | % |
Pate Rehabilitation Endeavors, LLC | | | 7.1 | | | | 19,449 | | | | 0.2 | % | | | 639,798 | | | | 0.2 | % |
Lummus Corporation | | | 3.6 | | | | 70,078 | | | | 0.7 | % | | | 412,024 | | | | 0.1 | % |
Subtotal | | | 4.4 | | | | 512,086 | | | | 5.2 | % | | $ | 12,121,877 | | | | 3.4 | % |
Total / Weighted Average | | | 10.0 | | | | 9,729,266 | | | | 100.0 | % | | $ | 346,325,560 | | | | 100.0 | % |
(1)If a property is leased to multiple tenants the weighted average remaining lease term, leased square feet, annualized lease income and percentage of total annualized lease income have been allocated to the respective tenant agency.
(2)Weighted based on leased square feet.
Certain of our leases are currently in the “soft-term” period of the lease, meaning that the U.S. Government tenant agency has the right to terminate the lease prior to its stated lease end date. We believe that, from the U.S. Government’s perspective, leases with such provisions are helpful for budgetary purposes. While some of our leases are contractually subject to early termination, we do not believe that our tenant agencies are likely to terminate these leases early given the build-to-suit features at the properties subject to the leases, the average age of these properties based on the date the property was built or renovated-to-suit where applicable (approximately 19.5 years), the mission-critical focus of the properties subject to the leases and the current level of operations at such properties. The following table sets forth a schedule of lease expirations for leases in place as of December 31, 2024, and includes leases in place for properties held by our unconsolidated joint venture:
| | | | | | | | | | | | | | | | | | | | | | |
Year of Lease Expiration (1) | | Number of
Leases
Expiring | | Square
Footage
Expiring | | | Percentage of
Portfolio Square
Footage Expiring | | | Annualized
Lease Income Expiring | | | Percentage
of Total
Annualized
Lease Income Expiring | | | Annualized Lease
Income per
Leased Square
Foot Expiring | |
2025 | | 12 | | | 592,906 | | | | 6.1 | % | | | 18,868,413 | | | | 5.4 | % | | | 31.82 | |
2026 | | 6 | | | 394,832 | | | | 4.1 | % | | | 14,600,404 | | | | 4.2 | % | | | 36.98 | |
2027 | | 10 | | | 544,368 | | | | 5.6 | % | | | 20,068,900 | | | | 5.8 | % | | | 36.87 | |
2028 | | 11 | | | 802,397 | | | | 8.2 | % | | | 17,652,883 | | | | 5.1 | % | | | 22.00 | |
2029 | | 9 | | | 731,036 | | | | 7.5 | % | | | 22,205,212 | | | | 6.4 | % | | | 30.37 | |
2030 | | 1 | | | 1,536 | | | | 0.0 | % | | | 59,478 | | | | 0.0 | % | | | 38.72 | |
2031 | | 3 | | | 117,875 | | | | 1.2 | % | | | 4,549,908 | | | | 1.3 | % | | | 38.60 | |
2032 | | 10 | | | 683,660 | | | | 7.0 | % | | | 20,993,082 | | | | 6.1 | % | | | 30.71 | |
2033 | | 10 | | | 566,197 | | | | 5.8 | % | | | 22,077,072 | | | | 6.4 | % | | | 38.99 | |
2034 | | 10 | | | 507,793 | | | | 5.2 | % | | | 21,315,514 | | | | 6.2 | % | | | 41.98 | |
Thereafter | | 53 | | | 4,786,666 | | | | 49.3 | % | | | 183,934,694 | | | | 53.1 | % | | | 38.43 | |
Total / Weighted Average | | 135 | | | 9,729,266 | | | | 100.0 | % | | $ | 346,325,560 | | | | 100.0 | % | | $ | 35.60 | |
(1)The year of lease expirations is pursuant to current contract terms. Some tenants have the right to vacate their space during a specified period, or “soft term,” before the stated terms of their leases expire. As of December 31, 2024, 8 leases occupying approximately 5.8% of our leased square feet and contributing approximately 5.2% of our annualized lease income have exercisable rights to terminate their leases before the stated term of their lease expires.
Information about our development property as of December 31, 2024 is set forth in the table below:
| | | | | | | | | | | | | |
Property Name | | Location | | Tenant | | Property
Type | | Lease Term | | Estimated Leased
Square
Feet | |
FDA - Atlanta | | Atlanta, GA | | Food and Drug Administration | | L (1) | | 20-year | | | | 162,000 | |
JUD - Flagstaff | | Flagstaff, AZ | | Judiciary of the U.S. Government | | C (2) | | 20-year | | | | 50,777 | |
Total | | | | | | | | | | | | 212,777 | |
Item 3. Legal Proceedings
We are not currently involved in any material litigation nor, to our knowledge, is any material litigation threatened against us.
Item 4. Mine Safety Disclosure
Not applicable.
PART II
Item 5. Market for Registrant’s Common Equity, Related Stockholder Matters and Issuer Purchases of Equity Securities
Shares of our common stock are traded on the New York Stock Exchange under the symbol “DEA”. We had 31 stockholders of record of our common stock as of February 18, 2025. Certain shares are held in “street” name and accordingly, the number of beneficial owners of such shares is not known or included in the foregoing number.
Distribution Policy
In order to maintain our qualification as a REIT under the Internal Revenue Code, we must distribute at least 90% of our taxable income to stockholders. We intend to pay regular quarterly distributions to holders of our common stock in a manner to satisfy this requirement. Any distributions we make will be at the discretion of our board of directors and will be dependent upon a number of factors, including prohibitions or restrictions under financing agreements or applicable law and other factors described herein. We anticipate distributing all of our taxable income. See Item 1A, “Risk Factors,” and Item 7, “Management’s Discussion and Analysis of Financial Conditions and Results of Operations,” of this Annual Report on Form 10-K for information regarding the sources of funds used for distributions and for a discussion of factors, if any, which may adversely affect our ability to make distributions to our stockholders.
Performance Graph
The following performance graph compares the cumulative total stockholder return of our common stock with the cumulative total return of the Russell 2000 Index and the cumulative total return of the FTSE Nareit Equity REITs Index. The FTSE Nareit Equity REITs Index represents performance of all publicly-traded US Equity REITs not designated as Timber REITs or Infrastructure REITs. The graph covers the period from December 31, 2019 through December 31, 2024 and assumes that $100 was invested in our common stock and in each index on December 31, 2019 and that all dividends were reinvested. The information in this paragraph and the following performance graph are deemed to be furnished, not filed.
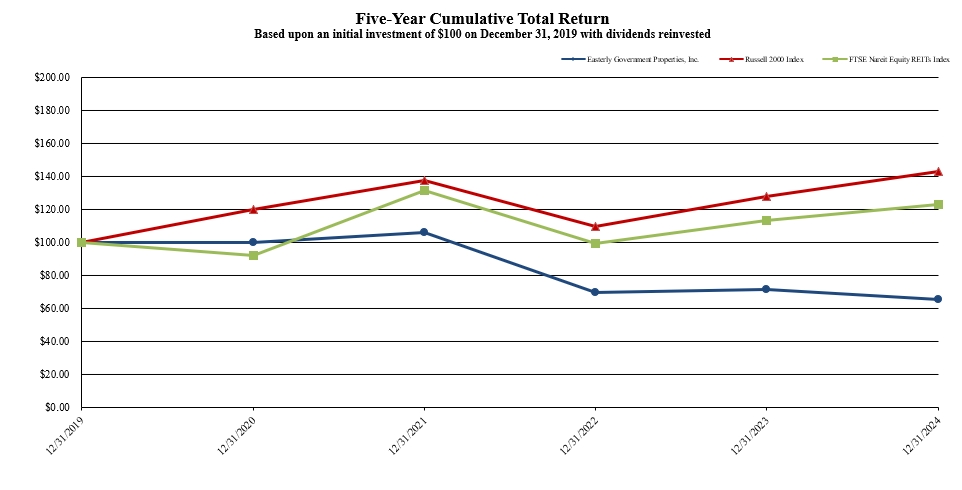
Recent Sales of Unregistered Securities
None.
Recent Purchases of Equity Securities
None.
Item 6. Reserved
Item 7. Management’s Discussion and Analysis of Financial Condition and Results of Operations
You should read the following discussion of our results of operations and financial condition in conjunction with the audited consolidated financial statements and related notes thereto as of December 31, 2024 and 2023 and for the years ended December 31, 2024, 2023 and 2022 and the sections entitled “Risk Factors,” “Forward Looking Statements,” “Business,” and “Properties” contained elsewhere in this Annual Report on Form 10-K. This discussion contains forward-looking statements that involve risks and uncertainties. The forward-looking statements are not historical facts, but rather are based on current expectations, estimates, assumptions and projections about our industry, business and future financial results. Our actual results could differ materially from the results contemplated by these forward-looking statements due to a number of factors, including those discussed in the sections of this Annual Report on Form 10-K entitled “Risk Factors” and “Forward Looking Statements.”
Overview
References to “Easterly,” “we,” “our,” “us” and “our company” refer to Easterly Government Properties, Inc., a Maryland corporation, together with our consolidated subsidiaries including Easterly Government Properties LP, a Delaware limited partnership, which we refer to herein as our operating partnership. We present certain financial information and metrics “at Easterly Share,” which is calculated on an entity-by-entity basis. “At Easterly Share” information, which we also refer to as being “at share,” “pro rata,” “our pro rata share” or “our share” is not, and is not intended to be, a presentation in accordance with accounting principles generally accepted in the United States of America (“GAAP”).
We are an internally managed real estate investment trust, or REIT, focused primarily on the acquisition, development and management of Class A commercial properties that are leased to U.S. Government agencies that serve essential functions. We generate over 90% of our revenue by leasing our properties to such agencies, either directly or through the U.S. General Services Administration, which we refer to herein as the GSA. Our objective is to generate attractive risk-adjusted returns for our stockholders over the long term through dividends and capital appreciation.
We focus primarily on acquiring, developing and managing U.S. Government-leased properties that are essential to supporting the mission of the tenant agency and strive to be a partner of choice for the U.S. Government, working closely with the tenant agency to meet its needs and objectives. We may also consider other potential opportunities to add properties to our portfolio, including acquiring properties leased to state and local governments with strong creditworthiness and other opportunities that directly or indirectly support the mission of select government agencies. As of December 31, 2024, we wholly owned 90 operating properties and ten operating properties through an unconsolidated joint venture (the “JV”) in the United States encompassing approximately 9.7 million leased square feet (9.2 million pro rata), including 92 operating properties that were leased primarily to U.S. Government tenant agencies, four operating properties leased to tenant agencies of a U.S. state or local government and three operating properties that were entirely leased to private tenants. As of December 31, 2024, our operating properties were 97% leased. For purposes of calculating percentage leased, we exclude from the denominator total square feet that was unleased and to which we attributed no value at the time of acquisition. In addition, we wholly owned two properties under development that we expect will encompass approximately 0.2 million leased square feet upon completion.
Our operating partnership holds substantially all of our assets and conducts substantially all of our business. We are the sole general partner of our operating partnership and owned approximately 95.2% of the aggregate limited partnership interests in our operating partnership, which we refer to herein as common units, as of December 31, 2024. We have elected to be taxed as a REIT and believe that we have operated and have been organized in conformity with the requirements for qualification and taxation as a REIT for U.S. federal income tax purposes commencing with our taxable year ended December 31, 2015.
Acquisitions
On April 12, 2024, we acquired a 129,046 leased square foot U.S. Immigration and Customs Enforcement (“ICE”) facility near Dallas, Texas that has lease expirations ranging from 2032 to 2040.
On May 7, 2024, we acquired a 27,840 leased square foot Homeland Security Investigations (“HSI”) facility in Orlando, Florida with a 15-year lease that does not expire until March 2036.
On May 9, 2024, we acquired a 49,420 leased square foot ICE facility in Orlando, Florida with a 20-year lease that does not expire until August 2040.
On September 4, 2024, we acquired a 99,246 leased square foot Northrop Grumman facility near Dayton, Ohio with a 5-year lease through August 2029.
On October 10, 2024, we acquired a 104,136 leased square foot Northrop Grumman facility in Aurora, Colorado with a 9-year lease through February 2032.
On November 21, 2024, we acquired a 100,000 leased square foot Internal Revenue Service (“IRS”) facility in Ogden, Utah with a 5-year lease through January 2029.
On November 27, 2024, we acquired a 295,253 square foot campus across three assets leased primarily to the Wake County Public School System with a 10-year lease through June 30, 2034.
Investment in unconsolidated real estate venture
On August 29, 2024, the JV acquired a 193,100 square foot Veteran Affairs (“VA”) outpatient facility in Jacksonville, Florida with a 20-year lease that does not expire until October 2043.
Development
On April 4, 2024, we acquired land to develop a 50,777 square foot Federal courthouse in Flagstaff, Arizona. The courthouse will be primarily leased to the GSA for beneficial use of the Judiciary of the U.S. Government (“JUD”) over a 20 year non-cancelable term.
Results of Operations
Comparison of Results of Operations for the Years Ended December 31, 2024 and December 31, 2023
The financial information presented below summarizes the results of operations of our company for the years ended December 31, 2024 and 2023.
| | | | | | | | | | | | |
| | For the years ended December 31, | |
(Amounts in thousands) | | 2024 | | | 2023 | | | Change | |
Revenues | | | | | | | | | |
Rental income | | $ | 289,601 | | | $ | 273,906 | | | $ | 15,695 | |
Tenant reimbursements | | | 6,544 | | | | 8,908 | | | | (2,364 | ) |
Asset management income | | | 2,302 | | | | 2,110 | | | | 192 | |
Other income | | | 3,605 | | | | 2,303 | | | | 1,302 | |
Total revenues | | | 302,052 | | | | 287,227 | | | | 14,825 | |
Expenses | | | | | | | | | |
Property operating | | | 70,151 | | | | 71,964 | | | | (1,813 | ) |
Real estate taxes | | | 30,924 | | | | 30,461 | | | | 463 | |
Depreciation and amortization | | | 96,333 | | | | 91,292 | | | | 5,041 | |
Acquisition costs | | | 1,878 | | | | 1,661 | | | | 217 | |
Corporate general and administrative | | | 24,450 | | | | 27,118 | | | | (2,668 | ) |
Provision for credit losses | | | 1,527 | | | | — | | | | 1,527 | |
Total expenses | | | 225,263 | | | | 222,496 | | | | 2,767 | |
Other income (expense) | | | | | | | | | |
Income from unconsolidated real estate venture | | | 6,051 | | | | 5,498 | | | | 553 | |
Interest expense, net | | | (62,433 | ) | | | (49,169 | ) | | | (13,264 | ) |
Gain on the sale of real estate | | | 171 | | | | — | | | | 171 | |
Net income | | $ | 20,578 | | | $ | 21,060 | | | $ | (482 | ) |
Revenues
Total revenues increased $14.8 million to $302.1 million for the year ended December 31, 2024 compared to $287.2 million for the year ended December 31, 2023.
The $15.7 million increase in Rental income is primarily attributable to the nine operating properties acquired since December 31, 2023 and a full period of operations from the three operating properties acquired during the year ended December 31, 2023.
The $2.4 million decrease in Tenant reimbursements is primarily attributable to a decrease in tenant project reimbursements.
The $0.2 million increase in Asset management income is attributable to the fee earned by us for asset management of the JV from the one property acquired since December 31, 2023 and a full period of operations from the one property acquired during the year ended December 31, 2023.
The $1.3 million increase in Other income is primarily attributable to an increase in interest income from our loan receivable.
Expenses
Total expenses increased by $2.8 million to $225.3 million for the year ended December 31, 2024 compared to $222.5 million for the year ended December 31, 2023.
The $1.8 million decrease in Property operating expenses is primarily attributable to a decrease in tenant reimbursable projects and utility costs across the portfolio partially offset by an increase from the nine operating properties acquired since December 31, 2023 and a full period of operations from the three operating properties acquired during the year ended December 31, 2023.
The $0.5 million increase in Real estate taxes is primarily attributable to the nine operating properties acquired since December 31, 2023 as well as a full period of operations from the three operating properties acquired during the year ended December 31, 2023.
The $5.0 million increase in Depreciation and amortization is primarily attributable to the nine operating properties acquired since December 31, 2023 as well as a full period of operations from the three operating properties acquired during the year ended December 31, 2023.
The $2.7 million decrease in Corporate and general administrative costs was primarily due to a decrease in employee costs and non-cash compensation.
The $1.5 million increase in Provision for credit losses is primarily due to a construction loan entered into on August 6, 2024 to lend up to $52.1 million to a developer.
Income from unconsolidated real estate venture
The $0.6 million increase in Income from unconsolidated real estate venture is primarily attributable to our pro rata share of operations from the one operating property acquired by the JV since December 31, 2023 and a full period of operations from the one operating property acquired by the JV during the year ended December 31, 2023.
Interest expense, net
Interest expense, net increased by $13.3 million to $62.4 million for the year ended December 31, 2024 compared to $49.2 million for the year ended December 31, 2023. The increase is primarily attributable to the fixed rate, senior unsecured notes entered into during the three months ended June 30, 2024 and September 30, 2024 and higher weighted average interest rates across the Company's borrowings.
Gain on the sale of real estate
For the year ended December 31, 2024, we recognized a Gain on the sale of a land parcel totaling $0.2 million.
Comparison of Results of Operations for the Years Ended December 31, 2023 and December 31, 2022
Information pertaining to fiscal year 2022 was included in our Annual Report on Form 10-K for the year ended December 31, 2023 on page 40 under Part II, Item 7, “Management’s Discussion and Analysis of Financial Condition and Results of Operations”, which was filed with the Securities and Exchange Commission, or SEC, on February 27, 2024.
Liquidity and Capital Resources
We anticipate that our cash flows from the sources listed below will provide adequate capital for the next 12 months for all anticipated uses, including all scheduled principal and interest payments on our outstanding indebtedness, current and anticipated tenant improvements, development activities at FDA – Atlanta and JUD – Flagstaff, planned and possible acquisitions of properties, stockholder distributions to maintain our qualification as a REIT, potential repurchases of common stock under our share repurchase program and other capital obligations associated with conducting our business. At December 31, 2024, we had approximately $19.4 million available in cash and cash equivalents, $8.5 million of restricted cash and there was approximately $125.3 million available under our revolving credit facility.
Our primary expected sources of capital are as follows:
•distribution of cash flows from the JV;
•available borrowings under our 2024 revolving credit facility;
•issuance of long-term debt;
•issuance of equity, including under our ATM Programs (as described below); and
Our short-term liquidity requirements consist primarily of funds to pay for the following:
•development and redevelopment activities, including major redevelopment, renovation or expansion programs at FDA – Atlanta, JUD – Flagstaff and other individual properties;
•potential property acquisitions;
•tenant improvements, allowances and leasing costs;
•recurring maintenance and capital expenditures;
•debt repayment requirements;
•commitments to fund advancements through loan receivables;
•corporate and administrative costs;
•interest payments on our outstanding indebtedness;
•distribution payments; and
•repurchases of common stock under our share repurchase program.
Our long-term liquidity needs, in addition to recurring short-term liquidity needs as discussed above, consist primarily of funds necessary to pay for acquisitions, non-recurring capital expenditures, and scheduled debt maturities. Although we may be able to anticipate and plan for certain of our liquidity needs, unexpected increases in uses of cash that are beyond our control and which affect our financial condition and results of operations may arise, or our sources of liquidity may be fewer than, and the funds available from such sources may be less than, anticipated or required. As of the date of this filing, there were no known commitments or events that would have a material impact on our liquidity.
Equity
Shelf Registration Statement on Form S-3
On February 28, 2024, we filed an automatic universal shelf registration statement on Form S-3 with the SEC, which was deemed automatically effective and provides for the registration of unspecified amounts of securities. However, there can be no assurance that we will be able to complete any such offerings of securities in the future.
ATM Programs
We entered into separate equity distribution agreements on each of December 20, 2019 (the “2019 ATM Program”) and June 22, 2021 (the “2021 ATM Program” and, together with the 2019 ATM Program, the “ATM Programs”) with various financial institutions pursuant to which we may issue and sell shares of our common stock having an aggregate offering price of up to $300.0 million under each ATM Program from time to time in negotiated transactions or transactions that are deemed to be “at the market” offerings as defined in Rule 415 under the Securities Act. Under each of the ATM Programs, we may enter into one or more forward transactions (each, a “forward sale transaction”) under separate master forward sale confirmations and related supplemental confirmations with each of the various financial institutions party to the respective ATM Program for the sale of shares of our common stock on a forward basis.
The following table sets forth certain information with respect to issuances under the 2019 ATM Program in each fiscal quarter for the year ended December 31, 2024 (amounts in thousands except share amounts):
| | | | | | | | |
| | 2019 ATM Program | |
For the Three Months Ended: | | Number of Shares Issued (1) | | | Net Proceeds (1) | |
March 31, 2024 | | | — | | | $ | — | |
June 30, 2024 | | | 589,647 | | | | 7,903 | |
September 30, 2024 | | | 2,631,727 | | | | 35,077 | |
December 31, 2024 | | | 2,269,843 | | | | 28,112 | |
Total | | | 5,491,217 | | | $ | 71,092 | |
(1)Shares issued by us, which were all issued in settlement of forward sale transactions. As of December 31, 2024, we had settled all of our outstanding forward sale transactions under the 2019 ATM Program. We accounted for the forward sale transactions as equity.
No sales of shares of our common stock were made under the 2021 ATM Program during the year ended December 31, 2024.
We used the net proceeds received from such sales for general corporate purposes. As of December 31, 2024, we had approximately $300.0 million of gross sales of our common stock available under the 2021 ATM Program and $15.4 million of gross sales of our common stock available under the 2019 ATM Program.
Share Repurchase Program
On April 28, 2022, our board of directors authorized a share repurchase program whereby we may repurchase up to 4,538,994 shares of our common stock, or approximately 5% of our outstanding shares as of the authorization date. We are not required to purchase shares under the share repurchase program, but may choose to do so in the open market or through privately negotiated transactions at times and amounts based on our evaluation of market conditions and other factors.
No repurchases of shares of our common stock were made under the share repurchase program during the year ended December 31, 2024.
Debt
Indebtedness Outstanding
The following table sets forth certain information with respect to our outstanding indebtedness as of December 31, 2024 (dollars in thousands):
| | | | | | | | | |
| | Principal Outstanding | | | Interest | | Current | |
Loan | | December 31, 2024 | | | Rate (1) | | Maturity | |
Revolving credit facility: | | | | | | | | |
2024 revolving credit facility (2) | | $ | 274,550 | | | S + 145bps (3) | | June 2028 (4) | |
Total revolving credit facility | | | 274,550 | | | | | | |
| | | | | | | | |
Term loan facilities: | | | | | | | | |
2016 term loan facility | | | 100,000 | | | 5.31% (5) | | January 2025 (6) | |
2018 term loan facility | | | 174,500 | | | 5.23% (7) | | July 2026 | |
Total term loan facilities | | | 274,500 | | | | | | |
Less: Total unamortized deferred financing fees | | | (491 | ) | | | | | |
Total term loan facilities, net | | | 274,009 | | | | | | |
| | | | | | | | |
Notes payable: | | | | | | | | |
2017 series A senior notes | | | 95,000 | | | 4.05% | | May 2027 | |
2017 series B senior notes | | | 50,000 | | | 4.15% | | May 2029 | |
2017 series C senior notes | | | 30,000 | | | 4.30% | | May 2032 | |
2019 series A senior notes | | | 85,000 | | | 3.73% | | September 2029 | |
2019 series B senior notes | | | 100,000 | | | 3.83% | | September 2031 | |
2019 series C senior notes | | | 90,000 | | | 3.98% | | September 2034 | |
2021 series A senior notes | | | 50,000 | | | 2.62% | | October 2028 | |
2021 series B senior notes | | | 200,000 | | | 2.89% | | October 2030 | |
2024 series A senior notes | | | 150,000 | | | 6.56% | | May 2033 | |
2024 series B senior notes | | | 50,000 | | | 6.56% | | August 2033 | |
Total notes payable | | | 900,000 | | | | | | |
Less: Total unamortized deferred financing fees | | | (5,324 | ) | | | | | |
Total notes payable, net | | | 894,676 | | | | | | |
| | | | | | | | |
Mortgage notes payable: | | | | | | | | |
USFS II - Albuquerque | | | 9,624 | | | 4.46% (8) | | July 2026 | |
ICE - Charleston | | | 10,491 | | | 4.21% (8) | | January 2027 | |
VA - Loma Linda | | | 127,500 | | | 3.59% (8) | | July 2027 | |
CBP - Savannah | | | 8,683 | | | 3.40% (8) | | July 2033 | |
Total mortgage notes payable | | | 156,298 | | | | | | |
Less: Total unamortized deferred financing fees | | | (579 | ) | | | | | |
Less: Total unamortized premium/discount | | | (133 | ) | | | | | |
Total mortgage notes payable, net | | | 155,586 | | | | | | |
| | | | | | | | |
Total debt | | $ | 1,598,821 | | | | | | |
(1)The current interest rate is not adjusted to include the amortization of deferred financing fees or debt issuance costs incurred in obtaining debt or any unamortized fair market value premiums.
(2)The $400.0 million 2024 revolving credit facility (the “2024 revolving credit facility”) had available capacity of $125.3 million at December 31, 2024, which includes an accordion feature that provides us with additional capacity of up to $300.0 million, subject to syndication of the increase and the satisfaction of customary terms and conditions.
(3)Our 2024 revolving credit facility is subject to one interest rate swap with an effective date of June 23, 2023 and a notional value of $100.0 million, of which $25.5 million is associated with our 2024 revolving credit facility, to effectively fix the interest rate on the $25.5 million at 5.46% annually. The spread over the secured overnight financing rate (“SOFR”) is based on our consolidated leverage ratio, as defined in our 2024 revolving credit facility agreement. Additionally, at December 31, 2024, $249.1 million of amounts outstanding under our 2024 revolving credit facility had a floating rate of 4.31% under USD SOFR with a five day lookback.
(4)Our 2024 revolving credit facility has two six-month as-of-right extension options subject to certain conditions and the payment of an extension fee.
(5)Our 2016 term loan facility (our “2016 term loan facility”) is subject to three interest rate swaps, all with effective dates of December 23, 2024 and an aggregate notional value of $100.0 million, which effectively fixes the interest rate at 5.31% annually. The spread over SOFR is based on our consolidated leverage ratio, as defined in our 2016 term loan facility agreement.
(6)On January 8, 2025, we entered into the ninth amendment to our senior unsecured term loan agreement, dated as of September 29, 2016, to extend the maturity date of our 2016 term loan facility from January 30, 2025 to January 28, 2028.
(7)Our 2018 term loan facility (as amended, our “2018 term loan facility”) is subject to two interest rate swaps with effective dates of June 23 and September 29, 2023 and an aggregate notional value of $200.0 million, of which $174.5 million is associated with our 2018 term loan facility, to effectively fix the interest rate on the $174.5 million at 5.23% annually. The spread over SOFR is based on our consolidated leverage ratio, as defined in our 2018 term loan facility agreement.
(8)Effective interest rates are as follows: USFS II – Albuquerque 3.92%, ICE – Charleston 3.93%, VA – Loma Linda 3.78%, CBP – Savannah 4.12%.
Mortgage Notes Payable
On April 1, 2024, we used $8.4 million of available cash to extinguish the mortgage note obligation on VA – Golden.
On August 6, 2024, we used $51.5 million of available cash to extinguish the mortgage note obligation on USCIS – Kansas City.
2024 Senior Note Agreement
On May 29, 2024, we entered into a master note purchase agreement pursuant to which the Operating Partnership agreed to issue and sell an aggregate of up to $200 million of fixed rate, senior unsecured notes (“Senior Notes”) consisting of (i) 6.56% Series A Senior Notes due May 29, 2033 (“Series A Senior Notes”), in an aggregate principal amount of $150.0 million, and (ii) 6.56% Series B Senior Notes due August 14, 2033 (“Series B Senior Notes”), in an aggregate principal amount of $50.0 million. The Series A Senior Notes were issued on May 29, 2024 and the Series B Senior Notes were issued on August 14, 2024. We, together with various subsidiaries of the Operating Partnership, have guaranteed the Senior Notes.
2024 Revolving Credit Facility
On June 3, 2024, we entered into a credit agreement (the “2024 Credit Agreement”) that provides for the $400.0 million 2024 revolving credit facility which includes an accordion feature that provides us with additional capacity of up to $300.0 million, subject to syndication of the increase and the satisfaction of customary terms and conditions. The 2024 revolving credit facility has an initial four-year term and will mature in June 2028, with two six-month as-of-right extension options, subject to certain conditions and the payment of an extension fee.
Borrowings under the 2024 revolving credit facility will, at the Operating Partnership's option, bear interest at floating rates equal to either (i) a fluctuating rate equal to the sum of (a) the highest of (x) Citibank, N.A.'s base rate, (y) the federal funds effective rate plus 0.50% and (z) the one-month adjusted term SOFR plus 1.00%, plus, in each case, (b) a margin ranging from 0.20% to 0.80% based on our leverage ratio, (ii) the daily simple SOFR plus a credit spread adjustment of 0.10% (the “Adjusted DSS”), or (iii) the term SOFR, plus a credit spread adjustment of 0.10% (the “Term SOFR”), plus, in the case of borrowings bearing interest at Adjusted DSS or Term SOFR, a margin ranging from 1.20% to 1.80% based on our leverage ratio.
2021 Revolving Credit Facility
We are also party to the second amended and restated credit agreement, dated July 23, 2021 (as amended, restated, or otherwise modified from time to time, the “2021 Credit Facility”), which provides for (i) a $450.0 million senior unsecured revolving credit facility (the “2021 revolving credit facility”) and (ii) our 2018 term loan facility.
In connection with the entry into the 2024 Credit Agreement on June 3, 2024, we repaid all amounts outstanding under and terminated the revolver portion of the 2021 Credit Facility, including all unused commitments. Other than the foregoing, the terms of the 2021 Credit Facility remain unchanged and our 2018 term loan portion of the 2021 Credit Facility remains outstanding. We recognized an aggregate $0.3 million loss on debt extinguishment during the twelve months ended December 31, 2024 which is included in Interest expense, net on our Consolidated Statement of Operations.
Term Loan Facilities
On January 23, 2024, we entered into the seventh amendment to the senior unsecured term loan agreement, dated as of September 29, 2016, that governs our 2016 term loan facility to extend the maturity date of our 2016 term loan facility from March 29, 2024 to January 30, 2025.
On June 3, 2024, we repaid $25.0 million of amounts outstanding under our 2018 term loan facility using available cash derived from the issuance of Series A Senior Notes.
On July 8, 2024, we used $0.5 million of available cash to pay down a portion of our 2018 term loan facility.
On July 15, 2024, we amended the credit agreements governing our 2016 and 2018 term loan facilities to conform certain definitions related to leverage covenants to the provisions of the 2024 Credit Agreement.
On December 23, 2024, we entered into three SOFR-based interest rate swaps with a total notional value of $100.0 million that were designated as cash flow hedges of interest rate risk. The interest rate swaps became effective in December 2024 upon the maturity of our $100.0 million notional value interest rate swap on December 23, 2024. For more information on our interest rate swaps, see Note 7 to the Consolidated Financial Statements.
On January 8, 2025, we entered into the ninth amendment to our senior unsecured term loan agreement, dated as of September 29, 2016, to extend the maturity date of our 2016 term loan facility from January 30, 2025 to January 28, 2028.
See Note 6 to the Consolidated Financial Statements for additional information on our 2024 revolving credit facility, our 2018 term loan facility and our 2016 term loan facility.
Our 2024 revolving credit facility, term loan facilities, notes payable, and mortgage notes payable are subject to ongoing compliance with a number of financial and other covenants. As of December 31, 2024, we were in compliance with all applicable financial covenants.
The chart below details our debt capital structure as of December 31, 2024 (dollars in thousands):
| | | | |
Debt Capital Structure | | December 31, 2024 | |
Total principal outstanding | | $ | 1,605,348 | |
Weighted average maturity | | 4.5 years | |
Weighted average interest rate | | | 4.6 | % |
% Variable debt | | | 15.5 | % |
% Fixed debt (1) | | | 84.5 | % |
% Secured debt | | | 9.8 | % |
(1)Our 2016 term loan facility and 2018 term loan facility are swapped to be fixed and as such are included as fixed rate debt in the table above and $25.5 million of the 2024 revolving credit facility.
Material Cash Commitments
The following table shows our material cash commitments as of December 31, 2024:
| | | | | | | | | | | | | | | | | | | | | | | | | | | | |
| | Payments due by period | |
| | Total | | | 2025 | | | 2026 | | | 2027 | | | 2028 | | | 2029 | | | Thereafter | |
Mortgage principal and interest | | $ | 170,655 | | | $ | 10,319 | | | $ | 15,470 | | | $ | 138,367 | | | $ | 1,169 | | | $ | 1,168 | | | $ | 4,162 | |
Revolving credit facility
principal and interest | | | 329,480 | | | | 16,038 | | | | 16,038 | | | | 16,038 | | | | 281,366 | | | | — | | | | — | |
Term loan facilities
principal and interest | | | 289,258 | | | | 109,604 | | | | 179,654 | | | | — | | | | — | | | | — | | | | — | |
Senior unsecured notes payable
principal and interest | | | 1,152,644 | | | | 38,005 | | | | 38,005 | | | | 130,699 | | | | 83,879 | | | | 165,652 | | | | 696,404 | |
Development property obligations (1) | | | 53,756 | | | | 44,574 | | | | 9,182 | | | | — | | | | — | | | | — | | | | — | |
Total | | $ | 1,995,793 | | | $ | 218,540 | | | $ | 258,349 | | | $ | 285,104 | | | $ | 366,414 | | | $ | 166,820 | | | $ | 700,566 | |
(1)Due to the long-term nature of certain construction and development contracts included in this line, the amounts reported in the table represent our estimate of the timing for the related obligations being paid.
As of December 31, 2024, we have a commitment to fund $52.1 million through a loan receivable that will accrue interest monthly at a fixed market rate of 9.00% per annum. As of December 31, 2024 and the date of this Annual Report on Form 10-K, the outstanding balance of the loan receivable was $35.1 million and $41.4 million, respectively. We expect to fund the remaining commitment through the anticipated maturity of the loan on August 31, 2027, depending on the borrower's election to use the commitments. For a more complete description of the real estate loan receivable, see Note 5 to the Consolidated Financial Statements.
Unconsolidated Real Estate Venture
We consolidate entities in which we have a controlling interest or are the primary beneficiary in a variable interest entity. From time to time, we may have off-balance sheet unconsolidated real estate ventures and other unconsolidated arrangements with varying structures.
As of December 31, 2024, our investment in the JV was $316.5 million. As of December 31, 2024, we committed capital, net of return of over committed capital, to the JV totaling $329.7 million and have a remaining capital commitment of $8.5 million. None of the properties owned by the JV are encumbered by mortgage indebtedness.
Dividend Policy
In order to qualify as a REIT, we are required to distribute to our stockholders, on an annual basis, at least 90% of our REIT taxable income, determined without regard to the deduction for dividends paid and excluding net capital gains. We anticipate distributing all of our taxable income. We expect to make quarterly distributions to our stockholders in a manner intended to satisfy this requirement. Prior to making any distributions for U.S. federal tax purposes or otherwise, we must first satisfy our operating and debt service obligations. It is possible that it would be necessary to utilize cash reserves, liquidate assets at unfavorable prices or incur additional indebtedness in order to make required distributions. It is also possible that our board of directors could decide to make required distributions in part by using shares of our common stock.
A summary of dividends declared by the board of directors per share of common stock and per common unit of our operating partnership at the date of record is as follows:
| | | | | | | | | | |
Quarter | | Declaration Date | | Record Date | | Pay Date | | Dividend | |
Q1 2024 | | April 25, 2024 | | May 9, 2024 | | May 21, 2024 | | | 0.265 | |
Q2 2024 | | July 17, 2024 | | August 1, 2024 | | August 13, 2024 | | | 0.265 | |
Q3 2024 | | October 31, 2024 | | November 15, 2024 | | November 27, 2024 | | | 0.265 | |
Q4 2024 | | February 19, 2025 | | March 5, 2025 | | March 17, 2025 | | | 0.265 | |
We use long-term investment partnership units in our operating partnership (“LTIP units”), which we refer to herein as LTIP units, as a form of performance-based award and service-based award for annual long-term incentive equity compensation. LTIP units are convertible into common units upon the satisfaction of certain conditions. Prior to the end of the performance period as set forth in the applicable LTIP unit award, holders of performance-based LTIP units are entitled to receive dividends per LTIP unit equal to 10% of the dividend paid per common unit of our operating partnership. After the end of the performance period, the number of LTIP units, both vested and unvested, that LTIP award recipients have earned, if any, are entitled to receive dividends in an amount per LTIP unit equal to dividends, both regular and special, payable per common unit of our operating partnership. Holders of LTIP units that are not subject to the attainment of performance goals are entitled to receive dividends per LTIP unit equal to 100% of the dividend paid per common unit beginning on the grant date.
Cash Flow
Comparison of Cash Flow for the Years Ended December 31, 2024 and December 31, 2023
The following table sets forth a summary of cash flows for our company for the years ended December 31, 2024 and 2023:
| | | | | | | | | | | | |
| | For the years ended December 31, | |
| | 2024 | | | 2023 | | | Change | |
(Amounts in thousands) | | | |
Net cash provided by (used in): | | | | | | | | | |
Operating activities | | $ | 162,635 | | | $ | 114,479 | | | $ | 48,156 | |
Investing activities | | | (409,645 | ) | | | (127,008 | ) | | | (282,637 | ) |
Financing activities | | | 252,875 | | | | 17,194 | | | | 235,681 | |
Operating Activities
We generated $162.6 million and $114.5 million of cash from operating activities during the years ended December 31, 2024 and 2023, respectively. Net cash provided by operating activities for the year ended December 31, 2024 included $107.0 million in net cash from rental activities net of expenses, $43.5 million related to the changes in tenant accounts receivables, prepaid expense and other assets, real estate loan interest receivable, deferred revenue associated with operating leases, principal payments on operating lease obligations and accounts payable, accrued expenses and other liabilities and distributions from investment in unconsolidated real estate venture of $12.1 million. Net cash provided by operating activities for the year ended December 31, 2023 included $101.7 million in net cash from rental activities net of expenses, distributions from investment in unconsolidated real estate venture of $10.2 million and $2.6 million related to the changes in tenant accounts receivables, prepaid expense and other assets, deferred revenue associated with operating leases, principal payments on operating lease obligations and accounts payable, accrued expenses and other liabilities.
Investing Activities
We used $409.6 million and $127.0 million in cash for investing activities during the years ended December 31, 2024 and 2023, respectively. Net cash used in investing activities for the year ended December 31, 2024 primarily included $188.1 million in real estate acquisitions and deposits, $116.0 million in additions to development properties, $40.1 million in investment in unconsolidated real estate venture, $35.4 million in additions to operating properties, and $34.2 million in investment in real estate loan receivable, net, offset by $2.2 million in proceeds from sale, net and $2.0 million in distributions from investment in unconsolidated real estate venture. Net cash used in investing activities for the year ended December 31, 2023 primarily included $63.4 million in real estate acquisitions and deposits, $28.1 million in additions to operating properties, $17.8 million in additions to development properties and $17.7 million in investment in unconsolidated real estate venture, offset by $0.1 million in distributions from investment in unconsolidated real estate venture.
Financing Activities
We generated $252.9 million and $17.2 million in cash from financing activities during the years ended December 31, 2024 and 2023, respectively. Net cash generated in financing activities for the year ended December 31, 2024 included $200.0 million in note payable issuances, $195.6 million in net draws under the revolving credit facility, and $71.8 million in gross proceeds from issuance of shares of our common stock offset by $115.9 million in dividends, $64.3 million in mortgage debt repayment, $25.5 million in term loan repayments, $7.9 million in deferred financing costs and $0.9 million in the payment of deferred offering costs. Net cash generated by financing activities for the year ended December 31, 2023 included $86.5 million in gross proceeds from issuance of shares of our common stock, $50.0 million delayed draw on our 2018 term loan and $13.5 million in net draws under the revolving credit facility offset by $112.4 million in dividends, $20.0 million in mortgage debt repayment and $0.4 million in the payment of deferred offering costs.
Comparison of Cash Flow for the Years Ended December 31, 2023 and December 31, 2022
Information pertaining to fiscal year 2022 was included in our Annual Report on Form 10-K for the year ended December 31, 2023 on page 47 under Part II, Item 7, “Management’s Discussion and Analysis of Financial Condition and Results of Operations”, which was filed with SEC on February 27, 2024.
Non-GAAP Financial Measures
We use and present FFO and Core FFO as supplemental measures of our performance. The summary below describes our use of FFO and Core FFO and provides information regarding why we believe these measures are meaningful supplemental measures of our performance and reconciles these measures from net income, presented in accordance with GAAP.
Funds From Operations and Core Funds From Operations
FFO is a supplemental measure of our performance. We present FFO calculated in accordance with the current National Association of Real Estate Investment Trusts (“Nareit”) definition set forth in the Nareit FFO White Paper – Restatement 2018. FFO includes the REIT’s share of FFO generated by unconsolidated affiliates. In addition, we present Core FFO for certain other adjustments that we believe enhance the comparability of our FFO across periods and to the FFO reported by other publicly traded REITs. FFO is a supplemental performance measure that is commonly used in the real estate industry to assist investors and analysts in comparing results of REITs.
FFO is defined by Nareit as net income (calculated in accordance with GAAP), excluding:
•Depreciation and amortization related to real estate.
•Gains and losses from the sale of certain real estate assets.
•Gains and losses from change in control.
•Impairment write-downs of certain real estate assets and investments in entities when the impairment is directly attributable to decreases in the value of depreciable real estate held by the entity.
We present FFO because we consider it an important supplemental measure of our operating performance, and we believe it is frequently used by securities analysts, investors and other interested parties in the evaluation of REITs, many of which present FFO when reporting results.
We adjust FFO to present Core FFO as an alternative measure of our operating performance, which, when applicable, excludes items which we believe are not representative of ongoing operating results, such as liability management related costs (including losses on extinguishment of debt and modification costs), provision for credit losses, catastrophic event charges, depreciation of non-real estate assets, and the unconsolidated real estate venture’s allocated share of these adjustments. In future periods, we may also exclude other items from Core FFO that we believe may help investors compare our results. We believe Core FFO more accurately reflects the ongoing operational and financial performance of our core business.
FFO and Core FFO are presented as supplemental financial measures and do not fully represent our operating performance. Other REITs may use different methodologies for calculating FFO and Core FFO or use other definitions of FFO and Core FFO and, accordingly, our presentation of these measures may not be comparable to other REITs. Neither FFO nor Core FFO is intended to be a measure of cash flow or liquidity. Please refer to our financial statements, prepared in accordance with GAAP, for purposes of evaluating our financial condition, results of operations and cash flows.
The following table sets forth a reconciliation of our net income to FFO and Core FFO for the years ended December 31, 2024, 2023, and 2022 (dollars in thousands):
| | | | | | | | | | | | |
| | For the years ended December 31, | |
| | 2024 | | | 2023 | | | 2022 | |
Net income | | $ | 20,578 | | | $ | 21,060 | | | $ | 35,562 | |
Depreciation of real estate assets | | | 95,326 | | | | 90,288 | | | | 97,262 | |
Gain on sale of operating property | | | (171 | ) | | | — | | | | (13,590 | ) |
Impairment loss | | | — | | | | — | | | | 5,540 | |
Unconsolidated real estate venture allocated share of above adjustments | | | 8,256 | | | | 7,639 | | | | 4,937 | |
FFO | | | 123,989 | | | | 118,987 | | | | 129,711 | |
Adjustments to FFO: | | | | | | | | | |
Loss on extinguishment of debt | | | 260 | | | | 14 | | | | 20 | |
Provision for credit losses | | | 1,527 | | | | — | | | | — | |
Natural disaster event expense, net of recovery | | | 95 | | | | 69 | | | | 96 | |
Depreciation of non-real estate assets | | | 1,007 | | | | 1,003 | | | | 992 | |
Unconsolidated real estate venture allocated share of above adjustments | | | 66 | | | | 66 | | | | 66 | |
Core FFO | | $ | 126,944 | | | $ | 120,139 | | | $ | 130,885 | |
Factors That May Influence Future Results of Operations
Revenue
Our revenues primarily arise from the rental of space to tenants in our properties and tenant reimbursements, which include reimbursement for operating expenses, which are determined by the base year operating expenses and are subject to reimbursement in subsequent years largely based on changes in the Consumer Price Index for Urban Wage Earners and Clerical Workers. Our revenue also includes amounts due from tenants for real estate taxes, projects and other reimbursements. Real estate taxes over the base year are reimbursed by the tenant.
Over 90% of our rental income comes from U.S. Government tenants. We expect that leases to agencies of the U.S. Government will continue to be our primary source of revenues for the foreseeable future. Due to such concentration, adverse events or conditions that affect the U.S. Government could have a more negative effect on our financial condition and operations than if our tenant base was more diverse. However, positive or negative changes in conditions in local markets, such as changes in economic or other conditions, employment rates, local tax and budget conditions, recession, competition for real property investments in these markets, uncertainty about the future and other factors are significantly less likely to impact our overall performance.
Operating Expenses
Our operating expenses generally consist of repairs and maintenance, utilities, roads and grounds, property management fees, insurance, janitorial and other operating expenses. Factors that may impact our ability to control these operating expenses include increases in utilities, increases in third party management expenses, increases in insurance premiums, increases in repair and maintenance costs and expenses related to inclement weather. Additionally, the cost of compliance with zoning and building codes as well as local, state and federal tax laws may impact our expenses. As a public company our annual general and administrative expenses are meaningfully higher due to legal, insurance, accounting, audit and other expenses related to corporate governance, SEC reporting, other compliance matters and the costs of operating as a public company. Increases in costs from any of the foregoing factors may adversely affect our future results and cash flows. Circumstances such as declines in market rental rates or increased competition may cause revenues to decrease, although the expenses of owning and operating a property will not necessarily decline. For certain of our properties, expenses may vary with occupancy, while costs arising from our property investments, interest expense and general maintenance will not be materially reduced even if a property is not fully occupied. As a result, our future cash flow and results of operations may be adversely affected and losses could be incurred if revenues decrease in the future.
Cost of Funds and Interest Rates
We expect future changes in interest rates will impact our overall performance. We manage and may continue to manage our market risk on variable rate debt by entering into interest rate swap agreements or similar instruments, subject to maintaining our qualification as a REIT for U.S. federal income tax purposes. Although we may seek to cost-effectively manage our exposure to future rate increases through such means, a portion of our overall debt may at various times float at then current rates.
Development Activities
As of December 31, 2024, we had two properties under development. We intend to continue to engage in development and redevelopment activities with respect to our properties, including build-to-suit new developments and redevelopments for existing U.S. Government tenant agencies. These development activities may include some risks such as:
•the availability and timely receipt of zoning and other regulatory approvals;
•development costs exceeding expectations;
•cost overruns and untimely completion of construction (including risks beyond our control, such as weather or labor conditions, or material shortages);
•the inability to complete construction and leasing of a property on schedule, resulting in increased debt service expense and development and redevelopment costs; and
•the availability and pricing of financing on favorable terms or at all.
Inflation
Substantially all of our leases provide for operating expense escalation. We believe inflationary increases in expenses may be at least partially offset by the contractual expense escalations described above. We do not believe inflation has had a material impact on our historical financial position or results of operations.
Critical Accounting Estimates
The preparation of financial statements in conformity with GAAP requires management to use judgment in the application of accounting policies, including making estimates and assumptions. We base these estimates, judgments, and assumptions on historical experience, current trends, and various other factors that we believe to be reasonable under the circumstances. If our judgment or interpretation of the facts and circumstances relating to various transactions had been different, or different assumptions were made, it is possible that different accounting policies would have been applied, resulting in different financial results or a different presentation of our financial statements.
Below is a discussion of the accounting policies that we consider critical to an understanding of our financial condition and operating results that may require complex or significant judgment in their application or require estimates about matters which are inherently uncertain. A discussion of our significant accounting policies, which utilize these critical accounting estimates, can be found in Note 2, “Significant Accounting Policies,” of our consolidated financial statements.
Real Estate Properties Acquired
When we acquire properties, we allocate the purchase price to numerous tangible and intangible components. Our process for determining the allocation to these components requires many estimates and assumptions, including the following: (1) determination of market land, rental, discount and capitalization rates; (2) estimation of leasing and tenant improvement costs associated with the remaining term of acquired leases; (3) assumptions used in determining the in-place lease and if-vacant value including the rental rates, period of time that it would take to lease vacant space and estimated tenant improvement and leasing costs; and (4) allocation of the if-vacant value between land and building. A change in any of the above key assumptions can materially change not only the presentation of acquired properties in our consolidated financial statements but also our reported results of operations.
We completed acquisitions of ten wholly owned properties for an aggregate purchase price of $184.9 million during the year ended December 31, 2024. We completed acquisitions of three wholly owned properties for an aggregate purchase price of $63.1 million during the year ended December 31, 2023. These transactions were accounted for as asset acquisitions, and the purchase price of each was allocated based on the relative fair value of the asset acquired and liabilities assumed.
Impairment of Long-Lived Assets
We regularly evaluate whether events or changes in circumstances have occurred that could indicate an impairment in the value of long-lived assets. If there is an indication that the carrying value of an asset is not recoverable, we estimate the projected undiscounted cash flows to determine whether an asset may be impaired. We estimate fair value through an evaluation of recent financial performance and projected discounted cash flows using standard industry valuation techniques. Fair value estimates are made as of a specific point in time, are subjective in nature and involve uncertainties and matters of significant judgment. We determine the amount of any impairment loss by comparing the historical carrying value to estimated fair value. Upon determination that an impairment has occurred, a write-down is recognized to reduce the carrying amount to its estimated fair value.
In addition to consideration of impairment upon the events or changes in circumstances described above, we regularly evaluate the remaining lives of our long-lived assets. If we change our estimate of the remaining lives, we allocate the carrying value of the affected assets over their revised remaining lives.
On a quarterly basis, we assess the recoverability of the carrying amount of our real estate and related intangibles. Our assessment resulted in the remeasurement of ICE – Otay in the third quarter of 2022, which was written down to its estimated fair value and was classified as Level 3 in the fair value hierarchy. Our estimate of the fair value was based on a combination of a pending offer from a third party to acquire the property and a discounted cash flow analysis. We used two significant unobservable inputs in the various scenarios, which were the cash flow discount rate (ranging from 6.25%-9.00%) and average price per square foot of comparable sales in the market ($109.08-$185.90). There is no assurance that we will sell ICE – Otay on the terms proposed or at all. The remeasurement resulted in an impairment loss of $5.5 million, which is included in "Impairment loss" in our Consolidated Statements of Operations for the year ended December 31, 2022.
As of December 31, 2024 and 2023, no impairment related to our long-lived assets was identified.
Impairment of Unconsolidated Real Estate Venture
We account for our investment in the unconsolidated real estate venture under the equity method. Under the equity method of accounting, we initially recognize our investment at cost and subsequently adjust the carrying amount of the investment for our share of the earnings or losses, distributions received, and other-than-temporary impairments.
Our unconsolidated real estate venture is evaluated for impairment when conditions exist that may indicate that the decrease in the carrying amount of our investment has occurred and is other than temporary. Triggering events or impairment indicators for our unconsolidated real estate venture include, recurring operating losses of an investee, absence of an ability to recover the carrying amount of the investee, the ability of an investee to sustain an earnings capacity, a carrying amount that exceeds the fair value of the investment and that decline in fair value is other-than-temporary. Upon determination that an other-than-temporary impairment has occurred, a write-down is recognized to reduce the carrying amount of investment to its estimated fair value. Fair value estimates are made as of a specific point in time, are subjective in nature and involve uncertainties and matters of significant judgement.
As of December 31, 2024, the carrying amount of our investment in our unconsolidated real estate venture was $316.5 million, or approximately 9.8% of our total assets. As of December 31, 2023, the carrying amount of our investment in our unconsolidated real estate venture was $284.5 million, or approximately 9.9% of our total assets. During the years ended December 31, 2024 and 2023, no other-than-temporary impairment related to our unconsolidated real estate venture was identified.
Loan Receivable and Allowance for Credit Losses
The measurement of expected credit losses under the current expected credit loss (“CECL”) methodology (“ASU 2016-13”) is applicable to our financial assets measured at amortized cost, including loan receivables and certain off-balance sheet credit exposures such as unfunded loan commitments. We adopted this standard on January 1, 2020 and apply this methodology to our loan receivables and off-balance sheet credit exposure. To determine our expected credit losses under CECL, we utilize a probability of default (“PD”) and loss given default (“LGD”) methodology. We determined that we have one portfolio segment and reserve for loan losses on an asset-specific basis. We have a limited history of incurred losses and consequently have elected to employ external data to perform our CECL calculation. Our model's inputs consider a default grade or industry relative default grade associated with the borrower and prospective tenant funding the development to determine an appropriate default risk and allowance for credit loss under the PD and LGD methodology. If a reserve is recorded, the allowance is increased as a provision for credit losses and is decreased by charge-offs when losses are confirmed through the receipt of assets such as cash or via ownership control of the underlying collateral in full. The allowance for loan losses reflects management's estimate of loan losses as of the balance sheet date.
Item 7A. Quantitative and Qualitative Disclosures About Market Risk
Market risk is the risk of loss from adverse changes in market prices and interest rates. Our future earnings, cash flows and fair values relevant to financial instruments are dependent upon prevailing market interest rates. Our primary market risk results from our indebtedness, which bears interest at both fixed and variable rates. We manage and may continue to manage our market risk on variable rate debt by entering into swap arrangements to, in effect, fix the rate on all or a portion of the debt for varying periods up to maturity. This in turn, reduces the risks of variability of cash flows created by variable rate debt and mitigates the risk of increases in interest rates. Our objective when undertaking such arrangements will be to reduce our floating rate exposure and we do not intend to enter into hedging arrangements for speculative purposes.
As of December 31, 2024, $1.4 billion, or 84.5% of our debt, excluding unamortized premiums and discounts, had fixed interest rates or rates effectively fixed through interest rate swaps and $249.1 million, or 15.5%, had variable interest rates based on SOFR. If market rates of interest on our variable rate debt fluctuate by 25 basis points, interest expense would increase or decrease, depending on rate movement, future earnings and cash flows, by $0.6 million annually.
Item 8. Financial Statements and Supplementary Data
This item is included in a separate section at the end of this report beginning on page F-1.
Item 9. Changes in and Disagreements with Accountants on Accounting and Financial Disclosure
None.
Item 9A. Controls and Procedures
Evaluation of Disclosure Controls and Procedures
Our management carried out an evaluation required by the Exchange Act, under the supervision and with the participation of our principal executive officer and principal financial officer, of the effectiveness of the design and operation of our disclosure controls and procedures, as defined in Rules 13a -15(e) and 15d-15(e) of the Exchange Act, as of December 31, 2024. Based on this evaluation our principal executive officer and principal financial officer concluded that, as of December 31, 2024, our disclosure controls and procedures were effective to provide reasonable assurance that information required to be disclosed by us in the reports that we file or
submit under the Exchange Act is recorded, processed, summarized and reported within the time periods specified in the SEC’s rules and forms and to provide reasonable assurance that such information is accumulated and communicated to our management, including our principal executive officer and principal financial officer, as appropriate, to allow timely decisions regarding required disclosures.
Management’s Report on Internal Control over Financial Reporting
Our management is responsible for establishing and maintaining adequate internal control over financial reporting (as defined in Rules 13a-15(f) and 15d-15(f) of the Exchange Act). Our management has assessed the effectiveness of our internal control over financial reporting at December 31, 2024. In making this assessment, management used the criteria set forth by the Committee of Sponsoring Organizations of the Treadway Commission in Internal Control – Integrated Framework (2013 Framework). Based on our assessment management concluded that, as of December 31, 2024, our internal control over financial reporting is effective based on those criteria.
The effectiveness of our internal control over financial reporting as of December 31, 2024 has been audited by PricewaterhouseCoopers LLP, an independent registered public accounting firm, as stated in their report, which appears on page F-2 of this Annual Report on Form 10-K.
Changes in Internal Control over Financial Reporting
There were no changes in our internal control over financial reporting during the quarter ended December 31, 2024 that materially affected, or are reasonably likely to materially affect, our internal control over financial reporting.
Item 9B. Other Information
During the three months ended December 31, 2024, none of our directors or officers (as defined in Rule 16a-1(f) of the Exchange Act) adopted, terminated or modified a Rule 10b5-1 trading arrangement or non-Rule 10b5-1 trading arrangement (as such terms are defined in Item 408 of Regulation S-K).
Item 9C. Disclosure Regarding Foreign Jurisdictions that Prevent Inspections
Not applicable.
PART III
Item 10. Directors, Executive Officers and Corporate Governance
The other information required by Item 10 will be set forth in our Definitive Proxy Statement for our 2025 Annual Meeting of Stockholders, which we anticipate will be filed no later than 120 days after the end of our fiscal year ended December 31, 2024, to be filed pursuant to Regulation 14A under the Securities and Exchange Act of 1934, as amended, or our Proxy Statement, and is incorporated herein by reference.
We have an insider trading policy governing the purchase, sale and other dispositions of our securities that applies to all of our directors, officers, employees and other covered persons. We believe that our insider trading policy is reasonably designed to promote compliance with insider trading laws, rules and regulations and listing standards applicable to us. It is also our policy to comply with all insider trading laws and regulations. A copy of our insider trading policy is filed as Exhibit 19.1 to this Annual Report on Form 10-K.
Item 11. Executive Compensation
The information required by Item 11 will be set forth in our Proxy Statement and is incorporated herein by reference.
Item 12. Security Ownership of Certain Beneficial Owners and Management and Related Stockholder Matters
The following table summarizes certain information about our equity compensation plans as of December 31, 2024.
| | | | | | | | | | | | |
Plan Category | | Number of securities to
be issued upon exercise
of outstanding options,
warrants and rights (1) | | | Weighted-average
exercise price of
outstanding
options,
warrants and
rights | | | Number of securities
remaining
available for future
issuance
under equity
compensation plans
(excluding securities
reflected in
the first column of this
table) | |
| | (a) | | | (b) | | | (c) | |
Equity compensation plans
approved by stockholders(2)(3)(4) | | | 4,369,045 | | | $ | — | | | | 3,725,247 | |
Equity compensation plans not
approved by stockholders | | | — | | | | — | | | | — | |
Total | | | 4,369,045 | | | $ | — | | | | 3,725,247 | |
(1)Includes information related to the Company's 2015 and 2024 Equity Incentive Plans.
(2)The amount in column (a) includes 4,355,444 LTIP units issued under our 2015 Equity Incentive Plan and 13,601 LTIP units issued under our 2024 Equity Incentive Plan that, upon the satisfaction of certain conditions, are convertible into common units, which may then be redeemed for cash, or, at our option, an equal number of shares of common stock, subject to certain restrictions. There is no exercise price associated with LTIP units.
(3)The amount in column (c) excludes the number of LTIP units referenced in column (a) and 67,459 shares of restricted common stock issued under our 2024 Equity Incentive Plan and 2015 Equity Incentive Plan.
(4)The amount in column (c) includes forfeited awards under prior plans.
Additional information concerning security ownership of certain beneficial owners and management required by Item 12 will be set forth in our Proxy Statement and is incorporated herein by reference.
Item 13. Certain Relationships and Related Transactions, and Director Independence
The information required by Item 13 will be set forth in our Proxy Statement and is incorporated herein by reference.
Item 14. Principal Accountant Fees and Services
The information required by Item 14 will be set forth in our Proxy Statement and is incorporated herein by reference.
PART IV
Item 15. Exhibits and Financial Statement Schedule
The financial statements listed in the accompanying index to financial statements beginning on page F-1 are filed as a part of this report.
2.Financial Statement Schedule
The financial statement schedule listed in the accompanying index to financial statements beginning on page S-1 are filed as a part of this report.
All other schedules for which provision is made in Regulation S-X are either not required to be included herein under the related instructions or are inapplicable or the related information is included in the footnotes to the applicable financial statement and, therefore, have been omitted.
The following documents are filed as exhibits to this report:
| | |
Exhibit | | Exhibit Description |
| | |
3.1 | | Amended and Restated Articles of Amendment and Restatement of Easterly Government Properties, Inc. (previously filed as Exhibit 3.1 to Amendment No. 2 to the Company’s Registration Statement on Form S-11 on January 30, 2015 and incorporated herein by reference) |
| | |
3.2 | | Amended and Restated Bylaws of Easterly Government Properties, Inc. (previously filed as Exhibit 3.2 to Amendment No. 2 to the Company’s Registration Statement on Form S-11 on January 30, 2015 and incorporated herein by reference) |
| | |
3.3 | | First Amendment to Amended and Restated Bylaws of Easterly Government Properties, Inc. (previously filed as Exhibit 3.1 to the Company’s Current Report on Form 8-K on February 27, 2019 and incorporated herein by reference) |
| | |
3.4 | | Second Amendment to Amended and Restated Bylaws of Easterly Government Properties, Inc. (previously filed as Exhibit 3.1 to the Company’s Current Report on Form 8-K on May 20, 2021 and incorporated herein by reference) |
| | |
4.1 | | Specimen Certificate of Common Stock of Easterly Government Properties, Inc. (previously filed as Exhibit 4.1 to Amendment No. 2 to the Company’s Registration Statement on Form S-11 on January 30, 2015 and incorporated herein by reference) |
| | |
4.2 | | Description of Securities of Easterly Government Properties, Inc. (previously filed as Exhibit 4.2 to the Company’s Annual Report on Form 10-K on February 28, 2022 and incorporated herein by reference) |
| | |
10.1 | | Amended and Restated Limited Partnership Agreement of Easterly Government Properties LP (previously filed as Exhibit 10.2 to the Company’s Current Report on Form 8-K on February 11, 2015 and incorporated herein by reference) |
| | |
10.2 | | First Amendment to the Amended and Restated Agreement of Limited Partnership of Easterly Government Properties LP, dated May 6, 2015 (previously filed as Exhibit 10.2 to the Company’s Quarterly Report on Form 10-Q on August 6, 2015 and incorporated herein by reference) |
| | |
10.3 | | Second Amendment to the Amended and Restated Agreement of Limited Partnership of Easterly Government Properties LP, dated February 26, 2016 (previously filed as Exhibit 10.3 to the Company’s Annual Report on Form 10-K on March 2, 2016 and incorporated herein by reference) |
| | |
10.4† | | 2015 Equity Incentive Plan (previously filed as Exhibit 10.3 to the Company’s Annual Report on Form 10-K on March 30, 2015 and incorporated herein by reference) |
| | |
| | |
Exhibit | | Exhibit Description |
| | |
10.5† | | Easterly Government Properties, Inc. 2024 Equity Incentive Plan (previously filed as Exhibit 10.1 to the Company's Current Report on Form 8-K on May 21, 2024 and incorporated herein by reference) |
| | |
10.6† | | Employment Agreement, by and among Easterly Government Properties Services LLC, Easterly Government Properties LP, Easterly Government Properties, Inc., and Meghan G. Baivier, dated May 12, 2015 (previously filed as Exhibit 10.1 to the Company’s Current Report on Form 8-K on May 13, 2015 and incorporated herein by reference) |
| | |
10.7† | | Form of Indemnification Agreement between Easterly Government Properties, Inc. and each of its Directors and Executive Officers (previously filed as Exhibit 10.4 to Amendment No. 2 to the Company’s Registration Statement on Form S-11 on January 30, 2015 and incorporated herein by reference) |
| | |
10.8 | | Form of Tax Protection Agreement by and among Easterly Government Properties, Inc., Easterly Government Properties LP and Michael P. Ibe (previously filed as Exhibit 10.9 to Amendment No. 2 to the Company’s Registration Statement on Form S-11 on January 30, 2015 and incorporated herein by reference) |
| | |
10.9 | | Tax Protection Agreement among Easterly Government Properties LP, West Pleasanton Lab, LLC and Michael P. Ibe, dated October 21, 2015 (previously filed as Exhibit 10.1 to the Company’s Quarterly Report on Form 10-Q on November 5, 2015 and incorporated herein by reference) |
| | |
10.10 | | License Agreement between Easterly Government Properties, Inc. and Easterly Capital, LLC, dated January 26, 2015 (previously filed as Exhibit 10.11 to Amendment No. 3 to the Company’s Registration Statement on Form S-11 on February 4, 2015 and incorporated herein by reference) |
| | |
10.11 | | Second Amended and Restated Credit Agreement dated as of July 23, 2021, by and among Easterly Government Properties Inc., Easterly Government Properties LP, the Guarantors, name therein, with Citibank, N.A., as administrative agent, PNC Bank, National Association and Wells Fargo Bank, N.A., as Co-Syndication agents, BMO Harris Bank, N.A., Raymond James Bank, N.A., Royal Bank of Canada and Truist Bank as Co-Documentation agents, and Citibank, N.A., PNC Capital Markets LLC and Wells Fargo Securities, LLC, as Joint Lead Arrangers and Joint Book Running Managers and the other financial institutions party thereto (previously filed as Exhibit 10.1 to the Company’s Current Report on Form 8-K on July 29, 2021 and incorporated herein by reference) |
| | |
10.12 | | First Amendment to Second Amended and Restated Credit Agreement, dated as of July 22, 2022, by and among Easterly Government Properties Inc., Easterly Government Properties LP, the Guarantors named therein, the Initial Lenders and Initial Issuing Banks named therein, and Citibank, N.A., as Administrative Agent, Wells Fargo Bank, N.A. and PNC Bank, National, as Co-Syndication Agents, BMO Harris Bank, N.A., Raymond James Bank, Royal Bank of Canada and Truist Bank, as Co-Documentation Agents, and Citibank, N.A., Wells Fargo Securities, LLC and PNC Capital Markets LLC, as Joint Lead Arrangers and Joint Book Running Managers (previously filed as Exhibit 10.1 to the Company’s Current Report on Form 8-K on July 26, 2022 and incorporated herein by reference) |
| | |
10.13 | | Second Amendment to Second Amended and Restated Credit Agreement, dated as of November 23, 2022, by and among Easterly Government Properties Inc., Easterly Government Properties LP, the Guarantors named therein, the Initial Lenders and Initial Issuing Banks named therein, and Citibank, N.A., as Administrative Agent, Wells Fargo Bank, N.A. and PNC Bank, National Association, as Co-Syndication Agents, BMO Harris Bank, N.A., Raymond James Bank, Royal Bank of Canada and Truist Bank, as Co-Documentation Agents, and Citibank, N.A., Wells Fargo Securities, LLC and PNC Capital Markets LLC, as Joint Lead Arrangers and Joint Book Running Managers (previously filed as Exhibit 10.1 to the Company’s Current Report on Form 8-K on November 30, 2022 and incorporated herein by reference) |
| | |
10.14 | | Third Amendment to Second Amended and Restated Credit Agreement, dated as of May 30, 2023, by and among the Easterly Government Properties Inc., Easterly Government Properties LP, the Guarantors named therein, the Initial Lenders and Initial Issuing Banks named therein, and Citibank, N.A., as Administrative Agent, Wells Fargo Bank, N.A. and PNC Bank, National Association, as Co-Syndication Agents, BMO Harris Bank, N.A., Raymond James Bank, Royal Bank of Canada and Truist Bank, as Co-Documentation Agents, and Citibank, N.A., Wells Fargo Securities, LLC and PNC Capital Markets LLC, as Joint Lead Arrangers and Joint Book Running Managers (previously filed as Exhibit 10.1 to the Company’s Current Report on Form 8-K on June 2, 2023 and incorporated herein by reference) |
| | |
Exhibit | | Exhibit Description |
10.15 | | Fourth Amendment to Second Amended and Restated Credit Agreement, dated as of July 15, 2024, by and among Easterly Government Properties Inc., Easterly Government Properties LP, the Guarantors named therein, the Initial Lenders and Initial Issuing Banks named therein, and Citibank, N.A., as Administrative Agent, Wells Fargo Bank, N.A. and PNC Bank, National Association, as Co-Syndication Agents, BMO Harris Bank, N.A., Raymond James Bank, Royal Bank of Canada and Truist Bank, as Co-Documentation Agents, and Citibank, N.A., Wells Fargo Securities, LLC and PNC Capital Markets LLC, as Joint Lead Arrangers and Joint Book Running Managers (previously filed as Exhibit 10.4 to the Company's Quarterly Report on Form 10-Q on July 31, 2024 and incorporated herein by reference) |
| | |
10.16 | | Credit Agreement, dated as of June 3, 2024, by and among Easterly Government Properties Inc., Easterly Government Properties LP, the Guarantors named therein, the Initial Lenders and Initial Issuing Banks named therein, and Citibank, N.A., as Administrative Agent, Wells Fargo Bank, N.A., PNC Bank, National Association and Truist Bank, as Co-Syndication Agents, BMO Bank, N.A., Raymond James Bank and U.S. Bank National Association, as Co-Documentation Agents, and Citibank, N.A., Wells Fargo Securities, LLC, PNC Capital Markets LLC and Truist Securities, Inc., as Joint Lead Arrangers and Joint Book Running Managers (previously filed as Exhibit 10.1 to the Company’s Current Report on Form 8-K filed on June 5, 2024 and incorporated herein by reference) |
| | |
10.17 | | Term Loan Agreement, among Easterly Government Properties LP, as Borrower, Easterly Government Properties, Inc., as Parent Guarantor, and certain subsidiaries of Easterly Government Properties, Inc. from time to time party thereto, as Guarantors, PNC Bank, National Association, as Administrative Agent, U.S. Bank National Association and SunTrust Bank, as Syndication Agents, and PNC Capital Markets LLC, U.S. Bank National Association and SunTrust Robinson Humphrey, Inc., as Joint Lead Arrangers and Joint Bookrunners and the Initial Lenders named therein, dated September 29, 2016 (previously filed as Exhibit 10.1 to the Company’s Current Report on Form 8-K on October 5, 2016 and incorporated herein by reference) |
| | |
10.18 | | Second Amendment to Term Loan Agreement by and among Easterly Government Properties, Inc., Easterly Government Properties LP, the Guarantors named therein, PNC Bank, National Association, as Administrative Agent and U.S. Bank National Association and SunTrust Bank, as Lenders, dated as of June 18, 2018 (previously filed as Exhibit 10.2 to the Company’s Current Report on Form 8-K on June 21, 2018 and incorporated herein by reference) |
| | |
10.19 | | Third Letter Amendment to Term Loan Agreement, dated as of October 3, 2018, by and among Easterly Government Properties, Inc., as Parent Guarantor, Easterly Government Properties LP, as Borrower, the Subsidiary Guarantors named therein, PNC Bank, National Association, as Administrative Agent and U.S. Bank National Association and SunTrust Bank, as Lenders (previously filed as Exhibit 10.1 to the Company’s Quarterly Report on Form 10-Q on November 5, 2018 and incorporated herein by reference) |
| | |
10.20 | | Fourth Amendment to Term Loan Agreement, dated as of July 23, 2021, by and among Easterly Government Properties, Inc., Easterly Government Properties LP, the Guarantors named therein, PNC Bank, National Association, as Administrative Agent and U.S. Bank National Association and Truist Bank, as Lenders (previously filed as Exhibit 10.2 to the Company’s Current Report on Form 8-K on July 29, 2021 and incorporated herein by reference) |
| | |
10.21 | | Fifth Amendment to Term Loan Agreement, dated as of November 29, 2022, by and among Easterly Government Properties, Inc., Easterly Government Properties LP, the Guarantors named therein, PNC Bank, National Association, as Administrative Agent and U.S. Bank National Association and Truist Bank, as Lenders (previously filed as Exhibit 10.2 to the Company’s Current Report on Form 8-K on November 30, 2022 and incorporated herein by reference) |
| | |
10.22 | | Sixth Amendment to Term Loan Agreement, dated as of May 30, 2023, by and among Easterly Government Properties Inc., Easterly Government Properties LP, the Guarantors named therein, PNC Bank, National Association, as Administrative Agent and a Lender, and U.S. Bank National Association and Truist Bank, as Lenders (previously filed as Exhibit 10.2 to the Company's Current Report on Form 8-K on June 2, 2023 and incorporated herein by reference) |
| | |
10.23 | | Seventh Amendment to Term Loan Agreement, dated as of January 23, 2024, by and among Easterly Government Properties Inc., Easterly Government Properties LP, the Guarantors named therein, PNC Bank, National Association, as Administrative Agent and a Lender, and U.S. Bank National Association and Truist Bank, as Lenders (previously filed as Exhibit 10.1 to the Company's Current Report on Form 8-K on January 25, 2024 and incorporated herein by reference) |
| | |
Exhibit | | Exhibit Description |
10.24 | | Eighth Amendment to Term Loan Agreement, dated as of July 15, 2024, by and among Easterly Government Properties Inc., Easterly Government Properties LP, the Guarantors named therein, PNC Bank, National Association, as Administrative Agent and a Lender, and U.S. Bank National Association and Truist Bank, as Lenders (previously filed as Exhibit 10.3 to the Company's Quarterly Report on Form 10-Q filed on July 31, 2024 and incorporated herein by reference) |
| | |
10.25 | | Ninth Amendment to Term Loan Agreement, dated as of January 8, 2025, by and among Easterly Government Properties Inc., Easterly Government Properties LP, the Guarantors named therein, PNC Bank, National Association, as Administrative Agent and a Lender, and U.S. Bank National Association and Truist Bank, as Lenders (previously filed as Exhibit 10.1 to the Company's Current Report on Form 8-K on January 14, 2025 and incorporated herein by reference) |
| | |
10.26 | | Purchase and Sale Agreement, dated as of September 30, 2021, between the sellers identified therein and Easterly Government Properties LP (previously filed as Exhibit 10.1 to the Company’s Current Report on Form 8-K on October 15, 2021 and incorporated herein by reference) |
| | |
10.27 | | First Amendment to Purchase and Sale Agreement between the sellers identified therein and Easterly Government Properties LP dated as of October 12, 2021 (previously filed as Exhibit 10.1 to the Company’s Quarterly Report on Form 10-Q on October 31, 2023 and incorporated herein by reference) |
| | |
10.28 | | Second Amendment to Purchase and Sale Agreement between the sellers identified therein and Easterly Government Properties LP dated as of November 1, 2021 (previously filed as Exhibit 10.2 to the Company’s Quarterly Report on Form 10-Q on October 31, 2023 and incorporated herein by reference) |
| | |
10.29 | | Third Amendment to Purchase and Sale Agreement between the sellers identified therein and Easterly Government Properties LP dated as of December 21, 2021 (previously filed as Exhibit 10.3 to the Company’s Quarterly Report on Form 10-Q on October 31, 2023 and incorporated herein by reference) |
| | |
10.30 | | Fourth Amendment to Purchase and Sale Agreement between the sellers identified therein and Easterly Government Properties LP dated as of December 21, 2021 (previously filed as Exhibit 10.4 to the Company’s Quarterly Report on Form 10-Q on October 31, 2023 and incorporated herein by reference) |
| | |
10.31 | | Fifth Amendment to Purchase and Sale Agreement between the sellers identified therein and Easterly Government Properties LP dated as of November 14, 2022 (previously filed as Exhibit 10.5 to the Company’s Quarterly Report on Form 10-Q on October 31, 2023 and incorporated herein by reference) |
| | |
10.32 | | Sixth Amendment to Purchase and Sale Agreement between the sellers identified therein and Easterly Government Properties LP dated as of April 10, 2023 (previously filed as Exhibit 10.6 to the Company’s Quarterly Report on Form 10-Q on October 31, 2023 and incorporated herein by reference) |
| | |
10.33 | | Seventh Amendment to Purchase and Sale Agreement between the sellers identified therein and Easterly Government Properties LP dated as of August 17, 2023 (previously filed as Exhibit 10.1 to the Company’s Current Report on Form 8-K on August 23, 2023 and incorporated herein by reference) |
| | |
10.34 | | Transition and Separation Agreement and Release, dated as of December 6, 2023, among William C. Trimble, III, Easterly Government Properties, Inc., Easterly Government Properties Services LLC, Easterly Government Properties LP (previously filed as Exhibit 10.1 to the Company’s Current Report on Form 8-K on December 7, 2023 and incorporated herein by reference) |
† Exhibit is a management contract or compensatory plan or arrangement.
* Filed herewith
** Furnished herewith
Item 16. Form 10-K Summary
Not applicable.
SIGNATURES
Pursuant to the requirements of Section 13 or 15(d) of the Securities Exchange Act of 1934, the registrant has duly caused this report to be signed on its behalf by the undersigned, thereunto duly authorized, in the City of Washington, District of Columbia, on February 25, 2025.
| |
EASTERLY GOVERNMENT PROPERTIES, INC. |
| |
By: | /s/ Darrell W. Crate |
Name: | Darrell W. Crate |
Title: | President, Chief Executive Officer and Director |
Pursuant to the requirements of the Securities Exchange Act of 1934, this report has been signed below by the following persons on behalf of the registrant and in the capacities and on the dates indicated.
| | | | |
Signature | | Title | | Date |
| | | | |
/s/ Darrell W. Crate | | President, Chief Executive Officer and Director (Principal Executive Officer) | | February 25, 2025 |
Darrell W. Crate | | |
| | | | |
/s/ Allison E. Marino | | Executive Vice President, Chief Financial Officer and Chief Accounting Officer (Principal Financial and Accounting Officer) | | February 25, 2025 |
Allison E. Marino |
| | | | |
/s/ William H. Binnie | | Chairman of the Board of Directors | | February 25, 2025 |
William H. Binnie | | | | |
| | | | |
/s/ Michael P. Ibe | | Director, Vice Chairman of the Board of Directors and Executive Vice President—Development and Acquisitions | | February 25, 2025 |
Michael P. Ibe |
| | | | |
/s/ Cynthia A. Fisher | | Director | | February 25, 2025 |
Cynthia A. Fisher |
| | | | |
/s/ Scott D. Freeman | | Director | | February 25, 2025 |
Scott D. Freeman |
| | | | |
/s/ Emil W. Henry, Jr. | | Director | | February 25, 2025 |
Emil W. Henry, Jr. |
| | | | |
/s/ Tara S. Innes | | Director | | February 25, 2025 |
Tara S. Innes |
INDEX TO FINANCIAL STATEMENTS
| |
| Page |
Easterly Government Properties, Inc. | |
Report of Independent Registered Public Accounting Firm (PCAOB ID: 238) | F-2 |
Consolidated Balance Sheets as of December 31, 2024 and 2023 | F-4 |
Consolidated Statements of Operations for the years ended December 31, 2024, 2023 and 2022 | F-5 |
Consolidated Statements of Comprehensive Income (Loss) for the years ended December 31, 2024, 2023 and 2022 | F-6 |
Consolidated Statements of Stockholders’ Equity for the years ended December 31, 2024, 2023 and 2022 | F-7 |
Consolidated Statements of Cash Flows for the years ended December 31, 2024, 2023 and 2022 | F-8 |
Notes to the Consolidated Financial Statements | F-10 |
Schedule III - Real Estate and Accumulated Depreciation as of December 31, 2024 | S-1 |
Report of Independent Registered Public Accounting Firm
To the Board of Directors and Stockholders of Easterly Government Properties, Inc.
Opinions on the Financial Statements and Internal Control over Financial Reporting
We have audited the accompanying consolidated balance sheets of Easterly Government Properties, Inc. and its subsidiaries (the "Company") as of December 31, 2024 and 2023, and the related consolidated statements of operations, of comprehensive income (loss), of stockholders’ equity and of cash flows for each of the three years in the period ended December 31, 2024, including the related notes and financial statement schedule listed in the accompanying index (collectively referred to as the "consolidated financial statements"). We also have audited the Company's internal control over financial reporting as of December 31, 2024, based on criteria established in Internal Control - Integrated Framework (2013) issued by the Committee of Sponsoring Organizations of the Treadway Commission (COSO).
In our opinion, the consolidated financial statements referred to above present fairly, in all material respects, the financial position of the Company as of December 31, 2024 and 2023, and the results of its operations and its cash flows for each of the three years in the period ended December 31, 2024 in conformity with accounting principles generally accepted in the United States of America. Also in our opinion, the Company maintained, in all material respects, effective internal control over financial reporting as of December 31, 2024, based on criteria established in Internal Control - Integrated Framework (2013) issued by the COSO.
Basis for Opinions
The Company's management is responsible for these consolidated financial statements, for maintaining effective internal control over financial reporting, and for its assessment of the effectiveness of internal control over financial reporting, included in Management’s Report on Internal Control over Financial Reporting appearing under Item 9A. Our responsibility is to express opinions on the Company’s consolidated financial statements and on the Company's internal control over financial reporting based on our audits. We are a public accounting firm registered with the Public Company Accounting Oversight Board (United States) (PCAOB) and are required to be independent with respect to the Company in accordance with the U.S. federal securities laws and the applicable rules and regulations of the Securities and Exchange Commission and the PCAOB.
We conducted our audits in accordance with the standards of the PCAOB. Those standards require that we plan and perform the audits to obtain reasonable assurance about whether the consolidated financial statements are free of material misstatement, whether due to error or fraud, and whether effective internal control over financial reporting was maintained in all material respects.
Our audits of the consolidated financial statements included performing procedures to assess the risks of material misstatement of the consolidated financial statements, whether due to error or fraud, and performing procedures that respond to those risks. Such procedures included examining, on a test basis, evidence regarding the amounts and disclosures in the consolidated financial statements. Our audits also included evaluating the accounting principles used and significant estimates made by management, as well as evaluating the overall presentation of the consolidated financial statements. Our audit of internal control over financial reporting included obtaining an understanding of internal control over financial reporting, assessing the risk that a material weakness exists, and testing and evaluating the design and operating effectiveness of internal control based on the assessed risk. Our audits also included performing such other procedures as we considered necessary in the circumstances. We believe that our audits provide a reasonable basis for our opinions.
Definition and Limitations of Internal Control over Financial Reporting
A company’s internal control over financial reporting is a process designed to provide reasonable assurance regarding the reliability of financial reporting and the preparation of financial statements for external purposes in accordance with generally accepted accounting principles. A company’s internal control over financial reporting includes those policies and procedures that (i) pertain to the maintenance of records that, in reasonable detail, accurately and fairly reflect the transactions and dispositions of the assets of the company; (ii) provide reasonable assurance that transactions are recorded as necessary to permit preparation of financial statements in accordance with generally accepted accounting principles, and that receipts and expenditures of the company are being made only in accordance with authorizations of management and directors of the company; and (iii) provide reasonable assurance regarding prevention or timely detection of unauthorized acquisition, use, or disposition of the company’s assets that could have a material effect on the financial statements.
Because of its inherent limitations, internal control over financial reporting may not prevent or detect misstatements. Also, projections of any evaluation of effectiveness to future periods are subject to the risk that controls may become inadequate because of changes in conditions, or that the degree of compliance with the policies or procedures may deteriorate.
Critical Audit Matters
The critical audit matter communicated below is a matter arising from the current period audit of the consolidated financial statements that was communicated or required to be communicated to the audit committee and that (i) relates to accounts or disclosures that are material to the consolidated financial statements and (ii) involved our especially challenging, subjective, or complex judgments. The communication of critical audit matters does not alter in any way our opinion on the consolidated financial statements, taken as a whole, and we are not, by communicating the critical audit matter below, providing a separate opinion on the critical audit matter or on the accounts or disclosures to which it relates.
Allocation of Purchase Price of Real Estate Properties Acquired
As described in Notes 2 and 3 to the consolidated financial statements, during the year ended December 31, 2024, the Company acquired nine operating properties in asset acquisitions for an aggregate purchase price of $184.9 million. When the Company acquires properties, management allocates the purchase price to numerous tangible and intangible components. Management allocates the purchase price of properties based on the estimated fair value of the assets acquired and liabilities assumed, which generally consists of land, building, tenant improvements, and intangible assets and liabilities, which include in-place leases, leasing commissions and above and below market leases. Management’s process for determining the allocation requires many estimates and assumptions, including: (i) market land, rental, discount and capitalization rates, (ii) leasing and tenant improvement costs associated with the remaining term of acquired leases, (iii) assumptions used in determining the in-place lease and if-vacant value including the rental rates, period of time that it would take to lease vacant space and estimated tenant improvement and leasing costs, and (iv) allocation of the if-vacant value between land and building.
The principal considerations for our determination that performing procedures relating to purchase price accounting is a critical audit matter are (i) the significant judgment and estimation by management when developing the purchase price allocation, which in turn led to a high degree of auditor judgment and subjectivity in performing procedures to evaluate management’s estimates and significant assumptions, (ii) significant audit effort was necessary in evaluating significant assumptions related to discount rates, capitalization rates, market rental rates, market land rates, leasing costs, tenant improvement costs, and the period of time that it would take to lease vacant space, (iii) significant auditor judgment was necessary in evaluating audit evidence related to such assumptions, and (iv) the audit effort included the involvement of professionals with specialized skill and knowledge to assist in evaluating the audit evidence obtained from these procedures.
Addressing the matter involved performing procedures and evaluating audit evidence in connection with forming our overall opinion on the consolidated financial statements. These procedures included testing the effectiveness of controls relating to asset acquisition accounting, including controls over the assumptions used related to discount rates, capitalization rates, market rental rates, market land rates, leasing costs, tenant improvement costs, and the period of time that it would take to lease vacant space to determine the fair value of the assets acquired and liabilities assumed and allocate the purchase price to the tangible and intangible components. These procedures also included, among others, (i) reading the purchase agreements for all acquisitions, (ii) testing management’s process by evaluating the appropriateness of methods used to determine fair value of assets acquired and liabilities assumed, and (iii) for certain acquisitions, testing the significant inputs and evaluating the reasonableness of the significant assumptions utilized by management in developing the purchase price allocation, related to discount rates, capitalization rates, market rental rates, market land rates, leasing costs, tenant improvement costs, and the period of time that it would take to lease vacant space. Assessing management’s assumptions involved evaluating the consistency of the assumptions used with external market data and with evidence obtained in other areas of the audit. For certain acquisitions, professionals with specialized skill and knowledge were used to assist in evaluating the reasonableness of certain significant assumptions utilized by management, as appropriate.
/s/ PricewaterhouseCoopers LLP
Boston, Massachusetts
February 25, 2025
We have served as the Company’s auditor since 2014.
Easterly Government Properties, Inc.
Consolidated Balance Sheets
(Amounts in thousands, except share amounts)
| | | | | | | | |
| | December 31, 2024 | | | December 31, 2023 | |
Assets | | | | | | |
Real estate properties, net | | $ | 2,572,095 | | | $ | 2,319,143 | |
Cash and cash equivalents | | | 19,353 | | | | 9,381 | |
Restricted cash | | | 8,451 | | | | 12,558 | |
Tenant accounts receivable | | | 71,172 | | | | 66,274 | |
Investment in unconsolidated real estate venture | | | 316,521 | | | | 284,544 | |
Real estate loan receivable, net | | | 34,081 | | | | — | |
Intangible assets, net | | | 161,425 | | | | 148,453 | |
Interest rate swaps | | | 717 | | | | 1,994 | |
Prepaid expenses and other assets | | | 39,256 | | | | 37,405 | |
Total assets | | $ | 3,223,071 | | | $ | 2,879,752 | |
Liabilities | | | | | | |
Revolving credit facility | | | 274,550 | | | | 79,000 | |
Term loan facilities, net | | | 274,009 | | | | 299,108 | |
Notes payable, net | | | 894,676 | | | | 696,532 | |
Mortgage notes payable, net | | | 155,586 | | | | 220,195 | |
Intangible liabilities, net | | | 14,885 | | | | 12,480 | |
Deferred revenue | | | 120,977 | | | | 82,712 | |
Accounts payable, accrued expenses and other liabilities | | | 101,271 | | | | 80,209 | |
Total liabilities | | | 1,835,954 | | | | 1,470,236 | |
| | | | | | |
Commitments and contingencies (Note 14) | | | | | | |
| | | | | | |
Equity | | | | | | |
Common stock, par value $0.01, 200,000,000 shares authorized,
107,970,559 and 100,973,247 shares issued and outstanding at December 31, 2024 and December 31, 2023, respectively | | | 1,080 | | | | 1,010 | |
Additional paid-in capital | | | 1,873,545 | | | | 1,783,338 | |
Retained earnings | | | 131,854 | | | | 112,301 | |
Cumulative dividends | | | (686,044 | ) | | | (576,319 | ) |
Accumulated other comprehensive income | | | 683 | | | | 1,871 | |
Total stockholders’ equity | | | 1,321,118 | | | | 1,322,201 | |
Non-controlling interest in Operating Partnership | | | 65,999 | | | | 87,315 | |
Total equity | | | 1,387,117 | | | | 1,409,516 | |
Total liabilities and equity | | $ | 3,223,071 | | | $ | 2,879,752 | |
The accompanying notes are an integral part of these consolidated financial statements.
Easterly Government Properties, Inc.
Consolidated Statements of Operations
(Amounts in thousands, except share and per share amounts)
| | | | | | | | | | | | |
| | For the years ended December 31, | |
| | 2024 | | | 2023 | | | 2022 | |
Revenues | | | | | | | | | |
Rental income | | $ | 289,601 | | | $ | 273,906 | | | $ | 284,488 | |
Tenant reimbursements | | | 6,544 | | | | 8,908 | | | | 5,920 | |
Asset management income | | | 2,302 | | | | 2,110 | | | | 1,409 | |
Other income | | | 3,605 | | | | 2,303 | | | | 1,789 | |
Total revenues | | | 302,052 | | | | 287,227 | | | | 293,606 | |
Expenses | | | | | | | | | |
Property operating | | | 70,151 | | | | 71,964 | | | | 66,781 | |
Real estate taxes | | | 30,924 | | | | 30,461 | | | | 30,900 | |
Depreciation and amortization | | | 96,333 | | | | 91,292 | | | | 98,254 | |
Acquisition costs | | | 1,878 | | | | 1,661 | | | | 1,370 | |
Corporate general and administrative | | | 24,450 | | | | 27,118 | | | | 24,785 | |
Provision for credit losses | | | 1,527 | | | | — | | | | — | |
Total expenses | | | 225,263 | | | | 222,496 | | | | 222,090 | |
Other income (expense) | | | | | | | | | |
Income from unconsolidated real estate venture | | | 6,051 | | | | 5,498 | | | | 3,374 | |
Interest expense, net | | | (62,433 | ) | | | (49,169 | ) | | | (47,378 | ) |
Gain on the sale of real estate | | | 171 | | | | — | | | | 13,590 | |
Impairment loss | | | — | | | | — | | | | (5,540 | ) |
Net income | | | 20,578 | | | | 21,060 | | | | 35,562 | |
Non-controlling interest in Operating Partnership | | | (1,025 | ) | | | (2,256 | ) | | | (4,088 | ) |
Net income available to Easterly Government Properties, Inc. | | $ | 19,553 | | | $ | 18,804 | | | $ | 31,474 | |
Net income available to Easterly Government Properties, Inc.
per share: | | | | | | | | | |
Basic | | $ | 0.18 | | | $ | 0.19 | | | $ | 0.34 | |
Diluted | | $ | 0.18 | | | $ | 0.19 | | | $ | 0.34 | |
Weighted-average common shares outstanding | | | | | | | | | |
Basic | | | 103,443,951 | | | | 94,264,166 | | | | 90,613,966 | |
Diluted | | | 103,758,546 | | | | 94,556,055 | | | | 90,948,701 | |
Dividends declared per common share | | $ | 1.06 | | | $ | 1.06 | | | $ | 1.06 | |
The accompanying notes are an integral part of these consolidated financial statements.
Easterly Government Properties, Inc.
Consolidated Statements of Comprehensive Income (Loss)
(Amounts in thousands)
| | | | | | | | | | | | |
| | For the years ended December 31, | |
| | 2024 | | | 2023 | | | 2022 | |
Net income | | $ | 20,578 | | | $ | 21,060 | | | $ | 35,562 | |
Other comprehensive gain (loss): | | | | | | | | | |
Unrealized gain (loss) on interest rate swaps, net | | | (1,277 | ) | | | (2,025 | ) | | | 9,719 | |
Other comprehensive gain (loss): | | | (1,277 | ) | | | (2,025 | ) | | | 9,719 | |
Comprehensive income | | | 19,301 | | | | 19,035 | | | | 45,281 | |
Non-controlling interest in Operating Partnership | | | (1,025 | ) | | | (2,256 | ) | | | (4,088 | ) |
Other comprehensive (gain) loss attributable to non-controlling interest | | | 89 | | | | 350 | | | | (1,101 | ) |
Comprehensive income attributable to Easterly Government Properties, Inc. | | $ | 18,365 | | | $ | 17,129 | | | $ | 40,092 | |
The accompanying notes are an integral part of these consolidated financial statements.
Easterly Government Properties, Inc.
Consolidated Statements of Stockholders’ Equity
(Amounts in thousands, except share amounts)
| | | | | | | | | | | | | | | | | | | | | | | | | | | | | | | | |
| | Shares | | | Common
Stock
Par
Value | | | Additional
Paid-in
Capital | | | Retained Earnings
(Deficit) | | | Cumulative Dividends | | | Accumulated Other Comprehensive Income (Loss) | | | Non-
controlling
Interest in
Operating
Partnership | | | Total
Equity | |
Balance at December 31, 2021 | | | 90,147,868 | | | $ | 901 | | | $ | 1,604,712 | | | $ | 62,023 | | | $ | (379,895 | ) | | $ | (5,072 | ) | | $ | 158,912 | | | $ | 1,441,581 | |
Stock based compensation | | | — | | | | — | | | | 625 | | | | — | | | | — | | | | — | | | | 5,911 | | | | 6,536 | |
Grant of unvested restricted
stock | | | 26,477 | | | | — | | | | — | | | | — | | | | — | | | | — | | | | — | | | | — | |
Dividends and distributions
paid ($1.06 per share) | | | — | | | | — | | | | — | | | | — | | | | (96,088 | ) | | | — | | | | (13,088 | ) | | | (109,176 | ) |
Redemption of common units
to common stock | | | 204,751 | | | | 2 | | | | 2,909 | | | | — | | | | — | | | | — | | | | (2,911 | ) | | | — | |
Contribution of property for
common units | | | — | | | | — | | | | — | | | | — | | | | — | | | | — | | | | 17,361 | | | | 17,361 | |
Issuance of common stock, net | | | 434,925 | | | | 5 | | | | 9,394 | | | | — | | | | — | | | | — | | | | — | | | | 9,399 | |
Unrealized gain on interest
rate swaps | | | — | | | | — | | | | — | | | | — | | | | — | | | | 8,618 | | | | 1,101 | | | | 9,719 | |
Net income | | | — | | | | — | | | | — | | | | 31,474 | | | | — | | | | — | | | | 4,088 | | | | 35,562 | |
Allocation of non-controlling interest in Operating Partnership | | | — | | | | — | | | | 5,273 | | | | — | | | | — | | | | — | | | | (5,273 | ) | | | — | |
Balance at December 31, 2022 | | | 90,814,021 | | | | 908 | | | | 1,622,913 | | | | 93,497 | | | | (475,983 | ) | | | 3,546 | | | | 166,101 | | | | 1,410,982 | |
Stock based compensation | | | — | | | | — | | | | 553 | | | | — | | | | — | | | | — | | | | 5,194 | | | | 5,747 | |
Grant of unvested restricted
stock | | | 32,486 | | | | — | | | | — | | | | — | | | | — | | | | — | | | | — | | | | — | |
Dividends and distributions
paid ($1.06 per share) | | | — | | | | — | | | | — | | | | — | | | | (100,336 | ) | | | — | | | | (12,043 | ) | | | (112,379 | ) |
Redemption of common units
�� to common stock | | | 5,867,740 | | | | 59 | | | | 78,341 | | | | — | | | | — | | | | — | | | | (78,400 | ) | | | — | |
Contribution of property for
common units | | | — | | | | — | | | | — | | | | — | | | | — | | | | — | | | | 219 | | | | 219 | |
Issuance of common stock, net | | | 4,259,000 | | | | 43 | | | | 85,869 | | | | — | | | | — | | | | — | | | | — | | | | 85,912 | |
Unrealized gain on interest
rate swaps | | | — | | | | — | | | | — | | | | — | | | | — | | | | (1,675 | ) | | | (350 | ) | | | (2,025 | ) |
Net income | | | — | | | | — | | | | — | | | | 18,804 | | | | — | | | | — | | | | 2,256 | | | | 21,060 | |
Allocation of non-controlling interest in Operating Partnership | | | — | | | | — | | | | (4,338 | ) | | | — | | | | — | | | | — | | | | 4,338 | | | | — | |
Balance at December 31, 2023 | | | 100,973,247 | | | $ | 1,010 | | | $ | 1,783,338 | | | $ | 112,301 | | | $ | (576,319 | ) | | $ | 1,871 | | | $ | 87,315 | | | $ | 1,409,516 | |
Stock based compensation | | | — | | | | — | | | | 448 | | | | — | | | | — | | | | — | | | | 2,760 | | | | 3,208 | |
Grant of unvested restricted
stock, net | | | 67,459 | | | | 1 | | | | (1 | ) | | | — | | | | — | | | | — | | | | — | | | | — | |
Dividends and distributions
paid ($1.06 per share) | | | — | | | | — | | | | — | | | | — | | | | (109,725 | ) | | | — | | | | (6,184 | ) | | | (115,909 | ) |
Redemption of common units
to common stock | | | 1,438,636 | | | | 14 | | | | 18,811 | | | | — | | | | — | | | | — | | | | (18,825 | ) | | | — | |
Issuance of common stock, net | | | 5,491,217 | | | | 55 | | | | 70,946 | | | | — | | | | — | | | | — | | | | — | | | | 71,001 | |
Unrealized loss on interest
rate swaps | | | — | | | | — | | | | — | | | | — | | | | — | | | | (1,188 | ) | | | (89 | ) | | | (1,277 | ) |
Net income | | | — | | | | — | | | | — | | | | 19,553 | | | | — | | | | — | | | | 1,025 | | | | 20,578 | |
Allocation of non-controlling interest in Operating Partnership | | | — | | | | — | | | | 3 | | | | — | | | | — | | | | — | | | | (3 | ) | | | — | |
Balance at December 31, 2024 | | | 107,970,559 | | | $ | 1,080 | | | $ | 1,873,545 | | | $ | 131,854 | | | $ | (686,044 | ) | | $ | 683 | | | $ | 65,999 | | | $ | 1,387,117 | |
The accompanying notes are an integral part of these consolidated financial statements.
Easterly Government Properties, Inc.
Consolidated Statements of Cash Flows
(Amounts in thousands)
| | | | | | | | | | | | |
| | For the years ended December 31, | |
| | 2024 | | | 2023 | | | 2022 | |
Cash flows from operating activities | | | | | | | | | |
Net income | | $ | 20,578 | | | $ | 21,060 | | | $ | 35,562 | |
Adjustments to reconcile net income to net cash provided by operating activities | | | | | | | | | |
Depreciation and amortization | | | 96,333 | | | | 91,292 | | | | 98,254 | |
Straight line rent | | | (2,989 | ) | | | (3,897 | ) | | | (410 | ) |
Income from unconsolidated real estate venture | | | (6,051 | ) | | | (5,498 | ) | | | (3,374 | ) |
Amortization of above- / below-market leases | | | (1,935 | ) | | | (2,730 | ) | | | (3,105 | ) |
Amortization of unearned revenue | | | (6,887 | ) | | | (6,249 | ) | | | (5,797 | ) |
Amortization of loan premium / discount | | | (675 | ) | | | (1,098 | ) | | | (1,122 | ) |
Amortization of deferred financing costs | | | 3,043 | | | | 2,122 | | | | 2,056 | |
Amortization of lease inducements | | | 1,124 | | | | 942 | | | | 856 | |
Amortization of real estate loan origination fees | | | (58 | ) | | | — | | | | — | |
Gain on the sale of real estate | | | (171 | ) | | | — | | | | (13,590 | ) |
Impairment loss | | | — | | | | — | | | | 5,540 | |
Distributions from investment in unconsolidated real estate venture | | | 12,109 | | | | 10,232 | | | | 6,434 | |
Non-cash compensation | | | 3,208 | | | | 5,747 | | | | 6,536 | |
Provision for credit losses | | | 1,527 | | | | — | | | | — | |
Net change in: | | | | | | | | | |
Tenant accounts receivable | | | (1,672 | ) | | | (3,173 | ) | | | (126 | ) |
Prepaid expenses and other assets | | | (2,975 | ) | | | (5,562 | ) | | | (2,829 | ) |
Real estate loan interest receivable | | | (1,229 | ) | | | — | | | | — | |
Deferred revenue associated with operating leases | | | 45,152 | | | | 5,652 | | | | 1,973 | |
Principal payments on operating lease obligations | | | (672 | ) | | | (497 | ) | | | (599 | ) |
Accounts payable, accrued expenses and other liabilities | | | 4,875 | | | | 6,136 | | | | (318 | ) |
Net cash provided by operating activities | | | 162,635 | | | | 114,479 | | | | 125,941 | |
Cash flows from investing activities | | | | | | | | | |
Real estate acquisitions and deposits | | | (188,085 | ) | | | (63,412 | ) | | | (93,737 | ) |
Additions to operating properties | | | (35,441 | ) | | | (28,143 | ) | | | (22,568 | ) |
Additions to development properties | | | (116,029 | ) | | | (17,820 | ) | | | (12,350 | ) |
Proceeds from sale of operating properties, net | | | 2,173 | | | | — | | | | 202,416 | |
Distributions from investment in unconsolidated real estate venture | | | 2,037 | | | | 103 | | | | 983 | |
Investment in unconsolidated real estate venture | | | (40,071 | ) | | | (17,736 | ) | | | (143,847 | ) |
Investment in real estate loan receivable, net | | | (34,229 | ) | | | — | | | | — | |
Net cash used in investing activities | | | (409,645 | ) | | | (127,008 | ) | | | (69,103 | ) |
Cash flows from financing activities | | | | | | | | | |
Payment of deferred financing costs | | | (7,861 | ) | | | — | | | | — | |
Issuance of common shares | | | 71,809 | | | | 86,472 | | | | 9,504 | |
Credit facility draws | | | 617,550 | | | | 198,250 | | | | 230,750 | |
Credit facility repayments | | | (422,000 | ) | | | (184,750 | ) | | | (179,750 | ) |
Term loan draws | | | — | | | | 50,000 | | | | — | |
Term loan repayments | | | (25,500 | ) | | | — | | | | — | |
Issuance of notes payable | | | 200,000 | | | | — | | | | — | |
Repayments of mortgage notes payable | | | (64,298 | ) | | | (20,002 | ) | | | (10,899 | ) |
Dividends and distributions paid | | | (115,909 | ) | | | (112,379 | ) | | | (109,176 | ) |
Payment of offering costs | | | (916 | ) | | | (397 | ) | | | (136 | ) |
Net cash provided by (used in) financing activities | | | 252,875 | | | | 17,194 | | | | (59,707 | ) |
Net increase (decrease) in Cash and cash equivalents and Restricted cash | | | 5,865 | | | | 4,665 | | | | (2,869 | ) |
Cash and cash equivalents and Restricted cash, beginning of year | | | 21,939 | | | | 17,274 | | | | 20,143 | |
Cash and cash equivalents and Restricted cash, end of year | | $ | 27,804 | | | $ | 21,939 | | | $ | 17,274 | |
Easterly Government Properties, Inc.
Consolidated Statements of Cash Flows
(Amounts in thousands)
Supplemental disclosure of cash flow information is as follows:
| | | | | | | | | | | | |
| | For the years ended December 31, | |
| | 2024 | | | 2023 | | | 2022 | |
Cash paid for interest, net of capitalized interest | | $ | 57,223 | | | $ | 47,530 | | | $ | 40,207 | |
Capitalized interest | | $ | 4,726 | | | $ | 1,483 | | | $ | 1,220 | |
Non-cash investing and financing activities: | | | | | | | | | |
Additions to operating properties | | $ | 8,952 | | | $ | 8,518 | | | $ | 4,859 | |
Additions to development properties | | | 23,730 | | | | 7,672 | | | | 4,135 | |
Deferred financing accrued, not paid | | | 30 | | | | — | | | | — | |
Offering costs accrued, not paid | | | 21 | | | | 16 | | | | — | |
Unrealized gain (loss) on interest rate swaps, net | | | (1,277 | ) | | | (2,025 | ) | | | 9,719 | |
Properties acquired for common units | | | — | | | | 219 | | | | 17,361 | |
Contingent consideration accrued, not received | | | — | | | | 41 | | | | 125 | |
Recognition of operating lease right-of-use assets | | | — | | | | — | | | | 2,445 | |
Recognition of liabilities related to operating lease right-of-use assets | | | — | | | | — | | | | 2,445 | |
Derecognition of operating lease right-of-use assets | | | — | | | | — | | | | 689 | |
Exchange of Common Units for Shares of Common Stock | | | | | | | | | |
Non-controlling interest in Operating Partnership | | $ | (18,825 | ) | | $ | (78,400 | ) | | $ | (2,911 | ) |
Common stock | | | 14 | | | | 59 | | | | 2 | |
Additional paid-in capital | | | 18,811 | | | | 78,341 | | | | 2,909 | |
Total | | $ | — | | | $ | — | | | $ | — | |
The accompanying notes are an integral part of these consolidated financial statements.
Easterly Government Properties, Inc.
Notes to the Consolidated Financial Statements
1. Organization and Basis of Presentation
Easterly Government Properties, Inc. (the “Company”) is a Maryland corporation that has elected to be taxed as a real estate investment trust (a “REIT”) under the Internal Revenue Code, as amended (the “Code”), commencing with its taxable year ended December 31, 2015. The operations of the Company are carried out primarily through Easterly Government Properties, LP (the “Operating Partnership”) and the wholly owned subsidiaries of the Operating Partnership. As used herein, the “Company,” “we,” “us,” or “our” refer to Easterly Government Properties, Inc. and its consolidated subsidiaries and partnerships, including the Operating Partnership, except where context otherwise requires.
We are an internally managed REIT, focused primarily on the acquisition, development, and management of Class A commercial properties that are leased to U.S. Government agencies that serve essential functions. We generate over 90% of our revenue by leasing our properties to such agencies either directly or through the U.S. General Services Administration (“GSA”). Our objective is to generate attractive risk-adjusted returns for our stockholders over the long term through dividends and capital appreciation.
We focus on acquiring, developing and managing U.S. Government-leased properties that are essential to supporting the mission of the tenant agency and strive to be a partner of choice for the U.S. Government, working closely with the tenant agency to meet its needs and objectives. We may also consider other potential opportunities to add properties to our portfolio, including acquiring properties leased to state and local governments with strong creditworthiness and other opportunities that directly or indirectly support the mission of select government agencies. As of December 31, 2024, we wholly owned 90 operating properties and ten operating properties through an unconsolidated joint venture (the “JV”) in the United States encompassing approximately 9.7 million leased square feet, including 92 operating properties that were leased primarily to U.S. Government tenant agencies, four operating properties leased to tenant agencies of a U.S. state or local government and three operating properties that were entirely leased to private tenants. As of December 31, 2024, our operating properties were 97% leased. For purposes of calculating percentage leased, we exclude from the denominator total square feet that was unleased and to which we attributed no value at the time of acquisition. In addition, we wholly owned two properties under development that we expect will encompass approximately 0.2 million leased square feet upon completion. All references to square footage and asset age within the notes are unaudited.
The Operating Partnership holds substantially all of our assets and conducts substantially all our business. The Company is the sole general partner of the Operating Partnership and owned approximately 95.2% of the aggregate limited partnership interests in the Operating Partnership, which we refer to herein as common units, as of December 31, 2024. We have elected to be taxed as a REIT and believe that we have operated and have been organized in conformity with the requirements for qualification and taxation as a REIT for U.S. federal income tax purposes commencing with our taxable year ended December 31, 2015.
Principles of Consolidation
The accompanying consolidated financial statements are presented on the accrual basis of accounting in accordance with accounting principles generally accepted in the United States of America (“GAAP”) and include the accounts of the Company, including Easterly Government Properties TRS, LLC and Easterly Government Services, LLC, the Operating Partnership and its other subsidiaries. All significant intercompany balances and transactions have been eliminated in consolidation.
2. Summary of Significant Accounting Policies
The preparation of the consolidated financial statements requires management to make estimates and assumptions that affect the reported amounts of assets and liabilities and disclosures of contingent assets and liabilities at the date of the balance sheet and the reported amounts of revenues and expenses during the reporting period. Actual results could differ from those estimates.
Real Estate Properties
Real estate properties comprise all tangible assets we hold for rent or development. Real property is recognized at cost less accumulated depreciation. Third party costs related to asset acquisitions are capitalized. Development, re-development and certain costs directly related to the improvement of real properties are capitalized. Maintenance and repair expenses are charged to expense as incurred.
When we acquire properties, we allocate the purchase price to numerous tangible and intangible components. Our process for determining the allocation to these components requires many estimates and assumptions, including the following: (1) determination of market land, rental, discount and capitalization rates; (2) estimation of leasing and tenant improvement costs associated with the
remaining term of acquired leases; (3) assumptions used in determining the in-place lease and if-vacant value including the rental rates, period of time that it would take to lease vacant space and estimated tenant improvement and leasing costs; and (4) allocation of the if-vacant value between land and building. A change in any of the above key assumptions can materially change not only the presentation of acquired properties in our consolidated financial statements but also our reported results of operations. The allocation to different components affects the following:
•the amount of the purchase price allocated among different categories of assets and liabilities on our consolidated balance sheets; and the amount of costs assigned to individual properties in multiple property acquisitions;
•where the amortization of the components appear over time in our consolidated statements of operations. Allocations to above- and below-market leases are amortized into rental revenue, whereas allocations to most of the other tangible and intangible assets are amortized into depreciation and amortization expense. As a REIT, this is important to us since much of the investment community evaluates our operating performance using non-GAAP measures such as Funds From Operations, the computation of which includes rental revenue but does not include depreciation and amortization expense; and
•the timing over which the items are recognized as revenue or expense in our consolidated statements of operations. For example, for allocations to the as-if vacant value, the land portion is not depreciated and the building portion is depreciated over a longer period of time than the other components (generally 40 years). Allocations to above- and below-market leases and in-place lease value are amortized over significantly shorter time frames, and if individual tenants’ leases are terminated early, any unamortized amounts remaining associated with those tenants are written off upon termination. These differences in timing can materially affect our reported results of operations.
Tenant improvements are capitalized in real property when we own the improvement. When we are required to provide improvements under the terms of a lease, we determine whether the improvements constitute landlord assets or tenant assets. If the improvements are considered landlord assets, we capitalize the cost of the improvements and recognize depreciation expense associated with such improvements generally over the shorter of the useful life of the assets or the term of the lease and recognize any payments from the tenant as rental revenue over the term of the lease. If the improvements are considered tenant assets, we defer the cost of improvements funded by us as a lease incentive asset and amortize it as a reduction of rental revenue over the term of the lease. Our determination of whether improvements are landlord assets or tenant assets also may affect when we commence revenue recognition in connection with a lease. In determining whether improvements constitute landlord or tenant assets, we consider numerous factors including: whether the improvements are unique to the tenant or reusable by other tenants; whether the tenant is permitted to alter or remove the improvements without our consent or without compensating us for any lost fair value; whether the ownership of the improvements remains with us or remains with the tenant at the end of the lease term; and whether the economic substance of the lease terms is properly reflected.
We capitalize pre-development costs incurred in pursuit of new development opportunities for which we currently believe future development is probable. Additionally, we capitalize interest expense, real estate taxes and direct and indirect project costs (including related compensation and other indirect costs) associated with properties, or portions thereof, undergoing construction, development and redevelopment activities. In capitalizing interest expense, if there is a specific borrowing for the property undergoing construction, development and redevelopment activities, we apply the interest rate of that borrowing to the average accumulated expenditures that do not exceed such borrowing; for the portion of expenditures exceeding any such specific borrowing, we apply our weighted average interest rate on unsecured borrowings to the expenditures. We continue to capitalize costs while construction, development or redevelopment activities are underway until the building is substantially complete and ready for its intended use, at which time rental income recognition can commence and rental operating costs, real estate taxes, insurance, and other subsequent carrying costs are expensed as incurred.
Depreciation of an asset begins when it is available for use and is calculated using the straight-line method over the estimated useful lives. Each period, depreciation is charged to expense and credited to the related accumulated depreciation account. A used asset acquired is depreciated over its estimated remaining useful life, not to exceed the life of a new asset. Range of useful lives for depreciable assets are as follows:
| | |
Category | | Term |
Buildings | | 40 years |
Building improvements | | 5 - 40 years |
Tenant improvements | | Generally shorter of the remaining life of the lease or useful life |
Furniture and equipment | | 3 - 7 years |
We regularly evaluate whether events or changes in circumstances have occurred that could indicate an impairment in the value of long-lived assets. If there is an indication that the carrying value of an asset is not recoverable, we estimate the projected
undiscounted cash flows to determine whether an asset may be impaired. We determine the amount of any impairment loss by comparing the historical carrying value to estimated fair value. We estimate fair value through an evaluation of recent financial performance and projected discounted cash flows using standard industry valuation techniques. Fair value estimates are made as of a specific point in time, are subjective in nature and involve uncertainties and matters of significant judgment. In addition to consideration of impairment upon the events or changes in circumstances described above, we regularly evaluate the remaining lives of our long-lived assets. If we change our estimate of the remaining lives, we allocate the carrying value of the affected assets over their revised remaining lives. From time to time, natural disasters or other loss events may result in damage or destruction to our assets. In these instances, any loss on involuntary conversion is recognized as Depreciation and amortization in our Consolidated Statements of Operations in the period in which the damage occurred.
Cash and Cash Equivalents
Cash and cash equivalents on the accompanying Consolidated Balance Sheets include all cash and liquid investments that mature three months or less from when they were purchased. Cash equivalents are reported at cost, which approximates fair value. We maintain our cash in bank accounts in amounts that may exceed federally insured limits at times. We have not experienced any losses in these accounts and believe that we are not exposed to significant credit risk because our accounts are deposited with major financial institutions.
Restricted Cash
Restricted cash on the accompanying Consolidated Balance Sheets consists of amounts escrowed for future real estate taxes, insurance, capital expenditures and debt service, as required by certain of our mortgage debt agreements or lease agreements.
Investment in Unconsolidated Real Estate Venture
We analyze each real estate venture to determine whether the entity should be consolidated. If it is determined that an entity is a variable interest entity (“VIE”) in which we have a variable interest, we assess whether we are the primary beneficiary of the VIE to determine whether it should be consolidated. We are not the primary beneficiary of an entity when we do not have voting control, lack the power to direct the activities that most significantly impact the entity’s economic performance or other partners have substantive participatory rights, we do not have the obligation to absorb losses or we do not have the right to receive returns from the VIE that could potentially be significant. If we determine that the entity is not a VIE, then we base our consolidation assessment on whether we have a controlling financial interest in the entity. Management uses its judgment when determining if we are the primary beneficiary of, or have a controlling financial interest in, an entity in which we have a variable interest. Factors considered in determining whether we have the power to direct the activities that most significantly impact the entity’s economic performance include voting rights, involvement in day-to-day capital and operating decisions, and the extent of our involvement in the entity.
We use the equity method of accounting for investments in unconsolidated real estate ventures when we have significant influence but do not control the entity. Under the equity method, we record our investment in "Investment in unconsolidated real estate venture" on our Consolidated Balance Sheets and our proportionate share of earnings or losses, pursuant to the terms of the joint venture agreement as these may change depending on returns, in "Income from unconsolidated real estate venture" in the accompanying Consolidated Statements of Operations. We classify distributions received from equity method investees within our Consolidated Statements of Cash Flows using the nature of distribution approach. Under this method, cash flows generated from the operations of an unconsolidated real estate venture are classified as a return on investment (cash inflow from operating activities) and cash flows from property sales, debt refinancing or sales of our investments are classified as a return of investment (cash inflow from investing activities).
We earn revenue from asset management services to our unconsolidated real estate venture. These fees are determined following the terms specific to each arrangement. We account for this revenue gross of our ownership interest in the respective real estate venture and recognize such revenue as "Asset management income" in our Consolidated Statements of Operations when earned. Our proportionate share of related expense is recognized in "Income from unconsolidated real estate venture".
We assess quarterly whether there are any indicators, including underlying property operating performance and general market conditions, that the value of our investment may be impaired. We consider an investment in a real estate venture impaired if we determine that its fair value is less than the net carrying value of the investment on an other-than-temporary basis. If our analysis indicates that there is an other-than-temporary impairment related to the investment in a particular real estate venture, the carrying value of the venture will be adjusted to an amount that reflects the estimated fair value of the investment.
Receivables and Credit Losses
Tenant accounts receivable on the accompanying Consolidated Balance Sheets includes accrued rental income and other tenant accounts receivables. We accrue rental and other tenant income earned, but not yet received, in accordance with GAAP.
Non-tenant receivables are included in Prepaid expenses and other assets on the accompanying Consolidated Balance Sheets.
We account for loans receivable at their unamortized cost, net of any unamortized deferred fees or costs, premiums or discounts and an allowance for credit losses. Loan fees and direct costs associated with loans originated by us are deferred and amortized using the effective interest method over the term of the loan as interest income.
The measurement of expected credit losses under the CECL methodology is applicable to our financial assets measured at amortized cost, including loan receivables and certain off-balance sheet credit exposures such as unfunded loan commitments. We adopted this standard on January 1, 2020 and apply this methodology to our loan receivables and off-balance sheet credit exposure. To determine our expected credit losses under CECL, we utilize a probability of default (“PD”) and loss given default (“LGD”) methodology. We determined that we have one portfolio segment and reserve for loan losses on an asset-specific basis. We have a limited history of incurred losses and consequently have elected to employ external data to perform our CECL calculation. Our model's inputs consider a default grade or industry relative default grade associated with the borrower and prospective tenant funding the development to determine an appropriate default risk and allowance for credit loss under the PD and LGD methodology. If a reserve is recorded, the allowance is increased as a provision for credit losses and is decreased by charge-offs when losses are confirmed through the receipt of assets such as cash or via ownership control of the underlying collateral in full. The allowance for loan losses reflects management's estimate of loan losses as of the balance sheet date.
Deferred Costs
Deferred financing fees and debt issuance costs include costs incurred in obtaining debt that are capitalized and are presented as a direct deduction from the carrying amount of the associated debt liability that is not a line-of-credit arrangement on the accompanying Consolidated Balance Sheets. Deferred financing fees and debt issuance costs related to line-of-credit arrangements are presented as an asset in Prepaid expenses and other assets on the accompanying Consolidated Balance Sheets. The deferred financing fees and debt issuance costs are amortized through interest expense over the life of the respective loans on a basis which approximates the effective interest method. Any unamortized amounts upon early repayment of debt are written off in the period of repayment as a loss on extinguishment of debt. Fully amortized deferred financing fees and debt issuance costs are removed from the books upon maturity of the underlying debt.
Deferred offering costs include certain legal, accounting and other third-party fees that are directly associated with in-process equity financings until such financings are consummated. After consummation of the equity financing, these costs are recorded as a reduction to capital. Should the equity no longer be considered probable of being consummated, the deferred offering costs would be expensed immediately as a charge to Corporate general and administrative expenses in the accompanying Consolidated Statement of Operations.
Deferred leasing commissions include commissions, compensation costs of leasing personnel for those leases which commenced prior to the adoption of Accounting Standards Codification (“ASC”) Topic 842, Leases (“ASC 842”) on January 1, 2019, and other direct and incremental costs incurred to obtain new tenant leases as well as to renew existing tenant leases and are presented in Prepaid expenses and other assets on the accompanying Consolidated Balance Sheets. Leasing commissions are capitalized and amortized over the terms of the related leases upon lease commencement using the straight-line method. If a lease terminates prior to the expiration of its initial term, any unamortized costs related to the lease are accelerated into amortization expense. Changes in leasing commissions are presented in the cash flows from operating activities section of the accompanying Consolidated Statements of Cash Flows.
Interest Rate Hedges
Our primary objective in using interest rate derivatives is to add stability to interest expense and to manage exposure to interest rate movements. To accomplish this objective, we primarily use interest rate swaps as part of our interest rate risk management strategy. Interest rate swaps designated as cash flow hedges involve the receipt of variable- rate amounts from a counterparty in exchange for our making fixed- rate payments over the life of the agreements without exchange of the underlying notional amount. Derivatives are used to hedge the cash flows associated with interest rates on existing debt as well as future debt. We recognize derivatives as assets or liabilities on the balance sheet at fair value. We defer the effective portion of changes in fair value of the designated cash flow hedges to accumulated other comprehensive income (“AOCI”) or loss (“AOCL”) and reclassify such deferrals to interest expense as interest expense is recognized on the hedged forecasted transitions. We recognize the ineffective portion of the
change in fair value of interest rate derivatives directly in interest expense. When an interest rate swap designated as a cash flow hedge no longer qualifies for hedge accounting, we recognize changes in fair value of the hedge previously deferred to AOCI or AOCL, along with any changes in fair value occurring thereafter, through earnings. We do not use interest rate derivatives for trading or speculative purposes. We manage counterparty risk by only entering into contracts with major financial institutions based upon their credit ratings and other risk factors.
We use standard market conventions and techniques such as discounted cash flow analysis, option pricing models, replacement cost and termination cost in computing the fair value of derivatives at each balance sheet date. We made an accounting policy election to measure the credit risk of its derivative financial instruments that are subject to master netting agreements on a gross basis by counterparty portfolio.
Please refer to Note 7 for more information pertaining to interest rate derivatives.
Fair Value Measurements
Accounting standards define fair value as the exit price, or the amount that would be received upon sale of an asset or paid to transfer a liability in an orderly transaction between market participants at the measurement date. The standards also establish a hierarchy for inputs used in measuring fair value that maximizes the use of observable inputs and minimizes the use of unobservable inputs by requiring that the most observable inputs be used when available. Observable inputs are inputs market participants would use in valuing the asset or liability developed based on market data obtained from sources independent of us. Unobservable inputs are inputs that reflect our assumptions about the factors market participants would use in valuing the asset or liability developed based upon the best information available in the circumstances. The hierarchy of these inputs is broken down into three levels: Level 1, defined as observable inputs such as quoted prices in active markets; Level 2, defined as inputs other than quoted prices in active markets that are either directly or indirectly observable; and Level 3, defined as unobservable inputs in which little or no market data exists, therefore requiring an entity to develop its own assumptions. Categorization within the valuation hierarchy is based upon the lowest level of input that is most significant to the fair value measurement.
Recurring fair value measurements
The fair values of our interest rate swaps are determined using widely accepted valuation techniques, including discounted cash flow analysis on the expected cash flows of each derivative. This analysis reflects the contractual terms of the derivatives, including the period to maturity, and uses observable market-based inputs, including interest rate curves and implied volatilities in such interest rates. While we determined that the majority of the inputs used to value its derivatives fall within Level 2 of the fair value hierarchy, the credit valuation adjustments associated with its derivatives utilize Level 3 inputs, such as estimates of current credit spreads to evaluate the likelihood of default by us and our counterparties. We have determined that the significance of the impact of the credit valuation adjustments made to its derivative contracts, which determination was based on the fair value of each individual contract, was not significant to the overall valuation. As a result, all of our derivatives held as of December 31, 2024 and 2023 were classified as Level 2 of the fair value hierarchy.
The carrying values of cash and cash equivalents, restricted cash, accounts receivable, other assets and accounts payable and accrued expenses are reasonable estimates of fair values because of the short maturities of these instruments.
Please refer to Note 8 for more information pertaining to fair value measurements.
Deferred Revenue
Deferred revenue consists primarily of lump sum reimbursements made by tenants to us for landlord improvements in excess of a tenant improvement allowance. Lump sum reimbursements are recorded as Deferred revenue on the Consolidated Balance Sheets and are amortized over the life of the lease through Rental income. Deferred revenue also includes rent received in advance, which is recognized within Rental income once earned.
Non-Controlling Interests
Non-controlling interests relate to the common units of the Operating Partnership not owned by us. Unitholders receive a distribution per unit equivalent to the dividend per share of our common stock. Pursuant to ASC 810 with respect to the accounting and reporting for non-controlling interest changes and changes in ownership interest of a subsidiary, changes in parent’s ownership interest when the parent retains controlling interest in the subsidiary should be accounted for as equity transactions. The carrying amount of the non-controlling interest shall be adjusted to reflect the change in its ownership interest in the subsidiary, with the offset to equity attributable to us.
Revenue Recognition
Rental income includes base rents paid by each tenant in accordance with its lease agreement conditions. We recognize rental income on a straight-line basis over the lease term of each lease. For acquisitions of existing buildings, we recognize rental income from leases already in place coincident with the date of property closing. Lease incentives are recorded as a deferred asset and amortized as a reduction of revenue on a straight-line basis over the respective lease term. Above- and below-market leases are amortized into rental income over the terms of the respective leases. Further, Rental income includes certain tenant reimbursement income (real estate taxes, operating expenses, utility usage, and other reimbursements), which are accrued as variable lease payments in the same periods as the related expenses are incurred in accordance with ASC 842.
Tenant reimbursement income includes revenue from tenant construction projects. When revenue and costs for such projects can be estimated with reasonable accuracy, we recognize a percentage of the total estimated revenue on a project based on the cost of services provided on the project as of a point in time relative to the total estimated costs on the project (percentage of completion method). When these criteria do not apply to a project, we recognize revenue from that project using the completed contract method. Fully reimbursed income was included within Tenant reimbursements and associated expenses were included in Property operating expenses within the Consolidated Statements of Operations.
Other income includes income on the associated tenant reimbursement construction projects, parking income, interest income recognized from our real estate loan receivable and other miscellaneous income.
Asset management income includes revenue from asset management services to our unconsolidated real estate venture. The asset management fees are earned by us for managing properties owned by related parties. The asset management fees are based upon contractual rates applied to actively invested capital, with fee income recognized on a monthly basis. The fees are recognized as a single performance obligation comprised of a series of distinct services related to property operations. We believe the overall services provided by asset management activities have the same pattern of performance over the term of the agreement. We account for this revenue gross of our ownership interest in the respective real estate venture and recognize such revenue as "Asset management income" in our Consolidated Statements of Operations when earned. Our proportionate share of related expense is recognized in "Income from unconsolidated real estate venture."
Sales of Properties
We recognize gains from sales of consolidated interests in properties to non-customer third parties when we have transferred control of such interests.
Income Taxes
We believe that we have operated and have been organized in conformity with the requirements for qualification and taxation as a REIT for U.S. federal income tax purposes commencing with our taxable year ended December 31, 2015. So long as we qualify as a REIT, we generally will not be subject to U.S. federal income tax on our net income that we distribute to our stockholders. To maintain our qualification as a REIT, we are required under the Code to distribute at least 90% of our REIT taxable income (without regard to the deduction for dividends paid and excluding net capital gains) to our stockholders and meet certain other requirements. If we fail to qualify as a REIT in any taxable year, we will be subject to U.S. federal income tax on our taxable income at regular corporate rates. Even if we qualify as a REIT, we will be subject to certain U.S. federal, state and local taxes on our income and property, and on taxable income that we do not distribute to our stockholders. In addition, we may provide services that are not customarily provided by a landlord, hold properties for sale and engage in other activities (such as a management business) through Taxable REIT Subsidiaries (“TRSs”) and the income of those subsidiaries will be subject to U.S. federal income tax at regular corporate rates. For the years ended December 31, 2024, 2023 and 2022, we did not incur any material tax liability associated with any of the above.
We do not anticipate any potential expense related to uncertain tax positions as we closely monitor our REIT compliance, do not have any prohibited transactions related to property sales, and the states in which we operate do not subject us to withholding tax requirements.
For federal income tax purposes, dividends to shareholders may be characterized as ordinary income, capital gains or return of capital. The characterization of dividends paid on our common shares during each of the last three years was as follows:
| | | | | | | | | | | | |
| | For the years ended December 31, | |
| | 2024 | | | 2023 | | | 2022 | |
Ordinary income | | | 49.29 | % | | | 40.31 | % | | | 47.48 | % |
Long-term capital gain | | | 0.14 | % | | | 0.00 | % | | | 0.00 | % |
Return of capital | | | 50.57 | % | | | 59.69 | % | | | 52.52 | % |
The dividends allocated to each of the above years for federal income tax purposes included dividends paid on our common shares during each of those years. We distributed all of our REIT taxable income in 2024, 2023, and 2022 and, as a result, did not incur federal income tax in those years.
Stock Based Compensation
We grant equity-based compensation awards to its officers, employees and non-employee directors in the form of restricted shares of common stock and long-term incentive plan units in the Operating Partnership. See Note 9 for further discussion of restricted shares of common stock and LTIP units. The restricted shares of common stock and LTIP units issued to officers, employees, and non-employee directors vest over a period of time as determined by our board of directors at the date of grant. We recognize compensation expense for non-vested restricted shares of common stock and LTIP units granted to officers, employees and non-employee directors on a straight-line basis over the requisite service and/or performance period based upon the fair market value of the shares on the date of grant, as adjusted for forfeitures.
Earnings Per Share of Common Stock Amount
Basic earnings per share is calculated by dividing net income available to Easterly Government Properties, Inc. by the weighted-average number of shares of common stock outstanding during the period, excluding the weighted average number of unvested restricted shares. Diluted earnings per share is calculated by dividing net income by the weighted-average number of shares of common stock outstanding during the period plus other potentially dilutive securities such as unvested restricted shares, LTIP units, and shares issuable under forward sales agreements. Unvested restricted shares and LTIP units are considered participating securities which require the use of the two-class method for the computation of basic and diluted earnings per share.
Segments
We manage our operations as a single segment for the purposes of assessing performance and making operating decisions. All revenue has been generated and all tangible assets are held in the United States. See Note 16 to the Consolidated Financial Statements for additional information.
Standard Adopted
In November 2023, the Financial Accounting Standards Board (“FASB”) issued Accounting Standards Update (“ASU”) 2023-07, "Segment Reporting (Topic 280): Improvements to Reportable Segments Disclosures" ("Topic 280"). Topic 280 enhances disclosures of significant segment expenses and other segment items regularly provided to the chief operating decision maker ("CODM"), extends certain annual disclosures to interim periods and permits more than one measure of segment profit (loss) to be reported under certain conditions. We adopted ASU 2023-07 on December 15, 2024.
Recent Accounting Pronouncements Not Yet Adopted
In October 2023, the FASB issued ASU 2023-06, Disclosure Improvements: Codification Amendments in Response to the SEC’s Disclosure Update and Simplification Initiative (“ASU 2023-06”). ASU 2023-06 adds interim and annual disclosure requirements to GAAP at the request of the Securities and Exchange Commission (the “SEC”). The guidance in ASU 2023-06 is required to be applied prospectively and the GAAP requirements will be effective when the removal of the related SEC disclosure requirements is effective. If the SEC does not act to remove its related requirement by June 30, 2027, any related FASB amendments will be removed from the ASC and will not be effective. We do not anticipate that the adoption of ASU 2023-06 will have a material impact on the consolidated financial statements.
In December 2023, the FASB issued ASU 2023-09, Income Taxes (Topic 740): Improvements to Income Tax Disclosures. The standard is intended to enhance the transparency and decision usefulness of income tax disclosures through changes to the rate
reconciliation and income taxes paid information. The new standard is effective for annual periods beginning after December 15, 2024. We are currently evaluating the impact of this standard on our consolidated financial statements and related disclosures.
3. Real Estate and Intangibles
Acquisitions
During the year ended December 31, 2024, we acquired nine operating properties in asset acquisitions, ICE – Dallas, HSI – Orlando, ICE – Orlando, Northrop Grumman – Dayton, Northrop Grumman – Aurora, IRS – Ogden, and a three building portfolio in Cary, NC, for an aggregate purchase price of $184.9 million. During the year ended December 31, 2023, we acquired three operating properties in asset acquisitions, CA – Anaheim, DHS – Atlanta and JUD – Newport News, for an aggregate purchase price of $63.1 million.
We allocated the aggregate purchase price of these acquisitions based on the estimated fair values of the acquired assets and assumed liabilities as follows (amounts in thousands):
| | | | | | | | |
| | | | | | |
| | December 31, 2024 | | | December 31, 2023 | |
Real estate | | | | | | |
Land | | $ | 41,591 | | | $ | 8,407 | |
Building | | | 104,618 | | | | 37,328 | |
Acquired tenant improvements | | | 9,794 | | | | 4,283 | |
Total real estate | | | 156,003 | | | | 50,018 | |
Intangible assets | | | | | | |
In-place leases | | | 24,552 | | | | 9,538 | |
Acquired leasing commissions | | | 9,842 | | | | 3,919 | |
Total intangible assets | | | 34,394 | | | | 13,457 | |
Intangible liabilities | | | | | | |
Below-market leases | | | (5,469 | ) | | | — | |
Total intangible liabilities | | | (5,469 | ) | | | — | |
Prepaid expenses and other assets | | | | | | |
Contingent consideration | | | — | | | | 41 | |
Accounts payable, accrued expenses and other liabilities | | | | | | |
Contingent consideration | | | — | | | | (388 | ) |
Purchase price | | | 184,928 | | | | 63,128 | |
In addition to the above operating property activity, we acquired one land parcel for development, JUD – Flagstaff, during the year ended December 31, 2024.
No debt was assumed on acquisitions made during the years ended December 31, 2024 and 2023. The intangible assets and liabilities of the acquired operating properties have an aggregate weighted average amortization period of 9.12 years and 10.46 as of December 31, 2024 and 2023, respectively.
During the year ended December 31, 2024, we included $7.2 million of revenues and $2.9 million of net income in our Consolidated Statement of Operations related to the operating properties acquired. Additionally, we incurred $1.9 million of acquisition-related costs primarily consisting of internal costs associated with the property acquisitions.
During the year ended December 31, 2023, we included $1.5 million of revenues and $0.4 million of net income in our Consolidated Statement of Operations related to the operating properties acquired. Additionally, we incurred $1.7 million of acquisition-related costs primarily consisting of internal costs associated with the property acquisitions.
Dispositions
In July 2024, we entered into an agreement to sell a land parcel located in Lincoln, Nebraska for $2.3 million. The land parcel had a carrying value of $2.0 million. On October 3, 2024, we sold the land parcel for a gross sales price of $2.3 million and we recognized a gain on the sale of approximately $0.2 million for the year ended December 31, 2024.
No operating properties were disposed of during the year ended December 31, 2023.
Consolidated Real Estate and Intangibles
Real estate and intangibles on our consolidated balance sheets consisted of the following (amounts in thousands):
| | | | | | | | |
| | December 31, 2024 | | | December 31, 2023 | |
Real estate properties, net | | | | | | |
Land | | $ | 267,543 | | | $ | 221,999 | |
Building | | | 2,490,330 | | | | 2,349,846 | |
Acquired tenant improvements | | | 94,894 | | | | 85,949 | |
Construction in progress | | | 184,512 | | | | 52,426 | |
Accumulated depreciation | | | (465,184 | ) | | | (391,077 | ) |
Total Real estate properties, net | | $ | 2,572,095 | | | $ | 2,319,143 | |
Intangible assets, net | | | | | | |
In-place leases | | | 302,302 | | | | 280,604 | |
Acquired leasing commissions | | | 81,915 | | | | 72,560 | |
Above market leases | | | 14,620 | | | | 14,620 | |
Payment in lieu of taxes | | | 6,394 | | | | 6,394 | |
Accumulated amortization | | | (243,806 | ) | | | (225,725 | ) |
Total Intangible assets, net | | $ | 161,425 | | | $ | 148,453 | |
Intangible liabilities, net | | | | | | |
Below market leases | | | (77,029 | ) | | | (72,037 | ) |
Accumulated amortization | | | 62,144 | | | | 59,557 | |
Total Intangible liabilities, net | | $ | (14,885 | ) | | $ | (12,480 | ) |
During the third quarter of 2022, we recognized an impairment loss totaling approximately $5.5 million for its ICE – Otay property and reduced its carrying value to its estimated fair value, which declined due to changes in expected cash flows related to the tenant’s lease expiration in 2022. ICE – Otay is a 47,919 rentable square foot office building located in San Diego, California. See Note 8 for additional information.
Amortization of intangible assets within Depreciation and amortization expense was $20.3 million, $21.1 million and $25.7 million for the years ended December 31, 2024, 2023 and 2022, respectively.
The projected amortization of total intangible assets and intangible liabilities as of December 31, 2024 are as follows (amounts in thousands):
| | | | |
| | Total | |
Intangible assets | | | |
2025 | | $ | 21,499 | |
2026 | | | 20,380 | |
2027 | | | 18,453 | |
2028 | | | 15,589 | |
2029 | | | 12,342 | |
Thereafter | | | 73,162 | |
| | $ | 161,425 | |
Intangible liabilities | | | |
2025 | | $ | (2,931 | ) |
2026 | | | (2,693 | ) |
2027 | | | (2,469 | ) |
2028 | | | (1,924 | ) |
2029 | | | (1,238 | ) |
Thereafter | | | (3,630 | ) |
| | $ | (14,885 | ) |
The following table summarizes the scheduled amortization of our acquired above- and below-market lease intangibles for each of the five succeeding years as of December 31, 2024 (amounts in thousands):
| | | | | | | | |
| | Acquired Above-Market Lease Intangibles | | | Acquired Below-Market Lease Intangibles | |
2025 | | $ | 1,097 | | | $ | (2,931 | ) |
2026 | | | 1,096 | | | | (2,693 | ) |
2027 | | | 1,096 | | | | (2,469 | ) |
2028 | | | 725 | | | | (1,924 | ) |
2029 | | | 193 | | | | (1,238 | ) |
Thereafter | | | 641 | | | | (3,631 | ) |
Above-market lease amortization reduces Rental income on our Consolidated Statements of Operations and below-market lease amortization increases Rental income on our Consolidated Statements of Operations. Amortization of above- and below-market lease intangibles increased Rental income by $1.9 million, $2.7 million and $3.1 million for the years ended December 31, 2024, 2023 and 2022, respectively.
4. Investment in Unconsolidated Real Estate Venture
The following is a summary of our investment in our unconsolidated real estate venture (dollars in thousands):
| | | | | | | | | | |
| | | | As of December 31, | |
Joint Venture | | Ownership Interest | | 2024 | | | 2023 | |
MedBase Venture | | 53.0% | | $ | 316,521 | | | $ | 284,544 | |
On October 13, 2021, we formed the JV, with a global investor to fund the acquisition of a portfolio of ten properties that encompasses 1,214,165 leased square feet (the “VA Portfolio”). We own a 53.0% interest in the JV, subject to preferred allocations as provided in the JV agreement.
During the year ended December 31, 2024, the JV acquired VA – Jacksonville for a purchase price of $77.4 million. During the year ended December 31, 2023, the JV acquired VA – Corpus Christi for a purchase price of $34.5 million. As of December 31, 2024, all ten properties in the VA Portfolio had been acquired by the JV.
We provide asset management services to our unconsolidated real estate venture. We recognized asset management service revenue of $2.3 million, $2.1 million and $1.4 million for the years ended December 31, 2024, 2023 and 2022, respectively.
The following is a summary of financial information for our unconsolidated real estate venture:
| | | | | | | | |
| | As of December 31, | |
Balance sheet information: | | 2024 | | | 2023 | |
Real estate, net | | $ | 501,938 | | | $ | 449,956 | |
Other assets, net (1) | | | 105,808 | | | | 97,190 | |
Total assets | | $ | 607,746 | | | $ | 547,146 | |
| | | | | | |
Total liabilities (2) | | $ | 11,142 | | | $ | 10,854 | |
Total equity | | | 596,604 | | | | 536,292 | |
Total liabilities and equity | | $ | 607,746 | | | $ | 547,146 | |
| | | | | | |
Company’s share of equity | | $ | 316,146 | | | $ | 284,169 | |
Basis differential (3) | | | 375 | | | | 375 | |
Carrying value of the Company’s investment in the unconsolidated venture | | $ | 316,521 | | | $ | 284,544 | |
(1)At December 31, 2024 and 2023, this amount included right-of-use assets - finance leases totaling approximately $4.7 million and $4.8 million, respectively, representing a ground lease at VA – Lubbock.
(2)At both December 31, 2024 and 2023, this amount included lease liabilities - finance leases totaling approximately $5.0 million representing a ground lease at VA – Lubbock.
(3)This amount represents the aggregate difference between our historical cost basis and the basis reflected at the joint venture level.
| | | | | | | | | | | | |
| | For the year ended December 31, | |
Income statement information: | | 2024 | | | 2023 | | | 2022 | |
Total revenue | | $ | 45,517 | | | $ | 40,693 | | | $ | 25,898 | |
Operating income | | | 11,572 | | | | 10,567 | | | | 6,530 | |
Net income | | | 11,408 | | | | 10,402 | | | | 6,366 | |
| | | | | | | | | |
Company’s share of net income | | $ | 6,051 | | | $ | 5,498 | | | $ | 3,374 | |
5. Real Estate Loan Receivable
On August 6, 2024, we entered into a construction loan agreement to lend up to $52.1 million to a developer (the “Borrower”). The construction loan will accrue interest monthly at a fixed market rate of 9.00% per annum. The construction loan shall be re-paid in full on or before August 31, 2027, the maturity date. Upon completion of the development, we have the option to purchase at fair value all of the issued and outstanding membership interest from the Borrower in a special purpose entity (“SPE”) which solely holds the developed property. We hold a variable interest in the SPE, but we do not consolidate the SPE as we are not the primary beneficiary due to our lack of power to direct significant activities performed by the SPE.
A summary of our real estate loan receivable consisted of the following (in thousands):
| | | | | | | | |
| | December 31, 2024 | | | December 31, 2023 | |
Real estate loan receivable | | $ | 35,517 | | | $ | — | |
Allowance for credit losses | | | (1,436 | ) | | | — | |
Real estate loan receivable, net | | $ | 34,081 | | | $ | — | |
During the year ended December 31, 2024, we recognized interest income from our real estate loan receivable of $1.2 million. No interest income was recognized from real estate loan receivables during the years ended December 31, 2023, and 2022. Interest income from our real estate loan receivable is included within Other income on our Consolidated Statements of Operations. As of December 31, 2024, we recognized an allowance for credit loss liability of $0.1 million for the undrawn capacity on the construction loan. Allowance for credit loss liability is included within Accounts payable, accrued expenses and other liabilities on our Consolidated Balance Sheets.
The fair value of this real estate loan receivable was approximately $35.9 million as of December 31, 2024.
6. Debt
At December 31, 2024 and December 31, 2023 (dollars in thousands):
| | | | | | | | | | | | | |
| | Principal Outstanding | | | Interest | | Current | |
Loan | | December 31, 2024 | | | December 31, 2023 | | | Rate (1) | | Maturity | |
Revolving credit facility: | | | | | | | | | | | |
2024 revolving credit facility (2) | | $ | 274,550 | | | $ | 79,000 | | | S + 145bps (3) | | June 2028 (4) | |
Total revolving credit facility | | | 274,550 | | | | 79,000 | | | | | | |
| | | | | | | | | | | |
Term loan facilities: | | | | | | | | | | | |
2016 term loan facility | | | 100,000 | | | | 100,000 | | | 5.31% (5) | | January 2025 (6) | |
2018 term loan facility | | | 174,500 | | | | 200,000 | | | 5.23% (7) | | July 2026 | |
Total term loan facilities | | | 274,500 | | | | 300,000 | | | | | | |
Less: Total unamortized deferred financing fees | | | (491 | ) | | | (892 | ) | | | | | |
Total term loan facilities, net | | | 274,009 | | | | 299,108 | | | | | | |
| | | | | | | | | | | |
Notes payable: | | | | | | | | | | | |
2017 series A senior notes | | | 95,000 | | | | 95,000 | | | 4.05% | | May 2027 | |
2017 series B senior notes | | | 50,000 | | | | 50,000 | | | 4.15% | | May 2029 | |
2017 series C senior notes | | | 30,000 | | | | 30,000 | | | 4.30% | | May 2032 | |
2019 series A senior notes | | | 85,000 | | | | 85,000 | | | 3.73% | | September 2029 | |
2019 series B senior notes | | | 100,000 | | | | 100,000 | | | 3.83% | | September 2031 | |
2019 series C senior notes | | | 90,000 | | | | 90,000 | | | 3.98% | | September 2034 | |
2021 series A senior notes | | | 50,000 | | | | 50,000 | | | 2.62% | | October 2028 | |
2021 series B senior notes | | | 200,000 | | | | 200,000 | | | 2.89% | | October 2030 | |
2024 series A senior notes | | | 150,000 | | | | — | | | 6.56% | | May 2033 | |
2024 series B senior notes | | | 50,000 | | | | — | | | 6.56% | | August 2033 | |
Total notes payable | | | 900,000 | | | | 700,000 | | | | | | |
Less: Total unamortized deferred financing fees | | | (5,324 | ) | | | (3,468 | ) | | | | | |
Total notes payable, net | | | 894,676 | | | | 696,532 | | | | | | |
| | | | | | | | | | | |
Mortgage notes payable: | | | | | | | | | | | |
VA – Golden | | | — | | | | 8,447 | | | 5.00% (8) | | April 2024 | |
USFS II – Albuquerque | | | 9,624 | | | | 11,603 | | | 4.46% (8) | | July 2026 | |
ICE – Charleston | | | 10,491 | | | | 11,998 | | | 4.21% (8) | | January 2027 | |
VA – Loma Linda | | | 127,500 | | | | 127,500 | | | 3.59% (8) | | July 2027 | |
CBP – Savannah | | | 8,683 | | | | 9,549 | | | 3.40% (8) | | July 2033 | |
USCIS - Kansas City | | | — | | | | 51,500 | | | 3.68% (8) | | August 2024 | |
Total mortgage notes payable | | | 156,298 | | | | 220,597 | | | | | | |
Less: Total unamortized deferred financing fees | | | (579 | ) | | | (944 | ) | | | | | |
Less: Total unamortized premium/discount | | | (133 | ) | | | 542 | | | | | | |
Total mortgage notes payable, net | | | 155,586 | | | | 220,195 | | | | | | |
| | | | | | | | | | | |
Total debt | | $ | 1,598,821 | | | $ | 1,294,835 | | | | | | |
(1)The current interest rate is not adjusted to include the amortization of deferred financing fees or debt issuance costs incurred in obtaining debt or any unamortized fair market value premiums.
(2)The $400.0 million 2024 revolving credit facility (the “2024 revolving credit facility”) had available capacity of $125.3 million at December 31, 2024, which includes an accordion feature that provides us with additional capacity of up to $300.0 million, subject to syndication of the increase and the satisfaction of customary terms and conditions.
(3)Our 2024 revolving credit facility is subject to one interest rate swap with an effective date of June 23, 2023 and a notional value of $100.0 million, of which $25.5 million is associated with our 2024 revolving credit facility, to effectively fix the interest rate
on the $25.5 million at 5.46% annually. The spread over the secured overnight financing rate (“SOFR”) is based on our consolidated leverage ratio, as defined in our 2024 revolving credit facility agreement. Additionally, at December 31, 2024, $249.1 million of amounts outstanding under our 2024 revolving credit facility had a floating rate of 4.31% under USD SOFR with a five day lookback.
(4)Our 2024 revolving credit facility has two six-month as-of-right extension options subject to certain conditions and the payment of an extension fee.
(5)Our 2016 term loan facility (our “2016 term loan facility”) is subject to three interest rate swaps, all with effective dates of December 23, 2024 and an aggregate notional value of $100.0 million, which effectively fixes the interest rate at 5.31% annually. The spread over SOFR is based on our consolidated leverage ratio, as defined in our 2016 term loan facility agreement.
(6)On January 8, 2025, we entered into the ninth amendment to our senior unsecured term loan agreement, dated as of September 29, 2016, to extend the maturity date of our 2016 term loan facility from January 30, 2025 to January 28, 2028.
(7)Our 2018 term loan facility (as amended, our “2018 term loan facility”) is subject to two interest rate swaps with effective dates of June 23 and September 29, 2023 and an aggregate notional value of $200.0 million, of which $174.5 million is associated with our 2018 term loan facility, to effectively fix the interest rate on the $174.5 million at 5.23% annually. The spread over SOFR is based on our consolidated leverage ratio, as defined in our 2018 term loan facility agreement.
(8)Effective interest rates are as follows: USFS II – Albuquerque 3.92%, ICE – Charleston 3.93%, VA – Loma Linda 3.78%, CBP – Savannah 4.12%.
As of December 31, 2024 and 2023, the net carrying value of real estate collateralizing our mortgages payable totaled $216.9 million and $325.9 million, respectively. We were not in default under any mortgage loan as of December 31, 2024. See Note 8 for the fair value of our debt instruments.
2024 Senior Note Agreement
On May 29, 2024, we entered into a master note purchase agreement pursuant to which the Operating Partnership agreed to issue and sell an aggregate of up to $200 million of fixed rate, senior unsecured notes (“Senior Notes”) consisting of (i) 6.56% Series A Senior Notes due May 29, 2033 (“Series A Senior Notes”), in an aggregate principal amount of $150.0 million, and (ii) 6.56% Series B Senior Notes due August 14, 2033 (“Series B Senior Notes”), in an aggregate principal amount of $50.0 million. The Series A Senior Notes were issued on May 29, 2024 and the Series B Senior Notes were issued on August 14, 2024. We, together with various subsidiaries of the Operating Partnership, have guaranteed the Senior Notes.
2024 Revolving Credit Facility
On June 3, 2024, we entered into a credit agreement (the “2024 Credit Agreement”) that provides for the $400.0 million 2024 revolving credit facility which includes an accordion feature that provides us with additional capacity of up to $300.0 million, subject to syndication of the increase and the satisfaction of customary terms and conditions. The 2024 revolving credit facility has an initial four-year term and will mature in June 2028, with two six-month as-of-right extension options, subject to certain conditions and the payment of an extension fee.
Borrowings under the 2024 revolving credit facility will, at the Operating Partnership's option, bear interest at floating rates equal to either (i) a fluctuating rate equal to the sum of (a) the highest of (x) Citibank, N.A.'s base rate, (y) the federal funds effective rate plus 0.50% and (z) the one-month adjusted term SOFR plus 1.00%, plus, in each case, (b) a margin ranging from 0.20% to 0.80% based on our leverage ratio, (ii) the daily simple SOFR plus a credit spread adjustment of 0.10% (the “Adjusted DSS”), or (iii) the term SOFR, plus a credit spread adjustment of 0.10% (the “Term SOFR”), plus, in the case of borrowings bearing interest at Adjusted DSS or Term SOFR, a margin ranging from 1.20% to 1.80% based on our leverage ratio.
2021 Revolving Credit Facility
We are also party to the second amended and restated credit agreement, dated July 23, 2021 (as amended, restated, or otherwise modified from time to time, the “2021 Credit Facility”), which provides for (i) a $450.0 million senior unsecured revolving credit facility (the “2021 revolving credit facility”) and (ii) our 2018 term loan facility.
On January 2, 2024, the margin spreads under the second amended senior unsecured credit agreement were reduced by 1 basis point as a result of achieving our sustainability metric percentage.
In connection with the entry into the 2024 Credit Agreement on June 3, 2024, we repaid all amounts outstanding under and terminated the revolver portion of the 2021 Credit Facility, including all unused commitments. Other than the foregoing, the terms of the 2021 Credit Facility remain unchanged and our 2018 term loan portion of the 2021 Credit Facility remains outstanding. We recognized an aggregate $0.3 million loss on debt extinguishment during the year ended December 31, 2024 which is included in Interest expense, net on our Consolidated Statements of Operations.
Term Loan Facilities
On January 23, 2024, we entered into the seventh amendment to the senior unsecured term loan agreement, dated as of September 29, 2016, that governs our 2016 term loan facility to extend the maturity date of our 2016 term loan facility from March 29, 2024 to January 30, 2025.
On December 23, 2024, we entered into three SOFR-based interest rate swaps with a total notional value of $100.0 million that were designated as cash flow hedges of interest rate risk. The interest rate swaps became effective in December 2024 upon the maturity of our $100.0 million notional value interest rate swap on December 23, 2024. For more information on our interest rate swaps, see Note 7 to the Consolidated Financial Statements.
2025 Activity
On January 8, 2025, we entered into the ninth amendment to our senior unsecured term loan agreement, dated as of September 29, 2016, to extend the maturity date of our 2016 term loan facility from January 30, 2025 to January 28, 2028.
2024 Activity
On April 1, 2024, we used $8.4 million of available cash to extinguish the mortgage note obligation on VA – Golden.
On June 3, 2024, we repaid $25.0 million of amounts outstanding under our 2018 term loan facility using available cash derived from the issuance of Series A Senior Notes.
On July 8, 2024, we used $0.5 million of available cash to pay down a portion of our 2018 term loan facility.
On July 15, 2024, we amended the credit agreements governing our 2016 and 2018 term loan facilities to conform certain definitions related to leverage covenants to the provisions of the 2024 Credit Agreement.
On August 6, 2024, we used $51.5 million of available cash to extinguish the mortgage note obligation on USCIS – Kansas City.
2023 Activity
On February 3, 2023, we entered into three SOFR-based interest rate swaps each with a notional value of $100.0 million that were designated as cash flow hedges of interest rate risk. Two of the interest rate swaps, with an aggregate notional value of $200.0 million, became effective in June 2023. The third swap, with a notional value of $100.0 million, became effective in September 2023. For more information on our interest rate swaps, see Note 7 to the Consolidated Financial Statements.
On May 30, 2023, we entered into the third amendment to our second amended and restated credit agreement, dated as of July 23, 2021 and into the sixth amendment to our senior unsecured term loan agreement, dated as of September 29, 2016. These amendments added a daily simple SOFR-based option to the term SOFR-based floating interest rate option as a benchmark rate for borrowings denominated in U.S. dollars for all purposes under the credit and term loan agreements, including, in each case, a credit spread adjustment of 0.10%.
On July 20, 2023, we exercised in full the $50.0 million delayed draw option on our 2018 term loan facility, increasing our 2018 term loan facility commitments from $150.0 million to $200.0 million, and transferred $50.0 million of our interest rate swap with a notional value of $100.0 million, from our revolving credit facility to the $50.0 million delayed draw.
Financial Covenant Considerations
As of December 31, 2024, we were in compliance with all financial and other covenants related to our 2024 revolving credit facility, 2016 term loan facility, 2018 term loan facility, notes payable and mortgage notes payable.
Aggregate Debt Maturities
Aggregated debt maturities based on outstanding principal as of December 31, 2024 are as follows (dollars in thousands):
| | | | |
| | Total | |
2025 | | $ | 104,598 | |
2026 | | | 184,554 | |
2027 | | | 230,733 | |
2028 | | | 325,533 | |
2029 | | | 136,016 | |
Thereafter | | | 623,914 | |
| | | 1,605,348 | |
Unamortized premium/discount & deferred financing | | | (6,527 | ) |
| | $ | 1,598,821 | |
7. Derivatives and Hedging Activities
The following table sets forth the key terms and fair values of our interest rate swap derivatives, each of which was designated as a cash flow hedge (dollars in thousands):
| | | | | | | | | | | | | | | | | | | | |
| | | | | | | | | | | | Fair Value at December 31, | |
Notional Amount | | | Fixed Rate | | | Floating Rate Index (1) | | Effective Date | | Expiration Date | | 2024 | | | 2023 | |
$ | 100,000 | | | | 4.01 | % | | USD-SOFR with -5 Day Lookback | | June 23, 2023 | | March 23, 2025 | | $ | 69 | | | $ | 599 | |
$ | 100,000 | | | | 4.18 | % | | USD-SOFR with -5 Day Lookback | | June 23, 2023 | | December 23, 2024 | | $ | — | | | $ | 501 | |
$ | 100,000 | | | | 3.70 | % | | USD-SOFR with -5 Day Lookback | | September 29, 2023 | | June 29, 2025 | | $ | 259 | | | $ | 894 | |
$ | 40,000 | | | | 3.85 | % | | USD-SOFR with -5 Day Lookback | | December 23, 2024 | | December 23, 2027 | | $ | 161 | | | $ | — | |
$ | 30,000 | | | | 3.86 | % | | USD-SOFR with -5 Day Lookback | | December 23, 2024 | | December 23, 2027 | | $ | 115 | | | $ | — | |
$ | 30,000 | | | | 3.86 | % | | USD-SOFR with -5 Day Lookback | | December 23, 2024 | | December 23, 2027 | | $ | 113 | | | $ | — | |
The table below sets forth the fair value of our interest rate derivatives as well as their classification on our Consolidated Balance Sheets (dollars in thousands):
| | | | | | | | |
| | Fair Value at December 31, | |
Balance Sheet Line Item | | 2024 | | | 2023 | |
Interest rate swaps-Asset | | $ | 717 | | | $ | 1,994 | |
Cash Flow Hedges of Interest Rate Risk
The gains or losses on derivatives designated and that qualify as cash flow hedges is recorded in AOCI and will be reclassified to interest expense in the period that the hedged forecasted transactions affect earnings on our variable rate debt.
Amounts reported in AOCI related to derivatives designated as qualifying cash flow hedges will be reclassified to interest expense as interest payments are made on our variable rate debt. We estimate that $0.9 million will be reclassified from AOCI as a decrease to interest expense over the next 12 months.
The table below presents the effects of our interest rate derivatives on our Consolidated Statements of Operations and Comprehensive Income (Loss) (dollars in thousands):
| | | | | | | | | | | | |
| | For the years ended December 31, | |
| | 2024 | | | 2023 | | | 2022 | |
Unrealized gain recognized in AOCI | | $ | 2,399 | | | $ | 3,811 | | | $ | 8,427 | |
Gain (loss) reclassified from AOCI into interest expense | | | 3,676 | | | | 5,836 | | | | (1,292 | ) |
Credit-Risk Related Contingent Features
We have agreements with each of its derivative counterparties that contain a provision where we could be declared in default on its derivative obligations if repayment of the underlying indebtedness is accelerated by the lender due to our default on such indebtedness. As of December 31, 2024, we were not in a net liability position with any derivative counterparty. As of December 31, 2024, we were in compliance with these agreements and had not posted any collateral related to these agreements.
8. Fair Value Measurements
The carrying values of cash and cash equivalents, restricted cash, accounts receivable, other assets and accounts payable and accrued expenses are reasonable estimates of fair values because of the short maturities of these instruments. The table below presents our assets and liabilities measured at fair value on a recurring basis as of December 31, 2024 and 2023, aggregated by the level in the fair value hierarchy within which those measurements fall (amounts in thousands):
| | | | | | | | | | | | |
| | As of December 31, 2024 | |
Balance Sheet Line Item | | Level 1 | | | Level 2 | | | Level 3 | |
Interest rate swaps - Asset | | $ | — | | | $ | 717 | | | $ | — | |
| | | | | | | | | | | | |
| | As of December 31, 2023 | |
Balance Sheet Line Item | | Level 1 | | | Level 2 | | | Level 3 | |
Interest rate swaps - Asset | | $ | — | | | $ | 1,994 | | | $ | — | |
For our disclosure of debt fair values, we estimated the fair value of our 2016 term loan facility and our 2018 term loan facility based on the variable interest rate and credit spreads (categorized within Level 3 of the fair value hierarchy) and estimated the fair value of our other debt based on the discounted estimated future cash payments to be made on such debt (categorized within Level 3 of the fair value hierarchy); the discount rates used approximate current market rates for loans, or groups of loans, with similar maturities and credit quality, and the estimated future payments included scheduled principal and interest payments. Fair value estimates are made as of a specific point in time, are subjective in nature and involve uncertainties and matters of significant judgment. Settlement at such fair value amounts may not be possible and may not be a prudent management decision.
Nonrecurring fair value measurements
On a quarterly basis we assess the recoverability of the carrying amount of our real estate and related intangibles. In the third quarter of 2022, our assessment resulted in the remeasurement of ICE – Otay, which was written down to its estimated fair value and was classified as Level 3 in the fair value hierarchy. Our estimate of the fair value was based on a combination of a pending offer from a third party to acquire the property and a discounted cash flow analysis. We used two significant unobservable inputs in the various scenarios, which were the cash flow discount rate (ranging from 6.25%-9.00%) and average price per square foot of comparable sales in the market ($109.08-$185.90). There is no assurance that we will sell ICE – Otay on the terms proposed or at all. The remeasurement resulted in an impairment loss of $5.5 million during the year ended December 31, 2022, which is included in "Impairment loss" in our Consolidated Statements of Operations.
No impairment charges were incurred during the years ended December 31, 2024 and 2023.
Financial assets and liabilities not measured at fair value
The following table summarizes the aggregate principal outstanding under the Company's indebtedness and the corresponding estimate of fair value as of December 31, 2024 and 2023:
| | | | | | | | | | | | | | | | |
| | December 31, 2024 | | | December 31, 2023 | |
Financial liabilities | | Carrying Amount (1) | | | Fair Value (2) | | | Carrying Amount (1) | | | Fair Value (2) | |
Revolving credit facility | | $ | 274,550 | | | $ | 274,550 | | | $ | 79,000 | | | $ | 79,000 | |
2016 Term loan facility | | $ | 100,000 | | | $ | 100,000 | | | $ | 100,000 | | | $ | 100,000 | |
2018 Term loan facility | | $ | 174,500 | | | $ | 174,500 | | | $ | 200,000 | | | $ | 200,000 | |
Notes payable | | $ | 900,000 | | | $ | 825,395 | | | $ | 700,000 | | | $ | 607,046 | |
Mortgages payable | | $ | 156,298 | | | $ | 147,634 | | | $ | 220,597 | | | $ | 208,743 | |
(1)The carrying amount consists of principal only.
(2)We deem the fair value measurement of the financial liability instrument a Level 3 measurement.
9. Equity Incentive Plan
On May 17, 2024, the stockholders of the Company approved our 2024 Equity Incentive Plan (the “2024 Plan”), which initially authorized an aggregate of 3,600,000 shares of our common stock for issuance. The 2024 Plan replaced our 2015 Equity Incentive Plan, as last amended on May 9, 2017 (the “Prior Plan”), and upon the effectiveness of the 2024 Plan no awards may be granted under the Prior Plan. Pursuant to the terms of the 2024 Plan, the shares of our common stock underlying any awards that are forfeited, cancelled, or are otherwise terminated (other than by exercise) under the 2024 Plan and Prior Plan are added back to the shares available for issuance under the 2024 Plan. As of December 31, 2024, 3,725,247 shares were available for issuance under the 2024 Plan. No shares of our common stock were authorized or available for issuance under the Prior Plan as of December 31, 2024.
The 2024 Plan is administered by the compensation committee of our board of directors (the “Compensation Committee”) and the award of stock options (both incentive and non-qualified options), stock appreciation rights, restricted stock, restricted stock units, unrestricted stock, cash-based awards, dividend equivalent rights, and other equity-based awards is permitted. Shares tendered or held back for taxes will not be added back to the reserved pool under the 2024 Plan. Upon the exercise of a stock appreciation right that is settled in shares of common stock, the full number of shares underlying the award will be charged to the reserved pool. Additionally, shares we reacquire on the open market will not be added back to the reserved pool under the 2024 Plan. Stock options and stock appreciation rights will not be repriced in any manner, nor will any material amendments be made to the 2024 Plan without stockholder approval. The term of the 2024 Plan will expire on May 17, 2034.
On December 6, 2023, we entered into a Transition and Separation Agreement with William C. Trimble III (the “Separation Agreement”), pursuant to which Mr. Trimble retired from his positions as Chief Executive Officer and President of the Company and as a member of the Company’s board of directors effective December 31, 2023. Pursuant to the terms of the Separation Agreement, Mr. Trimble received a lump sum severance payment of $0.4 million and his annual cash bonus for 2023 of $1.3 million which was included in compensation expense for the year ended December 31, 2023. In addition, Mr. Trimble’s LTIP Units were treated as follows: (i) all of the LTIP Units subject to only time-based vesting conditions vested as of December 31, 2023; and (ii) all of the LTIP Units subject to both time- and performance-based vesting conditions will remain eligible to be earned and will continue to vest following December 31, 2023, with the number of LTIP Units earned under each award agreement to be calculated as of the end of the applicable performance period set forth in the corresponding award agreement in the same manner as if his retirement had not occurred. On December 6, 2023, we revalued Mr. Trimble’s unvested LTIP units and recognized the fair value of the modified award less compensation cost previously recognized over his remaining requisite service period. We recognized $0.4 million and less than $0.1 million in compensation expense related to the modification of Mr. Trimble’s service and operational LTIP Unit awards, respectively, for the year ended December 31, 2023. Additionally, we recaptured $0.8 million in compensation expense related to the modification of Mr. Trimble’s performance LTIP Unit awards for the year ended December 31, 2023.
Restricted Shares
We award restricted stock to certain members of management and non‑employee directors. Management awards generally vest over a range of one to four years. Non‑employee director shares vest upon the earlier of the anniversary of the date of the grant or the next annual stockholder meeting, as long as the grantee remains a director or employee on such date. Restricted stock awards issued under the 2024 Plan and Prior Plan may not be sold or otherwise transferred until restrictions have lapsed, as established by the Compensation Committee.
We value our non-vested restricted share awards at the grant date fair value, which was the market price of our common stock as of the applicable grant date. We recognized $0.4 million, $0.6 million and $0.6 million in compensation expense, related to restricted common stock awards, for the years ended December 31, 2024, 2023 and 2022, respectively.
The fair value of restricted stock that vested was $0.4 million during 2024, $0.4 million during 2023, and $1.3 million during 2022, based on the market price at the vesting date. The balance of unamortized restricted stock expense as of December 31, 2024, was $0.6 million, which is expected to be recognized over a weighted‑average period of 1.3 years.
A summary of the status of our restricted shares as of December 31, 2024, 2023 and 2022 and changes during the years then ended are presented below:
| | | | | | | | |
| | Restricted Shares | | | Restricted Shares Weighted average grant date fair value | |
Outstanding, December 31, 2021 | | | 86,006 | | | $ | 19.16 | |
Vested | | | (71,168 | ) | | | 18.49 | |
Granted (1) | | | 29,078 | | | | 18.81 | |
Forfeited | | | (2,601 | ) | | | 21.16 | |
Outstanding, December 31, 2022 | | | 41,315 | | | $ | 19.94 | |
Vested | | | (30,987 | ) | | $ | 19.43 | |
Granted (1) | | | 32,486 | | | | 14.18 | |
Forfeited | | | — | | | | — | |
Outstanding, December 31, 2023 | | | 42,814 | | | $ | 15.94 | |
Vested | | | (31,702 | ) | | $ | 15.52 | |
Granted | | | 68,604 | | | | 11.95 | |
Forfeited | | | (1,145 | ) | | | 13.54 | |
Outstanding, December 31, 2024 | | | 78,571 | | | $ | 12.66 | |
(1)Reflects the number of restricted shares issued to the grantee as part of the Prior Plan.
LTIP Units
We grant LTIP units to certain members of management and non‑employee directors. Management awards generally vest immediately or over a range of two to four years. Non‑employee director shares vest upon the earlier of the anniversary of the date of the grant or the next annual stockholder meeting, as long as the grantee remains a director or employee on such date. Performance-based LTIP units are earned subject to us achieving certain thresholds, including absolute total shareholder returns, relative total shareholder returns, or operational hurdles through the performance period. Service-based LTIP units are earned over time, subject to continued employment and other terms of the awards.
The following is a summary of our granted LTIP unit awards:
| | | | | | | | | | | | | | | | |
Award
Type | | Grant
Date | | Performance Period
End Date | | | Vest Date | | Units Granted | | | Units Vested | |
Service | | January 3, 2022 | | | — | | | December 31, 2024 | | | 110,906 | | | 56,858 (1) | |
Operational Performance | | January 3, 2022 | | December 31, 2024 | | | (2) | | | 80,160 | | | (2) | |
TSR Performance | | January 3, 2022 | | December 31, 2024 | | | (3) | | | 158,535 | | | (3) | |
Service | | May 11, 2022 | | | — | | | May 2, 2023 | | | 11,238 | | | | 11,238 | |
2022 LTIP Grant | | | | | | | | | | 360,839 | | | | |
| | | | | | | | | | | | | |
Service | | January 3, 2023 | | | — | | | December 31, 2025 | | | 219,859 | | | (1) | |
Operational Performance | | January 3, 2023 | | December 31, 2025 | | | (4) | | | 127,291 | | | (4) | |
TSR Performance | | January 3, 2023 | | December 31, 2025 | | | (4) | | | 148,633 | | | (4) | |
Service | | March 2, 2023 | | | — | | | March 2, 2026 | | | 3,438 | | | | - | |
Service | | May 9, 2023 | | | — | | | May 9, 2024 | | | 16,244 | | | | 16,244 | |
2023 LTIP Grant | | | | | | | | | | 515,465 | | | | |
| | | | | | | | | | | | | |
Service | | January 2, 2024 | | | — | | | December 31, 2026 | | | 201,150 | | | | |
Operational Performance | | January 2, 2024 | | December 31, 2026 | | | (4) | | | 116,737 | | | (4) | |
TSR Performance | | January 2, 2024 | | December 31, 2026 | | | (4) | | | 77,256 | | | (4) | |
TSR Performance | | January 19, 2024 | | December 31, 2026 | | | (4) | | | 69,419 | | | (4) | |
Service | | June 14, 2024 | | | — | | | (5) | | | 13,601 | | | (5) | |
2024 LTIP Grant | | | | | | | | | | 478,163 | | | | |
(1)37,392 service-based LTIP units granted on January 3, 2022 and 75,044 service-based LTIP units granted on January 3, 2023 to William C. Trimble, III, our former Chief Executive Officer and President, vested on December 31, 2023 in accordance with the terms of Mr. Trimble's Transition and Separation Agreement with the Company, dated December 6, 2023.
(2)An aggregate of 41,642 Operational Performance LTIP units were earned as of December 31, 2024 and vested on February 19, 2025.
(3)Based on the Company's performance through the performance period ending December 31, 2024, no TSR Performance LTIP units were earned.
(4)Operational and TSR performance LTIP units may be earned based on the Company's performance through the performance period ending December 31, 2024, December 31, 2025 or December 31, 2026, as applicable. Subject to the grantee's continued employment, earned awards will vest upon the determination of the number of earned LTIP units following the end of the applicable performance period.
(5)Represents LTIP units granted to our independent directors that will vest on the earlier of the anniversary of the grant date or the 2025 annual meeting of stockholders.
We value our LTIP unit awards that are subject to us achieving certain operational performance conditions at the grant date fair value, which is the market price of our common stock as of the applicable grant date. We value our service-based LTIP unit awards at the grant date fair value, which is the market price of our common stock as of the applicable grant date, discounted by the risk related to the timing of book-up events. For the LTIP unit awards granted that are subject to us achieving certain total shareholder return performance thresholds we used a Monte Carlo Simulation (risk-neutral approach) to determine the number of shares that may be issued pursuant to the award.
The following is a summary of the significant assumptions used to value the total shareholder return performance-based LTIP units:
| | | | | | | | | | |
| | Year Ended December 31, | |
| | 2024 | | | 2023 | | 2022 | |
Expected volatility |
| | 24.0 | % | | 26.0% - 39.0% | | | 27.0 | % |
Dividend yield | | 6.6% - 6.7% | | | 5.6% - 8.5% | | | 4.8 | % |
Risk-free interest rate | | 4.1% | | | 4.2% - 5.2% | | | 1.0 | % |
Expected life | | 3 years | | | 3 years | | 3 years | |
The fair value of LTIP units that vested were $2.0 million during 2024, $6.9 million during 2023, and $5.5 million during 2022, based on the market price at the vesting date. We recognized $2.8 million, $5.2 million and $5.9 million in compensation expense related to LTIP unit awards, for the years ended December 31, 2024, 2023 and 2022, respectively. The balance of unamortized LTIP expense as of December 31, 2024 was $4.6 million, which is expected to be recognized over a weighted‑average period of 1.5 years. As of December 31, 2024, management considers it probable that the operational performance conditions on three of our four unvested grants will be achieved.
A summary of the status of our LTIP units as of December 31, 2024, 2023 and 2022 and changes during the years then ended are presented below:
| | | | | | | | |
| | LTIP Units (1) | | | LTIP Units Weighted average grant date fair value | |
Outstanding, December 31, 2021 | | | 651,238 | | | $ | 21.02 | |
Vested | | | (115,412 | ) | | | 18.66 | |
Granted | | | 360,839 | | | | 17.48 | |
Forfeited | | | — | | | | — | |
Outstanding, December 31, 2022 | | | 896,665 | | | $ | 19.90 | |
Vested | | | (423,969 | ) | | $ | 18.73 | |
Granted (2) | | | 857,228 | | | | 10.54 | |
Forfeited (2) | | | (427,115 | ) | | | 16.23 | |
Outstanding, December 31, 2023 | | | 902,809 | | | $ | 13.30 | |
Vested | | | (150,344 | ) | | $ | 19.48 | |
Granted | | | 478,163 | | | | 11.24 | |
Forfeited | | | (283,513 | ) | | | 13.48 | |
Outstanding, December 31, 2024 | | | 947,115 | | | $ | 11.22 | |
(1)Reflects the number LTIP units issued to the grantee on the grant date which may be different from the number of LTIP units actually earned in the case of performance-based LTIP units.
(2)Modified LTIP Units are treated as forfeited and re-granted at their new fair value.
10. Equity
Offering of Common Stock on a Forward Basis
On August 11, 2021, we completed an underwritten public offering of 6,300,000 shares of common stock offered on a forward basis. In connection with the offering, we also entered into separate forward sale agreements with each of the forward purchasers (the “Forward Sales Agreements”), pursuant to which the forward purchasers borrowed and sold to the underwriters an aggregate of 6,300,000 shares of our common stock. On December 28, 2021, we issued 3,991,000 shares of our common stock for net proceeds of $85.0 million, which shares were issued in partial settlement of the Forward Sales Agreements entered into in connection with the underwritten public offering. During the year ended December 31, 2023, we issued 2,309,000 shares of common stock under the Forward Sale Agreements and received net cash proceeds of approximately $46.8 million. As of December 31, 2024 and 2023, all shares of common stock under the Forward Sales Agreements had been issued and settled.
Redemption of Common Units to Common Stock
During the year ended December 31, 2022, we issued 204,751 shares of our common stock upon the redemption of 204,751 common units in accordance with the terms of the partnership agreement of the Operating Partnership. During the year ended December 31, 2023, we issued 5,867,740 shares of our common stock upon the redemption of 5,867,740 common units in accordance with the terms of the partnership agreement of the Operating Partnership. During the year ended December 31, 2024, we issued 1,438,636 shares of our common stock upon the redemption of 1,438,636 common units in accordance with the terms of the partnership agreement of the Operating Partnership.
Dividends and Distributions Paid
A summary of dividends declared by the board of directors per share of common stock and per common unit of our operating partnership at the date of record is as follows:
| | | | | | | | | | |
Quarter | | Declaration Date | | Record Date | | Pay Date | | Dividend | |
Q1 2022 | | April 27, 2022 | | May 13, 2022 | | May 25, 2022 | | | 0.265 | |
Q2 2022 | | July 27, 2022 | | August 11, 2022 | | August 23, 2022 | | | 0.265 | |
Q3 2022 | | October 26, 2022 | | November 11, 2022 | | November 23, 2022 | | | 0.265 | |
Q4 2022 | | February 22, 2023 | | March 9, 2023 | | March 21, 2023 | | | 0.265 | |
Q1 2023 | | April 26, 2023 | | May 11, 2023 | | May 23, 2023 | | | 0.265 | |
Q2 2023 | | August 2, 2023 | | August 17, 2023 | | August 29, 2023 | | | 0.265 | |
Q3 2023 | | October 26, 2023 | | November 9, 2023 | | November 21, 2023 | | | 0.265 | |
Q4 2023 | | February 21, 2024 | | March 6, 2024 | | March 18, 2024 | | | 0.265 | |
Q1 2024 | | April 25, 2024 | | May 9, 2024 | | May 21, 2024 | | | 0.265 | |
Q2 2024 | | July 17, 2024 | | August 1, 2024 | | August 13, 2024 | | | 0.265 | |
Q3 2024 | | October 31, 2024 | | November 15, 2024 | | November 27, 2024 | | | 0.265 | |
Q4 2024 | | February 19, 2025 | | March 5, 2025 | | March 17, 2025 | | | 0.265 | |
Prior to the end of the performance period as set forth in the applicable LTIP unit award, holders of performance-based LTIP units are entitled to receive dividends per LTIP unit equal to 10% of the dividend paid per common unit of our operating partnership. After the end of the performance period, the number of LTIP units, both vested and unvested, that LTIP award recipients have earned, if any, are entitled to receive dividends in an amount per LTIP unit equal to dividends, both regular and special, payable per common unit of our operating partnership. Holders of LTIP units that are not subject to the attainment of performance goals are entitled to receive dividends per LTIP unit equal to 100% of the dividend paid per common unit beginning on the grant date.
ATM Programs
We entered into separate equity distribution agreements on each of December 20, 2019 (the “2019 ATM Program”) and June 22, 2021 (the “2021 ATM Program” and, together with the 2019 ATM Program, the “ATM Programs”) with various financial institutions pursuant to which it may issue and sell shares of its common stock having an aggregate offering price of up to $300.0 million under each ATM Program from time to time in negotiated transactions or transactions that are deemed to be “at the market”
offerings as defined in Rule 415 under the Securities Act of 1933, as amended (the “Securities Act”). Under each of the ATM Programs, we may enter into one or more forward transactions (each, a “forward sale transaction”) under separate master forward sale confirmations and related supplemental confirmations with each of the various financial institutions party to the respective ATM Program for the sale of shares of its common stock on a forward basis.
The following table sets forth certain information with respect to issuances, made under the 2019 ATM Program in each fiscal year for the year ended December 31, 2024 (amounts in thousands except share amounts):
| | | | | | | | | |
| | 2019 ATM Program | | |
For the Year Ended: | | Number of Shares Issued (1) | | | Net Proceeds (1) | | |
December 31, 2022 | | | 434,925 | | | $ | 9,409 | | |
December 31, 2023 | | | 1,950,000 | | | $ | 39,279 | | |
December 31, 2024 | | | 5,491,217 | | | $ | 71,092 | | |
(1)Shares issued by us, which were all issued in settlement of forward sale transactions. As of December 31, 2024, we had settled all of our outstanding forward sale transactions under the 2019 ATM Program. We accounted for the forward sale transactions as equity.
No sales of shares of our common stock were made under the 2021 ATM Program during the year ended December 31, 2024.
We used the net proceeds received from such sales for general corporate purposes. As of December 31, 2024, we had $300.0 million of gross sales of its common stock available under the 2021 ATM Program and $15.4 million of gross sales of its common stock available under the 2019 ATM Program.
Share Repurchase Program
On April 28, 2022, our board of directors authorized a share repurchase program whereby we may repurchase up to 4,538,994 shares of its common stock, or approximately 5% of its outstanding shares as of the authorization date. We are not required to purchase shares under the share repurchase program, but may choose to do so in the open market or through privately negotiated transactions at times and amounts based on our evaluation of market conditions and other factors.
No repurchases of shares of our common stock were made under the share repurchase program during the year ended December 31, 2024.
Contribution of Property for Common Units
On January 25, 2023, the Operating Partnership issued 12,391 common units and fully settled a contingent earn-out liability in connection with our acquisition of FBI / DEA - El Paso on May 26, 2020. The issuance of the common units was effected in reliance upon an exemption from registration provided by Section 4(a)(2) under the Securities Act.
On May 10, 2022, we acquired NARA – Broomfield for which it issued, as partial consideration, 827,791 common units. The issuance of common units was effected in reliance upon an exemption from registration provided by Section 4(a)(2) under the Securities Act.
11. Earnings Per Share
Basic earnings or loss per share of common stock (“EPS”) is calculated by dividing net income or loss attributable to common stockholders by the weighted average shares of common stock outstanding for the periods presented. Diluted EPS is computed after adjusting the basic EPS computation for the effect of dilutive common equivalent shares outstanding during the periods presented. Unvested restricted shares of common stock and unvested LTIP units are considered participating securities which require the use of the two-class method for the computation of basic and diluted earnings per share. The following table sets forth the computation of our basic and diluted earnings per share of common stock for the years ended December 31, 2024, 2023 and 2022 (dollars in thousands, except per share amounts):
| | | | | | | | | | | | |
| | For the years ended December 31, | |
| | 2024 | | | 2023 | | | 2022 | |
Numerator | | | | | | | | | |
Net income | | $ | 20,578 | | | $ | 21,060 | | | $ | 35,562 | |
Less: Non-controlling interest in Operating Partnership | | | (1,025 | ) | | | (2,256 | ) | | | (4,088 | ) |
Net income available to Easterly Government
Properties, Inc. | | | 19,553 | | | | 18,804 | | | | 31,474 | |
Less: Dividends on participating securities | | | (554 | ) | | | (599 | ) | | | (546 | ) |
Net income available to common stockholders | | $ | 18,999 | | | $ | 18,205 | | | $ | 30,928 | |
Denominator for basic EPS | | | 103,443,951 | | | | 94,264,166 | | | | 90,613,966 | |
Dilutive effect of share-based compensation awards | | | 19,548 | | | | 18,128 | | | | 19,336 | |
Dilutive effect of LTIP units (1) | | | 295,047 | | | | 269,685 | | | | 315,399 | |
Dilutive effect of shares issuable under forward
sales agreements (2) | | | — | | | | 4,076 | | | | — | |
Denominator for diluted EPS | | | 103,758,546 | | | | 94,556,055 | | | | 90,948,701 | |
Basic EPS | | $ | 0.18 | | | $ | 0.19 | | | $ | 0.34 | |
Diluted EPS | | $ | 0.18 | | | $ | 0.19 | | | $ | 0.34 | |
(1)During the years ended December 31, 2024, 2023 and 2022, there were approximately 415,291, 387,010 and 314,529 unvested performance-based LTIP units, respectively, that were not included in the computation of diluted earnings per share because to do so would have been antidilutive for the period.
(2)During the years ended December 31, 2024 and 2023, there were no shares of underlying unsettled forward sales transactions that were included in the computation of diluted earnings per share because to do so would have been antidilutive for the period. During the year ended December 31, 2022, 4,259,000 shares of underlying unsettled forward sales transactions that were not included in the computation of diluted earnings per share because to do so would have been antidilutive for the period.
12. Leases
Lessor
We lease commercial space to the U.S. Government through the GSA or other federal, state and local agencies or nongovernmental tenants. These leases may contain extension options that are predominately at the sole discretion of the tenant. Certain of our leases contain a “soft-term” period of the lease, meaning that the U.S. Government tenant agency has the right to terminate the lease prior to its stated lease end date. While certain of our leases are contractually subject to early termination, we do not believe that our tenant agencies are likely to terminate these leases early given the build-to-suit features at the properties subject to the leases, the weighted average age of these properties based on the date the property was built or renovated-to-suit, where applicable (approximately 19.5 years as of December 31, 2024), the mission-critical focus of the properties subject to the leases and the current level of operations at such properties. Certain lease agreements include variable lease payments that, in the future, will vary based on changes in inflationary measures, real estate tax rates, usage, or share of expenditures of the leased premises.
The following table summarizes the maturity of fixed lease payments under our leases as of December 31, 2024 (amounts in thousands):
| | | | | | | | | | | | | | | | | | | | | | | | | | | | |
| | Payments due by period | |
| | Total | | | 2025 | | | 2026 | | | 2027 | | | 2028 | | | 2029 | | | Thereafter | |
Fixed lease payments | | $ | 2,157,284 | | | | 253,667 | | | | 241,166 | | | | 229,336 | | | | 208,931 | | | | 184,217 | | | | 1,039,967 | |
The table below sets forth our composition of lease revenue recognized between fixed and variable components (amounts in thousands):
| | | | | | | | | | | | |
| | Years Ended December 31, | |
| | 2024 | | | 2023 | | | 2022 | |
Fixed | | $ | 269,141 | | | $ | 254,017 | | | $ | 265,126 | |
Variable | | | 20,460 | | | | 19,889 | | | | 19,362 | |
Property rental revenue | | | 289,601 | | | | 273,906 | | | | 284,488 | |
Information about our leases for our development properties as of December 31, 2024 are set forth in the table below:
| | | | | | | | | | | | | |
Property Name | | Location | | Tenant | | Property
Type | | Lease Term | | Estimated Leased
Square
Feet | |
FDA - Atlanta | | Atlanta, GA | | Food and Drug Administration | | L (1) | | 20-year | | | | 162,000 | |
JUD - Flagstaff | | Flagstaff, AZ | | Judiciary of the U.S. Government | | C (2) | | 20-year | | | | 50,777 | |
Total | | | | | | | | | | | | 212,777 | |
Lessee
We lease corporate office space under operating lease arrangements in Washington, D.C. and San Diego, CA. The leases include variable lease payments that, in the future, will vary based on changes in real estate tax rates, usage, or share of expenditures of the leased premises. We have elected not to separate lease and non-lease components for our corporate office leases.
As of December 31, 2024, the unamortized balances associated with our right-of-use operating lease asset and operating lease liability for our two commenced office leases was $2.3 million and $2.3 million, respectively. As of December 31, 2023, the unamortized balance associated with our right-of-use operating lease asset and operating lease liability for our two commenced office leases was $3.0 million and $3.0 million, respectively. Our right-of-use operating lease asset and operating lease liability were included in “Prepaid expenses and other assets” and “Accounts payable, accrued expenses and other liabilities” on the Consolidated Balance Sheets, respectively as of December 31, 2024, and 2023. We used our incremental borrowing rate, which was arrived at utilizing prevailing market rates and the spread on our revolving credit facility, in order to determine the net present value of the minimum lease payments.
The following table provides quantitative information for our commenced operating leases for the year ended December 31, 2024, 2023 and 2022 (amounts in thousands):
| | | | | | | | | | | | |
| | Years Ended December 31, | |
| | 2024 | | | 2023 | | | 2022 | |
Cash flows from operating lease costs | | $ | 770 | | | $ | 620 | | | $ | 624 | |
| | | | | | | | | |
Other Information | | | | | | | | | |
Weighted average remaining lease term (in years) | | | 3.88 | | | | 4.67 | | | | 5.62 | |
Weighted average discount rate | | | 3.32 | % | | | 3.19 | % | | | 3.15 | % |
In addition, the maturity of future minimum lease payments under our commenced corporate office leases as of December 31, 2024 is summarized in the table below (amounts in thousands):
| | | | |
Year ending December 31, | | Payments due by period | |
2025 | | | 793 | |
2026 | | | 661 | |
2027 | | | 368 | |
2028 | | | 385 | |
2029 | | | 333 | |
Thereafter | | | — | |
Total future minimum lease payments | | $ | 2,540 | |
Imputed interest | | | (233 | ) |
Total | | $ | 2,307 | |
13. Revenue
The table below sets forth revenue from tenant construction projects disaggregated by tenant agency for the years ended December 31, 2024, 2023, and 2022 (amounts in thousands).
| | | | | | | | | | | | |
| | For the year ended December 31, | | | For the year ended December 31, | | | For the year ended December 31, | |
Tenant | | 2024 | | | 2023 | | | 2022 | |
Department of Veteran Affairs (“VA”) | | $ | 3,481 | | | $ | 5,702 | | | $ | 2,373 | |
Customs and Border Protection (“CBP”) | | | 1,747 | | | | 293 | | | | 157 | |
U.S. Joint Staff Command (“JSC”) | | | 655 | | | | 2,132 | | | | 948 | |
U.S. Citizenship and Immigration Services (“USCIS”) | | | 294 | | | | 56 | | | | 250 | |
Internal Revenue Service (“IRS”) | | | 286 | | | | 20 | | | | 37 | |
U.S. Coast Guard (“USCG”) | | | 155 | | | | 346 | | | | 182 | |
The Judiciary of the U.S. Government (“JUD”) | | | 153 | | | | 163 | | | | 391 | |
Federal Bureau of Investigation (“FBI”) | | | 151 | | | | 792 | | | | 1,307 | |
Food and Drug Administration (“FDA”) | | | 124 | | | | 45 | | | | 346 | |
Department of Transportation (“DOT”) | | | 34 | | | | 142 | | | | — | |
Environmental Protection Agency (“EPA”) | | | 34 | | | | — | | | | — | |
General Services Administration - Other | | | 26 | | | | 39 | | | | 42 | |
National Weather Service (“NWS”) | | | 25 | | | | — | | | | 2 | |
Immigration and Customs Enforcement (“ICE”) | | | 20 | | | | 111 | | | | 7 | |
Department of Homeland Security (“DHS”) | | | 4 | | | | — | | | | — | |
State of California (“CA”) | | | 3 | | | | — | | | | — | |
Federal Emergency Management Agency (“FEMA”) | | | — | | | | 89 | | | | 318 | |
Bonneville Power Administration (“BPA”) | | | — | | | | 16 | | | | — | |
National Archives and Records Administration (“NARA”) | | | — | | | | 13 | | | | — | |
Department of Labor (“DOL”) | | | — | | | | 3 | | | | — | |
Occupational Safety and Health Administration (“OSHA”) | | | — | | | | — | | | | 116 | |
National Park Service (“NPS”) | | | — | | | | — | | | | 110 | |
Drug Enforcement Administration (“DEA”) | | | — | | | | — | | | | 40 | |
Federal Aviation Administration (“FAA”) | | | — | | | | — | | | | 29 | |
Patent and Trademark Office (“PTO”) | | | — | | | | — | | | | 14 | |
Health Resources and Services Administration (“HRSA”) | | | — | | | | — | | | | 4 | |
| | $ | 7,192 | | | $ | 9,962 | | | $ | 6,673 | |
The balance in Accounts receivable related to tenant construction projects and the associated project management income was $8.1 million and $9.6 million, as of December 31, 2024 and 2023, respectively. The duration of the majority of tenant construction project reimbursement arrangements are less than a year and payment is typically due once a project is complete and work has been
accepted by the tenant. There were no projects ongoing as of December 31, 2024 or as of December 31, 2023 with a duration of greater than one year.
During the years ended December 31, 2024, 2023, and 2022, we also recognized $0.5 million, $0.5 million, and $0.4 million, respectively, in parking garage income generated from the operations of parking garages situated on both the Various GSA – Buffalo property and on the Various GSA - Portland property. The monthly and transient daily parking revenue falls within the scope of ASC Topic 606 Revenue from Contracts with Customers and is accounted for at the point in time when control of the goods or services transfers to the customer and our performance obligation is satisfied. As of December 31, 2024 and 2023, there was less than $0.1 million in Accounts receivable attributable to parking garage income.
There were no contract assets or liabilities as of December 31, 2024 and 2023.
14. Commitments and Contingencies
a) Environmental
As an owner of real estate, we are subject to various environmental laws of federal, state, and local governments. Our compliance with existing laws has not had a material adverse effect on its financial condition and results of operations, and we do not believe it will have a material adverse effect in the future. However, we cannot predict the impact of unforeseen environmental contingencies or new or changed laws or regulations on its current properties or on properties that we may acquire.
b) Tax Protection Agreements
Concurrent with the completion of our initial public offering and the related formation transactions, we also entered into a tax protection agreement with Michael P. Ibe, a director and our Vice Chairman and Executive Vice President — Development and Acquisitions, under which we agreed to indemnify Mr. Ibe for any taxes incurred as a result of a taxable sale of the properties contributed by certain entities beneficially owned by Mr. Ibe in the formation transactions for a period of eight years after the closing of the initial public offering and the formation transactions. We also agreed in the tax protection agreement with Mr. Ibe to use the “traditional method” of making allocations under Section 704(c) of the Code for the eight-year period.
In connection with our acquisitions of certain properties in 2021 and 2022 we entered into a tax protection agreement, under which we agreed to indemnify the contributor for any taxes incurred as a result of a taxable sale of such property for a period of four years. We also agreed in the tax protection agreement with the contributor to use the “traditional method” of making allocations under Section 704(c) of the Code for the four-year period.
Letters of Credit
As of each of December 31, 2024 and 2023, we had $0.1 million of standby letters of credit. There were no draws against these letters of credit during the years ended December 31, 2024 or 2023.
15. Concentration Risk
Concentrations of credit risk arise for us when multiple tenants of the Company are engaged in similar business activities, are located in the same geographic region or have similar economic features that impact in a similar manner their ability to meet contractual obligations, including those to us. We regularly monitor our tenant base to assess potential concentrations of credit risk.
At December 31, 2024, the U.S. Government accounted for 91.1% of our total leased square feet, state and local government tenants accounted for 3.7% of our total leased square feet and non-governmental tenants accounted for the remaining 5.2% of our total leased square feet. At December 31, 2023, the U.S. Government accounted for 96.0% of our leased square feet, state and local government tenants accounted for 1.2% of our total leased square feet and non-governmental tenants accounted for the remaining 2.8% of our total leased square feet.
At December 31, 2024, 18 of our 100 wholly-owned and unconsolidated operating properties were located in California, accounting for approximately 14.2% of our total leased square feet. At December 31, 2023, 18 of our 90 operating properties were located in California, accounting for approximately 15.7% of our total leased square feet. To the extent that weak economic or real estate conditions or natural disasters affect California, our business, financial condition and results of operations could be negatively impacted.
16. Segment Information
For the years ended December 31, 2024, 2023 and 2022, our operations are reported within one reportable and operating segment in the consolidated financial statements and all of our properties are included within this single reportable and operating segment (the “segment”).
Our CODM includes our Chief Executive Officer and our Chief Financial and Accounting Officer as they are responsible for allocating resources, assessing performance and determining appropriate operating segments.
The CODM assesses performance for the segment and decides how to allocate resources based on net income, which is reported on our Consolidated Statements of Operations as Net Income. The Consolidated Statements of Operations, inclusive of significant expenses, are provided to the CODM for performance assessment. The CODM uses net income to evaluate income generated from our properties when deciding whether to reinvest profits into our assets or into other parts of the entity, such as for acquisitions or to pay dividends. Net income is also used to monitor budgeted versus actual results. The CODM also uses net income in competitive analysis by benchmarking to our competitors. The competitive analysis, along with the monitoring of budgeted versus actual results, is used in assessing performance of the segment and in establishing employee and management compensation.
The measure of segment assets is reported on our Consolidated Balance Sheets as Total Assets. The accounting policies of the segment are the same as those described in our Summary of Significant Accounting Policies.
17. Related Parties
We have reimbursement arrangements with entities controlled by our former Chairman, who was appointed Chief Executive Officer effective January 1, 2024, and Vice Chairman, which provide for reimbursement of costs paid on our behalf, or those we pay on their behalf. For the years ended December 31, 2024, 2023 and 2022, we were responsible for reimbursing costs of $0.9 million, $0.8 million and $0.4 million, respectively, and received reimbursement for costs of $0.1 million, less than $0.1 million, and less than $0.1 million, respectively.
We provide asset management services to properties owned by the JV. For the years ended December 31, 2024, 2023 and 2022 we recognized Asset management fees of $2.3 million, $2.1 million and $1.4 million, respectively, and reimbursement for certain costs that we paid on their behalf of $0.5 million, $0.3 million and $0.1 million, respectively.
As of December 31, 2024, and 2023, Accounts receivable from related parties was $0.3 million and $0.2 million, respectively. As of December 31, 2024, and 2023, Accounts payable, accrued expenses and other liabilities included $0.1 million and $0.4 million, respectively, owed to related parties.
18. Subsequent Events
For its consolidated financial statements as of December 31, 2024, we evaluated subsequent events as of the filing date of this Annual Report on Form 10-K and noted the following significant events:
On January 2, 2025, we granted an aggregate of 400,920 performance-based LTIP units to members of management pursuant to the 2024 Plan, consisting of (i) 213,430 LTIP units that are subject to us achieving certain total shareholder return performance thresholds (on both an absolute and relative basis) and (ii) 187,490 LTIP units that are subject to us achieving certain operational performance hurdles, in each case through a performance period ending on December 31, 2027. The performance-based LTIP units will vest to the extent earned following the end of the performance period on December 31, 2027. On January 2, 2025, we also granted an aggregate of 323,903 service-based LTIP units to members of management pursuant to the 2024 Plan, which will vest on December 31, 2027. The LTIP units are subject to the grantee’s continued employment and the other terms of the awards.
Easterly Government Properties, Inc.
Schedule III - Real Estate and Accumulated Depreciation
December 31, 2024
(Amounts in thousands)
| | | | | | | | | | | | | | | | | | | | | | | | | | | | | | | | | | | | | | |
| | | | | | | Initial Cost to Company | | | | | | Cost amount carried at Close of Period | | | | | | | | |
Location | | Type(1) | | Encumbrances(2) | | | Land | | | Buildings and Improvements | | | Costs
Capitalized Subsequent to Acquisition(3) | | | Land | | | Buildings and Improvements | | | Total(4) | | | Accumulated Depreciation(3)(5) | | | Original Construction Date(s)
(Unaudited) | | Date
Acquired |
Aberdeen, MS | | C | | $ | — | | | $ | 1,147 | | | $ | 14,044 | | | $ | 297 | | | $ | 1,147 | | | $ | 14,341 | | | $ | 15,488 | | | $ | 3,575 | | | 2005 | | 6/17/2015 |
Alameda, CA | | L | | | — | | | | 5,438 | | | | 4,312 | | | | 70,463 | | | | 5,438 | | | | 74,775 | | | | 80,213 | | | | 10,000 | | | 2019 | | 8/1/2016 |
Albany, NY | | SF | | | — | | | | 1,801 | | | | 11,544 | | | | 403 | | | | 1,801 | | | | 11,947 | | | | 13,748 | | | | 3,107 | | | 2004 | | 2/11/2015 |
Albany, NY | | SF | | | — | | | | 1,412 | | | | 17,128 | | | | 7,743 | | | | 1,412 | | | | 24,871 | | | | 26,283 | | | | 4,879 | | | 1998 | | 11/22/2016 |
Albuquerque, NM | | SF | | | — | | | | 3,062 | | | | 28,201 | | | | 288 | | | | 3,062 | | | | 28,489 | | | | 31,551 | | | | 8,076 | | | 2011 | | 2/17/2016 |
Albuquerque, NM | | O | | | — | | | | 2,905 | | | | 23,804 | | | | 61 | | | | 2,905 | | | | 23,865 | | | | 26,770 | | | | 6,294 | | | 2006 | | 2/11/2015 |
Albuquerque, NM | | O | | | 9,690 | | | | 2,345 | | | | 28,611 | | | | 546 | | | | 2,345 | | | | 29,157 | | | | 31,502 | | | | 10,098 | | | 2011 | | 2/11/2015 |
Anaheim, CA | | O | | | — | | | | 7,081 | | | | 16,346 | | | | 347 | | | | 7,081 | | | | 16,693 | | | | 23,774 | | | | 632 | | | 1991 / 2020 | | 10/3/2023 |
Arlington, VA | | SF | | | — | | | | 14,350 | | | | 44,442 | | | | 6,235 | | | | 14,350 | | | | 50,677 | | | | 65,027 | | | | 15,066 | | | 2009 | | 2/11/2015 |
Atlanta, GA | | SF | | | — | | | | 1,074 | | | | 10,788 | | | | 8,193 | | | | 1,074 | | | | 18,981 | | | | 20,055 | | | | 1,238 | | | 2008 / 2023 | | 10/3/2023 |
Aurora, CO | | SF | | | — | | | | 2,661 | | | | 16,549 | | | | 15 | | | | 2,661 | | | | 16,564 | | | | 19,225 | | | | 117 | | | 2002 | | 10/10/2024 |
Bakersfield, CA | | SF | | | — | | | | 438 | | | | 2,253 | | | | 807 | | | | 438 | | | | 3,060 | | | | 3,498 | | | | 639 | | | 2000 | | 10/16/2018 |
Beavercreek, OH | | SF | | | — | | | | 4,477 | | | | 11,212 | | | | — | | | | 4,477 | | | | 11,212 | | | | 15,689 | | | | 91 | | | 2012 | | 9/4/2024 |
Birmingham, AL | | SF | | | — | | | | 408 | | | | 10,853 | | | | 249 | | | | 408 | | | | 11,102 | | | | 11,510 | | | | 2,623 | | | 2005 | | 7/1/2016 |
Birmingham, AL | | SF | | | — | | | | 755 | | | | 22,537 | | | | 3,999 | | | | 755 | | | | 26,536 | | | | 27,291 | | | | 5,869 | | | 2005 | | 7/1/2016 |
Birmingham, AL | | O | | | — | | | | 1,410 | | | | 17,276 | | | | 120 | | | | 1,410 | | | | 17,396 | | | | 18,806 | | | | 3,502 | | | 2014 | | 11/9/2018 |
Broomfield, CO | | W | | | — | | | | 4,002 | | | | 19,253 | | | | 21 | | | | 4,002 | | | | 19,274 | | | | 23,276 | | | | 1,273 | | | 2012 | | 5/10/2022 |
Brownsburg, IN | | OC | | | — | | | | 1,774 | | | | 26,300 | | | | 24 | | | | 1,774 | | | | 26,324 | | | | 28,098 | | | | 2,084 | | | 2021 | | 11/1/2021 |
Buffalo, NY | | O | | | — | | | | 246 | | | | 80,913 | | | | 10,531 | | | | 246 | | | | 91,444 | | | | 91,690 | | | | 17,837 | | | 2004 | | 9/13/2018 |
Cary, NC | | O | | | — | | | | 3,942 | | | | 13,303 | | | | — | | | | 3,942 | | | | 13,303 | | | | 17,245 | | | | 32 | | | 1991 | | 11/27/2024 |
Cary, NC | | O | | | — | | | | 5,413 | | | | 17,284 | | | | — | | | | 5,413 | | | | 17,284 | | | | 22,697 | | | | 41 | | | 1994 | | 11/27/2024 |
Cary, NC | | O | | | — | | | | 7,026 | | | | 15,460 | | | | — | | | | 7,026 | | | | 15,460 | | | | 22,486 | | | | 42 | | | 1997 | | 11/27/2024 |
Charleston, SC | | C | | | — | | | | 1,324 | | | | 21,189 | | | | 3,540 | | | | 1,324 | | | | 24,729 | | | | 26,053 | | | | 3,785 | | | 1999 | | 10/16/2018 |
Charleston, WV | | O | | | — | | | | 551 | | | | 13,732 | | | | 2,010 | | | | 551 | | | | 15,742 | | | | 16,293 | | | | 3,145 | | | 1959 / 2000 | | 9/13/2018 |
Chico, CA | | OC | | | — | | | | 5,183 | | | | 24,405 | | | | 56 | | | | 5,183 | | | | 24,461 | | | | 29,644 | | | | 2,869 | | | 2019 | | 4/30/2020 |
Clarksburg, WV | | O | | | — | | | | 108 | | | | 13,421 | | | | 1,280 | | | | 108 | | | | 14,701 | | | | 14,809 | | | | 2,652 | | | 1999 | | 9/13/2018 |
Cleveland, OH | | O | | | — | | | | 563 | | | | 18,559 | | | | 500 | | | | 563 | | | | 19,059 | | | | 19,622 | | | | 2,225 | | | 1981 / 2021 | | 7/22/2021 |
Council Bluffs, IA | | C | | | — | | | | 791 | | | | 11,984 | | | | — | | | | 791 | | | | 11,984 | | | | 12,775 | | | | 987 | | | 2021 | | 8/23/2022 |
Dallas, TX | | SF | | | — | | | | 1,005 | | | | 14,546 | | | | 3,306 | | | | 1,005 | | | | 17,852 | | | | 18,857 | | | | 4,472 | | | 2001 | | 2/11/2015 |
Dallas, TX | | L | | | — | | | | 2,753 | | | | 23,848 | | | | 4,632 | | | | 2,753 | | | | 28,480 | | | | 31,233 | | | | 6,116 | | | 2001 | | 12/1/2015 |
Dallas, TX | | SF | | | — | | | | 740 | | | | 8,191 | | | | 802 | | | | 740 | | | | 8,993 | | | | 9,733 | | | | 1,726 | | | 2005 | | 9/13/2018 |
Del Rio, TX | | C | | | — | | | | 210 | | | | 30,676 | | | | 1,803 | | | | 210 | | | | 32,479 | | | | 32,689 | | | | 9,092 | | | 1992 / 2004 | | 2/11/2015 |
Des Plaines, IL | | O | | | — | | | | 1,742 | | | | 9,325 | | | | 393 | | | | 1,742 | | | | 9,718 | | | | 11,460 | | | | 1,790 | | | 1971 / 1999 | | 9/13/2018 |
El Centro, CA | | C | | | — | | | | 1,084 | | | | 20,765 | | | | 1,506 | | | | 1,084 | | | | 22,271 | | | | 23,355 | | | | 6,296 | | | 2004 | | 2/11/2015 |
El Paso, TX | | SF | | | — | | | | 2,430 | | | | 33,649 | | | | 5,021 | | | | 2,430 | | | | 38,670 | | | | 41,100 | | | | 5,736 | | | 1998 -2005 | | 3/26/2020 |
Fresno, CA | | O | | | — | | | | 1,499 | | | | 68,309 | | | | 5,566 | | | | 1,499 | | | | 73,875 | | | | 75,374 | | | | 20,491 | | | 2003 | | 2/11/2015 |
Easterly Government Properties, Inc.
Schedule III - Real Estate and Accumulated Depreciation
December 31, 2024
(Amounts in thousands)
| | | | | | | | | | | | | | | | | | | | | | | | | | | | | | | | | | | | | | |
| | | | | | | Initial Cost to Company | | | | | | Cost amount carried at Close of Period | | | | | | | | |
Location | | Type(1) | | Encumbrances(2) | | | Land | | | Buildings and Improvements | | | Costs
Capitalized Subsequent to Acquisition(3) | | | Land | | | Buildings and Improvements | | | Total(4) | | | Accumulated Depreciation(3)(5) | | | Original Construction Date(s)
(Unaudited) | | Date
Acquired |
Golden, CO | | W | | $ | — | | | $ | 4,080 | | | $ | 8,933 | | | $ | 705 | | | $ | 4,080 | | | $ | 9,638 | | | $ | 13,718 | | | $ | 2,467 | | | 1996 / 2011 | | 5/24/2018 |
Irvine, TX | | SF | | | — | | | | 6,736 | | | | 12,864 | | | | — | | | | 6,736 | | | | 12,864 | | | | 19,600 | | | | 529 | | | 2000 / 2020 | | 4/12/2024 |
Jackson, TN | | C | | | — | | | | 332 | | | | 24,324 | | | | 1,557 | | | | 332 | | | | 25,881 | | | | 26,213 | | | | 2,563 | | | 1998 | | 12/24/2020 |
Kansas City, KS | | L | | | — | | | | 828 | | | | 33,035 | | | | 2,673 | | | | 828 | | | | 35,708 | | | | 36,536 | | | | 8,007 | | | 2003 | | 7/1/2016 |
Kansas City, MO | | SF | | | — | | | | 645 | | | | 24,431 | | | | 122 | | | | 645 | | | | 24,553 | | | | 25,198 | | | | 2,984 | | | 1998 / 2020 | | 5/20/2021 |
Knoxville, TN | | SF | | | — | | | | 2,840 | | | | 25,775 | | | | 536 | | | | 2,840 | | | | 26,311 | | | | 29,151 | | | | 4,222 | | | 2010 | | 3/17/2021 |
Lakewood, CO | | O | | | — | | | | 1,521 | | | | 32,865 | | | | 1,453 | | | | 1,521 | | | | 34,318 | | | | 35,839 | | | | 10,678 | | | 2004 | | 2/11/2015 |
Lees Summit, MO | | O | | | — | | | | 2,974 | | | | 90,858 | | | | 3,123 | | | | 2,974 | | | | 93,981 | | | | 96,955 | | | | 8,704 | | | 1969 / 1999 | | 10/14/2021 |
Lenexa, KS | | O | | | — | | | | 4,367 | | | | 42,692 | | | | 982 | | | | 4,367 | | | | 43,674 | | | | 48,041 | | | | 8,347 | | | 2007 / 2012 | | 8/22/2019 |
Lenexa, KS | | L | | | — | | | | 649 | | | | 3,449 | | | | 62,485 | | | | 649 | | | | 65,934 | | | | 66,583 | | | | 7,036 | | | 2020 | | 5/27/2017 |
Lincoln, NE | | O | | | — | | | | 2,311 | | | | 26,328 | | | | 1,281 | | | | 2,311 | | | | 27,609 | | | | 29,920 | | | | 8,003 | | | 2005 | | 11/12/2015 |
Little Rock, AR | | SF | | | — | | | | 2,278 | | | | 19,318 | | | | 855 | | | | 2,278 | | | | 20,173 | | | | 22,451 | | | | 5,782 | | | 2001 | | 2/11/2015 |
Loma Linda, CA | | OC | | | 126,921 | | | | 12,476 | | | | 177,357 | | | | 432 | | | | 12,476 | | | | 177,789 | | | | 190,265 | | | | 33,784 | | | 2016 | | 6/1/2017 |
Louisville, KY | | SF | | | — | | | | 1,005 | | | | 5,473 | | | | 170 | | | | 1,005 | | | | 5,643 | | | | 6,648 | | | | 557 | | | 2011 | | 3/17/2021 |
Louisville, KY | | SF | | | — | | | | 1,015 | | | | 21,885 | | | | 295 | | | | 1,015 | | | | 22,180 | | | | 23,195 | | | | 2,404 | | | 2011 | | 3/17/2021 |
Lubbock, TX | | W | | | — | | | | 541 | | | | 972 | | | | — | | | | 541 | | | | 972 | | | | 1,513 | | | | 328 | | | 2013 | | 2/11/2015 |
Martinsburg, WV | | SF | | | — | | | | 1,700 | | | | 13,294 | | | | 258 | | | | 1,700 | | | | 13,552 | | | | 15,252 | | | | 4,006 | | | 2007 | | 2/11/2015 |
Mobile, AL | | SF | | | — | | | | 2,045 | | | | 20,400 | | | | 8,019 | | | | 2,045 | | | | 28,419 | | | | 30,464 | | | | 2,263 | | | 2001 | | 9/18/2020 |
Mobile, AL | | OC | | | — | | | | 6,311 | | | | 31,030 | | | | 185 | | | | 6,311 | | | | 31,215 | | | | 37,526 | | | | 3,691 | | | 2018 | | 4/30/2020 |
New Orleans, LA | | SF | | | — | | | | 664 | | | | 24,471 | | | | 915 | | | | 664 | | | | 25,386 | | | | 26,050 | | | | 3,613 | | | 1999 / 2006 | | 5/9/2019 |
Newport News, VA | | C | | | — | | | | 252 | | | | 14,477 | | | | 130 | | | | 252 | | | | 14,607 | | | | 14,859 | | | | 452 | | | 2008 | | 10/19/2023 |
North Charleston, SC | | SF | | | 10,544 | | | | 963 | | | | 34,987 | | | | 1,892 | | | | 963 | | | | 36,879 | | | | 37,842 | | | | 10,082 | | | 1994 / 2012 | | 2/11/2015 |
North Charleston, SC | | W | | | — | | | | 918 | | | | 14,033 | | | | 32 | | | | 918 | | | | 14,065 | | | | 14,983 | | | | 1,461 | | | 2020 | | 11/3/2020 |
Ogden, UT | | W | | | — | | | | 4,964 | | | | 11,507 | | | | — | | | | 4,964 | | | | 11,507 | | | | 16,471 | | | | 32 | | | 1996 | | 11/21/2024 |
Omaha, NE | | SF | | | — | | | | 4,635 | | | | 41,319 | | | | 1,330 | | | | 4,635 | | | | 42,649 | | | | 47,284 | | | | 14,313 | | | 2009 | | 2/11/2015 |
Omaha, NE | | SF | | | — | | | | 1,517 | | | | 14,156 | | | | 518 | | | | 1,517 | | | | 14,674 | | | | 16,191 | | | | 4,016 | | | 2004 | | 5/19/2016 |
Orange, CT | | OC | | | — | | | | 3,098 | | | | 23,613 | | | | 37 | | | | 3,098 | | | | 23,650 | | | | 26,748 | | | | 3,026 | | | 2019 | | 11/21/2019 |
Orlando, FL | | SF | | | — | | | | 3,351 | | | | 11,135 | | | | — | | | | 3,351 | | | | 11,135 | | | | 14,486 | | | | 179 | | | 1996 / 2010 | | 5/7/2024 |
Orlando, FL | | SF | | | — | | | | 3,021 | | | | 5,098 | | | | — | | | | 3,021 | | | | 5,098 | | | | 8,119 | | | | 83 | | | 2006 | | 5/9/2024 |
Parkersburg, WV | | O | | | — | | | | 365 | | | | 52,200 | | | | 1,192 | | | | 365 | | | | 53,392 | | | | 53,757 | | | | 9,288 | | | 2004 / 2006 | | 9/13/2018 |
Pittsburgh, PA | | SF | | | — | | | | 384 | | | | 24,877 | | | | 3,501 | | | | 384 | | | | 28,378 | | | | 28,762 | | | | 5,638 | | | 2001 | | 9/13/2018 |
Pleasanton, CA | | L | | | — | | | | 5,765 | | | | 20,859 | | | | 373 | | | | 5,765 | | | | 21,232 | | | | 26,997 | | | | 4,892 | | | 2015 | | 10/21/2015 |
Portland, OR | | O | | | — | | | | 4,913 | | | | 75,794 | | | | 3,862 | | | | 4,913 | | | | 79,656 | | | | 84,569 | | | | 13,613 | | | 2002 | | 1/31/2019 |
Richmond, VA | | SF | | | — | | | | 3,041 | | | | 23,931 | | | | 2,285 | | | | 3,041 | | | | 26,216 | | | | 29,257 | | | | 6,778 | | | 2001 | | 12/7/2015 |
Riverside, CA | | SF | | | — | | | | 1,983 | | | | 6,755 | | | | 3,679 | | | | 1,983 | | | | 10,434 | | | | 12,417 | | | | 2,068 | | | 1997 | | 2/11/2015 |
Easterly Government Properties, Inc.
Schedule III - Real Estate and Accumulated Depreciation
December 31, 2024
(Amounts in thousands)
| | | | | | | | | | | | | | | | | | | | | | | | | | | | | | | | | | | | | | |
| | | | | | | | | | | | | | | | | | | | | | | | | | | | | | |
| | | | | | | Initial Cost to Company | | | | | | Cost amount carried at Close of Period | | | | | | | | |
Location | | Type(1) | | Encumbrances(2) | | | Land | | | Buildings and Improvements | | | Costs
Capitalized Subsequent to Acquisition(3) | | | Land | | | Buildings and Improvements | | | Total(4) | | | Accumulated Depreciation(3)(5) | | | Original Construction Date(s)
(Unaudited) | | Date
Acquired |
Sacramento, CA | | SF | | $ | — | | | $ | 1,434 | | | $ | 9,369 | | | $ | 3,320 | | | $ | 1,434 | | | $ | 12,689 | | | $ | 14,123 | | | $ | 3,798 | | | 2002 | | 2/11/2015 |
Salt Lake City, UT | | SF | | | — | | | | 2,049 | | | | 79,955 | | | | 986 | | | | 2,049 | | | | 80,941 | | | | 82,990 | | | | 16,824 | | | 2012 | | 9/28/2017 |
San Antonio, TX | | SF | | | — | | | | 3,745 | | | | 49,153 | | | | 2,007 | | | | 3,745 | | | | 51,160 | | | | 54,905 | | | | 14,919 | | | 2007 | | 2/11/2015 |
San Diego, CA | | W | | | — | | | | 3,060 | | | | 510 | | | | 914 | | | | 3,060 | | | | 1,424 | | | | 4,484 | | | | 677 | | | 1999 | | 2/11/2015 |
San Diego, CA | | O | | | — | | | | 2,252 | | | | 12,280 | | | | (7,841 | ) | | | 1,216 | | | | 5,475 | | | | 6,691 | | | | 532 | | | 2001 | | 9/11/2015 |
San Diego, CA | | SF | | | — | | | | 773 | | | | 2,481 | | | | 1,036 | | | | 773 | | | | 3,517 | | | | 4,290 | | | | 1,102 | | | 2003 | | 2/11/2015 |
San Jose, CA | | OC | | | — | | | | 10,419 | | | | 52,750 | | | | 86 | | | | 10,419 | | | | 52,836 | | | | 63,255 | | | | 8,547 | | | 2018 | | 7/11/2018 |
Santa Ana, CA | | SF | | | — | | | | 6,413 | | | | 8,635 | | | | 827 | | | | 6,413 | | | | 9,462 | | | | 15,875 | | | | 3,190 | | | 2004 | | 2/11/2015 |
Savannah, GA | | L | | | 8,431 | | | | 3,221 | | | | 10,687 | | | | 602 | | | | 3,221 | | | | 11,289 | | | | 14,510 | | | | 3,210 | | | 2013 | | 2/11/2015 |
South Bend, IN | | C | | | — | | | | 514 | | | | 6,590 | | | | 543 | | | | 514 | | | | 7,133 | | | | 7,647 | | | | 1,604 | | | 1996 / 2011 | | 12/23/2016 |
South Bend, IN | | OC | | | — | | | | 3,954 | | | | 38,503 | | | | 441 | | | | 3,954 | | | | 38,944 | | | | 42,898 | | | | 6,956 | | | 2017 | | 11/16/2017 |
Springfield, IL | | SF | | | — | | | | 118 | | | | 16,629 | | | | 75 | | | | 118 | | | | 16,704 | | | | 16,822 | | | | 1,543 | | | 2002 | | 4/22/2021 |
Sterling, VA | | L | | | — | | | | 2,556 | | | | 21,817 | | | | 13,713 | | | | 2,556 | | | | 35,530 | | | | 38,086 | | | | 5,135 | | | 2001 | | 1/31/2019 |
Suffolk, VA | | SF | | | — | | | | 7,141 | | | | 61,577 | | | | 9,353 | | | | 7,141 | | | | 70,930 | | | | 78,071 | | | | 10,144 | | | 1993 / 2004 | | 5/8/2019 |
Tampa, FL | | SF | | | — | | | | 5,002 | | | | 57,553 | | | | 1,537 | | | | 5,002 | | | | 59,090 | | | | 64,092 | | | | 3,860 | | | 2005 | | 5/18/2022 |
Tracy, CA | | W | | | — | | | | 2,678 | | | | 548 | | | | 29,739 | | | | 2,678 | | | | 30,287 | | | | 32,965 | | | | 4,716 | | | 2018 | | 10/4/2017 |
Tustin, CA | | O | | | — | | | | 8,532 | | | | 24,279 | | | | 342 | | | | 8,532 | | | | 24,621 | | | | 33,153 | | | | 4,128 | | | 1979 / 2019 | | 10/22/2019 |
Upper Marlboro, MD | | L | | | — | | | | 5,054 | | | | 18,301 | | | | 2,752 | | | | 5,054 | | | | 21,054 | | | | 26,108 | | | | 3,282 | | | 2002 | | 11/15/2018 |
Vista, CA | | L | | | — | | | | 3,998 | | | | 24,053 | | | | 2,942 | | | | 3,998 | | | | 26,995 | | | | 30,993 | | | | 6,631 | | | 2002 | | 2/11/2015 |
Various | | Various | | | — | | | | 8,028 | | | | 15,691 | | | | 168,823 | | | | 8,028 | | | | 184,514 | | | | 192,542 | | | | — | | | N/A | | Various |
| | | | $ | 155,586 | | | $ | 268,579 | | | $ | 2,290,868 | | | $ | 477,831 | | | $ | 267,543 | | | $ | 2,769,736 | | | $ | 3,037,279 | | | $ | 465,184 | | | | | |
(1)OC=Outpatient Clinic; SF=Specialized Facility; O=Office; C=Courthouse; L=Laboratory; W=Warehouse.
(2)Includes the unamortized balance of the fair value adjustments.
(3)Includes asset impairments recognized, write-offs of involuntary conversions and write-offs of acquired tenant improvements upon the tenant vacating the space.
(4)Excludes value of real estate intangibles.
(5)Depreciation of real estate property is computed on a straight-line basis over the estimated useful lives of the assets. The estimated lives of our assets range from 5 to 40 years or to the term of the underlying lease.
The aggregate cost and accumulated depreciation for tax purposes was approximately $2,855.4 million and $504.0 million, respectively.
Easterly Government Properties, Inc.
Schedule III - Real Estate and Accumulated Depreciation
December 31, 2024
(Amounts in thousands)
Analysis of the carrying amount of real estate properties and accumulated depreciation:
| | | | | | | | |
| | Real Estate Properties | | | Accumulated Depreciation | |
Balance at December 31, 2021 | | | 2,676,565 | | | | 277,377 | |
Additions | | | 135,914 | | | | 69,999 | |
Dispositions | | | (198,214 | ) | | | (23,960 | ) |
Real estate impaired (1) | | | (7,675 | ) | | | (2,134 | ) |
Balance at December 31, 2022 | | | 2,606,590 | | | | 321,282 | |
Additions | | | 103,630 | | | | 69,795 | |
Dispositions | | | — | | | | — | |
Balance at December 31, 2023 | | | 2,710,220 | | | | 391,077 | |
Additions | | | 329,061 | | | | 74,107 | |
Dispositions | | | (2,002 | ) | | | — | |
Balance at December 31, 2024 | | | 3,037,279 | | | | 465,184 | |
(1)During the quarter ended September 30, 2022, we recognized an impairment loss totaling approximately $5.5 million for its ICE – Otay. See Note 3 and Note 8 for additional information.