
Management’s Discussion and Analysis
For the three months ended March 31, 2019
The following management discussion and analysis (“MD&A”) of the consolidated operations and financial position of Osisko Gold Royalties Ltd (“Osisko” or the “Company”) and its subsidiaries for the three months ended March 31, 2019 should be read in conjunction with the Company’s unaudited condensed interim consolidated financial statements and related notes for the three months ended March 31, 2019. The unaudited condensed interim consolidated financial statements have been prepared in accordance with International Financial Reporting Standards (“IFRS”) as issued by the International Accounting Standards Board (“IASB”). Management is responsible for the preparation of the consolidated financial statements and other financial information relating to the Company included in this report. The Board of Directors is responsible for ensuring that management fulfills its responsibilities for financial reporting. In furtherance of the foregoing, the Board of Directors has appointed an Audit Committee composed of independent directors. The Audit Committee meets with management and the auditors in order to discuss results of operations and the financial condition of the Company prior to making recommendations and submitting the consolidated financial statements to the Board of Directors for its consideration and approval for issuance to shareholders. The information included in this MD&A is as of May 1, 2019, the date when the Board of Directors has approved the Company’s unaudited condensed interim consolidated financial statements for the three months ended March 31, 2019 following the recommendation of the Audit Committee. All monetary amounts included in this report are expressed in Canadian dollars, the Company’s reporting and functional currency, unless otherwise noted. Assets and liabilities of the subsidiaries that have a functional currency other than the Canadian dollar are translated into Canadian dollars at the exchange rate in effect on the consolidated balance sheet date and revenues and expenses are translated at the average exchange rate over the reporting period. This MD&A contains forward-looking statements and should be read in conjunction with the risk factors described in the “Forward-Looking Statements” section.
Table of Contents
Description of the Business | 2 |
Business Model and Strategy | 2 |
Highlights — First Quarter of 2019 | 2 |
Highlight — Subsequent to March 31, 2019 | 2 |
Portfolio of Royalty, Stream and Other Interests | 3 |
Impairment of asset | 13 |
Equity Investments | 14 |
Sustainability Activities | 17 |
Exploration and Evaluation Activities | 17 |
Quarterly Dividends | 18 |
Normal Course Issuer Bid | 18 |
Gold Market and Currency | 19 |
Selected Financial Information | 20 |
Overview of Financial Results | 21 |
Liquidity and Capital Resources | 24 |
Cash Flows | 24 |
Quarterly Information | 26 |
Outlook | 27 |
Related Party Transactions | 27 |
Contractual Obligations and Commitments | 28 |
Off-balance Sheet Items | 29 |
Outstanding Share Data | 30 |
Subsequent Event to March 31, 2019 | 30 |
Risks and Uncertainties | 30 |
Disclosure Controls and Procedures and Internal Control over Financial Reporting | 30 |
Basis of Presentation of Consolidated Financial Statements | 31 |
Critical Accounting Estimates and Judgements | 32 |
Financial Instruments | 32 |
Non-IFRS Financial Performance Measures | 33 |
Forward-looking Statements | 34 |
Cautionary Note to U.S. Investors Regarding the Use of Mineral Reserve and Mineral Resource Estimates | 35 |
Corporate Information | 36 |
Description of the Business
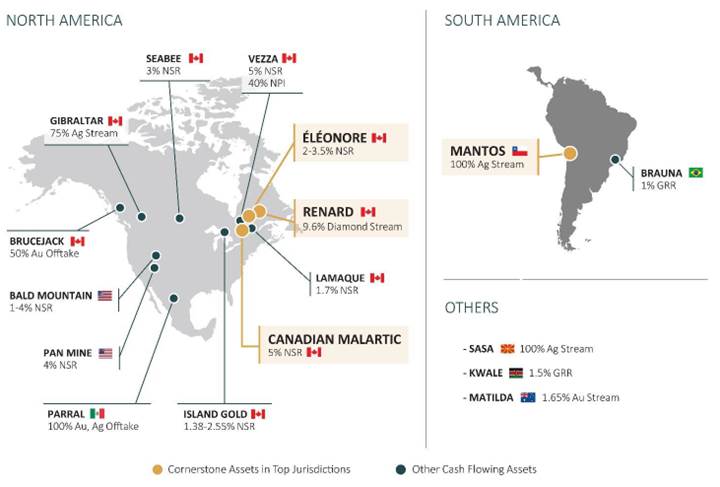
Osisko Gold Royalties Ltd is incorporated under the Business Corporations Act (Québec) and is focused on acquiring and managing precious metal and other high-quality royalties, streams and similar interests in Canada and worldwide. The Company owns a portfolio of royalties, streams, offtakes, options on royalty/stream financings and exclusive rights to participate in future royalty/stream financings on various projects, mainly in Canada. The Company owns a North American focused portfolio of over 135 royalty, stream and offtake interests, including the following cornerstone assets: a 5% net smelter return (“NSR”) royalty on the Canadian Malartic mine, a sliding scale 2.0% - 3.5% NSR royalty on the Éléonore mine and a 9.6% diamond stream on the Renard diamond mine, all located in Canada, as well as a 100% silver stream on the Mantos Blancos copper mine in Chile. Furthermore, the Company invests in equities of exploration and development companies.
Business Model and Strategy
Osisko is a growth-oriented and Canadian-focused precious metal royalty and streaming company that is focused on maximizing returns for its shareholders by growing its asset base, both organically and through accretive acquisitions of precious metal and other high-quality royalties, streams and similar interests, and by returning capital to its shareholders through a quarterly dividend payment and share repurchases. Osisko has a unique growth strategy that consists not only of acquiring and structuring both producing and late-stage development royalty and stream products, but also of investing in longer term assets where the Company feels it is uniquely positioned to create value and realize returns through the development of these assets. The Company has a successful track-record of strong technical capabilities, which it puts to work creating its own pipeline of organic growth opportunities that provide exposure to the upside of commodity prices and to the optionality of mineral reserve and resource growth.
Osisko’s main focus is on high quality, long-life precious metals assets located in favourable jurisdictions and operated by established mining companies, as these assets provide the best risk/return profile. The Company also evaluates and invests in opportunities in other commodities and jurisdictions. Given that a core aspect of the Company’s business is the ability to compete for investment opportunities, Osisko plans to maintain a strong balance sheet and ability to deploy capital.
Highlights — First Quarter of 2019
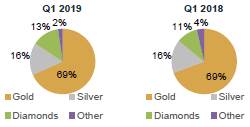
· Gold equivalent ounces (“GEOs1”) earned of 19,753 (compared to 20,036 GEOs in Q1 20182);
· Revenues from royalties and streams of $33.5 million (compared to $32.6 million in Q1 2018);
· Cash flows provided by operating activities of $24.8 million (compared to $23.3 million in Q1 2018);
· Net loss of $26.5 million, $0.17 per basic share (compared to net earnings of $2.3 million, $0.01 per basic share in Q1 2018), reflecting an impairment charge of $38.9 million ($28.6 million, net of income taxes) on the Renard diamond stream;
· Adjusted earnings3 of $5.8 million, $0.04 per basic share (compared to $8.9 million, $0.06 per basic share in Q1 2018);
· Closed the previously announced senior secured silver stream facility with reference to up to 100% of the future silver produced from the Horne 5 property owned by Falco Resources Ltd.;
· Repaid in full the revolving credit facility in January 2019 (payment of $30.0 million);
· Acquired for cancellation 852,500 common shares for $10.2 million (average acquisition cost of $11.96 per share); and
· Declared a quarterly dividend of $0.05 per common share paid on April 15, 2019 to shareholders of record as of the close of business on March 29, 2019.
Highlight — Subsequent to March 31, 2019
· Declared a quarterly dividend of $0.05 per common share payable on July 15, 2019 to shareholders of record as of the close of business on June 28, 2019.
(1) GEOs are calculated on a quarterly basis and include royalties, streams and offtakes. Silver earned from royalty and stream agreements was converted to gold equivalent ounces by multiplying the silver ounces by the average silver price for the period and dividing by the average gold price for the period. Diamonds, other metals and cash royalties were converted into gold equivalent ounces by dividing the associated revenue by the average gold price for the period. Offtake agreements were converted using the financial settlement equivalent divided by the average gold price for the period. Refer to the Portfolio of Royalty, Stream and Other Interests section for average metal prices used.
(2) Three months ended March 31, 2018 or first quarter of 2018 (“Q1 2018”).
(3) “Adjusted earnings” and “Adjusted earnings per basic share” are non-IFRS financial performance measures which have no standard definition under IFRS. Refer to the non-IFRS measures provided under the Non-IFRS Financial Performance Measures section of this Management’s Discussion and Analysis.
Portfolio of Royalty, Stream and Other Interests
The following table details the GEOs earned from Osisko’s producing royalty, stream and other interests:
|
| Three months ended |
| ||
|
| March 31, |
| ||
|
| 2019 |
| 2018 |
|
Gold |
|
|
|
|
|
Canadian Malartic royalty |
| 8,155 |
| 8,077 |
|
Éléonore royalty |
| 2,151 |
| 1,768 |
|
Seabee royalty |
| 877 |
| 1,126 |
|
Pan royalty |
| 484 |
| 295 |
|
Island Gold royalty |
| 470 |
| 327 |
|
Brucejack offtake |
| 310 |
| 515 |
|
Matilda stream/offtake |
| 274 |
| 244 |
|
Vezza royalty |
| 229 |
| 373 |
|
Lamaque royalty |
| 219 |
| — |
|
Bald Mountain royalty |
| 205 |
| 391 |
|
Other |
| 137 |
| 782 |
|
|
| 13,511 |
| 13,898 |
|
Silver |
|
|
|
|
|
Mantos stream |
| 1,333 |
| 1,592 |
|
Sasa stream |
| 1,076 |
| 1,176 |
|
Gibraltar stream |
| 533 |
| 322 |
|
Canadian Malartic royalty |
| 122 |
| 125 |
|
Other |
| 83 |
| 91 |
|
|
| 3,147 |
| 3,306 |
|
Diamonds |
|
|
|
|
|
Renard stream |
| 2,610 |
| 2,052 |
|
Other |
| 43 |
| 54 |
|
|
| 2,653 |
| 2,106 |
|
Other metals |
|
|
|
|
|
Kwale royalty |
| 435 |
| 726 |
|
Other |
| 7 |
| — |
|
|
| 442 |
| 726 |
|
Total GEOs |
| 19,753 |
| 20,036 |
|
GEOs by Product
The following table details the gold and silver ounces and the diamond carats attributable to Osisko for its main producing royalty, stream and other interests:
|
| Three months ended |
| ||
|
| 2019 |
| 2018 |
|
|
|
|
|
|
|
Royalties and streams — Gold |
|
|
|
|
|
(in ounces) |
|
|
|
|
|
Canadian Malartic royalty |
| 8,155 |
| 8,077 |
|
Éléonore royalty |
| 2,151 |
| 1,768 |
|
Seabee royalty (1) |
| 877 |
| 1,126 |
|
Island Gold royalty |
| 470 |
| 327 |
|
Matilda stream (2) |
| 274 |
| — |
|
Vezza royalty |
| 229 |
| 373 |
|
|
|
|
|
|
|
Royalties and streams — Silver |
|
|
|
|
|
(in ounces) |
|
|
|
|
|
Mantos stream |
| 111,653 |
| 126,161 |
|
Sasa stream |
| 90,105 |
| 93,221 |
|
Gibraltar stream |
| 44,649 |
| 25,494 |
|
Canadian Malartic royalty |
| 10,251 |
| 9,872 |
|
|
|
|
|
|
|
Streams — Diamonds |
|
|
|
|
|
(in carats) |
|
|
|
|
|
Renard stream (3) |
| 41,233 |
| 26,066 |
|
(1) The Seabee royalty was paid in cash up to the first quarter of 2018.
(2) The Matilda offtake was converted in a stream effective April 1, 2018.
(3) Including the incidental carats sold outside of the run of mine sales.
Average Metal Prices and Exchange Rate
|
| Three months ended |
| ||||
|
| 2019 |
| 2018 |
| ||
|
|
|
|
|
|
|
|
Gold(1) |
| $ | 1,304 |
| $ | 1,329 |
|
Silver(2) |
| $ | 15.57 |
| $ | 16.77 |
|
|
|
|
|
|
| ||
Exchange rate (US$/Can$)(3) |
| 1.3295 |
| 1.2647 |
| ||
(1) The London Bullion Market Association’s pm price in U.S. dollars.
(2) The London Bullion Market Association’s price in U.S. dollars.
(3) Bank of Canada daily rate.
Royalty, Stream and Other Interests Portfolio Overview
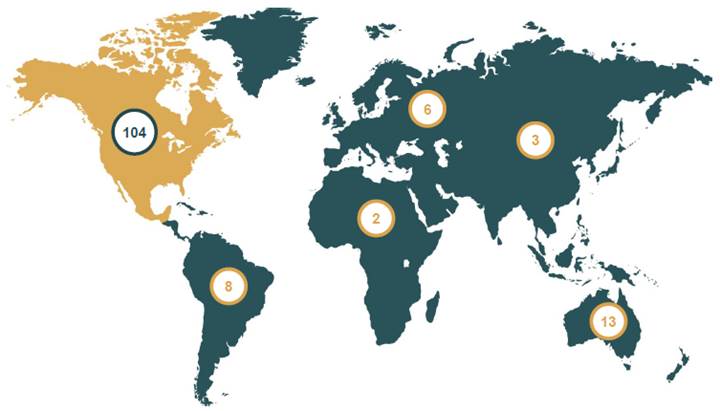
Osisko owns a portfolio of 136 royalties, streams and offtakes assets, as well as 38 royalty options. The portfolio consists of 122 royalties, 9 streams and 5 offtakes. Currently, the Company has 18 producing assets.
Portfolio by asset stage
Asset stage |
| Royalties |
| Streams |
| Offtakes |
| Total number |
|
Producing |
| 11 |
| 5 |
| 2 |
| 18 |
|
Development (construction) |
| 7 |
| 4 |
| 2 |
| 13 |
|
Exploration and evaluation |
| 104 |
| — |
| 1 |
| 105 |
|
|
| 122 |
| 9 |
| 5 |
| 136 |
|
Producing assets
Asset |
| Operator |
| Interest |
| Commodity |
| Jurisdiction |
North America |
|
|
|
|
|
|
|
|
Canadian Malartic |
| Agnico Eagle Mines Limited Yamana Gold Inc. |
| 5% NSR royalty |
| Au |
| Canada |
Éléonore |
| Newmont Goldcorp Corporation |
| 2.0-3.5% NSR royalty |
| Au |
| Canada |
Renard |
| Stornoway Diamond Corporation |
| 9.6% stream |
| Diamonds |
| Canada |
Gibraltar |
| Taseko Mines Limited |
| 75% stream |
| Ag |
| Canada |
Seabee |
| SSR Mining Inc. |
| 3% NSR royalty |
| Au |
| Canada |
Island Gold |
| Alamos Gold Inc. |
| 1.38-2.55% NSR royalty(1) |
| Au |
| Canada |
Brucejack |
| Pretium Resources Inc. |
| 50% offtake |
| Au |
| Canada |
Vezza |
| Ressources Nottaway Inc. |
| 5% NSR royalty & 40% NPI |
| Au |
| Canada |
Bald Mtn. Alligator Ridge / Duke & Trapper |
| Kinross Gold Corporation |
| 1% / 4% NSR royalty |
| Au |
| USA |
Pan |
| Fiore Gold Ltd. |
| 4% NSR royalty |
| Au |
| USA |
Parral |
| GoGold Resources Inc. |
| 100% offtake |
| Au, Ag |
| Mexico |
Lamaque South |
| Eldorado Gold Corp. |
| 1.7% NSR royalty(1) |
| Au |
| Canada |
Holloway |
| Kirkland Lake Gold |
| $8.50/ounce |
| Au |
| Canada |
|
|
|
|
|
|
|
|
|
Outside of North America |
|
|
|
|
|
|
|
|
Mantos Blancos |
| Mantos Copper S.A. |
| 100% stream |
| Ag |
| Chile |
Sasa |
| Central Asia Metals plc |
| 100% stream |
| Ag |
| Macedonia |
Kwale |
| Base Resources Limited |
| 1.5% GRR(2) |
| Rutile, Ilmenite, Zircon |
| Kenya |
Brauna |
| Lipari Mineração Ltda |
| 1% GRR(2) |
| Diamonds |
| Brazil |
Matilda(3) |
| Blackham Resources Limited |
| 1.65% stream |
| Au |
| Australia |
Key development / exploration and evaluation assets
Asset |
| Operator |
| Interest |
| Commodities |
| Jurisdiction |
Amulsar |
| Lydian International Ltd. |
| 4.22% Au / 62.5% Ag stream |
| Au, Ag |
| Armenia |
Amulsar |
| Lydian International Ltd. |
| 81.9% offtake |
| Au |
| Armenia |
Eagle |
| Victoria Gold Corp. |
| 5% NSR royalty |
| Au |
| Canada |
Back Forty |
| Aquila Resources Inc. |
| 18.5% Au / 75% Ag streams |
| Au, Ag |
| USA |
Horne 5(4) |
| Falco Resources Ltd. |
| 90%-100% stream |
| Ag |
| Canada |
Malartic — Odyssey South |
| Agnico Eagle Mines Limited |
| 5% NSR royalty |
| Au |
| Canada |
Malartic — Odyssey North |
| Agnico Eagle Mines Limited |
| 3% NSR royalty |
| Au |
| Canada |
Cariboo |
| Barkerville Gold Mines Ltd. |
| 4% NSR royalty(5), (6) |
| Au |
| Canada |
Windfall Lake |
| Osisko Mining Inc. |
| 1.5% NSR royalty |
| Au |
| Canada |
Hermosa |
| South 32 Limited |
| 1% NSR royalty |
| Zn, Pb, Ag |
| USA |
Spring Valley |
| Waterton Global Resource Management |
| 0.5% NSR royalty |
| Au |
| USA |
Upper Beaver |
| Agnico Eagle Mines Limited |
| 2% NSR royalty |
| Au, Cu |
| Canada |
Copperwood |
| Highland Copper Company Inc. |
| 3% NSR royalty(7) |
| Ag, Cu |
| USA |
Marban |
| Osisko Mining Inc. |
| 0.425% NSR royalty |
| Au |
| Canada |
Ollachea |
| Kuri Kullu / Minera IRL |
| 1% NSR royalty |
| Au |
| Peru |
Casino |
| Western Copper & Gold Corporation |
| 2.75% NSR royalty |
| Au, Ag, Cu |
| Canada |
Altar |
| Sibanye-Stillwater |
| 1% NSR royalty |
| Cu, Au |
| Argentina |
(1) After the sale of a 15% interest in the royalties acquired from Teck Resources Limited to Caisse de dépôt et placement du Québec. Eldorado Gold Corporation has an option to buy back 50% of the Lamaque South NSR royalty for $1.7 million within one year of the commencement of commercial production. Commercial production was declared on March 31, 2019 on Lamaque.
(2) Gross revenue royalty (“GRR”).
(3) In March 2018, Osisko and Blackham Resources Limited entered into an agreement to restructure the gold offtake (which was applicable on 55% of the gold production from the Matilda mine) into a 1.65% gold stream, effective April 1, 2018.
(4) In February 2019, Osisko closed a senior secured silver stream credit facility with Falco with reference to up to 100% of the future silver produced from the Horne 5 property. This transaction is further described in the Portfolio of Investments section of this MD&A.
(5) Osisko has the option to acquire an additional 1% NSR royalty on the Cariboo property for additional cash consideration of $13.0 million.
(6) Including the Bonanza Ledge mine that has produced gold in 2018.
(7) 3.0% NSR royalty on the Copperwood project. Upon closing of the acquisition of the White Pine project, Highland Copper Company will grant Osisko a 1.5% NSR royalty on all metals produced from the White Pine project, and Osisko’s royalty on Copperwood will be reduced to 1.5%.
Canadian Malartic Royalty (Agnico Eagle Mines Limited and Yamana Gold Inc.)
One of the Company’s cornerstone assets is a 5% NSR royalty on the Canadian Malartic property which is located in Malartic, Québec, and operated by the Canadian Malartic General Partnership (the “Partnership”) formed by Agnico Eagle Mines Limited (“Agnico Eagle”) and Yamana Gold Inc. (“Yamana”) (together the “Partners”). Canadian Malartic is Canada’s largest and the world’s 14th largest producing gold mine.
Osisko also holds a 3% NSR royalty on the Odyssey North zone and a 5% NSR royalty on the Odyssey South zone, which are located adjacent to the Canadian Malartic mine on Osisko’s royalty ground.
On February 14, 2019, Agnico Eagle reported that the Partnership is evaluating the potential for underground mining of the Odyssey deposit and East Malartic deposit, which lies on the Canadian Malartic mine property, from surface to a depth of 600 metres. These deposits could provide higher grade tonnes that could potentially supplement open pit production at Canadian Malartic. The Partners reported that Odyssey contains inferred mineral resources of 809,000 ounces of gold (11.5 million tonnes grading 2.19 g/t Au); and East Malartic has indicated mineral resources of 361,000 ounces gold (5.3 million tonnes grading 2.13 g/t Au) and inferred mineral resources of 1.4 million ounces of gold (22.0 million tonnes grading 1.98 g/t Au). Drilling is ongoing to extend and upgrade the mineral resources in these zones. The permit and Certificate of Authorization was received in December 2018, which allows for the development of an underground ramp at Odyssey.
Update on operations
In February 2019, Agnico Eagle released its increased guidance for gold production at the Canadian Malartic mine to 660,000 ounces in 2019, and 690,000 to 710,000 in 2020 and 2021, as higher grades from the Barnat pit are expected to increase production.
On April 25, 2019, Agnico Eagle reported that gold production in the first quarter of 2019 reached 167,340 ounces, slightly increasing when compared to the prior-year period due to slightly higher throughput levels and higher grades, partially offset by slightly lower gold recoveries.
Work on the Barnat extension project is proceeding on budget and on schedule. Work is primarily focused on the Highway 117 road deviation, overburden stripping and rock excavation. The highway deviation work re-started in April 2019 and is expected to be completed in late 2019. Production activities at Barnat are scheduled to begin in late 2019, following completion of the highway deviation.
Agnico Eagle reported that exploration programs are ongoing to evaluate several deposits to the east of the Canadian Malartic open pit, including the Odyssey, East Malartic, Sladen and Sheehan zones. These opportunities have the potential to provide new sources of ore for the Canadian Malartic mill. Additional exploration will be carried out in 2019 to assess the potential of these zones.
For more information, refer to Agnico Eagle’s press release dated February 14, 2019 entitled “Agnico Eagle Reports Fourth Quarter and Full Year 2018 Results - Three-Year Guidance Outlines Growing Production with Stable to Declining Unit Costs; Meliadine Mill Commissioning Underway with Project Ahead of Schedule and Under Budget; Year-Over-Year Increase in Mineral Reserves and Mineral Resources; Quarterly Dividend Increased”, and Agnico Eagle’s press release entitled “Agnico Eagle Reports First Quarter 2019 Results; Solid Production and Cost Performance; Nunavut Development Projects Advancing as Planned with Meliadine Expected to Achieve Commercial Production in May; Exploration Drilling Continues to Advance Project Pipeline”, both filed on www.sedar.com.
Éléonore Royalty (Newmont Goldcorp Corporation)
Osisko owns a sliding scale 2.0% to 3.5% NSR royalty on the Éléonore gold property located in the Province of Québec and operated by Newmont Goldcorp Corporation (“Newmont Goldcorp”), following the combination of Newmont Mining Corporation and Goldcorp Inc. (“Goldcorp”) completed in April 2019. Osisko currently receives an NSR royalty of 2.2% on production at Éléonore.
Update on operations
On April 25, 2019, Newmont Goldcorp reported in its conference call presentation for the first quarter of 2019 earnings that the objectives for the Éléonore mine in the second half of 2019 is to optimize development and mining rates and increase mill throughput and recoveries.
On February 13, 2019, Goldcorp had reported that the mine achieved sustainable mining rates of over 6,100 tonnes per day in November and 6,600 tonnes per day in December of 2018, in line with targeted annual gold production of 400,000 ounces.
On October 24, 2018, Goldcorp had updated its mineral reserve and resource estimates for the Éléonore mine as at June 30, 2018. Proven and probable gold mineral reserves as of June 30, 2018 totaled 3.3 million ounces (17.8 million tonnes grading 5.69 g/t Au). Measured and indicated gold mineral resources as of June 30, 2018 were estimated at 0.5 million ounces (3.2 million tonnes grading 5.03 g/t Au). Inferred gold mineral resources as of June 30, 2018 were estimated at 0.59 million ounces (3.2 million tonnes grading 5.76 g/t Au). Goldcorp stated that mineral resources were negatively impacted as the geologic modelling methodology that has been applied to the mineral reserves has been applied to mineral resources, in addition to economic stope optimization.
For additional information, please refer to Newmont Goldcorp’s presentation for the first quarter of 2019 earnings conference call, Goldcorp’s press release dated October 24, 2018 entitled “Goldcorp Reports 2018 Reserve And Resource Estimates And Provides Exploration Update”, and Goldcorp’s press release dated February 13, 2019 entitled “Goldcorp Reports Fourth Quarter 2018 Results”, all available on Newmont Goldcorp’s website at www.newmontgoldcorp.com.
Renard Stream (Stornoway Diamond Corporation)
Osisko owns a 9.6% diamond stream on the Renard diamond mine operated by Stornoway Diamond Corporation (“Stornoway”) and located approximately 350 kilometres north of Chibougamau in the James Bay region of north-central Québec.
Under the amended stream agreement, upon the completion of a sale of diamonds, Osisko will remit to Stornoway a cash transfer payment which shall be the lesser of 40% of achieved sales price and US$40 per carat. For the purpose of calculating stream remittances, Stornoway shall separately sell any diamonds smaller than the +7 DTC sieve size that are recovered in excess of the maximum agreed-upon proportion within a sale of run of mine (“ROM”) diamonds (the excess small diamonds, or incidentals). In this manner, Stornoway shall restrict the proportion of small diamonds contained in a ROM sale such that the streamers and Stornoway will be fully aligned on upside price exposure with downside protection on price and product mix.
Update on operations
On April 9, 2019, Stornoway reported first quarter mine production of 444,562 carats recovered from the processing of 582,613 tonnes of ore at an attributable grade of 76 carats per hundred tonnes (“cpht”). Carats recoveries decreased by 8% compared to the fourth quarter of 2018, principally due to mechanical issues at the front end of the process plant related to very cold weather in January and February. In March, the process plant surpassed its budgeted daily rate with an average of 7,209 tonnes processed per day. Stornoway mentioned that it has made the decision to suspend open pit mining operations starting in April, as the current stockpile of Renard 65 open pit ore is sufficient to meet planned process plant feed requirements into the second quarter of 2020.
During the first quarter of 2019, Stornoway reported sales of 429,506 carats sold at an average price of US$83 per carat ($110 per carat) from two tender sales. In terms of total carats sold, pricing and gross proceeds, this represents increases of 38%, 8% and 47% over the fourth quarter of 2018, respectively. First quarter diamond sales represent diamonds recovered during the fourth quarter of 2018.
On January 16, 2019, Stornoway reported that it expects to produce between 1.8 and 2.1 million carats in 2019 from the processing of 2.40 to 2.55 million tonnes of ore. 2019 production guidance reflects the steady-state operations at the 290 meter level of Renard 2 underground mine and improvement in grades demonstrated in the fourth quarter of 2018, with further operational flexibility and grade increases expected once Renard 3 underground ore becomes available. Between 1.80 and 2.10 million carats are expected to be sold in 8 tender sales at prices between US$80 and US$105 per carat.
For the three months ended March 31, 2019, Osisko incurred an impairment charge of $38.9 million ($28.6 million, net of income taxes) on its Renard diamond stream (refer to section Impairment of Assets).
For additional information, please refer to Stornoway’s press release dated January 16, 2019 entitled “Stornoway Announces Fourth Quarter and 2018 Production and Sales Results, and 2019 Guidance”, and Stornoway’s press release dated April 9, 2019 entitled “Stornoway Reports First Quarter 2019 Production and Sales Results”, both filed on SEDAR at www.sedar.com.
Mantos Blancos Stream (Mantos Copper S.A.)
Osisko owns a 100% silver stream on the Mantos Blancos mine, which is owned and operated by Mantos Copper S.A. (“Mantos”), a private mining company focused on the extraction and sale of copper. The company owns and operates the Mantos Blancos mine and Mantoverde project, located in the Antofagasta and Atacama regions in northern Chile.
Under the Mantos stream agreement, Osisko will receive 100% of the payable silver from the Mantos Blancos copper mine until 19.3 million ounces have been delivered, after which the stream percentage will be 30%. The purchase price for the silver under the Mantos stream is 25% of the monthly average silver market price for each ounce of refined silver sold and delivered and/or credited by Mantos to Osisko Bermuda Limited (“OBL”), a subsidiary of Osisko. Mantos may elect to reduce the amount of refined silver to be delivered and sold to OBL by 50% in 2018, 2019 or 2020, provided that Mantos has delivered no less than 1.99 million ounces of silver under the stream agreement in which case Mantos shall make a cash payment of US$70.0 million ($95.5 million) to OBL. As of March 31, 2019, a total of 1.87 million ounces of silver have been delivered under the stream agreement. Osisko expects that Mantos will reach the 1.99 million ounces of silver threshold by the end of the second quarter of 2019, based on expected production. The buy-down payment of US$70.0 million can be exercised in September 2019 or September 2020.
Update on operations
As per Mantos, production of silver at the Mantos Blancos mine and concentrator plant for the first quarter of 2019 was higher than the fourth quarter of 2018 at 140,990 ounces compared to 137,534 ounces due to higher recovery rates (79.5% vs 72.2%), offsetting slightly lower grade (4.60g/t Ag vs 4.68g/t Ag) and less material milled.
Work on the Mantos Blancos Concentrator Debottlenecking Project (“MB-CDP”) is expected to commence during the third
quarter of 2019, once financing has been finalized. The MB-CDP project should increase processing capacity at the
concentrator by approximately 70%. The key environmental permits are in place.
Brucejack Offtake (Pretium Resources Inc.)
Osisko owns a 50% gold offtake on the Brucejack gold mine. The Brucejack offtake agreement applies to the sales from the first 7,067,000 ounces (of which 3,533,500 ounces are attributable to OBL) of refined gold. OBL is required to pay for refined gold based on a market referenced gold price in U.S. dollars per ounce during a defined pricing period before and after the date of each sale. The offtake obligation applies to 100% (50% attributable to OBL) of refined gold produced at the Brucejack, subject to the reduction election described below. On December 31, 2019, Pretium has the option to reduce the offtake obligation to either (i) 50% (25% attributable to OBL) by paying US$13 per ounce multiplied by 0.50, on the remaining undelivered gold ounces, or (ii) 25% (12.5% attributable to OBL) by paying US$13 per ounce multiplied by 0.75, on the remaining undelivered gold ounces.
Update on operations
On April 3, 2019, Pretium reported that its planned ramp-up to 3,800 tonnes per day (“tpd”) production rate at its Brucejack Mine, and its underground exploration drilling program, are both progressing on schedule. The company also re-affirmed its 2019 production guidance of 390,000 ounces to 420,000 ounces and the planned production ramp-up from 2,700 tpd to 3,800 tpd over the course of the year.
On April 4, 2019, Pretium announced an updated mineral reserve and mineral resource for the Brucejack mine as well as an updated life of mine plan. The updated life of mine plan highlights an average annual production of over 520,000 ounces of gold over the first 5 years, an average annual production of over 525,000 ounces of gold over the first 10 years and over 440,000 ounces of gold over the 14-year mine life. As of January 1, 2019, the total proven and probable mineral reserve estimate for the Brucejack mine stands to 6.4 million ounces of gold (16.0 million tonnes grading 12.6 g/t Au).
For more information on Brucejack, refer to Pretium’s press release dated April 3, 2019 entitled “Production Ramp-up and
Underground Exploration Drilling Campaign on Track - 2019 Guidance Re-affirmed” and Pretium’s press release dated
April 4, 2019 entitled “Continued Robust Economics of Brucejack Mine Confirmed with Updated Mineral Reserve and
Resource, 14-Year Mine Plan”, both filed on www.sedar.com.
Sasa Stream (Central Asia Metals plc)
Osisko owns a 100% silver stream on the Sasa mine, operated by Central Asia Metals plc (“Central Asia”) and located in Macedonia. The Sasa mine is one of the largest zinc, lead and silver mines in Europe, producing approximately 30,000 tonnes of lead, 22,000 tonnes of zinc and 400,000 ounces of silver in concentrates per annum. OBL’s entitlement under the Sasa stream applies to 100% of the payable silver production in exchange for US$5 per ounce (plus refining costs) of refined silver increased annually from 2017, based on inflation.
Update on operations
On April 10, 2019, Central Asia reported sales of 88,392 ounces of payable silver in the first quarter of 2019.
For more information on the Sasa mine, refer to Central Asia’s press release dated April 10, 2019, entitled “Q1 2019 Operations Update” available on their website at www.centralasiametals.com.
Seabee Royalty (SSR Mining Inc.)
Osisko holds a 3% NSR royalty on the Seabee gold operations operated by SSR Mining Inc. (“SSR Mining”) and located in Saskatchewan, Canada.
Update on operations
On April 10, 2019, SSR Mining reported that the Seabee gold operations achieved a record quarterly gold production at Seabee producing 31,183 ounces of gold due to the higher mill throughput and timing of gold pours at year-end, representing a quarter-on-quarter increase of 52%. The mill achieved an average throughput of 1,008 tpd over the first quarter, a 7% increase compared to the previous quarter, and 1,079 tpd for the month of March, both reflecting a higher mining rate at the Santoy mine. Gold mill feed grade was 8.59 g/t, in line with the mine plan. Gold recovery remained consistent at 97.2%.
At Seabee gold operations, management expects to continue increasing mining and milling rates to deliver another record gold production year in 2019. SSR Mining’s guidance for gold production in 2019 is estimated between 95,000 to 110,000 ounces. Exploration expenditures at Seabee total $6.0 million to continue underground exploration at depth, expansion of Santoy Gap hanging wall and continued testing of surface targets.
For more information, refer to SSR Mining’s press release dated January 15, 2019, entitled “SSR Mining Reports Fourth Quarter and Year-End 2018 Production Results and 2019 Guidance” and SSR Mining’s press release dated April 10, 2019 entitled “SSR Mining reports first quarter 2019 production results”, both filed on www.sedar.com.
Kwale Royalty (Base Resources Limited)
Osisko holds a 1.5% gross return royalty on the rutile, ilmenite and zircon produced from the Kwale mine, operated by Base Resources Limited (“Base Resources”) and located 10 kilometres inland from the Kenyan coast and 50 kilometres south of Mombasa.
Update on operations
On January 17, 2019, Base Resources reported highlights of its fourth quarter operations and noted an increase of 5% in tonnes of ore mined after a 35% increase in the third quarter following the successful implementation of the Kwale Phase 2 mine optimization project. Production in the fourth quarter reached 108,465 tonnes of ilmenite, 24,505 tonnes of rutile and 8,252 tonnes of zircon. Base Resources also noted continued strengthening of rutile and zircon prices with the ilmenite price remaining stable.
Production for the financial year ending June 30, 2019 is estimated at 385,000 to 415,000 tonnes of ilmenite, 88,000 to 94,000 tonnes of rutile and 31,000 to 34,000 tonnes of zircon.
On April 10, 2019, Base Resources reported production guidance for financial year ending June 30, 2020, estimated at 315,000 to 350,000 tonnes of ilmenite, 64,000 to 70,000 tonnes of rutile and 25,000 to 28,000 tonnes of zircon. The 2020 production guidance is lower than that for 2019 as a consequence of the lower heavy mineral grade of the South Dune orebody, depletion of stockpiled heavy mineral concentrates during the transition of mining operations to the South Dune and normal uncertainties associated with mining a new orebody.
For more information on the Kwale mine, refer to Base Resources’ quarterly activities report dated January 17, 2019 and Base Resources’ press release dated April 10, 2019 entitled “Production Guidance for FY20”, both available on their website at www.baseresources.com.au.
Gibraltar Stream (Taseko Mines Limited)
Osisko owns a 100% silver stream on Taseko Mines Limited’s (“Taseko”) attributable portion of the Gibraltar copper mine (“Gibraltar”), held by Gibraltar Mines Ltd. (“Gibco”) and located in British Columbia, Canada. Under the stream agreement, Osisko will receive from Taseko an amount equal to 100% of Gibco’s share of silver production until the delivery to Osisko of 5.9 million ounces of silver and 35% of Gibco’s share of silver production thereafter. Osisko will make ongoing payments under the stream of US$2.75 per ounce of silver delivered. Gibraltar is the second largest open pit copper mine in Canada and fourth largest in North America.
Island Gold Royalty (Alamos Gold Inc.)
Osisko owns NSR royalties ranging from 1.38% to 2.55% on the Island Gold mine, operated by Alamos Gold Inc. (“Alamos”) and located in Ontario, Canada.
Alamos announced expected gold production at Island Gold for 2019 to increase 32% to reach 135,000 to 145,000 ounces. Higher grades and higher throughput are expected as a result of the completion of the Phase I expansion in September 2018, which expanded the mill to a design capacity of approximately 1,200 tpd. The current mine infrastructure can support similar mining rates; however, the operation is currently permitted to operate at an average annual rate of 1,100 tpd. With a mine and mill that can support higher throughput rates, the company is in the process of permitting an amendment to 1,200 tpd which is expected to be received by the end of 2019 as part of a Phase II expansion. In parallel, the company has started an evaluation of a potential Phase III expansion of the operations.
For more information, refer to Alamos’ press release dated January 14, 2019, entitled “Alamos Reports Fourth Quarter 2018 Production and Provides 2019 Outlook” filed on www.sedar.com.
Amulsar Stream (Lydian International Ltd.)
Osisko owns a 4.22% gold stream and 62.5% silver stream on the Amulsar project, owned by Lydian International Ltd. (“Lydian”) and located in southern Armenia. The Amulsar project is in the development and construction stage and Amulsar is expected to be Armenia’s largest gold mine, with estimated mineral resources containing 3.5 million measured and indicated gold ounces and 1.3 million inferred gold ounces. The details of the mineral inventory can be found under Lydian International Ltd.’s profile on SEDAR at www.sedar.com. Gold production is targeted to average approximately 225,000 ounces annually over an initial 10-year mine life. OBL’s entitlement under the Amulsar stream applies to 4.22% of refined gold production and 62.5% of refined silver until 89,034 ounces of refined gold and 434,093 ounces of refined silver are delivered to OBL. The stream agreement includes ongoing transfer payments by OBL to Lydian of US$400 per ounce of refined gold and US$4.00 per ounce of refined silver delivered under the stream subject to a 1% annual increase starting on the third anniversary of commercial production. Lydian has the option to buy back a portion of the stream by one of the following options:
(i) the stream percentage may be reduced by 50% on the second anniversary of commercial production for US$55.0 million (US$34.4 million attributable to OBL); or
(ii) the stream percentage may be reduced by 50% on the third anniversary of commercial production for US$50.0 million (US$31.3 million attributable to OBL).
Update on development and construction activities
On December 24, 2018, Lydian announced that it has entered into an amended and restated forbearance agreement with its senior lenders, stream financing providers, and equipment financiers (the “A&R Forbearance Agreement”), pursuant to which they have agreed to: (a) continue to temporarily suspend all principal and interest payments due and payable, and (b) continue to forbear from declaring or acting upon, or exercising default-related rights or remedies under such creditor’s financing agreement with respect to certain events of default, in each case, until the earlier of (a) June 30, 2019, (b) the occurrence of an additional event of default under such creditor’s financing agreement, or (c) any breach by the company of the A&R Forbearance Agreement.
Orion CO IV (ED) Limited (“Orion CO IV”), Resource Capital Fund VI L.P. (“RCF”) and OBL have committed to make available up to US$18.6 million (OBL’s commitment is US$5.0 million) to fund Lydian during the forbearance period through an amendment to the company’s existing credit agreement (the “Forbearance Facility”).
The Forbearance Facility will be available to be drawn in multiple advances from January 1, 2019 through June 30, 2019, and has a maturity date of June 30, 2019. The Forbearance Facility will bear interest at a rate of 15% per annum and includes a further 3% fee paid by original issue discount at each drawdown. Osisko Bermuda advanced an amount of US$2.3 million ($3.1 million) in January 2019 under the Forbearance Facility.
If Orion CO IV and either RCF or OBL reasonably determine that the Lydian’s pursuit of strategic alternatives will not be completed by June 30, 2019, they will be entitled to terminate the A&R Forbearance Agreement at the end of the calendar month in which such determination is made.
The A&R Forbearance Agreement continues to be required as a result of the previously announced illegal blockades that have prevented Lydian and its contractors from entering the Amulsar site since late June 2018. During the period of forbearance, Lydian has continued to petition local and national government officials to enforce the rule of law by removing the illegal blockades.
On March 19, 2019, Lydian announced that the Republic of Armenia Government has commenced its third-party assessment (“Third Audit”) of the Amulsar gold project’s environmental impact on water resources, geology, biodiversity and water quality. In September 2018, an assessment was ordered by the Armenian government to study possible impacts of the Amulsar gold project on water resources. The scope of work will now also include a review of the company’s Environmental and Social Impact Assessment (“ESIA”) and Environmental Impact Assessment (“EIA”). This is despite the fact that the company’s EIA was previously approved by Armenian authorities in accordance with Armenian law before Lydian began constructing the Amulsar gold project. Earth Link and Advanced Resources Development has been selected by the Armenian government as the consulting firm to perform the assessment, which is expected to last approximately 12 to 16 weeks. Lydian does not accept the need or legal basis for the Third Audit, since the Armenian government already confirmed that the Amulsar gold project complied with Armenian environmental requirements when it approved the EIA, and that Lydian relied on this approval when investing hundreds of millions of dollars in Armenia.
On April 12, 2019, Lydian announced that the Administrative Court of the Republic of Armenia ruled in favour of Lydian and instructed the Armenian police to remove trespassers and their property from Lydian’s Amulsar gold project site and assure Lydian free passage to Amulsar.
For more information on the Amulsar project, refer to Lydian’s press release dated December 24, 2018, entitled “Lydian Announces Extension of Forbearance Period and Additional Sources of Liquidity”, Lydian’s press release dated March 19, 2019 entitled “Armenia Government Commences the Third Audit”, and Lydian’s press release dated April 12, 2019 entitled “Court Order Police to Remove Trespassers and Assure Lydian Free Access to Amulsar”, all filed on www.sedar.com.
Back Forty Stream (Aquila Resources Inc.)
Osisko owns an 18.5% gold stream (reduced to 9.25% after the delivery of 105,000 gold ounces) and a 75% silver stream on the Back Forty project, owned by Aquila Resources Inc. (“Aquila”), and located along the mineral-rich Penokean Volcanic Belt in Michigan’s Upper Peninsula, USA. Aquila has completed a preliminary economic assessment in 2014 that demonstrated strong economics and has published results of an open pit feasibility study on August 1, 2018. Aquila has been granted all final permits by the Michigan’s Department of Environmental Quality and has received all State and Federal permissions required for the construction and commencement of operations at the Back Forty project. Gold production is targeted to reach a total of 468,000 ounces over the seven-year mine life, including 135,000 ounces in the first year. The stream agreement includes ongoing transfer payments to Aquila of 30% of the gold spot price (with a maximum of US$600 per ounce) and US$4 per ounce of silver.
For more information on the Back Forty project, refer to Aquila’s web site (aquilaresources.com) and press releases filed
on www.sedar.com.
Impairment of asset
Renard mine diamond stream (Stornoway Diamond Corporation)
On March 28, 2019, Stornoway, the operator of the Renard diamond mine in Québec, Canada, announced a significant impairment charge of $83.2 million on its Renard diamond mine reflecting an outlook of lower than expected diamond pricing. This was considered an indicator of impairment among other facts and circumstances and, accordingly, management performed an impairment assessment as at March 31, 2019. The Company recorded an impairment charge of $38.9 million ($28.6 million, net of income taxes) on the Renard diamond stream for the three months ended March 31, 2019.
On March 31, 2019, the Renard diamond stream was written down to its estimated recoverable amount of $122.4 million, which was determined by the fair value less cost of disposal using a discounted cash-flows approach. The fair value of the Renard diamond stream is classified as level 3 of the fair value hierarchy because the main valuation inputs used are significant unobservable inputs. The main valuation inputs used were the cash flows expected to be generated by the sale of diamonds from the Renard diamond stream over the estimated life of the Renard diamond mine, based on expected long-term diamond prices per carat and a post-tax real discount rate of 4.7%.
Equity Investments
The Company’s assets include a portfolio of shares, mainly of publicly traded exploration and development mining companies. Osisko invests, and intends to continue to invest, from time to time in companies where it holds a royalty, stream or similar interest and in various companies within the mining industry for investment purposes and with the objective of improving its ability to acquire future royalties, streams or similar interests. In addition to investment objectives, in some cases, the Company may decide to take a more active role, including providing management personnel, technical and/or administrative support, as well as nominating individuals to the investee’s board of directors. These investments are reflected in investments in associates in the consolidated financial statements and include mainly Osisko Mining Inc. (“Osisko Mining”), Barkerville Gold Mines Ltd. (“Barkerville”), Falco Resources Ltd. (“Falco”) and Victoria Gold Corp. (“Victoria”).
Osisko may, from time to time and without further notice except as required by law or regulations, increase or decrease its investments at its discretion.
During the first quarter of 2019, Osisko acquired investments for $5.8 million and disposed investments for $0.4 million.
Fair value of marketable securities / private placements
The following table presents the carrying value and fair value of the investments in marketable securities and private companies (excluding notes and warrants) as at March 31, 2019 (in thousands of dollars):
Marketable securities |
| Carrying value(i) |
| Fair value(ii) |
|
|
| $ |
| $ |
|
Associates |
| 303,407 |
| 286,352 |
|
Other |
| 117,400 |
| 117,400 |
|
|
| 420,807 |
| 403,752 |
|
(i) The carrying value corresponds to the amount recorded on the consolidated balance sheet, which is the equity method for the investments in marketable securities of associates and the fair value for the other investments in marketable securities, as per IFRS 9, Financial Instruments.
(ii) The fair value corresponds to the quoted price of the investments in a recognized stock exchange as at March 31, 2019 for public companies. For private investments, an internal or external evaluation is used to determine the fair value.
Main Strategic Investments
The following table presents the main strategic investments of the Company in marketable securities as at March 31, 2019 (in thousands of dollars):
Company |
| Number of |
| Ownership(i) |
| Cash |
| Fair |
|
|
|
|
| % |
| $ |
| $ |
|
Osisko Mining Inc. |
| 43,690,269 |
| 16.6 |
| 92,535 |
| 127,576 |
|
Barkerville Gold Mines Ltd. |
| 162,864,251 |
| 32.2 |
| 78,274 |
| 61,074 |
|
Victoria Gold Corp. |
| 120,427,087 |
| 15.3 |
| 65,939 |
| 51,784 |
|
Falco Resources Ltd. |
| 41,385,240 |
| 19.9 |
| 24,253 |
| 13,243 |
|
(i) As at March 31, 2019.
(ii) See table above for definition of fair value.
(iii) The cash cost of an investment is a non-IFRS measure representing the cash paid on the acquisition of an investment.
Osisko Mining Inc.
Osisko Mining is a Canadian focused gold exploration and development company. Osisko holds a 1.5% NSR royalty on the Windfall Lake gold project, for which a positive preliminary economic assessment was released in July 2018, and 1% NSR royalty on other properties held by Osisko Mining. As part of a previous investment agreement with Osisko Mining, Osisko obtained the right to purchase Osisko Mining’s buy-back rights on existing royalties on the Windfall Lake property for $5.0 million (of which $2.0 million were paid in 2018), thus allowing it to increase its royalty by an additional 1-2% NSR royalty for a total potential NSR royalty of 2.5-3.5%.
In May 2018, Osisko Mining released a first mineral resources estimate on Windfall Lake gold deposit. Osisko Mining indicated that mineral resources were estimated at 601,000 ounces of gold in the measured and indicated category
(2,382,000 tonnes grading 7.85 grams per tonne (“g/t”) Au) and 2,284,000 ounces of gold in the inferred category (10,605,000 tonnes grading 6.70 g/t Au). In November 2018, Osisko Mining released a mineral resource update including the mineral resource update for the Lynx zone. Estimated measured and indicated resources were increased to 754,000 ounces of gold (2,874,000 tonnes grading 8.17 g/t Au) and inferred mineral resources were increased to 2,366,000 ounces of gold (10,352,000 tonnes grading 7.11 g/t Au).
For more information, refer to Osisko Mining’s press release dated May 14, 2018 entitled: “Osisko Releases Its First Mineral Resource Estimate For Windfall Gold Deposit” and Osisko Mining’s press release dated November 27, 2018 entitled “Osisko Releases Mineral Resource Update for Lynx”, both filed on www.sedar.com.
In addition, a positive preliminary economic assessment on the Windfall Lake project was released in July 2018 with an after-tax internal rate of return of 33%. Osisko Mining is also pursuing an 800,000 meter drilling program on the Windfall Lake property as well as a metallurgical program. In October 2018, through the construction of an exploration ramp, Osisko Mining achieved access to Zone 27, wireframe 115, which was selected for the initial 5,000 tonne bulk sample to be processed in the fourth quarter of 2018. In December 2018, Osisko Mining released preliminary results from the first 2,078 tonnes mined. The average head grade obtained is 9.7 g/t Au and 5.5 g/t Ag, which is 39% higher than indicated in the resource block model for this area. The balance of 2,922 tonnes will be processed in 2019. For more information, refer to Osisko Mining’s press release dated July 17, 2018 entitled: “Osisko Delivers Positive PEA For Windfall Project” and Osisko Mining’s press release dated December 18, 2018 entitled “Osisko Windfall Initial Bulk Sample Returns 9.7 g/t Au Head Grade”, both filed on www.sedar.com.
In 2016 and 2017, Osisko entered into earn-in agreements with Osisko Mining on properties held by Osisko in the James Bay area. The transactions are detailed in the Exploration and Evaluation Activities section of this MD&A.
The Company converted warrants into common shares of Osisko Mining during the three months ended March 31, 2019 for $1.2 million. As at March 31, 2019, the Company holds 43,690,269 common shares representing 16.6% interest in Osisko Mining (16.7% as at December 31, 2018). Based on the fact that some officers and directors of Osisko are also officers and directors of Osisko Mining, and because of other facts and circumstances, the Company concluded that it exercises significant influence over Osisko Mining and accounts for its investment using the equity method.
Barkerville Gold Mines Ltd.
Osisko holds a 4% NSR royalty on the Cariboo gold project and has the option to acquire an additional 1% NSR royalty on the Cariboo property for additional cash consideration of $13.0 million. Osisko also holds a right of first refusal relating to any gold stream offer received by Barkerville with respect to the Cariboo gold project. Barkerville is focused on the development of its extensive land package located in the historical Cariboo Mining District of central British Columbia, Canada, where it has completed a 157,000 meter drilling program.
On May 2, 2018, Barkerville announced the maiden mineral resource estimate for Cow and Island Mountain deposits at its 100% owned Cariboo gold project. The underground mineral resource estimate incorporates the Cow Mountain and Valley Zones on Cow Mountain and Shaft Zone and Mosquito Creek on Island Mountain at a cut-off grade of 3.0 g/t Au. A mineral resource on Bonanza Ledge and BC Vein is also included. The resource is defined over 6 kilometers of Barkerville’s 67-kilometer-long land package. Infill and exploration drilling is ongoing and resource updates will be presented annually. Barkerville indicated that mineral resources at the Cariboo gold project was estimated at 1.60 million ounces of gold in the measured and indicated category (8.1 million tonnes grading 6.1 g/t Au) and 2.16 million ounces of gold in the inferred category (12.7 million tonnes grading 5.2 g/t Au).
For more information, refer to Barkerville’s press release dated May 2, 2018 entitled: “BGM Defines Cow and Island Mountains Maiden Underground Resource and Barkerville Mountain Update” and filed on www.sedar.com.
In September 2018, Barkerville announced positive results from its initial test mining of 80,000 tonnes at Bonanza Ledge. Barkerville’s Bonanza Ledge mine has allowed the company to assess mining methods, understand what ground conditions to expect in different lithological units, train a local workforce, and generate cash flows to offset some explora tion expenditures. Test mining at Bonanza Ledge was completed in December 2018 on Barkerville Mountain. A total of 1,400 meters of development took place at the Bonanza Ledge and BC Vein test mine. Approximately 122,000 tonnes were extracted and processed at a grade of 5.98 g/t Au and 21,125 ounces of gold were poured in 2018. The company has also applied for permit amendment to extend the test mining for BC vein ore bodies on Barkerville Mountain.
The 2019 exploration program will include a total of 50,000 meters planned for the initial phase and an additional 40,000 meters will be proposed following results of Phase 1.
For more information, refer to Barkerville’s press release dated September 11, 2018 entitled: “Barkerville Gold Mines Reports Positive Results From Initial Test Mining Of 80,000 Tonnes At Bonanza Ledge, Better Mine Grades And Solid Mill Performance” and Barkerville’s press release dated January 17, 2019 entitled: “Barkerville Gold Mines Defines Significant Exploration Potential and Provides Corporate Update and 2019 Catalysts”, both filed on www.sedar.com.
As at March 31, 2019, the Company holds 162,864,251 common shares representing a 32.2% interest in Barkerville (32.2% as at December 31, 2018). In April 2019, Osisko acquired 20,761,334 additional common shares of Barkerville for $7.5 million as part of a $20.0 million financing completed by Barkerville. Following this financing, Osisko’s interest in Barkerville represents 32.7%. The Company concluded that it exercises significant influence over Barkerville and accounts for its investment using the equity method.
Victoria Gold Corp.
Osisko holds a 5% NSR royalty on the Dublin Gulch property which hosts the Eagle Gold project located in Yukon, Canada. The 5% NSR royalty applies to all metals and minerals produced from the Dublin Gulch property, until an aggregate of 97,500 ounces of refined gold has been delivered to Osisko, and a 3% NSR royalty thereafter. The last tranches of the purchase price (total acquisition price was $98.0 million) were paid during the three months ended March 31, 2019 for $19.6 million.
The Dublin Gulch property is located approximately 85 kilometres by road north northeast of the village of Mayo, in central Yukon, Canada. The property hosts the Eagle gold deposit, the Wolf tungsten deposit and a 13 kilometres-long belt of gold and silver mineralization known as the Potato Hills Trend.
The Eagle Gold project is the most advanced project in the region and is on track to be the largest gold mine in Yukon history. The proposed Eagle gold mine will produce doré from a conventional open pit operation with a three-stage crushing plant, in-valley heap leach and carbon-in-leach adsorption-desorption gold recovery plant. The mine will employ 350 to 400 people and will be a significant economic contributor to Yukon.
The Eagle Gold project has received all major permits for construction and operations, completed the Environmental Assessment process and has a signed Comprehensive Cooperation and Benefits Agreement with the local Nacho Nyak Dun First Nation, whose traditional territory the project is located within.
In February 2019, Victoria Gold provided an update on construction of the Eagle Gold mine and reported that the project was 75% complete. Victoria Gold expects that the first ore reporting to the heap leach pad will occur in July 2019 with a first gold pour target of September 2019. Over 3 million metric tonnes of ore are expected to be delivered to the heap leach pad by year-end 2019.
For more information, refer to Victoria’s press release dated February 25, 2019 entitled: “Victoria Gold: Eagle Mine Construction Update, Dublin Gulch, Yukon” and filed on www.sedar.com.
As at March 31, 2019, the Company holds 120,427,087 common shares representing a 15.3% interest in Victoria (15.4% as at December 31, 2018). In April 2019, Osisko acquired 34,090,909 additional common shares of Victoria for $15.0 million as part of a $34.4 million financing completed by Victoria, including the over-allotment option. Following this financing, Osisko’s interest in Victoria represents 18.8%. Based on the fact that the chair of the Board of Directors and Chief Executive Officer of Osisko is also a director of Victoria, and because of other facts and circumstances, the Company concluded that it exercises significant influence over Victoria since the second quarter of 2018 and has started to account for its investment using the equity method.
Falco Resources Ltd.
Falco’s main asset is the Horne 5 gold project, for which a positive feasibility study was released in October 2017. For more information, refer to Falco’s press release dated October 16, 2017 and entitled: “Falco Announces Positive Feasibility Study Results on Horne 5 Gold Project” and filed on www.sedar.com.
In 2018, Osisko entered into a binding term sheet to provide Falco with a senior secured silver stream credit facility (“Falco Silver Stream”) with reference to up to 100% of the future silver produced from the Horne 5 property (“Horne 5” or the “Project”) located in Rouyn-Noranda, Québec. As part of the Falco Silver Stream, Osisko will make staged upfront cash deposits to Falco of up to $180.0 million and will make ongoing payments equal to 20% of the spot price of silver, to a maximum of US$6 per ounce. The Falco Silver Stream will be secured by a first priority lien on the Project and all assets of Falco.
The Falco Silver Stream was closed in February 2019, which triggered the payment of the first installment of $25.0 million to Falco. Two previously outstanding notes receivable amounting to $20.0 million were applied against the first installment and the remaining balance of $5.0 million was paid to Falco. Interests receivable amounting of $1.8 million related to these loans were settled in exchange for 5,353,791 additional common shares of Falco.
On February 22, 2019, Osisko entered into an agreement to provide Falco with a secured senior loan of $10.0 million. The loan bears interests at a rate of 7%, compounded quarterly. The principal amount and accrued interests shall be payable on December 31, 2019. The loan will be used for the advancement of the Horne 5 Project and for general corporate purposes.
As at March 31, 2019, the Company holds 41,385,240 common shares representing a 19.9% interest in Falco (17.8% as at December 31, 2018). Based on the fact that some officers and directors of Osisko are also officers and directors of Falco, and because of other facts and circumstances, the Company concluded that it exercises significant influence over Falco and accounts for its investment using the equity method.
Sustainability Activities
Osisko views sustainability as a key part of its strategy to create value for its shareholders and other stakeholders.
The Company focuses on the following key areas:
· Promoting the mining industry and its benefits to society;
· Maintaining strong relationships with the Federal government and the Provincial, Municipal and First Nations governments in Québec;
· Supporting the economic development of regions where Osisko operates (directly or indirectly through its interests);
· Supporting university education in mining fields and employee development;
· Promoting diversity throughout the organization and the mining industry; and
· Encouraging investee companies to adhere to the same areas of focus in sustainability.
As part of its investment analysis process, the Company evaluates the risk and performance of the investee companies in the sustainability areas on projects where Osisko has a direct or indirect interest.
Exploration and Evaluation Activities
In 2016, Osisko entered into earn-in agreements with Osisko Mining.
Under the first earn-in agreement, Osisko Mining may earn a 100% interest in 26 of Osisko’s exploration properties located in the James Bay area and Labrador Trough (excluding the Coulon copper-zinc project) upon completing expenditures of $26.0 million over a 7-year period; Osisko Mining may earn a first 50% interest upon completing expenditures totaling $15.6 million over a 4-year period. Osisko will retain an escalating NSR royalty ranging from 1.5% to 3.5% on precious metals and a 2.0% NSR royalty on other metals and minerals produced from the 26 properties. During the first three months of 2019, Osisko Mining invested approximately $0.1 million on these properties for a total to date of $4.6 million (excluding the Kan property).
Under the second earn-in agreement, Osisko Mining had the option to earn a 100% interest in the Kan property (comprised of the Kan and Fosse Au properties) upon completing expenditures totaling $6.0 million over a 7-year period. The Company received notice from Osisko Mining in the first quarter of 2019 that the threshold had been reached. Therefore, a 100% interest in the Kan property will be transferred to Osisko Mining and Osisko will hold an escalating NSR royalty ranging from 1.5% to 3.5% on precious metals and a 2.0% NSR royalty on other metals and minerals produced from the Kan property.
New properties acquired by Osisko Mining in a designated area during the 7-year term will be subject to a royalty agreement in favour of Osisko with similar terms.
As at March 31, 2019, the net book value of the properties under the earn-in agreements amounted to $31.7 million.
As a result of the earn-in agreements with Osisko Mining, the exploration and evaluation activities have been significantly reduced. During the three months ended March 31, 2019, investments amounted to $0.1 million and the Company received previously claimed tax credits of $0.2 million. As at March 31, 2019, the carrying value of the Coulon project was $59.9 million ($59.9 million as at December 31, 2018) and the carrying value of other properties, including those under the earn-in agreements with Osisko Mining, was $32.9 million ($35.1 million as at December 31, 2018).
Quarterly Dividends
The Board of Directors has approved the initiation of the Company’s quarterly dividend program on November 17, 2014.
The following table provides details on the dividends declared and paid or payable:
|
| Dividend |
|
|
|
|
| Dividends paid or |
|
Declaration date |
| per share |
| Record date(i) |
| Payment date(i) |
| payable |
|
|
| $ |
|
|
|
|
| $ |
|
Year 2014 |
| 0.03 |
| n/a |
| n/a |
| 1,551,000 |
|
Year 2015 |
| 0.13 |
| n/a |
| n/a |
| 12,229,000 |
|
Year 2016 |
| 0.16 |
| n/a |
| n/a |
| 17,037,000 |
|
Year 2017 |
| 0.18 |
| n/a |
| n/a |
| 24,275,000 |
|
Year 2018 |
| 0.20 |
| n/a |
| n/a |
| 31,213,000 |
|
February 20, 2019 |
| 0.05 |
| March 29, 2019 |
| April 15, 2019 |
| 7,757,000 |
|
May 1, 2019 |
| 0.05 |
| June 28, 2019 |
| July 15, 2019 |
| tbd | (ii) |
Year-to-date 2019 |
| 0.10 |
|
|
|
|
|
|
|
(i) Not applicable (“n/a”) for annual summaries.
(ii) To be determined (“tbd”) on June 28, 2019 based on the number of shares outstanding and the number of shares participating in the dividend reinvestment plan on the record date.
Dividend Reinvestment Plan
The Company has a dividend reinvestment plan (“DRIP”) that allows Canadian shareholders and U.S. shareholders to reinvest their cash dividends into additional common shares either purchased on the open market through the facilities of the TSX or the NYSE, or issued directly from treasury by the Company, or acquired by a combination thereof. In the case of a treasury issuance, the price will be the weighted average price of the common shares on the TSX or the NYSE during the five (5) trading days immediately preceding the dividend payment date, less a discount, if any, of up to 5%, at the Company’s sole election. No commissions, service charges or brokerage fees are payable by shareholders who elect to participate in the DRIP.
As at March 29, 2019, the holders of 5,087,058 common shares had elected to participate in the DRIP, representing dividends payable of $0.3 million. Therefore, 17,324 common shares were issued on April 16, 2019 at a discount rate of 3%.
Normal Course Issuer Bid
In December 2018, Osisko renewed its normal course issuer bid (“NCIB”) program. Under the terms of the 2018 NCIB program, Osisko could acquire up to 10,459,829 of its common shares from time to time in accordance with the normal course issuer bid procedures of the TSX. Repurchases under the 2018 NCIB program are authorized until December 11, 2019. Daily purchases will be limited to 71,940 common shares, other than block purchase exemptions, representing 25% of the average daily trading volume of the common shares on the TSX for the six-month period ending November 30, 2018, being 287,760 common shares.
During the three months ended March 31, 2019, the Company purchased for cancellation a total of 852,500 common shares under the 2018 NCIB program for $10.2 million (average acquisition price per share of $11.96). The Company also paid $1.7 million for common shares acquired for cancellation in December 2018.
The Company expects to maintain active NCIB programs in the next few years.
Gold Market and Currency
Gold Market
Commodity prices increased in early 2019 and the gold price extended its gains from December 2018 reaching over US$1,300 per ounce for the first time since June 2018, before retreating slightly and closing the quarter at US$1,295 per ounce. Sentiment towards gold has turned more favorable over the last six months. Recent gains were driven by the U.S. Federal Reserve’s patient stance on monetary policy returning to a neutral position on rates, and escalating worries over a global economic slowdown. Uncertainty linked to the Brexit, a potential commercial trade war between the U.S. and China, and a strong stock market with a strong U.S. dollar were among other factors affecting the gold price in the first quarter of 2019.
During the first quarter of 2019, the gold price gained 1.3% in U.S. dollars, or US$16 per ounce on the London fix, to close at US$1,295 per ounce. The average price amounted to US$1,304 per ounce, up from the previous quarter by US$78 per ounce, but US$25 lower on a year-over-year basis. The price was volatile during the period with a trading range of US$64 per ounce.
The historical price is as follows:
(US$/ounce of gold) |
| High |
| Low |
| Average |
| Close |
| ||||
2019-Q1 |
| $ | 1,344 |
| $ | 1,280 |
| $ | 1,304 |
| $ | 1,295 |
|
2018 |
| 1,355 |
| 1,178 |
| 1,268 |
| 1,279 |
| ||||
2017 |
| 1,346 |
| 1,151 |
| 1,257 |
| 1,291 |
| ||||
2016 |
| 1,366 |
| 1,077 |
| 1,251 |
| 1,146 |
| ||||
2015 |
| 1,296 |
| 1,049 |
| 1,160 |
| 1,060 |
| ||||
In Canadian dollar terms, the average price per ounce of gold averaged $1,733 in the first quarter of 2019 compared to $1,619 in the fourth quarter of 2018 and $1,681 in the first quarter of 2018. The gold price closed at $1,731 per ounce on March 31, 2019 compared to $1,745 as at December 31, 2018.
Currency
After ending the year on a weaker tone, the Canadian dollar rebounded in January 2019 following a recovery in oil prices and other commodities. The Canadian dollar lost its momentum later in February and March as domestic demand has been weaker than expected. The Bank of Canada adopted a more prudent tone keeping the currency lower.
The Canadian dollar traded between a range of 1.3600 and 1.3095 in the first quarter of 2019 to close at 1.3363. The Canadian dollar averaged 1.3295 in the first quarter of 2019 compared to 1.3204 in the fourth quarter of 2018 and 1.2647 in the first quarter of 2018.
As expected, the Bank of Canada kept the overnight rate unchanged to a target of 1.75% at its January and March meetings.
The exchange rate for the U.S./Canadian dollar is outlined below:
|
| High |
| Low |
| Average |
| Close |
|
2019-Q1 |
| 1.3600 |
| 1.3095 |
| 1.3295 |
| 1.3363 |
|
2018 |
| 1.3642 |
| 1.2288 |
| 1.2957 |
| 1.3642 |
|
2017 |
| 1.3743 |
| 1.2128 |
| 1.2986 |
| 1.2545 |
|
2016 |
| 1.4589 |
| 1.2544 |
| 1.3248 |
| 1.3427 |
|
2015 |
| 1.3990 |
| 1.1728 |
| 1.2787 |
| 1.3840 |
|
Selected Financial Information(1)
(in thousands of dollars, except figures for ounces and amounts per ounce and per share)
|
| Three months ended |
| ||
|
| 2019 |
| 2018 |
|
|
| $ |
| $ |
|
Revenues |
| 100,726 |
| 125,614 |
|
Cash margin(2) |
| 30,622 |
| 31,947 |
|
Gross profit |
| 18,246 |
| 18,717 |
|
Impairment of asset |
| (38,900 | ) | — |
|
Operating income (loss) |
| (28,326 | ) | 13,099 |
|
Net earnings (loss) |
| (26,549 | ) | 2,310 |
|
Basic net earnings (loss) per share |
| (0.17 | ) | 0.01 |
|
Diluted net earnings (loss) per share |
| (0.17 | ) | 0.01 |
|
|
|
|
|
|
|
Total assets |
| 2,160,816 |
| 2,502,233 |
|
Total long-term debt |
| 324,355 |
| 467,483 |
|
|
|
|
|
|
|
Average selling price of gold (per ounce sold) |
|
|
|
|
|
In C$(3) |
| 1,731 |
| 1,688 |
|
In US$ |
| 1,302 |
| 1,333 |
|
|
|
|
|
|
|
Operating cash flows |
| 24,750 |
| 23,303 |
|
|
|
|
|
|
|
Weighted average shares outstanding (in thousands) |
|
|
|
|
|
Basic |
| 155,059 |
| 157,665 |
|
Diluted(5) |
| 155,059 |
| 157,695 |
|
(1) Unless otherwise noted, financial information is in Canadian dollars and prepared in accordance with IFRS.
(2) Cash margin is a non-IFRS financial performance measure which has no standard definition under IFRS. It is calculated by deducting the cost of sales from the revenues. Please refer to the Overview of Financial Results section of this MD&A for a reconciliation of the cash margin per interest.
(3) Using actual exchange rates at the date of the transactions.
(4) As a result of the net loss for the three months ended March 31, 2019, all potentially dilutive common shares are deemed to be antidilutive and thus diluted net loss per share is equal to the basic net loss per share.
Overview of Financial Results
Financial Summary — First quarter of 2019
· Revenues from royalties and streams of $33.5 million ($100.7 million including offtakes) compared to $32.6 million ($125.6 million including offtakes) in Q1 2018;
· Gross profit of $18.2 million compared to $18.7 million in Q1 2018;
· Impairment charge of $38.9 million ($28.6 million, net of income taxes) on the Renard diamond stream;
· Operating loss of $28.3 million compared to operating income of $13.1 million in Q1 2018;
· Net loss of $26.5 million or $0.17 per basic and diluted share, compared to net earnings of $2.3 million or $0.01 per basic and diluted share in Q1 2018;
· Adjusted earnings1 of $5.8 million or $0.04 per basic share1 compared to $8.9 million or $0.06 per basic share in Q1 2018; and
· Cash flows provided by operating activities of $24.8 million compared to $23.3 million in Q1 2018.
Revenues from royalties and streams increased in the first quarter of 2019 and total revenues, including offtakes, decreased, mainly as a result of the conversion of the Matilda gold offtake to a stream on April 1, 2018.
Gross profit amounted to $18.2 million in the first quarter of 2019 compared to $18.7 million in the first quarter of 2018. The slight decrease is mainly due to a lower gross profit on offtake agreements. Under the offtake agreements, the metal is acquired from the producers at the lowest market price over a certain period of time (quotational period), and is subsequently sold by Osisko, resulting in a net profit that will usually vary between 0% and 5% of the sales proceeds. The profit margin is highly impacted by the volatility of the commodity prices during the quotational period.
During the first quarter of 2019, the Company incurred an operating loss as a result of an impairment charge of $38.9 million on the Renard diamond stream interest. Excluding the impairment charge, operating income would have been $10.6 million compared to $13.1 million in the first quarter of 2018. The decrease in operating income in the first quarter of 2019 of $2.5 million (excluding the impairment charge) is mainly the result of higher general and administrative (“G&A”) expenses and business development expenses. The increase in G&A expenses and business development expenses is mainly due to a higher share-based compensation expense, mainly related to the deferred share units, resulting from the increase in the share price in the first quarter of 2019 partially offset by a decrease in professional fees and other fees. Lower cost recoveries in the first quarter of 2019 also affected negatively the operating loss.
The net loss for the first quarter of 2019 is the result of the impairment charge of $28.6 million, net of income taxes. Excluding the impact of the impairment charge (net of income taxes), net earnings in the first quarter of 2019 would have been $2.1 million compared to $2.3 million in the first quarter of 2018. The slight decrease is mainly the result of lower operating income (excluding the impairment charge) and a loss on foreign exchange of $1.1 million, partially offset by lower finance costs ($5.7 million in the first quarter of 2019 compared to $6.6 million in the first quarter of 2018), due to the repayment of the revolving credit facility in January 2019, and a loss on investments of $2.6 million in the first quarter of 2018 compared to nil in the first quarter of 2019.
Adjusted earnings were $5.8 million in the first quarter of 2019 compared to $8.9 million in the first quarter of 2018. The decrease was mainly the result of higher G&A expenses and business development expenses resulting from a higher share-based compensation expense.
Net cash flows provided by operating activities in the first quarter of 2019 amounted to $24.8 million compared to
$23.3 million in the first quarter of 2018, mainly as a result of a positive impact in non-cash working capital items, partially
offset by a lower gross profit before depletion of royalty, stream and other interests (cash margin, see reconciliation below).
(1) “Adjusted earnings” and “Adjusted earnings per basic share” are non-IFRS financial performance measures which have no standard definition under IFRS. Refer to the non-IFRS measures provided under the Non-IFRS Financial Performance Measures section of this Management and Discussion Analysis.
Consolidated Statements of Income (Loss)
The following table presents summarized consolidated statements of income (loss) for the three months ended March 31, 2019 and 2018 (in thousands of dollars, except amounts per share):
|
|
|
| 2019 |
| 2018 |
|
|
|
|
| $ |
| $ |
|
|
|
|
|
|
|
|
|
Revenues |
| (a) |
| 100,726 |
| 125,614 |
|
Cost of sales |
| (b) |
| (70,104 | ) | (93,667 | ) |
Depletion of royalty, stream and offtake interests |
| (c) |
| (12,376 | ) | (13,230 | ) |
Gross profit |
| (d) |
| 18,246 |
| 18,717 |
|
Other operating expenses |
|
|
|
|
|
|
|
General and administrative |
| (e) |
| (5,934 | ) | (4,426 | ) |
Business development |
| (f) |
| (1,738 | ) | (1,192 | ) |
Impairment of asset |
| (g) |
| (38,900 | ) | — |
|
Operating income (loss) |
|
|
| (28,326 | ) | 13,099 |
|
Other expenses, net |
| (h) |
| (7,493 | ) | (8,933 | ) |
Earnings (loss) before income taxes |
|
|
| (35,819 | ) | 4,166 |
|
Income tax recovery (expense) |
| (i) |
| 9,270 |
| (1,856 | ) |
|
|
|
|
|
|
|
|
Net earnings (loss) |
|
|
| (26,549 | ) | 2,310 |
|
Net earnings (loss) per share |
|
|
|
|
|
|
|
Basic |
|
|
| (0.17 | ) | 0.01 |
|
Diluted |
|
|
| (0.17 | ) | 0.01 |
|
(a) Revenues are comprised of the following:
|
| Three months ended March 31, |
| ||||||||||
|
| 2019 |
| 2018 |
| ||||||||
|
| Average |
| Ounces / |
| Total |
| Average |
| Ounces / |
| Total |
|
|
|
|
|
|
|
|
|
|
|
|
|
|
|
Gold sold |
| 1,731 |
| 48,235 |
| 83,497 |
| 1,688 |
| 63,375 |
| 106,953 |
|
Silver sold |
| 21 |
| 496,110 |
| 10,174 |
| 21 |
| 499,362 |
| 10,564 |
|
Diamonds sold(i) |
| 110 |
| 41,233 |
| 4,524 |
| 132 |
| 26,066 |
| 3,450 |
|
Other (paid in cash) |
| — |
| — |
| 2,351 |
| — |
| — |
| 4,647 |
|
|
|
|
|
|
| 100,726 |
|
|
|
|
| 125,614 |
|
(i) The diamonds were sold by an agent for Osisko for a blended selling price of $110 (US$83) per carat in the first quarter of 2019. The average selling price includes 6,538 incidental carats sold outside of the run of mine sales at an average price of $20 (US$15) per carat. No incidental carats were sold in the first quarter of 2018. Excluding the incidental carats, 34,695 carats were sold at an average price of $127 (US$95) per carat in the first quarter of 2019.
The decrease in gold ounces sold in 2019 is mainly the result of the conversion of the Matilda offtake into a stream on April 1, 2018 and lower ounces delivered under the Brucejack offtake. The increase in diamonds sold in 2019 is the result of higher diamonds acquired and sold under the Renard stream.
(b) Cost of sales represents mainly the acquisition price of the metals and diamonds under the offtake and stream agreements, as well as minimal refining, insurance and transportation costs related to the metals received under royalty agreements. The decrease in 2019 is mainly the result of the conversion of the Matilda offtake into a stream on April 1, 2018 and lower ounces delivered under the Brucejack offtake.
(c) The royalty, stream and other interests are depleted using the units-of-production method over the estimated life of the properties or the life of the agreement. The decrease is due to the mix of sales in the first quarter of 2019 compared to the corresponding period in 2018.
(d) The breakdown of gross profit per nature of interest is as follows (in $000’s):
|
| Three months ended |
| ||
|
| 2019 |
| 2018 |
|
|
| $ |
| $ |
|
Royalty interests |
|
|
|
|
|
Revenues |
| 23,445 |
| 23,944 |
|
Cost of sales |
| (101 | ) | (32 | ) |
Cash margin |
| 23,344 |
| 23,912 |
|
Depletion |
| (5,866 | ) | (6,637 | ) |
Gross profit |
| 17,478 |
| 17,275 |
|
|
|
|
|
|
|
Stream interests |
|
|
|
|
|
Revenues |
| 10,055 |
| 8,641 |
|
Cost of sales |
| (3,493 | ) | (3,031 | ) |
Cash margin |
| 6,562 |
| 5,610 |
|
Depletion |
| (5,828 | ) | (4,806 | ) |
Gross profit |
| 734 |
| 804 |
|
|
|
|
|
|
|
Royalty and stream interests |
|
|
|
|
|
Cash margin |
| 29,906 |
| 29,522 |
|
|
| 89.3 | % | 90.6 | % |
Offtake interests |
|
|
|
|
|
Revenues |
| 67,226 |
| 93,029 |
|
Cost of sales |
| (66,510 | ) | (90,604 | ) |
Cash margin |
| 716 |
| 2,425 |
|
|
| 1.1 | % | 2.6 | % |
Depletion |
| (682 | ) | (1,787 | ) |
Gross profit |
| 34 |
| 638 |
|
Total — Gross profit |
| 18,246 |
| 18,717 |
|
(e) G&A expenses increased to $5.9 million in the first quarter of 2019 compared to $4.4 million in the first quarter of 2018. The increase is mainly due to higher share-based compensation expense of $1.8 million mainly related to the deferred share units resulting from the increase in share price in the first quarter of 2019 compared to a decrease in the first quarter of 2018.
(f) Business development expenses increased to $1.7 million in the first quarter of 2019 compared to $1.2 million in the first quarter of 2018. The increase is mainly due to lower costs recoveries from associates and higher share-based compensation.
(g) In the first quarter of 2019, the Company recorded an impairment charge of $38.9 million ($28.6 million, net of income taxes) on its Renard diamond stream, which is explained in detail in the Impairment of assets section of this MD&A.
(h) Other expenses, net, of $7.5 million in the first quarter of 2019 include finance costs of $5.7 million, a share of loss of associates of $1.8 million and a foreign exchange loss of $1.1 million, partially offset by interest income of $1.2 million.
Other expenses, net, of $8.9 million in the first quarter of 2018 include finance costs of $6.6 million, a net loss on investments of $2.6 million and a share of loss of associates of $1.4 million, partially offset by interest income of $1.5 million.
(i) The effective income tax rate for the first quarter of 2019 is 25.9% compared to 44.6% in the first quarter of 2018. The statutory rate is 26.6% in 2019 and 26.7% in 2018. The elements that impacted the effective income taxes are the non-taxable (or deductible) part of capital gains (or losses) (50%) and non-deductible expenses. Cash taxes of $0.2 million were paid in the first quarter of 2019 and 2018 and were related to taxes on royalties earned in foreign jurisdictions.
Liquidity and Capital Resources
As at March 31, 2019, the Company’s cash position amounted to $108.5 million compared to $174.3 million as at December 31, 2018. Significant variations in the liquidity and capital resources for the first quarter of 2019 are explained below under the Cash Flows section.
The Company has a credit facility of $350.0 million (with an additional uncommitted accordion of up to $100.0 million, for a total availability of up to $450.0 million), which was not drawn at March 31, 2019 following the reimbursement of the outstanding balance of $30.0 million in January 2019. The credit facility includes covenants that require the Company to maintain certain financial ratios, including the Company’s leverage ratios and meet certain non-financial requirements. As at March 31, 2019, all such ratios and requirements were met.
Cash Flows
The following table summarizes the cash flows (in thousands of dollars):
|
| Three months ended |
| ||
|
| 2019 |
| 2018 |
|
|
| $ |
| $ |
|
Cash flows |
|
|
|
|
|
Operations |
| 22,621 |
| 24,462 |
|
Working capital items |
| 2,129 |
| (1,159 | ) |
Operating activities |
| 24,750 |
| 23,303 |
|
Investing activities |
| (46,394 | ) | 2,555 |
|
Financing activities |
| (42,690 | ) | (28,331 | ) |
Effects of exchange rate changes on cash and cash equivalents |
| (1,434 | ) | 1,385 |
|
Decrease in cash and cash equivalents |
| (65,768 | ) | (1,088 | ) |
Cash and cash equivalents — beginning of period |
| 174,265 |
| 333,705 |
|
Cash and cash equivalents — end of period |
| 108,497 |
| 332,617 |
|
Operating Activities
Cash flows provided by operating activities during the first quarter of 2019 amounted to $24.8 million compared to $23.3 million in the corresponding period of 2018.
Net cash flows provided by operating activities increased in the first quarter of 2019 as a result of a positive impact of non-cash working capital items, partially offset by a lower gross profit before depletion of royalty, stream and other interest (cash margin).
Investing Activities
Cash flows used in investing activities amounted to $46.4 million in the first quarter of 2019 compared to cash provided by investing activities of $2.6 million in the first quarter of 2018.
In the first quarter of 2019, Osisko invested $28.0 million in acquisitions of royalty and stream interests, including the last payments totalling $19.6 million on the Dublin Gulch property NSR royalty (hosting the Eagle Gold project which is in construction) and a net payment of $5.0 million on the Falco Silver Stream. The Company also disbursed $13.1 million in short-term investments, including a $10.0 million loan to Falco, and $5.8 million in investments. Proceeds on disposal of investments generated $0.4 million during the first quarter of 2019.
During the first quarter of 2018, Osisko invested $13.6 million in investments, $10.0 million in royalty interests and $0.5 million in short-term investments. Proceeds on the sale of investments generated $25.6 million, mainly from the disposal of the AuRico Metals Inc. shares to Centerra Gold Inc. for proceeds of $25.5 million. Exploration and evaluation activities generated $1.1 million as the Company received payments of previously claimed governmental tax credits.
Financing Activities
During the first quarter of 2019, cash flows used in financing activities amounted to $42.7 million compared to $28.3 million in the corresponding period of 2018.
During the first quarter of 2019, Osisko repaid the remaining balance of $30.0 million on its revolving credit facility, paid $11.9 million under the 2018 NCIB program and $6.3 million in dividends to its shareholders. The exercise of share options generated $5.6 million and the employee share purchase plan generated $0.1 million.
During the first quarter of 2018, the Company paid $20.3 million under the 2017 NCIB program and $7.5 million in dividends to its shareholders.
The following table summarizes the financings completed since the creation of Osisko Gold Royalties Ltd:
|
| No of Shares/ |
| Price |
| Gross |
| Net Cash |
|
|
|
|
|
|
|
|
|
|
|
2019 |
|
|
|
|
|
|
|
|
|
Exercise of share options |
| 302,332 |
| 14.38 |
| 4,349 |
| 4,349 |
|
Exercise of replacement share options(vi) |
| 110,851 |
| 11.32 |
| 1,255 |
| 1,255 |
|
Employee share purchase plan |
| 6,734 |
| 11.70 |
| 79 |
| 79 |
|
Total |
| 419,917 |
|
|
| 5,683 |
| 5,683 |
|
2018 |
|
|
|
|
|
|
|
|
|
Exercise of replacement share options(vi) |
| 2,710 |
| 13.93 |
| 38 |
| 38 |
|
Employee share purchase plan |
| 26,709 |
| 12.00 |
| 320 |
| 320 |
|
Total |
| 29,419 |
|
|
| 358 |
| 358 |
|
2017 |
|
|
|
|
|
|
|
|
|
Bought deal — Convertible debentures(i) |
| n/a |
| n/a |
| 300,000 |
| 288,476 |
|
Private placement(ii) |
| 19,272,820 |
| 14.27 |
| 275,000 |
| 261,060 |
|
Revolving credit facility(ii) |
| n/a |
| n/a |
| 147,323 |
| 147,323 |
|
Exercise of share options |
| 43,970 |
| 14.21 |
| 625 |
| 625 |
|
Exercise of replacement share options(vi) |
| 190,471 |
| 11.28 |
| 2,148 |
| 2,148 |
|
Employee share purchase plan |
| 15,426 |
| 15.04 |
| 233 |
| 233 |
|
Total |
| 19,522,687 |
|
|
| 725,329 |
| 699,865 |
|
2016 |
|
|
|
|
|
|
|
|
|
Convertible debenture(iii) |
| n/a |
| n/a |
| 50,000 |
| 49,225 |
|
Issuance of Units (bought-deal financing)(iv) |
| 11,431,000 |
| 15.10 |
| 172,608 |
| 164,543 |
|
Exercise of share options |
| 12,335 |
| 15.22 |
| 188 |
| 188 |
|
Exercise of replacement share options(vi) |
| 505,756 |
| 9.50 |
| 4,806 |
| 4,806 |
|
Employee share purchase plan |
| 21,762 |
| 15.27 |
| 332 |
| 332 |
|
Total |
| 11,970,853 |
|
|
| 227,934 |
| 219,094 |
|
2015 |
|
|
|
|
|
|
|
|
|
Issuance of special warrants(v) |
| 10,960,000 |
| 18.25 |
| 200,020 |
| 189,158 |
|
Exercise of replacement share options(vi) |
| 750,837 |
| 6.51 |
| 4,887 |
| 4,887 |
|
Total |
| 11,710,837 |
|
|
| 204,907 |
| 194,045 |
|
2014 — from June 16 |
|
|
|
|
|
|
|
|
|
Private placements(vii) |
| 2,794,411 |
| 15.03 |
| 42,000 |
| 39,173 |
|
Total |
| 2,794,411 |
|
|
| 42,000 |
| 39,173 |
|
Cumulative cash proceeds |
|
|
|
|
| 1,206,211 |
| 1,158,218 |
|
(i) On November 3, 2017, Osisko closed a bought deal offering of convertible senior unsecured debentures for net proceeds of $288.5 million. The debentures bear interest at a rate of 4.0% per annum, payable semi-annually on June 30 and December 31 of each year, commencing on June 30, 2018. The Debentures are convertible at the holder’s option into Osisko common shares at a conversion price of $22.89 per share. The Debentures will mature on December 31, 2022 and may be redeemed by Osisko, in certain circumstances, on or after December 31, 2020.
(ii) On July 31, 2017, Osisko closed a private placement with Caisse de dépôt et placement du Québec and Fonds de solidarité FTQ to fund a portion of the acquisition price of Orion’s portfolio of assets. A total of 18,887,363 common shares were issued at a price of $14.56 per common share plus a 7% capital commitment payment payable partially in shares (2% representing 385,457 common shares) and in cash (5% representing $13.8 million). Additionally, Osisko drew US$118.0 million ($147.3 million based on the Bank of Canada daily exchange rate of July 31, 2017) under its revolving credit facility with the National Bank of Canada and Bank of Montreal.
(iii) On February 12, 2016, Osisko closed a convertible debenture with Investissement Québec, maturing in February 2021 and bearing interest at an annual rate of 4% payable quarterly. The debenture is convertible at the holder option into common shares of the Company at a price of $19.08 at any time during the term.
(iv) On February 26, 2016, Osisko closed a bought deal public offering of 11,431,000 Units, including the full exercise of the over-allotment option by the underwriters, at a price of $15.10 per Unit for aggregate gross proceeds of $172.6 million (net proceeds of $164.5 million).
(v) On March 5, 2015, the special warrants were converted into 10,960,000 common shares and 5,480,000 warrants exercisable at a price of $36.50 for a period of 7 years.
(vi) On the date of acquisition of Virginia, the Virginia share options were converted into Osisko replacement share options using the same exchange rate than for the common shares (0.92 replacement share option for each Virginia share option).
(vii) On November 17, 2014, Osisko closed two private placements whereby Osisko issued a total of 2,794,411 common shares to Caisse de dépôt et placement du Québec and Fonds de solidarité FTQ at a price of $15.03 per common share for total gross proceeds of $42.0 million.
Quarterly Information
The selected quarterly financial information(1) for the past eight financial quarters is outlined below:
(in thousands of dollars, except for amounts per share)
|
| 2019 |
| 2018 |
| 2017 |
| ||||||||||
|
| Q1 |
| Q4 |
| Q3 |
| Q2 |
| Q1 |
| Q4 |
| Q3 |
| Q2 |
|
|
|
|
|
|
|
|
|
|
|
|
|
|
|
|
|
|
|
GEOs |
| 19,753 |
| 20,005 |
| 20,006 |
| 20,506 |
| 20,036 |
| 20,990 |
| 16,664 |
| 10,863 |
|
Cash and cash equivalents |
| 108,497 |
| 174,265 |
| 137,188 |
| 188,631 |
| 332,617 |
| 333,705 |
| 108,902 |
| 348,642 |
|
Short-term investments |
| 13,119 |
| 10,000 |
| 10,000 |
| 1,000 |
| 500 |
| — |
| 1,447 |
| 1,547 |
|
Working capital |
| 107,328 |
| 174,596 |
| 281,858 |
| 180,605 |
| 325,206 |
| 324,101 |
| 113,689 |
| 329,927 |
|
Total assets |
| 2,160,816 |
| 2,234,646 |
| 2,441,668 |
| 2,458,641 |
| 2,502,233 |
| 2,516,343 |
| 2,320,930 |
| 1,438,511 |
|
Total long-term debt |
| 324,355 |
| 352,769 |
| 419,680 |
| 419,228 |
| 467,483 |
| 464,308 |
| 193,738 |
| 46,236 |
|
Equity |
| 1,727,396 |
| 1,771,595 |
| 1,868,196 |
| 1,884,101 |
| 1,878,405 |
| 1,894,405 |
| 1,931,759 |
| 1,218,302 |
|
Revenues |
| 100,726 |
| 115,337 |
| 111,702 |
| 137,819 |
| 125,614 |
| 109,552 |
| 68,179 |
| 18,359 |
|
Net cash flows from operating activities |
| 24,750 |
| 18,559 |
| 20,636 |
| 19,660 |
| 23,303 |
| 21,523 |
| 1,094 |
| 14,082 |
|
Impairment of assets, net of income taxes |
| (28,600 | ) | (123,655 | ) | — |
| — |
| — |
| (65,415 | ) | — |
| — |
|
Net earnings (loss) |
| (26,549 | ) | (113,882 | ) | 5,474 |
| 511 |
| 2,310 |
| (64,348 | ) | 6,728 |
| 11,043 |
|
Basic and diluted net earnings (loss) per share |
| (0.17 | ) | (0.73 | ) | 0.04 |
| — |
| 0.01 |
| (0.41 | ) | 0.05 |
| 0.10 |
|
Weighted average shares outstanding (000’s) |
|
|
|
|
|
|
|
|
|
|
|
|
|
|
|
|
|
- Basic |
| 155,059 |
| 156,336 |
| 156,252 |
| 156,232 |
| 157,665 |
| 157,256 |
| 140,605 |
| 106,656 |
|
- Diluted |
| 155,059 |
| 156,336 |
| 156,263 |
| 156,257 |
| 157,695 |
| 157,256 |
| 140,837 |
| 106,771 |
|
Share price — TSX — closing |
| 15.01 |
| 11.97 |
| 9.80 |
| 12.45 |
| 12.44 |
| 14.52 |
| 16.10 |
| 16.85 |
|
Share price — NYSE — closing |
| 11.24 |
| 8.78 |
| 7.59 |
| 9.47 |
| 9.67 |
| 11.56 |
| 12.91 |
| 12.22 |
|
Warrant price — TSX — closing |
|
|
|
|
|
|
|
|
|
|
|
|
|
|
|
|
|
OR.WT |
| 0.80 |
| 0.37 |
| 0.70 |
| 1.06 |
| 1.50 |
| 2.40 |
| 2.80 |
| 2.75 |
|
OR.WT.A(2) |
| n/a |
| 0.01 |
| 0.10 |
| 0.39 |
| 0.61 |
| 1.41 |
| 2.45 |
| 2.65 |
|
Debenture price — TSX — closing(3) |
|
|
|
|
|
|
|
|
|
|
|
|
|
|
|
|
|
OR.DB |
| 103 |
| 98.99 |
| 99.00 |
| 100.25 |
| 100.00 |
| 104.50 |
| — |
| — |
|
Price of gold (average US$) |
| 1,304 |
| 1,226 |
| 1,213 |
| 1,306 |
| 1,329 |
| 1,275 |
| 1,278 |
| 1,257 |
|
Closing exchange rate(4) (US$/Can$) |
| 1.3363 |
| 1.3642 |
| 1.2945 |
| 1.3168 |
| 1.2894 |
| 1.2713 |
| 1.2480 |
| 1.3449 |
|
(1) Unless otherwise noted, financial information in Canadian dollars and prepared in accordance with IFRS.
(2) The warrants expired unexercised on February 26, 2019.
(3) Osisko 4% convertible debentures began trading on November 3, 2017 by tranche of nominal value of $100.00.
(4) Bank of Canada Daily Rate.
During the first quarter of 2019, the Company recorded an impairment charge of $38.9 million ($28.6 million, net of income taxes) on the Renard diamond stream and fully reimbursed the outstanding amount of $30.0 million under its revolving credit facility.
During the fourth quarter of 2018, Osisko received the payment of US$118.5 million ($159.4 million) from Pretium in regards to its election to exercise its option to fully repurchase by December 31, 2018 OBL’s interest in the Brucejack gold and silver stream. The Company recorded impairment charges of $166.3 million ($123.7 million, net of income taxes) including $148.5 million on the Éléonore NSR royalty ($109.1 million, net of income taxes) and reimbursed $71.7 million on its credit facility.
During the second quarter of 2018, Osisko acquired from Victoria a 5% NSR royalty for $98.0 million on the Dublin Gulch property, of which a first $48.0 million was paid in the second quarter and $14.7 million in the third quarter, and acquired common shares of Victoria for $50.0 million.
During the fourth quarter of 2017, the Company recorded an impairment charge of $89.0 million ($65.4 million, net of income taxes) on the Éléonore NSR royalty.
Outlook
Osisko’s 2019 outlook on royalty, stream and offtake interests is based on publicly available forecasts, in particular the forecasts for the Canadian Malartic mine published by Yamana and Agnico Eagle, for the Éléonore mine published by Newmont Goldcorp, and for the Renard mine published by Stornoway. When publicly available forecasts on properties are not available, Osisko obtains internal forecasts from the producers, which is the case for the Mantos Blancos mine, or uses management’s best estimate.
Attributable GEOs for 2019 remains unchanged from previous guidance. GEOs and cash margin by interest are estimated as follows:
|
| Low |
| High |
| Cash margin |
|
|
| (GEOs) |
| (GEOs) |
| (%) |
|
|
|
|
|
|
|
|
|
Royalty interests |
| 54,700 |
| 61,100 |
| 99.9 |
|
Stream interests |
| 28,000 |
| 31,300 |
| 65.5 |
|
Offtake interests |
| 2,300 |
| 2,600 |
| 1.2 |
|
|
| 85,000 |
| 95,000 |
|
|
|
For the 2019 guidance, silver, diamonds and cash royalties have been converted to GEOs using commodity prices of US$1,300 per ounce of gold, US$15.50 per ounce of silver and US$95 per carat for diamonds from the Renard mine (blended sales price) and an exchange rate (US$/C$) of 1.30.
Related Party Transactions
During the three months ended March 31, 2019 and 2018, the following amounts were invoiced by Osisko to associates for recoveries of costs related to professional services and rental of offices and are reflected as a reduction of general and administrative expenses and business development expenses in the consolidated statements of income (loss) (in thousands of dollars):
|
| 2019 |
| 2018 |
|
|
| $ |
| $ |
|
Amounts invoiced to associates as a reduction of: |
|
|
|
|
|
General and administrative expenses |
| 197 |
| 433 |
|
Business development expenses |
| 535 |
| 847 |
|
Total amounts invoiced to associates |
| 732 |
| 1,280 |
|
An amount of $0.6 million (including sales taxes) is receivable from associates and included in amounts receivable as at March 31, 2019 ($3.2 million as at December 31, 2018).
During the three months ended March 31, 2019 and 2018, interest revenues of $0.2 million were accounted for with regards to notes receivable from associates. As at March 31, 2019, interests receivable from associates of $0.1 million are included in amounts receivable ($1.7 million as at December 31, 2018). During the three months ended March 31, 2019, interests receivable of $1.8 million from two notes issued to Falco were converted into common shares of Falco.
During the three months ended March 31, 2019, two notes receivable from Falco amounting to $20.0 million were applied against the first installment of the Falco Silver Stream. An additional secured senior note of $10.0 million was issued to Falco. The loan bears interests at a rate of 7%, compounded quarterly and the principal amount and accrued interests shall be payable on December 31, 2019.
Additional transactions with related parties are described under the sections Portfolio of Royalty, Stream and Other Interests and Portfolio of investments.
Contractual Obligations and Commitments
Offtake and stream purchase agreements
The following table summarizes the significant commitments to pay for gold, silver and diamonds to which Osisko has the contractual right pursuant to the associated precious metals and diamond purchase agreements:
|
| Attributable payable production |
| Per ounce/carat |
| Term of |
|
|
| |||||||||
Interest |
| Gold |
| Silver |
| Diamond |
| Gold |
| Silver |
| Diamond |
| agreement |
| Date of contract |
| |
|
|
|
|
|
|
|
|
|
|
|
|
|
|
|
|
|
| |
Amulsar stream(1) |
| 4.22 | % | 62.5 | % |
|
| $400 |
| $4 |
|
|
| 40 years |
| Nov. 30, 2015 |
| |
|
|
|
|
|
|
|
|
|
|
|
|
|
|
|
|
|
| |
Amulsar offtake(2) |
| 81.91 | % |
|
|
|
| Based on quotational period |
|
|
|
|
| Until delivery of 2,110,425 ounces Au |
| Nov. 30, 2015 |
| |
|
|
|
|
|
|
|
|
|
|
|
|
|
|
|
|
|
| |
Back Forty stream |
| 18.5 | %(3) | 75 | % |
|
| 30% spot price (max $600) |
| $4 |
|
|
| Life of mine |
| Mar. 31, 2015 |
| |
|
|
|
|
|
|
|
|
|
|
|
|
|
|
|
|
|
| |
Brucejack offtake |
| 50 | % |
|
|
|
| Based on quotational period |
|
|
|
|
| Until delivery of 3,533,500 ounces Au(4) |
| Sep. 21, 2015 |
| |
|
|
|
|
|
|
|
|
|
|
|
|
|
|
|
|
|
| |
Mantos stream(5) |
|
|
| 100 | % |
|
|
|
| 25% spot |
|
|
| Life of mine |
| Sep. 11, 2015 |
| |
|
|
|
|
|
|
|
|
|
|
|
|
|
|
|
|
|
| |
Renard stream(6) |
|
|
|
|
| 9.6 | % |
|
|
|
| Higher of 40% of sales price or $40 |
| 40 years |
| Jul. 8, 2014 |
| |
|
|
|
|
|
|
|
|
|
|
|
|
|
|
|
|
|
|
|
Sasa stream(7) |
|
|
| 100 | % |
|
|
|
| $5 |
|
|
| 40 years |
| Nov. 3, 2015 |
| |
|
|
|
|
|
|
|
|
|
|
|
|
|
|
|
|
|
|
|
Gibraltar stream(8) |
|
|
| 75 | % |
|
|
|
| $2.75 |
|
|
| Life of mine |
| Mar. 3, 2017 |
| |
(1) Stream capped at 89,034 ounces of gold and 434,093 ounces of silver delivered. Subject to multiple buy-down options: 50% for $34.4 million and $31.3 million on 2nd and 3rd anniversary of commercial production, respectively.
(2) Offtake percentage will increase to 84.87% if Lydian elects to reduce the gold stream as outlined above. The Amulsar offtake applies to the sales from the first 2,110,425 ounces of refined gold, of which 1,853,751 ounces are attributable to OBL (less any ounces delivered pursuant to the Amulsar stream).
(3) The gold stream will be reduced to 9.25% after the delivery of 105,000 gold ounces.
(4) The Brucejack offtake applies to the sales from the first 7,067,000 ounces of refined gold, of which 3,533,500 ounces are attributable to OBL.
(5) The stream percentage shall be payable on 100% of silver until 19,300,000 ounces have been delivered, after which the stream percentage will be 30%.
(6) The stream term shall be automatically extended beyond the initial term for successive 10-year periods. The Renard stream was amended in October 2018.
(7) The stream term shall be automatically extended beyond initial term for successive 10-year periods. 3% or consumer price index (CPI) per ounce price escalation after 2016.
(8) Under the silver stream, Osisko will make ongoing payments of US$2.75 per ounce of silver delivered. Osisko will receive from Taseko an amount equal to 100% of Gibco’s share of silver production, which represents 75% of Gibraltar mine’s production, until reaching the delivery to Osisko of 5.9 million ounces of silver, and 35% of Gibco’s share of silver production thereafter.
Investments in royalty and stream interests
As at March 31, 2019, the Company had commitments related to the acquisition of royalties and streams as detailed in the following table:
Company |
| Project (asset) |
| Installments |
| Triggering events |
|
|
|
|
|
|
|
Aquila Resources Inc. |
| Back Forty project |
| US$10.0 million |
| Positive construction decision. |
|
|
|
|
|
|
|
Falco Resources Ltd. |
| Horne 5 project |
| $20.0 million |
| Receipt of all necessary material third-party approvals, licenses, rights of way and surface rights on the property. |
|
|
|
| $35.0 million |
| Receipt of all material construction permits, positive construction decision, and raising a minimum of $100.0 million in non-debt financing. |
|
|
|
| $60.0 million |
| Upon total projected capital expenditure having been demonstrated to be financed. |
|
|
|
| $40.0 million |
| Payable with fourth installment, at sole election of Osisko, to increase the silver stream to 100% of payable silver (from 90%). |
|
|
|
|
|
|
|
Barkerville Gold Mines Ltd. |
| Cariboo Gold project |
| $13.0 million |
| Osisko has the option to acquire an additional 1% NSR royalty for $13.0 million. |
Long-term lease agreements
The Company is committed to minimum amounts under long-term lease agreements for office space, which expire at the latest in 2029. As at March 31, 2019, minimum commitments remaining under these leases were approximately $12.7 million over the following years ending March 31:
|
| $ |
|
|
| (‘000) |
|
|
|
|
|
2019 |
| 1,518 |
|
2020 |
| 1,216 |
|
2021 |
| 1,120 |
|
2022 |
| 1,120 |
|
2023 |
| 1,131 |
|
2024-2029 |
| 6,589 |
|
|
| 12,694 |
|
Foreign exchange contracts
During the three months ended March 31, 2019, the Company entered into foreign exchange contracts (collar options) to sell US dollars and buy Canadian dollars for a total amount of US$9.0 million. The contracts cover the period from April 2019 to December 2019 for the sale of US$1.0 million to US$2.0 million per month. The contracts were put in place to protect revenues in Canadian dollars from the sale of gold ounces received from royalty interests which are denominated in US dollars. The fair value of the contracts is booked at each reporting period on the consolidated balance sheets. As at March 31, 2019, the fair value (mark-to-market) of these contracts was immaterial. The Company does not apply hedge accounting for these contracts.
Off-balance Sheet Items
There are no significant off-balance sheet arrangements, other than the foreign exchange contracts discussed under the Contractual Obligations and Commitments section.
Outstanding Share Data
As of May 1, 2019, 155,179,020 common shares were issued and outstanding. A total of 3,877,764 share options and 5,480,000 warrants were outstanding to purchase common shares. A convertible debenture of $50.0 million with Ressources Québec entitles the holder to convert the debenture, at its option, into 2,620,545 common shares of the Company (conversion price of $19.08) at any time during the term of the debenture. Convertible senior unsecured debentures of $300.0 million are outstanding and convertible at the holder’s option into Osisko common shares at a conversion price of $22.89 per common share, representing a total of 13,106,160 common shares if all the debentures were converted.
Subsequent Event to March 31, 2019
Dividends
On May 1, 2019, the Board of Directors declared a quarterly dividend of $0.05 per common share payable on July 15, 2019 to shareholders of record as of the close of business on June 28, 2019.
Risks and Uncertainties
The Company is a royalty, stream, and offtake interests holder and investor that operates in an industry that is dependent on a number of factors that include environmental, legal and political risks, the discovery of economically recoverable resources and the conversion of these mineral resources to mineral reserves and the ability of third-party partners to maintain an economic production. An investment in the Company’s securities is subject to a number of risks and uncertainties. An investor should carefully consider the risks described in Osisko’s most recent Annual Information Form and the other information filed with the Canadian securities regulators and the U.S Securities and Exchange Commission (“SEC”) before investing in the Company’s securities. If any of such described risks occur, or if others occur, the Company’s business, operating results and financial condition could be seriously harmed and investors may lose a significant proportion of their investment.
There are important risks which management believes could impact the Company’s business. For information on risks and uncertainties, please also refer to the Risk Factors section of Osisko’s most recent Annual Information Form filed on SEDAR at www.sedar.com and on EDGAR at www.sec.gov.
Disclosure Controls and Procedures and Internal Control over Financial Reporting
Disclosure Controls and Procedures
The Chief Executive Officer (the “CEO”) and the Chief Financial Officer (the “CFO”) of the Company are responsible for establishing and maintaining the Company’s disclosure controls and procedures (“DCP”) including adherence to the Disclosure Policy adopted by the Company. The Disclosure Policy requires all staff to keep senior management fully apprised of all material information affecting the Company so that they may evaluate and discuss this information and determine the appropriateness and timing for public disclosure.
The Company maintains DCP designed to ensure that information required to be disclosed in reports filed under applicable Canadian securities laws and the U.S. Securities Exchange Act of 1934, as amended, (the “Exchange Act”), is recorded, processed, summarized and reported within the appropriate time periods and that such information is accumulated and communicated to the Company’s management, including the CEO and CFO, to allow for timely decisions regarding required disclosure.
The CEO and CFO have evaluated whether there were changes to the DCP during the three months ended March 31, 2019 that have materially affected, or are reasonably likely to materially affect, the DCP. No such changes were identified through their evaluation.
In designing and evaluating DCP, the Company recognizes that any disclosure controls and procedures, no matter how well conceived or operated, can only provide reasonable, not absolute, assurance that the objectives of the control system are met, and management is required to exercise its judgment in evaluating the cost-benefit relationship of possible controls and procedures.
Internal Control over Financial Reporting
The Company’s management, including the CEO and the CFO, are responsible for establishing and maintaining adequate internal control over financial reporting (“ICFR”) for the Company to provide reasonable assurance regarding the reliability of financial reporting and the preparation of financial statements for external purposes in accordance with IFRS. The fundamental issue is ensuring all transactions are properly authorized and identified and entered into a well-designed, robust and clearly understood accounting system on a timely basis to minimize risk of inaccuracy, failure to fairly reflect transactions, failure to fairly record transactions necessary to present financial statements in accordance with IFRS, unauthorized receipts and expenditures, or the inability to provide assurance that unauthorized acquisitions or dispositions of assets can be detected.
The CEO and CFO have evaluated whether there were changes to the ICFR during the three months ended March 31, 2019 that have materially affected, or are reasonably likely to materially affect, the ICFR. No such changes were identified through their evaluation.
The Company’s ICFR may not prevent or detect all misstatements because of inherent limitations. Additionally, projections of any evaluation of effectiveness to future periods are subject to the risk that controls may become inadequate because changes in conditions or deterioration in the degree of compliance with the Company’s policies and procedures.
Basis of Presentation of Consolidated Financial Statements
The unaudited condensed interim consolidated financial statements for the three months ended March 31, 2019 have been prepared in accordance with the IFRS as issued by the IASB applicable to the preparation of interim financial statements, including International Accounting Standard (“IAS”) 34, Interim Financial Reporting. The unaudited condensed interim consolidated financial statements should be read in conjunction with the Company’s annual consolidated financial statements for the year ended December 31, 2018, which have been prepared in accordance with IFRS as issued by the IASB. The accounting policies, methods of computation and presentation applied in the unaudited condensed interim consolidated financial statements are consistent with those of the previous financial year, except for the adoption of a new accounting standard (IFRS 16, Leases), which is described below.
The significant accounting policies of Osisko are detailed in the notes to the audited consolidated financial statements for the year ended December 31, 2018, filed on SEDAR at www.sedar.com, EDGAR at www.sec.gov and on Osisko’s w ebsite at www.osiskogr.com, except for the new accounting policy related to the adoption of IFRS 16, Leases, which is described below.
IFRS 16, Leases
In January 2016, the IASB issued IFRS 16, Leases (“IFRS 16”). IFRS 16 sets out the principles for the recognition, measurement, presentation and disclosure of leases for both parties to a contract, which is the customer (“lessee”) and the supplier (“lessor”). IFRS 16 replaces IAS 17, Leases (“IAS 17”), and related interpretations. All leases result in the lessee obtaining the right to use an asset at the start of the lease and incurring a financing obligation corresponding to the lease payments to be made over time. Accordingly, for lessees, IFRS 16 eliminates the classification of leases as either operating leases or finance leases as was required by IAS 17 and, instead, introduces a single lessee accounting model. Applying that model, a lessee is required to recognize:
i) assets and liabilities for all leases with a term of more than 12 months, unless the underlying asset is of low value; and
ii) amortization of lease assets separately from interest on lease liabilities in the statement of income (loss).
Management has reviewed all of the Company’s leasing arrangements in light of the requirements of IFRS 16. The standard affects primarily the accounting for the Company’s operating leases. As at December 31, 2018, the Company had non-cancellable operating lease commitments of $13.0 million. Of these commitments, approximately $0.6 million were related to short-term leases which are not recognized as a right-of-use asset and continued to be recognized on a straight-line basis as expense in the consolidated statement of income (loss).
IFRS 16, Leases (continued)
The new standard is effective for the Company’s annual periods beginning on January 1, 2019. The Company applied the simplified transition approach and, consequently, did not restate comparative figures for 2018. Right-of-use assets for property leases were measured on transition as if the new standard had been applied since the respective leases’ commencement date but using the Company’s incremental borrowing rate of 4.79% as at January 1, 2019.
The Company recognized right-of-use assets of $9.4 million on January 1, 2019 (presented under other assets on the consolidated balance sheet), lease liabilities of $10.0 million and deferred tax assets of $0.1 million. Overall, net assets were approximately $0.4 million lower, and net current assets were $0.7 million lower due to the presentation of a portion of the lease liability as a current liability. The Company expects that the adoption of IFRS 16 will have the effect of reducing net income after tax by approximately $0.2 million for 2019 based on the leases in place on January 1, 2019. For the same period, operating cash flows will increase and financing cash flows decrease by approximately $0.7 million as repayment of the principal portion of the lease liabilities will be classified as cash flows from financing activities.
The Company’s activities as a lessor are not material.
Accounting policy - Leases
The Company is committed to long-term lease agreements, mainly for office space. Prior to January 1, 2019, payments made under operating lease agreements were recognized in profit or loss on a straight-line basis over the period of the lease.
From January 1, 2019, leases are recognized as a right-of-use asset (presented under non-current other assets on the consolidated balance sheet) and a corresponding liability at the date at which the leased asset is available for use by the Company. Each lease payment is allocated between the liability and finance cost. The finance cost is charged to profit or loss over the lease period so as to produce a constant periodic rate of interest on the remaining balance of the liability for each period. The right-of-use asset is depreciated over the shorter of the asset’s useful life and the lease term on a straight-line basis.
Assets and liabilities arising from a lease are initially measured on a present value basis. The lease payments are discounted using the interest rate implicit in the lease. If that rate cannot be readily determined, the lessee’s incremental borrowing rate is used, being the rate that the lessee would have to pay to borrow the funds necessary to obtain an asset of similar value in a similar economic environment with similar terms and conditions.
Payments associated with short-term leases (12 months or less) and leases of low-value assets are recognized on a straight-line basis as an expense in profit or loss.
Critical Accounting Estimates and Judgements
Estimates and assumptions are continually evaluated and are based on historical experience and other factors, including expectations of future events that are believed to be reasonable under the circumstances. The determination of estimates requires the exercise of judgement based on various assumptions and other factors such as historical experience and current and expected economic conditions. Actual results could differ from those estimates.
Critical accounting estimates and assumptions as well as critical judgements in applying the Company’s accounting policies are detailed in the audited consolidated financial statements for the year ended December 31, 2018, filed on SEDAR at www.sedar.com, EDGAR at www.sec.gov and on Osisko’s website at www.osiskogr.com.
Financial Instruments
All financial instruments are required to be measured at fair value on initial recognition. The fair value is based on quoted market prices, unless the financial instruments are not traded in an active market. In this case, the fair value is determined by using valuation techniques like discounted cash flows, the Black-Scholes option pricing model or other valuation techniques. Measurement in subsequent periods depends on the classification of the financial instrument. A description of financial instruments and their fair value is included in the audited consolidated financial statements for the year ended December 31, 2018 and in the unaudited condensed interim consolidated financial statements for the three months ended March 31, 2019, both filed on SEDAR at www.sedar.com, EDGAR at www.sec.gov and on Osisko’s website at www.osiskogr.com.
Non-IFRS Financial Performance Measures
The Company has included certain non-IFRS measures including “Adjusted Earnings” and “Adjusted Earnings per basic share” to supplement its consolidated financial statements, which are presented in accordance with IFRS.
The Company believes that these measures, together with measures determined in accordance with IFRS, provide investors with an improved ability to evaluate the underlying performance of the Company. Non-IFRS measures do not have any standardized meaning prescribed under IFRS, and therefore they may not be comparable to similar measures employed by other companies. The data is intended to provide additional information and should not be considered in isolation or as a substitute for measures of performance prepared in accordance with IFRS.
Adjusted Earnings and Adjusted Earnings per Basic Share
“Adjusted earnings” is defined as “Net earnings (loss)” less certain items: “Foreign exchange gain (loss)”, “Impairment charges”, “Gains (losses) on disposal of exploration and evaluation assets”, “Unrealized gain (loss) on investments”, “Impairment on financial assets and investments in associates”, “Share of income (loss) of associates”, “Deferred income tax expense” and other unusual items such as transaction costs.
Adjusted earnings per basic share is obtained from the “adjusted earnings” divided by the “Weighted average number of common shares outstanding” for the period.
|
| Three months ended |
| ||
(in thousands of dollars, except per share amounts) |
| 2019 |
| 2018 |
|
|
| $ |
| $ |
|
|
|
|
|
|
|
Net earnings (loss) |
| (26,549 | ) | 2,310 |
|
Adjustments: |
|
|
|
|
|
Impairment of asset |
| 38,900 |
| — |
|
Foreign exchange loss |
| 1,159 |
| 898 |
|
Unrealized loss on investments |
| 35 |
| 2,581 |
|
Share of loss of associates |
| 1,762 |
| 1,397 |
|
Deferred income tax expense (recovery) |
| (9,482 | ) | 1,667 |
|
Adjusted earnings |
| 5,825 |
| 8,853 |
|
Weighted average number of common shares outstanding (000’s) |
| 155,059 |
| 157,665 |
|
Adjusted earnings per basic share |
| 0.04 |
| 0.06 |
|
Forward-looking Statements
Certain statements contained in this MD&A may be deemed “forward-looking statements” within the meaning of applicable Canadian and U.S. securities laws. All statements in this MD&A, other than statements of historical fact, that address future events, developments or performance that Osisko expects to occur including management’s expectations regarding Osisko’s growth, results of operations, estimated future revenues, requirements for additional capital, mineral reserve and mineral resource estimates, production estimates, production costs and revenue estimates, future demand for and prices of commodities, business prospects and opportunities and outlook on gold, silver, diamonds, other commodities and currency markets are forward-looking statements. In addition, statements (including data in tables) relating to mineral reserves and resources and gold equivalent ounces are forward-looking statements, as they involve implied assessment, based on certain estimates and assumptions, and no assurance can be given that the estimates will be realized. Forward-looking statements are statements that are not historical facts and are generally, but not always, identified by the words “expects”, “plans”, “anticipates”, “believes”, “intends”, “estimates”, “projects”, “potential”, “scheduled” and similar expressions or variations (including negative variations), or that events or conditions “will”, “would”, “may”, “could” or “should” occur including, without limitation, the performance of the assets of Osisko, the estimate of gold equivalent ounces to be received in 2019, the realization of the anticipated benefits deriving from Osisko’s investments and transactions, and Osisko’s ability to seize future opportunities. Although Osisko believes the expectations expressed in such forward-looking statements are based on reasonable assumptions, such statements involve known and unknown risks, uncertainties and other factors, most of which are beyond the control of Osisko, and are not guarantees of future performance and actual results may accordingly differ materially from those in forward-looking statements. Factors that could cause the actual results to differ materially from those in forward-looking statements include, without limitation: fluctuations in the prices of the commodities that drive royalties, streams, offtakes and investments held by Osisko; fluctuations in the value of the Canadian dollar relative to the U.S. dollar; regulatory changes by national and local governments, including permitting and licensing regimes and taxation policies; regulations and political or economic developments in any of the countries where properties in which Osisko holds a royalty, stream or other interest are located or through which they are held; risks related to the operators of the properties in which Osisko holds a royalty, stream or other interests; the unfavorable outcome of litigation relating to any of the properties in which Osisko holds a royalty, stream or other interests; business opportunities that become available to, or are pursued by Osisko; continued availability of capital and financing and general economic, market or business conditions; litigation; title, permit or license disputes related to interests on any of the properties in which Osisko holds a royalty, stream or other interest; development, permitting, infrastructure, operating or technical difficulties on any of the properties in which Osisko holds a royalty, stream or other interest; rate and timing of production differences from resource estimates or production forecasts by operators of properties in which Osisko holds a royalty, stream or other interest; risks and hazards associated with the business of exploring, development and mining on any of the properties in which Osisko holds a royalty, stream or other interest, including, but not limited to unusual or unexpected geological and metallurgical conditions, slope failures or cave-ins, flooding and other natural disasters or civil unrest or other uninsured risks. The forward-looking statements contained in this MD&A are based upon assumptions management believes to be reasonable, including, without limitation: the ongoing operation of the properties in which Osisko holds a royalty, stream or other interest by the owners or operators of such properties in a manner consistent with past practice; the accuracy of public statements and disclosures made by the owners or operators of such underlying properties; no material adverse change in the market price of the commodities that underlie the asset portfolio; no adverse development in respect of any significant property in which Osisko holds a royalty, stream or other interest; the accuracy of publicly disclosed expectations for the development of underlying properties that are not yet in production; and the absence of any other factors that could cause actions, events or results to differ from those anticipated, estimated or intended. For additional information on risks, uncertainties and assumptions, please refer to the Annual Information Form of Osisko filed on SEDAR at www.sedar.com and EDGAR at www.sec.gov which also provides additional general assumptions in connection with these statements. Osisko cautions that the foregoing list of risk and uncertainties is not exhaustive. Investors and others should carefully consider the above factors as well as the uncertainties they represent and the risk they entail. Osisko believes that the assumptions reflected in those forward-looking statements are reasonable, but no assurance can be given that these expectations will prove to be correct and such forward-looking statements included in this MD&A should not be unduly relied upon. These statements speak only as of the date of this MD&A. Osisko undertakes no obligation to publicly update or revise any forward-looking statements, whether as a result of new information, future events or otherwise, other than as required by applicable law.
Cautionary Note to U.S. Investors Regarding the Use of Mineral Reserve and Mineral Resource Estimates
Osisko is subject to the reporting requirements of the applicable Canadian securities laws, and as a result reports its mineral reserves according to Canadian standards. Canadian reporting requirements for disclosure of mineral properties are governed by National Instrument 43-101, Standards of Disclosure for Mineral Properties (“NI 43-101”). The definitions of NI 43-101 are adopted from those given by the Canadian Institute of Mining, Metallurgy and Petroleum (“CIM”). U.S. reporting requirements are currently governed by the SEC’s Industry Guide 7 (“Guide 7”). This MD&A includes estimates of mineral reserves and mineral resources reported in accordance with NI 43-101. These reporting standards have similar goals in terms of conveying an appropriate level of confidence in the disclosures being reported, but embody different approaches and definitions. For example, under Guide 7, mineralization may not be classified as a “reserve” unless the determination has been made that the mineralization could be economically and legally produced or extracted at the time the reserve determination is made. Consequently, the definitions of “Proven Mineral Reserves” and “Probable Mineral Reserves” under CIM standards differ in certain respects from the standards of Guide 7. Osisko also reports estimates of “mineral resources” in accordance with NI 43-101. While the terms “Mineral Resource,” “Measured Mineral Resource,” “Indicated Mineral Resource” and “Inferred Mineral Resource” are recognized by NI 43-101, they are not defined terms under Guide 7 and, generally, U.S. companies reporting pursuant to Guide 7 are not permitted to report estimates of mineral resources of any category in documents filed with the SEC. As such, certain information contained in this MD&A concerning descriptions of mineralization and estimates of mineral reserves and mineral resources under Canadian standards is not comparable to similar information made public by United States companies subject to the reporting and disclosure requirements of the SEC pursuant to Guide 7. Readers are cautioned not to assume that all or any part of Measured Mineral Resources or Indicated Mineral Resources will ever be converted into Mineral Reserves. Readers are also cautioned not to assume that all or any part of an Inferred Mineral Resource exists, or is economically or legally mineable. Further, an “Inferred Mineral Resource” has a great amount of uncertainty as to its existence and as to its economic and legal feasibility, and a reader cannot assume that all or any part of an Inferred Mineral Resource will ever be upgraded to a higher category. Under Canadian rules, estimates of Inferred Mineral Resources may not form the basis of feasibility or other economic studies.
(Signed) Sean Roosen |
| (Signed) Elif Lévesque |
Sean Roosen |
| Elif Lévesque |
Chair and Chief Executive Officer |
| Vice President, Finance and Chief Financial Officer |
|
|
|
May 1, 2019 |
|
|
Corporate Information |
|
|
|
Corporate Office | Osisko Bermuda Limited |
1100 av. des Canadiens-de-Montréal | Cumberland House |
Suite 300 | 1 Victoria Street |
Montréal, Québec, Canada H3B 2S2 | Hamilton HM11 |
Tel.: (514) 940-0670 | Bermuda |
Fax: (514) 940-0669 | Tel.: (441) 824-7474 |
Email: info@osiskogr.com | Fax: (441) 292-6140 |
Web site: www.osiskogr.com |
|
| Michael Spencer, Managing Director |
|
|
|
|
Directors | Officers |
Sean Roosen, Chair and Chief Executive Officer | Sean Roosen, Chair and Chief Executive Officer |
Joanne Ferstman, Lead Director | Bryan A. Coates, President |
Françoise Bertrand | Luc Lessard, Senior Vice President, Technical Services |
John Burzynski | Elif Lévesque, Vice President, Finance and Chief |
Pierre D. Chenard(1) | Financial Officer |
Christopher C. Curfman | Joseph de la Plante, Vice President, Corporate Development |
André Gaumond(1) | André Le Bel, Vice President, Legal Affairs and |
Pierre Labbé | Corporate Secretary |
Oskar Lewnowski | Frédéric Ruel, Vice President and Corporate Controller |
Charles E. Page | François Vézina, Vice President, Technical Services |
|
|
(1) Mr. Pierre D. Chenard and André Gaumond are not standing for re-election at the 2019 Annual Meeting of Shareholders.
Qualified Person (as defined by NI 43-1 01) |
|
Guy Desharnais, Director of Mineral Resources Evaluation |
|
Exchange listings |
|
Toronto Stock Exchange |
|
|
|
· Common shares: | OR |
· Warrants: | OR.WT (Exercise price: $36.50 / Expiry date: March 5, 2022) |
· Convertible debentures: | OR.DB (Conversion price: $22.89 / Maturity date: December 31, 2022) |
|
|
New York Stock Exchange |
|
|
|
· Common shares: | OR |
|
|
Dividend Reinvestment Plan |
|
Information available at http://osiskogr.com/en/dividends/drip/ | |
| |
Transfer Agents | |
Canada: AST Trust Company (Canada) | |
United States of America: American Stock Transfer & Trust Company, LLC | |
| |
Auditors | |
PricewaterhouseCoopers LLP/s.r.l./s.e.n.c.r.l. | |