As filed with the Securities and Exchange Commission on September 15, 2016
File No. 000-
U.S. SECURITIES AND EXCHANGE COMMISSION
Washington, D.C. 20549
FORM 10
GENERAL FORM FOR REGISTRATION OF SECURITIES
PURSUANT TO SECTION 12(b) OR 12(g) OF
THE SECURITIES EXCHANGE ACT OF 1934
Golub Capital Investment Corporation
(Exact name of registrant as specified in charter)
| Maryland | | 47-1893276 |
| (State or other jurisdiction of incorporation or registration) | | (I.R.S. Employer Identification No.) |
150 South Wacker Drive, Suite 800 Chicago, Illinois | | 60606 |
| (Address of principal executive offices) | | (Zip Code) |
(312) 205-5050
(Registrant’s telephone number, including area code)
with copies to:
Thomas J. Friedmann
David J. Harris
William J. Tuttle
Dechert LLP
One International Place, 40th Floor
100 Oliver Street
Boston, MA 02110
(617) 728-7100
Securities to be registered pursuant to Section 12(b) of the Exchange Act:
None
Securities to be registered pursuant to Section 12(g) of the Exchange Act:
Common Stock, par value $0.001 per share
(Title of class)
Indicate by check mark whether the registrant is a large accelerated filer, an accelerated filer, a non-accelerated filer, or a smaller reporting company. See definitions of “large accelerated filer,” “accelerated filer” and “smaller reporting company” in Rule 12b-2 of the Exchange Act. (Check one):
| Large accelerated filer | | ¨ | | Accelerated filer | | ¨ |
| | | | |
| Non-accelerated filer | | x (Do not check if a smaller reporting company) | | Smaller reporting company | | ¨ |
TABLE OF CONTENTS
EXPLANATORY NOTE
Golub Capital Investment Corporation is filing this registration statement on Form 10, or the Registration Statement, under the Securities Exchange Act of 1934, as amended, or the Exchange Act, on a voluntary basis in connection with its election to be regulated as a business development company under the Investment Company Act of 1940, or the 1940 Act, and in order to provide current public information to the investment community. Once this Registration Statement is effective, we will be subject to the requirements of Section 13(a) of the Exchange Act, including the rules and regulations promulgated thereunder, which will require us, among other things, to file annual reports on Form 10-K, quarterly reports on Form 10-Q and current reports on Form 8-K, and we will be required to comply with all other obligations of the Exchange Act applicable to issuers filing registration statements pursuant to Section 12(g) of the Exchange Act.
In this Registration Statement, unless otherwise specified, the terms:
| | • | “we,” “us,” “our” and “GCIC” refer to Golub Capital Investment Corporation, a Maryland corporation, and its consolidated subsidiaries; |
| | | |
| | • | “GCIC Funding” refers to GCIC Funding LLC, a Delaware limited liability company, or LLC, our direct subsidiary; |
| | | |
| | • | “GCIC Holdings” refers to GCIC Holdings LLC, a Delaware LLC, our direct subsidiary; |
| | | |
| | • | “GCIC 2016 Issuer” refers to Golub Capital Investment Corporation CLO 2016(M) LLC, a Delaware LLC, our direct subsidiary; |
| | | |
| | • | “GCIC 2016 Debt Securitization” refers to the $410.1 million term debt securitization that we completed on August 16, 2016, in which the GCIC 2016 Issuer issued notes, or the Notes, consisting of $220.0 million of Aaa/AAA Class A Notes, which bear interest at a rate of three-month LIBOR plus 2.15%, $32.5 million of Aa1 Class B Notes which bear interest at a rate of three-month LIBOR plus 3.00%, $42.3 million Class C Notes, which bear interest at a rate of three-month LIBOR plus 3.10%, and $28.6 million Class D Notes, which bear interest at a rate of three-month LIBOR plus 3.25%, and issued $86.7 million of LLC equity interests that were retained by the Company in partial consideration for the loans transferred as part of the debt securitization. |
| | | |
| | • | “GCIC SLF” refers to GCIC Senior Loan Fund LLC, an unconsolidated Delaware LLC, in which we co-invest with an unaffiliated third party, currently Aurora National Life Assurance Company, or Aurora, primarily in senior secured loans of middle-market companies. GCIC SLF is capitalized as transactions are completed and all portfolio and investment decisions in respect of GCIC SLF must be approved by the GCIC SLF investment committee, which presently consists of two representatives of each of the members (with unanimous approval required from either (i) one representative of each of us and Aurora or (ii) both representatives of each of us and Aurora). We will own 87.5% of both the outstanding subordinated notes and LLC equity interests of GCIC SLF at all times. As of June 30, 2016, GCIC SLF had subordinated note commitments from its members totaling $100.0 million and LLC equity interest subscriptions from its members totaling $25.0 million. We have committed to fund $87.5 million of subordinated notes and $21.9 million of LLC equity interest subscriptions to GCIC SLF; |
| | | |
| | • | “Credit Facility” refers to the senior secured revolving credit facility that GCIC Funding originally entered into on October 10, 2014 with Wells Fargo Securities, LLC, as administrative agent, and Wells Fargo Bank, N.A., as lender, that, as most recently amended on July 12, 2016, allows for borrowing of up to $420.0 million and that bears interest at a rate of one-month London Interbank Offered Rate, or LIBOR, plus 2.25% per annum through the reinvestment period, which ends May 12, 2017, and bears interest at a rate of one-month LIBOR plus 2.75% for the period following the reinvestment period through the stated maturity date of May 13, 2020; |
| | | |
| | • | “Revolver” refers to the $40.0 million revolving line of credit with GC Advisors; |
| | | |
| | • | “SMBC Revolver” refers to the $75.0 million revolving credit facility that GCIC entered into on May 17, 2016 with Sumitomo Mitsui Banking Corporation as administrative agent, sole lead arranger and sole manager; |
| | • | “GC Advisors” refers to GC Advisors LLC, a Delaware LLC, our investment adviser; |
| | | |
| • | “Administrator” refers to Golub Capital LLC, a Delaware LLC, an affiliate of GC Advisors and our administrator; and |
| | | |
| | • | “Golub Capital” refers, collectively, to the activities and operations of Golub Capital Incorporated, Golub Capital LLC (formerly Golub Capital Management LLC), which entity employs all of Golub Capital’s investment professionals, GC Advisors and associated investment funds and their respective affiliates. |
FORWARD-LOOKING STATEMENTS
Some of the statements in this Registration Statement constitute forward-looking statements, which relate to future events or our future performance or financial condition. The forward-looking statements contained in this Registration Statement involve risks and uncertainties, including statements as to:
| • | | our future operating results; |
| | | |
| • | | our business prospects and the prospects of our portfolio companies; |
| | | |
| • | | the effect of investments that we expect to make and the competition for those investments; |
| | | |
| • | | our contractual arrangements and relationships with third parties; |
| | | |
| • | | actual and potential conflicts of interest with GC Advisors and other affiliates of Golub Capital; |
| | | |
| • | | the dependence of our future success on the general economy and its effect on the industries in which we invest; |
| | | |
| • | | the ability of our portfolio companies to achieve their objectives; |
| | | |
| • | | the use of borrowed money to finance a portion of our investments; |
| | | |
| • | | the adequacy of our financing sources and working capital; |
| | | |
| • | | the timing of cash flows, if any, from the operations of our portfolio companies; |
| | | |
| • | | general economic trends and other external factors; |
| | | |
| • | | the ability of GC Advisors to locate suitable investments for us and to monitor and administer our investments; |
| | | |
| • | | the ability of GC Advisors or its affiliates to attract and retain highly talented professionals; |
| | | |
| • | | our ability to qualify and maintain our qualification as a regulated investment company, or RIC, and as a business development company; |
| | | |
| • | | general price and volume fluctuations in the stock markets; |
| | | |
| • | | the impact on our business of the Dodd-Frank Wall Street Reform and Consumer Protection Act, or Dodd-Frank, and the rules and regulations issued thereunder; and |
| | | |
| • | | the effect of changes to tax legislation and our tax position. |
Such forward-looking statements may include statements preceded by, followed by or that otherwise include the words “may,” “might,” “will,” “intend,” “should,” “could,” “can,” “would,” “expect,” “believe,” “estimate,” “anticipate,” “predict,” “potential,” “plan” or similar words. The forward-looking statements contained in this Registration Statement involve risks and uncertainties. Our actual results could differ materially from those implied or expressed in the forward-looking statements for any reason, including the factors set forth as “Item 1A. Risk Factors” and elsewhere in this Registration Statement.
We have based the forward-looking statements included in this Registration Statement on information available to us on the date of the filing of this Registration Statement. Actual results could differ materially from those anticipated in our forward-looking statements and future results could differ materially from historical performance. You are advised to consult any additional disclosures that we may make directly to you or through reports that we in the future may file with the Securities and Exchange Commission, or SEC, including annual reports on Form 10-K, quarterly reports on Form 10-Q and current reports on Form 8-K. This Registration Statement contains statistics and other data that have been obtained from or compiled from information made available by third-party service providers. We have not independently verified such statistics or data.
You should understand that, under Sections 27A(b)(2)(B) of the Securities Act of 1933, as amended, or the Securities Act, and Section 21E(b)(2)(B) of the Exchange Act, the “safe harbor” provisions of the Private Securities Litigation Reform Act of 1995 do not apply to the statements made in this Registration Statement or in periodic reports we will file under the Exchange Act upon effectiveness of this Registration Statement.
ITEM 1. BUSINESS.
Golub Capital Investment Corporation
We are an externally managed, closed-end, non-diversified management investment company that has elected to be regulated as a business development company under the Investment Company Act of 1940, as amended, or the 1940 Act. In addition, for U.S. federal income tax purposes, we have elected to be treated as a RIC under Subchapter M of the Internal Revenue Code of 1986, as amended, or the Code. We were formed in September 2014 to make investments and generate current income and capital appreciation by investing primarily in senior secured and one stop (a loan that combines characteristics of traditional first lien senior secured loans and second lien or subordinated loans) loans of middle-market companies that are, in most cases, sponsored by private equity firms. We structure our one stop loans as senior secured loans, and we obtain security interests in the assets of the portfolio company that serve as collateral in support of the repayment of these loans. This collateral may take the form of first-priority liens on the assets of the portfolio company. In many cases, we are the sole lender, or we together with our affiliates are the sole lenders, of one stop loans, which can afford us additional influence over the borrower in terms of monitoring and, if necessary, remediation in the event of underperformance. In this Registration Statement, the term “middle-market” generally refers to companies having earnings before interest, taxes, depreciation and amortization, or EBITDA, of between $10.0 million and $75.0 million annually.
Our investment objective is to generate current income and capital appreciation by investing primarily in senior secured and one stop loans of U.S. middle-market companies. We may also selectively invest in second lien and subordinated (a loan that ranks senior only to a borrower’s equity securities and ranks junior to all of such borrower’s other indebtedness in priority of payment) loans of, and warrants and minority equity securities in, middle-market companies. We intend to achieve our investment objective by (1) accessing the established loan origination channels developed by Golub Capital, a leading lender to middle-market companies with over $18.0 billion in capital under management as of June 30, 2016, (2) selecting investments within our core middle-market company focus, (3) partnering with experienced private equity firms, or sponsors, in many cases with whom Golub Capital has invested alongside in the past, (4) implementing the disciplined underwriting standards of Golub Capital and (5) drawing upon the aggregate experience and resources of Golub Capital.
We were formed on September 22, 2014, and we commenced operations on December 31, 2014 upon completion of our formation transactions, or the Formation Transactions. See “— Formation Transactions” below. We have sold and continue to offer shares of our common stock in private placement transactions pursuant to certain exemptions of the Securities Act the laws of the states and jurisdictions where any offering is made. See “— Private Placement of Our Common Stock” below.
We seek to create a portfolio that includes primarily senior secured and one stop loans by primarily investing approximately $5.0 million to $30.0 million of capital, on average, in the securities of U.S. middle-market companies. We may also selectively invest more than $30.0 million in some of our portfolio companies and generally expect that the size of our individual investments will vary proportionately with the size of our capital base.
We generally invest in securities that have been rated below investment grade by independent rating agencies or that would be rated below investment grade if they were rated. These securities, which may be referred to as “junk,” have predominantly speculative characteristics with respect to the issuer’s capacity to pay interest and repay principal. In addition, many of our debt investments have floating interest rates that reset on a periodic basis and typically do not fully pay down principal prior to maturity, which may increase our risk of losing part or all of our investment.
As of June 30, 2016 and September 30, 2015, our portfolio at fair value was comprised of the following:
| | | As of June 30, 2016 | | | As of September 30, 2015 | |
| | | Investments at
Fair Value | | | Percentage of
Total | | | Investments at
Fair Value | | | Percentage of
Total | |
| Investment Type | | (In thousands) | | | Investments | | | (In thousands) | | | Investments | |
| | | | | | | | | | | | | |
| Senior secured | | $ | 108,494 | | | | 11.9 | % | | $ | 153,194 | | | | 27.8 | % |
| One stop | | | 744,357 | | | | 81.5 | | | | 393,563 | | | | 71.3 | |
| Subordinated debt | | | 39 | | | | 0.0 | * | | | - | | | | - | |
| Subordinated notes in GCIC SLF (1) | | | 34,567 | | | | 3.8 | | | | - | | | | - | |
| LLC equity interests in GCIC SLF (1) | | | 13,385 | | | | 1.5 | | | | - | | | | - | |
| Equity | | | 11,997 | | | | 1.3 | | | | 5,121 | | | | 0.9 | |
| Total | | $ | 912,839 | | | | 100.0 | % | | $ | 551,878 | | | | 100.0 | % |
| * | Represents an amount less than 0.1% |
| (1) | Proceeds from the subordinated notes and LLC equity interests invested in GCIC SLF were utilized by GCIC SLF to invest in senior secured loans. |
One stop loans include loans to technology companies undergoing strong growth due to new services, increased adoption and/or entry into new markets. We refer to loans to these companies as late stage lending loans. Other targeted characteristics of late stage lending businesses include strong customer revenue retention rates, a diversified customer base and backing from growth equity or venture capital firms. In some cases, the borrower’s high revenue growth is supported by a high level of discretionary spending. As part of the underwriting of such loans and consistent with industry practice, we may adjust our characterization of the earnings of such borrowers for a reduction or elimination of such discretionary expenses, if appropriate. As of June 30, 2016 and September 30, 2015, one stop loans included $31.2 million and $7.9 million, respectively, of late stage lending loans at fair value.
As of June 30, 2016 and September 30, 2015, we had debt and equity investments in 156 and 141 portfolio companies, respectively, and, as of June 30, 2016, we had investments in subordinated notes and LLC equity interests in GCIC SLF.
The weighted average annualized income yield and weighted average annualized investment income yield of our income producing debt investments, which represented nearly 100% of our debt investments, for the three and nine months ended June 30, 2016 and 2015 and the year ended September 30, 2015 were as follows:
| | | For the three months
ended June 30, | | | For the nine months
ended June 30, | | | For the year
ended
September 30, | |
| | | 2016 | | | 2015 | | | 2016 | | | 2015 | | | 2015 | |
| Weighted average annualized income yield (1)(2) | | | 7.4 | % | | | 6.9 | % | | | 7.3 | % | | | 7.0 | % | | | 6.9 | % |
| Weighted average annualized investment income yield (2)(3) | | | 7.7 | % | | | 7.1 | % | | | 7.7 | % | | | 7.3 | % | | | 7.2 | % |
| (1) | Represents income from interest, including subordinated notes in GCIC SLF, and fees excluding amortization of capitalized fees and discounts divided by the average fair value of earning debt investments. |
| (2) | For the nine months ended June 30, 2015 and for the year ended September 30, 2015, the averages are calculated from December 31, 2014, the date of the commencement of operations, through June 30, 2015 and September 30, 2015, respectively. |
| (3) | Represents income from interest, including subordinated notes in GCIC SLF, fees and amortization of capitalized fees and discounts divided by the average fair value of earning debt investments. |
As of June 30, 2016, we and Aurora owned 87.5% and 12.5%, respectively, of both the outstanding subordinated notes and LLC equity interests of GCIC SLF. Additionally, on October 21, 2015, GCIC Senior Loan Fund II LLC, a wholly-owned subsidiary of GCIC SLF, or GCIC SLF II, entered into a senior secured revolving credit facility, or the GCIC SLF Credit Facility, with Wells Fargo Bank, N.A., which allows GCIC SLF II to borrow up to $150.0 million, subject to leverage and borrowing base restrictions. The reinvestment period of the GCIC SLF Credit Facility ends October 22, 2017, and the stated maturity date is October 21, 2020. As of June 30, 2016 and September 30, 2015, GCIC SLF had subordinated note commitments from its members totaling $100.0 million, of which approximately $ 39.9 million and $0 in aggregate principal amount was funded at June 30, 2016 and September 30, 2015, respectively. As of June 30, 2016 and September 30, 2015, GCIC SLF had LLC equity interest subscriptions from its members totaling $25 million, of which approximately $14.0 million and $0 in aggregate was called and contributed as of June 30, 2016 and September 30, 2015, respectively. Our investment in GCIC SLF is not a qualifying asset under Section 55(a) of the 1940 Act. Under the 1940 Act, we may not acquire any non-qualifying asset unless, at the time the acquisition is made, qualifying assets represent at least 70% of our total assets.
Our Adviser
Our investment activities are managed by our investment adviser, GC Advisors. GC Advisors is responsible for sourcing potential investments, conducting research and due diligence on prospective investments and equity sponsors, analyzing investment opportunities, structuring our investments and monitoring our investments and portfolio companies on an ongoing basis. GC Advisors was organized in September 2008 and is a registered investment adviser under the Investment Advisers Act of 1940, as amended, or the Advisers Act. Under our investment advisory agreement, or the Investment Advisory Agreement, with GC Advisors, we pay GC Advisors a base management fee and an incentive fee for its services. See “— Investment Advisory Agreement — Management Fee” for a discussion of the base management fee and incentive fee, including the cumulative income incentive fee and the income and capital gains incentive fee, payable by us to GC Advisors. Unlike most closed-end funds whose fees are based on assets net of leverage, our base management fee is based on our average-adjusted gross assets (including leverage but adjusted to exclude cash and cash equivalents so that investors do not pay the base management fee on such assets) and, therefore, GC Advisors benefits when we incur debt or use leverage. For purposes of the Investment Advisory Agreement, cash equivalents means U.S. government securities and commercial paper instruments maturing within 270 days of purchase. Additionally, under the incentive fee structure, GC Advisors benefits when capital gains are recognized and, because it determines when a holding is sold, GC Advisors controls the timing of the recognition of capital gains. Our board of directors is charged with protecting our interests by monitoring how GC Advisors addresses these and other conflicts of interest associated with its management services and compensation. While not expected to review or approve each borrowing, our independent directors periodically review GC Advisors’ services and fees as well as its portfolio management decisions and portfolio performance. In connection with these reviews, our independent directors consider whether our fees and expenses (including those related to leverage) remain appropriate. See “— Investment Advisory Agreement — Board Approval of the Investment Advisory Agreement.”
GC Advisors is an affiliate of Golub Capital and pursuant to a staffing agreement, or the Staffing Agreement, Golub Capital LLC makes experienced investment professionals available to GC Advisors and provides access to the senior investment personnel of Golub Capital LLC and its affiliates. The Staffing Agreement provides GC Advisors with access to investment opportunities, which we refer to in the aggregate as deal flow, generated by Golub Capital LLC and its affiliates in the ordinary course of their businesses and commits the members of GC Advisors’ investment committee to serve in that capacity. As our investment adviser, GC Advisors is obligated to allocate investment opportunities among us and its other clients fairly and equitably over time in accordance with its allocation policy. See “— Conflicts of Interest” below and “Item 7. Certain Relationships and Related Transactions, and Director Independence.” However, there can be no assurance that such opportunities will be allocated to us fairly or equitably in the short-term or over time. GC Advisors seeks to capitalize on the significant deal origination, credit underwriting, due diligence, investment structuring, execution, portfolio management and monitoring experience of Golub Capital LLC’s investment professionals.
Golub Capital LLC
Golub Capital LLC, our Administrator and an affiliate of GC Advisors, provides the administrative services necessary for us to operate. See “— Administration Agreement” below for a discussion of the fees and expenses (subject to the review and approval of our independent directors) we are required to reimburse to the Administrator.
About Golub Capital
Golub Capital, founded in 1994, is a leading lender to middle-market companies, with a long track record of investing in senior secured, one stop, second lien and subordinated loans. As of June 30, 2016, Golub Capital managed over $13.1 billion of invested or available capital for senior secured, one stop, second lien and subordinated loan investments in middle-market companies. Since its inception, Golub Capital has closed deals with over 200 middle-market sponsors and repeat transactions with over 130 sponsors.
Golub Capital’s middle-market lending group is managed by a four-member senior management team consisting of Lawrence E. Golub, David B. Golub, Andrew H. Steuerman and Gregory W. Cashman. As of June 30, 2016, Golub Capital’s more than 90 investment professionals had an average of over 12 years of investment experience and were supported by more than 185 administrative and back office personnel that focus on operations, finance, legal and compliance, accounting and reporting, marketing, information technology and office management.
Market Trends
We have identified the following trends that may affect our business:
Target Market. We believe that small and middle-market companies in the United States with annual revenues between $10.0 million and $2.5 billion represent a significant growth segment of the U.S. economy and often require substantial capital investments to grow. Middle -market companies have generated a significant number of investment opportunities for investment funds managed or advised by Golub Capital, and we believe that this market segment will continue to produce significant investment opportunities for us.
Specialized Lending Requirements. We believe that several factors render many U.S. financial institutions ill-suited to lend to U.S. middle-market companies. For example, based on the experience of our management team, lending to U.S. middle-market companies (1) is generally more labor intensive than lending to larger companies due to the smaller size of each investment and the fragmented nature of information for such companies, (2) requires due diligence and underwriting practices consistent with the demands and economic limitations of the middle market and (3) may also require more extensive ongoing monitoring by the lender.
Demand for Debt Capital. We believe there is a large pool of uninvested private equity capital for middle-market companies. We expect private equity firms will seek to leverage their investments by combining equity capital with senior secured loans and subordinated debt from other sources, such as us.
Competition from Bank Lenders. We believe that many commercial and investment banks have, in recent years, de-emphasized their service and product offerings to middle-market businesses in favor of lending to large corporate clients and managing capital markets transactions. In addition, these lenders may be constrained in their ability to underwrite and hold bank loans for middle-market issuers as they seek to meet existing and future regulatory capital requirements. We believe these factors may result in opportunities for alternative funding sources to middle-market companies and therefore more market opportunities for us.
Market Environment. We believe that as part of the path of economic recovery following the credit crisis, there has been increased competition for new middle-market investments due to some new non-bank finance companies that have entered the market and due to improving financial performance of middle-market companies. However, we believe that our scale and strong market position will continue to allow us to find investment opportunities with attractive risk-adjusted returns.
Competitive Strengths
Deep, Experienced Management Team. We are managed by GC Advisors, which, as of June 30, 2016, had access through the Staffing Agreement to the resources and expertise of Golub Capital’s more than 280 employees, led by our chairman, Lawrence E. Golub, and our president and chief executive officer, David B. Golub. As of June 30, 2016, the more than 90 investment professionals of Golub Capital had an average of over 12 years of investment experience and were supported by more than 185 administrative and back office personnel that focus on operations, finance, legal and compliance, accounting and reporting, marketing, information technology and office management. GC Advisors also manages Golub Capital BDC, Inc., or GBDC, a Delaware corporation that has elected to be regulated as a business development company and whose shares of common stock are publicly traded on the Nasdaq Global Select Market. Golub Capital seeks to hire and retain high-quality investment professionals and reward those personnel based on investor returns.
Leading U.S. Debt Platform Provides Access to Proprietary Relationship-Based Deal Flow. GC Advisors gives us access to the deal flow of Golub Capital, one of the leading middle-market lenders in the United States. Golub Capital has been ranked a top 3 Traditional Middle Market Bookrunner each year from 2008 through 2Q 2016 by Thomson Reuters LPC for senior secured loans of up to $500.0 million for leveraged buyouts (based on number of deals completed). Since its inception, Golub Capital has closed deals with over 200 middle-market sponsors and repeat transactions with over 130 sponsors. We believe that Golub Capital receives relationship-based “early looks” and “last looks” at many investment opportunities in the U.S. middle-market market, allowing it to be highly selective in the transactions it pursues.
Disciplined Investment and Underwriting Process. GC Advisors utilizes the established investment process of Golub Capital for reviewing lending opportunities, structuring transactions and monitoring investments. Using its disciplined approach to lending, GC Advisors seeks to minimize credit losses through effective underwriting, comprehensive due diligence investigations, structuring and the implementation of restrictive debt covenants.
Regimented Credit Monitoring. Following each investment, GC Advisors implements a regimented credit monitoring system. This careful approach, which involves ongoing review and analysis by teams of professionals,
has enabled GC Advisors to identify problems early and to assist borrowers before they face difficult liquidity constraints.
Concentrated Middle-Market Focus. Because of our focus on the middle-market, we understand the following general characteristics of middle-market lending:
| | • | middle-market companies are generally less leveraged than large companies and, we believe, offer more attractive investment returns in the form of upfront fees, prepayment penalties and higher interest rates; |
| | • | middle-market issuers are more likely to have simple capital structures; |
| | • | carefully structured covenant packages enable middle-market lenders to take early action to remediate poor financial performance; and |
| | • | middle-market lenders can undertake thorough due diligence investigations prior to investment. |
Investment Criteria/Guidelines
We seek to generate strong risk-adjusted net returns by assembling a portfolio of investments across a broad range of industries and private equity investors.
We primarily target U.S. middle-market companies controlled by private equity investors that require capital for growth, acquisitions, recapitalizations, refinancings and leveraged buyouts. We may also make opportunistic loans to independently owned and publicly held middle-market companies. We seek to partner with strong management teams executing long-term growth strategies. Target businesses will typically exhibit some or all of the following characteristics:
| | • | annual EBITDA of $10.0 million to $75.0 million; |
| | | |
| | • | sustainable leading positions in their respective markets; |
| | | |
| | • | scalable revenues and operating cash flow; |
| | | |
| | • | experienced management teams with successful track records; |
| | | |
| | • | stable, predictable cash flows with low technology and market risks; |
| | | |
| | • | a substantial equity cushion in the form of capital ranking junior to our investment; |
| | | |
| | • | low capital expenditures requirements; |
| | | |
| | • | a North American base of operations; |
| | | |
| | • | strong customer relationships; |
| | | |
| | • | products, services or distribution channels having distinctive competitive advantages; |
| | | |
| | • | defensible niche strategy or other barriers to entry; and |
| | | |
| | • | demonstrated growth strategies. |
While we believe that the criteria listed above are important in identifying and investing in prospective portfolio companies, not all of these criteria will be met by each prospective portfolio company.
Investment Process Overview
We view our investment process as consisting of four distinct phases described below:
Origination. GC Advisors sources investment opportunities through access to a network of over 10,000 individual contacts developed in the financial services and related industries by Golub Capital and managed through a proprietary customer relationship database. Among these contacts is an extensive network of private equity firms and relationships with leading middle-market senior lenders. The senior deal professionals of Golub Capital supplement these leads through personal visits and marketing campaigns. It is their responsibility to identify specific opportunities, to refine opportunities through candid exploration of the underlying facts and circumstances and to apply creative and flexible thinking to solve clients’ financing needs. Golub Capital’s origination personnel are located in offices in Chicago, New York, San Francisco and Charlotte. Each originator maintains long-standing customer relationships and is responsible for covering a specified target market. We believe those originators’
strength and breadth of relationships across a wide range of markets generate numerous financing opportunities, which we believe enables GC Advisors to be highly selective in recommending investments to us.
Underwriting. We utilize the systematic, consistent approach to underwriting developed by Golub Capital, with a particular focus on determining the value of a business in a downside scenario. The key criteria that we consider include (1) strong and resilient underlying business fundamentals, (2) a substantial equity cushion in the form of capital ranking junior in right of payment to our investment and (3) a conclusion that overall “downside” risk is manageable. While the size of this equity cushion will vary over time and across industries, the equity cushion generally sought by GC Advisors today is between 35% and 45% of total portfolio capitalization. We generally focus on the criteria developed by Golub Capital for evaluating prospective portfolio companies, and we put more emphasis on credit considerations (such as (1) loan-to-value ratio (which is the amount of our loan divided by the enterprise value of the company in which we are investing), (2) the ability of the company to maintain a liquidity cushion through economic cycles and in downside scenarios, (3) the ability of the company to service its fixed charge obligations under a variety of scenarios and (4) its anticipated strategic value in a downturn) than on profit potential and loan pricing. Our due diligence process for middle-market credits will typically entail:
| | • | a thorough review of historical and pro forma financial information; |
| | | |
| | • | on-site visits; |
| | | |
| | • | interviews with management and employees; |
| | | |
| | • | a review of loan documents and material contracts; |
| | | |
| | • | third-party “quality of earnings” accounting due diligence; |
| | | |
| | • | when appropriate, background checks on key managers and research relating to the company’s business, industry, markets, customers, suppliers, products and services and competitors; and |
| | | |
| | • | the commission of third-party market studies when appropriate. |
The following chart illustrates the stages of Golub Capital’s evaluation and underwriting process:
ILLUSTRATIVE DEAL EVALUATION PROCESS
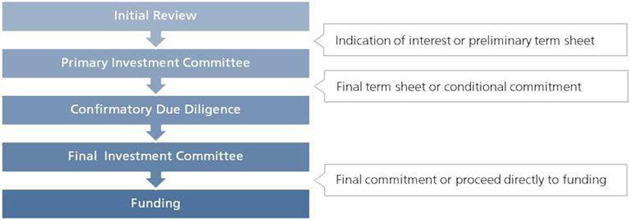
Execution. In executing transactions for us, GC Advisors utilizes the due diligence process developed by Golub Capital. Through a consistent approach to underwriting and careful attention to the details of execution, it seeks to close deals as fast or faster than competitive financing providers while maintaining discipline with respect to credit, pricing and structure to ensure the ultimate success of the financing. Upon completion of due diligence, the investment team working on an investment delivers a memorandum to GC Advisors’ investment committee. Once an investment has been approved by the investment committee, it moves through a series of steps towards negotiation of final documentation. Upon completion of final documentation, a loan is funded upon the execution of an investment committee memorandum by members of GC Advisors’ investment committee.
Monitoring. We view active portfolio monitoring as a vital part of our investment process. We consider board observation rights, where appropriate, regular dialogue with company management and sponsors and detailed, internally generated monitoring reports to be critical to our performance. Golub Capital has developed a monitoring
template that is designed to reasonably ensure compliance with these standards. This template is used by GC Advisors as a tool to assess investment performance relative to our investment plan.
As part of the monitoring process, GC Advisors regularly assesses the risk profile of each of our investments and rates each of them based on an internal system developed by Golub Capital and its affiliates. This system is not generally accepted in our industry or used by our competitors. It is based on the following categories, which we refer to as GC Advisors’ internal performance rating:
| Internal Performance Ratings |
| Rating | | Definition |
| 5 | | Involves the least amount of risk in our portfolio. The borrower is performing above expectations, and the trends and risk factors are generally favorable. |
| | | |
| 4 | | Involves an acceptable level of risk that is similar to the risk at the time of origination. The borrower is generally performing as expected, and the risk factors are neutral to favorable. |
| | | |
| 3 | | Involves a borrower performing below expectations and indicates that the loan’s risk has increased somewhat since origination. The borrower may be out of compliance with debt covenants; however, loan payments are generally not past due. |
| | | |
| 2 | | Involves a borrower performing materially below expectations and indicates that the loan’s risk has increased materially since origination. In addition to the borrower being generally out of compliance with debt covenants, loan payments may be past due (but generally not more than 180 days past due). |
| | | |
| 1 | | Involves a borrower performing substantially below expectations and indicates that the loan’s risk has substantially increased since origination. Most or all of the debt covenants are out of compliance and payments are substantially delinquent. Loans rated 1 are not anticipated to be repaid in full and we will reduce the fair market value of the loan to the amount we anticipate will be recovered. |
Our internal performance ratings do not constitute any rating of investments by a nationally recognized statistical rating organization or represent or reflect any third-party assessment of any of our investments.
For any investment rated 1, 2 or 3, GC Advisors will increase its monitoring intensity and prepare regular updates for the investment committee, summarizing current operating results and material impending events and suggesting recommended actions.
GC Advisors monitors and, when appropriate, changes the internal performance ratings assigned to each investment in our portfolio. In connection with our valuation process, GC Advisors and our board of directors review these internal performance ratings on a quarterly basis.
The following table shows the distribution of our investments on the 1 to 5 internal performance rating scale at fair value as of June 30, 2016 and September 30, 2015:
| | | As of June 30, 2016 | | | As of September 30, 2015 | |
| Internal | | Investments | | | Percentage of | | | Investments | | | Percentage of | |
| Performance | | at Fair Value | | | Total | | | at Fair Value | | | Total | |
| Rating | | (In thousands) | | | Investments | | | (In thousands) | | | Investments | |
| 5 | | $ | 16,267 | | | | 1.8 | % | | $ | 23,183 | | | | 4.2 | % |
| 4 | | | 840,814 | | | | 92.1 | | | | 514,348 | | | | 93.2 | |
| 3 | | | 55,586 | | | | 6.1 | | | | 14,133 | | | | 2.6 | |
| 2 | | | 172 | | | | 0.0 | * | | | 214 | | | | 0.0 | * |
| 1 | | | - | | | | - | | | | - | | | | - | |
| Total | | $ | 912,839 | | | | 100.0 | % | | $ | 551,878 | | | | 100.0 | % |
* Represents an amount less than 0.1%.
There were no investments outstanding as of September 30, 2014.
Investment Committee
GC Advisors’ investment committee, which is comprised of officers of GC Advisors, evaluates and approves all of our investments, subject to the oversight of our board of directors. The investment committee process is intended to bring the diverse experience and perspectives of the committee’s members to the analysis and consideration of each investment. The investment committee currently consists of Lawrence E. Golub, David B. Golub, Andrew H. Steuerman and Gregory W. Cashman. The investment committee serves to provide investment consistency and adherence to our core investment philosophy and policies. The investment committee also determines appropriate investment sizing and suggests ongoing monitoring requirements.
In addition to reviewing investments, investment committee meetings serve as a forum to discuss credit views and outlooks. Potential transactions and deal flow are reviewed on a regular basis. Members of the investment team are encouraged to share information and credit views with the investment committee early in their analysis. We believe this process improves the quality of the analysis and assists the deal team members to work more efficiently.
Each transaction is presented to the investment committee in a formal written report. All of our new investments must be approved by a consensus of the investment committee. Each member of the investment committee performs a similar role for other investment funds, accounts or other investment vehicles, collectively referred to as accounts, sponsored or managed by Golub Capital and its affiliates.
Investment Structure
Once we have determined that a prospective portfolio company is suitable for investment, we work with the management of that company and its other capital providers to structure an investment. We negotiate among these parties to agree on how our investment is expected to perform relative to the other capital in the portfolio company’s capital structure.
We structure our investments, which typically have maturities of three to seven years as described below. Our loans typically provide for moderate loan amortization in the early years of the loan, with the majority of the amortization deferred until loan maturity, and there is a risk of loss if the borrower is unable to pay the lump sum or refinance the amount at maturity.
Senior Secured Loans. When we structure investments in senior secured loans, we obtain security interests in the assets of the portfolio company that serve as collateral in support of the repayment of such loans. This collateral may take the form of first-priority liens on the assets of the portfolio company borrower.
One Stop Loans. We structure our one stop loans as senior secured loans. We obtain security interests in the assets of the portfolio company that serve as collateral in support of the repayment of these loans. This collateral may take the form of first-priority liens on the assets of the portfolio company. In many cases, we are the sole lender, or we together with our affiliates are the sole lenders, of one stop loans, which can afford us additional influence over the borrower in terms of monitoring and, if necessary, remediation in the event of underperformance.
Second Lien Loans. We structure these investments as junior, secured loans. We obtain security interests in the assets of the portfolio company that serve as collateral in support of the repayment of such loans. This collateral may take the form of second priority liens on the assets of a portfolio company.
Subordinated Loans. We structure these investments as unsecured, subordinated loans that provide for relatively high, fixed interest rates that provide us with significant current interest income. These loans typically have interest-only payments (often representing a combination of cash pay and payment-in-kind, or PIK, interest) in the early years. Subordinated loan investments are generally more volatile than secured loans and may involve a greater risk of loss of principal. In addition, the PIK feature of many subordinated loans, which effectively operates as negative amortization of loan principal, increases credit risk exposure over the life of the loan.
Subordinated loan investments are generally more volatile than secured loans and may involve a greater risk of loss of principal. In addition, the PIK feature of many subordinated loans, which effectively operates as negative amortization of loan principal, increases credit risk exposure over the life of the loan.
Warrants and Minority Equity Securities. In some cases, we may receive nominally priced warrants or options to buy a minority equity interest in the portfolio company in connection with a loan, which can allow us to achieve additional investment return from this equity interest. We may structure such warrants to include provisions protecting our rights as a minority-interest holder, as well as a “put,” or right to sell such securities back to the issuer, upon the occurrence of specified events.
Senior Loan Fund. We have invested in GCIC SLF, which invests in debt securities that are secured by a first lien on some or all of the issuer’s assets, including traditional senior debt and any related revolving or similar credit
facility, in generally the same manner as our senior secured loans. GCIC SLF commenced operations on October 21, 2015 and had a portfolio of loans to 39 different borrowers as of June 30, 2016.
We tailor the terms of each investment to the facts and circumstances of the transaction and the prospective portfolio company, negotiating a structure that protects our rights and manages our risk while creating incentives for the portfolio company to achieve its business plan and improve its operating results. We seek to limit the downside potential of our investments by:
| | • | selecting investments that we believe have a very low probability of loss; |
| | | |
| | • | requiring a total return on our investments that we believe will compensate us appropriately for credit risk; and |
| | | |
| | • | negotiating covenants in connection with our investments that afford our portfolio companies as much flexibility in managing their businesses as possible, consistent with the preservation of our capital. Such restrictions may include affirmative and negative covenants, default penalties, lien protection, change of control provisions and board rights. |
We expect to hold most of our investments to maturity or repayment, but we may sell some of our investments earlier if a liquidity event occurs, such as a sale, recapitalization or worsening of the credit quality of the portfolio company.
Investments
We seek to create a portfolio that includes primarily senior secured and one stop loans by investing approximately $5.0 million to $30.0 million of capital, on average, in the securities of middle-market companies. Set forth below is a list of our ten largest portfolio company investments as of June 30, 2016, as well as the top ten industries in which we and our subsidiaries were invested as of June 30, 2016, calculated as a percentage of our total investments as of such date, in each case, excluding GCIC SLF.
| Portfolio Company | | Fair Value
of Investments
(In thousands) | | | Percentage
of Total
Investments | |
| PT Intermediate Holdings III, LLC | | $ | 32,163 | | | | 3.7 | % |
| Diligent Corporation | | | 32,151 | | | | 3.7 | |
| Sovos Compliance Formerly Taxware, LLC | | | 31,950 | | | | 3.7 | |
| Mills Fleet Farm Group LLC | | | 30,662 | | | | 3.5 | |
| DCA Investment Holding, LLC | | | 30,059 | | | | 3.5 | |
| Bomgar Corporation | | | 29,050 | | | | 3.4 | |
| Vetcor Professional Practices LLC | | | 28,818 | | | | 3.3 | |
| Market Track, LLC | | | 28,770 | | | | 3.3 | |
| ADCS Clinics Intermediate Holdings, LLC | | | 22,667 | | | | 2.6 | |
| Workforce Software, LLC | | | 22,371 | | | | 2.6 | |
| | | $ | 288,661 | | | | 33.4 | % |
| Industry | | Fair Value
of Investments
(In thousands) | | | Percentage
of Total
Investments | |
| Diversified/Conglomerate Service | | $ | 178,377 | | | | 19.5 | % |
| Healthcare, Education and Childcare | | | 172,470 | | | | 18.9 | |
| Electronics | | | 126,068 | | | | 13.8 | |
| Retail Stores | | | 86,023 | | | | 9.4 | |
| Investment Funds and Vehicles | | | 47,952 | | | | 5.3 | |
| Automobile | | | 46,863 | | | | 5.1 | |
| Beverage, Food and Tobacco | | | 44,642 | | | | 4.9 | |
| Personal, Food and Miscellaneous Services | | | 42,863 | | | | 4.7 | |
| Printing and Publishing | | | 28,992 | | | | 3.2 | |
| Diversified/Conglomerate Manufacturing | | | 23,312 | | | | 2.6 | |
| | | $ | 797,562 | | | | 87.4 | % |
Managerial Assistance
As a business development company, we offer, and must provide upon request, significant managerial assistance to our portfolio companies. This assistance would involve an arrangement to provide significant guidance and counsel concerning the management, operations or business objectives and policies of the portfolio company. The Administrator or an affiliate of the Administrator provides such managerial assistance on our behalf to portfolio companies that request this assistance. We may receive fees for these services and reimburse the Administrator or an affiliate of the Administrator, as applicable, for its allocated costs in providing such assistance, subject to the review and approval by our board of directors, including our independent directors.
Competition
Our primary competitors in providing financing to middle-market companies include public and private funds, other business development companies, commercial and investment banks, commercial financing companies and, to the extent they provide an alternative form of financing, private equity and hedge funds. Many of our competitors are substantially larger and have considerably greater financial, technical and marketing resources than we do. For example, we believe some competitors may have access to funding sources that are not available to us. In addition, some of our competitors may have higher risk tolerances or different risk assessments, which could allow them to consider a wider variety of investments and establish more relationships than us. Furthermore, many of our competitors are not subject to the regulatory restrictions that the 1940 Act imposes on us as a business development company or to the source-of-income, asset diversification and distribution requirements we must satisfy to qualify as a RIC.
We use the expertise of the investment professionals of Golub Capital and its affiliates to which we have access to assess investment risks and determine appropriate pricing for our investments in portfolio companies. In addition, the relationships of the senior members of Golub Capital and its affiliates enable us to learn about, and compete effectively for, financing opportunities with attractive middle-market companies in the industries in which we invest. See “Item 1A. Risk Factors — Risks Relating to our Business and Structure — We operate in a highly competitive market for investment opportunities, which could reduce returns and result in losses.”
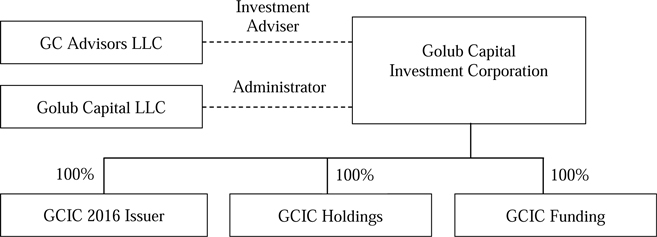
Organizational Structure
The following shows a simplified organizational chart reflecting our relationship with GC Advisors and the Administrator and our direct ownership interest in certain of our subsidiaries, as of the date of the filing of this Registration Statement:
Formation Transactions
We were formed on September 22, 2014, and we commenced operations on December 31, 2014. Immediately prior to our election to be regulated as a business development company, we acquired our initial portfolio of investments by purchasing (1) 100% of the equity interests of each of GCIC Holdings and GCIC Funding, from GEMS Fund, L.P., a Delaware limited partnership, or LP, whose general partner is controlled by GC Advisors, or GEMS, and (2) certain debt securities from unaffiliated third-party investors.
All of the loans comprising our initial portfolio of investments were senior secured and one stop loans to middle-market companies consistent with our investment objectives and strategies. In addition, each such loan had been underwritten by GC Advisors at the time of origination or acquisition using the same criteria and standards as GC Advisors uses in connection with the origination or acquisition of loans for us. See “— Investment Process Overview,” “— Investment Committee,” “— Investment Structure” and “— Investments” for additional information about our underwriting standards.
On December 31, 2014, certain investors entered into subscription agreements to purchase shares of our common stock in a private placement. Pursuant to a capital call on such subscription agreements, we issued 6,072,227.636 shares of our common stock on December 31, 2014 in exchange for aggregate capital contributions of $91.1 million. In addition, on December 30, 2014, GC Advisors transferred 666.670 shares of our common stock acquired in connection with our formation to GCOP LLC, an affiliate of GC Advisors, for $10,000.05.
The shares of our common stock acquired by GEMS, GCOP LLC and the unaffiliated investors in the private placement or in consideration for the sale of debt securities have not been and will not be registered under the Securities Act and are, accordingly, subject to restrictions on transfer.
In this Registration Statement, we refer to the transactions occurring immediately prior to our election to be regulated as a business development company as the Formation Transactions.
Private Placement of Our Common Stock
We have sold and continue to offer shares of our common stock in a private placement in the United States under the exemption provided by Section 4(a)(2) of the Securities Act and Regulation D promulgated thereunder, Regulation S under the Securities Act and other exemptions from the registration requirements of the Securities Act. Investors who acquire shares of our common stock in our private placement are required to complete, execute and deliver a subscription agreement, or a Subscription Agreement, and related documentation, which includes customary representations and warranties, certain covenants and restrictions and indemnification provisions. Additionally, such investors may be required to provide due diligence information for compliance with certain legal requirements. We do not presently intend to incur any placement or underwriting fees or sales commissions in connection with the private placement of our common stock, and we will not incur any such fees or commissions if our net proceeds received upon a sale of our common stock after such costs would be less than the net asset value per share of our common stock.
Pursuant to Subscription Agreements, investors make commitments to purchase shares of our common stock, or Capital Commitments. The Subscription Agreements provide that investors are required to fund capital contributions to purchase shares of our common stock, or a Drawdown Purchase, each time we deliver a drawdown notice, which we deliver at least ten calendar days prior to the date on which contributions will be due. Drawdown Purchases are allocated among investors with unfunded Capital Commitments in amounts proportional to the Capital Commitment of each investor in our private placement; provided, that we retain the right at our discretion to call Drawdown Purchases on a non-pro rata basis to comply with ownership limitations under the Employee Retirement Income Security Act of 1974, as amended, or ERISA, or to allow an investor with less than 20% of its original Capital Commitment remaining unfunded to subscribe for the full unfunded balance. Each Drawdown Purchase is made at a price per share of common stock equal to our most recent quarterly net asset value per share as determined by our board of directors minus any distributions since the end of such quarter, provided that the purchase price is subject to adjustment to the extent required by Section 23 of the 1940 Act. No investor in our private placement will be required to invest more than the total amount of its Capital Commitment.
The commitment period, or Commitment Period, set forth in each Subscription Agreement, starts on the date the subscription agreement is accepted by us and ends on the earlier of (1) the pricing of an initial public offering of our common stock or the listing of our shares on a national securities exchange and (2) the third anniversary of such investor’s subscription. After termination of the Commitment Period, investors will be released from any obligation to fund any undrawn Capital Commitment, except, in the case of termination of the Commitment Period pursuant to clause (2), to the extent necessary to:
| • | pay expenses, including the base management fee payable to GC Advisors, amounts due or that may become due under any financing or similar obligations, and indemnity obligations; or |
| • | fund investments or obligations (including guarantees) of the Company in connection with any transaction for which there is a binding written agreement as of the end of the applicable Commitment Period (including phased investments). |
In addition to all legal remedies available to us, failure by an investor in our private placement to make a Drawdown Purchase after receiving a drawdown notice will (following a cure period of ten days after the due date for such Drawdown Purchase) result in that investor being subject to certain default provisions. Among other consequences, defaulting investors may also forfeit their right to participate in purchasing additional shares of our common stock on any future drawdown date.
Liquidity Event
Our term is perpetual; however, we intend to seek a Liquidity Event (as defined below) within three to four years of the commencement of our operations. If we have not consummated a Liquidity Event within six years of the commencement of operations, our board of directors (to the extent consistent with its fiduciary duties and subject to any necessary stockholder approvals and applicable requirements of the 1940 Act) will use its commercially reasonable efforts to wind down or liquidate and dissolve the Company or to consummate a strategic sale to a third party.
A “Liquidity Event” is defined as any of the following: (1) an initial public offering of our common stock or the listing of our shares on a national securities exchange, (2) a distribution to our stockholders of either (a) cash proceeds from an orderly liquidation of our investments or (b) securities or other assets of ours as a distribution-in-kind, or (3) a sale of some or all of our assets to, or other liquidity event with, an entity for consideration of either cash and/or publicly listed securities of the acquirer, which potential acquirers may include other business development companies, including business development companies affiliated with GC Advisors, and entities that are not business development companies.
Recent Developments
On July 1, 2016, August 1, 2016 and September 1, 2016, we received additional stockholder capital subscriptions totaling $101.1 million in the aggregate.
On July 12, 2016, GCIC Funding, a wholly-owned subsidiary of ours, entered into an amendment, or the Credit Facility Amendment, to the documents governing the Credit Facility. The Credit Facility Amendment was effective as of July 12, 2016. The Credit Facility Amendment, among other things, increased the size of the Credit Facility from $370.0 million to $420.0 million.
On May 3, 2016 and August 3, 2016, our board of directors declared distributions to holders of record as set forth in the table below:
| Record Date | | Payment Date | | Amount Per Share |
| July 22, 2016 | | September 26, 2016 | | Net increase in net assets resulting from operations earned by us (if positive) as determined in accordance with generally accepted accounting principles in the United States of America, or GAAP, for the period July 1, 2016 through July 31, 2016 per share |
| | | | | |
| August 29, 2016 | | November 21, 2016 | | Net increase in net assets resulting from operations earned by us (if positive) as determined in accordance with GAAP for the period August 1, 2016 through August 31, 2016 per share |
| | | | | |
| September 23, 2016 | | November 21, 2016 | | Net increase in net assets resulting from operations earned by us (if positive) as determined in accordance with GAAP for the period September 1, 2016 through September 30, 2016 per share |
| | | | | |
| October 24, 2016 | | December 30, 2016 | | Net increase in net assets resulting from operations earned by us (if positive) as determined in accordance with GAAP for the period October 1, 2016 through October 31, 2016 per share |
On July 22, 2016, we priced a $410.1 million term debt securitization that closed on August 16, 2016. The notes offered in the securitization consist of $220.0 million of Aaa/AAA Class A notes and $32.5 million of Aa1 Class B notes that were each offered at par. The Class A notes bear interest at three-month LIBOR plus 2.15% and the Class B notes bear interest at three-month LIBOR plus 3.00%. The $42.3 million Class C notes, $28.6 million Class D notes and $86.7 million of LLC equity interests were retained by the Company in consideration for the loans transferred as part of the debt securitization.
On July 28, 2016 we issued 338,670.977 shares to the stockholders participating in the dividend reinvestment plan, or DRIP.
We issued capital calls to stockholders that were due on August 12, 2016 and will be due September 22, 2016, which are summarized in the following table:
| | | Date | | Shares Issued | | | Net Asset Value
($) Per Share | | | Proceeds | |
| | | | | | | | | | | (in thousands) | |
| Issuance of shares | | August 12, 2016 | | | 5,008,697.983 | | | | 15.00 | | | | 75,130 | |
| Issuance of shares | | September 22, 2016 | | | 1,505,808.534 | | | | 15.00 | | | | 22,587 | |
Operating and Regulatory Structure
Our investment activities are managed by GC Advisors and supervised by our board of directors, a majority of whom are independent of us, GC Advisors and its affiliates.
As a business development company, we are required to comply with certain regulatory requirements. For example, while we are permitted to finance investments using leverage, which may include the issuance of shares of preferred stock, or notes and other borrowings, our ability to use leverage is limited in significant respects. See “— Regulation.” Any decision on our part to use leverage will depend upon our assessment of the attractiveness of available investment opportunities in relation to the costs and perceived risks of such leverage. GC Advisors makes recommendations to our board of directors with respect to leverage policies. Our board of directors determines our leverage policy, including approving in advance the incurrence of material indebtedness and the execution of material contracts, and directs GC Advisors to implement such policies. The use of leverage to finance investments creates certain risks and potential conflicts of interest. See “Item 1A. Risk Factors — Risks Relating to our Business and Structure — There are significant potential conflicts of interest that could affect our investment returns — Our management and incentive fee structure may create incentives for GC Advisors that are not fully aligned with the interests of our stockholders and may induce GC Advisors to make certain investments, including speculative investments,” “— Risks Relating to our Business and Structure — Regulations governing our operation as a
business development company affect our ability to, and the way in which we, raise additional capital. As a business development company, the necessity of raising additional capital exposes us to risks, including the typical risks associated with leverage” and “— Risks Relating to our Business and Structure — We intend to finance our investments with borrowed money, which will magnify the potential for gain or loss on amounts invested and may increase the risk of investing in us.”
Also, as a business development company, we are generally prohibited from acquiring assets other than “qualifying assets” unless, after giving effect to any acquisition, at least 70% of our total assets are qualifying assets. Qualifying assets generally include securities of “eligible portfolio companies,” cash, cash equivalents, U.S. government securities and high-quality debt investments maturing in one year or less from the time of investment. Under the 1940 Act and the rules thereunder, “eligible portfolio companies” include (1) private domestic operating companies, (2) public domestic operating companies whose securities are not listed on a national securities exchange (e.g., the New York Stock Exchange, NYSE MKT LLC and The NASDAQ Stock Market) or registered under the Securities Exchange Act of 1934, as amended, or the Exchange Act, and (3) public domestic operating companies having a market capitalization of less than $250.0 million. Public domestic operating companies whose securities are quoted on the over-the-counter bulletin board and through Pink Sheets LLC are not listed on a national securities exchange and therefore are eligible portfolio companies. See “— Regulation.”
Conflicts of Interest
Subject to certain 1940 Act restrictions on co-investments with affiliates, GC Advisors offers us the right to participate in all investment opportunities that it determines are appropriate for us in view of our investment objective, positions, policies, strategies and restrictions as well as regulatory requirements and other relevant factors. Such offers are subject to the exception that, in accordance with GC Advisors’ code of ethics and allocation policies, we might not participate in each individual opportunity but will, on an overall basis, be entitled to participate equitably with other entities sponsored or managed by GC Advisors and its affiliates.
To the extent that we compete with entities sponsored or managed by GC Advisors or its affiliates for a particular investment opportunity, GC Advisors will allocate investment opportunities across the entities for which such opportunities are appropriate, consistent with (1) its internal conflict of interest and allocation policies, (2) the requirements of the Advisers Act and (3) certain restrictions under the 1940 Act regarding co-investments with affiliates. GC Advisors’ allocation policies are intended to ensure that, over time, we may generally share equitably in investment opportunities with other investment funds, accounts or other investment vehicles, together referred to as accounts, sponsored or managed by GC Advisors or its affiliates, particularly those involving a security with limited supply or involving differing classes of securities of the same issuer which may be suitable for us and such other accounts.
GC Advisors and its affiliates have other clients with similar or competing investment objectives, including GBDC and several private funds that are pursuing an investment strategy similar to ours, some of which are continuing to seek new capital commitments. In serving these clients, GC Advisors may have obligations to other clients or investors in those entities. Our investment objective may overlap with such affiliated accounts. GC Advisors’ allocation procedures are designed to allocate investment opportunities among the accounts sponsored or managed by GC Advisors and its affiliates in a manner consistent with its obligations under the Advisers Act. If two or more accounts with similar investment strategies are actively investing, GC Advisors will seek to allocate investment opportunities among eligible accounts in a manner that is fair and equitable over time and consistent with its allocation policy. GC Advisors has put in place a conflict-resolution policy that addresses the co-investment restrictions set forth under the 1940 Act. See “Item 1A. Risk Factors — Risks Relating to our Business and Structure — There are significant potential conflicts of interest that could affect our investment returns — Conflicts related to obligations GC Advisors’ investment committee, GC Advisors or its affiliates have to other clients.”
GC Advisors seeks to ensure the equitable allocation of investment opportunities when we are able to invest alongside other accounts sponsored or managed by GC Advisors and its affiliates. When we invest alongside such other accounts, such investments are made consistent with GC Advisors’ allocation policy. Under this allocation policy, if an investment opportunity is appropriate for us and another similar eligible account, the opportunity will be allocated pro rata based on the relative capital available for investment of each of us and such other eligible accounts, subject to minimum and maximum investment size limits. To the extent we do not have available capital and are at or near our targeted leverage ratio, we may receive smaller allocations, if any, on new investment opportunities under GC Advisors’ allocation policy. In situations in which co-investment with other entities sponsored or managed by GC Advisors or its affiliates is not permitted or appropriate, such as when, in the absence of exemptive relief described below, we and such other entities would be making different investments in the same issuer, GC Advisors will need to decide whether we or such other entity or entities will proceed with the
investment. GC Advisors will make these determinations based on its policies and procedures, which generally require that such opportunities be offered to eligible accounts on a basis that will be fair and equitable over time, including, for example, through random or rotational methods. We and GC Advisors have submitted an exemptive application to the SEC to permit greater flexibility to negotiate the terms of co-investments if our board of directors determines that it would be advantageous for us to co-invest with other accounts sponsored or managed by GC Advisors or its affiliates in a manner consistent with our investment objectives, positions, policies, strategies and restrictions as well as regulatory requirements and other pertinent factors. There is no assurance that our application for exemptive relief will be granted by the SEC or that, if granted, it will be on the terms set forth in our application. Our board of directors regularly reviews the allocation policy of Golub Capital and annually reviews the code of ethics of GC Advisors. See “Item 7. Certain Relationships and Related Transactions, and Director Independence.”
Additionally, under our incentive fee structure, GC Advisors benefits when we recognize capital gains and, because GC Advisors determines when a holding is sold, GC Advisors controls the timing of the recognition of such capital gains. See “Item 1A. Risk Factors — Risks Relating to our Business and Structure — There are significant potential conflicts of interest that could affect our investment returns — Our management and incentive fee structure may create incentives for GC Advisors that are not fully aligned with the interests of our stockholders and may induce GC Advisors to make certain investments, including speculative investments.” In addition, because the base management fee that we pay to GC Advisors is based on our average adjusted gross assets, including those assets acquired through the use of leverage, GC Advisors has a financial incentive to incur leverage.
Investment Advisory Agreement
GC Advisors is located at 150 South Wacker Drive, Suite 800, Chicago, IL 60606. GC Advisors is registered as an investment adviser under the Advisers Act. All of the beneficial interests in GC Advisors are owned, indirectly, by two affiliated trusts. The trustees of those trusts are David B. Golub and Louis Finegold. Subject to the overall supervision of our board of directors and in accordance with the 1940 Act, GC Advisors manages our day-to-day operations and provides investment advisory services to us. Under the terms of the Investment Advisory Agreement, GC Advisors:
| | • | determines the composition of our portfolio, the nature and timing of the changes to our portfolio and the manner of implementing such changes; |
| | | |
| | • | identifies, evaluates and negotiates the structure of the investments we make; |
| | | |
| | • | executes, closes, services and monitors the investments we make; |
| | | |
| | • | determines the securities and other assets that we purchase, retain or sell; |
| | | |
| | • | performs due diligence on prospective portfolio companies; and |
| | | |
| | • | provides us with such other investment advisory, research and related services as we may, from time to time, reasonably require for the investment of our funds. |
Certain personnel of Golub Capital LLC conduct activities on our behalf directly through, and under the supervision of, GC Advisors. GC Advisors’ services under the Investment Advisory Agreement are not exclusive. Pursuant to the Staffing Agreement, Golub Capital LLC provides GC Advisors with the resources to fulfill its obligations under the Investment Advisory Agreement, including staffing by experienced investment professionals and access to the senior investment personnel of Golub Capital LLC, including a commitment by each member of GC Advisors’ investment committee to serve in such capacity. These personnel services are provided under the Staffing Agreement on a direct cost reimbursement basis to GC Advisors. Subject to the requirements of the 1940 Act, GC Advisors may enter into one or more sub-advisory agreements under which GC Advisors may obtain assistance in fulfilling its responsibilities under the Investment Advisory Agreement.
Management Fee
Pursuant to the Investment Advisory Agreement, we pay GC Advisors a fee for investment advisory and management services consisting of two components — a base management fee and an incentive fee, or the Incentive Fee. The cost of both the base management fee and the Incentive Fee is ultimately borne by our stockholders.
The base management fee is calculated at an annual rate equal to the lesser of (a) 1.50% or (b) the base management fee of GBDC (currently 1.375%) in either case on the fair value of our average adjusted gross assets at the end of the two most recently completed calendar quarters (excluding cash and cash equivalents but including
assets purchased with borrowed funds and leverage) and is payable quarterly in arrears. The base management fee is adjusted, based on the actual number of days elapsed relative to the total number of days in such calendar quarter, for any share issuances or repurchases during such calendar quarter. For periods prior to the closing of a Liquidity Event, GC Advisors has irrevocably agreed to waive any base management fee in excess of 1.00% of the fair value of our average adjusted gross assets as calculated in accordance with the Investment Advisory Agreement and as described above. For the three and nine months ended June 30, 2016, we paid GC Advisors base management fees of $1.6 million and $4.3 million, respectively, pursuant to the Investment Advisory Agreement. For each of the three and nine months ended June 30, 2015, we paid GC Advisors base management fees of $0.6 million pursuant to the Investment Advisory Agreement. For the fiscal year ended September 30, 2015, we paid GC Advisors base management fees of $1.5 million pursuant to the Investment Advisory Agreement.
We pay GC Advisors an Incentive Fee that consists of three parts: (1) the income component, or the Income Incentive Fee, (2) the capital gains component, or the Capital Gain Incentive Fee, and (3) the subordinated liquidation incentive component, or the Subordinated Liquidation Incentive Fee.
We have structured the calculation of the Incentive Fee to include a fee limitation such that the Income Incentive Fee and the Capital Gain Incentive Fee will not be paid at any time if, after such payment, the cumulative Incentive Fees paid to GC Advisors since December 31, 2014, the effective date of our election to become a business development company, would be less than or equal to 20.0% of our Cumulative Pre-Incentive Fee Net Income (as defined below). For periods prior to the closing of a Liquidity Event, GC Advisors has agreed to waive any Incentive Fee payable in excess of 15.0% of our Cumulative Pre-Incentive Fee Net Income; provided that any amounts so waived shall be deemed to have been paid to GC Advisors for purposes of the Incentive Fee Cap after the closing of a Liquidity Event.
We accomplish this limitation by subjecting each quarterly incentive fee payable under the Income and Capital Gain Incentive Fee Calculation (as defined below) to an incentive fee cap, or the Incentive Fee Cap. The Incentive Fee Cap in any quarter is equal to the difference between (a) 20.0% of Cumulative Pre-Incentive Fee Net Income and (b) cumulative incentive fees of any kind paid to GC Advisors by us since December 31, 2014. To the extent the Incentive Fee Cap is zero or a negative value in any quarter, no incentive fee would be payable in that quarter. “Cumulative Pre-Incentive Fee Net Income” is equal to the sum of (a) Pre-Incentive Fee Net Investment Income (as defined below) for each period since December 31, 2014 and (b) cumulative aggregate realized capital gains, cumulative aggregate realized capital losses, cumulative aggregate unrealized capital depreciation and cumulative aggregate unrealized capital appreciation since December 31, 2014. “Pre-Incentive Fee Net Investment Income” means interest income, dividend income and any other income (including any other fees such as commitment, origination, structuring, diligence and consulting fees or other fees that we receive from portfolio companies but excluding fees for providing managerial assistance) accrued during the calendar quarter, minus operating expenses for the calendar quarter (including the base management fee, taxes, any expenses payable under the Investment Advisory Agreement and the Administration Agreement, any expenses of securitizations and any interest expense and dividends paid on any outstanding preferred stock, but excluding the incentive fee). Pre-Incentive Fee Net Investment Income includes, in the case of investments with a deferred interest feature such as market discount, debt instruments with PIK interest, preferred stock with PIK dividends, and zero coupon securities, accrued income that we have not yet received in cash. GC Advisors does not return to us amounts paid to it on accrued income that we have not yet received in cash if such income is not ultimately received by us in cash. If we do not ultimately receive income, a loss would be recognized, reducing future fees.
If, for any relevant period, the Incentive Fee Cap calculation results in our paying less than the amount of the Incentive Fee calculated pursuant to the Income and Capital Gain Incentive Fee Calculation, then the difference between the Incentive Fee and the Incentive Fee Cap will not be paid by us, and will not be received by GC Advisors as an Incentive Fee either at the end of such relevant period or at the end of any future period. For the avoidance of doubt, our stockholders benefit from a reduction in the amount of Incentive Fees that we pay, and that they pay indirectly, equal to the sum of the differences, if any, between the Incentive Fee and the Incentive Fee Cap.
The components of the Incentive Fee are calculated as described below. The Income Incentive Fee is payable quarterly in arrears and the Capital Gain Incentive Fee is payable at the end of each calendar year in arrears (or, in each case, upon termination of the Investment Advisory Agreement, as of the termination date). The Subordinated Liquidation Incentive Fee is payable upon a liquidation of GCIC. For the three and nine months ended June 30, 2016, we paid GC Advisors incentive fees of $0.7 million and $1.6 million, respectively, pursuant to the Investment Advisory Agreement. For each of the three and nine months ended June 30, 2015, we paid GC Advisors incentive
fees of $0.2 million pursuant to the Investment Advisory Agreement. For the fiscal year ended September 30, 2015, we paid GC Advisors incentive fees of $0.4 million pursuant to the Investment Advisory Agreement.
We will deposit one-third of each Incentive Fee payment into an escrow account, or the Escrow Account, administered by The Bank of New York Mellon, or the Escrow Agent. Assets in the Escrow Account will be held by the Escrow Agent until the closing of a Liquidity Event at which time the Escrow Agent will release the assets to GC Advisors. If no Liquidity Event occurs prior to December 31, 2020, the Escrow Agent will return all assets in the Escrow Account to us for the benefit of our stockholders. For the three and nine months ended June 30, 2016, we deposited $0.3 million and $0.8 million, respectively, into the Escrow Account. For each of the three and nine months ended June 30, 2015, we deposited $0.1 million into the Escrow Account. For the fiscal year ended September 30, 2015, we deposited $0.2 million into the Escrow Account.
Income and Capital Gain Incentive Fee Calculation
The “Income and Capital Gain Incentive Fee Calculation” has two parts: the Income Incentive Fee component and the Capital Gain Incentive Fee component. The Income Incentive Fee component is calculated quarterly in arrears based on our Pre-Incentive Fee Net Investment Income for the immediately preceding calendar quarter.
Pre-Incentive Fee Net Investment Income does not include any realized capital gains, realized capital losses or unrealized capital appreciation or depreciation. Because of the structure of the Income Incentive Fee component, it is possible that an Incentive Fee may be calculated under this formula with respect to a period in which we have incurred a loss. For example, if we receive Pre-Incentive Fee Net Investment Income in excess of the hurdle rate (as defined below) for a calendar quarter, the income component will result in a positive value and an Incentive Fee will be paid unless the payment of such Incentive Fee would cause us to pay Incentive Fees on a cumulative basis that exceed 20.0% of our Cumulative Pre-Incentive Fee Net Income.
Pre-Incentive Fee Net Investment Income, expressed as a rate of return on the value of our net assets (defined as total assets less indebtedness and before taking into account any incentive fees payable during the period) at the end of the immediately preceding calendar quarter, is compared to a fixed “hurdle rate” of 1.5% quarterly. If market interest rates rise, we may be able to invest our funds in debt instruments that provide for a higher return, which would increase our Pre-Incentive Fee Net Investment Income and make it easier for GC Advisors to surpass the fixed hurdle rate and receive an Income Incentive Fee. Our Pre-Incentive Fee Net Investment Income used to calculate this part of the Incentive Fee is also included in the amount of our total assets (excluding cash and cash equivalents but including assets purchased with borrowed funds and leverage) used to calculate the base management fee.
We calculate the Income Incentive Fee component of the Income and Capital Gain Incentive Fee Calculation with respect to our Pre-Incentive Fee Net Investment Income quarterly, in arrears, as follows:
| | • | zero in any calendar quarter in which the Pre-Incentive Fee Net Investment Income does not exceed the hurdle rate; |
| | • | 50.0% of our Pre-Incentive Fee Net Investment Income with respect to that portion of such Pre-Incentive Fee Net Investment Income, if any, that exceeds the hurdle rate but is less than the percentage at which amounts payable to GC Advisors pursuant to the Income Incentive Fee equal 20.0% of our Pre-Incentive Fee Net Investment Income as if a hurdle rate did not apply. We refer to this portion of our Pre-Incentive Fee Net Investment Income as the “catch-up” provision.; and |
| | • | 20.0% of the amount of our Pre-Incentive Fee Net Investment Income, if any, that exceeds the catch-up provision in any calendar quarter. |
The sum of these calculations yields the Income Incentive Fee. This amount is appropriately adjusted for any share issuances or repurchases during the quarter. For periods prior to the closing of a Liquidity Event, GC Advisors agreed to waive that portion of the Income Incentive Fee calculated in excess of the Income Incentive Fee calculated with respect to our Pre-Incentive Fee Net Investment Income quarterly, in arrears, as follows:
| | • | zero in any calendar quarter in which the Pre-Incentive Fee Net Investment Income does not exceed the hurdle rate; |
| | • | 50.0% of our Pre-Incentive Fee Net Investment Income with respect to that portion of such Pre-Incentive Fee Net Investment Income, if any, that exceeds the hurdle rate but is less than the percentage at which amounts payable to GC Advisors pursuant to the Income Incentive Fee equal 15.0% of our Pre-Incentive |
| | | Fee Net Investment Income as if a hurdle rate did not apply. We refer to this portion of our Pre-Incentive Fee Net Investment Income as the “catch-up” provision; and |
| | • | 15.0% of the amount of our Pre-Incentive Fee Net Investment Income, if any, that exceeds the catch-up provision in any calendar quarter. |
The Capital Gain Incentive Fee equals (a) 20.0% of our Capital Gain Incentive Fee Base (as defined below), if any, calculated in arrears as of the end of each calendar year (or upon termination of the Investment Advisory Agreement, as of the termination date), commencing with the calendar year ending December 31, 2015, less (b) the aggregate amount of any previously paid Capital Gain Incentive Fees. Our “Capital Gain Incentive Fee Base” equals (1) the sum of (A) our realized capital gains, if any, on a cumulative positive basis from December 31, 2014 through the end of each calendar year, (B) all realized capital losses on a cumulative basis and (C) all unrealized capital depreciation on a cumulative basis, less (2) our unamortized deferred financing costs as of the date of calculation, if and to the extent such costs exceed all unrealized capital appreciation on a cumulative basis.
| | • | The cumulative aggregate realized capital losses are calculated as the sum of the amounts by which (a) the net sales price of each investment in our portfolio when sold is less than (b) the accreted or amortized cost basis of such investment. |
| | • | The cumulative aggregate realized capital gains are calculated as the sum of the differences, if positive, between (a) the net sales price of each investment in our portfolio when sold and (b) the accreted or amortized cost basis of such investment. |
| | • | The aggregate unrealized capital depreciation is calculated as the sum of the differences, if negative, between (a) the valuation of each investment in our portfolio as of the applicable Capital Gain Incentive Fee calculation date and (b) the accreted or amortized cost basis of such investment. |
Prior to the closing of a Liquidity Event, GC Advisors has agreed to waive that portion of the Capital Gain Incentive Fee, calculated as described above, in excess of 15.0% of the Capital Gain Incentive Fee Base, provided that any amounts so waived shall be deemed to have been paid to GC Advisors for purposes of determining the Capital Gain Incentive fee payable after the closing of a Liquidity Event.
The Capital Gain Incentive Fee payable as calculated under the Investment Advisory Agreement (as described above) for the three and nine months ended June 30, 2016 and 2015 and the year ended September 30, 2015 was $0. However, in accordance with GAAP we are required to accrue for the Capital Gain Incentive Fee on a quarterly basis and are further required to include the aggregate unrealized capital appreciation on investments when calculating the capital gain incentive fee accrual, as if such unrealized capital appreciation were realized, even though such unrealized capital appreciation is not permitted to be considered in calculating the fee actually payable under the Investment Advisory Agreement. If the Capital Gain Incentive Fee Base, adjusted as required by GAAP to include unrealized appreciation, is positive at the end of a period, then GAAP requires us to accrue a capital gain incentive fee equal to 20.0% of such amount (15.0% prior to the closing of a Liquidity Event), less the aggregate amount of the actual Capital Gain Incentive Fees paid or capital gain incentive fees accrued under GAAP in all prior periods. If such amount is negative, then there is no accrual for such period. The resulting accrual under GAAP for any capital gain incentive fee payable in a given period may result in additional expense if such cumulative amount is greater than in the prior period or a reversal of previously recorded expense if such cumulative amount is less than in the prior period. There can be no assurance that such unrealized capital appreciation will be realized in the future. The accrual for capital gain incentive fee under GAAP was $0.4 million for the three months ended June 30, 2016 and $0.7 million for the nine months ended June 30, 2016. We did not accrue a capital gain incentive fee under GAAP for the three months ended June 30, 2015 or for the year ended September 30, 2015.
The third part of the Incentive Fee, which we refer to as the Subordinated Liquidation Incentive Fee, equals 20.0% of the net proceeds from a liquidation of GCIC in excess of adjusted capital, as calculated immediately prior to liquidation; subject, however, to the limit of cumulative Incentive Fees of all types not exceeding the Incentive Fee Cap. For purposes of this calculation, “liquidation” includes any merger of GCIC with another entity or the acquisition of all or substantially all of the shares of our common stock in a single or series of related transactions. The Investment Advisory Agreement provides that no Subordinated Liquidation Incentive Fee shall be payable for any liquidation that occurs more than six months after the date of an initial public offering of our common stock or a listing of our common stock on a national securities exchange. For periods prior to the date of an initial public offering of our common stock or a listing of our common stock on a national securities exchange, GC Advisors has
agreed to waive that portion of the Subordinated Liquidation Incentive Fee in excess of 10.0% of the net proceeds from a liquidation.
Examples of Incentive Fee Calculation
Example 1 — Quarterly Income Incentive Fee(1):
Assumptions
Hurdle rate(2) = 1.50%
Management fee(3) = 0.344%
Other expenses (legal, accounting, custodian, transfer agent, etc.)(4) = 0.35%
| (1) | The hypothetical amount of Pre-Incentive Fee Net Investment Income shown is based on a percentage of total net assets. In addition, the example assumes that during the most recent four full calendar quarter period ending on or prior to the date the payment set forth in the example is to be made, the sum of (a) our aggregate distributions to our stockholders and (b) our change in net assets (defined as total assets less indebtedness and before taking into account any incentive fees payable during the period) is at least 6.0% of our net assets at the beginning of such period (as adjusted for any share issuances or repurchases). |
| (2) | Represents a quarter of the 6.0% annualized hurdle rate. |
| (3) | Represents a quarter of the 1.375% annualized management fee. |
| (4) | Excludes offering expenses. |
Alternative 1
Additional Assumptions
Investment income (including interest, dividends, fees, etc.) = 1.25%
Pre-Incentive Fee Net Investment Income (investment income - (management fee + other expenses)) = 0.556%
Pre-Incentive Fee Net Investment Income does not exceed the hurdle rate, therefore there is no Incentive Fee.
Alternative 2
Additional Assumptions
Investment income (including interest, dividends, fees, etc.) = 2.80%
Pre-Incentive Fee Net Investment Income (investment income - (management fee + other expenses)) = 2.106%
Pre-Incentive Fee Net Investment Income exceeds hurdle rate, therefore there is an Incentive Fee.
Prior to a Liquidity Event the Incentive Fee would be:
| Incentive Fee | = 50% × “catch-up” + the greater of 0% AND (15% × (Pre-Incentive Fee
Net Investment Income - 2.143%))
= (50% × (2.106% – 1.50%)) + 0%
= 50% × 0.606%
= 0.303% |
Following a Liquidity Event the Incentive Fee would be:
| Incentive Fee | = 50% × “catch-up” + the greater of 0% AND (20% × (Pre-Incentive Fee
Net Investment Income - 2.50%))
= (50% × (2.106% – 1.50%)) + 0%
= 50% × 0.606%
= 0.303% |
Alternative 3
Additional Assumptions
Investment income (including interest, dividends, fees, etc.) = 3.50%
Pre-Incentive Fee Net Investment Income (investment income - (management fee + other expenses)) = 2.806%
Pre-Incentive Fee Net Investment Income exceeds hurdle rate, therefore there is an Incentive Fee.
Prior to a Liquidity Event the Incentive Fee would be:
| Incentive Fee | = 50% × “catch-up” + the greater of 0% AND (15% × (Pre-Incentive Fee
Net Investment Income - 2.143%))
= (50% × (2.143% - 1.50%)) + (15% × (2.806% - 2.143%))
= 50% × 0.643% + 15% × 0.663%
= 0.322% + 0.099%
= 0.421% |
Following a Liquidity Event the Incentive Fee would be:
| Incentive Fee | = 50% × “catch-up” + the greater of 0% AND (20% × (Pre-Incentive Fee
Net Investment Income - 2.50%))
= (50% × (2.50% - 1.50%)) + (20% × (2.806% - 2.50%))
= 50% × 1.00% + 20% × 0.306%
= 0.50% + 0.061%
= 0.561% |
Example 2 — Capital Gain Incentive Fee:
Alternative 1
Assumptions
| Year 1: | | $20 million investment made in Company A (“Investment A”) and $30 million investment made in Company B (“Investment B”) |
| | | |
| Year 2: | | Investment A is sold for $15 million and fair market value (“FMV”) of Investment B determined to be $29 million |
| | | |
| Year 3: | | FMV of Investment B determined to be $27 million |
| | | |
| Year 4: | | Investment B sold for $25 million |
Both prior to and following a Liquidity Event, the Capital Gain Incentive Fee, if any, would be:
| Year 1: | | None (No sales transactions) |
| | | |
| Year 2: | | None (Sales transaction resulted in a realized capital loss on Investment A) |
| | | |
| Year 3: | | None (No sales transactions) |
| | | |
| Year 4: | | None (Sales transaction resulted in a realized capital loss on Investment B) |
Each quarterly incentive fee calculated quarterly, in arrears, pursuant to the Income and Capital Gain Incentive Fee Calculation is subject to the Incentive Fee Cap. Below are the necessary adjustments to the Incentive Fee payable to adhere to the Incentive Fee Cap.
| Year 1: | | No adjustment; no realized capital losses or unrealized capital depreciation. |
| | | |
| Year 2: | | Investment A sold at a $5 million loss. Investment B has unrealized capital depreciation of $1 million. Therefore, GC Advisors would not be paid on the $6 million realized/unrealized loss, which would result in a lower Incentive Fee by $0.9 million prior to a Liquidity Event, or $1.2 million following a Liquidity Event. |
| | | |
| Year 3: | | Investment B has unrealized capital depreciation of $2 million. Therefore, GC Advisors would not be paid on the $2 million unrealized capital depreciation, which would result in a lower Incentive Fee by $300,000 prior to a Liquidity Event, or $400,000 following a Liquidity Event. |
| | | |
| Year 4: | | Investment B sold at a $5 million loss. Investment B was previously marked down by $3 million; |
| | | therefore, we would realize a $5 million loss on Investment B and reverse the previous $3 million in unrealized capital depreciation. The net effect would be a loss of $2 million. GC Advisors would not be paid on the $2 million loss, which would result in a lower Incentive Fee by $300,000 prior to a Liquidity Event, or $400,000 following a Liquidity Event. |
Alternative 2
Assumptions
| Year 1: | | $20 million investment made in Company A (“Investment A”), $30 million investment made in Company B (“Investment B”) and $25 million investment made in Company C (“Investment C”) |
| | | |
| Year 2: | | FMV of Investment A determined to be $18 million, FMV of Investment B determined to be $25 million and FMV of Investment C determined to be $25 million. |
| | | |
| Year 3: | | Investment A sold for $18 million. FMV of Investment B determined to be $24 million and FMV of Investment C determined to be $25 million |
| | | |
| Year 4: | | FMV of Investment B determined to be $22 million. Investment C sold for $24 million |
| | | |
| Year 5: | | Investment B sold for $20 million |
Both prior to and following a Liquidity Event, the Capital Gain Incentive Fee, if any, would be:
| Year 1: | | None (No sales transactions) |
| | | |
| Year 2: | | None (No sales transactions) |
| | | |
| Year 3: | | None (Sales transaction resulted in a realized capital loss on Investment A) |
| | | |
| Year 4: | | None (Sales transaction resulted in a realized capital loss on Investment C) |
| | | |
| Year 5: | | None (Sales transaction resulted in a realized capital loss on Investment B) |
Each quarterly Incentive Fee payable on the Income and Capital Gain Incentive Fee Calculation is subject to the Incentive Fee Cap. Below are the necessary adjustments to the Incentive Fee payable to adhere to the Incentive Fee Cap.
| Year 1: | | No adjustment; no realized capital losses or unrealized capital depreciation. |
| | | |
| Year 2: | | Investment A has unrealized capital depreciation of $2 million. Investment B has unrealized capital depreciation of $5 million. Therefore, GC Advisors would not be paid on the $7 million unrealized capital depreciation which would result in a lower Incentive Fee by $1.05 million prior to a Liquidity Event, or $1.4 million following a Liquidity Event. |
| | | |
| Year 3: | | Investment A sold at a $2 million loss. Investment A was previously marked down by $2 million; therefore, we would realize a $2 million loss on Investment A and reverse the previous $2 million in unrealized capital depreciation. Investment B has additional unrealized capital depreciation of $1 million. The net effect would be a loss of $1 million. GC Advisors would not be paid on the $1 million loss, which would result in a lower Incentive Fee by $150,000 prior to a Liquidity Event, or $200,000 following a Liquidity Event. |
| | | |
| Year 4: | | Investment B has additional unrealized capital depreciation of $2 million. Investment C sold at a $1 million realized loss. Therefore, GC Advisors would not be paid on the $3 million realized/unrealized loss, which would result in a lower Incentive Fee by $450,000 prior to a Liquidity Event, or $600,000 following a Liquidity Event. |
| | | |
| Year 5: | | Investment B sold at a $10 million loss. Investment B was previously marked down by $8 million; therefore, we would realize a $10 million loss on Investment B and reverse the previous $8 million in unrealized capital depreciation. The net effect would be a loss of $2 million. GC Advisors would not be paid on the $2 million loss, which would result in a lower Incentive Fee by $300,000 prior to a Liquidity Event, or $400,000 following a Liquidity Event. |
Alternative 3
Assumptions
| Year 1: | | $25 million investment made in Company A (“Investment A”) and $20 million investment made in Company B (“Investment B”) |
| | | |
| Year 2: | | Investment A is sold for $30 million and FMV of Investment B determined to be $21 million and $2 million of unamortized deferred financing costs |
| | | |
| Year 3: | | FMV of Investment B determined to be $23 million and $1 million of unamortized deferred financing costs |
| | | |
| Year 4: | | Investment B sold for $23 million and $0 of unamortized deferred financing costs |
Prior to a Liquidity Event the Capital Gain Incentive Fee, if any, would be:
| Year 1: | | None (No sales transactions) |
| | | |
| Year 2: | | $600,000 (15% multiplied by (i) $5 million realized capital gains on sale of Investment A less (ii) $1 million unamortized deferred financing costs ($2 million of unamortized deferred financing costs less $1 million of unrealized gain)) |
| | | |
| Year 3: | | $150,000 (15% multiplied by $5 million realized capital gains on sale of Investment A less $600,000 (Capital Gain Incentive Fee paid in year 2)) |
| | | |
| Year 4: | | $450,000 (15% multiplied by $8 million realized capital gains on sale of Investment A and Investment B less Capital Gain Incentive Fee paid in years 2 and 3) |
Following a Liquidity Event the Capital Gain Incentive Fee, if any, would be:
| Year 1: | | None (No sales transactions) |
| | | |
| Year 2: | | $800,000 (20% multiplied by (i) $5 million realized capital gains on sale of Investment A less (ii) $1 million unamortized deferred financing costs ($2 million of unamortized deferred financing costs less $1 million of unrealized gain)) |
| | | |
| Year 3: | | $200,000 (20% multiplied by $5 million realized capital gains on sale of Investment A less $800,000 (Capital Gain Incentive Fee paid in year 2)) |
| | | |
| Year 4: | | $600,000 (20% multiplied by $8 million realized capital gains on sale of Investment A and Investment B less Capital Gain Incentive Fee paid in years 2 and 3) |
Each quarterly Incentive Fee payable on the Income and Capital Gain Incentive Fee Calculation is subject to the Incentive Fee Cap. Below are the necessary adjustments to the Incentive Fee payable to adhere to the Incentive Fee Cap both prior to and following a Liquidity Event.
| Year 1: | | No adjustment necessary |
| | | |
| Year 2: | | No adjustment necessary. GC Advisors would not be paid on the $1 million unrealized gain on Investment B. |
| | | |
| Year 3: | | No adjustment necessary. GC Advisors would not be paid on the $3 million unrealized gain on Investment B. |
| | | |
| Year 4: | | No adjustment necessary |
Example 3 — Subordinated Liquidation Incentive Fee:
Alternative 1
Assumptions
| Year 1: | | $20 million investment made in Company A (“Investment A”), $30 million investment made in |
| | | Company B (“Investment B”) and $25 million investment made in Company C (“Investment C”). Investment A, Investment B, and Investment C sold in an orderly liquidation for total proceeds of $55 million within six months of the closing of a Liquidity Event. |
Both prior to and following a Liquidity Event, the Subordinated Liquidation Incentive Fee, if any, would be:
| Year 1: | | No Subordinated Liquidation Incentive Fee payable as liquidation proceeds of $55 million are less than adjusted capital immediately prior to liquidation (Net asset value of $75 million with no unrealized capital appreciation) |
Alternative 2
Assumptions
| Year 1: | | $20 million investment made in Company A (“Investment A”), $30 million investment made in Company B (“Investment B”) and $25 million investment made in Company C (“Investment C”). Investment A, Investment B, and Investment C sold in an orderly liquidation for total proceeds of $80 million within six months of the closing of a Liquidity Event. |
Prior to a Liquidity Event the Subordinated Liquidation Incentive Fee, if any, would be:
| Year 1: | | $500,000 Subordinated Liquidation Incentive Fee (10% multiplied by $80 million liquidation proceeds less adjusted capital immediately prior to liquidation (Net asset value of $75 million and no unrealized capital appreciation)) |
Following a Liquidity Event the Subordinated Liquidation Incentive Fee, if any, would be:
| Year 1: | | $1 million Subordinated Liquidation Incentive Fee (20% multiplied by $80 million liquidation proceeds less adjusted capital immediately prior to liquidation (Net asset value of $75 million and no unrealized capital appreciation)) |
Alternative 3
Assumptions
| Year 1: | | $20 million investment made in Company A (“Investment A”), $30 million investment made in Company B (“Investment B”) and $25 million investment made in Company C (“Investment C”). |
| | | |
| Year 2: | | Investment A, Investment B, and Investment C sold in an orderly liquidation for total proceeds of $80 million more than six months after the closing of an initial public offering of our common stock or a listing of our common stock on a national securities exchange. |
The Subordinated Liquidation Incentive Fee, if any, would be:
| Year 1: | | None (no sales transactions) |
| | | |
| Year 2: | | No Subordinated Liquidation Incentive Fee is payable on any liquidation occurring more than six months after the closing of an initial public offering of our common stock or a listing of our common stock on a national securities exchange. |
Payment of Our Expenses
All investment professionals of GC Advisors and/or its affiliates, when and to the extent engaged in providing investment advisory and management services to us, and the compensation and routine overhead expenses of personnel allocable to these services to us, are provided and paid for by GC Advisors and not by us. We bear all other out-of-pocket costs and expenses of our operations and transactions. See “Item 2. Financial Information — Management’s Discussion and Analysis of Financial Condition, Results of Operations and Cash Flows — Consolidated Results of Operations — Expenses.”
Duration and Termination
Unless terminated earlier as described below, the Investment Advisory Agreement will continue in effect from year to year if approved annually by our board of directors or by the affirmative vote of the holders of a majority of our outstanding voting securities, and, in either case, if also approved by a majority of our directors who are not “interested persons,” as that term is defined in the 1940 Act, of us or GC Advisors. The Investment Advisory Agreement automatically terminates in the event of its assignment, as defined in the 1940 Act, by GC Advisors and may be terminated by either party without penalty upon not less than 60 days’ written notice to the other. The holders of a majority of our outstanding voting securities, by vote, may also terminate the Investment Advisory Agreement without penalty. See “Item 1A. Risk Factors — Risks Relating to our Business and Structure — We are dependent upon GC Advisors for our future success and upon their access to the investment professionals and partners of Golub Capital and its affiliates.”
Indemnification
The Investment Advisory Agreement provides that, absent willful misfeasance, bad faith or gross negligence in the performance of its duties or by reason of the reckless disregard of its duties and obligations, GC Advisors and its officers, managers, partners, agents, employees, controlling persons, members and any other person or entity affiliated with it are entitled to indemnification from us for any damages, liabilities, costs and expenses (including reasonable attorneys’ fees and amounts reasonably paid in settlement) arising from the rendering of GC Advisors’ services under the Investment Advisory Agreement or otherwise as our investment adviser.
Board Approval of the Investment Advisory Agreement
At a meeting of our board of directors held in May 2016, our board of directors voted unanimously to reapprove the Investment Advisory Agreement. In reaching a decision to approve the Investment Advisory Agreement, the board of directors reviewed a significant amount of information and considered, among other things:
| | • | the nature, extent and quality of services provided to us by GC Advisors; |
| | • | the relative investment performance of us since our inception; |
| | • | the fees paid by other comparable business development companies; and |
Based on the information reviewed and the considerations detailed above, our board of directors, including all of the directors who are not “interested persons,” as that term is defined in the 1940 Act, of us or GC Advisors, concluded that the investment advisory fee rates and terms are fair and reasonable in relation to the services provided and approved the renewal of the Investment Advisory Agreement for a one year term.
Administration Agreement
Pursuant to the Administration Agreement, the Administrator furnishes us with office facilities and equipment and provides clerical, bookkeeping, recordkeeping and other administrative services at such facilities. Under the Administration Agreement, the Administrator performs, or oversees the performance of, our required administrative services, which include being responsible for the financial records that we are required to maintain and preparing reports to our stockholders and reports filed with the SEC. In addition, the Administrator assists us in determining and publishing our net asset value, oversees the preparation and filing of our tax returns and the printing and dissemination of reports to our stockholders, and generally oversees the payment of our expenses and the performance of administrative and professional services rendered to us by others. The Administrator may retain third parties to assist in providing administrative services to us. To the extent that the Administrator outsources any of its functions, we pay the fees associated with such functions on a direct basis without profit to the Administrator. We reimburse the Administrator for the allocable portion (subject to approval of our board of directors) of the Administrator’s overhead and other expenses incurred by it in performing its obligations under the Administration Agreement, including rent, the fees and expenses associated with performing compliance functions and our allocable portion of the cost of our chief financial officer and chief compliance officer and their respective staffs. In addition, if requested to provide managerial assistance to our portfolio companies, the Administrator is paid an additional amount based on the cost of the services provided, which shall not exceed the amount we receive from such portfolio companies for providing this assistance. In May 2016, the Administration Agreement was renewed for a
one-year term with the unanimous approval of our board of directors. The Administration Agreement may be terminated by either party without penalty upon 60 days’ written notice to the other party.
Indemnification
The Administration Agreement provides that, absent willful misfeasance, bad faith or negligence in the performance of its duties or by reason of the reckless disregard of its duties and obligations, the Administrator and its officers, managers, partners, agents, employees, controlling persons, members and any other person or entity affiliated with it are entitled to indemnification from us for any damages, liabilities, costs and expenses (including reasonable attorneys’ fees and amounts reasonably paid in settlement) arising from the rendering of the Administrator’s services under the Administration Agreement or otherwise as our administrator.
License Agreement
We have entered into a license agreement with Golub Capital LLC under which Golub Capital LLC has granted us a non-exclusive, royalty-free license to use the name “Golub Capital”. Under this agreement, we will have a right to use the “Golub Capital” name and the agreement will remain in effect for so long as GC Advisors or one of its affiliates remains our investment adviser. Other than with respect to this limited license, we will have no legal right to the “Golub Capital” name.
Staffing Agreement
We do not have any internal management capacity or employees. We depend on the diligence, skill and network of business contacts of the senior investment professionals of GC Advisors to achieve our investment objective. GC Advisors is an affiliate of Golub Capital LLC and depends upon access to the investment professionals and other resources of Golub Capital LLC and its affiliates to fulfill its obligations to us under the Investment Advisory Agreement. GC Advisors also depends upon Golub Capital LLC to obtain access to deal flow generated by the professionals of Golub Capital LLC and its affiliates. Under the Staffing Agreement, Golub Capital LLC provides GC Advisors with the resources necessary to fulfill these obligations. The Staffing Agreement provides that Golub Capital LLC will make available to GC Advisors experienced investment professionals and access to the senior investment personnel of Golub Capital LLC for purposes of evaluating, negotiating, structuring, closing and monitoring our investments. The Staffing Agreement also includes a commitment that the members of GC Advisors’ investment committee serve in such capacity. The Staffing Agreement remains in effect until terminated and may be terminated by either party without penalty upon 60 days’ written notice to the other party. Services under the Staffing Agreement are provided to GC Advisors on a direct cost reimbursement basis, and such fees are not our obligation.
Regulation
We are a business development company under the 1940 Act and have elected to be treated as a RIC under the Code. The 1940 Act contains prohibitions and restrictions relating to transactions between business development companies and their affiliates (including any investment advisers), principal underwriters and affiliates of those affiliates or underwriters and requires that a majority of the directors of a business development company be persons other than “interested persons,” as that term is defined in the 1940 Act. In addition, the 1940 Act provides that we may not change the nature of our business so as to cease to be, or withdraw our election as, a business development company without the approval of a majority of our outstanding voting securities.
We may invest up to 100% of our assets in securities acquired directly from issuers in privately negotiated transactions. With respect to such securities, we may, for the purpose of public resale, be deemed an “underwriter,” as that term is defined in the Securities Act. Our intention is to not write (sell) or buy put or call options to manage risks associated with the publicly traded securities of our portfolio companies, except that we may enter into hedging transactions to manage the risks associated with interest rate fluctuations. However, we may purchase or otherwise receive warrants to purchase the common stock of our portfolio companies in connection with acquisition financing or other investments. Similarly, in connection with an acquisition, we may acquire rights to require the issuers of acquired securities or their affiliates to repurchase them under certain circumstances. We also do not intend to acquire securities issued by any investment company in excess of the limits imposed by the 1940 Act. With regard to that portion of our portfolio invested in securities issued by investment companies, it should be noted that such investments might subject our stockholders to additional expenses. None of these policies, or any of our other policies, is fundamental and each may be changed without stockholder approval. To the extent we adopt any
fundamental policies, no person from whom we borrow will have, in his or her capacity as lender or debt holder, either a veto power or a vote in approving or changing any of our fundamental policies.
Qualifying Assets
Under the 1940 Act, a business development company may not acquire any asset other than assets of the type listed in Section 55(a) of the 1940 Act, which are referred to as “qualifying assets,” unless, at the time the acquisition is made, qualifying assets represent at least 70% of the company’s total assets. The principal categories of qualifying assets relevant to our business are the following:
| | (1) | Securities purchased in transactions not involving any public offering from the issuer of such securities, which issuer (subject to certain limited exceptions) is an eligible portfolio company, or from any person who is, or has been during the preceding 13 months, an affiliated person of an eligible portfolio company, or from any other person, subject to such rules as may be prescribed by the SEC. An eligible portfolio company is defined in the 1940 Act as any issuer that: |
| | • | is organized under the laws of, and has its principal place of business in, the United States; |
| | • | is not an investment company (other than a small business investment company wholly owned by the business development company) or a company that would be an investment company but for certain exclusions under the 1940 Act; and |
| | • | satisfies either of the following: |
| | • | does not have any class of securities listed on a national securities exchange or has any class of securities listed on a national securities exchange subject to a $250.0 million market capitalization maximum; or |
| | • | is controlled by a business development company or a group of companies including a business development company, the business development company actually exercises a controlling influence over the management or policies of the eligible portfolio company, and, as a result, the business development company has an affiliated person who is a director of the eligible portfolio company. |
| | (2) | Securities of any eligible portfolio company which we control. |
| | (3) | Securities purchased in a private transaction from a U.S. issuer that is not an investment company or from an affiliated person of the issuer, or in transactions incident to such a private transaction, if the issuer is in bankruptcy and subject to reorganization or if the issuer, immediately prior to the purchase of its securities, was unable to meet its obligations as they came due without material assistance other than conventional lending or financing arrangements. |
| | (4) | Securities of an eligible portfolio company purchased from any person in a private transaction if there is no ready market for such securities and we already own 60% of the outstanding equity of the eligible portfolio company. |
| | (5) | Securities received in exchange for or distributed on or with respect to securities described above, or pursuant to the exercise of warrants or rights relating to such securities. |
| | (6) | Cash, cash equivalents, U.S. government securities or high-quality debt securities that mature in one year or less from the date of investment. |
The regulations defining and interpreting qualifying assets may change over time. We may adjust our investment focus as needed to comply with and/or take advantage of any regulatory, legislative, administrative or judicial actions in this area.
We look through our consolidated subsidiaries to the underlying holdings (considered together with portfolio assets held outside of our consolidated subsidiaries) for purposes of determining compliance with the 70% qualifying assets requirement of the 1940 Act. At least 70% of our assets will be eligible assets.
Managerial Assistance to Portfolio Companies
A business development company must have been organized and have its principal place of business in the United States and must be operated for the purpose of making investments in the types of securities described in (1),
(2) or (3) above. However, in order to count portfolio securities as qualifying assets for the purpose of the 70% test, the business development company must either control the issuer of the securities or must offer to make available to the issuer of the securities significant managerial assistance; except that, when the business development company purchases such securities in conjunction with one or more other persons acting together, one of the other persons in the group may make available such managerial assistance. Making available significant managerial assistance means any arrangement whereby the business development company, through its directors, officers or employees, offers to provide, and, if accepted, does so provide, significant guidance and counsel concerning the management, operations or business objectives and policies of a portfolio company.
Temporary Investments
Pending investment in other types of qualifying assets, as described above, our investments may consist of cash, cash equivalents, U.S. government securities, repurchase agreements and high-quality debt investments that mature in one year or less from the date of investment, which we refer to, collectively, as temporary investments, so that 70% of our assets are qualifying assets or temporary investments. Typically, we will invest in U.S. Treasury bills or in repurchase agreements, so long as the agreements are fully collateralized by cash or securities issued by the U.S. government or its agencies. A repurchase agreement involves the purchase by an investor, such as us, of a specified security and the simultaneous agreement by the seller to repurchase it at an agreed-upon future date and at a price that is greater than the purchase price by an amount that reflects an agreed-upon interest rate. There is no percentage restriction on the proportion of our assets that may be invested in such repurchase agreements. However, if more than 25% of our total assets constitute repurchase agreements from a single counterparty, we would generally not meet the Diversification Tests, as defined in section 851(b)(3) of the Code in order to qualify as a RIC for U.S. federal income tax purposes.
Accordingly, we do not intend to enter into repurchase agreements with a single counterparty in excess of this limit. GC Advisors will monitor the creditworthiness of the counterparties with which we enter into repurchase agreement transactions.
Senior Securities
We are permitted, under specified conditions, to issue multiple classes of indebtedness and one class of stock senior to our common stock if our asset coverage, as that term is defined in the 1940 Act, is at least equal to 200% immediately after each such issuance. In addition, while any senior securities remain outstanding, we must make provisions to prohibit any distribution to our stockholders or the repurchase of such securities or shares unless we meet the applicable asset coverage ratios at the time of the distribution or repurchase. We may also borrow amounts up to 5% of the value of our total assets for temporary or emergency purposes without regard to asset coverage. We consolidate our financial results with all of our wholly-owned subsidiaries, including GCIC Funding and GCIC Holdings, for financial reporting purposes and measure our compliance with the leverage test applicable to business development companies under the 1940 Act on a consolidated basis. For a discussion of the risks associated with leverage, see “Item 1A. Risk Factors — Risks Relating to our Business and Structure — Regulations governing our operation as a business development company affect our ability to, and the way in which we, raise additional capital. As a business development company, the necessity of raising additional capital exposes us to risks, including the typical risks associated with leverage.”
Codes of Ethics
We and GC Advisors have each adopted a code of ethics pursuant to Rule 17j-1 under the 1940 Act that establishes procedures for personal investments and restricts certain personal securities transactions. Personnel subject to each code may invest in securities for their personal investment accounts, including securities that may be purchased or held by us, so long as such investments are made in accordance with the code’s requirements. You may read and copy the code of ethics from the SEC’s Public Reference Room in Washington, D.C. You may obtain information on the operation of the Public Reference Room by calling the SEC at 1-202-551-8090. In addition, each code of ethics is attached as an exhibit to this Registration Statement and is available on the EDGAR Database on the SEC’s website atwww.sec.gov. You may also obtain copies of each code of ethics, after paying a duplicating fee, by electronic request topublicinfo@sec.gov, or by writing the SEC’s Public Reference Section, 100 F Street, N.E., Washington, D.C. 20549.
Proxy Voting Policies and Procedures
We have delegated our proxy voting responsibility to GC Advisors. The proxy voting policies and procedures of GC Advisors are set out below. The guidelines are reviewed periodically by GC Advisors and our directors who are not “interested persons” and, accordingly, are subject to change.
Introduction
As an investment adviser registered under the Advisers Act, GC Advisors has a fiduciary duty to act solely in our best interests. As part of this duty, GC Advisors recognizes that it must vote our securities in a timely manner free of conflicts of interest and in our best interests.
GC Advisors’ policies and procedures for voting proxies for its investment advisory clients are intended to comply with Section 206 of, and Rule 206(4)-6 under, the Advisers Act.
Proxy Policies
GC Advisors votes proxies relating to our portfolio securities in what it perceives to be the best interest of our stockholders. GC Advisors reviews on a case-by-case basis each proposal submitted to a stockholder vote to determine its effect on the portfolio securities we hold. In most cases GC Advisors will vote in favor of proposals that GC Advisors believes are likely to increase the value of the portfolio securities we hold. Although GC Advisors will generally vote against proposals that may have a negative effect on our portfolio securities, GC Advisors may vote for such a proposal if there exist compelling long-term reasons to do so.
Our proxy voting decisions are made by GC Advisors’ chief executive officer and president. To ensure that GC Advisors’ vote is not the product of a conflict of interest, GC Advisors requires that (1) anyone involved in the decision-making process disclose to our chief compliance officer any potential conflict that he or she is aware of and any contact that he or she has had with any interested party regarding a proxy vote and (2) employees involved in the decision-making process or vote administration are prohibited from revealing how GC Advisors intends to vote on a proposal in order to reduce any attempted influence from interested parties. Where conflicts of interest may be present, GC Advisors will disclose such conflicts to us, including our independent directors and may request guidance from us on how to vote such proxies.
Proxy Voting Records
You may obtain information without charge about how GC Advisors voted proxies during the period ended June 30, 2016 by making a written request for proxy voting information to: Golub Capital Investment Corporation, Attention: Investor Relations, 150 South Wacker Drive, Suite 800, Chicago, IL 60606, or by calling Golub Capital Investment Corporation collect at (312) 205-5050.
Privacy Principles
We are committed to maintaining the privacy of our stockholders and to safeguarding their nonpublic personal information. The following information is provided to help you understand what personal information we collect, how we protect that information and why, in certain cases, we may share information with select other parties.
Generally, we do not receive any nonpublic personal information relating to our stockholders, although certain nonpublic personal information of our stockholders may become available to us. We do not disclose any nonpublic personal information about our stockholders or former stockholders to anyone, except as permitted by law or as is necessary in order to service stockholder accounts (for example, to a transfer agent or third-party administrator).
We restrict access to nonpublic personal information about our stockholders to employees of GC Advisors and its affiliates with a legitimate business need for the information. We will maintain physical, electronic and procedural safeguards designed to protect the nonpublic personal information of our stockholders.
Other
Under the 1940 Act, we are required to provide and maintain a bond issued by a reputable fidelity insurance company to protect us against larceny and embezzlement. Furthermore, as a business development company, we are prohibited from protecting any director or officer against any liability to us or our stockholders arising from willful misfeasance, bad faith, gross negligence or reckless disregard of the duties involved in the conduct of such person’s office.
We and GC Advisors are required to adopt and implement written policies and procedures reasonably designed to prevent violation of relevant federal securities laws, review these policies and procedures annually for their adequacy and the effectiveness of their implementation, and designate a chief compliance officer to be responsible for administering these policies and procedures.
We may also be prohibited under the 1940 Act from knowingly participating in certain transactions with our affiliates without the prior approval of our board of directors who are not interested persons and, in some cases, prior approval by the SEC. The SEC has interpreted the business development company prohibition on transactions with affiliates to prohibit “joint transactions” among entities that share a common investment adviser. The staff of the SEC has granted no-action relief permitting purchases of a single class of privately placed securities provided that the adviser negotiates no term other than price and certain other conditions are met. Any co-investment would be made subject to compliance with existing regulatory guidance, applicable regulations and our allocation procedures. If opportunities arise that would otherwise be appropriate for us and for another account sponsored or managed by GC Advisors to make different investments in the same issuer, GC Advisors will need to decide which account will proceed with the investment. Moreover, in certain circumstances, we may be unable to invest in an issuer in which another account sponsored or managed by GC Advisors has previously invested.
We and GC Advisors have submitted an exemptive application to the SEC to permit greater flexibility to negotiate the terms of co-investments if our board of directors determines that it would be advantageous for us to co-invest with other accounts sponsored or managed by GC Advisors or its affiliates in a manner consistent with our investment objective, positions, policies, strategies and restrictions as well as regulatory requirements and other pertinent factors. We believe that co-investment by us and accounts sponsored or managed by GC Advisors may afford us additional investment opportunities and the ability to achieve greater diversification.
Under the terms of the relief requested by the exemptive application, a “required majority” (as defined in Section 57(o) of the 1940 Act) of our independent directors would make certain conclusions in connection with a co-investment transaction, including that (1) the terms of the proposed transaction are reasonable and fair to us and our stockholders and do not involve overreaching of us or our stockholders on the part of any person concerned and (2) the transaction is consistent with the interests of our stockholders and is consistent with our investment strategies and policies. There is no assurance that our application for exemptive relief will be granted by the SEC or that, if granted, it will be on the terms set forth above.
Sarbanes-Oxley Act
The Sarbanes-Oxley Act of 2002, as amended, or the Sarbanes-Oxley Act, imposes a variety of regulatory requirements on companies with a class of securities registered under the Exchange Act and their insiders. Many of these requirements affect us. For example:
| | • | our principal executive officer and principal financial officer must certify the accuracy of the financial statements contained in our periodic reports; |
| | • | our periodic reports must disclose our conclusions about the effectiveness of our disclosure controls and procedures; |
| | • | beginning with our fiscal year ending September 30, 2017, our management must prepare an annual report regarding its assessment of our internal control over financial reporting, which must be audited by our independent registered public accounting firm; and |
| | • | beginning with our fiscal year ending September 30, 2017, our periodic reports must disclose whether there were significant changes in our internal controls over financial reporting or in other factors that could significantly affect these controls subsequent to the date of their evaluation, including any corrective actions with regard to significant deficiencies and material weaknesses. |
The Sarbanes-Oxley Act requires us to review our current policies and procedures to determine whether we comply with the Sarbanes-Oxley Act and the regulations promulgated under such act. We will continue to monitor our compliance with all regulations that are adopted under the Sarbanes-Oxley Act and will take actions necessary to ensure that we comply with that act.
JOBS Act
We currently are and expect to remain an “emerging growth company,” as defined in the Jumpstart Our Business Startups Act, or the JOBS Act, until the earliest of:
| | • | the last day of our fiscal year in which the fifth anniversary of an initial public offering of shares of our common stock occurs; |
| | • | The end of the fiscal year in which our total annual gross revenues first exceed $1 billion; |
| | • | The date on which we have, during the prior three-year period, issued more than $1.0 billion in non-convertible debt; and |
| | • | The last day of a fiscal year in which we (1) have an aggregate worldwide market value of our common stock held by non-affiliates of $700 million or more, computed at the end of each fiscal year as of the last business day of our most recently completed second fiscal quarter and (2) have been an Exchange Act reporting company for at least one year (and filed at least one annual report under the Exchange Act. |
Under the JOBS Act, we are exempt from the provisions of Section 404(b) of the Sarbanes-Oxley Act, which would require that our independent registered public accounting firm provide an attestation report on the effectiveness of our internal control over financial reporting. This may increase the risk that material weaknesses or other deficiencies in our internal control over financial reporting go undetected.
Under the JOBS Act, emerging growth companies can delay adopting new or revised accounting standards until such time as those standards apply to private companies. We intend to make an irrevocable election not to take advantage of this exemption from new or revised accounting standards. We will therefore be subject to the same new or revised accounting standards as other public companies that are not emerging growth companies.
Reporting Obligations
Subsequent to the effectiveness of this Registration Statement, we will be required to file annual reports, quarterly reports and current reports with the SEC. This information will be available at the SEC’s public reference room at 100 F Street, N.E., Washington, D.C. 20549 and on the SEC’s website at www.sec.gov. Information on the operation of the SEC’s public reference room may be obtained by calling the SEC at (202) 551-8090 or (800) SEC-0330.
Material U.S. Federal Income Tax Considerations
The following discussion is a general summary of the material U.S. federal income tax considerations applicable to us and to an investment in our shares of common stock. This summary does not purport to be a complete description of the income tax considerations applicable to such an investment. For example, we have not described certain considerations that may be relevant to certain types of holders subject to special treatment under U.S. federal income tax laws, including stockholders subject to the alternative minimum tax, tax-exempt organizations, insurance companies, dealers in securities, traders in securities that elect to mark-to-market their securities holdings, pension plans and trusts, and financial institutions. This summary assumes that investors hold our common stock as capital assets (within the meaning of the Code). The discussion is based upon the Code, Treasury regulations, and administrative and judicial interpretations, each as of the date of the filing of this Registration Statement and all of which are subject to change, possibly retroactively, which could affect the continuing validity of this discussion. We have not sought and will not seek any ruling from the Internal Revenue Service, or the IRS, regarding any offering of our securities. This summary does not discuss any aspects of U.S. estate or gift tax or foreign, state or local tax. It does not discuss the special treatment under U.S. federal income tax laws that could result if we invested in tax-exempt securities or certain other investment assets.
A “U.S. stockholder” is a beneficial owner of shares of our common stock that is for U.S. federal income tax purposes:
| | • | a citizen or individual resident of the United States; |
| | • | a corporation, or other entity treated as a corporation for U.S. federal income tax purposes, created or organized in or under the laws of the United States or any state thereof or the District of Columbia; |
| | • | an estate, the income of which is subject to U.S. federal income taxation regardless of its source; or |
| | • | a trust if either a U.S. court can exercise primary supervision over its administration and one or more U.S. persons have the authority to control all of its substantial decisions or the trust was in existence on August |
| | | 20, 1996, was treated as a U.S. person prior to that date, and has made a valid election to be treated as a U.S. person. |
A “Non-U.S. stockholder” is a beneficial owner of shares of our common stock that is not a U.S. stockholder.
If a partnership (including an entity treated as a partnership for U.S. federal income tax purposes) holds shares of our common stock, the tax treatment of a partner in the partnership will generally depend upon the status of the partner and the activities of the partnership. A prospective investor that is a partner in a partnership that will hold shares of our common stock should consult its tax advisors with respect to the purchase, ownership and disposition of shares of our common stock.
Tax matters are very complicated and the tax consequences to an investor of an investment in our shares of common stock will depend on the facts of his, her or its particular situation. We encourage investors to consult their own tax advisors regarding the specific consequences of such an investment, including tax reporting requirements, the applicability of U.S. federal, state, local and foreign tax laws, eligibility for the benefits of any applicable tax treaty, and the effect of any possible changes in the tax laws.
Election to Be Taxed as a RIC
As a business development company, we have elected to be treated as a RIC under Subchapter M of the Code. As a RIC, we generally will not have to pay corporate-level U.S. federal income taxes on any net ordinary income or capital gains that we timely distribute to our stockholders as dividends. To qualify as a RIC, we must, among other things, meet certain source-of-income and asset diversification requirements (as described below). In addition, we must distribute to our stockholders, for each taxable year, dividends of an amount at least equal to 90% of our “investment company taxable income,” which is generally our net ordinary income plus the excess of realized net short-term capital gains over realized net long-term capital losses and determined without regard to any deduction for dividends paid, or the Annual Distribution Requirement. Although not required for us to maintain our RIC tax status, in order to preclude the imposition of a 4% nondeductible federal excise tax imposed on RICs, we must distribute to our stockholders in respect of each calendar year dividends of an amount at least equal to the sum of (1) 98% of our net ordinary income (taking into account certain deferrals and elections) for the calendar year, (2) 98.2% of the excess (if any) of our realized capital gains over our realized capital losses, or capital gain net income (adjusted for certain ordinary losses), generally for the one-year period ending on October 31 of the calendar year and (3) the sum of any net ordinary income plus capital gains net income for preceding years that were not distributed during such years and on which we paid no federal income tax, or the Excise Tax Avoidance Requirement.
Taxation as a RIC
If we:
| | • | satisfy the Annual Distribution Requirement; |
then we will not be subject to U.S. federal income tax on the portion of our investment company taxable income and net capital gain, defined as net long-term capital gains in excess of net short-term capital losses, we distribute to stockholders. We will be subject to U.S. federal income tax at regular corporate rates on any net income or net capital gain not distributed as dividends to our stockholders.
In order to qualify as a RIC for U.S. federal income tax purposes, we must, among other things:
| | • | qualify to be treated as a business development company under the 1940 Act at all times during each taxable year; |
| | • | derive in each taxable year at least 90% of our gross income from dividends, interest, payments with respect to certain securities loans, gains from the sale of stock or other securities, or other income derived with respect to our business of investing in such stock or securities, and net income derived from interests in “qualified publicly traded partnerships” (partnerships that are traded on an established securities market or tradable on a secondary market, other than partnerships that derive 90% of their income from interest, dividends and other permitted RIC income), or the 90% Income Test; and |
| | • | diversify our holdings, or the Diversification Tests, so that at the end of each quarter of the taxable year: |
| | • | at least 50% of the value of our assets consists of cash, cash equivalents, U.S. government securities, securities of other RICs, and other securities if such other securities of any one issuer do not represent more than 5% of the value of our assets or more than 10% of the outstanding voting securities of the issuer; and |
| | • | no more than 25% of the value of our assets is invested in the securities, other than U.S. government securities or securities of other RICs, of one issuer or of two or more issuers that are controlled, as determined under applicable tax rules, by us and that are engaged in the same or similar or related trades or businesses or in the securities of one or more qualified publicly traded partnerships. |
We may invest in partnerships, including qualified publicly traded partnerships, which may result in our being subject to state, local or foreign income, franchise or other tax liabilities.
In addition, we are subject to ordinary income and capital gain distribution requirements under U.S. federal excise tax rules for each calendar year. If we do not meet the required distributions we will be subject to a 4% nondeductible federal excise tax on the undistributed amount. The failure to meet U.S. federal excise tax distribution requirements will not cause us to lose our RIC status. We currently intend to make sufficient distributions each taxable year to satisfy the U.S. federal excise tax requirements.
Any underwriting fees paid by us are not deductible. We may be required to recognize taxable income in circumstances in which we do not receive cash. For example, if we hold debt obligations that are treated under applicable tax rules as having original issue discount (such as debt instruments with PIK interest or, in certain cases, with increasing interest rates or issued with warrants), we must include in income each year a portion of the original issue discount that accrues over the life of the obligation, regardless of whether cash representing such income is received by us in the same taxable year. Because any original issue discount accrued will be included in our investment company taxable income for the taxable year of accrual, we may be required to make a distribution to our stockholders in order to satisfy the Annual Distribution Requirement, even though we will not have received any corresponding cash amount.
Certain of our investment practices may be subject to special and complex U.S. federal income tax provisions that may, among other things, (1) treat dividends that would otherwise constitute qualified dividend income as non-qualified dividend income, (2) treat dividends that would otherwise be eligible for the corporate dividends received deduction as ineligible for such treatment, (3) disallow, suspend or otherwise limit the allowance of certain losses or deductions, (4) convert lower-taxed long-term capital gain into higher-taxed short-term capital gain or ordinary income, (5) convert an ordinary loss or a deduction into a capital loss (the deductibility of which is more limited), (6) cause us to recognize income or gain without a corresponding receipt of cash, (7) adversely affect the time as to when a purchase or sale of stock or securities is deemed to occur, (8) adversely alter the characterization of certain complex financial transactions and (9) produce income that will not be qualifying income for purposes of the 90% Income Test. We intend to monitor our transactions and may make certain tax elections to mitigate the effect of these provisions and prevent our ability to be subject to tax as a RIC.
Gain or loss realized by us from warrants acquired by us as well as any loss attributable to the lapse of such warrants generally will be treated as capital gain or loss. Such gain or loss generally will be long term or short term, depending on how long we held a particular warrant.
Although we do not presently expect to do so, we are authorized to borrow funds and to sell assets in order to satisfy distribution requirements. However, under the 1940 Act, we are not permitted to make distributions to our stockholders while our debt obligations and other senior securities are outstanding unless certain “asset coverage” tests are met. See “— Regulation — Senior Securities.” Moreover, our ability to dispose of assets to meet our distribution requirements may be limited by (1) the illiquid nature of our portfolio and/or (2) other requirements relating to our qualification as a RIC, including the Diversification Tests. If we dispose of assets in order to meet the Annual Distribution Requirement or the Excise Tax Avoidance Requirement, we may make such dispositions at times that, from an investment standpoint, are not advantageous.
Some of the income and fees that we may recognize, such as fees for providing managerial assistance, certain fees earned with respect to our investments, income recognized in a work-out or restructuring of a portfolio investment, or income recognized from an equity investment in an operating partnership, will not satisfy the 90% Income Test. In order to manage the risk that such income and fees might disqualify us as a RIC for a failure to satisfy the 90% Income Test, we may be required to recognize such income and fees indirectly through one or more entities treated as corporations for U.S. federal income tax purposes. Such corporations will be required to pay U.S. corporate income tax on their earnings, which ultimately will reduce our return on such income and fees.
Failure to Qualify as a RIC
If we were unable to qualify for treatment as a RIC and are unable to cure the failure, for example, by disposing of certain investments quickly or raising additional capital to prevent the loss of RIC status, we would be subject to tax on all of our taxable income at regular corporate rates. The Code provides some relief from RIC disqualification due to failures to comply with the 90% Income Test and the Diversification Tests, although there may be additional taxes due in such cases. We cannot assure you that we would qualify for any such relief should we fail the 90% Income Test or the Diversification Tests.
Should failure occur, not only would all our taxable income be subject to tax at regular corporate rates, we would not be able to deduct dividend distributions to stockholders, nor would they be required to be made. Distributions, including distributions of net long-term capital gain, would generally be taxable to our stockholders as ordinary dividend income to the extent of our current and accumulated earnings and profits. Subject to certain limitations under the Code, certain corporate stockholders would be eligible to claim a dividends received deduction with respect to such dividends and non-corporate stockholders would generally be able to treat such dividends as “qualified dividend income,” which is subject to reduced rates of U.S. federal income tax. Distributions in excess of our current and accumulated earnings and profits would be treated first as a return of capital to the extent of the stockholder’s tax basis, and any remaining distributions would be treated as a capital gain. If we fail to qualify as a RIC, we may be subject to regular corporate tax on any net built-in gains with respect to certain of our assets (i.e., the excess of the aggregate gains, including items of income, over aggregate losses that would have been realized with respect to such assets if we had been liquidated) that we elect to recognize on requalification or when recognized over the next five taxable years.
The remainder of this discussion assumes that we qualify as a RIC and have satisfied the Annual Distribution Requirement.
Taxation of U.S. Stockholders
Distributions by us generally are taxable to U.S. stockholders as ordinary income or capital gains. Distributions of our “investment company taxable income” (which is, generally, our net ordinary income plus net short-term capital gains in excess of net long-term capital losses) will be taxable as ordinary income to U.S. stockholders to the extent of our current or accumulated earnings and profits, whether paid in cash or reinvested in additional shares of our common stock. To the extent such distributions paid by us to non-corporate stockholders (including individuals) are attributable to dividends from U.S. corporations and certain qualified foreign corporations and if certain holding period requirements are met, such distributions generally will be treated as qualified dividend income and generally eligible for a maximum U.S. federal tax rate of either 15% or 20%, depending on whether the individual shareholder’s income exceeds certain threshold amounts, and if other applicable requirements are met, such distributions generally will be eligible for the corporate dividends received deduction to the extent such dividends have been paid by a U.S. corporation. In this regard, it is anticipated that distributions paid by us will generally not be attributable to dividends and, therefore, generally will not qualify for the preferential maximum U.S. federal tax rate applicable to non-corporate stockholders as well as will not be eligible for the corporate dividends received deduction.
Distributions of our net capital gains (which is generally our realized net long-term capital gains in excess of realized net short-term capital losses) properly designated by us as “capital gain dividends” will be taxable to a U.S. stockholder as long-term capital gains (currently generally at a maximum rate of either 15% or 20%, depending on whether the individual shareholder’s income exceeds certain threshold amounts) in the case of individuals, trusts or estates, regardless of the U.S. stockholder’s holding period for his, her or its common stock and regardless of whether paid in cash or reinvested in additional common stock. Distributions in excess of our earnings and profits first will reduce a U.S. stockholder’s adjusted tax basis in such stockholder’s common stock and, after the adjusted basis is reduced to zero, will constitute capital gains to such U.S. stockholder. Stockholders receiving dividends or distributions in the form of additional shares of our common stock purchased in the market should be treated for U.S. federal income tax purposes as receiving a distribution in an amount equal to the amount of money that the stockholders receiving cash dividends or distributions will receive, and should have a cost basis in the shares received equal to such amount. Stockholders receiving dividends in newly issued shares of our common stock will be treated as receiving a distribution equal to the value of the shares received, and should have a cost basis of such amount.
Although we currently intend to distribute any net capital gains at least annually, we may in the future decide to retain some or all of our net capital gains but designate the retained amount as a “deemed distribution.” In that case, among other consequences, we will pay tax on the retained amount, each U.S. stockholder will be required to include their share of the deemed distribution in income as if it had been distributed to the U.S. stockholder, and the U.S. stockholder will be entitled to claim a credit equal their allocable share of the tax paid on the deemed distribution by us. The amount of the deemed distribution net of such tax will be added to the U.S. stockholder’s tax basis for their common stock. Since we expect to pay tax on any retained net capital gains at our regular corporate tax rate, and since that rate is in excess of the maximum rate currently payable by individuals on long-term capital gains, the amount of tax that individual stockholders will be treated as having paid and for which they will receive a credit will exceed the tax they owe on the retained net capital gain. Such excess generally may be claimed as a credit against the U.S. stockholder’s other U.S. federal income tax obligations or may be refunded to the extent it exceeds a stockholder’s liability for U.S. federal income tax. A stockholder that is not subject to U.S. federal income tax or otherwise required to file a U.S. federal income tax return would be required to file a U.S. federal income tax return on the appropriate form in order to claim a refund for the taxes we paid. In order to utilize the deemed distribution approach, we must provide written notice to our stockholders prior to the expiration of 60 days after the close of the relevant taxable year. We cannot treat any of our investment company taxable income as a “deemed distribution.”
As a RIC, we will be subject to alternative minimum tax, also referred to as “AMT,” but any items that are treated differently for AMT purposes must be apportioned between us and our U.S. stockholders, and this may affect the U.S. stockholders’ AMT liabilities. Although Treasury regulations explaining the precise method of apportionment have not yet been issued, such items will generally be apportioned in the same proportion that dividends paid to each U.S. stockholder bear to our taxable income (determined without regard to the dividends paid deduction), unless a different method for a particular item is warranted under the circumstances.
For purposes of determining (1) whether the Annual Distribution Requirement is satisfied for any tax year and (2) the amount of capital gain dividends paid for that tax year, we may, under certain circumstances, elect to treat a dividend that is paid during the following tax year as if it had been paid during the tax year in question. If we make such an election, the U.S. stockholder will still be treated as receiving the dividend in the tax year in which the distribution is made. However, any dividend declared by us in October, November or December of any calendar year, payable to stockholders of record on a specified date in such a month and actually paid during January of the following calendar year, will be treated as if it had been received by our U.S. stockholders on December 31 of the calendar year in which the dividend was declared.
If an investor purchases shares of our common stock shortly before the record date of a distribution, the price of the shares of our common stock will include the value of the distribution and the investor will be subject to tax on the distribution even though it represents a return of their investment.
A stockholder generally will recognize taxable gain or loss if the stockholder sells or otherwise disposes of their shares of our common stock. Any gain arising from such sale or disposition generally will be treated as long-term capital gain or loss if the stockholder has held their shares of common stock for more than one year. Otherwise, it would be classified as short-term capital gain or loss. However, any capital loss arising from the sale or disposition of shares of our common stock held for six months or less will be treated as long-term capital loss to the extent of the amount of capital gain dividends received, or undistributed capital gain deemed received, with respect to such shares. In addition, all or a portion of any loss recognized upon a disposition of shares of our common stock may be disallowed if other shares of our common stock are purchased (whether through reinvestment of distributions or otherwise) within 30 days before or after the disposition. In such a case, the basis of the common stock acquired will be increased to reflect the disallowed loss.
In general, individual U.S. stockholders are subject to a maximum U.S. federal income tax rate of either 15% or 20% (depending on whether the individual U.S. stockholder’s income exceeds certain threshold amounts) on their net capital gain,i.e., the excess of realized net long-term capital gain over realized net short-term capital loss for a taxable year, including a long-term capital gain derived from an investment in our shares of common stock. Such rate is lower than the maximum federal income tax rate on ordinary taxable income currently payable by individuals. Corporate U.S. stockholders currently are subject to U.S. federal income tax on net capital gain at the maximum 35% rate also applied to ordinary income. Non-corporate stockholders incurring net capital losses for a tax year (i.e., net capital losses in excess of net capital gains) generally may deduct up to $3,000 of such losses against their ordinary income each tax year; any net capital losses of a non-corporate stockholder in excess of $3,000 generally may be carried forward and used in subsequent tax years as provided in the Code. Corporate stockholders generally
may not deduct any net capital losses for a tax year, but may carry back such losses for three tax years or carry forward such losses for five tax years.
We will send to each of our U.S. stockholders, as promptly as possible after the end of each calendar year, a notice detailing, on a per share and per distribution basis, the amounts includible in such U.S. stockholder’s taxable income for such year as ordinary income and as long-term capital gain. In addition, the U.S. federal tax status of each calendar year’s distributions generally will be reported to the IRS. Distributions may also be subject to additional state, local and foreign taxes depending on a U.S. stockholder’s particular situation. Dividends distributed by us generally will not be eligible for the dividends-received deduction or the lower tax rates applicable to certain qualified dividends.
Until and unless we are treated as a “publicly offered regulated investment company” (within the meaning of Section 67 of the Code) as a result of either (i) shares of our common stock and our preferred stock collectively being held by at least 500 persons at all times during a taxable year or (ii) shares of our common stock being treated as regularly traded on an established securities market for any taxable year, for purposes of computing the taxable income of U.S. stockholders that are individuals, trusts or estates, (i) our earnings will be computed without taking into account such U.S. stockholders’ allocable shares of the management and incentive fees paid to our investment adviser and certain of our other expenses, (ii) each such U.S. stockholder will be treated as having received or accrued a dividend from us in the amount of such U.S. stockholder’s allocable share of these fees and expenses for such taxable year, (iii) each such U.S. stockholder will be treated as having paid or incurred such U.S. stockholder’s allocable share of these fees and expenses for the calendar year and (iv) each such U.S. stockholder’s allocable share of these fees and expenses will be treated as miscellaneous itemized deductions by such U.S. stockholder. Miscellaneous itemized deductions generally are deductible by a U.S. stockholder that is an individual, trust or estate only to the extent that the aggregate of such U.S. stockholder’s miscellaneous itemized deductions exceeds 2% of such U.S. stockholder’s adjusted gross income for U.S. federal income tax purposes, are not deductible for purposes of the alternative minimum tax and are subject to the overall limitation on itemized deductions under Section 68 of the Code.
We may be required to withhold U.S. federal income tax (“backup withholding”) currently at a rate of 28% from all taxable distributions to any non-corporate U.S. stockholder (1) who fails to furnish us with a correct taxpayer identification number or a certificate that such stockholder is exempt from backup withholding or (2) with respect to whom the IRS notifies us that such stockholder has failed to properly report certain interest and dividend income to the IRS and to respond to notices to that effect. An individual’s taxpayer identification number is his or her social security number. Any amount withheld under backup withholding is allowed as a credit against the U.S. stockholder’s U.S. federal income tax liability and may entitle such stockholder to a refund, provided that proper information is timely provided to the IRS.
If a U.S. stockholder recognizes a loss with respect to shares of our common stock of $2 million or more for an individual stockholder or $10 million or more for a corporate stockholder, the stockholder must file with the IRS a disclosure statement on Form 8886. Direct stockholders of portfolio securities are in many cases exempted from this reporting requirement, but under current guidance, stockholders of a RIC are not exempted. The fact that a loss is reportable under these regulations does not affect the legal determination of whether the taxpayer’s treatment of the loss is proper. U.S. stockholders should consult their tax advisors to determine the applicability of these regulations in light of their specific circumstances.
An additional 3.8% Medicare tax is imposed on certain net investment income (including ordinary dividends and capital gain distributions received from us and net gains from redemptions or other taxable dispositions of our shares) of U.S. individuals, estates and trusts to the extent that such person’s “modified adjusted gross income” (in the case of an individual) or “adjusted gross income” (in the case of an estate or trust) exceed certain threshold amounts.
Taxation of Non-U.S. Stockholders
Whether an investment in the shares of our common stock is appropriate for a Non-U.S. stockholder will depend upon that person’s particular circumstances. An investment in the shares of our common stock by a Non-U.S. stockholder may have adverse tax consequences. Non-U.S. stockholders should consult their tax advisors before investing in our common stock.
Subject to the discussion below, distributions of our “investment company taxable income” to Non-U.S. stockholders (including interest income, net short-term capital gain or foreign-source dividend and interest income, which generally would be free of withholding if paid to Non-U.S. stockholders directly) will be subject to
withholding of U.S. federal tax at a 30% rate (or lower rate provided by an applicable treaty) to the extent of our current and accumulated earnings and profits unless the distributions are effectively connected with a U.S. trade or business of the Non-U.S. stockholder, in which case the distributions will generally be subject to U.S. federal income tax at the rates applicable to U.S. persons. In that case, we will not be required to withhold U.S. federal tax if the Non-U.S. stockholder complies with applicable certification and disclosure requirements. Special certification requirements apply to a Non-U.S. stockholder that is a foreign partnership or a foreign trust, and such entities are urged to consult their own tax advisors.
Certain properly designated dividends received by a Non-U.S. stockholder generally are exempt from U.S. federal withholding tax when they (1) are paid in respect of our “qualified net interest income” (generally, our U.S. source interest income, other than certain contingent interest and interest from obligations of a corporation or partnership in which we are at least a 10% stockholder, reduced by expenses that are allocable to such income), or (2) are paid in connection with our “qualified short-term capital gains” (generally, the excess of our net short-term capital gain over our long-term capital loss for a tax year) as well as if certain other requirements are satisfied. Nevertheless, it should be noted that in the case of shares of our stock held through an intermediary, the intermediary may have withheld U.S. federal income tax even if we designated the payment as an interest-related dividend or short-term capital gain dividend. Moreover, depending on the circumstances, we may designate all, some or none of our potentially eligible dividends as derived from such qualified net interest income or as qualified short-term capital gains, or treat such dividends, in whole or in part, as ineligible for this exemption from withholding.
Actual or deemed distributions of our net capital gains to a Non-U.S. stockholder, and gains realized by a Non-U.S. stockholder upon the sale of our common stock, will not be subject to federal withholding tax and generally will not be subject to U.S. federal income tax unless the distributions or gains, as the case may be, are effectively connected with a U.S. trade or business of the Non-U.S. stockholder and, if an income tax treaty applies, are attributable to a permanent establishment maintained by the Non-U.S. stockholder in the United States or, in the case of an individual Non-U.S. stockholder, the stockholder is present in the United States for 183 days or more during the year of the sale or capital gain dividend and certain other conditions are met.
If we distribute our net capital gains in the form of deemed rather than actual distributions (which we may do in the future), a Non-U.S. stockholder will be entitled to a U.S. federal income tax credit or tax refund equal to the stockholder’s allocable share of the tax we pay on the capital gains deemed to have been distributed. In order to obtain the refund, the Non-U.S. stockholder must obtain a U.S. taxpayer identification number and file a U.S. federal income tax return even if the Non-U.S. stockholder would not otherwise be required to obtain a U.S. taxpayer identification number or file a U.S. federal income tax return. For a corporate Non-U.S. stockholder, distributions (both actual and deemed), and gains realized upon the sale of our common stock that are effectively connected with a U.S. trade or business may, under certain circumstances, be subject to an additional “branch profits tax” at a 30% rate (or at a lower rate if provided for by an applicable treaty).
A Non-U.S. stockholder who is a non-resident alien individual, and who is otherwise subject to withholding of U.S. federal income tax, may be subject to information reporting and backup withholding of U.S. federal income tax on dividends unless the Non-U.S. stockholder provides us or the dividend paying agent with a U.S. nonresident withholding tax certification (e.g., an IRS Form W-8BEN, IRS Form W-8BEN-E, or an acceptable substitute form) or otherwise meets documentary evidence requirements for establishing that it is a Non-U.S. stockholder or otherwise establishes an exemption from backup withholding.
The Code requires us to withhold U.S. tax (at a 30% rate) with respect to payments of dividends and (effective January 1, 2019) certain capital gain dividends made to certain non-U.S. entities that fail to comply (or be deemed compliant) with extensive new reporting and withholding requirements designed to inform the U.S. Department of the Treasury of U.S.-owned foreign investment accounts. Stockholders may be requested to provide additional information to enable the applicable withholding agent to determine whether withholding is required.
An investment in shares by a non-U.S. person may also be subject to U.S. federal estate tax. Non-U.S. persons should consult their own tax advisors with respect to the U.S. federal income tax, U.S. federal estate tax, withholding tax, and state, local and foreign tax consequences of acquiring, owning or disposing of our common stock.
ITEM 1A. RISK FACTORS.
Investing in our common stock involves a number of significant risks. Before you invest in our common stock, you should be aware of various risks, including those described below. The risks set out below are not the only risks we face. Additional risks and uncertainties not presently known to us or not presently deemed material by us may also impair our operations and performance. If any of the following events occur, our business, financial condition, results of operations and cash flows could be materially and adversely affected. In such case, our net asset value could decline, and you may lose all or part of your investment. The risk factors described below are the principal risk factors associated with an investment in us as well as those factors generally associated with an investment company with investment objectives, investment policies, capital structure or trading markets similar to ours.
Risks Relating to Our Business and Structure
We are a new company with a limited operating history.
We were formed in September 2014 and commenced operations on December 31, 2014. We are subject to all of the business risks and uncertainties associated with any new business, including the risk that we will not achieve our investment objective, or that we will not qualify or maintain our qualification to be treated as a RIC, and that the value of your investment could decline substantially.
The 1940 Act and the Code impose numerous constraints on the operations of business development companies and RICs that do not apply to certain of the other investment vehicles managed by GC Advisors and its affiliates. Business development companies are required, for example, to invest at least 70% of their total assets primarily in securities of U.S. private or thinly traded public companies, cash, cash equivalents, U.S. government securities and other high-quality debt instruments that mature in one year or less from the date of investment. Moreover, qualification for taxation as a RIC requires satisfaction of source-of-income, asset diversification and distribution requirements. We do not have any operating history under these constraints, which may hinder our ability to take advantage of attractive investment opportunities and to achieve our investment objective.
We anticipate that we will use substantially all of the net proceeds of any sales of our securities within approximately six months following the completion of any such sales of our securities, depending on the availability of appropriate investment opportunities consistent with our investment objectives and market conditions. Until such appropriate investment opportunities can be found, we will invest the net proceeds primarily in cash, cash equivalents, U.S. government securities and high-quality debt investments that mature in one year or less from the date of investment. We may also invest the net proceeds in broadly syndicated loans to be held for short-term investment purposes until appropriate investment opportunities can be found. We expect these temporary investments to earn yields substantially lower than the income that we expect to receive in respect of investments in senior secured and one stop loans. As a result, any distributions we make during this period may be substantially smaller than the distributions that we expect to pay when our portfolio is fully invested.
In connection with our Formation Transactions, we purchased 100% of the equity interests of each of GCIC Holdings and GCIC Funding from GEMS and certain debt securities. We can offer no assurance that GEMS, the sellers of the debt securities or the private placement investors will not, at a later date, assert claims against us, and indirectly our stockholders, in connection with actual or alleged harm that they may experience in connection with the Formation Transactions. In addition, we cannot assure you that the beneficial holders of interests in GEMS will not assert derivative claims against us and, indirectly our stockholders, on behalf of GEMS as a result of the Formation Transactions.
We are subject to risks associated with the current interest rate environment and to the extent we use debt to finance our investments, changes in interest rates will affect our cost of capital and net investment income.
Since the economic downturn that began in mid-2007, interest rates have remained low. Because longer-term inflationary pressure is likely to result from the U.S. government’s fiscal policies and challenges during this time, we will likely experience rising interest rates, rather than falling rates, at some point in the future.
To the extent we borrow money or issue debt securities or preferred stock to make investments, our net investment income will depend, in part, upon the difference between the rate at which we borrow funds or pay interest or dividends on such debt securities or preferred stock and the rate at which we invest these funds. In addition, many of our debt investments and borrowings have floating interest rates that reset on a periodic basis, and many of our investments are subject to interest rate floors. As a result, a significant change in market interest rates
could have a material adverse effect on our net investment income. In periods of rising interest rates, our cost of funds will increase because the interest rates on the majority of amounts we have borrowed are floating, which could reduce our net investment income to the extent any debt investments have fixed interest rates, and the interest rate on investments with an interest rate floor will not increase until interest rates exceed the applicable floor. We may use interest rate risk management techniques in an effort to limit our exposure to interest rate fluctuations. Such techniques may include various interest rate hedging activities to the extent permitted by the 1940 Act and applicable commodities laws. These activities may limit our ability to participate in the benefits of lower interest rates with respect to the hedged borrowings. Adverse developments resulting from changes in interest rates or hedging transactions could have a material adverse effect on our business, financial condition and results of operations.
You should also be aware that a rise in the general level of interest rates typically will lead to higher interest rates applicable to our debt investments, which may result in an increase of the amount of incentive fees payable to GC Advisors. Also, an increase in interest rates available to investors could make an investment in our common stock less attractive if we are not able to increase our distribution rate, which could reduce the value of our common stock.
Global capital markets could enter a period of severe disruption and instability. These conditions have historically affected and could again materially and adversely affect debt and equity capital markets in the United States and around the world and our business.
The U.S. and global capital markets experienced extreme volatility and disruption during the economic downturn that began in mid-2007, and the U.S. economy was in a recession for several consecutive calendar quarters during the same period. In 2010, a financial crisis emerged in Europe, triggered by high budget deficits and rising direct and contingent sovereign debt, which created concerns about the ability of certain nations to continue to service their sovereign debt obligations. Risks resulting from such debt crisis and any future debt crisis in Europe or any similar crisis elsewhere could have a detrimental impact on the global economic recovery, sovereign and non-sovereign debt in certain countries and the financial condition of financial institutions generally. In July and August 2015, Greece reached agreements with its creditors for bailouts that provide aid in exchange for certain austerity measures. These and similar austerity measures may adversely affect world economic conditions and have an adverse impact on our business and that of our portfolio companies. In the second quarter of 2015, stock prices in China experienced a significant drop, resulting primarily from continued sell-off of shares trading in Chinese markets. In August 2015, Chinese authorities sharply devalued China’s currency. In June 2016, the United Kingdom held a referendum in which voters approved an exit from the European Union, and the implications of the United Kingdom’s pending withdrawal from the European Union are unclear at present. These market and economic disruptions adversely affected, and these and other similar market and economic disruptions may in the future affect, the U.S. capital markets, which could adversely affect our business and that of our portfolio companies. These market disruptions materially and adversely affected, and may in the future affect, the broader financial and credit markets and has reduced the availability of debt and equity capital for the market as a whole and to financial firms, in particular. At various times, these disruptions resulted in, and may in the future result, a lack of liquidity in parts of the debt capital markets, significant write-offs in the financial services sector and the repricing of credit risk. These conditions may reoccur for a prolonged period of time again or materially worsen in the future, including as a result of further downgrades to the U.S. government’s sovereign credit rating or the perceived credit worthiness of the United States or other large global economies. Unfavorable economic conditions, including future recessions, also could increase our funding costs, limit our access to the capital markets or result in a decision by lenders not to extend credit to us. We may in the future have difficulty accessing debt and equity capital on attractive terms, or at all, and a severe disruption and instability in the global financial markets or deteriorations in credit and financing conditions may cause us to reduce the volume of loans we originate and/or fund, adversely affect the value of our portfolio investments or otherwise have a material adverse effect on our business, financial condition, results of operations and cash flows.
We are dependent upon GC Advisors for our success and upon their access to the investment professionals and partners of Golub Capital and its affiliates.
We do not have any internal management capacity or employees. We depend on the diligence, skill and network of business contacts of the senior investment professionals of GC Advisors to achieve our investment objective. GC Advisors’ investment committee, which consists of two members of our board of directors and two additional
employees of Golub Capital LLC, provides oversight over our investment activities. We also cannot assure you that we will replicate the historical results achieved by members of the investment committee, and we caution you that our investment returns could be substantially lower than the returns achieved by them in prior periods. We expect that GC Advisors will evaluate, negotiate, structure, close and monitor our investments in accordance with the terms of the Investment Advisory Agreement. We can offer no assurance, however, that the senior investment professionals of GC Advisors will continue to provide investment advice to us. If these individuals do not maintain their existing relationships with Golub Capital LLC and its affiliates and do not develop new relationships with other sources of investment opportunities, we may not be able to identify appropriate replacements or grow our investment portfolio. The loss of any member of GC Advisors’ investment committee or of other senior investment professionals of GC Advisors and its affiliates would limit our ability to achieve our investment objective and operate as we anticipate. This could have a material adverse effect on our financial condition, results of operations and cash flows.
The Staffing Agreement provides that Golub Capital LLC makes available to GC Advisors experienced investment professionals and provides access to the senior investment personnel of Golub Capital LLC for purposes of evaluating, negotiating, structuring, closing and monitoring our investments. We are not a party to the Staffing Agreement and cannot assure you that Golub Capital LLC will fulfill its obligations under the agreement. If Golub Capital LLC fails to perform, we cannot assure you that GC Advisors will enforce the Staffing Agreement, that such agreement will not be terminated by either party or that we will continue to have access to the investment professionals of Golub Capital LLC and its affiliates or their information and deal flow.
Our business model depends to a significant extent upon strong referral relationships with sponsors. Any inability of GC Advisors to maintain or develop these relationships, or the failure of these relationships to generate investment opportunities, could adversely affect our business.
We depend upon Golub Capital LLC’s relationships with sponsors, and we intend to rely to a significant extent upon these relationships to provide us with potential investment opportunities. If Golub Capital LLC fails to maintain such relationships, or to develop new relationships with other sponsors or sources of investment opportunities, we will not be able to grow our investment portfolio. In addition, individuals with whom the principals of Golub Capital LLC have relationships are not obligated to provide us with investment opportunities, and, therefore, we can offer no assurance that these relationships will generate investment opportunities for us in the future.
We may not replicate the historical results achieved by other entities managed or sponsored by members of GC Advisors’ investment committee, or by GC Advisors or its affiliates.
Our investments may differ from those of existing accounts that are or have been sponsored or managed by members of GC Advisors’ investment committee, GC Advisors or affiliates of GC Advisors. Investors in our securities are not acquiring an interest in any accounts that are or have been sponsored or managed by members of GC Advisors’ investment committee, GC Advisors or affiliates of GC Advisors. We may consider co-investing in portfolio investments with other accounts sponsored or managed by members of GC Advisors’ investment committee, GC Advisors or its affiliates. Any such investments are subject to regulatory limitations and approvals by directors who are not “interested persons,” as defined in the 1940 Act. We can offer no assurance, however, that we will obtain such approvals or develop opportunities that comply with such limitations. We also cannot assure you that we will replicate the historical results achieved by members of the investment committee, and we caution you that our investment returns could be substantially lower than the returns achieved by them in prior periods. Additionally, all or a portion of the prior results may have been achieved in particular market conditions which may never be repeated. Moreover, current or future market volatility and regulatory uncertainty may have an adverse impact on our future performance.
Our financial condition, results of operations and cash flows depend on our ability to manage our business effectively.
Our ability to achieve our investment objective depends on our ability to manage our business and to grow. This depends, in turn, on GC Advisors’ ability to identify, invest in and monitor companies that meet our investment criteria. The achievement of our investment objectives on a cost-effective basis depends upon GC Advisors’ execution of our investment process, its ability to provide competent, attentive and efficient services to us and, to a lesser extent, our access to financing on acceptable terms. GC Advisors has substantial responsibilities under the
Investment Advisory Agreement, as well as responsibilities in connection with the management of other accounts sponsored or managed by GC Advisors, members of GC Advisors’ investment committee or Golub Capital LLC and its affiliates. The personnel of the Administrator and its affiliates may be called upon to provide managerial assistance to our portfolio companies. These activities may distract them or slow our rate of investment. Any failure to manage our business and our future growth effectively could have a material adverse effect on our business, financial condition, results of operations and cash flows.
There are significant potential conflicts of interest that could affect our investment returns.
As a result of our arrangements with GC Advisors and its affiliates and GC Advisors’ investment committee, there may be times when GC Advisors or such persons have interests that differ from those of our securityholders, giving rise to a conflict of interest.
Conflicts related to obligations GC Advisors’ investment committee, GC Advisors or its affiliates have to other clients.
The members of GC Advisors’ investment committee serve or may serve as officers, directors or principals of entities that operate in the same or a related line of business as we do or of accounts sponsored or managed by GC Advisors or its affiliates. Currently, our officers and directors also serve as officers and directors of GBDC (NASDAQ: GBDC), a closed-end, non-diversified management investment company that has also elected to be regulated as a business development company under the 1940 Act and whose shares of common stock are publicly traded on the Nasdaq Global Select Market. Similarly, GC Advisors or its affiliates currently manage and may have other clients with similar or competing investment objectives. In serving in these multiple capacities, they may have obligations to other clients or investors in those entities, the fulfillment of which may not be in the best interests of us or our stockholders. For example, Lawrence E. Golub and David B. Golub have management responsibilities for other accounts managed or sponsored by GC Advisors or its affiliates, including GBDC. Our investment objective may overlap with the investment objectives of such affiliated accounts. For example, GC Advisors currently manages GBDC and several private funds that are pursuing an investment strategy similar to ours, some of which may seek additional capital from time to time, and we may compete with these and other accounts sponsored or managed by GC Advisors and its affiliates for capital and investment opportunities. As a result, those individuals may face conflicts in the allocation of investment opportunities among us and other accounts advised by or affiliated with GC Advisors. GC Advisors seeks to allocate investment opportunities among eligible accounts in a manner that is fair and equitable over time and consistent with its allocation policy. However, we can offer no assurance that such opportunities will be allocated to us fairly or equitably in the short-term or over time, and there can be no assurance that we will be able to participate in all investment opportunities that are suitable to us.
GC Advisors’ investment committee, GC Advisors or its affiliates may, from time to time, possess material non-public information, limiting our investment discretion.
Principals of GC Advisors and its affiliates and members of GC Advisors’ investment committee may serve as directors of, or in a similar capacity with, companies in which we invest, the securities of which are purchased or sold on our behalf. In the event that material nonpublic information is obtained with respect to such companies, or we become subject to trading restrictions under the internal trading policies of those companies or as a result of applicable law or regulations, we could be prohibited for a period of time from purchasing or selling the securities of such companies, and this prohibition may have an adverse effect on us.
Our management and incentive fee structure may create incentives for GC Advisors that are not fully aligned with the interests of our stockholders and may induce GC Advisors to make certain investments, including speculative investments.
In the course of our investing activities, we pay management and incentive fees to GC Advisors. The management fee is based on our average adjusted gross assets and the incentive fee is computed and paid on income, both of which include leverage. As a result, investors in our common stock will invest on a “gross” basis and receive distributions on a “net” basis after expenses, resulting in a lower rate of return than one might achieve through direct investments. Because these fees are based on our average adjusted gross assets, GC Advisors benefits when we incur debt or use leverage. Under certain circumstances, the use of leverage may increase the likelihood of default, which would disfavor or our securityholders.
Additionally, the incentive fee payable by us to GC Advisors may create an incentive for GC Advisors to cause us to realize capital gains or losses that may not be in the best interests of us or our stockholders. Under the incentive fee structure, GC Advisors benefits when we recognize capital gains and, because GC Advisors determines when an investment is sold, GC Advisors controls the timing of the recognition of such capital gains. Our board of directors is charged with protecting our stockholders’ interests by monitoring how GC Advisors addresses these and other conflicts of interest associated with its management services and compensation.
The way in which these fees payable to GC Advisors are determined may encourage GC Advisors to use leverage to increase the return on our investments. Under certain circumstances, the use of leverage may increase the likelihood of default, which would disfavor our securityholders.
The part of the management and incentive fees payable to GC Advisors that relates to our net investment income is computed and paid on income that may include interest income that has been accrued but not yet received in cash, such as market discount, debt instruments with PIK interest, preferred stock with PIK dividends, zero coupon securities, and other deferred interest instruments and may create an incentive for GC Advisors to make investments on our behalf that are riskier or more speculative than would be the case in the absence of such compensation arrangement. This fee structure may be considered to involve a conflict of interest for GC Advisors to the extent that it may encourage GC Advisors to favor debt financings that provide for deferred interest, rather than current cash payments of interest. Under these investments, we accrue the interest over the life of the investment but do not receive the cash income from the investment until the end of the term. Our net investment income used to calculate the income portion of our investment fee, however, includes accrued interest. GC Advisors may have an incentive to invest in deferred interest securities in circumstances where it would not have done so but for the opportunity to continue to earn the fees even when the issuers of the deferred interest securities would not be able to make actual cash payments to us on such securities. This risk could be increased because GC Advisors is not obligated to reimburse us for any fees received even if we subsequently incur losses or never receive in cash the deferred income that was previously accrued.
The valuation process for certain of our portfolio holdings creates a conflict of interest.
The majority of our portfolio investments are expected to be made in the form of securities that are not publicly traded. As a result, our board of directors will determine the fair value of these securities in good faith. In connection with that determination, investment professionals from GC Advisors may provide our board of directors with portfolio company valuations based upon the most recent portfolio company financial statements available and projected financial results of each portfolio company. In addition, Lawrence E. Golub and David B. Golub have an indirect pecuniary interest in GC Advisors. The participation of GC Advisors’ investment professionals in our valuation process, and the indirect pecuniary interest in GC Advisors by Lawrence E. Golub and David B. Golub, could result in a conflict of interest as GC Advisors’ management fee is based, in part, on our average adjusted gross assets and our incentive fees will be based, in part, on unrealized gains and losses.
Conflicts related to other arrangements with GC Advisors or its affiliates.
We have entered into a license agreement with Golub Capital LLC under which Golub Capital LLC has granted us a non-exclusive, royalty-free license to use the name “Golub Capital.” See “Item 1. Business — License Agreement.” In addition, we pay to the Administrator our allocable portion of overhead and other expenses incurred by the Administrator in performing its obligations under the Administration Agreement, such as rent and our allocable portion of the cost of our chief financial officer and chief compliance officer and their respective staffs. These arrangements create conflicts of interest that our board of directors must monitor.
The Investment Advisory Agreement and the Administration Agreement were not negotiated on an arm’s-length basis and may not be as favorable to us as if they had been negotiated with an unaffiliated third party.
The Investment Advisory Agreement and the Administration Agreement were negotiated between related parties. Consequently, their terms, including fees payable to GC Advisors, may not be as favorable to us as if they had been negotiated with an unaffiliated third party. In addition, we may choose not to enforce, or to enforce less vigorously, our rights and remedies under these agreements and the Revolver because of our desire to maintain our ongoing relationship with GC Advisors, the Administrator and their respective affiliates. Any such decision, however, would breach our fiduciary obligations to our stockholders.
Our ability to enter into transactions with our affiliates will be restricted, which may limit the scope of investments available to us.
We are prohibited under the 1940 Act from participating in certain transactions with our affiliates without the prior approval of our independent directors and, in some cases, the SEC. Any person that owns, directly or indirectly, five percent or more of our outstanding voting securities is our affiliate for purposes of the 1940 Act, and we are generally prohibited from buying or selling any security from or to such affiliate, absent the prior approval of our independent directors. We consider GC Advisors and its affiliates to be our affiliates for such purposes. The 1940 Act also prohibits certain “joint” transactions with certain of our affiliates, which could include investments in the same portfolio company, without prior approval of our independent directors and, in some cases, the SEC. We are prohibited from buying or selling any security from or to, among others, any person who owns more than 25% of our voting securities or certain of that person’s affiliates, or entering into prohibited joint transactions with such persons, absent the prior approval of the SEC.
We may, however, invest alongside GC Advisors’ and its affiliates’ other clients in certain circumstances where doing so is consistent with applicable law and SEC staff interpretations. For example, we may invest alongside such accounts consistent with guidance promulgated by the SEC staff permitting us and such other accounts to purchase interests in a single class of privately placed securities so long as certain conditions are met, including that GC Advisors, acting on our behalf and on behalf of its other clients, negotiates no term other than price. We may also invest alongside GC Advisors’ other clients as otherwise permissible under regulatory guidance, applicable regulations and GC Advisors’ allocation policy. Under this allocation policy, if an investment opportunity is appropriate for us and another similar eligible account, the opportunity will be allocated pro rata based on relative capital available for investment of each of us and such other eligible accounts, subject to minimum and maximum investment size limits. However, we can offer no assurance that investment opportunities will be allocated to us fairly or equitably in the short-term or over time.
In situations in which co-investment with other accounts sponsored or managed by GC Advisors or its affiliates is not permitted or appropriate, such as when, in the absence of exemptive relief described below, we and such other entities may make investments in the same issuer or where the different investments could be expected to result in a conflict between our interests and those of other GC Advisors clients, GC Advisors needs to decide whether we or such other entity or entities will proceed with such investments. GC Advisors makes these determinations based on its policies and procedures, which generally require that such investment opportunities be offered to eligible accounts on a basis that is fair and equitable over time, including, for example, through random or rotational methods. Moreover, in certain circumstances, we may be unable to invest in an issuer in which an account sponsored or managed by GC Advisors or its affiliates has previously invested. Similar restrictions limit our ability to transact business with our officers or directors or their affiliates. These restrictions may limit the scope of investment opportunities that would otherwise be available to us.
We and GC Advisors have submitted an application for exemptive relief from the SEC to permit greater flexibility to negotiate the terms of co-investments if our board of directors determines that it would be advantageous for us to co-invest with other accounts sponsored or managed by GC Advisors or its affiliates in a manner consistent with our investment objectives, positions, policies, strategies and restrictions as well as regulatory requirements and other pertinent factors. We believe that co-investments by us and other accounts sponsored or managed by GC Advisors and its affiliates may afford us additional investment opportunities and an ability to achieve greater diversification. Accordingly, our application for exemptive relief seeks an exemptive order that would permit us to invest with accounts sponsored or managed by GC Advisors or its affiliates in the same portfolio companies under circumstances in which such investments would otherwise not be permitted under the 1940 Act. We expect that such exemptive relief permitting co-investments, if granted, would apply only if our independent directors review and approve each co-investment.
We operate in a highly competitive market for investment opportunities, which could reduce returns and result in losses.
A number of entities compete with us to make the types of investments that we plan to make. We compete with public and private funds, commercial and investment banks, commercial financing companies and, to the extent they provide an alternative form of financing, private equity and hedge funds. Many of our competitors are substantially larger and have considerably greater financial, technical and marketing resources than we do. For example, we believe some of our competitors may have access to funding sources that are not available to us. In addition, some of
our competitors may have higher risk tolerances or different risk assessments, which could allow them to consider a wider variety of investments and establish more relationships than us. Furthermore, many of our competitors are not subject to the regulatory restrictions that the 1940 Act imposes on us as a business development company or the source of income, asset diversification and distribution requirements we must satisfy to qualify and maintain our qualification as a RIC. The competitive pressures we face may have a material adverse effect on our business, financial condition, results of operations and cash flows. As a result of this competition, we may not be able to take advantage of attractive investment opportunities from time to time, and we may not be able to identify and make investments that are consistent with our investment objective.
With respect to the investments we make, we do not seek to compete based primarily on the interest rates we offer, and we believe that some of our competitors may make loans with interest rates that will be lower than the rates we offer. In the secondary market for acquiring existing loans, we compete generally on the basis of pricing terms. With respect to all investments, we may lose some investment opportunities if we do not match our competitors’ pricing, terms and structure. However, if we match our competitors’ pricing, terms and structure, we may experience decreased net interest income, lower yields and increased risk of credit loss. We may also compete for investment opportunities with accounts managed or sponsored by GC Advisors or its affiliates. Although GC Advisors allocates opportunities in accordance with its allocation policy, allocations to such other accounts will reduce the amount and frequency of opportunities available to us and may not be in the best interests of us and our securityholders. Moreover, the performance of investments will not be known at the time of allocation.
We will be subject to corporate-level income tax if we are unable to qualify as a RIC.
In order to be subject to tax as a RIC under the Code, we must meet certain source-of-income, asset diversification and distribution requirements. The distribution requirement for a RIC is satisfied if we distribute dividends of an amount at least equal to 90% of our investment company taxable income, which is generally our net ordinary income plus the excess of our net short-term capital gains in excess of our net long-term capital losses, determined without regard to any deduction for dividends paid, to our stockholders on an annual basis. We are subject, to the extent we use debt financing, to certain asset coverage ratio requirements under the 1940 Act and financial covenants under loan and credit agreements that could, under certain circumstances, restrict us from making distributions necessary to qualify as a RIC. If we are unable to obtain cash from other sources, we may fail to qualify as a RIC and, thus, may be subject to corporate-level income tax. To qualify as a RIC, we must also meet certain asset diversification requirements at the end of each quarter of our taxable year. Failure to meet these requirements may result in our having to dispose of certain investments quickly in order to prevent the loss of our qualification as a RIC. Because most of our investments are in private or thinly traded public companies, any such dispositions could be made at disadvantageous prices and may result in substantial losses. If we fail to qualify as a RIC for any reason and become subject to corporate-level income tax, the resulting corporate taxes could substantially reduce our net assets, the amount of income available for distributions to stockholders and the amount of our distributions and the amount of funds available for new investments. Such a failure would have a material adverse effect on us and our securityholders. See “Item 1. Business — Material U.S. Federal Income Tax Considerations — Taxation as a RIC.”
We may need to raise additional capital to grow because we must distribute most of our income.
We may need additional capital to fund new investments and grow our portfolio of investments. We intend to access the capital markets periodically to issue debt or equity securities or borrow from financial institutions in order to obtain such additional capital. Unfavorable economic conditions could increase our funding costs, limit our access to the capital markets or result in a decision by lenders not to extend credit to us. A reduction in the availability of new capital could limit our ability to grow. In addition, in order to qualify as a RIC, we will be required to distribute at least 90% of our net ordinary income and net short-term capital gains in excess of net long-term capital losses, if any, to our stockholders. As a result, these earnings are not available to fund new investments. An inability to access the capital markets successfully could limit our ability to grow our business and execute our business strategy fully and could decrease our earnings, if any, which may have an adverse effect on the value of our securities.
We may have difficulty paying our required distributions if we recognize income before, or without, receiving cash representing such income.
For U.S. federal income tax purposes, we include in income certain amounts that we have not yet received in cash, such as the accretion of original issue discount. This may arise if we receive warrants in connection with the
making of a loan and in other circumstances, or through contracted PIK interest, which represents contractual interest added to the loan balance and due at the end of the loan term. Such original issue discount, which could be significant relative to our overall investment activities, or increases in loan balances as a result of contracted PIK arrangements, is included in income before we receive any corresponding cash payments. We also may be required to include in income certain other amounts that we do not receive in cash.
That part of the incentive fee payable by us that relates to our net investment income is computed and paid on income that may include interest that has been accrued but not yet received in cash, such as market discount, debt instruments with PIK interest, preferred stock with PIK dividends and zero coupon securities. If a portfolio company defaults on a loan that is structured to provide accrued interest, it is possible that accrued interest previously used in the calculation of the incentive fee will become uncollectible, and GC Advisors will have no obligation to refund any fees it received in respect of such accrued income.
Since in certain cases we may recognize income before or without receiving cash representing such income, we may have difficulty meeting the requirement in a given taxable year to distribute dividends of an amount at least equal to 90% of our investment company taxable income, determined without regard to any deduction for dividends paid, to our stockholders to qualify and maintain our ability to be subject to tax as a RIC. In such a case, we may have to sell some of our investments at times we would not consider advantageous, raise additional debt or equity capital or reduce new investment originations to meet these distribution requirements. If we are not able to obtain such cash from other sources, we may fail to qualify as a RIC and thus be subject to corporate-level income tax. See “Item 1. Business — Material U.S. Federal Income Tax Considerations — Taxation as a RIC.”
If we are not treated as a “publicly offered regulated investment company,” as defined in the Code, U.S. stockholders that are individuals, trusts or estates will be taxed as though they received a distribution of some of our expenses
We do not expect to be treated initially as a “publicly offered regulated investment company”. Until and unless we are treated as a “publicly offered regulated investment company” as a result of either (i) shares of our common stock and our preferred stock collectively being held by at least 500 persons at all times during a taxable year or (ii) shares of our common stock being treated as regularly traded on an established securities market, each U.S. stockholder that is an individual, trust or estate will be treated as having received a dividend from us in the amount of such U.S. stockholder’s allocable share of the management and incentive fees paid to our investment adviser and certain of our other expenses for the calendar year, and these fees and expenses will be treated as miscellaneous itemized deductions of such U.S. stockholder. Miscellaneous itemized deductions generally are deductible by a U.S. stockholder that is an individual, trust or estate only to the extent that the aggregate of such U.S. stockholder’s miscellaneous itemized deductions exceeds 2% of such U.S. stockholder’s adjusted gross income for U.S. federal income tax purposes, are not deductible for purposes of the alternative minimum tax and are subject to the overall limitation on itemized deductions under the Code. See “Item 1. Business — Material U.S. Federal Income Tax Considerations — Taxation of U.S. Stockholders.”
Regulations governing our operation as a business development company affect our ability to, and the way in which we, raise additional capital. As a business development company, the necessity of raising additional capital exposes us to risks, including the typical risks associated with leverage.
We may issue debt securities or preferred stock and/or borrow money from banks or other financial institutions, which we refer to collectively as “senior securities,” up to the maximum amount permitted by the 1940 Act. Under the provisions of the 1940 Act, we are permitted as a business development company to issue senior securities in amounts such that our asset coverage, as defined in the 1940 Act, equals at least 200% of gross assets less all liabilities and indebtedness not represented by senior securities, after each issuance of senior securities. If the value of our assets declines, we may be unable to satisfy this ratio. If that happens, we may be required to sell a portion of our investments and, depending on the nature of our leverage, repay a portion of our indebtedness at a time when such sales may be disadvantageous. Also, any amounts that we use to service our indebtedness would not be available for distributions to our common stockholders. If we issue senior securities, we will be exposed to typical risks associated with leverage, including an increased risk of loss. As of June 30, 2016, we had $404.4 million of outstanding borrowings.
In the absence of an event of default, no person or entity from which we borrow money has a veto right or voting power over our ability to set policy, make investment decisions or adopt investment strategies. If we issue preferred
stock, which is another form of leverage, the preferred stock would rank “senior” to common stock in our capital structure, preferred stockholders would have separate voting rights on certain matters and might have other rights, preferences or privileges more favorable than those of our common stockholders, and the issuance of preferred stock could have the effect of delaying, deferring or preventing a transaction or a change of control that might involve a premium price for holders of our common stock or otherwise be in the best interest of our common stockholders. Holders of our common stock will directly or indirectly bear all of the costs associated with offering and servicing any preferred stock that we issue. In addition, any interests of preferred stockholders may not necessarily align with the interests of holders of our common stock and the rights of holders of shares of preferred stock to receive dividends would be senior to those of holders of shares of our common stock. We do not, however, anticipate issuing preferred stock in the next 12 months.
We are not generally able to issue and sell our common stock at a price below net asset value per share. We may, however, sell our common stock, or warrants, options or rights to acquire our common stock, at a price below the then-current net asset value per share of our common stock if our board of directors determines that such sale is in the best interests of us and our stockholders, and if our stockholders approve such sale. In any such case, the price at which our securities are to be issued and sold may not be less than a price that, in the determination of our board of directors, closely approximates the market value of such securities (less any distributing commission or discount). If we raise additional funds by issuing common stock or senior securities convertible into, or exchangeable for, our common stock, then the percentage ownership of our stockholders at that time will decrease, and holders of our common stock might experience dilution.
We intend to finance our investments with borrowed money, which will magnify the potential for gain or loss on amounts invested and may increase the risk of investing in us.
The use of leverage magnifies the potential for gain or loss on amounts invested. The use of leverage is generally considered a speculative investment technique and increases the risks associated with investing in our securities. The amount of leverage that we employ will depend on GC Advisors’ and our board of directors’ assessment of market and other factors at the time of any proposed borrowing. We cannot assure you that we will be able to obtain credit at all or on terms acceptable to us. We may issue senior debt securities to banks, insurance companies and other lenders. Lenders of these senior securities will have fixed dollar claims on our assets that are superior to the claims of our common stockholders, and we would expect such lenders to seek recovery against our assets in the event of a default. We may pledge up to 100% of our assets and may grant a security interest in all of our assets under the terms of any debt instruments we may enter into with lenders. The terms of our existing indebtedness require us to comply with certain financial and operational covenants, and we expect similar covenants in future debt instruments. Failure to comply with such covenants could result in a default under the applicable credit facility or debt instrument if we are unable to obtain a waiver from the applicable lender or holder, and such lender or holder could accelerate repayment under such indebtedness and negatively affect our business, financial condition, results of operations and cash flows. In addition, under the terms of any credit facility or other debt instrument we enter into, we are likely to be required by its terms to use the net proceeds of any investments that we sell to repay a portion of the amount borrowed under such facility or instrument before applying such net proceeds to any other uses. If the value of our assets decreases, leveraging would cause our net asset value to decline more sharply than it otherwise would have had we not leveraged, thereby magnifying losses or eliminating our equity stake in a leveraged investment. Similarly, any decrease in our net investment income will cause our net income to decline more sharply than it would have had we not borrowed. Such a decline would also negatively affect our ability to make distributions on our common stock or any outstanding preferred stock. Our ability to service our debt depends largely on our financial performance and is subject to prevailing economic conditions and competitive pressures. Our common stockholders bear the burden of any increase in our expenses as a result of our use of leverage, including interest expenses and any increase in the base management fee payable to GC Advisors.
The following table illustrates the effect of leverage on returns from an investment in our common stock as of June 30, 2016, assuming various annual returns, net of expenses. The calculations in the table below are hypothetical and actual returns may be higher or lower than those appearing in the table below.
| | | Assumed Return on Our Portfolio (Net of Expenses) | |
| | | -10% | | | -5% | | | 0% | | | 5% | | | 10% | |
| Corresponding return to common stockholder(1) | | | -20.26 | % | | | -11.17 | % | | | -2.08 | % | | | 7.02 | % | | | 16.11 | % |
| (1) | Assumes $930.9 million in total assets, $404.4 million in debt outstanding and $511.8 million in net assets as of June 30, 2016 and an effective annual interest rate of 2.63% as of June 30, 2016. |
Based on our outstanding indebtedness of $404.4 million as of June 30, 2016 and the effective annual interest rate of 2.63% as of that date, our investment portfolio would have been required to experience an annual return of at least 1.14% to cover annual interest payments on the outstanding debt.
We are subject to risks associated with the GCIC 2016 Debt Securitization.
As a result of the GCIC 2016 Debt Securitization, we are subject to a variety of risks, including those set forth below. We use the term “debt securitization” in this Registration Statement to describe a form of secured borrowing under which an operating company (sometimes referred to as an “originator” or “sponsor”) acquires or originates mortgages, receivables, loans or other assets that earn income, whether on a one-time or recurring basis (collectively, “income producing assets”), and borrows money on a non-recourse basis against a legally separate pool of loans or other income producing assets. In a typical debt securitization, the originator transfers the loans or income producing assets to a single-purpose, bankruptcy-remote subsidiary (also referred to as a “special purpose entity”), which is established solely for the purpose of holding loans and income producing assets and issuing debt secured by these income producing assets. The special purpose entity completes the borrowing through the issuance of notes secured by the loans or other assets. The special purpose entity may issue the notes in the capital markets to a variety of investors, including banks, non-bank financial institutions and other investors. In the GCIC 2016 Debt Securitization, institutional investors purchased the notes issued by the GCIC 2016 Issuer in a private placement.
We are subject to certain risks as a result of our direct interests in the junior notes and membership interests of the GCIC 2016 Issuer.
Under the terms of the loan sale agreement governing the GCIC 2016 Debt Securitization, we sold and/or contributed to the GCIC 2016 Issuer all of our ownership interest in our portfolio loans and participations for the purchase price and other consideration set forth in such loan sale agreement. Following this transfer, the GCIC 2016 Issuer held all of the ownership interest in such portfolio loans and participations. As a result of the GCIC 2016 Debt Securitization, we hold the Class C Notes and Class D Notes issued by the GCIC 2016 Issuer as well as all of the membership interests of the GCIC 2016 Issuer. As a result, we will consolidate the financial statements of the GCIC 2016 Issuer, as well as our other subsidiaries, in our consolidated financial statements. Because the GCIC 2016 Issuer is disregarded as an entity separate from its owner for U.S. federal income tax purposes, the sale or contribution by us to the GCIC 2016 Issuer did not constitute a taxable event for U.S. federal income tax purposes. If the IRS were to take a contrary position, there could be a material adverse effect on our business, financial condition, results of operations or cash flows. We may, from time to time, hold asset-backed securities, or the economic equivalent thereof, issued by a securitization vehicle sponsored by another business development company to the extent permitted under the 1940 Act.
The Class C Notes and Class D Notes are subordinated obligations of the GCIC 2016 Issuer and we may not receive cash from the GCIC 2016 Issuer.
The Class C Notes and Class D Notes are the most junior classes of notes issued by the GCIC 2016 Issuer, are subordinated in priority of payment to the Class A Notes and the Class B Notes and are subject to certain payment restrictions set forth in the indenture governing the notes issued by the GCIC 2016 Issuer. Therefore, we only receive cash distributions on the Class C Notes and Class D Notes if the GCIC 2016 Issuer has made all cash interest payments to all other notes it has issued. Consequently, to the extent that the value of the GCIC 2016 Issuer’s portfolio of loan investments has been reduced as a result of conditions in the credit markets, or as a result of defaulted loans or individual fund assets, the value of the Class C Notes and the Class D Notes at their redemption could be reduced. If the GCIC 2016 Issuer does not meet the asset coverage tests or the interest coverage test set forth in the documents governing the GCIC 2016 Debt Securitization, cash would be diverted from the Class C Notes and Class D Notes to first pay the Class A Notes and Class B Notes in amounts sufficient to cause such tests to be satisfied.
The GCIC 2016 Issuer is the residual claimant on funds, if any, remaining after holders of all classes of notes issued by the GCIC 2016 Issuer have been paid in full on each payment date or upon maturity of such notes under the GCIC 2016 Debt Securitization documents. The membership interests in the GCIC 2016 Issuer represent all of the equity interest in the GCIC 2016 Issuer, and, as the holder of the membership interests, we may receive distributions, if any, only to the extent that the GCIC 2016 Issuer makes distributions out of funds remaining after holders of all classes of notes have been paid in full on each payment date any amounts due and owing on such payment date or upon maturity of such notes. In the event that we fail to receive cash directly from the GCIC 2016 Issuer, we could be unable to make such distributions in amounts sufficient to maintain our status as a RIC, or at all.
The interests of holders of the senior classes of securities issued by the GCIC 2016 Issuer may not be aligned with our interests.
The Class A Notes are the debt obligations ranking senior in right of payment to other securities issued by the GCIC 2016 Issuer in the GCIC 2016 Debt Securitization. As such, there are circumstances in which the interests of holders of the Class A Notes may not be aligned with the interests of holders of the other classes of notes issued by, and membership interests of, the GCIC 2016 Issuer. For example, under the terms of the Class A Notes, holders of the Class A Notes have the right to receive payments of principal and interest prior to holders of the Class B Notes, the Class C Notes, the Class D Notes and the GCIC 2016 Issuer.
For as long as the Class A Notes remain outstanding, holders of the Class A Notes comprise the most senior class of notes then outstanding, or the Controlling Class, under the GCIC 2016 Debt Securitization. If the Class A Notes are paid in full, the Class B Notes would comprise the Controlling Class under the GCIC 2016 Debt Securitization. Holders of the Controlling Class under the GCIC 2016 Debt Securitization have the right to act in certain circumstances with respect to the portfolio loans in ways that may benefit their interests but not the interests of holders of more junior classes of notes and membership interests, including by exercising remedies under the indenture in the GCIC 2016 Debt Securitization.
If an event of default has occurred and acceleration occurs in accordance with the terms of the indenture for the GCIC 2016 Debt Securitization, the Controlling Class, as the most senior class of notes then outstanding will be paid in full before any further payment or distribution on the more junior classes of notes and membership interests. In addition, if an event of default under the GCIC 2016 Debt Securitization occurs, holders of a majority of the Controlling Class may be entitled to determine the remedies to be exercised under the indenture, subject to the terms of such indenture. For example, upon the occurrence of an event of default with respect to the notes issued by the GCIC 2016 Issuer, the trustee or holders of a majority of the Controlling Class may declare the principal, together with any accrued interest, of all the notes of such class and any junior classes to be immediately due and payable. This would have the effect of accelerating the principal on such notes, triggering a repayment obligation on the part of the GCIC 2016 Issuer. If at such time the portfolio loans were not performing well, the GCIC 2016 Issuer may not have sufficient proceeds available to enable the trustee under the indenture to repay the obligations of holders of the Class C Notes, Class D Notes, or to pay a dividend to holders of the membership interests.
Remedies pursued by the Controlling Class could be adverse to the interests of the holders of the notes that are subordinated to the Controlling Class (which would include the Class C Notes and Class D Notes to the extent the Class A Notes or Class B Notes constitute the Controlling Class), and the Controlling Class will have no obligation to consider any possible adverse effect on such other interests. Thus, we cannot assure you that any remedies pursued by the Controlling Class will be in the best interests of us or that we will receive any payments or distributions from the GCIC 2016 Issuer upon an acceleration of the notes if there are not sufficient proceeds to pay the holders of more senior notes. In a liquidation under the GCIC 2016 Debt Securitization, the Class C Notes and Class D Notes will be subordinated to payment of the Class A Notes and Class B Notes and may not be paid in full to the extent funds remaining after payment of the Class A Notes and Class B Notes are insufficient. In addition, under the GCIC 2016 Debt Securitization, after the Class A Notes and Class B Notes are paid in full, the holder of the Class C Notes and Class D Notes will be the only remaining noteholders and may amend the applicable indenture to, among other things, direct the assignment of any remaining assets to other wholly-owned subsidiaries for a price less than the fair market value of such assets with the difference in price to be considered an equity contribution to such subsidiaries. Any failure of the GCIC 2016 Issuer to make distributions on the notes we hold, whether as a result of an event of default, liquidation or otherwise, could have a material adverse effect on our business, financial condition, results of operations and cash flows and may result in an inability of us to make distributions sufficient to maintain our status as a RIC.
The GCIC 2016 Issuer may fail to meet certain asset coverage tests.
Under the documents governing the GCIC 2016 Debt Securitization, there are two asset coverage tests applicable to the Class A Notes and Class B Notes. The first such test compares the amount of interest received on the portfolio loans held by the GCIC 2016 Issuer to the amount of interest payable in respect of the Class A Notes, Class B Notes and Class C Notes. To meet this first test, interest received on the portfolio loans must equal at least 120% of the interest payable in respect of the Class A Notes and Class B Notes, taken together, and at least 110% of the interest payable in respect of the Class C Notes. The second such test compares the principal amount of the portfolio loans to the aggregate outstanding principal amount of the Class A Notes, the Class B Notes and the Class C Notes. To meet this second test at any time, the aggregate principal amount of the portfolio loans must equal at least 149.4% of the Class A Notes and the Class B Notes, taken together, and 128.2% of the Class C Notes. If any asset coverage test with respect to the Class A Notes, the Class B Notes or Class C Notes is not met, proceeds from the portfolio of loan investments that otherwise would have been distributed to the holders of the Class C Notes, Class D Notes and the GCIC 2016 Issuer will instead be used to redeem first the Class A Notes and then the Class B Notes, to the extent necessary to satisfy the applicable asset coverage tests on a pro forma basis after giving effect to all payments made in respect of the notes, which we refer to as a mandatory redemption, or to obtain the necessary ratings confirmation.
The value of the Class C Notes or the Class D Notes could be adversely affected by a mandatory redemption because such redemption could result in the applicable notes being redeemed at par at a time when they are trading in the secondary market at a premium to their stated principal amount and when other investments bearing the same rate of interest may be difficult or expensive to acquire. A mandatory redemption could also result in a shorter investment duration than a holder of such notes may have wanted or anticipated, which could, in turn, result in such a holder incurring breakage costs on related hedging transactions. In addition, the reinvestment period under the GCIC 2016 Debt Securitization may extend through as late as August 8, 2020, which could affect the value of the collateral securing the Class C Notes and Class D Notes.
We may be required to assume liabilities of the GCIC 2016 Issuer and are indirectly liable for certain representations and warranties in connection with the GCIC 2016 Debt Securitization.
The structure of the GCIC 2016 Debt Securitization is intended to prevent, in the event of our bankruptcy, the consolidation of the GCIC 2016 Issuer with our operations. If the true sale of the assets in the GCIC 2016 Debt Securitization were not respected in the event of our insolvency, a trustee or debtor-in-possession might reclaim the assets of the GCIC 2016 Issuer for our estate. However, in doing so, we would become directly liable for all of the indebtedness then outstanding under the GCIC 2016 Debt Securitization, which would equal the full amount of debt of the GCIC 2016 Issuer that will be reflected on our consolidated balance sheet. In addition, we cannot assure you that the recovery in the event we were consolidated with the GCIC 2016 Issuer for purposes of any bankruptcy proceeding would exceed the amount to which we would otherwise be entitled as an indirect holder of the Class C Notes and Class D Notes had we not been consolidated with the GCIC 2016 Issuer.
In addition, in connection with the GCIC 2016 Debt Securitization, we indirectly gave the lenders certain customary representations with respect to the legal structure of the GCIC 2016 Issuer and the quality of the assets transferred to the GCIC 2016 Issuer. We remain indirectly liable for any breach of such representations for the life of the GCIC 2016 Debt Securitization.
The GCIC 2016 Issuer may issue additional Notes.
Under the terms of the GCIC 2016 Debt Securitization documents, the GCIC 2016 Issuer could issue additional notes in any class at any time during the reinvestment period on a pro rata basis for each class of notes or, if additional Class A Notes are not being issued, on a pro rata basis for all classes that are subordinate to the Class A Notes and use the net proceeds of such issuance to purchase additional portfolio loans or for another permitted use as provided in the GCIC 2016 Debt Securitization documents. Any such additional issuance, however, would require the consent of the collateral manager to the GCIC 2016 Debt Securitization and either the holders of a majority the Class A Notes or, in the case of an additional issuance of Class A Notes, the holders of a supermajority of the Class A Notes. Among the other conditions that must be satisfied in connection with an additional issuance of notes, the aggregate principal amount of all additional issuances of any class of notes may not exceed 100% of the outstanding principal amount of such class of notes; the GCIC 2016 Issuer must notify each rating agency of such issuance prior to the issuance date and such rating agency, if it then rates any class of notes, must confirm in writing that no immediate withdrawal or reduction with respect to its then-current rating of any such class of notes will
occur as a result of such issuance; and the terms of the notes to be issued must be identical to the terms of previously issued notes of the same class (except that all monies due on such additional notes will accrue from the issue date of such notes and that the spread over LIBOR and prices of such notes do not have to be identical to those of the initial notes, provided that the interest rate on such additional notes must not exceed the interest rate applicable to the initial class of such notes). We do not expect to cause the GCIC 2016 Issuer to issue any additional notes at this time. The total purchase price for any additional notes that may be issued may not always equal 100% of the par value of such notes, depending on several factors, including fees and closing expenses.
We are subject to risks associated with the Credit Facility.
On October 10, 2014, GCIC Funding, our wholly-owned subsidiary, entered into the Credit Facility, a senior secured revolving credit facility. As a result of the Credit Facility, we are subject to a variety of risks, including those set forth below.
Our interests in GCIC Funding are subordinated and we may not receive cash on our equity interests from GCIC Funding.
We own 100% of the equity interests in GCIC Funding. We consolidate the financial statements of GCIC Funding in our consolidated financial statements and treat the indebtedness of GCIC Funding as our leverage. Our interests in GCIC Funding are subordinated in priority of payment to every other obligation of GCIC Funding and are subject to certain payment restrictions set forth in the Credit Facility. We receive cash distributions on our equity interests in GCIC Funding only if GCIC Funding has made all required cash interest payments to the lenders and no default exists under the Credit Facility. We cannot assure you that distributions on the assets held by GCIC Funding will be sufficient to make any distributions to us or that such distributions will meet our expectations.
We receive cash from GCIC Funding only to the extent that we receive distributions on our equity interests in GCIC Funding. GCIC Funding may make distributions on its equity interests only to the extent permitted by the payment priority provisions of the Credit Facility. The Credit Facility generally provides that payments on such interests may not be made on any payment date unless all amounts owing to the lenders and other secured parties are paid in full. In addition, if GCIC Funding does not meet the borrowing base test set forth in the Credit Facility documents, a default would occur. In the event of a default under the Credit Facility documents, cash would be diverted from GCIC Funding to pay the lender and other secured parties until they are paid in full. In the event that we fail to receive cash from GCIC Funding, we could be unable to make distributions to our stockholders in amounts sufficient to maintain our status as a RIC, or at all. We also could be forced to sell investments in portfolio companies at less than their fair value in order to continue making such distributions.
Our equity interests in GCIC Funding rank behind all of the secured and unsecured creditors, known or unknown, of GCIC Funding, including the lenders in the Credit Facility. Consequently, to the extent that the value of GCIC Funding’s portfolio of loan investments has been reduced as a result of conditions in the credit markets, defaulted loans, capital gains and losses on the underlying assets, prepayment or changes in interest rates, the return on our investment in GCIC Funding could be reduced. Accordingly, our investment in GCIC Funding may be subject to up to a complete loss.
Our ability to sell investments held by GCIC Funding is limited.
The Credit Facility places significant restrictions on GC Advisors’ ability, as servicer, to sell investments. As a result, there may be times or circumstances during which GC Advisors is unable to sell investments or take other actions that might be in our best interests.
Our ability to invest in public companies may be limited in certain circumstances.
To maintain our status as a business development company, we are not permitted to acquire any assets other than “qualifying assets” specified in the 1940 Act unless, at the time the acquisition is made, at least 70% of our total assets are qualifying assets (with certain limited exceptions). Subject to certain exceptions for follow-on investments and investments in distressed companies, an investment in an issuer that has outstanding securities listed on a national securities exchange may be treated as qualifying assets only if such issuer has a common equity market capitalization that is less than $250.0 million at the time of such investment.
We may enter into reverse repurchase agreements, which are another form of leverage.
We may enter into reverse repurchase agreements as part of our management of our temporary investment portfolio. Under a reverse repurchase agreement, we will effectively pledge our assets as collateral to secure a short-term loan. Generally, the other party to the agreement makes the loan in an amount equal to a percentage of the fair value of the pledged collateral. At the maturity of the reverse repurchase agreement, we will be required to repay the loan and correspondingly receive back our collateral. While used as collateral, the assets continue to pay principal and interest which are for the benefit of us.
Our use of reverse repurchase agreements, if any, involves many of the same risks involved in our use of leverage, as the proceeds from reverse repurchase agreements generally will be invested in additional securities. There is a risk that the market value of the securities acquired in the reverse repurchase agreement may decline below the price of the securities that we have sold but remain obligated to purchase. In addition, there is a risk that the market value of the securities retained by us may decline. If a buyer of securities under a reverse repurchase agreement were to file for bankruptcy or experience insolvency, we may be adversely affected. Also, in entering into reverse repurchase agreements, we would bear the risk of loss to the extent that the proceeds of such agreements at settlement are less than the fair value of the underlying securities being pledged. In addition, due to the interest costs associated with reverse repurchase agreements, our net asset value would decline, and, in some cases, we may be worse off than if we had not used such agreements.
Adverse developments in the credit markets may impair our ability to enter into new debt financing arrangements.
During the economic downturn in the United States that began in mid-2007, many commercial banks and other financial institutions stopped lending or significantly curtailed their lending activity. In addition, in an effort to stem losses and reduce their exposure to segments of the economy deemed to be high risk, some financial institutions limited routine refinancing and loan modification transactions and even reviewed the terms of existing facilities to identify bases for accelerating the maturity of existing lending facilities. To the extent these circumstances arise again in the future, it may be difficult for us to finance the growth of our investments on acceptable economic terms, or at all and one or more of our leverage facilities could be accelerated by the lenders.
If we do not invest a sufficient portion of our assets in qualifying assets, we could fail to qualify as a business development company or be precluded from investing according to our current business strategy.
As a business development company, we may not acquire any assets other than “qualifying assets” unless, at the time of and after giving effect to such acquisition, at least 70% of our total assets are qualifying assets. See “Item 1. Business — Regulation — Qualifying Assets.”
In the future, we believe that most of our investments will constitute qualifying assets. However, we may be precluded from investing in what we believe are attractive investments if such investments are not qualifying assets for purposes of the 1940 Act. If we do not invest a sufficient portion of our assets in qualifying assets, we could violate the 1940 Act provisions applicable to business development companies. As a result of such violation, specific rules under the 1940 Act could prevent us, for example, from making follow-on investments in existing portfolio companies (which could result in the dilution of our position) or could require us to dispose of investments at inappropriate times in order to come into compliance with the 1940 Act. If we need to dispose of such investments quickly, it could be difficult to dispose of such investments on favorable terms. We may not be able to find a buyer for such investments and, even if we do find a buyer, we may have to sell the investments at a substantial loss. Any such outcomes would have a material adverse effect on our business, financial condition, results of operations and cash flows.
Failure to qualify as a business development company will decrease our operating flexibility.
If we do not maintain our status as a business development company, we would be subject to regulation as a registered closed-end investment company under the 1940 Act. As a registered closed-end investment company, we would be subject to substantially more regulatory restrictions under the 1940 Act which would significantly decrease our operating flexibility.
The majority of our portfolio investments are recorded at fair value as determined in good faith by our board of directors and, as a result, there may be uncertainty as to the value of our portfolio investments.
The majority of our portfolio investments take the form of securities that are not publicly traded. The fair value of securities and other investments that are not publicly traded may not be readily determinable, and we value these securities at fair value as determined in good faith by our board of directors, including to reflect significant events affecting the value of our securities. As discussed in more detail under “Item 2. Financial Information —Management’s Discussion and Analysis of Financial Condition, Results of Operations and Cash Flows — Critical Accounting Policies,” most, if not all, of our investments (other than cash and cash equivalents) are classified as Level 3 under Accounting Standards Codification, or ASC, Topic 820,Fair Value Measurements and Disclosures, or ASC Topic 820. This means that our portfolio valuations are based on unobservable inputs and our own assumptions about how market participants would price the asset or liability in question. Inputs into the determination of fair value of our portfolio investments require significant management judgment or estimation. Even if observable market data are available, such information may be the result of consensus pricing information or broker quotes, which may include a disclaimer that the broker would not be held to such a price in an actual transaction. The non-binding nature of consensus pricing and/or quotes accompanied by disclaimers materially reduces the reliability of such information.
We have retained the services of several independent service providers to review the valuation of these securities. At least once annually, the valuation for each portfolio investment for which a market quote is not readily available is reviewed by an independent valuation firm. The types of factors that the board of directors may take into account in determining the fair value of our investments generally include, as appropriate, comparison to publicly traded securities, including such factors as yield, maturity and measures of credit quality, the enterprise value of a portfolio company, the nature and realizable value of any collateral, the portfolio company’s ability to make payments and its earnings and discounted cash flow, the markets in which the portfolio company does business and other relevant factors. Because such valuations, and particularly valuations of private securities and private companies, are inherently uncertain, may fluctuate over short periods of time and may be based on estimates, our determinations of fair value may differ materially from the values that would have been used if a ready market for these securities existed. Our net asset value could be adversely affected if our determinations regarding the fair value of our investments were materially higher than the values that we ultimately realize upon the disposal of such securities.
We adjust quarterly the valuation of our portfolio to reflect our board of directors’ determination of the fair value of each investment in our portfolio. Any changes in fair value are recorded in our consolidated statement of operations as net change in unrealized appreciation or depreciation.
We may experience fluctuations in our quarterly operating results.
We could experience fluctuations in our quarterly operating results due to a number of factors, including the interest rate payable on the debt securities we acquire, the default rate on such securities, the number and size of investments we originate or acquire, the level of our expenses, variations in and the timing of the recognition of realized and unrealized gains or losses, the degree to which we encounter competition in our markets and general economic conditions. In light of these factors, results for any period should not be relied upon as being indicative of our performance in future periods.
New or modified laws or regulations governing our operations may adversely affect our business.
We and our portfolio companies are subject to regulation by laws at the U.S. federal, state and local levels. These laws and regulations, as well as their interpretation, may change from time to time, and new laws, regulations and interpretations may also come into effect. Any such new or changed laws or regulations could have a material adverse effect on our business. In particular, the scope of Dodd-Frank impacts many aspects of the financial services industry, and it requires the development and adoption of many implementing regulations over the next several years. The effects of Dodd-Frank on the financial services industry will depend, in large part, upon the extent to which regulators exercise the authority granted to them and the approaches taken in implementing regulations. While the impact of Dodd-Frank on us and our portfolio companies may not be known for an extended period of time, Dodd-Frank, including future rules implementing its provisions and the interpretation of those rules, along with other legislative and regulatory proposals directed at the financial services industry or affecting taxation that are proposed or pending in the U.S. Congress, may negatively impact the operations, cash flows or financial condition of us or our portfolio companies, impose additional costs on us or our
portfolio companies, intensify the regulatory supervision of us or our portfolio companies or otherwise adversely affect our business or the business of our portfolio companies. In addition, if we do not comply with applicable laws and regulations, we could lose any licenses that we then hold for the conduct of our business and may be subject to civil fines and criminal penalties.
Additionally, changes to the laws and regulations governing our operations, including those associated with RICs, may cause us to alter our investment strategy in order to avail ourselves of new or different opportunities or result in the imposition of corporate-level taxes on us. Such changes could result in material differences to our strategies and plans and may shift our investment focus from the areas of expertise of GC Advisors to other types of investments in which GC Advisors may have little or no expertise or experience. Any such changes, if they occur, could have a material adverse effect on our results of operations and the value of your investment. If we invest in commodity interests in the future, GC Advisors may determine not to use investment strategies that trigger additional regulation by the U.S. Commodity Futures Trading Commission, or CFTC, or may determine to operate subject to CFTC regulation, if applicable. If we or GC Advisors were to operate subject to CFTC regulation, we may incur additional expenses and would be subject to additional regulation.
Over the last several years, there also has been an increase in regulatory attention to the extension of credit outside of the traditional banking sector, raising the possibility that some portion of the non-bank financial sector will be subject to new regulation. While it cannot be known at this time whether any regulation will be implemented or what form it will take, increased regulation of non-bank credit extension could negatively impact our operations, cash flows or financial condition, impose additional costs on us, intensify the regulatory supervision of us or otherwise adversely affect our business, financial condition and results of operations.
Our board of directors may change our investment objective, operating policies and strategies without prior notice or stockholder approval.
Our board of directors has the authority, except as otherwise provided in the 1940 Act, to modify or waive our investment objective and certain of our operating policies and strategies without prior notice and without stockholder approval. However, absent stockholder approval, we may not change the nature of our business so as to cease to be, or withdraw our election as, a business development company. We cannot predict the effect any changes to our current investment objective, operating policies and strategies would have on our business, operating results and the price value of our common stock. Nevertheless, any such changes could adversely affect our business and impair our ability to make distributions.
Provisions of the Maryland General Corporation Law and of our charter and bylaws could deter takeover attempts and have an adverse effect on the price of our common stock.
The Maryland General Corporation Law, or the MGCL, our charter and our bylaws contain provisions that may discourage, delay or make more difficult a change in control of us or the removal of our directors. We are subject to the Maryland Business Combination Act, the application of which is subject to any applicable requirements of the 1940 Act. Our board of directors may adopt a resolution exempting from the Maryland Business Combination Act any business combination between us and any other person, subject to prior approval of such business combination by our board, including approval by a majority of our disinterested directors. The Maryland Business Combination Act may discourage third parties from trying to acquire control of us and increase the difficulty of consummating such an offer.
In addition, our bylaws exempt from the Maryland Control Share Acquisition Act acquisitions of our common stock by any person. If we amend our bylaws to repeal the exemption from such act, it may make it more difficult for a third party to obtain control of us and increase the difficulty of consummating such an offer. The staff of the SEC’s Division of Investment Management has taken the position that a business development company failing to opt out of the Maryland Control Share Acquisition Act is acting in a manner inconsistent with Section 18(i) of the 1940 Act. Also, our charter provides for classifying our board of directors in three classes serving staggered three-year terms, and provisions of our charter authorize our board of directors to classify or reclassify shares of our stock in one or more classes or series, to cause the issuance of additional shares of our stock and to amend our charter, without stockholder approval, to increase or decrease the number of shares of stock that we have authority to issue.
These anti-takeover provisions may inhibit a change of control in circumstances that could give our stockholders the opportunity to realize a premium over the net asset value of our common stock.
GC Advisors can resign on 60 days’ notice, and we may not be able to find a suitable replacement within that time, resulting in a disruption in our operations that could adversely affect our financial condition, business and results of operations.
GC Advisors has the right to resign under the Investment Advisory Agreement at any time upon not less than 60 days’ written notice, whether we have found a replacement or not. If GC Advisors resigns, we may not be able to find a new investment adviser or hire internal management with similar expertise and ability to provide the same or equivalent services on acceptable terms within 60 days, or at all. If we are unable to do so quickly, our operations are likely to experience a disruption, our business, financial condition, results of operations and cash flows as well as our ability to pay distributions are likely to be adversely affected and the value of our shares may decline. In addition, the coordination of our internal management and investment activities is likely to suffer if we are unable to identify and reach an agreement with a single institution or group of executives having the expertise possessed by GC Advisors and its affiliates. Even if we are able to retain comparable management, whether internal or external, the integration of such management and their lack of familiarity with our investment objective may result in additional costs and time delays that may adversely affect our business, financial condition, results of operations and cash flows.
The Administrator can resign on 60 days’ notice, and we may not be able to find a suitable replacement, resulting in a disruption in our operations that could adversely affect our financial condition, business and results of operations.
The Administrator has the right to resign under the Administration Agreement at any time upon not less than 60 days’ written notice, whether we have found a replacement or not. If the Administrator resigns, we may not be able to find a new administrator or hire internal management with similar expertise and ability to provide the same or equivalent services on acceptable terms, or at all. If we are unable to do so quickly, our operations are likely to experience a disruption, our financial condition, business and results of operations as well as our ability to pay distributions are likely to be adversely affected and the value of our shares may decline. In addition, the coordination of our internal management and administrative activities is likely to suffer if we are unable to identify and reach an agreement with a service provider or individuals with the expertise possessed by the Administrator. Even if we are able to retain a comparable service provider or individuals to perform such services, whether internal or external, their integration into our business and lack of familiarity with our investment objective may result in additional costs and time delays that may adversely affect our business, financial condition, results of operations and cash flows.
We are an “emerging growth company,” and we do not know if such status will make our shares less attractive to investors.
We are an “emerging growth company,” as defined in the JOBS Act, until the earliest of:
| | • | the last day of the fiscal year ending after the fifth anniversary of any initial public offering of shares of our common stock; |
| | • | the year in which our total annual gross revenues first exceed $1.0 billion; |
| | • | the date on which we have, during the prior three-year period, issued more than $1.0 billion in non-convertible debt; and |
| | • | the last day of a fiscal year in which we (1) have an aggregate worldwide market value of our common stock held by non-affiliates of $700 million or more, computed at the end of each fiscal year as of the last business day of our most recently completed second fiscal quarter, and (2) have been a reporting company under the Exchange Act for at least one year (and filed at least one annual report under the Exchange Act). |
Although we are still evaluating the JOBS Act, we may take advantage of some or all of the reduced regulatory and disclosure requirements permitted by the JOBS Act and, as a result, some investors may consider our common stock less attractive. For example, while we are an emerging growth company, we may take advantage of exemption from the provisions of Section 404(b) of the Sarbanes-Oxley Act requiring that our independent registered public accounting firm provide an attestation report on the effectiveness of our internal control over financial reporting and an extended transition period available to emerging growth companies to comply with “new or revised accounting standards” until those standards are applicable to private companies. As a result, our financial statements may not be
comparable to the financial statements of issuers who are required to comply with the effective dates for new or revised accounting standards that are applicable to public companies. This may increase the risk that material weaknesses or other deficiencies in our internal control over financial reporting go undetected.
We will incur significant costs as a result of being registered under the Exchange Act.
We will incur legal, accounting and other expenses, including costs associated with the periodic reporting requirements applicable to a company whose securities are registered under the Exchange Act, as well as additional corporate governance requirements, including requirements under the Sarbanes-Oxley Act and other rules implemented by the SEC.
Efforts to comply with the Sarbanes-Oxley Act will involve significant expenditures, and non-compliance with the Sarbanes-Oxley Act would adversely affect us and the value of our common stock.
Upon effectiveness of this Registration Statement, we will be required to comply with certain requirements of the Sarbanes-Oxley Act and the related rules and regulations promulgated by the SEC but will not have to comply with certain requirements until we have been registered under the Exchange Act for a specified period of time or cease to be an “emerging growth company.” Beginning with our fiscal year ending September 30, 2017, our management will be required to report on our internal control over financial reporting pursuant to Section 404 of the Sarbanes-Oxley Act and related rules and regulations of the SEC. We will be required to review on an annual basis our internal control over financial reporting, and on a quarterly and annual basis to evaluate and disclose changes in our internal control over financial reporting. As a result, we expect to incur significant additional expenses that may negatively impact our financial performance and our ability to make distributions. This process will also result in a diversion of management’s time and attention. We do not know when our evaluation, testing and remediation actions will be completed or its impact on our operations. In addition, we may be unable to ensure that the process is effective or that our internal control over financial reporting is or will be effective. In the event that we are unable to come into and maintain compliance with the Sarbanes-Oxley Act and related rules, we and the value of our securities would be adversely affected.
We are highly dependent on information systems and systems failures could significantly disrupt our business, which may, in turn, negatively affect the value of our common stock and our ability to pay dividends and other distributions.
Our business depends on the communications and information systems of GC Advisors and its affiliates. These systems are subject to potential attacks, including through adverse events that threaten the confidentiality, integrity or availability of our information resources (i.e., cyber incidents). These attacks could involve gaining unauthorized access to our information systems for purposes of misappropriating assets, stealing confidential information, corrupting data or causing operational disruption and result in disrupted operations, misstated or unreliable financial data, liability for stolen assets or information, increased cybersecurity protection and insurance costs, litigation and damage to our business relationships, any of which could, in turn, have a material adverse effect on our operating results and negatively affect the value of our securities and our ability to pay dividends and other distributions to our securityholders. As our reliance on technology has increased, so have the risks posed to our information systems, both internal and those provided by GC Advisors and third-party service providers.
Risks Relating to Our Investments
Economic recessions or downturns could impair our portfolio companies and defaults by our portfolio companies will harm our operating results.
Many of our portfolio companies are susceptible to economic slowdowns or recessions and may be unable to repay our loans during these periods. Therefore, our non-performing assets are likely to increase and the value of our portfolio is likely to decrease during these periods. Adverse economic conditions may decrease the value of collateral securing some of our loans and the value of our equity investments. Economic slowdowns or recessions could lead to financial losses in our portfolio and a decrease in revenues, net income and assets. Unfavorable economic conditions also could increase our funding costs, limit our access to the capital markets or result in a decision by lenders not to extend credit to us. These events could prevent us from increasing our investments and harm our operating results.
A portfolio company’s failure to satisfy financial or operating covenants imposed by us or other lenders could lead to defaults and, potentially, termination of its loans and foreclosure on its assets, which could trigger cross-defaults under other agreements and jeopardize our portfolio company’s ability to meet its obligations under the debt securities that we hold. We may incur expenses to the extent necessary to seek recovery upon default or to negotiate new terms with a defaulting portfolio company. In addition, lenders in certain cases can be subject to lender liability claims for actions taken by them when they become too involved in the borrower’s business or exercise control over a borrower. It is possible that we could become subject to a lender’s liability claim, including as a result of actions taken if we render managerial assistance to the borrower. Furthermore, if one of our portfolio companies were to file for bankruptcy protection, even though we may have structured our investment as senior secured debt, depending on the facts and circumstances, including the extent to which we provided managerial assistance to that portfolio company, a bankruptcy court might re-characterize our debt holding and subordinate all or a portion of our claim to claims of other creditors.
Our debt investments may be risky and we could lose all or part of our investments.
The debt that we invest in is typically not initially rated by any rating agency, but we believe that if such investments were rated, they would be below investment grade (rated lower than “Baa3” by Moody’s Investors Service, lower than “BBB-” by Fitch Ratings or lower than “BBB-” by Standard & Poor’s Ratings Services), which under the guidelines established by these entities is an indication of having predominantly speculative characteristics with respect to the issuer’s capacity to pay interest and repay principal. Bonds that are rated below investment grade are sometimes referred to as “high yield bonds” or “junk bonds.” Therefore, our investments may result in an above average amount of risk and volatility or loss of principal.
Our investments in leveraged portfolio companies may be risky, and you could lose all or part of your investment.
Investment in leveraged companies involves a number of significant risks. Leveraged companies in which we invest may have limited financial resources and may be unable to meet their obligations under their debt securities that we hold. Such developments may be accompanied by a deterioration in the value of any collateral and a reduction in the likelihood of our realizing any guarantees that we may have obtained in connection with our investment. Smaller leveraged companies also may have less predictable operating results and may require substantial additional capital to support their operations, finance their expansion or maintain their competitive position.
Our investments in private and middle-market portfolio companies are risky, and you could lose all or part of your investment.
Investment in private and middle-market companies involves a number of significant risks. Generally, little public information exists about these companies, and we rely on the ability of GC Advisors’ investment professionals to obtain adequate information to evaluate the potential returns from investing in these companies. If GC Advisors is unable to uncover all material information about these companies, it may not make a fully informed investment decision, and we may lose money on our investments. Middle-market companies generally have less predictable operating results and may require substantial additional capital to support their operations, finance expansion or maintain their competitive position. Middle-market companies may have limited financial resources, may have difficulty accessing the capital markets to meet future capital needs and may be unable to meet their obligations under their debt securities that we hold, which may be accompanied by a deterioration in the value of any collateral and a reduction in the likelihood of our realizing any guarantees we may have obtained in connection with our investment. In addition, such companies typically have shorter operating histories, narrower product lines and smaller market shares than larger businesses, which tend to render them more vulnerable to competitors’ actions and market conditions, as well as general economic downturns. Additionally, middle-market companies are more likely to depend on the management talents and efforts of a small group of persons. Therefore, the death, disability, resignation or termination of one or more of these persons could have a material adverse impact on our portfolio company and, in turn, on us. Middle-market companies also may be parties to litigation and may be engaged in rapidly changing businesses with products subject to a substantial risk of obsolescence. In addition, our executive officers, directors and GC Advisors may, in the ordinary course of business, be named as defendants in litigation arising from our investments in the portfolio companies.
The lack of liquidity in our investments may adversely affect our business.
We may invest all of our assets in illiquid securities, and a substantial portion of our investments in leveraged companies are and will be subject to legal and other restrictions on resale or will otherwise be less liquid than more broadly traded public securities. The illiquidity of these investments may make it difficult for us to sell such investments if the need arises. In addition, if we are required to liquidate all or a portion of our portfolio quickly, we may realize significantly less than the value at which we have previously recorded our investments. We may also face other restrictions on our ability to liquidate an investment in a portfolio company to the extent that we, GC Advisors, Golub Capital or any of its affiliates have material nonpublic information regarding such portfolio company.
Price declines and illiquidity in the corporate debt markets may adversely affect the fair value of our portfolio investments, reducing our net asset value through increased net unrealized depreciation.
As a business development company, we are required to carry our investments at market value or, if no market value is ascertainable, at fair value as determined in good faith by our board of directors. As part of the valuation process, we may take into account the following types of factors, if relevant, in determining the fair value of our investments:
| • | a comparison of the portfolio company’s securities to publicly traded securities; |
| • | the enterprise value of the portfolio company; |
| • | the nature and realizable value of any collateral; |
| • | the portfolio company’s ability to make payments and its earnings and discounted cash flow; |
| • | the markets in which the portfolio company does business; and |
| • | changes in the interest rate environment and the credit markets generally that may affect the price at which similar investments may be made in the future and other relevant factors. |
When an external event such as a purchase transaction, public offering or subsequent equity sale occurs, we use the pricing indicated by the external event to corroborate our valuation. We record decreases in the market values or fair values of our investments as unrealized depreciation. Declines in prices and liquidity in the corporate debt markets may result in significant net unrealized depreciation in our portfolio. The effect of all of these factors on our portfolio may reduce our net asset value by increasing net unrealized depreciation in our portfolio. Depending on market conditions, we could incur substantial realized losses and may suffer additional unrealized losses in future periods, which could have a material adverse effect on our business, financial condition, results of operations and cash flows.
Our portfolio companies may prepay loans, which may reduce our yields if capital returned cannot be invested in transactions with equal or greater expected yields.
The loans in our investment portfolio may be prepaid at any time, generally with little advance notice. Whether a loan is prepaid will depend both on the continued positive performance of the portfolio company and the existence of favorable financing market conditions that allow such company the ability to replace existing financing with less expensive capital. As market conditions change, we do not know when, and if, prepayment may be possible for each portfolio company. In some cases, the prepayment of a loan may reduce our achievable yield if the capital returned cannot be invested in transactions with equal or greater expected yields, which could have a material adverse effect on our business, financial condition and results of operations.
Our portfolio companies may be unable to repay or refinance outstanding principal on their loans at or prior to maturity, and rising interests rates may make it more difficult for portfolio companies to make periodic payments on their loans.
Our portfolio companies may be unable to repay or refinance outstanding principal on their loans at or prior to maturity. This risk and the risk of default is increased to the extent that the loan documents do not require the portfolio companies to pay down the outstanding principal of such debt prior to maturity. In addition, if general interest rates rise, there is a risk that our portfolio companies will be unable to pay escalating interest amounts, which could result in a default under their loan documents with us. Rising interests rates could also cause portfolio companies to shift cash from other productive uses to the payment of interest, which may have a material adverse
effect on their business and operations and could, over time, lead to increased defaults. Any failure of one or more portfolio companies to repay or refinance its debt at or prior to maturity or the inability of one or more portfolio companies to make ongoing payments following an increase in contractual interest rates could have a material adverse effect on our business, financial condition, results of operations and cash flows.
We have not yet identified the portfolio company investments we will acquire.
While we currently hold a portfolio of investments, we have not yet identified additional potential investments for our portfolio that we will acquire with the proceeds of any sales of our securities or repayments of investments currently in our portfolio. Privately negotiated investments in illiquid securities or private middle-market companies require substantial due diligence and structuring, and we cannot assure you that we will achieve our anticipated investment pace. GC Advisors selects all of our investments, and our stockholders will have no input with respect to such investment decisions. These factors increase the uncertainty, and thus the risk, of investing in our securities. We anticipate that we will use substantially all of the net proceeds of any sale of our securities within approximately six months following the completion of any such sale of our securities, depending on the availability of appropriate investment opportunities consistent with our investment objectives and market conditions. Until such appropriate investment opportunities can be found, we will invest the net proceeds primarily in cash, cash equivalents, U.S. government securities and high-quality debt investments that mature in one year or less from the date of investment. We expect these temporary investments to earn yields substantially lower than the income that we expect to receive in respect of investments in senior secured, one stop, second lien and subordinated loans and equity securities. As a result, any distributions we make during this period may be substantially smaller than the distributions that we expect to pay when our portfolio is fully invested.
We are a non-diversified investment company within the meaning of the 1940 Act, and therefore we are not limited with respect to the proportion of our assets that may be invested in securities of a single issuer.
We are classified as a non-diversified investment company within the meaning of the 1940 Act, which means that we are not limited by the 1940 Act with respect to the proportion of our assets that we may invest in securities of a single issuer. To the extent that we assume large positions in the securities of a small number of issuers, our net asset value may fluctuate to a greater extent than that of a diversified investment company as a result of changes in the financial condition or the market’s assessment of the issuer. We may also be more susceptible to any single economic or regulatory occurrence than a diversified investment company. Beyond our asset diversification requirements as a RIC under the Code, we do not have fixed guidelines for diversification, and our investments could be concentrated in relatively few portfolio companies.
Our portfolio may be concentrated in a limited number of portfolio companies and industries, which will subject us to a risk of significant loss if any of these companies defaults on its obligations under any of its debt instruments or if there is a downturn in a particular industry.
Our portfolio may be concentrated in a limited number of portfolio companies and industries. As a result, the aggregate returns we realize may be significantly and adversely affected if a small number of investments perform poorly or if we need to write down the value of any one investment. Additionally, while we are not targeting any specific industries, our investments may be concentrated in relatively few industries. As a result, a downturn in any particular industry in which we are invested could also significantly impact the aggregate returns we realize.
We may hold the debt securities of leveraged companies that may, due to the significant volatility of such companies, enter into bankruptcy proceedings.
Leveraged companies may experience bankruptcy or similar financial distress. The bankruptcy process has a number of significant inherent risks. Many events in a bankruptcy proceeding are the product of contested matters and adversary proceedings and are beyond the control of the creditors. A bankruptcy filing by an issuer may adversely and permanently affect the issuer. If the proceeding is converted to a liquidation, the value of the issuer may not equal the liquidation value that was believed to exist at the time of the investment. The duration of a bankruptcy proceeding is also difficult to predict, and a creditor’s return on investment can be adversely affected by delays until the plan of reorganization or liquidation ultimately becomes effective. The administrative costs of a bankruptcy proceeding are frequently high and would be paid out of the debtor’s estate prior to any return to creditors. Because the standards for classification of claims under bankruptcy law are vague, our influence with respect to the class of securities or other obligations we own may be lost by increases in the number and amount of
claims in the same class or by different classification and treatment. In the early stages of the bankruptcy process, it is often difficult to estimate the extent of, or even to identify, any contingent claims that might be made. In addition, certain claims that have priority by law (for example, claims for taxes) may be substantial.
Depending on the facts and circumstances of our investments and the extent of our involvement in the management of a portfolio company, upon the bankruptcy of a portfolio company, a bankruptcy court may recharacterize our debt investments as equity interests and subordinate all or a portion of our claim to that of other creditors. This could occur even though we may have structured our investment as senior debt.
Our failure to make follow-on investments in our portfolio companies could impair the value of our portfolio.
Following an initial investment in a portfolio company, we may make additional investments in that portfolio company as “follow-on” investments, in seeking to:
| • | increase or maintain in whole or in part our position as a creditor or equity ownership percentage in a portfolio company; |
| • | exercise warrants, options or convertible securities that were acquired in the original or subsequent financing; or |
| • | preserve or enhance the value of our investment. |
We have discretion to make follow-on investments, subject to the availability of capital resources. Failure on our part to make follow-on investments may, in some circumstances, jeopardize the continued viability of a portfolio company and our initial investment, or may result in a missed opportunity for us to increase our participation in a successful portfolio company. Even if we have sufficient capital to make a desired follow-on investment, we may elect not to make a follow-on investment because we may not want to increase our level of risk, because we prefer other opportunities or because of regulatory or other considerations. Our ability to make follow-on investments may also be limited by GC Advisors’ allocation policy.
Because we generally do not hold controlling equity interests in our portfolio companies, we may not be able to exercise control over our portfolio companies or to prevent decisions by management of our portfolio companies that could decrease the value of our investments.
To the extent we do not hold controlling equity positions in our portfolio companies, we are subject to the risk that a portfolio company may make business decisions with which we disagree, and that the management and/or stockholders of a portfolio company may take risks or otherwise act in ways that are adverse to our interests. Due to the lack of liquidity of the debt and equity investments that we typically hold in our portfolio companies, we may not be able to dispose of our investments in the event we disagree with the actions of a portfolio company and may therefore suffer a decrease in the value of our investments.
Our portfolio companies may incur debt that ranks equally with, or senior to, our investments in such companies and such portfolio companies may not generate sufficient cash flow to service their debt obligations to us.
We may invest a portion of our capital in second lien and subordinated loans issued by our portfolio companies. Any such portfolio companies would or may be permitted to incur, other debt that ranks equally with, or senior to, the debt securities in which we invest. Such subordinated investments are subject to greater risk of default than senior obligations as a result of adverse changes in the financial condition of the obligor or in general economic conditions. If we make a subordinated investment in a portfolio company, the portfolio company may be highly leveraged, and its relatively high debt-to-equity ratio may create increased risks that its operations might not generate sufficient cash flow to service all of its debt obligations. By their terms, such debt instruments may provide that the holders are entitled to receive payment of interest or principal on or before the dates on which we are entitled to receive payments in respect of the debt securities in which we invest. Also, in the event of insolvency, liquidation, dissolution, reorganization or bankruptcy of a portfolio company, holders of debt instruments ranking senior to our investment in that portfolio company would typically be entitled to receive payment in full before we receive any distribution in respect of our investment. After repaying senior creditors, the portfolio company may not have any remaining assets to use for repaying its obligation to us where we are junior creditor. In the case of debt ranking equally with debt securities in which we invest, we would have to share any distributions on an equal and ratable basis with other creditors holding such debt in the event of an insolvency, liquidation, dissolution, reorganization or bankruptcy of the relevant portfolio company.
Additionally, certain loans that we make to portfolio companies may be secured on a second priority basis by the same collateral securing senior secured debt of such companies. The first priority liens on the collateral will secure the portfolio company’s obligations under any outstanding senior debt and may secure certain other future debt that may be permitted to be incurred by the portfolio company under the agreements governing the loans. The holders of obligations secured by first priority liens on the collateral will generally control the liquidation of, and be entitled to receive proceeds from, any realization of the collateral to repay their obligations in full before us. In addition, the value of the collateral in the event of liquidation will depend on market and economic conditions, the availability of buyers and other factors. There can be no assurance that the proceeds, if any, from sales of all of the collateral would be sufficient to satisfy the loan obligations secured by the second priority liens after payment in full of all obligations secured by the first priority liens on the collateral. If such proceeds were not sufficient to repay amounts outstanding under the loan obligations secured by the second priority liens, then we, to the extent not repaid from the proceeds of the sale of the collateral, will only have an unsecured claim against the portfolio company’s remaining assets, if any.
We may make unsecured loans to portfolio companies, meaning that such loans will not benefit from any interest in collateral of such companies. Liens on a portfolio company’s collateral, if any, will secure the portfolio company’s obligations under its outstanding secured debt and may secure certain future debt that is permitted to be incurred by the portfolio company under its secured loan agreements. The holders of obligations secured by such liens will generally control the liquidation of, and be entitled to receive proceeds from, any realization of such collateral to repay their obligations in full before us. In addition, the value of such collateral in the event of liquidation will depend on market and economic conditions, the availability of buyers and other factors. There can be no assurance that the proceeds, if any, from sales of such collateral would be sufficient to satisfy our unsecured loan obligations after payment in full of all loans secured by collateral. If such proceeds were not sufficient to repay the outstanding secured loan obligations, then our unsecured claims would rank equally with the unpaid portion of such secured creditors’ claims against the portfolio company’s remaining assets, if any.
The rights we may have with respect to the collateral securing the loans we make to our portfolio companies with senior debt outstanding may also be limited pursuant to the terms of one or more intercreditor agreements that we enter into with the holders of such senior debt. Under a typical intercreditor agreement, at any time that obligations that have the benefit of the first priority liens are outstanding, any of the following actions that may be taken in respect of the collateral will be at the direction of the holders of the obligations secured by the first priority liens:
| • | the ability to cause the commencement of enforcement proceedings against the collateral; |
| • | the ability to control the conduct of such proceedings; |
| • | the approval of amendments to collateral documents; |
| • | releases of liens on the collateral; and |
| • | waivers of past defaults under collateral documents. |
We may not have the ability to control or direct such actions, even if our rights are adversely affected.
The disposition of our investments may result in contingent liabilities.
A significant portion of our investments involve private securities. In connection with the disposition of an investment in private securities, we may be required to make representations about the business and financial affairs of the portfolio company typical of those made in connection with the sale of a business. We may also be required to indemnify the purchasers of such investment to the extent that any such representations turn out to be inaccurate or with respect to potential liabilities. These arrangements may result in contingent liabilities that ultimately result in funding obligations that we must satisfy through our return of distributions previously made to us.
GC Advisors’ liability is limited, and we have agreed to indemnify GC Advisors against certain liabilities, which may lead GC Advisors to act in a riskier manner on our behalf than it would when acting for its own account.
Under the Investment Advisory Agreement, GC Advisors does not assume any responsibility to us other than to render the services called for under that agreement, and it is not responsible for any action of our board of directors in following or declining to follow GC Advisors’ advice or recommendations. Under the terms of the Investment Advisory Agreement, GC Advisors, its officers, members, personnel and any person controlling or controlled by GC
Advisors are not liable to us, any subsidiary of ours, our directors, our stockholders or any subsidiary’s stockholders or partners for acts or omissions performed in accordance with and pursuant to the Investment Advisory Agreement, except those resulting from acts constituting gross negligence, willful misconduct, bad faith or reckless disregard of GC Advisors’ duties under the Investment Advisory Agreement. In addition, we have agreed to indemnify GC Advisors and each of its officers, directors, members, managers and employees from and against any claims or liabilities, including reasonable legal fees and other expenses reasonably incurred, arising out of or in connection with our business and operations or any action taken or omitted on our behalf pursuant to authority granted by the Investment Advisory Agreement, except where attributable to gross negligence, willful misconduct, bad faith or reckless disregard of such person’s duties under the Investment Advisory Agreement. These protections may lead GC Advisors to act in a riskier manner when acting on our behalf than it would when acting for its own account.
We may be subject to risks under hedging transactions and may become subject to risks if we invest in foreign securities.
As of June 30, 2016, we were invested in the securities of one non-U.S. company. Securities issued by non-U.S. companies are not “qualifying assets” under the 1940 Act, and we may invest in non-U.S. companies, including emerging market issuers, to the limited extent such investments are permitted under the 1940 Act. We expect that these investments would focus on the same types of investments that we make in U.S. middle-market companies and accordingly would be complementary to our overall strategy and enhance the diversity of our holdings. Investing in securities of emerging market issuers involves many risks including economic, social, political, financial, tax and security conditions in the emerging market, potential inflationary economic environments, regulation by foreign governments, different accounting standards and political uncertainties. Economic, social, political, financial, tax and security conditions also could negatively affect the value of emerging market companies. These factors could include changes in the emerging market government’s economic and fiscal policies, the possible imposition of, or changes in, currency exchange laws or other laws or restrictions applicable to the emerging market companies or investments in their securities and the possibility of fluctuations in the rate of exchange between currencies.
We may engage in hedging transactions to the limited extent such transactions are permitted under the 1940 Act and applicable commodities laws. Engaging in hedging transactions or investing in foreign securities would entail additional risks to our stockholders. We could, for example, use instruments such as interest rate swaps, caps, collars and floors and, if we were to invest in foreign securities, we could use instruments such as forward contracts or currency options and borrow under a credit facility in currencies selected to minimize our foreign currency exposure. In each such case, we generally would seek to hedge against fluctuations of the relative values of our portfolio positions from changes in market interest rates or currency exchange rates. Hedging against a decline in the values of our portfolio positions would not eliminate the possibility of fluctuations in the values of such positions or prevent losses if the values of the positions declined. However, such hedging could establish other positions designed to gain from those same developments, thereby offsetting the decline in the value of such portfolio positions. Such hedging transactions could also limit the opportunity for gain if the values of the underlying portfolio positions increased. Moreover, it might not be possible to hedge against an exchange rate or interest rate fluctuation that was so generally anticipated that we would not be able to enter into a hedging transaction at an acceptable price. Use of a hedging transaction could involve counterparty credit risk.
While we may enter into hedging transactions to seek to reduce currency exchange rate and interest rate risks, unanticipated changes in currency exchange rates or interest rates could result in poorer overall investment performance than if we had not engaged in any such hedging transactions. In addition, the degree of correlation between price movements of the instruments used in a hedging strategy and price movements in the portfolio positions being hedged could vary. Moreover, for a variety of reasons, we might not seek to establish a perfect correlation between the hedging instruments and the portfolio holdings being hedged. Any such imperfect correlation could prevent us from achieving the intended hedge and expose us to risk of loss. In addition, it might not be possible to hedge fully or perfectly against currency fluctuations affecting the value of securities denominated in non-U.S. currencies because the value of those securities would likely fluctuate as a result of factors not related to currency fluctuations. Our ability to engage in hedging transactions may also be adversely affected by rules adopted by the CFTC.
We may not realize gains from our equity investments.
When we invest in one-stop, second lien and subordinated loans, we may acquire warrants or other equity securities of portfolio companies as well. We may also invest in equity securities directly. To the extent we hold
equity investments, we will attempt to dispose of them and realize gains upon our disposition of them. However, the equity interests we receive may not appreciate in value and may decline in value. As a result, we may not be able to realize gains from our equity interests, and any gains that we do realize on the disposition of any equity interests may not be sufficient to offset any other losses we experience.
Risks Relating to Our Common Stock
There is no public market for shares of our common stock, and we do not expect there to be a market for our shares.
There is no existing trading market for shares of our common stock, and no market for our shares may develop in the future. If developed, any such market may not be sustained. In the absence of a trading market, holders of shares of our common stock may be unable to liquidate an investment in our shares.
The shares of our common stock have not been registered under the Securities Act or any state securities laws and, unless so registered, may not be offered or sold except pursuant to an exemption from, or in a transaction not subject to, the registration requirements of the Securities Act and applicable state securities laws.
There are restrictions on the ability of holders of our common stock to transfer shares in excess of the restrictions typically associated with a private placement of securities under Regulation D and other exemptions from registration under the Securities Act, and these additional restrictions could further limit the liquidity of an investment in shares of our common stock and the price at which holders may be able to sell the shares.
We are relying on an exemption from registration under the Securities Act and state securities laws in offering shares of our common stock our pursuant to the Subscription Agreements. As such, absent an effective registration statement covering our common stock, such shares may be resold only in transactions that are exempt from the registration requirements of the Securities Act and with our prior consent. Our common stock will have limited transferability which could delay, defer or prevent a transaction or a change of control of the company that might involve a premium price for our securities or otherwise be in the best interest of our stockholders.
Furthermore, should there be an initial public offering of our common stock, holders of our common stock will be subject to lock-up restrictions pursuant to which they will be prohibited from selling shares of our common stock for a minimum of 180 days after the pricing of such initial public offering. The specific terms of this restriction and any other limitations on the sale of our common stock in connection with or following an initial public offering will be agreed in advance between our board of directors and GC Advisors, acting on behalf of our investors, and the underwriters of the initial public.
There is a risk that you may not receive distributions or that our distributions may not grow over time and a portion of our distributions may be a return of capital.
We intend to make periodic distributions to our stockholders out of assets legally available for distribution. We cannot assure you that we will achieve investment results that will allow us to make a specified level of cash distributions or year-to-year increases in cash distributions. Our ability to pay distributions might be adversely affected by the impact of one or more of the risk factors described in this Registration Statement. Due to the asset coverage test applicable to us under the 1940 Act as a business development company, we may be limited in our ability to make distributions. If we declare a dividend and if more stockholders opt to receive cash distributions rather than participate in our DRIP, we may be forced to sell some of our investments in order to make cash dividend payments. To the extent we make distributions to stockholders that include a return of capital, such portion of the distribution essentially constitutes a return of the stockholder’s investment. Although such return of capital may not be taxable, such distributions may increase an investor’s tax liability for capital gains upon the future sale of our common stock.
Investing in our common stock may involve an above average degree of risk.
The investments we make in accordance with our investment objective may result in a higher amount of risk than alternative investment options and a higher risk of volatility or loss of principal. Our investments in portfolio companies involve higher levels of risk, and therefore, an investment in our shares may not be suitable for someone with lower risk tolerance. In addition, our common stock is intended for long-term investors and should not be treated as a trading vehicle.
Our stockholders will experience dilution in their ownership percentage if they do not participate in our DRIP.
All dividends declared in cash payable to stockholders that are participants in our DRIP are automatically reinvested in shares of our common stock. As a result, our stockholders that do not participate in our DRIP will experience dilution in their ownership percentage of our common stock over time.
ITEM 2. FINANCIAL INFORMATION.
Selected Consolidated Financial Data
The following selected consolidated financial data of ours as of and for the fiscal year ended September 30, 2015 and for the period from September 22, 2014 (inception) to September 30, 2014 are derived from our consolidated financial statements that have been audited by an independent registered public accounting firm. Our consolidated financial data for the nine month periods ended June 30, 2016 and 2015 is derived from our unaudited financial statements. Interim results may be subject to significant variations and may not be indicative of the results of operations to be expected for a full fiscal year. This financial data should be read in conjunction with our consolidated financial statements and related notes thereto and “— Management’s Discussion and Analysis of Financial Condition, Results of Operations and Cash Flows” included elsewhere in this Registration Statement.
| | | Golub Capital Investment Corporation | |
| | | Nine Months
Ended June 30,
2016 | | | Nine Months
Ended June 30,
2015 | | | Year Ended
September 30,
2015 | | | Period from
September 22,
2014 (Inception)
to September 30,
2014 | |
| | | (In thousands, except per share data) | |
| Statement of Operations data: | | | | | | | | | | | | | | | | |
| Total investment income | | $ | 37,451 | | | $ | 10,428 | | | $ | 19,401 | | | | $ | |
| Base management fee | | | 6,805 | | | | 2,108 | | | | 3,820 | | | | — | |
| Base management fee waiver | | | (1,856 | ) | | | (575 | ) | | | (1,042 | ) | | | — | |
| Incentive fee | | | 3,698 | | | | 612 | | | | 1,239 | | | | — | |
| Interest and other debt financing expenses | | | 7,585 | | | | 1,955 | | | | 3,731 | | | | — | |
| All other expenses | | | 1,498 | | | | 674 | | | | 1,147 | | | | — | |
| Net investment income | | | 19,721 | | | | 5,654 | | | | 10,506 | | | | — | |
| Net realized gain (loss) on investments | | | 710 | | | | 42 | | | | 42 | | | | — | |
| Net change in unrealized appreciation (depreciation) on investments | | | 3,554 | | | | 901 | | | | 2,479 | | | | — | |
| Net increase/(decrease) in net assets resulting from operations | | | 23,985 | | | | 6,597 | | | | 13,027 | | | | — | |
| Per share data: | | | | | | | | | | | | | | | | |
| Net asset value | | $ | 15.00 | | | $ | 15.00 | | | $ | 15.00 | | | $ | 15.00 | |
| Net investment income | | | 0.77 | | | | 0.51 | | | | 0.76 | | | | — | |
| Net realized (loss) gain on investments | | | 0.02 | | | | — | | | | — | | | | — | |
| Net change in unrealized appreciation (depreciation) on investments | | | 0.14 | | | | 0.08 | | | | 0.18 | | | | — | |
| Net increase/(decrease) in net assets resulting from operations | | | 0.93 | | | | 0.59 | | | | 0.94 | | | | — | |
| Per share distributions declared | | | 0.92 | | | | 0.55 | | | | 0.89 | | | | — | |
| From net investment income | | | 0.66 | | | | 0.47 | | | | 0.76 | | | | — | |
| From capital gains | | | 0.03 | | | | — | | | | — | | | | — | |
| From return of capital | | | 0.23 | | | | 0.08 | | | | 0.13 | | | | — | |
| Dollar amount of distributions declared | | | 23,985 | | | | 6,597 | | | | 13,027 | | | | — | |
| From net investment income | | | 17,200 | | | | 5,654 | | | | 11,080 | | | | — | |
| From capital gains | | | 752 | | | | 42 | | | | — | | | | — | |
| From return of capital | | | 6,033 | | | | 901 | | | | 1,947 | | | | — | |
| Other(1) | | | (0.01 | ) | | | (0.04 | ) | | | (0.05 | ) | | | — | |
| Balance Sheet data at period end: | | | | | | | | | | | | | | | | |
| Investments, at fair value | | $ | 912,839 | | | $ | 413,594 | | | $ | 551,878 | | | $ | — | |
| Cash and cash equivalents | | | 4,847 | | | | 5,689 | | | | 2,747 | | | | 10 | |
| Restricted cash and cash equivalents | | | 9,815 | | | | 10,470 | | | | 10,145 | | | | — | |
| Other assets | | | 3,420 | | | | 1,679 | (2) | | | 2,469 | (2) | | | — | |
| Total assets | | | 930,921 | | | | 431,432 | (2) | | | 567,239 | (2) | | | 10 | |
| Total debt | | | 404,350 | | | | 196,300 | | | | 249,700 | | | | — | |
| Total liabilities | | | 419,083 | | | | 203,349 | (2) | | | 254,592 | (2) | | | — | |
| Total net assets | | | 511,838 | | | | 228,083 | | | | 312,647 | | | | 10 | |
| | | Golub Capital Investment Corporation | |
| | | Nine Months
Ended June 30,
2016 | | | Nine Months
Ended June 30,
2015(3) | | | Year Ended
September 30,
2015(4) | | | Period from
September 22, 2014
(Inception) to
September 30, 2014 |
| | | (In thousands, except per share data) | |
| Other data: | | | | | | | | | | | | | | |
| Weighted average annualized income yield(5) | | | 7.3 | % | | | 7.0 | % | | | 6.9 | % | | NA |
| Number of portfolio companies at period end | | | 156 | | | | 128 | | | | 141 | | | NA |
| (1) | Includes the impact of different share amounts as a result of calculating certain per share data based on weighted average shares outstanding during the period and certain per share data based on the shares outstanding as of the period end. |
| (2) | On October 1, 2015, we adopted Accounting Standards Update 2015-03,Interest — Imputation of Interest (Subtopic 835-30): Simplifying the Presentation of Debt Issuance Costs, or ASU 2015-03, which requires that debt issuance costs related to a recognized debt liability be presented on the balance sheet as a direct deduction from the carrying amount of the debt liability rather than as an asset. Adoption of ASU 2015-03 requires the changes to be applied retrospectively. |
| (3) | For the nine months ended June 30, 2015, the averages are calculated from December 31, 2014, the date of the commencement of operations, through June 30, 2015. |
| (4) | For the year ended September 30, 2015, the averages are calculated from December 31, 2014, the date of the commencement of operations, through September 30, 2015. |
| (5) | Weighted average annualized yield on income producing investments is computed by dividing (a) income from interest and fees excluding amortization of capitalized fees and discounts on accruing loans and debt securities by (b) total income producing investments at fair value. |
Management’s Discussion and Analysis of Financial Condition and Results of Operations
The following discussion and analysis of our financial condition, results of operations and cash flows should be read in conjunction with “Selected Consolidated Financial Data” and the financial statements and the related notes thereto appearing elsewhere in this Registration Statement. The information in this section contains forward-looking statements that involve risks and uncertainties. Please see “Item 1A. Risk Factors” and “Forward-Looking Statements” for a discussion of the uncertainties, risks and assumptions associated with these statements.
Overview
We are an externally managed, closed-end, non-diversified management investment company that has elected to be regulated as a business development company under the 1940 Act. In addition, for U.S. federal income tax purposes, we have elected to be treated as a RIC under Subchapter M of the Code. As a business development company and a RIC, we are also subject to certain constraints, including limitations imposed by the 1940 Act and the Code. We were formed in September 2014 and commenced operations on December 31, 2014.
Our investment objective is to generate current income and capital appreciation by investing primarily in senior secured and one stop loans of U.S. middle-market companies. We may also selectively invest in second lien and subordinated loans of, and warrants and minority equity securities in, U.S. middle-market companies. We intend to achieve our investment objective by (1) accessing the established loan origination channels developed by Golub Capital, a leading lender to middle-market companies with over $18.0 billion in capital under management as of June 30, 2016, (2) selecting investments within our core middle-market company focus, (3) partnering with experienced sponsors, in many cases with whom Golub Capital has invested alongside in the past, (4) implementing the disciplined underwriting standards of Golub Capital and (5) drawing upon the aggregate experience and resources of Golub Capital.
Our investment activities are managed by GC Advisors and supervised by our board of directors of which a majority of the members are independent of us, GC Advisors and its affiliates.
Under the Investment Advisory Agreement, which was most recently reapproved by our board of directors in May 2016, we have agreed to pay GC Advisors an annual base management fee based on our average adjusted gross assets as well as an incentive fee based on our investment performance. We have also entered into the Administration Agreement with the Administrator, under which we have agreed to reimburse the Administrator for our allocable portion (subject to the review and approval of our independent directors) of overhead and other expenses incurred by the Administrator in performing its obligations under the Administration Agreement.
We seek to create a portfolio that includes primarily senior secured and one stop loans by primarily investing approximately $5.0 million to $30.0 million of capital, on average, in the securities of U.S. middle-market companies. We may also selectively invest more than $30.0 million in some of our portfolio companies and generally expect that the size of our individual investments will vary proportionately with the size of our capital base.
We generally invest in securities that have been rated below investment grade by independent rating agencies or that would be rated below investment grade if they were rated. These securities, which may be referred to as “junk,” have predominantly speculative characteristics with respect to the issuer’s capacity to pay interest and repay principal. In addition, many of our debt investments have floating interest rates that reset on a periodic basis and typically do not fully pay down principal prior to maturity, which may increase our risk of losing part or all of our investment.
As of June 30, 2016 and September 30, 2015, our portfolio at fair value was comprised of the following:
| | | As of June 30, 2016 | | | As of September 30, 2015 | |
| | | Investments at
Fair Value | | | Percentage of
Total | | | Investments at
Fair Value | | | Percentage of
Total | |
| Investment Type | | (In thousands) | | | Investments | | | (In thousands) | | | Investments | |
| | | | | | | | | | | | | |
| Senior secured | | $ | 108,494 | | | | 11.9 | % | | $ | 153,194 | | | | 27.8 | % |
| One stop | | | 744,357 | | | | 81.5 | | | | 393,563 | | | | 71.3 | |
| Subordinated debt | | | 39 | | | | 0.0 | * | | | - | | | | - | |
| Subordinated notes in GCIC SLF (1) | | | 34,567 | | | | 3.8 | | | | - | | | | - | |
| LLC equity interests in GCIC SLF (1) | | | 13,385 | | | | 1.5 | | | | - | | | | - | |
| Equity | | | 11,997 | | | | 1.3 | | | | 5,121 | | | | 0.9 | |
| Total | | $ | 912,839 | | | | 100.0 | % | | $ | 551,878 | | | | 100.0 | % |
| | * | Represents an amount less than 0.1% |
| | (1) | Proceeds from the subordinated notes and LLC equity interests invested in GCIC SLF were utilized by GCIC SLF to invest in senior secured loans. |
One stop loans include loans to technology companies undergoing strong growth due to new services, increased adoption and/or entry into new markets. We refer to loans to these companies as late stage lending loans. Other targeted characteristics of late stage lending businesses include strong customer revenue retention rates, a diversified customer base and backing from growth equity or venture capital firms. In some cases, the borrower’s high revenue growth is supported by a high level of discretionary spending. As part of the underwriting of such loans and consistent with industry practice, we may adjust our characterization of the earnings of such borrowers for a reduction or elimination of such discretionary expenses, if appropriate. As of June 30, 2016 and September 30, 2015, one stop loans included $31.2 million and $7.9 million, respectively, of late stage lending loans at fair value.
As of June 30, 2016 and September 30, 2015, we had debt and equity investments in 156 and 141 portfolio companies, respectively, and as of June 30, 2016 we had investments in subordinated notes and LLC equity interests in GCIC SLF.
The weighted average annualized income yield and weighted average annualized investment income yield of our income producing debt investments, which represented nearly 100% of our debt investments, for the three and nine months ended June 30, 2016 and 2015 and the year ended September 30, 2015 were as follows:
| | | For the three months
ended June 30, | | | For the nine months
ended June 30, | | | For the year ended
September 30, | |
| | | 2016 | | | 2015 | | | 2016 | | | 2015 | | | 2015 | |
| Weighted average annualized income yield(1)(2) | | | 7.4 | % | | | 6.9 | % | | | 7.3 | % | | | 7.0 | % | | | 6.9 | % |
| Weighted average annualized investment income yield(2)(3) | | | 7.7 | % | | | 7.1 | % | | | 7.7 | % | | | 7.3 | % | | | 7.2 | % |
| (1) | Represents income from interest, including subordinated notes in GCIC SLF, and fees excluding amortization of capitalized fees and discounts divided by the average fair value of earning debt investments. |
| (2) | For the nine months ended June 30, 2015 and for the year ended September 30, 2015, the averages are calculated from December 31, 2014, the date of the commencement of operations, through June 30, 2015 and September 30, 2015, respectively. |
| (3) | Represents income from interest, including subordinated notes in GCIC SLF, fees and amortization of capitalized fees and discounts divided by the average fair value of earning debt investments. |
Revenues: We generate revenue in the form of interest and fee income on debt investments and capital gains and distributions, if any, on portfolio company investments that we originate or acquire. Our debt investments typically have a term of three to seven years and bear interest at a fixed or floating rate. In some instances, we receive payments on our debt investments based on scheduled amortization of the outstanding balances. In addition, we receive repayments of some of our debt investments prior to their scheduled maturity date. The frequency or volume of these repayments fluctuates significantly from period to period. Our portfolio activity also reflects the proceeds of sales of securities. In some cases, our investments provide for deferred interest payments or PIK interest. The principal amount of loans and any accrued but unpaid interest generally become due at the maturity date. In addition, we may generate revenue in the form of commitment, origination, amendment, structuring or due diligence fees, fees for providing managerial assistance and consulting fees. For additional details on revenues, see “— Critical Accounting Policies — Revenue Recognition.”
We recognize realized gains or losses on investments based on the difference between the net proceeds from the disposition and the amortized cost basis of the investment or derivative instrument, without regard to unrealized gains or losses previously recognized. We record current period changes in fair value of investments and derivative instruments that are measured at fair value as a component of the net change in unrealized appreciation (depreciation) on investments in the consolidated statements of operations. See “— Critical Accounting Policies — Revenue Recognition.”
Expenses: Our primary operating expenses include the payment of fees to GC Advisors under the Investment Advisory Agreement and interest expense on our outstanding debt. We bear all out-of-pocket costs and expenses of our operations and transactions, including:
| · | reimbursement to GC Advisors of organizational expenses up to an aggregate amount of $0.7 million; |
| | · | calculating our net asset value (including the cost and expenses of any independent valuation firm); |
| | · | fees and expenses incurred by GC Advisors payable to third parties, including agents, consultants or other advisors, in monitoring financial and legal affairs for us and in monitoring our investments and performing due diligence on our prospective portfolio companies or otherwise relating to, or associated with, evaluating and making investments, which fees and expenses may include, among other items, due diligence reports, appraisal reports, any studies that may be commissioned by GC Advisors and travel and lodging expenses; |
| | · | expenses related to unsuccessful portfolio acquisition efforts; |
| | · | administration fees and expenses, if any, payable under the Administration Agreement (including payments based upon our allocable portion of the Administrator’s overhead in performing its obligations under the Administration Agreement, including rent and the allocable portion of the cost of our chief compliance officer, chief financial officer and their respective staffs); |
| | · | fees payable to third parties, including agents, consultants or other advisors, relating to, or associated with, evaluating and making investments in portfolio companies, including costs associated with meeting financial sponsors; |
| | · | transfer agent, dividend agent and custodial fees and expenses; |
| | · | U.S. federal and state registration and franchise fees; |
| | · | U.S. federal, state and local taxes; |
| | · | independent directors’ fees and expenses; |
| | · | costs of preparing and filing reports or other documents required by the SEC or other regulators; |
| | · | costs of any reports, proxy statements or other notices to stockholders, including printing costs; |
| | · | costs associated with individual or group stockholders; |
| | · | our allocable portion of any fidelity bond, directors and officers/errors and omissions liability insurance, and any other insurance premiums; |
| | · | direct costs and expenses of administration, including printing, mailing, long distance telephone, copying, secretarial and other staff, independent auditors and outside legal costs; |
| | · | proxy voting expenses; and |
| | · | all other expenses incurred by us or the Administrator in connection with administering our business. |
We expect our general and administrative expenses to be relatively stable or decline as a percentage of total assets during periods of asset growth and to increase during periods of asset declines.
Recent Developments
On July 1, 2016, August 1, 2016 and September 1, 2016, we received additional stockholder capital subscriptions totaling $101.1 million in the aggregate.
On July 12, 2016, GCIC Funding, a wholly-owned subsidiary of ours, entered into the Credit Facility Amendment. The Credit Facility Amendment was effective as of July 12, 2016. The Credit Facility Amendment, among other things, increased the size of the Credit Facility from $370.0 million to $420.0 million.
On May 3, 2016 and August 3, 2016, our board of directors declared distributions to holders of record as set forth in the table below:
| Record Date | | Payment Date | | Amount Per Share |
| July 22, 2016 | | September 26, 2016 | | Net increase in net assets resulting from operations earned by us (if positive) as determined in accordance with GAAP for the period July 1, 2016 through July 31, 2016 per share |
| | | | | |
| August 29, 2016 | | November 21, 2016 | | Net increase in net assets resulting from operations earned by us (if positive) as determined in accordance with GAAP for the period August 1, 2016 through August 31, 2016 per share |
| | | | | |
| September 23, 2016 | | November 21, 2016 | | Net increase in net assets resulting from operations earned by us (if positive) as determined in accordance with GAAP for the period September 1, 2016 through September 30, 2016 per share |
| | | | | |
| October 24, 2016 | | December 30, 2016 | | Net increase in net assets resulting from operations earned by us (if positive) as determined in accordance with GAAP for the period October 1, 2016 through October 31, 2016 per share |
On July 22, 2016, we priced a $410.1 million term debt securitization that closed on August 16, 2016. The notes offered in the securitization consist of $220.0 million of Aaa/AAA Class A notes and $32.5 million of Aa1 Class B notes that were each offered at par. The Class A notes bear interest at three-month LIBOR plus 2.15% and the Class B notes bear interest at three-month LIBOR plus 3.00%. The $42.3 million Class C notes, $28.6 million Class D notes and $86.7 million of LLC equity interests were retained by the Company in consideration for the loans transferred as part of the debt securitization.
On July 28, 2016 we issued 338,670.977 shares to the stockholders participating in the DRIP.
We issued capital calls to stockholders that were due on August 12, 2016 and will be due September 22, 2016, which are summarized in the following table:
| | | Date | | Shares Issued | | | Net Asset Value
($) Per Share | | | Proceeds | |
| | | | | | | | | | | (in thousands) | |
| Issuance of shares | | August 12, 2016 | | | 5,008,697.983 | | | | 15.00 | | | | 75,130 | |
| Issuance of shares | | September 22, 2016 | | | 1,505,808.534 | | | | 15.00 | | | | 22,587 | |
Consolidated Results of Operations
Three and Nine Months Ended June 30, 2016
Consolidated operating results for the three and nine months ended June 30, 2016 and 2015 are as follows:
| | | For the three months ended June 30, | | | Variances | | | For the nine months ended June 30, | | | Variances | |
| | | 2016 | | | 2015 | | | 2016 vs. 2015 | | | 2016 | | | 2015 | | | 2016 vs. 2015 | |
| | | | (In thousands) | | | (In thousands) | |
| | | | | | | | | | | | | | | | | | | |
| Interest income | | $ | 13,204 | | | $ | 6,112 | | | $ | 7,092 | | | $ | 33,007 | | | $ | 10,022 | | | $ | 22,985 | |
| Income from accretion of discounts and origination fees | | | 652 | | | | 223 | | | | 429 | | | | 2,055 | | | | 360 | | | | 1,695 | |
| Interest income from subordinated notes of GCIC SLF | | | 733 | | | | - | | | | 733 | | | | 1,948 | | | | - | | | | 1,948 | |
| Dividend income | | | 48 | | | | - | | | | 48 | | | | 65 | | | | - | | | | 65 | |
| Fee income | | | 1 | | | | 4 | | | | (3 | ) | | | 376 | | | | 46 | | | | 330 | |
| | | | | | | | | | | | | | | | | | | | | | | | | |
| Total investment income | | | 14,638 | | | | 6,339 | | | | 8,299 | | | | 37,451 | | | | 10,428 | | | | 27,023 | |
| | | | | | | | | | | | | | | | | | | | | | | | | |
| Total expenses | | | 7,103 | | | | 2,903 | | | | 4,200 | | | | 17,730 | | | | 4,774 | | | | 12,956 | |
| | | | | | | | | | | | | | | | | | | | | | | | | |
| Net investment income | | | 7,535 | | | | 3,436 | | | | 4,099 | | | | 19,721 | | | | 5,654 | | | | 14,067 | |
| | | | | | | | | | | | | | | | | | | | | | | | | |
| Net realized gain (loss) on investments | | | (23 | ) | | | 42 | | | | (65 | ) | | | 710 | | | | 42 | | | | 668 | |
| Net change in unrealized appreciation (depreciation) on investments | | | 2,521 | | | | 752 | | | | 1,769 | | | | 3,554 | | | | 901 | | | | 2,653 | |
| | | | | | | | | | | | | | | | | | | | | | | | | |
| Net income | | $ | 10,033 | | | $ | 4,230 | | | $ | 5,803 | | | $ | 23,985 | | | $ | 6,597 | | | $ | 17,388 | |
| | | | | | | | | | | | | | | | | | | | | | | | | |
| Average earning portfolio company investments, at fair value(1) | | $ | 761,581 | | | $ | 356,241 | | | $ | 405,340 | | | $ | 647,557 | | | $ | 288,994 | | | $ | 358,563 | |
| | | | | | | | | | | | | | | | | | | | | | | | | |
| Average debt outstanding(1) | | $ | 355,583 | | | $ | 161,528 | | | $ | 194,055 | | | $ | 289,099 | | | $ | 128,260 | | | $ | 160,839 | |
| (1) | For the nine months ended June 30, 2015, the averages are calculated from December 31, 2014, the date of commencement of operations, through June 30, 2015. |
As we commenced operations on December 31, 2014, no income was earned during the periods prior to December 31, 2014. Net income can vary substantially from period to period for various reasons, including the recognition of realized gains and losses, unrealized appreciation and depreciation and the growth of our portfolio. As a result, quarterly comparisons of net income may not be meaningful.
As we commenced operations on December 31, 2014, operating results for the nine months ended June 30, 2015 is inclusive of six months of activity rather than nine. As a result, comparisons between the nine months ended June 30, 2015 and June 30, 2016 are not meaningful and have been omitted from this discussion.
Investment Income
Investment income increased from the three months ended June 30, 2015 to the three months ended June 30, 2016 by $8.3 million primarily as a result of an increase in the average earning investment balance, which is the annual average balance of accruing loans in our investment portfolio, of $405.3 million and the inclusion of interest income earned on the subordinated notes of GCIC SLF of $0.7 million.
The annualized income yield by security type for the three and nine months ended June 30, 2016 and 2015 was as follows:
| | | For the three months ended June 30, | | | For the nine months ended June 30, | |
| | | 2016 | | | 2015 | | | 2016 | | | 2015 | |
| Senior secured(1) | | | 6.4 | % | | | 6.1 | % | | | 6.2 | % | | | 6.2 | % |
| One stop(1) | | | 7.4 | % | | | 7.2 | % | | | 7.4 | % | | | 7.5 | % |
| Subordinated debt | | | 19.8 | % | | | N/A | | | | 19.8 | % | | | N/A | |
| Subordinated notes in GCIC SLF (2) | | | 8.5 | % | | | N/A | | | | 8.4 | % | | | N/A | |
| | (1) | The average annualized income yield for the nine months ended June 30, 2015 is calculated for the period from December 31, 2014, the commencement of operations, through June 30, 2015. |
| | (2) | GCIC SLF’s proceeds from the subordinated notes were utilized by GCIC SLF to fund senior secured loans. |
Annualized income yields on senior secured and one stop loans have increased for the three months ended June 30, 2016 compared to the three months ended June 30, 2015 primarily due to increased pricing on new originations compared to the three months ended June 30, 2015. As of June 30, 2016, we have one subordinated debt investment shown in the Consolidated Schedule of Investments. GCIC SLF commenced operations in October 2015.
For additional details on investment yields and asset mix, refer to the “— Liquidity and Capital Resources — Portfolio Composition, Investment Activity and Yield” section below.
Expenses
The following table summarizes our expenses:
| | | For the three months ended June 30, | | | Variances | | | For the nine months ended June 30, | | | Variances | |
| | | 2016 | | | 2015 | | | 2016 vs. 2015 | | | 2016 | | | 2015 | | | 2016 vs. 2015 | |
| | | (In thousands) | | | (In thousands) | |
| | | | | | | | | | | | | | | | | | | |
| Interest and other debt financing expenses | | $ | 2,430 | | | $ | 1,075 | | | $ | 1,355 | | | $ | 6,076 | | | $ | 1,732 | | | $ | 4,344 | |
| Amortization of debt issuance costs | | | 545 | | | | 158 | | | | 387 | | | | 1,509 | | | | 223 | | | | 1,286 | |
| Base management fee, net of waiver | | | 1,943 | | | | 909 | | | | 1,034 | | | | 4,949 | | | | 1,533 | | | | 3,416 | |
| Income Incentive Fee | | | 1,336 | | | | 377 | | | | 959 | | | | 3,041 | | | | 612 | | | | 2,429 | |
| Capital gain incentive fee accrued under GAAP | | | 383 | | | | - | | | | 383 | | | | 657 | | | | - | | | | 657 | |
| Professional fees | | | 198 | | | | 184 | | | | 14 | | | | 771 | | | | 358 | | | | 413 | |
| Administrative service fee | | | 216 | | | | 195 | | | | 21 | | | | 661 | | | | 307 | | | | 354 | |
| General and administrative expenses | | | 52 | | | | 5 | | | | 47 | | | | 66 | | | | 9 | | | | 57 | |
| | | | | | | | | | | | | | | | | | | | | | | | | |
| Total expenses | | $ | 7,103 | | | $ | 2,903 | | | $ | 4,200 | | | $ | 17,730 | | | $ | 4,774 | | | $ | 12,956 | |
As we commenced operations on December 31, 2014, no expenses were incurred during the period prior to December 31, 2014.
Interest and other debt financing expenses increased by $1.2 million from the three months ended June 30, 2015 to the three months ended June 30, 2016 primarily due to an increase in weighted average of outstanding borrowings from $161.5 million for the three months ended June 30, 2015 to $355.6 million for the three months ended June 30, 2016 and an increase in the average London Interbank Offered Rate, or LIBOR, which is the index that determines the interest rate on our floating rate liabilities. The increase in our debt was primarily driven by an increase in our use of debt under the Credit Facility to $329.4 million as of June 30, 2016 from an outstanding balance of $194.9 million as of June 30, 2015 as well as under the SMBC Revolver, which had an outstanding balance of $75.0 million as of June 30, 2016 from $0.0 as of June 30, 2015.
Amortization of debt issuance costs increased by $0.4 million from the three months ended June 30, 2015 to the three months ended June 30, 2016 primarily due to additional capitalized debt issuance costs associated with the SMBC Revolver and various amendments to the Credit Facility. The increase in our effective annualized average interest rate on our outstanding debt from 3.1% for the three months ended June 30, 2015 to 3.4% for the three months ended June 30, 2016 was primarily the result of the increased amortization of debt issuance costs coupled with an increase in the average LIBOR on the Credit Facility.
The base management fee, net of waiver, increased as a result of a sequential increase in average assets from December 31, 2014, the date of the commencement of operations, to June 30, 2016.
The incentive fee payable under the Investment Advisory Agreement consists of two parts: (1) the income component, or the Income Incentive Fee, and (2) the capital gains component, or the Capital Gain Incentive Fee. The Income Incentive Fee increased by $1.0 million from the three months ended June 30, 2015, to the three months ended June 30, 2016, as the portfolio investments increased along with our Pre-Incentive Fee Net Investment Income (as defined below), expressed as a rate of return on the value of our net assets. For the three months ended June 30, 2016, the Income Incentive Fee expense as a percentage of Pre-Incentive Fee Net Investment Income was 14.4% compared to 9.9% for the three months ended June 30, 2015. For the nine months ended June 30, 2016, the Income Incentive Fee expense as a percentage of Pre-Incentive Fee Net Investment Income was 13.0%. “Pre-Incentive Fee Net Investment Income” means interest income, dividend income and any other income (including any other fees such as commitment, origination, structuring, diligence and consulting fees or other fees that we receive from portfolio companies but excluding fees for providing managerial assistance) accrued during the calendar quarter, minus operating expenses for the calendar quarter (including the base management fee, taxes, any expenses payable under the Investment Advisory Agreement and the Administration Agreement, any expenses of securitizations and any interest expense and dividends paid on any outstanding preferred stock, but excluding the Incentive Fee). Pre-Incentive Fee Net Investment Income includes, in the case of investments with a deferred interest feature such as market discount, debt instruments with PIK interest, preferred stock with PIK dividends and zero coupon securities, accrued income that we have not yet received in cash.
The Capital Gain Incentive Fee payable as calculated under the Investment Advisory Agreement for the three and nine months ended June 30, 2016 and 2015 was $0. However, in accordance with GAAP, we are required to include the aggregate unrealized capital appreciation on investments in the calculation and accrue a capital gain incentive fee on a quarterly basis, as if such unrealized capital appreciation were realized, even though such unrealized capital appreciation is not permitted to be considered in calculating the fee actually payable under the Investment Advisory Agreement. The accrual for capital gain incentive fee under GAAP was $0.4 million for the three months ended June 30, 2016 and $0.7 million for the nine months ended June 30, 2016. We did not accrue a capital gain incentive fee under GAAP for the three months ended June 30, 2015. The increase in accruals for a capital gain incentive fee under GAAP for the three months ended June 30, 2016 from the three months ended June 30, 2015 was primarily the result of an increase in unrealized appreciation on portfolio company investments and realized gains on the sale of debt investments.
For additional details on the sale of debt investments, refer to the “— Net Realized and Unrealized Gains and Losses” section below.
The Administrator pays for certain expenses incurred by us. These expenses are subsequently reimbursed in cash. Total expenses reimbursed by us to the Administrator for the three and nine months ended June 30, 2016 were
an amount less than $0.1 million and $0.5 million, respectively. Total expenses reimbursed by us to the Administrator for the three months ended June 30, 2015 were $0.1 million.
As of June 30, 2016 and September 30, 2015, included in accounts payable and accrued expenses were $0.1 million and an amount less than $0.1 million, respectively, for accrued expenses paid on behalf of us by the Administrator.
Net Realized and Unrealized Gains and Losses
The following table summarizes our net realized and unrealized gains (losses) for the periods presented:
| | | For the three months ended June 30, | | | Variances | | | For the nine months ended June 30, | | | Variances | |
| | | 2016 | | | 2015 | | | 2016 vs. 2015 | | | 2016 | | | 2015 | | | 2016 vs. 2015 | |
| | | (In thousands) | | | (In thousands) | |
| | | | | | | | | | | | | | | | | | | |
| Net realized gain (loss) on investments | | $ | (23 | ) | | $ | 42 | | | $ | (65 | ) | | $ | 710 | | | $ | 42 | | | $ | 668 | |
| Net realized gain (loss) | | | (23 | ) | | | 42 | | | | (65 | ) | | | 710 | | | | 42 | | | | 668 | |
| Unrealized appreciation on investments | | | 5,507 | | | | 1,415 | | | | 4,092 | | | | 8,074 | | | | 1,741 | | | | 6,333 | |
| Unrealized (depreciation) on investments | | | (3,534 | ) | | | (663 | ) | | | (2,871 | ) | | | (5,297 | ) | | | (840 | ) | | | (4,457 | ) |
| Unrealized appreciation on investments in GCIC SLF (1) | | | 548 | | | | - | | | | 548 | | | | 1,126 | | | | - | | | | 1,126 | |
| Unrealized (depreciation) on investments in GCIC SLF(1) | | | - | | | | - | | | | - | | | | (349 | ) | | | - | | | | (349 | ) |
| Net change in unrealized appreciation (depreciation) on investments and investments in GCIC SLF | | $ | 2,521 | | | $ | 752 | | | $ | 1,769 | | | $ | 3,554 | | | $ | 901 | | | $ | 2,653 | |
| | (1) | Unrealized appreciation (depreciation) on investments in GCIC SLF include the Company’s investments in subordinated notes and LLC interests in GCIC SLF. |
For the three months ended June 30, 2016, we had net realized losses in an amount less than $0.1 million primarily due to the realized loss on the sale of one non-accrual portfolio company investment that was partially offset by the sale of portfolio company investments to GCIC SLF. For the nine months ended June 30, 2016, we had net realized gains of $0.7 million primarily due to the sale of portfolio company investments to GCIC SLF.
During the three months ended June 30, 2016, we had $5.5 million in unrealized appreciation on 87 portfolio company investments, which was partially offset by $3.5 million in unrealized depreciation on 96 portfolio company investments. For the nine months ended June 30, 2016, we had $8.1 million in unrealized appreciation on 104 portfolio company investments, which was partially offset by $5.3 million in unrealized depreciation on 87 portfolio company investments. Unrealized depreciation primarily resulted from the amortization of discounts and negative credit related adjustments that caused a reduction in fair value. Unrealized appreciation during the three and nine months ended June 30, 2016 resulted from an increase in fair value primarily due to the rise in market prices of portfolio company investments.
For the three months ended June 30, 2016 we had $0.5 million in unrealized appreciation on our investment in GCIC SLF equity interests, which was driven by positive credit related adjustments associated with GCIC SLF’s investment portfolio. For the nine months ended June 30, 2016, we had $1.1 million in unrealized appreciation on our investment in GCIC SLF LLC equity interests which was partially offset by $0.3 million in unrealized depreciation on our investment in GCIC SLF subordinated notes. The unrealized depreciation was the result of the lower yielding contractual rate compared to comparable market pricing of subordinated notes. The unrealized appreciation on the GCIC SLF LLC equity interests was driven by the offsetting impact of the pricing on the subordinated notes and positive credit related adjustments associated with GCIC SLF’s investment portfolio.
For the three months ended June 30, 2015, we had a net realized gain of less than $0.1 million primarily due to a post-close syndication of an investment.
During the three months ended June 30, 2015, we had $1.4 million in unrealized appreciation on 45 portfolio company investments, which was offset by $0.6 million in unrealized depreciation on 61 portfolio company investments. Unrealized appreciation during the three months ended June 30, 2015 resulted from an increase in fair value primarily due to the rise in market prices of portfolio company investments. Unrealized depreciation primarily
resulted from the amortization of discounts and negative credit related adjustments that caused a reduction in fair value.
Year Ended September 30, 2015
Consolidated operating results for the year ended September 30, 2015 are as follows:
| | | For the year ended | |
| | | September 30, 2015 | |
| | | (In thousands) | |
| Interest income | | $ | 18,546 | |
| Income from accretion of discounts and origination fees | | | 800 | |
| Fee income | | | 55 | |
| | | | | |
| Total investment income | | | 19,401 | |
| | | | | |
| Total expenses | | | 8,895 | |
| | | | | |
| Net investment income | | | 10,506 | |
| | | | | |
| Net realized gains (losses) on investments | | | 42 | |
| Net change in unrealized appreciation (depreciation) on investments | | | 2,479 | |
| | | | | |
| Net income | | $ | 13,027 | |
| | | | | |
| Average earning portfolio company investments, at fair value (1) | | $ | 358,092 | |
| | | | | |
| Average debt outstanding (1) | | $ | 160,079 | |
| (1) | Calculated from December 31, 2014, the date of the commencement of operations, through September 30, 2015. |
As we commenced operations on December 31, 2014, no income was earned during the period September 22, 2014 through September 30, 2014.
Expenses
The following table summarizes our expenses:
| | | For the year ended | |
| | | September 30, 2015 | |
| | | (In thousands) | |
| | | | | |
| Interest and other debt financing expenses | | $ | 3,211 | |
| Amortization of debt issuance costs | | | 520 | |
| Base management fee | | | 3,820 | |
| Base management fee waiver | | | (1,042 | ) |
| Incentive fee | | | 1,239 | |
| Professional fees | | | 576 | |
| Administrative service fee | | | 555 | |
| General and administrative expenses | | | 16 | |
| Total expenses | | $ | 8,895 | |
As we commenced operations on December 31, 2014, no expenses were incurred during the period September 22, 2014 through September 30, 2014.
Net Realized and Unrealized Gains and Losses
The following table summarizes our net realized and unrealized gains (losses) for the periods presented:
| | | For the year ended | |
| | | September 30, 2015 | |
| | | (In thousands) | |
| | | | | |
| Net realized gain (loss) on investments | | $ | 42 | |
| Unrealized appreciation on investments | | $ | 3,732 | |
| Unrealized (depreciation) on investments | | | (1,253 | ) |
| Net change in unrealized appreciation (depreciation) on investments | | $ | 2,479 | |
For the year ended September 30, 2015, we had a realized gain of less than $0.1 million primarily due to the post-close syndication sales of portfolio company investments.
For the year ended September 30, 2015, we had $3.7 million in unrealized appreciation on 80 portfolio company investments, which was partially offset by $1.3 million in unrealized depreciation on 34 portfolio company investments. Unrealized depreciation primarily resulted from the amortization of discounts and negative credit related adjustments that caused a reduction in fair value. Unrealized appreciation during the year ended September 30, 2015 resulted from an increase in fair value primarily due to the rise in market prices.
Liquidity and Capital Resources
For the nine months ended June 30, 2016, we experienced a net increase in cash and cash equivalents of $2.1 million. During the period we used $332.5 million in operating activities, primarily as a result of fundings of portfolio investments of $588.5 million. This was partially offset by proceeds from principal payments and sales of portfolio investments of $236.3 million and net investment income of $24.0 million. During the same period, cash provided by investment activities of $0.3 million was driven by the decrease in restricted cash and cash equivalents. Lastly, cash provided by financing activities was $334.3 million, primarily driven by borrowings on debt of $627.4 million and proceeds from issuance of common shares of $188.9 million that were partially offset by repayments of debt of $472.7 million and distributions paid of $8.5 million.
For the nine months ended June 30, 2015, we experienced a net increase in cash and cash equivalents of $5.7 million. During the period, we used $288.5 million in operating activities primarily as a result of fundings of portfolio investments of $339.9 million. This was partially offset by proceeds from principal payments of portfolio investments of $45.3 million and net investment income of $5.7 million. During the same period, cash used in investment activities of $10.5 million was driven by the net increase in restricted cash and cash equivalents. Lastly, cash provided by financing activities was $304.7 million, primarily driven by proceeds from issuance of common shares of $154.8 million and borrowings on debt of $403.9 million that were partially offset by repayments of debt of $252.4 million and distributions paid of $2.4 million.
For the year ended September 30, 2015, we experienced a net increase in cash and cash equivalents of $2.7 million. During the period we used $420.0 million in operating activities, primarily as a result of fundings of portfolio investments of $499.6 million. This was partially offset by proceeds from principal payments and sales of portfolio investments of $68.8 million and net investment income of $13.0 million. During the same period, cash used in investment activities of $10.1 million was driven by the increase in restricted cash and cash equivalents. Lastly, cash provided by financing activities was $432.9 million, primarily driven by proceeds from issuance of common shares of $239.4 million and borrowings on debt of $717.6 million that were partially offset by repayments of debt of $512.7 million and distributions paid of $8.2 million.
As of June 30, 2016, September 30, 2015 and 2014, we had cash and cash equivalents of $4.8 million, $2.7 million and $10,000, respectively. In addition, we had restricted cash and cash equivalents of $9.8 million and $10.1 million as of June 30, 2016 and September 30, 2015, respectively. We had no restricted cash and cash equivalents as of September 30, 2014. Cash and cash equivalents are available to fund new investments, pay operating expenses and pay distributions. As of June 30, 2016, restricted cash and cash equivalents could be used to fund investments that meet the guidelines under the Credit Facility as well as for the payment of interest expense and revolving debt of the Credit Facility.
As of June 30, 2016 and September 30, 2015, we were permitted to borrow up to $370.0 million at any one time outstanding, subject to leverage and borrowing base restrictions under the terms of our Credit Facility. As of June 30, 2016 and September 30, 2015, subject to leverage and borrowing base restrictions, we had approximately $40.6 and $120.3 million, respectively, of remaining commitments and $40.6 and $7.4 million, respectively, of availability on the Credit Facility. As of June 30, 2016 and September 30, 2015, we had $329.4 million and $249.7 million, respectively, outstanding under the Credit Facility. On July 12, 2016, GCIC Funding entered into the Credit Facility Amendment, which, among other things, increased the size of the Credit Facility from $370 million to $420 million. See “— Recent Developments.”
On May 17, 2016 we entered into the SMBC Revolver, which permitted us to borrow up to $75.0 million at any one time outstanding, subject to leverage and borrowing base restrictions under the terms of the SMBC Revolver. As of June 30, 2016 we had $75.0 million outstanding under the SMBC Revolver and $0 of remaining commitments and $0 of availability on the SMBC Revolver. The SMBC Revolver was not outstanding as of September 30, 2015.
As of June 30, 2016 and September 30, 2015, we were permitted to borrow up to $40.0 million at any one time outstanding, under the terms of our Revolver with GC Advisors. As of June 30, 2016 and September 30, 2015, we had no amounts outstanding under the Revolver.
In accordance with the 1940 Act, with certain limited exceptions, we are only allowed to borrow amounts such that our asset coverage, as defined in the 1940 Act, is at least 200% after such borrowing. As of June 30, 2016 and September 30, 2015, our asset coverage for borrowed amounts was 226.4% and 225.0%, respectively.
As of June 30, 2016 and September 30, 2015, we had investor capital subscriptions totaling $841.8 million and $689.2 million, respectively, of which $496.5 million and $307.7 million, respectively, had been called and contributed. On July 1, 2016 and August 1, 2016, we received additional investor capital subscriptions totaling $31.2 million in the aggregate.
As of June 30, 2016 and September 30, 2015, we had outstanding commitments to fund investments totaling $61.3 million and $58.8 million, respectively. These amounts may or may not be funded to the borrowing party now or in the future. We had no outstanding commitments to fund investments as of September 30, 2014. The unfunded commitments relate to loans with various maturity dates, but the entire amount was eligible for funding to the borrowers as of June 30, 2016 and September 30, 2015, respectively, subject to the terms of each loan’s respective credit agreement.
Although we expect to fund the growth of our investment portfolio through net proceeds from capital calls on existing and future investor capital subscriptions and through our DRIP as well as future borrowings, to the extent permitted by the 1940 Act, we cannot assure you that our efforts to raise capital will be successful. In addition to capital not being available, it also may not be available on favorable terms. To the extent we are not able to raise capital on what we believe are favorable terms, we will focus on optimizing returns by investing capital generated by repayments into new investments we believe are attractive from a risk/reward perspective.
As of June 30, 2016, we believe that we had sufficient assets and uncalled capital subscriptions from our stockholders to adequately cover any obligations under our unfunded commitments.
Portfolio Composition, Investment Activity and Yield
As of June 30, 2016 and September 30, 2015 we had investments in 156 and 141 portfolio companies, respectively, with a total fair value of $912.8 and $551.9 million, respectively. As of June 30, 2016, we had investments in subordinated notes and LLC equity interests in GCIC SLF with a total fair value of $48.0 million. On December 31, 2014, in connection with our formation, we acquired investments in 101 portfolio companies with a total fair value of $231.1 million.
The following table shows the asset mix of our new investment commitments for the three and nine months ended June 30, 2016 and 2015:
| | | For the three months ended June 30, | | | For the nine months ended June 30, | |
| | | 2016 | | | 2015 | | | 2016 | | | 2015 | |
| | | (In thousands) | | | Percentage of
Commitments | | | (In thousands) | | | Percentage of
Commitments | | | (In thousands) | | | Percentage of
Commitments | | | (In thousands) | | | Percentage of
Commitments | |
| | | | | | | | | | | | | | | | | | | | | | | | | |
| Senior secured | | $ | 35,136 | | | | 12.9 | % | | $ | 25,791 | | | | 13.8 | % | | $ | 105,523 | | | | 16.9 | % | | $ | 50,840 | | | | 20.8 | % |
| One stop | | | 229,468 | | | | 84.2 | | | | 159,491 | | | | 85.3 | | | | 465,428 | | | | 74.5 | | | | 191,343 | | | | 78.1 | |
| Subordinated debt | | | 39 | | | | 0.0 | * | | | - | | | | - | | | | 39 | | | | 0.0 | * | | | - | | | | - | |
| Subordinated notes in GCIC SLF(1) | | | - | | | | - | | | | - | | | | - | | | | 34,917 | | | | 5.6 | | | | - | | | | - | |
| LLC equity interests in GCIC SLF(1) | | | 2,914 | | | | 1.1 | | | | - | | | | - | | | | 12,258 | | | | 1.9 | | | | - | | | | - | |
| Equity securities | | | 4,915 | | | | 1.8 | | | | 1,653 | | | | 0.9 | | | | 6,599 | | | | 1.1 | | | | 2,796 | | | | 1.1 | |
| Total new investment commitments | | $ | 272,472 | | | | 100.0 | % | | $ | 186,935 | | | | 100.0 | % | | $ | 624,764 | | | | 100.0 | % | | $ | 244,979 | | | | 100.0 | % |
| * | Represents an amount less than 0.1% |
| | (1) | GCIC SLF’s proceeds from the subordinated notes and LLC equity interests were utilized by GCIC SLF to fund senior secured loans. As of June 30, 2016, GCIC SLF funded senior secured loans to 39 different borrowers. |
For the three and nine months ended June 30, 2016, we had approximately $19.4 million and $81.2 million, respectively, in proceeds from principal payments and return of capital distributions of portfolio companies. For the three and nine months ended June 30, 2016, we had sales of securities in 7 and 40 portfolio companies, respectively, aggregating approximately $27.9 million and $155.1 million, respectively in net proceeds.
For the three and nine months ended June 30, 2015, we had approximately $34.2 million and $45.3 million, respectively, in proceeds from principal payments of portfolio companies.
The following table shows the asset mix of our new origination commitments for the year ended September 30, 2015:
| | | For the year ended
September 30, 2015 | |
| | | (In thousands) | | | Percentage of
Commitments | |
| Senior secured | | $ | 83,084 | | | | 20.2 | % |
| One stop | | | 324,117 | | | | 78.6 | |
| Equity securities | | | 5,007 | | | | 1.2 | |
| Total new investment commitments | | $ | 412,208 | | | | 100.0 | % |
The following table summarizes portfolio composition and investment activity as of and for the nine months ended June 30, 2016 and the year ended September 30, 2015:
| | | As of and for the
nine months ended
June 30, 2016 | | | As of and for the
year ended
September 30, 2015 | |
| | | (In thousands) | |
| Investments, at fair value | | $ | 912,839 | | | $ | 551,878 | |
| Investments in GCIC SLF, at fair value | | $ | 47,952 | | | | — | |
| Number of portfolio companies (at period end) | | | 156 | | | | 141 | |
| New investment fundings | | $ | 588,484 | | | $ | 499,633 | |
| Principal payments and sales of portfolio investments | | $ | 236,278 | | | $ | 68,778 | |
The following table shows the par, amortized cost and fair value of our portfolio of investments by asset class:
| | | As of June 30, 2016 (1) | | | As of September 30, 2015 (1) | |
| | | | | | Amortized | | | Fair | | | | | | Amortized | | | Fair | |
| | | Par | | | Cost | | | Value | | | Par | | | Cost | | | Value | |
| | | (In thousands) | |
| | | | | | | | | | | | | | | | | | | |
| Senior secured: | | | | | | | | | | | | | | | | | | | | | | | | |
| Performing | | $ | 109,240 | | | $ | 107,860 | | | $ | 108,494 | | | $ | 154,248 | | | $ | 152,795 | | | $ | 153,194 | |
| | | | | | | | | | | | | | | | | | | | | | | | | |
| One stop: | | | | | | | | | | | | | | | | | | | | | | | | |
| Performing | | | 750,842 | | | | 740,110 | | | | 744,341 | | | | 395,565 | | | | 391,181 | | | | 393,384 | |
| Non-accrual (2) | | | 53 | | | | 28 | | | | 16 | | | | 542 | | | | 416 | | | | 179 | |
| | | | | | | | | | | | | | | | | | | | | | | | | |
| Subordinated Debt: | | | | | | | | | | | | | | | | | | | | | | | | |
| Performing | | | 39 | | | | 39 | | | | 39 | | | | - | | | | - | | | | - | |
| | | | | | | | | | | | | | | | | | | | | | | | | |
| Subordinated notes in GCIC SLF (3): | | | | | | | | | | | | | | | | | | | | | | | | |
| Performing | | | 34,917 | | | | 34,917 | | | | 34,567 | | | | - | | | | - | | | | - | |
| | | | | | | | | | | | | | | | | | | | | | | | | |
| LLC equity interests in GCIC SLF (3): | | | N/A | | | | 12,258 | | | | 13,385 | | | | N/A | | | | - | | | | - | |
| | | | | | | | | | | | | | | | | | | | | | | | | |
| Equity | | | N/A | | | | 11,594 | | | | 11,997 | | | | N/A | | | | 5,007 | | | | 5,121 | |
| | | | | | | | | | | | | | | | | | | | | | | | | |
| Total | | $ | 895,091 | | | $ | 906,806 | | | $ | 912,839 | | | $ | 550,355 | | | $ | 549,399 | | | $ | 551,878 | |
| | (1) | Ten and seven of our loans included a feature permitting a portion of the interest due on such loan to be PIK interest as of June 30, 2016 and September 30, 2015, respectively. |
| | (2) | We refer to a loan as non-accrual when we cease recognizing interest income on the loan because we have stopped pursuing repayment of the loan or, in certain circumstances, it is past due 90 days or more on principal and interest or our management has reasonable doubt that principal or interest will be collected. See “— Critical Accounting Policies — Revenue Recognition.” |
| | (3) | GCIC SLF’s proceeds from the subordinated notes and LLC equity interests were utilized by GCIC SLF to fund senior secured loans. |
As of June 30, 2016 and September 30, 2015, the fair value of our debt investments, including our investment in GCIC SLF subordinated notes, as a percentage of the outstanding par value was 99.1% and 99.3%, respectively.
The following table shows the weighted average rate, spread over LIBOR of floating rate and fees of investments originated and the weighted average rate of sales and payoffs of portfolio companies during the three and nine months ended June 30, 2016 and 2015 and the year ended September 30, 2015:
| | | For the three months
ended June 30, | | | For the nine months
ended June 30, | | | For the year ended
September 30, | |
| | | 2016 | | | 2015 | | | 2016 | | | 2015 | | | 2015 | |
| Weighted average rate of new investment fundings (1) | | | 7.7 | % | | | 6.7 | % | | | 7.2 | % | | | 6.7 | % | | | 6.8 | % |
| Weighted average spread over LIBOR of new floating rate investment fundings | | | 6.7 | % | | | 5.7 | % | | | 6.2 | % | | | 5.7 | % | | | 5.8 | % |
| Weighted average rate of new fixed rate investment fundings | | | 10.6 | | | | N/A | % | | | 10.6 | | | | 10.8 | % | | | 10.8 | % |
| Weighted average fees of new investment fundings | | | 1.7 | % | | | 1.2 | % | | | 1.7 | % | | | 1.2 | % | | | 1.3 | % |
| Weighted average rate of sales and payoffs of portfolio companies(2) | | | 6.1 | % | | | 6.5 | % | | | 6.2 | % | | | 6.4 | % | | | 6.5 | % |
| Weighted average annualized income yield(3)(4) | | | 7.4 | % | | | 6.9 | % | | | 7.3 | % | | | 7.0 | % | | | 6.9 | % |
| (1) | Excludes subordinated note investment in GCIC SLF. |
| (2) | Excludes exits on investments on non-accrual status. |
| (3) | Represents income from interest, including subordinated notes in GCIC SLF, and fees excluding amortization of capitalized fees and discounts divided by the average fair value of earning debt investments. |
| (4) | The weighted average annualized income yield for the nine months ended June 30, 2015 and for the year ended September 30, 2015 is calculated for the period from December 31, 2014, the commencement of operations, |
through June 30, 2015 and September 30, 2015, respectively.
As of June 30, 2016, 95.9% and 95.8% of our debt portfolio at fair value and at amortized cost, respectively, had interest rate floors that limit the minimum applicable interest rates on such loans. As of September 30, 2015, 99.7% and 99.7% of our debt portfolio at fair value and at amortized cost, respectively, had interest rate floors that limit the minimum applicable interest rates on such loans.
As of June 30, 2016, the portfolio median EBITDA for our portfolio companies was $24.6 million. The portfolio median EBITDA data is based on the most recently reported trailing twelve-month EBITDA received from the portfolio company. The portfolio median EBITDA excludes underlying borrowers in GCIC SLF.
GCIC Senior Loan Fund LLC
We co-invest with Aurora, a wholly-owned subsidiary of RGA Reinsurance Company, or RGA, in senior secured loans through GCIC SLF, an unconsolidated Delaware LLC. GCIC SLF is capitalized as transactions are completed and all portfolio and investment decisions in respect of GCIC SLF must be approved by the GCIC SLF investment committee consisting of two representatives of each of us and Aurora (with unanimous approval required from (i) one member of each of us and Aurora or (ii) both representatives of each of us and Aurora). GCIC SLF may cease making new investments upon notification of either representative but operations will continue until all investments have been sold or paid-off in the normal course of business.
GCIC SLF is capitalized with subordinated notes and LLC equity interest subscriptions from its members. As of June 30, 2016, we and Aurora owned 87.5% and 12.5%, respectively, of both the outstanding subordinated notes and LLC equity interests.
GCIC SLF commenced operations in October 2015. As of June 30, 2016 and September 30, 2015, GCIC SLF had the following commitments from its members:
| | | As of June 30, 2016 | | | As of September 30, 2015 | |
| | | Committed | | | Funded | | | Committed | | | Funded | |
| | | (Dollars in thousands) | |
| Subordinated note commitments (1) | | $ | 100,000 | | | $ | 39,905 | | | $ | 100,000 | | | $ | - | |
| LLC equity commitments (1) | | | 25,000 | | | | 14,009 | | | | 25,000 | | | | - | |
| Total | | $ | 125,000 | | | $ | 53,914 | | | $ | 125,000 | | | $ | - | |
| (1) | Commitments presented are combined for us and Aurora. |
On October 21, 2015, GCIC SLF II, a wholly-owned subsidiary of GCIC SLF, entered into the GCIC SLF Credit Facility, which allowed GCIC SLF II to borrow up to $150 million at any one time outstanding, subject to leverage and borrowing base restrictions. The reinvestment period of the GCIC SLF Credit Facility ends October 22, 2017, and the stated maturity date is October 21, 2020. As of June 30, 2016, GCIC SLF II had outstanding debt under the GCIC SLF Credit Facility of $96.9 million.
Through the reinvestment period, the GCIC SLF Credit Facility bears interest at one-month LIBOR plus a rate between 1.75% and 2.25%, depending on the composition of the collateral asset portfolio, per annum. After the reinvestment period, the rate will reset to one-month LIBOR plus 2.75% per annum for the remaining term of the GCIC SLF Credit Facility.
As of June 30, 2016, GCIC SLF had total assets at fair value of $150.8 million. As of June 30, 2016, GCIC SLF did not have any investments on non-accrual status. The portfolio companies in GCIC SLF are in industries and geographies similar to those in which we may invest directly. Additionally, as of June 30, 2016, GCIC SLF had commitments to fund various undrawn revolving credit and delayed draw loans to its portfolio companies totaling $12.4 million.
Below is a summary of GCIC SLF’s portfolio, followed by a listing of the individual loans in GCIC SLF’s portfolio as of June 30, 2016:
| | | As of June 30, 2016 | |
| | | (Dollars in thousands) | |
| Senior secured loans (1) | | $ | 147,797 | |
| Weighted average current interest rate on senior secured loans (2) | | | 6.0 | % |
| Number of borrowers in GCIC SLF | | | 39 | |
| Largest portfolio company investment (1) | | $ | 8,388 | |
| Total of five largest portfolio company investments (1) | | $ | 38,715 | |
| | (2) | Computed as the (a) annual stated interest rate on accruing senior secured loans divided by (b) total senior secured loans at principal amount. |
GCIC SLF Loan Portfolio as of June 30, 2016
| | | | | | | | | Current | | | | | | | |
| | | | | | | Maturity | | Interest | | | Principal/Par | | | Fair | |
| Portfolio Company | | Business Description | | Security Type | | Date | | Rate(1) | | | Amount | | | Value(2) | |
| | | | | | | | | | | | (In thousands) | |
| AG Kings Holdings Inc.(3) | | Grocery | | Senior loan | | 04/2020 | | | 7.3 | % | | $ | 4,987 | | | $ | 4,987 | |
| Aimbridge Hospitality, LLC(3) | | Hotels, Motels, Inns, and Gaming | | Senior loan | | 10/2018 | | | 5.8 | | | | 2,443 | | | | 2,443 | |
| American Seafoods Group LLC | | Beverage, Food and Tobacco | | Senior loan | | 08/2021 | | | 6.0 | | | | 3,156 | | | | 3,108 | |
| Argon Medical Devices, Inc. | | Healthcare, Education and Childcare | | Senior loan | | 12/2021 | | | 5.8 | | | | 3,529 | | | | 3,529 | |
| Boot Barn, Inc. | | Retail Stores | | Senior loan | | 06/2021 | | | 5.5 | | | | 5,611 | | | | 5,611 | |
| Brandmuscle, Inc. | | Printing and Publishing | | Senior loan | | 12/2021 | | | 5.8 | | | | 4,266 | | | | 4,266 | |
| C.B. Fleet Company, Incorporated | | Personal and Non Durable Consumer Products | | Senior loan | | 12/2021 | | | 5.8 | | | | 8,388 | | | | 8,388 | |
| Checkers Drive-In Restaurants, Inc. | | Beverage, Food and Tobacco | | Senior loan | | 01/2022 | | | 6.5 | | | | 4,287 | | | | 4,254 | |
| CLP Healthcare Services, Inc. | | Healthcare, Education and Childcare | | Senior loan | | 12/2020 | | | 6.3 | | | | 2,075 | | | | 2,075 | |
| CLP Healthcare Services, Inc. | | Healthcare, Education and Childcare | | Senior loan | | 12/2020 | | | 6.3 | | | | 1,046 | | | | 1,046 | |
| Community Veterinary Partners, LLC | | Personal, Food and Miscellaneous Services | | Senior loan | | 10/2021 | | | 6.5 | | | | 2,122 | | | | 2,122 | |
| Community Veterinary Partners, LLC | | Personal, Food and Miscellaneous Services | | Senior loan | | 10/2021 | | | 6.5 | | | | 692 | | | | 692 | |
| Curo Health Services LLC | | Healthcare, Education and Childcare | | Senior loan | | 02/2022 | | | 6.5 | | | | 4,938 | | | | 4,922 | |
| Express Oil Change, LLC | | Retail Stores | | Senior loan | | 12/2017 | | | 6.0 | | | | 346 | | | | 342 | |
| Flexan, LLC | | Chemicals, Plastics and Rubber | | Senior loan | | 02/2020 | | | 6.3 | | | | 2,725 | | | | 2,725 | |
| Hygenic Corporation, The | | Personal and Non Durable Consumer Products | | Senior loan | | 10/2020 | | | 7.5 | | | | 3,323 | | | | 3,323 | |
| Jensen Hughes, Inc. | | Diversified/Conglomerate Service | | Senior loan | | 12/2021 | | | 6.0 | | | | 95 | | | | 95 | |
| Jensen Hughes, Inc. | | Diversified/Conglomerate Service | | Senior loan | | 12/2021 | | | 6.0 | | | | 2,024 | | | | 2,024 | |
| Loar Group Inc. | | Aerospace and Defense | | Senior loan | | 01/2022 | | | 5.8 | | | | 2,005 | | | | 2,005 | |
| Mediaocean LLC(3) | | Diversified/Conglomerate Service | | Senior loan | | 08/2022 | | | 5.8 | | | | 1,921 | | | | 1,921 | |
| Pentec Acquisition Sub, Inc. | | Healthcare, Education and Childcare | | Senior loan | | 05/2018 | | | 6.3 | | | | 454 | | | | 454 | |
| PetVet Care Centers LLC | | Personal, Food and Miscellaneous Services | | Senior loan | | 12/2020 | | | 5.8 | | | | 2,918 | | | | 2,918 | |
| PetVet Care Centers LLC | | Personal, Food and Miscellaneous Services | | Senior loan | | 12/2020 | | | 5.8 | | | | 607 | | | | 607 | |
| PowerPlan Holdings, Inc.(3) | | Utilities | | Senior loan | | 02/2022 | | | 6.3 | | | | 7,522 | | | | 7,522 | |
| PPT Management, LLC | | Healthcare, Education and Childcare | | Senior loan | | 04/2020 | | | 6.0 | | | | 6,308 | | | | 6,308 | |
| Premise Health Holding Corp. (3) | | Healthcare, Education and Childcare | | Senior loan | | 06/2020 | | | 5.5 | | | | 6,000 | | | | 6,000 | |
| Pyramid Healthcare, Inc.(3) | | Healthcare, Education and Childcare | | Senior loan | | 08/2019 | | | 6.8 | | | | 2,017 | | | | 2,017 | |
| Radiology Partners, Inc. | | Healthcare, Education and Childcare | | Senior loan | | 09/2020 | | | 6.0 | | | | 6,448 | | | | 6,448 | |
| Radiology Partners, Inc. | | Healthcare, Education and Childcare | | Senior loan | | 09/2020 | | | 6.0 | | | | 730 | | | | 730 | |
| RSC Acquisition, Inc.(3) | | Insurance | | Senior loan | | 11/2022 | | | 6.3 | | | | 3,218 | | | | 3,218 | |
| RSC Acquisition, Inc.(3) | | Insurance | | Senior loan | | 11/2022 | | | 6.3 | | | | 148 | | | | 148 | |
| Rubio’s Restaurants, Inc | | Beverage, Food and Tobacco | | Senior loan | | 11/2018 | | | 6.0 | | | | 1,697 | | | | 1,697 | |
| Rug Doctor LLC | | Personal and Non Durable Consumer Products | | Senior loan | | 06/2018 | | | 6.3 | | | | 2,204 | | | | 2,204 | |
| Saldon Holdings, Inc. | | Diversified/Conglomerate Service | | Senior loan | | 09/2021 | | | 5.5 | | | | 2,261 | | | | 2,261 | |
| Sarnova HC, LLC | | Healthcare, Education and Childcare | | Senior loan | | 01/2022 | | | 5.8 | | | | 3,342 | | | | 3,342 | |
| SEI, Inc. | | Electronics | | Senior loan | | 07/2021 | | | 5.8 | | | | 5,284 | | | | 5,284 | |
| Self Esteem Brands, LLC | | Leisure, Amusement, Motion Pictures, Entertainment | | Senior loan | | 02/2020 | | | 5.0 | | | | 5,720 | | | | 5,720 | |
| Severin Acquisition, LLC | | Diversified/Conglomerate Service | | Senior loan | | 07/2021 | | | 5.9 | | | | 7,949 | | | | 7,907 | |
| Severin Acquisition, LLC | | Diversified/Conglomerate Service | | Senior loan | | 07/2021 | | | 5.9 | | | | 32 | | | | 32 | |
| Smashburger Finance LLC | | Beverage, Food and Tobacco | | Senior loan | | 05/2018 | | | 6.3 | | | | 5,816 | | | | 5,816 | |
| Smashburger Finance LLC | | Beverage, Food and Tobacco | | Senior loan | | 05/2018 | | | 6.3 | | | | 458 | | | | 458 | |
| Smashburger Finance LLC | | Beverage, Food and Tobacco | | Senior loan | | 05/2018 | | | 6.3 | | | | 457 | | | | 457 | |
| Smashburger Finance LLC | | Beverage, Food and Tobacco | | Senior loan | | 05/2018 | | | 6.3 | | | | 456 | | | | 456 | |
| Smashburger Finance LLC | | Beverage, Food and Tobacco | | Senior loan | | 05/2018 | | | 6.3 | | | | 459 | | | | 459 | |
| Tate’s Bake Shop, Inc.(3) | | Beverage, Food and Tobacco | | Senior loan | | 08/2019 | | | 6.0 | | | | 714 | | | | 714 | |
| Teasdale Quality Foods, Inc. | | Grocery | | Senior loan | | 10/2020 | | | 5.3 | | | | 1,104 | | | | 1,061 | |
| Transaction Data Systems, Inc.(3) | | Diversified/Conglomerate Service | | Senior loan | | 06/2021 | | | 6.3 | | | | 2,366 | | | | 2,366 | |
| Transaction Data Systems, Inc.(3) | | Diversified/Conglomerate Service | | Senior loan | | 06/2020 | | | 5.5 | | | | 9 | | | | 9 | |
| Worldwide Express Operations, LLC(3) | | Cargo Transport | | Senior loan | | 07/2019 | | | 6.0 | | | | 5,963 | | | | 5,963 | |
| Worldwide Express Operations, LLC(3) | | Cargo Transport | | Senior loan | | 07/2019 | | | 6.0 | | | | 36 | | | | 36 | |
| Young Innovations, Inc. | | Healthcare, Education and Childcare | | Senior loan | | 01/2019 | | | 5.3 | | | | 355 | | | | 355 | |
| Young Innovations, Inc. | | Healthcare, Education and Childcare | | Senior loan | | 01/2018 | | | 6.8 | | | | 22 | | | | 22 | |
| Zest Holdings, LLC | | Healthcare, Education and Childcare | | Senior loan | | 08/2020 | | | 5.8 | | | | 4,744 | | | | 4,744 | |
| | | | | | | | | | | | | $ | 147,797 | | | $ | 147,611 | |
| (1) | Represents the weighted average annual current interest rate as of June 30, 2016. All interest rates are payable in cash. |
| (2) | Represents the fair value in accordance with ASC Topic 820. The determination of such fair value is not included in our board of directors’ valuation process described elsewhere herein. |
| (3) | We also hold a portion of the first lien senior secured loan in this portfolio company. |
We have committed to fund $87.5 million of subordinated notes and $21.9 million of LLC equity interest subscriptions to GCIC SLF. The amortized cost and fair value of the subordinated notes in GCIC SLF held by us were $34.9 million and $34.6 million, respectively, as of June 30, 2016. As of June 30, 2016, the subordinated notes paid a weighted average interest rate of three-month LIBOR plus 8.0%. For the three and nine months ended June 30, 2016, we earned interest income of $0.7 million and $1.9 million, respectively, on the subordinated notes. As of June 30, 2016, $12.3 million of our LLC equity interest subscriptions to GCIC SLF had been called and contributed. For the three and nine months ended June 30, 2016, we did not earn dividend income from the GCIC SLF LLC equity interests.
For the three and nine months ended June 30, 2016, we earned an annualized total return on our weighted average capital invested in GCIC SLF of 11.3% and 9.3%, respectively. The annualized total return on weighted average capital invested is calculated by dividing total income earned on our investments in GCIC SLF subordinated notes and LLC equity interests by the combined daily average of our investments in (1) the principal of the GCIC SLF subordinated notes and (2) the net asset value of theGCICSLF LLC equity interests.
Below is certain summarized financial information for GCIC SLF as of and for the three and nine months ended June 30, 2016:
| | | As of June 30, 2016 | |
| | | (In thousands) | |
| Selected Balance Sheet Information: | | | | |
| Investments, at fair value | | $ | 147,611 | |
| Cash and other assets | | | 3,172 | |
| Total assets | | $ | 150,783 | |
| | | | | |
| Senior credit facility | | $ | 96,900 | |
| Unamortized debt issuance costs | | | (1,190 | ) |
| Other liabilities | | | 271 | |
| Total liabilities | | | 95,981 | |
| Subordinated notes and members’ equity | | | 54,802 | |
| Total liabilities and members’ equity | | $ | 150,783 | |
| | | For the three months
ended June 30, 2016 | | | For the nine months
ended June 30, 2016 | |
| | | (In thousands) | |
| Selected Statement of Operations Information: | | | | | | |
| Interest income | | $ | 2,140 | | | $ | 4,493 | |
| Total investment income | | | 2,140 | | | | 4,493 | |
| | | | | | | | | |
| Interest expense | | | 1,620 | | | | 3,869 | |
| Administrative service fee | | | 38 | | | | 112 | |
| Other expenses | | | 26 | | | | 65 | |
| Total expenses | | | 1,684 | | | | 4,046 | |
| Net investment income (loss) | | | 456 | | | | 447 | |
| | | | | | | | | |
| Net change in unrealized appreciation (depreciation) on investments and subordinated notes | | | 171 | | | | 840 | |
| Net increase (decrease) in net assets | | $ | 627 | | | $ | 1,287 | |
GCIC SLF has elected to fair value the subordinated notes issued to us and Aurora under ASC Topic 825 –Financial Instruments,or ASC Topic 825. The subordinated notes are valued by calculating the net present value of the future expected cash flow streams using an appropriate risk-adjusted discount rate model. For the three and nine months ended June 30, 2016, GCIC SLF recognized $0.4 million in unrealized depreciation on the subordinated notes.
The following table presents the difference between fair value and the aggregate contractual principal amounts of all of the subordinated notes issued by GCIC SLF for which the fair value option has been elected as of June 30, 2016:
| | | As of June 30, 2016 | |
| | | (In thousands) | |
| | | Par Value | | | Carrying Value | | | Fair Value | |
| | | | | | | | | | |
| Subordinated notes | | $ | 39,905 | | | $ | 39,905 | | | $ | 39,506 | |
Contractual Obligations and Off-Balance Sheet Arrangements
A summary of our significant contractual payment obligations as of June 30, 2016 is as follows:
| | | Payments Due by Period (In millions) | |
| | | | | | Less Than | | | | | | | | | More Than | |
| | | Total | | | 1 Year | | | 1-3 Years | | | 3-5 Years | | | 5 Years | |
| | | | | | | | | | | | | | | | |
| Credit Facility | | $ | 329.4 | | | $ | - | | | $ | - | | | $ | 329.4 | | | $ | - | |
| SMBC Revolver | | | 75.0 | | | | - | | | | 75.0 | | | | - | | | | - | |
| Revolver | | | - | | | | - | | | | - | | | | - | | | | - | |
| Unfunded commitments (1) | | | 61.3 | | | | 61.3 | | | | - | | | | - | | | | - | |
| Total contractual obligations | | $ | 465.7 | | | $ | 61.3 | | | $ | 75.0 | | | $ | 329.4 | | | $ | - | |
| | (1) | Unfunded commitments represent all amounts unfunded as of June 30, 2016. These amounts may or may not be funded to the borrowing party now or in the future. The unfunded commitments relate to loans with various maturity dates, but we are showing this amount in the less than one year category as this entire amount was eligible for funding to the borrowers as of June 30, 2016, subject to the terms of each loan’s respective credit agreement. |
We may become a party to financial instruments with off-balance sheet risk in the normal course of our business to meet the financial needs of our portfolio companies. These instruments may include commitments to extend credit and involve, to varying degrees, elements of liquidity and credit risk in excess of the amount recognized in the balance sheet. As of June 30, 2016 and September 30, 2015, we had outstanding commitments to fund investments totaling $61.3 million and $58.8 million, respectively. We have commitments of up to $65.1 million to GCIC SLF
as of June 30, 2016, that may be contributed primarily for the purpose of funding new investments approved by the GCIC SLF investment committee. GCIC SLF had not commenced operations as of September 30, 2015.
We have certain contracts under which we have material future commitments. We have entered into the Investment Advisory Agreement with GC Advisors in accordance with the 1940 Act. Under the Investment Advisory Agreement, GC Advisors provides us with investment advisory and management services.
Under the Administration Agreement, the Administrator furnishes us with office facilities and equipment, provides us with clerical, bookkeeping and record keeping services at such facilities and provides us with other administrative services necessary to conduct our day-to-day operations. The Administrator also provides on our behalf managerial assistance to those portfolio companies to which we are required to offer to provide such assistance.
If any of the contractual obligations discussed above is terminated, our costs under any new agreements that we enter into may increase. In addition, we would likely incur significant time and expense in locating alternative parties to provide the services we receive under our Investment Advisory Agreement and our Administration Agreement. Any new investment advisory agreement would also be subject to approval by our stockholders.
Critical Accounting Policies
The preparation of financial statements and related disclosures in conformity with GAAP requires management to make estimates and assumptions that affect the reported amounts of assets and liabilities, disclosure of contingent assets and liabilities at the date of the financial statements and revenues and expenses during the periods reported. Actual results could materially differ from those estimates. We have identified the following items as critical accounting policies.
Fair Value Measurements
We value investments for which market quotations are readily available at their market quotations. However, a readily available market value is not expected to exist for many of the investments in our portfolio, and we value these portfolio investments at fair value as determined in good faith by our board of directors under our valuation policy and process.
Valuation methods may include comparisons of the portfolio companies to peer companies that are public, determination of the enterprise value of a portfolio company, discounted cash flow analysis and a market interest rate approach. The factors that are taken into account in fair value pricing investments include: available current market data, including relevant and applicable market trading and transaction comparables; applicable market yields and multiples; security covenants; call protection provisions; information rights; the nature and realizable value of any collateral; the portfolio company’s ability to make payments, its earnings and discounted cash flows and the markets in which it does business; comparisons of financial ratios of peer companies that are public; comparable merger and acquisition transactions; and the principal market and enterprise values. When an external event such as a purchase transaction, public offering or subsequent equity sale occurs, we will consider the pricing indicated by the external event to corroborate the private equity valuation. Due to the inherent uncertainty of determining the fair value of investments that do not have a readily available market value, the fair value of the investments may differ significantly from the values that would have been used had a readily available market value existed for such investments and may differ materially from values that may ultimately be received or settled.
Our board of directors is ultimately and solely responsible for determining, in good faith, the fair value of investments that are not publicly traded, whose market prices are not readily available on a quarterly basis or any other situation where portfolio investments require a fair value determination.
With respect to investments for which market quotations are not readily available, our board of directors undertakes a multi-step valuation process each quarter, as described below:
| • | Our quarterly valuation process begins with each portfolio company investment being initially valued by the investment professionals of GC Advisors responsible for credit monitoring. |
| • | Preliminary valuation conclusions are then documented and discussed with our senior management and GC Advisors. |
| • | The audit committee of our board of directors reviews these preliminary valuations. |
| • | At least once annually, the valuation for each portfolio investment is reviewed by an independent valuation firm. |
| • | The board of directors discusses valuations and determines the fair value of each investment in our portfolio in good faith. |
Determination of fair values involves subjective judgments and estimates. Under current auditing standards, the notes to our consolidated financial statements refer to the uncertainty with respect to the possible effect of such valuations, and any change in such valuations, on our consolidated financial statements.
We follow ASC Topic 820 for measuring fair value. Fair value is the price that would be received in the sale of an asset or paid to transfer a liability in an orderly transaction between market participants at the measurement date. Where available, fair value is based on observable market prices or parameters, or derived from such prices or parameters. Where observable prices or inputs are not available, valuation models are applied. These valuation models involve some level of management estimation and judgment, the degree of which is dependent on the price transparency for the assets or liabilities or market and the assets’ or liabilities’ complexity. Our fair value analysis includes an analysis of the value of any unfunded loan commitments. Assets and liabilities are categorized for disclosure purposes based upon the level of judgment associated with the inputs used to measure their value. The valuation hierarchical levels are based upon the transparency of the inputs to the valuation of the asset or liability as of the measurement date. The three levels are defined as follows:
Level 1: Inputs are unadjusted, quoted prices in active markets for identical assets or liabilities at the measurement date.
Level 2: Inputs include quoted prices for similar assets or liabilities in active markets and inputs that are observable for the assets or liabilities, either directly or indirectly, for substantially the full term of the assets or liabilities.
Level 3: Inputs include significant unobservable inputs for the assets or liabilities and include situations where there is little, if any, market activity for the assets or liabilities. The inputs into the determination of fair value are based upon the best information available and may require significant management judgment or estimation.
In certain cases, the inputs used to measure fair value may fall into different levels of the fair value hierarchy. In such cases, an asset’s or a liability’s categorization within the fair value hierarchy is based on the lowest level of input that is significant to the fair value measurement. Our assessment of the significance of a particular input to the fair value measurement in its entirety requires judgment, and we consider factors specific to the asset or liability. We assess the levels of assets and liabilities at each measurement date, and transfers between levels are recognized on the actual date of the event or change in circumstances that caused the transfers. There were no transfers among Level 1, 2 and 3 of the fair value hierarchy for assets and liabilities during the three and nine months ended June 30, 2016 and 2015 and the years ended September 30, 2015 and 2014. The following section describes the valuation techniques used by us to measure different assets and liabilities at fair value and includes the level within the fair value hierarchy in which the assets and liabilities are categorized.
Valuation of Investments
Level 1 investments are valued using quoted market prices. Level 2 investments are valued using market consensus prices that are corroborated by observable market data and quoted market prices for similar assets and liabilities. Level 3 investments are valued at fair value as determined in good faith by our board of directors, based on input of management, the audit committee and independent valuation firms that have been engaged at the direction of our board of directors to assist in the valuation of each portfolio investment without a readily available market quotation at least once during a trailing twelve-month period under a valuation policy and a consistently applied valuation process. This valuation process is conducted at the end of each fiscal quarter, with approximately 25% (based on the number of portfolio companies) of our valuations of debt and equity investments without readily available market quotations subject to review by an independent valuation firm. All investments as of June 30, 2016 and September 30, 2015 and 2014, with the exception of money market funds included in cash and cash equivalents (Level 1 investments) and investments measured at fair value using net asset value, were valued using Level 3 inputs of the fair value hierarchy.
When determining fair value of Level 3 debt and equity investments, we may take into account the following factors, where relevant: the enterprise value of a portfolio company, the nature and realizable value of any collateral, the portfolio company’s ability to make payments and its earnings and discounted cash flows, the markets in which the portfolio company does business, comparisons to publicly traded securities and changes in the interest rate environment and the credit markets generally that may affect the price at which similar investments may be made and other relevant factors. The primary method for determining enterprise value uses a multiple analysis whereby
appropriate multiples are applied to the portfolio company’s EBITDA. The enterprise value analysis is performed to determine the value of equity investments and to determine if debt investments are credit impaired. If debt investments are credit impaired, we will use the enterprise value analysis or a liquidation basis analysis to determine fair value. For debt investments that are not determined to be credit impaired, we use a market interest rate yield analysis to determine fair value.
In addition, for certain debt investments, we may base our valuation on indicative bid and ask prices provided by an independent third party pricing service. Bid prices reflect the highest price that we and others may be willing to pay. Ask prices represent the lowest price that we and others may be willing to accept. We generally use the midpoint of the bid/ask range as our best estimate of fair value of such investment.
Due to the inherent uncertainty of determining the fair value of Level 3 investments that do not have a readily available market value, the fair value of the investments may differ significantly from the values that would have been used had a ready market existed for such investments and may differ materially from the values that may ultimately be received or settled. Further, such investments are generally subject to legal and other restrictions or otherwise are less liquid than publicly traded instruments. If we were required to liquidate a portfolio investment in a forced or liquidation sale, we may realize significantly less than the value at which such investment had previously been recorded.
Our investments are subject to market risk. Market risk is the potential for changes in the value due to market changes. Market risk is directly impacted by the volatility and liquidity in the markets in which the investments are traded.
Valuation of Other Financial Assets and Liabilities
Fair value of our debt is estimated using Level 3 inputs by discounting remaining payments using comparable market rates or market quotes for similar instruments at the measurement date, if available.
Revenue Recognition:
Our revenue recognition policies are as follows:
Investments and Related Investment Income: Interest income is accrued based upon the outstanding principal amount and contractual interest terms of debt investments. Premiums, discounts, and origination fees are amortized or accreted into interest income over the life of the respective debt investment. For investments with contractual PIK interest, which represents contractual interest accrued and added to the principal balance that generally becomes due at maturity, we do not accrue PIK interest if the portfolio company valuation indicates that the PIK interest is not likely to be collectible. In addition, we may generate revenue in the form of amendment, structuring or due diligence fees, fees for providing managerial assistance, consulting fees and prepayment premiums on loans and record these fees as fee income when received. Loan origination fees, original issue discount and market discount or premium are capitalized, and we accrete or amortize such amounts as interest income. We record prepayment premiums on loans as fee income. Dividend income on preferred equity securities is recorded as dividend income on an accrual basis to the extent that such amounts are payable by the portfolio company and are expected to be collected. Dividend income on common equity securities is recorded on the record date for private portfolio companies or on the ex-dividend date for publicly traded portfolio companies. Distributions received from LLC and LP investments are evaluated to determine if the distribution should be recorded as dividend income or a return of capital. Generally, we will not record distributions from equity investments in LLCs and LPs as dividend income unless there are sufficient accumulated tax-basis earnings and profits in the LLC or LP prior to the distribution. Distributions that are classified as a return of capital are recorded as a reduction in the cost basis of the investment.
We account for investment transactions on a trade-date basis. Realized gains or losses on investments are measured by the difference between the net proceeds from the disposition and the amortized cost basis of investment, without regard to unrealized gains or losses previously recognized. We report changes in fair value of investments from the prior period that are measured at fair value as a component of the net change in unrealized appreciation (depreciation) on investments in our consolidated statement of operations.
Non-accrual: Loans may be left on accrual status during the period we are pursuing repayment of the loan. Management reviews all loans that become past due 90 days or more on principal and interest or when there is reasonable doubt that principal or interest will be collected for possible placement on non-accrual status. We generally reverse accrued interest when a loan is placed on non-accrual. Additionally, any original issue discount and market discount are no longer accreted to interest income as of the date the loan is placed on non-accrual status. Interest payments received on non-accrual loans may be recognized as income or applied to principal depending
upon management’s judgment. We restore non-accrual loans to accrual status when past due principal and interest are paid and, in our management’s judgment, are likely to remain current. The total fair value of our non-accrual loans was an amount less than $0.1 million as of June 30, 2016 and $0.2 million as of September 30, 2015.
Income taxes:
We have elected to be treated as a RIC under Subchapter M of the Code and operate in a manner so as to qualify for the tax treatment applicable to RICs. In order to be subject to tax as a RIC, we are required to meet certain source of income and asset diversification requirements, as well as timely distribute to our stockholders at least 90% of investment company taxable income, as defined by the Code and determined without regard to any deduction for dividends paid, for each tax year. We have made and intend to continue to make the requisite distributions to our stockholders, which will generally relieve us from U.S. federal income taxes.
On January 1, 2015, GCIC Equity LLC, a Delaware LLC and wholly-owned, direct subsidiary of GCIC, or GCIC Equity, elected to be classified as a corporation for U.S. federal income tax purposes. On May 2, 2016, GCIC Equity merged with and into GCIC Holdings, with GCIC Holdings being the surviving entity. As part of this merger, GCIC Equity intends to elect deemed-sale treatment and the assetsof GCIC Equity will be treated as sold at fair value for tax purposes.This will result in a U.S. federal income tax expense of $49,000 that is included in general and administrative expenses on the consolidated statements of operations.
Depending on the level of taxable income earned in a tax year, we may choose to retain taxable income in excess of current year distributions into the next tax year in an amount less than what would trigger payments of federal income tax under Subchapter M of the Code. We may then be required to pay a 4% excise tax on such income. To the extent that we determine that our estimated current year annual taxable income may exceed estimated current year distributions, we accrue excise tax, if any, on estimated excess taxable income as taxable income is earned.
Because federal income tax regulations differ from GAAP, distributions in accordance with tax regulations may differ from net investment income and realized gains recognized for financial reporting purposes. Differences may be permanent or temporary. Permanent differences are reclassified within capital accounts in the financial statements to reflect their tax character. For example, permanent differences in classification may result from the treatment of distributions paid from short-term gains as ordinary income dividends for tax purposes. Temporary differences arise when certain items of income, expense, gain or loss are recognized at some time in the future.
Quantitative and Qualitative Disclosures about Market Risk
We are subject to financial market risks, including changes in interest rates. Many of the loans in our portfolio have floating interest rates, and we expect that our loans in the future may also have floating interest rates. These loans are usually based on a floating LIBOR and typically have interest rate reset provisions that adjust applicable interest rates under such loans to current market rates on a quarterly basis. The loans that are subject to floating LIBOR are also subject to a minimum base rate, or floor, that we charge on our loans if the current market rates are below the respective floors. As of June 30, 2016 and September 30, 2015, the weighted average LIBOR floor on the loans subject to floating interest rates was 1.01% and 1.02%, respectively. In addition, the Credit Facility has a floating interest rate provision based on one-month LIBOR that resets daily and the SMBC Revolver has a floating interest rate provision based on one-month LIBOR that resets monthly. We expect that other credit facilities into which we enter in the future may have floating interest rate provisions.
Assuming that the interim and unaudited consolidated statement of financial condition as of June 30, 2016 were to remain constant and that we took no actions to alter our interest rate sensitivity as of such date, the following table shows the annualized impact of hypothetical base rate changes in interest rates.
| Change in interest rates | | Increase (decrease) in
interest income | | | Increase (decrease) in
interest expense | | | Net increase
(decrease) in
investment income | |
| | | (in thousands) | |
| Down 25 basis points | | $ | (88 | ) | | $ | (1,011 | ) | | $ | 923 | |
| Up 50 basis points | | | 1,449 | | | | 2,022 | | | | (573 | ) |
| Up 100 basis points | | | 5,865 | | | | 4,044 | | | | 1,821 | |
| Up 150 basis points | | | 10,311 | | | | 6,065 | | | | 4,246 | |
| Up 200 basis points | | | 14,758 | | | | 8,087 | | | | 6,671 | |
Assuming that the consolidated statement of financial condition as of September 30, 2015 were to remain constant and that we took no actions to alter our interest rate sensitivity as of such date, the following table shows the annualized impact of hypothetical base rate changes in interest rates.
| Change in interest rates | | Increase
(decrease)
in interest
income | | | Increase (decrease)
in interest expense | | | Net increase
(decrease)
in investment
income | |
| | | | | | (in thousands) | | | | |
| Down 25 basis points | | $ | (1 | ) | | $ | (624 | ) | | $ | 623 | |
| Up 50 basis points | | | 1 | | | | 1,249 | | | | (1,248 | ) |
| Up 100 basis points | | | 1,676 | | | | 2,497 | | | | (821 | ) |
| Up 150 basis points | | | 4,398 | | | | 3,746 | | | | 652 | |
| Up 200 basis points | | | 7,124 | | | | 4,994 | | | | 2,130 | |
Although we believe that these analyses are indicative of our sensitivity to interest rate changes as of June 30, 2016 and September 30, 2015, respectively, they do not adjust for changes in the credit market, credit quality, the size and composition of the assets in our portfolio and other business developments, including borrowing under the Credit Facility, the SMBC Revolver, the Revolver or other borrowings, that could affect net increase in net assets resulting from operations, or net income. Accordingly, we can offer no assurances that actual results would not differ materially from the analysis above.
We may in the future hedge against interest rate fluctuations by using standard hedging instruments such as interest rate swaps, futures, options and forward contracts to the limited extent permitted under the 1940 Act and applicable commodities laws. While hedging activities may insulate us against adverse changes in interest rates, they may also limit our ability to participate in the benefits of lower interest rates with respect to the investments in our portfolio with fixed interest rates.
ITEM 3. PROPERTIES.
We do not own any real estate or other physical properties materially important to our operation. Our headquarters are located at 150 South Wacker Drive, Suite 800, Chicago, IL 60606 and are provided by the Administrator pursuant to the Administration Agreement. We believe that our office facilities are suitable and adequate to our business.
ITEM 4. SECURITY OWNERSHIP OF CERTAIN BENEFICIAL OWNERS AND MANAGEMENT.
As of September 14, 2016, there were 39,469,915.648 shares of our common stock outstanding. As of the date of the filing of this Registration Statement, the following table sets out certain ownership information with respect to our common stock for those persons who directly or indirectly own, control or hold with the power to vote five percent or more of our outstanding common stock, each of our directors and officers and all officers and directors as a group.
| Name and Address | | Type of Ownership | | Shares Owned | | | Percentage | |
| Lawrence E. Golub(1)(2) | | Beneficial | | | 5,029,427.564 | | | | 12.7 | % |
| David B. Golub(1)(2) | | Beneficial | | | 5,029,427.564 | | | | 12.7 | % |
| John T. Baily(1) | | N/A | | | — | | | | — | |
| Kenneth F. Bernstein(1) | | N/A | | | — | | | | — | |
| Anita R. Rosenberg(1) | | N/A | | | — | | | | — | |
| William M. Webster IV(1)(3) | | Beneficial | | | 10,100.909 | | | | * | % |
| Ross A. Teune(1)(4) | | Beneficial | | | 519.730 | | | | * | % |
| Joshua M. Levinson(1) | | N/A | | | — | | | | — | |
| All officers and directors as a group (8 persons)(1) | | Beneficial | | | 5,029,427.564 | | | | 12.7 | % |
| GEMS Fund, L.P. | | Record and beneficial | | | 3,004,309.592 | | | | 7.6 | % |
| Pentegra Defined Benefit Plan for Financial Institutions | | Record and beneficial | | | 3,333,333.333 | | | | 8.4 | % |
| Southern Farm Bureau Life Insurance Company | | Record and beneficial | | | 3,333,333.333 | | | | 8.4 | % |
| State Teachers Retirement System of Ohio | | Record and beneficial | | | 11,371,201.782 | | | | 28.8 | % |
| * | Represents less than 0.1%. |
| (1) | The address for each of our officers and directors is c/o Golub Capital Investment Corporation, 150 South Wacker Drive, Suite 800, Chicago, IL 60606. |
| (2) | Messrs. Lawrence E. Golub and David B. Golub are control persons of GCOP LLC. The shares of common stock shown in the above table as being owned by each named individual reflect the fact that, due to their control of GCOP LLC, each may be viewed as having shared voting and dispositive power over all of the 1,004,905.973 shares of common stock directly owned by GCOP LLC although shares will be held for the benefit of employees of such entity. The shares of common stock shown in the above table as being owned by each named individual reflect the fact that, due to their control of GEMS, each may be viewed as having shared voting and dispositive power over all of the 3,004,309.592 shares of common stock directly owned by GEMS although voting rights have been passed through to the limited partners. Messrs. Lawrence E. Golub and David B. Golub disclaim beneficial ownership of such shares of common stock except to the extent of their respective pecuniary interest therein. The shares of common stock shown in the above table as being owned by each named individual reflect the fact that, due to their control of GEMS Fund 4, L.P., each may be viewed as having shared voting and dispositive power over all of the 1,020,211.999 shares of common stock directly owned by GEMS Fund 4, L.P. although voting rights have been passed through to the limited partners. Messrs. Lawrence E. Golub and David B. Golub disclaim beneficial ownership of such shares of common stock except to the extent of their respective pecuniary interest therein. |
| (3) | The shares of common stock shown in the above table as being owned by Mr. William M. Webster IV are owned indirectly through investments in GEMS Fund 4, L.P., which directly owns 1,020,211.999 shares of common stock. |
| (4) | The shares of common stock shown in the above table as being owned by Ross A. Teune are owned indirectly through investments in GEMS, which directly owns 3,004,309.592 shares of common stock. |
| | As of September 14, 2016, we had 131 record holders of our common stock. |
ITEM 5. DIRECTORS AND EXECUTIVE OFFICERS.
Board of Directors and its Leadership Structure
Our business and affairs are managed under the direction of our board of directors. The board of directors consists of six members, four of whom are not “interested persons” of GCIC, GC Advisors or their respective affiliates as defined in Section 2(a)(19) of the 1940 Act. We refer to these individuals as our “independent directors.” The board of directors elects our officers, who serve at the discretion of the board of directors. The responsibilities of the board of directors include quarterly valuation of our assets, corporate governance activities, oversight of our financing arrangements and oversight of our investment activities.
Oversight of our investment activities extends to oversight of the risk management processes employed by GC Advisors as part of its day-to-day management of our investment activities. The board of directors reviews risk management processes throughout the year, consulting with appropriate representatives of GC Advisors as necessary and periodically requesting the production of risk management reports or presentations. The goal of the board of directors’ risk oversight function is to ensure that the risks associated with our investment activities are accurately identified, thoroughly investigated and responsibly addressed. Investors should note, however, that the board of directors’ oversight function cannot eliminate all risks or ensure that particular events do not adversely affect the value of investments.
The board of directors has established an audit committee and a nominating and corporate governance committee, and may establish additional committees from time to time as necessary. The scope of each committee’s responsibilities is discussed in greater detail below. Lawrence E. Golub, Chief Executive Officer of Golub Capital, and therefore an interested person of GCIC, serves as Chairman of the board of directors. The board of directors believes that it is in the best interests of stockholders for Mr. Golub to lead the board of directors because of his broad experience with the day-to-day management and operation of other investment funds and his significant background in the financial services industry, as described below. The board of directors does not have a lead independent director. However, William M. Webster IV, the chairman of the audit committee and the nominating and corporate governance committee, is an independent director and acts as a liaison between the independent directors and management between meetings of the board of directors and is involved in the preparation of agendas for board and committee meetings. The board of directors believes that its leadership structure is appropriate in light of the characteristics and circumstances of GCIC because the structure allocates areas of responsibility among the individual directors and the committees in a manner that enhances effective oversight. The board of directors also believes that its small size creates a highly efficient governance structure that provides ample opportunity for direct communication and interaction between GC Advisors and the board of directors. Each of our directors has been selected such that the board of directors represents a range of backgrounds and experiences.
Board of Directors
Under our charter and bylaws, our directors are divided into three classes. At each annual meeting, directors are elected for staggered terms of three years, with the term of office of only one of these three classes of directors expiring each year. Each director will hold office for the term to which he or she is elected and until his or her successor is duly elected and qualifies. Our board of directors met six times during the fiscal year ended September 30, 2015.
Directors
Information regarding the board of directors is as follows:
Name, Address and
Age(1) | | Position(s) held
with the Registrant | | Term of Office and
Length of Service | | Principal Occupation(s)
During the Past 5 Years | | Other Directorships
Held by Director or Nominee for Director
During the Past 5 years |
| Interested Directors | | | | | | | | |
Lawrence E.
Golub (56)(2) | | Chairman of the
Board of Directors | | Class III Director
since 2014; Term
Expires 2019 | | Serves as the Chief Executive Officer of Golub Capital. | | A member of the Financial Control Board of the State of New York. A member of the board of directors of GBDC (NASDAQ). Previously served on the board of directors of Empire State Realty Trust, Inc. (NYSE) from 2013 to 2014. Also served as Treasurer of the White House Fellows Foundation from 1996 to 2013. |
| | | | | | | | | |
David B.
Golub (54)(2) | | President, Chief
Executive Officer
and Director | | Class I Director
since 2014; Term
Expires 2017 | | Serves as the President of Golub Capital. | | A member of the board of directors of GBDC (NASDAQ) since 2009. Serves on the board of directors of the Michael J. Fox Foundation for Parkinson’s Research. Also serves on the board of directors of The Burton Corporation. |
| Independent Directors | | | | | | | | |
| John T. Baily (72) | | Director | | Class II Director
since 2014; Term
Expires 2018 | | Retired. | | A member of the board of directors of RLI Corp. (NYSE), Endurance Specialty Holdings, Ltd. (NYSE) and GBDC (NASDAQ). Also served as a member of the board of directors of Erie Indemnity Company (NASDAQ) from 2003 to 2008 and of NYMagic, Inc. (NYSE) from 2003 to 2010. |
| | | | | | | | | |
| Kenneth F. Bernstein (54) | | Director | | Class II Director
since 2014; Term
Expires 2018 | | Chief executive officer of Acadia Realty Trust since 2001 and the president and a trustee since its formation in 1998. | | A member of the board of directors of GBDC (NASDAQ). An independent trustee of BRT Realty Trust since 2004. A member of the National Association of Corporate Directors, International Council of Shopping Centers, National Association of Real Estate Investment Trusts, for which he serves on the Board of Governors, Urban Land Institute and the Real Estate Roundtable, where he is currently chairman of the Tax Policy Committee. A member of the board of advisors of the Young Presidents’ Organization Real Estate Network. |
| | | | | | | | | |
Anita R.
Rosenberg (52) | | Director | | Class I Director
since 2014; Term
Expires 2017 | | Independent Consultant. Former independent advisor to Magnetar Capital from April 2011 to May 2012. Partner and Portfolio Manager at Harris Alternatives, LLC, and its predecessor, Harris Associates, L.P., from 1999 to 2009. | | An independent trustee at Baron Funds Management since May 2013. An independent director for Impala Asset Management since January 2014. A member of the board of directors of GBDC (NASDAQ) since May 2011. |
| | | | | | | | | |
William M.
Webster IV (58) | | Director | | Class III Director
since 2014; Term
Expires 2019 | | Retired. Co-founder of Advance America, Advance Cash Centers, Inc. Served as the Chief Executive Officer of Advance America, Advance Cash Centers, Inc. from its inception in 1997 through August 2005 and served as Chairman of the board of directors from August 2008 through May 2012. | | Serves on the board of directors of LKQ Corporation (NYSE), GBDC (NASDAQ) and Compass Systems Inc. |
| (1) | The business address of each of our directors is c/o Golub Capital Investment Corporation, 150 South Wacker Drive, Suite 800, Chicago, IL 60606. |
| (2) | Messrs. Lawrence E. Golub and David B. Golub, who are brothers, are interested directors due to their positions as officers of the Registrant and of Golub Capital. |
Officers Who Are Not Directors
Information regarding our officers who are not directors is as follows:
| Name | | Age | | Position |
| | | | | |
| Ross A. Teune | | 48 | | Chief Financial Officer and Treasurer |
| | | | | |
| Joshua M. Levinson | | 40 | | Chief Compliance Officer and Secretary |
| | | | | |
| Gregory A. Robbins | | 41 | | Managing Director |
| | | | | |
| Jonathan D. Simmons | | 34 | | Director of Corporate Strategy |
The address for each of our officers is c/o Golub Capital Investment Corporation, 150 South Wacker Drive, Suite 800, Chicago, IL 60606.
Biographical Information
The board of directors has determined that each of the directors is qualified to serve as our director, based on a review of the experience, qualifications, attributes and skills of each director, including those described below. The board of directors has determined that each director has significant experience in the investment or financial services industries and has held management, board or oversight positions in other companies and organizations. Each of our directors has demonstrated high character and integrity and has expertise and diversity of experience to be able to offer advice and guidance to our management. For the purposes of this presentation, our directors have been divided into two groups — independent directors and interested directors. Interested directors are “interested persons” as defined in the 1940 Act.
Independent Directors
John T. Baily brings over three decades of experience in the accounting industry and a substantial background in insurance industry matters. Mr. Baily currently serves as a member of the board of directors of GBDC (NASDAQ), RLI Corp. (NYSE) and Endurance Specialty Holdings, Ltd. (NYSE). He was elected to serve as a director to GBDC in 2010 and to RLI Corp. and Endurance Specialty Holdings, Ltd. in 2003. Mr. Baily also served as a member of the board of directors of Erie Indemnity Company (NASDAQ) from 2003 to 2008 and of NYMagic, Inc. (NYSE) from 2003 to 2010. From 1999 until 2002, Mr. Baily was the President of Swiss Re Capital Partners. Prior to joining Swiss Re Capital Partners, Mr. Baily was a partner at PricewaterhouseCoopers LLP and its predecessor, Coopers & Lybrand, where he worked from 1965 until 1999. Mr. Baily was the National Insurance Industry Chairman of Coopers & Lybrand from 1986 until 1998 and a member of Coopers & Lybrand’s International Insurance Industry Committee from 1984 until 1998. Mr. Baily graduated cum laude from Albright College in 1965, received his CPA with honors in 1968 and received his M.B.A. from the University of Chicago in 1979. Mr. Baily’s experience as an accountant and past service as a director of public companies led our Nominating and Corporate Governance Committee to conclude that Mr. Baily is qualified to serve as a director.
Kenneth F. Bernstein brings to the board of directors expertise in accounting and business operations. Mr. Bernstein has been the chief executive officer of Acadia Realty Trust since 2001 and the president and a trustee since its formation in 1998. Mr. Bernstein is responsible for strategic planning as well as overseeing the day-to-day activities of Acadia Realty Trust including operations, acquisitions and capital markets. He has been an independent trustee of BRT Realty Trust since 2004. From 1990 to 1998, he served as chief operating officer of RD Capital, Inc. until its merger into Acadia Realty Trust. He was an associate with the New York law firm of Battle Fowler LLP, from 1986 to 1990. Mr. Bernstein has been a member of the board of directors of GBDC (NASDAQ) since 2010. He has been a member of the National Association of Corporate Directors, International Council of Shopping Centers, the National Association of Real Estate Investment Trusts, for which he serves on the Board of Governors, the Urban Land Institute and the Real Estate Roundtable, where he is currently chairman of the Tax Policy Committee. Mr. Bernstein was also the founding chairman of the Young Presidents’ Organization Real Estate Network and is currently a member of its board of advisors. He holds a B.A. from the University of Vermont and a J.D. from Boston University School of Law. Mr. Bernstein’s experience as a senior executive officer within finance companies led our Nominating and Corporate Governance Committee to conclude that Mr. Bernstein is qualified to serve as a director.
Anita R. Rosenberg brings to the board of directors a diverse knowledge of business and finance. She has been a member of the board of directors of GBDC (NASDAQ) since May 2011. Ms. Rosenberg became a trustee of Baron Investment Funds Trust in May 2013 and an independent director for Impala Asset Management in January 2014. From April 2011 through May 2012, she served as an independent advisor to Magnetar Capital, a multi-strategy hedge fund. From 1999 until her retirement in February 2009, Ms. Rosenberg was a Partner and Portfolio Manager at Harris Alternatives, LLC, and its predecessor, Harris Associates, L.P. Ms. Rosenberg brings to the board of directors expertise in capital markets, portfolio management and business operations. As a Portfolio Manager at Harris Alternatives, LLC, Ms. Rosenberg managed all aspects of a $14 billion fund of hedge funds, including asset selection, risk assessment, and allocation across investment strategies. Prior to Harris Alternatives, LLC, Ms. Rosenberg held senior level positions at several large asset management/investment banking institutions, including Banker’s Trust, Global Asset Management, and Merrill Lynch Capital Markets. Ms. Rosenberg received her B.A. in 1985 from Harvard University. Ms. Rosenberg’s experience as a partner and senior executive in several asset
management firms led our Nominating and Corporate Governance Committee to conclude that Ms. Rosenberg is qualified to serve as a director.
William M. Webster IV brings to the board of directors a diverse knowledge of business and finance. Mr. Webster is one of the co-founders of Advance America, Advance Cash Centers, Inc. Mr. Webster served as a director from the company’s inception in 1997 through May 2012 and as the Chairman of the board of directors from August 2008 through May 2012 and previously from January 2000 through July 2004. He was the Chief Executive Officer of Advance America, Advance Cash Centers, Inc. from its inception through August 2005. From May 1996 to May 1997, Mr. Webster served as Executive Vice President of Education Management Corporation and was responsible for corporate development, human resources, management information systems, legal affairs and government relations. From October 1994 to October 1995, Mr. Webster served as Assistant to the President of the United States and Director of Scheduling and Advance. Mr. Webster served as Chief of Staff to U.S. Department of Education Secretary Richard W. Riley from January 1993 to October 1994. From November 1992 to January 1993, Mr. Webster was Chief of Staff to Richard W. Riley as part of the Presidential Transition Team. Mr. Webster serves on the board of directors of GBDC (NASDAQ), LKQ Corporation (NYSE) and Compass Systems Inc. Mr. Webster holds an Executive Masters Professional Director Certification, the highest level, from the American College of Corporate Directors, a public company director education and credentialing organization. Mr. Webster is a 1979 summa cum laude graduate of Washington and Lee University and a Fulbright Scholar. Mr. Webster is also a graduate of the University of Virginia School of Law. Mr. Webster’s knowledge of business and finance developed as a senior executive officer led our Nominating and Corporate Governance Committee to conclude that Mr. Webster is qualified to serve as a director.
Interested Directors
Lawrence E. Golub has served as Chairman of our board of directors since 2014. The board of directors benefits from Mr. Golub’s business leadership and experience and knowledge of the financial services industry. He is currently chairman of the board of directors of GBDC (NASDAQ). Mr. Lawrence E. Golub previously spent ten years as a principal investor and investment banker. As a Managing Director of the Risk Merchant Bank at Bankers Trust Company, he applied derivative products to principal investing and merger and acquisitions transactions. As a Managing Director of Wasserstein Perella Co., Inc., he established that firm’s capital markets group and debt restructuring practice. As an officer of Allen & Company Incorporated, he engaged in principal investing, mergers and acquisitions advisory engagements and corporate finance transactions. Mr. Golub is active in charitable and civic organizations. He is one of three private members of the Financial Control Board of the State of New York, President of the Harvard University JD-MBA Alumni Association and a member of the Harvard University Committee on University Resources. Mr. Golub was a White House Fellow and served for over 15 years as Treasurer of the White House Fellows Foundation. Mr. Golub was chairman of Mosholu Preservation Corporation, a non-profit developer and manager of low income housing in the Bronx. He served for over fifteen years as a trustee of Montefiore Medical Center, the university hospital of the Albert Einstein Medical School. He also served for six years as a trustee of Horace Mann School and for five years on the Harvard University Committee for Science and Engineering. Mr. Golub previously served on the board of directors of Empire State Realty Trust, Inc. (NYSE). Mr. Golub’s experiences with Golub Capital and his focus on middle-market lending led our Nominating and Corporate Governance Committee to conclude that Mr. Golub is qualified to serve as a director.
David B. Golub has served as our President and Chief Executive Officer since 2014. Mr. Golub brings to the board of directors a diverse knowledge of business and finance. Mr. Golub joined Golub Capital as Vice Chairman in January 2004, after having served as a director of affiliates of the firm since 1995. He is currently Chief Executive Officer of GBDC (NASDAQ) and serves on the board of directors of GBDC and has held such positions since November 2009. From 1995 through October 2003, Mr. Golub was a Managing Director of Centre Partners Management LLC, a leading private equity firm. From 1995 through 2000, Mr. Golub also served as a Managing Director of Corporate Partners, a private equity fund affiliated with Lazard Fréres & Co. formed to acquire significant minority stakes in established companies. Mr. Golub was the first Chairman of the board of directors and is a long-standing Director of the Michael J. Fox Foundation for Parkinson’s Research. He also serves on the board of directors of The Burton Corporation and has served on the board of public and private companies. Mr. Golub is the brother of Lawrence E. Golub, Chairman of our board of directors. Mr. Golub earned his A.B. degree in Government from Harvard College. He received an M.Phil. in International Relations from Oxford University, where he was a Marshall Scholar, and an M.B.A. from Stanford Graduate School of Business, where he was named
an Arjay Miller Scholar. Mr. Golub’s experiences with Golub Capital and his focus on middle-market lending led our Nominating and Corporate Governance Committee to conclude that Mr. Golub is qualified to serve as a director.
Officers Who Are Not Directors
Ross A. Teune has served as our Chief Financial Officer and Treasurer since 2014. Mr. Teune is currently the Chief Financial Officer and Treasurer for GBDC (NASDAQ). Prior to being elected the Chief Financial Officer and Treasurer for GBDC (NASDAQ), Mr. Teune served as Senior Vice President of Finance at Golub Capital Incorporated from November 2007 to December 2008 and the Administrator from January 2009 to present with responsibility for the financial reporting for its privately managed debt funds. Mr. Teune served as Director of Strategic Planning at Merrill Lynch Capital from April 2006 to November 2007. Prior to this position, Mr. Teune was Vice President of Finance at Antares Capital Corporation from July 2002 to April 2006, where he was responsible for overseeing operations and financial reporting. Mr. Teune also served as the primary liaison to the tax, treasury, external reporting and market risk departments of Massachusetts Life Insurance Company, Antares Capital’s parent company. Mr. Teune also worked at Heller Financial Corporation and KPMG LLP. Mr. Teune graduated from Hope College with a B.A. in Accounting and is a Certified Public Accountant (inactive).
Joshua M. Levinson has served as our Chief Compliance Officer and Secretary since 2014 and is also the Co-General Counsel and Chief Compliance Officer of GC Advisors, where he has primary responsibility for legal and compliance matters. Mr. Levinson is currently the Chief Compliance Officer and Secretary for GBDC (NASDAQ) and has served in such positions since 2011. Mr. Levinson served as Counsel at Magnetar Capital from 2006 to 2010, where he was responsible for the legal affairs of a number of business units and also served as Secretary of Magnetar Spectrum Fund. Prior thereto, Mr. Levinson was a private equity and investment funds attorney at King & Spalding LLP and a corporate attorney at Wilson Sonsini Goodrich & Rosati. Mr. Levinson holds a B.S. from Vanderbilt University and received a J.D. from Georgetown University Law Center, where he was an associate editor of the Georgetown Law Journal.
Gregory A. Robbins is a Managing Director of Golub Capital and has served as our Managing Director since 2014. He currently serves as Managing Director for GBDC (NASDAQ). Prior to joining Golub Capital in 2004, Mr. Robbins was a Vice President in the Merchant Banking Group at Indosuez Capital. During his tenure at Indosuez Capital, Mr. Robbins originated, structured, executed and managed leveraged finance transactions for middle-market private equity sponsors across multiple assets classes. Prior thereto, Mr. Robbins was an associate at Saw Mill Capital, a private equity firm.
Jonathan D. Simmons is a Director of Golub Capital and has served as our Director of Corporate Strategy since 2016. He also currently serves as Director of Corporate Strategy for GBDC (NASDAQ). Prior to joining Golub Capital in 2009, Mr. Simmons served as a Senior Associate at Churchill Financial and as an investment banking Associate at J.P. Morgan Securities Inc. Mr. Simmons graduated magna cum laude from Colgate University with a B.A. in Mathematics and Economics.
Committees of the Board
Audit Committee
The members of the Audit Committee are John T. Baily, Kenneth F. Bernstein, Anita R. Rosenberg and William M. Webster IV, each of whom is financially literate and meets the independence standards established by the SEC for audit committees and is independent for purposes of the 1940 Act. William M. Webster IV serves as Chairman of the audit committee. Our board of directors has determined that Mr. Baily, Mr. Bernstein and Mr. Webster are each an “audit committee financial expert” as that term is defined under Item 407 of Regulation S-K.
The purpose of the audit committee is to monitor (i) the integrity of our financial statements, (ii) the independent auditor’s qualifications and independence, (iii) the performance of our internal audit function and independent auditors and (iv) our compliance with legal and regulatory requirements. The audit committee is directly responsible for approving and overseeing our independent accountants, reviewing with our independent accountants the plans and results of the audit engagement, approving professional services provided by our independent accountants, reviewing the independence of our independent accountants and reviewing and overseeing the adequacy of our internal accounting controls. The audit committee is responsible for reviewing and discussing with management and our independent accountants our annual audited financial statements, including disclosures made in management’s discussion and analysis, and recommending to the board of directors whether the audited financial statements should
be included in our annual report to shareholders. On a quarterly basis, the audit committee reviews and discusses with management and our independent accountants our earnings releases and quarterly financial statements prior to the distribution of our quarterly reports to shareholders. Periodically during each fiscal year, the audit committee meets, including private meetings, with our independent accountants and selected executive officers of ours, as appropriate, for consultation on audit, accounting and related financial matters. At least annually, the audit committee reviews a report from the independent accountants regarding the independent accountant’s internal quality-control procedures, any material issues raised by internal quality review, or peer review, of the firm or any inquiry or investigation by governmental or professional authorities within the preceding five years respecting one or more independent audits carried out by the firm and any steps taken to deal with any such issues, as well as all relationships between us and the independent accountants. In its consideration of whether to recommend that stockholders ratify the selection of our independent accountants, the audit committee considers both the independence of the independent accountants from us and management and whether retaining the independent accountants is in the best interests of the us and our stockholders. The audit committee reviews and approves the amount of audit fees and any other fees paid to our independent accountants.
The function of the audit committee is oversight. The independent accountants are accountable to the board of directors and the audit committee, as representatives of our stockholders. The board of directors and the audit committee have the ultimate authority and responsibility to select, evaluate and, where appropriate, replace our independent accountants (subject, if applicable, to stockholder ratification).
In fulfilling their responsibilities, the members of the audit committee are not full-time employees of us or management and are not, and do not represent themselves to be, accountants or auditors by profession. Accordingly, it is not the duty or the responsibility of the audit committee or its members to conduct “field work” or other types of auditing or accounting reviews or procedures, to determine that our financial statements are complete and accurate and are in accordance with GAAP, or to set auditor independence standards.
The audit committee is also responsible for aiding our board of directors in fair value pricing debt and equity securities that are not publicly traded or for which current market values are not readily available. The board of directors and audit committee utilize the services of independent valuation firms to help them determine the fair value of these securities. The audit committee met four times during the fiscal year ended September 30, 2015.
Nominating and Corporate Governance Committee
The members of the nominating and corporate governance committee are John T. Baily, Kenneth F. Bernstein, Anita R. Rosenberg and William M. Webster IV, each of whom is independent for purposes of the 1940 Act. William M. Webster IV serves as Chairman of the nominating and corporate governance committee.
The nominating and corporate governance committee is responsible for selecting, researching and nominating directors for election by our stockholders, selecting nominees to fill vacancies on the board of directors or a committee of the board of directors, developing and recommending to the board of directors a set of corporate governance principles and overseeing the evaluation of the board of directors and our management.
The nominating and corporate governance committee considers stockholder recommendations for possible nominees for election as directors when such recommendations are submitted in accordance with our bylaws, the nominating and corporate governance committee’s charter and any applicable law, rule or regulation regarding director nominations.
Our bylaws provide that a stockholder who wishes to nominate a person for election as a director at a meeting of stockholders must deliver written notice to our corporate secretary, Joshua M. Levinson, c/o Golub Capital Investment Corporation, 150 South Wacker Drive, Suite 800, Chicago, Illinois 60606. This notice must contain certain information specified by our bylaws about the stockholder, its affiliates and any nominee for election as a director, including, as to each nominee, all information that would be required under applicable SEC rules to be disclosed in connection with election of a director and certain other information set forth in our bylaws, including the following minimum information for each director nominee: full name, age and address; principal occupation during the past five years; directorships on publicly held companies and investment companies during the past five years; number of shares of our common stock owned, if any; and a written consent of the individual to stand for election if nominated by the board of directors and to serve if elected by the stockholders. In order to be eligible to be a nominee for election as a director by a stockholder, such potential nominee must deliver to our corporate secretary a written questionnaire providing the requested information about the background and qualifications of such nominee and a written representation and agreement that such nominee is not and will not become a party to any voting agreements, any agreement or understanding with any person with respect to any compensation or
indemnification in connection with services on the board of directors and would be in compliance with all of our publicly disclosed corporate governance, conflict of interest, confidentiality and stock ownership and trading policies and guidelines.
Criteria considered by the nominating and corporate governance committee in evaluating the qualifications of individuals for election as members of the board of directors include compliance with the independence and other applicable requirements of the 1940 Act and the SEC, and all other applicable laws, rules, regulations and listing standards; the criteria, policies and principles set forth in the nominating and corporate governance committee’s charter and the ability to contribute to the effective management of GCIC, taking into account our needs and such factors as the individual’s experience, perspective, skills and knowledge of the industry in which we operate. The nominating and corporate governance committee also may consider such other factors as it may deem are in the best interests of us and our stockholders. The nominating and corporate governance committee met three times during the fiscal year ended September 30, 2015.
Investment Committee
The investment committee of GC Advisors responsible for our investments meets regularly to consider our investments, direct our strategic initiatives and supervise the actions taken by GC Advisors on our behalf. In addition, the investment committee reviews and determines whether to make prospective investments identified by GC Advisors and monitors the performance of our investment portfolio. Our investment professionals receive no compensation from us. The compensation of these individuals is paid by an affiliate of GC Advisors and includes an annual base salary and, in certain cases, an annual bonus based on an assessment of short-term and long-term performance.
Information regarding members of GC Advisors’ investment committee is as follows:
| Name | | Age | | Position |
| | | | | |
| Lawrence E. Golub | | 56 | | Chairman of our board of directors |
| | | | | |
| David B. Golub | | 54 | | President, Chief Executive Officer, Director |
| | | | | |
| Gregory W. Cashman | | 51 | | Senior Managing Director of Golub Capital |
| | | | | |
| Andrew H. Steuerman | | 48 | | Senior Managing Director of Golub Capital |
The address for each member of the investment committee is c/o Golub Capital Investment Corporation, 150 South Wacker Drive, Suite 800, Chicago, IL 60606.
Members of GC Advisors’ Investment Committee Who Are Not Our Directors or Officers
Gregory W. Cashman has served on GC Advisors’ investment committee since the registration of GC Advisors as a registered investment adviser. Mr. Cashman is a Senior Managing Director of Golub Capital. Mr. Cashman co-heads Golub Capital’s Direct Lending Group, overseeing Underwriting, Deal Execution and Portfolio Management and is a member of the firm’s investment and watch list committees. Mr. Cashman also oversees Golub Capital’s Middle-market Club Investments business. Prior to joining Golub Capital in 1996, Mr. Cashman worked in various finance positions at Bristol-Myers Squibb Co. from 1993 to 1996, and was named Manager of Business Development for the venture capital arm of Bristol-Myers Squibb Co.’s Consumer Medicines Division. In that position, he was responsible for analyzing and negotiating investment and acquisition opportunities. Previously, Mr. Cashman spent four years as a senior accountant with Arthur Andersen & Co., serving emerging growth companies. He is a director or advisory director of a number of Golub Capital’s portfolio companies. Mr. Cashman graduated from the McIntire School of The University of Virginia with a B.S. in Commerce and received an M.B.A. from the Darden School of Business.
Andrew H. Steuerman has served on GC Advisors’ investment committee since the registration of GC Advisors as a registered investment adviser. Mr. Steuerman is a Senior Managing Director of Golub Capital. Mr. Steuerman co-heads Golub Capital’s Direct Lending group, overseeing Origination, Deal Execution and Capital Markets and is a member of the firm’s investment and watch list committees. Prior to joining Golub Capital in 2004, Mr. Steuerman was a Managing Director at Albion Alliance from April 1998 to January 2004, where he originated, executed and supervised subordinated debt and equity investments for two private partnerships. Prior to Albion, Mr. Steuerman was a Vice President at Bankers Trust Alex Brown from 1997 to 1998 and an investment manager with New York Life Insurance Company from 1989 to 1997 in the Private Equity and Mezzanine Group. At New York Life, Mr.
Steuerman was a senior member of the Private Equity Group managing leveraged senior loans, mezzanine investments, private equity securities and limited partnership assets. Mr. Steuerman graduated from Pace University with a B.B.A. in Finance and holds an M.B.A. in Finance from St. John’s University.
Portfolio Management
Each investment opportunity requires the consensus and generally receives the unanimous approval of GC Advisors’ investment committee. Follow-on investments in existing portfolio companies may require the investment committee’s approval beyond that obtained when the initial investment in the company was made. In addition, temporary investments, such as those in cash equivalents, U.S. government securities and other high quality debt investments that mature in one year or less, may require approval by the investment committee. The day-to-day management of investments approved by the investment committee is overseen by Messrs. Lawrence and David Golub. Biographical information with respect to Messrs. Lawrence and David Golub is set out under “— Biographical Information — Interested Directors.”
Each of Lawrence Golub and David Golub has ownership and financial interests in, and may receive compensation and/or profit distributions from, GC Advisors. Neither Lawrence Golub nor David Golub receives any direct compensation from us. As of the date of the filing of this Registration Statement, Lawrence Golub and David Golub each beneficially owned more than $1 million of our common stock. Lawrence Golub and David Golub are also primarily responsible for the day-to-day management of approximately 20 other pooled investment vehicles, with over $14.9 billion of capital under management, and approximately 20 other accounts, with over $2.4 billion of capital under management, in which their affiliates receive incentive fees. See “Item 4. Security Ownership of Certain Beneficial Owners and Management.”
ITEM 6. EXECUTIVE COMPENSATION.
Compensation of Executive Officers
None of our executive officers is currently compensated by us. We do not currently have any employees. Our day-to-day operations are managed by GC Advisors.
Compensation of Directors
The following table shows information regarding the compensation earned by our directors for the fiscal year ended September 30, 2015. No compensation is paid to directors who are “interested persons.”
| Name | | Aggregate
Compensation
from GCIC | | | Pension or
Retirement
Benefits Accrued
as Part of Our
Expenses(1) | | | Total
Compensation from
GCIC Paid
to Director | |
| Independent Directors | | | | | | | | | | | | |
| John T. Baily | | $ | 35,000 | | | | — | | | $ | 35,000 | |
| Kenneth F. Bernstein | | $ | 35,000 | | | | — | | | $ | 35,000 | |
| Anita R. Rosenberg | | $ | 35,000 | | | | — | | | $ | 35,000 | |
| William M. Webster IV | | $ | 40,000 | | | | — | | | $ | 40,000 | |
| Interested Directors | | | | | | | | | | | | |
| Lawrence E. Golub | | | — | | | | — | | | | — | |
| David B. Golub | | | — | | | | — | | | | — | |
| (1) | We do not have a profit-sharing or retirement plan, and directors do not receive any pension or retirement benefits. |
The independent directors will receive an annual fee of $30,000 for the fiscal year ending September 30, 2016. They also receive $1,000 plus reimbursement of reasonable out-of-pocket expenses incurred in connection with attending in person or telephonically each regular board of directors meeting and $500 for each special telephonic meeting. They also receive $1,000 plus reimbursement of reasonable out-of-pocket expenses incurred in connection with each committee meeting attended in person and $500 for each telephonic committee meeting (provided that such compensation will only be paid if the committee meeting is not held on the same day as any regular board meeting). The chairman of the audit committee receives an annual fee of $5,000. We have obtained directors’ and officers’ liability insurance on behalf of our directors and officers. We do not have a profit-sharing or retirement plan, and directors do not receive any pension or retirement benefits. No compensation is paid to directors who are “interested persons.” The board of directors reviews and determines the compensation of independent directors.
Item 7. Certain Relationships and Related Transactions, and Director Independence.
Certain Relationships and Related Transactions
We have entered into agreements with GC Advisors, in which members of our senior management and members of GC Advisors’ investment committee have ownership and financial interests. Members of our senior management and the investment committee also serve as principals of other investment advisers affiliated with GC Advisors that do and may in the future sponsor or manage accounts with investment objectives similar to ours. In addition, our executive officers and directors and the members of GC Advisors and its investment committee serve or may serve as officers, directors or principals of entities that operate in the same, or related, line of business as we do or of accounts managed or sponsored by our affiliates. These accounts may have investment objectives similar to our investment objective.
Subject to certain 1940 Act restrictions on co-investments with affiliates, GC Advisors offers us the right to participate in all investment opportunities that it determines are appropriate for us in view of our investment objective, positions, policies, strategies and restrictions as well as regulatory requirements and other relevant factors. Such offers are subject to the exception that, in accordance with GC Advisors’ code of ethics and allocation policies, we might not participate in each individual opportunity but will, on an overall basis, be entitled to participate equitably with other entities sponsored or managed by GC Advisors and its affiliates.
GC Advisors and its affiliates have both subjective and objective policies and procedures in place and designed to manage the potential conflicts of interest between GC Advisors’ fiduciary obligations to us and its similar fiduciary obligations to other clients. To the extent that we compete with entities sponsored or managed by GC Advisors or its affiliates for a particular investment opportunity, GC Advisors will allocate investment opportunities across the entities for which such opportunities are appropriate, consistent with (1) its internal conflict of interest and allocation policies, (2) the requirements of the Advisers Act and (3) certain restrictions under the 1940 Act regarding co-investments with affiliates. GC Advisors’ allocation policies are intended to ensure that, over time, we may generally share equitably with other accounts sponsored or managed by GC Advisors or its affiliates in investment opportunities, particularly those involving a security with limited supply or involving differing classes of securities of the same issuer which may be suitable for us and such other accounts. There can be no assurance that GC Advisors’ or its affiliates’ efforts to allocate any particular investment opportunity fairly among all clients for whom such opportunity is appropriate will result in an allocation of all or part of such opportunity to us. Not all conflicts of interest can be expected to be resolved in our favor.
GC Advisors has historically sponsored or managed, and currently sponsors or manages, accounts with similar or overlapping investment strategies and has put in place a conflict-resolution policy that addresses the co-investment restrictions set forth under the 1940 Act. GC Advisors seeks to ensure the equitable allocation of investment opportunities when we are able to invest alongside other accounts sponsored or managed by GC Advisors and its affiliates. When we invest alongside such other accounts, such investments are made consistent with GC Advisors’ allocation policy. Under this allocation policy, if an investment opportunity is appropriate for us and another similar eligible account, the opportunity will be allocated pro rata based on relative capital available for investment of each of us and such other eligible accounts, subject to minimum and maximum investment size limits. Where there is an insufficient amount of an investment opportunity to fully satisfy us and other accounts sponsored or managed by GC Advisors or its affiliates, the allocation policy further provides that allocations among us and such other accounts will generally be made pro rata to us and each other eligible account based on the capital available for investment of each of us and such other eligible accounts, subject to the minimum and maximum
investment size limits for each such party. In situations in which co-investment with other entities sponsored or managed by GC Advisors or its affiliates is not permitted or appropriate, such as when, in the absence of exemptive relief described below, we and such other entities would be making different investments in the same issuer, GC Advisors will need to decide whether we or such other entity or entities will proceed with the investment. GC Advisors will make these determinations based on its policies and procedures, which generally require that such opportunities be offered to eligible accounts on a basis that will be fair and equitable over time, including, for example, through random or rotational methods.
We expect to co-invest on a concurrent basis with other affiliates of GC Advisors, unless doing so is impermissible with existing regulatory guidance, applicable regulations, the terms of any exemptive relief granted to us and our allocation procedures. Certain types of negotiated co-investments may be made only if we receive an order from the SEC permitting us to do so. There can be no assurance that we will obtain any such order. We and GC Advisors have submitted an exemptive application to the SEC to permit greater flexibility to negotiate the terms of co-investments if our board of directors determines that it would be advantageous for us to co-invest with other accounts sponsored or managed by GC Advisors or its affiliates in a manner consistent with our investment objective, positions, policies, strategies and restrictions as well as regulatory requirements and other pertinent factors. There is no assurance that our application for exemptive relief will be granted by the SEC or that, if granted, it will be on the terms set forth in our application.
GC Advisors and its affiliates have other clients with similar or competing investment objectives, including GBDC and several private funds that are pursuing an investment strategy similar to ours, some of which may seek new capital from time to time. In serving these clients, GC Advisors may have obligations to other clients or investors in those entities. Our investment objective may overlap with such affiliated accounts. GC Advisors’ allocation procedures are designed to allocate investment opportunities among the accounts sponsored or managed by GC Advisors and its affiliates in a manner consistent with its obligations under the Advisers Act. If two or more accounts with similar investment strategies are actively investing, GC Advisors will seek to allocate investment opportunities among eligible accounts in a manner that is fair and equitable over time and consistent with its allocation policy. Our board of directors regularly reviews the allocation policy of Golub Capital and annually reviews the code of ethics of GC Advisors.
Our senior management, members of GC Advisors’ investment committee and other investment professionals from GC Advisors may serve as directors of, or in a similar capacity with, companies in which we invest or in which we are considering making an investment. Through these and other relationships with a company, these individuals may obtain material non-public information that might restrict our ability to buy or sell the securities of such company under the policies of the company or applicable law. In addition, we have adopted a formal code of ethics that governs the conduct of our and GC Advisors’ officers, directors and employees. Our officers and directors also remain subject to the duties imposed by both the 1940 Act and the MGCL.
We have entered into the Investment Advisory Agreement with GC Advisors pursuant to which we pay GC Advisors a base management fee and incentive fee. Our board of directors reapproved the Investment Advisory Agreement for a one-year term in May 2016. The incentive fee is computed and paid on income that we may not have yet received in cash. This fee structure may create an incentive for GC Advisors to make certain types of investments. Additionally, we rely on investment professionals from GC Advisors to assist our board of directors with the valuation of our portfolio investments. GC Advisors’ base management fee and incentive fee are based on the value of our investments and there may be a conflict of interest when personnel of GC Advisors are involved in the valuation process of our portfolio investments.
We have entered into a license agreement with Golub Capital LLC under which Golub Capital LLC granted us a non-exclusive, royalty-free license to use the name “Golub Capital.”
Pursuant to the Administration Agreement, the Administrator furnishes us with office facilities and equipment and provides clerical, bookkeeping, recordkeeping and other administrative services at such facilities. Our board of directors reapproved the Administration Agreement for a one-year term in May 2016. Under our Administration Agreement, Golub Capital LLC performs, or oversees the performance of, our required administrative services, which include, among other things, being responsible for the financial records that we are required to maintain and preparing reports to our stockholders and reports filed with the SEC. GC Advisors is the sole member of and controls the Administrator.
GC Advisors is an affiliate of Golub Capital LLC, with whom it has entered into the Staffing Agreement. Under this agreement, Golub Capital LLC makes available to GC Advisors experienced investment professionals and access to the senior investment personnel and other resources of Golub Capital LLC and its affiliates. The Staffing
Agreement provides GC Advisors with access to deal flow generated by the professionals of Golub Capital LLC and its affiliates and commits the members of GC Advisors’ investment committee to serve in that capacity. GC Advisors seeks to capitalize on what we believe to be the significant deal origination, credit underwriting, due diligence, investment structuring, execution, portfolio management and monitoring experience of Golub Capital LLC’s investment professionals.
Immediately prior to our election to be regulated as a business development company, we acquired our initial portfolio of investments by purchasing (1) 100% of the equity interests of each of GCIC Funding and GCIC Holdings from GEMS, a Delaware LP whose general partner is GC Advisors, and (2) certain debt securities from unaffiliated third party investors. All of the loans comprising our initial portfolio of investments were senior secured and one stop loans to middle-market companies consistent with our investment objectives and strategies. In addition, each such loan had been underwritten by GC Advisors at the time of origination or acquisition using the same criteria and standards as GC Advisors uses in connection with the origination or acquisition of loans for us. We consolidate the financial statements of GCIC Holdings, GCIC Funding and GCIC Equity LLC in our consolidated financial statements and treat the indebtedness of GCIC Funding as our leverage.
Effective December 31, 2014, we entered into an agreement to co-invest with RGA through GCIC SLF primarily in senior secured loans of middle-market companies, and, effective December 30, 2015, RGA assigned its interests in GCIC SLF to its affiliate, Aurora. GCIC SLF commenced operations in October 2015. During the three and nine months ended June 30, 2016, we sold $29.6 million and $169.8 million of investments and unfunded commitments to GCIC SLF at fair value, respectively, and recognized $0.2 million and $ 0.9 million of net realized gains, respectively.
On December 31, 2014, GCOP LLC, an affiliate of GC Advisors, entered into a subscription agreement to purchase shares of our common stock in a private placement. Pursuant to capital calls on such subscription agreement during the fiscal year ended September 30, 2015 and the nine months ended June 30, 2016, we issued an aggregate of 783,572.643 and 221,333.330 shares of our common stock, including through the DRIP, respectively, to GCOP LLC in exchange for aggregate capital contributions of $11.75 million and $3.32 million, respectively. In addition, on December 30, 2014, GC Advisors transferred 666.670 shares of our common stock acquired in connection with our formation to GCOP LLC for $10,000.05.
On December 31, 2014, GEMS entered into a $40 million subscription agreement to purchase shares of our common stock in a private placement. In connection with the our acquisition of GCIC Holdings and GCIC Funding from GEMS on December 31, 2014, we issued 2,666,666.667 shares of our common stock and entered into an $11.82 million short-term unsecured promissory note with GEMS, or the GEMS Note. The GEMS Note carried a fixed interest rate of 3.25% and matured and was paid-off on March 2, 2015. As of June 30, 2016, we have issued 2,937,835.022 shares of our common stock, including through the DRIP, to GEMS in exchange for aggregate capital contributions totaling $44.07 million.
On February 3, 2015, we entered into the Revolver with GC Advisors, with a maximum credit limit of $40 million and expiration date of February 3, 2018. The Revolver bears an interest rate equal to the short-term Applicable Federal Rate, which was 0.64% as of June 30, 2016. As of June 30, 2016 and September 30, 2015, we had no outstanding debt under the Revolver. For the year ended September 30, 2015, we had borrowings on the Revolver of $22.4 million and repayments on the Revolver of $22.4 million. For the three and nine months ended June 30, 2016, we had borrowings on the Revolver of $12.2 million and $78.0 million, respectively, and repayments on the Revolver of $12.2 million and $78.0 million, respectively. For the three and nine months ended June 30, 2015, we had borrowings on the Revolver of $14.1 million and 16.6 million, respectively, and repayments on the Revolver of $12.7 million and 15.2 million, respectively.
On June 1, 2015, GEMS Fund 4, L.P, a Delaware LP whose general partner is controlled by GC Advisors, entered into a subscription agreement, which was subsequently increased to $30.2 million, to purchase shares of our common stock in a private placement. As of June 30, 2016, we have issued 798,647.999 shares of our common stock to GEMS Fund 4, L.P in exchange for aggregate capital contributions totaling $11.98 million.
Golub Capital LLC serves as administrative agent for GCIC SLF, an unconsolidated Delaware LLC that invests in senior secured loans and is co-managed by GCIC and Aurora. Pursuant to the Administrative and Loan Services Agreement between GCIC SLF and Golub Capital LLC, Golub Capital LLC provides certain loan servicing and administrative functions to GCIC SLF and is reimbursed for certain of its costs and expenses by GCIC SLF.
The audit committee, in consultation with our Chief Executive Officer, Chief Compliance Officer and legal counsel, has established a written policy to govern the review of potential related party transactions. The audit
committee conducts quarterly reviews of any potential related party transactions and, during these reviews, it also considers any conflicts of interest brought to its attention pursuant to our Code of Conduct or Code of Ethics.
Director Independence
The 1940 Act requires that at least a majority of our directors not be “interested persons” (as defined in the 1940 Act) of the Company. On an annual basis, each member of our board of directors is required to complete an independence questionnaire designed to provide information to assist our board of directors in determining whether the director is independent under the 1940 Act and our corporate governance guidelines. Our board of directors has determined that each of our directors, other than Mr. Lawrence E. Golub and Mr. David B. Golub, is independent under the Exchange Act, the 1940 Act and the listing standards of the NASDAQ Stock Market LLC. Our governance guidelines require any director who has previously been determined to be independent to inform the chairman of the board of directors, the chairman of the nominating and corporate governance committee and our corporate secretary of any change in circumstance that may cause his or her status as an independent director to change. Our board of directors limits membership on the audit committee and the nominating and corporate governance committee to independent directors.
ITEM 8. LEGAL PROCEEDINGS
We, GC Advisors, the Administrator and our wholly-owned subsidiaries are not currently subject to any material litigation.
ITEM 9. MARKET PRICE OF AND DIVIDENDS ON THE REGISTRANT’S COMMON EQUITY AND RELATED STOCKHOLDER MATTERS
Market Information
Until the completion of a Liquidity Event, our outstanding common stock will be offered and sold in transactions exempt from registration under the Securities Act under Section 4(a)(2) and Regulation D. See “Item 10. Recent Sales of Unregistered Securities” for more information. There is no public market for our common stock currently, nor can we give any assurance that one will develop.
Because shares of our common stock have been acquired by investors in one or more transactions “not involving a public offering,” they are “restricted securities” and may be required to be held indefinitely. Such shares may not be sold, transferred, assigned, pledged or otherwise disposed of unless (i) our consent is granted, and (ii) the shares are registered under applicable securities laws or specifically exempted from registration (in which case the stockholder may, at our option, be required to provide us with a legal opinion, in form and substance satisfactory to us, that registration is not required). Accordingly, an investor must be willing to bear the economic risk of investment in the shares until we are liquidated. No sale, transfer, assignment, pledge or other disposition, whether voluntary or involuntary, of the shares may be made except by registration of the transfer on our books. Each transferee will be required to execute an instrument agreeing to be bound by these restrictions and the other restrictions imposed on the shares and to execute such other instruments or certifications as are reasonably required by us.
Holders
Please see “Item 4. Security Ownership of Certain Beneficial Owners and Management” for disclosure regarding the holders of our common stock.
Distributions
To the extent that we have income available, we intend to make periodic distributions to our stockholders. Our distributions, if any, are determined by our board of directors. Any distributions to our stockholders will be declared out of assets legally available for distribution.
We have elected to be treated, and intend to qualify annually, as a RIC under Subchapter M of the Code. To maintain RIC qualification, we must distribute dividends to our stockholders in respect of each tax year of an amount generally at least equal to 90% of our investment company taxable, determined without regard to any deduction for dividends paid. In addition, we are subject to ordinary income and capital gain distribution requirements under U.S. federal excise tax rules for each calendar year. If we do not meet the required distributions we will be subject to a 4% nondeductible federal excise tax on the undistributed amount.
The following table reflects the cash distributions, including dividends and returns of capital per share that we have paid on our common stock since January 1, 2015.
| | | | | Distributions Declared | |
| Record Dates | | Payment Dates | | Per Share | | | Dollar amount | |
| | | | | (In thousands except per share data) | |
| Fiscal year ended September 30, 2015 | | | | | | | | | | |
| February 4, 2015 | | April 28, 2015 | | $ | 0.0747 | | | $ | 628 | |
| February 27, 2015 | | April 28, 2015 | | | 0.0817 | | | | 755 | |
| March 31, 2015 | | April 28, 2015 | | | 0.0936 | | | | 984 | |
| April 30, 2015 | | July 28, 2015 | | | 0.1121 | | | | 1,430 | |
| May 27, 2015 | | July 28, 2015 | | | 0.0979 | | | | 1,357 | |
| June 26, 2015 | | July 28, 2015 | | | 0.0949 | | | | 1,443 | |
| July 24, 2015 | | September 18, 2015 | | | 0.0881 | | | | 1,558 | |
| August 26, 2015 | | November 20, 2015 | | | 0.1739 | | | | 3,307 | |
| September 24, 2015 | | November 20, 2015 | | | 0.0751 | | | | 1,565 | |
| Fiscal year ending September 30, 2016(1) | | | | | | | | | | |
| October 27, 2015 | | December 30, 2015 | | | 0.0818 | | | | 1,705 | |
| November 19, 2015 | | December 30, 2015 | | | 0.1252 | | | | 2,776 | |
| December 17, 2015 | | February 26, 2016 | | | 0.0891 | | | | 2,177 | |
| January 22, 2016 | | February 26, 2016 | | | 0.0957 | | | | 2,354 | |
| February 22, 2016 | | May 20, 2016 | | | 0.0705 | | | | 1,734 | |
| March 22, 2016 | | May 20, 2016 | | | 0.1176 | | | | 3,205 | |
| April 30, 2016 | | July 28, 2016 | | | 0.1046 | | | | 2,852 | |
| May 19, 2016 | | July 28, 2016 | | | 0.1331 | | | | 3,893 | |
| June 20, 2016 | | July 28, 2016 | | | 0.1047 | | | | 3,288 | |
| Total | | | | $ | 1.8143 | | | $ | 37,011 | |
| (1) | On May 3, 2016 and August 3, 2016, our board of directors declared distributions to holders of record as set forth in the table below: |
| Record Date | | Payment Date | | Amount Per Share |
| July 22, 2016 | | September 26, 2016 | | Net increase in net assets resulting from operations earned by us (if positive) as determined in accordance with GAAP for the period July 1, 2016 through July 31, 2016 per share |
| | | | | |
| August 29, 2016 | | November 21, 2016 | | Net increase in net assets resulting from operations earned by us (if positive) as determined in accordance with GAAP for the period August 1, 2016 through August 31, 2016 per share |
| | | | | |
| September 23, 2016 | | November 21, 2016 | | Net increase in net assets resulting from operations earned |
| | | | | by us (if positive) as determined in accordance with GAAP for the period September 1, 2016 through September 30, 2016 per share |
| | | | | |
| October 24, 2016 | | December 30, 2016 | | Net increase in net assets resulting from operations earned by us (if positive) as determined in accordance with GAAP for the period October 1, 2016 through October 31, 2016 per share |
We currently intend to distribute net capital gains (i.e., net long-term capital gains in excess of net short-term capital losses), if any, at least annually out of the assets legally available for such distributions. However, we may decide in the future to retain such capital gains for investment and elect to treat such gains as deemed distributions to you. If this happens, you will be treated for U.S. federal income tax purposes as if you had received an actual distribution of the capital gains that we retain and reinvested the net after tax proceeds in us. In this situation, you would be eligible to claim a tax credit (or, in certain circumstances, a tax refund) equal to your allocable share of the tax we paid on the capital gains deemed distributed to you. See “Item 1. Business — Material U.S. Federal Income Tax Considerations — Taxation of U.S. Stockholders.” We cannot assure you that we will achieve results that will permit us to pay any cash distributions, and if we issue senior securities, we will be prohibited from making distributions if doing so would cause us to fail to maintain the asset coverage ratios stipulated by the 1940 Act or if such distributions are limited by the terms of any of our borrowings.
Unless you elect to receive your distributions in cash, we intend to make such distributions in additional shares of our common stock under our DRIP. Although distributions paid in the form of additional shares of our common stock will generally be subject to U.S. federal, state and local taxes in the same manner as cash distributions, investors participating in our DRIP will not receive any corresponding cash distributions with which to pay any such applicable taxes. If you hold shares of our common stock in the name of a broker or financial intermediary, you should contact such broker or financial intermediary regarding your election to receive distributions in cash in lieu of shares of our common stock. Any distributions reinvested through the issuance of shares through our DRIP will increase our gross assets on which the base management fee and the incentive fee are determined and paid to GC Advisors. See “— Dividend Reinvestment Plan.”
Dividend Reinvestment Plan
We have adopted a DRIP that provides for reinvestment of our dividends and other distributions on behalf of our stockholders, unless a stockholder elects to receive cash as provided below. As a result, if our board of directors authorizes, and we declare, a cash dividend or other distribution, then our stockholders who have not “opted out” of our DRIP will have their cash distribution automatically reinvested in additional shares of our common stock, rather than receiving the cash distribution.
No action is required on the part of a registered stockholder to have their cash dividend or other distribution reinvested in shares of our common stock. A registered stockholder may elect to receive an entire distribution in cash by notifying us, in our capacity as plan administrator, in writing so that such notice is received by the plan administrator no later than the record date for distributions to stockholders. The plan administrator will set up an account for shares acquired through the plan for each stockholder who has not elected to receive dividends or other distributions in cash and hold such shares in non-certificated form. Upon request by a stockholder participating in the plan, received in writing not less than three days prior to the record date, the plan administrator will, instead of crediting shares to the participant’s account, issue a certificate registered in the participant’s name for the number of whole shares of our common stock and a check for any fractional share.
Those stockholders whose shares are held by a broker or other financial intermediary may receive dividends and other distributions in cash by notifying their broker or other financial intermediary of their election.
Prior to the pricing of an initial public offering of our common stock or the listing of our shares on a national securities exchange, we will use newly issued shares of common stock to implement the plan issued at net asset value per share determined as of the valuation date fixed by our board of directors for such dividend or distribution. The number of shares of common stock to be issued to a stockholder prior to the pricing of an initial public offering of our common stock or the listing of our shares on a national securities exchange would be determined by dividing the total dollar amount of the dividend or distribution payable to such stockholder by the net asset value per share.
After the pricing of an initial public offering of our common stock or the listing of our shares on a national securities exchange, if any, we may use newly issued shares to implement the plan, whether our shares are trading at a premium or at a discount to net asset value. However, we expect to reserve the right to purchase shares in the open market in connection with our expected implementation of the plan. The number of shares to be issued to a stockholder is expected to be determined by dividing the total dollar amount of the distribution payable to such stockholder by the market price per share of our common stock at the close of regular trading on the national securities exchange on which our shares are listed on the date of such distribution, provided that in the event the market price per share on the date of such distribution exceeds the most recently computed net asset value per share, we would expect to issue shares at the greater of the most recently computed net asset value per share or 95% of the current market price per share (or such lesser discount to the current market price per share that still exceeds the most recently computed net asset value per share). The market price per share on that date would be the closing price for such shares on the national securities exchange on which our shares are listed or, if no sale is reported for such day, at the average of their reported bid and asked prices. The number of shares of our common stock to be outstanding after giving effect to payment of the dividend or other distribution cannot be established until the value per share at which additional shares will be issued has been determined and elections of our stockholders have been tabulated.
There will be no brokerage charges or other charges to stockholders who participate in the plan. The plan administrator’s fees are paid by us. If a participant elects by written notice to the plan administrator prior to termination of his or her account to have the plan administrator sell part or all of the shares held by the plan administrator in the participant’s account and remit the proceeds to the participant, the plan administrator is authorized to deduct a $15.00 transaction fee plus a $0.10 per share brokerage commission from the proceeds.
Stockholders who receive dividends and other distributions in the form of stock are generally subject to the same U.S. federal, state and local tax consequences as are stockholders who elect to receive their distributions in cash; however, since their cash dividends will be reinvested, such stockholders will not receive cash with which to pay any applicable taxes on reinvested dividends. A stockholder’s basis for determining gain or loss upon the sale of stock received in a dividend or other distribution from us generally will be equal to the total dollar value of the distribution paid to the stockholder. Any stock received in a dividend or other distribution will have a new holding period for tax purposes commencing on the day following the day on which the shares are credited to the stockholder’s account. To the extent a stockholder is subject to U.S. federal withholding tax on a distribution, we will withhold the applicable tax and the balance will be reinvested in our common stock (or paid to such stockholder in cash if the stockholder has opted out of our DRIP).
Participants may terminate their accounts under the plan by filling out the transaction request form located at the bottom of the participant’s statement and sending it to the plan administrator at the address below.
The plan may be terminated or suspended by us upon notice in writing mailed to each participant at least 30 days prior to any record date for the payment of any dividend or other distribution by us. All correspondence concerning the plan should be directed to the plan administrator by mail at Golub Capital Investment Corporation, Attention: Investor Relations, 150 South Wacker Drive, Suite 800, Chicago, IL 60606.
If you withdraw or the plan is terminated, you will receive the number of whole shares in your account under the plan and a cash payment for any fraction of a share in your account.
If you hold your common stock with a brokerage firm that does not participate in the plan, you will not be able to participate in the plan and any dividend reinvestment may be effected on different terms than those described above. Consult your financial advisor for more information.
ITEM 10. RECENT SALES OF UNREGISTERED SECURITIES.
We are party to subscription agreements with several investors, including affiliates of GC Advisors, providing for the private placement of our common stock, or the Subscription Agreements. Under the terms of the Subscription Agreements, investors are required to fund drawdowns to purchase our common stock, at a price per share equal to the most recent net asset value per share as determined by our board of directors, up to the amount of their respective capital subscriptions on an as-needed basis as determined by us with a minimum of 10 calendar days prior notice.
As of June 30, 2016, our stockholders have subscribed to contribute capital to us of $841.8 million pursuant to the Subscription Agreements of which $496.5 million was called and contributed through June 30, 2016.
The following table summarizes the shares of our common stock sold since our inception which were not registered under the Securities Act:
| Date | | Shares
Sold | | | Net asset value
per share | | | Proceeds
(In
thousands) | |
| | | | | | | | | | |
| September 22, 2014(1) | | | 666.670 | | | $ | 15.00 | | | $ | 10 | |
Shares sold during the period from September 22, 2014 (inception) to September 30, 2014 | | | 666.670 | | | $ | 15.00 | | | $ | 10 | |
| | | | | | | | | | | | | |
| December 31, 2014 | | | 4,884,727.636 | | | $ | 15.00 | | | $ | 73,271 | |
| December 31, 2014 | | | 1,187,500.000 | | | | 15.00 | | | | 17,813 | |
| January 12, 2015 | | | 2,311,954.667 | | | | 15.00 | | | | 34,979 | |
| February 5, 2015 | | | 632,446.104 | | | | 15.00 | | | | 9,487 | |
| February 27, 2015 | | | 197,166.667 | | | | 15.00 | | | | 2,957 | |
| March 2, 2015 | | | 303,333.333 | | | | 15.00 | | | | 4,550 | |
| March 20, 2015 | | | 970,666.667 | | | | 15.00 | | | | 14,560 | |
| April 1, 2015 | | | 834,166.667 | | | | 15.00 | | | | 12,513 | |
| April 9, 2015 | | | 773,500.000 | | | | 15.00 | | | | 11,602 | |
| April 17, 2015 | | | 540,714.191 | | | | 15.00 | | | | 8,111 | |
| May 14, 2015 | | | 1,111,719.995 | | | | 15.00 | | | | 16,676 | |
| June 1, 2015 | | | 1,334,947.940 | | | | 15.00 | | | | 20,024 | |
| July 2, 2015 | | | 1,021,078.072 | | | | 15.00 | | | | 15,316 | |
| July 20, 2015 | | | 1,463,847.589 | | | | 15.00 | | | | 21,958 | |
| August 13, 2015 | | | 1,153,308.534 | | | | 15.00 | | | | 17,299 | |
| August 27, 2015 | | | 1,768,406.410 | | | | 15.00 | | | | 26,526 | |
Shares sold during the year ended September 30, 2015 | | | 20,509,484.472 | | | $ | 15.00 | | | $ | 307,642 | |
| | | | | | | | | | | | | |
| November 6, 2015 | | | 1,329,458.533 | | | $ | 15.00 | | | $ | 19,942 | |
| December 14, 2015 | | | 2,078,187.800 | | | | 15.00 | | | | 31,173 | |
| February 23, 2016 | | | 2,488,930.923 | | | | 15.00 | | | | 37,334 | |
| May 16, 2016 | | | 1,994,478.077 | | | | 15.00 | | | | 29,917 | |
| June 2, 2016 | | | 1,994,478.077 | | | | 15.00 | | | | 29,917 | |
| June 21, 2016 | | | 2,707,383.731 | | | | 15.00 | | | | 40,611 | |
| August 12, 2016 | | | 5,008,697.983 | | | | 15.00 | | | | 75,130 | |
Shares sold during the year ended September 30, 2016 (through September 14, 2016) | | | 17,601,615.124 | | | $ | 15.00 | | | $ | 264,024 | |
| (1) | Shares issued in exchange for our initial portfolio of investments. |
The sales of our common stock pursuant to the Subscription Agreements were exempt from the registration requirements of the Securities Act pursuant to Section 4(a)(2) thereof. We did not engage in general solicitation or advertising with regard to such sales of our common stock and did not offer securities to the public in connection with such issuance and sale. The investors who purchased common stock were all accredited investors.
ITEM 11. DESCRIPTION OF REGISTRANT’S SECURITIES TO BE REGISTERED.
The following description is based on relevant portions of the MGCL and on our charter and bylaws. This summary is not necessarily complete, and we refer you to the MGCL and our charter and bylaws for a more detailed description of the provisions summarized below.
Capital Stock
Our authorized stock consists of 100,000,000 shares of common stock, par value $0.001 per share, and 1,000,000 shares of preferred stock, par value $0.001 per share. There is currently no market for our common stock, and we can offer no assurances that a market for our shares will develop in the future. There are no outstanding options or warrants to purchase our stock. No stock has been authorized for issuance under any equity compensation plans. Under Maryland law, our stockholders generally are not personally liable for our debts or obligations.
The following are our outstanding classes of securities as of September 14, 2016:
| (1) Title of Class | | (2) Amount
Authorized | | | (3) Amount Held
by us or for Our
Account | | | (4) Amount
Outstanding
Exclusive of
Amounts Shown
Under (3) | |
| Common Stock | | | 100,000,000 | | | | — | | | | 39,469,915.648 | |
| Preferred Stock | | | 1,000,000 | | | | — | | | | — | |
Under our charter, our board of directors is authorized to classify and reclassify any unissued shares of stock into other classes or series of stock and authorize the issuance of shares of stock without obtaining stockholder approval. As permitted by the MGCL, our charter provides that the board of directors, without any action by our stockholders, may amend the charter from time to time to increase or decrease the aggregate number of shares of stock or the number of shares of stock of any class or series that we have authority to issue.
All shares of our common stock have equal rights as to earnings, assets, dividends and other distributions and voting and, when they are issued, will be duly authorized, validly issued, fully paid and nonassessable. Distributions may be paid to the holders of our common stock if, as and when authorized by our board of directors and declared by us out of funds legally available therefrom. Shares of our common stock have no preemptive, exchange, conversion or redemption rights and are freely transferable, except when their transfer is restricted by federal and state securities laws or by contract. In the event of our liquidation, dissolution or winding up, each share of our common stock would be entitled to share ratably in all of our assets that are legally available for distribution after we pay all debts and other liabilities and subject to any preferential rights of holders of our preferred stock, if any preferred stock is outstanding at such time. Each share of our common stock is entitled to one vote on all matters submitted to a vote of stockholders, including the election of directors. Except as provided with respect to any other class or series of stock, the holders of our common stock will possess exclusive voting power. There is no cumulative voting in the election of directors, which means that holders of a majority of the outstanding shares of common stock can elect all of our directors, and holders of less than a majority of such shares will not be able to elect any directors.
Transfer and Resale Restrictions
We have sold and continue to offer shares of our common stock in a private placement in the United States under the exemption provided by Section 4(a)(2) of the Securities Act and Regulation D promulgated thereunder, Regulation S under the Securities Act and other exemptions from the registration requirements of the Securities Act. Investors who acquire shares of our common stock in our private placement are required to complete, execute and deliver a Subscription Agreement and related documentation, which includes customary representations and warranties, certain covenants and restrictions and indemnification provisions. Additionally, such investors may be required to provide due diligence information for compliance with certain legal requirements. We do not presently intend to incur any placement or underwriting fees or sales commissions in connection with the private placement of our common stock, and we will not incur any such fees or commissions if our net proceeds received upon a sale of our common stock after such costs would be less than the net asset value per share of our common stock.
Prior to an initial public offering of our common stock, no transfer of our investors’ Capital Commitments or all or any portion of our investors’ shares of our common stock may be made without (a) registration of the transfer on our books and (b) our prior written consent. In any event, our consent may be withheld (i) if the creditworthiness of the proposed transferee, as determined by us in our sole discretion, is not sufficient to satisfy all obligations under the Subscription Agreement or (ii) unless, in the opinion of counsel satisfactory in form and substance to us:
| | · | such transfer would not violate the Securities Act or any state (or other jurisdiction) securities or “blue sky” laws applicable to us or the shares to be transferred; and |
| | · | in the case of a transfer to: |
| | o | an “employee benefit plan” as defined in Section 3(3) of ERISA, that is subject to ERISA; |
| | o | a “plan” described in Section 4975(e)(1) of the Code, that is subject to Section 4975 of the Code; |
| | o | an entity that is, or is deemed to be, using (under the Plan Assets Regulation or otherwise for purposes of ERISA or Section 4975 of the Code) “plan assets” to purchase or hold its investments; or |
| | o | a person (including an entity) that has discretionary authority or control with respect to our assets or a person who provides investment advice with respect to our assets or an “affiliate” of such person. |
such transfer would not be a “prohibited transaction” under ERISA or Section 4975 of the Code or cause all or any portion of our assets to constitute “plan assets” under ERISA or Section 4975 of the Code.
Any person that acquires all or any portion of our investors’ shares of our common stock in a transfer permitted under the Subscription Agreement shall be obligated to pay to us the appropriate portion of any amounts thereafter becoming due in respect of the Capital Commitment committed to be made by its predecessor in interest. Our investors shall remain liable for their Capital Commitments prior to the time, if any, when the purchaser, assignee or transferee of such shares, or fraction thereof, becomes a holder of such shares.
Furthermore, should there be an initial public offering of our common stock, holders of our common stock will be subject to lock-up restrictions pursuant to which they will be prohibited from selling shares of our common stock for a minimum of 180 days after the pricing of such initial public offering. The specific terms of this restriction and any other limitations on the sale of our common stock in connection with or following an initial public offering will be agreed in advance between our board of directors and GC Advisors, acting on behalf of our investors, and the underwriters of the initial public offering.
Provisions of the MGCL and Our Charter and Bylaws
Limitation on Liability of Directors and Officers; Indemnification and Advance of Expenses
The MGCL permits a Maryland corporation to include in its charter a provision limiting the liability of its directors and officers to the corporation and its stockholders for money damages except for liability resulting from (a) actual receipt of an improper benefit or profit in money, property or services or (b) active and deliberate dishonesty established by a final judgment as being material to the cause of action. Our charter contains such a provision which eliminates directors’ and officers’ liability to the maximum extent permitted by Maryland law, subject to the requirements of the 1940 Act.
Our charter authorizes us, to the maximum extent permitted by the MGCL and subject to the requirements of the 1940 Act, to obligate us to indemnify, and to pay or reimburse reasonable expenses in advance of final disposition of a proceeding to, any present or former director or officer or any individual who, while a director or officer and at our request, serves or has served another corporation, partnership, joint venture, limited liability company, trust, employee benefit plan, or other enterprise as a director, officer, partner, member, manager or trustee, from and against any claim or liability to which that person may become subject or which that person may incur by reason of his or her service in any such capacity and to pay or reimburse their reasonable expenses in advance of final disposition of a proceeding.
Our bylaws obligate us, to the maximum extent permitted by the MGCL and subject to the requirements of the 1940 Act, to indemnify any present or former director or officer or any individual who, while a director or officer and at our request, serves or has served another corporation, partnership, joint venture, limited liability company, trust, employee benefit plan or other enterprise as a director, officer, partner, member, manager or trustee and who is made, or threatened to be made, a party to a proceeding by reason of his or her service in any such capacity from and against any claim or liability to which that person may become subject or which that person may incur by reason of his or her service in any such capacity and, without requiring a preliminary determination of the ultimate entitlement to indemnification to pay or reimburse their reasonable expenses in advance of final disposition of a proceeding. Our charter and bylaws also permit us to indemnify and advance expenses to any person who served a predecessor of us in any of the capacities described above and any of our employees or agents or any employees or agents of our predecessor. In accordance with the 1940 Act, we will not indemnify any person for any liability to which such
person would be subject by reason of such person’s willful misfeasance, bad faith, gross negligence or reckless disregard of the duties involved in the conduct of his or her office.
The MGCL requires a corporation (unless its charter provides otherwise, which our charter does not) to indemnify a director or officer who has been successful, on the merits or otherwise, in the defense of any proceeding to which he or she is made, or threatened to be made, a party by reason of his or her service in that capacity. The MGCL permits a corporation to indemnify its present and former directors and officers, among others, against judgments, penalties, fines, settlements and reasonable expenses actually incurred by them in connection with any proceeding to which they may be made, or threatened to be made, a party by reason of their service in those or other capacities unless it is established that (a) the act or omission of the director or officer was material to the matter giving rise to the proceeding and (1) was committed in bad faith or (2) was the result of active and deliberate dishonesty, (b) the director or officer actually received an improper personal benefit in money, property or services or (c) in the case of any criminal proceeding, the director or officer had reasonable cause to believe that the act or omission was unlawful. However, under the MGCL, a Maryland corporation may not indemnify for an adverse judgment in a suit by or in the right of the corporation or for a judgment of liability on the basis that a personal benefit was improperly received unless, in either case, a court orders indemnification, and then only for expenses. In addition, the MGCL permits a corporation to advance reasonable expenses to a director or officer upon the corporation’s receipt of (a) a written affirmation by the director or officer of his or her good faith belief that he or she has met the standard of conduct necessary for indemnification by the corporation and (b) a written undertaking by him or her or on his or her behalf to repay the amount paid or reimbursed by the corporation if it is ultimately determined that the standard of conduct was not met.
Election of Directors
Our bylaws provide that the affirmative vote of a majority of the total votes cast “for” or “against” a nominee for director at a duly called meeting of stockholders at which a quorum is present is required to elect a director in an uncontested election. In a contested election, directors are elected by a plurality of the votes cast at a meeting of stockholders duly called and at which is a quorum is present. Under our bylaws, our board of directors may amend the bylaws to alter the vote required to elect directors.
Classified Board of Directors
Our board of directors is divided into three classes of directors serving staggered three-year terms, with the term of office of only one of the three classes expiring each year. At each annual meeting of stockholders, directors of the class of directors whose term expires at such meeting will be elected to hold office for a term expiring at the third succeeding annual meeting of stockholders following the meeting at which they were elected and until their successors are duly elected and qualified. A classified board may render a change in control of us or removal of our incumbent management more difficult. We believe, however, that the longer time required to elect a majority of a classified board of directors helps to ensure the continuity and stability of our management and policies.
Number of Directors; Removal; Vacancies
Our charter and bylaws provide that the number of directors will be set only by the board of directors. Our bylaws provide that a majority of our entire board of directors may at any time increase or decrease the number of directors. However, unless our bylaws are amended, the number of directors may never be less than the minimum number required by the MGCL nor more than 12. We have elected to be subject to the provision of Subtitle 8 of Title 3 of the MGCL regarding the filling of vacancies on the board of directors. Accordingly, except as may be provided by the board of directors in setting the terms of any class or series of preferred stock, any and all vacancies on the board of directors, including a vacancy resulting from an enlargement of the board of directors, may be filled only by vote of a majority of the directors then in office, even if the remaining directors do not constitute a quorum, and any director elected to fill a vacancy will serve for the remainder of the full term of the directorship in which the vacancy occurred and until a successor is elected and qualifies, subject to any applicable requirements of the 1940 Act. Our charter provides that a director may be removed only for cause, as defined in our charter, and then only by the affirmative vote of at least two-thirds of the votes entitled to be cast in the election of directors. The limitations on the ability of our stockholders to remove directors and fill vacancies could make it more difficult for a third-party to acquire, or discourage a third-party from seeking to acquire, control of us.
Action by Stockholders
Under the MGCL, stockholder action can be taken only at an annual or special meeting of stockholders or by unanimous written consent in lieu of a meeting (unless the charter provides for stockholder action by less than unanimous consent, which our charter does not). These provisions, combined with the requirements of our bylaws regarding the calling of a stockholder-requested meeting of stockholders discussed below, may have the effect of delaying consideration of a stockholder proposal until the next annual meeting.
Advance Notice Provisions for Stockholder Nominations and Stockholder Proposals
Our bylaws provide that with respect to an annual meeting of stockholders, nominations of persons for election to the board of directors and the proposal of business to be considered by stockholders may be made only (1) by or at the direction of the board of directors, (2) pursuant to our notice of meeting or (3) by a stockholder who was a stockholder of record at the time of provision of notice and at the time of the meeting, who is entitled to vote at the meeting and who has complied with the advance notice procedures of the bylaws. With respect to special meetings of stockholders, only the business specified in our notice of the meeting may be brought before the meeting. Nominations of persons for election to the board of directors at a special meeting may be made only (1) by or at the direction of the board of directors or (2) provided that the special meeting has been called in accordance with our bylaws for the purposes of electing directors, by a stockholder who was a stockholder of record at the time of provision of notice and at the time of the meeting, who is entitled to vote at the meeting and who has complied with the advance notice provisions of the bylaws.
The purpose of requiring stockholders to give us advance notice of nominations and other business is to afford our board of directors a meaningful opportunity to consider the qualifications of the proposed nominees and the advisability of any other proposed business and, to the extent deemed necessary or desirable by our board of directors, to inform stockholders and make recommendations about such qualifications or business, as well as to provide a more orderly procedure for conducting meetings of stockholders. Although our bylaws do not give our board of directors any power to disapprove stockholder nominations for the election of directors or proposals recommending certain action, they may have the effect of precluding a contest for the election of directors or the consideration of stockholder proposals if proper procedures are not followed and of discouraging or deterring a third party from conducting a solicitation of proxies to elect its own slate of directors or to approve its own proposal without regard to whether consideration of such nominees or proposals might be harmful or beneficial to us and our stockholders.
Calling of Special Meetings of Stockholders
Our bylaws provide that special meetings of stockholders may be called by our board of directors and certain of our officers. Additionally, our bylaws provide that, subject to the satisfaction of certain procedural and informational requirements by the stockholders requesting the meeting, a special meeting of stockholders will be called by the secretary of the corporation upon the written request of stockholders entitled to cast not less than a majority of all the votes entitled to be cast at such meeting.
Approval of Extraordinary Corporate Action; Amendment of Charter and Bylaws
Under the MGCL, a Maryland corporation generally cannot dissolve, amend its charter, merge, converge, sell all or substantially all of its assets, engage in a share exchange or engage in similar transactions outside the ordinary course of business, unless the action is declared advisable by the board of directors and approved by the affirmative vote of stockholders entitled to cast at least two-thirds of the votes entitled to be cast on the matter. However, a Maryland corporation may provide in its charter for approval of these matters by a lesser percentage, but not less than a majority of all the votes entitled to be cast on the matter. Our charter provides for approval of these matters, other than charter amendments, by the affirmative vote of the holders of a majority of the total number of shares entitled to vote on the matter.
Our charter and bylaws provide that the board of directors will have the exclusive power to adopt, alter or repeal any provision of our bylaws and to make new bylaws.
No Appraisal Rights
Except with respect to appraisal rights arising in connection with the Maryland Control Share Acquisition Act discussed below, as permitted by the MGCL, our charter provides that stockholders will not be entitled to exercise appraisal rights.
Control Share Acquisitions
The Control Share Acquisition Act provides that control shares of a Maryland corporation acquired in a control share acquisition have no voting rights except to the extent approved by a vote of two-thirds of the votes entitled to be cast on the matter. Shares owned by the acquirer, by officers or by directors who are employees of the corporation are excluded from shares entitled to vote on the matter. Control shares are voting shares of stock which, if aggregated with all other shares of stock owned by the acquirer or in respect of which the acquirer is able to exercise or direct the exercise of voting power (except solely by virtue of a revocable proxy), would entitle the acquirer to exercise voting power in electing directors within one of the following ranges of voting power:
| | • | one-tenth or more but less than one-third; |
| | • | one-third or more but less than a majority; or |
| | • | a majority or more of all voting power. |
The requisite stockholder approval must be obtained each time an acquirer crosses one of the thresholds of voting power set forth above. Control shares do not include shares the acquiring person is then entitled to vote as a result of having previously obtained stockholder approval. A control share acquisition means the acquisition of control shares, subject to certain exceptions.
A person who has made or proposes to make a control share acquisition may compel the board of directors of the corporation to call a special meeting of stockholders to be held within 50 days of demand to consider the voting rights of the shares. The right to compel the calling of a special meeting is subject to the satisfaction of certain conditions, including an undertaking to pay the expenses of the meeting. If no request for a meeting is made, the corporation may itself present the question at any stockholders meeting.
If voting rights are not approved at the meeting or if the acquiring person does not deliver an acquiring person statement as required by the statute, then the corporation may repurchase for fair value any or all of the control shares, except those for which voting rights have previously been approved. The right of the corporation to repurchase control shares is subject to certain conditions and limitations, including, as provided in our bylaws, compliance with the 1940 Act. Fair value is determined, without regard to the absence of voting rights for the control shares, as of the date of the last control share acquisition by the acquirer or of any meeting of stockholders at which the voting rights of the shares are considered and not approved. If voting rights for control shares are approved at a stockholders meeting and the acquirer becomes entitled to vote a majority of the shares entitled to vote, all other stockholders may exercise appraisal rights. The fair value of the shares as determined for purposes of appraisal rights may not be less than the highest price per share paid by the acquirer in the control share acquisition.
The Control Share Acquisition Act does not apply (a) to shares acquired in a merger, consolidation or share exchange if the corporation is a party to the transaction or (b) to acquisitions approved or exempted by the charter or bylaws of the corporation.
Our bylaws contain a provision exempting from the Control Share Acquisition Act any and all acquisitions by any person of our shares of stock. There can be no assurance that such provision will not be amended or eliminated at any time in the future to the extent permitted by the 1940 Act.
Business Combinations
Under the MGCL, “business combinations” between a Maryland corporation and an interested stockholder or an affiliate of an interested stockholder are prohibited for five years after the most recent date on which the interested stockholder becomes an interested stockholder. These business combinations include a merger, consolidation, share exchange or, in circumstances specified in the statute, an asset transfer or issuance or reclassification of equity securities. An interested stockholder is defined as:
| | • | any person who beneficially owns 10% or more of the voting power of the corporation’s shares; or |
| | • | an affiliate or associate of the corporation who, at any time within the two-year period prior to the date in |
| | | question, was the beneficial owner of 10% or more of the voting power of the then outstanding voting stock of the corporation. |
A person is not an interested stockholder under this statute if the board of directors approved in advance the transaction by which he otherwise would have become an interested stockholder. However, in approving a transaction, the board of directors may provide that its approval is subject to compliance, at or after the time of approval, with any terms and conditions determined by the board.
After the five-year prohibition, any business combination between the corporation and an interested stockholder generally must be recommended by the board of directors of the corporation and approved by the affirmative vote of at least:
| | • | 80% of the votes entitled to be cast by holders of outstanding shares of voting stock of the corporation; and |
| | • | two-thirds of the votes entitled to be cast by holders of voting stock of the corporation other than shares held by the interested stockholder with whom or with whose affiliate the business combination is to be effected or held by an affiliate or associate of the interested stockholder. |
These super-majority vote requirements do not apply if the corporation’s common stockholders receive a minimum price, as defined under the MGCL, for their shares in the form of cash or other consideration in the same form as previously paid by the interested stockholder for its shares.
The statute permits various exemptions from its provisions, including business combinations that are exempted by the board of directors before the time that the interested stockholder becomes an interested stockholder. Our board of directors may adopt a resolution that any business combination between us and any other person is exempted from the provisions of the Business Combination Act, provided that the business combination is first approved by the board of directors, including a majority of the directors who are not interested persons as defined in the 1940 Act. This resolution, however, may be altered or repealed in whole or in part at any time. The Maryland Business Combination Act may discourage third parties from trying to acquire control of us and increase the difficulty of consummating such an offer.
Conflict with 1940 Act
Our bylaws provide that, if and to the extent that any provision of the MGCL, including the Control Share Acquisition Act (if we amend our bylaws to be subject to such Act) and the Business Combination Act, or any provision of our charter or bylaws conflicts with any provision of the 1940 Act, the applicable provision of the 1940 Act will control.
ITEM 12. INDEMNIFICATION OF DIRECTORS AND OFFICERS.
See “Item 11. Description of Registrant’s Securities to be Registered— Provisions of the MGCL and Our Charter and Bylaws— Limitation on Liability of Directors and Officers; Indemnification and Advance of Expenses.”
In addition, we have entered into indemnification agreements with each of our directors and officers pursuant to which we are required to indemnify each such director and officer to the maximum extent permitted by Maryland Law unless it is established that (i) the director or officer’s conduct was in bad faith or the result of active and deliberate dishonesty, (ii) the director or officer received an improper personal benefit in money, property or services, or (iii) in the case of a criminal proceeding, the director or officers had reasonable cause to believe his or her conduct was unlawful.
We have also obtaineddirectors and officers/errors and omissions liability insurance for our directors and officers.
ITEM 13. FINANCIAL STATEMENTS AND SUPPLEMENTARY DATA.
Set forth below is a list of our audited and unaudited financial statements included in this Registration Statement.
| | | Page | |
| Index to Consolidated Financial Statements | | | F-1 | |
| Consolidated Statements of Financial Condition as of June 30, 2016 (unaudited) and September 30, 2015 | | | F-2 | |
| Consolidated Statements of Operations for the three and nine months ended June 30, 2016 (unaudited) and 2015 (unaudited) | | | F-3 | |
| Consolidated Statements of Changes in Net Assets for the nine months ended June 30, 2016 (unaudited) and 2015 (unaudited) | | | F-4 | |
| Consolidated Statements of Cash Flows for the nine months ended June 30, 2016 (unaudited) and 2015 (unaudited) | | | F-5 | |
| Consolidated Schedule of Investments as of June 30, 2016 (unaudited) and September 30, 2015 | | | F-7 | |
| Notes to Consolidated Financial Statements (unaudited) | | | F-21 | |
| Report of Independent Registered Public Accounting Firm | | | F-51 | |
| Consolidated Statements of Financial Condition as of September 30, 2015 and 2014 | | | F-52 | |
| Consolidated Statements of Operations for the Year Ended September 30, 2015 and for the period September 22, 2014 through September 30, 2015 | | | F-53 | |
| Consolidated Statements of Changes in Net Assets for the Year Ended September 30, 2015 and for the period September 22, 2014 through September 30, 2015 | | | F-54 | |
| Consolidated Statements of Cash Flows for the Year Ended September 30, 2015 and for the period September 22, 2014 through September 30, 2015 | | | F-55 | |
| Consolidated Schedule of Investments as of September 30, 2015 | | | F-57 | |
Notes to the Consolidated Financial Statements | | | F-67 | |
ITEM 14. CHANGES IN AND DISAGREEMENTS WITH ACCOUNTANTS ON ACCOUNTING AND FINANCIAL DISCLOSURE.
On November 17, 2015, our board of directors dismissed RSM US LLP, or RSM, as our independent registered public accounting firm. Our board of directors’ decision to dismiss RSM was recommended by our audit committee.
RSM served as our independent registered public accounting firm for the fiscal year ended September 30, 2015. The audit reports of RSM on our financial statements as of and for the year ended September 30, 2015 did not contain an adverse opinion or disclaimer of opinion and was not qualified or modified as to uncertainty, audit scope or accounting principles.
During the fiscal year ended September 30, 2015 and through November 17, 2015, there were no disagreements with RSM on any matter of accounting principles or practices, financial statement disclosure or auditing scope or procedure, which disagreements if not resolved to the satisfaction of RSM would have caused it to make reference to the subject matter of the disagreements in connection with its audit report, nor were there any “reportable events” as such term is described in Item 304(a)(1)(v) of Regulation S-K, promulgated under the Exchange Act.
We requested that RSM furnish us with a letter addressed to the SEC stating whether it agrees with the above statements. A copy of RSM’s letter dated September 15, 2016 is filed as an exhibit to this Registration Statement.
ITEM 15. FINANCIAL STATEMENTS AND EXHIBITS.
| (a) | List separately all financial statements filed |
The financial statements included in this Registration Statement are listed in Item 13 and commence on page F-2.
Exhibit Index
| 3.1 | | Articles of Amendment and Restatement. |
| | | |
| 3.2 | | Bylaws. |
| | |
| 4.1 | | Form of Stock Certificate. |
| | | |
| 10.1 | | Investment Advisory Agreement, dated as of December 31, 2014, by and between the Company and GC Advisors LLC. |
| | |
| 10.2 | | Administration Agreement, dated as of December 31, 2014, by and between the Company and Golub Capital LLC. |
| | | |
| 10.3 | | Purchase and Sale Agreement, dated as of December 31, 2014, by and between the Company, as the seller, and GCIC Funding LLC, as the purchaser. |
| | | |
| 10.4 | | Amended and Restated Loan and Servicing Agreement, dated as of May 13, 2015, by and among GCIC Funding LLC, as the borrower; GC Advisors LLC, as the servicer, the Company, as the transferor, Wells Fargo Securities, LLC, as the administrative agent, each of the conduit lenders and institutional lenders from time to time party thereto, each of the lender agents from time to time party thereto and Wells Fargo Bank, N.A., as the swingline lender, and Wells Fargo Bank, N.A., as the collateral agent, account bank and collateral custodian. |
| | | |
| 10.5 | | First Amendment to Amended and Restated Loan and Servicing Agreement, dated as of September 10, 2015, by and between GCIC Funding LLC, as the borrower, GC Advisors LLC, as the servicer, the Company, as the transferor, the institutional lenders identified on the signature pages thereto, Wells Fargo Bank, N.A., as the swingline lender, Wells Fargo Bank, N.A., as the collateral agent, the account bank and the collateral custodian and Wells Fargo Securities, LLC, as the administrative agent. |
| | | |
| 10.6 | | Second Amendment to Amended and Restated Loan and Servicing Agreement, dated as of March 9, 2016, by and between GCIC Funding LLC, as the borrower, GC Advisors LLC, as the servicer, the Company, as the transferor, the institutional lenders identified on the signature pages thereto, Wells Fargo Bank, N.A., as the swingline lender, Wells Fargo Bank, N.A., as the collateral agent, the account bank and the collateral custodian and Wells Fargo Securities, LLC, as the administrative agent. |
| | | |
| 10.7 | | Joinder Supplement, dated as of July 12, 2016, among Wells Fargo Bank, N.A., as lender and lender agent, GCIC Funding LLC, as the borrower, and Wells Fargo Securities, LLC, as the administrative agent. |
| | | |
| 10.8 | | Custody Agreement, dated as of December 31 2014, by and between the Company and U.S. Bank National Association. |
| | | |
| 10.9 | | Trademark License Agreement, dated as of December 31, 2014, by and between Golub Capital LLC and the Company. |
| | | |
| 10.10 | | Dividend Reinvestment Plan. |
| | | |
| 10.11 | | Limited Liability Company Agreement of GCIC Senior Loan Fund LLC, dated as of December 31, 2014, by and between the Company and RGA Reinsurance Company. |
| | | |
| 10.12 | | Amendment No. 2 to the Limited Liability Agreement of GCIC Senior Loan Fund LLC, dated as of |
| | | December 30, 2015, by and between the Company and Aurora National Life Assurance Company. |
| | | |
| 10.13 | | Revolving Loan Agreement, dated as of February 3, 2015, by and between GC Advisors LLC, as lender, and the Company, as borrower. |
| | | |
| 10.14 | | Waiver Agreement, dated as of December 31, 2014, by and between the Company and GC Advisors LLC. |
| | | |
| 10.15 | | Form of Subscription Agreement. |
| | | |
| 10.16 | | Revolving Credit Agreement, dated as of May 17, 2016, between the Company and Sumitomo Mitsui Banking Corporation. |
| | | |
| 10.17 | | Note Purchase and Placement Agreement, dated August 16, 2016, by and among Golub Capital Investment Corporation CLO 2016(M) LLC, Wells Fargo Securities, LLC and the Company. |
| | | |
| 10.18 | | Loan Sale Agreement, dated as of August 16, 2016, by and between the Company and Golub Capital Investment Corporation CLO 2016(M) LLC. |
| | | |
| 10.19 | | Indenture, dated as of August 16, 2016, by and between Golub Capital Investment Corporation CLO 2016(M) LLC and Wells Fargo Bank, National Association. |
| | | |
| 10.20 | | Collateral Management Agreement, dated as of August 16, 2016, by and between Golub Capital Investment Corporation CLO 2016(M) LLC and GC Advisors LLC. |
| | | |
| 11.1 | | Computation of per share earnings (included in the notes to the financial statements included in this Registration Statement). |
| | | |
| 14.1 | | Joint Code of Ethics for Golub Capital BDC, Inc., the Company and GC Advisors LLC. |
| | | |
| 16.1 | | Letter regarding change in certifying accountant. |
| | | |
| 21.1 | | List of subsidiaries. |
SIGNATURES
Pursuant to the requirements of Section 12 of the Securities Exchange Act of 1934, the registrant has duly caused this Registration Statement to be signed on its behalf by the undersigned, thereunto duly authorized.
| | GOLUB CAPITAL INVESTMENT CORPORATION |
| | | |
| | By: | | /s/ David B. Golub |
| | | | Name: David B. Golub |
| | | | Title: President and Chief Executive Officer |
Date: September 15, 2016
INDEX TO FINANCIAL STATEMENTS
| | Page |
| Index to Consolidated Financial Statements | F-1 |
| Consolidated Statements of Financial Condition as of June 30, 2016 (unaudited) and September 30, 2015 | F-2 |
| Consolidated Statements of Operations for the three and nine months ended June 30, 2016 (unaudited) and 2015 (unaudited) | F-3 |
| Consolidated Statements of Changes in Net Assets for the nine months ended June 30, 2016 (unaudited) and 2015 (unaudited) | F-4 |
| Consolidated Statements of Cash Flows for the nine months ended June 30, 2016 (unaudited) and 2015 (unaudited) | F-5 |
| Consolidated Schedule of Investments as of June 30, 2016 (unaudited) and September 30, 2015 | F-7 |
| Notes to Consolidated Financial Statements (unaudited) | F-21 |
| Report of Independent Registered Public Accounting Firm | F-51 |
| Consolidated Statements of Financial Condition as of September 30, 2015 and 2014 | F-52 |
| Consolidated Statements of Operations for the Year Ended September 30, 2015 and for the period September 22, 2014 through September 30, 2015 | F-53 |
| Consolidated Statements of Changes in Net Assets for the Year Ended September 30, 2015 and for the period September 22, 2014 through September 30, 2015 | F-54 |
| Consolidated Statements of Cash Flows for the Year Ended September 30, 2015 and for the period September 22, 2014 through September 30, 2015 | F-55 |
| Consolidated Schedule of Investments as of September 30, 2015 | F-57 |
Notes to the Consolidated Financial Statements | F-67 |
Golub Capital Investment Corporation and Subsidiaries
Consolidated Statements of Financial Condition
(In thousands, except share and per share data)
| | | June 30, 2016 | | | September 30, 2015 | |
| | (unaudited) | | | | | |
| Assets | | | | | | | | |
| Investments, at fair value | | | | | | | | |
| Non-controlled/non-affiliate company investments | | $ | 864,887 | | | $ | 551,878 | |
| Controlled affiliate company investments | | | 47,952 | | | | - | |
| Total investments, at fair value (amortized cost of $906,806 and $549,399, respectively) | | | 912,839 | | | | 551,878 | |
| Cash and cash equivalents | | | 4,847 | | | | 2,747 | |
| Restricted cash and cash equivalents | | | 9,815 | | | | 10,145 | |
| Interest receivable | | | 3,116 | | | | 2,043 | |
| Other assets | | | 304 | | | | 426 | |
| Total Assets | | $ | 930,921 | | | $ | 567,239 | |
| | | | | | | | | |
| Liabilities | | | | | | | | |
| Debt | | $ | 404,350 | | | $ | 249,700 | |
| Less unamortized debt issuance costs | | | 2,406 | | | | 3,213 | |
| Debt less unamortized debt issuance costs | | | 401,944 | | | | 246,487 | |
| Interest payable | | | 613 | | | | 398 | |
| Dividends and distributions payable | | | 10,033 | | | | 4,872 | |
| Management and incentive fees payable | | | 3,935 | | | | 1,872 | |
| Payable for open trades | | | 1,858 | | | | - | |
| Accounts payable and accrued expenses | | | 693 | | | | 953 | |
| Accrued trustee fees | | | 7 | | | | 10 | |
| Total Liabilities | | | 419,083 | | | | 254,592 | |
| Commitments and contingencies (Note 9) | | | | | | | | |
| | | | | | | | | |
| Net Assets | | | | | | | | |
| Preferred stock, par value $0.001 per share, 1,000,000 shares authorized, zero shares issued and outstanding as of June 30, 2016 and September 30, 2015 | | | - | | | | - | |
| Common stock, par value $0.001 per share, 100,000,000 shares authorized, 34,122,546.688 and 20,843,155.219 shares issued and outstanding as of June 30, 2016 and September 30, 2015, respectively | | | 34 | | | | 21 | |
| Paid in capital in excess of par | | | 505,771 | | | | 312,626 | |
| Capital distributions in excess of net investment income | | | - | | | | (2,521 | ) |
| Net unrealized appreciation (depreciation) on investments | | | 6,033 | | | | 2,479 | |
| Net realized gain (loss) on investments | | | - | | | | 42 | |
| Total Net Assets | | | 511,838 | | | | 312,647 | |
| Total Liabilities and Total Net Assets | | $ | 930,921 | | | $ | 567,239 | |
| | | | | | | | | |
| Number of common shares outstanding | | | 34,122,546.688 | | | | 20,843,155.219 | |
| Net asset value per common share | | $ | 15.00 | | | $ | 15.00 | |
See Notes to Consolidated Financial Statements.
Golub Capital Investment Corporation and Subsidiaries
Consolidated Statements of Operations (unaudited)
(In thousands, except share and per share data)
| | | Three months ended June 30, | | | Nine months ended June 30, | |
| | | 2016 | | | 2015 | | | 2016 | | | 2015 | |
| Investment income | | | | | | | | | | | | | | | | |
| From non-controlled/non-affiliate company investments: | | | | | | | | | | | | | | | | |
| Interest income | | $ | 13,856 | | | $ | 6,335 | | | $ | 35,062 | | | $ | 10,382 | |
| Dividend income | | | 48 | | | | - | | | | 65 | | | | - | |
| Fee income | | | 1 | | | | 4 | | | | 376 | | | | 46 | |
| Total investment income from non-controlled/non-affiliate company investments | | | 13,905 | | | | 6,339 | | | | 35,503 | | | | 10,428 | |
| | | | | | | | | | | | | | | | | |
| From controlled affiliate company investments: | | | | | | | | | | | | | | | | |
| Interest income | | | 733 | | | | - | | | | 1,948 | | | | - | |
| Total investment income from controlled affiliate company investments | | | 733 | | | | - | | | | 1,948 | | | | - | |
| | | | | | | | | | | | | | | | | |
| Total investment income | | | 14,638 | | | | 6,339 | | | | 37,451 | | | | 10,428 | |
| | | | | | | | | | | | | | | | | |
| Expenses | | | | | | | | | | | | | | | | |
| Interest and other debt financing expenses | | | 2,975 | | | | 1,233 | | | | 7,585 | | | | 1,955 | |
| Base management fee | | | 2,672 | | | | 1,250 | | | | 6,805 | | | | 2,108 | |
| Base management fee waiver | | | (729 | ) | | | (341 | ) | | | (1,856 | ) | | | (575 | ) |
| Incentive fee | | | 1,719 | | | | 377 | | | | 3,698 | | | | 612 | |
| Professional fees | | | 198 | | | | 184 | | | | 771 | | | | 358 | |
| Administrative service fee | | | 216 | | | | 195 | | | | 661 | | | | 307 | |
| General and administrative expenses | | | 52 | | | | 5 | | | | 66 | | | | 9 | |
| | | | | | | | | | | | | | | | | |
| Total expenses | | | 7,103 | | | | 2,903 | | | | 17,730 | | | | 4,774 | |
| | | | | | | | | | | | | | | | | |
| Net investment income | | | 7,535 | | | | 3,436 | | | | 19,721 | | | | 5,654 | |
| | | | | | | | | | | | | | | | | |
| Net gain (loss) on investments | | | | | | | | | | | | | | | | |
| Net realized gain (loss) on investments: | | | | | | | | | | | | | | | | |
| Non-controlled/non-affiliate company investments | | | (23 | ) | | | 42 | | | | 710 | | | | 42 | |
| Net realized gain (loss) on investments: | | | (23 | ) | | | 42 | | | | 710 | | | | 42 | |
| Net change in unrealized appreciation (depreciation) on investments: | | | | | | | | | | | | | | | | |
| Non-controlled/non-affiliate company investments | | | 1,973 | | | | 752 | | | | 2,777 | | | | 901 | |
| Controlled affiliate company investments | | | 548 | | | | - | | | | 777 | | | | - | |
| Net change in unrealized appreciation (depreciation) on investments | | | 2,521 | | | | 752 | | | | 3,554 | | | | 901 | |
| | | | | | | | | | | | | | | | | |
| Net gain (loss) on investments | | | 2,498 | | | | 794 | | | | 4,264 | | | | 943 | |
| | | | | | | | | | | | | | | | | |
| Net increase in net assets resulting from operations | | $ | 10,033 | | | $ | 4,230 | | | $ | 23,985 | | | $ | 6,597 | |
| | | | | | | | | | | | | | | | | |
| Per Common Share Data | | | | | | | | | | | | | | | | |
| Basic and diluted earnings per common share | | $ | 0.35 | | | $ | 0.32 | | | $ | 0.93 | | | $ | 0.59 | |
| Basic and diluted weighted average common shares outstanding(1) | | | 29,278,962 | | | | 13,592,026 | | | | 25,697,689 | | | | 11,213,803 | |
| (1) | The basic and diluted weighted average common shares outstanding for the nine months ended June 30, 2015 are calculated for the period from December 31, 2014, the commencement of operations, through June 30, 2015. |
See Notes to Consolidated Financial Statements.
Golub Capital Investment Corporation and Subsidiaries
Consolidated Statements of Changes in Net Assets (unaudited)
(In thousands, except share data)
| | | | | | | | | | | | | | | Net Unrealized | | | | | | | |
| | | Common Stock | | | Paid in Capital | | | Capital Distributions | | | Appreciation | | | | | | | |
| | | | | | Par | | | in Excess | | | in Excess of Net | | | (Depreciation) on | | | Net Realized Gain | | | Total | |
| | | Shares | | | Amount | | | of Par | | | Investment Income | | | Investments | | | (Loss) on Investments | | | Net Assets | |
| Balance at September 30, 2014 | | | 666.670 | | | $ | - | | | $ | 10 | | | $ | - | | | $ | - | | | $ | - | | | $ | 10 | |
| Issuance of common stock(1) | | | 15,102,843.867 | | | | 15 | | | | 226,527 | | | | - | | | | - | | | | - | | | | 226,542 | |
| Net increase in net assets resulting from operations | | | - | | | | - | | | | - | | | | 5,654 | | | | 901 | | | | 42 | | | | 6,597 | |
| Distributions to stockholders: | | | | | | | | | | | | | | | | | | | | | | | | | | | | |
| Stock issued in connection with dividend reinvestment plan | | | 102,032.997 | | | | - | | | | 1,531 | | | | - | | | | - | | | | - | | | | 1,531 | |
| Distributions from net investment income | | | - | | | | - | | | | - | | | | (5,654 | ) | | | - | | | | - | | | | (5,654 | ) |
| Distributions from net realized gain | | | - | | | | - | | | | - | | | | - | | | | - | | | | (42 | ) | | | (42 | ) |
| Return of capital distributions | | | - | | | | - | | | | (901 | ) | | | - | | | | - | | | | - | | | | (901 | ) |
| Total increase (decrease) for the period ended June 30, 2015 | | | 15,204,876.864 | | | | 15 | | | | 227,157 | | | | - | | | | 901 | | | | - | | | | 228,073 | |
| Balance at June 30, 2015 | | | 15,205,543.534 | | | $ | 15 | | | $ | 227,167 | | | $ | - | | | $ | 901 | | | $ | - | | | $ | 228,083 | |
| Balance at September 30, 2015 | | | 20,843,155.219 | | | $ | 21 | | | $ | 312,626 | | | $ | (2,521 | ) | | $ | 2,479 | | | $ | 42 | | | $ | 312,647 | |
| Issuance of common stock(2) | | | 12,592,917.141 | | | | 13 | | | | 188,881 | | | | - | | | | - | | | | - | | | | 188,894 | |
| Net increase in net assets resulting from operations | | | - | | | | - | | | | - | | | | 19,721 | | | | 3,554 | | | | 710 | | | | 23,985 | |
| Distributions to stockholders: | | | | | | | | | | | | | | | | | | | | | | | | | | | | |
| Stock issued in connection with dividend reinvestment plan | | | 686,474.328 | | | | - | | | | 10,297 | | | | - | | | | - | | | | - | | | | 10,297 | |
| Distributions from net investment income | | | - | | | | - | | | | - | | | | (17,200 | ) | | | - | | | | - | | | | (17,200 | ) |
| Distributions from net realized gain | | | - | | | | - | | | | - | | | | - | | | | - | | | | (752 | ) | | | (752 | ) |
| Return of capital distributions | | | - | | | | - | | | | (6,033 | ) | | | - | | | | - | | | | - | | | | (6,033 | ) |
| Total increase (decrease) for the period ended June 30, 2016 | | | 13,279,391.469 | | | | 13 | | | | 193,145 | | | | 2,521 | | | | 3,554 | | | | (42 | ) | | | 199,191 | |
| Balance at June 30, 2016 | | | 34,122,546.688 | | | $ | 34 | | | $ | 505,771 | | | $ | - | | | $ | 6,033 | | | $ | - | | | $ | 511,838 | |
| (1) | Refer to Note 3 for a detailed listing of the common stock share issuances for the period ended December 31, 2014, the commencement of operations, through June 30, 2015. |
| (2) | Refer to Note 3 for a detailed listing of the common stock share issuances for the nine months ended June 30, 2016. |
See Notes to Consolidated Financial Statements.
Golub Capital Investment Corporation and Subsidiaries
Consolidated Statements of Cash Flows (unaudited)
(In thousands)
| | | Nine months ended June 30, | |
| | | 2016 | | | 2015 | |
| Cash flows from operating activities | | | | | | | | |
| Net increase in net assets resulting from operations | | $ | 23,985 | | | $ | 6,597 | |
| Adjustments to reconcile net increase in net assets resulting from operations to net cash (used in) provided by operating activities: | | | | | | | | |
| Amortization of debt issuance costs | | | 1,509 | | | | 222 | |
| Accretion of discounts and amortization of premiums | | | (2,055 | ) | | | (360 | ) |
| Net realized (gain) loss on investments | | | (710 | ) | | | (42 | ) |
| Net change in unrealized (appreciation) depreciation on investments | | | (3,554 | ) | | | (901 | ) |
| Proceeds from (fundings of) revolving loans, net | | | (2,362 | ) | | | (1,014 | ) |
| Fundings of investments | | | (588,484 | ) | | | (339,883 | ) |
| Proceeds from principal payments and sales of portfolio investments | | | 236,278 | | | | 45,256 | |
| PIK interest | | | (74 | ) | | | (21 | ) |
| Changes in operating assets and liabilities: | | | | | | | | |
| Interest receivable | | | (1,073 | ) | | | (832 | ) |
| Other assets | | | 122 | | | | (357 | ) |
| Interest payable | | | 215 | | | | 96 | |
| Management and incentive fees payable | | | 2,063 | | | | 1,286 | |
| Payable for open trades | | | 1,858 | | | | - | |
| Accounts payable and accrued expenses | | | (260 | ) | | | 708 | |
| Accrued trustee fees | | | (3 | ) | | | (1 | ) |
| Net cash (used in) provided by operating activities | | | (332,545 | ) | | | (288,506 | ) |
| | | | | | | | | |
| Cash flows from investing activities | | | | | | | | |
| Net change in restricted cash and cash equivalents | | | 330 | | | | (10,470 | ) |
| Net cash (used in) provided by investing activities | | | 330 | | | | (10,470 | ) |
| | | | | | | | | |
| Cash flows from financing activities | | | | | | | | |
| Borrowings on debt | | | 627,350 | | | | 403,895 | |
| Repayments of debt | | | (472,700 | ) | | | (252,395 | ) |
| Capitalized debt issuance costs | | | (702 | ) | | | (2,250 | ) |
| Capital calls received in advance | | | - | | | | 2,970 | |
| Proceeds from issuance of common shares | | | 188,894 | | | | 154,802 | |
| Dividends and distributions paid | | | (8,527 | ) | | | (2,367 | ) |
| Net cash (used in) provided by financing activities | | | 334,315 | | | | 304,655 | |
| | | | | | | | | |
| Net change in cash and cash equivalents | | | 2,100 | | | | 5,679 | |
| | | | | | | | | |
| Cash and cash equivalents, beginning of period | | | 2,747 | | | | 10 | |
| | | | | | | | | |
| Cash and cash equivalents, end of period | | $ | 4,847 | | | $ | 5,689 | |
| | | | | | | | | |
| Supplemental disclosure of cash flow information | | | | | | | | |
| Cash paid during the period for interest | | $ | 5,861 | | | $ | 1,636 | |
| Dividends and distributions declared during the period | | | 10,033 | | | | 6,597 | |
See Notes to Consolidated Financial Statements.
Golub Capital Investment Corporation and Subsidiaries
Consolidated Statements of Cash Flows (unaudited) - (continued)
(In thousands)
| | | Nine months ended June 30, | |
| | | 2016 | | | 2015 | |
| Supplemental disclosure of noncash financing activity | | | | | | | | |
| | | | | | | | | |
| Dividends and distributions payable | | $ | 10,033 | | | $ | 4,230 | |
| | | | | | | | | |
| Acquisition of subsidiaries: | | | | | | | | |
| Noncash assets purchased: | | | | | | | | |
| Investments, at fair value | | $ | - | | | $ | (116,629 | ) |
| Receivable from investment sold | | | - | | | | (740 | ) |
| Interest receivable | | | - | | | | (490 | ) |
| Total noncash assets purchased | | | - | | | | (117,859 | ) |
| | | | | | | | | |
| Liabilities assumed: | | | | | | | | |
| Debt | | | - | | | | 44,800 | |
| Less unamortized debt issuance costs | | | - | | | | 521 | |
| Debt less unamortized debt issuance costs | | | - | | | | 44,279 | |
| Interest payable | | | - | | | | 229 | |
| Accounts payable and accrued expenses | | | - | | | | 72 | |
| Accrued trustee fees | | | - | | | | 8 | |
| Total liabilites assumed | | | - | | | | 44,588 | |
| | | | | | | | | |
| Issuance of common shares | | $ | - | | | $ | 73,271 | |
See Notes to Consolidated Financial Statements.
Golub Capital Investment Corporation and Subsidiaries
Consolidated Schedule of Investments (unaudited)
June 30, 2016
(In thousands)
| | | | | Spread | | | | | | | | | | | | Percentage | | | | |
| | | | | Above | | | | Maturity | | Principal / Par($), | | | Amortized | | | of | | | Fair | |
| | | Investment Type | | Index(1) | | Interest Rate(2) | | Date | | Shares/Units(3) | | | Cost | | | Net Assets | | | Value | |
| | | | | | | | | | | | | | | | | | | | | |
| Investments | | | | | | | | | | | | | | | | | | | | | | | | |
| Non-controlled/non-affiliate company investments | | | | | | | | | | | | | | | | | | | | | | | | |
| Debt investments | | | | | | | | | | | | | | | | | | | | | | | | |
| Aerospace and Defense | | | | | | | | | | | | | | | | | | | | | | | | |
| ILC Dover, LP | | One stop | | P + 6.00% | | 9.50% | | 03/2020 | | $ | 2,376 | | | $ | 2,315 | | | | 0.4 | % | | $ | 2,019 | |
| ILC Dover, LP | | One stop | | P + 6.00% | | 9.50% | | 03/2019 | | | 104 | | | | 101 | | | | - | | | | 84 | |
| NTS Technical Systems# | | One stop | | L + 6.25% | | 7.25% | | 06/2021 | | | 3,917 | | | | 3,861 | | | | 0.8 | | | | 3,878 | |
| NTS Technical Systems(4) | | One stop | | L + 6.25% | | N/A(5) | | 06/2021 | | | - | | | | (6 | ) | | | - | | | | (4 | ) |
| NTS Technical Systems(4) | | One stop | | L + 6.25% | | N/A(5) | | 06/2021 | | | - | | | | (13 | ) | | | - | | | | (5 | ) |
| Tresys Technology Holdings, Inc.(6) | | One stop | | L + 6.75% | | 8.00% | | 12/2017 | | | 53 | | | | 28 | | | | - | | | | 16 | |
| Tresys Technology Holdings, Inc. | | One stop | | L + 6.75% | | 8.00% | | 12/2017 | | | 7 | | | | 7 | | | | - | | | | 7 | |
| Whitcraft LLC# | | One stop | | L + 6.50% | | 7.50% | | 05/2020 | | | 6,762 | | | | 6,709 | | | | 1.3 | | | | 6,762 | |
| Whitcraft LLC(4) | | One stop | | L + 6.50% | | N/A(5) | | 05/2020 | | | - | | | | (1 | ) | | | - | | | | - | |
| | | | | | | | | | | | 13,219 | | | | 13,001 | | | | 2.5 | | | | 12,757 | |
| Automobile | | | | | | | | | | | | | | | | | | | | | | | | |
| American Driveline Systems, Inc. | | Senior loan | | L + 5.75% | | 6.75% | | 03/2020 | | | 379 | | | | 346 | | | | 0.1 | | | | 360 | |
| American Driveline Systems, Inc. | | Senior loan | | L + 5.75% | | 6.75% | | 03/2020 | | | 49 | | | | 48 | | | | - | | | | 49 | |
| American Driveline Systems, Inc. | | Senior loan | | P + 4.75% | | 8.25% | | 03/2020 | | | 24 | | | | 19 | | | | - | | | | 22 | |
| CH Hold Corp.# | | Senior loan | | L + 5.25% | | 6.25% | | 11/2019 | | | 2,301 | | | | 2,283 | | | | 0.4 | | | | 2,301 | |
| Dent Wizard International Corporation# | | Senior loan | | L + 4.75% | | 5.75% | | 04/2020 | | | 1,195 | | | | 1,190 | | | | 0.2 | | | | 1,195 | |
| K&N Engineering, Inc.# | | Senior loan | | L + 4.25% | | 5.25% | | 07/2019 | | | 1,142 | | | | 1,142 | | | | 0.2 | | | | 1,142 | |
| K&N Engineering, Inc.# | | Senior loan | | L + 4.25% | | 5.25% | | 07/2019 | | | 56 | | | | 56 | | | | - | | | | 56 | |
| K&N Engineering, Inc. | | Senior loan | | L + 4.25% | | N/A(5) | | 07/2019 | | | - | | | | - | | | | - | | | | - | |
| OEConnection LLC# | | Senior loan | | L + 5.00% | | 6.00% | | 06/2022 | | | 11,195 | | | | 10,908 | | | | 2.2 | | | | 11,027 | |
| OEConnection LLC(4) | | Senior loan | | L + 5.00% | | N/A(5) | | 06/2021 | | | - | | | | (1 | ) | | | - | | | | (1 | ) |
| Polk Acquisition Corp.# | | Senior loan | | L + 5.00% | | 6.00% | | 06/2022 | | | 13,635 | | | | 13,416 | | | | 2.7 | | | | 13,567 | |
| Polk Acquisition Corp. | | Senior loan | | P + 4.00% | | 7.50% | | 06/2022 | | | 12 | | | | 11 | | | | - | | | | 12 | |
| Polk Acquisition Corp. | | Senior loan | | L + 5.00% | | N/A(5) | | 06/2022 | | | - | | | | - | | | | - | | | | - | |
| Polk Acquisition Corp.(4) | | Senior loan | | L + 5.00% | | N/A(5) | | 06/2022 | | | - | | | | (2 | ) | | | - | | | | - | |
| T5 Merger Corporation# | | One stop | | L + 6.25% | | 7.25% | | 03/2022 | | | 16,732 | | | | 16,451 | | | | 3.3 | | | | 16,732 | |
| T5 Merger Corporation(4) | | One stop | | L + 6.25% | | N/A(5) | | 03/2022 | | | - | | | | (2 | ) | | | - | | | | - | |
| | | | | | | | | | | | 46,720 | | | | 45,865 | | | | 9.1 | | | | 46,462 | |
| Beverage, Food and Tobacco | | | | | | | | | | | | | | | | | | | | | | | | |
| Abita Brewing Co., L.L.C.# | | One stop | | L + 5.75% | | 6.75% | | 04/2021 | | | 3,868 | | | | 3,836 | | | | 0.7 | | | | 3,481 | |
| Abita Brewing Co., L.L.C.(4) | | One stop | | L + 5.75% | | 6.75% | | 04/2021 | | | 4 | | | | 3 | | | | - | | | | (11 | ) |
| ABP Corporation# | | Senior loan | | L + 4.75% | | 6.00% | | 09/2018 | | | 606 | | | | 606 | | | | 0.1 | | | | 600 | |
| ABP Corporation | | Senior loan | | P + 3.50% | | 7.25% | | 09/2018 | | | 27 | | | | 27 | | | | - | | | | 26 | |
| Benihana, Inc.# | | One stop | | L + 5.50% | | 6.75% | | 01/2019 | | | 304 | | | | 304 | | | | 0.1 | | | | 304 | |
| Benihana, Inc. | | One stop | | P + 4.25% | | 7.75% | | 07/2018 | | | 15 | | | | 15 | | | | - | | | | 15 | |
| C. J. Foods, Inc.# | | One stop | | L + 5.50% | | 6.50% | | 05/2019 | | | 7,668 | | | | 7,668 | | | | 1.5 | | | | 7,668 | |
| C. J. Foods, Inc. | | One stop | | L + 5.50% | | 6.50% | | 05/2019 | | | 1,617 | | | | 1,617 | | | | 0.3 | | | | 1,617 | |
| C. J. Foods, Inc. | | One stop | | L + 5.50% | | N/A(5) | | 05/2019 | | | - | | | | - | | | | - | | | | - | |
| Firebirds International, LLC# | | One stop | | L + 5.75% | | 7.00% | | 05/2018 | | | 3,339 | | | | 3,339 | | | | 0.7 | | | | 3,339 | |
| Firebirds International, LLC# | | One stop | | L + 5.75% | | 7.00% | | 05/2018 | | | 938 | | | | 938 | | | | 0.2 | | | | 938 | |
| Firebirds International, LLC | | One stop | | L + 5.75% | | N/A(5) | | 05/2018 | | | - | | | | - | | | | - | | | | - | |
| Firebirds International, LLC | | One stop | | L + 5.75% | | N/A(5) | | 05/2018 | | | - | | | | - | | | | - | | | | - | |
| First Watch Restaurants, Inc.# | | One stop | | L + 6.00% | | 7.00% | | 12/2020 | | | 3,578 | | | | 3,548 | | | | 0.7 | | | | 3,578 | |
| First Watch Restaurants, Inc. | | One stop | | L + 6.00% | | 7.00% | | 12/2020 | | | 173 | | | | 172 | | | | - | | | | 173 | |
| First Watch Restaurants, Inc. | | One stop | | L + 6.00% | | 7.00% | | 12/2020 | | | 150 | | | | 149 | | | | - | | | | 150 | |
| First Watch Restaurants, Inc.(4) | | One stop | | L + 6.00% | | N/A(5) | | 12/2020 | | | - | | | | (1 | ) | | | - | | | | - | |
| First Watch Restaurants, Inc.(4) | | One stop | | L + 6.00% | | N/A(5) | | 12/2020 | | | - | | | | (1 | ) | | | - | | | | - | |
| Hopdoddy Holdings, LLC | | One stop | | L + 8.00% | | 9.00% | | 08/2020 | | | 427 | | | | 423 | | | | 0.1 | | | | 427 | |
| Hopdoddy Holdings, LLC | | One stop | | L + 8.00% | | N/A(5) | | 08/2020 | | | - | | | | - | | | | - | | | | - | |
| Hopdoddy Holdings, LLC(4) | | One stop | | L + 8.00% | | N/A(5) | | 08/2020 | | | - | | | | (2 | ) | | | - | | | | - | |
| Julio & Sons Company# | | One stop | | L + 5.50% | | 6.50% | | 09/2017 | | | 948 | | | | 948 | | | | 0.2 | | | | 948 | |
| Julio & Sons Company | | One stop | | L + 5.50% | | 6.50% | | 09/2017 | | | 83 | | | | 83 | | | | - | | | | 83 | |
| Julio & Sons Company | | One stop | | L + 5.50% | | 6.50% | | 09/2017 | | | 75 | | | | 75 | | | | - | | | | 75 | |
| Northern Brewer, LLC | | One stop | | L + 6.50% | | 8.01% | | 02/2018 | | | 617 | | | | 519 | | | | 0.1 | | | | 586 | |
| Northern Brewer, LLC | | One stop | | L + 6.50% | | 8.00% | | 02/2018 | | | 72 | | | | 61 | | | | - | | | | 69 | |
| Purfoods, LLC# | | One stop | | L + 6.25% | | 7.25% | | 05/2021 | | | 8,067 | | | | 7,950 | | | | 1.6 | | | | 7,986 | |
| Purfoods, LLC | | One stop | | N/A | | 7.00% PIK | | 05/2026 | | | 95 | | | | 95 | | | | - | | | | 95 | |
| Purfoods, LLC(4) | | One stop | | L + 6.25% | | N/A(5) | | 05/2021 | | | - | | | | (1 | ) | | | - | | | | (1 | ) |
| Purfoods, LLC(4) | | One stop | | L + 6.25% | | N/A(5) | | 05/2021 | | | - | | | | (1 | ) | | | - | | | | (1 | ) |
| Smashburger Finance LLC | | Senior loan | | L + 5.00% | | 6.25% | | 05/2018 | | | 530 | | | | 528 | | | | 0.1 | | | | 530 | |
| Smashburger Finance LLC(4) | | Senior loan | | L + 5.00% | | N/A(5) | | 05/2018 | | | - | | | | (14 | ) | | | - | | | | - | |
| Surfside Coffee Company LLC# | | One stop | | L + 5.25% | | 6.25% | | 06/2020 | | | 2,351 | | | | 2,332 | | | | 0.5 | | | | 2,351 | |
| Surfside Coffee Company LLC | | One stop | | L + 5.25% | | 6.25% | | 06/2020 | | | 127 | | | | 123 | | | | - | | | | 127 | |
| Surfside Coffee Company LLC | | One stop | | L + 5.25% | | 6.25% | | 06/2020 | | | 21 | | | | 20 | | | | - | | | | 21 | |
| Tate's Bake Shop, Inc.# | | Senior loan | | L + 5.00% | | 6.00% | | 08/2019 | | | 144 | | | | 143 | | | | - | | | | 144 | |
| The Original Cakerie Ltd.#(7)(8) | | Senior loan | | L + 5.00% | | 6.00% | | 12/2020 | | | 1,417 | | | | 1,404 | | | | 0.3 | | | | 1,417 | |
| The Original Cakerie Ltd.(7)(8) | | Senior loan | | L + 5.00% | | N/A(5) | | 12/2020 | | | - | | | | - | | | | - | | | | - | |
| Uinta Brewing Company# | | One stop | | L + 7.00% | | 8.00% | | 08/2019 | | | 900 | | | | 900 | | | | 0.2 | | | | 864 | |
| Uinta Brewing Company | | One stop | | L + 7.00% | | 8.00% | | 08/2019 | | | 74 | | | | 74 | | | | - | | | | 70 | |
| United Craft Brews LLC# | | One stop | | L + 6.25% | | 7.25% | | 03/2020 | | | 5,377 | | | | 5,328 | | | | 1.0 | | | | 5,377 | |
| United Craft Brews LLC | | One stop | | L + 6.25% | | 7.25% | | 03/2020 | | | 542 | | | | 536 | | | | 0.1 | | | | 542 | |
| United Craft Brews LLC | | One stop | | L + 6.25% | | 7.25% | | 03/2020 | | | 362 | | | | 357 | | | | 0.1 | | | | 362 | |
| | | | | | | | | | | | 44,516 | | | | 44,101 | | | | 8.6 | | | | 43,950 | |
| Broadcasting and Entertainment | | | | | | | | | | | | | | | | | | | | | | | | |
| Extreme Reach Inc.# | | Senior loan | | L + 6.25% | | 7.25% | | 02/2020 | | | 2,376 | | | | 2,346 | | | | 0.5 | | | | 2,373 | |
| TouchTunes Interactive Networks, Inc.# | | Senior loan | | L + 4.75% | | 5.75% | | 05/2021 | | | 699 | | | | 696 | | | | 0.1 | | | | 703 | |
| | | | | | | | | | | | 3,075 | | | | 3,042 | | | | 0.6 | | | | 3,076 | |
See Notes to Consolidated Financial Statements
Golub Capital Investment Corporation and Subsidiaries
Consolidated Schedule of Investments (unaudited) -(continued)
June 30, 2016
(In thousands)
| | | | | Spread | | | | | | | | | | | | Percentage | | | | |
| | | | | Above | | | | Maturity | | Principal / Par($), | | | Amortized | | | of | | | Fair | |
| | | Investment Type | | Index(1) | | Interest Rate(2) | | Date | | Shares/Units(3) | | | Cost | | | Net Assets | | | Value | |
| | | | | | | | | | | | | | | | | | | | | |
| Building and Real Estate | | | | | | | | | | | | | | | | | | | | | | | | |
| Brooks Equipment Company, LLC# | | One stop | | L + 5.00% | | 6.00% | | 08/2020 | | | 6,351 | | | | 6,351 | | | | 1.2 | | | | 6,351 | |
| Brooks Equipment Company, LLC | | One stop | | L + 5.00% | | N/A(5) | | 08/2020 | | | - | | | | - | | | | - | | | | - | |
| Paradigm DKD Group, LLC# | | Senior loan | | L + 5.25% | | 6.50% | | 11/2018 | | | 2,165 | | | | 2,134 | | | | 0.5 | | | | 2,079 | |
| Paradigm DKD Group, LLC | | Senior loan | | L + 5.25% | | 6.60% | | 11/2018 | | | 261 | | | | 250 | | | | - | | | | 230 | |
| | | | | | | | | | | | 8,777 | | | | 8,735 | | | | 1.7 | | | | 8,660 | |
| Cargo Transport | | | | | | | | | | | | | | | | | | | | | | | | |
| Worldwide Express Operations, LLC# | | Senior loan | | L + 5.00% | | 6.00% | | 07/2019 | | | 1,767 | | | | 1,750 | | | | 0.3 | | | | 1,767 | |
| | | | | | | | | | | | | | | | | | | | | | | | | |
| Containers, Packaging and Glass | | | | | | | | | | | | | | | | | | | | | | | | |
| Fort Dearborn Company# | | Senior loan | | L + 4.75% | | 5.95% | | 10/2018 | | | 961 | | | | 959 | | | | 0.2 | | | | 961 | |
| Fort Dearborn Company# | | Senior loan | | L + 4.25% | | 5.25% | | 10/2017 | | | 168 | | | | 168 | | | | - | | | | 168 | |
| | | | | | | | | | | | 1,129 | | | | 1,127 | | | | 0.2 | | | | 1,129 | |
| Diversified Conglomerate Manufacturing | | | | | | | | | | | | | | | | | | | | | | | | |
| Chase Industries, Inc.# | | One stop | | L + 5.75% | | 6.75% | | 09/2020 | | | 6,692 | | | | 6,692 | | | | 1.3 | | | | 6,692 | |
| Chase Industries, Inc. | | One stop | | L + 5.75% | | 6.75% | | 09/2020 | | | 1,088 | | | | 1,088 | | | | 0.2 | | | | 1,088 | |
| Chase Industries, Inc. | | One stop | | L + 5.75% | | N/A(5) | | 09/2020 | | | - | | | | - | | | | - | | | | - | |
| Harvey Tool Company, LLC# | | Senior loan | | L + 5.00% | | 6.01% | | 03/2020 | | | 2,010 | | | | 1,993 | | | | 0.4 | | | | 2,010 | |
| Harvey Tool Company, LLC | | Senior loan | | L + 5.00% | | N/A(5) | | 03/2019 | | | - | | | | - | | | | - | | | | - | |
| Inventus Power, Inc# | | One stop | | L + 5.50% | | 6.50% | | 04/2020 | | | 10,481 | | | | 10,424 | | | | 1.9 | | | | 9,852 | |
| Inventus Power, Inc(4) | | One stop | | L + 5.50% | | N/A(5) | | 04/2020 | | | - | | | | (3 | ) | | | - | | | | (39 | ) |
| Onicon Incorporated# | | One stop | | L + 6.00% | | 7.00% | | 04/2020 | | | 143 | | | | 141 | | | | - | | | | 143 | |
| Onicon Incorporated | | One stop | | L + 6.00% | | N/A(5) | | 04/2020 | | | - | | | | - | | | | - | | | | - | |
| Pasternack Enterprises, Inc.# | | Senior loan | | L + 5.00% | | 6.00% | | 05/2022 | | | 1,534 | | | | 1,519 | | | | 0.3 | | | | 1,519 | |
| PetroChoice Holdings, Inc.# | | Senior loan | | L + 5.00% | | 6.00% | | 08/2022 | | | 1,649 | | | | 1,601 | | | | 0.3 | | | | 1,616 | |
| Sunless Merger Sub, Inc. | | Senior loan | | L + 5.25% | | 6.50% | | 07/2019 | | | 301 | | | | 251 | | | | 0.1 | | | | 295 | |
| Sunless Merger Sub, Inc. | | Senior loan | | P + 4.00% | | 7.50% | | 07/2019 | | | 30 | | | | 27 | | | | - | | | | 29 | |
| | | | | | | | | | | | 23,928 | | | | 23,733 | | | | 4.5 | | | | 23,205 | |
| Diversified Conglomerate Service | | | | | | | | | | | | | | | | | | | | | | | | |
| Accellos, Inc.# | | One stop | | L + 5.75% | | 6.75% | | 07/2020 | | | 6,268 | | | | 6,259 | | | | 1.2 | | | | 6,268 | |
| Accellos, Inc. | | One stop | | L + 5.75% | | N/A(5) | | 07/2020 | | | - | | | | - | | | | - | | | | - | |
| Actiance, Inc. | | One stop | | L + 9.00% | | 10.00% | | 04/2018 | | | 1,401 | | | | 1,362 | | | | 0.3 | | | | 1,401 | |
| Actiance, Inc. | | One stop | | L + 9.00% | | N/A(5) | | 04/2018 | | | - | | | | - | | | | - | | | | - | |
| Agility Recovery Solutions Inc.# | | One stop | | L + 6.50% | | 7.50% | | 03/2020 | | | 6,296 | | | | 6,227 | | | | 1.2 | | | | 6,296 | |
| Agility Recovery Solutions Inc.(4) | | One stop | | L + 6.50% | | N/A(5) | | 03/2020 | | | - | | | | (3 | ) | | | - | | | | - | |
| Bomgar Corporation# | | One stop | | L + 7.50% | | 8.50% | | 06/2022 | | | 28,713 | | | | 28,140 | | | | 5.6 | | | | 28,425 | |
| Bomgar Corporation(4) | | One stop | | L + 7.50% | | N/A(5) | | 06/2022 | | | - | | | | (2 | ) | | | - | | | | (1 | ) |
| CIBT Holdings, Inc.# | | Senior loan | | L + 5.25% | | 6.25% | | 06/2022 | | | 1,887 | | | | 1,868 | | | | 0.4 | | | | 1,868 | |
| CIBT Holdings, Inc. | | Senior loan | | L + 5.25% | | N/A(5) | | 06/2022 | | | - | | | | - | | | | - | | | | - | |
| DISA Holdings Acquisition Subsidiary Corp.# | | Senior loan | | L + 4.50% | | 5.50% | | 12/2020 | | | 1,378 | | | | 1,368 | | | | 0.3 | | | | 1,337 | |
| DISA Holdings Acquisition Subsidiary Corp. | | Senior loan | | L + 4.50% | | 5.50% | | 12/2020 | | | 77 | | | | 75 | | | | - | | | | 67 | |
| DTI Holdco, Inc.# | | Senior loan | | L + 5.00% | | 6.00% | | 08/2020 | | | 3,909 | | | | 3,880 | | | | 0.8 | | | | 3,909 | |
| EGD Security Systems, LLC# | | One stop | | L + 6.25% | | 7.25% | | 06/2022 | | | 10,371 | | | | 10,243 | | | | 2.0 | | | | 10,268 | |
| EGD Security Systems, LLC(4) | | One stop | | L + 6.25% | | N/A(5) | | 06/2022 | | | - | | | | (2 | ) | | | - | | | | (2 | ) |
| EGD Security Systems, LLC(4) | | One stop | | L + 6.25% | | N/A(5) | | 06/2022 | | | - | | | | (2 | ) | | | - | | | | (2 | ) |
| HealthcareSource HR, Inc.# | | One stop | | L + 6.75% | | 7.75% | | 05/2020 | | | 8,388 | | | | 8,273 | | | | 1.6 | | | | 8,388 | |
| HealthcareSource HR, Inc.(4) | | One stop | | L + 6.75% | | N/A(5) | | 05/2020 | | | - | | | | (1 | ) | | | - | | | | - | |
| Host Analytics, Inc. | | One stop | | N/A | | 8.50% cash/2.25% PIK | | 02/2020 | | | 1,342 | | | | 1,333 | | | | 0.3 | | | | 1,342 | |
| Host Analytics, Inc. | | One stop | | N/A | | 8.50% cash/2.25% PIK | | 02/2020 | | | 327 | | | | 325 | | | | 0.1 | | | | 327 | |
| Integration Appliance, Inc. | | One stop | | L + 8.25% | | 9.50% | | 09/2020 | | | 1,550 | | | | 1,536 | | | | 0.3 | | | | 1,550 | |
| Jensen Hughes, Inc.# | | Senior loan | | L + 5.00% | | 6.00% | | 12/2021 | | | 135 | | | | 134 | | | | - | | | | 135 | |
| Mediaocean LLC# | | Senior loan | | L + 4.75% | | 5.75% | | 08/2022 | | | 109 | | | | 107 | | | | - | | | | 109 | |
| Netsmart Technologies, Inc.# | | Senior loan | | L + 4.75% | | 5.75% | | 04/2023 | | | 1,653 | | | | 1,637 | | | | 0.3 | | | | 1,651 | |
| Netsmart Technologies, Inc.(4) | | Senior loan | | L + 4.75% | | N/A(5) | | 04/2023 | | | - | | | | (9 | ) | | | - | | | | (1 | ) |
| PT Intermediate Holdings III, LLC# | | One stop | | L + 6.50% | | 7.50% | | 06/2022 | | | 32,650 | | | | 32,162 | | | | 6.3 | | | | 32,160 | |
| PT Intermediate Holdings III, LLC | | One stop | | L + 6.50% | | 7.50% | | 06/2022 | | | 7 | | | | 3 | | | | - | | | | 3 | |
| Quickbase, Inc.# | | One stop | | L + 7.50% | | 8.50% | | 04/2022 | | | 11,496 | | | | 11,276 | | | | 2.2 | | | | 11,381 | |
| Quickbase, Inc.(4) | | One stop | | L + 7.50% | | N/A(5) | | 04/2022 | | | - | | | | (2 | ) | | | - | | | | (1 | ) |
| Secure-24, LLC# | | One stop | | L + 6.00% | | 7.25% | | 08/2017 | | | 811 | | | | 811 | | | | 0.2 | | | | 811 | |
| Secure-24, LLC# | | One stop | | L + 6.00% | | 7.25% | | 08/2017 | | | 119 | | | | 119 | | | | - | | | | 119 | |
| Secure-24, LLC | | One stop | | L + 6.00% | | N/A(5) | | 08/2017 | | | - | | | | - | | | | - | | | | - | |
| Severin Acquisition, LLC# | | Senior loan | | L + 5.38% | | 6.38% | | 07/2021 | | | 1,445 | | | | 1,432 | | | | 0.3 | | | | 1,468 | |
| Severin Acquisition, LLC# | | Senior loan | | L + 5.00% | | 6.00% | | 07/2021 | | | 1,287 | | | | 1,275 | | | | 0.3 | | | | 1,287 | |
| Steelwedge Software, Inc. | | One stop | | L + 10.00% | | 9.00% cash/2.00% PIK | | 09/2020 | | | 1,758 | | | | 1,683 | | | | 0.3 | | | | 1,758 | |
| Steelwedge Software, Inc. | | One stop | | L + 10.00% | | N/A(5) | | 09/2020 | | | - | | | | - | | | | - | | | | - | |
| TA MHI Buyer, Inc.# | | One stop | | L + 6.50% | | 7.50% | | 09/2021 | | | 6,639 | | | | 6,588 | | | | 1.3 | | | | 6,639 | |
| TA MHI Buyer, Inc.# | | One stop | | L + 6.50% | | 7.50% | | 09/2021 | | | 538 | | | | 532 | | | | 0.1 | | | | 538 | |
| TA MHI Buyer, Inc.# | | One stop | | L + 6.50% | | 7.50% | | 09/2021 | | | 192 | | | | 190 | | | | - | | | | 192 | |
| TA MHI Buyer, Inc. | | One stop | | L + 6.50% | | N/A(5) | | 09/2021 | | | - | | | | - | | | | - | | | | - | |
| Transaction Data Systems, Inc.# | | Senior loan | | L + 5.25% | | 6.25% | | 06/2021 | | | 404 | | | | 400 | | | | 0.1 | | | | 404 | |
| Trintech, Inc.# | | One stop | | L + 6.00% | | 7.00% | | 10/2021 | | | 8,831 | | | | 8,731 | | | | 1.7 | | | | 8,743 | |
| Trintech, Inc.(4) | | One stop | | L + 6.00% | | N/A(5) | | 10/2021 | | | - | | | | (1 | ) | | | - | | | | - | |
| Vendavo, Inc. | | One stop | | L + 8.50% | | 9.50% | | 10/2019 | | | 3,734 | | | | 3,702 | | | | 0.7 | | | | 3,734 | |
| Vendavo, Inc.(4) | | One stop | | L + 8.50% | | N/A(5) | | 10/2019 | | | - | | | | (3 | ) | | | - | | | | - | |
| Vendor Credentialing Service LLC# | | One stop | | L + 6.00% | | 7.00% | | 11/2021 | | | 11,371 | | | | 11,211 | | | | 2.2 | | | | 11,371 | |
| Vendor Credentialing Service LLC(4) | | One stop | | L + 6.00% | | N/A(5) | | 11/2021 | | | - | | | | (1 | ) | | | - | | | | - | |
| Vitalyst, LLC# | | Senior loan | | L + 5.25% | | 6.50% | | 09/2017 | | | 100 | | | | 100 | | | | - | | | | 97 | |
| Vitalyst, LLC | | Senior loan | | P + 4.25% | | 7.75% | | 09/2017 | | | 1 | | | | 1 | | | | - | | | | - | |
| Workforce Software, LLC | | One stop | | L + 10.50% | | 4.50% cash/7.00% PIK | | 06/2021 | | | 21,221 | | | | 21,064 | | | | 4.1 | | | | 21,062 | |
| Workforce Software, LLC | | One stop | | L + 3.50% | | N/A(5) | | 06/2021 | | | - | | | | - | | | | - | | | | - | |
| | | | | | | | | | | | 176,408 | | | | 174,021 | | | | 34.2 | | | | 175,101 | |
See Notes to Consolidated Financial Statements
Golub Capital Investment Corporation and Subsidiaries
Consolidated Schedule of Investments (unaudited) -(continued)
June 30, 2016
(In thousands)
| | | | | Spread | | | | | | | | | | | | Percentage | | | | |
| | | | | Above | | | | Maturity | | Principal / Par($), | | | Amortized | | | of | | | Fair | |
| | | Investment Type | | Index(1) | | Interest Rate(2) | | Date | | Shares/Units(3) | | | Cost | | | Net Assets | | | Value | |
| | | | | | | | | | | | | | | | | | | | | |
| Electronics | | | | | | | | | | | | | | | | | | | | | | | | |
| Appriss Holdings, Inc.# | | Senior loan | | L + 4.75% | | 5.75% | | 11/2020 | | | 13,888 | | | | 13,757 | | | | 2.7 | | | | 13,888 | |
| Appriss Holdings, Inc. | | Senior loan | | L + 4.75% | | 5.75% | | 11/2020 | | | 703 | | | | 693 | | | | 0.1 | | | | 703 | |
| Compusearch Software Holdings, Inc.# | | Senior loan | | L + 4.50% | | 5.50% | | 05/2021 | | | 633 | | | | 632 | | | | 0.1 | | | | 633 | |
| Diligent Corporation# | | One stop | | L + 6.75% | | 7.75% | | 04/2022 | | | 32,100 | | | | 31,403 | | | | 6.2 | | | | 31,618 | |
| Diligent Corporation(4) | | One stop | | L + 6.75% | | N/A(5) | | 04/2022 | | | - | | | | (2 | ) | | | - | | | | (2 | ) |
| ECI Acquisition Holdings, Inc.# | | One stop | | L + 6.25% | | 7.25% | | 03/2019 | | | 7,167 | | | | 7,167 | | | | 1.5 | | | | 7,167 | |
| ECI Acquisition Holdings, Inc.# | | One stop | | L + 6.25% | | 7.25% | | 03/2019 | | | 464 | | | | 464 | | | | 0.1 | | | | 464 | |
| ECI Acquisition Holdings, Inc. | | One stop | | L + 6.25% | | N/A(5) | | 03/2019 | | | - | | | | - | | | | - | | | | - | |
| Gamma Technologies, LLC# | | One stop | | L + 5.50% | | 6.50% | | 06/2021 | | | 9,468 | | | | 9,389 | | | | 1.8 | | | | 9,468 | |
| Gamma Technologies, LLC(4) | | One stop | | L + 5.50% | | N/A(5) | | 06/2021 | | | - | | | | (1 | ) | | | - | | | | - | |
| Park Place Technologies LLC# | | One stop | | L + 5.25% | | 6.25% | | 06/2022 | | | 10,747 | | | | 10,600 | | | | 2.1 | | | | 10,747 | |
| Park Place Technologies LLC(4) | | One stop | | L + 5.25% | | N/A(5) | | 06/2022 | | | - | | | | (2 | ) | | | - | | | | - | |
| Sloan Company, Inc., The# | | One stop | | L + 8.50% | | 9.25% cash/0.25% PIK | | 04/2020 | | | 3,635 | | | | 3,583 | | | | 0.7 | | | | 3,381 | |
| Sloan Company, Inc., The(4) | | One stop | | L + 8.25% | | N/A(5) | | 04/2020 | | | - | | | | (1 | ) | | | - | | | | (4 | ) |
| Sovos Compliance Formerly Taxware, LLC# | | One stop | | L + 6.75% | | 7.75% | | 03/2022 | | | 31,950 | | | | 31,422 | | | | 6.2 | | | | 31,950 | |
| Sovos Compliance Formerly Taxware, LLC(4) | | One stop | | L + 6.75% | | N/A(5) | | 03/2022 | | | - | | | | (1 | ) | | | - | | | | - | |
| Sparta Holding Corporation# | | One stop | | L + 5.50% | | 6.50% | | 07/2020 | | | 695 | | | | 695 | | | | 0.1 | | | | 695 | |
| Sparta Holding Corporation | | One stop | | L + 5.50% | | N/A(5) | | 07/2020 | | | - | | | | - | | | | - | | | | - | |
| Syncsort Incorporated# | | One stop | | L + 5.50% | | 6.50% | | 11/2021 | | | 14,289 | | | | 14,032 | | | | 2.8 | | | | 14,289 | |
| Syncsort Incorporated(4) | | One stop | | L + 5.50% | | N/A(5) | | 11/2021 | | | - | | | | (2 | ) | | | - | | | | - | |
| | | | | | | | | | | | 125,739 | | | | 123,828 | | | | 24.4 | | | | 124,997 | |
| Grocery | | | | | | | | | | | | | | | | | | | | | | | | |
| AG Kings Holdings Inc.# | | One stop | | L + 6.25% | | 7.25% | | 04/2020 | | | 11,665 | | | | 11,542 | | | | 2.3 | | | | 11,665 | |
| AG Kings Holdings Inc.(4) | | One stop | | L + 6.25% | | N/A(5) | | 04/2020 | | | - | | | | (9 | ) | | | - | | | | - | |
| Teasdale Quality Foods, Inc.# | | Senior loan | | P + 3.75% | | 7.25% | | 10/2020 | | | 177 | | | | 173 | | | | - | | | | 173 | |
| Teasdale Quality Foods, Inc.# | | Senior loan | | L + 4.75% | | 5.75% | | 10/2020 | | | 131 | | | | 130 | | | | - | | | | 129 | |
| | | | | | | | | | | | 11,973 | | | | 11,836 | | | | 2.3 | | | | 11,967 | |
| Healthcare, Education and Childcare | | | | | | | | | | | | | | | | | | | | | | | | |
| Active Day, Inc.# | | One stop | | L + 6.00% | | 7.00% | | 12/2021 | | | 11,672 | | | | 11,487 | | | | 2.3 | | | | 11,672 | |
| Active Day, Inc.(4) | | One stop | | L + 6.00% | | N/A(5) | | 12/2021 | | | - | | | | (2 | ) | | | - | | | | - | |
| Active Day, Inc.(4) | | One stop | | L + 6.00% | | N/A(5) | | 12/2021 | | | - | | | | (33 | ) | | | - | | | | - | |
| ADCS Clinics Intermediate Holdings, LLC# | | One stop | | L + 5.75% | | 6.75% | | 05/2022 | | | 22,182 | | | | 21,747 | | | | 4.3 | | | | 21,960 | |
| ADCS Clinics Intermediate Holdings, LLC | | One stop | | L + 5.75% | | 6.75% | | 05/2022 | | | 110 | | | | 109 | | | | - | | | | 108 | |
| ADCS Clinics Intermediate Holdings, LLC(4) | | One stop | | L + 5.75% | | N/A(5) | | 05/2022 | | | - | | | | (5 | ) | | | - | | | | (2 | ) |
| ADCS Clinics Intermediate Holdings, LLC(4) | | One stop | | L + 5.75% | | N/A(5) | | 05/2022 | | | - | | | | (2 | ) | | | - | | | | (1 | ) |
| Advanced Pain Management Holdings, Inc.# | | Senior loan | | L + 5.00% | | 6.25% | | 02/2018 | | | 5,800 | | | | 5,796 | | | | 1.1 | | | | 5,742 | |
| Advanced Pain Management Holdings, Inc.# | | Senior loan | | L + 5.00% | | 6.25% | | 02/2018 | | | 397 | | | | 396 | | | | 0.1 | | | | 393 | |
| Advanced Pain Management Holdings, Inc.(4) | | Senior loan | | L + 5.00% | | N/A(5) | | 02/2018 | | | - | | | | - | | | | - | | | | (10 | ) |
| Agilitas USA, Inc.# | | Senior loan | | L + 4.00% | | 5.00% | | 10/2020 | | | 512 | | | | 508 | | | | 0.1 | | | | 507 | |
| Apothecary Products, LLC# | | Senior loan | | L + 4.00% | | 5.00% | | 02/2019 | | | 1,857 | | | | 1,857 | | | | 0.4 | | | | 1,839 | |
| Apothecary Products, LLC(4) | | Senior loan | | L + 4.25% | | N/A(5) | | 02/2019 | | | - | | | | - | | | | - | | | | (8 | ) |
| Aris Teleradiology Company, LLC | | Senior loan | | L + 4.75% | | 5.75% | | 03/2021 | | | 875 | | | | 866 | | | | 0.2 | | | | 875 | |
| Aris Teleradiology Company, LLC | | Senior loan | | L + 4.75% | | N/A(5) | | 03/2021 | | | - | | | | - | | | | - | | | | - | |
| Avalign Technologies, Inc.# | | Senior loan | | L + 4.50% | | 5.50% | | 07/2021 | | | 756 | | | | 753 | | | | 0.2 | | | | 756 | |
| BIORECLAMATIONIVT, LLC# | | One stop | | L + 6.25% | | 7.25% | | 01/2021 | | | 12,760 | | | | 12,558 | | | | 2.5 | | | | 12,760 | |
| BIORECLAMATIONIVT, LLC(4) | | One stop | | L + 6.25% | | N/A(5) | | 01/2021 | | | - | | | | (2 | ) | | | - | | | | - | |
| California Cryobank, LLC# | | One stop | | L + 5.50% | | 6.50% | | 08/2019 | | | 2,667 | | | | 2,667 | | | | 0.5 | | | | 2,667 | |
| California Cryobank, LLC | | One stop | | L + 5.50% | | 6.50% | | 08/2019 | | | 74 | | | | 74 | | | | - | | | | 74 | |
| California Cryobank, LLC | | One stop | | P + 4.25% | | 7.75% | | 08/2019 | | | 37 | | | | 37 | | | | - | | | | 37 | |
| Certara L.P.# | | One stop | | L + 6.25% | | 7.25% | | 12/2018 | | | 3,727 | | | | 3,723 | | | | 0.7 | | | | 3,727 | |
| Certara L.P. | | One stop | | L + 6.25% | | N/A(5) | | 12/2018 | | | - | | | | - | | | | - | | | | - | |
| CLP Healthcare Services, Inc.# | | Senior loan | | L + 5.25% | | 6.25% | | 12/2020 | | | 948 | | | | 939 | | | | 0.2 | | | | 948 | |
| CPI Buyer, LLC# | | Senior loan | | L + 4.50% | | 5.50% | | 08/2021 | | | 3,201 | | | | 3,164 | | | | 0.6 | | | | 3,137 | |
| DCA Investment Holding, LLC# | | One stop | | L + 5.25% | | 6.25% | | 07/2021 | | | 14,787 | | | | 14,623 | | | | 2.9 | | | | 14,787 | |
| DCA Investment Holding, LLC# | | One stop | | L + 5.25% | | 6.25% | | 07/2021 | | | 13,799 | | | | 13,597 | | | | 2.7 | | | | 13,799 | |
| DCA Investment Holding, LLC | | One stop | | P + 4.25% | | 7.75% | | 07/2021 | | | 858 | | | | 841 | | | | 0.2 | | | | 858 | |
| Deca Dental Management LLC | | One stop | | L + 6.25% | | 7.25% | | 07/2020 | | | 7,615 | | | | 7,522 | | | | 1.5 | | | | 7,615 | |
| Deca Dental Management LLC | | One stop | | L + 6.25% | | 7.25% | | 07/2020 | | | 926 | | | | 909 | | | | 0.2 | | | | 926 | |
| Deca Dental Management LLC | | One stop | | L + 6.25% | | 7.25% | | 07/2020 | | | 37 | | | | 36 | | | | - | | | | 37 | |
| Dental Holdings Corporation# | | One stop | | L + 5.50% | | 6.50% | | 02/2020 | | | 3,395 | | | | 3,363 | | | | 0.7 | | | | 3,395 | |
| Dental Holdings Corporation | | One stop | | L + 5.50% | | 6.50% | | 02/2020 | | | 326 | | | | 320 | | | | 0.1 | | | | 326 | |
| Dental Holdings Corporation | | One stop | | P + 4.25% | | 7.75% | | 02/2020 | | | 95 | | | | 90 | | | | - | | | | 95 | |
| Encore GC Acquisition, LLC# | | Senior loan | | L + 5.25% | | 6.25% | | 01/2020 | | | 2,135 | | | | 2,107 | | | | 0.4 | | | | 2,135 | |
| Encore GC Acquisition, LLC | | Senior loan | | P + 4.25% | | 7.75% | | 01/2020 | | | 74 | | | | 71 | | | | - | | | | 74 | |
| eSolutions, Inc.# | | One stop | | L + 6.50% | | 7.50% | | 03/2022 | | | 12,152 | | | | 12,009 | | | | 2.4 | | | | 12,152 | |
| eSolutions, Inc.(4) | | One stop | | L + 6.50% | | N/A(5) | | 03/2022 | | | - | | | | (1 | ) | | | - | | | | - | |
| Katena Holdings, Inc.# | | One stop | | L + 6.25% | | 7.25% | | 06/2021 | | | 4,579 | | | | 4,539 | | | | 0.9 | | | | 4,579 | |
| Katena Holdings, Inc.(4) | | One stop | | L + 6.25% | | N/A(5) | | 06/2021 | | | - | | | | (1 | ) | | | - | | | | - | |
| Katena Holdings, Inc.(4) | | One stop | | L + 6.25% | | N/A(5) | | 06/2021 | | | - | | | | (4 | ) | | | - | | | | - | |
| Lombart Brothers, Inc.# | | One stop | | L + 6.50% | | 7.50% | | 04/2022 | | | 3,271 | | | | 3,214 | | | | 0.6 | | �� | | 3,222 | |
| Lombart Brothers, Inc. | | One stop | | L + 6.50% | | 7.50% | | 04/2022 | | | 16 | | | | 15 | | | | - | | | | 15 | |
| Maverick Healthcare Group, LLC# | | Senior loan | | L + 9.50% | | 9.25% cash/2.00% PIK | | 04/2017 | | | 631 | | | | 627 | | | | 0.1 | | | | 631 | |
| Oliver Street Dermatology Holdings, LLC# | | One stop | | L + 6.50% | | 7.50% | | 05/2022 | | | 8,050 | | | | 7,900 | | | | 1.6 | | | | 7,930 | |
| Oliver Street Dermatology Holdings, LLC(4) | | One stop | | L + 6.50% | | N/A(5) | | 05/2022 | | | - | | | | (1 | ) | | | - | | | | (1 | ) |
| Oliver Street Dermatology Holdings, LLC(4) | | One stop | | L + 6.50% | | N/A(5) | | 05/2022 | | | - | | | | (3 | ) | | | - | | | | (2 | ) |
| PPT Management, LLC# | | One stop | | L + 5.00% | | 6.00% | | 04/2020 | | | 1,194 | | | | 1,183 | | | | 0.2 | | | | 1,194 | |
| PPT Management, LLC | | One stop | | L + 5.00% | | 6.00% | | 04/2020 | | | 454 | | | | 450 | | | | 0.1 | | | | 454 | |
| PPT Management, LLC | | One stop | | L + 5.00% | | 6.00% | | 04/2020 | | | 342 | | | | 339 | | | | 0.1 | | | | 342 | |
| Premise Health Holding Corp.# | | One stop | | L + 4.50% | | 5.50% | | 06/2020 | | | 2,012 | | | | 2,012 | | | | 0.4 | | | | 2,012 | |
| Premise Health Holding Corp. | | One stop | | L + 4.50% | | N/A(5) | | 06/2020 | | | - | | | | - | | | | - | | | | - | |
See Notes to Consolidated Financial Statements
Golub Capital Investment Corporation and Subsidiaries
Consolidated Schedule of Investments (unaudited) -(continued)
June 30, 2016
(In thousands)
| | | | | Spread | | | | | | | | | | | | Percentage | | | | |
| | | | | Above | | | | Maturity | | Principal / Par($), | | | Amortized | | | of | | | Fair | |
| | | Investment Type | | Index(1) | | Interest Rate(2) | | Date | | Shares/Units(3) | | | Cost | | | Net Assets | | | Value | |
| | | | | | | | | | | | | | | | | | | | | |
| Pyramid Healthcare, Inc.# | | One stop | | L + 5.75% | | 6.75% | | 08/2019 | | | 358 | | | | 355 | | | | 0.1 | | | | 358 | |
| Reliant Pro ReHab, LLC# | | Senior loan | | L + 5.00% | | 6.00% | | 12/2017 | | | 1,185 | | | | 1,182 | | | | 0.2 | | | | 1,185 | |
| Reliant Pro ReHab, LLC | | Senior loan | | P + 4.00% | | 7.50% | | 12/2017 | | | 23 | | | | 22 | | | | - | | | | 23 | |
| RXH Buyer Corporation# | | One stop | | L + 5.75% | | 6.75% | | 09/2021 | | | 11,276 | | | | 11,081 | | | | 2.1 | | | | 10,825 | |
| RXH Buyer Corporation | | One stop | | P + 4.75% | | 8.25% | | 09/2021 | | | 20 | | | | 17 | | | | - | | | | 12 | |
| RXH Buyer Corporation(4) | | One stop | | L + 5.75% | | N/A(5) | | 09/2021 | | | - | | | | (31 | ) | | | - | | | | (73 | ) |
| Southern Anesthesia and Surgical# | | One stop | | L + 5.50% | | 6.50% | | 11/2017 | | | 240 | | | | 240 | | | | - | | | | 240 | |
| Southern Anesthesia and Surgical# | | One stop | | L + 5.50% | | 6.50% | | 11/2017 | | | 118 | | | | 118 | | | | - | | | | 118 | |
| Southern Anesthesia and Surgical | | One stop | | L + 5.50% | | 6.50% | | 11/2017 | | | 27 | | | | 27 | | | | - | | | | 27 | |
| Spear Education, LLC# | | One stop | | L + 6.00% | | 7.00% | | 08/2019 | | | 3,579 | | | | 3,561 | | | | 0.7 | | | | 3,543 | |
| Spear Education, LLC | | One stop | | L + 6.00% | | 7.00% | | 08/2019 | | | 184 | | | | 182 | | | | - | | | | 181 | |
| Spear Education, LLC(4) | | One stop | | L + 6.00% | | N/A(5) | | 08/2019 | | | - | | | | (1 | ) | | | - | | | | (3 | ) |
| Summit Behavioral Holdings I, LLC# | | One stop | | L + 5.00% | | 6.00% | | 06/2021 | | | 4,189 | | | | 4,137 | | | | 0.8 | | | | 4,147 | |
| Summit Behavioral Holdings I, LLC(4) | | One stop | | L + 5.00% | | N/A(5) | | 06/2021 | | | - | | | | (1 | ) | | | - | | | | - | |
| Summit Behavioral Holdings I, LLC(4) | | One stop | | L + 5.00% | | N/A(5) | | 06/2021 | | | - | | | | (2 | ) | | | - | | | | (1 | ) |
| Surgical Information Systems, LLC# | | Senior loan | | L + 3.00% | | 4.00% | | 09/2018 | | | 179 | | | | 179 | | | | - | | | | 179 | |
| U.S. Anesthesia Partners, Inc.# | | One stop | | L + 5.00% | | 6.00% | | 12/2019 | | | 3,789 | | | | 3,789 | | | | 0.7 | | | | 3,789 | |
| | | | | | | | | | | | 169,490 | | | | 167,248 | | | | 32.9 | | | | 168,306 | |
| Home and Office Furnishings, Housewares, and Durable Consumer | | | | | | | | | | | | | | | | | | | | | | | | |
| 1A Smart Start LLC# | | Senior loan | | L + 4.75% | | 5.75% | | 02/2022 | | | 1,368 | | | | 1,356 | | | | 0.3 | | | | 1,365 | |
| Floor & Decor Outlets of America, Inc.# | | One stop | | L + 6.50% | | 7.75% | | 05/2019 | | | 1,143 | | | | 1,143 | | | | 0.2 | | | | 1,143 | |
| Plano Molding Company, LLC# | | One stop | | L + 6.00% | | 7.00% | | 05/2021 | | | 8,677 | | | | 8,607 | | | | 1.6 | | | | 8,157 | |
| | | | | | | | | | | | 11,188 | | | | 11,106 | | | | 2.1 | | | | 10,665 | |
| Hotels, Motels, Inns, and Gaming | | | | | | | | | | | | | | | | | | | | | | | | |
| Aimbridge Hospitality, LLC# | | Senior loan | | L + 4.50% | | 5.75% | | 10/2018 | | | 396 | | | | 389 | | | | 0.1 | | | | 396 | |
| | | | | | | | | | | | | | | | | | | | | | | | | |
| Insurance | | | | | | | | | | | | | | | | | | | | | | | | |
| Captive Resources Midco, LLC# | | One stop | | L + 5.75% | | 6.75% | | 06/2020 | | | 8,149 | | | | 8,066 | | | | 1.6 | | | | 8,149 | |
| Captive Resources Midco, LLC(4) | | One stop | | L + 5.75% | | N/A(5) | | 06/2020 | | | - | | | | (4 | ) | | | - | | | | - | |
| Captive Resources Midco, LLC(4) | | One stop | | L + 5.75% | | N/A(5) | | 06/2020 | | | - | | | | (10 | ) | | | - | | | | - | |
| Higginbotham Insurance Agency, Inc.# | | Senior loan | | L + 5.25% | | 6.25% | | 11/2021 | | | 1,122 | | | | 1,112 | | | | 0.2 | | | | 1,122 | |
| Internet Pipeline, Inc.# | | One stop | | L + 7.25% | | 8.25% | | 08/2022 | | | 10,488 | | | | 10,328 | | | | 2.1 | | | | 10,488 | |
| Internet Pipeline, Inc.(4) | | One stop | | L + 7.25% | | N/A(5) | | 08/2021 | | | - | | | | (1 | ) | | | - | | | | - | |
| RSC Acquisition, Inc.# | | Senior loan | | L + 5.25% | | 6.25% | | 11/2022 | | | 543 | | | | 539 | | | | 0.1 | | | | 543 | |
| | | | | | | | | | | | 20,302 | | | | 20,030 | | | | 4.0 | | | | 20,302 | |
| Leisure, Amusement, Motion Pictures and Entertainment | | | | | | | | | | | | | | | | | | | | | | | | |
| Competitor Group, Inc.# | | One stop | | L + 9.25% | | 5.00% cash/5.50% PIK | | 11/2018 | | | 424 | | | | 381 | | | | 0.1 | | | | 392 | |
| Competitor Group, Inc. | | One stop | | L + 9.25% | | 5.00% cash/5.50% PIK | | 11/2018 | | | 49 | | | | 45 | | | | - | | | | 46 | |
| NFD Operating, LLC# | | One stop | | L + 7.00% | | 8.25% | | 06/2021 | | | 2,192 | | | | 2,159 | | | | 0.4 | | | | 2,170 | |
| NFD Operating, LLC | | One stop | | L + 7.00% | | N/A(5) | | 06/2021 | | | - | | | | - | | | | - | | | | - | |
| NFD Operating, LLC(4) | | One stop | | L + 7.00% | | N/A(5) | | 06/2021 | | | - | | | | (2 | ) | | | - | | | | (1 | ) |
| Teaching Company, The# | | One stop | | L + 6.25% | | 7.25% | | 08/2020 | | | 12,240 | | | | 12,164 | | | | 2.4 | | | | 12,240 | |
| Teaching Company, The(4) | | One stop | | L + 6.25% | | N/A(5) | | 08/2020 | | | - | | | | (1 | ) | | | - | | | | - | |
| Titan Fitness, LLC# | | One stop | | L + 7.00% | | 8.25% | | 09/2019 | | | 1,979 | | | | 1,979 | | | | 0.4 | | | | 1,979 | |
| Titan Fitness, LLC | | One stop | | L + 7.00% | | 8.25% | | 09/2019 | | | 261 | | | | 261 | | | | 0.1 | | | | 261 | |
| Titan Fitness, LLC | | One stop | | L + 7.00% | | 8.25% | | 09/2019 | | | 87 | | | | 81 | | | | - | | | | 87 | |
| Titan Fitness, LLC | | One stop | | P + 5.75% | | 9.25% | | 09/2019 | | | 63 | | | | 63 | | | | - | | | | 63 | |
| | | | | | | | | | | | 17,295 | | | | 17,130 | | | | 3.4 | | | | 17,237 | |
| Mining, Steel, Iron and Non-Precious Metals | | | | | | | | | | | | | | | | | | | | | | | | |
| Benetech, Inc.# | | One stop | | L + 9.00% | | 10.25% | | 10/2017 | | | 195 | | | | 195 | | | | - | | | | 171 | |
| Benetech, Inc. | | One stop | | P + 7.75% | | 11.25% | | 10/2017 | | | 7 | | | | 7 | | | | - | | | | 1 | |
| | | | | | | | | | | | 202 | | | | 202 | | | | - | | | | 172 | |
| Oil and Gas Total | | | | | | | | | | | | | | | | | | | | | | | | |
| Drilling Info, Inc.# | | One stop | | L + 5.96% | | 6.96% | | 06/2018 | | | 2,324 | | | | 2,320 | | | | 0.5 | | | | 2,324 | |
| Drilling Info, Inc.(4) | | One stop | | L + 5.00% | | N/A(5) | | 06/2018 | | | - | | | | (8 | ) | | | - | | | | - | |
| | | | | | | | | | | | 2,324 | | | | 2,312 | | | | 0.5 | | | | 2,324 | |
| Personal and Non-Durable Consumer Products | | | | | | | | | | | | | | | | | | | | | | | | |
| Georgica Pine Clothiers, LLC# | | One stop | | L + 5.50% | | 6.50% | | 11/2021 | | | 4,935 | | | | 4,890 | | | | 0.9 | | | | 4,935 | |
| Georgica Pine Clothiers, LLC(4) | | One stop | | L + 5.50% | | N/A(5) | | 11/2021 | | | - | | | | (1 | ) | | | - | | | | - | |
| Massage Envy, LLC# | | One stop | | L + 7.25% | | 8.50% | | 09/2018 | | | 986 | | | | 986 | | | | 0.2 | | | | 986 | |
| Massage Envy, LLC | | One stop | | L + 7.25% | | N/A(5) | | 09/2018 | | | - | | | | - | | | | - | | | | - | |
| Orthotics Holdings, Inc# | | One stop | | L + 5.00% | | 6.00% | | 02/2020 | | | 3,742 | | | | 3,707 | | | | 0.7 | | | | 3,554 | |
| Orthotics Holdings, Inc#(7) | | One stop | | L + 5.00% | | 6.00% | | 02/2020 | | | 613 | | | | 608 | | | | 0.1 | | | | 583 | |
| Orthotics Holdings, Inc | | One stop | | L + 5.00% | | 6.00% | | 02/2020 | | | 62 | | | | 57 | | | | - | | | | 34 | |
| Orthotics Holdings, Inc(4) | | One stop | | L + 5.00% | | N/A(5) | | 02/2020 | | | - | | | | (1 | ) | | | - | | | | (3 | ) |
| Orthotics Holdings, Inc(4) | | One stop | | L + 5.00% | | N/A(5) | | 02/2020 | | | - | | | | (6 | ) | | | - | | | | (31 | ) |
| Team Technologies Acquisition Company# | | Senior loan | | L + 5.00% | | 6.25% | | 12/2017 | | | 288 | | | | 288 | | | | 0.1 | | | | 285 | |
| Team Technologies Acquisition Company# | | Senior loan | | L + 5.50% | | 6.75% | | 12/2017 | | | 53 | | | | 53 | | | | - | | | | 53 | |
| Team Technologies Acquisition Company | | Senior loan | | L + 5.00% | | N/A(5) | | 12/2017 | | | - | | | | - | | | | - | | | | - | |
| | | | | | | | | | | | 10,679 | | | | 10,581 | | | | 2.0 | | | | 10,396 | |
| Personal, Food and Miscellaneous Services | | | | | | | | | | | | | | | | | | | | | | | | |
| California Pizza Kitchen# | | Senior loan | | L + 4.25% | | 5.25% | | 03/2018 | | | 465 | | | | 456 | | | | 0.1 | | | | 435 | |
| Clarkson Eyecare LLC# | | One stop | | L + 6.25% | | 7.25% | | 04/2021 | | | 2,770 | | | | 2,742 | | | | 0.5 | | | | 2,742 | |
| Clarkson Eyecare LLC | | One stop | | L + 6.25% | | 7.25% | | 04/2021 | | | 2,549 | | | | 2,525 | | | | 0.5 | | | | 2,523 | |
| Clarkson Eyecare LLC | | One stop | | L + 6.25% | | 7.25% | | 04/2021 | | | 671 | | | | 671 | | | | 0.1 | | | | 665 | |
| Clarkson Eyecare LLC | | One stop | | L + 6.25% | | 7.25% | | 04/2021 | | | 495 | | | | 484 | | | | 0.1 | | | | 490 | |
| Clarkson Eyecare LLC | | One stop | | L + 6.25% | | 7.25% | | 04/2021 | | | 372 | | | | 192 | | | | 0.1 | | | | 248 | |
| Clarkson Eyecare LLC | | One stop | | L + 6.25% | | 7.25% | | 04/2021 | | | 312 | | | | 307 | | | | 0.1 | | | | 306 | |
| Ignite Restaurant Group, Inc.# | | One stop | | L + 7.00% | | 8.00% | | 02/2019 | | | 1,102 | | | | 1,102 | | | | 0.2 | | | | 1,102 | |
| PetVet Care Centers LLC | | Senior loan | | L + 4.75% | | 5.75% | | 12/2020 | | | 2,424 | | | | 2,401 | | | | 0.5 | | | | 2,424 | |
See Notes to Consolidated Financial Statements
Golub Capital Investment Corporation and Subsidiaries
Consolidated Schedule of Investments (unaudited) -(continued)
June 30, 2016
(In thousands)
| | | | | Spread | | | | | | | | | | | | Percentage | | | | |
| | | | | Above | | | | Maturity | | Principal / Par($), | | | Amortized | | | of | | | Fair | |
| | | Investment Type | | Index(1) | | Interest Rate(2) | | Date | | Shares/Units(3) | | | Cost | | | Net Assets | | | Value | |
| | | | | | | | | | | | | | | | | | | | | |
| PetVet Care Centers LLC(4) | | Senior loan | | L + 4.75% | | N/A(5) | | 12/2020 | | | - | | | | (31 | ) | | | - | | | | - | |
| R.G. Barry Corporation# | | Senior loan | | L + 5.00% | | 6.00% | | 09/2019 | | | 1,482 | | | | 1,482 | | | | 0.3 | | | | 1,467 | |
| Vetcor Professional Practices LLC(4) | | One stop | | L + 6.25% | | N/A(5) | | 04/2021 | | | - | | | | (47 | ) | | | - | | | | (24 | ) |
| Vetcor Professional Practices LLC# | | One stop | | L + 6.25% | | 7.25% | | 04/2021 | | | 27,624 | | | | 27,095 | | | | 5.3 | | | | 27,347 | |
| Vetcor Professional Practices LLC# | | One stop | | L + 6.25% | | 7.25% | | 04/2021 | | | 636 | | | | 629 | | | | 0.1 | | | | 630 | |
| Vetcor Professional Practices LLC# | | One stop | | L + 6.25% | | 7.25% | | 04/2021 | | | 190 | | | | 188 | | | | - | | | | 188 | |
| Vetcor Professional Practices LLC | | One stop | | L + 6.25% | | 7.25% | | 04/2021 | | | 63 | | | | 58 | | | | - | | | | 60 | |
| Vetcor Professional Practices LLC(4) | | One stop | | L + 6.25% | | N/A(5) | | 04/2021 | | | - | | | | (2 | ) | | | - | | | | (2 | ) |
| Vetcor Professional Practices LLC(4) | | One stop | | L + 6.25% | | N/A(5) | | 04/2021 | | | - | | | | (34 | ) | | | - | | | | (16 | ) |
| Veterinary Specialists of North America, LLC# | | One stop | | L + 5.00% | | 6.00% | | 11/2020 | | | 1,390 | | | | 1,379 | | | | 0.3 | | | | 1,390 | |
| Veterinary Specialists of North America, LLC | | One stop | | L + 5.00% | | 6.00% | | 11/2020 | | | 33 | | | | 29 | | | | - | | | | 33 | |
| Veterinary Specialists of North America, LLC | | One stop | | L + 5.00% | | N/A(5) | | 11/2020 | | | - | | | | - | | | | - | | | | - | |
| | | | | | | | | | | | 42,578 | | | | 41,626 | | | | 8.2 | | | | 42,008 | |
| Printing and Publishing | | | | | | | | | | | | | | | | | | | | | | | | |
| Market Track, LLC# | | One stop | | L + 7.00% | | 8.00% | | 10/2019 | | | 19,670 | | | | 19,434 | | | | 3.8 | | | | 19,670 | |
| Market Track, LLC# | | One stop | | L + 7.00% | | 8.00% | | 10/2019 | | | 4,996 | | | | 4,977 | | | | 1.0 | | | | 4,996 | |
| Market Track, LLC# | | One stop | | L + 7.00% | | 8.00% | | 10/2019 | | | 2,268 | | | | 2,235 | | | | 0.4 | | | | 2,268 | |
| Market Track, LLC | | One stop | | L + 7.00% | | 8.00% | | 10/2019 | | | 858 | | | | 838 | | | | 0.2 | | | | 858 | |
| Market Track, LLC# | | One stop | | L + 7.00% | | 8.00% | | 10/2019 | | | 380 | | | | 378 | | | | 0.1 | | | | 380 | |
| Market Track, LLC# | | One stop | | L + 7.00% | | 8.00% | | 10/2019 | | | 374 | | | | 371 | | | | 0.1 | | | | 374 | |
| Market Track, LLC | | One stop | | L + 7.00% | | 8.00% | | 10/2019 | | | 224 | | | | 223 | | | | - | | | | 224 | |
| | | | | | | | | | | | 28,770 | | | | 28,456 | | | | 5.6 | | | | 28,770 | |
| Retail Stores | | | | | | | | | | | | | | | | | | | | | | | | |
| CVS Holdings I, LP# | | One stop | | L + 6.25% | | 7.25% | | 08/2021 | | | 13,174 | | | | 12,948 | | | | 2.6 | | | | 13,174 | |
| CVS Holdings I, LP# | | One stop | | L + 6.25% | | 7.25% | | 08/2021 | | | 1,253 | | | | 1,242 | | | | 0.3 | | | | 1,253 | |
| CVS Holdings I, LP# | | One stop | | L + 6.25% | | 7.25% | | 08/2021 | | | 1,238 | | | | 1,216 | | | | 0.2 | | | | 1,238 | |
| CVS Holdings I, LP# | | One stop | | L + 6.25% | | 7.25% | | 08/2021 | | | 728 | | | | 722 | | | | 0.1 | | | | 728 | |
| CVS Holdings I, LP# | | One stop | | L + 6.25% | | 7.25% | | 08/2021 | | | 583 | | | | 577 | | | | 0.1 | | | | 583 | |
| CVS Holdings I, LP# | | One stop | | L + 6.25% | | 7.25% | | 08/2021 | | | 284 | | | | 282 | | | | 0.1 | | | | 284 | |
| CVS Holdings I, LP | | One stop | | L + 6.25% | | 7.25% | | 08/2021 | | | 99 | | | | 91 | | | | - | | | | 99 | |
| CVS Holdings I, LP | | One stop | | P + 5.25% | | 8.75% | | 08/2020 | | | 23 | | | | 19 | | | | - | | | | 23 | |
| Cycle Gear, Inc.# | | One stop | | L + 6.50% | | 7.50% | | 01/2020 | | | 7,668 | | | | 7,574 | | | | 1.5 | | | | 7,668 | |
| Cycle Gear, Inc.(4) | | One stop | | L + 6.50% | | N/A(5) | | 01/2020 | | | - | | | | (10 | ) | | | - | | | | - | |
| Cycle Gear, Inc.(4) | | One stop | | L + 6.50% | | N/A(5) | | 01/2020 | | | - | | | | (11 | ) | | | - | | | | - | |
| DTLR, Inc. # | | One stop | | L + 6.50% | | 7.50% | | 10/2020 | | | 9,803 | | | | 9,719 | | | | 1.9 | | | | 9,803 | |
| Elite Sportswear, L.P.# | | Senior loan | | L + 5.00% | | 6.00% | | 03/2020 | | | 1,260 | | | | 1,251 | | | | 0.3 | | | | 1,241 | |
| Elite Sportswear, L.P.# | | Senior loan | | L + 5.25% | | 6.25% | | 03/2020 | | | 648 | | | | 642 | | | | 0.1 | | | | 642 | |
| Elite Sportswear, L.P. | | Senior loan | | P + 3.75% | | 7.25% | | 03/2020 | | | 79 | | | | 76 | | | | - | | | | 74 | |
| Express Oil Change, LLC | | Senior loan | | L + 5.00% | | 6.02% | | 12/2017 | | | 56 | | | | 55 | | | | - | | | | 54 | |
| Feeders Supply Company, LLC# | | One stop | | L + 5.75% | | 6.75% | | 04/2021 | | | 4,111 | | | | 4,062 | | | | 0.8 | | | | 4,070 | |
| Feeders Supply Company, LLC | | Subordinated debt | | N/A | | 12.50% cash/7.00% PIK | | 04/2021 | | | 39 | | | | 39 | | | | - | | | | 39 | |
| Feeders Supply Company, LLC(4) | | One stop | | L + 5.75% | | N/A(5) | | 04/2021 | | | - | | | | (1 | ) | | | - | | | | - | |
| Marshall Retail Group, LLC, The# | | One stop | | L + 6.00% | | 7.00% | | 08/2020 | | | 3,206 | | | | 3,206 | | | | 0.6 | | | | 2,950 | |
| Marshall Retail Group, LLC, The | | One stop | | L + 6.00% | | 7.00% | | 08/2019 | | | 280 | | | | 280 | | | | 0.1 | | | | 234 | |
| Marshall Retail Group, LLC, The(4) | | One stop | | L + 6.00% | | N/A(5) | | 08/2020 | | | - | | | | - | | | | - | | | | (19 | ) |
| Mills Fleet Farm Group LLC# | | One stop | | L + 5.50% | | 6.50% | | 02/2022 | | | 30,662 | | | | 29,755 | | | | 6.0 | | | | 30,662 | |
| RCPSI Corporation# | | One stop | | L + 5.75% | | 6.75% | | 04/2021 | | | 10,376 | | | | 10,207 | | | | 2.0 | | | | 10,376 | |
| RCPSI Corporation | | One stop | | L + 5.75% | | 7.17% | | 04/2020 | | | 30 | | | | 27 | | | | - | | | | 30 | |
| Sneaker Villa, Inc.# | | One stop | | L + 7.75% | | 8.75% | | 12/2020 | | | 173 | | | | 172 | | | | - | | | | 173 | |
| Specialty Commerce Corp.# | | One stop | | L + 6.00% | | 7.50% | | 07/2017 | | | 95 | | | | 95 | | | | - | | | | 95 | |
| Specialty Commerce Corp. | | One stop | | L + 6.00% | | N/A(5) | | 07/2017 | | | - | | | | - | | | | - | | | | - | |
| | | | | | | | | | | | 85,868 | | | | 84,235 | | | | 16.7 | | | | 85,474 | |
| Telecommunications | | | | | | | | | | | | | | | | | | | | | | | | |
| Hosting.com Inc.# | | Senior loan | | L + 4.50% | | 5.75% | | 12/2017 | | | 610 | | | | 610 | | | | 0.1 | | | | 610 | |
| Hosting.com Inc. | | Senior loan | | L + 4.50% | | 5.75% | | 12/2017 | | | 70 | | | | 70 | | | | - | | | | 70 | |
| Wilcon Operations LLC(4) | | One stop | | L + 6.00% | | N/A(5) | | 10/2018 | | | - | | | | (27 | ) | | | - | | | | (18 | ) |
| Wilcon Operations LLC# | | One stop | | L + 6.00% | | 7.00% | | 10/2018 | | | 2,725 | | | | 2,711 | | | | 0.5 | | | | 2,698 | |
| Wilcon Operations LLC | | One stop | | L + 6.00% | | 7.00% | | 10/2018 | | | 866 | | | | 866 | | | | 0.2 | | | | 855 | |
| Wilcon Operations LLC# | | One stop | | L + 6.00% | | 7.00% | | 10/2018 | | | 415 | | | | 411 | | | | 0.1 | | | | 411 | |
| Wilcon Operations LLC | | One stop | | L + 6.00% | | 7.00% | | 10/2018 | | | 161 | | | | 157 | | | | - | | | | 159 | |
| | | | | | | | | | | | 4,847 | | | | 4,798 | | | | 0.9 | | | | 4,785 | |
| Textile and Leather | | | | | | | | | | | | | | | | | | | | | | | | |
| 5.11, Inc.# | | Senior loan | | L + 5.00% | | 6.00% | | 02/2020 | | | 2,629 | | | | 2,622 | | | | 0.5 | | | | 2,629 | |
| SHO Holding I Corporation# | | Senior loan | | L + 5.00% | | 6.00% | | 10/2022 | | | 1,774 | | | | 1,732 | | | | 0.4 | | | | 1,774 | |
| SHO Holding I Corporation(4) | | Senior loan | | L + 4.00% | | N/A(5) | | 10/2021 | | | - | | | | (1 | ) | | | - | | | | - | |
| | | | | | | | | | | | 4,403 | | | | 4,353 | | | | 0.9 | | | | 4,403 | |
| Utilities | | | | | | | | | | | | | | | | | | | | | | | | |
| Arcos, LLC# | | One stop | | L + 6.50% | | 7.50% | | 02/2021 | | | 3,731 | | | | 3,697 | | | | 0.7 | | | | 3,731 | |
| Arcos, LLC | | One stop | | L + 6.50% | | N/A(5) | | 02/2021 | | | - | | | | - | | | | - | | | | - | |
| PowerPlan Holdings, Inc.# | | Senior loan | | L + 5.25% | | 6.25% | | 02/2022 | | | 850 | | | | 834 | | | | 0.2 | | | | 850 | |
| | | | | | | | | | | | 4,581 | | | | 4,531 | | | | 0.9 | | | | 4,581 | |
| | | | | | | | | | | | | | | | | | | | | | | | | |
| Total non-controlled/non-affiliate company debt investments | | | | $ | 860,174 | | | $ | 848,036 | | | | 166.6 | % | | $ | 852,890 | |
See Notes to Consolidated Financial Statements
Golub Capital Investment Corporation and Subsidiaries
Consolidated Schedule of Investments (unaudited) -(continued)
June 30, 2016
(In thousands)
| | | | | Spread | | | | | | | | | | | | Percentage | | | | |
| | | | | Above | | | | Maturity | | Principal / Par($), | | | Amortized | | | of | | | Fair | |
| | | Investment Type | | Index(1) | | Interest Rate(2) | | Date | | Shares/Units(3) | | | Cost | | | Net Assets | | | Value | |
| | | | | | | | | | | | | | | | | | | | | |
| Equity investments(9)(10) | | | | | | | | | | | | | | | | | | | | | | | | |
| Automobile | | | | | | | | | | | | | | | | | | | | | | | | |
| Polk Acquisition Corp. | | LP interest | | N/A | | N/A | | N/A | | | - | | | $ | 401 | | | | 0.1 | % | | $ | 401 | |
| | | | | | | | | | | | | | | | | | | | | | | | | |
| Beverage, Food and Tobacco | | | | | | | | | | | | | | | | | | | | | | | | |
| Hopdoddy Holdings, LLC | | LLC units | | N/A | | N/A | | N/A | | | 17 | | | | 84 | | | | - | | | | 34 | |
| Hopdoddy Holdings, LLC | | LLC units | | N/A | | N/A | | N/A | | | 8 | | | | 24 | | | | - | | | | 10 | |
| Purfoods, LLC | | LLC interest | | N/A | | N/A | | N/A | | | 355 | | | | 355 | | | | 0.1 | | | | 355 | |
| United Craft Brews LLC | | LP interest | | N/A | | N/A | | N/A | | | - | | | | 293 | | | | 0.1 | | | | 293 | |
| | | | | | | | | | | | | | | | 756 | | | | 0.2 | | | | 692 | |
| Chemicals, Plastics and Rubber | | | | | | | | | | | | | | | | | | | | | | | | |
| Flexan, LLC | | Preferred stock | | N/A | | N/A | | N/A | | | - | | | | 32 | | | | - | | | | 36 | |
| Flexan, LLC | | Common stock | | N/A | | N/A | | N/A | | | - | | | | - | | | | - | | | | 2 | |
| | | | | | | | | | | | | | | | 32 | | | | - | | | | 38 | |
| Diversified/Conglomerate Manufacturing | | | | | | | | | | | | | | | | | | | | | | | | |
| ICCN Acquisition Corp. | | Preferred stock | | N/A | | N/A | | N/A | | | - | | | | 259 | | | | - | | | | 107 | |
| ICCN Acquisition Corp. | | Common stock | | N/A | | N/A | | N/A | | | - | | | | - | | | | - | | | | - | |
| | | | | | | | | | | | | | | | 259 | | | | - | | | | 107 | |
| Diversified/Conglomerate Service | | | | | | | | | | | | | | | | | | | | | | | | |
| Actiance, Inc. | | Warrant | | N/A | | N/A | | N/A | | | 194 | | | | 46 | | | | - | | | | 48 | |
| Agility Recovery Solutions Inc. | | Preferred stock | | N/A | | N/A | | N/A | | | 30 | | | | 152 | | | | - | | | | 229 | |
| Bomgar Corporation | | Common stock | | N/A | | N/A | | N/A | | | 1 | | | | 620 | | | | 0.1 | | | | 620 | |
| Bomgar Corporation | | Common stock | | N/A | | N/A | | N/A | | | 415 | | | | 6 | | | | - | | | | 6 | |
| HealthcareSource HR, Inc. | | LLC interest | | N/A | | N/A | | N/A | | | - | | | | 165 | | | | - | | | | 161 | |
| Host Analytics, Inc. | | Warrant | | N/A | | N/A | | N/A | | | 80 | | | | - | | | | - | | | | 34 | |
| Quickbase, Inc. | | Common stock | | N/A | | N/A | | N/A | | | 615 | | | | 615 | | | | 0.1 | | | | 615 | |
| Steelwedge Software, Inc. | | Warrant | | N/A | | N/A | | N/A | | | 29,443 | | | | 61 | | | | - | | | | 68 | |
| TA MHI Buyer, Inc. | | Preferred stock | | N/A | | N/A | | N/A | | | - | | | | 163 | | | | - | | | | 186 | |
| Workforce Software, LLC | | LLC units | | N/A | | N/A | | N/A | | | 1,309 | | | | 1,309 | | | | 0.3 | | | | 1,309 | |
| | | | | | | | | | | | | | | | 3,137 | | | | 0.5 | | | | 3,276 | |
| Electronics | | | | | | | | | | | | | | | | | | | | | | | | |
| Diligent Corporation | | Preferred stock | | N/A | | N/A | | N/A | | | 535 | | | | 535 | | | | 0.1 | | | | 535 | |
| Gamma Technologies, LLC | | LLC units | | N/A | | N/A | | N/A | | | 1 | | | | 82 | | | | - | | | | 79 | |
| SEI, Inc. | | LLC units | | N/A | | N/A | | N/A | | | 207 | | | | 207 | | | | 0.1 | | | | 231 | |
| Sloan Company, Inc., The | | LLC units | | N/A | | N/A | | N/A | | | - | | | | 59 | | | | - | | | | - | |
| Sloan Company, Inc., The | | LLC units | | N/A | | N/A | | N/A | | | 1 | | | | 7 | | | | - | | | | - | |
| Syncsort Incorporated | | Preferred stock | | N/A | | N/A | | N/A | | | 78 | | | | 194 | | | | 0.1 | | | | 226 | |
| | | | | | | | | | | | | | | | 1,084 | | | | 0.3 | | | | 1,071 | |
| Healthcare, Education and Childcare | | | | | | | | | | | | | | | | | | | | | | | | |
| Active Day, Inc. | | LLC interest | | N/A | | N/A | | N/A | | | 1 | | | | 529 | | | | 0.1 | | | | 506 | |
| ADCS Clinics Intermediate Holdings, LLC | | Preferred stock | | N/A | | N/A | | N/A | | | 1 | | | | 596 | | | | 0.1 | | | | 596 | |
| ADCS Clinics Intermediate Holdings, LLC | | Common stock | | N/A | | N/A | | N/A | | | - | | | | 6 | | | | - | | | | 6 | |
| BIORECLAMATIONIVT, LLC | | LLC units | | N/A | | N/A | | N/A | | | - | | | | 323 | | | | 0.1 | | | | 323 | |
| DCA Investment Holding, LLC | | LLC units | | N/A | | N/A | | N/A | | | 5,253 | | | | 525 | | | | 0.1 | | | | 562 | |
| DCA Investment Holding, LLC | | LLC units | | N/A | | N/A | | N/A | | | 53 | | | | 5 | | | | - | | | | 53 | |
| Deca Dental Management LLC | | LLC units | | N/A | | N/A | | N/A | | | 651 | | | | 651 | | | | 0.1 | | | | 684 | |
| Dental Holdings Corporation | | LLC units | | N/A | | N/A | | N/A | | | 345 | | | | 345 | | | | 0.1 | | | | 466 | |
| Encore GC Acquisition, LLC | | LLC units | | N/A | | N/A | | N/A | | | 8 | | | | 81 | | | | - | | | | 89 | |
| Encore GC Acquisition, LLC | | LLC units | | N/A | | N/A | | N/A | | | 8 | | | | - | | | | - | | | | 16 | |
| Katena Holdings, Inc. | | LLC units | | N/A | | N/A | | N/A | | | - | | | | 205 | | | | - | | | | 202 | |
| Lombart Brothers, Inc. | | Common stock | | N/A | | N/A | | N/A | | | - | | | | 99 | | | | - | | | | 99 | |
| Oliver Street Dermatology Holdings, LLC | | LLC units | | N/A | | N/A | | N/A | | | - | | | | 218 | | | | 0.1 | | | | 218 | |
| RXH Buyer Corporation | | LP interest | | N/A | | N/A | | N/A | | | 4 | | | | 443 | | | | 0.1 | | | | 344 | |
| | | | | | | | | | | | | | | | 4,026 | | | | 0.8 | | | | 4,164 | |
| Insurance | | | | | | | | | | | | | | | | | | | | | | | | |
| Internet Pipeline, Inc. | | Preferred stock | | N/A | | N/A | | N/A | | | - | | | | 207 | | | | 0.1 | | | | 233 | |
| Internet Pipeline, Inc. | | Common stock | | N/A | | N/A | | N/A | | | 90 | | | | 2 | | | | - | | | | 70 | |
| | | | | | | | | | | | | | | | 209 | | | | 0.1 | | | | 303 | |
| Leisure, Amusement, Motion Pictures, Entertainment | | | | | | | | | | | | | | | | | | | | | | | | |
| Competitor Group, Inc.# | | Preferred stock | | N/A | | N/A | | N/A | | | - | | | | 184 | | | | - | | | | 5 | |
| Competitor Group, Inc.# | | Common stock | | N/A | | N/A | | N/A | | | 1 | | | | - | | | | - | | | | - | |
| | | | | | | | | | | | | | | | 184 | | | | - | | | | 5 | |
| Personal and Non Durable Consumer Products | | | | | | | | | | | | | | | | | | | | | | | | |
| Georgica Pine Clothiers, LLC | | LLC units | | N/A | | N/A | | N/A | | | 9 | | | | 91 | | | | - | | | | 100 | |
| | | | | | | | | | | | | | | | | | | | | | | | | |
| Personal, Food and Miscellaneous Services | | | | | | | | | | | | | | | | | | | | | | | | |
| Clarkson Eyecare LLC | | LLC units | | N/A | | N/A | | N/A | | | - | | | | 63 | | | | - | | | | 104 | |
| Community Veterinary Partners, LLC | | Common stock | | N/A | | N/A | | N/A | | | 1 | | | | 98 | | | | - | | | | 116 | |
| Vetcor Professional Practices LLC | | LLC units | | N/A | | N/A | | N/A | | | 498 | | | | 341 | | | | 0.1 | | | | 341 | |
| Vetcor Professional Practices LLC | | LLC units | | N/A | | N/A | | N/A | | | 55 | | | | 55 | | | | 0.1 | | | | 294 | |
| | | | | | | | | | | | | | | | 557 | | | | 0.2 | | | | 855 | |
| Printing and Publishing | | | | | | | | | | | | | | | | | | | | | | | | |
| Brandmuscle, Inc. | | LLC interest | | N/A | | N/A | | N/A | | | - | | | | 207 | | | | 0.1 | | | | 222 | |
| | | | | | | | | | | | | | | | 207 | | | | 0.1 | | | | 222 | |
| Retail Stores | | | | | | | | | | | | | | | | | | | | | | | | |
| Cycle Gear, Inc. | | LLC units | | N/A | | N/A | | N/A | | | 8 | | | | 111 | | | | - | | | | 154 | |
| Elite Sportswear, L.P. | | LLC interest | | N/A | | N/A | | N/A | | | - | | | | 37 | | | | - | | | | 46 | |
| Feeders Supply Company, LLC | | Preferred stock | | N/A | | N/A | | N/A | | | 1 | | | | 145 | | | | - | | | | 145 | |
| RCPSI Corporation | | LLC interest | | N/A | | N/A | | N/A | | | 222 | | | | 222 | | | | - | | | | 204 | |
| | | | | | | | | | | | | | | | 515 | | | | - | | | | 549 | |
See Notes to Consolidated Financial Statements
Golub Capital Investment Corporation and Subsidiaries
Consolidated Schedule of Investments (unaudited) -(continued)
June 30, 2016
(In thousands)
| | | | | Spread Above | | | | Maturity | | Principal / Par($), | | | Amortized | | | Percentage of | | | Fair | |
| | | Investment Type | | Index(1) | | Interest Rate(2) | | Date | | Shares/Units(3) | | | Cost | | | Net Assets | | | Value | |
| | | | | | | | | | | | | | | | | | | | | |
| Utilities | | | | | | | | | | | | | | | | | | | | | | | | |
| PowerPlan Holdings, Inc. | | Common stock | | N/A | | N/A | | N/A | | | - | | | | 135 | | | | - | | | | 152 | |
| PowerPlan Holdings, Inc. | | Common stock | | N/A | | N/A | | N/A | | | 68 | | | | 1 | | | | - | | | | 62 | |
| | | | | | | | | | | | | | | | 136 | | | | - | | | | 214 | |
| | | | | | | | | | | | | | | | | | | | | | | | | |
| Total non-controlled/non-affiliate company equity investments | | | | | | | | | | | | | | $ | 11,594 | | | | 2.3 | % | | $ | 11,997 | |
| | | | | | | | | | | | | | | | | | | | | | | | | |
| Total non-controlled/non-affiliate company investments | | | | | | | | | | $ | 860,174 | | | $ | 859,631 | | | | 168.9 | % | | $ | 864,887 | |
| | | | | | | | | | | | | | | | | | | | | | | | | |
| Controlled affiliate company investments(11) | | | | | | | | | | | | | | | | | | | | | | |
| Debt investments | | | | | | | | | | | | | | | | | | | | | | | | |
| Investment Funds and Vehicles | | | | | | | | | | | | | | | | | | | | | | | | |
| GCIC Senior Loan Fund LLC(7) | | Subordinated debt | | L + 8.00% | | 8.44% | | 12/2021 | | $ | 34,917 | | | $ | 34,917 | | | | 6.8 | % | | $ | 34,567 | |
| | | | | | | | | | | | | | | | | | | | | | | | | |
| Total controlled affiliate company debt investments | | | | | | | | | | $ | 34,917 | | | $ | 34,917 | | | | 6.8 | % | | $ | 34,567 | |
| | | | | | | | | | | | | | | | | | | | | | | | | |
| Equity investments | | | | | | | | | | | | | | | | | | | | | | | | |
| Investment Funds and Vehicles | | | | | | | | | | | | | | | | | | | | | | | | |
| GCIC Senior Loan Fund LLC(7) | | LLC interest | | N/A | | N/A | | N/A | | | 12,258 | | | $ | 12,258 | | | | 2.6 | % | | $ | 13,385 | |
| | | | | | | | | | | | | | | | | | | | | | | | | |
| Total controlled affiliate company equity investments | | | | | | | | | | | | | | $ | 12,258 | | | | 2.6 | % | | $ | 13,385 | |
| | | | | | | | | | | | | | | | | | | | | | | | | |
| Total controlled affiliate company investments | | | | | | | | | | $ | 34,917 | | | $ | 47,175 | | | | 9.4 | % | | $ | 47,952 | |
| | | | | | | | | | | | | | | | | | | | | | | | | |
| Total Investments | | | | | | | | | | $ | 895,091 | | | $ | 906,806 | | | | 178.3 | % | | $ | 912,839 | |
| | | | | | | | | | | | | | | | | | | | | | | | | |
| Cash, Restricted Cash and Cash Equivalents | | | | | | | | | | | | | | | | | | | | |
| Cash and Restricted Cash | | | | | | | | | | | | | | $ | 14,661 | | | | 2.9 | % | | $ | 14,661 | |
| BlackRock Liquidity Funds T-Fund Institutional Shares (CUSIP 09248U718) | | | | | | | | | 1 | | | | - | | | | 1 | |
| Total Cash, Restricted Cash and Cash Equivalents | | | | | | | | | | | | | �� | $ | 14,662 | | | | 2.9 | % | | $ | 14,662 | |
| | | | | | | | | | | | | | | | | | | | | | | | | |
| Total Investments and Cash, Restricted Cash and Cash Equivalents | | | | | | | | $ | 921,468 | | | | 181.2 | % | | $ | 927,501 | |
| # | Denotes that all or a portion of the loan collateralizes the Credit Facility (as defined in Note 8). |
| (1) | The majority of the investments bear interest at a rate that may be determined by reference to London Interbank Offered Rate ("LIBOR" or "L") or Prime ("P") and which reset daily, quarterly or semiannually. For each, the Company has provided the spread over LIBOR or Prime and the weighted average current interest rate in effect at June 30, 2016. Certain investments are subject to a LIBOR or Prime interest rate floor. For fixed rate loans, a spread above a reference rate is not applicable. |
| (2) | For portfolio companies with multiple interest rate contracts, the interest rate shown is a weighted average current interest rate in effect at June 30, 2016. |
| (3) | The total principal amount is presented for debt investments while the number of shares or units owned is presented for equity investments. |
| (4) | The negative fair value is the result of the capitalized discount on the loan or the unfunded commitment being valued below par. The negative amortized cost is the result of the capitalized discount being greater than the principal amount outstanding on the loan. |
| (5) | The entire commitment was unfunded at June 30, 2016. As such, no interest is being earned on this investment. |
| (6) | Loan was on non-accrual status as of June 30, 2016, meaning that the Company has ceased recognizing interest income on the loan. |
| (7) | The investment is treated as a non-qualifying asset under Section 55(a) of the Investment Company Act of 1940, as amended (the “1940 Act”). Under the 1940 Act, the Company may not acquire any non-qualifying asset unless, at the time the acquisition is made, qualifying assets represent at least 70% of the Company's total assets. |
| (8) | The headquarters of this portfolio company are located in Canada. |
| (9) | Non-income producing securities. |
| (10) | Ownership of certain equity investments may occur through a holding company or partnership. |
| (11) | As defined in the 1940 Act, the Company is deemed to be both an "Affiliated Person" of and "Control" this portfolio company as the Company owns more than 25% of the portfolio company's outstanding voting securities or has the power to exercise control over management or policies of such portfolio company (including through a management agreement). See Note 6 in the accompanying notes to the consolidated financial statements for transactions during the nine months ended June 30, 2016 in which the issuer was both an Affiliated Person and a portfolio company that the Company is deemed to Control. |
See Notes to Consolidated Financial Statements
Golub Capital Investment Corporation and Subsidiaries
Consolidated Schedule of Investments
September 30, 2015
(In thousands)
| | | | | Spread | | | | | | | | | | | | Percentage | | | | |
| | | | | Above | | | | Maturity | | Principal / Par | | | Amortized | | | of | | | Fair | |
| | | Investment Type | | Index(1) | | Interest Rate(2) | | Date | | Amount | | | Cost | | | Net Assets | | | Value | |
| | | | | | | | | | | | | | | | | | | | | |
| Investments | | | | | | | | | | | | | | | | | | | | | | | | |
| United States | | | | | | | | | | | | | | | | | | | | | | | | |
| Debt investments | | | | | | | | | | | | | | | | | | | | | | | | |
| Aerospace and Defense | | | | | | | | | | | | | | | | | | | | | | | | |
| ILC Dover, LP | | One stop | | P + 6.00% | | 9.25% | | 03/2019 | | | 104 | | | | 100 | | | | - | % | | | 93 | |
| ILC Dover, LP | | One stop | | L + 7.00% | | 8.00% | | 03/2020 | | | 2,423 | | | | 2,349 | | | | 0.7 | | | | 2,253 | |
| ILC Industries, Inc.(3) | | One stop | | L + 6.00% | | N/A(4) | | 07/2020 | | | - | | | | (13 | ) | | | - | | | | (24 | ) |
| ILC Industries, Inc. | | One stop | | L + 6.00% | | 7.00% | | 07/2020 | | | 9,246 | | | | 9,160 | | | | 2.9 | | | | 9,131 | |
| NTS Technical Systems(3) | | One stop | | L + 6.00% | | N/A(4) | | 06/2021 | | | - | | | | (7 | ) | | | - | | | | - | |
| NTS Technical Systems(3) | | One stop | | L + 6.00% | | N/A(4) | | 06/2021 | | | - | | | | (15 | ) | | | - | | | | - | |
| NTS Technical Systems | | One stop | | L + 6.00% | | 7.00% | | 06/2021 | | | 3,947 | | | | 3,881 | | | | 1.3 | | | | 3,947 | |
| Tresys Technology Holdings, Inc. | | One stop | | L + 6.75% | | 8.00% | | 12/2017 | | | 5 | | | | 5 | | | | - | | | | 5 | |
| Tresys Technology Holdings, Inc.(5) | | One stop | | L + 6.75% | | 8.00% | | 12/2017 | | | 53 | | | | 28 | | | | - | | | | 16 | |
| Whitcraft LLC | | One stop | | P + 5.25% | | 8.50% | | 05/2020 | | | 3 | | | | 2 | | | | - | | | | 2 | |
| Whitcraft LLC | | One stop | | L + 6.50% | | 7.50% | | 05/2020 | | | 6,813 | | | | 6,749 | | | | 2.2 | | | | 6,745 | |
| | | | | | | | | | | | 22,594 | | | | 22,239 | | | | 7.1 | | | | 22,168 | |
| Automobile | | | | | | | | | | | | | | | | | | | | | | | | |
| American Driveline Systems, Inc. | | Senior loan | | P + 4.50% | | 7.75% | | 03/2020 | | | 12 | | | | 6 | | | | - | | | | 12 | |
| American Driveline Systems, Inc. | | Senior loan | | L + 5.50% | | 6.50% | | 03/2020 | | | 382 | | | | 342 | | | | 0.1 | | | | 382 | |
| CH Hold Corp. (Caliber Collision) | | Senior loan | | L + 4.75% | | 5.75% | | 11/2019 | | | 149 | | | | 147 | | | | - | | | | 149 | |
| CH Hold Corp. (Caliber Collision) | | Senior loan | | L + 4.75% | | 5.75% | | 11/2019 | | | 831 | | | | 824 | | | | 0.3 | | | | 831 | |
| Dent Wizard International Corporation | | Senior loan | | L + 4.75% | | 5.75% | | 04/2020 | | | 1,248 | | | | 1,241 | | | | 0.4 | | | | 1,238 | |
| Integrated Supply Network, LLC | | Senior loan | | P + 4.00% | | 6.87% | | 02/2020 | | | 481 | | | | 471 | | | | 0.2 | | | | 481 | |
| Integrated Supply Network, LLC | | Senior loan | | L + 5.25% | | 6.25% | | 02/2020 | | | 7,871 | | | | 7,776 | | | | 2.5 | | | | 7,871 | |
| K&N Engineering, Inc. | | Senior loan | | L + 4.25% | | 5.25% | | 07/2019 | | | 57 | | | | 57 | | | | - | | | | 55 | |
| K&N Engineering, Inc.(3) | | Senior loan | | L + 4.25% | | N/A(4) | | 07/2019 | | | - | | | | - | | | | - | | | | (3 | ) |
| K&N Engineering, Inc. | | Senior loan | | L + 4.25% | | 5.25% | | 07/2019 | | | 1,164 | | | | 1,164 | | | | 0.4 | | | | 1,129 | |
| | | | | | | | | | | | 12,195 | | | | 12,028 | | | | 3.9 | | | | 12,145 | |
| Beverage, Food and Tobacco | | | | | | | | | | | | | | | | | | | | | | | | |
| Abita Brewing Co., L.L.C.(3) | | One stop | | L + 5.75% | | N/A(4) | | 04/2021 | | | - | | | | (1 | ) | | | - | | | | - | |
| Abita Brewing Co., L.L.C. | | One stop | | L + 5.75% | | 6.75% | | 04/2021 | | | 3,897 | | | | 3,861 | | | | 1.3 | | | | 3,897 | |
| ABP Corporation | | Senior loan | | P + 3.50% | | 7.25% | | 09/2018 | | | 21 | | | | 21 | | | | - | | | | 21 | |
| ABP Corporation | | Senior loan | | L + 4.75% | | 6.00% | | 09/2018 | | | 611 | | | | 611 | | | | 0.2 | | | | 611 | |
| American Seafoods Group LLC | | Senior loan | | L + 5.00% | | 6.00% | | 08/2021 | | | 3,226 | | | | 3,194 | | | | 1.0 | | | | 3,210 | |
| C. J. Foods, Inc. | | One stop | | L + 5.50% | | N/A(4) | | 05/2019 | | | - | | | | - | | | | - | | | | - | |
| C. J. Foods, Inc. | | One stop | | L + 5.50% | | N/A(4) | | 05/2019 | | �� | - | | | | - | | | | - | | | | - | |
| C. J. Foods, Inc. | | One stop | | L + 5.50% | | 6.50% | | 05/2019 | | | 7,771 | | | | 7,771 | | | | 2.5 | | | | 7,771 | |
| Firebirds International, LLC | | One stop | | L + 5.75% | | 7.00% | | 05/2018 | | | 943 | | | | 943 | | | | 0.3 | | | | 943 | |
| Firebirds International, LLC | | One stop | | L + 5.75% | | N/A(4) | | 05/2018 | | | - | | | | - | | | | - | | | | - | |
| Firebirds International, LLC | | One stop | | L + 5.75% | | N/A(4) | | 05/2018 | | | - | | | | - | | | | - | | | | - | |
| Firebirds International, LLC | | One stop | | L + 5.75% | | 7.00% | | 05/2018 | | | 3,365 | | | | 3,365 | | | | 1.1 | | | | 3,365 | |
| First Watch Restaurants, Inc.(3) | | One stop | | L + 6.00% | | N/A(4) | | 12/2020 | | | - | | | | (2 | ) | | | - | | | | - | |
| First Watch Restaurants, Inc.(3) | | One stop | | L + 6.00% | | N/A(4) | | 12/2020 | | | - | | | | (2 | ) | | | - | | | | - | |
| First Watch Restaurants, Inc.(3) | | One stop | | L + 6.00% | | N/A(4) | | 12/2020 | | | - | | | | (1 | ) | | | - | | | | - | |
| First Watch Restaurants, Inc.(3) | | One stop | | L + 6.00% | | N/A(4) | | 12/2020 | | | - | | | | (1 | ) | | | - | | | | - | |
| First Watch Restaurants, Inc. | | One stop | | L + 6.00% | | 7.00% | | 12/2020 | | | 3,606 | | | | 3,569 | | | | 1.2 | | | | 3,606 | |
| Hopdoddy Holdings, LLC | | One stop | | L + 8.00% | | 9.00% | | 08/2020 | | | 430 | | | | 426 | | | | 0.1 | | | | 426 | |
| Hopdoddy Holdings, LLC(3) | | One stop | | L + 8.00% | | N/A(4) | | 08/2020 | | | - | | | | (2 | ) | | | - | | | | (2 | ) |
| Hopdoddy Holdings, LLC | | One stop | | L + 8.00% | | N/A(4) | | 08/2020 | | | - | | | | - | | | | - | | | | - | |
| Julio & Sons Company | | One stop | | L + 5.50% | | N/A(4) | | 09/2017 | | | - | | | | - | | | | - | | | | - | |
| Julio & Sons Company | | One stop | | L + 5.50% | | 6.50% | | 09/2017 | | | 35 | | | | 35 | | | | - | | | | 35 | |
| Julio & Sons Company | | One stop | | L + 5.50% | | 6.50% | | 09/2017 | | | 955 | | | | 955 | | | | 0.3 | | | | 955 | |
| Northern Brewer, LLC | | One stop | | P + 7.25% | | 8.50% cash/2.00% PIK | | 02/2018 | | | 72 | | | | 55 | | | | - | | | | 58 | |
| Northern Brewer, LLC | | One stop | | P + 7.25% | | 8.50% cash/2.00% PIK | | 02/2018 | | | 662 | | | | 508 | | | | 0.2 | | | | 529 | |
| Smashburger Finance LLC | | Senior loan | | L + 5.00% | | 6.25% | | 05/2018 | | | 459 | | | | 459 | | | | 0.1 | | | | 459 | |
| Smashburger Finance LLC | | Senior loan | | L + 5.00% | | 6.25% | | 05/2018 | | | 460 | | | | 456 | | | | 0.1 | | | | 460 | |
| Smashburger Finance LLC(3) | | Senior loan | | L + 5.00% | | N/A(4) | | 05/2018 | | | - | | | | (4 | ) | | | - | | | | - | |
| Smashburger Finance LLC | | Senior loan | | L + 5.00% | | N/A(4) | | 05/2018 | | | - | | | | - | | | | - | | | | - | |
| Smashburger Finance LLC | | Senior loan | | L + 5.00% | | 6.25% | | 05/2018 | | | 5,860 | | | | 5,834 | | | | 1.9 | | | | 5,860 | |
| Surfside Coffee Company LLC | | One stop | | L + 5.25% | | 6.25% | | 06/2020 | | | 69 | | | | 64 | | | | - | | | | 64 | |
| Surfside Coffee Company LLC | | One stop | | L + 5.25% | | 6.25% | | 06/2020 | | | 10 | | | | 10 | | | | - | | | | 10 | |
| Surfside Coffee Company LLC | | One stop | | L + 5.25% | | 6.25% | | 06/2020 | | | 2,369 | | | | 2,346 | | | | 0.8 | | | | 2,345 | |
| Tate's Bake Shop, Inc. | | Senior loan | | L + 4.75% | | N/A(4) | | 08/2019 | | | - | | | | - | | | | - | | | | - | |
| Tate's Bake Shop, Inc. | | Senior loan | | L + 4.75% | | N/A(4) | | 08/2019 | | | - | | | | - | | | | - | | | | - | |
| Tate's Bake Shop, Inc. | | Senior loan | | L + 4.75% | | 5.75% | | 08/2019 | | | 717 | | | | 717 | | | | 0.3 | | | | 717 | |
| Uinta Brewing Company | | One stop | | L + 6.00% | | 7.00% | | 08/2019 | | | 93 | | | | 93 | | | | - | | | | 87 | |
| Uinta Brewing Company | | One stop | | L + 6.00% | | 7.00% | | 08/2019 | | | 772 | | | | 772 | | | | 0.2 | | | | 749 | |
| Unidine Corporation | | One stop | | L + 6.00% | | 7.25% | | 11/2018 | | | 362 | | | | 362 | | | | 0.1 | | | | 362 | |
| Unidine Corporation | | One stop | | L + 6.00% | | N/A(4) | | 11/2018 | | | - | | | | - | | | | - | | | | - | |
| Unidine Corporation | | One stop | | L + 6.00% | | 7.25% | | 11/2018 | | | 1,897 | | | | 1,897 | | | | 0.6 | | | | 1,897 | |
| United Craft Brews LLC | | One stop | | L + 6.25% | | 7.25% | | 03/2020 | | | 241 | | | | 235 | | | | 0.1 | | | | 241 | |
See Notes to Consolidated Financial Statements
Golub Capital Investment Corporation and Subsidiaries
Consolidated Schedule of Investments - (continued)
September 30, 2015
(In thousands)
| | | | | Spread | | | | | | | | | | | | Percentage | | | | |
| | | | | Above | | | | Maturity | | Principal / Par | | | Amortized | | | of | | | Fair | |
| | | Investment Type | | Index(1) | | Interest Rate(2) | | Date | | Amount | | | Cost | | | Net Assets | | | Value | |
| | | | | | | | | | | | | | | | | | | | | |
| United Craft Brews LLC | | One stop | | L + 6.25% | | 7.25% | | 03/2020 | | | 30 | | | | 24 | | | | - | | | | 30 | |
| United Craft Brews LLC | | One stop | | L + 6.25% | | 7.25% | | 03/2020 | | | 5,418 | | | | 5,358 | | | | 1.7 | | | | 5,418 | |
| | | | | | | | | | | | 44,351 | | | | 43,928 | | | | 14.1 | | | | 44,124 | |
| Broadcasting and Entertainment | | | | | | | | | | | | | | | | | | | | | | | | |
| Extreme Reach Inc. | | Senior loan | | L + 5.75% | | 6.75% | | 01/2020 | | | 2,649 | | | | 2,625 | | | | 0.8 | | | | 2,640 | |
| TouchTunes Interactive Networks, Inc. | | Senior loan | | L + 4.75% | | 5.75% | | 05/2021 | | | 704 | | | | 701 | | | | 0.3 | | | | 706 | |
| | | | | | | | | | | | 3,353 | | | | 3,326 | | | | 1.1 | | | | 3,346 | |
| Building and Real Estate | | | | | | | | | | | | | | | | | | | | | | | | |
| Accruent, LLC | | One stop | | L + 6.25% | | 7.25% | | 11/2019 | | | 1,126 | | | | 1,117 | | | | 0.4 | | | | 1,126 | |
| Brooks Equipment Company, LLC | | One stop | | L + 5.75% | | N/A(4) | | 08/2020 | | | - | | | | - | | | | - | | | | - | |
| Brooks Equipment Company, LLC | | One stop | | L + 5.75% | | 6.75% | | 08/2020 | | | 6,668 | | | | 6,668 | | | | 2.1 | | | | 6,668 | |
| Paradigm DKD Group, LLC | | Senior loan | | L + 5.50% | | 6.75% | | 11/2018 | | | 315 | | | | 302 | | | | 0.1 | | | | 315 | |
| Paradigm DKD Group, LLC | | Senior loan | | L + 5.50% | | 6.75% | | 11/2018 | | | 2,202 | | | | 2,161 | | | | 0.7 | | | | 2,202 | |
| | | | | | | | | | | | 10,311 | | | | 10,248 | | | | 3.3 | | | | 10,311 | |
| Chemicals, Plastics and Rubber | | | | | | | | | | | | | | | | | | | | | | | | |
| Flexan, LLC(3) | | One stop | | L + 5.25% | | N/A(4) | | 02/2020 | | | - | | | | (3 | ) | | | - | | | | - | |
| Flexan, LLC | | One stop | | L + 5.25% | | 6.25% | | 02/2020 | | | 2,745 | | | | 2,721 | | | | 0.9 | | | | 2,745 | |
| Flexan, LLC | | One stop | | L + 5.25% | | N/A(4) | | 02/2020 | | | - | | | | - | | | | - | | | | - | |
| | | | | | | | | | | | 2,745 | | | | 2,718 | | | | 0.9 | | | | 2,745 | |
| Containers, Packaging and Glass | | | | | | | | | | | | | | | | | | | | | | | | |
| Fort Dearborn Company | | Senior loan | | L + 4.25% | | 5.25% | | 10/2017 | | | 182 | | | | 182 | | | | - | | | | 182 | |
| Fort Dearborn Company | | Senior loan | | L + 4.75% | | 5.75% | | 10/2018 | | | 842 | | | | 841 | | | | 0.3 | | | | 842 | |
| | | | | | | | | | | | 1,024 | | | | 1,023 | | | | 0.3 | | | | 1,024 | |
| Diversified Conglomerate Manufacturing | | | | | | | | | | | | | | | | | | | | | | | | |
| Chase Industries, Inc. | | One stop | | L + 5.75% | | 6.75% | | 09/2020 | | | 1,096 | | | | 1,096 | | | | 0.4 | | | | 1,096 | |
| Chase Industries, Inc. | | One stop | | P + 4.50% | | 7.75% | | 09/2020 | | | 76 | | | | 76 | | | | - | | | | 76 | |
| Chase Industries, Inc. | | One stop | | L + 5.75% | | 6.75% | | 09/2020 | | | 6,743 | | | | 6,743 | | | | 2.2 | | | | 6,743 | |
| Harvey Tool Company, LLC | | Senior loan | | L + 5.00% | | N/A(4) | | 03/2019 | | | - | | | | - | | | | - | | | | - | |
| Harvey Tool Company, LLC | | Senior loan | | L + 5.00% | | 6.00% | | 03/2020 | | | 2,020 | | | | 2,000 | | | | 0.6 | | | | 2,000 | |
| ICC-Nexergy, Inc(3) | | One stop | | L + 5.50% | | N/A(4) | | 04/2020 | | | - | | | | (4 | ) | | | - | | | | - | |
| ICC-Nexergy, Inc | | One stop | | L + 5.50% | | 6.50% | | 04/2020 | | | 10,707 | | | | 10,638 | | | | 3.4 | | | | 10,707 | |
| Onicon Incorporated | | One stop | | L + 6.00% | | N/A(4) | | 04/2020 | | | - | | | | - | | | | - | | | | - | |
| Onicon Incorporated | | One stop | | L + 6.00% | | 7.00% | | 04/2020 | | | 127 | | | | 126 | | | | - | | | | 127 | |
| Pasternack Enterprises, Inc. | | Senior loan | | L + 5.00% | | 6.25% | | 12/2017 | | | 67 | | | | 67 | | | | - | | | | 67 | |
| Sunless Merger Sub, Inc. | | Senior loan | | P + 4.00% | | 7.25% | | 07/2016 | | | 12 | | | | 9 | | | | - | | | | 6 | |
| Sunless Merger Sub, Inc. | | Senior loan | | L + 5.25% | | 6.50% | | 07/2016 | | | 328 | | | | 285 | | | | 0.1 | | | | 229 | |
| | | | | | | | | | | | 21,176 | | | | 21,036 | | | | 6.7 | | | | 21,051 | |
| Diversified Conglomerate Service | | | | | | | | | | | | | | | | | | | | | | | | |
| Accellos, Inc. | | One stop | | L + 5.75% | | N/A(4) | | 07/2020 | | | - | | | | - | | | | - | | | | - | |
| Accellos, Inc. | | One stop | | L + 5.75% | | 6.75% | | 07/2020 | | | 6,485 | | | | 6,473 | | | | 2.1 | | | | 6,485 | |
| Actiance, Inc. | | One stop | | L + 9.00% | | N/A(4) | | 04/2018 | | | - | | | | - | | | | - | | | | - | |
| Actiance, Inc. | | One stop | | L + 9.00% | | 10.00% | | 04/2018 | | | 1,207 | | | | 1,163 | | | | 0.4 | | | | 1,207 | |
| Aderant North America, Inc. | | Senior loan | | L + 4.25% | | 5.25% | | 12/2018 | | | 29 | | | | 28 | | | | - | | | | 29 | |
| Aderant North America, Inc. | | Senior loan | | L + 4.25% | | 5.25% | | 12/2018 | | | 269 | | | | 268 | | | | 0.1 | | | | 269 | |
| Agility Recovery Solutions Inc.(3) | | One stop | | L + 6.50% | | N/A(4) | | 03/2020 | | | - | | | | (3 | ) | | | - | | | | - | |
| Agility Recovery Solutions Inc. | | One stop | | L + 6.50% | | 7.50% | | 03/2020 | | | 4,613 | | | | 4,572 | | | | 1.5 | | | | 4,613 | |
| DISA Holdings Acquisition Subsidiary Corp. | | Senior loan | | P + 3.50% | | 6.75% | | 12/2020 | | | 29 | | | | 26 | | | | - | | | | 13 | |
| DISA Holdings Acquisition Subsidiary Corp. | | Senior loan | | L + 4.50% | | 5.50% | | 12/2020 | | | 1,389 | | | | 1,377 | | | | 0.4 | | | | 1,319 | |
| DTI Holdco, Inc. | | Senior loan | | L + 5.00% | | 6.00% | | 08/2020 | | | 4,025 | | | | 3,987 | | | | 1.3 | | | | 3,904 | |
| HealthcareSource HR, Inc.(3) | | One stop | | L + 6.75% | | N/A(4) | | 05/2020 | | | - | | | | (2 | ) | | | - | | | | - | |
| HealthcareSource HR, Inc. | | One stop | | L + 6.75% | | 7.75% | | 05/2020 | | | 8,452 | | | | 8,314 | | | | 2.7 | | | | 8,452 | |
| Host Analytics, Inc.(3) | | One stop | | N/A | | N/A(4) | | 02/2020 | | | - | | | | (3 | ) | | | - | | | | - | |
| Host Analytics, Inc. | | One stop | | N/A | | 8.50% cash/2.25% PIK | | 02/2020 | | | 1,319 | | | | 1,309 | | | | 0.4 | | | | 1,319 | |
| Mediaocean LLC(3) | | Senior loan | | L + 4.50% | | N/A(4) | | 08/2020 | | | - | | | | (1 | ) | | | - | | | | - | |
| Mediaocean LLC | | Senior loan | | L + 4.75% | | 5.75% | | 08/2022 | | | 1,936 | | | | 1,893 | | | | 0.6 | | | | 1,916 | |
| NetSmart Technologies, Inc. | | One stop | | P + 4.25% | | 7.50% | | 02/2019 | | | 8 | | | | 7 | | | | - | | | | 8 | |
| NetSmart Technologies, Inc. | | One stop | | L + 5.25% | | 6.25% | | 02/2019 | | | 347 | | | | 344 | | | | 0.1 | | | | 347 | |
| PC Helps Support, LLC | | Senior loan | | P + 4.25% | | 7.50% | | 09/2017 | | | 4 | | | | 4 | | | | - | | | | 4 | |
| PC Helps Support, LLC | | Senior loan | | L + 5.25% | | 6.50% | | 09/2017 | | | 104 | | | | 104 | | | | - | | | | 102 | |
| Saldon Holdings, Inc. | | Senior loan | | L + 4.50% | | N/A(4) | | 09/2021 | | | - | | | | - | | | | - | | | | - | |
| Saldon Holdings, Inc. | | Senior loan | | L + 4.50% | | 5.50% | | 09/2021 | | | 2,405 | | | | 2,381 | | | | 0.8 | | | | 2,381 | |
| Secure-24, LLC | | One stop | | L + 6.00% | | N/A(4) | | 08/2017 | | | - | | | | - | | | | - | | | | - | |
| Secure-24, LLC | | One stop | | L + 6.00% | | 7.25% | | 08/2017 | | | 830 | | | | 830 | | | | 0.3 | | | | 830 | |
| Secure-24, LLC | | One stop | | L + 6.00% | | 7.25% | | 08/2017 | | | 121 | | | | 121 | | | | - | | | | 121 | |
| Severin Acquisition, LLC(3) | | Senior loan | | L + 4.50% | | N/A(4) | | 07/2021 | | | - | | | | (1 | ) | | | - | | | | (1 | ) |
| Severin Acquisition, LLC | | Senior loan | | L + 4.50% | | 5.50% | | 07/2021 | | | 8,009 | | | | 7,892 | | | | 2.5 | | | | 7,928 | |
| Steelwedge Software, Inc. | | One stop | | L + 10.00% | | N/A(4) | | 09/2020 | | | - | | | | - | | | | - | | | | - | |
| Steelwedge Software, Inc. | | One stop | | P + 10.75% | | 14.00% | | 09/2020 | | | 1,732 | | | | 1,653 | | | | 0.5 | | | | 1,653 | |
| TA MHI Buyer, Inc. | | One stop | | L + 6.50% | | N/A(4) | | 09/2021 | | | - | | | | - | | | | - | | | | - | |
| TA MHI Buyer, Inc. | | One stop | | L + 6.50% | | 7.50% | | 09/2021 | | | 6,672 | | | | 6,614 | | | | 2.1 | | | | 6,614 | |
| Transaction Data Systems, Inc. | | Senior loan | | L + 4.50% | | N/A(4) | | 06/2020 | | | - | | | | - | | | | - | | | | - | |
See Notes to Consolidated Financial Statements
Golub Capital Investment Corporation and Subsidiaries
Consolidated Schedule of Investments - (continued)
September 30, 2015
(In thousands)
| | | | | Spread | | | | | | | | | | | | Percentage | | | | |
| | | | | Above | | | | Maturity | | Principal / Par | | | Amortized | | | of | | | Fair | |
| | | Investment Type | | Index(1) | | Interest Rate(2) | | Date | | Amount | | | Cost | | | Net Assets | | | Value | |
| | | | | | | | | | | | | | | | | | | | | |
| Transaction Data Systems, Inc. | | Senior loan | | L + 4.50% | | 5.50% | | 06/2021 | | | 2,384 | | | | 2,362 | | | | 0.8 | | | | 2,384 | |
| Vendavo, Inc.(3) | | One stop | | L + 8.50% | | N/A(4) | | 10/2019 | | | - | | | | (3 | ) | | | - | | | | - | |
| Vendavo, Inc. | | One stop | | L + 8.50% | | 9.50% | | 10/2019 | | | 3,734 | | | | 3,695 | | | | 1.2 | | | | 3,734 | |
| | | | | | | | | | | | 56,103 | | | | 55,404 | | | | 17.8 | | | | 55,631 | |
| | | | | | | | | | | | | | | | | | | | | | | | | |
| Electronics | | | | | | | | | | | | | | | | | | | | | | | | |
| Appriss Holdings, Inc. | | Senior loan | | L + 4.75% | | 5.07% | | 11/2020 | | | 427 | | | | 415 | | | | 0.1 | | | | 413 | |
| Appriss Holdings, Inc. | | Senior loan | | L + 4.75% | | 5.75% | | 11/2020 | | | 13,994 | | | | 13,839 | | | | 4.5 | | | | 13,854 | |
| Compusearch Software Holdings, Inc. | | Senior loan | | L + 4.50% | | 5.50% | | 05/2021 | | | 638 | | | | 636 | | | | 0.2 | | | | 638 | |
| ECI Acquisition Holdings, Inc. | | One stop | | L + 6.25% | | 7.25% | | 03/2019 | | | 465 | | | | 465 | | | | 0.1 | | | | 465 | |
| ECI Acquisition Holdings, Inc. | | One stop | | L + 6.25% | | N/A(4) | | 03/2019 | | | - | | | | - | | | | - | | | | - | |
| ECI Acquisition Holdings, Inc. | | One stop | | L + 6.25% | | 7.25% | | 03/2019 | | | 7,185 | | | | 7,185 | | | | 2.3 | | | | 7,185 | |
| Gamma Technologies, LLC(3) | | One stop | | L + 5.50% | | N/A(4) | | 06/2021 | | | - | | | | (1 | ) | | | - | | | | - | |
| Gamma Technologies, LLC | | One stop | | L + 5.50% | | 6.50% | | 06/2021 | | | 9,539 | | | | 9,448 | | | | 3.1 | | | | 9,539 | |
| Park Place Technologies LLC | | One stop | | L + 5.50% | | N/A(4) | | 07/2021 | | | - | | | | - | | | | - | | | | - | |
| Park Place Technologies LLC | | One stop | | L + 5.50% | | 6.50% | | 07/2021 | | | 14,546 | | | | 14,441 | | | | 4.6 | | | | 14,473 | |
| SEI, Inc.(3) | | Senior loan | | L + 4.75% | | N/A(4) | | 07/2021 | | | - | | | | (1 | ) | | | - | | | | (1 | ) |
| SEI, Inc. | | Senior loan | | L + 4.75% | | 5.75% | | 07/2021 | | | 5,324 | | | | 5,259 | | | | 1.7 | | | | 5,270 | |
| Sloan Company, Inc., The | | One stop | | L + 6.25% | | 7.25% | | 04/2020 | | | 31 | | | | 30 | | | | - | | | | 29 | |
| Sloan Company, Inc., The | | One stop | | L + 6.25% | | 7.25% | | 04/2020 | | | 3,663 | | | | 3,621 | | | | 1.1 | | | | 3,553 | |
| Sparta Holding Corporation | | One stop | | L + 5.50% | | N/A(4) | | 07/2020 | | | - | | | | - | | | | - | | | | - | |
| Sparta Holding Corporation | | One stop | | L + 5.50% | | 6.50% | | 07/2020 | | | 720 | | | | 720 | | | | 0.2 | | | | 720 | |
| Syncsort Incorporated | | Senior loan | | L + 4.75% | | N/A(4) | | 03/2019 | | | - | | | | - | | | | - | | | | - | |
| Syncsort Incorporated | | Senior loan | | L + 4.75% | | N/A(4) | | 03/2019 | | | - | | | | - | | | | - | | | | - | |
| Syncsort Incorporated | | Senior loan | | L + 4.75% | | 5.75% | | 03/2019 | | | 5,406 | | | | 5,406 | | | | 1.7 | | | | 5,406 | |
| Taxware, LLC(3) | | One stop | | L + 6.50% | | N/A(4) | | 04/2022 | | | - | | | | (4 | ) | | | - | | | | - | |
| Taxware, LLC | | One stop | | L + 6.50% | | 7.50% | | 04/2022 | | | 16,523 | | | | 16,369 | | | | 5.3 | | | | 16,523 | |
| | | | | | | | | | | | 78,461 | | | | 77,828 | | | | 24.9 | | | | 78,067 | |
| Grocery | | | | | | | | | | | | | | | | | | | | | | | | |
| AG Kings Holdings Inc.(3) | | One stop | | L + 5.50% | | N/A(4) | | 04/2020 | | | - | | | | (18 | ) | | | - | | | | - | |
| AG Kings Holdings Inc. | | One stop | | L + 5.50% | | 6.50% | | 04/2020 | | | 15,016 | | | | 14,880 | | | | 4.8 | | | | 15,016 | |
| Teasdale Quality Foods, Inc. | | Senior loan | | L + 4.25% | | 5.25% | | 10/2020 | | | 1,120 | | | | 1,101 | | | | 0.4 | | | | 1,120 | |
| | | | | | | | | | | | 16,136 | | | | 15,963 | | | | 5.2 | | | | 16,136 | |
| Healthcare, Education and Childcare | | | | | | | | | | | | | | | | | | | | | | | | |
| Advanced Pain Management Holdings, Inc. | | Senior loan | | L + 5.00% | | 6.25% | | 02/2018 | | | 405 | | | | 404 | | | | 0.1 | | | | 392 | |
| Advanced Pain Management Holdings, Inc.(3) | | Senior loan | | L + 5.00% | | N/A(4) | | 02/2018 | | | - | | | | - | | | | - | | | | (20 | ) |
| Advanced Pain Management Holdings, Inc. | | Senior loan | | L + 5.00% | | 6.25% | | 02/2018 | | | 5,920 | | | | 5,914 | | | | 1.9 | | | | 5,802 | |
| Agilitas USA, Inc. | | Senior loan | | L + 4.00% | | 5.00% | | 10/2020 | | | 512 | | | | 507 | | | | 0.2 | | | | 512 | |
| Apothecary Products, LLC(3) | | Senior loan | | L + 4.00% | | N/A(4) | | 02/2019 | | | - | | | | - | | | | - | | | | (39 | ) |
| Apothecary Products, LLC | | Senior loan | | L + 4.00% | | 5.00% | | 02/2019 | | | 1,958 | | | | 1,958 | | | | 0.6 | | | | 1,860 | |
| Avalign Technologies, Inc. | | Senior loan | | L + 4.50% | | 5.50% | | 07/2021 | | | 776 | | | | 772 | | | | 0.2 | | | | 772 | |
| Avatar International, LLC(5) | | One stop | | L + 7.89% | | 6.19% cash/2.95% PIK | | 09/2016 | | | 87 | | | | 69 | | | | - | | | | 29 | |
| Avatar International, LLC | | One stop | | L + 7.89% | | 6.19% cash/2.95% PIK | | 09/2016 | | | 30 | | | | 30 | | | | - | | | | 30 | |
| Avatar International, LLC(5) | | One stop | | L + 7.89% | | 6.19% cash/2.95% PIK | | 09/2016 | | | 402 | | | | 319 | | | | - | | | | 134 | |
| California Cryobank, LLC | | One stop | | L + 5.50% | | 6.50% | | 08/2019 | | | 2,667 | | | | 2,667 | | | | 0.9 | | | | 2,667 | |
| California Cryobank, LLC | | One stop | | L + 5.50% | | 6.50% | | 08/2019 | | | 74 | | | | 74 | | | | - | | | | 74 | |
| California Cryobank, LLC | | One stop | | P + 4.25% | | 7.50% | | 08/2019 | | | 74 | | | | 74 | | | | - | | | | 74 | |
| Certara L.P. | | One stop | | L + 6.25% | | N/A(4) | | 12/2018 | | | - | | | | - | | | | - | | | | - | |
| Certara L.P. | | One stop | | L + 6.25% | | 7.25% | | 12/2018 | | | 3,946 | | | | 3,941 | | | | 1.3 | | | | 3,946 | |
| CLP Healthcare Services, Inc. | | Senior loan | | L + 4.75% | | 5.75% | | 12/2020 | | | 1,054 | | | | 1,049 | | | | 0.3 | | | | 1,050 | |
| CPI Buyer, LLC (Cole-Parmer) | | Senior loan | | L + 4.50% | | 5.50% | | 08/2021 | | | 3,275 | | | | 3,232 | | | | 1.0 | | | | 3,259 | |
| Curo Health Services LLC | | Senior loan | | L + 5.50% | | 6.50% | | 02/2022 | | | 4,975 | | | | 4,930 | | | | 1.6 | | | | 4,992 | |
| DCA Investment Holding, LLC(3) | | One stop | | L + 5.25% | | N/A(4) | | 07/2021 | | | - | | | | (2 | ) | | | - | | | | (1 | ) |
| DCA Investment Holding, LLC | | One stop | | L + 5.25% | | 6.25% | | 07/2021 | | | 8,673 | | | | 8,507 | | | | 2.7 | | | | 8,586 | |
| Deca Dental Management LLC(3) | | One stop | | L + 6.25% | | N/A(4) | | 07/2020 | | | - | | | | (20 | ) | | | - | | | | (14 | ) |
| Deca Dental Management LLC | | One stop | | P + 5.25% | | 8.50% | | 07/2020 | | | 20 | | | | 19 | | | | - | | | | 20 | |
| Deca Dental Management LLC | | One stop | | L + 6.25% | | 7.25% | | 07/2020 | | | 7,673 | | | | 7,562 | | | | 2.4 | | | | 7,596 | |
| Dental Holdings Corporation(3) | | One stop | | L + 5.50% | | N/A(4) | | 02/2020 | | | - | | | | (7 | ) | | | - | | | | - | |
| Dental Holdings Corporation(3) | | One stop | | L + 5.50% | | N/A(4) | | 02/2020 | | | - | | | | (5 | ) | | | - | | | | - | |
| Dental Holdings Corporation | | One stop | | L + 5.50% | | 6.50% | | 02/2020 | | | 2,930 | | | | 2,898 | | | | 0.9 | | | | 2,930 | |
| Encore GC Acquisition, LLC(3) | | Senior loan | | L + 4.50% | | N/A(4) | | 01/2020 | | | - | | | | (4 | ) | | | - | | | | - | |
| Encore GC Acquisition, LLC | | Senior loan | | L + 4.50% | | 5.50% | | 01/2020 | | | 1,555 | | | | 1,534 | | | | 0.5 | | | | 1,555 | |
| IntegraMed America, Inc. | | One stop | | L + 7.25% | | 8.50% | | 09/2017 | | | 7 | | | | 7 | | | | - | | | | 7 | |
| IntegraMed America, Inc. | | One stop | | L + 7.25% | | 8.50% | | 09/2017 | | | 259 | | | | 259 | | | | 0.1 | | | | 254 | |
| Katena Holdings, Inc.(3) | | One stop | | L + 6.25% | | N/A(4) | | 06/2021 | | | - | | | | (4 | ) | | | - | | | | - | |
| Katena Holdings, Inc.(3) | | One stop | | L + 6.25% | | N/A(4) | | 06/2021 | | | - | | | | (1 | ) | | | - | | | | - | |
| Katena Holdings, Inc. | | One stop | | L + 6.25% | | 7.25% | | 06/2021 | | | 4,271 | | | | 4,231 | | | | 1.4 | | | | 4,271 | |
| Maverick Healthcare Group, LLC | | Senior loan | | L + 5.50% | | 7.25% | | 12/2016 | | | 634 | | | | 624 | | | | 0.2 | | | | 634 | |
| Pentec Acquisition Sub, Inc. | | Senior loan | | L + 5.00% | | N/A(4) | | 05/2017 | | | - | | | | - | | | | - | | | | - | |
| Pentec Acquisition Sub, Inc. | | Senior loan | | L + 5.00% | | 6.25% | | 05/2018 | | | 490 | | | | 490 | | | | 0.2 | | | | 490 | |
| PPT Management, LLC(3) | | One stop | | L + 5.00% | | N/A(4) | | 04/2020 | | | - | | | | (1 | ) | | | - | | | | - | |
See Notes to Consolidated Financial Statements
Golub Capital Investment Corporation and Subsidiaries
Consolidated Schedule of Investments - (continued)
September 30, 2015
(In thousands)
| | | | | Spread | | | | | | | | | | | | Percentage | | | | |
| | | | | Above | | | | Maturity | | Principal / Par | | | Amortized | | | of | | | Fair | |
| | | Investment Type | | Index(1) | | Interest Rate(2) | | Date | | Amount | | | Cost | | | Net Assets | | | Value | |
| | | | | | | | | | | | | | | | | | | | | |
| PPT Management, LLC | | One stop | | L + 5.00% | | 6.00% | | 04/2020 | | | 6,356 | | | | 6,298 | | | | 2.0 | | | | 6,356 | |
| Premise Health Holding Corp. | | One stop | | L + 4.50% | | 5.50% | | 06/2020 | | | 202 | | | | 202 | | | | 0.1 | | | | 202 | |
| Premise Health Holding Corp. | | One stop | | L + 4.50% | | 5.50% | | 06/2020 | | | 8,012 | | | | 8,012 | | | | 2.6 | | | | 8,012 | |
| Pyramid Healthcare, Inc. | | One stop | | P + 4.50% | | 7.75% | | 08/2019 | | | 75 | | | | 75 | | | | - | | | | 75 | |
| Pyramid Healthcare, Inc. | | One stop | | L + 5.75% | | 6.75% | | 08/2019 | | | 2,033 | | | | 2,030 | | | | 0.7 | | | | 2,033 | |
| Radiology Partners, Inc. | | One stop | | L + 5.00% | | N/A(4) | | 09/2020 | | | - | | | | - | | | | - | | | | - | |
| Radiology Partners, Inc. | | One stop | | L + 5.00% | | N/A(4) | | 09/2020 | | | - | | | | - | | | | - | | | | - | |
| Radiology Partners, Inc. | | One stop | | L + 5.00% | | 6.00% | | 09/2020 | | | 6,498 | | | | 6,498 | | | | 2.1 | | | | 6,498 | |
| Reliant Pro ReHab, LLC | | Senior loan | | P + 4.00% | | 7.25% | | 06/2017 | | | 101 | | | | 101 | | | | - | | | | 101 | |
| Reliant Pro ReHab, LLC | | Senior loan | | L + 5.00% | | 6.00% | | 06/2017 | | | 1,492 | | | | 1,492 | | | | 0.5 | | | | 1,492 | |
| RXH Buyer Corporation(3) | | One stop | | L + 5.75% | | N/A(4) | | 09/2021 | | | - | | | | (36 | ) | | | - | | | | (18 | ) |
| RXH Buyer Corporation(3) | | One stop | | L + 5.75% | | N/A(4) | | 09/2021 | | | - | | | | (4 | ) | | | - | | | | (2 | ) |
| RXH Buyer Corporation | | One stop | | L + 5.75% | | 6.75% | | 09/2021 | | | 11,361 | | | | 11,137 | | | | 3.6 | | | | 11,248 | |
| Southern Anesthesia and Surgical | | One stop | | L + 5.50% | | N/A(4) | | 11/2017 | | | - | | | | - | | | | - | | | | - | |
| Southern Anesthesia and Surgical | | One stop | | L + 5.50% | | N/A(4) | | 11/2017 | | | - | | | | - | | | | - | | | | - | |
| Southern Anesthesia and Surgical | | One stop | | L + 5.50% | | 6.50% | | 11/2017 | | | 244 | | | | 244 | | | | 0.1 | | | | 244 | |
| Spear Education, LLC | | One stop | | L + 5.00% | | 6.00% | | 08/2019 | | | 1,866 | | | | 1,866 | | | | 0.6 | | | | 1,866 | |
| Spear Education, LLC | | One stop | | L + 5.00% | | 6.00% | | 08/2019 | | | 157 | | | | 156 | | | | 0.1 | | | | 157 | |
| Spear Education, LLC | | One stop | | L + 5.00% | | N/A(4) | | 08/2019 | | | - | | | | - | | | | - | | | | - | |
| Surgical Information Systems, LLC | | Senior loan | | L + 3.00% | | 4.00% | | 09/2018 | | | 200 | | | | 200 | | | | 0.1 | | | | 200 | |
| U.S. Anesthesia Partners, Inc. | | One stop | | L + 5.00% | | 6.00% | | 12/2019 | | | 3,818 | | | | 3,818 | | | | 1.2 | | | | 3,818 | |
| Young Innovations, Inc. | | Senior loan | | L + 3.25% | | N/A(4) | | 01/2018 | | | - | | | | - | | | | - | | | | - | |
| Young Innovations, Inc. | | Senior loan | | L + 4.25% | | 5.25% | | 01/2019 | | | 374 | | | | 374 | | | | 0.1 | | | | 374 | |
| | | | | | | | | | | | 95,456 | | | | 94,490 | | | | 30.3 | | | | 94,518 | |
| Healthcare, Education and Childcare | | | | | | | | | | | | | | | | | | | | |
| 1A Smart Start LLC | | Senior loan | | L + 4.75% | | 5.75% | | 02/2022 | | | 1,375 | | | | 1,362 | | | | 0.4 | | | | 1,372 | |
| Plano Molding Company, LLC | | One stop | | L + 6.00% | | 7.00% | | 05/2021 | | | 8,743 | | | | 8,661 | | | | 2.8 | | | | 8,743 | |
| | | | | | | | | | | | 10,118 | | | | 10,023 | | | | 3.2 | | | | 10,115 | |
| | | | | | | | | | | | | | | | | | | | | | | | | |
| Home and Office Furnishings, Housewares, and Durable Consumer | | | | | | | | | | | | | | | | | | |
| Aimbridge Hospitality, LLC(3) | | Senior loan | | L + 4.50% | | N/A(4) | | 10/2018 | | | - | | | | (5 | ) | | | - | | | | - | |
| Aimbridge Hospitality, LLC | | Senior loan | | L + 4.50% | | 5.75% | | 10/2018 | | | 2,512 | | | | 2,490 | | | | 0.8 | | | | 2,512 | |
| | | | | | | | | | | | 2,512 | | | | 2,485 | | | | 0.8 | | | | 2,512 | |
| Insurance | | | | | | | | | | | | | | | | | | | | | | | | |
| Captive Resources Midco, LLC(3) | | One stop | | L + 5.75% | | N/A(4) | | 06/2020 | | | - | | | | (12 | ) | | | - | | | | (10 | ) |
| Captive Resources Midco, LLC(3) | | One stop | | L + 5.75% | | N/A(4) | | 06/2020 | | | - | | | | (4 | ) | | | - | | | | (4 | ) |
| Captive Resources Midco, LLC | | One stop | | L + 5.75% | | 6.75% | | 06/2020 | | | 8,351 | | | | 8,252 | | | | 2.6 | | | | 8,268 | |
| Internet Pipeline, Inc.(3) | | One stop | | L + 7.25% | | N/A(4) | | 08/2021 | | | - | | | | (1 | ) | | | - | | | | - | |
| Internet Pipeline, Inc. | | One stop | | L + 7.25% | | 8.25% | | 08/2022 | | | 10,567 | | | | 10,386 | | | | 3.3 | | | | 10,462 | |
| | | | | | | | | | | | 18,918 | | | | 18,621 | | | | 5.9 | | | | 18,716 | |
| Leisure, Amusement, Motion Pictures and Entertainment | | | | | | | | | | | | | | | | | | |
| Competitor Group, Inc. | | One stop | | L + 7.75% | | 9.00% | | 11/2018 | | | 40 | | | | 35 | | | | - | | | | 35 | |
| Competitor Group, Inc. | | One stop | | L + 9.25% | | 9.00% cash/1.50% PIK | | 11/2018 | | | 573 | | | | 527 | | | | 0.2 | | | | 516 | |
| Self Esteem Brands, LLC | | Senior loan | | L + 4.00% | | N/A(4) | | 02/2020 | | | - | | | | - | | | | - | | | | - | |
| Self Esteem Brands, LLC | | Senior loan | | L + 4.00% | | 5.00% | | 02/2020 | | | 6,385 | | | | 6,385 | | | | 2.0 | | | | 6,385 | |
| Starplex Operating, L.L.C. | | One stop | | L + 7.00% | | N/A(4) | | 12/2017 | | | - | | | | - | | | | - | | | | - | |
| Starplex Operating, L.L.C. | | One stop | | L + 7.00% | | 8.00% | | 12/2017 | | | 137 | | | | 137 | | | | - | | | | 137 | |
| Teaching Company, The | | One stop | | L + 6.25% | | 7.25% | | 08/2020 | | | 30 | | | | 29 | | | | - | | | | 29 | |
| Teaching Company, The | | One stop | | L + 6.25% | | 7.25% | | 08/2020 | | | 12,302 | | | | 12,211 | | | | 3.9 | | | | 12,179 | |
| Titan Fitness, LLC | | One stop | | L + 6.50% | | N/A(4) | | 09/2019 | | | - | | | | - | | | | - | | | | - | |
| Titan Fitness, LLC | | One stop | | L + 6.50% | | 7.75% | | 09/2019 | | | 1,989 | | | | 1,989 | | | | 0.7 | | | | 1,989 | |
| Titan Fitness, LLC | | One stop | | L + 6.50% | | N/A(4) | | 09/2019 | | | - | | | | - | | | | - | | | | - | |
| | | | | | | | | | | | 21,456 | | | | 21,313 | | | | 6.8 | | | | 21,270 | |
| Machinery (Non-Agriculture, Non-Construction, Non-Electronic) | | | | | | | | | | | | | | | | | | |
| Spectro, Inc. | | Senior loan | | L + 3.75% | | 4.75% | | 09/2018 | | | 251 | | | | 251 | | | | 0.1 | | | | 251 | |
| Spectro, Inc. | | Senior loan | | L + 3.75% | | 4.75% | | 09/2018 | | | 1,776 | | | | 1,776 | | | | 0.5 | | | | 1,776 | |
| Spectro, Inc. | | Senior loan | | L + 3.75% | | 4.75% | | 09/2018 | | | 251 | | | | 251 | | | | 0.1 | | | | 251 | |
| | | | | | | | | | | | 2,278 | | | | 2,278 | | | | 0.7 | | | | 2,278 | |
| Mining, Steel, Iron and Non-Precious Metals | | | | | | | | | | | | | | | | | | | | | | | | |
| Benetech, Inc. | | One stop | | P + 7.75% | | 11.00% | | 10/2017 | | | 13 | | | | 13 | | | | - | | | | 13 | |
| Benetech, Inc. | | One stop | | L + 9.00% | | 10.25% | | 10/2017 | | | 204 | | | | 204 | | | | 0.1 | | | | 204 | |
| | | | | | | | | | | | 217 | | | | 217 | | | | 0.1 | | | | 217 | |
| Oil and Gas Total | | | | | | | | | | | | | | | | | | | | | | | | |
| Drilling Info, Inc. | | One stop | | L + 6.02% | | 7.02% | | 06/2018 | | | 2,402 | | | | 2,396 | | | | 0.8 | | | | 2,402 | |
| Drilling Info, Inc. | | One stop | | L + 5.00% | | N/A(4) | | 06/2018 | | | - | | | | - | | | | - | | | | - | |
| | | | | | | | | | | | 2,402 | | | | 2,396 | | | | 0.8 | | | | 2,402 | |
| Personal and Non-Durable Consumer Products | | | | | | | | | | | | | | | | | | |
| C.B. Fleet Company, Incorporated | | Senior loan | | L + 4.38% | | 5.38% | | 10/2020 | | | 763 | | | | 745 | | | | 0.2 | | | | 763 | |
| C.B. Fleet Company, Incorporated(3) | | Senior loan | | L + 4.38% | | N/A(4) | | 10/2020 | | | - | | | | (8 | ) | | | - | | | | - | |
See Notes to Consolidated Financial Statements
Golub Capital Investment Corporation and Subsidiaries
Consolidated Schedule of Investments - (continued)
September 30, 2015
(In thousands)
| | | | | Spread | | | | | | | | | | | | Percentage | | | | |
| | | | | Above | | | | Maturity | | Principal / Par | | | Amortized | | | of | | | Fair | |
| | | Investment Type | | Index(1) | | Interest Rate(2) | | Date | | Amount | | | Cost | | | Net Assets | | | Value | |
| | | | | | | | | | | | | | | | | | | | | |
| C.B. Fleet Company, Incorporated | | Senior loan | | L + 4.38% | | 5.38% | | 10/2020 | | | 6,173 | | | | 6,119 | | | | 2.0 | | | | 6,173 | |
| The Hygenic Corporation(3) | | Senior loan | | L + 5.00% | | N/A(4) | | 10/2019 | | | - | | | | (2 | ) | | | - | | | | - | |
| The Hygenic Corporation | | Senior loan | | L + 5.00% | | 6.00% | | 10/2020 | | | 3,349 | | | | 3,321 | | | | 1.1 | | | | 3,349 | |
| Massage Envy, LLC | | One stop | | L + 7.25% | | N/A(4) | | 09/2018 | | | - | | | | - | | | | - | | | | - | |
| Massage Envy, LLC | | One stop | | L + 7.25% | | 8.50% | | 09/2018 | | | 1,013 | | | | 1,013 | | | | 0.3 | | | | 1,013 | |
| Orthotics Holdings, Inc(3)(6) | | One stop | | L + 5.00% | | N/A(4) | | 02/2020 | | | - | | | | (1 | ) | | | - | | | | - | |
| Orthotics Holdings, Inc(6) | | One stop | | L + 5.00% | | 6.00% | | 02/2020 | | | 618 | | | | 611 | | | | 0.2 | | | | 618 | |
| Orthotics Holdings, Inc(3) | | One stop | | L + 5.00% | | N/A(4) | | 02/2020 | | | - | | | | (7 | ) | | | - | | | | - | |
| Orthotics Holdings, Inc(3) | | One stop | | L + 5.00% | | N/A(4) | | 02/2020 | | | - | | | | (6 | ) | | | - | | | | - | |
| Orthotics Holdings, Inc | | One stop | | L + 5.00% | | 6.00% | | 02/2020 | | | 3,770 | | | | 3,728 | | | | 1.2 | | | | 3,770 | |
| Rug Doctor LLC | | Senior loan | | L + 5.25% | | N/A(4) | | 12/2016 | | | - | | | | - | | | | - | | | | - | |
| Rug Doctor LLC | | Senior loan | | L + 5.25% | | 6.25% | | 12/2016 | | | 2,531 | | | | 2,531 | | | | 0.8 | | | | 2,531 | |
| Team Technologies Acquisition Company | | Senior loan | | L + 5.00% | | N/A(4) | | 12/2017 | | | - | | | | - | | | | - | | | | - | |
| Team Technologies Acquisition Company | | Senior loan | | L + 5.00% | | 6.25% | | 12/2017 | | | 291 | | | | 291 | | | | 0.1 | | | | 291 | |
| Team Technologies Acquisition Company | | Senior loan | | L + 5.50% | | 6.75% | | 12/2017 | | | 54 | | | | 53 | | | | - | | | | 54 | |
| | | | | | | | | | | | 18,562 | | | | 18,388 | | | | 5.9 | | | | 18,562 | |
| Personal, Food and Miscellaneous Services | | | | | | | | | | | | | | | | | | | | |
| Affordable Care Inc. | | Senior loan | | L + 4.50% | | N/A(4) | | 12/2017 | | | - | | | | - | | | | - | | | | - | |
| Affordable Care Inc. | | Senior loan | | L + 4.50% | | 5.50% | | 12/2018 | | | 255 | | | | 255 | | | | 0.1 | | | | 255 | |
| California Pizza Kitchen | | Senior loan | | L + 4.25% | | 5.25% | | 03/2018 | | | 467 | | | | 454 | | | | 0.1 | | | | 460 | |
| Clarkson Eyecare LLC | | One stop | | L + 5.75% | | 6.75% | | 04/2021 | | | 2,568 | | | | 2,541 | | | | 0.8 | | | | 2,568 | |
| Clarkson Eyecare LLC(3) | | One stop | | L + 5.75% | | N/A(4) | | 04/2021 | | | - | | | | (6 | ) | | | - | | | | - | |
| Clarkson Eyecare LLC(3) | | One stop | | L + 5.75% | | N/A(4) | | 04/2021 | | | - | | | | (7 | ) | | | - | | | | - | |
| Clarkson Eyecare LLC | | One stop | | L + 5.75% | | 6.75% | | 04/2021 | | | 2,791 | | | | 2,759 | | | | 0.9 | | | | 2,791 | |
| Ignite Restaurant Group, Inc (Joe's Crab Shack) | | One stop | | L + 7.00% | | 8.00% | | 02/2019 | | | 1,471 | | | | 1,471 | | | | 0.5 | | | | 1,471 | |
| PetVet Care Centers LLC | | Senior loan | | L + 4.50% | | 5.50% | | 12/2020 | | | 321 | | | | 315 | | | | 0.1 | | | | 321 | |
| PetVet Care Centers LLC(3) | | Senior loan | | L + 4.50% | | N/A(4) | | 12/2019 | | | - | | | | (3 | ) | | | - | | | | - | |
| PetVet Care Centers LLC | | Senior loan | | L + 4.50% | | 5.50% | | 12/2020 | | | 2,941 | | | | 2,915 | | | | 0.9 | | | | 2,941 | |
| R.G. Barry Corporation | | Senior loan | | L + 5.00% | | 6.00% | | 09/2019 | | | 1,511 | | | | 1,511 | | | | 0.5 | | | | 1,496 | |
| Vetcor Professional Practices LLC(3) | | One stop | | L + 6.00% | | N/A(4) | | 04/2021 | | | - | | | | (9 | ) | | | - | | | | - | |
| Vetcor Professional Practices LLC | | One stop | | L + 6.00% | | 7.00% | | 04/2021 | | | 8 | | | | 3 | | | | - | | | | 8 | |
| Vetcor Professional Practices LLC | | One stop | | L + 6.00% | | 7.00% | | 04/2021 | | | 16,449 | | | | 16,144 | | | | 5.3 | | | | 16,449 | |
| Veterinary Specialists of North America, LLC | | One stop | | L + 5.00% | | N/A(4) | | 05/2020 | | | - | | | | - | | | | - | | | | - | |
| Veterinary Specialists of North America, LLC | | One stop | | L + 5.00% | | 6.00% | | 05/2020 | | | 283 | | | | 281 | | | | 0.1 | | | | 283 | |
| | | | | | | | | | | | 29,065 | | | | 28,624 | | | | 9.3 | | | | 29,043 | |
| Printing and Publishing | | | | | | | | | | | | | | | | | | | | | | | | |
| Market Track, LLC | | One stop | | L + 7.00% | | 8.00% | | 10/2019 | | | 383 | | | | 381 | | | | 0.1 | | | | 379 | |
| Market Track, LLC | | One stop | | L + 7.00% | | 8.00% | | 10/2019 | | | 240 | | | | 233 | | | | 0.1 | | | | 234 | |
| Market Track, LLC | | One stop | | P + 6.00% | | 9.25% | | 10/2019 | | | 322 | | | | 298 | | | | 0.1 | | | | 303 | |
| Market Track, LLC | | One stop | | L + 7.00% | | 8.00% | | 10/2019 | | | 5,048 | | | | 5,024 | | | | 1.6 | | | | 4,997 | |
| Market Track, LLC | | One stop | | L + 7.00% | | 8.00% | | 10/2019 | | | 19,819 | | | | 19,528 | | | | 6.3 | | | | 19,620 | |
| | | | | | | | | | | | 25,812 | | | | 25,464 | | | | 8.2 | | | | 25,533 | |
| Retail Stores | | | | | | | | | | | | | | | | | | | | | | | | |
| Benihana, Inc. | | One stop | | P + 4.75% | | 8.00% | | 07/2018 | | | 17 | | | | 17 | | | | - | | | | 16 | |
| Benihana, Inc. | | One stop | | L + 6.00% | | 7.25% | | 01/2019 | | | 306 | | | | 306 | | | | 0.1 | | | | 300 | |
| Boot Barn, Inc. | | Senior loan | | L + 4.50% | | 5.50% | | 06/2021 | | | 5,653 | | | | 5,572 | | | | 1.8 | | | | 5,653 | |
| CVS Holdings I, LP | | One stop | | L + 6.25% | | 7.25% | | 08/2021 | | | 236 | | | | 212 | | | | 0.1 | | | | 224 | |
| CVS Holdings I, LP(3) | | One stop | | L + 6.25% | | N/A(4) | | 08/2020 | | | - | | | | (4 | ) | | | - | | | | (2 | ) |
| CVS Holdings I, LP | | One stop | | L + 6.25% | | 7.25% | | 08/2021 | | | 13,273 | | | | 13,013 | | | | 4.2 | | | | 13,140 | |
| Cycle Gear, Inc.(3) | | One stop | | L + 6.00% | | N/A(4) | | 01/2020 | | | - | | | | (7 | ) | | | - | | | | - | |
| Cycle Gear, Inc. | | One stop | | L + 6.00% | | 7.00% | | 01/2020 | | | 2,894 | | | | 2,863 | | | | 0.9 | | | | 2,894 | |
| Elite Sportswear, L.P.(3) | | Senior loan | | L + 5.00% | | N/A(4) | | 03/2020 | | | - | | | | (3 | ) | | | - | | | | - | |
| Elite Sportswear, L.P. | | Senior loan | | L + 5.00% | | 6.00% | | 03/2020 | | | 1,270 | | | | 1,258 | | | | 0.4 | | | | 1,270 | |
| Express Oil Change, LLC | | Senior loan | | L + 5.00% | | 6.00% | | 12/2017 | | | 7 | | | | 7 | | | | - | | | | 7 | |
| Express Oil Change, LLC | | Senior loan | | L + 5.00% | | 6.00% | | 12/2017 | | | 88 | | | | 88 | | | | - | | | | 88 | |
| Express Oil Change, LLC | | Senior loan | | L + 5.00% | | N/A(4) | | 12/2017 | | | - | | | | - | | | | - | | | | - | |
| Express Oil Change, LLC | | Senior loan | | L + 5.00% | | 6.00% | | 12/2017 | | | 235 | | | | 234 | | | | 0.1 | | | | 235 | |
| Floor & Decor Outlets of America, Inc. | | One stop | | L + 6.50% | | 7.75% | | 05/2019 | | | 1,151 | | | | 1,151 | | | | 0.4 | | | | 1,151 | |
| Marshall Retail Group, LLC, The(3) | | One stop | | L + 6.00% | | N/A(4) | | 08/2020 | | | - | | | | - | | | | - | | | | (7 | ) |
| Marshall Retail Group, LLC, The | | One stop | | L + 6.00% | | 7.00% | | 08/2019 | | | 38 | | | | 38 | | | | - | | | | 21 | |
| Marshall Retail Group, LLC, The | | One stop | | L + 6.00% | | 7.00% | | 08/2020 | | | 3,231 | | | | 3,231 | | | | 1.0 | | | | 3,134 | |
| RCPSI Corporation(3) | | One stop | | L + 5.75% | | N/A(4) | | 04/2020 | | | - | | | | (4 | ) | | | - | | | | - | |
| RCPSI Corporation | | One stop | | L + 5.75% | | 6.75% | | 04/2021 | | | 10,811 | | | | 10,611 | | | | 3.5 | | | | 10,811 | |
| Rubio's Restaurants, Inc | | Senior loan | | L + 4.75% | | 6.00% | | 11/2018 | | | 848 | | | | 848 | | | | 0.3 | | | | 848 | |
| Sneaker Villa, Inc. | | One stop | | L + 8.50% | | 10.00% | | 12/2017 | | | 9 | | | | 9 | | | | - | | | | 9 | |
| Sneaker Villa, Inc. | | One stop | | L + 8.50% | | 10.00% | | 12/2017 | | | 10 | | | | 10 | | | | - | | | | 10 | |
| Sneaker Villa, Inc. | | One stop | | L + 8.50% | | 10.00% | | 12/2017 | | | 17 | | | | 17 | | | | - | | | | 17 | |
| Sneaker Villa, Inc. | | One stop | | P + 7.00% | | 10.25% | | 12/2017 | | | 18 | | | | 18 | | | | - | | | | 18 | |
| Sneaker Villa, Inc. | | One stop | | L + 8.50% | | 10.00% | | 12/2017 | | | 35 | | | | 34 | | | | - | | | | 35 | |
| Sneaker Villa, Inc. | | One stop | | L + 8.50% | | 10.00% | | 12/2017 | | | 58 | | | | 57 | | | | - | | | | 58 | |
| Sneaker Villa, Inc. | | One stop | | L + 8.50% | | 10.00% | | 12/2017 | | | 60 | | | | 60 | | | | - | | | | 60 | |
See Notes to Consolidated Financial Statements
Golub Capital Investment Corporation and Subsidiaries
Consolidated Schedule of Investments - (continued)
September 30, 2015
(In thousands)
| | | | | Spread | | | | | | | | | | | | Percentage | | | | |
| | | | | Above | | | | Maturity | | Principal / Par | | | Amortized | | | of | | | Fair | |
| | | Investment Type | | Index(1) | | Interest Rate(2) | | Date | | Amount | | | Cost | | | Net Assets | | | Value | |
| | | | | | | | | | | | | | | | | | | | | |
| Specialty Catalog Corp. | | One stop | | L + 6.00% | | N/A(4) | | 07/2017 | | | - | | | | - | | | | - | | | | - | |
| Specialty Catalog Corp. | | One stop | | L + 6.00% | | 7.50% | | 07/2017 | | | 104 | | | | 104 | | | | - | | | | 104 | |
| | | | | | | | | | | | 40,369 | | | | 39,740 | | | | 12.8 | | | | 40,094 | |
| Telecommunications | | | | | | | | | | | | | | | | | | | | | | | | |
| Hosting.com Inc. | | Senior loan | | P + 3.25% | | 6.50% | | 12/2017 | | | 31 | | | | 31 | | | | - | | | | 31 | |
| Hosting.com Inc. | | Senior loan | | L + 4.50% | | 5.75% | | 12/2017 | | | 653 | | | | 653 | | | | 0.2 | | | | 653 | |
| Wilcon Operations LLC | | One stop | | L + 6.50% | | 7.75% | | 10/2018 | | | 418 | | | | 412 | | | | 0.1 | | | | 418 | |
| Wilcon Operations LLC | | One stop | | L + 6.50% | | 7.75% | | 10/2018 | | | 558 | | | | 558 | | | | 0.2 | | | | 558 | |
| Wilcon Operations LLC | | One stop | | L + 6.50% | | 7.75% | | 10/2018 | | | 161 | | | | 161 | | | | 0.1 | | | | 161 | |
| Wilcon Operations LLC | | One stop | | L + 6.50% | | 7.75% | | 10/2018 | | | 2,746 | | | | 2,738 | | | | 0.9 | | | | 2,746 | |
| | | | | | | | | | | | 4,567 | | | | 4,553 | | | | 1.5 | | | | 4,567 | |
| Textile and Leather | | | | | | | | | | | | | | | | | | | | | | | | |
| 5.11, Inc. | | Senior loan | | L + 5.00% | | 6.00% | | 02/2020 | | | 2,650 | | | | 2,649 | | | | 0.9 | | | | 2,658 | |
| | | | | | | | | | | | | | | | | | | | | | | | | |
| Utilities | | | | | | | | | | | | | | | | | | | | | | | | |
| PowerPlan Holdings, Inc.(3) | | Senior loan | | L + 5.25% | | N/A(4) | | 02/2021 | | | - | | | | (11 | ) | | | - | | | | - | |
| PowerPlan Holdings, Inc. | | Senior loan | | L + 5.25% | | 6.25% | | 02/2022 | | | 7,524 | | | | 7,421 | | | | 2.4 | | | | 7,524 | |
| | | | | | | | | | | | 7,524 | | | | 7,410 | | | | 2.4 | | | | 7,524 | |
| | | | | | | | | | | | | | | | | | | | | | | | | |
| Total debt investments United States | | | | $ | 550,355 | | | $ | 544,392 | | | | 174.9 | % | | $ | 546,757 | |
| | | | | | | | | | | | | | | | | | | | | | | | | |
| Fair Value as a percentage of Principal Amount | | | | | | | | | | | | | | | | | 99.3 | % |
See Notes to Consolidated Financial Statements
Golub Capital Investment Corporation and Subsidiaries
Consolidated Schedule of Investments - (continued)
September 30, 2015
(In thousands)
| | | | | Spread | | | | | | | | | | | | Percentage | | | | |
| | | | | Above | | | | Maturity | | Shares / | | | | | | of | | | Fair | |
| | | Investment Type | | Index(1) | | Interest Rate(2) | | Date | | Contracts | | | Cost | | | Net Assets | | | Value | |
| | | | | | | | | | | | | | | | | | | | | |
| Equity Investments(7)(8) | | | | | | | | | | | | | | | | | | | | | | | | |
| Beverage, Food and Tobacco | | | | | | | | | | | | | | | | | | | | | | | | |
| Hopdoddy Holdings, LLC | | LLC interest | | N/A | | N/A | | N/A | | | 18 | | | | 84 | | | | - | | | | 84 | |
| United Craft Brews LLC | | LP interest | | N/A | | N/A | | N/A | | | - | | | | 293 | | | | 0.1 | | | | 291 | |
| | | | | | | | | | | | | | | | 377 | | | | 0.1 | | | | 375 | |
| Chemicals, Plastics and Rubber | | | | | | | | | | | | | | | | | | | | | | | | |
| Flexan, LLC | | Preferred stock | | N/A | | N/A | | N/A | | | - | | | | 32 | | | | - | | | | 34 | |
| Flexan, LLC | | Common stock | | N/A | | N/A | | N/A | | | - | | | | - | | | | - | | | | 6 | |
| | | | | | | | | | | | | | | | 32 | | | | - | | | | 40 | |
| Diversified Conglomerate Manufacturing | | | | | | | | | | | | | | | | | | | | | | | | |
| ICC-Nexergy, Inc | | Common stock | | N/A | | N/A | | N/A | | | - | | | | - | | | | - | | | | - | |
| ICC-Nexergy, Inc | | Preferred stock | | N/A | | N/A | | N/A | | | - | | | | 259 | | | | 0.1 | | | | 253 | |
| | | | | | | | | | | | | | | | 259 | | | | 0.1 | | | | 253 | |
| Diversified Conglomerate Service | | | | | | | | | | | | | | | | | | | | | | | | |
| Actiance, Inc. | | Warrant | | N/A | | N/A | | N/A | | | 167 | | | | 40 | | | | - | | | | 40 | |
| Agility Recovery Solutions Inc. | | Preferred stock | | N/A | | N/A | | N/A | | | 30 | | | | 191 | | | | 0.1 | | | | 199 | |
| HealthcareSource HR, Inc. | | LLC interest | | N/A | | N/A | | N/A | | | - | | | | 165 | | | | 0.1 | | | | 165 | |
| Host Analytics, Inc. | | Warrant | | N/A | | N/A | | N/A | | | 80 | | | | - | | | | - | | | | 43 | |
| Steelwedge Software, Inc. | | Warrant | | N/A | | N/A | | N/A | | | 29,443 | | | | 61 | | | | - | | | | 61 | |
| TA MHI Buyer, Inc. | | Preferred stock | | N/A | | N/A | | N/A | | | - | | | | 163 | | | | 0.1 | | | | 163 | |
| | | | | | | | | | | | | | | | 620 | | | | 0.3 | | | | 671 | |
| Electronics | | | | | | | | | | | | | | | | | | | | | | | | |
| Gamma Technologies, LLC | | LLC units | | N/A | | N/A | | N/A | | | 1 | | | | 82 | | | | - | | | | 82 | |
| SEI, Inc. | | LLC units | | N/A | | N/A | | N/A | | | 207 | | | | 207 | | | | 0.1 | | | | 207 | |
| Sloan Company, Inc., The | | LLC units | | N/A | | N/A | | N/A | | | 1 | | | | 7 | | | | - | | | | 7 | |
| Sloan Company, Inc., The | | LLC units | | N/A | | N/A | | N/A | | | - | | | | 59 | | | | - | | | | 59 | |
| | | | | | | | | | | | | | | | 355 | | | | 0.1 | | | | 355 | |
| Healthcare, Education and Childcare | | | | | | | | | | | | | | | | | | | | | | | | |
| DCA Investment Holding, LLC | | LLC units | | N/A | | N/A | | N/A | | | 39 | | | | 4 | | | | - | | | | 4 | |
| DCA Investment Holding, LLC | | LLC units | | N/A | | N/A | | N/A | | | 3,885 | | | | 388 | | | | 0.1 | | | | 388 | |
| Deca Dental Management LLC | | LLC units | | N/A | | N/A | | N/A | | | 651 | | | | 651 | | | | 0.2 | | | | 651 | |
| Dental Holdings Corporation | | LLC units | | N/A | | N/A | | N/A | | | 327 | | | | 327 | | | | 0.1 | | | | 328 | |
| Encore GC Acquisition, LLC | | LLC units | | N/A | | N/A | | N/A | | | 6 | | | | 63 | | | | - | | | | 64 | |
| Encore GC Acquisition, LLC | | LLC units | | N/A | | N/A | | N/A | | | 6 | | | | - | | | | - | | | | - | |
| Katena Holdings, Inc. | | LLC units | | N/A | | N/A | | N/A | | | - | | | | 205 | | | | 0.1 | | | | 205 | |
| RXH Buyer Corporation | | LP interest | | N/A | | N/A | | N/A | | | 4 | | | | 443 | | | | 0.1 | | | | 443 | |
| | | | | | | | | | | | | | | | 2,081 | | | | 0.6 | | | | 2,083 | |
| Insurance | | | | | | | | | | | | | | | | | | | | | | | | |
| Internet Pipeline, Inc. | | Common stock | | N/A | | N/A | | N/A | | | 90 | | | | 2 | | | | - | | | | 2 | |
| Internet Pipeline, Inc. | | Preferred stock | | N/A | | N/A | | N/A | | | - | | | | 207 | | | | 0.1 | | | | 207 | |
| | | | | | | | | | | | | | | | 209 | | | | 0.1 | | | | 209 | |
| Personal, Food and Miscellaneous Services | | | | | | | | | | | | | | | | | | | | | | | | |
| Clarkson Eyecare LLC | | LLC units | | N/A | | N/A | | N/A | | | - | | | | 63 | | | | - | | | | 77 | |
| Vetcor Professional Practices LLC | | LLC units | | N/A | | N/A | | N/A | | | 55 | | | | 55 | | | | - | | | | 55 | |
| Vetcor Professional Practices LLC | | LLC units | | N/A | | N/A | | N/A | | | 498 | | | | 498 | | | | 0.2 | | | | 498 | |
| | | | | | | | | | | | | | | | 616 | | | | 0.2 | | | | 630 | |
| Retail Stores | | | | | | | | | | | | | | | | | | | | | | | | |
| Cycle Gear, Inc. | | LLC units | | N/A | | N/A | | N/A | | | 7 | | | | 67 | | | | - | | | | 68 | |
| Elite Sportswear, L.P. | | LLC interest | | N/A | | N/A | | N/A | | | 0 | | | | 33 | | | | - | | | | 32 | |
| RCPSI Corporation | | LLC interest | | N/A | | N/A | | N/A | | | 222 | | | | 222 | | | | 0.1 | | | | 222 | |
| | | | | | | | | | | | | | | | 322 | | | | 0.1 | | | | 322 | |
| Utilities | | | | | | | | | | | | | | | | | | | | | | | | |
| PowerPlan Holdings, Inc. | | Common stock | | N/A | | N/A | | N/A | | | - | | | | 135 | | | | - | | | | 142 | |
| PowerPlan Holdings, Inc. | | Common stock | | N/A | | N/A | | N/A | | | 68 | | | | 1 | | | | - | | | | 41 | |
| | | | | | | | | | | | | | | | 136 | | | | - | | | | 183 | |
| | | | | | | | | | | | | | | | | | | | | | | | | |
| Total equity investments United States | | | | | | | | | | | | | | $ | 5,007 | | | | 1.6 | % | | $ | 5,121 | |
| | | | | | | | | | | | | | | | | | | | | | | | | |
| Total United States | | | | | | | | | | | | | | $ | 555,362 | | | | 176.5 | % | | $ | 551,878 | |
| | | | | | | | | | | | | | | | | | | | | | | | | |
| Total Investments | | | | | | | | | | | | | | $ | 555,362 | | | | 176.5 | % | | $ | 551,878 | |
| | | | | | | | | | | | | | | | | | | | | | | | | |
| Cash, Restricted Cash and Cash Equivalents | | | | | | | | | | | | | | | | | | | | | | | | |
| Cash and Restricted Cash | | | | | | | | | | | | | | $ | 12,884 | | | | 4.1 | % | | $ | 12,884 | |
| BlackRock Liquidity Funds T-Fund Institutional Shares (CUSIP 09248U718) | | | | | | | | | 8 | | | | - | | | | 8 | |
| Total Cash, Restricted Cash and Cash Equivalents | | | | | | | | $ | 12,892 | | | | 4.1 | | | $ | 12,892 | |
| | | | | | | | | | | | | | | | | | | | | | | | | |
| Total Investments and Cash, Restricted Cash and Cash Equivalents | | | | | | | | $ | 568,254 | | | | 180.6 | % | | $ | 564,770 | |
| (1) | The majority of the investments bear interest at a rate that may be determined by reference to LIBOR ("L") or Prime ("P") and which reset daily, quarterly or semiannually. For each, the Company has provided the spread over LIBOR or Prime and the weighted average current interest rate in effect at September 30, 2015. Certain investments are subject to a LIBOR or Prime interest rate floor. For fixed rate loans, a spread above a reference rate is not applicable. |
| (2) | For portfolio companies with multiple interest rate contracts, the interest rate shown is a weighted average current interest rate in effect at September 30, 2015. |
| (3) | The negative fair value is the result of the capitalized discount on the loan or the unfunded commitment being valued below par. The negative amortized cost is the result of the capitalized discount being greater than the principal amount outstanding on the loan. |
| (4) | The entire commitment was unfunded at September 30, 2015. As such, no interest is being earned on this investment. |
| (5) | Loan was on non-accrual status as of September 30, 2015, meaning that the Company has ceased recognizing interest income on the loan. |
| (6) | The investment is treated as a non-qualifying asset under Section 55(a) of the 1940 Act. Under the 1940 Act, the Company may not acquire any non-qualifying asset unless, at the time the acquisition is made, qualifying assets represent at least 70% of the Company's total assets. |
| (7) | Non-income producing securities. |
| (8) | Ownership of certain equity investments may occur through a holding company or partnership. |
See Notes to Consolidated Financial Statements
Golub Capital Investment Corporation and Subsidiaries
Notes to Unaudited Consolidated Financial Statements
(In thousands, except shares and per share data)
Golub Capital Investment Corporation (“GCIC” and collectively with its subsidiaries, the “Company”) is an externally managed, closed-end, non-diversified management investment company that was formed on September 22, 2014 and commenced operations on December 31, 2014, the effective date of the Company’s election to be treated as a business development company under the Investment Company Act of 1940, as amended (the “1940 Act”). In addition, for U.S. federal income tax purposes, the Company has elected to be treated as a regulated investment company (“RIC”) under Subchapter M of the Internal Revenue Code of 1986, as amended (the “Code”).
The Company’s investment strategy is to invest primarily in senior secured and one stop (a loan that combines characteristics of traditional first lien senior secured loans and second lien or subordinated loans) loans of U.S. middle-market companies. The Company may also selectively invest in second lien and subordinated (a loan that ranks senior only to a borrower’s equity securities and ranks junior to all of such borrower’s other indebtedness in priority of payment) loans of, and warrants and minority equity securities in, U.S. middle-market companies. The Company has entered into an investment advisory agreement (the “Investment Advisory Agreement”) with GC Advisors LLC (the “Investment Adviser”) under which the Investment Adviser manages the day-to-day operations of, and provides investment advisory services to, the Company. Under an administration agreement (the “Administration Agreement”) the Company is provided with certain services by an administrator (the “Administrator”), which is currently Golub Capital LLC.
Immediately prior to the Company’s election to be regulated as a business development company, the Company acquired its initial portfolio of investments by purchasing (1) 100% of the equity interests of each of GCIC Holdings LLC (“GCIC Holdings”) and GCIC Funding LLC (“GCIC Funding”) from GEMS Fund, L.P. (“GEMS”), a Delaware limited partnership whose general partner is controlled by the Investment Adviser, and (2) certain debt securities. The securities comprising the Company’s initial portfolio of investments had been underwritten by the Investment Adviser at the time of origination or acquisition using the same criteria and standards as the Investment Adviser uses in connection with the origination or acquisition of loans for the Company.
On December 31, 2014, certain investors entered into subscription agreements to purchase shares of GCIC’s common stock in a private placement. Pursuant to a capital call on such subscription agreements, GCIC issued 6,072,227.636 shares of its common stock on December 31, 2014 in exchange for aggregate capital contributions of $91,084.
| Note 2. | Significant Accounting Policies and Recent Accounting Updates |
Basis of presentation: The Company is an investment company as defined in the accounting and reporting guidance under Accounting Standards Codification (“ASC”) Topic 946 –Financial Services – Investment Companies (“ASC Topic 946”).
The accompanying consolidated financial statements of the Company and related financial information have been prepared in accordance with generally accepted accounting principles in the United States of America (“GAAP”) for interim financial information and pursuant to the requirements for reporting on Form 10-Q and Articles 6 or 10 of Regulation S-X. In the opinion of management, the consolidated financial statements reflect all adjustments and reclassifications consisting solely of normal accruals that are necessary for the fair presentation of financial results as of and for the periods presented. All intercompany balances and transactions have been eliminated. Certain prior period amounts have been reclassified to conform to the current period presentation.
Fair value of financial instruments: The Company applies fair value to all of its financial instruments in accordance with ASC Topic 820 —Fair Value Measurement(“ASC Topic 820”). ASC Topic 820 defines fair value, establishes a framework used to measure fair value and requires disclosures for fair value measurements. In accordance with ASC
Golub Capital Investment Corporation and Subsidiaries
Notes to Unaudited Consolidated Financial Statements
(In thousands, except shares and per share data)
Topic 820, the Company has categorized its financial instruments carried at fair value, based on the priority of the valuation technique, into a three-level fair value hierarchy. Fair value is a market-based measure considered from the perspective of the market participant who holds the financial instrument rather than an entity-specific measure. Therefore, when market assumptions are not readily available, the Company’s own assumptions are set to reflect those that management believes market participants would use in pricing the financial instrument at the measurement date.
The availability of observable inputs can vary depending on the financial instrument and is affected by a wide variety of factors, including, for example, the type of product, whether the product is new, whether the product is traded on an active exchange or in the secondary market and the current market conditions. To the extent that the valuation is based on models or inputs that are less observable or unobservable in the market, the determination of fair value requires more judgment. Accordingly, the degree of judgment exercised by the Company in determining fair value is greatest for financial instruments classified as Level 3.
Any changes to the valuation methodology are reviewed by management and the Company’s board of directors (the “Board”) to confirm that the changes are appropriate. As markets change, new products develop and the pricing for products becomes more or less transparent, the Company will continue to refine its valuation methodologies. See further description of fair value methodology in Note 7.
Use of estimates: The preparation of the consolidated financial statements in conformity with GAAP requires management to make estimates and assumptions that affect the reported amounts of assets and liabilities and disclosure of contingent assets and liabilities at the date of the consolidated financial statements and the reported amounts of revenues and expenses during the reporting period. Actual results could differ from those estimates.
Consolidation: As provided under ASC Topic 946, the Company will generally not consolidate its investment in a company other than an investment company subsidiary or a controlled operating company whose business consists of providing services to the Company. Accordingly, the Company consolidated the results of the Company’s wholly-owned subsidiaries, GCIC Holdings, GCIC Funding and GCIC Equity LLC (“GCIC Equity”), in its consolidated financial statements. Effective May 2, 2016, GCIC Equity merged with GCIC Holdings, with GCIC Holdings remaining as the surviving limited liability company (“LLC”). The Company does not consolidate its noncontrolling interest in GCIC Senior Loan Fund LLC (“GCIC SLF”). See further description of the Company’s investment in GCIC SLF in Note 5.
Assets related to transactions that do not meet ASC Topic 860 —Transfers and Servicing (“ASC Topic 860”) requirements for accounting sale treatment are reflected in the Company’s consolidated statements of financial condition as investments. Those assets are owned by special purpose entities, including GCIC Funding, that are consolidated in the Company’s consolidated financial statements. The creditors of the special purpose entities have received security interests in such assets and such assets are not intended to be available to the creditors of GCIC (or any affiliate of GCIC).
Cash and cash equivalents: Cash and cash equivalents are highly liquid investments with an original maturity of three months or less at the date of acquisition. The Company deposits its cash in financial institutions and, at times, such balances may be in excess of the Federal Deposit Insurance Corporation insurance limits.
Restricted cash and cash equivalents: Restricted cash and cash equivalents include amounts that are collected and are held by a trustee who has been appointed as custodian of the assets securing the Company’s senior secured revolving credit facility (as amended, the “Credit Facility”) with Wells Fargo Securities, LLC, as administrative agent, and Wells Fargo Bank, N.A., as lender. Restricted cash and cash equivalents are held by the trustee for payment of interest expense and principal on the outstanding borrowings or reinvestment into new assets.
Golub Capital Investment Corporation and Subsidiaries
Notes to Unaudited Consolidated Financial Statements
(In thousands, except shares and per share data)
Revenue recognition:
Investments and related investment income: Interest income is accrued based upon the outstanding principal amount and contractual interest terms of debt investments.
Loan origination fees, original issue discount and market discount or premium are capitalized, and the Company accretes or amortizes such amounts over the life of the loan as interest income. For the three and nine months ended June 30, 2016, the Company received loan origination fees of $4,556 and $9,604, respectively. For the three and nine months ended June 30, 2015, the Company received loan origination fees of $2,261 and $2,942, respectively. For the three and nine months ended June 30, 2016, interest income included $652 and $2,055, respectively, of accretion of discounts. For the three and nine months ended June 30, 2015, interest income included $223 and $360, respectively, of accretion of discounts.
For investments with contractual payment-in-kind (“PIK”) interest, which represents contractual interest accrued and added to the principal balance that generally becomes due at maturity, the Company will not accrue PIK interest if the portfolio company valuation indicates that the PIK interest is not collectible. For the three and nine months ended June 30, 2016, the Company recorded PIK income of $120 and $164, respectively, and received PIK payments in cash of $1 and $1, respectively. For the three and nine months ended June 30, 2015, the Company recorded PIK income of $17 and $30, respectively, and received PIK payments in cash of $0 and in an amount less than $1, respectively.
In addition, the Company may generate revenue in the form of amendment, structuring or due diligence fees, fees for providing managerial assistance, consulting fees and prepayment premiums on loans. The Company records these fees as fee income when received. All other income is recorded into income when earned. For the three and nine months ended June 30, 2016, fee income included $1 and $362, respectively, of prepayment premiums. For the three and nine months ended June 30, 2015, fee income included $4 and $44, respectively, of prepayment premiums.
For the three and nine months ended June 30, 2016, the Company received interest and fee income in cash, which excludes capitalized loan origination fees, of $13,128 and $34,095, respectively. For the three and nine months ended June 30, 2015, the Company received interest and fee income in cash, which excludes capitalized loan origination fees, of $5,770 and $8,716, respectively.
Dividend income on preferred equity securities is recorded as dividend income on an accrual basis to the extent that such amounts are payable by the portfolio company and are expected to be collected. Dividend income on common equity securities is recorded on the record date for private portfolio companies or on the ex-dividend date for publicly traded portfolio companies. Each distribution received from LLC and limited partnership (“LP”) investments is evaluated to determine if the distribution should be recorded as dividend income or a return of capital. Generally, the Company will not record distributions from equity investments in LLCs and LPs as dividend income unless there are sufficient accumulated tax-basis earnings and profits in the LLC or LP prior to the distribution. Distributions that are classified as a return of capital are recorded as a reduction in the cost basis of the investment. For the three and nine months ended June 30, 2016, the Company recorded dividend income of $48 and $65, respectively, and return of capital distributions of $157 and $196, respectively. For the three and nine months ended June 30, 2015, the Company did not record dividend income or return of capital distributions.
Investment transactions are accounted for on a trade-date basis. Realized gains or losses on investments are measured by the difference between the net proceeds from the disposition and the amortized cost basis of investment, without regard to unrealized gains or losses previously recognized. The Company reports current period changes in fair value of investments that are measured at fair value as a component of the net change in unrealized appreciation (depreciation) on investments in the consolidated statements of operations.
Golub Capital Investment Corporation and Subsidiaries
Notes to Unaudited Consolidated Financial Statements
(In thousands, except shares and per share data)
Non-accrual loans: A loan may be left on accrual status during the period the Company is pursuing repayment of the loan. Management reviews all loans that become 90 days or more past due on principal and interest, or when there is reasonable doubt that principal or interest will be collected, for possible placement on non-accrual status. When a loan is placed on non-accrual status, unpaid interest credited to income is reversed. Additionally, original issue discount and market discount are no longer accreted to interest income as of the date the loan is placed on non-accrual status. Interest payments received on non-accrual loans may be recognized as income or applied to principal depending upon management’s judgment. Non-accrual loans are restored to accrual status when past due principal and interest is paid and, in management’s judgment, payments are likely to remain current. The total fair value of non-accrual loans was $16 and $179 as of June 30, 2016 and September 30, 2015, respectively.
Income taxes: The Company has elected to be treated as a RIC under Subchapter M of the Code and operates in a manner so as to qualify for the tax treatment applicable to RICs. In order to be subject to tax as a RIC, among other things, the Company is required to meet certain source of income and asset diversification requirements and timely distribute dividends to its stockholders of an amount generally at least equal to 90% of its investment company taxable income, as defined by the Code and determined without regard to any deduction for dividends paid, for each tax year. The Company has made, and intends to continue to make, the requisite distributions to its stockholders, which will generally relieve the Company from U.S. federal income taxes with respect to all income distributed to its stockholders.
On January 1, 2015, GCIC Equity elected to be classified as a corporation for U.S. federal income tax purposes. As part of the GCIC Equity merger, GCIC Equity intends to elect deemed-sale treatment and the assetsof GCIC Equity will be treated as sold at fair value for tax purposes.This will result in a U.S. federal income tax expense of $49 that is included in general and administrative expenses on the consolidated statements of operations.
Depending on the level of taxable income earned in a tax year, the Company may choose to retain taxable income in excess of current year dividend distributions, and would distribute such taxable income in the next tax year. The Company may then be required to pay a 4% excise tax on such income. To the extent that the Company determines that its estimated current year annual taxable income, determined on a calendar year basis, could exceed estimated current calendar year dividend distributions, the Company accrues excise tax, if any, on estimated excess taxable income as taxable income is earned. For the three and nine months ended June 30, 2016 and 2015, no amount was recorded for U.S. federal excise tax.
The Company accounts for income taxes in conformity with ASC Topic 740 —Income Taxes (“ASC Topic 740”). ASC Topic 740 provides guidelines for how uncertain tax positions should be recognized, measured, presented and disclosed in financial statements. ASC Topic 740 requires the evaluation of tax positions taken in the course of preparing the Company’s tax returns to determine whether the tax positions are “more-likely-than-not” to be sustained by the applicable tax authority. Tax benefits of positions not deemed to meet the more-likely-than-not threshold would be recorded as a tax expense in the current year. It is the Company’s policy to recognize accrued interest and penalties related to uncertain tax benefits in income tax expense. There were no material uncertain income tax positions through June 30, 2016. The 2014 and 2015 tax years remain subject to examination by U.S. federal and most state tax authorities.
Distributions: Distributions to common stockholders are recorded on the record date. Subject to the discretion of and as determined by the Board, the Company intends to authorize and declare ordinary cash distributions based on a formula approved by the Board on a quarterly basis. The amount to be paid out as a dividend or distribution is determined by the Board each quarter and is generally based upon the earnings estimated by management. Net realized capital gains, if any, are distributed at least annually, although the Company may decide to retain such capital gains for investment.
Golub Capital Investment Corporation and Subsidiaries
Notes to Unaudited Consolidated Financial Statements
(In thousands, except shares and per share data)
The Company has adopted a dividend reinvestment plan (“DRIP”) that provides for reinvestment of any distributions the Company declares in cash on behalf of its stockholders, unless a stockholder elects to receive cash. As a result, if the Board authorizes and the Company declares a cash distribution, then stockholders who have not “opted out” of the DRIP will have their cash distribution automatically reinvested in additional shares of the Company’s common stock, rather than receiving the cash distribution. Shares issued under the DRIP will be issued at a price per share equal to the most recent net asset value (“NAV”) per share as determined by the Board.
Deferred debt issuance costs: Deferred debt issuance costs represent fees and other direct incremental costs incurred in connection with the Company’s borrowings. As of June 30, 2016 and September 30, 2015, the Company had deferred debt issuance costs of $2,406 and $3,213, respectively. These amounts are amortized and included in interest expense in the consolidated statements of operations over the estimated average life of the borrowings. Amortization expense for the three and nine months ended June 30, 2016 was $545 and $1,509, respectively. Amortization expense for the three and nine months ended June 30, 2015 was $158 and $222, respectively.
Recent accounting pronouncements: In April 2015, the Financial Accounting Standards Board (“FASB”) issued Accounting Standards Update (“ASU”) 2015-03,Interest – Imputation of Interest (Subtopic 835-30): Simplifying the Presentation of Debt Issuance Costs, which requires that debt issuance costs related to a recognized debt liability be presented in the balance sheet as a direct deduction from the carrying amount of that debt liability, consistent with debt discounts. This guidance is effective for annual reporting periods, and the interim periods within those periods, beginning after December 15, 2015 and early adoption is permitted. The Company has elected to adopt the ASU which did not have a material impact on the Company’s consolidated financial statements other than corresponding reductions to total assets and total liabilities on the consolidated statements of financial condition. Prior to adoption, the Company recorded deferred debt issuance costs as deferred financing costs as an asset on the consolidated statements of financial condition. Upon adoption, the Company reclassified these costs as unamortized debt issuance costs that reduce debt in the liabilities on the consolidated statements of financial condition and retrospectively reclassified the $3,213 of deferred debt issuance costs that were previously presented as deferred financing costs as an asset as of September 30, 2015.
| Note 3. | Stockholders’ Equity |
GCIC is authorized to issue 1,000,000 shares of preferred stock at a par value of $0.001 per share and 100,000,000 shares of common stock at a par value of $0.001 per share. Since the commencement of operations on December 31, 2014, GCIC entered into subscription agreements (collectively, the “Subscription Agreements”) with several investors, including with affiliates of the Adviser, providing for the private placement of GCIC’s common stock. Under the terms of the Subscription Agreements, investors are required to fund drawdowns to purchase GCIC’s common stock, at a price per share equal to the most recent NAV per share as determined by the Board, up to the amount of their respective capital subscriptions on an as-needed basis as determined by GCIC with a minimum of 10 calendar days prior notice.
As of June 30, 2016 and September 30, 2015, GCIC had the following subscriptions, pursuant to the Subscription Agreements, and contributions from its stockholders:
| | | As of June 30, 2016 | | | As of September 30, 2015 | |
| | | Subscriptions | | | Contributions | | | Subscriptions | | | Contributions | |
| | | | | | | | | | | | | |
| GCIC Stockholders | | $ | 841,804 | | | $ | 496,546 | | | $ | 689,154 | | | $ | 307,652 | |
| Total | | $ | 841,804 | | | $ | 496,546 | | | $ | 689,154 | | | $ | 307,652 | |
Golub Capital Investment Corporation and Subsidiaries
Notes to Unaudited Consolidated Financial Statements
(In thousands, except shares and per share data)
The following table summarizes the shares of GCIC common stock issued and outstanding for the nine months ended June 30, 2016 and 2015:
| | | | | Shares | | | NAV ($) | | | | |
| | | Date | | Issued | | | per share | | | Proceeds | |
| | | | | | | | | | | | | | | |
| Shares outstanding, September 30, 2014 | | | | | 666.670 | | | $ | 15.00 | | | $ | 10 | |
| | | | | | | | | | | | | | | |
| Issuance of shares (1) | | 12/31/14 | | | 4,884,727.636 | | | | 15.00 | | | | 73,271 | |
| Issuance of shares | | 12/31/14 | | | 1,187,500.000 | | | | 15.00 | | | | 17,813 | |
| Issuance of shares | | 01/12/15 | | | 2,331,954.667 | | | | 15.00 | | | | 34,979 | |
| Issuance of shares | | 02/05/15 | | | 632,446.104 | | | | 15.00 | | | | 9,487 | |
| Issuance of shares | | 02/27/15 | | | 197,166.667 | | | | 15.00 | | | | 2,957 | |
| Issuance of shares | | 03/02/15 | | | 303,333.333 | | | | 15.00 | | | | 4,550 | |
| Issuance of shares | | 03/20/15 | | | 970,666.667 | | | | 15.00 | | | | 14,560 | |
| Issuance of shares | | 04/01/15 | | | 834,166.667 | | | | 15.00 | | | | 12,513 | |
| Issuance of shares | | 04/09/15 | | | 773,500.000 | | | | 15.00 | | | | 11,602 | |
| Issuance of shares | | 04/17/15 | | | 540,714.191 | | | | 15.00 | | | | 8,111 | |
| Issuance of shares | | 05/14/15 | | | 1,111,719.995 | | | | 15.00 | | | | 16,676 | |
| Issuance of shares | | 06/01/15 | | | 1,334,947.940 | | | | 15.00 | | | | 20,024 | |
| Shares issued for capital drawdowns | | | | | 15,102,843.867 | | | $ | 15.00 | | | $ | 226,543 | |
| | | | | | | | | | | | | | | |
| Issuance of shares (2) | | 04/28/15 | | | 102,032.997 | | | | 15.00 | | | | 1,530 | |
| Shares issued through DRIP | | | | | 102,032.997 | | | $ | 15.00 | | | $ | 1,530 | |
| Shares outstanding, June 30, 2015 | | | | | 15,205,543.534 | | | $ | 15.00 | | | $ | 228,083 | |
| | | | | | | | | | | | | | | |
| Shares outstanding, September 30, 2015 | | | | | 20,843,155.219 | | | $ | 15.00 | | | $ | 312,647 | |
| | | | | | | | | | | | | | | |
| Issuance of shares | | 11/06/15 | | | 1,329,458.533 | | | | 15.00 | | | | 19,942 | |
| Issuance of shares | | 12/14/15 | | | 2,078,187.800 | | | | 15.00 | | | | 31,173 | |
| Issuance of shares | | 02/23/16 | | | 2,488,930.923 | | | | 15.00 | | | | 37,334 | |
| Issuance of shares | | 05/16/16 | | | 1,994,478.077 | | | | 15.00 | | | | 29,917 | |
| Issuance of shares | | 06/02/16 | | | 1,994,478.077 | | | | 15.00 | | | | 29,917 | |
| Issuance of shares | | 06/21/16 | | | 2,707,383.731 | | | | 15.00 | | | | 40,611 | |
| Shares issued for capital drawdowns | | | | | 12,592,917.141 | | | $ | 15.00 | | | $ | 188,894 | |
| | | | | | | | | | | | | | | |
| Issuance of shares (2) | | 11/20/15 | | | 182,861.440 | | | | 15.00 | | | | 2,743 | |
| Issuance of shares (2) | | 12/30/15 | | | 168,295.009 | | | | 15.00 | | | | 2,524 | |
| Issuance of shares (2) | | 02/26/16 | | | 170,848.215 | | | | 15.00 | | | | 2,563 | |
| Issuance of shares (2) | | 05/20/16 | | | 164,469.664 | | | | 15.00 | | | | 2,467 | |
| Shares issued through DRIP | | | | | 686,474.328 | | | $ | 15.00 | | | $ | 10,297 | |
| Shares outstanding, June 30, 2016 | | | | | 34,122,546.688 | | | $ | 15.00 | | | $ | 511,838 | |
| (1) | Shares issued as part of the Company's formation transaction. |
| | | |
| (2) | Shares issued through the DRIP. |
Golub Capital Investment Corporation and Subsidiaries
Notes to Unaudited Consolidated Financial Statements
(In thousands, except shares and per share data)
| Note 4. | Related Party Transactions |
Investment Advisory Agreement: Under the Investment Advisory Agreement, the Investment Adviser manages the day-to-day operations of, and provides investment advisory services to, GCIC. The Board most recently reapproved the Investment Advisory Agreement in May 2016. The Investment Adviser is a registered investment adviser with the Securities and Exchange Commission (the “SEC”). The Investment Adviser receives fees for providing services, consisting of two components, a base management fee and an Incentive Fee (as defined below).
The base management fee is calculated at an annual rate equal to the lesser of (a) 1.50% or (b) the base management fee of Golub Capital BDC, Inc. (currently 1.375%) in either case on the fair value of the average adjusted gross assets of the Company at the end of the two most recently completed calendar quarters (excluding cash and cash equivalents but including assets purchased with borrowed funds and leverage) and is payable quarterly in arrears. The base management fee is adjusted, based on the actual number of days elapsed relative to the total number of days in such calendar quarter, for any share issuances or repurchases during such calendar quarter. Base management fees for any partial quarter are appropriately pro-rated. For purposes of the Investment Advisory Agreement, cash equivalents means U.S. government securities and commercial paper instruments maturing within 270 days of purchase (which is different than the GAAP definition, which defines cash equivalents as U.S. government securities and commercial paper instruments maturing within 90 days of purchase). To the extent that the Investment Adviser or any of its affiliates provides investment advisory, collateral management or other similar services to a subsidiary of GCIC, the base management fee shall be reduced by an amount equal to the product of (1) the total fees paid to the Investment Adviser by such subsidiary for such services and (2) the percentage of such subsidiary’s total equity, including membership interests and any class of notes not exclusively held by one or more third parties, that is owned, directly or indirectly, by the Company. For periods prior to the earlier of (1) the date of the pricing of an initial public offering or listing on a national securities exchange of the securities of GCIC or (2) a sale of all or substantially all of the Company’s assets to, or other liquidity event with, an entity for consideration of publicly listed securities of the acquirer (each, a “Liquidity Event”), the Investment Adviser has irrevocably agreed to waive any base management fee in excess of 1.00% of the fair value of the Company’s average adjusted gross assets as calculated in accordance with the Investment Advisory Agreement and as described above. For the three and nine months ended June 30, 2016, the base management fee irrevocably waived by the Investment Adviser was $729 and $1,856, respectively. For the three and nine months ended June 30, 2015, the base management fee irrevocably waived by the Investment Adviser was $341 and $575, respectively.
The Incentive Fee consists of three parts: the income component (the “Income Incentive Fee”), the capital gains component (the “Capital Gain Incentive Fee”) and the subordinated liquidation incentive component (the “Subordinated Liquidation Incentive Fee” and, together with the Income Incentive Fee and the Capital Gain Incentive Fee, the “Incentive Fee”).
The Income Incentive Fee is calculated quarterly in arrears based on Pre-Incentive Fee Net Investment Income for the immediately preceding calendar quarter. “Pre-Incentive Fee Net Investment Income” means interest income, dividend income and any other income (including any other fees such as commitment, origination, structuring, diligence and consulting fees or other fees that the Company receives from portfolio companies but excluding fees for providing managerial assistance) accrued during the calendar quarter, minus operating expenses for the calendar quarter (including the base management fee, taxes, any expenses payable under the Investment Advisory Agreement and the Administration Agreement, any expenses of securitizations and any interest expense and dividends paid on any outstanding preferred stock, but excluding the Incentive Fee). Pre-Incentive Fee Net Investment Income includes, in the case of investments with a deferred interest feature such as market discount, debt instruments with PIK interest, preferred stock with PIK dividends and zero coupon securities, accrued income that the Company has not yet received in cash.
Golub Capital Investment Corporation and Subsidiaries
Notes to Unaudited Consolidated Financial Statements
(In thousands, except shares and per share data)
Pre-Incentive Fee Net Investment Income does not include any realized capital gains, realized capital losses or unrealized capital appreciation or depreciation. Because of the structure of the Income Incentive Fee, it is possible that an Incentive Fee may be calculated under this formula with respect to a period in which the Company has incurred a loss. For example, if the Company receives Pre-Incentive Fee Net Investment Income in excess of the hurdle rate (as defined below) for a calendar quarter, the Income Incentive Fee will result in a positive value and an Income Incentive Fee will be paid unless the payment of such Income Incentive Fee would be subject to the Incentive Fee Cap defined below.
Pre-Incentive Fee Net Investment Income, expressed as a rate of return on the value of the Company’s net assets (defined as total assets less indebtedness and before taking into account any Incentive Fees payable during the period) at the end of the immediately preceding calendar quarter, is compared to a fixed “hurdle rate” of 1.5% quarterly. If market interest rates rise, the Company may be able to invest funds in debt instruments that provide for a higher return, which would increase Pre-Incentive Fee Net Investment Income and make it easier for the Investment Adviser to surpass the fixed hurdle rate and receive an Incentive Fee based on such net investment income. The Company’s Pre-Incentive Fee Net Investment Income used to calculate this part of the Incentive Fee is also included in the amount of its total assets (excluding cash and cash equivalents but including assets purchased with borrowed funds and leverage) used to calculate the base management fee annual rate.
The Company calculates the Income Incentive Fee with respect to its Pre-Incentive Fee Net Investment Income quarterly, in arrears, as follows:
| · | Zero in any calendar quarter in which the Pre-Incentive Fee Net Investment Income does not exceed the hurdle rate; |
| · | 50.0% of the Company’s Pre-Incentive Fee Net Investment Income with respect to that portion of such Pre-Incentive Fee Net Investment Income, if any, that exceeds the hurdle rate but is less than the percentage at which the amount payable to the Investment Adviser equals 20.0% of the Pre-Incentive Fee Net Investment Income as if a hurdle rate did not apply. This portion of the Company’s Pre-Incentive Fee Net Investment Income that exceeds the hurdle rate is referred to as the “catch-up” provision; and |
| · | 20.0% of the amount of the Company’s Pre-Incentive Fee Net Investment Income, if any, that exceeds the catch-up provision in any calendar quarter. |
The sum of these calculations yields the Income Incentive Fee. This amount is appropriately adjusted for any share issuances or repurchases during the quarter. For the three and nine months ended June 30, 2016, the Income Incentive Fee incurred was $1,335 and $3,041, respectively. For the three and nine months ended June 30, 2015, the Income Incentive Fee incurred was $377 and $612, respectively.
For periods prior to a Liquidity Event, the Investment Adviser has irrevocably agreed to waive the Income Incentive fee calculated under the Investment Advisory Agreement in amounts in excess of the following amounts (computed on a quarterly basis, in arrears):
| · | 50.0% of the Company’s Pre-Incentive Fee Net Investment Income with respect to that portion of such Pre-Incentive Fee Net Investment Income, if any, that exceeds the hurdle rate but is less than the percentage at which the amount payable to the Investment Adviser equal to 15.0% of the Pre-Incentive Fee Net Investment Income as if a hurdle rate did not apply. This portion of the Company’s Pre-Incentive Fee Net Investment Income that exceeds the hurdle rate is referred to as the “catch-up” provision. |
| · | 15.0% of the amount of the Company’s Pre-Incentive Fee Net Investment Income, if any, that exceeds the catch-up provision in any calendar quarter. |
Golub Capital Investment Corporation and Subsidiaries
Notes to Unaudited Consolidated Financial Statements
(In thousands, except shares and per share data)
For the three and nine months ended June 30, 2016 and 2015, the Income Incentive Fee waived by the Investment Adviser was $0.
The second part of the Incentive Fee, the Capital Gain Incentive Fee, equals (a) 20.0% of the Company’s Capital Gain Incentive Fee Base (as defined below), if any, calculated in arrears as of the end of each calendar year (or upon termination of the Investment Advisory Agreement, as of the termination date), commencing with the calendar year ending December 31, 2014, less (b) the aggregate amount of any previously paid Capital Gain Incentive Fees. The Company’s “Capital Gain Incentive Fee Base” equals (1) the sum of (i) realized capital gains, if any, on a cumulative positive basis from December 31, 2014, the date the Company elected to become a business development company, through the end of each calendar year, (ii) all realized capital losses on a cumulative basis and (iii) all unrealized capital depreciation on a cumulative basis less (2) all unamortized deferred debt issuance costs, if and to the extent such costs exceed all unrealized capital appreciation on a cumulative basis.
| · | The cumulative aggregate realized capital losses are calculated as the sum of the amounts by which (a) the net sales price of each investment in the Company’s portfolio when sold is less than (b) the accreted or amortized cost basis of such investment. |
| · | The cumulative aggregate realized capital gains are calculated as the sum of the differences, if positive, between (a) the net sales price of each investment in the Company’s portfolio when sold and (b) the accreted or amortized cost basis of such investment. |
| · | The aggregate unrealized capital depreciation is calculated as the sum of the differences, if negative, between (a) the valuation of each investment in the Company’s portfolio as of the applicable Capital Gain Incentive Fee calculation date and (b) the accreted or amortized cost basis of such investment. |
The Capital Gain Incentive Fee is calculated on a cumulative basis from December 31, 2014 through the end of each calendar year. Prior to the closing of a Liquidity Event, the Investment Adviser has agreed to waive that portion of the Capital Gain Incentive Fee, calculated as described above, in excess of 15.0% of the Capital Gain Incentive Fee Base, provided that any amounts so waived shall be deemed to have been paid to the Investment Adviser for purposes of determining the Capital Gain Incentive Fee payable after the closing of a public offering.
There was no Capital Gain Incentive Fee as calculated under the Investment Advisory Agreement (as described above) payable for the three and nine months ended June 30, 2016 and 2015. However, in accordance with GAAP, the Company is required to include the aggregate unrealized capital appreciation on investments in the calculation and accrue a capital gain incentive fee on a quarterly basis, as if such unrealized capital appreciation were realized, even though such unrealized capital appreciation is not permitted to be considered in calculating the fee actually payable under the Investment Advisory Agreement. If the Capital Gain Incentive Fee Base, adjusted as required by GAAP to include unrealized appreciation, is positive at the end of a period, then GAAP requires the Company to accrue a capital gain incentive fee equal to 15.0% prior to a Liquidity Event (20.0% following a Liquidity Event) of such amount, less the aggregate amount of the actual Capital Gain Incentive Fees paid and capital gain incentive fees accrued under GAAP in all prior periods. If such amount is negative, then there is no accrual for such period. The resulting accrual under GAAP in a given period may result in additional expense if such cumulative amount is greater than in the prior period or a reversal of previously recorded expense if such cumulative amount is less than in the prior period. There can be no assurance that such unrealized capital appreciation will be realized in the future. For the three and nine months ended June 30, 2016, the Company accrued a capital gain incentive fee under GAAP of $383 and $657, respectively. For the three and nine months ended June 30, 2015, the Company did not accrue a capital gain incentive fee under GAAP.
The third part of the Incentive Fee, the Subordinated Liquidation Incentive Fee, equals 20.0% of the net proceeds from a liquidation of the Company in excess of adjusted capital, as calculated immediately prior to liquidation; subject, however, to the limit of cumulative Incentive Fees of all types not exceeding the Incentive Fee Cap (as
Golub Capital Investment Corporation and Subsidiaries
Notes to Unaudited Consolidated Financial Statements
(In thousands, except shares and per share data)
defined below). For purposes of this calculation, “liquidation” will include any merger of the Company with another entity or the acquisition of all or substantially all of the shares of common stock of GCIC in a single or series of related transactions. The Investment Advisory Agreement provides that no Subordinated Liquidation Incentive Fee shall be payable for any liquidation that occurs more than six months after the date of a public offering of securities of GCIC. For periods prior to the closing of a Liquidity Event, the Investment Adviser has agreed to waive that portion of the Subordinated Liquidation Incentive Fee in excess of 10.0% of the net proceeds from liquidation in excess of adjusted capital, as calculated immediately prior to liquidation.
The Company has structured the calculation of the Incentive Fee to include a fee limitation such that an Incentive Fee for any quarter can only be paid to the Investment Adviser if, after such payment, the cumulative Incentive Fees paid to the Investment Adviser since December 31, 2014, would be less than or equal to 20.0% of the Company’s Cumulative Pre-Incentive Fee Net Income (the “Incentive Fee Cap”). Cumulative Pre-Incentive Fee Net Income is equal to the sum of (a) Pre-Incentive Fee Net Investment Income for each period from December 31, 2014 and (b) cumulative aggregate realized capital gains, cumulative aggregate realized capital losses, cumulative aggregate unrealized capital depreciation and cumulative aggregate unrealized capital appreciation from December 31, 2014. For periods prior to a Liquidity Event, the Investment Adviser has agreed to irrevocably waive any Incentive Fee payable in excess of 15.0% of the Company’s Cumulative Pre-Incentive Fee Net Income; provided that any amounts so waived shall be deemed to have been paid to the Investment Adviser for purposes of the Incentive Fee Cap after the closing of such Liquidity Event.
The sum of the Income Incentive Fee, the Capital Gain Incentive Fee and the Subordinated Liquidation Incentive Fee is the Incentive Fee. The Company will deposit one-third of each Incentive Fee payment into an escrow account (the “Escrow Account”) administered by The Bank of New York Mellon (the “Escrow Agent”). Assets in the Escrow Account will be held by the Escrow Agent until the closing of a Liquidity Event at which time the Escrow Agent will release the assets to the Investment Adviser. If no Liquidity Event occurs prior to December 31, 2020, the Escrow Agent will return all assets in the Escrow Account to the Company for the benefit of its stockholders. For the three and nine months ended June 30, 2016, the Company deposited $347 and $777, respectively, into the Escrow Account. For each of the three and nine months ended June 30, 2015, the Company deposited $78 into the Escrow Account.
Administration Agreement: Under the Administration Agreement, the Administrator furnishes the Company with office facilities and equipment, provides the Company with clerical, bookkeeping and record keeping services at such facilities and provides the Company with other administrative services as the Administrator, subject to review by the Board, determines necessary to conduct the Company’s day-to-day operations. GCIC reimburses the Administrator the allocable portion (subject to the review and approval of the Board) of overhead and other expenses incurred by it in performing its obligations under the Administration Agreement, including rent, fees and expenses associated with performing compliance functions and GCIC’s allocable portion of the cost of its chief financial officer and chief compliance officer and their respective staffs. The Board reviews such expenses to determine that these expenses are reasonable and comparable to administrative services charged by unaffiliated third party asset managers. Under the Administration Agreement, the Administrator also provides, on the Company’s behalf, managerial assistance to those portfolio companies to which the Company is required to provide such assistance and will be paid an additional amount based on the cost of the services provided, which amount shall not exceed the amount the Company receives from such portfolio companies.
Included in accounts payable and accrued expenses is $216 and $248 as of June 30, 2016 and September 30, 2015, respectively, for accrued allocated shared services under the Administration Agreement.
Other related party transactions: The Company has agreed to reimburse the Investment Adviser for the organization costs incurred on its behalf up to an aggregate amount of $700. Organization costs include, among other things, the cost of incorporating, including legal, accounting, regulatory filing and other fees pertaining to the
Golub Capital Investment Corporation and Subsidiaries
Notes to Unaudited Consolidated Financial Statements
(In thousands, except shares and per share data)
Company’s organization that were paid by the Investment Adviser on behalf of the Company. As of June 30, 2016 and September 30, 2015, the organization costs incurred by the Company totaled $534 and $447, respectively.
The Administrator pays for certain unaffiliated third-party expenses incurred by the Company. Such expenses include postage, printing, office supplies and rating agency fees. These expenses are not marked-up and represent the same amount the Company would have paid had the Company paid the expenses directly. These expenses are subsequently reimbursed in cash.
Total expenses reimbursed to the Administrator during the three and nine months ended June 30, 2016 were $36 and $513, respectively. Total expenses reimbursed to the Administrator during each of the three and nine months ended June 30, 2015 were $119.
As of June 30, 2016 and September 30, 2015, included in accounts payable and accrued expenses were $135 and $53, respectively, for accrued expenses paid on behalf of the Company by the Administrator.
During the three and nine months ended June 30, 2016, the Company sold $29,632 and $169,754 of investments and unfunded commitments to GCIC SLF at fair value, respectively, and recognized $165 and $904 of net realized gains, respectively.
On December 30, 2014, the Investment Adviser transferred 666.670 shares of the Company’s common stock acquired in connection with the Company’s formation to GCOP LLC, an affiliate of the Investment Adviser, for $10. In addition, on December 31, 2014, GCOP LLC entered into a $15,000 subscription agreement to purchase shares of the Company’s common stock in a private placement. As of June 30, 2016, the Company has issued 1,004,905.973 shares of its common stock, including through the DRIP, to GCOP LLC in exchange for aggregate capital contributions totaling $15,074.
On December 31, 2014, GEMS entered into a $40,000 subscription agreement to purchase shares of the Company’s common stock in a private placement. In connection with the Company’s acquisition of GCIC Holdings and GCIC Funding from GEMS on December 31, 2014, the Company issued 2,666,666.667 shares of its common stock and entered into an $11,820 short-term unsecured promissory note with GEMS (“GEMS Note”). The GEMS Note carried a fixed interest rate of 3.25% and matured and was paid-off on March 2, 2015. As of June 30, 2016, the Company has issued 2,937,835.022 shares of its common stock, including through the DRIP, to GEMS in exchange for aggregate capital contributions totaling $44,068.
On February 3, 2015, the Company entered into an unsecured revolving credit facility with the Investment Adviser (the “Revolver”), with a maximum credit limit of $40,000 and expiration date of February 3, 2018. Refer to Note 8 for discussion of the Revolver.
On June 1, 2015, GEMS Fund 4, L.P, a Delaware limited partnership whose general partner is controlled by the Investment Adviser, entered into a subscription agreement, which was subsequently increased to $30,213, to purchase shares of the Company’s common stock in a private placement. As of June 30, 2016, the Company has issued 798,647.999 shares of its common stock to GEMS Fund 4, L.P in exchange for aggregate capital contributions totaling $11,980.
Golub Capital Investment Corporation and Subsidiaries
Notes to Unaudited Consolidated Financial Statements
(In thousands, except shares and per share data)
Investments as of June 30, 2016 and September 30, 2015 consisted of the following:
| | | As of June 30, 2016 | | | As of September 30, 2015 | |
| | | Par | | | Amortized Cost | | | Fair Value | | | Par | | | Amortized Cost | | | Fair Value | |
| Senior secured | | $ | 109,240 | | | $ | 107,860 | | | $ | 108,494 | | | $ | 154,248 | | | $ | 152,795 | | | $ | 153,194 | |
| One stop | | | 750,895 | | | | 740,138 | | | | 744,357 | | | | 396,107 | | | | 391,597 | | | | 393,563 | |
| Subordinated debt | | | 39 | | | | 39 | | | | 39 | | | | - | | | | - | | | | - | |
| Subordinated notes in GCIC SLF(1) | | | 34,917 | | | | 34,917 | | | | 34,567 | | | | - | | | | - | | | | - | |
| LLC equity interests in GCIC SLF(1) | | | N/A | | | | 12,258 | | | | 13,385 | | | | N/A | | | | - | | | | - | |
| Equity | | | N/A | | | | 11,594 | | | | 11,997 | | | | N/A | | | | 5,007 | | | | 5,121 | |
| Total | | $ | 895,091 | | | $ | 906,806 | | | $ | 912,839 | | | $ | 550,355 | | | $ | 549,399 | | | $ | 551,878 | |
| (1) | GCIC SLF's proceeds from the subordinated notes and LLC equity interests invested in GCIC SLF were utilized by GCIC SLF to invest in senior secured loans. |
The following tables show the portfolio composition by geographic region at amortized cost and fair value as a percentage of total investments in portfolio companies. The geographic composition is determined by the location of the corporate headquarters of the portfolio company, which may not be indicative of the primary source of the portfolio company’s business.
| | | As of June 30, 2016 | | | As of September 30, 2015 | |
| Amortized Cost: | | | | | | | | | | | | | | | | |
| United States | | | | | | | | | | | | | | | | |
| Mid-Atlantic | | $ | 220,025 | | | | 24.3 | % | | $ | 112,234 | | | | 20.4 | % |
| Midwest | | | 220,187 | | | | 24.3 | | | | 117,918 | | | | 21.4 | |
| West | | | 60,215 | | | | 6.6 | | | | 79,395 | | | | 14.5 | |
| Southeast | | | 239,321 | | | | 26.3 | | | | 134,689 | | | | 24.5 | |
| Southwest | | | 71,479 | | | | 7.9 | | | | 43,754 | | | | 8.0 | |
| Northeast | | | 94,175 | | | | 10.4 | | | | 61,409 | | | | 11.2 | |
| Canada | | | 1,404 | | | | 0.2 | | | | - | | | | - | |
| Total | | $ | 906,806 | | | | 100.0 | % | | $ | 549,399 | | | | 100.0 | % |
| | | | | | | | | | | | | | | | | |
| Fair Value: | | | | | | | | | | | | | | | | |
| United States | | | | | | | | | | | | | | | | |
| Mid-Atlantic | | $ | 221,750 | | | | 24.2 | % | | $ | 112,770 | | | | 20.4 | % |
| Midwest | | | 220,831 | | | | 24.2 | | | | 118,202 | | | | 21.4 | |
| West | | | 59,969 | | | | 6.6 | | | | 79,632 | | | | 14.5 | |
| Southeast | | | 241,973 | | | | 26.5 | | | | 135,356 | | | | 24.5 | |
| Southwest | | | 71,297 | | | | 7.8 | | | | 43,846 | | | | 7.9 | |
| Northeast | | | 95,602 | | | | 10.5 | | | | 62,072 | | | | 11.3 | |
| Canada | | | 1,417 | | | | 0.2 | | | | - | | | | - | |
| Total | | $ | 912,839 | | | | 100.0 | % | | $ | 551,878 | | | | 100.0 | % |
Golub Capital Investment Corporation and Subsidiaries
Notes to Unaudited Consolidated Financial Statements
(In thousands, except shares and per share data)
The industry compositions of the portfolio at amortized cost and fair value were as follows:
| | | As of June 30, 2016 | | | As of September 30, 2015 | |
| Amortized Cost: | | | | | | | | | | | | | | | | |
| Aerospace and Defense | | $ | 13,001 | | | | 1.4 | % | | $ | 22,239 | | | | 4.1 | % |
| Automobile | | | 46,266 | | | | 5.1 | | | | 12,028 | | | | 2.2 | |
| Beverage, Food and Tobacco | | | 44,857 | | | | 5.0 | | | | 44,305 | | | | 8.1 | |
| Broadcasting and Entertainment | | | 3,042 | | | | 0.3 | | | | 3,326 | | | | 0.6 | |
| Buildings and Real Estate | | | 8,735 | | | | 1.0 | | | | 10,248 | | | | 1.9 | |
| Cargo Transport | | | 1,750 | | | | 0.2 | | | | - | | | | - | |
| Chemicals, Plastics and Rubber | | | 32 | | | | 0.0 | * | | | 2,750 | | | | 0.5 | |
| Containers, Packaging and Glass | | | 1,127 | | | | 0.1 | | | | 1,023 | | | | 0.2 | |
| Diversified/Conglomerate Manufacturing | | | 23,992 | | | | 2.6 | | | | 21,295 | | | | 3.9 | |
| Diversified/Conglomerate Service | | | 177,158 | | | | 19.5 | | | | 56,024 | | | | 10.2 | |
| Electronics | | | 124,912 | | | | 13.8 | | | | 78,183 | | | | 14.2 | |
| Grocery | | | 11,836 | | | | 1.3 | | | | 15,963 | | | | 2.9 | |
| Healthcare, Education and Childcare | | | 171,275 | | | | 18.9 | | | | 96,571 | | | | 17.6 | |
| Home and Office Furnishings, Housewares, and Durable Consumer | | | 11,106 | | | | 1.2 | | | | 10,023 | | | | 1.8 | |
| Hotels, Motels, Inns, and Gaming | | | 389 | | | | 0.0 | * | | | 2,485 | | | | 0.5 | |
| Insurance | | | 20,239 | | | | 2.2 | | | | 18,830 | | | | 3.4 | |
| Investment Funds and Vehicles | | | 47,175 | | | | 5.2 | | | | - | | | | - | |
| Leisure, Amusement, Motion Pictures, Entertainment | | | 17,314 | | | | 1.9 | | | | 21,313 | | | | 3.9 | |
| Machinery (Non-Agriculture, Non-Construction, Non-Electronic) | | | - | | | | - | | | | 2,278 | | | | 0.4 | |
| Mining, Steel, Iron and Non-Precious Metals | | | 202 | | | | 0.0 | * | | | 217 | | | | 0.0 | * |
| Oil and Gas | | | 2,312 | | | | 0.3 | | | | 2,396 | | | | 0.4 | |
| Personal and Non Durable Consumer Products | | | 10,672 | | | | 1.2 | | | | 18,388 | | | | 3.3 | |
| Personal, Food and Miscellaneous Services | | | 42,183 | | | | 4.7 | | | | 29,240 | | | | 5.3 | |
| Printing and Publishing | | | 28,663 | | | | 3.2 | | | | 25,464 | | | | 4.6 | |
| Retail Stores | | | 84,750 | | | | 9.4 | | | | 40,062 | | | | 7.3 | |
| Telecommunications | | | 4,798 | | | | 0.5 | | | | 4,553 | | | | 0.8 | |
| Textiles and Leather | | | 4,353 | | | | 0.5 | | | | 2,649 | | | | 0.5 | |
| Utilities | | | 4,667 | | | | 0.5 | | | | 7,546 | | | | 1.4 | |
| Total | | $ | 906,806 | | | | 100.0 | % | | $ | 549,399 | | | | 100.0 | % |
*Represents an amount less than 0.1%
Golub Capital Investment Corporation and Subsidiaries
Notes to Unaudited Consolidated Financial Statements
(In thousands, except shares and per share data)
| | | As of June 30, 2016 | | | As of September 30, 2015 | |
| Fair Value: | | | | | | | | | | | | | | | | |
| Aerospace and Defense | | $ | 12,757 | | | | 1.4 | % | | $ | 22,168 | | | | 4.0 | % |
| Automobile | | | 46,863 | | | | 5.1 | | | | 12,145 | | | | 2.2 | |
| Beverage, Food and Tobacco | | | 44,642 | | | | 4.9 | | | | 44,499 | | | | 8.1 | |
| Broadcasting and Entertainment | | | 3,076 | | | | 0.3 | | | | 3,346 | | | | 0.6 | |
| Buildings and Real Estate | | | 8,660 | | | | 1.0 | | | | 10,311 | | | | 1.9 | |
| Cargo Transport | | | 1,767 | | | | 0.2 | | | | - | | | | - | |
| Chemicals, Plastics and Rubber | | | 38 | | | | 0.0 | * | | | 2,785 | | | | 0.5 | |
| Containers, Packaging and Glass | | | 1,129 | | | | 0.1 | | | | 1,024 | | | | 0.2 | |
| Diversified/Conglomerate Manufacturing | | | 23,312 | | | | 2.6 | | | | 21,304 | | | | 3.9 | |
| Diversified/Conglomerate Service | | | 178,377 | | | | 19.5 | | | | 56,302 | | | | 10.2 | |
| Electronics | | | 126,068 | | | | 13.8 | | | | 78,422 | | | | 14.2 | |
| Grocery | | | 11,967 | | | | 1.3 | | | | 16,136 | | | | 2.9 | |
| Healthcare, Education and Childcare | | | 172,470 | | | | 18.9 | | | | 96,601 | | | | 17.5 | |
| Home and Office Furnishings, Housewares, and Durable Consumer | | | 10,665 | | | | 1.2 | | | | 10,115 | | | | 1.8 | |
| Hotels, Motels, Inns, and Gaming | | | 396 | | | | 0.0 | * | | | 2,512 | | | | 0.5 | |
| Insurance | | | 20,605 | | | | 2.3 | | | | 18,925 | | | | 3.4 | |
| Investment Funds and Vehicles | | | 47,952 | | | | 5.3 | | | | - | | | | - | |
| Leisure, Amusement, Motion Pictures, Entertainment | | | 17,242 | | | | 1.9 | | | | 21,270 | | | | 3.9 | |
| Machinery (Non-Agriculture, Non-Construction, Non-Electronic) | | | - | | | | - | | | | 2,278 | | | | 0.4 | |
| Mining, Steel, Iron and Non-Precious Metals | | | 172 | | | | 0.0 | * | | | 217 | | | | 0.0 | * |
| Oil and Gas | | | 2,324 | | | | 0.3 | | | | 2,402 | | | | 0.4 | |
| Personal and Non Durable Consumer Products | | | 10,496 | | | | 1.1 | | | | 18,562 | | | | 3.4 | |
| Personal, Food and Miscellaneous Services | | | 42,863 | | | | 4.7 | | | | 29,673 | | | | 5.4 | |
| Printing and Publishing | | | 28,992 | | | | 3.2 | | | | 25,533 | | | | 4.6 | |
| Retail Stores | | | 86,023 | | | | 9.4 | | | | 40,416 | | | | 7.3 | |
| Telecommunications | | | 4,785 | | | | 0.5 | | | | 4,567 | | | | 0.8 | |
| Textiles and Leather | | | 4,403 | | | | 0.5 | | | | 2,658 | | | | 0.5 | |
| Utilities | | | 4,795 | | | | 0.5 | | | | 7,707 | | | | 1.4 | |
| Total | | $ | 912,839 | | | | 100.0 | % | | $ | 551,878 | | | | 100.0 | % |
*Represents an amount less than 0.1%
Golub Capital Investment Corporation and Subsidiaries
Notes to Unaudited Consolidated Financial Statements
(In thousands, except shares and per share data)
GCIC Senior Loan Fund LLC:
The Company co-invests with Aurora National Life Assurance Company, a wholly-owned subsidiary of RGA Reinsurance Company (“Aurora”), in senior secured loans through GCIC SLF, an unconsolidated Delaware LLC. GCIC SLF is capitalized as transactions are completed and all portfolio and investment decisions in respect of GCIC SLF must be approved by the GCIC SLF investment committee consisting of two representatives of each of the Company and Aurora (with unanimous approval required from (i) one representative of each of the Company and Aurora or (ii) both representatives of each of the Company and Aurora). GCIC SLF may cease making new investments upon notification of either member but operations will continue until all investments have been sold or paid-off in the normal course of business. Investments held by GCIC SLF are measured at fair value using the same valuation methodologies as described in Note 7.
GCIC SLF is capitalized with subordinated notes and LLC equity interest subscriptions from its members. As of June 30, 2016, the Company and Aurora owned 87.5% and 12.5%, respectively, of both the outstanding subordinated notes and LLC equity interests. GCIC SLF’s profits and losses are allocated to the Company and Aurora in accordance with their 87.5% and 12.5%, respectively, ownership interests. Additionally, GCIC SLF has entered into a senior secured revolving credit facility (as amended, the “GCIC SLF Credit Facility”) with Wells Fargo Bank, N.A. through its wholly-owned subsidiary GCIC Senior Loan Fund II LLC (“GCIC SLF II”), which as of June 30, 2016 allowed GCIC SLF II to borrow up to $150,000 at any one time outstanding, subject to leverage and borrowing base restrictions.
As of June 30, 2016 and September 30, 3015, GCIC SLF had the following commitments from its members:
| | | As of June 30, 2016 | | | As of September 30, 2015 | |
| | | Committed | | | Funded | | | Committed | | | Funded | |
| Subordinated note commitments (1) | | $ | 100,000 | | | $ | 39,905 | | | $ | 100,000 | | | $ | - | |
| LLC equity commitments (1) | | | 25,000 | | | | 14,009 | | | | 25,000 | | | | - | |
| Total | | $ | 125,000 | | | $ | 53,914 | | | $ | 125,000 | | | $ | - | |
| (1) | Commitments presented are combined for the Company and Aurora. |
As of June 30, 2016, GCIC SLF had total assets at fair value of $150,783. As of June 30, 2016, GCIC SLF did not have any investments on non-accrual status. The portfolio companies in GCIC SLF are in industries and geographies similar to those in which the Company may invest directly. Additionally, as of June 30, 2016, GCIC SLF had commitments to fund various undrawn revolvers and delayed draw investments to its portfolio companies totaling $12,366.
Golub Capital Investment Corporation and Subsidiaries
Notes to Unaudited Consolidated Financial Statements
(In thousands, except shares and per share data)
Below is a summary of GCIC SLF’s portfolio, followed by a listing of the individual loans in GCIC SLF’s portfolio as of June 30, 2016:
| | | As of June 30,
2016 | |
| Senior secured loans (1) | | $ | 147,797 | |
| Weighted average current interest rate on senior secured loans (2) | | | 6.0 | % |
| Number of borrowers in GCIC SLF | | | 39 | |
| Largest portfolio company investment (1) | | $ | 8,388 | |
| Total of five largest portfolio company investments (1) | | $ | 38,715 | |
| (1) | At principal/par amount. |
| (2) | Computed as the (a) annual stated interest rate on accruing senior secured loans, divided by (b) total senior secured loans at principal/par amount. |
Golub Capital Investment Corporation and Subsidiaries
Notes to Unaudited Consolidated Financial Statements
(In thousands, except shares and per share data)
| GCIC SLF Loan Portfolio as of June 30, 2016 |
| | | | | | | | | | | | | | | | |
| | | | | | | Maturity | | Current | | | Principal/Par | | | Fair | |
| Portfolio Company | | Business Description | | Security Type | | Date | | Interest Rate(1) | | | Amount | | | Value(2) | |
| AG Kings Holdings Inc.(3) | | Grocery | | Senior loan | | 04/2020 | | | 7.3 | % | | $ | 4,987 | | | $ | 4,987 | |
| Aimbridge Hospitality, LLC(3) | | Hotels, Motels, Inns, and Gaming | | Senior loan | | 10/2018 | | | 5.8 | | | | 2,443 | | | | 2,443 | |
| American Seafoods Group LLC | | Beverage, Food and Tobacco | | Senior loan | | 08/2021 | | | 6.0 | | | | 3,156 | | | | 3,108 | |
| Argon Medical Devices, Inc. | | Healthcare, Education and Childcare | | Senior loan | | 12/2021 | | | 5.8 | | | | 3,529 | | | | 3,529 | |
| Boot Barn, Inc. | | Retail Stores | | Senior loan | | 06/2021 | | | 5.5 | | | | 5,611 | | | | 5,611 | |
| Brandmuscle, Inc. | | Printing and Publishing | | Senior loan | | 12/2021 | | | 5.8 | | | | 4,266 | | | | 4,266 | |
| C.B. Fleet Company, Incorporated | | Personal and Non Durable Consumer Products | | Senior loan | | 12/2021 | | | 5.8 | | | | 8,388 | | | | 8,388 | |
| Checkers Drive-In Restaurants, Inc. | | Beverage, Food and Tobacco | | Senior loan | | 01/2022 | | | 6.5 | | | | 4,287 | | | | 4,254 | |
| CLP Healthcare Services, Inc. | | Healthcare, Education and Childcare | | Senior loan | | 12/2020 | | | 6.3 | | | | 2,075 | | | | 2,075 | |
| CLP Healthcare Services, Inc. | | Healthcare, Education and Childcare | | Senior loan | | 12/2020 | | | 6.3 | | | | 1,046 | | | | 1,046 | |
| Community Veterinary Partners, LLC | | Personal, Food and Miscellaneous Services | | Senior loan | | 10/2021 | | | 6.5 | | | | 2,122 | | | | 2,122 | |
| Community Veterinary Partners, LLC | | Personal, Food and Miscellaneous Services | | Senior loan | | 10/2021 | | | 6.5 | | | | 692 | | | | 692 | |
| Curo Health Services LLC | | Healthcare, Education and Childcare | | Senior loan | | 02/2022 | | | 6.5 | | | | 4,938 | | | | 4,922 | |
| Express Oil Change, LLC | | Retail Stores | | Senior loan | | 12/2017 | | | 6.0 | | | | 346 | | | | 342 | |
| Flexan, LLC | | Chemicals, Plastics and Rubber | | Senior loan | | 02/2020 | | | 6.3 | | | | 2,725 | | | | 2,725 | |
| Hygenic Corporation, The | | Personal and Non Durable Consumer Products | | Senior loan | | 10/2020 | | | 7.5 | | | | 3,323 | | | | 3,323 | |
| Jensen Hughes, Inc. | | Diversified/Conglomerate Service | | Senior loan | | 12/2021 | | | 6.0 | | | | 95 | | | | 95 | |
| Jensen Hughes, Inc. | | Diversified/Conglomerate Service | | Senior loan | | 12/2021 | | | 6.0 | | | | 2,024 | | | | 2,024 | |
| Loar Group Inc. | | Aerospace and Defense | | Senior loan | | 01/2022 | | | 5.8 | | | | 2,005 | | | | 2,005 | |
| Mediaocean LLC(3) | | Diversified/Conglomerate Service | | Senior loan | | 08/2022 | | | 5.8 | | | | 1,921 | | | | 1,921 | |
| Pentec Acquisition Sub, Inc. | | Healthcare, Education and Childcare | | Senior loan | | 05/2018 | | | 6.3 | | | | 454 | | | | 454 | |
| PetVet Care Centers LLC | | Personal, Food and Miscellaneous Services | | Senior loan | | 12/2020 | | | 5.8 | | | | 2,918 | | | | 2,918 | |
| PetVet Care Centers LLC | | Personal, Food and Miscellaneous Services | | Senior loan | | 12/2020 | | | 5.8 | | | | 607 | | | | 607 | |
| PowerPlan Holdings, Inc.(3) | | Utilities | | Senior loan | | 02/2022 | | | 6.3 | | | | 7,522 | | | | 7,522 | |
| PPT Management, LLC | | Healthcare, Education and Childcare | | Senior loan | | 04/2020 | | | 6.0 | | | | 6,308 | | | | 6,308 | |
| Premise Health Holding Corp. (3) | | Healthcare, Education and Childcare | | Senior loan | | 06/2020 | | | 5.5 | | | | 6,000 | | | | 6,000 | |
| Pyramid Healthcare, Inc.(3) | | Healthcare, Education and Childcare | | Senior loan | | 08/2019 | | | 6.8 | | | | 2,017 | | | | 2,017 | |
| Radiology Partners, Inc. | | Healthcare, Education and Childcare | | Senior loan | | 09/2020 | | | 6.0 | | | | 6,448 | | | | 6,448 | |
| Radiology Partners, Inc. | | Healthcare, Education and Childcare | | Senior loan | | 09/2020 | | | 6.0 | | | | 730 | | | | 730 | |
| RSC Acquisition, Inc.(3) | | Insurance | | Senior loan | | 11/2022 | | | 6.3 | | | | 3,218 | | | | 3,218 | |
| RSC Acquisition, Inc.(3) | | Insurance | | Senior loan | | 11/2022 | | | 6.3 | | | | 148 | | | | 148 | |
| Rubio's Restaurants, Inc | | Beverage, Food and Tobacco | | Senior loan | | 11/2018 | | | 6.0 | | | | 1,697 | | | | 1,697 | |
| Rug Doctor LLC | | Personal and Non Durable Consumer Products | | Senior loan | | 06/2018 | | | 6.3 | | | | 2,204 | | | | 2,204 | |
| Saldon Holdings, Inc. | | Diversified/Conglomerate Service | | Senior loan | | 09/2021 | | | 5.5 | | | | 2,261 | | | | 2,261 | |
| Sarnova HC, LLC | | Healthcare, Education and Childcare | | Senior loan | | 01/2022 | | | 5.8 | | | | 3,342 | | | | 3,342 | |
| SEI, Inc. | | Electronics | | Senior loan | | 07/2021 | | | 5.8 | | | | 5,284 | | | | 5,284 | |
| Self Esteem Brands, LLC | | Leisure, Amusement, Motion Pictures, Entertainment | | Senior loan | | 02/2020 | | | 5.0 | | | | 5,720 | | | | 5,720 | |
| Severin Acquisition, LLC | | Diversified/Conglomerate Service | | Senior loan | | 07/2021 | | | 5.9 | | | | 7,949 | | | | 7,907 | |
| Severin Acquisition, LLC | | Diversified/Conglomerate Service | | Senior loan | | 07/2021 | | | 5.9 | | | | 32 | | | | 32 | |
| Smashburger Finance LLC | | Beverage, Food and Tobacco | | Senior loan | | 05/2018 | | | 6.3 | | | | 5,816 | | | | 5,816 | |
| Smashburger Finance LLC | | Beverage, Food and Tobacco | | Senior loan | | 05/2018 | | | 6.3 | | | | 458 | | | | 458 | |
| Smashburger Finance LLC | | Beverage, Food and Tobacco | | Senior loan | | 05/2018 | | | 6.3 | | | | 457 | | | | 457 | |
| Smashburger Finance LLC | | Beverage, Food and Tobacco | | Senior loan | | 05/2018 | | | 6.3 | | | | 456 | | | | 456 | |
| Smashburger Finance LLC | | Beverage, Food and Tobacco | | Senior loan | | 05/2018 | | | 6.3 | | | | 459 | | | | 459 | |
| Tate's Bake Shop, Inc.(3) | | Beverage, Food and Tobacco | | Senior loan | | 08/2019 | | | 6.0 | | | | 714 | | | | 714 | |
| Teasdale Quality Foods, Inc. | | Grocery | | Senior loan | | 10/2020 | | | 5.3 | | | | 1,104 | | | | 1,061 | |
| Transaction Data Systems, Inc.(3) | | Diversified/Conglomerate Service | | Senior loan | | 06/2021 | | | 6.3 | | | | 2,366 | | | | 2,366 | |
| Transaction Data Systems, Inc.(3) | | Diversified/Conglomerate Service | | Senior loan | | 06/2020 | | | 5.5 | | | | 9 | | | | 9 | |
| Worldwide Express Operations, LLC(3) | | Cargo Transport | | Senior loan | | 07/2019 | | | 6.0 | | | | 5,963 | | | | 5,963 | |
| Worldwide Express Operations, LLC(3) | | Cargo Transport | | Senior loan | | 07/2019 | | | 6.0 | | | | 36 | | | | 36 | |
| Young Innovations, Inc. | | Healthcare, Education and Childcare | | Senior loan | | 01/2019 | | | 5.3 | | | | 355 | | | | 355 | |
| Young Innovations, Inc. | | Healthcare, Education and Childcare | | Senior loan | | 01/2018 | | | 6.8 | | | | 22 | | | | 22 | |
| Zest Holdings, LLC | | Healthcare, Education and Childcare | | Senior loan | | 08/2020 | | | 5.8 | | | | 4,744 | | | | 4,744 | |
| | | | | | | | | | | | | | | | | | | |
| | | | | | | | | | | | | $ | 147,797 | | | $ | 147,611 | |
| (1) | Represents the weighted average annual current interest rate as of June 30, 2016. All interest rates are payable in cash. |
| (2) | Represents the fair value in accordance with ASC Topic 820. The determination of such fair value is not included in the Board's valuation process described elsewhere herein. |
| (3) | The Company also holds a portion of the first lien senior secured loan in this portfolio company. |
Golub Capital Investment Corporation and Subsidiaries
Notes to Unaudited Consolidated Financial Statements
(In thousands, except shares and per share data)
The Company has committed to fund $87,500 of subordinated notes and $21,875 of LLC equity interest subscriptions to GCIC SLF. The amortized cost and fair value of the subordinated notes held by the Company was $34,917 and $34,567, respectively, as of June 30, 2016 and $0 and $0, respectively, as of September 30, 2015. As of June 30, 2016, the subordinated notes paid a weighted average interest rate of three-month LIBOR plus 8.0%. For the three and nine months ended June 30, 2016, the Company earned interest income on the subordinated notes of $733 and $1,948, respectively. As of June 30, 2016 and September 30, 2015, $12,258 and $0 of the Company’s LLC equity interest subscriptions to GCIC SLF had been called and contributed. For the three and nine months ended June 30, 2016, the Company received $0 in dividend income from the GCIC SLF LLC equity interests.
See below for certain summarized financial information for GCIC SLF as of and for the three and nine months ended June 30, 2016:
| | | | | | As of June 30, 2016 | |
| Selected Balance Sheet Information: | | | | | | | | |
| Investments, at fair value | | | | | | $ | 147,611 | |
| Cash and other assets | | | | | | | 3,172 | |
| Total assets | | | | | | $ | 150,783 | |
| | | | | | | | | |
| Senior credit facility | | | | | | $ | 96,900 | |
| Unamortized debt issuance costs | | | | | | | (1,190 | ) |
| Other liabilities | | | | | | | 271 | |
| Total liabilities | | | | | | | 95,981 | |
| Subordinated notes and members' equity | | | | | | | 54,802 | |
| Total liabilities and members' equity | | | | | | $ | 150,783 | |
| | | For the three
months ended
June 30, 2016 | | | For the nine
months ended
June 30, 2016 | |
| Selected Statement of Operations Information: | | | | | | | | |
| Interest income | | $ | 2,140 | | | $ | 4,493 | |
| Total investment income | | | 2,140 | | | | 4,493 | |
| | | | | | | | | |
| Interest expense | | | 1,620 | | | | 3,869 | |
| Administrative service fee | | | 38 | | | | 112 | |
| Other expenses | | | 26 | | | | 65 | |
| Total expenses | | | 1,684 | | | | 4,046 | |
| Net investment income (loss) | | | 456 | | | | 447 | |
| | | | | | | | | |
| Net change in unrealized appreciation (depreciation) on investments and subordinated notes | | | 171 | | | | 840 | |
| Net increase (decrease) in net assets | | $ | 627 | | | $ | 1,287 | |
There is no summarized financial information for GCIC SLF as of September 30, 2015 and for the three and nine months ended June 30, 2015 as GCIC SLF commenced operations in October 2015.
Golub Capital Investment Corporation and Subsidiaries
Notes to Unaudited Consolidated Financial Statements
(In thousands, except shares and per share data)
Note 6. Transactions with Affiliated Companies
An affiliated company is generally a portfolio company in which the Company owns 5% or more of the portfolio company’s voting securities. A controlled affiliate is generally a portfolio company in which the Company owns more than 25% of the portfolio company’s outstanding voting securities. The Company did not have any controlled or non-controlled affiliates for the nine months ended June 30, 2015. Transactions related to our investments with controlled affiliates for the nine months ended June 30, 2016 were as follows:
| Portfolio | | Fair value at | | | Purchases | | | Redemptions | | | Sales | | | Discount | | | Net unrealized | | | Fair value at | | | Net realized | | | Interest and | | | Dividend | |
| Company | | September 30, 2015 | | | (cost) | | | (cost) | | | (cost) | | | accretion | | | gains / (losses) | | | June 30, 2016 | | | gains / (losses) | | | fee income | | | income | |
| Controlled Affiliates | | | | | | | | | | | | | | | | | | | | | | | | | | | | | | | | | | | | | | | | |
| GCIC Senior Loan Fund LLC* | | | - | | | | 47,175 | | | | - | | | | - | | | | - | | | | 777 | | | | 47,952 | | | | - | | | | 1,948 | | | | - | |
| Total Controlled Affiliates | | $ | - | | | $ | 47,175 | | | $ | - | | | $ | - | | | $ | - | | | $ | 777 | | | $ | 47,952 | | | $ | - | | | $ | 1,948 | | | $ | - | |
| * | Together with Aurora, the Company co-invests through GCIC SLF. GCIC SLF is capitalized as transactions are completed and all portfolio and investment decisions in respect to GCIC SLF must be approved by the GCIC SLF investment committee consisting of two representatives of the Company and Aurora (with unanimous approval required from (i) one representative of each of the Company and Aurora or (ii) both representatives of each of the Company and Aurora). Therefore, although the Company owns more than 25% of the voting securities of GCIC SLF, the Company does not believe that it has control over GCIC SLF for purposes of the 1940 Act or otherwise. |
| Note 7. | Fair Value Measurements |
The Company follows ASC Topic 820 for measuring fair value. Fair value is the price that would be received in the sale of an asset or paid to transfer a liability in an orderly transaction between market participants at the measurement date. Where available, fair value is based on observable market prices or parameters, or derived from such prices or parameters. Where observable prices or inputs are not available, valuation models are applied. These valuation models involve some level of management estimation and judgment, the degree of which is dependent on the price transparency for the assets or liabilities or market and the assets’ or liabilities’ complexity. The Company’s fair value analysis includes an analysis of the value of any unfunded loan commitments. Assets and liabilities are categorized for disclosure purposes based upon the level of judgment associated with the inputs used to measure their value. The valuation hierarchical levels are based upon the transparency of the inputs to the valuation of the asset or liability as of the measurement date. The three levels are defined as follows:
Level 1: Inputs are unadjusted, quoted prices in active markets for identical assets or liabilities at the measurement date.
Level 2:Inputs include quoted prices for similar assets or liabilities in active markets and inputs that are observable for the assets or liabilities, either directly or indirectly, for substantially the full term of the assets or liabilities.
Level 3: Inputs include significant unobservable inputs for the assets or liabilities and include situations where there is little, if any, market activity for the assets or liabilities. The inputs into the determination of fair value are based upon the best information available and may require significant management judgment or estimation.
In certain cases, the inputs used to measure fair value may fall into different levels of the fair value hierarchy. In such cases, an asset’s or a liability’s categorization within the fair value hierarchy is based on the lowest level of input that is significant to the fair value measurement. The Company’s assessment of the significance of a particular input to the fair value measurement in its entirety requires judgment, and considers factors specific to the asset or liability. The Company assesses the levels of assets and liabilities at each measurement date, and transfers between levels are recognized on the actual date of the event or change in circumstances that caused the transfers. There were no transfers among Level 1, 2 and 3 of the fair value hierarchy for assets and liabilities during the three and nine months ended June 30, 2016 and 2015. The following section describes the valuation techniques used by the Company to measure different assets and liabilities at fair value and includes the level within the fair value hierarchy in which the assets and liabilities are categorized.
Golub Capital Investment Corporation and Subsidiaries
Notes to Unaudited Consolidated Financial Statements
(In thousands, except shares and per share data)
Investments
Level 1 investments are valued using quoted market prices. Level 2 investments are valued using market consensus prices that are corroborated by observable market data and quoted market prices for similar assets and liabilities. Level 3 investments are valued at fair value as determined in good faith by the Board, based on input of management, the audit committee and independent valuation firms that have been engaged at the direction of the Board to assist in the valuation of each portfolio investment without a readily available market quotation at least once during a trailing twelve-month period under a valuation policy and a consistently applied valuation process. This valuation process is conducted at the end of each fiscal quarter, with approximately 25% (based on the number of portfolio companies) of the Company’s valuations of debt and equity investments without readily available market quotations subject to review by an independent valuation firm. All investments as of June 30, 2016 and September 30, 2015, with the exception of money market funds included in cash and cash equivalents (Level 1 investments) and investments measured at fair value using the NAV, were valued using Level 3 inputs of the fair value hierarchy.
When determining fair value of Level 3 debt and equity investments, the Company may take into account the following factors, where relevant: the enterprise value of a portfolio company, the nature and realizable value of any collateral, the portfolio company’s ability to make payments and its earnings and discounted cash flows, the markets in which the portfolio company does business, comparisons to publicly traded securities, and changes in the interest rate environment and the credit markets generally that may affect the price at which similar investments may be made and other relevant factors. The primary method for determining enterprise value uses a multiple analysis whereby appropriate multiples are applied to the portfolio company’s net income before net interest expense, income tax expense, depreciation and amortization (“EBITDA”). The enterprise value analysis is performed to determine the value of equity investments and to determine if debt investments are credit impaired. If debt investments are credit impaired, the Company will use the enterprise value analysis or a liquidation basis analysis to determine fair value. For debt investments that are not determined to be credit impaired, the Company uses a market interest rate yield analysis to determine fair value.
In addition, for certain debt investments, the Company may base its valuation on indicative bid and ask prices provided by an independent third party pricing service. Bid prices reflect the highest price that the Company and others may be willing to pay. Ask prices represent the lowest price that the Company and others may be willing to accept. The Company generally uses the midpoint of the bid/ask range as its best estimate of fair value of such investment.
Due to the inherent uncertainty of determining the fair value of Level 3 investments that do not have a readily available market value, the fair value of the investments may differ significantly from the values that would have been used had a ready market existed for such investments and may differ materially from the values that may ultimately be received or settled. Further, such investments are generally subject to legal and other restrictions or otherwise are less liquid than publicly traded instruments. If the Company were required to liquidate a portfolio investment in a forced or liquidation sale, the Company may realize significantly less than the value at which such investment had previously been recorded.
The Company’s investments are subject to market risk. Market risk is the potential for changes in the value due to market changes. Market risk is directly impacted by the volatility and liquidity in the markets in which the investments are traded.
Golub Capital Investment Corporation and Subsidiaries
Notes to Unaudited Consolidated Financial Statements
(In thousands, except shares and per share data)
The following tables present fair value measurements of the Company’s investments and indicates the fair value hierarchy of the valuation techniques utilized by the Company to determine such fair value as of June 30, 2016 and September 30, 2015:
| As of June 30, 2016: | | Fair Value Measurements Using | |
| Description | | Level 1 | | | Level 2 | | | Level 3 | | | Total | |
| Assets: | | | | | | | | | | | | | | | | |
| Debt investments(1) | | $ | - | | | $ | - | �� | | $ | 887,457 | | | $ | 887,457 | |
| Equity investments(1) | | | - | | | | - | | | | 11,997 | | | | 11,997 | |
| Money market funds (1)(2) | | | 1 | | | | - | | | | - | | | | 1 | |
| Investment measured at NAV(3)(4) | | | - | | | | - | | | | - | | | | 13,385 | |
| Total assets: | | $ | 1 | | | $ | - | | | $ | 899,454 | | | $ | 912,840 | |
| As of September 30, 2015: | | Fair Value Measurements Using | |
| Description | | Level 1 | | | Level 2 | | | Level 3 | | | Total | |
| Assets: | | | | | | | | | | | | | | | | |
| Debt investments(1) | | $ | - | | | $ | - | | | $ | 546,757 | | | $ | 546,757 | |
| Equity investments(1) | | | - | | | | - | | | | 5,121 | | | | 5,121 | |
| Money market funds (1)(2) | | | 8 | | | | - | | | | - | | | | 8 | |
| Total assets: | | $ | 8 | | | $ | - | | | $ | 551,878 | | | $ | 551,886 | |
| (1) | Refer to the consolidated schedules of investments for further details. |
| (2) | Included in cash and cash equivalents and restricted cash and cash equivalents on the consolidated statements of financial condition. |
| (3) | Certain investments that are measured at fair value using the NAV have not been categorized in the fair value hierarchy. The fair value amounts presented in this table are intended to permit reconciliation of the fair value hierarchy to the amounts presented in the consolidated statements of financial condition. |
| (4) | Represents the Company's investment in LLC equity interests in GCIC SLF. The fair value of this investment has been estimated using the NAV of the Company's ownership interest in members' capital. |
The net change in unrealized appreciation (depreciation) for the three and nine months ended June 30, 2016 reported within the net change in unrealized appreciation (depreciation) on investments in the Company’s consolidated statement of operations attributable to the Company’s Level 3 assets held as of June 30, 2016 was $2,324 and $3,177, respectively.
The net change in unrealized appreciation (depreciation) for the three and nine months ended June 30, 2015 reported within the net change in unrealized appreciation (depreciation) on investments in the Company’s consolidated statement of operations attributable to the Company’s Level 3 assets held as of June 30, 2015 was $609 and $901, respectively.
Golub Capital Investment Corporation and Subsidiaries
Notes to Unaudited Consolidated Financial Statements
(In thousands, except shares and per share data)
The following tables present the changes in investments measured at fair value using Level 3 inputs for the nine months ended June 30, 2016 and 2015:
| | | For the nine months ended June 30, 2016 | |
| | | Debt Investments | | | Equity Investments | | | Total Investments | |
| | | | | | | | | | |
| Fair value, beginning of period | | $ | 546,757 | | | $ | 5,121 | | | $ | 551,878 | |
| | | | | | | | | | | | | |
| Net change in unrealized appreciation (depreciation) on investments | | | 2,138 | | | | 289 | | | | 2,427 | |
| Realized gain (loss) on investments | | | 710 | | | | - | | | | 710 | |
| Fundings of revolving loans, net | | | 2,362 | | | | - | | | | 2,362 | |
| Fundings of investments | | | 569,443 | | | | 6,783 | | | | 576,226 | |
| PIK interest | | | 74 | | | | - | | | | 74 | |
| Proceeds from principal payments and sales of portfolio investments | | | (236,082 | ) | | | (196 | ) | | | (236,278 | ) |
| Accretion of discounts and amortization of premiums | | | 2,055 | | | | - | | | | 2,055 | |
| Fair value, end of period | | $ | 887,457 | | | $ | 11,997 | | | $ | 899,454 | |
| | | For the nine months ended June 30, 2015 | |
| | | Debt Investments | | | Equity Investments | | | Total Investments | |
| | | | | | | | | | |
| Fair value, beginning of period | | $ | - | | | $ | - | | | $ | - | |
| | | | | | | | | | | | | |
| Net change in unrealized appreciation (depreciation) on investments | | | 857 | | | | 44 | | | | 901 | |
| Realized gain (loss) on investments | | | 42 | | | | - | | | | 42 | |
| Fundings of revolving loans, net | | | 1,014 | | | | - | | | | 1,014 | |
| Fundings of investments | | | 453,715 | | | | 2,797 | | | | 456,512 | |
| PIK interest | | | 21 | | | | - | | | | 21 | |
| Proceeds from principal payments and sales of portfolio investments | | | (45,256 | ) | | | - | | | | (45,256 | ) |
| Accretion of discounts and amortization of premiums | | | 360 | | | | - | | | | 360 | |
| Fair value, end of period | | $ | 410,753 | | | $ | 2,841 | | | $ | 413,594 | |
Golub Capital Investment Corporation and Subsidiaries
Notes to Unaudited Consolidated Financial Statements
(In thousands, except shares and per share data)
The following tables present quantitative information about the significant unobservable inputs of the Company’s Level 3 investments as of June 30, 2016 and September 30, 2015:
| Quantitative information about Level 3 Fair Value Measurements |
| | | | Fair value as of
June 30, 2016 | | | Valuation Techniques | | Unobservable Input | | Range (Weighted Average) |
| Assets: | | | | | | | | | | |
| Senior secured loans (1) | | $ | 97,709 | | | Market rate approach | | Market interest rate | | 4.0% - 33.3% (6.6%) |
| | | | | | | Market comparable companies | | EBITDA multiples | | 6.0x - 17.5x (12.0x) |
| | | | 10,785 | | | Market comparable | | Broker/dealer bids or quotes | | N/A |
| | | | | | | | | | | |
| Subordinated Notes of GCIC SLF | | $ | 34,567 | | | Discounted cash flow analysis | | Discount rate | | 8.2% |
| | | | | | | | | | | |
| One stop loans (1)(2) | | $ | 744,341 | | | Market rate approach | | Market interest rate | | 5.5% - 22.8% (7.8%) |
| | | | | | | Market comparable companies | | EBITDA multiples (3) | | 4.0x - 23.9x (12.6x) |
| | | | | | | | | Revenue multiples (3) | | 2.0x - 4.0x (3.6x) |
| | | | | | | | | | | |
| Subordinated and second lien loans | | $ | 39 | | | Market rate approach | | Market interest rate | | 19.5% |
| | | | | | | Market comparable companies | | EBITDA multiples | | 9.3x |
| | | | | | | | | | | |
| Equity securities (4) | | $ | 11,997 | | | Market comparable companies | | EBITDA multiples (5) | | 7.5x - 23.9x (13.1x) |
| | | | | | | | | Revenue multiples (5) | | 2.0x - 4.0x (3.9x) |
| | | | | | | | | | | |
| (1) | The fair value of this asset class was determined using the market rate approach as the investments in this asset class were determined not to be credit impaired using the market comparable companies approach. The unobservable inputs for both valuation techniques have been presented, but the fair value as of June 30, 2016 was determined using the market rate approach. |
| (2) | Excludes $16 of non-accrual loans at fair value, which the Company valued on a liquidation basis. |
| (3) | The Company valued $713,167 and $31,174 of one stop loans using EBITDA and revenue multiples, respectively. All one stop loans were also valued using the market rate approach. |
| (4) | Excludes $13,385 of LLC equity interests in GCIC SLF at fair value, which the Company valued using NAV. |
| (5) | The Company valued $10,538 and $1,459 of equity investments using EBITDA and revenue multiples, respectively. |
| Quantitative information about Level 3 Fair Value Measurements |
| | | | Fair value as of
September 30, 2015 | | | Valuation Techniques | | Unobservable Input | | Range (Weighted Average) |
| Assets: | | | | | | | | | | |
| Senior secured loans (1)(2) | | $ | 132,847 | | | Market rate approach | | Market interest rate | | 4.0% - 25.3% (6.2%) |
| | | | | | | Market comparable companies | | EBITDA multiples | | 4.0x - 17.5x (11.4x) |
| | | | | | | | | | | |
| One stop loans (1)(3) | | $ | 393,384 | | | Market rate approach | | Market interest rate | | 5.5% - 24.0% (7.4%) |
| | | | | | | Market comparable companies | | EBITDA multiples (4) | | 4.5x - 40.0x (11.6x) |
| | | | | | | | | Revenue multiples (4) | | 2.1x - 5.0x (3.0x) |
| | | | | | | | | | | |
| Equity securities | | $ | 5,121 | | | Market comparable companies | | EBITDA multiples (5) | | 8.5x - 40.0x (13.5x) |
| | | | | | | | | Revenue multiples (5) | | 2.1x - 5.0x (3.6x) |
| (1) | The fair value of this asset class was determined using the market rate approach as the investments in this asset class were determined not to be credit impaired using the market comparable companies approach. The unobservable inputs for both valuation techniques have been presented, but the fair value as of September 30, 2015 was determined using the market rate approach. |
| (2) | Excludes $20,347 of loans at fair value, which the Company valued using indicative bid and ask prices provided by an independent third party pricing service. |
| (3) | Excludes $179 of non-accrual loans at fair value, which the Company valued on a liquidation basis. |
| (4) | The Company valued $385,471 and $7,913 of one stop loans using EBITDA and revenue multiples, respectively. All one stop loans were also valued using the market rate approach. |
| (5) | The Company valued $4,977 and $144 of equity securities using EBITDA and revenue multiples, respectively. |
The above tables are not intended to be all-inclusive but rather to provide information on significant unobservable inputs and valuation techniques used by the Company.
The significant unobservable inputs used in the fair value measurement of the Company’s debt and equity investments are EBITDA multiples, revenue multiples and market interest rates. The Company uses EBITDA multiples and, to a lesser extent revenue multiples, on its debt and equity investments to determine any credit gains or losses. Increases or decreases in either of these inputs in isolation may result in a significantly lower or higher fair value measurement. The Company uses market interest rates for loans to determine if the effective yield on a loan is commensurate with the market yields for that type of loan. If a loan’s effective yield is significantly less than the market yield for a similar loan with a similar credit profile, then the resulting fair value of the loan may be lower.
Golub Capital Investment Corporation and Subsidiaries
Notes to Unaudited Consolidated Financial Statements
(In thousands, except shares and per share data)
Other Financial Assets and Liabilities
ASC Topic 820 requires disclosure of the fair value of financial instruments for which it is practical to estimate such value. As a result, all assets and liabilities approximate fair value on the consolidated statements of financial condition as they have a short maturity or are replaceable on demand.
In accordance with the 1940 Act, with certain limited exceptions, the Company is only allowed to borrow amounts such that its asset coverage, as defined in the 1940 Act, is at least 200% after such borrowing. As of June 30, 2016, the Company’s asset coverage for borrowed amounts was 226.4%.
Revolving Credit Facility: On December 31, 2014, as part of the Company’s formation transactions, the Company and GCIC Funding entered into an amendment to the Credit Facility, which as of June 30, 2016 allowed GCIC Funding to borrow up to $370,000 at any one time outstanding, subject to leverage and borrowing base restrictions.
Through the reinvestment period, which ends May 12, 2017, the Credit Facility bears interest at one-month LIBOR plus 2.25% per annum. After the reinvestment period, the rate will reset to one-month LIBOR plus 2.75% per annum for the remaining term of the Credit Facility. In addition to the stated interest expense on the Credit Facility, the Company is required to pay a non-usage fee rate between 0.50% and 2.00% per annum depending on the size of the unused portion of the Credit Facility. The stated maturity date of the Credit Facility is May 13, 2020.
On March 9, 2016 the Credit Facility was amended to, among other things, make certain amendments to the computation of the borrowing base restrictions in the Credit Facility. Our maximum borrowing capacity under the Credit Facility, the expiration of the reinvestment period and the stated maturity date of the Credit Facility did not change in connection with this amendment.
On July 12, 2016, the Company and GCIC Funding amended the Credit Facility to, among other things, increase the size of the Credit Facility from $370,000 to $420,000.
The Credit Facility is collateralized by all of the assets held by GCIC Funding, and GCIC has pledged its interests in GCIC Funding as collateral to Wells Fargo Bank, N.A., as the collateral agent, under an ancillary agreement to secure the obligations of GCIC as the transferor and servicer under the Credit Facility. Both GCIC and GCIC Funding have made customary representations and warranties and are required to comply with various covenants, reporting requirements and other customary requirements for similar credit facilities. Borrowing under the Credit Facility is subject to the leverage restrictions contained in the 1940 Act.
The Company plans to transfer certain loans and debt securities it has originated or acquired from time to time to GCIC Funding through a purchase and sale agreement and may cause GCIC Funding to originate or acquire loans in the future, consistent with the Company’s investment objectives.
As of June 30, 2016 and September 30, 2015, the Company had outstanding debt under the Credit Facility of $329,350 and $249,700, respectively. For the three and nine months ended June 30, 2016, the Company had borrowings on the Credit Facility of $215,900 and $474,350 and repayments on the Credit Facility of $190,450 and $394,700, respectively. For the three and nine months ended June 30, 2015, the Company had borrowings on the Credit Facility of $181,750 and $375,500 and repayments on the Credit Facility of $104,350 and $225,400, respectively.
| Golub Capital Investment Corporation and Subsidiaries |
| Notes to Unaudited Consolidated Financial Statements |
| (In thousands, except shares and per share data) |
For the three and nine months ended June 30, 2016 and 2015, the components of interest expense, cash paid for interest, annualized average interest rates and average outstanding balances for the Credit Facility were as follows:
| | | For the three months ended June 30, | | | For the nine months ended June 30, | |
| | | 2016 | | | 2015 | | | 2016 | | | 2015 | |
| Stated interest expense | | $ | 2,170 | | | $ | 987 | | | $ | 5,513 | | | $ | 1,526 | |
| Facility fees | | | 65 | | | | 86 | | | | 361 | | | | 159 | |
| Amortization of debt issuance costs | | | 517 | | | | 158 | | | | 1,481 | | | | 222 | |
| Total interest and other debt financing expenses | | $ | 2,752 | | | $ | 1,231 | | | $ | 7,355 | | | $ | 1,907 | |
| Cash paid for interest expense and facility fees | | $ | 2,213 | | | $ | 976 | | | $ | 5,721 | | | $ | 1,588 | |
| Annualized average stated interest rate | | | 2.7 | % | | | 2.5 | % | | | 2.7 | % | | | 2.5 | % |
| Average outstanding balance(1) | | $ | 318,773 | | | $ | 160,443 | | | $ | 275,210 | | | $ | 124,747 | |
| (1) | The average outstanding balance for the nine months ended June 30, 2015 is calculated from December 31, 2014, the commencement of operations, through June 30, 2015. |
Revolver: On February 3, 2015, the Company entered into the Revolver with the Investment Adviser, with a maximum credit limit of $40,000 and expiration date of February 3, 2018. The Revolver bears an interest rate equal to the short-term Applicable Federal Rate (“AFR”), which was 0.6% as of June 30, 2016. As of June 30, 2016 and September 30, 2015, the Company had no outstanding debt under the Revolver. For the three and nine months ended June 30, 2016, the Company had borrowings on the Revolver of $12,200 and $78,000 and repayments on the Revolver of $12,200 and $78,000, respectively. For the three and nine months ended June 30, 2015, the Company had borrowings on the Revolver of $14,075 and $16,575 and repayments on the Revolver of $12,675 and $15,175, respectively.
For the three and nine months ended June 30, 2016 and 2015, the components of interest expense, cash paid for interest, annualized average interest rates and average outstanding balances for the Revolver were as follows:
| | | For the three months ended June 30, | | | For the nine months ended June 30, | |
| | | 2016 | | | 2015 | | | 2016 | | | 2015 | |
| Stated interest expense | | $ | 1 | | | $ | 2 | | | $ | 8 | | | $ | 2 | |
| Cash paid for interest expense | | $ | 1 | | | $ | 2 | | | $ | 8 | | | $ | 2 | |
| Annualized average stated interest rate | | | 0.7 | % | | | 0.5 | % | | | 0.6 | % | | | 0.5 | % |
| Average outstanding balance(1) | | $ | 546 | | | $ | 1,085 | | | $ | 1,845 | | | $ | 656 | |
| (1) | The average outstanding balance for the nine months ended June 30, 2015 is calculated from December 31, 2014, the commencement of operations, through June 30, 2015. |
SMBC Revolver: On May 17, 2016, the Company entered into a revolving credit agreement with Sumitomo Mitsui Banking Corporation (the “SMBC Revolver”), which as of June 30, 2016 allowed GCIC to borrow up to $75,000 at any one time outstanding, subject to leverage and borrowing base restrictions, with a stated maturity date of May 17, 2018.
The SMBC Revolver bears interest at one-month LIBOR plus 1.60% per annum. In addition to the stated interest expense on the SMBC Revolver, the Company is required to pay a non-usage fee at a rate of 0.25% per annum on the unused portion of the SMBC Revolver.
The SMBC Revolver is secured by the unfunded capital commitments of certain GCIC stockholders. GCIC has made customary representations and warranties and is required to comply with various covenants, reporting requirements and other customary requirements for similar credit facilities. Borrowing under the SMBC Revolver is subject to the leverage restrictions contained in the 1940 Act.
As of June 30, 2016 and September 30, 2015, the Company had outstanding debt under the SMBC Revolver of $75,000 and $0, respectively. For the three and nine months ended June 30, 2016, the Company had borrowings on the SMBC Revolver of $75,000 and repayments on the SMBC Revolver of $0.
| Golub Capital Investment Corporation and Subsidiaries |
| Notes to Unaudited Consolidated Financial Statements |
| (In thousands, except shares and per share data) |
For each of the three and nine months ended June 30, 2016, the components of interest expense, cash paid for interest, annualized average interest rates and average outstanding balances for the SMBC Revolver were as follows:
| | | For the three months ended June 30, | | | For the nine months ended June 30, | |
| | | 2016 | | | 2015 | | | 2016 | | | 2015 | |
| Stated interest expense | | $ | 193 | | | | N/A | | | $ | 193 | | | | N/A | |
| Facility fees | | | 1 | | | | N/A | | | | 1 | | | | N/A | |
| Amortization of debt issuance costs | | | 28 | | | | N/A | | | | 28 | | | | N/A | |
| Total interest and other debt financing expenses | | $ | 222 | | | | N/A | | | $ | 222 | | | | N/A | |
| Cash paid for interest expense | | $ | 132 | | | | N/A | | | $ | 132 | | | | N/A | |
| Annualized average stated interest rate | | | 2.1 | % | | | N/A | | | | 2.1 | % | | | N/A | |
| Average outstanding balance | | $ | 36,264 | | | | N/A | | | $ | 12,044 | | | | N/A | |
On December 31, 2014, the Company entered into the $11,820 GEMS Note, which carried a fixed interest rate of 3.25%. The GEMS Note matured and was paid-off in full on March 2, 2015. Total interest expense paid on the note during each of the three and nine months ended June 30, 2015 was $46.
The Company’s average total debt outstanding (including the debt under the Credit Facility, Revolver, and SMBC Revolver) for the three and nine months ended June 30, 2016, was $355,583 and $289,099, respectively. The Company’s average total debt outstanding (including the debt under the Credit Facility, Revolver, and GEMS Note) for the three and nine months ended June 30, 2015 was $161,528 and $128,260, respectfully.
For the three and nine months ended June 30, 2016, the effective annualized average interest rate, which includes amortization of debt issuance costs and non-usage facility fees, on the Company’s total debt outstanding was 3.4% and 3.5%, respectively. For the three and nine months ended June 30, 2015, the effective annualized average interest rate, which includes amortization of debt issuance costs and non-usage facility fees, on the Company’s total debt outstanding was 3.1% and 3.1%, respectively.
A summary of the Company’s maturity requirements for borrowings as of June 30, 2016 is as follows:
| | | Payments Due by Period | |
| | | | | | Less Than | | | | | | | | | More Than | |
| | | Total | | | 1 Year | | | 1-3 Years | | | 3-5 Years | | | 5 Years | |
| | | | | | | | | | | | | | | | |
| Credit Facility | | $ | 329,350 | | | $ | - | | | $ | - | | | $ | 329,350 | | | $ | - | |
| SMBC Revolver | | | 75,000 | | | | - | | | | 75,000 | | | | - | | | | - | |
| Revolver | | | - | | | | - | | | | - | | | | - | | | | - | |
| Total borrowings | | $ | 404,350 | | | $ | - | | | $ | 75,000 | | | $ | 329,350 | | | $ | - | |
| Golub Capital Investment Corporation and Subsidiaries |
| Notes to Unaudited Consolidated Financial Statements |
| (In thousands, except shares and per share data) |
| Note 9. | Commitments and Contingencies |
Commitments:The Company had outstanding commitments to fund investments totaling $61,259 and $58,754 under various undrawn revolvers and other credit facilities as of June 30, 2016 and September 30, 2015, respectively. As described in Note 5, the Company had commitments of up to $62,200 to GCIC SLF as of June 30, 2016 that may be contributed primarily for the purpose of funding new investments approved by the GCIC SLF investment committee. GCIC SLF had not commenced operations as of September 30, 2015.
Indemnifications:In the normal course of business, the Company enters into contracts and agreements that contain a variety of representations and warranties that provide general indemnifications. The Company’s maximum exposure under these arrangements is unknown, as these involve future claims that may be made against the Company but that have not occurred. The Company expects the risk of any future obligations under these indemnifications to be remote.
Off-balance sheet risk:Off-balance sheet risk refers to an unrecorded potential liability that may result in a future obligation or loss, even though it does not appear on the consolidated statements of financial condition. The Company may enter into derivative instruments that contain elements of off-balance sheet market and credit risk. There were no commitments outstanding for derivative contracts as of June 30, 2016 and September 31, 2015. Derivative instruments can be affected by market conditions, such as interest rate volatility, which could impact the fair value of the derivative instruments. If market conditions move against the Company, it may not achieve the anticipated benefits of any derivative instruments and may realize a loss. The Company minimizes market risk through monitoring its investments and borrowings.
Concentration of credit and counterparty risk:Credit risk arises primarily from the potential inability of counterparties to perform in accordance with the terms of the contract. The Company may engage in derivative transactions with counterparties. In the event that the counterparties do not fulfill their obligations, the Company may be exposed to risk. The risk of default depends on the creditworthiness of the counterparties or issuers of the instruments. The Company’s maximum loss that it could incur related to counterparty risk on derivative instruments is the value of the collateral for that respective derivative instrument. It is the Company’s policy to review, as necessary, the credit standing of each counterparty.
Legal proceedings: In the normal course of business, the Company may be subject to legal and regulatory proceedings that are generally incidental to its ongoing operations. While there can be no assurance of the ultimate disposition of any such proceedings, the Company does not believe any disposition will have a material adverse effect on the Company’s consolidated financial statements.
| Golub Capital Investment Corporation and Subsidiaries |
| Notes to Unaudited Consolidated Financial Statements |
| (In thousands, except shares and per share data) |
| Note 10. | Financial Highlights |
The financial highlights for the Company are as follows:
| | | Nine months ended June 30, | |
| Per share data(1)(2): | | 2016 | | | 2015 | |
| Net asset value at beginning of period | | $ | 15.00 | | | $ | 15.00 | |
| Net investment income | | | 0.77 | | | | 0.51 | |
| Net realized gain (loss) on investments | | | 0.02 | | | | - | |
| Net change in unrealized appreciation (depreciation) on investments | | | 0.14 | | | | 0.08 | |
| Dividends and distributions declared(3) | | | | | | | | |
| From net investment income | | | (0.66 | ) | | | (0.47 | ) |
| From capital gains | | | (0.03 | ) | | | - | |
| From return of capital | | | (0.23 | ) | | | (0.08 | ) |
| Other(4) | | | (0.01 | ) | | | (0.04 | ) |
| Net asset value at end of period | | $ | 15.00 | | | $ | 15.00 | |
| | | | | | | | | |
| Per share net asset value at end of period | | $ | 15.00 | | | $ | 15.00 | |
| Total return based on net asset value per share(5) | | | 6.25 | % | | | 7.91 | % |
| Shares outstanding at end of period | | | 34,122,546.688 | | | | 15,205,543.534 | |
Listed below are supplemental data and ratios to the financial highlights:
| Ratio of expenses (without incentive fees and management fee waiver) to average net assets * | | | 5.51 | % | | | 5.68 | % |
| Ratio of management fee waiver to average net assets * | | | (0.64 | )% | | | (0.69 | )% |
| Ratio of incentive fees to average net assets | | | 0.96 | % | | | 0.36 | % |
| Ratio of total expenses to average net assets(6) | | | 5.83 | % | | | 5.35 | % |
| Ratio of net investment income to average net assets * | | | 6.85 | % | | | 6.78 | % |
| | | | | | | | | |
| Net assets at end of period | | $ | 511,838 | | | $ | 228,083 | |
| Average debt outstanding | | $ | 289,099 | | | $ | 128,260 | |
| Average debt outstanding per share | | $ | 8.47 | | | $ | 8.44 | |
| Asset coverage ratio(7) | | | 226.39 | % | | | 216.00 | % |
| Portfolio turnover * | | | 46.84 | % | | | 29.71 | % |
| * | Annualized for a period less than one year. |
| (1) | Based on actual number of shares outstanding at the end of the corresponding period or the weighted average shares outstanding for the period, unless otherwise noted, as appropriate. |
| (2) | For the nine months ended June 30, 2015, the weighted average shares outstanding is calculated from December 31, 2014, the commencement of operations, through June 30, 2015. |
| (3) | The per share data for dividends and distributions reflect the amount of distributions paid or payable with a record date during the applicable period. |
| (4) | Includes the impact of different share amounts as a result of calculating certain per share data based on weighted average shares outstanding during the period and certain per share data based on the shares outstanding as of the period end. |
| (5) | Total return based on net asset value at end of period assumes assumes dividends are reinvested. |
| (6) | Expenses, other than incentive fees, are annualized for a period less than one year. |
| (7) | In accordance with the 1940 Act, with certain limited exceptions, the Company is only allowed to borrow amounts such that its asset coverage, as defined in the 1940 Act, is at least 200% after such borrowing. |
| Golub Capital Investment Corporation and Subsidiaries |
| Notes to Unaudited Consolidated Financial Statements |
| (In thousands, except shares and per share data) |
| Note 11. | Earnings Per Share |
The following information sets forth the computation of the net increase in net assets per share resulting from operations for the three and nine months ended June 30, 2016 and 2015:
| | | Three months ended June 30, | | | Nine months ended June 30, | |
| | | 2016 | | | 2015 | | | 2016 | | | 2015 | |
| Earnings available to stockholders | | $ | 10,033 | | | $ | 4,230 | | | $ | 23,985 | | | $ | 6,597 | |
| Basic and diluted weighted average common shares outstanding | | | 29,278,962 | | | | 13,592,026 | | | | 25,697,689 | | | | 11,213,803 | |
| Basic and diluted earnings per common share(1) | | $ | 0.35 | | | $ | 0.32 | | | $ | 0.93 | | | $ | 0.59 | |
| (1) | For the nine months ended June 30, 2015, the basic and diluted weighted average common shares outstanding are calculated for the period from December 31, 2014, the commencement of operations, through June 30, 2015. |
| Note 12. | Dividends and Distributions |
The Company’s dividends and distributions are recorded on the record date. The following table summarizes the Company’s dividend declarations and distributions during the nine months ended June 30, 2016 and 2015:
| | | | | | | Shares | | | Amount | | | Cash | | | DRIP Shares | | | DRIP Shares | |
| Date Declared | | Record Date | | Payment Date | | Outstanding | | | Per Share | | | Distribution | | | Value | | | Issued | |
| | | | | | | | | | | | | | | | | | | | |
| Nine months ended June 30, 2016 | | | | | | | | | | | | | | | | | | | |
| 08/04/2015 | | 10/27/2015 | | 12/30/2015 | | | 20,843,155.219 | | | $ | 0.0818 | | | $ | 744 | | | $ | 961 | | | | 64,075.512 | |
| 11/17/2015 | | 11/19/2015 | | 12/30/2015 | | | 22,172,613.752 | | | $ | 0.1252 | | | $ | 1,213 | | | $ | 1,563 | | | | 104,219.497 | |
| 11/17/2015 | | 12/17/2015 | | 02/26/2016 | | | 24,433,662.992 | | | $ | 0.0891 | | | $ | 949 | | | $ | 1,228 | | | | 81,866.709 | |
| 11/17/2015 | | 01/22/2016 | | 02/26/2016 | | | 24,601,958.001 | | | $ | 0.0957 | | | $ | 1,019 | | | $ | 1,335 | | | | 88,981.506 | |
| 02/08/2016 | | 02/22/2016 | | 05/20/2016 | | | 24,601,958.001 | | | $ | 0.0705 | | | $ | 876 | | | $ | 858 | | | | 57,176.462 | |
| 02/08/2016 | | 03/24/2016 | | 05/20/2016 | | | 27,261,737.139 | | | $ | 0.1176 | | | $ | 1,596 | | | $ | 1,609 | | | | 107,293.202 | |
| 05/03/2016 | | 04/30/2016 | | 07/28/2016 | | | 27,261,737.139 | | | $ | 0.1046 | | | $ | 1,420 | | | $ | 1,432 | | | | N/A | (1) |
| 05/03/2016 | | 05/19/2016 | | 07/28/2016 | | | 29,256,215.216 | | | $ | 0.1331 | | | $ | 1,925 | | | $ | 1,968 | | | | N/A | (1) |
| 05/03/2016 | | 06/20/2016 | | 07/28/2016 | | | 31,415,162.957 | | | $ | 0.1047 | | | $ | 1,608 | | | $ | 1,680 | | | | N/A | (1) |
| | | | | | | | | | | | | | | | | | | | | | | | | |
| Nine months ended June 30, 2015 | | | | | | | | | | | | | | | | | | | | |
| 02/03/2015 | | 02/04/2015 | | 04/28/2015 | | | 8,404,848.973 | | | $ | 0.0747 | | | $ | 219 | | | $ | 409 | | | | 27,304.503 | |
| 02/03/2015 | | 02/27/2015 | | 04/28/2015 | | | 9,234,461.744 | | | $ | 0.0817 | | | $ | 266 | | | $ | 489 | | | | 32,553.581 | |
| 02/03/2015 | | 03/31/2015 | | 04/28/2015 | | | 10,508,461.744 | | | $ | 0.0936 | | | $ | 351 | | | $ | 633 | | | | 42,174.913 | |
| 02/03/2015 | | 04/30/2015 | | 07/28/2015 | | | 12,758,875.599 | | | $ | 0.1121 | | | $ | 564 | | | $ | 866 | | | | N/A | (2) |
| 05/11/2015 | | 05/27/2015 | | 07/28/2015 | | | 13,870,595.594 | | | $ | 0.0979 | | | $ | 539 | | | $ | 818 | | | | N/A | (2) |
| 05/11/2015 | | 06/26/2015 | | 07/28/2015 | | | 15,205,543.534 | | | $ | 0.0949 | | | $ | 581 | | | $ | 862 | | | | N/A | (2) |
| (1) | The DRIP shares were not issued as of June 30, 2016. |
| (2) | The DRIP shares were not issued as of June 30, 2015. |
There were no dividend declarations or distributions during the three months ended December 31, 2014.
| Golub Capital Investment Corporation and Subsidiaries |
| Notes to Unaudited Consolidated Financial Statements |
| (In thousands, except shares and per share data) |
| Note 13. | Subsequent Events |
In preparing these financial statements, the Company has evaluated events and transactions for potential recognition or disclosure through August 8, 2016, the date the financial statements were available to be issued. There are no subsequent events to disclose except for the following:
On July 1, 2016 and August 1, 2016, the Company received additional stockholder capital subscriptions totaling $31,200 in the aggregate.
On July 12, 2016, GCIC Funding entered into an amendment (the “Credit Facility Amendment”) to the documents governing GCIC Funding’s Credit Facility with Wells Fargo Securities, LLC, as administrative agent, and Wells Fargo Bank, N.A., as lender. The Credit Facility Amendment was effective as of July 12, 2016. The Credit Facility Amendment, among other things, increased the size of the Credit Facility from $370,000 to $420,000.
On May 3, 2016 and August 3, 2016, the Company’s Board declared distributions to holders of record as set forth in the table below:
| Record Date | | Payment Date | | Amount Per Share |
| July 22, 2016 | | September 26, 2016 | | Net increase in net assets resulting from operations earned by the Company (if positive) as determined in accordance with GAAP for the period July 1, 2016 through July 31, 2016 per share |
| | | | | |
| August 29, 2016 | | November 21, 2016 | | Net increase in net assets resulting from operations earned by the Company (if positive) as determined in accordance with GAAP for the period August 1, 2016 through August 31, 2016 per share |
| | | | | |
| September 23, 2016 | | November 21, 2016 | | Net increase in net assets resulting from operations earned by the Company (if positive) as determined in accordance with GAAP for the period September 1, 2016 through September 30, 2016 per share |
| | | | | |
| October 24, 2016 | | December 30, 2016 | | Net increase in net assets resulting from operations earned by the Company (if positive) as determined in accordance with GAAP for the period October 1, 2016 through October 31, 2016 per share |
On July 22, 2016, the Company priced a $410,086 term debt securitization that is scheduled to close on August 16, 2016. The notes offered in the securitization consist of $220,000 of Aaa/AAA Class A notes and $32,500 of Aa1 Class B notes that are each offered at par. The Class A notes bear interest at three-month LIBOR plus 2.15% and the Class B notes bear interest at three-month LIBOR plus 3.00%. The $42,300 Class C notes, $28,600 Class D notes and $86,686 of LLC equity interests will be retained by the Company in consideration for the loans transferred as part of the debt securitization.
[Intentionally Omitted.]
Golub Capital Investment Corporation and Subsidiaries
Consolidated Statements of Financial Condition
(In thousands, except share and per share data)
| | | September 30, | | | September 30, | |
| | | 2015 | | | 2014 | |
| Assets | | | | | | | | |
| Investments, at fair value | | | | | | | | |
| Non-controlled/non-affiliate company investments | | $ | 551,878 | | | $ | — | |
| Total investments, at fair value (cost of $549,399 and $0, respectively) | | | 551,878 | | | | — | |
| Cash and cash equivalents | | | 2,747 | | | | 10 | |
| Restricted cash and cash equivalents | | | 10,145 | | | | — | |
| Interest receivable | | | 2,043 | | | | — | |
| Deferred financing costs | | | 3,213 | | | | — | |
| Other assets | | | 426 | | | | — | |
| Total Assets | | $ | 570,452 | | | $ | 10 | |
| | | | | | | | | |
| Liabilities | | | | | | | | |
| Debt | | $ | 249,700 | | | $ | — | |
| Interest payable | | | 398 | | | | — | |
| Dividends and distributions payable | | | 4,872 | | | | — | |
| Management and incentive fees payable | | | 1,872 | | | | — | |
| Accounts payable and accrued expenses | | | 953 | | | | — | |
| Accrued trustee fees | | | 10 | | | | — | |
| Total Liabilities | | | 257,805 | | | | — | |
| Commitments and contingencies (Note 9) | | | | | | | | |
| | | | | | | | | |
| Net Assets | | | | | | | | |
| Preferred stock, par value $0.001 per share, 1,000,000 shares authorized, zero shares issued and outstanding as of September 30, 2015 and September 30, 2014 | | | — | | | | — | |
| Common stock, par value $0.001 per share, 100,000,000 shares authorized, 20,843,155.219 and 666.670 shares issued and outstanding as of September 30, 2015 and September 30, 2014, respectively | | | 21 | | | | — | |
| Paid in capital in excess of par | | | 312,626 | | | | 10 | |
| Capital distributions in excess of net investment income | | | (2,521 | ) | | | — | |
| Net unrealized appreciation (depreciation) on investments | | | 2,479 | | | | — | |
| Net realized gain (loss) on investments | | | 42 | | | | — | |
| Total Net Assets | | | 312,647 | | | | 10 | |
| Total Liabilities and Total Net Assets | | $ | 570,452 | | | $ | 10 | |
| Number of common shares outstanding | | | 20,843,155.219 | | | | 666.670 | |
| Net asset value per common share | | $ | 15.00 | | | $ | 15.00 | |
See Notes to Consolidated Financial Statements.
Golub Capital Investment Corporation and Subsidiaries
Consolidated Statement of Operations
(In thousands, except share and per share data)
| | | | | | Period from | |
| | | | | | September 22, | |
| | | | | | 2014 | |
| | | Year ended | | | (inception) to | |
| | | September 30, | | | September 30, | |
| | | 2015 | | | 2014 | |
| Investment income | | | | | | | | |
| From non-controlled/non-affiliate company investments: | | | | | | | | |
| Interest income | | $ | 19,346 | | | $ | — | |
| Fee income | | | 55 | | | | — | |
| Total investment income from non-controlled/non-affiliate company investments | | | 19,401 | | | | — | |
| Total investment income | | | 19,401 | | | | — | |
| | | | | | | | | |
| Expenses | | | | | | | | |
| Interest and other debt financing expenses | | | 3,731 | | | | — | |
| Base management fee | | | 3,820 | | | | — | |
| Base management fee waiver | | | (1,042 | ) | | | — | |
| Incentive fee | | | 1,239 | | | | — | |
| Professional fees | | | 576 | | | | — | |
| Administrative service fee | | | 555 | | | | — | |
| General and administrative expenses | | | 16 | | | | — | |
| Total expenses | | | 8,895 | | | | — | |
| Net investment income | | | 10,506 | | | | — | |
| | | | | | | | | |
| Net gain (loss) on investments | | | | | | | | |
| Net realized gains (losses) on investments: | | | | | | | | |
| Non-controlled/non-affiliate company investments | | | 42 | | | | — | |
| Net realized gains (losses) | | | 42 | | | | — | |
| | | | | | | | | |
| Net change in unrealized appreciation (depreciation) on investments: | | | | | | | | |
| Non-controlled/non-affiliate company investments | | | 2,479 | | | | — | |
| Net change in unrealized appreciation (depreciation) on investments | | | 2,479 | | | | — | |
| Net gain (loss) on investments | | | 2,521 | | | | — | |
| Net increase in net assets resulting from operations | | $ | 13,027 | | | $ | — | |
| | | | | | | | | |
| Per Common Share Data | | | | | | | | |
| Basic and diluted earnings per common share | | $ | 0.94 | | | $ | — | |
| Basic and diluted weighted average common shares outstanding(1) | | | 13,767,847 | | | | — | |
| (1) | The basic and diluted weighted average common shares outstanding are calculated for the period December 31, 2014, the commencement of operations, through September 30, 2015. |
See Notes to Consolidated Financial Statements.
Golub Capital Investment Corporation and Subsidiaries
Consolidated Statement of Changes in Net Assets
(In thousands, except share data)
| | | | | | | | | | | | Capital | | | | | | | | | | |
| | | | | | | | | | | | Distributions | | | Net | | | | | | | |
| | | | | | | | | Paid in | | | in Excess | | | Unrealized | | | | | | | |
| | | Common Stock | | | Capital in | | | of Net | | | Appreciation | | | Net Realized | | | | |
| | | | | | Par | | | Excess | | | Investment | | | (Depreciation) | | | Gain (Loss) | | | Total | |
| | | Shares | | | Amount | | | of Par | | | Income | | | on Investments | | | on Investments | | | Net Assets | |
| Balance at September 22, 2014 (inception) | | | — | | | $ | — | | | $ | — | | | $ | — | | | $ | — | | | $ | — | | | $ | — | |
| Issuance of common stock | | | 666.670 | | | | — | | | | 10 | | | | — | | | | — | | | | — | | | | 10 | |
| Net increase in net assets resulting from operations | | | — | | | | — | | | | — | | | | — | | | | — | | | | — | | | | — | |
| | | | | | | | | | | | | | | | | | | | | | | | | | | | | |
| Distributions to stockholders: | | | | | | | | | | | | | | | | | | | | | | | | | | | | |
| Stock issued in connection with dividend reinvestment plan | | | — | | | | — | | | | — | | | | — | | | | — | | | | — | | | | — | |
| Dividends and distributions | | | — | | | | — | | | | — | | | | — | | | | — | | | | — | | | | — | |
| Balance at September 30, 2014 | | | 666.670 | | | $ | — | | | $ | 10 | | | $ | — | | | $ | — | | | $ | — | | | $ | 10 | |
| Issuance of common stock(1) | | | 20,509,484.472 | | | | 21 | | | | 307,621 | | | | — | | | | — | | | | — | | | | 307,642 | |
| Net increase in net assets resulting from operations | | | — | | | | — | | | | — | | | | 10,506 | | | | 2,479 | | | | 42 | | | | 13,027 | |
| | | | | | | | | | | | | | | | | | | | | | | | | | | | | |
| Distributions to stockholders: | | | | | | | | | | | | | | | | | | | | | | | | | | | | |
| Stock issued in connection with dividend reinvestment plan | | | 333,004.077 | | | | — | | | | 4,995 | | | | — | | | | — | | | | — | | | | 4,995 | |
| Dividends and distributions | | | — | | | | — | | | | — | | | | (13,027 | ) | | | — | | | | — | | | | (13,027 | ) |
| Balance at September 30, 2015 | | | 20,843,155.219 | | | $ | 21 | | | $ | 312,626 | | | $ | (2,521 | ) | | $ | 2,479 | | | $ | 42 | | | $ | 312,647 | |
| (1) | Refer to Note 3 for a detailed listing of the common stock share issuances for the year ended September 30, 2015. |
See Notes to Consolidated Financial Statements.
Golub Capital Investment Corporation and Subsidiaries
Consolidated Statement of Cash Flows
(In thousands)
| | | | | | Period from | |
| | | | | | September 22, | |
| | | | | | 2014 | |
| | | Year ended | | | (inception) to | |
| | | September 30, | | | September 30, | |
| | | 2015 | | | 2014 | |
| Cash flows from operating activities | | | | | | | | |
| Net increase in net assets resulting from operations | | $ | 13,027 | | | $ | — | |
| Adjustments to reconcile net increase in net assets resulting from operations to net cash (used in) provided by operating activities | | | | | | | | |
| Amortization of deferred financing costs | | | 520 | | | | — | |
| Accretion of discounts and amortization of premiums | | | (800 | ) | | | — | |
| Net realized (gain) loss on investments | | | (42 | ) | | | — | |
| Net change in unrealized (appreciation) depreciation on investments | | | (2,479 | ) | | | — | |
| Proceeds from (fundings of) revolving loans, net | | | (1,038 | ) | | | — | |
| Fundings of investments | | | (499,633 | ) | | | — | |
| Proceeds from principal payments and sales of portfolio investments | | | 68,778 | | | | — | |
| PIK interest | | | (35 | ) | | | — | |
| | | | | | | | | |
| Changes in operating assets and liabilities: | | | | | | | | |
| Interest receivable | | | (1,553 | ) | | | — | |
| Receivable for investments sold | | | 740 | | | | — | |
| Other assets | | | (426 | ) | | | — | |
| Interest payable | | | 169 | | | | — | |
| Management and incentive fees payable | | | 1,872 | | | | — | |
| Accounts payable and accrued expenses | | | 881 | | | | — | |
| Accrued trustee fees | | | 2 | | | | — | |
| Net cash (used in) provided by operating activities | | | (420,017 | ) | | | — | |
| | | | | | | | | |
| Cash flows from investing activities | | | | | | | | |
| Net change in restricted cash and cash equivalents | | | (10,145 | ) | | | — | |
| Net cash (used in) provided by investing activities | | | (10,145 | ) | | | — | |
| | | | | | | | | |
| Cash flows from financing activities | | | | | | | | |
| Borrowings on debt | | | 435,395 | | | | — | |
| Repayments of debt | | | (230,495 | ) | | | — | |
| Capitalized debt financing costs | | | (3,212 | ) | | | — | |
| Proceeds from issuance of common shares | | | 234,371 | | | | 10 | |
| Dividends and distributions paid | | | (3,160 | ) | | | — | |
| Net cash (used in) provided by financing activities | | | 432,899 | | | | 10 | |
| Net change in cash and cash equivalents | | | 2,737 | | | | 10 | |
| Cash and cash equivalents, beginning of period | | | 10 | | | | — | |
| Cash and cash equivalents, end of period | | $ | 2,747 | | | $ | 10 | |
| | | | | | | | | |
| Supplemental disclosure of cash flow information | | | | | | | | |
| Cash paid during the period for interest | | $ | 3,042 | | | $ | — | |
| Dividends and distributions declared during the period | | | 13,027 | | | | — | |
See Notes to Consolidated Financial Statements.
Golub Capital Investment Corporation and Subsidiaries
Consolidated Statement of Cash Flows – (continued)
(In thousands)
| | | Year ended | |
| | | September 30, | |
| | | 2015 | |
| Supplemental disclosure of noncash financing activity | | | | |
| Dividends and distributions payable | | $ | 4,872 | |
| | | | | |
| Acquisition of subsidiaries: | | | | |
| Noncash assets purchased: | | | | |
| Investments, at fair value | | $ | (116,629 | ) |
| Receivable from investment sold | | | (740 | ) |
| Deferred financing costs | | | (521 | ) |
| Interest receivable | | | (490 | ) |
| Total noncash assets purchased | | | (118,380 | ) |
| | | | | |
| Liabilities assumed: | | | | |
| Debt | | | 44,800 | |
| Interest payable | | | 229 | |
| Accounts payable and accrued expenses | | | 72 | |
| Accrued trustee fees | | | 8 | |
| Total liabilites assumed | | | 45,109 | |
| Issuance of common shares | | $ | 73,271 | |
See Notes to Consolidated Financial Statements.
Golub Capital Investment Corp. and Subsidiaries
Consolidated Schedule of Investments
September 30, 2015
(In thousands)
| | | | | Spread | | | | | | Principal/ | | | | | | Percentage | | | | |
| | | Investment | | Above | | Interest | | Maturity | | Par | | | | | | of Net | | | Fair | |
| | | Type | | Index(1) | | Rate(2) | | Date | | Amount | | | Cost | | | Assets | | | Value | |
| Investments | | | | | | | | | | | | | | | | | | | | | | | | |
| United States | | | | | | | | | | | | | | | | | | | | | | | | |
| Debt investments | | | | | | | | | | | | | | | | | | | | | | | | |
| Aerospace and Defense | | | | | | | | | | | | | | | | | | | | | | | | |
| ILC Dover, LP | | One stop | | P + 6.00% | | 9.25% | | 03/2019 | | | 104 | | | | 100 | | | | — | % | | | 93 | |
| ILC Dover, LP | | One stop | | L + 7.00% | | 8.00% | | 03/2020 | | | 2,423 | | | | 2,349 | | | | 0.7 | | | | 2,253 | |
| ILC Industries, Inc.(3) | | One stop | | L + 6.00% | | N/A(4) | | 07/2020 | | | — | | | | (13 | ) | | | — | | | | (24 | ) |
| ILC Industries, Inc. | | One stop | | L + 6.00% | | 7.00% | | 07/2020 | | | 9,246 | | | | 9,160 | | | | 2.9 | | | | 9,131 | |
| NTS Technical Systems(3) | | One stop | | L + 6.00% | | N/A(4) | | 06/2021 | | | — | | | | (7 | ) | | | — | | | | — | |
| NTS Technical Systems(3) | | One stop | | L + 6.00% | | N/A(4) | | 06/2021 | | | — | | | | (15 | ) | | | — | | | | — | |
| NTS Technical Systems | | One stop | | L + 6.00% | | 7.00% | | 06/2021 | | | 3,947 | | | | 3,881 | | | | 1.3 | | | | 3,947 | |
| Tresys Technology Holdings, Inc. | | One stop | | L + 6.75% | | 8.00% | | 12/2017 | | | 5 | | | | 5 | | | | — | | | | 5 | |
| Tresys Technology Holdings, Inc.(5) | | One stop | | L + 6.75% | | 8.00% | | 12/2017 | | | 53 | | | | 28 | | | | — | | | | 16 | |
| Whitcraft LLC | | One stop | | P + 5.25% | | 8.50% | | 05/2020 | | | 3 | | | | 2 | | | | — | | | | 2 | |
| Whitcraft LLC | | One stop | | L + 6.50% | | 7.50% | | 05/2020 | | | 6,813 | | | | 6,749 | | | | 2.2 | | | | 6,745 | |
| | | | | | | | | | | | 22,594 | | | | 22,239 | | | | 7.1 | | | | 22,168 | |
| | | | | | | | | | | | | | | | | | | | | | | | | |
| Automobile | | | | | | | | | | | | | | | | | | | | | | | | |
| American Driveline Systems, Inc. | | Senior loan | | P + 4.50% | | 7.75% | | 03/2020 | | | 12 | | | | 6 | | | | — | | | | 12 | |
| American Driveline Systems, Inc. | | Senior loan | | L + 5.50% | | 6.50% | | 03/2020 | | | 382 | | | | 342 | | | | 0.1 | | | | 382 | |
| CH Hold Corp. (Caliber Collision) | | Senior loan | | L + 4.75% | | 5.75% | | 11/2019 | | | 149 | | | | 147 | | | | — | | | | 149 | |
| CH Hold Corp. (Caliber Collision) | | Senior loan | | L + 4.75% | | 5.75% | | 11/2019 | | | 831 | | | | 824 | | | | 0.3 | | | | 831 | |
| Dent Wizard International Corporation | | Senior loan | | L + 4.75% | | 5.75% | | 04/2020 | | | 1,248 | | | | 1,241 | | | | 0.4 | | | | 1,238 | |
| Integrated Supply Network, LLC | | Senior loan | | P + 4.00% | | 6.87% | | 02/2020 | | | 481 | | | | 471 | | | | 0.2 | | | | 481 | |
| Integrated Supply Network, LLC | | Senior loan | | L + 5.25% | | 6.25% | | 02/2020 | | | 7,871 | | | | 7,776 | | | | 2.5 | | | | 7,871 | |
| K&N Engineering, Inc. | | Senior loan | | L + 4.25% | | 5.25% | | 07/2019 | | | 57 | | | | 57 | | | | — | | | | 55 | |
| K&N Engineering, Inc.(3) | | Senior loan | | L + 4.25% | | N/A(4) | | 07/2019 | | | — | | | | — | | | | — | | | | (3 | ) |
| K&N Engineering, Inc. | | Senior loan | | L + 4.25% | | 5.25% | | 07/2019 | | | 1,164 | | | | 1,164 | | | | 0.4 | | | | 1,129 | |
| | | | | | | | | | | | 12,195 | | | | 12,028 | | | | 3.9 | | | | 12,145 | |
| | | | | | | | | | | | | | | | | | | | | | | | | |
| Beverage, Food and Tobacco | | | | | | | | | | | | | | | | | | | | | | | | |
| Abita Brewing Co., L.L.C.(3) | | One stop | | L + 5.75% | | N/A(4) | | 04/2021 | | | — | | | | (1 | ) | | | — | | | | — | |
| Abita Brewing Co., L.L.C. | | One stop | | L + 5.75% | | 6.75% | | 04/2021 | | | 3,897 | | | | 3,861 | | | | 1.3 | | | | 3,897 | |
| ABP Corporation | | Senior loan | | P + 3.50% | | 7.25% | | 09/2018 | | | 21 | | | | 21 | | | | — | | | | 21 | |
| ABP Corporation | | Senior loan | | L + 4.75% | | 6.00% | | 09/2018 | | | 611 | | | | 611 | | | | 0.2 | | | | 611 | |
| American Seafoods Group LLC | | Senior loan | | L + 5.00% | | 6.00% | | 08/2021 | | | 3,226 | | | | 3,194 | | | | 1.0 | | | | 3,210 | |
| C. J. Foods, Inc. | | One stop | | L + 5.50% | | N/A(4) | | 05/2019 | | | — | | | | — | | | | — | | | | — | |
| C. J. Foods, Inc. | | One stop | | L + 5.50% | | N/A(4) | | 05/2019 | | | — | | | | — | | | | — | | | | — | |
| C. J. Foods, Inc. | | One stop | | L + 5.50% | | 6.50% | | 05/2019 | | | 7,771 | | | | 7,771 | | | | 2.5 | | | | 7,771 | |
| Firebirds International, LLC | | One stop | | L + 5.75% | | 7.00% | | 05/2018 | | | 943 | | | | 943 | | | | 0.3 | | | | 943 | |
| Firebirds International, LLC | | One stop | | L + 5.75% | | N/A(4) | | 05/2018 | | | — | | | | — | | | | — | | | | — | |
| Firebirds International, LLC | | One stop | | L + 5.75% | | N/A(4) | | 05/2018 | | | — | | | | — | | | | — | | | | — | |
| Firebirds International, LLC | | One stop | | L + 5.75% | | 7.00% | | 05/2018 | | | 3,365 | | | | 3,365 | | | | 1.1 | | | | 3,365 | |
| First Watch Restaurants, Inc.(3) | | One stop | | L + 6.00% | | N/A(4) | | 12/2020 | | | — | | | | (2 | ) | | | — | | | | — | |
| First Watch Restaurants, Inc.(3) | | One stop | | L + 6.00% | | N/A(4) | | 12/2020 | | | — | | | | (2 | ) | | | — | | | | — | |
| First Watch Restaurants, Inc.(3) | | One stop | | L + 6.00% | | N/A(4) | | 12/2020 | | | — | | | | (1 | ) | | | — | | | | — | |
| First Watch Restaurants, Inc.(3) | | One stop | | L + 6.00% | | N/A(4) | | 12/2020 | | | — | | | | (1 | ) | | | — | | | | — | |
| First Watch Restaurants, Inc. | | One stop | | L + 6.00% | | 7.00% | | 12/2020 | | | 3,606 | | | | 3,569 | | | | 1.2 | | | | 3,606 | |
| Hopdoddy Holdings, LLC | | One stop | | L + 8.00% | | 9.00% | | 08/2020 | | | 430 | | | | 426 | | | | 0.1 | | | | 426 | |
| Hopdoddy Holdings, LLC(3) | | One stop | | L + 8.00% | | N/A(4) | | 08/2020 | | | — | | | | (2 | ) | | | — | | | | (2 | ) |
| Hopdoddy Holdings, LLC | | One stop | | L + 8.00% | | N/A(4) | | 08/2020 | | | — | | | | — | | | | — | | | | — | |
| Julio & Sons Company | | One stop | | L + 5.50% | | N/A(4) | | 09/2017 | | | — | | | | — | | | | — | | | | — | |
| Julio & Sons Company | | One stop | | L + 5.50% | | 6.50% | | 09/2017 | | | 35 | | | | 35 | | | | — | | | | 35 | |
| Julio & Sons Company | | One stop | | L + 5.50% | | 6.50% | | 09/2017 | | | 955 | | | | 955 | | | | 0.3 | | | | 955 | |
See Notes to Consolidated Financial Statements.
Golub Capital Investment Corp. and Subsidiaries
Consolidated Schedule of Investments – (continued)
September 30, 2015
(In thousands)
| | | | | Spread | | | | | | Principal/ | | | | | | Percentage | | | | |
| | | Investment | | Above | | Interest | | Maturity | | Par | | | | | | of Net | | | Fair | |
| | | Type | | Index(1) | | Rate(2) | | Date | | Amount | | | Cost | | | Assets | | | Value | |
| Beverage, Food and Tobacco - (continued) | | | | | | | | | | | | | | | | | | | | | | | | |
| Northern Brewer, LLC | | One stop | | P + 7.25% | | 8.50% cash/ 2.00% PIK | | 02/2018 | | | 72 | | | | 55 | | | | — | % | | | 58 | |
| Northern Brewer, LLC | | One stop | | P + 7.25% | | 8.50% cash/ 2.00% PIK | | 02/2018 | | | 662 | | | | 508 | | | | 0.2 | | | | 529 | |
| Smashburger Finance LLC | | Senior loan | | L + 5.00% | | 6.25% | | 05/2018 | | | 459 | | | | 459 | | | | 0.1 | | | | 459 | |
| Smashburger Finance LLC | | Senior loan | | L + 5.00% | | 6.25% | | 05/2018 | | | 460 | | | | 456 | | | | 0.1 | | | | 460 | |
| Smashburger Finance LLC(3) | | Senior loan | | L + 5.00% | | N/A(4) | | 05/2018 | | | — | | | | (4 | ) | | | — | | | | — | |
| Smashburger Finance LLC | | Senior loan | | L + 5.00% | | N/A(4) | | 05/2018 | | | — | | | | — | | | | — | | | | — | |
| Smashburger Finance LLC | | Senior loan | | L + 5.00% | | 6.25% | | 05/2018 | | | 5,860 | | | | 5,834 | | | | 1.9 | | | | 5,860 | |
| Surfside Coffee Company LLC | | One stop | | L + 5.25% | | 6.25% | | 06/2020 | | | 69 | | | | 64 | | | | — | | | | 64 | |
| Surfside Coffee Company LLC | | One stop | | L + 5.25% | | 6.25% | | 06/2020 | | | 10 | | | | 10 | | | | — | | | | 10 | |
| Surfside Coffee Company LLC | | One stop | | L + 5.25% | | 6.25% | | 06/2020 | | | 2,369 | | | | 2,346 | | | | 0.8 | | | | 2,345 | |
| Tate’s Bake Shop, Inc. | | Senior loan | | L + 4.75% | | N/A(4) | | 08/2019 | | | — | | | | — | | | | — | | | | — | |
| Tate’s Bake Shop, Inc. | | Senior loan | | L + 4.75% | | N/A(4) | | 08/2019 | | | — | | | | — | | | | — | | | | — | |
| Tate’s Bake Shop, Inc. | | Senior loan | | L + 4.75% | | 5.75% | | 08/2019 | | | 717 | | | | 717 | | | | 0.3 | | | | 717 | |
| Uinta Brewing Company | | One stop | | L + 6.00% | | 7.00% | | 08/2019 | | | 93 | | | | 93 | | | | — | | | | 87 | |
| Uinta Brewing Company | | One stop | | L + 6.00% | | 7.00% | | 08/2019 | | | 772 | | | | 772 | | | | 0.2 | | | | 749 | |
| Unidine Corporation | | One stop | | L + 6.00% | | 7.25% | | 11/2018 | | | 362 | | | | 362 | | | | 0.1 | | | | 362 | |
| Unidine Corporation | | One stop | | L + 6.00% | | N/A(4) | | 11/2018 | | | — | | | | — | | | | — | | | | — | |
| Unidine Corporation | | One stop | | L + 6.00% | | 7.25% | | 11/2018 | | | 1,897 | | | | 1,897 | | | | 0.6 | | | | 1,897 | |
| United Craft Brews LLC | | One stop | | L + 6.25% | | 7.25% | | 03/2020 | | | 241 | | | | 235 | | | | 0.1 | | | | 241 | |
| United Craft Brews LLC | | One stop | | L + 6.25% | | 7.25% | | 03/2020 | | | 30 | | | | 24 | | | | — | | | | 30 | |
| United Craft Brews LLC | | One stop | | L + 6.25% | | 7.25% | | 03/2020 | | | 5,418 | | | | 5,358 | | | | 1.7 | | | | 5,418 | |
| | | | | | | | | | | | 44,351 | | | | 43,928 | | | | 14.1 | | | | 44,124 | |
| | | | | | | | | | | | | | | | | | | | | | | | | |
| Broadcasting and Entertainment | | | | | | | | | | | | | | | | | | | | | | | | |
| Extreme Reach Inc. | | Senior loan | | L + 5.75% | | 6.75% | | 01/2020 | | | 2,649 | | | | 2,625 | | | | 0.8 | | | | 2,640 | |
| TouchTunes Interactive Networks, Inc. | | Senior loan | | L + 4.75% | | 5.75% | | 05/2021 | | | 704 | | | | 701 | | | | 0.3 | | | | 706 | |
| | | | | | | | | | | | 3,353 | | | | 3,326 | | | | 1.1 | | | | 3,346 | |
| | | | | | | | | | | | | | | | | | | | | | | | | |
| Building and Real Estate | | | | | | | | | | | | | | | | | | | | | | | | |
| Accruent, LLC | | One stop | | L + 6.25% | | 7.25% | | 11/2019 | | | 1,126 | | | | 1,117 | | | | 0.4 | | | | 1,126 | |
| Brooks Equipment Company, LLC | | One stop | | L + 5.75% | | N/A(4) | | 08/2020 | | | — | | | | — | | | | — | | | | — | |
| Brooks Equipment Company, LLC | | One stop | | L + 5.75% | | 6.75% | | 08/2020 | | | 6,668 | | | | 6,668 | | | | 2.1 | | | | 6,668 | |
| Paradigm DKD Group, LLC | | Senior loan | | L + 5.50% | | 6.75% | | 11/2018 | | | 315 | | | | 302 | | | | 0.1 | | | | 315 | |
| Paradigm DKD Group, LLC | | Senior loan | | L + 5.50% | | 6.75% | | 11/2018 | | | 2,202 | | | | 2,161 | | | | 0.7 | | | | 2,202 | |
| | | | | | | | | | | | 10,311 | | | | 10,248 | | | | 3.3 | | | | 10,311 | |
| | | | | | | | | | | | | | | | | | | | | | | | | |
| Chemicals, Plastics and Rubber | | | | | | | | | | | | | | | | | | | | | | | | |
| Flexan, LLC(3) | | One stop | | L + 5.25% | | N/A(4) | | 02/2020 | | | — | | | | (3 | ) | | | — | | | | — | |
| Flexan, LLC | | One stop | | L + 5.25% | | 6.25% | | 02/2020 | | | 2,745 | | | | 2,721 | | | | 0.9 | | | | 2,745 | |
| Flexan, LLC | | One stop | | L + 5.25% | | N/A(4) | | 02/2020 | | | — | | | | — | | | | — | | | | — | |
| | | | | | | | | | | | 2,745 | | | | 2,718 | | | | 0.9 | | | | 2,745 | |
| | | | | | | | | | | | | | | | | | | | | | | | | |
| Containers, Packaging and Glass | | | | | | | | | | | | | | | | | | | | | | | | |
| Fort Dearborn Company | | Senior loan | | L + 4.25% | | 5.25% | | 10/2017 | | | 182 | | | | 182 | | | | — | | | | 182 | |
| Fort Dearborn Company | | Senior loan | | L + 4.75% | | 5.75% | | 10/2018 | | | 842 | | | | 841 | | | | 0.3 | | | | 842 | |
| | | | | | | | | | | | 1,024 | | | | 1,023 | | | | 0.3 | | | | 1,024 | |
| | | | | | | | | | | | | | | | | | | | | | | | | |
| Diversified Conglomerate Manufacturing | | | | | | | | | | | | | | | | | | | | | | | | |
| Chase Industries, Inc. | | One stop | | L + 5.75% | | 6.75% | | 09/2020 | | | 1,096 | | | | 1,096 | | | | 0.4 | | | | 1,096 | |
| Chase Industries, Inc. | | One stop | | P + 4.50% | | 7.75% | | 09/2020 | | | 76 | | | | 76 | | | | — | | | | 76 | |
| Chase Industries, Inc. | | One stop | | L + 5.75% | | 6.75% | | 09/2020 | | | 6,743 | | | | 6,743 | | | | 2.2 | | | | 6,743 | |
| Harvey Tool Company, LLC | | Senior loan | | L + 5.00% | | N/A(4) | | 03/2019 | | | — | | | | — | | | | — | | | | — | |
See Notes to Consolidated Financial Statements.
Golub Capital Investment Corp. and Subsidiaries
Consolidated Schedule of Investments – (continued)
September 30, 2015
(In thousands)
| | | | | Spread | | | | | | Principal/ | | | | | | Percentage | | | | |
| | | Investment | | Above | | Interest | | Maturity | | Par | | | | | | of Net | | | Fair | |
| | | Type | | Index(1) | | Rate(2) | | Date | | Amount | | | Cost | | | Assets | | | Value | |
| Diversified Conglomerate Manufacturing - (continued) | | | | | | | | | | | | | | | | | | | | | | | | |
| Harvey Tool Company, LLC | | Senior loan | | L + 5.00% | | 6.00% | | 03/2020 | | | 2,020 | | | | 2,000 | | | | 0.6 | % | | | 2,000 | |
| ICC-Nexergy, Inc(3) | | One stop | | L + 5.50% | | N/A(4) | | 04/2020 | | | — | | | | (4 | ) | | | — | | | | — | |
| ICC-Nexergy, Inc | | One stop | | L + 5.50% | | 6.50% | | 04/2020 | | | 10,707 | | | | 10,638 | | | | 3.4 | | | | 10,707 | |
| Onicon Incorporated | | One stop | | L + 6.00% | | N/A(4) | | 04/2020 | | | — | | | | — | | | | — | | | | — | |
| Onicon Incorporated | | One stop | | L + 6.00% | | 7.00% | | 04/2020 | | | 127 | | | | 126 | | | | — | | | | 127 | |
| Pasternack Enterprises, Inc. | | Senior loan | | L + 5.00% | | 6.25% | | 12/2017 | | | 67 | | | | 67 | | | | — | | | | 67 | |
| Sunless Merger Sub, Inc. | | Senior loan | | P + 4.00% | | 7.25% | | 07/2016 | | | 12 | | | | 9 | | | | — | | | | 6 | |
| Sunless Merger Sub, Inc. | | Senior loan | | L + 5.25% | | 6.50% | | 07/2016 | | | 328 | | | | 285 | | | | 0.1 | | | | 229 | |
| | | | | | | | | | | | 21,176 | | | | 21,036 | | | | 6.7 | | | | 21,051 | |
| | | | | | | | | | | | | | | | | | | | | | | | | |
| Diversified Conglomerate Service | | | | | | | | | | | | | | | | | | | | | | | | |
| Accellos, Inc. | | One stop | | L + 5.75% | | N/A(4) | | 07/2020 | | | — | | | | — | | | | — | | | | — | |
| Accellos, Inc. | | One stop | | L + 5.75% | | 6.75% | | 07/2020 | | | 6,485 | | | | 6,473 | | | | 2.1 | | | | 6,485 | |
| Actiance, Inc. | | One stop | | L + 9.00% | | N/A(4) | | 04/2018 | | | — | | | | — | | | | — | | | | — | |
| Actiance, Inc. | | One stop | | L + 9.00% | | 10.00% | | 04/2018 | | | 1,207 | | | | 1,163 | | | | 0.4 | | | | 1,207 | |
| Aderant North America, Inc. | | Senior loan | | L + 4.25% | | 5.25% | | 12/2018 | | | 29 | | | | 28 | | | | — | | | | 29 | |
| Aderant North America, Inc. | | Senior loan | | L + 4.25% | | 5.25% | | 12/2018 | | | 269 | | | | 268 | | | | 0.1 | | | | 269 | |
| Agility Recovery Solutions Inc.(3) | | One stop | | L + 6.50% | | N/A(4) | | 03/2020 | | | — | | | | (3 | ) | | | — | | | | — | |
| Agility Recovery Solutions Inc. | | One stop | | L + 6.50% | | 7.50% | | 03/2020 | | | 4,613 | | | | 4,572 | | | | 1.5 | | | | 4,613 | |
| DISA Holdings Acquisition Subsidiary Corp. | | Senior loan | | P + 3.50% | | 6.75% | | 12/2020 | | | 29 | | | | 26 | | | | — | | | | 13 | |
| DISA Holdings Acquisition Subsidiary Corp. | | Senior loan | | L + 4.50% | | 5.50% | | 12/2020 | | | 1,389 | | | | 1,377 | | | | 0.4 | | | | 1,319 | |
| DTI Holdco, Inc. | | Senior loan | | L + 5.00% | | 6.00% | | 08/2020 | | | 4,025 | | | | 3,987 | | | | 1.3 | | | | 3,904 | |
| HealthcareSource HR, Inc.(3) | | One stop | | L + 6.75% | | N/A(4) | | 05/2020 | | | — | | | | (2 | ) | | | — | | | | — | |
| HealthcareSource HR, Inc. | | One stop | | L + 6.75% | | 7.75% | | 05/2020 | | | 8,452 | | | | 8,314 | | | | 2.7 | | | | 8,452 | |
| Host Analytics, Inc.(3) | | One stop | | N/A | | N/A(4) | | 02/2020 | | | — | | | | (3 | ) | | | — | | | | — | |
| Host Analytics, Inc. | | One stop | | N/A | | 8.50% cash/ 2.25% PIK | | 02/2020 | | | 1,319 | | | | 1,309 | | | | 0.4 | | | | 1,319 | |
| Mediaocean LLC(3) | | Senior loan | | L + 4.50% | | N/A(4) | | 08/2020 | | | — | | | | (1 | ) | | | — | | | | — | |
| Mediaocean LLC | | Senior loan | | L + 4.75% | | 5.75% | | 08/2022 | | | 1,936 | | | | 1,893 | | | | 0.6 | | | | 1,916 | |
| NetSmart Technologies, Inc. | | One stop | | P + 4.25% | | 7.50% | | 02/2019 | | | 8 | | | | 7 | | | | — | | | | 8 | |
| NetSmart Technologies, Inc. | | One stop | | L + 5.25% | | 6.25% | | 02/2019 | | | 347 | | | | 344 | | | | 0.1 | | | | 347 | |
| PC Helps Support, LLC | | Senior loan | | P + 4.25% | | 7.50% | | 09/2017 | | | 4 | | | | 4 | | | | — | | | | 4 | |
| PC Helps Support, LLC | | Senior loan | | L + 5.25% | | 6.50% | | 09/2017 | | | 104 | | | | 104 | | | | — | | | | 102 | |
| Saldon Holdings, Inc. | | Senior loan | | L + 4.50% | | N/A(4) | | 09/2021 | | | — | | | | — | | | | — | | | | — | |
| Saldon Holdings, Inc. | | Senior loan | | L + 4.50% | | 5.50% | | 09/2021 | | | 2,405 | | | | 2,381 | | | | 0.8 | | | | 2,381 | |
| Secure-24, LLC | | One stop | | L + 6.00% | | N/A(4) | | 08/2017 | | | — | | | | — | | | | — | | | | — | |
| Secure-24, LLC | | One stop | | L + 6.00% | | 7.25% | | 08/2017 | | | 830 | | | | 830 | | | | 0.3 | | | | 830 | |
| Secure-24, LLC | | One stop | | L + 6.00% | | 7.25% | | 08/2017 | | | 121 | | | | 121 | | | | — | | | | 121 | |
| Severin Acquisition, LLC(3) | | Senior loan | | L + 4.50% | | N/A(4) | | 07/2021 | | | — | | | | (1 | ) | | | — | | | | (1 | ) |
| Severin Acquisition, LLC | | Senior loan | | L + 4.50% | | 5.50% | | 07/2021 | | | 8,009 | | | | 7,892 | | | | 2.5 | | | | 7,928 | |
| Steelwedge Software, Inc. | | One stop | | L + 10.00% | | N/A(4) | | 09/2020 | | | — | | | | — | | | | — | | | | — | |
| Steelwedge Software, Inc. | | One stop | | P + 10.75% | | 14.00% | | 09/2020 | | | 1,732 | | | | 1,653 | | | | 0.5 | | | | 1,653 | |
| TA MHI Buyer, Inc. | | One stop | | L + 6.50% | | N/A(4) | | 09/2021 | | | — | | | | — | | | | — | | | | — | |
| TA MHI Buyer, Inc. | | One stop | | L + 6.50% | | 7.50% | | 09/2021 | | | 6,672 | | | | 6,614 | | | | 2.1 | | | | 6,614 | |
| Transaction Data Systems, Inc. | | Senior loan | | L + 4.50% | | N/A(4) | | 06/2020 | | | — | | | | — | | | | — | | | | — | |
| Transaction Data Systems, Inc. | | Senior loan | | L + 4.50% | | 5.50% | | 06/2021 | | | 2,384 | | | | 2,362 | | | | 0.8 | | | | 2,384 | |
| Vendavo, Inc.(3) | | One stop | | L + 8.50% | | N/A(4) | | 10/2019 | | | — | | | | (3 | ) | | | — | | | | — | |
| Vendavo, Inc. | | One stop | | L + 8.50% | | 9.50% | | 10/2019 | | | 3,734 | | | | 3,695 | | | | 1.2 | | | | 3,734 | |
| | | | | | | | | | | | 56,103 | | | | 55,404 | | | | 17.8 | | | | 55,631 | |
See Notes to Consolidated Financial Statements.
Golub Capital Investment Corp. and Subsidiaries
Consolidated Schedule of Investments – (continued)
September 30, 2015
(In thousands)
| | | | | Spread | | | | | | Principal/ | | | | | | Percentage | | | | |
| | | Investment | | Above | | Interest | | Maturity | | Par | | | | | | of Net | | | Fair | |
| | | Type | | Index(1) | | Rate(2) | | Date | | Amount | | | Cost | | | Assets | | | Value | |
| Electronics | | | | | | | | | | | | | | | | | | | | | | | | |
| Appriss Holdings, Inc. | | Senior loan | | L + 4.75% | | 5.07% | | 11/2020 | | | 427 | | | | 415 | | | | 0.1 | % | | | 413 | |
| Appriss Holdings, Inc. | | Senior loan | | L + 4.75% | | 5.75% | | 11/2020 | | | 13,994 | | | | 13,839 | | | | 4.5 | | | | 13,854 | |
| Compusearch Software Holdings, Inc. | | Senior loan | | L + 4.50% | | 5.50% | | 05/2021 | | | 638 | | | | 636 | | | | 0.2 | | | | 638 | |
| ECI Acquisition Holdings, Inc. | | One stop | | L + 6.25% | | 7.25% | | 03/2019 | | | 465 | | | | 465 | | | | 0.1 | | | | 465 | |
| ECI Acquisition Holdings, Inc. | | One stop | | L + 6.25% | | N/A(4) | | 03/2019 | | | — | | | | — | | | | — | | | | — | |
| ECI Acquisition Holdings, Inc. | | One stop | | L + 6.25% | | 7.25% | | 03/2019 | | | 7,185 | | | | 7,185 | | | | 2.3 | | | | 7,185 | |
| Gamma Technologies, LLC(3) | | One stop | | L + 5.50% | | N/A(4) | | 06/2021 | | | — | | | | (1 | ) | | | — | | | | — | |
| Gamma Technologies, LLC | | One stop | | L + 5.50% | | 6.50% | | 06/2021 | | | 9,539 | | | | 9,448 | | | | 3.1 | | | | 9,539 | |
| Park Place Technologies LLC | | One stop | | L + 5.50% | | N/A(4) | | 07/2021 | | | — | | | | — | | | | — | | | | — | |
| Park Place Technologies LLC | | One stop | | L + 5.50% | | 6.50% | | 07/2021 | | | 14,546 | | | | 14,441 | | | | 4.6 | | | | 14,473 | |
| SEI, Inc.(3) | | Senior loan | | L + 4.75% | | N/A(4) | | 07/2021 | | | — | | | | (1 | ) | | | — | | | | (1 | ) |
| SEI, Inc. | | Senior loan | | L + 4.75% | | 5.75% | | 07/2021 | | | 5,324 | | | | 5,259 | | | | 1.7 | | | | 5,270 | |
| Sloan Company, Inc., The | | One stop | | L + 6.25% | | 7.25% | | 04/2020 | | | 31 | | | | 30 | | | | — | | | | 29 | |
| Sloan Company, Inc., The | | One stop | | L + 6.25% | | 7.25% | | 04/2020 | | | 3,663 | | | | 3,621 | | | | 1.1 | | | | 3,553 | |
| Sparta Holding Corporation | | One stop | | L + 5.50% | | N/A(4) | | 07/2020 | | | — | | | | — | | | | — | | | | — | |
| Sparta Holding Corporation | | One stop | | L + 5.50% | | 6.50% | | 07/2020 | | | 720 | | | | 720 | | | | 0.2 | | | | 720 | |
| Syncsort Incorporated | | Senior loan | | L + 4.75% | | N/A(4) | | 03/2019 | | | — | | | | — | | | | — | | | | — | |
| Syncsort Incorporated | | Senior loan | | L + 4.75% | | N/A(4) | | 03/2019 | | | — | | | | — | | | | — | | | | — | |
| Syncsort Incorporated | | Senior loan | | L + 4.75% | | 5.75% | | 03/2019 | | | 5,406 | | | | 5,406 | | | | 1.7 | | | | 5,406 | |
| Taxware, LLC(3) | | One stop | | L + 6.50% | | N/A(4) | | 04/2022 | | | — | | | | (4 | ) | | | — | | | | — | |
| Taxware, LLC | | One stop | | L + 6.50% | | 7.50% | | 04/2022 | | | 16,523 | | | | 16,369 | | | | 5.3 | | | | 16,523 | |
| | | | | | | | | | | | 78,461 | | | | 77,828 | | | | 24.9 | | | | 78,067 | |
| | | | | | | | | | | | | | | | | | | | | | | | | |
| Grocery | | | | | | | | | | | | | | | | | | | | | | | | |
| AG Kings Holdings Inc.(3) | | One stop | | L + 5.50% | | N/A(4) | | 04/2020 | | | — | | | | (18 | ) | | | — | | | | — | |
| AG Kings Holdings Inc. | | One stop | | L + 5.50% | | 6.50% | | 04/2020 | | | 15,016 | | | | 14,880 | | | | 4.8 | | | | 15,016 | |
| Teasdale Quality Foods, Inc. | | Senior loan | | L + 4.25% | | 5.25% | | 10/2020 | | | 1,120 | | | | 1,101 | | | | 0.4 | | | | 1,120 | |
| | | | | | | | | | | | 16,136 | | | | 15,963 | | | | 5.2 | | | | 16,136 | |
| | | | | | | | | | | | | | | | | | | | | | | | | |
| Healthcare, Education and Childcare | | | | | | | | | | | | | | | | | | | | | | | | |
| Advanced Pain Management Holdings, Inc. | | Senior loan | | L + 5.00% | | 6.25% | | 02/2018 | | | 405 | | | | 404 | | | | 0.1 | | | | 392 | |
| Advanced Pain Management Holdings,Inc.(3) | | Senior loan | | L + 5.00% | | N/A(4) | | 02/2018 | | | — | | | | — | | | | — | | | | (20 | ) |
| Advanced Pain Management Holdings, Inc. | | Senior loan | | L + 5.00% | | 6.25% | | 02/2018 | | | 5,920 | | | | 5,914 | | | | 1.9 | | | | 5,802 | |
| Agilitas USA, Inc. | | Senior loan | | L + 4.00% | | 5.00% | | 10/2020 | | | 512 | | | | 507 | | | | 0.2 | | | | 512 | |
| Apothecary Products, LLC(3) | | Senior loan | | L + 4.00% | | N/A(4) | | 02/2019 | | | — | | | | — | | | | — | | | | (39 | ) |
| Apothecary Products, LLC | | Senior loan | | L + 4.00% | | 5.00% | | 02/2019 | | | 1,958 | | | | 1,958 | | | | 0.6 | | | | 1,860 | |
| Avalign Technologies, Inc. | | Senior loan | | L + 4.50% | | 5.50% | | 07/2021 | | | 776 | | | | 772 | | | | 0.2 | | | | 772 | |
| | | | | | | 6.19% cash/ | | | | | | | | | | | | | | | | | | |
| Avatar International, LLC(5) | | One stop | | L + 7.89% | | 2.95% PIK | | 09/2016 | | | 87 | | | | 69 | | | | — | | | | 29 | |
| | | | | | | 6.19% cash/ | | | | | | | | | | | | | | | | | | |
| Avatar International, LLC | | One stop | | L + 7.89% | | 2.95% PIK | | 09/2016 | | | 30 | | | | 30 | | | | — | | | | 30 | |
| | | | | | | 6.19% cash/ | | | | | | | | | | | | | | | | | | |
| Avatar International, LLC(5) | | One stop | | L + 7.89% | | 2.95% PIK | | 09/2016 | | | 402 | | | | 319 | | | | — | | | | 134 | |
| California Cryobank, LLC | | One stop | | L + 5.50% | | 6.50% | | 08/2019 | | | 2,667 | | | | 2,667 | | | | 0.9 | | | | 2,667 | |
| California Cryobank, LLC | | One stop | | L + 5.50% | | 6.50% | | 08/2019 | | | 74 | | | | 74 | | | | — | | | | 74 | |
| California Cryobank, LLC | | One stop | | P + 4.25% | | 7.50% | | 08/2019 | | | 74 | | | | 74 | | | | — | | | | 74 | |
| Certara L.P. | | One stop | | L + 6.25% | | N/A(4) | | 12/2018 | | | — | | | | — | | | | — | | | | — | |
| Certara L.P. | | One stop | | L + 6.25% | | 7.25% | | 12/2018 | | | 3,946 | | | | 3,941 | | | | 1.3 | | | | 3,946 | |
| CLP Healthcare Services, Inc. | | Senior loan | | L + 4.75% | | 5.75% | | 12/2020 | | | 1,054 | | | | 1,049 | | | | 0.3 | | | | 1,050 | |
| CPI Buyer, LLC (Cole-Parmer) | | Senior loan | | L + 4.50% | | 5.50% | | 08/2021 | | | 3,275 | | | | 3,232 | | | | 1.0 | | | | 3,259 | |
See Notes to Consolidated Financial Statements.
Golub Capital Investment Corp. and Subsidiaries
Consolidated Schedule of Investments – (continued)
September 30, 2015
(In thousands)
| | | | | Spread | | | | | | Principal/ | | | | | | Percentage | | | | |
| | | Investment | | Above | | Interest | | Maturity | | Par | | | | | | of Net | | | Fair | |
| | | Type | | Index(1) | | Rate(2) | | Date | | Amount | | | Cost | | | Assets | | | Value | |
| Healthcare, Education and Childcare – (continued) | | | | | | | | | | | | | | | | | | | | | | | | |
| Curo Health Services LLC | | Senior loan | | L + 5.50% | | 6.50% | | 02/2022 | | | 4,975 | | | | 4,930 | | | | 1.6 | % | | | 4,992 | |
| DCA Investment Holding, LLC(3) | | One stop | | L + 5.25% | | N/A(4) | | 07/2021 | | | — | | | | (2 | ) | | | — | | | | (1 | ) |
| DCA Investment Holding, LLC | | One stop | | L + 5.25% | | 6.25% | | 07/2021 | | | 8,673 | | | | 8,507 | | | | 2.7 | | | | 8,586 | |
| Deca Dental Management LLC(3) | | One stop | | L + 6.25% | | N/A(4) | | 07/2020 | | | — | | | | (20 | ) | | | — | | | | (14 | ) |
| Deca Dental Management LLC | | One stop | | P + 5.25% | | 8.50% | | 07/2020 | | | 20 | | | | 19 | | | | — | | | | 20 | |
| Deca Dental Management LLC | | One stop | | L + 6.25% | | 7.25% | | 07/2020 | | | 7,673 | | | | 7,562 | | | | 2.4 | | | | 7,596 | |
| Dental Holdings Corporation(3) | | One stop | | L + 5.50% | | N/A(4) | | 02/2020 | | | — | | | | (7 | ) | | | — | | | | — | |
| Dental Holdings Corporation(3) | | One stop | | L + 5.50% | | N/A(4) | | 02/2020 | | | — | | | | (5 | ) | | | — | | | | — | |
| Dental Holdings Corporation | | One stop | | L + 5.50% | | 6.50% | | 02/2020 | | | 2,930 | | | | 2,898 | | | | 0.9 | | | | 2,930 | |
| Encore GC Acquisition, LLC(3) | | Senior loan | | L + 4.50% | | N/A(4) | | 01/2020 | | | — | | | | (4 | ) | | | — | | | | — | |
| Encore GC Acquisition, LLC | | Senior loan | | L + 4.50% | | 5.50% | | 01/2020 | | | 1,555 | | | | 1,534 | | | | 0.5 | | | | 1,555 | |
| IntegraMed America, Inc. | | One stop | | L + 7.25% | | 8.50% | | 09/2017 | | | 7 | | | | 7 | | | | — | | | | 7 | |
| IntegraMed America, Inc. | | One stop | | L + 7.25% | | 8.50% | | 09/2017 | | | 259 | | | | 259 | | | | 0.1 | | | | 254 | |
| Katena Holdings, Inc.(3) | | One stop | | L + 6.25% | | N/A(4) | | 06/2021 | | | — | | | | (4 | ) | | | — | | | | — | |
| Katena Holdings, Inc.(3) | | One stop | | L + 6.25% | | N/A(4) | | 06/2021 | | | — | | | | (1 | ) | | | — | | | | — | |
| Katena Holdings, Inc. | | One stop | | L + 6.25% | | 7.25% | | 06/2021 | | | 4,271 | | | | 4,231 | | | | 1.4 | | | | 4,271 | |
| Maverick Healthcare Group, LLC | | Senior loan | | L + 5.50% | | 7.25% | | 12/2016 | | | 634 | | | | 624 | | | | 0.2 | | | | 634 | |
| Pentec Acquisition Sub, Inc. | | Senior loan | | L + 5.00% | | N/A(4) | | 05/2017 | | | — | | | | — | | | | — | | | | — | |
| Pentec Acquisition Sub, Inc. | | Senior loan | | L + 5.00% | | 6.25% | | 05/2018 | | | 490 | | | | 490 | | | | 0.2 | | | | 490 | |
| PPT Management, LLC(3) | | One stop | | L + 5.00% | | N/A(4) | | 04/2020 | | | — | | | | (1 | ) | | | — | | | | — | |
| PPT Management, LLC | | One stop | | L + 5.00% | | 6.00% | | 04/2020 | | | 6,356 | | | | 6,298 | | | | 2.0 | | | | 6,356 | |
| Premise Health Holding Corp. | | One stop | | L + 4.50% | | 5.50% | | 06/2020 | | | 202 | | | | 202 | | | | 0.1 | | | | 202 | |
| Premise Health Holding Corp. | | One stop | | L + 4.50% | | 5.50% | | 06/2020 | | | 8,012 | | | | 8,012 | | | | 2.6 | | | | 8,012 | |
| Pyramid Healthcare, Inc. | | One stop | | P + 4.50% | | 7.75% | | 08/2019 | | | 75 | | | | 75 | | | | — | | | | 75 | |
| Pyramid Healthcare, Inc. | | One stop | | L + 5.75% | | 6.75% | | 08/2019 | | | 2,033 | | | | 2,030 | | | | 0.7 | | | | 2,033 | |
| Radiology Partners, Inc. | | One stop | | L + 5.00% | | N/A(4) | | 09/2020 | | | — | | | | — | | | | — | | | | — | |
| Radiology Partners, Inc. | | One stop | | L + 5.00% | | N/A(4) | | 09/2020 | | | — | | | | — | | | | — | | | | — | |
| Radiology Partners, Inc. | | One stop | | L + 5.00% | | 6.00% | | 09/2020 | | | 6,498 | | | | 6,498 | | | | 2.1 | | | | 6,498 | |
| Reliant Pro ReHab, LLC | | Senior loan | | P + 4.00% | | 7.25% | | 06/2017 | | | 101 | | | | 101 | | | | — | | | | 101 | |
| Reliant Pro ReHab, LLC | | Senior loan | | L + 5.00% | | 6.00% | | 06/2017 | | | 1,492 | | | | 1,492 | | | | 0.5 | | | | 1,492 | |
| RXH Buyer Corporation(3) | | One stop | | L + 5.75% | | N/A(4) | | 09/2021 | | | — | | | | (36 | ) | | | — | | | | (18 | ) |
| RXH Buyer Corporation(3) | | One stop | | L + 5.75% | | N/A(4) | | 09/2021 | | | — | | | | (4 | ) | | | — | | | | (2 | ) |
| RXH Buyer Corporation | | One stop | | L + 5.75% | | 6.75% | | 09/2021 | | | 11,361 | | | | 11,137 | | | | 3.6 | | | | 11,248 | |
| Southern Anesthesia and Surgical | | One stop | | L + 5.50% | | N/A(4) | | 11/2017 | | | — | | | | — | | | | — | | | | — | |
| Southern Anesthesia and Surgical | | One stop | | L + 5.50% | | N/A(4) | | 11/2017 | | | — | | | | — | | | | — | | | | — | |
| Southern Anesthesia and Surgical | | One stop | | L + 5.50% | | 6.50% | | 11/2017 | | | 244 | | | | 244 | | | | 0.1 | | | | 244 | |
| Spear Education, LLC | | One stop | | L + 5.00% | | 6.00% | | 08/2019 | | | 1,866 | | | | 1,866 | | | | 0.6 | | | | 1,866 | |
| Spear Education, LLC | | One stop | | L + 5.00% | | 6.00% | | 08/2019 | | | 157 | | | | 156 | | | | 0.1 | | | | 157 | |
| Spear Education, LLC | | One stop | | L + 5.00% | | N/A(4) | | 08/2019 | | | — | | | | — | | | | — | | | | — | |
| Surgical Information Systems, LLC | | Senior loan | | L + 3.00% | | 4.00% | | 09/2018 | | | 200 | | | | 200 | | | | 0.1 | | | | 200 | |
| U.S. Anesthesia Partners, Inc. | | One stop | | L + 5.00% | | 6.00% | | 12/2019 | | | 3,818 | | | | 3,818 | | | | 1.2 | | | | 3,818 | |
| Young Innovations, Inc. | | Senior loan | | L + 3.25% | | N/A(4) | | 01/2018 | | | — | | | | — | | | | — | | | | — | |
| Young Innovations, Inc. | | Senior loan | | L + 4.25% | | 5.25% | | 01/2019 | | | 374 | | | | 374 | | | | 0.1 | | | | 374 | |
| | | | | | | | | | | | 95,456 | | | | 94,490 | | | | 30.3 | | | | 94,518 | |
| | | | | | | | | | | | | | | | | | | | | | | | | |
| Healthcare, Education and Childcare | | | | | | | | | | | | | | | | | | | | | | | | |
| 1A Smart Start LLC | | Senior loan | | L + 4.75% | | 5.75% | | 02/2022 | | | 1,375 | | | | 1,362 | | | | 0.4 | | | | 1,372 | |
| Plano Molding Company, LLC | | One stop | | L + 6.00% | | 7.00% | | 05/2021 | | | 8,743 | | | | 8,661 | | | | 2.8 | | | | 8,743 | |
| | | | | | | | | | | | 10,118 | | | | 10,023 | | | | 3.2 | | | | 10,115 | |
See Notes to Consolidated Financial Statements.
Golub Capital Investment Corp. and Subsidiaries
Consolidated Schedule of Investments – (continued)
September 30, 2015
(In thousands)
| | | | | Spread | | | | | | Principal/ | | | | | | Percentage | | | | |
| | | Investment | | Above | | Interest | | Maturity | | Par | | | | | | of Net | | | Fair | |
| | | Type | | Index(1) | | Rate(2) | | Date | | Amount | | | Cost | | | Assets | | | Value | |
| Home and Office Furnishings, Housewares, and Durable Consumer | | | | | | | | | | | | | | | | | | | | | | | | |
| Aimbridge Hospitality, LLC(3) | | Senior loan | | L + 4.50% | | N/A(4) | | 10/2018 | | | — | | | | (5 | ) | | | —% | | | | — | |
| Aimbridge Hospitality, LLC | | Senior loan | | L + 4.50% | | 5.75% | | 10/2018 | | | 2,512 | | | | 2,490 | | | | 0.8 | | | | 2,512 | |
| | | | | | | | | | | | 2,512 | | | | 2,485 | | | | 0.8 | | | | 2,512 | |
| Insurance | | | | | | | | | | | | | | | | | | | | | | | | |
| Captive Resources Midco, LLC(3) | | One stop | | L + 5.75% | | N/A(4) | | 06/2020 | | | — | | | | (12 | ) | | | — | | | | (10 | ) |
| Captive Resources Midco, LLC(3) | | One stop | | L + 5.75% | | N/A(4) | | 06/2020 | | | — | | | | (4 | ) | | | — | | | | (4 | ) |
| Captive Resources Midco, LLC | | One stop | | L + 5.75% | | 6.75% | | 06/2020 | | | 8,351 | | | | 8,252 | | | | 2.6 | | | | 8,268 | |
| Internet Pipeline, Inc.(3) | | One stop | | L + 7.25% | | N/A(4) | | 08/2021 | | | — | | | | (1 | ) | | | — | | | | — | |
| Internet Pipeline, Inc. | | One stop | | L + 7.25% | | 8.25% | | 08/2022 | | | 10,567 | | | | 10,386 | | | | 3.3 | | | | 10,462 | |
| | | | | | | | | | | | 18,918 | | | | 18,621 | | | | 5.9 | | | | 18,716 | |
| Leisure, Amusement, Motion Pictures and Entertainment | | | | | | | | | | | | | | | | | | | | | | | | |
| Competitor Group, Inc. | | One stop | | L + 7.75% | | 9.00% | | 11/2018 | | | 40 | | | | 35 | | | | — | | | | 35 | |
| Competitor Group, Inc. | | One stop | | L + 9.25% | | 9.00% cash/ 1.50% PIK | | 11/2018 | | | 573 | | | | 527 | | | | 0.2 | | | | 516 | |
| Self Esteem Brands, LLC | | Senior loan | | L + 4.00% | | N/A(4) | | 02/2020 | | | — | | | | — | | | | — | | | | — | |
| Self Esteem Brands, LLC | | Senior loan | | L + 4.00% | | 5.00% | | 02/2020 | | | 6,385 | | | | 6,385 | | | | 2.0 | | | | 6,385 | |
| Starplex Operating, L.L.C | | One stop | | L + 7.00% | | N/A(4) | | 12/2017 | | | — | | | | — | | | | — | | | | — | |
| Starplex Operating, L.L.C | | One stop | | L + 7.00% | | 8.00% | | 12/2017 | | | 137 | | | | 137 | | | | — | | | | 137 | |
| Teaching Company, The | | One stop | | L + 6.25% | | 7.25% | | 08/2020 | | | 30 | | | | 29 | | | | — | | | | 29 | |
| Teaching Company, The | | One stop | | L + 6.25% | | 7.25% | | 08/2020 | | | 12,302 | | | | 12,211 | | | | 3.9 | | | | 12,179 | |
| Titan Fitness, LLC | | One stop | | L + 6.50% | | N/A(4) | | 09/2019 | | | — | | | | — | | | | — | | | | — | |
| Titan Fitness, LLC | | One stop | | L + 6.50% | | 7.75% | | 09/2019 | | | 1,989 | | | | 1,989 | | | | 0.7 | | | | 1,989 | |
| Titan Fitness, LLC | | One stop | | L + 6.50% | | N/A(4) | | 09/2019 | | | — | | | | — | | | | — | | | | — | |
| | | | | | | | | | | | 21,456 | | | | 21,313 | | | | 6.8 | | | | 21,270 | |
| | | | | | | | | | | | | | | | | | | | | | | | | |
| Machinery (Non-Agriculture, Non-Construction, Non-Electronic) | | | | | | | | | | | | | | | | | | | | | | | | |
| Spectro, Inc. | | Senior loan | | L + 3.75% | | 4.75% | | 09/2018 | | | 251 | | | | 251 | | | | 0.1 | | | | 251 | |
| Spectro, Inc. | | Senior loan | | L + 3.75% | | 4.75% | | 09/2018 | | | 1,776 | | | | 1,776 | | | | 0.5 | | | | 1,776 | |
| Spectro, Inc. | | Senior loan | | L + 3.75% | | 4.75% | | 09/2018 | | | 251 | | | | 251 | | | | 0.1 | | | | 251 | |
| | | | | | | | | | | | 2,278 | | | | 2,278 | | | | 0.7 | | | | 2,278 | |
| | | | | | | | | | | | | | | | | | | | | | | | | |
| Mining, Steel, Iron and Non-Precious Metals | | | | | | | | | | | | | | | | | | | | | | | | |
| Benetech, Inc. | | One stop | | P + 7.75% | | 11.00% | | 10/2017 | | | 13 | | | | 13 | | | | — | | | | 13 | |
| Benetech, Inc. | | One stop | | L + 9.00% | | 10.25% | | 10/2017 | | | 204 | | | | 204 | | | | 0.1 | | | | 204 | |
| | | | | | | | | | | | 217 | | | | 217 | | | | 0.1 | | | | 217 | |
| | | | | | | | | | | | | | | | | | | | | | | | | |
| Oil and Gas Total | | | | | | | | | | | | | | | | | | | | | | | | |
| Drilling Info, Inc. | | One stop | | L + 6.02% | | 7.02% | | 06/2018 | | | 2,402 | | | | 2,396 | | | | 0.8 | | | | 2,402 | |
| Drilling Info, Inc. | | One stop | | L + 5.00% | | N/A(4) | | 06/2018 | | | — | | | | — | | | | — | | | | — | |
| | | | | | | | | | | | 2,402 | | | | 2,396 | | | | 0.8 | | | | 2,402 | |
| | | | | | | | | | | | | | | | | | | | | | | | | |
| Personal and Non-Durable Consumer Products | | | | | | | | | | | | | | | | | | | | | | | | |
| C.B. Fleet Company, Incorporated | | Senior loan | | L + 4.38% | | 5.38% | | 10/2020 | | | 763 | | | | 745 | | | | 0.2 | | | | 763 | |
| C.B. Fleet Company, Incorporated(3) | | Senior loan | | L + 4.38% | | N/A(4) | | 10/2020 | | | — | | | | (8 | ) | | | — | | | | — | |
| C.B. Fleet Company, Incorporated | | Senior loan | | L + 4.38% | | 5.38% | | 10/2020 | | | 6,173 | | | | 6,119 | | | | 2.0 | | | | 6,173 | |
| The Hygenic Corporation(3) | | Senior loan | | L + 5.00% | | N/A(4) | | 10/2019 | | | — | | | | (2 | ) | | | — | | | | — | |
| The Hygenic Corporation | | Senior loan | | L + 5.00% | | 6.00% | | 10/2020 | | | 3,349 | | | | 3,321 | | | | 1.1 | | | | 3,349 | |
See Notes to Consolidated Financial Statements.
Golub Capital Investment Corp. and Subsidiaries
Consolidated Schedule of Investments – (continued)
September 30, 2015
(In thousands)
| | | | | Spread | | | | | | Principal/ | | | | | | Percentage | | | | |
| | | Investment | | Above | | Interest | | Maturity | | Par | | | | | | of Net | | | Fair | |
| | | Type | | Index(1) | | Rate(2) | | Date | | Amount | | | Cost | | | Assets | | | Value | |
| Personal and Non-Durable Consumer Products – (continued) | | | | | | | | | | | | | | | | | | | | | | | | |
| Massage Envy, LLC | | One stop | | L + 7.25% | | N/A(4) | | 09/2018 | | | — | | | | — | | | | — | % | | | — | |
| Massage Envy, LLC | | One stop | | L + 7.25% | | 8.50% | | 09/2018 | | | 1,013 | | | | 1,013 | | | | 0.3 | | | | 1,013 | |
| Orthotics Holdings, Inc(3)(6) | | One stop | | L + 5.00% | | N/A(4) | | 02/2020 | | | — | | | | (1 | ) | | | — | | | | — | |
| Orthotics Holdings, Inc(6) | | One stop | | L + 5.00% | | 6.00% | | 02/2020 | | | 618 | | | | 611 | | | | 0.2 | | | | 618 | |
| Orthotics Holdings, Inc(3) | | One stop | | L + 5.00% | | N/A(4) | | 02/2020 | | | — | | | | (7 | ) | | | — | | | | — | |
| Orthotics Holdings, Inc(3) | | One stop | | L + 5.00% | | N/A(4) | | 02/2020 | | | — | | | | (6 | ) | | | — | | | | — | |
| Orthotics Holdings, Inc | | One stop | | L + 5.00% | | 6.00% | | 02/2020 | | | 3,770 | | | | 3,728 | | | | 1.2 | | | | 3,770 | |
| Rug Doctor LLC | | Senior loan | | L + 5.25% | | N/A(4) | | 12/2016 | | | — | | | | — | | | | — | | | | — | |
| Rug Doctor LLC | | Senior loan | | L + 5.25% | | 6.25% | | 12/2016 | | | 2,531 | | | | 2,531 | | | | 0.8 | | | | 2,531 | |
| Team Technologies Acquisition Company | | Senior loan | | L + 5.00% | | N/A(4) | | 12/2017 | | | — | | | | — | | | | — | | | | — | |
| Team Technologies Acquisition Company | | Senior loan | | L + 5.00% | | 6.25% | | 12/2017 | | | 291 | | | | 291 | | | | 0.1 | | | | 291 | |
| Team Technologies Acquisition Company | | Senior loan | | L + 5.50% | | 6.75% | | 12/2017 | | | 54 | | | | 53 | | | | — | | | | 54 | |
| | | | | | | | | | | | 18,562 | | | | 18,388 | | | | 5.9 | | | | 18,562 | |
| | | | | | | | | | | | | | | | | | | | | | | | | |
| Personal, Food and Miscellaneous Services | | | | | | | | | | | | | | | | | | | | | | | | |
| Affordable Care Inc. | | Senior loan | | L + 4.50% | | N/A(4) | | 12/2017 | | | — | | | | — | | | | — | | | | — | |
| Affordable Care Inc. | | Senior loan | | L + 4.50% | | 5.50% | | 12/2018 | | | 255 | | | | 255 | | | | 0.1 | | | | 255 | |
| California Pizza Kitchen | | Senior loan | | L + 4.25% | | 5.25% | | 03/2018 | | | 467 | | | | 454 | | | | 0.1 | | | | 460 | |
| Clarkson Eyecare LLC | | One stop | | L + 5.75% | | 6.75% | | 04/2021 | | | 2,568 | | | | 2,541 | | | | 0.8 | | | | 2,568 | |
| Clarkson Eyecare LLC(3) | | One stop | | L + 5.75% | | N/A(4) | | 04/2021 | | | — | | | | (6 | ) | | | — | | | | — | |
| Clarkson Eyecare LLC(3) | | One stop | | L + 5.75% | | N/A(4) | | 04/2021 | | | — | | | | (7 | ) | | | — | | | | — | |
| Clarkson Eyecare LLC | | One stop | | L + 5.75% | | 6.75% | | 04/2021 | | | 2,791 | | | | 2,759 | | | | 0.9 | | | | 2,791 | |
| Ignite Restaurant Group, Inc (Joe’s Crab Shack) | | One stop | | L + 7.00% | | 8.00% | | 02/2019 | | | 1,471 | | | | 1,471 | | | | 0.5 | | | | 1,471 | |
| PetVet Care Centers LLC | | Senior loan | | L + 4.50% | | 5.50% | | 12/2020 | | | 321 | | | | 315 | | | | 0.1 | | | | 321 | |
| PetVet Care Centers LLC(3) | | Senior loan | | L + 4.50% | | N/A(4) | | 12/2019 | | | — | | | | (3 | ) | | | — | | | | — | |
| PetVet Care Centers LLC | | Senior loan | | L + 4.50% | | 5.50% | | 12/2020 | | | 2,941 | | | | 2,915 | | | | 0.9 | | | | 2,941 | |
| R.G. Barry Corporation | | Senior loan | | L + 5.00% | | 6.00% | | 09/2019 | | | 1,511 | | | | 1,511 | | | | 0.5 | | | | 1,496 | |
| Vetcor Professional Practices LLC(3) | | One stop | | L + 6.00% | | N/A(4) | | 04/2021 | | | — | | | | (9 | ) | | | — | | | | — | |
| Vetcor Professional Practices LLC | | One stop | | L + 6.00% | | 7.00% | | 04/2021 | | | 8 | | | | 3 | | | | — | | | | 8 | |
| Vetcor Professional Practices LLC | | One stop | | L + 6.00% | | 7.00% | | 04/2021 | | | 16,449 | | | | 16,144 | | | | 5.3 | | | | 16,449 | |
| Veterinary Specialists of North America, LLC | | One stop | | L + 5.00% | | N/A(4) | | 05/2020 | | | — | | | | — | | | | — | | | | — | |
| Veterinary Specialists of North America, LLC | | One stop | | L + 5.00% | | 6.00% | | 05/2020 | | | 283 | | | | 281 | | | | 0.1 | | | | 283 | |
| | | | | | | | | | | | 29,065 | | | | 28,624 | | | | 9.3 | | | | 29,043 | |
| | | | | | | | | | | | | | | | | | | | | | | | | |
| Printing and Publishing | | | | | | | | | | | | | | | | | | | | | | | | |
| Market Track, LLC | | One stop | | L + 7.00% | | 8.00% | | 10/2019 | | | 383 | | | | 381 | | | | 0.1 | | | | 379 | |
| Market Track, LLC | | One stop | | L + 7.00% | | 8.00% | | 10/2019 | | | 240 | | | | 233 | | | | 0.1 | | | | 234 | |
| Market Track, LLC | | One stop | | P + 6.00% | | 9.25% | | 10/2019 | | | 322 | | | | 298 | | | | 0.1 | | | | 303 | |
| Market Track, LLC | | One stop | | L + 7.00% | | 8.00% | | 10/2019 | | | 5,048 | | | | 5,024 | | | | 1.6 | | | | 4,997 | |
| Market Track, LLC | | One stop | | L + 7.00% | | 8.00% | | 10/2019 | | | 19,819 | | | | 19,528 | | | | 6.3 | | | | 19,620 | |
| | | | | | | | | | | | 25,812 | | | | 25,464 | | | | 8.2 | | | | 25,533 | |
| | | | | | | | | | | | | | | | | | | | | | | | | |
| Retail Stores | | | | | | | | | | | | | | | | | | | | | | | | |
| Benihana, Inc. | | One stop | | P + 4.75% | | 8.00% | | 07/2018 | | | 17 | | | | 17 | | | | — | | | | 16 | |
| Benihana, Inc. | | One stop | | L + 6.00% | | 7.25% | | 01/2019 | | | 306 | | | | 306 | | | | 0.1 | | | | 300 | |
| Boot Barn, Inc. | | Senior loan | | L + 4.50% | | 5.50% | | 06/2021 | | | 5,653 | | | | 5,572 | | | | 1.8 | | | | 5,653 | |
| CVS Holdings I, LP | | One stop | | L + 6.25% | | 7.25% | | 08/2021 | | | 236 | | | | 212 | | | | 0.1 | | | | 224 | |
| CVS Holdings I, LP(3) | | One stop | | L + 6.25% | | N/A(4) | | 08/2020 | | | — | | | | (4 | ) | | | — | | | | (2 | ) |
See Notes to Consolidated Financial Statements.
Golub Capital Investment Corp. and Subsidiaries
Consolidated Schedule of Investments – (continued)
September 30, 2015
(In thousands)
| | | | | Spread | | | | | | Principal/ | | | | | | Percentage | | | | |
| | | Investment | | Above | | Interest | | Maturity | | Par | | | | | | of Net | | | Fair | |
| | | Type | | Index(1) | | Rate(2) | | Date | | Amount | | | Cost | | | Assets | | | Value | |
| Retail Stores - (continued) | | | | | | | | | | | | | | | | | | | | | | | | |
| CVS Holdings I, LP | | One stop | | L + 6.25% | | 7.25% | | 08/2021 | | | 13,273 | | | | 13,013 | | | | 4.2 | % | | | 13,140 | |
| Cycle Gear, Inc.(3) | | One stop | | L + 6.00% | | N/A(4) | | 01/2020 | | | — | | | | (7 | ) | | | — | | | | — | |
| Cycle Gear, Inc. | | One stop | | L + 6.00% | | 7.00% | | 01/2020 | | | 2,894 | | | | 2,863 | | | | 0.9 | | | | 2,894 | |
| Elite Sportswear, L.P.(3) | | Senior loan | | L + 5.00% | | N/A(4) | | 03/2020 | | | — | | | | (3 | ) | | | — | | | | — | |
| Elite Sportswear, L.P. | | Senior loan | | L + 5.00% | | 6.00% | | 03/2020 | | | 1,270 | | | | 1,258 | | | | 0.4 | | | | 1,270 | |
| Express Oil Change, LLC | | Senior loan | | L + 5.00% | | 6.00% | | 12/2017 | | | 7 | | | | 7 | | | | — | | | | 7 | |
| Express Oil Change, LLC | | Senior loan | | L + 5.00% | | 6.00% | | 12/2017 | | | 88 | | | | 88 | | | | — | | | | 88 | |
| Express Oil Change, LLC | | Senior loan | | L + 5.00% | | N/A(4) | | 12/2017 | | | — | | | | — | | | | — | | | | — | |
| Express Oil Change, LLC | | Senior loan | | L + 5.00% | | 6.00% | | 12/2017 | | | 235 | | | | 234 | | | | 0.1 | | | | 235 | |
| Floor & Decor Outlets of America, Inc. | | One stop | | L + 6.50% | | 7.75% | | 05/2019 | | | 1,151 | | | | 1,151 | | | | 0.4 | | | | 1,151 | |
| Marshall Retail Group, LLC, The(3) | | One stop | | L + 6.00% | | N/A(4) | | 08/2020 | | | — | | | | — | | | | — | | | | (7 | ) |
| Marshall Retail Group, LLC, The | | One stop | | L + 6.00% | | 7.00% | | 08/2019 | | | 38 | | | | 38 | | | | — | | | | 21 | |
| Marshall Retail Group, LLC, The | | One stop | | L + 6.00% | | 7.00% | | 08/2020 | | | 3,231 | | | | 3,231 | | | | 1.0 | | | | 3,134 | |
| RCPSI Corporation(3) | | One stop | | L + 5.75% | | N/A(4) | | 04/2020 | | | — | | | | (4 | ) | | | — | | | | — | |
| RCPSI Corporation | | One stop | | L + 5.75% | | 6.75% | | 04/2021 | | | 10,811 | | | | 10,611 | | | | 3.5 | | | | 10,811 | |
| Rubio’s Restaurants, Inc | | Senior loan | | L + 4.75% | | 6.00% | | 11/2018 | | | 848 | | | | 848 | | | | 0.3 | | | | 848 | |
| Sneaker Villa, Inc. | | One stop | | L + 8.50% | | 10.00% | | 12/2017 | | | 9 | | | | 9 | | | | — | | | | 9 | |
| Sneaker Villa, Inc. | | One stop | | L + 8.50% | | 10.00% | | 12/2017 | | | 10 | | | | 10 | | | | — | | | | 10 | |
| Sneaker Villa, Inc. | | One stop | | L + 8.50% | | 10.00% | | 12/2017 | | | 17 | | | | 17 | | | | — | | | | 17 | |
| Sneaker Villa, Inc. | | One stop | | P + 7.00% | | 10.25% | | 12/2017 | | | 18 | | | | 18 | | | | — | | | | 18 | |
| Sneaker Villa, Inc. | | One stop | | L + 8.50% | | 10.00% | | 12/2017 | | | 35 | | | | 34 | | | | — | | | | 35 | |
| Sneaker Villa, Inc. | | One stop | | L + 8.50% | | 10.00% | | 12/2017 | | | 58 | | | | 57 | | | | — | | | | 58 | |
| Sneaker Villa, Inc. | | One stop | | L + 8.50% | | 10.00% | | 12/2017 | | | 60 | | | | 60 | | | | — | | | | 60 | |
| Specialty Catalog Corp. | | One stop | | L + 6.00% | | N/A(4) | | 07/2017 | | | — | | | | — | | | | — | | | | — | |
| Specialty Catalog Corp. | | One stop | | L + 6.00% | | 7.50% | | 07/2017 | | | 104 | | | | 104 | | | | — | | | | 104 | |
| | | | | | | | | | | | 40,369 | | | | 39,740 | | | | 12.8 | | | | 40,094 | |
| | | | | | | | | | | | | | | | | | | | | | | | | |
| Telecommunications | | | | | | | | | | | | | | | | | | | | | | | | |
| Hosting.com Inc. | | Senior loan | | P + 3.25% | | 6.50% | | 12/2017 | | | 31 | | | | 31 | | | | — | | | | 31 | |
| Hosting.com Inc. | | Senior loan | | L + 4.50% | | 5.75% | | 12/2017 | | | 653 | | | | 653 | | | | 0.2 | | | | 653 | |
| Wilcon Operations LLC | | One stop | | L + 6.50% | | 7.75% | | 10/2018 | | | 418 | | | | 412 | | | | 0.1 | | | | 418 | |
| Wilcon Operations LLC | | One stop | | L + 6.50% | | 7.75% | | 10/2018 | | | 558 | | | | 558 | | | | 0.2 | | | | 558 | |
| Wilcon Operations LLC | | One stop | | L + 6.50% | | 7.75% | | 10/2018 | | | 161 | | | | 161 | | | | 0.1 | | | | 161 | |
| Wilcon Operations LLC | | One stop | | L + 6.50% | | 7.75% | | 10/2018 | | | 2,746 | | | | 2,738 | | | | 0.9 | | | | 2,746 | |
| | | | | | | | | | | | 4,567 | | | | 4,553 | | | | 1.5 | | | | 4,567 | |
| | | | | | | | | | | | | | | | | | | | | | | | | |
| Textile and Leather | | | | | | | | | | | | | | | | | | | | | | | | |
| 5.11, Inc. | | Senior loan | | L + 5.00% | | 6.00% | | 02/2020 | | | 2,650 | | | | 2,649 | | | | 0.9 | | | | 2,658 | |
| | | | | | | | | | | | | | | | | | | | | | | | | |
| Utilities | | | | | | | | | | | | | | | | | | | | | | | | |
| PowerPlan Holdings, Inc.(3) | | Senior loan | | L + 5.25% | | N/A(4) | | 02/2021 | | | — | | | | (11 | ) | | | — | | | | — | |
| PowerPlan Holdings, Inc. | | Senior loan | | L + 5.25% | | 6.25% | | 02/2022 | | | 7,524 | | | | 7,421 | | | | 2.4 | | | | 7,524 | |
| | | | | | | | | | | | 7,524 | | | | 7,410 | | | | 2.4 | | | | 7,524 | |
| Total debt investments United States | | | | | | | | | | $ | 550,355 | | | $ | 544,392 | | | | 174.9 | % | | $ | 546,757 | |
| Fair Value as a percentage of Principal Amount | | | | | | | | | | | | | | | | | | | | | | | 99.3 | % |
See Notes to Consolidated Financial Statements.
Golub Capital Investment Corp. and Subsidiaries
Consolidated Schedule of Investments – (continued)
September 30, 2015
(In thousands)
| | | | | Spread | | | | | | | | | | | | Percentage | | | | |
| | | Investment | | Above | | Interest | | Maturity | | Shares/ | | | | | | of Net | | | Fair | |
| | | Type | | Index(1) | | Rate(2) | | Date | | Contracts | | | Cost | | | Assets | | | Value | |
| Equity Investments(7)(8) | | | | | | | | | | | | | | | | | | | | | | | | |
| Beverage, Food and Tobacco | | | | | | | | | | | | | | | | | | | | | | | | |
| Hopdoddy Holdings, LLC | | LLC interest | | N/A | | N/A | | N/A | | | 18 | | | | 84 | | | | — | % | | | 84 | |
| United Craft Brews LLC | | LP interest | | N/A | | N/A | | N/A | | | — | | | | 293 | | | | 0.1 | | | | 291 | |
| | | | | | | | | | | | | | | | 377 | | | | 0.1 | | | | 375 | |
| | | | | | | | | | | | | | | | | | | | | | | | | |
| Chemicals, Plastics and Rubber | | | | | | | | | | | | | | | | | | | | | | | | |
| Flexan, LLC | | Preferred stock | | N/A | | N/A | | N/A | | | — | | | | 32 | | | | — | | | | 34 | |
| Flexan, LLC | | Common stock | | N/A | | N/A | | N/A | | | — | | | | — | | | | — | | | | 6 | |
| | | | | | | | | | | | | | | | 32 | | | | — | | | | 40 | |
| | | | | | | | | | | | | | | | | | | | | | | | | |
| Diversified Conglomerate Manufacturing | | | | | | | | | | | | | | | | | | | | | | | | |
| ICC-Nexergy, Inc | | Common stock | | N/A | | N/A | | N/A | | | — | | | | — | | | | — | | | | — | |
| ICC-Nexergy, Inc | | Preferred stock | | N/A | | N/A | | N/A | | | — | | | | 259 | | | | 0.1 | | | | 253 | |
| | | | | | | | | | | | | | | | 259 | | | | 0.1 | | | | 253 | |
| | | | | | | | | | | | | | | | | | | | | | | | | |
| Diversified Conglomerate Service | | | | | | | | | | | | | | | | | | | | | | | | |
| Actiance, Inc. | | Warrant | | N/A | | N/A | | N/A | | | 167 | | | | 40 | | | | — | | | | 40 | |
| Agility Recovery Solutions Inc. | | Preferred stock | | N/A | | N/A | | N/A | | | 30 | | | | 191 | | | | 0.1 | | | | 199 | |
| HealthcareSource HR, Inc. | | LLC interest | | N/A | | N/A | | N/A | | | — | | | | 165 | | | | 0.1 | | | | 165 | |
| Host Analytics, Inc. | | Warrant | | N/A | | N/A | | N/A | | | 80 | | | | — | | | | — | | | | 43 | |
| Steelwedge Software, Inc. | | Warrant | | N/A | | N/A | | N/A | | | 29,443 | | | | 61 | | | | — | | | | 61 | |
| TA MHI Buyer, Inc. | | Preferred stock | | N/A | | N/A | | N/A | | | — | | | | 163 | | | | 0.1 | | | | 163 | |
| | | | | | | | | | | | | | | | 620 | | | | 0.3 | | | | 671 | |
| | | | | | | | | | | | | | | | | | | | | | | | | |
| Electronics | | | | | | | | | | | | | | | | | | | | | | | | |
| Gamma Technologies, LLC | | LLC units | | N/A | | N/A | | N/A | | | 1 | | | | 82 | | | | — | | | | 82 | |
| SEI, Inc. | | LLC units | | N/A | | N/A | | N/A | | | 207 | | | | 207 | | | | 0.1 | | | | 207 | |
| Sloan Company, Inc., The | | LLC units | | N/A | | N/A | | N/A | | | 1 | | | | 7 | | | | — | | | | 7 | |
| Sloan Company, Inc., The | | LLC units | | N/A | | N/A | | N/A | | | — | | | | 59 | | | | — | | | | 59 | |
| | | | | | | | | | | | | | | | 355 | | | | 0.1 | | | | 355 | |
| | | | | | | | | | | | | | | | | | | | | | | | | |
| Healthcare, Education and Childcare | | | | | | | | | | | | | | | | | | | | | | | | |
| DCA Investment Holding, LLC | | LLC units | | N/A | | N/A | | N/A | | | 39 | | | | 4 | | | | — | | | | 4 | |
| DCA Investment Holding, LLC | | LLC units | | N/A | | N/A | | N/A | | | 3,885 | | | | 388 | | | | 0.1 | | | | 388 | |
| Deca Dental Management LLC | | LLC units | | N/A | | N/A | | N/A | | | 651 | | | | 651 | | | | 0.2 | | | | 651 | |
| Dental Holdings Corporation | | LLC units | | N/A | | N/A | | N/A | | | 327 | | | | 327 | | | | 0.1 | | | | 328 | |
| Encore GC Acquisition, LLC | | LLC units | | N/A | | N/A | | N/A | | | 6 | | | | 63 | | | | — | | | | 64 | |
| Encore GC Acquisition, LLC | | LLC units | | N/A | | N/A | | N/A | | | 6 | | | | — | | | | — | | | | — | |
| Katena Holdings, Inc. | | LLC units | | N/A | | N/A | | N/A | | | — | | | | 205 | | | | 0.1 | | | | 205 | |
| RXH Buyer Corporation | | LP interest | | N/A | | N/A | | N/A | | | 4 | | | | 443 | | | | 0.1 | | | | 443 | |
| | | | | | | | | | | | | | | | 2,081 | | | | 0.6 | | | | 2,083 | |
| | | | | | | | | | | | | | | | | | | | | | | | | |
| Insurance | | | | | | | | | | | | | | | | | | | | | | | | |
| Internet Pipeline, Inc. | | Common stock | | N/A | | N/A | | N/A | | | 90 | | | | 2 | | | | — | | | | 2 | |
| Internet Pipeline, Inc. | | Preferred stock | | N/A | | N/A | | N/A | | | — | | | | 207 | | | | 0.1 | | | | 207 | |
| | | | | | | | | | | | | | | | 209 | | | | 0.1 | | | | 209 | |
See Notes to Consolidated Financial Statements.
Golub Capital Investment Corp. and Subsidiaries
Consolidated Schedule of Investments – (continued)
September 30, 2015
(In thousands)
| | | | | Spread | | | | | | �� | | | | | | Percentage | | | | |
| | | Investment | | Above | | Interest | | Maturity | | Shares/ | | | | | | of Net | | | Fair | |
| | | Type | | Index(1) | | Rate(2) | | Date | | Contracts | | | Cost | | | Assets | | | Value | |
| Personal, Food and Miscellaneous Services | | | | | | | | | | | | | | | | | | | | | | | | |
| Clarkson Eyecare LLC | | LLC units | | N/A | | N/A | | N/A | | | — | | | | 63 | | | | — | % | | | 77 | |
| Vetcor Professional Practices LLC | | LLC units | | N/A | | N/A | | N/A | | | 55 | | | | 55 | | | | — | | | | 55 | |
| Vetcor Professional Practices LLC | | LLC units | | N/A | | N/A | | N/A | | | 498 | | | | 498 | | | | 0.2 | | | | 498 | |
| | | | | | | | | | | | | | | | 616 | | | | 0.2 | | | | 630 | |
| | | | | | | | | | | | | | | | | | | | | | | | | |
| Retail Stores | | | | | | | | | | | | | | | | | | | | | | | | |
| Cycle Gear, Inc. | | LLC units | | N/A | | N/A | | N/A | | | 7 | | | | 67 | | | | — | | | | 68 | |
| Elite Sportswear, L.P. | | LLC interest | | N/A | | N/A | | N/A | | | 0 | | | | 33 | | | | — | | | | 32 | |
| RCPSI Corporation | | LLC interest | | N/A | | N/A | | N/A | | | 222 | | | | 222 | | | | 0.1 | | | | 222 | |
| | | | | | | | | | | | | | | | 322 | | | | 0.1 | | | | 322 | |
| | | | | | | | | | | | | | | | | | | | | | | | | |
| Utilities | | | | | | | | | | | | | | | | | | | | | | | | |
| PowerPlan Holdings, Inc. | | Common stock | | N/A | | N/A | | N/A | | | — | | | | 135 | | | | — | | | | 142 | |
| PowerPlan Holdings, Inc. | | Common stock | | N/A | | N/A | | N/A | | | 68 | | | | 1 | | | | — | | | | 41 | |
| | | | | | | | | | | | | | | | 136 | | | | — | | | | 183 | |
| Total equity investments United States | | | | | | | | | | | | | | $ | 5,007 | | | | 1.6 | % | | $ | 5,121 | |
| Total United States | | | | | | | | | | | | | | $ | 555,362 | | | | 176.5 | % | | $ | 551,878 | |
| Total Investments | | | | | | | | | | | | | | $ | 555,362 | | | | 176.5 | % | | $ | 551,878 | |
| Cash, Restricted Cash and Cash Equivalents Cash and Restricted Cash | | | | | | | | | | | | | | $ | 12,884 | | | | 4.1 | % | | $ | 12,884 | |
| BlackRock Liquidity Funds T-Fund Institutional Shares (CUSIP 09248U718) | | | | | | | | | | | | | | | 8 | | | | — | | | | 8 | |
| Total Cash, Restricted Cash and Cash Equivalents | | | | | | | | | | | | | | $ | 12,892 | | | | 4.1 | % | | $ | 12,892 | |
| Total Investments and Cash, Restricted Cash and Cash Equivalents | | | | | | | | | | | | | | $ | 568,254 | | | | 180.6 | % | | $ | 564,770 | |
| (1) | The majority of the investments bear interest at a rate that may be determined by reference to London Interbank Offered Rate (“LIBOR” or “L”) or Prime (“P”) and which reset daily, quarterly or semiannually. For each, the Company has provided the spread over LIBOR or Prime and the weighted average current interest rate in effect at September 30, 2015. Certain investments are subject to a LIBOR or Prime interest rate floor. For fixed rate loans, a spread above a reference rate is not applicable. |
| (2) | For portfolio companies with multiple interest rate contracts, the interest rate shown is a weighted average current interest rate in effect at September 30, 2015. |
| (3) | The negative fair value is the result of the capitalized discount on the loan or the unfunded commitment being valued below par. The negative cost is the result of the capitalized discount being greater than the principal amount outstanding on the loan. |
| (4) | The entire commitment was unfunded at September 30, 2015. As such, no interest is being earned on this investment. |
| (5) | Loan was on non-accrual status as of September 30, 2015, meaning that the Company has ceased recognizing interest income on the loan. |
| (6) | The investment is treated as a non-qualifying asset under Section 55(a) of the 1940 Act. Under the 1940 Act, the Company may not acquire any non-qualifying asset unless, at the time the acquisition is made, qualifying assets represent at least 70% of the Company’s total assets. |
| (7) | Non-income producing securities. |
| (8) | Ownership of certain equity investments may occur through a holding company or partnership. |
See Notes to Consolidated Financial Statements.
Golub Capital Investment Corporation and Subsidiaries
Notes to Consolidated Financial Statements
(In thousands, except shares and per share data)
Note 1. Organization
Golub Capital Investment Corporation (“GCIC” and collectively with its subsidiaries, the “Company”) is an externally managed, closed-end, non-diversified management investment company that was formed on September 22, 2014 and commenced operations on December 31, 2014, the effective date of the Company’s election to be treated as a business development company (“BDC”) under the Investment Company Act of 1940, as amended (the “1940 Act”). In addition, for U.S. federal income tax purposes, the Company intends to elect to be treated as a regulated investment company (“RIC”) under Subchapter M of the Internal Revenue Code of 1986, as amended (the “Code”).
The Company’s investment strategy is to invest primarily in senior secured and one stop (a loan that combines characteristics of traditional first lien senior secured loans and second lien or subordinated loans) loans of U.S. middle-market companies that are, in most cases, sponsored by private equity firms. The Company may also selectively invest in second lien and subordinated (a loan that ranks senior only to a borrower’s equity securities and ranks junior to all of such borrower’s other indebtedness in priority of payment) loans of, and warrants and minority equity securities in, middle-market companies. The Company has entered into an investment advisory agreement (the “Investment Advisory Agreement”) with GC Advisors LLC (the “Investment Adviser”) under which the Investment Adviser manages the day-to-day operations of, and provides investment advisory services to, the Company. Under an administration agreement (the “Administration Agreement”) the Company is provided with certain services by an administrator (the “Administrator”), which is currently Golub Capital LLC.
Immediately prior to the Company’s election to be regulated as a business development company, the Company acquired its initial portfolio of investments by purchasing (1) 100% of the equity interests of each of GCIC Holdings LLC (“GCIC Holdings”) and GCIC Funding LLC (“GCIC Funding”) from GEMS Fund, L.P. (“GEMS”), a Delaware limited partnership whose general partner is controlled by the Investment Adviser, and (2) certain debt securities. The securities comprising the Company’s initial portfolio of investments had been underwritten by the Investment Adviser at the time of origination or acquisition using the same criteria and standards as the Investment Adviser uses in connection with the origination or acquisition of loans for the Company.
On December 31, 2014, certain investors entered into subscription agreements to purchase shares of GCIC’s common stock in a private placement. Pursuant to a capital call on such subscription agreements, GCIC issued 6,072,227.636 shares of its common stock on December 31, 2014 in exchange for aggregate capital contributions of $91,084.
Note 2. Significant Accounting Policies and Recent Accounting Updates
Basis of presentation: The Company is an investment company as defined in the accounting and reporting guidance under Accounting Standards Codification (“ASC”) Topic 946 —Financial Services — Investment Companies(“ASC Topic 946”).
The accompanying consolidated financial statements of the Company and related financial information have been prepared in accordance with generally accepted accounting principles in the United States of America (“GAAP”). In the opinion of management, the consolidated financial statements reflect all adjustments and reclassifications consisting solely of normal accruals that are necessary for the fair presentation of financial results as of and for the periods presented. All intercompany balances and transactions have been eliminated. Certain prior period amounts have been reclassified to conform to the current period presentation.
Fair value of financial instruments: The Company applies fair value to all of its financial instruments in accordance with ASC Topic 820 —Fair Value Measurements and Disclosures(“ASC Topic 820”).ASC Topic 820 defines fair value, establishes a framework used to measure fair value and requires disclosures for fair value measurements. In accordance with ASC Topic 820, the Company has categorized its financial instruments carried at fair value, based on the priority of the valuation technique, into a three-level fair value
Golub Capital Investment Corporation and Subsidiaries
Notes to Consolidated Financial Statements
(In thousands, except shares and per share data)
Note 2. Significant Accounting Policies and Recent Accounting Updates – (continued)
hierarchy. Fair value is a market-based measure considered from the perspective of the market participant who holds the financial instrument rather than an entity-specific measure. Therefore, when market assumptions are not readily available, the Company’s own assumptions are set to reflect those that management believes market participants would use in pricing the financial instrument at the measurement date.
The availability of observable inputs can vary depending on the financial instrument and is affected by a wide variety of factors, including, for example, the type of product, whether the product is new, whether the product is traded on an active exchange or in the secondary market and the current market conditions. To the extent that the valuation is based on models or inputs that are less observable or unobservable in the market, the determination of fair value requires more judgment. Accordingly, the degree of judgment exercised by the Company in determining fair value is greatest for financial instruments classified as Level 3.
Any changes to the valuation methodology are reviewed by management and the Company’s board of directors (the “Board”) to confirm that the changes are appropriate. As markets change, new products develop and the pricing for products becomes more or less transparent, the Company will continue to refine its valuation methodologies. See further description of fair value methodology in Note 6.
Use of estimates:The preparation of the consolidated financial statements in conformity with GAAP requires management to make estimates and assumptions that affect the reported amounts of assets and liabilities and disclosure of contingent assets and liabilities at the date of the consolidated financial statements and the reported amounts of revenues and expenses during the reporting period. Actual results could differ from those estimates.
Consolidation:As provided under ASC Topic 946, the Company will generally not consolidate its investment in a company other than an investment company subsidiary or a controlled operating company whose business consists of providing services to the Company. Accordingly, the Company consolidated the results of the Company’s wholly-owned subsidiaries, GCIC Holdings, GCIC Funding and GCIC Equity LLC (“GCIC Equity”), in its consolidated financial statements. The Company does not consolidate its noncontrolling interest in GCIC Senior Loan Fund, LLC (“GCIC SLF”). See further description of the Company’s investment in GCIC SLF in Note 5.
Assets related to transactions that do not meet ASC Topic 860 —Transfers and Servicing(“ASC Topic 860”) requirements for accounting sale treatment are reflected in the Company’s consolidated statements of financial condition as investments. Those assets are owned by special purpose entities, including GCIC Funding, that are consolidated in the Company’s consolidated financial statements. The creditors of the special purpose entities have received security interests in such assets and such assets are not intended to be available to the creditors of GCIC (or any affiliate of GCIC).
Cash and cash equivalents:Cash and cash equivalents are highly liquid investments with an original maturity of three months or less at the date of acquisition. The Company deposits its cash in financial institutions and, at times, such balances may be in excess of the Federal Deposit Insurance Corporation insurance limits.
Restricted cash and cash equivalents:Restricted cash and cash equivalents include amounts that are collected and are held by a trustee who has been appointed as custodian of the assets securing the Company’s senior secured revolving credit facility (as amended, the “Credit Facility”) with Wells Fargo Securities, LLC, as administrative agent, and Wells Fargo Bank, N.A., as lender. Restricted cash is held by the trustee for payment of interest expense and principal on the outstanding borrowings or reinvestment into new assets.
Golub Capital Investment Corporation and Subsidiaries
Notes to Consolidated Financial Statements
(In thousands, except shares and per share data)
Note 2. Significant Accounting Policies and Recent Accounting Updates – (continued)
Revenue recognition:
Investments and related investment income:Interest income is accrued based upon the outstanding principal amount and contractual interest terms of debt investments.
Loan origination fees, original issue discount and market discount or premium are capitalized, and the Company accretes or amortizes such amounts over the life of the loan as interest income. For the year ended September 30, 2015 the Company received loan origination fees of $5,277. For year ended September 30, 2015, interest income included $800 of accretion of discounts.
For investments with contractual payment-in-kind (“PIK”) interest, which represents contractual interest accrued and added to the principal balance that generally becomes due at maturity, the Company will not accrue PIK interest if the portfolio company valuation indicates that the PIK interest is not collectible. For the year ended September 30, 2015, the Company recorded PIK income of $44, and received PIK payments in cash in an amount less than $1.
In addition, the Company may generate revenue in the form of amendment, structuring or due diligence fees, fees for providing managerial assistance, consulting fees and prepayment premiums on loans. The Company records these fees as fee income when received. All other income is recorded into income when earned. For the year ended September 30, 2015, fee income included $50 of prepayment premiums.
For the year ended September 30, 2015, the Company received interest and fee income in cash, which excludes capitalized loan origination fees, of $16,514.
Investment transactions are accounted for on a trade-date basis. Realized gains or losses on investments are measured by the difference between the net proceeds from the disposition and the cost basis of investment, without regard to unrealized gains or losses previously recognized. The Company reports current period changes in fair value of investments that are measured at fair value as a component of the net change in unrealized appreciation (depreciation) on investments in the consolidated statements of operations.
Non-accrual loans:A loan may be left on accrual status during the period the Company is pursuing repayment of the loan. Management reviews all loans that become 90 days or more past due on principal and interest, or when there is reasonable doubt that principal or interest will be collected, for possible placement on non-accrual status. When a loan is placed on non-accrual status, unpaid interest credited to income is reversed. Additionally, any original issue discount and market discount are no longer accreted to interest income as of the date the loan is placed on non-accrual status. Interest payments received on non-accrual loans may be recognized as income or applied to principal depending upon management’s judgment. Non-accrual loans are restored to accrual status when past due principal and interest is paid and, in management’s judgment, payments are likely to remain current. The total fair value of non-accrual loans was $179 and $0 as of September 30, 2015 and 2014, respectively.
Income taxes:The Company intends to elect to be treated as a RIC under Subchapter M of the Code and operates in a manner so as to qualify for the tax treatment applicable to RICs. In order to qualify as a RIC, among other things, the Company is required to meet certain source of income and asset diversification requirements and timely distribute to its stockholders at least 90% of investment company taxable income, as defined by the Code, for each tax year. The Company has made, and intends to continue to make, the requisite distributions to its stockholders, which will generally relieve the Company from U.S. federal income taxes with respect to all income distributed to its stockholders.
Depending on the level of taxable income earned in a tax year, the Company may choose to retain taxable income in excess of current year dividend distributions, and would distribute such taxable income in the next tax year. The Company would then pay a 4% excise tax on such income, as required. To the extent that the Company determines that it’s estimated current year annual taxable income, determined on a calendar year
Golub Capital Investment Corporation and Subsidiaries
Notes to Consolidated Financial Statements
(In thousands, except shares and per share data)
Note 2. Significant Accounting Policies and Recent Accounting Updates – (continued)
basis, could exceed estimated current calendar year dividend distributions, the Company accrues excise tax, if any, on estimated excess taxable income as taxable income is earned. For the year ended September 30, 2015, no amount was recorded for U.S. federal excise tax.
The Company accounts for income taxes in conformity with ASC Topic 740 —Income Taxes(“ASC Topic 740”). ASC Topic 740 provides guidelines for how uncertain tax positions should be recognized, measured, presented and disclosed in financial statements. ASC Topic 740 requires the evaluation of tax positions taken in the course of preparing the Company’s tax returns to determine whether the tax positions are “more-likely-than-not” to be sustained by the applicable tax authority. Tax benefits of positions not deemed to meet the more-likely-than-not threshold would be recorded as a tax expense in the current year. It is the Company’s policy to recognize accrued interest and penalties related to uncertain tax benefits in income tax expense. There were no material uncertain income tax positions through September 30, 2015. The 2014 tax year remains subject to examination by U.S. federal and most state tax authorities.
Distributions:Distributions to common stockholders are recorded on the record date. Subject to the discretion of and as determined by the Board, the Company intends to authorize and declare ordinary cash distributions based on a formula approved by the Board on a quarterly basis. The amount to be paid out as a dividend or distribution is determined by the Board each quarter and is generally based upon the earnings estimated by management. Net realized capital gains, if any, are distributed at least annually, although the Company may decide to retain such capital gains for investment.
The Company has adopted a dividend reinvestment plan (“DRIP”) that provides for reinvestment of any distributions the Company declares in cash on behalf of its stockholders, unless a stockholder elects to receive cash. As a result, if the Board authorizes and the Company declares a cash distribution, then stockholders who have not “opted out” of the DRIP will have their cash distribution automatically reinvested in additional shares of the Company’s common stock, rather than receiving the cash distribution. Shares issued under the DRIP will be issued at a price per share equal to the most recent NAV per share as determined by the Board.
Deferred financing costs:Deferred financing costs represent fees and other direct incremental costs incurred in connection with the Company’s borrowings. As of September 30, 2015 and 2014, the Company had deferred financing costs of $3,213 and $0, respectively. These amounts are amortized and included in interest expense in the consolidated statements of operations over the estimated average life of the borrowings. Amortization expense for the year ended September 30, 2015 was $520.
Recent accounting pronouncements:In April 2015, the Financial Accounting Standards Board (“FASB”) issued Accounting Standards Update (“ASU”) 2015-03,Interest — Imputation of interest (Subtopic 835-30): Simplifying the Presentation of Debt Issuance Costs, which requires that debt issuance costs related to a recognized debt liability be presented in the balance sheet as a direct deduction from the carrying amount of that debt liability, consistent with debt discounts. This guidance is effective for annual and interim periods beginning after December 15, 2015. The Company is currently evaluating the impact this ASU will have on its consolidated financial statements.
In May 2015, FASB issued ASU 2015-07,Fair Value Measurement (Topic 820): Disclosures for Investments in Certain Entities That Calculate Net Asset Value per Share (or Its Equivalent), which removes the requirement to categorize within the fair value hierarchy all investments for which fair value is measured using the net asset value per share practical expedient. This guidance is effective for annual reporting periods, and the interim periods within those periods, beginning after December 15, 2015 and early adoption is permitted. The Company does not currently value any investments using the net asset value per share practical expedient but will adopt the ASU and incorporate the enhanced disclosures around fair value measurements in the even the Company does elect to use the net asset value per share practical expedient in the future.
Golub Capital Investment Corporation and Subsidiaries
Notes to Consolidated Financial Statements
(In thousands, except shares and per share data)
Note 3. Stockholders’ Equity
GCIC is authorized to issue 1,000,000 shares of preferred stock at a par value of $0.001 per share and 100,000,000 shares of common stock at a par value of $0.001 per share. For the year ended September 30, 2015, GCIC entered into subscription agreements (collectively, the “Subscription Agreements”) with several investors, including with affiliates of the Adviser, providing for the private placement of GCIC’s common stock. Under the terms of the Subscription Agreements, investors are required to fund drawdowns to purchase GCIC’s common stock, at a price per share equal to the most recent NAV per share as determined by the Board, up to the amount of their respective capital subscriptions on an as-needed basis as determined by GCIC with a minimum of 10 calendar days prior notice.
As of September 30, 2015, stockholders of GCIC have subscribed to contribute capital to GCIC of $689,154 pursuant to the Subscription Agreements of which $307,652 was called and contributed through September 30, 2015.
The following table summarizes the shares of GCIC common stock issued and outstanding for the year ended September 30, 2015:
| | | | | Shares | | | NAV ($) | | | | |
| | | Date | | Issued | | | per share | | | Proceeds | |
| Shares outstanding, September 30, 2014 | | | | | 666.670 | | | $ | 15.00 | | | $ | 10 | |
| Issuance of shares(1) | | 12/31/14 | | | 4,884,727.636 | | | | 15.00 | | | | 73,271 | |
| Issuance of shares | | 12/31/14 | | | 1,187,500.000 | | | | 15.00 | | | | 17,813 | |
| Issuance of shares | | 01/12/15 | | | 2,331,954.667 | | | | 15.00 | | | | 34,979 | |
| Issuance of shares | | 02/05/15 | | | 632,446.104 | | | | 15.00 | | | | 9,487 | |
| Issuance of shares | | 02/27/15 | | | 197,166.667 | | | | 15.00 | | | | 2,957 | |
| Issuance of shares | | 03/02/15 | | | 303,333.333 | | | | 15.00 | | | | 4,550 | |
| Issuance of shares | | 03/20/15 | | | 970,666.667 | | | | 15.00 | | | | 14,560 | |
| Issuance of shares | | 04/01/15 | | | 834,166.667 | | | | 15.00 | | | | 12,513 | |
| Issuance of shares | | 04/09/15 | | | 773,500.000 | | | | 15.00 | | | | 11,602 | |
| Issuance of shares | | 04/17/15 | | | 540,714.191 | | | | 15.00 | | | | 8,111 | |
| Issuance of shares | | 05/14/15 | | | 1,111,719.995 | | | | 15.00 | | | | 16,676 | |
| Issuance of shares | | 06/01/15 | | | 1,334,947.940 | | | | 15.00 | | | | 20,024 | |
| Issuance of shares | | 07/02/15 | | | 1,021,078.072 | | | | 15.00 | | | | 15,316 | |
| Issuance of shares | | 07/20/15 | | | 1,463,847.589 | | | | 15.00 | | | | 21,958 | |
| Issuance of shares | | 08/13/15 | | | 1,153,308.534 | | | | 15.00 | | | | 17,299 | |
| Issuance of shares | | 08/27/15 | | | 1,768,406.410 | | | | 15.00 | | | | 26,526 | |
| Shares issued for capital drawdowns | | | | | 20,509,484.472 | | | $ | 15.00 | | | $ | 307,642 | |
| Issuance of shares(2) | | 04/28/15 | | | 102,032.997 | | | | 15.00 | | | | 1,530 | |
| Issuance of shares(2) | | 07/28/15 | | | 169,728.357 | | | | 15.00 | | | | 2,546 | |
| Issuance of shares(2) | | 09/18/15 | | | 61,242.723 | | | | 15.00 | | | | 919 | |
| Shares issued through DRIP | | | | | 333,004.077 | | | $ | 15.00 | | | $ | 4,995 | |
| Shares outstanding, September 30, 2015 | | | | | 20,843,155.219 | | | $ | 15.00 | | | $ | 312,647 | |
| (1) | Shares issued in exchange for the acquisition of the Company’s initial portfolio of investments. |
| (2) | Shares issued through the DRIP. |
Golub Capital Investment Corporation and Subsidiaries
Notes to Consolidated Financial Statements
(In thousands, except shares and per share data)
Note 4. Related Party Transactions
Investment Advisory Agreement:On December 31, 2014, GCIC entered into the Investment Advisory Agreement with the Investment Adviser, under which the Investment Adviser manages the day-to-day operations of, and provides investment advisory services to the Company. The Board approved the Investment Advisory Agreement for a two-year term in November 2014. The Investment Adviser is a registered investment adviser with the Securities and Exchange Commission (the “SEC”). The Investment Adviser receives fees for providing services, consisting of two components, a base management fee and an Incentive Fee (as defined below).
The base management fee is calculated at an annual rate equal to the lesser of (a) 1.50% or (b) the base management fee of Golub Capital BDC, Inc. (currently 1.375%) in either case on the fair value of the average adjusted gross assets of the Company at the end of the two most recently completed calendar quarters (excluding cash and cash equivalents but including assets purchased with borrowed funds and leverage) and is payable quarterly in arrears. The base management fee is adjusted, based on the actual number of days elapsed relative to the total number of days in such calendar quarter, for any share issuances or repurchases during such calendar quarter. Base management fees for any partial quarter are appropriately pro-rated. For purposes of the Investment Advisory Agreement, cash equivalents means U.S. government securities and commercial paper instruments maturing within 270 days of purchase (which is different than the GAAP definition, which defines cash equivalents as U.S. government securities and commercial paper instruments maturing within 90 days of purchase). To the extent that the Investment Adviser or any of its affiliates provides investment advisory, collateral management or other similar services to a subsidiary of GCIC, the base management fee shall be reduced by an amount equal to the product of (1) the total fees paid to the Investment Adviser by such subsidiary for such services and (2) the percentage of such subsidiary’s total equity, including membership interests and any class of notes not exclusively held by one or more third parties, that is owned, directly or indirectly, by the Company. For periods prior to the earlier of (1) the date of the pricing of an initial public offering or listing on a national securities exchange of the securities of GCIC or (2) a sale of all or substantially all of the Company’s assets to, or other liquidity event with, an entity for consideration of publicly listed securities of the acquirer (each, a “Liquidity Event”), the Investment Adviser has irrevocably agreed to waive any base management fee in excess of 1.00% of the fair value of our average adjusted gross assets as calculated in accordance with the Investment Advisory Agreement and as described above. For the year ended September 30, 2015, the base management fee irrevocably waived by the Investment Adviser was $1,042.
The Incentive Fee consists of three parts: the income component (the “Income Incentive Fee”), the capital gains component (the “Capital Gain Incentive Fee”) and the subordinated liquidation incentive component (the “Subordinated Liquidation Incentive Fee” and, together with the Income Incentive Fee and the Capital Gain Incentive Fee, the “Incentive Fee”).
The Income Incentive Fee is calculated quarterly in arrears based on Pre-Incentive Fee Net Investment Income for the immediately preceding calendar quarter. “Pre-Incentive Fee Net Investment Income” means interest income, dividend income and any other income (including any other fees such as commitment, origination, structuring, diligence and consulting fees or other fees that the Company receives from portfolio companies but excluding fees for providing managerial assistance) accrued during the calendar quarter, minus operating expenses for the calendar quarter (including the base management fee, taxes, any expenses payable under the Investment Advisory Agreement and the Administration Agreement, any expenses of securitizations and any interest expense and dividends paid on any outstanding preferred stock, but excluding the Incentive Fee). Pre-Incentive Fee Net Investment Income includes, in the case of investments with a deferred interest feature such as market discount, debt instruments with PIK interest, preferred stock with PIK dividends and zero coupon securities, accrued income that the Company has not yet received in cash.
Golub Capital Investment Corporation and Subsidiaries
Notes to Consolidated Financial Statements
(In thousands, except shares and per share data)
Note 4. Related Party Transactions – (continued)
Pre-Incentive Fee Net Investment Income does not include any realized capital gains, realized capital losses or unrealized capital appreciation or depreciation. Because of the structure of the Income Incentive Fee, it is possible that an Incentive Fee may be calculated under this formula with respect to a period in which the Company has incurred a loss. For example, if the Company receives Pre-Incentive Fee Net Investment Income in excess of the hurdle rate (as defined below) for a calendar quarter, the Income Incentive Fee will result in a positive value and an Income Incentive Fee will be paid unless the payment of such Income Incentive Fee would be subject to the Incentive Fee Cap defined below.
Pre-Incentive Fee Net Investment Income, expressed as a rate of return on the value of the Company’s net assets (defined as total assets less indebtedness and before taking into account any Incentive Fees payable during the period) at the end of the immediately preceding calendar quarter, is compared to a fixed “hurdle rate” of 1.5% quarterly. If market interest rates rise, the Company may be able to invest funds in debt instruments that provide for a higher return, which would increase Pre-Incentive Fee Net Investment Income and make it easier for the Investment Adviser to surpass the fixed hurdle rate and receive an Incentive Fee based on such net investment income. The Company’s Pre-Incentive Fee Net Investment Income used to calculate this part of the Incentive Fee is also included in the amount of its total assets (excluding cash and cash equivalents but including assets purchased with borrowed funds and leverage) used to calculate the base management fee annual rate.
The Company calculates the Income Incentive Fee with respect to its Pre-Incentive Fee Net Investment Income quarterly, in arrears, as follows:
| • | Zero in any calendar quarter in which the Pre-Incentive Fee Net Investment Income does not exceed the hurdle rate; |
| • | 50.0% of the Company’s Pre-Incentive Fee Net Investment Income with respect to that portion of such Pre-Incentive Fee Net Investment Income, if any, that exceeds the hurdle rate but is less than the percentage at which the amount payable to the Investment Adviser equals 20.0% of the Pre-Incentive Fee Net Investment Income as if a hurdle rate did not apply. This portion of the Company’s Pre-Incentive Fee Net Investment Income that exceeds the hurdle rate is referred to as the “catch-up” provision; and |
| • | 20.0% of the amount of the Company’s Pre-Incentive Fee Net Investment Income, if any, that exceeds the catch-up provision in any calendar quarter. |
The sum of these calculations yields the Income Incentive Fee. This amount is appropriately adjusted for any share issuances or repurchases during the quarter. For the year ended September 30, 2015, the Income Incentive Fee incurred was $1,239.
For periods prior to a Liquidity Event, the Investment Adviser has irrevocably agreed to waive the Income Incentive fee calculated under the Investment Advisory Agreement in amounts in excess of the following amounts (computed on a quarterly basis, in arrears):
| • | 50.0% of the Company’s Pre-Incentive Fee Net Investment Income with respect to that portion of such Pre-Incentive Fee Net Investment Income, if any, that exceeds the hurdle rate but is less than the percentage at which the amount payable to the Investment Adviser equal to 15.0% of the Pre-Incentive Fee Net Investment Income as if a hurdle rate did not apply. This portion of the Company’s Pre-Incentive Fee Net Investment Income that exceeds the hurdle rate is referred to as the “catch-up” provision. |
| • | 15.0% of the amount of the Company’s Pre-Incentive Fee Net Investment Income, if any, that exceeds the catch-up provision in any calendar quarter. |
For the year ended September 30, 2015, the Income Incentive Fee waived by the Investment Adviser was $0.
Golub Capital Investment Corporation and Subsidiaries
Notes to Consolidated Financial Statements
(In thousands, except shares and per share data)
Note 4. Related Party Transactions – (continued)
The second part of the Incentive Fee, the Capital Gain Incentive Fee, will equal (a) 20.0% of the Company’s Capital Gain Incentive Fee Base (as defined below), if any, calculated in arrears as of the end of each calendar year (or upon termination of the Investment Advisory Agreement, as of the termination date), commencing with the calendar year ending December 31, 2015, less (b) the aggregate amount of any previously paid Capital Gain Incentive Fees. The Company’s “Capital Gain Incentive Fee Base” equals (1) the sum of (i) realized capital gains, if any, on a cumulative positive basis from December 31, 2014, the date the Company elected to become a BDC, through the end of each calendar year, (ii) all realized capital losses on a cumulative basis and (iii) all unrealized capital depreciation on a cumulative basis less (2) all unamortized deferred financing costs, if and to the extent such costs exceed all unrealized capital appreciation on a cumulative basis.
| • | The cumulative aggregate realized capital losses are calculated as the sum of the amounts by which (a) the net sales price of each investment in the Company’s portfolio when sold is less than (b) the accreted or amortized cost basis of such investment. |
| • | The cumulative aggregate realized capital gains are calculated as the sum of the differences, if positive, between (a) the net sales price of each investment in the Company’s portfolio when sold and (b) the accreted or amortized cost basis of such investment. |
| • | The aggregate unrealized capital depreciation is calculated as the sum of the differences, if negative, between (a) the valuation of each investment in the Company’s portfolio as of the applicable Capital Gain Incentive Fee calculation date and (b) the accreted or amortized cost basis of such investment. |
The Capital Gain Incentive Fee is calculated on a cumulative basis from December 31, 2014 through the end of each calendar year. Prior to the closing of a Liquidity Event, the Investment Adviser has agreed to waive that portion of the Capital Gain Incentive Fee, calculated as described above, in excess of 15.0% of the Capital Gain Incentive Fee Base, provided that any amounts so waived shall be deemed to have been paid to the Investment Adviser for purposes of determining the Capital Gain Incentive Fee payable after the closing of a public offering.
No Capital Gain Incentive Fee as calculated under the Investment Advisory Agreement (as described above) was payable for the year ended September 30, 2015. However, in accordance with GAAP, the Company is required to include the aggregate unrealized capital appreciation on investments in the calculation and accrue a capital gain incentive fee on a quarterly basis, as if such unrealized capital appreciation were realized, even though such unrealized capital appreciation is not permitted to be considered in calculating the fee actually payable under the Investment Advisory Agreement. If the Capital Gain Incentive Fee Base, adjusted as required by GAAP to include unrealized appreciation, is positive at the end of a period, then GAAP requires the Company to accrue a capital gain incentive fee equal to 15.0% prior to a Liquidity Event (20.0% following a Liquidity Event) of such amount, less the aggregate amount of the actual Capital Gain Incentive Fees paid and capital gain incentive fees accrued under GAAP in all prior periods. If such amount is negative, then there is no accrual for such period. The resulting accrual under GAAP in a given period may result in additional expense if such cumulative amount is greater than in the prior period or a reversal of previously recorded expense if such cumulative amount is less than in the prior period. There can be no assurance that such unrealized capital appreciation will be realized in the future. For the year ended September 30, 2015, the Company did not accrue a capital gain incentive fee under GAAP.
The third part of the Incentive Fee, the Subordinated Liquidation Incentive Fee, equals 20.0% of the net proceeds from a liquidation of the Company in excess of adjusted capital, as calculated immediately prior to liquidation; subject, however, to the limit of cumulative Incentive Fees of all types not exceeding the Incentive Fee Cap (as defined below). For purposes of this calculation, “liquidation” will include any merger of the Company with another entity or the acquisition of all or substantially all of the shares of common stock of GCIC in a single or series of related transactions. The Investment Advisory Agreement provides that no
Golub Capital Investment Corporation and Subsidiaries
Notes to Consolidated Financial Statements
(In thousands, except shares and per share data)
Note 4. Related Party Transactions – (continued)
Subordinated Liquidation Incentive Fee shall be payable for any liquidation that occurs more than six months after the date of a public offering of securities of GCIC. For periods prior to the closing of a Liquidity Event, the Investment Adviser has agreed to waive that portion of the Subordinated Liquidation Incentive Fee in excess of 10.0% of the net proceeds from liquidation in excess of adjusted capital, as calculated immediately prior to liquidation.
The Company has structured the calculation of the Incentive Fee to include a fee limitation such that an Incentive Fee for any quarter can only be paid to the Investment Adviser if, after such payment, the cumulative Incentive Fees paid to the Investment Adviser since December 31, 2014, would be less than or equal to 20.0% of the Company’s Cumulative Pre-Incentive Fee Net Income (the “Incentive Fee Cap”). Cumulative Pre-Incentive Fee Net Income is equal to the sum of (a) Pre-Incentive Fee Net Investment Income for each period from December 31, 2014 and (b) cumulative aggregate realized capital gains, cumulative aggregate realized capital losses, cumulative aggregate unrealized capital depreciation and cumulative aggregate unrealized capital appreciation from December 31, 2014. For periods prior to the closing of a public offering or listing on a national securities exchange of securities of GCIC, the Investment Adviser has agreed to waive any Incentive Fee payable in excess of 15.0% of the Company’s Cumulative Pre-Incentive Fee Net Income; provided that any amounts so waived shall be deemed to have been paid to the Investment Adviser for purposes of the Incentive Fee Cap after the closing of such public offering or listing.
The sum of the Income Incentive Fee, the Capital Gain Incentive Fee and the Subordinated Liquidation Incentive Fee is the Incentive Fee. The Company will deposit one-third of each Incentive Fee payment into an escrow account (the “Escrow Account”) administered by The Bank of New York Mellon (the “Escrow Agent”). Assets in the Escrow Account will be held by the Escrow Agent until the closing of a Liquidity Event at which time the Escrow Agent will release the assets to the Investment Adviser. If no Liquidity Event occurs prior to December 31, 2020, the Escrow Agent will return all assets in the Escrow Account to the Company for the benefit of its stockholders. For the year ended September 30, 2015, the Company deposited $204 into the Escrow Account.
Administration Agreement:Under the Administration Agreement, the Administrator furnishes the Company with office facilities and equipment, provides the Company with clerical, bookkeeping and record keeping services at such facilities and provides the Company with other administrative services as the Administrator, subject to review by the Board, determines necessary to conduct the Company’s day-to-day operations. GCIC reimburses the Administrator the allocable portion (subject to the review and approval of the Board) of overhead and other expenses incurred by it in performing its obligations under the Administration Agreement, including rent, fees and expenses associated with performing compliance functions and GCIC’s allocable portion of the cost of its chief financial officer and chief compliance officer and their respective staffs. The Board reviews such expenses to determine that these expenses are reasonable and comparable to administrative services charged by unaffiliated third party asset managers. Under the Administration Agreement, the Administrator also provides, on the Company’s behalf, managerial assistance to those portfolio companies to which the Company is required to provide such assistance and will be paid an additional amount based on the cost of the services provided, which amount shall not exceed the amount the Company receives from such portfolio companies.
Included in accounts payable and accrued expenses is $248 and $0 as of September 30, 2015 and 2014, respectively, for accrued allocated shared services under the Administration Agreement.
Other related party transactions:The Company has agreed to reimburse the Investment Adviser for the organization costs incurred on its behalf up to an aggregate amount of $700. Organization costs include, among other things, the cost of incorporating, including legal, accounting, regulatory filing and other fees pertaining to the Company’s organization that were paid by the Investment Adviser on behalf of the Company. As of September 30, 2015, the organization costs incurred by the Company totaled $447.
Golub Capital Investment Corporation and Subsidiaries
Notes to Consolidated Financial Statements
(In thousands, except shares and per share data)
Note 4. Related Party Transactions – (continued)
The Administrator pays for certain unaffiliated third-party expenses incurred by the Company. Such expenses include postage, printing, office supplies and rating agency fees. These expenses are not marked-up and represent the same amount the Company would have paid had the Company paid the expenses directly. These expenses are subsequently reimbursed in cash.
Total expenses reimbursed to the Administrator during the year ended September 30, 2015 were $171.
As of September 30, 2015 and 2014, included in accounts payable and accrued expenses were $53 and $0, respectively, for accrued expenses paid on behalf of the Company by the Administrator.
On December 30, 2014, the Investment Adviser transferred 666.670 shares of the Company’s common stock acquired in connection with the Company’s formation to GCOP LLC, an affiliate of the Investment Adviser, for $10. In addition, on December 31, 2014, GCOP LLC entered into a $15,000 subscription agreement to purchase shares of the Company’s common stock in a private placement. As of September 30, 2015, the Company has issued 783,572.643, shares of its common stock, including through the DRIP, to GCOP LLC in exchange for aggregate capital contributions totaling $11,754.
On December 31, 2014, GEMS entered into a $40,000 subscription agreement to purchase shares of the Company’s common stock in a private placement. In connection with the Company’s acquisition of GCIC Holdings and GCIC Funding from GEMS on December 31, 2014, the Company issued 2,666,666.667 shares of its common stock and entered into an $11,820 short-term unsecured promissory note with GEMS (“GEMS Note”). The GEMS Note carried a fixed interest rate of 3.25% and matured and was paid-off on March 2, 2015. Total interest expense paid on the note during the year ended September 30, 2015 was $46. As of September 30, 2015, the Company has issued 2,782,140.099 shares of its common stock, including through the DRIP, to GEMS in exchange for aggregate capital contributions totaling $41,732.
On February 3, 2015, the Company entered into an unsecured revolving credit facility with the Investment Adviser (the “Revolver”), with a maximum credit limit of $40,000 and expiration date of February 3, 2018. Refer to Note 7 for discussion of the Revolver.
On June 1, 2015, GEMS Fund 4, L.P, a Delaware limited partnership whose general partner is controlled by the Investment Adviser, entered into a $24,138 subscription agreement to purchase shares of the Company’s common stock in a private placement. As of September 30, 2015, the Company has issued 267,130.200 shares of its common stock to GEMS Fund 4, L.P in exchange for aggregate capital contributions totaling $4,007.
Golub Capital Investment Corporation and Subsidiaries
Notes to Consolidated Financial Statements
(In thousands, except shares and per share data)
Note 5. Investments
Investments as of September 30, 2015 consisted of the following:
| | | As of September 30, 2015 | |
| | | Par | | | Cost | | | Fair Value | |
| Senior secured | | $ | 154,248 | | | $ | 152,795 | | | $ | 153,194 | |
| One stop | | | 396,107 | | | | 391,597 | | | | 393,563 | |
| Equity | | | 5,007 | | | | 5,007 | | | | 5,121 | |
| Total | | $ | 555,362 | | | $ | 549,399 | | | $ | 551,878 | |
The following tables show the portfolio composition by geographic region at cost and fair value as a percentage of total investments in portfolio companies. The geographic composition is determined by the location of the corporate headquarters of the portfolio company, which may not be indicative of the primary source of the portfolio company’s business.
| | | As of September 30, 2015 | |
| Cost: | | | | | | | | |
| United States | | | | | | | | |
| Mid-Atlantic | | $ | 112,234 | | | | 20.4 | % |
| Midwest | | | 117,918 | | | | 21.4 | |
| West | | | 79,395 | | | | 14.5 | |
| Southeast | | | 134,689 | | | | 24.5 | |
| Southwest | | | 43,754 | | | | 8.0 | |
| Northeast | | | 61,409 | | | | 11.2 | |
| Total | | $ | 549,399 | | | | 100.0 | % |
| | | | | | | | | |
| Fair Value: | | | | | | | | |
| United States | | | | | | | | |
| Mid-Atlantic | | $ | 112,770 | | | | 20.4 | % |
| Midwest | | | 118,202 | | | | 21.4 | |
| West | | | 79,632 | | | | 14.5 | |
| Southeast | | | 135,356 | | | | 24.5 | |
| Southwest | | | 43,846 | | | | 7.9 | |
| Northeast | | | 62,072 | | | | 11.3 | |
| Total | | $ | 551,878 | | | | 100.0 | % |
Golub Capital Investment Corporation and Subsidiaries
Notes to Consolidated Financial Statements
(In thousands, except shares and per share data)
Note 5. Investments – (continued)
The industry compositions of the portfolio at cost and fair value were as follows:
| | | As of September 30, 2015 | |
| Cost: | | | | | | | | |
| Aerospace and Defense | | $ | 22,239 | | | | 4.1 | % |
| Automobile | | | 12,028 | | | | 2.2 | |
| Beverage, Food and Tobacco | | | 44,305 | | | | 8.1 | |
| Broadcasting and Entertainment | | | 3,326 | | | | 0.6 | |
| Buildings and Real Estate | | | 10,248 | | | | 1.9 | |
| Chemicals, Plastics and Rubber | | | 2,750 | | | | 0.5 | |
| Containers, Packaging and Glass | | | 1,023 | | | | 0.2 | |
| Diversified/Conglomerate Manufacturing | | | 21,295 | | | | 3.9 | |
| Diversified/Conglomerate Service | | | 56,024 | | | | 10.2 | |
| Electronics | | | 78,183 | | | | 14.2 | |
| Grocery | | | 15,963 | | | | 2.9 | |
| Healthcare, Education and Childcare | | | 96,571 | | | | 17.6 | |
| Home and Office Furnishings, Housewares, and Durable Consumer | | | 10,023 | | | | 1.8 | |
| Hotels, Motels, Inns, and Gaming | | | 2,485 | | | | 0.5 | |
| Insurance | | | 18,830 | | | | 3.4 | |
| Leisure, Amusement, Motion Pictures, Entertainment | | | 21,313 | | | | 3.9 | |
| Machinery (Non-Agriculture, Non-Construction, Non-Electronic) | | | 2,278 | | | | 0.4 | |
| Mining, Steel, Iron and Non-Precious Metals | | | 217 | | | | — | * |
| Oil and Gas | | | 2,396 | | | | 0.4 | |
| Personal and Non Durable Consumer Products | | | 18,388 | | | | 3.3 | |
| Personal, Food and Miscellaneous Services | | | 29,240 | | | | 5.3 | |
| Printing and Publishing | | | 25,464 | | | | 4.6 | |
| Retail Stores | | | 40,062 | | | | 7.3 | |
| Telecommunications | | | 4,553 | | | | 0.8 | |
| Textiles and Leather | | | 2,649 | | | | 0.5 | |
| Utilities | | | 7,546 | | | | 1.4 | |
| Total | | $ | 549,399 | | | | 100.0 | % |
* Represents an amount less than 0.1%
Golub Capital Investment Corporation and Subsidiaries
Notes to Consolidated Financial Statements
(In thousands, except shares and per share data)
Note 5. Investments – (continued)
| | | As of September 30, 2015 | |
| Fair Value: | | | | | | | | |
| Aerospace and Defense | | $ | 22,168 | | | | 4.0 | % |
| Automobile | | | 12,145 | | | | 2.2 | |
| Beverage, Food and Tobacco | | | 44,499 | | | | 8.1 | |
| Broadcasting and Entertainment | | | 3,346 | | | | 0.6 | |
| Buildings and Real Estate | | | 10,311 | | | | 1.9 | |
| Chemicals, Plastics and Rubber | | | 2,785 | | | | 0.5 | |
| Containers, Packaging and Glass | | | 1,024 | | | | 0.2 | |
| Diversified/Conglomerate Manufacturing | | | 21,304 | | | | 3.9 | |
| Diversified/Conglomerate Service | | | 56,302 | | | | 10.2 | |
| Electronics | | | 78,422 | | | | 14.2 | |
| Grocery | | | 16,136 | | | | 2.9 | |
| Healthcare, Education and Childcare | | | 96,601 | | | | 17.5 | |
| Home and Office Furnishings, Housewares, and Durable Consumer | | | 10,115 | | | | 1.8 | |
| Hotels, Motels, Inns, and Gaming | | | 2,512 | | | | 0.5 | |
| Insurance | | | 18,925 | | | | 3.4 | |
| Leisure, Amusement, Motion Pictures, Entertainment | | | 21,270 | | | | 3.9 | |
| Machinery (Non-Agriculture, Non-Construction, Non-Electronic) | | | 2,278 | | | | 0.4 | |
| Mining, Steel, Iron and Non-Precious Metals | | | 217 | | | | — | * |
| Oil and Gas | | | 2,402 | | | | 0.4 | |
| Personal and Non Durable Consumer Products | | | 18,562 | | | | 3.4 | |
| Personal, Food and Miscellaneous Services | | | 29,673 | | | | 5.4 | |
| Printing and Publishing | | | 25,533 | | | | 4.6 | |
| Retail Stores | | | 40,416 | | | | 7.3 | |
| Telecommunications | | | 4,567 | | | | 0.8 | |
| Textiles and Leather | | | 2,658 | | | | 0.5 | |
| Utilities | | | 7,707 | | | | 1.4 | |
| Total | | $ | 551,878 | | | | 100.0 | % |
| * | Represents an amount less than 0.1% |
GCIC Senior Loan Fund LLC:
Effective December 31, 2014, the Company has agreed to co-invest with RGA Reinsurance Company (“RGA”) primarily in senior secured loans through GCIC SLF, an unconsolidated Delaware limited liability company (“LLC”). GCIC SLF will be capitalized as transactions are completed and all portfolio and investment decisions in respect to GCIC SLF must be approved by the GCIC SLF investment committee consisting of two representatives of each of the Company and RGA (with unanimous approval required from (i) one representative of each of the Company and RGA or (ii) both representatives of each of the Company and RGA).
GCIC SLF will be capitalized with subordinated notes and LLC equity interest subscriptions from its members. As of September 30, 2015, RGA had $12,500 of subordinated note commitments and $3,125 of LLC equity interest subscriptions to GCIC SLF and the Company had $87,500 of subordinated note commitments and $21,875 of LLC equity interest subscriptions to GCIC SLF, none of which were funded at September 30, 2015. The subordinated notes will bear interest at a rate of three-month LIBOR plus 4.0% until GCIC SLF or one its subsidiary incurs senior debt from a third party at which time the subordinated notes will bear interest at a rate of LIBOR plus 8.0%. As of September 30, 2015, GCIC SLF has not made any investments and the Company’s investment in GCIC SLF totaled zero at cost and at fair value.
Golub Capital Investment Corporation and Subsidiaries
Notes to Consolidated Financial Statements
(In thousands, except shares and per share data)
Note 6. Fair Value Measurements
The Company follows ASC Topic 820 for measuring fair value. Fair value is the price that would be received in the sale of an asset or paid to transfer a liability in an orderly transaction between market participants at the measurement date. Where available, fair value is based on observable market prices or parameters, or derived from such prices or parameters. Where observable prices or inputs are not available, valuation models are applied. These valuation models involve some level of management estimation and judgment, the degree of which is dependent on the price transparency for the assets or liabilities or market and the assets’ or liabilities’ complexity. The Company’s fair value analysis includes an analysis of the value of any unfunded loan commitments. Assets and liabilities are categorized for disclosure purposes based upon the level of judgment associated with the inputs used to measure their value. The valuation hierarchical levels are based upon the transparency of the inputs to the valuation of the asset or liability as of the measurement date. The three levels are defined as follows:
Level 1: Inputs are unadjusted, quoted prices in active markets for identical assets or liabilities at the measurement date.
Level 2: Inputs include quoted prices for similar assets or liabilities in active markets and inputs that are observable for the assets or liabilities, either directly or indirectly, for substantially the full term of the assets or liabilities.
Level 3: Inputs include significant unobservable inputs for the assets or liabilities and include situations where there is little, if any, market activity for the assets or liabilities. The inputs into the determination of fair value are based upon the best information available and may require significant management judgment or estimation.
In certain cases, the inputs used to measure fair value may fall into different levels of the fair value hierarchy. In such cases, an asset’s or a liability’s categorization within the fair value hierarchy is based on the lowest level of input that is significant to the fair value measurement. The Company’s assessment of the significance of a particular input to the fair value measurement in its entirety requires judgment, and considers factors specific to the asset or liability. The Company assesses the levels of assets and liabilities at each measurement date, and transfers between levels are recognized on the actual date of the event or change in circumstances that caused the transfers. There were no transfers among Level 1, 2 and 3 of the fair value hierarchy for assets and liabilities during the year ended September 30, 2015. The following section describes the valuation techniques used by the Company to measure different assets and liabilities at fair value and includes the level within the fair value hierarchy in which the assets and liabilities are categorized.
Investments
Level 1 investments are valued using quoted market prices. Level 2 investments are valued using market consensus prices that are corroborated by observable market data and quoted market prices for similar assets and liabilities. Level 3 investments are valued at fair value as determined in good faith by the Board, based on input of management, the audit committee and independent valuation firms that have been engaged at the direction of the Board to assist in the valuation of each portfolio investment without a readily available market quotation at least once during a trailing twelve-month period under a valuation policy and a consistently applied valuation process. This valuation process is conducted at the end of each fiscal quarter, with approximately 25% (based on fair value) of the Company’s valuations of debt and equity investments without readily available market quotations subject to review by an independent valuation firm. All investments as of September 30, 2015 and 2014, with the exception of money market funds included in cash and cash equivalents (Level 1 investments), were valued using Level 3 inputs of the fair value hierarchy.
When determining fair value of Level 3 debt and equity investments, the Company may take into account the following factors, where relevant: the enterprise value of a portfolio company, the nature and realizable value of any collateral, the portfolio company’s ability to make payments and its earnings and discounted cash
Golub Capital Investment Corporation and Subsidiaries
Notes to Consolidated Financial Statements
(In thousands, except shares and per share data)
Note 6. Fair Value Measurements – (continued)
flows, the markets in which the portfolio company does business, comparisons to publicly traded securities, and changes in the interest rate environment and the credit markets generally that may affect the price at which similar investments may be made and other relevant factors. The primary method for determining enterprise value uses a multiple analysis whereby appropriate multiples are applied to the portfolio company’s net income before net interest expense, income tax expense, depreciation and amortization (“EBITDA”). The enterprise value analysis is performed to determine the value of equity investments and to determine if debt investments are credit impaired. If debt investments are credit impaired, the Company will use the enterprise value analysis or a liquidation basis analysis to determine fair value. For debt investments that are not determined to be credit impaired, the Company uses a market interest rate yield analysis to determine fair value.
In addition, for certain debt investments, the Company may base its valuation on indicative bid and ask prices provided by an independent third party pricing service. Bid prices reflect the highest price that the Company and others may be willing to pay. Ask prices represent the lowest price that the Company and others may be willing to accept. The Company generally uses the midpoint of the bid/ask range as its best estimate of fair value of such investment.
Due to the inherent uncertainty of determining the fair value of Level 3 investments that do not have a readily available market value, the fair value of the investments may differ significantly from the values that would have been used had a ready market existed for such investments and may differ materially from the values that may ultimately be received or settled. Further, such investments are generally subject to legal and other restrictions or otherwise are less liquid than publicly traded instruments. If the Company were required to liquidate a portfolio investment in a forced or liquidation sale, the Company may realize significantly less than the value at which such investment had previously been recorded.
The Company’s investments are subject to market risk. Market risk is the potential for changes in the value due to market changes. Market risk is directly impacted by the volatility and liquidity in the markets in which the investments are traded.
The following table presents fair value measurements of the Company’s investments and indicates the fair value hierarchy of the valuation techniques utilized by the Company to determine such fair value as of September 30, 2015:
| As of September 30, 2015: | | Fair Value Measurements Using | |
| Description | | Level 1 | | | Level 2 | | | Level 3 | | | Total | |
| Assets: | | | | | | | | | | | | | | | | |
| Debt investments(1) | | $ | — | | | $ | — | | | $ | 546,757 | | | $ | 546,757 | |
| Equity investments(1) | | | — | | | | — | | | | 5,121 | | | | 5,121 | |
| Money market funds(1)(2) | | | 8 | | | | — | | | | — | | | | 8 | |
| Total assets: | | $ | 8 | | | $ | — | | | $ | 551,878 | | | $ | 551,886 | |
| (1) | Refer to the consolidated schedule of investments for further details. |
| (2) | Incuded in cash and cash equivalents and restricted cash and cash equivalents on the consolidated statements of financial condition. |
The net change in unrealized appreciation (depreciation) for the year ended September 30, 2015 reported within the net change in unrealized appreciation (depreciation) on investments in the Company’s consolidated statement of operations attributable to the Company’s Level 3 assets held as of September 30, 2015 was $2,479.
Golub Capital Investment Corporation and Subsidiaries
Notes to Consolidated Financial Statements
(In thousands, except shares and per share data)
Note 6. Fair Value Measurements – (continued)
The following table presents the changes in investments measured at fair value using Level 3 inputs for the
year ended September 30, 2015:
| | | For the year ended September 30, 2015 | |
| | | Debt | | | Equity | | | Total | |
| | | Investments | | | Investments | | | Investments | |
| Fair value, beginning of period | | $ | — | | | $ | — | | | $ | — | |
| Net change in unrealized appreciation (depreciation) on investments | | | 2,365 | | | | 114 | | | | 2,479 | |
| Realized gain (loss) on investments | | | 42 | | | | — | | | | 42 | |
| Fundings of revolving loans, net | | | 1,038 | | | | — | | | | 1,038 | |
| Fundings of investments | | | 611,255 | | | | 5,007 | | | | 616,262 | |
| PIK interest | | | 35 | | | | — | | | | 35 | |
| Proceeds from principal payments and sales of portfolio investments | | | (68,778 | ) | | | — | | | | (68,778 | ) |
| Accretion of discounts and amortization of premiums | | | 800 | | | | — | | | | 800 | |
| Fair value, end of period | | $ | 546,757 | | | $ | 5,121 | | | $ | 551,878 | |
The following tables present quantitative information about the significant unobservable inputs of the Company’s Level 3 investments as of September 30, 2015:
Quantitative information about Level 3 Fair Value Measurements
| | | Fair value | | | | | | | |
| | | as of | | | | | | | |
| | | September 30, | | | | | | | Range |
| | | 2015 | | | Valuation Techniques | | Unobservable Input | | (Weighted Average) |
| Assets: | | | | | | | | | | |
| Senior secured loans(1)(2) | | $ | 132,847 | | | Market rate approach | | Market interest rate | | 4.0% - 25.3% (6.2%) |
| | | | | | | Market comparable companies | | EBITDA multiples | | 4.0x - 17.5x (11.4x) |
| One stop loans(1)(3) | | $ | 393,384 | | | Market rate approach | | Market interest rate | | 5.5% - 24.0% (7.4%) |
| | | | | | | Market comparable companies | | EBITDA multiples(4) | | 4.5x - 40.0x (11.6x) |
| | | | | | | | | Revenue multiples(4) | | 2.1x - 5.0x (3.0x) |
| Equity securities | | $ | 5,121 | | | Market comparable companies | | EBITDA multiples(5) | | 8.5x - 40.0x (13.5x) |
| | | | | | | | | Revenue multiples(5) | | 2.1x - 5.0x (3.6x) |
| (1) | The fair value of this asset class was determined using the market rate approach as the investments in this asset class were determined not to be credit impaired using the market comparable companies approach. The unobservable inputs for both valuation techniques have been presented, but the fair value as of September 30, 2015 was determined using the market rate approach. |
| (2) | Excludes $20,347 of loans at fair value, which the Company valued using indicative bid and ask prices provided by an independent third party pricing service. |
| (3) | Excludes $179 of non-accrual loans at fair value, which the Company valued on a liquidation basis. |
Golub Capital Investment Corporation and Subsidiaries
Notes to Consolidated Financial Statements
(In thousands, except shares and per share data)
Note 6. Fair Value Measurements – (continued)
| (4) | The Company valued $385,471 and $7,913 of one stop loans using EBITDA and revenue multiples, respectively. All one stop loans were also valued using the market rate approach. |
| (5) | The Company valued $4,977 and $144 of equity securities using EBITDA and revenue multiples, respectively. |
The above tables are not intended to be all-inclusive but rather to provide information on significant unobservable inputs and valuation techniques used by the Company.
The significant unobservable inputs used in the fair value measurement of the Company’s debt and equity investments are EBITDA multiples, revenue multiples and market interest rates. The Company uses EBITDA multiples and, to a lesser extent revenue multiples, on its debt and equity investments to determine any credit gains or losses. Significant increases or decreases in either of these inputs in isolation would result in a significantly lower or higher fair value measurement. The Company uses market interest rates for loans to determine if the effective yield on a loan is commensurate with the market yields for that type of loan. If a loan’s effective yield is significantly less than the market yield for a similar loan with a similar credit profile, then the resulting fair value of the loan may be lower.
Other Financial Assets and Liabilities
ASC Topic 820 requires disclosure of the fair value of financial instruments for which it is practical to estimate such value. As a result, all assets and liabilities approximate fair value on the consolidated statements of financial condition as they have a short maturity or are replaceable on demand.
Note 7. Borrowings
In accordance with the 1940 Act, with certain limited exceptions, the Company is only allowed to borrow amounts such that its asset coverage, as defined in the 1940 Act, is at least 200% after such borrowing. As of September 30, 2015, the Company’s asset coverage for borrowed amounts was 225.0%.
Revolving Credit Facility:On December 31, 2014, as part of the Company’s formation transactions, the Company and GCIC Funding entered into an amendment to the Credit Facility. Through a series of amendments, most recently on September 25, 2015, the Company and GCIC Funding amended the Credit Facility to, among other things, increase the size of the Credit Facility to $370,000. The expiration of the reinvestment period of the Credit Facility is May 12, 2017, during which period GCIC Funding may borrow up to $370,000 at any one time subject to leverage and borrowing base restrictions under the Credit Facility, and the stated maturity date of the Credit Facility is May 13, 2020.
Through the reinvestment period, the Credit Facility bears interest at one-month LIBOR plus 2.25% per annum. After the reinvestment period, the rate will reset to one-month LIBOR plus 2.75% per annum for the remaining term of the Credit Facility. In addition to the stated interest expense on the Credit Facility, the Company is required to pay a non-usage fee rate between 0.50% and 2.00% per annum depending on the size of the unused portion of the Credit Facility.
The Credit Facility is collateralized by all of the assets held by GCIC Funding, and GCIC has pledged its interests in GCIC Funding as collateral to Wells Fargo Bank, N.A., as the collateral agent, under an ancillary agreement to secure the obligations of GCIC as the transferor and servicer under the Credit Facility. Both GCIC and GCIC Funding have made customary representations and warranties and are required to comply with various covenants, reporting requirements and other customary requirements for similar credit facilities. Borrowing under the Credit Facility is subject to the leverage restrictions contained in the 1940 Act.
The Company plans to transfer certain loans and debt securities it has originated or acquired from time to time to GCIC Funding through a purchase and sale agreement and may cause GCIC Funding to originate or acquire loans in the future, consistent with the Company’s investment objectives.
Golub Capital Investment Corporation and Subsidiaries
Notes to Consolidated Financial Statements
(In thousands, except shares and per share data)
Note 7. Borrowings – (continued)
As of September 30, 2015 and September 30, 2014, the Company had outstanding debt under the Credit Facility of $249,700 and $0, respectively. For the year ended September 30, 2015, the Company had borrowings on the Credit Facility of $401,200 and repayments of $196,300.
For the year ended September 30, 2015, the components of interest expense, cash paid for interest, annualized average interest rates and average outstanding balances for the Credit Facility were as follows:
| | | For the year | |
| | | ended | |
| | | September 30, | |
| | | 2015 | |
| Stated interest expense | | $ | 2,914 | |
| Facility fees | | | 249 | |
| Amortization of debt issuance costs | | | 520 | |
| Total interest and other debt financing expenses | | $ | 3,683 | |
| Cash paid for interest expense and facility fees | | $ | 2,994 | |
| Annualized average stated interest rate | | | 2.5 | % |
| Average outstanding balance(1) | | $ | 157,602 | |
| (1) | The average outstanding balance is calculated for the period December 31, 2014, the commencement of operations, through September 30, 2015. |
Revolver:On February 3, 2015, the Company entered into the Revolver with the Investment Adviser, with a maximum credit limit of $40,000 and expiration date of February 3, 2018. The Revolver bears an interest rate equal to the short-term Applicable Federal Rate (“AFR”) which was 0.54% as of September 30, 2015. As of September 30, 2015 and September 30, 2014, the Company had no outstanding debt under the Revolver. For the year ended September 30, 2015, the Company had borrowings on the Revolver of $22,375 and repayments on the Revolver of $22,375, respectfully.
For the year ended September 30, 2015, the components of interest expense, cash paid for interest, annualized average interest rates and average outstanding balances for the Revolver were as follows:
| | | For the year | |
| | | ended | |
| | | September 30, | |
| | | 2015 | |
| Stated interest expense | | $ | 2 | |
| Cash paid for interest expense | | $ | 2 | |
| Annualized average stated interest rate | | | 0.5 | % |
| Average outstanding balance(1) | | $ | 583 | |
| (1) | The average outstanding balance is calculated for the period December 31, 2014, the commencement of operations, through September 30, 2015. |
On December 31, 2014, the Company entered into the $11,820 GEMS Note, which carried a fixed interest rate of 3.25%. The GEMS Note matured and was paid-off in full on March 2, 2015. Total interest expense paid on the note during the year ended September 30, 2015 was $46.
The Company’s average total debt outstanding (including the debt under the Credit Facility, Revolver, and GEMS Note) for the period December 31, 2014, the commencement of operations, through September 30, 2015 was $160,079.
Golub Capital Investment Corporation and Subsidiaries
Notes to Consolidated Financial Statements
(In thousands, except shares and per share data)
Note 7. Borrowings – (continued)
For the year ended September 30, 2015, the effective annualized average interest rate, which includes amortization of debt financing costs and non-usage facility fees, on the Company’s total debt outstanding was 3.1%.
A summary of the Company’s maturity requirements for borrowings as of September 30, 2015 is as follows:
| | | Payments Due by Period | |
| | | | | | Less Than | | | | | | | | | More Than | |
| | | Total | | | 1 Year | | | 1 - 3 Years | | | 3 - 5 Years | | | 5 Years | |
| Credit Facility | | $ | 249,700 | | | $ | — | | | $ | — | | | $ | 249,700 | | | $ | — | |
| Revolver | | | — | | | | — | | | | — | | | | — | | | | — | |
| Total borrowings | | $ | 249,700 | | | $ | — | | | $ | — | | | $ | 249,700 | | | $ | — | |
Note 8. Federal Income Tax Matters
The Company intends to elect to be treated and be subject to tax as a RIC under Subchapter M of the Code. As a result, the Company must distribute substantially all of its respective net taxable income each year as dividends to its stockholders. Accordingly, no provision for federal income tax has been made in the financial statements.
Dividends from net investment income and distributions from net realized capital gains are determined in accordance with U.S. federal tax regulations, which may differ from amounts determined in accordance with GAAP and those differences could be material. These book-to-tax differences are either temporary or permanent in nature. Reclassification due to permanent book-tax differences, including returns of capital, have no impact on net assets.
Taxable income generally differs from net increase (decrease) in net assets resulting from operations for financial reporting purposes due to temporary and permanent differences in the recognition of income and expenses and generally excludes unrealized appreciation (depreciation) on investments as investment gains and losses are not included in taxable income until they are realized.
Capital losses in excess of capital gains earned in a tax year may generally be carried forward and used to offset capital gains, subject to certain limitations. Capital losses incurred by the Company are not subject to expiration and retain their character as either short-term or long-term capital losses. As of September 30, 2015, the Company estimates that it will not have any capital loss carryforward available for use in subsequent tax years.
The following table reconciles net increase in net assets resulting from operations to taxable income for the year ended September 30, 2015:
| | | For the year | |
| | | ended | |
| | | September 30, | |
| | | 2015 | |
| Net increase in net assets resulting from operations | | $ | 13,027 | |
| Net change in unrealized (appreciation) depreciation on investments | | | (2,479 | ) |
| Other income not currently taxable | | | (14 | ) |
| Other income for tax but not book | | | 7 | |
| Other realized gain/loss differences | | | 539 | |
| Taxable income before deductions for distributions | | $ | 11,080 | |
Golub Capital Investment Corporation and Subsidiaries
Notes to Consolidated Financial Statements
(In thousands, except shares and per share data)
Note 8. Federal Income Tax Matters – (continued)
The tax character of distributions paid during the year ended September 30, 2015 were as follows:
| | | For the year | |
| | | ended | |
| | | September 30, | |
| | | 2015 | |
| Ordinary Income | | $ | 8,155 | |
| Long-Term Capital Gains | | | — | |
| Return of Capital | | | — | |
The tax basis components of distributable earnings/(accumulated losses) and reconciliation to accumulated earnings/(deficit) on a book basis for the year ended September 30, 2015 were as follows:
| | | For the year | |
| | | ended | |
| | | September 30, | |
| | | 2015 | |
| Undistributed ordinary income – tax basis | | $ | 2,925 | |
| Net unrealized appreciation (depreciation) on investments | | | 2,027 | |
| Other temporary differences | | | (4,952 | ) |
| Total accumulated earnings (deficit) – book basis | | $ | — | |
As of September 30, 2015, the Federal tax cost of investments was $549,851 resulting in estimated gross unrealized gains and losses of $3,732 and $1,705, respectively.
The differences between the components of distributable earnings on a tax basis and the amounts reflected in the consolidated statements of changes in net assets are primarily due to temporary book-tax differences that will reverse in a subsequent period.
Note 9. Commitments and Contingencies
Commitments:The Company had outstanding commitments to fund investments totaling $58,754 and $0 under various undrawn revolvers and other credit facilities as of September 30, 2015 and September 30, 2014, respectively.
Indemnifications:In the normal course of business, the Company enters into contracts and agreements that contain a variety of representations and warranties that provide general indemnifications. The Company’s maximum exposure under these arrangements is unknown, as these involve future claims that may be made against the Company but that have not occurred. The Company expects the risk of any future obligations under these indemnifications to be remote.
Off-balance sheet risk:Off-balance sheet risk refers to an unrecorded potential liability that may result in a future obligation or loss, even though it does not appear on the consolidated statements of financial condition. The Company may enter into derivative instruments that contain elements of off-balance sheet market and credit risk. Derivative instruments can be affected by market conditions, such as interest rate volatility, which could impact the fair value of the derivative instruments. If market conditions move against the Company, it may not achieve the anticipated benefits of any derivative instruments and may realize a loss. The Company minimizes market risk through monitoring its investments and borrowings.
Concentration of credit and counterparty risk:Credit risk arises primarily from the potential inability of counterparties to perform in accordance with the terms of the contract. The Company may engage in derivative transactions with counterparties. In the event that the counterparties do not fulfill their obligations, the Company may be exposed to risk. The risk of default depends on the creditworthiness of the counterparties or issuers of the instruments. The Company’s maximum loss that it could incur related to
Golub Capital Investment Corporation and Subsidiaries
Notes to Consolidated Financial Statements
(In thousands, except shares and per share data)
Note 9. Commitments and Contingencies – (continued)
counterparty risk on derivative instruments is the value of the collateral for that respective derivative instrument. It is the Company’s policy to review, as necessary, the credit standing of each counterparty.
Legal proceedings:In the normal course of business, the Company may be subject to legal and regulatory proceedings that are generally incidental to its ongoing operations. While there can be no assurance of the ultimate disposition of any such proceedings, the Company does not believe any disposition will have a material adverse effect on the Company’s consolidated financial statements.
Note 10. Financial Highlights
The financial highlights for the Company are as follows:
| | | | | | Period from | |
| | | | | | September 22, | |
| | | | | | 2014 | |
| | | Year ended | | | (inception) to | |
| | | September 30, | | | September 30, | |
| Per share data(1): | | 2015 | | | 2015 | |
| Net asset value at beginning of period | | $ | 15.00 | | | $ | — | |
| Net increase in net assets as a result of the issuance of common stock | | | — | | | | 15.00 | |
| Dividends and distributions declared(2) | | | | | | | | |
| From net investment income | | | (0.76 | ) | | | — | |
| From capital gains | | | — | | | | — | |
| From return of capital | | | (0.13 | ) | | | — | |
| Net investment income | | | 0.76 | | | | — | |
| Net realized gain (loss) on investments | | | — | | | | — | |
| Net change in unrealized appreciation (depreciation) on investments | | | 0.18 | | | | — | |
| Other(3) | | | (0.05 | ) | | | — | |
| Net asset value at end of period | | $ | 15.00 | | | $ | 15.00 | |
| Per share net asset value at end of period | | $ | 15.00 | | | $ | 15.00 | |
| Total return based on net asset value per share | | | 5.93 | % | | | N/A | |
| Shares outstanding at end of period | | | 20,843,155.219 | | | | 666.670 | |
| Ratios/Supplemental Data: | | | | | | | | |
| Ratio of expenses (without incentive fees and management fee waiver) to average net assets* | | | 5.64 | % | | | N/A | |
| Ratio of management fee waiver to average net assets* | | | (0.68 | )% | | | N/A | |
| Ratio of incentive fees to average net assets* | | | 0.80 | % | | | N/A | |
| Ratio of total expenses to average net assets* | | | 5.76 | % | | | N/A | |
| Ratio of net investment income to average net assets* | | | 6.81 | % | | | N/A | |
| Net assets at end of period | | $ | 312,647 | | | $ | 10 | |
| Average debt outstanding | | $ | 160,079 | | | | N/A | |
| Average debt outstanding per share | | $ | 7.68 | | | | N/A | |
| Asset coverage ratio(4) | | | 225.01 | % | | | N/A | |
| Portfolio turnover | | | 18.52 | % | | | N/A | |
| * | Annualized for the period December 31, 2014, the commencement of operations, through September 30, 2015. |
| (1) | Based on actual number of shares outstanding at the end of the corresponding period or the weighted average shares outstanding for the period from December 31, 2014, the commencement of operations, through September 30, 2015, unless otherwise noted, as appropriate. |
Golub Capital Investment Corporation and Subsidiaries
Notes to Consolidated Financial Statements
(In thousands, except shares and per share data)
Note 10. Financial Highlights – (continued)
| (2) | The per share data for dividends and distributions reflect the amount of distributions paid or payable with a record date during the applicable period. |
| (3) | Includes the impact of different share amounts as a result of calculating certain per share data based on weighted average shares outstanding during the period and certain per share data based on the shares outstanding as of the period end. |
| (4) | In accordance with the 1940 Act, with certain limited exceptions, the Company is only allowed to borrow amounts such that its asset coverage, as defined in the 1940 Act, is at least 200% after such borrowing. |
Note 11. Earnings Per Share
The following information sets forth the computation of the net increase in net assets per share resulting from operations for the year ended September 30, 2015:
| | | Year ended | |
| | | September 30, | |
| | | 2015 | |
| Earnings available to stockholders | | $ | 13,027 | |
| Basic and diluted weighted average common shares outstanding(1) | | | 13,767,847 | |
| Basic and diluted earnings per common share | | $ | 0.94 | |
| (1) | The basic and diluted weighted average commons shares outstanding are calculated for the period December 31, 2014, the commencement of operations, through September 30, 2015. |
Note 12. Dividends and Distributions
The Company’s dividends and distributions are recorded on the record date. The following table summarizes the Company’s dividend declarations and distributions during the year ended September 30, 2015:
| | | | | | | | | | | | | | | | DRIP | | | | |
| | | | | Payment | | Shares | | | Amount | | | Cash | | | Shares | | | DRIP Shares | |
| Date Declared | | Record Date | | Date | | Outstanding | | | Per Share | | | Distribution | | | Value | | | Issued | |
| Fiscal year ended September 30, 2015 | | | | | | | | | | | | | | | | | | | | | | | | |
| 02/03/2015 | | 02/04/2015 | | 04/28/2015 | | | 8,404,848.973 | | | $ | 0.0747 | | | $ | 218 | | | $ | 410 | | | | 27,304.503 | |
| 02/03/2015 | | 02/27/2015 | | 04/28/2015 | | | 9,234,461.744 | | | $ | 0.0817 | | | $ | 267 | | | $ | 488 | | | | 32,553.581 | |
| 02/03/2015 | | 03/31/2015 | | 04/28/2015 | | | 10,508,461.744 | | | $ | 0.0936 | | | $ | 352 | | | $ | 632 | | | | 42,174.913 | |
| 02/03/2015 | | 04/30/2015 | | 07/28/2015 | | | 12,758,875.599 | | | $ | 0.1121 | | | $ | 564 | | | $ | 866 | | | | 57,744.875 | |
| 05/11/2015 | | 05/27/2015 | | 07/28/2015 | | | 13,870,595.594 | | | $ | 0.0979 | | | $ | 539 | | | $ | 818 | | | | 54,520.152 | |
| 05/11/2015 | | 06/26/2015 | | 07/28/2015 | | | 15,205,543.534 | | | $ | 0.0949 | | | $ | 581 | | | $ | 862 | | | | 57,463.330 | |
| 05/11/2015 | | 07/24/2015 | | 09/18/2015 | | | 17,690,469.195 | | | $ | 0.0881 | | | $ | 639 | | | $ | 919 | | | | 61,242.723 | |
| 08/04/2015 | | 08/26/2015 | | 11/20/2015 | | | 19,013,506.086 | | | $ | 0.1739 | | | $ | 1,446 | | | $ | 1,861 | | | | N/A | (1) |
| 08/04/2015 | | 09/24/2015 | | 11/20/2015 | | | 20,843,155.219 | | | $ | 0.0751 | | | $ | 683 | | | $ | 882 | | | | N/A | (1) |
| (1) | The DRIP shares were not issued as of September 30, 2015. |
Note 13. Subsequent Events
In preparing these financial statements, the Company has evaluated events and transactions for potential recognition or disclosure through November 25, 2015, the date the financial statements were available to be issued. There are no subsequent events to disclose except for the following:
On October 1, 2015 and November 1, 2015, the Company received additional stockholder capital subscriptions totaling $56.1 million.
Golub Capital Investment Corporation and Subsidiaries
Notes to Consolidated Financial Statements
(In thousands, except shares and per share data)
Note 13. Subsequent Events – (continued)
On October 21, 2015, GCIC SLF commenced operations and entered into a senior secured revolving credit facility (“GCIC SLF Credit Facility”) with Wells Fargo Bank, N.A., through its wholly-owned subsidiary GCIC Senior Loan Fund II LLC (“GCIC SLF II”), which allowed GCIC SLF II to borrow up to $150,000 at any one time outstanding, subject to leverage and borrowing base restrictions. On October 28, 2015, the Company and RGA funded $32,288 and $4,613, respectively, of their $87,500 and $12,500 subordinated note commitments, respectively, and contributed $3,587 and $512, respectively, of their $21,875 and $3,125 LLC equity interest subscriptions, respectively.
Through November 25, 2015, the Company sold $70,844 of investments and unfunded commitments to GCIC SLF at fair value.
The Company issued capital calls to stockholders that were due on November 6, 2015 which is summarized in the following table:
| | | | | Shares | | | NAV ($) | | | | |
| | | Date | | Issued | | | per share | | | Proceeds | |
| Issuance of shares | | 11/06/15 | | | 1,329,458.533 | | | $ | 15.00 | | | $ | 19,942 | |
On November 20, 2015, the Company issued 182,861.440 shares to the stockholders participating in the DRIP.
Note 14. Selected Quarterly Financial Data (Unaudited)
| | | September 30, | | | June 30, | | | March 31, | | | December 31, | |
| | | 2015 | | | 2015 | | | 2015 | | | 2014 | |
| Total investment income | | $ | 8,973 | | | $ | 6,339 | | | $ | 4,089 | | | | N/A | |
| Net investment income | | | 4,852 | | | | 3,436 | | | | 2,218 | | | | N/A | |
| Net gain (loss) on investments | | | 1,578 | | | | 794 | | | | 149 | | | | N/A | |
| Net increase (decrease) in net assets resulting from operations | | | 6,430 | | | | 4,230 | | | | 2,367 | | | | N/A | |
| Earnings per share | | | 0.35 | | | | 0.32 | | | | 0.27 | | | | N/A | |
| Net asset value per common share at period end | | $ | 15.00 | | | $ | 15.00 | | | $ | 15.00 | | | $ | 15.00 | |