UNITED STATES
SECURITIES AND EXCHANGE COMMISSION
WASHINGTON, D.C. 20549
FORM N-CSR
CERTIFIED SHAREHOLDER REPORT OF REGISTERED
MANAGEMENT INVESTMENT COMPANIES
811-23016
(Investment Company Act file number)
Alternative Credit Income Fund
(Exact name of registrant as specified in charter)
650 Madison Avenue, 23rd Floor
New York, NY 10022
(Address of principal executive offices)
The Corporation Trust Company
Corporation Trust Center, 1209 Orange Street
Wilmington, DE 19801
(Name and address of agent for service)
Copy to:
JoAnn M. Strasser Thompson Hine LLP 41 South High Street, 17th Floor Columbus, OH 43215 (614) 469-3265 | Edward Goldthorpe Alternative Credit Income Fund 650 Madison Avenue, 23rd Floor New York, NY 10022 (212) 891-2880 |
Registrant's telephone number, including area code: (212) 891-2880
Date of fiscal year end: September 30
Date of reporting period: October 1, 2021 - March 31, 2022
Item 1. Reports to Stockholders.
(a)

TABLE OF CONTENTS
| Shareholder Letter | 1 |
| Portfolio Update | 4 |
| Consolidated Schedule of Investments | 6 |
| Consolidated Statement of Assets and Liabilities | 11 |
| Consolidated Statement of Operations | 12 |
| Consolidated Statements of Changes in Net Assets | 13 |
| Consolidated Statement of Cash Flows | 15 |
| Financial Highlights | |
| Class A | 16 |
| Class C | 17 |
| Class W | 18 |
| Class I | 19 |
| Class L | 20 |
| Notes to Consolidated Financial Statements | 22 |
| Additional Information | 32 |
| Privacy Notice | 33 |
| Alternative Credit Income Fund | Shareholder Letter |
| | March 31, 2022 (Unaudited) |
Dear Shareholders:
We are pleased to share detailed performance of the Alternative Credit Income Fund (the “Fund”), for the semi-annual period ended March 31, 2022.
The Fund1 posted a return of 2.43% during the six-month period as strength across the portfolio propelled continued outperformance relative to fixed income benchmarks, including the Barclay’s U.S. Aggregate Total Return Value Index2 (-5.92% in the six-months ended 3/31/2022), the S&P/LSTA Leveraged Loan Total Return Index3 (+0.64% in the six-months ended 3/31/2022) and the Bank of America High Yield Index (-3.89% in the six-months ended 3/31/2022)4.
We view this reporting period as noteworthy given the dramatic shift in the investment backdrop during the time period. First, at the end of last year, the U.S. Federal Reserve signaled the end of the wildly accommodative monetary policy that has defined the post-COVID era. Consistent with its hawkish tilt, in March 2022, the Fed raised interest rates by 25 basis points5 and ended the asset purchases that had boosted market liquidity. The reversing of gears by the Fed (and many other global central banks) weighed on long duration assets, particularly traditional fixed income.
For many Americans, inflation has migrated from an abstract concept to a painful pocketbook reality, punctuated by the eye-popping CPI or Consumer Price Index (a widely used measure of inflation) reading of 8.5% in March. “Sticker shock” and diminished purchasing power have further muted investor sentiment.
Last, events in Europe have introduced a degree of geopolitical uncertainty not seen in generations. The Cuban-Missile Crisis provides, in our view, the best historical analog to the tail-risk currently looming over the market. Put plainly: there is a non-zero chance of a calamitous outcome. While markets are clearly titled towards a peaceful resolution, this uncertainty has subdued risk appetite.
These myriad market challenges have plunged many (if not most) fixed income funds “into the red” during the period—particularly fixed income mutual funds and ETFs. The Alternative Credit Income Fund has nevertheless remained solidly positive. We highlight this dynamic not to “spike the football” on performance. Instead, we hope to underscore the importance of active management and private credit solutions amid a shifting market backdrop.
Fund Performance
During the six months ended March 31, 2022, the Fund1 posted a gain of 2.43%.
Repeating a familiar refrain from these letters, we encourage our shareholders to view performance through a long-term lens. Viewing returns in short time periods (even annually), can breed myopic investment thinking, which the Fund consciously avoids. We do not pursue fleeting returns chasing trading fades (e.g. SPACs), but, instead seek to compound long-term returns investing in underserved and overlooked segments of the corporate credit market.
Since our first investment on October 27, 2015 through the end of March 2022, the Fund has generated a compound annualized return of 8.29%, which outpaces the Barclay’s U.S. Aggregate Total Return Value Index2 (+2.02%), the S&P/LSTA Leveraged Loan Total Return Index3 (+4.53%) and the Bank of America High Yield Index (+5.81%)4.
Furthermore, during the six-month period ended calendar 1Q 2022, the Alternative Credit Income Fund also achieved the top-performance among competing corporate credit interval funds, as highlighted in the press release link below:
https://www.prnewswire.com/news-releases/alternative-credit-income-fund-rciix-ends-year-with-top-performing-fund-301473221.html?tc=eml_cleartime
For the fiscal 1H 2022, the Fund’s Public Credit segment (predominately publicly traded BDCs) increased 7.2%. Notable gainers in the period include Trinity Capital (ticker: TRIN), whose shares climbed 26.0% helped by robust deal pipeline.
Direct Credit (the Fund’s investments in public and private bonds, loans and structured credit) also posted strong returns in the period. We would call out performance of Whiting Petroleum (ticker: WLL), which gained +40.1%, for particular attention.
Investors may recall that the Fund owned convertible bonds of Whiting Petroleum, which sought bankruptcy protection at the peak of COVID in April 2020. We believed the market significantly undervalued Whiting’s assets (both pre-and post-pandemic) so we held firm to our convictions and our position, despite the market noise. With the surge in WLL in recent months, our investors have earned a significant return on our initial Whiting investment.
| Semi-Annual Report | March 31, 2022 | 1 |
| Alternative Credit Income Fund | Shareholder Letter |
| | March 31, 2022 (Unaudited) |
We highlight Whiting’s performance to underscore that the Alternative Credit Income Fund is structured to help our investor ride through—and ultimately benefit from—inevitable market storms.
Detractors in the period largely comprised supply chain impacted businesses, including loans of 8th Avenue Food & Provisions and bonds of Magic Mergco MIK (dba Michael’s Stores).
Positioning
We believe we have positioned the Fund to capitalize on the current challenging credit backdrop.
The Fund began positing itself for post-COVID inflation beginning in the summer of 2020. Today, the Alternative Credit Income Fund maintains a roughly 65% allocation to floating rate credit, which we believe will benefit our shareholders as the Fed attempts to normalize interest rates.
We strive to invest ahead of the curve—both literally and figuratively. Should the Fed succeed in aggressively hiking rates in 2022, the Alternative Credit Income Fund may begin shifting the portfolio into fixed rate assets at the end of the year. To be clear, the Fund does not “bet” on interest rates. Instead, the Alternative Credit Income Fund is actively managing its portfolio to account for the ever-shifting rate backdrop.
The Fund ended the period with roughly 10% of its assets invested in Public Credit. BDCs have remained resilient despite turbulence in the broader market this year. With limited international exposure and floating rate assets, BDCs have avoided some of the markets’ biggest headwinds of 2022.
Importantly, Business Development Company (BDC) portfolio defaults and stress ratios are significantly below long-term averages, which suggests a prolonged environment of limited credit loss. We would lastly highlight recent bipartisan support in Congress to potentially amend acquired fund fees & expenses treatment (“AFFE”) as part of the Jobs Act 4.0, which could bring meaningful structural change to the BDC market.
Within Direct Credit, private deals comprised roughly 30% of the portfolio at the end of fiscal 1H 2022. Shareholders are already seeing the benefit of these proprietary deals, in our view. For the twelve months through March 31, 2022, the Fund has generated a Sharpe Ratio of 2.8 compared to 0.7 for the S&P/LSTA Leveraged Loan, underscoring a further reduction of our already-low volatility.
Public markets have experienced meaningful rate-induced weakness to begin the year. While we are seeing more opportunities (as more bonds/loans trade down to our “wish list” price), we have continued to allocate to private credit. However, we continue to manage the Fund with zero-leverage, which will provide significant dry powder should the market volatility accelerate.
Conclusion
We endeavor to continue delivering on the Fund’s core mission. Since 2015, the Fund has generated above market yields and above market returns by investing across the corporate credit market.
We are humbly proud of what we have achieved thus far. Nevertheless, with the expanded investment capabilities of the BC Partners platform, we are more excited about the Fund’s future.
We thank you for your continued support.
Regards,
Michael Terwilliger, CFA
Portfolio Manager*
Alternative Credit Income Fund
| Alternative Credit Income Fund | Shareholder Letter |
| March 31, 2022 (Unaudited) |
| * | Effective October, 31, 2020, Sierra Crest Investment Management LLC (“Sierra Crest”) replaced Resource Alternative Advisor, LLC (“Resource”) as the Fund’s investment adviser. Michael Terwilliger has joined Sierra Crest as a portfolio manager to the Fund. |
| 1 | Fund performance refers to that of Class I. Unless otherwise stated, all performance figures provided are for the six-month period ended March 31, 2022. Past performance is not indicative of future results. The investment return and principal value of an investment will fluctuate. An investor’s shares when redeemed, may be worth more or less than the original cost. Total return is calculated assuming reinvestment of all dividends and distributions. Performance figures for periods less than one year are not annualized. For performance information current to the most recent month-end, please call toll-free 1-833-404-4103. |
The Adviser and the Fund have entered into an Expense Limitation Agreement under which the Adviser has agreed, until at least January 31, 2023 to waive its management fees (excluding any incentive fee) and to pay or absorb the ordinary annual operating expenses of the Fund (excluding interest, brokerage commissions, acquired fund fees and expenses and extraordinary expenses), to the extent that its management fees plus the Fund’s ordinary annual operating expenses exceed 2.34% per annum of the Fund’s average daily net assets attributable to Class I shares. Such Expense Limitation Agreement may not be terminated by the Adviser, but it may be terminated by the Board of Trustees, upon 60 days written notice to the Adviser. Any waiver or reimbursement by the Adviser is subject to repayment by the Fund within the three (3) years from the date the Adviser (or the previous investment adviser) waived any payment or reimbursed any expense, if the Fund is able to make the repayment without exceeding the lesser of the expense limitation in place at the time of the waiver or the current expense limitation and the repayment is approved by the Board of Trustees. See “Management of the Fund.”
| 2 | Barclays U.S. Aggregate Total Return Value Index - The Barclays U.S. Aggregate Total Return Value Index is a broad-based flagship benchmark that measures the investment grade, U.S. dollar-denominated, fixed-rate taxable bond market. The index includes Treasuries, government-related and corporate securities, MBS (agency fixed-rate and hybrid ARM pass-throughs), ABS and CMBS (agency and non-agency). Investors cannot invest directly in an index. |
| 3 | S&P/LSTA Leveraged Loan Total Return Index - The S&P/LSTA Leveraged Loan Index is a market value-weighted index designed to measure the performance of the U.S. leveraged loan market based upon market weightings, spreads and interest payments. Investors cannot invest directly in an index. |
| 4 | ICE BofA U.S. High Yield Index – The ICE BofA U.S. High Yield Index tracks the performance of US dollar denominated below investment grade corporate debt publicly issued in the U.S. domestic market. Investors cannot invest directly in an index. |
| 5 | Basis points are a common unit of measurement for interest rates. One basis point is equal to 1/100th of 1% or 0.01%. |
| Semi-Annual Report | March 31, 2022 | 3 |
| Alternative Credit Income Fund | Portfolio Update |
March 31, 2022 (Unaudited)
The Fund’s performance figures for the periods ended March 31, 2022, compared to its benchmark:
| Alternative Credit Income Fund | 1 Month | Quarter | 6 Month | YTD | 1 Year | 3 Year | 5 Year | Since Inception* | Inception |
| Class A Shares - Without Load | 0.78% | 1.05% | 1.56% | 1.05% | 7.63% | 7.47% | 6.56% | 7.36% | 4/17/2015 |
| Class A Shares - With Load | -5.01% | -4.76% | -4.31% | -4.76% | 1.43% | 5.38% | 5.31% | 6.32% | 4/17/2015 |
| Class C Shares - Without Load | 0.78% | 0.87% | 1.29% | 0.87% | 6.80% | 6.69% | 5.76% | 6.84% | 4/17/2015 |
| Class C Shares - With Load(a) | -1.72% | -1.63% | -1.20% | -1.63% | 4.18% | 6.14% | 5.44% | 6.61% | 4/17/2015 |
| Class W Shares - Without Load | 0.78% | 0.96% | 1.56% | 0.96% | 7.53% | 7.47% | 6.56% | 7.29% | 4/17/2015 |
| Class I Shares - Without Load | 0.84% | 1.03% | 1.69% | 1.03% | 7.90% | 7.75% | 6.82% | 7.61% | 4/17/2015 |
| Class L Shares - Without Load | 0.80% | 0.99% | 1.52% | 0.99% | 7.36% | 7.23% | 0.00% | 6.30% | 7/28/2017 |
| Class L Shares - With Load | -3.50% | -3.33% | -2.78% | -3.33% | 2.79% | 5.70% | 0.00% | 5.31% | 7/28/2017 |
| S&P/LSTA Leverage Loan Index | 0.05% | -0.10% | 0.64% | -0.10% | 3.25% | 4.22% | 4.01% | 3.97% | 4/17/2015 |
| (a) | Effective as of December 23, 2016, Class C shares no longer have a sales charge. |
The S&P/LSTA Leveraged Loan Index is a market value-weighted index designed to measure the performance of the U.S. leveraged loan market based upon market weightings, spreads and interest payments. Investors cannot invest directly in an index.
Past performance is not indicative of future results. The investment return and principal value of an investment will fluctuate. An investor’s shares when redeemed, may be worth more or less than the original cost. Total return is calculated assuming reinvestment of all dividends and distributions. Performance figures for periods less than one year are not annualized. As of the Fund’s most recent prospectus dated January 28, 2022, the Fund’s total annual operating expenses, including acquired fund fees and expenses, before fee waivers is 5.23% for Class A, 5.98% for Class C, 5.21% for Class W, 4.98% for Class I and 5.50% for Class L shares. After fee waivers, the Fund’s total annual operating expense is 5.04% for Class A, 5.79% for Class C, 5.04% for Class W, 4.79% for Class I and 5.28% for Class L shares. Class A shares are subject to maximum sales loads of 5.75% imposed on purchases. Class L shares are subject to a maximum sales load of 4.25% imposed on purchases. Share repurchases within 365 days may be subject to an early withdrawal charge of 0.50% for Class A and 1.00% for Class C shares. For performance information current to the most recent month-end, please call toll-free 1-833-404-4103.
| Alternative Credit Income Fund | Portfolio Update |
March 31, 2022 (Unaudited)
Comparison of the Change in Value of a $10,000 Investment
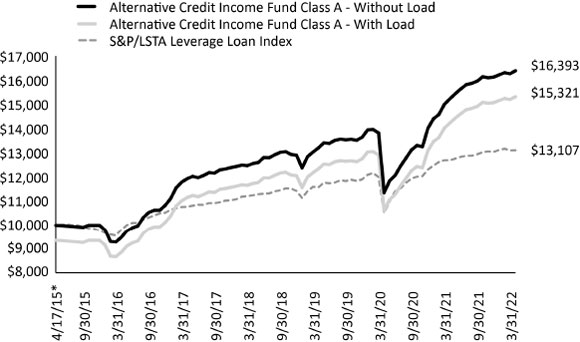
| * | Commencement of operations for Class A Shares. |
Consolidated Portfolio Composition as of March 31, 2022
| Asset Type | Percent of Net Assets |
| Bank Loans | 36.89% |
| Private Investment Funds | 25.36% |
| Common Equity | 13.84% |
| Short-Term Investments | 5.99% |
| Corporate Bonds | 5.47% |
| Preferred Stock | 4.92% |
| Asset Backed Securities | 4.72% |
| Convertible Corporate Bonds | 1.15% |
| Warrants | 0.38% |
| Total Investments | 98.72% |
| Other Assets in Excess of Liabilities | 1.28% |
| Net Assets | 100.00% |
Please see the Consolidated Schedule of Investments for a detailed listing of the Fund’s holdings.
| Semi-Annual Report | March 31, 2022 | 5 |
| Alternative Credit Income Fund | Consolidated Schedule of Investments |
March 31, 2022 (Unaudited)
| | | Coupon | | | Reference Rate & Spread | | Maturity | | | Principal | | | Value | |
BANK LOANS (36.89%)(a) | | | | | | | | | | | | |
Consumer Discretionary (4.04%) | | | | | | | | | | | | |
| Arrow Purchaser, Inc., First Lien Initial Term Loan(b) | | | 7.75 | % | | 3M US L + 6.75%, 1.00% Floor | | | 04/19/2026 | | | $ | 2,916,667 | | | $ | 2,879,917 | |
| Lucky Bucks Holdings LLC(b)(e) | | | 12.50 | % | | N/A | | | 05/29/2028 | | | | 8,000,000 | | | | 7,792,800 | |
| | | | | | | | | | | | | | | | | | 10,672,717 | |
Consumer Staples (3.61%) | | | | | | | | | | | | | | | | |
| 8th Avenue Food & Provisions, Inc., Second Lien Term Loan | | | 7.84 | % | | 3M US L + 7.84% | | | 10/01/2026 | | | | 2,500,000 | | | | 2,275,000 | |
| BrightPet, First Lien Term Loan(b) | | | 7.25 | % | | 3M US L + 6.25%, 1.00% Floor | | | 10/05/2026 | | | | 1,980,000 | | | | 1,961,586 | |
| BrightPet, Delayed Draw Term Loan(b)(c)(d) | | | – | | | 3M US L + 6.25%, 1.00% Floor | | | 10/05/2026 | | | | – | | | | (10,700 | ) |
| BrightPet, Revolver(b)(c)(d) | | | 7.25 | % | | 3M US L + 6.25%, 1.00% Floor | | | 10/05/2026 | | | | 431,250 | | | | 427,975 | |
| Florida Food Products LLC, Second Lien Term Loan(b) | | | 8.75 | % | | 1M US L + 8.00%, 0.75% Floor | | | 10/08/2029 | | | | 5,000,000 | | | | 4,887,500 | |
| | | | | | | | | | | | | | | | | | 9,541,361 | |
Financials (3.30%) | | | | | | | | | | | | | | | | | | |
| H-CA II, LLC, First Lien Term Loan(b)(e) | | | 19.00 | % | | N/A | | | 02/17/2024 | | | | 2,000,000 | | | | 2,000,000 | |
| Marble Point A&R, First Lien Term Loan(b) | | | 7.00 | % | | 3M US L + 6.00%, 1.00% Floor | | | 08/11/2028 | | | | 3,850,000 | | | | 3,784,165 | |
| Marble Point A&R, Delayed Draw Term Loan(b) | | | 7.00 | % | | 3M US L + 6.00%, 1.00% Floor | | | 08/11/2028 | | | | 995,417 | | | | 978,395 | |
| South Street Securities Holdings, Inc., First Lien Term Loan(b) | | | 9.00 | % | | 3M US L + 8.00%, 1.00% Floor | | | 03/24/2026 | | | | 1,986,667 | | | | 1,944,946 | |
| | | | | | | | | | | | | | | | | | 8,707,506 | |
Health Care (6.30%) | | | | | | | | | | | | | | | | | | |
| American Academy Holdings, LLC, Second Lien Term Loan(b)(e) | | | 14.50 | % | | N/A | | | 03/01/2028 | | | | 2,830,189 | | | | 2,746,415 | |
| American Academy Holdings, LLC, First Lien Term Loan(b) | | | 12.00 | % | | 3M US L + 11.00% | | | 01/01/2025 | | | | 1,808,176 | | | | 1,790,637 | |
| American Academy Holdings, LLC, Delayed Draw Term Loan(b)(c)(d) | | | 12.00 | % | | 3M US L + 11.00% | | | 01/01/2025 | | | | 40,182 | | | | 39,889 | |
| Upstream Rehabilitation, Inc., Second Lien Term Loan | | | 8.96 | % | | 1M US L + 8.50% | | | 11/20/2027 | | | | 7,500,000 | | | | 7,425,000 | |
| Viant Medical Holdings, Inc., Second Lien Initial Term Loan | | | 8.21 | % | | 1M US L + 7.75% | | | 07/02/2026 | | | | 5,000,000 | | | | 4,641,650 | |
| | | | | | | | | | | | | | | | | | 16,643,591 | |
Industrials (5.66%) | | | | | | | | | | | | | | | | | | |
| Accordion Partners, LLC, First Lien Term Loan(b) | | | 6.50 | % | | 3M US L + 5.50%, 1.00% Floor | | | 09/24/2027 | | | | 3,990,000 | | | | 3,940,923 | |
| Accordion Partners, LLC, Delayed Draw Term Loan(b)(c)(d) | | | – | | | 3M US L + 5.50%, 1.00% Floor | | | 09/24/2027 | | | | – | | | | (4,800 | ) |
| Accurate Background, LLC, First Lien Term Loan(b) | | | 7.00 | % | | 3M US L + 6.00%, 1.00% Floor | | | 03/26/2027 | | | | 2,992,386 | | | | 2,857,728 | |
| Jazz Acquisition, Inc., Second Lien Term Loan | | | 8.46 | % | | 1M US L + 8.00% | | | 06/18/2027 | | | | 4,000,000 | | | | 3,668,560 | |
| Restaurant Technologies, Inc., Second Lien Initial Term Loan | | | 6.71 | % | | 3M US L + 6.50% | | | 10/01/2026 | | | | 4,500,000 | | | | 4,483,125 | |
| | | | | | | | | | | | | | | | | | 14,945,536 | |
Information Technology (13.98%) | | | | | | | | | | | | | | | |
| Ancile Solutions, Inc., First Lien Term Loan(b)(e) | | | 11.00 | % | | 3M US L + 7.00%, 3.00% PIK%, 1.00% Floor | | | 06/30/2026 | | | | 4,044,210 | | | | 3,963,730 | |
| DCert Buyer, Inc. First Amendment Term Loan Refinancing, Second Lien Term Loan | | | 7.46 | % | | 1M US L + 7.00% | | | 02/19/2029 | | | | 3,600,000 | | | | 3,567,744 | |
See Notes to Consolidated Financial Statements.
| Alternative Credit Income Fund | Consolidated Schedule of Investments |
March 31, 2022 (Unaudited)
| | | Coupon | | | Reference Rate & Spread | | Maturity | | | Principal | | | Value | |
| EagleView Technology Corp., Second Lien Term Loan | | | 8.50 | % | | 3M US L + 7.50%, 1.00% Floor | | | 08/14/2026 | | | $ | 1,495,652 | | | $ | 1,465,739 | |
| LANDesk Software, Second Lien Term Loan | | | 7.75 | % | | 3M US L + 7.25%, 0.50% Floor | | | 12/01/2028 | | | | 4,000,000 | | | | 3,960,000 | |
| Monotype Imaging Holdings, Inc., First Lien Term Loan | | | 6.00 | % | | 3M US L + 5.00%, 0.75% Floor | | | 10/11/2026 | | | | 2,936,391 | | | | 2,938,241 | |
| Newscycle Solutions, First Lien Term Loan(b) | | | 8.00 | % | | 3M US L + 7.00%, 1.00% Floor | | | 12/29/2022 | | | | 1,420,767 | | | | 1,413,663 | |
| Newscycle Solutions(b) | | | 8.00 | % | | 3M US L + 7.00%, 1.00% Floor | | | 12/29/2022 | | | | 157,216 | | | | 155,644 | |
| Newscycle Solutions, Delayed Draw Term Loan(b) | | | 8.00 | % | | 3M US L + 7.00%, 1.00% Floor | | | 12/29/2022 | | | | 1,508,090 | | | | 1,500,549 | |
| Redstone HoldCo 2 LP, Second Lien Initial Term Loan | | | 8.50 | % | | 3M US L + 7.75%, 0.75% Floor | | | 04/27/2029 | | | | 5,000,000 | | | | 4,603,125 | |
| Secure Acquisition, Inc., Second Lien Term Loan(b) | | | 8.50 | % | | 3M US L + 7.75%, 0.75% Floor | | | 12/14/2029 | | | | 5,000,000 | | | | 4,887,500 | |
| Spectrio, First Lien Delayed Draw Term Loan(b) | | | 7.00 | % | | 1M US L + 6.00%, 1.00% Floor | | | 12/09/2026 | | | | 1,176,470 | | | | 1,196,602 | |
| Spectrio, First Lien Term Loan(b) | | | 7.00 | % | | 1M US L + 6.00%, 1.00% Floor | | | 12/09/2026 | | | | 2,795,365 | | | | 2,792,569 | |
| Virgin Pulse, Inc., First Lien Initial Term Loan(b) | | | 8.00 | % | | 1M US L + 7.25%, 0.75% Floor | | | 04/06/2029 | | | | 4,500,000 | | | | 4,455,900 | |
| | | | | | | | | | | | | | | | | | 36,901,006 | |
| TOTAL BANK LOANS | | | | | | | | | | | | | | | | | | |
| (Cost $98,106,242) | | | | | | | | | | | | | | | | | 97,411,717 | |
| | | | | | | | | | | | | | | | | | | |
BONDS & NOTES (11.34%) | | | | | | | | | | | | | | | |
ASSET BACKED SECURITIES (4.72%)(a) | | | | | | | | | | | | | | | |
| Canyon Capital CLO 2014-1, Ltd., Class ER(f) | | | 8.00 | % | | 3M US L + 7.70% | | | 01/30/2031 | | | | 1,000,000 | | | | 840,840 | |
| Jamestown CLO V, Ltd., Class F(f) | | | 6.09 | % | | 3M US L + 5.85% | | | 01/17/2027 | | | | 1,591,770 | | | | 272,922 | |
| JMP Credit Advisors CLO IV, Ltd., Class JSUB(b) | | | 17.42 | % | | N/A | | | 07/17/2029 | | | | 4,836,540 | | | | 1,983,465 | |
| JMP Credit Advisors CLO V, Ltd., Class JSUB(b) | | | 20.70 | % | | N/A | | | 07/17/2030 | | | | 4,486,426 | | | | 2,428,951 | |
| OCP CLO 2013-4, Ltd., Class DR(f) | | | 7.03 | % | | 3M US L + 6.77% | | | 04/24/2029 | | | | 1,000,000 | | | | 990,200 | |
| Octagon Investment Partners 36, Ltd., Class F(f) | | | 7.99 | % | | 3M US L + 7.75% | | | 04/15/2031 | | | | 1,000,000 | | | | 903,282 | |
| Octagon Investment Partners XIV, Ltd., Class ER(f) | | | 8.59 | % | | 3M US L + 8.35% | | | 07/15/2029 | | | | 2,132,000 | | | | 1,870,003 | |
| Saranac CLO VII, Ltd., Class ER(f) | | | 7.20 | % | | 3M US L + 6.72% | | | 11/20/2029 | | | | 500,000 | | | | 418,014 | |
| Tralee CLO II, Ltd., Class ER(f) | | | 8.10 | % | | 3M US L + 7.85% | | | 07/20/2029 | | | | 1,000,000 | | | | 988,612 | |
| Tralee CLO II, Ltd., Class FR(f) | | | 9.10 | % | | 3M US L + 8.85% | | | 07/20/2029 | | | | 1,000,000 | | | | 939,198 | |
| Voya CLO 2014-2, Ltd., Class ER(f) | | | 7.94 | % | | 3M US L + 7.70% | | | 04/17/2030 | | | | 1,000,000 | | | | 832,123 | |
| | | | | | | | | | | | | | | | | | 12,467,610 | |
CONVERTIBLE CORPORATE BONDS (1.15%) | | | | | | | | | | | | | | | |
Industrials (1.15%) | | | | | | | | | | | | | | | | | | |
| Scorpio Tankers, Inc. | | | 3.000 | % | | N/A | | | 05/15/2022 | | | | 3,025,000 | | | | 3,032,543 | |
| | | | | | | | | | | | | | | | | | | |
CORPORATE BONDS (5.47%) | | | | | | | | | | | | | | | |
Consumer Discretionary (1.47%) | | | | | | | | | | | | | | | |
| Michaels Cos., Inc.(f) | | | 7.875 | % | | N/A | | | 05/01/2029 | | | | 4,000,000 | | | | 3,429,980 | |
| Monitronics - Escrow(b) | | | – | | | N/A | | | 12/31/2049 | | | | 2,650,000 | | | | – | |
| Real Hero Merger Sub 2, Inc.(f) | | | 6.250 | % | | N/A | | | 02/01/2029 | | | | 500,000 | | | | 456,555 | |
| | | | | | | | | | | | | | | | | | 3,886,535 | |
Consumer Staples (2.91%) | | | | | | | | | | | | | | | | | | |
| H-Food Holdings LLC / Hearthside Finance Co., Inc.(f) | | | 8.500 | % | | N/A | | | 06/01/2026 | | | | 7,978,000 | | | | 7,679,503 | |
See Notes to Consolidated Financial Statements.
| Semi-Annual Report | March 31, 2022 | 7 |
| Alternative Credit Income Fund | Consolidated Schedule of Investments |
March 31, 2022 (Unaudited)
| | | Coupon | | | Reference Rate & Spread | | Maturity | | | Principal | | | Value | |
| CORPORATE BONDS (continued) | | | | | | | | | | | | | | | | | | |
| Industrials (1.09%) | | | | | | | | | | | | | | | | | | |
| New Enterprise Stone & Lime Co., Inc.(f) | | | 9.750 | % | | N/A | | | 07/15/2028 | | | $ | 1,000,000 | | | $ | 1,009,850 | |
| Wolverine Escrow LLC(f) | | | 13.125 | % | | N/A | | | 11/15/2027 | | | | 4,636,000 | | | | 1,877,580 | |
| | | | | | | | | | | | | | | | | | 2,887,430 | |
| TOTAL BONDS & NOTES | | | | | | | | | | | | | | | | | | |
| (Cost $35,450,967) | | | | | | | | | | | | | | | | | 29,953,621 | |
| | | Shares | | | Value | |
| COMMON EQUITY (13.84%) | | | | | | | | |
| Consumer Discretionary (0.60%) | | | | | | | | |
| CEC Entertainment, Inc.(g) | | | 79,564 | | | | 1,578,033 | |
| | | | | | | | | |
| Diversified (10.07%) | | | | | | | | |
| Apollo Investment Corp. | | | 106,332 | | | | 1,405,709 | |
| Ares Capital Corp. | | | 214,423 | | | | 4,492,162 | |
| FS KKR Capital Corp. | | | 165,246 | | | | 3,770,914 | |
| PennantPark Floating Rate Capital Ltd. | | | 303,163 | | | | 4,095,732 | |
| Portman Ridge Finance Corp. | | | 25,504 | | | | 616,687 | |
| SLR Investment Corp. | | | 265,211 | | | | 4,808,275 | |
| Trinity Capital, Inc. | | | 100,000 | | | | 1,931,000 | |
| WhiteHorse Finance, Inc. | | | 363,028 | | | | 5,474,462 | |
| | | | | | | | 26,594,941 | |
| Energy (1.20%) | | | | | | | | |
| Whiting Petroleum Corp. | | | 39,046 | | | | 3,182,639 | |
| | | | | | | | | |
| Real Estate (1.97%) | | | | | | | | |
| Copper Property Trust(g) | | | 319,520 | | | | 5,192,200 | |
| | | | | | | | | |
| TOTAL COMMON EQUITY | | | | | | | | |
| (Cost $29,744,870) | | | | | | | 36,547,813 | |
| | | | | | Shares | | | Value | |
| PREFERRED STOCK (4.92%) | | | | | | | | | | | | |
| Consumer Discretionary (1.84%) | | | | | | | | | | | | |
| Pennfoster(b)(g) | | | 10.750 | % | | | 4,959,647 | | | | 4,866,405 | |
| | | | | | | | | | | | | |
| Diversified (2.38%) | | | | | | | | | | | | |
| Trinity Capital, Inc. | | | 7.000 | % | | | 240,000 | | | | 6,270,000 | |
| | | | | | | | | | | | | |
| Financials (0.70%) | | | | | | | | | | | | |
| Maiden Holdings North America, Ltd. | | | 7.750 | % | | | 88,000 | | | | 1,847,120 | |
| | | | | | | | | | | | | |
| TOTAL PREFERRED STOCK | | | | | | | | | | | | |
| (Cost $12,861,860) | | | | | | | | | | | 12,983,525 | |
| | | Shares | | | Value | |
| PRIVATE INVESTMENT FUNDS (25.36%) | | | | | | | | |
| BlackRock Global Credit Opportunities Fund, LP(c)(d)(h) | | | | | | | 16,029,163 | |
| CVC European Mid-Market Solutions Fund(c)(d)(h) | | | | | | | 14,939,033 | |
| GSO Credit Alpha Fund II LP(c)(d)(h) | | | | | | | 7,737,627 | |
| Monroe Capital Private Credit Fund III LP(c)(d)(h) | | | | | | | 8,837,746 | |
See Notes to Consolidated Financial Statements.
| Alternative Credit Income Fund | Consolidated Schedule of Investments |
March 31, 2022 (Unaudited)
| | | Shares | | | Value | |
| PRIVATE INVESTMENT FUNDS (25.36%) (continued) | | | | | | | | |
| Tree Line Credit Strategies LP(c)(h) | | | | | | $ | 19,422,385 | |
| | | | | | | | | |
| TOTAL PRIVATE INVESTMENT FUNDS | | | | | | | | |
| (Cost $64,405,971) | | | | | | | 66,965,954 | |
| | | | | | | | | |
| WARRANTS (0.38%) | | | | | | | | |
| CEC Entertainment, Inc. | | | 237,941 | | | | 1,011,249 | |
| | | | | | | | | |
| TOTAL WARRANTS | | | | | | | | |
| (Cost $–) | | | | | | | 1,011,249 | |
| | | | | | | | | |
| SHORT-TERM INVESTMENTS (5.99%) | | | | | | | | |
| Money Market Funds (5.99%) | | | | | | | | |
| First American Government Obligations Fund, 0.18%(i) | | | 15,816,095 | | | | 15,816,095 | |
| | | | | | | | | |
| TOTAL SHORT-TERM INVESTMENTS | | | | | | | | |
| (Cost $15,816,095) | | | | | | | 15,816,095 | |
| | | | | | | | | |
| INVESTMENTS, AT VALUE (98.72%) | | | | | | | | |
| (Cost $256,386,005) | | | | | | $ | 260,689,974 | |
| | | | | | | | | |
| Other Assets In Excess Of Liabilities (1.28%) | | | | | | | 3,378,074 | |
| | | | | | | | | |
| NET ASSETS (100.00%) | | | | | | $ | 264,068,048 | |
Investment Abbreviations:
LIBOR - London Interbank Offered Rate
PIK - Payment in-kind
Reference Rates:
1M US L - 1 Month LIBOR as of March 31, 2022 was 0.45%
3M US L - 3 Month LIBOR as of March 31, 2022 was 0.96%
| (a) | Variable rate investment. Interest rates reset periodically. Interest rate shown reflects the rate in effect at March 31, 2022. For securities based on a published reference rate and spread, the reference rate and spread are indicated in the description above. Certain variable rate securities are not based on a published reference rate and spread but are determined by the issuer or agent and are based on current market conditions. These securities do not indicate a reference rate and spread in their description above. |
| (b) | As a result of the use of significant unobservable inputs to determine fair value, these investments have been classified as Level 3 assets. |
| (c) | Restricted security. See chart below. |
| (d) | All or a portion of this commitment was unfunded as of March 31, 2022. |
| (e) | Payment in kind security which may pay interest in additional par. |
| (f) | Securities exempt from registration under Rule 144A of the Securities Act of 1933, as amended. These securities may be sold in the ordinary course of business in transactions exempt from registration, normally to qualified institutional buyers. As of March 31, 2022, the aggregate market value of those securities was $22,500,000, representing 8.52% of net assets. |
| (g) | Non-income producing security. |
| (h) | Investment is held through CIF Investments LLC, a wholly-owned subsidiary. |
| (i) | Money market fund; interest rate reflects seven-day effective yield on March 31, 2022. |
See Notes to Consolidated Financial Statements.
| Semi-Annual Report | March 31, 2022 | 9 |
| Alternative Credit Income Fund | Consolidated Schedule of Investments |
March 31, 2022 (Unaudited)
Securities determined to be restricted under the procedures approved by the Fund's Board of Trustees are as follows.
| Date(s) of Purchase | | Security | | Cost | | | Value | | | % of Net Assets | |
| 3/31/2018 - 6/30/2021 | | BlackRock Global Credit Opportunities Fund, LP | | $ | 15,334,251 | | | $ | 16,029,163 | | | | 6.1 | % |
| 09/30/2017 - 09/30/2021 | | CVC European Mid-Market Solutions Fund | | | 14,875,785 | | | | 14,939,033 | | | | 5.7 | % |
| 6/30/2018 - 3/31/2021 | | GSO Credit Alpha Fund II LP | | | 6,694,675 | | | | 7,737,627 | | | | 2.9 | % |
| 9/30/2018 - 12/31/2020 | | Monroe Capital Private Credit Fund III LP | | | 8,501,260 | | | | 8,837,746 | | | | 3.4 | % |
| 12/31/2017 - 06/30/2019 | | Tree Line Credit Strategies LP | | | 19,000,000 | | | | 19,422,385 | | | | 7.4 | % |
| | | Total | | $ | 64,405,971 | | | $ | 66,965,954 | | | | 25.5 | % |
Additional information on investments in private investment funds:
| Security | | Value | | | Redemption Frequency | | Redemption Notice(Days) | | | Unfunded Commitments as of March 31, 2022 | |
| BlackRock Global Credit Opportunities Fund, LP(a) | | $ | 16,029,163 | | | N/A | | | N/A | | | $ | 6,229,040 | |
| CVC European Mid-Market Solutions Fund(b) | | | 14,939,033 | | | N/A | | | N/A | | | | 206,342 | |
| GSO Credit Alpha Fund II LP(a) | | | 7,737,627 | | | N/A | | | N/A | | | | 7,895,060 | |
| Monroe Capital Private Credit Fund III LP(b) | | | 8,837,746 | | | N/A | | | N/A | | | | 1,498,740 | |
| Tree Line Credit Strategies LP | | | 19,422,385 | | | Quarterly | | | 90 | | | | N/A | |
| Total | | $ | 66,965,954 | | | | | | | | | $ | 15,829,182 | |
Unfunded Debt Instruments
| Security | | | | | Maturity | | | Unfunded Commitment | |
| BrightPet, Delayed Draw Term Loan | | $ | (10,700 | ) | | | 10/05/2026 | | | $ | 1,000,000 | |
| BrightPet, Revolver | | | 427,975 | | | | 10/05/2026 | | | | 68,750 | |
| American Academy Holdings, LLC, Delayed Draw Term Loan | | | 39,889 | | | | 01/01/2025 | | | | 321,454 | |
| Accordion Partners, LLC, Delayed Draw Term Loan | | | (4,800 | ) | | | 09/24/2027 | | | | 1,000,000 | |
| Total | | $ | 452,364 | | | | | | | $ | 2,390,204 | |
| | | | | | | | | | | | | |
| Total Unfunded Commitments | | | | | | | | | | $ | 18,219,386 | |
| (a) | A voluntary withdrawal may be permitted at the General Partner's discretion with the General Partner's consent. |
| (b) | A voluntary withdrawal may be permitted with the General Partner's prior written consent. |
See Notes to Consolidated Financial Statements.
| Alternative Credit Income Fund | Consolidated Statement of Assets and Liabilities |
March 31, 2022 (Unaudited)
| ASSETS | | | |
| Investments, at value (Cost $256,386,005) | $ | 260,689,974 | |
| Cash | | 850,254 | |
| Interest and dividends receivable | | 4,120,036 | |
| Receivable for fund shares sold | | 367,407 | |
| Prepaid expenses and other assets | | 67,803 | |
| Total assets | | | 266,095,474 | |
| | | | | |
| LIABILITIES | | | | |
| Due to Adviser | | | 820,252 | |
| Administration fees payable | | | 148,606 | |
| Custody fees payable | | | 39,210 | |
| Payable for trustee fees and expenses | | | 3,926 | |
| Distribution fees payable | | | 61,657 | |
| Shareholder servicing fees payable | | | 65,110 | |
| Transfer agency fees payable | | | 204,929 | |
| Accrued expenses and other liabilities | | | 683,736 | |
| Total liabilities | | | 2,027,426 | |
| NET ASSETS | | $ | 264,068,048 | |
| | | | | |
| NET ASSETS CONSISTS OF | | | | |
| Paid-in capital | | $ | 259,814,788 | |
| Total distributable earnings | | | 4,253,260 | |
| NET ASSETS | | $ | 264,068,048 | |
| | | | | |
| Common Shares: | | | | |
| Class A | | | | |
| Net assets | | $ | 39,781,096 | |
| Shares of beneficial interest outstanding (no par value; unlimited number of shares) | | | 3,646,233 | |
| Net asset value(a) | | $ | 10.91 | |
| Maximum offering price per share (maximum sales charge of 5.75%) | | $ | 11.58 | |
| Class C | | | | |
| Net assets | | $ | 46,848,066 | |
| Shares of beneficial interest outstanding (no par value; unlimited shares) | | | 4,244,947 | |
| Net asset value(a) | | $ | 11.04 | |
| Class W | | | | |
| Net assets | | $ | 64,253,208 | |
| Shares of beneficial interest outstanding (no par value; unlimited shares) | | | 5,894,279 | |
| Net asset value | | $ | 10.90 | |
| Class I | | | | |
| Net assets | | $ | 100,316,446 | |
| Shares of beneficial interest outstanding (no par value; unlimited shares) | | | 9,177,633 | |
| Net asset value | | $ | 10.93 | |
| Class L | | | | |
| Net assets | | $ | 12,869,232 | |
| Shares of beneficial interest outstanding (no par value; unlimited shares) | | | 1,179,831 | |
| Net asset value | | $ | 10.91 | |
| Maximum offering price per share (maximum sales charge of 4.25%) | | $ | 11.39 | |
| (a) | Redemption price varies based on length of time held (Note 5). |
See Notes to Consolidated Financial Statements.
| Semi-Annual Report | March 31, 2022 | 11 |
| Alternative Credit Income Fund | Consolidated Statement of Operations |
For the Six Months Ended March 31, 2022 (Unaudited)
| INVESTMENT INCOME | | | |
| Interest | | $ | 7,216,198 | |
| Dividends | | | 4,044,828 | |
| Total investment income | | | 11,261,026 | |
| | | | | |
| EXPENSES | | | | |
| Investment advisory fees (Note 3) | | | 2,340,342 | |
| Administrative fees (Note 3) | | | 144,806 | |
| Distribution fees (Note 3): | | | | |
| Class C | | | 174,170 | |
| Class L | | | 16,500 | |
| Shareholder servicing fees (Note 3): | | | | |
| Class A | | | 36,622 | |
| Class C | | | 58,057 | |
| Class W | | | 73,618 | |
| Class L | | | 16,500 | |
| Interest expense (Note 7) | | | 18,536 | |
| Transfer agent fees (Note 3) | | | 237,768 | |
| Professional fees | | | 193,088 | |
| Printing expense | | | 78,429 | |
| Registration fees | | | 33,679 | |
| Custody fees | | | 33,038 | |
| Insurance expense | | | 46,158 | |
| Trustee fees and expenses (Note 3) | | | 19,526 | |
| Compliance services fees | | | 54,849 | |
| Networking Fees: | | | | |
| Class A | | | 5,775 | |
| Class C | | | 6,476 | |
| Class W | | | 1,230 | |
| Class I | | | 12,591 | |
| Class L | | | 5,988 | |
| Other expenses | | | 12,469 | |
| Total expenses | | | 3,620,215 | |
| Fees waived by Adviser (Note 3) | | | (249,308 | ) |
| Total net expenses | | | 3,370,907 | |
| NET INVESTMENT INCOME | | | 7,890,119 | |
| Net realized gain on investments | | | 181,590 | |
| Net change in unrealized depreciation on investments | | | (4,076,352 | ) |
| NET REALIZED AND UNREALIZED LOSS ON INVESTMENTS | | | (3,894,762 | ) |
| NET INCREASE IN NET ASSETS RESULTING FROM OPERATIONS | | $ | 3,995,357 | |
See Notes to Consolidated Financial Statements.
| Alternative Credit Income Fund | Consolidated Statements of Changes in Net Assets |
| | | For the Six Months Ended March 31, 2022 (Unaudited) | | | For the Year Ended September 30, 2021 | |
| OPERATIONS | | | | | | | | |
| Net investment income | | $ | 7,890,119 | | | $ | 17,626,022 | |
| Net realized gain/(loss) on investments | | | 181,590 | | | | (3,137,283 | ) |
| Net change in unrealized appreciation/(depreciation) on investments | | | (4,076,352 | ) | | | 35,269,063 | |
| Net increase in net assets resulting from operations | | | 3,995,357 | | | | 49,757,802 | |
| | | | | | | | | |
| DISTRIBUTIONS TO SHAREHOLDERS | | | | | | | | |
| Total Distributable Earnings | | | | | | | | |
| Class A | | | (1,271,498 | ) | | | (2,667,946 | ) |
| Class C | | | (1,305,559 | ) | | | (2,705,198 | ) |
| Class W | | | (1,977,976 | ) | | | (4,280,226 | ) |
| Class I | | | (3,152,266 | ) | | | (6,253,719 | ) |
| Class L | | | (400,175 | ) | | | (855,436 | ) |
| From return of capital: | | | | | | | | |
| Class A | | | – | | | | (271,732 | ) |
| Class C | | | – | | | | (275,533 | ) |
| Class W | | | – | | | | (3,843,913 | ) |
| Class I | | | – | | | | (5,616,173 | ) |
| Class L | | | – | | | | (87,223 | ) |
| Total distributions to shareholders | | | (8,107,474 | ) | | | (16,762,525 | ) |
| | | | | | | | | |
| COMMON SHARE TRANSACTIONS | | | | | | | | |
| Class A | | | | | | | | |
| Proceeds from sales of shares | | | 2,642,584 | | | | 1,771,605 | |
| Distributions reinvested | | | 560,296 | | | | 1,391,582 | |
| Cost of shares redeemed | | | (4,156,887 | ) | | | (5,615,381 | ) |
| Net transferred in(out) | | | (157,424 | ) | | | (44,560 | ) |
| Net decrease from share transactions | | | (1,111,431 | ) | | | (2,496,754 | ) |
| Class C | | | | | | | | |
| Proceeds from sales of shares | | | 2,246,749 | | | | 3,011,379 | |
| Distributions reinvested | | | 695,298 | | | | 1,463,320 | |
| Cost of shares redeemed | | | (1,910,102 | ) | | | (4,997,047 | ) |
| Net transferred in(out) | | | (1,080,864 | ) | | | (1,790,131 | ) |
| Net decrease from share transactions | | | (48,919 | ) | | | (2,312,479 | ) |
| Class W | | | | | | | | |
| Proceeds from sales of shares | | | 6,592,148 | | | | 5,929,421 | |
| Distributions reinvested | | | 600,850 | | | | 1,348,710 | |
| Cost of shares redeemed | | | (3,777,046 | ) | | | (23,029,689 | ) |
| Net transferred in(out) | | | (83,840 | ) | | | (975,359 | ) |
| Net increase/(decrease) from share transactions | | | 3,332,112 | | | | (16,726,917 | ) |
| Class I | | | | | | | | |
| Proceeds from sales of shares | | | 15,467,588 | | | | 12,381,801 | |
| Distributions reinvested | | | 1,854,885 | | | | 3,658,078 | |
| Cost of shares redeemed | | | (10,756,456 | ) | | | (24,077,835 | ) |
| Net transferred in(out) | | | 1,322,129 | | | | 2,905,793 | |
| Net increase/(decrease) from share transactions | | | 7,888,146 | | | | (5,132,163 | ) |
| Class L | | | | | | | | |
| Proceeds from sales of shares | | | 5,762 | | | | 1,598 | |
| Distributions reinvested | | | 231,527 | | | | 490,126 | |
| Cost of shares redeemed | | | (1,187,442 | ) | | | (749,635 | ) |
| Net transferred in(out) | | | – | | | | (95,743 | ) |
| Net decrease from share transactions | | | (950,153 | ) | | | (353,654 | ) |
| Total net increase/(decrease) from share transactions | | | 9,109,755 | | | | (27,021,967 | ) |
| Total net increase in net assets | | | 4,997,638 | | | | 5,973,310 | |
See Notes to Consolidated Financial Statements.
| Semi-Annual Report | March 31, 2022 | 13 |
| Alternative Credit Income Fund | Consolidated Statements of Changes in Net Assets (continued) |
| | | For the Six Months Ended March 31, 2022 (Unaudited) | | | For the Year Ended September 30, 2021 | |
| NET ASSETS | | | | | | | | |
| Beginning of period | | | 259,070,410 | | | | 253,097,100 | |
| End of period | | $ | 264,068,048 | | | $ | 259,070,410 | |
| | | | | | | | | |
| OTHER INFORMATION | | | | | | | | |
| Common Shares Transactions | | | | | | | | |
| Class A | | | | | | | | |
| Issued | | | 239,759 | | | | 164,210 | |
| Distributions reinvested | | | 51,401 | | | | 129,579 | |
| Redeemed | | | (375,653 | ) | | | (527,464 | ) |
| Net Transferred in(out) | | | (14,181 | ) | | | (4,543 | ) |
| Net decrease in shares | | | (98,674 | ) | | | (238,218 | ) |
| | | | | | | | | |
| Class C | | | | | | | | |
| Issued | | | 201,229 | | | | 278,801 | |
| Distributions reinvested | | | 63,036 | | | | 134,688 | |
| Redeemed | | | (170,733 | ) | | | (466,551 | ) |
| Net Transferred in(out) | | | (96,667 | ) | | | (159,923 | ) |
| Net decrease in shares | | | (3,135 | ) | | | (212,985 | ) |
| | | | | | | | | |
| Class W | | | | | | | | |
| Issued | | | 599,396 | | | | 547,875 | |
| Distributions reinvested | | | 55,174 | | | | 125,754 | |
| Redeemed | | | (341,728 | ) | | | (2,168,964 | ) |
| Net Transferred in(out) | | | (7,603 | ) | | | (98,968 | ) |
| Net increase/(decrease) in shares | | | 305,239 | | | | (1,594,303 | ) |
| | | | | | | | | |
| Class I | | | | | | | | |
| Issued | | | 1,399,421 | | | | 1,156,780 | |
| Distributions reinvested | | | 169,874 | | | | 340,010 | |
| Redeemed | | | (970,320 | ) | | | (2,281,823 | ) |
| Net Transferred in(out) | | | 119,232 | | | | 273,036 | |
| Net increase/(decrease) in shares | | | 718,207 | | | | (511,997 | ) |
| | | | | | | | | |
| Class L | | | | | | | | |
| Issued | | | 529 | | | | 150 | |
| Distributions reinvested | | | 21,241 | | | | 45,582 | |
| Redeemed | | | (107,314 | ) | | | (70,360 | ) |
| Net Transferred in(out) | | | – | | | | (8,688 | ) |
| Net decrease in shares | | | (85,544 | ) | | | (33,316 | ) |
See Notes to Consolidated Financial Statements.
| Alternative Credit Income Fund | Consolidated Statement of Cash Flows |
For the Six Months Ended March 31, 2022 (Unaudited)
| CASH FLOWS FROM OPERATING ACTIVITIES: | | | |
| Net increase in net assets from operations | | $ | 3,995,357 | |
| Adjustments to reconcile net decrease in net assets resulting from operations to net cash provided by operating activities: | | | | |
| Purchase of investment securities | | | (46,217,436 | ) |
| Proceeds from sale of investment securities | | | 35,240,257 | |
| Purchase of short-term investments securities - net | | | 2,003,290 | |
| Amortization of discount and accretion of discount on investments | | | (992,931 | ) |
| Net realized (gain)/loss on: | | | | |
| Investments | | | (181,590 | ) |
| Net change in unrealized (appreciation)/depreciation on: | | | | |
| Investments | | | 4,076,352 | |
| (Increase)/Decrease in assets: | | | | |
| Dividends and interest receivable | | | (220,003 | ) |
| Prepaid expenses and other assets | | | 76,293 | |
| Increase/(Decrease) in liabilities: | | | | |
| Due to adviser | | | 509,472 | |
| Interest on line of credit payable | | | (7,168 | ) |
| Administration fees payable | | | 47,423 | |
| Custody fees payable | | | 11,931 | |
| Shareholder servicing fees payable | | | 31,513 | |
| Trustee fees and expenses payable | | | 3,926 | |
| Distribution fees payable | | | 29,577 | |
| Transfer agency fees payable | | | 50,230 | |
| Accrued expenses and other liabilities | | | 480,426 | |
| Net cash used in operating activities | | | (1,063,081 | ) |
| | | | | |
| CASH FLOWS FROM FINANCING ACTIVITIES: | | | | |
| Proceeds from line of credit | | | 20,199,207 | |
| Payments on line of credit | | | (20,199,207 | ) |
| Proceeds from sales of shares | | | 26,605,976 | |
| Cost of shares redeemed | | | (21,787,933 | ) |
| Cash distributions paid | | | (4,164,618 | ) |
| Net cash provided by financing activities | | | 653,425 | |
| | | | | |
| Net change in cash & cash equivalents | | | (409,656 | ) |
| | | | | |
| Restricted and unrestricted cash, beginning of year | | $ | 1,259,910 | |
| Restricted and unrestricted cash, end of year | | $ | 850,254 | |
| | | | | |
| SUPPLEMENTAL DISCLOSURE OF CASH FLOW INFORMATION: | | | | |
| Non-cash financing activities not included herein consist of reinvestment of distributions of: | | $ | 3,942,856 | |
| Cash paid for interest on line of credit during the year was: | | $ | 25,704 | |
See Notes to Consolidated Financial Statements.
| Semi-Annual Report | March 31, 2022 | 15 |
| Alternative Credit Income Fund – Class A | Financial Highlights |
For a Share Outstanding Throughout the Years Presented
| | | For the Six Months Ended March 31, 2022 (Unaudited) | | | Year Ended September 30, 2021 | | | Year Ended September 30, 2020 | | | Year Ended September 30, 2019 | | | Year Ended September 30, 2018 | | | Year Ended September 30, 2017 | |
| NET ASSET VALUE, BEGINNING OF YEAR | | $ | 11.09 | | | $ | 9.75 | | | $ | 10.80 | | | $ | 11.09 | | | $ | 11.13 | | | $ | 10.26 | |
| | | | | | | | | | | | | | | | | | | | | | | | | |
| INCOME FROM INVESTMENT OPERATIONS | | | | | | | | | | | | | | | | | | | | | | | | |
| Net investment income(a) | | | 0.35 | | | | 0.74 | | | | 0.69 | | | | 0.73 | | | | 0.79 | | | | 0.57 | |
| Net realized and unrealized gain/(loss) on investments | | | (0.18 | ) | | | 1.30 | | | | 0.92 | | | | (0.32 | ) | | | (0.13 | ) | | | 1.02 | |
| Total income/(loss) from investment operations | | | 0.17 | | | | 2.04 | | | | (0.23 | ) | | | 0.41 | | | | 0.66 | | | | 1.59 | |
| | | | | | | | | | | | | | | | | | | | | | | | | |
| DISTRIBUTIONS TO SHAREHOLDERS | | | | | | | | | | | | | | | | | | | | | | | | |
| From net investment income | | | (0.35 | ) | | | (0.63 | ) | | | (0.70 | ) | | | (0.55 | ) | | | (0.57 | ) | | | (0.47 | ) |
| From net realized gain on investments | | | – | | | | – | | | | – | | | | – | | | | (0.04 | ) | | | (0.16 | ) |
| From return of capital | | | – | | | | (0.07 | ) | | | (0.12 | ) | | | (0.15 | ) | | | (0.09 | ) | | | (0.09 | ) |
| Total distributions | | | (0.35 | ) | | | (0.70 | ) | | | (0.82 | ) | | | (0.70 | ) | | | (0.70 | ) | | | (0.72 | ) |
| INCREASE/(DECREASE) IN NET ASSET VALUE | | | (0.18 | ) | | | 1.34 | | | | (1.05 | ) | | | (0.29 | ) | | | (0.04 | ) | | | 0.87 | |
| NET ASSET VALUE, END OF YEAR | | $ | 10.91 | | | $ | 11.09 | | | $ | 9.75 | | | $ | 10.80 | | | $ | 11.09 | | | $ | 11.13 | |
| | | | | | | | | | | | | | | | | | | | | | | | | |
| TOTAL RETURN(b) | | | 1.56 | %(c) | | | 21.33 | %(c) | | | (1.88 | )%(c)(d) | | | 3.91 | % | | | 6.09 | % | | | 15.79 | %(c) |
| | | | | | | | | | | | | | | | | | | | | | | | | |
| RATIOS AND SUPPLEMENTAL DATA | | | | | | | | | | | | | | | | | | | | | | | | |
| Net assets, end of year (in 000s) | | $ | 39,781 | | | $ | 41,519 | | | $ | 38,829 | | | $ | 38,901 | | | $ | 29,712 | | | $ | 16,049 | |
| | | | | | | | | | | | | | | | | | | | | | | | | |
| RATIOS TO AVERAGE NET ASSETS(e) | | | | | | | | | | | | | | | | | | | | | | | | |
| Including interest expense and interest amortization/accretion on securities sold short: | | | | | | | | | | | | | | | | | | | | | | | | |
| Expenses, gross | | | 2.76 | %(f) | | | 2.84 | % | | | 2.78 | % | | | 2.79 | % | | | 2.93 | % | | | 4.90 | % |
| Expenses, net of fees waived/expenses reimbursed by Adviser | | | 2.61 | %(f) | | | 2.65 | % | | | 2.68 | % | | | 2.67 | % | | | 2.61 | % | | | 2.59 | % |
| Excluding interest expense and interest amortization/accretion on securities sold short: | | | | | | | | | | | | | | | | | | | | | | | | |
| Expenses, gross | | | 2.74 | %(f) | | | 2.78 | % | | | 2.69 | % | | | 2.71 | % | | | 2.91 | % | | | 4.90 | % |
| Expenses, net of fees waived/expenses reimbursed by Adviser | | | 2.59 | %(f) | | | 2.59 | % | | | 2.59 | % | | | 2.59 | % | | | 2.59 | % | �� | | 2.59 | % |
| Net investment income | | | 6.30 | %(f) | | | 6.87 | % | | | 6.93 | % | | | 6.68 | % | | | 7.06 | % | | | 5.20 | % |
| | | | | | | | | | | | | | | | | | | | | | | | | |
| PORTFOLIO TURNOVER RATE | | | 14 | %(g) | | | 49 | % | | | 39 | % | | | 29 | % | | | 43 | % | | | 39 | % |
| (a) | Per share numbers have been calculated using the average shares method. |
| (b) | Total returns shown are historical in nature and assume changes in share price, reinvestment of dividends and capital gains distribution, if any. Had the Adviser not absorbed a portion of Fund expenses, total returns would have been lower. Returns shown exclude applicable sales charges. |
| (c) | Includes adjustments in accordance with accounting principles generally accepted in the United States of America and, as such, the net asset values for financial reporting purposes and the returns based upon those net asset values may differ from net asset values and returns for shareholder transactions. |
| (d) | 0.10% of the Fund’s total return consists of a reimbursement by the Adviser for a loss on a transaction. Excluding this item, total return would have been (1.98)%. |
| (e) | Ratios do not include expenses of underlying investment companies and private investment funds in which the Fund invests. |
See Notes to Consolidated Financial Statements.
| Alternative Credit Income Fund – Class C | Financial Highlights |
For a Share Outstanding Throughout the Years Presented
| | | For the Six Months Ended March 31, 2022 (Unaudited) | | | Year Ended September 30, 2021 | | | Year Ended September 30, 2020 | | | Year Ended September 30, 2019 | | | Year Ended September 30, 2018 | | | Year Ended September 30, 2017 | |
| NET ASSET VALUE, BEGINNING OF YEAR | | $ | 11.21 | | | $ | 9.86 | | | $ | 10.92 | | | $ | 11.22 | | | $ | 11.25 | | | $ | 10.36 | |
| | | | | | | | | | | | | | | | | | | | | | | | | |
| INCOME FROM INVESTMENT OPERATIONS | | | | | | | | | | | | | | | | | | | | | | | | |
| Net investment income(a) | | | 0.31 | | | | 0.66 | | | | 0.62 | | | | 0.66 | | | | 0.72 | | | | 0.50 | |
| Net realized and unrealized gain/(loss) on investments | | | (0.17 | ) | | | 1.31 | | | | (0.92 | ) | | | (0.34 | ) | | | (0.13 | ) | | | 1.03 | |
| Total income/(loss) from investment operations | | | 0.14 | | | | 1.97 | | | | (0.30 | ) | | | 0.32 | | | | 0.59 | | | | 1.53 | |
| | | | | | | | | | | | | | | | | | | | | | | | | |
| DISTRIBUTIONS TO SHAREHOLDERS | | | | | | | | | | | | | | | | | | | | | | | | |
| From net investment income | | | (0.31 | ) | | | (0.56 | ) | | | (0.66 | ) | | | (0.48 | ) | | | (0.50 | ) | | | (0.40 | ) |
| From net realized gain on investments | | | – | | | | – | | | | – | | | | – | | | | (0.04 | ) | | | (0.16 | ) |
| From return of capital | | | – | | | | (0.06 | ) | | | (0.10 | ) | | | (0.14 | ) | | | (0.08 | ) | | | (0.08 | ) |
| Total distributions | | | (0.31 | ) | | | (0.62 | ) | | | (0.76 | ) | | | (0.62 | ) | | | (0.62 | ) | | | (0.64 | ) |
| INCREASE/(DECREASE) IN NET ASSET VALUE | | | (0.17 | ) | | | 1.35 | | | | (1.06 | ) | | | (0.30 | ) | | | (0.03 | ) | | | 0.89 | |
| NET ASSET VALUE, END OF YEAR | | $ | 11.04 | | | $ | 11.21 | | | $ | 9.86 | | | $ | 10.92 | | | $ | 11.22 | | | $ | 11.25 | |
| | | | | | | | | | | | | | | | | | | | | | | | | |
| TOTAL RETURN(b) | | | 1.29 | %(c) | | | 20.36 | %(c) | | | (2.61 | )%(c)(d) | | | 3.05 | % | | | 5.39 | % | | | 15.03 | %(c) |
| | | | | | | | | | | | | | | | | | | | | | | | | |
| RATIOS AND SUPPLEMENTAL DATA | | | | | | | | | | | | | | | | | | | | | | | | |
| Net assets, end of year (in 000s) | | $ | 46,848 | | | $ | 47,640 | | | $ | 43,984 | | | $ | 41,575 | | | $ | 26,720 | | | $ | 8,965 | |
| | | | | | | | | | | | | | | | | | | | | | | | | |
| RATIOS TO AVERAGE NET ASSETS(e) | | | | | | | | | | | | | | | | | | | | | | | | |
| Including interest expense and interest amortization/accretion on securities sold short: | | | | | | | | | | | | | | | | | | | | | | | | |
| Expenses, gross | | | 3.57 | %(f) | | | 3.59 | % | | | 3.53 | % | | | 3.55 | % | | | 3.75 | % | | | 5.28 | % |
| Expenses, net of fees waived/expenses reimbursed by Adviser | | | 3.35 | %(f) | | | 3.40 | % | | | 3.43 | % | | | 3.42 | % | | | 3.37 | % | | | 3.34 | % |
| Excluding interest expense and interest amortization/accretion on securities sold short: | | | | | | | | | | | | | | | | | | | | | | | | |
| Expenses, gross | | | 3.56 | %(f) | | | 3.53 | % | | | 3.44 | % | | | 3.47 | % | | | 3.72 | % | | | 5.28 | % |
| Expenses, net of fees waived/expenses reimbursed by Adviser | | | 3.34 | %(f) | | | 3.34 | % | | | 3.34 | % | | | 3.34 | % | | | 3.34 | % | | | 3.34 | % |
| Net investment income | | | 5.53 | %(f) | | | 6.12 | % | | | 6.19 | % | | | 5.95 | % | | | 6.38 | % | | | 4.46 | % |
| | | | | | | | | | | | | | | | | | | | | | | | | |
| PORTFOLIO TURNOVER RATE | | | 14 | %(g) | | | 49 | % | | | 39 | % | | | 29 | % | | | 43 | % | | | 39 | % |
| (a) | Per share numbers have been calculated using the average shares method. |
| (b) | Total returns shown are historical in nature and assume changes in share price, reinvestment of dividends and capital gains distribution, if any. Had the Adviser not absorbed a portion of Fund expenses, total returns would have been lower. |
| (c) | Includes adjustments in accordance with accounting principles generally accepted in the United States of America and, as such, the net asset values for financial reporting purposes and the returns based upon those net asset values may differ from net asset values and returns for shareholder transactions. |
| (d) | 0.10% of the Fund’s total return consists of a reimbursement by the Adviser for a loss on a transaction. Excluding this item, total return would have been (2.71)%. |
| (e) | Ratios do not include expenses of underlying investment companies and private investment funds in which the Fund invests. |
See Notes to Consolidated Financial Statements.
| Semi-Annual Report | March 31, 2022 | 17 |
| Alternative Credit Income Fund – Class W | Financial Highlights |
For a Share Outstanding Throughout the Years Presented
| | | For the Six Months Ended March 31, 2022 (Unaudited) | | | Year Ended September 30, 2021 | | | Year Ended September 30, 2020 | | | Year Ended September 30, 2019 | | | Year Ended September 30, 2018 | | | Year Ended September 30, 2017 | |
| NET ASSET VALUE, BEGINNING OF YEAR | | $ | 11.08 | | | $ | 9.74 | | | $ | 10.79 | | | $ | 11.09 | | | $ | 11.12 | | | $ | 10.24 | |
| | | | | | | | | | | | | | | | | | | | | | | | | |
| INCOME FROM INVESTMENT OPERATIONS | | | | | | | | | | | | | | | | | | | | | | | | |
| Net investment income(a) | | | 0.35 | | | | 0.74 | | | | 0.69 | | | | 0.73 | | | | 0.79 | | | | 0.58 | |
| Net realized and unrealized gain/(loss) on investments | | | (0.18 | ) | | | 1.30 | | | | (0.92 | ) | | | (0.33 | ) | | | (0.12 | ) | | | 1.01 | |
| Total income/(loss) from investment operations | | | 0.17 | | | | 2.04 | | | | (0.23 | ) | | | 0.40 | | | | 0.67 | | | | 1.59 | |
| | | | | | | | | | | | | | | | | | | | | | | | | |
| DISTRIBUTIONS TO SHAREHOLDERS | | | | | | | | | | | | | | | | | | | | | | | | |
| From net investment income | | | (0.35 | ) | | | (0.63 | ) | | | (0.70 | ) | | | (0.55 | ) | | | (0.57 | ) | | | (0.46 | ) |
| From net realized gain on investments | | | – | | | | – | | | | – | | | | – | | | | (0.04 | ) | | | (0.16 | ) |
| From return of capital | | | – | | | | (0.07 | ) | | | (0.12 | ) | | | (0.15 | ) | | | (0.09 | ) | | | (0.09 | ) |
| Total distributions | | | (0.35 | ) | | | (0.70 | ) | | | (0.82 | ) | | | (0.70 | ) | | | (0.70 | ) | | | (0.71 | ) |
| INCREASE/(DECREASE) IN NET ASSET VALUE | | | (0.18 | ) | | | 1.34 | | | | (1.05 | ) | | | (0.30 | ) | | | (0.03 | ) | | | 0.88 | |
| NET ASSET VALUE, END OF YEAR | | $ | 10.90 | | | $ | 11.08 | | | $ | 9.74 | | | $ | 10.79 | | | $ | 11.09 | | | $ | 11.12 | |
| | | | | | | | | | | | | | | | | | | | | | | | | |
| TOTAL RETURN(b) | | | 1.56 | %(c) | | | 21.35 | %(c) | | | (1.89 | )%(c)(d) | | | 3.81 | % | | | 6.19 | % | | | 15.77 | %(c) |
| | | | | | | | | | | | | | | | | | | | | | | | | |
| RATIOS AND SUPPLEMENTAL DATA | | | | | | | | | | | | | | | | | | | | | | | | |
| Net assets, end of year (in 000s) | | $ | 64,253 | | | $ | 61,915 | | | $ | 69,993 | | | $ | 85,642 | | | $ | 75,275 | | | $ | 26,757 | |
| | | | | | | | | | | | | | | | | | | | | | | | | |
| RATIOS TO AVERAGE NET ASSETS(e) | | | | | | | | | | | | | | | | | | | | | | | | |
| Including interest expense and interest amortization/accretion on securities sold short: | | | | | | | | | | | | | | | | | | | | | | | | |
| Expenses, gross | | | 2.78 | %(f) | | | 2.81 | % | | | 2.75 | % | | | 2.79 | % | | | 2.98 | % | | | 4.35 | % |
| Expenses, net of fees waived/expenses reimbursed by Adviser | | | 2.60 | %(f) | | | 2.65 | % | | | 2.68 | % | | | 2.67 | % | | | 2.62 | % | | | 2.61 | %(g) |
| Excluding interest expense and interest amortization/accretion on securities sold short: | | | | | | | | | | | | | | | | | | | | | | | | |
| Expenses, gross | | | 2.77 | %(f) | | | 2.75 | % | | | 2.66 | % | | | 2.71 | % | | | 2.95 | % | | | 4.35 | % |
| Expenses, net of fees waived/expenses reimbursed by Adviser | | | 2.59 | %(f) | | | 2.59 | % | | | 2.59 | % | | | 2.59 | % | | | 2.59 | % | | | 2.61 | %(g) |
| Net investment income | | | 6.30 | %(f) | | | 6.89 | % | | | 6.92 | % | | | 6.68 | % | | | 7.10 | % | | | 5.22 | %(g) |
| | | | | | | | | | | | | | | | | | | | | | | | | |
| PORTFOLIO TURNOVER RATE | | | 14 | %(h) | | | 49 | % | | | 39 | % | | | 29 | % | | | 43 | % | | | 39 | % |
| (a) | Per share numbers have been calculated using the average shares method. |
| (b) | Total returns shown are historical in nature and assume changes in share price, reinvestment of dividends and capital gains distribution, if any. Had the Adviser not absorbed a portion of Fund expenses, total returns would have been lower. |
| (c) | Includes adjustments in accordance with accounting principles generally accepted in the United States of America and, as such, the net asset values for financial reporting purposes and the returns based upon those net asset values may differ from net asset values and returns for shareholder transactions. |
| (d) | 0.10% of the Fund’s total return consists of a reimbursement by the Adviser for a loss on a transaction. Excluding this item, total return would have been (1.99)%. |
| (e) | Ratios do not include expenses of underlying investment companies and private investment funds in which the Fund invests. |
| (g) | Effective January 5, 2017, the annual expense limitation changed from 3.09% to 2.59%. |
See Notes to Consolidated Financial Statements.
| Alternative Credit Income Fund – Class I | Financial Highlights |
For a Share Outstanding Throughout the Years Presented
| | | For the Six Months Ended March 31, 2022 (Unaudited) | | | Year Ended September 30, 2021 | | | Year Ended September 30, 2020 | | | Year Ended September 30, 2019 | | | Year Ended September 30, 2018 | | | Year Ended September 30, 2017 | |
| NET ASSET VALUE, BEGINNING OF YEAR | | $ | 11.11 | | | $ | 9.77 | | | $ | 10.82 | | | $ | 11.12 | | | $ | 11.15 | | | $ | 10.28 | |
| | | | | | | | | | | | | | | | | | | | | | | | | |
| INCOME FROM INVESTMENT OPERATIONS | | | | | | | | | | | | | | | | | | | | | | | | |
| Net investment income(a) | | | 0.36 | | | | 0.76 | | | | 0.72 | | | | 0.77 | | | | 0.84 | | | | 0.63 | |
| Net realized and unrealized gain/(loss) on investments | | | (0.18 | ) | | | 1.30 | | | | (0.92 | ) | | | (0.34 | ) | | | (0.14 | ) | | | 0.99 | |
| Total income/(loss) from investment operations | | | 0.18 | | | | 2.06 | | | | (0.20 | ) | | | 0.43 | | | | 0.70 | | | | 1.62 | |
| | | | | | | | | | | | | | | | | | | | | | | | | |
| DISTRIBUTIONS TO SHAREHOLDERS | | | | | | | | | | | | | | | | | | | | | | | | |
| From net investment income | | | (0.36 | ) | | | (0.65 | ) | | | (0.73 | ) | | | (0.57 | ) | | | (0.60 | ) | | | (0.50 | ) |
| From net realized gain on investments | | | – | | | | – | | | | – | | | | – | | | | (0.04 | ) | | | (0.16 | ) |
| From return of capital | | | – | | | | (0.07 | ) | | | (0.12 | ) | | | (0.16 | ) | | | (0.09 | ) | | | (0.09 | ) |
| Total distributions | | | (0.36 | ) | | | (0.72 | ) | | | (0.85 | ) | | | (0.73 | ) | | | (0.73 | ) | | | (0.75 | ) |
| INCREASE/(DECREASE) IN NET ASSET VALUE | | | (0.18 | ) | | | 1.34 | | | | (1.05 | ) | | | (0.30 | ) | | | (0.03 | ) | | | 0.87 | |
| NET ASSET VALUE, END OF YEAR | | $ | 10.93 | | | $ | 11.11 | | | $ | 9.77 | | | $ | 10.82 | | | $ | 11.12 | | | $ | 11.15 | |
| | | | | | | | | | | | | | | | | | | | | | | | | |
| TOTAL RETURN(b) | | | 1.69 | %(c) | | | 21.61 | %(c) | | | (1.61 | )%(c)(d) | | | 4.08 | % | | | 6.46 | % | | | 16.07 | %(c) |
| | | | | | | | | | | | | | | | | | | | | | | | | |
| RATIOS AND SUPPLEMENTAL DATA | | | | | | | | | | | | | | | | | | | | | | | | |
| Net assets, end of year (in 000s) | | $ | 100,316 | | | $ | 93,970 | | | $ | 87,634 | | | $ | 87,265 | | | $ | 29,273 | | | $ | 2,982 | |
| | | | | | | | | | | | | | | | | | | | | | | | | |
| RATIOS TO AVERAGE NET ASSETS(e) | | | | | | | | | | | | | | | | | | | | | | | | |
| Including interest expense and interest amortization/accretion on securities sold short: | | | | | | | | | | | | | | | | | | | | | | | | |
| Expenses, gross | | | 2.56 | %(f) | | | 2.59 | % | | | 2.52 | % | | | 2.54 | % | | | 2.78 | % | | | 4.45 | % |
| Expenses, net of fees waived/expenses reimbursed by Adviser | | | 2.35 | %(f) | | | 2.40 | % | | | 2.43 | % | | | 2.42 | % | | | 2.37 | % | | | 2.34 | % |
| Excluding interest expense and interest amortization/accretion on securities sold short: | | | | | | | | | | | | | | | | | | | | | | | | |
| Expenses, gross | | | 2.55 | %(f) | | | 2.53 | % | | | 2.43 | % | | | 2.46 | % | | | 2.75 | % | | | 4.45 | % |
| Expenses, net of fees waived/expenses reimbursed by Adviser | | | 2.34 | %(f) | | | 2.34 | % | | | 2.34 | % | | | 2.34 | % | | | 2.34 | % | | | 2.34 | % |
| Net investment income | | | 6.55 | %(f) | | | 7.12 | % | | | 7.20 | % | | | 7.00 | % | | | 7.51 | % | | | 5.71 | % |
| | | | | | | | | | | | | | | | | | | | | | | | | |
| PORTFOLIO TURNOVER RATE | | | 14 | %(g) | | | 49 | % | | | 39 | % | | | 29 | % | | | 43 | % | | | 39 | % |
| (a) | Per share numbers have been calculated using the average shares method. |
| (b) | Total returns shown are historical in nature and assume changes in share price, reinvestment of dividends and capital gains distribution, if any. Had the Adviser not absorbed a portion of Fund expenses, total returns would have been lower. |
| (c) | Includes adjustments in accordance with accounting principles generally accepted in the United States of America and, as such, the net asset values for financial reporting purposes and the returns based upon those net asset values may differ from net asset values and returns for shareholder transactions. |
| (d) | 0.10% of the Fund’s total return consists of a reimbursement by the Adviser for a loss on a transaction. Excluding this item, total return would have been (1.71)%. |
| (e) | Ratios do not include expenses of underlying investment companies and private investment funds in which the Fund invests. |
See Notes to Consolidated Financial Statements.
| Semi-Annual Report | March 31, 2022 | 19 |
| Alternative Credit Income Fund – Class L | Financial Highlights |
For a Share Outstanding Throughout the Years or Period Presented
| | | For the Six Months Ended March 31, 2022 (Unaudited) | | | Year Ended September 30, 2021 | | | Year Ended September 30, 2020 | | | Year Ended September 30, 2019 | | | Year Ended September 30, 2018 | | | For the Period Ended September 30, 2017(a) | |
| NET ASSET VALUE, BEGINNING OF YEAR OR PERIOD | | $ | 11.08 | | | $ | 9.75 | | | $ | 10.79 | | | $ | 11.09 | | | $ | 11.12 | | | $ | 11.19 | |
| | | | | | | | | | | | | | | | | | | | | | | | | |
| INCOME/(LOSS) FROM INVESTMENT OPERATIONS | | | | | | | | | | | | | | | | | | | | | | | | |
| Net investment income(b) | | | 0.33 | | | | 0.71 | | | | 0.67 | | | | 0.70 | | | | 0.77 | | | | 0.13 | |
| Net realized and unrealized gain/(loss) on investments | | | (0.16 | ) | | | 1.29 | | | | (0.91 | ) | | | (0.33 | ) | | | (0.13 | ) | | | (0.03 | )(c) |
| Total income/(loss) from investment operations | | | 0.17 | | | | 2.00 | | | | (0.24 | ) | | | 0.37 | | | | 0.64 | | | | 0.10 | |
| | | | | | | | | | | | | | | | | | | | | | | | | |
| DISTRIBUTIONS TO SHAREHOLDERS | | | | | | | | | | | | | | | | | | | | | | | | |
| From net investment income | | | (0.34 | ) | | | (0.60 | ) | | | (0.69 | ) | | | (0.52 | ) | | | (0.55 | ) | | | (0.10 | ) |
| From net realized gain on investments | | | – | | | | – | | | | – | | | | – | | | | (0.04 | ) | | | (0.04 | ) |
| From return of capital | | | – | | | | (0.07 | ) | | | (0.11 | ) | | | (0.15 | ) | | | (0.08 | ) | | | (0.03 | ) |
| Total distributions | | | (0.34 | ) | | | (0.67 | ) | | | (0.80 | ) | | | (0.67 | ) | | | (0.67 | ) | | | (0.17 | ) |
| INCREASE/(DECREASE) IN NET ASSET VALUE | | | (0.17 | ) | | | 1.33 | | | | (1.04 | ) | | | (0.30 | ) | | | (0.03 | ) | | | (0.07 | ) |
| NET ASSET VALUE, END OF YEAR OR PERIOD | | $ | 10.91 | | | $ | 11.08 | | | $ | 9.75 | | | $ | 10.79 | | | $ | 11.09 | | | $ | 11.12 | |
| | | | | | | | | | | | | | | | | | | | | | | | | |
| TOTAL RETURN(d) | | | 1.52 | %(e) | | | 20.92 | %(e) | | | (2.04 | )%(e)(f) | | | 3.55 | %(e) | | | 5.92 | % | | | 0.88 | % |
| | | | | | | | | | | | | | | | | | | | | | | | | |
| RATIOS AND SUPPLEMENTAL DATA | | | | | | | | | | | | | | | | | | | | | | | | |
| Net assets, end of year or period (in 000s) | | $ | 12,869 | | | $ | 14,026 | | | $ | 12,656 | | | $ | 13,972 | | | $ | 10,098 | | | $ | 2,445 | |
| | | | | | | | | | | | | | | | | | | | | | | | | |
| RATIOS TO AVERAGE NET ASSETS(g) | | | | | | | | | | | | | | | | | | | | | | | | |
| Including interest expense and interest amortization/accretion on securities sold short: | | | | | | | | | | | | | | | | | | | | | | | | |
| Expenses, gross | | | 3.13 | %(h) | | | 3.11 | % | | | 3.04 | % | | | 3.06 | % | | | 3.24 | % | | | 4.39 | %(h) |
| Expenses, net of fees waived/expenses reimbursed by Adviser | | | 2.86 | %(h) | | | 2.90 | % | | | 2.93 | % | | | 2.92 | % | | | 2.87 | % | | | 2.84 | %(h) |
| Excluding interest expense and interest amortization/accretion on securities sold short: | | | | | | | | | | | | | | | | | | | | | | | | |
| Expenses, gross | | | 3.12 | %(h) | | | 3.05 | % | | | 2.95 | % | | | 2.98 | % | | | 3.21 | % | | | 4.39 | %(h) |
| Expenses, net of fees waived/expenses reimbursed by Adviser | | | 2.85 | %(h) | | | 2.84 | % | | | 2.84 | % | | | 2.84 | % | | | 2.84 | % | | | 2.84 | %(h) |
| Net investment income | | | 6.03 | %(h) | | | 6.61 | % | | | 6.66 | % | | | 6.42 | % | | | 6.92 | % | | | 6.67 | %(h) |
| | | | | | | | | | | | | | | | | | | | | | | | | |
| PORTFOLIO TURNOVER RATE | | | 14 | %(i) | | | 49 | % | | | 39 | % | | | 29 | % | | | 43 | % | | | 39 | %(i)(j) |
See Notes to Consolidated Financial Statements.
| Alternative Credit Income Fund – Class L | Financial Highlights |
For a Share Outstanding Throughout the Years or Period Presented
| (a) | The Fund's Class L commenced operations on July 28, 2017. |
| (b) | Per share numbers have been calculated using the average shares method. |
| (c) | Realized and unrealized losses per share do not correlate to the aggregate of the net realized and unrealized gains on the Statement of Operations for the year ended September 30, 2017, primarily due to the timing of sales and repurchases of the Fund's shares in relation to fluctuating market values for the Fund's portfolio. |
| (d) | Total returns shown are historical in nature and assume changes in share price, reinvestment of dividends and capital gains distribution, if any. Had the Adviser not absorbed a portion of Fund expenses, total returns would have been lower. |
| (e) | Includes adjustments in accordance with accounting principles generally accepted in the United States of America and, as such, the net asset values for financial reporting purposes and the returns based upon those net asset values may differ from net asset values and returns for shareholder transactions. |
| (f) | 0.10% of the Fund’s total return consists of a reimbursement by the Adviser for a loss on a transaction. Excluding this item, total return would have been (2.14)%. |
| (g) | Ratios do not include expenses of underlying investment companies and private investment funds in which the Fund invests. |
| (j) | Portfolio turnover rate is calculated at the Fund level and represents the year ended September 30, 2017. |
See Notes to Consolidated Financial Statements.
| Semi-Annual Report | March 31, 2022 | 21 |
| Alternative Credit Income Fund | Notes to Consolidated Financial Statements |
March 31, 2022 (Unaudited)
1. ORGANIZATION
Alternative Credit Income Fund (the “Fund”) is a closed-end, diversified management Investment Company that is registered under the Investment Company Act of 1940, as amended (the "1940 Act"). The Fund is structured as an interval fund and continuously offers its shares. The Fund was organized as a Delaware statutory trust on December 11, 2014.
The Fund’s investment objectives are to produce current income and to achieve capital preservation with moderate volatility and low to moderate correlation to the broader equity markets. The Fund pursues its investment objectives by investing, under normal circumstances, at least 80% of its assets (defined as net assets plus the amount of any borrowing for investment purposes) in fixed-income and fixed-income related securities.
Sierra Crest Investment Management LLC (the “Adviser”) serves as the Fund’s investment adviser. Prior to October 31, 2020, Resource Alternative Advisor, LLC served as investment adviser to the Fund pursuant to an investment advisory agreement.
On February 3, 2020, the Fund formed a wholly-owned subsidiary, CIF Investments LLC, a Delaware corporation. To the extent permitted by the 1940 Act, the Fund may make investments through CIF Investments LLC, which is a pass-through entity.
2. SIGNIFICANT ACCOUNTING POLICIES
The following is a summary of significant accounting policies followed by the Fund in preparation of its consolidated financial statements. These policies are in conformity with U.S. generally accepted accounting principles (“U.S. GAAP”). The Fund is an investment company and follows the accounting and reporting guidance under Financial Accounting Standards Board (“FASB”) Accounting Standards Codification (“ASC”) Topic 946, Financial Services – Investment Companies. These consolidated financial statements reflect adjustments that in the opinion of the Fund are necessary for the fair presentation of the financial position and results of operations as of and for the periods presented herein. The Fund is considered an investment company for financial reporting purposes under U.S. GAAP and therefore applies the accounting and reporting guidance applicable to investment companies. The preparation of the consolidated financial statements requires management to make estimates and assumptions that affect the reported amounts of assets and liabilities and disclosure of contingent assets and liabilities at the date of the financial statements and the reported amounts of income and expenses for the year. Actual results could differ from those estimates, and such difference could be material. In accordance with U.S. GAAP guidance on consolidation, the Fund will generally not consolidate its investment in a portfolio company other than an investment company subsidiary or a controlled operating company whose business consists of providing services to the Fund. Accordingly, the Fund consolidated the accounts of the Fund’s wholly-owned subsidiary, CIF Investments LLC, in its consolidated financial statements. All significant intercompany balances and transactions have been eliminated in consolidation. All references made to the “Fund” herein include Alternative Credit Income Fund and its consolidated subsidiary, except as stated otherwise.
Securities Transactions and Investment Income – Investment transactions are recorded on the trade date. Realized gains or losses on investments are calculated using the specific identification method for both financial statement and federal income tax purposes. Dividend income is recorded on the ex-dividend date and interest income is recorded on an accrual basis. Premiums on securities are amortized to the earliest call date and purchase discounts are accreted over the life of the respective securities using the effective interest method.
Loans are generally placed on non-accrual status when there is reasonable doubt that principal or interest will be collected in full. The Fund considers many factors relevant to an investment when placing it on or removing it from non-accrual status including, but not limited to, the delinquency status of the investment, economic and business conditions, the overall financial condition of the underlying investment, the value of the underlying collateral, bankruptcy status, if any, and any other facts or circumstances relevant to the investment. Accrued interest is generally reversed when a loan is placed on non-accrual status. Payments received on non-accrual loans may be recognized as income or applied to principal depending upon management’s judgment regarding collectability of the outstanding principal and interest. Generally non-accrual loans may be restored to accrual status when past due principal and interest is paid current and are likely to remain current based on management’s judgment.
Securities Valuation – Securities listed on an exchange are valued at the last reported sale price at the close of the regular trading session of the exchange on the business day the value is being determined, or in the case of securities listed on NASDAQ, at the NASDAQ Official Closing Price. In the absence of a sale, such securities shall be valued at the mid price. Short-term investments that mature in 60 days or less may be valued at amortized cost, provided such valuations represent fair value.
Structured credit and other similar debt securities including, but not limited to, collateralized loan obligations (“CLO”) debt and equity securities, asset-backed securities (“ABS”), commercial mortgage-backed securities (“CMBS”) and other securitized investments backed by certain debt or other receivables (collectively, “Structured Credit Securities”), are valued on the basis of valuations provided by dealers in those instruments and/or independent pricing services recommended by the Adviser and approved by the Fund’s board of trustees (the “Board” or “Trustees”). In determining fair value, dealers and pricing services will generally use information with respect to transactions in the securities being valued, quotations from other dealers, market transactions in comparable securities, analyses and evaluations of various relationships between securities and yield to maturity information. The Adviser will, based on its reasonable judgment, select the dealer or pricing service quotation that most accurately reflects the fair market value of the Structured Credit Security while taking into account the information utilized by the dealer or pricing service to formulate the quotation in addition to any other relevant factors. In the event that there is a material discrepancy between quotations received from third-party dealers or the pricing services, the Adviser may (i) use an average of the quotations received or (ii) select an individual quotation that the Adviser, based upon its reasonable judgment, determines to be reasonable. In any instance in which the Adviser selects an individual quotation, the Adviser will provide to the Fund’s fair value committee (the “Valuation Committee”) an analysis of the factors relied upon in the selection of the relevant quotation.
| Alternative Credit Income Fund | Notes to Consolidated Financial Statements |
March 31, 2022 (Unaudited)
When price quotations for certain securities are not readily available, or if the available quotations are not believed to be reflective of market value by the Adviser, those securities will be valued at fair value as determined in good faith by the Valuation Committee using procedures adopted by and under the supervision of the Board. The Fund cannot ensure that fair values determined by the Board or persons acting in their direction would accurately reflect the price that the Fund could obtain for a security if the security was sold.
Fair valuation procedures may be used to value a substantial portion of the assets of the Fund. The Fund may use the fair value of a security to calculate its NAV when, for example, (1) a portfolio security is not traded in a public market or the principal market in which the security trades is closed, (2) trading in a portfolio security is suspended and not resumed prior to the normal market close, (3) a portfolio security is not traded in significant volume for a substantial period, or (4) the Adviser determines that the quotation or price for a portfolio security provided by a broker-dealer or independent pricing service is inaccurate.
The fair value of securities may be difficult to determine and thus judgment plays a greater role in the valuation process. The fair valuation methodology may include or consider the following guidelines, as appropriate: (1) evaluation of all relevant factors, including but not limited to, pricing history, current market level and supply and demand of the respective security; (2) comparison to the values and current pricing of securities that have comparable characteristics; (3) knowledge of historical market information with respect to the security; and (4) other factors relevant to the security which would include, but not be limited to, duration, yield, fundamental analytical data, the Treasury yield curve and credit quality.
Valuation of Private Investment Funds – The Fund invests a portion of its assets in private investment funds (“Private Investment Funds”). Private Investment Funds determine their investment assets at fair value and generally report a NAV or its equivalent on a calendar quarter basis. In accordance with U.S. GAAP guidance on fair value measurement, the Fund has elected to apply the practical expedient and to value its investments in Private Investment Funds at their respective NAVs at each quarter-end. For non-calendar quarter-end days, the Valuation Committee estimates the fair value of each Private Investment Fund by adjusting the most recent NAV for such Private Investment Fund, as necessary, by the change in a relevant benchmark that the Valuation Committee has deemed to be representative of the underlying securities in the Private Investment Fund.
Loan Participation and Assignments – The Fund invests in debt instruments, which are interests in amounts owed to lenders (the “Lenders”) by corporate, governmental or other borrowers. The Fund’s investments in loans may be in the form of direct investments, loans originated by the Fund, participations in loans or assignments of all or a portion of the loans from third parties or exposure to investments in loans through investment in Private Investment Funds or other pooled investment vehicle. When the Fund purchases an interest in a loan in the form of an assignment, the Fund acquires all of the direct rights and obligations of a lender (as such term is defined in the related credit agreement), including the right to vote on amendments or waivers of such credit agreement. However, the Fund generally has no right to enforce compliance with the terms of the loan agreement with the borrower. Instead, the administration of the loan agreement is often performed by a bank or other financial institution (the “Agent”) that acts as agent for the Lenders. Circumstances may arise in connection with which the Agent takes action that contradicts the will of the Lenders. For example, under certain circumstances, an Agent may refuse to declare the borrower in default, despite having received a notice of default from the Lenders. When the Fund purchases an interest in a loan in the form of a participation, the Fund purchases such participation interest from another existing Lender, and consequently, the Fund does not obtain the rights and obligations of the Lenders under the credit agreement, such as the right to vote on amendments or waivers. The Fund has the right to receive payments of principal, interest and any fees to which it is entitled only from the Lender from which the Fund has received that participation interest. In this instance, the Fund is subject to both the credit risk of the borrower and the credit risk of the Lender that sold the Fund such participation interest.
Unfunded Commitments – The Fund may enter into unfunded loan commitments, which are contractual obligations for future funding, such as delayed draws or revolving credit arrangements. Unfunded loan commitments represent a future obligation in full, even though a percentage of the notional loan amounts may not be utilized by the borrower. The Fund may receive a commitment fee based on the undrawn portion of the underlying line of credit portion of a floating rate loan.
| Semi-Annual Report | March 31, 2022 | 23 |
| Alternative Credit Income Fund | Notes to Consolidated Financial Statements |
March 31, 2022 (Unaudited)
Additionally, when the Fund invests in a Private Investment Fund, the Fund makes a commitment to invest a specified amount of capital in the applicable Private Investment Fund. The capital commitment may be drawn by the general partner of the Private Investment Fund either all at once or through a series of capital calls at the discretion of the general partner. The unfunded commitment represents the portion of the Fund’s overall capital commitment to a particular Private Investment Fund that has not yet been called by the general partner of the Private Investment Fund.
As of March 31, 2022, the Fund had unfunded commitments of $18,219,386.
Short Sales – The Fund may sell securities short. To do this the Fund will borrow and then sell (take short positions in) securities. To complete such a transaction, the Fund must borrow the security to deliver to the buyer. The Fund is then obligated to replace, or cover, the security borrowed by purchasing it in the open market at some later date. The Fund will generally have to pay a fee or premium to borrow a security and be obligated to repay the lender any dividend or interest that accrues on those securities during the period of the loan. The Fund bears the risk of a loss, unlimited in size, if the market price of the security increases between the date of the short sale and the date on which the Fund replaces the borrowed security. The Fund will realize a gain, limited to the price that the Fund sold the security short, if the security declines in value between those dates. There can be no assurance that securities necessary to cover a short position will be available for purchase. To mitigate leverage risk, the Fund will segregate liquid assets (which may include its long positions) at least equal to its short position exposure, marked-to- market daily.
Fair Value Measurements – A three-tier hierarchy has been established to classify fair value measurements for disclosure purposes. Inputs refer broadly to the assumptions that market participants would use in pricing the asset or liability, including assumptions about risk. Inputs may be observable or unobservable. Observable inputs are inputs that reflect the assumptions market participants would use in pricing the asset or liability that are developed based on market data obtained from sources independent of the reporting entity. Unobservable inputs are inputs that reflect the reporting entity’s own assumptions about the assumptions market participants would use in pricing the asset or liability that are developed based on the best information available. In accordance with the U.S. GAAP guidance on fair value measurements and disclosure, the Fund discloses the fair value of its investments in a hierarchy that prioritizes the inputs to valuation techniques used to measure the fair value.
Various inputs are used in determining the fair value of the Fund’s investments. These inputs are categorized in the following hierarchy under applicable accounting guidance:
| Level 1 – | Unadjusted quoted prices in active markets for identical, unrestricted assets or liabilities that the Fund has the ability to access at the measurement date; |
| | |
| Level 2 – | Quoted prices in markets that are not active, or quoted prices for similar assets or liabilities in active markets, or inputs other than quoted prices that are observable (either directly or indirectly) for substantially the full term of the asset or liability at the measurement date; and |
| | |
| Level 3 – | Significant unobservable prices or inputs (including the Fund’s own assumptions in determining the fair value of investments) where there is little or no market activity for the asset or liability at the measurement date. |
The availability of observable inputs can vary from security to security and is affected by a wide variety of factors, including, for example, the type of security, whether the security is new and not yet established in the marketplace, the liquidity of markets and other characteristics particular to the security. To the extent that valuation is based on models or inputs that are less observable or unobservable in the market, the determination of fair value requires more judgment. Accordingly, the degree of judgment exercised in determining fair value is greatest for instruments categorized in Level 3.
An investment level within the fair value hierarchy is based on the lowest level input, individually or in the aggregate, that is significant to fair value measurement. The valuation techniques used by the Fund to measure fair value maximizes the use of observable inputs and minimizes the use of unobservable inputs.
| Alternative Credit Income Fund | Notes to Consolidated Financial Statements |
March 31, 2022 (Unaudited)
The inputs or methodologies used for valuing securities are not necessarily an indication of the risk or liquidity associated with investing in those securities. The following is a summary of the fair values according to the inputs used in valuing the Fund’s investments as of March 31, 2022:
| Investments in Securities at Value | | Level 1 | | | Level 2 | | | Level 3 | | | Total | |
| Bank Loans(a) | | | | | | | | | | | | | | | | |
| Consumer Discretionary | | $ | – | | | $ | – | | | $ | 10,672,717 | | | $ | 10,672,717 | |
| Consumer Staples | | | – | | | | 2,275,000 | | | | 7,266,361 | | | | 9,541,361 | |
| Financials | | | – | | | | – | | | | 8,707,506 | | | | 8,707,506 | |
| Health Care | | | – | | | | 12,066,650 | | | | 4,576,941 | | | | 16,643,591 | |
| Industrials | | | – | | | | 8,151,685 | | | | 6,793,851 | | | | 14,945,536 | |
| Information Technology | | | – | | | | 16,537,696 | | | | 20,363,310 | | | | 36,901,006 | |
| Bonds & Notes(a) | | | | | | | | | | | | | | | | |
| Asset Backed Securities | | | – | | | | 8,055,194 | | | | 4,412,416 | | | | 12,467,610 | |
| Convertible Corporate Bond | | | – | | | | 3,032,543 | | | | – | | | | 3,032,543 | |
| Corporate Bonds | | | – | | | | 14,453,468 | | | | – | | | | 14,453,468 | |
| Common Equity(a) | | | | | | | | | | | | | | | | |
| Consumer Discretionary | | | – | | | | 1,578,033 | | | | – | | | | 1,578,033 | |
| Diversified | | | 26,594,941 | | | | – | | | | – | | | | 26,594,941 | |
| Energy | | | 3,182,639 | | | | – | | | | – | | | | 3,182,639 | |
| Real Estate | | | – | | | | 5,192,200 | | | | – | | | | 5,192,200 | |
| Preferred Stocks(a) | | | | | | | | | | | | | | | | |
| Consumer Discretionary | | | – | | | | – | | | | 4,866,405 | | | | 4,866,405 | |
| Diversified | | | 6,270,000 | | | | – | | | | – | | | | 6,270,000 | |
| Financials | | | 1,847,120 | | | | – | | | | – | | | | 1,847,120 | |
| Rights and Warrants(a) | | | – | | | | 1,011,249 | | | | – | | | | 1,011,249 | |
| Short-Term Investments(a) | | | 15,816,095 | | | | – | | | | – | | | | 15,816,095 | |
| TOTAL | | $ | 53,710,795 | | | $ | 72,353,718 | | | $ | 67,659,507 | | | $ | 193,724,020 | |
| Investments measured at net asset value(a) | | | | | | | | | | | | | | $ | 66,965,954 | |
| Total Investments, at fair value | | | | | | | | | | | | | | $ | 260,689,974 | |
| (a) | For detailed descriptions, see the accompanying Consolidated Schedule of Investments. |
The following table provides a reconciliation of the beginning and ending balances of investments for which the Trust has used Level 3 inputs to determine the fair value:
| Asset Type | | Balance as of September 30, 2021 | | | Accrued Discount/ premium | | | Realized Gain/(Loss) | | | Change in Unrealized Appreciation/ Depreciation | | | Purchases | | | Sales Proceeds | | | Transfer into Level 3 | | | Transfer Out of Level 3 | | | Balance as of March 31, 2022 | | | Net change in unrealized appreciation/ (depreciation) included in the Statements of Operations attributable to Level 3 investments held at March 31, 2022 | |
| Bank Loans | | $ | 42,396,431 | | | $ | 66,189 | | | $ | 16,453 | | | $ | (127,704 | ) | | $ | 27,615,300 | | | $ | (8,018,239 | ) | | $ | – | | | $ | (3,567,744 | ) | | $ | 58,380,686 | | | $ | 84,846 | |
| Bonds & Notes | | | – | | | | 713,152 | | | | – | | | | (1,050,736 | ) | | | 4,750,000 | | | | – | | | | – | | | | – | | | | 4,412,416 | | | | (1,050,736 | ) |
| Preferred Stock | | | 4,959,647 | | | | – | | | | – | | | | (93,242 | ) | | | – | | | | – | | | | – | | | | – | | | | 4,866,405 | | | | (93,242 | ) |
| | | $ | 47,356,078 | | | $ | 779,341 | | | $ | 16,453 | | | $ | (1,271,682 | ) | | $ | 32,365,300 | | | $ | (8,018,239 | ) | | $ | – | | | $ | (3,567,744 | ) | | $ | 67,659,507 | | | $ | (1,059,132 | ) |
| Semi-Annual Report | March 31, 2022 | 25 |
| Alternative Credit Income Fund | Notes to Consolidated Financial Statements |
March 31, 2022 (Unaudited)
There are significant unobservable valuation inputs for material Level 3 investments, and a change to the unobservable input may result in a significant change to the value of the investment. Level 3 investment valuation techniques and inputs as of March 31, 2022 are as follows:
| | | | | | Quantitative Information about Level 3 Fair Value Measurements | |
| Asset Category | | | Fair value at March 31, 2022 | | | Valuation Technique | | Unobservable Input(a) | | | Range of Input (Weighted Average) | |
| Bank loans | | | | | | | | | | | | |
| Consumer Discretionary | | $ | 10,672,717 | | | Discounted Cash Flows | | Market Yield | | | 8.4% – 13.2% (11.9%) | |
| Consumer Staples | | | 7,266,361 | | | Discounted Cash Flows | | Market Yield | | | 7.7% – 10.9% (9.9%) | |
| Financials | | | 8,707,506 | | | Discounted Cash Flows | | Market Yield | | | 7.6% – 20.5% (11.1%) | |
| Health Care | | | 4,576,941 | | | Recent Transaction | | Transaction Price | | | 97.0% – 99.0% (97.8%) | |
| Industrials | | | 6,793,851 | | | Discounted Cash Flows | | Market Yield | | | 7.0% – 9.7% (8.1%) | |
| Information Technology | | | 20,363,310 | | | Discounted Cash Flows | | Market Yield | | | 5.0% – 15.5% (8.9%) | |
| Asset Backed Securities | | | 4,412,416 | | | Discounted Cash Flows | | Market Yield | | | 19.5% – 22.2% (20.7%) | |
| Preferred Equity | | | 4,866,405 | | | Discounted Cash Flows | | Market Yield | | | 11.7% | |
| | | $ | 67,659,507 | | | | | | | | | |
| (a) | An increase in market yield would result in a decrease in fair value. A decrease in market yield would result in an increase in fair value. An increase in the transaction price would result in an increase in fair value. A decrease in the transaction price would result in a decrease in fair value. |
Concentration of Credit Risk – The Fund places its cash with one banking institution, which is insured by the Federal Deposit Insurance Corporation (“FDIC”). The FDIC limit is $250,000. At various times throughout the year, the amount on deposit may exceed the FDIC limit and subject the Fund to a credit risk.
Federal and Other Taxes – No provision for income taxes is included in the accompanying consolidated financial statements, as the Fund intends to distribute to shareholders all taxable investment income and realized gains and otherwise comply with Subchapter M of the Internal Revenue Code of 1986, as amended (the “Code”), applicable to regulated investment companies.
The Fund evaluates tax positions taken (or expected to be taken) in the course of preparing the Fund’s tax provisions to determine whether these positions meet a “more-likely-than-not” standard that, based on the technical merits, have a more than fifty percent likelihood of being sustained by a taxing authority upon examination. A tax position that meets the “more-likely-than-not” recognition threshold is measured to determine the amount of benefit to recognize in the consolidated financial statements.
As of and during the period ended March 31, 2022, the Fund did not have a liability for any unrecognized tax benefits. The Fund files U.S. federal, state and local tax returns as required. The Fund’s tax returns are subject to examination by the relevant tax authorities until expiration of the applicable statute of limitations, which is generally three years after the filing of the tax return for federal purposes and four years for most state returns. Tax returns for open years have incorporated no uncertain tax positions that require a provision for income taxes.
Distributions to Shareholders – Distributions from net investment income, if any, are declared and paid quarterly. Distributions from net realized capital gains, if any, are declared and paid annually and are recorded on the ex-dividend date. The character of income and gains to be distributed is determined in accordance with income tax regulations, which may differ from GAAP.
Early Withdrawal Charge – Selling brokers, or other financial intermediaries that have entered into distribution agreements with the Distributor (as defined below in Note 3), will receive a commission of (a) up to 1.00% of the purchase price of Class C shares and (b) up to 0.50% of the purchase of Class A shares of $1 million or more. Shareholders who tender for repurchase of such shareholder's Class C shares fewer than 365 days after the original purchase date will be subject to an early withdrawal charge of 1.00% of the original purchase price. Shareholders tendering Class A shares fewer than 365 days after the original purchase date will be subject to an early withdrawal charge of 0.50% of the original purchase price, which will be deducted from repurchase proceeds, if (i) the original purchase was for amounts of $1 million or more and (ii) the selling broker received the reallowance of the dealer-manager fee. The Distributor may waive the imposition of the early withdrawal charge in the event of shareholder death or shareholder disability. Any such waiver does not imply that the early withdrawal charge will be waived at any time in the future or that such early withdrawal charge will be waived for any other shareholder. Class A shares (with respect to purchases of less than $1 million) will not be subject to an early withdrawal charge.
Indemnification – The Fund indemnifies its officers and Trustees for certain liabilities that may arise from the performance of their duties to the Fund. Additionally, in the normal course of business, the Fund enters into contracts that contain a variety of representations and warranties and which provide general indemnities. The Fund’s maximum exposure under these arrangements is unknown, as this would involve future claims that may be made against the Fund that have not yet occurred. However, based on industry experience, the Fund expects the risk of loss due to these warranties and indemnities to be remote.
| Alternative Credit Income Fund | Notes to Consolidated Financial Statements |
March 31, 2022 (Unaudited)
3. ADVISORY FEES AND OTHER TRANSACTIONS WITH SERVICE PROVIDERS
Advisory Fees – On October 31, 2020, the Fund entered into a management agreement (the “Management Agreement”) with the Adviser. Under the terms of the Management Agreement, the Adviser provides certain investment advisory and administrative services to the Fund and in consideration of the advisory services provided, the Adviser is entitled to a fee consisting of two components — a base management fee and an incentive fee.
The base management fee is payable monthly in arrears at an annual rate of 1.85% of the average daily net assets of the Fund. For the year ended March 31, 2022, the Fund incurred $2,340,342 in base management fees.
The incentive fee is calculated and payable quarterly in arrears based upon the Fund’s “pre-incentive fee net investment income” for the immediately preceding quarter and is subject to a hurdle rate, expressed as a rate of return on the Fund’s “adjusted capital,” equal to 2.25% per quarter (or an annualized hurdle rate of 9.0%), subject to a “catch-up” feature. For this purpose, “pre-incentive fee net investment income” means interest income, dividend income and any other income accrued during the calendar quarter, less the Fund’s operating expenses for the quarter (including the management fee, expenses reimbursed to the Adviser and any interest expenses and distributions paid on any issued and outstanding preferred shares, but excluding the incentive fee). Pre-incentive fee net investment income includes, in the case of investments with a deferred interest feature (such as OID, debt instruments with paid-in-kind (“PIK”) interest and zero coupon securities), accrued income that the Fund has not yet received in cash. Pre-incentive fee net investment income does not include any realized capital gains, realized capital losses or unrealized capital appreciation or depreciation. “Adjusted capital” means the cumulative gross proceeds received by the Fund from the sale of shares (including pursuant to the Fund’s distribution reinvestment plan), reduced by amounts paid in connection with purchases of shares pursuant to the Fund’s share repurchase program.
No incentive fee is payable in any calendar quarter in which the Fund’s pre-incentive fee net investment income does not exceed the quarterly hurdle rate of 2.25%. For any calendar quarter in which the Fund’s pre-incentive fee net investment income is greater than the hurdle rate, but less than or equal to 2.8125%, the incentive fee will equal the amount of the Fund’s pre-incentive fee net investment income in excess of the hurdle rate. This portion of the Fund’s pre-incentive fee net investment income which exceeds the hurdle rate but is less than or equal to 2.8125% is referred to as the “catch-up.” The “catch-up” provision is intended to provide the Adviser with an incentive fee of 20.0% on all of the Fund’s pre-incentive fee net investment income when the Fund’s pre-incentive fee net investment income reaches 2.8125% in any calendar quarter. For any calendar quarter in which the Fund’s pre-incentive fee net investment income exceeds 2.8125% of adjusted capital, the incentive fee will equal 20.0% of pre-incentive fee net investment income. For the year ended March 31, 2022, the Advisor did not earn an incentive fee.
Under the Expense Limitation Agreement, dated October 31, 2020, the Adviser has contractually agreed to waive all or part of its management fees (excluding any incentive fee) and/or make payments to limit Fund expenses (excluding interest, brokerage commissions, acquired fund fees and expenses and extraordinary expenses) at least until October 31, 2022, such that the total annual operating expenses of the Fund do not exceed 2.59% per annum of Class A average daily net assets, 3.34% per annum of Class C average daily net assets, 2.59% per annum of Class W average daily net assets, 2.34% per annum of Class I average daily net assets, and 2.84% per annum of Class L average daily net assets. Fee waivers and expense payments may be recovered by the Adviser from the Fund, for a period of up to three years following the date of waiver or expense payment, if the Fund is able to make the repayment without exceeding the expense limitation in place at the time of waiver and the current expense limitation and the repayment is approved by the Board. For the period ended March 31, 2022, the Adviser waived fees of $249,308.
As of March 31, 2022, the following amounts that may be subject to reimbursement to the Adviser based upon their potential expiration dates:
| Fund | | 2022 | | | 2023 | | | 2024 | | | 2025 | |
| Alternative Credit Income Fund | | $ | 160,476 | | | $ | 225,631 | | | $ | 225,631 | | | $ | 249,308 | |
During the six months ended March 31, 2022, the Adviser did not recover any previously waived fees under the Expense Limitation Agreement.
| Semi-Annual Report | March 31, 2022 | 27 |
| Alternative Credit Income Fund | Notes to Consolidated Financial Statements |
March 31, 2022 (Unaudited)
Fund Accounting Fees and Expenses – ALPS Fund Services, Inc. (“ALPS”) serves as the Fund’s administrator and accounting agent (the “Administrator”) and receives customary fees from the Fund for such services.
Transfer Agent – DST Systems Inc. (the “Transfer Agent”), an affiliate of ALPS, serves as transfer, dividend paying and shareholder servicing agent for the Fund.
Distributor – The Fund has entered into a distribution agreement with ALPS Distributors, Inc. (the “Distributor”), an affiliate of ALPS, to provide distribution services to the Fund. There are no fees paid to the Distributor pursuant to the distribution agreement. The Board has adopted, on behalf of the Fund, a shareholder servicing plan under which the Fund may compensate financial industry professionals for providing ongoing services in respect of clients with whom they have distributed shares of the Fund. Under the shareholder servicing plan, the Fund’s Class A, Class C, Class W and Class L shares are subject to a shareholder servicing fee at an annual rate of 0.25% of the average daily net assets attributable to that share class. For the period ended March 31, 2022, the Fund's Class A, Class C, Class W and Class L shares incurred shareholder servicing fees of $418,224. The Class C and Class L shares also pay to the Distributor a distribution fee, pursuant to a distribution plan adopted by the Board, that accrues at an annual rate equal to 0.75% and 0.25%, respectively, of the Fund’s average daily net assets attributable to Class C and Class L shares, respectively, and is payable on a quarterly basis. Class A and Class I shares are not currently subject to a distribution fee. For the period ended March 31, 2022, the Fund's Class C and Class L shares incurred $190,670 in distribution fees.
The Distributor acts as the Fund’s principal underwriter in a continuous public offering of the Fund’s shares. During the six months ended March 31, 2022, no fees were retained by the Distributor.
Trustees – Each Trustee who is not affiliated with the Fund or the Adviser receives an annual fee of $10,000, $2,000 for attending the annual in-person meeting of the Board, and $500 for attending each of the remaining telephonic meetings, as well as reimbursement for any reasonable expenses incurred attending the meetings. None of the executive officers or interested Trustees receives compensation from the Trust.
4. INVESTMENT TRANSACTIONS
The cost of purchases and proceeds from the sale of securities, other than short-term securities, for the six months ended March 31, 2022 amounted to $46,218,436 and $33,414,599, respectively.
5. CAPITAL SHARES
The Fund, pursuant to an exemptive order granted by the SEC on July 22, 2014, offers multiple classes of shares. Class A, Class C, Class W, and Class I shares commenced operations on April 20, 2015. Class L shares commenced operations on July 28, 2017. Class C, Class W and Class I shares are offered at net asset value (“NAV”). Class A shares are offered at NAV plus a maximum sales charge of 5.75% and may also be subject to a 0.50% early withdrawal charge, which will be deducted from repurchase proceeds, for shareholders tendering shares fewer than 365 days after the original purchase date, if (i) the original purchase was for amounts of $1 million or more and (ii) the selling broker received the reallowance of the dealer-manager fee. Class C shares are subject to a 1.00% early withdrawal charge. Class L shares are offered at NAV plus a maximum sales charge of 4.25%. Each class represents an interest in the same assets of the Fund and classes are identical except for differences in their sales charge structures, ongoing service and distribution charges and early withdrawal charges. All classes of shares have equal voting privileges except that each class has exclusive voting rights with respect to its service and/or distribution plans. The Fund’s income, non-class specific expenses and realized and unrealized gains and losses are allocated proportionately daily based upon the relative net assets of each class. Class specific expenses, where applicable, include distribution fees, shareholder servicing fees, and networking fees.
Share Repurchase Program
As an interval fund, the Fund offers its shareholders the option of redeeming shares on a quarterly basis, at NAV, of up to 5% of the Fund’s issued and outstanding shares as of the close of regular business hours on the New York Stock Exchange on the Repurchase Pricing Date. If shareholders tender for repurchase more than 5% of the outstanding shares of the Fund, the Fund may, but is not required to, repurchase up to an additional 2% of the outstanding shares of the Fund. If the Fund determines not to repurchase up to an additional 2% of the outstanding shares of the Fund, or if more than 7% of the outstanding shares of the Fund are tendered, then the Fund will repurchase shares on a pro rata basis based upon the number of shares tendered by each shareholder. There can be no assurance that the Fund will be able to repurchase all shares that each shareholder has tendered. In the event of an oversubscribed offer, you may not be able to tender all shares that you wish to tender and you may have to wait until the next quarterly repurchase offer to tender the remaining shares, subject to any proration. Subsequent repurchase requests will not be given priority over other shareholder requests.
| Alternative Credit Income Fund | Notes to Consolidated Financial Statements |
March 31, 2022 (Unaudited)
For the period ended March 31, 2022, the Fund completed two quarterly repurchase offers. In these repurchase offers, the Fund offered to repurchase up to 5% of the number of its outstanding shares (up to 7% at the discretion of the officers of the Fund) as of the Repurchase Pricing Dates. For the six months ended March 31, 2022, none of the quarterly repurchase offers were oversubscribed. The result of those repurchase offers were as follows:
| | Repurchase Offer #1 | Repurchase Offer #2 |
| Commencement Date | September 13, 2021 | December 13, 2021 |
| Repurchase Request Deadline | October 13, 2021 | January 12, 2022 |
| Repurchase Pricing Date | October 13, 2021 | January 12, 2022 |
| Amount Repurchased | $13,987,510 | $7,800,424 |
| Shares Repurchased | 1,262,503 | 703,246 |
6. BANK LINE OF CREDIT
The Fund has a secured revolving bank line of credit through BNP Paribas Prime Brokerage International, Ltd. (“BNP”).
Borrowings under the BNP arrangement bear interest at the three-month LIBOR plus 95 basis points at the time of borrowing. For the period ended March 31, 2022, the Fund incurred $18,536 of interest expense related to the borrowings. Average borrowings and the average interest rate for the days the line of credit was outstanding during the period ended March 31, 2022 were $4,842,081 and 1.16%, respectively. The largest outstanding borrowing for the period ended March 31, 2022 was $11,007,896. As of March 31, 2022, the Fund did not have any outstanding borrowings.
Under the 1940 Act, the Fund is not permitted to incur indebtedness, including through the issuance of debt securities, unless immediately thereafter the Fund will have an asset coverage of at least 300%. In general, the term “asset coverage” for this purpose means the ratio which the value of the total assets of the Fund, less all liabilities and indebtedness not represented by senior securities, bears to the aggregate amount of senior securities representing indebtedness of the Fund. In addition, the Fund may be limited in its ability to declare any cash distribution on its capital stock or purchase its capital stock unless, at the time of such declaration or purchase, the Fund has an asset coverage (on its indebtedness) of at least 300% after deducting the amount of such distribution or purchase price, as applicable.
7. TAX BASIS INFORMATION
The following information is computed on a tax basis for each item as of March 31, 2021:
| | Gross Appreciation | | | Gross Depreciation (excess of tax cost over value) | | | Net Appreciation | | | Cost of Investments for Income Tax Purposes | |
| | $ | 29,214,150 | | | $ | (7,354,533 | ) | | $ | 21,859,617 | | | $ | 233,711,007 | |
| The tax characteristics of distributions paid for the year ended September 30, 2021, were as follows: |
| | Ordinary Income | | | Long-Term Capital Gain | | | Return of Capital | |
| | $ | 15,054,178 | | | $ | – | | | $ | 1,708,347 | |
| | | | | | | | | | | | |
8. RISK FACTORS
LIBOR Rate Risk
On July 27, 2017, the Financial Conduct Authority (“FCA”) announced that it would phase out the LIBOR as a benchmark by the end of 2021. It is unclear whether new methods of calculating LIBOR will be established such that it continues to exist after 2021 and has indicated that market participants should not rely on LIBOR being available after 2021. As an alternative to LIBOR, for example, the U.S. Federal Reserve, in conjunction with the Alternative Reference Rates Committee, a steering committee comprised of large U.S. financial institutions, is considering replacing U.S.-dollar LIBOR with the Secured Overnight Financing Rate ("SOFR"), a new index calculated by short-term repurchase agreements, backed by Treasury securities. Abandonment of or modifications to LIBOR could have adverse impacts on newly issued financial instruments and our existing financial instruments which reference LIBOR. While some instruments may contemplate a scenario where LIBOR is no longer available by providing for an alternative rate setting methodology, not all instruments may have such provisions and there is significant uncertainty regarding the effectiveness of any such alternative methodologies. Abandonment of or modifications to LIBOR could lead to significant short-term and long-term uncertainty and market instability. If LIBOR ceases to exist, we and our portfolio companies may need to amend or restructure our existing LIBOR-based debt instruments and any related hedging arrangements that extend beyond 2021, which may be difficult, costly and time consuming. In addition, from time to time we invest in floating rate loans and investment securities whose interest rates are indexed to LIBOR. Uncertainty as to the nature of alternative reference rates and as to potential changes or other reforms to LIBOR, or any changes announced with respect to such reforms, may result in a sudden or prolonged increase or decrease in the reported LIBOR rates and the value of LIBOR-based loans and securities, including those of other issuers we or our funds currently own or may in the future own. It remains uncertain how such changes would be implemented and the effects such changes would have on us, issuers of instruments in which we invest and financial markets generally.
| Semi-Annual Report | March 31, 2022 | 29 |
| Alternative Credit Income Fund | Notes to Consolidated Financial Statements |
March 31, 2022 (Unaudited)
The expected discontinuation of LIBOR could have a significant impact on our business. The dollar amount of our outstanding debt investments and borrowings that are linked to LIBOR with maturity dates after the anticipated discontinuation date of 2021 is material. We anticipate significant operational challenges for the transition away from LIBOR including, but not limited to, amending existing loan agreements with borrowers on investments that may have not been modified with fallback language and adding effective fallback language to new agreements in the event that LIBOR is discontinued before maturity. Beyond these challenges, we anticipate there may be additional risks to our current processes and information systems that will need to be identified and evaluated by us. Due to the uncertainty of the replacement for LIBOR, the potential effect of any such event on our cost of capital and net investment income cannot yet be determined. In addition, the cessation of LIBOR could:
| ● | Adversely impact the pricing, liquidity, value of, return on and trading for a broad array of financial products, including any LIBOR-linked securities, loans and derivatives that are included in our assets and liabilities; |
| ● | Require extensive changes to documentation that governs or references LIBOR or LIBOR-based products, including, for example, pursuant to time-consuming renegotiations of existing documentation to modify the terms of outstanding investments; |
| ● | Result in inquiries or other actions from regulators in respect of our preparation and readiness for the replacement of LIBOR with one or more alternative reference rates; |
| ● | Result in disputes, litigation or other actions with portfolio companies, or other counterparties, regarding the interpretation and enforceability of provisions in our LIBOR-based investments, such as fallback language or other related provisions, including, in the case of fallbacks to the alternative reference rates, any economic, legal, operational or other impact resulting from the fundamental differences between LIBOR and the various alternative reference rates; |
| ● | Require the transition and/or development of appropriate systems and analytics to effectively transition our risk management processes from LIBOR-based products to those based on one or more alternative reference rates, which may prove challenging given the limited history of the proposed alternative reference rates; and |
| ● | Cause us to incur additional costs in relation to any of the above factors. |
There is no guarantee that a transition from LIBOR to an alternative will not result in financial market disruptions, significant increases in benchmark rates, or borrowing costs to borrowers, any of which could have a material adverse effect on our business, result of operations, financial condition, and unit price.
Market Disruption Risk
The outbreak of the novel coronavirus, or COVID-19, in many countries continues to adversely impact global commercial activity and has contributed to significant volatility in financial markets. The global impact of the outbreak has been rapidly evolving, and as cases of the virus have continued to be identified in additional countries, many countries have reacted by instituting or reinstituting quarantines, restrictions on travel and other measures to mitigate the impact of this pandemic. While many of these measures have been relaxed, spread of the virus continues and restrictions generally remain in place. Such actions have created disruption in global supply chains, and have adversely impacted a number of industries, including, among others, transportation, hospitality and entertainment. The outbreak has triggered a period of global economic slowdown and continued volatility and could have a continued adverse impact on economic and market conditions. The rapid development and fluidity of this situation precludes any prediction as to the duration and extent of this pandemic and its impact on the Fund’s business, financial condition and results of operations, as well as the business, financial condition and results of operations of the Fund’s portfolio companies. Nevertheless, the novel coronavirus presents material uncertainty and risk with respect to the Fund and the Fund’s portfolio companies’ performance and financial results. The Adviser is actively monitoring developments with respect to this pandemic and its impact as part of the Fund’s overall investment objective and strategy. To the extent the Fund’s portfolio companies are adversely impacted by the effects of COVID-19, it may have a material adverse impact on the Fund’s future net investment income, the fair value of its portfolio investments, its financial condition and the results of operations and financial condition of the Fund’s portfolio companies.
The U.S. capital markets have experienced extreme volatility and disruption following the global outbreak of COVID-19 that began in December 2019. Some economists, major investment banks and The World Bank have indicated that current indicators point to a global recession that started in February 2020. Disruptions in the capital markets have increased the spread between the yields realized on risk-free and higher risk securities, resulting in illiquidity in parts of the capital markets. These and future market disruptions and/or illiquidity have had, and are expected to continue to have an adverse effect on the Fund’s business, financial condition, results of operations and cash flows. Unfavorable economic conditions also would be expected to increase the Fund’s funding costs, limit our access to the capital markets or result in a decision by lenders not to extend credit to the Fund. These events have limited and could continue to limit the Fund’s investment originations, limit the Fund’s ability to grow and have a material negative impact on the Fund’s operating results and the fair values of our debt and equity investments.
| Alternative Credit Income Fund | Notes to Consolidated Financial Statements |
March 31, 2022 (Unaudited)
The Adviser is closely monitoring developments related to the COVID-19 pandemic to assess its impact on the Fund and the Fund’s portfolio companies’ business; while, due to the evolving and highly uncertain nature of this event, it currently is not possible to estimate its total impact precisely, the COVID-19 pandemic has and could continue to impact the Fund’s business, financial condition, results of operations, liquidity or prospects and those of the Fund’s portfolio companies in a number of ways. For instance, the Fund’s investment portfolio (and, specifically, the valuations of investment assets the Fund holds) has been, and may continue to be, adversely affected as a result of market developments from the COVID-19 pandemic and uncertainty regarding its outcome. Moreover, changes in interest rates, reduced liquidity or a continued slowdown in U.S. or global economic conditions has, and may continue to, adversely affect the Fund’s business, financial condition, results of operations, liquidity and/or prospects and those of the Fund’s portfolio companies. Further, extreme market volatility may leave the Fund and the Fund’s portfolio companies unable to react to market events in a prudent manner consistent with the Fund’s historical practices in dealing with more orderly markets. Although it is impossible to predict with certainty the potential full magnitude of the business and economic ramifications, COVID-19 has impacted, and may further impact, the Fund’s business in various ways, including but not limited to:
| ● | From an operational perspective, the Adviser’s employees, as well as the workforces of the Fund’s vendors, service providers and counterparties, may also be adversely affected by the COVID-19 pandemic or efforts to mitigate the pandemic, including government-mandated shutdowns, requests or orders for employees to work remotely, and other self-imposed social distancing measures, in the U.S., which could result in an adverse impact on the Fund’s ability to conduct its business; |
| ● | While the market dislocation caused by COVID-19 may present attractive investment opportunities, due to increased volatility in the financial markets, the Fund may not be able to complete those investments; |
| ● | If the impact of COVID-19 continues as is currently predicted by central banks and the International Monetary Fund, the Fund may have more limited opportunities to successfully exit existing investments, due to, among other reasons, lower valuations, decreased revenues and earnings, or lack of potential buyers with financial resources to pursue an acquisition, resulting in a reduced ability to realize value from such investments; |
| ● | The Fund’s portfolio companies are facing or may face in the future increased credit and liquidity risk due to volatility in financial markets, reduced revenue streams, and limited or higher cost of access to preferred sources of funding, which may result in write-down or write-off in the value of the Fund’s investments. Changes in the debt financing markets are impacting, or, if the volatility in financial market continues, may in the future impact, the ability of the Fund’s portfolio companies to meet their respective financial obligations; |
| ● | Borrowers of loans, notes and other credit instruments in the Fund’s portfolio may be unable to meet their principal or interest payment obligations or satisfy financial covenants, resulting in a decrease in value of the Fund’s investments and lower than expected return. In addition, for variable interest instruments, lower reference rates resulting from government stimulus programs in response to COVID-19 could lead to lower interest income; |
| ● | Many of the Fund’s portfolio companies operate in industries that are materially impacted by COVID-19, including but not limited to healthcare, travel, entertainment and hospitality. Many of these companies are facing operational and financial hardships resulting from the spread of COVID-19 and related governmental measures, such as the closure of stores, restrictions on travel, quarantines or stay-at-home orders. If the disruptions caused by COVID-19 continue and the restrictions put in place are not lifted, the businesses of these portfolio companies could suffer materially or become insolvent, which would decrease the value of the Fund’s investments. Even if restrictions are lifted, as is the case in many jurisdictions in the U.S. and worldwide, business levels may not return to pre-pandemic levels and continuing outbreaks of COVID-19 could discourage people from resuming normal activities and governments may put restrictions back in place; |
| ● | An extended period of remote working by the Adviser’s employees could strain its technology resources and introduce operational risks, including heightened cybersecurity risk. Remote working environments may be less secure and more susceptible to hacking attacks, including phishing and social engineering attempts that seek to exploit the COVID-19 pandemic; and |
| ● | COVID-19 presents a significant threat to the Adviser’s employees’ well-being and morale. While the Adviser has implemented a business continuity plan to protect the health of its employees and has contingency plans in place for key employees or executive officers who may become sick or otherwise unable to perform their duties for an extended period of time, such plans cannot anticipate all scenarios, and the Adviser may experience potential loss of productivity or a delay in the roll out of certain strategic plans. |
9. SUBSEQUENT EVENTS
The Fund has evaluated subsequent events through the date of issuance of the consolidated financial statements.
| Semi-Annual Report | March 31, 2022 | 31 |
| Alternative Credit Income Fund | Additional Information |
March 31, 2022 (Unaudited)
1. PROXY VOTING POLICIES AND VOTING RECORD
A description of the policies and procedures that the Fund uses to vote proxies relating to portfolio securities is available without charge upon request by calling toll-free 833-404-4103, or on the Securities and Exchange Commission’s (“SEC”) website at http://www.sec.gov. Information regarding how the Fund voted proxies relating to portfolio securities during the most recent 12-month period ended June 30th is available without charge upon request by calling toll-free 833-404-4103, or on the SEC’s website at http://www.sec.gov.
2. QUARTERLY PORTFOLIO HOLDINGS
The Fund files a complete listing of portfolio holdings for the Fund with the SEC as of the first and third quarters of each fiscal year on Form N-PORT. The filings are available upon request by calling 833-404-4103. Furthermore, you may obtain a copy of the filing on the SEC’s website at http://www.sec.gov.
| Alternative Credit Income Fund | Privacy Notice |
| | March 31, 2022 (Unaudited) |
| FACTS | WHAT DOES ALTERNATIVE CREDIT INCOME FUND DO WITH YOUR PERSONAL INFORMATION? |
| Why? | Financial companies choose how they share your personal information. Federal law gives consumers the right to limit some but not all sharing. Federal law also requires us to tell you how we collect, share, and protect your personal information. Please read this notice carefully to understand what we do. |
| What? | The types of personal information we collect and share depend on the product or service you have with us. This information can include: |
| | • Social Security number | • Purchase History |
| | • Assets | • Account Balances |
| | • Retirement Assets | • Account Transactions |
| | • Transaction History | • Wire Transfer Instructions |
| | • Checking Account Information | |
| | When you are no longer our customer, we continue to share your information as described in this notice. |
| How? | All financial companies need to share customers’ personal information to run their everyday business. In the section below, we list the reasons financial companies can share their customers’ personal information; the reasons Alternative Credit Income Fund chooses to share; and whether you can limit this sharing. |
| REASONS WE CAN SHARE YOUR PERSONAL INFORMATION | Does Alternative
Credit Income
Fund share? | Can you limit
this sharing? |
| For our everyday business purposes — such as to process your transactions, maintain your account(s), respond to court orders and legal investigations, or report to credit bureaus | Yes | No |
| For our marketing purposes — to offer our products and services to you | No | We don’t share |
| For joint marketing with other financial companies | No | We don’t share |
| For our affiliates’ everyday business purposes — information about your transactions and experiences | No | We don’t share |
| For our affiliates’ everyday business purposes — information about your creditworthiness | No | We don’t share |
| For nonaffiliates to market to you | No | We don’t share |
| QUESTIONS? | Call 1-833-404-4103 |
| Semi-Annual Report | March 31, 2022 | 33 |
| Alternative Credit Income Fund | Privacy Notice |
| | March 31, 2022 (Unaudited) |
| WHO WE ARE | |
| Who is providing this notice? | Alternative Credit Income Fund |
| WHAT WE DO | |
| How does Alternative Credit Income Fund protect my personal information? | To protect your personal information from unauthorized access and use, we use security measures that comply with federal law. These measures include computer safeguards and secured files and buildings.
Our service providers are held accountable for adhering to strict policies and procedures to prevent any misuse of your nonpublic personal information. |
| How does Alternative Credit Income Fund collect my personal information? | We collect your personal information, for example, when you • Open an account • Provide account information • Give us your contact information • Make deposits or withdrawals from your account • Make a wire transfer • Tell us where to send the money • Tells us who receives the money • Show your government-issued ID • Show your driver’s license We also collect your personal information from other companies. |
| Why can’t I limit all sharing? | Federal law gives you the right to limit only • Sharing for affiliates’ everyday business purposes – information about your creditworthiness • Affiliates from using your information to market to you • Sharing for nonaffiliates to market to you State laws and individual companies may give you additional rights to limit sharing. |
| DEFINITIONS | |
| Affiliates | Companies related by common ownership or control. They can be financial and nonfinancial companies. • Alternative Credit Income Fund does not share with our affiliates. |
| Nonaffiliates | Companies not related by common ownership or control. They can be financial and nonfinancial companies. • Alternative Credit Income Fund does not share with nonaffiliates so they can market to you. |
| Joint marketing | A formal agreement between nonaffiliated financial companies that together market financial products or services to you. • Alternative Credit Income Fund doesn’t jointly market. |
This Page Intentionally Left Blank

INVESTMENT ADVISER
Sierra Crest Investment Management, LLC
650 Madison Avenue, 23rd Floor
New York, New York 10022
DISTRIBUTOR
ALPS Distributors, Inc.
1290 Broadway, Suite 1000
Denver, Colorado 80203
LEGAL COUNSEL
Thompson Hine LLP
41 South High Street, Suite 1700
Columbus, Ohio 43215
INDEPENDENT REGISTERED
PUBLIC ACCOUNTING FIRM
BBD, LLP
1835 Market Street, 3rd Floor
Philadelphia, Pennsylvania 19103
Must be accompanied or preceded by a Prospectus.
ALPS Distributors, Inc. is the Distributor for Alternative Credit Income Fund.
Item 1. Reports to Stockholders.
Item 2. Code of Ethics.
Not applicable to this report.
Item 3. Audit Committee Financial Expert.
Not applicable to this report.
Item 4. Principal Accountant Fees and Services.
Not applicable to this report.
Item 5. Audit Committee of Listed Registrants.
Not applicable to the Registrant.
Item 6. Investments.
| (a) | The schedule of investments is included as part of the Reports to Shareholders filed under Item 1 of this report. |
| (b) | Not applicable to the Registrant. |
Item 7. Disclosure of Proxy Voting Policies and Procedures for Closed-End Management Investment Companies.
Not applicable to this report.
Item 8. Portfolio Managers of Closed-End Management Investment Companies.
| (a) | Not applicable to this report. |
| (b) | Not applicable to this report. |
Item 9. Purchases of Equity Securities by Closed-End Management Investment Company and Affiliates Purchasers.
None.
Item 10. Submission of Matters to a Vote of Security Holders.
None.
Item 11. Controls and Procedures.
| (a) | Based on an evaluation of the Registrant’s disclosure controls and procedures as of a date within 90 days of the filing date of this report, the Registrant’s principal executive officer and principal financial officer have concluded that the disclosure controls and procedures are reasonably designed to ensure that the information required in filings on Form N-CSR is recorded, processed, summarized and reported by the filing date, including that information required to be disclosed is accumulated and communicated to the Registrant’s management, including the Registrant’s principal executive officer and principal financial officer, as appropriate to allow timely decisions regarding required disclosure. |
| (b) | There were no significant changes in the Registrant’s internal control over financial reporting that occurred during the Registrant’s last fiscal half-year that have materially affected, or are reasonably likely to materially affect, the Registrant’s internal control over financial reporting. |
Item 12. Disclosure of Securities Lending Activities for Closed-End Management Investment Companies.
None.
Item 13. Exhibits.
SIGNATURES
Pursuant to the requirements of the Securities Exchange Act of 1934 and the Investment Company Act of 1940, the Registrant has duly caused this report to be signed on its behalf by the undersigned, thereunto duly authorized.
ALTERNATIVE CREDIT INCOME FUND
By: | /s/ Edward Goldthorpe | | |
| Edward Goldthorpe | | |
| President (Principal Executive Officer) |
Date: June 6, 2022
Pursuant to the requirements of the Securities Exchange Act of 1934 and the Investment Company Act of 1940, this report has been signed below by the following persons on behalf of the Registrant and in the capacities and on the dates indicated.
By: | /s/ Edward Goldthorpe | | |
| Edward Goldthorpe | | |
| President (Principal Executive Officer) |
Date: June 6, 2022
By: | /s/ Jason Roos | | |
| Jason Roos | | |
| Chief Financial Officer (Principal Financial Officer) |
Date: June 6, 2022