UNITED STATES
SECURITIES AND EXCHANGE COMMISSION
WASHINGTON, D.C. 20549
FORM N-CSR
CERTIFIED SHAREHOLDER REPORT OF REGISTERED
MANAGEMENT INVESTMENT COMPANIES
811-23016
(Investment Company Act file number)
Alternative Credit Income Fund
(Exact name of Registrant as specified in charter)
650 Madison Avenue, 23rd Floor
New York, NY 10022
(Address of principal executive offices)(Zip code)
The Corporation Trust Company
Corporation Trust Center, 1209 Orange Street
Wilmington, DE 19801
(Name and address of agent for service)
Registrant's telephone number, including area code: (212) 891-2880
Date of fiscal year end: September 30
Date of reporting period: October 1, 2023 - March 31, 2024
Item 1. Reports to Stockholders.

TABLE OF CONTENTS
| Shareholder Letter | 1 |
| Portfolio Update | 13 |
| Consolidated Schedule of Investments | 15 |
| Consolidated Statement of Assets and Liabilities | 22 |
| Consolidated Statement of Operations | 23 |
| Consolidated Statements of Changes in Net Assets | 24 |
| Consolidated Statement of Cash Flows | 26 |
| Financial Highlights | |
| Class A | 27 |
| Class C | 28 |
| Class W | 29 |
| Class I | 30 |
| Class L | 31 |
| Notes to Consolidated Financial Statements | 32 |
| Additional Information | 43 |
| Privacy Notice | 45 |

| Alternative Credit Income Fund | Shareholder Letter |
March 31, 2024 (Unaudited)
Dear Shareholders:
We are excited to share with our partners the latest letter for the Alternative Credit Income Fund (ticker: RCIIX)1 for the semi-annual period ended March 31, 2024. The Fund gained 2.9% in the period with notable strength to begin calendar 2024.
This letter comes at a particularly opportune time, in our view, given the decidedly murky macro backdrop. Public markets have been ebullient in recent months, boosted by the Fed’s dovish tilt in December 2023, which has amplified the “soft landing” narrative. Soft landing has become such a market buzzword that it requires examining what such an outcome would entail.
A soft-landing suggests that the market and the economy could escape the massive over-stimulus and inflationary spiral of COVID-19 and the resulting ~550bps of interest rate hikes—without experiencing economic pain or downturn. Such an optimistic outcome would seem to belie basic reason. More importantly, the soft-landing thesis ignores certain tremors at the foundation of our economy.
Macro Backdrop: The Concerning
Again, the Federal Reserve (the "Fed") alluding to cuts this year reignited the market’s animal spirits and loosened market conditions for many. However, not all corners of the economy have participated in the latest market celebration. As reflected in the chart below, small- and medium-sized banks have continued to tighten lending activity:
U.S. Bank Lending

Source: FRB, Haver Analytics, Apollo Chief Economist.
A range of (not-insignificant) challenges has contributed to muted bank lending, including marked-to-market losses on long duration assets, commercial real estate (“CRE”) concerns, regulatory overhang post-Silicon Valley Bank and depositor flight into Money Market Funds. In our view, none of these troubles appear likely to abate in the near-term.
| Semi-Annual Report | March 31, 2024 | 1 |
| Alternative Credit Income Fund | Shareholder Letter |
March 31, 2024 (Unaudited)
Further, as highlighted in the chart below, banks play a vital role in our economy, beyond just business lending. Small banks provide nearly 70% of CRE loans, nearly 40% of residential real estate debt and more than 20% of consumer loans:
Small banks’ share of total bank lending, by loan type

Source: FRB, Haver Analytics, Apollo Chief Economist.
There are few segments of the U.S. economy not touched by the traditional banking channel.
Banks have historically helped the gears of U.S. GDP to turn. Without lending, our economy will inevitably slow, as capital deprived businesses may forgo expansion plans or (worst case) struggle to stock their shelves. In short, if banks remain sidelined, we believe a soft-landing will ultimately prove elusive.
The health of the U.S. consumer represents another potential threat to the market’s current bull-run. As has been well documented, a lack of opportunities to spend during the pandemic as well as aggressive fiscal stimulus, enabled households to build “excess savings,” which has helped propel our post-COVID-19 economy. However, as this chart reveals, much of these savings have been exhausted—particularly among the most economically sensitive Americans:
U.S. Household “Excess Savings”
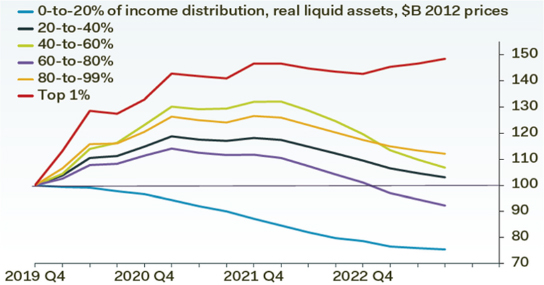
Source: Pantheon Research
| Alternative Credit Income Fund | Shareholder Letter |
March 31, 2024 (Unaudited)
Much of these remaining savings may remain trapped from an economic perspective. Given the lower marginal propensity to consume among wealthy households, these dollars may not be spent into our economy in the near-term, if at all.
Economically sensitive households—those who have borne the brunt of inflationary pain—have also not participated in recent market-driven wealth effects. Hence, while many consumers appear to be doing quite well, many are not. Underscoring this dynamic, as reflected below, an increasing number of Americans are paying minimum monthly debt payments and leaving significant balances outstanding:
Household Payments and Revolving Balances

Source: Federal Reserve Bank of Philadelphia
Federal Reserve Bank of Philadelphia data for 4Q 2023 also reflected the highest credit card delinquency rate since 2012, with 3.5% of card balances at least 30 days past due at year end.
With segments of our population experiencing real pain from higher prices and higher cost of debt, consumer spending may shift from a tailwind to a headwind, which could upend the market’s latest tear.
Business sentiment appears to reflect some of the underlying challenges in our economy. Notably, the NFIB Small Business Optimism Index for March registered the lowest reading since 2012:
NFIB Small Business Optimism
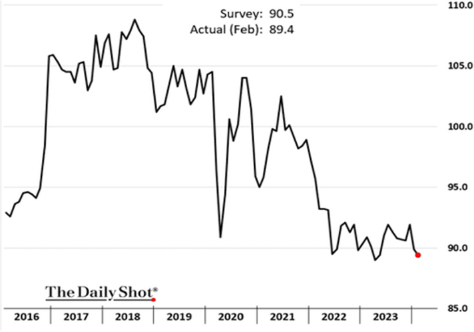
Source: NFIB and The Daily Dash
| Semi-Annual Report | March 31, 2024 | 3 |
| Alternative Credit Income Fund | Shareholder Letter |
March 31, 2024 (Unaudited)
In our jobs, we confront seemingly endless amounts of information—much of which gets lost in the noise. However, we would argue the previous chart requires a pause for contemplation: despite a seemingly strong economy and an enthusiastic equity market, small business sentiment is worse than during the troughs of the pandemic. We find this fact, both stupefying and ominous.
Interest rates represent a much-discussed market overhang as well. Relatedly, as evidenced in the graphs below, U.S. equity market valuations are near historic levels:
Distribution of S&P 500 P/E Ratios Now and During the “Dot-com” Peak
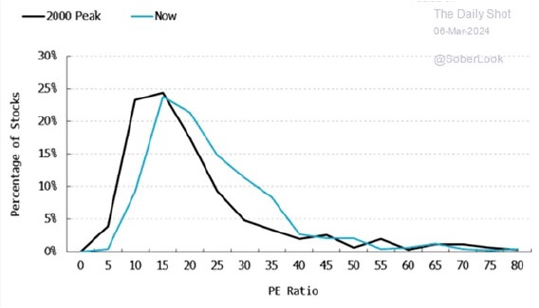
Source: Bloomberg
Market Cap of the Largest Stock Relative to the 75th Percentile of Stocks
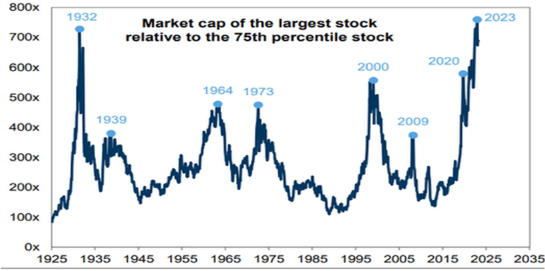
Source: Compustat, CRSP, Goldman Sachs Investment Research (4/9/2024)
Artificial Intelligence ("AI") is centerstage of the stock market’s recent furious gains (contributing to the S&P 500’s concentration). Only time will reveal if artificial intelligence represents a paradigm shifting economic force—and therefore worthy of the market’s current lofty valuations.
Beyond AI, expectations for rate cuts have also catalyzed the latest market rally. However, these much-anticipated cuts have confronted the reality of an economy stronger than feared, a job market that continues to expand and inflation that refused to surrender (even before accounting for the latest rise in oil prices).
| Alternative Credit Income Fund | Shareholder Letter |
March 31, 2024 (Unaudited)
As the following chart shows, the S&P 500 Index ("S&P") has yet to recalibrate for a more realistic appraisal of the path of rates in 2024:
S&P 500 vs. Fed Fund Futures

Source: Oxford Economics / Haver Analytics (3/7/2024)
For economic and political reasons, we anticipate one 25bps cut this year—mostly likely in July; we believe September would be considered too close to the election.
The economic case for cuts, in part, stems from concerns about real interest rates. Even with inflation lodged in the +3.0% context, inflation-adjusted Fed Funds remain at the highest level since the global financial crises ("GFC"):
Real Fed Funds Rate
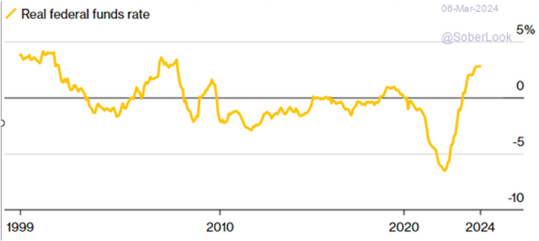
Source: Bloomberg
| Semi-Annual Report | March 31, 2024 | 5 |
| Alternative Credit Income Fund | Shareholder Letter |
March 31, 2024 (Unaudited)
High real rates have historically been associated with—if not the proximal cause of—things “breaking” in the market:
U.S. 10 Year Real Rates and Bubble “Pops”
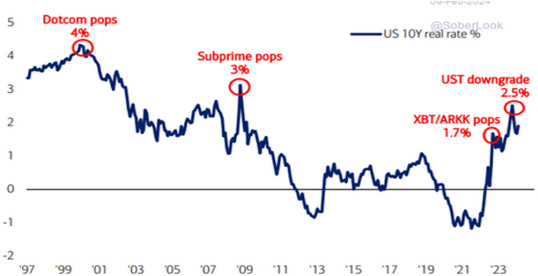
Source: BofA Global Investment Strategist
Additionally, much of the globe appears to be entering a synchronous cutting cycle, with Bank of England, ECB and Bank of Canada all signaling cuts this summer. Other than Bank of Japan which may need to hike to defend its spiraling Yen, the trajectory of global rates is definitively downward. If the U.S. Federal Reserve does not cut, we risk an overheated dollar, which could weigh on GDP from lower export demand.
Finally, on the political front, the Fed will face increasing pressure from Washington to push rates lower in an election year—particularly with many consumers starting to feel the bite of higher rates. Hence, while perhaps not entirely economically justified, we expect one cut this summer.
Macro Backdrop: The Positive
Tempering our decidedly guarded tone thus far, there are unquestionably many positive signals in the current backdrop. Namely, jobs are plentiful and—as demonstrated in the charts below— household and corporate balance sheets are historically strong:
Net Interest Paid by Corps. as % of GDP vs. Household Debt Service Ratio (%)
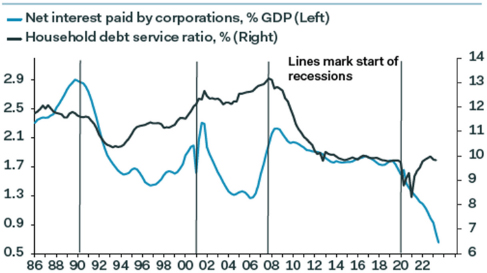
Source: Pantheon Macro
| Alternative Credit Income Fund | Shareholder Letter |
March 31, 2024 (Unaudited)
Household Balance Sheet (as % of GDP)
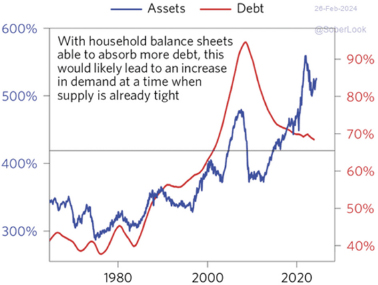
Source: Bridgewater Associates
Cash Held by U.S. Corporations, All-Time High
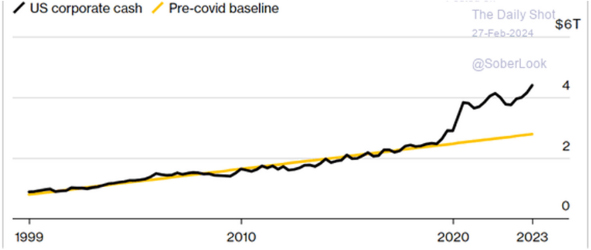
Source: Bridgewater Associates
Additionally, circling back to artificial intelligence, AI enthusiasm could kick-off a wave of corporate investment and productivity reminiscent of the 1990s (hopefully without the resulting market bubble). We would note, however, that the 1990s productivity boom happened amid an era of budget surplus, unlike our current period of crushing fiscal deficits.
Another clear positive, should the economy weaken, the Fed has cuts at their disposal. Rate cuts provided diminishing efficacy during much of the post-GFC era. Because rates had been so low for so long (and the specter of inflation had become a faded memory), incremental cuts elicited little change in corporate or household behavior.
Now, after having experienced the discomfort (if not agony, for some) of higher rates, people will likely pounce when the cost of debt declines. People may race out to buy that car or dish washer, or other rate sensitive goods, for fear that rates may go up again, which could rekindle the economy.
| Semi-Annual Report | March 31, 2024 | 7 |
| Alternative Credit Income Fund | Shareholder Letter |
March 31, 2024 (Unaudited)
Macro Backdrop: The Opportunity
The discordant signals in the market provide a challenging backdrop for investors, but credit, in our view, remains a haven. Unlike exuberantly priced equities, middle market credit remains rich with opportunity. Muted bank lending is troubling for the economy, broadly, but has unambiguously translated into an opportunity for our shareholders. Small and medium-sized businesses are increasingly turning to non-traditional platforms, like BC Partners, for capital solutions, a fact highlighted by the graph below:
Assets: Banks vs. Fund Managers

Source: Board of Governors of the Federal Reserve; ICI/Prequin/HFR
Blows to the U.S. banking system from COVID-19, rapidly interest rate increases, bad CRE loans and the Silicon Valley Bank collapse have accelerated the structural trend of increasing capital formation by non-bank institutions.
| Alternative Credit Income Fund | Shareholder Letter |
March 31, 2024 (Unaudited)
From an investor standpoint, we believe it is instructive to highlight the benefits of our private credit solutions as an asset class. As reflected in the chart below, private credit has handily outpaced all categories of fixed income and produced returns competitive with the S&P 500 (with markedly lower volatility), in recent years:
Index Returns, Rebased to 2019
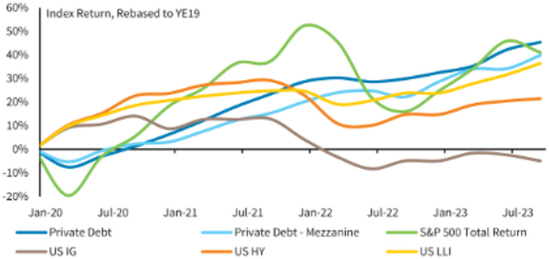
Source: Data through 3Q 2023, Prequin, Barclays Research (04/11/2024)
Much of this outperformance stems from the higher yield, greater issuance discounts and higher call protection available in private credit.
Not all private credit solutions, are the same, of course. BC Partners’ focus on lending to companies with $10mn to $50mn of EBITDA uniquely positions us to capitalize on the pullback by small- and medium-sized banks. Many competing private credit funds—with billions of capital to deploy—must chase larger companies, which still have access to traditional lending channels. Hence, we believe we are uniquely positioned as a Fund and a firm to benefit from the structural decline of banks.
Relatedly, we would emphasize another key difference between BC Partners and many of our private credit peers. Given less competition, lower middle market deals still generally command covenants—or governing docs that help protect investors. As reflected in the chart below, covenants are becoming increasingly scarce in larger deals, a segment in which BC Partners does not compete:
Covenant-Lite Share of New Issue Private Credit Loans by Initial Loan Amount, 2020-2023
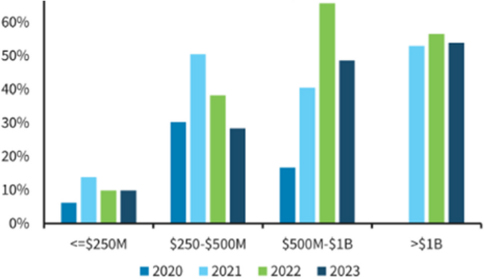
Source: Covenant Review, Barclays Research
What is the point of private credit without covenants? We would argue that competing large cap private funds have essentially become expensive and concentrated mutual funds.
| Semi-Annual Report | March 31, 2024 | 9 |
| Alternative Credit Income Fund | Shareholder Letter |
March 31, 2024 (Unaudited)
Fund Performance
The Fund generated a gain of 2.9% in the six-month period ended 3/31/2024 and we continue to handily outpace our fixed income benchmarks:
Cumulative returns RCIIX vs. Fixed Income Benchmarks
| Alternative Credit Income Fund (RCIIZ)2 | 71.6% |
| Barclay's U.S. Aggregate Total Return Value Index3 | 53.9% |
| Morningstar LSTA US Leverage Loan TR USD Index4 | 53.2% |
| Bank of America High Yield Index5 | 10.1% |
Source: Bloomberg. Total return from 10/27/2015 through March 31, 2024
What Didn’t Work (yet)
Highlighting detractors in the period, term loans backing Jo-Ann Stores (ticker: JOAN) declined to effectively zero by the end of March 2024. Long-time Fund holders know our previous success with JOAN—buying loans in the 30s during the pandemic which were shortly refinanced at par.
We purchased First Lien Term Loan of JOAN at 70 last summer after post-COVID-19 inflationary pressure battered the business. The company’s recovery has taken longer than anticipated and JOAN recently restructured its balance sheet. Post-reorg, we will hold our proportionate share of JOAN’s new equity as well as new debt paying our shareholders ~14%.
JOAN generated ~$250mn of EBITDA with remarkable consistency in the decade leading up to the pandemic. Inflated costs—including +$100mn of excess ocean freight—caused EBITDA to crash below $100mn in calendar 2023; freight rates have already normalized. Should JOAN return anywhere near previous profitability, our shareholders could enjoy returns significantly greater than par.
The Fund never buys debt with the express purpose of owning the equity through bankruptcy. Again, in our base-case, we expected JOAN would have rebounded more quickly. However, anytime you buy loans at 70, bankruptcy is not just a possibility, but a probability. We bought loans believing our bear-case, a restructuring, represented a near-term headache in exchange greater longer-term upside. We followed a similar thinking with Whiting Petroleum, which we recently sold for 17% IRR and 1.7x MOIC after the company’s bankruptcy in COVID-19. We will always seek opportunities with such positively skewed outcomes.
Hearthside Foods also detracted in the period, with bonds cratering to 10. We have owned Hearthside on and off for more than a decade. By acclamation they are the strongest operator in the contract food manufacturing space (a growing market segment), with “Tier 1” clients including Mondelez, General Mills, PepsiCo and Kellogg’s; Heathside, for example, manufactures Oreos and Girl Scout cookies.
Hearthside’s business grew at a breakneck pace during COVID, before supply chain challenges and labor availability upended its operational efficiency, causing EBITDA to fall. The company has sold a business unit and conducted sales-leasebacks to boost liquidity, but we nevertheless anticipate the company will restructure of its debt in the first half of 2024.
Hearthside’s business does not have structural flaws; demand for Oreos and Girl Scout Cookies has not ebbed due to the pandemic. Instead, the company’s recent woes have been operational, which often prove temporary and fixable.
Hearthside is a valuable business. The company represents the largest equity investment in the history of its private equity owners. Additionally, a peer business recently sold for a low double-digit multiple, highlighting the lofty values in this sector. We therefore would be stunned if the sponsors flushed $1bn of equity on Hearthside, given the quality of the company’s assets and path to normalization. We look forward updating our holders on Hearthside recovery in the coming quarters; given our marks, it is all upside from here.
What Did Work
Highlighting a few of the stories that “worked” during the period, loans backing 8th Avenue Foods gained 43.6% during the six-month period. The private label food manufacturer’s wheat costs—vital in the company’s pasta business—spiraled in 2022 with invasion of Ukraine. Normalized commodity costs and strength in the company’s private label peanut butter business has helped boost results. We believe a refinancing of the 8th Ave capital structure may be on the horizon, providing further upside to our shareholders.
Loans backing media measurement company Nielsen gained 10.2% during the period. Recall that the Fund purchased these 1st lien loans at a significant discount from a major investment bank during the peak of the 2022 selloff. The rebound of Nielsen highlights our consistent track record of opportunistically capitalizing on periods of market dislocation.
| Alternative Credit Income Fund | Shareholder Letter |
March 31, 2024 (Unaudited)
The Fund captured a gain of +40% from shorting bonds of biomass energy provider Enviva (ticker: EVA). We believed the company represented a “green washing” story or a business that attempted to attract capital by claiming to help the environment. While clean energy is a noble goal, we viewed Enviva’s business as neither green nor economically viable—a view vindicated by the company’s recent bankruptcy. Shorting will never represent a meaningful percent of our assets, but EVA underscores the value of our active management. Short or long; public or private; bonds or loans—the Fund navigates to wherever we find the best returns.
Positioning
We will no longer discuss the portfolio using our previous categories, which we feel were antiquated and failed to reflect how we manage the Fund.
From a positioning standpoint, we would highlight that we have reduced the Fund’s allocation to public Business Development Companies ("BDCs") —our most liquid assets—to roughly 5% of AUM. BDCs have enjoyed a furious run since the end of 2021, but valuations are currently stretched relative to historical levels. We will look for a better entry point down the road.
Our most important positioning remains in relation to leverage. Unlike most of our peers, the Fund does not employ running leverage. Additionally, given our more circumspect view of the economy, we ended the period with 0.0% leverage. We look forward to using our facility to feast during the market’s inevitable next downturn. Our levered competitors—who have sacrificed long-term performance in exchange for near-term gains—will be sidelined when the market is most attractive.
Conclusion
I will end this letter like the previous: investors simply must rethink their orientation to fixed income as the era of turbo-charged equity performance is likely over.
Immediately prior to the reign of easy money, the S&P returned just 4.8% a year from 1996 to 2008. From 2009 to 2021—a time-period highlighted by negative real interest rates and QE by the Fed—the S&P gained 16.0% per annum. Put differently, the S&P generated a CAGR of 9.6% from 1928 to 20236. Clearly the last 13 years (prior to 2022) represent the outlier.
With equity returns likely to revert to the mean (because math always wins, in time), investors can no longer under-allocate to fixed income nor tolerate traditional underperforming vehicles.
With roughly $150bn of AUM, the PIMCO Income Fund represents the bell-weather fund in the fixed income universe. The Credit Income Fund’s performance since inception tops PIMIX by a stunning 1.8x7. The Fund similarly outperforms the largest High Yield ETF, iShares High Yield Corporate Bonds ETF (ticker HYG), by a similarly eye-popping multiple8.
When equities generated double-digit annual returns, investors could perhaps tolerate such traditional laggards in their portfolio. With fixed income returns likely to rival the S&P going forward on an absolute basis (let alone on a risk adjusted basis), investors must reorientate their portfolio toward the best performing category in fixed income—private credit.
Regards,
Michael Terwilliger, CFA
Portfolio Manager*
Alternative Credit Income Fund
| * | Effective October, 31, 2020, Sierra Crest Investment Management LLC (“Sierra Crest”) replaced Resource Alternative Advisor, LLC (“Resource”) as the Fund’s investment adviser. Michael Terwilliger has joined Sierra Crest as a portfolio manager to the Fund. |
| 1 | Fund performance refers to that of Class I. Reflects six-month returns through 03/ 31/2024. Past performance is not indicative of future results. The investment return and principal value of an investment will fluctuate. An investor’s shares when redeemed, may be worth more or less than the original cost. Total return is calculated assuming reinvestment of all dividends and distributions. Performance figures for periods less than one year are not annualized. For performance information current to the most recent month-end, please call toll-free 1-833-404-4103. The Adviser and the Fund have entered into an Expense Limitation Agreement under which the Adviser has agreed, until at least January 31, 2025 to waive its management fees (excluding any incentive fee) and to pay or absorb the ordinary annual operating expenses of the Fund (excluding incentive fees, interest on borrowings, dividends, amortization/accretion and interest on securities sold short, brokerage commissions, acquired fund fees and expenses and extraordinary expenses) to the extent that its management fees plus the Fund’s ordinary annual operating expenses exceed 2.34% per annum of the Fund’s average daily net assets attributable to Class I shares. Such Expense Limitation Agreement may not be terminated by the Adviser, but it may be terminated by the Board of Trustees, upon 60 days written notice to the Adviser. Any waiver or reimbursement by the Adviser is subject to repayment by the Fund within the three (3) years from the date the Adviser (or the previous investment adviser) waived any payment or reimbursed any expense, if the Fund is able to make the repayment without exceeding the lesser of the expense limitation in place at the time of the waiver or the current expense limitation and the repayment is approved by the Board of Trustees. See “Management of the Fund.” |
| Semi-Annual Report | March 31, 2024 | 11 |
| Alternative Credit Income Fund | Shareholder Letter |
March 31, 2024 (Unaudited)
| 2 | Fund performance refers to that of Class I. Reflects cumulative returns 10/29/2015 through 03/31/2024. Past performance is not indicative of future results. The investment return and principal value of an investment will fluctuate. An investor’s shares when redeemed, may be worth more or less than the original cost. Total return is calculated assuming reinvestment of all dividends and distributions. Performance figures for periods less than one year are not annualized. For performance information current to the most recent month-end, please call toll-free 1-833-404-4103. |
| 3 | Barclays U.S. Aggregate Total Return Value Index – The Barclays U.S. Aggregate Total Return Value Index is a broad-based flagship benchmark that measures the investment grade, U.S. dollar-denominated, fixed-rate taxable bond market. The index includes Treasuries, government-related and corporate securities, MBS (agency fixed-rate and hybrid ARM pass-throughs), ABS and CMBS (agency and nonagency). Investors cannot invest directly in an index. Reflects cumulative return 10/28/2015 through 03/31/2024. |
| 4 | Morningstar LSTA US Leveraged Loan TR USD Index – The Morningstar LSTA US Leveraged Loan TR USD Index is a market value-weighted index designed to measure the performance of the U.S. leveraged loan market based upon market weightings, spreads and interest payments. Investors cannot invest directly in an index. Reflects cumulative return 10/28/2015 through 03/31/2024. |
| 5 | ICE BofA U.S. High Yield Index – The ICE BofA U.S. High Yield Index tracks the performance of US dollar denominated below investment grade corporate debt publicly issued in the U.S. domestic market. Investors cannot invest directly in an index. Reflects cumulative return 10/28/2015 through 03/31/2024. |
| 6 | “Cost of Capital and Capital Allocation, Investment in the Era of ‘Easy Money” Morgan Stanely (2/28/2024) |
| 7 | Bloomberg, Total Return 10/27/2015 through 4/23/2024 RCIIX vs. PIMIX. |
| 8 | Bloomberg, Total Return 10/27/2015 through 4/23/2024 RCIIX vs. HYG. |
| Alternative Credit Income Fund | Portfolio Update |
March 31, 2024 (Unaudited)
The Fund’s performance figures for the periods ended March 31, 2024, compared to its benchmark:
| Alternative Credit Income Fund | 1 Month | Quarter | 6 Month | YTD | 1 Year | 3 Year | 5 Year | Since
Inception* | Inception |
| Class A Shares - Without Load | 1.09% | 1.40% | 2.07% | 1.40% | 6.78% | 3.07% | 4.78% | 5.88% | 4/17/15 |
| Class A Shares - With Load | -4.70% | -4.42% | -3.82% | -4.42% | 0.65% | 1.05% | 3.55% | 5.08% | 4/17/15 |
| Class C Shares - Without Load | 1.01% | 1.32% | 1.80% | 1.32% | 6.08% | 2.30% | 4.01% | 5.30% | 4/17/15 |
| Class C Shares - With Load(a) | 0.01% | 0.32% | 0.82% | 0.32% | 5.08% | 2.30% | 4.01% | 5.30% | 4/17/15 |
| Class W Shares - Without Load | 1.09% | 1.51% | 2.17% | 1.51% | 6.89% | 3.07% | 4.80% | 5.83% | 4/17/15 |
| Class I Shares - Without Load | 1.15% | 1.57% | 2.31% | 1.57% | 7.16% | 3.34% | 5.05% | 6.13% | 4/17/15 |
| Class L Shares - Without Load | 1.02% | 1.34% | 1.94% | 1.34% | 6.62% | 2.81% | 4.53% | 4.56% | 7/28/17 |
| Class L Shares - With Load | -3.26% | -2.97% | -2.35% | -2.97% | 2.09% | 1.33% | 3.63% | 3.88% | 7/28/17 |
| Morningstar LSTA US Leveraged Loan TR USD Index | 0.85% | 2.46% | 5.40% | 2.46% | 12.47% | 5.99% | 5.48% | 4.72% | 4/17/15 |
| (a) | Effective as of December 23, 2016, Class C shares no longer have a sales charge. |
The Morningstar LSTA US Leveraged Loan TR USD Index is a market value-weighted index designed to measure the performance of the U.S. leveraged loan market based upon market weightings, spreads and interest payments. Investors cannot invest directly in an index.
Past performance is not indicative of future results. The investment return and principal value of an investment will fluctuate. An investor’s shares when redeemed, may be worth more or less than the original cost. Total return is calculated assuming reinvestment of all dividends and distributions. Performance figures for periods less than one year are not annualized. As of the Fund’s most recent prospectus dated January 26, 2024, the Fund’s total annual operating expenses, including acquired fund fees and expenses, before fee waivers is 4.95% for Class A, 5.69% for Class C, 4.93% for Class W, 4.69% for Class I and 5.20% for Class L shares. After fee waivers, the Fund’s total annual operating expense is 4.82% for Class A, 5.57% for Class C, 4.82% for Class W, 4.57% for Class I and 5.07% for Class L shares. Class A shares are subject to maximum sales loads of 5.75% imposed on purchases. Class L shares are subject to a maximum sales load of 4.25% imposed on purchases. Share repurchases within 365 days may be subject to an early withdrawal charge of 0.50% for Class A and 1.00% for Class C shares. For performance information current to the most recent month-end, please call toll-free 1-833-404-4103.
| Semi-Annual Report | March 31, 2024 | 13 |
| Alternative Credit Income Fund | Portfolio Update |
March 31, 2024 (Unaudited)
Comparison of the Change in Value of a $10,000 Investment
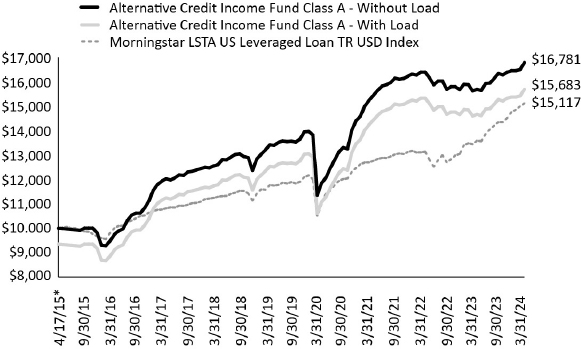
| * | Commencement of operations for Class A Shares. |
Consolidated Portfolio Composition as of March 31, 2024
| Asset Type | Percent of Net Assets |
| Banks Loans | 55.47% |
| Private Investment Funds | 19.99% |
| Common Equity | 7.25% |
| Asset Backed Securities and Corporate Bonds | 6.62% |
| Short Term Investments | 5.54% |
| Interval Fund | 3.13% |
| Prefered Stock | 2.51% |
| Equipment Financing | 0.70% |
| Warrants | 0.32% |
| Joint Venture | 0.16% |
| Securities Sold Short | -0.53% |
| Total Investments | 101.16% |
| Other Liabilities in Excess of Other Assets | -1.16% |
| Net Assets | 100.00% |
Please see the Consolidated Schedule of Investments for a detailed listing of the Fund’s holdings.
| Alternative Credit Income Fund | Consolidated Schedule of Investments |
March 31, 2024 (Unaudited)
| | | Coupon | | | Reference Rate & Spread | | Maturity | | Principal | | | Value | |
| BANK LOANS (55.47%)(a) | | | | | | | | | | | | | |
| | | | | | | | | | | | | | |
| Communication Services (4.38%) | | | | | | | | | | | | | | | | |
| Neptune Bidco US Inc., First Lien Term Loan(b) | | | 10.42 | % | | 3M SOFR + 5.00%, 0.50% Floor | | 04/11/2029 | | $ | 4,813,625 | | | $ | 4,449,306 | |
| Next Flight Ventures Delayed Draw Term Loan(b)(c)(f) | | | –% | | | 10.00% PIK | | 12/26/2025 | | | – | | | | 61 | |
| Next Flight Ventures, First Lien Term Loan(b)(c) | | | 10.00 | % | | 10.00% PIK | | 12/26/2025 | | | 3,874,492 | | | | 3,774,143 | |
| Synamedia Americas Holdings, Inc., First Lien Term Loan(b) | | | 13.06 | % | | 3M SOFR + 7.75%, 1.00% Floor | | 12/05/2028 | | | 2,713,793 | | | | 2,639,164 | |
| | | | | | | | | | | | | | | | 10,862,674 | |
| Consumer Discretionary (3.78%) | | | | | | | | | | | | | | | | |
| Arrow Purchaser, Inc., First Lien Initial Term Loan(b) | | | 12.19 | % | | 1M SOFR + 6.75%, 1.00% Floor | | 04/15/2026 | | | 2,104,167 | | | | 2,082,283 | |
| Jo-Ann Stores LLC, First Lien Term Loan(b)(d) | | | – | % | | 3M SOFR + 4.75%, 0.75% Floor | | 06/30/2028 | | | 3,929,471 | | | | 1,856,963 | |
| Lucky Bucks Holdings LLC, Subordinated Note(b)(d) | | | – | % | | N/A | | 05/29/2028 | | | 10,226,174 | | | | 1,890,820 | |
| Riddell Inc., First LienTerm Loan(b) | | | 11.33 | % | | 1M SOFR + 6.00%, 1.00% Floor | | 03/29/2029 | | | 3,636,364 | | | | 3,545,455 | |
| Riddell Inc., Delayed Draw Term Loan(b)(f) | | | – | % | | 1M SOFR + 6.00%, 1.00% Floor | | 03/29/2029 | | | – | | | | – | |
| | | | | | | | | | | | | | | | 9,375,521 | |
| Consumer Staples (5.53%) | | | | | | | | | | | | | | | | |
| 8th Avenue Food & Provisions, Inc., Second Lien Senior Secured Term Loan(b) | | | 13.19 | % | | 1M SOFR + 7.75% | | 10/01/2026 | | | 2,500,000 | | | | 2,287,500 | |
| BrightPet, First Lien Term Loan(b)(c) | | | 12.46 | % | | 3M SOFR + 6.25%, 0.75% PIK, 1.00% Floor | | 10/06/2026 | | | 1,946,329 | | | | 1,890,275 | |
| BrightPet, Revolver(b)(f) | | | 11.80 | % | | 3M SOFR + 6.25%, 1.00% Floor | | 10/06/2026 | | | 363,615 | | | | 349,183 | |
| Florida Food Products LLC, Second Lien Term Loan(b) | | | 13.44 | % | | 1M SOFR + 8.00%, 0.75% Floor | | 10/18/2029 | | | 5,000,000 | | | | 4,181,500 | |
| Phillips Feed Service, Inc., First Lien Term Loan(b) | | | 12.42 | % | | 1M SOFR + 7.00% | | 05/30/2025 | | | 5,250,000 | | | | 5,000,100 | |
| | | | | | | | | | | | | | | | 13,708,558 | |
| Financials (7.85%) | | | | | | | | | | | | | | | | |
| AIS Holdco, LLC, Second Lien Term Loan(b) | | | 14.32 | % | | 3M SOFR + 8.75% | | 08/15/2026 | | | 1,000,000 | | | | 940,000 | |
| BetaNXT, Inc., First Lien Term Loan(b) | | | 11.05 | % | | 3M SOFR + 5.75% | | 07/01/2029 | | | 2,358,030 | | | | 2,256,635 | |
| Cor Leonis Limited, Revolver(b)(f) | | | 12.81 | % | | 3M SOFR + 7.50%, 1.50% Floor | | 05/15/2028 | | | 1,716,559 | | | | 1,724,080 | |
| H-CA II, LLC, First Lien Term Loan(b) | | | 16.00 | % | | N/A | | 04/01/2024 | | | 1,809,361 | | | | 1,801,581 | |
| Hunter Point Capital Structured Notes Issuer, LLC, Subordinated Delayed Draw Notes(b)(f) | | | N/A | | | N/A | | 07/15/2052 | | | 1,655,221 | | | | 2,491,233 | |
| Irradiant Intermediate Holdings, L.P., Delayed Draw Term Loan(b)(f) | | | – | % | | 3M SOFR + 6.50%, 1.50% Floor | | 06/08/2028 | | | – | | | | (33,930 | ) |
| Irradiant Intermediate Holdings, L.P., First Lien Term Loan(b) | | | 11.91 | % | | 3M SOFR + 6.50%, 1.50% Floor | | 06/08/2028 | | | 1,450,000 | | | | 1,416,070 | |
| Money Transfer Acquisition Inc., First Lien Term Loan(b) | | | 13.68 | % | | 1M SOFR + 8.25%, 1.00% Floor | | 12/14/2027 | | | 6,825,000 | | | | 6,671,437 | |
| SouthStreet Securities Holdings, Inc., First Lien Term Loan(b) | | | 9.00 | % | | N/A | | 09/20/2027 | | | 2,700,000 | | | | 2,187,000 | |
| | | | | | | | | | | | | | | | 19,454,106 | |
| Health Care (8.66%) | | | | | | | | | | | | | | | | |
| American Academy Holdings, LLC, First Lien Term Loan(b)(c) | | | 16.44 | % | | 1M SOFR + 5.75%, 5.25% PIK, 1.00% Floor | | 01/01/2025 | | | 2,348,849 | | | | 2,369,519 | |
| American Academy Holdings, LLC, Second Lien Term Loan(b)(c) | | | 14.50 | % | | 14.50% PIK | | 01/01/2028 | | | 3,810,744 | | | | 3,415,570 | |
See Notes to Consolidated Financial Statements.
| Semi-Annual Report | March 31, 2024 | 15 |
| Alternative Credit Income Fund | Consolidated Schedule of Investments |
March 31, 2024 (Unaudited)
| | | Coupon | | | Reference Rate & Spread | | Maturity | | Principal | | | Value | |
| PhyNet Dermatology LLC, Delayed Draw Term Loan(b)(f) | | | – | % | | 6M SOFR + 6.50%, 1.00% Floor | | 10/20/2029 | | $ | – | | | $ | 3,931 | |
| PhyNet Dermatology LLC, First Lien Term Loan(b) | | | 11.99 | % | | 6M SOFR + 6.50%, 1.00% Floor | | 10/20/2029 | | | 1,960,603 | | | | 1,938,645 | |
| Upstream Rehabilitation, Inc., Second Lien Term Loan(b) | | | 13.91 | % | | 3M SOFR + 8.50%, 2.00% Floor | | 11/22/2027 | | | 7,500,000 | | | | 6,431,250 | |
| VBC Spine Opco LLC (DxTX Pain and Spine LLC), Delayed Draw Term Loan(b)(f) | | | – | % | | 3M SOFR + 8.00%, 2.00% Floor | | 06/14/2028 | | | – | | | | 1,545 | |
| VBC Spine Opco LLC (DxTX Pain and Spine LLC), First Lien Term Loan(b) | | | 13.48 | % | | 3M SOFR + 8.00%, 2.00% Floor | | 06/14/2028 | | | 2,182,152 | | | | 2,141,346 | |
| VBC Spine Opco LLC (DxTX Pain and Spine LLC), Revolver(b)(f) | | | 13.47 | % | | 1M SOFR + 8.00%, 2.00% Floor | | 06/14/2028 | | | 241,935 | | | | 237,411 | |
| Viant Medical Holdings, Inc., Second Lien Initial Term Loan(b) | | | 13.19 | % | | 1M SOFR + 7.75% | | 07/02/2026 | | | 5,000,000 | | | | 4,937,525 | |
| | | | | | | | | | | | | | | | 21,476,742 | |
| Industrials (9.20%) | | | | | | | | | | | | | | | | |
| Accordion Partners, LLC, Delayed Draw Term Loan A(b) | | | 11.55 | % | | 3M SOFR + 6.25%, 0.75% Floor | | 08/29/2029 | | | 283,341 | | | | 283,341 | |
| Accordion Partners, LLC, Delayed Draw Term Loan B(b) | | | 11.31 | % | | 3M SOFR + 6.00%, 0.75% Floor | | 08/29/2029 | | | 355,066 | | | | 353,611 | |
| Accordion Partners, LLC, First Lien Term Loan A(b) | | | 11.30 | % | | 3M SOFR + 6.00%, 0.75% Floor | | 08/29/2029 | | | 3,227,954 | | | | 3,214,720 | |
| Epic Staffing Group, First Lien Term Loan(b) | | | 11.33 | % | | 1M SOFR + 6.00%, 0.50% Floor | | 06/28/2029 | | | 1,969,185 | | | | 1,888,055 | |
| Marvel APS (Autorola Group Holding A/S), Delayed Draw Term Loan(b)(c) | | | 10.00 | % | | PIK | | 12/21/2027 | | | 3,118,553 | | | | 3,364,462 | |
| Material Handling Systems, Inc., First Lien Term Loan(b) | | | 10.83 | % | | 3M SOFR + 5.50%, 0.50% Floor | | 06/08/2029 | | | 4,470,202 | | | | 4,071,616 | |
| PECF USS Intermediate Holding III Corporation, First Lien Term Loan(b) | | | 9.82 | % | | 3M SOFR + 4.25%, 0.50% Floor | | 12/15/2028 | | | 1,989,822 | | | | 1,524,711 | |
| Qualtek LLC, First Lien Term Loan(b)(c) | | | 15.16 | % | | 3M SOFR + 1.00%, 9.00% PIK, 1.00% Floor | | 07/14/2025 | | | 3,414,220 | | | | 3,084,167 | |
| Qualtek LLC, Second Lien Term Loan(b)(c)(d) | | | – | % | | 6M SOFR + 1.00%, 9.00% PIK, 1.00% Floor | | 01/14/2027 | | | 537,759 | | | | 95,345 | |
| Secure Acquisition, Inc., Second Lien Term Loan(b) | | | 13.21 | % | | 3M SOFR + 7.75%, 0.75% Floor | | 12/14/2029 | | | 5,000,000 | | | | 4,918,500 | |
| | | | | | | | | | | | | | | | 22,798,528 | |
| Information Technology (16.07%) | | | | | | | | | | | | | | | | |
| Accurate Background, LLC, First Lien Term Loan(b) | | | 11.56 | % | | 3M SOFR + 6.00%, 1.00% Floor | | 03/26/2027 | | | 4,405,108 | | | | 4,304,672 | |
| Ancile Solutions, Inc., First Lien Term Loan(b) | | | 15.57 | % | | 3M SOFR + 10.00%, 1.00% Floor | | 06/11/2026 | | | 3,560,235 | | | | 3,591,565 | |
| Colonnade Intermediate, LLC, First Lien Term Loan(b) | | | 12.40 | % | | 3M SOFR + 7.00%, 1.00% Floor | | 04/27/2024 | | | 3,023,837 | | | | 2,869,319 | |
| DCert Buyer, Inc. First Amendment Term Loan Refinancing, Second Lien Term Loan(b) | | | 12.33 | % | | 1M SOFR + 7.00% | | 02/16/2029 | | | 3,600,000 | | | | 3,269,520 | |
| Diamanti, Inc., Subordinated Note(b)(c) | | | 12.50 | % | | PIK | | 05/01/2024 | | | 3,722,624 | | | | 3,837,653 | |
| EagleView Technology Corp., Second Lien Term Loan(b) | | | 12.95 | % | | 3M SOFR + 7.50% | | 08/14/2026 | | | 1,495,652 | | | | 1,353,565 | |
| Ivanti Software, Inc., Second Lien Initial Term Loan(b) | | | 12.84 | % | | 3M SOFR + 7.25%, 0.50% Floor | | 12/01/2028 | | | 4,000,000 | | | | 3,475,000 | |
| Kofax, Inc., First Lien Term Loan(b) | | | 10.66 | % | | 3M SOFR + 5.25%, 0.50% Floor | | 07/20/2029 | | | 3,950,000 | | | | 3,664,613 | |
| Kofax, Inc., Second Lien Term Loan(b) | | | 13.06 | % | | 3M SOFR + 7.75%, 0.50% Floor | | 07/20/2030 | | | 4,000,000 | | | | 3,834,000 | |
See Notes to Consolidated Financial Statements.
| Alternative Credit Income Fund | Consolidated Schedule of Investments |
March 31, 2024 (Unaudited)
| | | Coupon | | | Reference Rate & Spread | | Maturity | | Principal | | | Value | |
| Precisely Software Incorporated, Second Lien Term Loan(b) | | | 12.84 | % | | 3M SOFR + 7.25%, 0.75% Floor | | 04/23/2029 | | | 3,000,000 | | | | 2,812,500 | |
| Redstone HoldCo 2 LP, Second Lien Term Loan(b) | | | 13.19 | % | | 1M SOFR + 7.75%, 0.75% Floor | | 04/16/2029 | | $ | 5,000,000 | | | $ | 3,008,325 | |
| Spectrio, Delayed Draw Term Loan(b) | | | 11.34 | % | | 6M SOFR + 6.00%, 1.00% | | 12/09/2026 | | | 1,171,745 | | | | 1,113,157 | |
| Spectrio, First Lien Term Loan(b) | | | 11.34 | % | | 6M SOFR + 6.00%, 1.00% Floor | | 12/09/2026 | | | 2,808,973 | | | | 2,668,524 | |
| | | | | | | | | | | | | | | | 39,802,413 | |
| TOTAL BANK LOANS | | | | | | | | | | | | | | | | |
| (Cost $153,373,317) | | | | | | | | | | | | | | | 137,478,542 | |
| | | | | | | | | | | | | | | | | |
| ASSET BACKED SECURITIES AND CORPOATE BONDS (6.62%) | | | | | | | | | | | | | | | | |
| ASSET BACKED SECURITIES (4.67%)(a) | | | | | | | | | | | | | | | | |
| Canyon Capital CLO 2014-1, Ltd., Class ER(a)(g) | | | 13.28 | % | | 3M SOFR + 7.70% | | 01/30/2031 | | | 1,000,000 | | | | 744,292 | |
| JMP Credit Advisors CLO IV, Ltd.(b) | | | 4.32 | % | | N/A | | 07/17/2029 | | | 4,836,540 | | | | 175,083 | |
| JMP Credit Advisors CLO V, Ltd.(b) | | | 21.54 | % | | N/A | | 07/17/2030 | | | 4,486,426 | | | | 832,232 | |
| Mount Logan Funding 2018-1 LP(b)(g)(h) | | | 22.14 | % | | N/A | | 01/22/2033 | | | 7,798,575 | | | | 6,518,829 | |
| Octagon Investment Partners 36, Ltd., Class F(g) | | | 13.33 | % | | 3M SOFR + 7.75% | | 04/15/2031 | | | 1,000,000 | | | | 746,614 | |
| Octagon Investment Partners XIV, Ltd., Class ER(g) | | | 13.93 | % | | 3M SOFR + 8.35% | | 07/15/2029 | | | 2,132,000 | | | | 1,123,099 | |
| Saranac CLO VII, Ltd., Class ER(g) | | | 12.30 | % | | 3M SOFR + 6.72% | | 11/20/2029 | | | 500,000 | | | | 199,087 | |
| Tralee CLO II, Ltd., Class ER(g) | | | 13.43 | % | | 3M SOFR + 7.85% | | 07/20/2029 | | | 1,000,000 | | | | 922,730 | |
| Tralee CLO II, Ltd., Class FR(d)(g) | | | – | % | | 3M SOFR + 7.85% | | 07/20/2029 | | | 1,000,000 | | | | 123,749 | |
| Voya CLO 2014-2, Ltd., Class ER(g) | | | 13.28 | % | | 3M SOFR + 7.70% | | 04/17/2030 | | | 1,000,000 | | | | 194,208 | |
| | | | | | | | | | | | | | | | 11,579,923 | |
| CORPORATE BONDS (1.95%) | | | | | | | | | | | | | | | | |
| Communications (0.58%) | | | | | | | | | | | | | | | | |
| Spanish Broadcasting System, Inc.(g) | | | 9.75 | % | | N/A | | 03/01/2026 | | | 3,000,000 | | | | 1,439,166 | |
| | | | | | | | | | | | | | | | | |
| Consumer Discretionary (–%) | | | | | | | | | | | | | | | | |
| Monitronics - Escrow(b) | | | – | % | | N/A | | 12/31/2049 | | | 2,650,000 | | | | – | |
| | | | | | | | | | | | | | | | | |
| Consumer Staples (0.24%) | | | | | | | | | | | | | | | | |
| H-Food Holdings LLC / Hearthside Finance Co., Inc.(d)(g) | | | – | % | | 8.50% | | 06/01/2026 | | | 7,978,000 | | | | 598,350 | |
| | | | | | | | | | | | | | | | | |
| Industrials (1.13%) | | | | | | | | | | | | | | | | |
| PECF USS Intermediate Holding III Corp.(g) | | | 8.00 | % | | N/A | | 11/15/2029 | | | 5,000,000 | | | | 2,639,785 | |
| Wesco Aircraft Holdings, Inc.(d)(g) | | | – | % | | N/A | | 11/15/2027 | | | 4,636,000 | | | | 162,260 | |
| | | | | | | | | | | | | | | | 2,802,045 | |
| TOTAL ASSET BACKED SECURITIES AND CORPOATE BONDS | | | | | | | | | | | | | | | | |
| (Cost $33,915,333) | | | | | | | | | | | | | | | 16,419,484 | |
| | | | | | | | | | | | | | | | | |
| EQUIPMENT FINANCING (0.70%) | | | | | | | | | | | | | | | | |
| Equipment Financing (0.70%) | | | | | | | | | | | | | | | | |
| White Oak Equipment Finance 1, LLC(b)(k) | | | 10.75 | % | | N/A | | 01/01/2027 | | | 1,723,776 | | | | 1,723,776 | |
| | | | | | | | | | | | | | | | | |
| TOTAL EQUIPMENT FINANCING | | | | | | | | | | | | | | | | |
| (Cost $1,723,776) | | | | | | | | | | | | | | | 1,723,776 | |
| | | Dividend Rate | | Shares | | | Value | |
| PREFERRED STOCK (2.51%) | | | | | | | | | | |
| Consumer Discretionary (2.38%) | | | | | | | | | | |
| EBSC Holdings LLC (Riddell, Inc.), Preferred(b)(c)(j) | | 10.00% PIK | | | 1,000 | | | | 980,000 | |
See Notes to Consolidated Financial Statements.
| Semi-Annual Report | March 31, 2024 | 17 |
| Alternative Credit Income Fund | Consolidated Schedule of Investments |
March 31, 2024 (Unaudited)
| | | Dividend Rate | | | Shares | | | Value | |
| Pennfoster(a)(b)(c)(j) | | | 16.13 | % | | | 5,133,089 | | | | 4,907,747 | |
| | | | | | | | | | | | 5,887,747 | |
| | | Shares | | | Value | |
| PREFERRED STOCK (2.51%) (continued) | | | | | | |
| Health Care (0.05%) | | | | | | |
| American Academy Holdings. Inc., Preferred Units(b)(j)(k) | | | 90,970 | | $ | | 125,079 | |
| | | | | | | | | |
| Industrials (0.08%) | | | | | | | | |
| GreenPark Infrastructure, LLC Series A(b)(h)(j)(k) | | | 400 | | | | 200,000 | |
| | | | | | | | | |
| TOTAL PREFERRED STOCK | | | | | | | | |
| (Cost $6,216,830) | | | | | | | 6,212,826 | |
| | | | | | | | | |
| COMMON EQUITY (7.25%) | | | | | | | | |
| Communication Services (0.02%) | | | | | | | | |
| Next Flight Ventures(b)(j) | | | 88 | | | | 13,526 | |
| NFV Co-Pilot, Inc.(b)(j) | | | 441 | | | | 24,264 | |
| | | | | | | | 37,790 | |
| | | | | | | | | |
| Consumer Discretionary (0.58%) | | | | | | | | |
| CEC Entertainment, Inc.(j) | | | 79,564 | | | | 1,432,152 | |
| | | | | | | | | |
| Diversified (4.27%) | | | | | | | | |
| Ares Capital Corp.(i) | | | 117,223 | | | | 2,440,583 | |
| CION Investment Corp.(i) | | | 120,800 | | | | 1,328,800 | |
| FS KKR Capital Corp.(i) | | | 105,137 | | | | 2,004,963 | |
| Portman Ridge Finance Corp.(h) | | | 25,504 | | | | 484,066 | |
| SLR Investment Corp.(i) | | | 115,211 | | | | 1,768,489 | |
| WhiteHorse Finance, Inc. | | | 207,328 | | | | 2,570,867 | |
| | | | | | | | 10,597,768 | |
| | | | | | | | | |
| Financials (0.89%) | | | | | | | | |
| Aperture Dodge 18 LLC(b)(j) | | | 2,045,271 | | | | 2,211,599 | |
| | | | | | | | | |
| Health Care (0.19%) | | | | | | | | |
| American Academy Holdings. Inc., Common Units(b)(j)(k) | | | 0.05 | | | | 317,110 | |
| DXTX Pain and Spine LLC, Common Units(b)(j)(k) | | | 98,854 | | | | 162,121 | |
| | | | | | | | 479,231 | |
| | | | | | | | | |
| Industrials (0.03%) | | | | | | | | |
| GreenPark Infrastructure, LLC Series M-1(b)(f)(h)(j)(k) | | | 200 | | | | 70,630 | |
| Qualtek LLC(b)(j) | | | 287,540 | | | | – | |
| | | | | | | | 70,630 | |
| | | | | | | | | |
| Real Estate (1.27%) | | | | | | | | |
| Copper Property CTL Pass Through Trust(j) | | | 319,520 | | | | 3,147,272 | |
| | | | | | | | | |
| TOTAL COMMON EQUITY | | | | | | | | |
| (Cost $18,568,732) | | | | | | | 17,976,442 | |
See Notes to Consolidated Financial Statements.
| Alternative Credit Income Fund | Consolidated Schedule of Investments |
March 31, 2024 (Unaudited)
| | | Shares | | | Value | |
| INTERVAL FUND (3.13%) | | | | | | |
| Interval Fund (3.13%) | | | | | | |
| Opportunistic Credit Interval Fund(h) | | | 664,452 | | | | 7,754,153 | |
| | | | | | | | | |
| TOTAL INTERVAL FUND | | | | | | | | |
| (Cost $8,000,000) | | | | | | | 7,754,153 | |
| | | | | | | | | |
| JOINT VENTURE (0.16%) | | | | | | | | |
| Joint Venture (0.16%) | | | | | | | | |
| Great Lakes Funding II LLC, Series A, Series 109122(e)(f)(h)(l) | | | 385,616 | $ | | | 396,413 | |
| | | | | | | | | |
| TOTAL JOINT VENTURE | | | | | | | | |
| (Cost $385,616) | | | | | | | 396,413 | |
| | | | | | | | | |
| PRIVATE INVESTMENT FUNDS (19.99%) | | | | | | | | |
| BlackRock Global Credit Opportunities Fund, LP(f)(l)(m) | | | | | | | 12,384,636 | |
| CVC European Mid-Market Solutions Fund(f)(l)(m) | | | | | | | 5,650,401 | |
| GSO Credit Alpha Fund II LP(f)(l)(m) | | | | | | | 4,209,755 | |
| Monroe Capital Private Credit Fund III LP(f)(l)(m) | | | | | | | 8,776,459 | |
| Pelham S2K SBIC II, L.P.(f)(l)(m) | | | | | | | 296,552 | |
| Tree Line Credit Strategies LP(l)(m) | | | | | | | 18,232,541 | |
| | | | | | | | 49,550,344 | |
| | | | | | | | | |
| TOTAL PRIVATE INVESTMENT FUNDS | | | | | | | | |
| (Cost $50,198,863) | | | | | | | 49,550,344 | |
| | | | | | | | | |
| Warrants (0.32%) | | | | | | | | |
| CEC Entertainment, Inc., Warrants | | | 1 | | | | 475,882 | |
| Diamanti, Inc., Class A(b) | | | 1 | | | | – | |
| SouthStreet Securities Holdings, Inc., Warrants(b) | | | 1 | | | | 326,366 | |
| | | | | | | | | |
| TOTAL Warrants | | | | | | | | |
| (Cost $390,456) | | | | | | | 802,248 | |
| | | | | | | | | |
| SHORT- TERM INVESTMENTS (5.54%) | | | | | | | | |
| Money Market Funds (5.54%) | | | | | | | | |
| US BANK MMDA - USBGFS 9, 5.24% | | | 13,740,394 | | | | 13,740,394 | |
| | | | | | | | | |
| TOTAL SHORT- TERM INVESTMENTS | | | | | | | | |
| (Cost $13,740,394) | | | | | | | 13,740,394 | |
| SCHEDULE OF SECURITIES SOLD SHORT (-0.53%) | | | | | | |
| | | Interest Rate | | | Maturity | | Principal | | | Value | |
| CORPORATE BONDS (-0.53%) | | | | | | | | | | | | | | |
| Enviva Partners LP | | | 6.50 | % | | 01/15/2026 | | $ | (3,000,000 | ) | | $ | (1,307,445 | ) |
| | | | | | | | | | | | | | | |
| TOTAL SCHEDULE OF SECURITIES SOLD SHORT | | | | | | | | | | | | | | |
| (Proceeds $2,931,317) | | | | | | | | | | | | $ | (1,307,445 | ) |
See Notes to Consolidated Financial Statements.
| Semi-Annual Report | March 31, 2024 | 19 |
| Alternative Credit Income Fund | Consolidated Schedule of Investments |
March 31, 2024 (Unaudited)
| | | Interest Rate | | | Maturity | | | Principal | | | Value | |
| INVESTMENTS, AT VALUE (101.16%) | | | | | | | | | | | | |
| (Cost $283,582,000) | | | | | | | | | | | | | | $ | 250,747,177 | |
| | | | | | | | | | | | | | | | | |
| Other Liabilities In Excess Of Other Assets (-1.16%) | | | | | | | | | | | | | | | (2,884,512 | ) |
| | | | | | | | | | | | | | | | | |
| NET ASSETS (100.00%) | | | | | | | | | | | | | | $ | 247,862,665 | |
Investment Abbreviations:
SOFR - Secured Overnight Financing Rate
PIK - Payment in-Kind
Reference Rates:
1M US SOFR - 1 Month SOFR as of March 31, 2024 was 5.33%.
3M US SOFR - 3 Month SOFR as of March 31, 2024 was 5.30%.
6M US SOFR - 6 Month SOFR as of March 31, 2024 was 5.22%.
| (a) | Variable rate investment. Interest rates reset periodically. Interest rate shown reflects the rate in effect at March 31, 2024. For securities based on a published reference rate and spread, the reference rate and spread are indicated in the description above. Certain variable rate securities are not based on a published reference rate and spread but are determined by the issuer or agent and are based on current market conditions. These securities do not indicate a reference rate and spread in their description above. |
| (b) | As a result of the use of significant unobservable inputs to determine fair value, these investments have been classified as Level 3 assets. |
| (c) | Payment in kind security which may pay interest in additional par. |
| (d) | Non-accrual investment. |
| (e) | During the period ended March 31, 2024, the Fund invested $- in Great Lakes Funding II, LLC - Series A units, received a return of capital distribution of $95,362, and reported change in unrealized appreciation of $21,260 on Great Lakes Funding II, LLC - Series A units. Additionally, Great Lakes Funding II LLC - Series A declared distributions of $37,395 during the period ended March 31, 2024. |
| (f) | All or a portion of this commitment was unfunded as of March 31, 2024. |
| (g) | Securities exempt from registration under Rule 144A of the Securities Act of 1933, as amended. These securities may be sold in the ordinary course of business in transactions exempt from registration, normally to qualified institutional buyers. As of March 31, 2024, the aggregate market value of those securities was $15,412,169, representing 6.22% of net assets. |
| (i) | All or a portion of each of these securities may be segregated as collateral for the Fund's securities sold short. The aggregate market value of those securities was $7,542,835 |
| (j) | Non-income producing security. |
| (k) | Investment is held through ACIF Master Blocker, LLC, wholly owned subsidiary. |
| (l) | Restricted security. See chart below. |
| (m) | Investment is held through CIF Investments LLC, a wholly-owned subsidiary. |
Securities determined to be restricted under the procedures approved by the Fund's Board of Trustees are as follows.
| Date(s) of Purchase | | Security | | Cost | | | Value | | | % of Net
Assets | |
| 3/31/2018 - 6/30/2021 | | BlackRock Global Credit Opportunities Fund, LP | | $ | 12,478,988 | | | $ | 12,384,636 | | | | 5.00 | % |
| 09/30/2017 - 09/30/2021 | | CVC European Mid-Market Solutions Fund | | | 7,072,577 | | | | 5,650,401 | | | | 2.28 | % |
| 08/05/2022 - 09/30/2023 | | Great Lakes Funding II LLC, Series A | | | 385,616 | | | | 396,413 | | | | 0.16 | % |
| 6/30/2018 - 3/31/2021 | | GSO Credit Alpha Fund II LP | | | 2,849,486 | | | | 4,209,755 | | | | 1.70 | % |
| 9/30/2018 - 12/31/2020 | | Monroe Capital Private Credit Fund III LP | | | 8,501,260 | | | | 8,776,459 | | | | 3.54 | % |
| 11/14/2022 - 03/31/2023 | | Pelham S2K SBIC II, L.P. | | | 296,552 | | | | 296,552 | | | | 0.12 | % |
| 12/31/2017 - 06/30/2019 | | Tree Line Credit Strategies LP | | | 19,000,000 | | | | 18,232,541 | | | | 7.36 | % |
| | | Total | | $ | 50,584,479 | | | $ | 49,946,757 | | | | 20.15 | % |
See Notes to Consolidated Financial Statements.
| Alternative Credit Income Fund | Consolidated Schedule of Investments |
March 31, 2024 (Unaudited)
Additional information on investments in private investment funds and unfunded commitments:
| Security | | Value | | | Redemption
Frequency | | Redemption
Notice(Days) | | Unfunded Commitments
as of March 31, 2024 | |
| BlackRock Global Credit Opportunities Fund, LP(a) | | $ | 12,384,636 | | | N/A | | N/A | | $ | 4,488,839 | |
| CVC European Mid-Market Solutions Fund(b) | | | 5,650,401 | | | N/A | | N/A | | | 206,342 | |
| Great Lakes Funding II LLC, Series A(a) | | | 396,413 | | | N/A | | N/A | | | 109,122 | |
| GSO Credit Alpha Fund II LP(a) | | | 4,209,755 | | | N/A | | N/A | | | 7,382,124 | |
| Monroe Capital Private Credit Fund III LP(b) | | | 8,776,459 | | | N/A | | N/A | | | 1,498,740 | |
| Pelham S2K SBIC II, L.P. | | | 296,552 | | | N/A | | N/A | | | 1,703,448 | |
| Tree Line Credit Strategies LP | | | 18,232,541 | | | Quarterly | | 90 | | | N/A | |
| Total | | $ | 49,946,757 | | | | | | | $ | 15,388,615 | |
Unfunded commitments:
| Security | | Value | | | Maturity | | Unfunded Commitment | |
| BrightPet, Revolver | | $ | 349,183 | | | 10/06/2026 | | $ | 137,500 | |
| Cor Leonis Limited, Revolver | | | 1,724,080 | | | 05/15/2028 | | | 432,341 | |
| GreenPark Infrastructure, LLC Series M-1 | | | 70,630 | | | N/A | | | 731,500 | |
| Hunter Point Capital Structured Notes Issuer, LLC, Subordinated Delayed Draw | | | 2,491,233 | | | 07/15/2052 | | | 4,219,779 | |
| Notes | | | | | | | | | | |
| Irradiant Intermediate Holdings, LP, Delayed Draw Term Loan | | | (33,930 | ) | | 06/08/2028 | | | 1,450,000 | |
| Next Flight Ventures, Delayed Draw Term Loan | | | 61 | | | 12/26/2025 | | | 1,190,625 | |
| PhyNet Dermatology LLC, Delayed Draw Term Loan | | | 3,931 | | | 10/20/2029 | | | 1,034,483 | |
| Riddell Inc, Delayed Draw Term Loan | | | – | | | 03/29/2029 | | | 363,636 | |
| VBC Spine Opco LLC (DxTx Pain and Spine LLC), Delayed Draw Term Loan | | | 1,545 | | | 06/14/2028 | | | 1,188,455 | |
| Total | | $ | 4,606,733 | | | | | $ | 10,748,319 | |
| | | | | | | | | | | |
| Total Unfunded Commitments | | | | | | | | | 26,136,934 | |
| (a) | A voluntary withdrawal may be permitted at the General Partner's discretion with the General Partner's consent. |
| (b) | A voluntary withdrawal may be permitted with the General Partner's prior written consent. |
See Notes to Consolidated Financial Statements.
| Semi-Annual Report | March 31, 2024 | 21 |
| Alternative Credit Income Fund | Consolidated Statement of Assets and Liabilities |
March 31, 2024 (Unaudited)
| ASSETS | | | |
| Investments, at value (Cost $270,831,548) | | $ | 236,630,531 | |
| Affiliated investments, at value (Cost $15,681,769) | | | 15,424,091 | |
| Cash | | | 89,828 | |
| Interest and distributions receivable | | | 3,071,040 | |
| Receivable for investments sold | | | 418,414 | |
| Receivable for fund shares sold | | | 405,487 | |
| Prepaid expenses and other assets | | | 20,290 | |
| Total assets | | | 256,059,681 | |
| | | | | |
| LIABILITIES | | | | |
| Securities sold short (Proceeds $2,931,317) | | | 1,307,445 | |
| Interest payable | | | 109,535 | |
| Payable for investments purchased | | | 6,278,032 | |
| Due to Broker | | | 2,250 | |
| Due to Adviser | | | 87,351 | |
| Payable for interest expense on securities sold short | | | 31,607 | |
| Administration fees payable | | | 74,225 | |
| Accrued expenses and other liabilities | | | 306,571 | |
| Total liabilities | | | 8,197,016 | |
| Commitments and contingencies (Note 2) | | | | |
| NET ASSETS | | $ | 247,862,665 | |
| | | | | |
| NET ASSETS CONSISTS OF | | | | |
| Paid-in capital | | $ | 274,489,422 | |
| Total accumulated deficit | | | (26,626,757 | ) |
| NET ASSETS | | $ | 247,862,665 | |
| | | | | |
| Common Shares: | | | | |
| Class A | | | | |
| Net assets | | $ | 31,412,771 | |
| Shares of beneficial interest outstanding (no par value; unlimited number of shares) | | | 3,257,339 | |
| Net asset value(a) | | $ | 9.64 | |
| Maximum offering price per share (maximum sales charge of 5.75%) | | $ | 10.23 | |
| Class C | | | | |
| Net assets | | $ | 38,529,103 | |
| Shares of beneficial interest outstanding (no par value; unlimited shares) | | | 3,947,566 | |
| Net asset value(a) | | $ | 9.76 | |
| Class W | | | | |
| Net assets | | $ | 49,862,790 | |
| Shares of beneficial interest outstanding (no par value; unlimited shares) | | | 5,172,699 | |
| Net asset value | | $ | 9.64 | |
| Class I | | | | |
| Net assets | | $ | 118,008,839 | |
| Shares of beneficial interest outstanding (no par value; unlimited shares) | | | 12,217,374 | |
| Net asset value | | $ | 9.66 | |
| Class L | | | | |
| Net assets | | $ | 10,049,162 | |
| Shares of beneficial interest outstanding (no par value; unlimited shares) | | | 1,042,001 | |
| Net asset value | | $ | 9.64 | |
| Maximum offering price per share (maximum sales charge of 4.25%) | | $ | 10.07 | |
| (a) | Redemption price varies based on length of time held (Note 6). |
See Notes to Consolidated Financial Statements.
| Alternative Credit Income Fund | Consolidated Statement of Operations |
For the Six Months Ended March 31, 2024 (Unaudited)
| INVESTMENT INCOME | | | |
| Interest | | $ | 10,755,151 | |
| Interest from affiliated investments | | | 787,461 | |
| Dividends | | | 4,200,354 | |
| Dividends from affiliated investments | | | 471,262 | |
| Collateral income | | | 45,981 | |
| Other Income | | | 115,395 | |
| Total investment income | | | 16,375,604 | |
| EXPENSES | | | | |
| Investment advisory fees (Note 4) | | | 2,256,243 | |
| Adminstrative fees (Note 4) | | | 147,060 | |
| Distribution fees (Note 4): | | | | |
| Class C | | | 140,427 | |
| Class L | | | 13,074 | |
| Shareholder servicing fees (Note 4): | | | | |
| Class A | | | 16,936 | |
| Class C | | | 46,813 | |
| Class W | | | 48,577 | |
| Class L | | | 13,074 | |
| Interest expense (Note 7) | | | 195,790 | |
| Interest and amortization/accretion on securities sold short | | | 192,145 | |
| Incentive fees (Note 4) | | | 641,586 | |
| Transfer agent fees (Note 4) | | | 68,945 | |
| Professional fees | | | 456,045 | |
| Printing expense | | | 63,667 | |
| Registration fees | | | 35,233 | |
| Custody fees | | | 26,253 | |
| Insurance expense | | | 110,191 | |
| Trustee fees and expenses (Note 4) | | | 18,354 | |
| Networking Fees: | | | | |
| Class A | | | 4,038 | |
| Class C | | | 4,075 | |
| Class W | | | 1,248 | |
| Class I | | | 10,089 | |
| Class L | | | 1,581 | |
| Other expenses | | | 9,010 | |
| Total expenses | | | 4,520,454 | |
| Fees waived by Adviser net of recoupment (Note 4) | | | (386,900 | ) |
| Total net expenses | | | 4,133,554 | |
| NET INVESTMENT INCOME | | | 12,242,050 | |
| Net realized gain on investments | | | 670,864 | |
| Net realized gain on securities sold short | | | 914,105 | |
| Net realized gain on foreign currency transactions | | | 20,711 | |
| Net change in unrealized depreciation on investments | | | (8,957,252 | ) |
| Net change in unrealized appreciation on securities sold short | | | 920,644 | |
| Net change in unrealized depreciation on affiliated investments | | | (651,731 | ) |
| Net change in unrealized depreciation on translation of assets and liabilities in foreign currencies | | | (24 | ) |
| NET REALIZED AND UNREALIZED LOSS ON INVESTMENTS | | | (7,082,683 | ) |
| NET INCREASE IN NET ASSETS RESULTING FROM OPERATIONS | | $ | 5,159,367 | |
See Notes to Consolidated Financial Statements.
| Semi-Annual Report | March 31, 2024 | 23 |
| | Consolidated Statements of |
| Alternative Credit Income Fund | Changes in Net Assets |
| | | For the Six
Months
Ended
March 31, 2024
(Unaudited) | | | For the
Year Ended
September 30, 2023 | |
| OPERATIONS | | | | | | |
| Net investment income | | $ | 12,242,050 | | | $ | 23,571,949 | |
| Net realized gain/(loss) on investments | | | 1,584,969 | | | | (1,309,135 | ) |
| Net realized gain on foreign currency transactions | | | 20,711 | | | | – | |
| Net change in unrealized depreciation on investments | | | (9,609,007 | ) | | | (12,958,005 | ) |
| Net change in unrealized appreciation on securities sold short | | | 920,644 | | | | 703,228 | |
| Net increase in net assets resulting from operations | | | 5,159,367 | | | | 10,008,037 | |
| | | | | | | | | |
| DISTRIBUTIONS TO SHAREHOLDERS | | | | | | | | |
| Total Distributable Earnings | | | | | | | | |
| Class A | | | (1,166,590 | ) | | | (2,622,103 | ) |
| Class C | | | (1,245,316 | ) | | | (2,637,980 | ) |
| Class W | | | (1,796,003 | ) | | | (3,744,180 | ) |
| Class I | | | (4,209,517 | ) | | | (8,114,488 | ) |
| Class L | | | (359,503 | ) | | | (774,234 | ) |
| Total distributions to shareholders | | | (8,776,929 | ) | | | (17,892,985 | ) |
| | | | | | | | | |
| COMMON SHARE TRANSACTIONS | | | | | | | | |
| Class A | | | | | | | | |
| Proceeds from sales of shares | | | 811,688 | | | | 2,849,033 | |
| Distributions reinvested | | | 557,305 | | | | 1,321,049 | |
| Cost of shares redeemed | | | (5,035,087 | ) | | | (4,557,578 | ) |
| Net transferred in(out) | | | (653,152 | ) | | | (684,076 | ) |
| Net decrease from share transactions | | | (4,319,246 | ) | | | (1,071,572 | ) |
| Class C | | | | | | | | |
| Proceeds from sales of shares | | | 439,735 | | | | 2,457,255 | |
| Distributions reinvested | | | 532,215 | | | | 1,210,338 | |
| Cost of shares redeemed | | | (2,290,549 | ) | | | (4,398,432 | ) |
| Net transferred in(out) | | | (520,320 | ) | | | (415,344 | ) |
| Net decrease from share transactions | | | (1,838,919 | ) | | | (1,146,183 | ) |
| Class W | | | | | | | | |
| Proceeds from sales of shares | | | 2,025,300 | | | | 8,000,677 | |
| Distributions reinvested | | | 446,035 | | | | 974,679 | |
| Cost of shares redeemed | | | (4,970,663 | ) | | | (8,988,259 | ) |
| Net transferred in(out) | | | (7,886 | ) | | | (3,645,027 | ) |
| Net decrease from share transactions | | | (2,507,214 | ) | | | (3,657,930 | ) |
| Class I | | | | | | | | |
| Proceeds from sales of shares | | | 15,399,283 | | | | 15,729,005 | |
| Distributions reinvested | | | 1,558,887 | | | | 4,180,602 | |
| Cost of shares redeemed | | | (9,243,960 | ) | | | (20,944,050 | ) |
| Net transferred in(out) | | | 1,181,358 | | | | 4,751,895 | |
| Net increase from share transactions | | | 8,895,568 | | | | 3,717,452 | |
| Class L | | | | | | | | |
| Proceeds from sales of shares | | | 39,780 | | | | 26,026 | |
| Distributions reinvested | | | 223,048 | | | | 462,806 | |
| Cost of shares redeemed | | | (1,173,982 | ) | | | (927,995 | ) |
| Net transferred in(out) | | | – | | | | (23,479 | ) |
| Net decrease from share transactions | | | (911,154 | ) | | | (462,642 | ) |
| Total net decrease in net assets | | | (4,298,527 | ) | | | (10,505,823 | ) |
| | | | | | | | | |
| NET ASSETS | | | | | | | | |
| Beginning of period | | | 252,161,192 | | | | 262,667,015 | |
| End of period | | $ | 247,862,665 | | | $ | 252,161,192 | |
See Notes to Consolidated Financial Statements.
| | Consolidated Statements |
| Alternative Credit Income Fund | of Changes in Net Assets (continued) |
| | | For the Six Months
Ended
March 31, 2024
(Unaudited) | | | For the
Year Ended
September 30, 2023 | |
| OTHER INFORMATION | | | | | | |
| Common Shares Transactions | | | | | | |
| Class A | | | | | | |
| Issued | | | 82,790 | | | | 286,914 | |
| Distributions reinvested | | | 57,710 | | | | 135,876 | |
| Redeemed | | | (518,977 | ) | | | (462,919 | ) |
| Net Transferred in(out) | | | (66,554 | ) | | | (68,557 | ) |
| Net decrease in shares | | | (445,031 | ) | | | (108,686 | ) |
| | | | | | | | | |
| Class C | | | | | | | | |
| Issued | | | 44,513 | | | | 243,786 | |
| Distributions reinvested | | | 54,445 | | | | 122,973 | |
| Redeemed | | | (232,985 | ) | | | (441,790 | ) |
| Net Transferred in(out) | | | (52,774 | ) | | | (41,807 | ) |
| Net decrease in shares | | | (186,801 | ) | | | (116,838 | ) |
| | | | | | | | | |
| Class W | | | | | | | | |
| Issued | | | 208,414 | | | | 811,476 | |
| Distributions reinvested | | | 46,225 | | | | 100,325 | |
| Redeemed | | | (511,707 | ) | | | (911,159 | ) |
| Net Transferred in(out) | | | (802 | ) | | | (361,196 | ) |
| Net decrease in shares | | | (257,870 | ) | | | (360,554 | ) |
| | | | | | | | | |
| Class I | | | | | | | | |
| Issued | | | 1,588,490 | | | | 1,588,810 | |
| Distributions reinvested | | | 161,214 | | | | 429,277 | |
| Redeemed | | | (951,168 | ) | | | (2,125,471 | ) |
| Net Transferred in(out) | | | 120,514 | | | | 473,281 | |
| Net increase in shares | | | 919,050 | | | | 365,897 | |
| | | | | | | | | |
| Class L | | | | | | | | |
| Issued | | | 4,096 | | | | 2,662 | |
| Distributions reinvested | | | 23,103 | | | | 47,604 | |
| Redeemed | | | (121,232 | ) | | | (94,229 | ) |
| Net Transferred in(out) | | | – | | | | (2,600 | ) |
| Net decrease in shares | | | (94,033 | ) | | | (46,563 | ) |
See Notes to Consolidated Financial Statements.
| Semi-Annual Report | March 31, 2024 | 25 |
| Alternative Credit Income Fund | Consolidated Statement of Cash Flows |
For the Six Months Ended March 31, 2024 (Unaudited)
| CASH FLOWS FROM OPERATING ACTIVITIES: | | | |
| Net increase in net assets from operations | | $ | 5,159,367 | |
| Adjustments to reconcile net increase in net assets resulting from operations to net cash provided by operating activities: | | | | |
| Purchase of investment securities | | | (18,147,022 | ) |
| Payment-in-kind | | | (1,256,350 | ) |
| Proceeds from sale of investment securities | | | 17,878,599 | |
| Purchases to cover securities sold short | | | (5,472,500 | ) |
| Purchase of short-term investment securities - net | | | 1,702,768 | |
| Amortization of discount and accretion of discount on investments | | | (1,691,375 | ) |
| Net realized (gain)/loss on: | | | | |
| Investments | | | (1,584,969 | ) |
| Net change in unrealized (appreciation)/depreciation on: | | | | |
| Investments | | | 8,688,363 | |
| (Increase)/Decrease in assets: | | | | |
| Deposit for Security Sold Short | | | 9,356,283 | |
| Interest and distributions receivable | | | 693,844 | |
| Prepaid expenses and other assets | | | 151,424 | |
| Increase/(Decrease) in liabilities: | | | | |
| Due to Adviser | | | (332,581 | ) |
| Administration fees payable | | | (120,275 | ) |
| Custody fees payable | | | (41,863 | ) |
| Shareholder servicing fees payable | | | (56,951 | ) |
| Distribution fees payable | | | (27,490 | ) |
| Transfer agency fees payable | | | (111,061 | ) |
| Interest expense on securities sold short payable | | | (215,173 | ) |
| Incentive fees payable | | | (220,881 | ) |
| Accrued expenses and other liabilities | | | (687,543 | ) |
| Due to Broker | | | 2,250 | |
| Interest Payable | | | 88,629 | |
| Net cash provided by operating activities | | | 13,755,493 | |
| | | | | |
| CASH FLOWS FROM FINANCING ACTIVITIES: | | | | |
| Proceeds from sales of shares | | | 18,386,671 | |
| Cost of shares redeemed | | | (22,714,241 | ) |
| Repayments on the BNP line of credit | | | (3,878,632 | ) |
| Borrowings on the US Bank line of credit | | | 5,000,000 | |
| Repayments on the US Bank line of credit | | | (5,000,000 | ) |
| Cash distributions paid | | | (5,459,439 | ) |
| Net cash used in financing activities | | | (13,665,641 | ) |
| | | | | |
| Effect of exchange rates on cash | | | (24 | ) |
| | | | | |
| Net change in cash & cash equivalents | | | 89,838 | |
| Restricted and unrestricted cash, beginning of period | | | – | |
| Restricted and unrestricted cash, end of period | | $ | 89,838 | |
| | | | | |
| Non-cash financing activities not included herein consist of reinvestment of distributions of: | | $ | 3,317,490 | |
| Cash paid for interest on line of credit during the year was: | | $ | 71,177 | |
See Notes to Consolidated Financial Statements.
| Alternative Credit Income Fund – Class A | Financial Highlights |
For a Share Outstanding Throughout the Years Presented
| | | For the Six
Months
Ended
March 31, 2024
(Unaudited) | | | Year Ended
September 30,
2023 | | | Year Ended
September 30,
2022 | | | Year Ended
September 30,
2021 | | | Year Ended
September 30,
2020 | | | Year Ended
September 30,
2019 | |
| NET ASSET VALUE, BEGINNING OF YEAR | | $ | 9.79 | | | $ | 10.09 | | | $ | 11.09 | | | $ | 9.75 | | | $ | 10.80 | | | $ | 11.09 | |
| | | | | | | | | | | | | | | | | | | | | | | | | |
| INCOME FROM INVESTMENT OPERATIONS | | | | | | | | | | | | | | | | | | | | | | | | |
| Net investment income/(loss)(a) | | | 0.49 | | | | (0.93 | ) | | | 0.61 | | | | 0.74 | | | | 0.69 | | | | 0.73 | |
| Net realized and unrealized gain/(loss) on investments | | | (0.29 | ) | | | (0.53 | ) | | | (0.91 | ) | | | 1.30 | | | | (0.92 | ) | | | (0.32 | ) |
| Total income/(loss) from investment operations | | | 0.20 | | | | 0.40 | | | | (0.30 | ) | | | 2.04 | | | | (0.23 | ) | | | 0.41 | |
| | | | | | | | | | | | | | | | | | | | | | | | | |
| DISTRIBUTIONS TO SHAREHOLDERS | | | | | | | | | | | | | | | | | | | | | | | | |
| From net investment income | | | (0.35 | ) | | | (0.70 | ) | | | (0.66 | ) | | | (0.63 | ) | | | (0.70 | ) | | | (0.55 | ) |
| From return of capital | | | – | | | | – | | | | (0.04 | ) | | | (0.07 | ) | | | (0.12 | ) | | | (0.15 | ) |
| Total distributions | | | (0.35 | ) | | | (0.70 | ) | | | (0.70 | ) | | | (0.70 | ) | | | (0.82 | ) | | | (0.70 | ) |
| INCREASE/(DECREASE) IN NET ASSET VALUE | | | (0.15 | ) | | | (0.30 | ) | | | (1.00 | ) | | | 1.34 | | | | (1.05 | ) | | | (0.29 | ) |
| NET ASSET VALUE, END OF YEAR | | $ | 9.64 | | | $ | 9.79 | | | $ | 10.09 | | | $ | 11.09 | | | $ | 9.75 | | | $ | 10.80 | |
| | | | | | | | | | | | | | | | | | | | | | | | | |
| TOTAL RETURN(b) | | | 2.07 | %(c) | | | 4.19 | %(c) | | | (2.85 | )% | | | 21.33 | %(c) | | | (1.88 | )%(c)(d) | | | 3.91 | % |
| | | | | | | | | | | | | | | | | | | | | | | | | |
| RATIOS AND SUPPLEMENTAL DATA | | | | | | | | | | | | | | | | | | | | | | | | |
| Net assets, end of year (in 000s) | | $ | 31,413 | | | $ | 36,233 | | | $ | 38,452 | | | $ | 41,519 | | | $ | 38,829 | | | $ | 38,901 | |
| | | | | | | | | | | | | | | | | | | | | | | | | |
| RATIOS TO AVERAGE NET ASSETS(e) | | | | | | | | | | | | | | | | | | | | | | | | |
| Including incentive fees, interest expense on borrowings and interest expense on securities sold short: | | | | | | | | | | | | | | | | | | | | | | | | |
| Expenses, gross | | | 3.64 | %(f) | | | 3.00 | % | | | 2.60 | % | | | 2.84 | % | | | 2.78 | % | | | 2.79 | % |
| Expenses, net of fees waived/expenses reimbursed by Adviser | | | 3.43 | %(f) | | | 2.87 | % | | | 2.60 | % | | | 2.65 | % | | | 2.68 | % | | | 2.67 | % |
| Excluding incentive fees, interest expense: | | | | | | | | | | | | | | | | | | | | | | | | |
| Expenses, gross | | | 2.80 | %(f) | | | 2.72 | % | | | 2.59 | % | | | 2.78 | % | | | 2.69 | % | | | 2.71 | % |
| Expenses, net of fees waived/expenses reimbursed by Adviser | | | 2.59 | %(f) | | | 2.59 | % | | | 2.59 | % | | | 2.59 | % | | | 2.59 | % | | | 2.59 | % |
| Net investment income | | | 10.09 | %(f) | | | 9.36 | % | | | 5.60 | % | | | 6.87 | % | | | 6.93 | % | | | 6.68 | % |
| | | | | | | | | | | | | | | | | | | | | | | | | |
| PORTFOLIO TURNOVER RATE | | | 7 | %(g) | | | 23 | % | | | 26 | % | | | 49 | % | | | 39 | % | | | 29 | % |
| (a) | Per share numbers have been calculated using the average shares method. |
| (b) | Total returns shown are historical in nature and assume changes in share price, reinvestment of dividends and capital gains distribution, if any. Had the Adviser not absorbed a portion of Fund expenses, total returns would have been lower. Returns shown exclude applicable sales charges. |
| (c) | Includes adjustments in accordance with accounting principles generally accepted in the United States of America and, as such, the net asset values for financial reporting purposes and the returns based upon those net asset values may differ from net asset values and returns for shareholder transactions. |
| (d) | 0.10% of the Fund’s total return consists of a reimbursement by the Adviser for a loss on a transaction. Excluding this item, total return would have been (1.98)%. |
| (e) | Ratios do not include expenses of underlying investment companies and private investment funds in which the Fund invests. |
See Notes to Consolidated Financial Statements.
| Semi-Annual Report | March 31, 2024 | 27 |
| Alternative Credit Income Fund – Class C | Financial Highlights |
For a Share Outstanding Throughout the Years Presented
| | | For the Six
Months
Ended
March 31, 2024
(Unaudited) | | | Year Ended
September 30,
2023 | | | Year Ended
September 30,
2022 | | | Year Ended
September 30,
2021 | | | Year Ended
September 30,
2020 | | | Year Ended
September 30,
2019 | |
| NET ASSET VALUE, BEGINNING OF YEAR | | $ | 9.90 | | | $ | 10.21 | | | $ | 11.21 | | | $ | 9.86 | | | $ | 10.92 | | | $ | 11.22 | |
| | | | | | | | | | | | | | | | | | | | | | | | | |
| INCOME FROM INVESTMENT OPERATIONS | | | | | | | | | | | | | | | | | | | | | | | | |
| Net investment income(a) | | | 0.46 | | | | 0.86 | | | | 0.53 | | | | 0.66 | | | | 0.62 | | | | 0.66 | |
| Net realized and unrealized gain/(loss) on investments | | | (0.28 | ) | | | (0.54 | ) | | | (0.90 | ) | | | 1.31 | | | | (0.92 | ) | | | (0.34 | ) |
| Total income/(loss) from investment operations | | | 0.18 | | | | 0.32 | | | | (0.37 | ) | | | 1.97 | | | | (0.30 | ) | | | 0.32 | |
| | | | | | | | | | | | | | | | | | | | | | | | | |
| DISTRIBUTIONS TO SHAREHOLDERS | | | | | | | | | | | | | | | | | | | | | | | | |
| From net investment income | | | (0.32 | ) | | | (0.63 | ) | | | (0.59 | ) | | | (0.56 | ) | | | (0.66 | ) | | | (0.48 | ) |
| From return of capital | | | – | | | | – | | | | (0.04 | ) | | | (0.06 | ) | | | (0.10 | ) | | | (0.14 | ) |
| Total distributions | | | (0.32 | ) | | | (0.63 | ) | | | (0.63 | ) | | | (0.62 | ) | | | (0.76 | ) | | | (0.62 | ) |
| INCREASE/(DECREASE) IN NET ASSET VALUE | | | (0.14 | ) | | | (0.31 | ) | | | (1.00 | ) | | | 1.35 | | | | (1.06 | ) | | | (0.30 | ) |
| NET ASSET VALUE, END OF YEAR | | $ | 9.76 | | | $ | 9.90 | | | $ | 10.21 | | | $ | 11.21 | | | $ | 9.86 | | | $ | 10.92 | |
| | | | | | | | | | | | | | | | | | | | | | | | | |
| TOTAL RETURN(b) | | | 1.80 | %(c) | | | 3.33 | %(c) | | | (3.48 | )% | | | 20.36 | %(c) | | | (2.61 | )%(c)(d) | | | 3.05 | % |
| | | | | | | | | | | | | | | | | | | | | | | | | |
| RATIOS AND SUPPLEMENTAL DATA | | | | | | | | | | | | | | | | | | | | | | | | |
| Net assets, end of year (in 000s) | | $ | 38,529 | | | $ | 40,947 | | | $ | 43,391 | | | $ | 47,640 | | | $ | 43,984 | | | $ | 41,575 | |
| | | | | | | | | | | | | | | | | | | | | | | | | |
| RATIOS TO AVERAGE NET ASSETS(e) | | | | | | | | | | | | | | | | | | | | | | | | |
| Including incentive fees, interest expense on borrowings and interest expense on securities sold short: | | | | | | | | | | | | | | | | | | | | | | | | |
| Expenses, gross | | | 4.46 | %(f) | | | 3.74 | % | | | 3.38 | % | | | 3.59 | % | | | 3.53 | % | | | 3.55 | % |
| Expenses, net of fees waived/expenses reimbursed by Adviser | | | 4.15 | %(f) | | | 3.62 | % | | | 3.35 | % | | | 3.40 | % | | | 3.43 | % | | | 3.42 | % |
| Excluding incentive fees, interest expense: | | | | | | | | | | | | | | | | | | | | | | | | |
| Expenses, gross | | | 3.65 | %(f) | | | 3.46 | % | | | 3.37 | % | | | 3.53 | % | | | 3.44 | % | | | 3.47 | % |
| Expenses, net of fees waived/expenses reimbursed by Adviser | | | 3.34 | %(f) | | | 3.34 | % | | | 3.34 | % | | | 3.34 | % | | | 3.34 | % | | | 3.34 | % |
| Net investment income | | | 9.33 | %(f) | | | 8.61 | % | | | 4.87 | % | | | 6.12 | % | | | 6.19 | % | | | 5.95 | % |
| | | | | | | | | | | | | | | | | | | | | | | | | |
| PORTFOLIO TURNOVER RATE | | | 7 | %(g) | | | 23 | % | | | 26 | % | | | 49 | % | | | 39 | % | | | 29 | % |
| (a) | Per share numbers have been calculated using the average shares method. |
| (b) | Total returns shown are historical in nature and assume changes in share price, reinvestment of dividends and capital gains distribution, if any. Had the Adviser not absorbed a portion of Fund expenses, total returns would have been lower. |
| (c) | Includes adjustments in accordance with accounting principles generally accepted in the United States of America and, as such, the net asset values for financial reporting purposes and the returns based upon those net asset values may differ from net asset values and returns for shareholder transactions. |
| (d) | 0.10% of the Fund’s total return consists of a reimbursement by the Adviser for a loss on a transaction. Excluding this item, total return would have been (2.71)%. |
| (e) | Ratios do not include expenses of underlying investment companies and private investment funds in which the Fund invests. |
See Notes to Consolidated Financial Statements.
| Alternative Credit Income Fund – Class W | Financial Highlights |
For a Share Outstanding Throughout the Years Presented
| | | For the Six
Months
Ended
March 31, 2024
(Unaudited) | | | Year Ended
September 30,
2023 | | | Year Ended
September 30,
2022 | | | Year Ended
September 30,
2021 | | | Year Ended
September 30,
2020 | | | Year Ended
September 30,
2019 | |
| NET ASSET VALUE, BEGINNING OF YEAR | | $ | 9.78 | | | $ | 10.08 | | | $ | 11.08 | | | $ | 9.74 | | | $ | 10.79 | | | $ | 11.09 | |
| | | | | | | | | | | | | | | | | | | | | | | | | |
| INCOME FROM INVESTMENT OPERATIONS | | | | | | | | | | | | | | | | | | | | | | | | |
| Net investment income(a) | | | 0.49 | | | | 0.93 | | | | 0.61 | | | | 0.74 | | | | 0.69 | | | | 0.73 | |
| Net realized and unrealized gain/(loss) on investments | | | (0.28 | ) | | | (0.53 | ) | | | (0.91 | ) | | | 1.30 | | | | (0.92 | ) | | | (0.33 | ) |
| Total income/(loss) from investment operations | | | 0.21 | | | | 0.40 | | | | (0.30 | ) | | | 2.04 | | | | (0.23 | ) | | | 0.40 | |
| | | | | | | | | | | | | | | | | | | | | | | | | |
| DISTRIBUTIONS TO SHAREHOLDERS | | | | | | | | | | | | | | | | | | | | | | | | |
| From net investment income | | | (0.35 | ) | | | (0.70 | ) | | | (0.66 | ) | | | (0.63 | ) | | | (0.70 | ) | | | (0.55 | ) |
| From return of capital | | | – | | | | – | | | | (0.04 | ) | | | (0.07 | ) | | | (0.12 | ) | | | (0.15 | ) |
| Total distributions | | | (0.35 | ) | | | (0.70 | ) | | | (0.70 | ) | | | (0.70 | ) | | | (0.82 | ) | | | (0.70 | ) |
| INCREASE/(DECREASE) IN NET ASSET VALUE | | | (0.14 | ) | | | (0.30 | ) | | | (1.00 | ) | | | 1.34 | | | | (1.05 | ) | | | (0.30 | ) |
| NET ASSET VALUE, END OF YEAR | | $ | 9.64 | | | $ | 9.78 | | | $ | 10.08 | | | $ | 11.08 | | | $ | 9.74 | | | $ | 10.79 | |
| | | | | | | | | | | | | | | | | | | | | | | | | |
| TOTAL RETURN(b) | | | 2.17 | %(c) | | | 4.19 | %(c) | | | (2.86 | )% | | | 21.35 | %(c) | | | (1.89 | )%(c)(d) | | | 3.81 | % |
| | | | | | | | | | | | | | | | | | | | | | | | | |
| RATIOS AND SUPPLEMENTAL DATA | | | | | | | | | | | | | | | | | | | | | | | | |
| Net assets, end of year (in 000s) | | $ | 49,863 | | | $ | 53,123 | | | $ | 58,382 | | | $ | 61,915 | | | $ | 69,993 | | | $ | 85,642 | |
| | | | | | | | | | | | | | | | | | | | | | | | | |
| RATIOS TO AVERAGE NET ASSETS(e) | | | | | | | | | | | | | | | | | | | | | | | | |
| Including incentive fees, interest expense on borrowings and interest expense on securities sold short: | | | | | | | | | | | | | | | | | | | | | | | | |
| Expenses, gross | | | 3.68 | %(f) | | | 2.98 | % | | | 2.60 | % | | | 2.81 | % | | | 2.75 | % | | | 2.79 | % |
| Expenses, net of fees waived/expenses reimbursed by Adviser | | | 3.39 | %(f) | | | 2.87 | % | | | 2.60 | % | | | 2.65 | % | | | 2.68 | % | | | 2.67 | % |
| Excluding incentive fees, interest expense: | | | | | | | | | | | | | | | | | | | | | | | | |
| Expenses, gross | | | 2.88 | %(f) | | | 2.70 | % | | | 2.59 | % | | | 2.75 | % | | | 2.66 | % | | | 2.71 | % |
| Expenses, net of fees waived/expenses reimbursed by Adviser | | | 2.59 | %(f) | | | 2.59 | % | | | 2.59 | % | | | 2.59 | % | | | 2.59 | % | | | 2.59 | % |
| Net investment income | | | 10.07 | %(f) | | | 9.36 | % | | | 5.63 | % | | | 6.89 | % | | | 6.92 | % | | | 6.68 | % |
| | | | | | | | | | | | | | | | | | | | | | | | | |
| PORTFOLIO TURNOVER RATE | | | 7 | %(g) | | | 23 | % | | | 26 | % | | | 49 | % | | | 39 | % | | | 29 | % |
| (a) | Per share numbers have been calculated using the average shares method. |
| (b) | Total returns shown are historical in nature and assume changes in share price, reinvestment of dividends and capital gains distribution, if any. Had the Adviser not absorbed a portion of Fund expenses, total returns would have been lower. |
| (c) | Includes adjustments in accordance with accounting principles generally accepted in the United States of America and, as such, the net asset values for financial reporting purposes and the returns based upon those net asset values may differ from net asset values and returns for shareholder transactions. |
| (d) | 0.10% of the Fund’s total return consists of a reimbursement by the Adviser for a loss on a transaction. Excluding this item, total return would have been (1.99)%. |
| (e) | Ratios do not include expenses of underlying investment companies and private investment funds in which the Fund invests. |
See Notes to Consolidated Financial Statements.
| Semi-Annual Report | March 31, 2024 | 29 |
| Alternative Credit Income Fund – Class I | Financial Highlights |
For a Share Outstanding Throughout the Years Presented
| | | For the Six
Months
Ended
March 31, 2024
(Unaudited) | | | Year Ended
September 30,
2023 | | | Year Ended
September 30,
2022 | | | Year Ended
September 30,
2021 | | | Year Ended
September 30,
2020 | | | Year Ended
September 30,
2019 | |
| NET ASSET VALUE, BEGINNING OF YEAR | | $ | 9.80 | | | $ | 10.11 | | | $ | 11.11 | | | $ | 9.77 | | | $ | 10.82 | | | $ | 11.12 | |
| | | | | | | | | | | | | | | | | | | | | | | | | |
| INCOME FROM INVESTMENT OPERATIONS | | | | | | | | | | | | | | | | | | | | | | | | |
| Net investment income(a) | | | 0.50 | | | | 0.95 | | | | 0.63 | | | | 0.76 | | | | 0.72 | | | | 0.77 | |
| Net realized and unrealized gain/(loss) on investments | | | (0.28 | ) | | | (0.53 | ) | | | (0.90 | ) | | | 1.30 | | | | (0.92 | ) | | | (0.34 | ) |
| Total income/(loss) from investment operations | | | 0.22 | | | | 0.42 | | | | (0.27 | ) | | | 2.06 | | | | (0.20 | ) | | | 0.43 | |
| | | | | | | | | | | | | | | | | | | | | | | | | |
| DISTRIBUTIONS TO SHAREHOLDERS | | | | | | | | | | | | | | | | | | | | | | | | |
| From net investment income | | | (0.36 | ) | | | (0.73 | ) | | | (0.69 | ) | | | (0.65 | ) | | | (0.73 | ) | | | (0.57 | ) |
| From return of capital | | | – | | | | – | | | | (0.04 | ) | | | (0.07 | ) | | | (0.12 | ) | | | (0.16 | ) |
| Total distributions | | | (0.36 | ) | | | (0.73 | ) | | | (0.73 | ) | | | (0.72 | ) | | | (0.85 | ) | | | (0.73 | ) |
| INCREASE/(DECREASE) IN NET ASSET VALUE | | | (0.14 | ) | | | (0.31 | ) | | | (1.00 | ) | | | 1.34 | | | | (1.05 | ) | | | (0.30 | ) |
| NET ASSET VALUE, END OF YEAR | | $ | 9.66 | | | $ | 9.80 | | | $ | 10.11 | | | $ | 11.11 | | | $ | 9.77 | | | $ | 10.82 | |
| | | | | | | | | | | | | | | | | | | | | | | | | |
| TOTAL RETURN(b) | | | 2.31 | %(c) | | | 4.36 | %(c) | | | (2.58 | )% | | | 21.61 | %(c) | | | (1.61 | )%(c)(d) | | | 4.08 | % |
| | | | | | | | | | | | | | | | | | | | | | | | | |
| RATIOS AND SUPPLEMENTAL DATA | | | | | | | | | | | | | | | | | | | | | | | | |
| Net assets, end of year (in 000s) | | $ | 118,009 | | | $ | 110,739 | | | $ | 110,512 | | | $ | 93,970 | | | $ | 87,634 | | | $ | 87,265 | |
| | | | | | | | | | | | | | | | | | | | | | | | | |
| RATIOS TO AVERAGE NET ASSETS(e) | | | | | | | | | | | | | | | | | | | | | | | | |
| Including incentive fees, interest expense on borrowings and interest expense on securities sold short: | | | | | | | | | | | | | | | | | | | | | | | | |
| Expenses, gross | | | 3.45 | %(f) | | | 2.74 | % | | | 2.36 | % | | | 2.59 | % | | | 2.52 | % | | | 2.54 | % |
| Expenses, net of fees waived/expenses reimbursed by Adviser | | | 3.08 | %(f) | | | 2.62 | % | | | 2.35 | % | | | 2.40 | % | | | 2.43 | % | | | 2.42 | % |
| Excluding incentive fees, interest expense: | | | | | | | | | | | | | | | | | | | | | | | | |
| Expenses, gross | | | 2.71 | %(f) | | | 2.46 | % | | | 2.35 | % | | | 2.53 | % | | | 2.43 | % | | | 2.46 | % |
| Expenses, net of fees waived/expenses reimbursed by Adviser | | | 2.34 | %(f) | | | 2.34 | % | | | 2.34 | % | | | 2.34 | % | | | 2.34 | % | | | 2.34 | % |
| Net investment income | | | 10.28 | %(f) | | | 9.63 | % | | | 5.78 | % | | | 7.12 | % | | | 7.20 | % | | | 7.00 | % |
| | | | | | | | | | | | | | | | | | | | | | | | | |
| PORTFOLIO TURNOVER RATE | | | 7 | %(g) | | | 23 | % | | | 26 | % | | | 49 | % | | | 39 | % | | | 29 | % |
| (a) | Per share numbers have been calculated using the average shares method. |
| (b) | Total returns shown are historical in nature and assume changes in share price, reinvestment of dividends and capital gains distribution, if any. Had the Adviser not absorbed a portion of Fund expenses, total returns would have been lower. |
| (c) | Includes adjustments in accordance with accounting principles generally accepted in the United States of America and, as such, the net asset values for financial reporting purposes and the returns based upon those net asset values may differ from net asset values and returns for shareholder transactions. |
| (d) | 0.10% of the Fund’s total return consists of a reimbursement by the Adviser for a loss on a transaction. Excluding this item, total return would have been (1.71)%. |
| (e) | Ratios do not include expenses of underlying investment companies and private investment funds in which the Fund invests. |
See Notes to Consolidated Financial Statements.
| Alternative Credit Income Fund – Class L | Financial Highlights |
For a Share Outstanding Throughout the Years Presented
| | | For the Six
Months
Ended
March 31, 2024
(Unaudited) | | | Year Ended
September 30,
2023 | | | Year Ended
September 30,
2022 | | | Year Ended
September 30,
2021 | | | Year Ended
September 30,
2020 | | | Year Ended
September 30,
2019 | |
| NET ASSET VALUE, BEGINNING OF YEAR | | $ | 9.79 | | | $ | 10.09 | | | $ | 11.08 | | | $ | 9.75 | | | $ | 10.79 | | | $ | 11.09 | |
| | | | | | | | | | | | | | | | | | | | | | | | | |
| INCOME/(LOSS) FROM INVESTMENT OPERATIONS | | | | | | | | | | | | | | | | | | | | | | | | |
| Net investment income(a) | | | 0.48 | | | | 0.90 | | | | 0.58 | | | | 0.71 | | | | 0.67 | | | | 0.70 | |
| Net realized and unrealized gain/(loss) on investments | | | (0.29 | ) | | | (0.53 | ) | | | (0.90 | ) | | | 1.29 | | | | (0.91 | ) | | | (0.33 | ) |
| Total income/(loss) from investment operations | | | 0.19 | | | | 0.37 | | | | (0.32 | ) | | | 2.00 | | | | (0.24 | ) | | | 0.37 | |
| | | | | | | | | | | | | | | | | | | | | | | | | |
| DISTRIBUTIONS TO SHAREHOLDERS | | | | | | | | | | | | | | | | | | | | | | | | |
| From net investment income | | | (0.34 | ) | | | (0.67 | ) | | | (0.63 | ) | | | (0.60 | ) | | | (0.69 | ) | | | (0.52 | ) |
| From net realized gain on investments | | | – | | | | – | | | | – | | | | – | | | | – | | | | – | |
| From return of capital | | | – | | | | – | | | | (0.04 | ) | | | (0.07 | ) | | | (0.11 | ) | | | (0.15 | ) |
| Total distributions | | | (0.34 | ) | | | (0.67 | ) | | | (0.67 | ) | | | (0.67 | ) | | | (0.80 | ) | | | (0.67 | ) |
| INCREASE/(DECREASE) IN NET ASSET VALUE | | | (0.15 | ) | | | (0.30 | ) | | | (0.99 | ) | | | 1.33 | | | | (1.04 | ) | | | (0.30 | ) |
| NET ASSET VALUE, END OF YEAR | | $ | 9.64 | | | $ | 9.79 | | | $ | 10.09 | | | $ | 11.08 | | | $ | 9.75 | | | $ | 10.79 | |
| | | | | | | | | | | | | | | | | | | | | | | | | |
| TOTAL RETURN(b) | | | 1.94 | %(c) | | | 3.93 | %(c) | | | (3.01 | )% | | | 20.92 | %(c) | | | (2.04 | )%(c)(d) | | | 3.55 | %(c) |
| | | | | | | | | | | | | | | | | | | | | | | | | |
| RATIOS AND SUPPLEMENTAL DATA | | | | | | | | | | | | | | | | | | | | | | | | |
| Net assets, end of year or period (in 000s) | | $ | 10,049 | | | $ | 11,119 | | | $ | 11,930 | | | $ | 14,026 | | | $ | 12,656 | | | $ | 13,972 | |
| | | | | | | | | | | | | | | | | | | | | | | | | |
| RATIOS TO AVERAGE NET ASSETS(e) | | | | | | | | | | | | | | | | | | | | | | | | |
| Including incentive fees, interest expense on borrowings and interest expense on securities sold short: | | | | | | | | | | | | | | | | | | | | | | | | |
| Expenses, gross | | | 4.04 | %(f) | | | 3.25 | % | | | 2.89 | % | | | 3.11 | % | | | 3.04 | % | | | 3.06 | % |
| Expenses, net of fees waived/expenses reimbursed by Adviser | | | 3.69 | %(f) | | | 3.12 | % | | | 2.85 | % | | | 2.90 | % | | | 2.93 | % | | | 2.92 | % |
| Excluding incentive fees, interest expense: | | | | | | | | | | | | | | | | | | | | | | | | |
| Expenses, gross | | | 3.19 | %(f) | | | 2.97 | % | | | 2.88 | % | | | 3.05 | % | | | 2.95 | % | | | 2.98 | % |
| Expenses, net of fees waived/expenses reimbursed by Adviser | | | 2.84 | %(f) | | | 2.84 | % | | | 2.84 | % | | | 2.84 | % | | | 2.84 | % | | | 2.84 | % |
| Net investment income | | | 9.85 | %(f) | | | 9.11 | % | | | 5.37 | % | | | 6.61 | % | | | 6.66 | % | | | 6.42 | % |
| | | | | | | | | | | | | | | | | | | | | | | | | |
| PORTFOLIO TURNOVER RATE | | | 7 | %(g) | | | 23 | % | | | 26 | % | | | 49 | % | | | 39 | % | | | 29 | % |
| (a) | Per share numbers have been calculated using the average shares method. |
| (b) | Total returns shown are historical in nature and assume changes in share price, reinvestment of dividends and capital gains distribution, if any. Had the Adviser not absorbed a portion of Fund expenses, total returns would have been lower. |
| (c) | Includes adjustments in accordance with accounting principles generally accepted in the United States of America and, as such, the net asset values for financial reporting purposes and the returns based upon those net asset values may differ from net asset values and returns for shareholder transactions. |
| (d) | 0.10% of the Fund’s total return consists of a reimbursement by the Adviser for a loss on a transaction. Excluding this item, total return would have been (2.14)%. |
| (e) | Ratios do not include expenses of underlying investment companies and private investment funds in which the Fund invests. |
See Notes to Consolidated Financial Statements.
| Semi-Annual Report | March 31, 2024 | 31 |
| Alternative Credit Income Fund | Notes to Consolidated Financial Statements |
March 31, 2024 (Unaudited)
1. ORGANIZATION
Alternative Credit Income Fund (the “Fund”) is a closed-end, diversified management Investment Company that is registered under the Investment Company Act of 1940, as amended (the "1940 Act"). The Fund is structured as an interval fund and continuously offers its shares. The Fund was organized as a Delaware statutory trust on December 11, 2014.
The Fund’s investment objectives are to produce current income and to achieve capital preservation with moderate volatility and low to moderate correlation to the broader equity markets. The Fund pursues its investment objectives by investing, under normal circumstances, at least 80% of its assets (defined as net assets plus the amount of any borrowing for investment purposes) in fixed-income and fixed-income related securities.
Sierra Crest Investment Management LLC (the “Adviser”) has served as the Fund’s investment adviser since October 31, 2020.
On February 3, 2020, the Fund formed a wholly-owned subsidiary, CIF Investments LLC, a Delaware corporation. To the extent permitted by the 1940 Act, the Fund may make investments through CIF Investments LLC, which is a pass-through entity.
On March 22, 2022, the Fund formed a wholly-owned taxable subsidiary, ACIF Master Blocker, LLC (the “Taxable Subsidiary”), a Delaware corporation, which is taxed as a corporation for U.S. federal income tax purposes. The Taxable Subsidiary allows the Fund to make equity investments in companies organized as pass-through entities while continuing to satisfy the requirements of a Regulated Investment Company under Subchapter M of the Internal Revenue Code of 1986, as amended (the “Code”).
2. SIGNIFICANT ACCOUNTING POLICIES
The following is a summary of significant accounting policies followed by the Fund in preparation of its consolidated financial statements. These policies are in conformity with U.S. generally accepted accounting principles (“U.S. GAAP”). The Fund is an investment company and follows the accounting and reporting guidance under Financial Accounting Standards Board (“FASB”) Accounting Standards Codification (“ASC”) Topic 946, Financial Services – Investment Companies. These consolidated financial statements reflect adjustments that in the opinion of the Fund are necessary for the fair presentation of the financial position and results of operations as of and for the periods presented herein. The Fund is considered an investment company for financial reporting purposes under U.S. GAAP and therefore applies the accounting and reporting guidance applicable to investment companies. The preparation of the consolidated financial statements requires management to make estimates and assumptions that affect the reported amounts of assets and liabilities and disclosure of contingent assets and liabilities at the date of the financial statements and the reported amounts of income and expenses for the year. Actual results could differ from those estimates, and such difference could be material. In accordance with U.S. GAAP guidance on consolidation, the Fund will generally not consolidate its investment in a portfolio company other than an investment company subsidiary or a controlled operating company whose business consists of providing services to the Fund. Accordingly, the Fund consolidated the accounts of the Fund’s wholly-owned subsidiaries, CIF Investments LLC and the Taxable Subsidiary, in its consolidated financial statements. All significant intercompany balances and transactions have been eliminated in consolidation. All references made to the “Fund” herein include Alternative Credit Income Fund and its consolidated subsidiaries, except as stated otherwise.
Securities Transactions and Investment Income – Investment transactions are recorded on the trade date. Realized gains or losses on investments are calculated using the specific identification method for both financial statement and federal income tax purposes. Dividend income is recorded on the ex-dividend date and interest income is recorded on an accrual basis. Premiums on securities are amortized to the earliest call date and purchase discounts are accreted over the life of the respective securities using the effective interest method.
Loans are generally placed on non-accrual status when there is reasonable doubt that principal or interest will be collected in full. The Fund considers many factors relevant to an investment when placing it on or removing it from non-accrual status including, but not limited to, the delinquency status of the investment, economic and business conditions, the overall financial condition of the underlying investment, the value of the underlying collateral, bankruptcy status, if any, and any other facts or circumstances relevant to the investment. Accrued interest is generally reversed when a loan is placed on non-accrual status. Payments received on non-accrual loans may be recognized as income or applied to principal depending upon management’s judgment regarding collectability of the outstanding principal and interest. Generally non-accrual loans may be restored to accrual status when past due principal and interest is paid current and are likely to remain current based on management’s judgment.
Securities Valuation – Securities listed on an exchange are valued at the last reported sale price at the close of the regular trading session of the exchange on the business day the value is being determined, or in the case of securities listed on NASDAQ, at the NASDAQ Official Closing Price. In the absence of a sale, such securities shall be valued at the mid-price. Short-term investments that mature in 60 days or less may be valued at amortized cost, provided such valuations represent fair value.
| Alternative Credit Income Fund | Notes to Consolidated Financial Statements |
March 31, 2024 (Unaudited)
Structured credit and other similar debt securities including, but not limited to, collateralized loan obligations (“CLO”) debt and equity securities, asset-backed securities (“ABS”), commercial mortgage-backed securities (“CMBS”) and other securitized investments backed by certain debt or other receivables (collectively, “Structured Credit Securities”), are valued on the basis of valuations provided by dealers in those instruments and/or independent pricing services recommended by the Adviser and approved by the Fund’s board of trustees (the "Board", "Trustees", or "Board of Trustees"). In determining fair value, dealers and pricing services will generally use information with respect to transactions in the securities being valued, quotations from other dealers, market transactions in comparable securities, analyses and evaluations of various relationships between securities and yield to maturity information. The Adviser will, based on its reasonable judgment, select the dealer or pricing service quotation that most accurately reflects the fair market value of the Structured Credit Security while taking into account the information utilized by the dealer or pricing service to formulate the quotation in addition to any other relevant factors. In the event that there is a material discrepancy between quotations received from third-party dealers or the pricing services, the Adviser may (i) use an average of the quotations received or (ii) select an individual quotation that the Adviser, based upon its reasonable judgment, determines to be reasonable.
When price quotations for certain securities are not readily available, or if the available quotations are not believed to be reflective of market value by the Adviser, those securities will be valued at fair value as determined in good faith by the Adviser in its capacity as the Board of Trustees’ valuation designee pursuant to Rule 2a-5 under the 1940 Act. Fair valuation involves subjective judgments, the Fund cannot ensure that fair values determined by the Board or persons acting in their direction would accurately reflect the price that the Fund could obtain for a security if the security was sold. As the valuation designee, the Adviser acts under the Board of Trustees’ oversight. The Adviser’s fair valuation policies and procedures are approved by the Board of Trustees.
Fair valuation procedures may be used to value a substantial portion of the assets of the Fund. The Fund may use the fair value of a security to calculate its net asset value ("NAV") when, for example, (1) a portfolio security is not traded in a public market or the principal market in which the security trades is closed, (2) trading in a portfolio security is suspended and not resumed prior to the normal market close, (3) a portfolio security is not traded in significant volume for a substantial period, or (4) the Adviser determines that the quotation or price for a portfolio security provided by a broker- dealer or independent pricing service is inaccurate.
The fair value of securities may be difficult to determine and thus judgment plays a greater role in the valuation process. The fair valuation methodology may include or consider the following guidelines, as appropriate: (1) evaluation of all relevant factors, including but not limited to, pricing history, current market level and supply and demand of the respective security; (2) comparison to the values and current pricing of securities that have comparable characteristics; (3) knowledge of historical market information with respect to the security; and (4) other factors relevant to the security which would include, but not be limited to, duration, yield, fundamental analytical data, the Treasury yield curve and credit quality.
Valuation of Private Investment Funds – The Fund invests a portion of its assets in private investment funds (“Private Investment Funds”). Private Investment Funds, including the joint venture Great Lakes Funding II LLC, value their investment assets at fair value and generally report a NAV or its equivalent in accordance with U.S. GAAP on a calendar quarter basis. The Fund has elected to apply the practical expedient and to value its investments in Private Investment Funds at their respective NAVs at each quarter-end in accordance with U.S. GAAP. For non-calendar quarter-end days, the Valuation Committee estimates the fair value of each Private Investment Fund by adjusting the most recent NAV for such Private Investment Fund, as necessary, by the change in a relevant benchmark that the Valuation Committee has deemed to be representative of the underlying securities in the Private Investment Fund.
Loan Participation and Assignments – The Fund invests in debt instruments, which are interests in amounts owed to lenders (the “Lenders”) by corporate, governmental or other borrowers. The Fund’s investments in loans may be in the form of direct investments, loans originated by the Fund, participations in loans or assignments of all or a portion of the loans from third parties or exposure to investments in loans through investment in Private Investment Funds or other pooled investment vehicles. When the Fund purchases an interest in a loan in the form of an assignment, the Fund acquires all of the direct rights and obligations of a lender (as such term is defined in the related credit agreement), including the right to vote on amendments or waivers of such credit agreement. However, the Fund generally has no right to enforce compliance with the terms of the loan agreement with the borrower. Instead, the administration of the loan agreement is often performed by a bank or other financial institution (the “Agent”) that acts as agent for the Lenders. Circumstances may arise in connection with which the Agent takes action that contradicts the will of the Lenders. For example, under certain circumstances, an Agent may refuse to declare the borrower in default, despite having received a notice of default from the Lenders. When the Fund purchases an interest in a loan in the form of a participation, the Fund purchases such participation interest from another existing Lender, and consequently, the Fund does not obtain the rights and obligations of the Lenders under the credit agreement, such as the right to vote on amendments or waivers. The Fund has the right to receive payments of principal, interest and any fees to which it is entitled only from the Lender from which the Fund has received that participation interest. In this instance, the Fund is subject to both the credit risk of the borrower and the credit risk of the Lender that sold the Fund such participation interest.
| Semi-Annual Report | March 31, 2024 | 33 |
| Alternative Credit Income Fund | Notes to Consolidated Financial Statements |
March 31, 2024 (Unaudited)
Unfunded Commitments – The Fund may enter into unfunded loan commitments, which are contractual obligations for future funding, such as delayed draw term loans or revolving credit arrangements. Unfunded loan commitments represent a future obligation in full, even though a percentage of the notional loan amounts may not be utilized by the borrower. The Fund may receive a commitment fee based on the undrawn portion of the underlying line of credit portion of a floating rate loan.
Additionally, when the Fund invests in a Private Investment Fund, the Fund makes a commitment to invest a specified amount of capital in the applicable Private Investment Fund. The capital commitment may be drawn by the general partner of the Private Investment Fund either all at once or through a series of capital calls at the discretion of the general partner. The unfunded commitment represents the portion of the Fund’s overall capital commitment to a particular Private Investment Fund that has not yet been called by the general partner of the Private Investment Fund.
As of March 31, 2024, the Fund had unfunded commitments of $26,136,934.
Short Sales – The Fund may sell securities short. To do this the Fund will borrow and then sell (take short positions in) securities. To complete such a transaction, the Fund must borrow the security to deliver to the buyer. The Fund is then obligated to replace, or cover, the security borrowed by purchasing it in the open market at some later date. The Fund will generally have to pay a fee or premium to borrow a security and be obligated to repay the lender any dividend or interest that accrues on those securities during the period of the loan. The Fund bears the risk of a loss, unlimited in size, if the market price of the security increases between the date of the short sale and the date on which the Fund replaces the borrowed security. The Fund will realize a gain, limited to the price that the Fund sold the security short, if the security declines in value between those dates. There can be no assurance that securities necessary to cover a short position will be available for purchase. To mitigate leverage risk, the Fund will segregate liquid assets (which may include its long positions) at least equal to its short position exposure, marked-to- market daily.
Fair Value Measurements – A three-tier hierarchy has been established to classify fair value measurements for disclosure purposes. Inputs refer broadly to the assumptions that market participants would use in pricing the asset or liability, including assumptions about risk. Inputs may be observable or unobservable. Observable inputs are inputs that reflect the assumptions market participants would use in pricing the asset or liability that are developed based on market data obtained from sources independent of the reporting entity. Unobservable inputs are inputs that reflect the reporting entity’s own assumptions about the assumptions market participants would use in pricing the asset or liability that are developed based on the best information available. In accordance with the U.S. GAAP guidance on fair value measurements and disclosure, the Fund discloses the fair value of its investments in a hierarchy that prioritizes the inputs to valuation techniques used to measure the fair value.
Various inputs are used in determining the fair value of the Fund’s investments. These inputs are categorized in the following hierarchy under applicable accounting guidance:
| Level 1 – | Unadjusted quoted prices in active markets for identical, unrestricted assets or liabilities that the Fund has the ability to access at the measurement date; |
| | |
| Level 2 – | Quoted prices in markets that are not active, or quoted prices for similar assets or liabilities in active markets, or inputs other than quoted prices that are observable (either directly or indirectly) for substantially the full term of the asset or liability at the measurement date; and |
| | |
| Level 3 – | Significant unobservable prices or inputs (including the Fund’s own assumptions in determining the fair value of investments) where there is little or no market activity for the asset or liability at the measurement date. |
The availability of observable inputs can vary from security to security and is affected by a wide variety of factors, including, for example, the type of security, whether the security is new and not yet established in the marketplace, the liquidity of markets and other characteristics particular to the security. To the extent that valuation is based on models or inputs that are less observable or unobservable in the market, the determination of fair value requires more judgment. Accordingly, the degree of judgment exercised in determining fair value is greatest for instruments categorized in Level 3.
An investment level within the fair value hierarchy is based on the lowest level input, individually or in the aggregate, that is significant to fair value measurement. The valuation techniques used by the Fund to measure fair value maximizes the use of observable inputs and minimizes the use of unobservable inputs.
| Alternative Credit Income Fund | Notes to Consolidated Financial Statements |
March 31, 2024 (Unaudited)
The inputs or methodologies used for valuing securities are not necessarily an indication of the risk or liquidity associated with investing in those securities. The following is a summary of the fair values according to the inputs used in valuing the Fund’s investments as of March 31, 2024:
| Investments in Securities at Value | | Level 1 | | | Level 2 | | | Level 3 | | | Total | |
| Bank Loans(a) | | | | | | | | | | | | |
| Communication Services | | $ | – | | | $ | – | | | $ | 10,862,674 | | | $ | 10,862,674 | |
| Consumer Discretionary | | | – | | | | – | | | | 9,375,521 | | | | 9,375,521 | |
| Consumer Staples | | | – | | | | – | | | | 13,708,558 | | | | 13,708,558 | |
| Financials | | | – | | | | – | | | | 19,454,106 | | | | 19,454,106 | |
| Healthcare | | | – | | | | – | | | | 21,476,742 | | | | 21,476,742 | |
| Industrials | | | – | | | | – | | | | 22,798,528 | | | | 22,798,528 | |
| Information Technology | | | – | | | | – | | | | 39,802,413 | | | | 39,802,413 | |
| Asset Backed Securities(a) | | | – | | | | 4,053,779 | | | | 7,526,144 | | | | 11,579,923 | |
| Corporate Bonds(a) | | | | | | | | | | | | | | | – | |
| Communications | | | – | | | | 1,439,166 | | | | – | | | | 1,439,166 | |
| Consumer Discretionary | | | – | | | | – | | | | – | | | | – | |
| Consumer Staples | | | – | | | | 598,350 | | | | – | | | | 598,350 | |
| Industrials | | | – | | | | 2,802,045 | | | | – | | | | 2,802,045 | |
| Equipment Financing(a) | | | – | | | | – | | | | 1,723,776 | | | | 1,723,776 | |
| Common Equity(a) | | | | | | | | | | | | | | | – | |
| Communication Services | | | – | | | | – | | | | 37,790 | | | | 37,790 | |
| Consumer Discretionary | | | – | | | | 1,432,152 | | | | – | | | | 1,432,152 | |
| Diversified | | | 10,597,768 | | | | – | | | | – | | | | 10,597,768 | |
| Financials | | | – | | | | – | | | | 2,211,599 | | | | 2,211,599 | |
| Healthcare | | | – | | | | – | | | | 479,231 | | | | 479,231 | |
| Industrials | | | – | | | | – | | | | 70,630 | | | | 70,630 | |
| Real Estate | | | – | | | | 3,147,272 | | | | – | | | | 3,147,272 | |
| Preferred Stock(a) | | | | | | | | | | | | | | | – | |
| Consumer Discretionary | | | – | | | | – | | | | 5,887,747 | | | | 5,887,747 | |
| Healthcare | | | – | | | | – | | | | 125,079 | | | | 125,079 | |
| Industrials | | | – | | | | – | | | | 200,000 | | | | 200,000 | |
| Interval Fund(a) | | | 7,754,153 | | | | – | | | | – | | | | 7,754,153 | |
| Warrants(a) | | | – | | | | 475,882 | | | | 326,366 | | | | 802,248 | |
| | | | | | | | | | | | | | | | | |
| Short Positions(a) | | | | | | | | | | | | | | | | |
| Corporate Bonds | | | – | | | | (1,307,445 | ) | | | – | | | | (1,307,445 | ) |
| Short-Term Investment(a) | | | 13,740,394 | | | | – | | | | – | | | | 13,740,394 | |
| TOTAL | | $ | 32,092,315 | | | $ | 12,641,201 | | | $ | 156,066,904 | | | $ | 200,800,420 | |
| Investments measured at net asset value(a) | | | | | | | | | | | | | | $ | 49,946,757 | |
| Total Investments, at fair value, net of Short Positions | | | | | | | | | | | | | | $ | 250,747,177 | |
| (a) | For detailed descriptions, see the accompanying Consolidated Schedule of Investments. |
| Semi-Annual Report | March 31, 2024 | 35 |
| Alternative Credit Income Fund | Notes to Consolidated Financial Statements |
March 31, 2024 (Unaudited)
The following table provides a reconciliation of the beginning and ending balances of investments for which the Fund has used Level 3 inputs to determine the fair value:
| Asset Type | | Balance as of September 30, 2023 | | Accrued Discount/ premium | | Return of Capital | | Realized Gain/(Loss) | | Change in Unrealized Appreciation/ Depreciation | | Purchases | | Sales Proceeds | | Transfer into Level 3 | | Transfer Out of Level 3 | | Balance as of March 31, 2024 | | Net change in unrealized appreciation/ (depreciation) included in the Statements of Operations attributable to Level 3 investments held at March 31, 2024 |
| Bank Loans | | $ | 118,416,035 | | | $ | 527,481 | | | $ | – | | | $ | (24,227 | ) | | $ | (795,059 | ) | | $ | 22,236,164 | | | $ | (2,881,852 | ) | | $ | – | | | $ | – | | | $ | 137,478,542 | | | $ | (795,059 | ) |
| Asset Backed Securities | | | 8,476,118 | | | | 915,732 | | | | – | | | | – | | | | (1,009,497 | ) | | | – | | | | (856,209 | ) | | | – | | | | – | | | | 7,526,144 | | | | (1,009,497 | ) |
| Preferred Stock | | | 5,335,005 | | | | – | | | | – | | | | – | | | | (102,190 | ) | | | 980,011 | | | | – | | | | – | | | | – | | | | 6,212,826 | | | | (102,190 | ) |
| Common Equity | | | 4,415,664 | | | | – | | | | – | | | | – | | | | (1,660,505 | ) | | | 44,091 | | | | – | | | | – | | | | – | | | | 2,799,250 | | | | (1,660,505 | ) |
| Warrants | | | 349,690 | | | | – | | | | – | | | | – | | | | (23,324 | ) | | | – | | | | – | | | | – | | | | – | | | | 326,366 | | | | (23,324 | ) |
| Equipment Financing | | | – | | | | – | | | | – | | | | – | | | | – | | | | 1,822,755 | | | | (98,979 | ) | | | – | | | | – | | | | 1,723,776 | | | | – | |
| | | $ | 136,992,512 | | | $ | 1,443,213 | | | $ | – | | | $ | (24,227 | ) | | $ | (3,590,575 | ) | | $ | 25,083,021 | | | $ | (3,837,040 | ) | | $ | – | | | $ | – | | | $ | 156,066,904 | | | $ | (3,590,575 | ) |
| Alternative Credit Income Fund | Notes to Consolidated Financial Statements |
March 31, 2024 (Unaudited)
There are significant unobservable valuation inputs for material Level 3 investments, and a change to the unobservable input may result in a significant change to the value of the investment. Level 3 investment valuation techniques and inputs as of March 31, 2024 are as follows:
| Asset Category | | Fair value at
March 31, 2024 | | | Valuation Technique | | Unobservable Input(a) | | Range of Input
(Weighted Average)(b) |
| Bank Loans | | | | | | | | | | |
| Communication Services | | $ | 2,639,164 | | | Discounted Cash Flows | | Market Yield | | 8.6% - 8.6% (8.6%) |
| Communication Services | | | 8,223,510 | | | Market | | Broker/Dealer Quotes | | N/A |
| Consumer Discretionary | | | 5,627,738 | | | Discounted Cash Flows | | Market Yield | | 8.0% - 12.0% (10.5%) |
| Consumer Discretionary | | | 1,890,820 | | | Enterprise Valuation | | EBITDA Multiple | | 4.5x - 4.5x (4.5x) |
| Consumer Discretionary | | | 1,856,963 | | | Market | | Broker/Dealer Quotes | | N/A |
| Consumer Staples | | | 6,420,958 | | | Discounted Cash Flows | | Market Yield | | 11.9% - 15.7% (14.4%) |
| Consumer Staples | | | 7,287,600 | | | Market | | Broker/Dealer Quotes | | N/A |
| Financials | | | 18,514,106 | | | Discounted Cash Flows | | Market Yield | | 9.4% - 19.0% (14.2%) |
| Financials | | | 940,000 | | | Market | | Broker/Dealer Quotes | | N/A |
| Healthcare | | | 10,107,967 | | | Discounted Cash Flows | | Market Yield | | 11.0% - 17.8% (14.9%) |
| Healthcare | | | 11,368,775 | | | Market | | Broker/Dealer Quotes | | N/A |
| Industrials | | | 14,022,689 | | | Discounted Cash Flows | | Market Yield | | 7.7% - 17.1% (10.9%) |
| Industrials | | | 95,345 | | | Enterprise Market Value | | EBITDA Multiple | | 4.7x - 4.7x (4.7x) |
| Industrials | | | 8,680,494 | | | Market | | Broker/Dealer Quotes | | N/A |
| Information Technology | | | 19,349,571 | | | Discounted Cash Flows | | Market Yield | | 8.1% - 15.9% (11.3%) |
| Information Technology | | | 2,869,319 | | | Enterprise Valuation | | EBITDA Multiple | | 5.8x - 5.8x (5.8x) |
| Information Technology | | | 17,583,523 | | | Market | | Broker/Dealer Quotes | | N/A |
| Asset Backed Securities | | | 7,526,144 | | | Discounted Cash Flows | | Market Yield | | 20.1% - 23.8% (20.5%) |
| Equipment Financing | | | 1,723,776 | | | Discounted Cash Flows | | Market Yield | | 10.8% - 10.8% (10.8%) |
| Common Equity | | | | | | | | | | |
| Communication Services | | | 37,790 | | | Market | | Broker/Dealer Quotes | | N/A |
| Financials | | | 2,211,599 | | | Enterprise Valuation | | EBITDA Multiple | | 7.3x - 7.3x (7.3x) |
| Healthcare | | | 479,231 | | | Enterprise Valuation | | EBITDA Multiple | | 10.0x - 18.3x (15.5x) |
| Industrials | | | 70,630 | | | Enterprise Valuation | | Book Value of Equity (Asset) | | 1.0x |
| Preferred Stock | | | | | | | | | | |
| Consumer Discretionary | | | 4,907,747 | | | Discounted Cash Flows | | Market Yield | | 13.3% - 13.3% (13.3%) |
| Consumer Discretionary | | | 980,000 | | | Enterprise Valuation | | EBITDA Multiple | | 9.4x - 9.4x (9.4x) |
| Healthcare | | | 125,079 | | | Enterprise Valuation | | EBITDA Multiple | | 18.3x - 18.3x (18.3x) |
| Industrials | | | 200,000 | | | Enterprise Valuation | | Book Value of Equity (Asset) | | 1.0x |
| Warrants | | | 326,366 | | | Discounted Cash Flows | | Stock Price | | $96.90 |
| | | | | | | | | Time | | 2.0 |
| | | | | | | | | Volatility | | 35.0% |
| | | $ | 156,066,904 | | | | | | | |
| (a) | An increase in market yield would result in a decrease in fair value. A decrease in market yield would result in an increase in fair value. An increase in the transaction price would result in an increase in fair value. A decrease in the transaction price would result in a decrease in fair value. An increase in the EBITDA multiple would result in an increase in fair value. A decrease in the EBITDA multiple would result in a decrease in fair value. |
| (b) | The weighted averages disclosed in the table above were weighted by their relative fair value. |
Concentration of Credit Risk – The Fund places its cash with one banking institution, which is insured by the Federal Deposit Insurance Corporation (“FDIC”). The FDIC limit is $250,000. At various times throughout the year, the amount on deposit may exceed the FDIC limit and subject the Fund to a credit risk.
Federal and Other Taxes – No provision for income taxes is included in the accompanying consolidated financial statements, as the Fund intends to distribute to shareholders all taxable investment income and realized gains and otherwise comply with Subchapter M of the Internal Revenue Code of 1986, as amended (the “Code”), applicable to regulated investment companies.
The Fund evaluates tax positions taken (or expected to be taken) in the course of preparing the Fund’s tax provisions to determine whether these positions meet a “more-likely-than-not” standard that, based on the technical merits, have a more than fifty percent likelihood of being sustained by a taxing authority upon examination. A tax position that meets the “more-likely-than-not” recognition threshold is measured to determine the amount of benefit to recognize in the consolidated financial statements.
| Semi-Annual Report | March 31, 2024 | 37 |
| Alternative Credit Income Fund | Notes to Consolidated Financial Statements |
March 31, 2024 (Unaudited)
As of and during the period ended March 31, 2024, the Fund did not have a liability for any unrecognized tax benefits. The Fund files U.S. federal, state and local tax returns as required. The Fund’s tax returns are subject to examination by the relevant tax authorities until expiration of the applicable statute of limitations, which is generally three years after the filing of the tax return for federal purposes and four years for most state returns. Tax returns for open years have incorporated no uncertain tax positions that require a provision for income taxes.
The Taxable Subsidiary records deferred tax assets or liabilities related to temporary book versus tax differences on the income or loss generated by the underlying equity investments held by the Taxable Subsidiary.
Distributions to Shareholders – Distributions from net investment income, if any, are declared and paid quarterly. Distributions from net realized capital gains, if any, are declared and paid annually and are recorded on the ex-dividend date. The character of income and gains to be distributed is determined in accordance with income tax regulations, which may differ from U.S. GAAP.
Early Withdrawal Charge – Selling brokers, or other financial intermediaries that have entered into distribution agreements with the Distributor (as defined below in Note 4), will receive a commission of (a) up to 1.00% of the purchase price of Class C shares and (b) up to 0.50% of the purchase of Class A shares of $1 million or more. Shareholders who tender for repurchase of such shareholder's Class C shares fewer than 365 days after the original purchase date will be subject to an early withdrawal charge of 1.00% of the original purchase price. Shareholders tendering Class A shares fewer than 365 days after the original purchase date will be subject to an early withdrawal charge of 0.50% of the original purchase price, which will be deducted from repurchase proceeds, if (i) the original purchase was for amounts of $1 million or more and (ii) the selling broker received the reallowance of the dealer-manager fee. The Distributor may waive the imposition of the early withdrawal charge in the event of shareholder death or shareholder disability. Any such waiver does not imply that the early withdrawal charge will be waived at any time in the future or that such early withdrawal charge will be waived for any other shareholder. Class A shares (with respect to purchases of less than $1 million) will not be subject to an early withdrawal charge.
Indemnification – The Fund indemnifies its officers and Trustees for certain liabilities that may arise from the performance of their duties to the Fund. Additionally, in the normal course of business, the Fund enters into contracts that contain a variety of representations and warranties and which provide general indemnities. The Fund’s maximum exposure under these arrangements is unknown, as this would involve future claims that may be made against the Fund that have not yet occurred. However, based on industry experience, the Fund expects the risk of loss due to these warranties and indemnities to be remote.
3. GREAT LAKES FUNDING II LLC
In August 2022, the Fund invested in Series A of Great Lakes Funding II LLC (the “Great Lakes II Joint Venture”), a joint venture with an investment strategy to underwrite and hold senior, secured unitranche loans made to middle-market companies. The Fund treats its investment in the Great Lakes II Joint Venture as a joint venture since an affiliate of the Adviser controls a 50% voting interest in the Great Lakes II Joint Venture. In connection with the launch of the Great Lakes II Joint Venture, the Fund entered into a series of transactions pursuant to which the Fund’s prior investment in BCP Great Lakes Holdings LP, a vehicle formed as a co-investment vehicle to facilitate the participation of certain co-investors to invest, directly or indirectly, in BCP Great Lakes Funding, LLC (the “Prior Great Lakes Joint Venture”) which the Fund invested in during the fourth quarter of 2022, and the corresponding assets held by the Prior Great Lakes Joint Venture in respect of the Fund’s investment in BCP Great Lakes Holdings LP, were transferred to the Great Lakes II Joint Venture in complete redemption of the Fund’s investment in BCP Great Lakes Holdings LP.
The Great Lakes II Joint Venture is a Delaware series limited liability company, and pursuant to the terms of the Great Lakes Funding II LLC Limited Liability Company Agreement (the “Great Lakes II LLC Agreement”), prior to the end of the investment period with respect to each series established under the Great Lakes II LLC Agreement, each member of the predecessor series would be offered the opportunity to roll its interests into any subsequent series of the Great Lakes II Joint Venture. The Fund does not pay any advisory fees in connection with its investment in the Great Lakes II Joint Venture. Certain other funds managed by the Adviser or its affiliates have also invested in the Great Lakes II Joint Venture.
The fair value of the Fund’s investment in the Great Lakes II Joint Venture as of March 31, 2024 was $396,413. Fair value has been determined utilizing the practical expedient in accordance with U.S. GAAP. Pursuant to the terms of the Great Lakes II LLC Agreement, the Fund generally may not affect any direct or indirect sale, transfer, assignment, hypothecation, pledge or other disposition of or encumbrance upon its interests in the Great Lakes II Joint Venture, except that the Fund may sell or otherwise transfer its interests with the consent of the managing members of the Great Lakes II Joint Venture or to an affiliate or a successor to substantially all of the assets of the Fund.
As of March 31, 2024, the Fund has a $109,122 unfunded commitment to the Great Lakes II Joint Venture.
| Alternative Credit Income Fund | Notes to Consolidated Financial Statements |
March 31, 2024 (Unaudited)
4. ADVISORY FEES AND OTHER TRANSACTIONS WITH SERVICE PROVIDERS
Advisory Fees – On October 31, 2020, the Fund entered into a management agreement (the “Management Agreement”) with the Adviser. Under the terms of the Management Agreement, the Adviser provides certain investment advisory and administrative services to the Fund and in consideration of the advisory services provided, the Adviser is entitled to a fee consisting of two components — a base management fee and an incentive fee. The base management fee is payable monthly in arrears at an annual rate of 1.85% of the average daily net assets of the Fund. For the six months ended March 31, 2024, the Fund incurred $2,256,243 in base management fees.
The incentive fee is calculated and payable quarterly in arrears based upon the Fund’s “pre-incentive fee net investment income” for the immediately preceding quarter and is subject to a hurdle rate, expressed as a rate of return on the Fund’s “adjusted capital,” equal to 2.25% per quarter (or an annualized hurdle rate of 9.0%), subject to a “catch-up” feature. For this purpose, “pre-incentive fee net investment income” means interest income, dividend income and any other income accrued during the calendar quarter, less the Fund’s operating expenses for the quarter (including the management fee, expenses reimbursed to the Adviser and any interest expenses and distributions paid on any issued and outstanding preferred shares, but excluding the incentive fee). Pre-incentive fee net investment income includes, in the case of investments with a deferred interest feature (such as OID, debt instruments with paid-in-kind (“PIK”) interest and zero coupon securities), accrued income that the Fund has not yet received in cash. Pre-incentive fee net investment income does not include any realized capital gains, realized capital losses or unrealized capital appreciation or depreciation. “Adjusted capital” means the cumulative gross proceeds received by the Fund from the sale of shares (including pursuant to the Fund’s distribution reinvestment plan), reduced by amounts paid in connection with purchases of shares pursuant to the Fund’s share repurchase program.
No incentive fee is payable in any calendar quarter in which the Fund’s pre-incentive fee net investment income does not exceed the quarterly hurdle rate of 2.25%. For any calendar quarter in which the Fund’s pre-incentive fee net investment income is greater than the hurdle rate, but less than or equal to 2.8125%, the incentive fee will equal the amount of the Fund’s pre-incentive fee net investment income in excess of the hurdle rate. This portion of the Fund’s pre-incentive fee net investment income which exceeds the hurdle rate but is less than or equal to 2.8125% is referred to as the “catch-up.” The “catch-up” provision is intended to provide the Adviser with an incentive fee of 20.0% on all of the Fund’s pre-incentive fee net investment income when the Fund’s pre-incentive fee net investment income reaches 2.8125% in any calendar quarter. For any calendar quarter in which the Fund’s pre-incentive fee net investment income exceeds 2.8125% of adjusted capital, the incentive fee will equal 20.0% of pre-incentive fee net investment income. For the six months ended March 31, 2024, the Advisor earned an incentive fee of $641,586.
During the period ended March 31, 2024, the Adviser reimbursed the Fund based on the NAV error correction policies and procedures in the Fund Compliance Manual in the amount of $27,845.
Under the Expense Limitation Agreement, dated October 31, 2020, the Adviser has contractually agreed to waive all or part of its management fees (excluding any incentive fee) and/or make payments to limit Fund expenses (excluding incentive fees, interest on borrowings, dividends, amortization/accretion and interest on securities sold short, brokerage commissions, acquired fund fees and expenses and extraordinary expenses) at least until January 31, 2025, such that the total annual operating expenses of the Fund do not exceed 2.59% per annum of Class A average daily net assets, 3.34% per annum of Class C average daily net assets, 2.59% per annum of Class W average daily net assets, 2.34% per annum of Class I average daily net assets, and 2.84% per annum of Class L average daily net assets. Fee waivers and expense payments may be recovered by the Adviser from the Fund, for a period of up to three years following the date of waiver or expense payment, if the Fund is able to make the repayment without exceeding the expense limitation in place at the time of waiver and the current expense limitation and the repayment is approved by the Board. For the six months ended March 31, 2024, the Adviser waived fees of $390,699.
As of March 31, 2024, the following amounts that may be subject to reimbursement to the Adviser based upon their potential expiration dates:
| Fund | | 2024 | | | 2025 | | | 2026 | | | 2027 | |
| Alternative Credit Income Fund | | $ | 209,048 | | | $ | 266,824 | | | $ | 360,993 | | | $ | 390,699 | |
During the six months ended March 31, 2024, the Adviser recovered previously waived fees under the Expense Limitation Agreement of $3,799.
During the six months ended March 31, 2024, the Adviser did not recover $140,730 of previously waived fees under the Expense Limitation Agreement which expired.
Fund Accounting Fees and Expenses – ALPS Fund Services, Inc. (“ALPS”) serves as the Fund’s administrator and accounting agent (the “Administrator”) and receives customary fees from the Fund for such services.
| Semi-Annual Report | March 31, 2024 | 39 |
| Alternative Credit Income Fund | Notes to Consolidated Financial Statements |
March 31, 2024 (Unaudited)
Transfer Agent – SS&C Global Investor & Distribution Solutions, Inc. (“SS&C GIDS”) (the “Transfer Agent”), an affiliate of ALPS, serves as transfer, dividend paying and shareholder servicing agent for the Fund.
Distributor – The Fund has entered into a distribution agreement with ALPS Distributors, Inc. (the “Distributor”), an affiliate of ALPS, to provide distribution services to the Fund. There are no fees paid to the Distributor pursuant to the distribution agreement. The Board has adopted, on behalf of the Fund, a shareholder servicing plan under which the Fund may compensate financial industry professionals for providing ongoing services in respect of clients with whom they have distributed shares of the Fund. Under the shareholder servicing plan, the Fund’s Class A, Class C, Class W and Class L shares are subject to a shareholder servicing fee at an annual rate of 0.25% of the average daily net assets attributable to that share class. For the six months ended March 31, 2024, the Fund's Class A, Class C, Class W and Class L shares incurred shareholder servicing fees of $125,400. The Class C and Class L shares also pay to the Distributor a distribution fee, pursuant to a distribution plan adopted by the Board, that accrues at an annual rate equal to 0.75% and 0.25%, respectively, of the Fund’s average daily net assets attributable to Class C and Class L shares, respectively, and is payable on a quarterly basis. Class A, Class I and Class W shares are not currently subject to a distribution fee. For the six months ended March 31, 2024, the Fund's Class C and Class L shares incurred $153,501 in distribution fees.
The Distributor acts as the Fund’s principal underwriter in a continuous public offering of the Fund’s shares. During the six months ended March 31, 2024, no fees were retained by the Distributor.
Trustees – Each Trustee who is not affiliated with the Fund or the Adviser receives an annual fee of $10,000, an additional $2,000 for attending the annual in-person meeting of the Board, and $500 for attending each of the remaining telephonic meetings, as well as reimbursement for any reasonable expenses incurred attending the meetings. None of the executive officers or interested Trustees receives compensation from the Fund.
5. INVESTMENT TRANSACTIONS
The cost of purchases and proceeds from the sale of securities, other than short-term securities, for the six months ended March 31, 2024 amounted to $18,147,022 and $17,878,599, respectively. Additionally, purchases to cover securities sold short amounted to $5,472,500.
6. CAPITAL SHARES
The Fund, pursuant to an exemptive order granted by the SEC on July 22, 2014, offers multiple classes of shares. Class A, Class C, Class W, and Class I shares commenced operations on April 20, 2015. Class L shares commenced operations on July 28, 2017. Class C, Class W and Class I shares are offered at NAV. Class A shares are offered at NAV plus a maximum sales charge of 5.75% and may also be subject to a 0.50% early withdrawal charge, which will be deducted from repurchase proceeds, for shareholders tendering shares fewer than 365 days after the original purchase date, if (i) the original purchase was for amounts of $1 million or more and (ii) the selling broker received the reallowance of the dealer-manager fee. Class C shares are subject to a 1.00% early withdrawal charge. Class L shares are offered at NAV plus a maximum sales charge of 4.25%. Each class represents an interest in the same assets of the Fund and classes are identical except for differences in their sales charge structures, ongoing service and distribution charges and early withdrawal charges. All classes of shares have equal voting privileges except that each class has exclusive voting rights with respect to its service and/or distribution plans. The Fund’s income, non-class specific expenses and realized and unrealized gains and losses are allocated proportionately daily based upon the relative net assets of each class. Class specific expenses, where applicable, include distribution fees, shareholder servicing fees, and networking fees.
Share Repurchase Program
As an interval fund, the Fund offers its shareholders the option of redeeming shares on a quarterly basis, at NAV, no less than 5% of the Fund’s issued and outstanding shares as of the close of regular business hours on the New York Stock Exchange on the Repurchase Pricing Date. If shareholders tender for repurchase more than 5% of the outstanding shares of the Fund, the Fund may, but is not required to, repurchase up to an additional 2% of the outstanding shares of the Fund. If the Fund determines not to repurchase up to an additional 2% of the outstanding shares of the Fund, or if more than 7% of the outstanding shares of the Fund are tendered, then the Fund will repurchase shares on a pro rata basis based upon the number of shares tendered by each shareholder. There can be no assurance that the Fund will be able to repurchase all shares that each shareholder has tendered. In the event of an oversubscribed offer, shareholders may not be able to tender all shares that they wish to tender and may have to wait until the next quarterly repurchase offer to tender the remaining shares, subject to any proration. Subsequent repurchase requests will not be given priority over other shareholder requests.
For the six months ended March 31, 2024, the Fund completed two quarterly repurchase offers. In these repurchase offers, the Fund offered to repurchase up to 5% of the number of its outstanding shares (up to 7% at the discretion of the officers of the Fund) as of the Repurchase Pricing Dates. For the six months ended March 31, 2024, none of the quarterly repurchase offers were oversubscribed such that pro-ration was required.
| Alternative Credit Income Fund | Notes to Consolidated Financial Statements |
March 31, 2024 (Unaudited)
The result of those repurchase offers were as follows:
| | Repurchase Offer #1 | Repurchase Offer #2 |
| Commencement Date | September 11, 2023 | December 11, 2023 |
| Repurchase Request Deadline | October 11, 2023 | January 10, 2024 |
| Repurchase Pricing Date | October 11, 2023 | January 10, 2024 |
| Amount Repurchased | $12,401,053 | $10,313,188 |
| Shares Repurchased | 1,270,312 | 1,065,756 |
7. BANK LINE OF CREDIT
On October 4, 2023, the Fund entered into a revolving bank line of credit (the “Credit Facility”) with U.S. Bank National Association (“USB”). The Credit Facility has a committed, available facility size of $50 million. The Credit Facility is an evergreen facility terminable by either party upon 179 days of receipt of written notice. The Credit Facility is secured by a first-priority perfected security interest in all the Fund's assets with a facility fee of 0.25% per annum, payable quarterly, pro-rated for the life of the Credit Facility if the Credit Facility is terminated, a commitment fee of 0.35% on the unused portion of the maximum facility size and the interest on the used portion is based on the Fund's option, either daily simple SOFR, 1 month SOFR plus the applicable margin of 1.75% or the USB Prime rate.
During the six months ended March 31, 2024, the Fund incurred $195,790 of interest and financing expenses related to the Credit Facility. Average borrowings during the six months ended March 31, 2024 and the average interest rate for the days the line of credit was outstanding during the six months ended March 31, 2024 were $1,361,111 and 7.08%, respectively. The largest outstanding borrowing during the six months ended March 31, 2024 was $5,000,000. As of March 31, 2024, the Fund had no outstanding borrowings.
As collateral for the Credit Facility, the Fund grants USB a first position security interest in and lien on substantially all securities of any kind or description held by the Fund in the pledge account.
Under the 1940 Act, the Fund is not permitted to incur indebtedness, including through the issuance of debt securities, unless immediately thereafter the Fund will have an asset coverage of at least 300%. In general, the term “asset coverage” for this purpose means the ratio which the value of the total assets of the Fund, less all liabilities and indebtedness not represented by senior securities, bears to the aggregate amount of senior securities representing indebtedness of the Fund. In addition, the Fund may be limited in its ability to declare any cash distribution on its capital stock or purchase its capital stock unless, at the time of such declaration or purchase, the Fund has an asset coverage (on its indebtedness) of at least 300% after deducting the amount of such distribution or purchase price, as applicable.
8. TAX BASIS INFORMATION
The following information is computed on a tax basis for each item as of March 31, 2024:
| | | Gross Appreciation | | | Gross Depreciation (excess of
tax cost over value) | | | Net Depreciation | | | Cost of Investments for
Income Tax Purposes | |
| | | $ | 10,061,703 | | | $ | (42,187,257 | ) | | $ | (32,125,554 | ) | | $ | 282,716,286 | |
The tax characteristics of distributions paid for the year ended September 30, 2023 were as follows:
| | | Long-Term Capital | |
| | | Ordinary Income | | | Gain | | | Return of Capital | |
| | | $ | 17,892,985 | | | $ | – | | | $ | – | |
Under current law, capital losses maintain their character as short-term or long-term and are carried forward to the next tax year without expiration. As of the current fiscal year end, the following amounts are available as carry forwards to the next tax year:
| | | Short-Term Capital Losses | | | Long-Term Capital Losses | |
| | | $ | – | | | $ | 5,462,773 | |
The Fund has formed a Taxable Subsidiary, which is taxed as a corporation for income tax purposes. The Taxable Subsidiary allows the Fund to make equity investments in companies organized as pass-through entities while continuing to satisfy the requirements of a RIC under the Code. The Taxable Subsidiary is a wholly owned subsidiary and consolidated in these financial statement statements for financial reporting purposes.
| Semi-Annual Report | March 31, 2024 | 41 |
| Alternative Credit Income Fund | Notes to Consolidated Financial Statements |
March 31, 2024 (Unaudited)
Deferred U.S. federal income taxes reflect the net tax effect of temporary differences between the carrying amount of assets and liabilities for financial reporting and U.S. federal income tax purposes. Components of deferred tax assets (liabilities) as of March 31, 2024 are as follows:
| | | As of March 31, 2024 | |
| Deferred tax assets: | | | |
| Net operating loss carryforwards | | $ | – | |
| Capital loss carryforwards | | | – | |
| Other deferred tax assets | | | – | |
| Less valuation allowance | | | – | |
| Total deferred tax assets | | $ | – | |
| Deferred tax liabilities: | | | | |
| Net unrealized appreciation/(depreciation) on investments | | $ | 95,125 | |
| Total deferred tax liabilities | | $ | 95,125 | |
| Net deferred tax liability | | $ | 95,125 | |
9. RISK FACTORS
Market Disruption Risk
Unexpected local, regional or global events, such as war; acts of terrorism; financial, political or social disruptions; natural, environmental or man-made disasters; climate-change and climate-related events; the spread of infectious illnesses or other public health issues; recessions and depressions; or other events may result in market volatility, may have long-term effects on the United States and worldwide financial markets and may cause further economic uncertainties in the United States and worldwide. The Fund cannot predict the effects of such events in the future on the U.S. economy and securities markets.
10. AFFILIATE TRANSACTIONS
The following investments represent affiliated investments transactions during the six months ended March 31, 2024 and the related positions as of March 31, 2024:
| Security Name | | Market Value
as of
September
30, 2023 | | Purchases(a) | | Sales(b) | | Market Value as of March 31, 2024 | | Share Balance as of March 31, 2024 | | Interest / Income Dividends | | Change in Unrealized Gain (Loss) | | Return of Capital |
| Great Lakes Funding II LLC, Series A | | $ | 470,515 | | | $ | – | | | $ | – | | | $ | 396,413 | | | | 385,616 | | | $ | 37,395 | | | $ | 21,260 | | | $ | (95,362 | ) |
| GreenPark Infrastructure, LLC Series A | | | 200,000 | | | | – | | | | – | | | | 200,000 | | | | 400 | | | | – | | | | – | | | | – | |
| GreenPark Infrastructure, LLC Series M | | | 70,626 | | | | – | | | | – | | | | 70,630 | | | | 200 | | | | – | | | | 4 | | | | – | |
| Mount Logan Funding 2018-1 LP | | | 7,139,595 | | | | 787,461 | | | | (848,430 | ) | | | 6,518,829 | | | | 7,798,575 | | | | 787,461 | | | | (559,797 | ) | | | – | |
| Opportunistic Credit Interval Fund | | | 7,860,465 | | | | – | | | | – | | | | 7,754,153 | | | | 664,452 | | | | 398,671 | | | | (106,312 | ) | | | – | |
| Portman Ridge Finance Corp. | | | 490,952 | | | | – | | | | – | | | | 484,066 | | | | 25,504 | | | | 35,196 | | | | (6,886 | ) | | | – | |
| | | $ | 16,232,153 | | | $ | 787,461 | | | $ | (848,430 | ) | | $ | 15,424,091 | | | | | | | $ | 1,258,723 | | | $ | (651,731 | ) | | $ | (95,362 | ) |
| (a) | Purchases include increases in the cost basis of investments resulting from new portfolio investments, follow-on investments, accrued PIK and accretion of original issue discount. Purchases also include transfers into Affiliate classification. |
| (b) | Sales include decreases in the cost basis of investments resulting from principal repayments and sales. Sales also include transfers out of Affiliate classification. |
11. SUBSEQUENT EVENTS
The Fund has evaluated subsequent events through the date of issuance of the financial statements and has determined that there have been no events that have occurred that would require adjustments to our disclosures in the financial statements.
| Alternative Credit Income Fund | Additional Information |
March 31, 2024 (Unaudited)
1. PROXY VOTING POLICIES AND VOTING RECORD
A description of the policies and procedures that the Fund uses to vote proxies relating to portfolio securities is available without charge upon request by calling toll-free 833-404-4103, or on the Securities and Exchange Commission’s (“SEC”) website at http://www.sec.gov. Information regarding how the Fund voted proxies relating to portfolio securities during the most recent 12-month period ended June 30th is available without charge upon request by calling toll-free 833-404-4103, or on the SEC’s website at http://www.sec.gov.
2. QUARTERLY PORTFOLIO HOLDINGS
The Fund files a complete listing of portfolio holdings for the Fund with the SEC as of the first and third quarters of each fiscal year on Form N-PORT. The filings are available upon request by calling 833-404-4103. Furthermore, you may obtain a copy of the filing on the SEC’s website at http://www.sec.gov.
3. APPROVAL OF INVESTMENT ADVISORY AGREEMENT
At a meeting held on November 7, 2023, the Board, including a majority of the Trustees who are not “interested persons” (as that term is defined in the 1940 Act) of the Fund (the “Independent Trustees”), considered the renewal of the Management Agreement between the Fund and the Adviser. In considering the renewal of the Management Agreement, the Trustees received materials specifically relating to the Adviser and the Management Agreement.
The Trustees considered the following material factors during their deliberations: (1) the nature, extent and quality of the services provided by the Adviser; (2) the investment performance of the Fund and other accounts managed by the Adviser; (3) the cost of services provided and the profits to be realized by the Adviser and its affiliates from the relationship with the Fund; (4) the extent to which economies of scale will be realized as the Fund grows; and (5) whether the fee levels reflect these economies of scale for the benefit of investors. The Trustees relied upon the advice of counsel and their own business judgment in determining the before-mentioned material factors to be considered in evaluating the Management Agreement and the weight to be given to each factor considered. The conclusions reached by the Trustees were based on a comprehensive evaluation of all of the information provided, including the Adviser’s responses to the Section 15(c) questionnaires provided in the Materials, and were not the result of any one factor. Moreover, each Trustee may have afforded different weight to the various factors in reaching his conclusions with respect to the renewal of the Management Agreement.
Nature, Extent and Quality of Service. The Board reviewed the Adviser’s business and current staffing and organizational structure, and discussed the nature, extent and quality of the services provided by the Adviser under the Management Agreement. The Board noted that these services had not materially changed since the last review of the Management Agreement. The Trustees discussed the nature of the Adviser’s operations, the quality of the Adviser’s compliance infrastructure and the experience and background of all key personnel of its fund management team. The Board noted that the Adviser was an affiliate of BC Partners, and the Adviser leveraged the established Fund Support and Administration infrastructure of the broader BC Partners/Sierra Crest organization, including its ability to leverage the collective scale of the Adviser and its affiliates when sourcing investment opportunities, receiving allocations and negotiating with third-party vendors. The Board discussed the organization’s significant investment in and commitment to hiring and retaining high quality professional personnel to support the Fund. The Board noted that there had been no changes in the investment team since the last review of the Management Agreement. The Board noted that the Adviser had reported no regulatory actions or compliance matters that would adversely impact the Adviser’s ability to serve as adviser to the Fund. The Board discussed cybersecurity initiatives undertaken by the Adviser to mitigate cybersecurity risks. The Trustees further considered the key risks associated with the Fund’s investment strategy and the policies and procedures adopted by the Adviser to mitigate those risks. They also discussed the Adviser’s practices for monitoring compliance with the Fund’s investment limitations as well as the Adviser’s broker-dealer selection practices and strong best execution analysis. The Board noted that they appreciated their access to the portfolio management team and senior firm management, were satisfied overall by the Adviser’s ongoing transparency, and looked forward to a continued high-level of service to benefit the Fund’s shareholders. The Trustees concluded that the Adviser had sufficient quality and depth of personnel, resources, investment methods and compliance policies and procedures essential to the continued performance of its duties under the Management Agreement.
Performance. The Trustees considered the performance of the Fund. Referring to the 15(c) response materials, the Trustees noted the Fund’s return of 4.36% for the 1-year period ended September 30, 2023, underperforming some of the peer funds selected by the Adviser. The Trustees also noted that the Fund’s Class I share underperformed the Morningstar LSTA US Leveraged Loan TR USD Index (SPBDAL) and the BAML US High Yield Index (H0A0) over the 1-year period ended September 30, 2023, but outperformed both benchmarks from Fund inception through September 30, 2023. They discussed the Adviser’s commentary regarding the factors that contributed to Fund performance, including among other things, limited use of leverage, which reduced downside risk amid market volatility during the period, a weighting toward floating rate loans in a high interest rate environment, and allocations to directly originated loans. They considered the objective of the Fund, and concluded that the Fund’s performance was satisfactory.
| Semi-Annual Report | March 31, 2024 | 43 |
| Alternative Credit Income Fund | Additional Information |
March 31, 2024 (Unaudited)
Fees and Expenses. The Board noted that the Adviser charged a 1.85% annual advisory fee based on the average net assets of the Fund, and was entitled to a performance fee if income exceeded certain hurdles. They further noted that while the fee was higher than the average of the Adviser selected peer group, it was within the range of the Adviser selected peer group, and the Adviser had agreed to waive its fees to limit total annual Fund operating expenses, exclusive of certain fees, so as not to exceed 2.59%, 3.34%, 2.59%, 2.34% and 2.84% per annum of the Fund’s average daily net assets attributable to Class A, Class C, Class W, Class I and Class L shares, respectively. The Board considered the potential impact of the performance incentive fee which is calculated based upon the Fund’s pre-incentive fee net investment income for the immediately preceding quarter, noting that during the last twelve months, the Adviser did not earn an incentive fee. The Board concluded that the advisory fee was not unreasonable.
Economies of Scale. The Trustees considered whether the Adviser had realized material economies of scale with respect to the management of the Fund. The Board discussed the growth projections provided by the Adviser in the 15(c) response materials and discussed the Adviser’s willingness to cap Fund operating expenses. The Board then discussed the benefit to shareholders of reduced overall expenses with continued Fund growth. After further discussion, the Trustees concluded that the absence of breakpoints at this time was acceptable, but that economies of scale would be revisited in the future should the Fund grow materially in size.
Profitability. The Trustees reviewed the profitability analysis provided by the Adviser and noted that the Adviser had made a net profit related to the Fund during the six months ended June 30, 2023 and during 2022. The Board discussed the costs associated with managing the Fund and noted that the profit of the Adviser did not seem unreasonable for the experience, resources, and associated business risk of the Adviser. The Board concluded that the Adviser’s profitability was not excessive.
Conclusion. Having requested and received such information from the Adviser as the Board of the Fund believed to be reasonably necessary to evaluate the terms of the Management Agreement, and as assisted by the advice of counsel, the Board concluded that renewal of the Management Agreement was in the best interests of the shareholders of the Fund.
| Alternative Credit Income Fund | Privacy Notice |
March 31, 2024 (Unaudited)
| FACTS | WHAT DOES ALTERNATIVE CREDIT INCOME FUND DO WITH YOUR PERSONAL INFORMATION? |
| Why? | Financial companies choose how they share your personal information. Federal law gives consumers the right to limit some but not all sharing. Federal law also requires us to tell you how we collect, share, and protect your personal information. Please read this notice carefully to understand what we do. |
| What? | The types of personal information we collect and share depend on the product or service you have with us. This information can include: |
| | • | Social Security number | • | Purchase History |
| | • | Assets | • | Account Balances |
| | • | Retirement Assets | • | Account Transactions |
| | • | Transaction History | • | Wire Transfer Instructions |
| | • | Checking Account Information | | |
| | When you are no longer our customer, we continue to share your information as described in this notice. |
| How? | All financial companies need to share customers’ personal information to run their everyday business. In the section below, we list the reasons financial companies can share their customers’ personal information; the reasons Alternative Credit Income Fund chooses to share; and whether you can limit this sharing. |
| REASONS WE CAN SHARE YOUR PERSONAL INFORMATION | Does Alternative
Credit Income
Fund share? | Can you limit
this sharing? |
| For our everyday business purposes — such as to process your transactions, maintain your | | |
| account(s), respond to court orders and legal investigations, or report to credit bureaus | Yes | No |
| For our marketing purposes — to offer our products and services to you | No | We don’t share |
| For joint marketing with other financial companies | No | We don’t share |
| For our affiliates’ everyday business purposes — information about your transactions | | |
| and experiences | No | We don’t share |
| For our affiliates’ everyday business purposes — information about your creditworthiness | No | We don’t share |
| For non-affiliates to market to you | No | We don’t share |
| QUESTIONS? | Call 1-833-404-4103 | | |
| Semi-Annual Report | March 31, 2024 | 45 |
| Alternative Credit Income Fund | Privacy Notice |
March 31, 2024 (Unaudited)
| WHO WE ARE | |
| Who is providing this notice? | Alternative Credit Income Fund |
| WHAT WE DO | |
| How does Alternative Credit Income Fund protect my personal information? | To protect your personal information from unauthorized access and use, we use security measures that comply with federal law. These measures include computer safeguards and secured files and buildings. Our service providers are held accountable for adhering to strict policies and procedures to prevent any misuse of your nonpublic personal information. |
| How does Alternative Credit Income Fund collect my personal information? | We collect your personal information, for example, when you • Open an account • Provide account information • Give us your contact information • Make deposits or withdrawals from your account • Make a wire transfer • Tell us where to send the money • Tells us who receives the money • Show your government-issued ID • Show your driver’s license We also collect your personal information from other companies. |
| Why can’t I limit all sharing? | Federal law gives you the right to limit only • Sharing for affiliates’ everyday business purposes – information about your creditworthiness • Affiliates from using your information to market to you • Sharing for non-affiliates to market to you State laws and individual companies may give you additional rights to limit sharing. |
| DEFINITIONS | |
| Affiliates | Companies related by common ownership or control. They can be financial and nonfinancial companies. • Alternative Credit Income Fund does not share with our affiliates. |
| Nonaffiliates | Companies not related by common ownership or control. They can be financial and nonfinancial companies. • Alternative Credit Income Fund does not share with non-affiliates so they can market to you. |
| Joint marketing | A formal agreement between nonaffiliated financial companies that together market financial products or services to you. • Alternative Credit Income Fund doesn’t jointly market. |
This Page Intentionally Left Blank
Item 2. Code of Ethics.
Not applicable to this report.
Item 3. Audit Committee Financial Expert.
Not applicable to this report.
Item 4. Principal Accountant Fees and Services.
Not applicable to this report.
Item 5. Audit Committee of Listed Registrants.
Not applicable to the Registrant.
Item 6. Investments.
| (a) | The schedule of investments is included as part of the Reports to Shareholders filed under Item 1 of this report. |
| (b) | Not applicable to the Registrant. |
Item 7. Disclosure of Proxy Voting Policies and Procedures for Closed-End Management Investment Companies.
Not applicable to this report.
Item 8. Portfolio Managers of Closed-End Management Investment Companies.
| (a) | Not applicable to this report. |
| (b) | Not applicable to this report. |
Item 9. Purchases of Equity Securities by Closed-End Management Investment Company and Affiliates Purchasers.
None.
Item 10. Submission of Matters to a Vote of Security Holders.
None.
Item 11. Controls and Procedures.
| (a) | Based on an evaluation of the Registrant’s disclosure controls and procedures as of a date within 90 days of the filing date of this report, the Registrant’s principal executive officer and principal financial officer have concluded that the disclosure controls and procedures are reasonably designed to ensure that the information required in filings on Form N-CSR is recorded, processed, summarized and reported by the filing date, including that information required to be disclosed is accumulated and communicated to the Registrant’s management, including the Registrant’s principal executive officer and principal financial officer, as appropriate to allow timely decisions regarding required disclosure. |
| (b) | There were no significant changes in the Registrant’s internal control over financial reporting that occurred during the Registrant’s last fiscal half-year that have materially affected, or are reasonably likely to materially affect, the Registrant’s internal control over financial reporting. |
Item 12. Disclosure of Securities Lending Activities for Closed-End Management Investment Companies.
None.
Item 13. Exhibits.
SIGNATURES
Pursuant to the requirements of the Securities Exchange Act of 1934 and the Investment Company Act of 1940, the Registrant has duly caused this report to be signed on its behalf by the undersigned, thereunto duly authorized.
| ALTERNATIVE CREDIT INCOME FUND |
| | | |
| By: | /s/ Edward Goldthorpe | |
| | Edward Goldthorpe | |
| | President and Chief Executive Officer | |
| | (Principal Executive Officer) | |
Date: June 7, 2024
Pursuant to the requirements of the Securities Exchange Act of 1934 and the Investment Company Act of 1940, this report has been signed below by the following persons on behalf of the Registrant and in the capacities and on the dates indicated.
| By: | /s/ Edward Goldthorpe | |
| | Edward Goldthorpe | |
| | President and Chief Executive Officer | |
| | (Principal Executive Officer) | |
Date: June 7, 2024
| By: | /s/ Brandon Satoren | |
| | Brandon Satoren | |
| | Chief Financial Officer | |
| | (Principal Financial Officer) | |
Date: June 7, 2024