UNITED STATES
SECURITIES AND EXCHANGE COMMISSION
WASHINGTON, D.C. 20549
FORM N-CSR
CERTIFIED SHAREHOLDER REPORT OF REGISTERED
MANAGEMENT INVESTMENT COMPANIES
811-23016
(Investment Company Act file number)
Alternative Credit Income Fund
(Exact name of Registrant as specified in charter)
650 Madison Avenue, 23rd Floor
New York, NY 10022
(Address of principal executive offices) (Zip code)
The Corporation Trust Company
Corporation Trust Center, 1209 Orange Street
Wilmington, DE 19801
(Name and address of agent for service)
Registrant’s telephone number, including area code: (212) 891-2880
Date of fiscal year end: September 30
Date of reporting period: October 1, 2022– September 30, 2023
Item 1. Reports to Stockholders.
| TABLE OF CONTENTS | |
| Shareholder Letter | 1 |
| Portfolio Update | 7 |
| Consolidated Schedule of Investments | 9 |
| Consolidated Statement of Assets and Liabilities | 16 |
| Consolidated Statement of Operations | 17 |
| Consolidated Statements of Changes in Net Assets | 18 |
| Consolidated Statement of Cash Flows | 20 |
| Financial Highlights | |
| Class A | 21 |
| Class C | 22 |
| Class W | 23 |
| Class I | 24 |
| Class L | 25 |
| Notes to Consolidated Financial Statements | 26 |
| Report of Independent Registered Public Accounting Firm | 38 |
| Additional Information | 39 |
| Trustees & Officers | 41 |
| Privacy Notice | 44 |

| Alternative Credit Income Fund | Shareholder Letter |
| | September 30, 2023 (Unaudited) |
Dear Shareholders:
We are pleased to share with our partners the performance for the Alternative Credit Income Fund (ticker: RCIIX)1 for fiscal year ended September 30, 2023, as well as to provide our perspective on the current market backdrop.
The Fund returned 4.35%1 in fiscal 2023, with notable strength in the back-half of the period.
We will concede our vulnerability to be biased toward fixed income, in general, and corporate credit, in particular. Nevertheless, it would be difficult to temper our enthusiasm about the backdrop. In short, opportunities abound.
Enough time has passed since the collapse of Silicon Valley Bank to quell concerns about a widespread banking panic. However, as reflect in the following chart, credit conditions in the U.S. have tightened notably this year:
Cumulative Loan Growth in the U.S. Banks by Week
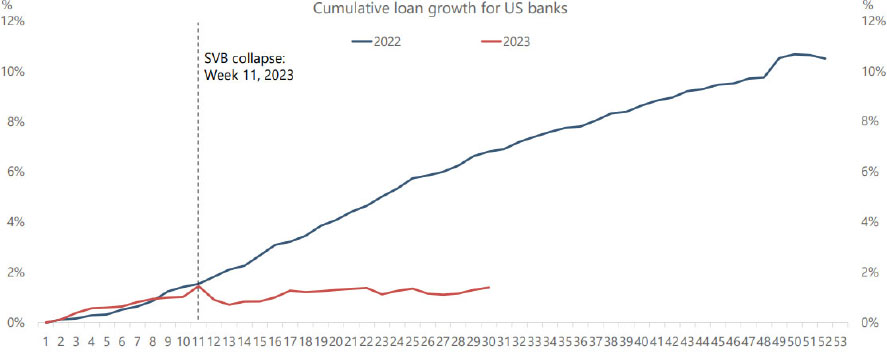
Source: FRB
Some restraining of lending has been intentional: the Fed has hiked +550bps in 18 months to temper economic activity to combat inflation. However, a derivative of these rate hikes has amplified the pullback by banks.
| Annual Report | September 30, 2023 | 1 |
| Alternative Credit Income Fund | Shareholder Letter |
| | September 30, 2023 (Unaudited) |
There is currently a yawning gap between what investors earn holding dollars inside banks versus outside banks. Federal Deposit Insurance Corp. data suggests the average cost of deposits at U.S. banks is currently 1.78% compared to the Fed Fund rate above 5.0%—the widest gap since the 1980s.6 As this chart starkly reveals, dollars have been racing out of banks as depositors seek higher yielding alternatives like money market funds or Treasuries:
Change in U.S. bank deposits
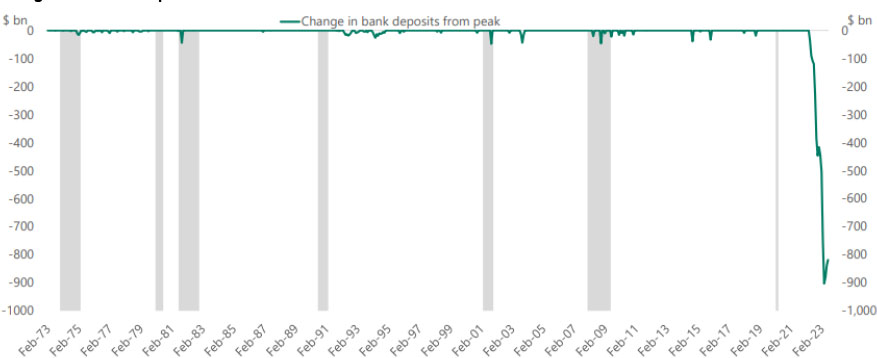
Source: FRB, Havner Analytics
This “cash sorting” or “depositor flight” has crippled U.S. banks’ ability and willingness to lend. In fact, Senior Loan Officer Survey Data suggests that credit conditions are approaching levels normally associated with recessions:
Federal Reserve Bank: Sr. Officers Survey: Banks Willingness to Lend to Consumers (%)
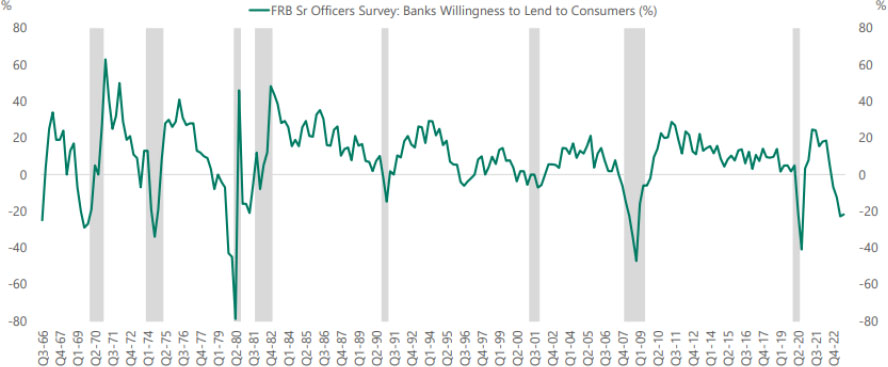
Source: FRB, Bloomberg
| Alternative Credit Income Fund | Shareholder Letter |
| | September 30, 2023 (Unaudited) |
Forecasting the direction of the U.S. economy is difficult given the many discordant signals. The most notably positive data pertains to jobs. An economy at full employment (and with more openings than workers) does not suggest imminent collapse. Layoffs have remained muted as companies appear reticent to lose a workforce they have spent years trying to re-build. Additionally, household and corporate balance sheets remain ironclad, bolstered by extraordinary COVID-era fiscal and monetary accommodation.
Despite some clear positives, we remain concerned that lower credit creation risks tipping us into a downturn. As evident in the chart below, changes in credit conditions have historically closely tracked changes in U.S. GDP:
Sr. Loan Officer Opinion Survey C&I Lending Standards vs. Changes in U.S. GDP

Source: FRB, Bloomberg
The gap between current lending standards and changes in GDP augers concern, in our view. To reconcile the current disconnect, amid the Fed’s “higher for longer” drumbeat, we view GDP declines as more likely than a loosening of credit conditions.
Hence, we view a so-called “soft landing” as fanciful. This is not to suggest a searing 2008-like downturn awaits. Again, jobs remain plentiful, and the economy lacks meaningful distortions or misallocations of capital that would lead to a protracted downturn. Nevertheless, I believe the economy will not be able to escape +500bps of higher rates without a modicum of economic pain.
As we have noted before, we never cheer for economic uncertainty. However, we have designed our structure and strategy to capitalize on these inevitable periods of tumult. Today, small- and medium-sized businesses still want and, importantly, many need capital. Traditional banks pulling back has created more opportunities for our firm and fund to provide solutions.
As an aside, when this letter publishes, the Fund will have celebrated its eight-year anniversary—a milestone we are endlessly proud of and thank our partners for helping us achieve. We have successfully navigated our shareholders through three extreme market dislocations: the Oil & Gas panic, rate collapse in 4Q 2018 and COVID. Outside of those turbulent periods, the current backdrop provides the deepest pipeline of deals we have ever seen. At the moment particularly in private markets, again, opportunity abounds.
Additionally, should the backdrop deteriorate, we expect even more opportunities to source dislocated liquid credit. We would ask our partners: what else in your portfolio directly benefits from downturns? Over eight years, the Credit Income Fund has demonstrated its ability to translate market disruptions into meaningful gains for our shareholders. Thus, we believe we are ideally positioned for the current environment.
| Annual Report | September 30, 2023 | 3 |
| Alternative Credit Income Fund | Shareholder Letter |
| | September 30, 2023 (Unaudited) |
Fund Performance
The Fund generated a gain of 4.31% in the six-month period ended 9/30/2023. Cumulative returns remains our focus, however, because they reflect the Fund’s longer-term investing perspective:
| Alternative Credit Income Fund (RCIIX) | 66.7% |
| Barclay’s U.S. Aggregate Total Return Value Index2 | 3.9% |
| Morningstar LSTA US Leveraged Loan TR USD Index3 | 45.4% |
| Bank of America High Yield Index4 | 41.6% |
Source: Bloomberg. Total return from 10/27/2015 through September 30, 2023
I would argue a Fund cannot beat its benchmark by more than 1.5x by focusing on quarterly performance.
We would highlight a recent realization as illustrative of the Fund’s long-view of markets. Investors may recall that the Credit Income Fund purchased convertible bonds for Whiting Petroleum at a significant discount in early 2020. We had expected a par payoff at maturity but anticipated a strong recovery in the unlikely event of a restructuring. Despite sufficient liquidity, Whiting elected to seek the shelter of bankruptcy at the height of the pandemic.
In early October, given our concern about the broader market, the Fund sold its reorg equity in Chord Energy (the successor entity of Whiting), for a 16.1% IRR and 1.67x MOIC. We actively seek to avoid restructurings given the resulting NAV “noise.” However, our long-term perspective enabled us to correct our misstep and maximize return for our shareholders.
As for a recent private market deal, the Credit Income Fund recently extended credit to a company known as Phillips Pet & Supply—a leading distributor of pet supplies to specialty retailers. We note that BC Partners' private equity segment owns PetSmart and its online platform Chewy, providing us deep insight into this category.
Our $5mn facility to Phillips Pet slots ahead of the company’s existing Term Loan, putting our shareholders in a “super priority” position. Our rate of SOFR+700bps and 5 points of discount translates into a yield of ~13%—an objectively strong return profile in any market.
Again, we do not extend loans with the intention of taking over businesses. However, being at the top of the capital structure positions us to steer positive outcomes should a situation deteriorate. BC Partners’ unparalleled expertise in the pet channel would enable us to maximize returns should the Phillips loan not unfold as expected. This risk-adjusted perspective only amplifies the attractive return profile of our Phillips Pet & Supply loan.
Positioning
Before digging into our allocations, we hope to modestly change our disclosure in future quarters. We feel our historical categories do not sufficiently describe the underlying investments. Hence, we intend to provide more portfolio detail in the coming periods. To be clear, this does not reflect a change in strategy, merely a semantic shift.
Private Credit (27.1% of the portfolio at 9/30/2023)
The Fund has historically characterized its allocations to LP stakes of credit funds as “Private Credit.” These assets comprised 27.1% of our assets at period end.
As we have previously shared, this segment has been de-emphasized as part of the BC Partners transition. The Fund’s expanded private market capabilities provide our investors a more efficient point of access. These Private Credit stakes nonetheless remain important to our shareholders in providing institutional access as well as providing asset level and manager diversification. We have nearly fully deployed our Private Credit commitments and have begun receiving returns of capital from certain vehicles in winddown.
We continue to actively manage this segment, seeking both primary and secondary investments, but have made no new allocations in the period.
Public Credit (4.5%)
We have classified our investments in public Business Development Companies (or BDCs) as “Public Credit.” These assets made up 4.5% of the portfolio at fiscal yearend.
Fundamentals for BDCs have remained notably strong. Higher interest rates have boosted dividend income and portfolio stress has remained limited, with both non-accrual and defaults well below historic levels.
| Alternative Credit Income Fund | Shareholder Letter |
| | September 30, 2023 (Unaudited) |
The Fund has generated unique total returns within this oft-ignored market niche. Plus, as “point-and-click” assets, Public Credit enables the Fund to unlock an illiquidity premium elsewhere in the portfolio.
Nevertheless, BDCs demand active management, in our view. Because they are largely owned by retail investors, BDCs have often exhibited volatility during downturns. Late in the credit cycle, we have reduced our Public Credit exposure to mute future NAV drag. Additionally, shrinking this segment now will enable us to reload should BDCs become cheap again.
Direct Credit (68.4%)
The balance of the portfolio entails investments in directly originated private deals as well as syndicated bonds, loans and (to a lesser extent) CLOs purchased at discounts in the secondary market.
Spreads have widened in recent weeks but remain relatively benign at around 450bps over Treasuries. However, we are uncovering significant dispersion within the Index, providing an ideal backdrop for credit selection. Through active management, there have been ample opportunities to earn low-double digit yields for first lien risk.
Further, the bonds and loans we have acquired in recent quarters continue to trade at notable discounts, which we believe represents future capital gains; we calibrate our assets as trading roughly 13% below par, currently.
Another recent crystallization provides a window into these potential future capital gains. The Credit Income Fund held loans for a company known as Virgin Pulse, a mobile-first digital wellness platform. In early October, HealthComp, a benefits and analytics business, announced plans to acquire Virgin Pulse for $3bn, which will entail refinancing our debt. In the days after the announcement, we sold our Virgin Pulse debt, previously marked in the mid-80s, for 99.5—leaving 50bps behind in exchange for eliminating deal risk and the ability to recycle our capital more quickly.
As Virgin Pulse underscores, we cannot time the potential pull to par. However, buying assets at discounts represents the core of our strategy— providing shareholders another avenue for return beyond our robust income.
Conclusion
The current market requires investors consider their portfolio allocations more broadly, in our view.
A convergence of geopolitical forces has enabled the S&P 5005 to deliver an annual return of nearly 9.0% since the Great Financial Crisis8, including the following:
| · | Low interest rates / Low inflation |
| · | Inexpensive cost of energy |
| · | Lower cost of labor (due to China integrating its workforce) |
The factors prevailing in the current backdrop, however, which we outline below, suggest a reversal of these equity-friendly trends:
| · | Higher rates / “Non-zero” inflation |
| · | De-globalizing and re-shoring |
Despite this clear paradigm shift, most investors remain under-invested in fixed income. Recency-bias likely underpins these allocations; being overweight stocks and underweighted credit has heretofore unambiguously “worked.” However, we believe credit-based investments will outperform equities in the years ahead—both on an absolute basis and (almost certainly) from a risk-adjusted perspective.
Finally, the Credit Income Fund built the bulk of its track-record during what we would characterize as a brutal backdrop for fixed income investing. From October 2015 through March 2022 (the Fed’s first hike of the post-COVID era), the 10 Year U.S. Treasury averaged just 1.91%.7 The Fund nonetheless has beaten its most relevant benchmarks by more than 1.5x. With higher rates, a deluge of deals from retrenching banks and the expanded firepower of BC Partners, we believe the next eight years can be even better.
Amid this context, we would argue that any portfolio and/or platform would benefit from an enhanced allocation to the Alternative Credit Income Fund.
| Annual Report | September 30, 2023 | 5 |
| Alternative Credit Income Fund | Shareholder Letter |
| | September 30, 2023 (Unaudited) |
Regards,
Michael Terwilliger, CFA
Portfolio Manager*
Alternative Credit Income Fund
| * | Effective October, 31, 2020, Sierra Crest Investment Management LLC (“Sierra Crest”) replaced Resource Alternative Advisor, LLC (“Resource”) as the Fund’s investment adviser. Michael Terwilliger has joined Sierra Crest as a portfolio manager to the Fund. |
| 1 | Fund performance refers to that of Class I. Unless otherwise stated, all performance figures provided are for the six-month period ended September 30, 2023. The returns were calculated using the net asset values used for shareholder transactions and thus do not include certain adjustments in accordance with accounting principles generally accepted in the United States of America. The net asset values for financial reporting purposes and the returns based upon those net asset values may differ from net asset values and returns for shareholder transactions. Past performance is not indicative of future results. The investment return and principal value of an investment will fluctuate. An investor’s shares when redeemed, may be worth more or less than the original cost. Total return is calculated assuming reinvestment of all dividends and distributions. Performance figures for periods less than one year are not annualized. For performance information current to the most recent month-end, please call toll-free 1-833-404-4103. |
The Adviser and the Fund have entered into an Expense Limitation Agreement under which the Adviser has agreed, until at least January 31, 2024 to waive its management fees (excluding any incentive fee) and to pay or absorb the ordinary annual operating expenses of the Fund (excluding interest, brokerage commissions, acquired fund fees and expenses and extraordinary expenses), to the extent that its management fees plus the Fund’s ordinary annual operating expenses exceed 2.34% per annum of the Fund’s average daily net assets attributable to Class I shares. Such Expense Limitation Agreement may not be terminated by the Adviser, but it may be terminated by the Board of Trustees, upon 60 days written notice to the Adviser. Any waiver or reimbursement by the Adviser is subject to repayment by the Fund within the three (3) years from the date the Adviser (or the previous investment adviser) waived any payment or reimbursed any expense, if the Fund is able to make the repayment without exceeding the lesser of the expense limitation in place at the time of the waiver or the current expense limitation and the repayment is approved by the Board of Trustees.
| 2 | Barclays U.S. Aggregate Total Return Value Index - The Barclays U.S. Aggregate Total Return Value Index is a broad-based flagship benchmark that measures the investment grade, U.S. dollar-denominated, fixed-rate taxable bond market. The index includes Treasuries, government-related and corporate securities, MBS (agency fixed-rate and hybrid ARM pass-throughs), ABS and CMBS (agency and nonagency). Investors cannot invest directly in an index. |
| 3 | Morningstar LSTA US Leveraged Loan TR USD Index - Morningstar LSTA US Leveraged Loan TR USD Index is a market value-weighted index designed to measure the performance of the U.S. leveraged loan market based upon market weightings, spreads and interest payments. Investors cannot invest directly in an index. |
| 4 | ICE BofA U.S. High Yield Index – The ICE BofA U.S. High Yield Index tracks the performance of US dollar denominated below investment grade corporate debt publicly issued in the U.S. domestic market. Investors cannot invest directly in an index. |
| 5 | S&P 500 – The S&P 500 is a market-capitalization-weighted index of the 500 largest publicly-traded companies in the U.S. Investors cannot invest directly in an index. |
| 6 | Wall Street Journal (10/13/2023) |
| 7 | Bloomberg, Average 10 Year U.S. Treasury Yield 10/28/2015 through 03/30/2022 |
| 8 | Bloomberg, SPY Index from 12/31/2007 through 10/23/2023, annual equivalent return of 8.99%. |
| Alternative Credit Income Fund | Portfolio Update |
| | September 30, 2023 (Unaudited) |
The Fund’s performance figures for the periods ended September 30, 2023, compared to its benchmark:
| Alternative Credit Income Fund | 1 Month | Quarter | 6 Month | YTD | 1 Year | 3 Year | 5 Year | Since Inception* | Inception |
| Class A Shares - Without Load | 1.28% | 2.63% | 4.61% | 4.24% | 4.19% | 7.09% | 4.60% | 5.98% | 4/17/15 |
| Class A Shares - With Load | -4.54% | -3.25% | -1.39% | -1.71% | -1.84% | 5.02% | 3.36% | 5.13% | 4/17/15 |
| Class C Shares - Without Load | 1.19% | 2.32% | 4.20% | 3.56% | 3.33% | 6.28% | 3.79% | 5.40% | 4/17/15 |
| Class C Shares - With Load(a) | 0.19% | 1.32% | 3.20% | 2.57% | 2.36% | 6.28% | 3.79% | 5.40% | 4/17/15 |
| Class W Shares - Without Load | 1.28% | 2.63% | 4.61% | 4.13% | 4.19% | 7.09% | 4.58% | 5.92% | 4/17/15 |
| Class I Shares - Without Load | 1.24% | 2.70% | 4.74% | 4.33% | 4.36% | 7.33% | 4.83% | 6.22% | 4/17/15 |
| Class L Shares - Without Load | 1.21% | 2.57% | 4.59% | 4.04% | 3.93% | 6.82% | 4.33% | 4.61% | 7/28/17 |
| Class L Shares - With Load | -3.12% | -1.78% | 0.14% | -0.38% | -0.51% | 5.29% | 3.44% | 3.87% | 7/28/17 |
Morningstar LSTA US Leveraged Loan TR
USD Index | 0.96% | 3.46% | 6.72% | 9.97% | 12.98% | 6.08% | 4.46% | 4.36% | 4/17/15 |
| (a) | Effective as of December 23, 2016, Class C shares no longer have a sales charge. |
The Morningstar LSTA US Leveraged Loan TR USD Index is a market value-weighted index designed to measure the performance of the U.S. leveraged loan market based upon market weightings, spreads and interest payments. Investors cannot invest directly in an index.
Past performance is not indicative of future results. The investment return and principal value of an investment will fluctuate. An investor’s shares when redeemed, may be worth more or less than the original cost. Total return is calculated assuming reinvestment of all dividends and distributions. Performance figures for periods less than one year are not annualized. As of the Fund’s most recent prospectus dated January 27, 2023, the Fund’s total annual operating expenses, including acquired fund fees and expenses, before fee waivers is 4.75% for Class A, 5.53% for Class C, 4.75% for Class W, 4.51% for Class I and 5.04% for Class L shares. After fee waivers, the Fund’s total annual operating expense is 4.75% for Class A, 5.50% for Class C, 4.75% for Class W, 4.50% for Class I and 5.00% for Class L shares. Class A shares are subject to maximum sales loads of 5.75% imposed on purchases. Class L shares are subject to a maximum sales load of 4.25% imposed on purchases. Share repurchases within 365 days may be subject to an early withdrawal charge of 0.50% for Class A and 1.00% for Class C shares. For performance information current to the most recent month-end, please call toll-free 1-833-404-4103.
| Annual Report | September 30, 2023 | 7 |
| Alternative Credit Income Fund | Portfolio Update |
| | September 30, 2023 (Unaudited) |
Comparison of the Change in Value of a $10,000 Investment

| * | Commencement of operations for Class A Shares. |
Consolidated Portfolio Composition as of September 30, 2023
| Asset Type | | Percent of Net Assets | |
| Bank Loans | | | 46.96% | |
| Private Investment Funds | | | 22.25% | |
| Common Equity | | | 9.27% | |
| Short Term Investments | | | 6.12% | |
| Asset Backed Securities | | | 5.22% | |
| Interval Fund | | | 3.12% | |
| Corporate Bonds | | | 2.89% | |
| Preferred Stock | | | 2.12% | |
| Warrants | | | 0.33% | |
| Joint Venture | | | 0.19% | |
| Securities Sold Short | | | -3.41% | |
| Total Investments | | | 95.06% | |
| Other Assets in Excess of Liabilities | | | 4.94% | |
| Net Assets | | | 100.00% | |
Please see the Consolidated Schedule of Investments for a detailed listing of the Fund’s holdings.
| Alternative Credit Income Fund | Consolidated Schedule of Investments |
| | September 30, 2023 |
| | | Coupon | | | Reference Rate & Spread | | Maturity | | | Principal | | | Value | |
| BANK LOANS (46.96%)(a) | | | | | | | | | | | | | | |
| | | | | | | | | | | | | | | |
| Communication Services (1.73%) | | | | | | | | | | | | | | |
| Neptune Bidco US Inc., First Lien Term Loan(b) | | | 10.40 | % | | 3M SOFR + 5.00%, 0.50% Floor | | | 04/11/2029 | | | $ | 4,837,875 | | | $ | 4,371,238 | |
| | | | | | | | | | | | | | | | | | | |
| Consumer Discretionary (2.14%) | | | | | | | | | | | | | | | | | | |
| Arrow Purchaser, Inc., First Lien Initial Term Loan(b) | | | 12.18 | % | | 1M SOFR + 6.75%, 1.00% Floor | | | 04/15/2026 | | | | 2,145,833 | | | | 2,120,083 | |
| Jo-Ann Stores LLC, First Lien Initial Term Loan(b) | | | 10.36 | % | | 3M SOFR + 4.75%, 0.75% Floor | | | 06/30/2028 | | | | 3,949,622 | | | | 1,323,123 | |
| Lucky Bucks Holdings LLC, Subordinated Note(b)(c)(d)(o) | | | – | % | | N/A | | | 05/29/2028 | | | | 9,617,393 | | | | 1,947,522 | |
| | | | | | | | | | | | | | | | | | 5,390,728 | |
| Consumer Staples (5.38%) | | | | | | | | | | | | | | | | | | |
| 8th Avenue Food & Provisions, Inc., Second Lien Term Loan(b) | | | 13.18 | % | | 1M SOFR + 7.75% | | | 10/01/2026 | | | | 2,500,000 | | | | 1,721,875 | |
| BrightPet, First Lien Term Loan(b)(e) | | | 12.54 | % | | 3M SOFR + 6.25%, 0.75% PIK, 1.00% Floor | | | 10/06/2026 | | | | 1,948,697 | | | | 1,889,067 | |
| BrightPet, Revolver(b)(f) | | | 13.27 | % | | 3M SOFR + 7.00%, 1.00% Floor | | | 10/06/2026 | | | | 187,648 | | | | 172,344 | |
| Florida Food Products LLC, Second Lien Term Loan(b) | | | 13.43 | % | | 1M SOFR + 8.00%, 0.75% Floor | | | 10/18/2029 | | | | 5,000,000 | | | | 4,777,000 | |
| Phillips Feed Service, Inc., First Lien Term Loan(b) | | | 12.55 | % | | 3M SOFR + 7.00% | | | 05/30/2025 | | | | 5,250,000 | | | | 5,000,100 | |
| | | | | | | | | | | | | | | | | | 13,560,386 | |
| Financials (6.63%) | | | | | | | | | | | | | | | | | | |
| BetaNXT, Inc., First Lien Term Loan(b) | | | 11.14 | % | | 3M SOFR + 5.75% | | | 07/01/2029 | | | | 2,970,000 | | | | 2,773,980 | |
| Cor Leonis Limited, Revolver(b)(f) | | | 12.89 | % | | 3M SOFR + 7.50%, 1.50% Floor | | | 05/15/2028 | | | | 1,244,892 | | | | 1,244,892 | |
| H-CA II, LLC, First Lien Term Loan(b)(c) | | | 16.00 | % | | N/A | | | 04/01/2024 | | | | 1,897,831 | | | | 1,897,831 | |
| Hunter Point Capital Structured Notes Issuer, LLC, Subordinated Delayed Draw Notes(b)(f) | | | N/A | | | N/A | | | 07/15/2052 | | | | 506,711 | | | | 524,598 | |
| Irradiant Intermediate Holdings, L.P., Delayed Draw Term Loan(b) | | | – | % | | 3M SOFR + 6.50%, 1.50% Floor | | | 06/08/2028 | | | | – | | | | (28,130 | ) |
| Irradiant Intermediate Holdings, L.P., First Lien Term Loan(b) | | | 11.99 | % | | 3M SOFR + 6.50%, 1.50% Floor | | | 06/08/2028 | | | | 1,450,000 | | | | 1,421,870 | |
| Money Transfer Acquisition Inc., First Lien Term Loan(b) | | | 13.67 | % | | 1M SOFR + 8.25%, 1.00% Floor | | | 12/14/2027 | | | | 6,868,750 | | | | 6,761,598 | |
| SouthStreet Securities Holdings, Inc., First Lien Term Loan(b)(c) | | | 9.00 | % | | N/A | | | 09/20/2027 | | | | 2,700,000 | | | | 2,126,250 | |
| | | | | | | | | | | | | | | | | | 16,722,889 | |
| Health Care (8.18%) | | | | | | | | | | | | | | | | | | |
| American Academy Holdings, LLC, First Lien Term Loan(b)(e) | | | 16.43 | % | | 3M SOFR + 5.75%, 5.25% PIK, 1.00% Floor | | | 01/01/2025 | | | | 2,298,783 | | | | 2,310,277 | |
| American Academy Holdings, LLC, Second Lien Term Loan(b)(c)(e) | | | 14.50 | % | | PIK | | | 03/01/2028 | | | | 3,545,394 | | | | 3,115,693 | |
| PhyNet Dermatology LLC, Delayed Draw Term Loan(b)(f) | | | – | % | | 6M SOFR + 6.50%, 0.75% Floor | | | 08/16/2024 | | | | – | | | | 15,517 | |
| PhyNet Dermatology LLC, First Lien Term Loan(b) | | | 11.87 | % | | 6M SOFR + 6.50%, 0.75% Floor | | | 08/16/2024 | | | | 1,960,603 | | | | 1,960,603 | |
| Upstream Rehabilitation, Inc., Second Lien Term Loan(b) | | | 13.92 | % | | 1M SOFR + 8.50%, 2.00% Floor | | | 11/22/2027 | | | | 7,500,000 | | | | 6,425,025 | |
| VBC Spine Opco LLC (DxTX Pain and Spine LLC), Delayed Draw Term Loan(b)(f) | | | – | % | | 3M SOFR + 8.00%, 2.00% Floor | | | 06/14/2028 | | | | – | | | | 1,545 | |
| See Notes to Consolidated Financial Statements. | |
| Annual Report | September 30, 2023 | 9 |
| Alternative Credit Income Fund | Consolidated Schedule of Investments |
| | September 30, 2023 |
| VBC Spine Opco LLC (DxTX Pain and Spine LLC), First Lien Term Loan(b) | | | 13.56 | % | | 3M SOFR + 8.00%, 2.00% Floor | | | 06/14/2028 | | | $ | 2,193,145 | | | $ | 2,152,133 | |
| VBC Spine Opco LLC (DxTX Pain and Spine LLC), Revolver(b)(f) | | | – | % | | 3M SOFR + 8.00%, 2.00% Floor | | | 06/14/2028 | | | | – | | | | (4,525 | ) |
| Viant Medical Holdings, Inc., Second Lien Initial Term Loan(b) | | | 13.18 | % | | 1M SOFR + 7.75% | | | 07/02/2026 | | | | 5,000,000 | | | | 4,637,500 | |
| | | | | | | | | | | | | | | | | | 20,613,768 | |
| Industrials (7.32%) | | | | | | | | | | | | | | | | | | |
| Accordion Partners, LLC, Delayed Draw Term Loan A(b) | | | 11.89 | % | | 3M SOFR + 6.50%, 0.75% Floor | | | 08/29/2029 | | | | 284,053 | | | | 282,349 | |
| Accordion Partners, LLC, Delayed Draw Term Loan B(b) | | | 11.62 | % | | 3M SOFR + 6.25%, 0.75% Floor | | | 08/29/2029 | | | | 355,956 | | | | 353,821 | |
| Accordion Partners, LLC, First Lien Term Loan A(b) | | | 11.64 | % | | 3M SOFR + 6.25%, 0.75% Floor | | | 08/29/2029 | | | | 3,236,106 | | | | 3,216,689 | |
| Epic Staffing Group, Delayed Draw Term Loan(b)(f) | | | – | % | | N/A | | | 06/28/2029 | | | | – | | | | (12,266 | ) |
| Epic Staffing Group, First Lien Term Loan(b) | | | 11.14 | % | | 3M SOFR + 5.75%, 0.50% Floor | | | 06/28/2029 | | | | 1,700,408 | | | | 1,625,591 | |
| Material Handling Systems, Inc., First Lien Term Loan(b) | | | 10.76 | % | | 3M SOFR + 5.50%, 0.50% Floor | | | 06/01/2029 | | | | 4,950,000 | | | | 4,399,560 | |
| Qualtek LLC, First Lien Term Loan (b)(e) | | | 15.31 | % | | 3M SOFR + 1.00%, 9.00% PIK, 1.00% Floor | | | 07/14/2025 | | | | 3,260,829 | | | | 3,260,828 | |
| Qualtek LLC, Second Lien Term Loan (b)(e) | | | 15.31 | % | | 3M SOFR + 1.00%, 9.00% PIK, 1.00% Floor | | | 01/14/2027 | | | | 513,599 | | | | 513,599 | |
| Secure Acquisition, Inc., Second Lien Term Loan(b) | | | 13.29 | % | | 3M SOFR + 7.75%, 0.75% Floor | | | 12/14/2029 | | | | 5,000,000 | | | | 4,819,000 | |
| | | | | | | | | | | | | | | | | | 18,459,171 | |
| Information Technology (15.58%) | | | | | | | | | | | | | | | | | | |
| Accurate Background, LLC, First Lien Term Loan(b) | | | 11.65 | % | | 3M SOFR + 6.00%, 1.00% Floor | | | 03/26/2027 | | | | 4,424,086 | | | | 4,274,552 | |
| Ancile Solutions, Inc., First Lien Term Loan(b)(e) | | | 15.67 | % | | 3M SOFR + 10.00%, 1.00% Floor | | | 06/11/2026 | | | | 3,610,054 | | | | 3,601,029 | |
| DCert Buyer, Inc. First Amendment Term Loan Refinancing, Second Lien Term Loan(b) | | | 12.32 | % | | 1M SOFR + 7.00% | | | 02/16/2029 | | | | 3,600,000 | | | | 3,378,006 | |
| Diamanti, Inc., Subordinated Note(b)(c)(e) | | | 12.50 | % | | PIK | | | 05/01/2024 | | | | 3,498,686 | | | | 3,555,714 | |
| EagleView Technology Corp., Second Lien Term Loan(b) | | | 13.04 | % | | 3M SOFR + 7.50% | | | 08/14/2026 | | | | 1,495,652 | | | | 1,331,130 | |
| Ivanti Software, Inc., Second Lien Initial Term Loan(b) | | | 12.78 | % | | 3M US L + 7.25%, 0.50% Floor | | | 12/01/2028 | | | | 4,000,000 | | | | 2,896,680 | |
| Kofax, Inc., First Lien Term Loan(b) | | | 10.72 | % | | 3M SOFR + 5.25%, 0.50% Floor | | | 07/20/2029 | | | | 3,970,000 | | | | 3,702,025 | |
| Kofax, Inc., Second Lien Term Loan(b) | | | 13.12 | % | | 3M SOFR + 7.75%, 0.50% Floor | | | 07/20/2030 | | | | 4,000,000 | | | | 3,810,000 | |
| Naviga, Inc., First Lien Term Loan(b) | | | 12.49 | % | | 3M SOFR + 7.00%, 1.00% Floor | | | 12/29/2023 | | | | 3,031,616 | | | | 3,011,305 | |
| Precisely Software Incorporated, Second Lien Term Loan(b) | | | 12.86 | % | | 3M SOFR + 7.25%, 0.75% Floor | | | 04/23/2029 | | | | 3,000,000 | | | | 2,717,415 | |
| Redstone HoldCo 2 LP, Second Lien Term Loan(b) | | | 13.18 | % | | 1M SOFR + 7.75%, 0.75% Floor | | | 04/16/2029 | | | | 5,000,000 | | | | 3,293,750 | |
| Spectrio, First Lien Term Loan(b) | | | 11.50 | % | | 6M SOFR + 6.00%, 1.00% Floor | | | 12/09/2026 | | | | 3,891,645 | | | | 3,726,249 | |
| | | | | | | | | | | | | | | | | | 39,297,855 | |
| TOTAL BANK LOANS | | | | | | | | | | | | | | | | | | |
| (Cost $133,528,017) | | | | | | | | | | | | | | | | | 118,416,035 | |
| See Notes to Consolidated Financial Statements. | |
| 10 | www.altcif.com |
| Alternative Credit Income Fund | Consolidated Schedule of Investments |
| | September 30, 2023 |
| ASSET BACKED SECURITIES AND CORPOATE BONDS (8.11%) | | | | | | | | | | | | | | |
| ASSET BACKED SECURITIES (5.22%)(a) | | | | | | | | | | | | | | |
| Canyon Capital CLO 2014-1, Ltd., Class ER(g) | | | 13.33 | % | | 3M US L + 7.70% | | | 01/30/2031 | | | $ | 1,000,000 | $ | | | 735,570 | |
| Jamestown CLO V, Ltd., Class F(g)(o)(p) | | | 10.64 | % | | 3M US L + 5.85% | | | 01/17/2027 | | | | 536,203 | | | | 43,915 | |
| JMP Credit Advisors CLO IV, Ltd.(b) | | | 24.43 | % | | N/A | | | 07/17/2029 | | | | 4,836,540 | | | | 316,310 | |
| JMP Credit Advisors CLO V, Ltd.(b) | | | 2.16 | % | | N/A | | | 07/17/2030 | | | | 4,486,426 | | | | 1,020,213 | |
| Mount Logan Funding 2018-1 LP(b)(g)(k) | | | 25.47 | % | | N/A | | | 01/22/2033 | | | | 7,798,575 | | | | 7,139,595 | |
| Octagon Investment Partners 36, Ltd., Class F(g) | | | 13.47 | % | | 3M US L + 7.75% | | | 04/15/2031 | | | | 1,000,000 | | | | 656,875 | |
| Octagon Investment Partners XIV, Ltd., Class ER(g)(p) | | | 13.92 | % | | 3M US L + 8.35% | | | 07/15/2029 | | | | 2,132,000 | | | | 1,203,506 | |
| Saranac CLO VII, Ltd., Class ER(g) | | | 12.23 | % | | 3M US L + 6.72% | | | 11/20/2029 | | | | 500,000 | | | | 265,679 | |
| Tralee CLO II, Ltd., Class ER(g)(p) | | | 13.44 | % | | 3M US L + 7.85% | | | 07/20/2029 | | | | 1,000,000 | | | | 933,557 | |
| Tralee CLO II, Ltd., Class FR(g)(o)(p) | | | – | % | | 3M US L + 8.85% | | | 07/20/2029 | | | | 1,000,000 | | | | 421,797 | |
| Voya CLO 2014-2, Ltd., Class ER(g) | | | 13.56 | % | | 3M US L + 7.70% | | | 04/17/2030 | | | | 1,000,000 | | | | 421,848 | |
| | | | | | | | | | | | | | | | | | 13,158,865 | |
| CORPORATE BONDS (2.89%) | | | | | | | | | | | | | | | | | | |
| Communications (0.80%) | | | | | | | | | | | | | | | | | | |
| Spanish Broadcasting System, Inc.(c)(g)(p) | | | 9.75 | % | | N/A | | | 03/01/2026 | | | | 3,000,000 | | | | 2,018,465 | |
| | | | | | | | | | | | | | | | | | | |
| Consumer Discretionary (0.15%) | | | | | | | | | | | | | | | | | | |
| Monitronics - Escrow(p) | | | 0.00 | % | | N/A | | | 12/31/2049 | | | | 2,650,000 | | | | – | |
| Real Hero Merger Sub 2, Inc.(c)(g)(p) | | | 6.25 | % | | N/A | | | 02/01/2029 | | | | 500,000 | | | | 386,753 | |
| | | | | | | | | | | | | | | | | | 386,753 | |
| Consumer Staples (0.80%) | | | | | | | | | | | | | | | | | | |
| H-Food Holdings LLC / Hearthside Finance Co., Inc.(c)(g)(p) | | | 8.50 | % | | N/A | | | 06/01/2026 | | | | 7,978,000 | | | | 2,004,034 | |
| | | | | | | | | | | | | | | | | | | |
| Industrials (1.14%) | | | | | | | | | | | | | | | | | | |
| PECF USS Intermediate Holding III Corp.(c)(g)(p) | | | 8.00 | % | | N/A | | | 11/15/2029 | | | | 5,000,000 | | | | 2,719,500 | |
| Wesco Aircraft Holdings, Inc.(c)(g)(o)(p) | | | – | % | | N/A | | | 11/15/2027 | | | | 4,636,000 | | | | 162,260 | |
| | | | | | | | | | | | | | | | | | 2,881,760 | |
| TOTAL ASSET BACKED | | | | | | | | | | | | | | | | | | |
| SECURITIES AND CORPOATE BONDS | | | | | | | | | | | | | | | | | | |
| (Cost $34,580,158) | | | | | | | | | | | | | | | | | 20,449,877 | |
| | | Dividend Rate | | | Shares | | | Value | |
| PREFERRED STOCK (2.12%) | | | | | | | | | |
| Consumer Discretionary (1.99%) | | | | | | | | | |
| Pennfoster(a)(b)(e)(i) | | | 16.30 | % | | | 5,133,089 | | | | 5,018,108 | |
| | | | | | | | | | | | | |
| Health Care (0.05%) | | | | | | | | | | | | |
| American Academy Holdings. Inc., Preferred Units(b)(i)(j) | | | 18.00 | % | | | 90,970 | | | | 116,897 | |
| | | | | | | | | | | | | |
| Industrials (0.08%) | | | | | | | | | | | | |
| GreenPark Infrastructure, LLC Series A(b)(i)(j)(k) | | | | | | | 400 | | | | 200,000 | |
| | | | | | | | | | | | | |
| TOTAL PREFERRED STOCK | | | | | | | | | | | | |
| (Cost $5,236,819) | | | | | | | | | | | 5,335,005 | |
| See Notes to Consolidated Financial Statements. | |
| Annual Report | September 30, 2023 | 11 |
| Alternative Credit Income Fund | Consolidated Schedule of Investments |
| | September 30, 2023 |
| | | Shares | | | Value | |
| COMMON EQUITY (9.27%) | | | | | | |
| Consumer Discretionary (0.56%) | | | | | | |
| CEC Entertainment, Inc.(i) | | | 79,564 | | | $ | 1,405,657 | |
| | | | | | | | | |
| Diversified (4.18%) | | | | | | | | |
| Ares Capital Corp.(p) | | | 117,223 | | | | 2,282,332 | |
| CION Investment Corp.(p) | | | 120,800 | | | | 1,276,856 | |
| FS KKR Capital Corp.(p) | | | 105,137 | | | | 2,070,148 | |
| Portman Ridge Finance Corp.(k)(p) | | | 25,504 | | | | 490,952 | |
| SLR Investment Corp.(p) | | | 115,211 | | | | 1,773,097 | |
| WhiteHorse Finance, Inc.(p) | | | 207,328 | | | | 2,647,579 | |
| | | | | | | | 10,540,964 | |
| | | | | | | | | |
| Energy (1.44%) | | | | | | | | |
| Chord Energy Corp.(p) | | | 22,373 | $ | | | 3,625,992 | |
| | | | | | | | | |
| Financials (0.84%) | | | | | | | | |
| Aperture Dodge 18 LLC(b)(i) | | | 2,038,970 | | | | 2,124,000 | |
| | | | | | | | | |
| Health Care (0.17%) | | | | | | | | |
| American Academy Holdings. Inc., Common Units(b)(i)(j) | | | 0.05 | | | | 274,283 | |
| DxTx Pain and Spine LLC, Common Units(b)(i)(j) | | | 98,854 | | | | 161,132 | |
| | | | | | | | 435,415 | |
| | | | | | | | | |
| Industrials (0.74%) | | | | | | | | |
| GreenPark Infrastructure, LLC Series M-1 (b)(f)(i)(j)(k) | | | 200 | | | | 70,626 | |
| Qualtek LLC(b)(i) | | | 287,540 | | | | 1,785,623 | |
| | | | | | | | 1,856,249 | |
| | | | | | | | | |
| Real Estate (1.34%) | | | | | | | | |
| Copper Property CTL Pass Through Trust(i)(p) | | | 319,520 | | | | 3,386,912 | |
| | | | | | | | | |
| TOTAL COMMON EQUITY | | | | | | | | |
| (Cost $20,893,537) | | | | | | | 23,375,189 | |
| | | | | | | | | |
| JOINT VENTURE (0.19%) | | | | | | | | |
| Joint Venture (0.19%) | | | | | | | | |
| Great Lakes Funding II LLC, Series A(f)(k)(l) | | | 480,978 | | | | 470,515 | |
| | | | | | | | 470,515 | |
| | | | | | | | | |
| TOTAL JOINT VENTURE | | | | | | | | |
| (Cost $480,978) | | | | | | | 470,515 | |
| | | | | | | | | |
| INTERVAL FUND (3.12%) | | | | | | | | |
| Interval Fund (3.12%) | | | | | | | | |
| Opportunistic Credit Interval Fund(k) | | | 664,452 | | | | 7,860,465 | |
| | | | | | | | | |
| TOTAL INTERVAL FUND | | | | | | | | |
| (Cost $8,000,000) | | | | | | | 7,860,465 | |
| See Notes to Consolidated Financial Statements. | |
| 12 | www.altcif.com |
| Alternative Credit Income Fund | Consolidated Schedule of Investments |
| | September 30, 2023 |
| | | Shares | | | Value | |
| PRIVATE INVESTMENT FUNDS (22.25%) | | | | | | |
| BlackRock Global Credit Opportunities Fund, LP(f)(l)(m) | | | | | | $ | 13,867,068 | |
| CVC European Mid-Market Solutions Fund(f)(l)(m) | | | | | | | 9,223,615 | |
| GSO Credit Alpha Fund II LP(f)(l)(m) | | | | | | | 5,150,526 | |
| Monroe Capital Private Credit Fund III LP(f)(l)(m) | | | | | | | 8,838,545 | |
| Pelham S2K SBIC II, L.P.(f)(l)(m) | | | | | | | 200,000 | |
| Tree Line Credit Strategies LP(l)(m) | | | | | | | 18,818,454 | |
| | | | | | | | 56,098,208 | |
| | | | | | | | | |
| TOTAL PRIVATE INVESTMENT | | | | | | | | |
| FUNDS | | | | | | | | |
| (Cost $54,570,613) | | | | | | | 56,098,208 | |
| | | | | | | | | |
| WARRANTS (0.33%) | | | | | | | | |
| CEC Entertainment, Inc.(P) | | | 237,941 | | | | 475,882 | |
| Diamanti, Inc., Class A(b) | | | 146,413 | | | | – | |
| SouthStreet Securities Holdings, Inc., Warrants(b) | | | 3,400 | | | $ | 349,690 | |
| | | | | | | | | |
| TOTAL WARRANTS | | | | | | | | |
| (Cost $390,456) | | | | | | | 825,572 | |
| | | | | | | | | |
| SHORT TERM INVESTMENTS (6.12%) | | | | | | | | |
| Money Market Funds (6.12%) | | | | | | | | |
| US BANK MMDA - USBGFS 9, 5.20%(n) | | | | | | | | |
| | | 15,443,162 | | | | 15,443,162 | |
| | | | | | | | | |
| TOTAL SHORT TERM | | | | | | | | |
| INVESTMENTS | | | | | | | | |
| (Cost $15,443,162) | | | | | | | 15,443,162 | |
SCHEDULE OF SECURITIES SOLD SHORT (-3.41%)
| | | Interest Rate | | | Maturity | | | Principal | | | Value | |
| CORPORATE BONDS (-3.41%) | | | | | | | | | | | | |
| Enviva Partners LP(c) | | | 6.50 | % | | | 01/15/2026 | | | | (4,500,000 | ) | | $ | (3,674,565 | ) |
| Life Time, Inc.(c) | | | 8.00 | % | | | 04/15/2026 | | | | (5,000,000 | ) | | | (4,917,825 | ) |
| | | | | | | | | | | | | | | | | |
| TOTAL CORPORATE BONDS | | | | | | | | | | | | | | | (8,592,390 | ) |
| | | | | | | | | | | | | | | | | |
| TOTAL SCHEDULE OF SECURITIES SOLD SHORT | | | | | | | | | | | | | | | | |
| (Proceeds $9,295,618) | | | | | | | | | | | | | | $ | (8,592,390 | ) |
| | | | | | | | | | | | | | | | | |
| INVESTMENTS, AT VALUE (95.06%) | | | | | | | | | | | | | | | | |
| (Cost $263,828,122) | | | | | | | | | | | | | | $ | 239,681,638 | |
| | | | | | | | | | | | | | | | | |
| Other Assets In Excess Of Liabilities (4.94%) | | | | | | | | | | | | | | | 12,479,554 | |
| | | | | | | | | | | | | | | | | |
| NET ASSETS (100.00%) | | | | | | | | | | | | | | $ | 252,161,192 | |
| See Notes to Consolidated Financial Statements. | |
| Annual Report | September 30, 2023 | 13 |
| Alternative Credit Income Fund | Consolidated Schedule of Investments |
| | September 30, 2023 |
Investment Abbreviations:
LIBOR - London Interbank Offered Rate
SOFR - Secured Overnight Financing Rate
PIK - Payment in-Kind
Reference Rates:
1M US L - 1 Month LIBOR as of September 30, 2023 was 5.43%
3M US L - 3 Month LIBOR as of September 30, 2023 was 5.66%
1M US SOFR - 1 Month SOFR as of September 30, 2023 was 5.32%.
3M US SOFR - 3 Month SOFR as of September 30, 2023 was 5.40%.
6M US SOFR - 6 Month SOFR as of September 30, 2023 was 5.44%.
| (a) | Variable rate investment, unless otherwise noted. Interest rates reset periodically. Interest rate shown reflects the rate in effect at September 30, 2023. For securities based on a published reference rate and spread, the reference rate and spread are indicated in the description above. Certain variable rate securities are not based on a published reference rate and spread but are determined by the issuer or agent and are based on current market conditions. |
| (b) | As a result of the use of significant unobservable inputs to determine fair value, these investments have been classified as Level 3 assets. |
| (c) | Fixed rate investment. |
| (d) | Non-accrual investment. |
| (e) | Payment in kind security which may pay interest in additional par. |
| (f) | All or a portion of this commitment was unfunded as of September 30, 2023. |
| (g) | Securities exempt from registration under Rule 144A of the Securities Act of 1933, as amended. These securities may be sold in the ordinary course of business in transactions exempt from registration, normally to qualified institutional buyers. As of September 30, 2023, the aggregate market value of those securities was $19,113,354, representing 7.58% of net assets. |
| (i) | Non-income producing security. |
| (j) | Investment is held through ACIF Master Blocker, LLC, wholly owned subsidiary. |
| (l) | Restricted security. See chart below. |
| (m) | Investment is held through CIF Investments LLC, a wholly-owned subsidiary. |
| (n) | Money market fund; interest rate reflects seven-day effective yield on September 30, 2023. |
| (o) | Non-accrual investment. |
| (p) | All or a portion of each of these securities have been segregated as collateral for line of credit. The aggregate market value of those securities was $27,923,537 (see Note 7) |
Securities determined to be restricted under the procedures approved by the Fund's Board of Trustees are as follows.
| Date(s) of Purchase | | | Security | | Cost | | | Value | | | % of Net Assets | |
| | 3/31/2018 - 6/30/2022 | | | BlackRock Global Credit Opportunities Fund, LP | | $ | 13,076,282 | | | $ | 13,867,068 | | | | 5.50 | % |
| | 09/30/2017 - 09/30/2021 | | | CVC European Mid-Market Solutions Fund | | | 10,003,216 | | | | 9,223,615 | | | | 3.66 | % |
| | 6/30/2018 - 3/31/2021 | | | GSO Credit Alpha Fund II LP | | | 3,789,855 | | | | 5,150,526 | | | | 2.04 | % |
| | 9/30/2018 - 12/31/2020 | | | Monroe Capital Private Credit Fund III LP | | | 8,501,260 | | | | 8,838,545 | | | | 3.51 | % |
| | 11/14/2022 - 03/31/2023 | | | Pelham S2K SBIC II, L.P. | | | 200,000 | | | | 200,000 | | | | 0.08 | % |
| | 12/31/2017 - 06/30/2019 | | | Tree Line Credit Strategies LP | | | 19,000,000 | | | | 18,818,454 | | | | 7.46 | % |
| | 08/05/2022 - 09/30/2023 | | | Great Lakes Funding II LLC, Series A | | | 480,978 | | | | 470,515 | | | | 0.19 | % |
| | | | | Total | | $ | 55,051,591 | | | $ | 56,568,723 | | | | 22.44 | % |
| See Notes to Consolidated Financial Statements. | |
| 14 | www.altcif.com |
| Alternative Credit Income Fund | Consolidated Schedule of Investments |
| | September 30, 2023 |
Additional information on investments in private investment funds, including our joint venture Great Lakes Funding II LLC, and unfunded commitments:
| Security | | Value | | | Redemption Frequency | | | Redemption Notice(Days) | | | Unfunded Commitments as of September 30, 2023 | |
| BlackRock Global Credit Opportunities Fund, LP(a) | | $ | 13,867,068 | | | | N/A | | | | N/A | | | $ | 4,883,202 | |
| CVC European Mid-Market Solutions Fund(b) | | | 9,223,615 | | | | N/A | | | | N/A | | | | 206,342 | |
| Great Lakes Funding II LLC, Series A(a) | | | 470,515 | | | | N/A | | | | N/A | | | | 13,760 | |
| GSO Credit Alpha Fund II LP(a) | | | 5,150,526 | | | | N/A | | | | N/A | | | | 7,382,124 | |
| Monroe Capital Private Credit Fund III LP(b) | | | 8,838,545 | | | | N/A | | | | N/A | | | | 1,498,740 | |
| Pelham S2K SBIC II, L.P. | | | 200,000 | | | | N/A | | | | N/A | | | | 1,800,000 | |
| Tree Line Credit Strategies LP | | | 18,818,454 | | | | Quarterly | | | | 90 | | | | N/A | |
| Total | | $ | 56,568,723 | | | | | | | | | | | $ | 15,784,168 | |
Unfunded commitments:
| Security | | Value | | | Maturity | | | Unfunded Commitment | |
| BrightPet, Revolver | | $ | 172,344 | | | | 10/06/2026 | | | $ | 312,500 | |
| Cor Leonis Limited, Revolver | | | 1,244,892 | | | | 05/15/2028 | | | | 904,014 | |
| Epic Staffing Group, Delayed Draw Term Loan | | | (12,266 | ) | | | 06/28/2029 | | | | 278,777 | |
| GreenPark Infrastructure, LLC Series M-1 | | | 70,626 | | | | 12/31/2049 | | | | 731,500 | |
| Hunter Point Capital Structured Notes Issuer, LLC, Subordinated Delayed Draw Notes | | | 524,598 | | | | 07/15/2052 | | | | 5,368,289 | |
| Irradiant Intermediate Holdings, L.P., Delayed Draw Term Loan | | | (28,130 | ) | | | 06/08/2028 | | | | 1,450,000 | |
| PhyNet Dermatology LLC, Delayed Draw Term Loan | | | 15,517 | | | | 08/16/2024 | | | | 1,034,483 | |
| VBC Spine Opco LLC (DxTX Pain and Spine LLC), Delayed Draw Term Loan | | | 1,545 | | | | 06/14/2028 | | | | 1,188,455 | |
| VBC Spine Opco LLC (DxTX Pain and Spine LLC), Revolver | | | (4,525 | ) | | | 06/14/2028 | | | | 241,936 | |
| Total | | $ | 1,984,601 | | | | | | | $ | 11,509,954 | |
| | | | | | | | | | | | | |
| Total Unfunded Commitments | | | | | | | | | | $ | 27,294,122 | |
| (a) | A voluntary withdrawal may be permitted at the General Partner's discretion with the General Partner's consent. |
| (b) | A voluntary withdrawal may be permitted with the General Partner's prior written consent. |
| See Notes to Consolidated Financial Statements. | |
| Annual Report | September 30, 2023 | 15 |
| Alternative Credit Income Fund | Consolidated Statement of Assets and Liabilities |
| | September 30, 2023 |
| ASSETS | | | |
| Investments, at value (Cost $257,285,640) | | $ | 232,041,875 | |
| Affiliated investments, at value (Cost $15,838,100) | | | 16,232,153 | |
| Deposit with broker for securities sold short | | | 9,356,283 | |
| Interest and distributions receivable | | | 3,764,884 | |
| Receivable for investments sold | | | 5,558,729 | |
| Receivable for fund shares sold | | | 76,372 | |
| Prepaid expenses and other assets | | | 171,714 | |
| Total assets | | | 267,202,010 | |
| | | | | |
| LIABILITIES | | | | |
| Securities sold short (Proceeds $9,295,618) | | | 8,592,390 | |
| Line of credit payable | | | 3,878,632 | |
| Interest payable | | | 20,906 | |
| Payable for investments purchased | | | 235,318 | |
| Due to Adviser | | | 419,932 | |
| Payable for interest expense on securities sold short | | | 246,780 | |
| Administration fees payable | | | 194,500 | |
| Custody fees payable | | | 41,863 | |
| Incentive fees payable | | | 220,881 | |
| Distribution fees payable | | | 27,490 | |
| Shareholder servicing fees payable | | | 56,951 | |
| Transfer agency fees payable | | | 111,061 | |
| Accrued expenses and other liabilities | | | 994,114 | |
| Total liabilities | | | 15,040,818 | |
| Commitments and contingencies (Note 2) | | | | |
| NET ASSETS | | $ | 252,161,192 | |
| | | | | |
| NET ASSETS CONSISTS OF | | | | |
| Paid-in capital | | $ | 275,170,387 | |
| Total accumulated deficit | | | (23,009,195 | ) |
| NET ASSETS | | $ | 252,161,192 | |
| | | | | |
| Common Shares: | | | | |
| Class A | | | | |
| Net assets | | $ | 36,233,208 | |
| Shares of beneficial interest outstanding (no par value; unlimited number of shares) | | | 3,702,370 | |
| Net asset value(a) | | $ | 9.79 | |
| Maximum offering price per share (maximum sales charge of 5.75%) | | $ | 10.39 | |
| Class C | | | | |
| Net assets | | $ | 40,947,271 | |
| Shares of beneficial interest outstanding (no par value; unlimited shares) | | | 4,134,367 | |
| Net asset value(a) | | $ | 9.90 | |
| Class W | | | | |
| Net assets | | $ | 53,123,329 | |
| Shares of beneficial interest outstanding (no par value; unlimited shares) | | | 5,430,569 | |
| Net asset value | | $ | 9.78 | |
| Class I | | | | |
| Net assets | | $ | 110,738,577 | |
| Shares of beneficial interest outstanding (no par value; unlimited shares) | | | 11,298,324 | |
| Net asset value | | $ | 9.80 | |
| Class L | | | | |
| Net assets | | $ | 11,118,807 | |
| Shares of beneficial interest outstanding (no par value; unlimited shares) | | | 1,136,034 | |
| Net asset value | | $ | 9.79 | |
| Maximum offering price per share (maximum sales charge of 4.25%) | | $ | 10.22 | |
| (a) | Redemption price varies based on length of time held (Note 6). |
| See Notes to Consolidated Financial Statements. | |
| 16 | www.altcif.com |
| Alternative Credit Income Fund | Consolidated Statement of Operations |
| | For the Year Ended September 30, 2023 |
| INVESTMENT INCOME | | | |
| Interest | | $ | 21,519,994 | |
| Interest - Affiliates | | | 741,968 | |
| Dividends | | | 7,827,574 | |
| Dividends - Affiliates | | | 395,688 | |
| Other Income | | | 409,805 | |
| Total investment income | | | 30,895,029 | |
| EXPENSES | | | | |
| Investment advisory fees (Note 4) | | | 4,650,865 | |
| Administrative fees (Note 4) | | | 349,298 | |
| Distribution fees (Note 4): | | | | |
| Class C | | | 313,172 | |
| Class L | | | 28,456 | |
| Shareholder servicing fees (Note 4): | | | | |
| Class A | | | 92,591 | |
| Class C | | | 104,391 | |
| Class W | | | 133,277 | |
| Class L | | | 28,456 | |
| Interest and amortization/accretion on securities sold short | | | 442,835 | |
| Interest expense (Note 7) | | | 52,867 | |
| Incentive fees (Note 4) | | | 220,881 | |
| Transfer agent fees (Note 4) | | | 240,470 | |
| Professional fees | | | 275,601 | |
| Printing expense | | | 173,662 | |
| Registration fees | | | 130,719 | |
| Custody fees | | | 62,501 | |
| Insurance expense | | | 239,284 | |
| Trustee fees and expenses (Note 4) | | | 31,500 | |
| Networking Fees: | | | | |
| Class A | | | 7,993 | |
| Class C | | | 8,540 | |
| Class W | | | 2,224 | |
| Class I | | | 23,887 | |
| Class L | | | 3,264 | |
| Other expenses | | | 7,873 | |
| Total expenses | | | 7,624,607 | |
| Fees waived by Adviser (Note 4) | | | (360,993 | ) |
| Recoupment of previously waived fees (Note 4) | | | 59,466 | |
| Total net expenses | | | 7,323,080 | |
| NET INVESTMENT INCOME | | | 23,571,949 | |
| Net realized loss on investments | | | (1,309,135 | ) |
| Net change in unrealized depreciation on investments | | | (13,211,870 | ) |
| Net change in unrealized appreciation on securities sold short | | | 703,228 | |
| Net change in unrealized depreciation on affiliated investments | | | 253,865 | |
| NET REALIZED AND UNREALIZED LOSS ON INVESTMENTS | | | (13,563,912 | ) |
| NET INCREASE IN NET ASSETS RESULTING FROM OPERATIONS | | $ | 10,008,037 | |
| See Notes to Consolidated Financial Statements. | |
| Annual Report | September 30, 2023 | 17 |
| Alternative Credit Income Fund | Consolidated Statements of Changes in Net Assets |
| | | For the Year Ended September 30, 2023 | | | For the Year Ended September 30, 2022 | |
| OPERATIONS | | | | | | |
| Net investment income | | $ | 23,571,949 | | | $ | 14,286,823 | |
| Net realized loss on investments | | | (1,309,135 | ) | | | (1,815,526 | ) |
| Net change in unrealized depreciation on investments | | | (12,958,005 | ) | | | (20,272,028 | ) |
| Net change in unrealized appreciation on securities sold short | | | 703,228 | | | | – | |
| Net increase/(decrease) in net assets resulting from operations | | | 10,008,037 | | | | (7,800,731 | ) |
| | | | | | | | | |
| DISTRIBUTIONS TO SHAREHOLDERS | | | | | | | | |
| Total Distributable Earnings | | | | | | | | |
| Class A | | | (2,622,103 | ) | | | (2,402,335 | ) |
| Class C | | | (2,637,980 | ) | | | (2,443,171 | ) |
| Class W | | | (3,744,180 | ) | | | (3,687,216 | ) |
| Class I | | | (8,114,488 | ) | | | (6,420,554 | ) |
| Class L | | | (774,234 | ) | | | (737,636 | ) |
| From return of capital: | | | | | | | | |
| Class A | | | – | | | | (181,145 | ) |
| Class C | | | – | | | | (184,186 | ) |
| Class W | | | – | | | | (277,971 | ) |
| Class I | | | – | | | | (484,007 | ) |
| Class L | | | – | | | | (55,610 | ) |
| Total distributions to shareholders | | | (17,892,985 | ) | | | (16,873,831 | ) |
| | | | | | | | | |
| COMMON SHARE TRANSACTIONS | | | | | | | | |
| Class A | | | | | | | | |
| Proceeds from sales of shares | | | 2,849,033 | | | | 7,096,469 | |
| Distributions reinvested | | | 1,321,049 | | | | 1,180,078 | |
| Cost of shares redeemed | | | (4,557,578 | ) | | | (7,434,940 | ) |
| Net transferred in(out) | | | (684,076 | ) | | | (233,721 | ) |
| Net increase/(decrease) from share transactions | | | (1,071,572 | ) | | | 607,886 | |
| Class C | | | | | | | | |
| Proceeds from sales of shares | | | 2,457,255 | | | | 4,341,937 | |
| Distributions reinvested | | | 1,210,338 | | | | 1,354,973 | |
| Cost of shares redeemed | | | (4,398,432 | ) | | | (4,576,994 | ) |
| Net transferred in(out) | | | (415,344 | ) | | | (1,134,257 | ) |
| Net decrease from share transactions | | | (1,146,183 | ) | | | (14,341 | ) |
| Class W | | | | | | | | |
| Proceeds from sales of shares | | | 8,000,677 | | | | 11,291,567 | |
| Distributions reinvested | | | 974,679 | | | | 1,199,030 | |
| Cost of shares redeemed | | | (8,988,259 | ) | | | (10,281,935 | ) |
| Net transferred in(out) | | | (3,645,027 | ) | | | (83,840 | ) |
| Net increase/(decrease) from share transactions | | | (3,657,930 | ) | | | 2,124,822 | |
| Class I | | | | | | | | |
| Proceeds from sales of shares | | | 15,729,005 | | | | 38,980,395 | |
| Distributions reinvested | | | 4,180,602 | | | | 4,007,867 | |
| Cost of shares redeemed | | | (20,944,050 | ) | | | (17,954,999 | ) |
| Net transferred in(out) | | | 4,751,895 | | | | 1,451,819 | |
| Net increase from share transactions | | | 3,717,452 | | | | 26,485,082 | |
| Class L | | | | | | | | |
| Proceeds from sales of shares | | | 26,026 | | | | 8,714 | |
| Distributions reinvested | | | 462,806 | | | | 468,500 | |
| Cost of shares redeemed | | | (927,995 | ) | | | (1,409,496 | ) |
| Net transferred in(out) | | | (23,479 | ) | | | – | |
| Net decrease from share transactions | | | (462,642 | ) | | | (932,282 | ) |
| Total net increase/(decrease) in net assets | | | (10,505,823 | ) | | | 3,596,605 | |
| See Notes to Consolidated Financial Statements. | |
| 18 | www.altcif.com |
| Alternative Credit Income Fund | Consolidated Statements of Changes in Net Assets (continued) |
| | | For the Year Ended September 30, 2023 | | | For the Year Ended September 30, 2022 | |
| NET ASSETS | | | | | | |
| Beginning of year | | | 262,667,015 | | | | 259,070,410 | |
| End of year | | $ | 252,161,192 | | | $ | 262,667,015 | |
| | | | | | | | | |
| OTHER INFORMATION | | | | | | | | |
| Common Shares Transactions | | | | | | | | |
| Class A | | | | | | | | |
| Issued | | | 286,914 | | | | 658,525 | |
| Distributions reinvested | | | 135,876 | | | | 111,687 | |
| Redeemed | | | (462,919 | ) | | | (682,622 | ) |
| Net Transferred in(out) | | | (68,557 | ) | | | (21,441 | ) |
| Net increase/(decrease) in shares | | | (108,686 | ) | | | 66,149 | |
| | | | | | | | | |
| Class C | | | | | | | | |
| Issued | | | 243,786 | | | | 395,978 | |
| Distributions reinvested | | | 122,973 | | | | 126,440 | |
| Redeemed | | | (441,790 | ) | | | (417,696 | ) |
| Net Transferred in(out) | | | (41,807 | ) | | | (101,599 | ) |
| Net increase/(decrease) in shares | | | (116,838 | ) | | | 3,123 | |
| | | | | | | | | |
| Class W | | | | | | | | |
| Issued | | | 811,476 | | | | 1,047,560 | |
| Distributions reinvested | | | 100,325 | | | | 113,394 | |
| Redeemed | | | (911,159 | ) | | | (951,268 | ) |
| Net Transferred in(out) | | | (361,196 | ) | | | (7,603 | ) |
| Net increase/(decrease) in shares | | | (360,554 | ) | | | 202,083 | |
| | | | | | | | | |
| Class I | | | | | | | | |
| Issued | | | 1,588,810 | | | | 3,612,283 | |
| Distributions reinvested | | | 429,277 | | | | 378,923 | |
| Redeemed | | | (2,125,471 | ) | | | (1,649,652 | ) |
| Net Transferred in(out) | | | 473,281 | | | | 131,447 | |
| Net increase in shares | | | 365,897 | | | | 2,473,001 | |
| | | | | | | | | |
| Class L | | | | | | | | |
| Issued | | | 2,662 | | | | 812 | |
| Distributions reinvested | | | 47,604 | | | | 44,282 | |
| Redeemed | | | (94,229 | ) | | | (127,872 | ) |
| Net Transferred in(out) | | | (2,600 | ) | | | – | |
| Net decrease in shares | | | (46,563 | ) | | | (82,778 | ) |
| See Notes to Consolidated Financial Statements. | |
| Annual Report | September 30, 2023 | 19 |
| Alternative Credit Income Fund | Consolidated Statement of Cash Flows |
| | For the Year Ended September 30, 2023 |
| CASH FLOWS FROM OPERATING ACTIVITIES: | | | |
| Net increase in net assets from operations | | $ | 10,008,037 | |
| Adjustments to reconcile net increase in net assets resulting from operations to net cash provided by operating activities: | | | | |
| Purchase of investment securities | | | (55,738,224 | ) |
| Proceeds from sale of investment securities | | | 53,998,146 | |
| Proceeds from securities sold short transactions | | | 9,243,750 | |
| Payment-in-kind income | | | (1,995,987 | ) |
| Purchase of short-term investment securities - net | | | 864,984 | |
| Amortization of discount and accretion of discount on investments | | | (2,318,091 | ) |
| Net realized (gain)/loss on: | | | | |
| Investments | | | 1,309,135 | |
| Net change in unrealized (appreciation)/depreciation on: | | | | |
| Investments | | | 12,254,777 | |
| (Increase)/Decrease in assets: | | | | |
| Deposit with broker for securities sold short | | | (9,356,283 | ) |
| Receivable from paydowns | | | 1,236,858 | |
| Interest and distributions receivable | | | (869,888 | ) |
| Receivable for investments sold | | | (5,558,729 | ) |
| Prepaid expenses and other assets | | | (23,226 | ) |
| Increase/(Decrease) in liabilities: | | | | |
| Due to Adviser | | | (167,298 | ) |
| Payable for investments purchased | | | (659,371 | ) |
| Administration fees payable | | | 92,203 | |
| Custody fees payable | | | 28,297 | |
| Shareholder servicing fees payable | | | 18,284 | |
| Trustee fees and expenses payable | | | (6,000 | ) |
| Distribution fees payable | | | (2,233 | ) |
| Transfer agency fees payable | | | (54,662 | ) |
| Interest expense on securities sold short payable | | | 246,780 | |
| Incentive fees payable | | | 220,881 | |
| Interest payable | | | 20,906 | |
| Accrued expenses and other liabilities | | | 541,083 | |
| Net cash provided by operating activities | | | 13,334,129 | |
| | | | | |
| CASH FLOWS FROM FINANCING ACTIVITIES: | | | | |
| Proceeds from sales of shares | | | 29,440,695 | |
| Cost of shares redeemed | | | (39,832,345 | ) |
| Borrowings on the BNP line of credit | | | 3,878,632 | |
| Cash distributions paid | | | (9,743,511 | ) |
| Net cash used in financing activities | | | (16,256,529 | ) |
| | | | | |
| Net change in cash & cash equivalents | | | (2,922,400 | ) |
| | | | | |
| Restricted and unrestricted cash, beginning of year | | $ | 2,922,400 | |
| Restricted and unrestricted cash, end of year | | $ | – | |
| | | | | |
| Non-cash financing activities not included herein consist of reinvestment of distributions of: | | $ | 8,149,474 | |
| See Notes to Consolidated Financial Statements. | |
| 20 | www.altcif.com |
| Alternative Credit Income Fund – Class A | Financial Highlights |
| | For a Share Outstanding Throughout the Years Presented |
| | | Year Ended September 30, 2023 | | | Year Ended September 30, 2022 | | | Year Ended September 30, 2021 | | | Year Ended September 30, 2020 | | | Year Ended September 30, 2019 | | |
| NET ASSET VALUE, BEGINNING OF YEAR | | $ | 10.09 | | | $ | 11.09 | | | $ | 9.75 | | | $ | 10.80 | | | $ | 11.09 | | |
| | | | | | | | | | | | | | | | | | | | | | |
| INCOME FROM INVESTMENT OPERATIONS | | | | | | | | | | | | | | | | | | | | | |
| Net investment income(a) | | | 0.93 | | | | 0.61 | | | | 0.74 | | | | 0.69 | | | | 0.73 | | |
| Net realized and unrealized gain/(loss) on investments | | | (0.53 | ) | | | (0.91 | ) | | | 1.30 | | | | (0.92 | ) | | | (0.32 | ) | |
| Total income/(loss) from investment operations | | | 0.40 | | | | (0.30 | ) | | | 2.04 | | | | (0.23 | ) | | | 0.41 | | |
| | | | | | | | | | | | | | | | | | | | | | |
| DISTRIBUTIONS TO SHAREHOLDERS | | | | | | | | | | | | | | | | | | | | | |
| From net investment income | | | (0.70 | ) | | | (0.66 | ) | | | (0.63 | ) | | | (0.70 | ) | | | (0.55 | ) | |
| From return of capital | | | – | | | | (0.04 | ) | | | (0.07 | ) | | | (0.12 | ) | | | (0.15 | ) | |
| Total distributions | | | (0.70 | ) | | | (0.70 | ) | | | (0.70 | ) | | | (0.82 | ) | | | (0.70 | ) | |
| INCREASE/(DECREASE) IN NET ASSET VALUE | | | (0.30 | ) | | | (1.00 | ) | | | 1.34 | | | | (1.05 | ) | | | (0.29 | ) | |
| NET ASSET VALUE, END OF YEAR | | $ | 9.79 | | | $ | 10.09 | | | $ | 11.09 | | | $ | 9.75 | | | $ | 10.80 | | |
| | | | | | | | | | | | | | | | | | | | | | |
| TOTAL RETURN(b) | | | 4.19 | %(c) | | | (2.85 | )% | | | 21.33 | %(c) | | | (1.88 | )%(c)(d) | | | 3.91 | % | |
| | | | | | | | | | | | | | | | | | | | | | |
| RATIOS AND SUPPLEMENTAL DATA | | | | | | | | | | | | | | | | | | | | | |
| Net assets, end of year (in 000s) | | $ | 36,233 | | | $ | 38,452 | | | $ | 41,519 | | | $ | 38,829 | | | $ | 38,901 | | |
| | | | | | | | | | | | | | | | | | | | | | |
| RATIOS TO AVERAGE NET ASSETS(e) | | | | | | | | | | | | | | | | | | | | | |
| Including incentive fees, interest expense on borrowings and interest expense on securities sold short: | | | | | | | | | | | | | | | | | | | | | |
| Expenses, gross | | | 3.00 | % | | | 2.60 | % | | | 2.84 | % | | | 2.78 | % | | | 2.79 | % | |
| Expenses, net of fees waived/expenses reimbursed by Adviser | | | 2.87 | % | | | 2.60 | % | | | 2.65 | % | | | 2.68 | % | | | 2.67 | % | |
| Excluding incentive fees, interest expense on borrowings and interest expense on securities sold short: | | | | | | | | | | | | | | | | | | | | | |
| Expenses, gross | | | 2.72 | % | | | 2.59 | % | | | 2.78 | % | | | 2.69 | % | | | 2.71 | % | |
| Expenses, net of fees waived/expenses reimbursed by Adviser | | | 2.59 | % | | | 2.59 | % | | | 2.59 | % | | | 2.59 | % | | | 2.59 | % | |
| Net investment income | | | 9.36 | % | | | 5.60 | % | | | 6.87 | % | | | 6.93 | % | | | 6.68 | % | |
| | | | | | | | | | | | | | | | | | | | | | |
| PORTFOLIO TURNOVER RATE | | | 23 | % | | | 26 | % | | | 49 | % | | | 39 | % | | | 29 | % | |
| BORROWINGS AT END OF YEAR | | | | | | | | | | | | | | | | | | | | | |
| Aggregate amount outstanding (000s) | | $ | 3,879 | | | | – | | | | – | | | | – | | | | – | | |
| Asset coverage per $1,000 (000s) | | $ | 66,093 | | | | – | | | | – | | | | – | | | | – | | |
| (a) | Per share numbers have been calculated using the average shares method. |
| (b) | Total returns shown are historical in nature and assume changes in share price, reinvestment of dividends and capital gains distribution, if any. Had the Adviser not absorbed a portion of Fund expenses, total returns would have been lower. Returns shown exclude applicable sales charges. |
| (c) | Includes adjustments in accordance with accounting principles generally accepted in the United States of America and, as such, the net asset values for financial reporting purposes and the returns based upon those net asset values may differ from net asset values and returns for shareholder transactions. |
| (d) | 0.10% of the Fund’s total return consists of a reimbursement by the Adviser for a loss on a transaction. Excluding this item, total return would have been (1.98)%. |
| (e) | Ratios do not include expenses of underlying investment companies and private investment funds in which the Fund invests. |
| See Notes to Consolidated Financial Statements. | |
| Annual Report | September 30, 2023 | 21 |
| Alternative Credit Income Fund – Class C | Financial Highlights |
| | For a Share Outstanding Throughout the Years Presented |
| | | Year Ended September 30, 2023 | | | Year Ended September 30, 2022 | | | Year Ended September 30, 2021 | | | Year Ended September 30, 2020 | | | Year Ended September 30, 2019 | | |
| NET ASSET VALUE, BEGINNING OF YEAR | | $ | 10.21 | | | $ | 11.21 | | | $ | 9.86 | | | $ | 10.92 | | | $ | 11.22 | | |
| | | | | | | | | | | | | | | | | | | | | | |
| INCOME FROM INVESTMENT OPERATIONS | | | | | | | | | | | | | | | | | | | | | |
| Net investment income(a) | | | 0.86 | | | | 0.53 | | | | 0.66 | | | | 0.62 | | | | 0.66 | | |
| Net realized and unrealized gain/(loss) on investments | | | (0.54 | ) | | | (0.90 | ) | | | 1.31 | | | | (0.92 | ) | | | (0.34 | ) | |
| Total income/(loss) from investment operations | | | 0.32 | | | | (0.37 | ) | | | 1.97 | | | | (0.30 | ) | | | 0.32 | | |
| | | | | | | | | | | | | | | | | | | | | | |
| DISTRIBUTIONS TO SHAREHOLDERS | | | | | | | | | | | | | | | | | | | | | |
| From net investment income | | | (0.63 | ) | | | (0.59 | ) | | | (0.56 | ) | | | (0.66 | ) | | | (0.48 | ) | |
| From return of capital | | | – | | | | (0.04 | ) | | | (0.06 | ) | | | (0.10 | ) | | | (0.14 | ) | |
| Total distributions | | | (0.63 | ) | | | (0.63 | ) | | | (0.62 | ) | | | (0.76 | ) | | | (0.62 | ) | |
INCREASE/(DECREASE) IN NET ASSET VALUE | | | (0.31 | ) | | | (1.00 | ) | | | 1.35 | | | | (1.06 | ) | | | (0.30 | ) | |
| NET ASSET VALUE, END OF YEAR | | $ | 9.90 | | | $ | 10.21 | | | $ | 11.21 | | | $ | 9.86 | | | $ | 10.92 | | |
| | | | | | | | | | | | | | | | | | | | | | |
| TOTAL RETURN(b) | | | 3.33 | %(c) | | | (3.48 | )% | | | 20.36 | %(c) | | | (2.61 | )%(c)(d) | | | 3.05 | % | |
| | | | | | | | | | | | | | | | | | | | | | |
| RATIOS AND SUPPLEMENTAL DATA | | | | | | | | | | | | | | | | | | | | | |
| Net assets, end of year (in 000s) | | $ | 40,947 | | | $ | 43,391 | | | $ | 47,640 | | | $ | 43,984 | | | $ | 41,575 | | |
| | | | | | | | | | | | | | | | | | | | | | |
| RATIOS TO AVERAGE NET ASSETS(e) | | | | | | | | | | | | | | | | | | | | | |
| Including incentive fees, interest expense on borrowings and interest expense on securities sold short: | | | | | | | | | | | | | | | | | | | | | |
| Expenses, gross | | | 3.74 | % | | | 3.38 | % | | | 3.59 | % | | | 3.53 | % | | | 3.55 | % | |
| Expenses, net of fees waived/expenses reimbursed by Adviser | | | 3.62 | % | | | 3.35 | % | | | 3.40 | % | | | 3.43 | % | | | 3.42 | % | |
| Excluding incentive fees, interest expense on borrowings and interest expense on securities sold short: | | | | | | | | | | | | | | | | | | | | | |
| Expenses, gross | | | 3.46 | % | | | 3.37 | % | | | 3.53 | % | | | 3.44 | % | | | 3.47 | % | |
| Expenses, net of fees waived/expenses reimbursed by Adviser | | | 3.34 | % | | | 3.34 | % | | | 3.34 | % | | | 3.34 | % | | | 3.34 | % | |
| Net investment income | | | 8.61 | % | | | 4.87 | % | | | 6.12 | % | | | 6.19 | % | | | 5.95 | % | |
| | | | | | | | | | | | | | | | | | | | | | |
| PORTFOLIO TURNOVER RATE | | | 23 | % | | | 26 | % | | | 49 | % | | | 39 | % | | | 29 | % | |
| BORROWINGS AT END OF YEAR | | | | | | | | | | | | | | | | | | | | | |
| Aggregate amount outstanding (000s) | | $ | 3,879 | | | | – | | | | – | | | | – | | | | – | | |
| Asset coverage per $1,000 (000s) | | $ | 66,093 | | | | – | | | | – | | | | – | | | | – | | |
| (a) | Per share numbers have been calculated using the average shares method. |
| (b) | Total returns shown are historical in nature and assume changes in share price, reinvestment of dividends and capital gains distribution, if any. Had the Adviser not absorbed a portion of Fund expenses, total returns would have been lower. |
| (c) | Includes adjustments in accordance with accounting principles generally accepted in the United States of America and, as such, the net asset values for financial reporting purposes and the returns based upon those net asset values may differ from net asset values and returns for shareholder transactions. |
| (d) | 0.10% of the Fund’s total return consists of a reimbursement by the Adviser for a loss on a transaction. Excluding this item, total return would have been (2.71)%. |
| (e) | Ratios do not include expenses of underlying investment companies and private investment funds in which the Fund invests. |
| See Notes to Consolidated Financial Statements. | |
| 22 | www.altcif.com |
| Alternative Credit Income Fund – Class W | Financial Highlights |
| | For a Share Outstanding Throughout the Years Presented |
| | | Year Ended September 30, 2023 | | | Year Ended September 30, 2022 | | | Year Ended September 30, 2021 | | | Year Ended September 30, 2020 | | | Year Ended September 30, 2019 | | |
| NET ASSET VALUE, BEGINNING OF YEAR | | $ | 10.08 | | | $ | 11.08 | | | $ | 9.74 | | | $ | 10.79 | | | $ | 11.09 | | |
| | | | | | | | | | | | | | | | | | | | | | |
| INCOME FROM INVESTMENT OPERATIONS | | | | | | | | | | | | | | | | | | | | | |
| Net investment income(a) | | | 0.93 | | | | 0.61 | | | | 0.74 | | | | 0.69 | | | | 0.73 | | |
| Net realized and unrealized gain/(loss) on investments | | | (0.53 | ) | | | (0.91 | ) | | | 1.30 | | | | (0.92 | ) | | | (0.33 | ) | |
| Total income/(loss) from investment operations | | | 0.40 | | | | (0.30 | ) | | | 2.04 | | | | (0.23 | ) | | | 0.40 | | |
| | | | | | | | | | | | | | | | | | | | | | |
| DISTRIBUTIONS TO SHAREHOLDERS | | | | | | | | | | | | | | | | | | | | | |
| From net investment income | | | (0.70 | ) | | | (0.66 | ) | | | (0.63 | ) | | | (0.70 | ) | | | (0.55 | ) | |
| From return of capital | | | – | | | | (0.04 | ) | | | (0.07 | ) | | | (0.12 | ) | | | (0.15 | ) | |
| Total distributions | | | (0.70 | ) | | | (0.70 | ) | | | (0.70 | ) | | | (0.82 | ) | | | (0.70 | ) | |
| INCREASE/(DECREASE) IN NET ASSET VALUE | | | (0.30 | ) | | | (1.00 | ) | | | 1.34 | | | | (1.05 | ) | | | (0.30 | ) | |
| NET ASSET VALUE, END OF YEAR | | $ | 9.78 | | | $ | 10.08 | | | $ | 11.08 | | | $ | 9.74 | | | $ | 10.79 | | |
| | | | | | | | | | | | | | | | | | | | | | |
| TOTAL RETURN(b) | | | 4.19 | %(c) | | | (2.86 | )% | | | 21.35 | %(c) | | | (1.89 | )%(c)(d) | | | 3.81 | % | |
| | | | | | | | | | | | | | | | | | | | | | |
| RATIOS AND SUPPLEMENTAL DATA | | | | | | | | | | | | | | | | | | | | | |
| Net assets, end of year (in 000s) | | $ | 53,123 | | | $ | 58,382 | | | $ | 61,915 | | | $ | 69,993 | | | $ | 85,642 | | |
| | | | | | | | | | | | | | | | | | | | | | |
| RATIOS TO AVERAGE NET ASSETS(e) | | | | | | | | | | | | | | | | | | | | | |
| Including incentive fees, interest expense on borrowings and interest expense on securities sold short: | | | | | | | | | | | | | | | | | | | | | |
| Expenses, gross | | | 2.98 | % | | | 2.60 | % | | | 2.81 | % | | | 2.75 | % | | | 2.79 | % | |
| Expenses, net of fees waived/expenses reimbursed by Adviser | | | 2.87 | % | | | 2.60 | % | | | 2.65 | % | | | 2.68 | % | | | 2.67 | % | |
| Excluding incentive fees, interest expense on borrowings and interest expense on securities sold short: | | | | | | | | | | | | | | | | | | | | | |
| Expenses, gross | | | 2.70 | % | | | 2.59 | % | | | 2.75 | % | | | 2.66 | % | | | 2.71 | % | |
| Expenses, net of fees waived/expenses reimbursed by Adviser | | | 2.59 | % | | | 2.59 | % | | | 2.59 | % | | | 2.59 | % | | | 2.59 | % | |
| Net investment income | | | 9.36 | % | | | 5.63 | % | | | 6.89 | % | | | 6.92 | % | | | 6.68 | % | |
| | | | | | | | | | | | | | | | | | | | | | |
| PORTFOLIO TURNOVER RATE | | | 23 | % | | | 26 | % | | | 49 | % | | | 39 | % | | | 29 | % | |
| BORROWINGS AT END OF YEAR | | | | | | | | | | | | | | | | | | | | | |
| Aggregate amount outstanding (000s) | | $ | 3,879 | | | | – | | | | – | | | | – | | | | – | | |
| Asset coverage per $1,000 (000s) | | $ | 66,093 | | | | – | | | | – | | | | – | | | | – | | |
| (a) | Per share numbers have been calculated using the average shares method. |
| (b) | Total returns shown are historical in nature and assume changes in share price, reinvestment of dividends and capital gains distribution, if any. Had the Adviser not absorbed a portion of Fund expenses, total returns would have been lower. |
| (c) | Includes adjustments in accordance with accounting principles generally accepted in the United States of America and, as such, the net asset values for financial reporting purposes and the returns based upon those net asset values may differ from net asset values and returns for shareholder transactions. |
| (d) | 0.10% of the Fund’s total return consists of a reimbursement by the Adviser for a loss on a transaction. Excluding this item, total return would have been (1.99)%. |
| (e) | Ratios do not include expenses of underlying investment companies and private investment funds in which the Fund invests. |
| See Notes to Consolidated Financial Statements. | |
| Annual Report | September 30, 2023 | 23 |
| Alternative Credit Income Fund – Class I | Financial Highlights |
| | For a Share Outstanding Throughout the Years Presented |
| | | Year Ended September 30, 2023 | | | Year Ended September 30, 2022 | | | Year Ended September 30, 2021 | | | Year Ended September 30, 2020 | | | Year Ended September 30, 2019 | | |
| NET ASSET VALUE, BEGINNING OF YEAR | | $ | 10.11 | | | $ | 11.11 | | | $ | 9.77 | | | $ | 10.82 | | | $ | 11.12 | | |
| | | | | | | | | | | | | | | | | | | | | | |
| INCOME FROM INVESTMENT OPERATIONS | | | | | | | | | | | | | | | | | | | | | |
| Net investment income(a) | | | 0.95 | | | | 0.63 | | | | 0.76 | | | | 0.72 | | | | 0.77 | | |
| Net realized and unrealized gain/(loss) on investments | | | (0.53 | ) | | | (0.90 | ) | | | 1.30 | | | | (0.92 | ) | | | (0.34 | ) | |
| Total income/(loss) from investment operations | | | 0.42 | | | | (0.27 | ) | | | 2.06 | | | | (0.20 | ) | | | 0.43 | | |
| | | | | | | | | | | | | | | | | | | | | | |
| DISTRIBUTIONS TO SHAREHOLDERS | | | | | | | | | | | | | | | | | | | | | |
| From net investment income | | | (0.73 | ) | | | (0.69 | ) | | | (0.65 | ) | | | (0.73 | ) | | | (0.57 | ) | |
| From return of capital | | | – | | | | (0.04 | ) | | | (0.07 | ) | | | (0.12 | ) | | | (0.16 | ) | |
| Total distributions | | | (0.73 | ) | | | (0.73 | ) | | | (0.72 | ) | | | (0.85 | ) | | | (0.73 | ) | |
| INCREASE/(DECREASE) IN NET ASSET VALUE | | | (0.31 | ) | | | (1.00 | ) | | | 1.34 | | | | (1.05 | ) | | | (0.30 | ) | |
| NET ASSET VALUE, END OF YEAR | | $ | 9.80 | | | $ | 10.11 | | | $ | 11.11 | | | $ | 9.77 | | | $ | 10.82 | | |
| | | | | | | | | | | | | | | | | | | | | | |
| TOTAL RETURN(b) | | | 4.36 | %(c) | | | (2.58 | )% | | | 21.61 | %(c) | | | (1.61 | )%(c)(d) | | | 4.08 | % | |
| | | | | | | | | | | | | | | | | | | | | | |
| RATIOS AND SUPPLEMENTAL DATA | | | | | | | | | | | | | | | | | | | | | |
| Net assets, end of year (in 000s) | | $ | 110,739 | | | $ | 110,512 | | | $ | 93,970 | | | $ | 87,634 | | | $ | 87,265 | | |
| | | | | | | | | | | | | | | | | | | | | | |
| RATIOS TO AVERAGE NET ASSETS(e) | | | | | | | | | | | | | | | | | | | | | |
| Including incentive fees, interest expense on borrowings and interest expense on securities sold short: | | | | | | | | | | | | | | | | | | | | | |
| Expenses, gross | | | 2.74 | % | | | 2.36 | % | | | 2.59 | % | | | 2.52 | % | | | 2.54 | % | |
| Expenses, net of fees waived/expenses reimbursed by Adviser | | | 2.62 | % | | | 2.35 | % | | | 2.40 | % | | | 2.43 | % | | | 2.42 | % | |
| Excluding incentive fees, interest expense on borrowings and interest expense on securities sold short: | | | | | | | | | | | | | | | | | | | | | |
| Expenses, gross | | | 2.46 | % | | | 2.35 | % | | | 2.53 | % | | | 2.43 | % | | | 2.46 | % | |
| Expenses, net of fees waived/expenses reimbursed by Adviser | | | 2.34 | % | | | 2.34 | % | | | 2.34 | % | | | 2.34 | % | | | 2.34 | % | |
| Net investment income | | | 9.63 | % | | | 5.78 | % | | | 7.12 | % | | | 7.20 | % | | | 7.00 | % | |
| | | | | | | | | | | | | | | | | | | | | | |
| PORTFOLIO TURNOVER RATE | | | 23 | % | | | 26 | % | | | 49 | % | | | 39 | % | | | 29 | % | |
| BORROWINGS AT END OF YEAR | | | | | | | | | | | | | | | | | | | | | |
| Aggregate amount outstanding (000s) | | $ | 3,879 | | | | – | | | | – | | | | – | | | | – | | |
| Asset coverage per $1,000 (000s) | | $ | 66,093 | | | | – | | | | – | | | | – | | | | – | | |
| (a) | Per share numbers have been calculated using the average shares method. |
| (b) | Total returns shown are historical in nature and assume changes in share price, reinvestment of dividends and capital gains distribution, if any. Had the Adviser not absorbed a portion of Fund expenses, total returns would have been lower. |
| (c) | Includes adjustments in accordance with accounting principles generally accepted in the United States of America and, as such, the net asset values for financial reporting purposes and the returns based upon those net asset values may differ from net asset values and returns for shareholder transactions. |
| (d) | 0.10% of the Fund’s total return consists of a reimbursement by the Adviser for a loss on a transaction. Excluding this item, total return would have been (1.71)%. |
| (e) | Ratios do not include expenses of underlying investment companies and private investment funds in which the Fund invests. |
| See Notes to Consolidated Financial Statements. | |
| 24 | www.altcif.com |
| Alternative Credit Income Fund – Class L | Financial Highlights |
| | For a Share Outstanding Throughout the Years Presented |
| | | Year Ended September 30, 2023 | | | Year Ended September 30, 2022 | | | Year Ended September 30, 2021 | | | Year Ended September 30, 2020 | | | Year Ended September 30, 2019 | | |
| NET ASSET VALUE, BEGINNING OF YEAR | | $ | 10.09 | | | $ | 11.08 | | | $ | 9.75 | | | $ | 10.79 | | | $ | 11.09 | | |
| | | | | | | | | | | | | | | | | | | | | | |
| INCOME/(LOSS) FROM INVESTMENT OPERATIONS | | | | | | | | | | | | | | | | | | | | | |
| Net investment income(a) | | | 0.90 | | | | 0.58 | | | | 0.71 | | | | 0.67 | | | | 0.70 | | |
| Net realized and unrealized gain/(loss) on investments | | | (0.53 | ) | | | (0.90 | ) | | | 1.29 | | | | (0.91 | ) | | | (0.33 | ) | |
| Total income/(loss) from investment operations | | | 0.37 | | | | (0.32 | ) | | | 2.00 | | | | (0.24 | ) | | | 0.37 | | |
| | | | | | | | | | | | | | | | | | | | | | |
| DISTRIBUTIONS TO SHAREHOLDERS | | | | | | | | | | | | | | | | | | | | | |
| From net investment income | | | (0.67 | ) | | | (0.63 | ) | | | (0.60 | ) | | | (0.69 | ) | | | (0.52 | ) | |
| From net realized gain on investments | | | – | | | | – | | | | – | | | | – | | | | – | | |
| From return of capital | | | – | | | | (0.04 | ) | | | (0.07 | ) | | | (0.11 | ) | | | (0.15 | ) | |
| Total distributions | | | (0.67 | ) | | | (0.67 | ) | | | (0.67 | ) | | | (0.80 | ) | | | (0.67 | ) | |
INCREASE/(DECREASE) IN NET ASSET VALUE | | | (0.30 | ) | | | (0.99 | ) | | | 1.33 | | | | (1.04 | ) | | | (0.30 | ) | |
| NET ASSET VALUE, END OF YEAR | | $ | 9.79 | | | $ | 10.09 | | | $ | 11.08 | | | $ | 9.75 | | | $ | 10.79 | | |
| | | | | | | | | | | | | | | | | | | | | | |
| TOTAL RETURN(b) | | | 3.93 | %(c) | | | (3.01 | )% | | | 20.92 | %(c) | | | (2.04 | )%(c)(d) | | | 3.55 | %(c) | |
| | | | | | | | | | | | | | | | | | | | | | |
| RATIOS AND SUPPLEMENTAL DATA | | | | | | | | | | | | | | | | | | | | | |
| Net assets, end of year or period (in 000s) | | $ | 11,119 | | | $ | 11,930 | | | $ | 14,026 | | | $ | 12,656 | | | $ | 13,972 | | |
| | | | | | | | | | | | | | | | | | | | | | |
| RATIOS TO AVERAGE NET ASSETS(e) | | | | | | | | | | | | | | | | | | | | | |
| Including incentive fees, interest expense on borrowings and interest expense on securities sold short: | | | | | | | | | | | | | | | | | | | | | |
| Expenses, gross | | | 3.25 | % | | | 2.89 | % | | | 3.11 | % | | | 3.04 | % | | | 3.06 | % | |
| Expenses, net of fees waived/expenses reimbursed by Adviser | | | 3.12 | % | | | 2.85 | % | | | 2.90 | % | | | 2.93 | % | | | 2.92 | % | |
| Excluding incentive fees, interest expense on borrowings and interest expense on securities sold short: | | | | | | | | | | | | | | | | | | | | | |
| Expenses, gross | | | 2.97 | % | | | 2.88 | % | | | 3.05 | % | | | 2.95 | % | | | 2.98 | % | |
| Expenses, net of fees waived/expenses reimbursed by Adviser | | | 2.84 | % | | | 2.84 | % | | | 2.84 | % | | | 2.84 | % | | | 2.84 | % | |
| Net investment income | | | 9.11 | % | | | 5.37 | % | | | 6.61 | % | | | 6.66 | % | | | 6.42 | % | |
| | | | | | | | | | | | | | | | | | | | | | |
| PORTFOLIO TURNOVER RATE | | | 23 | % | | | 26 | % | | | 49 | % | | | 39 | % | | | 29 | % | |
| BORROWINGS AT END OF YEAR | | | | | | | | | | | | | | | | | | | | | |
| Aggregate amount outstanding (000s) | | $ | 3,879 | | | | – | | | | – | | | | – | | | | – | | |
| Asset coverage per $1,000 (000s) | | $ | 66,093 | | | | – | | | | – | | | | – | | | | – | | |
| (a) | Per share numbers have been calculated using the average shares method. |
| (b) | Total returns shown are historical in nature and assume changes in share price, reinvestment of dividends and capital gains distribution, if any. Had the Adviser not absorbed a portion of Fund expenses, total returns would have been lower. |
| (c) | Includes adjustments in accordance with accounting principles generally accepted in the United States of America and, as such, the net asset values for financial reporting purposes and the returns based upon those net asset values may differ from net asset values and returns for shareholder transactions. |
| (d) | 0.10% of the Fund’s total return consists of a reimbursement by the Adviser for a loss on a transaction. Excluding this item, total return would have been (2.14)%. |
| (e) | Ratios do not include expenses of underlying investment companies and private investment funds in which the Fund invests. |
| See Notes to Consolidated Financial Statements. | |
| Annual Report | September 30, 2023 | 25 |
| Alternative Credit Income Fund | Notes to Consolidated Financial Statements |
| | September 30, 2023 |
1. ORGANIZATION
Alternative Credit Income Fund (the “Fund”) is a closed-end, diversified management Investment Company that is registered under the Investment Company Act of 1940, as amended (the "1940 Act"). The Fund is structured as an interval fund and continuously offers its shares. The Fund was organized as a Delaware statutory trust on December 11, 2014.
The Fund’s investment objectives are to produce current income and to achieve capital preservation with moderate volatility and low to moderate correlation to the broader equity markets. The Fund pursues its investment objectives by investing, under normal circumstances, at least 80% of its assets (defined as net assets plus the amount of any borrowing for investment purposes) in fixed-income and fixed-income related securities.
Sierra Crest Investment Management LLC (the “Adviser”) has served as the Fund’s investment adviser since October 31, 2020.
On February 3, 2020, the Fund formed a wholly-owned subsidiary, CIF Investments LLC, a Delaware corporation. To the extent permitted by the 1940 Act, the Fund may make investments through CIF Investments LLC, which is a pass-through entity.
On March 22, 2022, the Fund formed a wholly-owned taxable subsidiary, ACIF Master Blocker, LLC (the “Taxable Subsidiary”), which is taxed as a corporation for U.S. federal income tax purposes. The Taxable Subsidiary allows the Fund to make equity investments in companies organized as pass-through entities while continuing to satisfy the requirements of a Regulated Investment Company under Subchapter M of the Internal Revenue Code of 1986, as amended (the “Code”).
2. SIGNIFICANT ACCOUNTING POLICIES
The following is a summary of significant accounting policies followed by the Fund in preparation of its consolidated financial statements. These policies are in conformity with U.S. generally accepted accounting principles (“U.S. GAAP”). The Fund is an investment company and follows the accounting and reporting guidance under Financial Accounting Standards Board (“FASB”) Accounting Standards Codification (“ASC”) Topic 946, Financial Services – Investment Companies. These consolidated financial statements reflect adjustments that in the opinion of the Fund are necessary for the fair presentation of the financial position and results of operations as of and for the periods presented herein. The Fund is considered an investment company for financial reporting purposes under U.S. GAAP and therefore applies the accounting and reporting guidance applicable to investment companies. The preparation of the consolidated financial statements requires management to make estimates and assumptions that affect the reported amounts of assets and liabilities and disclosure of contingent assets and liabilities at the date of the financial statements and the reported amounts of income and expenses for the year. Actual results could differ from those estimates, and such difference could be material. In accordance with U.S. GAAP guidance on consolidation, the Fund will generally not consolidate its investment in a portfolio company other than an investment company subsidiary or a controlled operating company whose business consists of providing services to the Fund. Accordingly, the Fund consolidated the accounts of the Fund’s wholly-owned subsidiaries, CIF Investments LLC and the Taxable Subsidiary, in its consolidated financial statements. All significant intercompany balances and transactions have been eliminated in consolidation. All references made to the “Fund” herein include Alternative Credit Income Fund and its consolidated subsidiaries, except as stated otherwise.
Securities Transactions and Investment Income – Investment transactions are recorded on the trade date. Realized gains or losses on investments are calculated using the specific identification method for both financial statement and federal income tax purposes. Dividend income is recorded on the ex-dividend date and interest income is recorded on an accrual basis. Premiums on securities are amortized to the earliest call date and purchase discounts are accreted over the life of the respective securities using the effective interest method.
Loans are generally placed on non-accrual status when there is reasonable doubt that principal or interest will be collected in full. The Fund considers many factors relevant to an investment when placing it on or removing it from non-accrual status including, but not limited to, the delinquency status of the investment, economic and business conditions, the overall financial condition of the underlying investment, the value of the underlying collateral, bankruptcy status, if any, and any other facts or circumstances relevant to the investment. Accrued interest is generally reversed when a loan is placed on non-accrual status. Payments received on non-accrual loans may be recognized as income or applied to principal depending upon management’s judgment regarding collectability of the outstanding principal and interest. Generally non-accrual loans may be restored to accrual status when past due principal and interest is paid current and are likely to remain current based on management’s judgment.
Securities Valuation – Securities listed on an exchange are valued at the last reported sale price at the close of the regular trading session of the exchange on the business day the value is being determined, or in the case of securities listed on NASDAQ, at the NASDAQ Official Closing Price. In the absence of a sale, such securities shall be valued at the mid-price. Short-term investments that mature in 60 days or less may be valued at amortized cost, provided such valuations represent fair value.
| Alternative Credit Income Fund | Notes to Consolidated Financial Statements |
| | September 30, 2023 |
Structured credit and other similar debt securities including, but not limited to, collateralized loan obligations (“CLO”) debt and equity securities, assetbacked securities (“ABS”), commercial mortgage-backed securities (“CMBS”) and other securitized investments backed by certain debt or other receivables (collectively, “Structured Credit Securities”), are valued on the basis of valuations provided by dealers in those instruments and/or independent pricing services recommended by the Adviser and approved by the Fund’s board of trustees (the “Board” or “Trustees”). In determining fair value, dealers and pricing services will generally use information with respect to transactions in the securities being valued, quotations from other dealers, market transactions in comparable securities, analyses and evaluations of various relationships between securities and yield to maturity information. The Adviser will, based on its reasonable judgment, select the dealer or pricing service quotation that most accurately reflects the fair market value of the Structured Credit Security while taking into account the information utilized by the dealer or pricing service to formulate the quotation in addition to any other relevant factors. In the event that there is a material discrepancy between quotations received from third-party dealers or the pricing services, the Adviser may (i) use an average of the quotations received or (ii) select an individual quotation that the Adviser, based upon its reasonable judgment, determines to be reasonable.
When price quotations for certain securities are not readily available, or if the available quotations are not believed to be reflective of market value by the Adviser, those securities will be valued at fair value as determined in good faith by the Adviser in its capacity as the Board of Trustees’ valuation designee pursuant to Rule 2a-5 under the 1940 Act. Fair valuation involves subjective judgments, the Fund cannot ensure that fair values determined by the Board or persons acting in their direction would accurately reflect the price that the Fund could obtain for a security if the security was sold. As the valuation designee, the Adviser acts under the Board of Trustees’ oversight. The Adviser’s fair valuation policies and procedures are approved by the Board of Trustees.
Fair valuation procedures may be used to value a substantial portion of the assets of the Fund. The Fund may use the fair value of a security to calculate its NAV when, for example, (1) a portfolio security is not traded in a public market or the principal market in which the security trades is closed, (2) trading in a portfolio security is suspended and not resumed prior to the normal market close, (3) a portfolio security is not traded in significant volume for a substantial period, or (4) the Adviser determines that the quotation or price for a portfolio security provided by a brokerdealer or independent pricing service is inaccurate.
The fair value of securities may be difficult to determine and thus judgment plays a greater role in the valuation process. The fair valuation methodology may include or consider the following guidelines, as appropriate: (1) evaluation of all relevant factors, including but not limited to, pricing history, current market level and supply and demand of the respective security; (2) comparison to the values and current pricing of securities that have comparable characteristics; (3) knowledge of historical market information with respect to the security; and (4) other factors relevant to the security which would include, but not be limited to, duration, yield, fundamental analytical data, the Treasury yield curve and credit quality.
Valuation of Private Investment Funds – The Fund invests a portion of its assets in private investment funds (“Private Investment Funds”). Private Investment Funds, including the Great Lakes Funding II, LLC, value their investment assets at fair value and generally report a NAV or its equivalent in accordance with U.S. GAAP on a calendar quarter basis. The Fund has elected to apply the practical expedient and to value its investments in Private Investment Funds at their respective NAVs at each quarter-end in accordance with U.S. GAAP. For non-calendar quarter-end days, the Valuation Committee estimates the fair value of each Private Investment Fund by adjusting the most recent NAV for such Private Investment Fund, as necessary, by the change in a relevant benchmark that the Valuation Committee has deemed to be representative of the underlying securities in the Private Investment Fund.
Loan Participation and Assignments – The Fund invests in debt instruments, which are interests in amounts owed to lenders (the “Lenders”) by corporate, governmental or other borrowers. The Fund’s investments in loans may be in the form of direct investments, loans originated by the Fund, participations in loans or assignments of all or a portion of the loans from third parties or exposure to investments in loans through investment in Private Investment Funds or other pooled investment vehicles. When the Fund purchases an interest in a loan in the form of an assignment, the Fund acquires all of the direct rights and obligations of a lender (as such term is defined in the related credit agreement), including the right to vote on amendments or waivers of such credit agreement. However, the Fund generally has no right to enforce compliance with the terms of the loan agreement with the borrower. Instead, the administration of the loan agreement is often performed by a bank or other financial institution (the “Agent”) that acts as agent for the Lenders. Circumstances may arise in connection with which the Agent takes action that contradicts the will of the Lenders. For example, under certain circumstances, an Agent may refuse to declare the borrower in default, despite having received a notice of default from the Lenders. When the Fund purchases an interest in a loan in the form of a participation, the Fund purchases such participation interest from another existing Lender, and consequently, the Fund does not obtain the rights and obligations of the Lenders under the credit agreement, such as the right to vote on amendments or waivers. The Fund has the right to receive payments of principal, interest and any fees to which it is entitled only from the Lender from which the Fund has received that participation interest. In this instance, the Fund is subject to both the credit risk of the borrower and the credit risk of the Lender that sold the Fund such participation interest.
Unfunded Commitments – The Fund may enter into unfunded loan commitments, which are contractual obligations for future funding, such as delayed draw term loans or revolving credit arrangements. Unfunded loan commitments represent a future obligation in full, even though a percentage of the notional loan amounts may not be utilized by the borrower. The Fund may receive a commitment fee based on the undrawn portion of the underlying line of credit portion of a floating rate loan.
| Annual Report | September 30, 2023 | 27 |
| Alternative Credit Income Fund | Notes to Consolidated Financial Statements |
| | September 30, 2023 |
Additionally, when the Fund invests in a Private Investment Fund, the Fund makes a commitment to invest a specified amount of capital in the applicable Private Investment Fund. The capital commitment may be drawn by the general partner of the Private Investment Fund either all at once or through a series of capital calls at the discretion of the general partner. The unfunded commitment represents the portion of the Fund’s overall capital commitment to a particular Private Investment Fund that has not yet been called by the general partner of the Private Investment Fund.
As of September 30, 2023, the Fund had unfunded commitments of $27,294,122.
Short Sales – The Fund may sell securities short. To do this the Fund will borrow and then sell (take short positions in) securities. To complete such a transaction, the Fund must borrow the security to deliver to the buyer. The Fund is then obligated to replace, or cover, the security borrowed by purchasing it in the open market at some later date. The Fund will generally have to pay a fee or premium to borrow a security and be obligated to repay the lender any dividend or interest that accrues on those securities during the period of the loan. The Fund bears the risk of a loss, unlimited in size, if the market price of the security increases between the date of the short sale and the date on which the Fund replaces the borrowed security. The Fund will realize a gain, limited to the price that the Fund sold the security short, if the security declines in value between those dates. There can be no assurance that securities necessary to cover a short position will be available for purchase. To mitigate leverage risk, the Fund will segregate liquid assets (which may include its long positions) at least equal to its short position exposure, marked-to- market daily.
Fair Value Measurements – A three-tier hierarchy has been established to classify fair value measurements for disclosure purposes. Inputs refer broadly to the assumptions that market participants would use in pricing the asset or liability, including assumptions about risk. Inputs may be observable or unobservable. Observable inputs are inputs that reflect the assumptions market participants would use in pricing the asset or liability that are developed based on market data obtained from sources independent of the reporting entity. Unobservable inputs are inputs that reflect the reporting entity’s own assumptions about the assumptions market participants would use in pricing the asset or liability that are developed based on the best information available. In accordance with the U.S. GAAP guidance on fair value measurements and disclosure, the Fund discloses the fair value of its investments in a hierarchy that prioritizes the inputs to valuation techniques used to measure the fair value.
Various inputs are used in determining the fair value of the Fund’s investments. These inputs are categorized in the following hierarchy under applicable accounting guidance:
| Level 1 – | Unadjusted quoted prices in active markets for identical, unrestricted assets or liabilities that the Fund has the ability to access at the measurement date; |
| Level 2 – | Quoted prices in markets that are not active, or quoted prices for similar assets or liabilities in active markets, or inputs other than quoted prices that are observable (either directly or indirectly) for substantially the full term of the asset or liability at the measurement date; and |
| Level 3 – | Significant unobservable prices or inputs (including the Fund’s own assumptions in determining the fair value of investments) where there is little or no market activity for the asset or liability at the measurement date. |
The availability of observable inputs can vary from security to security and is affected by a wide variety of factors, including, for example, the type of security, whether the security is new and not yet established in the marketplace, the liquidity of markets and other characteristics particular to the security. To the extent that valuation is based on models or inputs that are less observable or unobservable in the market, the determination of fair value requires more judgment. Accordingly, the degree of judgment exercised in determining fair value is greatest for instruments categorized in Level 3.
An investment level within the fair value hierarchy is based on the lowest level input, individually or in the aggregate, that is significant to fair value measurement. The valuation techniques used by the Fund to measure fair value maximizes the use of observable inputs and minimizes the use of unobservable inputs.
| Alternative Credit Income Fund | Notes to Consolidated Financial Statements |
| | September 30, 2023 |
The inputs or methodologies used for valuing securities are not necessarily an indication of the risk or liquidity associated with investing in those securities. The following is a summary of the fair values according to the inputs used in valuing the Fund’s investments as of September 30, 2023:
| Investments in Securities at Value | | Level 1 | | | Level 2 | | | Level 3 | | | Total | |
| Bank Loans(a) | | | | | | | | | | | | |
| Communication Services | | $ | – | | | $ | – | | | $ | 4,371,238 | | | $ | 4,371,238 | |
| Consumer Staples | | | – | | | | – | | | | 13,560,386 | | | | 13,560,386 | |
| Consumer Discretionary | | | – | | | | – | | | | 5,390,728 | | | | 5,390,728 | |
| Financials | | | – | | | | – | | | | 16,722,889 | | | | 16,722,889 | |
| Health Care | | | – | | | | – | | | | 20,613,768 | | | | 20,613,768 | |
| Industrials | | | – | | | | – | | | | 18,459,171 | | | | 18,459,171 | |
| Information Technology | | | – | | | | – | | | | 39,297,855 | | | | 39,297,855 | |
| Asset Backed Securities(a) | | | – | | | | 4,682,747 | | | | 8,476,118 | | | | 13,158,865 | |
| Corporate Bonds(a) | | | | | | | | | | | | | | | | |
| Communications | | | – | | | | 2,018,465 | | | | – | | | | 2,018,465 | |
| Consumer Staples | | | – | | | | 2,004,034 | | | | – | | | | 2,004,034 | |
| Consumer Discretionary | | | – | | | | 386,753 | | | | – | | | | 386,753 | |
| Consumer, Non-cyclical | | | – | | | | 2,719,500 | | | | – | | | | 2,719,500 | |
| Industrials | | | – | | | | 162,260 | | | | – | | | | 162,260 | |
| Common Equity(a) | | | | | | | | | | | | | | | | |
| Consumer Discretionary | | | – | | | | 1,405,657 | | | | – | | | | 1,405,657 | |
| Diversified | | | 10,540,964 | | | | – | | | | – | | | | 10,540,964 | |
| Energy | | | 3,625,992 | | | | – | | | | – | | | | 3,625,992 | |
| Financial | | | – | | | | – | | | | 2,124,000 | | | | 2,124,000 | |
| Health Care | | | – | | | | – | | | | 435,415 | | | | 435,415 | |
| Industrials | | | – | | | | – | | | | 1,856,249 | | | | 1,856,249 | |
| Real Estate | | | – | | | | 3,386,912 | | | | – | | | | 3,386,912 | |
| Preferred Stock(a) | | | | | | | | | | | | | | | | |
| Consumer Discretionary | | | – | | | | – | | | | 5,018,108 | | | | 5,018,108 | |
| Financials | | | – | | | | – | | | | – | | | | – | |
| Health Care | | | – | | | | – | | | | 116,897 | | | | 116,897 | |
| Industrials | | | – | | | | – | | | | 200,000 | | | | 200,000 | |
| Interval Fund(a) | | | 7,860,465 | | | | – | | | | – | | | | 7,860,465 | |
| Warrants(a) | | | – | | | | 475,882 | | | | 349,690 | | | | 825,572 | |
| | | | | | | | | | | | | | | | | |
| Short Positions(a) | | | | | | | | | | | | | | | | |
| Corporate Bonds | | | – | | | | (8,592,390 | ) | | | – | | | | (8,592,390 | ) |
| Short-Term Investment(a) | | | 15,443,162 | | | | – | | | | – | | | | 15,443,162 | |
| TOTAL | | $ | 37,470,583 | | | $ | 8,649,820 | | | $ | 136,992,512 | | | $ | 183,112,915 | |
| Investments measured at net asset value(a) | | | | | | | | | | | | | | $ | 56,568,723 | |
| Total Investments, at fair value, net of Short Positions | | | | | | | | | | | | | | $ | 239,681,638 | |
| (a) | For detailed descriptions, see the accompanying Consolidated Schedule of Investments. |
| Annual Report | September 30, 2023 | 29 |
| Alternative Credit Income Fund | Notes to Consolidated Financial Statements |
| | September 30, 2023 |
The following table provides a reconciliation of the beginning and ending balances of investments for which the Fund has used Level 3 inputs to determine the fair value:
| Asset Type | | Balance as of September 30, 2022 | | | Accrued Discount/ premium | | | Realized Gain/(Loss) | | | Change in Unrealized Appreciation/ Depreciation | | | Purchases | | | Sales Proceeds | | | Transfer into Level 3 | | | Transfer Out of Level 3 | | | Balance as of September 30, 2023 | | | Net change in unrealized appreciation/ (depreciation) included in the Statements of Operations attributable to Level 3
investments
held at
September
30, 2023 | |
| Bank Loans | | $ | 79,020,860 | | | $ | 567,836 | | | $ | 2,661,708 | | | $ | (5,436,802 | ) | | $ | 34,882,563 | | | $ | (21,989,244 | ) | | $ | 28,709,114 | | | $ | – | | | $ | 118,416,035 | | | $ | (9,417,673 | ) |
| Asset Backed Securities | | | 4,084,525 | | | | 1,016,508 | | | | (4,008,628 | ) | | | 1,424,720 | | | | 6,570,793 | | | | (611,800 | ) | | | – | | | | – | | | | 8,476,118 | | | | 1,424,720 | |
| Preferred Stock | | | 5,324,200 | | | | 619 | | | | – | | | | 43,203 | | | | 196,401 | | | | (229,418 | ) | | | – | | | | – | | | | 5,335,005 | | | | 43,203 | |
| Common Equity | | | 277,647 | | | | – | | | | – | | | | (457,701 | ) | | | 4,595,718 | | | | – | | | | – | | | | – | | | | 4,415,664 | | | | (457,701 | ) |
| Warrants | | | 390,456 | | | | – | | | | – | | | | (40,766 | ) | | | – | | | | – | | | | – | | | | – | | | | 349,690 | | | | (40,766 | ) |
| | | | | | | | | | | | | | | | | | | | | | | | | | | | | | | | | | | | | | | | | |
| | | $ | 89,097,688 | | | $ | 1,584,963 | | | $ | (1,346,920 | ) | | $ | (4,467,346 | ) | | $ | 46,245,475 | | | $ | (22,830,462 | ) | | $ | 28,709,114 | | | $ | – | | | $ | 136,992,512 | | | $ | (8,448,217 | ) |
| Alternative Credit Income Fund | Notes to Consolidated Financial Statements |
| | September 30, 2023 |
There are significant unobservable valuation inputs for material Level 3 investments, and a change to the unobservable input may result in a significant change to the value of the investment. Level 3 investment valuation techniques and inputs as of September 30, 2023 are as follows:
| Asset Category | | Fair value at September 30, 2023 | | | Valuation Technique | | Unobservable Input(a) | | Range of Input (Weighted Average)(b) |
| Bank Loans | | | | | | | | | | |
| Communication Services | | $ | 4,371,238 | | | Market | | Broker/Dealer Quotes | | N/A |
| Consumer Discretionary | | | 2,120,083 | | | Discounted Cash Flows | | Market Yield | | 13.2% |
| Consumer Discretionary | | | 1,947,522 | | | Enterprise Market Value | | EBITDA Multiple | | 7.0x |
| Consumer Discretionary | | | 1,323,123 | | | Market | | Broker/Dealer Quotes | | N/A |
| Consumer Staples | | | 11,838,511 | | | Discounted Cash Flows | | Market Yield | | 10.0% – 16.9% (13.2%) |
| Consumer Staples | | | 1,721,875 | | | Market | | Broker/Dealer Quotes | | N/A |
| Financials | | | 16,722,889 | | | Discounted Cash Flows | | Market Yield | | 9.9% – 16.3% (12.0%) |
| Health Care | | | 9,551,243 | | | Discounted Cash Flows | | Market Yield | | 12.1% – 17.9% (15.3%) |
| Health Care | | | 11,062,525 | | | Market | | Broker/Dealer Quotes | | N/A |
| Industrials | | | 18,459,171 | | | Discounted Cash Flows | | Market Yield | | 7.7% – 18.0% (12.3%) |
| Information Technology | | | 25,680,874 | | | Discounted Cash Flows | | Market Yield | | 8.4% – 22.0% (13.9%) |
| Information Technology | | | 13,616,981 | | | Market | | Broker/Dealer Quotes | | N/A |
| Asset Backed Securities | | | 8,476,118 | | | Discounted Cash Flows | | Market Yield | | 21.6% – 24.9% (22%) |
| Preferred Equity | | | | | | | | | | |
| Consumer Discretionary | | | 5,018,108 | | | Discounted Cash Flows | | Market Yield | | 12.1% |
| Health Care | | | 116,897 | | | Enterprise Market Value | | EBITDA multiple | | 17.3x |
| Industrials | | | 200,000 | | | Enterprise Market Value | | Book Value of Equity (Asset) | | 1.0x |
| Common Equity | | | | | | | | | | |
| Financials | | | 2,124,000 | | | Enterprise Market Value | | EBITDA Multiple | | 6.75x |
| Health Care | | | 435,415 | | | Enterprise Market Value | | EBITDA multiple | | 8.3x – 17.3x (13.9x) |
| Industrials | | | 70,626 | | | Enterprise Market Value | | Book Value of Equity (Asset) | | 1.0x |
| Industrials | | | 1,785,623 | | | Enterprise Market Value | | EBITDA multiple | | 8.0x |
| Warrants | | | 349,690 | | | Discounted Cash Flows | | Stock Price | | $103.75 |
| | | | | | | | | Time to Exit (Years) | | 2.0 |
| | | | | | | | | Volatility | | 35.0% |
| | | $ | 136,992,512 | | | | | | | |
| (a) | An increase in market yield would result in a decrease in fair value. A decrease in market yield would result in an increase in fair value. An increase in the transaction price would result in an increase in fair value. A decrease in the transaction price would result in a decrease in fair value. An increase in the EBITDA multiple would result in an increase in fair value. A decrease in the EBITDA multiple would result in a decrease in fair value. |
| (b) | The weighted averages disclosed in the table above were weighted by their relative fair value. |
Concentration of Credit Risk – The Fund places its cash with one banking institution, which is insured by the Federal Deposit Insurance Corporation (“FDIC”). The FDIC limit is $250,000. At various times throughout the year, the amount on deposit may exceed the FDIC limit and subject the Fund to a credit risk.
Federal and Other Taxes – No provision for income taxes is included in the accompanying consolidated financial statements, as the Fund intends to distribute to shareholders all taxable investment income and realized gains and otherwise comply with Subchapter M of the Internal Revenue Code of 1986, as amended (the “Code”), applicable to regulated investment companies.
The Fund evaluates tax positions taken (or expected to be taken) in the course of preparing the Fund’s tax provisions to determine whether these positions meet a “more-likely-than-not” standard that, based on the technical merits, have a more than fifty percent likelihood of being sustained by a taxing authority upon examination. A tax position that meets the “more-likely-than-not” recognition threshold is measured to determine the amount of benefit to recognize in the consolidated financial statements.
As of and during the year ended September 30, 2023, the Fund did not have a liability for any unrecognized tax benefits. The Fund files U.S. federal, state and local tax returns as required. The Fund’s tax returns are subject to examination by the relevant tax authorities until expiration of the applicable statute of limitations, which is generally three years after the filing of the tax return for federal purposes and four years for most state returns. Tax returns for open years have incorporated no uncertain tax positions that require a provision for income taxes.
| Annual Report | September 30, 2023 | 31 |
| Alternative Credit Income Fund | Notes to Consolidated Financial Statements |
| | September 30, 2023 |
The Taxable Subsidiary records deferred tax assets or liabilities related to temporary book versus tax differences on the income or loss generated by the underlying equity investments held by the Taxable Subsidiary.
Distributions to Shareholders – Distributions from net investment income, if any, are declared and paid quarterly. Distributions from net realized capital gains, if any, are declared and paid annually and are recorded on the ex-dividend date. The character of income and gains to be distributed is determined in accordance with income tax regulations, which may differ from U.S. GAAP.
Early Withdrawal Charge – Selling brokers, or other financial intermediaries that have entered into distribution agreements with the Distributor (as defined below in Note 3), will receive a commission of (a) up to 1.00% of the purchase price of Class C shares and (b) up to 0.50% of the purchase of Class A shares of $1 million or more. Shareholders who tender for repurchase of such shareholder's Class C shares fewer than 365 days after the original purchase date will be subject to an early withdrawal charge of 1.00% of the original purchase price. Shareholders tendering Class A shares fewer than 365 days after the original purchase date will be subject to an early withdrawal charge of 0.50% of the original purchase price, which will be deducted from repurchase proceeds, if (i) the original purchase was for amounts of $1 million or more and (ii) the selling broker received the reallowance of the dealer-manager fee. The Distributor may waive the imposition of the early withdrawal charge in the event of shareholder death or shareholder disability. Any such waiver does not imply that the early withdrawal charge will be waived at any time in the future or that such early withdrawal charge will be waived for any other shareholder. Class A shares (with respect to purchases of less than $1 million) will not be subject to an early withdrawal charge.
Indemnification – The Fund indemnifies its officers and Trustees for certain liabilities that may arise from the performance of their duties to the Fund. Additionally, in the normal course of business, the Fund enters into contracts that contain a variety of representations and warranties and which provide general indemnities. The Fund’s maximum exposure under these arrangements is unknown, as this would involve future claims that may be made against the Fund that have not yet occurred. However, based on industry experience, the Fund expects the risk of loss due to these warranties and indemnities to be remote.
3. GREAT LAKES FUNDING II LLC
In August 2022, the Fund invested in Series A of Great Lakes Funding II LLC (the “Great Lakes II Joint Venture”), a joint venture with an investment strategy to underwrite and hold senior, secured unitranche loans made to middle-market companies. The Fund treats its investment in the Great Lakes II Joint Venture as a joint venture since an affiliate of the Adviser controls a 50% voting interest in the Great Lakes II Joint Venture. In connection with the launch of the Great Lakes II Joint Venture, the Fund entered into a series of transactions pursuant to which the Fund’s prior investment in BCP Great Lakes Holdings LP, a vehicle formed as a co-investment vehicle to facilitate the participation of certain co-investors to invest, directly or indirectly, in BCP Great Lakes Funding, LLC (the “Prior Great Lakes Joint Venture”) which the Fund invested in during the fourth quarter of 2022, and the corresponding assets held by the Prior Great Lakes Joint Venture in respect of the Fund’s investment in BCP Great Lakes Holdings LP, were transferred to the Great Lakes II Joint Venture in complete redemption of the Fund’s investment in BCP Great Lakes Holdings LP.
The Great Lakes II Joint Venture is a Delaware series limited liability company, and pursuant to the terms of the Great Lakes Funding II LLC Limited Liability Company Agreement (the “Great Lakes II LLC Agreement”), prior to the end of the investment period with respect to each series established under the Great Lakes II LLC Agreement, each member of the predecessor series would be offered the opportunity to roll its interests into any subsequent series of the Great Lakes II Joint Venture. The Fund does not pay any advisory fees in connection with its investment in the Great Lakes II Joint Venture. Certain other funds managed by the Adviser or its affiliates have also invested in the Great Lakes II Joint Venture.
The fair value of the Fund’s investment in the Great Lakes II Joint Venture as of September 30, 2023 was $470,515. Fair value has been determined utilizing the practical expedient in accordance with U.S. GAAP. Pursuant to the terms of the Great Lakes II LLC Agreement, the Fund generally may not affect any direct or indirect sale, transfer, assignment, hypothecation, pledge or other disposition of or encumbrance upon its interests in the Great Lakes II Joint Venture, except that the Fund may sell or otherwise transfer its interests with the consent of the managing members of the Great Lakes II Joint Venture or to an affiliate or a successor to substantially all of the assets of the Fund.
As of September 30, 2023, the Fund has a $13,760 unfunded commitment to the Great Lakes II Joint Venture.
| Alternative Credit Income Fund | Notes to Consolidated Financial Statements |
| | September 30, 2023 |
4. ADVISORY FEES AND OTHER TRANSACTIONS WITH SERVICE PROVIDERS
Advisory Fees – On October 31, 2020, the Fund entered into a management agreement (the “Management Agreement”) with the Adviser. Under the terms of the Management Agreement, the Adviser provides certain investment advisory and administrative services to the Fund and in consideration of the advisory services provided, the Adviser is entitled to a fee consisting of two components — a base management fee and an incentive fee.
The base management fee is payable monthly in arrears at an annual rate of 1.85% of the average daily net assets of the Fund. For the Year ended September 30, 2023, the Fund incurred $4,650,865 in base management fees.
The incentive fee is calculated and payable quarterly in arrears based upon the Fund’s “pre-incentive fee net investment income” for the immediately preceding quarter and is subject to a hurdle rate, expressed as a rate of return on the Fund’s “adjusted capital,” equal to 2.25% per quarter (or an annualized hurdle rate of 9.0%), subject to a “catch-up” feature. For this purpose, “pre-incentive fee net investment income” means interest income, dividend income and any other income accrued during the calendar quarter, less the Fund’s operating expenses for the quarter (including the management fee, expenses reimbursed to the Adviser and any interest expenses and distributions paid on any issued and outstanding preferred shares, but excluding the incentive fee). Pre-incentive fee net investment income includes, in the case of investments with a deferred interest feature (such as OID, debt instruments with paid-in-kind (“PIK”) interest and zero coupon securities), accrued income that the Fund has not yet received in cash. Pre-incentive fee net investment income does not include any realized capital gains, realized capital losses or unrealized capital appreciation or depreciation. “Adjusted capital” means the cumulative gross proceeds received by the Fund from the sale of shares (including pursuant to the Fund’s distribution reinvestment plan), reduced by amounts paid in connection with purchases of shares pursuant to the Fund’s share repurchase program.
No incentive fee is payable in any calendar quarter in which the Fund’s pre-incentive fee net investment income does not exceed the quarterly hurdle rate of 2.25%. For any calendar quarter in which the Fund’s pre-incentive fee net investment income is greater than the hurdle rate, but less than or equal to 2.8125%, the incentive fee will equal the amount of the Fund’s pre-incentive fee net investment income in excess of the hurdle rate. This portion of the Fund’s pre-incentive fee net investment income which exceeds the hurdle rate but is less than or equal to 2.8125% is referred to as the “catch-up.” The “catch-up” provision is intended to provide the Adviser with an incentive fee of 20.0% on all of the Fund’s pre-incentive fee net investment income when the Fund’s pre-incentive fee net investment income reaches 2.8125% in any calendar quarter. For any calendar quarter in which the Fund’s pre-incentive fee net investment income exceeds 2.8125% of adjusted capital, the incentive fee will equal 20.0% of pre-incentive fee net investment income. For the Year ended September 30, 2023, the Advisor earn an incentive fee of $220,881.
Under the Expense Limitation Agreement, dated October 31, 2020, the Adviser has contractually agreed to waive all or part of its management fees (excluding any incentive fee) and/or make payments to limit Fund expenses (excluding interest, brokerage commissions, acquired fund fees and expenses and extraordinary expenses) at least until January 31, 2024, such that the total annual operating expenses of the Fund do not exceed 2.59% per annum of Class A average daily net assets, 3.34% per annum of Class C average daily net assets, 2.59% per annum of Class W average daily net assets, 2.34% per annum of Class I average daily net assets, and 2.84% per annum of Class L average daily net assets. Fee waivers and expense payments may be recovered by the Adviser from the Fund, for a period of up to three years following the date of waiver or expense payment, if the Fund is able to make the repayment without exceeding the expense limitation in place at the time of waiver and the current expense limitation and the repayment is approved by the Board. For the year ended September 30, 2023, the Adviser waived fees of $360,993.
As of September 30, 2023, the following amounts that may be subject to reimbursement to the Adviser based upon their potential expiration dates:
| Fund | | 2024 | | | 2025 | | | 2026 | |
| Alternative Credit Income Fund | | $ | 353,828 | | | $ | 266,824 | | | $ | 360,993 | |
During the year ended September 30, 2023, the Adviser recovered previously waived fees under the Resource Expense Limitation Agreement of $59,466.
During the year ended September 30, 2023, the Adviser did not recover $23,158 of previously waived fees under the Expense Limitation Agreement which expired.
Fund Accounting Fees and Expenses – ALPS Fund Services, Inc. (“ALPS”) serves as the Fund’s administrator and accounting agent (the “Administrator”) and receives customary fees from the Fund for such services.
Transfer Agent – DST Systems Inc. (the “Transfer Agent”), an affiliate of ALPS, serves as transfer, dividend paying and shareholder servicing agent for the Fund.
| Annual Report | September 30, 2023 | 33 |
| Alternative Credit Income Fund | Notes to Consolidated Financial Statements |
| | September 30, 2023 |
Distributor – The Fund has entered into a distribution agreement with ALPS Distributors, Inc. (the “Distributor”), an affiliate of ALPS, to provide distribution services to the Fund. There are no fees paid to the Distributor pursuant to the distribution agreement. The Board has adopted, on behalf of the Fund, a shareholder servicing plan under which the Fund may compensate financial industry professionals for providing ongoing services in respect of clients with whom they have distributed shares of the Fund. Under the shareholder servicing plan, the Fund’s Class A, Class C, Class W and Class L shares are subject to a shareholder servicing fee at an annual rate of 0.25% of the average daily net assets attributable to that share class. For the year ended September 30, 2023, the Fund's Class A, Class C, Class W and Class L shares incurred shareholder servicing fees of $358,715. The Class C and Class L shares also pay to the Distributor a distribution fee, pursuant to a distribution plan adopted by the Board, that accrues at an annual rate equal to 0.75% and 0.25%, respectively, of the Fund’s average daily net assets attributable to Class C and Class L shares, respectively, and is payable on a quarterly basis. Class A, Class I and Class W shares are not currently subject to a distribution fee. For the year ended September 30, 2023, the Fund's Class C and Class L shares incurred $341,628 in distribution fees.
The Distributor acts as the Fund’s principal underwriter in a continuous public offering of the Fund’s shares. During the year ended September 30, 2023, no fees were retained by the Distributor.
Trustees – Each Trustee who is not affiliated with the Fund or the Adviser receives an annual fee of $10,000, an additional $2,000 for attending the annual in-person meeting of the Board, and $500 for attending each of the remaining telephonic meetings, as well as reimbursement for any reasonable expenses incurred attending the meetings. None of the executive officers or interested Trustees receives compensation from the Fund.
5. INVESTMENT TRANSACTIONS
The cost of purchases and proceeds from the sale of securities, other than short-term securities, for the year ended September 30, 2023 amounted to $55,738,224 and $53,998,146, respectively. Additionally, proceeds from securities sold short amounted to 9,243,750.
6. CAPITAL SHARES
The Fund, pursuant to an exemptive order granted by the SEC on July 22, 2014, offers multiple classes of shares. Class A, Class C, Class W, and Class I shares commenced operations on April 20, 2015. Class L shares commenced operations on July 28, 2017. Class C, Class W and Class I shares are offered at net asset value (“NAV”). Class A shares are offered at NAV plus a maximum sales charge of 5.75% and may also be subject to a 0.50% early withdrawal charge, which will be deducted from repurchase proceeds, for shareholders tendering shares fewer than 365 days after the original purchase date, if (i) the original purchase was for amounts of $1 million or more and (ii) the selling broker received the reallowance of the dealermanager fee. Class C shares are subject to a 1.00% early withdrawal charge. Class L shares are offered at NAV plus a maximum sales charge of 4.25%. Each class represents an interest in the same assets of the Fund and classes are identical except for differences in their sales charge structures, ongoing service and distribution charges and early withdrawal charges. All classes of shares have equal voting privileges except that each class has exclusive voting rights with respect to its service and/or distribution plans. The Fund’s income, non-class specific expenses and realized and unrealized gains and losses are allocated proportionately daily based upon the relative net assets of each class. Class specific expenses, where applicable, include distribution fees, shareholder servicing fees, and networking fees.
Share Repurchase Program
As an interval fund, the Fund offers its shareholders the option of redeeming shares on a quarterly basis, at NAV, no less than 5% of the Fund’s issued and outstanding shares as of the close of regular business hours on the New York Stock Exchange on the Repurchase Pricing Date. If shareholders tender for repurchase more than 5% of the outstanding shares of the Fund, the Fund may, but is not required to, repurchase up to an additional 2% of the outstanding shares of the Fund. If the Fund determines not to repurchase up to an additional 2% of the outstanding shares of the Fund, or if more than 7% of the outstanding shares of the Fund are tendered, then the Fund will repurchase shares on a pro rata basis based upon the number of shares tendered by each shareholder. There can be no assurance that the Fund will be able to repurchase all shares that each shareholder has tendered. In the event of an oversubscribed offer, shareholders may not be able to tender all shares that they wish to tender and may have to wait until the next quarterly repurchase offer to tender the remaining shares, subject to any proration. Subsequent repurchase requests will not be given priority over other shareholder requests.
For the year ended September 30, 2023, the Fund completed four quarterly repurchase offers. In these repurchase offers, the Fund offered to repurchase up to 5% of the number of its outstanding shares (up to 7% at the discretion of the officers of the Fund) as of the Repurchase Pricing Dates. For the year ended September 30, 2023, none of the quarterly repurchase offers were oversubscribed such that pro-ration was required.
| Alternative Credit Income Fund | Notes to Consolidated Financial Statements |
| | September 30, 2023 |
The result of those repurchase offers were as follows:
| | Repurchase Offer #1 | Repurchase Offer #2 | Repurchase Offer #3 | Repurchase Offer #4 |
| Commencement Date | September 12, 2022 | December 12, 2022 | March 13, 2023 | June 12, 2023 |
| Repurchase Request Deadline | October 12, 2022 | January 11, 2023 | April 12, 2023 | July 12, 2023 |
| Repurchase Pricing Date | October 12, 2022 | January 11, 2023 | April 12, 2023 | July 12, 2023 |
| Amount Repurchased | $ 9,530,746 | $ 12,086,129 | $ 7,226,620 | $ 10,972,819 |
| Shares Repurchased | 943,580 | 1,214,267 | 746,925 | 1,130,796 |
7. BANK LINE OF CREDIT
The Fund has a secured revolving bank line of credit through BNP Paribas Prime Brokerage International, Ltd. (“BNP”).
Borrowings under the BNP arrangement bear interest at the three-month LIBOR plus 95 basis points at the time of borrowing. During the year ended September 30, 2023, the Fund incurred $52,867 of interest expense related to borrowings on the BNP line of credit. Average borrowings and the average interest rate for the days the line of credit was outstanding during the year ended September 30, 2023 were $812,659 and 5.99%, respectively. The largest outstanding borrowing during the year ended September 30, 2023 was $3,878,632. As of September 30, 2023, the Fund had $3,878,632 of outstanding borrowings.
As collateral for the line of credit, the Fund grants BNP a first position security interest in and lien on all securities of any kind or description held by the Fund in the pledge account. As of September 30, 2023, the Fund had $27,923,537 in publicly traded securities available as collateral for the line of credit.
Under the 1940 Act, the Fund is not permitted to incur indebtedness, including through the issuance of debt securities, unless immediately thereafter the Fund will have an asset coverage of at least 300%. In general, the term “asset coverage” for this purpose means the ratio which the value of the total assets of the Fund, less all liabilities and indebtedness not represented by senior securities, bears to the aggregate amount of senior securities representing indebtedness of the Fund. In addition, the Fund may be limited in its ability to declare any cash distribution on its capital stock or purchase its capital stock unless, at the time of such declaration or purchase, the Fund has an asset coverage (on its indebtedness) of at least 300% after deducting the amount of such distribution or purchase price, as applicable.
8. TAX BASIS INFORMATION
For the year ended September 30, 2023, the following reclassifications, which had no impact on results of operations or net assets, were recorded to reflect tax character. These differences were primarily attributed to non-deductible expenses.
| | | Distributable Earnings | | | Paid-in Capital | |
| | | $ | 81 | | | $ | (81 | ) |
The following information is computed on a tax basis for each item as of September 30, 2023:
| | | Gross Appreciation | | | Gross Depreciation (excess of tax cost over value) | | | Net Depreciation | | | Cost of Investments for Income Tax Purposes | |
| | | $ | 9,731,132 | | | $ | (35,265,628 | ) | | $ | (25,534,496 | ) | | $ | 265,216,134 | |
The difference between book basis and tax basis distributable earnings and unrealized appreciation/(depreciation) is primarily attributable to the tax deferral of losses on wash sales, investments in partnerships and certain other investments.
As of September 30, 2023, the components of accumulated earnings on a tax basis were as follows:
| Undistributed ordinary income | | $ | 8,498,413 | |
| Accumulated capital losses | | | (5,462,773 | ) |
| Net unrealized depreciation on securities | | | (25,534,495 | ) |
| Other cumulative effect of timing differences | | | (510,340 | ) |
| Total accumulated earnings | | $ | (23,009,195 | ) |
| Annual Report | September 30, 2023 | 35 |
| Alternative Credit Income Fund | Notes to Consolidated Financial Statements |
| | September 30, 2023 |
The tax characteristics of distributions paid for the year ended September 30, 2023 were as follows:
| | | Ordinary Income | | | Long-Term Capital Gain | | | Return of Capital | |
| | | $ | 17,892,985 | | | $ | – | | | $ | – | |
The tax characteristics of distributions paid for the year ended September 30, 2022 were as follows:
| | | Ordinary Income | | | Long-Term Capital Gain | | | Return of Capital | |
| | | $ | 15,690,912 | | | $ | – | | | $ | 1,182,919 | |
Under current law, capital losses maintain their character as short-term or long-term and are carried forward to the next tax year without expiration. As of the current fiscal year end, the following amounts are available as carry forwards to the next tax year:
| | | Short-Term Capital Losses | | | Long-Term Capital Losses | |
| | | $ | – | | | $ | 5,462,773 | |
The Fund has formed a Taxable Subsidiary, which is taxed as a corporation for income tax purposes. The Taxable Subsidiary allows the Fund to make equity investments in companies organized as pass-through entities while continuing to satisfy the requirements of a RIC under the Code. The Taxable Subsidiary is a wholly owned subsidiary and consolidated in these financial statement statements for financial reporting purposes.
Deferred U.S. federal income taxes reflect the net tax effect of temporary differences between the carrying amount of assets and liabilities for financial reporting and U.S. federal income tax purposes. Components of deferred tax assets (liabilities) as of September 30, 2023 are as follows:
| | | As of September 30, 2023 | |
| Deferred tax assets: | | | | |
| Net operating loss carryforwards | | $ | – | |
| Capital loss carryforwards | | | – | |
| Other deferred tax assets | | | – | |
| Less valuation allowance | | | – | |
| Total deferred tax assets | | $ | – | |
| Deferred tax liabilities: | | | | |
| Net unrealized appreciation/(depreciation) on investments | | $ | 82,594 | |
| Total deferred tax liabilities | | $ | 82,594 | |
| Net deferred tax liability | | $ | 82,594 | |
9. RISK FACTORS
LIBOR Risk
Most LIBOR settings are no longer published as of June 30, 2023. While some instruments may address a scenario where LIBOR is no longer available by providing for an alternative rate setting methodology, and an increasing number of existing U.S. dollar debt instruments will be amended to provide for a benchmark reference rate other than LIBOR, not all instruments will have such provisions and there is significant uncertainty regarding the effectiveness of alternative methodologies and the potential for short-term and long-term market instability. These matters may result in a sudden or prolonged increase or decrease in reported benchmark rates, benchmark rates being more volatile than they have been in the past, and/or fewer debt instruments utilizing given benchmark rates as a component of interest payments. Additionally, in connection with the adoption of another benchmark as a replacement for LIBOR in a debt instrument's documentation, the interest rate (or method for calculating the interest rate) applicable to that debt instrument may be modified to account for differences between LIBOR and the applicable replacement benchmark used to calculate the rate of interest payable in respect of that instrument, which modification may be based on industry-accepted spread adjustments or recommendations from various governmental and non-governmental bodies. Because of the uncertainty regarding the nature of any replacement rate, the Fund cannot reasonably estimate the impact of the anticipated transition away from LIBOR at this time. If the LIBOR replacement rate is lower than market expectations, there could be an adverse impact on the value of debt instruments with floating or fixed-to-floating rate coupons and, in turn, a material adverse impact on the value of the Fund.
The transition away from LIBOR may affect the cost of capital, may require amending or restructuring debt instruments for the Fund, and may impact the liquidity and/or value of floating rate instruments based on LIBOR that are held or may be held by the Fund in the future, which may result in additional costs or adversely affect the Fund's liquidity, results of operations, and financial condition. Any such effects of the transition away from LIBOR, as well as other unforeseen effects, could result in losses for the Fund. Since the usefulness of LIBOR as a benchmark could also deteriorate during the transition period, effects could occur at any time.
| Alternative Credit Income Fund | Notes to Consolidated Financial Statements |
| | September 30, 2023 |
Market Disruption Risk
Unexpected local, regional or global events, such as war; acts of terrorism; financial, political or social disruptions; natural, environmental or manmade disasters; climate-change and climate-related events; the spread of infectious illnesses or other public health issues; recessions and depressions; or other events may result in market volatility, may have long-term effects on the United States and worldwide financial markets and may cause further economic uncertainties in the United States and worldwide. The Fund cannot predict the effects of such events in the future on the U.S. economy and securities markets.
10. AFFILIATE TRANSACTIONS
The following investments represent affiliated investments transactions during the year ended September 30, 2023 and the related positions as of September 30, 2023:
| Security Name | | Market Value as of September 30, 2022 | | | Purchases(a) | | | Sales(b) | | | Market Value as of September 30, 2023 | | | Shares/Par Balance as of September 30, 2023 | | | Interest Income/ Dividends | | | Change in Unrealized Gain\(Loss) | |
| GreenPark Infrastructure, LLC Series A | | $ | 200,000 | | | $ | – | | | $ | – | | | $ | 200,000 | | | | 400 | | | $ | – | | | $ | – | |
| GreenPark Infrastructure, LLC Series M-1 | | | 68,500 | | | | – | | | | – | | | | 70,626 | | | | 200 | | | | – | | | | 2,126 | |
| Great Lakes Funding II LLC, Series A | | | 269,509 | | | | 212,751 | | | | (9,017 | ) | | | 470,515 | | | | 480,978 | | | | 60,281 | | | | (2,728 | ) |
| Portman Ridge Finance Corp. | | | 535,584 | | | | – | | | | – | | | | 490,952 | | | | 25,504 | | | | 69,626 | | | | (44,632 | ) |
| Opportunistic Credit Interval Fund | | | – | | | | 8,000,000 | | | | – | | | | 7,860,465 | | | | 664,452 | | | | 265,781 | | | | (139,535 | ) |
| Mount Logan Funding 2018-1 LP | | | – | | | | 7,312,761 | | | | (611,800 | ) | | | 7,139,595 | | | | 7,798,575 | | | | 741,968 | | | | 438,634 | |
| | | $ | 1,073,593 | | | $ | 15,525,512 | | | $ | (620,817 | ) | | $ | 16,232,153 | | | | | | | $ | 1,137,656 | | | $ | 253,865 | |
| (a) | Purchases include increases in the cost basis of investments resulting from new portfolio investments, follow-on investments, accrued PIK and accretion of original issue discount. Purchases also include transfers into Affiliate classification. |
| (b) | Sales include decreases in the cost basis of investments resulting from principal repayments and sales. Sales also include transfers out of Affiliate classification. |
11. SUBSEQUENT EVENTS
The Fund has evaluated subsequent events through the date of issuance of the financial statements and has determined that there have been no events that have occurred that would require adjustments to our disclosures in the financial statements.
| Annual Report | September 30, 2023 | 37 |
| Alternative Credit Income Fund | Report of Independent Registered Public Accounting Firm |
To the Shareholders and the Board of Trustees of Alternative Credit Income Fund
Opinion on the Consolidated Financial Statements and Financial Highlights
We have audited the accompanying consolidated statement of assets and liabilities of Alternative Credit Income Fund (the “Fund”), including the consolidated schedule of investments, as of September 30, 2023, the related consolidated statements of operations, cash flows and changes in net assets, and the financial highlights for the year then ended, and the related notes. In our opinion, the consolidated financial statements and financial highlights present fairly, in all material respects, the financial position of the Fund as of September 30, 2023, and the consolidated results of its operations, its cash flows, the changes in its net assets, and the financial highlights for the year then ended, in conformity with accounting principles generally accepted in the United States of America. The statement of changes in net assets for the year ended September 30, 2022, and the financial highlights for the years ended September 30, 2022, 2021, 2020, and 2019 were audited by other auditors whose report, dated November 29, 2022, expressed an unqualified opinion on that financial statement and those financial highlights.
Basis for Opinion
These consolidated financial statements are the responsibility of the Fund's management. Our responsibility is to express an opinion on the Fund's consolidated financial statements based on our audit. We are a public accounting firm registered with the Public Company Accounting Oversight Board (United States) (PCAOB) and are required to be independent with respect to the Fund in accordance with the U.S. federal securities laws and the applicable rules and regulations of the Securities and Exchange Commission and the PCAOB.
We conducted our audit in accordance with the standards of the PCAOB. Those standards require that we plan and perform the audit to obtain reasonable assurance about whether the consolidated financial statements are free of material misstatement, whether due to error or fraud. The Fund is not required to have, nor were we engaged to perform, an audit of its internal control over financial reporting. As part of our audit we are required to obtain an understanding of internal control over financial reporting but not for the purpose of expressing an opinion on the effectiveness of the Fund’s internal control over financial reporting. Accordingly, we express no such opinion.
Our audit included performing procedures to assess the risks of material misstatement of the consolidated financial statements, whether due to error or fraud, and performing procedures that respond to those risks. Such procedures included examining, on a test basis, evidence regarding the amounts and disclosures in the consolidated financial statements. Our audit also included evaluating the accounting principles used and significant estimates made by management, as well as evaluating the overall presentation of the consolidated financial statements. Our procedures included confirmation of investments owned as of September 30, 2023, by correspondence with the custodian, loan agents, and borrowers; when replies were not received, we performed other auditing procedures. We believe that our audit provides a reasonable basis for our opinion.
/s/ Deloitte & Touche LLP
New York, New York
November 29, 2023
We have served as the Fund’s auditor since 2023.
| Alternative Credit Income Fund | Additional Information |
| | September 30, 2023 (Unaudited) |
1. PROXY VOTING POLICIES AND VOTING RECORD
A description of the policies and procedures that the Fund uses to vote proxies relating to portfolio securities is available without charge upon request by calling toll-free 833-404-4103, or on the Securities and Exchange Commission’s (“SEC”) website at http://www.sec.gov. Information regarding how the Fund voted proxies relating to portfolio securities during the most recent 12-month period ended June 30th is available without charge upon request by calling toll-free 833-404-4103, or on the SEC’s website at http://www.sec.gov.
2. QUARTERLY PORTFOLIO HOLDINGS
The Fund files a complete listing of portfolio holdings for the Fund with the SEC as of the first and third quarters of each fiscal year on Form N-PORT. The filings are available upon request by calling 833-404-4103. Furthermore, you may obtain a copy of the filing on the SEC’s website at http://www.sec.gov.
3. APPROVAL OF INVESTMENT ADVISORY AGREEMENT
At a meeting held on August 8, 2023, the Board of Trustees (the “Board” or the “Trustees” or the “Board of Trustees”), including a majority of the Trustees who are not “interested persons” (as that term is defined in the 1940 Act) of the Fund (the “Independent Trustees”), considered the renewal of the management agreement between the Fund and Sierra Crest Investment Management LLC (the “Adviser”) (the “Management Agreement”). In considering the renewal of the Management Agreement, the Trustees received materials specifically relating to the Adviser and the Management Agreement.
The Trustees considered the following material factors during their deliberations: (1) the nature, extent and quality of the services provided by the Adviser; (2) the investment performance of the Fund and other accounts managed by the Adviser; (3) the cost of services provided and the profits to be realized by the Adviser and its affiliates from the relationship with the Fund; (4) the extent to which economies of scale will be realized as the Fund grows; and (5) whether the fee levels reflect these economies of scale for the benefit of investors. The Trustees relied upon the advice of counsel and their own business judgment in determining the before-mentioned material factors to be considered in evaluating the Management Agreement and the weight to be given to each factor considered. The conclusions reached by the Trustees were based on a comprehensive evaluation of all of the information provided, including the Adviser’s responses to the Section 15(c) questionnaires provided in the Materials, and were not the result of any one factor. Moreover, each Trustee may have afforded different weight to the various factors in reaching his conclusions with respect to the renewal of the Management Agreement.
Nature, Extent and Quality of Service. The Board reviewed the Adviser’s business and current staffing and organizational structure, and discussed the nature, extent and quality of the services provided by the Adviser under the Management Agreement. The Board noted that these services had not materially changed since the last review of the Management Agreement. The Trustees discussed the nature of the Adviser’s operations, the quality of the Adviser’s compliance infrastructure and the experience and background of all key personnel of its fund management team. The Board noted that the Adviser was an affiliate of BC Partners, and the Adviser leveraged the established Fund Support and Administration infrastructure of the broader BC Partners organization. The Board discussed the organization’s significant investment in and commitment to hiring and retaining high quality professional personnel to support the Fund. The Board noted that there had been no changes in the investment team since the last review of the Management Agreement. The Board noted that the Adviser had reported no regulatory actions or compliance matters that would adversely impact the Adviser’s ability to serve as adviser to the Fund. The Board discussed cybersecurity initiatives undertaken by the Adviser to mitigate cybersecurity risks. The Trustees further considered the key risks associated with the Fund’s investment strategy and the policies and procedures adopted by the Adviser to mitigate those risks. They also discussed the Adviser’s practices for monitoring compliance with the Fund’s investment limitations as well as the Adviser’s broker-dealer selection practices and strong best execution analysis. The Board noted that they appreciated their access to the portfolio management team and senior firm management, were satisfied overall by the Adviser’s ongoing transparency, and looked forward to a continued high-level of service to benefit the Fund’s shareholders. The Trustees concluded that the Adviser had sufficient quality and depth of personnel, resources, investment methods and compliance policies and procedures essential to the continued performance of its duties under the Management Agreement.
Performance. The Trustees considered the performance of the Fund. Referring to the 15(c) response materials, the Trustees noted the Fund’s return of 1.59% for the 1-year period ended June 30, 2023, underperforming some of the peer funds selected by the Adviser. The Trustees also noted that the Fund’s Class I share underperformed the Morningstar LSTA US Leveraged Loan TR USD Index (SPBDAL) and the BAML US High Yield Index (H0A0) over the 1-year period ended June 30, 2023, but outperformed both benchmarks from Fund inception through June 30, 2023. They discussed the Adviser’s commentary regarding the factors that contributed to Fund performance, including among other things, limited use of leverage, which reduced downside risk amid market volatility during the period, a weighting toward floating rate loans in a high interest rate environment, and allocations to directly originated loans. The Trustees expressed their appreciation for the thoughtful and professional manner in which the Adviser implemented the strategy. They reasoned that the Adviser was managing the Fund’s portfolio in accordance with prospectus guidelines and concluded that the Fund’s performance was satisfactory.
| Annual Report | September 30, 2023 | 39 |
| Alternative Credit Income Fund | Additional Information |
| | September 30, 2023 (Unaudited) |
Fees and Expenses. The Board noted that the Adviser charged a 1.85% annual advisory fee based on the average net assets of the Fund, and was entitled to a performance fee if income exceeded certain hurdles. They further noted that while the fee was higher than the average of the Adviser selected peer group, it was within the range of the Adviser selected peer group, . and the Adviser had agreed to waive its fees to limit total annual Fund operating expenses, exclusive of certain fees, so as not to exceed 2.59%, 3.34%, 2.59%, 2.34% and 2.84% per annum of the Fund’s average daily net assets attributable to Class A, Class C, Class W, Class I and Class L shares, respectively. The Board considered the potential impact of the performance incentive fee which is calculated based upon the Fund’s pre-incentive fee net investment income for the immediately preceding quarter, noting that during the last twelve months, the Adviser did not earn an incentive fee. The Board then discussed the benefit to shareholders of reduced overall expenses with continued Fund growth. The Board concluded that the advisory fee was not unreasonable.
Economies of Scale. The Trustees considered whether the Adviser had realized material economies of scale with respect to the management of the Fund. The Board discussed the growth projections provided by the Adviser in the 15(c) response materials and discussed the Adviser’s affiliation with the larger BC Partners platform and the benefit to the Fund in terms of its ability to leverage the collective scale of the Adviser and its affiliates when sourcing investment opportunities, receiving allocations and negotiating with third-party vendors. After further discussion, the Trustees concluded that the absence of breakpoints at this time was acceptable, but that economies of scale would be revisited in the future should the Fund grow materially in size.
Profitability. The Trustees reviewed the profitability analysis provided by the Adviser and noted that the Adviser had made a net profit related to the Fund during the six months ended June 30, 2023 and during 2022. The Board discussed the costs associated with managing the Fund and noted that the profit of the Adviser did not seem unreasonable for the experience, resources, and associated business risk of the Adviser. The Board concluded that the Adviser’s profitability was not excessive.
Conclusion. Having requested and received such information from the Adviser as the Board of the Fund believed to be reasonably necessary to evaluate the terms of the Management Agreement, and as assisted by the advice of counsel, the Board concluded that renewal of the Management Agreement was in the best interests of the shareholders of the Fund.
| Alternative Credit Income Fund | Trustee & Officers |
| | September 30, 2023 (Unaudited) |
The business and affairs of the Fund are managed under the direction of the Trustees. Information concerning the Trustees and officers of the Fund as of its fiscal period end September 30, 2023 is set forth below. Generally, each Trustee and officer serves an indefinite term or until certain circumstances such as resignation, death or otherwise as specified in the Fund’s organizational documents. Any Trustee may be removed at a meeting of shareholders by a vote meeting the requirements of the Fund’s organization documents. The Statement of Additional Information of the Fund includes additional information about the Trustees and officers and is available, without charge, upon request by calling the Fund toll-free at 1-833-404-4103. Refer to Footnote 4 of the Fund’ financial statements for additional information on Independent Trustee Compensation. The Interested Trustees and officers do not receive compensation from the Fund for their services to the Fund.
INDEPENDENT TRUSTEES
Name, Address and Year of Birth* | Position/Term of Office** | Principal Occupation During the Past Five Years | Number of Portfolios in Fund Complex Overseen by Trustee | Other Directorships held by Trustee During Last 5 Years |
Alexander Duka 1966 | Trustee since October 2020 | Senior Advisor, Acceleration Bay LLC (a patent investment and technology acceleration business), January 2020 to present; Executive Vice President of Corporate Development, Acceleration Bay, 2017 to 2019; Senior Advisor, Texas Fabco Solutions LLC (oilfield services), 2019 to present; Bank/Managing Director, Citigroup Inc. (1997 to 2017). | 1 | BC Partners Lending Corp, 2018 to present Portman Ridge Finance Corp, 2019 to present Bondhouse Investment Trust, 2019 to 2021 Logan Ridge Finance Corporation, 2021 to present Opportunistic Credit Interval Fund, 2022 to present |
Robert Warshauer 1958 | Trustee since October 2020 | Chief Executive Officer of BLST Holdings, LLC (a finance company) 2020 - present. Former Managing Director and Head of Investment Banking - NY, Imperial Capital (an investment banking company), 2007 to 2020; Board Member, Icon Parking Holdings, LLC, 2020 to present, Global Knowledge (education service), 2020 - 2021, MD America (energy company), 2020; Board Member, Estrella Broadcasting (Spanish language media), 2019 to 2020. | 1 | BC Partners Lending Corp, 2018 to present Portman Ridge Finance Corp, 2019 to present Logan Ridge Finance Corporation, 2021 to present Opportunistic Credit Interval Fund, 2022 to present |
George Grunebaum 1963 | Trustee since October 2020 | President, Ashmore Funds, 2010 to present; CEO, Ashmore Funds, 2008 to present; Director/President, Gordonstoun American Foundation (non-profit education), 2000 to present. | 1 | BC Partners Lending Corp, 2018 to present Portman Ridge Finance Corp, 2019 to present Logan Ridge Finance Corporation, 2021 to present Opportunistic Credit Interval Fund, 2022 to present |
| Annual Report | September 30, 2023 | 41 |
| Alternative Credit Income Fund | Trustee & Officers |
| | September 30, 2023 (Unaudited) |
INDEPENDENT TRUSTEES AND OFFICERS
Name, Address and Year of Birth* | Position/ Term of Office** | Principal Occupation During the Past Five Years | Number of Portfolios in Fund Complex Overseen by Trustee | Other Directorships held by Trustee During Last 5 Years |
Edward Goldthorpe 1976 | Chief Executive Officer (Principal Executive Officer), President, Trustee and Chairman of the Board since October 2020 | Partner and Head of Credit, BC Partners (an asset management firm), 2017 to present. | 1 | BC Partners Lending Corp, 2018 to present Portman Ridge Finance Corp, 2019 to present Logan Ridge Finance Corporation, 2021 to present Mount Logan Capital Inc., 2019 to present Opportunistic Credit Interval Fund, 2021 to present |
Jason Roos 1978 | Chief Financial Officer (Principal Financial Officer) since 2021 | Chief Financial Officer of Credit, BC Partners (an asset management firm), March 2021 to present; Controller, BC Partners, May 2020 to February 2021; Controller, Data Quality Leader, Wells Fargo (a banking company), 2016 to May 2020. | N/A | N/A |
Brandon Satoren 1988 | Chief Accounting Officer (Principal Accounting Officer), Treasurer and Secretary since 2021 | Mr. Satoren has served as Chief Accounting Officer, Secretary and Treasurer of the Company since 2021. Mr. Satoren previously was a Vice President and Controller at PennantPark, a Vice President at AQR Capital Management, LLC and a Manager at PricewaterhouseCoopers LLP. He earned a Bachelor of Science in Accounting from the University of Central Florida in 2010. Mr. Satoren is a Certified Public Accountant licensed to practice in Colorado and is a member of the American Institute of Certified Public Accountants. | N/A | N/A |
| Alternative Credit Income Fund | Trustee & Officers |
| | September 30, 2023 (Unaudited) |
Name, Address and Year of Birth* | Position/ Term of Office** | Principal Occupation During the Past Five Years | Number of Portfolios in Fund Complex Overseen by Trustee | Other Directorships held by Trustee During Last 5 Years |
David Held 1970 | Chief Compliance Officer and AML Officer since 2021 | Mr. Held has served as Chief Compliance Officer of the Company since 2021. Since June 2021, Mr. Held has served as Chief Compliance Officer, Credit for BC Partners in New York City and has served as Chief Compliance Officer of Mount Logan Management. Between 2015 and 2021, he served as Chief Compliance Officer of Lyxor Asset Management Inc. | N/A | N/A |
| * | Unless otherwise noted, the address of each Trustee and Officer is c/o Sierra Crest Investment Management LLC, 650 Madison Avenue, 23rd Floor, New York, NY 10022. |
| ** | The term of office for each Trustee and officer listed above will continue indefinitely. |
| Annual Report | September 30, 2023 | 43 |
| Alternative Credit Income Fund | Privacy Notice |
| | September 30, 2023 (Unaudited) |
| FACTS | WHAT DOES ALTERNATIVE CREDIT INCOME FUND DO WITH YOUR PERSONAL INFORMATION? |
| Why? | Financial companies choose how they share your personal information. Federal law gives consumers the right to limit some but not all sharing. Federal law also requires us to tell you how we collect, share, and protect your personal information. Please read this notice carefully to understand what we do. |
| What? | The types of personal information we collect and share depend on the product or service you have with us. This information can include: |
| | · Social Security number · Assets · Retirement Assets · Transaction History · Checking Account Information | · Purchase History · Account Balances · Account Transactions · Wire Transfer Instructions |
| | When you are no longer our customer, we continue to share your information as described in this notice. |
| How? | All financial companies need to share customers’ personal information to run their everyday business. In the section below, we list the reasons financial companies can share their customers’ personal information; the reasons Alternative Credit Income Fund chooses to share; and whether you can limit this sharing. |
| REASONS WE CAN SHARE YOUR PERSONAL INFORMATION | Does Alternative Credit Income Fund share? | Can you limit this sharing? |
| For our everyday business purposes — such as to process your transactions, maintain your account(s), respond to court orders and legal investigations, or report to credit bureaus | Yes | No |
| For our marketing purposes — to offer our products and services to you | No | We don’t share |
| For joint marketing with other financial companies | No | We don’t share |
| For our affiliates’ everyday business purposes — information about your transactions and experiences | No | We don’t share |
| For our affiliates’ everyday business purposes — information about your creditworthiness | No | We don’t share |
| For non-affiliates to market to you | No | We don’t share |
| QUESTIONS? | Call 1-833-404-4103 |
| Alternative Credit Income Fund | Privacy Notice |
| | September 30, 2023 (Unaudited) |
| WHO WE ARE | |
| Who is providing this notice? | Alternative Credit Income Fund |
| WHAT WE DO | |
| How does Alternative Credit Income Fund protect my personal information? | To protect your personal information from unauthorized access and use, we use security measures that comply with federal law. These measures include computer safeguards and secured files and buildings. Our service providers are held accountable for adhering to strict policies and procedures to prevent any misuse of your nonpublic personal information. |
| How does Alternative Credit Income Fund collect my personal information? | We collect your personal information, for example, when you · Open an account · Provide account information · Give us your contact information · Make deposits or withdrawals from your account · Make a wire transfer · Tell us where to send the money · Tells us who receives the money · Show your government-issued ID · Show your driver’s license We also collect your personal information from other companies. |
| Why can’t I limit all sharing? | Federal law gives you the right to limit only · Sharing for affiliates’ everyday business purposes – information about your creditworthiness · Affiliates from using your information to market to you · Sharing for non-affiliates to market to you State laws and individual companies may give you additional rights to limit sharing. |
| | |
| DEFINITIONS | |
| Affiliates | Companies related by common ownership or control. They can be financial and nonfinancial companies. · Alternative Credit Income Fund does not share with our affiliates. |
| Nonaffiliates | Companies not related by common ownership or control. They can be financial and nonfinancial companies. · Alternative Credit Income Fund does not share with non-affiliates so they can market to you. |
| Joint marketing | A formal agreement between nonaffiliated financial companies that together market financial products or services to you. · Alternative Credit Income Fund doesn’t jointly market. |
| Annual Report | September 30, 2023 | 45 |
Item 2. Code of Ethics.
| (a) | As of the end of the period covered by this report, the Registrant has adopted a code of ethics that applies to the Registrant’s principal executive officer, principal financial officer, principal accounting officer or controller, or persons performing similar functions, regardless of whether these individuals are employed by the Registrant or a third party. |
| | |
| (b) | Not applicable. |
| (c) | During the period covered by this report, there have not been any amendments to the provisions of the code of ethics adopted in Item 2(a) of this report. |
| (d) | During the period covered by this report, the Registrant had not granted any express or implicit waivers from the provisions of the code of ethics adopted in Item 2(a) of this report. |
| (f) | The Registrant's Senior Officer Code of Ethics is filed herewith as Exhibit 13(a)(1) to this Form N-CSR. |
Item 3. Audit Committee Financial Expert.
| (a)(1)(i) | The Board of Trustees of the Registrant has determined that the Registrant has at least one Audit Committee Financial Expert serving on its audit committee. |
| (a)(2) | The Board of Trustees of the Registrant has designated Mr. Robert Warshauer as the Registrant’s Audit Committee Financial Expert. Mr. Warshauer is “independent” as defined in paragraph (a)(2) of Item 3 to Form N-CSR. |
Item 4. Principal Accountant Fees and Services.
| (a) | Audit Fees: For the Registrant’s fiscal years ended September 30, 2023 and September 30, 2022, the aggregate fees billed for professional services rendered by the principal accountant for the audit of the Registrant’s annual financial statements or services that are normally provided by the accountant in connection with statutory and regulatory filings or engagements were $183,750 and $25,000, respectively. |
| (b) | Audit-Related Fees: For the Registrant’s fiscal years ended September 30, 2023 and September 30, 2022, the aggregate fees billed for assurance and related services by the principal accountant that are reasonably related to the performance of the audit of the Registrant’s financial statements and are not otherwise reported under paragraph (a) of this Item 4, were $0 and $0, respectively. |
| (c) | Tax Fees: For the Registrant’s fiscal years ended September 30, 2023 and September 30, 2022, the aggregate fees billed for professional services rendered by the principal accountant for tax compliance, tax advice and tax planning, which were comprised of the preparation of Federal and state income tax returns, assistance with calculation of required income, capital gain and excise distributions and preparation of Federal excise tax returns, were $0 and $3,000, respectively. |
| (d) | All Other Fees: For the Registrant’s fiscal years ended September 30, 2023 and September 30, 2022, the aggregate fees billed for products and services provided by the principal accountant, other than the services reported in paragraphs (a) through (c) of this Item 4, were $0 and $0, respectively. |
| (e)(1) | The Registrant’s audit committee is required to pre-approve all audit services and, when appropriate, any non-audit services (including audit-related, tax and all other services) to the Registrant. The Registrant’s audit committee also is required to pre-approve, when appropriate, any non-audit services (including audit-related, tax and all other services) to its adviser, or any entity controlling, controlled by or under common control with the adviser that provides ongoing services to the Registrant, to the extent that the services may be determined to have an impact on the operations or financial reporting of the Registrant. Services are reviewed on an engagement by engagement basis by the Audit Committee. |
| (2) | No services described in paragraphs (b) through (d) of this Item 4 were approved by the Registrant’s audit committee pursuant to paragraph (c)(7)(i)(C) of Rule 2-01 of Regulation S-X. |
| (f) | During the audit of Registrant’s financial statements for the most recent fiscal year, less than 50 percent of the hours expended on the principal accountant’s engagement were attributed to work performed by persons other than the principal accountant’s full-time, permanent employees. |
| (g) | For the Registrant’s fiscal years ended September 30, 2023 and September 30, 2022, the aggregate non-audit fees for services billed by the Registrant’s accountant for services rendered to the Registrant and rendered to the Registrant’s investment adviser (not including any sub-adviser whose role is primarily portfolio management and is subcontracted with or overseen by another investment adviser) and any entity controlling, controlled by, or under common control with the adviser that provides ongoing services to the Registrant were $0 and $0, respectively. |
| (h) | The Registrant’s audit committee has considered whether the provision of non-audit services to the Registrant’s investment adviser (not including any sub-adviser whose role is primarily portfolio management and is subcontracted with or overseen by another investment adviser), and any entity controlling, controlled by, or under common control with the investment adviser that provides ongoing services to the Registrant, that were not pre-approved pursuant to paragraph (c)(7)(ii) of Rule 2-01 of Regulation S-X, is compatible with maintaining the principal accountant’s independence. |
| (i) | Not applicable to the Registrant. |
| (j) | Not applicable to the Registrant. |
Item 5. Audit Committee of Listed Registrants.
Not applicable to the Registrant.
Item 6. Investments.
(a) The schedule of investments is included as part of the Reports to Shareholders filed under Item 1(a) of this report.
(b) Not applicable to the Registrant.
Item 7. Disclosure of Proxy Voting Policies and Procedures for Closed-End Management Investment Companies.
Summary
- As a registered investment adviser, Sierra Crest Investment Management LLC (“Sierra Crest”) is required to adopt a policy setting forth the principles and procedures by which Sierra Crest votes or gives consent with respect to the securities owned by the Funds.
- A “vote” for purposes of this policy means any proxy or shareholder consent, including a vote or consent of a private company that does not involve a proxy.
- The guiding principle by which Sierra Crest votes is to vote in the best interest of the relevant Fund by maximizing the economic value of the relevant Fund’s holdings, taking into account certain factors as set forth below.
- Sierra Crest may abstain on any particular vote if a determination is made that withholding is advisable and in the best interests of the relevant Fund.
- All staff should refer any votes where there is a conflict of interest to the CCO.
Purpose and General Statement
The purpose of these voting policies and procedures is to set forth the principles and procedures by which Sierra Crest votes or gives consents with respect to the securities owned by the funds advised by Sierra Crest (collectively, the “Funds”) for which Sierra Crest exercises voting authority and discretion (the “Votes”). For avoidance of doubt, a Vote includes any proxy and any shareholder vote or consent, including a vote or consent for a private company that does not involve a proxy. These policies and procedures have been designed to help ensure that Votes are voted in the best interests of the Funds in accordance with Sierra Crest’s fiduciary duties and Rule 206(4)-6 under the Investment Advisers Act of 1940, as amended (the “Advisers Act”).
Policy
Sierra Crest and its affiliates engage in a broad range of activities, including investment activities for the account of other investment funds or accounts and providing investment advisory and other services to funds and operating companies. In the ordinary course of conducting Sierra Crest’s activities, the interests of a Fund may conflict with the interests of Sierra Crest, other Funds and/or Sierra Crest’s affiliates and their clients. Any conflicts of interest relating to the voting of Votes, regardless of whether actual or perceived, will be addressed in accordance with these policies and procedures. The guiding principle by which Sierra Crest votes all Votes is to vote in the best interests of each Fund by maximizing the economic value of the relevant Fund’s holdings, taking into account the relevant Fund’s investment horizon, the contractual obligations under the relevant advisory agreements or comparable documents, and all other relevant facts and circumstances at the time of the vote. Sierra Crest does not permit voting decisions to be influenced in any manner that is contrary to, or dilutive of, this guiding principle.
It is the general policy of Sierra Crest to vote or give consent on all matters presented to security holders in any Vote, and these policies and procedures have been designated with that in mind. However, Sierra Crest reserves the right to abstain on any particular Vote or otherwise withhold its vote or consent on any matter if, in the judgment of the Sierra Crest’s Chief Compliance Officer (“CCO”) or the relevant Sierra Crest investment professional, the costs associated with voting such Vote outweigh the benefits to the relevant Funds or if the circumstances make such an abstention or withholding otherwise advisable and in the best interests of the relevant Funds. In connection with the voting of Votes, Sierra Crest’s personnel may, in their discretion, meet with members of a company’s management and discuss matters of importance to the Funds and their economic interests.
Procedures
Conflicts of Interest
Compliance has the responsibility to monitor Votes for any conflicts of interest, regardless of whether they are actual or perceived. All Sierra Crest investment professionals are expected to perform their tasks relating to the voting of Votes in accordance with the principles set forth above, according the first priority to the best interest of the relevant Funds. If at any time any investment professional becomes aware of any potential or actual conflict of interest or perceived conflict of interest regarding any particular Voting decision, he or she should contact the CCO. If any investment professional is pressured or lobbied either from within or outside of Sierra Crest with respect to any particular Voting decision, he or she should contact the CCO. The CCO will use his or her best judgment to address any such conflict of interest and ensure that it is resolved in accordance with his or her independent assessment of the best interests of the Funds.
Where the CCO deems appropriate in his or her sole discretion, unaffiliated third parties may be used to help resolve conflicts. In this regard, the CCO shall have the power to retain independent fiduciaries, consultants, or professionals to assist with voting decisions and/or to delegate voting or consent powers to such fiduciaries, consultants or professionals.
In the event that the CCO retains independent fiduciaries, consultants or professionals to assist with voting decisions and/or delegates such voting or consent power to such fiduciaries, consultants or professionals, the CCO will follow the procedures below regarding third party accountability to the Funds:
| | · | Ascertain whether the third party has the capacity and competency to adequately analyze proxy issues, including the adequacy of the third party’s personnel and policies and procedures with regard to identifying and addressing conflicts of interest; |
| | · | Ascertain whether the third party has the capacity and competency to adequately analyze proxy issues, including the adequacy of the third party’s personnel and policies and procedures with regard to identifying and addressing conflicts of interest; |
| | · | Adopt ongoing oversight policies of the third party to ensure the third party continues to vote proxies in the best interest of the Funds; |
| | · | Determine that the third party has the capacity and competency to adequately analyze proxy issues by providing materially accurate information. |
Voting
All Sierra Crest personnel are responsible for promptly forwarding all proxy materials, consent or voting requests or notices or materials related thereto to the CCO.
All Voting decisions initially are referred to the appropriate investment professional for a voting decision. In most cases, the relevant deal team member will make the decision as to the appropriate vote for any particular Vote. In making such decision, he or she may rely on any of the information and/or research available to him or her.
Recordkeeping
Sierra Crest’s Recordkeeping Policies and Procedures apply to Votes. Sierra Crest personnel should refer to the Recordkeeping Policies and Procedures for additional guidance and information.
Item 8. Portfolio Managers of Closed-End Management Investment Companies.
Michael Terwilliger serves as the lead Portfolio Manager for the Fund, charged with the day to day management of the Fund. He has served the Fund as Portfolio Manager since October 2015. Mr. Terwilliger has more than a decade of credit investment experience, with expertise in a range of products including high yield bonds, distressed debt, structured securities, bank loans and convertibles. Mr. Terwilliger holds a Bachelor of Arts degree from Northwestern University and a Master of Business Administration from the University of Virginia Darden School Of Business. He is also a CFA charter holder.
As of September 30, 2023, Mr. Terwilliger owned between $100,001-$500,000 in Fund shares and did not manage any other accounts in addition to the Fund.
Edward Goldthorpe serves as Portfolio Manager for the Fund, charged with the day to day management of the Fund. He has served the Fund as Portfolio Manager since December 2020. Mr. Goldthorpe is currently a Partner at BC Partners Advisors LP (“BC Partners”), having launched the BC Partners Credit platform in February 2017, and also serves as the CEO and Chairman of Mount Logan Capital Inc. Mr. Goldthorpe holds a Bachelor of Commerce from Queen’s University.
As of September 30, 2023, Mr. Goldthorpe owned between $100,001-$500,000 in Fund shares.
As of September 30, 2023, Mr. Goldthorpe managed the following accounts in addition to the Fund:
Total Other Accounts Managed
| Registered Investment Company Accounts | Assets Managed | Pooled Investment Vehicle Accounts | Assets Managed | Other Accounts | Assets Managed |
| 5 | $0.9 billion | 8 | $4.3 billion | 3 | $1.3 billion |
Other Accounts Managed Subject to Performance-Based Fees
| Registered Investment Company Accounts | Assets Managed | Pooled Investment Vehicle Accounts | Assets Managed | Other Accounts | Assets Managed |
| 5 | $0.9 billion | 7 | $4.0 billion | 1 | <$0.1 billion |
Portfolio Manager Compensation
As compensation, Mr. Terwilliger receives from the Adviser a fixed base salary. Mr. Terwilliger is also entitled to receive a discretionary bonus which may be based upon, among other things, individual performance and the performance of the Fund and the Adviser.
Mr. Goldthorpe, a Partner of BC Partners, is compensated based on the success of various fund and business platforms. As part of this compensation, he receives a carried interest from the firm’s activities that is distributed based on factors such as seniority, longevity and performance, including successful deal sourcing and execution. As a Partner of BC Partners, Mr. Goldthorpe’s compensation would increase if the Fund’s performance (and net asset value) increased due to his indirect interest in the Adviser, but such compensation is not tied to any specific metric.
Item 9. Purchases of Equity Securities by Closed-End Management Investment Company and Affiliates Purchasers.
None.
Item 10. Submission of Matters to a Vote of Security Holders.
None.
Item 11. Controls and Procedures.
| (a) | Based on an evaluation of the Registrant’s disclosure controls and procedures as of a date within 90 days of the filing date of this report, the Registrant’s principal executive officer and principal financial officer have concluded that the disclosure controls and procedures are reasonably designed to ensure that the information required in filings on Form N-CSR is recorded, processed, summarized and reported by the filing date, including that information required to be disclosed is accumulated and communicated to the Registrant’s management, including the Registrant’s principal executive officer and principal financial officer, as appropriate to allow timely decisions regarding required disclosure. |
| (b) | There were no significant changes in the Registrant’s internal control over financial reporting that occurred during the Registrant’s last fiscal half-year that have materially affected, or are reasonably likely to materially affect, the Registrant’s internal control over financial reporting. |
Item 12. Disclosure of Securities Lending Activities for Closed-End Management Investment Companies.
None.
Item 13. Exhibits.
SIGNATURES
Pursuant to the requirements of the Securities Exchange Act of 1934 and the Investment Company Act of 1940, the Registrant has duly caused this report to be signed on its behalf by the undersigned, thereunto duly authorized.
ALTERNATIVE CREDIT INCOME FUND
| By: | /s/ Edward Goldthorpe | |
| | Edward Goldthorpe | |
| | President and Chief Executive Officer (Principal Executive Officer) |
Date: December 8, 2023
Pursuant to the requirements of the Securities Exchange Act of 1934 and the Investment Company Act of 1940, this report has been signed below by the following persons on behalf of the Registrant and in the capacities and on the dates indicated.
| By: | /s/ Edward Goldthorpe | |
| | Edward Goldthorpe | |
| | President and Chief Executive Officer (Principal Executive Officer) |
Date: December 8, 2023
| By: | /s/ Jason Roos | |
| | Jason Roos | |
| | Chief Financial Officer (Principal Financial Officer) |
Date: December 8, 2023