CapEdge
Loading...
Advanced
What's new? Log in Free sign up
  • Home
  • Sectors & IndustriesSectors
  • Earnings
  • IPOs
  • SPACs
  • Transcripts
  • Insider
  • Institutional
  • Crypto
  • Screeners
  • Reddit
  • Splits
  • PFHD Dashboard
  • Financials
  • Filings
  • Transcripts
  • ETFs
  • Insider
  • Institutional
  • Shorts
  • News
  • Patents
  • Reddit
  • 10-Q Filing

Professional Holding (PFHD) 10-Q2021 Q2 Quarterly report

Filed: 16 Aug 21, 4:25pm
Free signup for more
  • Track your favorite companies
  • Receive email alerts for new filings
  • Personalized dashboard of news and more
  • Access all data and search results
Sign up for free

Content analysis

?
Positive
Negative
Uncertain
Constraining
Legalese
Litigous
Readability
H.S. freshman Avg
New words: ago, beachfront, bottlenecked, buttressed, Champlain, confirmed, footprint, illustrate, infused, Jacksonville, MBS, NaN, notional, onset, Petersburg, recategorized, Surfside, taxable, tragedy, unwinding, variance, weakening
Removed: acquired, amortization, attrition, branch, carryover, chose, closed, commensurate, condensed, consisted, consolidating, converted, Coral, digit, employ, employed, environmental, estimating, exercising, expedient, explanation, finance, fractional, granted, grouped, headcount, headquartered, hindsight, identification, inception, index, intangible, integrating, invest, lieu, lifetime, location, mile, narrowed, online, oversight, package, pattern, pertaining, prevailing, relating, retrospective, sum, terminate, treated, unearned, vulnerable, wholly
Search this filing
?
Pre-defined:
Table of contents
    Filing tables
    Export all tables to Excel
    Filing exhibits
    SEC
    • 10-Q Quarterly report
    • 31.1 Management certification of annual or quarterly disclosure
    • 31.2 Management certification of annual or quarterly disclosure
    • 32.1 Management certification of annual or quarterly disclosure
    • 32.2 Management certification of annual or quarterly disclosure
    • Download Excel data file
    • View Excel data file
    Related press release
    • 29 Jul 21 Professional Holding Corp. Reports Second-Quarter Results
    PFHD similar filings
    • 2022 Q2 Quarterly report
    • 2022 Q1 Quarterly report
    • 2021 Q3 Quarterly report
    • 2021 Q2 Quarterly report
    • 2021 Q1 Quarterly report
    • 2020 Q3 Quarterly report
    • 2020 Q2 Quarterly report
    Filing view
    Share this filing

    Table of Contents

    ​

    ​

    UNITED STATES

    SECURITIES AND EXCHANGE COMMISSION

    Washington, D.C. 20549

    FORM 10-Q

    Quarterly report pursuant to Section 13 or 15(d) of

    the Securities Exchange Act of 1934

    (Mark One)

    ☒   QUARTERLY REPORT PURSUANT TO SECTION 13 OR 15(d) OF THE SECURITIES EXCHANGE ACT OF 1934

    For the quarterly period ended June 30, 2021

    OR

    ☐   TRANSITION REPORT PURSUANT TO SECTION 13 OR 15(d) OF THE SECURITIES EXCHANGE ACT OF 1934

    For the transition period from ___________ to ___________

    ​

    ​

    ​

    ​

    For the quarterly period ended


    Commission file

    June 30, 2021

    ​

    number 001-39215

    ​

    Professional Holding Corp.

    (Exact name of Registrant as specified in its charter)

    ​

    ​

    ​

    ​

    ​

    Florida


    ​


    46-5144312

    (State or other jurisdiction of

    ​

    ​

    ​

    (I.R.S. Employer

    incorporation or organization)

    ​

    ​

    ​

    Identification Number)

    ​

    396 Alhambra Circle, Suite 255

    Coral Gables, FL 33134 (786) 483-1757

    (Address, including zip code, and telephone number, including area code, of Registrant’s principal executive offices)

    Securities registered pursuant to Section 12(b) of the Act:

    Title of each class:


    Trading Symbol


    Name of each exchange on which registered:

    Class A Common Stock


    PFHD


    NASDAQ Global Select Market

    ​

    Indicate by check mark whether the registrant (1) has filed all reports required to be filed by Section 13 or 15(d) of the Securities Exchange Act of 1934 during the preceding 12 months (or for such shorter period that the registrant was required to file such reports), and (2) has been subject to such filing requirements for the past 90 days. ☒ Yes ☐ No

    Indicate by check mark whether the registrant has submitted electronically every Interactive Data File required to be submitted pursuant to Rule 405 of Regulation S-T (§232.405 of this chapter) during the preceding 12 months (or for such shorter period that the registrant was required to submit such files). ☒ Yes ☐ No

    Indicate by check mark whether the registrant is a large accelerated filer, an accelerated filer, a non-accelerated filer, a smaller reporting company, or an emerging growth company. See the definitions of “large accelerated filer,” “accelerated filer,” “smaller reporting company,” and “emerging growth company” in Rule 12b-2 of the Exchange Act.

    ​

    ​

    ​

    ​

    Large accelerated filer

    ☐

    Accelerated filer

    ☐

    ​

    ​

    ​

    ​

    Non-accelerated filer

    ☒

    Smaller reporting company

    ☒

    ​

    ​

    ​

    ​

    ​

    ​

    Emerging growth company

    ☒

    ​

    ​

    ​

    ​

    ​

    If an emerging growth company, indicate by check mark if the registrant has elected not to use the extended transition period for complying with any new or revised financial accounting standards provided pursuant to Section 13(a) of the Exchange Act. ☐

    Indicate by check mark whether the registrant is a shell company (as defined in Rule 12b-2 of the Exchange Act). ☐ Yes ☒ No

    ​

    Number of shares of common stock outstanding as of August 13, 2021: 13,419,010

    ​

    ​

    ​

    ​

    ​

    ​

    ​

    Table of Contents

    TABLE OF CONTENTS

    ​

    ​

    ​

    Part I


    Financial Information

    3

    ​

    ​

    ​

    ​

    Item 1

    ​

    Consolidated Financial Statements (unaudited)

    3

    ​

    ​

    ​

    ​

    Item 2

    ​

    Management’s Discussion and Analysis of Financial Condition and Results of Operations

    29

    ​

    ​

    ​

    ​

    Item 3

    ​

    Quantitative and Qualitative Disclosures About Market Risk

    65

    ​

    ​

    ​

    ​

    Item 4

    ​

    Controls and Procedures

    65

    ​

    ​

    ​

    ​

    Part II

    ​

    Other Information

    66

    ​

    ​

    ​

    ​

    Item 1

    ​

    Legal Proceedings

    66

    ​

    ​

    ​

    ​

    Item 1A

    ​

    Risk Factors

    66

    ​

    ​

    ​

    ​

    Item 2

    ​

    Unregistered Sales of Equity Securities and Use of Proceeds

    66

    ​

    ​

    ​

    ​

    Item 3

    ​

    Defaults Upon Senior Securities

    67

    ​

    ​

    ​

    ​

    Item 4

    ​

    Mine Safety Disclosures

    67

    ​

    ​

    ​

    ​

    Item 5

    ​

    Other Information

    67

    ​

    ​

    ​

    ​

    Item 6

    ​

    Exhibits

    67

    ​

    ​

    ​

    ​

    ​

    ​

    2

    Table of Contents

    PART I—FINANCIAL INFORMATION

    Item 1. Consolidated Financial Statements (unaudited).

    PROFESSIONAL HOLDING CORP.

    CONSOLIDATED BALANCE SHEETS (Unaudited)

    (Dollar amounts in thousands, except share data)

    ​

    ​

    ​

    ​

    ​

    ​

    ​

    ​


    June 30, 


    December 31, 

    ​

    ​

    2021

    ​

    2020

    ASSETS


    ​


    ​


    Cash and due from banks

    ​

    $

    29,803

    ​

    $

    62,305

    Interest-bearing deposits

    ​


    586,377

    ​


    129,291

    Federal funds sold

    ​


    36,156

    ​


    25,376

    Cash and cash equivalents

    ​


    652,336

    ​


    216,972

    Securities available for sale, at fair value - taxable

    ​


    100,735

    ​


    65,110

    Securities available for sale, at fair value - tax exempt

    ​

    ​

    19,761

    ​

    ​

    22,398

    Securities held to maturity (fair value June 30, 2021 – $1,296, December 31, 2020 – $1,561)

    ​


    1,285

    ​


    1,547

    Equity securities

    ​


    5,942

    ​


    6,005

    Loans, net of allowance of $10,418 and $16,259 as of June 30, 2021 and December 31, 2020, respectively

    ​


    1,680,168

    ​


    1,643,373

    Loans held for sale

    ​

    ​

    2,039

    ​

    ​

    1,270

    Federal Home Loan Bank stock, at cost

    ​


    2,341

    ​


    3,229

    Federal Reserve Bank stock, at cost

    ​


    4,954

    ​


    4,762

    Accrued interest receivable

    ​


    5,449

    ​


    6,666

    Premises and equipment, net

    ​


    4,000

    ​


    4,370

    Bank owned life insurance

    ​


    37,923

    ​


    37,360

    Deferred tax asset

    ​

    ​

    9,446

    ​

    ​

    10,525

    Goodwill

    ​

    ​

    24,621

    ​

    ​

    24,621

    Core deposit intangibles

    ​

    ​

    1,280

    ​

    ​

    1,422

    Other assets

    ​


    8,738

    ​


    7,640

    Total assets

    ​

    $

    2,561,018

    ​

    $

    2,057,270

    LIABILITIES AND STOCKHOLDERS’ EQUITY

    ​


    ​

    ​


    ​

    Deposits

    ​


    ​

    ​


    ​

    Demand – non-interest bearing

    ​

    $

    854,673

    ​

    $

    475,598

    Demand – interest bearing

    ​


    286,173

    ​


    232,367

    Money market and savings

    ​

    ​

    874,637

    ​

    ​

    715,003

    Time deposits

    ​


    261,680

    ​


    236,575

    Total deposits

    ​


    2,277,163

    ​


    1,659,543

    Official checks

    ​


    3,289

    ​


    4,447

    Federal Home Loan Bank advances

    ​


    35,000

    ​


    40,000

    Other borrowings

    ​

    ​

    —

    ​

    ​

    114,573

    Subordinated debt

    ​

    ​

    10,062

    ​

    ​

    10,153

    Accrued interest and other liabilities

    ​


    12,476

    ​


    12,989

    Total liabilities

    ​


    2,337,990

    ​


    1,841,705

    Stockholders’ equity

    ​


    ​

    ​


    ​

    Preferred stock, 10,000,000 shares authorized, NaN issued

    ​


    —

    ​


    —

    Class A Voting Common stock, $0.01 par value; authorized 50,000,000 shares, issued 14,289,480 and outstanding 13,475,781 shares as of June 30, 2021, and authorized 50,000,000 shares, issued 14,100,760 and outstanding 13,534,829 shares at December 31, 2020

    ​


    143

    ​


    141

    Class B Non-Voting Common stock, $0.01 par value; 10,000,000 shares authorized, NaN issued and outstanding at June 30, 2021 and December 31, 2020

    ​


    —

    ​


    —

    Treasury stock, at cost

    ​


    (13,544)

    ​


    (9,209)

    Additional paid-in capital

    ​


    210,274

    ​


    208,995

    Retained earnings

    ​


    25,872

    ​


    14,756

    Accumulated other comprehensive income (loss)

    ​


    283

    ​


    882

    Total stockholders’ equity

    ​


    223,028

    ​


    215,565

    Total liabilities and stockholders' equity

    ​

    $

    2,561,018

    ​

    $

    2,057,270

    ​

    3

    Table of Contents

    PROFESSIONAL HOLDING CORP.

    CONSOLIDATED STATEMENTS OF INCOME AND COMPREHENSIVE INCOME (Unaudited)

    (Dollar amounts in thousands, except share data)

    ​

    ​

    ​

    ​

    ​

    ​

    ​

    ​

    ​

    ​

    ​

    ​

    ​

    ​

    ​

    ​

    ​

    Three Months Ended June 30, 

    ​

    ​

    Six Months Ended June 30, 

    ​


    2021


    2020


    2021


    2020

    Interest income

    ​

    ​

    ​

    ​

    ​

    ​

    ​

    ​

    ​

    ​

    ​

    ​

    ​

    Loans, including fees

    ​

    $

    18,311

    ​

    $

    17,897

    ​

    ​

    $

    37,544

    ​

    $

    27,912

    Investment securities - taxable

    ​


    161

    ​


    232

    ​

    ​


    340

    ​


    434

    Investment securities - tax exempt

    ​

    ​

    189

    ​

    ​

    206

    ​

    ​

    ​

    392

    ​

    ​

    226

    Dividend income on restricted stock

    ​


    99

    ​


    131

    ​

    ​


    194

    ​


    210

    Other

    ​


    202

    ​


    56

    ​

    ​


    264

    ​


    760

    Total interest income

    ​


    18,962

    ​


    18,522

    ​

    ​


    38,734

    ​


    29,542

    ​

    ​

    ​

    ​

    ​

    ​

    ​

    ​

    ​

    ​

    ​

    ​

    ​

    ​

    Interest expense

    ​


    ​

    ​


    ​

    ​


    ​

    ​


    Deposits

    ​


    1,430

    ​


    1,617

    ​

    ​


    2,747

    ​


    4,243

    Federal Home Loan Bank advances

    ​


    190

    ​


    287

    ​

    ​


    386

    ​


    565

    Subordinated debt

    ​

    ​

    77

    ​

    ​

    59

    ​

    ​

    ​

    207

    ​

    ​

    189

    Other borrowings

    ​

    ​

    63

    ​

    ​

    268

    ​

    ​

    ​

    313

    ​

    ​

    193

    Total interest expense

    ​


    1,760

    ​


    2,231

    ​

    ​


    3,653

    ​


    5,190

    ​

    ​

    ​

    ​

    ​

    ​

    ​

    ​

    ​

    ​

    ​

    ​

    ​

    ​

    Net interest income

    ​


    17,202

    ​


    16,291

    ​

    ​


    35,081

    ​


    24,352

    Provision for loan losses

    ​


    762

    ​


    1,750

    ​

    ​


    1,800

    ​


    2,595

    Net interest income after provision for loan losses

    ​


    16,440

    ​


    14,541

    ​

    ​


    33,281

    ​


    21,757

    ​

    ​

    ​

    ​

    ​

    ​

    ​

    ​

    ​

    ​

    ​

    ​

    ​

    ​

    Non-interest income

    ​


    ​

    ​


    ​

    ​


    ​

    ​


    Service charges on deposit accounts

    ​


    1,199

    ​


    307

    ​

    ​


    1,594

    ​


    529

    Income from Bank owned life insurance

    ​


    281

    ​


    126

    ​

    ​


    563

    ​


    255

    SBA origination fees

    ​

    ​

    —

    ​

    ​

    84

    ​

    ​

    ​

    145

    ​

    ​

    114

    SWAP fees

    ​

    ​

    364

    ​

    ​

    210

    ​

    ​

    ​

    573

    ​

    ​

    473

    Third party loan sales

    ​

    ​

    226

    ​

    ​

    157

    ​

    ​

    ​

    301

    ​

    ​

    267

    Gain on sale and call of securities

    ​

    ​

    21

    ​

    ​

    11

    ​

    ​

    ​

    22

    ​

    ​

    15

    Other

    ​


    211

    ​


    73

    ​

    ​


    223

    ​


    171

    Total non-interest income

    ​


    2,302

    ​


    968

    ​

    ​


    3,421

    ​


    1,824

    ​

    ​

    ​

    ​

    ​

    ​

    ​

    ​

    ​

    ​

    ​

    ​

    ​

    ​

    Non-interest expense

    ​


    ​

    ​


    ​

    ​


    ​

    ​


    ​

    Salaries and employee benefits

    ​


    7,099

    ​


    6,912

    ​

    ​


    13,883

    ​


    12,175

    Occupancy and equipment

    ​


    905

    ​


    1,081

    ​

    ​


    2,007

    ​


    1,855

    Data processing

    ​


    276

    ​


    421

    ​

    ​


    566

    ​


    597

    Marketing

    ​


    165

    ​


    151

    ​

    ​


    318

    ​


    288

    Professional fees

    ​


    770

    ​


    806

    ​

    ​


    1,398

    ​


    1,161

    Acquisition expenses

    ​

    ​

    —

    ​

    ​

    560

    ​

    ​

    ​

    684

    ​

    ​

    2,223

    Regulatory assessments

    ​


    418

    ​


    300

    ​

    ​


    767

    ​


    514

    Other

    ​


    1,321

    ​


    1,317

    ​

    ​


    3,119

    ​


    2,221

    Total non-interest expense

    ​


    10,954

    ​


    11,548

    ​

    ​


    22,742

    ​


    21,034

    ​

    ​

    ​

    ​

    ​

    ​

    ​

    ​

    ​

    ​

    ​

    ​

    ​

    ​

    Income before income taxes

    ​


    7,788

    ​


    3,961

    ​

    ​


    13,960

    ​


    2,547

    Income tax provision

    ​


    1,457

    ​


    830

    ​

    ​


    2,844

    ​


    733

    Net income

    ​


    6,331

    ​


    3,131

    ​

    ​


    11,116

    ​


    1,814

    ​

    ​

    ​

    ​

    ​

    ​

    ​

    ​

    ​

    ​

    ​

    ​

    ​

    ​

    Earnings per share:

    ​


    ​

    ​


    ​

    ​


    ​

    ​


    Basic

    ​

    $

    0.47

    ​

    $

    0.23

    ​

    ​

    $

    0.83

    ​

    $

    0.16

    Diluted

    ​

    $

    0.45

    ​

    $

    0.22

    ​

    ​

    $

    0.80

    ​

    $

    0.15

    ​

    ​

    ​

    ​

    ​

    ​

    ​

    ​

    ​

    ​

    ​

    ​

    ​

    ​

    Other comprehensive income:

    ​


    ​

    ​


    ​

    ​


    ​

    ​


    Unrealized holding gain (loss) on securities available for sale

    ​


    (505)

    ​


    743

    ​

    ​


    (794)

    ​


    1,068

    Tax effect

    ​


    124

    ​


    (188)

    ​

    ​


    195

    ​


    (271)

    Other comprehensive gain (loss), net of tax

    ​


    (381)

    ​


    555

    ​

    ​


    (599)

    ​


    797

    Comprehensive income

    ​

    $

    5,950

    ​

    $

    3,686

    ​

    ​

    $

    10,517

    ​

    $

    2,611

    ​

    ​

    ​

    4

    Table of Contents

    ​

    PROFESSIONAL HOLDING CORP.

    CONSOLIDATED STATEMENTS OF STOCKHOLDERS’ EQUITY (Unaudited)

    (Dollar amounts in thousands, except share data)

    ​

    ​

    ​

    ​

    ​

    ​

    ​

    ​

    ​

    ​

    ​

    ​

    ​

    ​

    ​

    ​

    ​

    ​

    ​

    ​

    ​

    ​

    ​

    ​

    ​

    ​

    ​

    ​

    ​

    ​

    ​

    ​

    ​

    ​

    ​

    ​

    ​

    ​

    Accumulated

    ​

    ​

    ​

    ​

    ​

    ​

    ​

    ​

    ​

    ​

    ​

    ​

    ​

    Additional

    ​

    ​

    ​

    ​

    Other

    ​

    ​

    ​

    ​

    ​

    Common Stock

    ​

    Treasury

    ​

    Paid-in

    ​

    Retained

    ​

    Comprehensive

    ​

    ​

    ​

    ​

    ​

    Shares

    ​

    Amount

    ​

    Stock

    ​

    Capital

    ​

    Earnings


    Income (Loss)

    ​

    Total

    Balance at April 1, 2020

    ​

    13,537,565

    ​

    $

    138

    ​

    $

    (6,257)

    ​

    $

    201,670

    ​

    $

    5,134

    ​

    $

    169

    ​

    $

    200,854

    Issuance of common stock, net of issuance cost


    89,167

    ​


    1


    ​

    —


    ​

    450


    ​

    —


    ​

    —


    ​

    451

    Employee stock purchase plan


    —

    ​


    —


    ​

    —


    ​

    27


    ​

    —


    ​

    —


    ​

    27

    Stock based compensation


    —

    ​


    —


    ​

    —


    ​

    296


    ​

    —


    ​

    —


    ​

    296

    Treasury stock


    (182,097)

    ​


    —


    ​

    (2,875)


    ​

    (5)


    ​

    —


    ​

    —


    ​

    (2,880)

    Net loss


    —

    ​


    —


    ​

    —


    ​

    —


    ​

    3,131


    ​

    —


    ​

    3,131

    Other comprehensive income


    —

    ​


    —


    ​

    —


    ​

    —


    ​

    —


    ​

    555


    ​

    555

    Balance at June 30, 2020


    13,444,635

    ​

    $

    139

    ​

    $

    (9,132)

    ​

    $

    202,438

    ​

    $

    8,265

    ​

    $

    724

    ​

    $

    202,434

    ​

    ​

    ​

    ​

    ​

    ​

    ​

    ​

    ​

    ​

    ​

    ​

    ​

    ​

    ​

    ​

    ​

    ​

    ​

    ​

    ​

    Balance at April 1, 2021

    ​

    13,661,567

    ​

    $

    143

    ​

    $

    (10,087)

    ​

    $

    209,770

    ​

    $

    19,541

    ​

    $

    664

    ​

    $

    220,031

    Issuance of common stock, net of issuance cost


    8,359

    ​


    —


    ​

    —


    ​

    107


    ​

    —


    ​

    —


    ​

    107

    Employee stock purchase plan


    978

    ​


    —


    ​

    —


    ​

    18


    ​

    —


    ​

    —


    ​

    18

    Stock based compensation


    (1,834)

    ​


    —


    ​

    —


    ​

    385


    ​

    —


    ​

    —


    ​

    385

    Treasury stock


    (193,289)

    ​


    —


    ​

    (3,457)


    ​

    (6)


    ​

    —


    ​

    —


    ​

    (3,463)

    Net income


    —

    ​


    —


    ​

    —


    ​

    —


    ​

    6,331


    ​

    —


    ​

    6,331

    Other comprehensive income


    —

    ​


    —


    ​

    —


    ​

    —


    ​

    —


    ​

    (381)


    ​

    (381)

    Balance at June 30, 2021


    13,475,781

    ​

    $

    143

    ​

    $

    (13,544)

    ​

    $

    210,274

    ​

    $

    25,872

    ​

    $

    283

    ​

    $

    223,028

    ​

    ​

    ​

    ​

    ​

    ​

    ​

    ​

    ​

    ​

    ​

    ​

    ​

    ​

    ​

    ​

    ​

    ​

    ​

    ​

    ​

    Balance at January 1, 2020

    ​

    5,867,446

    ​

    $

    60

    ​

    $

    (4,155)

    ​

    $

    77,019

    ​

    $

    6,451

    ​

    $

    (73)

    ​

    $

    79,302

    Issuance of common stock, net of issuance cost


    3,664,667

    ​


    37


    ​

    —


    ​

    60,221


    ​

    —


    ​

    —


    ​

    60,258

    Marquis Bancorp (MBI) acquisition

    ​

    4,227,816

    ​

    ​

    42

    ​

    ​

    —

    ​

    ​

    64,657

    ​

    ​

    —

    ​

    ​

    —

    ​

    ​

    64,699

    Employee stock purchase plan


    —

    ​


    —


    ​

    —


    ​

    58


    ​

    —


    ​

    —


    ​

    58

    Stock based compensation


    —

    ​


    —


    ​

    —


    ​

    492


    ​

    —


    ​

    —


    ​

    492

    Treasury stock


    (315,294)

    ​


    —


    ​

    (4,977)


    ​

    (9)


    ​

    —


    ​

    —


    ​

    (4,986)

    Net loss


    —

    ​


    —


    ​

    —


    ​

    —


    ​

    1,814


    ​

    —


    ​

    1,814

    Other comprehensive income


    —

    ​


    —


    ​

    —


    ​

    —


    ​

    —


    ​

    797


    ​

    797

    Balance at June 30, 2020


    13,444,635

    ​

    $

    139

    ​

    $

    (9,132)

    ​

    $

    202,438

    ​

    $

    8,265

    ​

    $

    724

    ​

    $

    202,434

    ​

    ​

    ​

    ​

    ​

    ​

    ​

    ​

    ​

    ​

    ​

    ​

    ​

    ​

    ​

    ​

    ​

    ​

    ​

    ​

    ​

    Balance at January 1, 2021


    13,534,829

    ​

    $

    141

    ​

    $

    (9,209)

    ​

    $

    208,995

    ​

    $

    14,756

    ​

    $

    882

    ​

    $

    215,565

    Issuance of common stock, net of issuance cost


    61,204

    ​


    1


    ​

    —


    ​

    543


    ​

    —


    ​

    —


    ​

    544

    Employee stock purchase plan


    1,851

    ​


    —


    ​

    —


    ​

    34


    ​

    —


    ​

    —


    ​

    34

    Stock based compensation


    125,665

    ​


    1


    ​

    —


    ​

    709


    ​

    —


    ​

    —


    ​

    710

    Treasury stock


    (247,768)

    ​


    —


    ​

    (4,335)


    ​

    (7)


    ​

    —


    ​

    —


    ​

    (4,342)

    Net income


    —

    ​


    —


    ​

    —


    ​

    —


    ​

    11,116


    ​

    —


    ​

    11,116

    Other comprehensive income


    —

    ​


    —


    ​

    —


    ​

    —


    ​

    —


    ​

    (599)


    ​

    (599)

    Balance at June 30, 2021


    13,475,781

    ​

    $

    143


    $

    (13,544)


    $

    210,274


    $

    25,872


    $

    283


    $

    223,028

    ​

    ​

    ​

    ​

    ​

    5

    Table of Contents

    ​

    PROFESSIONAL HOLDING CORP.

    CONSOLIDATED STATEMENTS OF CASH FLOWS (Unaudited)

    (Dollar amounts in thousands, except share data)

    ​

    ​

    ​

    ​

    ​

    ​

    ​

    ​

    ​

    ​

    Six Months Ended June 30, 

    ​


    2021


    2020

    Cash flows from operating activities


    ​


    ​


    Net income (loss)

    ​

    $

    11,116

    ​

    $

    1,814

    Adjustments to reconcile net income to net cash from operating activities

    ​


    ​


    Provision for loan losses

    ​


    1,800

    ​


    2,595

    Deferred income tax benefit (expense)

    ​


    988

    ​


    (499)

    Depreciation and amortization

    ​


    739

    ​


    739

    Gain on sale of securities

    ​

    ​

    —

    ​

    ​

    (4)

    Gain on call of securities

    ​

    ​

    (22)

    ​

    ​

    (11)

    Equity unrealized change in market value

    ​

    ​

    63

    ​

    ​

    (24)

    Net amortization of securities

    ​


    1,396

    ​


    (906)

    Net amortization of deferred loan fees

    ​


    (4,400)

    ​


    1,118

    Loans held for sale

    ​

    ​

    (769)

    ​

    ​

    (1,070)

    Proceeds from sale of loans

    ​

    ​

    —

    ​

    ​

    110

    Income from bank owned life insurance

    ​


    (563)

    ​


    (255)

    Loss on disposal of premises and equipment

    ​

    ​

    137

    ​

    ​

    —

    Employee stock purchase plan

    ​

    ​

    34

    ​

    ​

    58

    Stock compensation

    ​


    710

    ​


    492

    Changes in operating assets and liabilities:

    ​


    ​


    Accrued interest receivable

    ​


    1,217

    ​


    (1,472)

    Other assets

    ​


    (1,098)

    ​


    1,887

    Official checks, accrued interest, interest payable and other liabilities

    ​


    (1,385)

    ​


    (3,395)

    Net cash provided by operating activities

    ​


    9,963

    ​


    1,177

    ​

    ​

    ​

    ​

    ​

    ​

    ​

    Cash flows from investing activities

    ​


    ​


    Proceeds from maturities and paydowns of securities available for sale

    ​


    11,123

    ​


    6,256

    Proceeds from calls of securities available for sale

    ​

    ​

    4,648

    ​

    ​

    4,835

    Proceeds from maturities and paydowns of securities held to maturity

    ​


    257

    ​


    44

    Purchase of securities available for sale

    ​


    (50,922)

    ​


    (60,693)

    Proceeds from sale of securities available for sale

    ​

    ​

    —

    ​

    ​

    1,739

    Loans originations, net of principal repayments

    ​


    (47,410)

    ​


    (256,731)

    Purchase of Federal Reserve Bank stock

    ​


    (192)

    ​


    (2,671)

    Proceeds from maturities of Federal Home Loan Bank Stock

    ​

    ​

    888

    ​

    ​

    —

    Purchase of Federal Home Loan Bank Stock

    ​


    —

    ​


    (1,297)

    Purchases of premises and equipment

    ​


    (455)

    ​


    (741)

    Proceeds from acquisition

    ​

    ​

    —

    ​

    ​

    26,860

    Net cash used in investing activities

    ​


    (82,063)

    ​


    (282,399)

    ​

    ​

    ​

    ​

    ​

    ​

    ​

    Cash flows from financing activities

    ​


    ​


    Net increase (decrease) in deposits

    ​


    617,620

    ​


    126,404

    Proceeds from issuance of stock, net of issuance costs

    ​


    544

    ​


    60,258

    Purchase of treasury stock

    ​

    ​

    (4,342)

    ​

    ​

    (4,986)

    Proceeds from Federal Home Loan Bank advances

    ​


    —

    ​


    10,000

    Repayments of Federal Home Loan advances

    ​


    (5,000)

    ​


    (25,000)

    Repayment of line of credit

    ​

    ​

    —

    ​

    ​

    (9,999)

    Proceeds from PPPLF advances

    ​

    ​

    —

    ​

    ​

    218,080

    Repayments of PPPLF advances

    ​

    ​

    (101,358)

    ​

    ​

    —

    Net cash provided by financing activities

    ​


    507,464

    ​


    374,757

    ​

    ​

    ​

    ​

    ​

    ​

    ​

    Increase in cash and cash equivalents

    ​


    435,364

    ​


    93,535

    ​

    ​

    ​

    ​

    ​

    ​

    ​

    Cash and cash equivalents at beginning of period

    ​


    216,972

    ​


    198,950

    ​

    ​

    ​

    ​

    ​

    ​

    ​

    Cash and cash equivalents at end of period

    ​

    $

    652,336

    ​

    $

    292,485

    ​

    ​

    ​

    ​

    ​

    ​

    ​

    Supplemental cash flow information:

    ​


    ​


    Cash paid during the period for interest

    ​

    $

    4,425

    ​

    $

    4,907

    Cash paid during the period for taxes

    ​


    3,000

    ​


    20

    ​

    ​

    ​

    ​

    ​

    ​

    ​

    Supplemental noncash disclosures:

    ​


    ​


    Lease liabilities arising from obtaining right of use assets

    ​

    $

    —

    ​

    $

    1,620

    Total assets acquired

    ​

    ​

    —

    ​

    ​

    589,374

    Total liabilities assumed

    ​

    ​

    —

    ​

    ​

    539,403

    ​

    ​

    ​

    ​

    ​

    ​

    ​

    ​

    ​

    ​

    ​

    ​

    ​

    ​

    ​

    ​

    ​

    6

    Table of Contents

    PROFESSIONAL HOLDING CORP.

    NOTES TO CONSOLIDATED FINANCIAL STATEMENTS (Unaudited)

    (Tables in thousands, except share data)

    NOTE 1 — SUMMARY OF SIGNIFICANT ACCOUNTING POLICIES

    Basis of Presentation:

    The accompanying unaudited consolidated financial statements of Professional Holding Corp. and its subsidiary, Professional Bank (the “Bank” and collectively with Professional Holding Corp., the “Company”), have been prepared in accordance with U.S. generally accepted accounting principles for interim financial information. Accordingly, they do not include all of the information and footnotes required by U.S. generally accepted accounting principles for complete financial statements. In the opinion of management, all adjustments (consisting of normal recurring accruals) considered necessary for a fair presentation have been included. Certain prior period amounts have been reclassified to conform to the current period presentation.

    Operating results for the six months ended June 30, 2021, are not necessarily indicative of the results that may be expected for the year ending December 31, 2021, or any other period. For further information, refer to the consolidated financial statements and footnotes thereto included in the Company’s Annual Report on Form 10-K for the year ended December 31, 2020.

    Use of Estimates:

    The preparation of these financial statements in conformity with accounting principles generally accepted in the United States of America requires management to make estimates and assumptions that affect the reported amounts of assets and liabilities and disclosures of contingent assets and liabilities at the date of the financial statements and the reported amounts of revenues and expenses during the reporting periods. Actual results could differ from those estimates.

    ​

    Adoption of new accounting standards:

    ASU 2019-12, Income Taxes (Topic 740)

    In December 2019, FASB issued guidance which simplifies the accounting for income taxes by removing multiple exceptions to the general principals in Topic 740. The standard is effective for public business entities for fiscal years, and for interim periods within those fiscal years, beginning after December 15, 2020. The new guidance did not materially impact the Company’s Consolidated Financial Statements or disclosures.

    ASU 2020-04, Reference Rate Reform (Topic 848)

    In March 2020, FASB issued guidance which provides optional guidance to ease the accounting burden in accounting for, or recognizing the effects from, reference rate reform on financial reporting. The new standard is a result of the London Interbank Offered Rate ("LIBOR") likely being discontinued as an available benchmark rate. The standard is elective and provides optional expedients and exceptions for applying U.S. Generally Accepted Accounting Principles (“GAAP”) to contracts, hedging relationships, or other transactions that reference LIBOR, or another reference rate expected to be discontinued. The amendments in the update are effective for all entities between March 12, 2020 and December 31, 2022. The Company has established a cross-functional working group to guide the Company’s transition from LIBOR and has begun efforts to transition to alternative rates consistent with industry timelines. The Company has identified its products that utilize LIBOR and has implemented enhanced fallback language to facilitate the transition to alternative reference rates. The Company is evaluating existing platforms and systems and preparing to offer new rates. The new guidance did not materially impact the Company’s Consolidated Financial Statements or disclosures.

    ​

    7

    Table of Contents

    New accounting standards that have not yet been adopted:

    The following provides a brief description of accounting standards that have been issued but are not yet adopted that could have a material effect on the Company’s financial statements:

    ​

    ​

    ASU 2016-13, Financial Instruments – Credit Losses (Topic 326)

    Description

    In June 2016, FASB issued guidance to replace the incurred loss model with an expected loss model, which is referred to as the current expected credit loss (CECL) model. The CECL model is applicable to the measurement of credit losses on financial assets measured at amortized cost, including loan receivables and held to maturity debt securities. It also applies to off-balance sheet credit exposures not accounted for as insurance (i.e. loan commitments, standby letters of credit, financial guarantees and other similar instruments).

    Date of Adoption

    For PBEs that are non-SEC filers and for SEC filers that are considered small reporting companies, it is effective for January 1, 2023. Early adoption is still permitted.

    Effect on the Consolidated Financial Statements

    The Company's management is in the process of evaluating credit loss estimation models. Updates to business processes and the documentation of accounting policy decisions are ongoing. The company may recognize an increase in the allowance for credit losses upon adoption, recorded as a one-time cumulative adjustment to retained earnings. However, the magnitude of the impact on the Company's consolidated financial statements has not yet been determined. The Company will adopt this accounting standard effective January 1, 2023.

    ​

    ​

    ​

    NOTE 2 — EARNINGS PER SHARE

    Basic earnings per common share is computed by dividing net income available to common stockholders by the weighted average number of shares of common stock outstanding during the year. Diluted earnings per common share is computed by dividing net income available to common stockholders by the weighted average number of shares of common stock outstanding plus the effect of employee stock options during the year.

    ​

    ​

    ​

    ​

    ​

    ​

    ​

    ​

    ​

    ​

    ​

    ​

    ​

    ​

    ​

    ​

    Three Months Ended June 30, 

    ​

    Six Months Ended June 30, 

    ​


    2021


    2020

    ​

    2021


    2020

    Basic earnings per share:


    ​


    ​


    ​

    ​


    ​


    Net income

    ​

    $

    6,331

    ​

    $

    3,131

    ​

    $

    11,116

    ​

    $

    1,814

    Total weighted average common stock outstanding

    ​


    13,397,747

    ​


    13,415,525

    ​


    13,419,929

    ​


    11,516,756

    Net income per share

    ​

    $

    0.47

    ​

    $

    0.23

    ​

    $

    0.83

    ​

    $

    0.16

    Diluted earnings per share:

    ​


    ​

    ​


    ​

    ​


    ​

    ​


    ​

    Net income

    ​

    $

    6,331

    ​

    $

    3,131

    ​

    $

    11,116

    ​

    $

    1,814

    Total weighted average common stock outstanding

    ​


    13,397,747

    ​


    13,415,525

    ​


    13,419,929

    ​


    11,516,756

    Add: Dilutive effect of employee stock options

    ​

    ​

    564,822

    ​

    ​

    518,435

    ​

    ​

    521,900

    ​

    ​

    526,503

    Total weighted average diluted stock outstanding

    ​

    ​

    13,962,569

    ​

    ​

    13,933,960

    ​

    ​

    13,941,829

    ​

    ​

    12,043,259

    Net income per share

    ​

    $

    0.45

    ​

    $

    0.22

    ​

    $

    0.80

    ​

    $

    0.15

    ​

    For the three months ended June 30, 2021, there were 270,850 thousand stock options that were anti-dilutive and for the three months ended June 30, 2020, there were 29,350 thousand stock options that were anti-dilutive. 
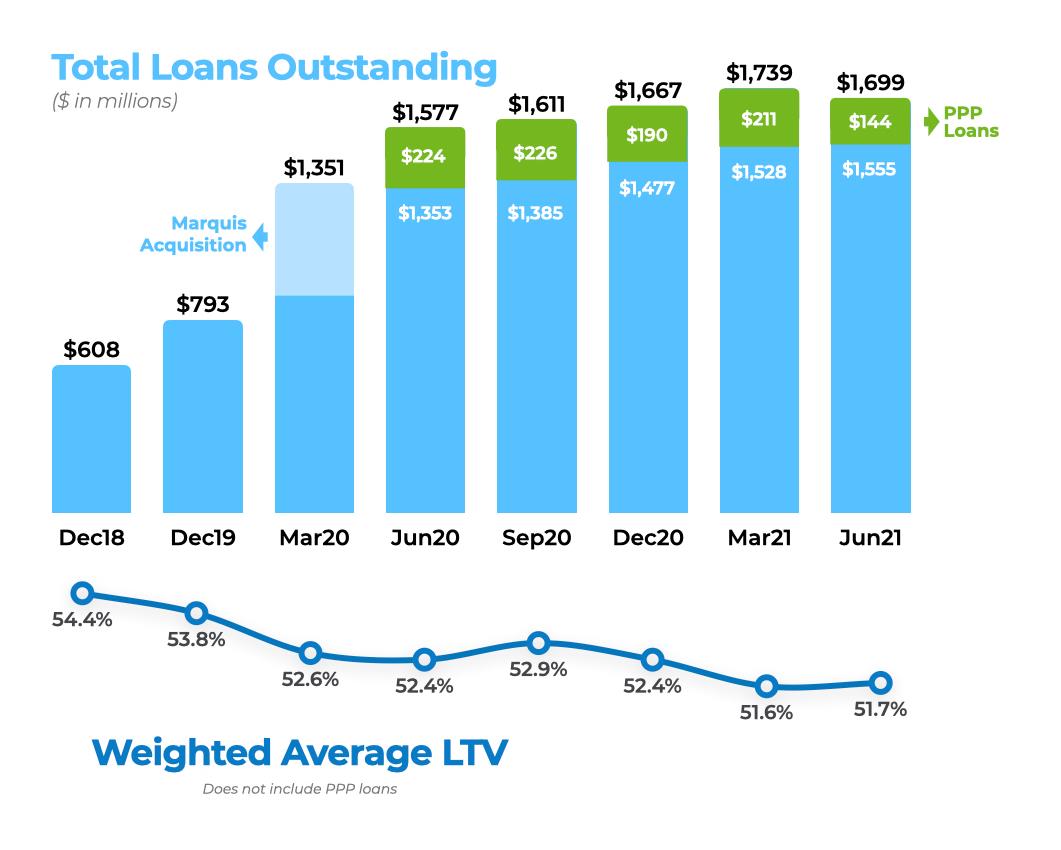
For the six months ended June 30, 2021, there were 270,850 thousand stock options that were anti-dilutive and for the six months ended June 30, 2020, there were 29,350 thousand stock options that were anti-dilutive.

    8

    Table of Contents

    NOTE 3 — SECURITIES

    The following table summarizes the amortized cost and fair value of securities available-for-sale and securities held-to-maturity at June 30, 2021 and December 31, 2020, and the corresponding amounts of gross unrealized gains and losses recognized in accumulated other comprehensive loss and gross unrecognized gains and losses:

    ​

    ​

    ​

    ​

    ​

    ​

    ​

    ​

    ​

    ​

    ​

    ​

    ​

    ​

    ​


    ​

    ​


    Gross


    Gross


    ​

    ​

    ​

    ​

    Amortized

    ​

    Unrealized

    ​

    Unrealized

    ​

    ​

    ​

    June 30, 2021

    ​

    Cost

    ​

    Gains

    ​

    Losses

    ​

    Fair Value

    Available-for-sale - taxable

    ​

    ​

    ​

    ​

    ​

    ​

    ​

    ​

    ​

    ​

    ​

    ​

    Small Business Administration loan pools

    ​

    $

    43,091

    ​

    $

    78

    ​

    $

    (573)

    ​

    $

    42,596

    Mortgage-backed securities

    ​


    54,517

    ​


    205

    ​


    (182)

    ​


    54,540

    United States agency obligations

    ​

    ​

    2,001

    ​

    ​

    88

    ​

    ​

    -

    ​

    ​

    2,089

    Corporate bonds

    ​


    1,500

    ​


    10

    ​


    -

    ​


    1,510

    Total available-for-sale - taxable

    ​

    $

    101,109

    ​

    $

    381

    ​

    $

    (755)

    ​

    $

    100,735

    Available-for-sale - tax exempt

    ​

    ​

    ​

    ​

    ​

    ​

    ​

    ​

    ​

    ​

    ​

    ​

    Community Development District bonds

    ​

    $

    17,954

    ​

    $

    704

    ​

    $

    -

    ​

    $

    18,658

    Municipals

    ​

    ​

    1,057

    ​

    ​

    46

    ​

    ​

    -

    ​

    ​

    1,103

    Total available-for-sale - tax exempt

    ​

    $

    19,011

    ​

    $

    750

    ​

    $

    -

    ​

    $

    19,761

    ​

    ​

    ​

    ​

    ​

    ​

    ​

    ​

    ​

    ​

    ​

    ​

    ​

    ​


    ​

    ​


    Gross


    Gross


    ​

    ​

    ​

    Amortized

    ​

    Unrecognized

    ​

    Unrecognized

    ​

    ​

    ​

    ​

    ​

    Cost

    ​

    Gains

    ​

    Losses

    ​

    Fair Value

    Held-to-Maturity

    ​


    ​


    ​


    ​


    Mortgage-backed securities

    ​

    $

    285

    ​

    $

    11

    ​

    $

    —

    ​

    $

    296

    Foreign Bonds

    ​

    ​

    1,000

    ​

    ​

    —

    ​

    ​

    —

    ​

    ​

    1,000

    Total Held-to-Maturity

    ​

    $

    1,285

    ​

    $

    11

    ​

    $

    —

    ​

    $

    1,296

    ​

    ​

    ​

    ​

    ​

    ​

    ​

    ​

    ​

    ​

    ​

    ​

    ​

    ​

    ​


    ​

    ​


    Gross


    Gross


    ​

    ​

    ​

    ​

    Amortized

    ​

    Unrealized

    ​

    Unrealized

    ​

    Fair

    December 31, 2020

    ​

    Cost

    ​

    Gains

    ​

    Losses

    ​

    Value

    Available-for-sale - taxable


    ​


    ​


    ​


    ​


    Small Business Administration loan pools

    ​

    $

    30,678

    ​

    $

    77

    ​

    $

    (199)

    ​

    $

    30,556

    Mortgage-backed securities

    ​


    28,514

    ​


    438

    ​


    (30)

    ​


    28,922

    United States agency obligations

    ​

    ​

    3,000

    ​

    ​

    122

    ​

    ​

    -

    ​

    ​

    3,122

    Corporate bonds

    ​


    2,501

    ​


    9

    ​


    -

    ​


    2,510

    Total available-for-sale - taxable

    ​

    $

    64,693

    ​

    $

    646

    ​

    $

    (229)

    ​

    $

    65,110

    Available-for-sale - tax exempt

    ​

    ​

    ​

    ​

    ​

    ​

    ​

    ​

    ​

    ​

    ​

    ​

    Community Development District bonds

    ​

    $

    20,582

    ​

    $

    717

    ​

    $

    -

    ​

    $

    21,299

    Municipals

    ​

    ​

    1,064

    ​

    ​

    35

    ​

    ​

    -

    ​

    ​

    1,099

    Total available-for-sale - tax exempt

    ​

    $

    21,646

    ​

    $

    752

    ​

    $

    -

    ​

    $

    22,398

    ​

    ​

    ​

    ​

    ​

    ​

    ​

    ​

    ​

    ​

    ​

    ​

    ​

    ​


    ​

    ​


    Gross


    Gross

    ​

    ​

    ​

    ​

    ​

    Amortized

    ​

    Unrecognized

    ​

    Unrecognized

    ​

    Fair

    ​

    ​

    Cost

    ​

    Gains

    ​

    Losses


    Value

    Held-to-Maturity


    ​


    ​


    ​


    ​


    Mortgage-backed securities

    ​

    $

    345

    ​

    $

    14

    ​

    $

    —

    ​

    $

    359

    United States Treasury

    ​

    ​

    202

    ​

    ​

    —

    ​

    ​

    —

    ​

    ​

    202

    Foreign Bonds

    ​

    ​

    1,000

    ​

    ​

    —

    ​

    ​

    —

    ​

    ​

    1,000

    Total Held-to-Maturity

    ​

    $

    1,547

    ​

    $

    14

    ​

    $

    —

    ​

    $

    1,561

    ​

    As of June 30, 2021 and December 31, 2020, Corporate bonds were comprised of investments in the financial services industry. During the six months ended June 30, 2021, the net investment portfolio increased by $32.6 million as a result of increases from purchases of $50.9 million in SBA and MBS securities combined with decreases of $17.4 million from paydowns, maturities and calls, as well as the unrealized holding loss on securities available for sale of $0.7 million with related tax effect of $0.2 million. Proceeds from the maturity and redemption of securities during the three and six months ended June 30, 2021, were $3.2 million and $4.7 million, with gross realized gains of $21 thousand and $22 thousand, respectively. Proceeds from the sales of securities during the year ended December 31, 2020,

    9

    Table of Contents

    were $1.7 million, with gross realized gains of $4 thousand. Proceeds from redemption of securities for the year ended December 31, 2020, were $9.1 million, with gross realized gains of $33 thousand. Total securities pledged as of June 30, 2021 and December 31, 2020, were $13.3 million and $12.5 million, respectively. Securities pledged for derivative SWAP transactions as of June 30, 2021, were $1.1 million which were included in the total securities pledged, such securities were generally pledged for public funds. There were no securities pledged for derivate SWAP transactions at December 31, 2020.

    The amortized cost and fair value of debt securities are shown by contractual maturity. Expected maturities may differ from contractual maturities if borrowers have the right to call or prepay obligations with or without call or prepayment penalties. Securities not due at a single maturity date are shown separately. The scheduled maturities of securities as of June 30, 2021, are as follows:

    ​

    ​

    ​

    ​

    ​

    ​

    ​

    ​

    ​

    ​

    June 30, 2021

    ​


    Amortized


    Fair

    ​

    ​

    Cost

    ​

    Value

    Available-for-sale

    ​

    ​

    ​

    ​

    ​

    ​

    Due in one year or less

    ​

    $

    1,038

    ​

    $

    1,056

    Due after one year through five years

    ​


    21,159

    ​


    21,975

    Due after five years through ten years

    ​

    ​

    315

    ​

    ​

    329

    Due after ten years

    ​

    ​

    —

    ​

    ​

    —

    Subtotal

    ​

    $

    22,512

    ​

    $

    23,360

    ​

    ​

    ​

    ​

    ​

    ​

    ​

    Small Business Administration loan pools

    ​

    $

    43,091

    ​

    $

    42,596

    Mortgage-backed securities

    ​

    ​

    54,517

    ​

    ​

    54,540

    Total available-for-sale

    ​

    $

    120,120

    ​

    $

    120,496

    ​

    ​

    ​

    ​

    ​

    ​

    ​

    Held-to-maturity

    ​

    ​

    ​

    ​

    ​

    ​

    Due in one year or less

    ​

    $

    1,000

    ​

    $

    1,000

    Due after one year through five years

    ​

    ​

    —

    ​

    ​

    —

    Subtotal

    ​

    $

    1,000

    ​

    $

    1,000

    ​

    ​

    ​

    ​

    ​

    ​

    ​

    Mortgage-backed securities

    ​

    $

    285

    ​

    $

    296

    Total held-to-maturity

    ​

    $

    1,285

    ​

    $

    1,296

    ​

    At June 30, 2021 and December 31, 2020, there were 0 holdings of securities of any one issuer, other than the U.S. Government and its agencies, in an amount greater than 10% of stockholders’ equity.

    At June 30, 2021 and December 31, 2020, the number of investment positions that are in an unrealized loss position were 48 and 36, respectively. The tables below indicate the fair value of debt securities with unrealized losses and for the period of time of which these

    10

    Table of Contents

    losses were outstanding at June 30, 2021 and December 31, 2020, respectively, aggregated by major security type and length of time in a continuous unrealized loss position:

    ​

    ​

    ​

    ​

    ​

    ​

    ​

    ​

    ​

    ​

    ​

    ​

    ​

    ​

    ​

    ​

    ​

    ​

    ​

    ​

    ​

    ​

    Less Than 12 Months

    ​

    12 Months or Longer

    ​

    Total

    ​


    Fair


    Unrealized


    Fair


    Unrealized


    Fair


    Unrealized

    ​

    ​

    Value

    ​

    Losses

    ​

    Value

    ​

    Losses

    ​

    Value

    ​

    Losses

    June 30, 2021

    ​

    ​

    ​

    ​

    ​

    ​

    ​

    ​

    ​

    ​

    ​

    ​

    ​

    ​

    ​

    ​

    ​

    ​

    Available-for-sale - taxable

    ​

    ​

    ​

    ​

    ​

    ​

    ​

    ​

    ​

    ​

    ​

    ​

    ​

    ​

    ​

    ​

    ​

    ​

    Small Business Administration loan pools

    ​

    $

    15,273

    ​

    $

    (427)

    ​

    $

    17,777

    ​

    $

    (146)

    ​

    $

    33,050

    ​

    $

    (573)

    Mortgage-backed securities

    ​


    14,648

    ​


    (181)

    ​


    1,286

    ​


    (1)

    ​


    15,934

    ​


    (182)

    United States agency obligations

    ​

    ​

    —

    ​

    ​

    —

    ​

    ​

    —

    ​

    ​

    —

    ​

    ​

    —

    ​

    ​

    —

    Corporate bonds

    ​


    —

    ​


    —

    ​


    —

    ​


    —

    ​


    —

    ​


    —

    Total available-for-sale - taxable

    ​

    $

    29,921

    ​

    $

    (608)

    ​

    $

    19,063

    ​

    $

    (147)

    ​

    $

    48,984

    ​

    $

    (755)

    Available-for-sale - tax exempt

    ​

    ​

    ​

    ​

    ​

    ​

    ​

    ​

    ​

    ​

    ​

    ​

    ​

    ​

    ​

    ​

    ​

    ​

    Community Development District bonds

    ​

    $

    —

    ​

    $

    —

    ​

    $

    —

    ​

    $

    —

    ​

    $

    —

    ​

    $

    —

    Municipals

    ​

    ​

    —

    ​

    ​

    —

    ​

    ​

    —

    ​

    ​

    —

    ​

    ​

    —

    ​

    ​

    —

    Total available-for-sale - tax exempt

    ​

    $

    —

    ​

    $

    —

    ​

    $

    —

    ​

    $

    —

    ​

    $

    —

    ​

    $

    —

    ​

    ​

    ​

    ​

    ​

    ​

    ​

    ​

    ​

    ​

    ​

    ​

    ​

    ​

    ​

    ​

    ​

    ​

    ​

    December 31, 2020

    ​


    ​


    ​


    ​


    ​


    ​


    Available-for-sale - taxable

    ​


    ​


    ​


    ​


    ​


    ​


    Small Business Administration loan pools

    ​

    $

    18,849

    ​

    $

    (133)

    ​

    $

    8,945

    ​

    $

    (66)

    ​

    $

    27,794

    ​

    $

    (199)

    Mortgage-backed securities

    ​


    5,839

    ​


    —

    ​


    2,510

    ​


    (30)

    ​


    8,349

    ​


    (30)

    United States agency obligations

    ​

    ​

    227

    ​

    ​

    —

    ​

    ​

    —

    ​

    ​

    —

    ​

    ​

    227

    ​

    ​

    —

    Corporate bonds

    ​


    —

    ​


    —

    ​


    —

    ​


    —

    ​


    —

    ​


    —

    Total available-for-sale - taxable

    ​

    $

    24,915

    ​

    $

    (133)

    ​

    $

    11,455

    ​

    $

    (96)

    ​

    $

    36,370

    ​

    $

    (229)

    Available-for-sale - tax exempt

    ​

    ​

    ​

    ​

    ​

    ​

    ​

    ​

    ​

    ​

    ​

    ​

    ​

    ​

    ​

    ​

    ​

    ​

    Community Development District bonds

    ​

    $

    —

    ​

    $

    —

    ​

    $

    —

    ​

    $

    —

    ​

    $

    —

    ​

    $

    —

    Municipals

    ​

    ​

    —

    ​

    ​

    —

    ​

    ​

    —

    ​

    ​

    —

    ​

    ​

    —

    ​

    ​

    —

    Total available-for-sale - tax exempt

    ​

    $

    —

    ​

    $

    —

    ​

    $

    —

    ​

    $

    —

    ​

    $

    —

    ​

    $

    —

    ​

    The unrealized holding losses within the investment portfolio are considered to be temporary and are mainly due to changes in the interest rate cycle. The unrealized loss positions may fluctuate positively or negatively with changes in interest rates or spreads. Since SBA loan pools and mortgage-backed securities are government sponsored entities that are highly rated, the decline in fair value is attributable to changes in interest rates and not credit quality. The Company does not have any securities in an Other Than Temporary Impairment (“OTTI”) position. The Company does not intend to sell these securities and it is likely that it will not be required to sell the securities before their anticipated recovery. The Company does not consider these securities to be other-than-temporarily impaired at June 30, 2021. NaN credit losses were recognized in operations during the six months ended June 30, 2021, or during the year ended December 31, 2020.

    ​

    11

    Table of Contents

    NOTE 4 — LOANS

    Loans at June 30, 2021 and December 31, 2020, were as follows:

    ​

    ​

    ​

    ​

    ​

    ​

    ​

    ​


    June 30, 2021


    December 31, 2020

    Commercial real estate

    ​

    $

    875,453

    ​

    $

    777,776

    Residential real estate

    ​


    361,946

    ​


    380,491

    Commercial

    ​


    373,333

    ​


    396,642

    Construction and land development

    ​


    74,175

    ​


    99,883

    Consumer and other

    ​


    14,575

    ​


    11,688

    Total loans

    ​


    1,699,482

    ​


    1,666,480

    Unearned loan origination (fees) costs, net

    ​


    (1,984)

    ​


    (1,323)

    Unearned PPP loan origination (fees) costs, net

    ​

    ​

    (4,855)

    ​

    ​

    (4,255)

    Allowance for loan loss

    ​


    (10,418)

    ​


    (16,259)

    Loans held for sale

    ​

    ​

    (2,039)

    ​

    ​

    (1,270)

    Other

    ​

    ​

    (18)

    ​

    ​

    —

    Loans, net

    ​

    $

    1,680,168

    ​

    $

    1,643,373

    ​

    The recorded investment in loans excludes accrued interest receivable due to immateriality.

    At June 30, 2021 and December 31, 2020, there were $209.9 million and $227.8 million, respectively in total loans pledged to the Federal Home Loan Bank (“FHLB”) for liquidity.

    Loan premiums for loans purchased are amortized over the life of the loan with acceleration upon the increase in principal paydowns or payoffs. At June 30, 2021 and December 31, 2020, loan premiums for purchased loans were $0.5 million and $0.6 million, respectively.

    There are 0 loans over 90 days past due and accruing as of June 30, 2021, or December 31, 2020. The following table presents the aging of the recorded investment in past due loans as of June 30, 2021 and December 31, 2020, by class of loans:

    ​

    ​

    ​

    ​

    ​

    ​

    ​

    ​

    ​

    ​

    ​

    ​

    ​

    ​

    ​

    ​

    ​

    ​

    ​

    ​

    ​

    ​

    ​

    ​

    30 – 59

    ​

    60 – 89

    ​

    Greater than

    ​

    ​

    ​

    ​

    ​

    ​

    ​

    ​

    ​

    ​

    ​

    ​

    ​

    ​

    Days

    ​

    Days

    ​

    89 Days

    ​

    ​

    ​

    ​

    Total

    ​

    Loans Not

    ​

    ​

    ​

    ​


    Past Due


    Past Due


    Past Due


    Nonaccrual


    Past Due


    Past Due


    Total

    June 30, 2021


    ​


    ​


    ​


    ​

    ​


    ​

    ​


    ​


    ​


    Commercial real estate

    ​

    $

    —

    ​

    $

    —

    ​

    $

    —

    ​

    $

    —

    ​

    $

    —

    ​

    $

    875,453

    ​

    $

    875,453

    Residential real estate

    ​


    —

    ​


    —

    ​


    —

    ​


    —

    ​


    —

    ​


    361,946

    ​


    361,946

    Commercial

    ​


    —

    ​


    —

    ​


    —

    ​


    1,468

    ​


    1,468

    ​


    371,865

    ​


    373,333

    Construction and land development

    ​


    —

    ​


    —

    ​


    —

    ​


    —

    ​


    —

    ​


    74,175

    ​


    74,175

    Consumer and other

    ​


    —

    ​


    94

    ​


    —

    ​

    ​

    1,307

    ​

    ​

    1,401

    ​


    13,174

    ​


    14,575

    Total

    ​

    $

    —

    ​

    $

    94

    ​

    $

    —

    ​

    $

    2,775

    ​

    $

    2,869

    ​

    $

    1,696,613

    ​

    $

    1,699,482

    ​

    ​

    ​

    ​

    ​

    ​

    ​

    ​

    ​

    ​

    ​

    ​

    ​

    ​

    ​

    ​

    ​

    ​

    ​

    ​

    ​

    ​

    ​

    ​

    ​

    30 – 59

    ​

    60 – 89

    ​

    Greater than

    ​

    ​

    ​

    ​

    ​

    ​

    ​

    ​

    ​

    ​

    ​

    ​

    ​

    ​

    Days

    ​

    Days

    ​

    89 Days

    ​

    ​

    ​

    ​

    Total

    ​

    Loans Not

    ​

    ​

    ​

    ​


    Past Due


    Past Due


    Past Due


    Nonaccrual


    Past Due


    Past Due


    Total

    December 31, 2020

    ​

    ​

    ​

    ​

    ​

    ​

    ​

    ​

    ​

    ​

    ​

    ​

    ​

    ​

    ​

    ​

    ​

    ​

    ​

    ​

    ​

    Commercial real estate

    ​

    $

    —

    ​

    $

    —

    ​

    $

    —

    ​

    $

    —

    ​

    $

    —

    ​

    $

    777,776

    ​

    $

    777,776

    Residential real estate

    ​


    1,303

    ​


    —

    ​


    —

    ​


    —

    ​


    1,303

    ​


    379,188

    ​


    380,491

    Commercial

    ​


    278

    ​


    —

    ​


    —

    ​


    9,127

    ​


    9,405

    ​


    387,237

    ​


    396,642

    Construction and land development

    ​


    —

    ​


    —

    ​


    —

    ​


    —

    ​


    —

    ​


    99,883

    ​


    99,883

    Consumer and other

    ​


    —

    ​


    —

    ​


    —

    ​

    ​

    1,307

    ​

    ​

    1,307

    ​


    10,381

    ​


    11,688

    Total

    ​

    $

    1,581

    ​

    $

    —

    ​

    $

    —

    ​

    $

    10,434

    ​

    $

    12,015

    ​

    $

    1,654,465

    ​

    $

    1,666,480

    ​

    12

    Table of Contents

    At June 30, 2021, there were 6 impaired loans (consisting of nonaccrual loans, troubled debt restructured loans, loans past due 90 days or more and still accruing interest and other loans based on management’s judgment) with both unpaid principal balance and recorded investments totaling $5.4 million. NaN of these loans were impaired loans with a recorded investment of $2.8 million with an allowance of $0.7 million and 1 substandard accruing loan with a recorded investment of $2.3 million with no allowance. The average net investment on the impaired residential real estate and commercial loans during the three months ended June 30, 2021, were $0.9 million. Residential real estate loans had $2.4 thousand and $5.0 thousand interest income recognized for the three and six months ended June 30, 2021 and 2020, respectively, which was equal to the cash basis interest income. At December 31, 2020, there were 6 impaired loans with recorded investments totaling $13.1 million, of which there were 3 impaired loans with a recorded investment of $10.4 million on nonaccrual with an allowance of $8.3 million and 1 substandard accruing loan with a recorded investment of $2.4 million with no allowance. The average net investment on the impaired residential real estate and commercial loans during the year ended December 31, 2020, was $2.2 million. The residential real estate loans had $12.7 thousand of interest income recognized during the year ended December 31, 2020, which was equal to the cash basis interest income.

    Troubled Debt Restructurings:

    The principal carrying balances of loans that met the criteria for consideration as troubled debt restructurings (“TDR”) were $252 thousand and $298 thousand as of June 30, 2021 and December 31, 2020, respectively. The Company has allocated 0 specific reserves to customers whose loan terms have been modified in troubled debt restructurings as of June 30, 2021 and December 31, 2020. The Company has not committed any additional amounts to customers whose loans are classified as a troubled debt restructuring.

    Credit Quality Indicators:

    The Company categorizes loans into risk categories based on relevant information about the ability of borrowers to service their debt including: current financial information, historical payment experience, credit documentation, public information, and current economic trends, among other factors. Generally, all credits greater than $1.0 million are reviewed at least annually to monitor and adjust, if necessary, the credit risk profile. Loans classified as substandard or special mention are reviewed quarterly by the Company for further evaluation to determine if they are appropriately classified and whether there is any impairment. Beyond the annual review, all loans are graded upon initial issuance. In addition, during the renewal process of any loan, as well as if a loan becomes past due, the Company will determine the appropriate loan grade.

    Loans excluded from the review process above are generally classified as pass credits until: (a) they become past due; (b) management becomes aware of deterioration in the creditworthiness of the borrower; or (c) the customer contacts the Company for a modification. In these circumstances, the loan is specifically evaluated for potential classification as to special mention, substandard, doubtful, or even charged-off. The Company uses the following definitions for risk ratings:

    Pass: A Pass loan’s primary source of loan repayment is satisfactory, with secondary sources very likely to be realized if necessary. The pass category includes the following:

    Riskless: Loans that are fully secured by liquid, properly margined collateral (listed stock, bonds, or other securities; savings accounts; certificates of deposit; loans or that portion thereof which are guaranteed by the U.S. Government or agencies backed by the “full faith and credit” thereof; loans secured by properly executed letters of credit from prime financial institutions).

    High Quality Risk: Loans to recognized national companies and well-seasoned companies that enjoy ready access to major capital markets or to a range of financing alternatives. Borrower’s public debt offerings are accorded highest ratings by recognized rating agencies, e.g., Moody’s or Standard & Poor’s. Companies display sound financial conditions and consistent superior income performance. The borrower’s trends and those of the industry to which it belongs are positive.

    Satisfactory Risk: Loans to borrowers, reasonably well established, that display satisfactory financial conditions, operating results and excellent future potential. Capacity to service debt is amply demonstrated. Current financial strength, while financially adequate, may be deficient in a number of respects. Normal comfort levels are achieved through a closely monitored collateral position and/or the strength of outside guarantors.

    Moderate Risk: Loans to borrowers who are in non-compliance with periodic reporting requirements of the loan agreement, and any other credit file documentation deficiencies, which do not otherwise affect the borrower’s credit risk profile. This may include borrowers who fail to supply updated financial information that supports the adequacy of the primary source of repayment to service the Bank’s debt and prevents bank management to evaluate the borrower’s current debt service capacity. Existing loans will include those with consistent

    13

    Table of Contents

    track record of timely loan payments, no material adverse changes to underlying collateral, and no material adverse change to guarantor(s) financial capacity, evidenced by public record searches.

    Special mention: A Special Mention loan has potential weaknesses that deserve management’s close attention. If left uncorrected, these potential weaknesses may result in the deterioration of the repayment prospects for the asset or the Company’s credit position at some future date. Special Mention loans are not adversely classified and do not expose an institution to sufficient risk to warrant adverse classification.

    Substandard: A Substandard loan is inadequately protected by the current sound worth and paying capacity of the obligor or of the collateral pledged, if any. Loans so classified must have a well-defined weakness or weaknesses that jeopardize the liquidation of the debt. They are characterized by the distinct possibility that the Company will sustain some loss if the deficiencies are not corrected.

    Doubtful: A loan classified Doubtful has all the weaknesses inherent in one classified Substandard with the added characteristics that the weaknesses make collection or liquidation in full, on the basis of currently existing facts, conditions, and values, highly questionable and improbable.

    Loss: A loan classified Loss is considered uncollectible and of such little value that continuance as a bankable asset is not warranted. This classification does not mean that the asset has absolutely no recovery or salvage value, but rather it is not practical or desirable to defer writing off this basically worthless asset even though partial recovery may be affected in the future.

    Based on the most recent analysis performed, the risk category of loans by class of loans is as follows:

    ​

    ​

    ​

    ​

    ​

    ​

    ​

    ​

    ​

    ​

    ​

    ​

    ​

    ​

    ​

    ​

    ​

    ​

    ​

    ​

    ​

    Special

    ​

    ​

    ​

    ​

    ​

    ​

    ​

    ​

    ​

    (Dollars in thousands)


    Pass


    Mention


    Substandard


    Doubtful


    Total

    June 30, 2021

    ​

    ​

    ​


    ​

    ​


    ​

    ​


    ​

    ​


    ​

    ​

    Commercial real estate

    ​

    $

    873,127

    ​

    $

    —

    ​

    $

    2,326

    ​

    $

    —

    ​

    $

    875,453

    Residential real estate

    ​


    361,946


    —


    —


    —


    361,946

    Commercial

    ​


    371,400


    465


    1,468


    —


    373,333

    Construction and land development

    ​


    74,175


    —


    —


    —


    74,175

    Consumer

    ​


    13,174


    94


    1,307


    —


    14,575

    Total

    ​

    $

    1,693,822


    $

    559


    $

    5,101


    $

    —


    $

    1,699,482

    ​

    ​

    ​

    ​


    ​

    ​


    ​

    ​


    ​

    ​


    ​

    ​

    December 31, 2020

    ​

    ​

    ​

    ​

    ​

    ​

    ​

    ​

    ​

    ​

    ​

    ​

    ​

    ​

    ​

    Commercial real estate

    ​

    $

    775,420

    ​

    $

    —

    ​

    $

    2,356

    ​

    $

    —

    ​

    $

    777,776

    Residential real estate

    ​


    380,062


    429


    —


    —


    380,491

    Commercial

    ​


    387,403


    112


    9,127


    —


    396,642

    Construction and land development

    ​


    99,883


    —


    —


    —


    99,883

    Consumer

    ​


    10,381


    —


    1,307


    —


    11,688

    Total

    ​

    $

    1,653,149


    $

    541


    $

    12,790


    $

    —


    $

    1,666,480

    ​

    Purchased Credit Impaired Loans:

    The Company has purchased loans, for which there was, at acquisition, evidence of deterioration of credit quality since origination and it was probable, at acquisition, that all contractually required payments would not be collected. The carrying amount of those loans is as follows:

    ​

    ​

    ​

    ​

    ​

    ​

    ​

    (Dollars in thousands)

    ​

    June 30, 2021


    December 31, 2020

    Commercial real estate(1)

    ​

    $

    5,892

    ​

    $

    —

    Residential real estate

    ​

    ​

    452

    ​

    ​

    405

    Commercial

    ​


    616

    ​


    746

    Construction and development(1)

    ​


    —

    ​


    3,732

    Carrying amount, net of total discounts

    ​

    $

    6,960

    ​

    $

    4,883

    (1)During the three months ended June 30, 2021, construction was completed on a construction loan and recategorized as a non-owner occupied commercial real estate loan.

    ​

    14

    Table of Contents

    Changes in the carrying amount of the accretable yield for all purchased credit impaired loans were as follows for the six months ended June 30, 2021:

    ​

    ​

    ​

    ​

    (Dollars in thousands)


    2021

    Balance at beginning of period

    ​

    $

    (630)

    Adjustment of income

    ​


    —

    Accretion

    ​


    195

    Reclassifications from nonaccretable difference

    ​


    (136)

    Disposals

    ​


    —

    Balance at end of period

    ​

    $

    (571)

    ​

    For those purchased credit impaired loans disclosed above, 0 allowances for loan losses were recorded or reversed during the six months ended June 30, 2021.

    The credit fair value adjustment on purchased credit impairment (“PCI”) loans represents the portion of the loan balances that have been deemed uncollectible based on the Company’s expectations of future cash flows for each respective loan. PCI loans purchased on March 26, 2020, for which it was probable at acquisition that all contractually required payments would not be collected are as follows:

    ​

    ​

    ​

    ​

    (Dollars in thousands)


    March 26, 2020

    Contractually required principal and interest by loan type

    ​

    ​

    ​

    Commercial real estate

    ​

    $

    427

    Residential real estate

    ​


    604

    Commercial

    ​


    2,176

    Construction and development

    ​


    5,614

    Consumer and other loans

    ​


    -

    Total

    ​

    $

    8,821

    Contractual cash flows not expected to be collected (nonaccretable discount)

    ​

    ​

    ​

    Commercial real estate

    ​

    $

    80

    Residential real estate

    ​


    138

    Commercial

    ​


    1,123

    Construction and development

    ​


    2,297

    Consumer and other loans

    ​


    -

    Total

    ​

    $

    3,638

    ​

    ​

    ​

    ​

    Expected cash flows

    ​

    $

    5,183

    Interest component of expected cash flows (accretable discount)

    ​

    ​

    (545)

    Fair value of PCI loans accounted for under ASC 310-30

    ​

    $

    4,638

    ​

    Non-Performing Assets

    As of June 30, 2021, the Company had nonperforming assets of $2.8 million, or 0.11% of total assets, compared to nonperforming assets of $10.4 million, or 0.51% of total assets, at December 31, 2020. The Bank’s charge-off policy for impaired loans is similar to its charge-off policy for all loans in that loans are charged-off in the month when a determination of a confirmed loss is made on a loan. In March 2021, the Company charged off $7.6 million of the Coex Coffee International, Inc. (“Coex”) loan, which amount was previously reserved during the third quarter of 2020. Based on a review of the estimated receivables collected by the assignee in the Florida case for the benefit of creditors (the “Assignee”), the remaining book balance of $0.6 million for the Coex loan appears to be collectable by the Company, subject to final accounting by the Assignee.

    Paycheck Protection Program

    During the three months ended June 30, 2021, the Company funded 172 loans representing $17.6 million under Round 3 of the Paycheck Protection Program (“PPP.”). As of June 30, 2021, the Company participated in all three rounds of the PPP and funded 2,287 small business loans representing approximately $340.5 million in relief proceeds, of which 1,362 loans totaling $196.9 million were forgiven by the SBA. Most of the PPP loans were initially pledged to the Federal Reserve as part of the Payroll Protection Program

    15

    Table of Contents

    Liquidity Facility ("PPPLF"). The PPPLF pledged loans are non-recourse to the Company. However, the Company paid off all of the PPPLF advances during the first and second quarter of 2021 and the balance was $0 as of June 30, 2021.

    Debt Service Relief Requests Related to COVID-19

    ​

    As a result of the COVID-19 pandemic the Company has reviewed and processed numerous debt service relief requests in accordance with Section 4013 of the CARES Act and interagency guidelines published by federal banking regulators on March 13, 2020. As currently interpreted by the agencies, the guidelines assert that short-term modifications made on good faith for reasons related to the COVID-19 pandemic to borrowers who were current prior to such relief are not considered TDRs. These modifications include deferrals of principal and interest, modification to interest only, and deferrals to escrow requirements. The modifications have varying terms up to six months. As of June 30, 2021, all these loans had returned to normal payment schedules.

    ​

    ​

    ​

    NOTE 5 — ALLOWANCE FOR LOAN LOSSES

    The following table presents the balance in the allowance for loan losses and the recorded investment in loans by portfolio segment and based on the impairment method for the six months ended June 30, 2021, and the year ended December 31, 2020:

    ​

    ​

    ​

    ​

    ​

    ​

    ​

    ​

    ​

    ​

    ​

    ​

    ​

    ​

    ​

    ​

    ​

    ​

    ​

    ​

    ​

    ​

    ​

    ​

    ​

    ​

    ​

    ​

    ​

    ​

    Construction

    ​

    ​

    ​

    ​

    ​

    ​

    ​

    Commercial

    ​

    Residential

    ​

    ​

    ​

    ​

    and land

    ​

    Consumer

    ​

    ​

    ​

    ​


    Real Estate


    Real Estate


    Commercial


    Development


    and Other


    Total

    June 30, 2021


    ​


    ​


    ​


    ​


    ​


    ​


    Allowance for loan losses:


    ​


    ​


    ​


    ​


    ​


    ​


    Beginning balance

    ​

    $

    3,159

    ​

    $

    2,177

    ​

    $

    10,462

    ​

    $

    388

    ​

    $

    73

    ​

    $

    16,259

    Provision for loan losses

    ​


    1,126

    ​


    92

    ​


    602

    ​


    (27)

    ​


    7

    ​


    1,800

    Loans charged-off

    ​


    -

    ​


    -

    ​


    (7,641)

    ​


    -

    ​


    -

    ​


    (7,641)

    Recoveries

    ​


    -

    ​


    -

    ​


    -

    ​


    -

    ​


    -

    ​


    -

    Total ending allowance balance

    ​

    $

    4,285

    ​

    $

    2,269

    ​

    $

    3,423

    ​

    $

    361

    ​

    $

    80

    ​

    $

    10,418

    ​

    ​

    ​

    ​

    ​

    ​

    ​

    ​

    ​

    ​

    ​

    ​

    ​

    ​

    ​

    ​

    ​

    ​

    ​

    ​

    ​

    ​

    ​

    ​

    ​

    ​

    ​

    ​

    ​

    ​

    ​

    Construction

    ​

    ​

    ​

    ​

    ​

    ​

    ​

    ​

    Commercial

    ​

    Residential

    ​

    ​

    ​

    ​

    and land

    ​

    Consumer

    ​

    ​

    ​

    ​


    Real Estate


    Real Estate


    Commercial


    Development


    and Other


    Total

    December 31, 2020


    ​


    ​


    ​


    ​


    ​


    ​


    Allowance for loan losses:


    ​


    ​


    ​


    ​


    ​


    ​


    Beginning balance

    ​

    $

    1,845

    ​

    $

    3,115

    ​

    $

    1,235

    ​

    $

    272

    ​

    $

    81

    ​

    $

    6,548

    Provision for loan losses

    ​


    1,314

    ​


    (731)

    ​


    9,326

    ​


    116

    ​


    (8)

    ​


    10,017

    Loans charged-off

    ​


    —

    ​


    (207)

    ​


    (99)

    ​


    —

    ​


    —

    ​


    (306)

    Recoveries

    ​


    —

    ​


    —

    ​


    —

    ​


    —

    ​


    —

    ​


    —

    Total ending allowance balance

    ​

    $

    3,159

    ​

    $

    2,177

    ​

    $

    10,462

    ​

    $

    388

    ​

    $

    73

    ​

    $

    16,259

    ​

    ​

    ​

    16

    Table of Contents

    ​

    ​

    ​

    ​

    ​

    ​

    ​

    ​

    ​

    ​

    ​

    ​

    ​

    ​

    ​

    ​

    ​

    ​

    ​

    ​

    ​

    ​

    ​

    ​

    ​

    ​

    ​

    ​

    ​

    ​

    Construction

    ​

    ​

    ​

    ​

    ​

    ​

    ​

    Commercial

    ​

    Residential

    ​

    ​

    ​

    ​

    and Land

    ​

    Consumer

    ​

    ​

    ​

    ​


    Real Estate


    Real Estate


    Commercial


    Development


    and Other


    Total

    June 30, 2021

    ​


    ​


    ​


    ​


    ​


    ​


    Allowance for loan losses:

    ​

    ​

    ​

    ​

    ​

    ​

    ​

    ​

    ​

    ​

    ​

    ​

    ​

    ​

    ​

    ​

    ​

    ​

    Ending allowance balance attributable to loans

    ​

    ​

    ​

    ​

    ​

    ​

    ​

    ​

    ​

    ​

    ​

    ​

    ​

    ​

    ​

    ​

    ​

    ​

    Individually evaluated for impairment

    ​

    $

    —

    ​

    $

    —

    ​

    $

    658

    ​

    $

    —

    ​

    $

    —

    ​

    $

    658

    Purchased Credit Impaired (PCI) loans

    ​

    ​

    —

    ​

    ​

    —

    ​

    ​

    —

    ​

    ​

    —

    ​

    ​

    —

    ​

    ​

    —

    Collectively evaluated for impairment

    ​

    ​

    4,285

    ​

    ​

    2,269

    ​

    ​

    2,765

    ​

    ​

    361

    ​

    ​

    80

    ​

    ​

    9,760

    Total ending allowance balance

    ​

    $

    4,285

    ​

    $

    2,269

    ​

    $

    3,423

    ​

    $

    361

    ​

    $

    80

    ​

    $

    10,418

    ​

    ​

    ​

    ​

    ​

    ​

    ​

    ​

    ​

    ​

    ​

    ​

    ​

    ​

    ​

    ​

    ​

    ​

    ​

    Loans:

    ​

    ​

    ​

    ​

    ​

    ​

    ​

    ​

    ​

    ​

    ​

    ​

    ​

    ​

    ​

    ​

    ​

    ​

    Loans individually evaluated for impairment

    ​

    $

    2,326

    ​

    $

    252

    ​

    $

    1,468

    ​

    $

    —

    ​

    $

    1,307

    ​

    $

    5,353

    Loans collectively evaluated for impairment

    ​

    ​

    873,127

    ​

    ​

    361,694

    ​

    ​

    371,865

    ​

    ​

    74,175

    ​

    ​

    13,268

    ​

    ​

    1,694,129

    Total ending loans balance

    ​

    $

    875,453

    ​

    $

    361,946

    ​

    $

    373,333

    ​

    $

    74,175

    ​

    $

    14,575

    ​

    $

    1,699,482

    ​

    ​

    ​

    ​

    ​

    ​

    ​

    ​

    ​

    ​

    ​

    ​

    ​

    ​

    ​

    ​

    ​

    ​

    ​

    December 31, 2020

    ​

    ​

    ​

    ​

    ​

    ​

    ​

    ​

    ​

    ​

    ​

    ​

    ​

    ​

    ​

    ​

    ​

    ​

    Allowance for loan losses:

    ​

    ​

    ​

    ​

    ​

    ​

    ​

    ​

    ​

    ​

    ​

    ​

    ​

    ​

    ​

    ​

    ​

    ​

    Ending allowance balance attributable to loans

    ​

    ​

    ​

    ​

    ​

    ​

    ​

    ​

    ​

    ​

    ​

    ​

    ​

    ​

    ​

    ​

    ​

    ​

    Individually evaluated for impairment

    ​

    $

    —

    ​

    $

    —

    ​

    $

    8,309

    ​

    $

    —

    ​

    $

    —

    ​

    $

    8,309

    Purchased Credit Impaired (PCI) loans

    ​

    ​

    —

    ​

    ​

    —

    ​

    ​

    —

    ​

    ​

    —

    ​

    ​

    —

    ​

    ​

    ​

    Collectively evaluated for impairment

    ​

    ​

    3,159

    ​

    ​

    2,177

    ​

    ​

    2,153

    ​

    ​

    388

    ​

    ​

    73

    ​

    ​

    7,950

    Total ending allowance balance

    ​

    $

    3,159

    ​

    $

    2,177

    ​

    $

    10,462

    ​

    $

    388

    ​

    $

    73

    ​

    $

    16,259

    ​

    ​

    ​

    ​

    ​

    ​

    ​

    ​

    ​

    ​

    ​

    ​

    ​

    ​

    ​

    ​

    ​

    ​

    ​

    Loans:

    ​

    ​

    ​

    ​

    ​

    ​

    ​

    ​

    ​

    ​

    ​

    ​

    ​

    ​

    ​

    ​

    ​

    ​

    Loans individually evaluated for impairment

    ​

    $

    2,356

    ​

    $

    298

    ​

    $

    9,127

    ​

    $

    —

    ​

    $

    1,307

    ​

    $

    13,088

    Loans collectively evaluated for impairment

    ​

    ​

    775,420

    ​

    ​

    380,193

    ​

    ​

    387,515

    ​

    ​

    99,883

    ​

    ​

    10,381

    ​

    ​

    1,653,392

    Total ending loans balance

    ​

    $

    777,776

    ​

    $

    380,491

    ​

    $

    396,642

    ​

    $

    99,883

    ​

    $

    11,688

    ​

    $

    1,666,480

    ​

    ​

    ​

    ​

    NOTE 6 — DEPOSITS

    ​

    The Company’s total deposits are comprised of the following at the dates indicated:

    ​

    ​

    ​

    ​

    ​

    ​

    ​

    ​

    ​

    ​

    ​

    ​

    ​

    ​

    For the Six Months Ended

    ​

    For the Year Ended 

    ​

    ​

    ​

    June 30, 2021

    ​

    December 31, 2020

    ​

    ​

    ​

    Ending

    ​

    ​

    ​

    Ending

    ​

    ​

    ​

    (Dollars in thousands)


    Balance


    % of Total


    Balance


    % of Total


    NOW accounts

    ​

    $

    286,173

    ​

    12.6

    %  

    $

    232,367

    ​

    14.0

    %  

    Money market accounts

    ​


    810,913


    35.6

    %  


    679,761


    41.0

    %  

    Brokered deposits

    ​

    ​

    56,534

    ​

    2.5

    %  

    ​

    30,137

    ​

    1.8

    %  

    Savings accounts

    ​


    11,814


    0.5

    %  


    9,727


    0.6

    %  

    Certificates of deposit

    ​


    257,056


    11.3

    %  


    231,953


    14.0

    %  

    Total interest-bearing deposits

    ​


    1,422,490


    62.5

    %  


    1,183,945


    71.3

    %  

    Noninterest-bearing deposits

    ​


    854,673


    37.5

    %  


    475,598


    28.7

    %  

    Total deposits

    ​

    $

    2,277,163

    ​

    100.0

    %  

    $

    1,659,543

    ​

    100.0

    %  

    (1)Balance Sheet does not illustrate brokered deposits as presented above .

    The following table presents the maturities of our time deposits including time deposits that exceed the $250,000 FDIC insurance limit as of June 30, 2021.

    ​

    ​

    ​

    ​

    ​

    ​

    ​

    ​

    ​

    ​

    ​

    ​

    ​

    ​

    ​

    ​

    ​


    ​

    ​


    Over


    Over Six


    ​

    ​


    ​

    ​

    ​

    ​

    Three

    ​

    Three

    ​

    Months

    ​

    ​

    ​

    ​

    ​

    ​

    ​

    ​

    Months or

    ​

    Through

    ​

    Through

    ​

    Over

    ​

    ​

    ​

    (Dollars in thousands)

    ​

    Less

    ​

    Six Months

    ​

    12 Months

    ​

    12 Months

    ​

    Total

    Time deposits of $250,000 or less

    ​

    $

    15,852

    ​

    $

    12,749

    ​

    $

    43,020

    ​

    $

    22,047

    ​

    $

    93,668

    Time deposits of more than $250,000

    ​

    ​

    23,302

    ​

    ​

    24,537

    ​

    ​

    85,376

    ​

    ​

    34,797

    ​

    ​

    168,012

    Total

    ​

    $

    39,154

    ​

    $

    37,286

    ​

    $

    128,396

    ​

    $

    56,844

    ​

    $

    261,680

    17

    Table of Contents

    The following tables present the maturities of our time deposits including time deposits that exceed the $250,000 FDIC insurance limit as of December 31, 2020.

    ​

    ​

    ​

    ​

    ​

    ​

    ​

    ​

    ​

    ​

    ​

    ​

    ​

    ​

    ​

    ​

    ​


    ​

    ​


    Over


    Over Six


    ​

    ​


    ​

    ​

    ​

    ​

    Three

    ​

    Three

    ​

    Months

    ​

    ​

    ​

    ​

    ​

    ​

    ​

    ​

    Months or

    ​

    Through

    ​

    Through

    ​

    Over

    ​

    ​

    ​

    (Dollars in thousands)

    ​

    Less

    ​

    Six Months

    ​

    12 Months

    ​

    12 Months

    ​

    Total

    Time deposits of $250,000 or less

    ​

    $

    20,767

    ​

    $

    13,258

    ​

    $

    24,805

    ​

    $

    19,240

    ​

    $

    78,070

    Time deposits of more than $250,000

    ​

    ​

    40,189

    ​

    ​

    35,314

    ​

    ​

    42,844

    ​

    ​

    40,158

    ​

    ​

    158,505

    Total

    ​

    $

    60,956

    ​

    $

    48,572

    ​

    $

    67,649

    ​

    $

    59,398

    ​

    $

    236,575

    ​

    As of June 30, 2021 and December 31, 2020, the Company had time deposits that meet or exceed the $250,000 FDIC insurance limit of $168.0 million and $158.5 million, respectively. Securities, mortgage loans or other financial instruments pledged as collateral for certain deposits were $52.4 million, and $54.7 million at June 30, 2021 and December 31, 2020, respectively. The aggregate amount of demand deposits that have been re-classified as loan balances at June 30, 2021 and December 31, 2020, were $0.3 million, and $0.1 million, respectively. Deposits from principal officers, directors and their affiliates at June 30, 2021 and December 31, 2020, were $17.9 million, and $12.1 million, respectively.

    ​

    For time deposits having a remaining term of more than one year, the aggregate amount of maturities for each of the five years at the dates indicated.

    ​

    ​

    ​

    ​

    ​

    ​

    ​

    ​

    ​

    ​

    June 30, 2021

    ​

    December 31, 2020

    Less than 1 year

    ​

    $

    204,836

    ​

    $

    177,178

    Over 1 through 2 years

    ​

    ​

    55,625

    ​

    ​

    57,034

    Over 2 through 3 years

    ​

    ​

    1,179

    ​

    ​

    1,658

    Over 3 through 4 years

    ​

    ​

    40

    ​

    ​

    705

    Over 4 through 5 years

    ​

    ​

    -

    ​

    ​

    -

    Over 5 years

    ​

    ​

    -

    ​

    ​

    -

    Total

    ​

    $

    261,680

    ​

    $

    236,575

    ​

    Banks are required to maintain cash reserves in the form of vault cash or in an account with the Federal Reserve Bank or in noninterest-earning accounts with other qualified banks. This requirement is based on the Bank’s amount of transaction deposit accounts. Due to the amount of transaction deposit accounts, the Bank was not required to have cash reserve requirements at June 30, 2021 and December 31, 2020. Additionally, the Company had $93.6 million and $98.2 million, in Qualified Public Deposits (“QPD”) that require collateral pledged as of June 30, 2021 and December 31, 2020.

    ​

    ​

    ​

    NOTE 7 — DEBT

    ​

    Subordinated Debt. On March 26, 2020, pursuant to terms of the acquisition, the Company assumed the subordinated notes payable of Marquis Bancorp, Inc. (“MBI”) at its fair value of $10.3 million. According to the terms of the subordinated note, the principal amount due is $10.0 million with a 7% fixed rate until October 30, 2021, and a variable rate thereafter at LIBOR plus 576 basis points. The note matures on October 30, 2026, and can be redeemed by the Company anytime on or after October 30, 2021. The subordinated debt was fair valued at a premium of $0.3 million and is being amortized over the expected life.

    Valley National Line of Credit. On December 19, 2019, the Company entered into a $10.0 million secured revolving line of credit with Valley National Bank, N.A. Amounts drawn under this line of credit bears interest at the Prime Rate, as announced by The Wall Street Journal from time to time as its prime rate, and its obligations under this line of credit are secured by shares of the capital stock of the Bank, which we have pledged as security. On January 7, 2021, (the “Closing Date”) the Company and Valley National Bank entered an amendment, which among other things, extended the maturity date of the note to March 19, 2021. No other material terms of the note changed. The principal balance outstanding pursuant to the note on the Closing Date was $0. On May 10, 2021, the Company and Valley National Bank entered into an extension agreement, which among other things, extended the maturity date of the note to March 1, 2022.

    18

    Table of Contents

    ​

    NOTE 8 — BORROWINGS

    The Company uses short-term and long-term borrowings to supplement deposits to fund lending and investment activities.

    FHLB Advances. The FHLB allows the Company to borrow up to 25% of its assets on a blanket floating lien status collateralized by certain securities and loans. As of June 30, 2021, approximately $209.9 million in loans were pledged as collateral for our FHLB borrowings. We utilize these borrowings to meet liquidity needs and to fund certain fixed rate loans in our portfolio. As of June 30, 2021, we had $35.0 million in outstanding advances and $134.7 million in additional available borrowing capacity from the FHLB based on the collateral that we have currently pledged. The following table sets forth certain information on our FHLB borrowings during the periods presented.

    ​

    ​

    ​

    ​

    ​

    ​

    ​

    ​

    ​

    ​

    Six Months Ended

    ​

    Year Ended 

    ​

    (Dollars in thousands)


    June 30, 2021


    December 31, 2020

    ​

    Amount outstanding at period-end

    ​

    $

    35,000

    ​

    $

    40,000

    ​

    Weighted average interest rate at period-end

    ​


    2.04

    %  


    1.96

    %

    Maximum month-end balance during period

    ​

    $

    40,000

    ​

    $

    70,000

    ​

    Average balance outstanding during period

    ​


    38,867

    ​


    58,210

    ​

    Weighted average interest rate during period

    ​


    1.98

    %  


    1.63

    %

    ​

    Federal Reserve Bank of Atlanta. The Federal Reserve Bank of Atlanta has an available borrower in custody arrangement which allows us to borrow on a collateralized basis. NaN advances were outstanding under this facility as of June 30, 2021.

    PPPLF Advances. The Company initially funded PPP loans with the PPPLF. Most of the PPP loans were initially pledged to the Federal Reserve as part of the PPPLF. The PPPLF pledged loans are non-recourse to the Company. In addition, we paid off approximately $101.4 million in PPPLF advances for a balance of $0 at June 30, 2021.

    ​

    ​

    NOTE 9 — COMMON STOCK AND PREFERRED STOCK

    Class A Voting Common Stock

    The Company has Class A voting common stock with a par value of $0.01 per share. As of June 30, 2021, there are 50,000,000 shares authorized as Class A voting common stock of which 13,475,781 are outstanding. During the six months ended June 30, 2021, the Company issued 193,764 shares of Class A voting common stock, inclusive of 127,499 shares of restricted stock grants, 64,414 shares of options exercised, and 1,851 shares pursuant to the employee stock purchase program.

    During the six months ended June 30, 2021, the Company repurchased 247,768 shares of Class A common stock. Further, during the same six month period, upon the vesting of a portion of restricted stock, employees of the Company elected to have 3,210 shares of Class A common voting stock withheld for tax purposes and had 1,834 in restricted stock cancellations.

    19

    Table of Contents

    Class B Non-voting Common Stock

    The Company has Class B non-voting common stock with a par value of $0.01 per share. As of June 30, 2021, there are 10,000,000 shares authorized as Class B non-voting common stock, NaN of which are outstanding.

    Preferred Stock

    The Company has 10,000,000 shares of undesignated and unissued preferred stock.

    NOTE 10 — FAIR VALUE

    Fair value is the exchange price that would be received for an asset or paid to transfer a liability (exit price) in the principal or most advantageous market for the asset or liability in an orderly transaction between market participants on the measurement date. There are three levels of inputs that may be used to measure fair values:

    Level 1 — Quoted prices (unadjusted) for identical assets or liabilities in active markets that the entity has the ability to access as of the measurement date.

    Level 2 — Significant other observable inputs other than Level 1 prices such as quoted prices for similar assets or liabilities; quoted prices in markets that are not active; or other inputs that are observable or can be corroborated by observable market data.

    Level 3 — Significant unobservable inputs that reflect a Company’s own assumptions about the assumptions that market participants would use in pricing an asset or liability.

    The Company used the following methods and significant assumptions to estimate fair value:

    Cash and cash equivalents: The carrying amounts of cash and cash equivalents approximate their fair value.

    Securities available for sale: Where quoted prices are available in an active market, securities are classified within Level 1 of the valuation hierarchy. Level 1 securities include highly liquid government bonds, certain mortgage products and exchange-traded equities. If quoted market prices are not available, then fair values are estimated by using pricing models, quoted prices of securities with similar characteristics, or discounted cash flows. Examples of such instruments, which would generally be classified within Level 2 of the valuation hierarchy, include certain collateralized mortgage and debt obligations, corporate bonds, municipal bonds and U.S. agency notes. In certain cases where there is limited activity or less transparency around inputs to the valuation, securities are classified within Level 3 of the valuation hierarchy. Securities classified within Level 3 might include certain residual interests in securitizations and other less liquid securities. As of June 30, 2021 and December 31, 2020, all securities available for sale were Level 2.

    Securities held-to-maturity: Reported at fair value utilizing Level 2 inputs. The estimated fair value is determined based on market quotes when available. If not available, quoted market prices of similar securities, discounted cash flow analysis, pricing models and observable market data are used in determining fair market value.

    Equity securities: The Company values equity securities at readily determinable market values based on the closing price at the end of each period. Changes in fair value are recognized through net income.

    Loans: Fair values are estimated for portfolios of loans with similar characteristics. Loans are segregated by type, such as commercial or residential mortgage. Each loan category is further segmented into fixed and adjustable rate interest terms as well as performing and non-performing categories. The fair value of loans is calculated by discounting scheduled cash flows through the estimated life including prepayment considerations and estimated market discount rates that reflect the risks inherent to the loan. The calculation of the fair value considers market driven variables including credit related factors and reflects an exit price as defined in ASC Topic 820.

    Loans held for sale: The carrying amounts of loans held for sale approximate their fair values.

    Federal Home Loan Bank stock: It is not practical to determine fair value due to restrictions placed on transferability.

    Federal Reserve Bank stock: It is not practical to determine fair value due to restrictions placed on transferability.

    20

    Table of Contents

    Accrued interest receivable: The carrying amounts of accrued interest approximate their fair values.

    Deposits: The fair values disclosed for demand, NOW, money-market and savings deposits are, by definition, equal to the amount payable on demand at the reporting date (that is, their carrying amounts). Fair values for fixed-rate time deposits are estimated using a current market rates offered for remaining or similar maturities.

    Federal Home Loan Bank advances: Fair values are estimated using discounted cash flow analysis based on the Bank’s current incremental borrowing rates for similar types of borrowing arrangements.

    Off-balance-sheet instruments: Fair values for off-balance-sheet lending commitments are based on fees currently charged to enter into similar agreements, taking into account the remaining terms of the agreements and the counterparties’ credit standing.

    Assets and Liabilities Measured on a Recurring Basis

    Assets and liabilities measured at fair value on a recurring basis, are summarized below:

    There were 0 securities reclassified into or out of Level 3 during the six months ended June 30, 2021, or for the year ended December 31, 2020.

    ​

    ​

    ​

    ​

    ​

    ​

    ​

    ​

    ​

    ​

    ​

    ​

    ​

    ​

    ​

    ​

    ​

    ​

    ​

    Fair Value Measurements

    ​

    ​

    ​

    ​

    ​

    at June 30, 2021 Using:

    ​

    ​

    ​

    ​

    ​

    ​

    ​

    ​

    Significant

    ​

    ​

    ​

    ​

    ​

    ​

    ​

    ​

    Quoted Prices in

    ​

    Other

    ​

    Significant

    ​

    ​

    ​

    ​

    ​

    Active Markets for

    ​

    Observable

    ​

    Unobservable

    ​

    ​

    Fair

    ​

    Identical Assets

    ​

    Inputs

    ​

    Inputs

    June 30, 2021


    Value


    (Level 1)


    (Level 2)


    (Level 3)

    Available-for-sale - taxable


    ​


    ​


    ​


    ​


    Small Business Administration loan pools

    ​

    $

    42,596

    ​

    $

    —

    ​

    $

    42,596

    ​

    $

    —

    Mortgage-backed securities

    ​


    54,540

    ​


    —

    ​


    54,540

    ​


    —

    United States agency obligations

    ​

    ​

    2,089

    ​

    ​

    —

    ​

    ​

    2,089

    ​

    ​

    —

    Corporate bonds

    ​


    1,510

    ​


    —

    ​


    1,510

    ​


    —

    Total

    ​

    $

    100,735

    ​

    $

    —

    ​

    $

    100,735

    ​

    $

    —

    Available-for-sale - tax exempt

    ​

    ​

    ​

    ​

    ​

    ​

    ​

    ​

    ​

    ​

    ​

    ​

    Community Development District bonds

    ​

    $

    18,658

    ​

    $

    —

    ​

    $

    18,658

    ​

    $

    —

    Municipals

    ​

    ​

    1,103

    ​

    ​

    —

    ​

    ​

    1,103

    ​

    ​

    —

    Total

    ​

    $

    19,761

    ​

    $

    —

    ​

    $

    19,761

    ​

    $

    —

    Equity


    ​


    ​


    ​


    ​


    Mutual funds

    ​

    $

    5,942

    ​

    $

    5,942

    ​

    $

    —

    ​

    $

    —

    Total

    ​

    $

    5,942

    ​

    $

    5,942

    ​

    $

    —

    ​

    $

    —

    ​

    21

    Table of Contents

    ​

    ​

    ​

    ​

    ​

    ​

    ​

    ​

    ​

    ​

    ​

    ​

    ​

    ​

    ​

    ​

    ​

    ​

    Fair Value Measurements

    ​

    ​

    ​

    ​

    ​

    at December 31, 2020 Using:

    ​

    ​

    ​

    ​

    ​

    ​

    ​

    ​

    Significant

    ​

    ​

    ​

    ​

    ​

    ​

    ​

    ​

    Quoted Prices in

    ​

    Other

    ​

    Significant

    ​

    ​

    ​

    ​

    ​

    Active Markets for

    ​

    Observable

    ​

    Unobservable

    ​

    ​

    Fair

    ​

    Identical Assets

    ​

    Inputs

    ​

    Inputs

    December 31, 2020


    Value


    (Level 1)


    (Level 2)


    (Level 3)

    Available-for-sale - taxable


    ​


    ​


    ​


    ​


    Small Business Administration loan pools

    ​

    $

    30,556

    ​

    $

    —

    ​

    $

    30,556

    ​

    $

    —

    Mortgage-backed securities

    ​


    28,922

    ​


    —

    ​


    28,922

    ​


    —

    United States agency obligations

    ​


    3,122

    ​


    —

    ​


    3,122

    ​


    —

    Corporate bonds

    ​


    2,510

    ​


    —

    ​


    2,510

    ​


    —

    Total

    ​

    $

    65,110

    ​

    $

    —

    ​

    $

    65,110

    ​

    $

    —

    Available-for-sale - tax exempt

    ​

    ​

    ​

    ​

    ​

    ​

    ​

    ​

    ​

    ​

    ​

    ​

    Community Development District bonds

    ​

    $

    21,299

    ​

    $

    —

    ​

    $

    21,299

    ​

    $

    —

    Municipals

    ​

    ​

    1,099

    ​

    ​

    —

    ​

    ​

    1,099

    ​

    ​

    —

    Total

    ​

    $

    22,398

    ​

    $

    —

    ​

    $

    22,398

    ​

    $

    —

    Equity


    ​


    ​


    ​


    ​


    Mutual funds

    ​

    $

    6,005

    ​

    $

    6,005

    ​

    $

    —

    ​

    $

    —

    Total

    ​

    $

    6,005

    ​

    $

    6,005

    ​

    $

    —

    ​

    $

    —

    ​

    ​

    ​

    ​

    ​

    ​

    ​

    ​

    ​

    ​

    ​

    ​

    ​

    ​

    ​

    ​

    ​

    ​

    ​

    ​

    at June 30, 2021 Using:

    ​

    ​

    ​

    ​

    ​

    ​

    ​

    ​

    Significant

    ​

    ​

    ​

    ​

    ​

    ​

    ​

    ​

    Quoted Prices in

    ​

    Other

    ​

    Significant

    ​

    ​

    ​

    ​

    ​

    Active Markets for

    ​

    Observable

    ​

    Unobservable

    ​

    ​

    Fair

    ​

    Identical Assets

    ​

    Inputs

    ​

    Inputs

    June 30, 2021


    Value


    (Level 1)


    (Level 2)


    (Level 3)

    Customer Derivatives: Interest Rate SWAPs


    ​


    ​


    ​


    ​


    Customer Derivatives - Interest Rate SWAPs Asset

    ​

    $

    863

    ​

    $

    —

    ​

    $

    863

    ​

    $

    —

    Customer Derivatives - Interest Rate SWAPs Liability

    ​

    ​

    (863)

    ​

    ​

    —

    ​

    ​

    (863)

    ​

    ​

    —

    Total

    ​

    $

    —

    ​

    $

    —

    ​

    $

    —

    ​

    $

    —

    ​

    As of December 31, 2020, the Company did not hold any interest rate SWAPs.

    Impaired loans: The fair value of impaired loans with specific allocations of the allowance for loan losses is generally based on recent real estate appraisals. These appraisals may utilize a single valuation approach or a combination of approaches including comparable sales and the income approach. Adjustments are routinely made in the appraisal process by the independent appraisers to adjust for differences between the comparable sales and income data available for similar loans and collateral underlying such loans. Such adjustments result in a Level 3 classification of the inputs for determining fair value. Non-real estate collateral may be valued using an appraisal, net book value per the borrower’s financial statements, or aging reports, adjusted or discounted based on management’s historical knowledge, changes in market conditions from the time of the valuation, and management’s expertise and knowledge of the client and client’s business, resulting in a Level 3 fair value classification. Impaired loans are evaluated on a quarterly basis for additional impairment and adjusted in accordance with the allowance policy.

    Specifically, regarding the Coex loan, the carrying amount of the loan for impairment purposes was determined based on the note outstanding balance at June 30, 2021, less the non-recourse amount sold to our participant, yielding a carrying value of $0.6 million. The fair value of the collateral was determined based on a review of information obtained from the Assignee related to the collectability of the collateral adjusted for legal and disposition costs. When netted in the same percentage as the non-recourse portion of the loan, the net fair

    22

    Table of Contents

    value of collateral was noted as $0.6 million. The net result of these calculations provides for 0 specific reserve within the Allowance for Loan and Lease Losses (“ALLL”) associated with the Coex loan or approximately 0% of the carrying value of the loan.

    Assets measured at fair value on a non-recurring basis are summarized below:

    ​

    ​

    ​

    ​

    ​

    ​

    ​

    ​

    ​

    ​

    ​

    ​

    ​

    ​

    ​

    ​

    ​

    ​

    ​

    ​

    ​

    ​

    Fair Value Measurements

    ​

    ​

    ​

    ​

    ​

    at June 30, 2021 Using:

    ​

    ​

    ​

    ​

    ​

    ​

    ​

    ​

    Significant

    ​

    ​

    ​

    ​

    ​

    ​

    ​

    ​

    ​

    ​

    ​

    Quoted Prices in

    ​

    Other

    ​

    Significant

    ​

    ​

    ​

    ​

    ​

    Total at

    ​

    Active Markets for

    ​

    Observable

    ​

    Unobservable

    ​

    ​

    ​

    ​

    ​

    June 30, 

    ​

    Identical Assets

    ​

    Inputs

    ​

    Inputs

    ​

    Total Gains

    (Dollars in thousands)


    2021


    (Level 1)


    (Level 2)


    (Level 3)


    (Losses)

    Impaired Loans:


    ​


    ​


    ​


    ​


    ​

    ​


    Commercial real estate

    ​

    $

    —

    ​

    $

    —

    ​

    $

    —

    ​

    $

    —

    ​

    $

    —

    Residential real estate

    ​


    —

    ​


    —

    ​


    —

    ​


    —

    ​


    —

    Commercial

    ​

    ​

    810

    ​

    ​

    —

    ​

    ​

    —

    ​

    ​

    810

    ​

    ​

    (658)

    Construction and land development

    ​

    ​

    —

    ​

    ​

    —

    ​

    ​

    —

    ​

    ​

    —

    ​

    ​

    —

    Consumer and other

    ​


    —

    ​


    —

    ​


    —

    ​


    —

    ​


    —

    Total

    ​

    $

    810

    ​

    $

    —

    ​

    $

    —

    ​

    $

    810

    ​

    $

    (658)

    ​

    ​

    ​

    ​

    ​

    ​

    ​

    ​

    ​

    ​

    ​

    ​

    ​

    ​

    ​

    ​

    ​

    ​

    ​

    ​

    ​

    ​

    Fair Value Measurements

    ​

    ​

    ​

    ​

    ​

    at December 31, 2020 Using:

    ​

    ​

    ​

    ​

    ​

    ​

    ​

    ​

    Significant

    ​

    ​

    ​

    ​

    ​

    ​

    ​

    ​

    ​

    ​

    ​

    Quoted Prices in

    ​

    Other

    ​

    Significant

    ​

    ​

    ​

    ​

    ​

    Total at

    ​

    Active Markets for

    ​

    Observable

    ​

    Unobservable

    ​

    ​

    ​

    ​

    ​

    December 31,

    ​

    Identical Assets

    ​

    Inputs

    ​

    Inputs

    ​

    Total Gains

    (Dollars in thousands)


    2020


    (Level 1)


    (Level 2)


    (Level 3)


    (Losses)

    Impaired Loans:


    ​


    ​


    ​


    ​


    ​

    ​


    Commercial real estate

    ​

    $

    —

    ​

    $

    —

    ​

    $

    —

    ​

    $

    —

    ​

    $

    —

    Residential real estate

    ​


    —

    ​


    —

    ​


    —

    ​


    —

    ​


    —

    Commercial

    ​

    ​

    818

    ​

    ​

    —

    ​

    ​

    —

    ​

    ​

    818

    ​

    ​

    (8,309)

    Construction and land development

    ​

    ​

    —

    ​

    ​

    —

    ​

    ​

    —

    ​

    ​

    —

    ​

    ​

    —

    Consumer and other

    ​


    —

    ​


    —

    ​


    —

    ​


    —

    ​


    —

    Total

    ​

    $

    818

    ​

    $

    —

    ​

    $

    —

    ​

    $

    818

    ​

    $

    (8,309)

    ​

    23

    Table of Contents

    As shown above our impaired loans consist solely of commercial loans considered to be Level 3. These Level 3 loans have significant unobservable inputs such as appraisal adjustments for local market conditions and economic factors that may result in changes in value of an assets over time.

    The table below presents the approximate carrying amount and estimated fair value of the Company’s financial instruments (in thousands):

    ​

    ​

    ​

    ​

    ​

    ​

    ​

    ​

    ​

    ​

    ​

    ​

    June 30, 2021

    ​

    ​

    Carrying

    ​

    Fair

    ​

    Fair Value

    ​


    Amount


    Value


    Hierarchy

    Financial Assets:


    ​


    ​


    Cash & Due from Banks, including interest bearing deposits

    ​

    $

    616,180

    ​

    $

    616,180


    Level 1

    Federal Funds Sold

    ​


    36,156

    ​


    36,156


    Level 1

    Securities, Available for Sale - taxable

    ​


    101,109

    ​


    100,735


    Level 2

    Securities, Available for Sale - tax exempt

    ​

    ​

    19,011

    ​

    ​

    19,761

    ​

    Level 2

    Securities, Held to Maturity

    ​


    1,285

    ​


    1,296


    Level 2

    Securities, Equity

    ​


    5,942

    ​


    5,942


    Level 1

    Loans, net

    ​


    1,680,168

    ​


    1,702,726


    Level 3

    Loans Held For Sale

    ​


    2,039

    ​


    2,039


    Level 1

    Bank Owned Life Insurance

    ​

    ​

    37,923

    ​

    ​

    37,923

    ​

    Level 2

    Accrued Interest Receivable

    ​


    5,449

    ​


    5,449


    Level 1, 2 & 3

    Customer Derivatives - Interest Rate SWAPs

    ​

    ​

    863

    ​

    ​

    863

    ​

    Level 2

    ​

    ​

    ​

    ​

    ​

    ​

    ​

    ​

    ​

    Financial Liabilities:

    ​


    ​


    Deposits

    ​


    2,277,163

    ​


    2,246,864


    Level 2

    Federal Home Loan Bank Advances

    ​


    35,000

    ​


    33,671


    Level 2

    Subordinated Debt

    ​

    ​

    10,062

    ​

    ​

    10,062

    ​

    Level 2

    PPPLF Advances

    ​

    ​

    —

    ​

    ​

    —

    ​

    Level 2

    Loan Participations

    ​

    ​

    —

    ​

    ​

    —

    ​

    Level 2

    Customer Derivatives - Interest Rate SWAPs

    ​

    ​

    863

    ​

    ​

    863

    ​

    Level 2

    Accrued Interest Payable

    ​


    267

    ​


    267


    Level 2

    ​

    ​

    ​

    ​

    ​

    ​

    ​

    ​

    ​

    ​

    ​

    ​

    December 31, 2020

    ​

    ​

    Carrying

    ​

    Fair

    ​

    Fair Value

    ​


    Amount


    Value


    Hierarchy

    Financial Assets:


    ​


    ​


    Cash & Due from Banks, including interest bearing deposits

    ​

    $

    191,597

    ​

    $

    191,597


    Level 1

    Federal Funds Sold

    ​


    25,375

    ​


    25,375


    Level 1

    Securities, Available for Sale - taxable

    ​


    65,110

    ​


    65,110


    Level 2

    Securities, Available for Sale - tax exempt

    ​

    ​

    22,398

    ​

    ​

    22,398

    ​

    Level 2

    Securities, Held to Maturity

    ​


    1,547

    ​


    1,561


    Level 2

    Securities, Equity

    ​


    6,005

    ​


    6,005


    Level 1

    Loans, net

    ​


    1,643,373

    ​


    1,653,401


    Level 3

    Loans Held For Sale

    ​

    ​

    1,270

    ​

    ​

    1,270

    ​

    Level 1

    Bank Owned Life Insurance

    ​


    37,360

    ​


    37,360


    Level 2

    Accrued Interest Receivable

    ​


    6,666

    ​


    6,666


    Level 1, 2 & 3

    ​

    ​

    ​

    ​

    ​

    ​

    ​

    ​

    ​

    Financial Liabilities:

    ​


    ​


    Deposits

    ​


    1,659,543

    ​


    1,693,331


    Level 2

    Federal Home Loan Bank Advances

    ​


    40,000

    ​


    37,927


    Level 2

    Subordinated Debt

    ​

    ​

    10,153

    ​

    ​

    10,153

    ​

    Level 2

    PPPLF Advances

    ​

    ​

    101,358

    ​

    ​

    101,519

    ​

    Level 2

    Loan Participations

    ​

    ​

    13,215

    ​

    ​

    13,215

    ​

    Level 2

    Accrued Interest Payable

    ​


    546

    ​


    546


    Level 2

    ​

    ​

    ​

    ​

    ​

    NOTE 11 — CUSTOMER DERIVATIVES — INTEREST RATE SWAPS

    ​

    During the first quarter of 2021, the Company established a program whereby it originates a variable rate loan and enters into a variable-to-fixed interest rate SWAP with the customer. The Company also enters into an offsetting SWAP with a SWAP dealer. These back-to-back SWAP agreements are intended to offset each other and allow the Company to originate a variable rate loan, while providing a contract for fixed interest payments for the customer. The net cash flow for the Company is equal to the interest income received from a variable rate loan originated with the customer. The SWAPs with both the customers and third parties are not designated as hedges under FASB ASC Topic 815, Derivatives and Hedging, and are marked to market through earnings. As the SWAPs are structured to offset each other, changes to the underlying benchmark interest rates considered in the valuation of these instruments do not result in an impact to

    24

    Table of Contents

    earnings; however, there may be fair value adjustments related to credit quality variations between counterparties, which may impact earnings as required by FASB ASC Topic 820, Fair Value Measurement and Disclosure (“ASC 820”). During the six months ended June 30, 2021, the Company recorded 5 SWAP transactions with clients having a total notional amount of $22.3 million, offset by five SWAP transactions with dealers having a total notional amount of $22.3 million. Additionally, we recorded $0.5 million in SWAP fees. The fair value of these derivatives is based on a market standard discounted cash flow approach. The Company incorporates credit value adjustments on derivatives to properly reflect the respective counterparty’s nonperformance risk in the fair value measurements of its derivatives. As of June 30, 2021, the Bank’s asset fair value position in other assets was $0.9 million and liability fair value position in other liabilities was $0.9 million, which were fully collateralized with pledged securities held with counterparty in excess of the exposure amount at quarter end.

    ​

    ​

    NOTE 12 — LOAN COMMITMENTS AND OTHER RELATED ACTIVITIES

    ​

    Some financial instruments, such as loan commitments, credit lines, letters of credit, and overdraft protection, are issued to meet customer financing needs. These are agreements to provide credit or to support the credit of others, as long as conditions established in the contract are met, and usually have expiration dates. Commitments may expire without being used. Off-balance-sheet risk to credit loss exists up to the face amount of these instruments, although material losses are not anticipated. The same credit policies are used to make such commitments as are used for loans, including obtaining collateral at exercise of the commitment.

    The contractual amounts of financial instruments with off-balance-sheet risk at June 30, 2021 and December 31, 2020, were as follows:

    ​

    ​

    ​

    ​

    ​

    ​

    ​

    ​

    (Dollars in thousands)


    June 30, 2021


    December 31, 2020

    Unfunded lines of credit

    ​

    $

    366,015

    ​

    $

    356,955

    Commitments to extend credit

    ​


    83,857

    ​


    40,629

    Letters of credit

    ​


    11,226

    ​


    13,036

    Total credit extension commitments

    ​

    $

    461,098

    ​

    $

    410,620

    ​

    ​

    ​

    NOTE 13 — REGULATORY CAPITAL MATTERS

    Banks and bank holding companies are subject to regulatory capital requirements administered by federal banking agencies. Capital adequacy guidelines and, additionally for banks, prompt corrective action regulations, involve quantitative measures of assets, liabilities, and certain off-balance-sheet items calculated under regulatory accounting practices. Capital amounts and classifications are also subject to qualitative judgments by regulators. Failure to meet capital requirements can initiate regulatory action. The final rules implementing Basel Committee on Banking Supervision’s capital guidelines for United States banks (Basel III rules) became effective for the Bank on January 1, 2015, with full compliance with all of the requirements being phased in over a multi-year schedule, and fully phased in by January 1, 2019. Under the Basel III rules, the Bank must hold a capital conservation buffer above the adequately capitalized risk-based capital ratios. The capital conservation buffer was phased in from 0.0% for 2015 to 2.50% by 2019. The capital conservation buffer for June 30, 2021, is 2.50% and for December 31, 2020, was 2.50%. The net unrealized gain or loss on available for sale securities is not included in computing regulatory capital. Management believes as of June 30, 2021, the Bank met all capital adequacy requirements to which it was subject.

    Prompt corrective action regulations provide 5 classifications: well capitalized, adequately capitalized, undercapitalized, significantly undercapitalized, and critically undercapitalized, although these terms are not used to represent overall financial condition. If adequately capitalized, regulatory approval is required to accept brokered deposits. If undercapitalized, capital distributions are limited, as is asset growth and expansion, and capital restoration plans are required. At June 30, 2021 and December 31, 2020, the most recent regulatory notifications categorized the Bank as well capitalized under the regulatory framework for prompt corrective action. There are no conditions or events since that notification that management believes have changed the institution’s category. Based on changes to the Federal Reserve’s definition of a “Small Bank Holding Company” that increased the threshold to $3 billion in assets in August 2018, the Company is not currently subject to separate minimum capital measurements. At such time as the Company reaches the $3 billion asset level, it will again be subject to capital measurements independent of the Bank. For comparison purposes, the Company’s ratios are included in following discussion as well, all of which would have exceeded the “well-capitalized” level had the Company been subject to separate capital minimums.

    25

    Table of Contents

    Actual and required capital amounts and ratios are presented below at June 30, 2021 and December 31, 2020. The required amounts for capital adequacy shown below do not include the capital conservation buffer previously discussed.

    ​

    ​

    ​

    ​

    ​

    ​

    ​

    ​

    ​

    ​

    ​

    ​

    ​

    ​

    ​

    ​

    ​

    ​

    ​

    ​

    ​

    ​

    ​

    ​

    ​

    ​

    ​

    ​

    ​

    ​

    Minimum to be well

    ​

    ​

    ​

    Actual

    ​

    Minimum for capital adequacy

    ​

    capitalized

    ​

    (Dollars in thousands)


    Amount


    Ratio


    Amount


    Ratio


    Amount


    Ratio


    June 30, 2021


    ​


    ​


    ​


    ​

    Total capital ratio


    ​


    ​


    ​


    ​


    ​

    Bank

    ​

    $

    198,836


    12.8

    %  

    $

    124,003


    8.0

    %  

    $

    155,004


    10.0

    %

    Company

    ​


    218,325


    14.1

    %  


    124,003


    8.0

    %  


    N/A


    N/A

    ​

    Tier 1 capital ratio

    ​


    ​

    ​


    ​


    ​

    Bank

    ​


    187,416


    12.1

    %  


    93,002


    6.0

    %  


    124,003


    8.0

    %

    Company

    ​


    196,844


    12.7

    %  


    93,002


    6.0

    %  


    N/A


    N/A

    ​

    Tier1 leverage ratio

    ​


    ​

    ​


    ​


    ​

    Bank

    ​


    187,416


    7.4

    %  


    101,368


    4.0

    %  


    126,710


    5.0

    %

    Company

    ​


    196,844


    7.8

    %  


    101,368


    4.0

    %  


    N/A


    N/A

    ​

    Common equity tier 1 capital ratio

    ​


    ​

    ​


    ​


    ​


    ​

    Bank

    ​


    187,416


    12.1

    %  


    69,752


    4.5

    %  


    100,753


    6.5

    %

    Company

    ​


    196,844


    12.7

    %  


    69,752


    4.5

    %  


    N/A


    N/A

    ​

    ​

    ​

    ​

    ​

    ​

    ​

    ​

    ​

    ​

    ​

    ​

    ​

    ​

    ​

    ​

    ​

    ​

    ​

    ​

    ​

    ​

    ​

    ​

    ​

    ​

    ​

    ​

    ​

    ​

    ​

    Minimum to be well


    ​

    ​

    Actual

    ​

    Minimum for capital adequacy

    ​

    capitalized


    (Dollars in thousands)


    Amount


    Ratio


    Amount


    Ratio


    Amount


    Ratio


    December 31, 2020

    ​


    ​


    ​


    ​

    Total capital ratio

    ​


    ​


    ​


    ​

    Bank

    ​

    $

    176,633


    12.0

    %  

    $

    117,298


    8.0

    %  

    $

    146,623


    10.0

    %

    Company

    ​


    215,977


    14.7

    %  


    117,298


    8.0

    %  


    N/A


    N/A

    ​

    Tier 1 capital ratio

    ​


    ​

    ​


    ​


    ​

    Bank

    ​


    159,448


    10.9

    %  


    87,974


    6.0

    %  


    117,298


    8.0

    %

    Company

    ​


    188,639


    12.9

    %  


    87,974


    6.0

    %  


    N/A


    N/A

    ​

    Tier1 leverage ratio

    ​


    ​

    ​


    ​


    ​

    Bank

    ​


    159,448


    8.4

    %  


    75,723


    4.0

    %  


    94,654


    5.0

    %

    Company

    ​


    188,639


    10.0

    %  


    75,723


    4.0

    %  


    N/A


    N/A

    ​

    Common equity tier 1 capital ratio

    ​


    ​

    ​


    ​


    ​


    ​

    Bank

    ​


    159,448


    10.9

    %  


    65,980


    4.5

    %  


    95,305


    6.5

    %

    Company

    ​


    188,639


    12.9

    %  


    65,980


    4.5

    %  


    N/A


    N/A

    ​

    ​

    ​

    NOTE 14 — STOCK BASED COMPENSATION

    ​

    Restricted Stock

    An award of restricted stock involves the immediate transfer by the Company to the participant of a specific number of shares of our Class A voting common stock, which are subject to a risk of forfeiture and a restriction on transferability. This restriction will lapse following a stated period of time. The participant does not pay for the restricted stock and has all of the rights of a holder of a share of our Class A voting common stock (except for the restriction on transferability), including the right to vote and receive dividends unless otherwise determined by the Compensation Committee and set forth in the award agreement.

    The Company has limited the aggregate number of shares of our Class A voting common stock to be awarded under the 2019 Equity Incentive Plan as restricted stock to 300,000 shares. The Company has 222,009 shares of restricted stock outstanding, at a weighted average exercise price of $16.82, to employees and directors under the 2019 Equity Incentive Plan as of June 30, 2021, for which the Company did not receive, nor will it receive, any monetary consideration. Therefore, there were 77,991 restricted shares available to be issued at June 30, 2021. As of June 30, 2021, there was approximately $2.9 million in unrecognized compensation expense in regard to restricted stock that will be recognized over a three-year period.

    ​

    ​

    26

    Table of Contents

    NOTE 15 — LEASES

    Operating leases in which the Company is the lessee are recorded as right-of-use (“ROU”) assets and operating lease liabilities, including premises and equipment and other liabilities, respectively on the Consolidated Balance Sheets. Currently the Company does not have any lessor leases (formerly known as capital leases) to report on its financials.

    The Company’s ROU assets are classified under premises and equipment on the Balance Sheet. The ROU liabilities are classified under other liabilities. The Company did 0t record new ROU during the six months ended June 30, 2021, and recorded $2.0 million during the year ended December 31, 2020. The total amount of ROU was $5.6 and $6.5 million at June 30, 2021 and December 31, 2020, respectively.

    The majority of the Company’s lessee leases are operating leases and consist of leased real estate for branches and operations centers. The Company elected the short term lease recognition exemption for all leases that qualify, meaning those with terms under twelve months. The ROU assets represent the Company’s right to use the underlying assets during the lease term and operating liabilities represent the obligation to make lease payments arising from the lease. ROU assets and operating lease liabilities are recognized at lease commencement. Options to extend and renew leases are generally exercised under normal circumstances. Advance notification is required prior to termination, and any noticing period is often limited to the months prior to renewal. Variable payments generally consist of common area maintenance and taxes. Rent escalations are generally specified by a payment schedule or are subject to a defined formula. The Company also does not separate lease and non-lease components for all leases, the majority of which consist of real estate common area maintenance expenses. Generally, leases do not include guaranteed residual values, but instead typically specify that the leased premises are to be returned in satisfactory condition with the Company liable for damages.

    Lease cost for the three and six months ended June 30, 2021 and 2020 consists of:

    ​

    ​

    ​

    ​

    ​

    ​

    ​

    ​

    ​

    ​

    ​

    ​

    ​

    ​

    ​

    Three Months Ended

    ​

    Three Months Ended

    ​

    Six Months Ended

    ​

    Six Months Ended

    ​


    June 30, 2021

    ​

    June 30, 2020

    ​

    June 30, 2021


    June 30, 2020

    Operating Lease and Interest Cost

    ​

    $

    326

    ​

    $

    445

    ​

    $

    794

    ​

    $

    756

    Variable Lease Cost

    ​


    82

    ​


    142

    ​


    199

    ​


    249

    Total Lease Cost

    ​

    $

    408

    ​

    $

    587

    ​

    $

    993

    ​

    $

    1,005

    ​

    The following table provides supplemental information related to leases for the three and six months ended June 30, 2021 and 2020:

    ​

    ​

    ​

    ​

    ​

    ​

    ​

    ​

    ​

    ​

    ​

    ​

    ​

    ​

    ​

    ​

    Three Months Ended

    ​

    Three Months Ended

    ​

    Six Months Ended

    ​

    Six Months Ended

    ​

    ​


    June 30, 2021

    ​

    June 30, 2020

    ​

    June 30, 2021


    June 30, 2020

    ​

    Operating Lease - Operating Cash Flows (Fixed Payments)

    ​

    $

    326

    ​

    $

    445

    ​

    $

    793

    ​

    $

    756

    ​

    Operating Lease - Operating Cash Flows (Liability Reduction)

    ​

    $

    296

    ​

    $

    416

    ​

    $

    921

    ​

    $

    669

    ​

    New ROU Assets - Operating Leases

    ​

    $

    —

    ​

    $

    —

    ​

    $

    —

    ​

    $

    1,620

    ​

    Weighted Average Lease Term (Years) - Operating Leases

    ​

    ​

    ​

    ​

    ​

    ​

    ​

    ​

    5.25

    ​

    ​

    6.02

    ​

    Weighted Average Discount Rate - Operating Leases

    ​

    ​

    ​

    %

    ​

    ​

    %

    ​

    3.13

    %

    ​

    3.02

    %

    ​

    A maturity analysis of operating lease liabilities and reconciliation of the undiscounted cash flows to the total operating lease liabilities as of June 30, 2021, is as follows:

    ​

    ​

    ​

    ​

    ​

    ​


    June 30, 2021

    Operating lease payments due:


    ​


    Within one year

    ​

    $

    1,400

    After one but within two years

    ​


    1,421

    After two but within three years

    ​

    ​

    1,296

    After three but within four years

    ​

    ​

    1,093

    After four years but within five years

    ​

    ​

    955

    After five years

    ​

    ​

    706

    Total undiscounted cash flows

    ​

    ​

    6,871

    Discount on cash flows

    ​

    ​

    (1,291)

    Total operating lease liabilities

    ​

    $

    5,580

    ​

    ​

    27

    Table of Contents

    NOTE 16 — SUBSEQUENT EVENTS

    Loan Production Offices

    On July 12, 2021, the Company expanded its Florida footprint by opening up 2 new loan production offices in Tampa/St. Petersburg and Jacksonville.  

    ​

    ​

    28

    Table of Contents

    Item 2. Management’s Discussion and Analysis of Financial Condition and Results of Operations.

    Introduction

    The following discussion and analysis are part of Professional Holding Corp.’s (the “Company”) Quarterly Report on Form 10-Q filed with the SEC and updates the Company’s Annual Report on Form 10-K for the year ended December 31, 2020, which was previously filed with the SEC. This financial information is presented to aid in understanding the Company’s financial position and results of operations and should be read together with the financial information contained in the Form 10-K. See Note 1 “Summary of Significant Accounting Policies - Basis of Presentation” to the consolidated financial statements for further detail. The emphasis of this discussion will be on the three and six months ended June 30, 2021, compared to the three and six months ended June 30, 2020, for the consolidated statements of income. For the consolidated balance sheets, the emphasis of this discussion will be the balances as of June 30, 2021, compared to December 31, 2020.

    Cautionary Note Regarding Forward Looking Information

    This Quarterly Report on Form 10-Q contains certain forward-looking statements, as defined in Section 27A of the Securities Act of 1933, as amended (the “Securities Act”), and Section 21E of the Securities Exchange Act of 1934, as amended (the “Exchange Act”). Such forward-looking statements reflect our current opinions, expectations, beliefs, plans, objectives, assumptions or projections regarding, among other things, future events or future results, in contrast with statements that reflect historical facts. These statements are often, but not always, made through the use of conditional words such as “anticipate,” “intend,” “believe,” “estimate,” “plan,” “seek,” “project” or “expect,” “may,” “will,” “would,” “could” or “should” or the negative versions of these terms or other comparable terminology. These forward-looking statements are not historical facts, and are based on current expectations, estimates and projections about our industry, management’s beliefs and certain assumptions made by management, many of which, by their nature, are inherently uncertain and beyond our control. Accordingly, we caution you that any such forward-looking statements are not guarantees of future performance and are subject to risks, assumptions and uncertainties that are difficult to predict. Although we believe that the expectations reflected in these forward-looking statements are reasonable as of the date made, actual results may prove to be materially different from the results expressed or implied by the forward-looking statements.

    Important factors related to forward-looking statements may include, among others, risks and assumptions regarding:

    ●the strength of the United States economy in general and the strength of the local economies in which we conduct operations;
    ●the effects of our lack of a diversified loan portfolio and concentration in the South Florida market, including the risks of geographic, depositor, and industry concentrations, including our concentration in loans secured by real estate;
    ●the duration and severity of the COVID-19 pandemic and the severity of COVID variants both in our principal area of operations and nationally, and the impact of the pandemic, including the government’s responses to the pandemic, on our and our customers’ operations, personnel, and business activity (including developments and volatility), as well as the pandemic’s impact on the credit quality of our loan portfolio and on financial market and general economic conditions;
    ●the frequency and magnitude of foreclosure of our loans;
    ●changes in the securities, real estate markets and commodities markets (including fluctuations in the price of coffee or oil);
    ●our ability to successfully manage interest rate risk, credit risk, liquidity risk, and other risks inherent to our industry;
    ●the accuracy of our financial statement estimates and assumptions, including the estimates used for our loan loss reserve and deferred tax asset valuation allowance;
    ●increased competition and its effect on pricing of our products and services as well as our margins;
    ●legislative or regulatory changes;
    ●our ability to comply with the extensive laws and regulations to which we are subject, including the laws for each jurisdiction where we operate;

    29

    Table of Contents

    ●the Professional Bank’s (the “Bank”) ability to make cash distributions to us and our ability to declare and pay dividends, the payment of which is subject to our capital and other requirements;
    ●changes in accounting principles, policies, practices or guidelines, including the effects of forthcoming CECL implementation;
    ●our ability to fund and manage our growth, both organic growth as well as growth through other means, such as future acquisitions;
    ●negative publicity and the impact on our reputation;
    ●our ability to attract and retain highly qualified personnel;
    ●technological changes;
    ●cybersecurity risks including security breaches, computer viruses, and data processing system failures and errors;
    ●our ability to manage operational risks, including, but not limited to, client, employee, or third-party fraud;
    ●changes in monetary and fiscal policies of the U.S. Government and the Federal Reserve;
    ●inflation, interest rate, unemployment rate, market, and monetary fluctuations;
    ●the efficiency and effectiveness of our internal control environment;
    ●the ability of our third-party service providers to continue providing services to us and clients without interruption;
    ●geopolitical developments;
    ●the effects of harsh weather conditions, including hurricanes, and other natural disasters (including pandemics such as COVID-19) and man-made disasters;
    ●potential business interruptions from catastrophic events such as terrorist attacks, active shooter situations, and advanced persistent threat groups;
    ●the willingness of clients to accept third-party products and services rather than our products and services and vice versa;
    ●changes in consumer spending and saving habits;
    ●growth and profitability of our noninterest income; and
    ●anti-takeover provisions under federal and state law as well as our governing documents.

    If one or more events related to these or other risks or uncertainties materialize or intensify, or if our underlying assumptions prove to be incorrect, actual results may differ materially from what we anticipate. Accordingly, you are cautioned not to place undue reliance on these forward-looking statements. The forward-looking statements included in this prospectus are made only as of the date of the Quarterly Report on Form 10-Q. New factors emerge from time to time, and it is not possible for us to predict which will arise. We do not undertake, and specifically decline, any obligation to update any such statements or to publicly announce the results of any revisions to any of such statements to reflect future events or developments, except as may be required by law.

    ​

    Executive Overview

    Highlights of our performance and financial condition as of and for the three and six months ended June 30, 2021, and other key events that have occurred during 2021 are provided below.

    30

    Table of Contents

    Results of Operations for the three months ended June 30, 2021

    ●Net income increased $1.5 million, or 32.3%, to $6.3 million compared to the prior quarter. The increase was primarily due to balance sheet expansion and increases in service charges on deposit accounts associated with acting as a correspondent bank for a Payroll Protection Program lender (the “Correspondent Banking Relationship”).
    ●During the quarter we continued to participate in the Small Business Association’s Payroll Protection Program (“PPP”). We recognized $1.4 million in revenue primarily from fees in connection with the forgiveness of PPP loans associated with the Bank’s participation in the PPP (“Professional Bank PPP”) and $0.7 million in revenue from deposit correspondent fees from the Correspondent Banking Relationship.
    ●Net interest income decreased $0.7 million, or 3.8%, to $17.2 million compared to the prior quarter primarily due to a decrease in Professional Bank PPP loan fees coupled with payoffs of higher yielding loans.
    ●Noninterest income increased $1.1 million, or 105.7%, to $2.3 million, compared to the prior quarter primarily due to increases in service charges from the Correspondent Banking Relationship, secondarily to an increase in SWAP fees, and to income due to repayment of a Federal Home Loan Bank (“FHLB”) advance at a favorable position during the quarter.
    ●Noninterest expense decreased $0.8 million, or 7.1%, to $11.0 million compared to the prior quarter primarily due to the payment of change-in-control obligations paid in the prior quarter.

    Results of Operations for the six months ended June 30, 2021

    ●The variance in the six-month Results of Operations for 2021 compared to 2020 occurred in part due to the March 26, 2020, closing date of the Marquis Bancorp, Inc. (“MBI”) acquisition as there were 95 days of MBI integration in the first six months of 2020 compared to 181 days in the first six month of 2021 (the “MBI Variance”).
    ●Net income increased $9.3 million, or 512.8%, to $11.1 million compared to the prior year. The increase was primarily due to the MBI Variance, Professional Bank PPP loan fees recognized, and deposit fees associated with the Correspondent Banking Relationship.
    ●Net interest income increased $10.7 million, or 44.1%, to $35.1 million from the prior year primarily due to loan growth.
    ●Noninterest income increased $1.6 million, or 87.6%, to $3.4 million, compared to the prior year primarily due to increases in service charges on deposit accounts associated with the Correspondent Banking Relationship, $0.5 million increase in SWAP referral fees, $0.3 million increase in Bank Owned Life Insurance (“BOLI”), and $0.2 million increase in fees generated from loans held for sale, offset by a $0.3 million decrease in SBA loan origination fees.
    ●Noninterest expense increased $1.7 million, or 8.1%, to $22.7 million compared to the prior year. The year over year increase was due to increased salaries and investment in digital infrastructure. The Bank’s number of employees increased from 137 as of December 31, 2019, to 179 as of June 30, 2020, which increase was due to the MBI acquisition, and further increased to 194 as of June 30, 2021.

    Financial Condition

    At June 30, 2021:

    ●Total assets increased 14.7%, or $0.4 billion, to $2.6 billion compared to the prior quarter primarily due to increases in customer deposit accounts associated with the Correspondent Banking Relationship and investments in taxable securities available-for-sale. Additionally, total assets increased 26.0%, or $0.5 billion, compared to June 30, 2020.
    ●Total loans were flat at $1.7 billion compared to the prior quarter. New loan originations were $186.8 million ($169.2 million of conventional loans, of which $118.0 million funded, coupled with $17.6 million of Professional Bank PPP loans). The Professional Bank PPP loan balance decreased $66.7 million, or 31.7%, from the prior quarter.

    31

    Table of Contents

    ●Total Deposits increased 19.7%, or $0.4 billion, to $2.3 billion compared to the prior quarter primarily due to increases in noninterest bearing demand deposit accounts. Additionally, average assets for the quarter increased due to large balances associated with the Correspondent Banking Relationship.
    ●Nonperforming assets remained unchanged at $2.8 million compared to the prior quarter. As compared to June 30, 2020, the Company had nonperforming assets of $6.2 million.

    Operating Results

    Results of Operations for the three months ended June 30, 2021 and 2020

    The following table sets forth the principal components of net income for the periods indicated.

    ​

    ​

    ​

    ​

    ​

    ​

    ​

    ​

    ​

    ​

    ​

    ​

    Three Months Ended June 30, 


    (Dollars in thousands)


    2021


    2020


    Change


    Interest income

    ​

    $

    18,962

    ​

    $

    18,522


    2.4

    %

    Interest expense

    ​


    1,760

    ​


    2,231


    (21.1)

    %

    Net Interest income

    ​


    17,202

    ​


    16,291


    5.6

    %

    Provision for loan losses

    ​


    762

    ​


    1,750


    (56.5)

    %

    Net interest income after provision

    ​


    16,440

    ​


    14,541


    13.1

    %

    Noninterest income

    ​


    2,302

    ​


    968


    137.8

    %

    Noninterest expense

    ​


    10,954

    ​


    11,548


    (5.1)

    %

    Income before income taxes

    ​


    7,788

    ​


    3,961


    96.6

    %

    Income tax expense

    ​


    1,457

    ​


    830


    75.5

    %

    Net income

    ​

    $

    6,331

    ​

    $

    3,131


    102.2

    %

    ​

    Net income for the three months ended June 30, 2021, was $6.3 million, an increase of $3.2 million, or 102.2%, compared to the three months ended June 30, 2020. Interest income increased $0.4 million while interest expense decreased $0.5 million, resulting in a net interest income increase of $0.9 million for the three months ended June 30, 2021, compared to the same period in the prior year. The increase in our interest income year-over-year was primarily due to increased loan portfolio growth and decreased cost of funds to the Company. Provision for loan losses decreased by $1.0 million for the three months ended June 30, 2021, compared to the same period in the prior year. The decrease in the provision expense was primarily due to loan payoffs in higher risk categories offset by an increase in loan originations. The increase in noninterest income during the three months ended June 30, 2021, compared to the same period in the prior year was primarily due to increases in service charges on deposit accounts associated with the Correspondent Banking Relationship, and secondarily to an increase in SWAP fees, as well as a one-time credit due to the unwinding fee of a FHLB advance. The decrease in noninterest expense for the three months ended June 30, 2021, compared to the same period in the prior year was primarily due to the lack of MBI acquisition expenses this quarter and to a lesser extent the realization of our implementation efforts regarding operational efficiencies in occupancy, equipment, and data processing expenses.

    Net Interest Income and Net Interest Margin Analysis

    We analyze our ability to maximize income generated from interest earning assets and control the interest expenses associated with our liabilities, measured as net interest income, through our net interest margin and net interest spread. Net interest income is the difference between the interest and fees earned on interest earning assets, such as loans and securities, and the interest expense paid on interest bearing liabilities, such as deposits and borrowings, which are used to fund those assets. Net interest margin is a ratio calculated as annualized net interest income divided by average interest earning assets for the same period. Net interest spread is the difference between average interest rates earned on interest earning assets and average interest rates paid on interest-bearing liabilities.

    Changes in market interest rates and the interest rates we earn on interest earning assets or pay on interest-bearing liabilities, as well as in the volume and types of interest earning assets, interest bearing and noninterest-bearing liabilities and stockholders’ equity, are usually the largest drivers of periodic changes in net interest income, net interest margin and net interest spread. Fluctuations in market interest rates are driven by many factors, including governmental monetary policies, inflation, deflation, macroeconomic developments, changes in unemployment rates, the money supply, political and international conditions, and circumstances, in domestic and foreign financial markets. Periodic changes in the volume and types of loans in our loan portfolio are affected by, among other factors, the economic and competitive conditions in the Miami-Dade MSA, as well as developments affecting the real estate, technology, government services, hospitality and tourism, and financial services sectors within the Miami-Dade MSA. Our ability to respond to changes in these factors by

    32

    Table of Contents

    using effective asset-liability management techniques is critical to maintaining the stability of our net interest income and net interest margin as our primary sources of earnings.

    The following table shows the average outstanding balance of each principal category of our assets, liabilities, and stockholders’ equity, together with the average yields on our assets and the average costs of our liabilities for the periods indicated. Such yields and costs are calculated by dividing the annualized income or expense by the average daily balances of the corresponding assets or liabilities for the same period.

    33

    Table of Contents

    ​

    ​

    ​

    ​

    ​

    ​

    ​

    ​

    ​

    ​

    ​

    ​

    ​

    ​

    ​

    ​

    ​

    ​

    ​

    ​

    For the Three Months Ended June 30, 

    ​

    ​

    2021

    ​

    2020

    ​

    ​


    Average


    Interest


    ​


    Average


    Interest


    ​


    ​

    ​

    Outstanding

    ​

    Income/

    ​

    Average

    ​

    Outstanding

    ​

    Income/

    ​

    Average

    ​

    (Dollars in thousands)

    ​

    Balance

    ​

    Expense(4)

    ​

    Yield/Rate

    ​

    Balance

    ​

    Expense(4)

    ​

    Yield/Rate

    ​

    Assets


    ​


    ​


    ​


    ​


    Interest earning assets


    ​


    ​


    ​


    ​


    Interest-bearing deposits

    ​

    $

    580,632

    ​

    $

    178


    0.12

    %  

    $

    170,658

    ​

    $

    44


    0.10

    %  

    Federal funds sold

    ​


    69,506

    ​


    24


    0.14

    %  


    32,965

    ​


    12


    0.15

    %  

    Federal Reserve Bank stock, FHLB stock and other corporate stock

    ​


    7,391

    ​


    99


    5.37

    %  


    7,598

    ​


    131


    6.93

    %  

    Investment securities - taxable

    ​


    70,137

    ​


    161


    0.92

    %  


    88,365

    ​


    241


    1.10

    %  

    Investment securities - tax exempt

    ​

    ​

    20,172

    ​

    ​

    189

    ​

    3.76

    %  

    ​

    20,973

    ​

    ​

    197

    ​

    3.78

    %  

    Loans(1)

    ​


    1,699,403

    ​


    18,311


    4.32

    %  


    1,501,590

    ​


    17,897


    4.79

    %  

    Total interest earning assets

    ​


    2,447,241

    ​


    18,962


    3.11

    %  


    1,822,149

    ​


    18,522


    4.09

    %  

    Loans held for sale

    ​

    ​

    2,638

    ​

    ​

    ​

    ​

    ​

    ​

    ​

    —

    ​

    ​

    ​

    ​

    ​

    ​

    Noninterest earning assets

    ​


    115,358

    ​


    ​

    ​


    102,663

    ​


    ​

    Total assets

    ​

    $

    2,565,237

    ​


    ​

    ​

    $

    1,924,812

    ​


    ​

    Liabilities and stockholders’ equity

    ​


    ​


    ​

    ​


    ​


    ​

    Interest-bearing liabilities

    ​


    ​


    ​

    ​


    ​


    ​

    Interest-bearing deposits

    ​


    1,377,712

    ​


    1,430


    0.42

    %  


    994,972

    ​


    1,617


    0.65

    %  

    Borrowed funds

    ​


    56,347

    ​


    330


    2.35

    %  


    230,516

    ​


    614


    1.07

    %  

    Total interest-bearing liabilities

    ​


    1,434,059

    ​


    1,760


    0.49

    %  


    1,225,488

    ​


    2,231


    0.73

    %  

    Noninterest-bearing liabilities

    ​


    ​


    ​

    ​


    ​


    ​

    Noninterest-bearing deposits

    ​


    890,292

    ​


    ​

    ​


    475,613

    ​


    ​

    Other noninterest-bearing liabilities

    ​


    17,690

    ​


    ​

    ​


    19,540

    ​


    ​

    Stockholders’ equity

    ​


    223,196

    ​


    ​

    ​


    204,171

    ​


    ​

    Total liabilities and stockholders’ equity

    ​

    $

    2,565,237

    ​


    ​

    ​

    $

    1,924,812

    ​


    ​

    Net interest spread(2)

    ​


    ​


    2.62

    %  


    ​


    3.36

    %  

    Net interest income