As filed with the U.S. Securities and Exchange Commission on June 5, 2024
UNITED STATES
SECURITIES AND EXCHANGE COMMISSION
Washington, D.C. 20549
FORM N-CSR
CERTIFIED SHAREHOLDER REPORT OF REGISTERED
MANAGEMENT INVESTMENT COMPANIES
Investment Company Act file number 811-23108
Amplify ETF Trust
(Exact name of registrant as specified in charter)
3333 Warrenville Road Suite #350
Lisle, IL 60532
(Address of principal executive offices) (Zip code)
Christian Magoon
Amplify ETF Trust
3333 Warrenville Road Suite #350
Lisle, IL 60532
(Name and address of agent for service)
With copies to:
Morrison C. Warren, Esq.
Chapman and Cutler LLP
111 West Monroe Street
Chicago, IL 60603
(855)-267-3837
Registrant's telephone number, including area code
Date of fiscal year end: September 30
Date of reporting period: March 31, 2024
Item 1. Reports to Stockholders.

| | 2024 Semi-Annual Report |
AMPLIFY ETF TRUST | MARCH 31, 2024 |
| | YYY | | Amplify High Income ETF |
| | | IBUY | | Amplify Online Retail ETF |
| | | DIVO | | Amplify CWP Enhanced Dividend Income ETF |
| | | BLOK | | Amplify Transformational Data Sharing ETF |
| | | BATT | | Amplify Lithium & Battery Technology ETF |
| | | SWAN | | Amplify BlackSwan Growth & Treasury Core ETF |
| | | EMFQ | | Amplify Emerging Markets FinTech ETF |
| | | CNBS | | Amplify Seymour Cannabis ETF |
| | | ISWN | | Amplify BlackSwan ISWN ETF |
| | | MVPS | | Amplify Thematic All-Stars ETF |
| | | QSWN | | Amplify BlackSwan Tech & Treasury ETF |
| | | IWIN | | Amplify Inflation Fighter ETF |
| | | NDIV | | Amplify Natural Resources Dividend Income ETF |
| | | IDVO | | Amplify International Enhanced Dividend Income ETF |
| | | COWS | | Amplify Cash Flow Dividend Leaders ETF |
| | | HCOW | | Amplify Cash Flow High Income ETF |
| | | SOF | | Amplify Samsung SOFR ETF |
| | | SILJ | | Amplify Junior Silver Miners ETF |
| | | HACK | | Amplify Cybersecurity ETF |
| | | IPAY | | Amplify Mobile Payments ETF |
| | | ITEQ | | Amplify BlueStar Israel Technology ETF |
| | | ETHO | | Amplify Etho Climate Leadership U.S. ETF |
| | | MJ | | Amplify Alternative Harvest ETF |
| | | IVES | | Amplify Global Cloud Technology ETF |
| | | GAMR | | Amplify Video Game Tech ETF |
| | | AIEQ | | Amplify AI Powered Equity ETF |
| | | AWAY | | Amplify Travel Tech ETF |
| | | GERM | | Amplify Treatments, Testing and Advancements ETF |
| | | MJUS | | Amplify U.S. Alternative Harvest ETF |
| | | | | |
Amplify ETF Trust
Table of Contents
Amplify ETF Trust (the “Trust”) files its complete schedule of fund holdings with the Securities and Exchange Commission (the “Commission”) for the first and third quarters of each fiscal year on Part F of Form N-PORT within sixty days after the end of the period. The Trust’s Part F of Form N-PORT is available on the Commission’s website at www.sec.gov, and may be reviewed and copied at the Commission’s Public Reference Room in Washington, DC. Information on the operation of the Public Reference Room may be obtained by calling 1-800-SEC-0330.
A description of the policies and procedures that Amplify Investments LLC (the “Adviser”) uses to determine how to vote proxies relating to portfolio securities, as well as information relating to how a fund voted proxies relating to portfolio securities during the most recent 12-month period ended June 30, is available (i) without charge, upon request, by calling 1-855-267-3837 and (ii) on the Commission’s website at www.sec.gov.
1
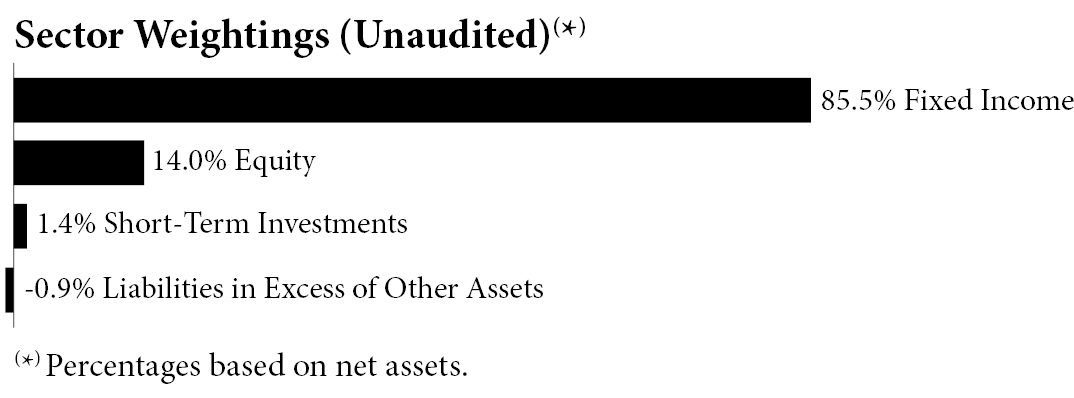
Amplify ETF Trust Amplify High Income ETF Schedule of Investments as of March 31, 2024 (Unaudited) |
Description | | Shares | | Value |
INVESTMENT COMPANIES — 99.5% | | | | | |
Equity — 14.0% | | | | | |
abrdn Total Dynamic Dividend Fund | | 1,505,002 | | $ | 12,476,467 |
Kayne Anderson Energy Infrastructure Fund | | 1,387,998 | | | 13,893,859 |
Liberty All-Star Equity Fund(a) | | 1,836,718 | | | 13,132,534 |
MainStay CBRE Global Infrastructure Megatrends Term Fund | | 927,433 | | | 11,657,833 |
Virtus Dividend Interest & Premium Strategy Fund | | 987,723 | | | 12,623,100 |
| | | | | | 63,783,793 |
Fixed Income — 85.5% | | | | | |
Aberdeen Asia-Pacific Income Fund,
Inc. | | 1,588,040 | | | 4,446,512 |
AllianceBernstein Global High Income Fund, Inc. | | 318,041 | | | 3,377,595 |
BlackRock Corporate High Yield Fund, Inc. | | 1,083,347 | | | 10,605,967 |
BlackRock Credit Allocation Income Trust | | 1,239,796 | | | 13,253,419 |
BlackRock Municipal Income Fund,
Inc. | | 432,048 | | | 5,210,499 |
BlackRock MuniHoldings California Quality Fund, Inc. | | 989,938 | | | 10,899,217 |
BlackRock MuniHoldings Fund, Inc. | | 388,323 | | | 4,690,942 |
BlackRock MuniHoldings New Jersey Quality Fund, Inc. | | 229,068 | | | 2,664,061 |
BlackRock MuniYield Fund, Inc. | | 209,986 | | | 2,322,445 |
BlackRock MuniYield Quality Fund III, Inc. | | 310,489 | | | 3,558,204 |
Blackstone Strategic Credit 2027 Term Fund | | 1,107,769 | | | 13,182,451 |
Brookfield Real Assets Income Fund,
Inc. | | 966,991 | | | 12,493,524 |
ClearBridge MLP & Midstream Fund, Inc. | | 267,804 | | | 12,260,067 |
DoubleLine Income Solutions Fund(a) | | 823,072 | | | 10,453,014 |
Description | | Shares | | Value |
Eagle Point Credit Co., Inc. | | 1,535,006 | | $ | 15,518,911 |
Eaton Vance Ltd. Duration Income
Fund | | 1,241,360 | | | 12,103,260 |
First Trust Intermediate Duration Preferred & Income Fund(a) | | 772,857 | | | 13,849,597 |
Flaherty & Crumrine Preferred and Income Securities Fund, Inc. | | 746,732 | | | 11,088,970 |
FS Credit Opportunities Corp. | | 2,017,301 | | | 11,962,595 |
Highland Opportunities and Income Fund | | 1,126,375 | | | 7,918,416 |
Invesco Senior Income Trust | | 2,670,995 | | | 11,431,859 |
Nuveen AMT-Free Municipal Credit Income Fund | | 556,441 | | | 6,760,758 |
Nuveen AMT-Free Quality Municipal Income Fund | | 702,802 | | | 7,780,018 |
Nuveen California Quality Municipal Income Fund | | 740,902 | | | 8,164,740 |
Nuveen Credit Strategies Income
Fund(a) | | 2,424,875 | | | 13,506,554 |
Nuveen Floating Rate Income Fund/Closed-end Fund | | 1,554,132 | | | 13,567,572 |
Nuveen Municipal Credit Income
Fund | | 623,345 | | | 7,629,743 |
Nuveen New York AMT-Free Quality Municipal Income Fund(a) | | 362,909 | | | 3,944,821 |
Nuveen Preferred & Income Opportunities Fund | | 1,854,872 | | | 13,336,530 |
Nuveen Quality Municipal Income
Fund | | 509,545 | | | 5,839,386 |
Oxford Lane Capital Corp.(a) | | 3,006,840 | | | 15,274,747 |
PIMCO Access Income Fund | | 977,581 | | | 15,377,349 |
PIMCO Corporate & Income Opportunity Fund | | 728,097 | | | 10,826,802 |
PIMCO Corporate & Income Strategy Fund(a) | | 186,295 | | | 2,602,541 |
Pimco Dynamic Income Fund(a) | | 840,641 | | | 16,215,966 |
PIMCO Dynamic Income Opportunities Fund(a) | | 1,167,822 | | | 15,380,216 |
PIMCO High Income Fund | | 1,363,283 | | | 6,734,618 |
PIMCO Income Strategy Fund II(a) | | 1,021,458 | | | 7,620,077 |
Western Asset Diversified Income
Fund | | 925,630 | | | 13,375,354 |
Western Asset Inflation-Linked Opportunities & Income Fund | | 1,394,776 | | | 12,036,917 |
| | | | | | 389,266,234 |
TOTAL INVESTMENT COMPANIES
(Cost $459,884,830) | | | | | 453,050,027 |
The accompanying notes are an integral part of the financial statements.
2
Amplify ETF Trust Amplify High Income ETF Schedule of Investments as of March 31, 2024 (Unaudited) (Continued) |
Description | | Shares | | Value |
SHORT-TERM INVESTMENTS — 1.4% | | | | | | |
Investments Purchased with Proceeds from Securities Lending — 1.3% | | | | | | |
First American Government Obligations Fund - Class X, 5.23%(b) | | 5,840,600 | | $ | 5,840,600 | |
Money Market Funds — 0.1% | | | | | | |
Invesco Government & Agency Portfolio - Institutional
Class, 5.24%(b) | | 428,528 | | | 428,528 | |
TOTAL SHORT-TERM INVESTMENTS
(Cost $6,269,128) | | | | | 6,269,128 | |
| | | | | | | |
TOTAL INVESTMENTS — 100.9%
(Cost $466,153,958) | | | | | 459,319,155 | |
Liabilities in Excess of Other Assets — (0.9)% | | | | | (4,141,992 | ) |
TOTAL NET ASSETS — 100.0% | | | | $ | 455,177,163 | |
The accompanying notes are an integral part of the financial statements.
3
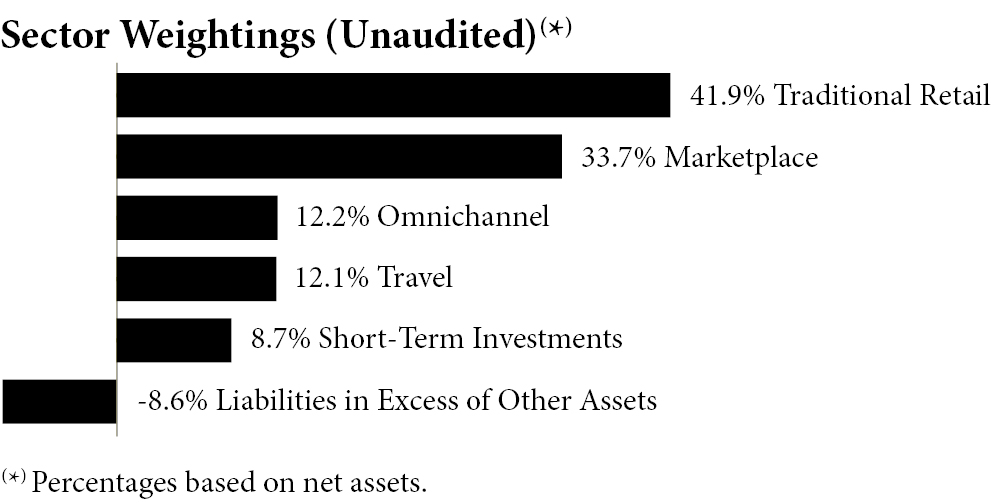
Amplify ETF Trust Amplify Online Retail ETF Schedule of Investments as of March 31, 2024 (Unaudited) |
Description | | Shares | | Value |
COMMON STOCKS — 99.9% | | | | | |
Marketplace — 33.7% | | | | | |
Affirm Holdings, Inc.(a) | | 168,455 | | $ | 6,276,634 |
Alibaba Group Holding Ltd. | | 123,900 | | | 1,112,123 |
BigCommerce Holdings, Inc.(a) | | 334,432 | | | 2,304,236 |
Copart, Inc.(a) | | 67,699 | | | 3,921,126 |
Coupang, Inc.(a) | | 187,747 | | | 3,340,019 |
Delivery Hero SE(a)(b)(c) | | 48,068 | | | 1,376,479 |
DoorDash, Inc. - Class A(a) | | 39,086 | | | 5,382,924 |
Etsy, Inc.(a) | | 48,903 | | | 3,360,614 |
Fiverr International Ltd.(a)(d) | | 60,429 | | | 1,273,239 |
Global-e Online Ltd.(a) | | 35,737 | | | 1,299,040 |
JD.com, Inc. - Class A | | 98,200 | | | 1,353,842 |
KE Holdings, Inc. - ADR | | 83,649 | | | 1,148,501 |
Maplebear, Inc.(a)(d) | | 118,424 | | | 4,416,031 |
Meituan - Class B(a)(b)(c) | | 89,000 | | | 1,100,780 |
MercadoLibre, Inc.(a) | | 954 | | | 1,442,410 |
Ozon Holdings PLC - ADR(a)(d)(e) | | 106,678 | | | 0 |
PayPal Holdings, Inc.(a) | | 57,425 | | | 3,846,901 |
PDD Holdings, Inc. - ADR(a) | | 12,035 | | | 1,399,069 |
Sea Ltd. - ADR(a) | | 30,634 | | | 1,645,352 |
Shopify, Inc. - Class A(a) | | 25,390 | | | 1,959,345 |
Uber Technologies, Inc.(a) | | 67,681 | | | 5,210,760 |
Upwork, Inc.(a) | | 297,241 | | | 3,644,175 |
Vivid Seats, Inc. - Class A(a) | | 517,697 | | | 3,101,005 |
VTEX - Class A(a) | | 228,560 | | | 1,867,335 |
| | | | | | 61,781,940 |
Omnichannel — 12.2% | | | | | |
Apple, Inc. | | 4,408 | | | 755,884 |
Best Buy Co., Inc. | | 11,740 | | | 963,032 |
Dick’s Sporting Goods, Inc. | | 7,152 | | | 1,608,199 |
Gap, Inc. | | 59,571 | | | 1,641,180 |
H & M Hennes & Mauritz AB - Class B | | 92,352 | | | 1,507,848 |
Home Depot, Inc. | | 2,691 | | | 1,032,268 |
Industria de Diseno Textil SA | | 35,549 | | | 1,791,790 |
Kohl’s Corp. | | 34,868 | | | 1,016,402 |
Description | | Shares | | Value |
Kroger Co. | | 16,959 | | $ | 968,868 |
Lululemon Athletica, Inc.(a) | | 1,940 | | | 757,861 |
Macy’s, Inc. | | 63,947 | | | 1,278,301 |
Next PLC | | 8,898 | | | 1,037,712 |
NIKE, Inc. - Class B | | 7,611 | | | 715,282 |
Nordstrom, Inc. | | 55,004 | | | 1,114,931 |
Tapestry, Inc. | | 29,075 | | | 1,380,481 |
Target Corp. | | 7,061 | | | 1,251,280 |
Ulta Beauty, Inc.(a) | | 2,039 | | | 1,066,152 |
Walmart, Inc. | | 13,989 | | | 841,718 |
Williams-Sonoma, Inc. | | 5,140 | | | 1,632,104 |
| | | | | | 22,361,293 |
Traditional — 41.9% | | | | | |
1-800-Flowers.com, Inc. - Class A(a) | | 383,752 | | | 4,156,034 |
Allegro.eu SA(a)(b)(c) | | 173,493 | | | 1,439,412 |
Amazon.com, Inc.(a) | | 21,658 | | | 3,906,670 |
ASKUL Corp. | | 95,400 | | | 1,386,765 |
Beyond, Inc.(a) | | 194,394 | | | 6,980,689 |
Carvana Co.(a)(d) | | 114,141 | | | 10,034,135 |
Chegg, Inc.(a) | | 395,518 | | | 2,994,071 |
Chewy, Inc. - Class A(a) | | 154,984 | | | 2,465,795 |
eBay, Inc. | | 77,112 | | | 4,069,971 |
Figs, Inc. - Class A(a) | | 560,760 | | | 2,792,585 |
HelloFresh SE(a) | | 55,967 | | | 398,448 |
Hims & Hers Health, Inc.(a) | | 503,632 | | | 7,791,187 |
IAC, Inc.(a) | | 70,512 | | | 3,761,110 |
Netflix, Inc.(a) | | 7,060 | | | 4,287,750 |
Ocado Group PLC(a) | | 214,233 | | | 1,231,635 |
Revolve Group, Inc.(a)(d) | | 219,739 | | | 4,651,875 |
Shutterstock, Inc. | | 79,968 | | | 3,663,334 |
Spotify Technology SA(a) | | 7,392 | | | 1,950,749 |
Vipshop Holdings Ltd. - ADR | | 86,387 | | | 1,429,705 |
Wayfair, Inc. - Class A(a) | | 66,848 | | | 4,537,642 |
Zalando SE(a)(b)(c) | | 52,655 | | | 1,506,411 |
ZOZO, Inc. | | 63,700 | | | 1,577,085 |
| | | | | | 77,013,058 |
Travel — 12.1% | | | | | |
Airbnb, Inc. - Class A(a) | | 24,830 | | | 4,095,957 |
Booking Holdings, Inc. | | 1,072 | | | 3,889,087 |
Expedia Group, Inc.(a) | | 31,811 | | | 4,381,965 |
MakeMyTrip Ltd.(a) | | 32,593 | | | 2,315,733 |
Trip.com Group Ltd.(a) | | 37,250 | | | 1,642,980 |
TripAdvisor, Inc.(a) | | 207,585 | | | 5,768,788 |
| | | | | | 22,094,510 |
TOTAL COMMON STOCKS (Cost $225,312,082) | | | | | 183,250,801 |
The accompanying notes are an integral part of the financial statements.
4
Amplify ETF Trust Amplify Online Retail ETF Schedule of Investments as of March 31, 2024 (Unaudited) (Continued) |
Description | | Shares | | Value |
SHORT-TERM INVESTMENTS — 8.7% | | | | | | |
Investments Purchased with Proceeds from Securities Lending — 8.6% | | | | | | |
First American Government Obligations Fund - Class X, 5.23%(f) | | 15,824,515 | | $ | 15,824,515 | |
Money Market Funds — 0.1% | | | | | | |
Invesco Government & Agency Portfolio - Institutional
Class, 5.24%(f) | | 142,275 | | | 142,275 | |
TOTAL SHORT-TERM INVESTMENTS
(Cost $15,966,790) | | | | | 15,966,790 | |
| | | | | | | |
TOTAL INVESTMENTS — 108.6%
(Cost $241,278,872) | | | | | 199,217,591 | |
Liabilities in Excess of Other Assets — (8.6)% | | | | | (15,805,434 | ) |
TOTAL NET ASSETS — 100.0% | | | | $ | 183,412,157 | |
The accompanying notes are an integral part of the financial statements.
5
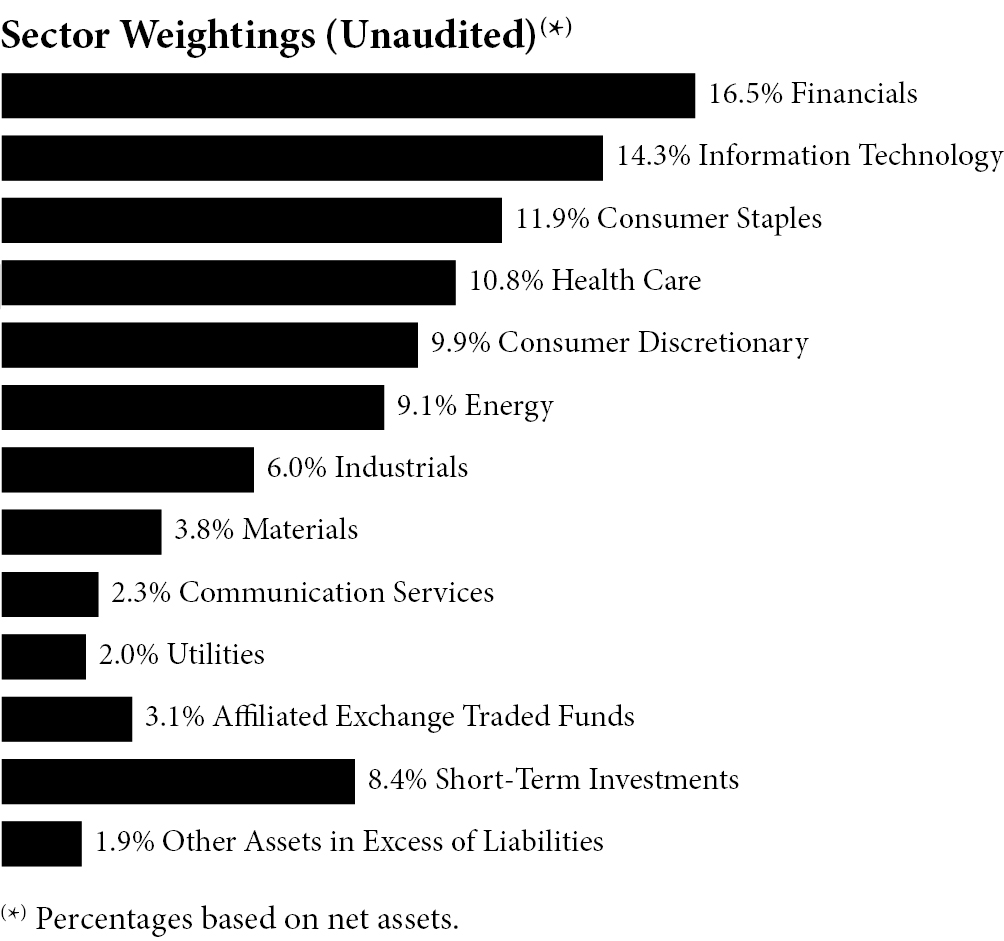
Amplify ETF Trust Amplify CWP Enhanced Dividend Income ETF Schedule of Investments as of March 31, 2024 (Unaudited) |
Description | | Shares | | Value |
COMMON STOCKS — 86.6% | | | | | |
Communication Services — 2.3% | | | | | |
Verizon Communications, Inc. | | 1,712,386 | | $ | 71,851,717 |
Consumer Discretionary — 9.9% | | | | | |
Home Depot, Inc. | | 440,377 | | | 168,928,617 |
McDonald’s Corp.(a) | | 507,362 | | | 143,050,716 |
| | | | | | 311,979,333 |
Consumer Staples — 11.9% | | | | | |
Coca-Cola Co. | | 1,038,965 | | | 63,563,879 |
Procter & Gamble Co. | | 963,004 | | | 156,247,399 |
Walmart, Inc.(a) | | 2,607,785 | | | 156,910,423 |
| | | | | | 376,721,701 |
Energy — 9.1% | | | | | |
Chevron Corp.(a) | | 974,265 | | | 153,680,561 |
ConocoPhillips | | 482,597 | | | 61,424,946 |
Marathon Petroleum Corp. | | 367,356 | | | 74,022,234 |
| | | | | | 289,127,741 |
Financials — 16.5% | | | | | |
CME Group, Inc. | | 492,918 | | | 106,120,316 |
Goldman Sachs Group, Inc. | | 373,728 | | | 156,102,448 |
JPMorgan Chase & Co. | | 512,382 | | | 102,630,115 |
Visa, Inc. - Class A(a) | | 567,483 | | | 158,373,156 |
| | | | | | 523,226,035 |
Health Care — 10.8% | | | | | |
Amgen, Inc. | | 275,396 | | | 78,300,591 |
Merck & Co., Inc. | | 785,793 | | | 103,685,386 |
UnitedHealth Group, Inc. | | 323,080 | | | 159,827,676 |
| | | | | | 341,813,653 |
Description | | Shares | | Value |
Industrials — 6.0% | | | | | |
Caterpillar, Inc. | | 332,158 | | $ | 121,712,656 |
Deere & Co. | | 166,649 | | | 68,449,410 |
| | | | | | 190,162,066 |
Information Technology — 14.3% | | | | | |
Apple, Inc. | | 531,329 | | | 91,112,297 |
Broadcom, Inc. | | 23,835 | | | 31,591,147 |
Cisco Systems, Inc. | | 1,260,533 | | | 62,913,202 |
International Business Machines Corp. | | 475,784 | | | 90,855,713 |
Microsoft Corp. | | 414,667 | | | 174,458,700 |
| | | | | | 450,931,059 |
Materials — 3.8% | | | | | |
Agnico Eagle Mines Ltd.(a) | | 859,456 | | | 51,266,550 |
Freeport-McMoRan, Inc. | | 1,455,615 | | | 68,443,018 |
| | | | | | 119,709,568 |
Utilities — 2.0% | | | | | |
Duke Energy Corp.(a) | | 643,487 | | | 62,231,628 |
TOTAL COMMON STOCKS (Cost $2,346,549,383) | | | | | 2,737,754,501 |
| | | | | | |
AFFILIATED EXCHANGE TRADED FUNDS — 3.1% | | | | | |
Amplify Samsung SOFR ETF(b)(c) | | 986,646 | | | 98,926,061 |
TOTAL AFFILIATED EXCHANGE TRADED FUNDS
(Cost $99,022,082) | | | | | 98,926,061 |
| | | | | | |
SHORT-TERM INVESTMENTS — 8.4% | | | | | |
Investments Purchased with Proceeds from Securities
Lending — 0.0%(d) | | | | | |
First American Government Obligations Fund - Class X,
5.23%(e) | | 73,831 | | | 73,831 |
Money Market Funds — 8.4% | | | | | |
Invesco Government & Agency Portfolio - Institutional Class,
5.24%(e) | | 264,406,249 | | | 264,406,249 |
TOTAL SHORT-TERM INVESTMENTS
(Cost $264,480,080) | | | | | 264,480,080 |
| | | | | | |
TOTAL INVESTMENTS — 98.1%
(Cost $2,710,051,545) | | | | | 3,101,160,642 |
Other Assets in Excess of
Liabilities — 1.9% | | | | | 59,095,014 |
TOTAL NET ASSETS — 100.0% | | | | $ | 3,160,255,656 |
The accompanying notes are an integral part of the financial statements.
6
Amplify ETF Trust Amplify CWP Enhanced Dividend Income ETF Schedule of Investments as of March 31, 2024 (Unaudited) (Continued) |
The accompanying notes are an integral part of the financial statements.
7
Amplify ETF Trust Amplify CWP Enhanced Dividend Income ETF Schedule of Options Written as of March 31, 2024 (Unaudited) |
| | Notional
Amount | | Contracts | | Value |
CALL OPTIONS WRITTEN — (0.1)%(a)(b) | | | | | | | | | | | |
Agnico Eagle Mines Ltd., Expiration: 04/19/2024; Exercise Price: $60.00 | | $ | (43,437,130 | ) | | (7,282 | ) | | $ | (1,001,275 | ) |
Chevron Corp.,
Expiration: 04/19/2024; Exercise Price: $157.50 | | | (86,757,000 | ) | | (5,500 | ) | | | (1,540,000 | ) |
Duke Energy Corp., Expiration: 04/19/2024; Exercise Price: $100.00 | | | (10,638,100 | ) | | (1,100 | ) | | | (27,500 | ) |
McDonald’s Corp., Expiration: 04/19/2024; Exercise Price: $295.00 | | | (119,828,750 | ) | | (4,250 | ) | | | (140,250 | ) |
Visa, Inc.,
Expiration: 04/19/2024; Exercise Price: $287.50 | | | (118,609,000 | ) | | (4,250 | ) | | | (476,000 | ) |
Walmart, Inc.,
Expiration: 04/12/2024; Exercise Price: $62.00 | | | (84,238,000 | ) | | (14,000 | ) | | | (147,000 | ) |
TOTAL OPTIONS WRITTEN
(Premiums received $3,609,058) | | | | | | | | | $ | (3,332,025 | ) |
The accompanying notes are an integral part of the financial statements.
8
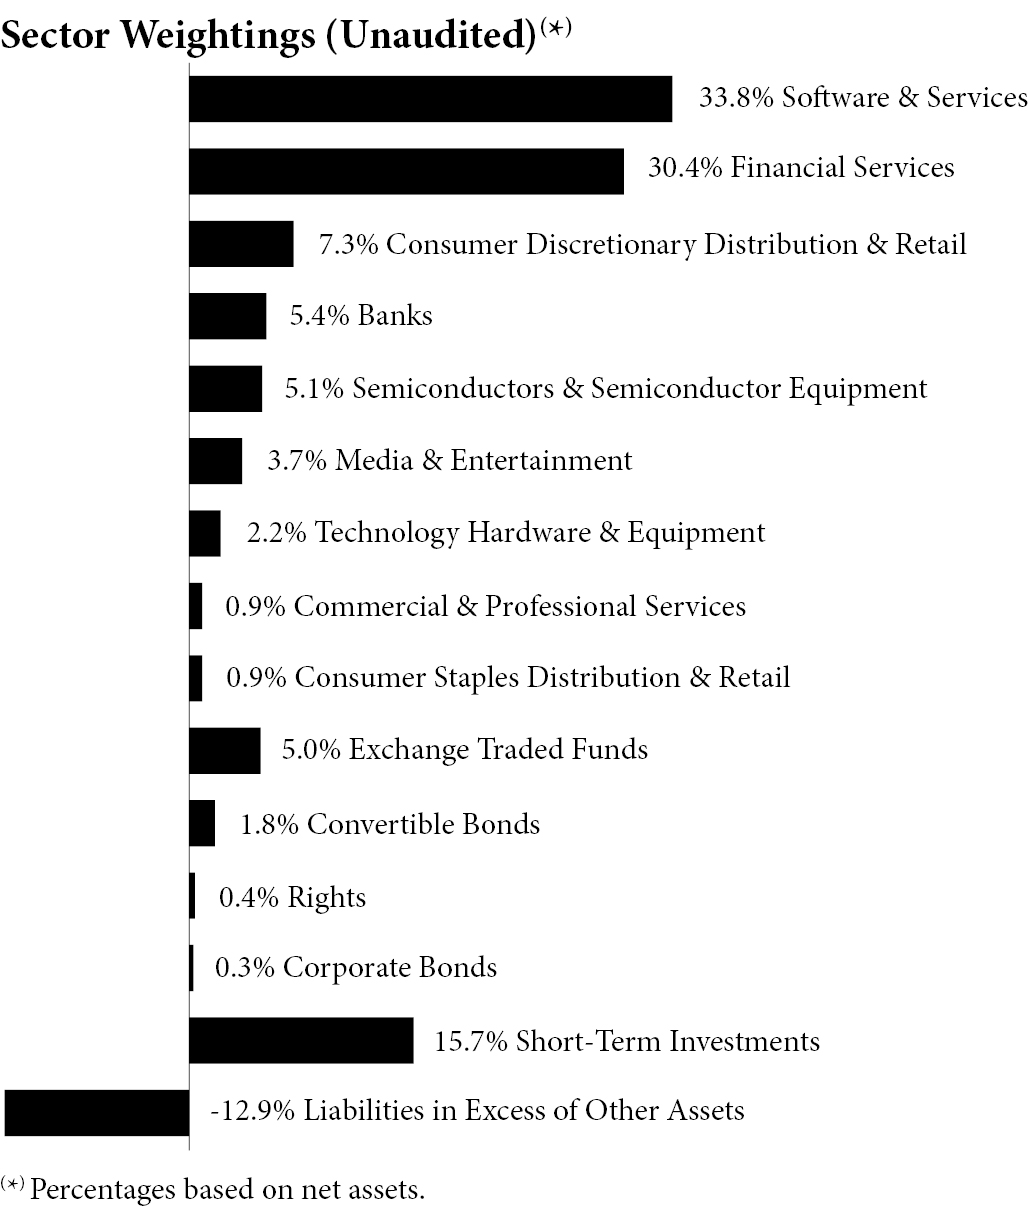
Amplify ETF Trust Amplify Transformational Data Sharing ETF Schedule of Investments as of March 31, 2024 (Unaudited) |
Description | | Shares | | Value |
COMMON STOCKS — 89.7% | | | | | |
Banks — 5.4% | | | | | |
Customers Bancorp, Inc.(a) | | 197,290 | | $ | 10,468,207 |
DBS Group Holdings Ltd. | | 323,138 | | | 8,622,597 |
NU Holdings Ltd./Cayman Islands - Class A(a) | | 1,849,825 | | | 22,068,412 |
| | | | | | 41,159,216 |
Commercial & Professional Services — 0.9% | | | | | |
CACI International, Inc.(a) | | 18,720 | | | 7,091,698 |
Consumer Discretionary Distribution & Retail — 7.3% | | | | | |
Alibaba Group Holding Ltd. - ADR | | 97,053 | | | 7,022,755 |
Beyond, Inc.(a) | | 927,611 | | | 33,310,512 |
MercadoLibre, Inc.(a) | | 9,696 | | | 14,659,964 |
| | | | | | 54,993,231 |
Consumer Staples Distribution & Retail — 0.9% | | | | | |
Walmart, Inc. | | 116,355 | | | 7,001,080 |
Financial Services — 30.4% | | | | | |
BlackRock, Inc. | | 13,923 | | | 11,607,605 |
Block, Inc.(a) | | 271,472 | | | 22,961,102 |
CME Group, Inc. | | 73,870 | | | 15,903,472 |
Description | | Shares | | Value |
Coinbase Global, Inc. - Class A(a) | | 130,106 | | $ | 34,493,703 |
Franklin Resources, Inc. | | 261,538 | | | 7,351,833 |
Galaxy Digital Holdings Ltd.(a) | | 3,584,876 | | | 38,295,490 |
Mastercard, Inc. - Class A | | 18,022 | | | 8,678,854 |
Mogo, Inc.(a)(b) | | 1,352,143 | | | 2,704,286 |
PayPal Holdings, Inc.(a) | | 373,220 | | | 25,002,008 |
Robinhood Markets, Inc. - Class A(a) | | 1,302,872 | | | 26,226,813 |
SBI Holdings, Inc. | | 890,574 | | | 23,267,408 |
Visa, Inc. - Class A | | 26,024 | | | 7,262,778 |
WisdomTree, Inc. | | 462,682 | | | 4,252,048 |
| | | | | | 228,007,400 |
Media & Entertainment — 3.7% | | | | | |
LY Corp. | | 2,634,740 | | | 6,657,339 |
ROBLOX Corp. - Class A(a) | | 541,800 | | | 20,685,924 |
| | | | | | 27,343,263 |
Semiconductors & Semiconductor Equipment — 5.1% | | | | | |
Advanced Micro Devices, Inc.(a) | | 78,782 | | | 14,219,363 |
Broadcom, Inc. | | 4,963 | | | 6,578,010 |
QUALCOMM, Inc. | | 41,644 | | | 7,050,329 |
Taiwan Semiconductor Manufacturing Co. Ltd. - ADR | | 79,922 | | | 10,873,388 |
| | | | | | 38,721,090 |
Software & Services — 33.8% | | | | | |
Accenture PLC - Class A | | 44,567 | | | 15,447,368 |
BIGG Digital Assets, Inc.(a)(b) | | 6,353,087 | | | 867,684 |
Bitfarms Ltd./Canada(a)(b) | | 6,942,531 | | | 15,481,844 |
Cipher Mining, Inc.(a)(b) | | 2,233,737 | | | 11,503,744 |
Cleanspark, Inc.(a) | | 1,183,456 | | | 25,101,102 |
Core Scientific, Inc.(a)(b) | | 3,383,550 | | | 11,977,767 |
Digital Garage, Inc. | | 416,452 | | | 9,023,402 |
GMO internet group, Inc. | | 939,412 | | | 16,960,055 |
Hive Digital Technologies Ltd.(a)(b) | | 3,452,957 | | | 11,636,465 |
Hut 8 Corp.(a)(b) | | 1,555,273 | | | 17,170,214 |
International Business Machines Corp. | | 111,166 | | | 21,228,259 |
Marathon Digital Holdings, Inc.(a)(b) | | 1,104,594 | | | 24,941,732 |
MicroStrategy, Inc.(a)(b) | | 19,786 | | | 33,726,424 |
Opera Ltd. - ADR(b) | | 438,049 | | | 6,925,555 |
Oracle Corp. | | 87,051 | | | 10,934,476 |
Riot Platforms, Inc.(a)(b) | | 1,660,683 | | | 20,326,760 |
| | | | | | 253,252,852 |
Technology Hardware &
Equipment — 2.2% | | | |
Canaan, Inc. - ADR(a)(b) | | 2,651,419 | | | 4,030,157 |
CompoSecure, Inc. - Class A(a) | | 1,721,693 | | | 12,447,840 |
| | | | | | 16,477,997 |
TOTAL COMMON STOCKS
(Cost $757,086,432) | | | | | 674,047,827 |
The accompanying notes are an integral part of the financial statements.
9
Amplify ETF Trust Amplify Transformational Data Sharing ETF Schedule of Investments as of March 31, 2024 (Unaudited) (Continued) |
Description | | Shares | | Value |
EXCHANGE TRADED FUNDS — 5.0% | | | | | |
3iQ Bitcoin ETF(a) | | 292,525 | | $ | 3,336,541 |
Bitcoin ETF(a) | | 115,361 | | | 2,961,317 |
CI Galaxy Bitcoin ETF(a) | | 1,254,170 | | | 16,655,377 |
Purpose Bitcoin ETF(a)(b) | | 1,125,675 | | | 14,487,437 |
TOTAL EXCHANGE TRADED FUNDS
(Cost $24,402,112) | | | | | 37,440,672 |
| | Par | | |
CONVERTIBLE BONDS — 1.8% | | | | | | | |
Core Scientific, Inc., 4.00% Cash and 12.00% PIK, 01/23/2029(a) | | $ | 14,836,015 | | | 13,222,598 | |
TOTAL CONVERTIBLE BONDS
(Cost $14,836,015) | | | | | | 13,222,598 | |
| | | | | | | | |
| | | Contracts | | |
RIGHTS — 0.4% | | | | | | | |
Core Scientific, Inc.(a) | | | 3,409,449 | | | 2,727,559 | |
TOTAL RIGHTS
(Cost $0) | | | | | | 2,727,559 | |
| | | | | | | | |
| | | Par | | |
CORPORATE BONDS — 0.3% | | | | | | | |
MicroStrategy, Inc., 6.13%, 06/15/2028(a)(c) | | $ | 2,000,000 | | | 1,934,258 | |
TOTAL CORPORATE BONDS
(Cost $1,591,694) | | | | | | 1,934,258 | |
| | | | | | | | |
| | | | Shares | | | | |
SHORT-TERM INVESTMENTS — 15.7% | | | | | | | |
Investments Purchased with Proceeds from Securities Lending — 14.1% | | | | | | | |
First American Government Obligations Fund - Class X, 5.23%(d) | | | 106,201,451 | | | 106,201,451 | |
Money Market Funds — 1.6% | | | | | | | |
Invesco Government & Agency Portfolio - Institutional Class, 5.24%(d) | | | 11,800,634 | | | 11,800,634 | |
TOTAL SHORT-TERM INVESTMENTS
(Cost $118,002,085) | | | | | | 118,002,085 | |
| | | | | | | | |
TOTAL INVESTMENTS — 112.9%
(Cost $915,918,338) | | | | | | 847,374,999 | |
Liabilities in Excess of Other Assets — (12.9)% | | | | | | (96,812,122 | ) |
TOTAL NET ASSETS — 100.0% | | | | | $ | 750,562,877 | |
Percentages are stated as a percent of net assets.
ADR - American Depositary Receipt
PIK - Payment in Kind
PLC - Public Limited Company
The Global Industry Classification Standard (GICS®) was developed by and/or is the exclusive property of MSCI, Inc. and Standard & Poor’s Financial Services LLC (“S&P”). GICS is a service mark of MSCI, Inc. and S&P and has been licensed for use by U.S. Bank Global Fund Services.
(a) Non-income producing security.
(b) All or a portion of this security is on loan as of March 31, 2024. The total market value of these securities was $98,438,702 which represented 13.1% of net assets.
(c) Security is exempt from registration pursuant to Rule 144A under the Securities Act of 1933, as amended. These securities may only be resold in transactions exempt from registration to qualified institutional investors. As of March 31, 2024, the value of these securities total $1,934,258 or 0.3% of the Fund’s net assets.
(d) The rate shown represents the 7-day effective yield as of March 31, 2024.
The accompanying notes are an integral part of the financial statements.
10
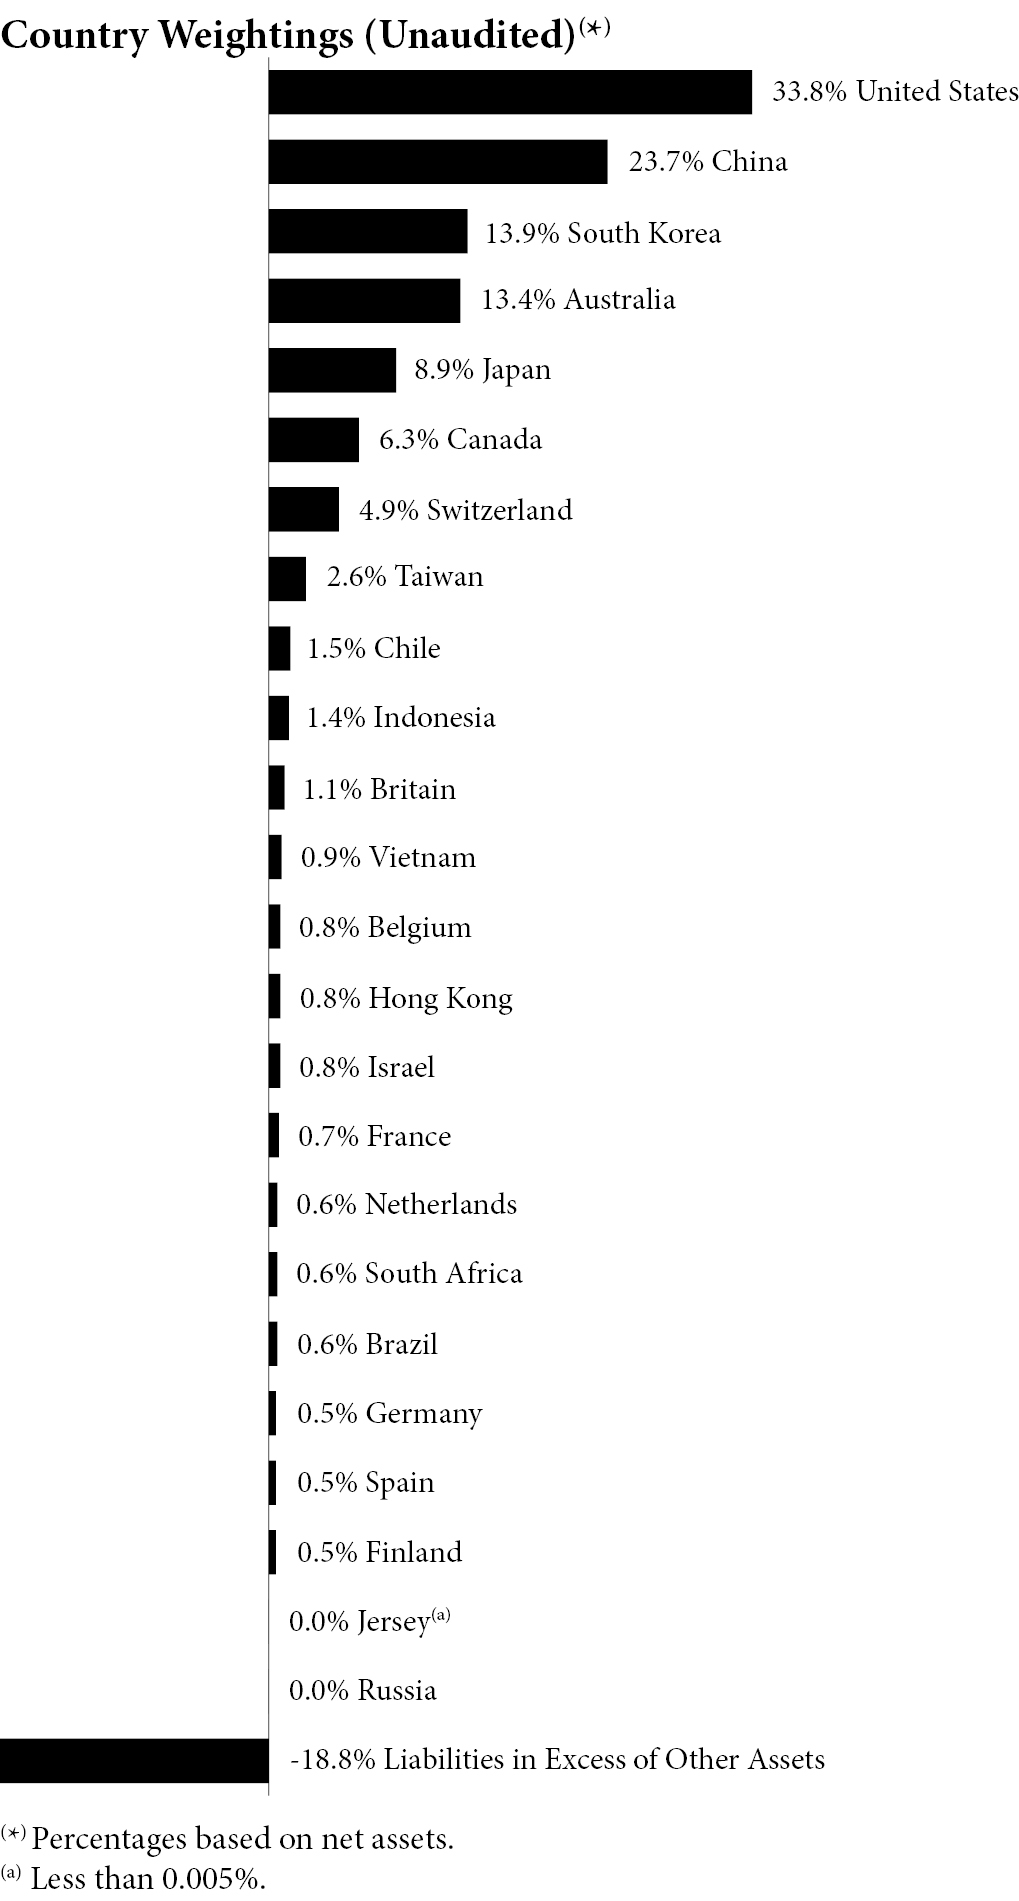
Amplify ETF Trust Amplify Lithium & Battery Technology ETF Schedule of Investments as of March 31, 2024 (Unaudited) |
Description | | Shares | | Value |
COMMON STOCKS — 99.4% | | | | | |
Consumer Discretionary — 20.3% | | | | | |
BAIC Motor Corp. Ltd. -
Class H(a)(b) | | 651,894 | | $ | 178,238 |
BYD Co. Ltd. | | 173,060 | | | 4,457,563 |
EVgo, Inc.(c)(d) | | 222,930 | | | 559,554 |
Li Auto, Inc. - ADR(c) | | 60,756 | | | 1,839,691 |
Lucid Group, Inc.(c)(d) | | 153,251 | | | 436,765 |
NIO, Inc. - ADR(c)(d) | | 126,061 | | | 567,275 |
Description | | Shares | | Value |
Panasonic Holdings Corp. | | 193,782 | | $ | 1,841,428 |
Polestar Automotive Holding UK PLC - ADR(c)(d) | | 170,730 | | | 262,924 |
QuantumScape Corp.(c)(d) | | 40,037 | | | 251,833 |
Rivian Automotive, Inc. - Class A(c) | | 61,109 | | | 669,144 |
Tesla, Inc.(c) | | 30,479 | | | 5,357,904 |
Vinfast Auto Ltd.(c)(d) | | 153,560 | | | 763,193 |
XPeng, Inc. - ADR(c) | | 61,382 | | | 471,414 |
Yadea Group Holdings Ltd.(a)(b) | | 236,766 | | | 383,574 |
Zhejiang Leapmotor Technology Co. Ltd.(a)(b)(c) | | 100,016 | | | 335,435 |
| | | | | | 18,375,935 |
Industrials — 26.9%(e) | | | | | |
Advanced Energy Solution Holding Co. Ltd. | | 28,442 | | | 615,880 |
ChargePoint Holdings, Inc.(c)(d) | | 249,787 | | | 474,595 |
Contemporary Amperex Technology Co. Ltd. | | 263,244 | | | 6,875,897 |
Ecopro BM Co. Ltd.(c) | | 8,858 | | | 1,825,883 |
EnerSys | | 7,078 | | | 668,588 |
Enovix Corp.(c)(d) | | 56,175 | | | 449,962 |
FuelCell Energy, Inc.(c)(d) | | 397,854 | | | 473,446 |
GS Yuasa Corp. | | 35,713 | | | 740,305 |
Kempower Oyj(c)(d) | | 18,495 | | | 410,641 |
L&F Co. Ltd.(c) | | 7,292 | | | 954,392 |
LG Energy Solution Ltd.(c) | | 15,232 | | | 4,542,728 |
Microvast Holdings, Inc.(c)(d) | | 516,358 | | | 432,192 |
Nikola Corp.(c)(d) | | 703,811 | | | 731,963 |
Plug Power, Inc.(c)(d) | | 136,704 | | | 470,262 |
Shin Heung Energy & Electronics Co. Ltd. | | 15,090 | | | 696,074 |
SK IE Technology Co. Ltd.(a)(b)(c) | | 14,162 | | | 768,982 |
Sociedad Quimica y Minera de Chile SA - ADR(d) | | 27,709 | | | 1,362,174 |
Varta AG(c)(d) | | 28,817 | | | 460,277 |
Vitzrocell Co. Ltd. | | 38,909 | | | 538,729 |
Wallbox NV(c)(d) | | 308,275 | | | 437,751 |
W-Scope Corp.(c) | | 90,696 | | | 326,525 |
| | | | | | 24,257,246 |
Information Technology — 12.0% | | | | | |
Dynapack International Technology Corp. | | 179,984 | | | 534,269 |
Lotte Energy Materials Corp. | | 21,792 | | | 808,550 |
NAURA Technology Group Co. Ltd. | | 43,864 | | | 1,861,327 |
NEC Corp. | | 23,460 | | | 1,707,041 |
Phoenix Silicon International Corp. | | 299,199 | | | 481,471 |
Power Logics Co. Ltd.(c) | | 57,951 | | | 390,429 |
Samsung SDI Co. Ltd. | | 5,668 | | | 2,010,377 |
The accompanying notes are an integral part of the financial statements.
11
Amplify ETF Trust Amplify Lithium & Battery Technology ETF Schedule of Investments as of March 31, 2024 (Unaudited) (Continued) |
Description | | Shares | | Value |
Simplo Technology Co. Ltd. | | 49,848 | | $ | 703,247 |
SolarEdge Technologies, Inc.(c) | | 10,034 | | | 712,213 |
TDK Corp. | | 31,886 | | | 1,557,018 |
| | | | | | 10,765,942 |
Materials — 40.2%(e) | | | | | |
African Rainbow Minerals Ltd. | | 61,267 | | | 532,059 |
Albemarle Corp. | | 10,775 | | | 1,419,498 |
Alpha HPA Ltd.(c) | | 952,242 | | | 546,064 |
AMG Critical Materials NV | | 24,275 | | | 551,020 |
Aneka Tambang Tbk | | 6,355,908 | | | 641,404 |
Arcadium Lithium PLC(c) | | 4,372 | | | 19,316 |
BHP Group Ltd. - ADR(d) | | 96,372 | | | 5,559,701 |
CMOC Group Ltd. - Class H | | 2,524,517 | | | 2,144,915 |
Core Lithium Ltd.(c) | | 4,038,626 | | | 407,923 |
Eramet SA | | 8,500 | | | 646,044 |
First Quantum Minerals Ltd. | | 90,078 | | | 968,245 |
Ganfeng Lithium Group Co. Ltd. - Class H(a)(b) | | 361,827 | | | 1,107,176 |
Glencore PLC | | 810,914 | | | 4,455,267 |
IGO Ltd. | | 148,767 | | | 685,392 |
Ivanhoe Electric, Inc./US(c)(d) | | 62,282 | | | 610,364 |
Jinchuan Group International Resources Co. Ltd. | | 7,091,335 | | | 742,937 |
Johnson Matthey PLC | | 33,538 | | | 757,282 |
Leo Lithium Ltd.(c)(f) | | 742,011 | | | 0 |
Liontown Resources Ltd.(c) | | 926,034 | | | 706,035 |
Lithium Americas Argentina Corp.(c) | | 119,143 | | | 642,181 |
Lithium Americas Corp.(c)(d) | | 120,949 | | | 812,777 |
Lundin Mining Corp. | | 101,294 | | | 1,036,458 |
Mineral Resources Ltd. | | 24,219 | | | 1,118,490 |
MMC Norilsk Nickel PJSC - ADR(c)(f) | | 182,937 | | | 0 |
MP Materials Corp.(c) | | 37,670 | | | 538,681 |
Nickel Industries Ltd. | | 1,289,654 | | | 680,725 |
Patriot Battery Metals, Inc.(c) | | 112,005 | | | 697,060 |
Pilbara Minerals Ltd. | | 387,291 | | | 966,606 |
Resonac Holdings Corp. | | 34,055 | | | 788,723 |
Sayona Mining Ltd.(c) | | 18,212,101 | | | 462,848 |
Sigma Lithium Corp.(c)(d) | | 38,698 | | | 501,526 |
South32 Ltd. | | 496,540 | | | 970,708 |
Standard Lithium Ltd.(c) | | 308,016 | | | 363,459 |
Sumitomo Metal Mining Co. Ltd. | | 34,930 | | | 1,034,425 |
Tianqi Lithium Corp. | | 235,914 | | | 1,097,148 |
TMC the metals co., Inc.(c)(d) | | 365,385 | | | 522,501 |
Umicore SA | | 35,146 | | | 758,158 |
Vale Indonesia Tbk PT | | 2,574,504 | | | 660,879 |
| | | | | | 36,153,995 |
TOTAL COMMON STOCKS
(Cost $121,452,439) | | | | | 89,553,118 |
Description | | Shares | | Value |
SHORT-TERM INVESTMENTS — 19.4% | | | | | | |
Investments Purchased with Proceeds from Securities Lending — 19.2% | | | | | | |
First American Government Obligations Fund - Class X, 5.23%(g) | | 17,317,647 | | $ | 17,317,647 | |
Money Market Funds — 0.2% | | | | | | |
Invesco Government & Agency Portfolio - Institutional
Class, 5.24%(g) | | 165,505 | | | 165,505 | |
TOTAL SHORT-TERM INVESTMENTS
(Cost $17,483,152) | | | | | 17,483,152 | |
| | | | | | | |
TOTAL INVESTMENTS — 118.8%
(Cost $138,935,591) | | | | | 107,036,270 | |
Liabilities in Excess of Other Assets — (18.8)% | | | | | (16,936,455 | ) |
TOTAL NET ASSETS — 100.0% | | | | $ | 90,099,815 | |
Percentages are stated as a percent of net assets.
The Global Industry Classification Standard (GICS®) was developed by and/or is the exclusive property of MSCI, Inc. and Standard & Poor’s Financial Services LLC (“S&P”). GICS is a service mark of MSCI, Inc. and S&P and has been licensed for use by U.S. Bank Global Fund Services.
ADR - American Depositary Receipt
AG - Aktiengesellschaft
NV - Naamloze Vennootschap
PJSC - Public Joint Stock Company
PLC - Public Limited Company
SA - Sociedad Anónima
(a) Security is exempt from registration pursuant to Rule 144A under the Securities Act of 1933, as amended. These securities may only be resold in transactions exempt from registration to qualified institutional investors. As of March 31, 2024, the value of these securities total $2,773,405 or 3.1% of the Fund’s net assets.
(b) Security is exempt from registration pursuant to Regulation S under the Securities Act of 1933, as amended. As of March 31, 2024, the value of these securities total $2,773,405 or 3.1% of the Fund’s net assets.
(c) Non-income producing security.
(d) All or a portion of this security is on loan as of March 31, 2024. The total market value of these securities was $16,332,991 which represented 18.1% of net assets.
(e) To the extent that the Fund invests more heavily in a particular industry or sector of the economy, its performance will be especially sensitive to developments that significantly affect those industries or sectors.
(f) Fair value determined using significant unobservable inputs in accordance with procedures established by and under the supervision of the Adviser, acting as Valuation Designee. These securities represented $0 or 0.0% of net assets as of March 31, 2024.
(g) The rate shown represents the 7-day effective yield as of March 31, 2024.
The accompanying notes are an integral part of the financial statements.
12
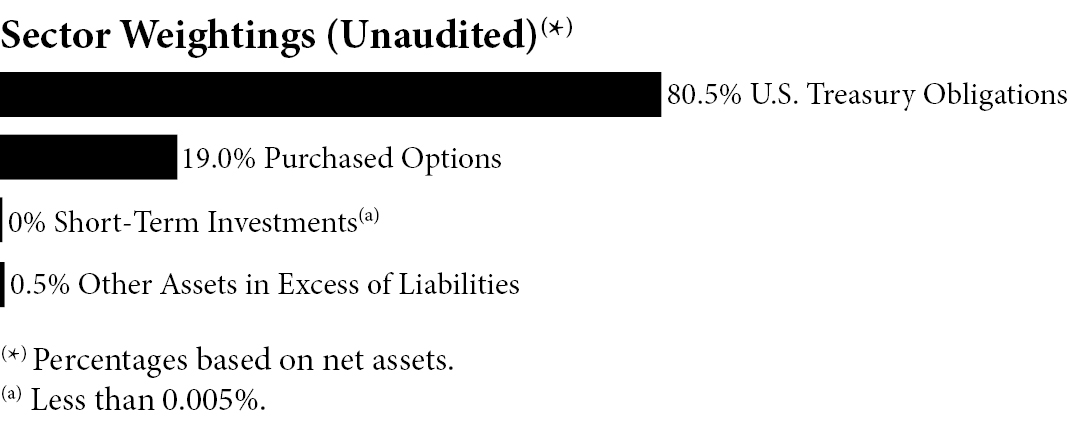
Amplify ETF Trust Amplify BlackSwan Growth & Treasury Core ETF Schedule of Investments as of March 31, 2024 (Unaudited) |
Description | | | | Par | | Value |
U.S. TREASURY OBLIGATIONS — 80.5% | | | |
United States Treasury Note/Bond | | | | | | | | | |
2.38%, 05/15/2029 | | | | | $ | 15,662,000 | | $ | 14,340,519 |
1.75%, 11/15/2029 | | | | | | 16,308,000 | | | 14,373,655 |
0.63%, 05/15/2030 | | | | | | 17,873,000 | | | 14,449,552 |
0.88%, 11/15/2030 | | | | | | 17,782,000 | | | 14,408,976 |
1.63%, 05/15/2031 | | | | | | 17,033,000 | | | 14,370,263 |
1.38%, 11/15/2031 | | | | | | 17,600,000 | | | 14,391,781 |
2.88%, 05/15/2032 | | | | | | 15,745,000 | | | 14,311,036 |
4.13%, 11/15/2032 | | | | | | 14,340,000 | | | 14,256,817 |
3.38%, 05/15/2033 | | | | | | 15,229,000 | | | 14,281,947 |
4.50%, 11/15/2033 | | | | | | 13,895,000 | | | 14,219,579 |
TOTAL U.S. TREASURY OBLIGATIONS
(Cost $146,800,017) | | | | | | | | | 143,404,125 |
| | | | | | | | | | |
| | | Notional
Amount | | Contracts | | |
PURCHASED OPTIONS — 19.0%(a)(b) | | | | | | | | | |
Call Options — 19.0% | | | | | | | | | |
SPDR S&P 500 ETF | | | | | | | | | |
Expiration: 06/21/2024; Exercise Price: $400.00 | | $ | 70,719,064 | | | 1,352 | | | 17,423,224 |
Expiration: 12/20/2024; Exercise Price: $440.00 | | | 83,795,814 | | | 1,602 | | | 16,478,172 |
Total Call Options | | | | | | | | | 33,901,396 |
TOTAL PURCHASED OPTIONS
(Cost $15,929,790) | | | | | | | | | 33,901,396 |
| | | | | | | | | | |
| | | | | Shares | | |
SHORT-TERM INVESTMENTS — 0.0%(c) | | | | | | | | | |
Money Market Funds — 0.0%(c) | | | | | | | | | |
Dreyfus Treasury Securities Cash Management, 4.39%(d) | | | | | | 28,819 | | | 28,819 |
Invesco Government & Agency Portfolio - Institutional Class, 5.24%(d) | | | | | | 2,239 | | | 2,239 |
TOTAL SHORT-TERM INVESTMENTS
(Cost $31,058) | | | | | | | | | 31,058 |
| | | | | | | | | | |
TOTAL INVESTMENTS — 99.5%
(Cost $162,760,865) | | | | | | | | | 177,336,579 |
Other Assets in Excess of Liabilities — 0.5% | | | | | | | | | 885,981 |
TOTAL NET ASSETS — 100.0% | | | | | | | | $ | 178,222,560 |
Percentages are stated as a percent of net assets.
(a) Exchange-traded.
(b) 100 shares per contract.
(c) Represents less than 0.05% of net assets.
(d) The rate shown represents the 7-day effective yield as of March 31, 2024.
The accompanying notes are an integral part of the financial statements.
13
Amplify ETF Trust Amplify Emerging Markets FinTech ETF Schedule of Investments as of March 31, 2024 (Unaudited) |
Description | | Shares | | Value |
COMMON STOCKS — 99.5% | | | | | |
Banking — 8.7% | | | | | |
Bank BTPN Syariah Tbk PT | | 623,200 | | $ | 53,260 |
Bank Jago Tbk PT(a) | | 296,900 | | | 49,998 |
NU Holdings Ltd. - Class A(a) | | 6,624 | | | 79,024 |
TCS Group Holding PLC - GDR(a)(b)(c) | | 2,536 | | | 0 |
| | | | | | 182,282 |
Digital Assets/Wallets — 9.1% | | | | | |
Danal Co. Ltd.(a) | | 20,160 | | | 61,847 |
Discovery Ltd. | | 8,000 | | | 50,963 |
OSL Group Ltd.(a) | | 73,000 | | | 79,282 |
| | | | | | 192,092 |
Fintech Software — 9.6% | | | | | |
Bairong, Inc.(a)(c)(d) | | 26,000 | | | 36,809 |
GoTo Gojek Tokopedia Tbk PT(a) | | 10,458,000 | | | 45,513 |
Linklogis, Inc. - Class B(c)(d) | | 275,500 | | | 49,281 |
Sapiens International Corp. NV | | 2,164 | | | 69,594 |
| | | | | | 201,197 |
Description | | Shares | | Value |
Insurance — 3.8% | | | | | |
Ping An Insurance Group Co. of China Ltd. - Class H | | 9,500 | | $ | 40,117 |
Renaissance Insurance Group JSC(b) | | 196,320 | | | 0 |
ZhongAn Online P&C Insurance Co. Ltd. - Class H(a)(c)(d) | | 25,500 | | | 40,727 |
| | | | | | 80,844 |
Investment & Trading — 7.9% | | | | | |
Futu Holdings Ltd. - ADR(a) | | 1,272 | | | 68,878 |
Up Fintech Holding Ltd. - ADR(a) | | 10,588 | | | 36,423 |
XP, Inc. - Class A | | 2,368 | | | 60,763 |
| | | | | | 166,064 |
Lending & Credit — 11.6% | | | | | |
FinVolution Group - ADR | | 8,244 | | | 41,550 |
LexinFintech Holdings Ltd. - ADR | | 21,876 | | | 39,377 |
Lufax Holding Ltd. - ADR | | 16,660 | | | 70,305 |
Pagaya Technologies Ltd. - Class A(a) | | 4,218 | | | 42,598 |
Qifu Technology, Inc. - ADR | | 2,771 | | | 51,070 |
| | | | | | 244,900 |
Payment — 47.0% | | | | | |
Alibaba Group Holding Ltd. | | 4,400 | | | 39,494 |
Dlocal Ltd./Uruguay(a) | | 3,632 | | | 53,390 |
EVERTEC, Inc. | | 1,464 | | | 58,414 |
Forth Smart Service PCL - NVDR | | 317,885 | | | 55,322 |
Grab Holdings Ltd. - Class A(a) | | 19,080 | | | 59,911 |
Jumia Technologies AG - ADR(a)(e) | | 19,968 | | | 102,236 |
Kakaopay Corp.(a) | | 1,712 | | | 49,468 |
Kginicis Co. Ltd. | | 6,444 | | | 56,147 |
MercadoLibre, Inc.(a) | | 36 | | | 54,431 |
Network International
Holdings PLC(a)(c)(d) | | 12,208 | | | 60,639 |
Pagseguro Digital Ltd. - Class A(a) | | 4,460 | | | 63,689 |
PAX Global Technology Ltd. | | 85,000 | | | 67,011 |
Sea Ltd. - ADR(a) | | 1,476 | | | 79,276 |
StoneCo Ltd. - Class A(a) | | 3,340 | | | 55,477 |
Tencent Holdings Ltd. | | 1,100 | | | 42,699 |
Valid Solucoes e Servicos de Seguranca em Meios de Pagamento
e Identificacao SA | | 13,600 | | | 50,101 |
Yeahka Ltd.(a) | | 25,200 | | | 39,218 |
| | | | | | 986,923 |
Real Estate Services — 1.8% | | | | | |
KE Holdings, Inc. - ADR | | 2,796 | | | 38,389 |
TOTAL COMMON STOCKS
(Cost $2,681,246) | | | | | 2,092,691 |
The accompanying notes are an integral part of the financial statements.
14
Amplify ETF Trust Amplify Emerging Markets FinTech ETF Schedule of Investments as of March 31, 2024 (Unaudited) (Continued) |
Description | | Shares | | Value |
SHORT-TERM INVESTMENTS — 5.0% | | | | | | |
Investments Purchased with Proceeds from Securities Lending — 4.5% | | | | | | |
First American Government
Obligations Fund - Class X,
5.23%(f) | | 93,948 | | $ | 93,948 | |
Money Market Funds — 0.5% | | | | | | |
Invesco Government & Agency Portfolio - Institutional Class, 5.24%(f) | | 10,064 | | | 10,064 | |
TOTAL SHORT-TERM INVESTMENTS
(Cost $104,012) | | | | | 104,012 | |
| | | | | | | |
TOTAL INVESTMENTS — 104.5%
(Cost $2,785,258) | | | | | 2,196,703 | |
Liabilities in Excess of Other
Assets — (4.5)% | | | | | (94,394 | ) |
TOTAL NET ASSETS — 100.0% | | | | $ | 2,102,309 | |
Percentages are stated as a percent of net assets.
For Fund compliance purposes, the Fund’s industry classifications refer to any one or more of the industry sub-classifications used by one or more widely recognized market indexes or ratings group indexes, and/or they may be defined by Fund management. This definition may not apply for purposes of this report, which may combine sub-classifications for reporting ease. Industries are shown as a percentage of net assets.
ADR - American Depositary Receipt
AG - Aktiengesellschaft
GDR - Global Depositary Receipt
NV - Naamloze Vennootschap
NVDR - Non-Voting Depositary Receipt
PLC - Public Limited Company
SA - Sociedad Anónima
The accompanying notes are an integral part of the financial statements.
15
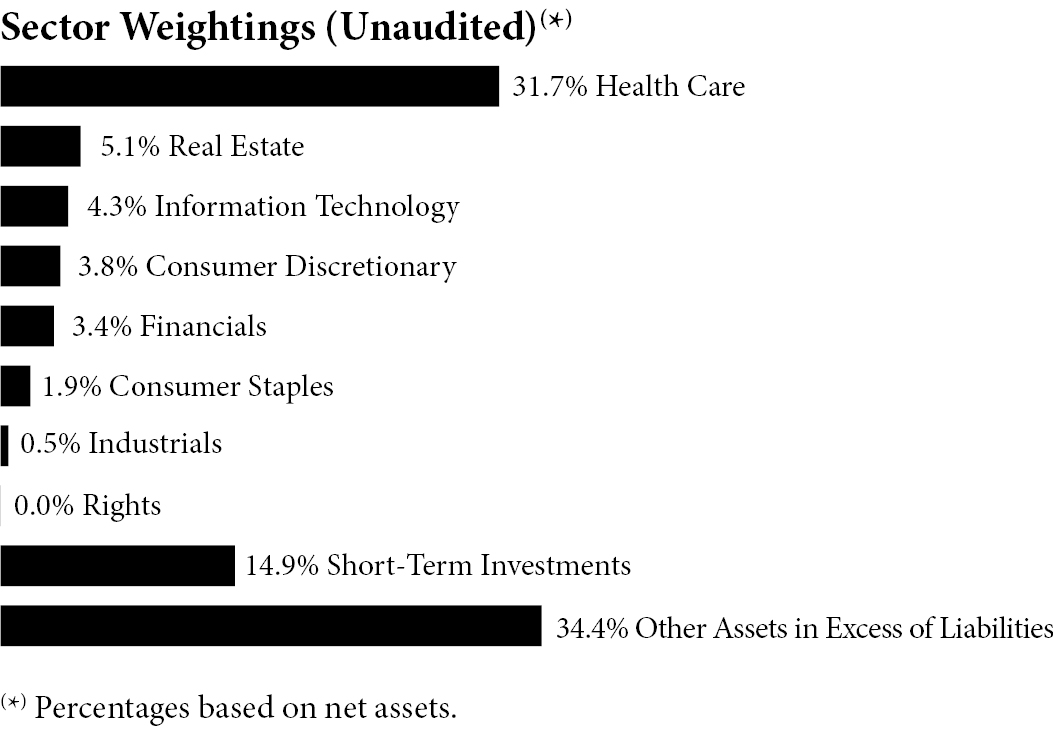
Amplify ETF Trust Amplify Seymour Cannabis ETF Schedule of Investments as of March 31, 2024 (Unaudited) |
Description | | Shares | | Value |
COMMON STOCKS — 50.7% | | | | | |
Consumer Discretionary — 3.8% | | | | | |
GrowGeneration Corp.(a)(b) | | 499,894 | | $ | 1,429,697 |
Consumer Staples — 1.9% | | | | | |
Village Farms International, Inc.(a)(b) | | 580,778 | | | 720,165 |
Financials — 3.4% | | | | | |
Chicago Atlantic Real Estate Finance, Inc. | | 30,000 | | | 473,100 |
Silver Spike Investment Corp. | | 82,918 | | | 796,842 |
| | | | | | 1,269,942 |
Health Care — 31.7%(c) | | | | | |
Aleafia Health, Inc.(a)(d) | | 80,872 | | | 0 |
Auxly Cannabis Group, Inc.(a) | | 3,137,044 | | | 115,797 |
Canopy Growth Corp.(a)(b) | | 36,276 | | | 313,062 |
Cara Therapeutics, Inc.(a) | | 65,538 | | | 59,640 |
Charlotte’s Web Holdings, Inc.(a)(b) | | 1,102,907 | | | 223,912 |
Clever Leaves Holdings, Inc.(a) | | 5,093 | | | 24,803 |
Cronos Group, Inc.(a) | | 524,169 | | | 1,368,081 |
Curaleaf Holdings, Inc.(a) | | 704,200 | | | 3,763,912 |
Jazz Pharmaceuticals PLC(a) | | 553 | | | 66,592 |
MediPharm Labs Corp.(a) | | 2,927,844 | | | 172,919 |
Organigram Holdings, Inc.(a)(b) | | 169,800 | | | 365,070 |
SNDL, Inc.(a)(b) | | 298,790 | | | 599,074 |
TerrAscend Corp.(a) | | 980,700 | | | 1,838,971 |
Tilray Brands, Inc.(a)(b) | | 1,168,784 | | | 2,886,895 |
| | | | | | 11,798,728 |
Industrials — 0.5% | | | | | |
Hydrofarm Holdings Group, Inc.(a) | | 171,646 | | | 185,378 |
Information Technology — 4.3% | | | | | |
WM Technology, Inc.(a) | | 1,214,393 | | | 1,615,143 |
Real Estate — 5.1% | | | | | |
Innovative Industrial Properties, Inc. | | 18,424 | | | 1,907,621 |
TOTAL COMMON STOCKS
(Cost $71,533,278) | | | | | 18,926,674 |
Description | | Contracts | | Value |
RIGHTS — 0.0%(e) | | | | | |
Harmony Biosciences Holdings, Inc., Expires 10/12/2024,
Exercise Price $2.54(a)(d) | | 220,858 | | $ | 0 |
TOTAL RIGHTS
(Cost $0) | | | | | 0 |
| | | | | | |
| | | Shares | | |
SHORT-TERM INVESTMENTS — 14.9% | | | | | |
Investments Purchased with Proceeds from Securities Lending — 12.4% | | | | | |
First American Government
Obligations Fund - Class X,
5.23%(f) | | 4,641,018 | | | 4,641,018 |
| | | | | | |
Money Market Funds — 2.5% | | | | | |
Invesco Government & Agency Portfolio - Institutional Class, 5.24%(f) | | 915,716 | | | 915,716 |
TOTAL SHORT-TERM INVESTMENTS
(Cost $5,556,734) | | | | | 5,556,734 |
| | | | | | |
TOTAL INVESTMENTS — 65.6%
(Cost $77,090,012) | | | | | 24,483,408 |
Other Assets in Excess of
Liabilities — 34.4% | | | | | 12,856,297 |
TOTAL NET ASSETS — 100.0% | | | | $ | 37,339,705 |
Percentages are stated as a percent of net assets.
The Global Industry Classification Standard (GICS®) was developed by and/or is the exclusive property of MSCI, Inc. and Standard & Poor’s Financial Services LLC (“S&P”). GICS is a service mark of MSCI, Inc. and S&P and has been licensed for use by U.S. Bank Global Fund Services.
PLC - Public Limited Company
The accompanying notes are an integral part of the financial statements.
16
Amplify ETF Trust Amplify Seymour Cannabis ETF Schedule of Total Return Swap Contracts as of March 31, 2024 (Unaudited) |
Reference Entity | | Counterparty | | Long/
Short | | Maturity
Date | | Financing
Rate(a) | | Payment
Frequency | | Notional
Amount | | Upfront
Payments
(Receipts) | | Value/
Unrealized
Appreciation
(Depreciation) |
Ayr Wellness, Inc. | | Nomura Global Financial Products, Inc. | | Long | | 05/28/2024 | | 6.82 | | Month | | $ | 637,394 | | $ | 0 | | $ | 148,351 |
Ayr Wellness, Inc. Warrant Expires 02/07/2026 | | Nomura Global Financial Products, Inc. | | Long | | 05/28/2024 | | 6.82 | | Month | | | 93,344 | | | 0 | | | 34,465 |
Cannabist Company | | Nomura Global Financial Products, Inc. | | Long | | 05/28/2024 | | 6.82 | | Month | | | 104,809 | | | 0 | | | 30,134 |
Cresco Lab, Inc. | | Nomura Global Financial Products, Inc. | | Long | | 05/28/2024 | | 6.82 | | Month | | | 2,425,614 | | | 0 | | | 193,587 |
Curaleaf Holdings, Inc. | | Nomura Global Financial Products, Inc. | | Long | | 05/28/2024 | | 6.82 | | Month | | | 765,441 | | | 0 | | | 54,470 |
Green Thumb Industries, Inc. | | Nomura Global Financial Products, Inc. | | Long | | 05/28/2024 | | 6.82 | | Month | | | 5,115,744 | | | 0 | | | 577,811 |
Truelieve Cannabis Corp. | | Nomura Global Financial Products, Inc.. | | Long | | 05/28/2024 | | 6.82 | | Month | | | 5,252,764 | | | 0 | | | 631,179 |
Verano Holdings Corp. | | Nomura Global Financial Products, Inc. | | Long | | 05/28/2024 | | 6.82 | | Month | | | 3,464,487 | | | 0 | | | 357,315 |
| | | | | | | | | | | | | | | | $ | 0 | | $ | 2,027,312 |
The accompanying notes are an integral part of the financial statements.
17
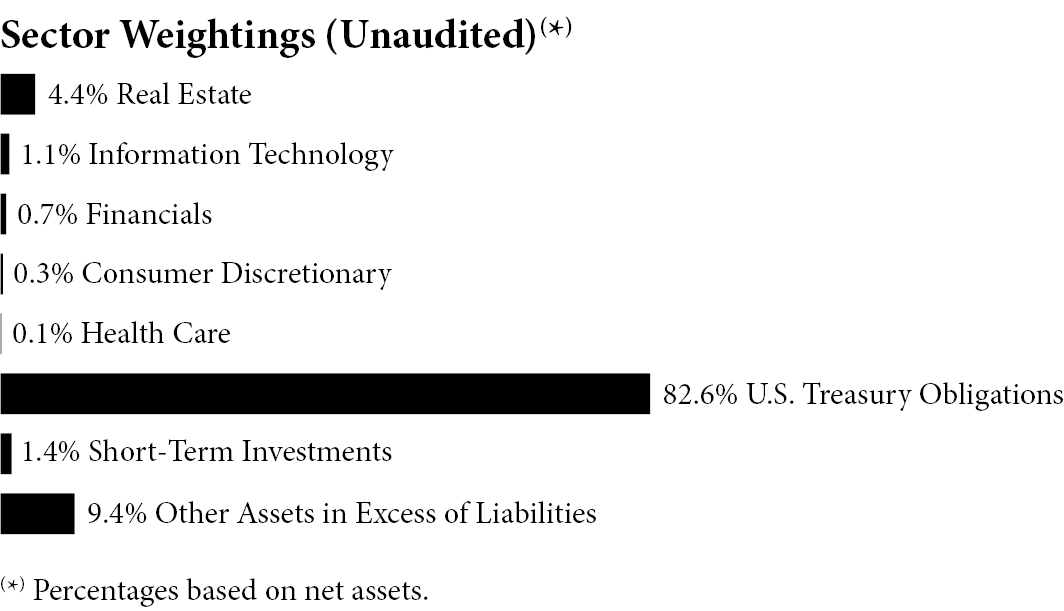
Amplify ETF Trust Amplify BlackSwan ISWN ETF Schedule of Investments as of March 31, 2024 (Unaudited) |
Description | | | | Par | | Value |
U.S. TREASURY OBLIGATIONS — 84.5% | | | | | | | | |
United States Treasury Note/Bond | | | | | | | | |
2.38%, 05/15/2029 | | | | $ | 3,594,000 | | $ | 3,290,756 |
1.75%, 11/15/2029 | | | | | 3,742,000 | | | 3,298,149 |
0.63%, 05/15/2030 | | | | | 4,101,000 | | | 3,315,483 |
0.88%, 11/15/2030 | | | | | 4,080,000 | | | 3,306,075 |
1.63%, 05/15/2031 | | | | | 3,909,000 | | | 3,297,913 |
1.38%, 11/15/2031 | | | | | 4,039,000 | | | 3,302,750 |
2.88%, 05/15/2032 | | | | | 3,613,000 | | | 3,283,949 |
4.13%, 11/15/2032 | | | | | 3,291,000 | | | 3,271,910 |
3.38%, 05/15/2033 | | | | | 3,495,000 | | | 3,277,655 |
4.50%, 11/15/2033 | | | | | 3,189,000 | | | 3,263,493 |
TOTAL U.S. TREASURY OBLIGATIONS
(Cost $33,675,861) | | | | | | | | 32,908,133 |
| | Notional
Amount | | Contracts | | |
PURCHASED OPTIONS — 14.6%(a)(b) | | | | | | | | |
Call Options — 14.6% | | | | | | | | |
iShares MSCI EAFE ETF | | | | | | | | |
Expiration: 12/20/2024; Exercise Price: $69.00 | | $ | 19,781,322 | | 2,477 | | | 3,182,945 |
Expiration: 12/20/2024; Exercise Price: $68.00 | | | 14,726,184 | | 1,844 | | | 2,517,060 |
Total Call Options | | | | | | | | 5,700,005 |
TOTAL PURCHASED OPTIONS
(Cost $3,881,401) | | | | | | | | 5,700,005 |
| | | | | | | | | |
| | | | | Shares | | |
SHORT-TERM INVESTMENTS — 0.1% | | | | | | | | |
Money Market Funds — 0.1% | | | | | | | | |
Dreyfus Treasury Securities Cash Management, 4.39%(c) | | | | | 2,552 | | | 2,552 |
Invesco Government & Agency Portfolio - Institutional Class, 5.24%(c) | | | | | 20,786 | | | 20,786 |
| | | | | | | | | 23,338 |
TOTAL SHORT-TERM INVESTMENTS
(Cost $23,338) | | | | | | | | 23,338 |
| | | | | | | | | |
TOTAL INVESTMENTS — 99.2%
(Cost $37,580,600) | | | | | | | | 38,631,476 |
Other Assets in Excess of Liabilities — 0.8% | | | | | | | | 299,456 |
TOTAL NET ASSETS — 100.0% | | | | | | | $ | 38,930,932 |
Percentages are stated as a percent of net assets.
The accompanying notes are an integral part of the financial statements.
18
Amplify ETF Trust Amplify Thematic All-Stars ETF Schedule of Investments as of March 31, 2024 (Unaudited) |
Description | | Shares | | Value |
COMMON STOCKS — 99.6% | | | | | |
Communication Services — 8.0% | | | | | |
Alphabet, Inc. - Class A(a) | | 559 | | $ | 84,369 |
Baidu, Inc. - Class A(a) | | 513 | | | 6,732 |
Meta Platforms, Inc. - Class A | | 115 | | | 55,842 |
Netflix, Inc.(a) | | 24 | | | 14,576 |
ROBLOX Corp. - Class A(a) | | 690 | | | 26,344 |
Roku, Inc.(a) | | 204 | | | 13,295 |
Tencent Holdings Ltd. | | 366 | | | 14,207 |
| | | | | | 215,365 |
Consumer Discretionary — 8.7% | | | | | |
Alibaba Group Holding Ltd. | | 998 | | | 8,958 |
Amazon.com, Inc.(a) | | 359 | | | 64,756 |
Aptiv PLC(a) | | 89 | | | 7,089 |
DraftKings, Inc. - Class A(a) | | 249 | | | 11,307 |
Lucid Group, Inc.(a)(b) | | 2,876 | | | 8,197 |
MercadoLibre, Inc.(a) | | 5 | | | 7,560 |
Rivian Automotive, Inc. - Class A(a) | | 972 | | | 10,643 |
Tesla, Inc.(a) | | 658 | | | 115,670 |
| | | | | | 234,180 |
Financials — 8.2% | | | | | |
Adyen NV(a)(c)(d) | | 5 | | | 8,467 |
Block, Inc.(a) | | 798 | | | 67,495 |
Coinbase Global, Inc. - Class A(a) | | 376 | | | 99,684 |
PayPal Holdings, Inc.(a) | | 164 | | | 10,986 |
Robinhood Markets, Inc. - Class A(a) | | 1,013 | | | 20,392 |
Toast, Inc. - Class A(a) | | 355 | | | 8,847 |
Visa, Inc. - Class A | | 23 | | | 6,419 |
| | | | | | 222,290 |
Description | | Shares | | Value |
Health Care — 2.1% | | | | | |
CRISPR Therapeutics AG(a) | | 120 | | $ | 8,179 |
Danaher Corp. | | 65 | | | 16,232 |
Intuitive Surgical, Inc.(a) | | 65 | | | 25,940 |
Teladoc Health, Inc.(a) | | 438 | | | 6,614 |
| | | | | | 56,965 |
Industrials — 6.9% | | | | | |
ABB Ltd. | | 487 | | | 22,649 |
Advanced Drainage Systems, Inc. | | 46 | | | 7,923 |
Array Technologies, Inc.(a) | | 801 | | | 11,943 |
Booz Allen Hamilton Holding Corp. | | 61 | | | 9,055 |
NEXTracker, Inc. - Class A(a) | | 145 | | | 8,159 |
Pentair PLC | | 102 | | | 8,715 |
Plug Power, Inc.(a)(b) | | 3,231 | | | 11,115 |
Schneider Electric SE | | 52 | | | 11,774 |
Shoals Technologies Group, Inc. -
Class A(a) | | 1,008 | | | 11,269 |
Siemens AG | | 36 | | | 6,880 |
Sunrun, Inc.(a) | | 1,800 | | | 23,724 |
Tetra Tech, Inc. | | 38 | | | 7,019 |
Uber Technologies, Inc.(a) | | 100 | | | 7,699 |
Veralto Corp. | | 84 | | | 7,447 |
Vestas Wind Systems AS(a) | | 504 | | | 14,084 |
Xylem, Inc./NY | | 149 | | | 19,257 |
| | | | | | 188,712 |
Information Technology — 62.7%(e) | | | | | |
Adobe, Inc.(a) | | 30 | | | 15,138 |
Advanced Micro Devices, Inc.(a) | | 321 | | | 57,937 |
Akamai Technologies, Inc.(a) | | 218 | | | 23,710 |
Ambarella, Inc.(a) | | 135 | | | 6,854 |
Analog Devices, Inc. | | 53 | | | 10,483 |
ANSYS, Inc.(a) | | 20 | | | 6,943 |
Apple, Inc. | | 141 | | | 24,179 |
Arista Networks, Inc.(a) | | 44 | | | 12,759 |
Autodesk, Inc.(a) | | 34 | | | 8,854 |
Broadcom, Inc. | | 49 | | | 64,945 |
Check Point Software Technologies Ltd.(a) | | 108 | | | 17,713 |
Cisco Systems, Inc. | | 1,069 | | | 53,354 |
Cleanspark, Inc.(a) | | 449 | | | 9,523 |
Cloudflare, Inc. - Class A(a) | | 470 | | | 45,510 |
Confluent, Inc. - Class A(a) | | 202 | | | 6,165 |
Crowdstrike Holdings, Inc. - Class A(a) | | 295 | | | 94,575 |
CyberArk Software Ltd.(a) | | 84 | | | 22,313 |
Datadog, Inc. - Class A(a) | | 122 | | | 15,079 |
Dynatrace, Inc.(a) | | 152 | | | 7,059 |
Enphase Energy, Inc.(a) | | 577 | | | 69,805 |
F5, Inc.(a) | | 52 | | | 9,859 |
The accompanying notes are an integral part of the financial statements.
19
Amplify ETF Trust Amplify Thematic All-Stars ETF Schedule of Investments as of March 31, 2024 (Unaudited) (Continued) |
Description | | Shares | | Value |
Fastly, Inc. - Class A(a) | | 490 | | $ | 6,355 |
First Solar, Inc.(a) | | 398 | | | 67,182 |
Fortinet, Inc.(a) | | 502 | | | 34,292 |
Gen Digital, Inc. | | 402 | | | 9,005 |
HubSpot, Inc.(a) | | 16 | | | 10,025 |
Infineon Technologies AG | | 211 | | | 7,182 |
Intel Corp. | | 558 | | | 24,647 |
International Business Machines Corp. | | 114 | | | 21,769 |
Intuit, Inc. | | 10 | | | 6,500 |
Itron, Inc.(a) | | 95 | | | 8,789 |
Juniper Networks, Inc. | | 258 | | | 9,561 |
Marathon Digital Holdings, Inc.(a) | | 374 | | | 8,445 |
Micron Technology, Inc. | | 85 | | | 10,021 |
Microsoft Corp. | | 172 | | | 72,365 |
MicroStrategy, Inc. - Class A(a) | | 8 | | | 13,636 |
MongoDB, Inc.(a) | | 28 | | | 10,042 |
NVIDIA Corp. | | 171 | | | 154,510 |
NXP Semiconductors NV | | 45 | | | 11,150 |
Okta, Inc.(a) | | 309 | | | 32,327 |
ON Semiconductor Corp.(a) | | 164 | | | 12,062 |
Oracle Corp. | | 200 | | | 25,122 |
Palo Alto Networks, Inc.(a) | | 198 | | | 56,258 |
PTC, Inc.(a) | | 36 | | | 6,802 |
Pure Storage, Inc. - Class A(a) | | 179 | | | 9,306 |
QUALCOMM, Inc. | | 261 | | | 44,187 |
Qualys, Inc.(a) | | 148 | | | 24,697 |
Rapid7, Inc.(a) | | 254 | | | 12,456 |
Riot Platforms, Inc.(a) | | 467 | | | 5,716 |
Roper Technologies, Inc. | | 15 | | | 8,413 |
Salesforce, Inc. | | 83 | | | 24,998 |
Samsung SDI Co. Ltd. | | 45 | | | 15,961 |
SentinelOne, Inc. - Class A(a) | | 1,474 | | | 34,359 |
ServiceNow, Inc.(a) | | 27 | | | 20,585 |
Shopify, Inc. - Class A(a) | | 383 | | | 29,556 |
Snowflake, Inc. - Class A(a) | | 38 | | | 6,141 |
SolarEdge Technologies, Inc.(a) | | 497 | | | 35,277 |
STMicroelectronics NV | | 160 | | | 6,898 |
Tenable Holdings, Inc.(a) | | 394 | | | 19,475 |
Teradyne, Inc. | | 107 | | | 12,073 |
Trend Micro, Inc./Japan | | 192 | | | 9,724 |
Trimble, Inc.(a) | | 153 | | | 9,847 |
Twilio, Inc. - Class A(a) | | 309 | | | 18,895 |
UiPath, Inc. - Class A(a) | | 1,727 | | | 39,151 |
Unity Software, Inc.(a) | | 869 | | | 23,202 |
Varonis Systems, Inc.(a) | | 344 | | | 16,226 |
Workday, Inc. - Class A(a) | | 26 | | | 7,092 |
Description | | Shares | | Value |
Zoom Video Communications, Inc. - Class A(a) | | 203 | | $ | 13,270 | |
Zscaler, Inc.(a) | | 230 | | | 44,305 | |
| | | | | | 1,692,614 | |
Materials — 1.6% | | | | | | |
Albemarle Corp. | | 177 | | | 23,318 | |
Ecolab, Inc. | | 83 | | | 19,165 | |
| | | | | | 42,483 | |
Real Estate — 0.3% | | | | | | |
Equinix, Inc. | | 9 | | | 7,428 | |
Utilities — 1.1% | | | | | | |
American Water Works Co., Inc. | | 62 | | | 7,577 | |
Ormat Technologies, Inc. | | 127 | | | 8,406 | |
Orsted AS(a)(c)(d) | | 138 | | | 7,681 | |
Sunnova Energy International, Inc.(a)(b) | | 1,071 | | | 6,565 | |
| | | | | | 30,229 | |
TOTAL COMMON STOCKS
(Cost $3,035,620) | | | | | 2,690,266 | |
| | | | | | | |
PREFERRED STOCKS — 0.3% | | | | | | |
Industrials — 0.3% | | | | | | |
Sociedad Quimica y Minera de Chile SA - Class B, 0.00% | | 160 | | | 7,781 | |
TOTAL PREFERRED STOCKS
(Cost $7,636) | | | | | 7,781 | |
| | | | | | | |
SHORT-TERM INVESTMENTS — 1.1% | | | | | | |
Investments Purchased with Proceeds from Securities Lending — 1.0% | | | | | | |
First American Government Obligations Fund - Class X, 5.23%(f) | | 27,290 | | | 27,290 | |
Money Market Funds — 0.1% | | | | | | |
Invesco Government & Agency Portfolio - Institutional
Class, 5.24%(f) | | 2,326 | | | 2,326 | |
TOTAL SHORT-TERM INVESTMENTS
(Cost $29,616) | | | | | 29,616 | |
| | | | | | | |
TOTAL INVESTMENTS — 101.0%
(Cost $3,072,872) | | | | | 2,727,663 | |
Liabilities in Excess of Other Assets — (1.0)% | | | | | (26,298 | ) |
TOTAL NET ASSETS — 100.0% | | | | $ | 2,701,365 | |
Percentages are stated as a percent of net assets.
The Global Industry Classification Standard (GICS®) was developed by and/or is the exclusive property of MSCI, Inc. and Standard & Poor’s Financial Services LLC (“S&P”). GICS is a service mark of MSCI, Inc. and S&P and has been licensed for use by U.S. Bank Global Fund Services.
The accompanying notes are an integral part of the financial statements.
20
Amplify ETF Trust Amplify Thematic All-Stars ETF Schedule of Investments as of March 31, 2024 (Unaudited) (Continued) |
(a) Non-income producing security.
(b) All or a portion of this security is on loan as of March 31, 2024. The total market value of these securities was $25,093 which represented 0.9% of net assets.
(c) Security is exempt from registration pursuant to Rule 144A under the Securities Act of 1933, as amended. These securities may only be resold in transactions exempt from registration to qualified institutional investors. As of March 31, 2024, the value of these securities total $16,148 or 0.6% of the Fund’s net assets.
(d) Security is exempt from registration under Regulation S under the Securities Act of 1933, as amended. As of March 31, 2024, the value of these securities total $16,148 or 0.6% of the Fund’s net assets.
(e) To the extent that the Fund invests more heavily in a particular industry or sector of the economy, its performance will be especially sensitive to developments that significantly affect those industries or sectors.
(f) The rate shown represents the 7-day effective yield as of March 31, 2024.
The accompanying notes are an integral part of the financial statements.
21
Amplify ETF Trust Amplify BlackSwan Tech & Treasury ETF Schedule of Investments as of March 31, 2024 (Unaudited) |
Description | | | | Par | | Value |
U.S. TREASURY OBLIGATIONS — 81.5% | | | |
United States Treasury Note/Bond | | | | | | | | |
2.38%, 05/15/2029 | | | | $ | 227,600 | | $ | 208,396 |
1.75%, 11/15/2029 | | | | | 237,600 | | | 209,417 |
0.63%, 05/15/2030 | | | | | 260,600 | | | 210,684 |
0.88%, 11/15/2030 | | | | | 258,600 | | | 209,547 |
1.63%, 05/15/2031 | | | | | 247,600 | | | 208,893 |
1.38%, 11/15/2031 | | | | | 256,600 | | | 209,826 |
2.88%, 05/15/2032 | | | | | 229,600 | | | 208,689 |
4.13%, 11/15/2032 | | | | | 208,600 | | | 207,390 |
3.38%, 05/15/2033 | | | | | 221,600 | | | 207,819 |
4.50%, 11/15/2033 | | | | | 202,300 | | | 207,026 |
TOTAL U.S. TREASURY OBLIGATIONS
(Cost $2,142,083) | | | | | | | | 2,087,687 |
| | Notional
Amount | | Contracts | | |
PURCHASED OPTIONS — 17.4%(a)(b) | | | | | | | | |
Call Options — 17.4% | | | | | | | | |
Invesco QQQ Trust Series 1 | | | | | | | | |
Expiration: 06/21/2024; Exercise Price: $329.78 | | $ | 888,020 | | 20 | | | 237,910 |
Expiration: 12/20/2024; Exercise Price: $369.78 | | | 976,822 | | 22 | | | 206,899 |
Total Call Options | | | | | | | | 444,809 |
TOTAL PURCHASED OPTIONS
(Cost $225,984) | | | | | | | | 444,809 |
| | | | | | | | | |
| | | | | Shares | | |
SHORT-TERM INVESTMENTS — 0.4% | | | | | | | | |
Money Market Funds — 0.4% | | | | | | | | |
Dreyfus Treasury Securities Cash Management, 4.39%(c) | | | | | 2,669 | | | 2,669 |
Invesco Government & Agency Portfolio - Institutional Class, 5.24%(c) | | | | | 8,083 | | | 8,083 |
| | | | | | | | | 10,752 |
TOTAL SHORT-TERM INVESTMENTS
(Cost $10,752) | | | | | | | | 10,752 |
| | | | | | | | | |
TOTAL INVESTMENTS — 99.3%
(Cost $2,378,819) | | | | | | | | 2,543,248 |
Other Assets in Excess of Liabilities — 0.7% | | | | | | | | 18,964 |
TOTAL NET ASSETS — 100.0% | | | | | | | $ | 2,562,212 |
Percentages are stated as a percent of net assets.
(a) Exchange-traded.
(b) 100 shares per contract.
(c) The rate shown represents the 7-day effective yield as of March 31, 2024.
The accompanying notes are an integral part of the financial statements.
22
Amplify ETF Trust Amplify Inflation Fighter ETF Consolidated Schedule of Investments as of March 31, 2024 (Unaudited) |
Description | | Shares | | Value |
COMMON STOCKS — 82.5% | | | | | |
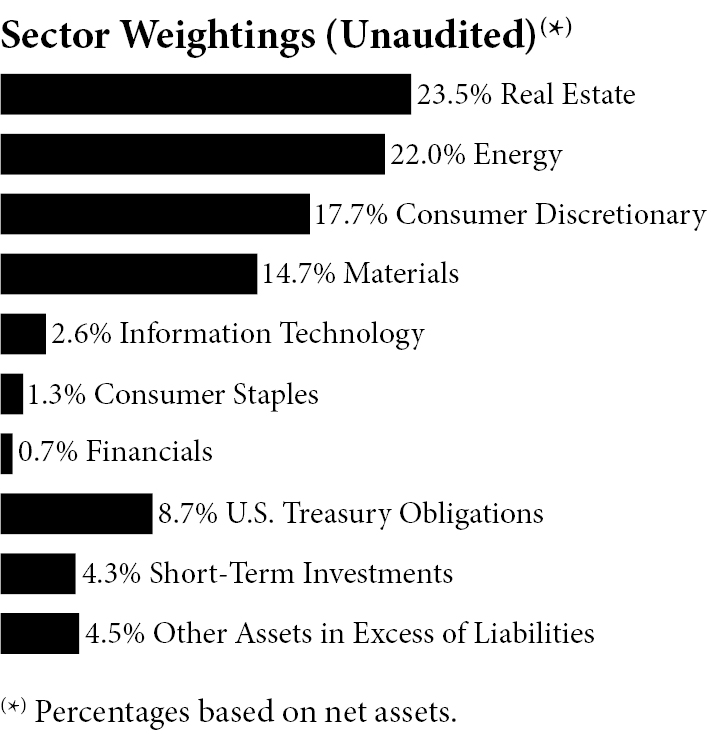
Consumer Discretionary — 17.7% | | | | | |
Airbnb, Inc. - Class A(a) | | 457 | | $ | 75,387 |
Century Communities, Inc. | | 1,799 | | | 173,604 |
DR Horton, Inc. | | 765 | | | 125,881 |
Green Brick Partners, Inc.(a) | | 4,144 | | | 249,592 |
Lennar Corp. - Class A | | 532 | | | 91,493 |
LGI Homes, Inc.(a) | | 785 | | | 91,350 |
M/I Homes, Inc.(a) | | 1,519 | | | 207,025 |
MDC Holdings, Inc. | | 2,073 | | | 130,412 |
PulteGroup, Inc. | | 1,064 | | | 128,340 |
Tri Pointe Homes, Inc.(a) | | 2,583 | | | 99,859 |
| | | | | | 1,372,943 |
Consumer Staples — 1.3% | | | | | |
Alico, Inc. | | 3,421 | | | 100,167 |
Energy — 22.0% | | | | | |
Antero Resources Corp.(a) | | 3,741 | | | 108,489 |
Cameco Corp. | | 5,694 | | | 246,500 |
Centrus Energy Corp. - Class A(a) | | 1,200 | | | 49,836 |
Denison Mines Corp.(a) | | 53,350 | | | 104,372 |
Energy Fuels, Inc.(a) | | 14,849 | | | 93,400 |
NexGen Energy Ltd.(a) | | 15,947 | | | 123,969 |
Ovintiv, Inc. | | 1,142 | | | 59,270 |
Petroleo Brasileiro SA - ADR | | 4,556 | | | 69,297 |
Phillips 66 | | 570 | | | 93,104 |
Shell PLC - ADR | | 1,064 | | | 71,331 |
Suncor Energy, Inc. | | 5,470 | | | 201,897 |
Texas Pacific Land Corp. | | 231 | | | 133,636 |
Uranium Energy Corp.(a) | | 45,245 | | | 305,403 |
Ur-Energy, Inc.(a) | | 30,000 | | | 48,000 |
| | | | | | 1,708,504 |
Description | | Shares | | Value |
Financials — 0.7% | | | | | |
LendingTree, Inc.(a) | | 1,267 | | $ | 53,645 |
Information Technology — 2.6% | | | | | |
Entegris, Inc. | | 555 | | | 78,000 |
QUALCOMM, Inc. | | 743 | | | 125,790 |
| | | | | | 203,790 |
Materials — 14.7% | | | | | |
Alcoa Corp. | | 3,038 | | | 102,654 |
Franco-Nevada Corp. | | 669 | | | 79,718 |
Nucor Corp. | | 1,064 | | | 210,566 |
Osisko Gold Royalties Ltd. | | 7,370 | | | 121,015 |
POSCO Holdings, Inc. - ADR(b) | | 1,419 | | | 111,278 |
Rio Tinto PLC - ADR | | 1,737 | | | 110,716 |
Royal Gold, Inc. | | 994 | | | 121,079 |
Vale SA - ADR | | 5,522 | | | 67,313 |
Wheaton Precious Metals Corp. | | 4,477 | | | 211,002 |
| | | | | | 1,135,341 |
Real Estate — 23.5% | | | | | |
Farmland Partners, Inc. | | 13,456 | | | 149,362 |
Five Point Holdings LLC - Class A(a) | | 17,001 | | | 53,213 |
Forestar Group, Inc.(a) | | 5,963 | | | 239,653 |
FRP Holdings, Inc.(a) | | 1,848 | | | 113,467 |
Gladstone Land Corp. | | 8,078 | | | 107,761 |
Howard Hughes Holdings, Inc.(a) | | 1,844 | | | 133,911 |
Kennedy-Wilson Holdings, Inc. | | 4,647 | | | 39,871 |
Morguard Corp. | | 705 | | | 61,592 |
PotlatchDeltic Corp. | | 2,882 | | | 135,512 |
Rayonier, Inc. | | 4,656 | | | 154,765 |
Redfin Corp.(a) | | 2,860 | | | 19,019 |
Stratus Properties, Inc.(a) | | 2,273 | | | 51,893 |
Tejon Ranch Co.(a) | | 5,996 | | | 92,398 |
The St Joe Co. | | 3,624 | | | 210,083 |
Weyerhaeuser Co. | | 5,920 | | | 212,587 |
Zillow Group, Inc. - Class C(a) | | 1,096 | | | 53,463 |
| | | | | | 1,828,550 |
TOTAL COMMON STOCKS
(Cost $6,144,666) | | | | | 6,402,940 |
The accompanying notes are an integral part of the financial statements.
23
Amplify ETF Trust Amplify Inflation Fighter ETF Consolidated Schedule of Investments as of March 31, 2024 (Unaudited) (Continued) |
Description | | Par | | Value |
U.S. TREASURY OBLIGATIONS — 8.7% | | | | | | |
United States Treasury Floating Rate Note(c) | | | | | | |
5.23% (3 Month US Treasury Money Market Yield + (0.08%)),
04/30/2024 | | $ | 225,000 | | $ | 224,946 |
5.34% (3 Month US Treasury Money Market Yield + 0.04%),
07/31/2024 | | | 225,000 | | | 224,985 |
5.44% (3 Month US Treasury Money Market Yield + 0.14%),
10/31/2024 | | | 225,000 | | | 225,096 |
TOTAL U.S. TREASURY OBLIGATIONS (Cost $674,591) | | | | | | 675,027 |
| | | Shares | | |
SHORT-TERM INVESTMENTS — 4.3% | | | | | | |
Money Market Funds — 2.8% | | | | | | |
Invesco Government & Agency Portfolio - Institutional Class, 5.24%(d) | | | 217,174 | | | 217,174 |
Investments Purchased with Proceeds from Securities Lending — 1.5% | | | | | | |
First American Government Obligation Fund - Class X, 5.23%(d) | | | 116,104 | | | 116,104 |
TOTAL SHORT-TERM INVESTMENTS
(Cost $333,278) | | | | | | 333,278 |
| | | | | | | |
TOTAL INVESTMENTS — 95.5%
(Cost $7,152,535) | | | | | | 7,411,245 |
Other Assets in Excess of
Liabilities — 4.5% | | | | | | 352,151 |
TOTAL NET ASSETS — 100.0% | | | | | $ | 7,763,396 |
Percentages are stated as a percent of net assets.
The Global Industry Classification Standard (GICS®) was developed by and/or is the exclusive property of MSCI, Inc. and Standard & Poor’s Financial Services LLC (“S&P”). GICS is a service mark of MSCI, Inc. and S&P and has been licensed for use by U.S. Bank Global Fund Services.
(a) Non-income producing security.
(b) All or a portion of this security is on loan as of March 31, 2024. The total market value of these securities was $107,906 which represented 1.4% of net assets.
(c) All or a portion of this security is held as collateral for the open futures. At March 31, 2024, the value of these securities amounted to $675,027 or 8.7% of net assets.
(d) The rate shown represents the 7-day effective yield as of March 31, 2024.
The accompanying notes are an integral part of the financial statements.
24
Amplify ETF Trust Amplify Inflation Fighter ETF Consolidated Schedule of Open Futures Contracts as of March 31, 2024 (Unaudited) |
Description | | Contracts
Purchased | | Expiration
Date | | Notional | | Value/Unrealized
Appreciation
(Depreciation) |
Bitcoin | | 93 | | 04/26/2024 | | $ | 665,229 | | $ | 11,875 |
Micro Gold | | 30 | | 06/26/2024 | | | 671,520 | | | 10,897 |
| | | | | | | | | | $ | 22,772 |
| | | | | | | | | | | |
Total Unrealized Appreciation (Depreciation) | | | | | | | | | $ | 22,772 |
The accompanying notes are an integral part of the financial statements.
25
Amplify ETF Trust
Amplify Natural Resources Dividend Income ETF
Schedule of Investments
as of March 31, 2024 (Unaudited)
Description | | Shares | | Value |
COMMON STOCKS — 99.4% | | | | | |
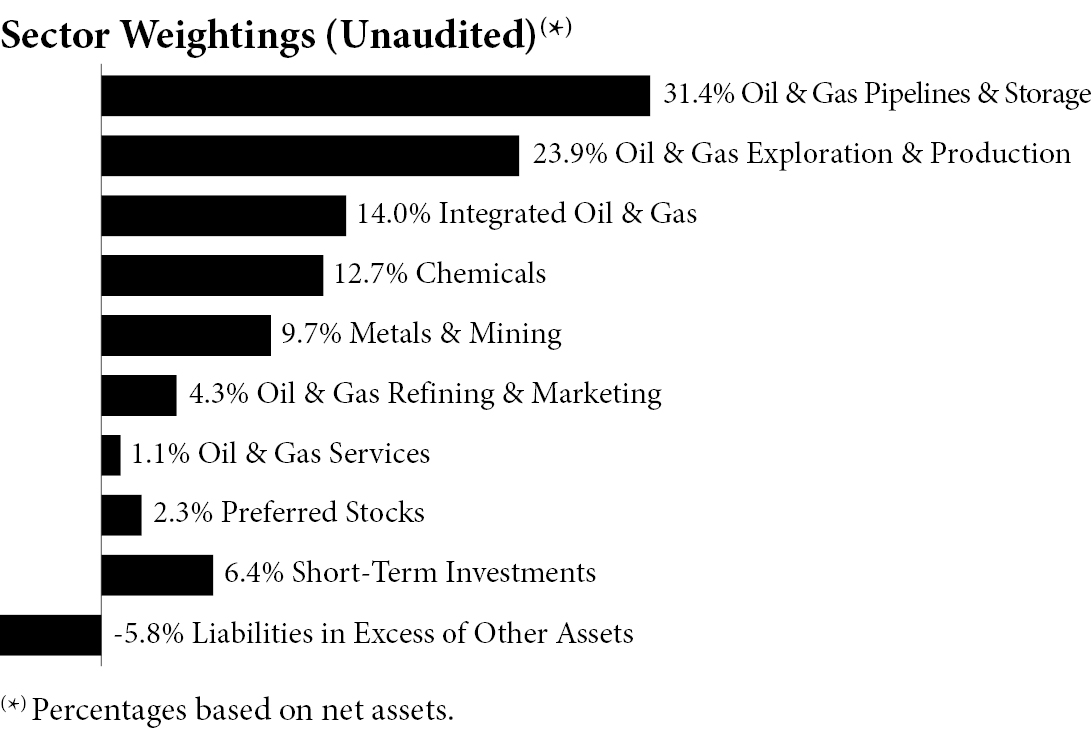
Chemicals — 12.7% | | | | | |
Chemours Co. | | 3,542 | | $ | 93,013 |
Dow, Inc. | | 3,121 | | | 180,800 |
Eastman Chemical Co. | | 1,461 | | | 146,421 |
FMC Corp. | | 2,290 | | | 145,873 |
ICL Group Ltd.(a) | | 32,618 | | | 175,485 |
International Flavors &
Fragrances, Inc. | | 1,676 | | | 144,119 |
LyondellBasell Industries
NV - Class A | | 1,793 | | | 183,388 |
Nutrien Ltd. | | 2,614 | | | 141,966 |
Sasol Ltd. - ADR(a) | | 34,516 | | | 269,570 |
| | | | | | 1,480,635 |
Integrated Oil & Gas — 14.1% | | | | | |
BP PLC - ADR | | 4,658 | | | 175,513 |
Chevron Corp. | | 950 | | | 149,853 |
Ecopetrol SA - ADR(a) | | 18,741 | | | 221,894 |
Eni SpA - ADR | | 4,615 | | | 146,388 |
Equinor ASA - ADR | | 3,648 | | | 98,605 |
Exxon Mobil Corp. | | 1,272 | | | 147,857 |
Petroleo Brasileiro SA - ADR | | 13,224 | | | 201,137 |
Shell PLC - ADR | | 2,278 | | | 152,717 |
Suncor Energy, Inc. | | 5,080 | | | 187,503 |
TotalEnergies SE - ADR | | 2,136 | | | 147,021 |
| | | | | | 1,628,488 |
Metals & Mining — 9.6% | | | | | |
Agnico Eagle Mines Ltd. | | 2,156 | | | 128,605 |
BHP Group Ltd. - ADR(a) | | 2,654 | | | 153,109 |
Glencore PLC - ADR | | 31,227 | | | 341,936 |
Newmont Corp. | | 4,233 | | | 151,711 |
Description | | Shares | | Value |
Rio Tinto PLC - ADR | | 2,357 | | $ | 150,235 |
Southern Copper Corp. | | 1,868 | | | 198,979 |
| | | | | | 1,124,575 |
Metal Fabrication — 2.3% | | | | | |
Gerdau SA - ADR | | 61,679 | | | 272,621 |
Oil & Gas Exploration &
Production — 23.7% | | | | | |
APA Corp. | | 3,431 | | | 117,958 |
Canadian Natural Resources Ltd. | | 2,391 | | | 182,481 |
Chesapeake Energy Corp.(a) | | 1,342 | | | 119,210 |
Chord Energy Corp. | | 1,336 | | | 238,129 |
Civitas Resources, Inc. | | 4,561 | | | 346,226 |
Coterra Energy, Inc. | | 4,310 | | | 120,163 |
Devon Energy Corp. | | 5,552 | | | 278,599 |
Diamondback Energy, Inc. | | 1,788 | | | 354,327 |
EOG Resources, Inc. | | 975 | | | 124,644 |
Permian Resources Corp. | | 8,966 | | | 158,340 |
Pioneer Natural Resources Co. | | 825 | | | 216,563 |
Viper Energy, Inc. | | 7,540 | | | 289,988 |
Woodside Energy Group Ltd. - ADR | | 11,550 | | | 230,654 |
| | | | | | 2,777,282 |
Oil & Gas Pipelines & Storage — 31.5%(b) | | | | | |
Antero Midstream Corp. | | 19,140 | | | 269,108 |
Cheniere Energy Partners LP | | 2,957 | | | 146,046 |
DT Midstream, Inc. | | 3,023 | | | 184,705 |
Enbridge, Inc. | | 6,606 | | | 239,006 |
Energy Transfer LP | | 12,672 | | | 199,331 |
Enterprise Products Partners LP | | 5,125 | | | 149,548 |
Hess Midstream LP - Class A | | 7,014 | | | 253,415 |
Kinder Morgan, Inc. | | 12,203 | | | 223,803 |
Kinetik Holdings, Inc. | | 8,684 | | | 346,231 |
MPLX LP | | 4,850 | | | 201,566 |
ONEOK, Inc. | | 2,628 | | | 210,687 |
Pembina Pipeline Corp. | | 5,372 | | | 189,846 |
Plains All American Pipeline LP | | 9,755 | | | 171,298 |
Plains GP Holdings LP | | 14,475 | | | 264,168 |
TC Energy Corp. | | 5,830 | | | 234,366 |
Western Midstream Partners LP | | 5,178 | | | 184,078 |
Williams Cos., Inc. | | 4,911 | | | 191,382 |
| | | | | | 3,658,584 |
Oil & Gas Refining & Marketing — 4.4% | | | | | |
HF Sinclair Corp. | | 2,127 | | | 128,407 |
Phillips 66 | | 797 | | | 130,182 |
Sunoco LP | | 1,688 | | | 101,770 |
Valero Energy Corp. | | 844 | | | 144,062 |
| | | | | | 504,421 |
The accompanying notes are an integral part of the financial statements.
26
Amplify ETF Trust
Amplify Natural Resources Dividend Income ETF
Schedule of Investments
as of March 31, 2024 (Unaudited) (Continued)
Description | | Shares | | Value |
Oil & Gas Services — 1.1% | | | | | | |
Noble Corp. PLC | | 2,616 | | $ | 126,850 | |
TOTAL COMMON STOCKS
(Cost $10,433,792) | | | | | 11,573,456 | |
| | | | | | | |
SHORT-TERM INVESTMENTS — 6.4% | | | | | | |
Investments Purchased with Proceeds from Securities Lending — 6.2% | | | | | | |
First American Government Obligations Fund - Class X, 5.23%(c) | | 719,859 | | | 719,859 | |
| | | | | | | |
Money Market Funds — 0.2% | | | | | | |
Invesco Government & Agency Portfolio - Institutional Class, 5.24%(c) | | 22,448 | | | 22,448 | |
TOTAL SHORT-TERM INVESTMENTS
(Cost $742,307) | | | | | 742,307 | |
| | | | | | | |
TOTAL INVESTMENTS — 105.8%
(Cost $11,176,099) | | | | | 12,315,763 | |
Liabilities in Excess of Other Assets — (5.8)% | | | | | (677,823 | ) |
TOTAL NET ASSETS — 100.0% | | | | $ | 11,637,940 | |
Percentages are stated as a percent of net assets.
The Global Industry Classification Standard (GICS®) was developed by and/or is the exclusive property of MSCI, Inc. and Standard & Poor’s Financial Services LLC (“S&P”). GICS is a service mark of MSCI, Inc. and S&P and has been licensed for use by U.S. Bank Global Fund Services.
ADR - American Depositary Receipt
ASA - Advanced Subscription Agreement
NV - Naamloze Vennootschap
PLC - Public Limited Company
SA - Sociedad Anónima
(a) All or a portion of this security is on loan as of March 31, 2024. The total market value of these securities was $691,403 which represented 5.9% of net assets.
(b) To the extent that the Fund invests more heavily in a particular industry or sector of the economy, its performance will be especially sensitive to developments that significantly affect those industries or sectors.
(c) The rate shown represents the 7-day effective yield as of March 31, 2024.
Sector Classification as of March 31, 2024 | | | | |
(% of Net Assets) | | | | | | | |
Energy | | $ | 8,695,625 | | | 74.8 | % |
Materials | | | 2,877,831 | | | 24.6 | |
Investments Purchased with Proceeds from Securities Lending | | | 719,859 | | | 6.2 | |
Money Market Funds | | | 22,448 | | | 0.2 | |
Liabilities in Excess of Other Assets | | | (677,823 | ) | | (5.8 | ) |
| | | | 11,637,940 | | | 100.0 | % |
The accompanying notes are an integral part of the financial statements.
27
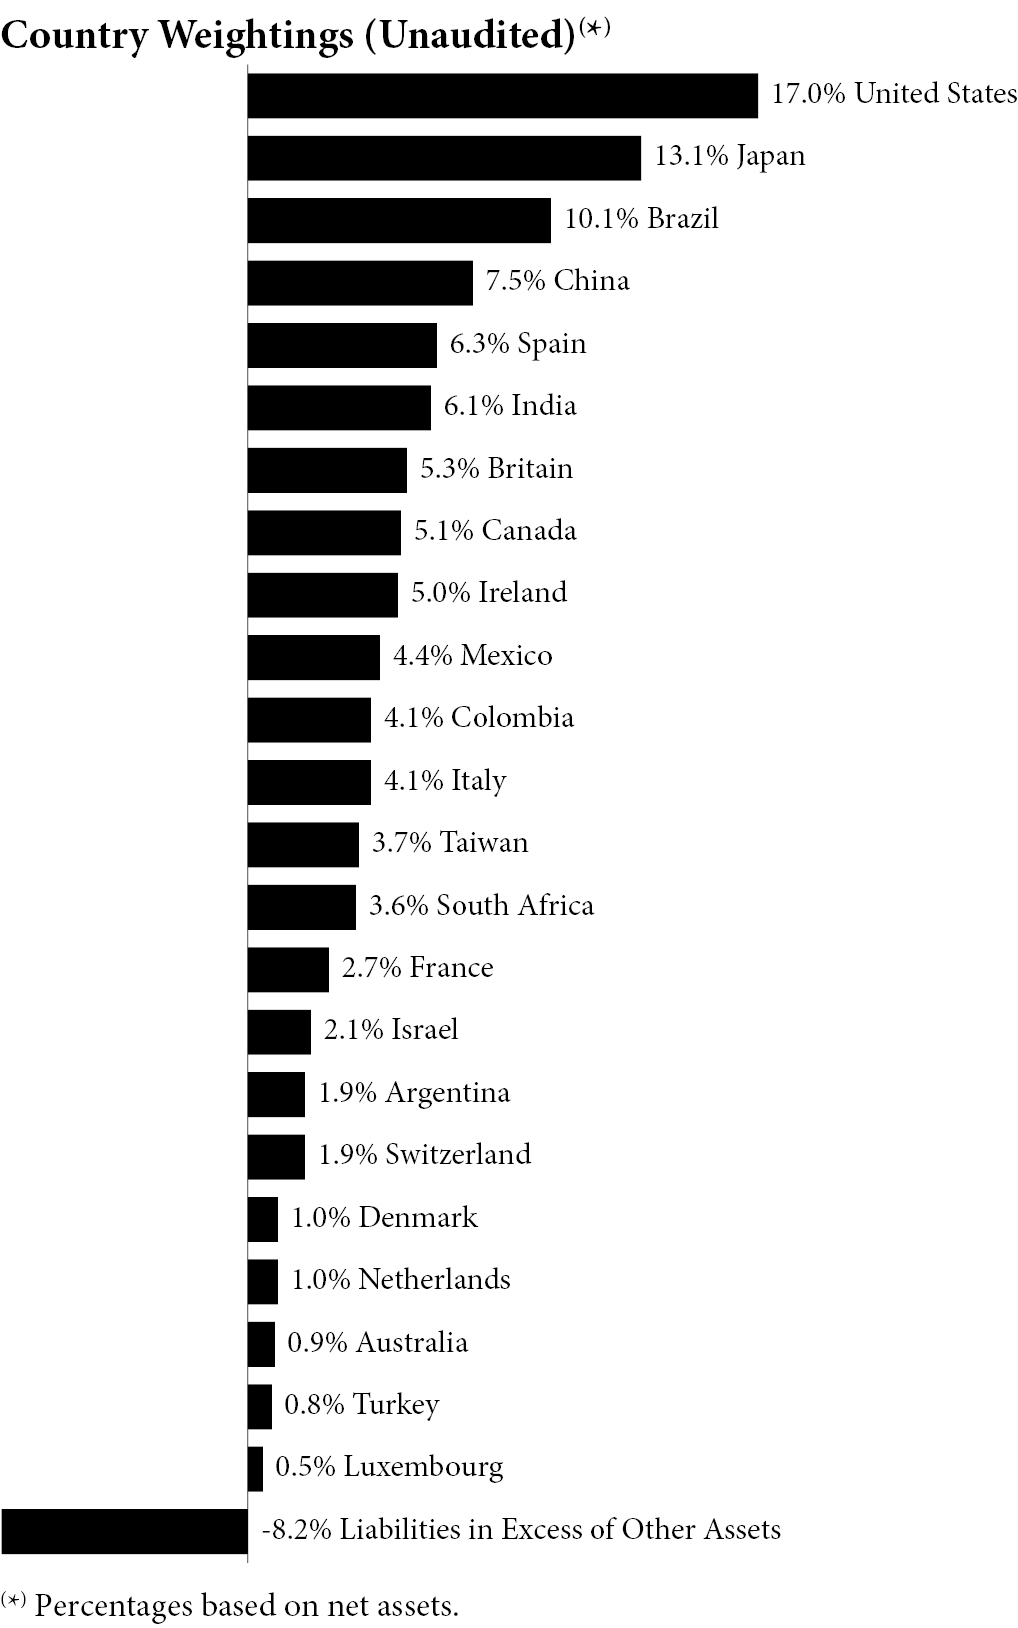
Amplify ETF Trust
Amplify International Enhanced Dividend Income ETF
Schedule of Investments
as of March 31, 2024 (Unaudited)
Description | | Shares | | Value |
COMMON STOCKS — 94.5% | | | | | |
Communication Services — 10.5% | | | | | |
NetEase, Inc. - ADR | | 26,189 | | $ | 2,709,776 |
Nintendo Co. Ltd. - ADR(a) | | 179,882 | | | 2,444,596 |
Tencent Music Entertainment Group - ADR(b)(c) | | 231,258 | | | 2,587,777 |
TIM SA - ADR | | 130,472 | | | 2,315,878 |
Turkcell Iletisim Hizmetleri AS - ADR | | 169,477 | | | 879,586 |
| | | | | | 10,937,613 |
Consumer Discretionary — 17.1% | | | | | |
Alibaba Group Holding Ltd. - ADR | | 22,615 | | | 1,636,421 |
Coupang, Inc.(b) | | 102,802 | | | 1,828,848 |
Ferrari NV(c) | | 7,511 | | | 3,274,346 |
Description | | Shares | | Value |
Flutter Entertainment PLC(b) | | 4,341 | | $ | 857,304 |
InterContinental Hotels Group PLC - ADR(a) | | 10,770 | | | 1,137,958 |
Li Auto, Inc. - ADR(b) | | 28,219 | | | 854,471 |
MakeMyTrip Ltd.(b)(c) | | 32,000 | | | 2,273,600 |
PDD Holdings, Inc. - ADR(b)(c) | | 16,993 | | | 1,975,436 |
Sony Group Corp. - ADR | | 11,735 | | | 1,006,159 |
Toyota Motor Corp. - ADR(a)(c) | | 11,671 | | | 2,937,357 |
| | | | | | 17,781,900 |
Consumer Staples — 4.5% | | | | | |
Coca-Cola Femsa SAB de CV - ADR | | 20,123 | | | 1,955,956 |
Fomento Economico Mexicano
SAB de CV - ADR(c) | | 20,625 | | | 2,686,818 |
| | | | | | 4,642,774 |
Energy — 14.9% | | | | | |
Cameco Corp. | | 73,184 | | | 3,170,331 |
Canadian Natural Resources Ltd. | | 27,896 | | | 2,129,023 |
Ecopetrol SA - ADR(a) | | 181,630 | | | 2,150,499 |
Eni SpA - ADR | | 31,326 | | | 993,661 |
Petroleo Brasileiro SA - ADR | | 185,100 | | | 2,815,371 |
TotalEnergies SE - ADR | | 32,516 | | | 2,238,076 |
Ultrapar Participacoes SA - ADR | | 167,304 | | | 956,979 |
YPF SA - ADR(b) | | 55,513 | | | 1,099,157 |
| | | | | | 15,553,097 |
Financials — 21.0% | | | | | |
Banco Bilbao Vizcaya Argentaria SA - ADR(c) | | 432,620 | | | 5,122,222 |
Banco Macro SA - ADR(c) | | 17,704 | | | 852,979 |
Banco Santander SA - ADR | | 294,147 | | | 1,423,671 |
Bancolombia SA - ADR | | 60,770 | | | 2,079,549 |
ICICI Bank Ltd. - ADR | | 154,338 | | | 4,076,067 |
Mitsubishi UFJ Financial Group, Inc. - ADR | | 454,363 | | | 4,648,133 |
Sumitomo Mitsui Financial Group, Inc. - ADR(a) | | 235,566 | | | 2,772,612 |
XP, Inc. - Class A | | 39,629 | | | 1,016,880 |
| | | | | | 21,992,113 |
Health Care — 5.5% | | | | | |
AstraZeneca PLC - ADR | | 8,180 | | | 554,195 |
Novartis AG - ADR(c) | | 20,024 | | | 1,936,922 |
Novo Nordisk A/S - ADR | | 8,075 | | | 1,036,830 |
Teva Pharmaceutical Industries Ltd. - ADR(b)(c) | | 153,730 | | | 2,169,130 |
| | | | | | 5,697,077 |
Industrials — 5.9% | | | | | |
Airbus SE - ADR | | 12,360 | | | 570,538 |
Embraer SA - ADR(b) | | 100,888 | | | 2,687,656 |
RELX PLC - ADR(a) | | 67,485 | | | 2,921,426 |
| | | | | | 6,179,620 |
The accompanying notes are an integral part of the financial statements.
28
Amplify ETF Trust
Amplify International Enhanced Dividend Income ETF
Schedule of Investments
as of March 31, 2024 (Unaudited) (Continued)
Description | | Shares | | Value |
Information Technology — 4.7% | | | | | | |
ASE Technology Holding Co. Ltd. - ADR(c) | | 255,070 | | $ | 2,803,219 | |
ASML Holding NV | | 1,050 | | | 1,018,994 | |
Taiwan Semiconductor Manufacturing Co. Ltd. - ADR | | 8,062 | | | 1,096,835 | |
| | | | | | 4,919,048 | |
Materials — 10.4% | | | | | | |
ArcelorMittal SA | | 19,750 | | | 544,705 | |
BHP Group Ltd. - ADR(a) | | 15,520 | | | 895,349 | |
CRH PLC | | 27,768 | | | 2,395,268 | |
Gold Fields Ltd. - ADR(c) | | 233,640 | | | 3,712,539 | |
Rio Tinto PLC - ADR | | 14,576 | | | 929,074 | |
Southern Copper Corp.(c) | | 14,877 | | | 1,584,698 | |
Suzano SA - ADR | | 62,301 | | | 796,207 | |
| | | | | | 10,857,840 | |
TOTAL COMMON STOCKS
(Cost $86,628,517) | | | | | 98,561,082 | |
SHORT-TERM INVESTMENTS — 13.7% | | | | | | |
Investments Purchased with Proceeds from Securities Lending — 9.7% | | | | | | |
First American Government Obligations Fund - Class X, 5.23%(d) | | 10,097,786 | | | 10,097,786 | |
Money Market Funds — 4.0% | | | | | | |
Invesco Government & Agency Portfolio - Institutional Class, 5.24%(d) | | 4,212,886 | | | 4,212,886 | |
TOTAL SHORT-TERM INVESTMENTS
(Cost $14,310,672) | | | | | 14,310,672 | |
| | | | | | | |
TOTAL INVESTMENTS — 108.2%
(Cost $100,939,189) | | | | | 112,871,754 | |
Liabilities in Excess of Other Assets — (8.2)% | | | | | (8,545,212 | ) |
TOTAL NET ASSETS — 100.0% | | | | $ | 104,326,542 | |
Percentages are stated as a percent of net assets.
The Global Industry Classification Standard (GICS®) was developed by and/or is the exclusive property of MSCI, Inc. and Standard & Poor’s Financial Services LLC (“S&P”). GICS is a service mark of MSCI, Inc. and S&P and has been licensed for use by U.S. Bank Global Fund Services.
ADR - American Depositary Receipt
AG - Aktiengesellschaft
NV - Naamloze Vennootschap
PLC - Public Limited Company
SA - Sociedad Anónima
SAB de CV - Sociedad Anónima Bursátil de Capital Variable
The accompanying notes are an integral part of the financial statements.
29
Amplify ETF Trust
Amplify International Enhanced Dividend Income ETF
Schedule of Options Written
as of March 31, 2024 (Unaudited)
| | Notional
Amount | | Contracts | | Value |
OPTIONS WRITTEN — (0.2)%(a)(b) | | | | | | | | | | | |
Call Options — (0.2)% | | | | | | | | | | | |
ASE Technology Holding Co. Ltd.,
Expiration: 04/19/2024; Exercise Price: $12.50 | | $ | (549,500 | ) | | (500 | ) | | $ | (7,500 | ) |
Banco Bilbao Vizcaya
Argentaria SA,
Expiration: 04/19/2024; Exercise Price: $10.00 | | | (745,920 | ) | | (630 | ) | | | (119,699 | ) |
Banco Macro SA | | | | | | | | | | | |
Expiration: 04/19/2024;
Exercise Price: $55.00 | | | (192,720 | ) | | (40 | ) | | | (2,400 | ) |
Expiration: 04/19/2024;
Exercise Price: $50.00 | | | (626,340 | ) | | (130 | ) | | | (24,700 | ) |
Ferrari NV,
Expiration: 04/19/2024; Exercise Price: $470.00 | | | (653,910 | ) | | (15 | ) | | | (1,425 | ) |
Fomento Economico
Mexicano SAB de CV, Expiration: 04/19/2024;
Exercise Price: $140.00 | | | (651,350 | ) | | (50 | ) | | | (3,250 | ) |
Gold Fields Ltd. | | | | | | | | | | | |
Expiration: 04/19/2024;
Exercise Price: $16.00 | | | (794,500 | ) | | (500 | ) | | | (28,750 | ) |
Expiration: 04/19/2024;
Exercise Price: $17.00 | | | (1,191,750 | ) | | (750 | ) | | | (18,750 | ) |
MakeMyTrip Ltd.,
Expiration: 04/19/2024;
Exercise Price: $75.00 | | | (710,500 | ) | | (100 | ) | | | (12,500 | ) |
Novartis AG,
Expiration: 04/19/2024;
Exercise Price: $97.50 | | | (677,110 | ) | | (70 | ) | | | (7,700 | ) |
PDD Holdings, Inc., Expiration: 04/19/2024; Exercise Price: $130.00 | | | (581,250 | ) | | (50 | ) | | | (3,650 | ) |
Southern Copper Corp., Expiration: 04/19/2024; Exercise Price: $115.00 | | | (585,860 | ) | | (55 | ) | | | (5,088 | ) |
Tencent Music Entertainment Group,
Expiration: 04/19/2024; Exercise Price: $12.00 | | | (671,400 | ) | | (600 | ) | | | (10,500 | ) |
Teva Pharmaceutical Industries Ltd.,
Expiration: 04/19/2024; Exercise Price: $15.00 | | | (423,300 | ) | | (300 | ) | | | (3,150 | ) |
| | Notional
Amount | | Contracts | | Value |
Toyota Motor Corp., Expiration: 04/19/2024; Exercise Price: $270.00 | | $ | (629,200 | ) | | (25 | ) | | $ | (1,688 | ) |
Total Call Options | | | | | | | | | | (250,750 | ) |
TOTAL OPTIONS WRITTEN (Premiums received $194,635) | | | | | | | | | $ | (250,750 | ) |
Percentages are stated as a percent of net assets.
The accompanying notes are an integral part of the financial statements.
30
Amplify ETF Trust
Amplify Cash Flow Dividend Leaders ETF
Schedule of Investments
as of March 31, 2024 (Unaudited)
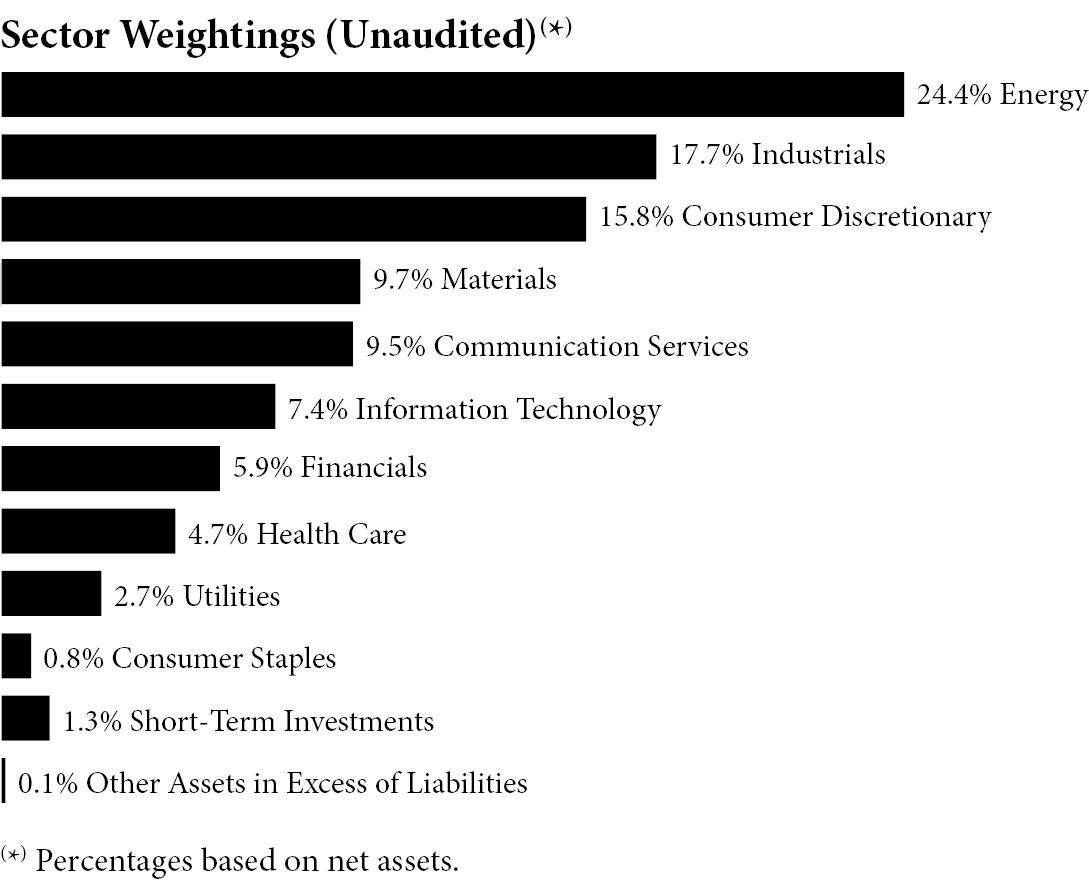
Description | | Shares | | Value |
COMMON STOCKS — 98.6% | | | | | |
Communication Services — 9.5% | | | | | |
AT&T, Inc. | | 11,167 | | $ | 196,539 |
Comcast Corp. - Class A | | 8,568 | | | 371,423 |
Interpublic Group of Cos., Inc. | | 4,968 | | | 162,106 |
Nexstar Media Group, Inc. | | 2,247 | | | 387,135 |
T-Mobile US, Inc. | | 2,154 | | | 351,576 |
| | | | | | 1,468,779 |
Consumer Discretionary — 15.8% | | | | | |
Booking Holdings, Inc. | | 33 | | | 119,720 |
BorgWarner, Inc. | | 3,642 | | | 126,523 |
Brunswick Corp./DE | | 4,114 | | | 397,083 |
eBay, Inc. | | 7,147 | | | 377,219 |
Harley-Davidson, Inc. | | 9,366 | | | 409,668 |
Macy’s, Inc. | | 14,305 | | | 285,957 |
Tapestry, Inc. | | 3,470 | | | 164,756 |
Thor Industries, Inc. | | 3,367 | | | 395,084 |
VF Corp. | | 10,834 | | | 166,194 |
| | | | | | 2,442,204 |
Consumer Staples — 0.8% | | | | | |
Ingredion, Inc. | | 997 | | | 116,499 |
Energy — 24.4% | | | | | |
Cheniere Energy, Inc. | | 2,059 | | | 332,076 |
Chevron Corp. | | 716 | | | 112,942 |
Exxon Mobil Corp. | | 2,974 | | | 345,698 |
Halliburton Co. | | 2,668 | | | 105,173 |
HF Sinclair Corp. | | 2,687 | | | 162,214 |
Magnolia Oil & Gas Corp. - Class A | | 5,930 | | | 153,884 |
Marathon Oil Corp. | | 12,960 | | | 367,285 |
Description | | Shares | | Value |
Matador Resources Co. | | 4,997 | | $ | 333,650 |
Murphy Oil Corp. | | 3,727 | | | 170,324 |
NOV, Inc. | | 7,873 | | | 153,681 |
Patterson-UTI Energy, Inc. | | 21,819 | | | 260,519 |
PBF Energy, Inc. - Class A | | 4,545 | | | 261,656 |
Phillips 66 | | 2,158 | | | 352,488 |
Range Resources Corp. | | 9,695 | | | 333,799 |
SM Energy Co. | | 7,148 | | | 356,327 |
| | | | | | 3,801,716 |
Financials — 5.9% | | | | | |
Fidelity National Financial, Inc. | | 6,590 | | | 349,929 |
Fidelity National Information Services, Inc. | | 5,172 | | | 383,659 |
Franklin Resources, Inc. | | 6,208 | | | 174,507 |
| | | | | | 908,095 |
Health Care — 4.7% | | | | | |
Bristol-Myers Squibb Co. | | 3,758 | | | 203,796 |
Cencora, Inc. | | 1,533 | | | 372,504 |
McKesson Corp. | | 291 | | | 156,223 |
| | | | | | 732,523 |
Industrials — 17.7% | | | | | |
Allison Transmission Holdings, Inc. | | 2,393 | | | 194,216 |
Concentrix Corp. | | 5,343 | | | 353,813 |
Dun & Bradstreet Holdings, Inc. | | 12,458 | | | 125,078 |
FedEx Corp. | | 1,444 | | | 418,385 |
Genpact Ltd. | | 10,629 | | | 350,226 |
Owens Corning | | 2,395 | | | 399,486 |
Snap-on, Inc. | | 1,262 | | | 373,830 |
Timken Co. | | 1,494 | | | 130,620 |
UFP Industries, Inc. | | 3,177 | | | 390,803 |
| | | | | | 2,736,457 |
Information Technology — 7.4% | | | | | |
Gen Digital, Inc. | | 6,679 | | | 149,610 |
Juniper Networks, Inc. | | 3,863 | | | 143,163 |
NetApp, Inc. | | 1,114 | | | 116,937 |
QUALCOMM, Inc. | | 2,149 | | | 363,826 |
Skyworks Solutions, Inc. | | 3,454 | | | 374,136 |
| | | | | | 1,147,672 |
Materials — 9.7% | | | | | |
Berry Global Group, Inc. | | 6,054 | | | 366,146 |
CF Industries Holdings, Inc. | | 4,429 | | | 368,537 |
Commercial Metals Co. | | 6,868 | | | 403,632 |
Reliance, Inc. | | 1,115 | | | 372,611 |
| | | | | | 1,510,926 |
Utilities — 2.7% | | | | | |
Vistra Corp. | | 5,934 | | | 413,303 |
TOTAL COMMON STOCKS
(Cost $14,265,921) | | | | | 15,278,174 |
The accompanying notes are an integral part of the financial statements.
31
Amplify ETF Trust
Amplify Cash Flow Dividend Leaders ETF
Schedule of Investments
as of March 31, 2024 (Unaudited) (Continued)
Description | | Shares | | Value |
SHORT-TERM INVESTMENTS — 1.3% | | | | | |
Money Market Funds — 1.3% | | | | | |
Invesco Government & Agency Portfolio - Institutional Class, 5.24%(a) | | 208,750 | | $ | 208,750 |
TOTAL SHORT-TERM INVESTMENTS (Cost $208,750) | | | | | 208,750 |
| | | | | | |
TOTAL INVESTMENTS — 99.9%
(Cost $14,474,671) | | | | | 15,486,924 |
Other Assets in Excess of Liabilities — 0.1% | | | | | 11,935 |
TOTAL NET ASSETS — 100.0% | | | | $ | 15,498,859 |
Percentages are stated as a percent of net assets.
The Global Industry Classification Standard (GICS®) was developed by and/or is the exclusive property of MSCI, Inc. and Standard & Poor’s Financial Services LLC (“S&P”). GICS is a service mark of MSCI, Inc. and S&P and has been licensed for use by U.S. Bank Global Fund Services.
The accompanying notes are an integral part of the financial statements.
32
Amplify ETF Trust Amplify Cash Flow High Income ETF Schedule of Investments as of March 31, 2024 (Unaudited) |
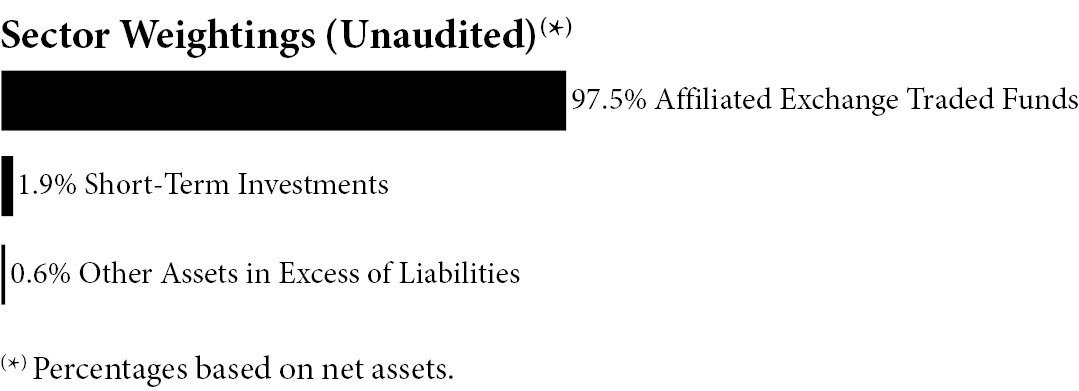
Description | | Shares | | Value |
AFFILIATED EXCHANGE TRADED FUNDS — 97.5% | | | | | |
Amplify Cash Flow Dividend Leaders ETF(a)(b) | | 107,632 | | $ | 3,209,586 |
TOTAL AFFILIATED EXCHANGE TRADED FUNDS
(Cost $2,674,405) | | | | | 3,209,586 |
| | | | | | |
SHORT-TERM INVESTMENTS — 1.9% | | | | | |
Money Market Funds — 1.9% | | | | | |
Invesco Government & Agency Portfolio - Institutional
Class, 5.24%(c) | | 64,026 | | | 64,026 |
TOTAL SHORT-TERM INVESTMENTS (Cost $64,026) | | | | | 64,026 |
| | | | | | |
TOTAL INVESTMENTS — 99.4% (Cost $2,738,431) | | | | | 3,273,612 |
Other Assets in Excess of
Liabilities — 0.6% | | | | | 18,648 |
TOTAL NET ASSETS — 100.0% | | | | $ | 3,292,260 |
Percentages are stated as a percent of net assets.
(a) Fair value of this security exceeds 25% of the Fund’s net assets. Additional information for this security, including the financial statements, is available from the SEC’s EDGAR database at www.sec.gov.
(b) Affiliated company as defined by the Investment Company Act of 1940.
(c) The rate shown represents the 7-day effective yield as of March 31, 2024.
The accompanying notes are an integral part of the financial statements.
33
Amplify ETF Trust Amplify Cash Flow High Income ETF Schedule of Total Return Swap Contracts as of March 31, 2024 (Unaudited) |
Reference Entity(a) | | Counterparty | | Long/
Short | | Maturity
Date | | Financing
Rate | | Payment
Frequency | | Notional
Amount | | Upfront
Payments
(Receipts) | | Value/
Unrealized
Appreciation
(Depreciation) |
RCXTAMU1 SWAP | | Goldman Sachs | | Long | | 09/20/2024 | | 0.00 | % | | 0 | | $ | 2,091,238 | | $ | 0 | | $ | (4,291 | ) |
| | | | | | | | | | | | | | | | | $ | 0 | | $ | (4,291 | ) |
(a) The swap agreements will seek to exchange the Target Call Income (the rate of which is expected to fluctuate) provided by the Call Income Strategy’s daily sold call options for a set percent of call premium over each Call period.
Description | | Expiration
Date | | Number of
Contracts Sold | | Notional
Amount | | Concentration
% of
Exposure |
Options Contracts: | | | | | | | | | | | |
S&P 500 Weekly C5230 Index | | 4/5/2024 | | (8.19 | ) | | $ | 43,036 | | 1.14 | % |
S&P 500 Weekly C5255 Index | | 4/5/2024 | | (16.27 | ) | | | 85,483 | | 2.26 | % |
S&P 500 Weekly C5270 Index | | 4/5/2024 | | (24.25 | ) | | | 127,418 | | 3.37 | % |
S&P 500 Weekly C5285 Index | | 4/5/2024 | | (12.58 | ) | | | 66,119 | | 1.75 | % |
S&P 500 Weekly C5300 Index | | 4/5/2024 | | (25.07 | ) | | | 131,745 | | 3.48 | % |
S&P 500 Weekly C5310 Index | | 4/5/2024 | | (31.98 | ) | | | 168,012 | | 4.44 | % |
S&P 500 Weekly C5320 Index | | 4/5/2024 | | (37.44 | ) | | | 196,701 | | 5.20 | % |
S&P 500 Weekly C5325 Index | | 4/5/2024 | | (49.74 | ) | | | 261,352 | | 6.91 | % |
S&P 500 Weekly C5285 Index | | 4/12/2024 | | (37.75 | ) | | | 198,358 | | 5.25 | % |
S&P 500 Weekly C5305 Index | | 4/12/2024 | | (25.07 | ) | | | 131,745 | | 3.48 | % |
S&P 500 Weekly C5330 Index | | 4/12/2024 | | (52.32 | ) | | | 274,898 | | 7.27 | % |
Total Options Contracts | | | | | | | | 1,684,867 | | 44.55 | % |
Cash | | | | | | | | | | | |
Cash | | | | | | | | 2,096,658 | | 55.45 | % |
Total Underlying Positions | | | | | | | $ | 3,781,525 | | 100.00 | % |
The accompanying notes are an integral part of the financial statements.
34
Amplify ETF Trust Amplify Samsung SOFR ETF Schedule of Investments as of March 31, 2024 (Unaudited) |
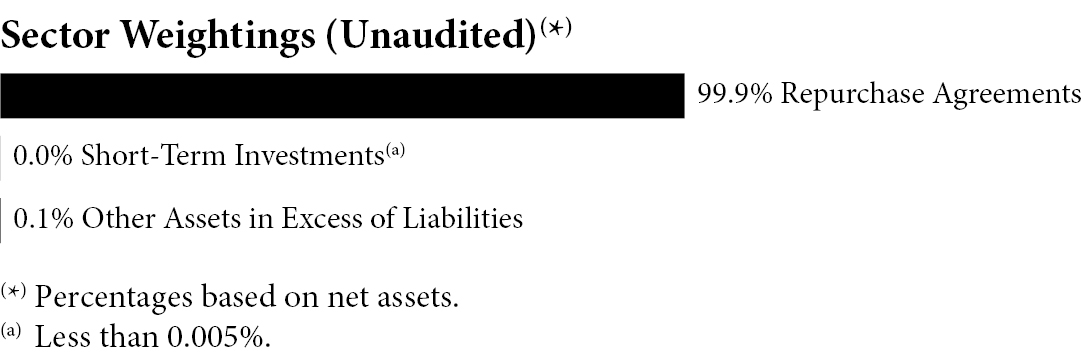
Description | | Principal Amount | | Value |
REPURCHASE AGREEMENTS — 99.9% | | | | | | |
Clear Street, LLC, 5.37%, dated 3/25/2024, due 4/1/2024, repurchase price $50,029,784 (collateralized by a U.S. Treasury Note 3.88% 8/15/2033: total value $50,190,629) | | $ | 49,999,950 | | $ | 49,999,950 |
Clear Street, LLC, 5.37%, dated 3/27/2024, due 4/3/2024, repurchase price $30,008,650 (collateralized by U.S. Treasury Note 2.75% 8/15/2032: total value $30,024,654) | | | 29,999,700 | | | 29,999,700 |
Curvature Securities, LLC, 5.38%, dated 3/28/2024, due 4/4/2024, repurchase $75,241,044 (collateralized by U.S. Treasury Note 1.00% 7/31/2028: total value $75,031,935) | | | 75,196,093 | | | 75,196,094 |
| | | | | | | 155,195,744 |
TOTAL REPURCHASE AGREEMENTS (Cost $155,195,744) | | | | | | 155,195,744 |
| | | | | | | |
| | | | Shares | | | |
SHORT-TERM INVESTMENTS — 0.0%(a) | | | | | | |
Money Market Funds — 0.0%(a) | | | | | | |
Invesco Government & Agency Portfolio - Institutional Class, 5.24%(b) | | | 24,432 | | | 24,432 |
TOTAL SHORT-TERM INVESTMENTS (Cost $24,432) | | | | | | 24,432 |
| | | | | | | |
TOTAL INVESTMENTS — 99.9% (Cost $155,220,176) | | | | | | 155,220,176 |
Other Assets in Excess of
Liabilities — 0.1% | | | | | | 93,920 |
TOTAL NET ASSETS — 100.0% | | | | | $ | 155,314,096 |
Percentages are stated as a percent of net assets.
The accompanying notes are an integral part of the financial statements.
35
Amplify ETF Trust Amplify Junior Silver Miners ETF Schedule of Investments as of March 31, 2024 (Unaudited) |
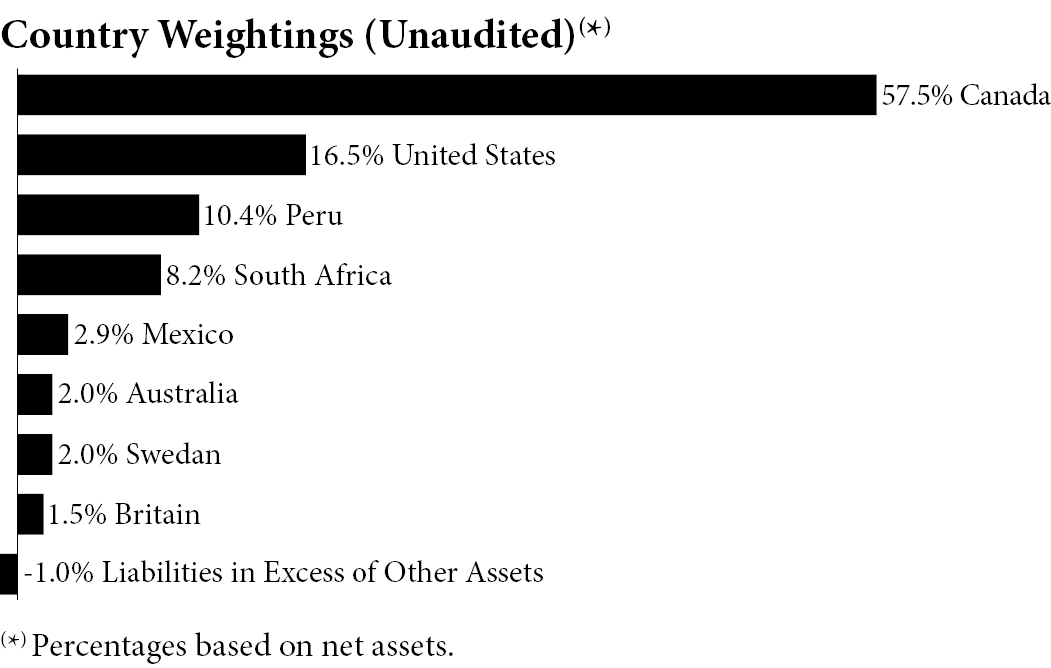
Description | | Shares | | Value |
COMMON STOCKS — 99.5% | | | | | |
Materials — 99.5%(a) | | | | | |
Adriatic Metals PLC(b) | | 4,172,032 | | $ | 10,751,257 |
Adriatic Metals PLC(b) | | 11,894 | | | 29,539 |
Americas Gold & Silver Corp.(b)(c) | | 6,794,655 | | | 1,494,824 |
Andean Precious Metals Corp.(b) | | 8,091,463 | | | 5,022,597 |
Artemis Gold, Inc.(b) | | 4,867,138 | | | 29,204,626 |
Ascot Resources, Ltd.(b) | | 11,139,020 | | | 6,173,482 |
Avino Silver & Gold Mines Ltd.(b) | | 3,059,206 | | | 1,905,885 |
Aya Gold & Silver, Inc.(b) | | 3,614,291 | | | 31,141,794 |
Bear Creek Mining Corp.(b) | | 4,913,244 | | | 816,907 |
Boliden AB | | 526,372 | | | 14,632,931 |
Chesapeake Gold Corp.(b) | | 909,927 | | | 1,297,735 |
Cia de Minas Buenaventura SAA - ADR | | 4,029,443 | | | 63,987,555 |
Coeur Mining, Inc.(b) | | 11,030,938 | | | 41,586,636 |
Coppernico Metals, Inc.(b) | | 585,867 | | | 12,988 |
Develop Global Ltd.(b) | | 4,167,213 | | | 6,470,490 |
Eldorado Gold Corp.(b) | | 812,469 | | | 11,431,439 |
Endeavour Silver Corp.(b) | | 7,887,228 | | | 19,008,220 |
First Majestic Silver Corp. | | 5,101,271 | | | 29,995,473 |
Fortuna Silver Mines, Inc.(b) | | 4,807,537 | | | 17,932,113 |
Fresnillo PLC | | 2,649,072 | | | 15,724,902 |
Gatos Silver, Inc.(b) | | 2,073,532 | | | 17,396,933 |
Generation Mining Ltd.(b) | | 18,931,931 | | | 3,707,343 |
GoGold Resources, Inc.(b) | | 8,176,310 | | | 7,431,636 |
Guanajuato Silver Co. Ltd.(b) | | 20,023,235 | | | 3,181,227 |
Harmony Gold Mining Co. Ltd. -
ADR | | 7,225,527 | | | 59,032,556 |
Hecla Mining Co. | | 8,851,485 | | | 42,575,643 |
Description | | Shares | | Value |
Hochschild Mining PLC(b) | | 6,568,200 | | $ | 10,570,719 | |
i-80 Gold Corp.(b)(c) | | 8,019,187 | | | 10,745,711 | |
Industrias Penoles SAB de CV(b) | | 367,994 | | | 5,223,990 | |
Ivanhoe Electric, Inc./US(b)(c) | | 238,543 | | | 2,337,722 | |
Kingsgate Consolidated, Ltd.(b) | | 4,616,160 | | | 3,674,136 | |
Kootenay Resources, Inc.(b)(d) | | 224,973 | | | 0 | |
MAG Silver Corp.(b) | | 2,127,100 | | | 22,504,718 | |
McEwen Mining, Inc.(b) | | 136,691 | | | 1,347,773 | |
Pan American Silver Corp. | | 3,769,282 | | | 56,840,773 | |
Prime Mining Corp.(b) | | 6,936,678 | | | 11,225,808 | |
Santacruz Silver Mining Ltd.(b) | | 17,133,461 | | | 3,165,243 | |
Seabridge Gold, Inc.(b) | | 1,152,031 | | | 17,418,709 | |
Sierra Metals, Inc.(b) | | 5,250,326 | | | 2,987,439 | |
Silver Mines Ltd.(b) | | 36,272,773 | | | 4,022,946 | |
Silvercorp Metals, Inc. | | 5,404,728 | | | 17,619,413 | |
SilverCrest Metals, Inc.(b) | | 4,352,930 | | | 28,990,514 | |
Skeena Resources Ltd.(b) | | 3,001,113 | | | 13,816,319 | |
SSR Mining, Inc. | | 1,454,005 | | | 6,484,862 | |
Taseko Mines Ltd.(b) | | 1,616,628 | | | 3,508,083 | |
Trevali Mining Corp.(b)(d) | | 967,999 | | | 0 | |
Trilogy Metals, Inc.(b) | | 1,049,466 | | | 524,733 | |
Triple Flag Precious Metals Corp. | | 425,274 | | | 6,145,209 | |
Vizsla Silver Corp.(b) | | 9,358,148 | | | 12,240,105 | |
Wheaton Precious Metals Corp. | | 697,802 | | | 32,887,408 | |
| | | | | | 716,229,064 | |
TOTAL COMMON STOCKS
(Cost $657,789,533) | | | | | 716,229,064 | |
| | | | | | | |
SHORT-TERM INVESTMENTS — 1.5% | | | | | | |
Investments Purchased with Proceeds from Securities Lending — 1.0% | | | | | | |
First American Government Obligations Fund - Class X, 5.23%(e) | | 7,056,426 | | | 7,056,426 | |
Money Market Funds — 0.5% | | | | | | |
Invesco Government & Agency Portfolio - Institutional Class, 5.24%(e) | | 3,919,747 | | | 3,919,747 | |
TOTAL SHORT-TERM INVESTMENTS (Cost $10,976,173) | | | | | 10,976,173 | |
| | | | | | | |
TOTAL INVESTMENTS — 101.0%
(Cost $668,765,706) | | | | | 727,205,237 | |
Liabilities in Excess of Other Assets — (1.0)% | | | | | (7,398,647 | ) |
TOTAL NET ASSETS — 100.0% | | | | $ | 719,806,590 | |
The accompanying notes are an integral part of the financial statements.
36
Amplify ETF Trust Amplify Junior Silver Miners ETF Schedule of Investments as of March 31, 2024 (Unaudited) (Continued) |
Percentages are stated as a percent of net assets.
The Global Industry Classification Standard (GICS®) was developed by and/or is the exclusive property of MSCI, Inc. and Standard & Poor’s Financial Services LLC (“S&P”). GICS is a service mark of MSCI, Inc. and S&P and has been licensed for use by U.S. Bank Global Fund Services.
ADR - American Depositary Receipt
PLC - Public Limited Company
SAA - Sociedad Anomina Abierta
SAB de CV - Sociedad Anónima Bursátil de Capital Variable
The accompanying notes are an integral part of the financial statements.
37
Amplify ETF Trust Amplify Cybersecurity ETF Schedule of Investments as of March 31, 2024 (Unaudited) |
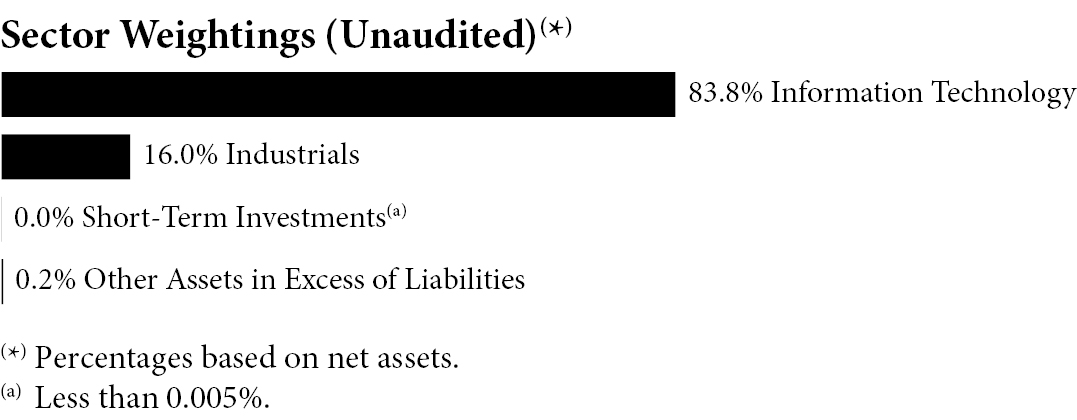
Description | | Shares | | Value |
COMMON STOCKS — 99.8% | | | | | |
Industrials — 16.0% | | | | | |
Booz Allen Hamilton Holding Corp. | | 494,873 | | $ | 73,458,948 |
General Dynamics Corp. | | 373,246 | | | 105,438,262 |
Northrop Grumman Corp. | | 218,795 | | | 104,728,415 |
| | | | | | 283,625,625 |
Information Technology — 83.8%(a) | | | | | |
Broadcom, Inc. | | 128,627 | | | 170,483,513 |
Check Point Software Technologies, Ltd.(b) | | 443,083 | | | 72,670,043 |
Cisco Systems, Inc. | | 2,679,735 | | | 133,745,574 |
Cloudflare, Inc. - Class A(b) | | 805,250 | | | 77,972,358 |
Crowdstrike Holdings, Inc. - Class A(b) | | 321,526 | | | 103,078,020 |
CyberArk Software, Ltd.(b) | | 251,056 | | | 66,688,005 |
Darktrace PLC(b) | | 10,136,157 | | | 55,929,983 |
F5 Networks, Inc(b) | | 339,236 | | | 64,315,753 |
Fastly, Inc. - Class A(b) | | 2,897,796 | | | 37,584,414 |
Fortinet, Inc.(b) | | 1,331,450 | | | 90,951,350 |
Gen Digital, Inc. | | 3,121,686 | | | 69,925,766 |
Okta, Inc.(b) | | 660,033 | | | 69,052,652 |
Palo Alto Networks, Inc.(b) | | 361,133 | | | 102,608,719 |
Qualys, Inc.(b) | | 327,776 | | | 54,695,981 |
Rapid7, Inc.(b) | | 824,982 | | | 40,457,117 |
SentinelOne, Inc. - Class A(b) | | 2,084,523 | | | 48,590,231 |
Tenable Holdings, Inc.(b) | | 1,126,607 | | | 55,688,184 |
Trend Micro, Inc./Japan | | 1,170,823 | | | 59,297,356 |
Varonis Systems, Inc.(b) | | 1,084,730 | | | 51,166,714 |
Zscaler, Inc.(b) | | 326,086 | | | 62,813,946 |
| | | | | | 1,487,715,679 |
TOTAL COMMON STOCKS
(Cost $1,548,512,898) | | | | | 1,771,341,304 |
Description | | Shares | | Value |
SHORT-TERM INVESTMENTS — 0.0%(c) | | | | | |
Money Market Funds — 0.0%(c) | | | | | |
Invesco Government & Agency Portfolio - Institutional Class, 5.24%(d) | | 264,295 | | $ | 264,295 |
TOTAL SHORT-TERM INVESTMENTS
(Cost $264,295) | | | | | 264,295 |
| | | | | | |
TOTAL INVESTMENTS — 99.8%
(Cost $1,548,777,193) | | | | | 1,771,605,599 |
Other Assets in Excess of Liabilities — 0.2% | | | | | 3,113,739 |
TOTAL NET ASSETS — 100.0% | | | | $ | 1,774,719,338 |
Percentages are stated as a percent of net assets.
The Global Industry Classification Standard (GICS®) was developed by and/or is the exclusive property of MSCI, Inc. and Standard & Poor’s Financial Services LLC (“S&P”). GICS is a service mark of MSCI, Inc. and S&P and has been licensed for use by U.S. Bank Global Fund Services.
PLC - Public Limited Company
(a) To the extent that the Fund invests more heavily in a particular industry or sector of the economy, its performance will be especially sensitive to developments that significantly affect those industries or sectors.
(b) Non-income producing security.
(c) Represents less than 0.05% of net assets.
(d) The rate shown represents the 7-day effective yield as of March 31, 2024.
The accompanying notes are an integral part of the financial statements.
38
Amplify ETF Trust Amplify Mobile Payments ETF Schedule of Investments as of March 31, 2024 (Unaudited) |
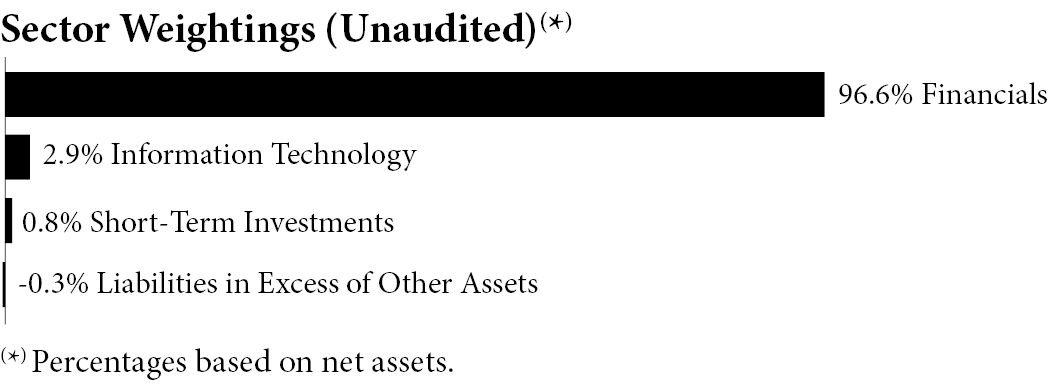
Description | | Shares | | Value |
COMMON STOCKS — 99.5% | | | | | |
Financials — 96.6%(a) | | | | | |
Adyen NV(b)(c)(d) | | 9,141 | | $ | 15,479,667 |
Affirm Holdings, Inc.(b) | | 294,715 | | | 10,981,081 |
American Express Co. | | 93,110 | | | 21,200,216 |
Block, Inc.(b) | | 226,133 | | | 19,126,329 |
Cielo SA | | 1,833,240 | | | 1,974,041 |
Coinbase Global, Inc. - Class A(b) | | 82,323 | | | 21,825,474 |
Corpay, Inc.(b) | | 54,650 | | | 16,861,711 |
Discover Financial Services | | 134,342 | | | 17,610,893 |
Dlocal Ltd./Uruguay(b) | | 111,467 | | | 1,638,565 |
Euronet Worldwide, Inc.(b) | | 69,825 | | | 7,675,862 |
EVERTEC, Inc. | | 84,020 | | | 3,352,398 |
Fidelity National Information Services, Inc. | | 233,201 | | | 17,298,850 |
Fiserv, Inc.(b) | | 133,689 | | | 21,366,176 |
Global Payments, Inc. | | 110,615 | | | 14,784,801 |
GMO Payment Gateway, Inc. | | 72,946 | | | 4,692,123 |
Green Dot Corp. - Class A(b) | | 116,557 | | | 1,087,477 |
International Money Express, Inc.(b) | | 47,508 | | | 1,084,608 |
Marqeta, Inc. - Class A(b) | | 581,992 | | | 3,468,672 |
Mastercard, Inc. - Class A | | 42,278 | | | 20,359,816 |
Nexi SpA(b)(c)(d) | | 1,101,393 | | | 6,987,118 |
Nuvei Corp. | | 103,236 | | | 3,264,322 |
Pagseguro Digital Ltd. - Class A(b) | | 268,448 | | | 3,833,437 |
PayPal Holdings, Inc.(b) | | 334,648 | | | 22,418,069 |
PayPoint PLC | | 156,311 | | | 959,654 |
QIWI PLC - ADR(b)(e)(f) | | 235,051 | | | 0 |
Shift4 Payments, Inc. - Class A(b) | | 93,617 | | | 6,185,275 |
StoneCo Ltd. - Class A(b) | | 416,618 | | | 6,920,026 |
Toast, Inc. - Class A(b) | | 587,058 | | | 14,629,485 |
Visa, Inc. - Class A | | 71,049 | | | 19,828,355 |
Western Union Co. | | 436,323 | | | 6,099,796 |
WEX, Inc.(b) | | 64,701 | | | 15,368,429 |
Wise PLC - Class A(b) | | 1,146,694 | | | 13,451,321 |
Worldline SA(b)(c)(d) | | 391,144 | | | 4,849,538 |
Zip Co. Ltd.(b) | | 1,815,810 | | | 1,646,644 |
| | | | | | 348,310,229 |
Description | | Shares | | Value |
Information Technology — 2.9% | | | | | | |
ACI Worldwide, Inc.(b) | | 152,071 | | $ | 5,050,278 | |
NCR Voyix Corp.(b) | | 128,816 | | | 1,626,946 | |
Q2 Holdings, Inc.(b) | | 74,634 | | | 3,922,763 | |
| | | | | | 10,599,987 | |
TOTAL COMMON STOCKS
(Cost $393,274,586) | | | | | 358,910,216 | |
| | | | | | | |
SHORT-TERM INVESTMENTS — 0.8% | | | | | | |
Investments Purchased with Proceeds from Securities Lending — 0.3% | | | | | | |
First American Government Obligations Fund - Class X, 5.23%(g) | | 1,043,709 | | | 1,043,709 | |
Money Market Funds — 0.5% | | | | | | |
Invesco Government & Agency Portfolio - Institutional Class, 5.24%(g) | | 1,650,522 | | | 1,650,522 | |
TOTAL SHORT-TERM INVESTMENTS
(Cost $2,694,231) | | | | | 2,694,231 | |
| | | | | | | |
TOTAL INVESTMENTS — 100.3%
(Cost $395,968,817) | | | | | 361,604,447 | |
Liabilities in Excess of Other Assets — (0.3)% | | | | | (1,064,990 | ) |
TOTAL NET ASSETS — 100.0% | | | | $ | 360,539,457 | |
Percentages are stated as a percent of net assets.
The Global Industry Classification Standard (GICS®) was developed by and/or is the exclusive property of MSCI, Inc. and Standard & Poor’s Financial Services LLC (“S&P”). GICS is a service mark of MSCI, Inc. and S&P and has been licensed for use by U.S. Bank Global Fund Services.
ADR - American Depositary Receipt
NV - Naamloze Vennootschap
PLC - Public Limited Company
SA - Sociedad Anónima
(a) To the extent that the Fund invests more heavily in a particular industry or sector of the economy, its performance will be especially sensitive to developments that significantly affect those industries or sectors.
(b) Non-income producing security.
(c) Security is exempt from registration pursuant to Rule 144A under the Securities Act of 1933, as amended. These securities may only be resold in transactions exempt from registration to qualified institutional investors. As of March 31, 2024, the value of these securities total $27,316,323 or 7.6% of the Fund’s net assets.
The accompanying notes are an integral part of the financial statements.
39
Amplify ETF Trust Amplify Mobile Payments ETF Schedule of Investments as of March 31, 2024 (Unaudited) (Continued) |
(d) Security is exempt from registration pursuant to Regulation S under the Securities Act of 1933, as amended. As of March 31, 2024, the value of these securities total $27,316,323 or 7.6% of the Fund’s net assets.
(e) Fair value determined using significant unobservable inputs in accordance with procedures established by and under the supervision of the Adviser, acting as Valuation Designee. These securities represented $0 or 0.0% of net assets as of March 31, 2024.
(f) All or a portion of this security is on loan as of March 31, 2024. The total market value of these securities was $954,403 which represented 0.3% of net assets.
(g) The rate shown represents the 7-day effective yield as of March 31, 2024.
The accompanying notes are an integral part of the financial statements.
40
Amplify ETF Trust Amplify BlueStar Israel Technology ETF Schedule of Investments as of March 31, 2024 (Unaudited) |
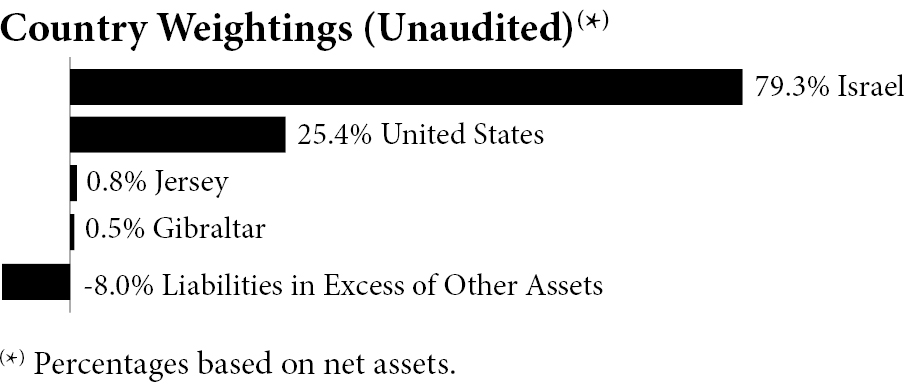
Description | | Shares | | Value |
COMMON STOCKS — 99.8% | | | | | |
Communication Services — 2.9% | | | | | |
Nexxen International Ltd.(a) | | 127,562 | | $ | 338,399 |
Perion Network Ltd.(a) | | 37,835 | | | 850,531 |
Playtika Holding Corp. | | 72,284 | | | 509,602 |
Taboola.com Ltd.(a) | | 181,450 | | | 805,638 |
| | | | | | 2,504,170 |
Consumer Discretionary — 5.2% | | | | | |
888 Holdings PLC(a) | | 351,091 | | | 392,511 |
Global-e Online Ltd.(a) | | 69,356 | | | 2,521,090 |
Maytronics, Ltd. | | 45,530 | | | 454,720 |
Mobileye Global, Inc. - Class A(a)(b) | | 23,020 | | | 740,093 |
NEOGAMES SA(a) | | 15,185 | | | 439,758 |
| | | | | | 4,548,172 |
Financials — 3.3% | | | | | |
Lemonade, Inc.(a)(b) | | 43,779 | | | 718,413 |
Payoneer Global, Inc.(a) | | 202,913 | | | 986,158 |
Plus500, Ltd. | | 50,693 | | | 1,155,883 |
| | | | | | 2,860,454 |
Health Care — 3.8% | | | | | |
Inmode Ltd.(a) | | 68,244 | | | 1,474,753 |
Nano-X Imaging Ltd.(a)(b) | | 71,386 | | | 697,441 |
Novocure, Ltd.(a) | | 44,466 | | | 695,004 |
Pluri, Inc.(a) | | 1 | | | 1 |
UroGen Pharma, Ltd.(a) | | 28,320 | | | 424,800 |
| | | | | | 3,291,999 |
Industrials — 8.6% | | | | | |
Elbit Systems Ltd. | | 18,494 | | | 3,887,994 |
Fiverr International Ltd.(a) | | 31,221 | | | 657,826 |
Hilan, Ltd. | | 10,117 | | | 645,619 |
Kornit Digital, Ltd.(a) | | 36,659 | | | 664,261 |
Leonardo DRS, Inc.(a) | | 48,655 | | | 1,074,789 |
Stratasys, Ltd.(a)(b) | | 51,429 | | | 597,605 |
| | | | | | 7,528,094 |
Description | | Shares | | Value |
Information Technology — 71.3%(c) | | | | | |
Amdocs, Ltd. | | 67,255 | | $ | 6,077,834 |
AudioCodes, Ltd. | | 24,931 | | | 325,100 |
Camtek Ltd./Israel(a) | | 20,486 | | | 1,716,112 |
Cellebrite DI Ltd.(a)(b) | | 58,988 | | | 653,587 |
CEVA, Inc.(a) | | 18,640 | | | 423,314 |
Check Point Software Technologies, Ltd.(a) | | 39,782 | | | 6,524,647 |
Cognyte Software, Ltd.(a) | | 62,228 | | | 514,626 |
CyberArk Software, Ltd.(a) | | 28,213 | | | 7,494,220 |
Formula Systems 1985, Ltd. | | 6,713 | | | 539,613 |
Gilat Satellite Networks Ltd.(a) | | 58,140 | | | 315,700 |
Innoviz Technologies Ltd.(a)(b) | | 191,369 | | | 258,348 |
JFrog Ltd.(a) | | 73,193 | | | 3,236,594 |
LivePerson, Inc.(a)(b) | | 98,201 | | | 97,946 |
Magic Software Enterprises, Ltd. | | 28,637 | | | 331,650 |
Matrix IT, Ltd. | | 28,061 | | | 620,855 |
Monday.com Ltd.(a) | | 20,267 | | | 4,577,707 |
Nano Dimension Ltd. - ADR(a)(b) | | 239,519 | | | 667,060 |
Nice Ltd. - ADR(a)(b) | | 28,081 | | | 7,318,471 |
Nova Ltd.(a) | | 14,597 | | | 2,589,216 |
One Software Technologies Ltd. | | 30,891 | | | 458,681 |
Pagaya Technologies Ltd. - Class A(a) | | 25,065 | | | 253,151 |
Radware, Ltd.(a) | | 26,371 | | | 493,665 |
Riskified Ltd. - Class A(a) | | 101,178 | | | 547,373 |
Sapiens International Corp. NV | | 27,069 | | | 870,539 |
SentinelOne, Inc. - Class A(a) | | 158,619 | | | 3,697,408 |
SolarEdge Technologies, Inc.(a) | | 41,255 | | | 2,928,280 |
Tower Semiconductor Ltd.(a) | | 82,363 | | | 2,755,042 |
Vishay Precision Group, Inc.(a) | | 12,341 | | | 436,008 |
WalkMe Ltd.(a) | | 33,657 | | | 289,450 |
Wix.com, Ltd.(a) | | 37,470 | | | 5,151,376 |
| | | | | | 62,163,573 |
Utilities — 4.7% | | | | | |
Energix-Renewable Energies, Ltd. | | 223,324 | | | 820,466 |
Enlight Renewable Energy, Ltd.(a) | | 59,345 | | | 996,663 |
Ormat Technologies, Inc. | | 32,952 | | | 2,187,385 |
| | | | | | 4,004,514 |
TOTAL COMMON STOCKS
(Cost $105,458,941) | | | | | 86,900,976 |
The accompanying notes are an integral part of the financial statements.
41
Amplify ETF Trust Amplify BlueStar Israel Technology ETF Schedule of Investments as of March 31, 2024 (Unaudited) (Continued) |
Description | | Shares | | Value |
SHORT-TERM INVESTMENTS — 8.2% | | | | | | |
Investments Purchased with Proceeds from Securities Lending — 8.1% | | | | | | |
First American Government Obligations Fund - Class X, 5.23%(d) | | 7,022,800 | | $ | 7,022,800 | |
Money Market Funds — 0.1% | | | | | | |
Invesco Government & Agency Portfolio - Institutional Class, 5.24%(d) | | 113,656 | | | 113,656 | |
TOTAL SHORT-TERM INVESTMENTS
(Cost $7,136,456) | | | | | 7,136,456 | |
| | | | | | | |
TOTAL INVESTMENTS — 108.0%
(Cost $112,595,397) | | | | | 94,037,432 | |
Liabilities in Excess of Other Assets — (8.0)% | | | | | (6,958,565 | ) |
TOTAL NET ASSETS — 100.0% | | | | $ | 87,078,867 | |
Percentages are stated as a percent of net assets.
The Global Industry Classification Standard (GICS®) was developed by and/or is the exclusive property of MSCI, Inc. and Standard & Poor’s Financial Services LLC (“S&P”). GICS is a service mark of MSCI, Inc. and S&P and has been licensed for use by U.S. Bank Global Fund Services.
ADR - American Depositary Receipt
NV - Naamloze Vennootschap
PLC ��- Public Limited Company
SA - Sociedad Anónima
(a) Non-income producing security.
(b) All or a portion of this security is on loan as of March 31, 2024. The total market value of these securities was $6,648,828 which represented 7.6% of net assets.
(c) To the extent that the Fund invests more heavily in a particular industry or sector of the economy, its performance will be especially sensitive to developments that significantly affect those industries or sectors.
(d) The rate shown represents the 7-day effective yield as of March 31, 2024.
The accompanying notes are an integral part of the financial statements.
42
Amplify ETF Trust
Amplify Etho Climate Leadership U.S. ETF
Schedule of Investments
as of March 31, 2024 (Unaudited)

Description | | Shares | | Value |
COMMON STOCKS — 99.8% | | | | | |
Communication Services — 6.4% | | | | | |
Atlanta Braves Holdings, Inc. - Class C(a) | | 254 | | $ | 9,921 |
ATN International, Inc. | | 16,350 | | | 515,107 |
EchoStar Corp. - Class A(a) | | 35,889 | | | 511,418 |
Electronic Arts, Inc. | | 5,505 | | | 730,348 |
Interpublic Group of Cos., Inc. | | 18,215 | | | 594,355 |
John Wiley & Sons, Inc. - Class A | | 17,406 | | | 663,691 |
Liberty Media Corp. - Liberty Formula One - Class C(a) | | 8,826 | | | 578,986 |
Liberty Media Corp. - Liberty Live - Class C(a) | | 375 | | | 16,433 |
Netflix, Inc.(a) | | 1,911 | | | 1,160,607 |
New York Times Co. - Class A | | 17,078 | | | 738,111 |
Omnicom Group, Inc. | | 7,161 | | | 692,898 |
Paramount Global - Class B | | 29,901 | | | 351,935 |
Sirius XM Holdings, Inc.(b) | | 168,976 | | | 655,627 |
Take-Two Interactive Software, Inc.(a) | | 5,536 | | | 822,041 |
TEGNA, Inc. | | 39,852 | | | 595,389 |
Telephone and Data Systems, Inc. | | 65,398 | | | 1,047,676 |
T-Mobile US, Inc. | | 4,586 | | | 748,527 |
TripAdvisor, Inc.(a) | | 33,256 | | | 924,184 |
Verizon Communications, Inc. | | 17,654 | | | 740,762 |
| | | | | | 12,098,016 |
Consumer Discretionary — 14.3% | | | | | |
Advance Auto Parts, Inc. | | 5,492 | | | 467,314 |
Booking Holdings, Inc. | | 249 | | | 903,342 |
Brunswick Corp./DE | | 8,167 | | | 788,279 |
Chipotle Mexican Grill, Inc.(a) | | 386 | | | 1,122,012 |
Darden Restaurants, Inc. | | 4,332 | | | 724,094 |
Description | | Shares | | Value |
eBay, Inc. | | 15,125 | | $ | 798,298 |
EVgo, Inc.(a)(b) | | 84,003 | | | 210,848 |
Expedia Group, Inc.(a) | | 6,806 | | | 937,527 |
Foot Locker, Inc. | | 17,064 | | | 486,324 |
Genuine Parts Co. | | 4,020 | | | 622,819 |
Graham Holdings Co. - Class B | | 1,117 | | | 857,499 |
Hasbro, Inc. | | 12,763 | | | 721,365 |
Hilton Worldwide Holdings, Inc. | | 4,700 | | | 1,002,557 |
Hyatt Hotels Corp. - Class A | | 5,929 | | | 946,387 |
KB Home | | 16,603 | | | 1,176,820 |
Lennar Corp. - Class A | | 6,340 | | | 1,090,353 |
LKQ Corp. | | 11,819 | | | 631,253 |
Lowe’s Cos., Inc. | | 3,350 | | | 853,346 |
Mattel, Inc.(a) | | 35,875 | | | 710,684 |
Penske Automotive Group, Inc. | | 4,723 | | | 765,079 |
PVH Corp. | | 7,416 | | | 1,042,764 |
QuantumScape Corp.(a)(b) | | 80,245 | | | 504,741 |
Ralph Lauren Corp. | | 5,732 | | | 1,076,240 |
Ross Stores, Inc. | | 6,271 | | | 920,332 |
Sabre Corp.(a) | | 153,008 | | | 370,279 |
Service Corp. International/US | | 9,718 | | | 721,173 |
Tapestry, Inc. | | 15,711 | | | 745,958 |
Tempur Sealy International, Inc. | | 16,850 | | | 957,417 |
Tesla, Inc.(a) | | 3,183 | | | 559,540 |
Toll Brothers, Inc. | | 11,062 | | | 1,431,090 |
Tractor Supply Co. | | 2,848 | | | 745,379 |
VF Corp. | | 29,682 | | | 455,322 |
Williams-Sonoma, Inc. | | 5,521 | | | 1,753,082 |
| | | | | | 27,099,517 |
Consumer Staples — 4.3% | | | | | |
Church & Dwight Co., Inc. | | 7,531 | | | 785,559 |
Coty, Inc. - Class A(a) | | 54,766 | | | 655,001 |
Edgewell Personal Care Co. | | 15,743 | | | 608,310 |
Energizer Holdings, Inc. | | 19,531 | | | 574,993 |
Estee Lauder Cos., Inc. - Class A | | 2,712 | | | 418,055 |
Grocery Outlet Holding Corp.(a) | | 23,371 | | | 672,617 |
Ingredion, Inc. | | 6,592 | | | 770,275 |
Kimberly-Clark Corp. | | 5,051 | | | 653,347 |
Kroger Co. | | 13,606 | | | 777,311 |
PriceSmart, Inc. | | 9,289 | | | 780,276 |
Spectrum Brands Holdings, Inc. | | 10,128 | | | 901,492 |
SunOpta, Inc.(a) | | 85,693 | | | 588,711 |
| | | | | | 8,185,947 |
Financials — 20.5% | | | | | |
Affiliated Managers Group, Inc. | | 4,638 | | | 776,726 |
Allstate Corp. | | 6,082 | | | 1,052,247 |
Ally Financial, Inc. | | 26,689 | | | 1,083,307 |
Amalgamated Financial Corp. | | 37,883 | | | 909,192 |
The accompanying notes are an integral part of the financial statements.
43
Amplify ETF Trust
Amplify Etho Climate Leadership U.S. ETF
Schedule of Investments
as of March 31, 2024 (Unaudited) (Continued)
Description | | Shares | | Value |
American Express Co. | | 4,034 | | $ | 918,501 |
Ares Management Corp. - Class A | | 8,079 | | | 1,074,345 |
Arthur J Gallagher & Co. | | 3,476 | | | 869,139 |
Associated Banc-Corp. | | 38,018 | | | 817,767 |
Bank of Hawaii Corp. | | 13,179 | | | 822,238 |
Capitol Federal Financial, Inc. | | 102,236 | | | 609,327 |
Cboe Global Markets, Inc. | | 4,966 | | | 912,403 |
Charles Schwab Corp. | | 12,766 | | | 923,492 |
CME Group, Inc. | | 3,562 | | | 766,863 |
CNA Financial Corp. | | 17,948 | | | 815,198 |
Discover Financial Services | | 6,816 | | | 893,509 |
Erie Indemnity Co. - Class A | | 2,878 | | | 1,155,719 |
FactSet Research Systems, Inc. | | 1,601 | | | 727,478 |
Fidelity National Financial, Inc. | | 19,487 | | | 1,034,760 |
First American Financial Corp. | | 12,166 | | | 742,734 |
Fiserv, Inc.(a) | | 5,842 | | | 933,668 |
Franklin Resources, Inc. | | 25,109 | | | 705,814 |
Fulton Financial Corp. | | 49,023 | | | 778,975 |
Hannon Armstrong Sustainable Infrastructure Capital, Inc. | | 23,917 | | | 679,243 |
Hanover Insurance Group, Inc. | | 5,240 | | | 713,531 |
Hartford Financial Services Group, Inc. | | 9,632 | | | 992,578 |
Intercontinental Exchange, Inc. | | 6,396 | | | 879,002 |
Invesco Ltd. | | 42,438 | | | 704,046 |
Lazard, Inc. | | 21,157 | | | 885,844 |
MarketAxess Holdings, Inc. | | 1,691 | | | 370,752 |
Marsh & McLennan Cos., Inc. | | 3,996 | | | 823,096 |
Mastercard, Inc. - Class A | | 1,823 | | | 877,902 |
MBIA, Inc. | | 163,508 | | | 1,105,315 |
Morningstar, Inc. | | 3,264 | | | 1,006,520 |
Nasdaq, Inc. | | 12,218 | | | 770,956 |
Northern Trust Corp. | | 7,698 | | | 684,506 |
Old Republic International Corp. | | 27,136 | | | 833,618 |
PayPal Holdings, Inc.(a) | | 8,697 | | | 582,612 |
Principal Financial Group, Inc. | | 9,111 | | | 786,370 |
Progressive Corp. | | 4,637 | | | 959,024 |
Prudential Financial, Inc. | | 8,289 | | | 973,129 |
Reinsurance Group of America, Inc. | | 5,051 | | | 974,237 |
S&P Global, Inc. | | 1,927 | | | 819,842 |
Unum Group | | 17,062 | | | 915,547 |
Visa, Inc. - Class A | | 2,945 | | | 821,891 |
WaFd, Inc. | | 22,505 | | | 653,320 |
White Mountains Insurance Group, Ltd. | | 479 | | | 859,470 |
| | | | | | 38,995,753 |
Health Care — 10.9% | | | | | |
Agilent Technologies, Inc. | | 4,792 | | | 697,284 |
Agios Pharmaceuticals, Inc.(a) | | 28,754 | | | 840,767 |
Align Technology, Inc.(a) | | 1,976 | | | 647,970 |
Description | | Shares | | Value |
Alnylam Pharmaceuticals, Inc.(a) | | 3,296 | | $ | 492,587 |
AMN Healthcare Services, Inc.(a) | | 7,961 | | | 497,642 |
Avanos Medical, Inc.(a) | | 22,071 | | | 439,434 |
Baxter International, Inc. | | 16,618 | | | 710,253 |
Becton Dickinson & Co. | | 2,696 | | | 667,125 |
Bio-Rad Laboratories, Inc. - Class A(a) | | 1,379 | | | 476,955 |
Bio-Techne Corp. | | 8,930 | | | 628,583 |
Cigna Group/ | | 2,617 | | | 950,467 |
DENTSPLY SIRONA, Inc. | | 16,951 | | | 562,604 |
DexCom, Inc.(a) | | 5,684 | | | 788,371 |
Edwards Lifesciences Corp.(a) | | 7,983 | | | 762,855 |
Hologic, Inc.(a) | | 8,183 | | | 637,947 |
Humana, Inc. | | 1,357 | | | 470,499 |
IDEXX Laboratories, Inc.(a) | | 1,320 | | | 712,708 |
Illumina, Inc.(a) | | 2,822 | | | 387,517 |
Ionis Pharmaceuticals, Inc.(a) | | 18,480 | | | 801,108 |
IQVIA Holdings, Inc.(a) | | 3,321 | | | 839,848 |
Merck & Co., Inc. | | 6,326 | | | 834,716 |
Mettler-Toledo International, Inc.(a) | | 431 | | | 573,786 |
Myriad Genetics, Inc.(a) | | 28,432 | | | 606,170 |
Patterson Cos., Inc. | | 25,283 | | | 699,075 |
Pediatrix Medical Group, Inc.(a) | | 44,024 | | | 441,561 |
Pfizer, Inc. | | 16,662 | | | 462,371 |
ResMed, Inc. | | 3,037 | | | 601,417 |
Revvity, Inc. | | 4,964 | | | 521,220 |
STERIS PLC | | 3,477 | | | 781,699 |
Teleflex, Inc. | | 2,618 | | | 592,113 |
Vertex Pharmaceuticals, Inc.(a) | | 2,096 | | | 876,149 |
Waters Corp.(a) | | 2,132 | | | 733,898 |
| | | | | | 20,736,699 |
Industrials — 12.6% | | | | | |
3D Systems Corp.(a) | | 61,043 | | | 271,031 |
A.O. Smith Corp. | | 9,666 | | | 864,720 |
AAON, Inc. | | 10,280 | | | 905,668 |
Advanced Drainage Systems, Inc. | | 7,868 | | | 1,355,184 |
Ameresco, Inc. - Class A(a) | | 13,296 | | | 320,832 |
Array Technologies, Inc.(a) | | 30,000 | | | 447,300 |
Babcock & Wilcox Enterprises, Inc.(a) | | 107,984 | | | 122,022 |
Beam Global(a)(b) | | 41,257 | | | 280,548 |
Blink Charging Co.(a)(b) | | 75,652 | | | 227,713 |
Bloom Energy Corp. - Class A(a)(b) | | 32,935 | | | 370,189 |
Brink’s Co. | | 9,973 | | | 921,306 |
Broadridge Financial Solutions, Inc. | | 4,560 | | | 934,162 |
ChargePoint Holdings, Inc.(a)(b) | | 62,501 | | | 118,752 |
Cintas Corp. | | 1,437 | | | 987,262 |
Copart, Inc.(a) | | 17,563 | | | 1,017,249 |
Deere & Co. | | 1,610 | | | 661,291 |
FuelCell Energy, Inc.(a)(b) | | 229,607 | | | 273,232 |
The accompanying notes are an integral part of the financial statements.
44
Amplify ETF Trust
Amplify Etho Climate Leadership U.S. ETF
Schedule of Investments
as of March 31, 2024 (Unaudited) (Continued)
Description | | Shares | | Value |
Herc Holdings, Inc. | | 5,884 | | $ | 990,277 |
Hubbell, Inc. | | 2,743 | | | 1,138,482 |
JB Hunt Transport Services, Inc. | | 3,787 | | | 754,560 |
Landstar System, Inc. | | 3,729 | | | 718,802 |
Lennox International, Inc. | | 2,644 | | | 1,292,281 |
ManpowerGroup, Inc. | | 8,231 | | | 639,055 |
MSC Industrial Direct Co., Inc. - Class A | | 8,004 | | | 776,708 |
NEXTracker, Inc. - Class A(a) | | 4,953 | | | 278,705 |
Old Dominion Freight Line, Inc. | | 3,886 | | | 852,239 |
Pitney Bowes, Inc. | | 176,481 | | | 764,163 |
Plug Power, Inc.(a)(b) | | 55,835 | | | 192,072 |
Shoals Technologies Group, Inc. - Class A(a) | | 28,802 | | | 322,006 |
Stem, Inc.(a)(b) | | 115,768 | | | 253,532 |
SunPower Corp.(a)(b) | | 47,282 | | | 141,846 |
Sunrun, Inc.(a) | | 32,576 | | | 429,352 |
TPI Composites, Inc.(a)(b) | | 50,144 | | | 145,919 |
United Parcel Service, Inc. - Class B | | 3,504 | | | 520,800 |
Verisk Analytics, Inc. | | 3,457 | | | 814,919 |
WESCO International, Inc. | | 4,302 | | | 736,847 |
Westinghouse Air Brake Technologies Corp. | | 6,563 | | | 956,098 |
Willdan Group, Inc.(a) | | 42,284 | | | 1,225,813 |
| | | | | | 24,022,937 |
Information Technology — 22.1% | | | | | |
Adobe Systems, Inc.(a) | | 1,714 | | | 864,884 |
Advanced Micro Devices, Inc.(a) | | 6,738 | | | 1,216,142 |
Akamai Technologies, Inc.(a) | | 8,434 | | | 917,282 |
Amdocs, Ltd. | | 6,978 | | | 630,602 |
Amtech Systems, Inc.(a) | | 69,232 | | | 374,545 |
Analog Devices, Inc. | | 3,393 | | | 671,101 |
Apple, Inc. | | 4,019 | | | 689,178 |
Applied Materials, Inc. | | 5,409 | | | 1,115,498 |
Arista Networks, Inc.(a) | | 3,934 | | | 1,140,781 |
Arrow Electronics, Inc.(a) | | 5,289 | | | 684,714 |
Autodesk, Inc.(a) | | 3,172 | | | 826,052 |
Avnet, Inc. | | 14,881 | | | 737,800 |
Badger Meter, Inc. | | 5,447 | | | 881,379 |
Belden, Inc. | | 7,624 | | | 706,059 |
Cadence Design System, Inc.(a) | | 3,143 | | | 978,353 |
Cisco Systems, Inc. | | 12,835 | | | 640,595 |
Corning, Inc. | | 19,196 | | | 632,700 |
Dolby Laboratories, Inc. - Class A | | 7,808 | | | 654,076 |
DXC Technology Co.(a) | | 25,840 | | | 548,066 |
Enphase Energy, Inc.(a) | | 3,122 | | | 377,700 |
F5 Networks, Inc(a) | | 4,533 | | | 859,411 |
First Solar, Inc.(a) | | 3,018 | | | 509,438 |
Flex Ltd.(a) | | 28,703 | | | 821,193 |
Gartner, Inc.(a) | | 2,027 | | | 966,210 |
Description | | Shares | | Value |
Gen Digital, Inc. | | 39,196 | | $ | 877,990 |
HP, Inc. | | 23,071 | | | 697,206 |
Intel Corp. | | 20,414 | | | 901,686 |
International Business Machines Corp. | | 5,201 | | | 993,183 |
Intuit, Inc. | | 1,486 | | | 965,900 |
Itron, Inc.(a) | | 11,911 | | | 1,102,006 |
Juniper Networks, Inc. | | 19,579 | | | 725,598 |
Micron Technology, Inc. | | 10,982 | | | 1,294,668 |
NVIDIA Corp. | | 2,378 | | | 2,148,667 |
ON Semiconductor Corp.(a) | | 8,023 | | | 590,092 |
OSI Systems, Inc.(a) | | 6,452 | | | 921,475 |
Qorvo, Inc.(a) | | 6,503 | | | 746,739 |
Qualcomm, Inc. | | 5,270 | | | 892,211 |
Rambus, Inc.(a) | | 12,885 | | | 796,422 |
Salesforce, Inc. | | 3,308 | | | 996,303 |
ServiceNow, Inc.(a) | | 1,420 | | | 1,082,608 |
Teradata Corp.(a) | | 16,397 | | | 634,072 |
Teradyne, Inc. | | 6,162 | | | 695,258 |
Trimble, Inc.(a) | | 12,599 | | | 810,872 |
Universal Display Corp. | | 4,283 | | | 721,471 |
Veeco Instruments, Inc.(a) | | 31,257 | | | 1,099,309 |
VeriSign, Inc.(a) | | 3,125 | | | 592,219 |
Viavi Solutions, Inc.(a) | | 60,986 | | | 554,363 |
Vishay Intertechnology, Inc. | | 29,527 | | | 669,672 |
Xerox Holdings Corp. | | 44,314 | | | 793,221 |
Zebra Technologies Corp. - Class A(a) | | 2,076 | | | 625,789 |
Zoom Video Communications, Inc. - Class A(a) | | 8,944 | | | 584,669 |
| | | | | | 41,957,428 |
Materials — 1.6% | | | | | |
Arcadium Lithium PLC(a) | | 72,712 | | | 313,389 |
Cabot Corp. | | 8,748 | | | 806,566 |
Ecolab, Inc. | | 4,021 | | | 928,448 |
Packaging Corp. of America | | 4,865 | | | 923,280 |
| | | | | | 2,971,683 |
Real Estate — 5.6% | | | | | |
American Tower Corp. | | 3,308 | | | 653,628 |
AvalonBay Communities, Inc. | | 4,005 | | | 743,168 |
Camden Property Trust | | 6,433 | | | 633,007 |
Digital Realty Trust, Inc. | | 6,902 | | | 994,164 |
Equinix, Inc. | | 928 | | | 765,906 |
Gladstone Land Corp. | | 40,766 | | | 543,818 |
Iron Mountain, Inc. | | 12,829 | | | 1,029,014 |
Prologis, Inc. | | 5,398 | | | 702,928 |
Public Storage, Inc. | | 2,251 | | | 652,925 |
Regency Centers Corp. | | 11,119 | | | 673,367 |
SBA Communications Corp. | | 2,558 | | | 554,319 |
UDR, Inc. | | 16,455 | | | 615,582 |
The accompanying notes are an integral part of the financial statements.
45
Amplify ETF Trust
Amplify Etho Climate Leadership U.S. ETF
Schedule of Investments
as of March 31, 2024 (Unaudited) (Continued)
Description | | Shares | | Value |
Ventas, Inc. | | 15,549 | | $ | 677,003 | |
Veris Residential, Inc. | | 45,315 | | | 689,241 | |
Welltower, Inc. | | 9,398 | | | 878,149 | |
| | | | | | 10,806,219 | |
Utilities — 1.5% | | | | | | |
American States Water Co. | | 7,536 | | | 544,401 | |
American Water Works Co., Inc. | | 4,576 | | | 559,233 | |
California Water Service Group | | 11,515 | | | 535,217 | |
Montauk Renewables, Inc.(a) | | 83,406 | | | 346,969 | |
Ormat Technologies, Inc. | | 7,827 | | | 518,069 | |
Sunnova Energy International, Inc.(a)(b) | | 42,023 | | | 257,601 | |
| | | | | | 2,761,490 | |
TOTAL COMMON STOCKS
(Cost $169,705,144) | | | | | 189,635,689 | |
| | | | | | | |
SHORT-TERM INVESTMENTS — 2.0% | | | | | | |
Investments Purchased with Proceeds from Securities Lending — 1.9% | | | | | | |
First American Government Obligations Fund - Class X, 5.23%(c) | | 3,639,773 | | | 3,639,773 | |
Money Market Funds — 0.1% | | | | | | |
Invesco Government & Agency Portfolio - Institutional Class, 5.24%(c) | | 188,962 | | | 188,962 | |
TOTAL SHORT-TERM INVESTMENTS
(Cost $3,828,735) | | | | | 3,828,735 | |
| | | | | | | |
TOTAL INVESTMENTS — 101.8%
(Cost $173,533,879) | | | | | 193,464,424 | |
Liabilities in Excess of Other
Assets — (1.8)% | | | | | (3,487,328 | ) |
TOTAL NET ASSETS — 100.0% | | | | $ | 189,977,096 | |
Percentages are stated as a percent of net assets.
The Global Industry Classification Standard (GICS®) was developed by and/or is the exclusive property of MSCI, Inc. and Standard & Poor’s Financial Services LLC (“S&P”). GICS is a service mark of MSCI, Inc. and S&P and has been licensed for use by U.S. Bank Global Fund Services.
PLC - Public Limited Company
(a) Non-income producing security.
(b) All or a portion of this security is on loan as of March 31, 2024. The total market value of these securities was $3,403,998 which represented 1.8% of net assets.
(c) The rate shown represents the 7-day effective yield as of March 31, 2024.
The accompanying notes are an integral part of the financial statements.
46
Amplify ETF Trust
Amplify Alternative Harvest ETF
Schedule of Investments
as of March 31, 2024 (Unaudited)
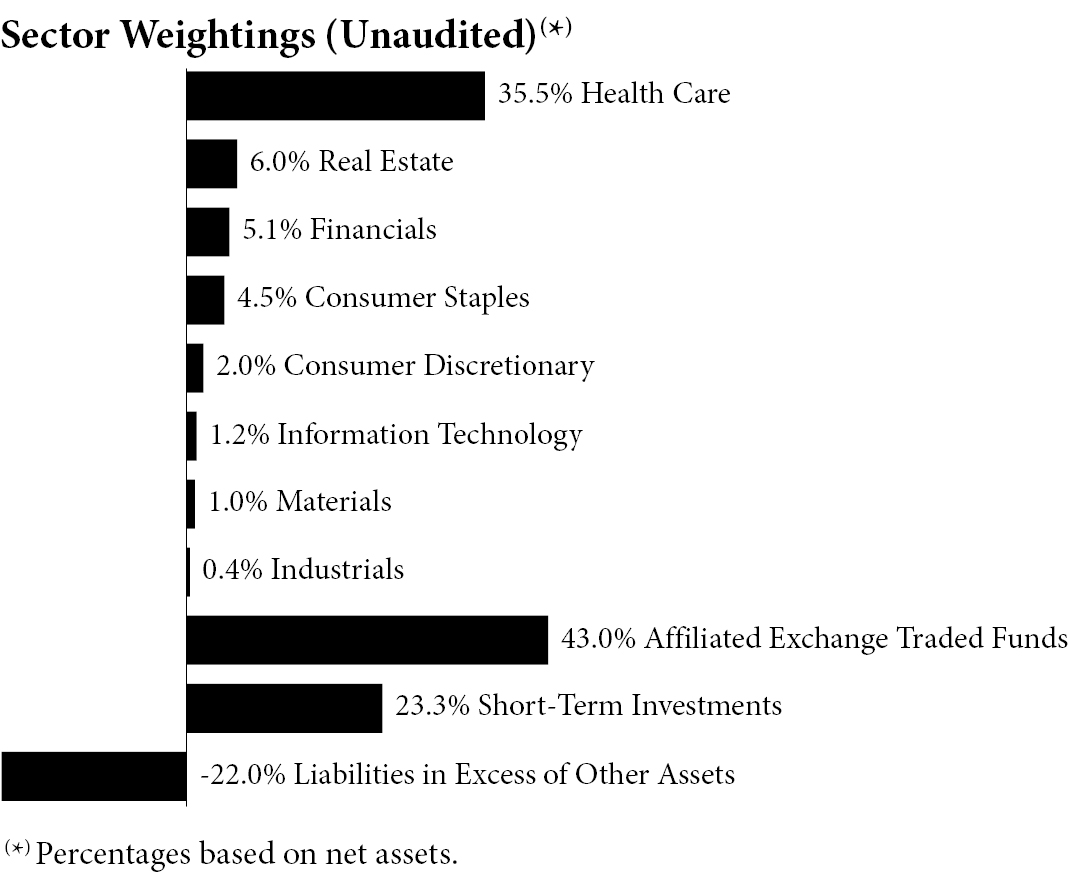
Description | | Shares | | Value |
COMMON STOCKS — 55.7% | | | | | |
Consumer Discretionary — 2.0% | | | | | |
GrowGeneration Corp.(a) | | 1,953,657 | | $ | 5,587,459 |
Consumer Staples — 4.5% | | | | | |
22nd Century Group, Inc.(a)(b) | | 202,864 | | | 24,344 |
Altria Group, Inc. | | 33,771 | | | 1,473,091 |
British American Tobacco PLC | | 46,772 | | | 1,421,577 |
Imperial Brands PLC | | 57,319 | | | 1,281,624 |
Ispire Technology, Inc.(a)(b) | | 31,933 | | | 195,750 |
Philip Morris International, Inc. | | 15,100 | | | 1,383,462 |
Scandinavian Tobacco Group AS(c)(d) | | 79,834 | | | 1,431,035 |
Turning Point Brands, Inc. | | 56,682 | | | 1,660,783 |
Vector Group, Ltd. | | 45,322 | | | 496,730 |
Village Farms International, Inc.(a)(b) | | 2,536,551 | | | 3,145,324 |
| | | | | | 12,513,720 |
Financials — 5.1% | | | | | |
AFC Gamma, Inc. | | 534,636 | | | 6,618,794 |
Chicago Atlantic Real Estate Finance, Inc. | | 493,294 | | | 7,779,247 |
| | | | | | 14,398,041 |
Health Care — 35.5%(e) | | | | | |
Aurora Cannabis, Inc.(a)(b) | | 1,101,903 | | | 4,837,355 |
Canopy Growth Corp.(a)(b) | | 2,516,529 | | | 21,717,646 |
Cronos Group, Inc.(a) | | 6,596,457 | | | 17,216,753 |
High Tide, Inc.(a) | | 2,424,511 | | | 4,837,377 |
Incannex Healthcare, Inc.(a) | | 397,313 | | | 1,426,354 |
Intercure Ltd.(a) | | 325,741 | | | 882,758 |
Jazz Pharmaceuticals PLC(a) | | 11,404 | | | 1,373,270 |
Organigram Holdings, Inc.(a)(b) | | 1,737,876 | | | 3,736,434 |
Description | | Shares | | Value |
SNDL, Inc.(a)(b) | | 9,095,885 | | $ | 18,237,250 | |
Tilray Brands, Inc.(a)(b) | | 10,642,146 | | | 26,286,100 | |
| | | | | | 100,551,297 | |
Industrials — 0.4% | | | | | | |
Empresas ICA SAB de CV(a)(f) | | 155,893 | | | 0 | |
Hydrofarm Holdings Group, Inc.(a) | | 1,035,276 | | | 1,118,098 | |
| | | | | | 1,118,098 | |
Information Technology — 1.2% | | | | | | |
WM Technology, Inc.(a) | | 2,504,067 | | | 3,330,409 | |
Materials — 1.0% | | | | | | |
Mativ Holdings, Inc. | | 50,645 | | | 949,594 | |
Scotts Miracle-Gro Co. | | 24,346 | | | 1,815,969 | |
| | | | | | 2,765,563 | |
Real Estate — 6.0% | | | | | | |
Innovative Industrial Properties, Inc. | | 163,562 | | | 16,935,210 | |
TOTAL COMMON STOCKS
(Cost $168,149,438) | | | | | 157,199,797 | |
| | | | | | | |
AFFILIATED EXCHANGE TRADED FUNDS — 43.0% | | | | | | |
Amplify U.S. Alternative Harvest ETF(b)(g)(h) | | 55,588,449 | | | 121,738,703 | |
TOTAL AFFILIATED EXCHANGE TRADED FUNDS
(Cost $103,632,244) | | | | | 121,738,703 | |
| | | | | | | |
SHORT-TERM INVESTMENTS — 23.3% | | | | | | |
Investments Purchased with Proceeds from Securities Lending — 23.3% | | | | | | |
First American Government Obligations Fund - Class X, 5.23%(i) | | 65,881,964 | | | 65,881,964 | |
TOTAL SHORT-TERM INVESTMENTS (Cost $65,881,964) | | | | | 65,881,964 | |
| | | | | | | |
TOTAL INVESTMENTS — 122.0%
(Cost $337,663,646) | | | | | 344,820,464 | |
Liabilities in Excess of Other Assets — (22.0)% | | | | | (62,115,894 | ) |
TOTAL NET ASSETS — 100.0% | | | | $ | 282,704,570 | |
Percentages are stated as a percent of net assets.
The Global Industry Classification Standard (GICS®) was developed by and/or is the exclusive property of MSCI, Inc. and Standard & Poor’s Financial Services LLC (“S&P”). GICS is a service mark of MSCI, Inc. and S&P and has been licensed for use by U.S. Bank Global Fund Services.
PLC - Public Limited Company
SAB de CV - Sociedad Anónima Bursátil de Capital Variable
(a) Non-income producing security.
(b) All or a portion of this security is on loan as of March 31, 2024. The total market value of these securities was $56,687,100 which represented 20.1% of net assets.
The accompanying notes are an integral part of the financial statements.
47
Amplify ETF Trust
Amplify Alternative Harvest ETF
Schedule of Investments
as of March 31, 2024 (Unaudited) (Continued)
(c) Security is exempt from registration pursuant to Rule 144A under the Securities Act of 1933, as amended. These securities may only be resold in transactions exempt from registration to qualified institutional investors. As of March 31, 2024, the value of these securities total $1,431,035 or 0.5% of the Fund’s net assets.
(d) Security is exempt from registration pursuant to Regulation S under the Securities Act of 1933, as amended. As of March 31, 2024, the value of these securities total $1,431,035 or 0.5% of the Fund’s net assets.
(e) To the extent that the Fund invests more heavily in a particular industry or sector of the economy, its performance will be especially sensitive to developments that significantly affect those industries or sectors.
(f) Fair value determined using significant unobservable inputs in accordance with procedures established by and under the supervision of the Adviser, acting as Valuation Designee. These securities represented $0 or 0.0% of net assets as of March 31, 2024.
(g) Fair value of this security exceeds 25% of the Fund’s net assets. Additional information for this security, including the financial statements, is available from the SEC’s EDGAR database at www.sec.gov.
(h) Affiliated company as defined by the Investment Company Act of 1940.
(i) The rate shown represents the 7-day effective yield as of March 31, 2024.
The accompanying notes are an integral part of the financial statements.
48
Amplify ETF Trust
Amplify Global Cloud Technology ETF
Schedule of Investments
as of March 31, 2024 (Unaudited)
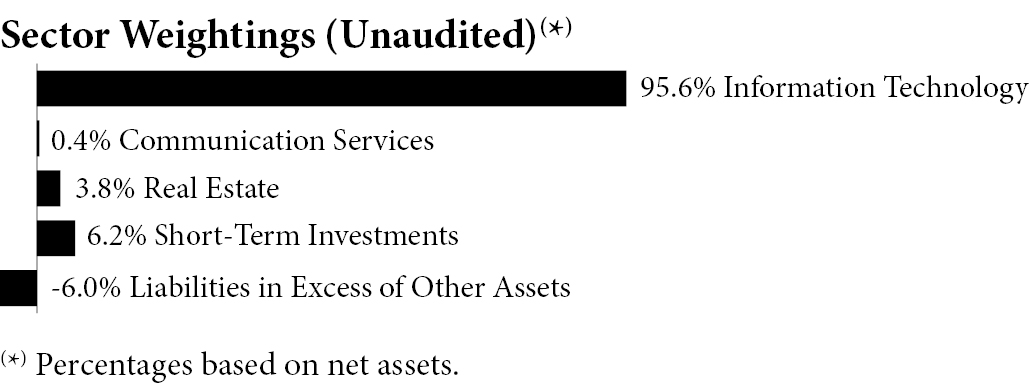
Description | | Shares | | Value |
COMMON STOCKS — 99.8% | | | | | |
Communication Services — 0.4% | | | | | |
KINX, Inc. | | 2,047 | | $ | 144,754 |
Information Technology — 95.6%(a) | | | | | |
8x8, Inc.(b) | | 7,279 | | | 19,653 |
Appfolio, Inc. - Class A(b) | | 2,115 | | | 521,855 |
Appian Corp. - Class A(b) | | 4,328 | | | 172,904 |
Backblaze, Inc. - Class A(b) | | 2,218 | | | 22,690 |
Blackbaud, Inc.(b) | | 3,154 | | | 233,838 |
Box, Inc. - Class A(b) | | 8,467 | | | 239,786 |
Bytes Technology Group PLC | | 101,061 | | | 652,369 |
Chinasoft International Ltd. | | 1,220,842 | | | 736,269 |
Cloudflare, Inc. - Class A(b) | | 9,412 | | | 911,364 |
CommVault Systems, Inc.(b) | | 2,575 | | | 261,182 |
Confluent, Inc. - Class A(b) | | 18,433 | | | 562,575 |
Cybozu, Inc. | | 22,045 | | | 255,635 |
Data#3 Ltd. | | 65,080 | | | 351,554 |
Datadog, Inc. - Class A(b) | | 7,055 | | | 871,998 |
DigitalOcean Holdings, Inc.(b) | | 5,354 | | | 204,416 |
Domo, Inc. - Class B(b) | | 2,160 | | | 19,267 |
Dropbox, Inc. - Class A(b) | | 20,282 | | | 492,853 |
Elastic NV(b) | | 10,996 | | | 1,102,240 |
Everbridge, Inc.(b) | | 2,437 | | | 84,881 |
Fastly, Inc. - Class A(b) | | 7,913 | | | 102,632 |
GDS Holdings Ltd. - ADR(b)(c) | | 80,285 | | | 533,895 |
Gitlab, Inc. - Class A(b) | | 9,181 | | | 535,436 |
Grid Dynamics Holdings, Inc.(b) | | 4,475 | | | 54,998 |
HashiCorp, Inc. - Class A(b) | | 11,549 | | | 311,246 |
Hennge KK(b) | | 13,606 | | | 108,690 |
Informatica, Inc. - Class A(b) | | 17,389 | | | 608,615 |
Intapp, Inc.(b) | | 4,261 | | | 146,152 |
Ionos SE(b) | | 58,800 | | | 1,352,629 |
Jamf Holding Corp.(b) | | 7,492 | | | 137,478 |
JFrog Ltd.(b) | | 6,269 | | | 277,215 |
Kingsoft Cloud Holdings Ltd. - ADR(b)(c) | | 99,205 | | | 301,583 |
Kyndryl Holdings, Inc.(b) | | 13,567 | | | 295,218 |
Megaport Ltd.(b) | | 66,619 | | | 651,500 |
MicroStrategy, Inc. - Class A(b)(c) | | 907 | | | 1,546,035 |
MongoDB, Inc.(b) | | 2,072 | | | 743,102 |
Description | | Shares | | Value |
N-able, Inc.(b) | | 10,846 | | $ | 141,757 | |
nCino, Inc.(b) | | 6,671 | | | 249,362 | |
NetApp, Inc. | | 10,407 | | | 1,092,422 | |
NEXTDC Ltd.(b) | | 129,316 | | | 1,500,869 | |
Nice, Ltd.(b) | | 5,994 | | | 1,566,027 | |
NS Solutions Corp. | | 38,240 | | | 1,244,389 | |
Nutanix, Inc. - Class A(b) | | 14,310 | | | 883,213 | |
Okta, Inc.(b) | | 8,644 | | | 904,335 | |
Open Text Corp. | | 38,237 | | | 1,485,119 | |
PagerDuty, Inc.(b) | | 5,418 | | | 122,880 | |
Pure Storage, Inc. - Class A(b) | | 17,616 | | | 915,856 | |
Rackspace Technology, Inc.(b) | | 12,760 | | | 20,161 | |
RingCentral, Inc. - Class A(b) | | 5,443 | | | 189,090 | |
Samsara, Inc. - Class A(b) | | 26,844 | | | 1,014,435 | |
SCSK Corp. | | 79,776 | | | 1,479,608 | |
Sinch AB(b)(d)(e) | | 354,679 | | | 890,794 | |
Smartsheet, Inc. - Class A(b) | | 8,034 | | | 309,309 | |
SolarWinds Corp.(b) | | 9,828 | | | 124,029 | |
Super Micro Computer, Inc.(b) | | 1,071 | | | 1,081,742 | |
TechMatrix Corp. | | 18,611 | | | 223,315 | |
Teradata Corp.(b) | | 5,743 | | | 222,082 | |
Unisys Corp.(b) | | 4,036 | | | 19,817 | |
Vnet Group, Inc. - ADR(b) | | 62,366 | | | 96,667 | |
Zeta Global Holdings Corp. - Class A(b) | | 12,836 | | | 140,298 | |
| | | | | | 31,341,329 | |
Real Estate — 3.8% | | | | | | |
Digital Core REIT Management Pte Ltd. | | 552,615 | | | 332,951 | |
Keppel DC REIT | | 722,991 | | | 926,774 | |
| | | | | | 1,259,725 | |
TOTAL COMMON STOCKS
(Cost $30,546,890) | | | | | 32,745,808 | |
| | | | | | | |
SHORT-TERM INVESTMENTS — 6.2% | | | | | | |
Investments Purchased with Proceeds from Securities Lending — 6.1% | | | | | | |
First American Government Obligations Fund - Class X, 5.23%(f) | | 2,011,604 | | | 2,011,604 | |
Money Market Funds — 0.1% | | | | | | |
Invesco Government & Agency Portfolio - Institutional Class, 5.24%(f) | | 25,510 | | | 25,510 | |
TOTAL SHORT-TERM INVESTMENTS (Cost $2,037,114) | | | | | 2,037,114 | |
| | | | | | | |
TOTAL INVESTMENTS — 106.0%
(Cost $32,584,004) | | | | | 34,782,922 | |
Liabilities in Excess of
Other Assets — (6.0)% | | | | | (1,978,037 | ) |
TOTAL NET ASSETS — 100.0% | | | | $ | 32,804,885 | |
The accompanying notes are an integral part of the financial statements.
49
Amplify ETF Trust
Amplify Global Cloud Technology ETF
Schedule of Investments
as of March 31, 2024 (Unaudited) (Continued)
Percentages are stated as a percent of net assets.
The Global Industry Classification Standard (GICS®) was developed by and/or is the exclusive property of MSCI, Inc. and Standard & Poor’s Financial Services LLC (“S&P”). GICS is a service mark of MSCI, Inc. and S&P and has been licensed for use by U.S. Bank Global Fund Services.
ADR - American Depositary Receipt
NV - Naamloze Vennootschap
PLC - Public Limited Company
(a) To the extent that the Fund invests more heavily in a particular industry or sector of the economy, its performance will be especially sensitive to developments that significantly affect those industries or sectors.
(b) Non-income producing security.
(c) All or a portion of this security is on loan as of March 31, 2024. The total market value of these securities was $1,806,882 which represented 5.5% of net assets.
(d) Security is exempt from registration pursuant to Rule 144A under the Securities Act of 1933, as amended. These securities may only be resold in transactions exempt from registration to qualified institutional investors. As of March 31, 2024, the value of these securities total $890,794 or 2.7% of the Fund’s net assets.
(e) Security is exempt from registration pursuant to Regulation S under the Securities Act of 1933, as amended. As of March 31, 2024, the value of these securities total $890,794 or 2.7% of the Fund’s net assets.
(f) The rate shown represents the 7-day effective yield as of March 31, 2024.
The accompanying notes are an integral part of the financial statements.
50
Amplify ETF Trust Amplify Video Game Tech ETF Schedule of Investments as of March 31, 2024 (Unaudited) |
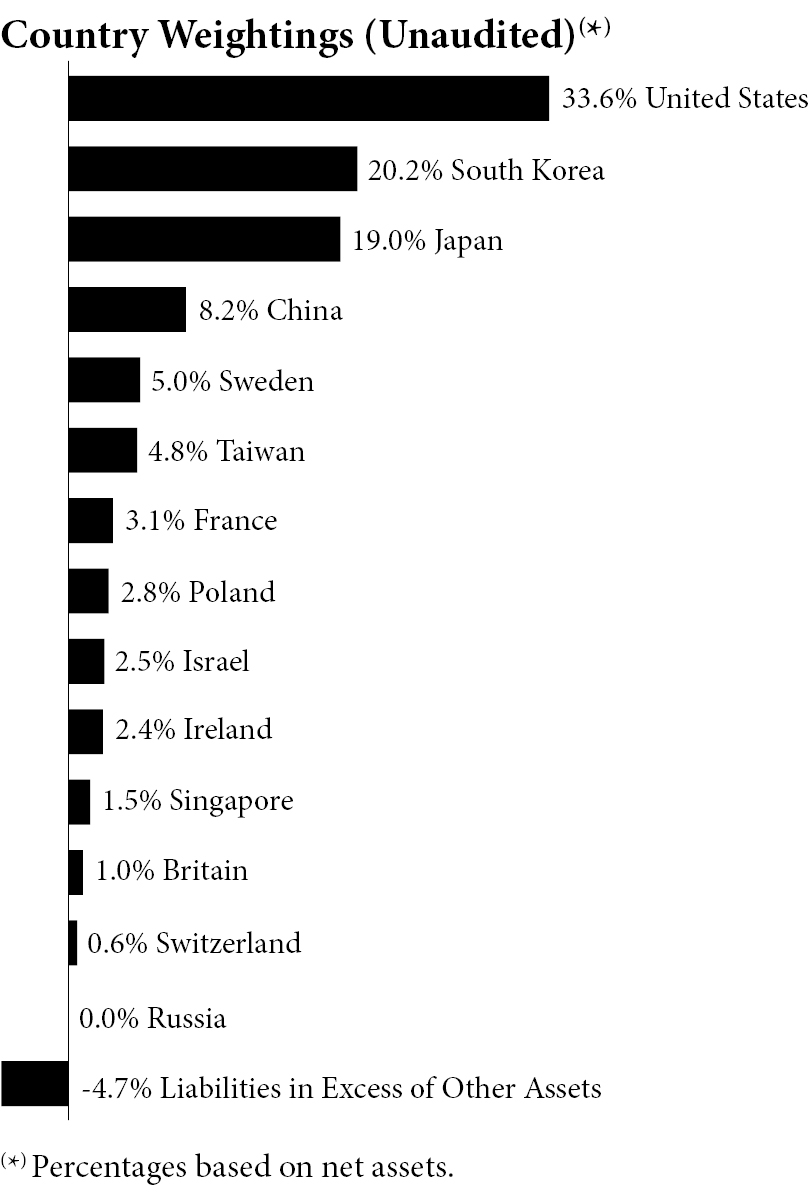
Description | | Shares | | Value |
COMMON STOCKS — 99.5% | | | | | |
Communication Services — 73.0%(a) | | | | | |
AfreecaTV Co. Ltd. | | 2,348 | | $ | 214,699 |
Akatsuki, Inc. | | 8,726 | | | 145,582 |
Alphabet, Inc. - Class A(b) | | 2,180 | | | 329,027 |
Bilibili, Inc. - ADR(b)(c) | | 109,730 | | | 1,228,975 |
Capcom Co. Ltd. | | 52,792 | | | 985,762 |
CD Projekt SA | | 38,677 | | | 1,133,808 |
CMGE Technology Group Ltd.(b) | | 1,209,971 | | | 177,790 |
COLOPL, Inc. | | 39,501 | | | 160,776 |
Com2uS Corp. | | 4,701 | | | 148,057 |
CyberAgent, Inc. | | 32,209 | | | 233,675 |
DeNA Co. Ltd.(b) | | 23,119 | | | 228,143 |
Devsisters Co. Ltd.(b) | | 4,825 | | | 174,363 |
Electronic Arts, Inc. | | 7,615 | | | 1,010,282 |
Embracer Group AB(b) | | 600,287 | | | 1,310,599 |
FriendTimes, Inc.(d) | | 1,097,706 | | | 136,048 |
Gamania Digital Entertainment Co.
Ltd. | | 66,925 | | | 151,819 |
Gree, Inc. | | 45,231 | | | 143,752 |
GungHo Online Entertainment, Inc. | | 15,599 | | | 249,170 |
HUYA, Inc. - ADR(b) | | 42,836 | | | 194,904 |
Description | | Shares | | Value |
iDreamSky Technology
Holdings, Ltd.(b)(d)(e) | | 581,057 | | $ | 190,061 |
IGG, Inc.(b) | | 320,320 | | | 135,062 |
International Games System Co. Ltd. | | 39,673 | | | 1,394,602 |
JOYY, Inc. - ADR | | 7,166 | | | 220,355 |
Kakao Games Corp.(b) | | 60,499 | | | 1,049,323 |
Koei Tecmo Holdings Co. Ltd. | | 18,121 | | | 192,591 |
Konami Group Corp. | | 15,813 | | | 1,073,042 |
Krafton, Inc.(b) | | 6,250 | | | 1,160,631 |
Meta Platforms, Inc. - Class A | | 616 | | | 299,117 |
MIXI, Inc. | | 13,697 | | | 236,391 |
Modern Times Group MTG
AB - Class B(b) | | 20,840 | | | 162,937 |
NCSoft Corp. | | 7,313 | | | 1,119,018 |
Neowiz | | 9,061 | | | 149,082 |
NetDragon Websoft Holdings, Ltd. | | 104,128 | | | 145,819 |
NetEase, Inc. - ADR | | 2,797 | | | 289,406 |
Netmarble Corp.(b)(d)(e) | | 22,994 | | | 1,077,750 |
Nexon Co. Ltd. | | 65,624 | | | 1,088,349 |
Nexon Games Co. Ltd.(b) | | 14,386 | | | 148,214 |
NHN Corp. | | 7,542 | | | 141,456 |
Nintendo Co. Ltd. | | 18,931 | | | 1,033,078 |
Paradox Interactive AB | | 16,295 | | | 286,655 |
Pearl Abyss Corp.(b) | | 46,745 | | | 1,053,824 |
Playtika Holding Corp. | | 143,345 | | | 1,010,582 |
ROBLOX Corp. - Class A(b) | | 26,621 | | | 1,016,390 |
Sea, Ltd. - ADR(b) | | 4,653 | | | 249,913 |
Soft-World International Corp. | | 35,843 | | | 159,596 |
Square Enix Holdings Co. Ltd. | | 25,132 | | | 966,788 |
Stillfront Group AB(b) | | 161,915 | | | 144,280 |
Take-Two Interactive Software, Inc.(b) | | 7,229 | | | 1,073,435 |
Team17 Group PLC(b) | | 49,280 | | | 146,294 |
Tencent Holdings, Ltd. | | 8,570 | | | 332,662 |
Ubisoft Entertainment SA(b) | | 46,370 | | | 976,798 |
Vivendi SE | | 27,042 | | | 294,973 |
VK IPJSC - GDR(b)(d)(f) | | 21,975 | | | 0 |
Webzen, Inc. | | 12,020 | | | 147,320 |
Wemade Co. Ltd.(b) | | 30,477 | | | 1,371,890 |
XD, Inc.(b)(d) | | 80,270 | | | 163,074 |
Zengame Technology Holding Ltd.(d) | | 260,590 | | | 117,202 |
Ziff Davis, Inc.(b) | | 3,283 | | | 206,960 |
Zx, Inc.(b)(d) | | 154,000 | | | 379,763 |
| | | | | | 29,761,914 |
Consumer Discretionary — 7.5% | | | | | |
Amazon.com, Inc.(b) | | 1,708 | | | 308,089 |
Bandai Namco Holdings, Inc. | | 11,670 | | | 215,750 |
DoubleUGames Co. Ltd. | | 4,320 | | | 135,897 |
Furyu Corp. | | 18,378 | | | 153,125 |
The accompanying notes are an integral part of the financial statements.
51
Amplify ETF Trust Amplify Video Game Tech ETF Schedule of Investments as of March 31, 2024 (Unaudited) (Continued) |
Description | | Shares | | Value |
GameStop Corp. - Class A(b)(c) | | 74,435 | | $ | 931,926 | |
GOLFZON Co. Ltd. | | 2,554 | | | 160,496 | |
Happinet Corp. | | 7,085 | | | 141,845 | |
Light & Wonder, Inc. - Class A(b) | | 2,246 | | | 229,294 | |
Mattel, Inc.(b) | | 11,459 | | | 227,003 | |
Sega Sammy Holdings, Inc. | | 18,042 | | | 222,507 | |
Sony Group Corp. | | 3,500 | | | 299,020 | |
| | | | | | 3,024,952 | |
Health Care — 0.4% | | | | | | |
Surgical Science Sweden AB(b) | | 10,420 | | | 147,833 | |
Information Technology — 18.6% | | | | | | |
Advanced Micro Devices, Inc.(b) | | 1,568 | | | 283,008 | |
Ansys, Inc.(b) | | 3,179 | | | 1,103,621 | |
Apple, Inc. | | 1,670 | | | 286,372 | |
AppLovin Corp. - Class A(b) | | 3,780 | | | 261,652 | |
ARM Holdings PLC - ADR(b) | | 2,140 | | | 267,478 | |
Corsair Gaming, Inc.(b) | | 82,022 | | | 1,012,151 | |
Dolby Laboratories, Inc. - Class A | | 2,787 | | | 233,467 | |
Intel Corp. | | 7,011 | | | 309,676 | |
Keywords Studios PLC | | 58,676 | | | 965,074 | |
Logitech International SA | | 2,561 | | | 229,628 | |
Microsoft Corp. | | 730 | | | 307,126 | |
NVIDIA Corp. | | 382 | | | 345,160 | |
PTC, Inc.(b) | | 1,234 | | | 233,152 | |
Qualcomm, Inc. | | 1,913 | | | 323,871 | |
Taiwan Semiconductor Manufacturing Co. Ltd. - ADR | | 1,755 | | | 238,768 | |
Unity Software, Inc.(b) | | 36,227 | | | 967,261 | |
Western Digital Corp.(b) | | 3,796 | | | 259,039 | |
| | | | | | 7,626,504 | |
TOTAL COMMON STOCKS
(Cost $47,218,688) | | | | | 40,561,203 | |
| | | | | | | |
SHORT-TERM INVESTMENTS — 5.2% | | | | | | |
Investments Purchased with Proceeds from Securities Lending — 5.0% | | | | | | |
First American Government Obligations Fund - Class X, 5.23%(g) | | 2,036,920 | | | 2,036,920 | |
Money Market Funds — 0.2% | | | | | | |
Invesco Government & Agency Portfolio - Institutional Class,
5.24%(g) | | 101,242 | | | 101,242 | |
TOTAL SHORT-TERM INVESTMENTS
(Cost $2,138,162) | | | | | 2,138,162 | |
| | | | | | | |
TOTAL INVESTMENTS — 104.7%
(Cost $49,356,850) | | | | | 42,699,365 | |
Liabilities in Excess of Other Assets — (4.7)% | | | | | (1,919,479 | ) |
TOTAL NET ASSETS — 100.0% | | | | $ | 40,779,886 | |
Percentages are stated as a percent of net assets.
The Global Industry Classification Standard (GICS®) was developed by and/or is the exclusive property of MSCI, Inc. and Standard & Poor’s Financial Services LLC (“S&P”). GICS is a service mark of MSCI, Inc. and S&P and has been licensed for use by U.S. Bank Global Fund Services.
ADR - American Depositary Receipt
GDR - Global Depositary Receipt
PLC - Public Limited Company
SA - Sociedad Anónima
(a) To the extent that the Fund invests more heavily in a particular industry or sector of the economy, its performance will be especially sensitive to developments that significantly affect those industries or sectors.
(b) Non-income producing security.
(c) All or a portion of this security is on loan as of March 31, 2024. The total market value of these securities was $1,882,545 which represented 4.6% of net assets.
(d) Security is exempt from registration pursuant to Regulation S under the Securities Act of 1933, as amended. As of March 31, 2024, the value of these securities total $2,063,898 or 5.1% of the Fund’s net assets.
(e) Security is exempt from registration pursuant to Rule 144A under the Securities Act of 1933, as amended. These securities may only be resold in transactions exempt from registration to qualified institutional investors. As of March 31, 2024, the value of these securities total $1,267,811 or 3.1% of the Fund’s net assets.
(f) Fair value determined using significant unobservable inputs in accordance with procedures established by and under the supervision of the Adviser, acting as Valuation Designee. These securities represented $0 or 0.0% of net assets as of March 31, 2024.
(g) The rate shown represents the 7-day effective yield as of March 31, 2024.
The accompanying notes are an integral part of the financial statements.
52
Amplify ETF Trust Amplify AI Powered Equity ETF Schedule of Investments as of March 31, 2024 (Unaudited) |
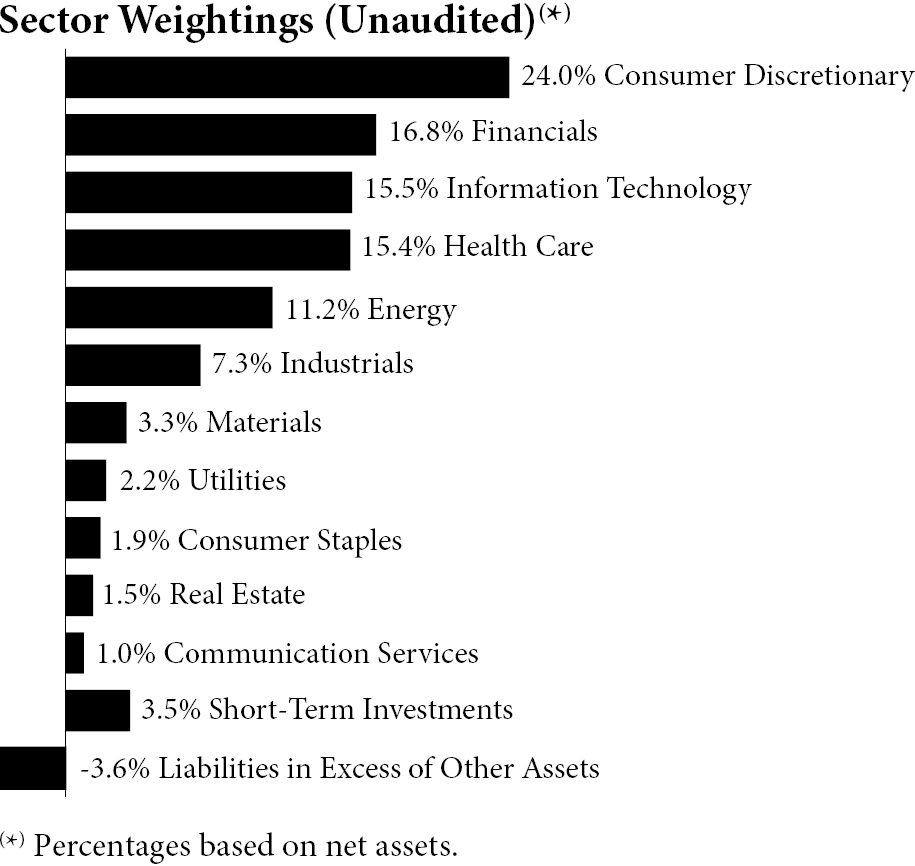
Description | | Shares | | Value |
COMMON STOCKS — 100.1% | | | | | |
Communication Services — 1.0% | | | | | |
Meta Platforms, Inc. - Class A | | 2,304 | | $ | 1,118,776 |
| | | | | | |
Consumer Discretionary — 24.0% | | | | | |
Choice Hotels International, Inc.(a) | | 1,045 | | | 132,036 |
Crocs, Inc.(b) | | 12,558 | | | 1,805,840 |
Dick’s Sporting Goods, Inc. | | 13,151 | | | 2,957,134 |
DR Horton, Inc. | | 6,841 | | | 1,125,687 |
Duolingo, Inc.(b) | | 533 | | | 117,569 |
Etsy, Inc.(b) | | 16,412 | | | 1,127,833 |
H&R Block, Inc. | | 4,935 | | | 242,358 |
Light & Wonder, Inc. - Class A(b) | | 948 | | | 96,781 |
Norwegian Cruise Line Holdings
Ltd.(b) | | 250,397 | | | 5,240,810 |
PulteGroup, Inc. | | 18,815 | | | 2,269,465 |
Ralph Lauren Corp. | | 2,177 | | | 408,754 |
Royal Caribbean Cruises Ltd.(b) | | 8,145 | | | 1,132,236 |
Tapestry, Inc. | | 10,285 | | | 488,332 |
Tesla, Inc.(b) | | 21,929 | | | 3,854,898 |
Toll Brothers, Inc. | | 2,049 | | | 265,079 |
Tractor Supply Co. | | 1,979 | | | 517,944 |
Wayfair, Inc. - Class A(b) | | 39,939 | | | 2,711,059 |
Wingstop, Inc. | | 5,858 | | | 2,146,371 |
| | | | | | 26,640,186 |
Consumer Staples — 1.9% | | | | | |
BJ’s Wholesale Club Holdings, Inc.(b) | | 6,812 | | | 515,328 |
Celsius Holdings, Inc.(b) | | 5,943 | | | 492,794 |
Coca-Cola Co. | | 15,352 | | | 939,235 |
Lancaster Colony Corp. | | 484 | | | 100,493 |
| | | | | | 2,047,850 |
Description | | Shares | | Value |
Energy — 11.2% | | | | | |
Civitas Resources, Inc. | | 1,920 | | $ | 145,747 |
CNX Resources Corp.(b) | | 13,954 | | | 330,989 |
Coterra Energy, Inc. | | 37,439 | | | 1,043,799 |
Exxon Mobil Corp. | | 9,702 | | | 1,127,760 |
Hess Corp. | | 5,347 | | | 816,166 |
Magnolia Oil & Gas Corp. - Class A | | 25,882 | | | 671,638 |
Matador Resources Co. | | 5,073 | | | 338,724 |
Murphy Oil Corp. | | 5,498 | | | 251,259 |
Northern Oil & Gas, Inc. | | 2,570 | | | 101,978 |
Permian Resources Corp. | | 64,079 | | | 1,131,635 |
Pioneer Natural Resources Co. | | 4,295 | | | 1,127,438 |
SM Energy Co. | | 30,207 | | | 1,505,819 |
Targa Resources Corp. | | 1,015 | | | 113,670 |
Williams Cos., Inc. | | 94,559 | | | 3,684,964 |
| | | | | | 12,391,586 |
Financials — 16.8% | | | | | |
Allstate Corp. | | 6,506 | | | 1,125,603 |
Ally Financial, Inc. | | 16,131 | | | 654,757 |
Ameriprise Financial, Inc. | | 1,925 | | | 843,997 |
Apollo Global Management, Inc. | | 4,854 | | | 545,832 |
BlackRock, Inc. | | 6,277 | | | 5,233,135 |
Block, Inc.(b) | | 45,803 | | | 3,874,018 |
Coinbase Global, Inc. - Class A(b) | | 4,934 | | | 1,308,102 |
Equitable Holdings, Inc. | | 8,531 | | | 324,263 |
Fifth Third Bancorp | | 26,349 | | | 980,446 |
Markel Group, Inc.(b) | | 340 | | | 517,303 |
MGIC Investment Corp. | | 7,011 | | | 156,766 |
Morningstar, Inc. | | 434 | | | 133,833 |
Nasdaq, Inc. | | 9,935 | | | 626,899 |
Raymond James Financial, Inc. | | 12,231 | | | 1,570,705 |
South State Corp. | | 1,493 | | | 126,950 |
Willis Towers Watson PLC | | 1,806 | | | 496,650 |
| | | | | | 18,519,259 |
Health Care — 15.4% | | | | | |
Agilent Technologies, Inc. | | 4,897 | | | 712,562 |
Alnylam Pharmaceuticals, Inc.(b) | | 1,094 | | | 163,498 |
Apellis Pharmaceuticals, Inc.(b) | | 2,009 | | | 118,089 |
Catalent, Inc.(b) | | 37,374 | | | 2,109,763 |
DaVita, Inc.(b) | | 2,632 | | | 363,348 |
Doximity, Inc. - Class A(b) | | 14,122 | | | 380,023 |
Elevance Health, Inc. | | 2,167 | | | 1,123,676 |
Encompass Health Corp. | | 2,605 | | | 215,121 |
Ensign Group, Inc. | | 589 | | | 73,283 |
Envista Holdings Corp.(b) | | 16,667 | | | 356,340 |
Haemonetics Corp.(b) | | 1,377 | | | 117,527 |
HCA Healthcare, Inc. | | 3,376 | | | 1,125,997 |
Intuitive Surgical, Inc.(b) | | 2,824 | | | 1,127,030 |
Johnson & Johnson | | 5,907 | | | 934,428 |
Merck & Co., Inc. | | 37,603 | | | 4,961,717 |
The accompanying notes are an integral part of the financial statements.
53
Amplify ETF Trust Amplify AI Powered Equity ETF Schedule of Investments as of March 31, 2024 (Unaudited) (Continued) |
Description | | Shares | | Value |
Neurocrine Biosciences, Inc.(b) | | 6,805 | | $ | 938,546 |
Penumbra, Inc.(b) | | 1,115 | | | 248,846 |
Tenet Healthcare Corp.(b) | | 3,132 | | | 329,205 |
United Therapeutics Corp.(b) | | 2,338 | | | 537,085 |
Veeva Systems, Inc. - Class A(b) | | 4,277 | | | 990,938 |
| | | | | | 16,927,022 |
Industrials — 7.3% | | | | | |
AZEK Co., Inc.(b) | | 9,179 | | | 460,969 |
Broadridge Financial Solutions, Inc. | | 1,704 | | | 349,081 |
Builders FirstSource, Inc.(b) | | 4,825 | | | 1,006,254 |
Casella Waste Systems, Inc. -
Class A(b) | | 921 | | | 91,059 |
Donaldson Co., Inc. | | 1,368 | | | 102,162 |
Graco, Inc. | | 1,811 | | | 169,256 |
Jacobs Solutions, Inc. | | 7,322 | | | 1,125,612 |
NORDSON Corp. | | 800 | | | 219,632 |
Pentair PLC | | 10,037 | | | 857,561 |
Quanta Services, Inc. | | 2,956 | | | 767,969 |
Textron, Inc. | | 2,570 | | | 246,540 |
TransDigm Group, Inc. | | 546 | | | 672,454 |
United Parcel Service, Inc. - Class B | | 7,575 | | | 1,125,873 |
Vertiv Holdings Co. - Class A | | 2,173 | | | 177,469 |
XPO, Inc.(b) | | 1,997 | | | 243,694 |
Xylem, Inc./NY | | 2,306 | | | 298,027 |
Zurn Elkay Water Solutions Corp. | | 3,822 | | | 127,922 |
| | | | | | 8,041,534 |
Information Technology — 15.5% | | | | | |
Atlassian Corp. - Class A(b) | | 5,799 | | | 1,131,443 |
Cognex Corp. | | 25,077 | | | 1,063,766 |
Coherent Corp.(b) | | 18,644 | | | 1,130,199 |
DocuSign, Inc.(b) | | 18,900 | | | 1,125,495 |
Fabrinet(b) | | 303 | | | 57,273 |
GoDaddy, Inc. - Class A(b) | | 7,480 | | | 887,726 |
KLA Corp. | | 1,618 | | | 1,130,286 |
Manhattan Associates, Inc.(b) | | 616 | | | 154,142 |
NVIDIA Corp. | | 5,482 | | | 4,953,316 |
Okta, Inc.(b) | | 9,961 | | | 1,042,120 |
Qualcomm, Inc. | | 6,658 | | | 1,127,199 |
Samsara, Inc. - Class A(b) | | 29,787 | | | 1,125,651 |
Silicon Laboratories, Inc.(b) | | 1,230 | | | 176,776 |
Smartsheet, Inc. - Class A(b) | | 4,941 | | | 190,229 |
Trimble, Inc.(b) | | 3,465 | | | 223,007 |
Twilio, Inc. - Class A(b) | | 18,463 | | | 1,129,012 |
UiPath, Inc. - Class A(b) | | 15,910 | | | 360,680 |
| | | | | | 17,008,320 |
Materials — 3.3% | | | | | |
Ashland, Inc. | | 1,900 | | | 185,003 |
ATI, Inc.(b) | | 2,698 | | | 138,057 |
International Flavors & Fragrances,
Inc. | | 6,577 | | | 565,556 |
Martin Marietta Materials, Inc. | | 894 | | | 548,862 |
Description | | Shares | | Value |
Nucor Corp. | | 5,689 | | $ | 1,125,854 | |
Olin Corp. | | 4,562 | | | 268,246 | |
Southern Copper Corp. | | 1,112 | | | 118,450 | |
Steel Dynamics, Inc. | | 2,845 | | | 421,714 | |
Westrock Co. | | 4,521 | | | 223,563 | |
| | | | | | 3,595,305 | |
Real Estate — 1.5% | | | | | | |
Host Hotels & Resorts, Inc. | | 30,557 | | | 631,919 | |
Simon Property Group, Inc. | | 6,321 | | | 989,173 | |
| | | | | | 1,621,092 | |
Utilities — 2.2% | | | | | | |
Dominion Energy, Inc. | | 22,875 | | | 1,125,221 | |
Duke Energy Corp. | | 11,656 | | | 1,127,252 | |
Southwest Gas Holdings, Inc. | | 2,371 | | | 180,504 | |
| | | | | | 2,432,977 | |
TOTAL COMMON STOCKS (Cost $109,573,404) | | | | | 110,343,907 | |
| | | | | | | |
SHORT-TERM INVESTMENTS — 3.5% | | | | | | |
Investments Purchased with Proceeds from Securities Lending — 3.4% | | | | | | |
First American Government Obligations Fund - Class X,
5.23%(c) | | 3,741,855 | | | 3,741,855 | |
Money Market Funds — 0.1% | | | | | | |
Invesco Government & Agency Portfolio - Institutional Class, 5.24%(c) | | 114,807 | | | 114,807 | |
TOTAL SHORT-TERM INVESTMENTS (Cost $3,856,662) | | | | | 3,856,662 | |
| | | | | | | |
TOTAL INVESTMENTS — 103.6% (Cost $113,430,066) | | | | | 114,200,569 | |
Liabilities in Excess of Other Assets — (3.6)% | | | | | (3,992,881 | ) |
TOTAL NET ASSETS — 100.0% | | | | $ | 110,207,688 | |
Percentages are stated as a percent of net assets.
The Global Industry Classification Standard (GICS®) was developed by and/or is the exclusive property of MSCI, Inc. and Standard & Poor’s Financial Services LLC (“S&P”). GICS is a service mark of MSCI, Inc. and S&P and has been licensed for use by U.S. Bank Global Fund Services.
PLC - Public Limited Company
(a) All or a portion of this security is on loan as of March 31, 2024. The total market value of these securities was $132,036 which represented 0.1% of net assets.
(b) Non-income producing security.
(c) The rate shown represents the 7-day effective yield as of March 31, 2024.
The accompanying notes are an integral part of the financial statements.
54
Amplify ETF Trust Amplify Travel Tech ETF Schedule of Investments as of March 31, 2024 (Unaudited) |
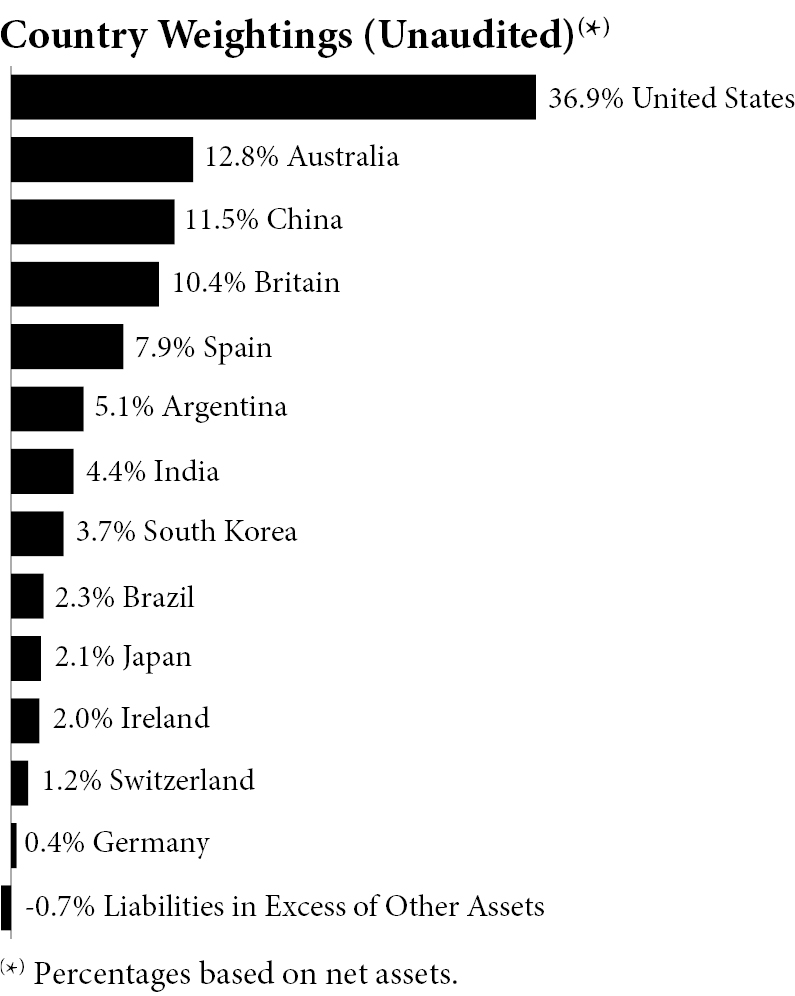
Description | | Shares | | Value |
COMMON STOCKS — 99.7% | | | | | |
Communication Services — 4.3% | | | | | |
TripAdvisor, Inc.(a) | | 125,974 | | $ | 3,500,817 |
Trivago NV - ADR | | 142,358 | | | 392,908 |
| | | | | | 3,893,725 |
Consumer Discretionary — 78.1%(b) | | | | | |
Adventure, Inc. | | 17,465 | | | 422,936 |
Airbnb, Inc. - Class A(a) | | 24,130 | | | 3,980,485 |
Airtrip Corp. | | 93,923 | | | 1,010,939 |
Amadeus IT Group SA | | 57,434 | | | 3,686,971 |
Booking Holdings, Inc. | | 1,098 | | | 3,983,413 |
Corporate Travel Management Ltd. | | 327,240 | | | 3,627,223 |
CVC Brasil Operadora e Agencia de Viagens SA(a) | | 3,591,053 | | | 2,094,850 |
Despegar.com Corp.(a) | | 379,079 | | | 4,533,785 |
eDreams ODIGEO SA(a) | | 459,282 | | | 3,348,151 |
Expedia Group, Inc.(a) | | 27,783 | | | 3,827,108 |
Global Business Travel Group I(a) | | 562,932 | | | 3,383,221 |
Hana Tour Service, Inc.(a) | | 68,329 | | | 3,258,475 |
Hostelworld Group PLC(a)(c)(d) | | 925,816 | | | 1,824,475 |
Lastminute.com NV(a) | | 44,250 | | | 1,053,805 |
MakeMyTrip Ltd.(a) | | 54,769 | | | 3,891,337 |
Mondee Holdings, Inc.(a)(e) | | 292,328 | | | 675,278 |
On the Beach Group PLC(a)(c)(d) | | 1,399,842 | | | 2,921,311 |
Description | | Shares | | Value |
Open Door, Inc.(a) | | 73,215 | | $ | 394,750 | |
Sabre Corp.(a) | | 1,274,933 | | | 3,085,338 | |
Tongcheng Travel Holdings Ltd.(a)(d) | | 1,338,890 | | | 3,532,646 | |
Trainline PLC(a)(c)(d) | | 863,015 | | | 4,038,109 | |
TravelSky Technology Ltd. - Class H | | 2,821,454 | | | 3,417,563 | |
Trip.com Group Ltd. - ADR(a) | | 75,975 | | | 3,334,543 | |
Webjet Ltd.(a) | | 741,948 | | | 4,274,140 | |
| | | | | | 69,600,852 | |
Industrials — 10.7% | | | | | | |
Blade Air Mobility, Inc.(a) | | 604,018 | | | 1,721,451 | |
Lyft, Inc. - Class A(a) | | 212,757 | | | 4,116,848 | |
Uber Technologies, Inc.(a) | | 47,813 | | | 3,681,123 | |
| | | | | | 9,519,422 | |
Information Technology — 6.6% | | | | | | |
accesso Technology Group PLC(a) | | 345,320 | | | 2,338,165 | |
SiteMinder Ltd.(a) | | 962,106 | | | 3,533,831 | |
| | | | | | 5,871,996 | |
TOTAL COMMON STOCKS (Cost $104,645,788) | | | | | 88,885,995 | |
| | | | | | | |
SHORT-TERM INVESTMENTS — 1.0% | | | | | | |
Investments Purchased with Proceeds from Securities Lending - 0.6% | | | | | | |
First American Government Obligations Fund – Class X, 5.23%(f) | | 564,705 | | | 564,705 | |
| | | | | | | |
Money Market Funds — 0.4% | | | | | | |
Invesco Government & Agency Portfolio - Institutional Class,
5.24%(f) | | 365,623 | | | 365,623 | |
TOTAL SHORT-TERM INVESTMENTS (Cost $930,328) | | | | | 930,328 | |
| | | | | | | |
TOTAL INVESTMENTS — 100.7% (Cost $105,576,116) | | | | | 89,816,323 | |
Liabilities in Excess of
Other Assets - (0.7)% | | | | | (624,203 | ) |
TOTAL NET ASSETS — 100.0% | | | | $ | 89,192,120 | |
Percentages are stated as a percent of net assets.
The Global Industry Classification Standard (GICS®) was developed by and/or is the exclusive property of MSCI, Inc. and Standard & Poor’s Financial Services LLC (“S&P”). GICS is a service mark of MSCI, Inc. and S&P and has been licensed for use by U.S. Bank Global Fund Services.
The accompanying notes are an integral part of the financial statements.
55
Amplify ETF Trust Amplify Travel Tech ETF Schedule of Investments as of March 31, 2024 (Unaudited) (Continued) |
ADR - American Depositary Receipt
NV - Naamloze Vennootschap
PLC - Public Limited Company
SA - Sociedad Anónima
(a) Non-income producing security.
(b) To the extent that the Fund invests more heavily in a particular industry or sector of the economy, its performance will be especially sensitive to developments that significantly affect those industries or sectors.
(c) Security is exempt from registration pursuant to Rule 144A under the Securities Act of 1933, as amended. These securities may only be resold in transactions exempt from registration to qualified institutional investors. As of March 31, 2024, the value of these securities total $8,783,895 or 9.8% of the Fund’s net assets.
(d) Security is exempt from registration pursuant to Regulation S under the Securities Act of 1933, as amended. As of March 31, 2024, the value of these securities total $12,316,541 or 13.8% of the Fund’s net assets.
(e) All or a portion of this security is on loan as of March 31, 2024. The total market value of these securities was $507,082 which represented 0.6% of net assets.
(f) The rate shown represents the 7-day effective yield as of March 31, 2024.
The accompanying notes are an integral part of the financial statements.
56
Amplify ETF Trust Amplify Treatments, Testing and Advancements ETF Schedule of Investments as of March 31, 2024 (Unaudited) |
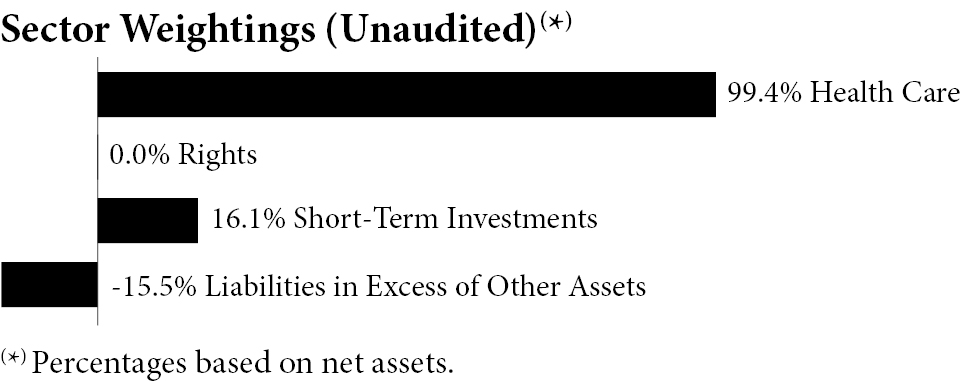
Description | | Shares | | Value |
COMMON STOCKS — 99.4% | | | | | |
Health Care — 99.4%(a) | | | | | |
Abbott Laboratories | | 768 | | $ | 87,291 |
AbbVie, Inc. | | 518 | | | 94,328 |
Adaptive Biotechnologies Corp.(b) | | 37,256 | | | 119,592 |
Alnylam Pharmaceuticals, Inc.(b) | | 4,345 | | | 649,360 |
Altimmune, Inc.(b) | | 13,827 | | | 140,759 |
AN2 Therapeutics, Inc.(b) | | 7,654 | | | 24,876 |
Arbutus Biopharma Corp.(b) | | 43,155 | | | 111,340 |
Arcturus Therapeutics Holdings, Inc.(b) | | 6,877 | | | 232,236 |
AstraZeneca PLC - ADR | | 1,421 | | | 96,273 |
AstraZeneca PLC(b)(c) | | 11,792 | | | 0 |
Atea Pharmaceuticals, Inc.(b) | | 21,472 | | | 86,747 |
BioCryst Pharmaceuticals, Inc.(b) | | 53,051 | | | 269,499 |
BioNTech SE - ADR(b) | | 7,379 | | | 680,712 |
Bio-Rad Laboratories, Inc. - Class A(b) | | 1,343 | | | 464,503 |
CEL-SCI Corp.(b) | | 13,891 | | | 26,532 |
Chimerix, Inc.(b) | | 22,876 | | | 24,249 |
CorMedix, Inc.(b) | | 14,105 | | | 59,805 |
Cue Biopharma, Inc.(b) | | 11,612 | | | 21,947 |
CureVac NV(b)(d) | | 57,625 | | | 174,604 |
Dynavax Technologies Corp.(b) | | 33,613 | | | 417,137 |
Eli Lilly and Co. | | 121 | | | 94,133 |
Emergent BioSolutions, Inc.(b) | | 13,352 | | | 33,781 |
Enanta Pharmaceuticals, Inc.(b) | | 5,444 | | | 95,052 |
Fulgent Genetics, Inc.(b) | | 7,626 | | | 165,484 |
Gilead Sciences, Inc. | | 1,264 | | | 92,588 |
Gritstone bio, Inc.(b) | | 24,536 | | | 63,058 |
GSK PLC - ADR | | 2,176 | | | 93,285 |
HilleVax, Inc.(b) | | 12,465 | | | 207,293 |
ImmunityBio, Inc.(b)(d) | | 92,518 | | | 496,822 |
Immunocore Holdings PLC - ADR(b)(d) | | 6,510 | | | 423,150 |
InflaRx NV(b)(d) | | 15,153 | | | 23,336 |
Inovio Pharmaceuticals, Inc.(b) | | 5,855 | | | 81,263 |
Invivyd, Inc.(b)(d) | | 28,337 | | | 125,816 |
Johnson & Johnson | | 565 | | | 89,377 |
Laboratory Corp. of America Holdings | | 3,041 | | | 664,336 |
Merck & Co., Inc. | | 717 | | | 94,608 |
Description | | Shares | | Value |
Moderna, Inc.(b) | | 7,116 | | $ | 758,280 | |
Novavax, Inc.(b)(d) | | 36,016 | | | 172,157 | |
Ocugen, Inc.(b)(d) | | 66,009 | | | 108,255 | |
OPKO Health, Inc.(b)(d) | | 198,940 | | | 238,728 | |
OraSure Technologies, Inc.(b) | | 18,911 | | | 116,303 | |
Pfizer, Inc. | | 3,433 | | | 95,266 | |
Quest Diagnostics, Inc. | | 5,256 | | | 699,625 | |
QuidelOrtho Corp.(b) | | 9,597 | | | 460,080 | |
Regeneron Pharmaceuticals, Inc.(b) | | 94 | | | 90,474 | |
Renovaro, Inc.(b)(d) | | 36,972 | | | 97,976 | |
Sanofi SA - ADR | | 1,905 | | | 92,583 | |
SIGA Technologies, Inc. | | 18,295 | | | 156,605 | |
Takeda Pharmaceutical Co. Ltd. - ADR | | 6,249 | | | 86,799 | |
Vaxart, Inc.(b) | | 43,449 | | | 56,484 | |
Vaxcyte, Inc.(b) | | 5,928 | | | 404,942 | |
Vaxxinity, Inc. - Class A(b) | | 32,617 | | | 23,403 | |
Vir Biotechnology, Inc.(b) | | 34,750 | | | 352,018 | |
XBiotech, Inc.(b) | | 7,833 | | | 63,682 | |
Zai Lab, Ltd. - ADR(b)(d) | | 20,858 | | | 334,145 | |
| | | | | | 11,032,977 | |
TOTAL COMMON STOCKS (Cost $22,478,998) | | | | | 11,032,977 | |
| | | | | | | |
| | | Contracts | | | | |
RIGHTS — 0.0%(e) | | | | | | |
Gurnet Point Capital LLC, Expires 09/23/2024, Exercise Price $0.85(b)(c) | | 16,557 | | | 0 | |
TOTAL RIGHTS
(Cost $0) | | | | | 0 | |
| | | | | | | |
| | | Shares | | | | |
SHORT-TERM INVESTMENTS — 16.1% | | | | | | |
Investments Purchased with Proceeds from Securities Lending — 16.0% | | | | | | |
First American Government Obligations Fund - Class X, 5.23%(f) | | 1,772,831 | | | 1,772,831 | |
Money Market Funds — 0.1% | | | | | | |
Invesco Government & Agency Portfolio - Institutional Class, 5.24%(f) | | 14,721 | | | 14,721 | |
TOTAL SHORT-TERM INVESTMENTS (Cost $1,787,552) | | | | | 1,787,552 | |
| | | | | | | |
TOTAL INVESTMENTS — 115.5% (Cost $24,266,550) | | | | | 12,820,529 | |
Liabilities in Excess of Other Assets — (15.5)% | | | | | (1,716,272 | ) |
TOTAL NET ASSETS — 100.0% | | | | $ | 11,104,257 | |
The accompanying notes are an integral part of the financial statements.
57
Amplify ETF Trust Amplify Treatments, Testing and Advancements ETF Schedule of Investments as of March 31, 2024 (Unaudited) (Continued) |
The accompanying notes are an integral part of the financial statements.
58
Amplify ETF Trust Amplify U.S. Alternative Harvest ETF Schedule of Investments as of March 31, 2024 (Unaudited) |
Description | | Shares | | Value |
COMMON STOCKS — 6.6% | | | | | | |
Consumer Discretionary — 0.3% | | | | | | |
GrowGeneration Corp.(a) | | | 121,098 | | $ | 346,340 |
Financials — 0.7% | | | | | | |
AFC Gamma, Inc. | | | 30,893 | | | 382,455 |
Chicago Atlantic Real Estate Finance, Inc. | | | 28,187 | | | 444,509 |
| | | | | | | 826,964 |
Health Care — 0.1% | | | | | | |
Incannex Healthcare, Inc.(a) | | | 26,097 | | | 93,688 |
Information Technology — 1.1% | | | | | | |
WM Technology, Inc.(a) | | | 1,018,470 | | | 1,354,565 |
Real Estate — 4.4% | | | | | | |
Innovative Industrial Properties, Inc. | | | 54,977 | | | 5,692,320 |
TOTAL COMMON STOCKS
(Cost $6,802,516) | | | | | | 8,313,877 |
| | | | | |
| | | Par | | |
U.S. TREASURY OBLIGATIONS — 82.6% | | | | | | |
United States Treasury Bill | | | | | | |
5.23%, 04/04/2024(b) | | $ | 1,879,000 | | | 1,878,188 |
5.23%, 04/11/2024(b) | | | 812,000 | | | 810,819 |
5.22%, 04/25/2024(b) | | | 13,343,000 | | | 13,296,283 |
5.24%, 05/02/2024(b) | | | 6,200,000 | | | 6,171,840 |
5.22%, 05/07/2024(b) | | | 5,300,000 | | | 5,272,209 |
5.24%, 05/09/2024(b) | | | 5,300,000 | | | 5,270,551 |
5.23%, 05/14/2024(b) | | | 5,741,000 | | | 5,704,971 |
5.24%, 05/16/2024(b) | | | 4,857,000 | | | 4,825,285 |
5.23%, 05/21/2024(b) | | | 17,339,000 | | | 17,212,328 |
5.24%, 05/30/2024(b) | | | 848,000 | | | 840,693 |
5.22%, 06/04/2024(b) | | | 25,554,000 | | | 25,319,561 |
5.24%, 06/06/2024(b) | | | 241,000 | | | 238,697 |
5.24%, 06/11/2024(b) | | | 6,196,000 | | | 6,132,594 |
5.18%, 06/25/2024(b) | | | 11,430,000 | | | 11,290,565 |
TOTAL U.S. TREASURY OBLIGATIONS
(Cost $104,272,793) | | | | | | 104,264,584 |
Description | | Shares | | Value |
SHORT-TERM INVESTMENTS — 1.4% | | | | | |
Money Market Funds — 1.4% | | | | | |
Invesco Government & Agency Portfolio - Institutional
Class, 5.24%(c) | | 1,706,542 | | $ | 1,706,542 |
TOTAL SHORT-TERM INVESTMENTS
(Cost $1,706,542) | | | | | 1,706,542 |
| | | | | | |
TOTAL INVESTMENTS — 90.6%
(Cost $112,781,851) | | | | | 114,285,003 |
Other Assets in Excess of Liabilities — 9.4% | | | | | 11,827,602 |
TOTAL NET ASSETS — 100.0% | | | | $ | 126,112,605 |
The accompanying notes are an integral part of the financial statements.
59
Amplify ETF Trust Amplify U.S. Alternative Harvest ETF Schedule of Total Return Swap Contracts as of March 31, 2024 (Unaudited) |
Reference Entity | | Counterparty | | Long/Short | | Maturity
Date | | Financing
Rate(a) | | Payment
Frequency | | Notional
Amount | | Upfront Payments (Receipts) | | Value/
Unrealized
Appreciation
(Depreciation) |
4Front Ventures Corp | | National Bank of Canada | | Long | | 03/19/2025 | | 6.84% | | Month | | $ | 490,518 | | $ | 0 | | $ | 52,555 | |
Ascend Wellness Holdings, Inc. | | National Bank of Canada | | Long | | 03/19/2025 | | 6.84% | | Month | | | 1,925,880 | | | 0 | | | 200,767 | |
Ayr Wellness, Inc. | | National Bank of Canada | | Long | | 03/19/2025 | | 6.84% | | Month | | | 1,414,088 | | | 0 | | | 329,123 | |
Cannabist Co. Holdings, Inc. | | National Bank of Canada | | Long | | 03/19/2025 | | 6.84% | | Month | | | 1,523,828 | | | 0 | | | 438,116 | |
Cresco Labs, Inc. | | National Bank of Canada | | Long | | 03/19/2025 | | 6.84% | | Month | | | 7,144,889 | | | 0 | | | 621,295 | |
Curaleaf Holdings, Inc. | | National Bank of Canada | | Long | | 03/19/2025 | | 6.84% | | Month | | | 26,364,947 | | | 0 | | | 1,876,157 | |
Glass House Brands, Inc. | | National Bank of Canada | | Long | | 03/19/2025 | | 6.84% | | Month | | | 3,586,720 | | | 0 | | | 344,361 | |
Gold Flora Corporation | | National Bank of Canada | | Long | | 03/19/2025 | | 6.84% | | Month | | | 1,064,760 | | | 0 | | | 243,784 | |
Green Thumb Industries, Inc. | | National Bank of Canada | | Long | | 03/19/2025 | | 6.84% | | Month | | | 30,835,892 | | | 0 | | | 3,482,842 | |
Jushi Holdings, Inc. | | National Bank of Canada | | Long | | 03/19/2025 | | 6.84% | | Month | | | 1,147,000 | | | 0 | | | 27,933 | |
MariMed, Inc. | | National Bank of Canada | | Long | | 03/19/2025 | | 6.84% | | Month | | | 902,791 | | | 0 | | | 13,881 | |
Medicine Technologies. Inc. | | National Bank of Canada | | Long | | 03/19/2025 | | 6.84% | | Month | | | 367,073 | | | 0 | | | (53,718 | ) |
Planet 13 Holdings, Inc. | | National Bank of Canada | | Long | | 03/19/2025 | | 6.84% | | Month | | | 996,273 | | | 0 | | | 123,649 | |
TerrAscend Corp. | | National Bank of Canada | | Long | | 03/19/2025 | | 6.84% | | Month | | | 5,645,020 | | | 0 | | | 537,621 | |
Trulieve Cannabis Corp | | National Bank of Canada | | Long | | 03/19/2025 | | 6.84% | | Month | | | 14,659,962 | | | 0 | | | 1,761,560 | |
Verano Holdings Corp | | National Bank of Canada | | Long | | 03/19/2025 | | 6.84% | | Month | | | 18,462,108 | | | 0 | | | 1,927,022 | |
| | | | | | | | | | | | | | | | $ | 0 | | $ | 11,926,948 | |
The accompanying notes are an integral part of the financial statements.
60
Amplify ETF Trust
Statements of Assets and Liabilities
March 31, 2024
| | Amplify
High Income
ETF | | Amplify
Online
Retail
ETF | | Amplify
CWP Enhanced
Dividend
Income
ETF | | Amplify
Transformational
Data Sharing
ETF | | Amplify
Lithium &
Battery
Technology
ETF |
Assets: | | | | | | | | | | | | | | | | | | | |
Investments in Unaffiliated Securities, at Cost | | $ | 466,153,958 | | | $ | 241,278,872 | | | $ | 2,611,029,462 | | $ | 915,918,338 | | | $ | 138,935,591 | |
Investments in Affiliated Securities, at Cost | | | — | | | | — | | | | 99,022,082 | | | — | | | | — | |
Foreign Currency, at Cost | | | — | | | | — | | | | — | | | 20 | | | | 53,588 | |
Investments in Unaffiliated Securities, at Value* | | $ | 459,319,155 | | | $ | 199,217,591 | | | $ | 3,002,234,581 | | $ | 847,374,999 | | | $ | 107,036,270 | |
Investments in Affiliated Securities, at Value* | | | — | | | | — | | | | 98,926,061 | | | — | | | | — | |
Foreign Currency, at Value | | | — | | | | — | | | | — | | | 19 | | | | 53,359 | |
Cash | | | 351,894 | | | | — | | | | — | | | 26,056 | | | | 141,102 | |
Receivable for Investments Sold | | | — | | | | — | | | | 62,930,692 | | | 18,177,288 | | | | — | |
Dividends and Interest Receivable | | | 1,514,133 | | | | 109,261 | | | | 3,120,908 | | | 1,545,973 | | | | 116,804 | |
Securities Lending Income Receivable | | | 21,508 | | | | 8,886 | | | | 53 | | | 298,365 | | | | 117,620 | |
Total Assets | | | 461,206,690 | | | | 199,335,738 | | | | 3,167,212,295 | | | 867,422,700 | | | | 107,465,155 | |
| | | | | | | | | | | | | | | | | | | | |
Liabilities: | | | | | | | | | | | | | | | | | | | |
Options Written, at Value (Premiums Received $0, $0, $3,609,058, $0, $0) | | | — | | | | — | | | | 3,332,025 | | | — | | | | — | |
Payable for Fund Shares Redeemed | | | — | | | | — | | | | 1,944,825 | | | — | | | | — | |
Payable for Investments Purchased | | | — | | | | — | | | | 171,087 | | | 10,231,431 | | | | — | |
Collateral Received for Securities Loaned (See Note 4) | | | 5,840,600 | | | | 15,824,515 | | | | 73,831 | | | 106,201,451 | | | | 17,317,647 | |
Advisory Fees Payable | | | 188,927 | | | | 99,066 | | | | 1,434,871 | | | 426,941 | | | | 45,230 | |
Due to Custodian | | | — | | | | — | | | | — | | | — | | | | 2,463 | |
Total Liabilities | | | 6,029,527 | | | | 15,923,581 | | | | 6,956,639 | | | 116,859,823 | | | | 17,365,340 | |
| | | | | | | | | | | | | | | | | | | | |
Net Assets | | $ | 455,177,163 | | | $ | 183,412,157 | | | $ | 3,160,255,656 | | $ | 750,562,877 | | | $ | 90,099,815 | |
| | | | | | | | | | | | | | | | | | | | |
Net Assets Consist of: | | | | | | | | | | | | | | | | | | | |
Paid-in Capital ($0.01 par value) | | $ | 379,000 | | | $ | 31,500 | | | $ | 812,500 | | $ | 206,000 | | | $ | 95,500 | |
Additional Paid-in Capital | | | 559,759,250 | | | | 602,054,013 | | | | 2,781,999,795 | | | 1,147,219,379 | | | | 213,543,547 | |
Total Distributable Earnings (Accumulated Deficit) | | | (104,961,087 | ) | | | (418,673,356 | ) | | | 377,443,361 | | | (396,862,502 | ) | | | (123,539,232 | ) |
Net Assets | | $ | 455,177,163 | | | $ | 183,412,157 | | | $ | 3,160,255,656 | | $ | 750,562,877 | | | $ | 90,099,815 | |
| | | | | | | | | | | | | | | | | | | | |
Outstanding Shares of Beneficial Interest (unlimited authorized – $0.01 par value) | | | 37,900,000 | | | | 3,150,000 | | | | 81,250,000 | | | 20,600,000 | | | | 9,550,000 | |
Net Asset Value, Offering and Redemption Price per Share | | $ | 12.01 | | | $ | 58.23 | | | $ | 38.90 | | $ | 36.44 | | | $ | 9.43 | |
*Includes Loaned Securities with a Value of | | $ | 5,532,544 | | | $ | 13,376,980 | | | $ | 70,186 | | $ | 98,438,702 | | | $ | 16,332,991 | |
The accompanying notes are an integral part of these financial statements.
61
Amplify ETF Trust
Statements of Assets and Liabilities
March 31, 2024
| | Amplify
BlackSwan
Growth &
Treasury Core
ETF | | Amplify
Emerging
Markets
FinTech
ETF | | Amplify
Seymour
Cannabis
ETF | | Amplify
BlackSwan
ISWN
ETF | | Amplify
Thematic
All-Stars
ETF |
Assets: | | | | | | | | | | | | | | | | | | | | |
Investments, at Cost | | $ | 162,760,865 | | | $ | 2,785,258 | | | $ | 77,090,012 | | | $ | 37,580,600 | | | $ | 3,072,872 | |
Foreign Currency, at Cost | | | — | | | | — | | | | — | | | | — | | | | 4 | |
Investments, at Value* | | $ | 177,336,579 | | | $ | 2,196,703 | | | $ | 24,483,408 | | | $ | 38,631,476 | | | $ | 2,727,663 | |
Foreign Currency, at Value | | | — | | | | — | | | | — | | | | — | | | | 4 | |
Collateral for Swaps | | | — | | | | — | | | | 15,490,000 | | | | — | | | | — | |
Receivable for Capital Shares Sold | | | 1,117,400 | | | | — | | | | — | | | | — | | | | — | |
Receivable for Investments Sold | | | — | | | | — | | | | 6,100 | | | | — | | | | — | |
Dividends and Interest Receivable | | | 1,375,574 | | | | 3,089 | | | | 54,971 | | | | 315,752 | | | | 1,988 | |
Securities Lending Income Receivable | | | — | | | | 390 | | | | 16,786 | | | | — | | | | 112 | |
Net Unrealized Appreciation on Swaps | | | — | | | | — | | | | 2,027,312 | | | | — | | | | — | |
Total Assets | | | 179,829,553 | | | | 2,200,182 | | | | 42,078,577 | | | | 38,947,228 | | | | 2,729,767 | |
| | | | | | | | | | | | | | | | | | | | | |
Liabilities: | | | | | | | | | | | | | | | | | | | | |
Payable for Investments Purchased | | | 1,533,617 | | | | 2,672 | | | | 21 | | | | — | | | | — | |
Payable to Broker for Swaps | | | — | | | | — | | | | 38,992 | | | | — | | | | — | |
Collateral Received for Securities Loaned (See Note 4) | | | — | | | | 93,948 | | | | 4,641,018 | | | | — | | | | 27,290 | |
Advisory Fees Payable | | | 73,376 | | | | 1,253 | | | | 120 | | | | 16,296 | | | | 1,112 | |
Accrued Custody Fees | | | — | | | | — | | | | 2,430 | | | | — | | | | — | |
Accrued Accounting, Administration & Transfer Agent Fees | | | — | | | | — | | | | 15,793 | | | | — | | | | — | |
Other Payables and Accrued Expenses | | | — | | | | — | | | | 40,498 | | | | — | | | | — | |
Total Liabilities | | | 1,606,993 | | | | 97,873 | | | | 4,738,872 | | | | 16,296 | | | | 28,402 | |
| | | | | | | | | | | | | | | | | | | | | |
Net Assets | | $ | 178,222,560 | | | $ | 2,102,309 | | | $ | 37,339,705 | | | $ | 38,930,932 | | | $ | 2,701,365 | |
| | | | | | | | | | | | | | | | | | | | | |
Net Assets Consist of: | | | | | | | | | | | | | | | | | | | | |
Paid-in Capital ($0.01 par value) | | $ | 63,800 | | | $ | 1,000 | | | $ | 64,500 | | | $ | 20,000 | | | $ | 1,250 | |
Additional Paid-in Capital | | | 276,126,295 | | | | 9,151,050 | | | | 133,360,466 | | | | 50,501,919 | | | | 5,996,941 | |
Total Distributable Earnings (Accumulated Deficit) | | | (97,967,535 | ) | | | (7,049,741 | ) | | | (96,085,261 | ) | | | (11,590,987 | ) | | | (3,296,826 | ) |
Net Assets | | $ | 178,222,560 | | | $ | 2,102,309 | | | $ | 37,339,705 | | | $ | 38,930,932 | | | $ | 2,701,365 | |
| | | | | | | | | | | | | | | | | | | | | |
Outstanding Shares of Beneficial Interest (unlimited authorized – $0.01 par value) | | | 6,380,000 | | | | 100,000 | | | | 6,450,000 | | | | 2,000,000 | | | | 125,000 | |
Net Asset Value, Offering and Redemption Price per Share | | $ | 27.93 | | | $ | 21.02 | | | $ | 5.79 | | | $ | 19.47 | | | $ | 21.61 | |
*Includes Loaned Securities with a Value of | | $ | — | | | $ | 84,992 | | | $ | 3,885,028 | | | $ | — | | | $ | 25,093 | |
The accompanying notes are an integral part of these financial statements.
62
Amplify ETF Trust
Statements of Assets and Liabilities
March 31, 2024
| | Amplify
BlackSwan
Tech &
Treasury
ETF | | Amplify
Inflation
Fighter
ETF(a) | | Amplify
Natural
Resources
Dividend
Income
ETF | | Amplify
International
Enhanced
Dividend
Income
ETF | | Amplify
Cash Flow
Dividend
Leaders
ETF |
Assets: | | | | | | | | | | | | | | | | |
Investments, at Cost | | $ | 2,378,819 | | | $ | 7,152,535 | | $ | 11,176,099 | | $ | 100,939,189 | | $ | 14,474,671 |
Investments, at Value* | | $ | 2,543,248 | | | $ | 7,411,245 | | $ | 12,315,763 | | $ | 112,871,754 | | $ | 15,486,924 |
Cash | | | — | | | | 1,790 | | | 10,690 | | | 21,497 | | | 3,136 |
Receivable for Investments Sold | | | — | | | | — | | | — | | | 1,521,438 | | | |
Dividends and Interest Receivable | | | 20,039 | | | | 15,710 | | | 35,995 | | | 311,604 | | | 8,799 |
Securities Lending Income Receivable | | | — | | | | 108 | | | 956 | | | 3,636 | | | — |
Net Unrealized Appreciation on Futures | | | — | | | | 22,772 | | | — | | | — | | | — |
Deposits at Broker for Futures** | | | — | | | | 433,490 | | | — | | | — | | | — |
Total Assets | | | 2,563,287 | | | | 7,885,115 | | | 12,363,404 | | | 114,729,929 | | | 15,498,859 |
| | | | | | | | | | | | | | | | | |
Liabilities: | | | | | | | | | | | | | | | | |
Options Written, at Value (Premiums Received $0, $0, $0, $194,635, $0) | | | — | | | | — | | | — | | | 250,750 | | | — |
Collateral Received for Securities Loaned (See Note 4) | | | — | | | | 116,104 | | | 719,859 | | | 10,097,786 | | | — |
Payable for Investments Purchased | | | 10 | | | | — | | | — | | | — | | | — |
Advisory Fees Payable | | | 1,065 | | | | 5,615 | | | 5,605 | | | 54,851 | | | — |
Total Liabilities | | | 1,075 | | | | 121,719 | | | 725,464 | | | 10,403,387 | | | — |
| | | | | | | | | | | | | | | | | |
Net Assets | | $ | 2,562,212 | | | $ | 7,763,396 | | $ | 11,637,940 | | $ | 104,326,542 | | $ | 15,498,859 |
| | | | | | | | | | | | | | | | | |
Net Assets Consist of: | | | | | | | | | | | | | | | | |
Paid-in Capital ($0.01 par value) | | $ | 1,250 | | | $ | 2,750 | | $ | 4,000 | | $ | 34,250 | | $ | 5,200 |
Additional Paid-in Capital | | | 2,953,402 | | | | 7,739,333 | | | 10,792,029 | | | 95,787,520 | | | 13,638,115 |
Total Distributable Earnings (Accumulated Deficit) | | | (392,440 | ) | | | 21,313 | | | 841,911 | | | 8,504,772 | | | 1,855,544 |
Net Assets | | $ | 2,562,212 | | | $ | 7,763,396 | | $ | 11,637,940 | | $ | 104,326,542 | | $ | 15,498,859 |
| | | | | | | | | | | | | | | | | |
Outstanding Shares of Beneficial Interest (unlimited authorized – $0.01 par value) | | | 125,000 | | | | 275,000 | | | 400,000 | | | 3,425,000 | | | 520,000 |
Net Asset Value, Offering and Redemption Price per Share | | $ | 20.50 | | | $ | 28.23 | | $ | 29.09 | | $ | 30.46 | | $ | 29.81 |
*Includes Loaned Securities with a Value of | | $ | — | | | $ | 107,906 | | $ | 691,403 | | $ | 9,594,435 | | $ | — |
**Required margin held as collateral for futures contracts | | | — | | | $ | 199,267 | | | — | | | — | | | — |
(a) | | Statement has been consolidated. See Note 1 in the Notes to Financial Statements for basis of consolidation. |
The accompanying notes are an integral part of these financial statements.
63
Amplify ETF Trust
Statements of Assets and Liabilities
March 31, 2024
| | Amplify
Cash Flow
High Income
ETF | | Amplify
Samsung
SOFR
ETF | | Amplify
Junior Silver
Miners
ETF | | Amplify
Cybersecurity
ETF | | Amplify
Mobile
Payments
ETF |
Assets: | | | | | | | | | | | | | | | | | | | |
Investments in Unaffiliated Securities, at Cost | | $ | 64,026 | | $ | 155,220,176 | | | $ | 668,765,706 | | | $ | 1,548,777,193 | | | $ | 395,968,817 | |
Investments in Affiliated Securities, at Cost | | | 2,674,405 | | | — | | | | — | | | | — | | | | — | |
Foreign Currency, at Cost | | | — | | | — | | | | — | | | | 1,835,965 | | | | — | |
Investments in Unaffiliated Securities, at Value* | | $ | 64,026 | | $ | 155,220,176 | | | $ | 727,205,237 | | | $ | 1,771,605,599 | | | $ | 361,604,447 | |
Investments in Affiliated Securities, at Value | | | 3,209,586 | | | — | | | | — | | | | — | | | | — | |
Foreign Currency, at Value | | | — | | | — | | | | — | | | | 1,825,396 | | | | — | |
Cash | | | 24,271 | | | — | | | | — | | | | 683,855 | | | | 133,040 | |
Receivable for Investments Sold | | | — | | | — | | | | — | | | | 15,910,472 | | | | — | |
Dividends and Interest Receivable | | | 417 | | | 119,937 | | | | 27,090 | | | | 1,562,285 | | | | 68,501 | |
Securities Lending Income Receivable | | | | | | — | | | | 14,746 | | | | 16 | | | | 3,863 | |
Total Assets | | | 3,298,300 | | | 155,340,113 | | | | 727,247,073 | | | | 1,791,587,623 | | | | 361,809,851 | |
| | | | | | | | | | | | | | | | | | | | |
Liabilities: | | | | | | | | | | | | | | | | | | | |
Collateral Received for Securities Loaned (See Note 4) | | | — | | | — | | | | 7,056,426 | | | | — | | | | 1,043,709 | |
Payable for Fund Shares Redeemed | | | — | | | — | | | | — | | | | 15,949,515 | | | | — | |
Net Unrealized Depreciation on Swaps | | | 4,291 | | | — | | | | — | | | | — | | | | — | |
Advisory Fees Payable | | | 1,749 | | | 26,017 | | | | 384,057 | | | | 918,770 | | | | 226,685 | |
Total Liabilities | | | 6,040 | | | 26,017 | | | | 7,440,483 | | | | 16,868,285 | | | | 1,270,394 | |
| | | | | | | | | | | | | | | | | | | | |
Net Assets | | $ | 3,292,260 | | $ | 155,314,096 | | | $ | 719,806,590 | | | $ | 1,774,719,338 | | | $ | 360,539,457 | |
| | | | | | | | | | | | | | | | | | | | |
Net Assets Consist of: | | | | | | | | | | | | | | | | | | | |
Paid-in Capital ($0.01 par value) | | $ | 1,200 | | $ | 15,500 | | | $ | 725,500 | | | $ | 276,500 | | | $ | 68,500 | |
Additional Paid-in Capital | | | 2,974,506 | | | 155,317,296 | | | | 1,147,512,626 | | | | 1,819,241,324 | | | | 689,927,351 | |
Total Distributable Earnings (Accumulated Deficit) | | | 316,554 | | | (18,700 | ) | | | (428,431,536 | ) | | | (44,798,486 | ) | | | (329,456,394 | ) |
Net Assets | | $ | 3,292,260 | | $ | 155,314,096 | | | $ | 719,806,590 | | | $ | 1,774,719,338 | | | $ | 360,539,457 | |
| | | | | | | | | | | | | | | | | | | | |
Outstanding Shares of Beneficial Interest (unlimited authorized – $0.01 par value) | | | 120,000 | | | 1,550,000 | | | | 72,550,000 | | | | 27,650,000 | | | | 6,850,000 | |
Net Asset Value, Offering and Redemption Price per Share | | $ | 27.44 | | $ | 100.20 | | | $ | 9.92 | | | $ | 64.19 | | | $ | 52.63 | |
*Includes Loaned Securities with a Value of | | $ | — | | $ | — | | | $ | 3,575,294 | | | $ | — | | | $ | 954,403 | |
The accompanying notes are an integral part of these financial statements.
64
Amplify ETF Trust
Statements of Assets and Liabilities
March 31, 2024
| | Amplify
BlueStar Israel
Technology
ETF | | Amplify
Etho Climate
Leadership
U.S. ETF | | Amplify
Alternative
Harvest
ETF | | Amplify
Global Cloud
Technology
ETF | | Amplify
Video Game
Tech
ETF |
Assets: | | | | | | | | | | | | | | | | | | | |
Investments in Unaffiliated Securities, at Cost | | $ | 112,595,397 | | | $ | 173,533,879 | | $ | 234,031,402 | | | $ | 32,584,004 | | | $ | 49,356,850 | |
Investments in Affiliated Securities, at Cost | | | — | | | | — | | | 103,632,244 | | | | — | | | | — | |
Investments in Unaffiliated Securities, at Value* | | $ | 94,037,432 | | | $ | 193,464,424 | | $ | 223,081,761 | | | $ | 34,782,922 | | | $ | 42,699,365 | |
Investments in Affiliated Securities, at Value | | | — | | | | — | | | 121,738,703 | | | | — | | | | — | |
Foreign Currency, at Value | | | — | | | | — | | | — | | | | — | | | | — | |
Cash | | | — | | | | 40,729 | | | 2,385,274 | | | | — | | | | — | |
Receivable for Investments Sold | | | — | | | | — | | | 35,232 | | | | — | | | | — | |
Dividends and Interest Receivable | | | 87,283 | | | | 159,157 | | | 946,851 | | | | 49,499 | | | | 140,344 | |
Securities Lending Income Receivable | | | 32,874 | | | | 22,550 | | | 417,130 | | | | 644 | | | | 1,103 | |
Return of Capital Receivable | | | — | | | | — | | | — | | | | 1,522 | | | | 2,252 | |
Total Assets | | | 94,157,589 | | | | 193,686,860 | | | 348,604,951 | | | | 34,834,587 | | | | 42,843,064 | |
| | | | | | | | | | | | | | | | | | | | |
Liabilities: | | | | | | | | | | | | | | | | | | | |
Advisory Fees Payable | | | 55,922 | | | | 69,991 | | | 18,417 | | | | 18,098 | | | | 26,258 | |
Collateral Received for Securities Loaned (See Note 4) | | | 7,022,800 | | | | 3,639,773 | | | 65,881,964 | | | | 2,011,604 | | | | 2,036,920 | |
Total Liabilities | | | 7,078,722 | | | | 3,709,764 | | | 65,900,381 | | | | 2,029,702 | | | | 2,063,178 | |
| | | | | | | | | | | | | | | | | | | | |
Net Assets | | $ | 87,078,867 | | | $ | 189,977,096 | | $ | 282,704,570 | | | $ | 32,804,885 | | | $ | 40,779,886 | |
| | | | | | | | | | | | | | | | | | | | |
Net Assets Consist of: | | | | | | | | | | | | | | | | | | | |
Paid-in Capital ($0.01 par value) | | $ | 18,000 | | | $ | 32,500 | | $ | 679,000 | | | $ | 7,000 | | | $ | 7,000 | |
Additional Paid-in Capital | | | 141,536,636 | | | | 186,475,507 | | | 2,107,443,220 | | | | 42,246,144 | | | | 93,884,881 | |
Total Distributable Earnings (Accumulated Deficit) | | | (54,475,769 | ) | | | 3,469,089 | | | (1,825,417,650 | ) | | | (9,448,259 | ) | | | (53,111,995 | ) |
Net Assets | | $ | 87,078,867 | | | $ | 189,977,096 | | $ | 282,704,570 | | | $ | 32,804,885 | | | $ | 40,779,886 | |
| | | | | | | | | | | | | | | | | | | | |
Outstanding Shares of Beneficial Interest (unlimited authorized – $0.01 par value) | | | 1,800,000 | | | | 3,250,000 | | | 67,900,000 | | | | 700,000 | | | | 700,000 | |
Net Asset Value, Offering and Redemption Price per Share | | $ | 48.38 | | | $ | 58.45 | | $ | 4.16 | | | $ | 46.86 | | | $ | 58.26 | |
*Includes Loaned Securities with a Value of | | $ | 6,648,828 | | | $ | 3,403,998 | | $ | 56,687,100 | | | $ | 1,806,882 | | | $ | 1,882,545 | |
The accompanying notes are an integral part of these financial statements.
65
Amplify ETF Trust
Statements of Assets and Liabilities
March 31, 2024
| | Amplify AI
Powered Equity
ETF | | Amplify Travel
Tech ETF | | Amplify
Treatments,
Testing and
Advancements
ETF | | Amplify
U.S. Alternative
Harvest ETF |
Assets: | | | | | | | | | | | | | | | | |
Investments in Securities, at Cost | | $ | 113,430,066 | | | $ | 105,576,115 | | | $ | 24,266,550 | | | $ | 112,781,851 | |
Investments in Securities, at Value* | | $ | 114,200,569 | | | $ | 89,816,323 | | | $ | 12,820,529 | | | $ | 114,285,003 | |
Cash | | | 15,848 | | | | 20,968 | | | | — | | | | 50,728 | |
Receivable for Investments Sold | | | 101,924,848 | | | | 80,660 | | | | 61,347 | | | | 45,271 | |
Dividends and Interest Receivable | | | 53,498 | | | | 34,537 | | | | 20,683 | | | | 133,112 | |
Net Unrealized Appreciation on Swaps | | | — | | | | — | | | | — | | | | 11,926,948 | |
Securities Lending Income Receivable | | | 1,085 | | | | 4,359 | | | | 17,653 | | | | 2,875 | |
Total Assets | | | 216,195,848 | | | | 89,956,847 | | | | 12,920,212 | | | | 126,443,937 | |
| | | | | | | | | | | | | | | | | |
Liabilities: | | | | | | | | | | | | | | | | |
Collateral Received for Securities Loaned (See Note 4) | | | 3,741,855 | | | | 564,705 | | | | 1,772,831 | | | | — | |
Payable for Investments Purchased | | | 102,176,645 | | | | 142,461 | | | | 36,784 | | | | 1,611 | |
Payable to Broker for Swaps | | | — | | | | — | | | | — | | | | 257,357 | |
Advisory Fees Payable, net of waiver, if any | | | 69,660 | | | | 57,561 | | | | 6,340 | | | | 72,364 | |
Total Liabilities | | | 105,988,160 | | | | 764,727 | | | | 1,815,955 | | | | 331,332 | |
| | | | | | | | | | | | | | | | | |
Net Assets | | $ | 110,207,688 | | | $ | 89,192,120 | | | $ | 11,104,257 | | | $ | 126,112,605 | |
| | | | | | | | | | | | | | | | | |
Net Assets Consist of: | | | | | | | | | | | | | | | | |
Paid-in Capital ($0.01 par value) | | $ | 30,250 | | | $ | 43,500 | | | $ | 6,000 | | | $ | 584,200 | |
Additional Paid-in Capital | | | 145,152,283 | | | | 232,825,901 | | | | 41,607,385 | | | | 132,287,866 | |
Total Distributable Earnings (Accumulated Deficit) | | | (34,974,845 | ) | | | (143,677,281 | ) | | | (30,509,128 | ) | | | (6,759,461 | ) |
Net Assets | | $ | 110,207,688 | | | $ | 89,192,120 | | | $ | 11,104,257 | | | $ | 126,112,605 | |
| | | | | | | | | | | | | | | | | |
Outstanding Shares of Beneficial Interest (unlimited authorized – $0.01 par value) | | | 3,025,000 | | | | 4,350,000 | | | | 600,000 | | | | 58,420,000 | |
Net Asset Value, Offering and Redemption Price per Share | | $ | 36.43 | | | $ | 20.50 | | | $ | 18.51 | | | $ | 2.16 | |
*Includes Loaned Securities with a Value of | | $ | 132,036 | | | $ | 507,082 | | | $ | 1,614,889 | | | $ | — | |
The accompanying notes are an integral part of these financial statements.
66
Amplify ETF Trust
Statements of Operations
For the Period Ended March 31, 2024
| | Amplify
High Income
ETF | | Amplify
Online Retail
ETF | | Amplify
CWP
Enhanced
Dividend Income
ETF | | Amplify
Transformational
Data Sharing
ETF | | Amplify
Lithium &
Battery
Technology
ETF |
Investment Income: | | | | | | | | | | | | | | | | | | | |
Dividend Income (Net of Foreign Withholding Tax of $0, $8,501, $67,883, $150,696, and $32,724, respectively) | | $ | 17,925,549 | | | $ | 445,099 | | | $ | 29,005,811 | | | $ | 3,596,119 | | $ | 347,980 | |
Dividend Income from Affiliated Investments | | | — | | | | — | | | | 1,788,377 | | | | — | | | — | |
Interest Income | | | 48,750 | | | | 2,795 | | | | 5,604,797 | | | | 2,962,833 | | | 6,963 | |
Securities Lending Income | | | 150,711 | | | | 63,123 | | | | 699 | | | | 2,465,745 | | | 724,075 | |
Total Investment Income | | | 18,125,010 | | | | 511,017 | | | | 36,399,684 | | | | 9,024,697 | | | 1,079,018 | |
Expenses: | | | | | | | | | | | | | | | | | | | |
Advisory Fees | | | 853,482 | | | | 493,339 | | | | 6,849,028 | | | | 2,393,415 | | | 249,095 | |
Total Expenses | | | 853,482 | | | | 493,339 | | | | 6,849,028 | | | | 2,393,415 | | | 249,095 | |
Advisory Fees Waived (See Note 3) | | | — | | | | — | | | | (64,038 | ) | | | — | | | — | |
Net Expenses | | | 853,482 | | | | 493,339 | | | | 6,784,990 | | | | 2,393,415 | | | 249,095 | |
Net Investment Income (Loss) | | | 17,271,528 | | | | 17,678 | | | | 29,614,694 | | | | 6,631,282 | | | 829,923 | |
| | | | | | | | | | | | | | | | | | | | |
Realized and Unrealized Gain (Loss): | | | | | | | | | | | | | | | | | | | |
Net Realized Gain (Loss) on: | | | | | | | | | | | | | | | | | | | |
Unaffiliated Investments | | | (21,416,748 | ) | | | (1,912,787 | ) | | | 49,221,984 | | | | 152,291,311 | | | (29,341,772 | ) |
Affiliated Investments | | | — | | | | — | | | | 4,316 | | | | — | | | — | |
Foreign Currency | | | — | | | | (17,743 | ) | | | — | | | | 2,692 | | | (69,127 | ) |
Options Written | | | — | | | | — | | | | 10,593,709 | | | | — | | | — | |
Net Change in Unrealized Appreciation/Depreciation on: | | | | | | | | | | | | | | | | | | | |
Unaffiliated Investments | | | 73,050,293 | | | | 62,567,102 | | | | 355,281,172 | | | | 251,676,698 | | | 28,282,293 | |
Affiliated Investments | | | — | | | | — | | | | (96,021 | ) | | | — | | | — | |
Foreign Currency | | | — | | | | 590 | | | | — | | | | 10,519 | | | 1,506 | |
Options Written | | | — | | | | — | | | | (2,701,781 | ) | | | — | | | — | |
Net Realized and Unrealized Gain (Loss) | | | 51,633,545 | | | | 60,637,162 | | | | 412,303,379 | | | | 403,981,220 | | | (1,127,100 | ) |
| | | | | | | | | | | | | | | | | | | | |
Net Increase (Decrease) in Net Assets Resulting from Operations | | $ | 68,905,073 | | | $ | 60,654,840 | | | $ | 441,918,073 | | | $ | 410,612,502 | | $ | (297,177 | ) |
The accompanying notes are an integral part of these financial statements.
67
Amplify ETF Trust
Statements of Operations
For the Period Ended March 31, 2024
| | Amplify
BlackSwan
Growth &
Treasury Core
ETF | | Amplify
Emerging
Markets
FinTech
ETF | | Amplify
Seymour
Cannabis
ETF | | Amplify
BlackSwan
ISWN
ETF | | Amplify
Thematic
All-Stars
ETF |
Investment Income: | | | | | | | | | | | | | | | | | | |
Dividend Income (Net of Foreign Withholding Tax of $0, $1,088, $0, $0, $291 respectively) | | $ | 244 | | $ | 8,387 | | | $ | 155,318 | | | $ | — | | $ | 5,286 | |
Interest Income | | | 2,456,550 | | | 78 | | | | 31,695 | | | | 572,998 | | | — | |
Securities Lending Income | | | — | | | 3,660 | | | | 61,647 | | | | — | | | 1,330 | |
Total Investment Income | | | 2,456,794 | | | 12,125 | | | | 248,660 | | | | 572,998 | | | 6,616 | |
Expenses: | | | | | | | | | | | | | | | | | | |
Advisory Fees | | | 358,551 | | | 6,017 | | | | 79,666 | | | | 80,644 | | | 5,681 | |
Fund Accounting, Administration & Transfer Agent Fees | | | — | | | — | | | | 26,432 | | | | — | | | — | |
Other Expenses | | | — | | | — | | | | 24,839 | | | | — | | | — | |
Legal Fees | | | — | | | — | | | | 9,210 | | | | — | | | — | |
Audit Fees | | | — | | | — | | | | 8,124 | | | | — | | | — | |
Trustee Fees | | | — | | | — | | | | 7,574 | | | | — | | | — | |
Principal Financial Officer Fees | | | — | | | — | | | | 6,232 | | | | — | | | — | |
Shareholder Servicing Fees | | | — | | | — | | | | 5,930 | | | | — | | | — | |
Compliance Fees | | | — | | | — | | | | 5,272 | | | | — | | | — | |
Custody Expenses | | | — | | | — | | | | 4,158 | | | | — | | | — | |
Total Expenses | | | 358,551 | | | 6,017 | | | | 177,437 | | | | 80,644 | | | 5,681 | |
Advisory Fees Waived/Reimbursed (See Note 3) | | | — | | | — | | | | (85,515 | ) | | | — | | | — | |
Net Expenses | | | 358,551 | | | 6,017 | | | | 91,922 | | | | 80,644 | | | 5,681 | |
Net Investment Income (Loss) | | | 2,098,243 | | | 6,108 | | | | 156,738 | | | | 492,354 | | | 935 | |
| | | | | | | | | | | | | | | | | | | |
Realized and Unrealized Gain (Loss): | | | | | | | | | | | | | | | | | | |
Net Realized Gain (Loss) on: | | | | | | | | | | | | | | | | | | |
Investments | | | 2,506,295 | | | (351,788 | ) | | | (15,810,652 | ) | | | 115,909 | | | (307,716 | ) |
Foreign Currency | | | — | | | (745 | ) | | | (1,679 | ) | | | — | | | (255 | ) |
Swaps | | | — | | | — | | | | 5,000,058 | | | | — | | | — | |
Net Change in Unrealized Appreciation/Depreciation on: | | | | | | | | | | | | | | | | | | |
Investments | | | 31,535,407 | | | 698,549 | | | | 19,531,928 | | | | 5,274,089 | | | 1,100,565 | |
Foreign Currency | | | — | | | (75 | ) | | | — | | | | — | | | 1 | |
Swaps | | | — | | | — | | | | 4,872,784 | | | | — | | | — | |
Net Realized and Unrealized Gain (Loss) | | | 34,041,702 | | | 345,941 | | | | 13,592,439 | | | | 5,389,998 | | | 792,595 | |
| | | | | | | | | | | | | | | | | | | |
Net Increase (Decrease) in Net Assets Resulting from Operations | | $ | 36,139,945 | | $ | 352,049 | | | $ | 13,749,177 | | | $ | 5,882,352 | | $ | 793,530 | |
The accompanying notes are an integral part of these financial statements.
68
Amplify ETF Trust
Statements of Operations
For the Period Ended March 31, 2024
| | Amplify
BlackSwan
Tech &
Treasury
ETF | | Amplify
Inflation
Fighter
ETF(a) | | Amplify
Natural
Resources
Dividend
Income
ETF | | Amplify
International
Enhanced
Dividend
Income
ETF | | Amplify
Cash Flow
Dividend
Leaders
ETF |
Investment Income: | | | | | | | | | | | | | | | | | |
Dividend Income (Net of Foreign Withholding Tax of $0, $4,136, $11,373, $78,812, $0) | | $ | — | | $ | 50,889 | | $ | 227,425 | | $ | 882,074 | | | $ | 89,308 | |
Interest Income | | | 33,727 | | | 21,775 | | | 892 | | | 85,786 | | | | 2,012 | |
Securities Lending Income | | | — | | | 1,681 | | | 5,120 | | | 18,611 | | | | — | |
Total Investment Income | | | 33,727 | | | 74,345 | | | 233,437 | | | 986,471 | | | | 91,320 | |
Expenses: | | | | | | | | | | | | | | | | | |
Advisory Fees | | | 5,020 | | | 29,545 | | | 25,673 | | | 209,024 | | | | 13,794 | |
Total Expenses | | | 5,020 | | | 29,545 | | | 25,673 | | | 209,024 | | | | 13,794 | |
Advisory Fees Waived/Reimbursed (See Note 3) | | | — | | | — | | | — | | | — | | | | (13,794 | ) |
Net Expenses | | | 5,020 | | | 29,545 | | | 25,673 | | | 209,024 | | | | — | |
Net Investment Income (Loss) | | | 28,707 | | | 44,800 | | | 207,764 | | | 777,447 | | | | 91,320 | |
| | | | | | | | | | | | | | | | | | |
Realized and Unrealized Gain (Loss): | | | | | | | | | | | | | | | | | |
Net Realized Gain (Loss) on: | | | | | | | | | | | | | | | | | |
Investments | | | 146,589 | | | 140,593 | | | 39,826 | | | (995,603 | ) | | | 848,872 | |
Foreign Currency | | | — | | | 7 | | | — | | | — | | | | — | |
Futures Contracts | | | — | | | 384,970 | | | — | | | — | | | | — | |
Options Written | | | — | | | — | | | — | | | 434,843 | | | | — | |
Net Change in Unrealized Appreciation/Depreciation on: | | | | | | | | | | | | | | | | | |
Investments | | | 258,135 | | | 1,312,714 | | | 1,156,618 | | | 12,281,320 | | | | 1,274,275 | |
Foreign Currency | | | — | | | — | | | 2 | | | — | | | | — | |
Futures Contracts | | | — | | | 18,104 | | | — | | | — | | | | — | |
Options Written | | | — | | | — | | | — | | | (122,646 | ) | | | — | |
Net Realized and Unrealized Gain (Loss) | | | 404,724 | | | 1,856,388 | | | 1,196,446 | | | 11,597,914 | | | | 2,123,147 | |
| | | | | | | | | | | | | | | | | | |
Net Increase (Decrease) in Net Assets Resulting from Operations | | $ | 433,431 | | $ | 1,901,188 | | $ | 1,404,210 | | $ | 12,375,361 | | | $ | 2,214,467 | |
(a) | | Statement has been consolidated. See Note 1 in the Notes to Financial Statements for basis of consolidation. |
The accompanying notes are an integral part of these financial statements.
69
Amplify ETF Trust
Statements of Operations
For the Period Ended March 31, 2024
| | Amplify
Cash Flow
High Income
ETF | | Amplify
Samsung
SOFR
ETF(a) | | Amplify
Junior Silver
Miners
ETF | | Amplify
Cybersecurity
ETF | | Amplify
Mobile
Payments
ETF |
Investment Income: | | | | | | | | | | | | | | | | | | | |
Dividend Income from Affilated Investments | | $ | 30,597 | | | $ | — | | $ | — | | | $ | — | | | $ | — | |
Dividend Income (Net of Foreign Withholding Tax of $0, $0, $238,048, $79,349, $42,243) | | | — | | | | — | | | 1,456,751 | | | | 6,967,185 | | | | 1,266,424 | |
Interest Income | | | 3,979 | | | | 2,822,662 | | | 156,991 | | | | 149,169 | | | | 56,430 | |
Securities Lending Income | | | — | | | | — | | | 14,746 | | | | 42,131 | | | | 43,081 | |
Total Investment Income | | | 34,576 | | | | 2,822,662 | | | 1,628,488 | | | | 7,158,485 | | | | 1,365,935 | |
Expenses: | | | | | | | | | | | | | | | | | | | |
Advisory Fees | | | 8,187 | | | | 102,800 | | | 2,174,866 | | | | 4,909,320 | | | | 1,292,836 | |
Total Expenses | | | 8,187 | | | | 102,800 | | | 2,174,866 | | | | 4,909,320 | | | | 1,292,836 | |
Net Expenses | | | 8,187 | | | | 102,800 | | | 2,174,866 | | | | 4,909,320 | | | | 1,292,836 | |
Net Investment Income (Loss) | | | 26,389 | | | | 2,719,862 | | | (546,378 | ) | | | 2,249,165 | | | | 73,099 | |
| | | | | | | | | | | | | | | | | | | | |
Realized and Unrealized Gain (Loss): | | | | | | | | | | | | | | | | | | | |
Net Realized Gain (Loss) on: | | | | | | | | | | | | | | | | | | | |
Investments | | | — | | | | — | | | (88,541,870 | ) | | | 87,671,327 | | | | (21,346,073 | ) |
Foreign Currency | | | — | | | | �� | | | (351,536 | ) | | | 129,317 | | | | (108,112 | ) |
Swaps | | | (125,578 | ) | | | — | | | — | | | | — | | | | — | |
Net Change in Unrealized Appreciation/Depreciation on: | | | | | | | | | | | | | | | | | | | |
Investments | | | — | | | | — | | | 194,226,562 | | | | 255,742,313 | | | | 122,666,181 | |
Affiliated Investments | | | 696,314 | | | | — | | | — | | | | — | | | | — | |
Foreign Currency | | | — | | | | — | | | — | | | | (8,155 | ) | | | 3,751 | |
Swaps | | | (16,262 | ) | | | — | | | — | | | | — | | | | — | |
Net Realized and Unrealized Gain (Loss) | | | 554,474 | | | | — | | | 105,333,156 | | | | 343,534,802 | | | | 101,215,747 | |
| | | | | | | | | | | | | | | | | | | | |
Net Increase (Decrease) in Net Assets Resulting from Operations | | $ | 580,863 | | | $ | 2,719,862 | | $ | 104,786,778 | | | $ | 345,783,967 | | | $ | 101,288,846 | |
(a) | | Fund commenced operations on November 14, 2023. |
The accompanying notes are an integral part of these financial statements.
70
Amplify ETF Trust
Statements of Operations
For the Period Ended March 31, 2024
| | Amplify
BlueStar
Israel
Technology
ETF | | Amplify
Etho Climate
Leadership U.S.
ETF | | Amplify
Alternative
Harvest
ETF | | Amplify
Global Cloud
Technology
ETF | | Amplify
Video
Game Tech
ETF |
Investment Income: | | | | | | | | | | | | | | | | | | | |
Dividend Income (Net of Foreign Withholding Tax of $24,365, $0, $0, $6,206, $21,924) | | $ | 161,982 | | | $ | 1,390,305 | | $ | 2,595,310 | | | $ | 68,780 | | | $ | 157,964 | |
Dividend Income from Affilated Investments | | | — | | | | — | | | 2,400,476 | | | | — | | | | — | |
Interest Income | | | 6,882 | | | | 20,411 | | | 44,595 | | | | 4,014 | | | | 4,485 | |
Securities Lending Income | | | 70,969 | | | | 245,093 | | | 1,694,263 | | | | 18,260 | | | | 10,360 | |
Total Investment Income | | | 239,833 | | | | 1,655,809 | | | 6,734,644 | | | | 91,054 | | | | 172,809 | |
Expenses: | | | | | | | | | | | | | | | | | | | |
Advisory Fees | | | 316,030 | | | | 395,045 | | | 861,109 | | | | 84,608 | | | | 160,499 | |
Total Expenses | | | 316,030 | | | | 395,045 | | | 861,109 | | | | 84,608 | | | | 160,499 | |
Advisory Fees Waived/Reimbursed (See Note 3) | | | — | | | | — | | | (439,094 | ) | | | | | | | — | |
Net Expenses | | | 316,030 | | | | 395,045 | | | 422,015 | | | | 84,608 | | | | 160,499 | |
Net Investment Income (Loss) | | | (76,197 | ) | | | 1,260,764 | | | 6,312,629 | | | | 6,446 | | | | 12,310 | |
| | | | | | | | | | | | | | | | | | | | |
Realized and Unrealized Gain (Loss): | | | | | | | | | | | | | | | | | | | |
Net Realized Gain (Loss) on: | | | | | | | | | | | | | | | | | | | |
Unaffiliated Investments | | | (3,587,370 | ) | | | 3,044,878 | | | (151,160,882 | ) | | | 1,812,719 | | | | (861,561 | ) |
Affiliated Investments | | | — | | | | — | | | (10,749,294 | ) | | | — | | | | — | |
Foreign Currency | | | (630 | ) | | | — | | | (8,533 | ) | | | (7,381 | ) | | | (15,174 | ) |
Net Change in Unrealized Appreciation/Depreciation on: | | | | | | | | | | | | | | | | | | | |
Unaffiliated Investments | | | 16,811,537 | | | | 24,636,931 | | | 166,730,081 | | | | 5,056,013 | | | | 4,516,316 | |
Affiliated Investments | | | — | | | | — | | | 29,812,200 | | | | — | | | | — | |
Foreign Currency | | | 19 | | | | — | | | 194 | | | | 568 | | | | (1,091 | ) |
Net Realized and Unrealized Gain (Loss) | | | 13,223,556 | | | | 27,681,809 | | | 34,623,766 | | | | 6,861,919 | | | | 3,638,490 | |
| | | | | | | | | | | | | | | | | | | | |
Net Increase (Decrease) in Net Assets Resulting from Operations | | $ | 13,147,359 | | | $ | 28,942,573 | | $ | 40,871,146 | | | $ | 6,868,365 | | | $ | 3,650,800 | |
The accompanying notes are an integral part of these financial statements.
71
Amplify ETF Trust
Statements of Operations
For the Period Ended March 31, 2024
| | Amplify AI
Powered
Equity
ETF | | Amplify
Travel Tech
ETF | | Amplify
Treatments,
Testing and
Advancements
ETF | | Amplify
U.S. Alternative
Harvest
ETF |
Investment Income: | | | | | | | | | | | | | | | |
Dividend Income (Net of Foreign Withholding Tax of $46, $10,130, $233, $0) | | $ | 828,511 | | $ | 426,253 | | | $ | 39,386 | | | $ | 281,695 | |
Interest Income | | | 5,594 | | | 14,326 | | | | 1,914 | | | | 2,690,472 | |
Securities Lending Income | | | 29,335 | | | 41,524 | | | | 68,501 | | | | 5,970 | |
Total Investment Income | | | 863,440 | | | 482,103 | | | | 109,801 | | | | 2,978,137 | |
Expenses: | | | | | | | | | | | | | | | |
Advisory Fees | | | 404,565 | | | 369,331 | | | | 41,343 | | | | 461,842 | |
Total Expenses | | | 404,565 | | | 369,331 | | | | 41,343 | | | | 461,842 | |
Net Expenses | | | 404,565 | | | 369,331 | | | | 41,343 | | | | 461,842 | |
Net Investment Income (Loss) | | | 458,875 | | | 112,772 | | | | 68,458 | | | | 2,516,295 | |
| | | | | | | | | | | | | | | | |
Realized and Unrealized Gain (Loss): | | | | | | | | | | | | | | | |
Net Realized Gain (Loss) on: | | | | | | | | | | | | | | | |
Investments | | | 20,468,395 | | | (6,112,065 | ) | | | (2,715,764 | ) | | | (11,469,693 | ) |
Foreign Currency | | | — | | | (27,873 | ) | | | — | | | | 14 | |
Swaps | | | — | | | — | | | | — | | | | 8,912,279 | |
Net Change in Unrealized Appreciation/Depreciation on: | | | | | | | | | | | | | | | |
Investments | | | 1,640,029 | | | 24,831,150 | | | | 3,053,427 | | | | 10,721,148 | |
Foreign Currency | | | — | | | 411 | | | | — | | | | — | |
Swaps | | | — | | | — | | | | — | | | | 11,926,948 | |
Net Realized and Unrealized Gain (Loss) | | | 22,108,424 | | | 18,691,623 | | | | 337,663 | | | | 20,090,696 | |
| | | | | | | | | | | | | | | | |
Net Increase (Decrease) in Net Assets Resulting from Operations | | $ | 22,567,299 | | $ | 18,804,395 | | | $ | 406,121 | | | $ | 22,606,991 | |
The accompanying notes are an integral part of these financial statements.
72
Amplify ETF Trust
Statements of Changes in Net Assets
| | Amplify High Income ETF |
| | | Period Ended
March 31,
2024
(Unaudited)(a) | | Year Ended
October 31,
2023 | | Year Ended
October 31,
2022 |
Operations: | | | | | | | | | | | | |
Net Investment Income (Loss) | | $ | 17,271,528 | | | $ | 33,462,803 | | | $ | 22,792,564 | |
Net Realized Gain (Loss) on Investments | | | (21,416,748 | ) | | | (2,508,621 | ) | | | (32,907,074 | ) |
Capital Gain Distributions from Underlying Closed End Funds | | | — | | | | 836,289 | | | | 189,538 | |
Net Change in Unrealized Appreciation/(Depreciation) on Investments | | | 73,050,293 | | | | (768,803 | ) | | | (93,747,918 | ) |
Net Increase (Decrease) in Net Assets Resulting from Operations | | | 68,905,073 | | | | 8,444,078 | | | | (103,672,890 | ) |
| | | | | | | | | | | | | |
Distributions to Shareholders: | | | | | | | | | | | | |
Dividends and Distributions | | | (21,456,000 | ) | | | (32,823,110 | ) | | | (23,924,398 | ) |
Return of Capital | | | — | | | | (10,544,890 | ) | | | (13,017,602 | ) |
Total Distributions | | | (21,456,000 | ) | | | (43,368,000 | ) | | | (36,942,000 | ) |
| | | | | | | | | | | | | |
Capital Share Transactions: | | | | | | | | | | | | |
Subscriptions | | | 70,846,925 | | | | 115,213,635 | | | | 55,386,975 | |
Redemptions | | | (4,066,110 | ) | | | (37,404,110 | ) | | | (65,681,329 | ) |
Transaction Fees (Note 1) | | | — | | | | — | | | | 54 | |
Increase (Decrease) in Net Assets from Capital Share Transactions | | | 66,780,815 | | | | 77,809,525 | | | | (10,294,300 | ) |
| | | | | | | | | | | | | |
Total Increase (Decrease) in Net Assets | | | 114,229,888 | | | | 42,885,603 | | | | (150,909,190 | ) |
| | | | | | | | | | | | | |
Net Assets: | | | | | | | | | | | | |
Beginning of Period | | | 340,947,275 | | | | 298,061,672 | | | | 448,970,862 | |
End of Period | | $ | 455,177,163 | | | $ | 340,947,275 | | | $ | 298,061,672 | |
| | | | | | | | | | | | | |
Share Transactions: | | | | | | | | | | | | |
Subscriptions | | | 6,100,000 | | | | 9,750,000 | | | | 4,050,000 | |
Redemptions | | | (350,000 | ) | | | (3,300,000 | ) | | | (4,700,000 | ) |
Net Increase (Decrease) in Shares Outstanding from Share Transactions | | | 5,750,000 | | | | 6,450,000 | | | | (650,000 | ) |
(a) | | For the period November 1, 2023 to March 31, 2024. See Note 1 to the Financial Statements. |
The accompanying notes are an integral part of these financial statements.
73
Amplify ETF Trust
Statements of Changes in Net Assets
| | Amplify Online Retail ETF |
| | | Period Ended
March 31,
2024
(Unaudited)(a) | | Year Ended
October 31,
2023 | | Year Ended
October 31,
2022 |
Operations: | | | | | | | | | | | | |
Net Investment Income (Loss) | | $ | 17,678 | | | $ | (256,749 | ) | | $ | 2,180,233 | |
Net Realized Gain (Loss) on Investments and Foreign Currency | | | (1,930,530 | ) | | | (174,441,573 | ) | | | (149,428,601 | ) |
Net Change in Unrealized Appreciation/(Depreciation) on Investments and Foreign Currency | | | 62,567,692 | | | | 182,284,853 | | | | (316,988,677 | ) |
Net Increase (Decrease) in Net Assets Resulting from Operations | | | 60,654,840 | | | | 7,586,531 | | | | (464,237,045 | ) |
| | | | | | | | | | | | | |
Capital Share Transactions: | | | | | | | | | | | | |
Subscriptions | | | 12,331,400 | | | | 67,742,930 | | | | 53,305,915 | |
Redemptions | | | (45,316,640 | ) | | | (105,954,075 | ) | | | (299,390,842 | ) |
Transaction Fees (Note 1) | | | 1,918 | | | | 5,641 | | | | | |
Increase (Decrease) in Net Assets from Capital Share Transactions | | | (32,983,322 | ) | | | (38,205,504 | ) | | | (246,084,927 | ) |
| | | | | | | | | | | | | |
Total Increase (Decrease) in Net Assets | | | 27,671,518 | | | | (30,618,973 | ) | | | (710,321,972 | ) |
| | | | | | | | | | | | | |
Net Assets: | | | | | | | | | | | | |
Beginning of Period | | | 155,740,639 | | | | 186,359,612 | | | | 896,681,584 | |
End of Period | | $ | 183,412,157 | | | $ | 155,740,639 | | | $ | 186,359,612 | |
| | | | | | | | | | | | | |
Share Transactions: | | | | | | | | | | | | |
Subscriptions | | | 250,000 | | | | 1,450,000 | | | | 750,000 | |
Redemptions | | | (850,000 | ) | | | (2,350,000 | ) | | | (4,200,000 | ) |
Net Increase (Decrease) in Shares Outstanding from Share Transactions | | | (600,000 | ) | | | (900,000 | ) | | | (3,450,000 | ) |
(a) | | For the period November 1, 2023 to March 31, 2024. See Note 1 to the Financial Statements. |
The accompanying notes are an integral part of these financial statements.
74
Amplify ETF Trust
Statements of Changes in Net Assets
| | Amplify CWP Enhanced Dividend Income ETF |
| | | Period Ended
March 31,
2024
(Unaudited)(a) | | Year Ended
October 31,
2023 | | Year Ended
October 31,
2022 |
Operations: | | | | | | | | | | | | |
Net Investment Income (Loss) | | $ | 29,614,694 | | | $ | 60,061,554 | | | $ | 22,060,258 | |
Net Realized Gain (Loss) on Investments and Options Written | | | 59,820,009 | | | | (4,190,535 | ) | | | 2,530,977 | |
Net Change in Unrealized Appreciation/(Depreciation) on Investments and Options Written | | | 352,483,370 | | | | (30,437,822 | ) | | | (79,374 | ) |
Net Increase (Decrease) in Net Assets Resulting from Operations | | | 441,918,073 | | | | 25,433,197 | | | | 24,511,861 | |
| | | | | | | | | | | | | |
Distributions to Shareholders: | | | | | | | | | | | | |
Dividends and Distributions | | | (60,622,296 | ) | | | (60,061,554 | ) | | | (32,662,560 | ) |
Return of Capital | | | — | | | | (72,626,691 | ) | | | (33,000,810 | ) |
Total Distributions | | | (60,622,296 | ) | | | (132,688,245 | ) | | | (65,663,370 | ) |
| | | | | | | | | | | | | |
Capital Share Transactions: | | | | | | | | | | | | |
Subscriptions | | | 68,551,375 | | | | 1,010,437,880 | | | | 1,387,185,500 | |
Redemptions | | | (129,644,270 | ) | | | (164,920,195 | ) | | | (10,597,300 | ) |
Transaction Fees (Note 1) | | | — | | | | 5 | | | | — | |
Increase (Decrease) in Net Assets from Capital Share Transactions | | | (61,092,895 | ) | | | 845,517,690 | | | | 1,376,588,200 | |
| | | | | | | | | | | | | |
Total Increase (Decrease) in Net Assets | | | 320,202,882 | | | | 738,262,642 | | | | 1,335,436,691 | |
| | | | | | | | | | | | | |
Net Assets: | | | | | | | | | | | | |
Beginning of Period | | | 2,840,052,774 | | | | 2,101,790,132 | | | | 766,353,441 | |
End of Period | | $ | 3,160,255,656 | | | $ | 2,840,052,774 | | | $ | 2,101,790,132 | |
| | | | | | | | | | | | | |
Share Transactions: | | | | | | | | | | | | |
Subscriptions | | | 1,850,000 | | | | 28,250,000 | | | | 39,000,000 | |
Redemptions | | | (3,550,000 | ) | | | (4,650,000 | ) | | | (300,000 | ) |
Net Increase (Decrease) in Shares Outstanding from Share Transactions | | | (1,700,000 | ) | | | 23,600,000 | | | | 38,700,000 | |
(a) | | For the period November 1, 2023 to March 31, 2024. See Note 1 to the Financial Statements. |
The accompanying notes are an integral part of these financial statements.
75
Amplify ETF Trust
Statements of Changes in Net Assets
| | Amplify Transformational Data Sharing ETF |
| | | Period Ended
March 31,
2024
(Unaudited)(a) | | Year Ended
October 31,
2023 | | Year Ended
October 31,
2022 |
Operations: | | | | | | | | | | | | |
Net Investment Income (Loss) | | $ | 6,631,282 | | | $ | 8,744,358 | | | $ | 11,637,629 | |
Net Realized Gain (Loss) on Investments and Foreign Currency | | | 152,294,003 | | | | (190,252,101 | ) | | | (181,682,166 | ) |
Net Change in Unrealized Appreciation/(Depreciation) on Investments, Foreign Currency, and Securities Sold Short | | | 251,687,217 | | | | 225,293,158 | | | | (757,847,628 | ) |
Net Increase (Decrease) in Net Assets Resulting from Operations | | | 410,612,502 | | | | 43,785,415 | | | | (927,892,165 | ) |
| | | | | | | | | | | | | |
Distributions to Shareholders: | | | | | | | | | | | | |
Dividends and Distributions | | | (12,491,001 | ) | | | — | | | | (167,906,335 | ) |
Total Distributions | | | (12,491,001 | ) | | | — | | | | (167,906,335 | ) |
| | | | | | | | | | | | | |
Capital Share Transactions: | | | | | | | | | | | | |
Subscriptions | | | 649,391,070 | | | | 17,641,355 | | | | 320,208,315 | |
Redemptions | | | (724,031,010 | ) | | | (98,650,555 | ) | | | (255,162,225 | ) |
Transaction Fees (Note 1) | | | 6,716 | | | | — | | | | 526 | |
Increase (Decrease) in Net Assets from Capital Share Transactions | | | (74,633,224 | ) | | | (81,009,200 | ) | | | 65,046,616 | |
| | | | | | | | | | | | | |
Total Increase (Decrease) in Net Assets | | | 323,488,277 | | | | (37,223,785 | ) | | | (1,030,751,884 | ) |
| | | | | | | | | | | | | |
Net Assets: | | | | | | | | | | | | |
Beginning of Period | | | 427,074,600 | | | | 464,298,385 | | | | 1,495,050,269 | |
End of Period | | $ | 750,562,877 | | | $ | 427,074,600 | | | $ | 464,298,385 | |
| | | | | | | | | | | | | |
Share Transactions: | | | | | | | | | | | | |
Subscriptions | | | 23,350,000 | | | | 950,000 | | | | 6,700,000 | |
Redemptions | | | (23,500,000 | ) | | | (5,250,000 | ) | | | (8,650,000 | ) |
Net Increase (Decrease) in Shares Outstanding from Share Transactions | | | (150,000 | ) | | | (4,300,000 | ) | | | (1,950,000 | ) |
The accompanying notes are an integral part of these financial statements.
76
Amplify ETF Trust
Statements of Changes in Net Assets
| | Amplify Lithium & Battery Technology ETF |
| | | Period Ended
March 31,
2024
(Unaudited)(a) | | Year Ended
October 31,
2023 | | Year Ended
October 31,
2022 |
Operations: | | | | | | | | | | | | |
Net Investment Income (Loss) | | $ | 829,923 | | | $ | 3,022,707 | | | $ | 6,356,741 | |
Net Realized Gain (Loss) on Investments and Foreign Currency | | | (29,410,899 | ) | | | (27,199,764 | ) | | | (8,576,670 | ) |
Net Change in Unrealized Appreciation/(Depreciation) on Investments and Foreign Currency | | | 28,283,799 | | | | (867,592 | ) | | | (86,320,529 | ) |
Net Increase (Decrease) in Net Assets Resulting from Operations | | | (297,177 | ) | | | (25,044,649 | ) | | | (88,540,458 | ) |
| | | | | | | | | | | | | |
Distributions to Shareholders: | | | | | | | | | | | | |
Dividends and Distributions | | | (3,657,984 | ) | | | (6,037,095 | ) | | | (5,449,017 | ) |
Total Distributions | | | (3,657,984 | ) | | | (6,037,095 | ) | | | (5,449,017 | ) |
| | | | | | | | | | | | | |
Capital Share Transactions: | | | | | | | | | | | | |
Subscriptions | | | 1,802,440 | | | | 7,256,025 | | | | 96,179,630 | |
Redemptions | | | (18,456,795 | ) | | | (25,274,805 | ) | | | (76,589,950 | ) |
Transaction Fees (Note 1) | | | 7,124 | | | | 11,624 | | | | 53,717 | |
Increase (Decrease) in Net Assets from Capital Share Transactions | | | (16,647,231 | ) | | | (18,007,156 | ) | | | 19,643,397 | |
| | | | | | | | | | | | | |
Total Increase (Decrease) in Net Assets | | | (20,602,392 | ) | | | (49,088,900 | ) | | | (74,346,078 | ) |
| | | | | | | | | | | | | |
Net Assets: | | | | | | | | | | | | |
Beginning of Period | | | 110,702,207 | | | | 159,791,107 | | | | 234,137,185 | |
End of Period | | $ | 90,099,815 | | | $ | 110,702,207 | | | $ | 159,791,107 | |
| | | | | | | | | | | | | |
Share Transactions: | | | | | | | | | | | | |
Subscriptions | | | 200,000 | | | | 550,000 | | | | 5,300,000 | |
Redemptions | | | (1,900,000 | ) | | | (2,000,000 | ) | | | (4,550,000 | ) |
Net Increase (Decrease) in Shares Outstanding from Share Transactions | | | (1,700,000 | ) | | | (1,450,000 | ) | | | 750,000 | |
The accompanying notes are an integral part of these financial statements.
77
Amplify ETF Trust
Statements of Changes in Net Assets
| | Amplify BlackSwan Growth & Treasury Core ETF |
| | | Period Ended
March 31,
2024
(Unaudited)(a) | | Year Ended
October 31,
2023 | | Year Ended
October 31,
2022 |
Operations: | | | | | | | | | | | | |
Net Investment Income (Loss) | | $ | 2,098,243 | | | $ | 6,854,775 | | | $ | 6,402,663 | |
Net Realized Gain (Loss) on Investments | | | 2,506,295 | | | | (40,187,128 | ) | | | (55,800,715 | ) |
Net Change in Unrealized Appreciation/(Depreciation) on Investments | | | 31,535,407 | | | | 30,752,637 | | | | (120,239,328 | ) |
Net Increase (Decrease) in Net Assets Resulting from Operations | | | 36,139,945 | | | | (2,579,716 | ) | | | (169,637,380 | ) |
| | | | | | | | | | | | | |
Distributions to Shareholders: | | | | | | | | | | | | |
Dividends and Distributions | | | (2,604,813 | ) | | | (6,977,010 | ) | | | (49,750,465 | ) |
Total Distributions | | | (2,604,813 | ) | | | (6,977,010 | ) | | | (49,750,465 | ) |
| | | | | | | | | | | | | |
Capital Share Transactions: | | | | | | | | | | | | |
Subscriptions | | | 1,117,400 | | | | 18,978,247 | | | | 378,151,950 | |
Redemptions | | | (38,112,673 | ) | | | (102,136,336 | ) | | | (795,833,189 | ) |
Increase (Decrease) in Net Assets from Capital Share Transactions | | | (36,995,273 | ) | | | (83,158,089 | ) | | | (417,681,239 | ) |
| | | | | | | | | | | | | |
Total Increase (Decrease) in Net Assets | | | (3,460,141 | ) | | | (92,714,815 | ) | | | (637,069,084 | ) |
| | | | | | | | | | | | | |
Net Assets: | | | | | | | | | | | | |
Beginning of Period | | | 181,682,701 | | | | 274,397,516 | | | | 911,466,600 | |
End of Period | | $ | 178,222,560 | | | $ | 181,682,701 | | | $ | 274,397,516 | |
| | | | | | | | | | | | | |
Share Transactions: | | | | | | | | | | | | |
Subscriptions | | | 40,000 | | | | 780,000 | | | | 10,650,000 | |
Redemptions | | | (1,500,000 | ) | | | (4,080,000 | ) | | | (25,030,000 | ) |
Net Increase (Decrease) in Shares Outstanding from Share Transactions | | | (1,460,000 | ) | | | (3,300,000 | ) | | | (14,380,000 | ) |
The accompanying notes are an integral part of these financial statements.
78
Amplify ETF Trust
Statements of Changes in Net Assets
| | Amplify Emerging Markets FinTech ETF |
| | | Period Ended
March 31,
2024
(Unaudited)(a) | | Year Ended
October 31,
2023 | | Year Ended
October 31,
2022 |
Operations: | | | | | | | | | | | | |
Net Investment Income (Loss) | | $ | 6,108 | | | $ | 41,623 | | | $ | 67,045 | |
Net Realized Gain (Loss) on Investments and Foreign Currency | | | (352,533 | ) | | | (621,158 | ) | | | (5,656,205 | ) |
Net Change in Unrealized Appreciation/(Depreciation) on Investments and Foreign Currency | | | 698,474 | | | | 633,399 | | | | 425,425 | |
Net Increase (Decrease) in Net Assets Resulting from Operations | | | 352,049 | | | | 53,864 | | | | (5,163,735 | ) |
| | | | | | | | | | | | | |
Distributions to Shareholders: | | | | | | | | | | | | |
Dividends and Distributions | | | (103,787 | ) | | | (6,458 | ) | | | — | |
Total Distributions | | | (103,787 | ) | | | (6,458 | ) | | | — | |
| | | | | | | | | | | | | |
Capital Share Transactions: | | | | | | | | | | | | |
Redemptions | | | — | | | | (530,910 | ) | | | (3,371,133 | ) |
Transaction Fees (Note 1) | | | — | | | | 575 | | | | — | |
Increase (Decrease) in Net Assets from Capital Share Transactions | | | — | | | | (530,335 | ) | | | (3,371,133 | ) |
| | | | | | | | | | | | | |
Total Increase (Decrease) in Net Assets | | | 248,262 | | | | (482,929 | ) | | | (8,534,868 | ) |
| | | | | | | | | | | | | |
Net Assets: | | | | | | | | | | | | |
Beginning of Period | | | 1,854,047 | | | | 2,336,976 | | | | 10,871,844 | |
End of Period | | $ | 2,102,309 | | | $ | 1,854,047 | | | $ | 2,336,976 | |
| | | | | | | | | | | | | |
Share Transactions: | | | | | | | | | | | | |
Redemptions | | | — | | | | (25,000 | ) | | | (125,000 | ) |
Net Increase (Decrease) in Shares Outstanding from Share Transactions | | | — | | | | (25,000 | ) | | | (125,000 | ) |
The accompanying notes are an integral part of these financial statements.
79
Amplify ETF Trust
Statements of Changes in Net Assets
| | Amplify Seymour Cannabis ETF |
| | | Period Ended
March 31,
2024
(Unaudited)(a) | | Year Ended
October 31,
2023 | | Year Ended
October 31,
2022 |
Operations: | | | | | | | | | | | | |
Net Investment Income (Loss) | | $ | 156,738 | | | $ | 379,055 | | | $ | 28,189 | |
Net Realized Gain (Loss) on Investments and Foreign Currency and Swaps | | | (10,812,273 | ) | | | (15,091,725 | ) | | | (40,016,078 | ) |
Net Change in Unrealized Appreciation/(Depreciation) on Investments, Foreign Currency and Swaps | | | 24,404,712 | | | | (5,504,762 | ) | | | (24,020,718 | ) |
Net Increase (Decrease) in Net Assets Resulting from Operations | | | 13,749,177 | | | | (20,217,432 | ) | | | (64,008,607 | ) |
| | | | | | | | | | | | | |
Distributions to Shareholders: | | | | | | | | | | | | |
Dividends and Distributions | | | — | | | | — | | | | (960 | ) |
Total Distributions | | | — | | | | — | | | | (960 | ) |
| | | | | | | | | | | | | |
Capital Share Transactions: | | | | | | | | | | | | |
Subscriptions | | | — | | | | 1,912,410 | | | | 9,048,720 | |
Redemptions | | | — | | | | (555,060 | ) | | | (5,949,360 | ) |
Increase (Decrease) in Net Assets from Capital Share Transactions | | | — | | | | 1,357,350 | | | | 3,099,360 | |
| | | | | | | | | | | | | |
Total Increase (Decrease) in Net Assets | | | 13,749,177 | | | | (18,860,082 | ) | | | (60,910,207 | ) |
| | | | | | | | | | | | | |
Net Assets: | | | | | | | | | | | | |
Beginning of Period | | | 23,590,528 | | | | 42,450,610 | | | | 103,360,817 | |
End of Period | | $ | 37,339,705 | | | $ | 23,590,528 | | | $ | 42,450,610 | |
| | | | | | | | | | | | | |
Share Transactions: | | | | | | | | | | | | |
Subscriptions | | | — | | | | 400,000 | | | | (650,000 | ) |
Redemptions | | | — | | | | (150,000 | ) | | | (400,000 | ) |
Net Increase (Decrease) in Shares Outstanding from Share Transactions | | | — | | | | 250,000 | | | | (1,050,000 | ) |
The accompanying notes are an integral part of these financial statements.
80
Amplify ETF Trust
Statements of Changes in Net Assets
| | Amplify BlackSwan ISWN ETF |
| | | Period Ended
March 31,
2024
(Unaudited)(a) | | Year Ended
October 31,
2023 | | Year Ended
October 31,
2022 |
Operations: | | | | | | | | | | | | |
Net Investment Income (Loss) | | $ | 492,354 | | | $ | 1,088,316 | | | $ | 594,092 | |
Net Realized Gain (Loss) on Investments | | | 115,909 | | | | (3,891,829 | ) | | | (8,354,905 | ) |
Net Change in Unrealized Appreciation/(Depreciation) on Investments | | | 5,274,089 | | | | 2,140,436 | | | | (6,900,721 | ) |
Net Increase (Decrease) in Net Assets Resulting from Operations | | | 5,882,352 | | | | (663,077 | ) | | | (14,661,534 | ) |
| | | | | | | | | | | | | |
Distributions to Shareholders: | | | | | | | | | | | | |
Dividends and Distributions | | | (595,840 | ) | | | (1,056,161 | ) | | | (704,129 | ) |
Total Distributions | | | (595,840 | ) | | | (1,056,161 | ) | | | (704,129 | ) |
| | | | | | | | | | | | | |
Capital Share Transactions: | | | | | | | | | | | | |
Subscriptions | | | — | | | | 10,617,990 | | | | 21,448,860 | |
Redemptions | | | (3,785,410 | ) | | | (2,816,528 | ) | | | (18,089,013 | ) |
Increase (Decrease) in Net Assets from Capital Share Transactions | | | (3,785,410 | ) | | | 7,801,462 | | | | 3,359,847 | |
| | | | | | | | | | | | | |
Total Increase (Decrease) in Net Assets | | | 1,501,102 | | | | 6,082,224 | | | | (12,005,816 | ) |
| | | | | | | | | | | | | |
Net Assets: | | | | | | | | | | | | |
Beginning of Period | | | 37,429,830 | | | | 31,347,606 | | | | 43,353,422 | |
End of Period | | $ | 38,930,932 | | | $ | 37,429,830 | | | $ | 31,347,606 | |
| | | | | | | | | | | | | |
Share Transactions: | | | | | | | | | | | | |
Subscriptions | | | — | | | | 575,000 | | | | 900,000 | |
Redemptions | | | (200,000 | ) | | | (150,000 | ) | | | (825,000 | ) |
Net Increase (Decrease) in Shares Outstanding from Share Transactions | | | (200,000 | ) | | | 425,000 | | | | 75,000 | |
The accompanying notes are an integral part of these financial statements.
81
Amplify ETF Trust
Statements of Changes in Net Assets
| | Amplify Thematic All-Stars ETF |
| | | Period Ended
March 31,
2024
(Unaudited)(a) | | Year Ended
October 31,
2023 | | Year Ended
October 31,
2022 |
Operations: | | | | | | | | | | | | |
Net Investment Income (Loss) | | $ | 935 | | | $ | 1,374 | | | $ | (2,522 | ) |
Net Realized Gain (Loss) on Investments and Foreign Currency | | | (307,971 | ) | | | (1,495,220 | ) | | | (2,605,469 | ) |
Net Change in Unrealized Appreciation/(Depreciation) on Investments and Foreign Currency | | | 1,100,566 | | | | 1,556,485 | | | | (3,878,252 | ) |
Net Increase (Decrease) in Net Assets Resulting from Operations | | | 793,530 | | | | 62,639 | | | | (6,486,243 | ) |
| | | | | | | | | | | | | |
Distributions to Shareholders: | | | | | | | | | | | | |
Dividends and Distributions | | | — | | | | — | | | | (378 | ) |
Total Distributions | | | — | | | | — | | | | (378 | ) |
| | | | | | | | | | | | | |
Capital Share Transactions: | | | | | | | | | | | | |
Subscriptions | | | — | | | | — | | | | 8,474,088 | |
Redemptions | | | (514,897 | ) | | | (2,467,558 | ) | | | (8,468,128 | ) |
Transaction Fees (Note 1) | | | — | | | | 28 | | | | 456 | |
Increase (Decrease) in Net Assets from Capital Share Transactions | | | (514,897 | ) | | | (2,467,530 | ) | | | 6,416 | |
| | | | | | | | | | | | | |
Total Increase (Decrease) in Net Assets | | | 278,633 | | | | (2,404,891 | ) | | | (6,480,205 | ) |
| | | | | | | | | | | | | |
Net Assets: | | | | | | | | | | | | |
Beginning of Period | | | 2,422,732 | | | | 4,827,623 | | | | 11,307,828 | |
End of Period | | $ | 2,701,365 | | | $ | 2,422,732 | | | $ | 4,827,623 | |
| | | | | | | | | | | | | |
Share Transactions: | | | | | | | | | | | | |
Subscriptions | | | — | | | | — | | | | 325,000 | |
Redemptions | | | (25,000 | ) | | | (150,000 | ) | | | (425,000 | ) |
Net Increase (Decrease) in Shares Outstanding from Share Transactions | | | (25,000 | ) | | | (150,000 | ) | | | (100,000 | ) |
The accompanying notes are an integral part of these financial statements.
82
Amplify ETF Trust
Statement of Changes in Net Assets
| | Amplify BlackSwan Tech & Treasury ETF |
| | | Period Ended
March 31,
2024
(Unaudited)(a) | | Year Ended
October 31,
2023 | | Year Ended
October 31,
2022(b) |
Operations: | | | | | | | | | | | | |
Net Investment Income (Loss) | | $ | 28,707 | | | $ | 66,795 | | | $ | 35,739 | |
Net Realized Gain (Loss) on Investments | | | 146,589 | | | | (131,904 | ) | | | (623,437 | ) |
Net Change in Unrealized Appreciation/(Depreciation) on Investments | | | 258,135 | | | | 182,747 | | | | (276,453 | ) |
Net Increase (Decrease) in Net Assets Resulting from Operations | | | 433,431 | | | | 117,638 | | | | (864,151 | ) |
| | | | | | | | | | | | | |
Distributions to Shareholders: | | | | | | | | | | | | |
Dividends and Distributions | | | (34,163 | ) | | | (68,651 | ) | | | (28,429 | ) |
Total Distributions | | | (34,163 | ) | | | (68,651 | ) | | | (28,429 | ) |
| | | | | | | | | | | | | |
Capital Share Transactions: | | | | | | | | | | | | |
Subscriptions | | | — | | | | — | | | | 4,293,098 | |
Redemptions | | | — | | | | (853,823 | ) | | | (432,738 | ) |
Increase (Decrease) in Net Assets from Capital Share Transactions | | | — | | | | (853,823 | ) | | | 3,860,360 | |
| | | | | | | | | | | | | |
Total Increase (Decrease) in Net Assets | | | 399,268 | | | | (804,836 | ) | | | 2,967,780 | |
| | | | | | | | | | | | | |
Net Assets: | | | | | | | | | | | | |
Beginning of Period | | | 2,162,944 | | | | 2,967,780 | | | | — | |
End of Period | | $ | 2,562,212 | | | $ | 2,162,944 | | | $ | 2,967,780 | |
| | | | | | | | | | | | | |
Share Transactions: | | | | | | | | | | | | |
Subscriptions | | | — | | | | — | | | | 200,000 | |
Redemptions | | | — | | | | (50,000 | ) | | | (25,000 | ) |
Net Increase (Decrease) in Shares Outstanding from Share Transactions | | | — | | | | (50,000 | ) | | | 175,000 | |
The accompanying notes are an integral part of these financial statements.
83
Amplify ETF Trust
Consolidated Statement of Changes in Net Assets
| | Amplify Inflation Fighter ETF |
| | | Period Ended
March 31,
2024
(Unaudited)(a) | | Year Ended
October 31,
2023 | | Year Ended
October 31,
2022(b) |
Operations: | | | | | | | | | | | | |
Net Investment Income (Loss) | | $ | 44,800 | | | $ | 68,716 | | | $ | 98,454 | |
Net Realized Gain (Loss) on Investments, Foreign Currency and Futures | | | 525,570 | | | | (766,125 | ) | | | (994,146 | ) |
Net Change in Unrealized Appreciation/(Depreciation) on Investments, Foreign Currency and Futures | | | 1,330,818 | | | | 2,152,886 | | | | (3,202,222 | ) |
Net Increase (Decrease) in Net Assets Resulting from Operations | | | 1,901,188 | | | | 1,455,477 | | | | (4,097,914 | ) |
| | | | | | | | | | | | | |
Distributions to Shareholders: | | | | | | | | | | | | |
Dividends and Distributions | | | (358,028 | ) | | | (54,504 | ) | | | — | |
Total Distributions | | | (358,028 | ) | | | (54,504 | ) | | | — | |
| | | | | | | | | | | | | |
Capital Share Transactions: | | | | | | | | | | | | |
Subscriptions | | | — | | | | 535,873 | | | | 23,417,260 | |
Redemptions | | | (2,002,645 | ) | | | (4,899,805 | ) | | | (8,135,840 | ) |
Transaction Fees (Note 1) | | | — | | | | 29 | | | | 2,305 | |
Increase (Decrease) in Net Assets from Capital Share Transactions | | | (2,002,645 | ) | | | (4,363,903 | ) | | | 15,283,725 | |
| | | | | | | | | | | | | |
Total Increase (Decrease) in Net Assets | | | (459,485 | ) | | | (2,962,930 | ) | | | 11,185,811 | |
| | | | | | | | | | | | | |
Net Assets: | | | | | | | | | | | | |
Beginning of Period | | | 8,222,881 | | | | 11,185,811 | | | | — | |
End of Period | | $ | 7,763,396 | | | $ | 8,222,881 | | | $ | 11,185,811 | |
| | | | | | | | | | | | | |
Share Transactions: | | | | | | | | | | | | |
Subscriptions | | | — | | | | 25,000 | | | | 900,000 | |
Redemptions | | | (75,000 | ) | | | (225,000 | ) | | | (350,000 | ) |
Net Increase (Decrease) in Shares Outstanding from Share Transactions | | | (75,000 | ) | | | (200,000 | ) | | | 550,000 | |
The accompanying notes are an integral part of these financial statements.
84
Amplify ETF Trust
Statement of Changes in Net Assets
| | Amplify Natural Resources Dividend Income ETF |
| | | Period Ended
March 31,
2024
(Unaudited)(a) | | Year Ended
October 31,
2023 | | Year Ended
October 31,
2022(b) |
Operations: | | | | | | | | | | | | |
Net Investment Income (Loss) | | $ | 207,764 | | | $ | 365,921 | | | $ | 8,965 | |
Net Realized Gain (Loss) on Investments and Foreign Currency | | | 39,826 | | | | 115,903 | | | | 36,776 | |
Net Change in Unrealized Appreciation/(Depreciation) on Investments and Foreign Currency | | | 1,156,620 | | | | 220 | | | | (17,176 | ) |
Net Increase (Decrease) in Net Assets Resulting from Operations | | | 1,404,210 | | | | 482,044 | | | | 28,565 | |
| | | | | | | | | | | | | |
Distributions to Shareholders: | | | | | | | | | | | | |
Dividends and Distributions | | | (296,140 | ) | | | (365,917 | ) | | | (8,953 | ) |
Return of Capital | | | — | | | | (129,309 | ) | | | (848 | ) |
Total Distributions | | | (296,140 | ) | | | (495,226 | ) | | | (9,801 | ) |
| | | | | | | | | | | | | |
Capital Share Transactions: | | | | | | | | | | | | |
Subscriptions | | | 3,394,323 | | | | 11,763,898 | | | | 2,486,810 | |
Redemptions | | | (1,992,608 | ) | | | (4,498,650 | ) | | | (629,485 | ) |
Increase (Decrease) in Net Assets from Capital Share Transactions | | | 1,401,715 | | | | 7,265,248 | | | | 1,857,325 | |
| | | | | | | | | | | | | |
Total Increase (Decrease) in Net Assets | | | 2,509,785 | | | | 7,252,066 | | | | 1,876,089 | |
| | | | | | | | | | | | | |
Net Assets: | | | | | | | | | | | | |
Beginning of Period | | | 9,128,155 | | | | 1,876,089 | | | | — | |
End of Period | | $ | 11,637,940 | | | $ | 9,128,155 | | | $ | 1,876,089 | |
| | | | | | | | | | | | | |
Share Transactions: | | | | | | | | | | | | |
Subscriptions | | | 125,000 | | | | 450,000 | | | | 100,000 | |
Redemptions | | | (75,000 | ) | | | (175,000 | ) | | | (25,000 | ) |
Net Increase (Decrease) in Shares Outstanding from Share Transactions | | | 50,000 | | | | 275,000 | | | | 75,000 | |
The accompanying notes are an integral part of these financial statements.
85
Amplify ETF Trust
Statement of Changes in Net Assets
| | Amplify International Enhanced
Dividend Income ETF |
| | | Period Ended
March 31,
2024
(Unaudited)(a) | | Year Ended
October 31,
2023 | | Year Ended
October 31,
2022(b) |
Operations: | | | | | | | | | | | | |
Net Investment Income (Loss) | | $ | 777,447 | | | $ | 851,164 | | | $ | 5,879 | |
Net Realized Gain (Loss) on Investments, Options Written, and Payment from Affiliate | | | (560,760 | ) | | | (992,658 | ) | | | (2,018 | ) |
Net Change in Unrealized Appreciation/(Depreciation) on Investments and Options Written | | | 12,158,674 | | | | (242,709 | ) | | | (39,515 | ) |
Net Increase (Decrease) in Net Assets Resulting from Operations | | | 12,375,361 | | | | (384,203 | ) | | | (35,654 | ) |
| | | | | | | | | | | | | |
Distributions to Shareholders: | | | | | | | | | | | | |
Dividends and Distributions | | | (2,088,900 | ) | | | (866,121 | ) | | | (5,879 | ) |
Return of Capital | | | — | | | | (583,515 | ) | | | (12,496 | ) |
Total Distributions | | | (2,088,900 | ) | | | (1,449,636 | ) | | | (18,375 | ) |
| | | | | | | | | | | | | |
Capital Share Transactions: | | | | | | | | | | | | |
Subscriptions | | | 59,478,745 | | | | 45,304,688 | | | | 2,478,528 | |
Redemptions | | | (7,292,175 | ) | | | (3,441,413 | ) | | | (606,125 | ) |
Transaction Fees (Note 1) | | | — | | | | 5,701 | | | | — | |
Increase (Decrease) in Net Assets from Capital Share Transactions | | | 52,186,570 | | | | 41,868,976 | | | | 1,872,403 | |
| | | | | | | | | | | | | |
Total Increase (Decrease) in Net Assets | | | 62,473,031 | | | | 40,035,137 | | | | 1,818,374 | |
| | | | | | | | | | | | | |
Net Assets: | | | | | | | | | | | — | |
Beginning of Period | | | 41,853,511 | | | | 1,818,374 | | | | | |
End of Period | | $ | 104,326,542 | | | $ | 41,853,511 | | | $ | 1,818,374 | |
| | | | | | | | | | | | | |
Share Transactions: | | | | | | | | | | | | |
Subscriptions | | | 2,100,000 | | | | 1,650,000 | | | | 100,000 | |
Redemptions | | | (275,000 | ) | | | (125,000 | ) | | | (25,000 | ) |
Net Increase (Decrease) in Shares Outstanding from Share Transactions | | | 1,825,000 | | | | 1,525,000 | | | | 75,000 | |
The accompanying notes are an integral part of these financial statements.
86
Amplify ETF Trust
Statement of Changes in Net Assets
| | Amplify Cash Flow Dividend
Leaders ETF |
| | | Period Ended
March 31,
2024
(Unaudited)(a) | | Period Ended
October 31,
2023(b) |
Operations: | | | | | | | | |
Net Investment Income (Loss) | | $ | 91,320 | | | $ | 7,010 | |
Net Realized Gain (Loss) on Investments | | | 848,872 | | | | (5,729 | ) |
Net Change in Unrealized Appreciation/(Depreciation) on Investments | | | 1,274,275 | | | | (262,022 | ) |
Net Increase (Decrease) in Net Assets Resulting from Operations | | | 2,214,467 | | | | (260,741 | ) |
| | | | | | | | | |
Distributions to Shareholders: | | | | | | | | |
Dividends and Distributions | | | (91,702 | ) | | | (6,480 | ) |
Total Distributions | | | (91,702 | ) | | | (6,480 | ) |
| | | | | | | | | |
Capital Share Transactions: | | | | | | | | |
Subscriptions | | | 12,693,927 | | | | 5,403,868 | |
Redemptions | | | (4,454,480 | ) | | | — | |
Increase (Decrease) in Net Assets from Capital Share Transactions | | | 8,239,447 | | | | 5,403,868 | |
| | | | | | | | | |
Total Increase (Decrease) in Net Assets | | | 10,362,212 | | | | 5,136,647 | |
| | | | | | | | | |
Net Assets: | | | | | | | | |
Beginning of Period | | | 5,136,647 | | | | — | |
End of Period | | $ | 15,498,859 | | | $ | 5,136,647 | |
| | | | | | | | | |
Share Transactions: | | | | | | | | |
Subscriptions | | | 460,000 | | | | 220,000 | |
Redemptions | | | (160,000 | ) | | | — | |
Net Increase (Decrease) in Shares Outstanding from Share Transactions | | | 300,000 | | | | 220,000 | |
The accompanying notes are an integral part of these financial statements.
87
Amplify ETF Trust
Statement of Changes in Net Assets
| | Amplify Cash Flow
High Income ETF |
| | | Period Ended
March 31,
2024
(Unaudited)(a) | | Period Ended
October 31,
2023(b) |
Operations: | | | | | | | | |
Net Investment Income (Loss) | | $ | 26,389 | | | $ | 3,543 | |
Net Realized Gain (Loss) on Investments and Swaps | | | (125,578 | ) | | | 5,228 | |
Net Change in Unrealized Appreciation/(Depreciation) on Investments and Swaps | | | 680,052 | | | | (149,162 | ) |
Net Increase (Decrease) in Net Assets Resulting from Operations | | | 580,863 | | | | (140,391 | ) |
| | | | | | | | | |
Distributions to Shareholders: | | | | | | | | |
Dividends and Distributions | | | (103,892 | ) | | | (20,026 | ) |
Total Distributions | | | (103,892 | ) | | | (20,026 | ) |
| | | | | | | | | |
Capital Share Transactions: | | | | | | | | |
Subscriptions | | | — | | | | 2,975,706 | |
Increase (Decrease) in Net Assets from Capital Share Transactions | | | — | | | | 2,975,706 | |
| | | | | | | | | |
Total Increase (Decrease) in Net Assets | | | 476,971 | | | | 2,815,289 | |
| | | | | | | | | |
Net Assets: | | | | | | | | |
Beginning of Period | | | 2,815,289 | | | | — | |
End of Period | | $ | 3,292,260 | | | $ | 2,815,289 | |
| | | | | | | | | |
Share Transactions: | | | | | | | | |
Subscriptions | | | — | | | | 120,000 | |
Net Increase (Decrease) in Shares Outstanding from Share Transactions | | | — | | | | 120,000 | |
The accompanying notes are an integral part of these financial statements.
88
Amplify ETF Trust
Statement of Changes in Net Assets
| | Amplify
Samsung SOFR
ETF |
| | | Period Ended
March 31,
2024
(Unaudited)(a) |
Operations: | | | | |
Net Investment Income (Loss) | | $ | 2,719,862 | |
Net Increase (Decrease) in Net Assets Resulting from Operations | | | 2,719,862 | |
| | | | | |
Distributions to Shareholders: | | | | |
Dividends and Distributions | | | (2,738,562 | ) |
Total Distributions | | | (2,738,562 | ) |
| | | | | |
Capital Share Transactions: | | | | |
Subscriptions | | | 155,290,680 | |
Transaction Fees (Note 1) | | | 42,116 | |
Increase (Decrease) in Net Assets from Capital Share Transactions | | | 155,332,796 | |
| | | | | |
Total Increase (Decrease) in Net Assets | | | 155,314,096 | |
| | | | | |
Net Assets: | | | | |
Beginning of Period | | | — | |
End of Period | | $ | 155,314,096 | |
| | | | | |
Share Transactions: | | | | |
Subscriptions | | | 1,550,000 | |
Net Increase (Decrease) in Shares Outstanding from Share Transactions | | | 1,550,000 | |
The accompanying notes are an integral part of these financial statements.
89
Amplify ETF Trust
Statement of Changes in Net Assets
| | Amplify Junior Silver Miners ETF |
| | | Six Months
Ended
March 31,
2024
(Unaudited) | | Year Ended
September 30,
2023 |
Operations: | | | | | | | | |
Net Investment Income (Loss) | | $ | (546,378 | ) | | $ | (1,107,772 | ) |
Net Realized Gain (Loss) on Investments and Foreign Currency | | | (88,893,406 | ) | | | (132,946,837 | ) |
Net Change in Unrealized Appreciation/(Depreciation) on Investments and Foreign Currency | | | 194,226,562 | | | | 86,306,661 | |
Net Increase (Decrease) in Net Assets Resulting from Operations | | | 104,786,778 | | | | (47,747,948 | ) |
| | | | | | | | | |
Distributions to Shareholders: | | | | | | | | |
Dividends and Distributions | | | (60,499 | ) | | | (380,891 | ) |
Total Distributions | | | (60,499 | ) | | | (380,891 | ) |
| | | | | | | | | |
Capital Share Transactions: | | | | | | | | |
Subscriptions | | | 40,567,765 | | | | 47,001,305 | |
Redemptions | | | (5,885,750 | ) | | | (24,831,770 | ) |
Increase (Decrease) in Net Assets from Capital Share Transactions | | | 34,682,015 | | | | 22,169,535 | |
| | | | | | | | | |
Total Increase (Decrease) in Net Assets | | | 139,408,294 | | | | (25,959,304 | ) |
| | | | | | | | | |
Net Assets: | | | | | | | | |
Beginning of Period | | | 580,398,296 | | | | 606,357,600 | |
End of Period | | $ | 719,806,590 | | | $ | 580,398,296 | |
| | | | | | | | | |
Share Transactions: | | | | | | | | |
Subscriptions | | | 4,500,000 | | | | 4,500,000 | |
Redemptions | | | (650,000 | ) | | | (2,350,000 | ) |
Net Increase (Decrease) in Shares Outstanding from Share Transactions | | | 3,850,000 | | | | 2,150,000 | |
The accompanying notes are an integral part of these financial statements.
90
Amplify ETF Trust
Statement of Changes in Net Assets
| | Amplify Cybersecurity ETF |
| | | Six Months
Ended
March 31,
2024
(Unaudited) | | Year Ended
September 30,
2023 |
Operations: | | | | | | | | |
Net Investment Income (Loss) | | $ | 2,249,165 | | | $ | 2,841,653 | |
Net Realized Gain (Loss) on Investments and Foreign Currency | | | 87,800,644 | | | | (4,404,126 | ) |
Net Change in Unrealized Appreciation/(Depreciation) on Investments and Foreign Currency | | | 255,734,158 | | | | 250,682,598 | |
Net Increase (Decrease) in Net Assets Resulting from Operations | | | 345,783,967 | | | | 249,120,125 | |
| | | | | | | | | |
Distributions to Shareholders: | | | | | | | | |
Dividends and Distributions | | | (2,297,225 | ) | | | (3,006,286 | ) |
Total Distributions | | | (2,297,225 | ) | | | (3,006,286 | ) |
| | | | | | | | | |
Capital Share Transactions: | | | | | | | | |
Subscriptions | | | 365,069,730 | | | | — | |
Redemptions | | | (357,629,585 | ) | | | (253,836,840 | ) |
Increase (Decrease) in Net Assets from Capital Share Transactions | | | 7,440,145 | | | | (253,836,840 | ) |
| | | | | | | | | |
Total Increase (Decrease) in Net Assets | | | 350,926,887 | | | | (7,723,001 | ) |
| | | | | | | | | |
Net Assets: | | | | | | | | |
Beginning of Period | | | 1,423,792,451 | | | | 1,431,515,452 | |
End of Period | | $ | 1,774,719,338 | | | $ | 1,423,792,451 | |
| | | | | | | | | |
Share Transactions: | | | | | | | | |
Subscriptions | | | 5,700,000 | | | | — | |
Redemptions | | | (5,650,000 | ) | | | (5,400,000 | ) |
Net Increase (Decrease) in Shares Outstanding from Share Transactions | | | 50,000 | | | | (5,400,000 | ) |
The accompanying notes are an integral part of these financial statements.
91
Amplify ETF Trust
Statement of Changes in Net Assets
| | Amplify Mobile Payments ETF |
| | | Six Months
Ended
March 31,
2024
(Unaudited) | | Year Ended
September 30,
2023 |
Operations: | | | | | | | | |
Net Investment Income (Loss) | | $ | 73,099 | | | $ | 268,653 | |
Net Realized Gain (Loss) on Investments and Foreign Currency | | | (21,454,185 | ) | | | (61,842,716 | ) |
Net Change in Unrealized Appreciation/(Depreciation) on Investments and Foreign Currency | | | 122,669,932 | | | | 89,485,662 | |
Net Increase (Decrease) in Net Assets Resulting from Operations | | | 101,288,846 | | | | 27,911,599 | |
| | | | | | | | | |
Distributions to Shareholders: | | | | | | | | |
Dividends and Distributions | | | (416,255 | ) | | | — | |
Total Distributions | | | (416,255 | ) | | | — | |
| | | | | | | | | |
Capital Share Transactions: | | | | | | | | |
Subscriptions | | | 6,747,635 | | | | 4,069,200 | |
Redemptions | | | (104,109,245 | ) | | | (182,204,515 | ) |
Transaction Fees (Note 1) | | | 13,588 | | | | 30,615 | |
Increase (Decrease) in Net Assets from Capital Share Transactions | | | (97,348,022 | ) | | | (178,104,700 | ) |
| | | | | | | | | |
Total Increase (Decrease) in Net Assets | | | 3,524,569 | | | | (150,193,101 | ) |
| | | | | | | | | |
Net Assets: | | | | | | | | |
Beginning of Period | | | 357,014,888 | | | | 507,207,989 | |
End of Period | | $ | 360,539,457 | | | $ | 357,014,888 | |
| | | | | | | | | |
Share Transactions: | | | | | | | | |
Subscriptions | | | 150,000 | | | | 100,000 | |
Redemptions | | | (2,400,000 | ) | | | (4,400,000 | ) |
Net Increase (Decrease) in Shares Outstanding from Share Transactions | | | (2,250,000 | ) | | | (4,300,000 | ) |
The accompanying notes are an integral part of these financial statements.
92
Amplify ETF Trust
Statement of Changes in Net Assets
| | Amplify BlueStar
Israel Technology ETF |
| | | Six Months
Ended
March 31,
2024
(Unaudited) | | Year Ended
September 30,
2023 |
Operations: | | | | | | | | |
Net Investment Income (Loss) | | $ | (76,197 | ) | | $ | 4,690 | |
Net Realized Gain (Loss) on Investments and Foreign Currency | | | (3,588,000 | ) | | | (7,538,396 | ) |
Net Change in Unrealized Appreciation/(Depreciation) on Investments and Foreign Currency | | | 16,811,556 | | | | 2,306,574 | |
Net Increase (Decrease) in Net Assets Resulting from Operations | | | 13,147,359 | | | | (5,227,132 | ) |
| | | | | | | | | |
Capital Share Transactions: | | | | | | | | |
Subscriptions | | | 2,282,100 | | | | 2,257,030 | |
Redemptions | | | (17,040,110 | ) | | | (24,783,240 | ) |
Increase (Decrease) in Net Assets from Capital Share Transactions | | | (14,758,010 | ) | | | (22,526,210 | ) |
| | | | | | | | | |
Total Increase (Decrease) in Net Assets | | | (1,610,651 | ) | | | (27,753,342 | ) |
| | | | | | | | | |
Net Assets: | | | | | | | | |
Beginning of Period | | | 88,689,518 | | | | 116,442,860 | |
End of Period | | $ | 87,078,867 | | | $ | 88,689,518 | |
| | | | | | | | | |
Share Transactions: | | | | | | | | |
Subscriptions | | | 50,000 | | | | 50,000 | |
Redemptions | | | (400,000 | ) | | | (550,000 | ) |
Net Increase (Decrease) in Shares Outstanding from Share Transactions | | | (350,000 | ) | | | (500,000 | ) |
The accompanying notes are an integral part of these financial statements.
93
Amplify ETF Trust
Statement of Changes in Net Assets
| | Amplify Etho Climate
Leadership U.S. ETF |
| | | Six Months
Ended
March 31,
2024
(Unaudited) | | Year Ended
September 30,
2023 |
Operations: | | | | | | | | |
Net Investment Income (Loss) | | $ | 1,260,764 | | | $ | 2,086,680 | |
Net Realized Gain (Loss) on Investments | | | 3,044,878 | | | | (8,294,769 | ) |
Net Change in Unrealized Appreciation/(Depreciation) on Investments | | | 24,636,931 | | | | 20,608,883 | |
Net Increase (Decrease) in Net Assets Resulting from Operations | | | 28,942,573 | | | | 14,400,794 | |
| | | | | | | | | |
Distributions to Shareholders: | | | | | | | | |
Dividends and Distributions | | | (1,422,177 | ) | | | (2,120,978 | ) |
Total Distributions | | | (1,422,177 | ) | | | (2,120,978 | ) |
| | | | | | | | | |
Capital Share Transactions: | | | | | | | | |
Subscriptions | | | 2,897,420 | | | | 17,582,385 | |
Redemptions | | | (12,962,050 | ) | | | (5,011,035 | ) |
Increase (Decrease) in Net Assets from Capital Share Transactions | | | (10,064,630 | ) | | | 12,571,350 | |
| | | | | | | | | |
Total Increase (Decrease) in Net Assets | | | 17,455,766 | | | | 24,851,166 | |
| | | | | | | | | |
Net Assets: | | | | | | | | |
Beginning of Period | | | 172,521,330 | | | | 147,670,164 | |
End of Period | | $ | 189,977,096 | | | $ | 172,521,330 | |
| | | | | | | | | |
Share Transactions: | | | | | | | | |
Subscriptions | | | 50,000 | | | | 350,000 | |
Redemptions | | | (250,000 | ) | | | (100,000 | ) |
Net Increase (Decrease) in Shares Outstanding from Share Transactions | | | (200,000 | ) | | | 250,000 | |
The accompanying notes are an integral part of these financial statements.
94
Amplify ETF Trust
Statement of Changes in Net Assets
| | Amplify Alternative
Harvest ETF |
| | | Six Months
Ended
March 31,
2024
(Unaudited) | | Year Ended
September 30,
2023 |
Operations: | | | | | | | | |
Net Investment Income (Loss) | | $ | 6,312,629 | | | $ | 8,118,418 | |
Net Realized Gain (Loss) on Investments and Foreign Currency | | | (161,918,709 | ) | | | (478,360,334 | ) |
Net Change in Unrealized Appreciation/(Depreciation) on Investments and Foreign Currency | | | 196,542,475 | | | | 411,153,991 | |
Net Increase (Decrease) in Net Assets Resulting from Operations | | | 40,936,395 | | | | (59,087,925 | ) |
| | | | | | | | | |
Distributions to Shareholders: | | | | | | | | |
Dividends and Distributions | | | (7,626,950 | ) | | | (8,926,095 | ) |
Total Distributions | | | (7,626,950 | ) | | | (8,926,095 | ) |
| | | | | | | | | |
Capital Share Transactions: | | | | | | | | |
Subscriptions | | | — | | | | 13,603,540 | |
Redemptions | | | (10,219,650 | ) | | | (10,704,480 | ) |
Increase (Decrease) in Net Assets from Capital Share Transactions | | | (10,219,650 | ) | | | 2,899,060 | |
| | | | | | | | | |
Total Increase (Decrease) in Net Assets | | | 23,089,795 | | | | (65,114,960 | ) |
| | | | | | | | | |
Net Assets: | | | | | | | | |
Beginning of Period | | | 259,614,775 | | | | 324,729,735 | |
End of Period | | $ | 282,704,570 | | | $ | 259,614,775 | |
| | | | | | | | | |
Share Transactions: | | | | | | | | |
Subscriptions | | | — | | | | 3,400,000 | |
Redemptions | | | (3,500,000 | ) | | | (2,250,000 | ) |
Net Increase (Decrease) in Shares Outstanding from Share Transactions | | | (3,500,000 | ) | | | 1,150,000 | |
The accompanying notes are an integral part of these financial statements.
95
Amplify ETF Trust
Statement of Changes in Net Assets
| | Amplify Global Cloud
Technology ETF |
| | | Six Months
Ended
March 31,
2024
(Unaudited) | | Year Ended
September 30,
2023 |
Operations: | | | | | | | | |
Net Investment Income (Loss) | | $ | 6,446 | | | $ | 3,724 | |
Net Realized Gain (Loss) on Investments and Foreign Currency | | | 1,805,338 | | | | (1,237,671 | ) |
Net Change in Unrealized Appreciation/(Depreciation) on Investments and Foreign Currency | | | 5,056,581 | | | | 5,913,497 | |
Net Increase (Decrease) in Net Assets Resulting from Operations | | | 6,868,365 | | | | 4,679,550 | |
| | | | | | | | | |
Distributions to Shareholders: | | | | | | | | |
Dividends and Distributions | | | (6,153 | ) | | | — | |
Total Distributions | | | (6,153 | ) | | | — | |
| | | | | | | | | |
Capital Share Transactions: | | | | | | | | |
Subscriptions | | | 7,081,285 | | | | 3,532,080 | |
Redemptions | | | (5,794,835 | ) | | | (6,480,250 | ) |
Transaction Fees (Note 1) | | | 157 | | | | 136 | |
Increase (Decrease) in Net Assets from Capital Share Transactions | | | 1,286,607 | | | | (2,948,034 | ) |
| | | | | | | | | |
Total Increase (Decrease) in Net Assets | | | 8,148,819 | | | | 1,731,516 | |
| | | | | | | | | |
Net Assets: | | | | | | | | |
Beginning of Period | | | 24,656,066 | | | | 22,924,550 | |
End of Period | | $ | 32,804,885 | | | $ | 24,656,066 | |
| | | | | | | | | |
Share Transactions: | | | | | | | | |
Subscriptions | | | 150,000 | | | | 100,000 | |
Redemptions | | | (150,000 | ) | | | (200,000 | ) |
Net Increase (Decrease) in Shares Outstanding from Share Transactions | | | — | | | | (100,000 | ) |
The accompanying notes are an integral part of these financial statements.
96
Amplify ETF Trust Statement of Changes in Net Assets |
| | Amplify Video Game Tech ETF |
| | | Six Months
Ended
March 31,
2024
(Unaudited) | | Year Ended
September 30,
2023 |
Operations: | | | | | | | | |
Net Investment Income (Loss) | | $ | 12,310 | | | $ | 146,187 | |
Net Realized Gain (Loss) on Investments and Foreign Currency | | | (876,735 | ) | | | (13,694,128 | ) |
Net Change in Unrealized Appreciation/(Depreciation) on Investments and Foreign Currency | | | 4,515,225 | | | | 16,680,126 | |
Net Increase (Decrease) in Net Assets Resulting from Operations | | | 3,650,800 | | | | 3,132,185 | |
| | | | | | | | | |
Distributions to Shareholders: | | | | | | | | |
Dividends and Distributions | | | (22,580 | ) | | | — | |
Total Distributions | | | (22,580 | ) | | | — | |
| | | | | | | | | |
Capital Share Transactions: | | | | | | | | |
Redemptions | | | (5,695,615 | ) | | | (11,294,385 | ) |
Transaction Fees (Note 1) | | | 2,927 | | | | 5,825 | |
Increase (Decrease) in Net Assets from Capital Share Transactions | | | (5,692,688 | ) | | | (11,288,560 | ) |
| | | | | | | | | |
Total Increase (Decrease) in Net Assets | | | (2,064,468 | ) | | | (8,156,375 | ) |
| | | | | | | | | |
Net Assets: | | | | | | | | |
Beginning of Period | | | 42,844,354 | | | | 51,000,729 | |
End of Period | | $ | 40,779,886 | | | $ | 42,844,354 | |
| | | | | | | | | |
Share Transactions: | | | | | | | | |
Redemptions | | | (100,000 | ) | | | (200,000 | ) |
Net Increase (Decrease) in Shares Outstanding from Share Transactions | | | (100,000 | ) | | | (200,000 | ) |
The accompanying notes are an integral part of these financial statements.
97
Amplify ETF Trust Statement of Changes in Net Assets |
| | Amplify AI Powered Equity ETF |
| | | Six Months
Ended
March 31,
2024
(Unaudited) | | Year Ended
September 30,
2023 |
Operations: | | | | | | | | |
Net Investment Income (Loss) | | $ | 458,875 | | | $ | 1,256,378 | |
Net Realized Gain on Investments | | | 20,468,395 | | | | (10,338,720 | ) |
Net Change in Unrealized Appreciation/(Depreciation) on Investments | | | 1,640,029 | | | | 11,416,406 | |
Net Increase (Decrease) in Net Assets Resulting from Operations | | | 22,567,299 | | | | 2,334,064 | |
| | | | | | | | | |
Distributions to Shareholders: | | | | | | | | |
Dividends and Distributions | | | (482,288 | ) | | | (1,342,664 | ) |
Total Distributions | | | (482,288 | ) | | | (1,342,664 | ) |
| | | | | | | | | |
Capital Share Transactions: | | | | | | | | |
Subscriptions | | | 3,089,813 | | | | 25,157,710 | |
Redemptions | | | (16,916,953 | ) | | | (23,259,583 | ) |
Increase (Decrease) in Net Assets from Capital Share Transactions | | | (13,827,140 | ) | | | 1,898,127 | |
| | | | | | | | | |
Total Increase (Decrease) in Net Assets | | | 8,257,871 | | | | 2,889,527 | |
| | | | | | | | | |
Net Assets: | | | | | | | | |
Beginning of Period | | | 101,949,817 | | | | 99,060,290 | |
End of Period | | $ | 110,207,688 | | | $ | 101,949,817 | |
| | | | | | | | | |
Share Transactions: | | | | | | | | |
Subscriptions | | | 100,000 | | | | 775,000 | |
Redemptions | | | (500,000 | ) | | | (775,000 | ) |
Net Increase (Decrease) in Shares Outstanding from Share Transactions | | | (400,000 | ) | | | — | |
The accompanying notes are an integral part of these financial statements.
98
Amplify ETF Trust Statement of Changes in Net Assets |
| | Amplify Travel Tech ETF |
| | | Six Months
Ended
March 31,
2024
(Unaudited) | | Year Ended
September 30,
2023 |
Operations: | | | | | | | | |
Net Investment Income (Loss) | | $ | 112,772 | | | $ | (655,431 | ) |
Net Realized Gain (Loss) on Investments and Foreign Currency | | | (6,139,938 | ) | | | (56,416,763 | ) |
Net Change in Unrealized Appreciation/(Depreciation) on Investments and Foreign Currency | | | 24,831,561 | | | | 67,391,971 | |
Net Increase (Decrease) in Net Assets Resulting from Operations | | | 18,804,395 | | | | 10,319,777 | |
| | | | | | | | | |
Distributions to Shareholders: | | | | | | | | |
Dividends and Distributions | | | (111,311 | ) | | | — | |
Total Distributions | | | (111,311 | ) | | | — | |
| | | | | | | | | |
Capital Share Transactions: | | | | | | | | |
Subscriptions | | | 4,941,475 | | | | — | |
Redemptions | | | (38,377,305 | ) | | | (53,125,815 | ) |
Transaction Fees (Note 1) | | | 6,110 | | | | 16,484 | |
Increase (Decrease) in Net Assets from Capital Share Transactions | | | (33,429,720 | ) | | | (53,109,331 | ) |
| | | | | | | | | |
Total Increase (Decrease) in Net Assets | | | (14,736,636 | ) | | | (42,789,554 | ) |
| | | | | | | | | |
Net Assets: | | | | | | | | |
Beginning of Period | | | 103,928,756 | | | | 146,718,310 | |
End of Period | | $ | 89,192,120 | | | $ | 103,928,756 | |
| | | | | | | | | |
Share Transactions: | | | | | | | | |
Subscriptions | | | 250,000 | | | | — | |
Redemptions | | | (2,050,000 | ) | | | (3,100,000 | ) |
Net Increase (Decrease) in Shares Outstanding from Share Transactions | | | (1,800,000 | ) | | | (3,100,000 | ) |
The accompanying notes are an integral part of these financial statements.
99
Amplify ETF Trust Statement of Changes in Net Assets |
| | Amplify Treatments, Testing and
Advancements ETF |
| | | Six Months
Ended
March 31,
2024
(Unaudited) | | Year Ended
September 30,
2023 |
Operations: | | | | | | | | |
Net Investment Income (Loss) | | $ | 68,458 | | | $ | 174,223 | |
Net Realized Gain on Investments | | | (2,715,764 | ) | | | (8,004,971 | ) |
Net Change in Unrealized Appreciation/(Depreciation) on Investments | | | 3,053,427 | | | | 6,310,769 | |
Net Increase (Decrease) in Net Assets Resulting from Operations | | | 406,121 | | | | (1,519,979 | ) |
| | | | | | | | | |
Distributions to Shareholders: | | | | | | | | |
Dividends and Distributions | | | (67,409 | ) | | | (192,053 | ) |
Total Distributions | | | (67,409 | ) | | | (192,053 | ) |
| | | | | | | | | |
Capital Share Transactions: | | | | | | | | |
Redemptions | | | (2,685,790 | ) | | | (6,599,865 | ) |
Increase (Decrease) in Net Assets from Capital Share Transactions | | | (2,685,790 | ) | | | (6,599,865 | ) |
| | | | | | | | | |
Total Increase (Decrease) in Net Assets | | | (2,347,078 | ) | | | (8,311,897 | ) |
| | | | | | | | | |
Net Assets: | | | | | | | | |
Beginning of Period | | | 13,451,335 | | | | 21,763,232 | |
End of Period | | $ | 11,104,257 | | | $ | 13,451,335 | |
| | | | | | | | | |
Share Transactions: | | | | | | | | |
Redemptions | | | (150,000 | ) | | | (300,000 | ) |
Net Increase (Decrease) in Shares Outstanding from Share Transactions | | | (150,000 | ) | | | (300,000 | ) |
The accompanying notes are an integral part of these financial statements.
100
Amplify ETF Trust Statement of Changes in Net Assets |
| | Amplify U.S. Alternative
Harvest ETF |
| | | Six Months
Ended
March 31,
2024
(Unaudited) | | Year Ended
September 30,
2023 |
Operations: | | | | | | | | |
Net Investment Income (Loss) | | $ | 2,516,295 | | | $ | 5,366,178 | |
Net Realized Gain (Loss) on Investments, Foreign Currency and Swaps | | | (2,557,400 | ) | | | (15,572,050 | ) |
Net Change in Unrealized Appreciation/(Depreciation) on Investments, Foreign Currency and Swaps | | | 22,648,096 | | | | (2,096,619 | ) |
Net Increase (Decrease) in Net Assets Resulting from Operations | | | 22,606,991 | | | | (12,302,491 | ) |
| | | | | | | | | |
Distributions to Shareholders: | | | | | | | | |
Dividends and Distributions | | | (2,518,432 | ) | | | — | |
Total Distributions | | | (2,518,432 | ) | | | — | |
| | | | | | | | | |
Capital Share Transactions: | | | | | | | | |
Subscriptions | | | 899,338 | | | | 100,679,726 | |
Redemptions | | | (31,999,354 | ) | | | (36,219,769 | ) |
Increase (Decrease) in Net Assets from Capital Share Transactions | | | (31,100,016 | ) | | | 64,459,957 | |
| | | | | | | | | |
Total Increase (Decrease) in Net Assets | | | (11,011,457 | ) | | | 52,157,466 | |
| | | | | | | | | |
Net Assets: | | | | | | | | |
Beginning of Period | | | 137,124,062 | | | | 84,966,596 | |
End of Period | | $ | 126,112,605 | | | $ | 137,124,062 | |
| | | | | | | | | |
Share Transactions: | | | | | | | | |
Subscriptions | | | 420,000 | | | | 56,940,000 | |
Redemptions | | | (15,830,000 | ) | | | (22,390,000 | ) |
Net Increase (Decrease) in Shares Outstanding from Share Transactions | | | (15,410,000 | ) | | | 34,550,000 | |
The accompanying notes are an integral part of these financial statements.
101
Amplify ETF Trust
Amplify High Income ETF
Financial Highlights
| | Period Ended
March 31,
2024(a) | | Year Ended
October 31,
2023 | | Year Ended
October 31,
2022 | | Year Ended
October 31,
2021 | | Year Ended
October 31,
2020 | | Period Ended
October 31,
2019(b) |
Net Asset Value, Beginning of Year/Period | | $ | 10.60 | | | $ | 11.60 | | | $ | 17.04 | | | $ | 14.28 | | | $ | 17.62 | | | $ | 16.09 | |
Income (Loss) from Investment Operations: | | | | | | | | | | | | | | | | | | | | | | | | |
Net Investment Income (Loss)(c) | | | 0.49 | | | | 1.12 | | | | 0.89 | | | | 0.81 | | | | 0.97 | | | | 0.86 | |
Net Realized and Unrealized Gain (Loss)(d) | | | 1.52 | | | | (0.68 | ) | | | (4.89 | ) | | | 3.48 | | | | (2.69 | ) | | | 1.97 | |
Total from Investment Operations | | | 2.01 | | | | 0.44 | | | | (4.00 | ) | | | 4.29 | | | | (1.72 | ) | | | 2.83 | |
| | | | | | | | | | | | | | | | | | | | | | | | | |
Distributions to Shareholders | | | | | | | | | | | | | | | | | | | | | | | | |
Net Investment Income | | | (0.60 | ) | | | (1.09 | ) | | | (0.93 | ) | | | (0.86 | ) | | | (1.03 | ) | | | (0.87 | ) |
Return of Capital | | | — | | | | (0.35 | ) | | | (0.51 | ) | | | (0.67 | ) | | | (0.59 | ) | | | (0.43 | ) |
Total from Distributions | | | (0.60 | ) | | | (1.44 | ) | | | (1.44 | ) | | | (1.53 | ) | | | (1.62 | ) | | | (1.30 | ) |
| | | | | | | | | | | | | | | | | | | | | | | | | |
Capital Share Transactions | | | | | | | | | | | | | | | | | | | | | | | | |
Transaction Fees | | | — | | | | — | | | | 0.00 | (e) | | | 0.00 | (e) | | | 0.00 | (e) | | | — | |
| | | | | | | | | | | | | | | | | | | | | | | | | |
Net Asset Value, End of Year/Period | | $ | 12.01 | | | $ | 10.60 | | | $ | 11.60 | | | $ | 17.04 | | | $ | 14.28 | | | $ | 17.62 | |
| | | | | | | | | | | | | | | | | | | | | | | | | |
Total Return on Net Asset Value(f) | | | 19.20 | %(g) | | | 3.52 | % | | | -24.46 | % | | | 30.71 | % | | | -9.84 | % | | | 17.86 | %(g) |
| | | | | | | | | | | | | | | | | | | | | | | | | |
Supplemental Data: | | | | | | | | | | | | | | | | | | | | | | | | |
Net Assets, End of Year/Period (000’s) | | $ | 455,177 | | | $ | 340,947 | | | $ | 298,062 | | | $ | 448,971 | | | $ | 222,820 | | | $ | 237,004 | |
Ratio of Expenses to Average Net Assets | | | 0.50 | %(h) | | | 0.50 | % | | | 0.50 | % | | | 0.50 | % | | | 0.50 | % | | | 0.50 | %(h) |
Ratio of Net Investment Income (Loss) to Average Net Assets(i) | | | 10.12 | %(h) | | | 9.57 | % | | | 6.23 | % | | | 4.81 | % | | | 6.29 | % | | | 5.93 | %(h) |
Portfolio Turnover(j) | | | 28 | %(g) | | | 48 | % | | | 59 | % | | | 90 | % | | | 43 | % | | | 28 | %(g) |
(a) | | For the period November 1, 2023 to March 31, 2024. See Note 1 to the Financial Statements. |
(b) | | For the period January 1, 2019 to October 31, 2019. |
(c) | | Calculated based on average shares outstanding during the period. |
(d) | | Realized and unrealized gains and losses per share in this caption are balancing amounts necessary to reconcile the change in net asset value per share for the period and may not reconcile with the aggregate gains and losses in the statement of operations due to share transactions for the year. |
(e) | | Less than $0.005. |
(f) | | Total Return on Net Asset Value is based on the change in net asset value (“NAV”) of a share during the period and assumes reinvestment of dividends and distributions at NAV. Total Return on Net Asset Value is for the period indicated and has not been annualized. The return shown does not reflect the deduction of taxes that a shareholder would pay on fund distributions or redemption of fund shares. |
(g) | | |
(h) | | Annualized. |
(i) | | These ratios exclude the impact of expenses of underlying security holdings as represented in the Schedule of Investments. Recognition of net investment income by the Fund is affected by the timing of the declaration of dividends by the underlying closed-end investment companies in which the Fund invests. |
(j) | | Excludes the impact of in-kind transactions. |
The accompanying notes are an integral part of these financial statements.
102
Amplify ETF Trust
Amplify Online Retail ETF
Financial Highlights
| | Period Ended
March 31,
2024(a) | | Year Ended
October 31,
2023 | | Year Ended
October 31,
2022 | | Year Ended
October 31,
2021 | | Year Ended
October 31,
2020 | | Year Ended
October 31,
2019 |
Net Asset Value, Beginning of Year/Period | | $ | 41.53 | | | $ | 40.08 | | | $ | 110.70 | | | $ | 88.69 | | | $ | 48.49 | | | $ | 43.86 | |
Income (Loss) from Investment Operations: | | | | | | | | | | | | | | | | | | | | | | | | |
Net Investment Income (Loss)(b) | | | 0.01 | | | | (0.06 | ) | | | 0.37 | | | | (0.07 | ) | | | 0.58 | | | | 0.16 | |
Net Realized and Unrealized Gain (Loss)(c) | | | 16.69 | | | | 1.51 | | | | (70.99 | ) | | | 22.70 | | | | 39.77 | | | | 4.47 | |
Total from Investment Operations | | | 16.70 | | | | 1.45 | | | | (70.62 | ) | | | 22.63 | | | | 40.35 | | | | 4.63 | |
| | | | | | | | | | | | | | | | | | | | | | | | | |
Distributions to Shareholders | | | | | | | | | | | | | | | | | | | | | | | | |
Net Investment Income | | | — | | | | — | | | | — | | | | (0.62 | ) | | | (0.15 | ) | | | — | |
Total from Distributions | | | — | | | | — | | | | — | | | | (0.62 | ) | | | (0.15 | ) | | | — | |
| | | | | | | | | | | | | | | | | | | | | | | | | |
Capital Share Transactions | | | | | | | | | | | | | | | | | | | | | | | | |
Transaction Fees | | | 0.00 | (d) | | | 0.00 | (d) | | | — | | | | 0.00 | (d) | | | — | | | | — | |
| | | | | | | | | | | | | | | | | | | | | | | | | |
Net Asset Value, End of Year/Period | | $ | 58.23 | | | $ | 41.53 | | | $ | 40.08 | | | $ | 110.70 | | | $ | 88.69 | | | $ | 48.49 | |
| | | | | | | | | | | | | | | | | | | | | | | | | |
Total Return on Net Asset Value(h) | | | 40.21 | %(f) | | | 3.62 | % | | | -63.80 | % | | | 25.49 | % | | | 83.46 | % | | | 10.54 | % |
| | | | | | | | | | | | | | | | | | | | | | | | | |
Supplemental Data: | | | | | | | | | | | | | | | | | | | | | | | | |
Net Assets, End of Year/Period (000’s) | | $ | 183,412 | | | $ | 155,741 | | | $ | 186,360 | | | $ | 896,682 | | | $ | 971,146 | | | $ | 240,005 | |
Ratio of Expenses to Average Net Assets | | | 0.65 | %(g) | | | 0.65 | % | | | 0.65 | % | | | 0.65 | % | | | 0.65 | % | | | 0.65 | % |
Ratio of Net Investment Income (Loss) to Average Net Assets | | | 0.02 | %(g) | | | -0.13 | % | | | 0.56 | % | | | -0.06 | % | | | 0.82 | % | | | 0.33 | % |
Portfolio Turnover(h) | | | 14 | %(f) | | | 62 | % | | | 57 | % | | | 61 | % | | | 28 | % | | | 36 | % |
(a) | | For the period November 1, 2023 to March 31, 2024. See Note 1 to the Financial Statements. |
(b) | | Calculated based on average shares outstanding during the period. |
(c) | | Realized and unrealized gains and losses per share in this caption are balancing amounts necessary to reconcile the change in net asset value per share for the period and may not reconcile with the aggregate gains and losses in the statement of operations due to share transactions for the year. |
(d) | | Less than $0.005. |
(e) | | Total Return on Net Asset Value is based on the change in net asset value (“NAV”) of a share during the period and assumes reinvestment of dividends and distributions at NAV. Total Return on Net Asset Value is for the period indicated and has not been annualized. The return shown does not reflect the deduction of taxes that a shareholder would pay on fund distributions or redemption of fund shares. |
(f) | | Not Annualized. |
(g) | | Annualized. |
(h) | | Excludes the impact of in-kind transactions. |
The accompanying notes are an integral part of these financial statements.
103
Amplify ETF Trust
Amplify CWP Enhanced Dividend Income ETF
Financial Highlights
| | Period Ended
March 31,
2024(a) | | Year Ended
October 31,
2023 | | Year Ended
October 31,
2022 | | Year Ended
October 31,
2021 | | Year Ended
October 31,
2020 | | Year Ended
October 31,
2019 |
Net Asset Value, Beginning of Year/Period | | $ | 34.24 | | | $ | 35.41 | | | $ | 37.11 | | | $ | 29.22 | | | $ | 30.41 | | | $ | 28.51 | |
Income (Loss) from Investment Operations: | | | | | | | | | | | | | | | | | | | | | | | | |
Net Investment Income (Loss)(b) | | | 0.36 | | | | 0.78 | | | | 0.59 | | | | 0.49 | | | | 0.48 | | | | 0.58 | |
Net Realized and Unrealized Gain (Loss)(c) | | | 5.04 | | | | (0.24 | ) | | | (0.57 | ) | | | 9.22 | | | | 0.79 | | | | 2.93 | |
Total from Investment Operations | | | 5.40 | | | | 0.54 | | | | 0.02 | | | | 9.71 | | | | 1.27 | | | | 3.51 | |
| | | | | | | | | | | | | | | | | | | | | | | | | |
Distributions to Shareholders | | | | | | | | | | | | | | | | | | | | | | | | |
Net Investment Income | | | (0.74 | ) | | | (0.77 | ) | | | (0.58 | ) | | | (1.56 | ) | | | (0.27 | ) | | | (1.61 | ) |
Net Realized Gains | | | — | | | | — | | | | (0.28 | ) | | | (0.11 | ) | | | (0.86 | ) | | | — | |
Return of Capital | | | — | | | | (0.94 | ) | | | (0.86 | ) | | | (0.15 | ) | | | (1.33 | ) | | | — | |
Total from Distributions | | | (0.74 | ) | | | (1.71 | ) | | | (1.72 | ) | | | (1.82 | ) | | | (2.46 | ) | | | (1.61 | ) |
| | | | | | | | | | | | | | | | | | | | | | | | | |
Capital Share Transactions | | | | | | | | | | | | | | | | | | | | | | | | |
Transaction Fees | | | — | | | | 0.00 | (d) | | | — | | | | — | | | | — | | | | — | |
| | | | | | | | | | | | | | | | | | | | | | | | | |
Net Asset Value, End of Year/Period | | $ | 38.90 | | | $ | 34.24 | | | $ | 35.41 | | | $ | 37.11 | | | $ | 29.22 | | | $ | 30.41 | |
| | | | | | | | | | | | | | | | | | | | | | | | | |
Total Return on Net Asset Value(e) | | | 15.91 | %(f) | | | 1.47 | % | | | 0.14 | % | | | 33.81 | % | | | 4.40 | % | | | 12.63 | % |
| | | | | | | | | | | | | | | | | | | | | | | | | |
Supplemental Data: | | | | | | | | | | | | | | | | | | | | | | | | |
Net Assets, End of Year/Period (000’s) | | $ | 3,160,256 | | | $ | 2,840,053 | | | $ | 2,101,790 | | | $ | 766,353 | | | $ | 106,668 | | | $ | 21,286 | |
Ratio of Expenses to Average Net Assets
(Before Advisory Fees Waived) | | | 0.55 | %(g) | | | 0.55 | % | | | 0.55 | % | | | 0.61 | % | | | 0.95 | % | | | 0.95 | % |
Ratio of Expenses to Average Net Assets
(After Advisory Fees Waived) | | | 0.54 | %(g) | | | N/A | | | | N/A | | | | 0.54 | % | | | 0.49 | % | | | 0.49 | % |
Ratio of Net Investment Income (Loss) to Average Net Assets (Before Advisory Fees Waived) | | | 2.37 | %(g) | | | 2.20 | % | | | 1.67 | % | | | 1.31 | % | | | 1.16 | % | | | 1.50 | % |
Ratio of Net Investment Income (Loss) to Average Net Assets (After Advisory Fees Waived) | | | 2.38 | %(g) | | | N/A | | | | N/A | | | | 1.38 | % | | | 1.62 | % | | | 1.96 | % |
Portfolio Turnover(h) | | | 39 | %(f) | | | 66 | % | | | 87 | % | | | 89 | % | | | 86 | % | | | 115 | % |
(a) | | For the period November 1, 2023 to March 31, 2024. See Note 1 to the Financial Statements. |
(b) | | Calculated based on average shares outstanding during the period. |
(c) | | Realized and unrealized gains and losses per share in this caption are balancing amounts necessary to reconcile the change in net asset value per share for the period and may not reconcile with the aggregate gains and losses in the statement of operations due to share transactions for the year. |
(d) | | Less than $0.005. |
(e) | | Total Return on Net Asset Value is based on the change in net asset value (“NAV”) of a share during the period and assumes reinvestment of dividends and distributions at NAV. Total Return on Net Asset Value is for the period indicated and has not been annualized. The return shown does not reflect the deduction of taxes that a shareholder would pay on fund distributions or redemption of fund shares. |
(f) | | Not Annualized. |
(g) | | Annualized. |
(h) | | |
The accompanying notes are an integral part of these financial statements.
104
Amplify ETF Trust
Amplify Transformational Data Sharing ETF
Financial Highlights |
| | Period Ended
March 31,
2024(a) | | Year Ended
October 31,
2023 | | Year Ended
October 31,
2022 | | Year Ended
October 31,
2021 | | Year Ended
October 31,
2020 | | Year Ended
October 31,
2019 |
Net Asset Value, Beginning of Year/Period | | $ | 20.58 | | | $ | 18.53 | | | $ | 55.37 | | | $ | 24.80 | | | $ | 18.21 | | | $ | 17.45 | |
Income (Loss) from Investment Operations: | | | | | | | | | | | | | | | | | | | | | | | | |
Net Investment Income (Loss)(b) | | | 0.23 | | | | 0.38 | | | | 0.41 | | | | 0.24 | | | | 0.17 | | | | 0.23 | |
Net Realized and Unrealized Gain (Loss)(c) | | | 15.97 | | | | 1.67 | | | | (31.50 | ) | | | 30.98 | | | | 6.80 | | | | 0.71 | |
Total from Investment Operations | | | 16.20 | | | | 2.05 | | | | (31.09 | ) | | | 31.22 | | | | 6.97 | | | | 0.94 | |
| | | | | | | | | | | | | | | | | | | | | | | | | |
Distributions to Shareholders | | | | | | | | | | | | | | | | | | | | | | | | |
Net Investment Income | | | (0.34 | ) | | | — | | | | (5.75 | ) | | | (0.66 | ) | | | (0.39 | ) | | | (0.19 | ) |
Total from Distributions | | | (0.34 | ) | | | — | | | | (5.75 | ) | | | (0.66 | ) | | | (0.39 | ) | | | (0.19 | ) |
| | | | | | | | | | | | | | | | | | | | | | | | | |
Capital Share Transactions | | | | | | | | | | | | | | | | | | | | | | | | |
Transaction Fees | | | 0.00 | (d) | | | — | | | | 0.00 | (d) | | | 0.01 | | | | 0.01 | | | | 0.01 | |
| | | | | | | | | | | | | | | | | | | | | | | | | |
Net Asset Value, End of Year/Period | | $ | 36.44 | | | $ | 20.58 | | | $ | 18.53 | | | $ | 55.37 | | | $ | 24.80 | | | $ | 18.21 | |
| | | | | | | | | | | | | | | | | | | | | | | | | |
Total Return on Net Asset Value(e) | | | 78.82 | %(f) | | | 11.05 | % | | | -61.76 | % | | | 127.54 | % | | | 38.97 | % | | | 5.72 | % |
| | | | | | | | | | | | | | | | | | | | | | | | | |
Supplemental Data: | | | | | | | | | | | | | | | | | | | | | | | | |
Net Assets, End of Year/Period (000’s) | | $ | 750,563 | | | $ | 427,075 | | | $ | 464,298 | | | $ | 1,495,050 | | | $ | 132,705 | | | $ | 99,269 | |
Ratio of Expenses to Average Net Assets (Before Advisory Fees Waived) | | | 0.70 | %(g) | | | 0.70 | % | | | 0.70 | % | | | 0.73 | % | | | 0.90 | % | | | 0.90 | % |
Ratio of Expenses to Average Net Assets (After Advisory Fees Waived) | | | N/A | | | | N/A | | | | N/A | | | | 0.70 | % | | | 0.70 | % | | | 0.70 | % |
Ratio of Net Investment Income (Loss) to Average Net Assets (Before Advisory Fees Waived) | | | 1.94 | %(g) | | | 1.94 | % | | | 1.33 | % | | | 0.47 | % | | | 0.65 | % | | | 1.15 | % |
Ratio of Net Investment Income (Loss) to Average Net Assets (After Advisory Fees Waived) | | | N/A | | | | N/A | | | | N/A | | | | 0.50 | % | | | 0.85 | % | | | 1.35 | % |
Portfolio Turnover(h) | | | 21 | %(f) | | | 36 | % | | | 39 | % | | | 41 | % | | | 44 | % | | | 35 | % |
(a) | | For the period November 1, 2023 to March 31, 2024. See Note 1 to the Financial Statements. |
(b) | | Calculated based on average shares outstanding during the period. |
(c) | | Realized and unrealized gains and losses per share in this caption are balancing amounts necessary to reconcile the change in net asset value per share for the period and may not reconcile with the aggregate gains and losses in the statement of operations due to share transactions for the year. |
(d) | | Less than $0.005. |
(e) | | Total Return on Net Asset Value is based on the change in net asset value (“NAV”) of a share during the period and assumes reinvestment of dividends and distributions at NAV. Total Return on Net Asset Value is for the period indicated and has not been annualized. The return shown does not reflect the deduction of taxes that a shareholder would pay on fund distributions or redemption of fund shares. |
(f) | | Not Annualized. |
(g) | | Annualized. |
(h) | | Excludes the impact of in-kind transactions. |
The accompanying notes are an integral part of these financial statements.
105
Amplify ETF Trust
Amplify Lithium & Battery Technology ETF
Financial Highlights |
| | Period Ended
March 31,
2024(a) | | Year Ended
October 31,
2023 | | Year Ended
October 31,
2022 | | Year Ended
October 31,
2021 | | Year Ended
October 31,
2020 | | Year Ended
October 31,
2019 |
Net Asset Value, Beginning of Year/Period | | $ | 9.84 | | | $ | 12.58 | | | $ | 19.59 | | | $ | 10.83 | | | $ | 10.59 | | | $ | 12.87 | |
Income (Loss) from Investment Operations: | | | | | | | | | | | | | | | | | | | | | | | | |
Net Investment Income (Loss)(b) | | | 0.08 | | | | 0.25 | | | | 0.49 | | | | 0.27 | | | | 0.16 | | | | 0.29 | |
Net Realized and Unrealized Gain (Loss)(c) | | | (0.15 | ) | | | (2.51 | ) | | | (7.08 | ) | | | 8.50 | | | | 0.41 | | | | (2.48 | ) |
Total from Investment Operations | | | (0.07 | ) | | | (2.26 | ) | | | (6.59 | ) | | | 8.77 | | | | 0.57 | | | | (2.19 | ) |
| | | | | | | | | | | | | | | | | | | | | | | | | |
Distributions to Shareholders | | | | | | | | | | | | | | | | | | | | | | | | |
Net Investment Income | | | (0.34 | ) | | | (0.48 | ) | | | (0.42 | ) | | | (0.03 | ) | | | (0.35 | ) | | | (0.10 | ) |
Total from Distributions | | | (0.34 | ) | | | (0.48 | ) | | | (0.42 | ) | | | (0.03 | ) | | | (0.35 | ) | | | (0.10 | ) |
| | | | | | | | | | | | | | | | | | | | | | | | | |
Capital Share Transactions | | | | | | | | | | | | | | | | | | | | | | | | |
Transaction Fees | | | 0.00 | (d) | | | 0.00 | (d) | | | 0.00 | (d) | | | 0.02 | | | | 0.02 | | | | 0.01 | |
| | | | | | | | | | | | | | | | | | | | | | | | | |
Net Asset Value, End of Year/Period | | $ | 9.43 | | | $ | 9.84 | | | $ | 12.58 | | | $ | 19.59 | | | $ | 10.83 | | | $ | 10.59 | |
| | | | | | | | | | | | | | | | | | | | | | | | | |
Total Return on Net Asset Value(e) | | | -1.05 | %(f) | | | -18.52 | % | | | -34.28 | % | | | 81.32 | % | | | 5.56 | % | | | -16.96 | % |
| | | | | | | | | | | | | | | | | | | | | | | | | |
Supplemental Data: | | | | | | | | | | | | | | | | | | | | | | | | |
Net Assets, End of Year/Period (000’s) | | $ | 90,100 | | | $ | 110,702 | | | $ | 159,791 | | | $ | 234,137 | | | $ | 9,747 | | | $ | 4,767 | |
Ratio of Expenses to Average Net Assets (Before Advisory Fees Waived) | | | 0.59 | %(g) | | | 0.59 | % | | | 0.59 | % | | | 0.59 | % | | | 0.89 | % | | | 0.92 | % |
Ratio of Expenses to Average Net Assets (After Advisory Fees Waived) | | | N/A | | | | N/A | | | | N/A | | | | N/A | | | | 0.71 | % | | | 0.72 | % |
Ratio of Net Investment Income (Loss) to Average Net Assets (Before Advisory Fees Waived) | | | 1.96 | %(g) | | | 1.98 | % | | | 3.05 | % | | | 1.57 | % | | | 1.42 | % | | | 2.23 | % |
Ratio of Net Investment Income (Loss) to Average Net Assets (After Advisory Fees Waived) | | | N/A | | | | N/A | | | | N/A | | | | N/A | | | | 1.60 | % | | | 2.43 | % |
Portfolio Turnover(h) | | | 28 | %(f) | | | 42 | % | | | 42 | % | | | 51 | % | | | 131 | % | | | 61 | % |
(a) | | For the period November 1, 2023 to March 31, 2024. See Note 1 to the Financial Statements. |
(b) | | Calculated based on average shares outstanding during the period. |
(c) | | Realized and unrealized gains and losses per share in this caption are balancing amounts necessary to reconcile the change in net asset value per share for the period and may not reconcile with the aggregate gains and losses in the statement of operations due to share transactions for the year. |
(d) | | Less than $0.005. |
(e) | | Total Return on Net Asset Value is based on the change in net asset value (“NAV”) of a share during the period and assumes reinvestment of dividends and distributions at NAV. Total Return on Net Asset Value is for the period indicated and has not been annualized. The return shown does not reflect the deduction of taxes that a shareholder would pay on fund distributions or redemption of fund shares. |
(f) | | Not Annualized. |
(g) | | Annualized. |
(h) | | Excludes the impact of in-kind transactions. |
The accompanying notes are an integral part of these financial statements.
106
Amplify ETF Trust
Amplify BlackSwan Growth & Treasury Core ETF
Financial Highlights |
| | Period Ended
March 31,
2024(a) | | Year Ended
October 31,
2023 | | Year Ended
October 31,
2022 | | Year Ended
October 31,
2021 | | Year Ended
October 31,
2020 | | Period Ended
October 31,
2019(b) |
Net Asset Value, Beginning of Year/Period | | $ | 23.17 | | | $ | 24.63 | | | $ | 35.72 | | | $ | 30.87 | | | $ | 28.57 | | | $ | 25.00 | |
Income (Loss) from Investment Operations: | | | | | | | | | | | | | | | | | | | | | | | | |
Net Investment Income (Loss)(c) | | | 0.31 | | | | 0.74 | | | | 0.33 | | | | 0.09 | | | | 0.12 | | | | 0.43 | |
Net Realized and Unrealized Gain (Loss)(d) | | | 4.85 | | | | (1.43 | ) | | | (9.41 | ) | | | 5.25 | | | | 3.05(e) | | | | 3.52 | |
Total from Investment Operations | | | 5.16 | | | | (0.69 | ) | | | (9.08 | ) | | | 5.34 | | | | 3.17 | | | | 3.95 | |
| | | | | | | | | | | | | | | | | | | | | | | | | |
Distributions to Shareholders | | | | | | | | | | | | | | | | | | | | | | | | |
Net Investment Income | | | (0.40 | ) | | | (0.77 | ) | | | (0.38 | ) | | | (0.07 | ) | | | (0.19 | ) | | | (0.38 | ) |
Net Realized Gains | | | — | | | | — | | | | (1.63 | ) | | | (0.42 | ) | | | (0.68 | ) | | | — | |
Total from Distributions | | | (0.40 | ) | | | (0.77 | ) | | | (2.01 | ) | | | (0.49 | ) | | | (0.87 | ) | | | (0.38 | ) |
| | | | | | | | | | | | | | | | | | | | | | | | | |
Capital Share Transactions | | | | | | | | | | | | | | | | | | | | | | | | |
Transaction Fees | | | — | | | | — | | | | — | | | | — | | | | 0.00 | (f) | | | — | |
| | | | | | | | | | | | | | | | | | | | | | | | | |
Net Asset Value, End of Year/Period | | $ | 27.93 | | | $ | 23.17 | | | $ | 24.63 | | | $ | 35.72 | | | $ | 30.87 | | | $ | 28.57 | |
| | | | | | | | | | | | | | | | | | | | | | | | | |
Total Return on Net Asset Value(g) | | | 22.32 | %(h) | | | -2.97 | % | | | -26.77 | % | | | 17.44 | % | | | 11.29 | %(i) | | | 15.94 | %(h) |
| | | | | | | | | | | | | | | | | | | | | | | | | |
Supplemental Data: | | | | | | | | | | | | | | | | | | | | | | | | |
Net Assets, End of Year/Period (000’s) | | $ | 178,223 | | | $ | 181,683 | | | $ | 274,398 | | | $ | 911,467 | | | $ | 685,231 | | | $ | 124,299 | |
Ratio of Expenses to Average Net Assets | | | 0.49 | %(j) | | | 0.49 | % | | | 0.49 | % | | | 0.49 | % | | | 0.49 | % | | | 0.49 | %(j) |
Ratio of Net Investment Income (Loss) to Average Net Assets | | | 2.87 | %(j) | | | 2.92 | % | | | 1.08 | % | | | 0.25 | % | | | 0.40 | % | | | 1.64 | %(j) |
Portfolio Turnover(k) | | | 17 | %(h) | | | 218 | % | | | 286 | % | | | 194 | % | | | 162 | % | | | 154 | %(h) |
(a) | | For the period November 1, 2023 to March 31, 2024. See Note 1 to the Financial Statements. |
(b) | | The Fund commenced operations on November 5, 2018. |
(c) | | Calculated based on average shares outstanding during the period. |
(d) | | Realized and unrealized gains and losses per share in this caption are balancing amounts necessary to reconcile the change in net asset value per share for the period and may not reconcile with the aggregate gains and losses in the statement of operations due to share transactions for the year. |
(e) | | Includes a less than $0.01 gain per share derived from payment from an affiliate. |
(f) | | Less than $0.005. |
(g) | | Total Return on Net Asset Value is based on the change in net asset value (“NAV”) of a share during the period and assumes reinvestment of dividends and distributions at NAV. Total Return on Net Asset Value is for the period indicated and has not been annualized. The return shown does not reflect the deduction of taxes that a shareholder would pay on fund distributions or redemption of fund shares. |
(h) | | Not Annualized. |
(i) | | Before payment from affiliate for the loss resulting from trade error, the total return for the period would have been 11.29%. |
(j) | | Annualized. |
(k) | | Excludes the impact of in-kind transactions. |
The accompanying notes are an integral part of these financial statements.
107
Amplify ETF Trust
Amplify Emerging Markets FinTech ETF
Financial Highlights |
| | Period Ended
March 31,
2024(a) | | Year Ended
October 31,
2023 | | Year Ended
October 31,
2022 | | Year Ended
October 31,
2021 | | Year Ended
October 31,
2020 | | Period Ended
October 31,
2019(b) |
Net Asset Value, Beginning of Year/Period | | $ | 18.54 | | | $ | 18.70 | | | $ | 43.49 | | | $ | 41.54 | | | $ | 26.73 | | | $ | 25.00 | |
Income (Loss) from Investment Operations: | | | | | | | | | | | | | | | | | | | | | | | | |
Net Investment Income (Loss)(c) | | | 0.06 | | | | 0.37 | | | | 0.39 | | | | (0.12 | ) | | | (0.07 | ) | | | (0.07 | ) |
Net Realized and Unrealized Gain (Loss)(d) | | | 3.46 | | | | (0.49 | ) | | | (25.18 | ) | | | 2.05 | | | | 14.92 | (e) | | | 1.79 | |
Total from Investment Operations | | | 3.52 | | | | (0.12 | ) | | | (24.79 | ) | | | 1.93 | | | | 14.85 | | | | 1.72 | |
| | | | | | | | | | | | | | | | | | | | | | | | | |
Distributions to Shareholders | | | | | | | | | | | | | | | | | | | | | | | | |
Net Investment Income | | | (1.04 | ) | | | (0.05 | ) | | | — | | | | — | | | | (0.05 | ) | | | — | |
Total from Distributions | | | (1.04 | ) | | | (0.05 | ) | | | — | | | | — | | | | (0.05 | ) | | | — | |
| | | | | | | | | | | | | | | | | | | | | | | | | |
Capital Share Transactions | | | | | | | | | | | | | | | | | | | | | | | | |
Transaction Fees | | | — | | | | 0.01 | | | | — | | | | 0.02 | | | | 0.01 | | | | 0.01 | |
| | | | | | | | | | | | | | | | | | | | | | | | | |
Net Asset Value, End of Year/Period | | $ | 21.02 | | | $ | 18.54 | | | $ | 18.70 | | | $ | 43.49 | | | $ | 41.54 | | | $ | 26.73 | |
| | | | | | | | | | | | | | | | | | | | | | | | | |
Total Return on Net Asset Value(f) | | | 18.97 | %(g) | | | -0.59 | % | | | -57.00 | % | | | 4.68 | % | | | 55.70 | %(h) | | | 6.91 | %(g) |
| | | | | | | | | | | | | | | | | | | | | | | | | |
Supplemental Data: | | | | | | | | | | | | | | | | | | | | | | | | |
Net Assets, End of Year/Period (000’s) | | $ | 2,102 | | | $ | 1,854 | | | $ | 2,337 | | | $ | 10,872 | | | $ | 10,386 | | | $ | 2,005 | |
Ratio of Expenses to Average Net Assets | | | 0.69 | %(i) | | | 0.69 | % | | | 0.69 | % | | | 0.69 | % | | | 0.69 | % | | | 0.69 | %(i) |
Ratio of Net Investment Income (Loss) to Average Net Assets | | | 0.70 | %(i) | | | 1.76 | % | | | 1.37 | % | | | -0.24 | % | | | -0.21 | % | | | -0.34 | %(i) |
Portfolio Turnover(j) | | | 32 | %(g) | | | 57 | % | | | 176 | % | | | 69 | % | | | 83 | % | | | 64 | %(g) |
(a) | | For the period November 1, 2023 to March 31, 2024. See Note 1 to the Financial Statements. |
(b) | | The Fund commenced operations on January 29, 2019. |
(c) | | Calculated based on average shares outstanding during the period. |
(d) | | Realized and unrealized gains and losses per share in this caption are balancing amounts necessary to reconcile the change in net asset value per share for the period and may not reconcile with the aggregate gains and losses in the statement of operations due to share transactions for the year. |
(e) | | Includes a $0.06 gain derived from a payment from affiliate. |
(f) | | Total Return on Net Asset Value is based on the change in net asset value (“NAV”) of a share during the period and assumes reinvestment of dividends and distributions at NAV. Total Return on Net Asset Value is for the period indicated and has not been annualized. The return shown does not reflect the deduction of taxes that a shareholder would pay on fund distributions or redemption of fund shares. |
(g) | | Not Annualized. |
(h) | | Before payment from affiliate for the loss resulting from trade error, the total return for the period would have been 55.47%. |
(i) | | Annualized. |
(j) | | Excludes the impact of in-kind transactions. |
The accompanying notes are an integral part of these financial statements.
108
Amplify ETF Trust
Amplify Seymour Cannabis ETF
Financial Highlights |
| | Period Ended
March 31,
2024(a) | | Year Ended
October 31,
2023 | | Year Ended
October 31,
2022 | | Year Ended
October 31,
2021 | | Year Ended
October 31,
2020 | | Period Ended
October 31,
2019(b) |
Net Asset Value, Beginning of Year/Period | | $ | 3.66 | | | $ | 6.85 | | | $ | 17.37 | | | $ | 11.81 | | | $ | 15.61 | | | $ | 24.71 | |
Income (Loss) from Investment Operations: | | | | | | | | | | | | | | | | | | | | | | | | |
Net Investment Income (Loss)(c) | | | 0.02 | | | | 0.06 | | | | 0.00 | (d) | | | 0.01 | | | | 0.31 | | | | 0.00 | (d) |
Net Realized and Unrealized Gain (Loss)(e) | | | 2.11 | | | | (3.25 | ) | | | (10.52 | ) | | | 5.65 | | | | (4.03 | ) | | | (9.10 | ) |
Total from Investment Operations | | | 2.13 | | | | (3.19 | ) | | | (10.52 | ) | | | 5.66 | | | | (3.72 | ) | | | (9.10 | ) |
| | | | | | | | | | | | | | | | | | | | | | | | | |
Distributions to Shareholders | | | | | | | | | | | | | | | | | | | | | | | | |
Net Investment Income | | | — | | | | — | | | | (0.00 | )(d) | | | (0.10 | ) | | | (0.08 | ) | | | — | |
Total from Distributions | | | — | | | | — | | | | (0.00 | )(d) | | | (0.10 | ) | | | (0.08 | ) | | | — | |
| | | | | | | | | | | | | | | | | | | | | | | | | |
Capital Share Transactions | | | | | | | | | | | | | | | | | | | | | | | | |
Transaction Fees | | | — | | | | — | | | | — | | | | — | | | | 0.00(d) | | | | — | |
| | | | | | | | | | | | | | | | | | | | | | | | | |
Net Asset Value, End of Year/Period | | $ | 5.79 | | | $ | 3.66 | | | $ | 6.85 | | | $ | 17.37 | | | $ | 11.81 | | | $ | 15.61 | |
| | | | | | | | | | | | | | | | | | | | | | | | | |
Total Return on Net Asset Value(f) | | | 58.30 | %(g) | | | -46.60 | % | | | -60.58 | % | | | 47.93 | % | | | -24.94 | % | | | -37.28 | %(g) |
| | | | | | | | | | | | | | | | | | | | | | | | | |
Supplemental Data: | | | | | | | | | | | | | | | | | | | | | | | | |
Net Assets, End of Year/Period (000’s) | | $ | 37,340 | | | $ | 23,591 | | | $ | 42,451 | | | $ | 103,361 | | | $ | 6,497 | | | $ | 5,465 | |
Ratio of Expenses to Average Net Assets (Before Advisory Fees Waived/Reimbursed��& Securities Lending Credit) | | | 1.45 | %(h) | | | 1.43 | % | | | 1.08 | % | | | 0.97 | % | | | 5.61 | % | | | 6.14 | %(h) |
Ratio of Expenses to Average Net Assets (After Advisory Fees Waived/Reimbursed) | | | 0.75 | %(h) | | | 0.75 | % | | | 0.75 | % | | | 0.75 | % | | | 2.22 | % | | | 5.73 | %(h) |
Ratio of Expenses to Average Net Assets (After Advisory Fees Waived/Reimbursed & Securities Lending Credit) | | | 0.75 | %(h) | | | 0.75 | % | | | 0.75 | % | | | 0.75 | % | | | 0.75 | % | | | 0.75 | %(h) |
Ratio of Net Investment Income (Loss) to Average Net Assets (Before Advisory Fees Waived) | | | 0.58 | %(h) | | | 0.59 | % | | | -0.28 | % | | | -0.17 | % | | | -1.93 | % | | | 6.14 | %(h) |
Ratio of Net Investment Income (Loss) to Average Net Assets (After Advisory Fees Waived) | | | 1.28 | %(h) | | | 1.27 | % | | | 0.05 | % | | | 0.05 | % | | | 2.93 | % | | | -0.10 | %(h) |
Portfolio Turnover(i) | | | 2 | %(g) | | | 46 | % | | | 27 | % | | | 124 | % | | | 64 | % | | | 23 | %(g) |
(a) | | For the period November 1, 2023 to March 31, 2024. See Note 1 to the Financial Statements. |
(b) | | The Fund commenced operations on July 22, 2019. |
(c) | | Calculated based on average shares outstanding during the period. |
(d) | | Less than $0.005. |
(e) | | Realized and unrealized gains and losses per share in this caption are balancing amounts necessary to reconcile the change in net asset value per share for the period and may not reconcile with the aggregate gains and losses in the statement of operations due to share transactions for the year. |
(f) | | Total Return on Net Asset Value is based on the change in net asset value (“NAV”) of a share during the period and assumes reinvestment of dividends and distributions at NAV. Total Return on Net Asset Value is for the period indicated and has not been annualized. The return shown does not reflect the deduction of taxes that a shareholder would pay on fund distributions or redemption of fund shares. |
(g) | | Not Annualized. |
(h) | | Annualized. |
(i) | | Excludes the impact of in-kind transactions. |
The accompanying notes are an integral part of these financial statements.
109
Amplify ETF Trust
Amplify BlackSwan ISWN ETF
Financial Highlights |
| | Period Ended
March 31,
2024(a) | | Year Ended
October 31,
2023 | | Year Ended
October 31,
2022 | | Period Ended
October 31,
2021(b) |
Net Asset Value, Beginning of Year/Period | | $ | 17.01 | | | $ | 17.66 | | | $ | 25.50 | | | $ | 25.00 | |
Income (Loss) from Investment Operations: | | | | | | | | | | | | | | | | |
Net Investment Income (Loss)(c) | | | 0.23 | | | | 0.55 | | | | 0.30 | | | | 0.07 | |
Net Realized and Unrealized Gain (Loss)(d) | | | 2.52 | | | | (0.66 | ) | | | (7.77 | ) | | | 0.48 | |
Total from Investment Operations | | | 2.75 | | | | (0.11 | ) | | | (7.47 | ) | | | 0.55 | |
| | | | | | | | | | | | | | | | | |
Distributions to Shareholders | | | | | | | | | | | | | | | | |
Net Investment Income | | | (0.29 | ) | | | (0.54 | ) | | | (0.27 | ) | | | (0.05 | ) |
Net Realized Gains | | | — | | | | — | | | | (0.10 | ) | | | — | |
Total from Distributions | | | (0.29 | ) | | | (0.54 | ) | | | (0.37 | ) | | | (0.05 | ) |
| | | | | | | | | | | | | | | | | |
Net Asset Value, End of Year/Period | | $ | 19.47 | | | $ | 17.01 | | | $ | 17.66 | | | $ | 25.50 | |
| | | | | | | | | | | | | | | | | |
Total Return on Net Asset Value(e) | | | 16.13 | %(f) | | | -0.80 | % | | | -29.51 | % | | | 2.23 | %(f) |
| | | | | | | | | | | | | | | | | |
Supplemental Data: | | | | | | | | | | | | | | | | |
Net Assets, End of Year/Period (000’s) | | $ | 38,931 | | | $ | 37,430 | | | $ | 31,348 | | | $ | 43,353 | |
Ratio of Expenses to Average Net Assets | | | 0.49 | %(g) | | | 0.49 | % | | | 0.49 | % | | | 0.49 | %(g) |
Ratio of Net Investment Income (Loss) to Average Net Assets | | | 2.99 | %(g) | | | 2.93 | % | | | 1.42 | % | | | 0.38 | %(g) |
Portfolio Turnover(h) | | | 15 | %(f) | | | 195 | % | | | 221 | % | | | 123 | %(f) |
(a) | | For the period November 1, 2023 to March 31, 2024. See Note 1 to the Financial Statements. |
(b) | | The Fund commenced operations on January 25, 2021. |
(c) | | Calculated based on average shares outstanding during the period. |
(d) | | Realized and unrealized gains and losses per share in this caption are balancing amounts necessary to reconcile the change in net asset value per share for the period and may not reconcile with the aggregate gains and losses in the statement of operations due to share transactions for the year. |
(e) | | Total Return on Net Asset Value is based on the change in net asset value (“NAV”) of a share during the period and assumes reinvestment of dividends and distributions at NAV. Total Return on Net Asset Value is for the period indicated and has not been annualized. The return shown does not reflect the deduction of taxes that a shareholder would pay on fund distributions or redemption of fund shares. |
(f) | | Not Annualized. |
(g) | | Annualized. |
(h) | | Excludes the impact of in-kind transactions. |
The accompanying notes are an integral part of these financial statements.
110
Amplify ETF Trust
Amplify Thematic All-Stars ETF
Financial Highlights
| | Period Ended
March 31,
2024(a) | | Year Ended
October 31,
2023 | | Year Ended
October 31,
2022 | | Period Ended
October 31,
2021(b) |
Net Asset Value, Beginning of Year/Period | | $ | 16.15 | | | $ | 16.09 | | | $ | 28.27 | | | $ | 25.05 | |
Income (Loss) from Investment Operations: | | | | | | | | | | | | | | | | |
Net Investment Income (Loss)(c) | | | 0.01 | | | | 0.01 | | | | (0.01 | ) | | | (0.02 | ) |
Net Realized and Unrealized Gain (Loss)(d) | | | 5.45 | | | | 0.05 | | | | (12.17 | ) | | | 3.24 | |
Total from Investment Operations | | | 5.46 | | | | 0.06 | | | | (12.18 | ) | | | 3.22 | |
| | | | | | | | | | | | | | | | | |
Distributions to Shareholders | | | | | | | | | | | | | | | | |
Net Realized Gains | | | — | | | | — | | | | (0.00 | )(e) | | | — | |
Total from Distributions | | | — | | | | — | | | | (0.00 | )(e) | | | — | |
| | | | | | | | | | | | | | | | | |
Capital Share Transactions | | | | | | | | | | | | | | | | |
Transaction Fees | | | — | | | | 0.00 | (e) | | | 0.00 | (e) | | | 0.00 | (e) |
| | | | | | | | | | | | | | | | | |
Net Asset Value, End of Year/Period | | $ | 21.61 | | | $ | 16.15 | | | $ | 16.09 | | | $ | 28.27 | |
| | | | | | | | | | | | | | | | | |
Total Return on Net Asset Value(f) | | | 33.80 | %(g) | | | 0.37 | % | | | -43.07 | % | | | 12.85 | %(g)(h) |
| | | | | | | | | | | | | | | | | |
Supplemental Data: | | | | | | | | | | | | | | | | |
Net Assets, End of Year/Period (000’s) | | $ | 2,701 | | | $ | 2,423 | | | $ | 4,828 | | | $ | 11,308 | |
Ratio of Expenses to Average Net Assets | | | 0.50 | %(i) | | | 0.49 | % | | | 0.49 | % | | | 0.49 | %(i) |
Ratio of Net Investment Income (Loss) to Average Net Assets | | | 0.08 | %(i) | | | 0.04 | % | | | -0.03 | % | | | -0.23 | %(i) |
Portfolio Turnover(j) | | | 32 | %(g) | | | 66 | % | | | 70 | % | | | 48 | %(g) |
(a) | | For the period November 1, 2023 to March 31, 2024. See Note 1 to the Financial Statements. |
(b) | | The Fund commenced operations on July 20, 2021. |
(c) | | Calculated based on average shares outstanding during the period. |
(d) | | Realized and unrealized gains and losses per share in this caption are balancing amounts necessary to reconcile the change in net asset value per share for the period and may not reconcile with the aggregate gains and losses in the statement of operations due to share transactions for the year. |
(e) | | Less than $0.005. |
(f) | | Total Return on Net Asset Value is based on the change in net asset value (“NAV”) of a share during the period and assumes reinvestment of dividends and distributions at NAV. Total Return on Net Asset Value is for the period indicated and has not been annualized. The return shown does not reflect the deduction of taxes that a shareholder would pay on fund distributions or redemption of fund shares. |
(g) | | Not Annualized. |
(h) | | Before payment from affiliate for the loss resulting from a trade error, the total return for the period would have been 12.84%. See Note 5. |
(i) | | Annualized. |
(j) | | Excludes the impact of in-kind transactions. |
The accompanying notes are an integral part of these financial statements.
111
Amplify ETF Trust
Amplify BlackSwan Tech & Treasury ETF
Financial Highlights
| | Period Ended
March 31,
2024(a) | | Year Ended
October 31,
2023 | | Period Ended
October 31,
2022(b) |
Net Asset Value, Beginning of Year/Period | | $ | 17.30 | | | $ | 16.96 | | | $ | 24.95 | |
Income (Loss) from Investment Operations: | | | | | | | | | | | | |
Net Investment Income (Loss)(c) | | | 0.23 | | | | 0.53 | | | | 0.30 | |
Net Realized and Unrealized Gain (Loss)(d) | | | 3.24 | | | | 0.36 | | | | (8.03 | ) |
Total from Investment Operations | | | 3.47 | | | | 0.89 | | | | (7.73 | ) |
| | | | | | | | | | | | | |
Distributions to Shareholders | | | | | | | | | | | | |
Net Investment Income | | | (0.27 | ) | | | (0.55 | ) | | | (0.26 | ) |
Total from Distributions | | | (0.27 | ) | | | (0.55 | ) | | | (0.26 | ) |
| | | | | | | | | | | | | |
Net Asset Value, End of Year/Period | | $ | 20.50 | | | $ | 17.30 | | | $ | 16.96 | |
| | | | | | | | | | | | | |
Total Return on Net Asset Value(e) | | | 20.06 | %(f) | | | 5.25 | % | | | -31.07 | %(f) |
| | | | | | | | | | | | | |
Supplemental Data: | | | | | | | | | | | | |
Net Assets, End of Year/Period (000’s) | | $ | 2,562 | | | $ | 2,163 | | | $ | 2,968 | |
Ratio of Expenses to Average Net Assets | | | 0.49 | %(g) | | | 0.49 | % | | | 0.49 | %(g) |
Ratio of Net Investment Income (Loss) to Average Net Assets | | | 2.80 | %(g) | | | 2.92 | % | | | 1.70 | %(g) |
Portfolio Turnover(h) | | | 19 | %(f) | | | 209 | % | | | 153 | %(f) |
(a) | | For the period November 1, 2023 to March 31, 2024. See Note 1 to the Financial Statements. |
(b) | | The Fund commenced operations on December 8, 2021. |
(c) | | Calculated based on average shares outstanding during the period. |
(d) | | Realized and unrealized gains and losses per share in this caption are balancing amounts necessary to reconcile the change in net asset value per share for the period and may not reconcile with the aggregate gains and losses in the statement of operations due to share transactions for the year. |
(e) | | Total Return on Net Asset Value is based on the change in net asset value (“NAV”) of a share during the period and assumes reinvestment of dividends and distributions at NAV. Total Return on Net Asset Value is for the period indicated and has not been annualized. The return shown does not reflect the deduction of taxes that a shareholder would pay on fund distributions or redemption of fund shares. |
(f) | | Not Annualized. |
(g) | | Annualized. |
(h) | | Excludes the impact of in-kind transactions. |
The accompanying notes are an integral part of these financial statements.
112
Amplify ETF Trust
Amplify Inflation Fighter ETF
Consolidated Financial Highlightss
| | Period Ended
March 31, 2024(b) | | Year Ended
October 31, 2023 | | Period Ended
October 31, 2022(c) |
Net Asset Value, Beginning of Year/Period | | $ | 23.49 | | | $ | 20.34 | | | $ | 24.77 | |
Income (Loss) from Investment Operations: | | | | | | | | | | | | |
Net Investment Income (Loss)(d) | | | 0.14 | | | | 0.17 | | | | 0.16 | |
Net Realized and Unrealized Gain (Loss)(e) | | | 5.70 | | | | 3.09 | | | | (4.59 | ) |
Total from Investment Operations | | | 5.84 | | | | 3.26 | | | | (4.43 | ) |
| | | | | | | | | | | | | |
Distributions to Shareholders | | | | | | | | | | | | |
Net Investment Income | | | (1.10 | ) | | | (0.11 | ) | | | — | |
Total from Distributions | | | (1.10 | ) | | | (0.11 | ) | | | — | |
| | | | | | | | | | | | | |
Capital Share Transactions | | | | | | | | | | | | |
Transaction Fees | | | — | | | | 0.00 | (f) | | | 0.00 | (f) |
| | | | | | | | | | | | | |
Net Asset Value, End of Year/Period | | $ | 28.23 | | | $ | 23.49 | | | $ | 20.34 | |
| | | | | | | | | | | | | |
Total Return on Net Asset Value(g) | | | 25.06 | %(h) | | | 16.14 | % | | | -17.88 | %(h) |
| | | | | | | | | | | | | |
Supplemental Data: | | | | | | | | | | | | |
Net Assets, End of Year/Period (000’s) | | $ | 7,763 | | | $ | 8,223 | | | $ | 11,186 | |
Ratio of Expenses to Average Net Assets | | | 0.85 | %(i) | | | 0.85 | % | | | 0.85 | %(i) |
Ratio of Net Investment Income (Loss) to Average Net Assets | | | 1.29 | %(i) | | | 0.75 | % | | | 0.93 | %(i) |
Portfolio Turnover(j) | | | 3 | %(h) | | | 23 | % | | | 61 | %(h) |
(a) | | Financial Highlights have been consolidated. See Note 1 in the Notes to Financial Statements for basis of consolidation. |
(b) | | For the period November 1, 2023 to March 31, 2024. See Note 1 to the Financial Statements. |
(c) | | The Fund commenced operations on February 1, 2022. |
(d) | | Calculated based on average shares outstanding during the period. |
(e) | | Realized and unrealized gains and losses per share in this caption are balancing amounts necessary to reconcile the change in net asset value per share for the period and may not reconcile with the aggregate gains and losses in the statement of operations due to share transactions for the year. |
(f) | | Less than $0.005. |
(g) | | Total Return on Net Asset Value is based on the change in net asset value (“NAV”) of a share during the period and assumes reinvestment of dividends and distributions at NAV. Total Return on Net Asset Value is for the period indicated and has not been annualized. The return shown does not reflect the deduction of taxes that a shareholder would pay on fund distributions or redemption of fund shares. |
(h) | | Not Annualized. |
(i) | | Annualized. |
(j) | | Excludes the impact of in-kind transactions. |
The accompanying notes are an integral part of these financial statements.
113
Amplify ETF Trust
Amplify Natural Resources Dividend Income ETF
Financial Highlights |
| | Period Ended
March 31,
2024(a) | | Year Ended
October 31,
2023 | | Period Ended
October 31,
2022(b) |
Net Asset Value, Beginning of Year/Period | | $ | 26.08 | | | $ | 25.01 | | | $ | 25.79 | |
Income (Loss) from Investment Operations: | | | | | | | | | | | | |
Net Investment Income (Loss)(c) | | | 0.54 | | | | 1.65 | | | | 0.18 | |
Net Realized and Unrealized Gain (Loss)(d) | | | 3.24 | | | | 1.34 | | | | (0.76 | ) |
Total from Investment Operations | | | 3.78 | | | | 2.99 | | | | (0.58 | ) |
| | | | | | | | | | | | | |
Distributions to Shareholders | | | | | | | | | | | | |
Net Investment Income | | | (0.77 | ) | | | (1.42 | ) | | | (0.18 | ) |
Return of Capital | | | — | | | | (0.50 | ) | | | (0.02 | ) |
Total from Distributions | | | (0.77 | ) | | | (1.92 | ) | | | (0.20 | ) |
| | | | | | | | | | | | | |
Net Asset Value, End of Year/Period | | $ | 29.09 | | | $ | 26.08 | | | $ | 25.01 | |
| | | | | | | | | | | | | |
Total Return on Net Asset Value(e) | | | 14.73 | %(f) | | | 12.34 | % | | | -2.16 | %(f) |
| | | | | | | | | | | | | |
Supplemental Data: | | | | | | | | | | | | |
Net Assets, End of Year/Period (000’s) | | $ | 11,638 | | | $ | 9,128 | | | $ | 1,876 | |
Ratio of Expenses to Average Net Assets | | | 0.59 | %(g) | | | 0.59 | % | | | 0.59 | %(g) |
Ratio of Net Investment Income (Loss) to Average Net Assets | | | 4.78 | %(g) | | | 6.34 | % | | | 3.94 | %(g) |
Portfolio Turnover(h) | | | 52 | %(f) | | | 135 | % | | | 31 | %(f) |
(a) | | |
(b) | | The Fund commenced operations on August 23, 2022. |
(c) | | Calculated based on average shares outstanding during the period. |
(d) | | |
(e) | | |
(f) | | |
(g) | | |
(h) | | |
The accompanying notes are an integral part of these financial statements.
114
Amplify ETF Trust
Amplify International Enhanced Dividend Income ETF
Financial Highlights |
| | Period Ended
March 31,
2024(a) | | Year Ended
October 31,
2023 | | Period Ended
October 31,
2022(b) |
Net Asset Value, Beginning of Year/Period | | $ | 26.16 | | | $ | 24.24 | | | $ | 25.03 | |
Income (Loss) from Investment Operations: | | | | | | | | | | | | |
Net Investment Income (Loss)(c) | | | 0.29 | | | | 1.03 | | | | 0.09 | |
Net Realized and Unrealized Gain (Loss)(d) | | | 4.74 | | | | 2.51 | (e) | | | (0.63 | ) |
Total from Investment Operations | | | 5.03 | | | | 3.54 | | | | (0.54 | ) |
| | | | | | | | | | | | | |
Distributions to Shareholders | | | | | | | | | | | | |
Net Investment Income | | | (0.73 | ) | | | (0.98 | ) | | | (0.07 | ) |
Return of Capital | | | — | | | | (0.65 | ) | | | (0.18 | ) |
Total from Distributions | | | (0.73 | ) | | | (1.63 | ) | | | (0.25 | ) |
| | | | | | | | | | | | | |
Capital Share Transactions | | | | | | | | | | | | |
Transaction Fees | | | — | | | | 0.01 | | | | — | |
| | | | | | | | | | | | | |
Net Asset Value, End of Year/Period | | $ | 30.46 | | | $ | 26.16 | | | $ | 24.24 | |
| | | | | | | | | | | | | |
Total Return on Net Asset Value(f) | | | 19.29 | %(h) | | | 14.59 | %(g) | | | -2.14 | %(h) |
| | | | | | | | | | | | | |
Supplemental Data: | | | | | | | | | | | | |
Net Assets, End of Year/Period (000’s) | | $ | 104,327 | | | $ | 41,854 | | | $ | 1,818 | |
Ratio of Expenses to Average Net Assets | | | 0.65 | %(i) | | | 0.65 | % | | | 0.65 | %(i) |
Ratio of Net Investment Income (Loss) to Average Net Assets | | | 2.42 | %(i) | | | 3.78 | % | | | 2.40 | %(i) |
Portfolio Turnover(i) | | | 51 | %(h) | | | 83 | % | | | 12 | %(h) |
(a) | | |
(b) | | |
(c) | | |
(d) | | |
(e) | | |
(f) | | |
(g) | | |
(h) | | |
(i) | | |
(j) | | |
The accompanying notes are an integral part of these financial statements.
115
Amplify ETF Trust
Amplify Cash Flow Dividend Leaders ETF
Financial Highlights |
| | Period Ended
March 31,
2024(a) | | Period Ended
October 31,
2023(b) |
Net Asset Value, Beginning of Period | | $ | 23.35 | | | $ | 25.13 | |
Income (Loss) from Investment Operations: | | | | | | | | |
Net Investment Income (Loss)(c) | | | 0.29 | | | | 0.05 | |
Net Realized and Unrealized Gain (Loss)(d) | | | 6.45 | | | | (1.79 | ) |
Total from Investment Operations | | | 6.74 | | | | (1.74 | ) |
| | | | | | | | | |
Distributions to Shareholders | | | | | | | | |
Net Investment Income | | | (0.28 | ) | | | (0.04 | ) |
Total from Distributions | | | (0.28 | ) | | | (0.04 | ) |
| | | | | | | | | |
Net Asset Value, End of Period | | $ | 29.81 | | | $ | 23.35 | |
| | | | | | | | | |
Total Return on Net Asset Value(e) | | | 29.02 | %(f) | | | -6.94 | %(f) |
| | | | | | | | | |
Supplemental Data: | | | | | | | | |
Net Assets, End of Period (000’s) | | $ | 15,499 | | | $ | 5,137 | |
Ratio of Expenses to Average Net Assets (Before Advisory Fees Waived) | | | 0.39 | %(g) | | | 0.39 | %(g) |
Ratio of Expenses to Average Net Assets (After Advisory Fees Waived) | | | 0.00 | %(g) | | | 0.00 | %(g) |
Ratio of Net Investment Income (Loss) to Average Net Assets (Before Advisory Fees Waived) | | | 2.19 | %(g) | | | 1.07 | %(g) |
Ratio of Net Investment Income (Loss) to Average Net Assets (After Advisory Fees Waived) | | | 2.58 | %(g) | | | 1.46 | %(g) |
Portfolio Turnover(h) | | | 65 | %(f) | | | 21 | %(f) |
(a) | | |
(b) | | |
(c) | | |
(d) | | |
(e) | | |
(f) | | |
(g) | | |
(h) | | |
The accompanying notes are an integral part of these financial statements.
116
Amplify ETF Trust
Amplify Cash Flow High Income ETF
Financial Highlights
| | Period Ended
March 31,
2024(a) | | Period Ended
October 31,
2023(b) |
Net Asset Value, Beginning of Period | | $ | 23.46 | | | $ | 24.92 | |
Income (Loss) from Investment Operations: | | | | | | | | |
Net Investment Income (Loss)(c) | | | 0.22 | | | | 0.03 | |
Net Realized and Unrealized Gain (Loss)(d) | | | 4.63 | | | | (1.32 | ) |
Total from Investment Operations | | | 4.85 | | | | (1.29 | ) |
| | | | | | | | | |
Distributions to Shareholders | | | | | | | | |
Net Investment Income | | | (0.87 | ) | | | (0.17 | ) |
Total from Distributions | | | (0.87 | ) | | | (0.17 | ) |
| | | | | | | | | |
Net Asset Value, End of Period | | $ | 27.44 | | | $ | 23.46 | |
| | | | | | | | | |
Total Return on Net Asset Value(e) | | | 20.96 | %(f) | | | -5.18 | %(f) |
| | | | | | | | | |
Supplemental Data: | | | | | | | | |
Net Assets, End of Period (000’s) | | $ | 3,292 | | | $ | 2,815 | |
Ratio of Expenses to Average Net Assets | | | 0.65 | %(g) | | | 0.65 | %(g) |
Ratio of Net Investment Income (Loss) to Average Net Assets | | | 2.10 | %(g) | | | 1.14 | %(g) |
Portfolio Turnover(h) | | | 0 | %(f) | | | 0 | %(f) |
(a) | | For the period November 1, 2023 to March 31, 2024. See Note 1 to the Financial Statements. |
(b) | | The Fund commenced operations on September 19, 2023. |
(c) | | Calculated based on average shares outstanding during the period. |
(d) | | Realized and unrealized gains and losses per share in this caption are balancing amounts necessary to reconcile the change in net asset value per share for the period and may not reconcile with the aggregate gains and losses in the statement of operations due to share transactions for the year. |
(e) | | Total Return on Net Asset Value is based on the change in net asset value (“NAV”) of a share during the period and assumes reinvestment of dividends and distributions at NAV. Total Return on Net Asset Value is for the period indicated and has not been annualized. The return shown does not reflect the deduction of taxes that a shareholder would pay on fund distributions or redemption of fund shares. |
(f) | | Not Annualized. |
(g) | | Annualized. |
(h) | | Excludes the impact of in-kind transactions. |
The accompanying notes are an integral part of these financial statements.
117
Amplify ETF Trust
Amplify Samsung SOFR ETF
Financial Highlights
| | Period Ended
March 31,
2024(a) |
Net Asset Value, Beginning of Period | | $ | 100.00 | |
Income (Loss) from Investment Operations: | | | | |
Net Investment Income (Loss)(b) | | | 2.00 | |
Net Realized and Unrealized Gain (Loss)(c) | | | (0.02 | ) |
Total from Investment Operations | | | 1.98 | |
| | | | | |
Distributions to Shareholders | | | | |
Net Investment Income | | | (1.81 | ) |
Total from Distributions | | | (1.81 | ) |
| | | | | |
Capital Share Transactions | | | | |
Transaction Fees | | | 0.03 | |
| | | | | |
Net Asset Value, End of Period | | $ | 100.20 | |
| | | | | |
Total Return on Net Asset Value(d) | | | 2.03 | %(e) |
| | | | | |
Supplemental Data: | | | | |
Net Assets, End of Period (000’s) | | $ | 155,314 | |
Ratio of Expenses to Average Net Assets | | | 0.20 | %(f) |
Ratio of Net Investment Income (Loss) to Average Net Assets | | | 5.29 | %(f) |
Portfolio Turnover(g) | | | 0 | %(e) |
(a) | | The Fund commenced operations on November 14, 2023. |
(b) | | Calculated based on average shares outstanding during the period. |
(c) | | Realized and unrealized gains and losses per share in this caption are balancing amounts necessary to reconcile the change in net asset value per share for the period and may not reconcile with the aggregate gains and losses in the statement of operations due to share transactions for the year. |
(d) | | Total Return on Net Asset Value is based on the change in net asset value (“NAV”) of a share during the period and assumes reinvestment of dividends and distributions at NAV. Total Return on Net Asset Value is for the period indicated and has not been annualized. The return shown does not reflect the deduction of taxes that a shareholder would pay on fund distributions or redemption of fund shares. |
(e) | | Not Annualized. |
(f) | | Annualized. |
(g) | | Excludes the impact of in-kind transactions. |
The accompanying notes are an integral part of these financial statements.
118
Amplify ETF Trust
Amplify Junior Silver Miners ETF
Financial Highlights
| | Six Months
Ended
March 31,
2024 | | Year Ended
September 30,
2023 | | Year Ended
September 30,
2022 | | Year Ended
September 30,
2021 | | Year Ended
September 30,
2020 | | Year Ended
September 30,
2019 |
Net Asset Value, Beginning of Year/Period | | $ | 8.45 | | | $ | 9.11 | | | $ | 11.82 | | | $ | 13.79 | | | $ | 9.45 | | | $ | 8.70 | |
Income (Loss) from Investment Operations: | | | | | | | | | | | | | | | | | | | | | | | | |
Net Investment Income (Loss)(a) | | | (0.01 | ) | | | (0.02 | ) | | | 0.01 | | | | (0.01 | ) | | | (0.05 | ) | | | (0.02 | ) |
Net Realized and Unrealized Gain (Loss)(b) | | | 1.48 | | | | (0.63 | ) | | | (2.68 | ) | | | (1.76 | ) | | | 4.56 | | | | 0.91 | |
Total from Investment Operations | | | 1.47 | | | | (0.65 | ) | | | (2.67 | ) | | | (1.77 | ) | | | 4.51 | | | | 0.89 | |
| | | | | | | | | | | | | | | | | | | | | | | | | |
Distributions to Shareholders | | | | | | | | | | | | | | | | | | | | | | | | |
Net Investment Income | | | — | | | | (0.01 | ) | | | (0.04 | ) | | | (0.20 | ) | | | (0.17 | ) | | | (0.14 | ) |
Total from Distributions | | | — | | | | (0.01 | ) | | | (0.04 | ) | | | (0.20 | ) | | | (0.17 | ) | | | (0.14 | ) |
| | | | | | | | | | | | | | | | | | | | | | | | | |
Capital Share Transactions | | | | | | | | | | | | | | | | | | | | | | | | |
Transaction Fees | | | — | | | | — | | | | 0.00(c) | | | | 0.00(c) | | | | — | | | | — | |
| | | | | | | | | | | | | | | | | | | | | | | | | |
Net Asset Value, End of Year/Period | | $ | 9.92 | | | $ | 8.45 | | | $ | 9.11 | | | $ | 11.82 | | | $ | 13.79 | | | $ | 9.45 | |
| | | | | | | | | | | | | | | | | | | | | | | | | |
Total Return on Net Asset Value(d) | | | 17.45 | %(e) | | | -7.23 | % | | | -22.63 | % | | | -13.06 | % | | | 48.06 | % | | | 10.45 | % |
| | | | | | | | | | | | | | | | | | | | | | | | | |
Supplemental Data: | | | | | | | | | | | | | | | | | | | | | | | | |
Net Assets, End of Year/Period (000’s) | | $ | 719,807 | | | $ | 580,398 | | | $ | 606,358 | | | $ | 727,987 | | | $ | 408,319 | | | $ | 100,119 | |
Ratio of Expenses to Average Net Assets | | | 0.69 | %(f) | | | 0.69 | % | | | 0.69 | % | | | 0.69 | % | | | 0.69 | % | | | 0.69 | % |
Ratio of Net Investment Income (Loss) to Average Net Assets | | | -0.17 | %(f) | | | -0.16 | % | | | 0.12 | % | | | -0.10 | % | | | -0.46 | % | | | -0.21 | % |
Portfolio Turnover(g) | | | 57 | %(e) | | | 80 | % | | | 34 | % | | | 26 | % | | | 71 | % | | | 34 | % |
(a) | | Calculated based on average shares outstanding during the period. |
(b) | | Realized and unrealized gains and losses per share in this caption are balancing amounts necessary to reconcile the change in net asset value per share for the period and may not reconcile with the aggregate gains and losses in the statement of operations due to share transactions for the year. |
(c) | | Less than $0.005. |
(d) | | Total Return on Net Asset Value is based on the change in net asset value (“NAV”) of a share during the period and assumes reinvestment of dividends and distributions at NAV. Total Return on Net Asset Value is for the period indicated and has not been annualized. The return shown does not reflect the deduction of taxes that a shareholder would pay on fund distributions or redemption of fund shares. |
(e) | | Not Annualized. |
(f) | | Annualized. |
(g) | | Excludes the impact of in-kind transactions. |
The accompanying notes are an integral part of these financial statements.
119
Amplify ETF Trust
Amplify Cybersecurity ETF
Financial Highlights |
| | Six Months
Ended
March 31,
2024 | | Year Ended
September 30,
2023 | | Year Ended
September 30,
2022 | | Year Ended
September 30,
2021 | | Year Ended
September 30,
2020 | | Year Ended
September 30,
2019 |
Net Asset Value, Beginning of Year/Period | | $ | 51.59 | | | $ | 43.38 | | | $ | 60.97 | | | $ | 46.56 | | | $ | 37.46 | | | $ | 40.08 | |
Income (Loss) from Investment Operations: | | | | | | | | | | | | | | | | | | | | | | | | |
Net Investment Income (Loss)(a) | | | 0.08 | | | | 0.09 | | | | 0.06 | | | | 0.20 | | | | 0.64 | | | | 0.07 | |
Net Realized and Unrealized Gain (Loss)(b) | | | 12.60 | | | | 8.22 | | | | (17.59 | ) | | | 14.39 | | | | 9.10 | | | | (2.64 | ) |
Total from Investment Operations | | | 12.68 | | | | 8.31 | | | | (17.53 | ) | | | 14.59 | | | | 9.74 | | | | (2.57 | ) |
| | | | | | | | | | | | | | | | | | | | | | | | | |
Distributions to Shareholders | | | | | | | | | | | | | | | | | | | | | | | | |
Net Investment Income | | | (0.08 | ) | | | (0.10 | ) | | | (0.06 | ) | | | (0.18 | ) | | | (0.64 | ) | | | (0.05 | ) |
Total from Distributions | | | (0.08 | ) | | | (0.10 | ) | | | (0.06 | ) | | | (0.18 | ) | | | (0.64 | ) | | | (0.05 | ) |
| | | | | | | | | | | | | | | | | | | | | | | | | |
Net Asset Value, End of Year/Period | | $ | 64.19 | | | $ | 51.59 | | | $ | 43.38 | | | $ | 60.97 | | | $ | 46.56 | | | $ | 37.46 | |
| | | | | | | | | | | | | | | | | | | | | | | | | |
Total Return on Net Asset Value(c) | | | 24.59 | %(d) | | | 19.18 | % | | | -28.77 | % | | | 31.34 | % | | | 26.75 | % | | | -6.42 | % |
| | | | | | | | | | | | | | | | | | | | | | | | | |
Supplemental Data: | | | | | | | | | | | | | | | | | | | | | | | | |
Net Assets, End of Year/Period (000’s) | | $ | 1,774,719 | | | $ | 1,423,792 | | | $ | 1,431,515 | | | $ | 2,307,648 | | | $ | 1,503,814 | | | $ | 1,427,200 | |
Ratio of Expenses to Average Net Assets | | | 0.60 | %(e) | | | 0.60 | % | | | 0.60 | % | | | 0.60 | % | | | 0.60 | % | | | 0.60 | % |
Ratio of Net Investment Income (Loss) to Average Net Assets | | | 0.28 | %(e) | | | 0.20 | % | | | 0.11 | % | | | 0.35 | % | | | 1.50 | % | | | 0.19 | % |
Portfolio Turnover(f) | | | 50 | %(d) | | | 16 | % | | | 51 | % | | | 34 | % | | | 33 | % | | | 36 | % |
(a) | | Calculated based on average shares outstanding during the period. |
(b) | | Realized and unrealized gains and losses per share in this caption are balancing amounts necessary to reconcile the change in net asset value per share for the period and may not reconcile with the aggregate gains and losses in the statement of operations due to share transactions for the year. |
(c) | | Total Return on Net Asset Value is based on the change in net asset value (“NAV”) of a share during the period and assumes reinvestment of dividends and distributions at NAV. Total Return on Net Asset Value is for the period indicated and has not been annualized. The return shown does not reflect the deduction of taxes that a shareholder would pay on fund distributions or redemption of fund shares. |
(d) | | Not Annualized. |
(e) | | Annualized. |
(f) | | Excludes the impact of in-kind transactions. |
The accompanying notes are an integral part of these financial statements.
120
Amplify ETF Trust
Amplify Mobile Payments ETF
Financial Highlights |
| | Six Months
Ended
March 31,
2024 | | Year Ended
September 30,
2023 | | Year Ended
September 30,
2022 | | Year Ended
September 30,
2021 | | Year Ended
September 30,
2020 | | Year Ended
September 30,
2019 |
Net Asset Value, Beginning of Year/Period | | $ | 39.23 | | | $ | 37.85 | | | $ | 67.82 | | | $ | 54.30 | | | $ | 46.60 | | | $ | 42.86 | |
Income (Loss) from Investment Operations: | | | | | | | | | | | | | | | | | | | | | | | | |
Net Investment Income (Loss)(a) | | | 0.01 | | | | 0.02 | | | | (0.04 | ) | | | (0.13 | ) | | | (0.04 | ) | | | 0.03 | |
Net Realized and Unrealized Gain (Loss)(b) | | | 13.44 | | | | 1.36 | | | | (29.93 | ) | | | 13.65 | | | | 7.75 | | | | 3.93 | |
Total from Investment Operations | | | 13.45 | | | | 1.38 | | | | (29.97 | ) | | | 13.52 | | | | 7.71 | | | | 3.96 | |
| | | | | | | | | | | | | | | | | | | | | | | | | |
Distributions to Shareholders | | | | | | | | | | | | | | | | | | | | | | | | |
Net Investment Income | | | (0.05 | ) | | | — | | | | — | | | | — | | | | (0.02 | ) | | | (0.05 | ) |
Net Realized Gains | | | — | | | | — | | | | — | | | | — | | | | — | | | | (0.18 | ) |
Total from Distributions | | | (0.05 | ) | | | — | | | | — | | | | — | | | | (0.02 | ) | | | (0.23 | ) |
| | | | | | | | | | | | | | | | | | | | | | | | | |
Capital Share Transactions | | | | | | | | | | | | | | | | | | | | | | | | |
Transaction Fees | | | 0.00 | (c) | | | 0.00 | (c) | | | — | | | | — | | | | 0.01 | | | | 0.01 | |
| | | | | | | | | | | | | | | | | | | | | | | | | |
Net Asset Value, End of Year/Period | | $ | 52.63 | | | $ | 39.23 | | | $ | 37.85 | | | $ | 67.82 | | | $ | 54.30 | | | $ | 46.60 | |
| | | | | | | | | | | | | | | | | | | | | | | | | |
Total Return on Net Asset Value(d) | | | 34.31 | %(e) | | | 3.64 | % | | | -44.18 | % | | | 24.91 | % | | | 16.56 | % | | | 9.49 | % |
| | | | | | | | | | | | | | | | | | | | | | | | | |
Supplemental Data: | | | | | | | | | | | | | | | | | | | | | | | | |
Net Assets, End of Year/Period (000’s) | | $ | 360,539 | | | $ | 357,015 | | | $ | 507,208 | | | $ | 1,193,637 | | | $ | 798,142 | | | $ | 743,198 | |
Ratio of Expenses to Average Net Assets | | | 0.75 | %(f) | | | 0.75 | % | | | 0.75 | % | | | 0.75 | % | | | 0.75 | % | | | 0.75 | % |
Ratio of Net Investment Income (Loss) to Average Net Assets | | | 0.04 | %(f) | | | 0.06 | % | | | -0.09 | % | | | -0.20 | % | | | -0.08 | % | | | 0.06 | % |
Portfolio Turnover(g) | | | 37 | %(e) | | | 23 | % | | | 35 | % | | | 27 | % | | | 19 | % | | | 28 | % |
(a) | | Calculated based on average shares outstanding during the period. |
(b) | | Realized and unrealized gains and losses per share in this caption are balancing amounts necessary to reconcile the change in net asset value per share for the period and may not reconcile with the aggregate gains and losses in the statement of operations due to share transactions for the year. |
(c) | | Less than $0.005. |
(d) | | Total Return on Net Asset Value is based on the change in net asset value (“NAV”) of a share during the period and assumes reinvestment of dividends and distributions at NAV. Total Return on Net Asset Value is for the period indicated and has not been annualized. The return shown does not reflect the deduction of taxes that a shareholder would pay on fund distributions or redemption of fund shares. |
(e) | | Not Annualized. |
(f) | | Annualized. |
(g) | | Excludes the impact of in-kind transactions. |
The accompanying notes are an integral part of these financial statements.
121
Amplify ETF Trust
Amplify BlueStar Israel Technology ETF
Financial Highlights |
| | Six Months
Ended
March 31,
2024 | | Year Ended
September 30,
2023 | | Year Ended
September 30,
2022 | | Year Ended
September 30,
2021 | | Year Ended
September 30,
2020 | | Year Ended
September 30,
2019 |
Net Asset Value, Beginning of Year/Period | | $ | 41.25 | | | $ | 43.94 | | | $ | 66.09 | | | $ | 55.57 | | | $ | 39.92 | | | $ | 36.03 | |
Income (Loss) from Investment Operations: | | | | | | | | | | | | | | | | | | | | | | | | |
Net Investment Income (Loss)(a) | | | (0.04 | ) | | | 0.00 | (b) | | | (0.05 | ) | | | (0.01 | ) | | | (0.06 | ) | | | (0.04 | ) |
Net Realized and Unrealized Gain (Loss)(c) | | | 7.17 | | | | (2.69 | ) | | | (22.10 | ) | | | 10.97 | | | | 15.71 | | | | 4.03 | |
Total from Investment Operations | | | 7.13 | | | | (2.69 | ) | | | (22.15 | ) | | | 10.96 | | | | 15.65 | | | | 3.99 | |
| | | | | | | | | | | | | | | | | | | | | | | | | |
Distributions to Shareholders | | | | | | | | | | | | | | | | | | | | | | | | |
Net Investment Income | | | — | | | | — | | | | — | | | | (0.44 | ) | | | — | | | | (0.09 | ) |
Return of Capital | | | — | | | | — | | | | — | | | | — | | | | — | | | | (0.01 | ) |
Total from Distributions | | | — | | | | — | | | | — | | | | (0.44 | ) | | | — | | | | (0.10 | ) |
| | | | | | | | | | | | | | | | | | | | | | | | | |
Net Asset Value, End of Year/Period | | $ | 48.38 | | | $ | 41.25 | | | $ | 43.94 | | | $ | 66.09 | | | $ | 55.57 | | | $ | 39.92 | |
| | | | | | | | | | | | | | | | | | | | | | | | | |
Total Return on Net Asset Value(d) | | | 17.27 | %(e) | | | -6.12 | % | | | -33.52 | % | | | 19.76 | % | | | 39.20 | % | | | 11.17 | % |
| | | | | | | | | | | | | | | | | | | | | | | | | |
Supplemental Data: | | | | | | | | | | | | | | | | | | | | | | | | |
Net Assets, End of Year/Period (000’s) | | $ | 87,079 | | | $ | 88,690 | | | $ | 116,443 | | | $ | 191,673 | | | $ | 127,802 | | | $ | 73,847 | |
Ratio of Expenses to Average Net Assets | | | 0.75 | %(f) | | | 0.75 | % | | | 0.75 | % | | | 0.75 | % | | | 0.75 | % | | | 0.75 | % |
Ratio of Net Investment Income (Loss) to Average Net Assets | | | -0.18 | %(f) | | | 0.00 | %(g) | | | -0.10 | % | | | -0.02 | % | | | -0.12 | % | | | -0.12 | % |
Portfolio Turnover(h) | | | 10 | %(e) | | | 17 | % | | | 25 | % | | | 21 | % | | | 19 | % | | | 24 | % |
(a) | | Calculated based on average shares outstanding during the period. |
(b) | | Less than $0.005. |
(c) | | Realized and unrealized gains and losses per share in this caption are balancing amounts necessary to reconcile the change in net asset value per share for the period and may not reconcile with the aggregate gains and losses in the statement of operations due to share transactions for the year. |
(d) | | Total Return on Net Asset Value is based on the change in net asset value (“NAV”) of a share during the period and assumes reinvestment of dividends and distributions at NAV. Total Return on Net Asset Value is for the period indicated and has not been annualized. The return shown does not reflect the deduction of taxes that a shareholder would pay on fund distributions or redemption of fund shares. |
(e) | | Not Annualized. |
(f) | | Annualized. |
(g) | | Less than .0.005%. |
(h) | | Excludes the impact of in-kind transactions. |
The accompanying notes are an integral part of these financial statements.
122
Amplify ETF Trust
Amplify Etho Climate Leadership U.S. ETF
Financial Highlights
| | Six Months
Ended
March 31,
2024 | | Year Ended
September 30,
2023 | | Year Ended
September 30,
2022 | | Year Ended
September 30,
2021 | | Year Ended
September 30,
2020 | | Year Ended
September 30,
2019 |
Net Asset Value, Beginning of Year/Period | | $ | 50.01 | | | $ | 46.15 | | | $ | 59.36 | | | $ | 44.18 | | | $ | 39.58 | | | $ | 37.50 | |
Income (Loss) from Investment Operations: | | | | | | | | | | | | | | | | | | | | | | | | |
Net Investment Income (Loss)(a) | | | 0.38 | | | | 0.63 | | | | 0.52 | | | | 0.47 | | | | 0.41 | | | | 0.33 | |
Net Realized and Unrealized Gain (Loss)(b) | | | 8.49 | | | | 3.87 | | | | (13.26 | ) | | | 15.17 | | | | 4.54 | | | | 2.08 | |
Total from Investment Operations | | | 8.87 | | | | 4.50 | | | | (12.74 | ) | | | 15.64 | | | | 4.95 | | | | 2.41 | |
| | | | | | | | | | | | | | | | | | | | | | | | | |
Distributions to Shareholders | | | | | | | | | | | | | | | | | | | | | | | | |
Net Investment Income | | | (0.43 | ) | | | (0.64 | ) | | | (0.47 | ) | | | (0.46 | ) | | | (0.35 | ) | | | (0.33 | ) |
Total from Distributions | | | (0.43 | ) | | | (0.64 | ) | | | (0.47 | ) | | | (0.46 | ) | | | (0.35 | ) | | | (0.33 | ) |
| | | | | | | | | | | | | | | | | | | | | | | | | |
Net Asset Value, End of Year/Period | | $ | 58.45 | | | $ | 50.01 | | | $ | 46.15 | | | $ | 59.36 | | | $ | 44.18 | | | $ | 39.58 | |
| | | | | | | | | | | | | | | | | | | | | | | | | |
Total Return on Net Asset Value(c) | | | 17.79 | %(d) | | | 9.74 | % | | | -21.58 | % | | | 35.48 | % | | | 12.59 | % | | | 6.53 | % |
| | | | | | | | | | | | | | | | | | | | | | | | | |
Supplemental Data: | | | | | | | | | | | | | | | | | | | | | | | | |
Net Assets, End of Year/Period (000’s) | | $ | 189,977 | | | $ | 172,521 | | | $ | 147,670 | | | $ | 178,070 | | | $ | 90,561 | | | $ | 53,431 | |
Ratio of Expenses to Average Net Assets | | | 0.45 | %(e) | | | 0.45 | % | | | 0.45 | % | | | 0.45 | % | | | 0.45 | % | | | 0.45 | % |
Ratio of Net Investment Income (Loss) to Average Net Assets | | | 1.44 | %(e) | | | 1.22 | % | | | 0.92 | % | | | 0.83 | % | | | 1.00 | % | | | 0.88 | % |
Portfolio Turnover(f) | | | 3 | %(d) | | | 50 | % | | | 30 | % | | | 45 | % | | | 37 | % | | | 41 | % |
(a) | | Calculated based on average shares outstanding during the period. |
(b) | | Realized and unrealized gains and losses per share in this caption are balancing amounts necessary to reconcile the change in net asset value per share for the period and may not reconcile with the aggregate gains and losses in the statement of operations due to share transactions for the year. |
(c) | | Total Return on Net Asset Value is based on the change in net asset value (“NAV”) of a share during the period and assumes reinvestment of dividends and distributions at NAV. Total Return on Net Asset Value is for the period indicated and has not been annualized. The return shown does not reflect the deduction of taxes that a shareholder would pay on fund distributions or redemption of fund shares. |
(d) | | Not Annualized. |
(e) | | Annualized. |
(f) | | Excludes the impact of in-kind transactions. |
The accompanying notes are an integral part of these financial statements.
123
Amplify ETF Trust
Amplify Alternative Harvest ETF
Financial Highlights
| | Six Months
Ended
March 31,
2024 | | Year Ended
September 30,
2023 | | Year Ended
September 30,
2022 | | Year Ended
September 30,
2021 | | Year Ended
September 30,
2020 | | Year Ended
September 30,
2019 |
Net Asset Value, Beginning of Year/Period | | $ | 3.64 | | | $ | 4.62 | | | $ | 14.40 | | | $ | 10.37 | | | $ | 20.83 | | | $ | 39.74 | |
Income (Loss) from Investment Operations: | | | | | | | | | | | | | | | | | | | | | | | | |
Net Investment Income (Loss)(a) | | | 0.09 | | | | 0.12 | | | | 0.18 | | | | 0.26 | | | | 0.91 | | | | 1.02 | |
Net Realized and Unrealized Gain (Loss)(b) | | | 0.54 | | | | (0.98 | ) | | | (9.78 | ) | | | 4.01 | | | | (10.49 | ) | | | (18.96 | ) |
Total from Investment Operations | | | 0.63 | | | | (0.86 | ) | | | (9.60 | ) | | | 4.27 | | | | (9.58 | ) | | | (17.94 | ) |
| | | | | | | | | | | | | | | | | | | | | | | | | |
Distributions to Shareholders | | | | | | | | | | | | | | | | | | | | | | | | |
Net Investment Income | | | (0.11 | ) | | | (0.12 | ) | | | (0.18 | ) | | | (0.24 | ) | | | (0.88 | ) | | | (0.97 | ) |
Total from Distributions | | | (0.11 | ) | | | (0.12 | ) | | | (0.18 | ) | | | (0.24 | ) | | | (0.88 | ) | | | (0.97 | ) |
| | | | | | | | | | | | | | | | | | | | | | | | | |
Net Asset Value, End of Year/Period | | $ | 4.16 | | | $ | 3.64 | | | $ | 4.62 | | | $ | 14.40 | | | $ | 10.37 | | | $ | 20.83 | |
| | | | | | | | | | | | | | | | | | | | | | | | | |
Total Return on Net Asset Value(c) | | | 18.08 | %(d) | | | -18.67 | % | | | -67.06 | % | | | 40.90 | % | | | -46.83 | % | | | -45.60 | % |
| | | | | | | | | | | | | | | | | | | | | | | | | |
Supplemental Data: | | | | | | | | | | | | | | | | | | | | | | | | |
Net Assets, End of Year/Period (000’s) | | $ | 282,705 | | | $ | 259,615 | | | $ | 324,730 | | | $ | 1,067,609 | | | $ | 495,971 | | | $ | 800,957 | |
Ratio of Expenses to Average Net Assets (Before Advisory Fees Waived) | | | 0.75 | %(e) | | | 0.75 | % | | | 0.75 | % | | | 0.75 | % | | | 0.75 | % | | | 0.75 | % |
Ratio of Expenses to Average Net Assets (After Advisory Fees Waived) | | | 0.37 | %(e) | | | 0.46 | % | | | 0.75 | % | | | 0.75 | % | | | 0.75 | % | | | 0.75 | % |
Ratio of Net Investment Income (Loss) to Average Net Assets (Before Advisory Fees Waived) | | | 5.06 | %(e) | | | 2.60 | % | | | 1.95 | % | | | 1.39 | % | | | 6.27 | % | | | 3.26 | % |
Ratio of Net Investment Income (Loss) to Average Net Assets (After Advisory Fees Waived) | | | 5.44 | %(e) | | | 2.89 | % | | | 1.95 | % | | | 1.39 | % | | | 6.27 | % | | | 3.26 | % |
Portfolio Turnover(f) | | | 24 | %(d) | | | 60 | % | | | 74 | % | | | 75 | % | | | 46 | % | | | 71 | % |
(a) | | Calculated based on average shares outstanding during the period. |
(b) | | Realized and unrealized gains and losses per share in this caption are balancing amounts necessary to reconcile the change in net asset value per share for the period and may not reconcile with the aggregate gains and losses in the statement of operations due to share transactions for the year. |
(c) | | Total Return on Net Asset Value is based on the change in net asset value (“NAV”) of a share during the period and assumes reinvestment of dividends and distributions at NAV. Total Return on Net Asset Value is for the period indicated and has not been annualized. The return shown does not reflect the deduction of taxes that a shareholder would pay on fund distributions or redemption of fund shares. |
(d) | | Not Annualized. |
(e) | | Annualized. |
(f) | | Excludes the impact of in-kind transactions. |
The accompanying notes are an integral part of these financial statements.
124
Amplify ETF Trust
Amplify Global Cloud Technology ETF
Financial Highlights
| | Six Months
Ended
March 31,
2024 | | Year Ended
September 30,
2023 | | Year Ended
September 30,
2022 | | Year Ended
September 30,
2021 | | Year Ended
September 30,
2020 | | Year Ended
September 30,
2019 |
Net Asset Value, Beginning of Year/Period | | $ | 35.22 | | | $ | 28.66 | | | $ | 51.58 | | | $ | 42.29 | | | $ | 35.92 | | | $ | 39.05 | |
Income (Loss) from Investment Operations: | | | | | | | | | | | | | | | | | | | | | | | | |
Net Investment Income (Loss)(a) | | | 0.01 | | | | 0.01 | | | | (0.03 | ) | | | (0.03 | ) | | | 0.26 | | | | 0.28 | |
Net Realized and Unrealized Gain (Loss)(b) | | | 11.64 | | | | 6.55 | | | | (22.89 | ) | | | 9.45 | | | | 6.34 | | | | (3.11 | ) |
Total from Investment Operations | | | 11.65 | | | | 6.56 | | | | (22.92 | ) | | | 9.42 | | | | 6.60 | | | | (2.83 | ) |
| | | | | | | | | | | | | | | | | | | | | | | | | |
Distributions to Shareholders | | | | | | | | | | | | | | | | | | | | | | | | |
Net Investment Income | | | (0.01 | ) | | | — | | | | — | | | | (0.13 | ) | | | (0.23 | ) | | | (0.30 | ) |
Total from Distributions | | | (0.01 | ) | | | — | | | | — | | | | (0.13 | ) | | | (0.23 | ) | | | (0.30 | ) |
| | | | | | | | | | | | | | | | | | | | | | | | | |
Capital Share Transactions | | | | | | | | | | | | | | | | | | | | | | | | |
Transaction Fees | | | 0.00(c) | | | | 0.00(c) | | | | 0.00(c) | | | | — | | | | — | | | | — | |
| | | | | | | | | | | | | | | | | | | | | | | | | |
Net Asset Value, End of Year/Period | | $ | 46.86 | | | $ | 35.22 | | | $ | 28.66 | | | $ | 51.58 | | | $ | 42.29 | | | $ | 35.92 | |
| | | | | | | | | | | | | | | | | | | | | | | | | |
Total Return on Net Asset Value(d) | | | 33.07 | %(e) | | | 22.92 | % | | | -44.44 | % | | | 22.28 | % | | | 18.58 | % | | | -7.23 | % |
| | | | | | | | | | | | | | | | | | | | | | | | | |
Supplemental Data: | | | | | | | | | | | | | | | | | | | | | | | | |
Net Assets, End of Year/Period (000’s) | | $ | 32,805 | | | $ | 24,656 | | | $ | 22,925 | | | $ | 54,155 | | | $ | 46,515 | | | $ | 37,720 | |
Ratio of Expenses to Average Net Assets | | | 0.68 | %(f) | | | 0.68 | % | | | 0.68 | % | | | 0.68 | % | | | 0.71 | %(g) | | | 0.75 | % |
Ratio of Net Investment Income (Loss) to Average Net Assets | | | 0.05 | %(f) | | | 0.02 | % | | | -0.09 | % | | | -0.06 | % | | | 0.70 | % | | | 0.83 | % |
Portfolio Turnover(h) | | | 21 | %(e) | | | 29 | % | | | 28 | % | | | 14 | % | | | 104 | % | | | 38 | % |
(a) | | Calculated based on average shares outstanding during the period. |
(b) | | Realized and unrealized gains and losses per share in this caption are balancing amounts necessary to reconcile the change in net asset value per share for the period and may not reconcile with the aggregate gains and losses in the statement of operations due to share transactions for the year. |
(c) | | Less than $0.005. |
(d) | | Total Return on Net Asset Value is based on the change in net asset value (“NAV”) of a share during the period and assumes reinvestment of dividends and distributions at NAV. Total Return on Net Asset Value is for the period indicated and has not been annualized. The return shown does not reflect the deduction of taxes that a shareholder would pay on fund distributions or redemption of fund shares. |
(e) | | Not Annualized. |
(f) | | Annualized. |
(g) | | Effective April 7, 2020, the Fund’s expense ratio was reduced to 0.68%. |
(h) | | Excludes the impact of in-kind transactions. |
The accompanying notes are an integral part of these financial statements.
125
Amplify ETF Trust
Amplify Video Game Tech ETF
Financial Highlights
| | Six Months
Ended
March 31, 2024 | | Year Ended
September 30,
2023 | | Year Ended
September 30,
2022 | | Year Ended
September 30,
2021 | | Year Ended
September 30,
2020 | | Year Ended
September 30,
2019 |
Net Asset Value, Beginning of Year/Period | | $ | 53.56 | | | $ | 51.00 | | | $ | 83.69 | | | $ | 67.61 | | | $ | 41.50 | | | $ | 47.49 | |
Income (Loss) from Investment Operations: | | | | | | | | | | | | | | | | | | | | | | | | |
Net Investment Income (Loss)(a) | | | 0.02 | | | | 0.17 | | | | 0.25 | | | | 0.74 | | | | 0.25 | | | | 0.52 | |
Net Realized and Unrealized Gain (Loss)(b) | | | 4.71 | | | | 2.38 | | | | (30.82 | ) | | | 15.96 | | | | 26.26 | | | | (5.87 | ) |
Total from Investment Operations | | | 4.73 | | | | 2.55 | | | | (30.57 | ) | | | 16.70 | | | | 26.51 | | | | (5.35 | ) |
| | | | | | | | | | | | | | | | | | | | | | | | | |
Distributions to Shareholders | | | | | | | | | | | | | | | | | | | | | | | | |
Net Investment Income | | | (0.03 | ) | | | — | | | | (2.14 | ) | | | (0.72 | ) | | | (0.41 | ) | | | (0.65 | ) |
Total from Distributions | | | (0.03 | ) | | | — | | | | (2.14 | ) | | | (0.72 | ) | | | (0.41 | ) | | | (0.65 | ) |
| | | | | | | | | | | | | | | | | | | | | | | | | |
Capital Share Transactions | | | | | | | | | | | | | | | | | | | | | | | | |
Transaction Fees | | | 0.00 | (c) | | | 0.01 | | | | 0.02 | | | | 0.10 | | | | 0.01 | | | | 0.01 | |
| | | | | | | | | | | | | | | | | | | | | | | | | |
Net Asset Value, End of Year/Period | | $ | 58.26 | | | $ | 53.56 | | | $ | 51.00 | | | $ | 83.69 | | | $ | 67.61 | | | $ | 41.50 | |
| | | | | | | | | | | | | | | | | | | | | | | | | |
Total Return on Net Asset Value(d) | | | 8.83 | %(e) | | | 5.01 | % | | | -37.58 | % | | | 24.91 | % | | | 64.12 | % | | | -11.26 | % |
| | | | | | | | | | | | | | | | | | | | | | | | | |
Supplemental Data: | | | | | | | | | | | | | | | | | | | | | | | | |
Net Assets, End of Year/Period (000’s) | | $ | 40,780 | | | $ | 42,844 | | | $ | 51,001 | | | $ | 100,427 | | | $ | 121,699 | | | $ | 83,000 | |
Ratio of Expenses to Average Net Assets | | | 0.75 | %(f) | | | 0.75 | % | | | 0.75 | % | | | 0.75 | % | | | 0.75 | % | | | 0.75 | % |
Ratio of Net Investment Income (Loss) to Average Net Assets | | | 0.06 | %(f) | | | 0.29 | % | | | 0.33 | % | | | 0.87 | % | | | 0.51 | % | | | 1.22 | % |
Portfolio Turnover(g) | | | 30 | %(e) | | | 44 | % | | | 53 | % | | | 89 | % | | | 53 | % | | | 38 | % |
(a) | | Calculated based on average shares outstanding during the period. |
(b) | | Realized and unrealized gains and losses per share in this caption are balancing amounts necessary to reconcile the change in net asset value per share for the period and may not reconcile with the aggregate gains and losses in the statement of operations due to share transactions for the year. |
(c) | | Less than $0.005. |
(d) | | Total Return on Net Asset Value is based on the change in net asset value (“NAV”) of a share during the period and assumes reinvestment of dividends and distributions at NAV. Total Return on Net Asset Value is for the period indicated and has not been annualized. The return shown does not reflect the deduction of taxes that a shareholder would pay on fund distributions or redemption of fund shares. |
(e) | | Not Annualized. |
(f) | | Annualized. |
(g) | | Excludes the impact of in-kind transactions. |
The accompanying notes are an integral part of these financial statements.
126
Amplify ETF Trust
Amplify AI Powered Equity ETF
Financial Highlights
| | Six Months
Ended
March 31, 2024 | | Year Ended
September 30,
2023 | | Year Ended
September 30,
2022 | | Year Ended
September 30,
2021 | | Year Ended
September 30,
2020 | | Year Ended
September 30,
2019 |
Net Asset Value, Beginning of Year/Period | | $ | 29.77 | | | $ | 28.92 | | | $ | 41.12 | | | $ | 30.72 | | | $ | 26.19 | | | $ | 29.50 | |
Income (Loss) from Investment Operations: | | | | | | | | | | | | | | | | | | | | | | | | |
Net Investment Income (Loss)(a) | | | 0.14 | | | | 0.35 | | | | 0.09 | | | | (0.03) | | | | 0.14 | | | | 0.16 | |
Net Realized and Unrealized Gain (Loss)(b) | | | 6.68 | | | | 0.87 | | | | (11.57 | ) | | | 10.47 | | | | 4.52 | | | | (1.41 | ) |
Total from Investment Operations | | | 6.82 | | | | 1.22 | | | | (11.48 | ) | | | 10.44 | | | | 4.66 | | | | (1.25 | ) |
| | | | | | | | | | | | | | | | | | | | | | | | | |
Distributions to Shareholders | | | | | | | | | | | | | | | | | | | | | | | | |
Net Investment Income | | | (0.16 | ) | | | (0.37 | ) | | | — | | | | (0.04 | ) | | | (0.13 | ) | | | (0.17 | ) |
Net Realized Gains | | | — | | | | — | | | | (0.72 | ) | | | — | | | | — | | | | (1.89 | ) |
Total from Distributions | | | (0.16 | ) | | | (0.37 | ) | | | (0.72 | ) | | | (0.04 | ) | | | (0.13 | ) | | | (2.06 | ) |
| | | | | | | | | | | | | | | | | | | | | | | | | |
Net Asset Value, End of Year/Period | | $ | 36.43 | | | $ | 29.77 | | | $ | 28.92 | | | $ | 41.12 | | | $ | 30.72 | | | $ | 26.19 | |
| | | | | | | | | | | | | | | | | | | | | | | | | |
Total Return on Net Asset Value(c) | | | 22.98 | %(d) | | | 4.20 | % | | | -28.45 | % | | | 34.00 | % | | | 17.94 | % | | | -2.32 | % |
| | | | | | | | | | | | | | | | | | | | | | | | | |
Supplemental Data: | | | | | | | | | | | | | | | | | | | | | | | | |
Net Assets, End of Year/Period (000’s) | | $ | 110,208 | | | $ | 101,950 | | | $ | 99,060 | | | $ | 167,562 | | | $ | 92,933 | | | $ | 114,573 | |
Ratio of Expenses to Average Net Assets | | | 0.75 | %(e) | | | 0.75 | % | | | 0.75 | % | | | 0.75 | % | | | 0.75 | % | | | 0.75 | % |
Ratio of Net Investment Income (Loss) to Average Net Assets | | | 0.85 | %(e) | | | 1.17 | % | | | 0.24 | % | | | -0.09 | % | | | 0.49 | % | | | 0.64 | % |
Portfolio Turnover(f) | | | 596 | %(d) | | | 2719 | % | | | 1708 | % | | | 540 | % | | | 239 | % | | | 129 | % |
(a) | | Calculated based on average shares outstanding during the period. |
(b) | | Realized and unrealized gains and losses per share in this caption are balancing amounts necessary to reconcile the change in net asset value per share for the period and may not reconcile with the aggregate gains and losses in the statement of operations due to share transactions for the year. |
(c) | | Total Return on Net Asset Value is based on the change in net asset value (“NAV”) of a share during the period and assumes reinvestment of dividends and distributions at NAV. Total Return on Net Asset Value is for the period indicated and has not been annualized. The return shown does not reflect the deduction of taxes that a shareholder would pay on fund distributions or redemption of fund shares. |
(d) | | Not Annualized. |
(e) | | Annualized. |
(f) | | Excludes the impact of in-kind transactions. |
The accompanying notes are an integral part of these financial statements.
127
Amplify ETF Trust
Amplify Travel Tech ETF
Financial Highlights
| | Six Months
Ended
March 31, 2024 | | Year Ended
September 30,
2023 | | Year Ended
September 30,
2022 | | Year Ended
September 30,
2021 | | Year Ended
September 30,
2020(a) |
Net Asset Value, Beginning of Year/Period | | $ | 16.90 | | | $ | 15.86 | | | $ | 28.37 | | | $ | 18.88 | | | $ | 25.00 | |
Income (Loss) from Investment Operations: | | | | | | | | | | | | | | | | | | | | |
Net Investment Income (Loss)(b) | | | 0.02 | | | | (0.08 | ) | | | (0.10 | ) | | | (0.13 | ) | | | (0.02 | ) |
Net Realized and Unrealized Gain (Loss)(c) | | | 3.60 | | | | 1.12 | | | | (12.42 | ) | | | 9.60 | | | | (6.12 | ) |
Total from Investment Operations | | | 3.62 | | | | 1.04 | | | | (12.52 | ) | | | 9.47 | | | | (6.14 | ) |
| | | | | | | | | | | | | | | | | | | | | |
Distributions to Shareholders | | | | | | | | | | | | | | | | | | | | |
Net Investment Income | | | (0.02 | ) | | | — | | | | — | | | | (0.01 | ) | | | — | |
Total from Distributions | | | (0.02 | ) | | | — | | | | — | | | | (0.01 | ) | | | — | |
| | | | | | | | | | | | | | | | | | | | | |
Capital Share Transactions | | | | | | | | | | | | | | | | | | | | |
Transaction Fees | | | 0.00 | (d) | | | 0.00(d) | | | | 0.01 | | | | 0.03 | | | | 0.02 | |
| | | | | | | | | | | | | | | | | | | | | |
Net Asset Value, End of Year/Period | | $ | 20.50 | | | $ | 16.90 | | | $ | 15.86 | | | $ | 28.37 | | | $ | 18.88 | |
| | | | | | | | | | | | | | | | | | | | | |
Total Return on Net Asset Value(e) | | | 21.48 | %(f) | | | 6.54 | % | | | -44.08 | % | | | 50.35 | % | | | -24.50 | %(f) |
| | | | | | | | | | | | | | | | | | | | | |
Supplemental Data: | | | | | | | | | | | | | | | | | | | | |
Net Assets, End of Year/Period (000’s) | | $ | 89,192 | | | $ | 103,929 | | | $ | 146,718 | | | $ | 321,957 | | | $ | 15,100 | |
Ratio of Expenses to Average Net Assets | | | 0.75 | %(g) | | | 0.75 | % | | | 0.76 | %(h) | | | 0.75 | % | | | 0.75 | %(g) |
Ratio of Net Investment Income (Loss)to Average Net Assets(h) | | | 0.23 | %(g) | | | -0.49 | % | | | -0.47 | % | | | -0.43 | % | | | 0.30 | %(g) |
Portfolio Turnover(i) | | | 19 | %(f) | | | 48 | % | | | 40 | % | | | 57 | % | | | 49 | %(f) |
(a) | | The Fund commenced operations on February 12, 2020. |
(b) | | Calculated based on average shares outstanding during the period. |
(c) | | Realized and unrealized gains and losses per share in this caption are balancing amounts necessary to reconcile the change in net asset value per share for the period and may not reconcile with the aggregate gains and losses in the statement of operations due to share transactions for the year. |
(d) | | Less than $0.005. |
(e) | | Total Return on Net Asset Value is based on the change in net asset value (“NAV”) of a share during the period and assumes reinvestment of dividends and distributions at NAV. Total Return on Net Asset Value is for the period indicated and has not been annualized. The return shown does not reflect the deduction of taxes that a shareholder would pay on fund distributions or redemption of fund shares. |
(f) | | Not Annualized. |
(g) | | Annualized. |
(h) | | Includes 0.01% of dividend and interest expense. |
(i) | | Excludes the impact of in-kind transactions. |
The accompanying notes are an integral part of these financial statements.
128
Amplify ETF Trust
Amplify Treatments, Testing and Advancements ETF
Financial Highlights
| | Six Months
Ended
March 31,
2024 | | Year Ended
September 30,
2023 | | Year Ended
September 30,
2022 | | Year Ended
September 30,
2021 | | Year Ended
September 30,
2020(a) |
Net Asset Value, Beginning of Year/Period | | $ | 17.94 | | | $ | 20.73 | | | $ | 40.96 | | | $ | 27.71 | | | $ | 25.00 | |
Income (Loss) from Investment Operations: | | | | | | | | | | | | | | | | | | | | |
Net Investment Income (Loss)(b) | | | 0.10 | | | | 0.19 | | | | 0.11 | | | | 0.36 | | | | 0.02 | |
Net Realized and Unrealized Gain (Loss)(c) | | | 0.58 | | | | (2.76 | ) | | | (20.23 | ) | | | 13.28 | | | | 2.69 | |
Total from Investment Operations | | | 0.68 | | | | (2.57 | ) | | | (20.12 | ) | | | 13.64 | | | | 2.71 | |
| | | | | | | | | | | | | | | | | | | | | |
Distributions to Shareholders | | | | | | | | | | | | | | | | | | | | |
Net Investment Income | | | (0.11 | ) | | | (0.22 | ) | | | (0.11 | ) | | | (0.39 | ) | | | — | |
Total from Distributions | | | (0.11 | ) | | | (0.22 | ) | | | (0.11 | ) | | | (0.39 | ) | | | — | |
| | | | | | | | | | | | | | | | | | | | | |
Net Asset Value, End of Year/Period | | $ | 18.51 | | | $ | 17.94 | | | $ | 20.73 | | | $ | 40.96 | | | $ | 27.71 | |
| | | | | | | | | | | | | | | | | | | | | |
Total Return on Net Asset Value(d) | | | 3.75 | %(f) | | | -12.53 | % | | | -49.14 | % | | | 49.43 | %(e) | | | 10.82 | %(f) |
| | | | | | | | | | | | | | | | | | | | | |
Supplemental Data: | | | | | | | | | | | | | | | | | | | | |
Net Assets, End of Year/Period (000’s) | | $ | 11,104 | | | $ | 13,451 | | | $ | 21,763 | | | $ | 63,481 | | | $ | 54,030 | |
Ratio of Expenses to Average Net Assets | | | 0.68 | %(g) | | | 0.68 | % | | | 0.68 | % | | | 0.68 | % | | | 0.68 | %(g) |
Ratio of Net Investment Income (Loss) to Average Net Assets | | | 1.13 | %(g) | | | 0.88 | % | | | 0.37 | % | | | 0.98 | % | | | 0.25 | %(g) |
Portfolio Turnover(h) | | | 15 | %(f) | | | 55 | % | | | 30 | % | | | 39 | % | | | 41 | %(f) |
(a) | | The Fund commenced operations on June 17, 2020. |
(b) | | Calculated based on average shares outstanding during the period. |
(c) | | Realized and unrealized gains and losses per share in this caption are balancing amounts necessary to reconcile the change in net asset value per share for the period and may not reconcile with the aggregate gains and losses in the statement of operations due to share transactions for the year. |
(d) | | Total Return on Net Asset Value is based on the change in net asset value (“NAV”) of a share during the period and assumes reinvestment of dividends and distributions at NAV. Total Return on Net Asset Value is for the period indicated and has not been annualized. The return shown does not reflect the deduction of taxes that a shareholder would pay on fund distributions or redemption of fund shares. |
(e) | | The returns reflect the actual performance for the period and do not include the impact of trades executed on the last business day of the period that were recorded on the first business day of the next period. |
(f) | | Not Annualized. |
(g) | | Annualized. |
(h) | | Excludes the impact of in-kind transactions. |
The accompanying notes are an integral part of these financial statements.
129
Amplify ETF Trust
Amplify U.S. Alternative Harvest ETF
Financial Highlights
| | Six Months
Ended
March 31,
2024 | | Year Ended
September 30,
2023 | | Year Ended
September 30,
2022 | | Year Ended
September 30,
2021(a) |
Net Asset Value, Beginning of Year/Period | | $ | 1.86 | | | $ | 2.16 | | | $ | 7.72 | | | $ | 10.00 | |
Income (Loss) from Investment Operations: | | | | | | | | | | | | | | | | |
Net Investment Income (Loss)(b) | | | 0.04 | | | | 0.08 | | | | 0.13 | | | | (0.01 | ) |
Net Realized and Unrealized Gain (Loss)(c) | | | 0.30 | | | | (0.38 | ) | | | (5.69 | ) | | | (2.27 | ) |
Total from Investment Operations | | | 0.34 | | | | (0.30 | ) | | | (5.56 | ) | | | (2.28 | ) |
| | | | | | | | | | | | | | | | | |
Distributions to Shareholders | | | | | | | | | | | | | | | — | |
Net Investment Income | | | (0.04 | ) | | | — | | | | — | | | | — | |
Total from Distributions | | | (0.04 | ) | | | — | | | | — | | | | — | |
| | | | | | | | | | | | | | | | | |
Net Asset Value, End of Year/Period | | $ | 2.16 | | | $ | 1.86 | | | $ | 2.16 | | | $ | 7.72 | |
| | | | | | | | | | | | | | | | | |
Total Return on Net Asset Value(d) | | | 18.67 | %(e) | | | -14.14 | % | | | -71.97 | % | | | -22.82 | %(e) |
| | | | | | | | | | | | | | | | | |
Supplemental Data: | | | | | | | | | | | | | | | | |
Net Assets, End of Year/Period (000’s) | | $ | 126,113 | | | $ | 137,124 | | | $ | 84,967 | | | $ | 6,097 | |
Ratio of Expenses to Average Net Assets | | | 0.75 | %(g) | | | 0.76 | %(f) | | | 0.75 | % | | | 0.75 | %(g) |
Ratio of Net Investment Income (Loss) to Average Net Assets | | | 4.09 | %(g) | | | 4.86 | % | | | 4.45 | % | | | -0.38 | %(g) |
Portfolio Turnover(h) | | | 29 | %(e) | | | 55 | % | | | 12 | % | | | 16 | %(e) |
(a) | | The Fund commenced operations on May 12, 2021. |
(b) | | Calculated based on average shares outstanding during the period. |
(c) | | Realized and unrealized gains and losses per share in this caption are balancing amounts necessary to reconcile the change in net asset value per share for the period and may not reconcile with the aggregate gains and losses in the statement of operations due to share transactions for the year. |
(d) | | Total Return on Net Asset Value is based on the change in net asset value (“NAV”) of a share during the period and assumes reinvestment of dividends and distributions at NAV. Total Return on Net Asset Value is for the period indicated and has not been annualized. The return shown does not reflect the deduction of taxes that a shareholder would pay on fund distributions or redemption of fund shares. |
(e) | | Not Annualized. |
(f) | | Includes 0.01% of interest expense at September 30, 2023. |
(g) | | Annualized. |
(h) | | Excludes the impact of in-kind transactions. |
The accompanying notes are an integral part of these financial statements.
130
Amplify ETF Trust Notes to the Financial Statements March 31, 2024 |
1. ORGANIZATION
Amplify ETF Trust (the “Trust”) was organized as a Massachusetts business trust on January 6, 2015, and is authorized to issue an unlimited number of shares in one or more series of funds. The Trust is an open-end management investment company, registered under the Investment Company Act of 1940, as amended (the “1940 Act”). The Trust currently consists of multiple operational series, all of which are covered in this report (each a “Fund” and collectively the “Funds”). Each Fund represents a beneficial interest in a separate portfolio of securities and other assets, with their own investment objectives and policies.
The Funds list and principally trade their shares on the New York Stock Exchange Arca (“NYSE”) and the Nasdaq Stock Market LLC (“Nasdaq”) (each an “Exchange” and collectively the “Exchanges”). Shares of the Funds trade on the Exchanges at market prices that may be below, at, or above the Funds’ net asset value (“NAV”). The Funds will issue and redeem shares on a continuous basis at NAV only in creation units.
Creation Units will be issued and redeemed principally in-kind for securities included in a specified universe. Once created, shares generally will trade in the secondary market at market prices that change throughout the day in quantities less than a Creation Unit. Except when aggregated in Creation Units, shares are not redeemable securities of a Fund. Shares of a Fund may only be purchased or redeemed by certain financial institutions (“Authorized Participants”). An Authorized Participant is either (i) a broker-dealer or other participant in the clearing process through the Continuous Net Settlement System of the National Securities Clearing Corporation or (ii) a DTC participant and, in each case, must have executed an Authorized Participant Agreement with Foreside Fund Services, LLC (“the Distributor”). Most retail investors will not qualify as Authorized Participants or have the resources to buy and sell whole Creation Units. Therefore, they will be unable to purchase or redeem the shares directly from the Funds. Rather, most retail investors will purchase shares in the secondary market with the assistance of a broker and will be subject to customary brokerage commissions or fees.
Each Fund currently offers one class of shares, which has no front end sales load, no deferred sales charge, and no redemption fee. The Funds may issue an unlimited number of shares of beneficial interest, with par value of $0.01 per share. All shares of the Funds have equal rights and privileges. In addition to the transaction fees noted below, each Fund may also charge up to a 2% variable fee on the creation or redemption of Creation or Redemption Units. Variable transaction fees during the fiscal year, if any, are disclosed in the Statements of Changes in Net Assets.
131
Amplify ETF Trust Notes to the Financial Statements March 31, 2024 (Continued) |
Fund Name | | Ticker | | Commencement of Operations | | Diversification | | Exchange | | Transaction
Fees | | Creation
Unit Size |
Amplify High Income ETF | | YYY | | June 11, 2012 | | Diversified | | NYSE | | $ | 500 | | 50,000 |
Amplify Online Retail ETF | | IBUY | | April 19, 2016 | | Diversified | | NYSE | | | 500 | | 50,000 |
Amplify CWP Enhanced Dividend Income ETF | | DIVO | | December 13, 2016 | | Non-Diversified | | NYSE | | | 500 | | 50,000 |
Amplify Transformational Data Sharing ETF | | BLOK | | January 16, 2018 | | Diversified | | NYSE | | | 500 | | 50,000 |
Amplify Lithium & Battery Technology ETF | | BATT | | June 4, 2018 | | Non-Diversified | | NYSE | | | 1,000 | | 50,000 |
Amplify BlackSwan Growth & Treasury Core ETF | | SWAN | | November 5, 2018 | | Diversified | | NYSE | | | 300 | | 10,000 |
Amplify Emerging Markets FinTech ETF | | EMFQ | | January 19, 2019 | | Diversified | | NYSE | | | 750 | | 25,000 |
Amplify Seymour Cannabis ETF | | CNBS | | July 22, 2019 | | Non-Diversified | | NYSE | | | 500 | | 50,000 |
Amplify BlackSwan ISWN ETF | | ISWN | | January 25, 2021 | | Non-Diversified | | NYSE | | | 300 | | 25,000 |
Amplify Thematic All-Stars ETF | | MVPS | | July 20, 2021 | | Non-Diversified | | NYSE | | | 1,500 | | 25,000 |
Amplify BlackSwan Tech & Treasury ETF | | QSWN | | December 8, 2021 | | Non-Diversified | | NYSE | | | 300 | | 25,000 |
Amplify Inflation Fighter ETF | | IWIN | | February 1, 2022 | | Non-Diversified | | NYSE | | | 500 | | 25,000 |
Amplify Natural Resources Dividend Income ETF | | NDIV | | August 23, 2022 | | Non-Diversified | | NYSE | | | 300 | | 25,000 |
Amplify International Enhanced Dividend Income ETF | | IDVO | | September 7, 2022 | | Non-Diversified | | NYSE | | | 300 | | 25,000 |
Amplify Cash Flow Dividend Leaders ETF | | COWS | | September 12, 2023 | | Non-Diversified | | NASDAQ | | | 300 | | 10,000 |
Amplify Cash Flow High Income ETF | | HCOW | | September 19, 2023 | | Non-Diversified | | NASDAQ | | | 300 | | 30,000 |
Amplify Samsung SOFR ETF | | SOF | | November 14, 2023 | | Non-Diversified | | NYSE | | | 300 | | 50,000 |
Amplify Junior Silver Miners ETF | | SILJ | | November 28, 2012 | | Non-Diversified | | NYSE | | | 750 | | 50,000 |
Amplify Cybersecurity ETF | | HACK | | November 11, 2014 | | Diversified | | NYSE | | | 750 | | 50,000 |
Amplify Mobile Payments ETF | | IPAY | | July 15, 2015 | | Non-Diversified | | NYSE | | | 300 | | 50,000 |
Amplify BlueStar Israel Technology ETF | | ITEQ | | November 2, 2015 | | Non-Diversified | | NYSE | | | 750 | | 50,000 |
Amplify Etho Climate Leadership U.S. ETF | | ETHO | | November 18, 2015 | | Diversified | | NYSE | | | 750 | | 50,000 |
Amplify Alternative Harvest ETF | | MJ | | December 3, 2015 | | Non-Diversified | | NYSE | | | 750 | | 50,000 |
Amplify Global Cloud Technology ETF | | IVES | | March 8, 2016 | | Diversified | | NYSE | | | 750 | | 50,000 |
Amplify Video Game Tech ETF | | GAMR | | March 8, 2016 | | Diversified | | NYSE | | | 750 | | 50,000 |
Amplify AI Powered Equity ETF | | AIEQ | | October 17, 2017 | | Diversified | | NYSE | | | 300 | | 25,000 |
Amplify Travel Tech ETF | | AWAY | | February 12, 2020 | | Diversified | | NYSE | | | 750 | | 50,000 |
Amplify Treatments, Testing and Advancements ETF | | GERM | | June 17, 2020 | | Non-Diversified | | NYSE | | | 300 | | 50,000 |
Amplify U.S. Alternative Harvest ETF | | MJUS | | May 12, 2021 | | Non-Diversified | | NYSE | | | 300 | | 10,000 |
132
Amplify ETF Trust Notes to the Financial Statements March 31, 2024 (Continued) |
The investment objectives of the Funds are to seek investment results that generally correspond (before fees and expenses) to the price and yield of the following indexes, respectively.
Ticker | | Index |
YYY | | ISE High IncomeTM Index |
IBUY | | EQM Online Retail Index |
BATT | | EQM Lithium & Battery Technology Index |
SWAN | | S-Network BlackSwan Core Index |
EMFQ | | EQM Emerging Markets Fintech |
ISWN | | S-Network BlackSwan International Index |
MVPS | | ETF All-Stars Thematic Composite Index |
QSWN | | S-Network BlackSwan Tech & Treasury Index |
NDIV | | EQM Natural Resources Dividend Income Index |
COWS | | Kelly US Cash Flow Dividend Leaders Index |
SILJ | | Nasdaq Metals Focus Silver Miners Index |
HACK | | Nasdaq ISE Cyber Security Select Index |
IPAY | | Nasdaq CTA Global Digital Payments Index |
ITEQ | | BlueStar Israel Global Technology IndexTM |
ETHO | | Etho Climate Leadership Index |
MJ | | Prime Alternative Harvest Index |
IVES | | Dan Ives Global Cloud Technology Prime Index |
GAMR | | EEFund Video Game TechTM Index |
AIEQ | | AI Powered Equity Index |
AWAY | | Prime Travel Technology Index |
GERM | | Prime Treatments, Testing and Advancements Index |
The investment objective of DIVO and IDVO is to provide current income as its primary objective and to provide capital appreciation as its secondary objective. The investment objective of BLOK is to provide investors with total return. The investment objective of CNBS is to provide investors capital appreciation. The investment objective of IWIN is to provide investors with long-term capital appreciation in inflation-adjusted terms. The investment objective of HCOW is to provide investors with current income. The investment objective of SOF is to provide investors with current income equal to the returns of the Secured Overnight Financing Rate (“SOFR”). The investment objective of MJUS is to provide income and long-term growth of capital.
Effective December 12, 2023, the Board of Trustees approved a change in fiscal year end for the Funds from October 31 to September 30.
The Acquiring Funds are the successor in interest to the Predecessor Funds listed below which were included as a series of another investment company, ETF Managers Trust (“Predecessor Trust”). On January 19, 2024, the shareholders of the Predecessor Funds approved the tax-free reorganization of the Predecessor Funds with and into the Amplify ETF Trust, and effective as of the close of business on January 26, 2024, the assets and liabilities of the Predecessor Funds were transferred to the Trust in exchange for shares of the Acquiring Funds. For financial reporting purposes, assets received and shares issued by the Funds were recorded at fair value; however, the cost basis of the investments received from the Predecessor Funds was carried forward to align ongoing reporting of the Acquiring Funds’ realized and unrealized gains and losses with amounts distributable to shareholders for tax purposes. Costs incurred by
133
Amplify ETF Trust Notes to the Financial Statements March 31, 2024 (Continued) |
the Acquiring Funds in connection with the reorganization were paid by the Adviser. The fiscal year end of the Predecessor Funds was September 30. The reporting period covered by this semi-annual report for the Acquiring Funds is October 1, 2023 through March 31, 2024. Operations prior to January 26, 2024 were for the Predecessor Fund. The net assets and shares outstanding transferred into the Trust at NAV at the close of business on January 26, 2024 were as follows:
Predecessor Fund | | Acquiring Fund | | Net Assets | | Shares
Outstanding |
ETFMG Prime Junior Silver Miners ETF | | Amplify Junior Silver Miners ETF | | $ | 580,398,296 | | 68,700,000 |
ETFMG Prime Cyber Security ETF | | Amplify Cybersecurity ETF | | | 1,423,792,451 | | 27,600,000 |
ETFMG Prime Mobile Payments ETF | | Amplify Mobile Payments ETF | | | 357,014,888 | | 9,100,000 |
BlueStar Israel Technology ETF | | Amplify BlueStar Israel Technology ETF | | | 88,689,518 | | 2,150,000 |
Amplify Etho Climate Leadership U.S. ETF | | Amplify Etho Climate Leadership U.S. ETF | | | 172,521,330 | | 3,450,000 |
ETFMG Alternative Harvest ETF | | Amplify Alternative Harvest ETF | | | 259,614,775 | | 71,400,000 |
Wedbush ETFMG Global Cloud Technology ETF | | Amplify Global Cloud Technology ETF | | | 24,656,066 | | 700,000 |
Wedbush ETFMG Video Game Tech ETF | | Amplify Video Game Tech ETF | | | 42,844,354 | | 800,000 |
AI Powered Equity ETF | | Amplify AI Powered Equity ETF | | | 101,949,817 | | 3,425,000 |
ETFMG Travel Tech ETF | | Amplify Travel Tech ETF | | | 103,928,756 | | 6,150,000 |
ETFMG Treatments, Testing and Advancements ETF | | Amplify Treatments, Testing and Advancements ETF | | | 13,451,335 | | 750,000 |
ETFMG U.S. Alternative Harvest ETF | | Amplify U.S. Alternative Harvest ETF | | | 137,124,062 | | 73,830,000 |
Below are the voting results from the special meeting:
Acquiring Fund | | For | | Against | | Abstain | | Broker
Non-Vote |
SILJ | | 27,422,140 | | 1,362,059 | | 1,143,658 | | 8,714,725 |
HACK | | 9,552,856 | | 247,556 | | 381,560 | | 3,938,578 |
IPAY | | 3,176,268 | | 89,710 | | 112,019 | | 1,341,441 |
ITEQ | | 787,807 | | 33,808 | | 20,053 | | 325,696 |
ETHO | | 1,589,300 | | 84,523 | | 85,353 | | 480,536 |
MJ | | 29,534,369 | | 1,391,977 | | 1,648,687 | | 10,984,896 |
IVES | | 257,634 | | 4,579 | | 7,156 | | 96,227 |
GAMR | | 263,460 | | 7,604 | | 17,009 | | 103,660 |
AIEQ | | 1,331,470 | | 73,527 | | 98,138 | | 439,434 |
AWAY | | 2,262,255 | | 62,373 | | 92,710 | | 901,495 |
GERM | | 338,337 | | 11,056 | | 22,353 | | 125,219 |
MJUS | | 72,105,223 | | 11,611 | | 7,564 | | 339,531 |
The Adviser and ETF Managers Group LLC (“ETFMG”) entered into an Asset Purchase Agreement in order to effect the Reorganizations because they believed that the synergies that exist between the two organizations make reorganizing each Predecessor Fund into its respective Acquiring Fund a compelling proposition. ETFMG was seeking to exit the investment advisory business and the similar investment style and objectives of each organization’s respective funds are complementary and led ETFMG to believe that transitioning Predecessor Fund shareholders into the Acquiring Funds would benefit such shareholders.
2. SIGNIFICANT ACCOUNTING POLICIES
The Funds are investment companies and accordingly follow the investment company accounting and reporting guidance of the Financial Accounting Standards Board (“FASB”) Accounting Standards Codification (“ASC”) Topic 946, Financial Services — Investment Companies.
The following is a summary of significant accounting policies consistently followed by the Funds in the preparation of their financial statements. These policies are in conformity with accounting principles generally accepted in the United States of America (“U.S. GAAP”).
134
Amplify ETF Trust Notes to the Financial Statements March 31, 2024 (Continued) |
CONSOLIDATION OF SUBSIDIARY
IWIN’s portfolio managers expect to obtain commodities exposure primarily through investments in commodity futures contracts via a wholly owned subsidiary of the Fund, Amplify Inflation Fighter (Cayman) Ltd. (the “Subsidiary”). The Subsidiary, which is organized under the laws of the Cayman Islands, is designed to enhance the ability of the Fund to obtain exposure to the commodities markets consistent with the limits of the U.S. federal tax law requirements applicable to registered investment companies. The Fund is the sole shareholder of the Subsidiary, which will not be sold or offered to other investors. The Subsidiary is overseen by its own board of directors. The Fund’s investment in the Subsidiary may not exceed 25% of the Fund’s total assets at each quarter-end of the Fund’s fiscal year end. The consolidated financial statements of the Fund include the financial statements of the Subsidiary. The Fund consolidates the results of subsidiaries in which the Fund holds a controlling financial interest. All inter-company accounts and transactions have been eliminated. As of the end of the reporting period, the net assets of the Subsidiary were $1,232,865 which represented 15.9% of the Fund’s net assets.
SECURITY VALUATION
In accordance with the authoritative guidance on fair value measurements and disclosure under U.S. GAAP, the Funds disclose fair value of their investments in a hierarchy that prioritizes the inputs to valuation techniques used to measure fair value. The objective of a fair value measurement is to determine the price that would be received to sell an asset or paid to transfer a liability in an orderly transaction between market participants at the measurement date (an exit price). Accordingly, the fair value hierarchy gives the highest priority to quoted prices (unadjusted) in active markets for identical assets or liabilities (Level 1) and the lowest priority to unobservable inputs (Level 3). The following describes the levels of the fair value hierarchy:
Level 1 – Unadjusted quoted prices in active markets for identical, unrestricted assets or liabilities that the Funds have the ability to access at the measurement date;
Level 2 – Quoted prices which are not active, or inputs that are observable (either directly or indirectly) for substantially the full term of the asset or liability; and
Level 3 – Prices, inputs or exotic modeling techniques which are both significant to the fair value measurement and unobservable (supported by little or no market activity).
The valuation techniques used by the Funds to measure fair value for the year ended October 31, 2023 maximized the use of observable inputs and minimized the use of unobservable inputs.
For the year ended October 31, 2023, there have been no significant changes to the Funds’ fair valuation methodologies.
Common stocks, preferred stock, and other equity securities listed on any national or foreign exchange (excluding Nasdaq) and the London Stock Exchange Alternative Investment Market (“AIM”) will be valued at the last price on the exchange on which they are principally traded or, for Nasdaq and AIM securities, the official closing price. Securities traded on more than one securities exchange are valued at the last sale price or official closing price, as applicable, at the close of the exchange representing the principal market for such securities. Foreign securities and other assets denominated in foreign currencies are translated into U.S. dollars at the current exchange rate, which approximates fair value. Redeemable securities issued by open-end investment companies shall be valued at the investment company’s applicable NAV, with the exception of exchange-traded open-end and closed-end investment companies which are priced as equity securities. Exchange-traded options will be valued at the current mean price where such contracts are principally traded. Securities traded in the over-the-counter market are valued at the mean of the bid and the asked price, if available, and otherwise at their closing bid price. Fixed income securities will be valued at the mean price. Fixed income securities having a remaining maturity of 60 days or less when purchased will be valued at the current market price. If there is no current market available then the securities will be valued at cost and adjusted for amortization of premiums and accretions of discounts. Swaps will be valued by using the market close price of the underlying holdings. Futures contracts will be valued at the settlement price. If there is no current market price available, then the securities will be valued at the last trade price.
135
Amplify ETF Trust Notes to the Financial Statements March 31, 2024 (Continued) |
The Trust’s Valuation Procedures provide for the designation of the Adviser as “Valuation Designee”. If no quotation is available from either a pricing service, or one or more brokers or there is reason to question the reliability or accuracy of a quotation supplied, securities are valued at fair value as determined in good faith, by the Valuation Designee pursuant to procedures established by the Funds’ Board of Trustees (the “Board”).
The following is a summary of the fair valuations according to the inputs used to value the Funds’ investments as of March 31, 2024:
Category | | YYY | | IBUY | | DIVO | | BLOK | | BATT |
Investments in Securities | | | | | | | | | | | | | | | |
Assets | | | | | | | | | | | | | | | |
Level 1 | | | | | | | | | | | | | | | |
Investment Companies | | $ | 453,050,027 | | $ | — | | $ | — | | $ | — | | $ | — |
Common Stocks | | | — | | | 183,250,801 | | | 2,737,754,501 | | | 674,047,827 | | | 89,553,118 |
Affiliated Exchange Traded Funds | | | — | | | — | | | 98,926,061 | | | — | | | — |
Exchange Traded Funds | | | — | | | — | | | 98,926,061 | | | 37,440,672 | | | — |
Money Market Funds | | | 458,528 | | | 142,275 | | | 73,831 | | | 11,800,634 | | | 165,505 |
Investments Purchased with Proceeds from Securities Lending | | | 5,840,600 | | | 15,824,515 | | | 264,406,249 | | | 106,201,451 | | | 17,317,647 |
Total Level 1 | | | 459,349,155 | | | 199,217,591 | | | 3,200,086,703 | | | 829,490,584 | | | 107,036,270 |
Level 2 | | | | | | | | | | | | | | | |
Rights | | | — | | | — | | | — | | | 2,727,559 | | | — |
Corporate Bonds | | | — | | | — | | | — | | | 1,934,258 | | | — |
Convertible Bonds | | | — | | | — | | | — | | | 13,222,598 | | | — |
Total Level 2 | | | — | | | — | | | — | | | 17,884,415 | | | — |
Level 3 | | | | | | | | | | | | | | | |
Common Stocks | | | — | | | 0 | | | — | | | — | | | 0 |
Total Level 3 | | | — | | | 0 | | | — | | | — | | | 0 |
Total | | $ | 459,349,155 | | $ | 199,217,591 | | $ | 3,200,086,703 | | $ | 847,374,999 | | $ | 107,036,270 |
Other Financial Instruments(a) | | | | | | | | | | | | | | | |
Liabilities | | | | | | | | | | | | | | | |
Level 1 | | | | | | | | | | | | | | | |
Options Written | | $ | — | | $ | — | | $ | 3,332,025 | | $ | — | | $ | — |
Total Level 1 | | | — | | | — | | | 3,332,025 | | | — | | | — |
Level 2 | | | — | | | — | | | — | | | — | | | — |
Total Level 2 | | | — | | | — | | | — | | | — | | | — |
Level 3 | | | — | | | — | | | — | | | — | | | — |
Total Level 3 | | | — | | | — | | | — | | | — | | | — |
Total | | $ | — | | $ | — | | $ | 3,332,025 | | $ | — | | $ | — |
136
Amplify ETF Trust Notes to the Financial Statements March 31, 2024 (Continued) |
Category | | SWAN | | EMFQ | | CNBS | | ISWN | | MVPS |
Investments in Securities | | | | | | | | | | | | | | | |
Assets | | | | | | | | | | | | | | | |
Level 1 | | | | | | | | | | | | | | | |
Common Stocks | | $ | — | | $ | 2,092,691 | | $ | 18,926,674 | | $ | — | | $ | 2,690,266 |
Preferred Stock | | | — | | | — | | | — | | | — | | | 7,781 |
Money Market Funds | | | 31,058 | | | 10,064 | | | 915,716 | | | 23,338 | | | 2,326 |
Investments Purchased with Proceeds from Securities Lending | | | — | | | 93,948 | | | 4,641,018 | | | — | | | 27,290 |
Total Level 1 | | | 31,058 | | | 2,196,703 | | | 24,483,408 | | | 23,338 | | | 2,727,663 |
Level 2 | | | | | | | | | | | | | | | |
U.S. Government Notes/Bonds | | | 143,404,125 | | | — | | | — | | | 32,908,133 | | | — |
Purchased Options | | | 33,901,396 | | | — | | | — | | | 5,700,005 | | | — |
Common Stocks | | | — | | | — | | | — | | | — | | | — |
Total Level 2 | | | 177,305,521 | | | — | | | — | | | 38,608,138 | | | — |
Level 3 | | | | | | | | | | | | | | | |
Common Stocks | | | — | | | 0 | | | 0 | | | — | | | — |
Rights | | | — | | | — | | | 0 | | | — | | | — |
Total Level 3 | | | — | | | 0 | | | 0 | | | — | | | — |
Total | | $ | 177,336,579 | | $ | 2,196,703 | | $ | 24,483,408 | | $ | 38,631,476 | | $ | 2,727,663 |
Other Financial Instruments(a) | | | | | | | | | | | | | | | |
Assets | | | | | | | | | | | | | | | |
Level 1 | | | — | | | — | | | — | | | — | | | — |
Total Level 1 | | | — | | | — | | | — | | | — | | | — |
Level 2 | | | | | | | | | | | | | | | |
Total Return Swaps | | | — | | | — | | $ | 2,027,312 | | | — | | | — |
Total Level 2 | | | — | | | — | | | 2,027,312 | | | — | | | — |
Level 3 | | | | | | | | | | | | | | | |
Total Level 3 | | | — | | | — | | | — | | | — | | | — |
Total | | $ | — | | $ | — | | $ | 2,027,312 | | $ | — | | $ | — |
137
Amplify ETF Trust Notes to the Financial Statements March 31, 2024 (Continued) |
Category | | QSWN | | IWIN | | NDIV | | IDVO | | COWS |
Investments in Securities | | | | | | | | | | | | | | | |
Assets | | | | | | | | | | | | | | | |
Level 1 | | | | | | | | | | | | | | | |
Common Stocks | | $ | — | | $ | 6,402,940 | | $ | 11,300,835 | | $ | 96,481,533 | | $ | 15,278,174 |
Preferred Stock | | | — | | | — | | | 272,621 | | | 2,079,549 | | | — |
Money Market Funds | | | 10,752 | | | 217,174 | | | 22,448 | | | 4,212,886 | | | 208,750 |
Investments Purchased with Proceeds from Securities Lending | | | — | | | 116,104 | | | 719,859 | | | 10,097,786 | | | — |
Total Level 1 | | | 10,752 | | | 6,736,218 | | | 12,315,763 | | | 112,871,754 | | | 15,486,924 |
Level 2 | | | | | | | | | | | | | | | |
U.S. Government Notes/Bonds | | | 2,087,687 | | | — | | | — | | | — | | | — |
U.S. Treasury Obligations | | | — | | | 675,027 | | | — | | | — | | | — |
Purchased Options | | | 444,809 | | | — | | | — | | | — | | | — |
Total Level 2 | | | 2,532,496 | | | 675,027 | | | — | | | — | | | — |
Level 3 | | | | | | | | | | | | | | | |
Total Level 3 | | | — | | | — | | | — | | | — | | | — |
Total | | $ | 2,543,248 | | $ | 7,411,245 | | $ | 12,315,763 | | $ | 112,871,754 | | $ | 15,486,924 |
Other Financial Instruments(a) | | | | | | | | | | | | | | | |
Assets | | | | | | | | | | | | | | | |
Level 1 | | | | | | | | | | | | | | | |
Futures Contracts | | $ | — | | $ | 22,772 | | $ | — | | $ | — | | $ | — |
Total Level 1 | | | — | | | 22,772 | | | — | | | — | | | — |
Level 2 | | | — | | | — | | | — | | | — | | | — |
Total Level 2 | | | — | | | — | | | — | | | — | | | — |
Level 3 | | | — | | | — | | | — | | | — | | | — |
Total Level 3 | | | — | | | — | | | — | | | — | | | — |
Total | | $ | — | | $ | 22,772 | | $ | — | | $ | — | | $ | — |
Other Financial Instruments(a) | | | | | | | | | | | | | | | |
Liabilities | | | | | | | | | | | | | | | |
Level 1 | | | — | | | — | | | — | | | — | | | — |
Total Level 1 | | | — | | | — | | | — | | | — | | | — |
Level 2 | | | | | | | | | | | | | | | |
Options Written | | | — | | | — | | | — | | | 250,750 | | | — |
Total Level 2 | | | — | | | — | | | — | | | 250,750 | | | — |
Level 3 | | | — | | | — | | | — | | | — | | | — |
Total Level 3 | | | — | | | — | | | — | | | — | | | — |
Total | | $ | — | | $ | — | | $ | — | | $ | 250,750 | | $ | — |
138
Amplify ETF Trust Notes to the Financial Statements March 31, 2024 (Continued) |
Category | | HCOW | | SOF | | SILJ | | HACK | | IPAY |
Investments in Securities | | | | | | | | | | | | | | | |
Assets | | | | | | | | | | | | | | | |
Level 1 | | | | | | | | | | | | | | | |
Affiliated Exchange Traded Funds | | $ | 3,209,586 | | $ | — | | $ | — | | $ | — | | $ | — |
Repurchase Agreements | | | — | | | 155,195,744 | | | — | | | — | | | — |
Common Stocks | | | — | | | — | | | 716,216,075 | | | 1,771,341,304 | | | 358,910,216 |
Money Market Funds | | | 64,026 | | | — | | | 3,919,747 | | | 264,295 | | | 1,043,709 |
Investments Purchased with Proceeds from Securities Lending | | | — | | | — | | | 7,056,426 | | | — | | | 1,650,522 |
Total Level 1 | | | 3,273,612 | | | 155,195,744 | | | 727,192,248 | | | 1,771,605,599 | | | 361,604,447 |
Level 2 | | | | | | | | | | | | | | | |
Common Stocks | | | — | | | — | | | 12,988 | | | — | | | — |
Repurchase Agreements | | | — | | | 24,432 | | | — | | | — | | | — |
Total Level 2 | | | — | | | 24,432 | | | 12,988 | | | — | | | — |
Level 3 | | | | | | | | | | | | | | | |
Common Stocks | | | — | | | — | | | 0 | | | — | | | 0 |
Total Level 3 | | | — | | | — | | | 0 | | | — | | | 0 |
Total | | $ | 3,273,612 | | $ | 155,220,176 | | $ | 727,205,236 | | $ | 1,771,605,599 | | $ | 361,604,447 |
Other Financial Instruments(a) | | | | | | | | | | | | | | | |
Liabilities | | | | | | | | | | | | | | | |
Level 1 | | | — | | | — | | | — | | | — | | | — |
Total Level 1 | | | — | | | — | | | — | | | — | | | — |
Level 2 | | | | | | | | | | | | | | | |
Total Return Swaps | | | 4,291 | | | — | | | — | | | — | | | — |
Total Level 2 | | | 4,291 | | | — | | | — | | | — | | | — |
Level 3 | | | — | | | — | | | — | | | — | | | — |
Total Level 3 | | | — | | | — | | | — | | | — | | | — |
Total | | $ | 4,291 | | $ | — | | $ | — | | $ | — | | $ | — |
139
Amplify ETF Trust Notes to the Financial Statements March 31, 2024 (Continued) |
Category | | ITEQ | | ETHO | | MJ | | IVES | | GAMR |
Investments in Securities | | | | | | | | | | | | | | | |
Assets | | | | | | | | | | | | | | | |
Level 1 | | | | | | | | | | | | | | | |
Affiliated Exchange Traded Funds | | $ | — | | $ | — | | $ | 121,738,703 | | $ | — | | $ | — |
Common Stocks | | | 86,900,976 | | | 189,635,689 | | | 157,199,790 | | | 32,412,855 | | | 40,561,203 |
Money Market Funds | | | 113,656 | | | 188,962 | | | — | | | 25,510 | | | 101,242 |
Investments Purchased with Proceeds from Securities Lending | | | 7,022,800 | | | 3,639,773 | | | 65,881,964 | | | 2,011,604 | | | 2,036,920 |
Total Level 1 | | | 94,037,432 | | | 193,464,424 | | | 344,820,457 | | | 34,449,969 | | | 42,699,365 |
Level 2 | | | | | | | | | | | | | | | |
Common Stocks | | | — | | | — | | | — | | | 332,951 | | | — |
Total Level 2 | | | — | | | — | | | — | | | 332,951 | | | — |
Level 3 | | | | | | | | | | | | | | | |
Common Stocks | | | — | | | — | | | 0 | | | — | | | 0 |
Total Level 3 | | | — | | | — | | | 0 | | | — | | | 0 |
Total | | $ | 94,037,432 | | $ | 193,464,424 | | $ | 344,820,457 | | $ | 34,782,920 | | $ | 42,699,365 |
140
Amplify ETF Trust Notes to the Financial Statements March 31, 2024 (Continued) |
Category | | AIEQ | | AWAY | | GERM | | MJUS |
Investments in Securities | | | | | | | | | | | | |
Assets | | | | | | | | | | | | |
Level 1 | | | | | | | | | | | | |
Common Stocks | | $ | 110,343,907 | | $ | 88,885,995 | | $ | 11,032,977 | | $ | 8,313,877 |
Money Market Funds | | | 114,807 | | | 365,623 | | | 14,721 | | | 1,706,542 |
Investments Purchased with Proceeds from Securities Lending | | | 3,741,855 | | | 564,705 | | | 1,772,831 | | | — |
Total Level 1 | | | 114,200,569 | | | 89,816,323 | | | 12,820,529 | | | 10,020,419 |
Level 2 | | | | | | | | | | | | |
U.S. Treasury Obligations | | | — | | | — | | | — | | | 104,264,584 |
Total Level 2 | | | — | | | — | | | — | | | 104,264,584 |
Level 3 | | | | | | | | | | | | |
Rights | | | — | | | — | | | 0 | | | — |
Common Stocks | | | — | | | — | | | 0 | | | — |
Total Level 3 | | | — | | | — | | | 0 | | | — |
Total | | $ | 114,200,569 | | $ | 89,816,323 | | $ | 12,820,529 | | $ | 114,285,003 |
Other Financial Instruments(a) | | | | | | | | | | | | |
Assets | | | | | | | | | | | | |
Level 1 | | | — | | | — | | | — | | | — |
Total Level 1 | | | — | | | — | | | — | | | — |
Level 2 | | | | | | | | | | | | |
Total Return Swaps | | | — | | | — | | | — | | | 11,926,948 |
Total Level 2 | | | — | | | — | | | — | | | 11,926,948 |
Level 3 | | | — | | | — | | | — | | | — |
Total Level 3 | | | — | | | — | | | — | | | — |
Total | | $ | — | | $ | — | | $ | — | | $ | 11,926,948 |
See the Schedules of Investments for further disaggregation of investment categories.
141
Amplify ETF Trust Notes to the Financial Statements March 31, 2024 (Continued) |
Below is a reconciliation of securities in Level 3 for The Funds for the period ended March 31, 2024.
| | Balance
as of
10/31/2023 | | Net
Realized
Gain (Loss) | | Amortization/
Accretion | | Net Change
in Unrealized
Appreciation
(Depreciation) | | Purchases/
Acquisition | | Sales | | Corporate
Action | | Transfers
In/Out of
Level 3 | | Balance
as of
3/31/2024 | | Net Change
in Unrealized
Appreciation
(Depreciation)
on Securities
held at
03/31/2024 |
BLOK – Convertible Bonds | | $ | 7,238,673 | | $ | — | | $ | 2,369,768 | | $ | 19,458,366 | | | $ | — | | $ | — | | $ | (15,844,209 | ) | | $ | (13,222,598 | ) | | $ | — | | $ | 19,458,366 | |
BATT – Common Stocks | | | 237,700 | | | — | | | — | | | (237,700 | ) | | | — | | | — | | | — | | | | — | | | | 0 | | | (237,700 | ) |
| | Balance as of
9/30/2023 | | Net
Realized
Gain (Loss) | | Amortization/
Accretion | | Net Change
in Unrealized
Appreciation
(Depreciation) | | Purchases/
Acquisition | | Sales | | Corporate
Action | | Transfers
In/Out of
Level 3 | | Balance
as of
3/31/2024 | | Net Change
in Unrealized
Appreciation
(Depreciation)
on Securities
held at
03/31/2024 |
SILJ – Common Stocks | | $ | 122,521 | | $ | — | | $ | — | | $ | (109,533 | ) | | $ | — | | $ | (271,704 | ) | | $ | — | | $ | (12,988 | ) | | $ | 0 | | $ | (122,521 | ) |
MJ – Common Stocks | | | 0 | | | — | | | — | | | — | | | | — | | | — | | | | — | | | — | | | | 0 | | | — | |
GERM – Common Stocks | | | 1,325 | | | — | | | — | | | (1,325 | ) | | | — | | | — | | | | — | | | — | | | | 0 | | | (1,325 | ) |
The following is a summary of quantitative information about Level 3 Fair Value Measurements:
BATT | | Fair Value
as of
03/31/2024 | | Valuation
Techniques | | Unobservable
Input | | Range/Weighted
Average
Unobservable Input | | Impact to Valuation
from an Increase to
Input |
Common Stock | | 0 | | Market Approch | | No Market Activity | | — | | Increase |
SILJ | | Fair Value
as of
03/31/2024 | | Valuation
Techniques | | Unobservable
Input | | Range/Weighted Average
Unobservable Input | | Impact to Valuation
from an Increase to
Input |
Common Stocks | | 0 | | Market Approch | | No Market Activity | | — | | Increase |
Common Stocks | | 0 | | Market Approch | | No Market Activity | | — | | Increase |
MJ | | Fair Value
as of
03/31/2024 | | Valuation
Techniques | | Unobservable
Input | | Range/Weighted
Average
Unobservable Input | | Impact to Valuation
from an Increase to Input |
Common Stock | | 0 | | Market Approch | | No Market Activity | | — | | Increase |
GERM | | Fair Value
as of
03/31/2024 | | Valuation
Techniques | | Unobservable
Input | | Range/Weighted
Average
Unobservable Input | | Impact to Valuation
from an Increase to
Input |
Common Stocks | | 0 | | Market Approch | | No Market Activity | | — | | Increase |
Common Stocks | | 0 | | Market Approch | | No Market Activity | | — | | Increase |
142
Amplify ETF Trust Notes to the Financial Statements March 31, 2024 (Continued) |
OPTION WRITING
DIVO and IDVO will each employ an option strategy in which they will write U.S. exchange-traded covered call options on equity securities in the portfolios in order to seek additional income (in the form of premiums on the options) and selective repurchase of such options. A call option written (sold) by DIVO or IDVO will give the holder (buyer) the right to buy a certain equity security at a predetermined strike price from DIVO or IDVO. A premium is the income received by an investor who sells or writes an option contract to another party. DIVO and IDVO seek to lower risk and enhance total return by tactically selling short-term call options on some, or all, of the equity securities in the portfolio. Specifically, DIVO seeks to provide gross income of approximately 2-3% from dividend income and 2-4% from option premium, plus the potential for capital appreciation. IDVO seeks to provide gross income of approximately 3-4% from dividend income and 2-4% from option premium, plus the potential for capital appreciation. Unlike a systematic covered call program, DIVO and IDVO are not obligated to continuously cover each individual equity position. When one of the underlying stocks demonstrates strength or an increase in implied volatility, DIVO and IDVO identify that opportunity and sell call options tactically, rather than keeping all positions covered and limiting potential upside.
When DIVO or IDVO write an option, an amount equal to the premium received by DIVO or IDVO, respectively is recorded as a liability and is subsequently adjusted to the current fair value of the option written. Premiums received from writing options that expire unexercised are treated by DIVO and IDVO on the expiration date as realized gains from options written. The difference between the premium and the amount paid on effecting a closing purchase transaction, including brokerage commissions, is also treated as a realized gain, or, if the premium is less than the amount paid for the closing purchase transaction, as a realized loss. If a call option is exercised, the premium is added to the proceeds from the sale of the underlying security in determining whether DIVO or IDVO has realized a gain or loss. DIVO and IDVO, as writers of an option, bear the market risk of an unfavorable change in the price of the security underlying the written option. During the period, DIVO and IDVO used written covered call options in a manner consistent with the strategy described above.
SWAN, ISWN, and QSWN’s investments in options contracts will primarily be long-term equity anticipation securities known as LEAP Options. LEAP Options are long-term exchange-traded call options that allow holders the opportunity to participate in the underlying securities’ appreciation in excess of a specified strike price without receiving payments equivalent to any cash dividends declared on the underlying securities. A holder of a LEAP Option will be entitled to receive a specified number of shares of the underlying stock upon payment of the exercise price, and therefore the LEAP Option will be exercisable at any time the price of the underlying stock is above the strike price. However, if at expiration the price of the underlying stock is at or below the strike price, the LEAP Option will expire and be worthless.
SWAP AGREEMENTS
CNBS, HCOW, and MJUS may enter total return swaps for investment purposes. Total return swaps are agreements to exchange the return generated by one instrument for the return generated by another instrument. Swap agreements are contracts entered into primarily with major financial institutions for a specified period ranging from a day to more than one year. For example, the agreement to pay a predetermined or fixed interest rate in exchange for a market-linked return based on a notional amount. To the extent the total return of a referenced index or instrument exceeds the offsetting interest obligation, a Fund will receive a payment from the counterparty. To the extent it is less, a Fund will make a payment to the counterparty. The marked-to-market value less a financing rate, if any, is recorded in net unrealized appreciation (depreciation) on swaps on the Statements of Assets and Liabilities. At termination or maturity date, a net cash flow is exchanged where the total return is equivalent to the return of the underlying reference asset less a financing rate, if any, and is recorded in net realized gain (loss) on swaps on the Statements of Operations. To the extent the marked-to market value of a total return swap appreciates to the benefit of a Fund and exceeds certain contractual thresholds, a Fund’s counterparty may be contractually required to provide collateral. If the marked-to-market value of a total return swap depreciates in value to the benefit of a counterparty and exceeds certain contractual thresholds, a Fund would generally be required to provide collateral for the benefit of its counterparty. Investments and cash provided by the Funds as collateral are reflected as a component of investments in unaffiliated securities at value and collateral for swaps, respectively, on the Statements of Assets and Liabilities and investments are noted on the Schedules of Investments. Assets and cash collateral provided to a Fund by a counterparty as collateral are not assets of the Fund and are not a component of a Fund’s net asset value. HCOW intends to use swaps on the Call Income Strategy’s sold call options on the S&P 500 Index.
143
Amplify ETF Trust Notes to the Financial Statements March 31, 2024 (Continued) |
FUTURES CONTRACTS
IWIN may use futures contracts to seek to enhance return, to hedge some of the risk of its investments in securities, as a substitute for a position in the underlying asset, to reduce transaction costs, to maintain full market exposure (which means to adjust the characteristics of their investments to more closely approximate those of the markets in which it invests), to manage cash flows, to limit exposure to losses due to changes to non-U.S. currency exchange rates or to preserve capital.
The value of derivative instruments on the Statements of Assets and Liabilities as of March 31, 2024 is as follows:
| | Derivatives | | Statement of Assets and Liabilities | | Value |
DIVO | | Equity Contracts – Options | | Options Written, at value (liability) | | $ | 3,332,025 |
SWAN | | Equity Contracts – Options | | Investments, at Value (asset) | | | 33,901,396 |
CNBS | | Equity Contracts – Swaps | | Net Unrealized Appreciation on Swaps (asset) | | | 2,027,312 |
ISWN | | Equity Contracts – Options | | Investments, at Value (asset) | | | 5,700,005 |
QSWN | | Equity Contracts – Options | | Investments, at Value (asset) | | | 444,809 |
IWIN | | Commodity Contracts – Futures | | Net Unrealized Appreciation on Futures (asset) | | | 22,772 |
IDVO | | Equity Contracts – Options | | Options Written, at value (liability) | | | 250,750 |
HCOW | | Equity Contracts – Swaps | | Net Unrealized Depreciation on Swaps (liability) | | | 4,291 |
MJUS | | Equity Contracts – Swaps | | Net Unrealized Appreciation on Swaps (asset) | | | 11,926,948 |
The effect of derivative instruments on the Statement of Operations for the period ended March 31, 2024 is as follows:
| | Derivatives | | Location of Gains (Losses)on
Derivatives Recognized in Income | | Net Realized
Gain (Loss) | | Net Change in Unrealized
Appreciation (Depreciation) |
DIVO | | Equity Contracts | | Options Written | | $ | 10,593,709 | | | $ | (2,701,781 | ) |
SWAN | | Equity Contracts | | Options Purchased(a) | | | 4,011,181 | | | | 22,717,276 | |
CNBS | | Equity Contracts | | Swaps | | | 5,000,058 | | | | 4,872,784 | |
ISWN | | Equity Contracts | | Options Purchased(a) | | | 246,618 | | | | 3,559,297 | |
QSWN | | Equity Contracts | | Options Purchased(a) | | | 146,589 | | | | 169,768 | |
IWIN | | Commodity Contracts | | Long Futures | | | 384,970 | | | | 18,104 | |
IDVO | | Equity Contracts | | Options Written | | | 434,843 | | | | (122,646 | ) |
HCOW | | Equity Contracts | | Swaps | | | (125,578 | ) | | | (16,262 | ) |
MJUS | | Equity Contracts | | Swaps | | | 8,912,279 | | | | 11,926,948 | |
The average monthly value of derivative activity during the period ended March 31, 2024 is as follows:
Average Market Value | | DIVO | | SWAN | | CNBS | | ISWN | | QSWN | | IWIN | | IDVO | | HCOW | | MJUS |
Options Written | | $ | (7,756,395 | ) | | $ | — | | $ | — | | $ | — | | $ | — | | $ | — | | $ | (11,925 | ) | | $ | — | | $ | — |
Options Purchased | | | — | | | | 26,511,193 | | | — | | | 4,774,702 | | | 398,601 | | | — | | | — | | | | — | | | — |
| | | | | | | | | | | | | | | | | | | | | | | | | | | | | | |
Average Notional Value | | | | | | | | | | | | | | | | | | | | | | | | | | | | | |
Total Return Swaps | | | — | | | | — | | | 16,384,046 | | | — | | | — | | | — | | | — | | | | 2,118,341 | | | 106,781,260 |
Futures Contracts – Long | | | — | | | | — | | | — | | | — | | | — | | | 1,266,771 | | | — | | | | — | | | — |
144
Amplify ETF Trust Notes to the Financial Statements March 31, 2024 (Continued) |
OFFSETTING ASSETS AND LIABILITIES
The Funds are subject to various Master Netting Arrangements, which govern the terms of certain transactions with select counterparties. The Master Netting Arrangements allow the Funds to close out and net their total exposure to a counterparty in the event of a default with respect to all the transactions governed under a single agreement with a counterparty. The Master Netting Arrangements also specify collateral posting arrangements at pre-arranged exposure levels. Under the Master Netting Arrangements, collateral is routinely transferred if the total net exposure to certain transactions (net of existing collateral already in place) governed under the relevant Master Netting Arrangement with a counterparty in a given account exceeds a specified threshold depending on the counterparty and type of Master Netting Arrangement.
Assets | | | | | | | | Gross Amounts not offset in
the Statement of Assets and
Liabilities | | |
Description / Counterparty | | Gross
Amounts of
Recognized
Assets | | Gross
Amounts
Offset in the
Statement of
Assets and
Liabilities | | Net Amounts
Presented in
the Statement
of Assets
and Liabilities | | Financial
Instruments | | Collateral
Received | | Net
Amount |
CNBS | | | | | | | | | | | | | | | | | | |
Swaps Executed | | | | | | | | | | | | | | | | | | |
Nomura Global Financial Products, Inc. | | $ | 2,027,312 | | $ | — | | $ | 2,027,312 | | $ | — | | $ | — | | $ | 2,027,312 |
| | | | | | | | | | | | | | | | | | | |
MJUS | | | | | | | | | | | | | | | | | | |
Swaps Executed | | | | | | | | | | | | | | | | | | |
National Bank of Canada | | $ | 11,926,948 | | $ | — | | $ | 11,926,948 | | $ | — | | $ | — | | $ | 11,926,948 |
Liabilities | | | | | | | | Gross Amounts not offset in
the Statement of Assets and
Liabilities | | |
Description / Counterparty | | Gross
Amounts of
Recognized
Liabilities | | Gross
Amounts
Offset in the
Statement of
Assets and
Liabilities | | Net Amounts
Presented in
the Statement
of Assets
and Liabilities | | Financial
Instruments | | Collateral
Pledged | | Net
Amount |
HCOW | | | | | | | | | | | | | | | | | | |
Swaps Executed | | | | | | | | | | | | | | | | | | |
Goldman Sachs | | $ | 4,291 | | $ | — | | $ | 4,291 | | $ | — | | $ | 4,291 | | $ | — |
In some instances, the collateral amounts disclosed in the tables were adjusted due to the requirement to limit the collateral amounts to avoid the effect of overcollateralization. Actual collateral received/pledged may be more than the amounts disclosed herein.
SHORT POSITIONS
When a Fund sells a security it does not own (known as a “short” position), it must buy or borrow the security sold short and deliver it to the broker-dealer through which it made the short sale. A gain, limited to the price at which the Fund sold the security short, or a loss, unlimited in size, will be recognized upon the termination of a short sale. For financial statement purposes, cash proceeds from securities sold short, if any, are included in the Statements of Assets and Liabilities as deposits at broker for securities sold short. The amount of the securities sold short, shown as a liability, is subsequently marked-to-market to reflect the current value of the short positions. Subsequent fluctuations in the market prices of securities sold short may require purchasing the securities at prices which could differ from the amount reflected in the Statements of Assets and Liabilities. A Fund is liable for any dividends or interest payable on securities while those securities are in a short position. Dividend and interest expense paid by the Funds, if any, are displayed in the Expenses section of the Statements of Operations.
145
Amplify ETF Trust Notes to the Financial Statements March 31, 2024 (Continued) |
SHARE VALUATION
The NAV per share of the Funds is calculated by dividing the sum of the value of the securities held by the Funds, plus cash and other assets, minus all liabilities (including estimated accrued expenses) by the total number of shares outstanding for each Fund, rounded to the nearest cent. The Funds’ shares will not be priced on the days on which the NYSE is closed for trading. The offering and redemption price per share for the Funds is equal to the Funds’ NAV.
USE OF ESTIMATES
The preparation of financial statements in conformity with U.S. GAAP requires management to make estimates and assumptions that affect the reported assets and liabilities and disclosure of contingent assets and liabilities at the date of the financial statements, as well as the reported amounts of revenues and expenses during the period. Actual results could differ from those estimates.
FOREIGN CURRENCY TRANSLATION
The books and records of the Funds are maintained in U.S. dollars. Investment securities and other assets and liabilities denominated in a foreign currency are translated into U.S. dollars on the date of valuation. Purchases and sales of investment securities, income and expenses are translated into U.S. dollars at the relevant rates of exchange prevailing on the respective dates of such transactions. The Funds do not isolate that portion of realized or unrealized gains and losses resulting from changes in the foreign exchange rates on investments and currency gains or losses realized between the trade and settlement dates on securities transactions from fluctuations arising from changes in the market prices of the securities. These gains and losses are included in net realized and unrealized gains (loss) on investments on the Statements of Operations. Net realized and unrealized gains and losses on foreign currency transactions represent net foreign exchange gains or losses from foreign currency exchange contracts, disposition of foreign currencies, currency gains or losses realized between trade and settlement dates on foreign currency transactions and the difference between the amount of the investment income and foreign withholding taxes recorded on the Funds’ books and the U.S. dollar equivalent amounts actually received or paid.
SECURITY TRANSACTIONS AND INVESTMENT INCOME
Security transactions are accounted for on trade date. Costs used in determining realized gains and losses on the sale of investment securities are based on specific identification. Dividend income is recorded on the ex-dividend date. Non-cash dividends included in dividend income or separately disclosed, if any, are recorded at the fair value of the security received. Interest income is recognized on the accrual basis. Withholding taxes on foreign dividends have been provided for in accordance with the Funds’ understanding of the applicable country’s tax rules and rates. Discounts and premiums on securities purchased are accreted and amortized over the lives of the respective securities using the effective interest method.
Paid-in-kind (“PIK”) interest income received in the form of securities in-lieu of cash are recorded at the par value of the securities received. PIK accrues to cost and principal on a current basis but is generally not paid in cash until maturity or some other determined payment date.
Distributions received from YYY’s investments in closed-end funds (“CEFs”) are recorded as ordinary income, net realized capital gain or return of capital based on information reported by the CEFs and management’s estimates of such amounts based on historical information. These estimates are adjusted with the tax returns after the actual source of distributions has been disclosed by the CEFs and may differ from the estimated amounts.
146
Amplify ETF Trust Notes to the Financial Statements March 31, 2024 (Continued) |
DIVIDENDS AND DISTRIBUTIONS TO SHAREHOLDERS
Dividends from net investment income and net realized capital gains, if any, will be declared and paid at least annually by the Funds. All distributions are recorded on the ex-dividend date.
The amount and character of income and capital gain distributions to be paid, if any, are determined in accordance with income tax regulations, which may differ from U.S. GAAP. As a result, net investment income (loss) and net realized gain (loss) on investments and foreign currency for a reporting period may differ significantly from distributions during such period. These book/tax differences may be temporary or permanent. To the extent these differences are permanent in nature, they are charged or credited to distributable earnings/(accumulated deficit) and paid-in capital, as appropriate, in the period that the differences arise.
GUARANTEES AND INDEMNIFICATIONS
In the normal course of business, the Funds enter into contracts with service providers that contain general indemnification clauses. The Funds’ maximum exposure under these arrangements is unknown, as this would involve future claims that may be made against the Funds that have not yet occurred. However, based on experience, the Funds expect risk of loss to be remote.
ORGANIZATIONAL AND OFFERING COSTS
All organizational costs incurred to establish the Funds were paid by the Adviser and are not subject to reimbursement.
3. AGREEMENTS
The Adviser serves as investment adviser to the Funds. Pursuant to an Investment Management Agreement (the “Management Agreement”) between the Trust, on behalf of the Funds, and the Adviser, the Adviser provides investment advice to the Funds and oversees the day-to-day operations of the Funds, subject to the direction and control of the Board and the officers of the Trust.
Under the Management Agreement, the Funds will pay the following investment advisory fees to the Adviser as compensation for the services rendered, facilities furnished, and expenses paid by it (with the exception of CNBS), including the cost of transfer agency, custody, fund administration, legal, audit and other service and license fees, but excluding interest, taxes, brokerage commissions, and other expenses connected with the execution of portfolio transactions, distribution and service fees payable pursuant to a Rule 12b-1 Plan, if any, and extraordinary expenses.
Fund | | Annual Rate of
Average Daily
Net Assets | | Fund | | Annual Rate of
Average Daily
Net Assets | | Fund | | Annual Rate of
Average Daily
Net Assets |
YYY | | 0.50% | | QSWN | | 0.49% | | ITEQ | | 0.75% |
IBUY | | 0.65% | | IWIN | | 0.85% | | ETHO | | 0.45% |
DIVO | | 0.55% | | NDIV | | 0.59% | | MJ | | 0.75% |
BLOK | | 0.70% | | IDVO | | 0.65% | | IVES | | 0.68% |
BATT | | 0.59% | | COWS | | 0.39% | | GAMR | | 0.75% |
SWAN | | 0.49% | | HCOW | | 0.65% | | AIEQ | | 0.75% |
EMFQ | | 0.69% | | SOF | | 0.20% | | AWAY | | 0.75% |
CNBS | | 0.65% | | SILJ | | 0.69% | | GERM | | 0.68% |
ISWN | | 0.49% | | HACK | | 0.60% | | MJUS | | 0.75% |
MVPS | | 0.49% | | IPAY | | 0.75% | | | | |
Pursuant to a contractual agreement between the Trust on behalf of CNBS, the Adviser has agreed to waive or reduce its fees to assume other expenses of CNBS, if necessary, in amounts that limit CNBS’ total operating expenses (exclusive of any Rule 12b-1 fees, taxes, interest, brokerage fees, acquired fund fees and expenses, expenses incurred in connection with any merger, reorganization, or proxy solicitation, litigation, and other extraordinary expenses) to not more than 0.75% of the average daily net assets of CNBS. For the period
147
Amplify ETF Trust Notes to the Financial Statements March 31, 2024 (Continued) |
ended March 31, 2024, the Adviser’s management fee was reduced by $85,515 and the Adviser reimbursed $5,848 of the Fund’s expenses. This contractual agreement expires on March 1, 2025. The Adviser is entitled to recoup any fees that it waived and/or fund expenses that it paid for a period of three years following such fee waivers and/or expense payments per the Expense Reimbursement and Fee Waiver Agreement as outlined in the schedule below:
Recoupment Expiration | | Amount of
Recoupment |
September 30, 2024 | | $ | 149,805 |
September 30, 2025 | | | 212,931 |
September 30, 2026 | | | 195,636 |
September 30, 2027 | | | 102,714 |
Pursuant to a contractual agreement between the Trust, on behalf of COWS, management fees paid to the Adviser were reduced by 0.39%. For the period ended October 31, 2023, the Adviser’s management fee was reduced by $1,875. This contractual agreement will continue until September 12, 2024. The Adviser is not eligible to recoup these amounts.
The Adviser has contractually agreed to waive the proportionate amount of the COWS’s advisory fee as applied to the net assets of the Fund invested in HCOW, for which the Adviser also serves as investment adviser. As a result, the Adviser receives a management fee of 0.26% from assets of HCOW invested in COWS. Given the fee waiver in COWS, there was no reduction in the management fee in HCOW for the period ended March 31, 2024.
The Adviser has contractually agreed to waive the proportionate amount of the DIVO’s advisory fee as applied to the net assets of the Fund invested in SOF, for which the Adviser also serves as investment adviser. As a result, the Adviser receives a management fee of 0.35% from assets of SOF invested in DIVO.
The Adviser has contractually agreed to waive the proportionate amount of the MJ’s advisory fee as applied to the net assets of the Fund invested in MJUS, for which the Adviser also serves as investment adviser. As a result, the Adviser receives no management fee from assets of MJUS invested in MJ.
The Adviser has overall responsibility for overseeing the investment of the Funds’ assets, managing the Funds’ business affairs and providing certain clerical, bookkeeping and other administrative services for the Trust. Penserra Capital Management, LLC (“Penserra”), Capital Wealth Planning, LLC (“CWP”), Seymour Asset management, LLC “SAM”), Tidal Investments, a Tidal Financial Group company (“Tidal”), Cerity Partners, LLC (“Cerity”), Kelly Strategic Management, LLC (“Kelly Intelligence”), and Samsung Asset Management (“Samsung”) serve as Sub-Advisers to Funds in the Trust. The Sub-Advisers for each Fund is as follows:
| | Sub-Adviser(s) | | | | | | Sub-Adviser(s) |
YYY | | Penserra | | | | HCOW | | Penserra & Kelly Intelligence |
IBUY | | Penserra | | | | SOF | | Samsung |
DIVO | | Penserra & CWP | | | | SILJ | | Tidal |
BLOK | | Tidal | | | | HACK | | Penserra |
BATT | | Tidal | | | | IPAY | | Penserra |
SWAN | | Tidal & Cerity | | | | ITEQ | | Tidal |
EMFQ | | Penserra | | | | ETHO | | Tidal |
CNBS | | Penserra & SAM | | | | MJ | | Tidal |
ISWN | | Tidal & Cerity | | | | IVES | | Penserra |
MVPS | | Tidal | | | | GAMR | | Penserra |
QSWN | | Tidal & Cerity | | | | AIEQ | | Tidal |
IWIN | | Tidal | | | | AWAY | | Tidal |
NDIV | | Tidal | | | | GERM | | Tidal |
IDVO | | Penserra & CWP | | | | MJUS | | Tidal |
COWS | | Penserra & Kelly Intelligence | | | | | | |
148
Amplify ETF Trust Notes to the Financial Statements March 31, 2024 (Continued) |
Each Sub-Adviser has responsibility for selecting and continuously monitoring the Fund’s investments. Sub-Advisory fees earned by Penserra, Tidal, Cerity, CWP, SAM, Kelly Intelligence, and Samsung are paid by the Adviser.
U.S. Bancorp Fund Services, LLC (“Fund Services” or “Administrator”), doing business as U.S. Bank Global Fund Services, acts as the Funds’ Administrator and, in that capacity, performs various administrative and accounting services for the Funds. The Administrator prepares various federal and state regulatory filings, reports and returns for the Funds, including regulatory compliance monitoring and financial reporting; prepares reports and materials to be supplied to the Board; monitors the activities of the Funds’ custodian, transfer agent and accountant. Fund Services also serves as the transfer agent and fund accountant to the Funds. U.S. Bank N.A. (“USB”), an affiliate of Fund Services, serves as the Funds’ custodian and securities lending agent.
The Distributor acts as the Funds’ principal underwriter in a continuous public offering of the Funds’ shares.
Certain officers and Trustees of the Trust are also officers or employees of the Adviser or its affiliates. The Chief Compliance Officer and the Principal Financial Officer of the Adviser provide services to CNBS and the Advisor is entitled to receive reimbursement from CNBS for their services pursuant to its fee arrangements with CNBS.
4. SECURITIES LENDING
The Funds may lend up to 33 1/3% of the value of the securities in their portfolios to brokers, dealers and financial institutions (but not individuals) under terms of participation in a securities lending programs administered by the Securities Lending Agents. The securities lending agreements require that loans are collateralized at all times in an amount equal to at least 102% of the value of any domestic loaned securities at the time of the loan, plus accrued interest. The use of loans of foreign securities, which are denominated and payable in U.S. dollars, shall be collateralized in an amount equal to 105% of the value of any loaned securities at the time of the loan plus accrued interest.
The Funds receive compensation in the form of fees and earn interest on the non-cash and cash collateral. Due to timing issues of when a security is recalled from loan, the financial statements may differ in presentation. The amount of fees depends on a number of factors including the type of security and length of the loan. The Funds continue to receive interest payments or dividends on the securities loaned during the borrowing period. Gain or loss in the value of securities loaned that may occur during the term of the loan will be for the account of the Funds. The Funds have the right under the terms of the securities lending agreements to recall the securities from the borrower on demand.
As of March 31, 2024, the Funds listed in the below table had loaned securities and received cash collateral for the loans. All of the securities on loan were classified as common stocks. The cash collateral is invested by the Securities Lending Agents in accordance with approved investment guidelines. Those guidelines require the cash collateral to be invested in readily marketable, high quality, short-term obligations; however, such investments are subject to risk of payment delays or default on the part of the issuer or counterparty or otherwise may not generate sufficient interest to support the costs associated with securities lending. The Funds could also experience delays in recovering its securities and possible loss of income or value if the borrower fails to return the borrowed securities, although the Funds are indemnified from this risk by contract with the Securities Lending Agents. The value of the securities on loan and the related collateral as of October 31, 2023, are disclosed in each Fund’s Schedule of Investments and Statement of Assets and Liabilities.
149
Amplify ETF Trust Notes to the Financial Statements March 31, 2024 (Continued) |
As of March 31, 2024, the values of the securities on loan and payable for collateral due to brokers were as follows:
Fund | | Value of
Securities on
Loan | | Payable for
Collateral
Received(a) |
YYY | | $ | 5,532,544 | | $ | 5,840,600 |
IBUY | | | 13,376,980 | | | 15,824,515 |
DIVO | | | 70,186 | | | 73,831 |
BLOK | | | 98,438,702 | | | 106,201,451 |
BATT | | | 16,332,991 | | | 17,317,647 |
SWAN | | | — | | | — |
EMFQ | | | 84,992 | | | 93,948 |
CNBS | | | 3,885,028 | | | 4,641,018 |
ISWN | | | — | | | — |
MVPS | | | 25,093 | | | 27,290 |
QSWN | | | — | | | — |
IWIN | | | 107,906 | | | 116,104 |
NIDV | | | 691,403 | | | 719,859 |
IDVO | | | 9,594,435 | | | 10,097,786 |
COWS | | | — | | | — |
HCOW | | | — | | | — |
SOF | | | — | | | — |
SILJ | | | 3,575,294 | | | 7,056,426 |
HACK | | | — | | | — |
IPAY | | | 954,403 | | | 1,043,709 |
ITEQ | | | 6,648,828 | | | 7,022,800 |
ETHO | | | 3,403,998 | | | 3,639,773 |
MJ | | | 56,687,100 | | | 65,881,964 |
IVES | | | 1,806,882 | | | 2,011,604 |
GAMR | | | 1,882,545 | | | 2,036,920 |
AIEQ | | | 132,036 | | | 3,741,855 |
AWAY | | | 507,082 | | | 564,705 |
GERM | | | 1,614,889 | | | 1,772,831 |
MJUS | | | — | | | — |
The interest income earned by the Funds on investments of cash collateral received from borrowers for the securities loaned to them (“Securities Lending Income”) is reflected in the Funds’ Statements of Operations.
Due to the absence of a master netting agreement related to the Funds’ participation in securities lending, no additional offsetting disclosures have been made on behalf of the Funds for the total borrowings listed above.
150
Amplify ETF Trust Notes to the Financial Statements March 31, 2024 (Continued) |
5. INVESTMENT TRANSACTIONS
For the period ended March 31, 2024, the in-kind transactions associated with creations and redemptions, and the long-term purchases and sales of U.S. Government Securities were as follows:
Fund | | Purchases | | Sales | | In-Kind
Purchases | | In-Kind
Sales | | U.S.
Government
Purchases | | U.S.
Government
Sales |
YYY | | $ | 114,404,937 | | $ | 118,295,774 | | $ | 70,153,169 | | $ | 4,034,687 | | $ | — | | $ | — |
IBUY | | | 25,655,877 | | | 25,971,611 | | | 11,977,378 | | | 44,634,765 | | | — | | | — |
DIVO | | | 1,111,019,104 | | | 1,067,182,876 | | | 61,612,425 | | | 118,473,667 | | | — | | | — |
BLOK | | | 154,182,222 | | | 172,338,408 | | | 584,143,033 | | | 663,807,515 | | | — | | | — |
BATT | | | 28,178,385 | | | 35,267,053 | | | 1,183,287 | | | 13,528,868 | | | — | | | — |
SWAN | | | 29,364,113 | | | 65,972,080 | | | — | | | — | | | 20,846,752 | | | 51,063,966 |
EMFQ | | | 661,202 | | | 760,093 | | | — | | | — | | | — | | | — |
CNBS | | | 4,837,452 | | | 300,237 | | | — | | | — | | | — | | | — |
ISWN | | | 5,813,704 | | | 9,422,936 | | | — | | | — | | | 3,704,059 | | | 7,170,048 |
MVPS | | | 869,848 | | | 885,831 | | | — | | | 499,986 | | | — | | | — |
QSWN | | | 465,542 | | | 482,813 | | | — | | | — | | | 352,006 | | | 228,357 |
IWIN | | | 267,234 | | | 455,411 | | | — | | | 1,655,042 | | | — | | | — |
NDIV | | | 5,334,186 | | | 5,334,433 | | | 3,362,498 | | | 1,973,447 | | | — | | | — |
IDVO | | | 37,328,491 | | | 38,648,784 | | | 56,215,788 | | | 6,958,427 | | | — | | | — |
COWS | | | 6,119,717 | | | 5,594,380 | | | 11,930,511 | | | 4,422,997 | | | — | | | — |
HCOW | | | — | | | — | | | — | | | — | | | — | | | — |
SOF | | | — | | | — | | | — | | | — | | | — | | | — |
SILJ | | | 357,231,581 | | | 355,570,591 | | | 39,116,631 | | | 5,859,226 | | | — | | | — |
HACK | | | 807,352,811 | | | 803,387,721 | | | 363,763,352 | | | 353,925,496 | | | — | | | — |
IPAY | | | 128,755,327 | | | 132,432,784 | | | 6,415,055 | | | 98,838,119 | | | — | | | — |
ITEQ | | | 8,175,624 | | | 8,133,128 | | | 2,272,139 | | | 16,947,939 | | | — | | | — |
ETHO | | | 4,755,312 | | | 4,465,264 | | | 2,869,091 | | | 12,778,831 | | | — | | | — |
MJ | | | 55,541,175 | | | 59,540,920 | | | — | | | 10,074,239 | | | — | | | — |
IVES | | | 7,636,298 | | | 5,272,635 | | | 4,660,532 | | | 5,600,635 | | | — | | | — |
GAMR | | | 12,650,179 | | | 13,879,713 | | | — | | | 4,405,442 | | | — | | | — |
AIEQ | | | 634,884,398 | | | 634,712,443 | | | 3,051,768 | | | 16,739,205 | | | — | | | — |
AWAY | | | 17,988,156 | | | 22,509,416 | | | 4,214,011 | | | 33,345,202 | | | — | | | — |
GERM | | | 1,809,522 | | | 1,817,369 | | | — | | | 2,656,512 | | | — | | | — |
MJUS | | | 4,216,799 | | | 29,980,206 | | | 49,692 | | | 234,154 | | | — | | | — |
6. TRANSACTIONS WITH AFFILIATED SECURITIES
Investments in issuers considered to be affiliate(s) of the Funds during the year ended October 31, 2023 for purposes of Section 2(a)(3) of the 1940 Act were as follows:
Investments in Amplify Samsung SOFR ETF | | Amplify
CWP Enhanced
Dividend Income
ETF |
Value at October 31, 2023 | | $ | — | |
Purchases at Cost | | | 102,128,708 | |
Proceeds from Sales | | | (3,110,942 | ) |
Net Realized Gain (Loss) | | | 4,316 | |
Change in Unrealized Appreciation/(Depreciation) | | | (96,021 | ) |
Value at March 31, 2024 | | $ | 98,926,061 | |
Shares held at March 31, 2024 | | | 986,646 | |
Dividend Income | | $ | 1,788,377 | |
151
Amplify ETF Trust Notes to the Financial Statements March 31, 2024 (Continued) |
Investments in Amplify Cash Flow Dividend Leaders ETF | | Amplify
Cash Flow
High Income
ETF |
Value at October 31, 2023 | | $ | 2,513,272 |
Purchases at Cost | | | — |
Proceeds from Sales | | | — |
Net Realized Gain (Loss) | | | — |
Change in Unrealized Appreciation/(Depreciation) | | | 696,314 |
Value at March 31, 2024 | | $ | 3,209,586 |
Shares held at March 31, 2024 | | | 107,632 |
Dividend Income | | $ | 30,595 |
Investments in Amplify U.S. Alternative Harvest ETF | | Amplify
Alternative
Harvest
ETF |
Value at September 30, 2023 | | $ | 132,937,993 | |
Purchases at Cost | | | — | |
Proceeds from Sales | | | (30,262,195 | ) |
Net Realized Gain (Loss) | | | (10,749,294 | ) |
Change in Unrealized Appreciation/(Depreciation) | | | 29,812,199 | |
Value at March 31, 2024 | | $ | 121,738,703 | |
Shares held at March 31, 2024 | | | 55,588,449 | |
Dividend Income | | $ | 2,400,476 | |
7. FEDERAL INCOME TAXES
As of and during the year ended October 31, 2023, the Funds did not have any tax positions that did not meet the “more-likely-than-not” threshold of being sustained by the applicable tax authority. As of and during the year/period ended October 31, 2023, the Funds did not have liabilities for any unrecognized tax benefits. The Funds recognize interest and penalties, if any, related to unrecognized tax benefits on uncertain tax positions as income tax expense in the Statements of Operations. During the year ended October 31, 2023, the Funds did not incur any interest or penalties.
The tax composition of distributions paid during the year/period ended October 31, 2023 for the Funds was as follows:
| | Ordinary Income | | Capital Gains | | Return of Capital |
YYY | | $ | 32,823,110 | | $ | — | | $ | 10,544,890 |
IBUY | | | — | | | — | | | — |
DIVO | | | 60,061,554 | | | — | | | 72,626,691 |
BLOK | | | — | | | — | | | — |
BATT | | | 6,037,095 | | | — | | | — |
SWAN | | | 6,977,010 | | | — | | | — |
EMFQ | | | 6,458 | | | — | | | — |
CNBS | | | — | | | — | | | — |
ISWN | | | 1,056,161 | | | — | | | — |
MVPS | | | — | | | — | | | — |
QSWN | | | 68,651 | | | — | | | — |
IWIN | | | 54,504 | | | — | | | — |
NDIV | | | 365,917 | | | — | | | 129,309 |
IDVO | | | 866,121 | | | — | | | 583,515 |
COWS | | | 6,480 | | | — | | | — |
HCOW | | | 20,026 | | | — | | | — |
152
Amplify ETF Trust Notes to the Financial Statements March 31, 2024 (Continued) |
The tax composition of distributions paid during the year ended September 30, 2023 for the Funds was as follows:
| | Ordinary Income | | Capital Gains | | Return of Capital |
SILJ | | $ | 380,891 | | $ | — | | $ | — |
HACK | | | 3,006,286 | | | — | | | — |
IPAY | | | — | | | — | | | — |
ITEQ | | | — | | | — | | | — |
ETHO | | | 2,120,978 | | | — | | | — |
MJ | | | 8,926,095 | | | — | | | — |
IVES | | | — | | | — | | | — |
GAMR | | | — | | | — | | | — |
AIEQ | | | 1,342,664 | | | — | | | — |
AWAY | | | — | | | — | | | — |
GERM | | | 192,053 | | | — | | | — |
MJUS | | | — | | | — | | | — |
The tax composition of distributions paid during the year/period ended October 31, 2022 for the Funds was as follows:
| | Ordinary Income | | Capital Gains | | Return of Capital |
YYY | | $ | 23,924,398 | | $ | — | | $ | 13,017,602 |
IBUY | | | — | | | — | | | — |
DIVO | | | 22,060,258 | | | 10,602,302 | | | 33,000,810 |
BLOK | | | 167,906,335 | | | — | | | — |
BATT | | | 5,449,017 | | | — | | | — |
SWAN | | | 23,594,215 | | | 26,156,250 | | | — |
EMFQ | | | — | | | — | | | |
CNBS | | | 960 | | | — | | | — |
ISWN | | | 704,129 | | | — | | | — |
MVPS | | | — | | | 378 | | | — |
QSWN | | | 28,429 | | | — | | | — |
IWIN | | | — | | | — | | | — |
NDIV | | | 8,953 | | | — | | | 848 |
IDVO | | | 5,879 | | | — | | | 12,496 |
The tax composition of distributions paid during the year ended September 30, 2022 for the Funds was as follows:
| | Ordinary Income | | Capital Gains | | Return of Capital |
SILJ | | $ | 2,774,481 | | $ | — | | $ | — |
HACK | | | 2,222,505 | | | — | | | — |
IPAY | | | — | | | — | | | — |
ITEQ | | | — | | | — | | | — |
ETHO | | | 1,482,849 | | | — | | | — |
MJ | | | 12,808,889 | | | — | | | — |
IVES | | | — | | | — | | | — |
GAMR | | | 2,457,762 | | | — | | | — |
AIEQ | | | — | | | 2,903,688 | | | — |
AWAY | | | — | | | — | | | — |
GERM | | | 119,444 | | | — | | | — |
MJUS | | | — | | | — | | | — |
153
Amplify ETF Trust Notes to the Financial Statements March 31, 2024 (Continued) |
The Funds intend to meet the requirements of Subchapter M of the Internal Revenue Code applicable to regulated investment companies and will distribute substantially all taxable income and capital gains to shareholders. Therefore, no federal income or excise tax provision has been made.
The cost basis of investments and distributable earnings (accumulated deficit) for federal income tax purposes as of October 31, 2023 was as follows:
| | YYY | | IBUY | | DIVO | | BLOK | | BATT |
| | | Investments | | Investments | | Investments | | Investments | | Investments |
Tax cost of investments | | $ | 433,671,469 | | | $ | 285,638,925 | | | $ | 2,830,696,279 | | | $ | 869,852,986 | | | $ | 192,702,877 | |
Gross tax unrealized appreciation | | | 5,395,982 | | | | 9,347,115 | | | | 154,590,776 | | | | 36,451,930 | | | | 4,034,540 | |
Gross tax unrealized depreciation | | | (91,483,475 | ) | | | (135,003,540 | ) | | | (145,607,308 | ) | | | (404,558,107 | ) | | | (71,737,730 | ) |
Net tax unrealized appreciation
(depreciation) | | | (86,087,493 | ) | | | (125,656,425 | ) | | | 8,983,468 | | | | (368,106,177 | ) | | | (67,703,190 | ) |
Undistributed ordinary income | | | — | | | | — | | | | — | | | | 12,491,001 | | | | 3,368,757 | |
Undistributed long-term capital gain | | | — | | | | — | | | | — | | | | — | | | | — | |
Total accumulated gain | | | — | | | | — | | | | — | | | | 12,491,001 | | | | 3,368,757 | |
Other accumulated gain (loss) | | | (66,322,667 | ) | | | (353,671,771 | ) | | | (12,835,884 | ) | | | (439,368,827 | ) | | | (55,249,638 | ) |
Distributable earnings/(accumulated
deficit) | | $ | (152,410,160 | ) | | $ | (479,328,196 | ) | | $ | (3,852,416 | ) | | $ | (794,984,003 | ) | | $ | (119,584,071 | ) |
| | SWAN | | EMFQ | | CNBS | | ISWN | | MVPS |
| | | Investments | | Investments | | Investments | | Investments | | Investments |
Tax cost of investments | | $ | 197,524,009 | | | $ | 3,410,029 | | | $ | 98,661,550 | | | $ | 41,264,172 | | | $ | 4,117,256 | |
Gross tax unrealized appreciation | | | 42,409 | | | | 115,148 | | | | 137,164 | | | | — | | | | 152,438 | |
Gross tax unrealized depreciation | | | (17,745,243 | ) | | | (1,568,121 | ) | | | (86,373,465 | ) | | | (4,224,133 | ) | | | (1,812,895 | ) |
Net tax unrealized appreciation
(depreciation) | | | (17,702,834 | ) | | | (1,452,973 | ) | | | (86,236,301 | ) | | | (4,224,133 | ) | | | (1,660,457 | ) |
Undistributed ordinary income | | | 505,413 | | | | 98,136 | | | | — | | | | 103,397 | | | | — | |
Undistributed long-term capital gain | | | — | | | | — | | | | — | | | | — | | | | — | |
Total accumulated gain | | | 505,413 | | | | 98,136 | | | | — | | | | 103,397 | | | | — | |
Other accumulated gain (loss) | | | (114,305,246 | ) | | | (5,943,166 | ) | | | (23,598,137 | ) | | | (12,756,763 | ) | | | (2,429,899 | ) |
Distributable earnings/(accumulated
deficit) | | $ | (131,502,667 | ) | | $ | (7,298,003 | ) | | $ | (109,834,438 | ) | | $ | (16,877,499 | ) | | $ | (4,090,356 | ) |
| | QSWN | | IWIN | | NDIV | | IDVO | | COWS |
| | | Investments | | Investments | | Investments | | Investments | | Investments |
Tax cost of investments | | $ | 2,235,646 | | | $ | 8,885,813 | | | $ | 9,328,122 | | | $ | 44,808,708 | | | $ | 5,395,943 | |
Gross tax unrealized appreciation | | | 72,984 | | | | 856,783 | | | | 260,808 | | | | 1,847,523 | | | | 48,216 | |
Gross tax unrealized depreciation | | | (166,690 | ) | | | (1,923,090 | ) | | | (349,731 | ) | | | (2,522,704 | ) | | | (311,341 | ) |
Net tax unrealized appreciation
(depreciation) | | | (93,706 | ) | | | (1,066,307 | ) | | | (88,923 | ) | | | (675,181 | ) | | | (263,125 | ) |
Undistributed ordinary income | | | 5,454 | | | | 337,806 | | | | — | | | | — | | | | 530 | |
Undistributed long-term capital gain | | | — | | | | — | | | | — | | | | — | | | | — | |
Total accumulated gain | | | 5,454 | | | | 337,806 | | | | — | | | | — | | | | 530 | |
Other accumulated gain (loss) | | | (703,456 | ) | | | (793,346 | ) | | | (177,236 | ) | | | (1,106,508 | ) | | | (4,626 | ) |
Distributable earnings/(accumulated
deficit) | | $ | (791,708 | ) | | $ | (1,521,847 | ) | | $ | (266,159 | ) | | $ | (1,781,689 | ) | | $ | (267,221 | ) |
154
Amplify ETF Trust Notes to the Financial Statements March 31, 2024 (Continued) |
| | HCOW |
| | | Investments |
Tax cost of investments | | $ | 2,950,644 | |
Gross tax unrealized appreciation | | | — | |
Gross tax unrealized depreciation | | | (161,133 | ) |
Net tax unrealized appreciation (depreciation) | | | (161,133 | ) |
Undistributed ordinary income | | | 716 | |
Undistributed long-term capital gain | | | — | |
Total accumulated gain | | | 716 | |
Other accumulated gain (loss) | | | — | |
Distributable earnings/(accumulated deficit) | | $ | (160,417 | ) |
The cost basis of investments and distributable earnings (accumulated deficit) for federal income tax purposes as of September 30, 2023 was as follows:
| | SILJ | | HACK | | IPAY | | ITEQ | | ETHO |
| | | Investments | | Investments | | Investments | | Investments | | Investments |
Tax cost of investments | | $ | 813,795,231 | | | $ | 1,515,386,270 | | | $ | 577,294,087 | | | $ | 145,037,652 | | | $ | 208,987,279 | |
Gross tax unrealized appreciation | | | 27,477,165 | | | | 165,686,349 | | | | 22,689,432 | | | | 8,777,049 | | | | 20,674,739 | |
Gross tax unrealized depreciation | | | (260,694,498 | ) | | | (243,761,801 | ) | | | (199,452,040 | ) | | | (49,045,212 | ) | | | (28,240,008 | ) |
Net tax unrealized appreciation (depreciation) | | | (233,217,333 | ) | | | (78,075,452 | ) | | | (176,762,608 | ) | | | (40,268,163 | ) | | | (7,565,269 | ) |
Undistributed ordinary income | | | — | | | | 51,555 | | | | 345,328 | | | | — | | | | 138,427 | |
Undistributed long-term capital gain | | | — | | | | — | | | | — | | | | — | | | | — | |
Total accumulated gain | | | — | | | | 51,555 | | | | 345,328 | | | | — | | | | 138,427 | |
Other accumulated gain (loss) | | | (299,940,482 | ) | | | (310,261,331 | ) | | | (253,911,705 | ) | | | (27,354,965 | ) | | | (16,624,465 | ) |
Distributable earnings/(accumulated deficit) | | $ | (533,157,815 | ) | | $ | (388,285,228 | ) | | $ | (430,328,985 | ) | | $ | (67,623,128 | ) | | $ | (24,051,307 | ) |
| | MJ | | IVES | | GAMR | | AIEQ | | AWAY |
| | | Investments | | Investments | | Investments | | Investments | | Investments |
Tax cost of investments | | $ | 694,010,638 | | | $ | 34,066,153 | | | $ | 63,052,945 | | | $ | 107,084,233 | | | $ | 155,549,981 | |
Gross tax unrealized appreciation | | | 12,663,232 | | | | 3,669,298 | | | | 3,282,333 | | | | 1,046,655 | | | | 4,109,815 | |
Gross tax unrealized depreciation | | | (351,106,545 | ) | | | (7,117,232 | ) | | | (17,520,484 | ) | | | (3,137,038 | ) | | | (47,922,181 | ) |
Net tax unrealized appreciation (depreciation) | | | (338,443,313 | ) | | | (3,447,934 | ) | | | (14,238,151 | ) | | | (2,090,383 | ) | | | (43,812,366 | ) |
Undistributed ordinary income | | | 1,560,377 | | | | — | | | | 11,336 | | | | 19,629 | | | | — | |
Undistributed long-term capital gain | | | — | | | | — | | | | — | | | | — | | | | — | |
Total accumulated gain | | | 1,560,377 | | | | — | | | | 11,336 | | | | 19,629 | | | | — | |
Other accumulated gain (loss) | | | (1,521,778,910 | ) | | | (12,862,537 | ) | | | (42,513,400 | ) | | | (54,989,103 | ) | | | (118,557,999 | ) |
Distributable earnings/(accumulated deficit) | | $ | (1,858,661,846 | ) | | $ | (16,310,471 | ) | | $ | (56,740,215 | ) | | $ | (57,059,857 | ) | | $ | (162,370,365 | ) |
155
Amplify ETF Trust Notes to the Financial Statements March 31, 2024 (Continued) |
| | GERM | | MJUS |
| | | Investments | | Investments |
Tax cost of investments | | $ | 31,788,428 | | | $ | 151,373,072 | |
Gross tax unrealized appreciation | | | 816,363 | | | | 768,943 | |
Gross tax unrealized depreciation | | | (15,559,954 | ) | | | (11,567,706 | ) |
Net tax unrealized appreciation (depreciation) | | | (14,743,591 | ) | | | (10,798,763 | ) |
Undistributed ordinary income | | | 3,587 | | | | — | |
Undistributed long-term capital gain | | | — | | | | — | |
Total accumulated gain | | | 3,587 | | | | — | |
Other accumulated gain (loss) | | | (16,107,836 | ) | | | (16,049,257 | ) |
Distributable earnings/(accumulated deficit) | | $ | (30,847,840 | ) | | $ | (26,848,020 | ) |
The difference between book and tax-basis cost is attributable to the deferral on wash sales, passive foreign investment companies, deferral on straddles and Swap mark-to-market.
At October 31, 2023, the Funds deferred, on a tax basis, late year ordinary losses of:
| | Late Year
Ordinary Loss
Deferral |
YYY | | $ | — |
IBUY | | | 216,859 |
DIVO | | | — |
BLOK | | | — |
BATT | | | — |
SWAN | | | — |
EMFQ | | | — |
CNBS | | | — |
ISWN | | | — |
MVPS | | | 310 |
QSWN | | | — |
IWIN | | | — |
NDIV | | | — |
IDVO | | | — |
COWS | | | — |
HCOW | | | — |
156
Amplify ETF Trust Notes to the Financial Statements March 31, 2024 (Continued) |
At September 30, 2023, the Funds deferred, on a tax basis, late year ordinary losses of:
| | Late Year
Ordinary Loss
Deferral |
SILJ | | $ | 1,372,333 |
HACK | | | — |
IPAY | | | — |
ITEQ | | | — |
ETHO | | | — |
MJ | | | — |
IVES | | | 90,700 |
GAMR | | | — |
AIEQ | | | — |
AWAY | | | — |
GERM | | | — |
MJUS | | | — |
At October 31, 2023, the Funds had the following capital loss carryforwards:
| | Short-Term | | Long-Term | | Expires |
YYY | | $ | 28,676,146 | | $ | 37,646,521 | | Unlimited |
IBUY | | | 124,545,169 | | | 228,909,156 | | Unlimited |
DIVO | | | 2,023,577 | | | 13,779,602 | | Unlimited |
BLOK | | | 176,350,224 | | | 263,011,016 | | Unlimited |
BATT | | | 24,296,437 | | | 30,942,939 | | Unlimited |
SWAN | | | 97,281,428 | | | 17,023,818 | | Unlimited |
EMFQ | | | 3,006,507 | | | 2,936,640 | | Unlimited |
CNBS | | | 7,458,346 | | | 16,139,791 | | Unlimited |
ISWN | | | 11,022,768 | | | 1,733,995 | | Unlimited |
MVPS | | | 1,640,757 | | | 788,844 | | Unlimited |
QSWN | | | 697,760 | | | 5,696 | | Unlimited |
IWIN | | | 736,267 | | | 61,747 | | Unlimited |
NDIV | | | 128,541 | | | 48,693 | | Unlimited |
IDVO | | | 1,163,035 | | | 10,004 | | Unlimited |
COWS | | | 4,626 | | | — | | Unlimited |
HCOW | | | — | | | — | | Unlimited |
157
Amplify ETF Trust Notes to the Financial Statements March 31, 2024 (Continued) |
At September 30, 2023, the Funds had the following capital loss carryforwards:
| | Short-Term | | Long-Term | | Expires |
SILJ | | $ | 132,046,895 | | $ | 166,521,331 | | Unlimited |
HACK | | | 173,594,335 | | | 136,666,850 | | Unlimited |
IPAY | | | 82,730,261 | | | 171,177,318 | | Unlimited |
ITEQ | | | 12,110,864 | | | 15,244,105 | | Unlimited |
ETHO | | | 8,557,418 | | | 8,067,047 | | Unlimited |
MJ | | | 429,384,981 | | | 1,092,392,312 | | Unlimited |
IVES | | | 2,648,434 | | | 10,107,033 | | Unlimited |
GAMR | | | 16,633,167 | | | 25,878,915 | | Unlimited |
AIEQ | | | 54,989,103 | | | — | | Unlimited |
AWAY | | | 55,624,141 | | | 62,932,988 | | Unlimited |
GERM | | | 5,093,526 | | | 11,014,310 | | Unlimited |
MJUS | | | 14,868,468 | | | 1,180,800 | | Unlimited |
Additionally, U.S. GAAP requires that certain components of net assets relating to permanent differences be reclassified between financial and tax reporting. These reclassifications have no effect on net assets or NAV per share. The permanent differences primarily relate to net operating losses, losses from the Fund’s wholly owned subsidiary in IWIN only, prior year return of capital true ups, and redemption-in-kind transactions. For the year ended October 31, 2023, the following table shows the reclassifications made:
| | Distributable
Earnings
(Accumulated
Deficit) | | Paid-In Capital |
YYY | | $ | 438,510 | | | $ | (438,510 | ) |
IBUY | | | (10,665,576 | ) | | | 10,665,576 | |
DIVO | | | (25,999,586 | ) | | | 25,999,586 | |
BLOK | | | 17,647,079 | | | | (17,647,079 | ) |
BATT | | | (1,204,552 | ) | | | 1,204,552 | |
SWAN | | | — | | | | — | |
EMFQ | | | (16,735 | ) | | | 16,735 | |
CNBS | | | 7,640,529 | | | | (7,640,529 | ) |
ISWN | | | — | | | | — | |
MVPS | | | 854,026 | | | | (854,026 | ) |
QSWN | | | 51,885 | | | | (51,885 | ) |
IWIN | | | 405,292 | | | | (405,292 | ) |
NDIV | | | (350,588 | ) | | | 350,588 | |
IDVO | | | (476,031 | ) | | | 476,031 | |
COWS | | | — | | | | — | |
HCOW | | | — | | | | — | |
158
Amplify ETF Trust Notes to the Financial Statements March 31, 2024 (Continued) |
For the year ended September 30, 2023, the following table shows the reclassifications made:
| | Distributable
Earnings
(Accumulated
Deficit) | | Paid-In Capital |
SILJ | | $ | (2,534,506 | ) | | $ | 2,534,506 | |
HACK | | | (45,048,100 | ) | | | 45,048,100 | |
IPAY | | | (1,774,347 | ) | | | 1,774,347 | |
ITEQ | | | (3,534,977 | ) | | | 3,534,977 | |
ETHO | | | (914,464 | ) | | | 916,464 | |
MJ | | | 15,616,605 | | | | (15,616,605 | ) |
IVES | | | (690,629 | ) | | | 690,629 | |
GAMR | | | (374,992 | ) | | | 374,992 | |
AIEQ | | | 303,014 | | | | (303,014 | ) |
AWAY | | | 8,681,836 | | | | (8,681,836 | ) |
GERM | | | (482,132 | ) | | | 482,132 | |
MJUS | | | 14,527,357 | | | | (14,527,357 | ) |
During the year/period ended October 31, 2023 and September 30, 2023, the Funds realized the following net capital gains (losses) resulting from in-kind redemptions, in which shareholders exchanged Fund shares for securities held by the Funds rather than for cash. Because such gains (losses) are not taxable to the Funds, and gains are not distributed to shareholders, they have been reclassified from total distributable earnings (accumulated deficit) to paid-in capital.
| | Year/Period Ended
October 31, 2023 |
YYY | | $ | (1,078,203 | ) |
IBUY | | | 10,741,393 | |
DIVO | | | 25,999,586 | |
BLOK | | | (17,647,079 | ) |
BATT | | | 1,204,552 | |
SWAN | | | — | |
EMFQ | | | 16,735 | |
CNBS | | | (24,912 | ) |
ISWN | | | — | |
MVPS | | | (850,391 | ) |
QSWN | | | (51,885 | ) |
IWIN | | | (401,218 | ) |
NDIV | | | 350,588 | |
IDVO | | | 476,030 | |
COWS | | | — | |
HCOW | | | — | |
159
Amplify ETF Trust Notes to the Financial Statements March 31, 2024 (Continued) |
| | Year Ended
September 30,
2023 |
SILJ | | $ | 5,474,021 | |
HACK | | | 50,528,039 | |
IPAY | | | 8,090,599 | |
ITEQ | | | 4,241,240 | |
ETHO | | | 940,435 | |
MJ | | | (107,901 | ) |
IVES | | | 1,192,225 | |
GAMR | | | 557,270 | |
AIEQ | | | 343,113 | |
AWAY | | | (2,241,789 | ) |
GERM | | | 632,010 | |
MJUS | | | 28,924 | |
SOF was launched after October 31, 2023, therefore there is not any federal income tax information.
8. SUBSEQUENT EVENTS
The Funds have evaluated the need for additional disclosures and/or adjustments resulting from subsequent events through the date the financial statements were issued. The evaluation did not result in any subsequent events that necessitated disclosure and/or adjustment.
160
Amplify ETF Trust
Approval of Investment Advisory Agreements
and Board Considerations (Unaudited)
Board Considerations Regarding Approval of
Investment Management Agreements and Sub-Advisory Agreements
Pursuant to Section 15(c) of the Investment Company Act of 1940 (the “1940 Act”), at a meeting held on
(i) June 16, 2023,1 the Board of Trustees (the “Board”) of Amplify ETF Trust (the “Trust”) considered the approval of, and approved, the following agreements (collectively, the “Agreements”): an Investment Management Agreement between Amplify Investments LLC (the “Adviser”) and the Trust, on behalf of the Amplify ETF Fund noted below and:
(a) the Investment Sub-Advisory Agreement between the Adviser and Penserra Capital Management LLC (“Penserra”) on behalf of the Amplify ETF Funds noted below:
AMPLIFY CYBER SECURITY ETF (“HACK”)
AMPLIFY MOBILE PAYMENTS ETF (“IPAY”)
AMPLIFY GLOBAL CLOUD TECHNOLOGY ETF (“IVES”)
AMPLIFY VIDEO GAME TECH ETF (“GAMR”)
(b) the Investment Sub-Advisory Agreement between the Adviser and Tidal Investments LLC, which was formerly known as Toroso Investments LLC (“Tidal”) on behalf of the Amplify ETF Funds noted below:
AMPLIFY JUNIOR SILVER MINERS ETF (“SILJ”)
AMPLIFY BLUESTAR ISRAEL TECHNOLOGY ETF (“ITEQ”)
AMPLIFY ETHO CLIMATE LEADERSHIP U.S. ETF (“ETHO”)
AMPLIFY ALTERNATIVE HARVEST ETF (“MJ”)
AMPLIFY AI POWERED EQUITY ETF (“AIEQ”)
AMPLIFY TRAVEL TECH ETF (“AWAY”)
AMPLIFY TREATMENTS TESTING & ADVANCEMENTS ETF (“GERM”)
AMPLIFY U.S. ALTERNATIVE HARVEST ETF (“MJUS”)
(ii) September 12, 2023, the Board considered the approval of, and approved, the Investment Management Agreement between the Trust and the Adviser and the Investment Sub-Advisory Agreement between the Adviser and Samsung Asset Management (New York), Inc. (“Samsung”) on behalf of the Amplify ETF Fund noted below:
AMPLIFY SOFR ETF EQUITY ETF (“SOF”)
and
(iii) December 12, 2023, the Board considered the approval of, and approved, the Investment Management Agreement between the Trust and the Adviser and:
(a) the Investment Sub-Advisory Agreements between (1) the Adviser and Penserra and (2) the Adviser and Capital Wealth Planning LLC (“CWP”) on behalf of the Amplify ETF Fund noted below:
AMPLIFY CWP ENHANCED DIVIDEND INCOME ETF (“DIVO”)
161
Amplify ETF Trust
Approval of Investment Advisory Agreements
and Board Considerations (Unaudited)
Board Considerations Regarding Approval of
Investment Management Agreements and Sub-Advisory Agreements (Continued)
(b) the Investment Sub-Advisory Agreement between the Adviser and Penserra, on behalf of the Amplify ETF Fund noted below:
AMPLIFY BLOCKCHAIN LEADERS ETF (“BLOK”)
AMPLIFY LITHIUM AND BATTERY TECHNOLOGY ETF (“BATT”)
AMPLIFY EMERGING MARKETS FINTECH ETF (“EMFQ”)
(c) the Investment Sub-Advisory Agreement between (1) the Adviser and Penserra and (2) the Adviser and Seymour Asset Management LLC (“SAM”) on behalf of the Amplify ETF Fund noted below:
AMPLIFY SEYMOUR CANNABIS ETF (CNBS)
(d) the Investment Sub-Advisory Agreement between the Adviser and Tidal on behalf of the Amplify ETF Fund noted below:
AMPLIFY INFLATION FIGHTER ETF (“IWIN”)
Each of the dates referenced above (June 16, 2023, September 12, 2023, and December 12, 2023) will be hereinafter referred to as the “Approval Meeting” with respect to the ETF Funds approved on such date.
With respect to HACK, IPAY, IVES, GAMR, BLOK, BATT and EMFQ, the term “Sub-Adviser” shall mean Penserra. With respect to SILJ, ITEQ, ETHO, MJ, AIETQ, AWAY, GERM, MJUS and IWIN, the term “Sub-Adviser” shall mean Tidal. With respect to SOF, the term Sub-Adviser shall mean Samsung. With respect to DIVO, the term “Sub-Adviser” shall mean both Penserra and CWP. With respect to CNBS, the term “Sub-Adviser” shall mean both Penserra and SAM.
The Adviser and the Sub-Adviser for HACK, IPAY, IVES, GAMR, SILJ, ITEQ, ETHO, MJ, AIETQ, AWAY, GERM, and MJUS were originally approved by the Board, and separately by its Independent Trustees, at a meeting held on or about June 16, 2023 for an initial two-year term.
The Adviser and the Sub-Adviser for SOF was originally approved by the Board, and separately by its Independent Trustees, on September 12, 2023 for an initial two-year term.
The Adviser and the Sub-Adviser for DIVO was originally approved by the Board, and separately by its Independent Trustees, at a meeting held on or about June 22, 2016 for an initial two-year term. Thereafter, the Adviser and Sub-Adviser for DIVO was approved by the Board, and separately by its Independent Trustees, for additional one-year terms at meetings held on or about June 12, 2018, June 11, 2019, December 10, 2019, December 8, 2020, December 2, 2021, December 14, 2022 and December 12, 2023.
The Adviser and the Sub-Adviser for BLOK was originally approved by the Board, and separately by its Independent Trustees, at a meeting held on or about June 22, 2016 for an initial two-year term. Thereafter, the Adviser and Sub-Adviser for BLOK was approved by the Board, and separately by its Independent Trustees, for additional one-year terms at meetings held on or about June 12, 2018, June 11, 2019, December 10, 2019, December 8, 2020, December 2, 2021, December 14, 2022 and December 12, 2023.
The Adviser and the Sub-Adviser for BATT was originally approved by the Board, and separately by its Independent Trustees, at a meeting held on or about March 13, 2018 for an initial two-year term. Thereafter, the Adviser and Sub-Adviser for BATT was approved by the Board, and separately by its Independent Trustees, for additional one-year terms at meetings held on or about December 10, 2019, December 8, 2020, December 2, 2021, December 14, 2022 and December 12, 2023.
162
Amplify ETF Trust
Approval of Investment Advisory Agreements
and Board Considerations (Unaudited)
Board Considerations Regarding Approval of
Investment Management Agreements and Sub-Advisory Agreements (Continued)
The Adviser and the Sub-Adviser for EMFQ was originally approved by the Board, and separately by its Independent Trustees, as Amplify International Online Retail ETF (with a ticker of XBUY) at a meeting held on or about September 18, 2018 for an initial two-year term. Thereafter, the Adviser and Sub-Adviser for XBUY was approved by the Board, and separately by its Independent Trustees, for additional one-year terms at meetings held on or about September 15, 2020 and September 14, 2021. At the meeting held on December 2, 2021, the Board was advised that XBUY changed its name to Amplify Emerging Markets FinTech ETF, with a ticker of EMFQ and the Board, including a separate vote by its Independent Trustees, approved the retention of the Adviser and Sub-Adviser for EFMQ at that meeting for an additional one year term. Thereafter, the Adviser and Sub-Adviser for EFMQ was approved by the Board, and separately by its Independent Trustees, for additional one-year terms at meetings held on or about December 14, 2022 and December 12, 2023
Amplify and Penserra were originally approved by the Board, and separately by its Independent Trustees, at a meeting held on or about March 12, 2019 as the Adviser and the initial sub-adviser for CNBS for an initial two-year term. Thereafter, Amplify and Penserra were approved by the Board, and separately by its Independent Trustees, for additional one-year terms at meetings held on or about December 8, 2020 and December 2, 2021 for additional one-year terms. At a meeting held on March 15, 2023, the Board, including a separate vote by its Independent Trustees, considered and approved adding SAM as a co-sub-adviser with Penserra (SAM and Penserra referred together hereinafter as the “Sub-Adviser”) to the Fund for an additional one- year term. Thereafter, the Adviser and Sub-Adviser for CNBS were approved by the Board, and separately by its Independent Trustees, for additional one-year terms at meetings held on or about December 12, 2023.
The Adviser and the Sub-Adviser for IWIN was originally approved by the Board, and separately by its Independent Trustees, at a meeting held on or about December 2, 2021 for an initial two-year term. Thereafter, the Adviser and Sub-Adviser for DIVO was approved by the Board, and separately by its Independent Trustees, for an additional one-year term at meetings held on or about December 12, 2023.
Each of the meetings referenced above are hereinafter referred to as the “Review Meetings” for the applicable ETF Fund.
At each of the Review Meetings, the Board, including the Trustees who are not parties to the Agreements or “interested persons” of any party thereto, as defined in the Investment Company Act of 1940, as amended (the “Independent Trustees”) requested and reviewed a wide variety of information from the Adviser and the Sub-Adviser. Prior to the Review Meetings, the Board, including the Independent Trustees, reviewed written materials from the Adviser and the Sub-Adviser regarding, among other things: (i) the nature, extent and quality of the services to be provided to fund shareholders by the Adviser and the Sub-Adviser; (ii) the Adviser and the Sub-Adviser’s costs and profits expected to be realized in providing their services, including any fall-out benefits expected to be enjoyed by the Adviser and the Sub-Adviser and (iii) the existence, or anticipated existence, of economies of scale. After review of the written materials and discussion during the Review Meeting, the Board, including the Independent Trustees in a separate vote, approved the initial two-year term for the Adviser and the respective Sub-Adviser for each of the Amplify ETF Funds listed for an additional one-year term.
At each of the Approval Meetings, the Board, including the Independent Trustees met to discuss and review the Agreements with respect to each of the Amplify ETF Funds listed herein. In preparation for the meeting, the Board requests and reviews a wide variety of information from the Adviser and the Sub-Adviser. Prior to the Approval Meetings, the Board, including the Independent Trustees, reviewed written materials from the Adviser and the Sub-Adviser regarding, among other things: (i) the nature, extent and quality of the services to be provided to fund shareholders by the Adviser and the Sub-Adviser; (ii) the Adviser and the Sub-Adviser’s costs and profits expected to be realized in providing their services, including any fall-out benefits expected to be enjoyed by the Adviser and the Sub-Adviser; and (iii) the existence, or anticipated existence, of economies of scale. At the Approval Meeting, representatives from the Adviser and the Sub-Adviser, along with other service providers of the applicable Amplify ETF Fund, presented additional oral and written information to help the Board evaluate the Adviser and the Sub-Adviser’s fees and other aspects of the Agreements. Among other things, representatives from the Adviser and the Sub-Adviser provided overviews of their advisory businesses, including investment personnel and investment processes. The representatives also discussed the rationale for launching each of the Amplify ETF Fund listed herein, the relevant Amplify ETF Fund’s fees and fee structures of comparable investment companies. The Board then discussed the written materials that it received before the meeting and the Adviser and Sub-Adviser’s oral presentations and any other information that the Board received at the meeting and deliberated on the approval of the Agreements in light of this information. In its deliberations, the
163
Amplify ETF Trust
Approval of Investment Advisory Agreements
and Board Considerations (Unaudited)
Board Considerations Regarding Approval of
Investment Management Agreements and Sub-Advisory Agreements (Continued)
Board did not identify any single piece of information discussed below that was all-important, controlling or determinative of its decision. Thereafter, the Board, including the Independent Trustees in a separate vote, approved the following Amplify ETF Fund products: DIVO, BLOK, BATT, EFMQ, CNBS, IWIN, SOF, SILJ, HACK, IPAY, ITEQ, ETHO, MJ, IVES, GAMR, AIEQ, AWAY, GERM and MJUS; the retention of the Adviser and each of the Sub-Adviser and their respective Agreements, for an additional one year term.
Nature, Extent and Quality of Services. In evaluating the nature, extent and quality of the Adviser’s services, the Trustees considered information concerning the functions to be performed by the Adviser and the Sub-Adviser and the personnel and resources of the Adviser and Sub-Adviser, including the investment management team that will be responsible for the day-to-day management of the relevant Amplify ETF Fund and the portfolio manager responsible for investing the portfolio of the relevant Amplify ETF Fund. The Trustees also considered statements by the Adviser and Sub-Adviser regarding their respective financial conditions, that each was financially stable and could support its performance of the services under its Agreement. The Trustees also considered the services to be provided by the Adviser in its oversight of the Fund’s service providers.
Based on their review, the Trustees concluded that the nature, extent and quality of the services to be provided by the Adviser and Sub-Adviser to the relevant Amplify ETF Fund listed herein under the respective Agreement were expected to be appropriate and reasonable.
Fees, Expenses and Profitability. The Trustees discussed the information provided by the Adviser on the relevant Amplify ETF Fund’s proposed investment management fee as set forth in the following chart:
DIVO | | AMPLIFY CWP ENHANCED DIVIDEND INCOME ETF (DIVO) | | 0.56 |
BLOK | | AMPLIFY BLOCKCHAIN LEADERS ETF (BLOK) | | 0.76 |
BATT | | AMPLIFY LITHIUM AND BATTERY TECHNOLOGY ETF (BATT) | | 0.59 |
EMFQ | | AMPLIFY EMERGING MARKETS FINTECH ETF (EMFQ) | | 0.69 |
CNBS | | AMPLIFY SEYMOUR CANNABIS ETF (“CNBS”) | | 0.652 |
IWIN | | AMPLIFY INFLATION FIGHTER ETF (IWIN) | | 0.87 |
SOF | | AMPLIFY SOFR ETF (SOF) | | 0.20 |
SILJ | | AMPLIFY JUNIOR SILVER MINERS ETF (“SILJ”) | | 0.69 |
HACK | | AMPLIFY CYBER SECURITY ETF (“HACK”) | | 0.60 |
IPAY | | AMPLIFY MOBILE PAYMENTS ETF (“IPAY”) | | 0.75 |
ITEQ | | AMPLIFY BLUESTAR ISRAEL TECHNOLOGY ETF (“ITEQ”) | | 0.75 |
ETHO | | AMPLIFY ETHO CLIMATE LEADERSHIP U.S. ETF (“ETHO”) | | 0.45 |
MJ | | AMPLIFY ALTERNATIVE HARVEST ETF(“MJ”) | | 0.78 |
IVES | | AMPLIFY GLOBAL CLOUD TECHNOLOGY ETF (“IVES”) | | 0.68 |
GAMR | | AMPLIFY VIDEO GAME TECH ETF (“GAMR”) | | 0.75 |
AIEQ | | AMPLIFY AI POWERED EQUITY ETF (“AIEQ”) | | 0.75 |
AWAY | | AMPLIFY TRAVEL TECH ETF (“AWAY”) | | 0.75 |
GERM | | AMPLIFY TREATMENTS TESTING & ADVANCEMENTS ETF (“GERM”) | | 0.68 |
MJUS | | AMPLIFY U.S. ALTERNATIVE HARVEST ETF (“MJUS”) | | 0.75 |
164
Amplify ETF Trust
Approval of Investment Advisory Agreements
and Board Considerations (Unaudited)
Board Considerations Regarding Approval of
Investment Management Agreements and Sub-Advisory Agreements (Continued)
The proposed investment management fee was compared to information provided by the Adviser on other similar products. The Trustees also considered that the Adviser and Sub-Adviser had managed the relevant Amplify ETF Fund to the Board’s satisfaction over the course of the previous years.
The Trustees noted that the proposed annual investment management fee to be charged to all of the Amplify ETF Fund noted in the chart above (with the exception of CNBS) was a unitary fee, and that the Adviser has agreed to pay all other expenses of the relevant Amplify ETF Fund, including fees payable to the Sub-Adviser, except brokerage commissions and other expenses connected with the execution of portfolio transactions, taxes, interest, distribution and service fees payable pursuant to a 12b-1 Plan, if any, and extraordinary expenses. The Board concluded that the unitary investment management fee to be charged to the relevant Amplify ETF Fund is reasonable and appropriate in light of the services expected to be provided by the Adviser and relevant Sub-Adviser. With respect to CNBS, the Trustees noted that the .65% fee charged to the Amplify ETF Fund, with the agreement to waive its advisory fee or assume as its own expense certain expenses which would otherwise be payable to CNBS to the extent necessary that the total annual fund operating expenses do not exceed .75% is reasonable and appropriate in light of the services expected to be provided by the Adviser and Sub-Adviser.
In conjunction with their review of the fees for CNBS and the unitary investment management fee for each of the other Amplify ETF Funds, the Trustees considered information provided by the Adviser and Sub-Adviser on their costs to be incurred in connection with the proposed Agreement and their estimated profitability and that any profitability would not be excessive. The Trustees concluded that the estimated profits to be realized by the Adviser and the Sub-Adviser with respect to the relevant Amplify ETF Fund appeared to be reasonable.
Economies of Scale and Whether the Fee Level Reflects These Economies of Scale. The Trustees considered the information provided by the Adviser and the Sub-Adviser as to the extent to which economies of scale may be realized as the relevant Amplify ETF Fund grows and whether the fee level reflects economies of scale for the benefit of shareholders. The Trustees noted that any reduction in fixed costs associated with the management of the relevant Amplify ETF Fund would be enjoyed by the Adviser and Sub-Adviser, but that a unitary fee provides a level of certainty in expenses for the relevant Amplify ETF Fund. The Trustees considered whether the proposed advisory fee rate for the relevant Amplify ETF Fund is reasonable in relation to the projected asset size of the relevant Amplify ETF Fund. The Trustees noted the Adviser’s and Sub-Adviser’s views on their expectations for growth, noting that, initially, the Adviser did not anticipate any material economies of scale. The Trustees concluded that the flat investment management fee was reasonable and appropriate.
The Trustees noted that the Adviser and Sub-Adviser had not identified any further benefits that it would derive from its relationship with the relevant Amplify ETF Fund, and had noted that it will not, initially, have any soft dollar arrangements.
Based on all of the information considered and the conclusions reached, the Board, including the Independent Trustees, have determined to approve the Agreements for the relevant Amplify ETF Fund listed herein.
165
Amplify ETF Trust
Review of Liquidity Risk Management Program
Consistent with Rule 22e-4 under the Investment Company Act of 1940, as amended, Amplify ETF Trust (the “Trust”), on behalf of each of its series (each a “Fund” and, collectively, the “Funds”), has established a liquidity risk management program to govern the Funds’ approach to managing liquidity risk (the “Program”). The Program is overseen by the Trust’s Chief Compliance Officer (the “Liquidity Risk Manager”). The Trust’s Board of Trustees (the “Board”) has approved the designation of the Liquidity Risk Manager to administer the Program.
The Program’s principal objectives include supporting the Funds’ compliance with limits on investments in illiquid assets and mitigating the risk that a Fund will be unable to meet its redemption obligations in a timely manner. The Program also includes a number of elements that support the management and assessment of liquidity risk, including an annual assessment of factors that influence each Fund’s liquidity and the periodic classification and re-classification of certain Funds’ investments into groupings that reflect the Liquidity Risk Manager’s assessment of their relative liquidity under current market conditions.
At a meeting of the Board held on December 12, 2023, the Trustees received a written report from the Liquidity Risk Manager regarding the design and operational effectiveness of the Program since its implementation. The Liquidity Risk Manager determined, and reported to the Board, that the Program is reasonably designed to assess and manage the Funds’ liquidity risk and has operated adequately and effectively to manage the Funds’ liquidity risk since implementation. The Liquidity Risk Manager reported that during the period covered by the report, there were no liquidity events that impacted the Funds or their ability to timely meet redemptions without dilution to existing shareholders. The Liquidity Risk Manager also noted no Fund has filed a Form N-LIQUID with the SEC.
The Liquidity Risk Manager noted that, with the exception of the Amplify BlackSwan Growth & Treasury Core ETF (“SWAN”), Amplify Seymour Cannabis ETF (“CNBS”), Amplify BlackSwan ISWN ETF (“ISWN”), Amplify BlackSwan Tech & Treasury ETF (“QSWN”), Amplify Inflation Fighter ETF (“IWIN”), Amplify Cash Cows High Income ETF (“HCOW”), Amplify Samsung SOFR ETF (“SOF”), and Amplify U.S. Alternative Harvest ETF (“MJUS”), the Funds continue to qualify as “in-kind” ETFs under Rule 22e-4 and, as such, are exempt from the requirement to set a highly liquid investment minimum. The Liquidity Risk Manager noted that SWAN, CNBS, ISWN, QSWN, IWIN, HCOW, SOF, and MJUS are invested in highly liquid securities and, accordingly, continue to be exempt from the requirement to determine a “highly liquid investment minimum” as defined in the Rule. Because of that continued qualification for the exemption, the Funds have not adopted any “highly liquid investment” minimum amounts. The Liquidity Risk Manager further noted that no material changes have been made to the Program since its implementation.
There can be no assurance that the Program will achieve its objectives in the future. Please refer to the Funds’ prospectus for more information regarding each Fund’s exposure to liquidity risk and other principal risks to which an investment in a Fund may be subject.
166
Amplify ETF Trust
Disclosure of Fund Expenses
March 31, 2024 (Unaudited)
All Exchange Traded Funds (“ETF”) have operating expenses. As a shareholder of an ETF, your investment is affected by these ongoing costs and transaction fees, which include costs for ETF management and other Fund expenses. It is important for you to understand the impact of these costs on your investment returns.
Operating expenses such as these are deducted from an ETF’s gross income and directly reduce its final investment return. These expenses are expressed as a percentage of the ETF’s average net assets; this percentage is known as the ETF’s expense ratio.
The following examples use the expense ratio and are intended to help you understand the ongoing costs (in dollars) of investing in your fund and to compare these costs with those of other funds. The examples are based on investment of $1,000 made at the beginning of the period shown and held for the periods shown below.
The table below illustrates your fund’s costs in two ways:
ACTUAL FUND RETURN
This section helps you to estimate the actual expenses after fee waivers that your fund incurred over the period shown. “Expenses Paid During Period” shows the actual dollar expense cost incurred by a $1,000 investment in the Fund, and the “Ending Account Value” number is derived from deducting that expense cost from the Fund’s gross investment return.
You can use this information, together with the actual amount you invested in the Fund, to estimate the expenses you paid during the period. Simply divide your actual account value by $1,000 to arrive at a ratio (for example, an $8,600 account value divided by $1,000 = 8.6), then multiply that ratio by the number shown for your fund under “Expenses Paid During Period.”
HYPOTHETICAL 5% RETURN
This section helps you compare your fund’s costs with those of other funds. It assumes that the Fund had an annual 5% return before expenses during the year, but that the “Annualized Expense Ratio” for the period is unchanged. This example is useful in making comparisons because the Commission requires all funds to make this 5% calculation. You can assess your fund’s comparative cost by comparing the hypothetical result of your fund under “Expenses Paid During Period” with those that appear in the same charts in the shareholder reports for other funds.
167
Amplify ETF Trust
Disclosure of Fund Expenses
March 31, 2024 (Unaudited) (Continued)
NOTE: Because the return is set at 5% for comparison purposes — NOT your fund’s actual return — the account values shown may not apply to your specific investment.
| | | | | | Actual Fund Return | | Hypothetical 5% Return |
| | | Annualized
Expense Ratios | | Beginning
Account Value
10/1/2023 | | Ending
Account Value
3/31/2024 | | Expenses
Paid During
Period(a) | | Ending
Account Value
3/31/2024 | | Expenses
Paid During
Period(a) |
YYY | | 0.50% | | $ | 1,000.00 | | $ | 1,153.90 | | $ | 2.69 | | $ | 1,022.50 | | $ | 2.53 |
IBUY | | 0.65% | | | 1,000.00 | | | 1,312.30 | | | 3.76 | | | 1,021.75 | | | 3.29 |
DIVO | | 0.55% | | | 1,000.00 | | | 1,149.50 | | | 2.96 | | | 1,022.25 | | | 2.78 |
BLOK | | 0.70% | | | 1,000.00 | | | 1,846.30 | | | 4.98 | | | 1,021.50 | | | 3.54 |
BATT | | 0.59% | | | 1,000.00 | | | 854.20 | | | 2.73 | | | 1,022.05 | | | 2.98 |
SWAN | | 0.49% | | | 1,000.00 | | | 1,184.90 | | | 2.68 | | | 1,022.55 | | | 2.48 |
EMFQ | | 0.69% | | | 1,000.00 | | | 1,085.90 | | | 3.60 | | | 1,021.55 | | | 3.49 |
CNBS | | 0.75% | | | 1,000.00 | | | 1,198.00 | | | 4.12 | | | 1,021.25 | | | 3.79 |
ISWN | | 0.49% | | | 1,000.00 | | | 1,123.40 | | | 2.60 | | | 1,022.55 | | | 2.48 |
MVPS | | 0.49% | | | 1,000.00 | | | 1,224.10 | | | 2.72 | | | 1,022.55 | | | 2.48 |
QSWN | | 0.49% | | | 1,000.00 | | | 1,166.10 | | | 2.65 | | | 1,022.55 | | | 2.48 |
IWIN | | 0.85% | | | 1,000.00 | | | 1,246.90 | | | 4.77 | | | 1,020.75 | | | 4.29 |
NDIV | | 0.59% | | | 1,000.00 | | | 1,131.40 | | | 3.14 | | | 1,022.05 | | | 2.98 |
IDVO | | 0.65% | | | 1,000.00 | | | 1,170.60 | | | 3.53 | | | 1,021.75 | | | 3.29 |
COWS | | 0.39% | | | 1,000.00 | | | 1,220.90 | | | 2.17 | | | 1,023.05 | | | 1.97 |
HCOW | | 0.65% | | | 1,000.00 | | | 1,156.90 | | | 3.50 | | | 1,021.75 | | | 3.29 |
SILJ | | 0.69% | | | 1,000.00 | | | 1,174.50 | | | 3.75 | | | 1,021.55 | | | 3.49 |
HACK | | 0.60% | | | 1,000.00 | | | 1,245.90 | | | 3.37 | | | 1,022.00 | | | 3.03 |
IPAY | | 0.75% | | | 1,000.00 | | | 1,343.10 | | | 4.39 | | | 1,021.25 | | | 3.79 |
ITEQ | | 0.75% | | | 1,000.00 | | | 1,172.70 | | | 4.07 | | | 1,021.25 | | | 3.79 |
ETHO | | 0.45% | | | 1,000.00 | | | 1,177.90 | | | 2.45 | | | 1,022.75 | | | 2.28 |
MJ | | 0.75% | | | 1,000.00 | | | 1,180.80 | | | 4.09 | | | 1,021.25 | | | 3.79 |
IVES | | 0.68% | | | 1,000.00 | | | 1,330.70 | | | 3.96 | | | 1,021.60 | | | 3.44 |
GAMR | | 0.75% | | | 1,000.00 | | | 1,088.30 | | | 3.92 | | | 1,021.25 | | | 3.79 |
AIEQ | | 0.75% | | | 1,000.00 | | | 1,229.80 | | | 4.18 | | | 1,021.25 | | | 3.79 |
AWAY | | 0.75% | | | 1,000.00 | | | 1,214.80 | | | 4.15 | | | 1,021.25 | | | 3.79 |
GERM | | 0.68% | | | 1,000.00 | | | 1,037.50 | | | 3.46 | | | 1,021.60 | | | 3.44 |
MJUS | | 0.75% | | | 1,000.00 | | | 1,186.70 | | | 4.10 | | | 1,021.25 | | | 3.79 |
| | | | | | Actual Fund Return | | Hypothetical 5% Return |
| | | Annualized
Expense Ratio | | Beginning
Account Value
11/14/2023(b) | | Ending
Account Value
3/31/2024 | | Expenses
Paid During
Period(c) | | Ending
Account Value
3/31/2024 | | Expenses
Paid During
Period(a) |
SOF | | 0.20% | | $ | 1,000.00 | | $ | 1,020.30 | | $ | 0.76 | | $ | 1,024.00 | | $ | 1.01 |
168
Amplify ETF Trust
Additional Information
March 31, 2024 (Unaudited)
Qualified Dividend Income/Dividends Received Deduction
For the fiscal year/periods ended October 31, 2023 and September 30, 2023, certain dividends paid by the Funds may be subject to a maximum tax rate of 23.5%, as provided for by the Jobs and Growth Tax Relief Reconciliation Act of 2003.
The percentage of dividends declared from ordinary income designated as qualified dividend income was as follows:
Year/Period Ended October 31, 2023: | | | | Year Ended September 30, 2023 |
YYY | | 13.84 | % | | SILJ | | 100.00 | % |
IBUY | | 0.00 | % | | HACK | | 100.00 | % |
DIVO | | 98.82 | % | | IPAY | | 0.00 | % |
BLOK | | 0.00 | % | | ITEQ | | 0.00 | % |
BATT | | 81.48 | % | | ETHO | | 100.00 | % |
SWAN | | 0.00 | % | | MJ | | 20.60 | % |
EMFQ | | 85.80 | % | | IVES | | 0.00 | % |
CNBS | | 0.00 | % | | GAMR | | 0.00 | % |
ISWN | | 0.00 | % | | AIEQ | | 26.30 | % |
MVPS | | 0.00 | % | | AWAY | | 0.00 | % |
QSWN | | 0.00 | % | | GERM | | 100.00 | % |
IWIN | | 78.94 | % | | MJUS | | 0.00 | % |
NDIV | | 100.00 | % | | | | | |
IDVO | | 100.00 | % | | | | | |
COWS | | 87.28 | % | | | | | |
HCOW | | 0.00 | % | | | | | |
For corporate shareholders, the percent of ordinary income distributions qualifying for the corporate dividends received deduction for the fiscal year/periods ended October 31, 2023 and September 30, 2023 was as follows:
Year/Period Ended October 31, 2023: | | | | Year Ended September 30, 2023 |
YYY | | 0.99 | % | | SILJ | | 48.64 | % |
IBUY | | 0.00 | % | | HACK | | 100.00 | % |
DIVO | | 98.89 | % | | IPAY | | 0.00 | % |
BLOK | | 0.00 | % | | ITEQ | | 0.00 | % |
BATT | | 0.59 | % | | ETHO | | 100.00 | % |
SWAN | | 0.00 | % | | MJ | | 13.28 | % |
EMFQ | | 0.00 | % | | IVES | | 0.00 | % |
CNBS | | 0.00 | % | | GAMR | | 0.00 | % |
ISWN | | 0.00 | % | | AIEQ | | 25.85 | % |
MVPS | | 0.00 | % | | AWAY | | 0.00 | % |
QSWN | | 0.00 | % | | GERM | | 99.10 | % |
IWIN | | 76.39 | % | | MJUS | | 0.00 | % |
NDIV | | 51.13 | % | | | | | |
IDVO | | 2.78 | % | | | | | |
COWS | | 87.28 | % | | | | | |
HCOW | | 0.00 | % | | | | | |
169
Amplify ETF Trust
Additional Information
March 31, 2024 (Unaudited) (Continued)
Short Term Capital Gains
The percentage of taxable ordinary income distributions that are designated as short-term capital gain distributions under Internal Revenue Section 871(k)(2)(C) for each fund were as follows:
| | | | | | | | |
YYY | | 0.00 | % | | SILJ | | 0.00 | % |
IBUY | | 0.00 | % | | HACK | | 0.00 | % |
DIVO | | 0.00 | % | | IPAY | | 0.00 | % |
BLOK | | 0.00 | % | | ITEQ | | 0.00 | % |
BATT | | 0.00 | % | | ETHO | | 0.00 | % |
SWAN | | 0.00 | % | | MJ | | 0.00 | % |
EMFQ | | 0.00 | % | | IVES | | 0.00 | % |
CNBS | | 0.00 | % | | GAMR | | 0.00 | % |
ISWN | | 0.00 | % | | AIEQ | | 0.00 | % |
MVPS | | 0.00 | % | | AWAY | | 0.00 | % |
QSWN | | 0.00 | % | | GERM | | 0.00 | % |
IWIN | | 0.00 | % | | MJUS | | 0.00 | % |
NDIV | | 0.00 | % | | | | | |
IDVO | | 0.00 | % | | | | | |
COWS | | 0.00 | % | | | | | |
HCOW | | 0.00 | % | | | | | |
Foreign Tax Credit Pass Through
Pursuant to Section 853 of the Internal Revenue Code, the Fund designates the following amount as foreign taxes paid for the years ended October 31, 2023 and September 30, 2023. Foreign taxes paid for purposes of Section 853 may be less than actual foreign taxes paid for financial statement purposes.
Year ended October 31, 2023:
| | Credible Foreign
Taxes Paid | | Per Share
Amount | | Portion of Ordinary
Income Distribution
Derived from Foreign
Sourced Income |
BATT | | $ | 190,935 | | $ | 0.2492 | | 99.01 | % |
EMFQ | | | 2,711 | | | 0.4397 | | 100.00 | % |
IDVO | | | 71,223 | | | 0.6318 | | 100.00 | % |
Year ended September 30, 2023:
| | Credible Foreign
Taxes Paid | | Per Share
Amount | | Portion of Ordinary
Income Distribution
Derived from Foreign
Sourced Income |
SILJ | | $ | 485,244 | | $ | 0.0071 | | 95.20 | % |
GAMR | | | 58,376 | | | 0.0730 | | 88.20 | % |
Foreign taxes paid or withheld should be included in taxable income with an offsetting deduction from gross income or as a credit for taxes paid to foreign governments.
170
Amplify ETF Trust
Additional Information
March 31, 2024 (Unaudited) (Continued)
Above figures may differ from those cited elsewhere in this report due to difference in the calculation of income and gains under GAAP purposes and Internal Revenue Service purposes.
Shareholders are strongly advised to consult their own tax advisers with respect to the tax consequences of their investments in the Funds.
Principal Risks
AGRICULTURE COMPANIES RISK (NDIV)
Economic forces, including forces affecting agricultural markets, as well as government policies and regulations affecting agriculture companies, could adversely impact the Fund’s investments. Agricultural and livestock production, profitability and trade flows are significantly affected by government policies and regulations. In addition, companies in the agriculture sector must comply with a broad range of environmental laws and regulations.
BANKING INDUSTRY RISK (EMFQ)
The performance of stocks in the banking industry may be affected by extensive governmental regulation which may limit both the amounts and types of loans and other financial commitments they can make, and the interest rates and fees they can charge and the amount of capital they must maintain. Profitability is largely dependent on the availability and cost of capital funds and can fluctuate significantly when interest rates change. Credit losses resulting from financial difficulties of borrowers can negatively impact banking companies. Banks may also be subject to severe price competition.
BITCOIN FUTURES RISK (IWIN)
The market for bitcoin futures may be less developed, less liquid and more volatile than more established futures markets. While the bitcoin futures market has grown substantially since bitcoin futures commenced trading, there can be no assurance that this growth will continue. Bitcoin futures are subject to collateral requirements and daily limits may impact the Fund’s ability to achieve the desired exposure or require the Fund to liquidate its position when it otherwise would not do so. Bitcoin and bitcoin futures contracts are a relatively new asset class and are subject to unique and substantial risks, including the risk that the value of the Fund’s investments could decline rapidly, including to zero.
Margin levels for Bitcoin futures contracts are substantially higher than the margin requirements for more established futures contracts and are subject to change. High margin requirements could prevent the Fund from obtaining sufficient exposure to Bitcoin futures and may adversely affect its ability to achieve its investment objective. Further, FCMs utilized by the Funds may impose limits on the amount of exposure to futures contracts the Fund can obtain through such FCMs. If the Fund cannot obtain sufficient exposure through its FCMs, the Fund may not be able to achieve its investment objective.
BITCOIN RISK (BLOK and IWIN)
Bitcoin is a relatively new financial innovation and the market for bitcoin is subject to rapid price swings, changes and uncertainty. The further development of the network involved in maintaining the ledger of bitcoin ownership and the acceptance and use of bitcoin are subject to a variety of factors that are difficult to evaluate. The slowing, stopping or reversing of the development of the Bitcoin Network or the acceptance of bitcoin may adversely affect the price of bitcoin. Bitcoin is subject to the risk of fraud, theft, manipulation or security failures, operational or other problems that impact bitcoin trading venues. Unlike the exchanges for more traditional assets, such as equity securities and futures contracts, bitcoin and bitcoin trading venues are largely unregulated. As a result of the lack of regulation, individuals or groups may engage in fraud or market manipulation and investors may be more exposed to the risk of theft, fraud and market manipulation than when investing in more traditional asset classes. Legal or regulatory changes may negatively impact the operation of the Bitcoin Network or restrict the use of bitcoin. The realization of any of these risks could result in a decline in the acceptance of bitcoin and consequently a reduction in the value of bitcoin, bitcoin futures, and the Fund. Even when held indirectly, investment vehicles may be affected by the high volatility associated with cryptocurrency exposure. Holding a privately offered investment vehicle in its portfolio may cause the Fund to trade at a premium or discount to NAV.
171
Amplify ETF Trust
Additional Information
March 31, 2024 (Unaudited) (Continued)
BIOTECHNOLOGY COMPANIES RISK (CNBS, MJ, and MJUS)
A biotechnology company’s valuation can often be based largely on the potential or actual performance of a limited number of products and can accordingly be greatly affected if one of its products proves, among other things, unsafe, ineffective or unprofitable. Biotechnology companies are subject to regulation by, and the restrictions of, the FDA, the U.S. Environmental Protection Agency, state and local governments, and non-U.S. regulatory authorities.
BLOCKCHAIN INVESTMENTS RISK (BLOK)
An investment in companies actively engaged in blockchain technology may be subject to risks associated with this relative new technology, including, but not limited to theft, loss or destruction, cyber security incidents, developmental risk intellectual property claims, lack of liquid markets, and possible manipulation of blockchain-based assets, uncertain regulatory environment, third party product defects or vulnerabilities and reliance on the Internet.
CANNABIS INDUSTRY RISK (CNBS, MJ, and MJUS)
Companies involved in the cannabis industry face competition, may have limited access to the services of banks, may have substantial burdens on company resources due to litigation, complaints or enforcement actions, and are heavily dependent on receiving necessary permits and authorizations to engage in medical cannabis research or to otherwise cultivate, possess or distribute cannabis. Since the use of cannabis is illegal under U.S. federal law, federally regulated banking institutions may be unwilling to make financial services available to growers and sellers of cannabis.
CHEMICALS INDUSTRY RISK (NDIV)
The chemicals industry includes companies that manufacture and produce industrial and basic chemicals (e.g., plastics, synthetic fibers and films), fertilizers, pesticides and other agricultural chemicals, industrial gases, specialty chemicals (e.g., advanced polymers and adhesives) and other diversified chemicals. The prices of securities of companies in the chemicals industry may fluctuate widely due to intense competition, product obsolescence, and raw materials prices. In addition, companies in the chemicals industry may be subject to risks associated with the production, handling and disposal of hazardous chemicals Legislative or regulatory changes and increased government supervisions may also affect companies in the chemicals industry.
CHINA RISK (BATT and EMFQ)
China is an emerging market and demonstrates significantly higher volatility from time to time in comparison to developed markets. The central government has historically exercised substantial control over virtually every sector of the Chinese economy through administrative regulation and/or state ownership and actions of the Chinese central and local government authorities continue to have a substantial effect on economic conditions in China. Furthermore, China’s economy is dependent on the economies of other Asian countries and can be significantly affected by currency fluctuations and increasing competition from Asia’s other emerging economies. China has experienced security concerns, such as terrorism and strained international relations. Incidents involving China’s or the region’s security may cause uncertainty in Chinese markets and may adversely affect the Chinese economy and the value of the Fund’s investments. Export growth continues to be a major driver of China’s rapid economic growth. Reduction in spending on Chinese products and services, institution of tariffs or other trade barriers, or a downturn in any of the economies of China’s key trading partners may have an adverse impact on the Chinese economy. Recent developments in relations between the U.S. and China have heightened concerns of increased tariffs and restrictions on trade between the two countries. China has experienced outbreaks of infectious illnesses, and the country may be subject to other public health threats, infectious illnesses, diseases or similar issues in the future, which could reduce consumer demand or economic output, result in market closures, travel restrictions or quarantines, and generally have a significant impact on the Chinese economy, which in turn could adversely affect the Fund’s investments.
172
Amplify ETF Trust
Additional Information
March 31, 2024 (Unaudited) (Continued)
CLOUD TECHNOLOGY COMPANY RISK (IVES)
Cloud Technology Companies may have limited product lines, markets, financial resources or personnel. These companies typically face intense competition and potentially rapid product obsolescence. In addition, many Cloud Technology Companies store sensitive consumer information and could be the target of cybersecurity attacks and other types of theft, which could have a negative impact on these companies. As a result, Cloud Technology Companies may be adversely impacted by government regulations, and may be subject to additional regulatory oversight with regard to privacy concerns and cybersecurity risk. These companies are also heavily dependent on intellectual property rights and may be adversely affected by loss or impairment of those rights. Cloud computing companies could be negatively impacted by disruptions in service caused by hardware or software failure, or by interruptions or delays in service by third-party data center hosting facilities and maintenance providers. Cloud Technology Companies, especially smaller companies, tend to be more volatile than companies that do not rely heavily on technology. The customers and/or suppliers of Cloud Technology Companies may be concentrated in a particular country, region or industry.
COMMODITY-LINKED DERIVATIVES RISK (IWIN)
Investments linked to the prices of commodities may be considered speculative. Significant investment exposure to commodities may subject the Fund to greater volatility than investments in traditional securities. Therefore, the value of such instruments may be volatile and fluctuate widely based on a variety of macroeconomic factors or commodity-specific factors. At times, price fluctuations may be quick and significant and may not correlate to price movements in other asset classes. A liquid secondary market may not exist for certain commodity-linked derivatives, which may make it difficult for the Fund to sell them at a desirable price or at the price at which it is carrying them.
COMMODITY REGULATORY RISK (IWIN)
The Fund’s investment decisions may need to be modified, and commodity contract positions held by the Fund may have to be liquidated at disadvantageous times or prices, to avoid exceeding any applicable position limits established by the CFTC, potentially subjecting the Fund to substantial losses. The regulation of commodity transactions in the United States is subject to ongoing modification by government, self-regulatory and judicial action. The effect of any future regulatory change with respect to any aspect of the Fund is impossible to predict, but could be substantial and adverse to the Fund.
COMMODITIES RISK (IWIN)
Commodity prices can have significant volatility, and exposure to commodities can cause the value of a Fund’s shares to decline or fluctuate in a rapid and unpredictable manner. The values of commodities may be affected by changes in overall market movements, real or perceived inflationary trends, commodity index volatility, changes in interest rates or currency exchange rates, population growth and changing demographics, international economic, political and regulatory developments, and factors affecting a particular region, industry or commodity, such as drought, floods, or other weather conditions, livestock disease, changes in storage costs, trade embargoes, competition from substitute products, transportation bottlenecks or shortages, fluctuations in supply and demand, and tariffs. A liquid secondary market may not exist for certain commodity investments, which may make it difficult for the Fund to sell them at a desirable price or at the price at which it is carrying them. The commodity markets are subject to temporary distortions or other disruptions due to, among other factors, lack of liquidity, the participation of speculators, and government regulation and other actions. The Fund is subject to the risk that a commodity price will change from one level to another between periods of trading.
COMMUNICATION SERVICES SECTOR RISK (QSWN)
Communication services companies may be subject to specific risks associated with legislative or regulatory changes, adverse market conditions, intellectual property use and/or increased competition. Communication services companies may also be particularly vulnerable to rapid advancements in technology, the innovation of competitors, rapid product obsolescence and government regulation and competition, both domestically and internationally.
173
Amplify ETF Trust
Additional Information
March 31, 2024 (Unaudited) (Continued)
CONCENTRATION RISK (AIEQ, COWS, YYY, EMFQ, IBUY, IPAY, ITEQ, IVES, SILJ, MJ and MVPS)
To the extent that the Index concentrates in the securities of issuers in a particular industry or sector, the Fund will also concentrate its investments to approximately the same extent. The Fund may be susceptible to loss due to adverse occurrences to the extent that the Fund’s investments are concentrated in a particular issuer or issuers, region, market, industry, group of industries, sector or asset class.
CONSTRUCTION AND HOMEBUILDING COMPANIES RISK (IWIN)
Construction and homebuilding companies may be significantly affected by changes in demand for their specific products or services, government spending, zoning laws, general economic conditions, commodity prices, consumer confidence and spending, taxation, demographic patterns, real estate values, labor relations and government regulations. Such companies can also be significantly affected by the national, regional and local real estate markets. This industry is also sensitive to interest rate fluctuations which can cause changes in the availability of mortgage capital and directly affect the purchasing power of potential homebuyers. The building industry can be significantly affected by changes in government spending, consumer confidence, demographic patterns and the level of new and existing home sales.
CONSUMER DISCRETIONARY COMPANIES RISK (COWS)
Consumer discretionary companies are companies that provide non-essential goods and services, such as retailers, media companies and consumer services. These companies manufacture products and provide discretionary services directly to the consumer, and the success of these companies is tied closely to the performance of the overall domestic and international economy, interest rates, competition and consumer confidence. Success depends heavily on disposable household income and consumer spending. Changes in demographics and consumer tastes can also affect the demand for, and success of, consumer discretionary products in the marketplace.
CONSUMER SERVICES SECTOR RISK (QSWN)
Companies in the consumer services sector may be adversely affected by, among other things, changes in industry competition, consumers’ disposable income and consumer preference. Companies in the consumer services industry are facing increased government and regulatory scrutiny and may be subject to adverse government or regulatory action.
CONSUMER STAPLES SECTOR RISK (DIVO, IBUY, MJ, and MJUS)
Consumer staples companies provide products directly to the consumer that are typically considered non-discretionary items based on consumer purchasing habits. Such products include food, beverages, household items and tobacco. Consumer staples companies may be affected by the regulation of various product components and production methods, new laws, regulations or litigation, marketing campaigns, competitive pricing and other factors affecting consumer demand. Changes in the worldwide economy, demographics, consumer preferences and/or spending, exploration and production spending may adversely affect these companies, as well as natural and man-made disasters, political, social or labor unrest, world events and economic conditions.
COUNTERPARY RISK (BLOK, CNBS, COWS, DIVO, HCOW, IWIN, SOF, MJUS, and QSWN)
Counterparty risk is the risk an issuer, guarantor or counterparty of a security held by the Fund is unable or unwilling to meet its obligation on the security. Counterparty risk may arise because of the counterparty’s financial condition, market activities, or for other reasons. A counterparty’s inability to fulfill its obligation may result in financial losses to the Fund, which could be significant. The Fund may be unable to recover its investment from the counterparty or may obtain a limited and/or delayed recovery.
COVERED CALL RISK (DIVO and IDVO)
Covered call option strategy risk is the risk that the Fund will forgo, during the option contract’s life, the opportunity to profit from increases in the market value of the security covering the call option above the sum of the premium and the strike price of the call, but has retained the risk of loss of the underlying security should the price of the underlying security decline. In addition, as the Fund sells (writes) covered call option contracts over more of its portfolio, its ability to benefit from capital appreciation becomes more limited.
174
Amplify ETF Trust
Additional Information
March 31, 2024 (Unaudited) (Continued)
The writer of an option contract has no control over the time when it may be required to fulfill its obligation as a writer of the option. Once an option writer has received an exercise notice, it cannot affect a closing purchase transaction in order to terminate its obligation under the option and must deliver the underlying security at the exercise price.
CYBER SECURITY RISK
The Fund is susceptible to operational risks through breaches in cyber security. A breach in cyber security refers to both intentional and unintentional events that may cause the Fund to lose proprietary information, suffer data corruption or lose operational capacity. Such events could cause the Fund to incur regulatory penalties, reputational damage, additional compliance costs associated with corrective measures and/or financial loss. Cyber security breaches may involve unauthorized access to the Fund’s digital information systems through “hacking” or malicious software coding, but may also result from outside attacks such as denial-of-service attacks through efforts to make network services unavailable to intended users. In addition, cyber security breaches of the Fund’s third-party service providers, such as its administrator, transfer agent, custodian, or sub-adviser, as applicable, or issuers in which the Fund invests, can also subject the Fund to many of the same risks associated with direct cyber security breaches.
DERIVATIVES RISK (BATT, BLOK, CNBS, COWS, HCOW, IWIN, QSWN, SOF, and SWAN)
The use of derivative instruments, such as options contracts, can lead to losses because of adverse movements in the price or value of the underlying asset, index or rate, which may be magnified by certain features of the derivatives. These risks are heightened when the Fund’s portfolio manager uses derivatives to enhance the Fund’s return or as a substitute for a position or security, rather than to hedge (or offset) the risk of a position or security held by the Fund. The use of derivatives can lead to losses because of adverse movements in the price or value of the underlying asset, index or rate, which may be magnified by certain features of the derivatives. The Fund enters into option contracts pursuant to Rule 18f-4 under the 1940 Act (“Rule 18f-4”). Rule 18f-4 requires a Fund to implement certain policies and procedures designed to manage its derivatives risks, dependent upon a Fund’s level of exposure to derivative instruments. To the extent the Fund is noncompliant with Rule 18f-4, the Fund may be required to adjust its investment portfolio which may, in turn, negatively impact its implementation of its investment strategies.
DEPOSITARY RECEIPTS RISK (CNBS, GERM, EMFQ, IBUY, MVPS, and NDIV)
Depositary receipts may be subject to certain of the risks associated with direct investments in the securities of non-U.S. companies, such as currency, political, economic and market risks, because their values depend on the performance of the non-dollar denominated underlying non-U.S. securities. Certain countries may limit the ability to convert depositary into the underlying non-U.S. securities and vice versa, which may cause the securities of the non-U.S. company to trade at a discount or premium to the market price of the related depositary receipts. Depositary receipts may be purchased through “sponsored” or “unsponsored” facilities. A sponsored facility is established jointly by a depositary and the issuer of the underlying security. A depositary may establish an unsponsored facility without participation by the issuer of the deposited security. Unsponsored receipts may involve higher expenses and may be less liquid. Holders of unsponsored depositary receipts generally bear all the costs of such facilities, and the depositary of an unsponsored facility frequently is under no obligation to distribute shareholder communications received from the issuer of the deposited security or to pass through voting rights to the holders of such receipts in respect of the deposited securities.
EMRGING MARKETS RISK (AWAY, BATT, CNBS, EMFQ, GAMR, HACK, IBUY, IDVO IPAY, IVES, NDIV, MVPS, and SILJ)
The Fund may invest in companies located in emerging market countries. Emerging market countries include, but are not limited to, those considered to be developing by the International Monetary Fund, the World Bank, the International Finance Corporation or one of the leading global investment banks. The majority of these countries are likely to be located in Asia, Latin America, the Middle East, Central and Eastern Europe, and Africa. Investments in emerging market issuers are subject to a greater risk of loss than investments in issuers located or operating in more developed markets. This is due to, among other things, the potential for greater market volatility, lower trading volume, higher levels of inflation, political and economic instability, greater risk of a market shutdown and more governmental limitations on foreign investments in emerging market countries than are typically found in more developed markets. Moreover, emerging markets often have less uniformity in accounting and reporting requirements, less reliable securities valuations and
175
Amplify ETF Trust
Additional Information
March 31, 2024 (Unaudited) (Continued)
greater risks associated with custody of securities than developed markets. In addition, emerging markets often have greater risk of capital controls through such measures as taxes or interest rate control than developed markets. Certain emerging market countries may also lack the infrastructure necessary to attract large amounts of foreign trade and investment.
ENERGY SECTOR RISK (COWS, DIVO, IDVO and NDIV)
The success of companies in the energy sector may be cyclical and highly dependent on energy prices. The market value of securities issued by energy companies may decline for many reasons, including, but not limited to, changes in the levels and volatility of global energy prices, energy supply and demand, capital expenditures on exploration and production of energy sources, exchange rates, interest rates, economic conditions, tax treatment, energy conservation efforts, increased competition and technological advances. Energy companies may be subject to substantial government regulation and contractual fixed pricing, which may increase the cost of doing business and limit the earnings of these companies. A significant portion of the revenues of energy companies may depend on a relatively small number of customers, including governmental entities and utilities. As a result, governmental budget constraints may have a material adverse effect on the stock prices of energy companies. Energy companies also face a significant risk of liability from accidents resulting in injury or loss of life or property, pollution or other environmental problems, equipment malfunctions or mishandling of materials and a risk of loss from terrorism, political strife or natural disasters.
EQUITY SECURITIES RISK (CNBS, COWS, DIVO, EMFQ, HCOW, IBUY, IDVO and NDIV)
The value of the Shares will fluctuate with changes in the value of the equity securities in which the Fund invests. Prices of equity securities fluctuate for several reasons, including changes in investors’ perceptions of the financial condition of an issuer or the general condition of the relevant stock market, such as the current market volatility, or when political or economic events affecting the issuers occur.
FINANCIAL COMPANIES RISK (BLOK, COWS, DIVO, EMFQ and IDVO)
Financial companies, such as retail and commercial banks, insurance companies and financial services companies, are especially subject to the adverse effects of economic recession, currency exchange rates, extensive government regulation, decreases in the availability of capital, volatile interest rates, portfolio concentrations in geographic markets, industries or products (such as commercial and residential real estate loans) and competition from new entrants and blurred distinctions in their fields of business.
FINANCIAL TECHNOLOGY (“FINTECH”) RISK (EMFQ)
FinTech companies may be adversely impacted by government regulations, economic conditions and deterioration in markets. These companies may have significant exposure to consumers and businesses, including small businesses, in the form of loans and other financial products or services. FinTech companies typically face intense competition and potentially rapid product obsolescence. In addition, many FinTech companies store sensitive consumer information and could be the target of cybersecurity attacks and other types of theft, which could have a negative impact on these companies. Many FinTech companies currently operate under less regulatory scrutiny than traditional financial services companies and banks, but there is significant risk that regulatory oversight could increase in the future. Higher levels of regulation could increase costs and adversely impact the current business models of some FinTech companies. These companies could be negatively impacted by disruptions in service caused by hardware or software failure, or by interruptions or delays in service by third-party data center hosting facilities and maintenance providers. FinTech companies, especially smaller companies, tend to be more volatile than companies that do not rely heavily on technology.
FOREIGN INVESTMENT RISK
Securities issued by Non-U.S. companies present risks beyond those of securities of U.S. issuers. Risks of investing in the securities of foreign companies include: different accounting standards; expropriation, nationalization or other adverse political or economic developments; currency devaluation, blockages or transfer restrictions; changes in foreign currency exchange rates; taxes; restrictions on foreign investments and exchange of securities; and less government supervision and regulation of issuers in foreign countries. Prices of foreign securities also may be more volatile.
176
Amplify ETF Trust
Additional Information
March 31, 2024 (Unaudited) (Continued)
FUND OF FUNDS RISK (YYY)
Because the Fund is a fund of funds, its investment performance largely depends on the investment performance of the Underlying Funds in which it invests. An investment in the Fund is subject to the risks associated with the Underlying Funds that comprise the Index. The Fund will pay indirectly a proportional share of the fees and expenses of the Underlying Funds in which it invests, including their investment advisory and administration fees, in addition to its own fees and expenses. In addition, at times certain segments of the market represented by constituent Underlying Funds may be out of favor and underperform other segments.
FUTURES CONTRACT RISK (BLOK and IWIN)
Risks of futures contracts include: (i) an imperfect correlation between the value of the futures contract and the underlying asset; (ii) possible lack of a liquid secondary market; (iii) the inability to close a futures contract when desired; (iv) losses caused by unanticipated market movements, which may be unlimited; (v) an obligation for the Fund to make daily cash payments to maintain its required margin, particularly at times when the Fund may have insufficient cash; and (vi) unfavorable execution prices from rapid selling. Unlike equities, which typically entitle the holder to a continuing stake in a corporation, futures contracts normally specify a certain date for settlement in cash based on the reference asset. As the futures contracts approach expiration, they may be replaced by similar contracts that have a later expiration. This process is referred to as “rolling.” If the market for these contracts is in “contango,” meaning that the prices of futures contracts in the nearer months are lower than the price of contracts in the distant months, the sale of the near-term month contract would be at a lower price than the longer-term contract, resulting in a cost to “roll” the futures contract. The actual realization of a potential roll cost will be dependent upon the difference in price of the near and distant contract.
HEALTH CARE COMPANIES RISK (CNBS, MJ, and MJUS)
Health care companies are subject to extensive government regulation and their profitability can be significantly affected by restrictions on government reimbursement for medical expenses, rising costs of medical products and services, pricing pressure (including price discounting), limited product lines, and an increased emphasis on the delivery of healthcare through outpatient services. Health care companies are heavily dependent on obtaining and defending patents, which may be time consuming and costly, and the expiration of patents may also adversely affect the profitability of the companies. Health care companies are also subject to extensive litigation based on product liability and similar claims. In addition, their products can become obsolete due to industry innovation, changes in technologies, or other market developments. Many new products in the health care field require significant research and development and may be subject to regulatory approvals, all of which may be time consuming and costly with no guarantee that any product will come to market.
INFLATION RISK
Inflation risk is the risk that the value of the Fund’s assets or income from investments held by the Fund will be less in the future since inflation decreases the value of money. As inflation increases, the present value of the Fund’s assets can decline as can the value of the Fund’s distributions.
INFORMATION TECHNOLOGY COMPANIES RISK (IBUY, BLOK, EMFQ, MVPS, and QSWN)
Information technology companies are generally subject to the following risks: rapidly changing technologies; short product life cycles; fierce competition; aggressive pricing and reduced profit margins; the loss of patent, copyright and trademark protections; cyclical market patterns; evolving industry standards; and frequent new product introductions. Information technology companies may be smaller and less experienced companies, with limited product lines, markets or financial resources and fewer experienced management or marketing personnel. Information technology company stocks, especially those which are internet related, have experienced extreme price and volume fluctuations that are often unrelated to their operating performance.
177
Amplify ETF Trust
Additional Information
March 31, 2024 (Unaudited) (Continued)
INTERNET COMPANIES RISK (BLOK, IBUY and EMFQ)
Internet companies are subject to rapid changes in technology, worldwide competition, rapid obsolescence of products and services, loss of patent protections, cyclical market patterns, evolving industry standards, frequent new product introductions and the considerable risk of owning small capitalization companies that have recently begun operations. In addition, the stocks of many internet companies have exceptionally high price-to-earnings ratios with little or no earnings histories. Many internet companies have experienced extreme price and volume fluctuations that often have been unrelated to their operating performance.
INTEREST RATE RISK (QSWN and SWAN)
Interest rate risk is the risk that the value of the debt securities in the Fund’s portfolio will decline because of rising market interest rates. Interest rate risk is generally lower for shorter term debt securities and higher for longer term debt securities. Duration is a measure of the expected price volatility of a debt security as a result of changes in market rates of interest, based on, among other factors, the weighted average timing of the debt security’s expected principal and interest payments. In general, duration represents the expected percentage change in the value of a security for an immediate 1% change in interest rates. For example, the price of a security with a three-year duration would be expected to drop by approximately 3% in response to a 1% increase in interest rates. Therefore, prices of debt securities with shorter durations tend to be less sensitive to interest rate changes than debt securities with longer durations. As the value of a debt security changes over time, so will its duration.
ISRAELI COMPANIES RISK (ITEQ)
Investment in securities of Israeli companies involves risks that may negatively affect the value of your investment in the Fund. Among other things, Israel’s economy depends on imports of certain key items, such as crude oil, coal, grains, raw materials and military equipment. Israel’s relations with the Palestinian Authority and certain neighboring countries such as Lebanon, Syria and Iran, among others, have at times been strained due to territorial disputes, historical animosities or security concerns, which may cause uncertainty in the Israeli markets and adversely affect the overall economy. In addition, U.S.-designated terrorist groups such as Hezbollah and Hamas operate in close proximity to Israel’s borders, and has resulted in armed conflicts that have a material negative impact on the country and has caused volatility for its economy. Furthermore, Israel’s economy is heavily dependent on trade relationships with key counterparties around the world, specifically the United States and European Union countries.
LARGE CAPITALIZATION COMPANIES RISK (DIVO, HCOW, IBUY and NDIV)
Large-capitalization companies may be less able than smaller-capitalization companies to adapt to changing market conditions. Large-capitalization companies may be more mature and subject to more limited growth potential compared with smaller-capitalization companies. During different market cycles, the performance of large capitalization companies has trailed the overall performance of the broader securities markets.
LEVERAGE RISK (YYY)
Leverage may result from ordinary borrowings or may be inherent in the structure of certain Underlying Fund investments such as derivatives. If the prices of those investments decrease, or if the cost of borrowing exceeds any increase in the prices of those investments, the NAV of the Underlying Fund’s shares will decrease faster than if the Underlying Fund had not used leverage. To repay borrowings, an Underlying Fund may have to sell investments at a time and at a price that is unfavorable to the Underlying Fund. Interest on borrowings is an expense the Underlying Fund would not otherwise incur. Leverage magnifies the potential for gain and the risk of loss. If an Underlying Fund uses leverage, there can be no assurance that the Underlying Fund’s leverage strategy will be successful.
MARKET EVENTS RISK
Turbulence in the economic, political and financial system has historically resulted, and may continue to result, in an unusually high degree of volatility in the capital markets. Both domestic and foreign capital markets have been experiencing increased volatility and turmoil, with issuers that have exposure to the real estate, mortgage and credit markets particularly affected, and it is uncertain whether or for how long these conditions could continue. Reduced liquidity in equity, credit and fixed-income markets may adversely affect many
178
Amplify ETF Trust
Additional Information
March 31, 2024 (Unaudited) (Continued)
issuers worldwide. This reduced liquidity may result in less money being available to purchase raw materials, goods and services from emerging markets, which may, in turn, bring down the prices of these economic staples. It may also result in small or emerging market issuers having more difficulty obtaining financing, which may, in turn, cause a decline in their security prices. These events and possible continued market turbulence may have an adverse effect on the Fund.
In addition, local, regional or global events such as war, acts of terrorism, spread of infectious diseases or other public health issues, recessions, or other events could have a significant negative impact on a Fund and its investments. Such events may affect certain geographic regions, countries, sectors and industries more significantly than others. Such events could adversely affect the prices and liquidity of a Fund’s portfolio securities or other instruments and could result in disruptions in the trading markets. Any of such circumstances could have a materially negative impact on the value of a Fund’s Shares and result in increased market volatility. During any such events, a Fund’s Shares may trade at increased premiums or discounts to their NAV.
Health crises caused by the outbreak of infectious diseases or other public health issues, may exacerbate other pre-existing political, social, economic, market and financial risks. The impact of any such events, could negatively affect the global economy, as well as the economies of individual countries or regions, the financial performance of individual companies, sectors and industries, and the markets in general in significant and unforeseen ways. Any such impact could adversely affect the prices and liquidity of the securities and other instruments in which a Fund invests and negatively impact a Fund’s investment return.
MARKET PRICE DISCOUNT FROM/PREMIUM TO NET ASSET VALUE RISK (YYY)
The shares of the Underlying Funds may trade at a discount or premium to their NAV. This characteristic is a risk separate and distinct from the risk that an Underlying Fund’s NAV could decrease as a result of investment activities. Whether investors, such as the Fund, will realize gains or losses upon the sale of shares will depend not on the Underlying Funds’ NAVs, but entirely upon whether the market price of the Underlying Funds’ shares at the time of sale is above or below an investor’s purchase price for shares.
MASTER LIMITED PARTNERSHIPS RISK (NDIV)
Investments in securities of MLPs involve certain risks different from or in addition to the risks of investing in common stocks. MLP common units can be affected by macro-economic factors and other factors unique to the partnership or company and the industry or industries in which the MLP operates. Certain MLP securities may trade in relatively low volumes due to their smaller capitalizations or other factors, which may cause them to have a high degree of price volatility and illiquidity. The structures of MLPs create certain risks, including, for example, risks related to the limited ability of investors to control an MLP and to vote on matters affecting the MLP, risks related to potential conflicts of interest between an MLP and the MLP’s general partner, the risk that an MLP will generate insufficient cash flow to meet its current operating requirements, the risk that an MLP will issue additional securities or engage in other transactions that will have the effect of diluting the interests of existing investors, and risks related to the general partner’s right to require unit-holders to sell their common units at an undesirable time or price.
MATERIALS SECTOR RISK (BATT and NDIV)
Many materials companies are significantly affected by the level and volatility of commodity prices, exchange rates, import controls, worldwide competition, environmental policies and consumer demand. At times, worldwide production of industrial materials has exceeded demand as a result of over-building or economic downturns, leading to poor investment returns or losses. Other risks may include liabilities for environmental damage and general civil liabilities, depletion of resources, and mandated expenditures for safety and pollution control. The materials sector may also be affected by economic cycles, technical progress, labor relations, and government regulations.
METALS AND MINING COMPANIES RISK (BATT, NDIV and SILJ)
Investments in metals and mining companies may be speculative and subject to greater price volatility than investments in other types of companies. The profitability of companies in the metals and mining industry is related to, among other things, worldwide metal prices and extraction and production costs. Worldwide metal prices may fluctuate substantially over short periods of time, and as a result, the Fund’s Share price may be more volatile than other types of investments. In addition, metals and mining companies may be significantly
179
Amplify ETF Trust
Additional Information
March 31, 2024 (Unaudited) (Continued)
affected by changes in global demand for certain metals, economic developments, energy conservation, the success of exploration projects, changes in exchange rates, interest rates, economic conditions, tax treatment, trade treaties, and government regulation and intervention, and events in the regions that the companies to which the Fund has exposure operate (e.g., expropriation, nationalization, confiscation of assets and property, the imposition of restrictions on foreign investments or repatriation of capital, military coups, social or political unrest, violence and labor unrest). Metals and mining companies may also be subject to the effects of competitive pressures in the metals and mining industry.
MID-CAPITALIZATION RISK (ISWN and QSWN)
Mid-capitalization companies may be less stable and more susceptible to adverse developments in comparison to large-capitalization companies. Additionally, the securities of mid-capitalization companies may be more volatile and less liquid than those of large-capitalization companies.
MINERAL AND RARE EARTH METAL MINING RISK (BATT and IWIN)
The Fund is subject to certain risks associated with companies involved in mining. Competitive pressures may have a significant effect on the financial condition of such companies. Companies involved in the various activities that are related to the mining, refining and/or manufacturing of rare earth metals tend to be small-, medium- and micro-capitalization companies. The value of such companies may be significantly affected by events relating to international, national and local political and economic developments, energy conservation efforts, the success of exploration projects, commodity prices, tax and other government regulations, depletion of resources, and mandated expenditures for safety and pollution control devices. Mining companies are highly dependent on the price of the underlying metal or element. These prices may fluctuate substantially over short periods of time so the Fund’s Share price may be more volatile than other types of investments. In particular, a drop in the price of green metals would particularly adversely affect the profitability of small- and medium-capitalization mining companies and their ability to secure financing. Furthermore, companies that are only in the exploration stage are typically unable to adopt specific strategies for controlling the impact of such price changes. A significant amount of the companies may be early stage mining companies that are in the exploration stage only or that hold properties that might not ultimately produce these metals. Exploration and development involves significant financial risks over a significant period of time which even a combination of careful evaluation, experience and knowledge may not eliminate.
MOBILE PAYMENT COMPANIES RISK (IPAY)
Mobile payment companies face intense competition, both domestically and internationally, and are subject to increasing regulatory constraints, particularly with respect to fees, competition and anti-trust matters, cybersecurity and privacy. Mobile Payment Companies may be highly dependent on their ability to enter into agreements with merchants and other third parties to utilize a particular payment method, system, software or service, and such agreements may be subject to increased regulatory scrutiny. Additionally, certain Mobile payment companies have recently faced increased costs related to class-action litigation challenging such agreements. Such factors may adversely affect the profitability and value of such companies.
NATURAL RESOURCES AND COMMODITY-RELATED INDUSTRIES (NDIV)
These industries can be significantly affected by (and often rapidly affected by) changes in the supply of, or demand for, various natural resources and commodities. Investments in natural resources companies, which include companies engaged in energy (oil, gas & consumable fuels), chemicals, agriculture, precious and industrial metals and mining, paper products, and timber can be significantly affected by events relating to these industries, including international political and economic developments, embargoes, tariffs, inflation, weather and natural disasters, livestock diseases, limits on exploration, rapid changes in the supply and demand for natural resources and other factors. The Fund’s investments may experience substantial price fluctuations as a result of these factors, and may move independently of the trends of other operating companies. Companies engaged in the industries listed above may be adversely affected by changes in government policies and regulations, technological advances and/or obsolescence, environmental damage claims, energy conservation efforts, the success of exploration projects, limitations on the liquidity of certain natural resources and commodities and competition from new market entrants. Changes in general economic conditions, including commodity price volatility, changes in exchange rates, imposition of import controls, rising interest rates, prices of raw materials and other commodities, depletion of resources and labor relations, could adversely affect the Fund’s investments.
180
Amplify ETF Trust
Additional Information
March 31, 2024 (Unaudited) (Continued)
NON-CANNABIS RELATED BUSINESS RISK (CNBS, MJ, and MJUS)
Many of the companies in the Index are engaged in other lines of business unrelated to the activities identified in the principal investment strategies, above, and these lines of business could adversely affect their operating results. The operating results of these companies may fluctuate as a result of events in the other lines of business. In addition, a company’s ability to engage in new activities may expose it to business risks with which it has less experience than it has with the business risks associated with its traditional businesses. There can be no assurance that the other lines of business in which these companies are engaged will not have an adverse effect on a company’s business or financial condition.
OIL AND GAS INDUSTRY RISK (NDIV)
Investments in the oil and gas industry can be significantly affected by worldwide energy prices, exploration costs and production spending. Oil and gas companies may be adversely affected by natural disasters or other catastrophes; changes in exchange rates, interest rates or economic conditions; technological developments, prices for competitive energy services and increased competition. Other risks may include changes in the actual or perceived availability of oil deposits; imposition of import controls, changes in tax treatment, or government regulation or government intervention; negative public perception; or unfavorable events in the regions where companies operate. Companies in the oil and gas industry may have significant capital investments in, or engage in transactions involving, emerging market countries, which may heighten these risks. Companies that own or operate gas pipelines are subject to certain risks, including pipeline and equipment leaks and ruptures, explosions, fires, unscheduled downtime, transportation interruptions, discharges or releases of toxic or hazardous gases and other environmental risks. Companies in the oil and gas industry may be at risk for environmental damage claims and other types of litigation.
ONLINE RETAIL RISK (IBUY)
Companies that operate in the online marketplace, retail and travel segments are subject to fluctuating consumer demand. Unlike traditional brick and mortar retailers, online marketplaces and retailers must assume shipping costs or pass such costs to consumers. Consumer access to price information for the same or similar products may cause companies that operate in the online marketplace, retail and travel segments to reduce profit margins in order to compete. The loss or public dissemination of sensitive customer information or other proprietary data may negatively affect the financial performance of such companies to a greater extent than traditional brick and mortar retailers. As a result of such companies being web-based and the fact that they process, store, and transmit large amounts of data, including personal information, for their customers, failure to prevent or mitigate data loss or other security breaches, including breaches of vendors’ technology and systems, could expose companies that operate in the online marketplace, retail and travel segments or their customers to a risk of loss or misuse of such information, adversely affect their operating results, result in litigation or potential liability, and otherwise harm their businesses.
OPTIONS CONTRACTS RISK (DIVO, IDVO, ISWN, QSWN and SWAN)
The use of option contracts involves investment strategies and risks different from those associated with ordinary portfolio securities transactions. The prices of option contracts are volatile and are influenced by, among other things, actual and anticipated changes in the value of the underlying instrument, changes in interest or currency exchange rates, including the anticipated volatility, which are affected by fiscal and monetary policies and by national and international political, changes in the actual or implied volatility or the reference asset, the time remaining until the expiration of the option contract and economic events. There may at times be an imperfect correlation between the movement in values option contracts and the reference asset of the option contract, and there may at times not be a liquid secondary market for certain option contracts.
PHARMACEUTICAL COMPANIES RISK (CNBS, MJ, and MJUS)
Companies in the pharmaceutical industry can be significantly affected by, among other things, government approval of products and services, government regulation and reimbursement rates, product liability claims, patent expirations and protection of intense competition.
181
Amplify ETF Trust
Additional Information
March 31, 2024 (Unaudited) (Continued)
POOLED INVESTMENT VEHICLE RISK (BLOK and IWIN)
The Fund may invest in commodity-linked instruments, including ETFs and shares of other pooled investment vehicles. Shareholders bear both their proportionate share of the Fund’s expenses and similar expenses of the underlying pooled investment vehicle. Pooled investment vehicles that invest in commodities are subject to the risks associated with direct investments in those commodities. The price and movement of a pooled investment vehicle designed to track an index may not track the index and may result in a loss. Certain pooled investment vehicles traded on exchanges may be thinly traded and experience large spreads between the “ask” price quoted by a seller and the “bid” price offered by a buyer. Certain pooled investment vehicles may also not have the protections applicable to other types of investments under federal securities or commodities laws and may be subject to counterparty or credit risk.
REIT RISK (AIEQ and CNBS)
Adverse economic, business or political developments affecting real estate could have a major effect on the value of the Fund’s investments in REITs. Investing in REITs may subject the Fund to risks associated with the direct ownership of real estate, such as decreases in real estate values, overbuilding, increased competition and other risks related to local or general economic conditions, increases in operating costs and property taxes, changes in zoning laws, casualty or condemnation losses, possible environmental liabilities, regulatory limitations on rent and fluctuations in rental income. In addition, REITs are subject to the possibility of failing to qualify for the favorable U.S. federal income tax treatment generally available to them under the Internal Revenue Code of 1986, as amended (the “Code”), and failing to maintain exemption from the registration requirements of the 1940 Act.
RISKS ASSOCIATED WITH INVESTMENTS IN SPACS (AIEQ)
Unless and until an acquisition is completed, a SPAC generally invests its assets in U.S. government securities, money market securities, and cash. Because SPACs have no operating history or ongoing business other than seeking acquisitions, the value of their securities is particularly dependent on the ability of the entity’s management to identify and complete a profitable acquisition. There is no guarantee that the SPACs in which the Fund invests will complete an acquisition or that any acquisitions that are completed will be profitable. Public stockholders of SPACs may not be afforded a meaningful opportunity to vote on a proposed initial business combination because certain stockholders, including stockholders affiliated with the management of the SPAC, may have sufficient voting power, and a financial incentive, to approve such a transaction without support from public stockholders. As a result, a SPAC may complete a business combination even though a majority of its public stockholders do not support such a combination.
RISKS ASSOCIATED WITH SPAC-DERIVED COMPANIES (AIEQ)
SPAC-derived companies are thus often subject to extreme price volatility and speculative trading. These stocks may have above-average price appreciation in connection with a potential business combination with a SPAC prior to investment by the Fund. The price of stocks invested in by the Fund may not continue to appreciate and the performance of these stocks may not replicate the performance exhibited in the past. In addition, SPAC-derived companies may share similar illiquidity risks of private equity and venture capital. The free float shares held by the public in a SPAC-derived company are typically a small percentage of the market capitalization. The ownership of many SPAC-derived companies often includes large holdings by venture capital and private equity investors who seek to sell their shares in the public market in the months following a business combination transaction when shares restricted by lock-up are released, causing greater volatility and possible downward pressure during the time that locked-up shares are released.
RUSSIAN AND UKRAINE SECURITIES RISK
The continued hostilities between the two countries may still result in more widespread conflict and could have a severe adverse effect on the region and the markets. Sanctions imposed on Russia by the United States and other countries, and any sanctions imposed in the future could have additional significant adverse impact on the Russian economy and related markets. The price and liquidity of investments may fluctuate widely as a result of the conflict and related events.
182
Amplify ETF Trust
Additional Information
March 31, 2024 (Unaudited) (Continued)
SILVER EXPLORATION AND PRODUCTION INDUSTRY CONCENTRATION RISK (SILJ)
The profitability of companies in the Silver Exploration & Production sub-industry is related to, among other things, the worldwide price of silver and the costs of extraction and production. Worldwide silver prices may fluctuate substantially over short periods of time, so the Fund’s share price may be more volatile than other types of investments. Companies in the sub-industry may be adversely affected by economic conditions, tax treatment, government regulation and intervention, and world events in the regions in which the companies operate (e.g., expropriation, nationalization, confiscation of assets and property, repatriation of capital, military coups, social unrest). The price of the equity securities of silver mining companies and silver may not always be closely correlated. Investing in a silver company involves certain risks unrelated to an investment in silver as a commodity, including production costs, operational and managerial risk, and the possibility that the company will take measures to hedge or minimize its exposure to the volatility of the market price of silver.
SMALL AND/OR MID CAPITALIZATION COMPANIES RISK (IWIN)
Small and/or mid-capitalization companies may be more vulnerable to adverse general market or economic developments, and their securities may be less liquid and may experience greater price volatility than larger, more established companies as a result of several factors, including limited trading volumes, products or financial resources, management inexperience and less publicly available information. Accordingly, such companies are generally subject to greater market risk than larger, more established companies.
SMALLER COMPANIES RISK (COWS, CNBS, IPAY, ITEQ, IVES, MJ, MJUS, MVPS, NDIV and SILJ)
Smaller companies may be more vulnerable to adverse business or economic events than larger, more established companies, and may underperform other segments of the market or the equity market as a whole. The securities of smaller companies also are often traded in the over-the-counter market and tend to be bought and sold less frequently and at significantly lower trading volumes than the securities of larger companies. As a result, it may be more difficult for the Fund to buy or sell a significant amount of the securities of a smaller company without an adverse impact on the price of the company’s securities, or the Fund may have to sell such securities in smaller quantities over a longer period of time, which may increase the Fund’s tracking error.
SOFTWARE INDUSTRY RISK (EMFQ)
The software industry can be significantly affected by intense competition, aggressive pricing, technological innovations, and product obsolescence. Companies in the software industry are subject to significant competitive pressures, such as aggressive pricing, new market entrants, competition for market share, short product cycles due to an accelerated rate of technological developments and the potential for limited earnings and/or falling profit margins. These companies also face the risks that new services, equipment or technologies will not be accepted by consumers and businesses or will become rapidly obsolete. These factors can affect the profitability of these companies and, as a result, the value of their securities. Also, patent protection is integral to the success of many companies in this industry, and profitability can be affected materially by, among other things, the cost of obtaining (or failing to obtain) patent approvals, the cost 7 of litigating patent infringement and the loss of patent protection for products (which significantly increases pricing pressures and can materially reduce profitability with respect to such products).
SUBSIDIARY INVESTMENT RISK (IWIN)
Changes in the laws of the United States and/or the Cayman Islands, under which the Fund and the Subsidiary are organized, respectively, could result in the inability of the Fund to operate as intended and could negatively affect the Fund and its shareholders. The Subsidiary is not registered under the 1940 Act and is not subject to all the investor protections of the 1940 Act. As the Subsidiary is wholly owned by the Fund and the investors of the Fund will have the investor protections of the 1940 Act, the Fund as a whole, including the Subsidiary, will provide investors with 1940 Act protection.
TECHNOLOGY COMPANIES RISK (AWAY, GAMR, HACK, IPAY, ITEQ and IVES)
Companies in the technology field, including companies in the computers, telecommunications and electronics industries, face intense competition, which may have an adverse effect on profit margins. Technology companies may have limited product lines, markets, financial resources or personnel. The products of technology companies may face obsolescence due to rapid technological developments
183
Amplify ETF Trust
Additional Information
March 31, 2024 (Unaudited) (Continued)
and frequent new product introduction, and such companies may face unpredictable changes in growth rates, competition for the services of qualified personnel and competition from foreign competitors with lower production costs. Companies in the technology sector are heavily dependent on patent and intellectual property rights. The loss or impairment of these rights may adversely affect the profitability of these companies.
TIMBER COMPANIES RISK (NDIV)
Timber companies may be affected by numerous factors, including events occurring in nature and international politics. For example, the volume and value of timber that can be harvested from timberlands may be limited by natural disasters and other events such as fire, volcanic eruptions, insect infestation, disease, ice storms, wind-storms, flooding, other weather conditions and other causes. In periods of poor logging conditions, timber companies may harvest less timber than expected. Timber companies are subject to many federal, state and local environmental and health and safety laws and regulations. In addition, rising interest rates and general economic conditions may affect the demand for timber products.
TREATMENT COMPANIES AND TESTING COMPANIES RISK (GERM)
Treatment Companies and Testing Companies are involved in discovering, developing and commercializing novel drugs or tests with significant market potential. These companies face challenges including pre-clinical testing and clinical trial stages of development. Clinical trials may be delayed and certain programs may never advance in the clinic or may be more costly to conduct than anticipated. Such companies may be dependent on their ability to secure significant funding for research, development, and commercialization of therapeutics, vaccines, tests, and other health care products or services. If there are delays in obtaining required regulatory and marketing approvals for products, the ability of such companies to generate revenue may be materially impaired. If regulatory approval is obtained, products will still remain subject to regulatory scrutiny with regulatory authorities having the ability to impose significant restrictions on the indicated uses or marketing. Lastly, even if a licensed product is achieved, such companies may encounter difficulties in manufacturing, product release, shelf life, testing, storage, supply chain management, or shipping.
U.S. TREASURY SECURITIES RISK (ISWN, QSWN and SWAN)
U.S. Treasury securities may differ from other securities in their interest rates, maturities, times of issuance and other characteristics and may provide relatively lower returns than those of other securities. U.S. government securities are guaranteed only as to the timely payment of interest and the payment of principal when held to maturity. Similar to other issuers, changes to the financial condition or credit rating of the U.S. government may cause the value of the Fund’s U.S. Treasury securities to decline.
VIDEO GAMING COMPANIES RISK (GAMR)
Video gaming companies face intense competition, both domestically and internationally, may have limited product lines, markets, financial resources, or personnel, may have products that face rapid obsolescence, and are heavily dependent on the protection of patent and intellectual property rights. Such factors may adversely affect the profitability and value of Video gaming companies.
184
Amplify ETF Trust
Supplemental Information
March 31, 2024 (Unaudited)
DISTRIBUTION OF PREMIUMS AND DISCOUNTS
NAV is the price per share at which the Fund issues and redeems shares. It is calculated in accordance with the standard formula for valuing mutual fund shares. The “Market Price” of the Fund generally is determined using the composite closing price each day. The Fund’s Market Price may be at, above or below its NAV. The NAV of the Fund will fluctuate with changes in the market value of the Fund’s holdings. The Market Price of the Fund will fluctuate in accordance with changes in its NAV, as well as market supply and demand.
Premiums or discounts are the differences (expressed as a percentage) between the NAV and Market Price of the Fund on a given day, generally at the time NAV is calculated. A premium is the amount that the Fund is trading above the reported NAV, expressed as a percentage of the NAV. A discount is the amount that the Fund is trading below the reported NAV, expressed as a percentage of the NAV.
Further information regarding premiums and discounts is available, without charge, on the Fund’s website at www.amplifyetfs.com.
INFORMATION ABOUT THE TRUSTEES
The Statement of Additional Information (“SAI”) includes additional information about the Fund’s Trustees and is available without charge, upon request, by calling 1-855-267-3837. Furthermore, you can obtain the SAI by accessing the Commission’s website at www.sec.gov or by accessing the Fund’s website at www.amplifyetfs.com.
DELIVERY OF SHAREHOLDER DOCUMENTS — HOUSEHOLDING
Householding is an option available to certain investors of the Fund. Householding is a method of delivery, based on the preference of the individual investor, in which a single copy of certain shareholder documents can be delivered to investors who share the same address, even if their accounts are registered under different names. Householding for the Fund is available through certain broker-dealers. If you are interested in enrolling in householding and receiving a single copy of the prospectus and other shareholder documents, please contact your broker-dealer. If you currently are enrolled in householding and wish to change your householding status, please contact your broker-dealer.
185
Amplify ETF Trust
Privacy Policy
March 31, 2024 (Unaudited)
AMPLIFY ETFS AND AMPLIFY AFFILIATES PRIVACY POLICY
Amplify recognizes the importance of protecting your personal and financial information when you visit our websites (each a “Website” and together “Websites”). This Policy is designed to help you understand the information collection practices on all Websites owned or operated by or on behalf of companies within the Amplify group of companies, including: Amplify Investments LLC, Amplify Development LLC, and Amplify Holding Company LLC. We are committed to:
(a) protecting the personal information you provide to us;
(b) telling you how we use the information we gather about you; and
(c) ensuring that you know why we intend to disclose your personal information.
CHANGES TO THIS PRIVACY POLICY
This Privacy Policy is dated January 1, 2016. Amplify reserves the right to amend this Privacy Policy at any time without notice, by updating this posting, in which case the date of the Policy will be revised. The current version of this Policy can be accessed from the link on the www.amplifyetfs.com homepage.
INFORMATION COLLECTION AND USE
Personally Identifiable Information: The personally identifiable information you submit to our Websites is used to service your interest and to improve our services to you and/or to provide you with information on Amplify products and services. The types of personal information that may be collected at our Websites include: name, address, email address and telephone number. We will not sell, share or rent your personally identifiable information to others in contravention of this Privacy Policy.
Additionally, if the Website is a password protected site, then (a) once you submit your password and enter, the Website will recognize who you are and will collect all information that you submit, including all electronic instructions (including all transaction information), and (b) any information collected about you from the Website may be associated with other identifying information that we have about you.
Aggregate Information: We generally record certain usage information, such as the number and frequency of visitors to our Websites. This information may include the websites that you access immediately before and after your visit to our Websites, the Internet browser you are using and your IP address. If we use such data at all it will be on an aggregate basis, and we will not disclose to third parties any information that could be used to identify you personally.
Service Providers: We may use internal or external service providers to operate our Websites and employ other persons to perform work on our behalf, such as sending postal mail and e-mail. These persons may have access to the personally identifiable information you submit through the Websites, but only for the purpose of performing their duties. These personnel may not use your personally identifiable information for any other purpose.
Compliance with Laws: We do not automatically collect personally identifiable information from visitors to our Websites, except to the extent we are required to do so pursuant to some statute or regulation applicable to us. We will not provide any personally identifiable information to any other persons, except if we are required to make disclosures by any law, any government or private parties in connection with a lawsuit, subpoena, investigation or similar proceeding.
E-mail and Marketing: Amplify does not sell its customers’ e-mail addresses, nor will we provide your personal information to third parties for their marketing purposes. Amplify will not send you e-mail messages without first receiving your permission, unless it relates to servicing your account or unless you have consented to receiving electronic delivery of fund documents as part of our E-Delivery service. It is our policy to include instructions for unsubscribing from these permission-based programs. We recommend that you do not send us any individual personal information via non secure methods of correspondence, including via public electronic communication channels, such as Internet e-mail, which are generally not secure.
186
Amplify ETF Trust
Privacy Policy
March 31, 2024 (Unaudited) (Continued)
Business Transfers: If the business, stock or assets of Amplify are acquired or merged with another business entity, we will share all or some of your information with this entity to continue to provide our service to you. You will receive notice of such an event and the new entity will inform you of any changes to the practices in this Privacy Policy. If the new entity wishes to make additional use of your information, you may decline such use at such time.
Disclosure to Third Parties: The personal information you provide to us will only be disclosed to third parties if we have your permission, or as set out in this Privacy Policy. We may disclose details about the general use of our Websites to third parties – for example, to demonstrate patterns of use to advertisers and other business partners. Information we pass on for this purpose will not include any personal information by which you may be identified. We endeavor to prevent unauthorized disclosures of your personal information by third parties but we are not responsible for any unauthorized disclosures or other breaches of security or for the actions of others if the information was passed to them with your authority or with the authority of anyone other than us or our group companies.
COOKIES
What are Cookies?
Cookies are small text files that are stored in your computer’s memory and hard drive when you visit certain web pages. They are used to enable websites to function or to provide information to the owners of a website.
Why Do We Use Cookies?
Cookies help us to provide customized services and information. We use cookies on all our Websites to tell us, in general terms, how and when pages in our Websites are visited, what our users’ technology preferences are – such as what type of video player they use – and whether our Websites are functioning properly.
If you are using one of our password-protected sites, then the website may use cookies or other technology to help us authenticate you, store and recognize your configuration and user attributes, facilitate your navigation of the website and customize its content so that the information made available is likely to be of more interest to you.
In broad terms, we use cookies on our Websites for the following purposes:
• Analytical purposes: Analytical cookies allow us to recognize measure and track visitors to our Websites. This helps us to improve and develop the way our Websites work, for example, by determining whether site visitors can find information easily, or by identifying the aspects of websites that are of the most interest to them.
• Usage preferences: Some of the cookies on our Websites are activated when visitors to our sites make a choice about their usage of the site. Our Websites then ‘remember’ the settings preferences of the user concerned. This allows us to tailor aspects of our sites to the individual user.
• Terms and conditions: We use cookies on our Websites to record when a site visitor has seen a policy, such as this one, or provided consent, such as consent to the terms and conditions on our Websites. This helps to improve the user’s experience of the site – for example, it avoids a user from repeatedly being asked to consent to the same terms.
• Session management: The software that runs our websites uses cookies for technical purposes needed by the internal workings of our servers. For instance, we use cookies to distribute requests among multiple servers, authenticate users and determine what features of the site they can access, verify the origin of requests, keep track of information about a user’s session and determine which options or pages to display in order for the site to function.
• Functional purposes: Functional purpose cookies store information that is needed by our applications to process and operate. For example, where transactions or requests within an application involve multiple workflow stages, cookies are used to store the information from each stage temporarily, in order to facilitate completion of the overall transaction or request.
187
Amplify ETF Trust
Privacy Policy
March 31, 2024 (Unaudited) (Continued)
Further Information About Cookies
If you would like to find out more about cookies in general and how to manage them, please visit www.allaboutcookies.org.
THIRD PARTY WEBSITES
Amplify disclaims responsibility for the privacy policies and customer information practices of third party internet websites hyperlinked from our Website or this Privacy Policy.
SECURITY
Amplify protects your personal information when you transact business on our Website by requiring the use of a browser software program that supports industry standard SSL encryption with 128-bit key lengths. The “128-bit” designation refers to the length of the key used to encrypt the data being transmitted, with a longer key representing a higher level of security.
CONTACT US
We welcome inquiries or comments about our Privacy Policy and any queries or concerns about Amplify ETFs at support@amplifyetfs.com or 1-855-267-3837.
188
Investment Adviser:
Amplify Investments LLC
3333 Warrenville Road, Suite 350
Lisle, IL 60532
Investment Sub-Advisers: |
Penserra Capital Management, LLC
4 Orinda Way, Suite 100-A
Orinda, CA 94563 | | | | Capital Wealth Planning
1016 Collier Center Way
Naples, FL 34110 |
Tidal Investments, LLC
234 W. Florida St., Suite 203
Milwaukee, WI 53204 | | | | Cerity Partners LLC
335 Madison Avenue, 23rd Floor
New York, NY 10017 |
Seymour Asset Management LLC
1 Old Point Road
Quogue, New York 11959 | | | | Kelly Strategic Management, LLC
7887 East Belleview Avenue, Suite 1100
Denver, CO 80111 |
Samsung Asset Management (New York), Inc.
152 West 57th Street
New York, New York 10019 |
Legal Counsel:
Chapman and Cutler LLP
111 West Monroe Street
Chicago, IL 60603
Independent Registered Public Accounting Firm:
Cohen & Company, Ltd.
342 North Water Street, Suite 830
Milwaukee, WI 53202
Distributor:
Foreside Fund Services, LLC
Three Canal Plaza, Suite 100
Portland, ME 04101
Administrator:
U.S. Bancorp Fund Services, LLC
777 East Wisconsin Avenue
Milwaukee, WI 53202
Transfer Agent:
U.S. Bancorp Fund Services, LLC
615 East Michigan Street
Milwaukee, WI 53202
Custodian:
U.S. Bank National Association
1555 North RiverCenter Drive, Suite 302
Milwaukee, WI 53212
This information must be preceded or accompanied by a current prospectus for the Funds.
Item 2. Code of Ethics.
Not applicable for semi-annual reports.
Item 3. Audit Committee Financial Expert.
Not applicable for semi-annual reports.
Item 4. Principal Accountant Fees and Services.
Not applicable for semi-annual reports.
Item 5. Audit Committee of Listed Registrants.
Not applicable for semi-annual reports.
Item 6. Investments.
Schedule of Investments is included as part of the report to shareholders filed under Item 1 of this Form.
Item 7. Disclosure of Proxy Voting Policies and Procedures for Closed-End Management Investment Companies.
Not applicable to open-end investment companies.
Item 8. Portfolio Managers of Closed-End Management Investment Companies.
Not applicable to open-end investment companies.
Item 9. Purchases of Equity Securities by Closed-End Management Investment Company and Affiliated Purchasers.
Not applicable to open-end investment companies.
Item 10. Submission of Matters to a Vote of Security Holders.
There have been no material changes to the procedures by which shareholders may recommend nominees to the registrant’s board of trustees.
Item 11. Controls and Procedures.
| (a) | The Registrant’s President/Principal Executive Officer and Treasurer/Principal Financial Officer have reviewed the Registrant's disclosure controls and procedures (as defined in Rule 30a-3(c) under the Investment Company Act of 1940 (the “Act”)) as of a date within 90 days of the filing of this report, as required by Rule 30a-3(b) under the Act and Rules 13a-15(b) or 15d-15(b) under the Securities Exchange Act of 1934. Based on their review, such officers have concluded that the disclosure controls and procedures are effective in ensuring that information required to be disclosed in this report is appropriately recorded, processed, summarized and reported and made known to them by others within the Registrant and by the Registrant’s service provider. |
| (b) | There were no changes in the Registrant's internal control over financial reporting (as defined in Rule 30a-3(d) under the Act) that occurred during the period covered by this report that have materially affected, or are reasonably likely to materially affect, the Registrant's internal control over financial reporting. |
Item 12. Disclosure of Securities Lending Activities for Closed-End Management Investment Companies
Not applicable to open-end investment companies.
Item 13. Exhibits.
| (a) | (1) Any code of ethics or amendment thereto, that is the subject of the disclosure required by Item 2, to the extent that the registrant intends to satisfy Item 2 requirements through filing an exhibit. Not Applicable. |
(2) A separate certification for each principal executive officer and principal financial officer pursuant to Section 302 of the Sarbanes-Oxley Act of 2002. Filed herewith.
(3) Any written solicitation to purchase securities under Rule 23c-1 under the Act sent or given during the period covered by the report by or on behalf of the registrant to 10 or more persons. Not applicable to open-end investment companies.
(4) Change in the registrant’s independent public accountant. There was no change in the registrant’s independent public accountant for the period covered by this report.
SIGNATURES
Pursuant to the requirements of the Securities Exchange Act of 1934 and the Investment Company Act of 1940, the registrant has duly caused this report to be signed on its behalf by the undersigned, thereunto duly authorized.
| (Registrant) | Amplify ETF Trust | |
| By (Signature and Title) | /s/ Christian Magoon | |
| | Christian Magoon, | |
| | President & Chief Executive Officer | |
Pursuant to the requirements of the Securities Exchange Act of 1934 and the Investment Company Act of 1940, this report has been signed below by the following persons on behalf of the registrant and in the capacities and on the dates indicated.
| By (Signature and Title) | /s/ Christian Magoon | |
| | Christian Magoon, | |
| | President & Chief Executive Officer | |
| By (Signature and Title) | /s/ Bradley H. Bailey | |
| | Bradley H. Bailey, | |
| | Chief Financial Officer | |
* Print the name and title of each signing officer under his or her signature.