Triloma EIG Energy Income Fund - Term I Inactive
Filed: 29 Aug 17, 12:00am
UNITED STATES
SECURITIES AND EXCHANGE COMMISSION
Washington, D.C. 20549
FORM N-CSRS
CERTIFIED SHAREHOLDER REPORT OF REGISTERED MANAGEMENT
INVESTMENT COMPANIES
Investment Company Act File Number 811-23032
Triloma EIG Energy Income Fund – Term I
(Exact name of registrant as specified in charter)
201 North New York Avenue, Suite 200
Winter Park, Florida 32789
(Address of principal executive offices) (Zip code)
NATIONAL REGISTERED AGENTS, INC.
160 Greentree Drive, Suite 101
Dover, DE 19904
(Name and address of agent for service)
Registrant’s telephone number, including area code: (407) 636-7115
Date of fiscal year end: December 31, 2017
Date of reporting period: June 30, 2017
| Item 1. | Reports to Stockholders. |
The semi-annual report is attached.
Triloma EIG Energy Income Fund - Term I


ENERGY ASSETS focusing on hard assets and long useful lives1 INCOME FOCUS with protection against rising interest rates1
GLOBAL DIVERSIFICATION through privately originated debt1 1 There can be no assurance that the Funds will achieve their investment objectives.
| 1 | ||||
| 2 | ||||
| 3 | ||||
| 4 | ||||
| 8 | ||||
| 9 | ||||
| 10 | ||||
| 11 | ||||
| 12 | ||||
| 13 | ||||
Approval of Renewal of Investment Advisory Agreement and Investment Sub-Advisory Agreement | 22 | |||
| 25 | ||||
Triloma EIG Energy Income Fund – Term I files its complete schedule of fund holdings with the Securities and Exchange Commission (the “Commission”) for the first and third quarters of each fiscal year on Form N-Q within sixty days after the end of the period. The Fund’s Forms N-Q are available on the Commission’s website at http://www.sec.gov, and may be reviewed and copied at the Commission’s Public Reference Room in Washington, D.C. Information on the operation of the Public Reference Room may be obtained by calling 1-800-SEC-0330.
A description of the policies and procedures that the Adviser uses to determine how to vote proxies relating to portfolio securities, as well as information relating to how the Fund voted proxies relating to portfolio securities during the most recent 12-month period ended June 30, will be available on Form N-PX: (i) without charge, upon request, by calling 1-844-224-4714 and (ii) on the SEC’s website at http://www.sec.gov.
Triloma EIG Energy Income Fund – Term I
Growth of a $10,000 Investment (Unaudited)
Inception of 07/24/2015 through 06/30/2017
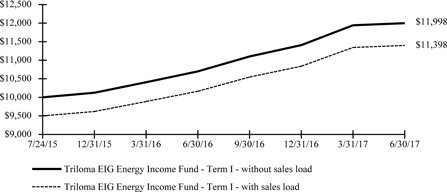
Performance as of June 30, 2017
| Total Return | Average Annual Total Return | |||||||||||||||
| Inception Date | 6 Months | 1 Year | Since Inception | |||||||||||||
Triloma EIG Energy Income Fund - Term 1- without sales load | 07/24/15 | 5.17 | % | 12.15 | % | 19.98 | % | |||||||||
Triloma EIG Energy Income Fund - Term 1- with sales load | 07/24/15 | -0.09 | % | 6.54 | % | 13.98 | % | |||||||||
The performance data presented represents past performance; future results may vary. Performance data does not reflect the deduction of taxes that would be paid on fund distributions or the redemption of fund shares. Investment return and principal value will fluctuate so that an investor’s shares, when repurchased, may be worth more or less than their original cost. Current performance may be lower or higher than performance quoted. Triloma EIG Energy Income Fund – Term I – with sales load return reflects the maximum sales load of 5.00% at the initial investment; the reinvestment does not reflect any sales charges as described in our Distribution Reinvestment Plan. Triloma EIG Energy Income Fund – Term I – without sales load return represents no sales load at the initial investment; the reinvestment does not reflect any sales loads as described in our Distribution Reinvestment Plan.
Performance figures reflect any fee waivers and/or expense reimbursements. Without such waivers and/or reimbursements, the performance would be lower.
Performance results do not include adjustments made for financial reporting purposes in accordance with U.S. generally accepted accounting principles and may differ from amounts reported in the Financial Highlights.
1
Triloma EIG Energy Income Fund – Term I
Understanding Your Fund’s Expenses (Unaudited)
As a shareholder of a fund, you incur ongoing costs, which include costs for fund management, administrative services, and shareholder reports, among others. Operating expenses, which are deducted from a fund’s gross income, directly reduce the investment return of a fund. The following examples are intended to help you understand the ongoing fees (in dollars) of investing in your Fund and to compare these costs with those of other funds. The examples are based on an investment of $1,000 invested at January 1, 2017, and held for the entire period until June 30, 2017.
The table illustrates your Fund’s costs in two ways.
| ● | Actual Expenses. This section helps you to estimate the actual expenses after fee waivers that you paid over the period. The “Ending Account Value” shown is derived from the Fund’s return calculated by using the beginning and ending net asset value of the Fund, and the fourth column shows the dollar amount that would have been paid by an investor who started with $1,000 in the Fund. You may use the information here, together with the amount you invested, to estimate the expenses that you paid over the period. To do so, simply divide your account value by $1,000 (for example, an $8,600 account value divided by $1,000 = 8.6), then multiply the result by the number given for your Fund under the heading “Expenses Paid During Period.” |
| ● | Hypothetical Example for Comparison Purposes. This section is intended to help you compare your Fund’s costs with those of other funds. It assumes that the Fund had an annual return of 5% before expenses during the period, but that the expense ratio is unchanged. In this case, because the return used is not the Fund’s actual return, the results do not apply to your investment. The example is useful in making comparisons because the Securities and Exchange Commission requires all mutual funds to calculate expenses based on a 5% return. You can assess your Fund’s costs by comparing this hypothetical example with the hypothetical examples that appear in shareholder reports of other mutual funds. Because the return is set at 5% for comparison purposes — NOT your Funds’ actual return — the account values shown do not apply to your specific investment. |
Please note that the expenses shown in the table are meant to highlight ongoing costs and do not reflect any transactional costs, such as sales loads. If these transactional costs were included, your costs would have been higher.
| Actual Expenses | Hypothetical Expenses | |||||||||||||||||||
Beginning Account Value | Ending Account Value June 30, 2017 | Expenses Paid During January 1, 2017 - June 30, 2017 (a) | Ending Account Value June 30, 2017 | Expenses Paid During January 1, 2017 - June 30, 2017 (a) | Annualized Expense Ratio (b) | |||||||||||||||
| $ 1,000.00 | $ | 1,065.10 | $ | - | $ | 1,024.79 | $ | - | 0.00% | |||||||||||
(a) Expenses are calculated using the Fund’s annualized expense ratio (as disclosed in the above table), multiplied by the average account value for the period, multiplied by the number of days in the period (181 days), and divided by the number of days in the year (365 days).
(b) Expense ratio includes waived and reimbursed expenses; had the Fund not had such waivers and reimbursements in place, the expense ratio would have been higher.
2
Triloma EIG Energy Income Fund – Term I
Investment Portfolio Overview (Unaudited)
The information contained in this section should be read in conjunction with the following attached Schedule of Investments.
The following table summarizes the composition of the Fund’s investment portfolio, excluding Short Term Investments, by investment type at fair value and enumerates the percentage, by fair value as of June 30, 2017:
Asset Types | Fair Value | Percentage of Portfolio | ||||||
Senior Unsecured Debt | $ 7,593,572 | 65.4% | ||||||
Senior Secured Debt | 3,974,847 | 34.3% | ||||||
Equity/Other | 37,676 | 0.3% | ||||||
The table below describes investments by industry sub-sectors and enumerates the percentage, by fair value, of the total portfolio assets in such industry sub-sectors, excluding Short Term Investments, as of June 30, 2017:
Sub-Sectors | Fair Value | Percentage of Portfolio | ||||||
Upstream | $ 4,365,459 | 37.6% | ||||||
Power | 2,995,231 | 25.8% | ||||||
Midstream | 2,310,400 | 19.9% | ||||||
Renewables | 1,330,100 | 11.5% | ||||||
Downstream | 604,905 | 5.2% | ||||||
The table below describes investments by country and enumerates the percentage, by fair value, of the total portfolio assets in such countries, excluding Short Term Investments, as of June 30, 2017:
Country | Fair Value | Percentage of Portfolio | ||||||
United States | $ 10,147,085 | 87.4% | ||||||
Congo-Brazzaville | 897,603 | 7.7% | ||||||
Kazakhstan | 402,542 | 3.5% | ||||||
United Kingdom | 158,865 | 1.4% | ||||||
3
Triloma EIG Energy Income Fund – Term I
Schedule of Investments
June 30, 2017 (Unaudited)
Company | Sub-Sector | Asset Type | Interest Rate | Base Rate Floor | Maturity/ Expiration Date | Principal (a)/Shares | Cost(b)(c) | Fair Value | % of Net Assets | |||||||||||||||||||||||
Congo-Brazzaville — 8.6% | ||||||||||||||||||||||||||||||||
New Age, Ltd. (d)(e)(f)(g) | Upstream | Senior Secured Debt | 15.00 | % | - | 06/28/2020 | $735,936 | $719,752 | $ | 859,927 | 8.2% | |||||||||||||||||||||
| Warrants(h)(i) | N/A | - | 06/28/2026 | 15,131 | 18,228 | 37,676 | 0.4% | |||||||||||||||||||||||||
|
| |||||||||||||||||||||||||||||||
Total Congo-Brazzaville | 737,980 | 897,603 | �� | 8.6% | ||||||||||||||||||||||||||||
|
| |||||||||||||||||||||||||||||||
Kazakhstan — 3.8% | ||||||||||||||||||||||||||||||||
Tengizchevroil Finance Company International LTD(j) | Upstream | Senior Secured Debt | 4.00 | % | - | 08/15/2026 | 418,000 | 406,514 | 402,542 | 3.8% | ||||||||||||||||||||||
|
| |||||||||||||||||||||||||||||||
Total Kazakhstan | 406,514 | 402,542 | 3.8% | |||||||||||||||||||||||||||||
|
| |||||||||||||||||||||||||||||||
United Kingdom — 1.5% | ||||||||||||||||||||||||||||||||
Bioenergy Infrastructure Holdings, Ltd.(d)(e)(f)(k) | Renewables | Senior Secured Debt | L + 7.25 | % | 1.00 | % | 12/22/2022 | 158,865 | 157,497 | 158,865 | 1.5% | |||||||||||||||||||||
|
| |||||||||||||||||||||||||||||||
Total United Kingdom | 157,497 | 158,865 | 1.5% | |||||||||||||||||||||||||||||
|
| |||||||||||||||||||||||||||||||
United States — 96.6% | ||||||||||||||||||||||||||||||||
AES Corp./VA | Power | Senior Unsecured Debt | 6.00 | % | - | 05/15/2026 | 289,000 | 292,700 | 309,230 | 2.9% | ||||||||||||||||||||||
| Senior Unsecured Debt | 5.50 | % | - | 03/15/2024 | 305,000 | 311,391 | 317,581 | 3.0% | ||||||||||||||||||||||||
AmeriGas Partners LP Fin Corp. | Downstream | Senior Unsecured Debt | 5.63 | % | - | 05/20/2024 | 346,000 | 349,503 | 357,245 | 3.4% | ||||||||||||||||||||||
| Senior Unsecured Debt | 5.50 | % | - | 05/20/2025 | 244,000 | 249,797 | 247,660 | 2.4% | ||||||||||||||||||||||||
Archrock Partners LP/Fin | Midstream | Senior Unsecured Debt | 6.00 | % | - | 04/01/2021 | 221,000 | 217,751 | 215,475 | 2.1% | ||||||||||||||||||||||
| Senior Unsecured Debt | 6.00 | % | - | 10/01/2022 | 360,000 | 361,357 | 349,200 | 3.3% | ||||||||||||||||||||||||
Calpine Corp. | Power | Senior Unsecured Debt | 5.75 | % | - | 01/15/2025 | 684,000 | 666,547 | 641,250 | 6.1% | ||||||||||||||||||||||
Concho Resources Inc. | Upstream | Senior Unsecured Debt | 5.50 | % | - | 10/01/2022 | 178,000 | 184,177 | 182,673 | 1.7% | ||||||||||||||||||||||
| Senior Unsecured Debt | 4.38 | % | - | 01/15/2025 | 261,000 | 266,803 | 266,220 | 2.5% | ||||||||||||||||||||||||
Covanta Holding Corp. | Renewables | Senior Unsecured Debt | 5.88 | % | - | 03/01/2024 | 412,000 | 406,175 | 401,700 | 3.8% | ||||||||||||||||||||||
| Senior Unsecured Debt | 5.88 | % | - | 07/01/2025 | 123,000 | 122,818 | 119,310 | 1.1% | ||||||||||||||||||||||||
Genesis Energy L.P. | Midstream | Senior Unsecured Debt | 5.63 | % | - | 06/15/2024 | 607,000 | 600,654 | 575,132 | 5.5% | ||||||||||||||||||||||
Holly Energy Partners LP(j) | Midstream | Senior Unsecured Debt | 6.00 | % | - | 08/01/2024 | 477,000 | 500,128 | 496,080 | 4.7% | ||||||||||||||||||||||
Panda Hummel(k) | Power | Senior Secured Debt | L + 6.00 | % | 1.00 | % | 10/27/2022 | 1,200,000 | 1,122,000 | 1,104,000 | 10.5% | |||||||||||||||||||||
Matador Resources, Co | Upstream | Senior Unsecured Debt | 6.88 | % | - | 04/15/2023 | 274,000 | 289,744 | 284,275 | 2.7% | ||||||||||||||||||||||
Northeast Natural Energy, LLC(d)(e)(f)(k) | Upstream | Senior Secured Debt | L + 8.00 | % | - | 03/02/2022 | 775,000 | 763,753 | 775,000 | 7.4% | ||||||||||||||||||||||
NRG Energy Inc. | Power | Senior Unsecured Debt | 6.25 | % | - | 05/01/2024 | 617,000 | 614,961 | 623,170 | 5.9% | ||||||||||||||||||||||
NRG Yield Operating LLC | Renewables | Senior Unsecured Debt | 5.38 | % | - | 08/15/2024 | 620,000 | 628,748 | 650,225 | 6.2% | ||||||||||||||||||||||
PDC Energy | Upstream | Senior Unsecured Debt | 7.75 | % | - | 10/15/2022 | 296,000 | 309,478 | 307,100 | 2.9% | ||||||||||||||||||||||
QEP Resources Inc. | Upstream | Senior Unsecured Debt | 6.88 | % | - | 03/01/2021 | 73,000 | 76,091 | 75,738 | 0.7% | ||||||||||||||||||||||
| Senior Unsecured Debt | 5.25 | % | - | 05/01/2023 | 419,000 | 416,219 | 395,955 | 3.8% | ||||||||||||||||||||||||
RSP Permian Inc.(j) | Upstream | Senior Unsecured Debt | 5.25 | % | - | 01/15/2025 | 491,000 | 500,160 | 491,613 | 4.7% | ||||||||||||||||||||||
Sabine Pass Liquefaction | Midstream | Senior Secured Debt | 6.25 | % | - | 03/15/2022 | 203,000 | 200,499 | 229,872 | 2.2% | ||||||||||||||||||||||
| Senior Secured Debt | 5.63 | % | - | 04/15/2023 | 400,000 | 440,359 | 444,641 | 4.3% | ||||||||||||||||||||||||
SM Energy, Co | Upstream | Senior Unsecured Debt | 5.00 | % | - | 01/15/2024 | 324,000 | 314,212 | 286,740 | 2.8% | ||||||||||||||||||||||
|
| |||||||||||||||||||||||||||||||
Total United States | 10,206,025 | 10,147,085 | 96.6% | |||||||||||||||||||||||||||||
|
| |||||||||||||||||||||||||||||||
The accompanying notes are an integral part of these financial statements.
4
Triloma EIG Energy Income Fund – Term I
Schedule of Investments
June 30, 2017 (Unaudited)
| Company | Sub-Sector | Asset Type | Interest Rate | Base Rate Floor | Maturity/ Expiration Date | Principal (a)/Shares | Cost(b)(c) | Fair Value | % of Net Assets | |||||||||||||||||||||||
Short Term Investments (US) — 25.2% | ||||||||||||||||||||||||||||||||
Fidelity Institutional Government Portfolio, 0.82%(l) | Short-Term | Money Market | N/A | — | $ | 1,327,542 | $ | 1,327,542 | $ | 1,327,542 | 12.6% | |||||||||||||||||||||
Invesco Short Term Investments Trust Government & Agency Portfolio, 0.88%(l) | Short-Term | Money Market | N/A | — | 1,327,541 | 1,327,541 | 1,327,541 | 12.6% | ||||||||||||||||||||||||
|
| |||||||||||||||||||||||||||||||
Total Short Term Investments | 2,655,083 | 2,655,083 | 25.2% | |||||||||||||||||||||||||||||
|
| |||||||||||||||||||||||||||||||
Total Investments | 14,163,099 | 14,261,178 | 135.7% | |||||||||||||||||||||||||||||
Other Assets and Liabilities | (3,751,506) | (35.7)% | ||||||||||||||||||||||||||||||
|
| |||||||||||||||||||||||||||||||
Total Net Assets | $ | 10,509,672 | 100.0% | |||||||||||||||||||||||||||||
|
| |||||||||||||||||||||||||||||||
Shares Outstanding | 394,322 | |||||||||||||||||||||||||||||||
Net Asset Value Per Common Share | $26.65 | |||||||||||||||||||||||||||||||
Portfolio Composition
ASSET TYPE | ||||
Senior Unsecured Debt | 72.2% | |||
Senior Secured Debt | 37.9% | |||
Money Market | 25.2% | |||
Warrants | 0.4% | |||
Other Assets and Liabilities | (35.7)% | |||
| 100.0% | ||||
As of June 30, 2017, the Fund’s investments were categorized as follows in the fair valuation hierarchy:
Investments in Securities | Level 1 - Quoted Prices | Level 2 - Other Significant Observable Inputs | Level 3 - Significant Unobservable Inputs | Total | ||||||||||||
Congo-Brazzaville | $ | — | $ | — | $ | 897,603 | $ | 897,603 | ||||||||
Kazakhstan | — | 402,542 | — | 402,542 | ||||||||||||
United Kingdom | — | — | 158,865 | 158,865 | ||||||||||||
United States | — | 12,027,168 | 775,000 | 12,802,168 | ||||||||||||
|
|
|
|
|
|
|
| |||||||||
Total Investments in Securities | $ | — | $ | 12,429,710 | $ | 1,831,468 | $ | 14,261,178 | ||||||||
|
|
|
|
|
|
|
| |||||||||
The accompanying notes are an integral part of these financial statements.
5
Triloma EIG Energy Income Fund – Term I
Schedule of Investments
June 30, 2017 (Unaudited)
The following is a reconciliation of the investments in which significant unobservable inputs were used in determining value:
| Investment in Securities | Beginning Balance at December 31, 2016 | Purchases | Sales (m) | Accrued Discounts (Premiums) | Total Realized Gain (Loss) | Net Change in Unrealized Appreciation (Depreciation) (n) | Net Transfers into (out of) Level 3 | Ending Balance at June 30, 2017 |
Net Change in Unrealized | |||||||||||||||||||||||||||
Congo-Brazzaville | $ | - | $ | 735,937 | $ | - | $ | 2,044 | $ | - | $ | 159,622 | $ | - | $ | 897,603 | $ | 159,622 | ||||||||||||||||||
United Kingdom | - | 157,433 | - | 65 | - | 1,367 | - | 158,865 | 1,367 | |||||||||||||||||||||||||||
United States | 357,298 | 763,244 | (359,511) | (122) | 12,751 | 1,340 | - | 775,000 | 11,248 | |||||||||||||||||||||||||||
The following table summarizes the quantitative inputs and assumptions used for items categorized as recurring Level 3 assets as of June 30, 2017. The following disclosures also include qualitative information on the sensitivity of the fair value measurements to changes in the significant unobservable inputs.
| Investments in Securities | Fair Value at June 30, 2017 | Valuation Techniques | Unobservable Inputs | Ranges (Average) |
Impact to valuation from | |||||
Congo-Brazzaville | $897,603 | Discounted Cash Flow | Discount Rate | 10.5% - 15.0% (10.5%) | Decrease | |||||
| Contractual Terms | $1.70 - $3.21 | Increase | ||||||||
United Kingdom | $158,865 | Discounted Cash Flow | Discount Rate | 9.90% - 10.10% (10.0%) | Decrease | |||||
United States | $775,000 | Discounted Cash Flow | Discount Rate | 10.33% - 11.33% (10.33%) | Decrease |
The unobservable inputs used to determine fair value of recurring Level 3 assets may have similar or diverging impacts on valuation. Significant increases and decreases in these inputs in isolation and interrelationships between those inputs could result in significantly higher or lower fair value measurement.
(a) Denominated in U.S. Dollars, unless otherwise noted.
(b) Cost represents amortized cost for debt securities, cost plus capitalized payment-in-kind distributions on the debt securities and cost for all other types of investments.
(c) Aggregate cost for federal income tax purposes is $14,163,099. Aggregate gross unrealized appreciation and depreciation for all securities is $266,042 and ($167,963), respectively. Net unrealized appreciation for tax purposes is $98,079.
(d) Securities are categorized as Level 3 securities under the fair valuation hierarchy. The total value of Level 3 securities is 17.5% of the Fund’s Net Assets.
(e) Fair valued as determined in good faith in accordance with procedures established by the Board. At June 30, 2017, total aggregate fair valued investments are $1,831,468, representing 17.5% of the Fund’s net assets.
(f) Restricted securities held by the Fund as of June 30, 2017 are as follows:
| Country | Company | Acquisition Date | Acquisition Cost | Value | Value as Percentage of Net Assets | |||||||||||||||
Congo-Brazzaville | New Age, Ltd. | 1/20/2017 | $ | 735,937 | $ | 897,603 | 8.6% | |||||||||||||
United Kingdom | Bioenergy Infrastructure Holdings, Ltd. | 2/16/2017 | 157,433 | 158,865 | 1.5% | |||||||||||||||
United States | Northeast Natural Energy, LLC | 3/2/2017 | 763,244 | 775,000 | 7.4% | |||||||||||||||
|
| |||||||||||||||||||
| $ | 1,656,614 | $ | 1,831,468 | 17.5% | ||||||||||||||||
|
| |||||||||||||||||||
The accompanying notes are an integral part of these financial statements.
6
Triloma EIG Energy Income Fund – Term I
Schedule of Investments
June 30, 2017 (Unaudited)
(g) Payment-In-Kind. Income may be received in additional securities and/or cash. (h) Non income producing.
(i) Warrants have exercise price of $4.00.
(j) Security exempt from registration under Regulation S of the Securities Act of 1933, which exempts from registration securities offered and sold outside the United States. Security may not be offered or sold in the United States except pursuant to an exemption form, or in a transaction not subject to, the registration requirements of the Securities Act of 1933. At June 30, 2017, the value of the Regulation S security is $1,390,235, representing 13.2% of the fund’s net assets.
(k) The interest rate on these senior secured debt holdings are subject to a base lending rate plus a spread. As of June 30, 2017, the rates are as follows:
| Country | Company | Current Rate | ||
United Kingdom | Bioenergy Infrastructure Holdings, Ltd. | 8.55% | ||
United States | Panda Hummel | 7.30% | ||
United States | Northeast Natural Energy, LLC | 9.30% |
(l) Rates disclosed reflect the 1-day yield at June 30, 2017.
(m) Sales include all sales of securities, maturities, paydowns and securities tendered in corporate actions.
(n) Any difference between net change in unrealized appreciation/(depreciation) on investments held at June 30, 2017, may be due to an investment no longer held as Level 3 or transferred into/out of Level 3.
The accompanying notes are an integral part of these financial statements.
7
Triloma EIG Energy Income Fund – Term I
Statement of Assets and Liabilities
(Unaudited)
| June 30, 2017 | ||||
Assets | ||||
Investments, at Fair Value (Cost $11,508,016) | $ | 11,606,095 | ||
Cash and Cash Equivalents | 2,659,669 | |||
Receivable Due from Sub-Advisor | 377,485 | |||
Interest Receivable | 137,463 | |||
Prepaid Expenses | 68,767 | |||
|
| |||
Total Assets | 14,849,479 | |||
|
| |||
Liabilities | ||||
Payable for Line of Credit | 2,500,000 | |||
Payable for Investment Securities Purchased | 1,122,000 | |||
Legal Fees Payable | 179,353 | |||
Distribution Fees Payable | 114,745 | |||
Marketing Fees Payable | 100,657 | |||
Due Diligence Fees Payable | 91,551 | |||
Audit and Tax Fees Payable | 87,732 | |||
Payable Due to Administrator | 44,667 | |||
Printing Fee Payable | 25,396 | |||
Management Fee Payable | 18,940 | |||
Trustee’s Fees Payable | 12,017 | |||
Interest Expense Payable | 1,348 | |||
Other Accrued Expenses | 41,401 | |||
|
| |||
Total Liabilities | 4,339,807 | |||
|
| |||
Commitments and Contingencies (See Note 3) | ||||
Total Net Assets | $ | 10,509,672 | ||
|
| |||
Components of Net Assets | ||||
Paid-in Capital | $ | 10,385,839 | ||
Accumulated Net Realized Gain on Investments | 25,754 | |||
Net Unrealized Appreciation on Investments | 98,079 | |||
|
| |||
Total Net Assets | $ | 10,509,672 | ||
|
| |||
Shares Outstanding (Unlimited Shares Authorized) | 394,322 | |||
Net Asset Value (NAV) Per Share | $ | 26.65 | ||
Maximum Public Offering Price (POP) | $ | 28.42 | ||
The accompanying notes are an integral part of these financial statements.
8
Triloma EIG Energy Income Fund – Term I
Statement of Operations
(Unaudited)
| For the Six Months Ended June 30, 2017 | ||||
Investment Income | ||||
Interest Income | $ | 223,255 | ||
Payment-In-Kind Income | 18,144 | |||
Other Income | 9,793 | |||
|
| |||
Total Investment Income | 251,192 | |||
Expenses | ||||
Management Fee | 78,186 | |||
Administration Fees | 262,002 | |||
Distribution Fees | 60,315 | |||
Legal Fees | �� | 247,945 | ||
Marketing Fees | 159,979 | |||
Due Diligence Fees | 126,452 | |||
Audit and Tax Fees | 76,603 | |||
Transfer Agent Fees | 52,542 | |||
Trustees’ Fees | 35,462 | |||
Printing Fees | 23,893 | |||
Interest Expense | 21,198 | |||
Custody Fees | 15,497 | |||
Registration Fees | 8,509 | |||
Pricing Fees | 981 | |||
Miscellaneous Expenses | 56,726 | |||
|
| |||
Total Expenses | 1,226,290 | |||
Expense Support Payments by Sub-Advisor | (1,226,290) | |||
|
| |||
Total Net Operating Expenses | – | |||
|
| |||
Net Investment Income | 251,192 | |||
|
| |||
Net Realized Gain on Investments | 25,754 | |||
Net Change in Unrealized Appreciation/(Depreciation) on Investments | 49,436 | |||
|
| |||
Net Realized and Unrealized Gain on Investments | 75,190 | |||
|
| |||
Additional Expense Support Payments by Sub-Advisor | 10,496 | |||
|
| |||
Increase in Net Assets Resulting from Operations | $ | 336,878 | ||
|
| |||
The accompanying notes are an integral part of these financial statements.
9
Triloma EIG Energy Income Fund – Term I
Statements of Changes in Net Assets
| Six Months Ended June 30, 2017 (Unaudited) | For the Year Ended December 31, 2016 | |||||||
|
| |||||||
Operations: | ||||||||
Net Investment Income | $ | 251,192 | $ | 59,503 | ||||
Net Realized Gain on Investments | 25,754 | – | ||||||
Net Change in Unrealized Appreciation/(Depreciation) on Investments | 49,436 | 48,643 | ||||||
Net Increase from Additional Expense Support Payments from Sub-Advisor | 10,496 | 102,310 | ||||||
|
| |||||||
Increase in Net Assets Resulting from Operations | 336,878 | 210,456 | ||||||
|
| |||||||
Dividends and Distributions: | ||||||||
Net Investment Income | (261,688 | ) | (161,813) | |||||
|
| |||||||
Total Dividends and Distributions to Shareholders | (261,688 | ) | (161,813) | |||||
|
| |||||||
Capital Share Transactions: | ||||||||
Proceeds from Shares Issued | 5,550,617 | 4,576,869 | ||||||
Reinvestments of Distributions | 107,411 | 47,137 | ||||||
Cost of Shares Redeemed | – | (1,195) | ||||||
|
| |||||||
Net Increase in Net Assets from Capital Share Transactions | 5,658,028 | 4,622,811 | ||||||
|
| |||||||
Total Increase in Net Assets | 5,733,218 | 4,671,454 | ||||||
|
| |||||||
Net Assets: | ||||||||
Beginning of Period | 4,776,454 | 105,000 | ||||||
|
| |||||||
End of Period | $ | 10,509,672 | $ | 4,776,454 | ||||
|
| |||||||
Undistributed Net Investment Income | $ | – | $ | – | ||||
|
| |||||||
Share Transactions: | ||||||||
Shares Issued | 206,101 | 178,273 | ||||||
Shares Issued from Reinvestments of Distributions | 3,978 | 1,816 | ||||||
Shares Redeemed | – | (46) | ||||||
|
| |||||||
Net Increase in Shares Outstanding from Share Transactions | 210,079 | 180,043 | ||||||
|
| |||||||
The accompanying notes are an integral part of these financial statements.
10
Triloma EIG Energy Income Fund – Term I
Statement of Cash Flows
(Unaudited)
| For the Six Months Ended June 30, 2017 | ||||
|
| |||
Cash Flows from Operating Activities: | ||||
Net Increase in Net Asset Resulting from Operations | $ | 336,878 | ||
Adjustments to Reconcile Net Increase in Net Assets Resulting from Operations to Net Cash from Operating Activities: | ||||
Purchases of Investments | (9,586,193) | |||
Proceeds from Disposition of Investment Securities | 632,817 | |||
Payment-In-Kind Income | (18,144) | |||
Net Realized (Gain)/Loss from Investments | (25,754) | |||
Net Change in Unrealized (Appreciation)/Depreciation on Investments | (49,436) | |||
Amortization of Premium/Accretion of Discount on Investments, Net | (871) | |||
Increase in Receivable Due from Sub-Advisor | (323,055) | |||
Increase in Interest Receivable | (106,420) | |||
Increase in Prepaid Expenses | (36,177) | |||
Increase in Payable for Investment Securities Purchased | 1,122,000 | |||
Decrease in Legal Fees Payable | (35,628) | |||
Increase in Marketing Fees Payable | 77,220 | |||
Decrease in Due Diligence Fees Payable | (16,359) | |||
Increase in Audit and Tax Fees Payable | 24,282 | |||
Increase in Payable Due to Administator | 3,000 | |||
Decrease in Printing Fee Payable | (26,617) | |||
Increase in Management Fee Payable | 10,293 | |||
Increase in Distribution Fees Payable | 60,315 | |||
Increase in Trustee’s Fees Payable | 1,410 | |||
Decrease in Payable Due to Sub-Advisor | (53,500) | |||
Decrease in Other Accrued Expenses | (13,747) | |||
|
| |||
Net Cash (Used in) Operating Activities | (8,023,686) | |||
|
| |||
Cash Flows From Financing Activities | ||||
Cash Distributions Paid | $ | (154,277) | ||
Proceeds from Capital Shares Sold | 5,550,617 | |||
Line of Credit Borrowings | 2,500,000 | |||
Increase in Interest Expense Payable | 1,348 | |||
|
| |||
Net Cash Provided by Financing Activities | 7,897,688 | |||
|
| |||
Net Change in Cash | (125,998) | |||
Cash and Cash Equivalents at beginning of period | 2,785,667 | |||
|
| |||
Cash and Cash Equivalents at end of period | $ | 2,659,669 | ||
|
| |||
Supplemental Disclosure of Cash Flow Information | ||||
Non-cash Financing Activities do not include | ||||
Reinvestments of Distributions | $ | 107,411 | ||
Interest Expense paid during the year | $ | 19,850 | ||
The accompanying notes are an integral part of these financial statements.
11
Triloma EIG Energy Income Fund – Term I
Financial Highlights
Selected Per Share Data & Ratios
For a Share Outstanding Throughout the Period
| Six Months Ended June 30, 2017 (Unaudited) | For the Year Ended December 31, 2016 | For the Period July 24, 2015 to December 31, 2015(a) | ||||||||||
Net Asset Value, Beginning of Period | $ | 25.92 | $ | 25.00 | $ | 25.00 | ||||||
|
|
|
|
|
| |||||||
Income (Loss) from Investment Operations: | ||||||||||||
Net Investment Income(b) | 0.92 | 0.67 | 0.31 | |||||||||
Net Realized and Unrealized Gain | 0.54 | 0.50 | — | |||||||||
Additional Expense Support Payments(b) | 0.04 | 1.15 | — | |||||||||
|
|
|
|
|
| |||||||
Total from Investment Operations | 1.50 | 2.32 | 0.31 | |||||||||
|
|
|
|
|
| |||||||
Dividends and Distributions: | ||||||||||||
Net Investment Income(c) | (0.96) | (1.82) | (0.31) | |||||||||
|
|
|
|
|
| |||||||
Total Dividends and Distributions | (0.96) | (1.82) | (0.31) | |||||||||
|
|
|
|
|
| |||||||
Issuance of Common Stock above Net Asset Value(b) | 0.19 | 0.42 | — | |||||||||
|
|
|
|
|
| |||||||
Net increase resulting from capital share transactions(d) | 0.19 | 0.42 | — | |||||||||
|
|
|
|
|
| |||||||
Net Asset Value, End of Period | $ | 26.65 | $ | 25.92 | $ | 25.00 | ||||||
|
|
|
|
|
| |||||||
Maximum Public Offering Price, End of Period | $ | 28.42 | $ | 27.63 | $ | 26.32 | ||||||
|
|
|
|
|
| |||||||
Total Return - NAV(e) | 6.51%(f) | 11.28%(f) | 1.23%(f) | |||||||||
|
|
|
|
|
| |||||||
Total Return - Price(g) | 5.17%(h) | 11.28%(h) | 1.23%(h) | |||||||||
|
|
|
|
|
| |||||||
Ratios and Supplemental Data | ||||||||||||
Net Assets, End of Period (in thousands) | $ | 10,510 | $ | 4,776 | $ | 105 | ||||||
Ratios to Average Net Assets: | ||||||||||||
Net Investment Income(i) | 3.41%(j) | 2.61%(j) | 2.82% | |||||||||
Net Operating Expenses(i) | 0.00% | 0.00% | 0.00% | |||||||||
Total Operating Expenses(i) | 16.64% | 89.43% | 2,022.58%(k) | |||||||||
Portfolio Turnover Rate | 9% | 0% | 0% | |||||||||
Amounts designated as “—” are either not applicable, $0 or have been rounded to $0.
| (a) | The inception date of the Fund was July 24, 2015. |
| (b) | Per share calculations were performed using average shares. |
| (c) | The per share data for distributions reflects the actual amount of distributions paid per share during the period. |
| (d) | The continuous issuance of common stock may cause an increase in net asset value per share due to sales of shares at the prevailing public offering price and the net proceeds received that are in the excess of net asset value per share for each subscription. The per share data is the sum of the number of shares issued times the difference between the net proceeds per share and the net asset value per share on each transaction date divided by the average shares for the period. |
| (e) | Total Return - NAV is based on the change in current net asset value on the first day of each period reported and a sale at the current net asset value on the last day of each period reported, and assuming reinvestment of distributions in accordance with the Fund’s distribution reinvestment plan. Total return based on net asset value is hypothetical as investors cannot purchase or sell Fund shares at the net asset value. |
| (f) | Had the Expense Support Agreement (see Note 5) not been provided support beyond Operating Expenses, the Total Return – NAV would have been 8.72% for the period ended 2017, 10.27% for the year ended 2016 and (0.02)% for the period ended 2015. |
| (g) | Total Return - Price is based on the change in the public offering price, net of sales loads, on the first day of each period reported and a sale at the current net asset value on the last day of each period reported, and assuming reinvestment of distributions, in accordance with the Fund’s distribution reinvestment plan. |
| (h) | Had the Expense Support Agreement (see Note 5) not been provided support beyond Operating Expenses, the Total Return – Price would have been 5.07% for the period ended 2017, 8.91% for the year ended 2016 and (0.02)% for the period ended 2015. |
| (i) | Annualized. |
| (j) | Percentage does not include Expense Support Payments. |
| (k) | Non-recurring organizational and operating expenses of $255,000 have not been annualized, but are included in the ratio. |
The accompanying notes are an integral part of these financial statements.
12
Triloma EIG Energy Income Fund – Term I
Notes to Financial Statements
June 30, 2017 (Unaudited)
Note 1. Organization
Triloma EIG Energy Income Fund – Term I (the “Fund”) was formed as a Delaware statutory trust on February 18, 2015, and commenced upon the effectiveness of its registration statement on July 24, 2015. The Fund is an externally managed, non-diversified, closed-end management investment company under the Investment Company Act of 1940, as amended (the “1940 Act”), and has elected to be treated as a regulated investment company (a “RIC”) for federal income tax purposes under Subchapter M of the Internal Revenue Code of 1986, as amended (the “Code”). The Fund’s investment advisor and administrator, Triloma Energy Advisors, LLC, (the “Advisor”, “TEA” or the “Administrator”) is responsible for the overall management of the Fund’s activities. EIG Credit Management Company, LLC (“EIG” or the “Sub-Advisor”), the Fund’s investment sub-advisor, is responsible for the day-to-day management of the Fund’s investment portfolio. The Advisor and the Sub-Advisor are each a private investment firm that is registered as an investment advisor with the Securities and Exchange Commission (the “SEC”) under the Investment Advisers Act of 1940, as amended (the “Advisers Act”). The investment process is a collaborative effort between the Advisor and the Sub-Advisor and the investment committee of each must approve all Fund portfolio investments.
The Fund’s investment objective is primarily to provide shareholders with current income; as secondary investment objectives, the Fund will seek to provide capital preservation and, to a lesser extent, long-term capital appreciation. The Fund seeks to achieve its investment objectives by investing primarily in a global portfolio of privately originated energy company and project debt. Under normal circumstances, the Fund will invest at least 80% of its total assets in debt and equity investments of energy companies and projects. There can be no assurance that the Fund will achieve its investment objectives.
Note 2. Summary of Significant Accounting Policies
The Fund is an investment company and follows accounting and reporting guidance under Accounting Standards Codification Topic 946, Financial Services – Investment Companies. The accompanying financial statements were prepared in accordance with generally accepted accounting principles in the United States of America (“GAAP”). Net Asset Value per share (“NAV”) for financial reporting purposes may differ from the NAV for processing transactions.
Cash and Cash Equivalents: The Fund considers all highly liquid investments with original maturities of 90 days or less to be cash equivalents. The Fund’s cash and cash equivalents are maintained with a major United States financial institution, which is a member of the Federal Deposit Insurance Corporation. At any time, cash in bank may exceed insured limits.
Securities Valuation: Securities listed on a securities exchange, market or automated quotation system for which quotations are readily available, including securities traded over the counter, are valued at the last quoted sale price on the primary exchange or market (foreign or domestic) on which they are traded, or, if there is no such reported sale, at the most recent quoted bid price. Values of debt securities are generally reported at the last sales price if the security is actively traded. If a debt security is not actively traded it is valued at an evaluated bid price by employing methodologies that utilize actual market transactions, broker-supplied valuations, or other methodologies designed to identify the market value for such securities. Debt obligations with remaining maturities of sixty days or less may be valued at their amortized cost, provided such amount approximates market value.
Securities for which market prices are not “readily available” are valued in accordance with fair value procedures established by the Fund’s Board of Trustees (“Board”). The Fund’s fair value procedures are implemented by the Advisor as designed by the Board. Factors considered in valuation may include information obtained by contacting issuer or analysts, analysis of the issuer’s financial statements and, if necessary, information concerning other securities in similar circumstances. When a security is valued in accordance with the fair value procedures, the Advisor will determine the value after taking into consideration relevant information reasonably available to the Advisor.
13
Triloma EIG Energy Income Fund – Term I
Notes to Financial Statements (Continued)
June 30, 2017 (Unaudited)
Hierarchy of Fair Value Inputs
In accordance with the authoritative guidance on fair value measurements and disclosure under GAAP, the Fund discloses fair value of its investments in a hierarchy that prioritizes the inputs to valuation techniques used to measure the fair value. The objective of a fair value measurement is to determine the price that would be received to sell an asset or paid to transfer a liability in an orderly transaction between market participants at the measurement date (an exit price). Accordingly, the fair value hierarchy gives the highest priority to quoted prices (unadjusted) in active markets for identical assets or liabilities (Level 1) and the lowest priority to unobservable inputs (Level 3). The three levels of the fair value hierarchy are described below:
| ● | Level 1 — Unadjusted quoted prices in active markets for identical, unrestricted assets or liabilities that the Fund has the ability to access at the measurement date; |
| ● | Level 2 — Other significant observable inputs, which may include quoted prices for similar securities, interest rates, prepayment speeds, credit risk, referenced indices, quoted prices in inactive markets, adjusted quoted prices in inactive markets, etc.; and |
| ● | Level 3 — Unobservable inputs, which may include management’s own assumptions in determining the fair value of investments. Factors considered in making this determination may include, but are not limited to, information obtained by contacting the sub-adviser, issuer, analysts, or the appropriate stock exchange (for exchange-traded securities), analysis of the issuer’s financial statements or other available documents and, if necessary, available information concerning other securities in similar circumstances. |
Investments are classified within the level of the lowest significant input considered in determining fair value. Investments classified within Level 3 whose fair value measurement considers several inputs may include Level 1 or Level 2 inputs as components of the overall fair value measurement.
All transfers, if any, are recognized by the Fund at the end of each period. For details of the investment classifications, refer to the Schedule of Investments for the Fund.
During the six month period ended June 30, 2017, there have been no significant changes to the Fund’s fair value methodologies.
Fair Value Measurements: Descriptions of the valuation techniques applied to the Fund’s significant categories of assets and liabilities measured at fair value on a recurring basis are as follows:
Corporate bonds: The fair value of corporate bonds is estimated using various techniques, which consider recently executed transactions in securities of the issuer or comparable issuers, market price quotations (where observable), bond spreads, fundamental data relating to the issuer, and credit default swap spreads adjusted for any basis difference between cash and derivative instruments. While most corporate bonds are categorized in Level 2 of the fair value hierarchy, in instances where lower relative weight is placed on transaction prices, quotations, or similar observable inputs, they are categorized in Level 3.
Financial Instruments Disclosed, but Not Carried, at Fair Value: The carrying value of the Payable for Line of Credit balance on the Statement of Assets and Liabilities approximates its fair value and it is considered to be classified as a Level 3 liability in the fair value hierarchy.
Security transactions and investment income: Security transactions are recorded on the trade date. Loan organizations are recorded on the funding date. Realized gains and losses are reported on the identified cost basis. Net change in unrealized appreciation or depreciation reflects the change in portfolio investment values during the reporting period, including any reversal of previously recorded unrealized gains or losses, when gains or losses are realized, and the respective unrealized gain or loss on foreign currency for any foreign denominated investments, if applicable. Dividend income, if any, is recorded on the ex-dividend date or, in the case of foreign securities, as soon as the Fund is informed of the ex-dividend dates, net of foreign taxes. Interest income, including accretion of discounts and amortization of premiums, is recorded on the accrual basis commencing on the settlement date.
Fee Income: The Fund may earn fees associated with the creation of EIG-originated debt instruments. These fees are generally non-recurring and are recognized as fee income to the extent that the fee is allocable to future funding commitments upon the earlier of the investment commitment date or investment closing date. This portion of the fee
14
Triloma EIG Energy Income Fund – Term I
Notes to Financial Statements (Continued)
June 30, 2017 (Unaudited)
income is included in the Statement of Operations in Other Income. The portion of the fee that is allocable to the funding required at the investment closing date, will accrue in correspondence with the originated debt instrument. This portion of the fee is included in the Statement of Operations in Interest Income.
Trustee compensation: The Fund pays the members of the Board of Trustees (“Trustees”), a majority of whom are independent, certain remuneration for their services, plus travel and other expenses. The Fund does not pay compensation to Trustees who also serve in an executive officer capacity for the Fund, the Advisor or the Sub-Advisor. Amounts payable to Trustees for compensation and reimbursable expenses are included in the accompanying Statement of Assets and Liabilities. Trustees’ fees earned during the period are reported in the Statement of Operations.
Distributions to shareholders: Distributions are recorded at the time the dividend or distribution is made and are determined in accordance with federal income tax regulations, which may differ from GAAP.
Use of Estimates: The preparation of the financial statements in conformity with GAAP requires management to make estimates and assumptions that affect the reported amounts of assets and liabilities, and disclosure of contingent assets and liabilities at the date of the financial statements and the reported amounts of revenues and expenses during the reporting period. Actual results could differ from those estimates and such differences could be material under different assumptions and conditions.
Contingencies: In the normal business, the Fund may enter into contracts that contain general indemnification clauses. The Fund’s maximum exposure under these arrangements is unknown as this would involve future claims that may be made against the Fund. However, based on experience, the Fund expects the risk to be remote.
Risks: The Fund’s principal risk are generally attributable to the underlying investments. The Fund’s holdings are subject to the following risks:
| ● | Market risk – risk due to the factors affecting the securities market |
| ● | Sector risk – risk due to investments concentrated in the energy sector |
| ● | Issuer risk – risk due to a specific issuer |
| ● | Counterparty risk - risk due to counterparty non-performance |
| ● | Interest Rate risk – risk due to fluctuations in interest rates |
Note 3. Securities and Other Investments
Loan participations and assignments: The Fund may invest in direct debt instruments which are interests in amounts owed to lenders or lending syndicates by corporate or other borrowers, either in the form of participations at the time the loan is originated (“Participations”) or buying an interest in the loan in the secondary market from a financial institution or institutional investor (“Assignments”). Participations and Assignments in commercial and project financing loans may be secured or unsecured. These investments may include standby financing commitments, including revolving credit facilities that obligate the Funds to supply additional cash to the borrowers on demand, also referred to as unfunded commitments. Loan Participations and Assignments involve risks of insolvency of the lending banks or other financial intermediaries. As such, the Funds assume the credit risks associated with the corporate borrowers and may assume the credit risks associated with the interposed banks or other financial intermediaries.
Based on the ability to invest in Loan Participations and Assignments, the Fund may be contractually obligated to receive approval from the agent banks and/or borrowers prior to the sale of these investments. A fund that participates in such syndications, or that can buy a portion of the loans, become part lenders. Loans are often administered by agent banks acting as agents for all holders.
The agent banks administer the terms of the loans, as specified in the loan agreements. In addition, the agent banks are normally responsible for the collection of principal and interest payments from the borrowers and the apportionment of these payments to the credit of all institutions that are parties to the loan agreements. Unless the Fund has direct recourse against the borrowers under the terms of the loans or other indebtedness, the Fund may
15
Triloma EIG Energy Income Fund – Term I
Notes to Financial Statements (Continued)
June 30, 2017 (Unaudited)
have to rely on the agent banks or other financial intermediaries to apply appropriate credit remedies against corporate borrowers.
The Fund had commitments that were entered during 2017 that remain unfunded at June 30, 2017. Since these commitments and the associated amounts may expire without being drawn upon, the total commitment does not necessarily represent a future cash requirement. Below are the pending unfunded commitments entered into by the Fund:
Borrower | Unfunded Commitment Amount | |
Bioenergy Infrastructure Holdings | $541,438 | |
Northeast Natural Energy, LLC | $726,000 |
At June 30, 2017, the Fund had sufficient cash, credit line capacity and/or securities to cover these commitments should the funding requirements occur.
The Fund held no unsecured loan participations at June 30, 2017. Open secured loan participations and assignments are included within the Schedule of Investments.
Payment-in-kind securities (“PIK”): PIKs give the issuer the option of making interest payments in either cash or additional debt securities at each interest payment date. Those additional debt securities usually have the same terms, including maturity dates and interest rates, and associated risks as the original bonds.
PIK Securities held at June 30, 2017 are identified in the Schedule of Investments.
Restricted and illiquid securities: The Fund may invest in unregulated restricted securities. Restricted and illiquid securities are subject to legal or contractual restrictions on resale or are illiquid. Restricted securities generally may be resold in transactions exempt from registration under the Securities Act of 1933. A security may be considered illiquid if it lacks a readily available market or if its valuation has not changed for a certain period of time. Disposal of these securities may involve time-consuming negotiations and expense, and prompt sale at the current valuation may be difficult.
Restricted and illiquid securities held at June 30, 2017 are identified in the Schedule of Investments.
Note 4. Related Party Transactions
In the initial year of operations, the Advisor invested in the Fund. As of June 30, 2017, TEA owned 17,047 shares or 4.32% of the outstanding shares.
Investment Advisory Agreement
Pursuant to an investment advisory agreement (the “Investment Advisory Agreement”) between the Fund and the Advisor, the Advisor is entitled to a fee consisting of two components—a base management fee (the “Management Fee”) and an incentive fee (the “Incentive Fee”).
The Management Fee is calculated and payable monthly in arrears at the annual rate of 2% of the Fund’s average gross assets during the relevant month. The Management Fee may or may not be taken by the Advisor in whole or in part at the discretion of the Advisor. All or any part of the Management Fee not taken as to any month will be deferred without interest and may be taken in any such other month as the Advisor may determine. The Management Fee for any partial month will be appropriately prorated. No part of the Management Fee was deferred during the period.
The Management Fee for the six month period ended June 30, 2017 was $78,186.
The Incentive Fee is earned on “pre-incentive fee net investment income” and shall be calculated and payable in arrears as of the end of each calendar quarter during which the Investment Advisory Agreement or Sub-Advisory Agreement is in effect. In the case of a liquidation or if the Investment Advisory Agreement or Investment Sub-Advisory Agreement is terminated, the fee will also become payable as of the effective date of the event. The Incentive Fee is subject to a hurdle rate, expressed as a rate of return on the Fund’s average “adjusted capital,” equal
16
Triloma EIG Energy Income Fund – Term I
Notes to Financial Statements (Continued)
June 30, 2017 (Unaudited)
to 1.875% per quarter (or an annualized hurdle rate of 7.5%), and is subject to a “catch-up” feature. For this purpose, “pre-incentive fee net investment income” is the sum of interest income, dividend income and any other income accrued during the calendar quarter, minus the Fund’s operating expenses for the quarter. Also, pre-incentive fee net investment income includes, in the case of investments with a deferred interest feature (such as OID, debt instruments with PIK interest and zero coupon securities), accrued income only when the cash is received by the Fund.
For purposes of computing the Incentive Fee, net interest, if any, associated with a derivative or swap (which represents the difference between (i) the interest income and fees received in respect of the reference assets of the derivative or swap and (ii) the interest expense paid by the Fund to the derivative or swap counterparty) will be included in the calculation of quarterly pre-incentive fee net investment income.
“Adjusted capital” means the (a) cumulative proceeds received by the Fund from the sale of Shares, including proceeds from the Fund’s distribution reinvestment plan, net of sales load reduced by the sum of (b) (i) distributions paid to our Shareholders that represent return of capital and (ii) amounts paid for share repurchases pursuant to the Fund’s share repurchase program.
No Incentive Fee was charged to or paid by the Fund for the six month period ended June 30, 2017.
Administration Agreement
Pursuant to an administration agreement between the Fund and the Administrator (the “Administration Agreement”), the Administrator performs and oversees all aspects of the general day-to-day business activities and operations of the Fund, including custodial, distribution disbursing, accounting, auditing, compliance and related services. The Administrator manages the Fund’s corporate affairs subject to the supervision of the Board and furnishes the Fund with office facilities and executive personnel together with clerical and certain recordkeeping and administrative services necessary to administer the Fund. These services include maintaining and preserving certain records, preparing and filing various materials with state and U.S. federal regulators, providing general ledger accounting, fund accounting, legal and other administrative services. In addition, the Administrator assists the Fund in calculating its NAV, overseeing the preparation and filing of tax returns and the preparation, printing and dissemination of annual and other reports to shareholders and to the SEC, and generally overseeing the payment of the Fund’s expenses and the performance of administrative and professional services rendered to the Fund by others.
The Fund pays the Administrator an Administration Fee for its services under the Administration Agreement, calculated weekly and payable monthly in arrears. The fee consists of two components: (i) a fixed administrative fee of $31,250 per month for the period of January 1, 2017 to February 28, 2017; and $34,250 per month thereafter and (ii) a variable administrative fee ranging between the annual rates of 0.05% and 0.10% of the Fund’s average net assets during the relevant month, subject to a monthly minimum fee of $10,417. The variable administrative fee is calculated at the following annual rates based on the average net assets: 0.10% on the first $300,000,000 of average net assets; 0.07% on the next $300,000,000 of average net assets; 0.06% on the next $900,000,000 of average net assets; and 0.05% on average net assets over $1.5 billion. The Administration Fee may be taken in whole or in part at the discretion of the Administrator. All or any part of the Administration Fee not taken as to any month will be deferred without interest and may be taken in any such other month as the Administrator may determine. The Administration Fee for any partial month will be appropriately prorated. No part of the Administration Fee was deferred during the six month period.
Administration Fees totaled $262,002 for the six month period ended June 30, 2017.
Plan of Distribution
The dealer manager for the Fund’s continuous public offering is Triloma Securities (“TSEC” or “Dealer Manager”), which is a subsidiary of Triloma Financial Group. Triloma Financial Group wholly owns TEA. As of May 26, 2017, a new Dealer Manager Agreement was formed between the Fund and TSEC, or the dealer manager agreement, TSEC is entitled to receive a sales load in connection with the sale of shares in the Fund’s continuous public offering, asset-based distribution fees and ongoing shareholder servicing fees, all or a portion of which may be re-
17
Triloma EIG Energy Income Fund – Term I
Notes to Financial Statements (Continued)
June 30, 2017 (Unaudited)
allowed to participating broker-dealers. As of May 26, 2017, the Fund will pay the dealer manager, beginning the first calendar month after the close of the offering period, asset-based distribution and shareholder servicing fees at an annualized rate of one percent (1.0%) of the Fund’s net asset value. Such distribution and shareholder servicing fees consists of three quarter percent (0.75%) distribution fees and one quarter percent (0.25%) ongoing shareholder servicing fees. The Fund will cease paying distribution and shareholder servicing fees at the earlier of: (i) the date at which the underwriting compensation, including the upfront dealer manager fees and the asset-based distribution and shareholder servicing fees, paid by the Fund and shareholders, equals 8.0% of the gross proceeds from our offering; or (ii) the date at which a liquidity event occurs. Although the amount of asset-based distribution fees the Fund will incur is uncertain and payments are currently estimated to commence August 2018, the Fund is accruing the potential maximum asset-based distribution fees of approximately $330,000 over the Offering period. As of June 30, 2017, the current accrued liability is $114,745 and is included on the Statement of Assets and Liabilities.
Prior to the amended Dealer Manager Agreement on May 26, 2017, the Fund would have paid the dealer manager, beginning the first calendar quarter after the close of the Offering period, asset-based distribution and dealer manager fees at an annualized rate of one percent (1.0%) of the price, net of all sales load, at which Shares are being sold in the offering. No fees had been accrued by the Fund under this agreement as of May 26, 2017. If the Fund had accrued asset-based distribution fees under this prior Dealer Manager Agreement, the accrued liability as of December 31, 2016, would have been $54,430 which would have been fully reimbursed pursuant to the Expense Support and Reimbursement Agreement (Note 5).
Note 5. Expense Support and Reimbursement Agreement
Pursuant to an expense support and reimbursement agreement between the Fund and the Sub-Advisor, the Sub-Advisor has agreed to pay operating expenses (including organizational and offering expenses) (an “Expense Payment”) to ensure that the Fund bears a reasonable level of expenses in relation to its income. The purpose of this arrangement is to ensure that no portion of any distributions (at a rate set by the Fund) will be paid from offering proceeds or borrowings and no portion of a distribution will constitute a return of capital. Under this arrangement, the Sub-Advisor will make payments to the Fund monthly in an amount equal to the positive difference, if any, between the Fund’s cumulative distributions paid to the Fund’s shareholders during the relevant portion of the fiscal year (the “Relevant Period”) less cumulative Available Operating Funds (defined below) received by the Fund on account of its investment portfolio during such Relevant Period, reduced by cumulative Expense Payments (defined below) received by the Fund or increased by cumulative Payments (defined below) paid by the Fund during such Relevant Period. “Available Operating Funds” means, in respect of the relevant month, the sum of (i) the Fund’s estimated net investment taxable income (including net short-term capital gains reduced by net long-term capital losses), (ii) the Fund’s net capital gains (including the excess of net long-term capital gains over net short-term capital losses) and (iii) dividends and other distributions paid to the Fund on account of preferred and common equity investments (to the extent such amounts listed in clause (iii) are not included under clauses (i) and (ii) above).
The Sub-Advisor is entitled to be conditionally reimbursed by the Fund (a “Reimbursement Payment”) for Expense Payments funded by Sub-Adviser under this arrangement if (and only to the extent that), during any calendar month occurring within three years of the date on which the Sub-Advisor funded such amount, the Fund’s Available Operating Funds exceed the cumulative distributions paid to Fund Shareholders in such month; provided, however, that (i) the Fund will only reimburse the Sub-Advisor for expense support payments made by the Sub-Advisor to the extent that the payment of such reimbursement (together with any other reimbursement paid during such fiscal year) does not cause Other Operating Expenses (as defined below) (on an annualized basis and net of any expense reimbursement payments received by the Fund during such fiscal year) to exceed the lesser of (i) 2% of the Fund’s average net assets attributable to the Fund’s common shares of beneficial interest for the fiscal year-to-date period after taking such Expense Payments into account and (ii) the percentage of the Fund’s average net assets attributable to the Fund’s common shares of beneficial interest represented by Other Operating Expenses during the fiscal year in which such Expense Payment was made (provided, however, that this clause (ii) shall not apply to any Reimbursement Payment which relates to an Expense Payment made during the same fiscal year). “Other Operating Expenses” means the Fund’s total Operating Expenses, excluding management fees, incentive fees, organization and offering expenses, distribution fees, dealer manager fees, financing fees and costs, interest expense, brokerage commissions and extraordinary expenses.
18
Triloma EIG Energy Income Fund – Term I
Notes to Financial Statements (Continued)
June 30, 2017 (Unaudited)
The Fund or the Sub-Advisor may terminate the expense support and reimbursement agreement at any time. The Sub-Advisor has indicated it expects to continue such reimbursements until it deems that the Fund has achieved economies of scale sufficient to ensure that it bears a reasonable level of expenses in relation to its income. The conditional obligation of the Fund to reimburse the Sub-Advisor shall survive the termination of such agreement by either party. The table below summarizes the expense support received and terms for recapturing previously reimbursed expenses.
For the Month Ended | Amount of Expense Payment from Sub- Advisor | Other Operating Limitation (1) | Annualized Share (2) | Reimbursement Eligilibity Experiation | ||||||||||||
July 2015 | 936,586 | 2.00% | - | July 2018 | ||||||||||||
August 2015 | 27,540 | 2.00% | - | August 2018 | ||||||||||||
September 2015 | 73,928 | 2.00% | - | September 2018 | ||||||||||||
October 2015 | 141,240 | 2.00% | - | October 2018 | ||||||||||||
November 2015 | 113,677 | 2.00% | 1.78 | November 2018 | ||||||||||||
December 2015 | 390,834 | 2.00% | 1.78 | December 2018 | ||||||||||||
January 2016 | 68,384 | 2.00% | 1.78 | January 2019 | ||||||||||||
February 2016 | 77,186 | 2.00% | 1.78 | February 2019 | ||||||||||||
March 2016 | 165,121 | 2.00% | 1.78 | March 2019 | ||||||||||||
April 2016 | 252,910 | 2.00% | 1.79 | April 2019 | ||||||||||||
May 2016 | 255,816 | 2.00% | 1.81 | May 2019 | ||||||||||||
June 2016 | 241,300 | 2.00% | 1.81 | June 2019 | ||||||||||||
July 2016 | 213,047 | 2.00% | 1.82 | July 2019 | ||||||||||||
August 2016 | 219,948 | 2.00% | 1.85 | August 2019 | ||||||||||||
September 2016 | 234,628 | 2.00% | 1.85 | September 2019 | ||||||||||||
October 2016 | 231,306 | 2.00% | 1.85 | October 2019 | ||||||||||||
November 2016 | 99,638 | 2.00% | 1.87 | November 2019 | ||||||||||||
December 2016 | 76,013 | 2.00% | 1.87 | December 2019 | ||||||||||||
January 2017 | 90,266 | 2.00% | 1.87 | February 2020 | ||||||||||||
February 2017 | 174,343 | 2.00% | 1.92 | March 2020 | ||||||||||||
March 2017 | 247,794 | 2.00% | 1.92 | April 2020 | ||||||||||||
April 2017 | 196,482 | 2.00% | 1.92 | May 2020 | ||||||||||||
May 2017 | 203,444 | 2.00% | 1.92 | June 2020 | ||||||||||||
June 2017 | 276,487 | 2.00% | 1.92 | July 2020 | ||||||||||||
(1) The Other Operating Expense Ratio Limiation equals the lesser of 2.0% of the Fund’s average net assets or the percentage of the Fund’s average net assets represented by Other Operating Expenses during the fiscal year in which such Expense Payment was made. “Other Operating Expenses” means all operating costs and expenses incurred by the Fund, excluding management fees, incentive fees, organization and offering expenses, distribution fees, dealer manager fees, financing fees and costs, interest expense, brokerage commissions and extraordinary expenses.
(2) The Annualized Distribution Rate Per Share equals the projected annualized distribution amount which is calculated based on the average weekly regular cash distributions per share that were declared with record dates in the applicable Expense Payment month.
EIG, the Sub-Advisor, is an affiliate of EIG Separate Investments, LP. EIG Separate Investments, LP within the first year of operations, has invested in the Fund. As of June 30, 2017, the affiliate of the Sub-Advisor owned 22,597 shares or 5.73% of the outstanding shares.
Note 6. Capital and Distributions
During the six month period ended June 30, 2017, the Fund issued 206,101 common shares at Public Offering Price on issue date. During the six month period ended, the Fund did not repurchase any common shares. In connection with the Fund’s Distribution Reinvestment Plan, the Fund issued 3,978 common shares at Public Offering Price without sales load on issue date. At June 30, 2017, the Fund had 394,322 outstanding common shares.
19
Triloma EIG Energy Income Fund – Term I
Notes to Financial Statements (Continued)
June 30, 2017 (Unaudited)
The following table reflects the sources of the cash distributions that the Fund declared on its common shares during the periods noted below:
| Six Months Ended June 30, 2017 | Year Ended December 31, 2016 | |||||||||||||||
Source of Distribution | Distribution Amount | Percentage | Distribution Amount | Percentage | ||||||||||||
Net Investment Income (excluding Additional Expense Support Payments) | $ | 251,192 | 96.0% | $ | 59,503 | 36.8% | ||||||||||
Short-term Capital Gains Proceeds from the Sale of Investments | - | - | ||||||||||||||
Long-term Capital Gains Proceeds from the Sale of Investments | - | - | ||||||||||||||
Additional Expense Support Payments from Sub-Advisor | 10,496 | 4.0% | 102,310 | 63.2% | ||||||||||||
|
|
|
|
|
|
|
| |||||||||
| $ | 261,688 | 100.0% | $ | 161,813 | 100.0% | |||||||||||
|
|
|
|
|
|
|
| |||||||||
| Available Capital Gains as of June 30, 2017 | Distributable Amount | |||||||||||||||
Short-term Capital Gains Proceeds from the Sale of Investments | $ | 16,099 | ||||||||||||||
Long-term Capital Gains Proceeds from the Sale of Investments | 9,656 | |||||||||||||||
|
| |||||||||||||||
| $ | 25,755 | |||||||||||||||
|
| |||||||||||||||
Note 7. Credit Facility
The Fund entered into a credit agreement with the Bank of Nova Scotia in December 2016, in the amount of $10,000,000. This credit facility provides a source of funds for general business purposes, including the purchase of investment securities. Under the terms of the credit facility, in addition to interest charged on drawn balances, the Fund shall pay an annual commitment fee of 0.25% on the unused commitment unless the Fund has drawn 75% or greater of the total line. These fees of $21,198 are reflected in Interest Expense in the Statement of Operations. For the six month period ended June 30, 2017, the Fund has drawn $2,500,000 from the credit facility.
As of June 30, 2017, the Fund paid a weighted average interest rate of 1.97% on its outstanding borrowings. For the six month period ended June 30, 2017, the average borrowings and interest under the credit facility were $1,589,806 and 1.98%, respectively. The June 30, 2017 balance of $2,500,000 was the maximum amount borrowed during the period. The Fund had borrowings under the credit facility for 103 days during 2017.
Note 8. Investment Transactions
For the six month period ended June 30, 2017, the Fund made purchases of $9,586,193 of investment securities other than long-term U.S. Government and short-term securities. The Fund made sales of $632,817 of investment securities during the year. The Fund had no purchases or sales of long-term U.S. Government securities.
Note 9. Federal Tax Information
The Fund has not made any provision for federal income or excise taxes due to its policy to distribute all of its taxable income and capital gains to its shareholders and otherwise qualify as a regulated investment company under Subchapter M of the Internal Revenue Code. The Fund recognizes the tax benefits of uncertain tax positions only where the position is “more likely than not” to be sustained assuming examination by tax authorities. The Fund’s federal and state tax returns remain subject to examination by the Internal Revenue Service and state tax authorities for the prior three years, as applicable. Management has evaluated the Fund’s tax provisions taken for all open tax years, as well as tax positions expected to be taken in 2017, and has concluded that no provision for income tax is required in the Fund’s financial statements. If applicable, the Fund recognizes interest accrued related to unrecognized tax benefits in interest and penalties expense in Miscellaneous Expenses on the Statement of Operations. The Fund identifies its major tax jurisdictions as U.S. Federal, the state of Florida, and foreign jurisdictions where the Fund makes significant investments; however, the Fund is not aware of any tax positions for which it is reasonably possible that the total amounts of unrecognized tax benefits will change materially in the next twelve months. Income and capital gain distributions are determined in accordance with income tax regulations, which may differ from GAAP.
20
Triloma EIG Energy Income Fund – Term I
Notes to Financial Statements (Continued)
June 30, 2017 (Unaudited)
Note 10. New Accounting Pronouncement
In October 2016, the SEC adopted new rules and amended existing rules (together the, “Final Rules”) intended to modernize the reporting and disclosure of information by registered investment companies. In part, the Final Rules amend Regulation S-X and require standardized, enhanced disclosure about derivatives in investment company financial statements, as well as other amendments. The compliance date for the amendments to Regulation S-X is August 1, 2017. Management is currently evaluating the implication, if any, of the additional disclosure requirements and its impact on the Funds’ financial statements.
Note 11. Subsequent Events
The Securities and Exchange Commission has deemed the Fund’s shares may not have been properly registered under the Securities Act of 1933 during the period beginning May 1, 2017 and ending July 5, 2017 (the “Rescission Period.”) As such, the Fund is in the process of updating its registration statement and will subsequently announce a rescission offer with respect to the 87,069 shares sold during the Rescission Period. We do not expect the rescission offer to have a material impact on the Fund’s financial condition or liquidity.
21
Triloma EIG Energy Income Fund – Term I
Approval of Renewal of Investment Advisory Agreement and Investment Sub-Advisory Agreement
June 30, 2017 (Unaudited)
Board of Trustees Considerations in Approving the Renewal of the Investment Advisory Agreement and Investment Sub-Advisory Agreement
At the meeting of the Board held on February 22, 2017 (“Meeting”), including the Trustees who are not “interested persons” of the Trust under the Investment Company Act of 1940, as amended (the “Independent Trustees”), considered and unanimously approved the renewal of the investment advisory agreement (“Investment Advisory Agreement”) with Triloma Energy Advisors, LLC. In addition, the Board considered and unanimously approved the renewal of the of the investment sub-advisory agreement (“Sub-Advisory Agreement” and, together with the Investment Advisory Agreement, the “Advisory Agreements”) with EIG Credit Management, LLC.
In connection with its review of the Advisory Agreements, the Board considered information provided specifically in relation to the consideration of the renewal of the Advisory Agreements in response to requests of the Independent Trustees.
Based on their review, the Independent Trustees and the Board concluded that it was in the best interest of the Fund to approve the renewal of the Advisory Agreements.
In their deliberations, the Board considered a range of materials and information. Such information, material factors and conclusions that formed the basis for the Board’s approvals are summarized below. In their deliberations, the Board did not identify any single factor or group of factors as all-important or controlling, but considered all factors together.
Approval of Renewal of Advisory Agreement
Nature, Extent and Quality of Services. The Board reviewed and considered the nature and extent of the investment advisory services provided by the Advisor under the Investment Advisory Agreement (the “Advisory Agreement”) with the Fund. The Board reviewed and considered the qualifications of the portfolio managers and other key personnel of the Advisor who provide the advisory services to the Fund and concluded that the nature and extent of the advisory and supervisory services are necessary and appropriate for the conduct of the business and investment activities of the Fund and supported its decision to approve the renewal of the Advisory Agreement. In reaching their conclusions, the Trustees considered that the Advisor and Sub-Advisor each perform certain portions of the advisory services provided to the Fund.
Performance Relative to Comparable Funds Managed by Other Investment Advisors. The Board considered the Fund’s performance for the period ended June 30, 2016, as well as the performance of a group of peer funds managed by other investment advisors selected by the Advisor. After reviewing the materials, the Board concluded the Fund’s performance was comparable to that of its peer group.
Fees Relative to Other Proprietary Funds Managed by the Advisor With Comparable Investment Strategies. The Board noted that the Advisor did not currently manage any other funds and, accordingly, no comparison of the Fund’s fees to those of other proprietary funds managed by the Advisor with comparable investment strategies could be made at this time.
Fees Relative to Comparable Funds and Other Accounts Managed by Other Advisors. The Board (i) reviewed the advisory fee rate proposed to be paid under the Advisory Agreement and noted the Expense Support and Reimbursement Agreement between the Fund and Sub-Advisor; and (ii) reviewed information provided by the Advisor regarding the advisory fee rates paid by an expense peer group, including that, unlike many peer funds, the Fund does not pay an incentive fee on capital gains, and for purposes of calculating its incentive fee on income, treat the pre-incentive fee net investment income as including, in the case of investments with a deferred interest feature, accrued income only when the cash is received by the Fund. The Trustees noted that the Fund’s advisory fees were comparable to those of its peer group. The Trustees concluded that the current contractual advisory fee, including the incentive fees to be paid to the Advisor was fair and reasonable. The Trustees further noted that, based on (i) the discussions conducted earlier during the Meeting regarding the roles of the Advisor and Sub-Advisor in the management of the Fund; and (ii) its determination
22
Triloma EIG Energy Income Fund – Term I
Approval of Renewal of Investment Advisory Agreement and Investment Sub-Advisory Agreement (Continued)
June 30, 2017 (Unaudited)
detailed below that the fees of the Sub-Advisor are reasonable with respect to the services to be provided, the split of the total advisory fee between the Advisor and the Sub-Advisor was reasonable in light of the services provided by each.
Economies of Scale. The Board reviewed the structure of the advisory fee schedule under the Advisory Agreement. The Board considered that the Fund’s potential growth continued to remain uncertain and concluded that it would be premature to consider economies of scale as a factor in approving the renewal of the Advisory Agreement at the present time.
Profitability of the Advisor. The Trustees considered the Advisor’s profitability and whether these profits are reasonable in light of the services provided to the Fund. The Trustees reviewed a profitability analysis prepared by the Advisor and found that the expenses of servicing the Fund was higher than the gross advisory fee earned by the Advisor and therefore the Advisor’s relationship with the Fund was not profitable during the initial term of the Advisory Agreement.
Other Benefits of the Relationship. The Board considered other benefits to the Advisor derived from its relationship with the Fund and concluded that there were no material other benefits of the relationship that needed to be considered at this time.
Resources of the Advisor. The Board considered whether the Advisor was financially sound and had the resources necessary to perform its obligations under the Advisory Agreement. The Board also reviewed and considered the organizational structure of the Advisor and the policies and procedures formulated and adopted by the Advisor for managing the Fund’s operations.
General Conclusion. After considering and weighing all of the above factors, the Board concluded that it would be in the best interest of the Fund and its shareholders to approve the renewal of the Advisory Agreement, which will remain in effect for one year and must be approved annually by the Board to continue in effect thereafter. In reaching this conclusion, the Board did not give particular weight to any single factor referenced above. It is possible that individual Board members may have weighed these factors differently in reaching their individual decisions to approve the renewal of the Advisory Agreement.
Approval of Renewal of Sub-Advisory Agreement
Nature, Extent and Quality of Services. The Board reviewed and considered the nature and extent of the investment advisory services provided by the Sub-Advisor under the Investment Sub-Advisory Agreement (the “Sub-Advisory Agreement”). The Board reviewed and considered the qualifications of the portfolio managers and other key personnel of the Sub-Advisor who provide the advisory services to the Fund and concluded that the nature and extent of the advisory services are necessary and appropriate for the conduct of the business and investment activities of the Fund and supported its decision to approve the renewal of the Sub-Advisory Agreement. In reaching their conclusions, the Trustees considered that the Advisor and Sub-Advisor each perform certain portions of the advisory services provided to the Fund.
Performance Relative to Comparable Funds Managed by Other Investment Advisors. The Board considered the Fund’s performance for the period ended June 30, 2016, as well as the performance of a group of peer funds managed by other investment advisors selected by the Advisor. After reviewing the materials, the Board concluded the Fund’s performance was comparable to that of its peer group.
Fees Relative to Other Proprietary Funds Managed by the Sub-Advisor With Comparable Investment Strategies. The Board noted that the Sub-Advisor manages certain other private funds with strategies comparable to that of the Fund. It noted that the fees for such funds were higher than those of the Fund.
Fees Relative to Comparable Funds and Other Accounts Managed by Other Advisors. The Board (i) reviewed the advisory fee rate proposed to be paid under the Sub-Advisory Agreement and noted the Expense Support and Reimbursement Agreement between the Fund and the Sub-Advisor; and (ii) reviewed information
23
Triloma EIG Energy Income Fund – Term I
Approval of Renewal of Investment Advisory Agreement and Investment Sub-Advisory Agreement (Continued)
June 30, 2017 (Unaudited)
provided by the Advisor regarding the advisory fee rates paid by an expense peer group, including that, unlike many peer funds, the Fund does not pay an incentive fee on capital gains, and for purposes of calculating its incentive fee on income, treat the pre-incentive fee net investment income as including, in the case of investments with a deferred interest feature, accrued income only when the cash is received by the Fund. The Trustees noted that the Fund’s advisory fees were comparable to those of its peer group. The Trustees concluded that the current contractual sub-advisory fee, including the incentive fees to be paid to the Sub-Advisor was fair and reasonable. The Trustees further noted that, based on (i) the discussions conducted earlier during the Meeting regarding the roles of the Advisor and Sub-Advisor in the management of the Fund; and (ii) its determination detailed above that the fees of the Advisor are reasonable with respect to the services to be provided, the split of the total advisory fee between the Advisor and Sub-Advisor was reasonable in light of the services provided by each.
Economies of Scale. The Board reviewed the structure of the advisory fee schedule under the Sub-Advisory Agreement. The Board considered that the Fund’s potential growth continued to remain uncertain and concluded that it would be premature to consider economies of scale as a factor in approving the renewal of the Sub-Advisory Agreement at the present time.
Profitability of the Sub-Advisor. The Trustees considered the Sub-Advisor’s profitability and whether these profits are reasonable in light of the services provided to the Fund. The Trustees reviewed a profitability analysis prepared by the Sub-Advisor and found that the expenses of servicing the Fund, including the expenses associated with the Fund’s expense support arrangements, were higher than the gross advisory fee earned by the Sub-Advisor and therefore the Sub-Advisor’s relationship with the Fund was not profitable during the initial term of the Sub-Advisory Agreement.
Other Benefits of the Relationship. The Board considered other benefits to the Sub-Advisor derived from its relationship with the Fund and concluded that there were no material other benefits of the relationship that needed to be considered at this time.
Resources of the Sub-Advisor. The Board considered whether the Sub-Advisor was financially sound and had the resources necessary to perform its obligations under the Sub-Advisory Agreement. The Board also reviewed and considered the organizational structure of the Sub-Advisor and the policies and procedures formulated and adopted by the Sub-Advisor with respect to the Fund.
General Conclusion. After considering and weighing all of the above factors, the Board concluded that it would be in the best interest of the Fund and its shareholders to approve the renewal of the Sub-Advisory Agreement, which will remain in effect for one year and must be approved annually by the Board to continue in effect thereafter. In reaching this conclusion, the Board did not give particular weight to any single factor referenced above. It is possible that individual Board members may have weighed these factors differently in reaching their individual decisions to approve the renewal of the Sub-Advisory Agreement.
24
Triloma EIG Energy Income Fund – Term I
Supplemental Information
June 30, 2017 (Unaudited)
Shareholder meeting results
At a January 26, 2017, Special Meeting of Shareholders a proposal to approve an amended and restated investment advisory agreement for the Fund was approved as follows:
Votes for
| Votes against
| Abstentions
| ||
100,247.471
| 0
| 0
| ||
25
PRIVACY POLICY NOTICE
TRILOMA EIG ENERGY INCOME FUND and
TRILOMA EIG ENERGY INCOME FUND – TERM I
(each a “Fund,” and together, the “Funds”)
THIS PRIVACY POLICY NOTICE PROVIDES INFORMATION ON THE PRIVACY POLICIES OF TRILOMA EIG ENERGY INCOME FUND AND TRILOMA EIG ENERGY INCOME FUND – TERM I, RESPECTIVELY.
The Funds are committed to protecting the privacy of its respective Shareholders. This privacy notice explains the privacy policies of the Funds. This notice supersedes any other privacy notice Shareholders may have received from the Funds.
The Funds will safeguard, according to strict standards of security and confidentiality, all information the Funds receive about Shareholders. The only information the Funds collect from Shareholders is their name, address, number of Shares held and their social security number or tax identification number. This information is used only so that the Funds can send Shareholders annual reports, semiannual reports and other information about the Funds and required by law.
The Funds do not share this information with any nonaffiliated third party except as described below.
• Authorized employees of Triloma and EIG. It is the Funds’ policy that only authorized employees of Triloma and EIG who need to know a Shareholder’s personal information will have access to it.
• Service providers. The Funds may disclose a Shareholder’s personal information to companies that provide services on the Funds behalf, such as record keeping, processing the Shareholder’s trades and mailing the Shareholder information. These companies are required to protect the Shareholder’s information and use it solely for the purpose for which they received it.
• Courts and government officials. If required by law, the Funds may disclose a Shareholder’s personal information in accordance with a court order or at the request of government regulators. Only that information required by law, subpoena or court order will be disclosed.
26
(This page intentionally left blank.)
Officers Deryck A. Harmer President and Chief Executive Officer Elizabeth Strouse Chief Financial Officer Hope L. Newsome
Secretary and Chief Compliance Officer Board of Trustees Barry L. Goff Interested Trustee Brian T. Gilmore Interested Trustee
Jack A. Cuneo Independent Trustee David W. Rothschild Independent Trustee Bruce E. Waits Independent Trustee Profile
The Triloma EIG Energy Income Funds are unlisted investment companies that invest primarily in a global portfolio of privately originated energy company and project debt. The Funds’ investment objectives are primarily to provide shareholders with current income; as secondary investment objectives, the Funds will seek to provide capital preservation and, to a lesser extent, long-term capital appreciation. 2 They are managed by Triloma Energy Advisors and EIG Credit Management Company, and offer individuals an opportunity to invest in U.S. and non-U.S. energy companies and projects, in many instances alongside institutional investors.
2 There can be no assurance that the Funds will achieve their investment objectives.
Triloma EIG Energy Income Fund and Triloma EIG Energy Income Fund - Term I (together, the Triloma EIG Energy
Income Funds) are advised by Triloma Energy Advisors, LLC and EIG Credit Management Company, LLC, affiliates of Triloma Financial Group (Triloma) and EIG Global Energy Partners (EIG), respectively. Triloma and EIG are not affiliated.
Shareholder Information
Client Services 844-224-4714
Our Client Services team is available Monday through
Friday, 8:00 a.m. to 5:00 p.m. Central Time.
Corporate Offices
201 N New York Avenue, Suite 200
Winter Park, FL 32789
407-636-7115
trilomaenergy.com
Advisors
Triloma Energy Advisors, LLC
EIG Credit Management Company, LLC
Legal Counsel
Dechert LLP
1095 Avenue of the Americas
New York, NY 10036
Independent Registered Certified
Public Accounting Firm
PricewaterhouseCoopers LLP
4040 W Boy Scout Blvd, Suite 1000
Tampa, FL 33607
The Triloma EIG Energy Income Funds’ annual and semi-annual reports and other information filed with the U.S. Securities and Exchange Commission (SEC), can be obtained upon request and without charge by writing to the Triloma EIG Energy Income Funds at 201 North New York Avenue, Suite 200, Winter Park, FL 32789, by calling the Triloma EIG Energy Income Funds collect at 407-636-7115 or by accessing the Triloma EIG Energy Income Funds’ website at trilomaenergy.com.
© 2017 Triloma Financial Group TERM-RPT-SEMI-ANNUAL |  |
| Item 2. | Code of Ethics. |
Not applicable for semi-annual report.
| Item 3. | Audit Committee Financial Expert. |
Not applicable for semi-annual report.
| Item 4. | Principal Accountant Fees and Services. |
Not applicable for semi-annual report.
| Item 5. | Audit Committee of Listed Registrants. |
Not applicable for semi-annual report.
| Item 6. | Schedule of Investments. |
(a) See Item 1.
(b) Not applicable.
| Item 7. | Disclosure of Proxy Voting Policies and Procedures for Closed-End Management Investment Companies. |
Not applicable for semi-annual report.
| Item 8. | Portfolio Managers of Closed-End Management Investment Companies. |
(a) Not applicable for semi-annual report.
(b) Not applicable.
| Item 9. | Purchases of Equity Securities by Closed-End Management Company and Affiliated Purchasers. |
Not applicable.
| Item 10. | Submission of Matters to a Vote of Security Holders. |
None.
| Item 11. | Controls and Procedures. |
(a) The certifying officers, whose certifications are included herewith, have evaluated the Registrant’s disclosure controls and procedures within 90 days of the filing date of this report. In their opinion, based on their evaluation, the Registrant’s disclosure controls and procedures are adequately designed, and are operating effectively to ensure, that information required to be disclosed by the Registrant in the reports it files or submits under the Securities Exchange Act of 1934 is recorded, processed, summarized and reported within the time periods specified in the Securities and Exchange Commission’s rules and forms.
(b) There were no significant changes in the Registrant’s internal control over financial reporting that occurred during the Registrant’s last fiscal half-year that have materially affected, or are reasonably likely to materially affect, the Registrant’s internal control over financial reporting.
| Items 12. | Exhibits. |
(a)(1) Not applicable.
(a)(2) A separate certification for the principal executive officer and the principal financial officer of the Registrant as required by Rule 30a-2(a) under the Investment Company Act of 1940, as amended (17 CFR 270.30a-2(a)), are filed herewith as Exhibit A(2).
(b) Officer certifications as required by Rule 30a-2(b) under the Investment Company Act of 1940, as amended (17 CFR 270.30a-2(b)) also accompany this filing as Exhibit B.
SIGNATURES
Pursuant to the requirements of the Securities Exchange Act of 1934 and the Investment Company Act of 1940, the registrant has duly caused this report to be signed on its behalf by the undersigned, thereunto duly authorized.
| (Registrant) | Triloma EIG Energy Income Fund – Term I | |||
| By (Signature and Title) | /s/ Deryck A. Harmer | |||
| Deryck A. Harmer | ||||
| Chief Executive Officer | ||||
Date: August 29, 2017
Pursuant to the requirements of the Securities Exchange Act of 1934 and the Investment Company Act of 1940, this report has been signed below by the following persons on behalf of the registrant and in the capacities and on the dates indicated.
| By (Signature and Title) | /s/ Deryck A. Harmer | |||
| Deryck A. Harmer | ||||
| Chief Executive Officer | ||||
Date: August 29, 2017
| By (Signature and Title) | /s/ Elizabeth Strouse | |||
| Elizabeth Strouse | ||||
| Chief Financial Officer | ||||
Date: August 29, 2017