Triloma EIG Energy Income Fund - Term I Inactive
Filed: 27 Feb 18, 12:00am
UNITED STATES
SECURITIES AND EXCHANGE COMMISSION
Washington, D.C. 20549
FORM N-CSR
CERTIFIED SHAREHOLDER REPORT OF REGISTERED
MANAGEMENT INVESTMENT COMPANIES
Investment Company Act File Number 811-23032
Triloma EIG Energy Income Fund - Term I
(Exact name of registrant as specified in charter)
201 North New York Avenue, Suite 200
Winter Park, Florida 32789
(Address of principal executive offices) (Zip code)
NATIONAL REGISTERED AGENTS, INC.
160 Greentree Drive, Suite 101
Dover, DE 19904
(Name and address of agent for service)
Registrant’s telephone number, including area code: (407) 636-7115
Date of fiscal year end: December 31
Date of reporting period: December 31, 2017
| Item 1. | Reports to Stockholders. |
The audited financial statements of Triloma EIG Energy Income Fund - Term I (the “Fund” or the “Registrant”) are attached.

Triloma EIG Energy Income Fund - Term I


Officers
Deryck A. Harmer President and Chief Executive Officer
Elizabeth Strouse Chief Financial Officer
Hope L. Newsome Secretary and Chief Compliance Officer
Board of Trustees
Barry L. Goff Interested Trustee
Brian T. Gilmore Interested Trustee
Jack A. Cuneo Independent Trustee
David W. Rothschild Independent Trustee
Bruce E. Waits Independent Trustee
Profile
The Triloma EIG Energy Income Funds are unlisted investment companies that invest primarily in a global portfolio of privately originated energy company and project debt. The Funds’ investment objectives are primarily to provide shareholders with current income; as secondary investment objectives, the Funds will seek to provide capital preservation and, to a lesser extent, long-term capital appreciation.1 They are managed by Triloma Energy Advisors and EIG Credit Management Company, and offer individuals an opportunity to invest in U.S. and non-U.S. energy companies and projects, in many instances alongside institutional investors.
|
|
|
ENERGY ASSETS
Focusing on hard assets and long useful lives1
INCOME FOCUS
Seeks to mitigate inflation risk1
GLOBAL DIVERSIFICATION
Through privately originated debt1
OFFERING HIGHLIGHTS1
Monthly Income
Potentially Mitigates Inflation Risk
1099 Reporting
Finite Offering
Liquidity Event | |||||
1There can be no assurance that the Funds will achieve their investment objectives. Triloma EIG Energy Income Fund and Triloma EIG Energy Income Fund - Term I (together, the Triloma EIG Energy Income Funds) are advised by Triloma Energy Advisors, LLC and EIG Credit Management Company, LLC, affiliates of Triloma Financial Group (Triloma) and EIG Global Energy Partners (EIG), respectively. Triloma and EIG are not affiliated.
| ||||||||

TRILOMA EIG ENERGY INCOME FUND – TERM I
Dear Fellow Shareholders,
As an investment manager, our primary goal is to identify and mitigate risk for our investors. To achieve that goal, we look to invest in undervalued assets, and in 2017, that proved challenging. A look at the stock market reveals nearly every industry average at all-time highs with significant gains realized since the financial crisis in 2008. The economy is truly enjoying one of the longest bull markets on record. In light of this record-breaking market and bond uncertainty with the risk of rising interest rates, we often hear investors ask, “Where can you find appropriate risk-adjusted returns today without potential stock market volatility?”
We are happy to report that not all asset classes are at all-time highs and in fact we have observed diverging cycles between the energy industry and the rest of the market over the last few years. Often, investing in an industry when it has stabilized after a recovery can mitigate risk and provide outsized returns. Compounded by global population growth, the demand for energy and the infrastructure to provide it is only expected to rise. We believe that investment opportunities focused on financing hard energy assets provides an effective strategy that mitigates the potential volatility and uncertainty in the financial markets.
Investment Opportunities
In 2017, oil prices stabilized as cutbacks in production from the Organization of the Petroleum Exporting Countries (“OPEC”) helped lower overall inventories while natural gas prices remained low but stable domestically. Liquefied natural gas (“LNG”) exports continued to ramp up as the spreads between domestic natural gas prices and global LNG prices remain wide. We continue to see investment opportunities related to natural gas, which benefits from the globalization of LNG and demand for cleaner power generation. In the upstream sector, we continue to pursue opportunities to invest in high quality assets with low cost production and proven reserves diversified across multiple basins.
It was once commonly accepted that midstream energy infrastructure assets were immune to commodity price changes due to their longer-term contracts and volume based pricing, but the last few years have revealed the importance of understanding the impact of the changing marketplace across the value chain. With the shale revolution, the location of the growing oil and gas supply has changed in the United States. Continued investments in infrastructure connecting these new supplies to end markets is required. We seek to identify these midstream investment opportunities that not only are secured by hard assets, but are also in markets with positive long-term supply demand dynamics and supported with long-term contracts.
The power and renewable markets experienced a number of industry changing events during the year including continued cost efficiency and consolidation. Historically renewable projects such as solar and wind power generation depended on subsidies to be economically viable. Today with continued technological improvement and cost declines, renewables are becoming more and more competitive in comparison to fossil fuels in countries such as Chile, South Africa and Australia.
Supported by an asset that has a long-term useful life and predicable cash flows, we continue to focus on opportunities to invest in an evolving generation of new power projects globally.
At the core of our investment approach is a focus on investing in energy companies and projects that are secured by hard assets. Asset-based lending is a method of funding in which the lender looks primarily to the revenues and assets of a single project, both as a source of repayment and as collateral for their exposure. This type of financing is generally used for large, complex and expensive assets or projects that might include power plants, processing facilities, pipelines, and transportation infrastructure. By investing primarily in debt, our investors typically have a priority claim on the assets and cash flows of a company.
Triloma EIG Energy Income Fund – Term I
In light of the opportunities and challenges identified above, we are excited to share that the Triloma EIG Energy Income Fund – Term I (“Fund”) has continued to successfully execute the strategy of investing in a global portfolio of privately originated energy companies and project debt, reaching important milestones in 2017 by growing and diversifying the portfolio, participating in numerous originated investments both domestically and internationally alongside EIG Global Energy Partners (“EIG”) managed investment vehicles, as well as increasing the Fund’s net asset values and distributions to shareholders throughout the year.
Through our partnership with EIG, we participated in eight energy and infrastructure projects with total commitments in excess of $2.0 billion during the year. Due to our partnership with EIG, we were able to diversify the portfolio across the energy value chain, investing in assets that generally would be too large to access on a stand-alone basis. In 2017, we capitalized on opportunities to generate gains in order to reinvest in directly originated projects. We will continue to seek those opportunities as we believe direct investments can offer stronger risk-adjusted returns than those offered in the broadly syndicated market.
Global energy, resource and related infrastructure markets are in a period of dynamic change. Fundamental shifts in global supply and demand have, and will continue to, put pressure on the entire energy and resource delivery system, from the wellhead to infrastructure, midstream, transportation, power and alternative energy assets. For investors seeking income-oriented strategies during 2017, the Fund provided access to proprietary investments focused on taking advantage of these trends in the global energy and infrastructure marketplace. Thank you for your trust and investment in the Triloma EIG Energy Income Fund – Term I, and we look forward to the year ahead.
Sincerely,

Deryck Harmer
President & CEO
Triloma EIG Energy Income Fund – Term I
| 1 | ||||
| 2 | ||||
| 3 | ||||
| 4 | ||||
| 8 | ||||
| 9 | ||||
| 10 | ||||
| 11 | ||||
| 12 | ||||
| 13 | ||||
| 25 | ||||
| 26 | ||||
| 29 | ||||
Triloma EIG Energy Income Fund – Term I files its complete schedule of fund holdings with the Securities and Exchange Commission (the “Commission”) for the first and third quarters of each fiscal year on Form N-Q within sixty days after the end of the period. The Fund’s Forms N-Q are available on the Commission’s website at http://www.sec.gov, and may be reviewed and copied at the Commission’s Public Reference Room in Washington, D.C. Information on the operation of the Public Reference Room may be obtained by calling 1-800-SEC-0330.
A description of the policies and procedures that the Adviser uses to determine how to vote proxies relating to portfolio securities, as well as information relating to how the Fund voted proxies relating to portfolio securities during the most recent 12-month period ended June 30, will be available on Form N-PX: (i) without charge, upon request, by calling 1-844-224-4714 and (ii) on the SEC’s website at http://www.sec.gov.
Triloma EIG Energy Income Fund – Term I
Growth of a $10,000 Investment (Unaudited)
Inception of 07/24/2015 through 12/31/2017
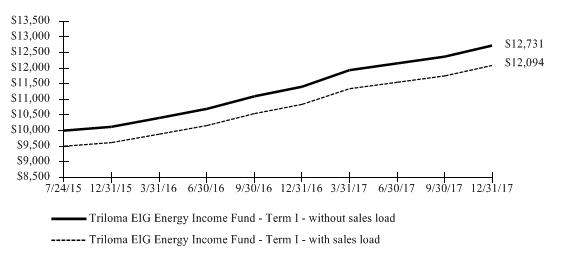
| Performance as of December 31, 2017 | ||||||
| Total Return |
Cumulative Average | |||||
| Inception Date | 1 Year | Since Inception | ||||
Triloma EIG Energy Income Fund - Term I - without sales load | 07/24/15 | 11.59% | 27.31% | |||
Triloma EIG Energy Income Fund - Term I - with sales load | 07/24/15 | 6.01% | 20.94% |
The performance data presented represents past performance; future results may vary. Performance data does not reflect the deduction of taxes that would be paid on fund distributions or the redemption of fund shares. Investment return and principal value will fluctuate so that an investor’s shares, when repurchased, may be worth more or less than their original cost. Current performance may be lower or higher than performance quoted. Triloma EIG Energy Income Fund – Term I – with sales load return reflects the maximum sales load of 5.00% at the initial investment; the reinvestment does not reflect any sales charges as described in our Distribution Reinvestment Plan. Triloma EIG Energy Income Fund – Term I – without sales load return represents no sales load at the initial investment; the reinvestment does not reflect any sales loads as described in our Distribution Reinvestment Plan.
Performance figures reflect any fee waivers and/or expense reimbursements. Without such waivers and/or reimbursements, the performance would be lower.
Performance results do not include adjustments made for financial reporting purposes in accordance with U.S. generally accepted accounting principles and may differ from amounts reported in the Financial Highlights.
1
Triloma EIG Energy Income Fund – Term I
Understanding Your Fund’s Expenses (Unaudited)
As a shareholder of a fund, you incur ongoing costs, which include costs for fund management, administrative services, and shareholder reports, among others. Operating expenses, which are deducted from a fund’s gross income, directly reduce the investment return of a fund. The following examples are intended to help you understand the ongoing fees (in dollars) of investing in your fund and to compare these costs with those of other funds. The examples are based on an investment of $1,000 invested at July 1, 2017, and held for the entire period until December 31, 2017.
The table illustrates your fund’s costs in two ways.
| · | Actual Expenses. This section helps you to estimate the actual expenses after fee waivers that you paid over the period. The “Ending Account Value” shown is derived from the fund’s return calculated by using the beginning and ending net asset value of the fund, and the fourth column shows the dollar amount that would have been paid by an investor who started with $1,000 in the fund. You may use the information here, together with the amount you invested, to estimate the expenses that you paid over the period. To do so, simply divide your account value by $1,000 (for example, an $8,600 account value divided by $1,000 = 8.6), then multiply the result by the number given for your fund under the heading “Expenses Paid During Period.” |
| · | Hypothetical Example for Comparison Purposes. This section is intended to help you compare your fund’s costs with those of other funds. It assumes that the fund had an annual return of 5% before expenses during the period, but that the expense ratio is unchanged. In this case, because the return used is not the fund’s actual return, the results do not apply to your investment. The example is useful in making comparisons because the Securities and Exchange Commission requires all mutual funds to calculate expenses based on a 5% return. You can assess your fund’s costs by comparing this hypothetical example with the hypothetical examples that appear in shareholder reports of other mutual funds. Because the return is set at 5% for comparison purposes — NOT your fund’s actual return — the account values shown do not apply to your specific investment. |
Please note that the expenses shown in the table are meant to highlight ongoing costs and do not reflect any transactional costs, such as sales loads. If these transactional costs were included, your costs would have been higher.
| Actual Expenses | Hypothetical Expenses | |||||||||||||||||
Beginning Value | Ending Account Value December 31, 2017 | Expenses Paid During July 1, 2017 - December 31, 2017 (a) | Ending Account Value December 31, 2017 | Expenses Paid During July 1, 2017 - December 31, 2017 (a) | Annualized Expense Ratio (b) | |||||||||||||
| $ 1,000.00 | $ | 1,060.90 | $ | 14.03 | $ | 1,011.59 | $ | 13.69 | 2.70% | |||||||||
(a) Expenses are calculated using the fund’s annualized expense ratio (as disclosed in the above table), multiplied by the average account value for the period, multiplied by the number of days in the period (184 days), and divided by the number of days in the year (365 days).
(b) Expense ratio includes waived and reimbursed expenses; had the fund not had such waivers and reimbursements in place, the expense ratio would have been higher.
2
Triloma EIG Energy Income Fund – Term I
Investment Portfolio Overview (Unaudited)
The information contained in this section should be read in conjunction with the following attached Schedule of Investments.
The following table summarizes the composition of the Fund’s investment portfolio, excluding Short Term Investments, by investment type at fair value and enumerates the percentage, by fair value as of December 31, 2017:
Asset Types | Fair Value | Percentage of Portfolio | ||||||||||
Senior Secured Debt | $ 9,080,625 | 53.8% | ||||||||||
Senior Unsecured Debt | 6,846,636 | 40.6% | ||||||||||
Equity/Other | 938,150 | 5.6% | ||||||||||
| The table below describes investments by industry sub-sectors and enumerates the percentage, by fair value, of the total portfolio assets in such industry sub-sectors, excluding Short Term Investments, as of December 31, 2017: | ||||||||||||
Sub-Sectors | Fair Value | Percentage of Portfolio | ||||||||||
Upstream | $ 7,590,273 | 45.0% | ||||||||||
Midstream | 3,491,250 | 20.7% | ||||||||||
Power | 3,054,283 | 18.1% | ||||||||||
Renewables | 2,123,325 | 12.6% | ||||||||||
Downstream | 606,280 | 3.6% | ||||||||||
| The table below describes investments by country and enumerates the percentage, by fair value, of the total portfolio assets in such countries, excluding Short Term Investments, as of December 31, 2017: | ||||||||||||
Country | Fair Value | Percentage of Portfolio | ||||||||||
United States | $ 15,263,799 | 90.5% | ||||||||||
Congo-Brazzaville | 911,557 | 5.4% | ||||||||||
Kazakhstan | 419,045 | 2.5% | ||||||||||
United Kingdom | 271,010 | 1.6% | ||||||||||
3
| Company | Sub-Sector | Asset Type | Interest Rate | Base Rate Floor | Maturity/ Expiration Date | Principal (a)/Shares | Cost (b)(c) | Fair Value | % of Net Assets | |||||||||||||||
Congo-Brazzaville — 5.8% |
| |||||||||||||||||||||||
New Age, Ltd. (d)(e)(f) | Upstream | Senior Secured Debt (g) | 15.00% | - | 06/28/2020 | $ | 754,641 | $740,667 | $873,407 | 5.5% | ||||||||||||||
| Warrants (h)(i) | N/A | - | 06/28/2026 | 15,131 | 18,228 | 38,150 | 0.3% | |||||||||||||||||
Total Congo-Brazzaville |
| 758,895 | 911,557 | 5.8% | ||||||||||||||||||||
Kazakhstan — 2.7% |
| |||||||||||||||||||||||
Tengizchevroil Finance Company International LTD (j) | Upstream | Senior Secured Debt | 4.00% | - | 08/15/2026 | 418,000 | 407,033 | 419,045 | 2.7% | |||||||||||||||
Total Kazakhstan |
| 407,033 | 419,045 | 2.7% | ||||||||||||||||||||
United Kingdom — 1.7% |
| |||||||||||||||||||||||
Bioenergy Infrastructure Holdings, Ltd. (d)(e)(f)(k) | Renewables | Senior Secured Debt | L + 7.25% | 1.00% | 12/22/2022 | 271,010 | 269,743 | 271,010 | 1.7% | |||||||||||||||
Total United Kingdom |
| 269,743 | 271,010 | 1.7% | ||||||||||||||||||||
United States — 96.7% |
| |||||||||||||||||||||||
AES Corp. | Power | Senior Unsecured Debt | 6.00% | - | 05/15/2026 | 289,000 | 292,535 | 312,120 | 2.0% | |||||||||||||||
| Senior Unsecured Debt | 5.50% | - | 03/15/2024 | 305,000 | 310,982 | 317,200 | 2.0% | |||||||||||||||||
Aethon United LP (d)(e)(f)(k) | Upstream | Senior Secured Debt | L + 6.75% | 1.00% | 09/08/2023 | 687,500 | 667,691 | 682,344 | 4.3% | |||||||||||||||
AmeriGas Partners LP Fin Corp. | Downstream | Senior Unsecured Debt | 5.63% | - | 05/20/2024 | 346,000 | 349,288 | 359,840 | 2.3% | |||||||||||||||
| Senior Unsecured Debt | 5.50% | - | 05/20/2025 | 244,000 | 249,493 | 246,440 | 1.5% | |||||||||||||||||
ARB Midstream LLC (d)(e)(f)(k) | Midstream | Senior Secured Debt | L + 7.25% | 1.00% | 11/06/2021 | 1,145,455 | 1,112,009 | 1,134,000 | 7.2% | |||||||||||||||
Archrock Partners LP/Fin | Midstream | Senior Unsecured Debt | 6.00% | - | 04/01/2021 | 221,000 | 218,137 | 221,000 | 1.4% | |||||||||||||||
| Senior Unsecured Debt | 6.00% | - | 10/01/2022 | 360,000 | 361,240 | 360,000 | 2.3% | |||||||||||||||||
Calpine Corp. | Power | Senior Unsecured Debt | 5.75% | - | 01/15/2025 | 684,000 | 667,473 | 650,655 | 4.1% | |||||||||||||||
Covanta Holding Corp. | Renewables | Senior Unsecured Debt | 5.88% | - | 03/01/2024 | 412,000 | 406,530 | 418,180 | 2.6% | |||||||||||||||
| Senior Unsecured Debt | 5.88% | - | 07/01/2025 | 123,000 | 122,827 | 123,615 | 0.8% | |||||||||||||||||
Enviva Partners, LP | Renewables | Senior Unsecured Debt | 8.50% | - | 11/01/2021 | 628,000 | 667,578 | 668,820 | 4.2% | |||||||||||||||
Felix Investments Holdings (d)(e)(f)(k) | Upstream | Senior Secured Debt | L +6.50% | 1.00% | 08/09/2022 | 666,667 | 655,724 | 666,667 | 4.2% | |||||||||||||||
Genesis Energy L.P. | Midstream | Senior Unsecured Debt | 5.63% | - | 06/15/2024 | 607,000 | 601,028 | 591,825 | 3.7% | |||||||||||||||
Holly Energy Partners LP (j) | Midstream | Senior Unsecured Debt | 6.00% | - | 08/01/2024 | 477,000 | 498,755 | 497,273 | 3.2% | |||||||||||||||
Matador Resources, Co | Upstream | Senior Unsecured Debt | 6.88% | - | 04/15/2023 | 274,000 | 288,574 | 288,385 | 1.8% | |||||||||||||||
Northeast Natural Energy, LLC (d)(e)(f)(k) | Upstream | Senior Secured Debt | L +8.00% | - | 03/02/2022 | 1,025,000 | 1,012,343 | 1,025,000 | 6.5% | |||||||||||||||
NRG Energy Inc. | Power | Senior Unsecured Debt | 6.25% | - | 05/01/2024 | 617,000 | 615,067 | 646,308 | 4.1% | |||||||||||||||
NRG Yield Operating LLC | Renewables | Senior Unsecured Debt | 5.38% | - | 08/15/2024 | 620,000 | 628,225 | 641,700 | 4.1% | |||||||||||||||
Panda Hummel (k) | Power | Senior Secured Debt | L + 6.00% | 1.00% | 10/27/2022 | 1,200,000 | 1,127,375 | 1,128,000 | 7.2% | |||||||||||||||
Rosehill Operating Company, LLC (d)(e)(f) | Upstream | Senior Secured Debt | 10.00% | - | 01/31/2023 | 600,000 | 582,577 | 594,000 | 3.8% | |||||||||||||||
| Preferred Stock (g)(l) | 10.00% | - | 900,000 | 900,000 | 900,000 | 5.7% | ||||||||||||||||||
RSP Permian (j) | Upstream | Senior Unsecured Debt | 5.25% | - | 01/15/2025 | 491,000 | 499,655 | 503,275 | 3.2% | |||||||||||||||
Sabine Pass Liquefaction | Midstream | Senior Secured Debt | 5.63% | - | 04/15/2023 | 626,000 | 691,155 | 687,152 | 4.4% | |||||||||||||||
The accompanying notes are an integral part of these financial statements.
4
Triloma EIG Energy Income Fund – Term I
Schedule of Investments
December 31, 2017
| Company | Sub-Sector | Asset Type | Interest Rate | Base Rate Floor | Maturity/ Expiration Date | Principal (a)/Shares | Cost (b)(c) | Fair Value | % of Net Assets | |||||||||||||||
United States (continued) |
| |||||||||||||||||||||||
SilverBow Resources (d)(e)(f)(k) | Upstream | Senior Secured Debt | L +7.50% | 1.00% | 12/15/2024 | $ | 1,600,000 | $1,568,089 | $1,600,000 | 10.1% | ||||||||||||||
Total United States |
| 15,094,350 | 15,263,799 | 96.7% | ||||||||||||||||||||
Short Term Investments (US) — 8.2% |
| |||||||||||||||||||||||
Fidelity Institutional Government Portfolio, 1.165% (m) | Short-Term | Money Market | N/A | - | 648,046 | 648,046 | 648,046 | 4.1% | ||||||||||||||||
Invesco Short Term Investments Trust Government & Agency Portfolio, 1.217% (m) | Short-Term | Money Market | N/A | - | 648,047 | 648,047 | 648,047 | 4.1% | ||||||||||||||||
Total Short Term Investments |
| 1,296,093 | 1,296,093 | 8.2% | ||||||||||||||||||||
Total Investments | $17,826,114 | $18,161,504 | 115.1% | |||||||||||||||||||||
Other Assets and Liabilities | (2,386,319) | (15.1)% | ||||||||||||||||||||||
Total Net Assets | $15,775,185 | 100.0% | ||||||||||||||||||||||
Shares Outstanding | 578,087 | |||||||||||||||||||||||
Net Asset Value Per Common Share | $27.29 | |||||||||||||||||||||||
Portfolio Composition
| ASSET TYPE | % of Net Assets | |
Senior Secured Debt | 57.6% | |
Senior Unsecured Debt | 43.4% | |
Money Market | 8.2% | |
Equity/Warrants | 5.9% | |
Other Assets and Liabilities | (15.1)% | |
| 100.0% | ||
As of December 31, 2017, the Fund’s investments were categorized as follows in the fair valuation hierarchy:
Investments in Securities | Level 1 - Quoted Prices | Level 2 - Other Significant Observable Inputs | Level 3 - Significant Unobservable Inputs | Total | ||||||||||||
United States | $ | 1,296,093 | $ | 8,661,788 | $ | 6,602,011 | $ | 16,559,892 | ||||||||
Congo-Brazzaville | — | — | 911,557 | 911,557 | ||||||||||||
Kazakhstan | — | 419,045 | — | 419,045 | ||||||||||||
United Kingdom | — | — | 271,010 | 271,010 | ||||||||||||
|
|
|
|
|
|
|
| |||||||||
Total Investments in Securities | $ | 1,296,093 | $ | 9,080,833 | $ | 7,784,578 | $ | 18,161,504 | ||||||||
|
|
|
|
|
|
|
| |||||||||
The accompanying notes are an integral part of these financial statements.
5
Triloma EIG Energy Income Fund – Term I
Schedule of Investments
December 31, 2017
The following is a reconciliation of the investments in which significant unobservable inputs were used in determining value:
Investment in Securities | Beginning Balance 2016 | Purchases | Sales (n) | Accrued Discounts (Premiums) | Total Realized Gain (Loss) | Net Change in Unrealized Appreciation (Depreciation) (o) | Net Transfers into (out of) Level 3 | Ending Balance at December 31, 2017 |
Net Change in Unrealized (Depreciation) on Investments Held at December 31, 2017 (o) | |||||||||||||||||||||||||||
Congo-Brazzaville | $ | - | $ | 754,641 | $ | - | $ | 4,253 | $ | - | $ | 152,663 | $ | - | $ | 911,557 | $ | 152,663 | ||||||||||||||||||
United Kingdom | - | 269,578 | - | 165 | - | 1,267 | - | 271,010 | 1,267 | |||||||||||||||||||||||||||
United States | 357,298 | 6,493,710 | (359,511 | ) | 4,093 | 12,751 | 93,670 | - | 6,602,011 | 103,578 | ||||||||||||||||||||||||||
The following table summarizes the quantitative inputs and assumptions used for items categorized as recurring Level 3 assets as of December 31, 2017. The following disclosures also include qualitative information on the sensitivity of the fair value measurements to changes in the significant unobservable inputs.
Investments in Securities | Fair Value at December 31, 2017 | Valuation Techniques | Significant Unobservable Inputs | Ranges (Average) |
Impact to valuation from an increase in input | |||||||
Congo-Brazzaville | $911,557 | Discounted cash flow Black-Scholes | Discount Rate Risk Free Rate Volatility Rate | 10.00% 2.09% 65.0% - 85.0% (80.5%) | Decrease Increase Increase | |||||||
United Kingdom | 271,010 | Discounted cash flow | Discount Rate | 9.30% | Decrease | |||||||
United States | 6,602,011 | Discounted cash flow | Discount Rate | 8.9% - 16.5% (11.1%) | Decrease | |||||||
The unobservable inputs used to determine fair value of recurring Level 3 assets may have similar or diverging impacts on valuation. Significant increases and decreases in these inputs in isolation and interrelationships between those inputs could result in significantly higher or lower fair value measurement.
(a) Denominated in U.S. Dollars, unless otherwise noted.
(b) Cost represents amortized cost for debt securities, cost plus capitalized payment-in-kind distributions on the debt securities and cost for all other types of investments.
(c) Aggregate cost for federal income tax purposes is $17,826,114. Aggregate gross unrealized appreciation and depreciation for all securities is $371,378 and $(35,988), respectively. Net unrealized appreciation for tax purposes is $335,390.
(d) Securities are categorized as Level 3 securities under the fair valuation hierarchy. The total value of Level 3 securities is 49.3% of the Fund’s Net Assets.
(e) Fair valued as determined in good faith in accordance with procedures established by the Board. At December 31, 2017, total aggregate fair valued investments are $7,784,578, representing 49.3% of the Fund’s net assets.
(f) Restricted securities held by the Fund as of December 31, 2017 are as follows:
| Country | Company | Acquisition Date | Acquisition Cost | Value | Value as Percentage of Net Assets | |||||||||||
Congo-Brazzaville | New Age, Ltd. | 1/20/2017 | $717,792 | $868,909 | 5.5% | |||||||||||
| 6/28/2017 | 18,144 | 20,999 | 0.1% | |||||||||||||
| 12/28/2017 | 18,705 | 21,649 | 0.2% | |||||||||||||
United Kingdom | Bioenergy Infrastructure Holdings, Ltd. | 2/16/2017 | 141,750 | 143,181 | 0.9% | |||||||||||
| 5/16/2017 | 15,683 | 15,683 | 0.1% | |||||||||||||
| 8/15/2017 | 92,940 | 92,941 | 0.6% | |||||||||||||
| 11/15/2017 | 19,205 | 19,205 | 0.1% | |||||||||||||
United States | Aethon United LP | 9/8/2017 | 666,875 | 682,344 | 4.3% | |||||||||||
United States | ARB Midstream LLC | 11/6/2017 | 1,111,091 | 1,134,000 | 7.2% | |||||||||||
The accompanying notes are an integral part of these financial statements.
6
Triloma EIG Energy Income Fund – Term I
Schedule of Investments
December 31, 2017
(f) Restricted securities (continued)
| Country | Company | Acquisition Date | Acquisition Cost | Value | Value as Percentage of Net Assets | |||||||||||
United States | Felix Investments Holdings | 8/9/2017 | $655,000 | $666,667 | 4.2% | |||||||||||
United States | Northeast Natural Energy, LLC | 3/2/2017 | 614,744 | 625,000 | 4.0% | |||||||||||
| 5/26/2017 | 148,500 | 150,000 | 0.9% | |||||||||||||
| 8/15/2017 | 123,750 | 125,000 | 0.8% | |||||||||||||
| 11/22/2017 | 123,750 | 125,000 | 0.8% | |||||||||||||
United States | Rosehill Operating Company, LLC | 12/8/2017 | 1,482,000 | 1,494,000 | 9.5% | |||||||||||
United States | SilverBow Resources | 12/15/2017 | 1,568,000 | 1,600,000 | 10.1% | |||||||||||
|
| |||||||||||||||
| $7,517,929 | $7,784,578 | 49.3% | ||||||||||||||
|
| |||||||||||||||
(g) Payment-In-Kind. Income may be received in additional securities and/or cash. Rates are the minimum interest rate to be received in cash and the maximum possible payment-in-kind rate, as of December 31, 2017.
| Country | Company | Cash Rate | Payment In-Kind Rate | |||
Congo-Brazzaville | New Age, Ltd. | 10.00% | 5.00% | |||
United States | Rosehill Operating Company, LLC | 6.00% | 4.00% |
(h) Non income producing.
(i) Warrants have exercise price of $4.00.
(j) Security exempt from registration under Regulation S of the Securities Act of 1933, which exempts from registration securities offered and sold outside the United States. Security may not be offered or sold in the United States except pursuant to an exemption from, or in a transaction not subject to, the registration requirements of the Securities Act of 1933. At December 31, 2017, the value of the Regulation S securities are $1,419,593, representing 9.0% of the Fund’s net assets.
(k) The interest rate on these senior secured debt holdings are subject to a base lending rate plus a spread. As of December 31, 2017, the rates are as follows:
| Country | Company | Reference Rate | Current Rate | |||||
United Kingdom | Bioenergy Infrastructure Holdings, Ltd. | 3 month Libor + 7.25% | 8.69 | % | ||||
United States | Aethon United LP | 3 month Libor + 6.75% | 8.27 | % | ||||
United States | ARB Midstream LLC | 3 month Libor + 7.25% | 8.64 | % | ||||
United States | Felix Investments Holdings | 3 month Libor + 6.50% | 7.90 | % | ||||
United States | Northeast Natural Energy, LLC | 3 month Libor + 8.00% | 9.49 | % | ||||
United States | Panda Hummel | 1 month Libor + 6.00% | 7.57 | % | ||||
United States | SilverBow Resources | 3 month Libor + 7.50% | 9.09 | % | ||||
(l) Series B, redeemable after January 31, 2023.
(m) Rates disclosed reflect the 1-day yield at December 31, 2017.
(n) Sales include all sales of securities, maturities, paydowns and securities tendered in corporate actions.
(o) Any difference between net change in unrealized appreciation (depreciation) and net change in unrealized appreciation (depreciation) on investments still held at December 31, 2017, is generally due to investments no longer held or categorized as Level 3 at year end.
The accompanying notes are an integral part of these financial statements.
7
Triloma EIG Energy Income Fund – Term I
Statement of Assets and Liabilities
| December 31, 2017 | ||||
Assets | ||||
Investments, at Fair Value (Cost $17,826,114) | $ | 18,161,504 | ||
Cash | 14,347 | |||
Receivable Due from Sub-Advisor | 605,245 | |||
Interest Receivable | 227,025 | |||
Other Income Receivable | 2,454 | |||
Prepaid Expenses and Other Assets | 50,696 | |||
|
|
| ||
Total Assets | 19,061,271 | |||
|
|
| ||
Liabilities | ||||
Payable for Investment Securities Purchased | 20,998 | |||
Management Fee Payable | 27,502 | |||
Administrative Fees Payable | 44,667 | |||
Distribution Fees Payable | 241,175 | |||
Payable for Line of Credit | 2,500,000 | |||
Due Diligence Fees Payable | 86,484 | |||
Pricing Fees Payable | 73,928 | |||
Audit and Tax Fees Payable | 65,950 | |||
Marketing Fees Payable | 48,178 | |||
Printing Fee Payable | 34,501 | |||
Legal Fees Payable | 30,008 | |||
Trustee’s Fees Payable | 8,567 | |||
Interest Expense Payable | 1,450 | |||
Other Accrued Expenses | 102,678 | |||
|
|
| ||
Total Liabilities | 3,286,086 | |||
|
|
| ||
Commitments and Contingencies (See Note 4) | ||||
Total Net Assets | $ | 15,775,185 | ||
|
|
| ||
Components of Net Assets | ||||
Paid-in Capital | $ | 15,428,963 | ||
Accumulated Net Realized Gain on Investments | 10,832 | |||
Net Unrealized Appreciation on Investments | 335,390 | |||
|
|
| ||
Total Net Assets | $ | 15,775,185 | ||
|
|
| ||
Shares Outstanding, Par Value $0.001 Per Share (Unlimited Shares Authorized) | 578,087 | |||
Net Asset Value (NAV) Per Share | $ | 27.29 | ||
Maximum Public Offering Price (POP) | $ | 29.00 | ||
The accompanying notes are an integral part of these financial statements.
8
Triloma EIG Energy Income Fund – Term I
Statement of Operations
| For the Year Ended December 31, 2017 | ||||
Investment Income | ||||
Interest Income | $ | 690,620 | ||
Payment-In-Kind Income | 39,667 | |||
Other Income | 49,786 | |||
|
|
| ||
Total Investment Income | 780,073 | |||
Expenses | ||||
Management Fee | 223,441 | |||
Administration Fees | 530,004 | |||
Legal Fees | 304,147 | |||
Due Diligence Fees | 302,440 | |||
Marketing Fees | 243,992 | |||
Distribution Fees | 186,755 | |||
Transfer Agent Fees | 154,106 | |||
Audit and Tax Fees | 149,930 | |||
Pricing Fees | 136,590 | |||
Trustees’ Fees | 81,251 | |||
Printing Fees | 74,707 | |||
Interest Expense | 59,541 | |||
Custody Fees | 25,430 | |||
Registration Fees | 20,232 | |||
Miscellaneous Expenses | 163,503 | |||
|
|
| ||
Total Expenses | 2,656,069 | |||
Expense Support Payments by Sub-Advisor | (2,504,706 | ) | ||
|
|
| ||
Total Net Operating Expenses | 151,363 | |||
|
|
| ||
Net Investment Income | 628,710 | |||
|
|
| ||
Net Realized Gain on Investments | 69,539 | |||
Net Change in Unrealized Appreciation/(Depreciation) on Investments |
|
286,747 |
| |
|
|
| ||
Net Realized and Unrealized Gain on Investments | 356,286 | |||
|
|
| ||
Additional Expense Support Payments by Sub-Advisor | – | |||
|
|
| ||
Increase in Net Assets Resulting from Operations | $ | 984,996 | ||
|
|
| ||
The accompanying notes are an integral part of these financial statements.
9
Triloma EIG Energy Income Fund – Term I
Statements of Changes in Net Assets
| For the Year Ended | For the Year Ended | |||||
| December 31, 2017 | December 31, 2016 | |||||
|
| |||||
Operations: | ||||||
Net Investment Income | $ | 628,710 | $ 59,503 | |||
Net Realized Gain on Investments | 69,539 | – | ||||
Net Change in Unrealized Appreciation/(Depreciation) on Investments | 286,747 | 48,643 | ||||
Net Increase from Additional Expense Support Payments from Sub-Advisor | – | 102,310 | ||||
|
| |||||
Increase in Net Assets Resulting from Operations | 984,996 | 210,456 | ||||
|
| |||||
Dividends and Distributions: | ||||||
Net Investment Income | (628,710) | (161,813) | ||||
Capital Gains | (58,707) | – | ||||
|
| |||||
Total Dividends and Distributions to Shareholders | (687,417) | (161,813) | ||||
|
| |||||
Capital Share Transactions: | ||||||
Proceeds from Shares Issued | 10,417,611 | 4,576,869 | ||||
Reinvestments of Distributions | 283,541 | 47,137 | ||||
Cost of Shares Repurchased | – | (1,195) | ||||
|
| |||||
Net Increase in Net Assets from Capital Share Transactions | 10,701,152 | 4,622,811 | ||||
|
| |||||
Total Increase in Net Assets | 10,998,731 | 4,671,454 | ||||
|
| |||||
Net Assets: | ||||||
Beginning of Year | 4,776,454 | 105,000 | ||||
|
| |||||
End of Year | $ | 15,775,185 | $ 4,776,454 | |||
|
| |||||
Undistributed Net Investment Income | $ | – | $ – | |||
|
| |||||
The accompanying notes are an integral part of these financial statements.
10
Triloma EIG Energy Income Fund – Term I
Statement of Cash Flows
| For the Year Ended | ||||
| December 31, 2017 | ||||
Cash Flows from Operating Activities: | ||||
Net Increase in Net Asset Resulting from Operations | $ | 984,996 | ||
Adjustments to Reconcile Net Increase in Net Assets Resulting from Operations to Net Cash used in Operating Activities: | ||||
Purchases of Long Term Investments | (17,068,369 | ) | ||
Proceeds from Disposition of Investment Securities | 3,155,606 | |||
Net Purchases of Short Term Investments | (1,296,093 | ) | ||
Payment-In-Kind Income Received | (36,791 | ) | ||
Net Realized (Gain)/Loss from Investments | (69,539 | ) | ||
Net Change in Unrealized (Appreciation)/Depreciation on Investments | (286,747 | ) | ||
Amortization of Premium/Accretion of Discount on Investments, Net | (1,057 | ) | ||
Increase in Receivable Due from Sub-Advisor | (550,815 | ) | ||
Increase in Interest Receivable | (195,982 | ) | ||
Increase in Other Income Receivable | (2,454 | ) | ||
Increase in Prepaid Expenses and Other Assets | (18,106 | ) | ||
Increase in Payable for Investment Securities Purchased | 20,998 | |||
Increase in Management Fee Payable | 18,855 | |||
Increase in Administrative Fees Payable | 3,000 | |||
Increase in Distribution Fees Payable | 186,745 | |||
Decrease in Due Diligence Fees Payable | (21,426 | ) | ||
Increase in Pricing Fees Payable | 73,928 | |||
Increase in Audit and Tax Fees Payable | 2,500 | |||
Increase in Marketing Fees Payable | 24,741 | |||
Decrease in Printing Fee Payable | (17,512 | ) | ||
Decrease in Legal Fees Payable | (184,973 | ) | ||
Decrease in Trustee’s Fees Payable | (2,040 | ) | ||
Increase in Interest Expense Payable | 1,450 | |||
Decrease in Payable Due to Sub-Advisor | (53,500 | ) | ||
Increase in Other Accrued Expenses | 47,530 | |||
|
| |||
Net Cash (Used in) Operating Activities | (15,285,055 | ) | ||
|
| |||
Cash Flows From Financing Activities | ||||
Cash Distributions Paid | $ | (403,876 | ) | |
Proceeds from Capital Shares Sold | 10,417,611 | |||
Line of Credit Borrowings | 2,500,000 | |||
|
| |||
Net Cash Provided by Financing Activities | 12,513,735 | |||
|
| |||
Net Change in Cash | (2,771,320 | ) | ||
Cash and Cash Equivalents at beginning of year | 2,785,667 | |||
|
| |||
Cash at end of year | $ | 14,347 | ||
|
| |||
Supplemental Disclosure of Cash Flow Information | ||||
Non-cash Financing Activities not included herein consist of Reinvestments of Distributions | $ | 283,541 | ||
Interest paid during the year | $ | 36,294 | ||
The accompanying notes are an integral part of these financial statements.
11
Triloma EIG Energy Income Fund – Term I
Financial Highlights
Selected Per Share Data & Ratios
For a Share Outstanding Throughout the Period
| For the Year | For the Year | For the Period | ||||||||||
| Ended | Ended | July 24, 2015 | ||||||||||
| December 31, | December 31, | to December | ||||||||||
| 2017 | 2016 | 31, 2015(a) | ||||||||||
Net Asset Value, Beginning of Period | $ | 25.92 | $ | 25.00 | $ | 25.00 | ||||||
|
|
|
|
|
| |||||||
Income (Loss) from Investment Operations: | ||||||||||||
Net Investment Income(b) | 1.75 | 0.67 | 0.31 | |||||||||
Net Realized and Unrealized Gain | 1.25 | 0.50 | — | |||||||||
Additional Expense Support Payments(b) | — | 1.15 | — | |||||||||
|
|
|
|
|
| |||||||
Total from Investment Operations | 3.00 | 2.32 | 0.31 | |||||||||
|
|
|
|
|
| |||||||
Dividends and Distributions: | ||||||||||||
Net Investment Income(c) | (1.80) | (1.82) | (0.31) | |||||||||
Net Realized Gain(c) | (0.12) | — | — | |||||||||
|
|
|
|
|
| |||||||
Total Dividends and Distributions | (1.92) | (1.82) | (0.31) | |||||||||
|
|
|
|
|
| |||||||
Issuance of Common Stock above Net Asset Value(b) | 0.29 | 0.42 | — | |||||||||
|
|
|
|
|
| |||||||
Net increase resulting from capital share transactions(d) | 0.29 | 0.42 | — | |||||||||
|
|
|
|
|
| |||||||
Net Asset Value, End of Period | $ | 27.29 | $ | 25.92 | $ | 25.00 | ||||||
|
|
|
|
|
| |||||||
Maximum Public Offering Price, End of Period | $ | 29.00 | $ | 27.63 | $ | 26.32 | ||||||
|
|
|
|
|
| |||||||
Total Return – NAV(e) | 13.01% | 11.28%(f) | 1.23%(f) | |||||||||
|
|
|
|
|
| |||||||
Total Return – Price(g) | 11.59% | 11.28%(h) | 1.23%(h) | |||||||||
|
|
|
|
|
| |||||||
Ratios and Supplemental Data | ||||||||||||
Net Assets, End of Period (in thousands) | $ | 15,775 | $ | 4,776 | $ | 105 | ||||||
Ratios to Average Net Assets: | ||||||||||||
Net Investment Income(i) | 6.49%(k) | 2.61%(k) | 2.82% | |||||||||
Net Operating Expenses(i) | 1.56% | 0.00% | 0.00% | |||||||||
Total Operating Expenses(i) | 27.40% | 89.43% | 2,022.58%(j) | |||||||||
Portfolio Turnover Rate | 30% | 0% | 0% | |||||||||
Amounts designated as “—” are either not applicable, $0 or have been rounded to $0.
| (a) | Fund commenced operations on July 24, 2015. |
| (b) | Per share calculations were performed using average shares. |
| (c) | The per share data for distributions reflects the actual amount of distributions paid per share during the period. |
| (d) | The continuous issuance of common stock may cause an increase in net asset value per share due to sales of shares at the prevailing public offering price and the net proceeds received that are in the excess of net asset value per share for each subscription. The per share data is the sum of the number of shares issued times the difference between the net proceeds per share and the net asset value per share on each transaction date divided by the average shares for the period. |
| (e) | Total Return - NAV is based on the change in current net asset value on the first day of each period reported and a sale at the current net asset value on the last day of each period reported, and assuming reinvestment of distributions in accordance with the Fund’s distribution reinvestment plan. Total return based on net asset value is hypothetical as investors cannot purchase or sell Fund shares at the net asset value. |
| (f) | Had the Expense Support Agreement (see Note 5) not been provided support beyond Operating Expenses, the Total Return – NAV would have been 10.27% for the year ended 2016 and (0.02)% for the period ended 2015. |
| (g) | Total Return - Price is based on the change in the public offering price, net of sales loads, on the first day of each period reported and a sale at the current net asset value on the last day of each period reported, and assuming reinvestment of distributions, in accordance with the Fund’s distribution reinvestment plan. |
| (h) | Had the Expense Support Agreement (see Note 5) not been provided support beyond Operating Expenses, the Total Return – Price would have been 8.91% for the year ended 2016 and (0.02)% for the period ended 2015. |
| (i) | Annualized. |
| (j) | Non-recurring organizational and operating expenses of $255,000 have not been annualized, but are included in the ratio. |
| (k) | Percentage does not include Expense Support Payments. |
The accompanying notes are an integral part of these financial statements.
12
Triloma EIG Energy Income Fund – Term I
Notes to Financial Statements
December 31, 2017
Note 1. Organization
Triloma EIG Energy Income Fund – Term I (the “Fund”) was formed as a Delaware statutory trust, and commenced upon the effectiveness of its registration statement on July 24, 2015. The Fund is an externally managed, non-diversified, closed-end management investment company under the Investment Company Act of 1940, as amended (the “1940 Act”). The Fund’s investment advisor and administrator, Triloma Energy Advisors, LLC, (the “Advisor”, “Triloma” or the “Administrator”) is responsible for the overall management of the Fund’s activities. EIG Credit Management Company, LLC (“EIG” or the “Sub-Advisor”), the Fund’s investment sub-advisor, is responsible for the day-to-day management of the Fund’s investment portfolio. The Advisor and the Sub-Advisor are each a private investment firm that is registered as an investment advisor with the Securities and Exchange Commission (the “SEC”) under the Investment Advisers Act of 1940, as amended (the “Advisers Act”). The investment process is a collaborative effort between the Advisor and the Sub-Advisor and the investment committee of each must approve all Fund portfolio investments.
The Fund’s investment objective is primarily to provide shareholders with current income; as secondary investment objectives, the Fund will seek to provide capital preservation and, to a lesser extent, long-term capital appreciation. The Fund seeks to achieve its investment objectives by investing primarily in a global portfolio of privately originated energy company and project debt. Under normal circumstances, the Fund will invest at least 80% of its total assets in debt and equity investments of energy companies and projects. There can be no assurance that the Fund will achieve its investment objectives.
Note 2. Summary of Significant Accounting Policies
The financial statements are prepared in conformity with accounting principles generally accepted in the United States of America (“U.S. GAAP”), which may require management to make estimates and assumptions that affect the reported amounts of assets and liabilities in the financial statements, disclosure of contingent assets and liabilities at the date of the financial statements and the reported amounts of increases and decreases in net assets from operations during the reporting period. Actual results could differ from those estimates and those differences could be material. Net Asset Value per share (“NAV”) for financial reporting purposes may differ from the NAV for processing transactions. The Fund is considered an investment company under U.S. GAAP and follows the accounting and reporting guidance applicable to investment companies. Below is a summary of significant accounting policies:
Cash and Cash Equivalents: The Fund considers all highly liquid investments with original maturities of 90 days or less to be cash equivalents. The Fund’s cash and cash equivalents are maintained with a major United States financial institution, which is a member of the Federal Deposit Insurance Corporation. At any time, cash in bank may exceed insured limits.
Security transactions and investment income: Security transactions are recorded on the trade date. Loan originations are recorded on the funding date. Realized gains and losses are reported on the specific identified cost basis. Net change in unrealized appreciation or depreciation reflects the change in portfolio investment values during the reporting period, including any reversal of previously recorded unrealized gains or losses, when gains or losses are realized, and the respective unrealized gain or loss on foreign currency for any foreign denominated investments, if applicable. Dividend income, if any, is recorded on the ex-dividend date or, in the case of foreign securities, as soon as the Fund is informed of the ex-dividend dates, net of foreign taxes. Interest income, including accretion of discounts and amortization of premiums, is recorded on the accrual basis commencing on the settlement date.
Payment-in-kind interest income (“PIK”) is accrued as interest income and is reclassified as payment-in-kind interest income if there is a contracted set rate or when the additional securities are received.
Fee Income: The Fund may earn fees associated with the creation of EIG-originated debt instruments. These fees are generally non-recurring and are recognized as fee income to the extent that the fee is allocable to future funding commitments upon the earlier of the investment commitment date or investment closing date. This portion of the fee income is included in the Statement of Operations in Other Income. The portion of the fee that is allocable to the
13
Triloma EIG Energy Income Fund – Term I
Notes to Financial Statements (Continued)
December 31, 2017
funding required at the investment closing date, will accrue in correspondence with the originated debt instrument. This portion of the fee is included in the Statement of Operations in Interest Income.
Trustee compensation: The Fund pays the members of the Board of Trustees (“Board” or “Trustees”), a majority of whom are independent, certain remuneration for their services, plus travel and other expenses. The Fund does not pay compensation to Trustees who also serve in an executive officer capacity for the Fund, the Advisor or the Sub-Advisor. Amounts payable to Trustees for compensation and reimbursable expenses are included in the accompanying Statement of Assets and Liabilities. Trustees’ fees earned during the period are reported in the Statement of Operations.
Distributions to shareholders: Distributions from net investment income and/or additional expense support received from the Sub-Advisor are recorded at the time the dividend or distribution is made. Distributions of capital gains are recorded upon payment and made at least annually. The character and timing of distributions are determined in accordance with U.S. federal income tax regulations, which may differ from U.S. GAAP.
Contingencies: In the normal business, the Fund may enter into contracts that contain general indemnification clauses. The Fund’s maximum exposure under these arrangements is unknown as this would involve future claims that may be made against the Fund. However, based on experience, the Fund expects the risk to be remote.
Principal Risks: In the normal course of business, the Fund invests in securities or other instruments and may enter into certain transactions, and such activities are subject to various risks. The Fund’s prospectus provides details of the risks to which the Fund is subject to. Key principal risks driven by the investments in which the Fund holds are summarized below:
| · | Market/Valuation Risks - The market values of equities, such as common stocks and preferred securities or equity related investments may decline due to general market conditions which are not specifically related to a particular company. They may also decline due to factors which affect a particular industry or industries. The Fund may invest in illiquid investments and may experience difficulty in selling those investments in a timely manner at the price that they believe the investments are worth. Prices may fluctuate widely over short or extended periods in response to company, market or economic news. Markets also tend to move in cycles, with periods of rising and falling prices. This volatility may cause the Fund’s NAV to experience significant increases or decreases over short periods of time. If there is a general decline in the securities and other markets, the NAV of the Fund may lose value, regardless of the individual results of the securities and other instruments in which the Fund invests. |
The price the Fund could receive upon the sale of any particular portfolio investment may differ from the Fund’s valuation of the investment, particularly for securities that trade in thin or volatile markets or that are valued using a fair valuation technique or a price provided by an independent pricing service. Changes to significant unobservable inputs and assumptions (i.e., publicly traded company multiples, growth rate, time to exit) due to the lack of observable inputs may significantly impact the resulting fair value and therefore the Fund’s results of operations. As a result, the price received upon the sale of an investment may be less than the value ascribed by the Fund, and could realize a greater than expected loss or lesser than expected gain upon the sale of the investment.
| · | Liquidity Risk - Illiquid and restricted investments may be difficult to dispose of at a fair price at the times when the Fund believes it is desirable to do so. The market price of illiquid and restricted securities generally is more volatile than that of more liquid investments, which may adversely affect the price that the Fund recovers upon the sale of such investments. Illiquid and restricted investments may also be more difficult to value, especially in challenging markets. The Advisor’s and/or Sub-Advisor’s judgment, through the means of a committee, may play a greater role in the valuation process. Investment of the Fund’s assets in illiquid and restricted investments may restrict the Fund’s ability to take advantage of market opportunities. Contractual restrictions on the resale of investments vary in length and scope and are generally the result of a negotiation between the issuer and acquirer of the investments. In either case, the Fund could bear market risks during that period. |
14
Triloma EIG Energy Income Fund – Term I
Notes to Financial Statements (Continued)
December 31, 2017
| · | Concentration Risk – The Fund primarily invests its assets in fixed-income securities. Changes in market interest rates or economic conditions may affect the value and/or liquidity of such investments. Interest rate risk is the risk that prices of bonds and other fixed-income securities will increase as interest rates fall and decrease as interest rates rise. The Fund may be subject to a greater risk of rising interest rates due to the current period of historically low rates. |
Additionally, the Fund has a significant level of holdings in privately originated debt. Changes in economic conditions, including delinquencies and/or defaults on assets underlying these securities, can affect the value, income and/or liquidity of such positions.
| · | Energy Sector Risk – The Fund’s investments in energy companies expose the Fund to risks associated with adverse economic, environmental or regulatory occurrences affecting the energy sector, and a downturn in the energy sector could have a significant impact on the Fund. |
Note 3. Investment Valuation and Fair Value Measurements
Investment Valuation Policies: The Fund’s investments are valued at fair value (also referred to as “market value” within the financial statements) as of the close of trading on the NYSE (generally 4:00 p.m., Eastern time) (or if the reporting date falls on a day the NYSE is closed, investments are valued at fair value as of the period end). U.S. GAAP defines fair value as the price the Fund would receive to sell an asset or pay to transfer a liability in an orderly transaction between market participants at the measurement date. The Fund determines the fair values of the financial instruments using various pricing services or independent broker-dealers under policies approved by the Board. Under the delegation of the Board, the Advisor has formed a committee to develop pricing policies and procedures and to oversee the pricing function for all financial instruments.
The Board has delegated the day-to-day responsibility for applying and administering the Fund’s valuation policy (“Valuation Policy”) to a valuation committee (“Valuation Committee”), comprised of certain officers of the Funds and other employees of the Advisor with the assistance and support of the Sub-Advisor. The composition of this Valuation Committee may change from time to time. The Valuation Committee follows fair valuation guidelines as set forth in the Valuation Policy to make fair value determinations on all securities and assets for which market quotations are unavailable or unreliable. The Board retains the responsibility for periodic review and consideration of the appropriateness of any fair value pricing methodology established or implemented for the Fund. Fair value pricing methods, the Valuation Policy and independent pricing services can change from time to time as approved by the Board, as deemed necessary or changes in industry best practices.
Fair Value Inputs and Methodologies: The following methods and inputs are used to establish the fair value of the Fund’s assets and liabilities:
| · | Fixed-income securities for which market quotations are readily available are generally valued using the last available bid prices or current market quotations provided by independent dealers or third-party pricing services. The pricing services may use matrix pricing or valuation models that utilize certain inputs and assumptions to derive values, including transaction data (e.g., recent representative bids and offers), credit quality information, perceived market movements, news, and other relevant information. The amortized cost method of valuation may be used with respect to debt obligations with sixty days or less remaining to maturity unless the Advisor determines such method does not represent fair value. |
| · | Money market funds are permitted by compliance with certain conditions under Rule 2a-7 of the 1940 Act, to value securities at amortized cost which approximates fair value. Government money market funds value all security positions using amortized cost, which approximates fair value. The Fund holds all money market securities at their respective NAVs. |
| · | Warrants and rights which are listed on major security exchanges are valued at their last reported sales price as of the valuation date or, if there is no reported sale price, at the midpoint of the most recent quoted bid and ask prices at the close of business. |
| · | The Payable for the Line of Credit carrying balance held by the Fund, located on the Statement of Assets and Liabilities approximates its fair value. |
15
Triloma EIG Energy Income Fund – Term I
Notes to Financial Statements (Continued)
December 31, 2017
If events (e.g., a company announcement, market volatility or a natural disaster) occur that are expected to materially affect the value of such investments, or in the event that the application of these methods of valuation results in a price for an investment that is deemed not to be representative of the market value of such investment, or if a price is not available, the investment will be valued by the Advisor with the assistance of the Fund’s Sub-Advisor, or its delegates, in accordance with a policy approved by the Board as reflecting fair value (“Fair Valued Investments”). Valuation techniques such as discounted cash flow, use of market comparables and matrix pricing are types of valuation approaches and are typically used in determining fair value. When determining the price for Fair Valued Investments, the Advisor, or its delegate, seeks to determine the price that the Fund might reasonably expect to receive or pay from the current sale or purchase of that asset or liability in an arm’s-length transaction. Fair value determinations shall be based upon all available factors that the Advisor and Sub-Advisor, or its delegates, deem relevant and consistent with the principles of fair value measurement.
Various methods for calibrating valuation approaches for investments where an active market does not exist are used, including regular due diligence of the Fund’s pricing vendors, regular reviews of key inputs and assumptions, transactional back testing, reviews of missing or stale prices and large movements in market values and reviews of any market related activity. The pricing of all Fair Valued Investments is subsequently reported to the Board or a committee thereof on a quarterly basis. As a result of the inherent uncertainty in valuation of these investments, the fair values may differ from the values that would have been used had an active market existed.
For investments in equity (including warrants and rights) or debt that are not considered marketable securities, the Advisor and Sub-Advisor generally fair values each investment using a discounted cash flow method by calculating the net present value of the projected cash flows from the investment over the period the investment is expected to be held. The discount rate applied is based on a risk-adjusted premium which reasonably reflects the risk of not achieving a return of capital on the investment within the stated term of the investment. Inherent also in this analysis is the assessment of the probability of a payment default. In determining the appropriate discount rate for each investment, the company’s current and future financial prospects as well as inherent uncertainties in the timing of underlying cash flows and other information deemed pertinent including external engineering reports, comparable transactions and commodity prices are considered. The Sub-Advisor also develops commodity price decks, which are reviewed by the Advisor, which reflect the market’s view on commodity prices over the term of an investment, by using actual historic and forecast forward price data. Average, rather than spot price, commodity inputs are considered more relevant valuation inputs as they are more closely aligned to the Fund’s long-term investment strategy. Commodity price inputs are expected to have a greater impact on the valuation of equity holdings and non-performing or under-performing loans. Commodity price inputs have only limited impact on the valuation of performing loans.
Where the Fund has access to price data for other securities or other investments or interest from multiple sources, a relative weighting is given to all such data (based on management’s assessment of the relevance and reliability of such data) as well as to the results of the discounted cash flow method described above in order to arrive at a valuation for the investment.
Where the date of acquisition of an investment is in the close proximity to the fair market value measurement date, the price at which such investment is closed or the par value of such investment is used as the primary determinant of fair market value.
The information received from private companies in the valuation of non-marketable investments is often not subject to the public company disclosure, timing and reporting standards held by the Fund. Typically, the most recently available information is as of a date that varies from the date the Fund calculates its NAV. This factor may result in a difference between the value of the investment and the price the Fund could receive upon the sale of the investment.
Hierarchy of Fair Value Inputs: In accordance with the authoritative guidance on fair value measurements and disclosure under U.S. GAAP, the Fund discloses fair value of its investments in a hierarchy that prioritizes the inputs to valuation techniques used to measure the fair value. The objective of a fair value measurement is to determine the price that would be received to sell an asset or paid to transfer a liability in an orderly transaction between market participants at the measurement date (an exit price). Accordingly, the fair value hierarchy gives the highest priority to quoted prices (unadjusted) in active markets for identical assets or liabilities (Level 1) and the lowest priority to
16
Triloma EIG Energy Income Fund – Term I
Notes to Financial Statements (Continued)
December 31, 2017
unobservable inputs (Level 3). The three levels of the fair value hierarchy are described below:
· Level 1 – Unadjusted quoted prices in active markets for identical, unrestricted assets or liabilities that the Fund has the ability to access at the measurement date; | ||
· Level 2 – Other significant observable inputs, which may include quoted prices for similar securities, interest rates, prepayment speeds, credit risk, referenced indices, quoted prices in inactive markets, adjusted quoted prices in inactive markets, etc.; and | ||
· Level 3 – Unobservable inputs, which may include management’s own assumptions in determining the fair value of investments. Factors considered in making this determination may include, but are not limited to, information obtained by contacting the sub-adviser, issuer, analysts, or the appropriate stock exchange (for exchange-traded securities), analysis of the issuer’s financial statements or other available documents and, if necessary, available information concerning other securities in similar circumstances. | ||
Investments are classified within the level of the lowest significant input considered in determining fair value. Investments classified within Level 3 whose fair value measurement considers several inputs may include Level 1 or Level 2 inputs as components of the overall fair value measurement. In such cases, for disclosure purposes, the fair value hierarchy classification is determined based on the lowest level input that is significant to the fair value measurement in its entirety. Investments classified within Level 3 have significant unobservable inputs used by the Advisor in determining the price for Fair Valued Investments. Level 3 investments include non-marketable equity (including, warrants and rights) or debt. There may not be a secondary market, and/or there are a limited number of investors. Level 3 investments may also be adjusted to reflect illiquidity and/or non-transferability, with the amount of such discount estimated by the Sub-Advisor and reviewed by the Advisor in the absence of market information.
Changes in valuation techniques may result in transfers into or out of an assigned level within the hierarchy. In accordance with the Fund’s policy, transfers between different levels of the fair value hierarchy are deemed to have occurred as of the end of the reporting period. The categorization of a value determined for investments is based on the pricing transparency of the investments and is not necessarily an indication of the risks associated with investing in those securities. During the year ended December 31, 2017, the Fund did not have any transfers between any of the levels of the fair value hierarchy.
Note 4. Securities and Other Investments
Loan participations and assignments: The Fund may invest in direct debt instruments which are interests in amounts owed to lenders or lending syndicates by corporate or other borrowers, either in the form of participations at the time the loan is originated (“Participations”) or buying an interest in the loan in the secondary market from a financial institution or institutional investor (“Assignments”). Participations and Assignments in commercial and project financing loans may be secured or unsecured. These investments may include standby financing commitments, including revolving credit facilities that obligate the Fund to supply additional cash to the borrowers on demand, also referred to as unfunded commitments. Loan Participations and Assignments involve risks of insolvency of the lending banks or other financial intermediaries. As such, the Fund assumes the credit risks associated with the corporate borrowers and may assume the credit risks associated with the interposed banks or other financial intermediaries.
Based on the ability to invest in Loan Participations and Assignments, the Fund may be contractually obligated to receive approval from the agent banks and/or borrowers prior to the sale of these investments. A fund that participates in such syndications, or that can buy a portion of the loans, become part lenders. Loans are often administered by agent banks acting as agents for all holders.
The agent banks administer the terms of the loans, as specified in the loan agreements. In addition, the agent banks are normally responsible for the collection of principal and interest payments from the borrowers and the apportionment of these payments to the credit of all institutions that are parties to the loan agreements. Unless the Fund has direct recourse against the borrowers under the terms of the loans or other indebtedness, the Fund may have to rely on the agent banks or other financial intermediaries to apply appropriate credit remedies against corporate borrowers.
17
Triloma EIG Energy Income Fund – Term I
Notes to Financial Statements (Continued)
December 31, 2017
The Fund had commitments that were entered into that remain unfunded at December 31, 2017. Since these commitments and the associated amounts may expire without being drawn upon, the total commitment does not necessarily represent a future cash requirement. Below are the pending unfunded commitments entered into by the Fund:
| Borrower | Unfunded Commitment Amount | |
Aethon United BR, LP | $312,500 | |
ARB Midstream Operating Company, LLC | $654,660 | |
Bioenergy Infrastructure Holdings LTD | $429,005 | |
Felix Investments Holdings II, LLC | $333,333 | |
Northeast Natural Energy, LLC | $477,300 | |
Rosehill Operating Company, LLC | $300,000 |
At December 31, 2017, the Fund had sufficient cash, credit line capacity and/or securities to cover these commitments should the funding requirements occur.
The Fund held no unsecured loan participations at December 31, 2017. Open secured loan participations and assignments are included within the Schedule of Investments.
Preferred Stocks: Preferred stock has a preference over common stock in liquidation (and generally in receiving dividends as well), but is subordinated to the liabilities of the issuer in all respects. As a general rule, the market value of preferred stock with a fixed dividend rate and no conversion element varies inversely with interest rates and perceived credit risk while the market price of convertible preferred stock generally also reflects some element of conversion value. Because preferred stock is junior to debt securities and other obligations of the issuer, deterioration in the credit quality of the issuer will cause greater changes in the value of a preferred stock than in a more senior debt security with similar stated yield characteristics. The preferred stock can be structured with either a fixed or adjustable coupon that can have either a perpetual or stated maturity date. Unlike interest payments on debt securities, preferred stock dividends are payable only if declared by the issuer’s board of directors or dictated within the purchase agreement for non-marketable preferred stock. Preferred stock also may be subject to optional or mandatory redemption provisions.
Payment-in-kind securities (“PIK”): PIKs give the issuer the option of making interest payments in either cash or additional securities at each interest payment date. Those additional securities usually have the same terms, including maturity dates and interest rates, and associated risks as the original instruments held.
PIK Securities held at December 31, 2017 are identified in the Schedule of Investments.
Restricted and illiquid securities: The Fund may invest in unregulated restricted securities. Restricted and illiquid securities are subject to legal or contractual restrictions on resale or are illiquid. Restricted securities generally may be resold in transactions exempt from registration under the Securities Act of 1933. A security may be considered illiquid if it lacks a readily available market or if its valuation has not changed for a certain period of time. Disposal of these securities may involve time-consuming negotiations and expense, and prompt sale at the current valuation may be difficult.
Restricted and illiquid securities held at December 31, 2017 are identified in the Schedule of Investments.
Note 5. Related Party Transactions
In the initial year of operations, the Advisor invested in the Fund. As of December 31, 2017, the Advisor owned 17,047 shares or 2.95% of the outstanding shares.
EIG, the Sub-Advisor, is an affiliate of EIG Separate Investments, LP. EIG Separate Investments, LP has invested in the Fund. As of December 31, 2017, the affiliate of the Sub-Advisor owned 22,597 shares or 3.91% of the outstanding shares.
18
Triloma EIG Energy Income Fund – Term I
Notes to Financial Statements (Continued)
December 31, 2017
Investment Advisory Agreement
Pursuant to an investment advisory agreement (the “Investment Advisory Agreement”) between the Fund and the Advisor, the Advisor is entitled to a fee consisting of two components—a base management fee (the “Management Fee”) and an incentive fee (the “Incentive Fee”).
The Management Fee is calculated and payable monthly in arrears at the annual rate of 2% of the Fund’s average gross assets. The Management Fee may or may not be taken by the Advisor in whole or in part at the discretion of the Advisor. All or any part of the Management Fee not taken as to any month will be deferred without interest and may be taken in any such other month as the Advisor may determine. The Management Fee for any partial month will be appropriately prorated. No part of the Management Fee was deferred during the period.
The Management Fee for the year ended December 31, 2017 was $223,441.
The Incentive Fee is earned on “pre-incentive fee net investment income” and shall be calculated and payable in arrears as of the end of each calendar quarter during which the Investment Advisory Agreement or Sub-Advisory Agreement is in effect. In the case of a liquidation or if the Investment Advisory Agreement or Investment Sub-Advisory Agreement is terminated, the fee will also become payable as of the effective date of the event. The Incentive Fee is subject to a hurdle rate, expressed as a rate of return on the Fund’s average “adjusted capital,” equal to 1.875% per quarter (or an annualized hurdle rate of 7.5%), and is subject to a “catch-up” feature. For this purpose, “pre-incentive fee net investment income” is the sum of interest income, dividend income and any other income accrued during the calendar quarter, minus the Fund’s operating expenses for the quarter. Also, pre-incentive fee net investment income includes, in the case of investments with a deferred interest feature (such as OID, debt instruments with PIK interest and zero coupon securities), accrued income only when the cash is received by the Fund.
For purposes of computing the Incentive Fee, net interest, if any, associated with a derivative or swap (which represents the difference between (i) the interest income and fees received in respect of the reference assets of the derivative or swap and (ii) the interest expense paid by the Fund to the derivative or swap counterparty) will be included in the calculation of quarterly pre-incentive fee net investment income.
“Adjusted capital” means the (a) cumulative proceeds received by the Fund from the sale of Shares, including proceeds from the Fund’s distribution reinvestment plan, net of sales load reduced by the sum of (b) (i) distributions paid to our Shareholders that represent return of capital and (ii) amounts paid for share repurchases pursuant to the Fund’s share repurchase program.
No Incentive Fee was charged to or paid by the Fund for the year ended December 31, 2017.
Administration Agreement
Pursuant to an administration agreement between the Fund and the Administrator (the “Administration Agreement”), the Administrator performs and oversees all aspects of the general day-to-day business activities and operations of the Fund, including custodial, distribution disbursing, accounting, auditing, compliance and related services. The Administrator manages the Fund’s corporate affairs subject to the supervision of the Board and furnishes the Fund with office facilities and executive personnel together with clerical and certain recordkeeping and administrative services necessary to administer the Fund. These services include maintaining and preserving certain records, preparing and filing various materials with state and U.S. federal regulators, providing general ledger accounting, fund accounting, legal and other administrative services. In addition, the Administrator assists the Fund in calculating its NAV, overseeing the preparation and filing of tax returns and the preparation, printing and dissemination of annual and other reports to shareholders and to the SEC, and generally overseeing the payment of the Fund’s expenses and the performance of administrative and professional services rendered to the Fund by others.
The Fund pays the Administrator an Administration Fee for its services under the Administration Agreement, calculated weekly and payable monthly in arrears. The fee consists of two components: (i) a fixed administrative fee of $31,250 per month for the period of January 1, 2017 to February 28, 2017; and $34,250 per month thereafter, and (ii) a variable administrative fee ranging between the annual rates of 0.05% and 0.10% of the Fund’s average net
19
Triloma EIG Energy Income Fund – Term I
Notes to Financial Statements (Continued)
December 31, 2017
assets during the relevant month, subject to a monthly minimum fee of $10,417. The variable administrative fee is calculated at the following annual rates based on the average net assets: 0.10% on the first $300,000,000 of average net assets; 0.07% on the next $300,000,000 of average net assets; 0.06% on the next $900,000,000 of average net assets; and 0.05% on average net assets over $1.5 billion. The Administration Fee may be taken in whole or in part at the discretion of the Administrator. All or any part of the Administration Fee not taken as to any month will be deferred without interest and may be taken in any such other month as the Administrator may determine. The Administration Fee for any partial month will be appropriately prorated. No part of the Administration Fee was deferred during the year.
Administration Fees totaled $530,004 for the year ended December 31, 2017.
Plan of Distribution
The dealer manager for the Fund’s continuous public offering is Triloma Securities (“Dealer Manager”), which is a subsidiary of Triloma Financial Group. Triloma Financial Group wholly owns TEA. As of May 26, 2017, a new Dealer Manager Agreement was formed between the Fund and the Dealer Manager. The Dealer Manager is entitled to receive a sales load in connection with the sale of shares in the Fund’s continuous public offering, asset-based distribution fees and ongoing shareholder servicing fees, all or a portion of which may be re-allowed to participating broker-dealers. As of May 26, 2017, the Fund will pay the dealer manager, beginning the first calendar month after the close of the offering period, asset-based distribution and shareholder servicing fees at an annualized rate of one percent (1.0%) of the Fund’s net asset value. Such distribution and shareholder servicing fees consists of three quarter percent (0.75%) distribution fees and one quarter percent (0.25%) ongoing shareholder servicing fees. The Fund will cease paying distribution and shareholder servicing fees at the earlier of: (i) the date at which the underwriting compensation, including the upfront dealer manager fees and the asset-based distribution and shareholder servicing fees, paid by the Fund and shareholders, equals 8.0% of the gross proceeds from our offering; or (ii) the date at which a liquidity event occurs. Although the amount of asset-based distribution fees the Fund will incur is uncertain and payments are currently estimated to commence August 2018, the Fund is accruing the potential maximum asset-based distribution fees of approximately $467,000 over the Offering period. As of December 31, 2017, the current accrued liability is $241,175 and is included on the Statement of Assets and Liabilities.
Prior to the amended Dealer Manager Agreement on May 26, 2017, the Fund would have paid the dealer manager, beginning the first calendar quarter after the close of the Offering period, asset-based distribution and dealer manager fees at an annualized rate of one percent (1.0%) of the price, net of all sales load, at which Shares are being sold in the offering. Under U.S. GAAP, the Fund was required to accrue for distribution expenses of three quarter percent (0.75%). Incorrectly, no distribution expenses had been accrued by the Fund under this agreement as of December 31, 2016. If the Fund had correctly accrued asset-based distribution fees under this prior Dealer Manager Agreement, the accrued liability as of December 31, 2016 would have been $54,430, which would have been fully reimbursed pursuant to the Expense Support and Reimbursement Agreement (Note 6).
Note 6. Expense Support and Reimbursement Agreement
Pursuant to an expense support and reimbursement agreement between the Fund and the Sub-Advisor, the Sub-Advisor has agreed to pay operating expenses (including organizational and offering expenses) (an “Expense Payment”) to ensure that the Fund bears a reasonable level of expenses in relation to its income. The purpose of this arrangement is to ensure that no portion of any distributions (at a rate set by the Fund) will be paid from offering proceeds or borrowings and no portion of a distribution will constitute a return of capital. Under this arrangement, the Sub-Advisor will make payments to the Fund monthly in an amount equal to the positive difference, if any, between the Fund’s cumulative distributions paid to the Fund’s shareholders during the relevant portion of the fiscal year (the “Relevant Period”) less cumulative Available Operating Funds (defined below) received by the Fund on account of its investment portfolio during such Relevant Period, reduced by cumulative expense payments, as described below, received by the Fund or increased by cumulative Reimbursement Payments (defined below) paid by the Fund during such relevant period. “Available Operating Funds” means, in respect of the relevant month, the sum of (i) the Fund’s estimated net investment taxable income (including net short-term capital gains reduced by net long-term capital losses), (ii) the Fund’s net capital gains (including the excess of net long-term capital gains over
20
Triloma EIG Energy Income Fund – Term I
Notes to Financial Statements (Continued)
December 31, 2017
net short-term capital losses) and (iii) dividends and other distributions paid to the Fund on account of preferred and common equity investments (to the extent such amounts listed in clause (iii) are not included under clauses (i) and (ii) above). For the avoidance of doubt, realized gains and losses shall be included in Available Operating Funds calculation annually in conjunction with the Fund’s tax assessment of distributable gains.
The Sub-Advisor is entitled to be conditionally reimbursed by the Fund (a “Reimbursement Payment”) for Expense Payments funded by Sub-Adviser under this arrangement if (and only to the extent that), during any calendar month occurring within three years of the date on which the Sub-Advisor funded such amount, the Fund’s Available Operating Funds exceed the cumulative distributions paid to Fund Shareholders in such month; provided, however, that (i) the Fund will only reimburse the Sub-Advisor for expense support payments made by the Sub-Advisor to the extent that the payment of such reimbursement (together with any other reimbursement paid during such fiscal year) does not cause Other Operating Expenses (as defined below) (on an annualized basis and net of any expense reimbursement payments received by the Fund during such fiscal year) to exceed the lesser of (i) 2% of the Fund’s average net assets attributable to the Fund’s common shares of beneficial interest for the fiscal year-to-date period after taking such Expense Payments into account and (ii) the percentage of the Fund’s average net assets attributable to the Fund’s common shares of beneficial interest represented by Other Operating Expenses during the fiscal year in which such Expense Payment was made (provided, however, that this clause (ii) shall not apply to any Reimbursement Payment which relates to an Expense Payment made during the same fiscal year). “Other Operating Expenses” means the Fund’s total Operating Expenses, excluding management fees, incentive fees, organization and offering expenses, distribution fees, dealer manager fees, financing fees and costs, interest expense, brokerage commissions and extraordinary expenses.
The Fund or the Sub-Advisor may terminate the expense support and reimbursement agreement at any time. The Sub-Advisor has indicated it expects to continue such reimbursements until it deems that the Fund has achieved economies of scale sufficient to ensure that it bears a reasonable level of expenses in relation to its income. The conditional obligation of the Fund to reimburse the Sub-Advisor shall survive the termination of such agreement by either party. The table below summarizes the expense support received and terms for recapturing previously reimbursed expenses.
21
Triloma EIG Energy Income Fund – Term I
Notes to Financial Statements (Continued)
December 31, 2017
For the Month Ended | Amount of Expense Support Payment | Other Operating Expense Ratio Limitation (1) | Annualized Distribution Rate Per Share (2) | Reimbursement Eligibility Expiration | ||||||
July 2015 | $908,088 | 2.00% | $ - | July 2018 | ||||||
August 2015 | $27,540 | 2.00% | $ - | August 2018 | ||||||
September 2015 | $73,936 | 2.00% | $ - | September 2018 | ||||||
October 2015 | $141,248 | 2.00% | $ - | October 2018 | ||||||
November 2015 | $113,684 | 2.00% | $1.78 | November 2018 | ||||||
December 2015 | $390,841 | 2.00% | $1.78 | December 2018 | ||||||
January 2016 | $68,388 | 2.00% | $1.78 | January 2019 | ||||||
February 2016 | $77,437 | 2.00% | $1.78 | February 2019 | ||||||
March 2016 | $165,591 | 2.00% | $1.78 | March 2019 | ||||||
April 2016 | $253,411 | 2.00% | $1.79 | April 2019 | ||||||
May 2016 | $256,323 | 2.00% | $1.81 | May 2019 | ||||||
June 2016 | $241,827 | 2.00% | $1.81 | June 2019 | ||||||
July 2016 | $213,576 | 2.00% | $1.82 | July 2019 | ||||||
August 2016 | $220,521 | 2.00% | $1.85 | August 2019 | ||||||
September 2016 | $235,226 | 2.00% | $1.85 | September 2019 | ||||||
October 2016 | $231,931 | 2.00% | $1.85 | October 2019 | ||||||
November 2016 | $100,238 | 2.00% | $1.87 | November 2019 | ||||||
December 2016 | $76,380 | 2.00% | $1.87 | December 2019 | ||||||
January 2017 | $192,685 | 2.00% | $1.87 | January 2020 | ||||||
February 2017 | $173,940 | 2.00% | $1.92 | February 2020 | ||||||
March 2017 | $198,126 | 2.00% | $1.92 | March 2020 | ||||||
April 2017 | $196,304 | 2.00% | $1.92 | April 2020 | ||||||
May 2017 | $203,546 | 2.00% | $1.92 | May 2020 | ||||||
June 2017 | $277,751 | 2.00% | $1.92 | June 2020 | ||||||
July 2017 | $226,151 | 2.00% | $1.92 | July 2020 | ||||||
August 2017 | $226,859 | 2.00% | $1.92 | August 2020 | ||||||
September 2017 | $206,422 | 2.00% | $1.92 | September 2020 | ||||||
October 2017 | $154,906 | 2.00% | $1.93 | October 2020 | ||||||
November 2017 | $51,540 | 2.00% | $1.95 | November 2020 | ||||||
December 2017 | $396,476 | 2.00% | $1.96 | December 2020 | ||||||
(1) The Other Operating Expense Ratio Limitation equals the lesser of 2.0% of the Fund’s average net assets or the percentage of the Fund’s average net assets represented by Other Operating Expenses during the fiscal year in which such Expense Payment was made. “Other Operating Expenses” means all operating costs and expenses incurred by the Fund, excluding management fees, incentive fees, organization and offering expenses, distribution fees, dealer manager fees, financing fees and costs, interest expense, brokerage commissions and extraordinary expenses.
(2) The Annualized Distribution Rate Per Share equals the projected annualized distribution amount which is calculated based on the average weekly regular cash distributions per share that were declared with record dates in the applicable Expense Payment month.
Note 7. Capital and Distributions
The Fund accepts purchases of shares of common stock weekly, which is generally each Wednesday (or next business day if Wednesday is a holiday or the markets are closed). The Fund does not issue shares (and an investor does not become a shareholder) until the close of business on each weekly closing. Consequently, purchase proceeds do not represent capital of the Fund, and do not become assets of the Fund, until such date. Shares are sold at the Public Offering Price (“POP”) set by the Fund, as defined by the Board.
Distributions are paid to shareholders, when declared, each month on the last weekly closing of each month. Shareholders may elect to participate in the Distribution Reinvestment Plan (“DRP”) whereby the shareholder receives shares of common stock of the Fund instead of cash distributions. The price used to determine the number of shares to be issued pursuant to the DRP, is the public offering price on the payable date of the distribution, net of all sales loads.
The Fund has a share repurchase program, whereby up to 2.5% of the weighted average number of shares outstanding in the prior four calendar quarters can be repurchased. All shares repurchased by the Fund pursuant to the share repurchase program will be retired and; thereafter, will be authorized and unissued shares. The price of the share repurchase is the Fund’s NAV on the date of repurchase.
22
Triloma EIG Energy Income Fund – Term I
Notes to Financial Statements (Continued)
December 31, 2017
Transactions in capital shares were as follows:
| Year Ended December 31, 2017 | Year Ended December 31, 2016 | |||||||
Shares issued | 383,411 | 178,273 | ||||||
Shares issued in reinvestment of distributions | 10,433 | 1,816 | ||||||
Shares repurchased | - | (46) | ||||||
|
|
|
|
| ||||
Net increase (decrease) in shares | 393,844 | 180,043 | ||||||
|
|
|
|
| ||||
The Securities and Exchange Commission has deemed the Fund’s shares may not have been properly registered under the Securities Act of 1933 during the period beginning May 1, 2017 and ending July 5, 2017 (the “Rescission Period.”) As such, the Fund updated its registration statement and announced a rescission offer. One investor accepted the rescission offer for a total of 894 common shares; including shares issued in the reinvestment of distributions, and the rescission offer is now expired. The table above includes the impact of the rescinded shares.
The following table reflects the sources of the cash distributions that the Fund declared on its common shares during the periods noted below:
| Year Ended December 31, 2017 | Year Ended December 31, 2016 | |||||||||||||||
Source of Distribution | Distribution Amount | Percentage | Distribution Amount | Percentage | ||||||||||||
Net Investment Income (excluding Additional Expense Support Payments) | $ | 628,710 | 91.4% | $ | 59,503 | 36.8% | ||||||||||
Short-term Capital Gains Proceeds from the Sale of Investments | 18,287 | 2.7% | - | - | ||||||||||||
Long-term Capital Gains Proceeds from Sale of Investments | 40,420 | 5.9% | - | - | ||||||||||||
Additional Expense Support Payments from Sub-Advisor | - | 0.0% | 102,310 | 63.2% | ||||||||||||
|
|
|
|
|
|
|
| |||||||||
| $ | 687,417 | 100.0% | $ | 161,813 | 100.0% | |||||||||||
|
|
|
|
|
|
|
| |||||||||
Note 8. Credit Facility
The Fund entered into a credit agreement with the Bank of Nova Scotia in December 2016, with a maximum available balance of $10,000,000. This credit facility provides source of funds for general business purposes, including the purchase of investment securities. Under the terms of the credit facility, in addition to interest charged on drawn balances, the Fund shall pay an annual commitment fee of 0.25% on the unused commitment unless the Fund has drawn 75% or greater of the total line. These fees of $22,191 are reflected in Interest Expense in the Statement of Operations. For the year ended December 31, 2017, the Fund has drawn $2,500,000 from the credit facility.
As of December 31, 2017, the Fund paid a weighted average interest rate of 2.15% on its outstanding borrowings. For the year ended on December 31, 2017, the average borrowings and interest under the credit facility were $2,038,710 and 2.15%, respectively. The Fund had borrowings under the credit facility for 286 days during 2017.
Note 9. Investment Transactions
For the year ended December 31, 2017, the Fund made purchases of $17,068,369 of investment securities other than long-term U.S. Government and short-term securities. The Fund made sales of $3,155,606 of investment securities other than long-term U.S. Government and short-term securities during the year. The Fund had no purchases or sales of long-term U.S. Government securities.
Note 10. Federal Tax Information
The Fund has not made any provision for federal income or excise taxes due to its policy to distribute all of its taxable income and capital gains to its shareholders and otherwise qualify as a regulated investment company under Subchapter M of the Internal Revenue Code. The Fund recognizes the tax benefits of uncertain tax positions only where the position is “more likely than not” to be sustained assuming examination by tax authorities. The Fund’s
23
Triloma EIG Energy Income Fund – Term I
Notes to Financial Statements (Concluded)
December 31, 2017
federal and state tax returns remain subject to examination by the Internal Revenue Service and state tax authorities for the prior three years, as applicable. Management has evaluated the Fund’s tax provisions taken for all open tax years, as well as tax positions expected to be taken in 2017, and has concluded that no provision for income tax is required in the Fund’s financial statements. If applicable, the Fund recognizes interest accrued related to unrecognized tax benefits in interest and penalties expense in Miscellaneous Expenses on the Statement of Operations. The Fund identifies its major tax jurisdictions as U.S. Federal, the state of Florida, and foreign jurisdictions where the Fund makes significant investments; however, the Fund is not aware of any tax positions for which it is reasonably possible that the total amounts of unrecognized tax benefits will change materially in the next twelve months. Income and capital gain distributions are determined in accordance with income tax regulations, which may differ from U.S. GAAP.
The tax character of dividends and distributions declared during the years ended December 31, were as follows:
| Ordinary Income | Long-Term Capital Gain | Total | ||||||||||
| 2017 | $ | 646,997 | $ | 40,420 | $ | 687,417 | ||||||
| 2016 | 161,813 | - | 161,813 | |||||||||
As of December 31, 2017, the components of Distributable Earnings on a tax basis were as follows:
Undistributed Ordinary Income | $ | - | ||
Undistributed Long-Term Capital Gains | 10,832 | |||
Capital Loss Carryforwards | - | |||
Other Temporary Differences | - | |||
Unrealized Appreciation/(Depreciation) | 335,390 |
Note 11. New Accounting Pronouncement
In November 2016, the Financial Accounting Standards Board issued Accounting Standards Update “Restricted Cash” which will require entities to include the total of cash, cash equivalents, restricted cash, and restricted cash equivalents in the beginning and ending cash balances in the Statements of Cash Flows. The guidance will be applied retrospectively and is effective for fiscal years beginning after December 15, 2017, and interim periods within those years. Management is evaluating the impact, if any, of this guidance on the Fund’s presentation in the Statement of Cash Flows.
In March 2017, the Financial Accounting Standards Board issued Accounting Standards Update “Premium Amortization of Purchased Callable Debt Securities”, which amends the amortization period for certain purchased callable debt securities. Under the new guidance, the premium amortization of purchased callable debt securities that have explicit, non-contingent call features and are callable at fixed prices will be amortized to the earliest call date. The guidance will be applied on a modified retrospective basis and is effective for fiscal years, and their interim periods, beginning after December 15, 2018. Management is currently evaluating the impact of this guidance to the Fund.
In December 2017, the Tax Cut and Jobs Act of 2017 (“TCJA”) was passed. On initial review of TCJA, there is no anticipated direct impact to the Fund. However, Management is continuing to evaluate the impact of the TCJA to the Fund.
Note 12. Subsequent Events
Management has evaluated the impact of all subsequent events on the Fund through the date the financial statements were issued and has determined that there are no subsequent events requiring adjustment or additional disclosure in the financial statements.
24
Triloma EIG Energy Income Fund – Term I
Report of Independent Registered Public Accounting Firm
To the Board of Trustees and Shareholders of the Triloma EIG Energy Income Fund - Term I
Opinion on the Financial Statements
We have audited the accompanying statement of assets and liabilities, including the schedule of investments, of Board of Trustees and Shareholders of the Triloma EIG Energy Income Fund – Term I (the “Fund”) as of December 31, 2017, the related statements of operations and cash flows for the year ended December 31, 2017, the statement of changes in net assets for each of the two years in the period ended December 31, 2017, including the related notes, and the financial highlights for each of the two years in the period ended December 31, 2017 and for the period July 24, 2015 (commencement of operations) through December 31, 2015 (collectively referred to as the “financial statements”). In our opinion, the financial statements present fairly, in all material respects, the financial position of the Fund as of December 31, 2017, the results of its operations and its cash flows for the year then ended, the changes in its net assets for each of the two years in the period ended December 31, 2017 and the financial highlights for each of the two years in the period ended December 31, 2017 and for the period July 24, 2015 (commencement of operations) through December 31, 2015 in conformity with accounting principles generally accepted in the United States of America.
Basis for Opinion
These financial statements are the responsibility of the Fund’s management. Our responsibility is to express an opinion on the Fund’s financial statements based on our audits. We are a public accounting firm registered with the Public Company Accounting Oversight Board (United States) (“PCAOB”) and are required to be independent with respect to the Fund in accordance with the U.S. federal securities laws and the applicable rules and regulations of the Securities and Exchange Commission and the PCAOB.
We conducted our audits of these financial statements in accordance with the standards of the PCAOB. Those standards require that we plan and perform the audit to obtain reasonable assurance about whether the financial statements are free of material misstatement, whether due to error or fraud.
Our audits included performing procedures to assess the risks of material misstatement of the financial statements, whether due to error or fraud, and performing procedures that respond to those risks. Such procedures included examining, on a test basis, evidence regarding the amounts and disclosures in the financial statements. Our audits also included evaluating the accounting principles used and significant estimates made by management, as well as evaluating the overall presentation of the financial statements. Our procedures included confirmation of securities owned as of December 31, 2017 by correspondence with the custodian and brokers; when replies were not received from brokers, we performed other auditing procedures. We believe that our audits provide a reasonable basis for our opinion.

Certified Public Accountants
Tampa, Florida
February 26, 2018
We have served as the auditor of one or more investment companies in the Triloma EIG Energy Income Funds since 2015.
25
Triloma EIG Energy Income Fund – Term I
Trustees and Officers of the Fund (Unaudited)
The following chart lists Trustees and Officers as of December 31, 2017.
The Fund’s Statement of Additional Information (“SAI”) includes additional information about the Trustees and Officers. The SAI may be obtained without charge by calling 1-844-224-4714.
| Name | Birthdate | Trustee Since | NUMBER OF REGISTERED INVESTMENT COMPANIES IN FUND COMPLEX OVERSEEN BY TRUSTEE | |||
Interested Trustee | ||||||
Barry L. Goff
| 1961
| 2015
| 2
| |||
Brian T. Gilmore
| 1969
| 2015
| 2
| |||
Independent Trustees | ||||||
Jack A Cuneo
| 1947
| 2015
| 2
| |||
David W. Rothschild
| 1948
| 2015
| 2
| |||
Bruce E. Waits
| 1955
| 2015
| 2
| |||
The address for each Trustee is 201 North New York Avenue, Suite 200, Winter Park, FL 32789, unless otherwise indicated.
Interested Trustees
Barry L. Goff. Mr. Goff serves as the Fund’s Trustee. Mr. Goff also currently serves as an investment committee member of Triloma. Mr. Goff co-founded and has served as a principal and officer of various affiliates of Triloma Financial Group since 2012. Mr. Goff is responsible for the overall management of private equity and real estate investment opportunities at Triloma Financial Group. From 2003 to 2011, Mr. Goff served as a managing director of Tavistock Group, the private investment vehicle of Forbes Billionaire Joe Lewis. During that time Mr. Goff also served as the chief executive officer of Tavistock Restaurants, where he and his team assembled and operated a portfolio of almost 100 restaurants for Tavistock Group. While with Tavistock Group, from 2009 to 2011, Mr. Goff also organized and led Tavistock Capital Group, a team focused exclusively on originating and investing in various U.S.-based distressed asset opportunities, including the purchase of the senior secured debt of a restaurant operating company, the acquisition of a $491 million face value residential loan pool in a joint venture with the FDIC, and the acquisition of the St. Regis Hotel & Residences, a recently-developed world class property located in the heart of Buckhead in Atlanta, Georgia. Prior to joining Tavistock, Mr. Goff spent five years at CNL Financial Group serving as the Chief Investment Officer and President of CNL Restaurant Properties, Inc., where he was responsible for more than $1.4 billion of real estate investments and over $100 million of legacy equity and mezzanine funds. Previously, Mr. Goff practiced law for ten years in Atlanta, Georgia, Los Angeles, California and Orlando, Florida. Mr. Goff received a B.S. degree from the University of Central Florida, a J.D. from the University of Florida Levin College of Law, and an L.L.M. from New York University School of Law.
Brian T. Gilmore. Mr. Gilmore serves as the Fund’s Trustee. Mr. Gilmore also currently serves as a Senior Vice President of EIG and is one of EIG’s investment professionals responsible for the origination, evaluation, negotiation and acquisition of energy and infrastructure investments on a global basis. He is also a portfolio manager for EIG’s Global Project Funds. Mr. Gilmore joined EIG in 2002 from Banc of America Securities where he was a Vice President focusing on mergers and acquisitions in the Energy and Power Group. Previously, he was an Associate in the Project and Structured Finance group at Deutsche Banc Securities and also worked for National Economic Research Associates and Cambridge Energy Research Associates. Mr. Gilmore received an AB from Vassar College and an MBA from the University of Chicago.
26
Triloma EIG Energy Income Fund – Term I
Trustees and Officers of the Fund (Unaudited)
Independent Trustees
Jack A. Cuneo. Mr. Cuneo serves as the Fund’s Trustee. Mr. Cuneo has over 40 years of experience in the real estate industry and had been involved in a wide range of real estate investment activity including acquisitions, development, joint venture structuring, property sales, work outs and private equity financing for REITs and real estate operating companies. Mr. Cuneo was the founder, President and Chief Executive Officer of Chambers Street Properties (NYSE: CSG) until his retirement in March 2015. Prior to Chambers Street, he was the Chairman, President and CEO of CB Richards Ellis Realty Trust from March 2004 to June 2012, and an Executive Managing Director of CBRE Global Investors from July 2008 until June 2012. Mr. Cuneo also spent 26 years at Merrill Lynch where he served from 1997 to 2000 as Chairman and CEO of Merrill Lynch Hubbard, a real estate investment subsidiary which provided real estate investment programs for individual investors. Mr. Cuneo was a Managing Director of the Global Real Estate and Hospitality Group at Merrill Lynch from 2000 to 2002 where he led private equity, and advisory activities. Mr. Cuneo is a member of The Urban Land Institute, and the Policy Advisory Board at the Haas School of Business, at the University of California, Berkeley. Mr. Cuneo received a B.A. from City College of New York.
David W. Rothschild. Mr. Rothschild serves as the Fund’s Trustee. Mr. Rothschild has been engaged in the private practice of law in Canada primarily focusing on national and international business transactions involving Japanese corporations; complex commercial litigation; aboriginal transactions involving business, energy start- ups and infrastructure projects. Since 2012, Mr. Rothschild has served as a consultant supporting various energy and infrastructure projects with the Mohawk Council of Kahnawake and the Kahnawake Economic Development Corporation. From 2000 until 2012, Mr. Rothschild served as an independent Investment Committee member to three energy and infrastructure funds managed by EIG Global Energy Partners. From 1996 to 2012, Mr. Rothschild was a partner with Davis, LLP and co-managing partner of its Montreal Office. Prior to joining Davis, Mr. Rothschild was the co-founding partner of Hara Rothschild, Eastern Canada’s only boutique firm focused exclusively on Japan, and served as a partner of various other law firms including Fasken’s, Gottlieb & Associates, and Fraser & Beatty. Mr. Rothschild received a B.A. from Bishop’s University and a License en Droit from the Université de Sherbrooke.
Bruce E. Waits. Mr. Waits serves as the Fund’s Trustee. Since 2006, Mr. Waits has been engaged in the private practice of law in Texas serving large energy companies where he focuses on structuring tax efficient domestic and international commercial transactions, project review, documentation and tax planning, representation before the IRS and non-U.S. tax authorities, plus a wide range of other tax-related legal services. From 2000 to 2006, Mr. Waits was the General Tax Counsel for Chevron Phillips Chemical Company where he established and managed the tax department and was responsible for the company’s worldwide tax functions including project structuring, tax planning, controversies, legislation, compliance and tax accounting. Prior to joining Chevron Phillips, Mr. Waits spent 12 years with Phillips Petroleum Company where he began as a Senior Tax Attorney and was eventually promoted to General Tax Counsel with management responsibilities for worldwide tax planning and structuring, litigation and legislation. Previously, Mr. Waits worked seven years for the IRS, spent three years in public accounting and for two years was tax director of the First National Bank of Oklahoma City, at that time the largest bank in the state of Oklahoma. Mr. Waits earned a B.S. degree in business administration from Northeastern State University, a J.D. from the Tulsa University College of Law, and an LL.M. in tax from the New York University School of Law. Mr. Waits is licensed to practice law in the state of Oklahoma and Texas and is a member of the Oklahoma, Texas and American Bar Associations. Mr. Waits is also licensed as a certified public accountant in Oklahoma and Arkansas and has served in various committee leadership positions for the Tax Executives Institute, American Petroleum Institute and American Chemistry Council.
27
Triloma EIG Energy Income Fund – Term I
Trustees and Officers of the Fund (Unaudited)
Name | Birthdate | Positions Held | ||
Executive Officers | ||||
Deryck A. Harmer
| 1980
| President and Chief Executive Officer
| ||
Elizabeth Strouse
| 1974
| Chief Financial Officer
| ||
Hope L. Newsome
| 1977
| Secretary and Chief Compliance Officer
| ||
The address for each executive officer is 201 North New York Avenue, Suite 200, Winter Park, FL 32789.
Deryck A. Harmer. Mr. Harmer serves as the Fund’s President and Chief Executive Officer. Mr. Harmer also currently serves as president, chief executive officer and investment committee member of Triloma, positions that he has held since 2015. Prior to joining Triloma, Mr. Harmer spent over eleven years at CNL Financial Group, most recently as chief strategy officer, member of the operating committee and member of the board of directors for CNL Securities Corp., a FINRA registered broker-dealer. His responsibilities at CNL Financial Group included a variety of roles across the investment management and capital markets divisions, with experience creating, managing and raising capital for alternative investment vehicles. While at CNL Financial Group, Mr. Harmer also served as senior vice president and launched Corporate Capital Trust, a public non-traded business development company advised by CNL Fund Advisors Company and KKR Asset Management. Mr. Harmer served as senior vice president and investment committee member of CNL Fund Advisors Company, leading its investment and operating activities. Prior to joining CNL Financial Group, Mr. Harmer performed tax services for a broad range of companies at PricewaterhouseCoopers between 2002 and 2003. Mr. Harmer has a B.S., summa cum laude, in Accounting from Florida State University and an M.B.A. with a concentration in Finance from Rollins College.
Elizabeth Strouse. Ms. Strouse serves as our Chief Financial Officer. Ms. Strouse also currently serves as chief financial officer of Triloma, positions that she has held since 2016. Ms. Strouse has extensive accounting, administration and financial reporting experience in the investment management industry. Prior to joining Triloma, Ms. Strouse served as managing director with State Street Corp, primarily responsible for assisting their key asset management clients navigate the complex regulatory environment. From 2009 to 2014, Ms. Strouse served as chief accounting officer of Transamerica Asset Management, providing oversight for approximately $70 billion of assets under management within approximately 190 registered funds, including serving as the principal financial officer, chairman of the valuation committee, and member of various risk committees. Prior to joining Transamerica, Ms. Strouse led the fund administration team at TIAA-CREF and provided assurance services for investment management clients at PricewaterhouseCoopers. Ms. Strouse is a certified public accountant and received her B.B.A. in Accounting from the University of Michigan, and her M.Acc. from the University of South Florida.
Hope L. Newsome. Ms. Newsome serves as the Fund’s Secretary. Ms. Newsome also currently serves as chief compliance officer of Triloma and assistant general counsel and chief compliance officer to Triloma Securities, all positions that she has held since 2015. Ms. Newsome has extensive experience providing compliance and legal advice to financial institutions. Prior to joining Triloma, Ms. Newsome spent four years as chief compliance officer of Newport Group Securities, a FINRA registered broker-dealer and SEC registered investment adviser with over $21 billion dollars of assets under management. Ms. Newsome also held the positions of general counsel and chief compliance officer at International Assets Advisory, LLC, a firm managing over $124 million in assets, and as director, business practices and controls at AXA Equitable where she led a controls team that managed the review of more than 2,000 financial professionals across the United States. Ms. Newsome received her B.A. from Spelman College, and her J.D. from Barry University School of Law. She is a member of the Florida Bar and holds FINRA Series 7, 24, 53 and 66 licenses.
28
Triloma EIG Energy Income Fund – Term I
Supplemental Information (Unaudited)
Tax Information
For shareholders that do not have a December 31, 2017 tax year end, this notice is for informational purposes only. For shareholders with a December 31, 2017 tax year end, please consult your tax advisor as to the pertinence of this notice. For the fiscal year ended December 31, 2017, the Fund is designating the following items with regard to distributions paid during the year.
| Foreign Investors | ||||||||||||||
Ordinary Income
| Long-Term
| Total
|
Qualifying for
| Qualifying
| U.S. Government
| Interest Related
| Short-Term Capital Gain Dividends (5)
| |||||||
| 94.12% | 5.88% | 100.00% | 0.00% | 0.00% | 0.00% | 73.65% | 100.00% | |||||||
(1) Qualifying dividends represent dividends which qualify for the corporate dividends received deduction and is reflected as a percentage of ordinary Income distributions (the total of short-term capital gain and net investment income distributions).
(2) The percentage in this column represents the amount of “Qualifying Dividend Income” as created by the Jobs and Growth Tax Relief Reconciliation Act of 2003 and is reflected as a percentage of ordinary income distributions (the total of short-term capital gain and net investment income distributions). It is the intention of each of the aforementioned funds to designate the maximum amount permitted by law.
(3) “U.S. Government Interest” represents the amount of interest that was derived from direct U.S. Government obligations and distributed during the fiscal year. This amount is reflected as a percentage of ordinary income distributions. Generally, interest from direct U.S. Government obligations is exempt from state income tax. However, for shareholders who are residents of California, Connecticut and New York, the statutory threshold requirements were not satisfied to permit exemption of these amounts from state income.
(4) The percentage in this column represents the amount of “Interest Related Dividends” and is reflected as a percentage of ordinary income distribution. Interest related dividends are exempt from U.S. withholding tax when paid to foreign investors.
(5) The percentage of this column represents the amount of “Short-Term Capital Gain Dividends” and is reflected as a percentage of short-term capital gain distribution that is exempt from U.S. withholding tax when paid to foreign investors.
The information reported herein may differ from the information and distributions taxable to the shareholder for the calendar year ending December 31, 2017. Complete information will be computed and reported with your 2017 Form 1099-DIV.
29

Shareholder Information Client Services 844-224-4714 Our Client Services team is available Monday through Friday, 8:00 a.m. to 5:00 p.m. Central Time.
Corporate Offices 201 N New York Avenue, Suite 200 Winter Park, FL 32789 407-636-7115 trilomaenergy.com
Advisors Triloma Energy Advisors, LLC EIG Credit Management Company, LLC
Legal Counsel Dechert LLP 1095 Avenue of the Americas New York, NY 10036
Independent Registered Certified Public Accounting Firm PricewaterhouseCoopers LLP 4040 W Boy Scout Blvd, Suite 1000 Tampa, FL 33607
The Triloma EIG Energy Income Funds’ annual and semi-annual reports and other information filed with the U.S. Securities and Exchange Commission (SEC), can be obtained upon request and without charge by writing to the Triloma EIG Energy Income Funds at 201 North New York Avenue, Suite 200, Winter Park, FL 32789, by calling the Triloma EIG Energy Income Funds collect at 407-636-7115 or by accessing the Triloma EIG Energy Income Funds’ website at trilomaenergy.com.
| ||
© 2018 Triloma Financial Group TERM-RPT-ANNUAL |
|
| Item 2. | Code of Ethics. |
A code of ethics (the “Code of Ethics”), as defined in Item 2 of Form N-CSR, adopted by the Registrant and applicable to the Registrant’s principal executive officer and principal financial officer, was in effect during the entire period covered by this report. The Registrant has not made any substantive amendments to the Code of Ethics during the period covered by this report. The Registrant has not granted any waivers from provisions of the Code of Ethics during the period covered by this report. The Registrant’s Code of Ethics is attached hereto as Exhibit A(1).
| Item 3. | Audit Committee Financial Expert. |
The Registrant’s Board of Trustees has determined that Bruce E. Waits, Chair of the Registrant’s Audit Committee, is an “audit committee financial expert” and is not an “interested person” as that term is defined in Section 2(a)(19) of the Investment Company Act of 1940.
| Item 4. | Principal Accountant Fees and Services. |
(a)-(d) Aggregate fees billed to Registrant for the fiscal years ended December 31, 2017 and December 31, 2016 for professional services rendered by Registrant’s principal accountant was as follows:
| 2017 | 2016 | |||||||||
(a) | Audit Fees | $ | 102,856 | $ | 74,600 | |||||
(b) | Audit-Related Fees | $ | 8,250 | $ | -0- | |||||
(c) | Tax Fees | $ | 9,200 | $ | 35,700 | |||||
(d) | All Other Fees | $ | 900 | $ | 900 | |||||
Audit Fees include amounts related to the audit of the Registrant’s annual financial statements and services normally provided by the principal accountant in connection with statutory and regulatory filings.
All Other Fees include amounts billed for products and services other than those disclosed in paragraphs (a) through (c) of this Item.
(e)(1) The Registrant’s Audit Committee has adopted an Audit and Non-Audit Services Pre-Approval Policy (the “Policy”), which requires the Registrant’s Audit Committee to pre-approve all audit and non-audit services provided by the principal accountant to the Registrant. The Policy also requires the Audit Committee to pre-approve any engagement of the principal accountant to provide non-audit services to the Advisor or Sub-Advisor, if the services relate directly to the Registrant’s operations and financial reporting.
(e)(2) No fees included in (b)-(d) above were approved by the audit committee pursuant to paragraph (c)(7)(i)(C) of Rule 2-01 of Regulation S-X.
(f) Not applicable.
(g) Not applicable.
(h) Not applicable.
| Item 5. | Audit Committee of Listed Registrants. |
Not applicable.
| Item 6. | Schedule of Investments. |
| (a) | See Item 1. |
| (b) | Not applicable. |
| Item 7. | Disclosure of Proxy Voting Policies and Procedures for Closed-End Management Investment Companies. |
The Registrant has delegated its proxy voting responsibility to EIG. The proxy voting policies and procedures of EIG Credit Management Company, LLC (“EIG”), are set forth below. The guidelines are reviewed periodically by the Independent Trustees, and, accordingly, are subject to change.
Generally, client accounts being managed or advised by EIG invest in private securities (although on occasion client accounts may hold publicly traded securities). Regardless of how EIG obtains voting authority in portfolio securities (at time of acquisition or upon certain triggering events), EIG always endeavors to vote in such a way as to satisfy the goals and objectives of the particular client and pursuant to any written arrangements with a client account. Consistent with the requirements of Rule 206(4)-6 of the Investment Advisers Act of 1940 (the “Advisers Act”), before voting portfolio securities, EIG will follow the following procedures:
| • | EIG will consider all the relevant facts and circumstances surrounding the matter to be voted upon and any documents provided in connection with such matter, and will establish that: (i) there is a clear understanding of the vote at hand, (ii) any potential conflicts of interest are identified and communicated to the client prior to voting, and (iii) disclosure is provided as to how clients may obtain information on how their securities were voted. |
| • | EIG will provide complete proxy voting policies and procedures to clients upon request. |
Shareholder action may be required or solicited with respect to portfolio securities on matters including those relating to class actions (including matters relating to opting in or opting out of a class, and approving class settlements), bankruptcy or reorganizations. EIG will take all actions deemed appropriate by EIG with regard to such securities.
| Item 8. | Portfolio Managers of Closed-End Management Investment Companies. |
The management of the investment portfolio of the Fund is the responsibility of Triloma Energy Advisors, LLC (“Triloma”), and EIG (collectively referred to with Triloma as the “Advisors”) and their investment committees. The Triloma investment committee currently consists of Barry L. Goff, Deryck A. Harmer and Michael I. Wood. The EIG investment committee currently consists of R. Blair Thomas, William C. Sonneborn, Randall S. Wade and Rob H. Johnson.
Barry L. Goff. Mr. Goff serves as our Trustee. Mr. Goff also currently serves as an investment committee member of Triloma. Mr. Goff co-founded and has served as a principal and officer of various affiliates of Triloma Financial Group since 2012. Mr. Goff is responsible for the overall management of private equity and real estate investment opportunities at Triloma Financial Group. From 2003 to 2011, Mr. Goff served as a managing director of Tavistock Group, the private investment vehicle of Forbes Billionaire Joe Lewis. During that time Mr. Goff also served as the chief executive officer of Tavistock Restaurants, where he and his team assembled and operated a portfolio of almost 100 restaurants for Tavistock Group. While with Tavistock Group, from 2009 to 2011, Mr. Goff also organized and led Tavistock Capital Group, a team focused exclusively on originating and investing in various U.S.-based distressed asset opportunities, including the purchase of senior secured debt, the acquisition of a $491 million face value residential loan pool in a joint venture with the FDIC, and the acquisition of the St. Regis Hotel & Residences, a recently-developed world class property located in the heart of Buckhead in Atlanta, Georgia. Prior to joining Tavistock, Mr. Goff spent five years at CNL Financial Group serving as the Chief Investment Officer and President of CNL Restaurant Properties, Inc., where he was responsible for more than $1.4 billion of real estate investments and over $100 million of legacy equity and mezzanine funds. Previously, Mr. Goff practiced law for ten years in Atlanta, Los Angeles and Orlando, Florida. Mr. Goff received a B.S. degree from the University of Central Florida, a J.D. from the University of Florida Levin College of Law, and an L.L.M. from New York University School of Law.
Deryck A. Harmer. Mr. Harmer serves as our President and Chief Executive Officer. Mr. Harmer also currently serves as president, chief executive officer and investment committee member of Triloma, positions that he has held since 2015. Prior to joining Triloma, Mr. Harmer spent over eleven years at CNL Financial Group, most recently as chief strategy officer, member of the operating committee and member of the board of directors for CNL Securities Corp., a FINRA registered broker-dealer. His responsibilities at CNL Financial Group included a variety of roles across the investment management and capital markets divisions, with experience creating, managing and raising capital for alternative investment vehicles. While at CNL Financial Group, Mr. Harmer also served as senior vice president and launched Corporate Capital Trust, a public non-traded business development company advised by CNL Fund Advisors Company and KKR Asset Management. Mr. Harmer served as senior vice president and investment committee member of CNL Fund Advisors Company, leading its investment and operating activities. Prior to joining CNL Financial Group, Mr. Harmer performed tax services for a broad range of companies at PricewaterhouseCoopers between 2002 and 2003. Mr. Harmer has a B.S., summa cum laude, in Accounting from Florida State University and an M.B.A. with a concentration in Finance from Rollins College.
Michael I. Wood. Mr. Wood serves as investment committee member of Triloma. Mr. Wood co-founded and has served as a principal and officer of various affiliates of Triloma Financial Group since 2012. Mr. Wood has extensive investment, financial and operational management experience. From 2005 to 2011, Mr. Wood served as an executive with Tavistock Group, the private investment vehicle of Forbes billionaire Joe Lewis. Mr. Wood was responsible for sourcing, structuring and closing acquisitions and served as Executive Vice President of Tavistock Group and Chief Operating Officer of Tavistock Capital Group. From 1997 to 2005, Mr. Wood served as an executive officer at CNL Financial Group, with responsibilities including acquisitions, asset management, workouts, treasury, finance and strategic planning. Mr. Wood served as Chief Operating Officer of CNL Restaurant Properties, with responsibility for more than $1.4 billion in real estate assets, and represented the eighteen CNL Income Funds in a $2.5 billion merger with publicly-traded U.S. Restaurant Properties. Prior to joining CNL Financial Group, Mr. Wood spent ten years in the corporate headquarters of Xerox Corporation, where he oversaw strategic real estate finance projects. Mr. Wood received his B.S. in Computer Science and an M.B.A. from The University of North Carolina at Chapel Hill.
Below is biographical information relating to the members of EIG’s investment committee and certain members of its management team:
R. Blair Thomas. Mr. Thomas is Chief Executive Officer of EIG Partners, as well as Chairman of the Investment Committee and the Executive Committee. EIG was formerly part of Trust Company of the West where Mr. Thomas was a Group Managing Director and a member of the Board of Directors of TCW Asset Management Company. Prior to joining EIG Partners in 1998, Mr. Thomas was a senior investment officer with the Inter-American Development Bank and a project finance attorney at the law firm of Brown & Wood in New York. Mr. Thomas also served as an advisor on energy and budget policy in the first Bush White House. Mr. Thomas received a BA from the University of Virginia, a JD from New York Law School and an LLM from Georgetown University Law Center. Mr. Thomas is a member of the Board of Directors of Prumo Logistica and the Jefferson Scholars Foundation at the University of Virginia.
William C. Sonneborn. Mr. Sonneborn is the President of EIG Partners and a member of EIG’s Investment Committees and Allocation Committee, and EIG Partners’ Executive Committee. Prior to joining EIG Partners, he was a partner of Kohlberg Kravis Roberts & Co. and a member of KKR’s Management Committee. Mr. Sonneborn served as CEO of KKR Asset Management (the public markets side of KKR) as well as CEO and Director of KKR Financial Corporation (NYSE: KFN), a publicly traded specialty finance firm. He also sat on the board of Nephila Capital, a $10 billion Bermuda-based hedge fund in which KKR purchased a stake in 2013. Prior to joining KKR, he was with The TCW Group, Inc., most recently as President and Chief Operating Officer. Previously, he worked at Goldman, Sachs & Co. in New York and Hong Kong, where he focused on mergers & acquisitions for financial institutions. Mr. Sonneborn graduated with honors from Georgetown University. He is involved with a variety of non-profit organizations, serving as a director or trustee of the Georgetown University McDonough School of Business, Lucile Packard Foundation for Children’s Health at Stanford University, and the San Francisco Zoo.
Rob H. Johnson. Mr. Johnson is a Managing Director and leads EIG’s Oil & Gas Direct Lending investment activities in the United States. He is based in the firm’s Houston office and serves as a member of the Investment Committee. Mr. Johnson has over 20 years’ experience as a leveraged finance banker, including 10 years in the Energy sector. Prior to joining EIG in 2015, Mr. Johnson spent 17 years with Wells Fargo, most recently as Managing Director and Head of Energy & Power Leveraged Finance. In this capacity, he was responsible for originating, structuring and executing pro rata and institutional loans, 2nd lien loans, bridge financing, high yield bonds and mezzanine debt. Prior to Wells Fargo, Mr. Johnson worked for Citicorp Securities in Leveraged Finance, Restructuring Advisory and Loan Syndications. Before beginning his financial career, he served four years in the US Marine Corps. Mr. Johnson earned a B.A. in History from the Sewanee - University of the South, and his
M.B.A. from the University of North Carolina — Chapel Hill. He is on the Board of Sewanee’s Babson Center for Global Commerce.
Randall S. Wade. Mr. Wade is the Chief Operating Officer for EIG Partners and a member of EIG’s Investment Committees and Allocation Committee, and a member of EIG Partners’ Executive Committee. He has primary responsibility for the operations and administration of EIG Partners and its investment vehicles. Since joining EIG Partners in 1996, Mr. Wade has filled various roles including head of EIG Partners’ structured funds, investment professional with coverage responsibility for Australia and an analyst for oil and gas investments. Prior to joining EIG Partners, Mr. Wade was a Commercial Lending Officer for First Interstate Bank of Texas, where he was responsible for developing a middle-market loan portfolio. Mr. Wade received his BA in Economics and his BBA in Finance from the University of Texas at Austin.
Other Accounts Managed by Portfolio Managers
The portfolio managers primarily responsible for the day-to-day management of the Fund also manage other registered investment companies, other pooled investment vehicles and other accounts, as indicated below. The following table identifies, as of December 31, 2017: (i) the number of other registered investment companies, pooled investment vehicles and other accounts managed by each portfolio manager; and (ii) the total assets of such companies, vehicles and accounts, and the number and total assets of such companies, vehicles and accounts with respect to which the advisory fee is based on performance.
| (dollars in thousands) | Number of Accounts | Assets of Accounts | Number of Accounts Subject to a Performance Fee | Assets Subject to a Performance Fee | ||||||||||||
Barry L. Goff | ||||||||||||||||
Registered Investment Companies | 2 | $ | 44,392 | 2 | $ | 44,392 | ||||||||||
Pooled Investment Vehicles Other Than Registered Investment Companies | 0 | $ | 0 | 0 | $ | 0 | ||||||||||
Other Accounts | 0 | $ | 0 | 0 | $ | 0 | ||||||||||
Deryck A. Harmer | ||||||||||||||||
Registered Investment Companies | 2 | $ | 44,392 | 2 | $ | 44,392 | ||||||||||
Pooled Investment Vehicles Other Than Registered Investment Companies | 0 | $ | 0 | 0 | $ | 0 | ||||||||||
Other Accounts | 0 | $ | 0 | 0 | $ | 0 | ||||||||||
Michael I. Wood | ||||||||||||||||
Registered Investment Companies | 2 | $ | 44,392 | 2 | $ | 44,392 | ||||||||||
Pooled Investment Vehicles Other Than Registered Investment Companies | 0 | $ | 0 | 0 | $ | 0 | ||||||||||
Other Accounts | 0 | $ | 0 | 0 | $ | 0 | ||||||||||
R. Blair Thomas | ||||||||||||||||
Registered Investment Companies | 2 | $ | 44,392 | 2 | $ | 44,392 | ||||||||||
Pooled Investment Vehicles Other Than Registered Investment Companies* | 61 | $ | 16,477,356 | 41 | $ | 14,386,443 | ||||||||||
Other Accounts* | 11 | $ | 1,206,020 | 11 | $ | 1,206,020 | ||||||||||
William C. Sonneborn | ||||||||||||||||
Registered Investment Companies | 2 | $ | 44,392 | 2 | $ | 44,392 | ||||||||||
Pooled Investment Vehicles Other Than Registered Investment Companies* | 61 | $ | 16,477,356 | 41 | $ | 14,386,443 | ||||||||||
Other Accounts* | 11 | $ | 1,206,020 | 11 | $ | 1,206,020 | ||||||||||
Randall S. Wade | ||||||||||||||||
Registered Investment Companies | 2 | $ | 44,392 | 2 | $ | 44,392 | ||||||||||
Pooled Investment Vehicles Other Than Registered Investment Companies* | 61 | $ | 16,477,356 | 41 | $ | 14,386,443 | ||||||||||
Other Accounts* | 11 | $ | 1,206,020 | 11 | $ | 1,206,020 | ||||||||||
Rob H. Johnson | ||||||||||||||||
Registered Investment Companies | 2 | $ | 44,392 | 2 | $ | 44,392 | ||||||||||
Pooled Investment Vehicles Other Than Registered Investment Companies* | 11 | $ | 1,036,940 | 7 | $ | 794,385 | ||||||||||
Other Accounts* | 5 | $ | 1,205,944 | 5 | $ | 1,205,944 |
| * | All assets reported above are gross assets (including unfunded commitments) as of December 31, 2017. |
Compensation of Portfolio Managers
Each of Triloma Financial Group’s senior executives’ compensation, including each of the investment personnel who render services to us on behalf of Triloma, consists primarily of base pay and a discretionary bonus, profit participation, equity interest or other performance based incentive compensation. Senior executives also participate in benefit plans and programs generally available to all employees of Triloma Financial Group.
In general, the amount of the compensation will be based on a combination of factors that may include: the market levels of compensation for such position; an individual’s contribution, performance and execution of managerial responsibilities, client interactions and support of colleagues; the overall performance of Triloma including the revenues or profitability derived from the management of the Fund; and the overall performance and profitability of Triloma Financial Group.
EIG’s firm-wide compensation structure, which covers investment personnel who render services to the Fund, consists of a salary, bonus and carried interest participation. Carry allocations and other forms of compensation are generally commensurate with the seniority and expected contribution that the respective employees make to the success of the firm and the funds it manages.
Triloma’s and EIG’s investment personnel are not employed by the Fund and receive no direct compensation from the Fund in connection with their investment management activities.
Securities Ownership of Portfolio Managers
The following table shows the dollar range of equity securities in the Fund beneficially owned by each member of Triloma’s and EIG’s investment committee as of December 31, 2017.
Name of Investment Committee Member | Dollar Range of Equity Securities in the Fund(1) | |||
Barry L. Goff | $ | 10,001 - $50,000 | ||
Deryck A. Harmer | $ | 50,001 - $100,000 | ||
Michael I. Wood | $ | 10,001 - $50,000 | ||
R. Blair Thomas | $ | 100,001 - $500,000 | ||
William C. Sonneborn | $ | 100,001 - $500,000 | ||
Randall S. Wade | $ | 100,001 - $500,000 | ||
Rob H. Johnson | $ | 50,001 - $100,000 | ||
| (1) | Dollar ranges are as follows: None, $1 - $10,000, $10,001 - $50,000, $50,001 - $100,000, $100,001 - $500,000, $500,001 - $1,000,000, or Over $1,000,000. |
Potential Conflicts of Interest
Triloma, EIG and their respective affiliates will be subject to certain conflicts of interest as a result of EIG serving as the Fund’s investment sub-adviser. These conflicts will arise primarily from the involvement of Triloma, EIG and their respective affiliates in other activities that may conflict with those of the Fund. Shareholders should be aware that individual conflicts will not necessarily be resolved in favor of the Fund’s interest.
The Fund may compete with certain affiliates of Triloma and EIG for investments, subjecting Triloma and EIG and its affiliates to certain conflicts of interest in evaluating the suitability of investment opportunities and making or recommending acquisitions on the Fund’s behalf. The personnel of EIG and Triloma allocate their time between identifying investment opportunities and making investment recommendations and performing similar functions for other business activities in which
they may be involved. Triloma, EIG and their respective affiliates may give advice and recommend securities to other clients, in accordance with the investment objectives and strategies of such other clients, which may differ from advice given to, or the timing or nature of the action taken with respect to, the Fund so long as it is their policy, to the extent practicable, to recommend for allocation and/or allocate investment opportunities to the Fund on a fair and equitable basis relative to their other clients, even though their investment objectives may overlap with those of the Fund.
The Fund’s service providers (including lenders, brokers, attorneys and investment banking firms) may be investors in the Fund and/or sources of investment opportunities and counterparties therein. This may influence Triloma and EIG in deciding whether to select such a service provider. Notwithstanding the foregoing, investment transactions for the Fund that require the use of a service provider will generally be allocated to service providers on the basis of best execution (and possibly to a lesser extent in consideration of such service provider’s provision of certain investment-related services that Triloma and EIG believe to be of benefit to the Fund). The officers, directors, members, managers and employees of Triloma or EIG may trade in securities for their own accounts, subject to restrictions and reporting requirements as may be required by law and internal policies, or otherwise determined from time to time by Triloma or EIG.
| Item 9. | Purchases of Equity Securities by Closed-End Management Company and Affiliated Purchasers. |
Registrant Purchases of Equity Securities (5)
| Period | (a) Total Number of Shares Purchased | (b) Average Price Paid per Share | (c) Total Number of Shares Purchased as Part of Publicly Announced Plan | (d) Maximum Number of Shares that May Yet Be Purchased Under the Plan | ||||||||||||
December 31, 2016 to March 31, 2017 (1) | — | — | — | — | ||||||||||||
March 31, 2017 to June 30, 2017(2) | — | — | — | — | ||||||||||||
June 30, 2017 to September 30, 2017 (3) | — | — | — | — | ||||||||||||
September 30, 2017 to December 31, 2017(4) | — | — | — | — | ||||||||||||
Total | — | — | — | — | ||||||||||||
| (1) | The Fund, in accordance with the terms and conditions set forth in its prospectus, offered to purchase from shareholders of the Fund shares of the Fund. The offer commenced on February 27, 2017, for the purchase of up to 1,796 Shares and expired on March 24, 2017. |
| (2) | The Fund, in accordance with the terms and conditions set forth in its prospectus, offered to purchase from shareholders of the Fund shares of the Fund. The offer commenced on May 22, 2017, for the purchase of up to 2,420 Shares and expired on June 26, 2017. |
| (3) | The Fund, in accordance with the terms and conditions set forth in its prospectus, offered to purchase from shareholders of the Fund shares of the Fund. The offer commenced on August 28, 2017, for the purchase of up to 2,941 Shares and expired on September 26, 2017. |
| (4) | The Fund, in accordance with the terms and conditions set forth in its prospectus, offered to purchase from shareholders of the Fund shares of the Fund. The offer commenced on November 27, 2017, for the purchase of up to 6,862 Shares and expired on December 26, 2017. |
| (5) | The Fund conducts a share repurchase program, pursuant to which it intends to repurchase, during each calendar quarter, up to 2.5% of the average number of shares outstanding in the prior four calendar quarters (or a portion thereof during the Fund’s first fiscal year) at a price based on the Fund’s NAV per share on the date of repurchase. At the discretion of the Board of Trustees (the “Board”), the Fund intends to limit the number of shares to be repurchased during any calendar year to the number of shares the Fund can repurchase with cash on hand and cash available from borrowings. The Board may amend, suspend or terminate the share repurchase program upon 30 days’ notice. All |
| shares purchased by the Fund pursuant to the share repurchase program will be retired and thereafter will be authorized and unissued shares. |
| Item 10. | Submission of Matters to a Vote of Security Holders. |
None.
| Item 11. | Controls and Procedures. |
(a) The certifying officers, whose certifications are included herewith, have evaluated the Registrant’s disclosure controls and procedures within 90 days of the filing date of this report. In their opinion, based on their evaluation, the Registrant’s disclosure controls and procedures are adequately designed, and are operating effectively to ensure, that information required to be disclosed by the Registrant in the reports it files or submits under the Securities Exchange Act of 1934 is recorded, processed, summarized and reported within the time periods specified in the Securities and Exchange Commission’s rules and forms.
(b) There were no significant changes in the Registrant’s internal control over financial reporting that occurred during the Registrant’s last fiscal half-year that have materially affected, or are reasonably likely to materially affect, the Registrant’s internal control over financial reporting.
| Items 12. | Disclosure of Securities Lending Activities for Closed-End Management Investment Companies. |
None.
| Items 13. | Exhibits. |
(a)(1) The Registrant’s code of ethics pursuant to Item 2 of Form N-CSR is attached hereto as Exhibit A(1).
(a)(2) A separate certification for the principal executive officer and the principal financial officer of the Registrant as required by Rule 30a-2(a) under the Investment Company Act of 1940, as amended (17 CFR 270.30a-2(a)), are filed herewith as Exhibit A(2).
(b) Officer certifications as required by Rule 30a-2(b) under the Investment Company Act of 1940, as amended (17 CFR 270.30a-2(b)) also accompany this filing as Exhibit B.
SIGNATURES
Pursuant to the requirements of the Securities Exchange Act of 1934 and the Investment Company Act of 1940, the registrant has duly caused this report to be signed on its behalf by the undersigned, thereunto duly authorized.
| (Registrant) | Triloma EIG Energy Income Fund - Term I | |||||
| By (Signature and Title)* | /s/ Deryck A. Harmer | |||||
| Deryck A. Harmer | ||||||
| Chief Executive Officer | ||||||
| Date: February 27, 2018 | ||||||
Pursuant to the requirements of the Securities Exchange Act of 1934 and the Investment Company Act of 1940, this report has been signed below by the following persons on behalf of the registrant and in the capacities and on the dates indicated.
| By (Signature and Title)* | /s/ Deryck A. Harmer | |||||
| Deryck A. Harmer | ||||||
| Chief Executive Officer | ||||||
| Date: February 27, 2018 | ||||||
| By (Signature and Title)* | /s/ Elizabeth Strouse | |||||
| Elizabeth Strouse | ||||||
| Chief Financial Officer | ||||||
| Date: February 27, 2018 | ||||||
| * | Print the name and title of each signing officer under his or her signature. |